UNITED STATES
SECURITIES AND EXCHANGE COMMISSION
Washington, D.C. 20549
FORM N-CSR
CERTIFIED SHAREHOLDER REPORT OF REGISTERED
MANAGEMENT INVESTMENT COMPANIES
Investment Company Act file number 811-05514
Wilmington Funds
(Exact name of registrant as specified in charter)
Wilmington Funds Management Corporation
Rodney Square North
1100 North Market Street
Wilmington, DE 19890
(Address of principal executive offices) (Zip code)
John McDonnell
Wilmington Funds Management Corporation
Rodney Square North
1100 North Market Street
Wilmington, DE 19890-0001
(Name and address of agent for service)
Registrant’s telephone number, including area code: 302-651-8409
Date of fiscal year end: April 30
Date of reporting period: April 30, 2018
Explanatory Note: Due to a clerical error, net investment income per share and net asset value per share were incorrectly reported in the 2018 financial highlights for the Service Class of the Wilmington U.S. Government Money Market Fund. The amounts have been corrected in the financial highlights for the year ended April 30, 2018.
Form N-CSR is to be used by management investment companies to file reports with the Commission not later than 10 days after the transmission to stockholders of any report that is required to be transmitted to stockholders under Rule 30e-1 under the Investment Company Act of 1940 (17 CFR 270.30e-1). The Commission may use the information provided on Form N-CSR in its regulatory, disclosure review, inspection, and policymaking roles.
A registrant is required to disclose the information specified by Form N-CSR, and the Commission will make this information public. A registrant is not required to respond to the collection of information contained in Form N-CSR unless the Form displays a currently valid Office of Management and Budget (“OMB”) control number. Please direct comments concerning the accuracy of the information collection burden estimate and any suggestions for reducing the burden to Secretary, Securities and Exchange Commission, 450 Fifth Street, NW, Washington, DC 20549-0609. The OMB has reviewed this collection of information under the clearance requirements of 44 U.S.C. § 3507.
Item 1. Reports to Stockholders.
The Report to Shareholders is attached herewith.

WILMINGTON FUNDS April 30, 2018 PRESIDENT’S MESSAGE AND Annual Report WILMINGTON FUNDS Equity Fund Wilmington International Fund Alternatives Fund Wilmington Global Alpha Equities Fund Asset Allocation Funds Wilmington Real Asset Fund Wilmington Diversified Income Fund

Wilmington International Fund (“International Fund”), (formerly Wilmington Multi-Manager International Fund)
Wilmington Global Alpha Equities Fund (“Global Alpha Equities Fund”)
Wilmington Real Asset Fund (“Real Asset Fund”), (formerly Wilmington Multi-Manager Real Asset Fund)
Wilmington Diversified Income Fund (“Diversified Income Fund”), (formerly Wilmington Strategic Allocation Moderate Fund)
CONTENTS
[This Page Intentionally Left Blank]
i
Esteemed Shareholder:
I am pleased to present the Annual Report of the Wilmington Funds (the “Trust”), covering the Trust’s annual fiscal year of May 1, 2017, through April 30, 2018. Inside you will find a comprehensive review of the Trust’s holdings and financial statements.
The economy and financial markets in review
Wilmington Funds Management Corporation and Wilmington Trust Investment Advisors, Inc. (the Trust’s investment advisor and subadvisor, respectively), have provided the following review of the economy, bond markets, and stock markets for the Trust’s annual fiscal year period.
The economy
The U.S. economy has shown strength over the past year, with the second, third, and fourth quarters of 2018 exhibiting the strongest growth since 2015. Following the disappointment of Congress’s inability to pass comprehensive healthcare reform, Republicans redeemed themselves by passing the Tax Cuts and Jobs Act in December of 2017, which contributed to surging confidence from consumers and businesses alike. The Institute of Supply Management (“ISM”) Manufacturing Purchasing Managers Index (“PMI”)1 peaked at 60.8 in February 2018—the highest level since 2004. Also in February, the Conference Board’s measure of consumer confidence reached the highest levels since 2000. Yet against this euphoric backdrop, Core Personal Consumption Expenditure (“PCE”) inflation held below the Federal Reserve’s 2% target and has only recently accelerated. As a result, the “goldilocks” (not too hot, not too cold) characterization of the U.S. economy has continued to ring true, with economic data for much of the fiscal year meeting or exceeding expectations, but not coming in so strong as to force the hand of the Federal Reserve into accelerating monetary policy tightening. In our estimation, the U.S. economy will grow at a pace of approximately 3% in 2018, with 0.5–0.75% of that attributable to tax cuts.
We are increasingly aware that the U.S. is closer to the end of the business cycle than to the beginning. The U.S. economic expansion is officially the second-longest on record. The labor market is tight by multiple measures, and the Federal Reserve is in the midst of a rate-hiking campaign (although it continues to move gradually). This has led short-maturity interest rates higher and contributed to the flattening of the yield curve; at the time of writing, the yield curve is less than 45 basis points (0.45%) away from inverting. (An inverted yield curve has preceded each of the last five recessions.) We do not view a U.S. recession as imminent but consider the U.S. economy in the later stages of the economic cycle.
Moving beyond U.S. borders, the past year has marked a period of synchronized global growth. The eurozone far surpassed growth expectations in 2017, with measures of loan growth, business expansion, and consumer confidence accelerating in the second half of 2017. Japan has printed a string of eight positive quarters of GDP growth, the longest such stretch since the 1990s. Emerging markets have also benefited from robust global demand and rising oil prices, which have increased nearly 50% over the past year. Some of this momentum cooled as the calendar turned on the new year. We still see economic growth as having legs, but the pace of growth across the board has decelerated, particularly relative to elevated expectations. We are watching carefully for signs of a more sustained slowdown, which would challenge our overall view.
Bond markets
The past year has been a challenging one for bond investors. For the fiscal year through January, bonds were holding their value and even posting modest single-digit total returns. However, inflationary fears began to emerge in the first quarter of 2018, sending the yield on the 10-year U.S. Treasury above 3% by the end of April. This was the first time the 10-year yield breached 3% since the end of 2013. The upward move in the short end of the yield curve has been even more dramatic and, as mentioned above, the yield curve has flattened alongside three rate hikes from the Fed (in June, December, and March). Higher yields have weighed on the price return of bonds, particularly for short-to-intermediate maturities. The Bloomberg Barclays U.S. Treasury Bond Index2 has returned -1.07% over the period.
Investment-grade credit spreads remain tight but have increased in 2018. Spread stabilization and lower supply in coming months should support valuations. High-yield bond credit spreads to Treasuries remain quite low relative to history, despite higher volatility in 2018 and fund outflows from the asset class. Defaults are expected to remain low in the coming year.
For the 12-month period May 1, 2017 to April 30, 2018, certain Bloomberg indices performed as follows3:
| | | | | | | | |
| | | | |
Bloomberg Barclays U.S. Treasury Bond Index | | Bloomberg Barclays U.S. Aggregate Bond Index4 | | Bloomberg Barclays U.S. Credit Bond Index5 | | Bloomberg Barclays Municipal Bond Index6 | | Bloomberg Barclays U.S. Corporate High Yield
Bond Index7 |
| | | | |
-1.07% | | -0.32% | | 0.65% | | 1.56% | | 3.26% |
PRESIDENT’S MESSAGE / April 30, 2018 (unaudited)
ii
Equity markets
The synchronized global growth discussed earlier acted as a rising tide lifting all equity boats for most of the year, and equity markets enjoyed extremely low levels of volatility through January. U.S. equities were propelled by a healthy consumer, low inflation, a weakening dollar, and tax cuts. As strong as U.S. equity returns were, those of developed international and emerging economies were even better, particularly in U.S. dollar terms. However, equity markets experienced several hiccups in recent months. Concerns have mounted regarding higher inflation, regulations on technology companies, and protectionism, all of which have weighed on global equities and contributed to higher volatility in 2018. Additionally, the positive tailwind for U.S. and emerging markets equities coming from a weaker dollar will fade, as the U.S. dollar has reversed this year’s weakness. The dollar is 0.4% stronger year to date through April and increased 2.7% in the last two weeks of April alone. Equity markets have been choppier of late, but valuations are not overly concerning (though they are higher than 10-year averages across a number of regions), and we continue to believe the economic fundamentals are encouraging going forward. Therefore, we maintain our preference for stocks over bonds.
For the 12-month period May 1, 2017 to April 30, 2018, certain stock market indices performed as follows:
| | | | | | |
| | | |
S&P 500® Index8 | | Russell 2000® Index9 | | MSCI EAFE (Net) Index10 | | MSCI Emerging Markets (Net) Index11 |
| | | |
13.27% | | 11.54% | | 14.51% | | 21.71% |
Despite growing uncertainty in financial markets, we remain focused on managing risk and growing our clients’ capital to help achieve their long-term goals.
Sincerely,

|
Christopher D. Randall |
President |
May 25, 2018 |
April 30, 2018 (unaudited) / PRESIDENT’S MESSAGE
iii
Must be preceded or accompanied by a prospectus.
Past performance is no guarantee of future results. The index performance quoted is for illustrative purposes only and is not representative of any specific investment. Diversification does not ensure a profit nor protect against loss.
All investments involve risk, including the possible loss of principal. Equity Securities are subject to price fluctuation and possible loss of principal. Small- and mid-cap stocks involve greater risks and volatility than large-cap stocks. International investments are subject to special risks, including currency fluctuations, social, economic, and political uncertainties, which could increase volatility. These risks are magnified in emerging markets.
High-yield, lower-rated securities generally entail greater market, credit, and liquidity risks than investment grade securities and may include higher volatility and higher risk of default.
1. ISM Manufacturing PMI Report on Business is based on data compiled from monthly replies to questions asked of purchasing and supply executives in over 400 industrial companies. For each of the indicators measured (New Orders, Backlog of Orders, New Export Orders, Imports, Production, Supplier Deliveries, Inventories, Customers Inventories, Employment, and Prices), this report shows the percentage reporting each response, the net difference between the number of responses in the positive economic direction and the negative economic direction and the diffusion index. Responses are raw data and are never changed.
2. Bloomberg Barclays U.S. Treasury Bond Index is a market capitalization weighted index that includes all publicly issued, U.S. Treasury securities that have a remaining maturity of at least one year, are rated investment-grade, and have $250 million or more of outstanding face value. The index is unmanaged and investments cannot be made directly in an index.
3. Bond prices are sensitive to changes in interest rates and a rise in interest rates can cause decline in their prices.
4. Bloomberg Barclays U.S. Aggregate Bond Index is widely used benchmark index for the domestic investment-grade bond market composed of securities from the Barclays Government/Corporate Bond Index, Mortgage-Backed Securities Index and Asset-Backed Securities Index. The index typically includes fixed income securities with overall intermediate- to long-term average maturities. The index is unmanaged and investments cannot be made directly in an index.
5. Bloomberg Barclays U.S. Credit Bond Index tracks the performance of domestic investment-grade corporate bonds and is composed of all publicly issued, fixed-rate, nonconvertible, investment-grade corporate debt. The index is unmanaged and investments cannot be made directly in an index.
6. Bloomberg Barclays Municipal Bond Index tracks the performance of long-term, tax-exempt, investment-grade bond market. To be included in the index, bonds must have an outstanding par balance of at least $7 million and be issued as part of a transaction of at least $75 million. The index is unmanaged and investments cannot be made directly in an index.
7. Bloomberg Barclays U.S. Corporate High Yield Bond Index measures the USD-denominated, high yield, fixed-rate corporate bond market. Securities are classified as high yield if the middle rating of Moody’s, Fitch, and S&P is Ba1/BB+/BB+ or below. Bonds from issuers with an emerging markets country of risk, based on the Bloomberg Barclays EM country definition, are excluded. The U.S. Corporate High Yield Bond Index is a component of the U.S. Universal and Global High Yield Indices. An investment cannot be made directly in an index.
8. The S&P 500® Index is a capitalization-weighted index of 500 stocks designed to measure performance of the broad domestic economy through changes in the aggregate market value of 500 stocks representing all major industries. The index is unmanaged and investments cannot be made directly in an index.
9. The Russell 2000® Index measures the performance of the 2,000 smallest companies in the Russell 3000 Index, which represents approximately 8% of the total market capitalization of the Russell 3000 Index. As of its latest reconstitution, the index had a total market capitalization range of approximately $128 million to $1.3 billion.
10. MSCI EAFE (Net) Index is a free float-adjusted market capitalization index that is designed to measure equity market performance of developed markets, excluding the U.S. & Canada. The index consisted of the following 21 developed market country indices: Australia, Austria, Belgium, Denmark, Finland, France, Germany, Hong Kong, Ireland, Israel, Italy, Japan, Netherlands, New Zealand, Norway, Portugal, Singapore, Spain, Sweden, Switzerland and the United Kingdom. The index is unmanaged and investments cannot be made directly in an index. The performance of this index is reduced by the taxes on dividends paid by the international securities issuers in the index.
11. MSCI Emerging Markets (Net) Index is a free float-adjusted market capitalization index that is designed to measure equity market performance of emerging markets. The MSCI Emerging Markets Index consisted of the following 24 emerging market country indices: Brazil, Chile, China, Colombia, Czech Republic, Egypt, Greece, Hungary, India, Indonesia, Korea, Malaysia, Mexico, Pakistan, Peru, Philippines, Poland, Qatar, Russia, South Africa, Taiwan, Thailand, Turkey and United Arab Emirates. The index is unmanaged and investments cannot be made directly in an index. The performance of this index is reduced by the taxes on dividends paid by the international securities issuers in the index.
PRESIDENT’S MESSAGE / April 30, 2018 (unaudited)
1
WILMINGTON INTERNATIONAL FUND
Management’s Discussion of Fund Performance
For the fiscal year ended April 30, 2018, Wilmington International Fund (the “Fund”) had a total return of 17.18%* for Class A Shares and 17.29%* for Class I Shares, versus its benchmark, the Morgan Stanley Capital International - All Country World ex-US Index (Net, USD) (MSCI ACWI ex-US Net Index)** which had a total return of 15.91%. The MSCI ACWI ex-US Net Index is a free float-adjusted market capitalization index that is designed to measure developed and emerging market equity performance, excluding the United States.
For the fiscal year,Asian (excluding Japanese) stocks returned 24.01%. Chinese e-commerce and Korean and Taiwanese semi-conductor and mobile handset manufacturing stocks soared, particularly during the fiscal year’s first eight months. For the full fiscal year, Schroder Asian Opportunities, the Fund’s Asia ex-Japan strategy, returned 23.98%, which almost matched the return for the regional stock index. On an absolute return basis, the Schroders strategy was the Fund’s strongest performer. The Schroders portfolio management team is based mainly in Hong Kong.
The MSCI Japan index returned 19.19%. Japanese stocks showed particular strength during the fiscal year’s last four months, as a strengthening yen boosted Japanese market returns in U.S. terms. For the full fiscal year, Nikko Japan Active Value, the Fund’s Japan strategy, greatly outperformed the Japan stock index, returning 23.50%. On an absolute return basis, Nikko was the Fund’s second strongest performer, almost matching Schroders’ return. The Nikko portfolio management team is based in Tokyo.
For the fiscal year, MSCI Europe returned 13.65%. The asset-weighted combination of the Fund’s four European strategies returned 16.23%, greatly outperforming the European regional index. On an absolute basis, Berenberg European Equity Selection was the Fund’s strongest European performer, returning 19.70%. AXA Europe Small Cap returned 17.14%, while Allianz Europe Equity Growth Select returned 12.39%. The Fund added a fourth European strategy, Allianz High Dividend Europe, in late December 2017. During January-April 2018, this new strategy returned 2.69%, versus 0.73% for the MSCI Europe index. The Berenberg, AXA, and Allianz portfolio management teams are based in Hamburg, Paris, and Frankfurt, respectively.
As of the fiscal year’s end, the Fund’s European, Japanese, and Asia ex-Japan allocations were broadly aligned with those of the Fund’s benchmark index. This aims to protect the Fund’s benchmark relative performance against large swings in the euro-yen cross rate, as well as against adverse economic or political developments affecting one of the three regions. The Fund holds ETFs to obtain some market exposure to small markets where it has no sub-advisor coverage, namely Canada and Australia.
With the addition of the Allianz High Dividend Europe strategy, the Fund has become style neutral. The Fund is overweight consumer discretionary, technology, and financial stocks. It is underweight consumer staples, health care, and utilities. The Fund is all-cap by design, and so its stock holdings have lower median and weighted average market capitalizations than those for the benchmark index.
| * | Performance data quoted represents past performance, which is no guarantee of future results. Investment return and principal value will fluctuate so that an investor’s shares, when redeemed, may be worth more or less than their original cost. The total return shown assumes the reinvestment of all distributions and does not reflect the deduction of taxes that a shareholder would pay on fund distributions or the redemption of shares. The total return for Class A Shares was 10.70%, adjusted for the Fund’s maximum sales charge of 5.50%. Mutual fund performance changes over time and current performance may be lower or higher than what is stated. For the most recent month-end performance, please visit www.wilmingtonfunds.com or call 1-800-836-2211. |
| ** | The Morgan Stanley Capital International - All Country World ex-US Index (Net, USD) (MSCI ACWI ex-US Net Index) is a free float-adjusted market capitalization weighted index that is designed to measure the equity market performance of developed and emerging markets, excluding the United States. The MSCI ACWI ex-US consists of 46 country indices comprising 22 developed and 24 emerging market country indices. The developed market country indices included are: Australia, Austria, Belgium, Canada, Denmark, Finland, France, Germany, Hong Kong, Ireland, Israel, Japan, Netherlands, New Zealand, Norway, Portugal, Singapore, Spain, Sweden, Switzerland, and the United Kingdom. The emerging market country indices included are: Argentina, Brazil, Chile, China, Colombia, Czech Republic, Egypt, Greece, Hungary, India, Indonesia, Korea, Malaysia, Mexico, Pakistan, Peru, Philippines, Poland, Qatar, Russia, South Africa, Taiwan, Thailand, Turkey and United Arab Emirates. The performance of this index is reduced by the taxes on dividends paid by the international securities issuers in the index. The index is unmanaged and it is not possible to invest directly in an index. |
International investing involves special risks including currency risks, increased volatility of foreign securities, political risks and differences in auditing and other financial standards.
April 30, 2018 (unaudited) / ANNUAL REPORT
2
WILMINGTON INTERNATIONAL FUND
The graphs below illustrate the hypothetical investment of $10,0001 in the Class A Shares and $1,000,0001 in the Class I Shares of Wilmington International Fund from April 30, 2008 to April 30, 2018, compared to the MSCI ACWI ex-US Net Index.2
VALUE OF A HYPOTHETICAL $10,000 INVESTMENT
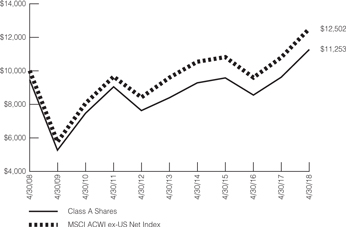
VALUE OF A HYPOTHETICAL $1,000,000 INVESTMENT

Performance data quoted represents past performance, which is no guarantee of future results. Investment return and principal value will fluctuate so that an investor’s shares, when redeemed, may be worth more or less than their original cost. The total return shown assumes the reinvestment of all distributions and does not reflect the deduction of taxes that a shareholder would pay on fund distributions or the redemption of shares. The total return for Class A Shares was 10.70%, adjusted for the Fund’s maximum sales charge of 5.50%. Mutual fund performance changes over time and current performance may be lower or higher than what is stated. For the most recent month-end performance, please visit www.wilmingtonfunds.com or call 1-800-836-2211.
| | | | | | |
| | | Average Annual Total Returns for the Periods Ended 4/30/18 |
| | | 1 Year | | 5 Years | | 10 Years |
| | | | |
Class A^ | | 10.70% | | 4.88% | | 1.19% |
| | | | |
Class I^ | | 17.29% | | 6.22% | | 1.93% |
| | | | |
MSCI ACWI ex-US Net Index2 | | 15.91% | | 5.46% | | 2.26% |
^Expense Ratios Before Waivers and Expense Ratios After Waivers for Class A are 1.55% and 1.05%, respectively. Expense Ratios Before Waivers and Expense Ratios After Waivers for Class I are 1.30% and 0.92%, respectively. Expense Ratios Before Waiver represent the operating costs borne by the Fund, expressed as a percentage of the Fund’s average net assets, as shown in the Fees and Expenses table in the Fund’s current prospectus (under “Total Annual Fund Operating Expenses”). Current information regarding the Fund’s Operating Expenses can be found in the Fund’s Financial Highlights.
| 1 | Represents a hypothetical investment of $10,000 in Class A of the Fund after deducting the maximum sales charge of 5.50% ($10,000 investment minus $550 sales charge = $9,450) and $1,000,000 in Class I of the Fund and assumes the reinvestment of all dividends and distributions. |
| 2 | The performance for the MSCI ACWI ex-US Net Index assumes the reinvestment of all dividends and distributions but does not reflect the deduction of a sales charge required for the Fund’s performance by the Securities and Exchange Commission. The performance of this index is reduced by the taxes on dividends paid by the international securities issuers in the index. It is not possible to invest directly in an index and the represented index is unmanaged. |
ANNUAL REPORT / April 30, 2018 (unaudited)
3
WILMINGTON GLOBAL ALPHA EQUITIES FUND
Management’s Discussion of Fund Performance
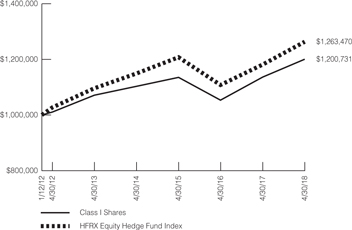
For the fiscal year ended April 30, 2018, the Wilmington Global Alpha Equities Fund (the “Fund”) had a total return of 5.41%* for Class A Shares and 5.63%* for Class I Shares, versus its benchmark, the HFRX Equity Hedge Fund Index**, which had a total return of 6.98%.
Performance Review
During the fiscal year that ended April 30, 2018, the Fund had strong risk-adjusted performance and met its objective of providing downside protected, hedge equity exposure.
While the Fund trailed its peers slightly, it did so with substantially less risk. The Fund volatility of returns was only 55% that of peers, yet it achieved nearly 100% of the returns, leading to a Sharpe ratio of 1.25 vs 0.82 for peers. As an illustration of the benefits of this risk orientation was performance during the episodes of volatility in early 2018 – from 1/29 to 2/8 the S&P 500 declined over 10% and the Fund’s peer group averaged a decline of 6.3% while the Fund only fell 3.4%. From 3/12 to 4/2, markets also exhibited stress with the S&P dropping another 7.3% — during this time period the Fund fell only 1.3%.
The Fund is a portfolio of long only equity strategies run by Wellington’s different portfolio management teams overseen and hedged with market financial futures contracts by Wellington’s investment strategy and risk team. During the year, a Japan focused value strategy was added to take advantage of promising market conditions in the country that are a result of recent shareholder friendly corporate reforms. Allocations were reduced in other strategies to make room for the new opportunity — no strategies were removed.
For the year, the long only equity strategies in total performed roughly in line with Global Equities as represented by the MSCI ACWI Index. The Fund was helped by stock selection, though it was hurt by country selection (due to an overweight to the US) and also sector selection, where the Fund was underweight tech. Notably, the Fund was without any exposure to FAANG stocks.
From an underlying strategy perspective two Portfolio Managers (“PMs”) outperformed significantly, two portfolio managers under-performed and the rest were roughly in-line with their benchmarks. Unsurprising in a market where growth dominated, the top performer was a manager who focused on quality growth companies. The poorest performer was a manager who focuses on dividend paying companies. The PMs faced factor headwinds as the top quartile of dividend payers underperformed the bottom quartile by 1000 basis points and experienced some selection difficulties within consumer staples.
The Fund uses equity index financial futures contracts to reduce the Fund’s net long exposure to the global equity market. The use of equity index financial futures contracts detracted from absolute performance for the period due to rising markets, but allowed the Fund to achieve its desired risk and exposure profile.
| | * | Performance data quoted represents past performance, which is no guarantee of future results. Investment return and principal value will fluctuate so that an investor’s shares, when redeemed, may be worth more or less than |
| | their original cost. The total return shown assumes the reinvestment of all distributions and does not reflect the deduction of taxes that a shareholder would pay on fund distributions or the redemption of shares. The total return for Class A Shares was -0.36%, adjusted for the Fund’s maximum sales charge of 5.50%. Mutual fund performance changes over time and current performance may be lower or higher than what is stated. For the most recent month-end performance, please visit www.wilmingtonfunds.com or call 1-800-836-2211. |
| | ** | The HFRX Equity Hedge Fund Index measures the performance of hedge fund strategies that primarily maintain long and short positions in equity derivative securities. Equity Hedge managers typically maintain at least 50%, and in some cases may be entirely invested in equity-related securities, both long and short. Managers may employ a broad range of processes and strategies, including both quantitative and fundamental techniques, as well as net exposures, level of concentration, use of leverage, holding periods, and market capitalizations. The index is weighted by asset size among reporting funds, which must have at least $50 million in assets or have been active for at least 12 months. |
| | | Sharpe ratio refers to a risk-adjusted measure calculated using standard deviation and excess returns to determine reward per unit of risk. The higher the ratio, the greater the risk-adjusted performance. |
| | | FAANG is an acronym for the market’s five most popular and best-performing tech stocks, namely Facebook, Apple, Amazon, Netflix and Alphabet’s Google. |
| | | Basis Points (“BPS”) is a unit that is equal to 1/100th of 1% and is used to denote the change in a financial instrument. The basis point is commonly used for calculating changes in interest rates, equity indices and the yield of a fixed-income security. |
| | | Investing involves risk and you may incur a profit or a loss. Investments such as mutual funds which focus on alternative strategies are subject to increased risk and loss of principal and are not suitable for all investors. Diversification does not ensure a profit or guarantee against a loss. There is no assurance that any investment strategy will be successful.Any investment in the Fund should be part of an overall investment program rather than, in itself, a complete program. Because the Fund invests in underlying mutual funds or other managed strategies, an investor in the Fund will bear the management fees and operating expenses of the “Underlying Strategies” in which the Fund invests. The total expenses borne by an investor in the Fund will be higher than if the investor invested directly in the Underlying Strategies, and the returns may therefore be lower. |
| | | The Fund, the Sub-Advisers, and the Underlying Strategies may use aggressive investment strategies, which are riskier than those used by typical mutual funds. If the Fund and Sub-Advisers are unsuccessful in applying these investment strategies, the Fund and you may lose more money than if you had invested in another fund that did not invest aggressively. The Fund is subject to risks associated with the Sub-Advisers making trading decisions independently, investing in other investment companies, using a particular style or set of styles, basing investment decisions on historical relationships and correlations, trading frequently, using leverage, making short sales, being non-diversified, and investing in securities with low correlation to the market. The use of leverage may magnify losses. |
| | | The Fund is also subject to risks associated with investments in foreign markets, emerging market securities, small cap companies, debt securities, derivatives, commodity-linked instruments, illiquid securities, asset-backed securities, and CMOs. Please see the prospectus and summary prospectus for information on these as well as other risk considerations. |
April 30, 2018 (unaudited) / ANNUAL REPORT
4
WILMINGTON GLOBAL ALPHA EQUITIES FUND
The graphs below illustrate the hypothetical investment of $10,0001 in the Class A Shares and $1,000,0001 in the Class I Shares of the Wilmington Global Alpha Equities Fund from January 12, 2012 (start of performance) to April 30, 2018 compared to the HFRX Equity Hedge Fund Index2.
VALUE OF A HYPOTHETICAL $10,000 INVESTMENT
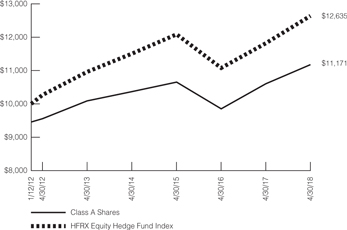
VALUE OF A HYPOTHETICAL $1,000,000 INVESTMENT
Performance data quoted represents past performance, which is no guarantee of future results. Investment return and principal value will fluctuate so that an investor’s shares, when redeemed, may be worth more or less than their original cost. The total return shown assumes the reinvestment of all distributions and does not reflect the deduction of taxes that a shareholder would pay on fund distributions or the redemption of shares. The total return for Class A Shares was -0.36%, adjusted for the Fund’s maximum sales charge of 5.50%. Mutual fund performance changes over time and current performance may be lower or higher than what is stated. For the most recent month-end performance, please visit www.wilmingtonfunds.com or call 1-800-836-2211.
| | | | | | |
| | | Average Annual Total Returns for the Periods Ended 4/30/18 |
| | | | | | | Start of Performance |
| | | 1 Year | | 5 Year | | (1/12/2012) |
| | | | |
Class A^ | | -0.36% | | 0.91% | | 1.77% |
| | | | |
Class I^ | | 5.63% | | 2.32% | | 2.95% |
| | | | |
HFRX Equity Hedge Fund Index2 | | 6.98% | | 2.89% | | 3.78% |
^Expense Ratios Before Waivers and Expense Ratios After Waivers for Class A are 2.57% and 1.50%, respectively. Expense Ratios Before Waivers and Expense Ratios After Waivers for Class I are 2.32% and 1.25%, respectively. Expense Ratios Before Waiver represent the operating costs borne by the Fund, expressed as a percentage of the Fund’s average net assets, as shown in the Fees and Expenses table in the Fund’s current prospectus (under “Total Annual Fund Operating Expenses”). Current information regarding the Fund’s Operating Expenses can be found in the Fund’s Financial Highlights.
| 1 | Represents a hypothetical investment of $10,000 in Class A of the Fund after deducting the maximum sales charge of 5.50% ($10,000 investment minus $550 sales charge = $9,450) and $1,000,000 in Class I of the Fund and assumes the reinvestment of all dividends and distributions. |
| 2 | The performance for the HFRX Equity Hedge Fund Index assumes the reinvestment of all dividends and distributions but does not reflect the deduction of a sales charge required for the Fund’s performance by the Securities and Exchange Commission. It is not possible to invest directly in an index and the represented index is unmanaged. |
ANNUAL REPORT / April 30, 2018 (unaudited)
5
WILMINGTON REAL ASSET FUND
Management’s Discussion of Fund Performance
For the fiscal year ended April 30, 2018, Wilmington Real Asset Fund (the “Fund”) had a total return of 7.11%* for Class A Shares and 7.31%* for Class I Shares, versus its benchmark, the Bloomberg Barclays U.S. Treasury Inflation Protected Securities (TIPS) Index (“Bloomberg Barclays U.S. TIPS Index”)** and the Real Asset Blended Index, which had total returns of 0.27% and 3.37%, respectively.
The Blended Index is currently a mix of 50% Bloomberg Barclays U.S. TIPS Index, 35% S&P Developed Property Index***, and 15% Bloomberg Commodity Index (Total Return)****. During this period, the Fund’s relative outperformance was due to both the Fund’s tactical asset allocation as well as positive manager selection.
U.S. Inflation-Linked Bond (“ILB”) markets posted flat returns for the year. Adding to returns was a pickup in inflation, as shown by 5-year inflation expectations increasing from around 1.8% to 2.2%. At the same time, real yields fell as the U.S. economy continued on a steady growth path, and the Federal Reserve (“the Fed”) hiked rates three times with more increases expected. The Fund’s underweight position to U.S. Treasury Inflation Protected Securities (“TIPS”) contributed to returns and our allocation outperformed the index through curve positioning and trading positions.
Global real estate securities, as measured by the S&P Developed Property Index, were up mid-single digits for the year, with significant dispersion by geography. The U.S. underperformed on high valuations and interest rate increases, which decreased the attractiveness of dividend payers. Performance was stronger abroad with particular strength in certain European and Asian markets which were helped by strong fundamental performance, lower valuations as well as tailwinds from a weakening dollar. The Fund benefited from an overweight position to the sector in general, and positioning within real estate that was overweight international companies.
Commodities performance was positive following a multi-year period of price declines. Within commodities, energy and industrial metals saw double digit price increases on increased demand combined with restraint on the supply side. Precious metals and agricultural commodities were more mixed. Our Fund had an equal weight allocation but outperformed the index due primarily to exposure to commodity related equities.
The Fund uses derivatives, which include interest rate/inflation options, interest rate financial futures contracts, interest rate/inflation swap agreements, and credit default swap agreements, to enhance returns of the Fund and to hedge (or protect) against adverse movements in interest rates and movements in the bond markets. During the fiscal year, the Fund’s use of derivatives had a positive impact on the relative performance of the Fund’s exposure to inflation protected securities versus the asset class benchmark.
| | * | Performance data quoted represents past performance, which is no guarantee of future results. Investment return and principal value will fluctuate so that an investor’s shares, when redeemed, may be worth more or less than their original cost. The total return shown assumes the reinvestment of all distributions and does not reflect the deduction of taxes that a shareholder would pay on fund distributions or the redemption of shares. The total return for Class A Shares was 1.20%, adjusted for the Fund’s maximum sales charge of 5.50%. Mutual fund performance changes over time and current performance may be lower or higher than what is stated. For the most recent month-end performance, please visit www.wilmingtonfunds.com or call 1-800-836-2211. |
| | ** | The Bloomberg Barclays U.S. TIPS Index measures the performance of the U.S. Treasury Inflation Protected Securities market. Federal Reserve holdings of U.S. TIPS are not index eligible and are excluded from the face amount outstanding of each bond in the index. |
| | *** | S&P Developed Property Index defines and measures the investable universe of publicly traded property companies in developed global markets. |
| | **** | Bloomberg Commodity Index (Total Return) is designed to be a diversified benchmark for commodities as an asset class, and reflects the returns that are potentially available through an unleveraged investment in the futures contracts on physical commodities comprising the Index plus the rate of interest that could be earned on cash collateral invested in specified Treasury Bills. The Index is currently composed of financial futures contracts on 20 physical commodities. |
International investing involves special risks including currency risks, increased volatility of foreign securities, political risks and differences in auditing and other financial standards.
April 30, 2018 (unaudited) / ANNUAL REPORT
6
WILMINGTON REAL ASSET FUND
The graphs below illustrate the hypothetical investment of $10,0001 in the Class A Shares and $1,000,0001 in the Class I Shares of the Wilmington Real Asset Fund from April 30, 2008 to April 30, 2018 compared to the Bloomberg Barclays U.S. TIPS Index.2
VALUE OF A HYPOTHETICAL $10,000 INVESTMENT
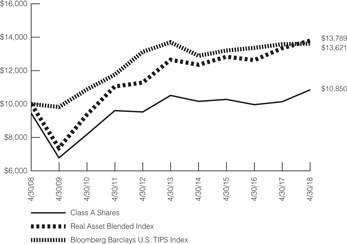
VALUE OF A HYPOTHETICAL $1,000,000 INVESTMENT
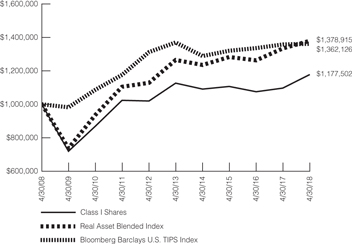
Performance data quoted represents past performance, which is no guarantee of future results. Investment return and principal value will fluctuate so that an investor’s shares, when redeemed, may be worth more or less than their original cost. The total return shown assumes the reinvestment of all distributions and does not reflect the deduction of taxes that a shareholder would pay on fund distributions or the redemption of shares. The total return for Class A Shares was 1.20%, adjusted for the Fund’s maximum sales charge of 5.50%. Mutual fund performance changes over time and current performance may be lower or higher than what is stated. For the most recent month-end performance, please visit www.wilmingtonfunds.com or call 1-800-836-2211.
| | | | | | |
| | | Average Annual Total Returns for the Periods Ended 4/30/18 |
| | | 1 Year | | 5 Years | | 10 Years |
| | | | |
Class A^ | | 1.20% | | -0.52% | | 0.82% |
| | | | |
Class I^ | | 7.31% | | 0.87% | | 1.65% |
| | | | |
Bloomberg Barclays U.S. TIPS Index2 | | 0.27% | | -0.12% | | 3.14% |
| | | | |
Real Asset Blended Index3 | | 3.37% | | 1.73% | | 3.27% |
^Expense Ratios Before Waivers and Expense Ratios After Waivers for Class A are 1.44% and 1.10%, respectively. Expense Ratios Before Waivers and Expense Ratios After Waivers for Class I are 1.19% and 0.85%, respectively. Expense Ratios Before Waiver represent the operating costs borne by the Fund, expressed as a percentage of the Fund’s average net assets, as shown in the Fees and Expenses table in the Fund’s current prospectus (under “Total Annual Fund Operating Expenses”). Current information regarding the Fund’s Operating Expenses can be found in the Fund’s Financial Highlights.
| 1 | Represents a hypothetical investment of $10,000 in Class A of the Fund after deducting the maximum sales charge of 5.50% ($10,000 investment minus $550 sales charge = $9,450) and $1,000,000 in Class I of the Fund and assumes the reinvestment of all dividends and distributions. |
| 2 | The performance for the Bloomberg Barclays U.S. TIPS Index assumes the reinvestment of all dividends and distributions but does not reflect the deduction of a sales charge required for the Fund’s performance by the Securities and Exchange Commission. It is not possible to invest directly in an index and the represented index is unmanaged. |
| 3 | The Real Asset Blended Index is calculated by the investment advisor and is currently based on a weighting of the following indices: 50% Bloomberg Barclays World GILB Index, 35% S&P Developed Property Index and 15% Bloomberg Commodity Index (Total Return). |
ANNUAL REPORT / April 30, 2018 (unaudited)
7
WILMINGTON DIVERSIFIED INCOME FUND
Management’s Discussion of Fund Performance
For the fiscal year ended April 30, 2018, Wilmington Diversified Income Fund (the “Fund”), formerly the Wilmington Strategic Allocation Moderate Fund, had a total return of 6.99%* for Class A Shares and 7.24%* for Class I Shares, versus its new benchmarks, the Russell 1000® Value Index**, the Bloomberg Barclays U.S. Aggregate Bond Index**, and the Diversified Blended Index***, which had total returns of 7.50%, -0.32% and 5.79%, respectively, and the old benchmark, the Russell 3000® Index****, which had a total return of 13.05%. The Russell 1000®Value Index**, is a more appropriate, broad-based securities market index against which to compare the Fund given its change in investment strategy. The Fund maintains the Bloomberg Barclays Capital U.S. Aggregate Bond Index as its secondary broad-based market index.
The Fund was transitioned during the fiscal year, from the process employed by the Wilmington Strategic Allocation Moderate Fund, to the new structure of the Wilmington Diversified Income Fund. The Fund was officially transitioned on August 31, 2017. The process employed by the Moderate Fund involved replicating the tactical asset allocation decisions made by the Wilmington Trust Investment Advisors, Inc. Investment Committee and then overlaying upon the asset allocation framework, active and passive managers that were closely benchmarked against the tactical asset allocations. The portfolio managers sought to add value through the combination of tactical asset allocation and manager selection. Post the transition, the new structure of the Wilmington Diversified Income Fund represents a much more stable and simplified allocation profile, with a goal to provide a high level of income and the potential for growth of capital.
Over the past year, the Class I Shares outperformed the Diversified Blended Index. The Fund’s positioning early in the fiscal year was beneficial, as the more balanced exposure between growth and value equities that existed prior to the Fund’s repositioning provided an advantage over the value-oriented equity components of the Diversified Blended Index. The returns of growth equities have enjoyed an outsized advantage over value equities for a lengthy period, an advantage to the Fund in the early months of the fiscal year.
Following the Fund’s transition, primary contributors to performance were led by the Wilmington Enhanced Dividend Income Strategy (“EDIS”). EDIS is the largest component of the Fund, and outperformed the benchmark by a comfortable margin in the period.
Leading detractors included the iShares International Select Dividend ETF (“IDV”), which underperformed the MSCI EAFE component of the Diversified Blended Index. IDV focuses on international stocks that are high dividend payers, and has a natural underweight to Japan, a market that offers few opportunities for high yielding equities. The Japanese market had a very strong year, and IDV’s substantial underweight to that market detracted from relative performance.
With regard to the outlook, the path forward is certainly shaping up as an interesting one. The first quarter of 2018 marked the return of volatility to the U.S. equity market. The S&P 500 finished the quarter slightly down -0.8%, its worst first quarter result in eight years. February was the first negative month for the S&P 500 since October
2016, ending a streak of 15 consecutive months with a positive total return. A tight labor market and rising input prices have stoked fears of a Fed that may become more aggressive in interest rate hikes, to the detriment of equity markets. Further clouding the picture is the threat of tariffs and trade wars, unwelcome developments that threaten the synchronized global recovery that has underpinned strong equity returns.
Balancing these negatives is the positive of continued strength in corporate earnings, strength that is anticipated to continue in 2018. As an income-oriented strategy, the Diversified Income Fund will need to balance the traditional defensive benefits of dividends, with the difficulties that yield-oriented products face in a rising rate environment. We are confident that our managers have the experience to deal effectively in this environment.
| | * | Performance data quoted represents past performance, which is no guarantee of future results. Investment return and principal value will fluctuate so that an investor’s shares, when redeemed, may be worth more or less than their original cost. The total return shown assumes the reinvestment of all distributions and does not reflect the deduction of taxes that a shareholder would pay on fund distributions or the redemption of shares. The total return for Class A Shares was 1.14%, adjusted for the Fund’s maximum sales charge of 5.50%. Mutual fund performance changes over time and current performance may be lower or higher than what is stated. For the most recent month-end performance, please visit www.wilmingtonfunds.com or call 1-800-836-2211. |
| | ** | The Russell 1000® Value Index measures the performance of those Russell 1000® Index companies with lower price-to-book ratios and lower forecasted growth values. The Bloomberg Barclays U.S. Aggregate Bond Index is an index measuring both the capital price changes and income provided by the underlying universe of securities, comprised of U.S. Treasury obligations, U.S. investment grade corporate debt and mortgage backed obligations. |
| | *** | The Diversified Blended Index is calculated by the investment advisor and represents the weighted returns of the following indices: 36.0% Russell 1000® Value Index; 24.0% Bloomberg Barclays U.S. Aggregate Bond Index; 17.0% MSCI EAFE Index; 7.0% Bloomberg Barclays U.S. Corporate High Yield Bond Index; 7.0%, Bloomberg Barclays U.S. Government Inflation-Linked Bond Index; 4.5% Dow Jones Global ex-U.S. Select Real Estate Securities Index; 2.5% S&P U.S. REIT Index; and 2.0% Ibbotson Associates SBBI 30-Day U.S. T-Bill Index. |
| | **** | The Russell 3000® Index measures the performance of the largest 3,000 U.S. companies representing approximately 98% of the investable U.S. equity market. |
| | | International investing involves special risks including currency risk, political risks, increased volatility of foreign securities, and differences in auditing and other financial standards. |
| | | Bond prices are sensitive to changes in interest rates and a rise in short-term interest rates could cause a decline in bond prices. |
| | | Due to its strategy of investing in other mutual funds, this Fund may incur certain additional expenses and tax results that would not be present with a direct investment in the underlying funds. |
April 30, 2018 (unaudited) / ANNUAL REPORT
8
WILMINGTON DIVERSIFIED INCOME FUND
The graphs below illustrate the hypothetical investment of $10,0001 in the Class A Shares and $1,000,0001 in the Class I Shares of the Wilmington Diversified Income Fund from April 30, 2008 to April 30, 2018 and June 11, 2010 (start of performance) to April 30, 2018, respectively, compared to the Russell 1000® Value Index2, the Russell 3000® Index2, the Bloomberg Barclays U.S. Aggregate Bond Index2 and the Diversified Blended Index.2,3
VALUE OF A HYPOTHETICAL $10,000 INVESTMENT
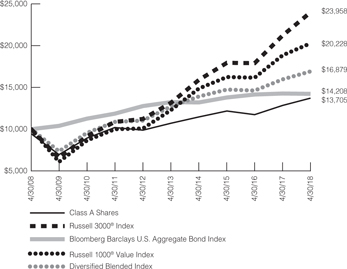
VALUE OF A HYPOTHETICAL $1,000,000 INVESTMENT
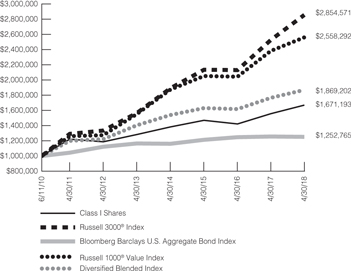
Performance data quoted represents past performance, which is no guarantee of future results. Investment return and principal value will fluctuate so that an investor’s shares, when redeemed, may be worth more or less than their original cost. The total return shown assumes the reinvestment of all distributions and does not reflect the deduction of taxes that a shareholder would pay on fund distributions or the redemption of shares. The total return for Class A Shares was 1.14%, adjusted for the Fund’s maximum sales charge of 5.50%. Mutual fund performance changes over time and current performance may be lower or higher than what is stated. For the most recent month-end performance, please visit www.wilmingtonfunds.com or call 1-800-836-2211.
| | | | | | |
| |
| | | Average Annual Total Returns for the Periods Ended 4/30/18 |
| | | 1 Year | | 5 Years | | 10 Years |
| | | | |
Class A^ | | 1.14% | | 3.94% | | 3.20%4 |
| | | | |
Class I^ | | 7.24% | | 5.41% | | 6.73%4 |
| | | | |
Russell 3000® Index2 | | 13.05% | | 12.75% | | 9.13% |
| | | | |
Russell 1000® Value Index2 | | 7.50% | | 10.52% | | 7.30% |
| | | | |
Bloomberg Barclays U.S. Aggregate Bond Index2 | | -0.32% | | 1.47% | | 3.57% |
| | | | |
Diversified Blended Index2,3 | | 5.79% | | 5.85% | | 5.37% |
^Expense Ratios Before Waivers and Expense Ratios After Waivers for Class A are 1.72% and 0.75%, respectively. Expense Ratios Before Waivers and Expense Ratios After Waivers for Class I are 1.47% and 0.50%, respectively. Expense Ratios Before Waiver represent the operating costs borne by the Fund, expressed as a percentage of the Fund’s average net assets, as shown in the Fees and Expenses table in the Fund’s current prospectus (under “Total Annual Fund Operating Expenses”). Current information regarding the Fund’s Operating Expenses can be found in the Fund’s Financial Highlights.
| 1 | Represents a hypothetical investment of $10,000 in Class A of the Fund after deducting the maximum sales charge of 5.50% ($10,000 investment minus $550 sales charge = $9,450) and $1,000,000 in Class I of the Fund and assumes the reinvestment of all dividends and distributions. |
| 2 | The performance for the Russell 1000® Value Index, the Russell 3000® Index, the Bloomberg Barclays U.S. Aggregate Bond Index and the Diversified Blended Index assumes the reinvestment of all dividends and distributions but does not reflect the deduction of a sales charge required for the Fund’s performance by the Securities and Exchange Commission. It is not possible to invest directly in an index and the |
ANNUAL REPORT / April 30, 2018 (unaudited)
9
| | represented indices are unmanaged. The Russell 1000® Value Index is the current appropriate broad-based index used by the Fund and the Russell 3000® Index was the old index which will be no longer shown in future reports. |
| 3 | The Diversified Blended Index is calculated by the investment advisor and represents the weighted returns of the following indices: 36.0% Russell 1000® Value Index; 24.0% Bloomberg Barclays U.S. Aggregate Bond Index; 17.0% MSCI EAFE Index; 7.0% Bloomberg Barclays U.S. Corporate High Yield Bond Index; 7.0%, Bloomberg Barclays U.S. Government Inflation-Linked Bond Index; 4.5% Dow Jones Global ex-U.S. Select Real Estate Securities Index; 2.5% S&P U.S. REIT Index; and 2.0% Ibbotson Associates SBBI 30-Day U.S T-Bill Index. |
| 4 | Represents the average total return for Class A Shares and Class I Shares from April 30, 2008 to April 30, 2018 and June 11, 2010 (start of performance) to April 30, 2018, respectively. |
April 30, 2018 (unaudited) / ANNUAL REPORT
10
SHAREHOLDER EXPENSE EXAMPLE (unaudited)
As a shareholder of the Funds, you incur two types of costs: (1) transaction costs, including sales charges (loads) on purchase payments, reinvested dividends, or other distributions; and redemption fees; and (2) ongoing costs, including management fees; distribution and/or service (12b-1) fees; and other Fund expenses. This Example is intended to help you to understand your ongoing costs (in dollars) of investing in the Funds and to compare these costs with the ongoing costs of investing in other mutual funds. It is based on an investment of $1,000 invested at the beginning of the period and held for the entire period from November 1, 2017 to April 30, 2018.
Actual Expenses
This section of the following table provides information about actual account values and actual expenses. You may use the information in this section, together with the amount you invested, to estimate the expenses that you incurred over the period. Simply divide your account value by $1,000 (for example, an $8,600 account value divided by $1,000 = 8.6), then multiply the result by the number in the first section under the heading entitled “Expenses Paid During Period” to estimate the expenses attributable to your investment during this period.
Hypothetical Example for
Comparison Purposes
This section of the following table provides information about hypothetical account values and hypothetical expenses based on the Fund’s actual expense ratios and assumed rates of return of 5% per year before expenses, which are not the Fund’s actual returns. Thus, you should not use the hypothetical account values and expenses to estimate the actual ending account balance or your expenses for the period. Rather, these figures are required to be provided to enable you to compare the ongoing costs of investing in the Funds with other funds. To do so, compare this 5% hypothetical example with the 5% hypothetical examples that appear in the shareholder reports of the other funds.
Please note that the expenses shown in the table are meant to highlight your ongoing costs only. Therefore, the Annualized Net Expense Ratio section of the table is useful in comparing ongoing costs only, and will not help you determine the relative total costs of owning different funds.
The Annualized Net Expense Ratios may be different from the net expense ratios in the Financial Highlights which are for the fiscal year ended April 30, 2018.
| | | | | | | | |
| | | Beginning
Account Value
11/01/17 | | Ending
Account Value
4/30/18 | | Expenses Paid
During Period1 | | Annualized Net
Expense Ratio2 |
| | | | |
WILMINGTON INTERNATIONAL FUND | | | | | | | | |
| | | | |
Actual | | | | | | | | |
| | | | |
Class A | | $1,000.00 | | $1,023.30 | | $5.22 | | 1.04% |
| | | | |
Class I | | $1,000.00 | | $1,024.60 | | $4.57 | | 0.91% |
| | | | |
Hypothetical (assuming a 5% return before expense) | | | | | | | | |
| | | | |
Class A | | $1,000.00 | | $1,019.64 | | $5.21 | | 1.04% |
| | | | |
Class I | | $1,000.00 | | $1,020.28 | | $4.56 | | 0.91% |
| | | | |
WILMINGTON GLOBAL ALPHA EQUITIES FUND | | | | | | | | |
| | | | |
Actual | | | | | | | | |
| | | | |
Class A | | $1,000.00 | | $1,009.10 | | $7.47 | | 1.50% |
| | | | |
Class I | | $1,000.00 | | $1,009.70 | | $6.23 | | 1.25% |
| | | | |
Hypothetical (assuming a 5% return before expense) | | | | | | | | |
| | | | |
Class A | | $1,000.00 | | $1,017.36 | | $7.50 | | 1.50% |
| | | | |
Class I | | $1,000.00 | | $1,018.60 | | $6.26 | | 1.25% |
| | | | |
WILMINGTON REAL ASSET FUND3 | | | | | | | | |
| | | | |
Actual | | | | | | | | |
| | | | |
Class A | | $1,000.00 | | $1,029.90 | | $4.83 | | 0.96% |
| | | | |
Class I | | $1,000.00 | | $1,031.00 | | $3.58 | | 0.71% |
| | | | |
Hypothetical (assuming a 5% return before expense) | | | | | | | | |
| | | | |
Class A | | $1,000.00 | | $1,020.03 | | $4.81 | | 0.96% |
| | | | |
Class I | | $1,000.00 | | $1,021.27 | | $3.56 | | 0.71% |
ANNUAL REPORT / April 30, 2018 (unaudited)
11
| | | | | | | | |
| | | Beginning
Account Value
11/01/17 | | Ending
Account Value
4/30/18 | | Expenses Paid
During Period1 | | Annualized Net
Expense Ratio2 |
| | | | |
WILMINGTON DIVERSIFIED INCOME FUND | | | | | | | | |
| | | | |
Actual | | | | | | | | |
| | | | |
Class A | | $1,000.00 | | $1,014.20 | | $3.10 | | 0.62% |
| | | | |
Class I | | $1,000.00 | | $1,015.40 | | $1.85 | | 0.37% |
| | | | |
Hypothetical (assuming a 5% return before expense) | | | | | | | | |
| | | | |
Class A | | $1,000.00 | | $1,021.72 | | $3.11 | | 0.62% |
| | | | |
Class I | | $1,000.00 | | $1,022.96 | | $1.86 | | 0.37% |
| (1) | Expenses are equal to the Funds’ annualized net expense ratios, multiplied by the average account value over the period, multiplied by 181/365 (to reflect the most recent one-half year period). |
| (2) | Expense ratio does not reflect the indirect expenses of the underlying funds in which it invests. |
| (3) | For Real Asset Fund, the expense ratio includes the impact of interest expense on reverse repurchase agreements. |
April 30, 2018 (unaudited) / ANNUAL REPORT
12
PORTFOLIO OF INVESTMENTS SUMMARY TABLE
Wilmington International Fund
At April 30, 2018, the Fund’s sector classifications and country allocations were as follows (unaudited):
| | | | | |
| Common Stocks | | Percentage of
Total Net Assets |
Financials | | | | 20.1 | % |
Information Technology | | | | 15.2 | % |
Consumer Discretionary | | | | 13.8 | % |
Industrials | | | | 13.4 | % |
Materials | | | | 5.1 | % |
Consumer Staples | | | | 4.6 | % |
Energy | | | | 4.5 | % |
Health Care | | | | 3.9 | % |
Telecommunication Services | | | | 3.8 | % |
Real Estate | | | | 2.9 | % |
Utilities | | | | 2.6 | % |
Investment Companies | | | | 4.4 | % |
Warrants | | | | 1.1 | % |
Preferred Stock | | | | 0.0 | %3 |
Rights | | | | 0.0 | %3 |
Cash Equivalents1 | | | | 9.8 | % |
Other Assets and Liabilities – Net2 | | | | (5.2 | )% |
| | | | | |
TOTAL | | | | 100.0 | % |
| | | | | |
| (1) | Cash Equivalents include investments in a money market fund and repurchase agreements. |
| (2) | Assets, other than investments in securities, less liabilities. See Statements of Assets and Liabilities. |
| (3) | Represents less than 0.05%. |
| | | | | |
| Country Allocation | | Percentage of
Total Net Assets |
Common Stocks | | | | | |
Japan | | | | 17.8 | % |
Germany | | | | 9.3 | % |
France | | | | 8.9 | % |
United Kingdom | | | | 8.3 | % |
China | | | | 6.5 | % |
Italy | | | | 5.5 | % |
Netherlands | | | | 5.3 | % |
Hong Kong | | | | 4.8 | % |
Switzerland | | | | 3.3 | % |
South Korea | | | | 2.6 | % |
Taiwan | | | | 2.6 | % |
Sweden | | | | 2.2 | % |
Spain | | | | 1.8 | % |
Ireland | | | | 1.8 | % |
India | | | | 1.4 | % |
Denmark | | | | 1.3 | % |
Finland | | | | 1.2 | % |
Norway | | | | 1.0 | % |
Luxembourg | | | | 1.0 | % |
All other countries less than 1.0% | | | | 3.3 | % |
Investment Companies | | | | 4.4 | % |
Warrants | | | | 1.1 | % |
Preferred Stock | | | | 0.0 | %3 |
Rights | | | | 0.0 | %3 |
Cash Equivalents1 | | | | 9.8 | % |
Other Assets and Liabilities – Net2 | | | | (5.2 | )% |
| | | | | |
TOTAL | | | | 100.0 | % |
| | | | | |
PORTFOLIO OF INVESTMENTS
April 30, 2018
| | | | | | | | |
Description | | Number of
Shares | | | Value | |
| | |
COMMON STOCKS – 89.9% | | | | | | | | |
| | |
AUSTRALIA – 0.1% | | | | | | | | |
| | |
BHP Billiton PLC | | | 21,552 | | | $ | 459,544 | |
| | |
AUSTRIA – 0.7% | | | | | | | | |
| | |
Erste Group Bank AG | | | 97,100 | | | | 4,748,345 | |
| | |
BELGIUM – 0.3% | | | | | | | | |
| | |
Anheuser-Busch InBev SA/NV# | | | 10,513 | | | | 1,044,293 | |
| | |
bpost SA | | | 12,683 | | | | 278,148 | |
| | |
KBC Group NV | | | 7,520 | | | | 653,702 | |
| | | | | | | | |
| | |
TOTAL BELGIUM | | | | | | $ | 1,976,143 | |
| | | | | | | | |
Description | | Number of
Shares | | | Value | |
| | |
BERMUDA – 0.3% | | | | | | | | |
| | |
Hiscox Ltd. | | | 95,557 | | | $ | 1,954,015 | |
| | |
BULGARIA – 0.0%** | | | | | | | | |
| | |
Petrol AD* | | | 2,384 | | | | 1,766 | |
| | |
CHINA – 6.5% | | | | | | | | |
| | |
Alibaba Group Holding Ltd. ADR* | | | 49,121 | | | | 8,770,063 | |
| | |
China Lodging Group Ltd. ADR | | | 11,801 | | | | 1,648,128 | |
| | |
China Mobile Ltd. | | | 275,000 | | | | 2,619,786 | |
| | |
China Pacific Insurance Group Co. Ltd. | | | 904,400 | | | | 3,990,827 | |
| | |
China Resources Phoenix Healthcare Holdings Co. Ltd. | | | 21,000 | | | | 27,448 | |
ANNUAL REPORT / April 30, 2018
13 PORTFOLIOS OF INVESTMENTS
Wilmington International Fund (continued)
| | | | | | | | |
Description | | Number of
Shares | | | Value | |
| | |
CNOOC Ltd. | | | 1,814,000 | | | $ | 3,068,769 | |
| | |
Ctrip.com International Ltd. ADR* | | | 12,161 | | | | 497,385 | |
| | |
Haitian International Holdings Ltd. | | | 594,000 | | | | 1,580,813 | |
| | |
Hollysys Automation Technologies Ltd. | | | 72,687 | | | | 1,603,475 | |
| | |
NetEase, Inc. ADR | | | 5,403 | | | | 1,388,949 | |
| | |
New Oriental Education & Technology Group, Inc. ADR | | | 27,023 | | | | 2,427,746 | |
| | |
Ping An Insurance Group Co. of China Ltd., Class H# | | | 276,500 | | | | 2,701,792 | |
| | |
Shenzhou International Group Holdings Ltd. | | | 229,000 | | | | 2,499,818 | |
| | |
Tencent Holdings Ltd. | | | 205,400 | | | | 10,098,065 | |
| | | | | | | | |
| | |
TOTAL CHINA | | | | | | $ | 42,923,064 | |
| | |
DENMARK – 1.3% | | | | | | | | |
| | |
Coloplast A/S, Class B | | | 18,702 | | | | 1,584,315 | |
| | |
Danske Bank A/S | | | 27,829 | | | | 968,509 | |
| | |
DSV A/S | | | 33,189 | | | | 2,628,429 | |
| | |
Novo Nordisk A/S, Class B | | | 65,249 | | | | 3,068,527 | |
| | |
Sydbank A/S | | | 764 | | | | 28,244 | |
| | | | | | | | |
| | |
TOTAL DENMARK | | | | | | $ | 8,278,024 | |
| | |
FINLAND – 1.2% | | | | | | | | |
| | |
DNA Oyj | | | 74,313 | | | | 1,739,171 | |
| | |
Fortum OYJ | | | 17,767 | | | | 408,690 | |
| | |
Kesko OYJ, Class B | | | 3,319 | | | | 194,891 | |
| | |
Nokia OYJ | | | 854,900 | | | | 5,129,579 | |
| | |
UPM-Kymmene OYJ | | | 11,908 | | | | 424,896 | |
| | |
Valmet OYJ | | | 12,634 | | | | 239,492 | |
| | | | | | | | |
| | |
TOTAL FINLAND | | | | | | $ | 8,136,719 | |
| | |
FRANCE – 8.9% | | | | | | | | |
| | |
Amundi SAW | | | 2,603 | | | | 221,371 | |
| | |
AXA SA | | | 41,448 | | | | 1,185,355 | |
| | |
BNP Paribas SA | | | 27,044 | | | | 2,087,776 | |
| | |
Bouygues SA | | | 8,284 | | | | 422,526 | |
| | |
Casino Guichard Perrachon SA | | | 5,118 | | | | 265,479 | |
| | |
Cie de Saint-Gobain | | | 89,300 | | | | 4,672,264 | |
| | |
Cie Generale des Etablissements Michelin | | | 36,629 | | | | 5,150,870 | |
| | |
CNP Assurances | | | 16,606 | | | | 425,341 | |
| | |
Credit Agricole SA | | | 27,353 | | | | 450,431 | |
| | |
Dassault Systemes SA | | | 8,472 | | | | 1,097,885 | |
| | |
Edenred | | | 79,748 | | | | 2,747,353 | |
| | |
Electricite de France SA | | | 4,816 | | | | 67,586 | |
| | |
Elior Group SAW | | | 63,165 | | | | 1,289,766 | |
| | |
Engie SA | | | 54,556 | | | | 956,992 | |
| | |
ID Logistics Group* | | | 7,864 | | | | 1,402,746 | |
| | |
Ingenico SA | | | 12,470 | | | | 1,090,788 | |
| | |
Legrand SA | | | 9,973 | | | | 776,027 | |
| | |
L’Oreal SA | | | 5,514 | | | | 1,327,713 | |
| | |
LVMH Moet Hennessy Louis Vuitton SA | | | 14,953 | | | | 5,203,818 | |
| | | | | | | | |
Description | | Number of
Shares | | | Value | |
| | |
Natixis SA | | | 69,393 | | | $ | 569,920 | |
| | |
Orange SA | | | 70,576 | | | | 1,283,044 | |
| | |
Renault SA | | | 46,314 | | | | 5,019,577 | |
| | |
Safran SA | | | 44,600 | | | | 5,231,134 | |
| | |
Sanofi | | | 15,335 | | | | 1,212,419 | |
| | |
Sartorius Stedim Biotech | | | 22,113 | | | | 2,061,333 | |
| | |
SCOR SE | | | 49,339 | | | | 2,000,848 | |
| | |
Societe BIC SA | | | 296 | | | | 30,200 | |
| | |
Societe Generale SA | | | 22,873 | | | | 1,251,810 | |
| | |
SPIE SA | | | 46,043 | | | | 1,041,813 | |
| | |
TOTAL SA | | | 48,923 | | | | 3,074,892 | |
| | |
Veolia Environnement SA | | | 202,000 | | | | 4,779,035 | |
| | |
Vinci SA | | | 2,443 | | | | 244,260 | |
| | | | | | | | |
| | |
TOTAL FRANCE | | | | | | $ | 58,642,372 | |
| | |
GERMANY – 9.3% | | | | | | | | |
| | |
Aareal Bank AG | | | 4,886 | | | | 244,393 | |
| | |
adidas AG | | | 18,600 | | | | 4,571,306 | |
| | |
AIXTRON SE* | | | 70,069 | | | | 994,538 | |
| | |
AURELIUS Equity Opportunities SE & Co. KGaA# | | | 26,346 | | | | 1,991,064 | |
| | |
BASF SE | | | 10,478 | | | | 1,090,166 | |
| | |
Bayerische Motoren Werke AG | | | 12,028 | | | | 1,337,294 | |
| | |
Continental AG | | | 16,900 | | | | 4,501,053 | |
| | |
Covestro AG W | | | 1,799 | | | | 163,466 | |
| | |
Daimler AG | | | 24,155 | | | | 1,899,018 | |
| | |
Deutsche Lufthansa AG | | | 11,193 | | | | 325,327 | |
| | |
Deutsche Post AG | | | 6,287 | | | | 272,883 | |
| | |
Deutsche Telekom AG | | | 292,536 | | | | 5,120,432 | |
| | |
Deutsche Wohnen SE | | | 101,400 | | | | 4,785,527 | |
| | |
Fielmann AG | | | 17,727 | | | | 1,455,722 | |
| | |
Freenet AG | | | 4,352 | | | | 138,149 | |
| | |
Fresenius SE & Co. KGaA | | | 23,483 | | | | 1,788,329 | |
| | |
Hannover Rueck SE | | | 3,050 | | | | 428,359 | |
| | |
HeidelbergCement AG | | | 754 | | | | 73,731 | |
| | |
HUGO BOSS AG | | | 20,381 | | | | 1,910,630 | |
| | |
Infineon Technologies AG | | | 133,923 | | | | 3,429,189 | |
| | |
Jenoptik AG | | | 73,400 | | | | 2,662,830 | |
| | |
LANXESS AG | | | 24,887 | | | | 1,843,486 | |
| | |
METRO AG | | | 20,350 | | | | 294,405 | |
| | |
Muenchener Rueckversicherungs AG | | | 3,556 | | | | 813,834 | |
| | |
SAP SE | | | 41,107 | | | | 4,567,214 | |
| | |
Scout24 AGW | | | 10,943 | | | | 565,514 | |
| | |
Siemens AG | | | 8,581 | | | | 1,089,742 | |
| | |
Sixt SE | | | 28,478 | | | | 3,351,000 | |
| | |
TAG Immobilien AG | | | 4,745 | | | | 100,271 | |
| | |
Telefonica Deutschland Holding AG | | | 63,375 | | | | 302,458 | |
| | |
thyssenkrupp AG | | | 175,300 | | | | 4,559,674 | |
April 30, 2018 / ANNUAL REPORT
PORTFOLIOS OF INVESTMENTS 14
Wilmington International Fund (continued)
| | | | | | | | |
Description | | Number of
Shares | | | Value | |
| | |
TLG Immobilien AG | | | 1,903 | | | $ | 54,747 | |
| | |
TUI AG | | | 6,946 | | | | 157,048 | |
| | |
XING SE | | | 7,375 | | | | 2,286,025 | |
| | |
Zalando SE*,W | | | 22,739 | | | | 1,170,072 | |
| | |
zooplus AG#, * | | | 5,970 | | | | 1,237,840 | |
| | | | | | | | |
| | |
TOTAL GERMANY | | | | | | $ | 61,576,736 | |
| | |
GHANA – 0.0%** | | | | | | | | |
| | |
Produce Buying Co. Ltd.*,†† | | | 288,000 | | | | — | |
| | |
HONG KONG – 4.8% | | | | | | | | |
| | |
AIA Group Ltd. | | | 859,600 | | | | 7,682,417 | |
| | |
ASM Pacific Technology Ltd. | | | 82,200 | | | | 1,126,414 | |
| | |
BOC Hong Kong Holdings Ltd. | | | 652,000 | | | | 3,370,531 | |
| | |
Brilliance China Automotive Holdings Ltd.# | | | 612,000 | | | | 1,089,676 | |
| | |
CK Hutchison Holdings Ltd. | | | 97,000 | | | | 1,147,011 | |
| | |
Hongkong Land Holdings Ltd. | | | 271,700 | | | | 1,963,641 | |
| | |
Jardine Matheson Holdings Ltd. | | | 50,800 | | | | 3,076,130 | |
| | |
Johnson Electric Holdings Ltd. | | | 455,000 | | | | 1,584,096 | |
| | |
Sands China Ltd. | | | 141,200 | | | | 816,049 | |
| | |
Sun Hung Kai Properties Ltd. | | | 121,000 | | | | 1,948,638 | |
| | |
Swire Properties Ltd. | | | 936,400 | | | | 3,323,743 | |
| | |
Techtronic Industries Co. Ltd. | | | 789,000 | | | | 4,622,113 | |
| | | | | | | | |
| | |
TOTAL HONG KONG | | | | | | $ | 31,750,459 | |
| | |
INDIA – 1.4% | | | | | | | | |
| | |
HDFC Bank Ltd. ADR | | | 68,280 | | | | 6,541,907 | |
| | |
Infosys Ltd. ADR | | | 93,685 | | | | 1,655,414 | |
| | |
Suzlon Energy Ltd. GDR - Reg S*,†† | | | 77,213 | | | | — | |
| | |
Tata Motors Ltd. ADR* | | | 39,727 | | | | 997,942 | |
| | | | | | | | |
| | |
TOTAL INDIA | | | | | | $ | 9,195,263 | |
| | |
INDONESIA – 0.0%** | | | | | | | | |
| | |
PP Persero Tbk PT†† | | | 19 | | | | — | |
| | |
Sugih Energy Tbk PT*,†† | | | 1,327,300 | | | | — | |
| | | | | | | | |
| | |
TOTAL INDONESIA | | | | | | $ | — | |
| | |
IRELAND – 1.8% | | | | | | | | |
| | |
DCC PLC | | | 15,916 | | | | 1,527,703 | |
| | |
Glanbia PLC | | | 81,791 | | | | 1,381,472 | |
| | |
Kerry Group PLC, Class A | | | 15,188 | | | | 1,548,266 | |
| | |
Kingspan Group PLC | | | 71,362 | | | | 3,230,479 | |
| | |
Ryanair Holdings PLC ADR* | | | 14,433 | | | | 1,587,197 | |
| | |
UDG Healthcare PLC | | | 201,884 | | | | 2,536,468 | |
| | | | | | | | |
| | |
TOTAL IRELAND | | | | | | $ | 11,811,585 | |
| | |
ITALY – 5.5% | | | | | | | | |
| | |
Assicurazioni Generali SpA# | | | 272,097 | | | | 5,490,628 | |
| | |
Atlantia SpA | | | 6,171 | | | | 204,259 | |
| | |
Credito Emiliano SpA | | | 260,780 | | | | 2,293,378 | |
| | | | | | | | |
Description | | Number of
Shares | | | Value | |
| | |
Enel SpA | | | 933,249 | | | $ | 5,920,264 | |
| | |
Eni SpA | | | 334,955 | | | | 6,547,829 | |
| | |
FinecoBank Banca Fineco SpA# | | | 216,903 | | | | 2,582,829 | |
| | |
Intesa Sanpaolo SpA | | | 1,520,788 | | | | 5,785,005 | |
| | |
Italgas SpA | | | 82,056 | | | | 530,993 | |
| | |
Poste Italiane SpAW | | | 52,420 | | | | 511,802 | |
| | |
Salvatore Ferragamo SpA# | | | 47,088 | | | | 1,391,365 | |
| | |
Snam SpA | | | 43,949 | | | | 211,002 | |
| | |
UniCredit SpA | | | 222,700 | | | | 4,828,115 | |
| | |
UnipolSai Assicurazioni SpA# | | | 99,244 | | | | 266,714 | |
| | | | | | | | |
| | |
TOTAL ITALY | | | | | | $ | 36,564,183 | |
| | |
JAPAN – 17.8% | | | | | | | | |
| | |
77 Bank Ltd. (The) | | | 38,400 | | | | 948,769 | |
| | |
Adastria Holdings Co. Ltd. | | | 8,100 | | | | 140,521 | |
| | |
Aeon Mall Co. Ltd. | | | 61,500 | | | | 1,243,618 | |
| | |
Ahresty Corp. | | | 121,400 | | | | 1,101,923 | |
| | |
Ajinomoto Co., Inc. | | | 88,000 | | | | 1,612,379 | |
| | |
Alpine Electronics, Inc. | | | 33,400 | | | | 631,592 | |
| | |
Anritsu Corp. | | | 40,300 | | | | 527,221 | |
| | |
AOI TYO Holdings, Inc. | | | 96,700 | | | | 1,344,433 | |
| | |
Ariake Japan Co. Ltd. | | | 4,300 | | | | 368,846 | |
| | |
Asics Corp. | | | 61,300 | | | | 1,158,360 | |
| | |
Bandai Namco Holdings, Inc. | | | 31,400 | | | | 1,062,538 | |
| | |
Cosmos Pharmaceutical Corp. | | | 5,200 | | | | 1,169,302 | |
| | |
Credit Saison Co. Ltd. | | | 18,800 | | | | 336,699 | |
| | |
Daihatsu Diesel Manufacturing Co. Ltd. | | | 124,000 | | | | 1,011,067 | |
| | |
Dai-ichi Life Holdings, Inc. | | | 110,200 | | | | 2,187,751 | |
| | |
Daiki Aluminium Industry Co. Ltd. | | | 105,300 | | | | 725,202 | |
| | |
Daikin Industries Ltd. | | | 20,000 | | | | 2,336,315 | |
| | |
Daiwa House Industry Co. Ltd. | | | 24,900 | | | | 910,376 | |
| | |
Daiwa Securities Group, Inc. | | | 57,000 | | | | 349,669 | |
| | |
DeNA Co. Ltd. | | | 34,200 | | | | 651,841 | |
| | |
Denka Co. Ltd. | | | 45,800 | | | | 1,630,541 | |
| | |
Denki Kogyo Co. Ltd. | | | 29,600 | | | | 894,549 | |
| | |
Ebara Corp. | | | 62,800 | | | | 2,398,677 | |
| | |
Electric Power Development Co. Ltd. | | | 23,000 | | | | 625,497 | |
| | |
ESPEC Corp. | | | 29,900 | | | | 703,325 | |
| | |
Hino Motors Ltd. | | | 232,900 | | | | 2,841,481 | |
| | |
Hitachi Chemical Co. Ltd. | | | 42,400 | | | | 929,993 | |
| | |
Hitachi Ltd. | | | 213,000 | | | | 1,554,593 | |
| | |
Hitachi Metals Ltd. | | | 45,200 | | | | 516,562 | |
| | |
Honda Motor Co. Ltd. | | | 29,200 | | | | 1,004,070 | |
| | |
Inpex Corp. | | | 51,800 | | | | 662,201 | |
| | |
Isetan Mitsukoshi Holdings Ltd. | | | 150,700 | | | | 1,676,569 | |
| | |
ITOCHU Corp. | | | 58,600 | | | | 1,171,908 | |
| | |
Jafco Co. Ltd. | | | 9,400 | | | | 412,266 | |
| | |
Japan Securities Finance Co. Ltd. | | | 104,000 | | | | 683,392 | |
ANNUAL REPORT / April 30, 2018
15 PORTFOLIOS OF INVESTMENTS
Wilmington International Fund (continued)
| | | | | | | | |
Description | | Number of
Shares | | | Value | |
| | |
Japan Tobacco, Inc. | | | 59,100 | | | $ | 1,588,679 | |
| | |
JFE Holdings, Inc. | | | 38,900 | | | | 798,319 | |
| | |
JXTG Holdings, Inc. | | | 167,500 | | | | 1,091,893 | |
| | |
Komatsu Ltd. | | | 18,800 | | | | 640,868 | |
| | |
K’s Holdings Corp. | | | 29,200 | | | | 421,154 | |
| | |
Macromill, Inc. | | | 27,000 | | | | 729,547 | |
| | |
Maeda Corp. | | | 46,500 | | | | 573,896 | |
| | |
Mimasu Semiconductor Industry Co. Ltd. | | | 57,000 | | | | 1,003,748 | |
| | |
Mirait Holdings Corp. | | | 65,000 | | | | 1,030,862 | |
| | |
Mitsubishi Corp. | | | 32,600 | | | | 898,963 | |
| | |
Mitsubishi Electric Corp. | | | 67,000 | | | | 1,027,147 | |
| | |
Mitsubishi Estate Co. Ltd. | | | 19,700 | | | | 359,969 | |
| | |
Mitsubishi Heavy Industries Ltd. | | | 9,500 | | | | 375,552 | |
| | |
Mitsubishi Logistics Corp. | | | 46,200 | | | | 1,065,608 | |
| | |
Mitsubishi UFJ Financial Group, Inc. | | | 445,600 | | | | 2,986,119 | |
| | |
Mitsui & Co. Ltd. | | | 23,800 | | | | 428,952 | |
| | |
Mitsui Fudosan Co. Ltd. | | | 46,900 | | | | 1,201,364 | |
| | |
Mitsui OSK Lines Ltd. | | | 9,800 | | | | 290,292 | |
| | |
Mizuho Financial Group, Inc. | | | 609,400 | | | | 1,102,549 | |
| | |
NET One Systems Co. Ltd. | | | 69,300 | | | | 1,115,358 | |
| | |
Nintendo Co. Ltd. | | | 7,400 | | | | 3,109,306 | |
| | |
Nippon Electric Glass Co. Ltd. | | | 23,600 | | | | 680,106 | |
| | |
Nippon Sheet Glass Co. Ltd.* | | | 133,100 | | | | 1,086,557 | |
| | |
Nippon Telegraph & Telephone Corp. | | | 31,500 | | | | 1,494,838 | |
| | |
Nippon Yusen KK | | | 18,900 | | | | 402,013 | |
| | |
Nishimatsu Construction Co. Ltd. | | | 17,800 | | | | 489,304 | |
| | |
Nissan Shatai Co. Ltd. | | | 27,500 | | | | 294,438 | |
| | |
Nissin Kogyo Co. Ltd. | | | 269,800 | | | | 4,734,096 | |
| | |
Nitori Holdings Co. Ltd. | | | 5,800 | | | | 978,082 | |
| | |
Nitto Denko Corp. | | | 5,300 | | | | 394,028 | |
| | |
Nomura Holdings, Inc. | | | 70,200 | | | | 404,321 | |
| | |
Noritz Corp. | | | 27,500 | | | | 501,066 | |
| | |
NTT DOCOMO, Inc. | | | 27,800 | | | | 718,185 | |
| | |
ORIX Corp. | | | 48,800 | | | | 855,896 | |
| | |
OSJB Holdings Corp. | | | 357,900 | | | | 1,048,727 | |
| | |
Pacific Industrial Co. Ltd. | | | 55,000 | | | | 780,120 | |
| | |
Persol Holdings Co. Ltd. | | | 8,300 | | | | 197,292 | |
| | |
Recruit Holdings Co. Ltd. | | | 54,100 | | | | 1,247,382 | |
| | |
Ryobi Ltd. | | | 49,300 | | | | 1,259,542 | |
| | |
San-A Co. Ltd. | | | 17,100 | | | | 911,875 | |
| | |
Santen Pharmaceutical Co. Ltd. | | | 58,100 | | | | 975,750 | |
| | |
SEC Carbon Ltd.# | | | 19,100 | | | | 1,152,569 | |
| | |
Seikagaku Corp. | | | 36,900 | | | | 609,948 | |
| | |
Seino Holdings Co. Ltd. | | | 97,100 | | | | 1,818,757 | |
| | |
Sekisui Chemical Co. Ltd. | | | 49,700 | | | | 879,197 | |
| | |
Senshu Electric Co. Ltd. | | | 28,200 | | | | 834,367 | |
| | |
Seven & i Holdings Co. Ltd. | | | 18,100 | | | | 797,501 | |
| | |
Shimamura Co. Ltd. | | | 8,600 | | | | 1,000,810 | |
| | | | | | | | |
Description | | Number of
Shares | | | Value | |
| | |
Shionogi & Co. Ltd. | | | 19,100 | | | $ | 981,581 | |
| | |
Showa Corp. | | | 96,300 | | | | 1,447,476 | |
| | |
Sinko Industries Ltd. | | | 52,100 | | | | 844,364 | |
| | |
SMC Corp. | | | 2,300 | | | | 873,984 | |
| | |
SoftBank Group Corp | | | 18,900 | | | | 1,444,125 | |
| | |
Sony Corp. | | | 42,800 | | | | 1,999,022 | |
| | |
Sumitomo Electric Industries Ltd. | | | 49,400 | | | | 756,268 | |
| | |
Sumitomo Heavy Industries Ltd. | | | 27,000 | | | | 1,031,678 | |
| | |
Sumitomo Metal Mining Co. Ltd. | | | 14,800 | | | | 631,373 | |
| | |
Sumitomo Mitsui Financial Group, Inc. | | | 49,300 | | | | 2,054,739 | |
| | |
Sumitomo Warehouse Co Ltd. (The) | | | 76,000 | | | | 519,957 | |
| | |
Suruga Bank Ltd. | | | 23,400 | | | | 316,987 | |
| | |
Suzuki Motor Corp. | | | 9,000 | | | | 483,731 | |
| | |
T&D Holdings, Inc. | | | 97,900 | | | | 1,662,732 | |
| | |
Taiheiyo Cement Corp. | | | 17,300 | | | | 653,247 | |
| | |
Taiyo Nippon Sanso Corp. | | | 64,600 | | | | 957,743 | |
| | |
Take And Give Needs Co. Ltd.# | | | 13,200 | | | | 138,274 | |
| | |
Takeei Corp. | | | 41,400 | | | | 505,221 | |
| | |
Teikoku Electric Manufacturing Co. Ltd. | | | 93,300 | | | | 1,388,875 | |
| | |
Terumo Corp. | | | 33,200 | | | | 1,878,484 | |
| | |
Tokio Marine Holdings, Inc. | | | 19,300 | | | | 910,907 | |
| | |
Tokyo Ohka Kogyo Co. Ltd. | | | 16,400 | | | | 576,188 | |
| | |
Tokyu Fudosan Holdings Corp. | | | 107,300 | | | | 844,398 | |
| | |
Toray Industries, Inc. | | | 93,800 | | | | 875,583 | |
| | |
Toyobo Co. Ltd. | | | 29,200 | | | | 568,800 | |
| | |
Toyota Motor Corp. | | | 24,500 | | | | 1,606,524 | |
| | |
Tsurumi Manufacturing Co. Ltd. | | | 37,600 | | | | 730,508 | |
| | |
Ube Industries Ltd. | | | 19,700 | | | | 600,144 | |
| | |
West Japan Railway Co. | | | 14,900 | | | | 1,053,151 | |
| | |
Xebio Holdings Co. Ltd. | | | 31,400 | | | | 591,571 | |
| | |
Yahoo Japan Corp.# | | | 463,300 | | | | 1,904,016 | |
| | |
Yamato Kogyo Co. Ltd. | | | 19,400 | | | | 571,886 | |
| | |
Yaoko Co. Ltd. | | | 10,200 | | | | 565,698 | |
| | | | | | | | |
| | |
TOTAL JAPAN | | | | | | $ | 117,880,193 | |
| | |
JERSEY – 0.2% | | | | | | | | |
| | |
Shire PLC | | | 22,170 | | | | 1,180,559 | |
| | |
LUXEMBOURG – 1.0% | | | | | | | | |
| | |
ArcelorMittal* | | | 148,300 | | | | 5,026,423 | |
| | |
RTL Group SA | | | 367 | | | | 30,200 | |
| | |
Samsonite International SA | | | 288,000 | | | | 1,299,080 | |
| | |
SES SA# | | | 17,183 | | | | 265,114 | |
| | | | | | | | |
| | |
TOTAL LUXEMBOURG | | | | | | $ | 6,620,817 | |
| | |
MALAYSIA – 0.0%** | | | | | | | | |
| | |
RHB Bank Bhd*,†† | | | 18,000 | | | | — | |
| | |
NETHERLANDS – 5.3% | | | | | | | | |
| | |
ABN AMRO Group NVW | | | 12,972 | | | | 402,277 | |
April 30, 2018 / ANNUAL REPORT
PORTFOLIOS OF INVESTMENTS 16
Wilmington International Fund (continued)
| | | | | | | | |
Description | | Number of
Shares | | | Value | |
| | |
Aegon NV | | | 130,920 | | | $ | 959,484 | |
| | |
ASML Holding NV# | | | 34,769 | | | | 6,619,445 | |
| | |
ASR Nederland NV | | | 1,447 | | | | 68,246 | |
| | |
BE Semiconductor Industries NV* | | | 2,185 | | | | 151,012 | |
| | |
IMCD NV | | | 39,350 | | | | 2,421,328 | |
| | |
ING Groep NV# | | | 51,317 | | | | 864,717 | |
| | |
Koninklijke Ahold Delhaize NV | | | 205,092 | | | | 4,947,734 | |
| | |
Koninklijke KPN NV# | | | 1,579,600 | | | | 4,916,079 | |
| | |
NN Group NV | | | 122,064 | | | | 5,849,877 | |
| | |
Royal Dutch Shell PLC, Class A | | | 87,776 | | | | 3,071,608 | |
| | |
Royal Dutch Shell PLC, Class B | | | 69,592 | | | | 2,484,371 | |
| | |
Wessanen# | | | 126,926 | | | | 2,560,830 | |
| | | | | | | | |
| | |
TOTAL NETHERLANDS | | | | | | $ | 35,317,008 | |
| | |
NORWAY – 1.0% | | | | | | | | |
| | |
DNB ASA# | | | 39,231 | | | | 733,673 | |
| | |
Marine Harvest ASA | | | 18,842 | | | | 410,150 | |
| | |
Norsk Hydro ASA# | | | 49,857 | | | | 311,405 | |
| | |
Salmar ASA | | | 2,041 | | | | 95,113 | |
| | |
Sbanken ASAW | | | 194,367 | | | | 1,754,708 | |
| | |
Telenor ASA | | | 14,243 | | | | 315,253 | |
| | |
TGS Nopec Geophysical Co. ASA | | | 59,345 | | | | 1,871,381 | |
| | |
Tomra Systems ASA | | | 72,848 | | | | 1,351,407 | |
| | | | | | | | |
| | |
TOTAL NORWAY | | | | | | $ | 6,843,090 | |
| | |
PHILIPPINES – 0.2% | | | | | | | | |
| | |
Ayala Land, Inc. | | | 1,694,300 | | | | 1,331,367 | |
| | |
RUSSIA – 0.0%** | | | | | | | | |
| | |
Polymetal International PLC | | | 4,638 | | | | 46,554 | |
| | |
SINGAPORE – 0.8% | | | | | | | | |
| | |
Jardine Cycle & Carriage Ltd. | | | 53,000 | | | | 1,363,628 | |
| | |
Oversea-Chinese Banking Corp. Ltd. | | | 350,500 | | | | 3,620,170 | |
| | | | | | | | |
| | |
TOTAL SINGAPORE | | | | | | $ | 4,983,798 | |
| | |
SOUTH AFRICA – 0.0%** | | | | | | | | |
| | |
African Phoenix Investments Ltd.* | | | 36,266 | | | | 1,926 | |
| | |
Investec PLC | | | 35,259 | | | | 278,928 | |
| | | | | | | | |
| | |
TOTAL SOUTH AFRICA | | | | | | $ | 280,854 | |
| | |
SOUTH KOREA – 2.6% | | | | | | | | |
| | |
Mando Corp. | | | 9,012 | | | | 1,906,639 | |
| | |
NAVER Corp. | | | 1,341 | | | | 894,236 | |
| | |
Samsung Electronics Co. Ltd.†† | | | 4,371 | | | | 10,833,997 | |
| | |
Samsung Fire & Marine Insurance Co. Ltd. | | | 8,479 | | | | 2,117,121 | |
| | |
SK Materials Co. Ltd. | | | 11,613 | | | | 1,667,854 | |
| | | | | | | | |
| | |
TOTAL SOUTH KOREA | | | | | | $ | 17,419,847 | |
| | |
SPAIN – 1.8% | | | | | | | | |
| | |
Abertis Infraestructuras SA | | | 10,449 | | | | 230,368 | |
| | | | | | | | |
Description | | Number of
Shares | | | Value | |
| | |
Acciona SA | | | 1,172 | | | $ | 98,033 | |
| | |
Amadeus IT Group SA | | | 31,892 | | | | 2,326,831 | |
| | |
Banco Bilbao Vizcaya Argentaria SA | | | 37,323 | | | | 302,019 | |
| | |
Banco Santander SA# | | | 239,742 | | | | 1,548,953 | |
| | |
Bankinter SA | | | 220,480 | | | | 2,304,264 | |
| | |
CaixaBank SA | | | 66,702 | | | | 324,363 | |
| | |
Enagas SA | | | 1,814 | | | | 52,726 | |
| | |
Iberdrola SA | | | 175,432 | | | | 1,355,376 | |
| | |
Industria de Diseno Textil SA# | | | 38,023 | | | | 1,178,643 | |
| | |
Mapfre SA | | | 51,242 | | | | 177,757 | |
| | |
Repsol SA | | | 54,168 | | | | 1,033,677 | |
| | |
Telefonica SA | | | 96,249 | | | | 980,823 | |
| | | | | | | | |
| | |
TOTAL SPAIN | | | | | | $ | 11,913,833 | |
| | |
SWEDEN – 2.2% | | | | | | | | |
| | |
Assa Abloy AB | | | 92,948 | | | | 1,947,904 | |
| | |
Atlas Copco AB, Class A | | | 44,036 | | | | 1,722,087 | |
| | |
Avanza Bank Holding AB# | | | 36,689 | | | | 1,724,673 | |
| | |
Hemfosa Fastigheter AB | | | 8,597 | | | | 106,492 | |
| | |
Hexagon AB | | | 40,693 | | | | 2,349,570 | |
| | |
Hexpol AB | | | 2,004 | | | | 20,738 | |
| | |
Munters Group AB#,*,W | | | 132,491 | | | | 765,211 | |
| | |
Nordea Bank AB | | | 71,847 | | | | 730,731 | |
| | |
Peab AB | | | 5,679 | | | | 50,278 | |
| | |
Skandinaviska Enskilda Banken AB, Class A | | | 55,201 | | | | 518,229 | |
| | |
Sweco AB, Class B | | | 71,419 | | | | 1,454,599 | |
| | |
Swedbank AB | | | 17,004 | | | | 369,383 | |
| | |
Tele2 AB, Class B | | | 152,796 | | | | 1,980,529 | |
| | |
Trelleborg AB, Class B | | | 32,984 | | | | 770,795 | |
| | |
Volvo AB, Class B | | | 13,577 | | | | 230,081 | |
| | | | | | | | |
| | |
TOTAL SWEDEN | | | | | | $ | 14,741,300 | |
| | |
SWITZERLAND – 3.3% | | | | | | | | |
| | |
Aryzta AG#, * | | | 54,941 | | | | 1,157,932 | |
| | |
Chocoladefabriken Lindt & Spruengli AG | | | 125 | | | | 803,506 | |
| | |
Cie Financiere Richemont SA | | | 28,739 | | | | 2,731,893 | |
| | |
Clariant AG* | | | 29,899 | | | | 690,228 | |
| | |
Comet Holding AG* | | | 10,140 | | | | 1,328,964 | |
| | |
Huber + Suhner AG# | | | 30,855 | | | | 1,762,347 | |
| | |
Julius Baer Group Ltd.* | | | 14,933 | | | | 886,249 | |
| | |
Nestle SA | | | 11,322 | | | | 877,116 | |
| | |
Novartis AG | | | 39,113 | | | | 3,010,697 | |
| | |
Oriflame Holding AG | | | 1,289 | | | | 61,082 | |
| | |
Partners Group Holding AG | | | 2,582 | | | | 1,883,235 | |
| | |
Roche Holding AG | | | 6,795 | | | | 1,509,764 | |
| | |
STMicroelectronics NV | | | 10,577 | | | | 230,887 | |
| | |
Straumann Holding AG | | | 2,483 | | | | 1,685,527 | |
| | |
Swiss Life Holding AG* | | | 2,095 | | | | 732,871 | |
ANNUAL REPORT / April 30, 2018
17 PORTFOLIOS OF INVESTMENTS
Wilmington International Fund (continued)
| | | | | | | | |
Description | | Number of
Shares | | | Value | |
| | |
Swiss Re AG | | | 11,849 | | | $ | 1,128,846 | |
| | |
UBS Group AG* | | | 30,660 | | | | 514,625 | |
| | |
Zurich Insurance Group AG | | | 1,947 | | | | 621,941 | |
| | | | | | | | |
| | |
TOTAL SWITZERLAND | | | | | | $ | 21,617,710 | |
| | |
TAIWAN – 2.6% | | | | | | | | |
| | |
Far EasTone Telecommunications Co. Ltd. | | | 203,000 | | | | 537,083 | |
| | |
Hon Hai Precision Industry Co. Ltd. | | | 881,000 | | | | 2,450,398 | |
| | |
Largan Precision Co. Ltd. | | | 17,000 | | | | 1,977,240 | |
| | |
Merida Industry Co. Ltd. | | | 355,000 | | | | 1,580,536 | |
| | |
Taiwan Semiconductor Manufacturing Co. | | | | | | | | |
| | |
Ltd. | | | 1,386,000 | | | | 10,557,637 | |
| | | | | | | | |
| | |
TOTAL TAIWAN | | | | | | $ | 17,102,894 | |
| | |
THAILAND – 0.4% | | | | | | | | |
| | |
Kasikornbank PCL | | | 465,700 | | | | 2,871,782 | |
| | |
UNITED KINGDOM – 8.3% | | | | | | | | |
| | |
AstraZeneca PLC | | | 5,532 | | | | 387,256 | |
| | |
Aviva PLC | | | 79,653 | | | | 578,736 | |
| | |
Barratt Developments PLC | | | 30,257 | | | | 232,014 | |
| | |
Berkeley Group Holdings PLC | | | 4,797 | | | | 268,557 | |
| | |
BP PLC | | | 297,127 | | | | 2,207,063 | |
| | |
British American Tobacco PLC | | | 39,170 | | | | 2,148,391 | |
| | |
BT Group PLC | | | 123,005 | | | | 422,198 | |
| | |
Capital & Counties Properties PLC | | | 269,738 | | | | 1,067,574 | |
| | |
Centrica PLC | | | 213,285 | | | | 450,201 | |
| | |
Compass Group PLC | | | 75,907 | | | | 1,628,427 | |
| | |
Crest Nicholson Holdings PLC | | | 4,232 | | | | 28,376 | |
| | |
Croda International PLC | | | 42,283 | | | | 2,586,579 | |
| | |
Dignity PLC | | | 53,054 | | | | 795,861 | |
| | |
Direct Line Insurance Group PLC | | | 154,498 | | | | 793,860 | |
| | |
Galliford Try PLC# | | | 13,759 | | | | 173,343 | |
| | |
GlaxoSmithKline PLC | | | 58,710 | | | | 1,177,564 | |
| | |
HSBC Holdings PLC | | | 618,230 | | | | 6,156,945 | |
| | |
Hunting PLC* | | | 239,856 | | | | 2,650,756 | |
| | |
International Consolidated Airlines Group SA | | | 27,898 | | | | 240,740 | |
| | |
Legal & General Group PLC | | | 162,423 | | | | 601,577 | |
| | |
Lloyds Banking Group PLC | | | 1,888,139 | | | | 1,674,690 | |
| | |
National Grid PLC | | | 94,862 | | | | 1,097,556 | |
| | |
NEX Group PLC | | | 118,930 | | | | 1,613,897 | |
| | |
Persimmon PLC | | | 17,251 | | | | 644,423 | |
| | |
Prudential PLC | | | 137,553 | | | | 3,537,069 | |
| | |
Reckitt Benckiser Group PLC | | | 32,697 | | | | 2,565,033 | |
| | |
Rio Tinto Ltd. | | | 48,363 | | | | 2,878,275 | |
| | |
Rio Tinto PLC | | | 29,556 | | | | 1,610,988 | |
| | |
Royal Mail PLC | | | 121,882 | | | | 972,010 | |
| | |
RSA Insurance Group PLC | | | 19,753 | | | | 178,232 | |
| | |
Serco Group PLC* | | | 925,203 | | | | 1,222,641 | |
| | | | | | | | |
Description | | Number of
Shares | | | Value | |
| | |
SSE PLC | | | 29,547 | | | $ | 560,764 | |
| | |
SSP Group PLC | | | 164,482 | | | | 1,471,888 | |
| | |
St James’s Place PLC | | | 186,230 | | | | 2,900,975 | |
| | |
Tate & Lyle PLC | | | 5,114 | | | | 40,390 | |
| | |
Taylor Wimpey PLC | | | 104,958 | | | | 276,413 | |
| | |
Tullow Oil PLC* | | | 569,293 | | | | 1,781,598 | |
| | |
Unilever NV# | | | 34,107 | | | | 1,955,303 | |
| | |
Vodafone Group PLC | | | 389,036 | | | | 1,135,298 | |
| | |
Weir Group PLC (The) | | | 63,057 | | | | 1,845,175 | |
| | | | | | | | |
| | |
TOTAL UNITED KINGDOM | | | | | | $ | 54,558,636 | |
| | |
UNITED STATES – 0.3% | | | | | | | | |
| | |
Cognizant Technology Solutions Corp., | | | | | | | | |
| | |
Class A | | | 22,873 | | | | 1,871,469 | |
| | | | | | | | |
| | |
TOTAL COMMON STOCKS (COST $506,943,671) | | | | | | $ | 594,599,929 | |
| | |
INVESTMENT COMPANIES – 4.4% | | | | | | | | |
| | |
iShares MSCI Australia ETF | | | 576,900 | | | | 12,801,411 | |
| | |
iShares S&P/TSX 60 Index ETF# | | | 892,000 | | | | 16,138,604 | |
| | | | | | | | |
| | |
TOTAL INVESTMENT COMPANIES (COST $30,524,307) | | | | | | $ | 28,940,015 | |
| | |
PREFERRED STOCK – 0.0%** | | | | | | | | |
| | |
GERMANY – 0.0%** | | | | | | | | |
| | |
Volkswagen AG | | | 1,212 | | | | 249,956 | |
| | | | | | | | |
| | |
TOTAL PREFERRED STOCK (COST $248,806) | | | | | | $ | 249,956 | |
| | |
MONEY MARKET FUND – 3.0% | | | | | | | | |
| | |
Dreyfus Government Cash Management | | | | | | | | |
| | |
Fund, Institutional Shares, 1.60%^ | | | 19,505,936 | | | | 19,505,936 | |
| | | | | | | | |
| | |
TOTAL MONEY MARKET FUND (COST $19,505,936) | | | | | | $ | 19,505,936 | |
| | |
RIGHTS – 0.0%** | | | | | | | | |
| | |
TUNISIA – 0.0%** | | | | | | | | |
| | |
Societe D’Articles Hygieniques SA*,†† | | | 2,800 | | | | — | |
| | | | | | | | |
| | |
TOTAL RIGHTS (COST $0) | | | | | | $ | — | |
| | |
WARRANTS – 1.1% | | | | | | | | |
| | |
CHINA – 0.3% | | | | | | | | |
| | |
China International Travel Service Corp. Ltd., Class A* | | | 149,261 | | | | 1,227,226 | |
| | |
Zhejiang Sanhua Intelligent Controls Co., | | | | | | | | |
| | |
Ltd., Class A* | | | 333,331 | | | | 823,722 | |
| | | | | | | | |
| | |
TOTAL CHINA | | | | | | $ | 2,050,948 | |
| | |
SWITZERLAND – 0.8% | | | | | | | | |
| | |
Hangzhou Hikvision Digital Technology Co. | | | | | | | | |
| | |
Ltd.* | | | 459,711 | | | | 2,794,706 | |
April 30, 2018 / ANNUAL REPORT
PORTFOLIOS OF INVESTMENTS 18
Wilmington International Fund (continued)
| | | | | | | | |
Description | | Number of
Shares | | | Value | |
| | |
Midea Group Co., Ltd.* | | $ | 310,149 | | | $ | 2,530,949 | |
| | | | | | | | |
| | |
TOTAL SWITZERLAND | | | | | | $ | 5,325,655 | |
| | | | | | | | |
| |
TOTAL WARRANTS (COST $5,250,497) | | | $ | 7,376,603 | |
| | | | | | | | |
| |
TOTAL INVESTMENTS IN SECURITIES – 98.4% (COST $562,473,217) | | | $ | 650,672,439 | |
| | | | | | | | |
| Description | | Par Value | | | Value | |
|
CASH COLLATERAL INVESTED FOR SECURITIES ON LOAN – 6.8% | |
| |
REPURCHASE AGREEMENTS – 6.8% | | | | | |
| | |
Barclays Capital, Inc., 1.71%, dated 4/30/18, due 5/01/18, repurchase price $2,256,470, collateralized by U.S. Treasury Securities, 0.00% to 3.00%, maturing 7/31/19 to 9/09/49; total market value of $2,301,490. | | $ | 2,256,363 | | | $ | 2,256,363 | |
| | |
Daiwa Capital Markets America, 1.72%, dated 4/30/18, due 5/01/18, repurchase price $8,599,996, collateralized by U.S. Government & Treasury Securities, 0.00% to 9.13%, maturing 5/15/18 to 12/01/51; total market value of $8,771,577. | | | 8,599,585 | | | | 8,599,585 | |
| | |
NBC Global Finance Ltd., 1.74%, dated 4/30/18, due 5/01/18, repurchase price $8,600,001, collateralized by U.S. Treasury Securities, 0.00% to 3.63%, maturing 6/30/19 to 9/09/49; total market value of $8,771,556. | | | 8,599,585 | | | | 8,599,585 | |
| | |
Nomura Securities International, Inc., 1.74%, dated 4/30/18, due 5/01/18, repurchase price $8,600,001, collateralized by U.S. Government Securities, 0.00% to 10.50%, maturing 5/01/18 to 3/20/68; total market value of $8,771,577. | | | 8,599,585 | | | | 8,599,585 | |
| | |
RBC Dominion Securities, Inc., 1.72%, dated 4/30/18, due 5/01/18, repurchase price $8,599,996, collateralized by U.S. Government & Treasury Securities, 0.13% to 7.00%, maturing 10/31/18 to 9/09/49; total market value of $8,771,577. | | | 8,599,585 | | | | 8,599,585 | |
| | |
TD Securities, Inc., 1.74%, dated 4/30/18, due 5/01/18, repurchase price $8,600,001, collateralized by U.S. Government Securities, 4.00% to 4.50%, maturing 3/01/47 to 3/01/48; total market value of $8,771,577. | | | 8,599,585 | | | | 8,599,585 | |
| | | | | | | | |
| |
TOTAL CASH COLLATERAL INVESTED FOR SECURITIES ON LOAN (COST $45,254,288) | | | $ | 45,254,288 | |
| | | | | | | | |
| | |
TOTAL INVESTMENTS – 105.2%ø (COST $607,727,505) | | | | | | $ | 695,926,727 | |
| |
| COLLATERAL FOR SECURITIES ON LOAN – (6.8%) | | | | (45,254,288 | ) |
| |
| OTHER ASSETS LESS LIABILITIES – 1.6% | | | | 10,610,160 | |
| | | | | | | | |
| | |
| TOTAL NET ASSETS – 100.0% | | | | | | $ | 661,282,599 | |
| | | | | | | | |
ANNUAL REPORT / April 30, 2018
19 PORTFOLIOS OF INVESTMENTS
Wilmington International Fund (continued)
Cost of investments for Federal income tax purposes is $609,947,321. The net unrealized appreciation/(depreciation) of investments was $86,095,881. This consists of net unrealized appreciation from investment for those securities having an excess of value over cost of $100,910,278 and net unrealized depreciation from investments for those securities having an excess of cost over value of $(14,814,397).
Various inputs are used in determining the value of the Fund’s investments. These inputs are summarized in the three broad levels listed below.
|
| Level 1 – quoted prices in active markets for identical securities |
| Level 2 – other significant observable inputs (including quoted prices for similar securities, interest rates, prepayment speeds, credit risk, etc.) |
| Level 3 – significant unobservable inputs (including the Fund’s own assumptions in determining the fair value of investments) |
The following is a summary of the inputs used as of April 30, 2018 in valuing the Fund’s assets carried at fair value:
| | | | | | | | | | | | | | | | |
| | | | |
| | | Level 1 | | | Level 2 | | | Level 3 | | | Total | |
Assets | | | | | | | | | | | | | | | | |
| | | | |
Investments in Securities | | | | | | | | | | | | | | | | |
| | | | |
Common Stocks | | | | | | | | | | | | | | | | |
| | | | |
Australia | | $ | — | | | $ | 459,544 | | | $ | — | | | $ | 459,544 | |
| | | | |
Austria | | | — | | | | 4,748,345 | | | | — | | | | 4,748,345 | |
| | | | |
Belgium | | | — | | | | 1,976,143 | | | | — | | | | 1,976,143 | |
| | | | |
Bermuda | | | — | | | | 1,954,015 | | | | — | | | | 1,954,015 | |
| | | | |
Bulgaria | | | 1,766 | | | | — | | | | — | | | | 1,766 | |
| | | | |
China | | | 16,335,746 | | | | 26,587,318 | | | | — | | | | 42,923,064 | |
| | | | |
Denmark | | | — | | | | 8,278,024 | | | | — | | | | 8,278,024 | |
| | | | |
Finland | | | — | | | | 8,136,719 | | | | — | | | | 8,136,719 | |
| | | | |
France | | | — | | | | 58,642,372 | | | | — | | | | 58,642,372 | |
| | | | |
Germany | | | — | | | | 61,576,736 | | | | — | | | | 61,576,736 | |
| | | | |
Ghana | | | — | | | | — | | | | — | | | | — | |
| | | | |
Hong Kong | | | — | | | | 31,750,459 | | | | — | | | | 31,750,459 | |
| | | | |
India | | | 9,195,263 | | | | — | | | | — | | | | 9,195,263 | |
| | | | |
Indonesia | | | — | | | | — | | | | — | | | | — | |
| | | | |
Ireland | | | 1,587,197 | | | | 10,224,388 | | | | — | | | | 11,811,585 | |
| | | | |
Italy | | | — | | | | 36,564,183 | | | | — | | | | 36,564,183 | |
| | | | |
Japan | | | — | | | | 117,880,193 | | | | — | | | | 117,880,193 | |
| | | | |
Jersey | | | — | | | | 1,180,559 | | | | — | | | | 1,180,559 | |
| | | | |
Luxembourg | | | — | | | | 6,620,817 | | | | — | | | | 6,620,817 | |
| | | | |
Malaysia | | | — | | | | — | | | | — | | | | — | |
| | | | |
Netherlands | | | — | | | | 35,317,008 | | | | — | | | | 35,317,008 | |
| | | | |
Norway | | | — | | | | 6,843,090 | | | | — | | | | 6,843,090 | |
| | | | |
Philippines | | | — | | | | 1,331,367 | | | | — | | | | 1,331,367 | |
| | | | |
Russia | | | — | | | | 46,554 | | | | — | | | | 46,554 | |
| | | | |
Singapore | | | — | | | | 4,983,798 | | | | — | | | | 4,983,798 | |
| | | | |
South Africa | | | — | | | | 280,854 | | | | — | | | | 280,854 | |
| | | | |
South Korea | | | — | | | | 17,419,847 | | | | — | | | | 17,419,847 | |
| | | | |
Spain | | | — | | | | 11,913,833 | | | | — | | | | 11,913,833 | |
| | | | |
Sweden | | | — | | | | 14,741,300 | | | | — | | | | 14,741,300 | |
| | | | |
Switzerland | | | — | | | | 21,617,710 | | | | — | | | | 21,617,710 | |
| | | | |
Taiwan | | | — | | | | 17,102,894 | | | | — | | | | 17,102,894 | |
| | | | |
Thailand | | | — | | | | 2,871,782 | | | | — | | | | 2,871,782 | |
| | | | |
United Kingdom | | | — | | | | 54,558,636 | | | | — | | | | 54,558,636 | |
| | | | |
United States | | | 1,871,469 | | | | — | | | | — | | | | 1,871,469 | |
| | | | |
Investment Companies | | | 28,940,015 | | | | — | | | | — | | | | 28,940,015 | |
| | | | |
Preferred Stocks | | | | | | | | | | | | | | | | |
| | | | |
Germany | | | — | | | | 249,956 | | | | — | | | | 249,956 | |
| | | | |
Money Market Fund | | | 19,505,936 | | | | — | | | | — | | | | 19,505,936 | |
April 30, 2018 / ANNUAL REPORT
PORTFOLIOS OF INVESTMENTS 20
Wilmington International Fund (continued)
| | | | | | | | | | | | | | | | |
| | | | |
| | | Level 1 | | | Level 2 | | | Level 3 | | | Total | |
| | | | |
Rights | | | | | | | | | | | | | | | | |
| | | | |
Tunisia | | $ | — | | | $ | — | | | $ | — | | | $ | — | |
| | | | |
Warrants | | | | | | | | | | | | | | | | |
| | | | |
China | | | — | | | | 2,050,948 | | | | — | | | | 2,050,948 | |
| | | | |
Switzerland | | | — | | | | 5,325,655 | | | | — | | | | 5,325,655 | |
| | | | |
Repurchase Agreements | | | — | | | | 45,254,288 | | | | — | | | | 45,254,288 | |
| | | | | | | | | | | | | | | | |
| | | | |
Total Investments in Securities | | | 77,437,392 | | | | 618,489,335 | | | | — | | | | 695,926,727 | |
| | | | | | | | | | | | | | | | |
| | | | |
Other Financial Instruments! | | | | | | | | | | | | | | | | |
| | | | |
Forward Foreign Currency Contracts | | $ | — | | | $ | 839 | | | $ | — | | | $ | 839 | |
| | | | |
Financial Futures Contracts | | | 117,414 | | | | — | | | | — | | | | 117,414 | |
| | | | | | | | | | | | | | | | |
| | | | |
Total Assets - Other Financial Instruments | | $ | 117,414 | | | $ | 839 | | | $ | — | | | $ | 118,253 | |
| | | | | | | | | | | | | | | | |
Liabilities | | | | | | | | | | | | | | | | |
| | | | |
Other Financial Instruments! | | | | | | | | | | | | | | | | |
| | | | |
Forward Foreign Currency Contracts | | $ | — | | | $ | (1,890 | ) | | $ | — | | | $ | (1,890 | ) |
| | | | | | | | | | | | | | | | |
| | | | |
Total Liabilities - Other Financial Instruments | | $ | — | | | $ | (1,890 | ) | | $ | — | | | $ | (1,890 | ) |
| | | | | | | | | | | | | | | | |
| ! | Other financial instruments are derivative instruments, such as forward foreign currency contracts and financial future contracts, which are valued at the unrealized appreciation (depreciation) on the instrument. |
| # | Security, or a portion thereof, is on loan. See Note 2 in Notes to Financial Statements. |
| * | Non-income producing security. |
| †† | Security is fair valued in accordance with procedures adopted by the Board of Trustees. See Note 2 in Notes to Financial Statements. At April 30, 2018, the value of these securities amounted to $10,833,997 representing 1.64% of total net assets. |
| W | Denotes a restricted security that may be resold without restriction to “qualified institutional buyers” as defined in Rule 144A under the Securities Act of 1933 and that the Fund has determined to be liquid under criteria established by the Fund’s Board of Trustees. At April 30, 2018, these liquid restricted securities amounted to $6,844,187 representing 1.03% of total net assets. |
| ø | On April 30, 2018, the Fund utilized International Fair Value Pricing, as defined in Note 2 in Notes to Financial Statements. The value of these securities amounted to $565,858,444 representing 85.57% of total net assets. |
| ** | Represents less than 0.05%. |
| | | | | | | | |
| The following acronyms are used throughout this Fund: | | Currency Code | | Currency | | |
| ADR | | American Depositary Receipt | | CHF | | Swiss Franc | | |
| ETF | | Exchange Traded Fund | | EUR | | Euro | | |
| GDR | | Global Depositary Receipt | | GBP | | British Pound Sterling | | |
| MSCI | | Morgan Stanley Capital International | | HKD | | Hong Kong Dollar | | |
| PLC | | Public Limited Company | | SEK | | Swedish Krona | | |
| Reg S | | Regulation S | | | | | | |
At April 30, 2018, the International Fund had the following outstanding forward foreign currency contracts, which contractually obligates the Fund to deliver or receive currencies at specified future dates:
| | | | | | | | | | | | | | | | | | | | |
| Settlement Date | | Counterparty | | Contracts to Deliver/Receive | | Contract
Amount | | | Contract
at Value | | | Unrealized
Appreciation | | | Unrealized
(Depreciation) | |
CONTRACTS PURCHASED | | | | | | | | | | | | | | | | | | |
5/3/2018 | | Bank of New York | | 181,432 SEK | | $ | 20,883 | | | $ | 20,719 | | | | $ — | | | | $(164) | |
5/3/2018 | | Bank of New York | | 83,119 EUR | | | 100,310 | | | | 100,374 | | | | 64 | | | | — | |
5/3/2018 | | Bank of New York | | 56,459 EUR | | | 68,136 | | | | 68,180 | | | | 44 | | | | — | |
5/3/2018 | | Bank of New York | | 13,968 EUR | | | 16,857 | | | | 16,868 | | | | 11 | | | | — | |
5/3/2018 | | Bank of New York | | 13,282 EUR | | | 16,029 | | | | 16,040 | | | | 11 | | | | — | |
CONTRACTS SOLD | | | | | | | | | | | | | | | | | | |
5/1/2018 | | Bank of New York | | 35,523 GBP | | | 49,432 | | | | 48,904 | | | | 528 | | | | — | |
5/2/2018 | | Bank of New York | | 1,105,101 HKD | | | 140,799 | | | | 140,801 | | | | — | | | | (2) | |
ANNUAL REPORT / April 30, 2018
21 PORTFOLIOS OF INVESTMENTS
Wilmington International Fund (concluded)
| | | | | | | | | | | | | | | | | | | | |
| Settlement Date | | Counterparty | | Contracts to
Deliver/Receive | | Contract
Amount | | | Contract
at Value | | | Unrealized
Appreciation | | | Unrealized
(Depreciation) | |
CONTRACTS SOLD (continued) | | | | | | | | | | | | | | | | | | |
5/2/2018 | | Bank of New York | | 340,253 HKD | | $ | 43,351 | | | $ | 43,352 | | | $ | — | | | $ | (1) | |
5/2/2018 | | Bank of New York | | 223,113 GBP | | | 306,223 | | | | 307,162 | | | | — | | | | (939) | |
5/2/2018 | | Bank of New York | | 101,128 GBP | | | 138,798 | | | | 139,224 | | | | — | | | | (426) | |
5/2/2018 | | Bank of New York | | 12,916 GBP | | | 17,727 | | | | 17,781 | | | | — | | | | (54) | |
5/2/2018 | | Bank of New York | | 12,664 EUR | | | 15,322 | | | | 15,292 | | | | 30 | | | | — | |
5/2/2018 | | Bank of New York | | 10,528 EUR | | | 12,700 | | | | 12,714 | | | | — | | | | (14) | |
5/2/2018 | | Bank of New York | | 8,292 EUR | | | 10,002 | | | | 10,013 | | | | — | | | | (11) | |
5/2/2018 | | Bank of New York | | 7,230 EUR | | | 8,748 | | | | 8,731 | | | | 17 | | | | — | |
5/2/2018 | | Bank of New York | | 6,990 EUR | | | 8,432 | | | | 8,442 | | | | — | | | | (10) | |
5/2/2018 | | Bank of New York | | 2,351 EUR | | | 2,836 | | | | 2,839 | | | | — | | | | (3) | |
5/2/2018 | | Bank of New York | | 1,510 EUR | | | 1,822 | | | | 1,824 | | | | — | | | | (2) | |
5/2/2018 | | Bank of New York | | 1,426 EUR | | | 1,720 | | | | 1,722 | | | | — | | | | (2) | |
5/2/2018 | | Bank of New York | | 1,176 EUR | | | 1,418 | | | | 1,420 | | | | — | | | | (2) | |
5/2/2018 | | Bank of New York | | 502 EUR | | | 606 | | | | 607 | | | | — | | | | (1) | |
5/3/2018 | | Bank of New York | | 259,204 HKD | | | 33,024 | | | | 33,025 | | | | — | | | | (1) | |
5/3/2018 | | Bank of New York | | 148,597 SEK | | | 17,104 | | | | 16,970 | | | | 134 | | | | — | |
5/3/2018 | | Bank of New York | | 120,644 EUR | | | 145,596 | | | | 145,689 | | | | — | | | | (93) | |
5/3/2018 | | Bank of New York | | 83,529 EUR | | | 100,805 | | | | 100,869 | | | | — | | | | (64) | |
5/3/2018 | | Bank of New York | | 28,283 CHF | | | 28,515 | | | | 28,539 | | | | — | | | | (24) | |
5/3/2018 | | Bank of New York | | 22,516 EUR | | | 27,162 | | | | 27,196 | | | | — | | | | (34) | |
5/3/2018 | | Bank of New York | | 17,758 EUR | | | 21,430 | | | | 21,444 | | | | — | | | | (14) | |
5/3/2018 | | Bank of New York | | 14,425 EUR | | | 17,408 | | | | 17,420 | | | | — | | | | (12) | |
5/3/2018 | | Bank of New York | | 10,369 EUR | | | 12,514 | | | | 12,522 | | | | — | | | | (8) | |
5/3/2018 | | Bank of New York | | 8,170 EUR | | | 9,859 | | | | 9,865 | | | | — | | | | (6) | |
5/3/2018 | | Bank of New York | | 3,457 EUR | | | 4,172 | | | | 4,175 | | | | — | | | | (3) | |
NET UNREALIZED APPRECIATION (DEPRECIATION) ON FORWARD FOREIGN CURRENCY CONTRACTS | | | | | | | | | | | $839 | | | | $(1,890) | |
At April 30, 2018, the International Fund had open financial futures contracts as follows:
| | | | | | | | | | | | | | | | | | | | | | | | | | |
Underlying Contracts to Buy/Sell | | Expiration Date | | Number of
Contracts | | | Notional
Amount | | | Contract
Amount | | | Contract
at Value | | | Unrealized
Appreciation(a) | | | Unrealized
(Depreciation)(a) | |
LONG POSITIONS: | | | | | | | | | | | | | | | | | | | | | | | | | | |
SGX Nifty 50 Index | | May 2018 | | | 384 | | | $ | 8,282,880 | | | $ | 8,165,466 | | | $ | 8,282,880 | | | $ | 117,414 | | | $ | — | |
NET UNREALIZED APPRECIATION (DEPRECIATION) ON FINANCIAL FUTURES CONTRACTS | | | | | | | | | | | $ | 117,414 | | | $ | — | |
| (a) | The variation margin shown on the Statement of Assets and Liabilities is the daily change in the unrealized appreciation (depreciation) for financial futures contracts. The unrealized appreciation (depreciation) presented above is the cumulative change in unrealized appreciation (depreciation) from the date the contract was open until April 30, 2018. If variation margin settles the same day, then no amount may be shown in the Statement of Assets and Liabilities. |
See Notes which are an integral part of the Financial Statements
April 30, 2018 / ANNUAL REPORT
22
PORTFOLIO OF INVESTMENTS SUMMARY TABLE
Wilmington Global Alpha Equities Fund
At April 30, 2018, the Fund’s portfolio composition was as follows (unaudited):
| | | | | | |
| Common Stocks | | Percentage of
Total Net Assets |
Insurance | | | 8.3 | % | | |
Diversified Financial Services | | | 6.6 | % | | |
Oil, Gas & Consumable Fuels | | | 3.9 | % | | |
IT Services | | | 3.6 | % | | |
Pharmaceuticals | | | 3.4 | % | | |
Real Estate Investment Trusts | | | 3.2 | % | | |
Machinery | | | 2.7 | % | | |
Commercial Services & Supplies | | | 2.5 | % | | |
Health Care Providers & Services | | | 2.5 | % | | |
Containers & Packaging | | | 2.3 | % | | |
Health Care Equipment & Supplies | | | 2.3 | % | | |
Electric Utilities | | | 2.1 | % | | |
Commercial Banks | | | 2.1 | % | | |
Road & Rail | | | 2.1 | % | | |
Diversified Telecommunication Services | | | 2.1 | % | | |
Specialty Retail | | | 2.1 | % | | |
Food Products | | | 1.8 | % | | |
Hotels, Restaurants & Leisure | | | 1.8 | % | | |
Software | | | 1.8 | % | | |
Chemicals | | | 1.8 | % | | |
Capital Markets | | | 1.7 | % | | |
Household Durables | | | 1.7 | % | | |
Internet Software & Services | | | 1.6 | % | | |
Semiconductors & Semiconductor Equipment | | | 1.6 | % | | |
Construction & Engineering | | | 1.5 | % | | |
Metals & Mining | | | 1.4 | % | | |
Communications Equipment | | | 1.3 | % | | |
Wireless Telecommunication Services | | | 1.2 | % | | |
Beverages | | | 1.2 | % | | |
Textiles, Apparel & Luxury Goods | | | 1.1 | % | | |
Auto Components | | | 1.0 | % | | |
Trading Companies & Distributors | | | 1.0 | % | | |
Tobacco | | | 0.9 | % | | |
Food & Staples Retailing | | | 0.9 | % | | |
Multi-Utilities | | | 0.9 | % | | |
Electronic Equipment, Instruments & Components | | | 0.9 | % | | |
Building Products | | | 0.9 | % | | |
Aerospace & Defense | | | 0.9 | % | | |
Automobiles | | | 0.8 | % | | |
Electrical Equipment | | | 0.8 | % | | |
Computers & Peripherals | | | 0.7 | % | | |
Media | | | 0.7 | % | | |
Gas Utilities | | | 0.7 | % | | |
Professional Services | | | 0.6 | % | | |
Consumer Finance | | | 0.6 | % | | |
Air Freight & Logistics | | | 0.6 | % | | |
Industrial Conglomerates | | | 0.5 | % | | |
Household Products | | | 0.5 | % | | |
Airlines | | | 0.4 | % | | |
| | | | | | | |
| Common Stocks | | Percentage of
Total Net Assets |
Multiline Retail | | | | 0.4 | % | | |
Real Estate Management & Development | | | | 0.4 | % | | |
Construction Materials | | | | 0.4 | % | | |
Personal Products | | | | 0.4 | % | | |
Paper & Forest Products | | | | 0.3 | % | | |
Transportation Infrastructure | | | | 0.3 | % | | |
Diversified Consumer Services | | | | 0.3 | % | | |
Marine | | | | 0.3 | % | | |
Water Utilities | | | | 0.2 | % | | |
Leisure Equipment & Products | | | | 0.2 | % | | |
Internet & Catalog Retail | | | | 0.1 | % | | |
Distributors | | | | 0.1 | % | | |
Energy Equipment & Services | | | | 0.1 | % | | |
Biotechnology | | | | 0.1 | % | | |
Health Care Technology | | | | 0.0 | %3 | | |
Life Sciences Tools & Services | | | | 0.0 | %3 | | |
Investment Companies | | | | 0.1 | % | | |
Preferred Stocks | | | | 0.1 | % | | |
Cash Equivalents1 | | | | 5.5 | % | | |
Other Assets and Liabilities – Net2 | | | | 3.1 | % | | |
TOTAL | | | | 100.0 | % | | |
ANNUAL REPORT / April 30, 2018
23 PORTFOLIOS OF INVESTMENTS
Wilmington Global Alpha Equities Fund (continued)
| | | | | | | |
| Common Stocks | | Percentage of
Total Net Assets |
| | |
Common Stocks | | | | | | | |
United States | | | | 43.5 | % | | |
Japan | | | | 12.2 | % | | |
United Kingdom | | | | 5.8 | % | | |
Canada | | | | 4.9 | % | | |
France | | | | 3.8 | % | | |
Switzerland | | | | 2.7 | % | | |
Netherlands | | | | 1.8 | % | | |
Germany | | | | 1.8 | % | | |
China | | | | 1.4 | % | | |
Sweden | | | | 1.3 | % | | |
Taiwan | | | | 1.2 | % | | |
Italy | | | | 1.2 | % | | |
Hong Kong | | | | 1.2 | % | | |
Ireland | | | | 1.0 | % | | |
Spain | | | | 1.0 | % | | |
All other countries less than 1.0% | | | | 6.4 | % | | |
Investment Companies | | | | 0.1 | % | | |
Preferred Stocks | | | | 0.1 | % | | |
Cash Equivalents1 | | | | 5.5 | % | | |
Other Assets and Liabilities – Net2 | | | | 3.1 | % | | |
TOTAL | | | | 100.0 | % | | |
| (1) | Cash Equivalent includes investment in a money market fund. |
| (2) | Assets, other than investments in securities, less liabilities. See Statements of Assets and Liabilities. |
| (3) | Represents less than 0.05%. |
PORTFOLIO OF INVESTMENTS
April 30, 2018
| | | | | | | | |
| Description | | Number of Shares | | | Value | |
| | |
| COMMON STOCKS – 91.2% | | | | | | | | |
| | |
AEROSPACE & DEFENSE – 0.9% | | | | | | | | |
| | |
BAE Systems PLC | | | 7,734 | | | $ | 64,890 | |
| | |
Huntington Ingalls Industries, Inc. | | | 145 | | | | 35,265 | |
| | |
L3 Technologies, Inc. | | | 1,042 | | | | 204,107 | |
| | |
Lockheed Martin Corp. | | | 706 | | | | 226,513 | |
| | |
Moog, Inc., Class A* | | | 2,900 | | | | 237,713 | |
| | |
Safran SA | | | 3,032 | | | | 355,623 | |
| | |
United Technologies Corp. | | | 1,695 | | | | 203,654 | |
| | | | | | | | |
| | |
TOTAL AEROSPACE & DEFENSE | | | | | | $ | 1,327,765 | |
| | |
AIR FREIGHT & LOGISTICS – 0.6% | | | | | | | | |
| | |
CTT-Correios de Portugal SA | | | 12,487 | | | | 46,047 | |
| | |
Deutsche Post AG | | | 6,729 | | | | 292,068 | |
| | |
PostNL NV | | | 29,261 | | | | 113,590 | |
| | | | | | | | |
| Description | | Number of Shares | | | Value | |
| | |
Royal Mail PLC | | | 5,243 | | | $ | 41,813 | |
| | |
United Parcel Service, Inc., Class B | | | 3,258 | | | | 369,783 | |
| | | | | | | | |
| | |
TOTAL AIR FREIGHT & LOGISTICS | | | | | | $ | 863,301 | |
| | |
AIRLINES – 0.4% | | | | | | | | |
| | |
Hawaiian Holdings, Inc. | | | 6,905 | | | | 284,486 | |
| | |
Japan Airlines Co. Ltd. | | | 4,357 | | | | 171,947 | |
| | |
JetBlue Airways Corp.* | | | 7,805 | | | | 149,778 | |
| | |
SAS AB* | | | 26,277 | | | | 65,577 | |
| | |
Southwest Airlines Co. | | | 548 | | | | 28,951 | |
| | | | | | | | |
| | |
TOTAL AIRLINES | | | | | | $ | 700,739 | |
| | |
AUTO COMPONENTS – 1.0% | | | | | | | | |
| | |
Aisan Industry Co. Ltd. | | | 3,835 | | | | 39,567 | |
| | |
Autoliv, Inc. | | | 211 | | | | 28,285 | |
| | |
Bridgestone Corp. | | | 4,256 | | | | 177,912 | |
| | |
Cie Generale des Etablissements Michelin | | | 529 | | | | 74,389 | |
| | |
Exedy Corp. | | | 3,245 | | | | 109,901 | |
April 30, 2018 / ANNUAL REPORT
PORTFOLIOS OF INVESTMENTS 24
Wilmington Global Alpha Equities Fund (continued)
| | | | | | | | |
| Description | | Number of Shares | | | Value | |
| | |
Keihin Corp. | | | 4,975 | | | $ | 98,276 | |
| | |
NGK Spark Plug Co. Ltd. | | | 5,297 | | | | 135,851 | |
| | |
Nissin Kogyo Co. Ltd. | | | 5,105 | | | | 89,576 | |
| | |
NOK Corp. | | | 4,985 | | | | 101,950 | |
| | |
Showa Corp. | | | 1,685 | | | | 25,327 | |
| | |
Sumitomo Electric Industries Ltd. | | | 11,457 | | | | 175,396 | |
| | |
Sumitomo Riko Co. Ltd. | | | 5,580 | | | | 58,330 | |
| | |
Tokai Rika Co. Ltd. | | | 11,647 | | | | 232,673 | |
| | |
Toyoda Gosei Co. Ltd. | | | 4,295 | | | | 108,444 | |
| | |
Toyota Industries Corp. | | | 2,214 | | | | 130,562 | |
| | | | | | | | |
| | |
TOTAL AUTO COMPONENTS | | | | | | $ | 1,586,439 | |
| |
AUTOMOBILES – 0.8% | | | | | |
| | |
Dongfeng Motor Group Co. Ltd., Class H | | | 110,000 | | | | 121,642 | |
| | |
Harley-Davidson, Inc. | | | 2,352 | | | | 96,738 | |
| | |
Honda Motor Co. Ltd. | | | 8,815 | | | | 303,112 | |
| | |
Isuzu Motors Ltd. | | | 8,996 | | | | 137,318 | |
| | |
Kia Motors Corp. | | | 4,181 | | | | 129,087 | |
| | |
Mitsubishi Motors Corp. | | | 5,565 | | | | 41,414 | |
| | |
Nissan Motor Co. Ltd. | | | 15,103 | | | | 158,891 | |
| | |
Renault SA | | | 543 | | | | 58,851 | |
| | |
Suzuki Motor Corp. | | | 3,572 | | | | 191,987 | |
| | | | | | | | |
| | |
TOTAL AUTOMOBILES | | | | | | $ | 1,239,040 | |
| |
BEVERAGES – 1.2% | | | | | |
| | |
Anheuser-Busch InBev SA/NV | | | 1,905 | | | | 189,230 | |
| | |
Asahi Group Holdings Ltd. | | | 4,511 | | | | 228,192 | |
| | |
Coca-Cola Co. (The) | | | 7,693 | | | | 332,415 | |
| | |
Coca-Cola European Partners | | | 1,100 | | | | 43,418 | |
| | |
Diageo PLC | | | 11,971 | | | | 427,064 | |
| | |
Heineken Holding NV | | | 502 | | | | 50,958 | |
| | |
Heineken NV | | | 2,543 | | | | 267,715 | |
| | |
PepsiCo, Inc. | | | 2,944 | | | | 297,167 | |
| | | | | | | | |
| | |
TOTAL BEVERAGES | | | | | | $ | 1,836,159 | |
| |
BIOTECHNOLOGY – 0.1% | | | | | |
| | |
Exact Sciences Corp.* | | | 2,457 | | | | 122,875 | |
| | |
BUILDING PRODUCTS – 0.9% | | | | | | | | |
| | |
Assa Abloy AB, Class B | | | 10,077 | | | | 211,183 | |
| | |
Cie de Saint-Gobain | | | 3,808 | | | | 199,238 | |
| | |
Lennox International, Inc. | | | 4,581 | | | | 885,828 | |
| | |
Noritz Corp. | | | 3,303 | | | | 60,183 | |
| | | | | | | | |
| | |
TOTAL BUILDING PRODUCTS | | | | | | $ | 1,356,432 | |
| |
CAPITAL MARKETS – 1.7% | | | | | |
| | |
Banca Generali SpA | | | 5,686 | | | | 184,449 | |
| | |
CI Financial Corp. | | | 1,426 | | | | 30,009 | |
| | |
FactSet Research Systems, Inc. | | | 2,643 | | | | 499,818 | |
| | |
GAM Holding AG* | | | 6,536 | | | | 104,329 | |
| | |
Ichiyoshi Securities Co. Ltd. | | | 4,280 | | | | 52,376 | |
| | | | | | | | |
| Description | | Number of Shares | | | Value | |
| | |
IG Group Holdings PLC | | | 19,182 | | | $ | 219,031 | |
| | |
IGM Financial, Inc. | | | 733 | | | | 22,499 | |
| | |
Intercontinental Exchange Group, Inc. | | | 7,602 | | | | 550,841 | |
| | |
Julius Baer Group Ltd.* | | | 1,803 | | | | 107,005 | |
| | |
Moody’s Corp. | | | 1,350 | | | | 218,970 | |
| | |
TD Ameritrade Holding Corp. | | | 7,457 | | | | 433,177 | |
| | |
UBS Group AG* | | | 14,843 | | | | 249,138 | |
| | |
Uranium Participation Corp.* | | | 9,066 | | | | 27,397 | |
| | | | | | | | |
| | |
TOTAL CAPITAL MARKETS | | | | | | $ | 2,699,039 | |
| |
CHEMICALS – 1.8% | | | | | |
| | |
ADEKA Corp. | | | 8,171 | | | | 145,097 | |
| | |
BASF SE | | | 1,290 | | | | 134,216 | |
| | |
China BlueChemical Ltd., Class H | | | 218,000 | | | | 57,296 | |
| | |
Daicel Corp. | | | 19,163 | | | | 221,108 | |
| | |
DowDuPont, Inc. | | | 3,185 | | | | 201,419 | |
| | |
Eastman Chemical Co. | | | 1,669 | | | | 170,372 | |
| | |
Formosa Chemicals & Fibre Corp. | | | 22,000 | | | | 80,831 | |
| | |
Formosa Plastics Corp. | | | 26,000 | | | | 91,240 | |
| | |
Fujimi, Inc. | | | 2,662 | | | | 57,627 | |
| | |
Fuso Chemical Co. Ltd. | | | 1,504 | | | | 38,117 | |
| | |
Johnson Matthey PLC | | | 923 | | | | 41,715 | |
| | |
JSR Corp. | | | 12,592 | | | | 237,209 | |
| | |
LyondellBasell Industries NV, Class A | | | 2,197 | | | | 232,289 | |
| | |
Nan Ya Plastics Corp. | | | 33,000 | | | | 90,387 | |
| | |
Nutrien Ltd. | | | 3,544 | | | | 161,358 | |
| | |
Praxair, Inc. | | | 1,794 | | | | 273,621 | |
| | |
Sanyo Chemical Industries Ltd. | | | 1,745 | | | | 82,344 | |
| | |
Sherwin-Williams Co. (The) | | | 1,228 | | | | 451,486 | |
| | | | | | | | |
| | |
TOTAL CHEMICALS | | | | | | $ | 2,767,732 | |
| |
COMMERCIAL BANKS – 2.1% | | | | | |
| | |
Bank of Ireland Group PLC | | | 11,240 | | | | 100,838 | |
| | |
Bank of the Ozarks | | | 7,662 | | | | 358,582 | |
| | |
First Citizens BancShares, Inc., Class A | | | 545 | | | | 235,598 | |
| | |
First Republic Bank | | | 5,051 | | | | 469,086 | |
| | |
Huntington Bancshares, Inc. | | | 47,116 | | | | 702,500 | |
| | |
Itau Unibanco Holding SA ADR | | | 19,061 | | | | 276,956 | |
| | |
KeyCorp | | | 7,744 | | | | 154,260 | |
| | |
People’s United Financial, Inc. | | | 4,583 | | | | 83,823 | |
| | |
PNC Financial Services Group, Inc. (The) | | | 4,012 | | | | 584,187 | |
| | |
San-In Godo Bank Ltd. (The) | | | 9,515 | | | | 89,459 | |
| | |
Tochigi Bank Ltd. (The) | | | 9,300 | | | | 35,240 | |
| | |
Toronto-Dominion Bank (The) | | | 2,540 | | | | 142,653 | |
| | |
Unicaja Banco SA*,W | | | 43,572 | | | | 79,027 | |
| | | | | | | | |
| | |
TOTAL COMMERCIAL BANKS | | | | | | $ | 3,312,209 | |
| |
COMMERCIAL SERVICES & SUPPLIES – 2.5% | | | | | |
| | |
ADT, Inc. | | | 25,651 | | | | 228,550 | |
ANNUAL REPORT / April 30, 2018
25 PORTFOLIOS OF INVESTMENTS
Wilmington Global Alpha Equities Fund (continued)
| | | | | | | | |
| Description | | Number of Shares | | | Value | |
| | |
Aeon Delight Co. Ltd. | | | 2,212 | | | $ | 77,389 | |
| | |
Babcock International Group PLC | | | 1,888 | | | | 19,057 | |
| | |
Cintas Corp. | | | 9,084 | | | | 1,547,005 | |
| | |
Clean Harbors, Inc.* | | | 10,058 | | | | 460,656 | |
| | |
ISS A/S | | | 923 | | | | 32,189 | |
| | |
Prosegur Cia de Seguridad SA | | | 24,975 | | | | 188,791 | |
| | |
Relia, Inc. | | | 4,275 | | | | 54,351 | |
| | |
Republic Services, Inc. | | | 4,522 | | | | 292,483 | |
| | |
Securitas AB, Class B | | | 1,875 | | | | 30,297 | |
| | |
Toppan Forms Co. Ltd. | | | 6,135 | | | | 68,529 | |
| | |
UniFirst Corp. | | | 2,112 | | | | 339,187 | |
| | |
Waste Connections, Inc. | | | 8,721 | | | | 630,528 | |
| | | | | | | | |
| | |
TOTAL COMMERCIAL SERVICES & SUPPLIES | | | | | | $ | 3,969,012 | |
| |
COMMUNICATIONS EQUIPMENT – 1.3% | | | | | |
| | |
Cisco Systems, Inc. | | | 9,014 | | | | 399,230 | |
| | |
Motorola Solutions, Inc. | | | 10,784 | | | | 1,184,407 | |
| | |
Nokia OYJ | | | 55,469 | | | | 332,826 | |
| | |
Telefonaktiebolaget LM Ericsson, Class B | | | 22,079 | | | | 168,319 | |
| | | | | | | | |
| | |
TOTAL COMMUNICATIONS EQUIPMENT | | | | | | $ | 2,084,782 | |
| |
COMPUTERS & PERIPHERALS – 0.7% | | | | | |
| | |
Acer, Inc.* | | | 112,420 | | | | 85,736 | |
| | |
Asustek Computer, Inc. | | | 5,000 | | | | 46,728 | |
| | |
Canon, Inc. | | | 3,615 | | | | 124,353 | |
| | |
Catcher Technology Co. Ltd. GDR | | | 3,913 | | | | 218,884 | |
| | |
Compal Electronics, Inc. GDR | | | 33,900 | | | | 111,141 | |
| | |
Melco Holdings, Inc. | | | 1,035 | | | | 38,045 | |
| | |
Neopost SA | | | 2,913 | | | | 78,602 | |
| | |
NetApp, Inc. | | | 6,139 | | | | 408,735 | |
| | | | | | | | |
| | |
TOTAL COMPUTERS & PERIPHERALS | | | | | | $ | 1,112,224 | |
| |
CONSTRUCTION & ENGINEERING – 1.5% | | | | | |
| | |
China Machinery Engineering Corp., Class H | | | 70,000 | | | | 40,668 | |
| | |
Chiyoda Corp. | | | 6,490 | | | | 66,638 | |
| | |
Hazama Ando Corp. | | | 20,430 | | | | 164,153 | |
| | |
JGC Corp. | | | 10,508 | | | | 257,540 | |
| | |
Kinden Corp. | | | 5,272 | | | | 91,948 | |
| | |
Kumagai Gumi Co. Ltd. | | | 3,671 | | | | 124,918 | |
| | |
Raubex Group Ltd. | | | 22,011 | | | | 36,557 | |
| | |
Skanska AB, Class B | | | 1,589 | | | | 30,947 | |
| | |
Taisei Corp. | | | 3,130 | | | | 168,851 | |
| | |
Toshiba Plant Systems & Services Corp. | | | 5,855 | | | | 122,187 | |
| | |
Toyo Engineering Corp.* | | | 4,769 | | | | 49,615 | |
| | |
Vinci SA | | | 11,626 | | | | 1,162,409 | |
| | | | | | | | |
| | |
TOTAL CONSTRUCTION & ENGINEERING | | | | | | $ | 2,316,431 | |
| |
CONSTRUCTION MATERIALS – 0.4% | | | | | |
| | |
Anhui Conch Cement Co. Ltd., Class H | | | 20,528 | | | | 128,125 | |
| | | | | | | | |
| Description | | Number of Shares | | | Value | |
| | |
Imerys SA | | | 285 | | | $ | 26,013 | |
| | |
LafargeHolcim Ltd.* | | | 3,103 | | | | 172,376 | |
| | |
Vicat SA | | | 1,031 | | | | 75,983 | |
| | |
Vulcan Materials Co. | | | 1,731 | | | | 193,335 | |
| | | | | | | | |
| | |
TOTAL CONSTRUCTION MATERIALS | | | | | | $ | 595,832 | |
| |
CONSUMER FINANCE – 0.6% | | | | | |
| | |
American Express Co. | | | 4,084 | | | | 403,295 | |
| | |
Credit Acceptance Corp.* | | | 1,603 | | | | 530,337 | |
| | | | | | | | |
| | |
TOTAL CONSUMER FINANCE | | | | | | $ | 933,632 | |
| |
CONTAINERS & PACKAGING – 2.3% | | | | | |
| | |
AMVIG Holdings Ltd. | | | 56,000 | | | | 14,397 | |
| | |
Ball Corp. | | | 24,122 | | | | 967,051 | |
| | |
Graphic Packaging Holding Co. | | | 15,163 | | | | 216,831 | |
| | |
International Paper Co. | | | 8,942 | | | | 461,050 | |
| | |
Nampak Ltd.* | | | 69,034 | | | | 76,815 | |
| | |
Packaging Corp. of America | | | 6,475 | | | | 749,093 | |
| | |
RPC Group PLC | | | 66,430 | | | | 720,828 | |
| | |
Silgan Holdings, Inc. | | | 9,429 | | | | 264,672 | |
| | |
WestRock Co. | | | 2,105 | | | | 124,532 | |
| | | | | | | | |
| | |
TOTAL CONTAINERS & PACKAGING | | | | | | $ | 3,595,269 | |
| |
DISTRIBUTORS – 0.1% | | | | | |
| | |
Genuine Parts Co. | | | 1,866 | | | | 164,805 | |
| |
DIVERSIFIED CONSUMER SERVICES – 0.3% | | | | | |
| | |
Benesse Holdings, Inc. | | | 1,485 | | | | 54,089 | |
| | |
New Oriental Education & Technology | | | | | | | | |
| | |
Group, Inc. ADR | | | 2,029 | | | | 182,285 | |
| | |
Service Corp. International | | | 7,186 | | | | 262,361 | |
| | | | | | | | |
| | |
TOTAL DIVERSIFIED CONSUMER SERVICES | | | | | | $ | 498,735 | |
| |
DIVERSIFIED FINANCIAL SERVICES – 6.6% | | | | | |
| | |
Ackermans & van Haaren NV | | | 1,152 | | | | 207,873 | |
| | |
AMP Ltd. | | | 11,641 | | | | 35,239 | |
| | |
Australia & New Zealand Banking Group Ltd. | | | 4,754 | | | | 95,566 | |
| | |
Banco Santander SA | | | 37,858 | | | | 244,597 | |
| | |
Bank Hapoalim BM | | | 5,460 | | | | 37,289 | |
| | |
Bank Leumi Le-Israel BM | | | 7,811 | | | | 46,082 | |
| | |
Bank of America Corp. | | | 10,973 | | | | 328,312 | |
| | |
Bank of Montreal | | | 1,237 | | | | 93,944 | |
| | |
Bank of Nova Scotia (The) | | | 3,829 | | | | 235,330 | |
| | |
Bank of Nova Scotia (The) | | | 1,901 | | | | 116,848 | |
| | |
Bank of the Philippine Islands | | | 29,270 | | | | 59,244 | |
| | |
BDO Unibank, Inc. | | | 30,340 | | | | 76,956 | |
| | |
Berkshire Hathaway, Inc., Class B* | | | 5,669 | | | | 1,098,255 | |
| | |
BNP Paribas SA | | | 6,223 | | | | 480,411 | |
| | |
BOC Hong Kong Holdings Ltd. | | | 13,000 | | | | 67,204 | |
| | |
BPER Banca | | | 17,065 | | | | 98,507 | |
| | |
CaixaBank SA | | | 31,108 | | | | 151,274 | |
April 30, 2018 / ANNUAL REPORT
PORTFOLIOS OF INVESTMENTS 26
Wilmington Global Alpha Equities Fund (continued)
| | | | | | | | |
| Description | | Number of Shares | | | Value | |
| | |
Canadian Imperial Bank of Commerce | | | 896 | | | $ | 78,040 | |
| | |
Cerved Group SpA | | | 18,026 | | | | 218,131 | |
| | |
Commonwealth Bank of Australia | | | 2,200 | | | | 118,457 | |
| | |
CTBC Financial Holding Co. Ltd. | | | 129,000 | | | | 91,998 | |
| | |
Dah Sing Financial Holdings Ltd. | | | 6,015 | | | | 40,166 | |
| | |
DBS Group Holdings Ltd. | | | 4,952 | | | | 114,253 | |
| | |
E.Sun Financial Holding Co. Ltd. | | | 114,778 | | | | 81,166 | |
| | |
G-Resources Group Ltd.* | | | 1,433,400 | | | | 11,829 | |
| | |
Grupo de Inversiones Suramericana SA | | | 5,490 | | | | 76,029 | |
| | |
Hang Seng Bank Ltd. | | | 2,600 | | | | 65,858 | |
| | |
HDFC Bank Ltd. ADR | | | 2,205 | | | | 211,261 | |
| | |
HSBC Holdings PLC | | | 42,585 | | | | 423,978 | |
| | |
Hua Nan Financial Holdings Co. Ltd. | | | 151,950 | | | | 91,889 | |
| | |
ING Groep NV | | | 27,913 | | | | 470,348 | |
| | |
Intesa Sanpaolo SpA | | | 61,296 | | | | 233,167 | |
| | |
JPMorgan Chase & Co. | | | 3,612 | | | | 392,913 | |
| | |
KB Financial Group, Inc. ADR | | | 2,251 | | | | 126,956 | |
| | |
Mega Financial Holding Co. Ltd. | | | 100,000 | | | | 88,281 | |
| | |
Mitsubishi UFJ Financial Group, Inc. | | | 89,774 | | | | 601,606 | |
| | |
Mizrahi Tefahot Bank Ltd. | | | 1,264 | | | | 23,102 | |
| | |
Mizuho Financial Group, Inc. | | | 117,910 | | | | 213,327 | |
| | |
National Australia Bank Ltd. | | | 4,496 | | | | 97,738 | |
| | |
National Bank of Canada | | | 1,195 | | | | 56,755 | |
| | |
Nordea Bank AB | | | 38,099 | | | | 387,492 | |
| | |
OTP Bank Nyrt | | | 5,065 | | | | 220,851 | |
| | |
Oversea-Chinese Banking Corp. Ltd. | | | 9,220 | | | | 95,230 | |
| | |
Royal Bank of Canada | | | 1,915 | | | | 145,629 | |
| | |
Sberbank of Russia PJSC ADR | | | 4,487 | | | | 66,273 | |
| | |
Shinhan Financial Group Co. Ltd. | | | 2,439 | | | | 108,601 | |
| | |
Shinhan Financial Group Co. Ltd. ADR | | | 2,436 | | | | 108,694 | |
| | |
SinoPac Financial Holdings Co. Ltd. | | | 283,875 | | | | 102,157 | |
| | |
Skandinaviska Enskilda Banken AB, Class A | | | 4,274 | | | | 40,124 | |
| | |
Societe Generale SA | | | 3,368 | | | | 184,326 | |
| | |
Standard Chartered PLC | | | 15,677 | | | | 164,673 | |
| | |
Sumitomo Mitsui Financial Group, Inc. | | | 5,915 | | | | 246,527 | |
| | |
Sumitomo Mitsui Trust Holdings, Inc. | | | 7,495 | | | | 317,841 | |
| | |
Svenska Handelsbanken AB, Class A | | | 4,628 | | | | 51,613 | |
| | |
Swedbank AB, Class A | | | 3,036 | | | | 65,952 | |
| | |
Taishin Financial Holding Co. Ltd. | | | 131,995 | | | | 64,139 | |
| | |
UniCredit SpA | | | 10,095 | | | | 218,859 | |
| | |
United Overseas Bank Ltd. | | | 3,941 | | | | 89,241 | |
| | |
Wells Fargo & Co. | | | 3,850 | | | | 200,046 | |
| | |
Westpac Banking Corp. | | | 5,043 | | | | 108,326 | |
| | | | | | | | |
| | |
TOTAL DIVERSIFIED FINANCIAL SERVICES | | | | | | $ | 10,386,773 | |
| |
DIVERSIFIED TELECOMMUNICATION
SERVICES – 2.1% | | | | | |
| | |
AT&T, Inc. | | | 14,179 | | | | 463,653 | |
| | | | | | | | |
| Description | | Number of Shares | | | Value | |
| | |
BCE, Inc. | | | 761 | | | $ | 32,296 | |
| | |
Bezeq The Israeli Telecommunication Corp. Ltd. | | | 14,209 | | | | 17,925 | |
| | |
BT Group PLC | | | 88,192 | | | | 302,707 | |
| | |
China Telecom Corp. Ltd., Class H | | | 322,000 | | | | 156,084 | |
| | |
China Unicom Hong Kong Ltd.* | | | 110,800 | | | | 156,677 | |
| | |
Deutsche Telekom AG | | | 5,719 | | | | 100,103 | |
| | |
Hellenic Telecommunications | | | | | | | | |
| | |
Organization SA | | | 9,096 | | | | 132,423 | |
| | |
HKT Trust & HKT Ltd. | | | 20,000 | | | | 26,314 | |
| | |
KT Corp. ADR | | | 9,715 | | | | 130,472 | |
| | |
Magyar Telekom Telecommunications PLC | | | | | | | | |
| | |
ADR | | | 9,280 | | | | 80,365 | |
| | |
Nippon Telegraph & Telephone Corp. | | | 21,310 | | | | 1,011,270 | |
| | |
Orange SA | | | 4,646 | | | | 84,462 | |
| | |
Proximus SADP | | | 951 | | | | 29,143 | |
| | |
Rostelecom PJSC ADR | | | 1,650 | | | | 10,088 | |
| | |
Singapore Telecommunications Ltd. | | | 22,700 | | | | 60,044 | |
| | |
Spark New Zealand Ltd. | | | 11,152 | | | | 27,082 | |
| | |
Swisscom AG | | | 95 | | | | 45,565 | |
| | |
Telenor ASA | | | 3,908 | | | | 86,499 | |
| | |
Telia Co. AB | | | 10,460 | | | | 51,502 | |
| | |
Telstra Corp. Ltd. | | | 13,882 | | | | 33,006 | |
| | |
TELUS Corp. | | | 1,005 | | | | 35,967 | |
| | |
Verizon Communications, Inc. | | | 2,915 | | | | 143,855 | |
| | | | | | | | |
| |
TOTAL DIVERSIFIED TELECOMMUNICATION SERVICES | | | $ | 3,217,502 | |
| |
ELECTRIC UTILITIES – 2.1% | | | | | |
| | |
Avangrid, Inc. | | | 12,771 | | | | 673,159 | |
| | |
China Longyuan Power Group Corp. Ltd., | | | | | | | | |
| | |
Class H | | | 462,000 | | | | 453,786 | |
| | |
CLP Holdings Ltd. | | | 5,500 | | | | 57,112 | |
| | |
Edison International | | | 8,046 | | | | 527,174 | |
| | |
EDP – Energias de Portugal SA | | | 45,541 | | | | 168,955 | |
| | |
Emera, Inc. | | | 502 | | | | 15,635 | |
| | |
Endesa SA | | | 1,616 | | | | 37,612 | |
| | |
Eversource Energy | | | 1,806 | | | | 108,811 | |
| | |
Fortis, Inc. | | | 1,481 | | | | 49,715 | |
| | |
Iberdrola SA | | | 12,727 | | | | 98,328 | |
| | |
OGE Energy Corp. | | | 7,260 | | | | 238,636 | |
| | |
Pinnacle West Capital Corp. | | | 811 | | | | 65,285 | |
| | |
Power Assets Holdings Ltd. | | | 31,365 | | | | 233,382 | |
| | |
Red Electrica Corp. SA | | | 2,010 | | | | 41,869 | |
| | |
Southern Co. (The) | | | 6,839 | | | | 315,415 | |
| | |
SSE PLC | | | 12,338 | | | | 234,160 | |
| | | | | | | | |
| | |
TOTAL ELECTRIC UTILITIES | | | | | | $ | 3,319,034 | |
| | |
ELECTRICAL EQUIPMENT – 0.8% | | | | | | | | |
| | |
AMETEK, Inc. | | | 7,376 | | | | 514,845 | |
ANNUAL REPORT / April 30, 2018
27 PORTFOLIOS OF INVESTMENTS
Wilmington Global Alpha Equities Fund (continued)
| | | | | | | | |
| Description | | Number of Shares | | | Value | |
| | |
Eaton Corp. PLC | | | 3,753 | | | $ | 281,588 | |
| | |
Nissin Electric Co. Ltd. | | | 6,850 | | | | 68,679 | |
| | |
Rockwell Automation, Inc. | | | 1,205 | | | | 198,259 | |
| | |
Ushio, Inc. | | | 6,135 | | | | 86,482 | |
| | |
Zumtobel Group AG | | | 4,981 | | | | 45,139 | |
| | | | | | | | |
| | |
TOTAL ELECTRICAL EQUIPMENT | | | | | | $ | 1,194,992 | |
| | |
ELECTRONIC EQUIPMENT, INSTRUMENTS & COMPONENTS – 0.9% | | | | | | | | |
| | |
Citizen Watch Co. Ltd. | | | 11,580 | | | | 86,280 | |
| | |
Enplas Corp. | | | 2,463 | | | | 70,842 | |
| | |
Hitachi High-Technologies Corp. | | | 3,382 | | | | 157,739 | |
| | |
Hon Hai Precision Industry Co. Ltd. | | | 27,000 | | | | 75,097 | |
| | |
Hosiden Corp. | | | 3,295 | | | | 39,284 | |
| | |
Kyocera Corp. | | | 3,571 | | | | 228,163 | |
| | |
Nichicon Corp. | | | 6,965 | | | | 78,588 | |
| | |
Simplo Technology Co. Ltd. | | | 11,440 | | | | 63,960 | |
| | |
TE Connectivity Ltd. | | | 3,155 | | | | 289,471 | |
| | |
Zebra Technologies Corp., Class A* | | | 2,576 | | | | 347,322 | |
| | | | | | | | |
| | |
TOTAL ELECTRONIC EQUIPMENT, INSTRUMENTS & | | | | | | | | |
| | |
COMPONENTS | | | | | | $ | 1,436,746 | |
| | |
ENERGY EQUIPMENT & SERVICES – 0.1% | | | | | | | | |
| | |
Fugro NV* | | | 4,206 | | | | 66,514 | |
| | |
Saipem SpA* | | | 19,669 | | | | 75,120 | |
| | | | | | | | |
| | |
TOTAL ENERGY EQUIPMENT & SERVICES | | | | | | $ | 141,634 | |
| | |
FOOD & STAPLES RETAILING – 0.9% | | | | | | | | |
| | |
Alimentation Couche Tard, Inc., Class B | | | 1,237 | | | | 53,480 | |
| | |
Cawachi Ltd. | | | 1,420 | | | | 33,016 | |
| | |
Costco Wholesale Corp. | | | 1,046 | | | | 206,229 | |
| | |
CVS Health Corp. | | | 532 | | | | 37,150 | |
| | |
George Weston Ltd. | | | 326 | | | | 26,708 | |
| | |
ICA Gruppen AB | | | 666 | | | | 20,680 | |
| | |
J Sainsbury PLC | | | 35,849 | | | | 152,114 | |
| | |
Koninklijke Ahold Delhaize NV | | | 3,260 | | | | 78,646 | |
| | |
Kroger Co. (The) | | | 879 | | | | 22,142 | |
| | |
Loblaw Cos. Ltd. | | | 856 | | | | 43,535 | |
| | |
Matsumotokiyoshi Holdings Co. Ltd. | | | 9,080 | | | | 404,479 | |
| | |
METRO AG | | | 5,857 | | | | 84,734 | |
| | |
Metro, Inc. | | | 1,127 | | | | 35,760 | |
| | |
SPAR Group Ltd. (The) | | | 1,536 | | | | 26,024 | |
| | |
Walgreens Boots Alliance, Inc. | | | 2,203 | | | | 146,389 | |
| | |
Wesfarmers Ltd. | | | 2,512 | | | | 82,644 | |
| | | | | | | | |
| | |
TOTAL FOOD & STAPLES RETAILING | | | | | | $ | 1,453,730 | |
| | |
FOOD PRODUCTS – 1.8% | | | | | | | | |
| | |
Archer-Daniels-Midland Co. | | | 10,700 | | | | 485,566 | |
| | |
Bunge Ltd. | | | 284 | | | | 20,513 | |
| | |
Ebro Foods SA | | | 9,828 | | | | 237,001 | |
| | | | | | | | |
| Description | | Number of Shares | | | Value | |
| | |
Hershey Co. (The) | | | 3,270 | | | $ | 300,644 | |
| | |
Hormel Foods Corp. | | | 8,258 | | | | 299,352 | |
| | |
Ingredion, Inc. | | | 2,741 | | | | 331,908 | |
| | |
JM Smucker Co. (The) | | | 420 | | | | 47,914 | |
| | |
Kellogg Co. | | | 998 | | | | 58,782 | |
| | |
Marine Harvest ASA | | | 1,943 | | | | 42,295 | |
| | |
Nestle SA | | | 4,829 | | | | 374,103 | |
| | |
Pinnacle Foods, Inc. | | | 3,773 | | | | 227,889 | |
| | |
Tate & Lyle PLC | | | 3,083 | | | | 24,349 | |
| | |
Tiger Brands Ltd. | | | 992 | | | | 31,003 | |
| | |
Viscofan SA | | | 4,364 | | | | 289,205 | |
| | |
Wilmar International Ltd. | | | 11,190 | | | | 27,376 | |
| | | | | | | | |
| | |
TOTAL FOOD PRODUCTS | | | | | | $ | 2,797,900 | |
| |
GAS UTILITIES –0.7% | | | | | |
| | |
Gas Natural SDG SA | | | 2,350 | | | | 59,238 | |
| | |
Rubis SCA | | | 8,646 | | | | 672,712 | |
| | |
UGI Corp. | | | 6,431 | | | | 311,196 | |
| | | | | | | | |
| | |
TOTAL GAS UTILITIES | | | | | | $ | 1,043,146 | |
| |
HEALTH CARE EQUIPMENT & SUPPLIES – 2.3% | | | | | |
| | |
Baxter International, Inc. | | | 6,807 | | | | 473,087 | |
| | |
Becton Dickinson & Co. | | | 2,060 | | | | 477,652 | |
| | |
DENTSPLY SIRONA, Inc. | | | 1,052 | | | | 52,958 | |
| | |
Hologic, Inc.* | | | 6,635 | | | | 257,372 | |
| | |
Insulet Corp.* | | | 4,147 | | | | 356,642 | |
| | |
Medtronic PLC | | | 4,559 | | | | 365,313 | |
| | |
Smith & Nephew PLC | | | 3,205 | | | | 61,379 | |
| | |
Steris PLC | | | 11,070 | | | | 1,046,336 | |
| | |
Stryker Corp. | | | 2,526 | | | | 427,955 | |
| | | | | | | | |
| | |
TOTAL HEALTH CARE EQUIPMENT & SUPPLIES | | | | | | $ | 3,518,694 | |
| |
HEALTH CARE PROVIDERS & SERVICES – 2.5% | | | | | |
| | |
AmerisourceBergen Corp. | | | 4,841 | | | | 438,498 | |
| | |
BML, Inc. | | | 4,762 | | | | 120,524 | |
| | |
Cardinal Health, Inc. | | | 3,255 | | | | 208,873 | |
| | |
HCA Healthcare, Inc. | | | 8,410 | | | | 805,173 | |
| | |
Laboratory Corp. of America Holdings* | | | 3,420 | | | | 583,965 | |
| | |
McKesson Corp. | | | 1,762 | | | | 275,242 | |
| | |
Quest Diagnostics, Inc. | | | 2,507 | | | | 253,708 | |
| | |
Suzuken Co. Ltd. | | | 2,415 | | | | 103,841 | |
| | |
UnitedHealth Group, Inc. | | | 2,484 | | | | 587,218 | |
| | |
Universal Health Services, Inc., Class B | | | 4,328 | | | | 494,258 | |
| | | | | | | | |
| | |
TOTAL HEALTH CARE PROVIDERS & SERVICES | | | | | | $ | 3,871,300 | |
| | |
HEALTH CARE TECHNOLOGY – 0.0%** | | | | | | | | |
| | |
AGFA-Gevaert NV* | | | 13,808 | | | | 49,228 | |
| | |
HOTELS, RESTAURANTS &
LEISURE – 1.8% | | | | | | | | |
| | |
Choice Hotels International, Inc. | | | 10,336 | | | | 827,397 | |
April 30, 2018 / ANNUAL REPORT
PORTFOLIOS OF INVESTMENTS 28
Wilmington Global Alpha Equities Fund (continued)
| | | | | | | | |
| Description | | Number of
Shares | | | Value | |
| | |
Compass Group PLC | | | 10,274 | | | $ | 220,407 | |
| | |
Hilton Worldwide Holdings, Inc. | | | 6,672 | | | | 526,020 | |
| | |
Marriott International, Inc., Class A | | | 530 | | | | 72,440 | |
| | |
McDonald’s Corp. | | | 2,118 | | | | 354,638 | |
| | |
Melco Resorts & Entertainment Ltd. ADR | | | 8,781 | | | | 274,055 | |
| | |
Royal Caribbean Cruises Ltd. | | | 1,362 | | | | 147,355 | |
| | |
Wyndham Worldwide Corp. | | | 398 | | | | 45,456 | |
| | |
Yum! Brands, Inc. | | | 3,648 | | | | 317,741 | |
| | | | | | | | |
| | |
TOTAL HOTELS, RESTAURANTS & LEISURE | | | | | | $ | 2,785,509 | |
| |
HOUSEHOLD DURABLES – 1.7% | | | | | |
| | |
Alpine Electronics, Inc. | | | 5,229 | | | | 98,880 | |
| | |
Casio Computer Co. Ltd. | | | 4,535 | | | | 67,550 | |
| | |
Funai Electric Co. Ltd.* | | | 6,830 | | | | 47,245 | |
| | |
Husqvarna AB, Class B | | | 3,097 | | | | 29,787 | |
| | |
Newell Brands, Inc. | | | 18,713 | | | | 517,040 | |
| | |
Nikon Corp. | | �� | 3,735 | | | | 64,991 | |
| | |
NVR, Inc.* | | | 329 | | | | 1,019,900 | |
| | |
Persimmon PLC | | | 5,913 | | | | 220,884 | |
| | |
Pioneer Corp.* | | | 46,510 | | | | 72,551 | |
| | |
Sekisui Chemical Co. Ltd. | | | 9,885 | | | | 174,866 | |
| | |
Token Corp. | | | 780 | | | | 74,280 | |
| | |
Toll Brothers, Inc. | | | 5,996 | | | | 252,791 | |
| | |
Whirlpool Corp. | | | 115 | | | | 17,819 | |
| | | | | | | | |
| | |
TOTAL HOUSEHOLD DURABLES | | | | | | $ | 2,658,584 | |
| |
HOUSEHOLD PRODUCTS – 0.5% | | | | | |
| | |
Colgate-Palmolive Co. | | | 3,950 | | | | 257,659 | |
| | |
Essity AB, Class B | | | 1,943 | | | | 49,285 | |
| | |
Henkel AG & Co. KGaA | | | 421 | | | | 50,117 | |
| | |
Procter & Gamble Co. (The) | | | 3,483 | | | | 251,960 | |
| | |
Reckitt Benckiser Group PLC | | | 2,439 | | | | 191,336 | |
| | | | | | | | |
| | |
TOTAL HOUSEHOLD PRODUCTS | | | | | | $ | 800,357 | |
| |
INDUSTRIAL CONGLOMERATES – 0.5% | | | | | |
| | |
CK Hutchison Holdings Ltd. | | | 6,000 | | | | 70,949 | |
| | |
Far Eastern New Century Corp. | | | 67,000 | | | | 63,948 | |
| | |
Koninklijke Philips NV | | | 6,176 | | | | 261,406 | |
| | |
Rheinmetall AG | | | 168 | | | | 21,954 | |
| | |
Siemens AG | | | 2,905 | | | | 368,920 | |
| | |
Smiths Group PLC | | | 1,915 | | | | 41,960 | |
| | | | | | | | |
| | |
TOTAL INDUSTRIAL CONGLOMERATES | | | | | | $ | 829,137 | |
| |
INSURANCE – 8.3% | | | | | |
| | |
Admiral Group PLC | | | 1,290 | | | | 35,303 | |
| | |
Aflac, Inc. | | | 6,954 | | | | 316,894 | |
| | |
Ageas | | | 2,977 | | | | 159,247 | |
| | |
AIA Group Ltd. | | | 18,735 | | | | 167,438 | |
| | |
Alleghany Corp. | | | 449 | | | | 258,027 | |
| | | | | | | | |
| Description | | Number of
Shares | | | Value | |
| | |
Allianz SE | | | 893 | | | $ | 211,216 | |
| | |
Allstate Corp. (The) | | | 1,017 | | | | 99,483 | |
| | |
Arthur J Gallagher & Co. | | | 3,399 | | | | 237,896 | |
| | |
Assicurazioni Generali SpA | | | 20,703 | | | | 417,765 | |
| | |
Baloise Holding AG | | | 259 | | | | 41,053 | |
| | |
Cathay Financial Holding Co. Ltd. | | | 35,000 | | | | 62,781 | |
| | |
Chubb Ltd. | | | 2,419 | | | | 328,186 | |
| | |
Cincinnati Financial Corp. | | | 3,186 | | | | 224,103 | |
| | |
CNO Financial Group, Inc. | | | 14,263 | | | | 305,799 | |
| | |
Coface SA* | | | 1,062 | | | | 13,455 | |
| | |
Dai-ichi Life Holdings, Inc. | | | 7,305 | | | | 145,023 | |
| | |
Direct Line Insurance Group | | | 7,430 | | | | 38,178 | |
| | |
Enstar Group Ltd.* | | | 2,015 | | | | 423,452 | |
| | |
Fairfax Financial Holdings Ltd. | | | 2,086 | | | | 1,154,867 | |
| | |
FNF Group | | | 7,906 | | | | 291,178 | |
| | |
Gjensidige Forsikring ASA | | | 1,467 | | | | 23,220 | |
| | |
Great-West Lifeco, Inc. | | | 1,372 | | | | 36,577 | |
| | |
Hannover Rueck SE | | | 312 | | | | 43,819 | |
| | |
Industrial Alliance Insurance & Financial Services, Inc. | | | 653 | | | | 27,428 | |
| | |
Insurance Australia Group Ltd. | | | 9,698 | | | | 57,411 | |
| | |
Intact Financial Corp. | | | 10,219 | | | | 779,189 | |
| | |
Lincoln National Corp. | | | 1,744 | | | | 123,196 | |
| | |
Markel Corp.* | | | 1,355 | | | | 1,531,204 | |
| | |
Marsh & McLennan Cos., Inc. | | | 2,534 | | | | 206,521 | |
| | |
MetLife, Inc. | | | 4,347 | | | | 207,221 | |
| | |
MS&AD Insurance Group Holdings, Inc. | | | 7,027 | | | | 236,783 | |
| | |
Muenchener Rueckversicherungs AG | | | 381 | | | | 87,196 | |
| | |
Ping An Insurance Group Co. of China Ltd., Class H | | | 22,800 | | | | 222,788 | |
| | |
Power Corp. of Canada | | | 1,671 | | | | 39,707 | |
| | |
Power Financial Corp. | | | 1,290 | | | | 33,467 | |
| | |
Rand Merchant Investment Holdings Ltd. | | | 17,427 | | | | 57,714 | |
| | |
RenaissanceRe Holdings Ltd. | | | 574 | | | | 78,087 | |
| | |
RSA Insurance Group PLC | | | 4,985 | | | | 44,980 | |
| | |
Sampo Oyj, Class A | | | 1,383 | | | | 74,795 | |
| | |
Shin Kong Financial Holding Co. Ltd. | | | 217,990 | | | | 88,596 | |
| | |
Sony Financial Holdings, Inc. | | | 34,746 | | | | 633,902 | |
| | |
Storebrand ASA | | | 6,461 | | | | 55,217 | |
| | |
Sun Life Financial, Inc. | | | 1,629 | | | | 67,243 | |
| | |
Suncorp Group Ltd. | | | 4,727 | | | | 49,717 | |
| | |
Swiss Life Holding AG* | | | 135 | | | | 47,226 | |
| | |
Swiss Re AG | | | 774 | | | | 73,738 | |
| | |
T&D Holdings, Inc. | | | 20,330 | | | | 345,284 | |
| | |
Tokio Marine Holdings, Inc. | | | 10,509 | | | | 495,996 | |
| | |
Tongyang Life Insurance Co. Ltd. | | | 8,114 | | | | 62,415 | |
| | |
Torchmark Corp. | | | 4,998 | | | | 433,527 | |
| | |
Travelers Cos., Inc. (The) | | | 586 | | | | 77,118 | |
ANNUAL REPORT / April 30, 2018
29 PORTFOLIOS OF INVESTMENTS
Wilmington Global Alpha Equities Fund (continued)
| | | | | | | | |
| Description | | Number of Shares | | | Value | |
| | |
Unum Group | | | 2,683 | | | $ | 129,804 | |
| | |
White Mountains Insurance Group Ltd. | | | 395 | | | | 341,790 | |
| | |
Willis Towers Watson PLC | | | 3,958 | | | | 587,803 | |
| | |
Zurich Insurance Group AG | | | 2,040 | | | | 651,649 | |
| | | | | | | | |
| | |
TOTAL INSURANCE | | | | | | $ | 12,983,672 | |
| |
INTERNET & CATALOG RETAIL – 0.1% | | | | | |
| | |
Qliro Group AB* | | | 18,138 | | | | 21,950 | |
| | |
Wayfair, Inc., Class A* | | | 3,145 | | | | 195,933 | |
| | | | | | | | |
| | |
TOTAL INTERNET & CATALOG RETAIL | | | | | | $ | 217,883 | |
| |
INTERNET SOFTWARE & SERVICES – 1.6% | | | | | |
| | |
Alibaba Group Holding Ltd. ADR* | | | 831 | | | | 148,367 | |
| | |
Alphabet, Inc., Class C* | | | 208 | | | | 211,605 | |
| | |
Cimpress NV* | | | 1,155 | | | | 166,101 | |
| | |
DeNA Co. Ltd. | | | 10,352 | | | | 197,306 | |
| | |
Facebook, Inc., Class A* | | | 1,574 | | | | 270,728 | |
| | |
GoDaddy, Inc., Class A* | | | 3,281 | | | | 211,821 | |
| | |
Gree, Inc. | | | 14,190 | | | | 78,404 | |
| | |
Mimecast Ltd.* | | | 4,769 | | | | 181,460 | |
| | |
Shopify, Inc., Class A* | | | 1,515 | | | | 202,449 | |
| | |
Spotify Technology SA* | | | 2,511 | | | | 405,953 | |
| | |
Tencent Holdings Ltd. | | | 353 | | | | 17,355 | |
| | |
Wix.com Ltd.* | | | 2,812 | | | | 231,287 | |
| | |
Yahoo Japan Corp. | | | 16,400 | | | | 67,399 | |
| | |
Yandex NV, Class A* | | | 5,116 | | | | 170,670 | |
| | | | | | | | |
| | |
TOTAL INTERNET SOFTWARE & SERVICES | | | | | | $ | 2,560,905 | |
| |
IT SERVICES – 3.6% | | | | | |
| | |
Accenture PLC, Class A | | | 4,441 | | | | 671,479 | |
| | |
Amdocs Ltd. | | | 6,572 | | | | 441,967 | |
| | |
Automatic Data Processing, Inc. | | | 4,408 | | | | 520,497 | |
| | |
Black Knight, Inc.* | | | 9,842 | | | | 478,813 | |
| | |
Booz Allen Hamilton Holding Corp. | | | 7,202 | | | | 285,415 | |
| | |
Capgemini SE | | | 2,460 | | | | 338,412 | |
| | |
CGI Group, Inc., Class A* | | | 870 | | | | 50,413 | |
| | |
DTS Corp. | | | 2,798 | | | | 101,405 | |
| | |
DXC Technology Co. | | | 8,023 | | | | 826,850 | |
| | |
Fidelity National Information Services, Inc. | | | 4,489 | | | | 426,320 | |
| | |
FleetCor Technologies, Inc.* | | | 1,114 | | | | 230,910 | |
| | |
Fujitsu Ltd. | | | 23,485 | | | | 142,377 | |
| | |
Genpact Ltd. | | | 7,549 | | | | 240,738 | |
| | |
International Business Machines Corp. | | | 1,176 | | | | 170,473 | |
| | |
PayPal Holdings, Inc.* | | | 3,199 | | | | 238,677 | |
| | |
Sopra Steria Group | | | 383 | | | | 81,754 | |
| | |
Visa, Inc., Class A | | | 2,516 | | | | 319,230 | |
| | | | | | | | |
| | |
TOTAL IT SERVICES | | | | | | $ | 5,565,730 | |
| |
LEISURE EQUIPMENT & PRODUCTS – 0.2% | | | | | |
| | |
Bandai Namco Holdings, Inc. | | | 4,568 | | | | 154,576 | |
| | | | | | | | |
| Description | | Number of Shares | | | Value | |
| | |
Sankyo Co. Ltd. | | | 2,850 | | | $ | 99,913 | |
| | | | | | | | |
| | |
TOTAL LEISURE EQUIPMENT & PRODUCTS | | | | | | $ | 254,489 | |
| |
LIFE SCIENCES TOOLS & SERVICES – 0.0%** | | | | | |
| | |
CMIC Holdings Co. Ltd. | | | 1,500 | | | | 34,398 | |
| |
MACHINERY – 2.7% | | | | | |
| | |
Allison Transmission Holdings, Inc. | | | 6,398 | | | | 249,458 | |
| | |
Alstom SA | | | 2,299 | | | | 104,670 | |
| | |
Amada Holdings Co. Ltd. | | | 11,266 | | | | 135,240 | |
| | |
Caterpillar, Inc. | | | 2,289 | | | | 330,440 | |
| | |
Cummins, Inc. | | | 395 | | | | 63,145 | |
| | |
Deere & Co. | | | 3,914 | | | | 529,682 | |
| | |
Dover Corp. | | | 457 | | | | 42,364 | |
| | |
Hisaka Works Ltd. | | | 2,200 | | | | 23,405 | |
| | |
IDEX Corp. | | | 6,904 | | | | 922,789 | |
| | |
Ingersoll-Rand PLC | | | 2,254 | | | | 189,088 | |
| | |
Japan Steel Works Ltd. (The) | | | 1,995 | | | | 65,347 | |
| | |
Middleby Corp.* | | | 3,253 | | | | 409,358 | |
| | |
Mitsubishi Heavy Industries Ltd. | | | 4,382 | | | | 173,228 | |
| | |
PACCAR, Inc. | | | 7,480 | | | | 476,252 | |
| | |
SMC Corp. | | | 305 | | | | 115,898 | |
| | |
Tadano Ltd. | | | 7,200 | | | | 110,801 | |
| | |
Takuma Co. Ltd. | | | 8,280 | | | | 90,722 | |
| | |
Toshiba Machine Co. Ltd. | | | 9,720 | | | | 64,385 | |
| | |
Wabtec Corp. | | | 245 | | | | 21,758 | |
| | |
Xylem, Inc. | | | 2,503 | | | | 182,469 | |
| | | | | | | | |
| | |
TOTAL MACHINERY | | | | | | $ | 4,300,499 | |
| |
MARINE – 0.3% | | | | | |
| | |
AP Moeller - Maersk A/S, Class B | | | 37 | | | | 59,274 | |
| | |
D/S Norden A/S* | | | 4,551 | | | | 83,028 | |
| | |
Kuehne + Nagel International AG | | | 1,212 | | | | 188,704 | |
| | |
Pacific Basin Shipping Ltd.* | | | 304,160 | | | | 80,874 | |
| | | | | | | | |
| | |
TOTAL MARINE | | | | | | $ | 411,880 | |
| |
MEDIA – 0.7% | | | | | |
| | |
Avex, Inc. | | | 5,105 | | | | 70,469 | |
| | |
CBS Corp., Non-Voting | | | 789 | | | | 38,819 | |
| | |
Fuji Media Holdings, Inc. | | | 4,195 | | | | 68,777 | |
| | |
Gendai Agency, Inc. | | | 1,400 | | | | 6,907 | |
| | |
Lagardere SCA | | | 870 | | | | 24,883 | |
| | |
Metropole Television SA | | | 1,070 | | | | 26,344 | |
| | |
Nippon Television Holdings, Inc. | | | 19,457 | | | | 341,039 | |
| | |
Proto Corp. | | | 1,050 | | | | 15,072 | |
| | |
Publicis Groupe SA | | | 690 | | | | 51,598 | |
| | |
RTL Group SA | | | 299 | | | | 24,773 | |
| | |
SES SA | | | 13,422 | | | | 207,086 | |
| | |
Television Francaise 1 | | | 5,982 | | | | 74,783 | |
| | |
TV Asahi Holdings Corp. | | | 4,599 | | | | 107,854 | |
April 30, 2018 / ANNUAL REPORT
PORTFOLIOS OF INVESTMENTS 30
Wilmington Global Alpha Equities Fund (continued)
| | | | | | | | |
| Description | | Number of
Shares | | | Value | |
| | |
WPP PLC | | | 3,110 | | | $ | 53,368 | |
| | | | | | | | |
| | |
TOTAL MEDIA | | | | | | $ | 1,111,772 | |
| |
METALS & MINING – 1.4% | | | | | |
| | |
Acacia Mining PLC* | | | 25,155 | | | | 49,628 | |
| | |
Anglo American Platinum Ltd. | | | 2,601 | | | | 69,798 | |
| | |
Anglo American PLC | | | 6,723 | | | | 158,188 | |
| | |
ArcelorMittal ADR* | | | 5,361 | | | | 181,416 | |
| | |
Barrick Gold Corp. | | | 7,731 | | | | 104,047 | |
| | |
Centerra Gold, Inc.* | | | 13,662 | | | | 83,422 | |
| | |
Chubu Steel Plate Co. Ltd. | | | 2,000 | | | | 13,869 | |
| | |
Compass Minerals International, Inc. | | | 3,642 | | | | 245,107 | |
| | |
Eldorado Gold Corp.* | | | 28,084 | | | | 26,680 | |
| | |
Gerdau SA ADR | | | 35,308 | | | | 164,888 | |
| | |
Gold Fields Ltd. | | | 25,730 | | | | 97,685 | |
| | |
Impala Platinum Holdings Ltd.* | | | 15,595 | | | | 27,776 | |
| | |
Kinross Gold Corp.* | | | 14,557 | | | | 56,481 | |
| | |
Kyoei Steel Ltd. | | | 4,275 | | | | 89,020 | |
| | |
Nakayama Steel Works Ltd. | | | 6,490 | | | | 45,596 | |
| | |
Neturen Co. Ltd. | | | 2,165 | | | | 21,833 | |
| | |
Northern Dynasty Minerals Ltd.* | | | 2,500 | | | | 2,259 | |
| | |
Nucor Corp. | | | 2,292 | | | | 141,233 | |
| | |
Pacific Metals Co. Ltd.* | | | 2,297 | | | | 80,592 | |
| | |
Petra Diamonds Ltd.* | | | 40,561 | | | | 38,113 | |
| | |
Resolute Mining Ltd. | | | 35,849 | | | | 30,616 | |
| | |
Salzgitter AG | | | 1,291 | | | | 70,896 | |
| | |
Tokyo Steel Manufacturing Co. Ltd. | | | 9,640 | | | | 80,445 | |
| | |
Western Areas Ltd. | | | 34,065 | | | | 87,719 | |
| | |
Yamato Kogyo Co. Ltd. | | | 8,105 | | | | 238,925 | |
| | | | | | | | |
| | |
TOTAL METALS & MINING | | | | | | $ | 2,206,232 | |
| |
MULTILINE RETAIL – 0.4% | | | | | |
| | |
Canadian Tire Corp. Ltd., Class A | | | 339 | | | | 46,200 | |
| | |
Dollar Tree, Inc.* | | | 3,579 | | | | 343,190 | |
| | |
Harvey Norman Holdings Ltd. | | | 5,175 | | | | 13,641 | |
| | |
Marks & Spencer Group PLC | | | 24,533 | | | | 97,005 | |
| | |
Marui Group Co. Ltd. | | | 9,320 | | | | 193,433 | |
| | | | | | | | |
| | |
TOTAL MULTILINE RETAIL | | | | | | $ | 693,469 | |
| |
MULTI-UTILITIES – 0.9% | | | | | |
| | |
Atco Ltd., Class I | | | 611 | | | | 18,488 | |
| | |
Canadian Utilities Ltd., Class A | | | 870 | | | | 22,157 | |
| | |
Centrica PLC | | | 65,212 | | | | 137,649 | |
| | |
CMS Energy Corp. | | | 1,862 | | | | 87,868 | |
| | |
Dominion Energy, Inc. | | | 1,908 | | | | 126,996 | |
| | |
E.ON SE | | | 33,100 | | | | 362,437 | |
| | |
Engie SA | | | 8,052 | | | | 141,244 | |
| | |
Innogy SEW | | | 1,279 | | | | 56,199 | |
| | |
National Grid PLC | | | 33,721 | | | | 390,153 | |
| | | | | | | | |
| Description | | Number of
Shares | | | Value | |
| | |
RWE AG | | | 4,036 | | | $ | 96,467 | |
| | | | | | | | |
| | |
TOTAL MULTI-UTILITIES | | | | | | $ | 1,439,658 | |
| |
OIL, GAS & CONSUMABLE FUELS – 3.9% | | | | | |
| | |
Advantage Oil & Gas Ltd.* | | | 12,700 | | | | 40,456 | |
| | |
ARC Resources Ltd. | | | 4,048 | | | | 45,148 | |
| | |
BP PLC | | | 60,881 | | | | 452,225 | |
| | |
Cameco Corp. | | | 4,477 | | | | 47,143 | |
| | |
Canadian Natural Resources Ltd. | | | 13,239 | | | | 477,663 | |
| | |
Chevron Corp. | | | 3,398 | | | | 425,124 | |
| | |
Enagas SA | | | 1,237 | | | | 35,955 | |
| | |
Eni SpA | | | 17,565 | | | | 343,367 | |
| | |
EOG Resources, Inc. | | | 3,731 | | | | 440,892 | |
| | |
Gazprom PJSC ADR | | | 32,105 | | | | 146,399 | |
| | |
Imperial Oil Ltd. | | | 7,069 | | | | 219,841 | |
| | |
Inpex Corp. | | | 7,990 | | | | 102,143 | |
| | |
Inter Pipeline Ltd. | | | 5,175 | | | | 93,307 | |
| | |
Japan Petroleum Exploration Co. Ltd. | | | 3,840 | | | | 99,926 | |
| | |
Kinder Morgan, Inc. | | | 8,083 | | | | 127,873 | |
| | |
LUKOIL PJSC ADR | | | 2,555 | | | | 168,349 | |
| | |
Lundin Petroleum AB | | | 9,072 | | | | 250,087 | |
| | |
Painted Pony Energy Ltd.* | | | 15,214 | | | | 33,178 | |
| | |
Pembina Pipeline Corp. | | | 9,000 | | | | 286,740 | |
| | |
Petroleo Brasileiro SA ADR* | | | 24,464 | | | | 344,698 | |
| | |
Royal Dutch Shell PLC, Class B | | | 20,178 | | | | 720,336 | |
| | |
Statoil ASA | | | 1,514 | | | | 38,717 | |
| | |
Surgutneftegas OJSC ADR | | | 23,005 | | | | 107,810 | |
| | |
TOTAL SA | | | 14,902 | | | | 936,615 | |
| | |
Tourmaline Oil Corp. | | | 2,711 | | | | 50,992 | |
| | | | | | | | |
| | |
TOTAL OIL, GAS & CONSUMABLE FUELS | | | | | | $ | 6,034,984 | |
| |
PAPER & FOREST PRODUCTS – 0.3% | | | | | |
| | |
Domtar Corp. | | | 8,333 | | | | 365,819 | |
| | |
Louisiana-Pacific Corp. | | | 5,200 | | | | 147,316 | |
| | |
Svenska Cellulosa AB, Class B | | | 1,943 | | | | 21,518 | |
| | | | | | | | |
| | |
TOTAL PAPER & FOREST PRODUCTS | | | | | | $ | 534,653 | |
| |
PERSONAL PRODUCTS – 0.4% | | | | | |
| | |
Unilever NV | | | 5,069 | | | | 290,598 | |
| | |
Unilever NV ADR | | | 4,727 | | | | 270,006 | |
| | | | | | | | |
| | |
TOTAL PERSONAL PRODUCTS | | | | | | $ | 560,604 | |
| |
PHARMACEUTICALS – 3.4% | | | | | |
| | |
Almirall SA | | | 3,989 | | | | 49,584 | |
| | |
AstraZeneca PLC | | | 9,097 | | | | 636,816 | |
| | |
AstraZeneca PLC ADR | | | 6,519 | | | | 231,620 | |
| | |
Bristol-Myers Squibb Co. | | | 4,519 | | | | 235,575 | |
| | |
Eisai Co. Ltd. | | | 5,200 | | | | 348,759 | |
| | |
GlaxoSmithKline PLC | | | 6,629 | | | | 132,960 | |
| | |
Hikma Pharmaceuticals PLC | | | 12,534 | | | | 221,007 | |
ANNUAL REPORT / April 30, 2018
31 PORTFOLIOS OF INVESTMENTS
Wilmington Global Alpha Equities Fund (continued)
| | | | | | | | |
| Description | | Number of
Shares | | | Value | |
| | |
Johnson & Johnson | | | 2,642 | | | $ | 334,187 | |
| | |
Merck & Co., Inc. | | | 5,432 | | | | 319,782 | |
| | |
Merck KGaA | | | 449 | | | | 43,863 | |
| | |
Novartis AG | | | 8,887 | | | | 684,071 | |
| | |
Ono Pharmaceutical Co. Ltd. | | | 20,168 | | | | 466,189 | |
| | |
Pfizer, Inc. | | | 13,282 | | | | 486,254 | |
| | |
Roche Holding AG | | | 3,408 | | | | 757,215 | |
| | |
Sanofi | | | 1,706 | | | | 134,880 | |
| | |
Takeda Pharmaceutical Co. Ltd. | | | 4,295 | | | | 180,863 | |
| | | | | | | | |
| | |
TOTAL PHARMACEUTICALS | | | | | | $ | 5,263,625 | |
| |
PROFESSIONAL SERVICES – 0.6% | | | | | |
| | |
Adecco Group AG | | | 1,348 | | | | 89,272 | |
| | |
CoStar Group, Inc.* | | | 956 | | | | 350,527 | |
| | |
Equifax, Inc. | | | 1,255 | | | | 140,623 | |
| | |
Experian PLC | | | 6,553 | | | | 150,145 | |
| | |
Hays PLC | | | 38,310 | | | | 94,409 | |
| | |
RELX NV | | | 3,220 | | | | 68,512 | |
| | |
SThree PLC | | | 4,332 | | | | 19,289 | |
| | |
Wolters Kluwer NV | | | 1,195 | | | | 64,661 | |
| | | | | | | | |
| | |
TOTAL PROFESSIONAL SERVICES | | | | | | $ | 977,438 | |
| |
REAL ESTATE INVESTMENT TRUSTS – 3.2% | | | | | |
| | |
American Tower Corp. | | | 10,613 | | | | 1,447,189 | |
| | |
Ascendas Real Estate Investment Trust | | | 15,520 | | | | 31,135 | |
| | |
AvalonBay Communities, Inc. | | | 1,316 | | | | 214,508 | |
| | |
Brixmor Property Group, Inc. | | | 24,577 | | | | 365,952 | |
| | |
CapitaLand Mall Trust | | | 17,640 | | | | 27,857 | |
| | |
Dexus | | | 5,026 | | | | 35,743 | |
| | |
Federal Realty Investment Trust | | | 268 | | | | 31,048 | |
| | |
Fonciere Des Regions | | | 259 | | | | 28,966 | |
| | |
Goodman Group | | | 7,851 | | | | 53,414 | |
| | |
GPT Group (The) | | | 9,373 | | | | 33,987 | |
| | |
Growthpoint Properties Ltd. | | | 13,678 | | | | 31,928 | |
| | |
H&R Real Estate Investment Trust | | | 1,195 | | | | 19,191 | |
| | |
ICADE | | | 299 | | | | 29,713 | |
| | |
Kimco Realty Corp. | | | 4,356 | | | | 63,206 | |
| | |
Klepierre SA | | | 1,005 | | | | 41,133 | |
| | |
LaSalle Logiport REIT | | | 183 | | | | 187,911 | |
| | |
Mid-America Apartment Communities, Inc. | | | 376 | | | | 34,389 | |
| | |
Mirvac Group | | | 20,701 | | | | 34,740 | |
| | |
Park Hotels & Resorts, Inc. | | | 8,851 | | | | 254,732 | |
| | |
Public Storage | | | 3,544 | | | | 715,108 | |
| | |
SL Green Realty Corp. | | | 201 | | | | 19,646 | |
| | |
Stockland | | | 11,369 | | | | 35,339 | |
| | |
STORE Capital Corp. | | | 12,049 | | | | 303,996 | |
| | |
UDR, Inc. | | | 1,866 | | | | 67,456 | |
| | |
Unibail-Rodamco SE | | | 978 | | | | 234,788 | |
| | | | | | | | |
| Description | | Number of
Shares | | | Value | |
| | |
Vicinity Centres | | | 16,613 | | | $ | 30,418 | |
| | |
Welltower, Inc. | | | 3,052 | | | | 163,099 | |
| | |
Weyerhaeuser Co. | | | 11,001 | | | | 404,617 | |
| | | | | | | | |
| | |
TOTAL REAL ESTATE INVESTMENT TRUSTS | | | | | | $ | 4,941,209 | |
| |
REAL ESTATE MANAGEMENT & DEVELOPMENT – 0.4% | | | | | |
| | |
CapitaLand Ltd. | | | 14,270 | | | | 40,239 | |
| | |
City Developments Ltd. | | | 3,410 | | | | 32,405 | |
| | |
CK Asset Holdings Ltd. | | | 10,000 | | | | 86,330 | |
| | |
Henderson Land Development Co. Ltd. | | | 5,400 | | | | 34,239 | |
| | |
Hongkong Land Holdings Ltd. | | | 5,480 | | | | 39,605 | |
| | |
Hysan Development Co. Ltd. | | | 5,000 | | | | 29,101 | |
| | |
LendLease Group | | | 3,070 | | | | 41,173 | |
| | |
Nexity SA | | | 2,789 | | | | 174,397 | |
| | |
Sun Hung Kai Properties Ltd. | | | 5,000 | | | | 80,522 | |
| | |
Swire Pacific Ltd., Class A | | | 3,500 | | | | 34,585 | |
| | |
Swire Properties Ltd. | | | 8,600 | | | | 30,526 | |
| | |
UOL Group Ltd. | | | 4,463 | | | | 29,476 | |
| | | | | | | | |
| |
TOTAL REAL ESTATE MANAGEMENT & DEVELOPMENT | | | $ | 652,598 | |
| |
ROAD & RAIL – 2.1% | | | | | |
| | |
AMERCO | | | 1,986 | | | | 670,315 | |
| | |
Canadian National Railway Co. | | | 18,506 | | | | 1,429,370 | |
| | |
ComfortDelGro Corp. Ltd. | | | 14,660 | | | | 24,743 | |
| | |
Genesee & Wyoming, Inc., Class A* | | | 10,311 | | | | 734,143 | |
| | |
Go-Ahead Group PLC | | | 3,973 | | | | 105,643 | |
| | |
Kansas City Southern | | | 1,657 | | | | 176,686 | |
| | |
Localiza Rent a Car SA | | | 20,500 | | | | 162,680 | |
| | | | | | | | |
| | |
TOTAL ROAD & RAIL | | | | | | $ | 3,303,580 | |
| |
SEMICONDUCTORS & SEMICONDUCTOR EQUIPMENT – 1.6% | | | | | |
| | |
Intel Corp. | | | 9,532 | | | | 492,042 | |
| | |
Marvell Technology Group Ltd. | | | 22,349 | | | | 448,321 | |
| | |
Maxim Integrated Products, Inc. | | | 4,547 | | | | 247,811 | |
| | |
MediaTek, Inc. | | | 4,065 | | | | 46,234 | |
| | |
Microchip Technology, Inc. | | | 537 | | | | 44,925 | |
| | |
Micron Technology, Inc.* | | | 3,072 | | | | 141,251 | |
| | |
Miraial Co. Ltd. | | | 1,500 | | | | 20,935 | |
| | |
QUALCOMM, Inc. | | | 6,441 | | | | 328,555 | |
| | |
Shinko Electric Industries Co. Ltd. | | | 10,210 | | | | 79,432 | |
| | |
Skyworks Solutions, Inc. | | | 2,446 | | | | 212,215 | |
| | |
Taiwan Semiconductor Manufacturing Co. Ltd. | | | 26,000 | | | | 198,051 | |
| | |
Tokyo Seimitsu Co. Ltd. | | | 4,715 | | | | 179,082 | |
| | |
United Microelectronics Corp. | | | 128,000 | | | | 69,027 | |
| | | | | | | | |
| |
TOTAL SEMICONDUCTORS & SEMICONDUCTOR EQUIPMENT | | | $ | 2,507,881 | |
| |
SOFTWARE – 1.8% | | | | | |
| | |
Alpha Systems, Inc. | | | 500 | | | | 10,374 | |
April 30, 2018 / ANNUAL REPORT
PORTFOLIOS OF INVESTMENTS 32
Wilmington Global Alpha Equities Fund (continued)
| | | | | | | | |
| Description | | Number of
Shares | | | Value | |
| | |
Guidewire Software, Inc.* | | | 2,375 | | | $ | 200,972 | |
| | |
Microsoft Corp. | | | 8,177 | | | | 764,713 | |
| | |
Nexon Co. Ltd.* | | | 15,370 | | | | 223,655 | |
| | |
NHN Entertainment Corp.* | | | 1,130 | | | | 64,774 | |
| | |
Nice Ltd.* | | | 394 | | | | 37,327 | |
| | |
NSD Co. Ltd. | | | 3,299 | | | | 68,781 | |
| | |
Open Text Corp. | | | 1,195 | | | | 42,190 | |
| | |
salesforce.com, Inc.* | | | 2,098 | | | | 253,837 | |
| | |
ServiceNow, Inc.* | | | 1,098 | | | | 182,422 | |
| | |
SS&C Technologies Holdings, Inc. | | | 12,732 | | | | 632,144 | |
| | |
Workday, Inc., Class A* | | | 2,428 | | | | 303,112 | |
| | | | | | | | |
| | |
TOTAL SOFTWARE | | | | | | $ | 2,784,301 | |
| |
SPECIALTY RETAIL – 2.1% | | | | | |
| | |
Camping World Holdings, Inc., Class A | | | 10,812 | | | | 309,548 | |
| | |
CarMax, Inc.* | | | 7,344 | | | | 459,000 | |
| | |
CECONOMY AG | | | 6,912 | | | | 77,455 | |
| | |
Halfords Group PLC | | | 16,778 | | | | 87,438 | |
| | |
Hikari Tsushin, Inc. | | | 580 | | | | 94,020 | |
| | |
Home Depot, Inc. (The) | | | 2,870 | | | | 530,376 | |
| | |
Honeys Holdings Co. Ltd. | | | 2,555 | | | | 24,430 | |
| | |
Kingfisher PLC | | | 9,413 | | | | 39,257 | |
| | |
L Brands, Inc. | | | 4,355 | | | | 152,033 | |
| | |
Nishimatsuya Chain Co. Ltd. | | | 10,535 | | | | 129,501 | |
| | |
PAL GROUP Holdings Co. Ltd. | | | 1,640 | | | | 44,926 | |
| | |
Ross Stores, Inc. | | | 3,293 | | | | 266,239 | |
| | |
Shimamura Co. Ltd. | | | 943 | | | | 109,740 | |
| | |
TJX Cos., Inc. (The) | | | 6,529 | | | | 553,986 | |
| | |
Tractor Supply Co. | | | 1,524 | | | | 103,632 | |
| | |
Via Varejo SA | | | 18,100 | | | | 152,624 | |
| | |
Xebio Holdings Co. Ltd. | | | 4,335 | | | | 81,671 | |
| | | | | | | | |
| | |
TOTAL SPECIALTY RETAIL | | | | | | $ | 3,215,876 | |
| |
TEXTILES, APPAREL & LUXURY GOODS – 1.1% | | | | | |
| | |
361 Degrees International Ltd. | | | 147,130 | | | | 46,522 | |
| | |
adidas AG | | | 783 | | | | 192,437 | |
| | |
Daphne International Holdings Ltd.* | | | 195,140 | | | | 10,011 | |
| | |
Geox SpA | | | 13,724 | | | | 46,160 | |
| | |
Hanesbrands, Inc. | | | 11,500 | | | | 212,405 | |
| | |
NIKE, Inc., Class B | | | 9,588 | | | | 655,723 | |
| | |
Sanyo Shokai Ltd. | | | 2,670 | | | | 61,852 | |
| | |
Under Armour, Inc., Class A* | | | 12,653 | | | | 224,717 | |
| | |
Under Armour, Inc., Class C* | | | 1,738 | | | | 26,678 | |
| | |
VF Corp. | | | 2,877 | | | | 232,663 | |
| | |
Xtep International Holdings Ltd. | | | 106,540 | | | | 61,897 | |
| | | | | | | | |
| | |
TOTAL TEXTILES, APPAREL & LUXURY GOODS | | | | | | $ | 1,771,065 | |
| |
TOBACCO – 0.9% | | | | | |
| | |
Altria Group, Inc. | | | 7,388 | | | | 414,541 | |
| | | | | | | | |
| Description | | Number of
Shares | | | Value | |
| | |
British American Tobacco PLC | | | 9,691 | | | $ | 531,531 | |
| | |
Imperial Brands PLC | | | 1,970 | | | | 70,486 | |
| | |
Japan Tobacco, Inc. | | | 8,392 | | | | 225,587 | |
| | |
Philip Morris International, Inc. | | | 2,229 | | | | 182,778 | |
| | |
Swedish Match AB | | | 1,032 | | | | 46,296 | |
| | | | | | | | |
| | |
TOTAL TOBACCO | | | | | | $ | 1,471,219 | |
| |
TRADING COMPANIES & DISTRIBUTORS – 1.0% | | | | | |
| | |
Brenntag AG | | | 8,611 | | | | 493,169 | |
| | |
Fastenal Co. | | | 6,036 | | | | 301,740 | |
| | |
ITOCHU Corp. | | | 26,525 | | | | 530,458 | |
| | |
Rexel SA | | | 7,750 | | | | 120,139 | |
| | |
SIG PLC | | | 28,432 | | | | 55,583 | |
| | | | | | | | |
| | |
TOTAL TRADING COMPANIES & DISTRIBUTORS | | | | | | $ | 1,501,089 | |
| |
TRANSPORTATION INFRASTRUCTURE – 0.3% | | | | | |
| | |
Hamburger Hafen und Logistik AG | | | 1,683 | | | | 40,413 | |
| | |
Jiangsu Expressway Co. Ltd., Class H | | | 225,000 | | | | 308,503 | |
| | |
Sydney Airport | | | 30,686 | | | | 164,295 | |
| | | | | | | | |
| | |
TOTAL TRANSPORTATION INFRASTRUCTURE | | | | | | $ | 513,211 | |
| |
WATER UTILITIES – 0.2% | | | | | |
| | |
Guangdong Investment Ltd. | | | 205,640 | | | | 318,296 | |
| |
WIRELESS TELECOMMUNICATION SERVICES – 1.2% | | | | | |
| | |
China Mobile Ltd. | | | 26,810 | | | | 255,405 | |
| | |
KDDI Corp. | | | 33,446 | | | | 897,811 | |
| | |
Millicom International Cellular SA | | | 5,023 | | | | 332,717 | |
| | |
NTT DOCOMO, Inc. | | | 11,880 | | | | 306,908 | |
| | |
Orange Belgium SA | | | 2,823 | | | | 58,596 | |
| | |
Rogers Communications, Inc., Class B | | | 1,277 | | | | 60,282 | |
| | |
StarHub Ltd. | | | 6,870 | | | | 11,720 | |
| | |
Vodacom Group Ltd. | | | 2,390 | | | | 29,880 | |
| | | | | | | | |
| | |
TOTAL WIRELESS TELECOMMUNICATION SERVICES | | | | | | $ | 1,953,319 | |
| | | | | | | | |
| | |
TOTAL COMMON STOCKS (COST $130,999,057) | | | | | | $ | 142,672,253 | |
| | |
INVESTMENT COMPANIES – 0.1% | | | | | | | | |
| |
EQUITY FUNDS – 0.1% | | | | | |
| | |
iShares Core MSCI EAFE ETF | | | 1,415 | | | | 94,296 | |
| | |
Nomura TOPIX ETF | | | 5,836 | | | | 98,469 | |
| | | | | | | | |
| | |
TOTAL EQUITY FUNDS | | | | | | $ | 192,765 | |
| | | | | | | | |
| | |
TOTAL INVESTMENT COMPANIES (COST $187,791) | | | | | | $ | 192,765 | |
| | |
PREFERRED STOCKS – 0.1% | | | | | | | | |
| |
TELECOMMUNICATION SERVICES – 0.0%** | | | | | |
| | |
Telefonica Brasil SA 2.41% | | | 3,700 | | | | 52,165 | |
ANNUAL REPORT / April 30, 2018
33 PORTFOLIOS OF INVESTMENTS
Wilmington Global Alpha Equities Fund (continued)
| | | | | | | | |
| Description | | Number of
Shares | | | Value | |
| | |
UTILITIES – 0.1% | | | | | | | | |
| | |
Cia Paranaense de Energia 3.73% | | | 12,400 | | | $ | 95,216 | |
| | | | | | | | |
| | |
TOTAL PREFERRED STOCKS (COST $158,165) | | | | | | $ | 147,381 | |
| | |
MONEY MARKET FUND – 5.5% | | | | | | | | |
| | |
Dreyfus Government Cash Management Fund, Institutional Shares, 1.60%^ | | | 8,605,950 | | | $ | 8,605,950 | |
| | | | | | | | |
| | |
TOTAL MONEY MARKET FUND (COST $8,605,950) | | | | | | $ | 8,605,950 | |
| | | | | | | | |
| | |
TOTAL INVESTMENTS – 96.9%ø (COST $139,950,963) | | | | | | $ | 151,618,349 | |
| | |
OTHER ASSETS LESS LIABILITIES – 3.1% | | | | | | | 4,882,486 | |
| | | | | | | | |
| | |
TOTAL NET ASSETS – 100.0% | | | | | | $ | 156,500,835 | |
| | | | | | | | |
Cost of investments for Federal income tax purposes is $140,627,727. The net unrealized appreciation/(depreciation) of investments was $10,738,150. This consists of net unrealized appreciation from investment for those securities having an excess of value over cost of $15,202,539 and net unrealized depreciation from investments for those securities having an excess of cost over value of $(4,464,389).
Various inputs are used in determining the value of the Fund’s investments. These inputs are summarized in the three broad levels listed below.
|
| Level 1 – quoted prices in active markets for identical securities |
| Level 2 – other significant observable inputs (including quoted prices for similar securities, interest rates, prepayment speeds, credit risk, etc.) |
| Level 3 – significant unobservable inputs (including the Fund’s own assumptions in determining the fair value of investments) |
The following is a summary of the inputs used as of April 30, 2018 in valuing the Fund’s assets carried at fair value:
| | | | | | | | | | | | | | | | |
| | | | |
| | | Level 1 | | | Level 2 | | | Level 3 | | | Total | |
Assets | | | | | | | | | | | | | | | | |
| | | | |
Investments in Securities | | | | | | | | | | | | | | | | |
| | | | |
Common Stocks | | | | | | | | | | | | | | | | |
| | | | |
Aerospace & Defense | | $ | 907,252 | | | $ | 420,513 | | | $ | — | | | $ | 1,327,765 | |
| | | | |
Air Freight & Logistics | | | 369,783 | | | | 493,518 | | | | — | | | | 863,301 | |
| | | | |
Airlines | | | 463,215 | | | | 237,524 | | | | — | | | | 700,739 | |
| | | | |
Auto Components | | | 28,285 | | | | 1,558,154 | | | | — | | | | 1,586,439 | |
| | | | |
Automobiles | | | 96,738 | | | | 1,142,302 | | | | — | | | | 1,239,040 | |
| | | | |
Beverages | | | 629,582 | | | | 1,206,577 | | | | — | | | | 1,836,159 | |
| | | | |
Biotechnology | | | 122,875 | | | | — | | | | — | | | | 122,875 | |
| | | | |
Building Products | | | 885,828 | | | | 470,604 | | | | — | | | | 1,356,432 | |
| | | | |
Capital Markets | | | 1,782,711 | | | | 916,328 | | | | — | | | | 2,699,039 | |
| | | | |
Chemicals | | | 1,490,545 | | | | 1,277,187 | | | | — | | | | 2,767,732 | |
| | | | |
Commercial Banks | | | 3,007,645 | | | | 304,564 | | | | — | | | | 3,312,209 | |
| | | | |
Commercial Services & Supplies | | | 3,498,409 | | | | 470,603 | | | | — | | | | 3,969,012 | |
| | | | |
Communications Equipment | | | 1,583,637 | | | | 501,145 | | | | — | | | | 2,084,782 | |
| | | | |
Computers & Peripherals | | | 738,760 | | | | 373,464 | | | | — | | | | 1,112,224 | |
| | | | |
Construction & Engineering | | | — | | | | 2,316,431 | | | | — | | | | 2,316,431 | |
| | | | |
Construction Materials | | | 193,335 | | | | 402,497 | | | | — | | | | 595,832 | |
| | | | |
Consumer Finance | | | 933,632 | | | | — | | | | — | | | | 933,632 | |
| | | | |
Containers & Packaging | | | 2,783,229 | | | | 812,040 | | | | — | | | | 3,595,269 | |
| | | | |
Distributors | | | 164,805 | | | | — | | | | — | | | | 164,805 | |
| | | | |
Diversified Consumer Services | | | 444,646 | | | | 54,089 | | | | — | | | | 498,735 | |
| | | | |
Diversified Financial Services | | | 3,335,285 | | | | 7,051,488 | | | | — | | | | 10,386,773 | |
| | | | |
Diversified Telecommunication Services | | | 886,608 | | | | 2,330,894 | | | | — | | | | 3,217,502 | |
April 30, 2018 / ANNUAL REPORT
PORTFOLIOS OF INVESTMENTS 34
Wilmington Global Alpha Equities Fund (continued)
| | | | | | | | | | | | | | | | |
| | | | |
| | | Level 1 | | | Level 2 | | | Level 3 | | | Total | |
| | | | |
Electric Utilities | | $ | 1,993,830 | | | $ | 1,325,204 | | | $ | — | | | $ | 3,319,034 | |
| | | | |
Electrical Equipment | | | 994,692 | | | | 200,300 | | | | — | | | | 1,194,992 | |
| | | | |
Electronic Equipment, Instruments & Components | | | 636,793 | | | | 799,953 | | | | — | | | | 1,436,746 | |
| | | | |
Energy Equipment & Services | | | — | | | | 141,634 | | | | — | | | | 141,634 | |
| | | | |
Food & Staples Retailing | | | 571,393 | | | | 882,337 | | | | — | | | | 1,453,730 | |
| | | | |
Food Products | | | 1,772,568 | | | | 1,025,332 | | | | — | | | | 2,797,900 | |
| | | | |
Gas Utilities | | | 311,196 | | | | 731,950 | | | | — | | | | 1,043,146 | |
| | | | |
Health Care Equipment & Supplies | | | 3,457,315 | | | | 61,379 | | | | — | | | | 3,518,694 | |
| | | | |
Health Care Providers & Services | | | 3,646,935 | | | | 224,365 | | | | — | | | | 3,871,300 | |
| | | | |
Health Care Technology | | | — | | | | 49,228 | | | | — | | | | 49,228 | |
| | | | |
Hotels, Restaurants & Leisure | | | 2,565,102 | | | | 220,407 | | | | — | | | | 2,785,509 | |
| | | | |
Household Durables | | | 1,807,550 | | | | 851,034 | | | | — | | | | 2,658,584 | |
| | | | |
Household Products | | | 509,619 | | | | 290,738 | | | | — | | | | 800,357 | |
| | | | |
Industrial Conglomerates | | | — | | | | 829,137 | | | | — | | | | 829,137 | |
| | | | |
Insurance | | | 8,339,767 | | | | 4,643,905 | | | | — | | | | 12,983,672 | |
| | | | |
Internet & Catalog Retail | | | 195,933 | | | | 21,950 | | | | — | | | | 217,883 | |
| | | | |
Internet Software & Services | | | 2,200,441 | | | | 360,464 | | | | — | | | | 2,560,905 | |
| | | | |
IT Services | | | 4,901,782 | | | | 663,948 | | | | — | | | | 5,565,730 | |
| | | | |
Leisure Equipment & Products | | | — | | | | 254,489 | | | | — | | | | 254,489 | |
| | | | |
Life Sciences Tools & Services | | | — | | | | 34,398 | | | | — | | | | 34,398 | |
| | | | |
Machinery | | | 3,416,803 | | | | 883,696 | | | | — | | | | 4,300,499 | |
| | | | |
Marine | | | — | | | | 411,880 | | | | — | | | | 411,880 | |
| | | | |
Media | | | 38,819 | | | | 1,072,953 | | | | — | | | | 1,111,772 | |
| | | | |
Metals & Mining | | | 1,005,533 | | | | 1,200,699 | | | | — | | | | 2,206,232 | |
| | | | |
Multiline Retail | | | 389,390 | | | | 304,079 | | | | — | | | | 693,469 | |
| | | | |
Multi-Utilities | | | 255,509 | | | | 1,184,149 | | | | — | | | | 1,439,658 | |
| | | | |
Oil, Gas & Consumable Fuels | | | 2,947,803 | | | | 3,087,181 | | | | — | | | | 6,034,984 | |
| | | | |
Paper & Forest Products | | | 513,135 | | | | 21,518 | | | | — | | | | 534,653 | |
| | | | |
Personal Products | | | 270,006 | | | | 290,598 | | | | — | | | | 560,604 | |
| | | | |
Pharmaceuticals | | | 1,607,418 | | | | 3,656,207 | | | | — | | | | 5,263,625 | |
| | | | |
Professional Services | | | 491,150 | | | | 486,288 | | | | — | | | | 977,438 | |
| | | | |
Real Estate Investment Trusts | | | 4,104,137 | | | | 837,072 | | | | — | | | | 4,941,209 | |
| | | | |
Real Estate Management & Development | | | — | | | | 652,598 | | | | — | | | | 652,598 | |
| | | | |
Road & Rail | | | 3,173,194 | | | | 130,386 | | | | — | | | | 3,303,580 | |
| | | | |
Semiconductors & Semiconductor Equipment | | | 1,915,120 | | | | 592,761 | | | | — | | | | 2,507,881 | |
| | | | |
Software | | | 2,379,390 | | | | 404,911 | | | | — | | | | 2,784,301 | |
| | | | |
Specialty Retail | | | 2,527,438 | | | | 688,438 | | | | — | | | | 3,215,876 | |
| | | | |
Textiles, Apparel & Luxury Goods | | | 1,352,186 | | | | 418,879 | | | | — | | | | 1,771,065 | |
| | | | |
Tobacco | | | 597,319 | | | | 873,900 | | | | — | | | | 1,471,219 | |
| | | | |
Trading Companies & Distributors | | | 301,740 | | | | 1,199,349 | | | | — | | | | 1,501,089 | |
| | | | |
Transportation Infrastructure | | | — | | | | 513,211 | | | | — | | | | 513,211 | |
| | | | |
Water Utilities | | | — | | | | 318,296 | | | | — | | | | 318,296 | |
| | | | |
Wireless Telecommunication Services | | | 60,282 | | | | 1,893,037 | | | | — | | | | 1,953,319 | |
| | | | |
Investment Companies | | | 94,296 | | | | 98,469 | | | | — | | | | 192,765 | |
| | | | |
Preferred Stocks | | | 147,381 | | | | — | | | | — | | | | 147,381 | |
| | | | |
Money Market Fund | | | 8,605,950 | | | | — | | | | — | | | | 8,605,950 | |
| | | | | | | | | | | | | | | | |
| | | | |
Total Investments in Securities | | | 94,445,720 | | | | 57,172,629 | | | | — | | | | 151,618,349 | |
| | | | | | | | | | | | | | | | |
ANNUAL REPORT / April 30, 2018
35 PORTFOLIOS OF INVESTMENTS
Wilmington Global Alpha Equities Fund (continued)
| | | | | | | | | | | | | | | | |
| | | | |
| | | Level 1 | | | Level 2 | | | Level 3 | | | Total | |
| | | | |
Other Financial Instruments! | | | | | | | | | | | | | | | | |
| | | | |
Forward Foreign Currency Contracts | | $ | — | | | $ | 357,122 | | | $ | — | | | $ | 357,122 | |
| | | | |
Financial Futures Contracts | | | 2,086,193 | | | | — | | | | — | | | | 2,086,193 | |
| | | | | | | | | | | | | | | | |
| | | | |
Total Assets - Other Financial Instruments | | $ | 2,086,193 | | | $ | 357,122 | | | $ | — | | | $ | 2,443,315 | |
| | | | | | | | | | | | | | | | |
Liabilities | | | | | | | | | | | | | | | | |
| | | | |
Other Financial Instruments! | | | | | | | | | | | | | | | | |
| | | | |
Forward Foreign Currency Contracts | | $ | — | | | $ | (43,673 | ) | | $ | — | | | $ | (43,673 | ) |
| | | | |
Financial Futures Contracts | | | (424,448 | ) | | | — | | | | — | | | | (424,448 | ) |
| | | | | | | | | | | | | | | | |
| | | | |
Total Liabilities - Other Financial Instruments | | $ | (424,448 | ) | | $ | (43,673 | ) | | $ | — | | | $ | (468,121 | ) |
| | | | | | | | | | | | | | | | |
| | ! | Other financial instruments are derivative instruments, such as forward foreign currency contracts and financial futures contracts, which are valued at the unrealized appreciation (depreciation) on the instrument. |
| | |
* | | Non-income producing security. |
| |
^ | | 7-Day net yield. |
| |
W | | Denotes a restricted security that may be resold without restriction to “qualified institutional buyers” as defined in Rule 144A under the Securities Act of 1933 and that the Fund has determined to be liquid under criteria established by the Fund’s Board of Trustees. At April 30, 2018, these liquid restricted securities amounted to $135,226 representing 0.09% of total net assets. |
| |
ø | | On April 30, 2018, the Fund utilized International Fair Value Pricing, as defined in Note 2 in Notes to Financial Statements. The value of these securities amounted to $57,172,629 representing 36.53% of total net assets. |
| |
** | | Represents less than 0.05%. |
| | | | | | | | |
| The following acronyms are used throughout this Fund: | | Currency Code | | Currency | | |
| ADR | | American Depositary Receipt | | AUD | | Australian Dollar | | |
| ETF | | Exchange Traded Fund | | CAD | | Canadian Dollar | | |
| GDR | | Global Depositary Receipt | | CHF | | Swiss Franc | | |
| MSCI | | Morgan Stanley Capital International | | EUR | | Euro | | |
| PLC | | Public Limited Company | | GBP | | British Pound Sterling | | |
| REIT | | Real Estate Investment Trust | | HKD | | Hong Kong Dollar | | |
| | | | JPY | | Japanese Yen | | |
At April 30, 2018, the Wilmington Global Alpha Equities Fund had the following outstanding forward foreign currency contracts, which contractually obligates the Fund to deliver or receive currencies at specified future dates:
| | | | | | | | | | | | | | | | | | | | |
| Settlement Date | | Counterparty | | Contracts to Deliver/Receive | | Contract
Amount | | | Contract
at Value | | | Unrealized
Appreciation | | | Unrealized
(Depreciation) | |
CONTRACTS PURCHASED | | | | | | | | | | | | | | | | | | |
5/1/2018 | | BNP Paribas SA | | 386,205 JPY | | $ | 3,541 | | | $ | 3,533 | | | | $ — | | | | $ (8) | |
5/2/2018 | | HSBC Bank USA, N.A. | | 192,828 HKD | | | 24,569 | | | | 24,568 | | | | — | | | | (1) | |
5/3/2018 | | State Street Corp. | | 48,159 EUR | | | 58,211 | | | | 58,157 | | | | — | | | | (54) | |
5/7/2018 | | Royal Bank of Canada | | 1,521,252 JPY | | | 13,922 | | | | 13,922 | | | | — | | | | — | |
CONTRACTS SOLD | | | | | | | | | | | | | | | | | | |
5/1/2018 | | BNP Paribas SA | | 14,257,741 JPY | | | 130,742 | | | | 130,422 | | | | 320 | | | | — | |
5/1/2018 | | Bank of New York | | 25,406 JPY | | | 232 | | | | 232 | | | | — | | | | — | |
5/1/2018 | | Bank of New York | | 1,447 CAD | | | 1,123 | | | | 1,126 | | | | — | | | | (3) | |
5/1/2018 | | Bank of New York | | 350 CAD | | | 272 | | | | 272 | | | | — | | | | — | |
5/1/2018 | | Bank of New York | | 108 CAD | | | 84 | | | | 84 | | | | — | | | | — | |
5/1/2018 | | Bank of New York | | 10 CAD | | | 8 | | | | 8 | | | | — | | | | — | |
5/2/2018 | | HSBC Bank USA, N.A. | | 1,937,338 JPY | | | 17,718 | | | | 17,722 | | | | — | | | | (4) | |
5/2/2018 | | HSBC Bank USA, N.A. | | 24,396 GBP | | �� | 33,563 | | | | 33,586 | | | | — | | | | (23) | |
5/2/2018 | | Bank of New York | | 7,738 EUR | | | 9,368 | | | | 9,345 | | | | 23 | | | | — | |
5/2/2018 | | Credit Agricole SA | | 6,036 JPY | | | 55 | | | | 55 | | | | — | | | | — | |
5/2/2018 | | Bank of New York | | 2,191 CHF | | | 2,208 | | | | 2,210 | | | | — | | | | (2) | |
5/2/2018 | | Bank of New York | | 1,507 EUR | | | 1,824 | | | | 1,819 | | | | 5 | | | | — | |
April 30, 2018 / ANNUAL REPORT
PORTFOLIOS OF INVESTMENTS 36
Wilmington Global Alpha Equities Fund (concluded)
| | | | | | | | | | | | | | | | | | | | | | | | |
| Settlement Date | | Counterparty | | | Contracts to Deliver/Receive | | | Contract
Amount | | | Contract at Value | | | Unrealized
Appreciation | | | Unrealized
(Depreciation) | |
CONTRACTS SOLD (continued) | | | | | | | | | | | | | | | | | | | | | |
5/2/2018 | | | Bank of New York | | | | 666 EUR | | | $ | 805 | | | $ | 804 | | | $ | 1 | | | $ | — | |
5/2/2018 | | | Bank of New York | | | | 609 CAD | | | | 475 | | | | 475 | | | | — | | | | — | |
5/2/2018 | | | Bank of New York | | | | 475 CAD | | | | 370 | | | | 370 | | | | — | | | | — | |
5/3/2018 | | | Bank of New York | | | | 2,412 EUR | | | | 2,918 | | | | 2,914 | | | | 4 | | | | — | |
5/3/2018 | | | Bank of New York | | | | 1,823 CHF | | | | 1,839 | | | | 1,839 | | | | — | | | | — | |
5/3/2018 | | | Bank of New York | | | | 1,379 EUR | | | | 1,668 | | | | 1,665 | | | | 3 | | | | — | |
5/3/2018 | | | Bank of New York | | | | 621 AUD | | | | 468 | | | | 468 | | | | — | | | | — | |
6/20/2018 | | | Australia & New Zealand Banking Group | | | | 859,100,000 JPY | | | | 8,123,647 | | | | 7,886,900 | | | | 236,747 | | | | — | |
6/20/2018 | | | Bank of Montreal | | | | 3,310,000 CAD | | | | 2,537,575 | | | | 2,581,153 | | | | — | | | | (43,578) | |
6/20/2018 | | | Deutsche Bank AG | | | | 3,187,000 EUR | | | | 3,952,932 | | | | 3,864,070 | | | | 88,862 | | | | — | |
6/20/2018 | | | Citigroup Global Markets | | | | 1,376,000 GBP | | | | 1,930,323 | | | | 1,899,166 | | | | 31,157 | | | | — | |
NET UNREALIZED APPRECIATION (DEPRECIATION) ON FORWARD FOREIGN CURRENCY CONTRACTS | | | | | | | | | | | | $ 357,122 | | | | $ (43,673) | |
At April 30, 2018, the Wilmington Global Alpha Equities Fund had open financial futures contracts as follows:
| | | | | | | | | | | | | | | | | | | | | | | | | | | | |
| Underlying Contracts to Buy/Sell | | Expiration
Date | | | Number of
Contracts | | | Notional
Amount(a) | | | Contract
Amount | | | Contract at
Value | | | Unrealized
Appreciation(b) | | | Unrealized
(Depreciation)(b) | |
SHORT POSITIONS: | | | | | | | | | | | | | | | | | | | | | | | | | | | | |
E-mini MSCI EAFE Index | | | June 2018 | | | | 206 | | | | $20,872,950 | | | | $20,969,924 | | | | $20,872,950 | | | | $ 96,974 | | | | $ — | |
E-Mini Russell 2000 Index | | | June 2018 | | | | 61 | | | | 4,708,590 | | | | 4,811,095 | | | | 4,708,590 | | | | 102,505 | | | | — | |
E-Mini S&P 500 | | | June 2018 | | | | 266 | | | | 35,205,100 | | | | 37,091,814 | | | | 35,205,100 | | | | 1,886,714 | | | | — | |
Euro STOXX 50 Index | | | June 2018 | | | | 48 | | | | 1,667,520EUR | | | | 1,967,034 | | | | 2,051,115 | | | | — | | | | (84,081 | ) |
FTSE 100 Index | | | June 2018 | | | | 19 | | | | 1,417,400GBP | | | | 1,875,552 | | | | 1,963,447 | | | | — | | | | (87,895 | ) |
S&P TSX 60 Index | | | June 2018 | | | | 29 | | | | 5,335,420CAD | | | | 4,145,163 | | | | 4,158,512 | | | | — | | | | (13,349 | ) |
TOPIX Index | | | June 2018 | | | | 38 | | | | 676,210,000JPY | | | | 6,121,711 | | | | 6,360,834 | | | | — | | | | (239,123 | ) |
NET UNREALIZED APPRECIATION (DEPRECIATION) ON FINANCIAL FUTURES CONTRACTS | | | | | | | | | | | | | | | | $2,086,193 | | | | $(424,448) | |
| (a) | Notional Amount denominated in USD unless otherwise noted. |
| (b) | The variation margin shown on the Statement of Assets and Liabilities is the daily change in the unrealized appreciation (depreciation) for financial futures contracts. The unrealized appreciation (depreciation) presented above is the cumulative change in unrealized appreciation (depreciation) from the date the contract was open until April 30, 2018. If variation margin settles the same day, then no amount may be shown in the Statement of Assets and Liabilities. |
See Notes which are an integral part of the Financial Statements
ANNUAL REPORT / April 30, 2018
37
PORTFOLIO OF INVESTMENTS SUMMARY TABLE
Wilmington Real Asset Fund
At April 30, 2018, the Fund’s portfolio composition was as follows (unaudited):
| | | | |
| | | Percentage of
Total Net Assets | |
Inflation-Linked & Fixed Income Securities: | | | | |
U.S. Government Inflation-Linked Securities | | | 19.7 | % |
Mortgage-Backed Securities | | | 3.1 | % |
Corporate Bonds | | | 1.6 | % |
Foreign Government Inflation-Linked Securities | | | 1.7 | % |
Foreign Government Securities | | | 1.5 | % |
Asset-Backed Securities | | | 1.3 | % |
U.S. Treasury | | | 0.2 | % |
Certificates of Deposit | | | 0.2 | % |
Real Estate Related Securities: | | | | |
Exchange-Traded Funds | | | 32.4 | % |
Real Estate Investment Trusts | | | 16.1 | % |
Common Stocks | | | 10.9 | % |
Investment Companies | | | 5.0 | % |
Commodity Related Securities: | | | | |
Exchange-Traded Funds | | | 12.4 | % |
Purchased Options | | | 0.1 | % |
Written Options | |
| 0.0
| %3
|
TBA Sale Commitment | | | (0.1 | )% |
Short-Term Investments | | | | |
Cash Equivalents1 | | | 7.5 | % |
Other Assets and Liabilities – Net2 | | | (13.6 | )% |
| |
TOTAL | | | 100.0 | % |
| (1) | Cash Equivalents include investments in a money market fund and repurchase agreements. |
| (2) | Assets, other than investments in securities, less liabilities. See Statements of Assets and Liabilities. |
| (3) | Represents less than 0.05%. |
PORTFOLIO OF INVESTMENTS
April 30, 2018
| | | | | | | | |
Description | | Par Value (a) | | | Value | |
INFLATION-LINKED & FIXED INCOME SECURITIES – 29.3% | |
| |
ASSET-BACKED SECURITIES – 1.3% | | | | | |
| |
COLLATERALIZED LOAN OBLIGATION – 0.3% | | | | | |
| | |
Dryden XXV Senior Loan Fund, Series 2012-25A, Class ARR, (3 Month USD LIBOR + 0.90%), 3.25%, 10/15/27D,W | | | 300,000 | | | $ | 300,065 | |
| | |
Symphony CLO VIII LP, Series 2012-8A, Class AR, (3 Month USD LIBOR + 1.10%), 3.43%, 1/09/23D,W | | | 47,931 | | | | 48,027 | |
| | |
Symphony CLO XVII Ltd., Series 2016-17A, Class AR, (3 Month USD LIBOR + 0.88%), 3.23%, 4/15/28D,W | | | 260,000 | | | | 259,997 | |
| | | | | | | | |
Description | | Par Value (a) | | | Value | |
| | |
Venture VII CDO Ltd., Series 2006-7A, Class A1A, (3 Month USD LIBOR + 0.23%), 2.59%, 1/20/22D,W | | | 156,292 | | | $ | 156,236 | |
| | |
Venture XII CLO Ltd., Series 2012-12A, Class ARR, (3 Month USD LIBOR + 0.80%), 2.78%, 2/28/26D,W | | | 270,000 | | | | 270,007 | |
| | | | | | | | |
| | |
TOTAL COLLATERALIZED LOAN OBLIGATION | | | | | | $ | 1,034,332 | |
| |
DIVERSIFIED FINANCIAL SERVICES – 0.3% | | | | | |
| | |
Ameriquest Mortgage Securities Trust, | | | | | | | | |
Series 2006-R1, Class M1, (1 Month USD LIBOR + 0.39%), 2.29%, 3/25/36D | | | 300,000 | | | | 301,769 | |
April 30, 2018 / ANNUAL REPORT
PORTFOLIOS OF INVESTMENTS 38
Wilmington Real Asset Fund (continued)
| | | | | | | | |
Description | | Par Value (a) | | | Value | |
| | |
Bear Stearns Asset Backed Securities I Trust, Series 2005-TC1, Class M2, (1 Month USD LIBOR + 0.98%), 2.87%, 5/25/35D | | | 545,623 | | | $ | 541,671 | |
| | | | | | | | |
| | |
TOTAL DIVERSIFIED FINANCIAL SERVICES | | | | | | $ | 843,440 | |
| |
WHOLE LOAN – 0.7% | | | | | |
| | |
Citigroup Mortgage Loan Trust, Inc., Series 2006-WFH2, Class A3, (1 Month USD LIBOR + 0.22%), 2.12%, 8/25/36D | | | 1,200,000 | | | | 1,173,338 | |
| | |
Credit-Based Asset Servicing and Securitization LLC, Series 2005-CB2, Class M2, (1 Month USD LIBOR + 0.95%), 2.84%, 4/25/36D | | | 241,321 | | | | 232,867 | |
| | |
Navient Student Loan Trust, Series 2016-7A, Class A, (1 Month USD LIBOR + 1.15%), 3.05%, 3/25/66D,W | | | 248,167 | | | | 253,285 | |
| | |
Nomura Home Equity Loan, Inc., Home Equity Loan Trust, Series 2006-WF1, Class M2, (1 Month USD LIBOR + 0.29%), 2.19%, 3/25/36D | | | 200,000 | | | | 197,839 | |
| | |
Saxon Asset Securities Trust, Series 2005-1, Class M2, (1 Month USD LIBOR + 0.72%), 2.62%, 5/25/35D | | | 208,458 | | | | 190,504 | |
| | |
VOLT LV LLC, Series 2017-NPL2, Class A1, (Current rate effective through 3/25/20. Thereafter rate will increase to 6.50%), 3.50%, 3/25/47ÿ,W | | | 69,580 | | | | 69,605 | |
| | | | | | | | |
| | |
TOTAL WHOLE LOAN | | | | | | $ | 2,117,438 | |
| | | | | | | | |
| | |
TOTAL ASSET-BACKED SECURITIES | | | | | | | | |
(COST $3,642,834) | | | | | | $ | 3,995,210 | |
| |
CERTIFICATES OF DEPOSIT – 0.2% | | | | | |
| |
CERTIFICATE OF DEPOSIT – 0.2% | | | | | |
| | |
Barclays Bank PLC, | | | | | | | | |
| | |
1.94%, 9/04/18 | | | 400,000 | | | | 399,236 | |
| | |
(3 Month USD LIBOR + 0.47%), 2.35%, 5/17/18D | | | 200,000 | | | | 200,058 | |
| | | | | | | | |
| | |
TOTAL CERTIFICATE OF DEPOSIT | | | | | | $ | 599,294 | |
| | | | | | | | |
| | |
TOTAL CERTIFICATES OF DEPOSIT | | | | | | | | |
(COST $600,000) | | | | | | $ | 599,294 | |
| |
CORPORATE BONDS – 1.6% | | | | | |
| |
ENERGY – 0.2% | | | | | |
| | |
Enbridge, Inc., Sr. Unsecured, (3 Month USD LIBOR + 0.40%), 2.74%, 1/10/20D | | | 100,000 | | | | 100,024 | |
| | |
NextEra Energy Capital Holdings, Inc., Company Guaranteed, (3 Month USD LIBOR + 0.32%), 2.37%, 9/03/19D | | | 110,000 | | | | 110,276 | |
| | |
Petrobras Global Finance BV, Company Guaranteed, | | | | | | | | |
| | |
6.00%, 1/27/28W | | | 291,000 | | | | 283,900 | |
| | |
7.38%, 1/17/27 | | | 100,000 | | | | 107,400 | |
| | | | | | | | |
| | |
TOTAL ENERGY | | | | | | $ | 601,600 | |
| | | | | | | | |
Description | | Par Value (a) | | | Value | |
| |
FINANCIALS – 1.3% | | | | | |
| | |
Ally Financial, Inc., Company Guaranteed, 3.50%, 1/27/19 | | | 100,000 | | | $ | 100,375 | |
| | |
Bank of America Corp., Sr. Unsecured, MTN, (Unidad de Inverso Index + 0.00%), 4.44%, 10/21/25D | | | 5,000,000MXN | | | | 341,540 | |
| | |
Bank of Nova Scotia (The), 1.53%, 5/23/18‡ | | | 1,000,000CAD | | | | 778,103 | |
| | |
BRFkredit A/S, 111E, Covered Bonds, 2.50%, 10/01/47 | | | 54,351DKK | | | | 9,130 | |
| | |
Credit Suisse Group Funding Guernsey Ltd., Company Guaranteed, 3.80%, 9/15/22 | | | 250,000 | | | | 250,178 | |
| | |
Goldman Sachs Group, Inc. (The), Sr. Unsecured, | | | | | | | | |
| | |
(3 Month USD LIBOR + 0.82%), 2.88%, 10/31/22D | | | 100,000 | | | | 97,412 | |
| | |
(3 Month USD LIBOR + 1.20%), 3.32%, 9/15/20D | | | 600,000 | | | | 611,962 | |
| | |
ING Bank NV, Covered Bonds, 2.63%, 12/05/22W | | | 200,000 | | | | 194,798 | |
| | |
International Lease Finance Corp., Sr. Unsecured, | | | | | | | | |
| | |
6.25%, 5/15/19 | | | 100,000 | | | | 103,312 | |
| | |
8.25%, 12/15/20 | | | 100,000 | | | | 111,392 | |
| | |
Intesa Sanpaolo SpA, Sr. Unsecured, 6.50%, 2/24/21W | | | 300,000 | | | | 321,844 | |
| | |
Nordea Kredit Realkreditaktieselskab, Covered Bonds, 2.50%, 10/01/47 | | | 563DKK | | | | 95 | |
| | |
Nykredit Realkredit A/S, 01E, Covered Bonds, 2.50%, 10/01/47 | | | 145,855DKK | | | | 24,503 | |
| | |
Realkredit Danmark A/S, 23S, Covered Bonds, MTN, 2.50%, 7/01/47 | | | 97,608DKK | | | | 16,406 | |
| | |
Royal Bank of Canada, | | | | | | | | |
| | |
1.53%, 5/28/18‡ | | | 100,000CAD | | | | 77,794 | |
| | |
1.54%, 5/16/18‡ | | | 540,000CAD | | | | 420,296 | |
| | |
UBS AG, Sr. Unsecured, | | | | | | | | |
| | |
(3 Month USD LIBOR + 0.32%), 2.35%, 12/07/18D,W | | | 200,000 | | | | 200,194 | |
| | |
(3 Month USD LIBOR + 0.58%), 2.63%, 6/08/20D,W | | | 200,000 | | | | 200,853 | |
| | | | | | | | |
| | |
TOTAL FINANCIALS | | | | | | $ | 3,860,187 | |
| |
INTERNET SOFTWARE & SERVICES – 0.0%** | | | | | |
| | |
eBay, Inc., Sr. Unsecured, 2.75%, 1/30/23 | | | 100,000 | | | | 96,283 | |
| |
OIL & GAS – 0.0%** | | | | | |
| | |
Sempra Energy, Sr. Unsecured, (3 Month USD LIBOR + 0.45%), 2.57%, 3/15/21D | | | 100,000 | | | | 100,206 | |
| |
TELECOMMUNICATIONS – 0.1% | | | | | |
| | |
AT&T, Inc., Sr. Unsecured, | | | | | | | | |
| | |
(3 Month USD LIBOR + 0.65%), 3.00%, 1/15/20D | | | 200,000 | | | | 201,319 | |
ANNUAL REPORT / April 30, 2018
39 PORTFOLIOS OF INVESTMENTS
Wilmington Real Asset Fund (continued)
| | | | | | | | |
Description | | Par Value (a) | | | Value | |
| | |
5.15%, 2/15/50W | | | 100,000 | | | $ | 101,625 | |
| | | | | | | | |
| | |
TOTAL TELECOMMUNICATIONS | | | | | | $ | 302,944 | |
| |
TOBACCO – 0.0%** | | | | | |
| | |
BAT Capital Corp., Company Guaranteed, (3 Month USD LIBOR + 0.59%), 2.42%, 8/14/20D,W | | | 100,000 | | | | 100,537 | |
| | | | | | | | |
| | |
TOTAL CORPORATE BONDS | | | | | | | | |
(COST $5,138,760) | | | | | | $ | 5,061,757 | |
| |
FOREIGN GOVERNMENT INFLATION-LINKED SECURITIES – 1.7% | | | | | |
| |
GOVERNMENT – 1.7% | | | | | |
| | |
Australia Government Bond, Sr. Unsecured, 3.00%, 9/20/25 | | | 310,000AUD | | | | 326,825 | |
| | |
Denmark Inflation Linked Government Bond, 0.10%, 11/15/23 | | | 2,141,129DKK | | | | 372,518 | |
| | |
France Government Bond OAT, | | | | | | | | |
| | |
0.10%, 3/01/25 | | | 90,000EUR | | | | 119,194 | |
| | |
1.85%, 7/25/27 | | | 270,000EUR | | | | 447,976 | |
| | |
Italy Buoni Poliennali Del Tesoro, | | | | | | | | |
| | |
2.55%, 9/15/41 | | | 33,128EUR | | | | 51,535 | |
| | |
2.35%, 9/15/24W | | | 110,000EUR | | | | 158,711 | |
| | |
Japanese Government CPI Linked Bond, 22, Sr. Unsecured, 0.10%, 3/10/27 | |
| 110,807,400JPY
|
| | | 1,075,436 | |
| | |
Mexican Udibonos, 4.50%, 11/22/35 | | | 1,977,200MXN | | | | 115,922 | |
| | |
New Zealand Government Bond, Sr. Unsecured, 2.00%, 9/20/25 | | | 1,150,000NZD | | | | 894,586 | |
| | |
United Kingdom Gilt Inflation Linked, | | | | | | | | |
| | |
0.13%, 3/22/26 | | | 808,000GBP | | | | 1,375,023 | |
| | |
0.13%, 3/22/46 | | | 75,496GBP | | | | 162,686 | |
| | |
0.13%, 8/10/48 | | | 20,000GBP | | | | 45,141 | |
| | |
0.13%, 11/22/56 | | | 1,000GBP | | | | 2,667 | |
| | |
0.13%, 11/22/65 | | | 25,000GBP | | | | 79,092 | |
| | | | | | | | |
| | |
TOTAL GOVERNMENT | | | | | | $ | 5,227,312 | |
| | | | | | | | |
| | |
TOTAL FOREIGN GOVERNMENT INFLATION-LINKED SECURITIES | | | | | | | | |
(COST $5,284,901) | | | | | | $ | 5,227,312 | |
| |
FOREIGN GOVERNMENT SECURITIES – 1.6% | | | | | |
| |
GOVERNMENT – 1.6% | | | | | |
| | |
Argentina Bonar Bonds, (Argentina Deposit Rates Badlar Private Banks + 2.00%), 24.94%, 4/03/22D | | | 99,000ARS | | | | 4,818 | |
| | |
Argentina POM Politica Monetaria, (Argentina Cental Bank + 0.00%), 27.93%, 6/21/20D | | | 3,820,000ARS | | | | 194,769 | |
| | |
Argentine Republic Government International Bond, Sr. Unsecured, 5.88%, 1/11/28 | | | 100,000 | | | | 91,788 | |
| | | | | | | | |
Description | | Par Value (a) | | | Value | |
| | |
Autonomous Community of Catalonia, Sr. Unsecured, 4.75%, 6/04/18 | | | 100,000EUR | | | $ | 121,290 | |
| | |
Corp. Andina de Fomento, Series 11U, Sr. Unsecured, 3.95%, 10/15/21 | | | 5,001,756MXN | | | | 261,450 | |
| | |
Cyprus Government International Bond, Sr. Unsecured, MTN, | | | | | | | | |
| | |
3.75%, 7/26/23 | | | 30,000EUR | | | | 39,991 | |
| | |
4.25%, 11/04/25 | | | 20,000EUR | | | | 27,454 | |
| | |
2.75%, 6/27/24 | | | 10,000EUR | | | | 12,703 | |
| | |
3.88%, 5/06/22 | | | 20,000EUR | | | | 26,626 | |
| | |
Italy Buoni Poliennali Del Tesoro, 0.25%, 5/15/18 | | | 100,000EUR | | | | 120,795 | |
| | |
Japan Treasury Discount Bill, | | | | | | | | |
| | |
0.00%, 5/01/18‡ | | | 120,000,000JPY | | | | 1,097,700 | |
| | |
0.00%, 5/07/18‡ | | | 41,000,000JPY | | | | 375,059 | |
| | |
0.00%, 5/21/18‡ | | | 80,000,000JPY | | | | 731,861 | |
| | |
0.00%, 5/21/18‡ | | | 23,300,000JPY | | | | 213,155 | |
| | |
0.00%, 7/30/18‡ | | | 120,000,000JPY | | | | 1,098,078 | |
| | |
Peru Government Bond, Sr. Unsecured, 6.15%, 8/12/32W | | | 700,000PEN | | | | 226,386 | |
| | |
United Kingdom Gilt, 4.25%, 12/07/27 | | | 100,000GBP | | | | 172,591 | |
| | | | | | | | |
| | |
TOTAL GOVERNMENT | | | | | | $ | 4,816,514 | |
| | | | | | | | |
| | |
TOTAL FOREIGN GOVERNMENT SECURITIES | | | | | | | | |
(COST $4,998,135) | | | | | | $ | 4,816,514 | |
| |
MORTGAGE-BACKED SECURITIES – 3.0% | | | | | |
| |
FEDERAL NATIONAL MORTGAGE ASSOCIATION (FNMA) – 2.3% | | | | | |
| | |
Fannie Mae Pool, | | | | | | | | |
| | |
3.50%, 9/01/45 | | | 157,467 | | | | 156,662 | |
| | |
3.50%, 9/01/46 | | | 602,962 | | | | 599,883 | |
| | |
3.50%, 6/01/48 | | | 4,470,000 | | | | 4,429,141 | |
| | |
4.00%, 6/01/48 | | | 2,000,000 | | | | 2,033,438 | |
| | | | | | | | |
| | |
TOTAL FEDERAL NATIONAL MORTGAGE ASSOCIATION (FNMA) | | | | | | $ | 7,219,124 | |
| |
WHOLE LOAN – 0.7% | | | | | |
| | |
BCAP LLC Trust, Series 2009-RR6-I, Class 3A1, 3.65%, 12/26/37D,W | | | 23,473 | | | | 23,601 | |
| | |
Grifonas Finance PLC, Class A, (6 Month EURIBOR + 0.28%), 0.01%, 8/28/39D | | | 456,821EUR | | | | 495,130 | |
| | |
Rise Ltd., 2014-1, Class A, 4.75%, 2/15/39 | | | 169,278 | | | | 169,278 | |
| | |
Sequoia Mortgage Trust 6, Series 6, Class A, (1 Month USD LIBOR + 0.64%), 2.54%, 4/19/27D | | | 690,841 | | | | 667,105 | |
| | |
Trinity Square 2015-1A PLC, Series 2015-1A, Class A, (3 Month GBP LIBOR + 1.15%), 1.94%, 7/15/51D,W | | | 393,818GBP | | | | 548,921 | |
| | |
Wamu Mortgage Pass-Through Certificates, Series 2006-AR14, Class 1A4, | | | | | | | | |
| | |
3.02%, 11/25/36D | | | 218,438 | | | | 213,291 | |
April 30, 2018 / ANNUAL REPORT
PORTFOLIOS OF INVESTMENTS 40
Wilmington Real Asset Fund (continued)
| | | | | | | | |
Description | | Par Value (a) | | | Value | |
| | |
3.52%, 3/25/37D | | | 77,315 | | | $ | 77,077 | |
| | | | | | | | |
| | |
TOTAL WHOLE LOAN | | | | | | $ | 2,194,403 | |
| | | | | | | | |
| | |
TOTAL MORTGAGE-BACKED SECURITIES | | | | | | | | |
(COST $9,326,882) | | | | | | $ | 9,413,527 | |
| |
U.S. GOVERNMENT INFLATION-LINKED SECURITIES – 19.7% | | | | | |
| |
U.S. TREASURY INFLATION INDEXED BONDS –19.7% | | | | | |
| | |
U.S. Treasury Inflation Indexed Bond, | | | | | | | | |
| | |
0.13%, 4/15/19 | | | 1,633,000 | | | | 1,727,684 | |
| | |
0.13%, 4/15/20 | | | 1,398,000 | | | | 1,474,156 | |
| | |
0.13%, 4/15/21 | | | 1,342,000 | | | | 1,390,397 | |
| | |
0.13%, 1/15/22 | | | 182,000 | | | | 196,888 | |
| | |
0.13%, 4/15/22 | | | 639,000 | | | | 640,786 | |
| | |
0.13%, 7/15/22 | | | 102,000 | | | | 108,631 | |
| | |
0.13%, 1/15/23 | | | 2,331,000 | | | | 2,456,092 | |
| | |
0.13%, 7/15/24 | | | 6,296,000 | | | | 6,397,518 | |
| | |
0.13%, 7/15/26 | | | 491,000 | | | | 486,647 | |
| | |
0.25%, 1/15/25 | | | 2,098,000 | | | | 2,138,542 | |
| | |
0.38%, 7/15/23 | | | 4,292,000 | | | | 4,544,222 | |
| | |
0.38%, 7/15/25 | | | 1,579,000 | | | | 1,622,871 | |
| | |
0.38%, 1/15/27 | | | 99,000 | | | | 98,772 | |
| | |
0.50%, 1/15/28 | | | 1,296,000 | | | | 1,276,835 | |
| | |
0.63%, 7/15/21 | | | 302,000 | | | | 335,564 | |
| | |
0.63%, 4/15/23 | | | 330,000 | | | | 329,959 | |
| | |
0.63%, 1/15/24 | | | 2,200,000 | | | | 2,341,500 | |
| | |
0.63%, 1/15/26 | | | 3,468,000 | | | | 3,603,063 | |
| | |
0.63%, 2/15/43 | | | 196,000 | | | | 199,232 | |
| | |
0.75%, 2/15/42 | | | 839,000 | | | | 896,555 | |
| | |
0.75%, 2/15/45 | | | 643,000 | | | | 652,202 | |
| | |
0.88%, 2/15/47 | | | 1,258,000 | | | | 1,281,817 | |
| | |
1.00%, 2/15/46 | | | 1,304,000 | | | | 1,396,245 | |
| | |
1.00%, 2/15/48 | | | 412,000 | | | | 424,785 | |
| | |
1.25%, 7/15/20 | | | 1,043,000 | | | | 1,215,707 | |
| | |
1.38%, 2/15/44 | | | 2,267,000 | | | | 2,679,883 | |
| | |
1.75%, 1/15/28 | | | 2,347,000 | | | | 3,043,053 | |
| | |
1.88%, 7/15/19 | | | 226,000 | | | | 269,382 | |
| | |
2.00%, 1/15/26 | | | 721,000 | | | | 991,193 | |
| | |
2.13%, 2/15/40 | | | 180,000 | | | | 260,337 | |
| | |
2.13%, 2/15/41 | | | 659,000 | | | | 946,606 | |
| | |
2.38%, 1/15/25 | | | 1,273,000 | | | | 1,866,046 | |
| | |
2.38%, 1/15/27 | | | 594,000 | | | | 833,895 | |
| | |
2.50%, 1/15/29 | | | 3,003,000 | | | | 4,091,646 | |
| | |
3.38%, 4/15/32 | | | 136,000 | | | | 254,233 | |
| | |
3.63%, 4/15/28 | | | 3,361,000 | | | | 6,579,179 | |
| | |
3.88%, 4/15/29 | | | 858,000 | | | | 1,714,836 | |
| | | | | | | | |
| | |
TOTAL U.S. TREASURY INFLATION INDEXED BONDS | | | | | | $ | 60,766,959 | |
| | | | | | | | |
| | |
TOTAL U.S. GOVERNMENT INFLATION-LINKED SECURITIES | | | | | | | | |
(COST $61,038,645) | | | | | | $ | 60,766,959 | |
| | | | | | | | |
Description | | Par Value (a) | | | Value | |
| |
U.S. TREASURY – 0.2% | | | | | |
| |
U.S. TREASURY NOTES – 0.2% | | | | | |
| | |
U.S. Treasury Note, | | | | | | | | |
| | |
1.88%, 7/31/22 | | | 400,000 | | | $ | 385,977 | |
| | |
2.75%, 2/15/28 | | | 281,000 | | | | 276,317 | |
| | | | | | | | |
| | |
TOTAL U.S. TREASURY NOTES | | | | | | $ | 662,294 | |
| | | | | | | | |
| | |
TOTAL U.S. TREASURY | | | | | | | | |
(COST $661,373) | | | | | | $ | 662,294 | |
| | | | | | | | |
| |
TOTAL INFLATION-LINKED & FIXED INCOME SECURITIES | | | | | |
(COST $90,691,530) | | | | | | $ | 90,542,867 | |
| | | Number of
Shares | | | | |
REAL ESTATE RELATED SECURITIES – 64.4% | | | | | |
| | |
COMMON STOCKS – 10.9% | | | | | | | | |
| | |
DIVERSIFIED – 0.0%** | | | | | | | | |
| | |
Argosy Property Ltd. | | | 61,413 | | | | $ 43,807 | |
| | |
Stride Stapled Group | | | 41,068 | | | | 49,903 | |
| | | | | | | | |
| | |
TOTAL DIVERSIFIED | | | | | | | $ 93,710 | |
| |
DIVERSIFIED REAL ESTATE ACTIVITIES – 5.5% | | | | | |
| | |
Airport City Ltd.* | | | 4,442 | | | | 50,714 | |
| | |
Allreal Holding AG | | | 1,074 | | | | 176,576 | |
| | |
CapitaLand Ltd. | | | 193,900 | | | | 546,769 | |
| | |
Chinese Estates Holdings Ltd. | | | 47,000 | | | | 69,905 | |
| | |
City Developments Ltd. | | | 46,300 | | | | 439,984 | |
| | |
D Carnegie & Co. AB* | | | 2,744 | | | | 42,684 | |
| | |
Daito Trust Construction Co. Ltd. | | | 5,900 | | | | 984,504 | |
| | |
Daiwa House Industry Co. Ltd. | | | 51,600 | | | | 1,886,561 | |
| | |
DIC Asset AG | | | 3,489 | | | | 42,928 | |
| | |
Far East Consortium International Ltd. | | | 78,000 | | | | 44,544 | |
| | |
Gateway Lifestyle | | | 18,241 | | | | 27,211 | |
| | |
Great Eagle Holdings Ltd. | | | 19,000 | | | | 95,975 | |
| | |
Hang Lung Properties Ltd. | | | 155,000 | | | | 366,819 | |
| | |
Heiwa Real Estate Co. Ltd. | | | 4,300 | | | | 100,720 | |
| | |
Henderson Land Development Co. Ltd. | | | 102,344 | | | | 648,918 | |
| | |
HKR International Ltd. | | | 60,800 | | | | 36,994 | |
| | |
K Wah International Holdings Ltd. | | | 85,000 | | | | 52,174 | |
| | |
Kerry Properties Ltd. | | | 45,500 | | | | 217,514 | |
| | |
LendLease Group | | | 43,161 | | | | 578,846 | |
| | |
Leopalace21 Corp. | | | 20,100 | | | | 174,326 | |
| | |
Mitsubishi Estate Co. Ltd. | | | 105,300 | | | | 1,924,100 | |
| | |
Mitsui Fudosan Co. Ltd. | | | 78,000 | | | | 1,998,005 | |
| | |
Mobimo Holding AG* | | | 508 | | | | 131,210 | |
| | |
New World Development Co. Ltd. | | | 413,000 | | | | 605,673 | |
| | |
Nomura Real Estate Holdings, Inc. | | | 11,000 | | | | 272,211 | |
| | |
PATRIZIA Immobilien AG* | | | 3,400 | | | | 67,872 | |
| | |
Property & Building Corp. Ltd. | | | 169 | | | | 12,577 | |
ANNUAL REPORT / April 30, 2018
41 PORTFOLIOS OF INVESTMENTS
Wilmington Real Asset Fund (continued)
| | | | | | | | |
| Description | | Number of
Shares | | | Value | |
| | |
Realia Business SA* | | | 22,825 | | | $ | 30,259 | |
| | |
RMR Group, Inc., Class A (The) | | | 300 | | | | 22,320 | |
| | |
SAMTY Co. Ltd. | | | 1,500 | | | | 27,721 | |
| | |
Shinoken Group Co. Ltd. | | | 1,000 | | | | 30,404 | |
| | |
Soundwill Holdings Ltd. | | | 17,500 | | | | 31,129 | |
| | |
Sumitomo Realty & Development Co. Ltd. | | | 37,000 | | | | 1,469,759 | |
| | |
Sun Frontier Fudousan Co. Ltd. | | | 1,700 | | | | 20,512 | |
| | |
Sun Hung Kai Properties Ltd. | | | 124,000 | | | | 1,996,951 | |
| | |
Tokyo Tatemono Co. Ltd. | | | 16,200 | | | | 246,713 | |
| | |
Tokyu Fudosan Holdings Corp. | | | 44,300 | | | | 348,619 | |
| | |
Tricon Capital Group, Inc. | | | 10,434 | | | | 81,752 | |
| | |
UOL Group Ltd. | | | 43,900 | | | | 289,943 | |
| | |
Wharf Holdings Ltd. | | | 75,000 | | | | 249,514 | |
| | |
Wheelock & Co. Ltd. | | | 59,000 | | | | 437,734 | |
| | | | | | | | |
| | |
TOTAL DIVERSIFIED REAL ESTATE ACTIVITIES | | | | | | $ | 16,879,644 | |
| | |
INDUSTRIALS – 0.0%** | | | | | | | | |
| | |
Propertylink Group | | | 45,110 | | | | 34,993 | |
| | |
OFFICE – 0.0%** | | | | | | | | |
| | |
Precinct Properties New Zealand Ltd. | | | 75,214 | | | | 67,617 | |
| | |
REAL ESTATE DEVELOPMENT – 1.2% | | | | | | | | |
| | |
ADLER Real Estate AG* | | | 1,923 | | | | 35,727 | |
| | |
Asian Growth Properties Ltd.*,†† | | | 22,824 | | | | — | |
| | |
Aveo Group | | | 16,575 | | | | 32,552 | |
| | |
CK Asset Holdings Ltd. | | | 205,000 | | | | 1,769,758 | |
| | |
Daikyo, Inc. | | | 2,300 | | | | 50,059 | |
| | |
DREAM Unlimited Corp., Class A* | | | 9,069 | | | | 67,596 | |
| | |
Frasers Property Ltd. | | | 26,000 | | | | 39,704 | |
| | |
Goldcrest Co. Ltd. | | | 2,700 | | | | 57,352 | |
| | |
Greenland Hong Kong Holdings Ltd. | | | 101,000 | | | | 46,534 | |
| | |
Helical PLC | | | 12,067 | | | | 62,458 | |
| | |
Howard Hughes Corp, (The)* | | | 630 | | | | 85,239 | |
| | |
Nexity SA | | | 3,356 | | | | 209,851 | |
| | |
Road King Infrastructure Ltd. | | | 28,000 | | | | 53,086 | |
| | |
Selvaag Bolig ASA | | | 6,948 | | | | 35,289 | |
| | |
Sino Land Co. Ltd. | | | 228,000 | | | | 393,568 | |
| | |
St. Modwen Properties PLC | | | 19,519 | | | | 110,200 | |
| | |
TAG Immobilien AG | | | 10,923 | | | | 230,824 | |
| | |
TK Development A/S* | | | 9,212 | | | | 10,522 | |
| | |
Villa World Ltd. | | | 19,108 | | | | 35,479 | |
| | |
Wang On Properties Ltd. | | | 288,000 | | | | 45,306 | |
| | |
Wheelock Properties Singapore Ltd. | | | 40,300 | | | | 55,115 | |
| | |
Wing Tai Holdings Ltd. | | | 57,900 | | | | 88,713 | |
| | |
Yoma Strategic Holdings Ltd. | | | 76,000 | | | | 24,482 | |
| | | | | | | | |
| | |
TOTAL REAL ESTATE DEVELOPMENT | | | | | | $ | 3,539,414 | |
| | |
REAL ESTATE MANAGEMENT & DEVELOPMENT – 0.2% | | | | | | | | |
| | |
ADO Properties SAW | | | 2,243 | | | | 123,298 | |
| | | | | | | | |
| Description | | Number of
Shares | | | Value | |
| | |
Aeon Mall Co. Ltd. | | | 8,600 | | | $ | 173,904 | |
| | |
BUWOG AG* | | | 8,520 | | | | 298,901 | |
| | |
Norstar Holdings, Inc. | | | 1,096 | | | | 19,329 | |
| | | | | | | | |
| | |
TOTAL REAL ESTATE MANAGEMENT & DEVELOPMENT | | | | | | $ | 615,432 | |
| | |
REAL ESTATE OPERATING COMPANIES – 4.0% | | | | | | | | |
| | |
ADO Group Ltd.* | | | 4,844 | | | | 88,325 | |
| | |
Africa Israel Properties Ltd.* | | | 936 | | | | 21,576 | |
| | |
Alony Hetz Properties & Investments Ltd. | | | 7,307 | | | | 64,817 | |
| | |
Alrov Properties & Lodgings Ltd. | | | 1 | | | | 22 | |
| | |
Amot Investments Ltd. | | | 8,779 | | | | 43,265 | |
| | |
Arealink Co. Ltd. | | | 1,100 | | | | 36,302 | |
| | |
Azrieli Group Ltd. | | | 2,722 | | | | 124,511 | |
| | |
Big Shopping Centers Ltd. | | | 209 | | | | 13,401 | |
| | |
Blue Square Real Estate Ltd. | | | 398 | | | | 14,252 | |
| | |
Brack Capital Properties NV* | | | 235 | | | | 26,035 | |
| | |
CA Immobilien Anlagen AG | | | 5,472 | | | | 189,746 | |
| | |
Capital & Counties Properties PLC | | | 62,500 | | | | 247,364 | |
| | |
Castellum AB | | | 20,447 | | | | 330,519 | |
| | |
Citycon OYJ | | | 29,240 | | | | 66,874 | |
| | |
Daibiru Corp. | | | 5,100 | | | | 60,810 | |
| | |
Deutsche Euroshop AG | | | 2,261 | | | | 81,261 | |
| | |
Deutsche Wohnen SE | | | 27,311 | | | | 1,288,931 | |
| | |
Dios Fastigheter AB | | | 6,443 | | | | 40,876 | |
| | |
Entra ASAW | | | 9,459 | | | | 129,725 | |
| | |
Fabege AB | | | 21,044 | | | | 242,299 | |
| | |
Fastighets AB Balder, Class B* | | | 7,816 | | | | 201,356 | |
| | |
First Capital Realty, Inc. | | | 12,590 | | | | 196,800 | |
| | |
Gazit-Globe Ltd. | | | 6,507 | | | | 61,519 | |
| | |
Grainger PLC | | | 31,155 | | | | 134,175 | |
| | |
Grand City Properties SA | | | 7,826 | | | | 188,542 | |
| | |
Hang Lung Group Ltd. | | | 62,000 | | | | 187,272 | |
| | |
Hemfosa Fastigheter AB | | | 11,802 | | | | 146,193 | |
| | |
Hongkong Land Holdings Ltd. | | | 87,500 | | | | 632,384 | |
| | |
Hufvudstaden AB, Class A | | | 8,814 | | | | 129,353 | |
| | |
Hulic Co. Ltd. | | | 36,200 | | | | 389,528 | |
| | |
Hysan Development Co. Ltd. | | | 47,001 | | | | 273,554 | |
| | |
Ichigo, Inc. | | | 17,500 | | | | 77,930 | |
| | |
IMMOFINANZ AG | | | 65,730 | | | | 172,079 | |
| | |
Inmobiliaria Colonial Socimi SA | | | 22,431 | | | | 260,646 | |
| | |
Intershop Holding AG | | | 103 | | | | 51,412 | |
| | |
Jerusalem Economy Ltd.* | | | 11,531 | | | | 28,029 | |
| | |
Keihanshin Building Co. Ltd. | | | 10,000 | | | | 85,202 | |
| | |
Kennedy-Wilson Holdings, Inc. | | | 2,630 | | | | 49,839 | |
| | |
Klovern AB, Class B | | | 62,004 | | | | 77,370 | |
| | |
Kungsleden AB | | | 14,057 | | | | 99,688 | |
| | |
Langham Hospitality Investments & | | | | | | | | |
| | |
Langham Hospitality Investments Ltd. | | | 59,000 | | | | 24,702 | |
April 30, 2018 / ANNUAL REPORT
PORTFOLIOS OF INVESTMENTS 42
Wilmington Real Asset Fund (continued)
| | | | | | | | |
| Description | | Number of
Shares | | | Value | |
| | |
LEG Immobilien AG | | | 4,697 | | | $ | 541,578 | |
| | |
Liu Chong Hing Investment Ltd. | | | 26,000 | | | | 41,804 | |
| | |
MAS Real Estate, Inc. | | | 26,391 | | | | 49,644 | |
| | |
Melisron Ltd. | | | 1,293 | | | | 52,794 | |
| | |
Nam Tai Property, Inc. | | | 3,727 | | | | 45,283 | |
| | |
NEPI Rockcastle PLC | | | 42,269 | | | | 465,836 | |
| | |
NTT Urban Development Corp. | | | 9,000 | | | | 106,041 | |
| | |
PSP Swiss Property AG | | | 3,582 | | | | 334,691 | |
| | |
S IMMO AG* | | | 4,007 | | | | 79,264 | |
| | |
Summit Real Estate Holdings Ltd. | | | 2,771 | | | | 24,868 | |
| | |
Swire Properties Ltd. | | | 87,600 | | | | 310,935 | |
| | |
Swiss Prime Site AG* | | | 5,348 | | | | 501,075 | |
| | |
Technopolis OYJ | | | 9,027 | | | | 42,224 | |
| | |
TLG Immobilien AG | | | 6,412 | | | | 184,465 | |
| | |
TOC Co. Ltd. | | | 6,500 | | | | 57,556 | |
| | |
Unizo Holdings Co. Ltd. | | | 900 | | | | 21,431 | |
| | |
Victoria Park AB, Class B | | | 9,481 | | | | 38,929 | |
| | |
Vonovia SE | | | 37,511 | | | | 1,879,481 | |
| | |
Wallenstam AB, Class B | | | 16,464 | | | | 147,498 | |
| | |
Wharf Real Estate Investment | | | 91,000 | | | | 682,295 | |
| | |
Wihlborgs Fastigheter AB | | | 5,176 | | | | 119,952 | |
| | | | | | | | |
| | |
TOTAL REAL ESTATE OPERATING COMPANIES | | | | | | $ | 12,306,128 | |
| | |
RETAIL – 0.0%** | | | | | | | | |
| | |
Investore Property Ltd. | | | 10,849 | | | | 10,829 | |
| | |
Kiwi Property Group Ltd. | | | 97,225 | | | | 93,494 | |
| | | | | | | | |
| | |
TOTAL RETAIL | | | | | | $ | 104,323 | |
| | | | | | | | |
| | |
TOTAL COMMON STOCKS | | | | | | | | |
(COST $25,625,506) | | | | | | $ | 33,641,261 | |
| | |
EXCHANGE-TRADED FUNDS – 32.4% | | | | | | | | |
| | |
EQUITY FUNDS – 32.4% | | | | | | | | |
| | |
Schwab U.S. REIT ETF | | | 647,800 | | | | 25,141,118 | |
| | |
Vanguard Global ex-U.S. Real Estate ETF# | | | 1,223,800 | | | | 74,945,512 | |
| | | | | | | | |
| | |
TOTAL EQUITY FUNDS | | | | | | $ | 100,086,630 | |
| | | | | | | | |
| | |
TOTAL EXCHANGE-TRADED FUNDS | | | | | | | | |
(COST $94,013,721) | | | | | | $ | 100,086,630 | |
| | |
INVESTMENT COMPANIES – 5.0% | | | | | | | | |
| | |
DIVERSIFIED – 5.0% | | | | | | | | |
| | |
Tortoise MLP & Pipeline Fund | | | 1,210,246 | | | | 15,430,638 | |
| | |
DIVERSIFIED REAL ESTATE ACTIVITIES – 0.0%** | | | | | | | | |
| | |
U.K. Commercial Property Trust Ltd. | | | 51,100 | | | | 62,782 | |
| | |
REAL ESTATE OPERATING COMPANIES – 0.0%** | | | | | | | | |
| | |
F&C Commercial Property Trust Ltd. | | | 66,616 | | | | 134,460 | |
| | | | | | | | |
| | |
TOTAL INVESTMENT COMPANIES | | | | | | | | |
(COST $16,642,310) | | | | | | $ | 15,627,880 | |
| | |
REAL ESTATE INVESTMENT TRUSTS – 16.1% | | | | | | | | |
| | | | | | | | |
| Description | | Number of
Shares | | | Value | |
| | |
DIVERSIFIED – 3.3% | | | | | | | | |
| | |
Abacus Property Group | | | 21,546 | | | $ | 58,459 | |
| | |
Activia Properties, Inc. | | | 49 | | | | 217,134 | |
| | |
Alexander & Baldwin, Inc. | | | 1,314 | | | | 30,091 | |
| | |
American Assets Trust, Inc. | | | 1,696 | | | | 56,935 | |
| | |
Armada Hoffler Properties, Inc. | | | 2,926 | | | | 39,706 | |
| | |
Artis Real Estate Investment Trust | | | 5,519 | | | | 57,556 | |
| | |
Babcock & Brown Japan Property*,†† | | | 7,569 | | | | — | |
| | |
Canadian Real Estate Investment Trust | | | 2,686 | | | | 105,645 | |
| | |
Charter Hall Group | | | 30,881 | | | | 136,673 | |
| | |
Charter Hall Long Wale REIT | | | 9,979 | | | | 30,634 | |
| | |
Cofinimmo SA | | | 1,514 | | | | 200,978 | |
| | |
Colony NorthStar, Inc. Class A# | | | 14,542 | | | | 88,852 | |
| | |
Cominar Real Estate Investment Trust | | | 7,650 | | | | 74,656 | |
| | |
Daiwa House REIT Investment Corp. | | | 124 | | | | 295,627 | |
| | |
Dream Global Real Estate Investment Trust | | | 5,043 | | | | 53,771 | |
| | |
Empire State Realty Trust, Inc., Class A | | | 2,249 | | | | 39,178 | |
| | |
Fonciere Des Regions | | | 4,302 | | | | 481,129 | |
| | |
Forest City Realty Trust, Inc., Class A | | | 5,715 | | | | 114,643 | |
| | |
Gecina SA | | | 3,545 | | | | 614,526 | |
| | |
Global Net Lease, Inc. | | | 1,038 | | | | 19,317 | |
| | |
Goodman Property Trust | | | 75,723 | | | | 72,653 | |
| | |
GPT Group (The) | | | 141,766 | | | | 514,058 | |
| | |
Gramercy Property Trust | | | 3,775 | | | | 88,713 | |
| | |
Growthpoint Properties Australia Ltd. | | | 18,802 | | | | 48,541 | |
| | |
H&R Real Estate Investment Trust | | | 11,690 | | | | 187,739 | |
| | |
Hamborner Real Estate Investment Trust AG | | | 5,966 | | | | 66,936 | |
| | |
Hankyu Real Estate Investment Trust, Inc. | | | 44 | | | | 56,176 | |
| | |
Heiwa Real Estate Investment Trust, Inc. | | | 76 | | | | 72,715 | |
| | |
Hispania Activos Inmobiliarios SOCIMI SA | | | 8,111 | | | | 171,964 | |
| | |
Hulic Real Estate Investment Trust, Inc. | | | 71 | | | | 109,583 | |
| | |
ICADE | | | 3,375 | | | | 335,388 | |
| | |
Ichigo Hotel REIT Investment Corp. | | | 29 | | | | 35,630 | |
| | |
iStar, Inc.#, * | | | 3,202 | | | | 32,468 | |
| | |
Kenedix Office Investment Corp. | | | 30 | | | | 184,030 | |
| | |
Land Securities Group PLC | | | 54,405 | | | | 738,563 | |
| | |
Lar Espana Real Estate Socimi SA | | | 6,779 | | | | 76,867 | |
| | |
Lexington Realty Trust | | | 5,082 | | | | 40,859 | |
| | |
Liberty Property Trust | | | 3,085 | | | | 129,015 | |
| | |
Londonmetric Property PLC | | | 36,333 | | | | 95,073 | |
| | |
Mapletree Greater China Commercial Trust | | | 138,100 | | | | 123,547 | |
| | |
Merlin Properties Socimi SA | | | 30,735 | | | | 474,235 | |
| | |
Mirvac Group | | | 277,270 | | | | 465,308 | |
| | |
Morguard Real Estate Investment Trust | | | 5,052 | | | | 52,371 | |
| | |
NIPPON Real Estate Investment Trust Investment Corp. | | | 29 | | | | 88,063 | |
| | |
Nomura Real Estate Master Fund, Inc. | | | 299 | | | | 417,958 | |
ANNUAL REPORT / April 30, 2018
43 PORTFOLIOS OF INVESTMENTS
Wilmington Real Asset Fund (continued)
| | | | | | | | |
| Description | | Number of
Shares | | | Value | |
| | |
NSI NV | | | 1,341 | | | $ | 57,714 | |
| | |
Premier Investment Corp. | | | 115 | | | | 112,586 | |
| | |
PS Business Parks, Inc. | | | 356 | | | | 41,040 | |
| | |
RDI Real Estate Investment Trust PLC | | | 41,348 | | | | 21,147 | |
| | |
Reit 1 Ltd. | | | 11,700 | | | | 46,944 | |
| | |
Sakura Sogo REIT Investment Corp. | | | 24 | | | | 20,534 | |
| | |
Samty Residential Investment Corp. | | | 22 | | | | 19,208 | |
| | |
Schroder Real Estate Investment Trust Ltd. | | | 71,756 | | | | 60,552 | |
| | |
Sekisui House Real Estate Investment Trust, Inc. | | | 261 | | | | 168,237 | |
| | |
Select Income Real Estate Investment Trust | | | 2,809 | | | | 53,259 | |
| | |
Soilbuild Business Space Real Estate Investment Trust | | | 134,120 | | | | 67,205 | |
| | |
Spirit Realty Capital, Inc. | | | 9,767 | | | | 78,624 | |
| | |
Star Asia Investment Corp. | | | 19 | | | | 18,312 | |
| | |
Stockland | | | 179,988 | | | | 559,475 | |
| | |
STORE Capital Corp. | | | 3,231 | | | | 81,518 | |
| | |
Sunlight Real Estate Investment Trust | | | 139,000 | | | | 94,067 | |
| | |
Suntec Real Estate Investment Trust | | | 190,600 | | | | 280,164 | |
| | |
Tokyu Real Estate Investment Trust, Inc. | | | 73 | | | | 98,334 | |
| | |
Tosei REIT Investment Corp. | | | 15 | | | | 15,420 | |
| | |
United Urban Investment Corp. | | | 249 | | | | 382,449 | |
| | |
VEREIT, Inc. | | | 24,828 | | | | 168,830 | |
| | |
Washington Real Estate Investment Trust | | | 2,685 | | | | 77,113 | |
| | |
WP Carey, Inc. | | | 2,186 | | | | 139,576 | |
| | |
Yuexiu Real Estate Investment Trust | | | 140,000 | | | | 93,452 | |
| | | | | | | | |
| | |
TOTAL DIVERSIFIED | | | | | | $ | 10,149,723 | |
| | |
DIVERSIFIED REAL ESTATE ACTIVITIES – 0.0%** | | | | | | | | |
| | |
Sella Capital Real Estate Ltd. | | | 10,469 | | | | 19,283 | |
| | |
INDUSTRIALS – 1.7% | | | | | | | | |
| | |
AIMS AMP Capital Industrial Real Estate Investment Trust | | | 42,000 | | | | 44,947 | |
| | |
Ascendas Real Estate Investment Trust | | | 181,600 | | | | 364,306 | |
| | |
Cache Logistics Trust | | | 83,800 | | | | 52,727 | |
| | |
DCT Industrial Trust, Inc. | | | 1,678 | | | | 110,026 | |
| | |
Dream Industrial Real Estate Investment Trust | | | 7,428 | | | | 58,258 | |
| | |
Duke Realty Corp. | | | 7,255 | | | | 196,611 | |
| | |
EastGroup Properties, Inc. | | | 609 | | | | 54,676 | |
| | |
ESR-REIT | | | 173,800 | | | | 69,272 | |
| | |
First Industrial Realty Trust, Inc. | | | 3,581 | | | | 111,405 | |
| | |
Frasers Logistics & Industrial Trust | | | 78,200 | | | | 61,759 | |
| | |
GLP J-Real Estate Investment Trust | | | 213 | | | | 228,968 | |
| | |
Goodman Group | | | 123,983 | | | | 843,521 | |
| | |
Granite Real Estate Investment Trust | | | 1,400 | | | | 55,075 | |
| | |
Hansteen Holdings PLC | | | 66,138 | | | | 120,721 | |
| | |
Industria Real Estate Investment Trust | | | 12,124 | | | | 23,108 | |
| | | | | | | | |
| Description | | Number of
Shares | | | Value | |
| | |
Industrial & Infrastructure Fund Investment Corp. | | | 116 | | | $ | 128,421 | |
| | |
Japan Logistics Fund, Inc. | | | 65 | | | | 131,785 | |
| | |
LaSalle Logiport Real Estate Investment Trust | | | 82 | | | | 84,200 | |
| | |
Mapletree Industrial Trust | | | 89,000 | | | | 135,837 | |
| | |
Mapletree Logistics Trust | | | 121,550 | | | | 116,120 | |
| | |
Mitsui Fudosan Logistics Park, Inc. | | | 15 | | | | 48,308 | |
| | |
Monmouth Real Estate Investment Corp. | | | 3,795 | | | | 59,316 | |
| | |
Nippon Prologis Real Estate Investment Trust, Inc. | | | 158 | | | | 332,995 | |
| | |
Prologis, Inc. | | | 10,946 | | | | 710,505 | |
| | |
Pure Industrial Real Estate Trust | | | 9,005 | | | | 56,669 | |
| | |
Rexford Industrial Realty, Inc. | | | 1,411 | | | | 43,106 | |
| | |
Segro PLC | | | 74,402 | | | | 660,230 | |
| | |
STAG Industrial, Inc. | | | 1,515 | | | | 37,224 | |
| | |
Terreno Realty Corp. | | | 2,213 | | | | 82,213 | |
| | |
Tritax Big Box Real Estate Investment Trust PLC | | | 98,589 | | | | 203,172 | |
| | |
Warehouses De Pauw CVA | | | 1,181 | | | | 145,260 | |
| | | | | | | | |
| | |
TOTAL INDUSTRIALS | | | | | | $ | 5,370,741 | |
| | |
OFFICE – 2.5% | | | | | | | | |
| | |
Alexandria Real Estate Equities, Inc. | | | 2,009 | | | | 250,261 | |
| | |
Allied Properties Real Estate Investment Trust | | | 3,498 | | | | 113,008 | |
| | |
Alstria Office Real Estate Investment Trust AG | | | 7,735 | | | | 116,367 | |
| | |
Axiare Patrimonio SOCIMI SA | | | 4,791 | | | | 101,565 | |
| | |
Befimmo SA | | | 1,704 | | | | 110,652 | |
| | |
Beni Stabili SpA SIIQ | | | 76,393 | | | | 72,340 | |
| | |
Boston Properties, Inc. | | | 3,229 | | | | 392,033 | |
| | |
Brandywine Realty Trust | | | 3,381 | | | | 54,468 | |
| | |
CapitaLand Commercial Trust | | | 176,200 | | | | 240,724 | |
| | |
Champion Real Estate Investment Trust | | | 160,000 | | | | 113,035 | |
| | |
City Office Real Estate Investment Trust, Inc. | | | 2,823 | | | | 32,126 | |
| | |
Columbia Property Trust, Inc. | | | 1,453 | | | | 31,036 | |
| | |
Corporate Office Properties Trust | | | 2,487 | | | | 68,417 | |
| | |
Cousins Properties, Inc. | | | 6,758 | | | | 60,079 | |
| | |
Cromwell Property Group | | | 96,051 | | | | 78,178 | |
| | |
Daiwa Office Investment Corp. | | | 25 | | | | 147,942 | |
| | |
Derwent London PLC | | | 8,430 | | | | 369,739 | |
| | |
Dexus | | | 75,836 | | | | 539,310 | |
| | |
Douglas Emmett, Inc. | | | 2,656 | | | | 98,989 | |
| | |
Dream Office Real Estate Investment Trust | | | 3,839 | | | | 71,102 | |
| | |
Equity Commonwealth* | | | 1,627 | | | | 50,421 | |
| | |
Franklin Street Properties Corp. | | | 1,900 | | | | 14,782 | |
| | |
Frasers Commercial Trust | | | 88,500 | | | | 93,233 | |
| | |
GDI Property Group | | | 37,938 | | | | 35,661 | |
| | |
Global One Real Estate Investment Corp. | | | 60 | | | | 60,056 | |
April 30, 2018 / ANNUAL REPORT
PORTFOLIOS OF INVESTMENTS 44
Wilmington Real Asset Fund (continued)
| | | | | | | | |
| Description | | Number of
Shares | | | Value | |
| | |
Government Properties Income Trust | | | 2,635 | | | | $ 32,911 | |
| | |
Great Portland Estates PLC | | | 20,959 | | | | 201,960 | |
| | |
Green Real Estate Investment Trust PLC | | | 41,277 | | | | 75,632 | |
| | |
Hibernia Real Estate Investment Trust PLC | | | 74,159 | | | | 132,794 | |
| | |
Highwoods Properties, Inc. | | | 2,372 | | | | 104,415 | |
| | |
Hudson Pacific Properties, Inc. | | | 3,947 | | | | 129,738 | |
| | |
Ichigo Office Real Estate Investment Trust Investment | | | 99 | | | | 73,438 | |
| | |
Intervest Offices & Warehouses NV | | | 942 | | | | 27,059 | |
| | |
Invesco Office J-Reit, Inc. | | | 488 | | | | 61,663 | |
| | |
Investa Office Fund | | | 45,951 | | | | 151,359 | |
| | |
Japan Excellent, Inc. | | | 97 | | | | 126,123 | |
| | |
Japan Prime Realty Investment Corp. | | | 62 | | | | 224,861 | |
| | |
Japan Real Estate Investment Corp. | | | 104 | | | | 538,810 | |
| | |
JBG SMITH Properties | | | 1,571 | | | | 57,923 | |
| | |
Keppel Real Estate Investment Trust | | | 134,000 | | | | 125,100 | |
| | |
Kilroy Realty Corp. | | | 2,079 | | | | 149,002 | |
| | |
Mack-Cali Realty Corp. | | | 2,859 | | | | 49,089 | |
| | |
Manulife US Real Estate Investment Trust | | | 43,400 | | | | 41,218 | |
| | |
MCUBS MidCity Investment Corp. | | | 100 | | | | 75,446 | |
| | |
Mori Hills Real Estate Investment Trust Investment Corp. | | | 104 | | | | 133,727 | |
| | |
Mori Trust Sogo Real Estate Investment Trust, Inc. | | | 71 | | | | 105,919 | |
| | |
Nippon Building Fund, Inc. | | | 112 | | | | 629,339 | |
| | |
NorthStar Realty Europe Corp. | | | 2,897 | | | | 42,007 | |
| | |
One REIT, Inc. | | | 16 | | | | 36,486 | |
| | |
Orix JREIT, Inc. | | | 223 | | | | 339,923 | |
| | |
Paramount Group, Inc. | | | 3,190 | | | | 45,776 | |
| | |
Piedmont Office Realty Trust, Inc., Class A | | | 3,093 | | | | 55,427 | |
| | |
Prosperity Real Estate Investment Trust | | | 177,000 | | | | 72,995 | |
| | |
SL Green Realty Corp. | | | 2,159 | | | | 211,021 | |
| | |
Spring Real Estate Investment Trust | | | 137,000 | | | | 56,904 | |
| | |
Tier Real Estate Investment Trust, Inc. | | | 1,076 | | | | 20,455 | |
| | |
Vornado Realty Trust | | | 3,694 | | | | 251,303 | |
| | |
Workspace Group PLC | | | 11,242 | | | | 171,703 | |
| | | | | | | | |
| | |
TOTAL OFFICE | | | | | | $ | 7,867,050 | |
|
REAL ESTATE OPERATING COMPANIES – 0.0%** | |
| | |
Picton Property Income Ltd. | | | 63,920 | | | | 79,129 | |
| | |
RESIDENTIAL – 1.4% | | | | | | | | |
| | |
Advance Residence Investment Corp. | | | 101 | | | | 260,203 | |
| | |
American Campus Communities, Inc. | | | 3,170 | | | | 123,979 | |
| | |
American Homes 4 Rent, Class A | | | 5,298 | | | | 107,020 | |
| | |
Apartment Investment & Management Co., Class A | | | 3,340 | | | | 135,604 | |
| | |
Ascott Residence Trust | | | 80,500 | | | | 69,142 | |
| | | | | | | | |
| Description | | Number of
Shares | | | Value | |
| | |
AvalonBay Communities, Inc. | | | 2,958 | | | $ | 482,154 | |
| | |
Bluerock Residential Growth Real Estate Investment Trust, Inc.# | | | 2,866 | | | | 25,765 | |
| | |
Boardwalk Real Estate Investment Trust | | | 1,273 | | | | 45,717 | |
| | |
Camden Property Trust | | | 1,986 | | | | 169,604 | |
| | |
Canadian Apartment Properties Real Estate Investment Trust | | | 4,973 | | | | 143,463 | |
| | |
Comforia Residential Real Estate Investment Trust, Inc. | | | 38 | | | | 87,268 | |
| | |
Education Realty Trust, Inc. | | | 2,267 | | | | 74,607 | |
| | |
Equity LifeStyle Properties, Inc. | | | 1,489 | | | | 132,759 | |
| | |
Equity Residential | | | 7,874 | | | | 485,905 | |
| | |
Essex Property Trust, Inc. | | | 1,414 | | | | 338,922 | |
| | |
Ingenia Communities Group | | | 24,221 | | | | 48,535 | |
| | |
InterRent Real Estate Investment Trust | | | 6,334 | | | | 49,628 | |
| | |
Invitation Homes, Inc. | | | 5,350 | | | | 123,799 | |
| | |
Irish Residential Properties Real Estate Investment Trust PLC | | | 33,709 | | | | 55,344 | |
| | |
Japan Rental Housing Investments, Inc. | | | 122 | | | | 94,897 | |
| | |
Kenedix Residential Next Investment Corp. | | | 81 | | | | 119,524 | |
| | |
Killam Apartment Real Estate Investment Trust | | | 2,717 | | | | 30,007 | |
| | |
Mid-America Apartment Communities, Inc. | | | 2,435 | | | | 222,705 | |
| | |
NexPoint Residential Trust, Inc. | | | 608 | | | | 16,288 | |
| | |
Nippon Accommodations Fund, Inc. | | | 36 | | | | 161,044 | |
| | |
Northview Apartment Real Estate Investment Trust | | | 2,317 | | | | 46,035 | |
| | |
Sun Communities, Inc. | | | 1,439 | | | | 135,050 | |
| | |
UDR, Inc. | | | 5,732 | | | | 207,212 | |
| | |
UMH Properties, Inc. | | | 2,326 | | | | 31,471 | |
| | |
Unite Group PLC (The) | | | 16,603 | | | | 190,611 | |
| | | | | | | | |
| | |
TOTAL RESIDENTIAL | | | | | | | $ 4,214,262 | |
| | |
RETAIL – 4.8% | | | | | | | | |
| | |
Acadia Realty Trust | | | 1,857 | | | | 43,825 | |
| | |
AEON Real Estate Investment Trust Investment Corp. | | | 103 | | | | 106,938 | |
| | |
Agree Realty Corp. | | | 997 | | | | 48,733 | |
| | |
Alexander’s, Inc. | | | 52 | | | | 20,454 | |
| | |
Altarea SCA | | | 324 | | | | 82,569 | |
| | |
British Land Co. PLC (The) | | | 78,791 | | | | 727,633 | |
| | |
Brixmor Property Group, Inc. | | | 7,820 | | | | 116,440 | |
| | |
BWP Trust | | | 53,889 | | | | 126,658 | |
| | |
Capital & Regional PLC | | | 68,165 | | | | 49,814 | |
| | |
CapitaLand Mall Trust | | | 201,700 | | | | 318,518 | |
| | |
CapitaLand Retail China Trust Management Ltd. | | | 57,300 | | | | 67,678 | |
| | |
CBL & Associates Properties, Inc.# | | | 2,337 | | | | 9,769 | |
| | |
Charter Hall Retail Real Estate Investment Trust | | | 20,074 | | | | 59,488 | |
ANNUAL REPORT / April 30, 2018
45 PORTFOLIOS OF INVESTMENTS
Wilmington Real Asset Fund (continued)
| | | | | | | | |
| Description | | Number of
Shares | | | Value | |
| | |
Choice Properties Real Estate Investment Trust | | | 3,565 | | | $ | 31,736 | |
| | |
Crombie Real Estate Investment Trust | | | 2,904 | | | | 28,114 | |
| | |
CT Real Estate Investment Trust | | | 2,299 | | | | 23,456 | |
| | |
DDR Corp. | | | 7,985 | | | | 57,891 | |
| | |
Eurocommercial Properties NV | | | 4,131 | | | | 173,136 | |
| | |
Federal Realty Investment Trust | | | 1,666 | | | | 193,006 | |
| | |
Fortune Real Estate Investment Trust | | | 134,000 | | | | 158,673 | |
| | |
Frasers Centrepoint Trust | | | 42,700 | | | | 71,999 | |
| | |
Frontier Real Estate Investment Corp. | | | 35 | | | | 144,288 | |
| | |
Fukuoka Real Investment Trust Corp. | | | 46 | | | | 71,301 | |
| | |
Getty Realty Corp. | | | 2,065 | | | | 51,728 | |
| | |
GGP, Inc. | | | 13,673 | | | | 273,323 | |
| | |
Hammerson PLC | | | 59,361 | | | | 447,490 | |
| | |
Immobiliare Grande Distribuzione SIIQ SpA | | | 2,492 | | | | 23,314 | |
| | |
Intu Properties PLC | | | 54,313 | | | | 145,947 | |
| | |
Japan Retail Fund Investment Corp. | | | 207 | | | | 388,083 | |
| | |
Kenedix Retail Real Estate Investment Trust Corp. | | | 44 | | | | 93,133 | |
| | |
Kimco Realty Corp. | | | 10,658 | | | | 154,648 | |
| | |
Kite Realty Group Trust | | | 2,854 | | | | 42,011 | |
| | |
Klepierre SA | | | 15,528 | | | | 635,541 | |
| | |
Link Real Estate Investment Trust | | | 169,500 | | | | 1,498,063 | |
| | |
Macerich Co. (The) | | | 2,828 | | | | 162,949 | |
| | |
Mapletree Commercial Trust | | | 133,100 | | | | 162,242 | |
| | |
Mercialys SA | | | 3,823 | | | | 73,158 | |
| | |
National Retail Properties, Inc. | | | 3,543 | | | | 134,776 | |
| | |
NewRiver REIT PLC | | | 17,468 | | | | 69,781 | |
| | |
Pennsylvania Real Estate Investment Trust# | | | 2,852 | | | | 27,607 | |
| | |
Ramco-Gershenson Properties Trust | | | 1,428 | | | | 17,065 | |
| | |
Realty Income Corp.# | | | 6,037 | | | | 304,929 | |
| | |
Regency Centers Corp. | | | 3,297 | | | | 194,028 | |
| | |
Retail Estates NV | | | 459 | | | | 40,314 | |
| | |
Retail Opportunity Investments Corp.# | | | 3,914 | | | | 67,321 | |
| | |
Retail Properties of America, Inc., Class A | | | 6,277 | | | | 72,437 | |
| | |
RioCan Real Estate Investment Trust | | | 10,956 | | | | 199,247 | |
| | |
Saul Centers, Inc. | | | 797 | | | | 38,136 | |
| | |
Scentre Group | | | 408,139 | | | | 1,233,601 | |
| | |
Seritage Growth Properties, Class A# | | | 494 | | | | 17,572 | |
| | |
Shaftesbury PLC | | | 20,795 | | | | 289,338 | |
| | |
Shopping Centres Australasia Property Group | | | 54,004 | | | | 96,446 | |
| | |
Simon Property Group, Inc. | | | 6,870 | | | | 1,074,056 | |
| | |
Smart Real Estate Investment Trust | | | 4,778 | | | | 107,174 | |
| | |
SPH Real Estate Investment Trust | | | 57,300 | | | | 42,773 | |
| | |
Starhill Global Real Estate Investment Trust | | | 128,800 | | | | 69,831 | |
| | |
Tanger Factory Outlet Centers, Inc.# | | | 1,934 | | | | 42,451 | |
| | | | | | | | |
| Description | | Number of
Shares | | | Value | |
| | |
Taubman Centers, Inc. | | | 1,151 | | | $ | 64,433 | |
| | |
Unibail-Rodamco SE | | | 7,758 | | | | 1,862,459 | |
| | |
Urban Edge Properties | | | 3,090 | | | | 63,561 | |
| | |
Vastned Retail NV | | | 820 | | | | 41,005 | |
| | |
Vicinity Centres | | | 212,391 | | | | 388,881 | |
| | |
Viva Energy REIT | | | 30,988 | | | | 46,980 | |
| | |
Washington Prime Group, Inc.# | | | 5,403 | | | | 34,957 | |
| | |
Weingarten Realty Investors | | | 2,477 | | | | 68,043 | |
| | |
Wereldhave NV | | | 2,363 | | | | 94,950 | |
| | |
Westfield Corp. | | | 147,830 | | | | 1,021,529 | |
| | | | | | | | |
| | |
TOTAL RETAIL | | | | | | $ | 14,709,428 | |
| | |
SPECIALIZED – 2.4% | | | | | | | | |
| | |
Aedifica SA | | | 1,327 | | | | 120,333 | |
| | |
Apple Hospitality Real Estate Investment Trust, Inc. | | | 4,206 | | | | 75,666 | |
| | |
Arena Real Estate Investment Trust | | | 17,467 | | | | 29,234 | |
| | |
Ascendas Hospitality Trust | | | 89,000 | | | | 54,545 | |
| | |
Ashford Hospitality Trust, Inc. | | | 4,262 | | | | 29,323 | |
| | |
Assura PLC | | | 165,119 | | | | 135,384 | |
| | |
Big Yellow Group PLC | | | 12,620 | | | | 159,676 | |
| | |
CareTrust Real Estate Investment Trust, Inc. | | | 3,065 | | | | 40,489 | |
| | |
CDL Hospitality Trusts | | | 63,800 | | | | 85,365 | |
| | |
Chesapeake Lodging Trust | | | 708 | | | | 20,914 | |
| | |
CoreCivic, Inc. | | | 2,464 | | | | 49,674 | |
| | |
CoreSite Realty Corp. | | | 620 | | | | 64,542 | |
| | |
CubeSmart | | | 4,498 | | | | 132,421 | |
| | |
CyrusOne, Inc. | | | 1,838 | | | | 98,498 | |
| | |
DiamondRock Hospitality Co. | | | 4,362 | | | | 48,200 | |
| | |
Digital Realty Trust, Inc. | | | 4,401 | | | | 465,142 | |
| | |
EPR Properties | | | 1,738 | | | | 95,625 | |
| | |
Extra Space Storage, Inc. | | | 2,766 | | | | 247,806 | |
| | |
First Real Estate Investment Trust | | | 38,800 | | | | 40,040 | |
| | |
Folkestone Education Trust | | | 30,135 | | | | 64,810 | |
| | |
Four Corners Property Trust, Inc. | | | 1,094 | | | | 24,790 | |
| | |
Gaming and Leisure Properties, Inc. | | | 4,280 | | | | 146,676 | |
| | |
Geo Group, Inc. (The) | | | 3,145 | | | | 70,763 | |
| | |
HCP, Inc. | | | 10,389 | | | | 242,687 | |
| | |
Health Care & Medical Investment Corp. | | | 17 | | | | 16,498 | |
| | |
Healthcare Realty Trust, Inc. | | | 3,364 | | | | 93,620 | |
| | |
Healthcare Trust of America, Inc., Class A | | | 4,580 | | | | 114,454 | |
| | |
Hersha Hospitality Trust | | | 1,071 | | | | 20,113 | |
| | |
Hoshino Resorts Real Estate Investment Trust, Inc. | | | 12 | | | | 59,052 | |
| | |
Hospitality Properties Trust | | | 3,356 | | | | 83,497 | |
| | |
Host Hotels & Resorts, Inc. | | | 15,583 | | | | 304,803 | |
| | |
Hotel Property Investments | | | 10,758 | | | | 24,860 | |
| | |
InfraREIT, Inc.* | | | 1,040 | | | | 22,162 | |
April 30, 2018 / ANNUAL REPORT
PORTFOLIOS OF INVESTMENTS 46
Wilmington Real Asset Fund (continued)
| | | | | | | | |
| Description | | Number of
Shares | | | Value | |
| | |
Invincible Investment Corp. | | | 304 | | | $ | 135,703 | |
| | |
Iron Mountain, Inc. | | | 6,666 | | | | 226,244 | |
| | |
Japan Hotel REIT Investment Corp. | | | 328 | | | | 248,169 | |
| | |
Keppel DC REIT | | | 59,000 | | | | 63,381 | |
| | |
LaSalle Hotel Properties | | | 2,292 | | | | 67,774 | |
| | |
Life Storage, Inc. | | | 995 | | | | 87,998 | |
| | |
LTC Properties, Inc. | | | 1,511 | | | | 54,623 | |
| | |
Medical Properties Trust, Inc. | | | 7,504 | | | | 95,901 | |
| | |
National Health Investors, Inc. | | | 1,042 | | | | 71,137 | |
| | |
National Storage Affiliates Trust | | | 816 | | | | 21,477 | |
| | |
National Storage Real Estate Investment Trust | | | 65,695 | | | | 78,874 | |
| | |
NorthWest Healthcare Properties Real Estate Investment Trust | | | 2,862 | | | | 24,965 | |
| | |
Omega Healthcare Investors, Inc.# | | | 4,446 | | | | 115,507 | |
| | |
Ooedo Onsen REIT Investment Corp. | | | 20 | | | | 16,387 | |
| | |
OUE Hospitality Trust | | | 87,500 | | | | 55,318 | |
| | |
Park Hotels & Resorts, Inc. | | | 3,451 | | | | 99,320 | |
| | |
Parkway Life Real Estate Investment Trust | | | 38,800 | | | | 81,457 | |
| | |
Pebblebrook Hotel Trust# | | | 953 | | | | 33,345 | |
| | |
Physicians Realty Trust | | | 4,415 | | | | 65,960 | |
| | |
Primary Health Properties PLC | | | 44,662 | | | | 69,514 | |
| | |
Public Storage | | | 3,308 | | | | 667,488 | |
| | |
QTS Realty Trust, Inc., Class A | | | 1,471 | | | | 52,059 | |
| | |
Quality Care Properties, Inc.* | | | 2,850 | | | | 62,614 | |
| | |
RLJ Lodging Trust | | | 3,544 | | | | 73,609 | |
| | |
Rural Funds Group | | | 12,162 | | | | 19,455 | |
| | |
Ryman Hospitality Properties, Inc. | | | 965 | | | | 75,637 | |
| | |
Sabra Health Care REIT, Inc. | | | 5,242 | | | | 95,981 | |
| | |
Safestore Holdings PLC | | | 15,484 | | | | 116,464 | |
| | |
Senior Housing Properties Trust | | | 5,418 | | | | 84,358 | |
| | |
Summit Hotel Properties, Inc. | | | 3,569 | | | | 51,679 | |
| | |
Sunstone Hotel Investors, Inc. | | | 4,010 | | | | 62,556 | |
| | |
Universal Health Realty Income Trust | | | 726 | | | | 43,509 | |
| | |
Ventas, Inc. | | | 8,043 | | | | 413,571 | |
| | |
Vital Healthcare Property Trust | | | 24,302 | | | | 35,448 | |
| | |
Welltower, Inc. | | | 8,315 | | | | 444,354 | |
| | |
Xenia Hotels & Resorts, Inc. | | | 4,295 | | | | 88,434 | |
| | | | | | | | |
| | |
TOTAL SPECIALIZED | | | | | | $ | 7,381,932 | |
| | | | | | | | |
| |
TOTAL REAL ESTATE INVESTMENT TRUSTS (COST $43,075,024) | | | $ | 49,791,548 | |
| | | | | | | | |
| |
TOTAL REAL ESTATE RELATED SECURITIES (COST $179,356,561) | | | $ | 199,147,319 | |
| |
COMMODITY RELATED SECURITIES – 12.4% | | | | | |
| |
EXCHANGE-TRADED FUNDS – 12.4% | | | | | |
| | |
COMMODITY FUNDS – 12.4% | | | | | | | | |
| | |
iShares Commodities Select Strategy ETF# | | | 331,100 | | | | 12,717,551 | |
| | | | | | | | |
| Description | | Number of
Shares | | | Value | |
| | |
iShares Gold Trust#, * | | | 597,000 | | | $ | 7,534,140 | |
| | |
iShares Silver Trust#, * | | | 202,600 | | | | 3,115,988 | |
| | |
SPDR S&P Global Natural Resources ETF | | | 298,400 | | | | 15,051,296 | |
| | | | | | | | |
| | |
TOTAL COMMODITY FUNDS | | | | | | $ | 38,418,975 | |
| | | | | | | | |
| |
TOTAL EXCHANGE-TRADED FUNDS (COST $34,651,127) | | | $ | 38,418,975 | |
| | | | | | | | |
| |
TOTAL COMMODITY RELATED SECURITIES (COST $34,651,127) | | | $ | 38,418,975 | |
| | |
PURCHASED OPTIONS – 0.1% | | | | | | | | |
| | |
TOTAL PURCHASED OPTIONS | | | | | | | | |
(SEE OPEN OPTION CONTRACTS TABLE) (COST $145,635) | | | $ | 157,495 | |
| | |
SHORT-TERM INVESTMENTS – 1.9% | | | | | | | | |
| | |
MONEY MARKET FUND – 1.9% | | | | | | | | |
| | |
Dreyfus Government Cash Management Fund, Institutional Shares, 1.60%^ | | | 5,753,672 | | | $ | 5,753,672 | |
| | | | | | | | |
| | |
TOTAL SHORT-TERM INVESTMENTS (COST $5,753,672) | | | | | | $ | 5,753,672 | |
| | | | | | | | |
| | |
| | | Par Value | | | | |
|
| CASH COLLATERAL INVESTED FOR SECURITIES ON LOAN – 5.6% | |
| | |
REPURCHASE AGREEMENTS – 5.6% | | | | | | | | |
| | |
BNP Paribas SA, 1.72%, dated 4/30/18, due 5/01/18, repurchase price $3,210,794, collateralized by U.S. Government & Treasury Securities, 0.00% to 9.13%, maturing 5/15/18 to 8/15/46; total market value of $3,274,854. | | $ | 3,210,641 | | | $ | 3,210,641 | |
| | |
Citigroup Global Markets, Inc., 1.72%, dated 4/30/18, due 5/01/18, repurchase price $3,210,794, collateralized by U.S. Government & Treasury Securities, 0.00% to 11.50%, maturing 5/01/18 to 3/20/67; total market value of $3,274,854. | | | 3,210,641 | | | | 3,210,641 | |
| | |
Daiwa Capital Markets America, 1.72%, dated 4/30/18, due 5/01/18, repurchase price $3,210,794, collateralized by U.S. Government & Treasury Securities, 0.00% to 9.13%, maturing 5/15/18 to 12/01/51; total market value of $3,274,854. | | | 3,210,641 | | | | 3,210,641 | |
| | |
JP Morgan Securities LLC, 1.71%, dated 4/30/18, due 5/01/18, repurchase price $1,276,034, collateralized by U.S. Treasury Securities, 1.13% to 2.25%, maturing 1/31/19 to 1/31/24; total market value of $1,301,494. | | | 1,275,973 | | | | 1,275,973 | |
| | |
Nomura Securities International, Inc., 1.74%, dated 4/30/18, due 5/01/18, repurchase price $3,210,796, collateralized by U.S. Government Securities, 0.00% to 10.50%, maturing 5/01/18 to 3/20/68; total market value of $3,274,854. | | | 3,210,641 | | | | 3,210,641 | |
ANNUAL REPORT / April 30, 2018
47 PORTFOLIOS OF INVESTMENTS
Wilmington Real Asset Fund (continued)
| | | | | | | | |
| | |
| Description | | Par Value | | | Value | |
| | |
RBC Dominion Securities, Inc., 1.72%, dated 4/30/18, due 5/01/18, repurchase price $3,210,794, collateralized by U.S. Government & Treasury Securities, 0.13% to 7.00%, maturing 10/31/18 to 9/09/49; total market value of $3,274,854. | | $ | 3,210,641 | | | $ | 3,210,641 | |
| | | | | | | | |
| |
TOTAL REPURCHASE AGREEMENTS (COST $17,329,178) | | | $ | 17,329,178 | |
| | | | | | | | |
| |
TOTAL CASH COLLATERAL INVESTED FOR SECURITIES ON LOAN (COST $17,329,178) | | | $ | 17,329,178 | |
| | | | | | | | |
| |
| TOTAL INVESTMENTS IN SECURITIES 113.7%ø | | | | | |
(COST $327,927,703) | | | | | | $ | 351,349,506 | |
| |
| WRITTEN OPTIONS – 0.0%** | | | | | |
| | |
TOTAL WRITTEN OPTIONS | | | | | | | | |
(SEE OPEN OPTION CONTRACTS TABLE) (PREMIUMS RECEIVED $(106,186)) | | | $ | 18,142 | |
| |
| TBA SALE COMMITMENT – (0.1%) | | | | | |
| |
MORTGAGE-BACKED SECURITIES – (0.1%) | | | | | |
| | |
Fannie Mae Pool, 3.00%, 6/01/48 | | $ | (300,000 | ) | | $ | (288,867 | ) |
| | | | | | | | |
| |
TBA SALE COMMITMENTS (PROCEEDS $(290,672)) | | | $ | (288,867) | |
| |
COLLATERAL FOR SECURITIES ON LOAN – (5.6%) | | | $ | (17,329,178) | |
| |
OTHER LIABILITIES LESS ASSETS – (8.0%) | | | | (24,718,603 | ) |
| | | | | | | | |
| |
TOTAL NET ASSETS – 100.0% | | | $ | 309,031,000 | |
| | | | | | | | |
Cost of investments for Federal income tax purposes is $332,615,640. The net unrealized appreciation/(depreciation) of investments was $19,337,236. This consists of net unrealized appreciation from investment for those securities having an excess of value over cost of $25,307,679 and net unrealized depreciation from investments for those securities having an excess of cost over value of $(5,970,443).
April 30, 2018 / ANNUAL REPORT
PORTFOLIOS OF INVESTMENTS 48
Wilmington Real Asset Fund (continued)
Various inputs are used in determining the value of the Fund’s investments. These inputs are summarized in the three broad levels listed below.
Level 1 – quoted prices in active markets for identical securities
Level 2 – other significant observable inputs (including quoted prices for similar securities, interest rates, prepayment speeds, credit risk, etc.)
Level 3 – significant unobservable inputs (including the Fund’s own assumptions in determining the fair value of investments)
The following is a summary of the inputs used as of April 30, 2018 in valuing the Fund’s assets carried at fair value:
| | | | | | | | | | | | | | | | |
| | | | |
| | | Level 1 | | | Level 2 | | | Level 3 | | | Total | |
Assets | | | | | | | | | | | | | | | | |
| | | | |
Investments in Securities | | | | | | | | | | | | | | | | |
Inflation-Linked & Fixed Income Securities | | | | | | | | | | | | | | | | |
Asset-Backed Securities | | $ | — | | | $ | 3,995,210 | | | $ | — | | | $ | 3,995,210 | |
Certificates of Deposit | | | — | | | | 599,294 | | | | — | | | | 599,294 | |
Corporate Bonds | | | — | | | | 5,061,757 | | | | — | | | | 5,061,757 | |
Foreign Government Inflation-Linked Securities | | | — | | | | 5,227,312 | | | | — | | | | 5,227,312 | |
Foreign Government Securities | | | — | | | | 4,816,514 | | | | — | | | | 4,816,514 | |
Mortgage-Backed Securities | | | — | | | | 9,413,527 | | | | — | | | | 9,413,527 | |
U.S. Government Inflation-Linked Securities | | | — | | | | 60,766,959 | | | | — | | | | 60,766,959 | |
U.S. Treasury | | | — | | | | 662,294 | | | | — | | | | 662,294 | |
| | | | |
Real Estate Related Securities | | | | | | | | | | | | | | | | |
Common Stocks | | | 548,829 | | | | 33,092,432 | | | | — | | | | 33,641,261 | |
Exchange-Traded Funds | | | 100,086,630 | | | | — | | | | — | | | | 100,086,630 | |
Investment Companies | | | 15,430,638 | | | | 197,242 | | | | — | | | | 15,627,880 | |
Real Estate Investment Trusts | | | 18,397,883 | | | | 31,393,665 | | | | — | | | | 49,791,548 | |
| | | | |
Commodity Related Securities | | | | | | | | | | | | | | | | |
Exchange-Traded Funds | | | 38,418,975 | | | | — | | | | — | | | | 38,418,975 | |
| | | | |
Purchased Options | | | — | | | | 157,495 | | | | — | | | | 157,495 | |
| | | | |
Short-Term Investments | | | | | | | | | | | | | | | | |
Money Market Fund | | | 5,753,672 | | | | — | | | | — | | | | 5,753,672 | |
Repurchase Agreements | | | — | | | | 17,329,178 | | | | — | | | | 17,329,178 | |
| | | | | | | | | | | | | | | | |
| | | | |
Total Investments in Securities | | | 178,636,627 | | | | 172,712,879 | | | | — | | | | 351,349,506 | |
| | | | | | | | | | | | | | | | |
| | | | |
Other Financial Instruments! | | | | | | | | | | | | | | | | |
Forward Foreign Currency Contracts | | $ | — | | | $ | 323,578 | | | $ | — | | | $ | 323,578 | |
Financial Futures Contracts | | | 5,876 | | | | — | | | | — | | | | 5,876 | |
Credit Default Swaps | | | — | | | | 51,289 | | | | — | | | | 51,289 | |
Interest Rate Swaps | | | — | | | | 806,220 | | | | — | | | | 806,220 | |
Written Options | | | — | | | | 42,990 | | | | — | | | | 42,990 | |
| | | | | | | | | | | | | | | | |
Total Assets - Other Financial Instruments | | $ | 5,876 | | | $ | 1,224,077 | | | $ | — | | | $ | 1,229,953 | |
| | | | | | | | | | | | | | | | |
| | | | |
Liabilities | | | | | | | | | | | | | | | | |
| | | | |
Other Financial Instruments! | | | | | | | | | | | | | | | | |
Written Options | | $ | (10,404 | ) | | $ | (14,444 | ) | | $ | — | | | $ | (24,848 | ) |
Forward Foreign Currency Contracts | | | — | | | | (97,382 | ) | | | — | | | | (97,382 | ) |
Financial Futures Contracts | | | (103,017 | ) | | | — | | | | — | | | | (103,017 | ) |
Credit Default Swaps | | | — | | | | (25,426 | ) | | | — | | | | (25,426 | ) |
Interest Rate Swaps | | | — | | | | (330,366 | ) | | | — | | | | (330,366 | ) |
TBA Sale Commitment | | | — | | | | (288,867 | ) | | | — | | | | (288,867 | ) |
| | | | | | | | | | | | | | | | |
Total Liabilities - Other Financial Instruments | | $ | (113,421 | ) | | $ | (756,485 | ) | | $ | — | | | $ | (869,906 | ) |
| | | | | | | | | | | | | | | | |
| | ! | Other financial instruments are derivative instruments and a TBA Sale Commitment. Forward foreign currency contracts, financial futures contracts, credit default swaps and interest rate swaps are valued at the unrealized appreciation (depreciation) on the instrument and written options and the TBA Sale Commitment are reported at their fair value at period end. |
ANNUAL REPORT / April 30, 2018
49 PORTFOLIOS OF INVESTMENTS
Wilmington Real Asset Fund (continued)
| (a) | Par Value denominated in USD unless otherwise noted. |
| # | Security, or a portion thereof, is on loan. See Note 2 in Notes to Financial Statements. |
| D | Variable rate security. The rate disclosed is the rate in effect on the report date. The Information in parenthesis represents the benchmark and reference rate for each relevant security and the rate floats based upon the reference rate and spread. The security may be further subject to interest rate floor and caps. Certain variable rate securities are not based on a published reference rate and spread, but are determined by the issuer or agent and are based on current market conditions, or, for mortgage-backed securities, are impacted by the individual mortgages which are paying off over time. These securities do not indicate a reference rate and spread in their descriptions. |
| ‡ | Zero coupon security. The rate shown reflects the effective yield at purchase date. |
| * | Non-income producing security. |
| †† | Security is fair valued in accordance with procedures adopted by the Board of Trustees. See Note 2 in Notes to Financial Statements. At April 30, 2018, the value of these securities amounted to $0 representing 0.00% of total net assets. |
| W | Denotes a restricted security that may be resold without restriction to “qualified institutional buyers” as defined in Rule 144A under the Securities Act of 1933 and that the Fund has determined to be liquid under criteria established by the Fund’s Board of Trustees. At April 30, 2018, these liquid restricted securities amounted to $3,971,615 representing 1.29% of total net assets. |
| ø | On April 30, 2018, the Fund utilized International Fair Value Pricing, as defined in Note 2 in Notes to Portfolios of Investments. The value of these securities amounted to $64,683,339 representing 20.93% of total net assets. |
| ÿ | Step coupon security. The rate disclosed is the rate in effect on the report date. |
| ** | Represents less than 0.05%. |
| | | | | | |
| | | The following acronyms are used throughout this Fund: | | Currency Code Currency |
CDX | | Markit CDX Index | | ARS | | Argentine Peso |
CMBX | | Commercial Mortgage-Backed Index | | AUD | | Australian Dollar |
CMS | | Constant Maturity Swaps | | CAD | | Canadian Dollar |
CPI | | Consumer Price Index | | CNY | | Chinese Yuan |
EONIA | | Euro OverNight Index Average | | COP | | Colombian Peso |
INF | | Inflation | | DKK | | Danish Krone |
IRO | | Interest Rate Option | | EUR | | Euro |
LIBOR | | London Interbank Offered Rate | | GBP | | British Pound Sterling |
LLC | | Limited Liability Corporation | | IDR | | Indonesian Indonesian |
LP | | Limited Partnership | | ILS | | Israeli New Shekel |
MTN | | Medium Term Note | | INR | | Indian Rupee |
NA | | National Association | | KRW | | Korean Won |
NSA | | Not seasonally adjusted | | JPY | | Japanese Yen |
OAT | | Obligations Assimilables | | MXN | | Mexican Peso |
PCL | | Public Company Limited | | NZD | | New Zealand Dollar |
OIS | | Overnight Index Swap | | PEN | | Peruvian Nuevo Sol |
PLC | | Public Limited Company | | RUB | | Russian Ruble |
REIT | | Real Estate Investment Trust | | USD | | United States Dollar |
RPI | | Retail Price Index | | ZAR | | South African Rand |
TELBOR | | Tel Aviv Interbank Offered Rate | | | | |
YOY | | Year Over Year | | | | |
April 30, 2018 / ANNUAL REPORT
PORTFOLIOS OF INVESTMENTS 50
Wilmington Real Asset Fund (continued)
| | At April 30, 2018, the Wilmington Real Asset Fund had the following outstanding forward foreign currency contracts, which contractually obligates the Fund to deliver or receive currencies at specified future dates: |
| | | | | | | | | | | | | | | | | | | | |
| Settlement Date | | Counterparty | | Contracts to Deliver/Receive | | Contract
Amount | | | Contract
at Value | | | Unrealized
Appreciation | | | Unrealized
(Depreciation) | |
CONTRACTS PURCHASED | | | | | | | | | | | | | | | | | | |
5/1/2018 | | JP Morgan Chase Bank, N.A. | | 80,000,000 JPY | | $ | 731,261 | | | $ | 731,797 | | | $ | 536 | | | $ | — | |
5/1/2018 | | JP Morgan Chase Bank, N.A. | | 40,000,000 JPY | | | 365,865 | | | | 365,898 | | | | 33 | | | | — | |
5/2/2018 | | Bank of America NA | | 83,100,000 JPY | | | 760,432 | | | | 760,154 | | | | — | | | | (278) | |
5/2/2018 | | Royal Bank of Scotland | | 19,600,000 JPY | | | 183,156 | | | | 179,290 | | | | — | | | | (3,866) | |
5/2/2018 | | Bank of America NA | | 1,474,513 ARS | | | 71,945 | | | | 71,875 | | | | — | | | | (70) | |
5/3/2018 | | Citigroup Global Markets | | 1,766,000 GBP | | | 2,441,034 | | | | 2,431,620 | | | | — | | | | (9,414) | |
5/3/2018 | | Deutsche Bank AG | | 1,314,000 EUR | | | 1,600,846 | | | | 1,587,147 | | | | — | | | | (13,699) | |
5/3/2018 | | HSBC Bank USA, N.A. | | 1,256,000 NZD | | | 887,458 | | | | 883,712 | | | | — | | | | (3,746) | |
5/3/2018 | | Citigroup Global Markets | | 399,000 EUR | | | 490,642 | | | | 481,942 | | | | — | | | | (8,700) | |
5/3/2018 | | JP Morgan Chase Bank, N.A. | | 65,000 GBP | | | 93,112 | | | | 89,499 | | | | — | | | | (3,613) | |
5/8/2018 | | Bank of America NA | | 1,179,000 ZAR | | | 97,550 | | | | 94,476 | | | | — | | | | (3,074) | |
5/10/2018 | | Citigroup Global Markets | | 11,997,504 MXN | | | 635,629 | | | | 640,438 | | | | 4,809 | | | | — | |
5/16/2018 | | Goldman Sachs Bank USA | | 843,000 ARS | | | 41,527 | | | | 40,419 | | | | — | | | | (1,108) | |
5/16/2018 | | Royal Bank of Scotland | | 413,000 ARS | | | 20,245 | | | | 19,802 | | | | — | | | | (443) | |
5/25/2018 | | HSBC Bank USA, N.A. | | 7,911,460 RUB | | | 136,169 | | | | 125,224 | | | | — | | | | (10,945) | |
5/25/2018 | | Credit Suisse International | | 5,166,635 RUB | | | 91,219 | | | | 81,779 | | | | — | | | | (9,440) | |
5/30/2018 | | Bank of America NA | | 352,150 ARS | | | 17,194 | | | | 16,638 | | | | — | | | | (556) | |
6/20/2018 | | HSBC Bank USA, N.A. | | 1,261,790,000 IDR | | | 91,322 | | | | 90,174 | | | | — | | | | (1,148) | |
6/20/2018 | | HSBC Bank USA, N.A. | | 45,628,800 KRW | | | 42,259 | | | | 42,786 | | | | 527 | | | | — | |
6/20/2018 | | Citigroup Global Markets | | 11,848,592 INR | | | 180,081 | | | | 176,549 | | | | — | | | | (3,532) | |
6/26/2018 | | Bank of America NA | | 1,474,513 ARS | | | 70,483 | | | | 68,533 | | | | — | | | | (1,950) | |
7/17/2018 | | Credit Suisse International | | 608,648,000 COP | | | 219,175 | | | | 216,349 | | | | — | | | | (2,826) | |
8/22/2018 | | Societe Generale Securities | | 291,000 ARS | | | 14,024 | | | | 13,049 | | | | — | | | | (975) | |
CONTRACTS SOLD | | | | | | | | | | | | | | | | | | |
5/1/2018 | | Citigroup Global Markets | | 120,000,000 JPY | | | 1,103,047 | | | | 1,097,695 | | | | 5,352 | | | | — | |
5/2/2018 | | Bank of America NA | | 102,700,000 JPY | | | 980,321 | | | | 939,444 | | | | 40,877 | | | | — | |
5/2/2018 | | Bank of America NA | | 1,474,513 ARS | | | 72,744 | | | | 71,875 | | | | 869 | | | | — | |
5/3/2018 | | HSBC Bank USA, N.A. | | 1,705,000 GBP | | | 2,427,245 | | | | 2,347,628 | | | | 79,617 | | | | — | |
5/3/2018 | | Citigroup Global Markets | | 1,256,000 NZD | | | 914,042 | | | | 883,712 | | | | 30,330 | | | | — | |
5/3/2018 | | Credit Suisse International | | 1,151,000 EUR | | | 1,428,466 | | | | 1,390,264 | | | | 38,202 | | | | — | |
5/3/2018 | | JP Morgan Chase Bank, N.A. | | 729,000 AUD | | | 559,971 | | | | 548,829 | | | | 11,142 | | | | — | |
5/3/2018 | | JP Morgan Chase Bank, N.A. | | 381,000 EUR | | | 465,554 | | | | 460,200 | | | | 5,354 | | | | — | |
5/3/2018 | | JP Morgan Chase Bank, N.A. | | 317,000 CAD | | | 246,202 | | | | 246,910 | | | | — | | | | (708) | |
5/3/2018 | | Goldman Sachs Bank USA | | 181,000 EUR | | | 221,056 | | | | 218,625 | | | | 2,431 | | | | — | |
5/3/2018 | | JP Morgan Chase Bank, N.A. | | 126,000 GBP | | | 175,960 | | | | 173,490 | | | | 2,470 | | | | — | |
5/7/2018 | | Citigroup Global Markets | | 40,000,000 JPY | | | 367,899 | | | | 366,076 | | | | 1,823 | | | | — | |
5/7/2018 | | Citigroup Global Markets | | 1,000,000 JPY | | | 9,479 | | | | 9,152 | | | | 327 | | | | — | |
5/8/2018 | | Bank of America NA | | 1,186,055 ZAR | | | 98,000 | | | | 95,041 | | | | 2,959 | | | | — | |
5/10/2018 | | HSBC Bank USA, N.A. | | 11,997,504 MXN | | | 632,506 | | | | 640,438 | | | | — | | | | (7,932) | |
5/15/2018 | | Deutsche Bank AG | | 100,000 EUR | | | 123,882 | | | | 120,898 | | | | 2,984 | | | | — | |
5/16/2018 | | Bank of America NA | | 540,000 CAD | | | 430,871 | | | | 420,717 | | | | 10,154 | | | | — | |
5/21/2018 | | Citigroup Global Markets | | 80,000,000 JPY | | | 754,336 | | | | 732,860 | | | | 21,476 | | | | — | |
5/21/2018 | | Goldman Sachs Bank USA | | 23,300,000 JPY | | | 219,439 | | | | 213,445 | | | | 5,994 | | | | — | |
5/21/2018 | | Citigroup Global Markets | | 784,207 PEN | | | 240,002 | | | | 240,917 | | | | — | | | | (915) | |
5/23/2018 | | JP Morgan Chase Bank, N.A. | | 1,000,000 CAD | | | 777,350 | | | | 779,219 | | | | — | | | | (1,869) | |
5/23/2018 | | Bank of America NA | | 466,090 ARS | | | 22,213 | | | | 22,185 | | | | 28 | | | | — | |
5/29/2018 | | JP Morgan Chase Bank, N.A. | | 100,000 CAD | | | 77,742 | | | | 77,932 | | | | — | | | | (190) | |
ANNUAL REPORT / April 30, 2018
51 PORTFOLIOS OF INVESTMENTS
Wilmington Real Asset Fund (continued)
| | | | | | | | | | | | | | | | | | | | |
| Settlement Date | | Counterparty | | Contracts to Deliver/Receive | | Contract
Amount | | | Contract
at Value | | | Unrealized
Appreciation | | | Unrealized
(Depreciation) | |
CONTRACTS SOLD (continued) | | | | | | | | | | | | | | | | | | |
6/4/2018 | | Bank of America NA | | 83,100,000 JPY | | $ | 762,012 | | | $ | 762,008 | | | $ | 4 | | | $ | — | |
6/4/2018 | | Citigroup Global Markets | | 1,766,000 GBP | | | 2,444,407 | | | | 2,435,421 | | | | 8,986 | | | | — | |
6/4/2018 | | Deutsche Bank AG | | 1,314,000 EUR | | | 1,604,502 | | | | 1,591,067 | | | | 13,435 | | | | — | |
6/5/2018 | | HSBC Bank USA, N.A. | | 1,256,000 NZD | | | 887,334 | | | | 883,613 | | | | 3,721 | | | | — | |
6/7/2018 | | Societe Generale Securities | | 13,063,400 RUB | | | 224,216 | | | | 206,455 | | | | 17,761 | | | | — | |
6/20/2018 | | Societe Generale Securities | | 185,162,720 KRW | | | 175,020 | | | | 173,626 | | | | 1,394 | | | | — | |
6/20/2018 | | JP Morgan Chase Bank, N.A. | | 2,076,199 CNY | | | 329,242 | | | | 326,662 | | | | 2,580 | | | | — | |
7/2/2018 | | Citigroup Global Markets | | 2,155,000 DKK | | | 358,454 | | | | 351,051 | | | | 7,403 | | | | — | |
7/17/2018 | | JP Morgan Chase Bank, N.A. | | 152,699,305 COP | | | 53,325 | | | | 54,278 | | | | — | | | | (953) | |
7/30/2018 | | JP Morgan Chase Bank, N.A. | | 80,000,000 JPY | | | 735,849 | | | | 736,550 | | | | — | | | | (701) | |
7/30/2018 | | JP Morgan Chase Bank, N.A. | | 40,000,000 JPY | | | 368,160 | | | | 368,275 | | | | — | | | | (115) | |
8/27/2018 | | Citigroup Global Markets | | 11,997,504 MXN | | | 624,880 | | | | 629,496 | | | | — | | | | (4,616) | |
NET UNREALIZED APPRECIATION (DEPRECIATION) ON FORWARD FOREIGN CURRENCY CONTRACTS | | | | | | | | | | | | $ | 323,578 | | | $ | (97,382) | |
At April 30, 2018, the Wilmington Real Asset Fund had the following open option contracts:
| | | | | | | | | | | | | | | | | | | | | | |
| Description | | Expiration
Date | | | Number of
Contracts | | | Notional
Amount(a) | | | Strike
Price | | | Counterparty | | Value | |
PURCHASED OPTIONS | | | | | | | | | | | | | | | | | | | | | | |
CALL SWAPTIONS | | | | | | | | | | | | | | | | | | | | | | |
30-Year U.S. Treasury Bond | | | 6/15/2018 | | | | — | | | $ | 550,000 | | | $ | 2.15 | | | Deutsche Bank AG | | $ | 7 | |
Interest Rate Cap U.S. 10-Year Swap Rate | | | 6/11/2018 | | | | — | | | | 2,100,000 | | | | 0.17 | | | Morgan Stanley Capital Services LLC | | | 9 | |
TOTAL CALL SWAPTIONS | | | | | | | | | | | | | | | | | | | | | 16 | |
PUT SWAPTIONS | | | | | | | | | | | | | | | | | | | | | | |
10-Year U.S. Treasury Note | | | 7/16/2018 | | | | — | | | | 2,250,000 | | | | 2.77 | | | Morgan Stanley Capital Services LLC | | | 48,244 | |
10-Year U.S. Treasury Note | | | 7/16/2018 | | | | — | | | | 750,000 | | | | 2.72 | | | Morgan Stanley Capital Services LLC | | | 18,473 | |
30-Year U.S. Treasury Bond | | | 6/15/2018 | | | | — | | | | 550,000 | | | | 2.15 | | | Deutsche Bank AG | | | 90,762 | |
TOTAL PUT SWAPTIONS | | | | | | | | | | | | | | | | | | | | | 157,479 | |
TOTAL PURCHASED OPTIONS | | | | | | | | | | | | | | | | | | | | $ | 157,495 | |
| | | | | | |
| | | | | | | | | | | | | | | | | | | | | | | |
April 30, 2018 / ANNUAL REPORT
PORTFOLIOS OF INVESTMENTS 52
Wilmington Real Asset Fund (continued)
| | | | | | | | | | | | | | | | | | | | | | |
| Description | | Expiration
Date | | | Number
of
Contracts | | | Notional
Amount(a) | | | Strike
Price | | | Counterparty | | Value | |
WRITTEN OPTIONS | | | | | | | | | | | | | | | | | | | | | | |
CALL OPTIONS | | | | | | | | | | | | | | | | | | | | | | |
30-Year U.S. Treasury Bond Future | | | 5/25/2018 | | | | (1 | ) | | | (143,844 | ) | | $ | 145.00 | | | Exchange Traded | | $ | (563 | ) |
30-Year U.S. Treasury Bond Future | | | 5/25/2018 | | | | (1 | ) | | | (143,844 | ) | | | 144.50 | | | Exchange Traded | | | (750 | ) |
30-Year U.S. Treasury Bond Future | | | 5/25/2018 | | | | (2 | ) | | | (287,688 | ) | | | 144.00 | | | Exchange Traded | | | (1,938 | ) |
TOTAL CALL OPTIONS | | | | | | | | | | | | | | | | | | | | | (3,251 | ) |
CALL SWAPTIONS | | | | | | | | | | | | | | | | | | | | | | |
Interest Rate Cap Eurozone CPI | | | 6/22/2035 | | | | — | | | | (600,000 | )EUR | | | 3.00EUR | | | Goldman Sachs Bank USA | | | (4,975 | ) |
Interest Rate Cap U.S. 30-Year CMS Rate | | | 6/11/2018 | | | | — | | | | (2,100,000 | ) | | | 0.16 | | | Morgan Stanley Capital Services LLC | | | (1 | ) |
iTRAXX Europe S29 5Y | | | 6/20/2018 | | | | — | | | | (700,000 | )EUR | | | 0.50EUR | | | Barclays Bank PLC | | | (348 | ) |
TOTAL CALL SWAPTIONS | | | | | | | | | | | | | | | | | | | | | (5,324 | ) |
PUT OPTIONS | | | | | | | | | | | | | | | | | | | | | | |
10-Year U.S. Treasury Note Future | | | 5/25/2018 | | | | (2 | ) | | | (239,250 | ) | | | 120.00 | | | Exchange Traded | | | (1,312 | ) |
30-Year U.S. Treasury Bond Future | | | 5/25/2018 | | | | (2 | ) | | | (287,688 | ) | | | 142.00 | | | Exchange Traded | | | (781 | ) |
30-Year U.S. Treasury Bond Future | | | 5/25/2018 | | | | (2 | ) | | | (287,688 | ) | | | 144.00 | | | Exchange Traded | | | (2,250 | ) |
30-Year U.S. Treasury Bond Future | | | 5/25/2018 | | | | (4 | ) | | | (575,375 | ) | | | 143.00 | | | Exchange Traded | | | (2,750 | ) |
Euro-Bund Future | | | 5/25/2018 | | | | (3 | ) | | | (390,000 | )EUR | | | 130.00EUR | | | Exchange Traded | | | (36 | ) |
Euro-Bund Future | | | 5/25/2018 | | | | (4 | ) | | | (516,000 | )EUR | | | 129.00EUR | | | Exchange Traded | | | (24 | ) |
TOTAL PUT OPTIONS | | | | | | | | | | | | | | | | | | | | | (7,153 | ) |
PUT SWAPTIONS | | | | | | | | | | | | | | | | | | | | | | |
CDX.NA.IG.29.5Y | | | 5/16/2018 | | | | — | | | | (200,000 | ) | | | 0.80 | | | Credit Suisse International | | | (10 | ) |
CDX.NA.IG.30.5Y | | | 5/16/2018 | | | | — | | | | (100,000 | ) | | | 0.85 | | | Bank of America NA | | | (6 | ) |
CDX.NA.IG.30.5Y | | | 6/20/2018 | | | | — | | | | (100,000 | ) | | | 0.90 | | | Citibank N.A. | | | (40 | ) |
CDX.NA.IG.30.5Y | | | 6/20/2018 | | | | — | | | | (100,000 | ) | | | 0.90 | | | Bank of America NA | | | (40 | ) |
CDX.NA.IG.30.5Y | | | 6/20/2018 | | | | — | | | | (100,000 | ) | | | 0.85 | | | Goldman Sachs Bank USA | | | (48 | ) |
CDX.NA.IG.30.5Y | | | 6/20/2018 | | | | — | | | | (200,000 | ) | | | 0.90 | | | JP Morgan Chase Bank, N.A. | | | (80 | ) |
CDX.NA.IG.30.5Y | | | 7/18/2018 | | | | — | | | | (100,000 | ) | | | 0.95 | | | Barclays Bank PLC | | | (59 | ) |
CDX.NA.IG.30.5Y | | | 7/18/2018 | | | | — | | | | (100,000 | ) | | | 0.95 | | | Deutsche Bank AG | | | (59 | ) |
CDX.NA.IG.30.5Y | | | 7/18/2018 | | | | — | | | | (200,000 | ) | | | 0.85 | | | Citibank N.A. | | | (167 | ) |
Interest Rate Cap U.S. CPI | | | 4/10/2020 | | | | — | | | | (8,300,000 | ) | | | 3.00 | | | JP Morgan Chase Bank, N.A. | | | 13,886 | |
Interest Rate Cap U.S. CPI | | | 4/22/2024 | | | | — | | | | (1,300,000 | ) | | | 4.00 | | | JP Morgan Chase Bank, N.A. | | | (457 | ) |
Interest Rate Cap U.S. CPI | | | 5/16/2024 | | | | — | | | | (100,000 | ) | | | 4.00 | | | JP Morgan Chase Bank, N.A. | | | (39 | ) |
Interest Rate Floor U.S. 10-Year Swap Rate | | | 1/2/2020 | | | | — | | | | (5,000,000 | ) | | | 1.00 | | | Morgan Stanley Capital Services LLC | | | (6,714 | ) |
Interest Rate Floor U.S. CPI | | | 3/24/2020 | | | | — | | | | (2,300,000 | ) | | | 0.00 | | | JP Morgan Chase Bank, N.A. | | | (1,108 | ) |
Interest Rate Floor U.S. CPI | | | 4/7/2020 | | | | — | | | | (2,600,000 | ) | | | 216.69 | | | Citibank NA | | | — | |
Interest Rate Floor U.S. CPI | | | 4/10/2020 | | | | — | | | | (8,300,000 | ) | | | 0.00 | | | JP Morgan Chase Bank, N.A. | | | 29,104 | |
iTRAXX Europe S29 5Y | | | 6/20/2018 | | | | — | | | | (700,000 | )EUR | | | 0.80EUR | | | Barclays Bank PLC | | | (293 | ) |
TOTAL PUT SWAPTIONS | | | | | | | | | | | | | | | | | | | | | 33,870 | |
TOTAL WRITTEN OPTIONS | | | | | | | | | | | | | | | | | | | | $ | 18,142 | |
| (a) | Notional Amount and Strike Price denominated in USD unless otherwise noted. |
ANNUAL REPORT / April 30, 2018
53 PORTFOLIOS OF INVESTMENTS
Wilmington Real Asset Fund (continued)
At April 30, 2018, the Wilmington Real Asset Fund had open financial futures contracts as follows:
| | | | | | | | | | | | | | | | | | | | | | | | | | | | |
Underlying Contracts to
Buy/Sell | | Expiration
Date | | | Number of
Contracts | | | Notional
Amount(a) | | | Contract
Amount | | | Contract at Value | | | Unrealized
Appreciation(b)
| | | Unrealized
(Depreciation)(b)
| |
LONG POSITIONS: | | | | | | | | | | | | | | | | | | | | | | | | | | | | |
10 - Year U.S Treasury Note Futures | | | June 2018 | | | | 18 | | | $ | 2,153,250 | | | $ | 2,155,909 | | | $ | 2,153,250 | | | | $ — | | | $ | (2,659) | |
5 - Year U.S Treasury Note Futures | | | June 2018 | | | | 5 | | | | 567,539 | | | | 570,359 | | | | 567,539 | | | | — | | | | (2,820) | |
Euro - Bund Futures | | | June 2018 | | | | 2 | | | | 317,480EUR | | | | 382,424 | | | | 387,343 | | | | 4,919 | | | | — | |
SHORT POSITIONS: | | | | | | | | | | | | | | | | | | | | | | | | | | | | |
10 - Year Australian Treasury Bond Futures | | | June 2018 | | | | 1 | | | | 97,215AUD | | | | 76,542 | | | | 76,594 | | | | — | | | | (52) | |
10 - Year Japanese Treasury Bond Futures (OSE) | | | June 2018 | | | | 2 | | | | 301,280,000JPY | | | | 2,841,151 | | | | 2,840,194 | | | | 957 | | | | — | |
10 - Year U.S Treasury Ultra Futures | | | June 2018 | | | | 1 | | | | 127,891 | | | | 127,477 | | | | 127,891 | | | | — | | | | (414) | |
Euro - BTP Futures | | | June 2018 | | | | 1 | | | | 139,010EUR | | | | 170,013 | | | | 170,053 | | | | — | | | | (40) | |
Euro - OAT Futures | | | June 2018 | | | | 9 | | | | 1,384,290EUR | | | | 1,679,240 | | | | 1,697,986 | | | | — | | | | (18,746) | |
GBP Long Gilt Futures | | | June 2018 | | | | 17 | | | | 2,078,420GBP | | | | 2,854,950 | | | | 2,894,399 | | | | — | | | | (39,449) | |
U.S Treasury Long Bond Futures | | | June 2018 | | | | 18 | | | | 2,589,188 | | | | 2,550,351 | | | | 2,589,188 | | | | — | | | | (38,837) | |
| NET UNREALIZED APPRECIATION (DEPRECIATION) ON FINANCIAL FUTURES CONTRACTS | | | | | | | | | | | | | | | | | | | | $5,876 | | | | $(103,017) | |
| (a) | Notional Amount denominated in USD unless otherwise noted. |
| (b) | The variation margin shown on the Statement of Assets and Liabilities is the daily change in the unrealized appreciation (depreciation) for financial futures contracts. The unrealized appreciation (depreciation) presented above is the cumulative change in unrealized appreciation (depreciation) from the date the contract was open until April 30, 2018. |
April 30, 2018 / ANNUAL REPORT
PORTFOLIOS OF INVESTMENTS 54
Wilmington Real Asset Fund (continued)
At April 30, 2018, the Wilmington Real Asset Fund had open interest rate swap agreements as follows:
| | | | | | | | | | | | | | | | | | | | | | | | | | | | | | | | | | |
| Counterparty | | Termination
Date | | | Notional
Amount(2) | | | Fixed
Rate | | | Floating Rate | | Payment
Frequency | | | Fair Value | | | Upfront
Premium Paid
(Received) | | | Unrealized
Appreciation | | | Unrealized
(Depreciation) | |
CENTRALLY CLEARED(d) | | | | | | | | | | | | | | | | | | | | | | | | | | | | | | | | | | |
Chicago Mercantile Exchange# | | | 6/15/18 | | | | 1,200,000 | | | | 1.25 | % | | 3-Month LIBOR | | | Quarter | | | $ | (1,356 | ) | | $ | 5,605 | | | $ | — | | | $ | (6,961 | ) |
Chicago Mercantile Exchange# | | | 6/21/19 | | | | 400,000 | | | | 1.25 | % | | 3-Month LIBOR | | | Quarter | | | | (5,894 | ) | | | (3,619 | ) | | | — | | | | (2,275 | ) |
Chicago Mercantile Exchange# | | | 12/16/22 | | | | 700,000 | | | | 2.25 | % | | 3-Month LIBOR | | | Quarter | | | | (20,047 | ) | | | 1,563 | | | | — | | | | (21,610 | ) |
Chicago Mercantile Exchange# | | | 12/20/22 | | | | 1,900,000 | | | | 2.25 | % | | 3-Month LIBOR | | | Semi-Annual | | | | (54,668 | ) | | | 2,393 | | | | — | | | | (57,061 | ) |
Chicago Mercantile Exchange# | | | 6/20/23 | | | | 800,000 | | | | 2.00 | % | | 3-Month LIBOR | | | Semi-Annual | | | | (35,093 | ) | | | (30,906 | ) | | | — | | | | (4,187 | ) |
Chicago Mercantile Exchange# | | | 10/19/23 | | | | 100,000 | | | | 2.66 | % | | 3-Month LIBOR | | | Quarter | | | | (1,528 | ) | | | — | | | | — | | | | (1,528 | ) |
Chicago Mercantile Exchange# | | | 10/25/23 | | | | 2,000,000 | | | | 2.68 | % | | 3-Month LIBOR | | | Quarter | | | | (28,638 | ) | | | — | | | | — | | | | (28,638 | ) |
Chicago Mercantile Exchange# | | | 11/19/23 | | | | 1,000,000 | | | | 2.67 | % | | 3-Month LIBOR | | | Quarter | | | | (14,966 | ) | | | — | | | | — | | | | (14,966 | ) |
Chicago Mercantile Exchange# | | | 12/12/23 | | | | 1,000,000 | | | | 2.68 | % | | 3-Month LIBOR | | | Quarter | | | | (14,683 | ) | | | — | | | | — | | | | (14,683 | ) |
Chicago Mercantile Exchange# | | | 12/19/23 | | | | 1,400,000 | | | | 2.50 | % | | 3-Month LIBOR | | | Quarter | | | | (32,305 | ) | | | (12,010 | ) | | | — | | | | (20,295 | ) |
Chicago Mercantile Exchange# | | | 7/27/26 | | | | 3,700,000 | | | | 2.00 | % | | 3-Month LIBOR | | | Semi-Annual | | | | 168,749 | | | | 46,583 | | | | 122,166 | | | | — | |
Chicago Mercantile Exchange# | | | 12/07/26 | | | | 3,700,000 | | | | 2.40 | % | | 3-Month LIBOR | | | Semi-Annual | | | | 105,073 | | | | 24,582 | | | | 80,491 | | | | — | |
London Clearing House* | | | 12/21/26 | | | | 3,240,000 | | | | 1.75 | % | | 3-Month LIBOR | | | Semi-Annual | | | | 300,363 | | | | (106,161 | ) | | | 406,524 | | | | — | |
Chicago Mercantile Exchange# | | | 12/20/27 | | | | 100,000 | | | | 2.50 | % | | 3-Month LIBOR | | | Semi-Annual | | | | 4,221 | | | | (1,055 | ) | | | 5,276 | | | | — | |
Chicago Mercantile Exchange# | | | 3/21/28 | | | | 400,000NZD | | | | 3.25 | % | | 3-Month LIBOR | | | Semi-Annual | | | | (590 | ) | | | 1,223 | | | | — | | | | (1,813 | ) |
Chicago Mercantile Exchange# | | | 4/17/28 | | | | 70,000 | | | | 3.10 | % | | 3-Month LIBOR | | | Semi-Annual | | | | (8 | ) | | | (481 | ) | | | 473 | | | | — | |
London Clearing House# | | | 6/20/28 | | | | 900,000 | | | | 2.25 | % | | 3-Month LIBOR | | | Semi-Annual | | | | 57,353 | | | | 49,659 | | | | 7,694 | | | | — | |
Chicago Mercantile Exchange# | | | 6/20/48 | | | | 440,000 | | | | 2.50 | % | | 3-Month LIBOR | | | Semi-Annual | | | | 48,851 | | | | 51,131 | | | | — | | | | (2,280 | ) |
London Clearing House# | | | 9/20/27 | | | | 110,000,000JPY | | | | 0.30 | % | | 6-Month LIBOR | | | Semi-Annual | | | | (1,069 | ) | | | (1,991 | ) | | | 922 | | | | — | |
London Clearing House# | | | 3/20/29 | | | | 140,000,000JPY | | | | 0.45 | % | | 6-Month LIBOR | | | Semi-Annual | | | | (8,363 | ) | | | (7,740 | ) | | | — | | | | (623 | ) |
London Clearing House# | | | 9/19/48 | | | | 230,000GBP | | | | 1.75 | % | | 6-Month LIBOR | | | Semi-Annual | | | | (6,410 | ) | | | (13,792 | ) | | | 7,382 | | | | — | |
London Clearing House* | | | 3/15/21 | | | | 200,000EUR | | | | 1.30 | % | | Eurostat Eurozone HICP Ex-Tobacco | | | At Term(1) | | | | 515 | | | | — | | | | 515 | | | | — | |
London Clearing House* | | | 12/15/26 | | | | 610,000EUR | | | | 1.39 | % | | Eurostat Eurozone HICP Ex-Tobacco | | | At Term(1) | | | | (10,884 | ) | | | (1,106 | ) | | | — | | | | (9,778 | ) |
London Clearing House* | | | 11/15/27 | | | | 500,000EUR | | | | 1.52 | % | | Eurostat Eurozone HICP Ex-Tobacco | | | At Term(1) | | | | (2,271 | ) | | | (935 | ) | | | — | | | | (1,336 | ) |
London Clearing House* | | | 3/15/28 | | | | 200,000EUR | | | | 1.54 | % | | Eurostat Eurozone HICP Ex-Tobacco | | | At Term(1) | | | | (551 | ) | | | — | | | | — | | | | (551 | ) |
ANNUAL REPORT / April 30, 2018
55 PORTFOLIOS OF INVESTMENTS
Wilmington Real Asset Fund (continued)
| | | | | | | | | | | | | | | | | | | | | | | | | | | | | | | | | | |
| Counterparty | | Termination
Date | | | Notional
Amount(2) | | | Fixed
Rate | | | Floating Rate | | Payment
Frequency | | | Fair Value | | | Upfront
Premium Paid
(Received) | | | Unrealized
Appreciation | | | Unrealized
(Depreciation) | |
London Clearing House* | | | 3/15/20 | | |
| 220,000EUR
|
| | | 1.17 | % | | France CPI Ex-Tobacco | | | At Term(1) | | | $ | 302 | | | $ | — | | | $ | 302 | | | $ | — | |
London Clearing House* | | | 4/15/20 | | |
| 300,000EUR
|
| | | 1.00 | % | | France CPI Ex-Tobacco | | | At Term(1) | | | | 2,130 | | | | — | | | | 2,130 | | | | — | |
London Clearing House* | | | 1/15/28 | | |
| 110,000EUR
|
| | | 1.58 | % | | France CPI Ex-Tobacco | | | At Term(1) | | | | 209 | | | | — | | | | 209 | | | | — | |
London Clearing House* | | | 2/15/28 | | |
| 260,000EUR
|
| | | 1.59 | % | | France CPI Ex-Tobacco | | | At Term(1) | | | | 1,013 | | | | 49 | | | | 964 | | | | — | |
London Clearing House* | | | 2/15/28 | | | | 50,000EUR | | | | 1.61 | % | | France CPI Ex-Tobacco | | | At Term(1) | | | | 298 | | | | — | | | | 298 | | | | — | |
London Clearing House# | | | 9/19/21 | | |
| 200,000EUR
|
| | | 0.05 | % | | Overnight EONIA | | | Annual | | | | 328 | | | | (208 | ) | | | 536 | | | | — | |
London Clearing House* | | | 5/23/18 | | | | 100,000 | | | | 1.58 | % | | U.S. CPI NSA | | | At Term(1) | | | | 736 | | | | 52 | | | | 684 | | | | — | |
London Clearing House* | | | 3/23/19 | | | | 460,000 | | | | 2.07 | % | | U.S. CPI NSA | | | At Term(1) | | | | 294 | | | | 26 | | | | 268 | | | | — | |
London Clearing House* | | | 4/10/19 | | | | 360,000 | | | | 1.98 | % | | U.S. CPI NSA | | | At Term(1) | | | | 122 | | | | — | | | | 122 | | | | — | |
London Clearing House* | | | 4/27/19 | | | | 1,310,000 | | | | 1.97 | % | | U.S. CPI NSA | | | At Term(1) | | | | (172 | ) | | | — | | | | — | | | | (172 | ) |
London Clearing House* | | | 4/25/20 | | | | 80,000 | | | | 2.14 | % | | U.S. CPI NSA | | | At Term(1) | | | | 45 | | | | — | | | | 45 | | | | — | |
London Clearing House* | | | 11/23/20 | | | | 700,000 | | | | 2.03 | % | | U.S. CPI NSA | | | At Term(1) | | | | 6,259 | | | | — | | | | 6,259 | | | | — | |
London Clearing House* | | | 11/25/20 | | | | 700,000 | | | | 2.02 | % | | U.S. CPI NSA | | | At Term(1) | | | | 6,370 | | | | — | | | | 6,370 | | | | — | |
London Clearing House* | | | 7/26/21 | | | | 500,000 | | | | 1.55 | % | | U.S. CPI NSA | | | At Term(1) | | | | 17,269 | | | | 16,923 | | | | 346 | | | | — | |
London Clearing House* | | | 9/12/21 | | | | 460,000 | | | | 1.60 | % | | U.S. CPI NSA | | | At Term(1) | | | | 14,281 | | | | 13,855 | | | | 426 | | | | — | |
London Clearing House* | | | 7/15/22 | | | | 100,000 | | | | 2.07 | % | | U.S. CPI NSA | | | At Term(1) | | | | 1,264 | | | | — | | | | 1,264 | | | | — | |
London Clearing House* | | | 2/05/23 | | | | 640,000 | | | | 2.21 | % | | U.S. CPI NSA | | | At Term(1) | | | | 3,199 | | | | — | | | | 3,199 | | | | — | |
London Clearing House* | | | 4/13/23 | | | | 1,020,000 | | | | 2.22 | % | | U.S. CPI NSA | | | At Term(1) | | | | 2,928 | | | | — | | | | 2,928 | | | | — | |
London Clearing House* | | | 4/27/23 | | | | 300,000 | | | | 2.26 | % | | U.S. CPI NSA | | | At Term(1) | | | | 121 | | | | — | | | | 121 | | | | — | |
London Clearing House* | | | 7/26/26 | | | | 500,000 | | | | 1.73 | % | | U.S. CPI NSA | | | At Term(1) | | | | (29,378 | ) | | | (26,802 | ) | | | — | | | | (2,576 | ) |
London Clearing House* | | | 9/12/26 | | | | 460,000 | | | | 1.80 | % | | U.S. CPI NSA | | | At Term(1) | | | | (23,524 | ) | | | (21,247 | ) | | | — | | | | (2,277 | ) |
London Clearing House* | | | 9/15/26 | | | | 300,000 | | | | 1.78 | % | | U.S. CPI NSA | | | At Term(1) | | | | (16,026 | ) | | | (14,562 | ) | | | — | | | | (1,464 | ) |
London Clearing House* | | | 9/20/27 | | | | 150,000 | | | | 2.18 | % | | U.S. CPI NSA | | | At Term(1) | | | | (3,427 | ) | | | — | | | | — | | | | (3,427 | ) |
London Clearing House* | | | 9/25/27 | | | | 100,000 | | | | 2.15 | % | | U.S. CPI NSA | | | At Term(1) | | | | (2,602 | ) | | | — | | | | — | | | | (2,602 | ) |
London Clearing House* | | | 10/17/27 | | | | 300,000 | | | | 2.16 | % | | U.S. CPI NSA | | | At Term(1) | | | | (7,561 | ) | | | — | | | | — | | | | (7,561 | ) |
London Clearing House* | | | 2/05/28 | | | | 330,000 | | | | 2.34 | % | | U.S. CPI NSA | | | At Term(1) | | | | (1,499 | ) | | | 716 | | | | — | | | | (2,215 | ) |
London Clearing House# | | | 12/15/47 | | | | 260,000 | | | | 2.00 | % | | U.S. Fed Fund Effective Rate | | | Annual | | | | 27,123 | | | | (487 | ) | | | 27,610 | | | | — | |
London Clearing House# | | | 12/20/47 | | | | 90,000 | | | | 2.50 | % | | U.S. Fed Fund Effective Rate | | | Annual | | | | 148 | | | | 225 | | | | — | | | | (77 | ) |
April 30, 2018 / ANNUAL REPORT
PORTFOLIOS OF INVESTMENTS 56
Wilmington Real Asset Fund (continued)
| | | | | | | | | | | | | | | | | | | | | | | | | | | | | | | | | | |
| Counterparty | | Termination
Date | | | Notional
Amount(2) | | | Fixed
Rate | | | Floating Rate | | Payment
Frequency | | | Fair
Value | | | Upfront
Premium
Paid
(Received) | | | Unrealized
Appreciation | | | Unrealized
(Depreciation) | |
London Clearing House# | | | 12/20/47 | | | | 55,000 | | | | 2.48 | % | | U.S. Fed Fund Effective Rate | | | Annual | | | $ | 166 | | | $ | 246 | | | $ | — | | | $ | (80 | ) |
London Clearing House* | | | 6/15/31 | | |
| 900,000GBP
|
| | | 3.10 | % | | United Kingdom RPI All Items NSA | | | At Term(1) | | | | (73,587 | ) | | | (104,556 | ) | | | 30,969 | | | | — | |
London Clearing House* | | | 10/15/31 | | |
| 640,000GBP
|
| | | 3.53 | % | | United Kingdom RPI All Items NSA | | | At Term(1) | | | | 26,044 | | | | 1,654 | | | | 24,390 | | | | — | |
London Clearing House* | | | 9/15/32 | | |
| 100,000GBP
|
| | | 3.47 | % | | United Kingdom RPI All Items NSA | | | At Term(1) | | | | 2,508 | | | | (775 | ) | | | 3,283 | | | | — | |
London Clearing House* | | | 10/15/46 | | | | 80,000GBP | | | | 3.59 | % | | United Kingdom RPI All Items NSA | | | At Term(1) | | | | (10,275 | ) | | | (4,520 | ) | | | — | | | | (5,755 | ) |
London Clearing House* | | | 3/15/47 | | |
| 130,000GBP
|
| | | 3.43 | % | | United Kingdom RPI All Items NSA | | | At Term(1) | | | | 68 | | | | 8,234 | | | | — | | | | (8,166 | ) |
| | | | | | | | | | | | | | | | | | | | | $ | 390,975 | | | | $(128,234) | | | | $744,166 | | | | $(224,957) | |
OVER THE
COUNTER(e) | | | | | | | | | | | | | | | | | | | | | | | | | | | | | | | |
Bank of America NA* | | | 2/16/20 | | | | 830,000ILS | | | | 0.97 | % | | 3-Month TELBOR | | | Annual | | | | (2,985 | ) | | | 6 | | | | — | | | | (2,991 | ) |
Bank of America NA* | | | 6/20/20 | | | | 510,000ILS | | | | 0.37 | % | | 3-Month TELBOR | | | Annual | | | | (53 | ) | | | — | | | | — | | | | (53 | ) |
Barclays Bank PLC* | | | 6/20/20 | | | | 440,000ILS | | | | 0.37 | % | | 3-Month TELBOR | | | Annual | | | | (56 | ) | | | — | | | | — | | | | (56 | ) |
Deutsche Bank AG* | | | 6/20/20 | | | | 420,000ILS | | | | 0.41 | % | | 3-Month TELBOR | | | Annual | | | | (146 | ) | | | — | | | | — | | | | (146 | ) |
Goldman Sachs Bank USA* | | | 6/20/20 | | | | 340,000ILS | | | | 0.37 | % | | 3-Month TELBOR | | | Annual | | | | (35 | ) | | | 26 | | | | — | | | | (61 | ) |
Bank of America NA# | | | 2/16/28 | | | | 180,000ILS | | | | 1.96 | % | | 3-Month TELBOR | | | Annual | | | | 751 | | | | (13 | ) | | | 764 | | | | — | |
Bank of America NA# | | | 6/20/28 | | | | 110,000ILS | | | | 2.00 | % | | 3-Month TELBOR | | | Annual | | | | 237 | | | | — | | | | 237 | | | | — | |
JP Morgan Chase Bank, N.A.# | | | 6/20/28 | | | | 90,000ILS | | | | 2.08 | % | | 3-Month TELBOR | | | Annual | | | | 381 | | | | — | | | | 381 | | | | — | |
Barclays Bank PLC# | | | 6/20/28 | | | | 90,000ILS | | | | 1.95 | % | | 3-Month TELBOR | | | Annual | | | | 84 | | | | — | | | | 84 | | | | — | |
Goldman Sachs Bank USA# | | | 6/20/28 | | | | 70,000ILS | | | | 2.00 | % | | 3-Month TELBOR | | | Annual | | | | 151 | | | | — | | | | 151 | | | | — | |
Bank of America NA* | | | 11/23/20 | | | | 2,400,000 | | | | 1.57 | % | | U.S. CPI NSA | | | At Term(1) | | | | 60,437 | | | | — | | | | 60,437 | | | | — | |
Morgan Stanley Capital Services LLC# | | | 7/18/26 | | | | 500,000 | | | | 1.79 | % | | U.S. CPI NSA | | | At Term(1) | | | | (26,230 | ) | | | — | | | | — | | | | (26,230 | ) |
Morgan Stanley Capital Services LLC# | | | 7/19/26 | | | | 800,000 | | | | 1.81 | % | | U.S. CPI NSA | | | At Term(1) | | | | (40,239 | ) | | | — | | | | — | | | | (40,239 | ) |
Morgan Stanley Capital Services LLC* | | | 7/20/26 | | | | 500,000 | | | | 1.80 | % | | U.S. CPI NSA | | | At Term(1) | | | | (25,569 | ) | | | — | | | | — | | | | (25,569 | ) |
Morgan Stanley Capital Services LLC* | | | 9/20/26 | | | | 200,000 | | | | 1.81 | % | | U.S. CPI NSA | | | At Term(1) | | | | (10,064 | ) | | | — | | | | — | | | | (10,064 | ) |
| | | | | | | | | | | | | | | | | | | | | $ | (43,336 | ) | | $ | 19 | | | $ | 62,054 | | | | $(105,409) | |
NET UNREALIZED (DEPRECIATION) ON INTEREST RATE SWAP CONTRACTS | | | | | | | | | | | | | $ | 347,639 | | | | $(128,215) | | | | $806,220 | | | | $(330,366) | |
At April 30, 2018, the Wilmington Real Asset Fund had open credit default swap agreements as follows:
| | | | | | | | | | | | | | | | | | | | | | | | | | | | | | | | |
| | | | | | | | | | |
| Counterparty | | Termination
Date | | Notional
Amount(a) | | | Fixed
Rate | | | Reference Equity
/Obligation | | Payment
Frequency | | Implied Credit Spread at
April 30, 2018(b) | | Fair
Value(c) | | | Upfront
Premium Paid
(Received) | | | Unrealized
Appreciation | | | Unrealized
(Depreciation) | |
| CENTRALLY CLEARED(d) | | | | | | | | | | | | | | | | | | | | | | | | | | | |
Intercontinental Exchange### | | 6/20/23 | | $ | 960,000 | | | | 5.00 | % | | CDX.NA.HY.30.5Y | | Quarter | | 3.40% | | | $(66,398) | | | | $(61,424) | | | | $— | | | $ | (4,974 | ) |
Intercontinental Exchange### | | 12/20/20 | | | 20,000EUR | | | | 1.00 | % | | Daimler AG | | Quarter | | 0.29% | | | 481 | | | | 332 | | | | 149 | | | | — | |
Intercontinental Exchange### | | 12/20/21 | | | 900,000EUR | | | | 1.00 | % | | iTRAXX.Europe.S26.5Y | | Quarter | | 0.31% | | | (27,678) | | | | (14,549) | | | | — | | | | (13,129 | ) |
ANNUAL REPORT / April 30, 2018
57 PORTFOLIOS OF INVESTMENTS
Wilmington Real Asset Fund (concluded)
| | | | | | | | | | | | | | | | | | | | | | | | | | | | | | | | | | | | | | |
| | | | | | | | | | |
| Counterparty | | Termination
Date | | | Notional
Amount(a) | | | Fixed
Rate | | | Reference Equity
/Obligation | | Payment
Frequency | | | Implied Credit
Spread at
April 30, 2018(b) | | | Fair
Value(c) | | | Upfront
Premium Paid
(Received) | | | Unrealized
Appreciation | | | Unrealized
(Depreciation) | |
Intercontinental Exchange### | | | 12/20/22 | | | | 2,300,000EUR | | | | 1.00 | % | | iTRAXX.Europe.S28.5Y | | | Quarter | | | | 0.46% | | | | $ (69,395) | | | | $ (62,072) | | | | $ — | | | | $ (7,323) | |
| | | | | | | | | | | | | | | | | | | | | | | | | | $(162,990) | | | | $(137,713) | | | | $ 149 | | | | $(25,426) | |
OVER THE COUNTER(e) | | | | | | | | | | | | | | | | | | | | | | | | | | | | | | | | | | | |
Goldman Sachs International## | | | 10/17/57 | | | | 400,000 | | | | 0.50 | % | | CMBX.NA.AAA.8 | | | Monthly | | | | 0.40% | | | | 2,084 | | | | (26,117 | ) | | | 28,201 | | | | — | |
Deutsche Bank AG## | | | 10/17/57 | | | | 400,000 | | | | 0.50 | % | | CMBX.NA.AAA.8 | | | Monthly | | | | 0.40% | | | | 2,084 | | | | (20,855 | ) | | | 22,939 | | | | — | |
| | | | | | | | | | | | | | | | | | | | | | | | | | $ 4,168 | | | | $ (46,972) | | | | $51,140 | | | | $ — | |
| NET UNREALIZED APPRECIATION (DEPRECIATION) ON CREDIT DEFAULT SWAP CONTRACTS | | | | | | | | | | | | | | | | | | | | | | | | | $(158,822) | | | | $(184,685) | | | | $51,289 | | | | $(25,426) | |
|
| (1) Termination date or maturity date. |
|
| (2) Notional Amount denominated in USD unless otherwise noted. |
|
| * Portfolio pays the fixed rate and receives the floating rate. |
|
# Portfolio pays the floating rate and receives the fixed rate. |
## The Portfolio is a seller of protection, it receives the fixed rate. When a credit event occurs, as defined under the terms of that particular swap agreement, the Portfolio will either (i) pay to the buyer of protection an amount equal to the notional amount of the swap and take delivery of the referenced obligation or underlying securities comprising the referenced index or (ii) pay a net settlement amount in the form of cash or securities equal to the notional amount of the swap less the recovery value of the referenced obligation or underlying securities comprising the referenced index. |
### The Portfolio is a buyer of protection, it pays the fixed rate. When a credit event occurs, as defined under the terms of that particular swap agreement, the Portfolio will either (i) receive from the seller of protection an amount equal to the notional amount of the swap and make delivery of the referenced obligation or underlying securities comprising the referenced index or (ii) receive a net settlement amount in the form of cash or securities equal to the notional amount of the swap less the recovery value of the referenced obligation or underlying securities comprising the referenced index. |
(a) “Notional amount” represents the maximum potential amount the Portfolio could be required to pay as a seller of credit protection or receive as a buyer of credit protection if a credit event occurs as defined under the terms of that particular swap agreement. Notional amount denominated in USD unless otherwise noted. |
(b) “Implied credit spreads”, represented in absolute terms, are utilized in determining the fair value of credit default swap agreements on corporate issues or sovereign issues of an emerging country as of the reporting date. Implied credit spreads serve as an indicator of the current status of the payment/performance risk and represent the likelihood of risk of default for the credit derivative. The implied credit spread of a particular referenced entity reflects the cost of buying/selling protection and may include up-front payments required to be made to enter into the agreement. Wider credit spreads represent a deterioration of the referenced entity’s credit soundness and a greater likelihood of risk of default or other credit event occurring as defined under the terms of the agreement. |
(c) “Fair value” of credit default swap agreements on asset-backed securities and credit indices serves as an indicator of the current status of the payment/performance risk and represents the likelihood of an expected liability (or profit) for the credit derivative should the notional amount of the swap agreement be closed/sold as of the reporting date. Increasing fair value in absolute terms, represents a deterioration of the referenced entity’s credit soundness and a greater likelihood of risk of default or other credit event occurring as defined under the terms of the agreement. |
(d)The variation margin shown on the Statement of Assets and Liabilities is the daily change in the unrealized appreciation (depreciation) for centrally cleared swap agreements. The unrealized appreciation (depreciation) presented above is the cumulative change in the unrealized appreciation (depreciation) from the date the contract was open until April 30, 2018. |
| (e)The value shown on the Statement of Assets and Liabilities for over the counter swap agreements is based upon the value presented in the table above. Over the counter swap agreements for which the fair value is a positive number, and the upfront premiums paid (received) associated with them, are presented as assets on the Statement of Assets and Liabilities. Over the counter swap agreements for which the fair value is a negative number, and the upfront premiums paid (received), are presented as liabilities on the Statement of Assets and Liabilities. |
See Notes which are an integral part of the Financial Statements
April 30, 2018 / ANNUAL REPORT
58
PORTFOLIO OF INVESTMENTS SUMMARY TABLE
Wilmington Diversified Income Fund
At April 30, 2018, the Fund’s portfolio composition was as follows (unaudited):
| | | | | |
| | | Percentage of |
| Investment Companies: | | Total Net Assets |
Exchange-Traded Funds | | | | 31.0 | % |
Inflation-Protected Securities Funds | | | | 7.1 | % |
Common Stocks | | | | 37.4 | % |
Corporate Bonds | | | | 7.8 | % |
U.S. Treasury | | | | 7.7 | % |
Mortgage-Backed Securities | | | | 5.0 | % |
Collateralized Mortgage Obligations | | | | 0.4 | % |
Enhanced Equipment Trust Certificates | | | | 0.2 | % |
Cash Equivalents1 | | | | 12.8 | % |
Other Assets and Liabilities - Net2 | | | | (9.4 | )% |
| | | | | |
TOTAL | | | | 100.0 | % |
| | | | | |
| (1) | Cash Equivalents include investments in a money market fund and repurchase agreements. |
| (2) | Assets, other than investments in securities, less liabilities. See Statements of Assets and Liabilities. |
PORTFOLIO OF INVESTMENTS
April 30, 2018
| | | | | | | | |
| | |
| Description | | Number of
Shares | | | Value | |
| |
INVESTMENT COMPANIES – 38.1% | | | | | |
| |
EXCHANGE-TRADED FUNDS – 31.0% | | | | | |
| | |
iShares iBoxx $ High Yield Corporate Bond ETF# | | | 33,800 | | | $ | 2,896,660 | |
| | |
iShares International Select Dividend ETF# | | | 209,400 | | | | 7,121,694 | |
| | |
SPDR Dow Jones International | | | | | | | | |
Real Estate ETF# | | | 50,625 | | | | 2,066,006 | |
| | |
Vanguard REIT ETF# | | | 13,000 | | | | 989,170 | |
| | | | | | | | |
| | |
TOTAL EXCHANGE-TRADED FUNDS | | | | | | $ | 13,073,530 | |
|
INFLATION-PROTECTED SECURITIES FUNDS – 7.1% | |
| | |
Vanguard Inflation-Protected Securities Fund, Admiral Shares | | | 118,109 | | | | 2,983,445 | |
| | | | | | | | |
| |
TOTAL INVESTMENT COMPANIES (COST $16,169,536) | | | $ | 16,056,975 | |
| | | | | | | | |
| | |
Description | | Par Value | | | Value | |
| |
COLLATERALIZED MORTGAGE OBLIGATIONS – 0.4% | | | | | |
|
FEDERAL NATIONAL MORTGAGE ASSOCIATION (FNMA) – 0.3% | |
| | |
Series 1988-23, Class C, 9.75%, 9/25/18 | | $ | 12 | | | $ | 13 | |
| | |
Series 2012-114, Class VM, 3.50%, 10/25/25 | | | 124,646 | | | | 126,187 | |
| | | | | | | | |
| |
TOTAL FEDERAL NATIONAL MORTGAGE ASSOCIATION (FNMA) | | | $ | 126,200 | |
| | |
WHOLE LOAN – 0.1% | | | | | | | | |
| | |
Banc of America Mortgage Securities, Inc., Series 2004-A, Class 2A1, 3.86%, 2/25/34D | | | 17,752 | | | | 18,202 | |
| | |
IndyMac INDA Mortgage Loan Trust, Series 2005-AR1, Class 2A1, 4.02%, 11/25/35D | | | 8,109 | | | | 7,738 | |
| | | | | | | | |
| | |
TOTAL WHOLE LOAN | | | | | | $ | 25,940 | |
| | | | | | | | |
| |
TOTAL COLLATERALIZED MORTGAGE OBLIGATIONS (COST $165,036) | | | $ | 152,140 | |
| | |
CORPORATE BONDS – 7.8% | | | | | | | | |
| | |
AEROSPACE & DEFENSE – 0.1% | | | | | | | | |
| | |
Rockwell Collins, Inc., Sr. Unsecured, 3.50%, 3/15/27 | | | 25,000 | | | | 23,707 | |
| | |
AUTOMOTIVE – 0.1% | | | | | | | | |
| | |
General Motors Financial Co., Inc., Company Guaranteed, 3.20%, 7/06/21 | | | 40,000 | | | | 39,548 | |
ANNUAL REPORT / April 30, 2018
59 PORTFOLIOS OF INVESTMENTS
Wilmington Diversified Income Fund (continued)
| | | | | | | | |
Description | | Par Value | | | Value | |
| | |
BEVERAGES – 0.2% | | | | | | | | |
| | |
Anheuser-Busch InBev Finance, Inc., | | | | | | | | |
Company Guaranteed, 4.90%, 2/01/46 | | $ | 20,000 | | | $ | 20,668 | |
| | |
Dr. Pepper Snapple Group, Inc., | | | | | | | | |
Company Guaranteed, 2.00%, 1/15/20 | | | 10,000 | | | | 9,791 | |
| | |
Dr. Pepper Snapple Group, Inc., | | | | | | | | |
Company Guaranteed, 2.70%, 11/15/22 | | | 40,000 | | | | 38,072 | |
| | | | | | | | |
| | |
TOTAL BEVERAGES | | | | | | $ | 68,531 | |
| | |
BIOTECHNOLOGY – 0.2% | | | | | | | | |
| | |
Amgen, Inc., | | | | | | | | |
Sr. Unsecured, 4.40%, 5/01/45 | | | 25,000 | | | | 24,115 | |
| | |
Celgene Corp., | | | | | | | | |
Sr. Unsecured, 2.75%, 2/15/23 | | | 25,000 | | | | 23,925 | |
| | |
Celgene Corp., | | | | | | | | |
Sr. Unsecured, 4.55%, 2/20/48 | | | 45,000 | | | | 42,587 | |
| | | | | | | | |
| | |
TOTAL BIOTECHNOLOGY | | | | | | $ | 90,627 | |
| | |
CAPITAL MARKETS – 0.3% | | | | | | | | |
| | |
Goldman Sachs Group, Inc. (The), | | | | | | | | |
Sr. Unsecured, (3 month USD LIBOR + 1.20%), 3.27%, 9/29/25D | | | 55,000 | | | | 52,398 | |
| | |
Goldman Sachs Group, Inc. (The), | | | | | | | | |
Sr. Unsecured, (3 month USD LIBOR + 1.51%), 3.69%, 6/05/28D | | | 35,000 | | | | 33,296 | |
| | |
Morgan Stanley, | | | | | | | | |
Subordinated, GMTN, 4.35%, 9/08/26 | | | 10,000 | | | | 9,941 | |
| | |
TD Ameritrade Holding Corp., | | | | | | | | |
Sr. Unsecured, 2.95%, 4/01/22 | | | 18,000 | | | | 17,705 | |
| | | | | | | | |
| | |
TOTAL CAPITAL MARKETS | | | | | | $ | 113,340 | |
| | |
COMMERCIAL BANKS – 0.5% | | | | | | | | |
| | |
BB&T Corp., | | | | | | | | |
Sr. Unsecured, MTN, 2.45%, 1/15/20 | | | 30,000 | | | | 29,691 | |
| | |
Fifth Third Bancorp, | | | | | | | | |
Sr. Unsecured, 3.50%, 3/15/22 | | | 100,000 | | | | 100,090 | |
| | |
Fifth Third Bancorp, | | | | | | | | |
Subordinated, 4.30%, 1/16/24 | | | 20,000 | | | | 20,345 | |
| | |
SunTrust Banks, Inc., | | | | | | | | |
Sr. Unsecured, 2.90%, 3/03/21 | | | 30,000 | | | | 29,686 | |
| | |
US Bancorp, | | | | | | | | |
Series V, Sr. Unsecured, MTN, 2.63%, 1/24/22 | | | 45,000 | | | | 44,103 | |
| | | | | | | | |
| | |
TOTAL COMMERCIAL BANKS | | | | | | $ | 223,915 | |
| | |
CONSUMER FINANCE – 0.1% | | | | | | | | |
| | |
American Express Co., | | | | | | | | |
Sr. Unsecured, (3 month USD LIBOR + 0.59%), 2.49%, 5/22/18D | | | 30,000 | | | | 30,003 | |
| | |
Capital One Financial Corp., | | | | | | | | |
Sr. Unsecured, 2.40%, 10/30/20 | | | 25,000 | | | | 24,413 | |
| | | | | | | | |
| | |
TOTAL CONSUMER FINANCE | | | | | | $ | 54,416 | |
| |
DIVERSIFIED FINANCIAL SERVICES – 1.0% | | | | | |
| | |
Bank of America Corp., | | | | | | | | |
Sr. Unsecured, MTN, 3.25%, 10/21/27 | | | 20,000 | | | | 18,607 | |
| | | | | | | | |
Description | | Par Value | | | Value | |
| | |
BlackRock, Inc., | | | | | | | | |
Sr. Unsecured, 3.38%, 6/01/22 | | $ | 38,000 | | | $ | 38,073 | |
| | |
Charles Schwab Corp. (The), | | | | | | | | |
Sr. Unsecured, 2.20%, 7/25/18 | | | 15,000 | | | | 14,998 | |
| | |
Citigroup, Inc., | | | | | | | | |
Sr. Unsecured, (3 month USD LIBOR + 0.95%), 2.88%, 7/24/23D | | | 35,000 | | | | 33,881 | |
| | |
FMR LLC, | | | | | | | | |
Sr. Unsecured, 6.45%, 11/15/39W | | | 100,000 | | | | 128,736 | |
| | |
HSBC USA, Inc., | | | | | | | | |
Sr. Unsecured, 2.63%, 9/24/18 | | | 40,000 | | | | 40,047 | |
| | |
JPMorgan Chase & Co., | | | | | | | | |
Sr. Unsecured, MTN, 2.30%, 8/15/21 | | | 100,000 | | | | 96,957 | |
| | |
Wells Fargo & Co., | | | | | | | | |
Subordinated, MTN, 4.40%, 6/14/46 | | | 40,000 | | | | 37,348 | |
| | |
Wells Fargo & Co., | | | | | | | | |
Series M, Subordinated, MTN,
3.45%, 2/13/23 | | | 35,000 | | | | 34,356 | |
| | | | | | | | |
| | |
TOTAL DIVERSIFIED FINANCIAL SERVICES | | | | | | $ | 443,003 | |
| | |
ELECTRIC – 0.3% | | | | | | | | |
| | |
DTE Energy Co., | | | | | | | | |
Series F, Sr. Unsecured, 3.85%, 12/01/23 | | | 10,000 | | | | 10,065 | |
| | |
Entergy Corp., | | | | | | | | |
Sr. Unsecured, 5.13%, 9/15/20 | | | 90,000 | | | | 92,754 | |
| | |
Pacific Gas & Electric Co., | | | | | | | | |
Sr. Unsecured, 3.75%, 2/15/24 | | | 20,000 | | | | 19,785 | |
| | | | | | | | |
| | |
TOTAL ELECTRIC | | | | | | $ | 122,604 | |
| | |
ENVIRONMENTAL CONTROL – 0.1% | | | | | | | | |
| | |
Waste Management, Inc., | | | | | | | | |
Company Guaranteed, 3.50%, 5/15/24 | | | 35,000 | | | | 34,757 | |
| | |
Waste Management, Inc., | | | | | | | | |
Company Guaranteed, 4.10%, 3/01/45 | | | 25,000 | | | | 24,865 | |
| | | | | | | | |
| | |
TOTAL ENVIRONMENTAL CONTROL | | | | | | $ | 59,622 | |
| | |
FOOD & STAPLES RETAILING – 0.1% | | | | | | | | |
| | |
Kroger Co. (The), | | | | | | | | |
Sr. Unsecured, 2.80%, 8/01/22 | | | 35,000 | | | | 33,867 | |
| | |
FOREST PRODUCTS & PAPER – 0.2% | | | | | | | | |
| | |
International Paper Co., | | | | | | | | |
Sr. Unsecured, 4.75%, 2/15/22 | | | 35,000 | | | | 36,400 | |
| | |
International Paper Co., | | | | | | | | |
Sr. Unsecured, 4.40%, 8/15/47 | | | 50,000 | | | | 45,831 | |
| | | | | | | | |
| | |
TOTAL FOREST PRODUCTS & PAPER | | | | | | $ | 82,231 | |
| |
HEALTH CARE EQUIPMENT & SUPPLIES – 0.1% | | | | | |
| | |
Abbott Laboratories, | | | | | | | | |
Sr. Unsecured, 2.35%, 11/22/19 | | | 12,000 | | | | 11,898 | |
| | |
Thermo Fisher Scientific, Inc., | | | | | | | | |
Sr. Unsecured, 3.30%, 2/15/22 | | | 20,000 | | | | 19,845 | |
| | | | | | | | |
| | |
TOTAL HEALTH CARE EQUIPMENT & SUPPLIES | | | | | | $ | 31,743 | |
| |
HEALTH CARE PROVIDERS & SERVICES – 0.3% | | | | | |
| | |
Anthem, Inc., | | | | | | | | |
Sr. Unsecured, 3.65%, 12/01/27 | | | 30,000 | | | | 28,562 | |
April 30, 2018 / ANNUAL REPORT
PORTFOLIOS OF INVESTMENTS 60
Wilmington Diversified Income Fund (continued)
| | | | | | | | |
Description | | Par Value | | | Value | |
| | |
Cardinal Health, Inc., | | | | | | | | |
Sr. Unsecured, 3.08%, 6/15/24 | | $ | 35,000 | | | $ | 33,084 | |
| | |
UnitedHealth Group, Inc., | | | | | | | | |
Sr. Unsecured, 2.75%, 2/15/23 | | | 25,000 | | | | 24,299 | |
| | |
UnitedHealth Group, Inc., | | | | | | | | |
Sr. Unsecured, 2.95%, 10/15/27 | | | 25,000 | | | | 23,374 | |
| | | | | | | | |
| | |
TOTAL HEALTH CARE PROVIDERS & SERVICES | | | | | | $ | 109,319 | |
| | |
HOME FURNISHINGS – 0.2% | | | | | | | | |
| | |
Whirlpool Corp., | | | | | | | | |
Sr. Unsecured, 4.70%, 6/01/22 | | | 65,000 | | | | 67,542 | |
| | |
HOUSEHOLD PRODUCTS – 0.2% | | | | | | | | |
| | |
Church & Dwight Co., Inc., | | | | | | | | |
Sr. Unsecured, 3.95%, 8/01/47 | | | 15,000 | | | | 13,500 | |
| | |
Tupperware Brands Corp., | | | | | | | | |
Company Guaranteed, 4.75%, 6/01/21 | | | 60,000 | | | | 61,261 | |
| | | | | | | | |
| | |
TOTAL HOUSEHOLD PRODUCTS | | | | | | $ | 74,761 | |
| | |
INSURANCE – 0.5% | | | | | | | | |
| | |
Aon PLC, | | | | | | | | |
Company Guaranteed, 4.00%, 11/27/23 | | | 40,000 | | | | 40,637 | |
| | |
CNA Financial Corp., | | | | | | | | |
Sr. Unsecured, 3.95%, 5/15/24 | | | 35,000 | | | | 34,874 | |
| | |
Lincoln National Corp., | | | | | | | | |
Sr. Unsecured, 3.63%, 12/12/26 | | | 25,000 | | | | 24,170 | |
| | |
WR Berkley Corp., | | | | | | | | |
Sr. Unsecured, 4.63%, 3/15/22 | | | 60,000 | | | | 61,995 | |
| | |
WR Berkley Corp., | | | | | | | | |
Sr. Unsecured, 4.75%, 8/01/44 | | | 45,000 | | | | 45,269 | |
| | | | | | | | |
| | |
TOTAL INSURANCE | | | | | | $ | 206,945 | |
| | |
MEDIA – 0.2% | | | | | | | | |
| | |
CBS Corp., | | | | | | | | |
Company Guaranteed, 4.60%, 1/15/45 | | | 75,000 | | | | 71,222 | |
| | |
Time Warner, Inc., | | | | | | | | |
Company Guaranteed, 4.85%, 7/15/45 | | | 25,000 | | | | 24,439 | |
| | |
Walt Disney Co. (The), | | | | | | | | |
Sr. Unsecured, GMTN, 4.13%, 6/01/44 | | | 10,000 | | | | 10,134 | |
| | | | | | | | |
| | |
TOTAL MEDIA | | | | | | $ | 105,795 | |
| |
MISCELLANEOUS MANUFACTURING – 0.1% | | | | | |
| | |
Illinois Tool Works, Inc., | | | | | | | | |
Sr. Unsecured, 3.50%, 3/01/24 | | | 45,000 | | | | 45,309 | |
| | |
Textron, Inc., | | | | | | | | |
Sr. Unsecured, 3.65%, 3/01/21 | | | 20,000 | | | | 20,118 | |
| | | | | | | | |
| | |
TOTAL MISCELLANEOUS MANUFACTURING | | | | | | $ | 65,427 | |
| | |
OIL & GAS – 0.5% | | | | | | | | |
| | |
BP Capital Markets PLC, | | | | | | | | |
Company Guaranteed, 2.50%, 11/06/22 | | | 50,000 | | | | 48,174 | |
| | |
Exxon Mobil Corp., | | | | | | | | |
Sr. Unsecured, 1.82%, 3/15/19 | | | 30,000 | | | | 29,848 | |
| | |
Marathon Petroleum Corp., | | | | | | | | |
Sr. Unsecured, 3.63%, 9/15/24 | | | 20,000 | | | | 19,765 | |
| | | | | | | | |
Description | | Par Value | | | Value | |
| | |
Phillips 66, | | | | | | | | |
Company Guaranteed, 4.30%, 4/01/22 | | $ | 20,000 | | | $ | 20,796 | |
| | |
Sempra Energy, | | | | | | | | |
Sr. Unsecured, 2.85%, 11/15/20 | | | 55,000 | | | | 54,401 | |
| | |
Shell International Finance BV, | | | | | | | | |
Company Guaranteed, 3.25%, 5/11/25 | | | 25,000 | | | | 24,594 | |
| | |
Valero Energy Corp., | | | | | | | | |
Sr. Unsecured, 4.90%, 3/15/45 | | | 10,000 | | | | 10,468 | |
| | | | | | | | |
| | |
TOTAL OIL & GAS | | | | | | $ | 208,046 | |
| | |
PHARMACEUTICALS – 0.3% | | | | | | | | |
| | |
AbbVie, Inc., | | | | | | | | |
Sr. Unsecured, 2.50%, 5/14/20 | | | 30,000 | | | | 29,636 | |
| | |
AbbVie, Inc., | | | | | | | | |
Sr. Unsecured, 4.40%, 11/06/42 | | | 20,000 | | | | 19,039 | |
| | |
CVS Health Corp., | | | | | | | | |
Sr. Unsecured, 5.05%, 3/25/48 | | | 30,000 | | | | 30,504 | |
| | |
Medco Health Solutions, Inc., | | | | | | | | |
Company Guaranteed, 4.13%, 9/15/20 | | | 20,000 | | | | 20,335 | |
| | |
Zoetis, Inc., | | | | | | | | |
Sr. Unsecured, 3.95%, 9/12/47 | | | 20,000 | | | | 18,701 | |
| | | | | | | | |
| | |
TOTAL PHARMACEUTICALS | | | | | | $ | 118,215 | |
| | |
PIPELINES – 0.8% | | | | | | | | |
| | |
Energy Transfer Partners LP, | | | | | | | | |
Sr. Unsecured, 3.60%, 2/01/23 | | | 35,000 | | | | 34,272 | |
| | |
Energy Transfer Partners LP, | | | | | | | | |
Sr. Unsecured, 4.20%, 4/15/27 | | | 40,000 | | | | 38,117 | |
| | |
Kinder Morgan Energy Partners LP, | | | | | | | | |
Company Guaranteed, 2.65%, 2/01/19 | | | 35,000 | | | | 34,922 | |
| | |
Kinder Morgan, Inc., | | | | | | | | |
Company Guaranteed, 5.20%, 3/01/48 | | | 40,000 | | | | 39,334 | |
| | |
MPLX LP, | | | | | | | | |
Sr. Unsecured, 4.00%, 3/15/28 | | | 30,000 | | | | 28,825 | |
| | |
ONEOK Partners LP, | | | | | | | | |
Company Guaranteed, 6.20%, 9/15/43 | | | 45,000 | | | | 51,483 | |
| | |
Spectra Energy Partners LP, | | | | | | | | |
Sr. Unsecured, 2.95%, 9/25/18 | | | 100,000 | | | | 100,145 | |
| | |
Spectra Energy Partners LP, | | | | | | | | |
Sr. Unsecured, 4.50%, 3/15/45 | | | 25,000 | | | | 23,466 | |
| | | | | | | | |
| | |
TOTAL PIPELINES | | | | | | $ | 350,564 | |
| |
REAL ESTATE INVESTMENT TRUSTS – 0.7% | | | | | |
| | |
American Tower Corp., | | | | | | | | |
Sr. Unsecured, 5.00%, 2/15/24 | | | 15,000 | | | | 15,760 | |
| | |
AvalonBay Communities, Inc., | | | | | | | | |
Sr. Unsecured, MTN, 3.35%, 5/15/27 | | | 25,000 | | | | 23,935 | |
| | |
Digital Realty Trust LP, | | | | | | | | |
Company Guaranteed, 5.88%, 2/01/20 | | | 100,000 | | | | 103,949 | |
| | |
HCP, Inc., | | | | | | | | |
Sr. Unsecured, 2.63%, 2/01/20 | | | 100,000 | | | | 98,792 | |
| | |
HCP, Inc., | | | | | | | | |
Sr. Unsecured, 4.20%, 3/01/24 | | | 15,000 | | | | 14,985 | |
ANNUAL REPORT / April 30, 2018
61 PORTFOLIOS OF INVESTMENTS
Wilmington Diversified Income Fund (continued)
| | | | | | | | |
Description | | Par Value | | | Value | |
| | |
Healthcare Realty Trust, Inc., | | | | | | | | |
Sr. Unsecured, 3.75%, 4/15/23 | | $ | 40,000 | | | $ | 39,415 | |
| | |
Healthcare Realty Trust, Inc., | | | | | | | | |
Sr. Unsecured, 3.88%, 5/01/25 | | | 15,000 | | | | 14,579 | |
| | | | | | | | |
| | |
TOTAL REAL ESTATE INVESTMENT TRUSTS | | | | | | $ | 311,415 | |
| |
SEMICONDUCTORS – 0.1% | | | | | |
| | |
Intel Corp., | | | | | | | | |
Sr. Unsecured, 2.70%, 12/15/22 | | | 35,000 | | | | 34,270 | |
| |
TELECOMMUNICATIONS – 0.2% | | | | | |
| | |
AT&T, Inc., | | | | | | | | |
Sr. Unsecured, (3 month USD LIBOR + 0.91%), 2.87%, 11/27/18D | | | 55,000 | | | | 55,221 | |
| | |
AT&T, Inc., | | | | | | | | |
Sr. Unsecured, 4.50%, 5/15/35 | | | 15,000 | | | | 14,357 | |
| | | | | | | | |
| | |
TOTAL TELECOMMUNICATIONS | | | | | | $ | 69,578 | |
| |
TRANSPORTATION – 0.4% | | | | | |
| | |
FedEx Corp., | | | | | | | | |
Company Guaranteed, 3.88%, 8/01/42 | | | 30,000 | | | | 27,326 | |
| | |
FedEx Corp., | | | | | | | | |
Company Guaranteed, 4.10%, 2/01/45 | | | 15,000 | | | | 13,936 | |
| | |
Ryder System, Inc., | | | | | | | | |
Sr. Unsecured, MTN, 2.65%, 3/02/20 | | | 100,000 | | | | 99,042 | |
| | |
Ryder System, Inc., | | | | | | | | |
Sr. Unsecured, MTN, 2.50%, 9/01/22 | | | 10,000 | | | | 9,574 | |
| | | | | | | | |
| | |
TOTAL TRANSPORTATION | | | | | | $ | 149,878 | |
| |
TRUCKING & LEASING – 0.0%** | | | | | |
| | |
GATX Corp., | | | | | | | | |
Sr. Unsecured, 5.20%, 3/15/44# | | | 20,000 | | | | 21,283 | |
| | | | | | | | |
| |
TOTAL CORPORATE BONDS (COST $3,299,909) | | | $ | 3,280,192 | |
| | | | | |
| | | Number of
Shares | | | | |
| | |
COMMON STOCKS – 37.4% | | | | | | | | |
| |
CONSUMER DISCRETIONARY – 1.7% | | | | | |
| |
HOTELS, RESTAURANTS & LEISURE – 1.0% | | | | | |
| | |
Darden Restaurants, Inc. | | | 2,650 | | | | 246,079 | |
| | |
Extended Stay America, Inc. | | | 8,775 | | | | 171,815 | |
| | | | | | | | |
| | |
| | | | | | $ | 417,894 | |
| |
TEXTILES, APPAREL & LUXURY GOODS – 0.7% | | | | | |
| | |
Tapestry, Inc. | | | 5,625 | | | | 302,456 | |
| | | | | | | | |
| | |
TOTAL CONSUMER DISCRETIONARY | | | | | | $ | 720,350 | |
| |
CONSUMER STAPLES – 2.8% | | | | | |
| |
BEVERAGES – 0.5% | | | | | |
| | |
Coca-Cola Co. (The) | | | 4,775 | | | | 206,328 | |
| |
FOOD & STAPLES RETAILING – 0.5% | | | | | |
| | |
CVS Health Corp. | | | 2,800 | | | | 195,524 | |
| | | | | | | | |
| Description | | Number of
Shares | | | Value | |
| |
HOUSEHOLD PRODUCTS – 0.6% | | | | | |
| | |
Procter & Gamble Co. (The) | | | 3,525 | | | $ | 254,998 | |
| |
TOBACCO – 1.2% | | | | | |
| | |
Altria Group, Inc. | | | 5,150 | | | | 288,967 | |
| | |
Philip Morris International, Inc. | | | 2,850 | | | | 233,700 | |
| | | | | | | | |
| | |
| | | | | | $ | 522,667 | |
| | | | | | | | |
| | |
TOTAL CONSUMER STAPLES | | | | | | $ | 1,179,517 | |
| |
ENERGY – 5.8% | | | | | |
| |
ENERGY EQUIPMENT & SERVICES – 0.6% | | | | | |
| | |
Schlumberger Ltd. | | | 3,575 | | | | 245,102 | |
| |
OIL, GAS & CONSUMABLE FUELS – 5.2% | | | | | |
| | |
BP PLC ADR | | | 8,675 | | | | 386,818 | |
| | |
Chevron Corp. | | | 4,825 | | | | 603,656 | |
| | |
Exxon Mobil Corp. | | | 2,850 | | | | 221,588 | |
| | |
Occidental Petroleum Corp. | | | 4,900 | | | | 378,574 | |
| | |
Suncor Energy, Inc. | | | 10,050 | | | | 384,211 | |
| | |
Targa Resources Corp. | | | 4,850 | | | | 227,804 | |
| | | | | | | | |
| | |
| | | | | | $ | 2,202,651 | |
| | | | | | | | |
| | |
TOTAL ENERGY | | | | | | $ | 2,447,753 | |
| |
FINANCIALS – 10.0% | | | | | |
| |
CAPITAL MARKETS – 1.1% | | | | | |
| | |
Invesco Ltd. | | | 7,950 | | | | 230,311 | |
| | |
Main Street Capital Corp. | | | 5,578 | | | | 210,625 | |
| | | | | | | | |
| | |
| | | | | | $ | 440,936 | |
| |
COMMERCIAL BANKS – 3.3% | | | | | |
| | |
First Hawaiian, Inc. | | | 7,150 | | | | 196,982 | |
| | |
PacWest Bancorp | | | 6,825 | | | | 349,713 | |
| | |
People’s United Financial, Inc. | | | 12,675 | | | | 231,826 | |
| | |
Umpqua Holdings Corp. | | | 14,625 | | | | 344,565 | |
| | |
United Bankshares, Inc. | | | 7,850 | | | | 266,507 | |
| | | | | | | | |
| | |
| | | | | | $ | 1,389,593 | |
| |
DIVERSIFIED FINANCIAL SERVICES – 3.0% | | | | | |
| | |
JPMorgan Chase & Co. | | | 4,850 | | | | 527,583 | |
| | |
Toronto-Dominion Bank (The) | | | 7,200 | | | | 404,280 | |
| | |
Wells Fargo & Co. | | | 6,500 | | | | 337,740 | |
| | | | | | | | |
| | |
| | | | | | $ | 1,269,603 | |
| |
INSURANCE – 2.0% | | | | | |
| | |
MetLife, Inc. | | | 7,230 | | | | 344,654 | |
| | |
Old Republic International Corp. | | | 14,625 | | | | 298,350 | |
| | |
Sun Life Financial, Inc. | | | 5,000 | | | | 206,400 | |
| | | | | | | | |
| | |
| | | | | | $ | 849,404 | |
| |
REAL ESTATE INVESTMENT TRUSTS – 0.6% | | | | | |
| | |
Blackstone Mortgage Trust, Inc., Class A | | | 8,625 | | | | 266,081 | |
| | | | | | | | |
| | |
TOTAL FINANCIALS | | | | | | $ | 4,215,617 | |
April 30, 2018 / ANNUAL REPORT
PORTFOLIOS OF INVESTMENTS 62
Wilmington Diversified Income Fund (continued)
| | | | | | | | |
| Description | | Number of
Shares | | | Value | |
| | |
HEALTH CARE – 4.7% | | | | | | | | |
| | |
BIOTECHNOLOGY – 0.4% | | | | | | | | |
| | |
Amgen, Inc. | | | 950 | | | $ | 165,756 | |
| | |
PHARMACEUTICALS – 4.3% | | | | | | | | |
| | |
AbbVie, Inc. | | | 4,200 | | | | 405,510 | |
| | |
Bristol-Myers Squibb Co. | | | 3,050 | | | | 158,997 | |
| | |
Johnson & Johnson | | | 3,250 | | | | 411,092 | |
| | |
Merck & Co., Inc. | | | 7,300 | | | | 429,751 | |
| | |
Pfizer, Inc. | | | 11,250 | | | | 411,862 | |
| | | | | | | | |
| | |
| | | | | | $ | 1,817,212 | |
| | | | | | | | |
TOTAL HEALTH CARE | | | | | | $ | 1,982,968 | |
| | |
INDUSTRIALS – 3.1% | | | | | | | | |
| | |
AEROSPACE & DEFENSE – 0.9% | | | | | | | | |
| | |
Lockheed Martin Corp. | | | 1,240 | | | | 397,842 | |
| | |
AIR FREIGHT & LOGISTICS – 0.6% | | | | | | | | |
| | |
United Parcel Service, Inc., Class B | | | 2,425 | | | | 275,237 | |
| | |
ELECTRICAL EQUIPMENT – 0.8% | | | | | | | | |
| | |
Emerson Electric Co. | | | 4,950 | | | | 328,730 | |
| |
MISCELLANEOUS MANUFACTURING – 0.8% | | | | | |
| | |
Eaton Corp. PLC | | | 4,300 | | | | 322,629 | |
| | | | | | | | |
| | |
TOTAL INDUSTRIALS | | | | | | $ | 1,324,438 | |
| |
INFORMATION TECHNOLOGY – 3.8% | | | | | |
| | |
COMMUNICATIONS EQUIPMENT – 1.7% | | | | | | | | |
Cisco Systems, Inc. | | | 15,625 | | | | 692,031 | |
|
SEMICONDUCTORS & SEMICONDUCTOR EQUIPMENT – 1.5% | |
Maxim Integrated Products, Inc. | | | 6,300 | | | | 343,350 | |
| | |
QUALCOMM, Inc. | | | 5,975 | | | | 304,785 | |
| | | | | | | | |
| | |
| | | | | | $ | 648,135 | |
| | |
SOFTWARE – 0.6% | | | | | | | | |
| | |
CA, Inc. | | | 6,825 | | | | 237,510 | |
| | | | | | | | |
TOTAL INFORMATION TECHNOLOGY | | | | | | $ | 1,577,676 | |
| | |
MATERIALS – 0.8% | | | | | | | | |
| | |
CHEMICALS – 0.8% | | | | | | | | |
| | |
LyondellBasell Industries NV, Class A | | | 3,325 | | | | 351,552 | |
| | |
REAL ESTATE – 1.4% | | | | | | | | |
|
REAL ESTATE INVESTMENT TRUSTS – 1.4% | |
| | |
Park Hotels & Resorts, Inc. | | | 7,000 | | | | 201,460 | |
| | |
Weyerhaeuser Co. | | | 10,100 | | | | 371,478 | |
| | | | | | | | |
| | |
| | | | | | $ | 572,938 | |
| | | | | | | | |
| | |
TOTAL REAL ESTATE | | | | | | $ | 572,938 | |
| |
TELECOMMUNICATION SERVICES – 0.9% | | | | | |
|
DIVERSIFIED TELECOMMUNICATION SERVICES – 0.9% | |
| | |
AT&T, Inc. | | | 11,300 | | | | 369,510 | |
| | | | | | | | |
Description | | Number of
Shares | | | Value | |
| |
UTILITIES – 2.4% | | | | | |
| | |
ELECTRIC UTILITIES – 2.4% | | | | | | | | |
| | |
American Electric Power Co., Inc. | | | 3,375 | | | $ | 236,183 | |
| | |
Duke Energy Corp. | | | 2,575 | | | | 206,412 | |
| | |
FirstEnergy Corp. | | | 7,625 | | | | 262,300 | |
| | |
NextEra Energy, Inc. | | | 1,770 | | | | 290,121 | |
| | | | | | | | |
| | |
| | | | | | $ | 995,016 | |
| | | | | | | | |
| | |
TOTAL UTILITIES | | | | | | $ | 995,016 | |
| | | | | | | | |
| |
TOTAL COMMON STOCKS (COST $14,888,388) | | | $ | 15,737,335 | |
| | | Par Value | | | | |
|
ENHANCED EQUIPMENT TRUST CERTIFICATES – 0.2% | |
| |
AIRLINES – 0.2% | | | | | |
Continental Airlines 2009-2, | | | | | | | | |
Series A, Pass-Through Certificates, 7.25%, 11/10/19 | | $ | 50,408 | | | | 53,054 | |
| | |
Delta Air Lines, 2007-1, | | | | | | | | |
Series A, Pass-Through Certificates, 6.82%, 8/10/22 | | | 37,304 | | | | 40,941 | |
| | | | | | | | |
| | |
TOTAL AIRLINES | | | | | | $ | 93,995 | |
| | | | | | | | |
|
TOTAL ENHANCED EQUIPMENT TRUST CERTIFICATES | |
(COST $86,871) | | | $ | 93,995 | |
| | |
MORTGAGE-BACKED SECURITIES – 5.0% | | | | | | | | |
|
FEDERAL HOME LOAN MORTGAGE CORPORATION (FHLMC) – 2.1% | |
| | |
Pool C00478, 8.50%, 9/01/26 | | | 1,390 | | | | 1,612 | |
| | |
Pool A15865, 5.50%, 11/01/33 | | | 31,244 | | | | 33,899 | |
| | |
Pool A19412, 5.00%, 3/01/34 | | | 89,143 | | | | 97,059 | |
| | |
Pool G05774, 5.00%, 1/01/40 | | | 182,252 | | | | 196,246 | |
| | |
Pool C03517, 4.50%, 9/01/40 | | | 23,793 | | | | 24,996 | |
| | |
Pool C03849, 3.50%, 4/01/42 | | | 45,041 | | | | 44,805 | |
| | |
Pool C04305, 3.00%, 11/01/42 | | | 156,223 | | | | 150,762 | |
| | |
Pool C09020, 3.50%, 11/01/42 | | | 135,115 | | | | 135,385 | |
| | |
Pool G07889, 3.50%, 8/01/43 | | | 32,612 | | | | 32,400 | |
| | |
Pool Q23891, 4.00%, 12/01/43 | | | 37,473 | | | | 38,239 | |
| | |
Pool G60038, 3.50%, 1/01/44 | | | 107,465 | | | | 107,680 | |
| | | | | | | | |
| | |
TOTAL FEDERAL HOME LOAN MORTGAGE CORPORATION (FHLMC) | | | | | | $ | 863,083 | |
|
FEDERAL NATIONAL MORTGAGE ASSOCIATION (FNMA) – 2.8% | |
| | |
Pool 326445, 0.88%, 5/21/18 | | | 165,000 | | | | 164,915 | |
| | |
Pool 580676, 1.63%, 11/27/18 | | | 165,000 | | | | 164,594 | |
| | |
Pool AB4089, 3.00%, 12/01/26 | | | 23,868 | | | | 23,851 | |
| | |
Pool 533246, 7.50%, 4/01/30 | | | 3,695 | | | | 3,798 | |
| | |
Pool AJ4050, 4.00%, 10/01/41 | | | 76,531 | | | | 78,565 | |
| | |
Pool AX5302, 4.00%, 1/01/42 | | | 24,137 | | | | 24,778 | |
| | |
Pool AT7899, 3.50%, 7/01/43 | | | 61,604 | | | | 61,203 | |
ANNUAL REPORT / April 30, 2018
63 PORTFOLIOS OF INVESTMENTS
Wilmington Diversified Income Fund (continued)
| | | | | | | | |
Description | | Par Value | | | Value | |
| | |
Pool AS0302, 3.00%, 8/01/43 | | $ | 66,083 | | | $ | 64,248 | |
| | |
Pool AL6325, 3.00%, 10/01/44 | | | 60,476 | | | | 58,798 | |
| | |
Pool BC0830, 3.00%, 4/01/46 | | | 76,602 | | | | 73,952 | |
| | |
Pool BC9468, 3.00%, 6/01/46 | | | 22,418 | | | | 21,628 | |
| | |
Pool BD7166, 4.50%, 4/01/47 | | | 80,461 | | | | 83,793 | |
| | |
Pool BE3625, 3.50%, 5/01/47 | | | 148,750 | | | | 147,733 | |
| | |
Pool BE3702, 4.00%, 6/01/47 | | | 206,269 | | | | 210,169 | |
| | |
Pool BE3767, 3.50%, 7/01/47 | | | 15,314 | | | | 15,209 | |
| | | | | | | | |
| |
TOTAL FEDERAL NATIONAL MORTGAGE ASSOCIATION (FNMA) | | | $ | 1,197,234 | |
| | |
GOVERNMENT NATIONAL MORTGAGE ASSOCIATION (GNMA) – 0.1% | | | | | | | | |
| | |
Pool 354677, 7.50%, 10/15/23 | | | 8,381 | | | | 9,673 | |
| | |
Pool 354765, 7.00%, 2/15/24 | | | 13,018 | | | | 14,001 | |
| | |
Pool 354827, 7.00%, 5/15/24 | | | 10,546 | | | | 11,078 | |
| | | | | | | | |
| | |
TOTAL GOVERNMENT NATIONAL MORTGAGE ASSOCIATION (GNMA) | | | | | | $ | 34,752 | |
| | | | | | | | |
| |
TOTAL MORTGAGE–BACKED SECURITIES (COST $2,146,557) | | | $ | 2,095,069 | |
| | |
U.S. TREASURY – 7.7% | | | | | | | | |
| | |
U.S. TREASURY BONDS – 1.5% | | | | | | | | |
| | |
2.50%, 2/15/46 | | | 65,000 | | | | 57,569 | |
| | |
2.75%, 8/15/47 | | | 70,000 | | | | 65,072 | |
| | |
3.00%, 11/15/44 | | | 53,000 | | | | 51,977 | |
| | |
3.00%, 11/15/45 | | | 8,000 | | | | 7,837 | |
| | |
3.00%, 2/15/47 | | | 21,000 | | | | 20,549 | |
| | |
3.00%, 5/15/47 | | | 30,000 | | | | 29,341 | |
| | |
3.13%, 8/15/44 | | | 11,000 | | | | 11,037 | |
| | |
3.38%, 5/15/44 | | | 139,000 | | | | 145,678 | |
| | |
3.63%, 2/15/44 | | | 87,000 | | | | 95,027 | |
| | |
4.38%, 5/15/40 | | | 120,000 | | | | 145,302 | |
| | |
4.75%, 2/15/37 | | | 21,000 | | | | 26,271 | |
| | | | | | | | |
| | |
TOTAL U.S. TREASURY BONDS | | | | | | $ | 655,660 | |
| | |
U.S. TREASURY NOTES – 6.2% | | | | | | | | |
| | |
1.13%, 2/28/21 | | | 250,000 | | | | 239,829 | |
| | |
1.50%, 12/31/18 | | | 87,000 | | | | 86,636 | |
| | |
1.50%, 3/31/19 | | | 100,000 | | | | 99,317 | |
| | |
1.50%, 11/30/19 | | | 40,000 | | | | 39,428 | |
| | |
1.50%, 8/15/26 | | | 90,000 | | | | 80,495 | |
| | |
1.63%, 11/15/22 | | | 96,000 | | | | 91,330 | |
| | |
1.63%, 5/15/26 | | | 195,000 | | | | 176,752 | |
| | |
1.75%, 5/15/23 | | | 405,000 | | | | 385,049 | |
| | |
2.00%, 10/31/21 | | | 165,000 | | | | 161,175 | |
| | |
2.00%, 4/30/24 | | | 170,000 | | | | 161,921 | |
| | |
2.00%, 2/15/25 | | | 115,000 | | | | 108,602 | |
| | |
2.00%, 8/15/25 | | | 35,000 | | | | 32,884 | |
| | |
2.13%, 8/31/20 | | | 115,000 | | | | 113,878 | |
| | | | | | | | |
Description | | Par Value | | | Value | |
| | |
2.13%, 6/30/22 | | $ | 175,000 | | | $ | 170,779 | |
| | |
2.13%, 11/30/23 | | | 215,000 | | | | 207,132 | |
| | |
2.13%, 5/15/25 | | | 140,000 | | | | 132,978 | |
| | |
2.25%, 11/15/24 | | | 80,000 | | | | 76,924 | |
| | |
2.25%, 11/15/25 | | | 5,000 | | | | 4,771 | |
| | |
2.38%, 8/15/24 | | | 140,000 | | | | 135,907 | |
| | |
3.50%, 5/15/20 | | | 100,000 | | | | 101,929 | |
| | | | | | | | |
| | |
TOTAL U.S. TREASURY NOTES | | | | | | $ | 2,607,716 | |
| | | | | | | | |
| | |
TOTAL U.S. TREASURY (COST $3,349,236) | | | | | | $ | 3,263,376 | |
| | | Number of
Shares | | | | |
| | |
MONEY MARKET FUND – 2.3% | | | | | | | | |
| | |
Dreyfus Government Cash Management Fund, Institutional Shares, 1.60%^ | | | 969,663 | | | | 969,663 | |
| | | | | | | | |
| | |
TOTAL MONEY MARKET FUND (COST $969,663) | | | | | | $ | 969,663 | |
| | | | | | | | |
| |
TOTAL INVESTMENTS IN SECURITIES – 98.9% (COST $41,075,196) | | | $ | 41,648,745 | |
| | |
| | | Par Value | | | | |
|
CASH COLLATERAL INVESTED FOR SECURITIES ON LOAN – 10.5% | |
| |
REPURCHASE AGREEMENTS – 10.5% | | | | | |
| | |
Barclays Capital, Inc., 1.71%, dated 4/30/18, due 5/01/18, repurchase price $325,734, collateralized by U.S. Treasury Securities, 0.00% to 3.00%, maturing 7/31/19 to 9/09/49; total market value of $332,233. | | $ | 325,719 | | | | 325,719 | |
| | |
BNP Paribas SA, 1.72%, dated 4/30/18, due 5/01/18, repurchase price $819,831, collateralized by U.S. Government & Treasury Securities, 0.00% to 9.13%, maturing 5/15/18 to 8/15/46; total market value of $836,188. | | | 819,792 | | | | 819,792 | |
| | |
Citigroup Global Markets, Inc., 1.72%, dated 4/30/18, due 5/01/18, repurchase price $819,831, collateralized by U.S. Government & Treasury Securities, 0.00% to 11.50%, maturing 5/01/18 to 3/20/67; total market value of $836,188. | | | 819,792 | | | | 819,792 | |
April 30, 2018 / ANNUAL REPORT
PORTFOLIOS OF INVESTMENTS 64
Wilmington Diversified Income Fund (continued)
| | | | | | | | |
Description | | Par Value | | | Value | |
| | |
NBC Global Finance Ltd., 1.74%, dated 4/30/18, due 5/01/18, repurchase price $819,832, collateralized by U.S. Treasury Securities, 0.00% to 3.63%, maturing 6/30/19 to 9/09/49; total market value of $836,186. | | $ | 819,792 | | | $ | 819,792 | |
| | |
Nomura Securities International, Inc., 1.74%, dated 4/30/18, due 5/01/18, repurchase price $819,832, collateralized by U.S. Government Securities, 0.00% to 10.50%, maturing 5/01/18 to 3/20/68; total market value of $836,188. | | | 819,792 | | | | 819,792 | |
| | |
RBC Dominion Securities, Inc., 1.72%, dated 4/30/18, due 5/01/18, repurchase price $819,831, collateralized by U.S. Government & Treasury Securities, 0.13% to 7.00%, maturing 10/31/18 to 9/09/49; total market value of $836,188. | | | 819,792 | | | | 819,792 | |
| | | | | | | | |
| |
TOTAL REPURCHASE AGREEMENTS | | | $ | 4,424,679 | |
| | | | | | | | |
| |
TOTAL CASH COLLATERAL INVESTED FOR SECURITIES ON LOAN (COST $4,424,679) | | | $ | 4,424,679 | |
| | | | | | | | |
| |
TOTAL INVESTMENTS – 109.4% (COST $45,499,875) | | | $ | 46,073,424 | |
| |
COLLATERAL FOR SECURITIES ON LOAN – (10.5%) | | | | (4,424,679 | ) |
| |
OTHER ASSETS LESS LIABILITIES – 1.1% | | | | 453,358 | |
| | | | | | | | |
| |
TOTAL NET ASSETS – 100.0% | | | $ | 42,102,103 | |
| | | | | | | | |
Cost of investments for Federal income tax purposes is $45,492,731. The net unrealized appreciation/(depreciation) of investments was $580,693. This consists of net unrealized appreciation from investment for those securities having an excess of value over cost of $1,626,102 and net unrealized depreciation from investments for those securities having an excess of cost over value of $(1,045,409).
Various inputs are used in determining the value of the Fund’s investments. These inputs are summarized in the three broad levels listed below.
Level 1 – quoted prices in active markets for identical securities
Level 2 – other significant observable inputs (including quoted prices for similar securities, interest rates, prepayment speeds, credit risk, etc.)
Level 3 – significant unobservable inputs (including the Fund’s own assumptions in determining the fair value of investments)
The following is a summary of the inputs used as of April 30, 2018 in valuing the Fund’s assets carried at fair value:
| | | | | | | | | | | | | | | | |
| | | | |
| | | Level 1 | | | Level 2 | | | Level 3 | | | Total | |
| | | | |
Investments in Securities | | | | | | | | | | | | | | | | |
| | | | |
Investment Companies | | $ | 16,056,975 | | | $ | — | | | $ | �� — | | | $ | 16,056,975 | |
| | | | |
Collateralized Mortgage Obligations | | | — | | | | 152,140 | | | | — | | | | 152,140 | |
| | | | |
Corporate Bonds | | | — | | | | 3,280,192 | | | | — | | | | 3,280,192 | |
| | | | |
Common Stocks | | | 15,737,335 | | | | — | | | | — | | | | 15,737,335 | |
| | | | |
Enhanced Equipment Trust Certificates | | | — | | | | 93,995 | | | | — | | | | 93,995 | |
| | | | |
Mortgage-Backed Securities | | | — | | | | 2,095,069 | | | | — | | | | 2,095,069 | |
| | | | |
U.S. Treasury | | | — | | | | 3,263,376 | | | | — | | | | 3,263,376 | |
| | | | |
Money Market Fund | | | 969,663 | | | | — | | | | — | | | | 969,663 | |
| | | | |
Repurchase Agreements | | | — | | | | 4,424,679 | | | | — | | | | 4,424,679 | |
| | | | | | | | | | | | | | | | |
| | | | |
Total | | $ | 32,763,973 | | | $ | 13,309,451 | | | $ | — | | | $ | 46,073,424 | |
| | | | | | | | | | | | | | | | |
ANNUAL REPORT / April 30, 2018
65 PORTFOLIOS OF INVESTMENTS
Wilmington Diversified Income Fund (concluded)
| # | Security, or a portion thereof, is on loan. See Note 2 in Notes to Financial Statements. |
| D | Variable rate security. The rate disclosed is the rate in effect on the report date. The Information in parenthesis represents the benchmark and reference rate for each relevant security and the rate floats based upon the reference rate and spread. The security may be further subject to interest rate floor and caps. Certain variable rate securities are not based on a published reference rate and spread, but are determined by the issuer or agent and are based on current market conditions, or, for mortgage-backed securities, are impacted by the individual mortgages which are paying off over time. These securities do not indicate a reference rate and spread in their descriptions. |
| W | Denotes a restricted security that may be resold without restriction to “qualified institutional buyers” as defined in Rule 144A under the Securities Act of 1933 and that the Fund has determined to be liquid under criteria established by the Fund’s Board of Trustees. At April 30, 2018, these liquid restricted securities amounted to $128,736 representing 0.31% of total net assets. |
| ** | Represents less than 0.05%. |
| | |
| The following acronyms are used throughout this Fund: |
| ADR | | American Depositary Receipt |
| ETF | | Exchange Traded Fund |
| FHLMC | | Federal Home Loan Mortgage Corporation |
| FNMA | | Federal National Mortgage Association |
| GMTN | | Global Medium Term Note |
| GNMA | | Government National Mortgage Association |
| LIBOR | | London Interbank Offered Rate |
| | |
| LLC | | Limited Liability Corporation |
| LP | | Limited Partnership |
| MTN | | Medium Term Note |
| PLC | | Public Limited Company |
| REIT | | Real Estate Investment Trust |
| | SPDR - Standard & Poor’s Depository |
| SPDR | | Receipts |
See Notes which are an integral part of the Financial Statements
April 30, 2018 / ANNUAL REPORT
STATEMENTS OF ASSETS AND LIABILITIES 66
| | | | | | | | | | | | | | | | | | | | | | | | | |
| April 30, 2018 | | | | Wilmington
International
Fund | | | | Wilmington
Global
Alpha
Equities
Fund | | |
ASSETS: | | | | | | | | | | | | | | | | | | | | | | | | | |
Investments, at identified cost | | | | | | | | $ | 607,727,505 | | | | | | | | | $ | 139,950,963 | | | | | | |
| | | | | | | | | | | | | | | | | | | | | | | | | |
Investments in securities, at value (Including $39,863,196 and $0 of securities on loan, respectively) (Note 2) | | | | | | | | $ | 695,926,727 | | | | | | | | | $ | 151,618,349 | | | | | | |
| | | | | | | | | | | | | | | | | | | | | | | | | |
Deposits for financial futures contracts | | | | | | | | | 1,680,486 | | | | | | | | | | 4,465,443 | | | | | | |
Cash denominated in foreign currencies | | | | | | | | | 4,072,821 | (a) | | | | | | | | | 10,906 | (a) | | | | | |
Income receivable | | | | | | | | | 2,226,146 | | | | | | | | | | 372,728 | | | | | | |
Tax reclaim receivable | | | | | | | | | 1,038,586 | | | | | | | | | | 107,863 | | | | | | |
Receivable for shares sold | | | | | | | | | 1,985,002 | | | | | | | | | | 125,476 | | | | | | |
Unrealized appreciation on forward foreign currency contracts | | | | | | | | | 839 | | | | | | | | | | 357,122 | | | | | | |
Receivable for investments sold | | | | | | | | | 1,873,611 | | | | | | | | | | 513,864 | | | | | | |
Prepaid assets | | | | | | | | | 26,501 | | | | | | | | | | 29,899 | | | | | | |
| | | | | | | | | | | | | | | | | | | | | | | | | |
TOTAL ASSETS | | | | | | | | | 708,830,719 | | | | | | | | | | 157,601,650 | | | | | | |
| | | | | | | | | | | | | | | | | | | | | | | | | | |
LIABILITIES: | | | | | | | | | | | | | | | | | | | | | | | | | |
Overdraft due to custodian denominated in foreign currencies | | | | | | | | | — | | | | | | | | | | 192,299 | (b) | | | | | |
Deferred capital gains tax payable | | | | | | | | | 29,841 | | | | | | | | | | — | | | | | | |
Payable for investments purchased | | | | | | | | | 1,549,343 | | | | | | | | | | 536,438 | | | | | | |
Collateral for securities on loan | | | | | | | | | 45,254,288 | | | | | | | | | | — | | | | | | |
Unrealized depreciation on forward foreign currency contracts | | | | | | | | | 1,890 | | | | | | | | | | 43,673 | | | | | | |
Payable for shares redeemed | | | | | | | | | 139,184 | | | | | | | | | | 44,381 | | | | | | |
Payable to sub-advisors | | | | | | | | | 187,460 | | | | | | | | | | 70,889 | | | | | | |
Payable for Trustees’ fees | | | | | | | | | 6,410 | | | | | | | | | | 6,410 | | | | | | |
Payable for distribution services fees | | | | | | | | | 1,126 | | | | | | | | | | 27 | | | | | | |
Payable for shareholder services fees | | | | | | | | | 64,374 | | | | | | | | | | — | | | | | | |
Other accrued expenses | | | | | | | | | 314,204 | | | | | | | | | | 206,698 | | | | | | |
| | | | | | | | | | | | | | | | | | | | | | | | | |
TOTAL LIABILITIES | | | | | | | | | 47,548,120 | | | | | | | | | | 1,100,815 | | | | | | |
| | | | | | | | | | | | | | | | | | | | | | | | | | |
NET ASSETS | | | | | | | | $ | 661,282,599 | | | | | | | | | $ | 156,500,835 | | | | | | |
| | | | | | | | | | | | | | | | | | | | | | | | | | |
NET ASSETS CONSIST OF: | | | | | | | | | | | | | | | | | | | | | | | | | |
| | | | | | | | | | | | | | | | | | | | | | | | | | |
Paid-in capital | | | | | | | | $ | 567,061,895 | | | | | | | | | $ | 155,095,262 | | | | | | |
Undistributed (distributions in excess of) net investment income | | | | | | | | | 1,956,169 | | | | | | | | | | (413,827 | ) | | | | | |
Accumulated net realized gain (loss) on investments and foreign currency transactions | | | | | | | | | 4,023,524 | | | | | | | | | | (11,815,004 | ) | | | | | |
Net unrealized appreciation (depreciation) of investments and foreign currencies | | | | | | | | | 88,241,011 | | | | | | | | | | 13,634,404 | | | | | | |
| | | | | | | | | | | | | | | | | | | | | | | | | |
TOTAL NET ASSETS | | | | | | | | $ | 661,282,599 | | | | | | | | | $ | 156,500,835 | | | | | | |
| | | | | | | | | | | | | | | | | | | | | | | | | | |
COMPUTATION OF NET ASSET VALUE AND OFFERING PRICE: | | | | | | | | | | | | | | | | | | | | | | | | | |
Class A | | | | | | | | | | | | | | | | | | | | | | | | | |
Net Assets | | | | | | | | $ | 5,472,997 | | | | | | | | | $ | 132,308 | | | | | | |
| | | | | | | | | | | | | | | | | | | | | | | | | |
Shares outstanding (unlimited shares authorized) | | | | | | | | | 600,936 | | | | | | | | | | 12,037 | | | | | | |
| | | | | | | | | | | | | | | | | | | | | | | | | |
Net Asset Value per share | | | | | | | | $ | 9.11 | | | | | | | | | $ | 10.99 | | | | | | |
| | | | | | | | | | | | | | | | | | | | | | | | | |
Offering price per share* | | | | | | | | $ | 9.64 | ** | | | | | | | | $ | 11.63 | ** | | | | | |
| | | | | | | | | | | | | | | | | | | | | | | | | |
Class I | | | | | | | | | | | | | | | | | | | | | | | | | |
Net Assets | | | | | | | | $ | 655,809,602 | | | | | | | | | $ | 156,368,527 | | | | | | |
| | | | | | | | | | | | | | | | | | | | | | | | | |
Shares outstanding (unlimited shares authorized) | | | | | | | | | 71,448,877 | | | | | | | | | | 14,106,777 | | | | | | |
| | | | | | | | | | | | | | | | | | | | | | | | | |
Net Asset Value per share | | | | | | | | $ | 9.18 | | | | | | | | | $ | 11.08 | | | | | | |
| | | | | | | | | | | | | | | | | | | | | | | | | |
| (a) | Cost of cash denominated in foreign currencies was $4,107,451 and $10,892, respectively. |
| (b) | Cost of overdraft due to custodian was $194,676. |
| * | See “How are Shares Priced?” in the Prospectus. |
| ** | Computation of offering price per share: 100/94.50 of net asset value. |
See Notes which are an integral part of the Financial Statements
ANNUAL REPORT / April 30, 2018
67 STATEMENTS OF ASSETS AND LIABILITIES (concluded)
| | | | | | | | | | | | | | | | | | | | | | | | | |
| April 30, 2018 | | | | Wilmington
Real Asset
Fund | | | | Wilmington
Diversified
Income
Fund | | |
ASSETS: | | | | | | | | | | | | | | | | | | | | | | | | | |
Investments, at identified cost | | | | | | | | $ | 327,927,703 | | | | | | | | | $ | 45,499,875 | | | | | | |
| | | | | | | | | | | | | | | | | | | | | | | | | |
Investments in securities, at value (Including $16,906,572 and $4,326,022 of securities on loan, respectively) (Note 2) | | | | | | | | $ | 351,349,506 | | | | | | | | | $ | 46,073,424 | | | | | | |
| | | | | | | | | | | | | | | | | | | | | | | | | |
Cash | | | | | | | | | — | | | | | | | | | | 2,822 | | | | | | |
Deposits for financial futures contracts | | | | | | | | | 189,080 | (a) | | | | | | | | | — | | | | | | |
Deposits for swaps | | | | | | | | | 526,904 | (b) | | | | | | | | | — | | | | | | |
Cash denominated in foreign currencies | | | | | | | | | 269,875 | (c) | | | | | | | | | — | | | | | | |
Variation margin receivable for centrally cleared swap agreements | | | | | | | | | 23,511 | | | | | | | | | | — | | | | | | |
Variation margin receivable for financial futures contracts | | | | | | | | | 4,728 | | | | | | | | | | — | | | | | | |
Income receivable | | | | | | | | | 532,746 | | | | | | | | | | 98,264 | | | | | | |
Tax reclaim receivable | | | | | | | | | 134,041 | | | | | | | | | | — | | | | | | |
Due from advisor | | | | | | | | | — | | | | | | | | | | 16,825 | | | | | | |
Receivable for shares sold | | | | | | | | | 137,251 | | | | | | | | | | 1,942 | | | | | | |
Over the counter swap agreements, at value (Net upfront payments received of $46,985 and $0, respectively) | | | | | | | | | 66,209 | | | | | | | | | | — | | | | | | |
Written options, at value | | | | | | | | | 42,990 | (d)(e) | | | | | | | | | — | | | | | | |
Unrealized appreciation on forward foreign currency contracts | | | | | | | | | 323,578 | | | | | | | | | | — | | | | | | |
Receivable for investments sold | | | | | | | | | 7,148,741 | | | | | | | | | | 428,952 | | | | | | |
Prepaid assets | | | | | | | | | 28,948 | | | | | | | | | | 15,192 | | | | | | |
| | | | | | | | | | | | | | | | | | | | | | | | | |
TOTAL ASSETS | | | | | | | | | 360,778,108 | | | | | | | | | | 46,637,421 | | | | | | |
| | | | | | | | | | | | | | | | | | | | | | | | | | |
LIABILITIES: | | | | | | | | | | | | | | | | | | | | | | | | | |
TBA Sale Commitments, at value | | | | | | | | | 288,867 | (f) | | | | | | | | | — | | | | | | |
Written options, at value | | | | | | | | | 24,848 | (d)(e) | | | | | | | | | — | | | | | | |
Variation margin payable for centrally cleared swap agreements | | | | | | | | | 44,655 | | | | | | | | | | — | | | | | | |
Variation margin payable for financial futures contracts | | | | | | | | | 38,570 | | | | | | | | | | — | | | | | | |
Payable for investments purchased | | | | | | | | | 33,314,110 | | | | | | | | | | — | | | | | | |
Collateral for securities on loan | | | | | | | | | 17,329,178 | | | | | | | | | | 4,424,679 | | | | | | |
Due to broker for swap agreements | | | | | | | | | 100,000 | | | | | | | | | | — | | | | | | |
Over the counter swap agreements, at value (Net upfront payments paid of $32 and $0, respectively) | | | | | | | | | 105,377 | | | | | | | | | | — | | | | | | |
Unrealized depreciation on forward foreign currency contracts | | | | | | | | | 97,382 | | | | | | | | | | — | | | | | | |
Payable for shares redeemed | | | | | | | | | 73,257 | | | | | | | | | | 2,628 | | | | | | |
Payable to sub-advisors | | | | | | | | | 26,190 | | | | | | | | | | — | | | | | | |
Payable for Trustees’ fees | | | | | | | | | 6,415 | | | | | | | | | | 6,410 | | | | | | |
Payable for distribution services fees | | | | | | | | | 266 | | | | | | | | | | 8,461 | | | | | | |
Other accrued expenses | | | | | | | | | 297,993 | | | | | | | | | | 93,140 | | | | | | |
| | | | | | | | | | | | | | | | | | | | | | | | | |
TOTAL LIABILITIES | | | | | | | | | 51,747,108 | | | | | | | | | | 4,535,318 | | | | | | |
| | | | | | | | | | | | | | | | | | | | | | | | | | |
NET ASSETS | | | | | | | | $ | 309,031,000 | | | | | | | | | $ | 42,102,103 | | | | | | |
| | | | | | | | | | | | | | | | | | | | | | | | | | |
NET ASSETS CONSIST OF: | | | | | | | | | | | | | | | | | | | | | | | | | |
Paid-in capital | | | | | | | | $ | 309,430,848 | | | | | | | | | $ | 41,329,481 | | | | | | |
Undistributed (distributions in excess of) net investment income | | | | | | | | | (2,768,125 | ) | | | | | | | | | 155,994 | | | | | | |
Accumulated net realized gain (loss) on investments and foreign currency transactions | | | | | | | | | (21,827,440 | ) | | | | | | | | | 43,079 | | | | | | |
Net unrealized appreciation (depreciation) of investments and foreign currencies | | | | | | | | | 24,195,717 | | | | | | | | | | 573,549 | | | | | | |
| | | | | | | | | | | | | | | | | | | | | | | | | |
TOTAL NET ASSETS | | | | | | | | $ | 309,031,000 | | | | | | | | | $ | 42,102,103 | | | | | | |
| | | | | | | | | | | | | | | | | | | | | | | | | | |
COMPUTATION OF NET ASSET VALUE AND OFFERING PRICE: | | | | | | | | | | | | | | | | | | | | | | | | | |
Class A | | | | | | | | | | | | | | | | | | | | | | | | | |
Net Assets | | | | | | | | $ | 1,297,113 | | | | | | | | | $ | 40,992,899 | | | | | | |
| | | | | | | | | | | | | | | | | | | | | | | | | |
Shares outstanding (unlimited shares authorized) | | | | | | | | | 89,592 | | | | | | | | | | 3,914,508 | | | | | | |
| | | | | | | | | | | | | | | | | | | | | | | | | |
Net Asset Value per share | | | | | | | | $ | 14.48 | | | | | | | | | $ | 10.47 | | | | | | |
| | | | | | | | | | | | | | | | | | | | | | | | | |
Offering price per share* | | | | | | | | $ | 15.32 | ** | | | | | | | | $ | 11.08 | ** | | | | | |
| | | | | | | | | | | | | | | | | | | | | | | | | |
Class I | | | | | | | | | | | | | | | | | | | | | | | | | |
Net Assets | | | | | | | | $ | 307,733,887 | | | | | | | | | $ | 1,109,204 | | | | | | |
| | | | | | | | | | | | | | | | | | | | | | | | | |
Shares outstanding (unlimited shares authorized) | | | | | | | | | 21,036,454 | | | | | | | | | | 105,806 | | | | | | |
| | | | | | | | | | | | | | | | | | | | | | | | | |
Net Asset Value per share | | | | | | | | $ | 14.63 | | | | | | | | | $ | 10.48 | | | | | | |
| | | | | | | | | | | | | | | | | | | | | | | | | |
| (a) | Includes cash denominated in foreign currencies with a value of $21,519 and a cost of $21,829. |
| (b) | Includes cash denominated in foreign currencies with a value of $20,093 and a cost of $20,461. |
| (c) | Cost of cash denominated in foreign currencies was $271,015. |
| (d) | Net written options, at value is $18,142. |
| (e) | Premiums received for options written were $106,186. |
| (f) | Proceeds received for TBA sales commitments were $290,672. |
| * | See “How are Shares Priced?” in the Prospectus. |
| ** | Computation of offering price per share: 100/94.50 of net asset value. |
See Notes which are an integral part of the Financial Statements
April 30, 2018 / ANNUAL REPORT
STATEMENTS OF OPERATIONS 68
| | | | | | | | | | | | | | | | | | | | |
| Year Ended April 30, 2018 | | | | | Wilmington
International
Fund | | | | | | Wilmington
Global Alpha
Equities
Fund | | | | |
INVESTMENT INCOME: | | | | | | | | | | | | | | | | | | | | |
Dividends | | | | | | $ | 10,917,583 | (a) | | | | | | $ | 3,123,655 | (a) | | | | |
Interest | | | | | | | 7,451 | | | | | | | | 22,245 | | | | | |
Securities lending income | | | | | | | 223,763 | | | | | | | | — | | | | | |
| | | | | | | | | | | | | | | | | | | | |
TOTAL INVESTMENT INCOME | | | | | | | 11,148,797 | | | | | | | | 3,145,900 | | | | | |
| | | | | | | | | | | | | | | | | | | | | |
EXPENSES: | | | | | | | | | | | | | | | | | | | | |
Investment advisory fee | | | | | | | 4,563,478 | | | | | | | | 2,074,407 | | | | | |
Administrative personnel and services fee | | | | | | | 184,050 | | | | | | | | 44,855 | | | | | |
Portfolio accounting and administration fees | | | | | | | 199,535 | | | | | | | | 67,444 | | | | | |
Custodian fees | | | | | | | 85,621 | | | | | | | | 103,997 | | | | | |
Transfer and dividend disbursing agent fees and expenses | | | | | | | 130,341 | | | | | | | | 112,826 | | | | | |
Trustees’ fees | | | | | | | 62,231 | | | | | | | | 62,231 | | | | | |
Professional fees | | | | | | | 229,762 | | | | | | | | 134,701 | | | | | |
Distribution services fee—Class A | | | | | | | 13,528 | | | | | | | | 349 | | | | | |
Shareholder services fee—Class A | | | | | | | 13,528 | | | | | | | | 349 | | | | | |
Shareholder services fee— Class I | | | | | | | 1,404,912 | | | | | | | | 345,385 | | | | | |
Share registration costs | | | | | | | 28,379 | | | | | | | | 31,467 | | | | | |
Printing and postage | | | | | | | 35,627 | | | | | | | | 36,136 | | | | | |
Miscellaneous | | | | | | | 58,661 | | | | | | | | 36,732 | | | | | |
| | | | | | | | | | | | | | | | | | | | |
TOTAL EXPENSES | | | | | | | 7,009,653 | | | | | | | | 3,050,879 | | | | | |
| | | | | | | | | | | | | | | | | | | | | |
WAIVERS AND REIMBURSEMENTS: | | | | | | | | | | | | | | | | | | | | |
Waiver/reimbursement by investment advisor/subadvisors | | | | | | | (1,095,405 | ) | | | | | | | (976,124 | ) | | | | |
Waiver of shareholder services fee—Class A | | | | | | | (13,528 | ) | | | | | | | (349 | ) | | | | |
Waiver of shareholder services fee—Class I | | | | | | | (745,119) | | | | | | | | (345,385) | | | | | |
| | | | | | | | | | | | | | | | | | | | |
TOTAL WAIVERS AND REIMBURSEMENTS | | | | | | | (1,854,052) | | | | | | | | (1,321,858) | | | | | |
| | | | | | | | | | | | | | | | | | | | | |
Net expenses | | | | | | | 5,155,601 | | | | | | | | 1,729,021 | | | | | |
| | | | | | | | | | | | | | | | | | | | |
Net investment income (loss) | | | | | | | 5,993,196 | | | | | | | | 1,416,879 | | | | | |
| | | | | | | | | | | | | | | | | | | | |
REALIZED AND UNREALIZED GAIN (LOSS) ON INVESTMENTS: | | | | | | | | | | | | | | | | | | | | |
Net realized gain (loss) on investments | | | | | | | 35,928,927 | | | | | | | | 5,447,974 | | | | | |
Net realized gain (loss) on forward foreign currency contracts | | | | | | | (100,478 | ) | | | | | | | (571,730 | ) | | | | |
Net realized gain (loss) on foreign currency transactions | | | | | | | (459,065 | ) | | | | | | | 49,049 | | | | | |
Net realized gain (loss) on financial futures contracts | | | | | | | 659,225 | | | | | | | | (9,245,538 | ) | | | | |
Litigation proceeds | | | | | | | 16,064 | (b) | | | | | | | 6,197 | (b) | | | | |
Net change in unrealized appreciation (depreciation) on investments | | | | | | | 39,043,433 | (c) | | | | | | | 6,645,097 | | | | | |
Net change in unrealized appreciation (depreciation) on forward foreign currency contracts | | | | | | | 627 | | | | | | | | 458,335 | | | | | |
Net change in unrealized appreciation (depreciation) on foreign currency transactions | | | | | | | (29,622 | ) | | | | | | | (793 | ) | | | | |
Net change in unrealized appreciation (depreciation) on financial futures contracts | | | | | | | 40,248 | | | | | | | | 2,638,062 | | | | | |
| | | | | | | | | | | | | | | | | | | | |
Net realized and unrealized gain (loss) on investments | | | | | | | 75,099,359 | | | | | | | | 5,426,653 | | | | | |
| | | | | | | | | | | | | | | | | | | | |
Change in net assets resulting from operations | | | | | | $ | 81,092,555 | | | | | | | $ | 6,843,532 | | | | | |
| | | | | | | | | | | | | | | | | | | | |
| (a) | Net of foreign withholding taxes withheld of $1,523,008 and $203,051, respectively. |
| (b) | The Litigation proceeds represent a class action settlement received by the Fund. |
| (c) | Net of foreign deferred capital gains taxes of $29,841. |
See Notes which are an integral part of the Financial Statements
ANNUAL REPORT / April 30, 2018
69 STATEMENTS OF OPERATIONS (Concluded)
| | | | | | | | | | | | | | | | | | | | | | | | | |
| | | | | |
| Year Ended April 30, 2018 | | | | Wilmington
Real Asset
Fund | | | | Wilmington
Diversified
Income Fund | | |
INVESTMENT INCOME: | | | | | | | | | | | | | | | | | | | | | | | | | |
Dividends from unaffiliated issuers | | | | | | | | $ | 9,052,879 | (a) | | | | | | | | $ | 935,666 | (a) | | | | | |
Dividends received from affiliated issuers | | | | | | | | | — | | | | | | | | | | 66,080 | | | | | | |
Interest | | | | | | | | | 2,162,752 | (b) | | | | | | | | | 244,154 | | | | | | |
Securities lending income | | | | | | | | | 212,634 | | | | | | | | | | 53,434 | | | | | | |
| | | | | | | | | | | | | | | | | | | | | | | | | |
| | | | | |
TOTAL INVESTMENT INCOME | | | | | | | | | 11,428,265 | | | | | | | | | | 1,299,334 | | | | | | |
| | | | | | | | | | | | | | | | | | | | | | | | | | |
EXPENSES: | | | | | | | | | | | | | | | | | | | | | | | | | |
Investment advisory fee | | | | | | | | | 1,820,881 | | | | | | | | | | 175,204 | | | | | | |
Administrative personnel and services fee | | | | | | | | | 106,680 | | | | | | | | | | 14,219 | | | | | | |
Portfolio accounting and administration fees | | | | | | | | | 180,461 | | | | | | | | | | 24,865 | | | | | | |
Custodian fees | | | | | | | | | 141,939 | | | | | | | | | | 2,024 | | | | | | |
Transfer and dividend disbursing agent fees and expenses | | | | | | | | | 119,291 | | | | | | | | | | 67,343 | | | | | | |
Trustees’ fees | | | | | | | | | 62,213 | | | | | | | | | | 62,231 | | | | | | |
Professional fees | | | | | | | | | 143,342 | | | | | | | | | | 113,491 | | | | | | |
Distribution services fee—Class A | | | | | | | | | 3,883 | | | | | | | | | | 106,747 | | | | | | |
Shareholder services fee—Class A | | | | | | | | | 3,883 | | | | | | | | | | 106,747 | | | | | | |
Shareholder services fee— Class I | | | | | | | | | 817,492 | | | | | | | | | | 2,755 | | | | | | |
Share registration costs | | | | | | | | | 32,464 | | | | | | | | | | 19,989 | | | | | | |
Printing and postage | | | | | | | | | 27,384 | | | | | | | | | | 30,060 | | | | | | |
Interest expense on reverse repurchase agreements | | | | | | | | | 389 | | | | | | | | | | — | | | | | | |
Miscellaneous | | | | | | | | | 52,202 | | | | | | | | | | 27,069 | | | | | | |
| | | | | | | | | | | | | | | | | | | | | | | | | |
| | | | | |
TOTAL EXPENSES | | | | | | | | | 3,512,504 | | | | | | | | | | 752,744 | | | | | | |
| | | | | | | | | | | | | | | | | | | | | | | | | | |
WAIVERS AND REIMBURSEMENTS: | | | | | | | | | | | | | | | | | | | | | | | | | |
Waiver/reimbursement by investment advisor/subadvisors | | | | | | | | | (269,754 | ) | | | | | | | | | (356,588 | ) | | | | | |
Waiver of shareholder services fee—Class A | | | | | | | | | (3,883 | ) | | | | | | | | | (106,747 | ) | | | | | |
Waiver of shareholder services fee—Class I | | | | | | | | | (817,492 | ) | | | | | | | | | (2,755 | ) | | | | | |
| | | | | | | | | | | | | | | | | | | | | | | | | |
TOTAL WAIVERS AND REIMBURSEMENTS | | | | | | | | | (1,091,129 | ) | | | | | | | | | (466,090 | ) | | | | | |
| | | | | | | | | | | | | | | | | | | | | | | | | | |
Net expenses | | | | | | | | | 2,421,375 | | | | | | | | | | 286,654 | | | | | | |
| | | | | | | | | | | | | | | | | | | | | | | | | |
Net investment income (loss) | | | | | | | | | 9,006,890 | | | | | | | | | | 1,012,680 | | | | | | |
| | | | | | | | | | | | | | | | | | | | | | | | | |
REALIZED AND UNREALIZED GAIN (LOSS) ON INVESTMENTS: | | | | | | | | | | | | | | | | | | | | | | | | | |
Net realized gain (loss) on investments in unaffiliated issuers | | | | | | | | | 1,052,510 | | | | | | | | | | 3,594,374 | | | | | | |
Net realized gain (loss) on affiliated investment companies | | | | | | | | | — | | | | | | | | | | 2,787,145 | | | | | | |
Realized gain distributions received from unaffiliated investment companies | | | | | | | | | — | | | | | | | | | | 44,765 | | | | | | |
Net realized gain (loss) on forward foreign currency contracts | | | | | | | | | (1,257,731 | ) | | | | | | | | | — | | | | | | |
Net realized gain (loss) on foreign currency transactions | | | | | | | | | 11,606 | | | | | | | | | | — | | | | | | |
Net realized gain (loss) on financial futures contracts | | | | | | | | | (104,538 | ) | | | | | | | | | — | | | | | | |
Net realized gain (loss) on swap agreements | | | | | | | | | 88,298 | | | | | | | | | | — | | | | | | |
Net realized gain (loss) on purchased options | | | | | | | | | (54,081 | ) | | | | | | | | | — | | | | | | |
Net realized gain (loss) on written options | | | | | | | | | 284,324 | | | | | | | | | | — | | | | | | |
Net realized gain (loss) on securities sold short | | | | | | | | | 39,735 | | | | | | | | | | — | | | | | | |
Net change in unrealized appreciation (depreciation) on investments in unaffiliated issuers | | | | | | | | | 14,273,462 | | | | | | | | | | (2,340,668 | ) | | | | | |
Net change in unrealized appreciation (depreciation) on affiliated investment companies | | | | | | | | | — | | | | | | | | | | (2,103,990 | ) | | | | | |
Net change in unrealized appreciation (depreciation) on forward foreign currency contracts | | | | | | | | | 716,447 | | | | | | | | | | — | | | | | | |
Net change in unrealized appreciation (depreciation) on foreign currency transactions | | | | | | | | | 9,066 | | | | | | | | | | — | | | | | | |
Net change in unrealized appreciation (depreciation) on financial futures contracts | | | | | | | | | (25,067 | ) | | | | | | | | | — | | | | | | |
Net change in unrealized appreciation (depreciation) on swap agreements | | | | | | | | | 66,177 | | | | | | | | | | — | | | | | | |
Net change in unrealized appreciation (depreciation) on purchased options | | | | | | | | | 30,129 | | | | | | | | | | — | | | | | | |
Net change in unrealized appreciation (depreciation) on written options | | | | | | | | | (40,806 | ) | | | | | | | | | — | | | | | | |
Net change in unrealized appreciation (depreciation) on TBA Sales Commitments | | | | | | | | | 1,805 | | | | | | | | | | — | | | | | | |
| | | | | | | | | | | | | | | | | | | | | | | | | |
Net realized and unrealized gain (loss) on investments | | | | | | | | | 15,091,336 | | | | | | | | | | 1,981,626 | | | | | | |
| | | | | | | | | | | | | | | | | | | | | | | | | |
Change in net assets resulting from operations | | | | | | | | $ | 24,098,226 | | | | | | | | | $ | 2,994,306 | | | | | | |
| | | | | | | | | | | | | | | | | | | | | | | | | |
| (a) | Net of foreign withholding taxes withheld of $238,408 and $3,843, respectively. |
| (b) | Net of foreign withholding taxes withheld of $11,351. |
See Notes which are an integral part of the Financial Statements
April 30, 2018 / ANNUAL REPORT
STATEMENTS OF CHANGES IN NET ASSETS 70
| | | | | | | | | | | | | | | | |
| | |
| | | Wilmington
International
Fund | | | Wilmington
Global Alpha
Equities Fund | |
| | | | |
| | | Year Ended
April 30,
2018 | | | Year Ended
April 30, 2017 | | | Year Ended
April 30,
2018 | | | Year Ended
April 30, 2017 | |
OPERATIONS: | | | | | | | | | | | | | | | | |
Net investment income (loss) | | $ | 5,993,196 | | | $ | 5,209,793 | | | $ | 1,416,879 | | | $ | 401,305 | |
Net realized gain (loss) on investments | | | 36,044,673 | | | | 15,203,263 | | | | (4,314,048 | ) | | | 3,770,269 | |
Net change in unrealized appreciation (depreciation) of investments | | | 39,054,686 | | | | 30,945,335 | | | | 9,740,701 | | | | 4,820,213 | |
| | | | | | | | | | | | | | | | |
Change in net assets resulting from operations | | | 81,092,555 | | | | 51,358,391 | | | | 6,843,532 | | | | 8,991,787 | |
| | | | | | | | | | | | | | | | |
DISTRIBUTIONS TO SHAREHOLDERS: | | | | | | | | | | | | | | | | |
Distributions from net investment income | | | | | | | | | | | | | | | | |
Class A | | | (57,207 | ) | | | (62,135 | ) | | | (1,430 | ) | | | (462 | ) |
Class I | | | (6,025,954 | ) | | | (5,670,589 | ) | | | (1,746,039 | ) | | | (302,238 | ) |
| | | | | | | | | | | | | | | | |
Change in net assets resulting from distributions to shareholders | | | (6,083,161 | ) | | | (5,732,724 | ) | | | (1,747,469 | ) | | | (302,700 | ) |
| | | | | | | | | | | | | | | | |
SHARE TRANSACTIONS: | | | | | | | | | | | | | | | | |
Proceeds from sale of shares | | | | | | | | | | | | | | | | |
Class A | | | 142,951 | | | | 49,030 | | | | 3,180 | | | | 12,149 | |
Class I | | | 209,478,095 | | | | 101,289,157 | | | | 63,763,339 | | | | 14,479,634 | |
Distributions reinvested | | | | | | | | | | | | | | | | |
Class A | | | 51,111 | | | | 55,898 | | | | 1,430 | | | | 462 | |
Class I | | | 3,127,481 | | | | 3,573,511 | | | | 928,262 | | | | 198,217 | |
Cost of shares redeemed | | | | | | | | | | | | | | | | |
Class A | | | (412,815 | ) | | | (492,657 | ) | | | (58,910 | ) | | | (1,149,734 | ) |
Class I | | | (70,000,982 | ) | | | (122,380,114 | ) | | | (17,180,893 | ) | | | (77,771,723 | ) |
| | | | | | | | | | | | | | | | |
Change in net assets resulting from share transactions | | | 142,385,841 | | | | (17,905,175 | ) | | | 47,456,408 | | | | (64,230,995 | ) |
| | | | | | | | | | | | | | | | |
Change in net assets | | | 217,395,235 | | | | 27,720,492 | | | | 52,552,471 | | | | (55,541,908 | ) |
NET ASSETS: | | | | | | | | | | | | | | | | |
Beginning of year | | | 443,887,364 | | | | 416,166,872 | | | | 103,948,364 | | | | 159,490,272 | |
| | | | | | | | | | | | | | | | |
End of year | | $ | 661,282,599 | | | $ | 443,887,364 | | | $ | 156,500,835 | | | $ | 103,948,364 | |
| | | | | | | | | | | | | | | | |
Undistributed (distributions in excess of) net investment income included in net assets at end of year | | $ | 1,956,169 | | | $ | 1,675,297 | | | $ | (413,827 | ) | | $ | 256,240 | |
| | | | | | | | | | | | | | | | |
SHARES OF BENEFICIAL INTEREST: | | | | | | | | | | | | | | | . | |
Shares sold | | | | | | | | | | | | | | | | |
Class A | | | 16,510 | | | | 6,734 | | | | 292 | | | | 1,191 | |
Class I | | | 23,545,685 | | | | 14,188,431 | | | | 5,793,564 | | | | 1,417,814 | |
Distributions reinvested | | | | | | | | | | | | | | | | |
Class A | | | 6,083 | | | | 8,080 | | | | 130 | | | | 45 | |
Class I | | | 368,522 | | | | 512,694 | | | | 83,778 | | | | 19,357 | |
Shares redeemed | | | | | | | | | | | | | | | | |
Class A | | | (46,745 | ) | | | (68,746 | ) | | | (5,481 | ) | | | (115,488 | ) |
Class I | | | (7,909,116 | ) | | | (16,928,812 | ) | | | (1,555,130 | ) | | | (7,697,101 | ) |
| | | | | | | | | | | | | | | | |
Net change resulting from share transactions | | | 15,980,939 | | | | (2,281,619 | ) | | | 4,317,153 | | | | (6,374,182 | ) |
| | | | | | | | | | | | | | | | |
| | | | | | | | | | | | | | | | |
See Notes which are an integral part of the Financial Statements
ANNUAL REPORT / April 30, 2018
71 STATEMENTS OF CHANGES IN NET ASSETS (concluded)
| | | | | | | | | | | | | | | | |
| | |
| | | Wilmington Real Asset Fund | | | Wilmington Diversified Income Fund | |
| | | | |
| | | Year Ended
April 30,
2018 | | | Year Ended
April 30, 2017 | | | Year Ended
April 30, 2018 | | | Year Ended
April 30, 2017 | |
OPERATIONS: | | | | | | | | | | | | | | | | |
Net investment income (loss) | | $ | 9,006,890 | | | $ | 8,532,279 | | | $ | 1,012,680 | | | $ | 514,788 | |
Net realized gain (loss) on investments | | | 60,123 | | | | 22,756,958 | | | | 6,426,284 | | | | 356,476 | |
Net change in unrealized appreciation (depreciation) of investments | | | 15,031,213 | | | | (24,335,733 | ) | | | (4,444,658 | ) | | | 3,073,829 | |
| | | | | | | | | | | | | | | | |
Change in net assets resulting from operations | | | 24,098,226 | | | | 6,953,504 | | | | 2,994,306 | | | | 3,945,093 | |
| | | | | | | | | | | | | | | | |
DISTRIBUTIONS TO SHAREHOLDERS: | | | | | | | | | | | | | | | | |
Distributions from net investment income | | | | | | | | | | | | | | | | |
Class A | | | (43,902 | ) | | | — | | | | (901,794 | ) | | | (511,380 | ) |
Class I | | | (8,797,592 | ) | | | — | | | | (26,377 | ) | | | (13,529 | ) |
Distributions from net realized gain on investments | | | | | | | | | | | | | | | | |
Class A | | | — | | | | — | | | | (4,758,811 | ) | | | — | |
Class I | | | — | | | | — | | | | (126,237 | ) | | | — | |
| | | | | | | | | | | | | | | | |
Change in net assets resulting from distributions to shareholders | | | (8,841,494 | ) | | | — | | | | (5,813,219 | ) | | | (524,909 | ) |
| | | | | | | | | | | | | | | | |
SHARE TRANSACTIONS: | | | | | | | | | | | | | | | | |
Proceeds from sale of shares | | | | | | | | | | | | | | | | |
Class A | | | 138,570 | | | | 115,013 | | | | 621,536 | | | | 718,976 | |
Class I | | | 40,744,073 | | | | 54,174,835 | | | | 538,816 | | | | 155,458 | |
Distributions reinvested | | | | | | | | | | | | | | | | |
Class A | | | 32,615 | | | | — | | | | 5,292,918 | | | | 474,723 | |
Class I | | | 4,577,313 | | | | — | | | | 75,548 | | | | 1,591 | |
Cost of shares redeemed | | | | | | | | | | | | | | | | |
Class A | | | (591,544 | ) | | | (265,658 | ) | | | (5,063,276 | ) | | | (6,275,919 | ) |
Class I | | | (98,556,789 | ) | | | (168,480,798 | ) | | | (147,559 | ) | | | (627,698 | ) |
| | | | | | | | | | | | | | | | |
Change in net assets resulting from share transactions | | | (53,655,762 | ) | | | (114,456,608 | ) | | | 1,317,983 | | | | (5,552,869 | ) |
| | | | | | | | | | | | | | | | |
Change in net assets | | | (38,399,030 | ) | | | (107,503,104 | ) | | | (1,500,930 | ) | | | (2,132,685 | ) |
NET ASSETS: | | | | | | | | | | | | | | | | |
Beginning of year | | | 347,430,030 | | | | 454,933,134 | | | | 43,603,033 | | | | 45,735,718 | |
| | | | | | | | | | | | | | | | |
End of year | | $ | 309,031,000 | | | $ | 347,430,030 | | | $ | 42,102,103 | | | $ | 43,603,033 | |
| | | | | | | | | | | | | | | | |
Undistributed (distributions in excess of) net investment income included in net assets at end of year | | $ | (2,768,125 | ) | | $ | (1,420,920 | ) | | $ | 155,994 | | | $ | 58,750 | |
| | | | | | | | | | | | | | | | |
SHARES OF BENEFICIAL INTEREST: | | | | | | | | | | | | | | | | |
Shares sold | | | | | | | | | | | | | | | | |
Class A | | | 9,652 | | | | 8,418 | | | | 55,698 | | | | 66,205 | |
Class I | | | 2,815,356 | | | | 3,913,708 | | | | 47,689 | | | | 14,825 | |
Distributions reinvested | | | | | | | | | | | | | | | | |
Class A | | | 2,257 | | | | — | | | | 496,247 | | | | 44,416 | |
Class I | | | 314,292 | | | | — | | | | 7,087 | | | | 149 | |
Shares redeemed | | | | | | | | | | | | | | | | |
Class A | | | (40,766 | ) | | | (19,269 | ) | | | (451,606 | ) | | | (584,999 | ) |
Class I | | | (6,780,177 | ) | | | (12,240,278 | ) | | | (13,423 | ) | | | (58,979 | ) |
| | | | | | | | | | | | | | | | |
Net change resulting from share transactions | | | (3,679,386 | ) | | | (8,337,421 | ) | | | 141,692 | | | | (518,383 | ) |
| | | | | | | | | | | | | | | | |
See Notes which are an integral part of the Financial Statements
April 30, 2018 / ANNUAL REPORT
FINANCIAL HIGHLIGHTS 72
For a share outstanding throughout each year ended April 30, unless otherwise noted:
|
WILMINGTON INTERNATIONAL FUND |
| | | | | | | | | | | | | | | | | | | | | | | | | | | | | | | | | | | |
| CLASS A | | Year Ended
April 30, 2018 | | Year Ended
April 30, 2017 | | Year Ended
April 30, 2016 | | Year Ended
April 30, 2015 | | Year Ended
April 30, 2014 | | | | |
Net Asset Value, Beginning of Year | | | | $7.86 | | | | | $7.08 | | | | | $8.04 | | | | | $7.90 | | | | | $7.27 | | | | | | | | | | | |
Income (Loss) From Operations: | | | | | | | | | | | | | | | | | | | | | | | | | | | | | | | | | | | |
Net Investment Income (Loss)(a) | | | | 0.08 | | | | | 0.08 | | | | | 0.08 | | | | | 0.09 | | | | | 0.12 | | | | | | | | | | | |
Net Realized and Unrealized Gain (Loss) on Investments and Foreign Currency | | | | 1.26 | (b) | | | | 0.79 | (c) | | | | (0.95 | ) | | | | 0.17 | | | | | 0.63 | | | | | | | | | | | |
| | | | | | | | | | |
Total Income (Loss) From Operations | | | | 1.34 | | | | | 0.87 | | | | | (0.87 | ) | | | | 0.26 | | | | | 0.75 | | | | | | | | | | | |
| | | | | | | | | | |
Less Distributions From: | | | | | | | | | | | | | | | | | | | | | | | | | | | | | | | | | | | |
Net Investment Income | | | | (0.09 | ) | | | | (0.09 | ) | | | | (0.09 | ) | | | | (0.12 | ) | | | | (0.12 | ) | | | | | | | | | | |
| | | | | | | | | | |
| Total Distributions | | | | (0.09 | ) | | | | (0.09 | ) | | | | (0.09 | ) | | | | (0.12 | ) | | | | (0.12 | ) | | | | | | | | | | |
| | | | | | | | | | |
Net Asset Value, End of Year | | | | $9.11 | | | | | $7.86 | | | | | $7.08 | | | | | $8.04 | | | | | $7.90 | | | | | | | | | | | |
| | | | | | | | | | |
Total Return(d) | | | | 17.18 | % | | | | 12.52 | % | | | | (10.82 | )% | | | | 3.29 | % | | | | 10.53 | % | | | | | | | | | | |
Net Assets, End of Year (000’s) | | | | $5,473 | | | | | $4,913 | | | | | $4,810 | | | | | $5,909 | | | | | $6,107 | | | | | | | | | | | |
Ratios to Average Net Assets | | | | | | | | | | | | | | | | | | | | | | | | | | | | | | | | | | | |
Gross Expense | | | | 1.48 | % | | | | 1.79 | % | | | | 1.87 | % | | | | 1.84 | % | | | | 1.78 | % | | | | | | | | | | |
Net Expenses(e) | | | | 1.04 | % | | | | 1.22 | % | | | | 1.31 | % | | | | 1.42 | % | | | | 1.49 | % | | | | | | | | | | |
Net Investment Income (Loss) | | | | 0.93 | % | | | | 1.16 | % | | | | 1.15 | % | | | | 1.20 | % | | | | 1.64 | % | | | | | | | | | | |
Portfolio Turnover Rate | | | | 75 | % | | | | 177 | % | | | | 71 | % | | | | 78 | % | | | | 49 | % | | | | | | | | | | |
| | | | | | | | | | | | | | | | | | | | | | | | | | | | | | | | | | | |
| CLASS I | | Year Ended
April 30, 2018 | | Year Ended
April 30, 2017 | | Year Ended
April 30, 2016 | | Year Ended
April 30, 2015 | | Year Ended
April 30, 2014 | | | | |
Net Asset Value, Beginning of Year | | | | $7.92 | | | | | $7.13 | | | | | $8.09 | | | | | $7.94 | | | | | $7.30 | | | | | | | | | | | |
Income (Loss) From Operations: | | | | | | | | | | | | | | | | | | | | | | | | | | | | | | | | | | | |
Net Investment Income (Loss)(a) | | | | 0.09 | | | | | 0.09 | | | | | 0.09 | | | | | 0.10 | | | | | 0.13 | | | | | | | | | | | |
Net Realized and Unrealized Gain (Loss) on Investments and Foreign Currency | | | | 1.27 | (b) | | | | 0.80 | (c) | | | | (0.95 | ) | | | | 0.18 | | | | | 0.64 | | | | | | | | | | | |
| | | | | | | | | | |
Total Income (Loss) From Operations | | | | 1.36 | | | | | 0.89 | | | | | (0.86 | ) | | | | 0.28 | | | | | 0.77 | | | | | | | | | | | |
| | | | | | | | | | |
Less Distributions From: | | | | | | | | | | | | | | | | | | | | | | | | | | | | | | | | | | | |
Net Investment Income | | | | (0.10 | ) | | | | (0.10 | ) | | | | (0.10 | ) | | | | (0.13 | ) | | | | (0.13 | ) | | | | | | | | | | |
| | | | | | | | | | |
Total Distributions | | | | (0.10 | ) | | | | (0.10 | ) | | | | (0.10 | ) | | | | (0.13 | ) | | | | (0.13 | ) | | | | | | | | | | |
| | | | | | | | | | |
Net Asset Value, End of Year | | | | $9.18 | | | | | $7.92 | | | | | $7.13 | | | | | $8.09 | | | | | $7.94 | | | | | | | | | | | |
| | | | | | | | | | |
Total Return(d) | | | | 17.29 | % | | | | 12.69 | % | | | | (10.70 | )% | | | | 3.46 | % | | | | 10.73 | % | | | | | | | | | | |
Net Assets, End of Year (000’s) | | | | $655,810 | | | | | $438,974 | | | | | $411,357 | | | | | $535,446 | | | | | $526,874 | | | | | | | | | | | |
Ratios to Average Net Assets | | | | | | | | | | | | | | | | | | | | | | | | | | | | | | | | | | | |
Gross Expense | | | | 1.23 | % | | | | 1.54 | % | | | | 1.62 | % | | | | 1.59 | % | | | | 1.53 | % | | | | | | | | | | |
Net Expenses(e) | | | | 0.91 | % | | | | 1.09 | % | | | | 1.18 | % | | | | 1.29 | % | | | | 1.36 | % | | | | | | | | | | |
Net Investment Income (Loss) | | | | 1.06 | % | | | | 1.28 | % | | | | 1.28 | % | | | | 1.32 | % | | | | 1.75 | % | | | | | | | | | | |
Portfolio Turnover Rate | | | | 75 | % | | | | 177 | % | | | | 71 | % | | | | 78 | % | | | | 49 | % | | | | | | | | | | |
| (a) | Per share numbers have been calculated using the average shares method. |
| (b) | Amount includes a non-recurring payment for Litigation proceeds which represents proceeds from securities litigation by the Fund. The litigation proceeds impacted the realized and unrealized gain (loss) per share by $0.00 and $0.00 for Class A and Class I, respectively. |
| (c) | Amount includes a non-recurring payment for Litigation proceeds which represents a class action settlement received by the Fund related to best execution of foreign exchange transactions. The litigation proceeds impacted the realized and unrealized gain (loss) per share by $0.01 and $0.01 for Class A and Class I, respectively. |
| (d) | Based on net asset value, which does not reflect the sales charge or contingent deferred sales charge, if applicable. Total returns for periods of less than one year, if any, are not annualized. |
| (e) | The investment advisor and other service providers waived or reimbursed a portion of their fees. |
See Notes which are an integral part of the Financial Statements
ANNUAL REPORT / April 30, 2018
73 FINANCIAL HIGHLIGHTS (continued)
For a share outstanding throughout each year ended April 30, unless otherwise noted:
|
WILMINGTON GLOBAL ALPHA EQUITIES FUND |
| | | | | | | | | | | | | | | | | | | | | | | | | | | | | | |
| CLASS A | | Year Ended
April 30, 2018 | | Year Ended
April 30, 2017 | | Year Ended
April 30, 2016 | | Year Ended
April 30, 2015 | | Year Ended
April 30, 2014 | | |
Net Asset Value, Beginning of Year | | | | $10.54 | | | | | $9.82 | | | | | $10.86 | | | | | $10.74 | | | | | $10.58 | | | | | | |
Income (Loss) From Operations: | | | | | | | | | | | | | | | | | | | | | | | | | | | | | | |
Net Investment Income (Loss)(a) | | | | 0.05 | | | | | (0.01) | | | | | (0.05 | ) | | | | (0.06 | ) | | | | (0.04 | ) | | | | | |
Net Realized and Unrealized Gain (Loss) on Investments and Foreign Currency | | | | 0.52 | (b) | | | | 0.75 | | | | | (0.75 | ) | | | | 0.35 | | | | | 0.34 | | | | | | |
| | | | | |
Total Income (Loss) From Operations | | | | 0.57 | | | | | 0.74 | | | | | (0.80 | ) | | | | 0.29 | | | | | 0.30 | | | | | | |
| | | | | |
Less Distributions From: | | | | | | | | | | | | | | | | | | | | | | | | | | | | | | |
Net Investment Income | | | | (0.12 | ) | | | | (0.02 | ) | | | | (0.24 | ) | | | | — | | | | | (0.01 | ) | | | | | |
Net Realized Gains | | | | — | | | | | — | | | | | — | | | | | (0.17 | ) | | | | (0.13 | ) | | | | | |
| | | | | |
| Total Distributions | | | | (0.12 | ) | | | | (0.02 | ) | | | | (0.24 | ) | | | | (0.17 | ) | | | | (0.14 | ) | | | | | |
| | | | | |
Net Asset Value, End of Year | | | | $10.99 | | | | | $10.54 | | | | | $9.82 | | | | | $10.86 | | | | | $10.74 | | | | | | |
| | | | | |
Total Return(c) | | | | 5.41 | % | | | | 7.59 | % | | | | (7.48 | )% | | | | 2.73 | % | | | | 2.74 | % | | | | | |
Net Assets, End of Year (000’s) | | | | $132 | | | | | $180 | | | | | $1,290 | | | | | $2,723 | | | | | $4,156 | | | | | | |
Ratios to Average Net Assets | | | | | | | | | | | | | | | | | | | | | | | | | | | | | | |
Gross Expense | | | | 2.46 | % | | | | 3.06 | % | | | | 2.89 | % | | | | 3.04 | % | | | | 3.30 | % | | | | | |
Net Expenses(d)(e) | | | | 1.50 | % | | | | 2.48 | % | | | | 2.46 | % | | | | 2.68 | % | | | | 2.71 | % | | | | | |
Net Investment Income (Loss) | | | | 0.42 | % | | | | (0.06 | )% | | | | (0.44 | )% | | | | (0.52 | )% | | | | (0.33 | )% | | | | | |
Portfolio Turnover Rate | | | | 58 | %(f) | | | | 367 | % | | | | 387 | % | | | | 434 | % | | | | 403 | % | | | | | |
| | | | | | | | | | | | | | | | | | | | | | | | | | | | | | |
| CLASS I | | Year Ended
April 30, 2018 | | Year Ended
April 30, 2017 | | Year Ended
April 30, 2016 | | Year Ended
April 30, 2015 | | Year Ended
April 30, 2014 | | |
Net Asset Value, Beginning of Year | | | | $10.61 | | | | | $9.86 | | | | | $10.88 | | | | | $10.74 | | | | | $10.56 | | | | | | |
Income (Loss) From Operations: | | | | | | | | | | | | | | | | | | | | | | | | | | | | | | |
Net Investment Income (Loss)(a) | | | | 0.11 | | | | | 0.03 | | | | | (0.02 | ) | | | | (0.03 | ) | | | | 0.00 | (g) | | | | | |
Net Realized and Unrealized Gain (Loss) on Investments and Foreign Currency | | | | 0.49 | (b) | | | | 0.75 | | | | | (0.76 | ) | | | | 0.34 | | | | | 0.32 | | | | | | |
| | | | | |
Total Income (Loss) From Operations | | | | 0.60 | | | | | 0.78 | | | | | (0.78 | ) | | | | 0.31 | | | | | 0.32 | | | | | | |
| | | | | |
Less Distributions From: | | | | | | | | | | | | | | | | | | | | | | | | | | | | | | |
Net Investment Income | | | | (0.13 | ) | | | | (0.03 | ) | | | | (0.24 | ) | | | | — | | | | | (0.01 | ) | | | | | |
Net Realized Gains | | | | — | | | | | — | | | | | — | | | | | (0.17 | ) | | | | (0.13 | ) | | | | | |
| | | | | |
Total Distributions | | | | (0.13 | ) | | | | (0.03 | ) | | | | (0.24 | ) | | | | (0.17 | ) | | | | (0.14 | ) | | | | | |
| | | | | |
Net Asset Value, End of Year | | | | $11.08 | | | | | $10.61 | | | | | $9.86 | | | | | $10.88 | | | | | $10.74 | | | | | | |
| | | | | |
Total Return(c) | | | | 5.63 | % | | | | 7.93 | % | | | | (7.22 | )% | | | | 2.91 | % | | | | 3.01 | % | | | | | |
Net Assets, End of Year (000’s) | | | | $156,369 | | | | | $103,768 | | | | | $158,200 | | | | | $193,639 | | | | | $207,530 | | | | | | |
Ratios to Average Net Assets | | | | | | | | | | | | | | | | | | | | | | | | | | | | | | |
Gross Expense | | | | 2.21 | % | | | | 2.82 | % | | | | 2.64 | % | | | | 2.78 | % | | | | 2.95 | % | | | | | |
Net Expenses(d)(e) | | | | 1.25 | % | | | | 2.12 | % | | | | 2.21 | % | | | | 2.41 | % | | | | 2.43 | % | | | | | |
Net Investment Income (Loss) | | | | 1.03 | % | | | | 0.32 | % | | | | (0.16 | )% | | | | (0.27 | )% | | | | (0.04 | )% | | | | | |
Portfolio Turnover Rate | | | | 58 | %(f) | | | | 367 | % | | | | 387 | % | | | | 434 | % | | | | 403 | % | | | | | |
| (a) | Per share numbers have been calculated using the average shares method. |
| (b) | Amount includes a non-recurring payment for Litigation proceeds which represents proceeds from securities litigation by the Fund. The litigation proceeds impacted the realized and unrealized gain (loss) per share by $0.00 and $0.00 for Class A and Class I, respectively. |
| (c) | Based on net asset value, which does not reflect the sales charge or contingent deferred sales charge, if applicable. Total returns for periods of less than one year, if any, are not annualized. |
| (d) | The investment advisor and other service providers waived or reimbursed a portion of their fees. |
| (e) | Expense ratio includes dividend and interest expense related to securities sold short. Excluding such dividend and interest expense, the ratio of expenses to average net assets for the years and the periods presented would be: |
| | | | | | |
| | | Class A | | Class I | | |
April 30, 2018 | | 1.50% | | 1.25% | | |
April 30, 2017 | | 2.06% | | 1.77% | | |
April 30, 2016 | | 2.15% | | 1.90% | | |
April 30, 2015 | | 2.19% | | 1.95% | | |
April 30, 2014 | | 2.23% | | 1.98% | | |
| (f) | In January 2017, the Fund transitioned to a single sub-advisor strategy. As a result, the portfolio turnover rate for the fiscal year ended April 30, 2018 was significantly lower than that of previous fiscal years. |
| (g) | Represents less than $0.005. |
See Notes which are an integral part of the Financial Statements
April 30, 2018 / ANNUAL REPORT
FINANCIAL HIGHLIGHTS (continued) 74
For a share outstanding throughout each year ended April 30, unless otherwise noted:
|
WILMINGTON REAL ASSET FUND |
| | | | | | | | | | | | | | | | | | | | | | | | | | | | | | |
| CLASS A | | Year Ended
April 30, 2018 | | Year Ended
April 30, 2017 | | Year Ended
April 30, 2016 | | Year Ended
April 30, 2015 | | Year Ended
April 30, 2014 | | |
Net Asset Value, Beginning of Year | | | | $13.87 | | | | | $13.63 | | | | | $14.77 | | | | | $14.81 | | | | | $15.55 | | | | | | |
Income (Loss) From Operations: | | | | | | | | | | | | | | | | | | | | | | | | | | | | | | |
Net Investment Income (Loss)(a) | | | | 0.35 | | | | | 0.23 | | | | | 0.21 | | | | | 0.13 | | | | | 0.10 | | | | | | |
Net Realized and Unrealized Gain (Loss) on Investments and Foreign Currency | | | | 0.63 | | | | | 0.01 | | | | | (0.68 | ) | | | | 0.04 | | | | | (0.65 | ) | | | | | |
| | | | | |
Total Income (Loss) From Operations | | | | 0.98 | | | | | 0.24 | | | | | (0.47 | ) | | | | 0.17 | | | | | (0.55 | ) | | | | | |
| | | | | |
Less Distributions From: | | | | | | | | | | | | | | | | | | | | | | | | | | | | | | |
Net Investment Income | | | | (0.37 | ) | | | | — | | | | | (0.67 | ) | | | | (0.21 | ) | | | | (0.19 | ) | | | | | |
| | | | | |
Total Distributions | | | | (0.37 | ) | | | | — | | | | | (0.67 | ) | | | | (0.21 | ) | | | | (0.19 | ) | | | | | |
| | | | | |
Net Asset Value, End of Year | | | | $14.48 | | | | | $13.87 | | | | | $13.63 | | | | | $14.77 | | | | | $14.81 | | | | | | |
| | | | | |
Total Return(b) | | | | 7.11 | % | | | | 1.76 | % | | | | (3.09 | )% | | | | 1.14 | % | | | | (3.46 | )% | | | | | |
Net Assets, End of Year (000’s) | | | | $1,297 | | | | | $1,643 | | | | | $1,762 | | | | | $2,242 | | | | | $2,606 | | | | | | |
Ratios to Average Net Assets | | | | | | | | | | | | | | | | | | | | | | | | | | | | | | |
Gross Expense | | | | 1.32 | % | | | | 1.45 | % | | | | 1.48 | % | | | | 1.49 | % | | | | 1.54 | % | | | | | |
Net Expenses(c)(d) | | | | 0.99 | % | | | | 1.20 | % | | | | 1.23 | % | | | | 1.23 | % | | | | 1.28 | % | | | | | |
Net Investment Income (Loss) | | | | 2.46 | % | | | | 1.68 | % | | | | 1.53 | % | | | | 0.89 | % | | | | 0.72 | % | | | | | |
Portfolio Turnover Rate | | | | 438 | % | | | | 593 | % | | | | 418 | % | | | | 242 | % | | | | 149 | % | | | | | |
| | | | | | | | | | | | | | | | | | | | | | | | | | | | | | |
CLASS I | | Year Ended
April 30, 2018 | | Year Ended
April 30, 2017 | | Year Ended
April 30, 2016 | | Year Ended
April 30, 2015 | | Year Ended
April 30, 2014 | | |
Net Asset Value, Beginning of Year | | | | $14.01 | | | | | $13.73 | | | | | $14.86 | | | | | $14.88 | | | | | $15.61 | | | | | | |
Income (Loss) From Operations: | | | | | | | | | | | | | | | | | | | | | | | | | | | | | | |
Net Investment Income (Loss)(a) | | | | 0.40 | | | | | 0.27 | | | | | 0.24 | | | | | 0.17 | | | | | 0.13 | | | | | | |
Net Realized and Unrealized Gain (Loss) on Investments and Foreign Currency | | | | 0.62 | | | | | 0.01 | | | | | (0.67 | ) | | | | 0.03 | | | | | (0.64 | ) | | | | | |
| | | | | |
Total Income (Loss) From Operations | | | | 1.02 | | | | | 0.28 | | | | | (0.43 | ) | | | | 0.20 | | | | | (0.51 | ) | | | | | |
| | | | | |
Less Distributions From: | | | | | | | | | | | | | | | | | | | | | | | | | | | | | | |
Net Investment Income | | | | (0.40 | ) | | | | — | | | | | (0.70 | ) | | | | (0.22 | ) | | | | (0.22 | ) | | | | | |
| | | | | |
Total Distributions | | | | (0.40 | ) | | | | — | | | | | (0.70 | ) | | | | (0.22 | ) | | | | (0.22 | ) | | | | | |
| | | | | |
Net Asset Value, End of Year | | | | $14.63 | | | | | $14.01 | | | | | $13.73 | | | | | $14.86 | | | | | $14.88 | | | | | | |
| | | | | |
Total Return(b) | | | | 7.31 | % | | | | 2.11 | % | | | | (2.89 | )% | | | | 1.40 | % | | | | (3.20 | )% | | | | | |
Net Assets, End of Year (000’s) | | | | $307,734 | | | | | $345,787 | | | | | $453,171 | | | | | $463,375 | | | | | $452,913 | | | | | | |
Ratios to Average Net Assets | | | | | | | | | | | | | | | | | | | | | | | | | | | | | | |
Gross Expense | | | | 1.07 | % | | | | 1.20 | % | | | | 1.23 | % | | | | 1.24 | % | | | | 1.29 | % | | | | | |
Net Expenses(c)(d) | | | | 0.74 | % | | | | 0.95 | % | | | | 0.98 | % | | | | 0.98 | % | | | | 1.03 | % | | | | | |
Net Investment Income (Loss) | | | | 2.74 | % | | | | 1.97 | % | | | | 1.75 | % | | | | 1.13 | % | | | | 0.93 | % | | | | | |
Portfolio Turnover Rate | | | | 438 | % | | | | 593 | % | | | | 418 | % | | | | 242 | % | | | | 149 | % | | | | | |
| (a) | Per share numbers have been calculated using the average shares method. |
| (b) | Based on net asset value, which does not reflect the sales charge or contingent deferred sales charge, if applicable. Total returns for periods of less than one year, if any, are not annualized. |
| (c) | The investment advisor and other service providers waived or reimbursed a portion of their fees. |
| (d) | Expense ratio includes interest expense related to securities sold short, reverse repurchase agreements and/or TBA sale commitments. Interest expense related to securities sold short, reverse repurchase agreements and/or TBA sale commitments had no impact on the ratio of expenses to average net assets for the years ended April 30, 2018 and April 30, 2017. |
See Notes which are an integral part of the Financial Statements
ANNUAL REPORT / April 30, 2018
75 FINANCIAL HIGHLIGHTS (concluded)
For a share outstanding throughout each year ended April 30, unless otherwise noted:
|
WILMINGTON DIVERSIFIED INCOME FUND |
| | | | | | | | | | | | | | | | | | | | | | | | | | | | | | | | | | | |
| CLASS A | | Year Ended
April 30, 2018 | | Year Ended
April 30, 2017 | | Year Ended
April 30, 2016 | | Year Ended
April 30, 2015 | | Year Ended
April 30, 2014 | | | | |
Net Asset Value, Beginning of Year | | | | $11.24 | | | | | $10.40 | | | | | $10.98 | | | | | $10.47 | | | | | $9.86 | | | | | | | | | | | |
Income (Loss) From Operations: | | | | | | | | | | | | | | | | | | | | | | | | | | | | | | | | | | | |
Net Investment Income (Loss)(a) | | | | 0.26 | | | | | 0.12 | | | | | 0.12 | | | | | 0.10 | | | | | 0.10 | | | | | | | | | | | |
Net Realized and Unrealized Gain (Loss) on Investments | | | | 0.52 | | | | | 0.85 | | | | | (0.53 | ) | | | | 0.53 | | | | | 0.62 | | | | | | | | | | | |
| | | | | | | | | | |
Total Income (Loss) From Operations | | | | 0.78 | | | | | 0.97 | | | | | (0.41 | ) | | | | 0.63 | | | | | 0.72 | | | | | | | | | | | |
| | | | | | | | | | |
Less Distributions From: | | | | | | | | | | | | | | | | | | | | | | | | | | | | | | | | | | | |
Net Investment Income | | | | (0.23 | ) | | | | (0.13 | ) | | | | (0.15 | ) | | | | (0.12 | ) | | | | (0.11 | ) | | | | | | | | | | |
Net Realized Gains | | | | (1.32 | ) | | | | — | | | | | (0.02 | ) | | | | — | | | | | — | | | | | | | | | | | |
| | | | | | | | | | |
Total Distributions | | | | (1.55 | ) | | | | (0.13 | ) | | | | (0.17 | ) | | | | (0.12 | ) | | | | (0.11 | ) | | | | | | | | | | |
| | | | | | | | | | |
Net Asset Value, End of Year | | | | $10.47 | | | | | $11.24 | | | | | $10.40 | | | | | $10.98 | | | | | $10.47 | | | | | | | | | | | |
| | | | | | | | | | |
Total Return(b) | | | | 6.99 | % | | | | 9.38 | % | | | | (3.70 | )% | | | | 6.09 | % | | | | 7.34 | % | | | | | | | | | | |
Net Assets, End of Year (000’s) | | | | $40,993 | | | | | $42,878 | | | | | $44,607 | | | | | $52,860 | | | | | $57,317 | | | | | | | | | | | |
Ratios to Average Net Assets | | | | | | | | | | | | | | | | | | | | | | | | | | | | | | | | | | | |
Gross Expense(c) | | | | 1.72 | % | | | | 1.59 | % | | | | 1.52 | % | | | | 1.46 | % | | | | 1.45 | % | | | | | | | | | | |
Net Expenses(c)(d) | | | | 0.66 | % | | | | 0.74 | % | | | | 0.74 | % | | | | 0.80 | % | | | | 0.84 | % | | | | | | | | | | |
Net Investment Income (Loss) | | | | 2.30 | % | | | | 1.16 | % | | | | 1.14 | % | | | | 0.90 | % | | | | 0.94 | % | | | | | | | | | | |
| Portfolio Turnover Rate | | | | 85 | % | | | | 9 | % | | | | 52 | % | | | | 23 | % | | | | 54 | % | | | | | | | | | | |
| | | | | | | | | | | | | | | | | | | | | | | | | | | | | | | | | | | |
| | | | | | | |
| CLASS I | | |
| Year Ended
April 30, 2018 |
| | |
| Year Ended
April 30, 2017 |
| | |
| Year Ended
April 30, 2016 |
| | |
| Year Ended
April 30, 2015 |
| | |
| Year Ended
April 30, 2014 |
| | | | | | | | | | |
Net Asset Value, Beginning of Year | | | | $11.25 | | | | | $10.41 | | | | | $10.98 | | | | | $10.47 | | | | | $9.84 | | | | | | | | | | | |
Income (Loss) From Operations: | | | | | | | | | | | | | | | | | | | | | | | | | | | | | | | | | | | |
Net Investment Income (Loss)(a) | | | | 0.29 | | | | | 0.15 | | | | | 0.15 | | | | | 0.12 | | | | | 0.13 | | | | | | | | | | | |
Net Realized and Unrealized Gain (Loss) on Investments | | | | 0.52 | | | | | 0.85 | | | | | (0.53 | ) | | | | 0.54 | | | | | 0.63 | | | | | | | | | | | |
| | | | | | | | | | |
Total Income (Loss) From Operations | | | | 0.81 | | | | | 1.00 | | | | | (0.38 | ) | | | | 0.66 | | | | | 0.76 | | | | | | | | | | | |
| | | | | | | | | | |
Less Distributions From: | | | | | | | | | | | | | | | | | | | | | | | | | | | | | | | | | | | |
Net Investment Income | | | | (0.26 | ) | | | | (0.16 | ) | | | | (0.17 | ) | | | | (0.15 | ) | | | | (0.13 | ) | | | | | | | | | | |
Net Realized Gains | | | | (1.32 | ) | | | | — | | | | | (0.02 | ) | | | | — | | | | | — | | | | | | | | | | | |
| | | | | | | | | | |
Total Distributions | | | | (1.58 | ) | | | | (0.16 | ) | | | | (0.19 | ) | | | | (0.15 | ) | | | | (0.13 | ) | | | | | | | | | | |
| | | | | | | | | | |
Net Asset Value, End of Year | | | | $10.48 | | | | | $11.25 | | | | | $10.41 | | | | | $10.98 | | | | | $10.47 | | | | | | | | | | | |
| | | | | | | | | | |
Total Return(b) | | | | 7.24 | % | | | | 9.64 | % | | | | (3.42 | )% | | | | 6.35 | % | | | | 7.76 | % | | | | | | | | | | |
Net Assets, End of Year (000’s) | | | | $1,109 | | | | | $725 | | | | | $1,129 | | | | | $1,323 | | | | | $971 | | | | | | | | | | | |
Ratios to Average Net Assets | | | | | | | | | | | | | | | | | | | | | | | | | | | | | | | | | | | |
Gross Expense(c) | | | | 1.48 | % | | | | 1.34 | % | | | | 1.27 | % | | | | 1.21 | % | | | | 1.19 | % | | | | | | | | | | |
Net Expenses(c)(d) | | | | 0.41 | % | | | | 0.49 | % | | | | 0.49 | % | | | | 0.55 | % | | | | 0.59 | % | | | | | | | | | | |
Net Investment Income (Loss) | | | | 2.62 | % | | | | 1.44 | % | | | | 1.39 | % | | | | 1.16 | % | | | | 1.33 | % | | | | | | | | | | |
| Portfolio Turnover Rate | | | | 85 | % | | | | 9 | % | | | | 52 | % | | | | 23 | % | | | | 54 | % | | | | | | | | | | |
| (a) | Per share numbers have been calculated using the average shares method. |
| (b) | Based on net asset value, which does not reflect the sales charge or contingent deferred sales charge, if applicable. Total returns for periods of less than one year, if any, are not annualized. |
| (c) | The Fund invests in other underlying funds and indirectly bears its proportionate share of fees and expenses incurred by the underlying funds in which the Fund is invested. This ratio does not include these indirect fees and expenses. |
| (d) | The investment advisor and other service providers waived or reimbursed a portion of their fees. |
See Notes which are an integral part of the Financial Statements
April 30, 2018 / ANNUAL REPORT
NOTES TO FINANCIAL STATEMENTS 76
Wilmington Funds
April 30, 2018
Wilmington Funds (the “Trust”) is registered under the Investment Company Act of 1940, as amended (the “Act”), as an open-end management investment company. The Trust consists of 12 portfolios, 4 of which are presented herein (individually referred to as a “Fund” or collectively as the “Funds”). The remaining 8 funds are presented in separate reports.
| | |
Fund | | Investment Goal |
Wilmington International Fund (“International Fund”)(d) | | The Fund seeks to provide long-term capital appreciation primarily through a diversified portfolio of non-U.S. equity securities. |
| |
Wilmington Global Alpha Equities Fund (“Global Alpha Equities Fund”)(d) | | The Fund seeks to achieve long-term growth of capital with lower volatility than broader equity markets. |
| |
Wilmington Real Asset Fund (“Real Asset Fund”)(d) | | The Fund seeks to achieve long-term preservation of capital with current income. |
| |
Wilmington Diversified Income Fund (“Diversified Income Fund“)(d) | | The Fund seeks a high level of total return consistent with a moderate level of risk. |
(d) Diversified
The Trust offers 6 classes of shares: Class A, Service Class, Select Class, Administrative Class, Class I and Institutional Class. Service Class, Select Class, Administrative Class and Institutional Class are not available for the Funds. All shares of the Trust have equal rights with respect to voting, except on class-specific matters.
The assets of each portfolio are segregated and a shareholder’s interest is limited to the portfolio in which shares are held.
In the normal course of business, the Funds may enter into contracts that provide general indemnifications. The Funds’ maximum exposure under these arrangements is dependent on claims that may be made against the Funds in the future, and, therefore, cannot be estimated; however, based on experience, the risk of material loss from such claims is considered remote.
| 2. | SUMMARY OF SIGNIFICANT ACCOUNTING POLICIES |
The following is a summary of significant accounting policies consistently followed by the Funds in the preparation of their financial statements. These policies are in conformity with U.S. generally accepted accounting principles (“GAAP”). The Trust is an investment company and follows accounting and reporting guidance under Financial Accounting Standards Board (“FASB”) Accounting Standards Codification (“ASC”) Topic 946, “Financial Services - Investment Companies.” The preparation of financial statements in conformity with GAAP requires management to make estimates and assumptions that affect the amounts of assets, liabilities, expenses and revenues reported in the financial statements. Actual results could differ from those estimated.
Investment Valuation – The Funds utilize a Fair Value approach. The fair value of the Funds’ portfolio securities are determined as follows:
|
•for equity securities, according to the last sale price or official closing price reported in the market in which they are primarily traded (either a national securities exchange or the over-the-counter market), if available; |
|
•in the absence of recorded sales for equity securities, according to the mean between the last closing bid and asked prices; |
|
•financial futures contracts and options are generally valued at market values established by the exchanges on which they are traded at the close of trading on such exchanges. Options traded in the over-the-counter market are generally valued according to the mean between the last bid and the last asked price for the option as provided by an investment dealer or other financial institution that deals in the option. The Board of Trustees (“Trustees”) may determine in good faith that another method of valuing such investments is necessary to appraise their fair value; |
|
•forward foreign currency contracts are valued at the mean between the last bid and asked prices; |
|
•investments in open-end regulated investment companies are valued at net asset value (“NAV”); |
|
•for fixed income securities, according to prices as furnished by an independent pricing service, except that fixed income securities with remaining maturities of less than 60 days at the time of purchase are valued at amortized cost provided such amount approximates fair value; |
|
•price information on listed securities, including underlying Exchange Traded Funds (”ETFs“) and Exchange Traded Notes (”ETNs“), is taken from the exchange where the security is primarily traded; |
|
•swap agreements are valued daily based upon the terms specific to each agreement with its counterparty; and |
|
•for all other securities at fair value as determined in accordance with procedures established by and under the general supervision of the Trustees. |
ANNUAL REPORT / April 30, 2018
77 NOTES TO FINANCIAL STATEMENTS (continued)
Trading in foreign securities may be completed at times which vary from the closing of the New York Stock Exchange (“NYSE”). In computing their NAV, the Funds value foreign securities using the latest closing price on the primary exchange on which they are traded immediately prior to the closing of the NYSE. Certain foreign currency exchange rates are generally determined at the latest rate prior to the closing of the NYSE. Foreign securities quoted in foreign currencies are translated into U.S. dollars at current rates. Events that affect these values and exchange rates may occur between the times at which they are determined and the closing of the NYSE. If such events materially affect the value of portfolio securities, these securities may be valued at their fair value as determined in good faith by the Trustees, although the actual calculation may be done by others. An event is considered material if there is both an affirmative expectation that the security’s value will change in response to the event and a reasonable basis for quantifying the resulting change in value.
The Trust follows the authoritative guidance (GAAP) for fair value measurements. The guidance establishes a framework for measuring fair value and a hierarchy for inputs and techniques used in measuring fair value that maximizes the use of observable inputs and minimizes the use of unobservable inputs and techniques by requiring that the most observable inputs be used when available. The guidance establishes three tiers of inputs that may be used to measure fair value. The three tiers of inputs are summarized at the end of each Fund’s Portfolio of Investments. The inputs or techniques used for valuing securities are not necessarily an indication of the risk associated with investing in those securities.
The Funds’ policy is to disclose transfers between levels based on valuations at the beginning of the reporting period. Each portfolio may hold securities which are periodically fair valued in accordance with the Funds’ fair value procedures. This may result in movements between Levels 1, 2 and 3 throughout the year. As of April 30, 2018, there were no transfers between Levels 1, 2 and 3 assets and liabilities, based on levels assigned to securities at the beginning of the period, except for the International Fund and the Real Asset Fund. For the International Fund, a security was transferred from Level 2 to Level 1 at a valuation of $0 due to the availability of a current market quotation or sufficient volume of trading in the security. For Real Asset Fund, a security was transferred from Level 1 to Level 2 at a valuation of $37,803 due to the application of fair value procedures necessitated by the lack of a current market quotation or sufficient volume of trading in the security. This does not include transfers between Level 1 and Level 2 due to the International Fund, Global Alpha Equities Fund and the Real Asset Fund utilizing International Fair Value Pricing (”IFVP“) during the period. Pursuant to the Funds’ fair value procedures noted previously, equity securities (including exchange traded securities and other open-end regulated investment companies) and exchange traded derivatives are generally categorized as Level 1 securities in the fair value hierarchy. Fixed income securities, non-exchange traded derivatives and money market instruments are generally categorized as Level 2 securities in the fair value hierarchy.
Investments for which there are no such quotations, or for which quotations do not appear reliable, are valued at fair value as determined in accordance with procedures established by and under the general supervision of the Trustees. These valuations are typically categorized as Level 2 or Level 3 securities in the fair value hierarchy.
Repurchase Agreements – Repurchase agreements are transactions in which a Fund buys a security from a dealer or bank and agrees to sell the security back at a mutually agreed upon time and price. The repurchase price exceeds the sale price, reflecting the Fund’s return on the transaction. It is each Fund’s policy to require the counterparty to a repurchase agreement to transfer to the Funds’ custodian or sub-custodian eligible securities or cash with a market value (after transaction costs) at least equal to the repurchase price to be paid under the repurchase agreement. The eligible securities are transferred to accounts with the custodian or sub-custodian in which the Funds hold a “securities entitlement” and exercise “control” as those terms are defined in the Uniform Commercial Code. The Funds have established procedures for monitoring the market value of the transferred securities and requiring the transfer of additional eligible securities if necessary to equal at least the repurchase price. These procedures also allow the counterparty to require securities to be transferred from the account to the extent that their market value exceeds the repurchase price or in exchange for other eligible securities of equivalent market value.
The insolvency of the counterparty or other failure to repurchase the securities may delay the disposition of the underlying securities or cause the Funds to receive less than the full repurchase price.
Repurchase agreements are entered into by the Funds under Master Repurchase Agreements (“MRA”) which permit the Funds, under certain circumstances including an event of default (such as bankruptcy or insolvency), to offset payables and/or receivables under the MRA with collateral held and/or posted to the counterparty and create one single net payment due to or from the Fund.
At April 30, 2018, the open repurchase agreements by counterparty which are subject to a MRA on a net payment basis are as follows:
| | | | | | | | | | | | | | | | |
| | | | |
| Fund/Counterparty | | Repurchase
Agreements | | | Fair Value of
Non-Cash Collateral
Received(1) | | | Cash Collateral
Received(1) | | | Net Amount(2)
| |
| | | | |
International Fund | | | | | | | | | | | | | | | | |
Barclays Capital, Inc. | | $ | 2,256,363 | | | $ | 2,256,363 | | | $ | — | | | $ | — | |
Daiwa Capital Markets America | | | 8,599,585 | | | | 8,599,585 | | | | — | | | | — | |
NBC Global Finance Ltd. | | | 8,599,585 | | | | 8,599,585 | | | | — | | | | — | |
Nomura Securities International, Inc. | | | 8,599,585 | | | | 8,599,585 | | | | — | | | | — | |
RBC Dominion Securities, Inc. | | | 8,599,585 | | | | 8,599,585 | | | | — | | | | — | |
TD Securities, Inc. | | | 8,599,585 | | | | 8,599,585 | | | | — | | | | — | |
| | | | | | | | | | | | | | | | |
| | $ | 45,254,288 | | | $ | 45,254,288 | | | $ | — | | | $ | — | |
| | | | | | | | | | | | | | | | |
April 30, 2018 / ANNUAL REPORT
NOTES TO FINANCIAL STATEMENTS (continued) 78
| | | | | | | | | | | | | | | | |
| | | | |
Fund/Counterparty | | Repurchase Agreements | | | Fair Value of Non-Cash Collateral Received(1) | | | Cash Collateral
Received(1) | | | Net Amount(2) | |
Real Asset Fund | | | | | | | | | | | | | | | | |
BNP Paribas SA | | $ | $3,210,641 | | | $ | $3,210,641 | | | | $— | | | | $— | |
Citigroup Global Markets, Inc. | | | 3,210,641 | | | | 3,210,641 | | | | — | | | | — | |
Daiwa Capital Markets America | | | 3,210,641 | | | | 3,210,641 | | | | — | | | | — | |
JP Morgan Securities LLC | | | 1,275,973 | | | | 1,275,973 | | | | — | | | | — | |
Nomura Securities International, Inc. | | | 3,210,641 | | | | 3,210,641 | | | | — | | | | — | |
RBC Dominion Securities, Inc. | | | 3,210,641 | | | | 3,210,641 | | | | — | | | | — | |
| | | | | | | | | | | | | | | | |
| | | | |
| | $ | 17,329,178 | | | $ | 17,329,178 | | | | $— | | | | $— | |
| | | | | | | | | | | | | | | | |
Diversified Income Fund | | | | | | | | | | | | | | | | |
Barclays Capital, Inc. | | $ | 325,719 | | | $ | 325,719 | | | | $— | | | | $— | |
BNP Paribas SA | | | 819,792 | | | | 819,792 | | | | — | | | | — | |
Citigroup Global Markets, Inc. | | | 819,792 | | | | 819,792 | | | | — | | | | — | |
NBC Global Finance Ltd. | | | 819,792 | | | | 819,792 | | | | — | | | | — | |
Nomura Securities International, Inc. | | | 819,792 | | | | 819,792 | | | | — | | | | — | |
RBC Dominion Securities, Inc. | | | 819,792 | | | | 819,792 | | | | — | | | | — | |
| | | | | | | | | | | | | | | | |
| | | | |
| | $ | 4,424,679 | | | $ | 4,424,679 | | | | $— | | | | $— | |
| | | | | | | | | | | | | | | | |
| | (1) | The amount of collateral reflected in the table does not include any over-collateralization received by the Fund. |
| | (2) | Net amount represents the net amount receivable due from the counterparty in the event of default. |
Reverse Repurchase Agreements – Reverse repurchase agreements are repurchase agreements in which a Fund is the seller (rather than the buyer) of the security, and agrees to repurchase the security at an agreed upon time and price. A reverse repurchase agreement may be viewed as a type of borrowing by a Fund. Reverse repurchase agreements are subject to credit risks. In addition, reverse repurchase agreements create leverage risks because a Fund must repurchase the underlying security at a higher price, regardless of the market value of the security at the time of repurchase.
For the year ended April 30, 2018, the Real Asset Fund had interest expense on reverse repurchase agreements totaling $389 and activity as follows:
| | | | | | | | |
| | | | |
| Average Daily Balance* | | | | Days
Outstanding | | Daily Weighted
Average
Interest Rate* | | Interest
Rate Range |
| | | $588,000 | | 14 | | 1.74% | | 1.74% - 1.74% |
* Average based on the number of days the Fund had the reverse repurchase agreement outstanding. The interest rates shown are annualized.
Investment Income, Gains and Losses, Expenses and Distributions – Interest income and expenses are accrued daily. All premiums and discounts on fixed income securities are amortized/accreted for financial statement purposes. Gains and losses realized on principal payment of mortgage-backed securities (paydown gains and losses) are classified as part of investment income. Dividends and distributions to shareholders are recorded on the ex-dividend date. Non-cash dividends included in dividend income, if any, are recorded at fair value. Foreign dividends are recorded on the ex-dividend date or when the Funds are informed of the ex-dividend date. Investment transactions are accounted for on a trade date basis for financial reporting purposes. Realized gains and losses from investment transactions are recorded on an identified cost basis.
Expenses of the Trust, which are directly identifiable to a specific Fund, are applied to that Fund. Expenses which are not identifiable to a specific Fund are allocated in such a manner as deemed equitable, taking into consideration the nature and type of expense.
All Funds offer multiple classes of shares. Investment income, realized and unrealized gains and losses, and certain fund-level expenses are allocated to each class based on relative daily net assets, except that each class bears certain expenses unique to that class such as distribution and shareholder services fees. Distributions are declared separately for each class. No class has preferential distribution rights; differences in per share distributions rates are generally due to differences in class specific expenses. Distributions from net realized gains, if any, are declared and paid to shareholders annually. Distributions from net investment income are declared and paid quarterly for the Funds, with the exception of the Global Alpha Equities Fund, which is paid annually.
Real Estate Investment Trusts – The Funds may invest in real estate investment trusts (“REITs”) that involve risks not associated with investing in stocks. Risks include declines in the value of real estate, general and economic conditions, changes in the value of the underlying property and defaults by borrowers. The value of assets in the real estate industry may go through cycles of relative underperformance and outperformance in comparison to equity securities markets in general. Dividend income is recorded using management’s estimate of the income included in distributions received from REIT investments. The actual amounts of income, return of capital and capital gains are only
ANNUAL REPORT / April 30, 2018
79 NOTES TO FINANCIAL STATEMENTS (continued)
determined by each REIT after its fiscal year-end and may differ from the estimated amount. Estimates of income are adjusted to the actual amounts when the amounts are determined.
Federal Taxes – It is the Funds’ policy to comply with the Subchapter M provision of the Internal Revenue Code of 1986, as amended (the “Code”), and to distribute to shareholders each year substantially all of their income. Accordingly, no provisions for Federal income tax or excise tax are necessary.
Withholding taxes and where appropriate, deferred withholding taxes, on foreign interest, dividends and capital gains have been provided for in accordance with the applicable country’s tax rules and rates.
The Funds recognize interest and penalties, if any, related to unrecognized tax benefits as income tax expense on the Statement of Operations. During the year ended April 30, 2018, the Funds did not incur any interest or penalties.
Warrants and Rights – Certain Funds hold warrants and rights acquired either through a direct purchase, including as part of private placement, or pursuant to corporate actions. Warrants and rights entitle the holder to buy a proportionate amount of common stock at a specific price and time through the expiration dates. Such warrants and rights are held as long positions by the Funds until exercised, sold or expired. Equity-linked warrants are purchased in order to own local exposure to certain countries in which the Funds are not locally registered. Warrants and rights are valued at fair value in accordance with the Trustees’ approved fair value procedures.
Foreign Currency Translation – The accounting records of the Funds are maintained in U.S. dollars. All assets and liabilities denominated in foreign currencies (“FCs”) are translated into U.S. dollars based on the rates of exchange of such currencies against U.S. dollars on the date of valuation. Purchases and sales of securities, income and expenses are translated at the rate of exchange quoted on the respective date that such transactions are recorded. The Funds do not isolate that portion of results of operations resulting from changes in foreign exchange rates on investments from fluctuations arising from changes in the net realized and unrealized gain or loss on investments.
Reported net realized foreign exchange gains or losses arise from sales of portfolio securities, sales and maturities of short-term securities, sales of FCs, currency gains or losses realized between the trade and settlement dates on securities transactions, the difference between the amounts of dividends, interest, and foreign withholding taxes recorded on the Funds’ books and the U.S. dollar equivalent of the amounts actually received or paid. Net unrealized foreign exchange gains and losses arise from changes in the value of assets and liabilities other than investments in securities at period end, resulting from changes in the exchange rates.
Restricted Securities – Restricted securities are securities that either (a) cannot be offered for public sale without first being registered, or being able to take advantage of an exemption from registration, under the Securities Act of 1933, as amended, or (b) are subject to contractual restrictions on public sales. In some cases, when a security cannot be offered for public sale without first being registered, the issuer of the restricted security has agreed to register such securities for resale, at the issuer’s expense, either upon demand by the Funds or in connection with another registered offering of the securities. Many such restricted securities may be resold in the secondary market in transactions exempt from registration. Restricted securities may be determined to be liquid under criteria established by the Trustees. A Fund will not incur any registration costs upon such resales. The Fund’s restricted securities are valued at the price provided by dealers in the secondary market or, if no market prices are available, at the fair value as determined in accordance with procedures established by and under the general supervision of the Trustees.
Securities Sold Short – Certain Funds may sell securities short. A short sale is a transaction in which the Fund sells a security it does not own in anticipation of a decline in market price. To sell a security short, the Fund must borrow the security. The Fund’s obligation to replace the security borrowed and sold short will be fully collateralized at all times by the proceeds from the short sale retained by the broker and by cash and securities deposited in a segregated account with the Fund’s custodian. If the price of the security sold short increases between the time of the short sale and the time the Fund replaces the borrowed security, the Fund will realize a loss, and if the price declines during the period, the Fund will realize a gain. Any realized gain will be decreased, and any realized loss increased, by the amount of transaction costs. The Funds are required to pay the lender any dividends declared on short positions. Such amounts are recorded on the ex-dividend date as dividends expense on securities sold short on the Statement of Operations.
In accordance with the terms of its prime brokerage agreement, the Funds may be charged a fee on borrowed securities. Such fees are calculated on a daily basis based upon the market value of each borrowed security and a variable rate that is dependent upon the availability of such security. The Funds are required to maintain margin cash balances at the prime broker sufficiently to satisfy their short sales positions on a daily basis. The Funds are charged interest expense at the Fed Funds open rate plus 50 basis points on the amount of any shortfall in the required cash margin. The Funds record these prime broker charges on a net basis as Prime Broker interest expense on securities sold short on the Statement of Operations.
For the year-ended April 30, 2018, the Funds had no borrowings.
Lending of Portfolio Securities – The Trust has entered into an agreement with its custodian whereby the custodian may lend securities owned by the Funds to brokers, dealers and other financial organizations. Any increase or decrease in the fair value of securities loaned and any interest or dividends earned on those securities during the term of the loan would be for the account of the Fund. In exchange for lending securities under the terms of the agreement with their custodian, the Funds receive a lender’s fee. Fees earned by the Funds on securities lending are recorded as income. Loans of securities by the Funds are collateralized by cash, U.S. government securities or money market instruments that are maintained at all times in an amount at least equal to the current market value of the loaned securities plus a margin which varies depending on the type of securities owned. The custodian establishes and maintains the collateral in a segregated account. The
April 30, 2018 / ANNUAL REPORT
NOTES TO FINANCIAL STATEMENTS (continued) 80
Funds have the right under the lending agreement to recover the securities from the borrower on demand. The market value of the loaned securities is determined at the close of business of the Fund and any additional required collateral is delivered to the Fund on the next business day.
Investments purchased with cash collateral are presented on the portfolios of investments under the caption “Cash Collateral Invested for Securities on Loan.”
The Funds maintain the risk of any loss on the securities on loan as well as the potential loss on investments purchased with cash collateral received from securities lending.
Securities lending transactions are entered into by the Funds under Master Securities Lending Agreements (“MSLA”) which permit the Funds, under certain circumstances including an event of default (such as bankruptcy or insolvency), to offset amounts payable by the Fund to the same counterparty against amounts to be received and create one single net payment due to or from the Fund.
At April 30, 2018, the securities loaned which are subject to a MSLA on a net payment basis are as follows:
| | | | | | | | | | | | | | | |
| Fund | | Value of
Securities
on Loan | | Cash
Collateral
Received(1) | | Net Amount(2) |
International Fund | | | $ | 39,863,196 | | | | $ | 39,863,196 | | | | $ | — | |
Real Asset Fund | | | | 16,906,572 | | | | | 16,906,572 | | | | | — | |
Diversified Income Fund | | | | 4,326,022 | | | | | 4,326,022 | | | | | — | |
| | (1) | Collateral with a value of $45,254,288, $17,329,178 and $4,424,679, respectively, has been received in connection with securities lending transactions. |
| | (2) | Net amount represents the net amount receivable due from the counterparty in the event of default. |
TBA Commitments – “TBA” (to be announced) commitments are commitments to purchase or sell mortgage-backed securities for a fixed price at a future date, typically not exceeding 45 days. TBAs may be considered securities in themselves and involve a risk of loss if the value of the TBA changes relative to our “basis” in the position prior to the settlement date. Unsettled TBAs are valued according to the procedures described in the section entitled “Investment Valuation.”
| 3. | DERIVATIVE FINANCIAL INSTRUMENTS |
Disclosures about derivative instruments and hedging activities are intended to improve financial reporting for derivative instruments by requiring enhanced disclosures that enables investors to understand how and why an entity uses derivatives, how derivatives are accounted for, and how derivative instruments affect and entity’s results of operations and financial position. Risk of loss on derivatives, including written options, forward foreign currency contracts, financial futures contracts and swaps, may exceed amounts recognized on the statements of assets and liabilities.
Options – Certain Funds may either purchase or write options in order to hedge against adverse market movements or fluctuations in value caused by changes in prevailing interest rates, value of equities or foreign exchange rates, with respect to securities which the Fund currently owns or intends to purchase. A Fund’s principal reason for writing options is to realize, through receipt of premiums, a greater current return than would be realized on the underlying security alone. When a Fund purchases an option, it pays a premium and an amount equal to that premium is recorded as an asset. When a Fund writes an option, it receives a premium and an amount equal to that premium is recorded as a liability. The asset or liability is adjusted daily to reflect the current market value of the option. If an option expires unexercised, a Fund realizes a gain or loss to the extent of the premium received or paid. If an option is exercised, the premium received or paid is recorded as an adjustment to the proceeds from the sale or the cost of the purchase in determining whether a Fund has realized a gain or loss. The difference between the premium and the amount received or paid on effecting a closing purchase or sale transaction is also treated as a realized gain or loss. Gain or loss on purchased options is included in net realized gain or loss on investment transactions. Gain or loss on written options is presented separately as net realized gain or loss on options written. A Fund, as writer of options, may have no control over whether the underlying securities may be sold (called) or purchased (put). As a result, a Fund bears the market risk of an unfavorable change in the price of the security underlying the written option. A Fund, as purchaser of over-the-counter options, bears the risk of the potential inability of the counterparties to meet the terms of their contracts.
The Real Asset Fund used interest rate options and options on swaps to enhance returns, and manage interest rate risk, inflation risk, credit risk and volatility exposures. The Real Asset Fund used foreign currency options as a short or long hedge against possible variations in foreign exchange rates or as a means to gain exposure to foreign currencies.
Forward Foreign Currency Contracts – Certain Funds may enter into foreign currency commitments or foreign currency exchange transactions. A Fund may enter into foreign currency contract transactions to protect assets against adverse changes in foreign currency exchange rates or exchange control regulations. Purchased contracts are used to acquire exposure to foreign currencies; whereas, contracts to sell are used to hedge a Fund’s securities against currency fluctuations. Risks may arise upon entering into these transactions from the potential inability of counterparties to meet the terms of their commitments and from unanticipated movements in security prices or foreign exchange rates. The foreign currency transactions are adjusted by the daily exchange rate of the underlying currency and any gains or losses are recorded
ANNUAL REPORT / April 30, 2018
81 NOTES TO FINANCIAL STATEMENTS (continued)
for financial statement purposes as unrealized until the settlement date. The International Fund entered into forward foreign currency contracts in connection with settling planned purchases or sales of securities. The Real Asset Fund and the Global Alpha Equities Fund entered into forward foreign currency contracts in connection with settling planned purchases or sales of securities, to hedge the currency exposure associated with some or all of the portfolio’s securities or as a means to express a view on the direction of a currency’s value as a part of the broader investment strategy.
Financial Futures Contracts – The Funds may invest in financial futures contracts to hedge their existing portfolios, manage cash flows, enhance yield and to potentially reduce transaction costs. Upon entering into a futures contract with a broker, the Fund is required to deposit in a segregated account a specified amount of cash or U.S. government securities. Futures contracts are valued daily and unrealized gains or losses are recorded in a “variation margin” account. Daily, and prior to computing its NAV, the Fund receives from or pays to the broker a specified amount of cash based upon changes in the variation margin account. When a contract is closed, the Fund recognizes a realized gain or loss. Futures contracts have market risks, including the risk that the change in the value of the contract may not correlate with the changes in the value of the underlying securities. The Global Alpha Equities Fund used foreign exchange futures contracts to gain exposure to the foreign currency markets both on a long and short strategy. The Global Alpha Equities Fund also used equity index futures contracts to manage equity market net and gross exposure. The Real Asset Fund used futures contracts to manage interest rate exposure, adjust duration and curve exposure and to gain exposure to foreign interest rates. The Real Asset Fund also used money market futures during the period in order to adjust the portfolio’s interest rate exposure on the front-end of the yield curve and to adjust the overall duration positioning of the portfolio.
Swap Agreements – Certain Funds may enter into credit default, interest rate, total return and other forms of swap agreements. A swap agreement is an agreement to exchange the return generated by one instrument for the return generated by another instrument. The swap agreements are valued daily at current market value and any change in value is included in the net unrealized appreciation or depreciation on investments. Payments received or paid by the Fund are recorded as realized gains or losses upon termination or maturity of the swap. Swap agreements outstanding at period end, if any, are listed on the Portfolio of Investments.
Centrally cleared swap agreements are agreements executed through a broker but are cleared through a central counterparty (the “CCP”) and a Fund’s counterparty on the swap becomes the CCP. The Fund is required to interface with the CCP through a broker and upon entering into a centrally cleared swap is required to deposit initial margin with the broker in the form of cash or securities in an amount that varies depending on the size and risk profile of a particular swap. Centrally cleared swaps are subject to general market risks and to liquidity risk. Pursuant to the swap agreement, the Fund agrees to pay to or receive from the counterparty an amount of cash equal to the daily fluctuation in the value of the swap (“variation margin”). Such payments are recorded by the Fund as unrealized gains or losses until the contract is closed or settled at which point the gain or loss is realized.
The Fund may utilize swap agreements in an attempt to gain exposure to the securities in a market without actually purchasing those securities, or to hedge a position.
Interest rate swap agreements – Interest rate swaps represent an agreement between counterparties to exchange cash flows based on the difference between two interest rates, applied to a notional principal amount for a specified period. The Fund is subject to interest rate risk exposure in the normal course of pursuing its investment objectives. The Fund may use interest rate swaps to either maintain its ability to generate steady cash flow by receiving a stream of fixed rate payments or to increase exposure to prevailing market rates by receiving floating rate payments using interest rate swap contracts. The Fund’s maximum risk of loss from counterparty credit risk is the discounted net value of the cash flows to be received from the counterparty over the contract’s remaining life. This risk may be mitigated by having a master netting arrangement between the Fund and the counterparty which may permit the Fund to offset amounts payable by the Fund to the same counterparty against amounts to be received; and by the receipt of collateral from the counterparty by the Fund, to cover the Fund’s exposure to the counterparty. However, there is no assurance that such mitigating factors are easily enforceable. The Real Asset Fund is subject to interest rate risk exposure in the normal course of pursuing its investment objectives. Because the portfolio holds fixed rate bonds, the value of these bonds may decrease if interest rates rise. To help hedge against this risk and to maintain its ability to generate income at prevailing market rates, the portfolio entered into interest rate swap agreements. Additionally, the portfolio invested in interest rate swaps as a risk-neutral substitute for physical securities, to obtain exposure in markets where no physical securities were available, and to refine the risk exposure in the portfolio (i.e. duration, inflation, credit, maturity mix, etc.).
Credit default swap agreements – Credit default swap agreements involve one party making a stream of payments (referred to as the buyer of protection) to another party (the seller of protection) in exchange for the right to receive a specified return in the event of a default or other credit event for the referenced entity, obligation or index. As a seller of protection on credit default swap agreements, a Fund will generally receive from the buyer of protection a fixed rate of income throughout the term of the swap provided that there is no credit event. As the seller, a Fund would effectively add leverage to its portfolio because, in addition to its total net assets, a Fund would be subject to investment exposure on the notional amount of the swap.
If a Fund is a seller of protection and a credit event occurs, as defined under the terms of that particular swap agreement, a Fund will either (i) pay to the buyer of protection an amount equal to the notional amount of the swap and take delivery of the referenced obligation, other deliverable obligations or underlying securities comprising the referenced index or (ii) pay a net settlement amount in the form of cash or securities equal to the notional amount of the swap less the recovery value of the referenced obligation or underlying securities comprising
April 30, 2018 / ANNUAL REPORT
NOTES TO FINANCIAL STATEMENTS (continued) 82
the referenced index. If a Fund is a buyer of protection and a credit event occurs, as defined under the terms of that particular swap agreement, a Fund will either (i) receive from the seller of protection an amount equal to the notional amount of the swap and deliver the referenced obligation, other deliverable obligations or underlying securities comprising the referenced index or (ii) receive a net settlement amount in the form of cash or securities equal to the notional amount of the swap less the recovery value of the referenced obligation or underlying securities comprising the referenced index. Recovery values are estimated by market makers considering either industry standard recovery rates or entity specific factors and considerations until a credit event occurs. If a credit event has occurred, the recovery value is determined by a facilitated auction whereby a minimum number of allowable broker bids, together with a specified valuation method, are used to calculate the settlement value.
Credit default swap agreements on corporate issues, sovereign issues of an emerging country or U.S. municipal issues involve one party making a stream of payments to another party in exchange for the right to receive a specified return in the event of a default or other credit event. If a credit event occurs and cash settlement is not elected, a variety of other deliverable obligations may be delivered in lieu of the specific referenced obligation. The ability to deliver other obligations may result in a cheapest-to deliver option (the buyer of protection’s right to choose the deliverable obligation with the lowest value following a credit event). A Fund may use credit default swaps on corporate issues, sovereign issues of an emerging country or U.S. municipal issues to provide a measure of protection against defaults of the issuers (i.e., to reduce risk where a Fund owns or has exposure to the referenced obligation) or to take an active long or short position with respect to the likelihood of a particular issuer’s default.
Credit default swap agreements on credit indices involve one party making a stream of payments to another party in exchange for the right to receive a specified return in the event of a write-down, principal shortfall, interest shortfall or default of all or part of the referenced entities comprising the credit index. A credit index is a basket of credit instruments or exposures designed to be representative of some part of the credit market as a whole. These indices are made up of reference credits that are judged by a poll of dealers to be the most liquid entities in the credit default swap market based on the sector of the index. Components of the indices may include, but are not limited to, investment grade securities, high yield securities, asset-backed securities, emerging markets, and/or various credit ratings within each sector. Credit indices are traded using credit default swaps with standardized terms including a fixed spread and standard maturity dates. An index credit default swap references all the names in the index, and if there is a default, the credit event is settled based on that name’s weight in the index. The composition of the indices changes periodically, usually every six months, and for most indices, each name has an equal weight in the index. A Fund may use credit default swaps on credit indices to hedge a portfolio of credit default swaps or bonds, which is less expensive than it would be to buy many credit default swaps to achieve a similar effect. Credit default swaps on indices are benchmarks for protecting investors owning bonds against default, and traders use them to speculate on changes in credit quality. Implied credit spreads, represented in absolute terms, utilized in determining the market value of credit default swap agreements on corporate issues, sovereign issues of an emerging country or U.S. municipal issues as of period end are disclosed in the footnotes to the Portfolios of Investments and serve as an indicator of the current status of the payment/performance risk and represent the likelihood or risk of default for the credit derivative. The implied credit spread of a particular referenced entity reflects the cost of buying/selling protection and may include upfront payments required to be made to enter into the agreement. For credit default swap agreements on credit indices, the quoted market prices and resulting values serve as the indicator of the current status of the payment/performance risk. Wider credit spreads represent a deterioration of the referenced entity’s credit soundness and a greater likelihood or risk of default or other credit event occurring as defined under the terms of the agreement. The maximum potential amount of future payments (undiscounted) that a Fund as a seller of protection could be required to make under a credit default swap agreement would be an amount equal to the notional amount of the agreement. The Real Asset Fund uses credit default swaps on corporate and sovereign issues to take an active long position with respect to the likelihood of a particular issuer’s default. The Real Asset Fund also used credit default swaps on credit indices to adjust the portfolio’s overall credit exposure.
The following is a summary of the location of derivatives on the Funds’ Statements of Assets and Liabilities as of April 30, 2018.
| | | | |
| |
| | | Location on the Statement of Assets and Liabilities |
| Derivative Type | | Asset Derivatives | | Liability Derivatives |
Equity contracts | | Variation margin receivable for financial futures contracts* | | Variation margin payable for financial futures contracts* |
| | |
Foreign exchange contracts | | Unrealized appreciation on forward foreign currency contracts.** | | Unrealized depreciation on forward foreign currency contracts.** |
| | |
Interest rate contracts | | Variation margin receivable for financial futures contracts.* | | Variation margin payable for financial futures contracts.* |
| | |
| | Investments in securities, at value. | | Written options, at value. |
| | |
| | Variation margin receivable for centrally cleared swap agreements.* | | Variation margin payable for centrally cleared swap agreements.* |
| | |
| | Over the counter swap agreements, at value.** | | Over the counter swap agreements, at value.** |
| | |
Credit Contracts | | Variation margin receivable for centrally cleared swap agreements.* | | Variation margin payable for centrally cleared swap agreements.* |
| | Over the counter swap agreements, at value.** | | Over the counter swap agreements, at value.** |
| | | | Written options, at value |
*The variation margin shown on the Statements of Assets and Liabilities is the daily change in the unrealized appreciation (depreciation) for centrally cleared swap agreements and financial futures contracts. The variation margin presented below is the cumulative change in unrealized appreciation (depreciation) from the date the contract was opened until April 30, 2018.
ANNUAL REPORT / April 30, 2018
83 NOTES TO FINANCIAL STATEMENTS (continued)
| | | | |
| | | Location on the Statement of Assets and Liabilities |
| Derivative Type | | Asset Derivatives | | Liability Derivatives |
**The amounts shown represent the unrealized appreciation (depreciation) from the date the contract was open. |
| | | | | | | | | | | | | | | | | | | | | | | | | |
| | | Asset Derivative Fair Value |
| Fund | | Total Value | | Equity
Contracts | | Foreign
Exchange
Contracts | | Interest
Rate
Contracts | | Credit
Contracts |
International Fund | | | | | | | | | | | | | | | | | | | | | | | | | |
Financial Futures Contracts | | | $ | 117,414 | | | | $ | 117,414 | | | | $ | — | | | | $ | — | | | | $ | — | |
Forward Foreign Currency Contracts | | | | 839 | | | | | — | | | | | 839 | | | | | — | | | | | — | |
| | | | | | | | | | | | | | | | | | | | | | | | | |
| | | | | |
Totals | | | $ | 118,253 | | | | $ | 117,414 | | | | $ | 839 | | | | $ | — | | | | $ | — | |
| | | | | | | | | | | | | | | | | | | | | | | | | |
| | | | | |
Global Alpha Equities Fund | | | | | | | | | | | | | | | | | | | | | | | | | |
Financial Futures Contracts | | | $ | 2,086,193 | | | | $ | 2,086,193 | | | | $ | — | | | | $ | — | | | | $ | — | |
Forward Foreign Currency Contracts | | | | 357,122 | | | | | — | | | | | 357,122 | | | | | — | | | | | — | |
| | | | | | | | | | | | | | | | | | | | | | | | | |
| | | | | |
Totals | | | $ | 2,443,315 | | | | $ | 2,086,193 | | | | $ | 357,122 | | | | $ | — | | | | $ | — | |
| | | | | | | | | | | | | | | | | | | | | | | | | |
| | | | | |
Real Asset Fund | | | | | | | | | | | | | | | | | | | | | | | | | |
Financial Futures Contracts | | | $ | 5,876 | | | | $ | — | | | | $ | — | | | | $ | 5,876 | | | | $ | — | |
Forward Foreign Currency Contracts | | | | 323,578 | | | | | — | | | | | 323,578 | | | | | — | | | | | — | |
Purchased Options | | | | 157,495 | | | | | — | | | | | — | | | | | 157,495 | | | | | — | |
Written Options | | | | 42,990 | | | | | — | | | | | — | | | | | 42,990 | | | | | — | |
Swap Agreements | | | | 857,509 | | | | | — | | | | | — | | | | | 806,220 | | | | | 51,289 | |
| | | | | | | | | | | | | | | | | | | | | | | | | |
| | | | | |
Totals | | | $ | 1,387,448 | | | | $ | — | | | | $ | 323,578 | | | | $ | 1,012,581 | | | | $ | 51,289 | |
| | | | | | | | | | | | | | | | | | | | | | | | | |
| | | | | | | | | | | | | | | | | | | | | | | | | |
| | | Liability Derivative Fair Value |
| Fund | | Total Value | | Equity
Contracts | | Foreign
Exchange
Contracts | | Interest
Rate
Contracts | | Credit
Contracts |
International Fund | | | | | | | | | | | | | | | | | | | | | | | | | |
Forward Foreign Currency Contracts | | | $ | 1,890 | | | | $ | — | | | | $ | 1,890 | | | | $ | — | | | | $ | — | |
| | | | | | | | | | | | | | | | | | | | | | | | | |
| | | | | |
Global Alpha Equities Fund | | | | | | | | | | | | | | | | | | | | | | | | | |
Financial Futures Contracts | | | $ | 424,448 | | | | $ | 424,448 | | | | $ | — | | | | $ | — | | | | $ | — | |
Forward Foreign Currency Contracts | | | | 43,673 | | | | | — | | | | | 43,673 | | | | | — | | | | | — | |
| | | | | | | | | | | | | | | | | | | | | | | | | |
| | | | | |
Totals | | | $ | 468,121 | | | | $ | 424,448 | | | | $ | 43,673 | | | | $ | — | | | | $ | — | |
| | | | | | | | | | | | | | | | | | | | | | | | | |
| | | | | |
Real Asset Fund | | | | | | | | | | | | | | | | | | | | | | | | | |
Financial Futures Contracts | | | $ | 103,017 | | | | $ | — | | | | $ | — | | | | $ | 103,017 | | | | $ | — | |
Forward Foreign Currency Contracts | | | | 97,382 | | | | | — | | | | | 97,382 | | | | | — | | | | | — | |
Written Options | | | | 24,848 | | | | | — | | | | | — | | | | | 23,698 | | | | | 1,150 | |
Swap Contracts | | | | 355,792 | | | | | — | | | | | — | | | | | 330,366 | | | | | 25,426 | |
| | | | | | | | | | | | | | | | | | | | | | | | | |
| | | | | |
Totals | | | $ | 581,039 | | | | $ | — | | | | $ | 97,382 | | | | $ | 457,081 | | | | $ | 26,576 | |
| | | | | | | | | | | | | | | | | | | | | | | | | |
The effect of derivative instruments on the Statements of Operations for the year ended April 30, 2018 are as follows:
| | |
| |
| Derivative Type | | Location on the Statement of Operations |
| |
| Equity contracts | | Net realized gain (loss) on financial futures contracts and written options. |
| | Net change in unrealized appreciation (depreciation) on financial futures contracts. |
| |
| Foreign exchange contracts | | Net realized gain (loss) on forward foreign currency contracts, purchased options and written options. |
| | Net change in unrealized appreciation (depreciation) on forward foreign currency contracts and written options. |
| |
Interest rate contracts | | Net realized gain (loss) on financial futures contracts, purchased options, written options and swap agreements. |
| | Net change in unrealized appreciation (depreciation) on financial futures contracts, purchased options, written options and swap agreements. |
| |
| Credit contracts | | Net realized gain (loss) on swap agreements and written options. |
| | Net change in unrealized appreciation (depreciation) on written options and swap agreements. |
April 30, 2018 / ANNUAL REPORT
NOTES TO FINANCIAL STATEMENTS (continued) 84
| | | | | | | | | | | | | | | | | | | | | | | | | |
| | | Total Realized Gain (Loss) on Derivatives Recognized in Results from Operations |
| Fund | | Total | | Equity
Contracts | | Foreign
Exchange
Contracts | | Interest Rate
Contracts | | Credit
Contracts |
International Fund | | | | | | | | | | | | | | | | | | | | | | | | | |
Financial Futures Contracts | | | $ | 659,225 | | | | $ | 659,225 | | | | $ | — | | | | $ | — | | | | $ | — | |
Forward Foreign Currency Contracts | | | | (100,478 | ) | | | | — | | | | | (100,478 | ) | | | | — | | | | | — | |
| | | | | | | | | | | | | | | | | | | | | | | | | |
| | | | | |
Totals | | | $ | 558,747 | | | | $ | 659,225 | | | | $ | (100,478 | ) | | | $ | — | | | | $ | — | |
| | | | | | | | | | | | | | | | | | | | | | | | | |
| | | | | |
Global Alpha Equities Fund | | | | | | | | | | | | | | | | | | | | | | | | | |
Financial Futures Contracts | | | $ | (9,245,538 | ) | | | $ | (9,245,538 | ) | | | | — | | | | $ | — | | | | $ | — | |
Forward Foreign Currency Contracts | | | | (571,730 | ) | | | | — | | | | | (571,730 | ) | | | | — | | | | | — | |
| | | | | | | | | | | | | | | | | | | | | | | | | |
| | | | | |
Totals | | | $ | (9,817,268 | ) | | | $ | (9,245,538 | ) | | | $ | (571,730 | ) | | | $ | — | | | | $ | — | |
| | | | | | | | | | | | | | | | | | | | | | | | | |
| | | | | |
Real Asset Fund | | | | | | | | | | | | | | | | | | | | | | | | | |
Financial Futures Contracts | | | $ | (104,538 | ) | | | $ | — | | | | $ | — | | | | $ | (104,538 | ) | | | $ | — | |
Forward Foreign Currency Contracts | | | | (1,257,731 | ) | | | | — | | | | | (1,257,731 | ) | | | | — | | | | | — | |
Purchased Options | | | | (54,081 | ) | | | | — | | | | | 927 | | | | | (55,008 | ) | | | | — | |
Written Options | | | | 284,324 | | | | | — | | | | | 19,195 | | | | | 256,801 | | | | | 8,328 | |
Swap Agreements | | | | 88,298 | | | | | — | | | | | — | | | | | 186,050 | | | | | (97,752 | ) |
| | | | | | | | | | | | | | | | | | | | | | | | | |
| | | | | |
Totals | | | $ | (1,043,728 | ) | | | $ | — | | | | $ | (1,237,609 | ) | | | $ | 283,305 | | | | $ | (89,424 | ) |
| | | | | | | | | | | | | | | | | | | | | | | | | |
| | | | | | | | | | | | | | | | | | | | | | | | | |
| | | Change in Unrealized Appreciation (Depreciation) on Derivatives Recognized in Results from Operations |
| Fund | | Total | | Equity
Contracts | | Foreign
Exchange
Contracts | | Interest Rate
Contracts | | Credit
Contracts |
International Fund | | | | | | | | | | | | | | | | | | | | | | | | | |
Financial Futures Contracts | | | $ | 40,248 | | | | $ | 40,248 | | | | $ | — | | | | $ | — | | | | $ | — | |
Forward Foreign Currency Contracts | | | | 627 | | | | | — | | | | | 627 | | | | | — | | | | | — | |
| | | | | | | | | | | | | | | | | | | | | | | | | |
| | | | | |
Totals | | | $ | 40,875 | | | | $ | 40,248 | | | | $ | 627 | | | | $ | — | | | | $ | — | |
| | | | | | | | | | | | | | | | | | | | | | | | | |
| | | | | |
Global Alpha Equities Fund | | | | | | | | | | | | | | | | | | | | | | | | | |
Financial Futures Contracts | | | $ | 2,638,062 | | | | $ | 2,638,062 | | | | $ | — | | | | $ | — | | | | $ | — | |
Forward Foreign Currency Contracts | | | | 458,335 | | | | | — | | | | | 458,335 | | | | | — | | | | | — | |
| | | | | | | | | | | | | | | | | | | | | | | | | |
| | | | | |
Totals | | | $ | 3,096,397 | | | | $ | 2,638,062 | | | | $ | 458,335 | | | | $ | — | | | | $ | — | |
| | | | | | | | | | | | | | | | | | | | | | | | | |
| | | | | |
Real Asset Fund | | | | | | | | | | | | | | | | | | | | | | | | | |
Financial Futures Contracts | | | $ | (25,067 | ) | | | $ | — | | | | $ | — | | | | $ | (25,067 | ) | | | $ | — | |
Forward Foreign Currency Contracts | | | | 716,447 | | | | | — | | | | | 716,447 | | | | | — | | | | | — | |
Purchased Options | | | | 30,129 | | | | | — | | | | | — | | | | | 30,129 | | | | | — | |
Written Options | | | | (40,806 | ) | | | | — | | | | | 30,339 | | | | | (76,076 | ) | | | | 4,931 | |
Swap Agreements | | | | 66,177 | | | | | — | | | | | — | | | | | 110,435 | | | | | (44,258 | ) |
| | | | | | | | | | | | | | | | | | | | | | | | | |
| | | | | |
Totals | | | $ | 746,880 | | | | $ | — | | | | $ | 746,786 | | | | $ | 39,421 | | | | $ | (39,327 | ) |
| | | | | | | | | | | | | | | | | | | | | | | | | |
The average volume of derivative activities for the year ended April 30, 2018 are as follows.
| | | | | | | | | | | | | | | |
| | | Asset Derivative Volume |
| Fund | | Purchased
Options1 | | Financial Futures Contracts1 | | Forward Foreign Currency
Contracts1 |
International Fund | | | $ | — | | | | $ | 7,592,518 | | | | $ | 447,740 | |
Global Alpha Equities Fund | | | | — | | | | | — | | | | | 177,070 | |
Real Asset Fund | | | | 213,251 | | | | | 3,721,176 | | | | | 12,692,267 | |
| | | | | | | | | | | | | | | | |
ANNUAL REPORT / April 30, 2018
85 NOTES TO FINANCIAL STATEMENTS (continued)
| | | | | | | | | | | | | | | |
| | | Liability Derivative Volume |
| Fund | | Written
Options3 | | Financial Futures
Contracts1 | | Forward Foreign Currency
Contracts1 |
| | | | |
International Fund | | | $ | — | | | | $ | — | | | | $ | 719,966 | |
Global Alpha Equities Fund | | | | — | | | | | 66,999,383 | | | | | 12,072,703 | |
Real Asset Fund | | | | 152,400 | | | | | 10,514,089 | | | | | 26,609,262 | |
| | | | | | | | | | | | | | | |
| Fund | | Interest Rate
Swap
Agreements4 | | Swap Volume
Credit Default Swap Agreements
(purchase
protection)4 | | Credit Default Swap Agreements (sell protection)4 |
| | | | |
Real Asset Fund | | | $ | 228,863,000 | | | | $ | 4,176,000 | | | | $ | 1,216,800 | |
1Cost.
2Contract Value.
3Premiums Received.
4Notional Amount.
Certain Funds are parties to International Swap and Derivatives Association, Inc. (“ISDA”) Master Agreements (“MA”) with various counterparties that govern over-the-counter derivative and foreign exchange contracts entered into from time to time. The ISDA MA may contain provisions regarding, among other things, the parties’ general obligations, representations, agreements, collateral requirements, events of default and early termination. With respect to certain counterparties, in accordance with the terms of the ISDA MA, collateral posted to the Fund is held in a segregated account by the Fund’s custodian and with respect to those amounts which can be sold or repledged, are presented in the Fund’s portfolio or Statements of Assets and Liabilities.
At April 30, 2018, derivative assets and liabilities (by type) held by the Funds are as follows:
| | | | | | | | | | |
| Fund | | Assets | | Liabilities |
International Fund | | | | | | | | | | |
Derivative Financial Instruments: | | | | | | | | | | |
Forward foreign currency contracts | | | $ | 839 | | | | $ | 1,890 | |
| | | | | | | | | | |
| | |
Total derivative assets and liabilities in the Statements of Assets and Liabilities | | | | 839 | | | | | 1,890 | |
Derivatives not subject to a MA or similar agreement | | | | — | | | | | — | |
| | | | | | | | | | |
Total assets and liabilities subject to a MA | | | $ | 839 | | | | $ | 1,890 | |
| | | | | | | | | | |
| | |
Global Alpha Equities Fund | | | | | | | | | | |
Derivative Financial Instruments: | | | | | | | | | | |
Forward foreign currency contracts | | | $ | 357,122 | | | | $ | 43,673 | |
| | | | | | | | | | |
| | |
Total derivative assets and liabilities in the Statements of Assets and Liabilities | | | | 357,122 | | | | | 43,673 | |
Derivatives not subject to a MA or similar agreement | | | | — | | | | | — | |
| | | | | | | | | | |
Total assets and liabilities subject to a MA | | | $ | 357,122 | | | | $ | 43,673 | |
| | | | | | | | | | |
| | |
Real Asset Fund | | | | | | | | | | |
Derivative Financial Instruments: | | | | | | | | | | |
Financial futures contracts | | | $ | 4,728 | | | | $ | 38,570 | |
Forward foreign currency contracts | | | | 323,578 | | | | | 97,382 | |
Options | | | | 200,485 | | | | | 24,848 | |
Swap Agreements | | | | 89,720 | | | | | 150,032 | |
| | | | | | | | | | |
| | |
Total derivative assets and liabilities in the Statements of Assets and Liabilities | | | | 618,511 | | | | | 310,832 | |
Derivatives not subject to a MA or similar agreement | | | | 28,239 | | | | | 93,629 | |
| | | | | | | | | | |
Total assets and liabilities subject to a MA | | | $ | 590,272 | | | | $ | 217,203 | |
| | | | | | | | | | |
April 30, 2018 / ANNUAL REPORT
NOTES TO FINANCIAL STATEMENTS (continued) 86
At April 30, 2018, derivative assets and liabilities by counterparty net of amounts available for offset under a MA and net of the related collateral received by each Fund are as follows:
| | | | | | | | | | | | | | | | | | | | | | | | | |
| Fund/Counterparty | | Derivative Assets Subject to
a MA | | Derivatives
Available for
Offset | | Non-Cash
Collateral
Received(1) | | Cash
Collateral
Received(1) | | Net Amount
of Derivative
Assets(2) |
International Fund | | | | | | | | | | | | | | | | | | | | | | | | | |
| | | | | |
Bank of New York Mellon | | | $ | 839 | | | | $ | (839 | ) | | | $ | — | | | | $ | — | | | | $ | — | |
| | | | | | | | | | | | | | | | | | | | | | | | | |
| | | | | |
Total Derivative Assets | | | $ | 839 | | | | $ | (839 | ) | | | $ | — | | | | $ | — | | | | $ | — | |
| | | | | | | | | | | | | | | | | | | | | | | | | |
| | | | | | | | | | | | | | | | | | | | | | | | | |
| | | Derivative Liabilities Subject to
a MA | | Derivatives
Available for
Offset | | Non-Cash
Collateral
Pledged(3) | | Cash
Collateral
Pledged(3) | | Net Amount
of Derivative
Liabilities(4) |
| | | | | |
Bank of New York Mellon | | | $ | (1,890 | ) | | | $ | 839 | | | | $ | — | | | | $ | — | | | | $ | (1,051 | ) |
| | | | | | | | | | | | | | | | | | | | | | | | | |
| | | | | |
Total Derivative Liabilities | | | $ | (1,890 | ) | | | $ | 839 | | | | $ | — | | | | $ | — | | | | $ | (1,051 | ) |
| | | | | | | | | | | | | | | | | | | | | | | | | |
| | | | | | | | | | | | | | | | | | | | | | | | | |
| | | Derivative
Assets Subject to a
MA | | Derivatives
Available for
Offset | | Non-Cash
Collateral
Received(1) | | Cash
Collateral
Received(1) | | Net Amount
of Derivative
Assets(2) |
Global Alpha Equities Fund | | | | | | | | | | | | | | | | | | | | | | | | | |
| | | | | |
Australia & New Zealand Banking Group | | | $ | 236,747 | | | | $ | — | | | | $ | — | | | | $ | — | | | | $ | 236,747 | |
Bank of New York Mellon | | | | 36 | | | | | (5 | ) | | | | — | | | | | — | | | | | 31 | |
BNP Paribas SA | | | | 320 | | | | | (8 | ) | | | | — | | | | | — | | | | | 312 | |
Citigroup Global Markets | | | | 31,157 | | | | | — | | | | | — | | | | | — | | | | | 31,157 | |
Deutsche Bank AG | | | | 88,862 | | | | | — | | | | | — | | | | | — | | | | | 88,862 | |
| | | | | | | | | | | | | | | | | | | | | | | | | |
| | | | | |
Total Derivative Assets | | | $ | 357,122 | | | | $ | (13 | ) | | | $ | — | | | | $ | — | | | | $ | 357,109 | |
| | | | | | | | | | | | | | | | | | | | | | | | | |
| | | | | | | | | | | | | | | | | | | | | | | | | |
| | | Derivative
Liabilities Subject to
a MA | | Derivatives
Available for
Offset | | Non-Cash
Collateral
Pledged(3) | | Cash
Collateral
Pledged(3) | | Net Amount
of Derivative
Liabilities(4) |
| | | | | |
Bank of Montreal | | | $ | (43,578 | ) | | | $ | — | | | | $ | — | | | | $ | — | | | | $ | (43,578 | ) |
Bank of New York Mellon | | | | (5 | ) | | | | 5 | | | | | — | | | | | — | | | | | — | |
BNP Paribas SA | | | | (8 | ) | | | | 8 | | | | | — | | | | | — | | | | | — | |
HSBC Bank USA, N.A. | | | | (28 | ) | | | | — | | | | | — | | | | | — | | | | | (28 | ) |
State Street Corp. | | | | (54 | ) | | | | — | | | | | — | | | | | — | | | | | (54 | ) |
| | | | | | | | | | | | | | | | | | | | | | | | | |
Total Derivative Liabilities | | | $ | (43,673) | | | | $ | 13 | | | | $ | — | | | | $ | — | | | | $ | (43,660 | ) |
| | | | | | | | | | | | | | | | | | | | | | | | | |
| | | | | | | | | | | | | | | | | | | | | | | | | |
| | | | | | | | | | | | | | | | | | | | | | | | | |
| Fund/Counterparty | | Derivative
Assets Subject to a
MA | | Derivatives
Available for
Offset | | Non-Cash
Collateral
Received (1) | | Cash
Collateral
Received(1) | | Net Amount
of Derivative
Assets(2) |
Real Asset Fund | | | | | | | | | | | | | | | | | | | | | | | | | |
| | | | | |
Bank of America NA | | | $ | 116,316 | | | | $ | (9,012 | ) | | | $ | — | | | | $ | — | | | | $ | 107,304 | |
Barclays Bank PLC | | | | 84 | | | | | (84 | ) | | | | — | | | | | — | | | | | — | |
Citigroup Global Markets | | | | 80,506 | | | | | (27,217 | ) | | | | — | | | | | — | | | | | 53,289 | |
Credit Suisse International | | | | 38,202 | | | | | (12,276 | ) | | | | — | | | | | — | | | | | 25,926 | |
Deutsche Bank AG | | | | 109,272 | | | | | (13,904 | ) | | | | — | | | | | — | | | | | 95,368 | |
Goldman Sachs Bank USA | | | | 10,660 | | | | | (6,166 | ) | | | | — | | | | | — | | | | | 4,494 | |
HSBC Bank USA, N.A. | | | | 83,865 | | | | | (23,771 | ) | | | | — | | | | | (60,000 | ) | | | | 94 | |
JP Morgan Chase Bank, N.A. | | | | 65,486 | | | | | (9,833 | ) | | | | — | | | | | (40,000 | ) | | | | 15,653 | |
Morgan Stanley Capital Services LLC | | | | 66,726 | | | | | (66,726 | ) | | | | — | | | | | — | | | | | — | |
Societe Generale Securities | | | | 19,155 | | | | | (975 | ) | | | | — | | | | | — | | | | | 18,180 | |
| | | | | | | | | | | | | | | | | | | | | | | | | |
Total Derivative Assets | | | $ | 590,272 | | | | $ | (169,964) | | | | $ | — | | | | $ | (100,000) | | | | $ | 320,308 | |
| | | | | | | | | | | | | | | | | | | | | | | | | |
| | | | | | | | | | | | | | | | | | | | | | | | | |
ANNUAL REPORT / April 30, 2018
87 NOTES TO FINANCIAL STATEMENTS (continued)
| | | | | | | | | | | | | | | | | | | | | | | | | |
| | | | | |
| | | Derivative
Liabilities Subject to
a MA | | Derivatives
Available for
Offset | | Non-Cash
Collateral
Pledged(3) | | Cash
Collateral
Pledged(3) | | Net Amount
of Derivative
Liabilities(4) |
| | | | | |
Bank of America NA | | | $ | (9,012 | ) | | | $ | 9,012 | | | | $ | — | | | | $ | — | | | | $ | — | |
Barclays Bank International | | | | (756 | ) | | | | 84 | | | | | — | | | | | — | | | | | (672 | ) |
Citibank NA | | | | (167 | ) | | | | — | | | | | — | | | | | — | | | | | (167 | ) |
Citigroup Global Markets | | | | (27,217 | ) | | | | 27,217 | | | | | — | | | | | — | | | | | — | |
Credit Suisse International | | | | (12,276 | ) | | | | 12,276 | | | | | — | | | | | — | | | | | — | |
Deutsche Bank AG | | | | (13,904 | ) | | | | 13,904 | | | | | — | | | | | — | | | | | — | |
Goldman Sachs Bank USA | | | | (6,166 | ) | | | | 6,166 | | | | | — | | | | | — | | | | | — | |
HSBC Bank USA, N.A. | | | | (23,771 | ) | | | | 23,771 | | | | | — | | | | | — | | | | | — | |
JP Morgan Chase Bank, N.A. | | | | (9,833 | ) | | | | 9,833 | | | | | — | | | | | — | | | | | — | |
Morgan Stanley Capital Services LLC | | | | (108,817 | ) | | | | 66,726 | | | | | — | | | | | — | | | | | (42,091 | ) |
Royal Bank of Scotland | | | | (4,309 | ) | | | | — | | | | | — | | | | | — | | | | | (4,309 | ) |
Societe Generale Securities | | | | (975 | ) | | | | 975 | | | | | — | | | | | — | | | | | — | |
| | | | | | | | | | | | | | | | | | | | | | | | | |
| | | | | |
Total Derivative Liabilities | | | $ | (217,203 | ) | | | $ | 169,964 | | | | $ | — | | | | $ | — | | | | $ | (47,239 | ) |
| | | | | | | | | | | | | | | | | | | | | | | | | |
| | (1) | Excess of collateral received is not shown for financial reporting purposes. |
| | (2) | Net amount represents the net amount receivable in the event of default. |
| | (3) | Excess of collateral pledged is not shown for financial reporting purposes. |
| | (4) | Net amount represents the net amount payable due in the event of default. |
| 4. | FEDERAL TAX INFORMATION |
As of April 30, 2018, there were no uncertain tax positions that would require financial statement recognition, de-recognition or disclosure. The Funds’ federal tax returns filed for the years ended 2017, 2016 and 2015, as well as the current tax year, remain subject to examination by the Internal Revenue Service.
The timing and character of income and capital gain distributions are determined in accordance with income tax regulations, which may differ from GAAP. These differences are due in part to the tax treatment of reclassifications of distributions, capital gain or loss as a result of paydown activity, mark to market of passive foreign investment companies and losses deferred due to wash sales. GAAP requires that permanent differences in net investment income and realized gains and losses due to differences between financial reporting and tax reporting be reclassified between various components of net assets and have no effect on the net assets nor the NAV of a class of the Funds.
For the year ended April 30, 2018, permanent differences identified and reclassified among the components of net assets were as follows:
| | | | | | | | | | | | | | | | | | | | |
| | | | |
| Fund | | Paid-in
Capital | | Increase (Decrease)
Undistributed Net
Investment Income | | Accumulated
Net Realized
Gain (Loss) | | |
International Fund | | | $ | — | | | | $ | 370,837 | | | | $ | (370,837 | ) | | | | | |
Global Alpha Equities Fund | | | | — | | | | | (339,477 | ) | | | | 339,477 | | | | | | |
Real Asset Fund | | | | (93,032,464) | | | | | (1,512,601 | ) | | | | 94,545,065 | | | | | | |
Diversified Income Fund | | | | — | | | | | 12,735 | | | | | (12,735 | ) | | | | | |
The permanent differences identified and reclassified were primarily attributable to the tax treatment of foreign currency gains/losses, adjustments related to passive foreign investment companies and the expiration of capital loss carryforwards.
The tax character of distributions for the corresponding fiscal year ends were as follows:
| | | | | | | | | | | | | | | | | | | | |
| | | 2018 | | 2017 |
| Fund | | Ordinary
Income* | | Long-Term
Capital Gains | | Ordinary
Income* | | Long-Term
Capital Gains |
International Fund | | | $ | 6,083,161 | | | | $ | — | | | | $ | 5,732,724 | | | | $ | — | |
Global Alpha Equities Fund | | | | 1,747,469 | | | | | — | | | | | 302,700 | | | | | — | |
Real Asset Fund | | | | 8,841,494 | | | | | — | | | | | — | | | | | — | |
Diversified Income Fund | | | | 928,171 | | | | | 4,885,048 | | | | | 524,909 | | | | | — | |
| | * | For tax purposes, short-term capital gain distributions are considered ordinary income distributions. |
April 30, 2018 / ANNUAL REPORT
NOTES TO FINANCIAL STATEMENTS (continued) 88
As of April 30, 2018, the components of distributable earnings on a tax basis were as follows:
| | | | | | | | | | | | | | | | | | | | | | | | | | | | | | |
| Fund | | Undistributed
Ordinary Income | | Undistributed
Long-Term
Capital Gains | | Other
Timing
Differences | | Unrealized
Appreciation | | Capital Loss
Carryforwards | | Late Year
Deferrals |
International Fund | | | $ | 2,938,407 | | | | $ | 5,260,990 | | | | $ | — | | | | $ | 86,021,307 | | | | $ | — | | | | $ | — | |
Global Alpha Equities Fund | | | | 187,993 | | | | | — | | | | | 2 | | | | | 10,729,951 | | | | | (9,512,373 | ) | | | | — | |
Real Asset Fund | | | | 933,683 | | | | | — | | | | | (268,241 | ) | | | | 19,354,076 | | | | | (20,419,366 | ) | | | | — | |
Diversified Income Fund | | | | 147,981 | | | | | 43,947 | | | | | 1 | | | | | 580,693 | | | | | — | | | | | — | |
At April 30, 2018, the following Funds had capital loss carryforwards which will reduce each Fund’s taxable income arising from future net realized gain on investments, if any, to the extent permitted by the (“Code”) and thus will reduce the amount of distributions to shareholders which would otherwise be necessary to relieve the Fund of any liability for federal income tax.
| | | | | | | | | | | | | | | |
| Fund | | Short-Term
No Expiration | | Long-Term
No Expiration | | Total Capital
Loss
Carryforwards |
Global Alpha Equities Fund | | | $ | 7,178,897 | | | | $ | 2,333,476 | | | | $ | 9,512,373 | |
Real Asset Fund | | | | 7,011,411 | | | | | 13,407,955 | | | | | 20,419,366 | |
The following Funds utilized capital loss carryforwards as follows to offset taxable capital gains realized during the year ended April 30, 2018:
| | | | | |
| Fund | | Capital Loss
Carryforwards
Utilized |
International Fund | | | $ | 29,963,391 | |
Real Asset Fund | | | | 1,271,830 | |
Diversified Income Fund | | | | 846,766 | |
The following Fund had capital loss carryforwards expire during the year ended April 30, 2018:
| | | | | |
| Fund | | Capital Loss
Carryforwards
Expired |
Real Asset Fund | | | $ | 93,032,464 | |
| 5. | ADVISORY FEES, SERVICING FEES, AND OTHER SERVICE PROVIDERS |
Investment Advisor – Wilmington Funds Management Corporation (“WFMC” or the “Advisor”) serves as the Investment Advisor to each of the Funds. Wilmington Trust Investment Advisors, Inc. (“WTIA”) provides sub-advisory services to the Funds. WFMC and WTIA are wholly-owned subsidiaries of M&T Bank Corporation. For its services, the Funds pay WFMC an annual investment advisory fee, accrued and paid daily, based on a percentage of each Fund’s average daily net assets as described below. WFMC, not the Funds, pays WTIA for its services.
| | | | | |
| Fund | | Advisory Fee
Annual Rate |
International Fund | | | | 0.45 | % |
Global Alpha Equities Fund | | | | 0.95 | % |
Real Asset Fund | | | | 0.45 | % |
Diversified Income Fund | | | | 0.40 | % |
The International Fund, Global Alpha Equities Fund and Real Asset Fund, utilize a multi-manager strategy, whereby WFMC allocates all or a portion of the Funds’ assets among one or more sub-advisors and strategies. For their services, the Funds pay each sub-advisor fees, accrued daily and paid monthly, as described below.
ANNUAL REPORT / April 30, 2018
89 NOTES TO FINANCIAL STATEMENTS (continued)
| | | | | | | | | | | | |
| Fund | | Gross Fees | | Fees Waived | | Current Fee as a % of average net asset of the
Fund/ Allocated Net Assets for Sub-advisors |
International Fund | | | | | | | | | | | | |
WFMC | | | $ | 2,553,198 | | | | $ | (1,095,405) | | | 0.45% |
Sub-advisors: | | | | | | | | | | | | |
Allianz Global Investors U.S. LLC | | | | 371,807 | | | | | — | | | 0.38% on assets allocated to the Europe Equity Growth Select Strategy; and 0.25% on assets allocated to the High Dividend Europe Strategy. |
AXA Investment Managers, Inc. | | | | 381,050 | | | | | — | | | 0.43% on the first $150 million; and 0.41% on assets in excess of $150 million |
Berenberg Asset Management LLC | | | | 260,875 | | | | | — | | | 0.27% |
Nikko Asset Management Americas, Inc. | | | | 314,913 | | | | | — | | | 0.32% |
Schroder Investment Management North America, Inc. | | | | 681,635 | | | | | — | | | 0.50% |
| | | | | | | | | | | | |
Total(a) | | | $ | 4,563,478 | | | | $ | (1,095,405 | ) | | |
| | | | | | | | | | | | |
| | | |
Global Alpha Equities Fund | | | | | | | | | | | | |
WFMC | | | $ | 1,313,791 | | | | $ | (976,124) | | | 0.95% |
Sub-advisor: | | | | | | | | | | | | |
Wellington Management Company LLP | | | | 760,616 | | | | | — | | | 0.55% |
| | | | | | | | | | | | |
Total(b) | | | $ | 2,074,407 | | | | $ | (976,124 | ) | | |
| | | | | | | | | | | | |
| | | |
Real Asset Fund | | | | | | | | | | | | |
WFMC | | | $ | 1,478,477 | | | | $ | (269,754) | | | 0.45% on all Assets except assets allocated to the inflation-protected and fixed-income securities (“TIPS”) strategy or the Enhanced Cash Strategy. The fee for assets allocated to the TIPS strategy: 0.52% of the first $25 million; 0.49% of the next $25 million; and 0.47% of Assets over $50 million. The fee for assets allocated to the Enhanced Cash strategy is 0.53% on the assets. |
Sub-advisors: | | | | | | | | | | | | |
Pacific Investment Management Company, LLC | | | | 190,298 | | | | | — | | | 0.25% |
Parametric Portfolio Associates LLC | | | | 152,106 | | | | | — | | | 0.25% on the first $20 million in assets; 0.20% of the next $20 million in assets; and 0.15% of assets in excess of $40 million |
| | | | | | | | | | | | |
Total(c) | | | $ | 1,820,881 | | | | $ | (269,754 | ) | | |
| | | | | | | | | | | | |
| | | |
Diversified Income Fund | | | | | | | | | | | | |
WFMC | | | $ | 175,204 | | | | $ | (356,588) | | | 0.40% |
| | | | | | | | | | | | |
| | | |
| | | | | | | | | | | | |
(a) The total gross advisory and sub-advisory fees during the period were 0.80% for the International Fund
(b) The total gross advisory and sub-advisory fees during the period were 1.50% for the Global Alpha Equities Fund
(c) The total gross advisory and sub-advisory fees during the period were 0.55% for the Real Asset Fund
WFMC and the Funds’ shareholder service providers have contractually agreed to waive their fees and/or reimburse expenses so that total annual fund operating expenses paid by the Funds (not including the effects of dividends or interest on short positions, acquired fund fees and expenses, taxes, or other extraordinary expenses expressed as an annualized percentage of average daily net assets), will not exceed the expense limitations set forth below. Neither WFMC nor the Funds’ distributor will recoup previously waived fees/expenses in subsequent years.
| | | | | | | | | | | | | | | |
| | | Current Contractual | | Current |
| | | Expense Limitations | | Termination |
| Fund | | Class A | | Class I | | Date |
International Fund | | | | 1.04 | % | | | | 0.91 | % | | | | 8/31/18 | |
Global Alpha Equities Fund | | | | 1.50 | % | | | | 1.25 | % | | | | 8/31/18 | |
Real Asset Fund* | | | | 0.96 | % | | | | 0.71 | % | | | | 8/31/18 | |
Diversified Income Fund** | | | | 0.62 | % | | | | 0.37 | % | | | | 8/31/18 | |
*Prior to July 1, 2017, the Real Asset Fund’s contractual expense limitation was 1.23% and 0.98% for Class A and Class I, respectively.
**Prior to September 1, 2017, the Diversified Income Fund’s contractual expense limitation was 0.74% and 0.49% for Class A and Class I, respectively.
Administrative Fees – The Bank of New York Mellon (“BNYM”) provides the Trust with fund administration services. The fees as described in the table below are a component of “Portfolio accounting and administration fees” as disclosed in the Statements of Operations. WFMC, in its role as Co-Administrator, provides the Funds with certain administrative personnel and services necessary to operate the Funds. Effec-
April 30, 2018 / ANNUAL REPORT
NOTES TO FINANCIAL STATEMENTS (continued) 90
tive October 1, 2017, the fees as described in the table below are accrued and paid daily and are disclosed on the Statement of Operations as “Administrative personnel and services fees.”
| | | | | | | |
| Administrator | | Maximum
Fee | | Average Aggregate Daily Net Assets of the Trust |
WFMC | | | | 0.040 | % | | on the first $5 billion |
| | | | 0.030 | % | | on the next $2 billion |
| | | | 0.025 | % | | on the next $3 billion |
| | | | 0.018 | % | | on assets in excess of $10 billion |
| | |
BNYM | | | | 0.0175 | % | | on the first $15 billion |
| | | | 0.0150 | % | | on the next $10 billion |
| | | | 0.0125 | % | | on assets in excess of $25 billion |
Prior to October 1, 2017, the administrative fees were as follows:
| | | | | | | |
| Administrator | | Maximum
Fee | | Average Aggregate Daily Net Assets of the Trust |
WFMC | | | | 0.040 | % | | on the first $5 billion |
| | | | 0.030 | % | | on the next $2 billion |
| | | | 0.025 | % | | on the next $3 billion |
| | | | 0.018 | % | | on assets in excess of $10 billion |
| | |
BNYM | | | | 0.0285 | % | | on the first $500 million |
| | | | 0.0280 | % | | on the next $500 million |
| | | | 0.0275 | % | | on assets in excess of $1 billion |
WFMC and BNYM may voluntarily choose to waive any portion of their fee and can add, modify or terminate a voluntary wavier at any time at their sole discretion. Neither WFMC nor BNYM will recoup previously waived fees/expenses in subsequent years. For the year ended April 30, 2018, neither WFMC nor BNYM waived any administrative fees.
Distribution Services Fee –The Trust has adopted a Distribution Services Plan (the “Plan”) pursuant to Rule 12b-1 under the Act. The Plan allows the Funds to pay fees to financial intermediaries, which may be paid through ALPS Distributors, Inc. (“ALPS”), the principal distributor, at an annual rate of up to 0.25% of the average daily net assets of the Funds’ Class A shares, for the sale, distribution, administration, customer servicing and record keeping of these shares.
The Trust may reduce the maximum amount of distribution services fees it pays from time to time at its sole discretion. In addition, a financial intermediary (including ALPS, the Advisor or their affiliates), may voluntarily waive or reduce any fees to which they are entitled.
For the year ended April 30, 2018, M&T Securities, Inc. and Manufacturers and Traders Trust Company (together “M&T”), affiliates of the Advisor, received a portion of the fees paid by the Funds which are listed below:
| | | | | |
| Fund | | Distribution
Fees |
International Fund | | | $ | 5,698 | |
Global Alpha Equities Fund | | | | 46 | |
Real Asset Fund | | | | 1,919 | |
Diversified Income Fund | | | | 96,639 | |
Sales Charges – The Class A shares of all the Funds bear front-end sales charges.
For the year ended April 30, 2018, M&T received the amounts listed below from sales charges on the sale of Class A shares.
| | | | | |
| Fund | | Sales Charges
from Class A |
International Fund | | | $ | 696 | |
Global Alpha Equities Fund | | | | 33 | |
Real Asset Fund | | | | 722 | |
Diversified Income Fund | | | | 28,317 | |
Shareholder Services Fee – Pursuant to a Shareholder Services Plan adopted by the Funds and administered by ALPS, the Funds may pay up to 0.25% of the average daily net assets of each Fund’s Class A and Class I shares to financial intermediaries (which may include ALPS, the Advisor or their affiliates) for providing shareholder services and maintaining shareholder accounts. M&T has entered into a Shareholders Services Agreement with ALPS, under which it is entitled to receive up to 0.25% of the average daily net assets of each Fund’s shares for whom M&T provides shareholder services. The Funds may reduce the maximum amount of shareholder service fees it pays from time to time at its sole discretion. In addition, a financial intermediary (including M&T) may waive or reduce any fees to which they are entitled.
ANNUAL REPORT / April 30, 2018
91 NOTES TO FINANCIAL STATEMENTS (continued)
For the year ended April 30, 2018, M&T received a portion of the fees paid by the following Fund which is listed below:
| | | | | |
| Fund | | Shareholder
Services Fee |
International Fund | | | $ | 646,720 | |
Other Service Providers – Foreside Management Services, LLC (“FMS”) provides a Principal Executive Officer and Principal Financial Officer to the Trust. FMS has no role in determining the investment policies or which securities are to be sold or purchased by the Trust or its Funds.
BNYM provides custody services to the Trust.
BNY Mellon Investment Servicing (U.S.) Inc. provides fund accounting and transfer agency services to the Trust.
General – Certain Officers of the Trust are also Officers or employees of the above companies that provide services to the Funds, and during their terms of office, receive no compensation from the Funds. The Trust’s Statement of Additional Information includes additional information about the Trustees.
Other Affiliated Parties and Transactions – Affiliated holdings are securities and mutual funds which are managed by the Advisor or an affiliate of the Advisor or which are distributed by an affiliate of the Funds’ distributor. Transactions with affiliated companies during the year ended April 30, 2018 are as follows:
| | | | | | | | | | | | | | | | | | | | | | | | | | | | | | | | | | | | | | | | | | | | | |
Fund/ Affiliated Investment Name | | Value 4/30/17 | | Purchases | | Sales | | Net Realized
Gain/(Loss)(a) | | Net Change in
Unrealized
Appreciation/
(Depreciation) | | Value
4/30/18 | | Number
of
Shares
4/30/18 | | Dividend
Income(b) | | Capital
Gain
Distributions |
Diversified Income Fund | | | | | | | | | | | | | | | | | | | | | | | | | | | | | | | | | | | | | | | | | | | | | |
Investment Companies - 0.0%* | | | | | | | | | | | | | | | | | | | | | | | | | | | | | | | | | | | | | | | | | | | | | |
Wilmington International Fund | | | | $ 6,204,954 | | | | | $— | | | | | $ 6,722,034 | | | | | $2,167,603 | | | | | $(1,650,523) | | | |
| $ —
| (c)
| | |
| —
| (c)
| | | | $46,490 | | | |
| $ —
| (c)
|
Wilmington Large-Cap Strategy Fund | | | | 4,284,311 | | | | | 19,590 | | | | | 4,469,976 | | | | | 619,542 | | | | | (453,467) | | | |
| —
| (c)
| | |
| —
| (c)
| | | | 19,590 | | | |
| —
| (c)
|
| | | | | | | | | | | | | | | | | | | | | | | | | | | | | | | | | | | | | | | | | | | | | |
TOTAL | | | | $ 10,489,265 | | | | | $19,590 | | | | | $ 11,192,010 | | | | | $2,787,145 | | | | | $(2,103,990) | | | | | $ — | | | | | — | | | | | $66,080 | | | | | $ — | |
| | | | | | | | | | | | | | | | | | | | | | | | | | | | | | | | | | | | | | | | | | | | | |
* As a percentage of Net Assets as of April 30, 2018.
(a) Realized Gain/(Loss) includes realized capital gain distributions paid by the affiliated fund and gain/(loss) on sales of the affiliated fund.
(b) Dividend Income may include distributions from net investment income and return of capital paid by the affiliated fund to the Fund.
(c) Value is zero.
| 6. | INVESTMENT TRANSACTIONS |
Purchases and sales of investments, excluding short-term obligations, U.S. Government Securities for the year ended April 30, 2018 were as follows:
| | | | | | | | |
| | | Investments | |
| Fund | | Purchases | | | Sales | |
International Fund | | | $537,914,429 | | | $ | 408,714,369 | |
Global Alpha Equities Fund | | | 106,733,617 | | | | 73,975,657 | |
Real Asset Fund | | | 236,013,230 | | | | 282,163,814 | |
Diversified Income Fund | | | 35,118,978 | | | | 39,522,709 | |
Purchases and sales of investments of U.S. Government Securities for the year ended April 30, 2018 were as follows:
| | | | | | | | |
| | | U.S. Government Securities | |
| Fund | | Purchases | | | Sales | |
Real Asset Fund | | $ | 1,287,654,982 | | | $ | 1,312,981,849 | |
Diversified Income Fund | | | 685,580 | | | | 500,000 | |
April 30, 2018 / ANNUAL REPORT
NOTES TO FINANCIAL STATEMENTS (continued) 92
Effective April 6, 2017, the Trust is participating in a $10,000,000 unsecured, committed revolving line of credit (“LOC”) agreement with BNYM. The LOC is available for extraordinary or emergency purposes, primarily for financing redemption payments. Borrowings are charged interest at a rate of 1.25% per annum over the greater of the Federal Funds Rate or the overnight LIBOR. The LOC includes a commitment fee of 0.15% per annum on the daily unused portion. The termination date of the current LOC is April 5, 2019.
The Funds did not utilize the LOC for the year ended April 30, 2018.
| 8. | RECENT REGULATORY UPDATES |
On October 13, 2016, the Securities and Exchange Commission (the “SEC”) adopted new rules and forms and amended existing rules and forms which are intended to modernize and enhance the reporting and disclosure of information by registered investment companies and to improve the quality of information that funds provide to investors, including modifications to Regulation S-X which would require standardized, enhanced disclosure about derivatives in investment company financial statements. The new rules also enhance disclosure regarding fund liquidity and redemption practices. The compliance dates of the modifications to Regulation S-X was August 1, 2017 and other amendments and rules are generally June 1, 2018 and December 1, 2018. The financial statements presented are in compliance with the most recent Regulation S-X amendments.
| 9. | RECENT ACCOUNTING PRONOUNCEMENTS |
In March 2017, the Financial Accounting Standards Board issued an Accounting Standards Update, ASU 2017-08, Receivables – Nonrefund-able Fees and Other Costs (Subtopic 310-20), Premium Amortization on Purchased Callable Debt Securities (the “ASU”) which amends the amortization period for certain purchased callable debt securities held at a premium, shortening such period to the earliest call date. The ASU does not require any accounting change for debt securities held at a discount; the discount continues to be amortized to maturity. The ASU is effective for fiscal years, and interim periods within those fiscal years, beginning after December 15, 2018. At this time, management is evaluating the implications of these changes on the financial statements.
Management has evaluated events and transactions for potential recognition or disclosure in the financial statements through the date the financial statements were issued. Management has determined that there are no additional material events that would require recognition or disclosure in the Funds’ financial statements through this date.
| 11. | FEDERAL TAX INFORMATION (UNAUDITED) |
Complete information regarding the tax status of distributions will be reported on Forms 1099.
Of the ordinary income (including short-term capital gain) distributions made by the Funds during the fiscal year ended April 30, 2018, the Funds designate the following percentages, or such greater percentages that constitute the maximum amount allowable pursuant to Code Sections Section 243 and 854(b)(2), as qualifying for the corporate dividends received deduction:
| | | | |
| Fund | | | |
International Fund | | | 0.00% | |
Global Alpha Equities Fund | | | 58.79% | |
Real Asset Fund | | | 12.37% | |
Diversified Income Fund | | | 28.80% | |
For the fiscal year ended April 30, 2018, the Funds designate the following percentages of the ordinary income dividends, or such greater percentages that constitute the maximum amount allowable pursuant to Code Sections 1(h)(11) and 854(b)(2), as qualified dividend income which may be subject to a maximum rate of federal income tax of 15%:
| | | | |
| Fund | | | |
International Fund | | | 64.11% | |
Global Alpha Equities Fund | | | 100.00% | |
Real Asset Fund | | | 28.31% | |
Diversified Income Fund | | | 50.45% | |
If the Funds meet the requirements of Section 853 of the Code, the Funds will pass through to shareholders credits of foreign taxes paid.
ANNUAL REPORT / April 30, 2018
93
REPORT OF INDEPENDENT REGISTERED PUBLIC ACCOUNTING FIRM
TO THE SHAREHOLDERS AND BOARD OF TRUSTEES OF WILMINGTON FUNDS
Opinion on the Financial Statements
We have audited the accompanying statements of assets and liabilities of Wilmington International Fund, Wilmington Global Alpha Equities Fund, Wilmington Real Asset Fund and Wilmington Diversified Income Fund (collectively referred to as the “Funds”), (four of the funds constituting the Wilmington Funds (the “Trust”)), including the portfolios of investments, as of April 30, 2018, and the related statements of operations for the year then ended, the statements of changes in net assets for each of the two years in the period then ended, the financial highlights for each of the five years in the period then ended and the related notes (collectively referred to as the “financial statements”). In our opinion, the financial statements present fairly, in all material respects, the financial position of each of the Funds (four of the funds constituting the Wilmington Funds) at April 30, 2018, the results of their operations for the year then ended, the changes in their net assets for each of the two years in the period then ended and their financial highlights for each of the five years in the period then ended, in conformity with U.S. generally accepted accounting principles.
Basis for Opinion
These financial statements are the responsibility of the Trust’s management. Our responsibility is to express an opinion on each of the Funds’ financial statements based on our audits. We are a public accounting firm registered with the Public Company Accounting Oversight Board (United States) (“PCAOB”) and are required to be independent with respect to the Trust in accordance with the U.S. federal securities laws and the applicable rules and regulations of the Securities and Exchange Commission and the PCAOB.
We conducted our audits in accordance with the standards of the PCAOB. Those standards require that we plan and perform the audit to obtain reasonable assurance about whether the financial statements are free of material misstatement, whether due to error or fraud. The Trust is not required to have, nor were we engaged to perform, an audit of the Trust’s internal control over financial reporting. As part of our audits, we are required to obtain an understanding of internal control over financial reporting, but not for the purpose of expressing an opinion on the effectiveness of the Trust’s internal control over financial reporting. Accordingly, we express no such opinion.
Our audits included performing procedures to assess the risks of material misstatement of the financial statements, whether due to error or fraud, and performing procedures that respond to those risks. Such procedures included examining, on a test basis, evidence regarding the amounts and disclosures in the financial statements. Our procedures included confirmation of securities owned as of April 30, 2018, by correspondence with the custodian and brokers or by other appropriate auditing procedures where replies from brokers were not received. Our audits also included evaluating the accounting principles used and significant estimates made by management, as well as evaluating the overall presentation of the financial statements. We believe that our audits provide a reasonable basis for our opinion.

We have served as the auditor of one or more Wilmington Funds’ investment companies since 1986.
Philadelphia, Pennsylvania
June 27, 2018
April 30, 2018 / ANNUAL REPORT
BOARD OF TRUSTEES AND TRUST OFFICERS 94
BOARD OF TRUSTEES AND TRUST OFFICERS
The following tables give information about each Trustee and the senior officers of the Trust. The tables separately list Trustee members who are “interested persons” of the Fund (i.e., “Interested” Trustees) and those who are not (i.e., “Independent” Trustees). The Trust is comprised of 12 funds. Unless otherwise noted, the business address of each Trustee and senior officer is 111 South Calvert Street, 26th floor, Baltimore, Maryland 21202. Each Trustee oversees all portfolios of the Trust and serves for an indefinite term. The Trust’s Statement of Additional Information includes additional information about the Trustees and is available, without charge and upon request, by calling 1-800-836-2211.
INTERESTED TRUSTEES BACKGROUND
| | | | |
Name Address Birth Year Position With Trust Date Service Began | | Principal Occupations and Other Directorships Held for Past Five Years | | |
| | |
Donald E. Foley* Birth year: 1951 TRUSTEE Began serving: December 2015 | | Principal Occupations: Director, BioSig Technologies (2015 to present); Director, AXA Equitable’s VIP Mutual Funds (2017 to present); Director, AXA Equitable (variable annuity) (2013 to present); Director, 1290 Mutual Funds (retail funds) (2013 to present); and Chairman and Director, Burke Rehabilitation Hospital Foundation (private hospital, research institute) (2005 to present). | | |
| | Other Directorships Held: Director, M&T Bank Corporation (commercial bank) (2011 to 2012); Chairman and Director,Wilmington Trust Corporation (commercial and trust bank) (2007 to 2011); Chairman, Director and President’s Council, Union College (private college) (2011 to 2015). | | |
| | Previous Positions: Advisory Member, Trust and Investment Committee, M&T Bank, Wilmington Trust, National Association, and Wilmington Trust Company (through 2016); Director of M&T Bank Corporation and M&T Bank (2011 to 2012); Chairman and Chief Executive Officer of Wilmington Trust Corporation (2010 to 2011); Senior Vice President and Treasurer at ITT Corporation (1996 to 2010); Assistant Treasurer at International Paper (1989 to 1996). | | |
Christopher D. Randall* Birth year: 1965 TRUSTEE Began serving: September 2015 PRESIDENT Began serving: September 2014 | | Principal Occupations: Senior Vice President, Wilmington Trust Corporation (2015 to present); Chief Operating Officer, Wilmington Trust Corporation (2012 to present); Senior Vice President, M&T Bank. | | |
| | Other Directorships Held: Trustee, Hilbert College (2015 to present). | | |
| | Previous Positions: President, Wilmington Retirement (2012 to 2015); President and Chief Executive Officer of Wilmington Trust Investment Advisors, Inc. and President of Wilmington Trust Investment Management, LLC (2014-2015); President, Mid-Atlantic Region Wealth Advisory Services, M&T Bank (2011 to 2013) | | |
| * | Christopher D. Randall is “interested” due to the positions he currently holds with the Funds, Wilmington Trust’s Wealth and Institutional Services Division, M&T Bank, the parent of the Fund’s Advisor, and previous positions held with WTIA and WFMC. Donald E. Foley is “interested” due to the positions he previously held with Wilmington Trust Corporation, M&T Bank Corporation and M&T Bank, the parent of the Fund’s Advisor. |
ANNUAL REPORT / April 30, 2018 (unaudited)
95 BOARD OF TRUSTEES AND TRUST OFFICERS
INDEPENDENT TRUSTEES BACKGROUND
| | |
Name
Birth Year
Position with Trust
Date Service Began | | Principal Occupations and Other Directorships Held for Past Five Years |
Nicholas A. Giordano Birth year: 1943 CHAIRMAN and TRUSTEE Began serving: March 2012 | | Principal Occupations: Consultant, financial services organizations (1997 to present). Other Directorships Held: Kalmar Pooled Investment Trust (through 6/17); The RBB Fund Inc. (19 portfolios) (registered investment companies); Independence Blue Cross; IntriCon Corporation (body-worn products) |
| |
| | Previous Positions: Interim President, LaSalle University (1998 to 1999); President and Chief Executive Officer, Philadelphia Stock Exchange (1981 to 1997). |
|
Robert H. Arnold Birth year: 1944 TRUSTEE Began serving: March 2012 | | Principal Occupations: Managing Director, R.H. Arnold & Co, Inc. (financial management consulting) (6/89 to present). Other Directorships Held: Trustee, First Potomac Realty Trust (real estate investment trust) (5/03 to present); Director, Treasury Strategies, Inc. (private treasury consulting services) (6/01 to 6/16). |
|
Gregory P. Chandler Birth year: 1966 TRUSTEE Began serving: July 2017 | | Principal Occupations: Chief Financial Officer Emtec, Inc. (information technology services) (4/09 to present); President, GCVC Consulting (corporate governance consulting) (2008 to present). Other Directorships Held: Trustee, RBB Fund Series Trust (19 portfolios) (registered investment companies) (2012 to present); Director, Emtec, Inc. (8/2005 to present); Director, FS Investment Corporation (business development company) (2007 to present); Trustee, FS Energy Partners (business development company) (2009 to present). Previous Positions: Managing Director, Head of Business Services and IT Services Practice, Janney Montgomery Scott LLC (investment banking/brokerage) (2003 to 2009). |
|
John S. Cramer Birth year: 1942 TRUSTEE Began serving: December 2000 | | Principal Occupations: Retired. Other Directorships Held: Chairman and Director, CI Supply Corp. (medical supplies and equipment) (1/14 to 1/15); Director, Check Med Corp. (medical supplies and equipment) (6/08 to 1/14); Director, Highmark Blue Shield (health insurance) (2/01 to 6/10). Previous Positions: Consultant, Yaffe & Co. (compensation consultants) (6/02 to 6/12); President and Chief Executive Officer, Pinnacle Health Systems (nonprofit hospital and health care system in Central Pennsylvania) (through 2012). |
|
Daniel R. Gernatt, Jr. Birth year: 1940 TRUSTEE Began serving: February 1988 | | Principal Occupations: President and CEO, Gernatt Asphalt Products, Inc. (asphalt, sand and gravel products) (1979 to present). Other Directorships Held: Director, Roswell Park Alliance (2008 to 2016); Trustee, Gernatt Family Foundation. |
|
Richard B. Seidel Birth year: 1941 TRUSTEE Began serving: September 2003 | | Principal Occupations: Chairman, Seidel & Associates (legal consulting) (1/14 to present); Chairman, Girard Private Investment Group (registered investment adviser) (1/14 to present). Other Directorships Held: Director, Tristate Capital Holdings (9/07 to present). Previous Positions: Chairman, Girard Capital (broker-dealer) (1/10 to 2016); Chairman, Girard Partners, Ltd. (1/10 to 2016). |
|
April 30, 2018 (unaudited) / ANNUAL REPORT
BOARD OF TRUSTEES AND TRUST OFFICERS 96
OFFICERS
| | |
Name
Address
Birth Year
Positions with Trust | | Principal Occupations for Past Five Years and Previous Positions |
Jeffrey M. Seling Birth year: 1970 ASSISTANT TREASURER Began serving: June 2013 VICE PRESIDENT Began serving: June 2007 | | Principal Occupations: Administrative Vice President, M&T Bank and Wilmington Trust Investment Advisors, Inc.; Assistant Treasurer, Wilmington Funds. Previous Positions: Vice President, MSD&T; Assistant Vice President, Wells Fargo Bank; Assistant Vice President, JP Morgan Chase Bank. |
|
John C. McDonnell Birth year: 1966 CHIEF OPERATIONS OFFICER Began serving: June 2017 | | Principal Occupations: Chief Operations Officer, Wilmington Funds and Wilmington Trust Investment Advisors, Inc.; Vice President, Wilmington Funds Management Corporation (2005 to present); Vice President, Wilmington Trust Investment Advisors, Inc. (2012 to present). Previous Positions: Vice President, Wilmington Trust Investment Management, LLC (2005 to 2012); Audit Senior, Deloitte LLP (2004 to 2005); Assistant Vice President, 1838 Investment Advisors, LP (1999 to 2004). |
|
Lisa Druelinger Birth year: 1978 CHIEF COMPLIANCE OFFICER and AML COMPLIANCE OFFICER. Began serving: November 2017 | | Principal Occupations: Chief Compliance Officer and Anti-Money Laundering Officer, Wilmington Funds; Vice President, M&T Bank. Previous Positions: Vice President and Senior Compliance Officer, Wilmington Trust Investment Advisors, Inc. (2015-2017); Wilmington Funds Product Manager, Wilmington Trust Investment Advisors, Inc. (2013-2015); Institutional and Retirement Services Product Manager, Wilmington Trust (2011-2013); Trust Compliance and Risk Management at M&T Bank (2006- 2011). |
|
John J. Kelley Birth year: 1959 VICE PRESIDENT Began serving: December 2016 | | Principal Occupations: President, Wilmington Funds Management Corporation; Group Vice President and Chief Administrative Officer, Wilmington Trust Investment Advisors, Inc. Previous Positions: Vice President, BNY Mellon Investment Servicing (formerly PNC Global Investment Servicing), (1/05 to 7/05); Vice President of Administration, 1838 Investment Advisors, LP (1999 to 2005); Chief Compliance Officer, 1838 Investment Advisors, LP (2004 to 2005). |
|
Ralph V. Partlow, III 25 South Charles Street, 22nd floor Baltimore, MD 21201 Birth year: 1957 VICE PRESIDENT Began serving: June 2010 | | Principal Occupation: Administrative Vice President and Deputy General Counsel, M&T Bank (2003 to present). Previous Positions: Vice President and Senior Counsel, Allfirst Bank (1995 to 2003). |
|
Christopher W. Roleke 10 High Street, Suite 302 Boston, MA 02110 Birth year: 1972 CHIEF FINANCIAL OFFICER AND TREASURER Began serving: July 2013 | | Principal Occupation: Managing Director and Fund Principal Financial Officer, Foreside Management Services, LLC (2011 to present). Previous Positions: Assistant Vice President, JP Morgan Investor Services Co. (2006 to 2011). |
|
Lisa R. Grosswirth Atlantic Terminal Office Tower, 2 Hanson Place, 12th Floor Brooklyn, NY 11217 Birth year: 1963 SECRETARY Began serving: September 2007 | | Principal Occupation: Vice President, BNY Mellon Asset Servicing (2004 to present). Previous Positions: Supervisory Paralegal, The Dreyfus Corporation (1998 to 2004). |
|
ANNUAL REPORT / April 30, 2018 (unaudited)
97 BOARD OF TRUSTEES AND TRUST OFFICERS
| | |
Name
Address
Birth Year
Positions with Trust | | Principal Occupations for Past Five Years and Previous Positions |
Richard J. Berthy Three Canal Plaza, Suite 100 Portland, ME 04101 Birth year: 1958 CHIEF EXECUTIVE OFFICER Began serving: September 2007 | | Principal Occupation: Chief Executive Officer, Foreside Financial Group, LLC (2012 to present). Previous Positions: President, Foreside Financial Group, LLC (2008 to 2012); Chief Administrative Officer, Foreside Financial Group, LLC (2005 to 2008); President and Secretary, Bainbridge Capital Management, LLC (2003 to 2006); Vice President, Bainbridge Capital Management (2002 to 2004). |
|
April 30, 2018 (unaudited) / ANNUAL REPORT
98
Shares of the Wilmington Funds are not FDIC insured or otherwise protected by the U.S. government, are not deposits or other obligations of, or guaranteed by, Manufacturers and Traders Trust Company, and are subject to investment risks, including possible loss of the principal amount invested.
VOTING PROXIES ON FUND PORTFOLIO SECURITIES
A description of the policies and procedures that the Funds use to determine how to vote proxies relating to securities held in the Funds’ portfolios is available, without charge and upon request, by calling 1-800-836-2211. A report on how the Funds voted any such proxies during the most recent 12-month period ended June 30 is available through Wilmington Funds’ website. Go to www.wilmingtonfunds.com select “Proxy Voting Record” to access the link. This information is also available from the Edgar database on the SEC’s website at www.sec.gov.
QUARTERLY PORTFOLIO SCHEDULE
The Funds file with the SEC a complete schedule of their portfolio holdings, as of the close of the first and third quarters of their fiscal year, on Form N-Q. These filings are available on the SEC’s website at www.sec.gov and may be reviewed and copied at the SEC’s Public Reference Room in Washington DC. (Call 1-800-SEC-0330 for information on the operation of the Public Reference Room.)
Electronic Delivery
Wilmington Funds encourages you to sign up for electronic delivery of investor materials. By doing so you will receive information faster, help lower shareholder costs, and reduce the impact to the environment. To enroll in electronic delivery:
| | 1.) | Go to www.wilmingtonfunds.com and select “Individual Investors” |
| | 2.) | Click on the link “Sign up for Electronic Delivery” |
| | 3.) | Login to your account or create new user ID |
| | 4.) | Select E-Delivery Consent from the available options, and |
| | 5.) | Complete the information requested, including providing the email address where you would like to receive notification for electronic documents. |
* If you hold your account through a financial intermediary, please contact your advisor to request electronic delivery of investor materials.
Householding
In an effort to reduce volume of mail you receive, only one copy of the prospectus, annual/semi-annual report, SAI and proxy statements will be sent to shareholders who are part of the same family and share the same address.
If you would like to request additional copies of the prospectus, annual/semi-annual report or SAI, or wish to opt out of householding mailings, please contact Shareholder Services at 1-800-836-2211, or write to Wilmington Funds, P.O. Box 9828, Providence, RI 02940-8025.
ANNUAL REPORT / April 30, 2018 (unaudited)
99
PRIVACY POLICY AND NOTICE
OF THE FUNDS AND THEIR DISTRIBUTOR
June 8, 2012
The Wilmington Funds, their distributor and their agents (referred to as “the Funds”, “we” or “us”) recognize that consumers (referred to as “you” or “your”) expect us to protect both your assets and financial information. We respect your right to privacy and your expectation that all personal information about you or your account will be maintained in a secure manner. We are committed to maintaining the confidentiality, security and integrity of client and shareholder information. We want you to understand the Funds’ policy that governs the handling of your information, how the Funds gather information, how that information is used and how it is kept secure.
Information The Funds Collect:
The Funds collect nonpublic personal information about you from the following sources:
| | • | | We may receive information from you, or from your financial representative, on account applications, other forms or electronically (such as through the Funds’ website or other electronic trading mechanisms). Examples of this information include your name, address, social security number, assets and income. |
| | • | | We may receive information from you, or from your financial representative, through transactions with us or others, correspondence and other communications. Examples of this information include specific investments and your account balances. |
| | • | | We may obtain other personal information from you in connection with providing you a financial product or service. Examples of this information include depository, debit or credit account numbers. |
Information Sharing Policy
The Funds may share nonpublic personal information about you, as described above, with financial or non-financial companies or other entities, including companies that may be affiliated with the Funds and other nonaffiliated third parties, for the following purposes:
| | • | | We may share information when it is necessary and required to process a transaction or to service a customer relationship. For example, information may be shared with a company that provides account record keeping services or a company that provides proxy services to shareholders. |
| | • | | We may share information when it is required or permitted by law. For example, information may be shared in response to a subpoena or to protect you against fraud or with someone who has established a legal beneficial interest, such as a power of attorney. |
| | • | | We may disclose some or all of the information described above to companies that perform marketing or other services on our behalf. For example, we may share information about you with the financial intermediary (bank, investment bank or broker-dealer) through whom you purchased the Funds’ products or services, or with providers of marketing, legal, accounting or other professional services. The Funds will not, however, disclose a consumer’s account number or similar form of access number or access code for credit card, deposit or transaction accounts to any nonaffiliated third party for use in telemarketing, direct mail or other marketing purposes. |
Except as described above, the Funds do not share customer information. We will not rent, sell, trade, or otherwise release or disclose any personal information about you. Any information you provide to us is for the Funds’ use only. If you decide to close your account(s) or become an inactive customer, we will adhere to the privacy policies and practices as described in this notice.
Information Security:
When the Funds share nonpublic customer information with third parties hired to facilitate the delivery of certain products or services to our customers, such information is made available for limited purposes and under controlled circumstances designed to protect our customers’ privacy. We require third parties to comply with our standards regarding security and confidentiality of such information. We do not permit them to use that information for their own or any other purposes, or rent, sell, trade or otherwise release or disclose the information to any other party. These requirements are reflected in written agreements between the Funds and the third party service providers.
The Funds protect your personal information in several ways. We maintain physical, electronic, and procedural safeguards to guard your nonpublic personal information. In addition, the Funds’ Transfer Agent and Shareholder Servicing Agent have procedures in place for the appropriate disposal of nonpublic personal information when they are no longer required to maintain the information.
Each of the following sections explains an aspect of the Funds’ commitment to protecting your personal information and respecting your privacy.
Employee Access to Information:
Our Code of Ethics, which applies to all employees, restricts the use of customer information and requires that it be held in the strictest of confidence. Employee access to customer information is authorized for business purposes only, and the degree of access is based on the sensitivity of the information and on an employee’s or agent’s need to know the information in order to service a customer’s account or comply with legal requirements.
Visiting The Funds’ Website:
The Funds’ website gathers and maintains statistics about the number of visitors as well as what information is viewed most frequently. This information is used to improve the content and level of service we provide to our clients and shareholders.
April 30, 2018 / ANNUAL REPORT
100
| | • | | Information or data entered into a website will be retained. |
| | • | | Where registration to a website or re-entering personal information on a website is required, “cookies” are used to improve your online experience. A cookie is a way for websites to recognize whether or not you have visited the site before. It is a small file that is stored on your computer that identifies you each time you re-visit our site so you don’t have to resubmit personal information. Cookies provide faster access into the website. |
| | • | | We may also collect non-personally identifiable Internet Protocol (“IP”) addresses for all other visitors to monitor the number of visitors to the site. These non-personally identifiable IP addresses are never shared with any third party. |
E-mail:
If you have opted to receive marketing information from the Funds by e-mail, it is our policy to include instructions in all marketing messages on how to unsubscribe from subsequent e-mail programs. Some products or services from the Funds are intended to be delivered and serviced electronically. E-mail communication may be utilized in such cases. If you participate in an employer-sponsored retirement plan administered by the Funds, we may, at your employer’s request, send you e-mail on matters pertaining to the retirement plan.
Please do not provide any account or personal information such as social security numbers, account numbers, or account balances within your e-mail correspondence to us. We cannot use e-mail to execute transaction instructions, provide personal account information, or change account registration. We can, however, use e-mail to provide you with the necessary forms or you may contact customer service toll-free at 1-800-836-2211.
Surveys/Aggregate Data:
Periodically, the Funds may conduct surveys about financial products and services or review elements of customer information in an effort to forecast future business needs. The Funds then generate reports that include aggregate data regarding its customers. Aggregate data classifies customer information in various ways but that does not identify individual customers. These reports may also include information on website traffic patterns and related information. These reports are used for the Funds’ planning, statistical and other corporate purposes. Aggregate data may also be shared with external parties, such as marketing organizations. However, no information is shared by which any individual customer could be identified.
Changes to Our Privacy Statement:
The effective date of this policy is June 8, 2012. We reserve the right to modify this policy at any time. When it is revised or materially changed, we will update the effective date. You can determine whether there have been changes since the last time you reviewed by simply checking the effective date.
Notice will be provided to you in advance of any changes that would affect your rights under this policy statement
ANNUAL REPORT / April 30, 2018
[This Page Intentionally Left Blank]
[This Page Intentionally Left Blank]
[This Page Intentionally Left Blank]
[This Page Intentionally Left Blank]
|
WILMINGTON FUNDS Investment Advisor Wilmington Funds Management Corp. 1100 North Market Street Wilmington, DE 19890 Sub-Advisor Wilmington Trust Investment Advisors 111 South Calvert Street 26th Floor Baltimore, MD 21202 Additional Sub-Advisors to the Wilmington International Fund Allianz Global Investors U.S. LLC 1633 Broadway New York, New York 10019 AXA Investment Managers, Inc. 100 West Putnam Avenue Greenwich, Connecticut 06830 Berenberg Asset Management LLC 330 N. Wabash Avenue, 39th floor Chicago, Illinois 60611 Nikko Asset Management Americas, Inc. 535 Madison Avenue, Suite 2500 New York, New York 10022 Schroder Investment Management North America, Inc. 875 Third Avenue New York, New York 10022 Additional Sub-Advisors to the Wilmington Global Alpha Equities Fund Wellington Management Company LLP 280 Congress Street Boston, Massachusetts 02210 Additional Sub-Advisors to the Wilmington Real Asset Fund Pacific Investment Management Company, LLC (“PIMCO”) 840 Newport Center Drive Newport Beach, CA 92660 Parametric Portfolio Associates, LLC 1918 Eighth Avenue, Suite 3100 Seattle, WA 98101 Co-Administrator Wilmington Funds Management Corp. 1100 North Market Street Wilmington, DE 19890 Custodian The Bank of New York Mellon 225 Liberty Street New York, NY 10286 Distributor ALPS Distributors, Inc. 1290 Broadway, Suite 1100 Denver, CO 80203 Fund Accountant, Co-Administrator, Transfer Agent and Dividend Disbursing Agent BNY Mellon Investment Servicing (U.S.) Inc. 301 Bellevue Parkway Wilmington, DE 19809 Independent Registered Public Accounting Firm Ernst & Young LLP One Commerce Square 2005 Market Street, Suite 700 Philadelphia, PA 19103 WT-AR-MMgr-0418 Wilmington Funds | 1-800-836-2211 | www.wilmingtonfunds.com We are pleased to send you this shareholder report for the Wilmington Funds. This report contains important information about your investments in the funds. |
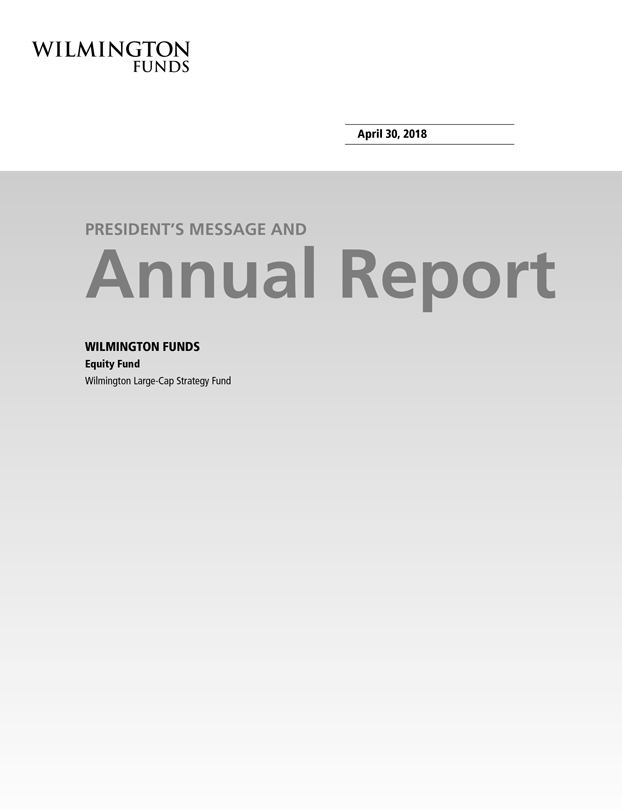

Wilmington Large-Cap Strategy Fund (“Large-Cap Strategy Fund”)

[This Page Intentionally Left Blank]
Esteemed Shareholder:
I am pleased to present the Annual Report of the Wilmington Funds (the “Trust”), covering the Trust’s annual fiscal year of May 1, 2017, through April 30, 2018. Inside you will find a comprehensive review of the Trust’s holdings and financial statements.
The economy and financial markets in review
Wilmington Funds Management Corporation and Wilmington Trust Investment Advisors, Inc. (the Trust’s investment advisor and subadvisor, respectively), have provided the following review of the economy, bond markets, and stock markets for the Trust’s annual fiscal year period.
The economy
The U.S. economy has shown strength over the past year, with the second, third, and fourth quarters of 2018 exhibiting the strongest growth since 2015. Following the disappointment of Congress’s inability to pass comprehensive healthcare reform, Republicans redeemed themselves by passing the Tax Cuts and Jobs Act in December of 2017, which contributed to surging confidence from consumers and businesses alike. The Institute of Supply Management (“ISM”) Manufacturing Purchasing Managers Index (“PMI”)1 peaked at 60.8 in February 2018—the highest level since 2004. Also in February, the Conference Board’s measure of consumer confidence reached the highest levels since 2000. Yet against this euphoric backdrop, Core Personal Consumption Expenditure (“PCE”) inflation held below the Federal Reserve’s 2% target and has only recently accelerated. As a result, the “goldilocks” (not too hot, not too cold) characterization of the U.S. economy has continued to ring true, with economic data for much of the fiscal year meeting or exceeding expectations, but not coming in so strong as to force the hand of the Federal Reserve into accelerating monetary policy tightening. In our estimation, the U.S. economy will grow at a pace of approximately 3% in 2018, with 0.5–0.75% of that attributable to tax cuts.
We are increasingly aware that the U.S. is closer to the end of the business cycle than to the beginning. The U.S. economic expansion is officially the second-longest on record. The labor market is tight by multiple measures, and the Federal Reserve is in the midst of a rate-hiking campaign (although it continues to move gradually). This has led short-maturity interest rates higher and contributed to the flattening of the yield curve; at the time of writing, the yield curve is less than 45 basis points (0.45%) away from inverting. (An inverted yield curve has preceded each of the last five recessions.) We do not view a U.S. recession as imminent but consider the U.S. economy in the later stages of the economic cycle.
Moving beyond U.S. borders, the past year has marked a period of synchronized global growth. The eurozone far surpassed growth expectations in 2017, with measures of loan growth, business expansion, and consumer confidence accelerating in the second half of 2017. Japan has printed a string of eight positive quarters of GDP growth, the longest such stretch since the 1990s. Emerging markets have also benefited from robust global demand and rising oil prices, which have increased nearly 50% over the past year. Some of this momentum cooled as the calendar turned on the new year. We still see economic growth as having legs, but the pace of growth across the board has decelerated, particularly relative to elevated expectations. We are watching carefully for signs of a more sustained slowdown, which would challenge our overall view.
Bond markets
The past year has been a challenging one for bond investors. For the fiscal year through January, bonds were holding their value and even posting modest single-digit total returns. However, inflationary fears began to emerge in the first quarter of 2018, sending the yield on the 10-year U.S. Treasury above 3% by the end of April. This was the first time the 10-year yield breached 3% since the end of 2013. The upward move in the short end of the yield curve has been even more dramatic and, as mentioned above, the yield curve has flattened alongside three rate hikes from the Fed (in June, December, and March). Higher yields have weighed on the price return of bonds, particularly for short-to-intermediate maturities. The Bloomberg Barclays U.S. Treasury Bond Index2 has returned -1.07% over the period.
Investment-grade credit spreads remain tight but have increased in 2018. Spread stabilization and lower supply in coming months should support valuations. High-yield bond credit spreads to Treasuries remain quite low relative to history, despite higher volatility in 2018 and fund outflows from the asset class. Defaults are expected to remain low in the coming year.
For the 12-month period May 1, 2017 to April 30, 2018, certain Bloomberg indices performed as follows3:
| | | | | | | | |
| | | | |
Bloomberg Barclays U.S. Treasury Bond Index | | Bloomberg
Barclays U.S. Aggregate Bond Index4 | | Bloomberg
Barclays U.S. Credit Bond Index5 | | Bloomberg
Barclays Municipal Bond Index6 | | Bloomberg
Barclays U.S. Corporate High Yield Bond Index7 |
-1.07% | | -0.32% | | 0.65% | | 1.56% | | 3.26% |
PRESIDENT’S MESSAGE / April 30, 2018 (unaudited)
Equity markets
The synchronized global growth discussed earlier acted as a rising tide lifting all equity boats for most of the year, and equity markets enjoyed extremely low levels of volatility through January. U.S. equities were propelled by a healthy consumer, low inflation, a weakening dollar, and tax cuts. As strong as U.S. equity returns were, those of developed international and emerging economies were even better, particularly in U.S. dollar terms. However, equity markets experienced several hiccups in recent months. Concerns have mounted regarding higher inflation, regulations on technology companies, and protectionism, all of which have weighed on global equities and contributed to higher volatility in 2018. Additionally, the positive tailwind for U.S. and emerging markets equities coming from a weaker dollar will fade, as the U.S. dollar has reversed this year’s weakness. The dollar is 0.4% stronger year to date through April and increased 2.7% in the last two weeks of April alone. Equity markets have been choppier of late, but valuations are not overly concerning (though they are higher than 10-year averages across a number of regions), and we continue to believe the economic fundamentals are encouraging going forward. Therefore, we maintain our preference for stocks over bonds.
For the 12-month period May 1, 2017 to April 30, 2018, certain stock market indices performed as follows:
| | | | | | |
| | | |
S&P 500® Index8 | | Russell
2000® Index9 | | MSCI EAFE
(Net) Index10 | | MSCI Emerging
Markets (Net) Index11 |
13.27 % | | 11.54% | | 14.51% | | 21.71% |
Despite growing uncertainty in financial markets, we remain focused on managing risk and growing our clients’ capital to help achieve their long-term goals.
Sincerely,

Christopher D. Randall
President
May 25, 2018
April 30, 2018 (unaudited) / PRESIDENT’S MESSAGE
Must be preceded or accompanied by a prospectus.
Past performance is no guarantee of future results. The index performance quoted is for illustrative purposes only and is not representative of any specific investment. Diversification does not ensure a profit nor protect against loss.
All investments involve risk, including the possible loss of principal. Equity Securities are subject to price fluctuation and possible loss of principal. Small-and mid-cap stocks involve greater risks and volatility than large-cap stocks. International investments are subject to special risks, including currency fluctuations, social, economic, and political uncertainties, which could increase volatility. These risks are magnified in emerging markets.
High-yield, lower-rated securities generally entail greater market, credit, and liquidity risks than investment grade securities and may include higher volatility and higher risk of default.
1. ISM Manufacturing PMI Report on Business is based on data compiled from monthly replies to questions asked of purchasing and supply executives in over 400 industrial companies. For each of the indicators measured (New Orders, Backlog of Orders, New Export Orders, Imports, Production, Supplier Deliveries, Inventories, Customers Inventories, Employment, and Prices), this report shows the percentage reporting each response, the net difference between the number of responses in the positive economic direction and the negative economic direction and the diffusion index. Responses are raw data and are never changed.
2. Bloomberg Barclays U.S. Treasury Bond Index is a market capitalization weighted index that includes all publicly issued, U.S. Treasury securities that have a remaining maturity of at least one year, are rated investment-grade, and have $250 million or more of outstanding face value. The index is unmanaged and investments cannot be made directly in an index.
3. Bond prices are sensitive to changes in interest rates and a rise in interest rates can cause decline in their prices.
4. Bloomberg Barclays U.S. Aggregate Bond Index is widely used benchmark index for the domestic investment-grade bond market composed of securities from the Barclays Government/Corporate Bond Index, Mortgage-Backed Securities Index and Asset-Backed Securities Index. The index typically includes fixed income securities with overall intermediate- to long-term average maturities. The index is unmanaged and investments cannot be made directly in an index.
5. Bloomberg Barclays U.S. Credit Bond Index tracks the performance of domestic investment-grade corporate bonds and is composed of all publicly issued, fixed-rate, nonconvertible, investment-grade corporate debt. The index is unmanaged and investments cannot be made directly in an index.
6. Bloomberg Barclays Municipal Bond Index tracks the performance of long-term, tax-exempt, investment-grade bond market. To be included in the index, bonds must have an outstanding par balance of at least $7 million and be issued as part of a transaction of at least $75 million. The index is unmanaged and investments cannot be made directly in an index.
7. Bloomberg Barclays U.S. Corporate High Yield Bond Index measures the USD-denominated, high yield, fixed-rate corporate bond market. Securities are classified as high yield if the middle rating of Moody’s, Fitch, and S&P is Ba1/BB+/BB+ or below. Bonds from issuers with an emerging markets country of risk, based on the Bloomberg Barclays EM country definition, are excluded. The U.S. Corporate High Yield Bond Index is a component of the U.S. Universal and Global High Yield Indices. An investment cannot be made directly in an index.
8. The S&P 500® Index is a capitalization-weighted index of 500 stocks designed to measure performance of the broad domestic economy through changes in the aggregate market value of 500 stocks representing all major industries. The index is unmanaged and investments cannot be made directly in an index.
9. The Russell 2000® Index measures the performance of the 2,000 smallest companies in the Russell 3000 Index, which represents approximately 8% of the total market capitalization of the Russell 3000 Index. As of its latest reconstitution, the index had a total market capitalization range of approximately $128 million to $1.3 billion.
10. MSCI EAFE (Net) Index is a free float-adjusted market capitalization index that is designed to measure equity market performance of developed markets, excluding the U.S. & Canada. The index consisted of the following 21 developed market country indices: Australia, Austria, Belgium, Denmark, Finland, France, Germany, Hong Kong, Ireland, Israel, Italy, Japan, Netherlands, New Zealand, Norway, Portugal, Singapore, Spain, Sweden, Switzerland and the United Kingdom. The index is unmanaged and investments cannot be made directly in an index. The performance of this index is reduced by the taxes on dividends paid by the international securities issuers in the index.
11. MSCI Emerging Markets (Net) Index is a free float-adjusted market capitalization index that is designed to measure equity market performance of emerging markets. The MSCI Emerging Markets Index consisted of the following 24 emerging market country indices: Brazil, Chile, China, Colombia, Czech Republic, Egypt, Greece, Hungary, India, Indonesia, Korea, Malaysia, Mexico, Pakistan, Peru, Philippines, Poland, Qatar, Russia, South Africa, Taiwan, Thailand, Turkey and United Arab Emirates. The index is unmanaged and investments cannot be made directly in an index. The performance of this index is reduced by the taxes on dividends paid by the international securities issuers in the index.
PRESIDENT’S MESSAGE / April 30, 2018 (unaudited)
WILMINGTON LARGE-CAP STRATEGY FUND
Management’s Discussion of Fund Performance
For the fiscal year ended April 30, 2018, the Wilmington Large-Cap Strategy Fund (the “Fund”) had a total return of 13.71%* for Class I Shares, versus its benchmark, the Russell 1000® Index**, which had a total return of 13.17%.
At the July 2015 meeting, the Investment Strategy Team (“IST”) recommended a shift toward weighting sectors rather than the market cap and growth/value tilts prior to this meeting. The Fund was rebalanced to track a custom index incorporating the sector overweight/ underweight recommendations. The sector positioning of the Fund added approximately 80 basis points of outperformance versus the Russell 1000® Index gross of fees. Over the last year, the Fund has generally had a pro-cyclical view of the market with over-weighted positions in the Technology, Financials, Industrials, Energy and Health-care sectors and underweights to the more defensive Utilities and Consumer Staples sectors. The sector positioning added to performance in every sector with particularly strong results from the underweights in Consumer Staples and Utilities and our over-weighted Technology position.
The IST and Investment Research Team are researching additional tactics to improve the risk adjusted return of the portfolio.
| | * | Performance data quoted represents past performance, which is no guarantee of future results. Investment return and principal value will fluctuate so that an investor’s shares, when redeemed, may be worth more or less than their original cost. Mutual Funds are not obligations of or guaranteed by any bank and are not federally insured. The total return shown assumes the reinvestment of all distributions and does not reflect the deduction of taxes that a shareholder would pay on fund distributions or the redemption of shares. Mutual fund performance changes over time and current performance may be lower or higher than what is stated. For the most recent month-end performance please visit www.wilmingtonfunds.com or call 1-800-836-2211. |
| | ** | The Russell 1000® Index measures the performance of the large-cap segment of the U.S. equity universe. It is subset of the Russell 3000® Index and includes approximately 1,000 of the largest securities based on a combination of their market cap and current index membership. The Russell 1000® Index represents approximately 92% of the U.S. market and is constructed to provide a comprehensive and unbiased barometer for the large-cap segment and is completely reconstituted annually to ensure new and growing equities are reflected. The Russell 3000® Index measures the performance of the largest 3,000 U.S. companies representing approximately 98% of the investable U.S. equity market. Russell 1000® Growth Index measures the performance of those Russell 1000 companies with higher price-to-book ratios and higher forecasted growth values. Russell 1000® Value Index measures the performance of those Russell 1000 companies with lower price-to-book ratios and lower forecasted growth values. |
Basis Points (“BPS”) is a unit that is equal to 1/100th of 1% and is used to denote the change in a financial instrument. The basis point is commonly used for calculating changes in interest rates, equity indices and the yield of a fixed-income security.
April 30, 2018 (unaudited) / ANNUAL REPORT
WILMINGTON LARGE-CAP STRATEGY FUND
The graph below illustrates the hypothetical investment of $1,000,0001 in the Class I Shares of the Wilmington Large-Cap Strategy Fund from April 30, 2008 to April 30, 2018, compared to the Russell 1000® Index.2
VALUE OF A HYPOTHETICAL $1,000,000 INVESTMENT
Performance data quoted represents past performance which is no guarantee of future results. Returns shown do not reflect the deduction of taxes that a shareholder would pay on Fund distributions or the redemption of Fund shares. Investment return and principal value will fluctuate so that an investor’s shares, when redeemed, may be worth more or less than their original cost. Mutual Funds are not obligations of or guaranteed by any bank and are not federally insured. Mutual fund performance changes over time and current performance may be lower or higher than what is stated. For current to the most recent month end performance, visit www.wilmingtonfunds.com or call 1-800-836-2211.
| | | | | | |
| |
| | | Average Annual Total Returns for the Periods Ended 4/30/18 |
| | | |
| | 1 Year | | 5 Years | | 10 Years |
| | | |
Class I^ | | 13.71% | | 12.91% | | 8.33% |
| | | |
Russell 1000® Index | | 13.17% | | 12.84% | | 9.10% |
^Expense Ratios Before Waivers and Expense Ratios After Waivers for Class I are 0.90% and 0.25%, respectively. Expense Ratios Before Waiver represent the operating costs borne by the Fund, expressed as a percentage of the Fund’s average net assets, as shown in the Fees and Expenses table in the Fund’s current prospectus (under “Total Annual Fund Operating Expenses”). Current information regarding the Fund’s Operating Expenses can be found in the Fund’s Financial Highlights.
| 1 | Represents a hypothetical investment of $1,000,000 in Class I and assumes the reinvestment of all dividends and distributions. |
| 2 | The Russell 1000® Index measures the performance of the 1,000 largest companies in the Russell 3000® Index, which represents approximately 92% of the total market capitalization of the Russell 3000® Index. Please note that an investor cannot invest directly in an index. |
ANNUAL REPORT / April 30, 2018 (unaudited)
SHAREHOLDER EXPENSE EXAMPLE (unaudited)
As a shareholder of the Funds, you incur two types of costs: (1) transaction costs, including sales charges (loads) on purchase payments, reinvested dividends, or other distributions; and redemption fees; and (2) ongoing costs, including management fees; distribution and/or service (12b-1) fees; and other Fund expenses. This Example is intended to help you to understand your ongoing costs (in dollars) of investing in the Funds and to compare these costs with the ongoing costs of investing in other mutual funds. It is based on an investment of $1,000 invested at the beginning of the period and held for the entire period from November 1, 2017 to April 30, 2018.
Actual Expenses
This section of the following table provides information about actual account values and actual expenses. You may use the information in this section, together with the amount you invested, to estimate the expenses that you incurred over the period. Simply divide your account value by $1,000 (for example, an $8,600 account value divided by $1,000 = 8.6), then multiply the result by the number in the first section under the heading entitled “Expenses Paid During Period” to estimate the expenses attributable to your investment during this period.
Hypothetical Example for
Comparison Purposes
This section of the following table provides information about hypothetical account values and hypothetical expenses based on the Fund’s actual expense ratios and assumed rates of return of 5% per year before expenses, which are not the Fund’s actual returns. Thus, you should not use the hypothetical account values and expenses to estimate the actual ending account balance or your expenses for the period. Rather, these figures are required to be provided to enable you to compare the ongoing costs of investing in the Funds with other funds. To do so, compare this 5% hypothetical example with the 5% hypothetical examples that appear in the shareholder reports of the other funds.
Please note that the expenses shown in the table are meant to highlight your ongoing costs only. Therefore, the Annualized Net Expense Ratio section of the table is useful in comparing ongoing costs only, and will not help you determine the relative total costs of owning different funds.
The Annualized Net Expense Ratios may be different from the net expense ratios in the Financial Highlights which are for the fiscal year ended April 30, 2018.
| | | | | | | | | | | | | | | | |
| | | | |
| | | Beginning Account Value 11/01/17 | | | Ending Account Value 4/30/18 | | | Expenses Paid During Period1 | | | Annualized Net Expense Ratio2 | |
| | | | |
WILMINGTON LARGE-CAP STRATEGY FUND | | | | | | | | | | | | | | | | |
Actual | | | | | | | | | | | | | | | | |
Class I | | | $1,000.00 | | | | $1,040.30 | | | | $1.26 | | | | 0.25% | |
Hypothetical (assuming a 5% return before expense) | | | | | | | | | | | | | | | | |
Class I | | | $1,000.00 | | | | $1,023.55 | | | | $1.25 | | | | 0.25% | |
| (1) | Expenses are equal to the Fund’s annualized net expense ratios, multiplied by the average account value over the period, multiplied by 181/365 (to reflect the most recent one-half year period). |
| (2) | Expense ratio does not reflect the indirect expenses of the underlying funds in which it invests. |
April 30, 2018 (unaudited) / ANNUAL REPORT
PORTFOLIO OF INVESTMENTS SUMMARY TABLE
Wilmington Large-Cap Strategy Fund
At April 30, 2018, the Fund’s sector classifications were as follows (unaudited):
| | | | | |
| | | Percentage of Total Net Assets |
Common Stocks | | | | | |
Information Technology | | | | 25.0 | % |
Financials | | | | 15.9 | % |
Consumer Discretionary | | | | 13.7 | % |
Health Care | | | | 13.5 | % |
Industrials | | | | 10.6 | % |
Energy | | | | 6.4 | % |
Consumer Staples | | | | 5.9 | % |
Materials | | | | 3.2 | % |
Real Estate | | | | 2.9 | % |
Telecommunication Services | | | | 1.6 | % |
Utilities | | | | 1.3 | % |
Investment Companies | | | | 0.0 | %3 |
Rights | | | | 0.0 | %3 |
Warrants | | | | 0.0 | %3 |
Cash Equivalents1 | | | | 1.1 | % |
Other Assets and Liabilities – Net2 | | | | (1.1 | )% |
| | | | | |
TOTAL | | | | 100.0 | % |
| | | | | |
| (1) | Cash Equivalents include investments in repurchase agreements. |
| (2) | Assets, other than investments in securities, less liabilities. See Statements of Assets and Liabilities. |
| (3) | Represent less than 0.05%. |
PORTFOLIO OF INVESTMENTS
April 30, 2018
| | | | | | | | |
| | |
| Description | |
| Number of
Shares |
| | | Value | |
| | |
COMMON STOCKS – 100.0% | | | | | | | | |
| |
CONSUMER DISCRETIONARY – 13.7% | | | | | |
| | |
AUTO COMPONENTS – 0.3% | | | | | | | | |
| | |
Adient PLC | | | 2,113 | | | $ | 129,506 | |
| | |
Aptiv PLC | | | 5,250 | | | | 444,045 | |
| | |
BorgWarner, Inc. | | | 4,380 | | | | 214,357 | |
| | |
Gentex Corp. | | | 4,680 | | | | 106,423 | |
| | |
Goodyear Tire & Rubber Co. (The) | | | 2,750 | | | | 69,052 | |
| | |
Lear Corp. | | | 2,100 | | | | 392,637 | |
| | |
Visteon Corp.* | | | 1,500 | | | | 186,660 | |
| | |
| | | | | | $ | 1,542,680 | |
| | |
AUTOMOBILES – 0.6% | | | | | | | | |
| | |
Ford Motor Co. | | | 68,400 | | | | 768,816 | |
| | |
General Motors Co. | | | 29,600 | | | | 1,087,504 | |
| | |
Harley-Davidson, Inc.# | | | 3,970 | | | | 163,286 | |
| | | | | | | | |
| | |
| Description | |
| Number of
Shares |
| | | Value | |
| | |
Tesla, Inc.#,* | | | 2,818 | | | $ | 828,210 | |
| | |
Thor Industries, Inc. | | | 1,380 | | | | 146,473 | |
| | |
| | | | | | $ | 2,994,289 | |
| | |
DISTRIBUTORS – 0.1% | | | | | | | | |
| | |
Genuine Parts Co. | | | 4,020 | | | | 355,046 | |
| | |
LKQ Corp.* | | | 3,880 | | | | 120,358 | |
| | |
| | | | | | $ | 475,404 | |
| |
DIVERSIFIED CONSUMER SERVICES – 0.1% | | | | | |
| | |
Graham Holdings Co., Class B | | | 140 | | | | 84,427 | |
| | |
Service Corp. International | | | 4,170 | | | | 152,247 | |
| | |
ServiceMaster Global Holdings, Inc.* | | | 2,280 | | | | 115,368 | |
| | |
| | | | | | $ | 352,042 | |
| |
HOTELS, RESTAURANTS & LEISURE – 2.3% | | | | | |
| | |
Aramark | | | 5,800 | | | | 216,862 | |
ANNUAL REPORT / April 30, 2018
| | |
| 5 | | PORTFOLIO OF INVESTMENTS |
| |
| | Wilmington Large-Cap Strategy Fund (continued) |
| | | | | | | | |
| | |
| Description | | Number of Shares | | | Value | |
| | |
Carnival Corp. | | | 9,400 | | | $ | 592,764 | |
| | |
Chipotle Mexican Grill, Inc.* | | | 200 | | | | 84,666 | |
| | |
Choice Hotels International, Inc. | | | 1,610 | | | | 128,880 | |
| | |
Darden Restaurants, Inc. | | | 1,440 | | | | 133,718 | |
| | |
Domino’s Pizza, Inc. | | | 1,500 | | | | 362,595 | |
| | |
Dunkin’ Brands Group, Inc.# | | | 3,900 | | | | 237,744 | |
| | |
Extended Stay America, Inc. | | | 5,000 | | | | 97,900 | |
| | |
Hilton Grand Vacations, Inc.* | | | 736 | | | | 31,648 | |
| | |
Hilton Worldwide Holdings, Inc. | | | 3,853 | | | | 303,771 | |
| | |
Hyatt Hotels Corp., Class A | | | 2,800 | | | | 215,236 | |
| | |
International Game Technology | | | 1,273 | | | | 35,988 | |
| | |
Las Vegas Sands Corp. | | | 9,520 | | | | 698,102 | |
| | |
Marriott International, Inc., Class A | | | 6,636 | | | | 907,008 | |
| | |
McDonald’s Corp. | | | 17,249 | | | | 2,888,173 | |
| | |
MGM Resorts International | | | 12,310 | | | | 386,780 | |
| | |
Norwegian Cruise Line Holdings* | | | 3,360 | | | | 179,659 | |
| | |
Restaurant Brands International LP | | | 47 | | | | 2,567 | |
| | |
Royal Caribbean Cruises Ltd. | | | 4,180 | | | | 452,234 | |
| | |
Six Flags Entertainment Corp.# | | | 3,100 | | | | 196,044 | |
| | |
Starbucks Corp. | | | 29,390 | | | | 1,691,982 | |
| | |
Wendy’s Co. (The) | | | 200 | | | | 3,348 | |
| | |
Wyndham Worldwide Corp. | | | 3,360 | | | | 383,746 | |
| | |
Wynn Resorts Ltd. | | | 2,200 | | | | 409,618 | |
| | |
Yum China Holdings, Inc. | | | 8,650 | | | | 369,874 | |
| | |
Yum! Brands, Inc. | | | 8,550 | | | | 744,705 | |
| | |
| | | | | | $ | 11,755,612 | |
| | |
HOUSEHOLD DURABLES – 0.4% | | | | | | | | |
| | |
DR Horton, Inc. | | | 5,070 | | | | 223,790 | |
| | |
Garmin Ltd. | | | 1,690 | | | | 99,152 | |
| | |
Leggett & Platt, Inc. | | | 3,670 | | | | 148,818 | |
| | |
Lennar Corp., Class A | | | 3,810 | | | | 201,511 | |
| | |
Lennar Corp., Class B | | | 76 | | | | 3,244 | |
| | |
Mohawk Industries, Inc.* | | | 1,700 | | | | 356,796 | |
| | |
Newell Brands, Inc. | | | 4,669 | | | | 129,004 | |
| | |
NVR, Inc.* | | | 30 | | | | 93,000 | |
| | |
PulteGroup, Inc. | | | 10,090 | | | | 306,332 | |
| | |
Tempur Sealy International, Inc.* | | | 200 | | | | 8,950 | |
| | |
Toll Brothers, Inc. | | | 6,050 | | | | 255,068 | |
| | |
Tupperware Brands Corp. | | | 1,000 | | | | 44,560 | |
| | |
Whirlpool Corp. | | | 550 | | | | 85,222 | |
| | |
| | | | | | $ | 1,955,447 | |
| | |
INTERNET & CATALOG RETAIL – 3.7% | | | | | | | | |
| | |
Amazon.com, Inc.* | | | 8,360 | | | | 13,092,847 | |
| | |
Booking Holdings, Inc.* | | | 1,030 | | | | 2,243,340 | |
| | |
Expedia Group, Inc. | | | 2,852 | | | | 328,379 | |
| | |
Liberty Expedia Holdings, Inc., Class A* | | | 1,640 | | | | 66,912 | |
| | |
Netflix, Inc.* | | | 8,400 | | | | 2,624,664 | |
| | | | | | | | |
| | |
| Description | | Number of
Shares | | | Value | |
| | |
Qurate Retail, Inc.* | | | 7,350 | | | $ | 172,063 | |
| | |
TripAdvisor, Inc.#,* | | | 2,200 | | | | 82,324 | |
| | |
| | | | | | $ | 18,610,529 | |
| |
LEISURE EQUIPMENT & PRODUCTS – 0.1% | | | | | |
| | |
Hasbro, Inc. | | | 3,490 | | | | 307,434 | |
| | |
Mattel, Inc.# | | | 2,050 | | | | 30,340 | |
| | |
Polaris Industries, Inc. | | | 1,900 | | | | 199,158 | |
| | |
| | | | | | $ | 536,932 | |
| | |
MEDIA – 2.6% | | | | | | | | |
| | |
AMC Networks, Inc., Class A* | | | 1,685 | | | | 87,620 | |
| | |
Cable One, Inc. | | | 140 | | | | 88,917 | |
| | |
CBS Corp., Non-Voting | | | 8,730 | | | | 429,516 | |
| | |
Charter Communications, Inc., Class A* | | | 4,102 | | | | 1,112,832 | |
| | |
Comcast Corp., Class A | | | 99,100 | | | | 3,110,749 | |
| | |
Discovery, Inc.#,* | | | 600 | | | | 14,190 | |
| | |
DISH Network Corp., Class A* | | | 4,580 | | | | 153,659 | |
| | |
GCI Liberty, Inc., Class A#,* | | | 2,461 | | | | 109,761 | |
| | |
Interpublic Group of Cos., Inc. (The) | | | 6,020 | | | | 142,012 | |
| | |
John Wiley & Sons, Inc., Class A | | | 2,100 | | | | 138,495 | |
| | |
Liberty Broadband Corp., Class A* | | | 1,335 | | | | 94,091 | |
| | |
Liberty Broadband Corp., Class C* | | | 371 | | | | 26,300 | |
| | |
Liberty Media Corp. - Liberty Formula One, Class A* | | | 210 | | | | 5,903 | |
| | |
Liberty Media Corp. - Liberty SiriusXM, Class A* | | | 843 | | | | 35,212 | |
| | |
Liberty Media Corp. - Liberty SiriusXM, Class C* | | | 6,086 | | | | 253,543 | |
| | |
Lions Gate Entertainment Corp., Class A | | | 2,380 | | | | 59,238 | |
| | |
Lions Gate Entertainment Corp., Class B | | | 2,290 | | | | 52,716 | |
| | |
Live Nation Entertainment, Inc.* | | | 4,370 | | | | 172,484 | |
| | |
Madison Square Garden Co., Class A (The)* | | | 729 | | | | 177,162 | |
| | |
News Corp., Class A | | | 16,157 | | | | 258,189 | |
| | |
News Corp., Class B | | | 300 | | | | 4,875 | |
| | |
Omnicom Group, Inc. | | | 5,490 | | | | 404,393 | |
| | |
Sirius XM Holdings, Inc.# | | | 52,540 | | | | 332,578 | |
| | |
Time Warner, Inc. | | | 16,216 | | | | 1,537,277 | |
| | |
Tribune Media Co., Class A | | | 2,550 | | | | 96,365 | |
| | |
Twenty-First Century Fox, Inc., Class A | | | 25,630 | | | | 937,033 | |
| | |
Twenty-First Century Fox, Inc., Class B | | | 5,180 | | | | 186,843 | |
| | |
Viacom, Inc., Class B | | | 9,200 | | | | 277,472 | |
| | |
Walt Disney Co. (The) | | | 30,346 | | | | 3,044,614 | |
| | |
| | | | | | $ | 13,344,039 | |
| | |
MULTILINE RETAIL – 0.5% | | | | | | | | |
| | |
Burlington Stores, Inc.* | | | 900 | | | | 122,265 | |
| | |
Dollar General Corp. | | | 6,800 | | | | 656,404 | |
| | |
Dollar Tree, Inc.* | | | 5,662 | | | | 542,929 | |
April 30, 2018 / ANNUAL REPORT
| | |
PORTFOLIO OF INVESTMENTS | | 6 |
Wilmington Large-Cap Strategy Fund (continued)
| | | | | | | | |
| | |
| Description | | Number of
Shares | | | Value | |
| | |
Kohl’s Corp. | | | 1,210 | | | $ | 75,165 | |
| | |
Macy’s, Inc. | | | 7,580 | | | | 235,511 | |
| | |
Nordstrom, Inc. | | | 580 | | | | 29,325 | |
| | |
Target Corp. | | | 9,360 | | | | 679,536 | |
| | |
| | | | | | $ | 2,341,135 | |
| | |
SPECIALTY RETAIL – 2.3% | | | | | | | | |
| | |
Advance Auto Parts, Inc. | | | 1,850 | | | | 211,732 | |
| | |
AutoNation, Inc.* | | | 480 | | | | 22,171 | |
| | |
AutoZone, Inc.* | | | 660 | | | | 412,183 | |
| | |
Bed Bath & Beyond, Inc. | | | 7,100 | | | | 123,966 | |
| | |
Best Buy Co., Inc. | | | 5,980 | | | | 457,649 | |
| | |
CarMax, Inc.* | | | 1,500 | | | | 93,750 | |
| | |
Foot Locker, Inc. | | | 4,510 | | | | 194,291 | |
| | |
Home Depot, Inc. (The) | | | 25,050 | | | | 4,629,240 | |
| | |
L Brands, Inc. | | | 1,710 | | | | 59,696 | |
| | |
Lowe’s Cos., Inc. | | | 18,500 | | | | 1,524,955 | |
| | |
Murphy USA, Inc.* | | | 1,387 | | | | 86,785 | |
| | |
O’Reilly Automotive, Inc.* | | | 2,000 | | | | 512,140 | |
| | |
Ross Stores, Inc. | | | 9,140 | | | | 738,969 | |
| | |
Signet Jewelers Ltd.# | | | 820 | | | | 31,882 | |
| | |
Tiffany & Co. | | | 3,250 | | | | 334,198 | |
| | |
TJX Cos., Inc. (The) | | | 13,740 | | | | 1,165,839 | |
| | |
Tractor Supply Co. | | | 1,200 | | | | 81,600 | |
| | |
Ulta Beauty, Inc.* | | | 1,700 | | | | 426,547 | |
| | |
Urban Outfitters, Inc.* | | | 4,900 | | | | 197,323 | |
| | |
Williams-Sonoma, Inc.# | | | 1,040 | | | | 49,712 | |
| | |
| | | | | | $ | 11,354,628 | |
| |
TEXTILES, APPAREL & LUXURY GOODS – 0.7% | | | | | |
| | |
Carter’s, Inc. | | | 1,400 | | | | 140,448 | |
| | |
Hanesbrands, Inc. | | | 6,100 | | | | 112,667 | |
| | |
Lululemon Athletica, Inc.* | | | 600 | | | | 59,880 | |
| | |
Michael Kors Holdings Ltd.* | | | 1,600 | | | | 109,472 | |
| | |
NIKE, Inc., Class B | | | 27,540 | | | | 1,883,461 | |
| | |
PVH Corp. | | | 680 | | | | 108,576 | |
| | |
Ralph Lauren Corp. | | | 700 | | | | 76,895 | |
| | |
Skechers U.S.A., Inc., Class A* | | | 1,900 | | | | 54,150 | |
| | |
Tapestry, Inc. | | | 8,010 | | | | 430,698 | |
| | |
Under Armour, Inc., Class A#,* | | | 4,600 | | | | 81,696 | |
| | |
Under Armour, Inc., Class C#,* | | | 722 | | | | 11,083 | |
| | |
VF Corp. | | | 6,050 | | | | 489,264 | |
| | |
| | | | | | $ | 3,558,290 | |
| | |
TOTAL CONSUMER DISCRETIONARY | | | | | | $ | 68,821,027 | |
| | |
CONSUMER STAPLES – 5.9% | | | | | | | | |
| | |
BEVERAGES – 1.5% | | | | | | | | |
| | |
Brown-Forman Corp., Class A | | | 1,100 | | | | 58,707 | |
| | | | | | | | |
| | |
| Description | | Number of Shares | | | Value | |
| | |
Brown-Forman Corp., Class B | | | 4,525 | | | $ | 253,581 | |
| | |
Coca-Cola Co. (The) | | | 67,200 | | | | 2,903,712 | |
| | |
Constellation Brands, Inc., Class A | | | 2,700 | | | | 629,451 | |
| | |
Dr. Pepper Snapple Group, Inc. | | | 2,200 | | | | 263,912 | |
| | |
Molson Coors Brewing Co., Class B | | | 1,200 | | | | 85,488 | |
| | |
Monster Beverage Corp.* | | | 9,500 | | | | 522,500 | |
| | |
PepsiCo, Inc. | | | 25,900 | | | | 2,614,346 | |
| | |
| | | | | | $ | 7,331,697 | |
| | |
FOOD & STAPLES RETAILING – 1.4% | | | | | | | | |
| | |
Casey’s General Stores, Inc. | | | 400 | | | | 38,640 | |
| | |
Costco Wholesale Corp. | | | 8,100 | | | | 1,596,996 | |
| | |
CVS Health Corp. | | | 15,300 | | | | 1,068,399 | |
| | |
Kroger Co. (The) | | | 15,500 | | | | 390,445 | |
| | |
Sprouts Farmers Market, Inc.* | | | 7,300 | | | | 182,719 | |
| | |
Sysco Corp. | | | 8,500 | | | | 531,590 | |
| | |
US Foods Holding Corp.* | | | 2,300 | | | | 78,614 | |
| | |
Walgreens Boots Alliance, Inc. | | | 14,100 | | | | 936,945 | |
| | |
Walmart, Inc. | | | 26,400 | | | | 2,335,344 | |
| | |
| | | | | | $ | 7,159,692 | |
| | |
FOOD PRODUCTS – 1.0% | | | | | | | | |
| | |
Archer-Daniels-Midland Co. | | | 12,200 | | | | 553,636 | |
| | |
Bunge Ltd. | | | 3,800 | | | | 274,474 | |
| | |
Campbell Soup Co.# | | | 2,900 | | | | 118,262 | |
| | |
Conagra Brands, Inc. | | | 10,500 | | | | 389,235 | |
| | |
General Mills, Inc. | | | 6,700 | | | | 293,058 | |
| | |
Hain Celestial Group, Inc. (The)* | | | 2,800 | | | | 81,564 | |
| | |
Hershey Co. (The) | | | 3,500 | | | | 321,790 | |
| | |
Hormel Foods Corp. | | | 2,100 | | | | 76,125 | |
| | |
Ingredion, Inc. | | | 500 | | | | 60,545 | |
| | |
JM Smucker Co. (The) | | | 900 | | | | 102,672 | |
| | |
Kellogg Co. | | | 2,000 | | | | 117,800 | |
| | |
Kraft Heinz Co. (The) | | | 8,300 | | | | 467,954 | |
| | |
Lamb Weston Holdings, Inc. | | | 2,700 | | | | 176,364 | |
| | |
McCormick & Co., Inc. | | | 700 | | | | 73,787 | |
| | |
Mondelez International, Inc., Class A | | | 28,200 | | | | 1,113,900 | |
| | |
Pilgrim’s Pride Corp.* | | | 4,600 | | | | 99,360 | |
| | |
Tyson Foods, Inc., Class A | | | 6,800 | | | | 476,680 | |
| | |
| | | | | | $ | 4,797,206 | |
| | |
HOUSEHOLD PRODUCTS – 1.0% | | | | | | | | |
| | |
Church & Dwight Co., Inc. | | | 2,800 | | | | 129,360 | |
| | |
Clorox Co. (The) | | | 2,700 | | | | 316,440 | |
| | |
Colgate-Palmolive Co. | | | 13,600 | | | | 887,128 | |
| | |
Energizer Holdings, Inc.# | | | 1,700 | | | | 97,512 | |
| | |
Kimberly-Clark Corp. | | | 4,900 | | | | 507,346 | |
| | |
Procter & Gamble Co. (The) | | | 42,700 | | | | 3,088,918 | |
| | |
| | | | | | $ | 5,026,704 | |
ANNUAL REPORT / April 30, 2018
| | |
| 7 | | PORTFOLIO OF INVESTMENTS |
| |
| | Wilmington Large-Cap Strategy Fund (continued) |
| | | | | | | | |
| | |
| Description | | Number of
Shares | | | Value | |
| | |
PERSONAL PRODUCTS – 0.2% | | | | | | | | |
| | |
Edgewell Personal Care Co.* | | | 3,900 | | | $ | 171,795 | |
| | |
Estee Lauder Cos., Inc., Class A (The) | | | 3,200 | | | | 473,888 | |
| | |
Herbalife Nutrition Ltd.#,* | | | 1,800 | | | | 190,314 | |
| | |
Nu Skin Enterprises, Inc., Class A | | | 1,500 | | | | 106,725 | |
| | |
| | | | | | $ | 942,722 | |
| | |
TOBACCO – 0.8% | | | | | | | | |
| | |
Altria Group, Inc. | | | 35,200 | | | | 1,975,072 | |
| | |
Philip Morris International, Inc. | | | 28,100 | | | | 2,304,200 | |
| | |
| | | | | | $ | 4,279,272 | |
| | |
TOTAL CONSUMER STAPLES | | | | | | $ | 29,537,293 | |
| | |
ENERGY – 6.4% | | | | | | | | |
| |
ENERGY EQUIPMENT & SERVICES – 0.8% | | | | | |
| | |
Baker Hughes, Inc. | | | 4,700 | | | | 169,717 | |
| | |
Halliburton Co. | | | 21,090 | | | | 1,117,559 | |
| | |
Helmerich & Payne, Inc. | | | 4,260 | | | | 296,283 | |
| | |
Nabors Industries Ltd. | | | 100 | | | | 761 | |
| | |
National Oilwell Varco, Inc. | | | 4,905 | | | | 189,676 | |
| | |
Patterson-UTI Energy, Inc. | | | 8,400 | | | | 179,928 | |
| | |
RPC, Inc.# | | | 3,450 | | | | 62,134 | |
| | |
Schlumberger Ltd. | | | 27,646 | | | | 1,895,410 | |
| | |
Transocean Ltd.#,* | | | 20,800 | | | | 257,296 | |
| | |
| | | | | | $ | 4,168,764 | |
| |
OIL, GAS & CONSUMABLE FUELS – 5.6% | | | | | |
| | |
Anadarko Petroleum Corp. | | | 10,650 | | | | 716,958 | |
| | |
Andeavor | | | 3,440 | | | | 475,821 | |
| | |
Apache Corp.# | | | 4,540 | | | | 185,913 | |
| | |
Cabot Oil & Gas Corp. | | | 14,200 | | | | 339,522 | |
| | |
Cheniere Energy, Inc.* | | | 4,830 | | | | 280,913 | |
| | |
Chevron Corp. | | | 41,620 | | | | 5,207,078 | |
| | |
Cimarex Energy Co. | | | 1,700 | | | | 171,003 | |
| | |
CNX Resources Corp.* | | | 6,500 | | | | 96,590 | |
| | |
Concho Resources, Inc.* | | | 3,460 | | | | 543,947 | |
| | |
ConocoPhillips | | | 27,260 | | | | 1,785,530 | |
| | |
CONSOL Energy, Inc.* | | | 1,162 | | | | 36,545 | |
| | |
Continental Resources, Inc.* | | | 2,620 | | | | 173,077 | |
| | |
Devon Energy Corp. | | | 6,780 | | | | 246,317 | |
| | |
Diamondback Energy, Inc.* | | | 2,200 | | | | 282,590 | |
| | |
Energen Corp.* | | | 4,380 | | | | 286,627 | |
| | |
EOG Resources, Inc. | | | 13,480 | | | | 1,592,932 | |
| | |
EQT Corp. | | | 2,426 | | | | 121,761 | |
| | |
Exxon Mobil Corp. | | | 89,193 | | | | 6,934,756 | |
| | |
Hess Corp. | | | 3,390 | | | | 193,196 | |
| | |
HollyFrontier Corp. | | | 6,440 | | | | 390,844 | |
| | |
Kinder Morgan, Inc. | | | 31,355 | | | | 496,036 | |
| | | | | | | | |
| | |
| Description | | Number of
Shares | | | Value | |
| | |
Laredo Petroleum, Inc.* | | | 4,900 | | | $ | 53,900 | |
| | |
Marathon Oil Corp. | | | 23,930 | | | | 436,722 | |
| | |
Marathon Petroleum Corp. | | | 12,130 | | | | 908,658 | |
| | |
Murphy Oil Corp. | | | 7,100 | | | | 213,781 | |
| | |
Noble Energy, Inc. | | | 5,720 | | | | 193,508 | |
| | |
Occidental Petroleum Corp. | | | 14,400 | | | | 1,112,544 | |
| | |
ONEOK, Inc. | | | 6,660 | | | | 401,065 | |
| | |
PBF Energy, Inc., Class A | | | 3,000 | | | | 114,990 | |
| | |
Phillips 66 | | | 10,490 | | | | 1,167,642 | |
| | |
Pioneer Natural Resources Co. | | | 4,450 | | | | 896,897 | |
| | |
QEP Resources, Inc.* | | | 5,800 | | | | 70,644 | |
| | |
SM Energy Co. | | | 6,450 | | | | 154,477 | |
| | |
Targa Resources Corp. | | | 4,300 | | | | 201,971 | |
| | |
Valero Energy Corp. | | | 10,620 | | | | 1,178,077 | |
| | |
Whiting Petroleum Corp.#,* | | | 5,287 | | | | 215,815 | |
| | |
Williams Cos., Inc. (The) | | | 11,870 | | | | 305,415 | |
| | |
WPX Energy, Inc.* | | | 3,017 | | | | 51,561 | |
| | |
| | | | | | $ | 28,235,623 | |
| | |
TOTAL ENERGY | | | | | | $ | 32,404,387 | |
| | |
FINANCIALS – 15.9% | | | | | | | | |
| | |
CAPITAL MARKETS – 3.5% | | | | | | | | |
| | |
Affiliated Managers Group, Inc. | | | 1,270 | | | | 209,372 | |
| | |
Ameriprise Financial, Inc. | | | 3,740 | | | | 524,385 | |
| | |
Bank of New York Mellon Corp. (The) | | | 23,420 | | | | 1,276,624 | |
| | |
BlackRock, Inc. | | | 2,860 | | | | 1,491,490 | |
| | |
Cboe Global Markets, Inc. | | | 3,000 | | | | 320,340 | |
| | |
Charles Schwab Corp. (The) | | | 27,150 | | | | 1,511,712 | |
| | |
CME Group, Inc. | | | 8,000 | | | | 1,261,440 | |
| | |
E*TRADE Financial Corp.* | | | 7,200 | | | | 436,896 | |
| | |
Eaton Vance Corp. | | | 270 | | | | 14,685 | |
| | |
FactSet Research Systems, Inc. | | | 840 | | | | 158,852 | |
| | |
Federated Investors, Inc., Class B | | | 370 | | | | 9,794 | |
| | |
Franklin Resources, Inc. | | | 2,520 | | | | 84,773 | |
| | |
Goldman Sachs Group, Inc. (The) | | | 7,940 | | | | 1,892,340 | |
| | |
Interactive Brokers Group, Inc., Class A | | | 2,300 | | | | 170,660 | |
| | |
Intercontinental Exchange, Inc. | | | 14,090 | | | | 1,020,961 | |
| | |
Invesco Ltd. | | | 3,520 | | | | 101,974 | |
| | |
Legg Mason, Inc. | | | 210 | | | | 8,337 | |
| | |
LPL Financial Holdings, Inc. | | | 3,200 | | | | 193,824 | |
| | |
Moody’s Corp. | | | 4,340 | | | | 703,948 | |
| | |
Morgan Stanley | | | 29,646 | | | | 1,530,327 | |
| | |
Morningstar, Inc. | | | 1,100 | | | | 119,438 | |
| | |
MSCI, Inc. | | | 2,820 | | | | 422,521 | |
| | |
Nasdaq, Inc. | | | 3,830 | | | | 338,266 | |
| | |
Northern Trust Corp. | | | 3,280 | | | | 350,140 | |
| | |
Raymond James Financial, Inc. | | | 3,910 | | | | 350,922 | |
April 30, 2018 / ANNUAL REPORT
| | |
PORTFOLIO OF INVESTMENTS | | 8 |
Wilmington Large-Cap Strategy Fund (continued)
| | | | | | | | |
| | |
| Description | | Number of Shares | | | Value | |
| | |
S&P Global, Inc. | | | 6,090 | | | $ | 1,148,574 | |
| | |
SEI Investments Co. | | | 3,840 | | | | 242,803 | |
| | |
State Street Corp. | | | 9,070 | | | | 905,005 | |
| | |
T. Rowe Price Group, Inc. | | | 3,680 | | | | 418,858 | |
| | |
TD Ameritrade Holding Corp. | | | 3,750 | | | | 217,837 | |
| | |
| | | | | | $ | 17,437,098 | |
| | |
COMMERCIAL BANKS – 1.7% | | | | | | | | |
| | |
Associated Banc-Corp. | | | 6,885 | | | | 182,108 | |
| | |
Bank of Hawaii Corp. | | | 2,470 | | | | 207,999 | |
| | |
BB&T Corp. | | | 16,690 | | | | 881,232 | |
| | |
BOK Financial Corp. | | | 820 | | | | 82,558 | |
| | |
Citizens Financial Group, Inc. | | | 13,750 | | | | 570,487 | |
| | |
Commerce Bancshares, Inc.# | | | 910 | | | | 57,803 | |
| | |
Cullen/Frost Bankers, Inc. | | | 1,440 | | | | 164,808 | |
| | |
East West Bancorp, Inc. | | | 2,500 | | | | 166,550 | |
| | |
Fifth Third Bancorp | | | 18,250 | | | | 605,352 | |
| | |
First Horizon National Corp. | | | 8,934 | | | | 163,492 | |
| | |
First Republic Bank | | | 4,700 | | | | 436,489 | |
| | |
Huntington Bancshares, Inc. | | | 16,541 | | | | 246,626 | |
| | |
KeyCorp | | | 19,044 | | | | 379,356 | |
| | |
M&T Bank Corp.§ | | | 1,610 | | | | 293,455 | |
| | |
PacWest Bancorp. | | | 2,239 | | | | 114,726 | |
| | |
PNC Financial Services Group, Inc. (The) | | | 11,060 | | | | 1,610,447 | |
| | |
Regions Financial Corp. | | | 28,556 | | | | 533,997 | |
| | |
Signature Bank* | | | 1,000 | | | | 127,150 | |
| | |
SunTrust Banks, Inc. | | | 11,980 | | | | 800,264 | |
| | |
SVB Financial Group* | | | 1,200 | | | | 359,532 | |
| | |
Synovus Financial Corp. | | | 5,194 | | | | 271,490 | |
| | |
TCF Financial Corp. | | | 710 | | | | 17,629 | |
| | |
Zions Bancorporation | | | 3,590 | | | | 196,552 | |
| | |
| | | | | | $ | 8,470,102 | |
| | |
CONSUMER FINANCE – 0.7% | | | | | | | | |
| | |
Ally Financial, Inc. | | | 3,900 | | | | 101,790 | |
| | |
American Express Co. | | | 16,040 | | | | 1,583,950 | |
| | |
Capital One Financial Corp. | | | 9,400 | | | | 851,828 | |
| | |
Credit Acceptance Corp.#,* | | | 250 | | | | 82,710 | |
| | |
Discover Financial Services | | | 9,580 | | | | 682,575 | |
| | |
Navient Corp. | | | 1,360 | | | | 18,034 | |
| | |
SLM Corp.* | | | 5,760 | | | | 66,125 | |
| | |
Synchrony Financial | | | 12,000 | | | | 398,040 | |
| | |
| | | | | | $ | 3,785,052 | |
| |
DIVERSIFIED FINANCIAL SERVICES – 6.5% | | | | | |
| | |
Bank of America Corp. | | | 206,750 | | | | 6,185,960 | |
| | |
Berkshire Hathaway, Inc., Class B* | | | 41,096 | | | | 7,961,528 | |
| | |
Citigroup, Inc. | | | 53,582 | | | | 3,658,043 | |
| | |
Comerica, Inc. | | | 5,030 | | | | 475,737 | |
| | |
JPMorgan Chase & Co. | | | 73,820 | | | | 8,030,140 | |
| | | | | | | | |
| | |
| Description | | Number of
Shares | | | Value | |
| | |
Leucadia National Corp. | | | 710 | | | $ | 17,068 | |
| | |
U.S. Bancorp | | | 29,970 | | | | 1,511,987 | |
| | |
Voya Financial, Inc. | | | 1,900 | | | | 99,465 | |
| | |
Wells Fargo & Co. | | | 89,975 | | | | 4,675,101 | |
| | |
| | | | | | $ | 32,615,029 | |
| | |
INSURANCE – 3.1% | | | | | | | | |
| | |
Aflac, Inc. | | | 19,300 | | | | 879,501 | |
| | |
Alleghany Corp. | | | 156 | | | | 89,649 | |
| | |
Allstate Corp. (The) | | | 8,980 | | | | 878,424 | |
| | |
American Financial Group, Inc. | | | 1,600 | | | | 181,152 | |
| | |
American International Group, Inc. | | | 16,080 | | | | 900,480 | |
| | |
Aon PLC | | | 6,300 | | | | 897,561 | |
| | |
Arch Capital Group Ltd.* | | | 2,590 | | | | 207,537 | |
| | |
Arthur J Gallagher & Co. | | | 5,580 | | | | 390,544 | |
| | |
Assurant, Inc. | | | 1,130 | | | | 104,887 | |
| | |
Assured Guaranty Ltd. | | | 3,550 | | | | 128,829 | |
| | |
Axis Capital Holdings Ltd. | | | 3,280 | | | | 192,536 | |
| | |
Brighthouse Financial, Inc.* | | | 168 | | | | 8,531 | |
| | |
Brown & Brown, Inc. | | | 9,540 | | | | 259,774 | |
| | |
Chubb Ltd. | | | 10,847 | | | | 1,471,612 | |
| | |
Cincinnati Financial Corp. | | | 5,106 | | | | 359,156 | |
| | |
CNA Financial Corp.# | | | 1,050 | | | | 52,983 | |
| | |
Erie Indemnity Co., Class A | | | 670 | | | | 78,236 | |
| | |
Everest Re Group Ltd. | | | 1,170 | | | | 272,224 | |
| | |
FNF Group | | | 5,341 | | | | 196,709 | |
| | |
Hanover Insurance Group, Inc. (The) | | | 1,100 | | | | 126,335 | |
| | |
Hartford Financial Services Group, Inc. (The) | | | 4,590 | | | | 247,126 | |
| | |
Lincoln National Corp. | | | 6,070 | | | | 428,785 | |
| | |
Loews Corp. | | | 5,050 | | | | 264,923 | |
| | |
Markel Corp.* | | | 280 | | | | 316,411 | |
| | |
Marsh & McLennan Cos., Inc. | | | 12,390 | | | | 1,009,785 | |
| | |
MetLife, Inc. | | | 15,751 | | | | 750,850 | |
| | |
Old Republic International Corp. | | | 1,900 | | | | 38,760 | |
| | |
Principal Financial Group, Inc. | | | 6,990 | | | | 413,948 | |
| | |
Progressive Corp. (The) | | | 12,930 | | | | 779,550 | |
| | |
Prudential Financial, Inc. | | | 10,330 | | | | 1,098,286 | |
| | |
Reinsurance Group of America, Inc. | | | 1,690 | | | | 252,486 | |
| | |
RenaissanceRe Holdings Ltd. | | | 20 | | | | 2,721 | |
| | |
Torchmark Corp. | | | 1,695 | | | | 147,024 | |
| | |
Travelers Cos., Inc. (The) | | | 6,780 | | | | 892,248 | |
| | |
Unum Group | | | 5,610 | | | | 271,412 | |
| | |
Validus Holdings Ltd. | | | 170 | | | | 11,521 | |
| | |
White Mountains Insurance Group Ltd. | | | 160 | | | | 138,446 | |
| | |
Willis Towers Watson PLC | | | 2,700 | | | | 400,977 | |
| | |
WR Berkley Corp. | | | 3,580 | | | | 266,925 | |
| | |
XL Group Ltd. | | | 2,770 | | | | 153,984 | |
| | |
| | | | | | $ | 15,562,828 | |
ANNUAL REPORT / April 30, 2018
| | |
| 9 | | PORTFOLIO OF INVESTMENTS |
| |
| | Wilmington Large-Cap Strategy Fund (continued) |
| | | | | | | | |
| | |
| Description | | Number of
Shares | | | Value | |
|
MORTGAGE REAL ESTATE INVESTMENT TRUSTS – 0.0%** | |
| | |
AGNC Investment Corp. | | | 430 | | | $ | 8,136 | |
| | |
Annaly Capital Management, Inc. | | | 9,980 | | | | 103,493 | |
| | |
Chimera Investment Corp. | | | 6,840 | | | | 119,632 | |
| | |
Granite Point Mortgage Trust, Inc. | | | 170 | | | | 2,829 | |
| | |
| | | | | | $ | 234,090 | |
| |
REAL ESTATE INVESTMENT TRUSTS – 0.0%** | | | | | |
| | |
Omega Healthcare Investors, Inc.# | | | 7,800 | | | | 202,644 | |
|
SEMICONDUCTORS & SEMICONDUCTOR EQUIPMENT – 0.4% | |
| | |
Broadcom, Inc. | | | 9,033 | | | | 2,072,351 | |
| | |
THRIFTS & MORTGAGE FINANCE – 0.0%** | | | | | | | | |
| | |
TFS Financial Corp. | | | 150 | | | | 2,236 | |
| | |
TOTAL FINANCIALS | | | | | | $ | 80,381,430 | |
| | |
HEALTH CARE – 13.5% | | | | | | | | |
| | |
BIOTECHNOLOGY – 2.0% | | | | | | | | |
| | |
Agios Pharmaceuticals, Inc.* | | | 900 | | | | 75,519 | |
| | |
Alexion Pharmaceuticals, Inc.* | | | 3,090 | | | | 363,477 | |
| | |
Alkermes PLC* | | | 800 | | | | 35,416 | |
| | |
Alnylam Pharmaceuticals, Inc.* | | | 1,700 | | | | 160,701 | |
| | |
Amgen, Inc. | | | 14,364 | | | | 2,506,231 | |
| | |
Biogen, Inc.* | | | 4,600 | | | | 1,258,560 | |
| | |
BioMarin Pharmaceutical, Inc.* | | | 2,900 | | | | 242,179 | |
| | |
Celgene Corp.* | | | 16,666 | | | | 1,451,609 | |
| | |
Gilead Sciences, Inc. | | | 28,644 | | | | 2,068,956 | |
| | |
Incyte Corp.* | | | 2,960 | | | | 183,342 | |
| | |
Intercept Pharmaceuticals, Inc.#,* | | | 600 | | | | 40,806 | |
| | |
Intrexon Corp.#,* | | | 2,360 | | | | 42,905 | |
| | |
Ionis Pharmaceuticals, Inc.#,* | | | 3,800 | | | | 163,514 | |
| | |
Neurocrine Biosciences, Inc.* | | | 1,500 | | | | 121,620 | |
| | |
Regeneron Pharmaceuticals, Inc.* | | | 1,300 | | | | 394,784 | |
| | |
United Therapeutics Corp.* | | | 1,140 | | | | 125,525 | |
| | |
Vertex Pharmaceuticals, Inc.* | | | 5,443 | | | | 833,650 | |
| | |
| | | | | | $ | 10,068,794 | |
| |
HEALTH CARE EQUIPMENT & SUPPLIES – 2.9% | | | | | |
| | |
Abbott Laboratories | | | 32,545 | | | | 1,891,841 | |
| | |
ABIOMED, Inc.* | | | 600 | | | | 180,570 | |
| | |
Align Technology, Inc.* | | | 1,160 | | | | 289,826 | |
| | |
Baxter International, Inc. | | | 12,130 | | | | 843,035 | |
| | |
Becton Dickinson & Co. | | | 5,334 | | | | 1,236,795 | |
| | |
Boston Scientific Corp.* | | | 32,700 | | | | 939,144 | |
| | |
Cooper Cos., Inc. (The) | | | 1,450 | | | | 331,629 | |
| | |
Danaher Corp. | | | 12,080 | | | | 1,211,866 | |
| | |
DENTSPLY SIRONA, Inc. | | | 3,679 | | | | 185,201 | |
| | |
DexCom, Inc.#,* | | | 1,500 | | | | 109,770 | |
| | |
Edwards Lifesciences Corp.* | | | 5,372 | | | | 684,178 | |
| | | | | | | | |
| | |
| Description | | Number of Shares | | | Value | |
| | |
Hill-Rom Holdings, Inc. | | | 2,260 | | | $ | 193,976 | |
| | |
Hologic, Inc.* | | | 6,740 | | | | 261,445 | |
| | |
IDEXX Laboratories, Inc.* | | | 2,180 | | | | 423,988 | |
| | |
Intuitive Surgical, Inc.* | | | 2,400 | | | | 1,057,872 | |
| | |
Medtronic PLC | | | 26,426 | | | | 2,117,515 | |
| | |
ResMed, Inc. | | | 4,220 | | | | 399,381 | |
| | |
Stryker Corp. | | | 7,600 | | | | 1,287,592 | |
| | |
Teleflex, Inc. | | | 1,360 | | | | 364,317 | |
| | |
Varian Medical Systems, Inc.* | | | 2,750 | | | | 317,873 | |
| | |
Zimmer Biomet Holdings, Inc. | | | 2,910 | | | | 335,145 | |
| | |
| | | | | | $ | 14,662,959 | |
| |
HEALTH CARE PROVIDERS & SERVICES – 2.9% | | | | | |
| | |
Aetna, Inc. | | | 7,131 | | | | 1,276,806 | |
| | |
AmerisourceBergen Corp. | | | 4,770 | | | | 432,067 | |
| | |
Anthem, Inc. | | | 5,710 | | | | 1,347,503 | |
| | |
Cardinal Health, Inc. | | | 5,520 | | | | 354,218 | |
| | |
Centene Corp.* | | | 4,132 | | | | 448,653 | |
| | |
Cigna Corp. | | | 5,430 | | | | 932,983 | |
| | |
DaVita, Inc.* | | | 2,788 | | | | 175,059 | |
| | |
Express Scripts Holding Co.* | | | 12,662 | | | | 958,513 | |
| | |
HCA Healthcare, Inc. | | | 5,400 | | | | 516,996 | |
| | |
Henry Schein, Inc.* | | | 4,720 | | | | 358,720 | |
| | |
Humana, Inc. | | | 3,230 | | | | 950,201 | |
| | |
Laboratory Corp. of America Holdings* | | | 1,857 | | | | 317,083 | |
| | |
LifePoint Health, Inc.* | | | 1,230 | | | | 58,917 | |
| | |
McKesson Corp. | | | 4,100 | | | | 640,461 | |
| | |
MEDNAX, Inc.* | | | 2,640 | | | | 121,202 | |
| | |
Patterson Cos., Inc. | | | 270 | | | | 6,286 | |
| | |
Quest Diagnostics, Inc. | | | 3,750 | | | | 379,500 | |
| | |
UnitedHealth Group, Inc. | | | 20,420 | | | | 4,827,288 | |
| | |
Universal Health Services, Inc., Class B | | | 2,480 | | | | 283,216 | |
| | |
| | | | | | $ | 14,385,672 | |
| | |
HEALTH CARE TECHNOLOGY – 0.1% | | | | | | | | |
| | |
Cerner Corp.* | | | 7,040 | | | | 410,080 | |
| | |
Veeva Systems, Inc., Class A* | | | 3,320 | | | | 232,832 | |
| | |
| | | | | | $ | 642,912 | |
| |
LIFE SCIENCES TOOLS & SERVICES – 0.9% | | | | | |
| | |
Agilent Technologies, Inc. | | | 7,490 | | | | 492,393 | |
| | |
Bio-Rad Laboratories, Inc., Class A* | | | 890 | | | | 225,802 | |
| | |
Bruker Corp. | | | 4,900 | | | | 144,697 | |
| | |
Charles River Laboratories | | | | | | | | |
| | |
International, Inc.* | | | 2,120 | | | | 220,883 | |
| | |
Illumina, Inc.* | | | 2,840 | | | | 684,241 | |
| | |
IQVIA Holdings, Inc.* | | | 2,480 | | | | 237,485 | |
| | |
Mettler-Toledo International, Inc.* | | | 620 | | | | 347,157 | |
| | |
PerkinElmer, Inc. | | | 4,070 | | | | 298,575 | |
| | |
Thermo Fisher Scientific, Inc. | | | 7,620 | | | | 1,602,867 | |
April 30, 2018 / ANNUAL REPORT
| | |
PORTFOLIO OF INVESTMENTS | | 10 |
Wilmington Large-Cap Strategy Fund (continued)
| | | | | | | | |
| | |
| Description | | Number of
Shares | | | Value | |
| | |
Waters Corp.* | | | 2,310 | | | $ | 435,227 | |
| | |
| | | | | | $ | 4,689,327 | |
| | |
PHARMACEUTICALS – 4.7% | | | | | | | | |
| | |
AbbVie, Inc. | | | 34,078 | | | | 3,290,231 | |
| | |
Allergan PLC | | | 6,085 | | | | 934,960 | |
| | |
Bristol-Myers Squibb Co. | | | 30,560 | | | | 1,593,093 | |
| | |
Eli Lilly & Co. | | | 18,630 | | | | 1,510,334 | |
| | |
Johnson & Johnson | | | 56,700 | | | | 7,171,983 | |
| | |
Merck & Co., Inc. | | | 54,766 | | | | 3,224,074 | |
| | |
Mylan NV* | | | 7,530 | | | | 291,863 | |
| | |
Perrigo Co. PLC | | | 940 | | | | 73,452 | |
| | |
Pfizer, Inc. | | | 119,903 | | | | 4,389,649 | |
| | |
Zoetis, Inc. | | | 11,581 | | | | 966,782 | |
| | |
| | | | | | $ | 23,446,421 | |
| | |
TOTAL HEALTH CARE | | | | | | $ | 67,896,085 | |
| | |
INDUSTRIALS – 10.6% | | | | | | | | |
| | |
AEROSPACE & DEFENSE – 3.2% | | | | | | | | |
| | |
Arconic, Inc. | | | 2,766 | | | | 49,262 | |
| | |
Boeing Co. (The) | | | 11,740 | | | | 3,915,994 | |
| | |
BWX Technologies, Inc. | | | 2,940 | | | | 199,332 | |
| | |
General Dynamics Corp. | | | 5,730 | | | | 1,153,506 | |
| | |
HEICO Corp., Class A | | | 1,562 | | | | 112,698 | |
| | |
Hexcel Corp. | | | 3,600 | | | | 239,292 | |
| | |
Honeywell International, Inc. | | | 16,870 | | | | 2,440,752 | |
| | |
Huntington Ingalls Industries, Inc. | | | 1,345 | | | | 327,117 | |
| | |
L3 Technologies, Inc. | | | 2,010 | | | | 393,719 | |
| | |
Lockheed Martin Corp. | | | 5,650 | | | | 1,812,746 | |
| | |
Northrop Grumman Corp. | | | 3,770 | | | | 1,214,091 | |
| | |
Raytheon Co. | | | 6,620 | | | | 1,356,703 | |
| | |
Rockwell Collins, Inc. | | | 2,800 | | | | 371,112 | |
| | |
Spirit AeroSystems Holdings, Inc., Class A | | | 1,940 | | | | 155,918 | |
| | |
Textron, Inc. | | | 3,270 | | | | 203,198 | |
| | |
TransDigm Group, Inc. | | | 1,490 | | | | 477,649 | |
| | |
United Technologies Corp. | | | 15,800 | | | | 1,898,370 | |
| | |
| | | | | | $ | 16,321,459 | |
| | |
AIR FREIGHT & LOGISTICS – 0.6% | | | | | | | | |
| | |
C.H. Robinson Worldwide, Inc. | | | 1,884 | | | | 173,385 | |
| | |
Expeditors International of Washington, Inc. | | | 1,380 | | | | 88,127 | |
| | |
FedEx Corp. | | | 5,560 | | | | 1,374,432 | |
| | |
United Parcel Service, Inc., Class B | | | 13,330 | | | | 1,512,955 | |
| | |
| | | | | | $ | 3,148,899 | |
| | |
AIRLINES – 0.5% | | | | | | | | |
| | |
Alaska Air Group, Inc. | | | 2,700 | | | | 175,311 | |
| | |
American Airlines Group, Inc. | | | 6,300 | | | | 270,459 | |
| | |
Copa Holdings SA , Class A | | | 200 | | | | 23,434 | |
| | | | | | | | |
| | |
| Description | | Number of Shares | | | Value | |
| | |
Delta Air Lines, Inc. | | | 12,490 | | | $ | 652,228 | |
| | |
Southwest Airlines Co. | | | 13,230 | | | | 698,941 | |
| | |
Spirit Airlines, Inc.* | | | 3,900 | | | | 139,308 | |
| | |
United Continental Holdings, Inc.* | | | 7,383 | | | | 498,648 | |
| | |
| | | | | | $ | 2,458,329 | |
| | |
BUILDING PRODUCTS – 0.4% | | | | | | | | |
| | |
Allegion PLC | | | 2,233 | | | | 172,343 | |
| | |
Fortune Brands Home & Security, Inc. | | | 4,760 | | | | 260,324 | |
| | |
Johnson Controls International PLC | | | 15,031 | | | | 509,100 | |
| | |
Lennox International, Inc. | | | 1,490 | | | | 288,121 | |
| | |
Masco Corp. | | | 9,030 | | | | 341,966 | |
| | |
Owens Corning | | | 2,290 | | | | 149,972 | |
| | |
Smith (A.O.) Corp. | | | 5,000 | | | | 306,750 | |
| | |
| | | | | | $ | 2,028,576 | |
| |
COMMERCIAL SERVICES & SUPPLIES – 0.4% | | | | | |
| | |
Cintas Corp. | | | 2,520 | | | | 429,156 | |
| | |
Copart, Inc.* | | | 3,800 | | | | 194,104 | |
| | |
Pitney Bowes, Inc. | | | 8,500 | | | | 86,870 | |
| | |
Republic Services, Inc. | | | 6,340 | | | | 410,071 | |
| | |
Stericycle, Inc.* | | | 52 | | | | 3,053 | |
| | |
Waste Management, Inc. | | | 10,640 | | | | 864,926 | |
| | |
| | | | | | $ | 1,988,180 | |
| | |
CONSTRUCTION & ENGINEERING – 0.1% | | | | | | | | |
| | |
Jacobs Engineering Group, Inc. | | | 4,150 | | | | 241,073 | |
| | |
Quanta Services, Inc.* | | | 560 | | | | 18,200 | |
| | |
| | | | | | $ | 259,273 | |
| | |
ELECTRICAL EQUIPMENT – 0.4% | | | | | | | | |
| | |
AMETEK, Inc. | | | 3,160 | | | | 220,568 | |
| | |
Eaton Corp. PLC | | | 7,478 | | | | 561,074 | |
| | |
Emerson Electric Co. | | | 11,440 | | | | 759,730 | |
| | |
Hubbell, Inc. | | | 1,290 | | | | 133,979 | |
| | |
Rockwell Automation, Inc. | | | 2,320 | | | | 381,710 | |
| | |
| | | | | | $ | 2,057,061 | |
| | |
ELECTRONIC EQUIPMENT, INSTRUMENTS & COMPONENTS – 0.1% | | | | | | | | |
| | |
Fortive Corp. | | | 8,340 | | | | 586,385 | |
| | |
INDUSTRIAL CONGLOMERATES – 1.2% | | | | | | | | |
| | |
3M Co. | | | 12,860 | | | | 2,499,855 | |
| | |
Carlisle Cos., Inc. | | | 1,290 | | | | 138,972 | |
| | |
General Electric Co. | | | 171,520 | | | | 2,413,286 | |
| | |
Roper Technologies, Inc. | | | 2,600 | | | | 686,894 | |
| | |
| | | | | | $ | 5,739,007 | |
| | |
MACHINERY – 2.1% | | | | | | | | |
| | |
AGCO Corp. | | | 3,260 | | | | 204,337 | |
| | |
Allison Transmission Holdings, Inc. | | | 4,800 | | | | 187,152 | |
| | |
Caterpillar, Inc. | | | 12,700 | | | | 1,833,372 | |
ANNUAL REPORT / April 30, 2018
| | |
| 11 | | PORTFOLIO OF INVESTMENTS |
| |
| | Wilmington Large-Cap Strategy Fund (continued) |
| | | | | | | | |
| | |
| Description | | Number of Shares | | | Value | |
| | |
Colfax Corp.* | | | 2,900 | | | $ | 89,929 | |
| | |
Crane Co. | | | 1,200 | | | | 100,368 | |
| | |
Cummins, Inc. | | | 3,980 | | | | 636,243 | |
| | |
Deere & Co. | | | 7,290 | | | | 986,556 | |
| | |
Donaldson Co., Inc. | | | 4,010 | | | | 177,483 | |
| | |
Dover Corp. | | | 4,160 | | | | 385,632 | |
| | |
Graco, Inc. | | | 6,420 | | | | 282,416 | |
| | |
IDEX Corp. | | | 2,120 | | | | 283,359 | |
| | |
Illinois Tool Works, Inc. | | | 7,000 | | | | 994,140 | |
| | |
Ingersoll-Rand PLC | | | 6,350 | | | | 532,701 | |
| | |
ITT, Inc. | | | 2,535 | | | | 123,936 | |
| | |
Lincoln Electric Holdings, Inc. | | | 1,900 | | | | 157,453 | |
| | |
Nordson Corp. | | | 1,500 | | | | 192,900 | |
| | |
Oshkosh Corp. | | | 1,790 | | | | 129,166 | |
| | |
PACCAR, Inc. | | | 6,390 | | | | 406,851 | |
| | |
Parker-Hannifin Corp. | | | 2,960 | | | | 487,275 | |
| | |
Pentair PLC | | | 3,816 | | | | 256,740 | |
| | |
Snap-on, Inc. | | | 1,280 | | | | 185,920 | |
| | |
Stanley Black & Decker, Inc. | | | 4,120 | | | | 583,351 | |
| | |
Terex Corp. | | | 3,730 | | | | 136,220 | |
| | |
Timken Co. (The) | | | 600 | | | | 25,650 | |
| | |
Toro Co. (The) | | | 3,780 | | | | 220,714 | |
| | |
Trinity Industries, Inc. | | | 2,400 | | | | 76,488 | |
| | |
Valmont Industries, Inc. | | | 1,060 | | | | 150,626 | |
| | |
WABCO Holdings, Inc.* | | | 2,050 | | | | 264,429 | |
| | |
Wabtec Corp.# | | | 1,720 | | | | 152,753 | |
| | |
Welbilt, Inc.* | | | 3,910 | | | | 74,916 | |
| | |
Xylem, Inc. | | | 5,010 | | | | 365,229 | |
| | |
| | | | | | $ | 10,684,305 | |
| |
PROFESSIONAL SERVICES – 0.3% | | | | | |
| | |
Equifax, Inc. | | | 3,660 | | | | 410,103 | |
| | |
IHS Markit Ltd.* | | | 5,587 | | | | 274,489 | |
| | |
ManpowerGroup, Inc. | | | 1,860 | | | | 178,039 | |
| | |
Nielsen Holdings PLC | | | 3,150 | | | | 99,067 | |
| | |
TransUnion* | | | 2,400 | | | | 155,784 | |
| | |
Verisk Analytics, Inc.* | | | 2,000 | | | | 212,900 | |
| | |
| | | | | | $ | 1,330,382 | |
| | |
ROAD & RAIL – 1.1% | | | | | | | | |
| | |
CSX Corp. | | | 20,000 | | | | 1,187,800 | |
| | |
JB Hunt Transport Services, Inc. | | | 2,280 | | | | 267,740 | |
| | |
Kansas City Southern | | | 2,180 | | | | 232,453 | |
| | |
Landstar System, Inc. | | | 1,590 | | | | 161,623 | |
| | |
Norfolk Southern Corp. | | | 6,960 | | | | 998,551 | |
| | |
Old Dominion Freight Line, Inc. | | | 2,100 | | | | 281,106 | |
| | |
Ryder System, Inc. | | | 40 | | | | 2,697 | |
| | |
Union Pacific Corp. | | | 17,470 | | | | 2,334,516 | |
| | |
| | | | | | $ | 5,466,486 | |
| | | | | | | | |
| | |
| Description | | Number of Shares | | | Value | |
| |
TRADING COMPANIES & DISTRIBUTORS – 0.2% | | | | | |
| | |
Air Lease Corp. | | | 1,200 | | | $ | 50,028 | |
| | |
Fastenal Co.# | | | 3,520 | | | | 175,965 | |
| | |
HD Supply Holdings, Inc.* | | | 1,000 | | | | 38,710 | |
| | |
MSC Industrial Direct Co., Inc., Class A | | | 1,390 | | | | 120,152 | |
| | |
United Rentals, Inc.* | | | 2,320 | | | | 348,000 | |
| | |
Watsco, Inc.# | | | 100 | | | | 16,742 | |
| | |
WW Grainger, Inc. | | | 1,140 | | | | 320,739 | |
| | |
| | | | | | $ | 1,070,336 | |
| |
TRANSPORTATION INFRASTRUCTURE – 0.0%** | | | | | |
| | |
Macquarie Infrastructure Corp. | | | 2,200 | | | | 83,380 | |
| | |
TOTAL INDUSTRIALS | | | | | | $ | 53,222,058 | |
| |
INFORMATION TECHNOLOGY – 25.0% | | | | | |
| |
COMMUNICATIONS EQUIPMENT – 1.2% | | | | | |
| | |
ARRIS International PLC* | | | 1,900 | | | | 51,300 | |
| | |
Cisco Systems, Inc. | | | 107,350 | | | | 4,754,531 | |
| | |
EchoStar Corp., Class A* | | | 70 | | | | 3,678 | |
| | |
F5 Networks, Inc.* | | | 490 | | | | 79,914 | |
| | |
Harris Corp. | | | 2,859 | | | | 447,205 | |
| | |
Juniper Networks, Inc. | | | 4,290 | | | | 105,491 | |
| | |
Motorola Solutions, Inc. | | | 4,830 | | | | 530,479 | |
| | |
Palo Alto Networks, Inc.* | | | 1,690 | | | | 325,342 | |
| | |
| | | | | | $ | 6,297,940 | |
| | |
COMPUTERS & PERIPHERALS – 4.0% | | | | | | | | |
| | |
Apple, Inc. | | | 107,660 | | | | 17,791,892 | |
| | |
Hewlett Packard Enterprise Co. | | | 37,790 | | | | 644,319 | |
| | |
HP, Inc. | | | 41,290 | | | | 887,322 | |
| | |
NCR Corp.* | | | 20 | | | | 615 | |
| | |
NetApp, Inc. | | | 3,553 | | | | 236,559 | |
| | |
Western Digital Corp. | | | 5,283 | | | | 416,248 | |
| | |
| | | | | | $ | 19,976,955 | |
| |
ELECTRONIC EQUIPMENT, INSTRUMENTS & COMPONENTS – 0.5% | | | | | |
| | |
Amphenol Corp., Class A | | | 7,900 | | | | 661,309 | |
| | |
Arrow Electronics, Inc.* | | | 2,940 | | | | 219,736 | |
| | |
CDW Corp. | | | 4,990 | | | | 355,737 | |
| | |
Cognex Corp. | | | 5,000 | | | | 231,250 | |
| | |
Corning, Inc. | | | 21,870 | | | | 590,927 | |
| | |
Dolby Laboratories, Inc., Class A | | | 150 | | | | 8,973 | |
| | |
IPG Photonics Corp.* | | | 700 | | | | 149,121 | |
| | |
Jabil, Inc. | | | 500 | | | | 13,300 | |
| | |
National Instruments Corp. | | | 1,930 | | | | 78,918 | |
| | |
Trimble Navigation Ltd.* | | | 6,680 | | | | 231,128 | |
| | |
| | | | | | $ | 2,540,399 | |
| |
INTERNET SOFTWARE & SERVICES – 4.7% | | | | | |
| | |
Akamai Technologies, Inc.* | | | 4,750 | | | | 340,337 | |
April 30, 2018 / ANNUAL REPORT
| | |
PORTFOLIO OF INVESTMENTS | | 12 |
Wilmington Large-Cap Strategy Fund (continued)
| | | | | | | | |
| | |
| Description | | Number of
Shares | | | Value | |
| | |
Alphabet, Inc., Class A* | | | 6,295 | | | $ | 6,411,961 | |
| | |
Alphabet, Inc., Class C* | | | 6,429 | | | | 6,540,415 | |
| | |
eBay, Inc.* | | | 23,690 | | | | 897,377 | |
| | |
Facebook, Inc., Class A* | | | 49,580 | | | | 8,527,760 | |
| | |
GoDaddy, Inc., Class A* | | | 650 | | | | 41,964 | |
| | |
IAC/InterActiveCorp* | | | 1,300 | | | | 210,782 | |
| | |
LogMeIn, Inc. | | | 57 | | | | 6,281 | |
| | |
Match Group, Inc.#,* | | | 1,200 | | | | 56,544 | |
| | |
Twitter, Inc.* | | | 9,110 | | | | 276,124 | |
| | |
VeriSign, Inc.#,* | | | 3,050 | | | | 358,131 | |
| | |
Zillow Group, Inc., Class A#,* | | | 1,200 | | | | 58,044 | |
| | |
Zillow Group, Inc., Class C#,* | | | 2,000 | | | | 96,980 | |
| | |
| | | | | | $ | 23,822,700 | |
| |
IT SERVICES – 4.6% | | | | | |
| | |
Accenture PLC, Class A | | | 13,900 | | | | 2,101,680 | |
| | |
Alliance Data Systems Corp. | | | 1,290 | | | | 261,934 | |
| | |
Amdocs Ltd. | | | 2,620 | | | | 176,195 | |
| | |
Automatic Data Processing, Inc. | | | 10,530 | | | | 1,243,382 | |
| | |
Black Knight, Inc.* | | | 2,037 | | | | 99,100 | |
| | |
Broadridge Financial Solutions, Inc. | | | 3,630 | | | | 389,172 | |
| | |
Cognizant Technology Solutions Corp., | | | | | | | | |
| | |
Class A | | | 11,910 | | | | 974,476 | |
| | |
DXC Technology Co. | | | 6,676 | | | | 688,029 | |
| | |
Fidelity National Information Services, Inc. | | | 6,443 | | | | 611,892 | |
| | |
First Data Corp., Class A* | | | 8,200 | | | | 148,420 | |
| | |
Fiserv, Inc.* | | | 10,720 | | | | 759,619 | |
| | |
FleetCor Technologies, Inc.* | | | 2,000 | | | | 414,560 | |
| | |
Gartner, Inc.* | | | 1,600 | | | | 194,064 | |
| | |
Global Payments, Inc. | | | 4,400 | | | | 497,420 | |
| | |
International Business Machines Corp. | | | 17,760 | | | | 2,574,490 | |
| | |
Jack Henry & Associates, Inc. | | | 1,900 | | | | 227,012 | |
| | |
Leidos Holdings, Inc. | | | 2,200 | | | | 141,306 | |
| | |
Mastercard, Inc., Class A | | | 19,820 | | | | 3,533,311 | |
| | |
Paychex, Inc. | | | 6,570 | | | | 397,945 | |
| | |
PayPal Holdings, Inc.* | | | 25,265 | | | | 1,885,022 | |
| | |
Square, Inc., Class A* | | | 5,100 | | | | 241,434 | |
| | |
Switch, Inc., Class A# | | | 1,700 | | | | 24,225 | |
| | |
Teradata Corp.* | | | 270 | | | | 11,048 | |
| | |
Total System Services, Inc. | | | 3,720 | | | | 312,703 | |
| | |
Visa, Inc., Class A | | | 38,920 | | | | 4,938,170 | |
| | |
Western Union Co. (The) | | | 6,540 | | | | 129,165 | |
| | |
Worldpay, Inc., Class A* | | | 5,100 | | | | 414,222 | |
| | |
Xerox Corp. | | | 700 | | | | 22,015 | |
| | |
| | | | | | $ | 23,412,011 | |
| |
PROFESSIONAL SERVICES – 0.1% | | | | | |
| | |
CoStar Group, Inc.* | | | 1,000 | | | | 366,660 | |
| | | | | | | | |
| | |
| Description | | Number of
Shares | | | Value | |
|
SEMICONDUCTORS & SEMICONDUCTOR EQUIPMENT – 3.8% | |
| | |
Advanced Micro Devices, Inc.#,* | | | 2,600 | | | $ | 28,288 | |
| | |
Analog Devices, Inc. | | | 7,952 | | | | 694,607 | |
| | |
Applied Materials, Inc. | | | 24,680 | | | | 1,225,856 | |
| | |
Cypress Semiconductor Corp. | | | 12,000 | | | | 174,960 | |
| | |
First Solar, Inc.* | | | 2,700 | | | | 191,457 | |
| | |
Intel Corp. | | | 101,970 | | | | 5,263,691 | |
| | |
KLA-Tencor Corp. | | | 4,150 | | | | 422,221 | |
| | |
Lam Research Corp. | | | 3,680 | | | | 681,021 | |
| | |
Marvell Technology Group Ltd. | | | 11,490 | | | | 230,489 | |
| | |
Maxim Integrated Products, Inc. | | | 3,420 | | | | 186,390 | |
| | |
Microchip Technology, Inc.# | | | 6,339 | | | | 530,321 | |
| | |
Micron Technology, Inc.* | | | 23,900 | | | | 1,098,922 | |
| | |
NVIDIA Corp. | | | 11,980 | | | | 2,694,302 | |
| | |
NXP Semiconductors NV* | | | 6,000 | | | | 629,400 | |
| | |
ON Semiconductor Corp.* | | | 8,220 | | | | 181,498 | |
| | |
Qorvo, Inc.* | | | 3,350 | | | | 225,790 | |
| | |
QUALCOMM, Inc. | | | 28,580 | | | | 1,457,866 | |
| | |
Skyworks Solutions, Inc. | | | 5,100 | | | | 442,476 | |
| | |
Teradyne, Inc. | | | 7,250 | | | | 235,988 | |
| | |
Texas Instruments, Inc. | | | 22,200 | | | | 2,251,746 | |
| | |
Versum Materials, Inc. | | | 2,600 | | | | 91,468 | |
| | |
Xilinx, Inc. | | | 5,500 | | | | 353,320 | |
| | |
| | | | | | $ | 19,292,077 | |
| | |
SOFTWARE – 6.0% | | | | | | | | |
| | |
Activision Blizzard, Inc. | | | 16,670 | | | | 1,106,054 | |
| | |
Adobe Systems, Inc.* | | | 10,160 | | | | 2,251,456 | |
| | |
ANSYS, Inc.* | | | 1,380 | | | | 223,091 | |
| | |
Atlassian Corp. PLC, Class A* | | | 900 | | | | 50,382 | |
| | |
Autodesk, Inc.* | | | 5,330 | | | | 671,047 | |
| | |
CA, Inc. | | | 2,480 | | | | 86,304 | |
| | |
Cadence Design Systems, Inc.* | | | 8,810 | | | | 352,929 | |
| | |
CDK Global, Inc. | | | 4,676 | | | | 305,062 | |
| | |
Citrix Systems, Inc.* | | | 3,590 | | | | 369,447 | |
| | |
Dell Technologies, Inc., Class V* | | | 3,283 | | | | 235,621 | |
| | |
Delphi Technologies PLC | | | 1,750 | | | | 84,717 | |
| | |
Electronic Arts, Inc.* | | | 7,010 | | | | 827,040 | |
| | |
FireEye, Inc.* | | | 800 | | | | 14,440 | |
| | |
Fortinet, Inc.* | | | 400 | | | | 22,144 | |
| | |
Intuit, Inc. | | | 6,000 | | | | 1,108,740 | |
| | |
Manhattan Associates, Inc.* | | | 300 | | | | 12,918 | |
| | |
Micro Focus International PLC ADR | | | 1,556 | | | | 26,950 | |
| | |
Microsoft Corp. | | | 158,549 | | | | 14,827,502 | |
| | |
Oracle Corp. | | | 63,710 | | | | 2,909,636 | |
| | |
PTC, Inc.* | | | 2,100 | | | | 172,935 | |
| | |
Red Hat, Inc.* | | | 4,030 | | | | 657,132 | |
ANNUAL REPORT / April 30, 2018
| | |
| 13 | | PORTFOLIO OF INVESTMENTS |
| |
| | Wilmington Large-Cap Strategy Fund (continued) |
| | | | | | | | |
| | |
| Description | | Number of
Shares | | | Value | |
| | |
salesforce.com, Inc.* | | | 14,930 | | | $ | 1,806,381 | |
| | |
ServiceNow, Inc.* | | | 3,900 | | | | 647,946 | |
| | |
Splunk, Inc.* | | | 2,800 | | | | 287,420 | |
| | |
Symantec Corp. | | | 12,620 | | | | 350,710 | |
| | |
Synopsys, Inc.* | | | 2,600 | | | | 222,326 | |
| | |
Take-Two Interactive Software, Inc.* | | | 1,200 | | | | 119,652 | |
| | |
Ultimate Software Group, Inc.* | | | 140 | | | | 33,589 | |
| | |
VMware, Inc., Class A#,* | | | 1,510 | | | | 201,223 | |
| | |
Workday, Inc., Class A* | | | 1,750 | | | | 218,470 | |
| | |
Zynga, Inc., Class A* | | | 1,300 | | | | 4,485 | |
| | |
| | | | | | $ | 30,207,749 | |
| |
TELECOMMUNICATIONS – 0.1%** | | | | | |
| | |
Arista Networks, Inc.* | | | 600 | | | | 158,730 | |
| | |
CommScope Holding Co., Inc.* | | | 2,400 | | | | 91,728 | |
| | |
| | | | | | $ | 250,458 | |
| | |
TOTAL INFORMATION TECHNOLOGY | | | | | | $ | 126,166,949 | |
| | |
MATERIALS – 3.2% | | | | | | | | |
| | |
CHEMICALS – 2.3% | | | | | | | | |
| | |
Air Products & Chemicals, Inc. | | | 5,100 | | | | 827,679 | |
| | |
Albemarle Corp. | | | 2,000 | | | | 193,920 | |
| | |
Ashland Global Holdings, Inc. | | | 1,200 | | | | 79,416 | |
| | |
Axalta Coating Systems Ltd.* | | | 4,300 | | | | 132,870 | |
| | |
Cabot Corp. | | | 600 | | | | 33,516 | |
| | |
Celanese Corp., Class A | | | 3,500 | | | | 380,345 | |
| | |
CF Industries Holdings, Inc. | | | 7,200 | | | | 279,360 | |
| | |
Chemours Co. (The) | | | 800 | | | | 38,728 | |
| | |
DowDuPont, Inc. | | | 46,337 | | | | 2,930,352 | |
| | |
Eastman Chemical Co. | | | 4,000 | | | | 408,320 | |
| | |
Ecolab, Inc. | | | 5,900 | | | | 854,143 | |
| | |
FMC Corp. | | | 3,900 | | | | 310,947 | |
| | |
Huntsman Corp. | | | 5,200 | | | | 154,804 | |
| | |
International Flavors & Fragrances, Inc. | | | 1,000 | | | | 141,260 | |
| | |
LyondellBasell Industries NV, Class A | | | 7,600 | | | | 803,548 | |
| | |
Monsanto Co. | | | 9,900 | | | | 1,241,163 | |
| | |
PPG Industries, Inc. | | | 5,000 | | | | 529,400 | |
| | |
Praxair, Inc. | | | 6,500 | | | | 991,380 | |
| | |
RPM International, Inc. | | | 2,700 | | | | 130,410 | |
| | |
Sherwin-Williams Co. (The) | | | 1,800 | | | | 661,788 | |
| | |
Valvoline, Inc. | | | 3,294 | | | | 66,802 | |
| | |
Westlake Chemical Corp. | | | 1,300 | | | | 139,061 | |
| | |
| | | | | | $ | 11,329,212 | |
| |
CONSTRUCTION MATERIALS – 0.1% | | | | | |
| | |
Eagle Materials, Inc. | | | 1,000 | | | | 98,960 | |
| | |
Martin Marietta Materials, Inc. | | | 1,400 | | | | 272,678 | |
| | |
Vulcan Materials Co. | | | 3,300 | | | | 368,577 | |
| | |
| | | | | | $ | 740,215 | |
| | | | | | | | |
| | |
| Description | | Number of
Shares | | | Value | |
| |
CONTAINERS & PACKAGING – 0.3% | | | | | |
| | |
Avery Dennison Corp. | | | 900 | | | $ | 94,329 | |
| | |
Ball Corp. | | | 3,300 | | | | 132,297 | |
| | |
International Paper Co. | | | 10,300 | | | | 531,068 | |
| | |
Owens-Illinois, Inc.* | | | 7,300 | | | | 148,409 | |
| | |
Packaging Corp. of America | | | 2,200 | | | | 254,518 | |
| | |
WestRock Co. | | | 5,300 | | | | 313,548 | |
| | |
| | | | | | $ | 1,474,169 | |
| |
METALS & MINING – 0.5% | | | | | |
| | |
Alcoa Corp.* | | | 4,588 | | | | 234,906 | |
| | |
Freeport-McMoRan, Inc. | | | 30,300 | | | | 460,863 | |
| | |
Newmont Mining Corp. | | | 12,300 | | | | 483,267 | |
| | |
Nucor Corp. | | | 8,500 | | | | 523,770 | |
| | |
Reliance Steel & Aluminum Co. | | | 1,800 | | | | 158,256 | |
| | |
Royal Gold, Inc. | | | 1,300 | | | | 115,440 | |
| | |
Southern Copper Corp.# | | | 800 | | | | 42,248 | |
| | |
Steel Dynamics, Inc. | | | 6,200 | | | | 277,822 | |
| | |
United States Steel Corp. | | | 5,900 | | | | 199,597 | |
| | |
| | | | | | $ | 2,496,169 | |
| |
PAPER & FOREST PRODUCTS – 0.0%** | | | | | |
| | |
Domtar Corp. | | | 3,100 | | | | 136,090 | |
| | |
TOTAL MATERIALS | | | | | | $ | 16,175,855 | |
| | |
REAL ESTATE – 2.9% | | | | | | | | |
| |
REAL ESTATE INVESTMENT TRUSTS – 2.8% | | | | | |
| | |
Alexandria Real Estate Equities, Inc. | | | 2,815 | | | | 350,665 | |
| | |
American Campus Communities, Inc. | | | 4,700 | | | | 183,817 | |
| | |
American Homes 4 Rent, Class A | | | 1,650 | | | | 33,330 | |
| | |
American Tower Corp. | | | 8,360 | | | | 1,139,970 | |
| | |
Apartment Investment & Management Co., | | | | | | | | |
| | |
Class A | | | 3,970 | | | | 161,182 | |
| | |
AvalonBay Communities, Inc. | | | 1,522 | | | | 248,086 | |
| | |
Boston Properties, Inc. | | | 2,750 | | | | 333,877 | |
| | |
Brandywine Realty Trust | | | 4,680 | | | | 75,395 | |
| | |
Camden Property Trust | | | 2,670 | | | | 228,018 | |
| | |
CoreCivic, Inc. | | | 167 | | | | 3,367 | |
| | |
Corporate Office Properties Trust | | | 4,700 | | | | 129,297 | |
| | |
Crown Castle International Corp. | | | 8,340 | | | | 841,256 | |
| | |
CyrusOne, Inc. | | | 600 | | | | 32,154 | |
| | |
Digital Realty Trust, Inc. | | | 3,910 | | | | 413,248 | |
| | |
Douglas Emmett, Inc. | | | 4,410 | | | | 164,361 | |
| | |
Duke Realty Corp. | | | 10,010 | | | | 271,271 | |
| | |
Equinix, Inc. | | | 1,681 | | | | 707,348 | |
| | |
Equity Commonwealth* | | | 4,992 | | | | 154,702 | |
| | |
Equity LifeStyle Properties, Inc. | | | 2,800 | | | | 249,648 | |
| | |
Equity Residential | | | 3,750 | | | | 231,412 | |
| | |
Essex Property Trust, Inc. | | | 1,073 | | | | 257,187 | |
April 30, 2018 / ANNUAL REPORT
| | |
PORTFOLIO OF INVESTMENTS | | 14 |
Wilmington Large-Cap Strategy Fund (continued)
| | | | | | | | |
| | |
| Description | | Number of
Shares | | | Value | |
| | |
Extra Space Storage, Inc. | | | 3,100 | | | $ | 277,729 | |
| | |
Federal Realty Investment Trust | | | 970 | | | | 112,374 | |
| | |
Forest City Realty Trust, Inc., Class A | | | 3,400 | | | | 68,204 | |
| | |
Gaming and Leisure Properties, Inc. | | | 1,404 | | | | 48,115 | |
| | |
GGP, Inc. | | | 3,443 | | | | 68,826 | |
| | |
HCP, Inc. | | | 4,530 | | | | 105,821 | |
| | |
Hospitality Properties Trust | | | 3,600 | | | | 89,568 | |
| | |
Host Hotels & Resorts, Inc. | | | 19,340 | | | | 378,290 | |
| | |
Iron Mountain, Inc. | | | 3,503 | | | | 118,892 | |
| | |
JBG SMITH Properties | | | 836 | | | | 30,823 | |
| | |
Kilroy Realty Corp. | | | 3,325 | | | | 238,303 | |
| | |
Kimco Realty Corp. | | | 10,480 | | | | 152,065 | |
| | |
Lamar Advertising Co., Class A | | | 2,400 | | | | 152,904 | |
| | |
Liberty Property Trust | | | 4,040 | | | | 168,953 | |
| | |
Life Storage, Inc. | | | 1,000 | | | | 88,440 | |
| | |
Macerich Co. (The) | | | 760 | | | | 43,791 | |
| | |
Mid-America Apartment Communities, Inc. | | | 3,271 | | | | 299,166 | |
| | |
National Retail Properties, Inc. | | | 2,500 | | | | 95,100 | |
| | |
Park Hotels & Resorts, Inc. | | | 292 | | | | 8,404 | |
| | |
Piedmont Office Realty Trust, Inc., Class A | | | 4,950 | | | | 88,704 | |
| | |
Prologis, Inc. | | | 11,490 | | | | 745,816 | |
| | |
Public Storage | | | 3,260 | | | | 657,803 | |
| | |
Rayonier, Inc. | | | 5,615 | | | | 208,822 | |
| | |
Realty Income Corp. | | | 6,710 | | | | 338,922 | |
| | |
Regency Centers Corp. | | | 2,035 | | | | 119,760 | |
| | |
Retail Properties of America, Inc., Class A | | | 5,400 | | | | 62,316 | |
| | |
SBA Communications Corp.* | | | 2,850 | | | | 456,655 | |
| | |
Senior Housing Properties Trust | | | 5,700 | | | | 88,749 | |
| | |
Simon Property Group, Inc. | | | 6,093 | | | | 952,580 | |
| | |
SL Green Realty Corp. | | | 490 | | | | 47,893 | |
| | |
Spirit Realty Capital, Inc. | | | 10,400 | | | | 83,720 | |
| | |
UDR, Inc. | | | 8,580 | | | | 310,167 | |
| | |
Uniti Group, Inc.* | | | 1,600 | | | | 28,832 | |
| | |
Ventas, Inc. | | | 3,286 | | | | 168,966 | |
| | |
Vornado Realty Trust | | | 2,473 | | | | 168,238 | |
| | |
Weingarten Realty Investors | | | 3,560 | | | | 97,793 | |
| | |
Welltower, Inc. | | | 3,770 | | | | 201,469 | |
| | |
Weyerhaeuser Co. | | | 13,642 | | | | 501,753 | |
| | |
| | | | | | $ | 14,084,317 | |
| |
REAL ESTATE MANAGEMENT & DEVELOPMENT – 0.1% | | | | | |
| | |
CBRE Group, Inc., Class A* | | | 5,510 | | | | 249,658 | |
| | |
Howard Hughes Corp. (The)* | | | 658 | | | | 89,027 | |
| | |
| | | | | | $ | 338,685 | |
| | |
TOTAL REAL ESTATE | | | | | | $ | 14,423,002 | |
| |
TELECOMMUNICATION SERVICES – 1.6% | | | | | |
| | | | | | | | |
| | |
| Description | | Number of Shares | | | Value | |
| |
DIVERSIFIED TELECOMMUNICATION SERVICES – 1.5% | | | | | |
| | |
AT&T, Inc. | | | 110,000 | | | $ | 3,597,000 | |
| | |
CenturyLink, Inc. | | | 14,085 | | | | 261,699 | |
| | |
Verizon Communications, Inc. | | | 79,700 | | | | 3,933,195 | |
| | |
Zayo Group Holdings, Inc.* | | | 700 | | | | 25,410 | |
| | |
| | | | | | $ | 7,817,304 | |
| |
WIRELESS TELECOMMUNICATION SERVICES – 0.1% | | | | | |
| | |
Sprint Corp.#,* | | | 6,950 | | | | 38,989 | |
| | |
T-Mobile US, Inc.* | | | 7,600 | | | | 459,876 | |
| | |
| | | | | | $ | 498,865 | |
| |
TOTAL TELECOMMUNICATION SERVICES | | | $ | 8,316,169 | |
| | |
UTILITIES – 1.3% | | | | | | | | |
| | |
ELECTRIC UTILITIES – 0.7% | | | | | | | | |
| | |
American Electric Power Co., Inc. | | | 4,100 | | | | 286,918 | |
| | |
Avangrid, Inc.# | | | 2,900 | | | | 152,859 | |
| | |
Duke Energy Corp. | | | 6,800 | | | | 545,088 | |
| | |
Edison International | | | 600 | | | | 39,312 | |
| | |
Entergy Corp. | | | 2,800 | | | | 228,452 | |
| | |
Eversource Energy | | | 4,300 | | | | 259,075 | |
| | |
Exelon Corp. | | | 12,000 | | | | 476,160 | |
| | |
NextEra Energy, Inc. | | | 4,500 | | | | 737,595 | |
| | |
OGE Energy Corp. | | | 6,600 | | | | 216,942 | |
| | |
PPL Corp. | | | 11,500 | | | | 334,650 | |
| | |
Southern Co. (The) | | | 6,200 | | | | 285,944 | |
| | |
| | | | | | $ | 3,562,995 | |
| | |
GAS UTILITIES – 0.0%** | | | | | | | | |
| | |
UGI Corp. | | | 1,400 | | | | 67,746 | |
| |
INDEPENDENT POWER PRODUCERS & ENERGY TRADERS – 0.0%** | | | | | |
| | |
NRG Energy, Inc. | | | 6,400 | | | | 198,400 | |
| |
MULTI-UTILITIES – 0.5% | | | | | |
| | |
CenterPoint Energy, Inc. | | | 9,100 | | | | 230,503 | |
| | |
CMS Energy Corp. | | | 5,200 | | | | 245,388 | |
| | |
Consolidated Edison, Inc. | | | 4,500 | | | | 360,585 | |
| | |
Dominion Energy, Inc. | | | 7,400 | | | | 492,544 | |
| | |
DTE Energy Co. | | | 500 | | | | 52,700 | |
| | |
PG&E Corp. | | | 1,400 | | | | 64,540 | |
| | |
Public Service Enterprise Group, Inc. | | | 3,400 | | | | 177,310 | |
| | |
Sempra Energy | | | 1,500 | | | | 167,700 | |
| | |
Vectren Corp. | | | 1,100 | | | | 77,297 | |
| | |
WEC Energy Group, Inc. | | | 1,900 | | | | 122,132 | |
| | |
Xcel Energy, Inc. | | | 7,700 | | | | 360,668 | |
| | |
| | | | | | $ | 2,351,367 | |
| | |
WATER UTILITIES – 0.1% | | | | | | | | |
| | |
American Water Works Co., Inc. | | | 1,800 | | | | 155,844 | |
ANNUAL REPORT / April 30, 2018
| | |
| 15 | | PORTFOLIO OF INVESTMENTS |
| |
| | Wilmington Large-Cap Strategy Fund (continued) |
| | | | | | | | |
| | |
| Description | | Number of Shares | | | Value | |
| | |
Aqua America, Inc. | | | 3,600 | | | $ | 126,540 | |
| | |
| | | | | | $ | 282,384 | |
| | |
TOTAL UTILITIES | | | | | | $ | 6,462,892 | |
| | |
TOTAL COMMON STOCKS (COST $245,223,850) | | | | | | $ | 503,807,147 | |
| | |
INVESTMENT COMPANIES – 0.0%** | | | | | | | | |
| | |
EQUITY FUNDS – 0.0%** | | | 700 | | | | 103,068 | |
| | |
iShares Russell 1000 ETF | | | | | | | | |
| | |
iShares Russell 1000 Growth ETF | | | 500 | | | | 68,225 | |
| | |
iShares Russell 1000 Value ETF | | | 500 | | | | 60,170 | |
| | |
TOTAL EQUITY FUNDS | | | | | | $ | 231,463 | |
| | |
TOTAL INVESTMENT COMPANIES (COST $228,360) | | | | | | $ | 231,463 | |
| | |
RIGHTS – 0.0%** | | | | | | | | |
| | |
Celgene Corp.*,†† | | | 89 | | | | 27 | |
| | |
Community Health Systems, Inc.* | | | 3,700 | | | | 39 | |
| | |
TOTAL RIGHTS (COST $142) | | | | | | $ | 66 | |
| | |
WARRANT – 0.0%** | | | | | | | | |
| | |
American International Group, Inc. CW21, Expire 1/19/21* | | | 2,055 | | | | 35,572 | |
| | |
TOTAL WARRANT (COST $34,935) | | | | | | $ | 35,572 | |
| | |
TOTAL INVESTMENTS IN SECURITIES – 100.0% (COST $245,487,287) | | | | | | $ | 504,074,248 | |
| | |
| | | Par Value | | | | |
|
CASH COLLATERAL INVESTED FOR SECURITIES ON LOAN –1.1% | |
| |
REPURCHASE AGREEMENTS – 1.1% | | | | | |
| | |
BNP Paribas SA, 1.72%, dated 4/30/18, due 5/01/18, repurchase price $1,040,181, collateralized by U.S. Government & Treasury Securities, 0.00% to 9.13%, maturing 5/15/18 to 8/15/46; total market value of $1,060,934. | | $ | 1,040,131 | | | $ | 1,040,131 | |
| | |
Daiwa Capital Markets America, 1.72%, dated 4/30/18, due 5/01/18, repurchase price $1,040,181, collateralized by U.S. Government & Treasury Securities, 0.00% to 9.13%, maturing 5/15/18 to 12/01/51; total market value of $1,060,934. | | | 1,040,131 | | | | 1,040,131 | |
| | |
JP Morgan Securities LLC, 1.71%, dated 4/30/18, due 5/01/18, repurchase price $413,317, collateralized by U.S. Treasury Securities, 1.13% to 2.25%, maturing 1/31/19 to 1/31/24; total market value of $421,564. | | | 413,297 | | | | 413,297 | |
| | | | | | | | |
| | |
| Description | | Par Value | | | Value | |
| | |
Nomura Securities International, Inc., 1.74%, dated 4/30/18, due 5/01/18, repurchase price $1,040,181, collateralized by U.S. Government Securities, 0.00% to 10.50%, maturing 5/01/18 to 3/20/68; total market value of $1,060,933. | | $ | 1,040,131 | | | $ | 1,040,131 | |
| | |
RBC Dominion Securities, Inc., 1.72%, dated 4/30/18, due 5/01/18, repurchase price $1,040,181, collateralized by U.S. Government & Treasury Securities, 0.13% to 7.00%, maturing 10/31/18 to 9/09/49; total market value of $1,060,934. | | | 1,040,131 | | | | 1,040,131 | |
| | |
TD Securities, Inc., 1.74%, dated 4/30/18, due 5/01/18, repurchase price $1,040,181, collateralized by U.S. Government Securities, 4.00% to 4.50%, maturing 3/01/47 to 3/01/48; total market value of $1,060,933. | | | 1,040,131 | | | | 1,040,131 | |
| |
TOTAL CASH COLLATERAL INVESTED FOR SECURITIES ON LOAN (COST $5,613,952) | | | $ | 5,613,952 | |
| |
TOTAL INVESTMENTS – 101.1% (COST $251,101,239) | | | $ | 509,688,200 | |
| |
COLLATERAL FOR SECURITIES ON LOAN – (1.1%) | | | | (5,613,952 | ) |
| |
OTHER LIABILITIES LESS ASSETS – 0.0%** | | | | (60,508 | ) |
| |
TOTAL NET ASSETS – 100.0% | | | $ | 504,013,740 | |
| | | | | | | | |
April 30, 2018 / ANNUAL REPORT
| | |
PORTFOLIO OF INVESTMENTS | | 16 |
Wilmington Large-Cap Strategy Fund (concluded)
Cost of investments for Federal income tax purposes is $260,679,175. The net unrealized appreciation/(depreciation) of investments was $249,009,025. This consists of net unrealized appreciation from investment for those securities having an excess of value over cost of $252,526,597 and net unrealized depreciation from investments for those securities having an excess of cost over value of $(3,517,572).
Various inputs are used in determining the value of the Fund’s investments. These inputs are summarized in the three broad levels listed below.
Level 1 – quoted prices in active markets for identical securities
Level 2 – other significant observable inputs (including quoted prices for similar securities, interest rates, prepayment speeds, credit risk, etc.)
Level 3 – significant unobservable inputs (including the Fund’s own assumptions in determining the fair value of investments)
The following is a summary of the inputs used as of April 30, 2018 in valuing the Fund’s assets carried at fair value:
| | | | | | | | | | | | | | | | |
| | | | |
| | | Level 1 | | | Level 2 | | | Level 3 | | | Total | |
| | | | |
Investments in Securities | | | | | | | | | | | | | | | | |
| | | | |
Common Stocks | | $ | 503,807,147 | | | $ | — | | | $ | — | | | $ | 503,807,147 | |
| | | | |
Investment Companies | | | 231,463 | | | | — | | | | — | | | | 231,463 | |
| | | | |
Rights | | | — | | | | 66 | | | | — | | | | 66 | |
| | | | |
Warrant | | | — | | | | 35,572 | | | | — | | | | 35,572 | |
| | | | |
Repurchase Agreements | | | — | | | | 5,613,952 | | | | — | | | | 5,613,952 | |
| | | | | | | | | | | | | | | | |
| | | | |
Total | | $ | 504,038,610 | | | $ | 5,649,590 | | | $ | — | | | $ | 509,688,200 | |
| | | | | | | | | | | | | | | | |
| # | Security, or a portion thereof, is on loan. See Note 2 in Notes to Financial Statements. |
| †† | Security is fair valued in accordance with procedures adopted by the Board of Trustees. See Note 2 in Notes to Financial Statements. At April 30, 2018, the value of these securities amounted to $27 representing 0.00% of total net assets. |
| * | Non-income producing security. |
| ** | Represents less than 0.05%. |
| § | Affiliated company. See Note 4 in Notes to Financial Statements. |
| | |
The following acronyms are used throughout this Fund: |
ADR | | American Depositary Receipt |
ETF | | Exchange Traded Fund |
LP | | Limited Partnership |
PLC | | Public Limited Company |
See Notes which are an integral part of the Financial Statements
ANNUAL REPORT / April 30, 2018
| | |
| 17 | | STATEMENT OF ASSETS AND LIABILITIES |
| | | | | | | | |
| | | |
| April 30, 2018 | | | |
| Wilmington
Large-Cap
Strategy Fund |
| | |
ASSETS: | | | | | | | | |
Investments, at identified cost | | | | $ | 251,101,239 | (a) | | |
| | | | | | | | |
Investments in repurchase agreements, at value | | | | $ | 5,613,952 | | | |
Investments in securities, at value (Including $5,477,079 of securities on loan) (Note 2) | | | | | 504,074,248 | (b) | | |
| | | | | | | | |
| | | |
TOTAL INVESTMENTS IN SECURITIES AND REPURCHASE AGREEMENTS | | | | | 509,688,200 | | | |
| | | | | | | | |
Income receivable | | | | | 404,542 | | | |
Receivable for shares sold | | | | | 292,608 | | | |
Receivable for investments sold | | | | | 489,474 | | | |
Prepaid assets | | | | | 18,337 | | | |
| | | | | | | | |
| | | |
TOTAL ASSETS | | | | | 510,893,161 | | | |
| | | | | | | | |
LIABILITIES: | | | | | | | | |
Overdraft due to custodian | | | | | 706,600 | | | |
Collateral for securities on loan | | | | | 5,613,952 | | | |
Payable for shares redeemed | | | | | 291,334 | | | |
Payable for Trustees’ fees | | | | | 6,410 | | | |
Other accrued expenses | | | | | 261,125 | | | |
| | | | | | | | |
| | | |
TOTAL LIABILITIES | | | | | 6,879,421 | | | |
| | | | | | | | |
NET ASSETS | | | | $ | 504,013,740 | | | |
| | | | | | | | |
NET ASSETS CONSIST OF: | | | | | | | | |
Paid-in capital | | | | $ | 245,915,631 | | | |
Undistributed net investment income | | | | | 634,043 | | | |
Accumulated net realized gain (loss) on investments | | | | | (1,122,895 | ) | | |
Net unrealized appreciation (depreciation) of investments | | | | | 258,586,961 | | | |
| | | | | | | | |
| | | |
TOTAL NET ASSETS | | | | $ | 504,013,740 | | | |
| | | | | | | | |
COMPUTATION OF NET ASSET VALUE AND OFFERING PRICE: | | | | | | | | |
Class I | | | | | | | | |
Net Assets | | | | $ | 504,013,740 | | | |
| | | | | | | | |
Shares outstanding (unlimited shares authorized) | | | | | 22,933,028 | | | |
| | | | | | | | |
Net Asset Value per share | | | | $ | 21.98 | | | |
| | | | | | | | |
| (a) | Includes $127,293 of investments in affiliated issuers. |
| (b) | Includes $293,455 of investments in affiliated issuers. |
See Notes which are an integral part of the Financial Statements
April 30, 2018 / ANNUAL REPORT
| | |
| STATEMENTS OF OPERATIONS | | 18 |
| | | | | | | | | |
| | | |
| Year Ended April 30, 2018 | | | | Wilmington Large-Cap Strategy Fund | | |
INVESTMENT INCOME: | | | | | | | | | |
Dividends | | | | | $ | 10,078,546 | (a)(b) | | |
Securities lending income | | | | | | 45,367 | | | |
| | | | | | | | | |
| | | |
TOTAL INVESTMENT INCOME | | | | | | 10,123,913 | | | |
| | | | | | | | | |
EXPENSES: | | | | | | | | | |
Investment advisory fee | | | | | | 2,710,747 | | | |
Administrative personnel and services fees | | | | | | 176,015 | | | |
Portfolio accounting and administration fees | | | | | | 144,088 | | | |
Custodian fees | | | | | | 62,283 | | | |
Transfer and dividend disbursing agent fees and expenses | | | | | | 113,118 | | | |
Trustees’ fees | | | | | | 62,231 | | | |
Professional fees | | | | | | 94,674 | | | |
Shareholder services fee— Class I | | | | | | 1,355,370 | | | |
Share registration costs | | | | | | 20,506 | | | |
Printing and postage | | | | | | 27,228 | | | |
Miscellaneous | | | | | | 113,607 | | | |
| | | | | | | | | |
| | | |
TOTAL EXPENSES | | | | | | 4,879,867 | | | |
| | | | | | | | | |
WAIVERS AND REIMBURSEMENTS: | | | | | | | | | |
Waiver/reimbursement by investment advisor | | | | | | (2,169,123 | ) | | |
Waiver of shareholder services fee—Class I | | | | | | (1,355,370 | ) | | |
| | | | | | | | | |
TOTAL WAIVERS AND REIMBURSEMENTS | | | | | | (3,524,493 | ) | | |
| | | | | | | | | |
Net expenses | | | | | | 1,355,374 | | | |
| | | | | | | | | |
Net investment income | | | | | | 8,768,539 | | | |
| | | | | | | | | |
REALIZED AND UNREALIZED GAIN (LOSS) ON INVESTMENTS: | | | | | | | | | |
Net realized gain (loss) on investments | | | | | | 25,914,532 | | | |
Net realized gain (loss) on foreign currency transactions | | | | | | 13 | | | |
Net change in unrealized appreciation (depreciation) of unaffiliated investments | | | | | | 36,272,016 | | | |
Net change in unrealized appreciation (depreciation) of affiliated investments | | | | | | 43,245 | | | |
| | | | | | | | | |
Net realized and unrealized gain (loss) on investments | | | | | | 62,229,806 | | | |
| | | | | | | | | |
Litigation Settlement (See Note 7) | | | | | | (18,572 | ) | | |
| | | | | | | | | |
Change in net assets resulting from operations | | | | | $ | 70,979,773 | | | |
| | | | | | | | | |
| (a) | Net of foreign withholding taxes withheld of $935. |
| (b) | Includes $4,830 received from affiliated issuers. |
See Notes which are an integral part of the Financial Statements
ANNUAL REPORT / April 30, 2018
| | |
| 19 | | STATEMENTS OF CHANGES IN NET ASSETS |
| | | | | | | | |
| |
| | | Wilmington
Large-Cap
Strategy Fund | |
| | |
| | | Year Ended April 30, 2018 | | | Year Ended April 30, 2017 | |
OPERATIONS: | | | | | | | | |
Net investment income | | $ | 8,768,539 | | | $ | 9,822,315 | |
Net realized gain (loss) on investments(a) | | | 25,895,973 | | | | 7,868,520 | |
Net change in unrealized appreciation (depreciation) of investments | | | 36,315,261 | | | | 76,903,218 | |
| | | | | | | | |
Change in net assets resulting from operations | | | 70,979,773 | | | | 94,594,053 | |
| | | | | | | | |
DISTRIBUTIONS TO SHAREHOLDERS: | | | | | | | | |
Distributions from net investment income | | | | | | | | |
Class I | | | (8,955,957 | ) | | | (10,065,232 | ) |
| | | | | | | | |
Change in net assets resulting from distributions to shareholders | | | (8,955,957 | ) | | | (10,065,232 | ) |
| | | | | | | | |
SHARE TRANSACTIONS: | | | | | | | | |
Proceeds from sale of shares | | | | | | | | |
Class I | | | 45,755,311 | | | | 80,203,786 | |
Distributions reinvested | | | | | | | | |
Class I | | | 2,208,114 | | | | 2,699,521 | |
Cost of shares redeemed | | | | | | | | |
Class I | | | (160,783,455 | ) | | | (219,530,415 | ) |
| | | | | | | | |
Change in net assets resulting from share transactions | | | (112,820,030 | ) | | | (136,627,108 | ) |
| | | | | | | | |
Change in net assets | | | (50,796,214 | ) | | | (52,098,287 | ) |
NET ASSETS: | | | | | | | | |
Beginning of year | | | 554,809,954 | | | | 606,908,241 | |
| | | | | | | | |
End of year | | $ | 504,013,740 | | | $ | 554,809,954 | |
| | | | | | | | |
Undistributed (accumulated) net investment income (loss) included in net assets at end of year | | $ | 634,043 | | | $ | 840,558 | |
| | | | | | | | |
SHARES OF BENEFICIAL INTEREST: | | | | | | | | |
Shares sold | | | | | | | | |
Class I | | | 2,130,793 | | | | 4,452,169 | |
Distributions reinvested | | | | | | | | |
Class I | | | 104,251 | | | | 149,601 | |
Shares redeemed | | | | | | | | |
Class I | | | (7,531,999 | ) | | | (12,258,584 | ) |
| | | | | | | | |
Net change resulting from share transactions | | | (5,296,955 | ) | | | (7,656,814 | ) |
| | | | | | | | |
| | | | | | | | |
| (a) | Includes Litigation settlement (See Note 7) |
See Notes which are an integral part of the Financial Statements
April 30, 2018 / ANNUAL REPORT
For a share outstanding throughout each year ended April 30, unless otherwise noted:
|
| WILMINGTON LARGE-CAP STRATEGY FUND |
| | | | | | | | | | | | | | | | | | | | | | | | | |
| CLASS I | | Year Ended April 30, 2018 | | Year Ended April 30, 2017 | | Year Ended April 30, 2016 | | Year Ended April 30, 2015 | | Year Ended April 30, 2014 |
Net Asset Value, Beginning of Year | | | | $19.65 | | | | | $16.91 | | | | | $18.46 | | | | | $17.27 | | | | | $14.63 | |
Income (Loss) From Operations: | | | | | | | | | | | | | | | | | | | | | | | | | |
Net Investment Income(a) | | | | 0.34 | | | | | 0.32 | | | | | 0.29 | | | | | 0.28 | | | | | 0.27 | |
Net Realized and Unrealized Gain (Loss) on Investments | | | | 2.34 | (b) | | | | 2.75 | | | | | (0.42 | ) | | | | 2.19 | | | | | 2.65 | |
| | | | | |
Total Income (Loss) From Operations | | | | 2.68 | | | | | 3.07 | | | | | (0.13 | ) | | | | 2.47 | | | | | 2.92 | |
| | | | | |
Less Distributions From: | | | | | | | | | | | | | | | | | | | | | | | | | |
Net Investment Income | | | | (0.35 | ) | | | | (0.33 | ) | | | | (0.28 | ) | | | | (0.27 | ) | | | | (0.28 | ) |
Net Realized Gains | | | | — | | | | | — | | | | �� | (1.14 | ) | | | | (1.01 | ) | | | | — | |
| | | | | |
Total Distributions | | | | (0.35 | ) | | | | (0.33 | ) | | | | (1.42 | ) | | | | (1.28 | ) | | | | (0.28 | ) |
| | | | | |
Net Asset Value, End of Year | | | | $21.98 | | | | | $19.65 | | | | | $16.91 | | | | | $18.46 | | | | | $17.27 | |
| | | | | |
Total Return | | | | 13.71 | %(b) | | | | 18.32 | % | | | | (0.87 | )% | | | | 14.52 | % | | | | 20.12 | % |
Net Assets, End of Year (000’s) | | | | $504,014 | | | | | $554,810 | | | | | $606,908 | | | | | $468,978 | | | | | $397,407 | |
Ratios to Average Net Assets | | | | | | | | | | | | | | | | | | | | | | | | | |
Gross Expense | | | | 0.90 | % | | | | 0.90 | % | | | | 0.89 | % | | | | 0.86 | % | | | | 0.87 | % |
Net Expenses(c) | | | | 0.25 | % | | | | 0.25 | % | | | | 0.25 | % | | | | 0.25 | % | | | | 0.25 | % |
Net Investment Income | | | | 1.62 | % | | | | 1.75 | % | | | | 1.68 | % | | | | 1.52 | % | | | | 1.71 | % |
Portfolio Turnover Rate | | | | 15 | % | | | | 18 | % | | | | 81 | % | | | | 15 | % | | | | 29 | % |
| (a) | Per share numbers have been calculated using the average shares method. |
| (b) | Amount includes a non-recurring settlement paid by the Fund related to Legal Proceedings (Note 7). The settlement payment impacted the realized (loss) per share by $0.00 for Class I. Total return was not impacted. |
| (c) | The investment advisor and other service providers waived or reimbursed a portion of their fees. |
See Notes which are an integral part of the Financial Statements
ANNUAL REPORT / April 30, 2018
| | |
| 21 | | NOTES TO FINANCIAL STATEMENTS |
Wilmington Funds
April 30, 2018
Wilmington Funds (the “Trust”) is registered under the Investment Company Act of 1940, as amended (the “Act”), as an open-end management investment company. The Trust consists of 12 portfolios, 1 of which is presented herein (referred to as the “Fund”). The remaining 11 funds are presented in separate reports.
| | |
| |
| Fund | | Investment Goal |
Wilmington Large-Cap Strategy Fund (“Large-Cap Strategy Fund”)(d) | | The Fund seeks to achieve long-term capital appreciation. |
(d) Diversified
The Trust offers 6 classes of shares: Class A, Service Class, Select Class, Administrative Class, Class I and Institutional Class. Class A, Service Class, Select Class, Administrative Class and Institutional Class are not available for the Fund. All shares of the Trust have equal rights with respect to voting, except on class-specific matters.
The assets of each portfolio are segregated and a shareholder’s interest is limited to the portfolio in which shares are held.
In the normal course of business, the Fund may enter into contracts that provide general indemnifications. The Fund’s maximum exposure under these arrangements is dependent on claims that may be made against the Fund in the future, and, therefore, cannot be estimated; however, based on experience, the risk of material loss from such claims is considered remote.
| 2. | SUMMARY OF SIGNIFICANT ACCOUNTING POLICIES |
The following is a summary of significant accounting policies consistently followed by the Fund in the preparation of its financial statements. These policies are in conformity with U.S. generally accepted accounting principles (“GAAP”). The Trust is an investment company and follows accounting and reporting guidance under Financial Accounting Standards Board (“FASB”) Accounting Standards Codification (“ASC”) Topic 946, “Financial Services - Investment Companies.” The preparation of financial statements in conformity with GAAP requires management to make estimates and assumptions that affect the amounts of assets, liabilities, expenses and revenues reported in the financial statements. Actual results could differ from those estimated.
Investment Valuation – The Fund utilizes a fair value approach. The fair value of the Fund’s portfolio securities are determined as follows:
| | • | | for equity securities, according to the last sale price or official closing price reported in the market in which they are primarily traded (either a national securities exchange or the over-the-counter market), if available; |
| | • | | in the absence of recorded sales for equity securities, according to the mean between the last closing bid and asked prices; |
| | • | | investments in open-end regulated investment companies are valued at net asset value (“NAV”); |
| | • | | for fixed income securities, according to prices as furnished by an independent pricing service, except that fixed income securities with remaining maturities of less than 60 days at the time of purchase are valued at amortized cost, provided such amount approximates fair value; and |
| | • | | for all other securities at fair value as determined in accordance with procedures established by and under the general supervision of the Trustees. |
Trading in foreign securities may be completed at times which vary from the closing of the New York Stock Exchange (“NYSE”). In computing its NAV, the Fund values foreign securities using the latest closing price on the primary exchange on which they are traded immediately prior to the closing of the NYSE. Certain foreign currency exchange rates are generally determined at the latest rate prior to the closing of the NYSE. Foreign securities quoted in foreign currencies are translated into U.S. dollars at current rates. Events that affect these values and exchange rates may occur between the times at which they are determined and the closing of the NYSE. If such events materially affect the value of portfolio securities, these securities may be valued at their fair value as determined in good faith by the Trustees, although the actual calculation may be done by others. An event is considered material if there is both an affirmative expectation that the security’s value will change in response to the event and a reasonable basis for quantifying the resulting change in value.
The Trust follows the authoritative guidance (GAAP) for fair value measurements. The guidance establishes a framework for measuring fair value and a hierarchy for inputs and techniques used in measuring fair value that maximizes the use of observable inputs and minimizes the use of unobservable inputs and techniques by requiring that the most observable inputs be used when available. The guidance establishes three tiers of inputs that may be used to measure fair value. The three tiers of inputs are summarized at the end of the Fund’s Portfolio of Investments. The inputs or techniques used for valuing securities are not necessarily an indication of the risk associated with investing in those securities.
The Fund’s policy is to disclose transfers between levels based on valuations at the beginning of the period. The Fund may hold securities which are periodically fair valued in accordance with the Fund’s fair value procedures. This may result in movements between Levels 1, 2 and 3 throughout the year. As of April 30, 2018, there were no transfers between Levels 1, 2 and 3 assets and liabilities, based on levels
April 30, 2018 / ANNUAL REPORT
| | |
| NOTES TO FINANCIAL STATEMENTS (continued) | | 22 |
assigned to securities at the beginning of the period, except for two securities, which were transferred from Level 1 to Level 2 at a valuation of $41,162 and $27, respectively, due to the application of fair value procedures necessitated by the lack of a current market quotation or sufficient volume of trading in the security. Pursuant to the Fund’s fair value procedures noted previously, equity securities (including exchange traded securities and other open-end regulated investment companies) and exchange traded derivatives are generally categorized as Level 1 securities in the fair value hierarchy. Fixed income securities, non-exchange traded derivatives and money market instruments are generally categorized as Level 2 securities in the fair value hierarchy.
Investments for which there are no such quotations, or for which quotations do not appear reliable, are valued at fair value as determined in accordance with procedures established by and under the general supervision of the Trustees. These valuations are typically categorized as Level 2 or Level 3 securities in the fair value hierarchy.
Repurchase Agreements - Repurchase agreements are transactions in which a fund buys a security from a dealer or bank and agrees to sell the security back at a mutually agreed upon time and price. The repurchase price exceeds the sale price, reflecting the Fund’s return on the transaction. It is the Fund’s policy to require the counterparty to a repurchase agreement to transfer to the Fund’s custodian or sub-custodian eligible securities or cash with a market value (after transaction costs) at least equal to the repurchase price to be paid under the repurchase agreement. The eligible securities are transferred to accounts with the custodian or sub-custodian in which the Fund holds a “securities entitlement” and exercise “control” as those terms are defined in the Uniform Commercial Code. The Fund has established procedures for monitoring the market value of the transferred securities and requiring the transfer of additional eligible securities if necessary to equal at least the repurchase price. These procedures also allow the counterparty to require securities to be transferred from the account to the extent that their market value exceeds the repurchase price or in exchange for other eligible securities of equivalent market value.
The insolvency of the counterparty or other failure to repurchase the securities may delay the disposition of the underlying securities or cause the Fund to receive less than the full repurchase price.
Repurchase agreements are entered into by the Fund under Master Repurchase Agreements (“MRA”) which permit the Fund, under certain circumstances including an event of default (such as bankruptcy or insolvency), to offset payables and/or receivables under the MRA with collateral held and/or posted to the counterparty and create one single net payment due to or from the Fund.
At April 30, 2018, the open repurchase agreements by counterparty which are subject to a MRA on a net payment basis are as follows:
| | | | | | | | | | | | | | | | |
| | | | |
| Fund/Counterparty | | Repurchase Agreements | | | Fair Value of Non-cash Collateral Received(1) | | | Cash Collateral Received(1) | | | Net Amount(2) | |
Large-Cap Strategy Fund | | | | | | | | | | | | | | | | |
BNP Paribas SA | | | $1,040,131 | | | | $1,040,131 | | | | $— | | | | $— | |
Daiwa Capital Markets America | | | 1,040,131 | | | | 1,040,131 | | | | — | | | | — | |
JP Morgan Securities LLC | | | 413,297 | | | | 413,297 | | | | — | | | | — | |
Nomura Securities International, Inc. | | | 1,040,131 | | | | 1,040,131 | | | | | | | | — | |
RBC Dominion Securities, Inc. | | | 1,040,131 | | | | 1,040,131 | | | | — | | | | — | |
TD Securities, Inc. | | | 1,040,131 | | | | 1,040,131 | | | | — | | | | — | |
| | | | |
| | | | | | | | | | | | | | | | |
| | | | |
| | | $5,613,952 | | | | $5,613,952 | | | | $— | | | | $— | |
(1)The amount of collateral reflected in the table does not include any over-collateralization received by the Fund.
(2)Net amount represents the net amount receivable due from the counterparty in the event of default.
Investment Income, Gains and Losses, Expenses and Distributions – Interest income and expenses are accrued daily. Dividends and distributions to shareholders are recorded on the ex-dividend date. Non-cash dividends included in dividend income, if any, are recorded at fair value. Foreign dividends are recorded on the ex-dividend date or when the Fund is informed of the ex-dividend date. Investment transactions are accounted for on a trade date basis for financial reporting purposes. Realized gains and losses from investment transactions are recorded on an identified cost basis.
Expenses of the Trust, which are directly identifiable to a specific fund, are applied to that fund. Expenses which are not identifiable to a specific fund are allocated in such a manner as deemed equitable, taking into consideration the nature and type of expense.
Distributions from net realized gains, if any, are declared and paid to shareholders annually. Distributions from net investment income, if any, are declared and paid quarterly.
Real Estate Investment Trusts – The Fund may invest in real estate investment trusts (“REITs”) that involve risks not associated with investing in stocks. Risks include declines in the value of real estate, general and economic conditions, changes in the value of the underlying property and defaults by borrowers. The value of assets in the real estate industry may go through cycles of relative underperformance and outperformance in comparison to equity securities markets in general. Dividend income is recorded using management’s estimate of the income included in distributions received from REIT investments. The actual amounts of income, return of capital and capital gains are only determined by each REIT after its fiscal year-end and may differ from the estimated amount. Estimates of income are adjusted to the actual amounts when the amounts are determined.
ANNUAL REPORT / April 30, 2018
| | |
| 23 | | NOTES TO FINANCIAL STATEMENTS (continued) |
Federal Taxes – It is the Fund’s policy to comply with the Subchapter M provision of the Internal Revenue Code of 1986, as amended (the “Code”), and to distribute to shareholders each year substantially all of its income. Accordingly, no provisions for Federal income tax or excise tax are necessary.
Withholding taxes and where appropriate, deferred withholding taxes, on foreign interest, dividends and capital gains have been provided for in accordance with the applicable country’s tax rules and rates.
The Fund recognizes interest and penalties, if any, related to unrecognized tax benefits as income tax expense on the Statement of Operations. During the year ended April 30, 2018, the Fund did not incur any interest or penalties.
Warrants and Rights – The Fund may hold warrants and rights acquired either through a direct purchase, including as part of private placement, or pursuant to corporate actions. Warrants and rights entitle the holder to buy a proportionate amount of common stock at a specific price and time through the expiration dates. Such warrants and rights are held as long positions by the Fund until exercised, sold or expired. Equity-linked warrants are purchased in order to own local exposure to certain countries in which the Fund is not locally registered. Warrants and rights are valued at fair value in accordance with the Trustees’ approved fair value procedures.
Lending of Portfolio Securities – The Trust has entered into an agreement with its custodian whereby the custodian may lend securities owned by the Fund to brokers, dealers and other financial organizations. Any increase or decrease in the fair value of securities loaned and any interest or dividends earned on those securities during the term of the loan would be for the account of the Fund. In exchange for lending securities under the terms of the agreement with its custodian, the Fund receives a lender’s fee. Fees earned by the Fund on securities lending are recorded as income. Loans of securities by the Fund are collateralized by cash, U.S. government securities or money market instruments that are maintained at all times in an amount at least equal to the current market value of the loaned securities plus a margin which varies depending on the type of securities owned. The custodian establishes and maintains the collateral in a segregated account. The Fund has the right under the lending agreement to recover the securities from the borrower on demand. The market value of the loaned securities is determined at the close of business of the Fund and any additional required collateral is delivered to the Fund on the next business day.
Investments purchased with cash collateral are presented on the portfolio of investments under the caption “Cash Collateral Invested for Securities on Loan.”
The Fund maintains the risk of any loss on the securities on loan as well as the potential loss on investments purchased with cash collateral received from securities lending.
Securities lending transactions are entered into by the Fund under Master Securities Lending Agreements (“MSLA”) which permit the Fund, under certain circumstances including an event of default (such as bankruptcy or insolvency), to offset amounts payable by the Fund to the same counterparty against amounts to be received and create one single net payment due to or from the Fund.
At April 30, 2018, the securities loaned which are subject to a MSLA on a net payment basis are as follows:
| | | | | | | | | | | | |
| | | |
| Fund | | Value of Securities on Loan | | | Cash Collateral Received(1) | | | Net Amount(2) | |
Large-Cap Strategy Fund | | | $5,477,079 | | | | $5,477,079 | | | | $— | |
| | | | | | | | | | | | |
(1)Collateral with a value of $5,613,952 has been received in connection with securities lending transactions.
(2)Net amount represents the net amount receivable due from the counterparty in the event of default.
| 3. | FEDERAL TAX INFORMATION |
As of April 30, 2018, there were no uncertain tax positions that would require financial statement recognition, de-recognition or disclosure. The Fund’s federal tax returns filed for the years ended 2017, 2016 and 2015, as well as the current year, remain subject to examination by the Internal Revenue Service.
The timing and character of income and capital gain distributions are determined in accordance with income tax regulations, which may differ from GAAP. These differences are due in part to losses deferred due to wash sales. GAAP requires that permanent differences in net investment income and realized gains and losses due to differences between financial reporting and tax reporting be reclassified between various components of net assets and have no effect on the net assets of the Fund nor the NAV of a class of the Fund.
For the year ended April 30, 2018, permanent differences identified and reclassified among the components of net assets were as follows:
| | | | | | |
| | | |
| Fund | | Paid-in
Capital | | Increase (Decrease) Undistributed Net Investment Income | | Accumulated Net Realized Gain (Loss) |
Large-Cap Strategy Fund | | $— | | $(19,097) | | $19,097 |
The permanent differences identified and reclassified were primarily attributable to the tax treatment of foreign currency gains/losses, adjustments related to partnerships.
The tax character of distributions for the corresponding fiscal year ends were as follows:
April 30, 2018 / ANNUAL REPORT
| | |
| NOTES TO FINANCIAL STATEMENTS (continued) | | 24 |
| | | | | | | | |
| | |
| | | 2018 | | 2017 |
| | | | |
| Fund | | Ordinary
Income* | | Long-Term Capital Gains | | Ordinary Income* | | Long-Term Capital Gains |
Large-Cap Strategy Fund | | $8,955,957 | | $— | | $10,065,232 | | $— |
* For tax purposes, short-term capital gain distributions are considered ordinary income distributions.
As of April 30, 2018, the components of distributable earnings on a tax basis were as follows:
| | | | | | | | | | | | |
| | | | | | |
| Fund | | Undistributed Ordinary Income | | Undistributed Long-Term Capital Gains | | Other Timing Differences | | Unrealized Appreciation/ (Depreciation) | | Capital Loss
Carryforwards | | Late Year Deferrals |
Large-Cap Strategy Fund | | $634,056 | | $8,455,028 | | $— | | $249,009,025 | | $— | | $— |
Under current tax regulations, capital losses on securities transactions realized after October 31 may be deferred and treated as occurring on the first day of the following fiscal year. Under the Regulated Investment Company Modernization Act of 2010, the Fund is permitted to defer taxable ordinary income losses incurred after December 31 and treat as occurring on the first day of the following fiscal year. At April 30, 2018, the Fund had no losses deferred to May 1, 2018.
The Fund utilized capital loss carryforwards as follows to offset taxable capital gains realized during the year ended April 30, 2018:
| | |
| |
| Fund | | Capital Loss Carryforwards Utilized |
Large-Cap Strategy Fund | | $15,922,203 |
| 4. | ADVISORY FEES, SERVICING FEES, AND OTHER SERVICE PROVIDERS |
Investment Advisor – Wilmington Funds Management Corporation (“WFMC” or the “Advisor”) serves as the Investment Advisor to the Fund. Wilmington Trust Investment Advisors, Inc. (“WTIA”) provides sub-advisory services to the Fund. WFMC and WTIA are wholly-owned subsidiaries of M&T Bank Corporation (“M&T”). For its services, the Fund pays WFMC an annual investment advisory fee, accrued and paid daily, based on a percentage of the Fund’s average daily net assets as described below. WFMC, not the Fund, pays WTIA for its services.
| | |
| |
| Fund | | Advisory Fee Annual Rate |
Large-Cap Strategy Fund | | 0.50% |
WFMC and the Fund’s shareholder service providers have contractually agreed to waive their fees and/or reimburse expenses so that total annual fund operating expenses paid by the Fund (not including the effects of dividends or interest on short positions, acquired fund fees and expenses, taxes, or other extraordinary expenses expressed as an annualized percentage of average daily net assets), will not exceed 0.25% for the Fund’s Class I Shares. Neither WFMC nor the Fund’s distributor will recoup previously waived fees/expenses in subsequent years.
Administrative Fees –The Bank of New York Mellon (“BNYM”) provides the Trust with fund administration services. The fees as described in the table below are a component of “Portfolio accounting and administration fees” as disclosed in the Statements of Operations. WFMC, in its role as Co-Administrator, provides the Fund with certain administrative personnel and services necessary to operate the Fund. Effective October 1, 2017, the fees as described in the table below are accrued and paid daily and are disclosed on the Statement of Operations as “Administrative personnel and services fees.”
| | | | | | |
| | |
| Administrator | | Maximum Fee | | | Average Aggregate Daily Net Assets of the Trust |
| | |
WFMC | | | 0.040% | | | on the first $5 billion |
| | |
| | | 0.030% | | | on the next $2 billion |
| | |
| | | 0.025% | | | on the next $3 billion |
| | |
| | | 0.018% | | | on assets in excess of $10 billion |
| | |
BNYM | | | 0.0175% | | | on the first $15 billion |
| | |
| | | 0.0150% | | | on the next $10 billion |
| | |
| | | 0.0125% | | | on assets in excess of $25 billion |
ANNUAL REPORT / April 30, 2018
| | |
| 25 | | NOTES TO FINANCIAL STATEMENTS (continued) |
Prior to October 1, 2017, the administrative fees were as follows:
| | | | | | |
| | |
| Administrator | | Maximum
Fee | | | Average Aggregate Daily Net Assets of the Trust |
| | |
WFMC | | | 0.040% | | | on the first $5 billion |
| | |
| | | 0.030% | | | on the next $2 billion |
| | |
| | | 0.025% | | | on the next $3 billion |
| | |
| | | 0.018% | | | on assets in excess of $10 billion |
| | |
BNYM | | | 0.0285% | | | on the first $500 million |
| | |
| | | 0.0280% | | | on the next $500 million |
| | |
| | | 0.0275% | | | on assets in excess of $1 billion |
WFMC and BNYM may voluntarily choose to waive any portion of their fee and can add, modify or terminate a voluntary wavier at any time at their sole discretion. Neither WFMC nor BNYM will recoup previously waived fees/expenses in subsequent years. For the year ended April 30, 2018, neither WFMC nor BNYM waived any administrative fees.
Shareholder Services Fee – Pursuant to a Shareholder Services Plan adopted by the Fund and administered by ALPS, the Fund may pay up to 0.25% of the average daily net assets of the Fund’s Class I shares to financial intermediaries (which may include ALPS, the Advisor or their affiliates) for providing shareholder services and maintaining shareholder accounts. M&T has entered into a Shareholders Services Agreement with ALPS, under which it is entitled to receive up to 0.25% of the average daily net assets of the Fund’s shares for whom M&T provides shareholder services. The Fund may reduce the maximum amount of shareholder service fees it pays from time to time at its sole discretion. In addition, a financial intermediary (including M&T) may waive or reduce any fees to which they are entitled. For the year ended April 30, 2018, no affiliates of the Advisor received these fees.
Other Service Providers – Foreside Management Services, LLC (“FMS”) provides a Principal Executive Officer and Principal Financial Officer to the Trust. FMS has no role in determining the investment policies or which securities are to be sold or purchased by the Trust or its Funds.
BNYM provides custody services to the Trust.
BNY Mellon Investment Servicing (U.S.) Inc. provides fund accounting and transfer agency services to the Trust.
General – Certain Officers of the Trust are also Officers or employees of the above companies that provide services to the Fund, and during their terms of office, receive no compensation from the Fund. The Trust’s Statement of Additional Information includes additional information about the Trustees.
Other Affiliated Parties and Transactions – Affiliated holdings are securities and mutual funds which are managed by the Advisor or an affiliate of the Advisor or which are distributed by an affiliate of the Funds’ distributor. Transactions with affiliated companies during the year ended April 30, 2018 are as follows:
| | | | | | | | | | | | | | | | | | | | | | | | | | | | | | | | | | | | | | | | | | | | | |
| | | | | | | | | |
Fund/ Affiliated Investment Name | | Value
4/30/17 | | Purchases | | Sales | | Net Realized Gain/(Loss) | | Net Change in Unrealized Appreciation/ Depreciation | | Value 4/30/18 | | Number of
Shares 4/30/18 | | Dividend
Income | | Capital Gain Distributions |
| | | | | | | | | |
Large-Cap Strategy Fund | | | | | | | | | | | | | | | | | | | | | | | | | | | | | | | | | | | | | | | | | | | | | |
| | | | | | | | | |
Common Stock - 0.1%* | | | | | | | | | | | | | | | | | | | | | | | | | | | | | | | | | | | | | | | | | | | | | |
| | | | | | | | | |
M&T Bank Corp. | | | | $250,210 | | | | | $— | | | | | $— | | | | | $— | | | | | $43,245 | | | | | $293,455 | | | | | 1,610 | | | | | $4,830 | | | | | $— | |
* As a percentage of Net Assets as of April 30, 2018.
The Fund may execute trades for security purchase and sale transactions through brokers that are affiliates of the Advisor or sub-advisors. Commissions paid on those trades for the year ended April 30, 2018 were as follows:
| | |
| |
| Fund | | Commissions |
Large-Cap Strategy Fund | | $58,356 |
| 5. | INVESTMENT TRANSACTIONS |
Purchases and sales of securities for the Fund (excluding U.S. Government and agency securities, and short-term securities) during the year ended April 30, 2018 were $81,370,190 and $193,609,857, respectively.
April 30, 2018 / ANNUAL REPORT
| | |
| NOTES TO FINANCIAL STATEMENTS (continued) | | 26 |
Effective April 6, 2017, the Trust is participating in a $10,000,000 unsecured, committed revolving line of credit (“LOC”) agreement with BNYM. The LOC is available for extraordinary or emergency purposes, primarily for financing redemption payments. Borrowings are charged interest at a rate of 1.25% per annum over the greater of the Federal Funds Rate or the overnight LIBOR. The LOC includes a commitment fee of 0.15% per annum on the daily unused portion. The termination date of the current LOC is April 5, 2019.
The Fund did not utilize the LOC during the year ended April 30, 2018.
The Fund is subject to claims and suits that arise from time to time in the ordinary course of business. For example, a court-appointed trustee on behalf of the unsecured creditors of Tribune Co. (the “Trustee”), together with certain individual creditors of the company (the “Individual Creditors”) filed actions against former Tribune shareholders who tendered their shares when Tribune went private in 2007 as part of a leveraged buyout (“LBO”). These cases are consolidated in a Multi-District Litigation (“MDL”) in the U.S. District Court for the Southern District of New York. There were thousands of defendants in the MDL, including the Large-Cap Strategy Fund (the “Fund”). The suits all sought the same thing: disgorgement of the amounts received by the former Tribune shareholders as part of the LBO, but by different legal theories. During the year ended April 30, 2018, Fund management accepted an offer to settle the MDL and the Fund paid $18,572 to settle the claim.
| 8. | RECENT REGULATORY UPDATES |
On October 13, 2016, the Securities and Exchange Commission (the “SEC”) adopted new rules and forms and amended existing rules and forms which are intended to modernize and enhance the reporting and disclosure of information by registered investment companies and to improve the quality of information that funds provide to investors, including modifications to Regulation S-X which would require standardized, enhanced disclosure about derivatives in investment company financial statements. The new rules also enhance disclosure regarding fund liquidity and redemption practices. The compliance dates of the modifications to Regulation S-X was August 1, 2017 and other amendments and rules are generally June 1, 2018 and December 1, 2018. The financial statements presented are in compliance with the most recent Regulation S-X amendments.
Management has evaluated events and transactions for potential recognition or disclosure in the financial statements through the date the financial statements were issued. Management has determined that there are no additional material events that would require recognition or disclosure in the Fund’s financial statements through this date.
| 10. | FEDERAL TAX INFORMATION (UNAUDITED) |
Complete information regarding the tax status of distributions will be reported on Forms 1099.
Of the ordinary income (including short-term capital gain) distributions made by the Fund during the fiscal year ended April 30, 2018, the Fund designates the following percentage, or such greater percentage that constitute the maximum amount allowable pursuant to Code Sections Section 243 and 854(b)(2), as qualifying for the corporate dividends received deduction:
| | | | |
| |
| Fund | | | |
Large-Cap Strategy Fund | | | 99.78% | |
For the fiscal year ended April 30, 2018, the Fund designates the following percentage of the ordinary income dividends, or such greater percentage that constitute the maximum amount allowable pursuant to Code Sections 1(h)(11) and 854(b)(2), as qualified dividend income which may be subject to a maximum rate of federal income tax of 15%:
| | | | |
| |
| Fund | | | |
Large-Cap Strategy Fund | | | 100.00% | |
If the Fund meets the requirements of Section 853 of the Code, the Fund will pass through to shareholders credits of foreign taxes paid.
ANNUAL REPORT / April 30, 2018
REPORT OF INDEPENDENT REGISTERED PUBLIC ACCOUNTING FIRM
TO THE SHAREHOLDERS OF WILMINGTON LARGE-CAP STRATEGY FUND AND THE BOARD OF TRUSTEES OF WILMINGTON FUNDS
Opinion on the Financial Statements
We have audited the accompanying statement of assets and liabilities of the Wilmington Large-Cap Strategy Fund (the “Fund”) (one of the funds constituting the Wilmington Funds (the “Trust”)), including the portfolio of investments, as of April 30, 2018, and the related statement of operations for the year then ended, the statements of changes in net assets for each of the two years in the period then ended, the financial highlights for each of the five years in the period then ended and the related notes (collectively referred to as the “financial statements”). In our opinion, the financial statements present fairly, in all material respects, the financial position of the Fund (one of the funds constituting the Wilmington Funds) at April 30, 2018, the results of its operations for the year then ended, the changes in its net assets for each of the two years in the period then ended and its financial highlights for each of the five years in the period then ended, in conformity with U.S. generally accepted accounting principles.
Basis for Opinion
These financial statements are the responsibility of the Trust’s management. Our responsibility is to express an opinion on the Fund’s financial statements based on our audits. We are a public accounting firm registered with the Public Company Accounting Oversight Board (United States) (“PCAOB”) and are required to be independent with respect to the Trust in accordance with the U.S. federal securities laws and the applicable rules and regulations of the Securities and Exchange Commission and the PCAOB.
We conducted our audits in accordance with the standards of the PCAOB. Those standards require that we plan and perform the audit to obtain reasonable assurance about whether the financial statements are free of material misstatement, whether due to error or fraud. The Trust is not required to have, nor were we engaged to perform, an audit of the Trust’s internal control over financial reporting. As part of our audits, we are required to obtain an understanding of internal control over financial reporting but not for the purpose of expressing an opinion on the effectiveness of the Trust’s internal control over financial reporting. Accordingly, we express no such opinion.
Our audits included performing procedures to assess the risks of material misstatement of the financial statements, whether due to error or fraud, and performing procedures that respond to those risks. Such procedures included examining, on a test basis, evidence regarding the amounts and disclosures in the financial statements. Our procedures included confirmation of securities owned as of April 30, 2018, by correspondence with the custodian and brokers or by other appropriate auditing procedures where replies from brokers were not received. Our audits also included evaluating the accounting principles used and significant estimates made by management, as well as evaluating the overall presentation of the financial statements. We believe that our audits provide a reasonable basis for our opinion.

We have served as the auditor of one or more Wilmington Funds’ investment companies since 1986.
Philadelphia, Pennsylvania
June 27, 2018
April 30, 2018 / ANNUAL REPORT
| | |
| BOARD OF TRUSTEES AND TRUST OFFICERS | | 28 |
BOARD OF TRUSTEES AND TRUST OFFICERS
The following tables give information about each Trustee and the senior officers of the Trust. The tables separately list Trustee members who are “interested persons” of the Fund (i.e., “Interested” Trustees) and those who are not (i.e., “Independent” Trustees). The Trust is comprised of 12 funds. Unless otherwise noted, the business address of each Trustee and senior officer is 111 South Calvert Street, 26th floor, Baltimore, Maryland 21202. Each Trustee oversees all portfolios of the Trust and serves for an indefinite term. The Trust’s Statement of Additional Information includes additional information about the Trustees and is available, without charge and upon request, by calling 1-800-836-2211.
INTERESTED TRUSTEES BACKGROUND
| | |
| |
Name Address Birth Year Position With Trust Date Service Began | | Principal Occupations and Other Directorships Held for Past Five Years |
| |
Donald E. Foley* Birth year: 1951 TRUSTEE Began serving: December 2015 | | Principal Occupations: Director, BioSig Technologies (2015 to present); Director, AXA Equitable’s VIP Mutual Funds (2017 to present); Director, AXA Equitable (variable annuity) (2013 to present); Director, 1290 Mutual Funds (retail funds) (2013 to present); and Chairman and Director, Burke Rehabilitation Hospital Foundation (private hospital, research institute) (2005 to present). |
| |
| | Other Directorships Held: Director, M&T Bank Corporation (commercial bank) (2011 to 2012); Chairman and Director, Wilmington Trust Corporation (commercial and trust bank) (2007 to 2011); Chairman, Director and President’s Council, Union College (private college) (2011 to 2015). |
| |
| | | Previous Positions: Advisory Member, Trust and Investment Committee, M&T Bank, Wilmington Trust, National Association, and Wilmington Trust Company (through 2016); Director of M&T Bank Corporation and M&T Bank (2011 to 2012); Chairman and Chief Executive Officer of Wilmington Trust Corporation (2010 to 2011); Senior Vice President and Treasurer at ITT Corporation (1996 to 2010); Assistant Treasurer at International Paper (1989 to 1996). |
| |
Christopher D. Randall* Birth year: 1965 TRUSTEE Began serving: September 2015 PRESIDENT Began serving: September 2014 | | Principal Occupations: Senior Vice President, Wilmington Trust Corporation (2015 to present); Chief Operating Officer, Wilmington Trust Corporation (2012 to present); Senior Vice President, M&T Bank. Other Directorships Held: Trustee, Hilbert College (2015 to present). Previous Positions: President, Wilmington Retirement (2012 to 2015); President and Chief Executive Officer of Wilmington Trust Investment Advisors, Inc. and President of Wilmington Trust Investment Management, LLC (2014-2015); President, Mid-Atlantic Region Wealth Advisory Services, M&T Bank (2011 to 2013) |
|
|
|
| * | Christopher D. Randall is “interested” due to the positions he currently holds with the Funds, Wilmington Trust’s Wealth and Institutional Services Division, M&T Bank, the parent of the Fund’s Advisor, and previous positions held with WTIA and WFMC. Donald E. Foley is “interested” due to the positions he previously held with Wilmington Trust Corporation, M&T Bank Corporation and M&T Bank, the parent of the Fund’s Advisor. |
ANNUAL REPORT / April 30, 2018 (unaudited)
| | |
| 29 | | BOARD OF TRUSTEES AND TRUST OFFICERS |
INDEPENDENT TRUSTEES BACKGROUND
| | |
| |
Name Birth Year Position with Trust Date Service Began | | Principal Occupations and Other Directorships Held for Past Five Years |
| |
Nicholas A. Giordano Birth year: 1943 CHAIRMAN and TRUSTEE Began serving: March 2012 | | Principal Occupations: Consultant, financial services organizations (1997 to present). Other Directorships Held: Kalmar Pooled Investment Trust (through 6/17); The RBB Fund Inc. (19 portfolios) (registered investment companies); Independence Blue Cross; IntriCon Corporation (body-worn products) Previous Positions: Interim President, LaSalle University (1998 to 1999); President and Chief Executive Officer, Philadelphia Stock Exchange (1981 to 1997). |
| |
Robert H. Arnold Birth year: 1944 TRUSTEE Began serving: March 2012 | | Principal Occupations: Managing Director, R.H. Arnold & Co, Inc. (financial management consulting) (6/89 to present). Other Directorships Held: Trustee, First Potomac Realty Trust (real estate investment trust) (5/03 to present); Director, Treasury Strategies, Inc. (private treasury consulting services) (6/01 to 6/16). |
| |
Gregory P. Chandler Birth year: 1966 TRUSTEE Began serving: July 2017 | | Principal Occupations: Chief Financial Officer Emtec, Inc. (information technology services) (4/09 to present); President, GCVC Consulting (corporate governance consulting) (2008 to present). Other Directorships Held: Trustee, RBB Fund Series Trust (19 portfolios) (registered investment companies) (2012 to present); Director, Emtec, Inc. (8/2005 to present); Director, FS Investment Corporation (business development company) (2007 to present); Trustee, FS Energy Partners (business development company) (2009 to present). Previous Positions: Managing Director, Head of Business Services and IT Services Practice, Janney Montgomery Scott LLC (investment banking/brokerage) (2003 to 2009). |
| |
John S. Cramer Birth year: 1942 TRUSTEE Began serving: December 2000 | | Principal Occupations: Retired. Other Directorships Held: Chairman and Director, CI Supply Corp. (medical supplies and equipment) (1/14 to 1/15); Director, Check Med Corp. (medical supplies and equipment) (6/08 to 1/14); Director, Highmark Blue Shield (health insurance) (2/01 to 6/10). Previous Positions: Consultant, Yaffe & Co. (compensation consultants) (6/02 to 6/12); President and Chief Executive Officer, Pinnacle Health Systems (nonprofit hospital and health care system in Central Pennsylvania) (through 2012). |
| |
Daniel R. Gernatt, Jr. Birth year: 1940 TRUSTEE Began serving: February 1988 | | Principal Occupations: President and CEO, Gernatt Asphalt Products, Inc. (asphalt, sand and gravel products) (1979 to present). Other Directorships Held: Director, Roswell Park Alliance (2008 to 2016); Trustee, Gernatt Family Foundation. |
| |
Richard B. Seidel Birth year: 1941 TRUSTEE Began serving: September 2003 | | Principal Occupations: Chairman, Seidel & Associates (legal consulting) (1/14 to present); Chairman, Girard Private Investment Group (registered investment adviser) (1/14 to present). Other Directorships Held: Director, Tristate Capital Holdings (9/07 to present). Previous Positions: Chairman, Girard Capital (broker-dealer) (1/10 to 2016); Chairman, Girard Partners, Ltd. (1/10 to 2016). |
April 30, 2018 (unaudited) / ANNUAL REPORT
| | |
| BOARD OF TRUSTEES AND TRUST OFFICERS | | 30 |
OFFICERS
| | |
| |
Name Address Birth Year Positions with Trust | | Principal Occupations for Past Five Years and Previous Positions |
| |
Jeffrey M. Seling Birth year: 1970 ASSISTANT TREASURER Began serving: June 2013 VICE PRESIDENT Began serving: June 2007 | | Principal Occupations: Administrative Vice President, M&T Bank and Wilmington Trust Investment Advisors, Inc.; Assistant Treasurer, Wilmington Funds. Previous Positions: Vice President, MSD&T; Assistant Vice President, Wells Fargo Bank; Assistant Vice President, JP Morgan Chase Bank. |
| |
John C. McDonnell Birth year: 1966 CHIEF OPERATIONS OFFICER Began serving: June 2017 | | Principal Occupations: Chief Operations Officer, Wilmington Funds and Wilmington Trust Investment Advisors, Inc.; Vice President, Wilmington Funds Management Corporation (2005 to present); Vice President, Wilmington Trust Investment Advisors, Inc. (2012 to present). Previous Positions: Vice President, Wilmington Trust Investment Management, LLC (2005 to 2012); Audit Senior, Deloitte LLP (2004 to 2005); Assistant Vice President, 1838 Investment Advisors, LP (1999 to 2004). |
| |
Lisa Druelinger Birth year: 1978 CHIEF COMPLIANCE OFFICER and AML COMPLIANCE OFFICER. Began serving: November 2017 | | Principal Occupations: Chief Compliance Officer and Anti-Money Laundering Officer, Wilmington Funds; Vice President, M&T Bank. Previous Positions: Vice President and Senior Compliance Officer, Wilmington Trust Investment Advisors, Inc. (2015-2017); Wilmington Funds Product Manager, Wilmington Trust Investment Advisors, Inc. (2013-2015); Institutional and Retirement Services Product Manager, Wilmington Trust (2011-2013); Trust Compliance and Risk Management at M&T Bank (2006- 2011). |
| |
John J. Kelley Birth year: 1959 VICE PRESIDENT Began serving: December 2016 | | Principal Occupations: President, Wilmington Funds Management Corporation; Group Vice President and Chief Administrative Officer, Wilmington Trust Investment Advisors, Inc. Previous Positions: Vice President, BNY Mellon Investment Servicing (formerly PNC Global Investment Servicing), (1/05 to 7/05); Vice President of Administration, 1838 Investment Advisors, LP (1999 to 2005); Chief Compliance Officer, 1838 Investment Advisors, LP (2004 to 2005). |
| |
Ralph V. Partlow, III 25 South Charles Street, 22nd floor Baltimore, MD 21201 Birth year: 1957 VICE PRESIDENT Began serving: June 2010 | | Principal Occupation: Administrative Vice President and Deputy General Counsel, M&T Bank (2003 to present). Previous Positions: Vice President and Senior Counsel, Allfirst Bank (1995 to 2003). |
| |
Christopher W. Roleke 10 High Street, Suite 302 Boston, MA 02110 Birth year: 1972 CHIEF FINANCIAL OFFICER AND TREASURER Began serving: July 2013 | | Principal Occupation: Managing Director and Fund Principal Financial Officer, Foreside Management Services, LLC (2011 to present). Previous Positions: Assistant Vice President, JP Morgan Investor Services Co. (2006 to 2011). |
| |
Lisa R. Grosswirth Atlantic Terminal Office Tower, 2 Hanson Place, 12th Floor Brooklyn, NY 11217 Birth year: 1963 SECRETARY Began serving: September 2007 | | Principal Occupation: Vice President, BNY Mellon Asset Servicing (2004 to present). Previous Positions: Supervisory Paralegal, The Dreyfus Corporation (1998 to 2004). |
ANNUAL REPORT / April 30, 2018 (unaudited)
| | |
| 31 | | BOARD OF TRUSTEES AND TRUST OFFICERS |
| | |
| |
Name Address Birth Year Positions with Trust | | Principal Occupations for Past Five Years and Previous Positions |
| |
Richard J. Berthy Three Canal Plaza, Suite 100 Portland, ME 04101 Birth year: 1958 CHIEF EXECUTIVE OFFICER Began serving: September 2007 | | Principal Occupation: Chief Executive Officer, Foreside Financial Group, LLC (2012 to present). Previous Positions: President, Foreside Financial Group, LLC (2008 to 2012); Chief Administrative Officer, Foreside Financial Group, LLC (2005 to 2008); President and Secretary, Bainbridge Capital Management, LLC (2003 to 2006); Vice President, Bainbridge Capital Management (2002 to 2004). |
April 30, 2018 (unaudited) / ANNUAL REPORT
Shares of the Wilmington Funds are not FDIC insured or otherwise protected by the U.S. government, are not deposits or other obligations of, or guaranteed by, Manufacturers and Traders Trust Company, and are subject to investment risks, including possible loss of the principal amount invested.
VOTING PROXIES ON FUND PORTFOLIO SECURITIES
A description of the policies and procedures that the Funds use to determine how to vote proxies relating to securities held in the Funds’ portfolios is available, without charge and upon request, by calling 1-800-836-2211. A report on how the Funds voted any such proxies during the most recent 12-month period ended June 30 is available through Wilmington Funds’ website. Go to www.wilmingtonfunds.com select “Proxy Voting Record” to access the link. This information is also available from the Edgar database on the SEC’s website at www.sec.gov.
QUARTERLY PORTFOLIO SCHEDULE
The Funds file with the SEC a complete schedule of their portfolio holdings, as of the close of the first and third quarters of their fiscal year, on Form N-Q. These filings are available on the SEC’s website at www.sec.gov and may be reviewed and copied at the SEC’s Public Reference Room in Washington DC. (Call 1-800-SEC-0330 for information on the operation of the Public Reference Room.)
Electronic Delivery
Wilmington Funds encourages you to sign up for electronic delivery of investor materials. By doing so you will receive information faster, help lower shareholder costs, and reduce the impact to the environment. To enroll in electronic delivery:
| | 1.) | Go to www.wilmingtonfunds.com and select “Individual Investors” |
| | 2.) | Click on the link “Sign up for Electronic Delivery” |
| | 3.) | Login to your account or create new user ID |
| | 4.) | Select E-Delivery Consent from the available options, and |
| | 5.) | Complete the information requested, including providing the email address where you would like to receive notification for electronic documents. |
* If you hold your account through a financial intermediary, please contact your advisor to request electronic delivery of investor materials.
Householding
In an effort to reduce volume of mail you receive, only one copy of the prospectus, annual/semi-annual report, SAI and proxy statements will be sent to shareholders who are part of the same family and share the same address.
If you would like to request additional copies of the prospectus, annual/semi-annual report or SAI, or wish to opt out of householding mailings, please contact Shareholder Services at 1-800-836-2211, or write to Wilmington Funds, P.O. Box 9828, Providence, RI 02940-8025.
ANNUAL REPORT / April 30, 2018
PRIVACY POLICY AND NOTICE
OF THE FUNDS AND THEIR DISTRIBUTOR
June 8, 2012
The Wilmington Funds, their distributor and their agents (referred to as “the Funds”, “we” or “us”) recognize that consumers (referred to as “you” or “your”) expect us to protect both your assets and financial information. We respect your right to privacy and your expectation that all personal information about you or your account will be maintained in a secure manner. We are committed to maintaining the confidentiality, security and integrity of client and shareholder information. We want you to understand the Funds’ policy that governs the handling of your information, how the Funds gather information, how that information is used and how it is kept secure.
Information The Funds Collect:
The Funds collect nonpublic personal information about you from the following sources:
| | • | | We may receive information from you, or from your financial representative, on account applications, other forms or electronically (such as through the Funds’ website or other electronic trading mechanisms). Examples of this information include your name, address, social security number, assets and income. |
| | • | | We may receive information from you, or from your financial representative, through transactions with us or others, correspondence and other communications. Examples of this information include specific investments and your account balances. |
| | • | | We may obtain other personal information from you in connection with providing you a financial product or service. Examples of this information include depository, debit or credit account numbers. |
Information Sharing Policy
The Funds may share nonpublic personal information about you, as described above, with financial or non-financial companies or other entities, including companies that may be affiliated with the Funds and other nonaffiliated third parties, for the following purposes:
| | • | | We may share information when it is necessary and required to process a transaction or to service a customer relationship. For example, information may be shared with a company that provides account record keeping services or a company that provides proxy services to shareholders. |
| | • | | We may share information when it is required or permitted by law. For example, information may be shared in response to a subpoena or to protect you against fraud or with someone who has established a legal beneficial interest, such as a power of attorney. |
| | • | | We may disclose some or all of the information described above to companies that perform marketing or other services on our behalf. For example, we may share information about you with the financial intermediary (bank, investment bank or broker-dealer) through whom you purchased the Funds’ products or services, or with providers of marketing, legal, accounting or other professional services. The Funds will not, however, disclose a consumer’s account number or similar form of access number or access code for credit card, deposit or transaction accounts to any nonaffiliated third party for use in telemarketing, direct mail or other marketing purposes. |
Except as described above, the Funds do not share customer information. We will not rent, sell, trade, or otherwise release or disclose any personal information about you. Any information you provide to us is for the Funds’ use only. If you decide to close your account(s) or become an inactive customer, we will adhere to the privacy policies and practices as described in this notice.
Information Security:
When the Funds share nonpublic customer information with third parties hired to facilitate the delivery of certain products or services to our customers, such information is made available for limited purposes and under controlled circumstances designed to protect our customers’ privacy. We require third parties to comply with our standards regarding security and confidentiality of such information. We do not permit them to use that information for their own or any other purposes, or rent, sell, trade or otherwise release or disclose the information to any other party. These requirements are reflected in written agreements between the Funds and the third party service providers.
The Funds protect your personal information in several ways. We maintain physical, electronic, and procedural safeguards to guard your nonpublic personal information. In addition, the Funds’ Transfer Agent and Shareholder Servicing Agent have procedures in place for the appropriate disposal of nonpublic personal information when they are no longer required to maintain the information.
Each of the following sections explains an aspect of the Funds’ commitment to protecting your personal information and respecting your privacy.
Employee Access to Information:
Our Code of Ethics, which applies to all employees, restricts the use of customer information and requires that it be held in the strictest of confidence. Employee access to customer information is authorized for business purposes only, and the degree of access is based on the sensitivity of the information and on an employee’s or agent’s need to know the information in order to service a customer’s account or comply with legal requirements.
Visiting The Funds’ Website:
The Funds’ website gathers and maintains statistics about the number of visitors as well as what information is viewed most frequently. This information is used to improve the content and level of service we provide to our clients and shareholders.
April 30, 2018 / ANNUAL REPORT
| | • | | Information or data entered into a website will be retained. |
| | • | | Where registration to a website or re-entering personal information on a website is required, “cookies” are used to improve your online experience. A cookie is a way for websites to recognize whether or not you have visited the site before. It is a small file that is stored on your computer that identifies you each time you re-visit our site so you don’t have to resubmit personal information. Cookies provide faster access into the website. |
| | • | | We may also collect non-personally identifiable Internet Protocol (“IP”) addresses for all other visitors to monitor the number of visitors to the site. These non-personally identifiable IP addresses are never shared with any third party. |
E-mail:
If you have opted to receive marketing information from the Funds by e-mail, it is our policy to include instructions in all marketing messages on how to unsubscribe from subsequent e-mail programs. Some products or services from the Funds are intended to be delivered and serviced electronically. E-mail communication may be utilized in such cases. If you participate in an employer-sponsored retirement plan administered by the Funds, we may, at your employer’s request, send you e-mail on matters pertaining to the retirement plan.
Please do not provide any account or personal information such as social security numbers, account numbers, or account balances within your e-mail correspondence to us. We cannot use e-mail to execute transaction instructions, provide personal account information, or change account registration. We can, however, use e-mail to provide you with the necessary forms or you may contact customer service toll-free at 1-800-836-2211.
Surveys/Aggregate Data:
Periodically, the Funds may conduct surveys about financial products and services or review elements of customer information in an effort to forecast future business needs. The Funds then generate reports that include aggregate data regarding its customers. Aggregate data classifies customer information in various ways but that does not identify individual customers. These reports may also include information on website traffic patterns and related information. These reports are used for the Funds’ planning, statistical and other corporate purposes. Aggregate data may also be shared with external parties, such as marketing organizations. However, no information is shared by which any individual customer could be identified.
Changes to Our Privacy Statement:
The effective date of this policy is June 8, 2012.We reserve the right to modify this policy at any time. When it is revised or materially changed, we will update the effective date. You can determine whether there have been changes since the last time you reviewed by simply checking the effective date.
Notice will be provided to you in advance of any changes that would affect your rights under this policy statement.
ANNUAL REPORT / April 30, 2018
[This Page Intentionally Left Blank]
[This Page Intentionally Left Blank]

| | |
| |
Investment Advisor Wilmington Funds Management Corp. 1100 North Market Street Wilmington, DE 19890 Sub-Advisor Wilmington Trust Investment Advisors 111 South Calvert Street 26th Floor Baltimore, MD 21202 Co-Administrator Wilmington Funds Management Corp. 1100 North Market Street Wilmington, DE 19890 Custodian The Bank of New York Mellon 225 Liberty Street New York, NY 10286 | | Distributor ALPS Distributors, Inc. 1290 Broadway, Suite 1100 Denver, CO 80203 Fund Accountant, Co-Administrator, Transfer Agent and Dividend Disbursing Agent BNY Mellon Investment Servicing (U.S.) Inc. 301 Bellevue Parkway Wilmington, DE 19809 Independent Registered Public Accounting Firm Ernst & Young LLP One Commerce Square 2005 Market Street, Suite 700 Philadelphia, PA 19103 |
| | |
| | |
| | |
| | |
| | |
| | |
| | |
| | |
| | |
| | |
| | |
| | |
| | |
| | |
| | |
| | |
| | |
| | |
| | |
| | |
| | |
| | |
| | |
| | |
WT-AR-EQ-0418 |
| Wilmington Funds | 1-800-836-2211 | www.wilmingtonfunds.com |
|
| We are pleased to send you this shareholder report for the Wilmington Funds. This report contains important information about your investments in the funds. |
|
|
|
|
|
|

Wilmington Broad Market Bond Fund (“Broad Market Bond Fund”)
Wilmington Intermediate-Term Bond Fund (“Intermediate-Term Bond Fund”)
Wilmington Short-Term Bond Fund (“Short-Term Bond Fund”)
Wilmington Municipal Bond Fund (“Municipal Bond Fund”)
Wilmington New York Municipal Bond Fund (“New York Municipal Bond Fund”)

CONTENTS
[This Page Intentionally Left Blank]
Esteemed Shareholder:
I am pleased to present the Annual Report of the Wilmington Funds (the “Trust”), covering the Trust’s annual fiscal year of May 1, 2017, through April 30, 2018. Inside you will find a comprehensive review of the Trust’s holdings and financial statements.
The economy and financial markets in review
Wilmington Funds Management Corporation and Wilmington Trust Investment Advisors, Inc. (the Trust’s investment advisor and subadvisor, respectively), have provided the following review of the economy, bond markets, and stock markets for the Trust’s annual fiscal year period.
The economy
The U.S. economy has shown strength over the past year, with the second, third, and fourth quarters of 2018 exhibiting the strongest growth since 2015. Following the disappointment of Congress’s inability to pass comprehensive healthcare reform, Republicans redeemed themselves by passing the Tax Cuts and Jobs Act in December of 2017, which contributed to surging confidence from consumers and businesses alike. The Institute of Supply Management (“ISM”) Manufacturing Purchasing Managers Index (“PMI”)1 peaked at 60.8 in February 2018—the highest level since 2004. Also in February, the Conference Board’s measure of consumer confidence reached the highest levels since 2000. Yet against this euphoric backdrop, Core Personal Consumption Expenditure (“PCE”) inflation held below the Federal Reserve’s 2% target and has only recently accelerated. As a result, the “goldilocks” (not too hot, not too cold) characterization of the U.S. economy has continued to ring true, with economic data for much of the fiscal year meeting or exceeding expectations, but not coming in so strong as to force the hand of the Federal Reserve into accelerating monetary policy tightening. In our estimation, the U.S. economy will grow at a pace of approximately 3% in 2018, with 0.5–0.75% of that attributable to tax cuts.
We are increasingly aware that the U.S. is closer to the end of the business cycle than to the beginning. The U.S. economic expansion is officially the second-longest on record. The labor market is tight by multiple measures, and the Federal Reserve is in the midst of a rate-hiking campaign (although it continues to move gradually). This has led short-maturity interest rates higher and contributed to the flattening of the yield curve; at the time of writing, the yield curve is less than 45 basis points (0.45%) away from inverting. (An inverted yield curve has preceded each of the last five recessions.) We do not view a U.S. recession as imminent but consider the U.S. economy in the later stages of the economic cycle.
Moving beyond U.S. borders, the past year has marked a period of synchronized global growth. The eurozone far surpassed growth expectations in 2017, with measures of loan growth, business expansion, and consumer confidence accelerating in the second half of 2017. Japan has printed a string of eight positive quarters of GDP growth, the longest such stretch since the 1990s. Emerging markets have also benefited from robust global demand and rising oil prices, which have increased nearly 50% over the past year. Some of this momentum cooled as the calendar turned on the new year. We still see economic growth as having legs, but the pace of growth across the board has decelerated, particularly relative to elevated expectations. We are watching carefully for signs of a more sustained slowdown, which would challenge our overall view.
Bond markets
The past year has been a challenging one for bond investors. For the fiscal year through January, bonds were holding their value and even posting modest single-digit total returns. However, inflationary fears began to emerge in the first quarter of 2018, sending the yield on the 10-year U.S. Treasury above 3% by the end of April. This was the first time the 10-year yield breached 3% since the end of 2013. The upward move in the short end of the yield curve has been even more dramatic and, as mentioned above, the yield curve has flattened alongside three rate hikes from the Fed (in June, December, and March). Higher yields have weighed on the price return of bonds, particularly for short-to-intermediate maturities. The Bloomberg Barclays U.S. Treasury Bond Index2 has returned -1.07% over the period.
Investment-grade credit spreads remain tight but have increased in 2018. Spread stabilization and lower supply in coming months should support valuations. High-yield bond credit spreads to Treasuries remain quite low relative to history, despite higher volatility in 2018 and fund outflows from the asset class. Defaults are expected to remain low in the coming year.
For the 12-month period May 1, 2017 to April 30, 2018, certain Bloomberg indices performed as follows3:
| | | | | | | | |
Bloomberg Barclays U.S. Treasury Bond Index | | Bloomberg
Barclays U.S.Aggregate Bond Index4 | | Bloomberg
Barclays U.S. Credit Bond Index5 | | Bloomberg Barclays Municipal Bond Index6 | | Bloomberg
Barclays U.S. Corporate High Yield Bond Index7 |
-1.07% | | -0.32% | | 0.65% | | 1.56% | | 3.26% |
PRESIDENT’S MESSAGE / April 30, 2018 (unaudited)
Equity markets
The synchronized global growth discussed earlier acted as a rising tide lifting all equity boats for most of the year, and equity markets enjoyed extremely low levels of volatility through January. U.S. equities were propelled by a healthy consumer, low inflation, a weakening dollar, and tax cuts. As strong as U.S. equity returns were, those of developed international and emerging economies were even better, particularly in U.S. dollar terms. However, equity markets experienced several hiccups in recent months. Concerns have mounted regarding higher inflation, regulations on technology companies, and protectionism, all of which have weighed on global equities and contributed to higher volatility in 2018. Additionally, the positive tailwind for U.S. and emerging markets equities coming from a weaker dollar will fade, as the U.S. dollar has reversed this year’s weakness. The dollar is 0.4% stronger year to date through April and increased 2.7% in the last two weeks of April alone. Equity markets have been choppier of late, but valuations are not overly concerning (though they are higher than 10-year averages across a number of regions), and we continue to believe the economic fundamentals are encouraging going forward. Therefore, we maintain our preference for stocks over bonds.
For the 12-month period May 1, 2017 to April 30, 2018, certain stock market indices performed as follows:
| | | | | | |
| | | |
S&P 500® Index8 | | Russell 2000® Index9 | | MSCI EAFE (Net) Index10 | | MSCI Emerging Markets (Net) Index11 |
13.27% | | 11.54% | | 14.51% | | 21.71% |
Despite growing uncertainty in financial markets, we remain focused on managing risk and growing our clients’ capital to help achieve their long-term goals.
Sincerely,

Christopher D. Randall
President
May 25, 2018
April 30, 2018 (unaudited) / PRESIDENT’S MESSAGE
Must be preceded or accompanied by a prospectus.
Past performance is no guarantee of future results. The index performance quoted is for illustrative purposes only and is not representative of any specific investment. Diversification does not ensure a profit nor protect against loss.
All investments involve risk, including the possible loss of principal. Equity Securities are subject to price fluctuation and possible loss of principal. Small- and mid-cap stocks involve greater risks and volatility than large-cap stocks. International investments are subject to special risks, including currency fluctuations, social, economic, and political uncertainties, which could increase volatility. These risks are magnified in emerging markets.
High-yield, lower-rated securities generally entail greater market, credit, and liquidity risks than investment grade securities and may include higher volatility and higher risk of default.
1. ISM Manufacturing PMI Report on Business is based on data compiled from monthly replies to questions asked of purchasing and supply executives in over 400 industrial companies. For each of the indicators measured (New Orders, Backlog of Orders, New Export Orders, Imports, Production, Supplier Deliveries, Inventories, Customers Inventories, Employment, and Prices), this report shows the percentage reporting each response, the net difference between the number of responses in the positive economic direction and the negative economic direction and the diffusion index. Responses are raw data and are never changed.
2. Bloomberg Barclays U.S. Treasury Bond Index is a market capitalization weighted index that includes all publicly issued, U.S. Treasury securities that have a remaining maturity of at least one year, are rated investment-grade, and have $250 million or more of outstanding face value. The index is unmanaged and investments cannot be made directly in an index.
3. Bond prices are sensitive to changes in interest rates and a rise in interest rates can cause decline in their prices.
4. Bloomberg Barclays U.S. Aggregate Bond Index is widely used benchmark index for the domestic investment-grade bond market composed of securities from the Barclays Government/Corporate Bond Index, Mortgage-Backed Securities Index and Asset-Backed Securities Index. The index typically includes fixed income securities with overall intermediate- to long-term average maturities. The index is unmanaged and investments cannot be made directly in an index.
5. Bloomberg Barclays U.S. Credit Bond Index tracks the performance of domestic investment-grade corporate bonds and is composed of all publicly issued, fixed-rate, nonconvertible, investment-grade corporate debt. The index is unmanaged and investments cannot be made directly in an index.
6. Bloomberg Barclays Municipal Bond Index tracks the performance of long-term, tax-exempt, investment-grade bond market. To be included in the index, bonds must have an outstanding par balance of at least $7 million and be issued as part of a transaction of at least $75 million. The index is unmanaged and investments cannot be made directly in an index.
7. Bloomberg Barclays U.S. Corporate High Yield Bond Index measures the USD-denominated, high yield, fixed-rate corporate bond market. Securities are classified as high yield if the middle rating of Moody’s, Fitch, and S&P is Ba1/BB+/BB+ or below. Bonds from issuers with an emerging markets country of risk, based on the Bloomberg Barclays EM country definition, are excluded. The U.S. Corporate High Yield Bond Index is a component of the U.S. Universal and Global High Yield Indices. An investment cannot be made directly in an index.
8. The S&P 500® Index is a capitalization-weighted index of 500 stocks designed to measure performance of the broad domestic economy through changes in the aggregate market value of 500 stocks representing all major industries. The index is unmanaged and investments cannot be made directly in an index.
9. The Russell 2000® Index measures the performance of the 2,000 smallest companies in the Russell 3000 Index, which represents approximately 8% of the total market capitalization of the Russell 3000 Index. As of its latest reconstitution, the index had a total market capitalization range of approximately $128 million to $1.3 billion.
10. MSCI EAFE (Net) Index is a free float-adjusted market capitalization index that is designed to measure equity market performance of developed markets, excluding the U.S. & Canada. The index consisted of the following 21 developed market country indices: Australia, Austria, Belgium, Denmark, Finland, France, Germany, Hong Kong, Ireland, Israel, Italy, Japan, Netherlands, New Zealand, Norway, Portugal, Singapore, Spain, Sweden, Switzerland and the United Kingdom. The index is unmanaged and investments cannot be made directly in an index. The performance of this index is reduced by the taxes on dividends paid by the international securities issuers in the index.
11. MSCI Emerging Markets (Net) Index is a free float-adjusted market capitalization index that is designed to measure equity market performance of emerging markets. The MSCI Emerging Markets Index consisted of the following 24 emerging market country indices: Brazil, Chile, China, Colombia, Czech Republic, Egypt, Greece, Hungary, India, Indonesia, Korea, Malaysia, Mexico, Pakistan, Peru, Philippines, Poland, Qatar, Russia, South Africa, Taiwan, Thailand, Turkey and United Arab Emirates. The index is unmanaged and investments cannot be made directly in an index. The performance of this index is reduced by the taxes on dividends paid by the international securities issuers in the index.
PRESIDENT’S MESSAGE / April 30, 2018 (unaudited)
WILMINGTON BROAD MARKET BOND FUND
Management’s Discussion of Fund Performance
For the fiscal year ended April 30, 2018, Wilmington Broad Market Bond Fund (the “Fund”) had a total return of -0.81%* for Class A Shares and -0.52%* for Class I Shares, versus its benchmark, the Bloomberg Barclays U.S. Aggregate Bond Index**, which had a total return of -0.32%, and its peer group, the Lipper Corporate A-Rated Debt Funds Average***, which had a total return of 0.50%.
The Federal Reserve (the “Fed”) continued to “normalize” short-term interest rates by raising the Fed Funds target three times over the past fiscal year. The target now stands in a range of 1.75% to 2.0%, which is 3/4 of a percent higher than this time last year. The Fed has acknowledged that the economic outlook has strengthened and that inflation is expected to move higher, and then stabilize around their 2% objective. The economy expanded for the eighth consecutive year as Gross Domestic Product (“GDP”) increased at a 2.9% rate for the year ended March 31, 2018, marking the fastest pace of growth since 2015. Equipment investment by corporations aided economic growth. The consumer continued to benefit from the strong job market. The unemployment rate declined to its lowest level since 2000, to a rate of 3.9% this past month. However, wage pressure remains moderate with wages only increasing at a 2.6% rate over the past year. The core Consumer Price Index (“CPI”) has recently started to move higher and is now at 2.1%.
In response to the Fed tightening monetary policy and the expectation for the Fed to raise interest rates at least two more times in 2018, interest rates have moved higher. The yield curve has also flattened over the past year. The 2-year Treasury yield almost doubled over the past year rising to a yield of 2.49% as of April 30, 2018, its highest yield since 2008. The 10-year Treasury yield rose by 2/3 of a percent to 2.95%, its highest yield since 2014. The combination of higher interest rates and low starting yields has caused most bond indices to post negative total rates of return for the past fiscal year. Negative total rates of return for the bond market indices are a rare occurrence. This marks only the third time that the Bloomberg Barclays Intermediate U.S. Government/Credit Bond Index has posted a negative return over the past 23 years.
The corporate sector of the bond market did provide positive excess returns over the past fiscal year as risk premiums tightened in response to improving corporate earnings and a continued search for yield. However, over the past four months, we have seen risk premiums move wider, as corporate issuance has been robust and concerns over large U.S. corporations investing less in the corporate bond market, as they repatriate profits from overseas in response to the new tax laws. The mortgage-backed sector of the market also provided positive excess returns as investors took the Fed’s gradual reduction of their balance sheet in stride.
Looking forward, we expect the Fed to raise interest rates either two or three additional times in 2018 and for the yield curve to continue to flatten with shorter-term interest rates moving higher than longer-term interest rates.
The Fund’s slight underperformance can be attributed to our overweight to the corporate sector which underperformed during 2018 for the first time since 2015. We also maintained an underweight allocation to the mortgage-backed sector which also detracted from
performance. Our duration strategy of maintaining a shorter duration than the index aided performance as interest rates moved higher. The Fund performance also benefitted from our bar belled yield curve strategy of maintaining an underweight allocation to the intermediate portion of the yield curve which underperformed in response to the Fed raising interest rates and the yield curve flattening.
| * | Performance data quoted represents past performance, which is no guarantee of future results. Investment return and principal value will fluctuate so that an investor’s shares, when redeemed, may be worth more or less than their original cost. The total return shown assumes the reinvestment of all distributions and does not reflect the deduction of taxes that a shareholder would pay on fund distributions or the redemption of shares. The total return for Class A Shares was -5.26%, adjusted for the Fund’s maximum sales charge of 4.50%. Mutual fund performance changes over time and current performance may be lower or higher than what is stated. For the most recent month-end performance, please visit www.wilmingtonfunds.com or call 1-800-836-2211. |
| ** | The Bloomberg Barclays U.S. Aggregate Bond Index is an index measuring both the capital price changes and income provided by the underlying universe of securities, comprised of U.S. Treasury obligations, U.S. investment grade corporate debt and mortgage-backed obligations. The index is unmanaged and it is not possible to invest directly in an index. |
| *** | Lipper figures represent the average of the total returns reported by all of the mutual funds designated by Lipper, Inc. as falling into the respective category indicated. These figures do not reflect sales charges. |
Bond prices are sensitive to changes in interest rates and a rise in short-term interest rates could cause a decline in bond prices
Gross Domestic Product (“GDP”) is the monetary value of all the finished goods and services produced within a country’s borders in a specific time period, though GDP is usually calculated on an annual basis. It includes all of private and public consumption, government outlays, investments and exports less imports that occur within a defined territory.
The Bloomberg Barclays Intermediate U.S. Government/Credit Bond Index is a widely recognized, market value weighted index of U.S. Treasury securities, U.S. government agency obligations, corporate debt securities, Yankee bonds and non-convertible corporate debt securities issued by or guaranteed by foreign governments and agencies. The index is unmanaged and it is not possible to invest directly in an index.
Consumer Price Index (“CPI”) is a measure that examines the weighted average of prices of a basket of consumer goods and services, such as transportation, food and medical care. The CPI is calculated by taking price changes for each item in the predetermined basket of goods and averaging them; the goods are weighted according to their importance. Changes in CPI are used to assess price changes associated with the cost of living.
Duration is a measure of a security’s price sensitivity to changes in interest rates. Securities with longer durations are more sensitive to changes in interest rates than securities of shorter durations.
April 30, 2018 (unaudited) / ANNUAL REPORT
Basis Points (“BPS”) is a unit that is equal to 1/100th of 1% and is used to denote the change in a financial instrument. The basis point is commonly used for calculating changes in interest rates, equity indices and the yield of a fixed-income security.
Excess Return is a security or sector’s return minus the return from a U.S. Treasury of similar maturity or duration.
ANNUAL REPORT / April 30, 2018 (unaudited)
WILMINGTON BROAD MARKET BOND FUND
The graphs below illustrate the hypothetical investment of $10,0001 in the Class A Shares and $1,000,0001 in the Class I Shares of the Wilmington Broad Market Bond Fund; from April 30, 2008 to April 30, 2018, compared to the Bloomberg Barclays U.S. Aggregate Bond Index.2
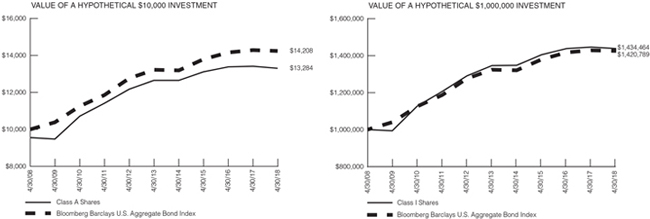
Performance data quoted represents past performance, which is no guarantee of future results. Investment return and principal value will fluctuate so that an investor’s shares, when redeemed, may be worth more or less than their original cost. The total return shown assumes the reinvestment of all distributions and does not reflect the deduction of taxes that a shareholder would pay on fund distributions or the redemption of shares. The total return for Class A Shares was -5.26%, adjusted for the Fund’s maximum sales charge of 4.50%. Mutual fund performance changes over time and cur-rent performance may be lower or higher than what is stated. For the most recent month-end performance, please visit www.wilmingtonfunds.com or call 1-800-836-2211.
| | | | | | |
| | Average Annual Total Returns for the Periods Ended 4/30/18 |
| | 1 Year | | 5 Years | | 10 Years |
Class A^ | | -5.26% | | 0.08% | | 2.88% |
Class I^ | | -0.52% | | 1.33% | | 3.67% |
Bloomberg Barclays U.S. Aggregate Bond Index2 | | -0.32% | | 1.47% | | 3.57% |
^Expense Ratios Before Waivers and Expense Ratios After Waivers for Class A are 1.09% and 0.84%, respectively. Expense Ratios Before Waivers and Expense Ratios After Waivers for Class I are 0.84% and 0.49%, respectively. Expense Ratios Before Waiver represent the operating costs borne by the Fund, expressed as a percentage of the Fund’s average net assets, as shown in the Fees and Expenses table in the Fund’s current prospectus (under “Total Annual Fund Operating Expenses”). Current information regarding the Fund’s Operating Expenses can be found in the Fund’s Financial Highlights.
| 1 | Represents a hypothetical investment of $10,000 in Class A of the Fund after deducting the maximum sales charge of 4.50% ($10,000 investment minus $450 sales charge = $9,550) and $1,000,000 in Class I of the Fund and assumes the reinvestment of all dividends and distributions. |
| 2 | The performance for the Bloomberg Barclays U.S. Aggregate Bond Index assumes the reinvestment of all dividends and distributions but does not reflect the deduction of a sales charge required for the Fund’s performance by the Securities and Exchange Commission. It is not possible to invest directly in an index, and the represented index is unmanaged. |
April 30, 2018 (unaudited) / ANNUAL REPORT
WILMINGTON INTERMEDIATE-TERM BOND FUND
Management’s Discussion of Fund Performance
For the fiscal year ended April 30, 2018, the Wilmington Intermediate-Term Bond Fund (the “Fund”) had a total return of -1.14%* for Class A Shares, and -0.72%* for Class I Shares, versus its benchmark, the Bloomberg Barclays Intermediate U.S. Government/ Credit Bond Index**, which had a total return of -0.79% and its peer group, the Lipper Short-Intermediate Investment Grade Debt Funds Average***, which had a total return of -0.12%.
The Federal Reserve (the “Fed”) continued to “normalize” short-term interest rates by raising the Fed Funds target three times over the past fiscal year. The target now stands at 1.75% to 2.0%, which is 3/4 of a percent higher than this time last year. The Fed has acknowledged that the economic outlook has strengthened and that inflation is expected to move higher, and then stabilize around their 2% objective. The economy expanded for the eighth consecutive year as Gross Domestic Product (“GDP”) increased at a 2.9% rate for the year ended March 31, 2018, marking the fastest pace of growth since 2015. Equipment investment by corporations aided economic growth. The consumer continued to benefit from the strong job market. The unemployment rate declined to its lowest level since 2000, to a rate of 3.9% this past month. However, wage pressure remains moderate with wages only increasing at a 2.6% rate over the past year. The core Consumer Price Index (“CPI”) has recently started to move higher and is now at 2.1%.
In response to the Fed tightening monetary policy and the expectation for the Fed to raise interest rates at least two more times in 2018, interest rates have moved higher. The yield curve has also flattened over the past year. The 2-year Treasury yield almost doubled over the past year rising to a yield of 2.49% as of April 30, 2018, its highest yield since 2008. The 10-year Treasury yield rose by 2/3 of a percent to 2.95%, its highest yield since 2014. The combination of higher interest rates and low starting yields caused most bond indices to post negative total rates of return for the past fiscal year. Negative total rates of return for the bond market indices are a rare occurrence. This marks only the third time for the Bloomberg Barclays Intermediate U.S. Government/Credit Bond Index to post a negative return over the past 23 years.
The corporate sector of the bond market did provide positive excess returns over the past fiscal year as risk premiums tightened in response to improving corporate earnings and a continued search for yield. However, over the past four months, we have seen risk premiums move wider as corporate issuance has been robust and concerns over large U.S. corporations investing less in the corporate market as they repatriate profits from overseas in response to the new tax laws. The mortgage-backed sector of the market also provided positive excess returns as investors took the Fed’s gradual reduction of their balance sheet in stride.
Looking forward, we expect the Fed to raise interest rates either two or three additional times in 2018 and for the yield curve to continue to flatten with shorter-term interest rates moving higher than longer-term interest rates.
The modest outperformance of the Fund relative to the benchmark is primarily due to the Fund’s overweight position to the corporate sector. Over the fiscal year, the option adjusted spread of the Bloomberg
Barclays U.S. Credit Bond Index declined to 102 basis points from 110 basis points in April of 2017. Tighter credit spreads led to relative outperformance of corporate bonds versus Treasuries. Curve positioning was more heavily weighted towards the 7-10 year part of the curve. This was a modest contributor to performance as the Treasury curve flattened by approximately 55 basis points during the fiscal year, as measured by the yield differential between 10-year Treasury bonds and 2-year Treasury notes. Duration positioning was equal to or slightly less than the benchmark throughout the year. This was also a small contributor to Fund Performance as interest rates moved higher.
The Fund remains positioned to benefit from higher interest rates and a flatter Treasury curve. Duration is currently shorter than the index and maintains a larger allocation to the 7-10 year part of the curve. The Fund remains underweight the 3-5 year part of the curve as we expect the Fed will continue to increase its benchmark rate, causing short-term interest rates to move higher. The Fund maintains an overweight position to the corporate sector based upon our expectation for solid growth in the U.S. and support from tax reform. However, we did reduce our overweight to credit. Less attractive valuations and decreased demand resulted in a modest reduction to corporate bonds.
| * | Performance data quoted represents past performance, which is no guarantee of future results. Investment return and principal value will fluctuate so that an investor’s shares, when redeemed, may be worth more or less than their original cost. The total return shown assumes the reinvestment of all distributions and does not reflect the deduction of taxes that a shareholder would pay on fund distributions or the redemption of shares. The total return for Class A Shares was -5.63%, adjusted for the Fund’s maximum sales charge of 4.50%. Mutual fund performance changes over time and current performance may be lower or higher than what is stated. For the most recent month-end performance, please visit www.wilmingtonfunds.com or call 1-800-836-2211. |
| ** | The Bloomberg Barclays Intermediate U.S. Government/Credit Bond Index is a widely recognized, market value weighted index of U.S. Treasury securities, U.S. government agency obligations, corporate debt securities, Yankee bonds and non-convertible corporate debt securities issued by or guaranteed by foreign governments and agencies. The index is unmanaged and it is not possible to invest directly in an index. |
| *** | Lipper figures represent the average of the total returns reported by all of the mutual funds designated by Lipper, Inc. as falling into the respective category indicated. These figures do not reflect sales charges. |
Bond prices are sensitive to changes in interest rates and a rise in short-term interest rates could cause a decline in bond prices.
Gross Domestic Product (“GDP”) is the monetary value of all the finished goods and services produced within a country’s borders in a specific time period, though GDP is usually calculated on an annual basis. It includes all of private and public consumption, government outlays, investments and exports less imports that occur within a defined territory.
ANNUAL REPORT / April 30, 2018 (unaudited)
| | |
The Bloomberg Barclays U.S. Credit Bond Index tracks the performance of domestic investment-grade corporate bonds and is composed of all publicly issued, fixed-rate, nonconvertible, investment-grade corporate debt. The index is unmanaged and investments cannot be made directly in an index. Consumer Price Index (“CPI”) is a measure that examines the weighted average of prices of a basket of consumer goods and services, such as transportation, food and medical care. The CPI is calculated by taking price changes for each item in the predetermined basket of goods and averaging them; the goods are weighted according to their importance. Changes in CPI are used to assess price changes associated with the cost of living. Duration is a measure of a security’s price sensitivity to changes in interest rates. Securities with longer durations are more sensitive to changes in interest rates than securities of shorter durations. Basis Points (“BPS”) is a unit that is equal to 1/100th of 1% and is used to denote the change in a financial instrument. The basis point is commonly used for calculating changes in interest rates, equity indices and the yield of a fixed-income security. Excess Return is a security or sector’s return minus the return from a U.S. Treasury of similar maturity or duration. | | |
April 30, 2018 (unaudited) / ANNUAL REPORT
WILMINGTON INTERMEDIATE-TERM BOND FUND
The graphs below illustrate the hypothetical investment of $10,0001 in the Class A Shares and $1,000,0001 in the Class I Shares of the Wilmington Intermediate-Term Bond Fund from April 30, 2008 to April 30, 2018 compared to the Bloomberg Barclays Intermediate U.S. Government/Credit Bond Index.2
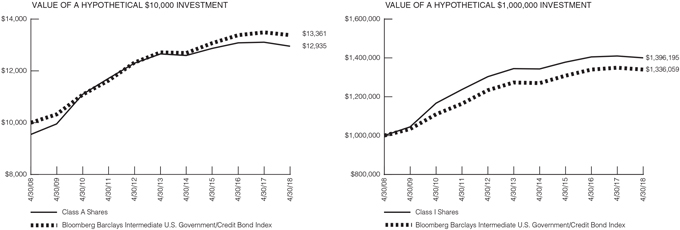
Performance data quoted represents past performance, which is no guarantee of future results. Investment return and principal value will fluctuate so that an investor’s shares, when redeemed, may be worth more or less than their original cost. The total return shown assumes the reinvestment of all distributions and does not reflect the deduction of taxes that a shareholder would pay on fund distributions or the redemption of shares. The total return for Class A Shares was -5.63%, adjusted for the Fund’s maximum sales charge of 4.50%. Mutual fund performance changes over time and current performance may be lower or higher than what is stated. For the most recent month-end performance, please visit www.wilmingtonfunds.com or call 1-800-836-2211.
| | | | | | |
| | Average Annual Total Returns for the Periods Ended 4/30/18 |
| | 1 Year | | 5 Years | | 10 Years |
| | | |
Class A^ | | -5.63% | | -0.45% | | 2.61% |
| | | |
Class I^ | | -0.72% | | 0.81% | | 3.39% |
| | | |
Bloomberg Barclays Intermediate U.S. Government/Credit Bond Index2 | | -0.79% | | 1.02% | | 2.94% |
^Expense Ratios Before Waivers and Expense Ratios After Waivers for Class A are 1.18% and 0.84%, respectively. Expense Ratios Before Waivers and Expense Ratios After Waivers for Class I are 0.93% and 0.49%, respectively. Expense Ratios Before Waiver represent the operating costs borne by the Fund, expressed as a percentage of the Fund’s average net assets, as shown in the Fees and Expenses table in the Fund’s current prospectus (under “Total Annual Fund Operating Expenses”). Current information regarding the Fund’s Operating Expenses can be found in the Fund’s Financial Highlights.
| 1 | Represents a hypothetical investment of $10,000 in Class A of the Fund after deducting the maximum sales charge of 4.50% ($10,000 investment minus $450 sales charge = $9,550) and $1,000,000 in Class I of the Fund and assumes the reinvestment of all dividends and distributions. |
| 2 | The performance for the Bloomberg Barclays Intermediate U.S. Government/Credit Bond Index assumes the reinvestment of all dividends and distributions but does not reflect the deduction of a sales charge required for the Fund’s performance by the Securities and Exchange Commission. It is not possible to invest directly in an index and the represented index is unmanaged. |
ANNUAL REPORT / April 30, 2018 (unaudited)
WILMINGTON SHORT-TERM BOND FUND
Management’s Discussion of Fund Performance
For the fiscal year ended April 30, 2018, the Wilmington Short-Term Bond Fund (the “Fund”) had a total return of -0.03%* for Class A Shares and 0.22%* for Class I Shares, versus its benchmark, the Bloomberg Barclays 1-3 Year U.S. Government/Credit Bond Index**, which had a total return of -0.05%, and its peer group, the Lipper Short Investment Grade Debt Funds Average***, which had a total return of 0.60%.
The Federal Reserve (the “Fed”) continued to “normalize” short-term interest rates by raising the Fed Funds target three times over the past fiscal year. The target now stands in a range of 1.75% to 2.0%, which is 3/4 of a percent higher than this time last year. The Fed has acknowledged that the economic outlook has strengthened and that inflation is expected to move higher, and then stabilize around their 2% objective. The economy expanded for the eighth consecutive year as Gross Domestic Product (“GDP”) increased at a 2.9% rate for the year ended March 31, 2018, marking the fastest pace of growth since 2015. Equipment investment by corporations aided economic growth. The consumer continued to benefit from the strong job market. The unemployment rate declined to its lowest level since 2000, to a rate of 3.9% this past month. However, wage pressure remains moderate with wages only increasing at a 2.6% rate over the past year. The core Consumer Price Index (“CPI”) has recently started to move higher and is now at 2.1%.
In response to the Fed tightening monetary policy and the expectation for the Fed to raise interest rates at least two more times in 2018, interest rates have moved higher. The yield curve has also flattened over the past year. The 2-year Treasury yield almost doubled over the past year rising to a yield of 2.49% as of April 30, 2018, its highest yield since 2008. The 10-year Treasury yield rose by 2/3 of a percent to 2.95%, its highest yield since 2014. The combination of higher interest rates and low starting yields has caused most bond indices to post negative total rates of return for the past fiscal year. Negative total rates of return for the bond market indices are a rare occurrence. This marks only the third time for the Bloomberg Barclays Intermediate U.S. Government/Credit Bond Index to post a negative return over the past 23 years.
The corporate sector of the bond market did provide positive excess returns over the past fiscal year as risk premiums tightened in response to improving corporate earnings and a continued search for yield. However, over the past four months, we have seen risk premiums move wider, as corporate issuance has been robust and concerns over large U.S. corporations investing less in the corporate bond market, as they repatriate profits from overseas in response to the new tax laws. The mortgage-backed sector of the market also provided positive excess returns as investors took the Fed’s gradual reduction of their balance sheet in stride.
Looking forward, we expect the Fed to raise interest rates either two or three additional times in 2018 and for the yield curve to continue to flatten with shorter-term interest rates moving higher than longer-term interest rates.
Given our expectations for continued rate increases by the Federal Reserve and greater government deficits, the Fund continued to have a shorter duration versus its benchmark. The Fund was also positioned
for a flatter yield curve. The Fund had a lower allocation to the two and three year parts of the yield curve and was overweight the less than one year as well as the five year portion of the curve. Both our overall duration profile as well as portfolio maturity structure added to our relative performance. Corporate securities have recently started to underperform in 2018 as new issue supply, demand, and leverage have weighed on the sector. The Fund has been over-weight the corporate sector versus the Index. Our sector weighing has recently detracted slightly from our relative performance to the Index.
| * | Performance data quoted represents past performance, which is no guarantee of future results. Investment return and principal value will fluctuate so that an investor’s shares, when redeemed, may be worth more or less than their original cost. The total return shown assumes the reinvestment of all distributions and does not reflect the deduction of taxes that a shareholder would pay on fund distributions or the redemption of shares. The total return for Class A Shares was -1.80%, adjusted for the Fund’s maximum sales charge of 1.75%. Mutual fund performance changes over time and current performance may be lower or higher than what is stated. For the most recent month-end performance, please visit www.wilmingtonfunds.com or call 1-800-836-2211. |
| ** | The Bloomberg Barclays 1-3 Year U.S. Government/Credit Bond Index is an index that captures funds with exposures to both government and commercial credit. The index is unmanaged and it is not possible to invest directly in an index. |
| *** | Lipper figures represent the average of the total returns reported by all of the mutual funds designated by Lipper, Inc. as falling into the respective category indicated. These figures do not reflect sales charges. |
Bond prices are sensitive to changes in interest rates and a rise in short-term interest rates could cause a decline in bond prices.
Gross Domestic Product (“GDP”) is the monetary value of all the finished goods and services produced within a country’s borders in a specific time period, though GDP is usually calculated on an annual basis. It includes all of private and public consumption, government outlays, investments and exports less imports that occur within a defined territory.
The Bloomberg Barclays Intermediate U.S. Government/Credit Bond Index is a widely recognized, market value weighted index of U.S. Treasury securities, U.S. government agency obligations, corporate debt securities, Yankee bonds and non-convertible corporate debt securities issues by or guaranteed by foreign governments and agencies. The index is unmanaged and it is not possible to invest directly in an index.
Consumer Price Index (“CPI”) is a measure that examines the weighted average of prices of a basket of consumer goods and services, such as transportation, food and medical care. The CPI is calculated by taking price changes for each item in the predetermined basket of goods and averaging them; the goods are weighted according to their importance. Changes in CPI are used to assess price changes associated with the cost of living.
April 30, 2018 (unaudited) / ANNUAL REPORT
Duration is a measure of a security’s price sensitivity to changes in interest rates. Securities with longer durations are more sensitive to changes in interest rates than securities of shorter durations.
Basis Points (“BPS”) is a unit that is equal to 1/100th of 1% and is used to denote the change in a financial instrument. The basis point is commonly used for calculating changes in interest rates, equity indices and the yield of a fixed-income security.
Excess Return is a security or sector’s return minus the return from a U.S. Treasury of similar maturity or duration.
ANNUAL REPORT / April 30, 2018 (unaudited)
WILMINGTON SHORT-TERM BOND FUND
The graphs below illustrate the hypothetical investment of $10,0001 in the Class A Shares and $1,000,0001 in the Class I Shares of the Wilmington Short-Term Bond Fund from April 30, 2008 to April 30, 2018 compared to the Bloomberg Barclays 1-3 Year U.S. Government/ Credit Bond Index.2
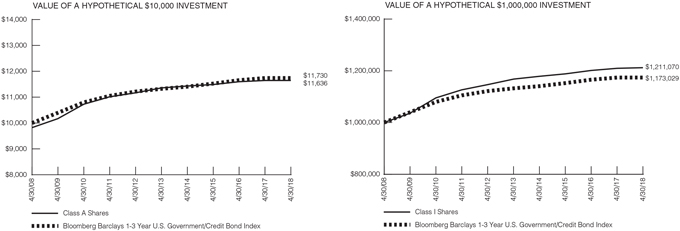
Performance data quoted represents past performance, which is no guarantee of future results. Investment return and principal value will fluctuate so that an investor’s shares, when redeemed, may be worth more or less than their original cost. The total return shown assumes the reinvestment of all distributions and does not reflect the deduction of taxes that a shareholder would pay on fund distributions or the redemption of shares. The total return for Class A Shares was -1.80%, adjusted for the Fund’s maximum sales charge of 1.75%. Mutual fund performance changes over time and current performance may be lower or higher than what is stated. For the most recent month-end performance, please visit www.wilmingtonfunds.com or call 1-800-836-2211.
| | | | | | |
| | | Average Annual Total Returns for the Periods Ended 4/30/18 |
| | | |
| | 1 Year | | 5 Years | | 10 Years |
Class A^ | | -1.80% | | 0.15% | | 1.53% |
Class I^ | | 0.22% | | 0.74% | | 1.93% |
Bloomberg Barclays 1-3 Year U.S. Government/Credit Bond Index2 | | -0.05% | | 0.71% | | 1.61% |
^Expense Ratios Before Waivers and Expense Ratios After Waivers for Class A are 1.23% and 0.73%, respectively. Expense Ratios Before Waivers and Expense Ratios After Waivers for Class I are 0.98% and 0.48%, respectively. Expense Ratios Before Waiver represent the operating costs borne by the Fund, expressed as a percentage of the Fund’s average net assets, as shown in the Fees and Expenses table in the Fund’s current prospectus (under “Total Annual Fund Operating Expenses”). Current information regarding the Fund’s Operating Expenses can be found in the Fund’s Financial Highlights.
| 1 | Represents a hypothetical investment of $10,000 in Class A of the Fund after deducting the maximum sales charge of 1.75% ($10,000 investment minus $175 sales charge = $9,825) and $1,000,000 in Class I of the Fund and assumes the reinvestment of all dividends and distributions. |
| 2 | The performance for the Bloomberg Barclays 1-3 Year U.S. Government/Credit Bond Index assumes the reinvestment of all dividends and distributions but does not reflect the deduction of a sales charge required for the Fund’s performance by the Securities and Exchange Commission. It is not possible to invest directly in an index and the represented index is unmanaged. |
April 30, 2018 (unaudited) / ANNUAL REPORT
WILMINGTON MUNICIPAL BOND FUND
Management’s Discussion of Fund Performance
For the fiscal year ended April 30, 2018, the Wilmington Municipal Bond Fund (the “Fund”) had a total return of -0.29%* for Class A Shares and -0.03%* for Class I Shares, versus its benchmark, the S&P Municipal Bond Intermediate Index**, which had a total return of 0.71%, and its peer group, the Lipper Intermediate Municipal Debt Funds Average***, which had a total return of 0.91%.
May of 2017 seems ancient history in light of the municipal market activity of the last five or six months. Triggered by tax reform – discussed in October and November and passed in December – the supply and demand dynamics of the market turned on their sides. By the end of November 2017, issuers and investment bankers were becoming increasingly concerned that Private Activity Bonds (“PABs”) and advance refunding were about to disappear. That is when the deluge of issuance began, and by the end of December, $62.502 billion in new deals had come to market, an all-time record for monthly issuance. In fact, the second-highest month of volume was $53.447 billion in October 2016. Worth mentioning is that while PABs narrowly escaped the executioner’s axe, advance refunding did not, which alone will have a negative effect on new issuance—advance refunding issuance accounted for roughly 10%–13% of supply in 2017. Nevertheless, year-end fatigue carried on uninterrupted into January, and by month-end, the $20.549 billion in supply stood at only 57% of the prior January’s $36.005 billion. While February 2018 lagged the same month in the prior year, the deficit narrowed such that 2018 year-to-date supply ended at 69% for the same period in 2017. By the close of first quarter 2018, new issuance stood at $65.772 billion versus $91.981 billion for the same period last year.
The relatively small decrease in the top marginal tax rate for individuals is not expected to have a meaningful impact on their buying decisions, but the same cannot be said for the corporate buyers. Banks and property & casualty insurers provide about 25% of the overall demand for tax-exempt municipals and the shift from a 35% top bracket to 21% is meaningful. While we have expected these institutional owners of municipal bonds to gradually shift a portion of their investments to other asset classes, we witnessed an increase in bids wanted coming from bank portfolios in the first quarter. These sell decisions may have been accelerated by an accounting change imposed by the Financial Accounting Standards Board on banks and their amortization of bond premiums.
Overall, the yield curve had many shifts over the course of the 12 months ended April 30, 2018 but ended up much flatter due largely to increased rates on the front end of the curve. 2-year high-grade bond yields increased by 88 basis points to end the period with 1.85% yields. In the 10-year range, those yields also increased, but by only 35 basis points, ending the fiscal year at 2.49%.
Performance for the fiscal year reflects that bear flattener, with shorter indices providing weaker returns. The Fund’s benchmark index, the S&P Municipal Bond Intermediate Index, which includes bonds from three to fifteen years, generated a 0.71% total return. S&P’s Municipal Bond Short Index, with bonds only out to a maximum four year maturity, barely eked out a positive total return, posting 0.05% for the 12 months ended April 30, 2018.
Fund performance, relative to the Lipper peer group, was in the fourth quartile for the year ended April 30, 2018. Several factors weighed in which detracted from relative performance. Longer duration bonds performed better over the year, as mentioned above in our bear flattener comment. Some of the funds in this universe are longer in nature, using the full spectrum of the yield curve. As we limit our exposures to bonds with maturities of 15 years and shorter, we were disadvantaged. Likewise, many of the funds in the universe own non-investment grade bonds inside the fund – we limit our positions to investment grade only. During the 12-month period, non-investment grade bonds outperformed. Also, some of our specific positions, like a higher education bond in Massachusetts or a general obligation bond in Illinois, experienced credit spread widening. While our credit opinion on those specific obligors has not changed, the spread widening detracted from relative performance.
One factor helping to offset some of these negative influences was our positioning in lower investment grade bonds. Just as non-investment grade bonds performed well, so did lower investment grade (BBB and A) versus the higher graded bonds. Our overweight to both those lower investment grade categories contributed positively to relative performance.
| * | Performance data quoted represents past performance, which is no guarantee of future results. Investment return and principal value will fluctuate so that an investor’s shares, when redeemed, may be worth more or less than their original cost. The total return shown assumes the reinvestment of all distributions and does not reflect the deduction of taxes that a shareholder would pay on fund distributions or the redemption of shares. The total return for Class A Shares was -4.78%, adjusted for the Fund’s maximum sales charge of 4.50%. Mutual fund performance changes over time and current performance may be lower or higher than what is stated. For the most recent month-end performance, please visit www.wilmingtonfunds.com or call 1-800-836-2211. |
| ** | Standard & Poor’s (“S&P”) Municipal Bond Intermediate Index consists of bonds in the S&P Municipal Bond Index with a minimum maturity of three years and a maximum maturity of up to, but not including, 15 years as measured from the Rebalancing Date. The S&P Municipal Bond Index is a broad, market value-weighted index that seeks to measure the performance of the U.S. municipal bond market. All bonds in the index are exempt from U.S. federal income taxes or subject to the Alternative Minimum Tax (“AMT”). The indices include general obligation bonds, revenue bonds, insured bonds and pre-refunded bonds. Indices are unmanaged and it is not possible to invest directly in an index. |
| *** | Lipper figures represent the average of the total returns reported by all of the mutual funds designated by Lipper, Inc. as falling into the respective category indicated. These figures do not reflect sales charges. |
A bear flattener is a yield-rate environment in which short-term interest rates are increasing at a faster rate than long-term interest rates. This causes the yield curve to flatten as short-term and long-term rates start to converge.
ANNUAL REPORT / April 30, 2018 (unaudited)
| | |
Standard & Poor’s (“S&P”) Municipal Bond Short Index consists of bonds in the S&P Municipal Bond Index with a minimum maturity of 6 months and a maximum maturity of 4 years. Duration is a measure of a security’s price sensitivity to changes in interest rates. Securities with longer durations are more sensitive to changes in interest rates than securities of shorter durations. High yield, lower-rated securities generally entail greater market, credit and liquidity risks than investment grade securities and may include higher volatility and higher risk of default. Credit ratings pertain only to the securities in the portfolio and do not protect fund shares against market risk. Bond prices are sensitive to changes in interest rates and a rise in short-term interest rates could cause a decline in bond prices. Basis Points (“BPS”) is a unit that is equal to 1/100th of 1% and is used to denote the change in a financial instrument. The basis point is commonly used for calculating changes in interest rates, equity indices and the yield of a fixed-income security. Income may be subject to the federal AMT. | | |
April 30, 2018 (unaudited) / ANNUAL REPORT
WILMINGTON MUNICIPAL BOND FUND
The graphs below illustrate the hypothetical investment of $10,0001 in the Class A Shares and $1,000,0001 in the Class I Shares of the Wilmington Municipal Bond Fund from April 30, 2008 to April 30, 2018 compared to the S&P Municipal Bond Intermediate Index.2
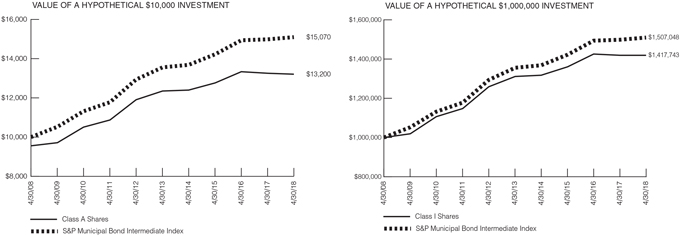
Performance data quoted represents past performance, which is no guarantee of future results. Investment return and principal value will fluctuate so that an investor’s shares, when redeemed, may be worth more or less than their original cost. The total return shown assumes the reinvestment of all distributions and does not reflect the deduction of taxes that a shareholder would pay on fund distributions or the redemption of shares. The total return for Class A Shares was-4.78%, adjusted for the Fund’s maximum sales charge of 4.50%. Mutual fund performance changes over time and current performance may be lower or higher than what is stated. For the most recent month-end performance, please visit www.wilmingtonfunds.com or call 1-800-836-2211.
| | | | | | |
| | Average Annual Total Returns for the Periods Ended 4/30/18 |
| | 1 Year | | 5 Years | | 10 Years |
Class A^ | | -4.78% | | 0.41% | | 2.81% |
Class I^ | | -0.03% | | 1.60% | | 3.55% |
S&P Municipal Bond Intermediate Index2 | | 0.71% | | 2.16% | | 4.19% |
^Expense Ratios Before Waivers and Expense Ratios After Waivers for Class A are 1.09% and 0.74%, respectively. Expense Ratios Before Waivers and Expense Ratios After Waivers for Class I are .84% and 0.49%, respectively. Expense Ratios Before Waiver represent the operating costs borne by the Fund, expressed as a percentage of the Fund’s average net assets, as shown in the Fees and Expenses table in the Fund’s current prospectus (under “Total Annual Fund Operating Expenses”). Current information regarding the Fund’s Operating Expenses can be found in the Fund’s Financial Highlights.
| 1 | Represents a hypothetical investment of $10,000 in Class A of the Fund after deducting the maximum sales charge of 4.50% ($10,000 investment minus $450 sales charge = $9,550) and $1,000,000 in Class I of the Fund and assumes the reinvestment of all dividends and distributions. |
| 2 | The performance for the S&P Municipal Bond Intermediate Index assumes the reinvestment of all dividends and distributions but does not reflect the deduction of a sales charge required for the Fund’s performance by the Securities and Exchange Commission. It is not possible to invest directly in an index and the represented index is unmanaged. |
ANNUAL REPORT / April 30, 2018 (unaudited)
WILMINGTON NEW YORK MUNICIPAL BOND FUND
Management’s Discussion of Fund Performance
For the fiscal year ended April 30, 2018, the Wilmington New York Municipal Bond Fund (the “Fund”) had a total return of -0.75%* for Class A Shares and -0.50%* for Class I Shares, versus its benchmark, the S&P Municipal Bond Intermediate Index**, which had a total return of 0.71%, and its peer group, the Lipper New York Intermediate Municipal Debt Funds Average***, which had a total return of 0.48%.
May of 2017 seems ancient history in light of the municipal market activity of the last five or six months. Triggered by tax reform – discussed in October and November and passed in December – the supply and demand dynamics of the market turned on their sides. By the end of November 2017, issuers and investment bankers were becoming increasingly concerned that Pivate Activity Bonds (“PABs”) and advance refunding were about to disappear. That is when the deluge of issuance began, and by the end of December, $62.502 billion in new deals had come to market, an all-time record for monthly issuance. In fact, the second-highest month of volume was $53.447 billion in October 2016. Worth mentioning is that while PABs narrowly escaped the executioner’s axe, advance refunding did not, which alone will have a negative effect on new issuance—advance refunding issuance accounted for roughly 10% – 13% of supply in 2017. Nevertheless, year-end fatigue carried on uninterrupted into January, and by month-end, the $20.549 billion in supply stood at only 57% of the prior January’s $36.005 billion. While February 2018 lagged the same month in the prior year, the deficit narrowed such that 2018 year-to-date supply ended at 69% for the same period in 2017. By the close of first quarter 2018, new issuance stood at $65.772 billion versus $91.981 billion for the same period last year.
The relatively small decrease in the top marginal tax rate for individuals is not expected to have a meaningful impact on their buying decisions, but the same cannot be said for the corporate buyers. Banks and property & casualty insurers provide about 25% of the overall demand for tax-exempt municipals and the shift from a 35% top bracket to 21% is meaningful. While we have expected these institutional owners of municipal bonds to gradually shift a portion of their investments to other asset classes, we witnessed an increase in bids wanted coming from bank portfolios in the first quarter. These sell decisions may have been accelerated by an accounting change imposed by the Financial Accounting Standards Board on banks and their amortization of bond premiums.
Overall, the yield curve had many shifts over the course of the 12 months ended April 30, 2018 but ended up much flatter due largely to increased rates on the front end of the curve. 2-year high-grade bond yields increased by 88 basis points to end the period with 1.85% yields. In the 10-year range, those yields also increased, but by only 35 basis points, ending the fiscal year at 2.49%.
Performance for the fiscal year reflects that bear flattener, with shorter indices providing weaker returns. The Fund’s benchmark index, the S&P Municipal Bond Intermediate Index, which includes bonds from three to fifteen years, generated a 0.71% total return. S&P’s Municipal Bond Short Index, with bonds only out to a maximum four year maturity, barely eked out a positive total return, posting 0.05% for the 12 months ended April 30, 2018.
Fund performance, relative to the Lipper peer group, was in the fourth quartile for the year ended April 30, 2018. Several factors weighed in which detracted from relative performance. Longer duration bonds performed better over the year, as mentioned above in our bear flattener comment. Some of the funds in this universe are longer in nature, using the full spectrum of the yield curve. As we limit our exposures to bonds with maturities of 15 years and shorter, we were disadvantaged. Likewise, many of the funds in the universe own non-investment grade bonds inside the fund – we limit our positions to investment grade only. During the 12-month period, non-investment grade bonds outperformed. Also, some of our specific positions, like an airport revenue bond in the New York City metro area, experienced credit spread widening. While our credit opinion on that specific obligor has not changed, the spread widening detracted from relative performance.
One factor helping to offset some of these negative influences was our positioning in lower investment grade bonds. Just as non-investment grade bonds performed well, so did lower investment grade (BBB and A) versus the higher graded bonds. Our overweight to single A rated issues contributed positively to relative performance.
| * | Performance data quoted represents past performance, which is no guarantee of future results. Investment return and principal value will fluctuate so that an investor’s shares, when redeemed, may be worth more or less than their original cost. The total return shown assumes the reinvestment of all distributions and does not reflect the deduction of taxes that a shareholder would pay on fund distributions or the redemption of shares. The total return for Class A Shares was -5.24%, adjusted for the Fund’s maximum sales charge of 4.50%. Mutual fund performance changes over time and current performance may be lower or higher than what is stated. For the most recent month-end performance, please visit www.wilmingtonfunds.com or call 1-800-836-2211. |
| ** | Standard & Poor’s (“S&P”) Municipal Bond Intermediate Index consists of bonds in the S&P Municipal Bond Index with a minimum maturity of three years and a maximum maturity of up to, but not including, 15 years as measured from the Rebalancing Date. The S&P Municipal Bond Index is a broad, market value-weighted index that seeks to measure the performance of the U.S. municipal bond market. All bonds in the index are exempt from U.S. federal income taxes or subject to the Alternative Minimum Tax (“AMT”). The indices include general obligation bonds, revenue bonds, insured bonds and pre-refunded bonds. Indices are unmanaged and it is not possible to invest directly in an index. |
| *** | Lipper figures represent the average of the total returns reported by all of the mutual funds designated by Lipper, Inc. as falling into the respective category indicated. These figures do not reflect sales charges. |
A bear flattener is a yield-rate environment in which short-term interest rates are increasing at a faster rate than long-term interest rates. This causes the yield curve to flatten as short-term and long-term rates start to converge.
April 30, 2018 (unaudited) / ANNUAL REPORT
Standard & Poor’s (“S&P”) Municipal Bond Short Index consists of bonds in the S&P Municipal Bond Index with a minimum maturity of 6 months and a maximum maturity of 4 years.
Duration is a measure of a security’s price sensitivity to changes in interest rates. Securities with longer durations are more sensitive to changes in interest rates than securities of shorter durations.
High yield, lower-rated securities generally entail greater market, credit and liquidity risks than investment grade securities and may include higher volatility and higher risk of default.
Credit ratings pertain only to the securities in the portfolio and do not protect fund shares against market risk.
Bond prices are sensitive to changes in interest rates and a rise in short-term interest rates could cause a decline in bond prices.
Basis Points (“BPS”) is a unit that is equal to 1/100th of 1% and is used to denote the change in a financial instrument. The basis point is commonly used for calculating changes in interest rates, equity indices and the yield of a fixed-income security.
Income may be subject to the federal AMT.
ANNUAL REPORT / April 30, 2018 (unaudited)
WILMINGTON NEW YORK MUNICIPAL BOND FUND
The graphs below illustrate the hypothetical investment of $10,0001 in the Class A Shares and $1,000,0001 in the Class I Shares of the Wilmington New York Municipal Bond Fund from April 30, 2008 to April 30, 2018 compared to the S&P Municipal Bond Intermediate Index.2
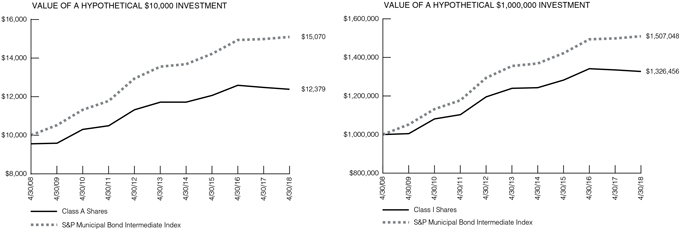
Performance data quoted represents past performance, which is no guarantee of future results. Investment return and principal value will fluctuate so that an investor’s shares, when redeemed, may be worth more or less than their original cost. The total return shown assumes the reinvestment of all distributions and does not reflect the deduction of taxes that a shareholder would pay on fund distributions or the redemption of shares. The total return for Class A Shares was -5.24%, adjusted for the Fund’s maximum sales charge of 4.50%. Mutual fund performance changes over time and cur-rent performance may be lower or higher than what is stated. For the most recent month-end performance, please visit www.wilmingtonfunds.com or call 1-800-836-2211.
| | | | | | |
| | Average Annual Total Returns for the Periods Ended 4/30/18 |
| | | 1 Year | | 5 Years | | 10 Years |
Class A^ | | -5.24% | | 0.19% | | 2.16% |
Class I^ | | -0.50% | | 1.38% | | 2.87% |
S&P Municipal Bond Intermediate Index2 | | 0.71% | | 2.16% | | 4.19% |
^Expense Ratios Before Waivers and Expense Ratios After Waivers for Class A are 1.25% and 0.84%, respectively. Expense Ratios Before Waivers and Expense Ratios After Waivers for Class I are 1.00% and 0.59%, respectively. Expense Ratios Before Waiver represent the operating costs borne by the Fund, expressed as a percentage of the Fund’s average net assets, as shown in the Fees and Expenses table in the Fund’s current prospectus (under “Total Annual Fund Operating Expenses”). Current information regarding the Fund’s Operating Expenses can be found in the Fund’s Financial Highlights.
| 1 | Represents a hypothetical investment of $10,000 in Class A of the Fund after deducting the maximum sales charge of 4.50% ($10,000 investment minus $450 sales charge = $9,550) and $1,000,000 in Class I of the Fund and assumes the reinvestment of all dividends and distributions. |
| 2 | The performance for the S&P Municipal Bond Intermediate Index assumes the reinvestment of all dividends and distributions but does not reflect the deduction of a sales charge required for the Fund’s performance by the Securities and Exchange Commission. It is not possible to invest directly in an index and the represented index is unmanaged. |
April 30, 2018 (unaudited) / ANNUAL REPORT
SHAREHOLDER EXPENSE EXAMPLE (unaudited)
As a shareholder of the Funds, you incur two types of costs: (1) transaction costs, including sales charges (loads) on purchase payments, reinvested dividends, or other distributions; and redemption fees; and (2) ongoing costs, including management fees; distribution and/or service (12b-1) fees; and other Fund expenses. This Example is intended to help you to understand your ongoing costs (in dollars) of investing in the Funds and to compare these costs with the ongoing costs of investing in other mutual funds. It is based on an investment of $1,000 invested at the beginning of the period and held for the entire period from November 1, 2017 to April 30, 2018.
Actual Expenses
This section of the following table provides information about actual account values and actual expenses. You may use the information in this section, together with the amount you invested, to estimate the expenses that you incurred over the period. Simply divide your account value by $1,000 (for example, an $8,600 account value divided by $1,000 = 8.6), then multiply the result by the number in the first section under the heading entitled “Expenses Paid During Period” to estimate the expenses attributable to your investment during this period.
Hypothetical Example for Comparison Purposes
This section of the following table provides information about hypothetical account values and hypothetical expenses based on the Fund’s actual expense ratios and assumed rates of return of 5% per year before expenses, which are not the Fund’s actual returns. Thus, you should not use the hypothetical account values and expenses to estimate the actual ending account balance or your expenses for the period. Rather, these figures are required to be provided to enable you to compare the ongoing costs of investing in the Funds with other funds. To do so, compare this 5% hypothetical example with the 5% hypothetical examples that appear in the shareholder reports of the other funds.
Please note that the expenses shown in the table are meant to highlight your ongoing costs only. Therefore, the Annualized Net Expense Ratio section of the table is useful in comparing ongoing costs only, and will not help you determine the relative total costs of owning different funds.
The Annualized Net Expense Ratios may be different from the net expense ratios in the Financial Highlights which are for the fiscal year ended April 30, 2018.
| | | | | | | | | | | | | | | | |
| | | Beginning Account Value
11/01/17 | | | Ending Account Value
4/30/18 | | | Expenses Paid During Period1 | | | Annualized Net Expense Ratio2 | |
| | | | |
WILMINGTON BROAD MARKET BOND FUND | | | | | | | | | | | | | | | | |
Actual | | | | | | | | | | | | | | | | |
Class A | | | $1,000.00 | | | | $979.30 | | | | $4.17 | | | | 0.85% | |
Class I | | | $1,000.00 | | | | $980.40 | | | | $2.50 | | | | 0.51% | |
Hypothetical (assuming a 5% return before expense) | | | | | | | | | | | | | | | | |
Class A | | | $1,000.00 | | | | $1,020.58 | | | | $4.26 | | | | 0.85% | |
Class I | | | $1,000.00 | | | | $1,022.27 | | | | $2.56 | | | | 0.51% | |
| | | | |
WILMINGTON INTERMEDIATE-TERM BOND FUND | | | | | | | | | | | | | | | | |
Actual | | | | | | | | | | | | | | | | |
Class A | | | $1,000.00 | | | | $981.70 | | | | $4.03 | | | | 0.82% | |
Class I | | | $1,000.00 | | | | $983.30 | | | | $2.46 | | | | 0.50% | |
Hypothetical (assuming a 5% return before expense) | | | | | | | | | | | | | | | | |
Class A | | | $1,000.00 | | | | $1,020.73 | | | | $4.11 | | | | 0.82% | |
Class I | | | $1,000.00 | | | | $1,022.32 | | | | $2.51 | | | | 0.50% | |
| | | | |
WILMINGTON SHORT-TERM BOND FUND | | | | | | | | | | | | | | | | |
Actual | | | | | | | | | | | | | | | | |
Class A | | | $1,000.00 | | | | $994.90 | | | | $3.61 | | | | 0.73% | |
Class I | | | $1,000.00 | | | | $996.10 | | | | $2.38 | | | | 0.48% | |
Hypothetical (assuming a 5% return before expense) | | | | | | | | | | | | | | | | |
Class A | | | $1,000.00 | | | | $1,021.17 | | | | $3.66 | | | | 0.73% | |
Class I | | | $1,000.00 | | | | $1,022.41 | | | | $2.41 | | | | 0.48% | |
ANNUAL REPORT / April 30, 2018 (unaudited)
| | | | | | | | | | | | | | | | |
| | | Beginning Account Value
11/01/17 | | | Ending Account Value
4/30/18 | | | Expenses Paid During Period1 | | | Annualized Net Expense Ratio2 | |
WILMINGTON MUNICIPAL BOND FUND | | | | | | | | | | | | | | | | |
Actual | | | | | | | | | | | | | | | | |
Class A | | | $1,000.00 | | | | $ 980.00 | | | | $3.63 | | | | 0.74% | |
Class I | | | $1,000.00 | | | | $ 981.90 | | | | $2.41 | | | | 0.49% | |
Hypothetical (assuming a 5% return before expense) | | | | | | | | | | | | | | | | |
Class A | | | $1,000.00 | | | | $1,021.12 | | | | $3.71 | | | | 0.74% | |
Class I | | | $1,000.00 | | | | $1,022.36 | | | | $2.46 | | | | 0.49% | |
| | | | |
WILMINGTON NEW YORK MUNICIPAL BOND FUND | | | | | | | | | | | | | | | | |
Actual | | | | | | | | | | | | | | | | |
Class A | | | $1,000.00 | | | | $ 978.50 | | | | $4.07 | | | | 0.83% | |
Class I | | | $1,000.00 | | | | $ 980.70 | | | | $2.85 | | | | 0.58% | |
Hypothetical (assuming a 5% return before expense) | | | | | | | | | | | | | | | | |
Class A | | | $1,000.00 | | | | $1,020.68 | | | | $4.16 | | | | 0.83% | |
Class I | | | $1,000.00 | | | | $1,021.92 | | | | $2.91 | | | | 0.58% | |
| (1) | Expenses are equal to the Funds’ annualized net expense ratios, multiplied by the average account value over the period, multiplied by 181/365 (to reflect the most recent one-half year period). |
| (2) | Expense ratio does not reflect the indirect expenses of the underlying funds in which it invests. |
April 30, 2018 (unaudited) / ANNUAL REPORT
PORTFOLIO OF INVESTMENTS SUMMARY TABLE
Wilmington Broad Market Bond Fund
At April 30, 2018, the Fund’s portfolio composition was as follows (unaudited):
| | | | | |
| | | Percentage of |
| | | Total Net Assets |
Corporate Bonds | | | | 44.6 | % |
U.S. Treasury | | | | 31.4 | % |
Mortgage-Backed Securities | | | | 18.9 | % |
Commercial Paper | | | | 2.9 | % |
Government Agencies | | | | 1.0 | % |
Collateralized Mortgage Obligations | | | | 0.6 | % |
Enhanced Equipment Trust Certificates | | | | 0.2 | % |
Asset-Backed Security | | | | 0.1 | % |
Cash Equivalents1 | | | | 4.9 | % |
Other Assets and Liabilities – Net2 | | | | (4.6 | )% |
| | | | | |
| |
TOTAL | | | | 100.0 | % |
| | | | | |
| | | | | |
| Credit Quality Diversification3 | | Percentage of |
| | Total Net Assets |
U.S. Government Agency Securities | | | | 20.5 | % |
U.S. Treasury | | | | 31.4 | % |
AAA / Aaa | | | | 0.2 | % |
AA / Aa | | | | 1.1 | % |
A / A | | | | 9.8 | % |
BBB / Baa | | | | 32.0 | % |
BB / Ba | | | | 1.8 | % |
Not Rated | | | | 7.8 | % |
Other Assets and Liabilities – Net2 | | | | (4.6 | )% |
| | | | | |
| |
TOTAL | | | | 100.0 | % |
| | | | | |
| (1) | Cash Equivalents include investments in a money market fund and repurchase agreements. |
| (2) | Assets, other than investments in securities, less liabilities. See Statements of Assets and Liabilities. |
| (3) | For financial reporting purposes, the Credit Quality Diversification table reflects the lowest rating assigned by either Moody’s Investors Service or Standard and Poor’s if the ratings differ. These rating agencies are independent, nationally recognized statistical rating organizations and are widely used. Investment grade ratings are credit ratings of BBB/Baa or higher. Below investment grade ratings are credit ratings of BB/Ba or lower. Investments designated as “Not Rated” are not rated by either rating agency and do not necessarily indicate low credit quality. Credit quality ratings are subject to change. |
PORTFOLIO OF INVESTMENTS
April 30, 2018
| | | | | | | | |
Description | | | Par Value | | | | Value | |
| | |
ASSET-BACKED SECURITY — 0.1% | | | | | | | | |
| | |
FINANCIAL SERVICES — 0.1% | | | | | | | | |
| | |
LA Arena Funding LLC, | | | | | | | | |
Series 1999-1, Class A, 7.66%, 12/15/26W | | $ | 393,714 | | | $ | 403,402 | |
| | |
TOTAL ASSET-BACKED SECURITY (COST $393,714) | | | | | | $ | 403,402 | |
| |
COLLATERALIZED MORTGAGE OBLIGATIONS — 0.6% | | | | | |
| |
FEDERAL HOME LOAN MORTGAGE CORPORATION (FHLMC) — 0.2% | | | | | |
| | |
Pool Q33547, 3.50%, 5/01/45 | | | 1,072,099 | | | | 1,066,472 | |
|
FEDERAL NATIONAL MORTGAGE ASSOCIATION (FNMA) — 0.3% | |
| | |
Series 1988-23, Class C, 9.75%, 9/25/18 | | | 38 | | | | 38 | |
| | | | | | | | |
Description | | | Par Value | | | | Value | |
| | |
Series 2005-29, Class WC, 4.75%, 4/25/35 | | $ | 24,621 | | | $ | 25,895 | |
| | |
Series 2012-114, Class VM, 3.50%, 10/25/25 | | | 1,682,717 | | | | 1,703,522 | |
| |
TOTAL FEDERAL NATIONAL MORTGAGE ASSOCIATION (FNMA) | | | $ | 1,729,455 | |
| | |
WHOLE LOAN – 0.1% | | | | | | | | |
| | |
Banc of America Mortgage Securities, Inc., | | | | | | | | |
Series 2004-A, Class 2A1, 3.86%, 2/25/34D | | | 88,125 | | | | 90,361 | |
| | |
Countrywide Home Loan Mortgage | | | | | | | | |
Pass-Through Trust, | | | | | | | | |
Series 2004-8, Class 2A1, 4.50%, 6/25/19 | | | 37,283 | | | | 37,410 | |
| | |
IndyMac INDA Mortgage Loan Trust, Series 2005-AR1, Class 2A1, 4.02%, 11/25/35D | | | 162,173 | | | | 154,762 | |
ANNUAL REPORT / April 30, 2018
| | |
| 19 | | PORTFOLIOS OF INVESTMENTS Wilmington Broad Market Bond Fund (continued) |
| | | | | | | | |
Description | | Par Value | | | Value | |
| | |
WaMu Mortgage Pass-Through Certificates, | | | | | | | | |
Series 2004-CB1, Class 1A, 5.25%, 6/25/19 | | $ | 108,014 | | | $ | 108,836 | |
| | |
TOTAL WHOLE LOAN | | | | | | $ | 391,369 | |
| | |
TOTAL COLLATERALIZED MORTGAGE OBLIGATIONS (COST $3,399,827) | | | | | | $ | 3,187,296 | |
| | |
COMMERCIAL PAPER – 2.9%t | | | | | | | | |
| | |
COMMERCIAL PAPER – 2.9% | | | | | | | | |
| | |
Anheuser-Busch InBev SA, 2.32%, 7/05/18 | | | 1,000,000 | | | | 996,030 | |
| | |
McCormick & Co., 2.19%, 5/01/18 | | | 7,000,000 | | | | 6,999,584 | |
| | |
Unitedhealth Group, Inc., 1.93%, 5/01/18 | | | 7,000,000 | | | | 6,999,633 | |
| | |
TOTAL COMMERCIAL PAPER | | | | | | $ | 14,995,247 | |
| | |
TOTAL COMMERCIAL PAPER (COST $14,995,929) | | | | | | $ | 14,995,247 | |
| | |
CORPORATE BONDS – 44.6% | | | | | | | | |
| | |
AEROSPACE & DEFENSE – 1.6% | | | | | | | | |
| | |
L3 Technologies, Inc., Company Guaranteed, 4.75%, 7/15/20 | | | 1,000,000 | | | | 1,029,208 | |
| | |
Lockheed Martin Corp., Sr. Unsecured, 1.85%, 11/23/18 | | | 2,000,000 | | | | 1,993,771 | |
| | |
Lockheed Martin Corp., Sr. Unsecured, 4.70%, 5/15/46 | | | 975,000 | | | | 1,032,685 | |
| | |
Northrop Grumman Corp., Sr. Unsecured, 2.93%, 1/15/25 | | | 1,000,000 | | | | 949,176 | |
| | |
Northrop Grumman Corp., Sr. Unsecured, 4.03%, 10/15/47 | | | 1,765,000 | | | | 1,640,871 | |
| | |
Rockwell Collins, Inc., Sr. Unsecured, 3.50%, 3/15/27 | | | 1,600,000 | | | | 1,517,226 | |
| | |
TOTAL AEROSPACE & DEFENSE | | | | | | $ | 8,162,937 | |
| | |
AUTOMOTIVE – 1.7% | | | | | | | | |
| | |
Daimler Finance North America LLC, Company Guaranteed, 1.50%, 7/05/19W | | | 2,000,000 | | | | 1,968,835 | |
| | |
Daimler Finance North America LLC, Company Guaranteed, 2.30%, 1/06/20W | | | 2,000,000 | | | | 1,973,692 | |
| | |
Daimler Finance North America LLC, Company Guaranteed, 3.88%, 9/15/21#W | | | 250,000 | | | | 254,123 | |
| | |
Ford Motor Credit Co. LLC, Sr. Unsecured, 5.75%, 2/01/21 | | | 500,000 | | | | 527,937 | |
| | |
Ford Motor Credit Co. LLC, Sr. Unsecured, 4.25%, 9/20/22 | | | 450,000 | | | | 453,939 | |
| | |
General Motors Co., Sr. Unsecured, 6.25%, 10/02/43 | | | 1,000,000 | | | | 1,063,070 | |
| | |
General Motors Financial Co., Inc., Company Guaranteed, 2.40%, 5/09/19 | | | 1,430,000 | | | | 1,422,299 | |
| | |
General Motors Financial Co., Inc., Company Guaranteed, 2.35%, 10/04/19 | | | 1,000,000 | | | | 989,772 | |
| | |
TOTAL AUTOMOTIVE | | | | | | $ | 8,653,667 | |
| | | | | | | | |
Description | | Par Value | | | Value | |
| | |
BEVERAGES – 0.8% | | | | | | | | |
| | |
Anheuser-Busch InBev Finance, Inc., Company Guaranteed, 4.90%, 2/01/46 | | $ | 1,125,000 | | | $ | 1,162,577 | |
| | |
Dr. Pepper Snapple Group, Inc., Company Guaranteed, 2.60%, 1/15/19 | | | 1,900,000 | | | | 1,895,352 | |
| | |
Dr. Pepper Snapple Group, Inc., Company Guaranteed, 2.53%, 11/15/21 | | | 1,000,000 | | | | 967,071 | |
| | |
TOTAL BEVERAGES | | | | | | $ | 4,025,000 | |
| | |
BIOTECHNOLOGY – 1.9% | | | | | | | | |
| | |
Amgen, Inc., Sr. Unsecured, 2.13%, 5/01/20 | | | 2,000,000 | | | | 1,963,238 | |
| | |
Amgen, Inc., Sr. Unsecured, 4.40%, 5/01/45 | | | 2,130,000 | | | | 2,054,603 | |
| | |
Celgene Corp., Sr. Unsecured, 2.25%, 5/15/19 | | | 1,500,000 | | | | 1,490,247 | |
| | |
Celgene Corp., Sr. Unsecured, 2.75%, 2/15/23 | | | 1,305,000 | | | | 1,248,887 | |
| | |
Celgene Corp., Sr. Unsecured, 4.55%, 2/20/48 | | | 2,520,000 | | | | 2,384,893 | |
| | |
Gilead Sciences, Inc., Sr. Unsecured, 4.60%, 9/01/35 | | | 650,000 | | | | 670,133 | |
| | |
TOTAL BIOTECHNOLOGY | | | | | | $ | 9,812,001 | |
| | |
BUILDING PRODUCTS – 0.0%** | | | | | | | | |
| | |
Johnson Controls International PLC, (Current rate until maturity), Sr. Unsecured, 4.63%, 7/02/44ÿ | | | 100,000 | | | | 100,926 | |
| | |
CAPITAL MARKETS – 1.9% | | | | | | | | |
| | |
Bank of New York Mellon Corp. (The), Subordinated, MTN, 3.00%, 10/30/28 | | | 775,000 | | | | 705,718 | |
| | |
Goldman Sachs Group, Inc. (The), Sr. Unsecured, (3 month USD LIBOR + 1.16%), 3.52%, 4/23/20D | | | 425,000 | | | | 431,651 | |
| | |
Goldman Sachs Group, Inc. (The), Sr. Unsecured, (3 month USD LIBOR + 1.20%), 3.32%, 9/15/20D | | | 1,425,000 | | | | 1,453,409 | |
| | |
Goldman Sachs Group, Inc. (The), Sr. Unsecured, 3.00%, 4/26/22 | | | 915,000 | | | | 895,563 | |
| | |
Goldman Sachs Group, Inc. (The), Sr. Unsecured, (3 month USD LIBOR + 1.20%), 3.27%, 9/29/25D | | | 800,000 | | | | 762,146 | |
| | |
Goldman Sachs Group, Inc. (The), Sr. Unsecured, (3 month USD LIBOR + 1.51%), 3.69%, 6/05/28D | | | 2,080,000 | | | | 1,978,760 | |
| | |
Morgan Stanley, Sr. Unsecured, GMTN, (3 month USD LIBOR + 0.55%), 2.29%, 2/10/21D | | | 1,625,000 | | | | 1,629,798 | |
| | |
Morgan Stanley, Sr. Unsecured, MTN, 3.13%, 7/27/26 | | | 340,000 | | | | 316,689 | |
| | |
Morgan Stanley, Subordinated, GMTN, 4.35%, 9/08/26 | | | 505,000 | | | | 502,029 | |
| | |
TD Ameritrade Holding Corp., Sr. Unsecured, 2.95%, 4/01/22 | | | 847,000 | | | | 833,139 | |
| | |
TOTAL CAPITAL MARKETS | | | | | | $ | 9,508,902 | |
April 30, 2018 / ANNUAL REPORT
| | |
PORTFOLIOS OF INVESTMENTS Wilmington Broad Market Bond Fund (continued) | | 20 |
| | | | | | | | |
Description | | Par Value | | | Value | |
| | |
COMMERCIAL BANKS – 4.9% | | | | | | | | |
| | |
BB&T Corp., Sr. Unsecured, MTN, 2.45%, 1/15/20 | | $ | 1,640,000 | | | $ | 1,623,121 | |
| | |
BB&T Corp., Sr. Unsecured, MTN, (3 month USD LIBOR + 0.65%), 2.96%, 4/01/22D | | | 2,000,000 | | | | 2,020,727 | |
| | |
Branch Banking & Trust Co., Subordinated, 3.80%, 10/30/26 | | | 1,000,000 | | | | 995,795 | |
| | |
Fifth Third Bancorp, Sr. Unsecured, 3.50%, 3/15/22 | | | 1,250,000 | | | | 1,251,123 | |
| | |
Fifth Third Bancorp, Subordinated, 4.30%, 1/16/24 | | | 530,000 | | | | 539,153 | |
| | |
Fifth Third Bank, Sr. Unsecured, BKNT, 1.63%, 9/27/19 | | | 2,000,000 | | | | 1,964,642 | |
| | |
KeyBank NA, Sr. Unsecured, 1.70%, 6/01/18 | | | 2,500,000 | | | | 2,498,359 | |
| | |
KeyCorp, Sr. Unsecured, MTN, 2.90%, 9/15/20 | | | 750,000 | | | | 745,654 | |
| | |
PNC Bank NA, Sr. Unsecured, BKNT, 2.40%, 10/18/19 | | | 1,500,000 | | | | 1,490,255 | |
| | |
PNC Bank NA, Subordinated, BKNT, 2.95%, 1/30/23 | | | 350,000 | | | | 339,665 | |
| | |
PNC Financial Services Group, Inc. (The), Subordinated, 3.90%, 4/29/24 | | | 1,500,000 | | | | 1,506,785 | |
| | |
SunTrust Banks, Inc., Sr. Unsecured, 2.50%, 5/01/19 | | | 2,000,000 | | | | 1,995,813 | |
| | |
SunTrust Banks, Inc., Sr. Unsecured, 2.90%, 3/03/21 | | | 1,475,000 | | | | 1,459,565 | |
| | |
Toronto-Dominion Bank (The), Sr. Unsecured, GMTN, 1.75%, 7/23/18# | | | 2,500,000 | | | | 2,496,776 | |
| | |
US Bancorp, Subordinated, MTN, 2.95%, 7/15/22 | | | 2,000,000 | | | | 1,962,343 | |
| | |
US Bank NA, Sr. Unsecured, BKNT, 2.13%, 10/28/19 | | | 2,000,000 | | | | 1,981,458 | |
| | | | | | | | |
| | |
TOTAL COMMERCIAL BANKS | | | | | | $ | 24,871,234 | |
| | |
COMMERCIAL FINANCE – 0.0%** | | | | | | | | |
| | |
General Electric Co., Subordinated, 5.30%, 2/11/21 | | | 250,000 | | | | 262,339 | |
| |
COMMERCIAL SERVICES & SUPPLIES – 0.4% | | | | | |
| | |
Total System Services, Inc., Sr. Unsecured, 2.38%, 6/01/18D | | | 1,900,000 | | | | 1,899,383 | |
| | |
CONSUMER FINANCE – 1.1% | | | | | | | | |
| | |
American Express Co., Sr. Unsecured, (3 month USD LIBOR + 0.59%), 2.49%, 5/22/18 | | | 655,000 | | | | 655,056 | |
| | |
American Express Credit Corp., Sr. Unsecured, MTN, 1.70%, 10/30/19 | | | 800,000 | | | | 786,851 | |
| | |
American Express Credit Corp., Sr. Unsecured, MTN, 2.20%, 3/03/20 | | | 1,000,000 | | | | 986,699 | |
| | |
Capital One Financial Corp., Sr. Unsecured, 2.45%, 4/24/19 | | | 750,000 | | | | 748,059 | |
| | |
Capital One Financial Corp., Sr. Unsecured, 2.40%, 10/30/20 | | | 1,365,000 | | | | 1,332,942 | |
| | | | | | | | |
Description | | Par Value | | | Value | |
| | |
Capital One NA, Sr. Unsecured, 2.35%, 1/31/20 | | $ | 1,000,000 | | | $ | 984,596 | |
| | | | | | | | |
| | |
TOTAL CONSUMER FINANCE | | | | | | $ | 5,494,203 | |
| |
DIVERSIFIED FINANCIAL SERVICES – 2.9% | | | | | |
| | |
Bank of America Corp., Sr. Unsecured, MTN, 3.25%, 10/21/27 | | | 1,095,000 | | | | 1,018,758 | |
| | |
Bank of America Corp., Subordinated, MTN, 4.25%, 10/22/26 | | | 1,000,000 | | | | 987,086 | |
| | |
Berkshire Hathaway Finance Corp., Company Guaranteed, 4.30%, 5/15/43 | | | 425,000 | | | | 434,569 | |
| | |
BlackRock, Inc., Series 2, Sr. Unsecured, 5.00%, 12/10/19 | | | 250,000 | | | | 258,685 | |
| | |
Charles Schwab Corp. (The), Sr. Unsecured, 2.20%, 7/25/18 | | | 1,370,000 | | | | 1,369,797 | |
| | |
Charles Schwab Corp. (The), Sr. Unsecured, 4.45%, 7/22/20 | | | 250,000 | | | | 257,919 | |
| | |
Citigroup, Inc., Sr. Unsecured, 6.13%, 5/15/18 | | | 275,000 | | | | 275,382 | |
| | |
Citigroup, Inc., Sr. Unsecured, (3 month USD LIBOR + 0.95%), 2.88%, 7/24/23D | | | 2,060,000 | | | | 1,994,124 | |
| | |
Citigroup, Inc., Subordinated, 4.13%, 7/25/28 | | | 1,650,000 | | | | 1,584,647 | |
| | |
FMR LLC, Sr. Unsecured, 6.45%, 11/15/39W | | | 1,000,000 | | | | 1,287,360 | |
| | |
JPMorgan Chase & Co., Sr. Unsecured, 4.63%, 5/10/21 | | | 100,000 | | | | 103,946 | |
| | |
JPMorgan Chase & Co., Sr. Unsecured, MTN, 2.30%, 8/15/21 | | | 700,000 | | | | 678,701 | |
| | |
JPMorgan Chase & Co., Series W, Jr. Subordinated, (3 month USD LIBOR + 1.00%), 2.84%, 5/15/47D | | | 1,000,000 | | | | 900,978 | |
| | |
Wells Fargo & Co., Sr. Unsecured, 2.10%, 7/26/21 | | | 2,000,000 | | | | 1,922,255 | |
| | |
Wells Fargo & Co., Subordinated, MTN, 4.40%, 6/14/46 | | | 2,075,000 | | | | 1,937,446 | |
| | | | | | | | |
| | |
TOTAL DIVERSIFIED FINANCIAL SERVICES | | | | | | $ | 15,011,653 | |
| | |
ELECTRIC – 2.1% | | | | | | | | |
| | |
Baltimore Gas & Electric Co., Sr. Unsecured, 3.50%, 8/15/46 | | | 1,550,000 | | | | 1,389,481 | |
| | |
Commonwealth Edison Co., 1st Mortgage, 3.80%, 10/01/42 | | | 1,000,000 | | | | 956,450 | |
| | |
Consolidated Edison, Inc., Sr. Unsecured, 2.00%, 5/15/21 | | | 750,000 | | | | 721,448 | |
| | |
Dominion Energy, Inc., Sr. Unsecured, 2.50%, 12/01/19 | | | 1,500,000 | | | | 1,483,444 | |
| | |
DTE Energy Co., Series F, Sr. Unsecured, 3.85%, 12/01/23 | | | 305,000 | | | | 306,993 | |
| | |
Entergy Arkansas, Inc., 1st Mortgage, 4.95%, 12/15/44 | | | 1,000,000 | | | | 1,016,236 | |
| | |
Entergy Corp., Sr. Unsecured, 5.13%, 9/15/20 | | | 1,300,000 | | | | 1,339,781 | |
ANNUAL REPORT / April 30, 2018
| | |
| 21 | | PORTFOLIOS OF INVESTMENTS Wilmington Broad Market Bond Fund (continued) |
| | | | | | | | |
Description | | Par Value | | | Value | |
| | |
FirstEnergy Corp., Sr. Unsecured, 3.90%, 7/15/27 | | $ | 800,000 | | | $ | 781,538 | |
| | |
FirstEnergy Transmission LLC, Sr. Unsecured, 4.35%, 1/15/25W | | | 2,250,000 | | | | 2,291,230 | |
| | |
System Energy Resources, Inc., 1st Mortgage, 4.10%, 4/01/23 | | | 500,000 | | | | 503,777 | |
| | | | | | | | |
| | |
TOTAL ELECTRIC | | | | | | $ | 10,790,378 | |
| | |
ELECTRONICS – 0.4% | | | | | | | | |
| | |
Corning, Inc., Sr. Unsecured, 1.50%, 5/08/18 | | | 2,000,000 | | | | 1,999,693 | |
| | |
ENVIRONMENTAL CONTROL – 0.5% | | | | | | | | |
| | |
Waste Management, Inc., Company Guaranteed, 3.50%, 5/15/24 | | | 1,255,000 | | | | 1,246,294 | |
| | |
Waste Management, Inc., Company Guaranteed, 4.10%, 3/01/45 | | | 1,520,000 | | | | 1,511,763 | |
| | | | | | | | |
| | |
TOTAL ENVIRONMENTAL CONTROL | | | | | | $ | 2,758,057 | |
| | |
FOOD – 0.1% | | | | | | | | |
| | |
Kraft Heinz Foods Co., Company Guaranteed, 5.20%, 7/15/45 | | | 500,000 | | | | 496,839 | |
| | |
FOOD & STAPLES RETAILING – 0.7% | | | | | | | | |
| | |
Kroger Co. (The), Sr. Unsecured, 2.95%, 11/01/21 | | | 1,750,000 | | | | 1,723,739 | |
| | |
Kroger Co. (The), Sr. Unsecured, 2.80%, 8/01/22 | | | 2,060,000 | | | | 1,993,290 | |
| | | | | | | | |
| | |
TOTAL FOOD & STAPLES RETAILING | | | | | | $ | 3,717,029 | |
| | |
FOREST PRODUCTS & PAPER – 0.6% | | | | | | | | |
| | |
International Paper Co., Sr. Unsecured, 4.75%, 2/15/22 | | | 1,665,000 | | | | 1,731,594 | |
| | |
International Paper Co., Sr. Unsecured, 4.40%, 8/15/47 | | | 1,500,000 | | | | 1,374,933 | |
| | | | | | | | |
| | |
TOTAL FOREST PRODUCTS & PAPER | | | | | | $ | 3,106,527 | |
| |
HEALTH CARE EQUIPMENT & SUPPLIES – 1.3% | | | | | |
| | |
Abbott Laboratories, Sr. Unsecured, 2.35%, 11/22/19 | | | 803,000 | | | | 796,190 | |
| | |
Becton Dickinson & Co., Sr. Unsecured, 3.70%, 6/06/27 | | | 3,000,000 | | | | 2,845,122 | |
| | |
Thermo Fisher Scientific, Inc., Sr. Unsecured, 4.70%, 5/01/20 | | | 1,000,000 | | | | 1,030,344 | |
| | |
Thermo Fisher Scientific, Inc., Sr. Unsecured, 3.30%, 2/15/22 | | | 1,100,000 | | | | 1,091,499 | |
| | |
Zimmer Biomet Holdings, Inc., Sr. Unsecured, (3 month USD LIBOR + 0.75%), 2.93%, 3/19/21D | | | 1,000,000 | | | | 1,003,218 | |
| | | | | | | | |
| | |
TOTAL HEALTH CARE EQUIPMENT & SUPPLIES | | | | | | $ | 6,766,373 | |
| |
HEALTH CARE PROVIDERS & SERVICES – 1.6% | | | | | |
| | |
Anthem, Inc., Sr. Unsecured, 2.30%, 7/15/18 | | | 2,500,000 | | | | 2,499,346 | |
| | |
Anthem, Inc., Sr. Unsecured, 3.65%, 12/01/27 | | | 1,650,000 | | | | 1,570,908 | |
| | |
Cardinal Health, Inc., Sr. Unsecured, 3.08%, 6/15/24 | | | 2,080,000 | | | | 1,966,158 | |
| | | | | | | | |
Description | | Par Value | | | Value | |
| | |
Cardinal Health, Inc., Sr. Unsecured, 4.50%, 11/15/44 | | $ | 650,000 | | | $ | 625,306 | |
| | |
UnitedHealth Group, Inc., Sr. Unsecured, 2.95%, 10/15/27 | | | 1,350,000 | | | | 1,262,195 | |
| | |
UnitedHealth Group, Inc., Sr. Unsecured, 3.95%, 10/15/42 | | | 290,000 | | | | 278,282 | |
| | | | | | | | |
| | |
TOTAL HEALTH CARE PROVIDERS & SERVICES | | | | | | $ | 8,202,195 | |
| | |
HOME FURNISHINGS – 0.3% | | | | | | | | |
| | |
Whirlpool Corp., Sr. Unsecured, 4.70%, 6/01/22 | | | 1,500,000 | | | | 1,558,661 | |
| | |
HOUSEHOLD PRODUCTS – 0.2% | | | | | | | | |
| | |
Church & Dwight Co., Inc., Sr. Unsecured, 3.95%, 8/01/47 | | | 870,000 | | | | 782,972 | |
| | |
INSURANCE – 2.5% | | | | | | | | |
| | |
American International Group, Inc., Sr. Unsecured, 4.20%, 4/01/28 | | | 1,000,000 | | | | 992,594 | |
| | |
Aon PLC, Company Guaranteed, 4.00%, 11/27/23 | | | 1,450,000 | | | | 1,473,100 | |
| | |
CNA Financial Corp., Sr. Unsecured, 5.75%, 8/15/21 | | | 1,000,000 | | | | 1,066,540 | |
| | |
CNA Financial Corp., Sr. Unsecured, 3.95%, 5/15/24 | | | 950,000 | | | | 946,576 | |
| | |
Lincoln National Corp., Sr. Unsecured, 4.20%, 3/15/22# | | | 1,000,000 | | | | 1,024,591 | |
| | |
Lincoln National Corp., Sr. Unsecured, 3.63%, 12/12/26 | | | 1,380,000 | | | | 1,334,183 | |
| | |
MetLife, Inc., Series A, Sr. Unsecured, 6.82%, 8/15/18 | | | 3,000,000 | | | | 3,040,080 | |
| | |
Principal Financial Group, Inc., Company Guaranteed, 3.30%, 9/15/22 | | | 250,000 | | | | 248,046 | |
| | |
WR Berkley Corp., Sr. Unsecured, 4.63%, 3/15/22 | | | 1,000,000 | | | | 1,033,251 | |
| | |
WR Berkley Corp., Sr. Unsecured, 4.75%, 8/01/44 | | | 1,715,000 | | | | 1,725,263 | |
| | | | | | | | |
| | |
TOTAL INSURANCE | | | | | | $ | 12,884,224 | |
| | |
MEDIA – 1.2% | | | | | | | | |
| | |
21st Century Fox America, Inc., Company Guaranteed, 4.75%, 11/15/46 | | | 1,000,000 | | | | 1,056,627 | |
| | |
CBS Corp., Company Guaranteed, 4.60%, 1/15/45 | | | 1,100,000 | | | | 1,044,589 | |
| | |
Charter Communications Operating LLC, Sr. Secured, 3.58%, 7/23/20 | | | 1,500,000 | | | | 1,504,342 | |
| | |
Discovery Communications LLC, Company Guaranteed, 3.95%, 3/20/28 | | | 1,000,000 | | | | 950,762 | |
| | |
Time Warner, Inc., Company Guaranteed, 4.85%, 7/15/45 | | | 1,190,000 | | | | 1,163,311 | |
| | |
Walt Disney Co. (The), Sr. Unsecured, GMTN, 4.13%, 6/01/44# | | | 565,000 | | | | 572,568 | |
| | | | | | | | |
| | |
TOTAL MEDIA | | | | | | $ | 6,292,199 | |
| | |
METALS & MINING – 0.2% | | | | | | | | |
| | |
Barrick Gold Corp., Sr. Unsecured, 5.25%, 4/01/42 | | | 1,000,000 | | | | 1,075,437 | |
April 30, 2018 / ANNUAL REPORT
| | |
PORTFOLIOS OF INVESTMENTS Wilmington Broad Market Bond Fund (continued) | | 22 |
| | | | | | | | |
Description | | Par Value | | | Value | |
| |
MISCELLANEOUS MANUFACTURING – 0.5% | | | | | |
| | |
Ingersoll-Rand Luxembourg Finance SA, | | | | | | | | |
Company Guaranteed, 2.63%, 5/01/20 | | $ | 1,135,000 | | | $ | 1,123,244 | |
| | |
Textron, Inc., | | | | | | | | |
Sr. Unsecured, 3.65%, 3/01/21 | | | 480,000 | | | | 482,824 | |
| | |
Textron, Inc., | | | | | | | | |
Sr. Unsecured, 3.88%, 3/01/25 | | | 750,000 | | | | 742,895 | |
| | | | | | | | |
| | |
TOTAL MISCELLANEOUS MANUFACTURING | | | | | | $ | 2,348,963 | |
| | |
OIL & GAS – 2.9% | | | | | | | | |
| | |
Canadian Natural Resources Ltd., | | | | | | | | |
Sr. Unsecured, GMTN, 4.95%, 6/01/47 | | | 1,000,000 | | | | 1,035,473 | |
| | |
Chevron Corp., | | | | | | | | |
Sr. Unsecured, 1.72%, 6/24/18 | | | 2,000,000 | | | | 1,998,423 | |
| | |
Exxon Mobil Corp., | | | | | | | | |
Sr. Unsecured, 1.82%, 3/15/19 | | | 925,000 | | | | 920,313 | |
| | |
Marathon Oil Corp., | | | | | | | | |
Sr. Unsecured, 4.40%, 7/15/27 | | | 1,500,000 | | | | 1,510,724 | |
| | |
Marathon Petroleum Corp., | | | | | | | | |
Sr. Unsecured, 3.63%, 9/15/24 | | | 745,000 | | | | 736,260 | |
| | |
Phillips 66, | | | | | | | | |
Company Guaranteed, 4.30%, 4/01/22 | | | 1,450,000 | | | | 1,507,682 | |
| | |
Schlumberger Holdings Corp., | | | | | | | | |
Sr. Unsecured, 3.63%, 12/21/22W | | | 1,500,000 | | | | 1,505,435 | |
| | |
Sempra Energy, | | | | | | | | |
Sr. Unsecured, 2.85%, 11/15/20 | | | 2,870,000 | | | | 2,838,733 | |
| | |
Sempra Energy, | | | | | | | | |
Sr. Unsecured, 2.90%, 2/01/23 | | | 760,000 | | | | 738,597 | |
| | |
Southern Co. Gas Capital Corp., | | | | | | | | |
Company Guaranteed, 3.95%, 10/01/46 | | | 1,425,000 | | | | 1,309,976 | |
| | |
Valero Energy Corp., | | | | | | | | |
Sr. Unsecured, 4.90%, 3/15/45 | | | 563,000 | | | | 589,344 | |
| | | | | | | | |
| | |
TOTAL OIL & GAS | | | | | | $ | 14,690,960 | |
| | |
PHARMACEUTICALS – 1.4% | | | | | | | | |
| | |
AbbVie, Inc., | | | | | | | | |
Sr. Unsecured, 2.50%, 5/14/20 | | | 1,485,000 | | | | 1,466,959 | |
| | |
AbbVie, Inc., | | | | | | | | |
Sr. Unsecured, 4.40%, 11/06/42 | | | 460,000 | | | | 437,895 | |
| | |
CVS Health Corp., | | | | | | | | |
Sr. Unsecured, 5.05%, 3/25/48 | | | 1,510,000 | | | | 1,535,367 | |
| | |
Express Scripts Holding Co., | | | | | | | | |
Company Guaranteed, 4.80%, 7/15/46 | | | 2,000,000 | | | | 1,947,596 | |
| | |
Medco Health Solutions, Inc., | | | | | | | | |
Sr. Unsecured, 4.13%, 9/15/20 | | | 940,000 | | | | 955,766 | |
| | |
Zoetis, Inc., | | | | | | | | |
Sr. Unsecured, 3.95%, 9/12/47 | | | 1,005,000 | | | | 939,722 | |
| | | | | | | | |
| | |
TOTAL PHARMACEUTICALS | | | | | | $ | 7,283,305 | |
| | |
PIPELINES – 3.2% | | | | | | | | |
| | |
Energy Transfer Partners LP, | | | | | | | | |
Company Guaranteed, 2.50%, 6/15/18 | | | 1,000,000 | | | | 999,964 | |
| | |
Energy Transfer Partners LP, | | | | | | | | |
Company Guaranteed, 3.60%, 2/01/23 | | | 870,000 | | | | 851,914 | |
| | |
Energy Transfer Partners LP, | | | | | | | | |
Company Guaranteed, 5.30%, 4/15/47 | | | 2,250,000 | | | | 2,108,082 | |
| | | | | | | | |
Description | | Par Value | | | Value | |
| | |
Enterprise Products Operating LLC, | | | | | | | | |
Company Guaranteed, 2.80%, 2/15/21 | | $ | 1,075,000 | | | $ | 1,060,816 | |
| | |
Enterprise Products Operating LLC, | | | | | | | | |
Company Guaranteed, 4.95%, 10/15/54 | | | 500,000 | | | | 512,181 | |
| | |
Kinder Morgan Energy Partners LP, | | | | | | | | |
Company Guaranteed, 2.65%, 2/01/19 | | | 1,965,000 | | | | 1,960,613 | |
| | |
Kinder Morgan Energy Partners LP, | | | | | | | | |
Company Guaranteed, 5.40%, 9/01/44 | | | 1,000,000 | | | | 996,698 | |
| | |
Kinder Morgan, Inc., | | | | | | | | |
Company Guaranteed, 5.20%, 3/01/48 | | | 2,040,000 | | | | 2,006,058 | |
| | |
MPLX LP, | | | | | | | | |
Sr. Unsecured, 4.70%, 4/15/48 | | | 1,000,000 | | | | 947,324 | |
| | |
ONEOK Partners LP, | | | | | | | | |
Company Guaranteed, 6.20%, 9/15/43 | | | 1,000,000 | | | | 1,144,063 | |
| | |
Spectra Energy Partners LP, | | | | | | | | |
Sr. Unsecured, 2.95%, 9/25/18 | | | 2,000,000 | | | | 2,002,895 | |
| | |
Spectra Energy Partners LP, | | | | | | | | |
Sr. Unsecured, 3.50%, 3/15/25 | | | 670,000 | | | | 635,538 | |
| | |
Spectra Energy Partners LP, | | | | | | | | |
Sr. Unsecured, 4.50%, 3/15/45 | | | 1,125,000 | | | | 1,055,986 | |
| | | | | | | | |
| | |
TOTAL PIPELINES | | | | | | $ | 16,282,132 | |
| |
REAL ESTATE INVESTMENT TRUSTS – 3.0% | | | | | |
| | |
American Tower Corp., | | | | | | | | |
Sr. Unsecured, 3.40%, 2/15/19 | | | 2,000,000 | | | | 2,007,796 | |
| | |
American Tower Corp., | | | | | | | | |
Sr. Unsecured, 5.00%, 2/15/24 | | | 415,000 | | | | 436,030 | |
| | |
American Tower Corp., | | | | | | | | |
Sr. Unsecured, 3.13%, 1/15/27 | | | 1,000,000 | | | | 906,946 | |
| | |
AvalonBay Communities, Inc., | | | | | | | | |
Sr. Unsecured, GMTN, 3.63%, 10/01/20 | | | 1,145,000 | | | | 1,155,638 | |
| | |
AvalonBay Communities, Inc., | | | | | | | | |
Sr. Unsecured, MTN, 3.35%, 5/15/27 | | | 1,420,000 | | | | 1,359,485 | |
| | |
Digital Realty Trust LP, | | | | | | | | |
Company Guaranteed, 3.40%, 10/01/20 | | | 2,115,000 | | | | 2,121,241 | |
| | |
Digital Realty Trust LP, | | | | | | | | |
Company Guaranteed, 3.63%, 10/01/22 | | | 1,100,000 | | | | 1,094,481 | |
| | |
HCP, Inc., | | | | | | | | |
Sr. Unsecured, 2.63%, 2/01/20 | | | 1,000,000 | | | | 987,919 | |
| | |
HCP, Inc., | | | | | | | | |
Sr. Unsecured, 4.00%, 12/01/22 | | | 2,000,000 | | | | 2,012,537 | |
| | |
HCP, Inc., | | | | | | | | |
Sr. Unsecured, 4.20%, 3/01/24 | | | 450,000 | | | | 449,545 | |
| | |
Health Care REIT, Inc., | | | | | | | | |
Sr. Unsecured, 5.25%, 1/15/22 | | | 250,000 | | | | 262,231 | |
| | |
Healthcare Realty Trust, Inc., | | | | | | | | |
Sr. Unsecured, 3.75%, 4/15/23 | | | 695,000 | | | | 684,834 | |
| | |
Healthcare Realty Trust, Inc., | | | | | | | | |
Sr. Unsecured, 3.88%, 5/01/25 | | | 915,000 | | | | 889,324 | |
| | |
Healthcare Realty Trust, Inc., | | | | | | | | |
Sr. Unsecured, 3.63%, 1/15/28 | | | 800,000 | | | | 746,927 | |
| | | | | | | | |
| | |
TOTAL REAL ESTATE INVESTMENT TRUSTS | | | | | | $ | 15,114,934 | |
| | |
RETAIL – 0.6% | | | | | | | | |
| | |
CVS Health Corp., | | | | | | | | |
Sr. Unsecured, 1.90%, 7/20/18 | | | 2,000,000 | | | | 1,997,902 | |
ANNUAL REPORT / April 30, 2018
| | |
| 23 | | PORTFOLIOS OF INVESTMENTS Wilmington Broad Market Bond Fund (continued) |
| | | | | | | | |
Description | | Par Value | | | Value | |
| | |
Nordstrom, Inc., | | | | | | | | |
Sr. Unsecured, 5.00%, 1/15/44 | | $ | 1,000,000 | | | $ | 909,669 | |
| | | | | | | | |
| | |
TOTAL RETAIL | | | | | | $ | 2,907,571 | |
| | |
SEMICONDUCTORS – 0.2% | | | | | | | | |
| | |
QUALCOMM, Inc., | | | | | | | | |
Sr. Unsecured, 3.25%, 5/20/27 | | | 1,000,000 | | | | 918,814 | |
| | |
SOFTWARE – 0.8% | | | | | | | | |
| | |
Microsoft Corp., | | | | | | | | |
Sr. Unsecured, 4.75%, 11/03/55 | | | 1,000,000 | | | | 1,117,015 | |
| | |
Oracle Corp., | | | | | | | | |
Sr. Unsecured, 4.30%, 7/08/34 | | | 1,730,000 | | | | 1,793,745 | |
| | |
Oracle Corp., | | | | | | | | |
Sr. Unsecured, 4.00%, 7/15/46 | | | 1,300,000 | | | | 1,249,221 | |
| | | | | | | | |
| | |
TOTAL SOFTWARE | | | | | | $ | 4,159,981 | |
| | |
TELECOMMUNICATIONS – 1.4% | | | | | | | | |
| | |
AT&T, Inc., | | | | | | | | |
Sr. Unsecured, 2.38%, 11/27/18 | | | 2,000,000 | | | | 1,999,319 | |
| | |
AT&T, Inc., | | | | | | | | |
Sr. Unsecured, 4.50%, 5/15/35 | | | 845,000 | | | | 808,753 | |
| | |
AT&T, Inc., | | | | | | | | |
Sr. Unsecured, 5.15%, 2/14/50 | | | 1,000,000 | | | | 1,011,500 | |
| | |
Cisco Systems, Inc., | | | | | | | | |
Sr. Unsecured, (3 month USD LIBOR + 0.34%), 2.54%, 9/20/19D | | | 1,600,000 | | | | 1,606,911 | |
| | |
Verizon Communications, Inc., | | | | | | | | |
Sr. Unsecured, 4.86%, 8/21/46 | | | 2,000,000 | | | | 1,963,257 | |
| | | | | | | | |
| | |
TOTAL TELECOMMUNICATIONS | | | | | | $ | 7,389,740 | |
| | |
TRANSPORTATION – 1.1% | | | | | | | | |
| | |
FedEx Corp., | | | | | | | | |
Company Guaranteed, 4.10%, 2/01/45 | | | 685,000 | | | | 636,422 | |
| | |
FedEx Corp., | | | | | | | | |
Company Guaranteed, 4.05%, 2/15/48 | | | 500,000 | | | | 456,266 | |
| | |
Norfolk Southern Corp., | | | | | | | | |
Sr. Unsecured, 5.90%, 6/15/19 | | | 250,000 | | | | 257,798 | |
| | |
Ryder System, Inc., | | | | | | | | |
Sr. Unsecured, MTN, 2.45%, 9/03/19 | | | 2,450,000 | | | | 2,434,300 | |
| | |
Ryder System, Inc., | | | | | | | | |
Sr. Unsecured, MTN, 2.50%, 9/01/22 | | | 980,000 | | | | 938,291 | |
| | |
Union Pacific Corp., | | | | | | | | |
Sr. Unsecured, 4.38%, 11/15/65 | | | 1,000,000 | | | | 958,644 | |
| | | | | | | | |
| | |
TOTAL TRANSPORTATION | | | | | | $ | 5,681,721 | |
| | |
TRUCKING & LEASING – 0.6% | | | | | | | | |
| | |
GATX Corp., | | | | | | | | |
Sr. Unsecured, 3.25%, 9/15/26 | | | 1,065,000 | | | | 980,384 | |
| | |
GATX Corp., | | | | | | | | |
Sr. Unsecured, 3.85%, 3/30/27 | | | 1,500,000 | | | | 1,443,498 | |
| | |
GATX Corp., | | | | | | | | |
Sr. Unsecured, 5.20%, 3/15/44# | | | 640,000 | | | | 681,062 | |
| | | | | | | | |
| | |
TOTAL TRUCKING & LEASING | | | | | | $ | 3,104,944 | |
| | |
TOTAL CORPORATE BONDS (COST $231,453,886) | | | | | | $ | 228,115,894 | |
| | | | | | | | |
Description | | Par Value | | | Value | |
| |
ENHANCED EQUIPMENT TRUST CERTIFICATES – 0.2% | | | | | |
| | |
AIRLINES – 0.2% | | | | | | | | |
| | |
American Airlines 2011-1, Series A, Pass-Through Certificates, 5.25%, 1/31/21 | | $ | 235,153 | | | $ | 242,335 | |
| | |
Continental Airlines 2009-2, Series A, Pass-Through Certificates, 7.25%, 11/10/19 | | | 157,524 | | | | 165,794 | |
| | |
Delta Air Lines, 2007-1, Series A, Pass-Through Certificates, 6.82%, 8/10/22 | | | 233,148 | | | | 255,879 | |
| | |
Delta Air Lines, 2009-1, Series A, Pass-Through Certificates, 7.75%, 12/17/19 | | | 151,353 | | | | 159,534 | |
| | | | | | | | |
| | |
TOTAL AIRLINES | | | | | | $ | 823,542 | |
| | | | | | | | |
| |
TOTAL ENHANCED EQUIPMENT TRUST CERTIFICATES (COST $777,178) | | | $ | 823,542 | |
| | |
GOVERNMENT AGENCIES – 1.0% | | | | | | | | |
| |
FEDERAL HOME LOAN MORTGAGE CORPORATION (FHLMC) – 0.7% | | | | | |
| | |
1.25%, 10/02/19 | | | 1,300,000 | | | | 1,278,298 | |
| | |
1.75%, 5/30/19# | | | 2,000,000 | | | | 1,987,942 | |
| | |
2.38%, 1/13/22 | | | 125,000 | | | | 123,171 | |
| |
TOTAL FEDERAL HOME LOAN MORTGAGE CORPORATION (FHLMC) | | | $ | 3,389,411 | |
| |
FEDERAL NATIONAL MORTGAGE ASSOCIATION
(FNMA) – 0.3% | | | | | |
| | |
6.25%, 5/15/29 | | | 750,000 | | | | 955,943 | |
| | |
7.25%, 5/15/30 | | | 400,000 | | | | 556,195 | |
| | | | | | | | |
| |
TOTAL FEDERAL NATIONAL MORTGAGE ASSOCIATION (FNMA) | | | $ | 1,512,138 | |
| | |
TOTAL GOVERNMENT AGENCIES (COST $4,768,772) | | | | | | $ | 4,901,549 | |
| | |
MORTGAGE-BACKED SECURITIES – 18.9% | | | | | | | | |
| |
FEDERAL HOME LOAN MORTGAGE CORPORATION
(FHLMC) – 8.6% | | | | | |
| | |
Pool B17616, 5.50%, 1/01/20 | | | 31,809 | | | | 31,931 | |
| | |
Pool G12709, 5.00%, 7/01/22 | | | 33,377 | | | | 33,940 | |
| | |
Pool C00478, 8.50%, 9/01/26 | | | 12,507 | | | | 14,507 | |
| | |
Pool E09010, 2.50%, 9/01/27 | | | 900,658 | | | | 884,811 | |
| | |
Pool G18497, 3.00%, 1/01/29 | | | 113,296 | | | | 113,179 | |
| | |
Pool C01272, 6.00%, 12/01/31 | | | 24,212 | | | | 26,883 | |
| | |
Pool A13990, 4.50%, 10/01/33 | | | 29,588 | | | | 31,030 | |
| | |
Pool G01625, 5.00%, 11/01/33 | | | 32,048 | | | | 34,328 | |
| | |
Pool G08097, 6.50%, 11/01/35 | | | 14,647 | | | | 16,527 | |
| | |
Pool G02296, 5.00%, 6/01/36 | | | 170,943 | | | | 183,517 | |
| | |
Pool G02390, 6.00%, 9/01/36 | | | 5,621 | | | | 6,281 | |
| | |
Pool G05317, 5.00%, 4/01/37 | | | 676,971 | | | | 726,794 | |
| | |
Pool G03703, 5.50%, 12/01/37 | | | 17,664 | | | | 19,294 | |
| | |
Pool G04776, 5.50%, 7/01/38 | | | 55,742 | | | | 60,878 | |
| | |
Pool G05500, 5.00%, 5/01/39 | | | 589,938 | | | | 633,056 | |
April 30, 2018 / ANNUAL REPORT
| | |
PORTFOLIOS OF INVESTMENTS Wilmington Broad Market Bond Fund (continued) | | 24 |
| | | | | | | | |
Description | | Par Value | | | Value | |
| | |
Pool A93415, 4.00%, 8/01/40 | | $ | 1,513,440 | | | $ | 1,548,209 | |
| | |
Pool A93505, 4.50%, 8/01/40 | | | 1,170,035 | | | | 1,229,251 | |
| | |
Pool A93996, 4.50%, 9/01/40 | | | 919,035 | | | | 965,474 | |
| | |
Pool G06222, 4.00%, 1/01/41 | | | 1,685,565 | | | | 1,724,505 | |
| | |
Pool A97047, 4.50%, 2/01/41 | | | 910,076 | | | | 956,128 | |
| | |
Pool G06956, 4.50%, 8/01/41 | | | 910,647 | | | | 956,805 | |
| | |
Pool C03750, 3.50%, 2/01/42 | | | 354,747 | | | | 355,455 | |
| | |
Pool C03849, 3.50%, 4/01/42 | | | 180,166 | | | | 179,220 | |
| | |
Pool Q08305, 3.50%, 5/01/42 | | | 1,022,518 | | | | 1,019,047 | |
| | |
Pool C04305, 3.00%, 11/01/42 | | | 2,752,437 | | | | 2,656,230 | |
| | |
Pool C09020, 3.50%, 11/01/42 | | | 2,555,525 | | | | 2,560,627 | |
| | |
Pool G07266, 4.00%, 12/01/42 | | | 2,246,898 | | | | 2,291,012 | |
| | |
Pool C04444, 3.00%, 1/01/43 | | | 100,698 | | | | 97,955 | |
| | |
Pool C09029, 3.00%, 3/01/43 | | | 458,490 | | | | 446,005 | |
| | |
Pool G08534, 3.00%, 6/01/43 | | | 573,920 | | | | 558,294 | |
| | |
Pool Q19476, 3.50%, 6/01/43 | | | 1,047,851 | | | | 1,049,136 | |
| | |
Pool C09044, 3.50%, 7/01/43 | | | 1,217,492 | | | | 1,218,984 | |
| | |
Pool G07889, 3.50%, 8/01/43 | | | 1,124,713 | | | | 1,117,427 | |
| | |
Pool G07624, 4.00%, 12/01/43 | | | 1,039,806 | | | | 1,065,431 | |
| | |
Pool G60038, 3.50%, 1/01/44 | | | 5,464,917 | | | | 5,475,834 | |
| | |
Pool G07680, 4.00%, 4/01/44 | | | 1,708,432 | | | | 1,750,452 | |
| | |
Pool G07943, 4.50%, 8/01/44 | | | 127,351 | | | | 132,614 | |
| | |
Pool G08607, 4.50%, 9/01/44 | | | 783,231 | | | | 815,694 | |
| | |
Pool Q36970, 4.00%, 10/01/45 | | | 535,298 | | | | 546,422 | |
| | |
Pool G60384, 4.50%, 12/01/45 | | | 87,219 | | | | 90,988 | |
| | |
Pool Q39438, 4.00%, 3/01/46 | | | 3,971,876 | | | | 4,054,269 | |
| | |
Pool Q39644, 3.50%, 3/01/46 | | | 4,938,610 | | | | 4,916,482 | |
| | |
Pool G08705, 3.00%, 5/01/46 | | | 337,766 | | | | 326,875 | |
| | |
Pool G08708, 4.50%, 5/01/46 | | | 661,782 | | | | 688,954 | |
| | | | | | | | |
| |
TOTAL FEDERAL HOME LOAN MORTGAGE CORPORATION (FHLMC) | | | $ | 43,610,735 | |
| |
FEDERAL NATIONAL MORTGAGE ASSOCIATION
(FNMA) – 10.3% | | | | | |
| | |
Pool 254759, 4.50%, 6/01/18 | | | 556 | | | | 556 | |
| | |
Pool 254833, 4.50%, 8/01/18 | | | 354 | | | | 354 | |
| | |
Pool 975207, 5.00%, 3/01/23 | | | 36,753 | | | | 37,358 | |
| | |
Pool AE2520, 3.00%, 1/01/26 | | | 408,774 | | | | 406,146 | |
| | |
Pool 329794, 7.00%, 2/01/26 | | | 18,428 | | | | 19,681 | |
| | |
Pool 256639, 5.00%, 2/01/27 | | | 12,989 | | | | 13,830 | |
| | |
Pool 256752, 6.00%, 6/01/27 | | | 20,347 | | | | 22,560 | |
| | |
Pool 402255, 6.50%, 12/01/27 | | | 1,300 | | | | 1,332 | |
| | |
Pool AB8997, 2.50%, 4/01/28 | | | 193,918 | | | | 188,736 | |
| | |
Pool AS4480, 2.50%, 2/01/30 | | | 1,198,781 | | | | 1,170,810 | |
| | |
Pool AS7462, 2.50%, 6/01/31 | | | 466,940 | | | | 454,451 | |
| | |
Pool 254007, 6.50%, 10/01/31 | | | 13,250 | | | | 14,799 | |
| | |
Pool 638023, 6.50%, 4/01/32 | | | 52,603 | | | | 56,826 | |
| | |
Pool 642345, 6.50%, 5/01/32 | | | 49,579 | | | | 56,175 | |
| | |
Pool 651292, 6.50%, 7/01/32 | | | 66,082 | | | | 68,858 | |
| | | | | | | | |
Description | | Par Value | | | Value | |
| | |
Pool 686398, 6.00%, 3/01/33 | | $ | 149,368 | | | $ | 162,058 | |
| | |
Pool 745412, 5.50%, 12/01/35 | | | 22,409 | | | | 24,487 | |
| | |
Pool 888789, 5.00%, 7/01/36 | | | 245,085 | | | | 263,220 | |
| | |
Pool 256515, 6.50%, 12/01/36 | | | 14,894 | | | | 16,642 | |
| | |
Pool AE0217, 4.50%, 8/01/40 | | | 144,219 | | | | 151,464 | |
| | |
Pool AB1796, 3.50%, 11/01/40 | | | 913,324 | | | | 915,429 | |
| | |
Pool AH5583, 4.50%, 2/01/41 | | | 417,867 | | | | 438,863 | |
| | |
Pool 890551, 4.50%, 8/01/41 | | | 85,724 | | | | 90,032 | |
| | |
Pool AL0658, 4.50%, 8/01/41 | | | 498,153 | | | | 523,189 | |
| | |
Pool AL1319, 4.50%, 10/01/41 | | | 935,627 | | | | 975,929 | |
| | |
Pool AL6302, 4.50%, 10/01/41 | | | 869,636 | | | | 913,424 | |
| | |
Pool AX5302, 4.00%, 1/01/42 | | | 1,460,205 | | | | 1,499,018 | |
| | |
Pool AK4523, 4.00%, 3/01/42 | | | 1,647,097 | | | | 1,680,978 | |
| | |
Pool AL2034, 4.50%, 4/01/42 | | | 196,863 | | | | 206,731 | |
| | |
Pool AB7936, 3.00%, 2/01/43 | | | 1,745,042 | | | | 1,683,674 | |
| | |
Pool AL3761, 4.50%, 2/01/43 | | | 317,419 | | | | 333,146 | |
| | |
Pool MA1458, 3.00%, 6/01/43 | | | 526,498 | | | | 511,895 | |
| | |
Pool AT7899, 3.50%, 7/01/43 | | | 3,189,571 | | | | 3,168,836 | |
| | |
Pool AS0302, 3.00%, 8/01/43 | | | 4,753,904 | | | | 4,621,932 | |
| | |
Pool AU4279, 3.00%, 9/01/43 | | | 921,658 | | | | 896,087 | |
| | |
Pool AL5537, 4.50%, 4/01/44 | | | 403,495 | | | | 423,788 | |
| | |
Pool AS3155, 4.00%, 8/01/44 | | | 108,225 | | | | 110,262 | |
| | |
Pool AX0833, 3.50%, 9/01/44 | | | 1,010,983 | | | | 1,005,981 | |
| | |
Pool AL6325, 3.00%, 10/01/44 | | | 3,065,014 | | | | 2,979,989 | |
| | |
Pool AS5136, 4.00%, 6/01/45 | | | 449,981 | | | | 459,213 | |
| | |
Pool AZ7362, 4.00%, 11/01/45 | | | 1,216,974 | | | | 1,239,831 | |
| | |
Pool AZ9565, 3.50%, 12/01/45 | | | 1,997,242 | | | | 1,984,877 | |
| | |
Pool BC0326, 3.50%, 12/01/45 | | | 1,577,460 | | | | 1,566,719 | |
| | |
Pool BC0245, 3.00%, 2/01/46 | | | 855,515 | | | | 825,945 | |
| | |
Pool BC0830, 3.00%, 4/01/46 | | | 1,276,706 | | | | 1,232,539 | |
| | |
Pool AS7568, 4.50%, 7/01/46 | | | 259,588 | | | | 270,784 | |
| | |
Pool MA2771, 3.00%, 10/01/46 | | | 516,102 | | | | 497,912 | |
| | |
Pool AS8276, 3.00%, 11/01/46 | | | 1,745,644 | | | | 1,684,126 | |
| | |
Pool BC9003, 3.00%, 11/01/46 | | | 1,557,677 | | | | 1,502,772 | |
| | |
Pool BE3767, 3.50%, 7/01/47 | | | 2,167,857 | | | | 2,153,031 | |
| | |
Pool BH2618, 3.50%, 8/01/47 | | | 622,221 | | | | 617,967 | |
| | |
Pool MA3088, 4.00%, 8/01/47 | | | 2,321,723 | | | | 2,365,603 | |
| | |
Pool BH4010, 4.50%, 9/01/47 | | | 2,032,235 | | | | 2,120,657 | |
| | |
Pool BJ0639, 4.00%, 3/01/48 | | | 846,720 | | | | 862,937 | |
| | |
Pool TBA, 5.00%, 5/01/48 | | | 6,700,000 | | | | 7,111,422 | |
| | | | | | | | |
| |
TOTAL FEDERAL NATIONAL MORTGAGE ASSOCIATION (FNMA) | | | $ | 52,605,861 | |
| |
GOVERNMENT NATIONAL MORTGAGE ASSOCIATION (GNMA) – 0.0%** | | | | | |
| | |
Pool 354677, 7.50%, 10/15/23 | | | 13,329 | | | | 15,384 | |
| | |
Pool 354713, 7.50%, 12/15/23 | | | 11,474 | | | | 13,173 | |
| | |
Pool 354765, 7.00%, 2/15/24 | | | 22,811 | | | | 24,534 | |
ANNUAL REPORT / April 30, 2018
| | |
| 25 | | PORTFOLIOS OF INVESTMENTS Wilmington Broad Market Bond Fund (continued) |
| | | | | | | | |
Description | | Par Value | | | Value | |
| | |
Pool 354827, 7.00%, 5/15/24 | | $ | 17,576 | | | $ | 18,462 | |
| | |
Pool 360869, 7.50%, 5/15/24 | | | 18,343 | | | | 18,861 | |
| | |
Pool 385623, 7.00%, 5/15/24 | | | 24,158 | | | | 25,988 | |
| | |
Pool 2077, 7.00%, 9/20/25 | | | 6,982 | | | | 7,571 | |
| | |
Pool 503405, 6.50%, 4/15/29 | | | 19,836 | | | | 21,208 | |
| | | | | | | | |
| |
TOTAL GOVERNMENT NATIONAL MORTGAGE ASSOCIATION (GNMA) | | | $ | 145,181 | |
| | | | | | | | |
| |
TOTAL MORTGAGE-BACKED SECURITIES (COST $99,918,585) | | | $ | 96,361,777 | |
| | |
U.S. TREASURY – 31.4% | | | | | | | | |
| | |
U.S. TREASURY BONDS – 4.8% | | | | | | | | |
| | |
2.50%, 2/15/45 | | | 2,135,000 | | | | 1,897,929 | |
| | |
2.50%, 2/15/46 | | | 280,000 | | | | 247,991 | |
| | |
2.88%, 8/15/45 | | | 300,000 | | | | 286,895 | |
| | |
3.00%, 5/15/42 | | | 500,000 | | | | 492,917 | |
| | |
3.00%, 11/15/44 | | | 2,000,000 | | | | 1,961,382 | |
| | |
3.00%, 5/15/45 | | | 2,000,000 | | | | 1,960,137 | |
| | |
3.00%, 11/15/45 | | | 765,000 | | | | 749,396 | |
| | |
3.00%, 2/15/47 | | | 1,098,000 | | | | 1,074,409 | |
| | |
3.00%, 5/15/47 | | | 1,695,000 | | | | 1,657,789 | |
| | |
3.13%, 8/15/44 | | | 6,637,000 | | | | 6,659,227 | |
| | |
3.63%, 2/15/44 | | | 2,106,000 | | | | 2,300,310 | |
| | |
3.63%, 8/15/43 | | | 881,000 | | | | 961,732 | |
| | |
3.75%, 11/15/43 | | | 365,000 | | | | 406,605 | |
| | |
5.25%, 2/15/29# | | | 500,000 | | | | 605,676 | |
| | |
5.38%, 2/15/31 | | | 600,000 | | | | 753,089 | |
| | |
6.25%, 5/15/30 | | | 500,000 | | | | 665,541 | |
| | |
6.38%, 8/15/27# | | | 450,000 | | | | 575,613 | |
| | |
8.88%, 2/15/19# | | | 1,130,000 | | | | 1,188,488 | |
| | | | | | | | |
| | |
TOTAL U.S. TREASURY BONDS | | | | | | $ | 24,445,126 | |
| | |
U.S. TREASURY NOTES – 26.6% | | | | | | | | |
| | |
1.13%, 6/15/18# | | | 1,000,000 | | | | 999,299 | |
| | |
1.25%, 10/31/18# | | | 2,085,000 | | | | 2,076,907 | |
| | |
1.25%, 1/31/19 | | | 250,000 | | | | 248,251 | |
| | |
1.38%, 3/31/20 | | | 3,300,000 | | | | 3,232,240 | |
| | |
1.38%, 6/30/18 | | | 5,300,000 | | | | 5,295,903 | |
| | |
1.38%, 9/30/18 | | | 1,240,000 | | | | 1,236,925 | |
| | |
1.38%, 2/28/19 | | | 2,500,000 | | | | 2,482,133 | |
| | |
1.50%, 12/31/18 | | | 2,486,000 | | | | 2,475,594 | |
| | |
1.50%, 1/31/19 | | | 9,400,000 | | | | 9,351,878 | |
| | |
1.50%, 5/31/19# | | | 535,000 | | | | 530,431 | |
| | |
1.50%, 11/30/19 | | | 1,145,000 | | | | 1,128,628 | |
| | |
1.63%, 3/31/19# | | | 820,000 | | | | 815,296 | |
| | |
1.63%, 11/30/20 | | | 1,710,000 | | | | 1,669,010 | |
| | |
1.63%, 5/31/23 | | | 12,400,000 | | | | 11,707,787 | |
| | |
1.63%, 2/15/26 | | | 3,000,000 | | | | 2,727,680 | |
| | | | | | | | |
Description | | Par Value | | | Value | |
| | |
1.63%, 5/15/26 | | $ | 4,695,000 | | | $ | 4,255,634 | |
| | |
1.63%, 8/15/22 | | | 6,000,000 | | | | 5,726,838 | |
| | |
1.63%, 11/15/22 | | | 1,928,000 | | | | 1,834,209 | |
| | |
1.75%, 9/30/19 | | | 5,700,000 | | | | 5,647,845 | |
| | |
1.75%, 3/31/22 | | | 5,000,000 | | | | 4,818,646 | |
| | |
1.75%, 5/15/22 | | | 380,000 | | | | 365,785 | |
| | |
1.75%, 5/15/23 | | | 2,000,000 | | | | 1,901,477 | |
| | |
1.88%, 6/30/20 | | | 5,845,000 | | | | 5,764,173 | |
| | |
2.00%, 11/15/21 | | | 1,000,000 | | | | 976,687 | |
| | |
2.00%, 4/30/24 | | | 10,195,000 | | | | 9,710,502 | |
| | |
2.00%, 2/15/25 | | | 4,655,000 | | | | 4,396,028 | |
| | |
2.00%, 8/15/25 | | | 295,000 | | | | 277,162 | |
| | |
2.00%, 11/15/26 | | | 4,180,000 | | | | 3,882,927 | |
| | |
2.13%, 6/30/22 | | | 6,615,000 | | | | 6,455,431 | |
| | |
2.13%, 5/15/25 | | | 2,500,000 | | | | 2,374,603 | |
| | |
2.13%, 8/15/21 | | | 3,750,000 | | | | 3,683,639 | |
| | |
2.25%, 7/31/18 | | | 500,000 | | | | 500,475 | |
| | |
2.25%, 7/31/21 | | | 6,600,000 | | | | 6,512,072 | |
| | |
2.25%, 11/15/25 | | | 230,000 | | | | 219,472 | |
| | |
2.38%, 8/15/24 | | | 5,600,000 | | | | 5,436,287 | |
| | |
2.50%, 3/31/23# | | | 7,000,000 | | | | 6,906,730 | |
| | |
2.50%, 8/15/23 | | | 200,000 | | | | 196,899 | |
| | |
2.63%, 11/15/20# | | | 500,000 | | | | 500,436 | |
| | |
2.75%, 2/15/28 | | | 6,000,000 | | | | 5,900,006 | |
| | |
3.13%, 5/15/19 | | | 750,000 | | | | 756,249 | |
| | |
3.63%, 2/15/20 | | | 750,000 | | | | 765,066 | |
| | |
4.00%, 8/15/18 | | | 500,000 | | | | 502,976 | |
| | | | | | | | |
| | |
TOTAL U.S. TREASURY NOTES | | | | | | $ | 136,246,216 | |
| | | | | | | | |
| | |
TOTAL U.S. TREASURY (COST $164,472,049) | | | | | | $ | 160,691,342 | |
| | | | | | | | |
| | | Number of
Shares | | | | |
| | |
MONEY MARKET FUND – 1.0% | | | | | | | | |
| | |
Dreyfus Government Cash Management Fund, Institutional Shares, 1.60%^ | | | 4,978,823 | | | $ | 4,978,823 | |
| | | | | | | | |
| | |
TOTAL MONEY MARKET FUND | | | | | | | | |
(COST $4,978,823) | | | | | | $ | 4,978,823 | |
| | | | | | | | |
| |
TOTAL INVESTMENTS IN SECURITIES – 100.7% | | | | | |
(COST $525,158,763) | | | | | | $ | 514,458,872 | |
| | | | | | | | |
April 30, 2018 / ANNUAL REPORT
| | |
PORTFOLIOS OF INVESTMENTS Wilmington Broad Market Bond Fund (continued) | | 26 |
| | | | | | | | |
Description | | Par Value | | | Value | |
|
CASH COLLATERAL INVESTED FOR SECURITIES ON LOAN – 3.9% | |
| |
REPURCHASE AGREEMENTS – 3.9% | | | | | |
| | |
Barclays Capital, Inc., 1.71%, dated 4/30/18, due 5/01/18, repurchase price $977,187, collateralized by U.S. Treasury Securities, 0.00% to 3.00%, maturing 7/31/19 to 9/09/49; total market value of $996,684 | | $ | 977,141 | | | $ | 977,141 | |
| | |
Daiwa Capital Markets America, 1.72%, dated 4/30/18, due 5/01/18, repurchase price $3,772,714, collateralized by U.S. Government & Treasury Securities, 0.00% to 9.13%, maturing 5/15/18 to 12/01/51; total market value of $3,847,985 | | | 3,772,534 | | | | 3,772,534 | |
| | |
HSBC Securities USA, Inc., 1.72%, dated 4/30/18, due 5/01/18, repurchase price $3,772,714, collateralized by U.S. Government Securities, 2.50% to 6.50%, maturing 3/01/22 to 4/01/48; total market value of $3,847,987 | | | 3,772,534 | | | | 3,772,534 | |
| | |
NBC Global Finance Ltd., 1.74%, dated 4/30/18, due 5/01/18, repurchase price $3,772,716, collateralized by U.S. Treasury Securities, 0.00% to 3.63%, maturing 6/30/19 to 9/09/49; total market value of $3,847,976 | | | 3,772,534 | | | | 3,772,534 | |
| | |
Nomura Securities International, Inc., 1.74%, dated 4/30/18, due 5/01/18, repurchase price $3,772,716, collateralized by U.S. Government Securities, 0.00% to 10.50%, maturing 5/01/18 to 3/20/68; total market value of $3,847,984 | | | 3,772,534 | | | | 3,772,534 | |
| | | | | | | | |
Description | | Par Value | | | Value | |
| | |
RBC Dominion Securities, Inc., 1.72%, dated 4/30/18, due 5/01/18, repurchase price $3,772,714, collateralized by U.S. Government & Treasury Securities, 0.13% to 7.00%, maturing 10/31/18 to 9/09/49; total market value of $3,847,985. | | $ | 3,772,534 | | | $ | 3,772,534 | |
| | | | | | | | |
| |
TOTAL CASH COLLATERAL INVESTED FOR SECURITIES ON LOAN (COST $19,839,811) | | | $ | 19,839,811 | |
| | | | | | | | |
| |
TOTAL INVESTMENTS – 104.6% (COST $544,998,574) | | | $ | 534,298,683 | |
| |
COLLATERAL FOR SECURITIES ON LOAN – (3.9%) | | | | (19,839,811 | ) |
| |
OTHER LIABILITIES LESS ASSETS – (0.7%) | | | | (3,445,370 | ) |
| | | | | | | | |
| |
TOTAL NET ASSETS – 100.0% | | | $ | 511,013,502 | |
| | | | | | | | |
Cost of investments for Federal income tax purposes is $544,998,574. The net unrealized appreciation/(depreciation) of investments was $(10,699,891). This consists of net unrealized appreciation from investment for those securities having an excess of value over cost of $2,991,665 and net unrealized depreciation from investments for those securities having an excess of cost over value of $(13,691,556).
ANNUAL REPORT / April 30, 2018
| | |
| 27 | | PORTFOLIOS OF INVESTMENTS Wilmington Broad Market Bond Fund (concluded) |
Various inputs are used in determining the value of the Fund’s investments. These inputs are summarized in the three broad levels listed below.
Level 1 – quoted prices in active markets for identical securities
Level 2 – other significant observable inputs (including quoted prices for similar securities, interest rates, prepayment speeds, credit risk, etc.)
Level 3 – significant unobservable inputs (including the Fund’s own assumptions in determining the fair value of investments)
The following is a summary of the inputs used as of April 30, 2018 in valuing the Fund’s assets carried at fair value:
| | | | | | | | | | | | | | | | | | |
| | | Level 1 | | | Level 2 | | | Level 3 | | | Total | | | |
| | | | | |
Investments in Securities | | | | | | | | | | | | | | | | | | |
| | | | | |
Asset-Backed Security | | $ | — | | | $ | 403,402 | | | $ | — | | | $ | 403,402 | | | |
| | | | | |
Collateralized Mortgage Obligations | | | — | | | | 3,187,296 | | | | — | | | | 3,187,296 | | | |
| | | | | |
Commercial Paper | | | — | | | | 14,995,247 | | | | — | | | | 14,995,247 | | | |
| | | | | |
Corporate Bonds | | | — | | | | 228,115,894 | | | | — | | | | 228,115,894 | | | |
| | | | | |
Enhanced Equipment Trust Certificates | | | — | | | | 823,542 | | | | — | | | | 823,542 | | | |
| | | | | |
Government Agencies | | | — | | | | 4,901,549 | | | | — | | | | 4,901,549 | | | |
| | | | | |
Mortgage-Backed Securities | | | — | | | | 96,361,777 | | | | — | | | | 96,361,777 | | | |
| | | | | |
U.S. Treasury | | | — | | | | 160,691,342 | | | | — | | | | 160,691,342 | | | |
| | | | | |
Money Market Fund | | | 4,978,823 | | | | — | | | | — | | | | 4,978,823 | | | |
| | | | | |
Repurchase Agreements | | | �� | | | | 19,839,811 | | | | — | | | | 19,839,811 | | | |
| | | | | | | | | | | | | | | | | | |
Total | | $ | 4,978,823 | | | $ | 529,319,860 | | | $ | — | | | $ | 534,298,683 | | | |
| | | | | | | | | | | | | | | | | | |
| # | Security, or a portion thereof, is on loan. See Note 2 in Notes to Financial Statements. |
| D | Variable rate security. The rate disclosed is the rate in effect on the report date. The Information in parenthesis represents the benchmark and reference rate for each relevant security and the rate floats based upon the reference rate and spread. The security may be further subject to interest rate floor and caps. Certain variable rate securities are not based on a published reference rate and spread, but are determined by the issuer or agent and are based on current market conditions, or, for mortgage-backed securities, are impacted by the individual mortgages which are paying off over time. These securities do not indicate a reference rate and spread in their descriptions. |
| ◆ | The rate shown reflects the effective yield at purchase date. |
| W | Denotes a restricted security that may be resold without restriction to “qualified institutional buyers” as defined in Rule 144A under the Securities Act of 1933 and that the Fund has determined to be liquid under criteria established by the Fund’s Board of Trustees. At April 30, 2018, these liquid restricted securities amounted to $9,684,077 representing 1.90% of total net assets. |
| ÿ | Step coupon security. The rate disclosed is the rate in effect on the report date. |
| ** | Represents less than 0.05% |
| | | | | | | | | | |
| | The following acronyms are used throughout this Fund: | | LLC | | Limited Liability Corporation |
| | BKNT | | Bank Note | | | | LP | | Limited Partnership |
| | FHLMC | | Federal Home Loan Mortgage Corporation | | | | MTN | | Medium Term Note |
| | FNMA | | Federal National Mortgage Association | | | | NA | | National Association |
| | GMTN | | Global Medium Term Note | | | | PLC | | Public Limited Company |
| | GNMA | | Government National Mortgage Association | | | | REIT | | Real Estate Investment Trust |
| | LIBOR | | London Interbank Offered Rate | | | | TBA | | To Be Announced Security |
See Notes which are an integral part of the Financial Statements
April 30, 2018 / ANNUAL REPORT
PORTFOLIO OF INVESTMENTS SUMMARY TABLE
Wilmington Intermediate-Term Bond Fund
At April 30, 2018, the Fund’s portfolio composition was as follows (unaudited):
| | | | | |
| | | Percentage of Total Net Assets |
Corporate Bonds | | | | 59.7 | % |
U.S. Treasury | | | | 31.3 | % |
Government Agencies | | | | 3.1 | % |
Commercial Paper | | | | 2.4 | % |
Mortgage-Backed Securities | | | | 1.3 | % |
Adjustable Rate Mortgage4 | | | | 0.0 | % |
Cash Equivalents1 | | | | 3.1 | % |
Other Assets and Liabilities – Net2 | | | | (0.9 | )% |
| | | | | |
| |
TOTAL | | | | 100.0 | % |
| | | | | |
| | | | | |
| Credit Quality Diversification3 | | Percentage of Total Net Assets |
U.S. Government Agency Securities | | | | 4.4 | % |
U.S. Treasury | | | | 31.3 | % |
AAA / Aaa | | | | 0.6 | % |
AA / Aa | | | | 1.5 | % |
A / A | | | | 13.9 | % |
BBB / Baa | | | | 41.1 | % |
BB / Ba | | | | 2.6 | % |
Not Rated | | | | 5.5 | % |
Other Assets and Liabilities – Net2 | | | | (0.9 | )% |
| | | | | |
| |
TOTAL | | | | 100.0 | % |
| | | | | |
| (1) | Cash Equivalents include investments in a money market fund and repurchase agreements. |
| (2) | Assets, other than investments in securities, less liabilities. See Statements of Assets and Liabilities. |
| (3) | For financial reporting purposes, the Credit Quality Diversification table reflects the lowest rating assigned by either Moody’s Investors Service or Standard and Poor’s if the ratings differ. These rating agencies are independent, nationally recognized statistical rating organizations and are widely used. Investment grade ratings are credit ratings of BBB/Baa or higher. Below investment grade ratings are credit ratings of BB/Ba or lower. Investments designated as “Not Rated” are not rated by either rating agency and do not necessarily indicate low credit quality. Credit quality ratings are subject to change. |
| (4) | Represent less than 0.05%. |
PORTFOLIO OF INVESTMENTS
April 30, 2018
| | | | | | | | |
| | |
| Description | | Par Value | | | Value | |
| |
ADJUSTABLE RATE MORTGAGE – 0.0%** | | | | | |
| |
FEDERAL NATIONAL MORTGAGE ASSOCIATION (FNMA) – 0.0%** | | | | | |
| | |
Pool 612514, (12 month USD LIBOR + 1.72%), 3.59%, 5/01/33D | | $ | 21,318 | | | $ | 22,304 | |
| | | | | | | | |
TOTAL ADJUSTABLE RATE MORTGAGE | | | | | |
(COST $21,288) | | | | | | $ | 22,304 | |
| | |
COMMERCIAL PAPER – 2.4%t | | | | | | | | |
| | |
COMMERCIAL PAPER – 2.4% | | | | | | | | |
| | |
McCormick & Co., 2.19%, 5/01/18 | | | 1,000,000 | | | | 999,941 | |
| | |
UnitedHealth Group, Inc., 1.93%, 5/01/18 | | | 1,000,000 | | | | 999,948 | |
TOTAL COMMERCIAL PAPER | | | | | | | | |
(COST $2,000,000) | | | | | | $ | 1,999,889 | |
| | | | | | | | |
| | |
| Description | | Par Value | | | Value | |
|
| CORPORATE BONDS – 59.7% | |
|
AEROSPACE & DEFENSE – 1.8% | |
| | |
L3 Technologies, Inc., | | | | | | | | |
Company Guaranteed, 4.75%, 7/15/20 | | $ | 750,000 | | | $ | 771,906 | |
| | |
Lockheed Martin Corp., | | | | | | | | |
Sr. Unsecured, 3.10%, 1/15/23 | | | 500,000 | | | | 493,756 | |
| | |
Rockwell Collins, Inc., | | | | | | | | |
Sr. Unsecured, 1.95%, 7/15/19 | | | 150,000 | | | | 148,166 | |
| | |
United Technologies Corp., | | | | | | | | |
Sr. Unsecured, 1.50%, 11/01/19 | | | 150,000 | | | | 147,093 | |
| | | | | | | | |
| | |
TOTAL AEROSPACE & DEFENSE | | | | | | $ | 1,560,921 | |
| | |
AUTO MANUFACTURERS – 0.3% | | | | | | | | |
| | |
General Motors Co., | | | | | | | | |
Sr. Unsecured, 3.50%, 10/02/18 | | | 220,000 | | | | 220,805 | |
ANNUAL REPORT / April 30, 2018
| | |
| 29 | | PORTFOLIOS OF INVESTMENTS Wilmington Intermediate-Term Bond Fund (continued) |
| | | | | | | | |
| | |
| Description | | Par Value | | | Value | |
| | |
AUTOMOTIVE – 2.3% | | | | | | | | |
| | |
Ford Motor Credit Co. LLC, | | | | | | | | |
Series 1, Sr. Unsecured, (3 month USD | | | | | | | | |
LIBOR + 0.83%), 2.90%, 3/12/19D | | $ | 1,000,000 | | | $ | 1,003,224 | |
| | |
General Motors Financial Co., Inc., | | | | | | | | |
Company Guaranteed, 2.40%, 5/09/19 | | | 700,000 | | | | 696,230 | |
| | |
Toyota Motor Credit Corp., | | | | | | | | |
Sr. Unsecured, MTN, (3 month USD LIBOR + 0.37%), 2.44%, 3/12/20D | | | 250,000 | | | | 251,240 | |
| | | | | | | | |
| | |
TOTAL AUTOMOTIVE | | | | | | $ | 1,950,694 | |
| | |
BEVERAGES – 0.3% | | | | | | | | |
| | |
PepsiCo, Inc., | | | | | | | | |
Sr. Unsecured, 2.38%, 10/06/26 | | | 250,000 | | | | 228,001 | |
| | |
BIOTECHNOLOGY – 1.9% | | | | | | | | |
| | |
Amgen, Inc., | | | | | | | | |
Sr. Unsecured, 2.13%, 5/01/20 | | | 500,000 | | | | 490,810 | |
| | |
Amgen, Inc., | | | | | | | | |
Sr. Unsecured, 2.20%, 5/11/20 | | | 270,000 | | | | 265,364 | |
| | |
Amgen, Inc., | | | | | | | | |
Sr. Unsecured, 2.25%, 8/19/23 | | | 225,000 | | | | 210,476 | |
| | |
Celgene Corp., | | | | | | | | |
Sr. Unsecured, 2.25%, 5/15/19 | | | 430,000 | | | | 427,204 | |
| | |
Celgene Corp., | | | | | | | | |
Sr. Unsecured, 2.75%, 2/15/23 | | | 260,000 | | | | 248,820 | |
| | | | | | | | |
| | |
TOTAL BIOTECHNOLOGY | | | | | | $ | 1,642,674 | |
| |
BUILDING PRODUCTS – 0.5% | | | | | |
| | |
Johnson Controls International PLC, | | | | | | | | |
(Current rate until maturity), Sr. Unsecured, 3.63%, 7/02/24ÿ | | | 400,000 | | | | 396,164 | |
| |
CAPITAL MARKETS – 4.3% | | | | | |
| | |
Bank of New York Mellon Corp. (The), | | | | | | | | |
Sr. Unsecured, MTN, 2.60%, 8/17/20 | | | 475,000 | | | | 471,618 | |
| | |
Bank of New York Mellon Corp. (The), | | | | | | | | |
Sr. Unsecured, MTN, (3 month USD LIBOR + 0.63%), 2.66%, 5/16/23D | | | 400,000 | | | | 386,298 | |
| | |
Bank of New York Mellon Corp. (The), | | | | | | | | |
Sr. Unsecured, MTN, 2.80%, 5/04/26 | | | 300,000 | | | | 279,767 | |
| | |
Goldman Sachs Group, Inc. (The), | | | | | | | | |
Sr. Unsecured, (3 month USD LIBOR + 1.16%), 3.52%, 4/23/20D | | | 500,000 | | | | 507,825 | |
| | |
Goldman Sachs Group, Inc. (The), | | | | | | | | |
Sr. Unsecured, (3 month USD LIBOR + 1.20%), 3.27%, 9/29/25D | | | 210,000 | | | | 200,063 | |
| | |
Morgan Stanley, | | | | | | | | |
Sr. Unsecured, 2.50%, 1/24/19 | | | 325,000 | | | | 324,691 | |
| | |
Morgan Stanley, | | | | | | | | |
Sr. Unsecured, 3.63%, 1/20/27 | | | 500,000 | | | | 482,563 | |
| | |
Morgan Stanley, | | | | | | | | |
Sr. Unsecured, GMTN, (3 month USD LIBOR + 0.55%), 2.29%, 2/10/21D | | | 240,000 | | | | 240,709 | |
| | |
State Street Corp., | | | | | | | | |
Subordinated, 3.10%, 5/15/23 | | | 250,000 | | | | 246,278 | |
| | | | | | | | |
| | |
| Description | | Par Value | | | Value | |
| | |
TD Ameritrade Holding Corp., | | | | | | | | |
Sr. Unsecured, 2.95%, 4/01/22 | | $ | 450,000 | | | $ | 442,636 | |
| | | | | | | | |
| | |
TOTAL CAPITAL MARKETS | | | | | | $ | 3,582,448 | |
| | |
COMMERCIAL BANKS – 5.0% | | | | | | | | |
| | |
BB&T Corp., | | | | | | | | |
| | |
Sr. Unsecured, MTN, (3 month USD LIBOR + | | | 345,000 | | | | 348,575 | |
0.65%), 2.96%, 4/01/22D |
| | |
Branch Banking & Trust Co., | | | | | | | | |
Subordinated, 3.63%, 9/16/25 | | | 500,000 | | | | 493,232 | |
| | |
Fifth Third Bancorp, | | | | | | | | |
Subordinated, 4.30%, 1/16/24 | | | 500,000 | | | | 508,635 | |
| | |
Fifth Third Bank, | | | | | | | | |
Sr. Unsecured, BKNT, 1.63%, 9/27/19 | | | 500,000 | | | | 491,161 | |
| | |
Huntington National Bank (The), | | | | | | | | |
Sr. Unsecured, 2.40%, 4/01/20 | | | 350,000 | | | | 345,350 | |
| | |
KeyBank NA, | | | | | | | | |
Sr. Unsecured, 1.70%, 6/01/18 | | | 500,000 | | | | 499,672 | |
| | |
KeyCorp, | | | | | | | | |
Sr. Unsecured, MTN, 2.90%, 9/15/20 | | | 250,000 | | | | 248,551 | |
| | |
PNC Financial Services Group, Inc. (The), | | | | | | | | |
Subordinated, 3.90%, 4/29/24 | | | 420,000 | | | | 421,900 | |
| | |
SunTrust Banks, Inc., | | | | | | | | |
Sr. Unsecured, 2.50%, 5/01/19 | | | 250,000 | | | | 249,477 | |
| | |
SunTrust Banks, Inc., | | | | | | | | |
Sr. Unsecured, 2.70%, 1/27/22 | | | 250,000 | | | | 243,308 | |
| | |
Toronto-Dominion Bank (The), | | | | | | | | |
Sr. Unsecured, MTN, 2.13%, 4/07/21 | | | 370,000 | | | | 359,259 | |
| | | | | | | | |
| | |
TOTAL COMMERCIAL BANKS | | | | | | $ | 4,209,120 | |
| |
COMMERCIAL SERVICES & SUPPLIES – 1.2% | | | | | |
| | |
Total System Services, Inc., | | | | | | | | |
Sr. Unsecured, 2.38%, 6/01/18 | | | 450,000 | | | | 449,854 | |
| | |
Total System Services, Inc., | | | | | | | | |
Sr. Unsecured, 3.80%, 4/01/21 | | | 525,000 | | | | 528,174 | |
| | | | | | | | |
| | |
TOTAL COMMERCIAL SERVICES & SUPPLIES | | | | | | $ | 978,028 | |
| | |
COMPUTERS – 0.9% | | | | | | | | |
| | |
Hewlett Packard Enterprise Co., | | | | | | | | |
Sr. Unsecured, 2.10%, 10/04/19W | | | 750,000 | | | | 739,420 | |
| | |
CONSUMER FINANCE – 1.9% | | | | | | | | |
| | |
American Express Co., | | | | | | | | |
Sr. Unsecured, (3 month USD LIBOR + | | | 500,000 | | | | 500,043 | |
0.59%), 2.49%, 5/22/18D |
| | |
American Express Credit Corp., | | | | | | | | |
Sr. Unsecured, MTN, 1.70%, 10/30/19 | | | 260,000 | | | | 255,727 | |
| | |
Capital One Financial Corp., | | | | | | | | |
Sr. Unsecured, 2.45%, 4/24/19 | | | 100,000 | | | | 99,741 | |
| | |
Capital One Financial Corp., | | | | | | | | |
Sr. Unsecured, 2.40%, 10/30/20 | | | 170,000 | | | | 166,007 | |
| | |
Capital One Financial Corp., | | | | | | | | |
Sr. Unsecured, (3 month USD LIBOR + | | | 250,000 | | | | 251,845 | |
0.95%), 3.01%, 3/09/22D |
April 30, 2018 / ANNUAL REPORT
| | |
PORTFOLIOS OF INVESTMENTS Wilmington Intermediate-Term Bond Fund (continued) | | 30 |
| | | | | | | | |
| | |
| Description | | Par Value | | | Value | |
| | |
Capital One NA, | | | | | | | | |
Sr. Unsecured, (3 month USD LIBOR + | | $ | 300,000 | | | $ | 302,044 | |
0.77%), 2.85%, 9/13/19D |
| | | | | | | | |
| | |
TOTAL CONSUMER FINANCE | | | | | | $ | 1,575,407 | |
| | |
DIVERSIFIED FINANCIAL SERVICES – 5.7% | | | | | | | | |
| | |
American Honda Finance Corp., | | | | | | | | |
Sr. Unsecured, MTN, 1.20%, 7/12/19 | | | 120,000 | | | | 117,773 | |
| | |
Bank of America Corp., | | | | | | | | |
Sr. Unsecured, MTN, (3 month USD LIBOR + | | | 350,000 | | | | 342,176 | |
0.63%), 2.33%, 10/01/21D |
| | |
Bank of America Corp., | | | | | | | | |
Sr. Unsecured, MTN, 2.50%, 10/21/22 | | | 415,000 | | | | 397,033 | |
| | |
Bank of America Corp., | | | | | | | | |
Sr. Unsecured, MTN, 4.13%, 1/22/24 | | | 250,000 | | | | 255,822 | |
| | |
Bank of Montreal, | | | | | | | | |
Sr. Unsecured, MTN, 1.50%, 7/18/19 | | | 250,000 | | | | 246,227 | |
| | |
Bank of Montreal, | | | | | | | | |
Sr. Unsecured, MTN, 1.90%, 8/27/21# | | | 430,000 | | | | 411,655 | |
| | |
Berkshire Hathaway, Inc., | | | | | | | | |
Sr. Unsecured, 2.75%, 3/15/23 | | | 175,000 | | | | 170,477 | |
| | |
BlackRock, Inc., | | | | | | | | |
Series 2, Sr. Unsecured, 5.00%, 12/10/19 | | | 300,000 | | | | 310,422 | |
| | |
Canadian Imperial Bank of Commerce, | | | | | | | | |
Sr. Unsecured, BKNT, 2.10%, 10/05/20 | | | 255,000 | | | | 248,910 | |
| | |
Charles Schwab Corp. (The), | | | | | | | | |
Sr. Unsecured, 3.20%, 3/02/27 | | | 665,000 | | | | 635,330 | |
| | |
Citigroup, Inc., | | | | | | | | |
Sr. Unsecured, 2.45%, 1/10/20 | | | 450,000 | | | | 445,798 | |
| | |
Citigroup, Inc., | | | | | | | | |
Sr. Unsecured, 2.75%, 4/25/22 | | | 250,000 | | | | 243,186 | |
| | |
HSBC USA, Inc., | | | | | | | | |
Sr. Unsecured, 2.00%, 8/07/18 | | | 220,000 | | | | 219,813 | |
| | |
JPMorgan Chase & Co., | | | | | | | | |
Sr. Unsecured, 2.55%, 10/29/20 | | | 250,000 | | | | 246,494 | |
| | |
Westpac Banking Corp., | | | | | | | | |
Sr. Unsecured, 4.88%, 11/19/19 | | | 250,000 | | | | 257,255 | |
| | |
Westpac Banking Corp., | | | | | | | | |
Sr. Unsecured, 3.40%, 1/25/28 | | | 240,000 | | | | 229,439 | |
| | | | | | | | |
| | |
TOTAL DIVERSIFIED FINANCIAL SERVICES | | | | | | $ | 4,777,810 | |
| | |
ELECTRIC – 4.8% | | | | | | | | |
| | |
Duke Energy Indiana LLC, 1st Mortgage, 3.75%, 7/15/20 | | | 670,000 | | | | 681,386 | |
| | |
Entergy Corp., | | | | | | | | |
Sr. Unsecured, 2.95%, 9/01/26 | | | 505,000 | | | | 464,539 | |
| | |
Exelon Corp., | | | | | | | | |
Sr. Unsecured, 2.45%, 4/15/21 | | | 500,000 | | | | 485,272 | |
| | |
Exelon Generation Co. LLC, | | | | | | | | |
Sr. Unsecured, 2.95%, 1/15/20 | | | 700,000 | | | | 697,665 | |
| | |
FirstEnergy Corp., | | | | | | | | |
Series B, Sr. Unsecured, 3.90%, 7/15/27 | | | 200,000 | | | | 195,385 | |
| | |
FirstEnergy Transmission LLC, | | | | | | | | |
Sr. Unsecured, 4.35%, 1/15/25W | | | 750,000 | | | | 763,743 | |
| | |
Southern Co. (The), | | | | | | | | |
Sr. Unsecured, 2.35%, 7/01/21 | | | 500,000 | | | | 485,852 | |
| | | | | | | | |
| | |
| Description | | Par Value | | | Value | |
| | |
WEC Energy Group, Inc., | | | | | | | | |
Sr. Unsecured, 2.45%, 6/15/20 | | $ | 300,000 | | | $ | 295,595 | |
| | | | | | | | |
| | |
TOTAL ELECTRIC | | | | | | $ | 4,069,437 | |
| | |
ENVIRONMENTAL CONTROL – 0.2% | | | | | | | | |
| | |
Waste Management, Inc., | | | | | | | | |
Company Guaranteed, 2.40%, 5/15/23 | | | 160,000 | | | | 151,236 | |
| | |
FOOD & STAPLES RETAILING – 0.9% | | | | | | | | |
| | |
General Mills, Inc., | | | | | | | | |
Sr. Unsecured, 3.70%, 10/17/23 | | | 240,000 | | | | 239,893 | |
| | |
Kroger Co. (The), | | | | | | | | |
Sr. Unsecured, 2.30%, 1/15/19 | | | 250,000 | | | | 249,111 | |
| | |
Kroger Co. (The), | | | | | | | | |
Sr. Unsecured, 2.95%, 11/01/21 | | | 250,000 | | | | 246,248 | |
| | | | | | | | |
| | |
TOTAL FOOD & STAPLES RETAILING | | | | | | $ | 735,252 | |
| |
HEALTH CARE EQUIPMENT & SUPPLIES – 1.4% | | | | | |
| | |
Abbott Laboratories, | | | | | | | | |
Sr. Unsecured, 2.35%, 11/22/19 | | | 284,000 | | | | 281,592 | |
| | |
Medtronic Global Holdings SCA, | | | | | | | | |
Company Guaranteed, 1.70%, 3/28/19 | | | 400,000 | | | | 396,798 | |
| | |
Thermo Fisher Scientific, Inc., | | | | | | | | |
Sr. Unsecured, 4.70%, 5/01/20 | | | 500,000 | | | | 515,172 | |
| | | | | | | | |
| |
TOTAL HEALTH CARE EQUIPMENT & SUPPLIES | | | $ | 1,193,562 | |
| |
HEALTH CARE PROVIDERS & SERVICES – 3.4% | | | | | |
| | |
Aetna, Inc., | | | | | | | | |
Sr. Unsecured, 1.70%, 6/07/18 | | | 175,000 | | | | 174,895 | |
| | |
Anthem, Inc., | | | | | | | | |
Sr. Unsecured, 2.30%, 7/15/18 | | | 500,000 | | | | 499,869 | |
| | |
Anthem, Inc., | | | | | | | | |
Sr. Unsecured, 3.65%, 12/01/27 | | | 235,000 | | | | 223,735 | |
| | |
Cardinal Health, Inc., | | | | | | | | |
Sr. Unsecured, 1.95%, 6/14/19 | | | 180,000 | | | | 177,931 | |
| | |
Cardinal Health, Inc., | | | | | | | | |
Sr. Unsecured, 3.20%, 3/15/23 | | | 350,000 | | | | 342,123 | |
| | |
Cardinal Health, Inc., | | | | | | | | |
Sr. Unsecured, 3.41%, 6/15/27 | | | 200,000 | | | | 185,903 | |
| | |
CVS Health Corp., | | | | | | | | |
Sr. Unsecured, (3 month USD LIBOR + | | | 500,000 | | | | 501,512 | |
0.63%), 2.69%, 3/09/20D |
| | |
CVS Health Corp., | | | | | | | | |
Sr. Unsecured, 3.70%, 3/09/23 | | | 500,000 | | | | 498,689 | |
| | |
UnitedHealth Group, Inc., | | | | | | | | |
Sr. Unsecured, 2.38%, 10/15/22 | | | 300,000 | | | | 288,005 | |
| | | | | | | | |
| |
TOTAL HEALTH CARE PROVIDERS & SERVICES | | | $ | 2,892,662 | |
| | |
HOME FURNISHINGS – 0.3% | | | | | | | | |
| | |
Whirlpool Corp., | | | | | | | | |
Sr. Unsecured, 2.40%, 3/01/19 | | | 220,000 | | | | 219,259 | |
| | |
INSURANCE – 1.0% | | | | | | | | |
| | |
Aon PLC, | | | | | | | | |
Company Guaranteed, 2.80%, 3/15/21 | | | 240,000 | | | | 235,786 | |
ANNUAL REPORT / April 30, 2018
| | |
| 31 | | PORTFOLIOS OF INVESTMENTS Wilmington Intermediate-Term Bond Fund (continued) |
| | | | | | | | |
| | |
| Description | | Par Value | | | Value | |
| | |
Aon PLC, | | | | | | | | |
Company Guaranteed, 4.00%, 11/27/23 | | $ | 250,000 | | | $ | 253,983 | |
| | |
Hartford Financial Services Group, Inc. (The), | | | | | | | | |
Sr. Unsecured, 5.13%, 4/15/22 | | | 360,000 | | | | 381,909 | |
| | | | | | | | |
| | |
TOTAL INSURANCE | | | | | | $ | 871,678 | |
| | |
MEDIA – 1.5% | | | | | | | | |
| | |
CBS Corp., Company Guaranteed, 3.38%, 3/01/22 | | | 350,000 | | | | 346,961 | |
| | |
Charter Communications Operating LLC, Sr. Secured, 3.58%, 7/23/20 | | | 500,000 | | | | 501,447 | |
| | |
Discovery Communications LLC, Company Guaranteed, 2.95%, 3/20/23 | | | 220,000 | | | | 210,321 | |
| | |
Time Warner, Inc., Company Guaranteed, 2.95%, 7/15/26 | | | 270,000 | | | | 246,169 | |
| | | | | | | | |
| | |
TOTAL MEDIA | | | | | | $ | 1,304,898 | |
|
MISCELLANEOUS MANUFACTURING – 1.8% | |
| | |
Ingersoll-Rand Global Holding Co. Ltd., Company Guaranteed, 4.25%, 6/15/23 | | | 330,000 | | | | 339,177 | |
| | |
Ingersoll-Rand Luxembourg Finance SA, Company Guaranteed, 2.63%, 5/01/20 | | | 250,000 | | | | 247,411 | |
| | |
Textron, Inc., Sr. Unsecured, 3.65%, 3/01/21 | | | 425,000 | | | | 427,500 | |
| | |
Textron, Inc., Sr. Unsecured, 4.30%, 3/01/24 | | | 500,000 | | | | 512,565 | |
| | | | | | | | |
| | |
TOTAL MISCELLANEOUS MANUFACTURING | | | | | | $ | 1,526,653 | |
| | |
OIL & GAS – 2.5% | | | | | | | | |
| | |
Marathon Oil Corp., Sr. Unsecured, 4.40%, 7/15/27 | | | 750,000 | | | | 755,362 | |
| | |
Marathon Petroleum Corp., Sr. Unsecured, 3.63%, 9/15/24 | | | 125,000 | | | | 123,534 | |
| | |
Phillips 66, Company Guaranteed, 4.30%, 4/01/22 | | | 400,000 | | | | 415,912 | |
| | |
Schlumberger Holdings Corp., Sr. Unsecured, 2.35%, 12/21/18W | | | 370,000 | | | | 368,870 | |
| | |
Total Capital International SA, Company Guaranteed, (3 month USD LIBOR + 0.35%), 2.53%, 6/19/19D | | | 450,000 | | | | 451,605 | |
| | | | | | | | |
| | |
TOTAL OIL & GAS | | | | | | $ | 2,115,283 | |
| | |
PHARMACEUTICALS – 1.8% | | | | | | | | |
| | |
AbbVie, Inc., Sr. Unsecured, 2.50%, 5/14/20 | | | 300,000 | | | | 296,355 | |
| | |
AbbVie, Inc., Sr. Unsecured, 3.60%, 5/14/25 | | | 350,000 | | | | 339,723 | |
| | |
Allergan Funding SCS, Company Guaranteed, (3 month USD LIBOR + 1.26%), 3.33%, 3/12/20D | | | 500,000 | | | | 505,754 | |
| | |
Medco Health Solutions, Inc., Sr. Unsecured, 4.13%, 9/15/20 | | | 250,000 | | | | 254,193 | |
| | |
Zoetis, Inc., Sr. Unsecured, 3.00%, 9/12/27 | | | 125,000 | | | | 115,738 | |
| | | | | | | | |
| | |
TOTAL PHARMACEUTICALS | | | | | | $ | 1,511,763 | |
| | | | | | | | |
| | |
| Description | | Par Value | | | Value | |
| | |
PIPELINES – 3.0% | | | | | | | | |
| | |
Enterprise Products Operating LLC, Company Guaranteed, 2.55%, 10/15/19 | | $ | 325,000 | | | $ | 324,485 | |
| | |
Enterprise Products Operating LLC, Company Guaranteed, 2.80%, 2/15/21 | | | 225,000 | | | | 222,031 | |
| | |
Kinder Morgan Energy Partners LP, Company Guaranteed, 2.65%, 2/01/19 | | | 650,000 | | | | 648,549 | |
| | |
Kinder Morgan, Inc., Company Guaranteed, 4.30%, 3/01/28 | | | 500,000 | | | | 488,049 | |
| | |
MPLX LP, Sr. Unsecured, 3.38%, 3/15/23# | | | 50,000 | | | | 49,259 | |
| | |
Spectra Energy Partners LP, Sr. Unsecured, 2.95%, 9/25/18 | | | 302,000 | | | | 302,437 | |
| | |
Valero Energy Partners LP, Sr. Unsecured, 4.38%, 12/15/26 | | | 500,000 | | | | 492,593 | |
| | | | | | | | |
| | |
TOTAL PIPELINES | | | | | | $ | 2,527,403 | |
| |
REAL ESTATE INVESTMENT TRUSTS – 5.6% | | | | | |
| | |
American Tower Corp., Sr. Unsecured, 3.45%, 9/15/21 | | | 250,000 | | | | 248,589 | |
| | |
American Tower Corp., Sr. Unsecured, 5.00%, 2/15/24 | | | 505,000 | | | | 530,591 | |
| | |
American Tower Corp., Sr. Unsecured, 3.55%, 7/15/27 | | | 235,000 | | | | 219,763 | |
| | |
Boston Properties LP, Sr. Unsecured, 2.75%, 10/01/26 | | | 400,000 | | | | 360,181 | |
| | |
Digital Realty Trust LP, Company Guaranteed, 3.40%, 10/01/20 | | | 425,000 | | | | 426,254 | |
| | |
HCP, Inc., Sr. Unsecured, 3.75%, 2/01/19 | | | 200,000 | | | | 201,048 | |
| | |
HCP, Inc., Sr. Unsecured, 2.63%, 2/01/20 | | | 250,000 | | | | 246,980 | |
| | |
HCP, Inc., Sr. Unsecured, 4.20%, 3/01/24 | | | 540,000 | | | | 539,454 | |
| | |
Healthcare Realty Trust, Inc., Sr. Unsecured, 3.88%, 5/01/25 | | | 550,000 | | | | 534,566 | |
| | |
Healthcare Realty Trust, Inc., Sr. Unsecured, 3.63%, 1/15/28 | | | 300,000 | | | | 280,098 | |
| | |
Ventas Realty LP / Ventas Capital Corp., Company Guaranteed, 2.70%, 4/01/20 | | | 550,000 | | | | 544,010 | |
| | |
Ventas Realty LP / Ventas Capital Corp., Company Guaranteed, 4.25%, 3/01/22 | | | 250,000 | | | | 254,958 | |
| | |
Welltower, Inc., Sr. Unsecured, 4.25%, 4/01/26 | | | 330,000 | | | | 326,183 | |
| | | | | | | | |
| | |
TOTAL REAL ESTATE INVESTMENT TRUSTS | | | | | | $ | 4,712,675 | |
| | |
RETAIL – 0.5% | | | | | | | | |
| | |
Home Depot, Inc. (The), Sr. Unsecured, 2.13%, 9/15/26 | | | 225,000 | | | | 200,527 | |
| | |
Walgreens Boots Alliance, Inc., Sr. Unsecured, 3.30%, 11/18/21 | | | 225,000 | | | | 223,817 | |
| | | | | | | | |
| | |
TOTAL RETAIL | | | | | | $ | 424,344 | |
| | |
SEMICONDUCTORS – 1.0% | | | | | | | | |
| | |
QUALCOMM, Inc., Sr. Unsecured, 1.85%, 5/20/19 | | | 850,000 | | | | 844,209 | |
April 30, 2018 / ANNUAL REPORT
| | |
PORTFOLIOS OF INVESTMENTS Wilmington Intermediate-Term Bond Fund (continued) | | 32 |
| | | | | | | | |
| | |
| Description | | Par Value | | | Value | |
| | |
SOFTWARE – 1.2% | | | | | | | | |
| | |
Microsoft Corp., Sr. Unsecured, 1.10%, 8/08/19 | | $ | 350,000 | | | $ | 343,696 | |
| | |
Microsoft Corp., Sr. Unsecured, 1.55%, 8/08/21 | | | 175,000 | | | | 167,627 | |
| | |
Oracle Corp., Sr. Unsecured, 1.90%, 9/15/21 | | | 250,000 | | | | 241,330 | |
| | |
Oracle Corp., Sr. Unsecured, 3.25%, 11/15/27 | | | 300,000 | | | | 289,013 | |
| | | | | | | | |
| | |
TOTAL SOFTWARE | | | | | | $ | 1,041,666 | |
| | |
TELECOMMUNICATIONS – 1.3% | | | | | | | | |
| | |
AT&T, Inc., Sr. Unsecured, (3 month USD LIBOR + 0.93%), 3.23%, 6/30/20 | | | 500,000 | | |
| 505,940
|
|
| | |
AT&T, Inc., Sr. Unsecured, 3.40%, 8/14/24 | | | 300,000 | | | | 303,450 | |
| | |
Cisco Systems, Inc., Sr. Unsecured, 2.20%, 9/20/23 | | | 295,000 | | | | 279,126 | |
| | | | | | | | |
| | |
TOTAL TELECOMMUNICATIONS | | | | | | $ | 1,088,516 | |
| | |
TRANSPORTATION – 0.9% | | | | | | | | |
| | |
Ryder System, Inc., Sr. Unsecured, MTN, 2.50%, 9/01/22 | | | 265,000 | | | | 253,721 | |
| | |
Ryder System, Inc., Sr. Unsecured, MTN, 3.40%, 3/01/23 | | | 500,000 | | | | 495,171 | |
| | | | | | | | |
| | |
TOTAL TRANSPORTATION | | | | | | $ | 748,892 | |
| | |
TRUCKING & LEASING – 0.5% | | | | | | | | |
| | |
GATX Corp., Sr. Unsecured, 3.25%, 9/15/26 | | | 505,000 | | | | 464,877 | |
| | | | | | | | |
| |
TOTAL CORPORATE BONDS | | | | | |
(COST $51,019,620) | | | | | | $ | 50,305,757 | |
| |
GOVERNMENT AGENCIES – 3.1% | | | | | |
| |
FEDERAL HOME LOAN MORTGAGE CORPORATION | | | | | |
(FHLMC) – 3.1% | | | | | | | | |
| | |
1.38%, 5/01/20# | | | 750,000 | | | | 732,729 | |
| | |
1.75%, 5/30/19 | | | 605,000 | | | | 601,352 | |
| | |
2.38%, 1/13/22 | | | 1,000,000 | | | | 985,366 | |
| | |
3.75%, 3/27/19 | | | 250,000 | | | | 253,350 | |
| |
TOTAL FEDERAL HOME LOAN MORTGAGE CORPORATION (FHLMC) | | | $ | 2,572,797 | |
| |
TOTAL GOVERNMENT AGENCIES | | | | | |
(COST $2,604,016) | | | | | | $ | 2,572,797 | |
| |
MORTGAGE-BACKED SECURITIES – 1.3% | | | | | |
| |
FEDERAL HOME LOAN MORTGAGE CORPORATION | | | | | |
(FHLMC) – 0.2% | | | | | | | | |
| | |
Pool C90293, 7.50%, 9/01/19 | | | 16,191 | | | | 16,804 | |
| | |
Pool B19228, 4.50%, 4/01/20 | | | 7,804 | | | | 7,831 | |
| | |
Pool C90504, 6.50%, 12/01/21 | | | 11,533 | | | | 12,447 | |
| | |
Pool G01625, 5.00%, 11/01/33 | | | 32,048 | | | | 34,328 | |
| | |
Pool A18401, 6.00%, 2/01/34 | | | 50,757 | | | | 56,574 | |
| | | | | | | | |
| | |
| Description | | Par Value | | | Value | |
| | |
Pool G08097, 6.50%, 11/01/35 | | $ | 23,703 | | | $ | 26,745 | |
| | |
Pool G02390, 6.00%, 9/01/36 | | | 9,838 | | | | 10,992 | |
Pool G08193, 6.00%, 4/01/37 | | | 29,333 | | | | 32,774 | |
| |
TOTAL FEDERAL HOME LOAN MORTGAGE CORPORATION (FHLMC) | | | $ | 198,495 | |
|
FEDERAL NATIONAL MORTGAGE ASSOCIATION (FNMA) – 0.8% | |
| | |
Pool 254833, 4.50%, 8/01/18 | | | 472 | | | | 472 | |
| | |
Pool 839291, 5.00%, 9/01/20 | | | 1,529 | | | | 1,547 | |
| | |
Pool AE2520, 3.00%, 1/01/26 | | | 518,530 | | | | 515,195 | |
| | |
Pool 256639, 5.00%, 2/01/27 | | | 25,979 | | | | 27,659 | |
| | |
Pool 256752, 6.00%, 6/01/27 | | | 25,434 | | | | 28,199 | |
| | |
Pool 257007, 6.00%, 12/01/27 | | | 42,227 | | | | 46,837 | |
| | |
Pool 254240, 7.00%, 3/01/32 | | | 40,954 | | | | 46,612 | |
| | |
Pool 745412, 5.50%, 12/01/35 | | | 22,589 | | | | 24,683 | |
| | | | | | | | |
| |
TOTAL FEDERAL NATIONAL MORTGAGE ASSOCIATION (FNMA) | | | $ | 691,204 | |
|
| GOVERNMENT NATIONAL MORTGAGE ASSOCIATION (GNMA) – 0.3% | |
| | |
Pool 780825, 6.50%, 7/15/28 | | | 57,100 | | | | 64,018 | |
| | |
Pool 2616, 7.00%, 7/20/28 | | | 36,870 | | | | 43,319 | |
| | |
Pool 2701, 6.50%, 1/20/29 | | | 70,024 | | | | 76,664 | |
| | |
Pool 426727, 7.00%, 2/15/29 | | | 6,003 | | | | 6,311 | |
| | |
Pool 781231, 7.00%, 12/15/30 | | | 32,456 | | | | 36,193 | |
| |
TOTAL GOVERNMENT NATIONAL MORTGAGE ASSOCIATION (GNMA) | | | $ | 226,505 | |
| |
TOTAL MORTGAGE-BACKED SECURITIES | | | | | |
(COST $1,065,935) | | | | | | $ | 1,116,204 | |
| |
U.S. TREASURY – 31.3% | | | | | |
| |
U.S. TREASURY NOTES – 31.3% | | | | | |
| | |
1.00%, 6/30/19 | | | 250,000 | | | | 246,186 | |
| | |
1.38%, 1/31/21 | | | 500,000 | | | | 483,642 | |
| | |
1.38%, 5/31/21 | | | 660,000 | | | | 635,082 | |
| | |
1.50%, 8/15/26 | | | 500,000 | | | | 447,195 | |
| | |
1.63%, 5/31/23 | | | 1,000,000 | | | | 944,176 | |
| | |
1.63%, 10/31/23 | | | 1,000,000 | | | | 938,872 | |
| | |
1.63%, 2/15/26 | | | 1,000,000 | | | | 909,227 | |
| | |
1.63%, 5/15/26 | | | 25,000 | | | | 22,660 | |
| | |
1.75%, 5/15/23 | | | 1,000,000 | | | | 950,738 | |
| | |
1.88%, 7/31/22 | | | 450,000 | | | | 434,224 | |
| | |
2.00%, 7/31/20 | | | 250,000 | | | | 247,052 | |
| | |
2.00%, 11/15/21 | | | 1,000,000 | | | | 976,687 | |
| | |
2.00%, 2/15/22 | | | 500,000 | | | | 487,097 | |
| | |
2.00%, 7/31/22 | | | 250,000 | | | | 242,525 | |
| | |
2.00%, 2/15/23 | | | 1,000,000 | | | | 964,953 | |
| | |
2.00%, 2/15/25 | | | 1,003,000 | | | | 947,200 | |
| | |
2.00%, 8/15/25 | | | 1,500,000 | | | | 1,409,299 | |
| | |
2.00%, 11/15/26 | | | 650,000 | | | | 603,804 | |
| | |
2.13%, 1/31/21 | | | 500,000 | | | | 493,487 | |
ANNUAL REPORT / April 30, 2018
| | |
| 33 | | PORTFOLIOS OF INVESTMENTS Wilmington Intermediate-Term Bond Fund (continued) |
| | | | | | | | |
| | |
| Description | | Par Value | | | Value | |
| | |
2.13%, 6/30/21 | | $ | 625,000 | | | $ | 614,718 | |
| | |
2.13%, 8/15/21 | | | 825,000 | | | | 810,401 | |
| | |
2.13%, 9/30/21 | | | 500,000 | | | | 490,685 | |
| | |
2.13%, 5/15/25 | | | 1,250,000 | | | | 1,187,301 | |
| | |
2.25%, 1/31/24 | | | 1,400,000 | | | | 1,355,556 | |
| | |
2.25%, 11/15/25 | | | 1,500,000 | | | | 1,431,339 | |
| | |
2.25%, 2/15/27 | | | 30,000 | | | | 28,393 | |
| | |
2.25%, 11/15/27 | | | 500,000 | | | | 471,037 | |
| | |
2.38%, 8/15/24 | | | 750,000 | | | | 728,074 | |
| | |
2.50%, 3/31/23 | | | 275,000 | | | | 271,336 | |
| | |
2.50%, 8/15/23 | | | 1,000,000 | | | | 984,496 | |
| | |
2.50%, 5/15/24 | | | 1,000,000 | | | | 979,511 | |
| | |
2.63%, 8/15/20 | | | 500,000 | | | | 500,823 | |
| | |
2.75%, 11/15/23 | | | 1,000,000 | | | | 995,752 | |
| | |
2.75%, 2/15/28 | | | 2,100,000 | | | | 2,065,002 | |
| | |
3.13%, 5/15/21 | | | 550,000 | | | | 557,537 | |
| | |
3.63%, 2/15/20 | | | 500,000 | | | | 510,044 | |
| | | | | | | | |
| | |
TOTAL U.S. TREASURY NOTES | | | | | | $ | 26,366,111 | |
| | |
TOTAL U.S. TREASURY | | | | | | | | |
(COST $27,270,589) | | | | | | $ | 26,366,111 | |
| | | | | | | | |
| | |
| | | Number of Shares | | | | |
| | |
MONEY MARKET FUND – 1.7% | | | | | | | | |
| | |
Dreyfus Government Cash Management Fund, Institutional Shares, 1.60%^ | | | 1,418,994 | | | | 1,418,994 | |
| | | | | | | | |
| | |
TOTAL MONEY MARKET FUND | | | | | | | | |
| (COST $1,418,994) | | | | | | $ | 1,418,994 | |
| |
TOTAL INVESTMENTS IN SECURITIES – 99.5% | | | | | |
| (COST $85,400,442) | | | | | | $ | 83,802,056 | |
| | | | | | | | |
| | |
| | | Par Value | | | | |
|
CASH COLLATERAL INVESTED FOR SECURITIES ON LOAN – 1.4% | |
| | |
REPURCHASE AGREEMENTS – 1.4% | | | | | | | | |
| | |
Barclays Capital, Inc., 1.71%, dated 4/30/18, due 5/01/18, repurchase price $56,131, collateralized by U.S. Treasury Securities, 0.00% to 3.00%, maturing 7/31/19 to 9/09/49; total market value of $57,250 | | $ | 56,128 | | | | 56,128 | |
| | | | | | | | |
| | |
| Description | | Par Value | | | Value | |
| | |
Daiwa Capital Markets America, 1.72%, dated 4/30/18, due 5/01/18, repurchase price $221,750, collateralized by U.S. Government & Treasury Securities, 0.00% to 9.13%, maturing 5/15/18 to 12/01/51; total market value of $226,174 | | $ | 221,739 | | | $ | 221,739 | |
| | |
NBC Global Finance Ltd., 1.74%, dated 4/30/18, due 5/01/18, repurchase price $221,750, collateralized by U.S. Treasury Securities, 0.00% to 3.63%, maturing 6/30/19 to 9/09/49; total market value of $226,173 | | | 221,739 | | | | 221,739 | |
| | |
Nomura Securities International, Inc., 1.74%, dated 4/30/18, due 5/01/18, repurchase price $221,750, collateralized by U.S. Government Securities, 0.00% to 10.50%, maturing 5/01/18 to 3/20/68; total market value of $226,174 | | | 221,739 | | | | 221,739 | |
| | |
RBC Dominion Securities, Inc., 1.72%, dated 4/30/18, due 5/01/18, repurchase price $221,750, collateralized by U.S. Government & Treasury Securities, 0.13% to 7.00%, maturing 10/31/18 to 9/09/49; total market value of $226,174 | | | 221,739 | | | | 221,739 | |
| | |
TD Securities, Inc., 1.74%, dated 4/30/18, due 5/01/18, repurchase price $221,750, collateralized by U.S. Government Securities, 4.00% to 4.50%, maturing 3/01/47 to 3/01/48; total market value of $226,174 | | | 221,739 | | | | 221,739 | |
|
TOTAL CASH COLLATERAL INVESTED FOR SECURITIES ON | |
LOAN | | | | | | | | |
(COST $1,164,823) | | | | | | $ | 1,164,823 | |
| | | | | | | | |
| |
TOTAL INVESTMENTS – 100.9% (COST $86,565,265) | | | $ | 84,966,879 | |
| |
COLLATERAL FOR SECURITIES ON LOAN – (1.4%) | | | | (1,164,823 | ) |
| |
| OTHER ASSETS LESS LIABILITIES – 0.5% | | | | 411,242 | |
| | |
TOTAL NET ASSETS – 100.0% | | | | | | $ | 84,213,298 | |
| | | | | | | | |
April 30, 2018 / ANNUAL REPORT
| | |
PORTFOLIOS OF INVESTMENTS Wilmington Intermediate-Term Bond Fund (concluded) | | 34 |
Cost of investments for Federal income tax purposes is $86,581,518. The net unrealized appreciation/(depreciation) of investments was $(1,614,639). This consists of net unrealized appreciation from investment for those securities having an excess of value over cost of $213,964 and net unrealized depreciation from investments for those securities having an excess of cost over value of $(1,828,603).
Various inputs are used in determining the value of the Fund’s investments. These inputs are summarized in the three broad levels listed below.
Level 1 – quoted prices in active markets for identical securities
Level 2 – other significant observable inputs (including quoted prices for similar securities, interest rates, prepayment speeds, credit risk, etc.)
Level 3 – significant unobservable inputs (including the Fund’s own assumptions in determining the fair value of investments)
The following is a summary of the inputs used as of April 30, 2018 in valuing the Fund’s assets carried at fair value:
| | | | | | | | | | | | | | | | |
| | | | |
| | | Level 1 | | | Level 2 | | | Level 3 | | | Total | |
| | | | |
Investments in Securities | | | | | | | | | | | | | | | | |
| | | | |
Adjustable Rate Mortgage | | $ | — | | | $ | 22,304 | | | $ | — | | | $ | 22,304 | |
| | | | |
Commercial Paper | | | — | | | | 1,999,889 | | | | — | | | | 1,999,889 | |
| | | | |
Corporate Bonds | | | — | | | | 50,305,757 | | | | — | | | | 50,305,757 | |
| | | | |
Government Agencies | | | — | | | | 2,572,797 | | | | — | | | | 2,572,797 | |
| | | | |
Mortgage-Backed Securities | | | — | | | | 1,116,204 | | | | — | | | | 1,116,204 | |
| | | | |
U.S. Treasury | | | — | | | | 26,366,111 | | | | — | | | | 26,366,111 | |
| | | | |
Money Market Fund | | | 1,418,994 | | | | — | | | | — | | | | 1,418,994 | |
| | | | |
Repurchase Agreements | | | — | | | | 1,164,823 | | | | — | | | | 1,164,823 | |
| | | | | | | | | | | | | | | | |
| | | | |
Total | | $ | 1,418,994 | | | $ | 83,547,885 | | | $ | — | | | $ | 84,966,879 | |
| | | | | | | | | | | | | | | | |
| # | Security, or a portion thereof, is on loan. See Note 2 in Notes to Financial Statements. |
| D | Variable rate security. The rate disclosed is the rate in effect on the report date. The Information in parenthesis represents the benchmark and reference rate for each relevant security and the rate floats based upon the reference rate and spread. The security may be further subject to interest rate floor and caps. Certain variable rate securities are not based on a published reference rate and spread, but are determined by the issuer or agent and are based on current market conditions, or, for mortgage-backed securities, are impacted by the individual mortgages which are paying off over time. These securities do not indicate a reference rate and spread in their descriptions. |
| W | Denotes a restricted security that may be resold without restriction to “qualified institutional buyers” as defined in Rule 144A under the Securities Act of 1933 and that the Fund has determined to be liquid under criteria established by the Fund’s Board of Trustees. At April 30, 2018, these liquid restricted securities amounted to $1,872,033 representing 2.22% of total net assets. |
| ¨ | The rate shown reflects the effective yield at purchase date. |
| ÿ | Step coupon security. The rate disclosed is the rate in effect on the report date. |
| ** | Represents less than 0.05%. |
| | | | |
| | The following acronyms are used throughout this Fund: |
| | BKNT | | Bank Note |
| | FHLB | | Federal Home Loan Bank |
| | FHLMC | | Federal Home Loan Mortgage Corporation |
| | FNMA | | Federal National Mortgage Association |
| | GMTN | | Global Medium Term Note |
| | LIBOR | | London Interbank Offered Rate |
| | LLC | | Limited Liability Corporation |
| | LP | | Limited Partnership |
| | MTN | | Medium Term Note |
| | NA | | National Association |
| | PLC | | Public Limited Company |
See Notes which are an integral part of the Financial Statements
ANNUAL REPORT / April 30, 2018
PORTFOLIO OF INVESTMENTS SUMMARY TABLE
Wilmington Short-Term Bond Fund
At April 30, 2018, the Fund’s portfolio classifications were as follows (unaudited):
| | | | |
| | | Percentage of
Total Net Assets |
U.S. Treasury Notes | | | 26.4 | % |
Consumer Finance | | | 6.7 | % |
Commercial Banks | | | 6.7 | % |
Federal National Mortgage Association (FNMA) | | | 5.1 | % |
Diversified Financial Services | | | 5.1 | % |
Electric | | | 4.9 | % |
Health Care Providers & Services | | | 3.9 | % |
Media | | | 3.8 | % |
Oil & Gas | | | 3.7 | % |
Federal Home Loan Mortgage Corporation (FHLMC) | | | 3.0 | % |
Federal Home Loan Bank (FHLB) | | | 2.8 | % |
Commercial Services & Supplies | | | 2.8 | % |
Capital Markets | | | 1.9 | % |
Automotive | | | 1.9 | % |
Household Products | | | 1.9 | % |
Trucking & Leasing | | | 1.9 | % |
Pipelines | | | 1.9 | % |
Aerospace & Defense | | | 1.9 | % |
Insurance | | | 1.9 | % |
Semiconductors | | | 1.9 | % |
Food & Staples Retailing | | | 1.9 | % |
Telecommunications | | | 1.7 | % |
Commercial Paper | | | 1.6 | % |
Electronic Equipment, Instruments & Components | | | 0.9 | % |
Whole Loan | | | 0.8 | % |
Food Products | | | 0.8 | % |
Health Care Equipment & Supplies | | | 0.6 | % |
Biotechnology | | | 0.6 | % |
Government National Mortgage Association (GNMA) | | | 0.5 | % |
Municipal Bond | | | 0.1 | % |
Small Business Administration4 | | | 0.0 | % |
| | | | | |
| | | Percentage of
Total Net Assets |
Cash Equivalents1 | | | | 9.4 | % |
Other Assets and Liabilities – Net2 | | | | (9.0 | )% |
| | | | | |
| |
TOTAL | | | | 100.0 | % |
| | | | | |
| |
| Credit Quality Diversification3 | | Percentage of Total Net Assets |
U.S. Government Agency Securities | | | | 11.4 | % |
U.S. Treasury | | | | 26.4 | % |
AA / Aa | | | | 2.0 | % |
A / A | | | | 28.1 | % |
BBB / Baa | | | | 27.8 | % |
BB / Ba | | | | 1.8 | % |
Not Rated | | | | 11.5 | % |
Other Assets and Liabilities – Net2 | | | | (9.0 | )% |
| | | | | |
| |
TOTAL | | | | 100.0 | % |
| | | | | |
| (1) | Cash Equivalents include investments in a money market fund and repurchase agreements. |
| (2) | Assets, other than investments in securities, less liabilities. See Statements of Assets and Liabilities. |
| (3) | For financial reporting purposes, the Credit Quality Diversification table reflects the lowest rating assigned by either Moody’s Investors Service or Standard and Poor’s if the ratings differ. These rating agencies are independent, nationally recognized statistical rating organizations and are widely used. Investment grade ratings are credit ratings of BBB/Baa or higher. Below investment grade ratings are credit ratings of BB/Ba or lower. Investments designated as “Not Rated” are not rated by either rating agency and do not necessarily indicate low credit quality. Credit quality ratings are subject to change. |
| (4) | Represents less than 0.05%. |
PORTFOLIO OF INVESTMENTS
April 30, 2018
| | | | | | | | |
| | |
| Description | | Par Value | | | Value | |
| |
ADJUSTABLE RATE MORTGAGE – 0.0%** | | | | | |
|
FEDERAL NATIONAL MORTGAGE ASSOCIATION (FNMA) – 0.0%** | |
| | |
Pool 399251, (UST Yield Curve CMT 1 Year + 2.07%), 3.19%, 9/01/27D | | $ | 42 | | | $ | 44 | |
| | |
TOTAL ADJUSTABLE RATE MORTGAGE | | | | | | | | |
(COST $42) | | | | | | $ | 44 | |
| |
COLLATERALIZED MORTGAGE OBLIGATIONS – 3.8% | | | | | |
| |
FEDERAL HOME LOAN MORTGAGE CORPORATION | | | | | |
(FHLMC) – 0.2% | | | | | | | | |
| | |
Series 1989-112, Class I, 6.50%, 1/15/21 | | | 225 | | | | 228 | |
| | | | | | | | |
| | |
| Description | | Par Value | | | Value | |
| | |
Series 1990-136, Class E, 6.00%, 4/15/21 | | $ | 769 | | | $ | 787 | |
| | |
Series 1990-141, Class D, 5.00%, 5/15/21 | | | 292 | | | | 296 | |
| | |
Series 1993-1577, Class PK, 6.50%, 9/15/23 | | | 14,775 | | | | 15,706 | |
| | |
Series 1993-1644, Class K, 6.75%, 12/15/23 | | | 11,748 | | | | 12,228 | |
| | |
Series 1994-1686, Class PJ, 5.00%, 2/15/24 | | | 1,354 | | | | 1,399 | |
| | |
Series 2003-2649, Class KA, 4.50%, 7/15/18 | | | 236 | | | | 236 | |
April 30, 2018 / ANNUAL REPORT
| | |
PORTFOLIOS OF INVESTMENT Wilmington Short-Term Bond Fund (continued) | | 36 |
| | | | | | | | |
Description | | Par Value | | | Value | |
Series 2011-3799, Class GK, 2.75%, 1/15/21 | | $ | 51,514 | | | $ | 51,209 | |
| |
TOTAL FEDERAL HOME LOAN MORTGAGE CORPORATION (FHLMC) | | | $ | 82,089 | |
|
FEDERAL NATIONAL MORTGAGE ASSOCIATION (FNMA) – 2.8% | |
| | |
Series 1993-113, Class PK, 6.50%, 7/25/23 | | | 16,746 | | | | 17,688 | |
| | |
Series 1993-127, Class H, 6.50%, 7/25/23 | | | 16,026 | | | | 16,849 | |
| | |
Series 1993-202, Class J, 6.50%, 11/25/23 | | | 9,612 | | | | 10,269 | |
| | |
Series 1994-3, Class PL, 5.50%, 1/25/24 | | | 17,446 | | | | 18,482 | |
| | |
Series 1994-55, Class H, 7.00%, 3/25/24 | | | 19,711 | | | | 21,298 | |
| | |
Series 2002-52, Class QA, 6.00%, 7/18/32 | | | 594 | | | | 596 | |
| | |
Series 2009-70, Class NM, 3.25%, 8/25/19 | | | 24,621 | | | | 24,654 | |
| | |
Series 2011-66, Class QE, 2.00%, 7/25/21 | | | 205,212 | | | | 203,158 | |
| | |
Series 2011-81, Class PA, 3.50%, 8/25/26 | | | 1,157,219 | | | | 1,170,656 | |
| | | | | | | | |
| |
TOTAL FEDERAL NATIONAL MORTGAGE ASSOCIATION (FNMA) | | | $ | 1,483,650 | |
| | |
WHOLE LOAN – 0.8% | | | | | | | | |
| | |
Banc of America Mortgage Securities, Inc., | | | 94,465 | | | | 96,862 | |
Series 2004-A, Class 2A1, 3.86%, 2/25/34D |
| | |
Banc of America Mortgage Securities, Inc., | | | 66,528 | | | | 66,855 | |
Series 2004-B, Class 2A1, 3.92%, 3/25/34D |
| | |
IndyMac INDA Mortgage Loan Trust, | | | | | | | | |
Series 2005-AR1, Class 2A1, 4.02%, 11/25/35D | | | 270,289 | | | | 257,936 | |
| | | | | | | | |
| | |
TOTAL WHOLE LOAN | | | | | | $ | 421,653 | |
| | | | | | | | |
| |
TOTAL COLLATERALIZED MORTGAGE OBLIGATIONS (COST $2,046,201) | | | $ | 1,987,392 | |
| | |
COMMERCIAL PAPER – 1.6%◆ | | | | | | | | |
| | |
COMMERCIAL PAPER – 1.6% | | | | | | | | |
| | |
McCormick & Co., 2.19%, 5/01/18 | | | 855,000 | | | | 854,949 | |
| | | | | | | | |
| | |
TOTAL COMMERCIAL PAPER (COST $855,000) | | | | | | $ | 854,949 | |
| | |
CORPORATE BONDS – 59.3% | | | | | | | | |
| | |
AEROSPACE & DEFENSE – 1.9% | | | | | | | | |
Lockheed Martin Corp., | | | | | | | | |
Sr. Unsecured, 1.85%, 11/23/18 | | | 1,000,000 | | | | 996,885 | |
| | |
AUTOMOTIVE – 1.9% | | | | | | | | |
Ford Motor Credit Co. LLC, | | | | | | | | |
Sr. Unsecured, (3 Month USD LIBOR + | | | 1,000,000 | | | | 1,003,224 | |
0.83%), 2.90%, 3/12/19D |
| | |
BIOTECHNOLOGY – 0.6% | | | | | | | | |
Gilead Sciences, Inc., | | | | | | | | |
Sr. Unsecured, 1.85%, 9/04/18 | | | 285,000 | | | | 284,558 | |
| | |
CAPITAL MARKETS – 1.9% | | | | | | | | |
Goldman Sachs Group, Inc. (The), | | | | | | | | |
Sr. Unsecured, (3 Month USD LIBOR + | | | 1,000,000 | | | | 1,014,842 | |
1.11%), 3.47%, 4/26/22D |
| | | | | | | | |
Description | | Par Value | | | Value | |
| | |
COMMERCIAL BANKS – 6.7% | | | | | | | | |
| | |
KeyBank NA, | | | | | | | | |
Sr. Unsecured, BKNT, 2.35%, 3/08/19 | | $ | 1,650,000 | | | $ | 1,646,943 | |
| | |
PNC Bank NA, | | | | | | | | |
Sr. Unsecured, BKNT, 1.95%, 3/04/19 | | | 700,000 | | | | 696,096 | |
| | |
US Bank NA, | | | | | | | | |
Sr. Unsecured, BKNT, 1.40%, 4/26/19 | | | 1,150,000 | | | | 1,137,403 | |
| | | | | | | | |
| | |
TOTAL COMMERCIAL BANKS | | | | | | $ | 3,480,442 | |
| |
COMMERCIAL SERVICES & SUPPLIES – 2.8% | | | | | |
| | |
Total System Services, Inc., | | | | | | | | |
Sr. Unsecured, 2.38%, 6/01/18 | | | 1,460,000 | | | | 1,459,526 | |
| | |
CONSUMER FINANCE – 6.7% | | | | | | | | |
| | |
American Express Credit Corp., | | | | | | | | |
Sr. Unsecured, (3 Month USD LIBOR + 0.55%), 2.73%, 3/18/19D | | | 800,000 | | | | 802,569 | |
| | |
American Express Credit Corp., | | | | | | | | |
Sr. Unsecured, MTN, 1.70%, 10/30/19 | | | 750,000 | | | | 737,673 | |
| | |
Capital One Financial Corp., | | | | | | | | |
Sr. Unsecured, (3 Month USD LIBOR + 0.76%), 2.57%, 5/12/20D | | | 1,000,000 | | | | 1,005,273 | |
| | |
John Deere Capital Corp., | | | | | | | | |
Sr. Unsecured, MTN, 1.95%, 1/08/19# | | | 950,000 | | | | 946,079 | |
| | | | | | | | |
| | |
TOTAL CONSUMER FINANCE | | | | | | $ | 3,491,594 | |
| | |
DIVERSIFIED FINANCIAL SERVICES – 5.1% | | | | | | | | |
| | |
Canadian Imperial Bank of Commerce, | | | | | | | | |
Sr. Unsecured, (3 Month USD LIBOR + 0.52%), 2.55%, 9/06/19#,D | | | 1,000,000 | | | | 1,004,417 | |
| | |
Citigroup, Inc., | | | | | | | | |
Sr. Unsecured, 2.05%, 6/07/19 | | | 500,000 | | | | 496,123 | |
| | |
Royal Bank of Canada, | | | | | | | | |
Sr. Unsecured, GMTN, 2.13%, 3/02/20 | | | 665,000 | | | | 654,250 | |
| | |
Wells Fargo & Co., | | | | | | | | |
Sr. Unsecured, MTN, 3.00%, 1/22/21 | | | 500,000 | | | | 497,740 | |
| | | | | | | | |
| | |
TOTAL DIVERSIFIED FINANCIAL SERVICES | | | | | | $ | 2,652,530 | |
| | |
ELECTRIC – 4.9% | | | | | | | | |
| | |
FirstEnergy Corp., | | | | | | | | |
Sr. Unsecured, 2.85%, 7/15/22 | | | 1,000,000 | | | | 963,808 | |
| | |
NextEra Energy Capital Holdings, Inc., | | | | | | | | |
Company Guaranteed, 2.30%, 4/01/19 | | | 600,000 | | | | 597,729 | |
| | |
WEC Energy Group, Inc., | | | | | | | | |
Sr. Unsecured, 2.45%, 6/15/20 | | | 1,000,000 | | | | 985,316 | |
| | | | | | | | |
| | |
TOTAL ELECTRIC | | | | | | $ | 2,546,853 | |
| |
ELECTRONIC EQUIPMENT, INSTRUMENTS & COMPONENTS – 0.9% | | | | | |
| | |
Emerson Electric Co., | | | | | | | | |
Sr. Unsecured, 5.25%, 10/15/18 | | | 485,000 | | | | 491,261 | |
| | |
FOOD & STAPLES RETAILING – 1.9% | | | | | | | | |
| | |
Kroger Co. (The), | | | | | | | | |
Sr. Unsecured, 2.80%, 8/01/22 | | | 1,000,000 | | | | 967,616 | |
| | |
FOOD PRODUCTS – 0.8% | | | | | | | | |
| | |
Hershey Co. (The), | | | | | | | | |
| | |
Sr. Unsecured, 1.60%, 8/21/18 | | | 400,000 | | | | 398,760 | |
ANNUAL REPORT / April 30, 2018
| | |
| 37 | | PORTFOLIOS OF INVESTMENT Wilmington Short-Term Bond Fund (continued) |
| | | | | | | | |
Description | | Par Value | | | Value | |
| |
HEALTH CARE EQUIPMENT & SUPPLIES – 0.6% | | | | | |
| | |
Abbott Laboratories, | | | | | | | | |
Sr. Unsecured, 2.35%, 11/22/19 | | $ | 316,000 | | | $ | 313,320 | |
| |
HEALTH CARE PROVIDERS & SERVICES – 3.9% | | | | | |
| | |
Cardinal Health, Inc., | | | | | | | | |
Sr. Unsecured, 1.95%, 6/14/19 | | | 600,000 | | | | 593,105 | |
| | |
UnitedHealth Group, Inc., | | | | | | | | |
Sr. Unsecured, 1.95%, 10/15/20 | | | 1,500,000 | | | | 1,465,496 | |
| | | | | | | | |
| | |
TOTAL HEALTH CARE PROVIDERS & SERVICES | | | | | | $ | 2,058,601 | |
| |
HOUSEHOLD PRODUCTS – 1.9% | | | | | |
| | |
Church & Dwight Co., Inc., | | | | | | | | |
Sr. Unsecured, (3 Month USD LIBOR + 0.15%), 2.51%, 1/25/19D | | | 1,000,000 | | | | 999,803 | |
| |
INSURANCE – 1.9% | | | | | |
| | |
Metropolitan Life Global Funding I, | | | | | | | | |
Sr. Secured, 1.95%, 12/03/18W | | | 1,000,000 | | | | 996,538 | |
| |
MEDIA – 3.8% | | | | | |
| | |
Comcast Corp., | | | | | | | | |
Company Guaranteed, 5.70%, 7/01/19 | | | 1,000,000 | | | | 1,032,693 | |
| | |
Walt Disney Co. (The), | | | | | | | | |
Sr. Unsecured, MTN, 0.88%, 7/12/19 | | | 980,000 | | | | 957,523 | |
| | | | | | | | |
| | |
TOTAL MEDIA | | | | | | $ | 1,990,216 | |
| |
OIL & GAS – 3.7% | | | | | |
| | |
BP Capital Markets PLC, | | | | | | | | |
Company Guaranteed, 1.68%, 5/03/19 | | | 950,000 | | | | 941,523 | |
| | |
Schlumberger Holdings Corp., | | | | | | | | |
Sr. Unsecured, 2.35%, 12/21/18W | | | 1,000,000 | | | | 996,946 | |
| | | | | | | | |
| | |
TOTAL OIL & GAS | | | | | | $ | 1,938,469 | |
| |
PIPELINES – 1.9% | | | | | |
| | |
Kinder Morgan Energy Partners LP, | | | | | | | | |
Company Guaranteed, 2.65%, 2/01/19 | | | 1,000,000 | | | | 997,767 | |
| |
SEMICONDUCTORS – 1.9% | | | | | |
| | |
QUALCOMM, Inc., | | | | | | | | |
Sr. Unsecured, 1.85%, 5/20/19 | | | 1,000,000 | | | | 993,187 | |
| |
TELECOMMUNICATIONS – 1.7% | | | | | |
| | |
AT&T, Inc., | | | | | | | | |
Sr. Unsecured, (3 Month USD LIBOR + 0.93%), 3.23%, 6/30/20D | | | 900,000 | | | | 910,691 | |
| |
TRUCKING & LEASING – 1.9% | | | | | |
| | |
GATX Corp., | | | | | | | | |
Sr. Unsecured, 2.38%, 7/30/18 | | | 1,000,000 | | | | 999,381 | |
| | | | | | | | |
| | |
TOTAL CORPORATE BONDS | | | | | | | | |
(COST $31,206,055) | | | | | | $ | 30,986,064 | |
| | |
GOVERNMENT AGENCIES – 2.8% | | | | | | | | |
| |
FEDERAL HOME LOAN BANK (FHLB) – 2.8% | | | | | |
| | |
1.38%, 11/15/19 | | | 1,500,000 | | | | 1,475,264 | |
| | | | | | | | |
| | |
TOTAL FEDERAL HOME LOAN BANK (FHLB) | | | | | | $ | 1,475,264 | |
| | | | | | | | |
Description | | Par Value | | | Value | |
| | |
SMALL BUSINESS | | | | | | | | |
ADMINISTRATION – 0.0%** | | | | | | | | |
| | |
Small Business Administration Participation Certificates, Series 1999-20I, 1, 7.30%, 9/01/19 | | $ | 898 | | | $ | 914 | |
| | | | | | | | |
| |
TOTAL SMALL BUSINESS ADMINISTRATION | | | $ | 914 | |
| | | | | | | | |
| |
TOTAL GOVERNMENT AGENCIES (COST $1,498,286) | | | $ | 1,476,178 | |
| |
MORTGAGE-BACKED SECURITIES – 5.6% | | | | | |
| |
FEDERAL HOME LOAN MORTGAGE CORPORATION (FHLMC) – 2.8% | | | | | |
| | |
Pool 538733, 9.00%, 9/01/19 | | | 93 | | | | 95 | |
| | |
Pool G12709, 5.00%, 7/01/22 | | | 50,927 | | | | 51,786 | |
| | |
Pool C80328, 7.50%, 7/01/25 | | | 16,479 | | | | 18,840 | |
| | |
Pool G14695, 4.50%, 6/01/26 | | | 189,555 | | | | 190,961 | |
| | |
Pool G01425, 7.50%, 5/01/32 | | | 41,905 | | | | 48,615 | |
| | |
Pool C78010, 5.50%, 4/01/33 | | | 539,077 | | | | 597,266 | |
| | |
Pool A18401, 6.00%, 2/01/34 | | | 418,301 | | | | 466,240 | |
| | |
Pool G01831, 6.00%, 5/01/35 | | | 75,089 | | | | 83,860 | |
| | | | | |
| |
TOTAL FEDERAL HOME LOAN MORTGAGE CORPORATION (FHLMC) | | | $ | 1,457,663 | |
|
FEDERAL NATIONAL MORTGAGE ASSOCIATION (FNMA) – 2.3% | |
| | |
Pool 202957, 8.00%, 8/01/21 | | | 75 | | | | 76 | |
| | |
Pool MA0909, 3.00%, 11/01/21 | | | 241,494 | | | | 240,468 | |
| | |
Pool 334593, 7.00%, 5/01/24 | | | 35,047 | | | | 39,828 | |
| | |
Pool AE2520, 3.00%, 1/01/26 | | | 172,843 | | | | 171,732 | |
| | |
Pool 436746, 6.50%, 8/01/28 | | | 21,388 | | | | 22,249 | |
| | |
Pool 440401, 6.50%, 8/01/28 | | | 70,678 | | | | 78,867 | |
| | |
Pool 323419, 6.00%, 12/01/28 | | | 31,427 | | | | 34,842 | |
| | |
Pool 485678, 6.50%, 3/01/29 | | | 14,898 | | | | 15,514 | |
| | |
Pool 494375, 6.50%, 4/01/29 | | | 872 | | | | 891 | |
| | |
Pool 252439, 6.50%, 5/01/29 | | | 15,184 | | | | 16,959 | |
| | |
Pool 545051, 6.00%, 9/01/29 | | | 54,638 | | | | 60,654 | |
| | |
Pool 725418, 6.50%, 5/01/34 | | | 81,870 | | | | 91,442 | |
| | |
Pool 833143, 5.50%, 9/01/35 | | | 314,989 | | | | 341,716 | |
| | |
Pool 843323, 5.50%, 10/01/35 | | | 15,646 | | | | 16,441 | |
| | |
Pool 255933, 5.50%, 11/01/35 | | | 75,272 | | | | 82,234 | |
| | | | | | | | |
| |
TOTAL FEDERAL NATIONAL MORTGAGE ASSOCIATION (FNMA) | | | $ | 1,213,913 | |
| |
GOVERNMENT NATIONAL MORTGAGE ASSOCIATION (GNMA) – 0.5% | | | | | |
| | |
Pool 306066, 8.50%, 7/15/21 | | | 1,472 | | | | 1,632 | |
| | |
Pool 1061, 9.00%, 4/20/23 | | | 7,069 | | | | 7,258 | |
| | |
Pool 346572, 7.00%, 5/15/23 | | | 3,468 | | | | 3,636 | |
| | |
Pool 484269, 7.00%, 9/15/28 | | | 20,844 | | | | 21,982 | |
| | |
Pool 592505, 6.00%, 4/15/33 | | | 131,946 | | | | 138,168 | |
April 30, 2018 / ANNUAL REPORT
| | |
PORTFOLIOS OF INVESTMENT Wilmington Short-Term Bond Fund (continued) | | 38 |
| | | | | | | | |
Description | | Par Value | | | Value | |
| | |
Pool 581522, 6.00%, 5/15/33 | | $ | 94,284 | | | $ | 98,247 | |
| | | | | | | | |
| |
TOTAL GOVERNMENT NATIONAL MORTGAGE ASSOCIATION (GNMA) | | | $ | 270,923 | |
| | | | | | | | |
| | |
TOTAL MORTGAGE-BACKED SECURITIES (COST $2,825,388) | | | | | | $ | 2,942,499 | |
| | |
MUNICIPAL BOND – 0.1% | | | | | | | | |
| | |
DEVELOPMENT – 0.1% | | | | | | | | |
| | |
City of Miami, FL, Rent Revenue, | | | | | | | | |
Series 1998, 8.65%, 7/01/19 | | | 45,000 | | | | 46,772 | |
| | | | | | | | |
| | |
TOTAL MUNICIPAL BOND (COST $45,933) | | | | | | $ | 46,772 | |
| | |
U.S. TREASURY – 26.4% | | | | | | | | |
| | |
U.S. TREASURY NOTES – 26.4% | | | | | | | | |
| | |
0.75%, 7/15/19# | | | 2,000,000 | | | | 1,962,304 | |
| | |
1.00%, 3/15/19 | | | 85,000 | | | | 84,087 | |
| | |
1.13%, 8/31/21 | | | 495,000 | | | | 470,462 | |
| | |
1.50%, 6/15/20 | | | 7,890,000 | | | | 7,725,403 | |
| | |
1.75%, 6/30/22 | | | 1,150,000 | | | | 1,105,547 | |
| | |
1.88%, 7/31/22 | | | 1,000,000 | | | | 964,941 | |
| | |
2.50%, 3/31/23# | | | 1,500,000 | | | | 1,480,014 | |
| | | | | | | | |
| | |
TOTAL U.S. TREASURY NOTES | | | | | | $ | 13,792,758 | |
| | | | | | | | |
| | |
TOTAL U.S. TREASURY (COST $14,081,769) | | | | | | $ | 13,792,758 | |
| | | | | | | | |
| | | Number of Shares | | | | |
| | |
MONEY MARKET FUND – 0.0%** | | | | | | | | |
Dreyfus Government Cash Management Fund, Institutional Shares, 1.60%^ | | | 3,479 | | | | 3,479 | |
| | | | | | | | |
| | |
TOTAL MONEY MARKET FUND | | | | | | | | |
(COST $3,479) | | | | | | $ | 3,479 | |
| | | | | | | | |
| | | | | | | | |
| | |
TOTAL INVESTMENTS IN SECURITIES – 99.6% | | | | | | | | |
(COST $52,562,153) | | | | | | $ | 52,090,135 | |
| | | | | | | | |
Description | | Par Value | | | Value | |
|
CASH COLLATERAL INVESTED FOR SECURITIES ON LOAN – 9.4% | |
| | |
REPURCHASE AGREEMENTS – 9.4% | | | | | | | | |
| | |
Barclays Capital, Inc., 1.71%, dated 4/30/18, due 5/01/18, repurchase price $241,627, collateralized by U.S. Treasury Securities, 0.00% to 3.00%, maturing 7/31/19 to 9/09/49; total market value of $246,448 | | $ | 241,616 | | | $ | 241,616 | |
| | |
Daiwa Capital Markets America, 1.72%, dated 4/30/18, due 5/01/18, repurchase price $930,541, collateralized by U.S. Government & Treasury Securities, 0.00% to 9.13%, maturing 5/15/18 to 12/01/51; total market value of $949,107 | | | 930,497 | | | | 930,497 | |
| | |
NBC Global Finance Ltd., 1.74%, dated 4/30/18, due 5/01/18, repurchase price $930,542, collateralized by U.S. Treasury Securities, 0.00% to 3.63%, maturing 6/30/19 to 9/09/49; total market value of $949,105 | | | 930,497 | | | | 930,497 | |
| | |
Nomura Securities International, Inc., 1.74%, dated 4/30/18, due 5/01/18, repurchase price $930,542, collateralized by U.S. Government Securities, 0.00% to 10.50%, maturing 5/01/18 to 3/20/68; total market value of $949,107 | | | 930,497 | | | | 930,497 | |
| | |
RBC Dominion Securities, Inc., 1.72%, dated 4/30/18, due 5/01/18, repurchase price $930,541, collateralized by U.S. Government & Treasury Securities, 0.13% to 7.00%, maturing 10/31/18 to 9/09/49; total market value of $949,107 | | | 930,497 | | | | 930,497 | |
| | |
TD Securities, Inc., 1.74%, dated 4/30/18, due 5/01/18, repurchase price $930,542, collateralized by U.S. Government Securities, 4.00% to 4.50%, maturing 3/01/47 to 3/01/48; total market value of $949,107 | | | 930,497 | | | | 930,497 | |
| | | | | | | | |
| |
TOTAL CASH COLLATERAL INVESTED FOR SECURITIES ON LOAN (COST $4,894,101) | | | $ | 4,894,101 | |
| | | | | | | | |
| | | | | | | | |
| | |
TOTAL INVESTMENTS – 109.0% (COST $57,456,254) | | | | | | $ | 56,984,236 | |
| |
| COLLATERAL FOR SECURITIES ON LOAN – (9.4%) | | | | (4,894,101 | ) |
| | |
OTHER ASSETS LESS LIABILITIES – 0.4% | | | | | | | 192,130 | |
| | | | | | | | |
| | |
TOTAL NET ASSETS – 100.0% | | | | | | $ | 52,282,265 | |
| | | | | | | | |
ANNUAL REPORT / April 30, 2018
| | |
| 39 | | PORTFOLIOS OF INVESTMENT Wilmington Short-Term Bond Fund (concluded) |
Cost of investments for Federal income tax purposes is $57,459,837. The net unrealized appreciation/(depreciation) of investments was $(475,601). This consists of net unrealized appreciation from investment for those securities having an excess of value over cost of $204,044 and net unrealized depreciation from investments for those securities having an excess of cost over value of $(679,645).
Various inputs are used in determining the value of the Fund’s investments. These inputs are summarized in the three broad levels listed below.
Level 1 – quoted prices in active markets for identical securities
Level 2 – other significant observable inputs (including quoted prices for similar securities, interest rates, prepayment speeds, credit risk, etc.)
Level 3 – significant unobservable inputs (including the Fund’s own assumptions in determining the fair value of investments)
The following is a summary of the inputs used as of April 30, 2018 in valuing the Fund’s assets carried at fair value:
| | | | | | | | | | | | | | | | | | |
| | | Level 1 | | | Level 2 | | | Level 3 | | | Total | | | |
| | | | | |
Investments in Securities | | | | | | | | | | | | | | | | | | |
| | | | | |
Adjustable Rate Mortgage | | $ | — | | | $ | 44 | | | $ | — | | | $ | 44 | | | |
| | | | | |
Collateralized Mortgage Obligations | | | — | | | | 1,987,392 | | | | — | | | | 1,987,392 | | | |
| | | | | |
Commercial Paper | | | — | | | | 854,949 | | | | — | | | | 854,949 | | | |
| | | | | |
Corporate Bonds | | | — | | | | 30,986,064 | | | | — | | | | 30,986,064 | | | |
| | | | | |
Government Agencies | | | — | | | | 1,476,178 | | | | — | | | | 1,476,178 | | | |
| | | | | |
Mortgage-Backed Securities | | | — | | | | 2,942,499 | | | | — | | | | 2,942,499 | | | |
| | | | | |
Municipal Bond | | | — | | | | 46,772 | | | | — | | | | 46,772 | | | |
| | | | | |
U.S. Treasury | | | — | | | | 13,792,758 | | | | — | | | | 13,792,758 | | | |
| | | | | |
Money Market Fund | | | 3,479 | | | | — | | | | — | | | | 3,479 | | | |
| | | | | |
Repurchase Agreements | | | — | | | | 4,894,101 | | | | — | | | | 4,894,101 | | | |
| | | | | | | | | | | | | | | | | | |
| | | | | |
Total | | $ | 3,479 | | | $ | 56,980,757 | | | $ | — | | | $ | 56,984,236 | | | |
| | | | | | | | | | | | | | | | | | |
| # | Security, or a portion thereof, is on loan. See Note 2 in Notes to Financial Statements. |
| D | Variable rate security. The rate disclosed is the rate in effect on the report date. The Information in parenthesis represents the benchmark and reference rate for each relevant security and the rate floats based upon the reference rate and spread. The security may be further subject to interest rate floor and caps. Certain variable rate securities are not based on a published reference rate and spread, but are determined by the issuer or agent and are based on current market conditions, or, for mortgage-backed securities, are impacted by the individual mortgages which are paying off over time. These securities do not indicate a reference rate and spread in their descriptions. |
| W | Denotes a restricted security that may be resold without restriction to “qualified institutional buyers” as defined in Rule 144A under the Securities Act of 1933 and that the Fund has determined to be liquid under criteria established by the Fund’s Board of Trustees. At April 30, 2018, these liquid restricted securities amounted to $1,993,484 representing 3.81% of total net assets. |
| ** | Represents less than 0.05%. |
| ◆ | The rate shown reflects the effective yield at purchase date. |
| | | | | | | | | | |
| | The following acronyms are used throughout this Fund: | | LIBOR | | London Interbank Offered Rate |
| | BKNT | | Bank Note | | | | LLC | | Limited Liability Corporation |
| | | FHLMC | | Federal Home Loan Mortgage Corporation | | | | LP | | Limited Partnership |
| | FNMA | | Federal National Mortgage Association | | | | MTN | | Medium Term Note |
| | GMTN | | Global Medium Term Note | | | | NA | | National Association |
| | GNMA | | Government National Mortgage Association | | | | PLC | | Public Limited Company |
See Notes which are an integral part of the Financial Statements
April 30, 2018 / ANNUAL REPORT
PORTFOLIO OF INVESTMENTS SUMMARY TABLE
Wilmington Municipal Bond Fund
At April 30, 2018, the Fund’s portfolio composition was as follows (unaudited):
| | | | | |
| | | Percentage of |
| | | Total Net Assets |
General Obligations | | | | 25.1 | % |
Dedicated Tax | | | | 16.4 | % |
Higher Education | | | | 11.6 | % |
School District | | | | 9.2 | % |
Transportation | | | | 7.2 | % |
Medical | | | | 6.6 | % |
Airport | | | | 5.4 | % |
Lease | | | | 5.4 | % |
Water | | | | 3.5 | % |
Water & Sewer | | | | 2.4 | % |
Power | | | | 2.0 | % |
Utilities | | | | 1.1 | % |
Housing | | | | 0.7 | % |
Cash Equivalents1 | | | | 1.2 | % |
Other Assets and Liabilities – Net2 | | | | 2.2 | % |
| | | | | |
| |
TOTAL | | | | 100.0 | % |
| | | | | |
| | | | | |
| | | Percentage of |
| Credit Quality Diversification3 | | Total Net Assets |
AAA / Aaa | | | | 12.7 | % |
AA / Aa | | | | 40.8 | % |
A / A | | | | 31.5 | % |
BBB / Baa | | | | 11.6 | % |
Not Rated | | | | 1.2 | % |
Other Assets and Liabilities – Net2 | | | | 2.2 | % |
| | | | | |
| |
TOTAL | | | | 100.0 | % |
| | | | | |
| (1) | Cash Equivalents include investments in a money market fund. |
| (2) | Assets, other than investments in securities, less liabilities. See Statements of Assets and Liabilities. |
| (3) | For financial reporting purposes, the Credit Quality Diversification table reflects the lowest rating assigned by either Moody’s Investors Service or Standard and Poor’s if the ratings differ. These rating agencies are independent, nationally recognized statistical rating organizations and are widely used. Investment grade ratings are credit ratings of BBB/Baa or higher. Below investment grade ratings are credit ratings of BB/Ba or lower. Investments designated as “Not Rated” are not rated by either rating agency and do not necessarily indicate low credit quality. Credit quality ratings are subject to change. |
PORTFOLIO OF INVESTMENTS
April 30, 2018
| | | | | | | | |
Description | | Par Value | | | Value | |
| | |
MUNICIPAL BONDS – 96.6% | | | | | | | | |
| | |
ALABAMA – 0.4% | | | | | | | | |
| | |
HIGHER EDUCATION – 0.4% | | | | | | | | |
| | |
Auburn University, AL, Advance Refunding | | | | | | | | |
Revenue Bonds, (Series A), 5.00%, 6/01/21 | | $ | 1,200,000 | | | $ | 1,307,772 | |
| | | | | | | | |
| | |
TOTAL ALABAMA | | | | | | $ | 1,307,772 | |
| | |
ARIZONA – 3.8% | | | | | | | | |
| | |
AIRPORT – 2.0% | | | | | | | | |
| | |
City of Phoenix Civic Improvement Corp., AZ, Advance Refunding Revenue Bonds, Junior Lien Airport, Special Tax Obligation, 5.00%, 7/01/24 | | | 5,000,000 | | | | 5,712,850 | |
| | | | | | | | |
Description | | Par Value | | | Value | |
| | |
POWER – 0.7% | | | | | | | | |
| | |
Salt River Project Agricultural Improvement & Power District, AZ, Advance Refunding Revenue Bonds, Salt River Electricity Project, 5.00%, 1/01/33 | | $ | 1,765,000 | | | $ | 2,080,247 | |
| | |
SCHOOL DISTRICT – 0.7% | | | | | | | | |
| | |
Maricopa County Unified School District No 80 Chandler, AZ, GO Limited, Economic Defeasance, 5.00%, 7/01/21 | | | 2,000,000 | | | | 2,179,800 | |
ANNUAL REPORT / April 30, 2018
| | |
| 41 | | PORTFOLIOS OF INVESTMENTS Wilmington Municipal Bond Fund (continued) |
| | | | | | | | |
Description | | Par Value | | | Value | |
| | |
TRANSPORTATION – 0.4% | | | | | | | | |
| | |
Arizona Department of Transportation State Highway, AZ, Refunding Revenue Bonds, 5.00%, 7/01/25 | | $ | 1,015,000 | | | $ | 1,166,590 | |
| | | | | | | | |
| | |
TOTAL ARIZONA | | | | | | $ | 11,139,487 | |
| | |
CALIFORNIA – 6.3% | | | | | | | | |
| | |
DEDICATED TAX – 1.3% | | | | | | | | |
| | |
Fontana Redevelopment Agency Successor Agency, CA, (Series A), 5.00%, 10/01/30 | | | 3,060,000 | | | | 3,638,738 | |
| | |
GENERAL OBLIGATIONS – 0.4% | | | | | | | | |
| | |
State of California, CA, GO Unlimited, Current Refunding, 5.00%, 8/01/30 | | | 1,010,000 | | | | 1,200,749 | |
| | |
HIGHER EDUCATION – 0.4% | | | | | | | | |
| | |
California Municipal Finance Authority, CA, Advance Refunding Revenue Bonds, (Series B), (Emerson College), 5.00%, 1/01/28 | | | 1,015,000 | | | | 1,180,465 | |
| | |
TRANSPORTATION – 1.9% | | | | | | | | |
| | |
Bay Area Toll Authority, CA, Refunding Revenue Bonds, (San Francisco Bay Area), 5.00%, 4/01/26 | | | 5,000,000 | | | | 5,563,900 | |
| | |
WATER – 0.4% | | | | | | | | |
| | |
California Infrastructure & Economic Development Bank, CA, Revenue Bonds, (Clean Water State Revolving Fund), 5.00%, 10/01/33 | | | 1,020,000 | | | | 1,205,620 | |
| | |
WATER & SEWER – 1.9% | | | | | | | | |
| | |
City of San Francisco Public Utilities Commission Water Revenue, CA, Refunding Revenue Bonds, (Series C), (Water Revenue), 5.00%, 11/01/27 | | | 5,000,000 | | | | 5,547,050 | |
| | |
TOTAL CALIFORNIA | | | | | | $ | 18,336,522 | |
| | |
COLORADO – 0.8% | | | | | | | | |
| | |
AIRPORT – 0.8% | | | | | | | | |
| | |
City & County of Denver Airport System Revenue, CO, Refunding Revenue Bonds, (Series B), 5.00%, 11/15/25 | | | 2,000,000 | | | | 2,231,320 | |
| | |
TOTAL COLORADO | | | | | | $ | 2,231,320 | |
| | |
CONNECTICUT – 5.3% | | | | | | | | |
| | |
DEDICATED TAX – 3.9% | | | | | | | | |
| | |
State of Connecticut, CT, Special Tax Obligation Bonds Transportation Infrastructure Purposes, Refunding Revenue Bonds, (Fuel Sales Tax Revenue), (2012 Series B), 5.00%, 1/01/25 | | | 5,125,000 | | | | 5,588,812 | |
| | |
State of Connecticut, CT, Special Tax Obligation Bonds Transportation Infrastructure Purposes, Revenue Bond, (Series A), (Fuel Sales Tax Revenue), 5.00%, 9/01/30 | | | 5,000,000 | | | | 5,606,750 | |
| | |
TOTAL DEDICATED TAX | | | | | | $ | 11,195,562 | |
| | | | | | | | |
Description | | Par Value | | | Value | |
| | |
HIGHER EDUCATION – 1.4% | | | | | | | | |
| | |
Connecticut State Health & Educational Facilities Authority, CT, Advance Refunding Revenue Bonds, (Series R), Fairfield University, 5.00%, 7/01/31 | | $ | 1,385,000 | | | $ | 1,583,955 | |
| | |
Connecticut State Health & Educational Facilities Authority, CT, Revenue Bonds, (Series I-1), Sacred Heart University, 5.00%, 7/01/28 | | | 1,335,000 | | | | 1,548,653 | |
| | |
University of Connecticut, CT, Revenue Bonds, (Series A), 5.00%, 3/15/32 | | | 1,000,000 | | | | 1,108,890 | |
| | |
TOTAL HIGHER EDUCATION | | | | | | $ | 4,241,498 | |
| | |
TOTAL CONNECTICUT | | | | | | $ | 15,437,060 | |
| | |
DISTRICT OF COLUMBIA – 1.0% | | | | | | | | |
| | |
HIGHER EDUCATION – 1.0% | | | | | | | | |
| | |
District of Columbia, DC, Advance Refunding, Revenue Bonds, (Georgetown University), 5.00%, 4/01/31 | | | 2,455,000 | | | | 2,840,631 | |
| | |
TOTAL DISTRICT OF COLUMBIA | | | | | | $ | 2,840,631 | |
| | |
FLORIDA – 2.6% | | | | | | | | |
| | |
AIRPORT – 0.9% | | | | | | | | |
| | |
Greater Orlando Aviation Authority, FL, Revenue Bonds, (Port, Airport & Marina Improvements), (Sub-Series A), 5.00%, 10/01/24 | | | 2,250,000 | | | | 2,534,490 | |
| | |
HIGHER EDUCATION – 0.6% | | | | | | | | |
| | |
Florida Higher Educational Facilities Financial Authority, FL, Revenue Bonds, (Educational Facilities Ringling College Project), 5.00%, 3/01/28 | | | 1,600,000 | | | | 1,791,200 | |
| | |
LEASE – 1.1% | | | | | | | | |
| | |
Broward County School Board, FL, Certificate Participation Refunding Bonds, (Series A), 5.00%, 7/01/21 | | | 3,000,000 | | | | 3,260,070 | |
| | |
TOTAL FLORIDA | | | | | | $ | 7,585,760 | |
| | |
GEORGIA – 3.9% | | | | | | | | |
| | |
HIGHER EDUCATION – 1.0% | | | | | | | | |
| | |
Athens-Clarke County Unified Government Development Authority, GA, Revenue Bonds, (Series A), (UGAAP), 5.00%, 9/01/23 | | | 1,000,000 | | | | 1,126,140 | |
| | |
Bulloch County Development Authority, GA, Advance Refunding Revenue Bonds, (Georgia Southern University Housing Foundation Four, LLC Project), 5.00%, 7/01/31 | | | 1,575,000 | | | | 1,801,249 | |
| | |
TOTAL HIGHER EDUCATION | | | | | | $ | 2,927,389 | |
| | |
LEASE – 1.7% | | | | | | | | |
| | |
Gwinnett County Development Authority, GO, Certificate Participation Refunding Bonds, (NATL-RE), 5.25%, 1/01/22 | | | 4,370,000 | | | | 4,841,479 | |
April 30, 2018 / ANNUAL REPORT
| | |
PORTFOLIOS OF INVESTMENTS Wilmington Municipal Bond Fund (continued) | | 42 |
| | | | | | | | |
Description | | Par Value | | | Value | |
| | |
POWER – 0.5% | | | | | | | | |
| | |
Municipal Electric Authority of Georgia, GA, Refunding Revenue Bonds, (Series A), 5.00%, 1/01/28 | | $ | 1,160,000 | | | $ | 1,320,532 | |
| | |
SCHOOL DISTRICT – 0.7% | | | | | | | | |
| | |
Hall County School District, GA, GO Unlimited, School Improvements, (ST AID WITHHLDG), 5.00%, 11/01/22 | | | 1,925,000 | | | | 2,156,347 | |
| | |
TOTAL GEORGIA | | | | | | $ | 11,245,747 | |
| | |
ILLINOIS – 17.9% | | | | | | | | |
| | |
DEDICATED TAX – 0.8% | | | | | | | | |
| | |
State of Illinois, IL, Revenue Bonds, (Sales Tax Revenue), (NATL-RE), 6.00%, 6/15/27 | | | 2,000,000 | | | | 2,459,380 | |
| | |
GENERAL OBLIGATIONS – 10.5% | | | | | | | | |
| | |
Chicago Park District, IL, (Ad Valorem Property Tax) | | | | | | | | |
| | |
5.00%, 1/01/26 | | | 1,250,000 | | | | 1,388,225 | |
| | |
5.00%, 1/01/27 | | | 3,455,000 | | | | 3,810,623 | |
| | |
Cook County, IL, GO Unlimited, Current Refunding, (Series A), (AGM), 5.00%, 11/15/26 | | | 2,050,000 | | | | 2,340,136 | |
| | |
Elk Grove Village, IL, GO Unlimited, Refunding Revenue Notes, (Ad Valorem Property Tax), 5.00%, 1/01/32 | | | 1,000,000 | | | | 1,143,350 | |
| | |
Metropolitan Water Reclamation District of Greater Chicago, IL, GO Limited, (Series C-Green Bond), (Water Utility & Sewer Improvements), 5.00%, 12/01/28 | | | 6,790,000 | | | | 7,608,263 | |
| | |
State of Illinois, IL, GO Unlimited, (Series D), 5.00%, 11/01/25 | | | 3,065,000 | | | | 3,197,255 | |
State of Illinois, IL, GO Unlimited, Public Improvements, (Series B), 5.00%, 12/01/25 | | | 7,935,000 | | | | 8,280,411 | |
| | |
State of Illinois, IL, GO Unlimited, Refunding Bonds, 5.00%, 8/01/25 | | | 2,500,000 | | | | 2,583,775 | |
| | |
TOTAL GENERAL OBLIGATIONS | | | | | | $ | 30,352,038 | |
| | |
POWER – 0.8% | | | | | | | | |
| | |
Illinois Municipal Electric Agency, IL, Advance Refunding Revenue Bonds, (Series A), 5.00%, 2/01/25 | | | 2,000,000 | | | | 2,268,720 | |
| | |
SCHOOL DISTRICT – 3.0% | | | | | | | | |
| | |
Du Page County High School District No 88, IL, GO Unlimited, Current Refunding, (Addison Trail & Willowbrook High Schools), 5.00%, 1/15/25 | | | 6,615,000 | | | | 7,511,465 | |
| | |
Kendall Kane & Will Counties Community Unit School District No 308, IL, GO Unlimited, Refunding Bonds, 5.50%, 2/01/22 | | | 1,100,000 | | �� | | 1,213,982 | |
| | |
TOTAL SCHOOL DISTRICT | | | | | | $ | 8,725,447 | |
| | |
TRANSPORTATION – 2.8% | | | | | | | | |
| | |
Illinois State Toll Highway Authority, IL, Refunding Revenue Bonds, (Series A), 5.00%, 12/01/22 | | | 2,125,000 | | | | 2,368,142 | |
| | | | | | | | |
Description | | Par Value | | | Value | |
| | |
Illinois State Toll Highway Authority, IL, Refunding Revenue Bonds, (Series D), 5.00%, 1/01/24 | | $ | 5,000,000 | | | $ | 5,656,150 | |
| | |
TOTAL TRANSPORTATION | | | | | | $ | 8,024,292 | |
| | |
TOTAL ILLINOIS | | | | | | $ | 51,829,877 | |
| | |
LOUISIANA – 0.4% | | | | | | | | |
| | |
HIGHER EDUCATION – 0.4% | | | | | | | | |
| | |
Louisiana Public Facilities Authority, LA, Revenue Bonds, (Loyola University Project), 5.00%, 10/01/23 | | | 1,000,000 | | | | 1,101,330 | |
| | |
TOTAL LOUISIANA | | | | | | $ | 1,101,330 | |
| | |
MARYLAND – 2.7% | | | | | | | | |
| | |
GENERAL OBLIGATIONS – 2.3% | | | | | | | | |
| | |
Montgomery County, MD, GO Unlimited, Refunding Bonds, (Series A), 5.00%, 7/01/21 | | | 2,000,000 | | | | 2,181,080 | |
| | |
Washington Suburban Sanitary Commission, MD, GO Unlimited, Crossover Refunding, 5.00%, 6/01/21 | | | 4,185,000 | | | | 4,555,582 | |
| | |
TOTAL GENERAL OBLIGATIONS | | | | | | $ | 6,736,662 | |
| | |
MEDICAL – 0.4% | | | | | | | | |
| | |
Maryland Health & Higher Educational Facilities Authority, MD, Refunding Revenue Bonds, (Anne Arundel Health Systems), 5.00%, 7/01/22 | | | 1,000,000 | | | | 1,104,080 | |
| | |
TOTAL MARYLAND | | | | | | $ | 7,840,742 | |
| | |
MASSACHUSETTS – 2.6% | | | | | | | | |
| | |
DEDICATED TAX – 0.7% | | | | | | | | |
| | |
Massachusetts School Building Authority, MA, Refunding Revenue Bonds, (Series B), (Senior Dedicated Sales Tax), 5.00%, 8/15/30 | | | 1,755,000 | | | | 1,932,220 | |
| | |
GENERAL OBLIGATIONS – 0.7% | | | | | | | | |
| | |
Commonwealth of Massachusetts, MA, GO Limited, (Series C), 5.00%, 5/01/33 | | | 1,900,000 | | | | 2,105,827 | |
| | |
HIGHER EDUCATION – 1.2% | | | | | | | | |
| | |
Massachusetts Development Finance Agency, MA, Advance Refunding Revenue Bonds, (Series A), (Emerson College), 5.00%, 1/01/31 | | | 3,005,000 | | | | 3,369,116 | |
| | |
TOTAL MASSACHUSETTS | | | | | | $ | 7,407,163 | |
| | |
MICHIGAN – 7.0% | | | | | | | | |
| | |
DEDICATED TAX – 2.7% | | | | | | | | |
| | |
Michigan Finance Authority, MI, Revenue Bonds, (Income Tax Revenue), 4.00%, 10/01/24 | | | 2,000,000 | | | | 2,079,120 | |
| | |
Michigan Finance Authority, MI, Revenue Bonds, Repayment of Bank Loan, (Series H-1), 5.00%, 10/01/25 | | | 5,215,000 | | | | 5,812,848 | |
| | |
TOTAL DEDICATED TAX | | | | | | $ | 7,891,968 | |
ANNUAL REPORT / April 30, 2018
| | |
| 43 | | PORTFOLIOS OF INVESTMENTS Wilmington Municipal Bond Fund (continued) |
| | | | | | | | |
Description | | Par Value | | | Value | |
| | |
SCHOOL DISTRICT – 2.4% | | | | | | | | |
| | |
Chippewa Valley Schools, GO Unlimited, Current Refunding, (Series B), (Q-SBLF), 5.00%, 5/01/22 | | $ | 3,000,000 | | | $ | 3,311,280 | |
| | |
Grand Ledge Public Schools, MI, GO Unlimited, Current Refunding, (Q-SBLF), 5.00%, 5/01/22 | | | 1,195,000 | | | | 1,318,993 | |
| | |
Troy School District, MI, GO Unlimited, Advance Refunding, (Q-SBLF), 5.00%, 5/01/20 | | | 2,085,000 | | | | 2,210,663 | |
| | |
TOTAL SCHOOL DISTRICT | | | | | | $ | 6,840,936 | |
| | |
UTILITIES – 1.1% | | | | | | | | |
| | |
Lansing Board of Water & Light, MI, Revenue Bonds, (Series A), 5.00%, 7/01/29 | | | 3,000,000 | | | | 3,242,850 | |
| | |
WATER – 0.8% | | | | | | | | |
| | |
Great Lakes Water Authority Water Supply System, MI, Revenue Bonds, 5.00%, 7/01/23 | | | 2,000,000 | | | | 2,225,360 | |
| | |
TOTAL MICHIGAN | | | | | | $ | 20,201,114 | |
| | |
MISSOURI – 2.1% | | | | | | | | |
| | |
MEDICAL – 2.1% | | | | | | | | |
| | |
Health & Educational Facilities Authority, MI, Current Refunding, Revenue Bonds, (Saint Luke’s Health Systems, Inc.), 5.00%, 11/15/30 | | | 5,425,000 | | | | 6,132,583 | |
| | |
TOTAL MISSOURI | | | | | | $ | 6,132,583 | |
| | |
NEVADA – 1.8% | | | | | | | | |
| | |
DEDICATED TAX – 1.8% | | | | | | | | |
| | |
Clark County, NV, Refunding Revenue Bonds, (Series B), (Fuel Sales Tax Revenue), 5.00%, 7/01/30 | | | 4,505,000 | | | | 5,106,598 | |
| | |
TOTAL NEVADA | | | | | | $ | 5,106,598 | |
| | |
NEW JERSEY – 4.4% | | | | | | | | |
| | |
HIGHER EDUCATION – 1.2% | | | | | | | | |
| | |
Gloucester County Improvement Authority, NJ, Advance Refunding Revenue Bonds, (Series A), (Rowan University Project), 5.00%, 7/01/28 | | | 1,030,000 | | | | 1,153,415 | |
| | |
Gloucester County Improvement Authority, NJ, Advance Refunding Revenue Bonds, (Series B), (Rowan University Project), 5.00%, 7/01/27 | | | 2,000,000 | | | | 2,247,820 | |
| | |
TOTAL HIGHER EDUCATION | | | | | | $ | 3,401,235 | |
| | |
LEASE – 2.6% | | | | | | | | |
| | |
New Jersey Economic Development Authority, NJ, Refunding Revenue Bonds, (Series B), 5.00%, 11/01/23 | | | 6,805,000 | | | | 7,378,730 | |
| | | | | | | | |
Description | | Par Value | | | Value | |
| | |
TRANSPORTATION – 0.6% | | | | | | | | |
| | |
New Jersey State Turnpike Authority, NJ, Revenue Bonds, (Series A), (Highway Improvement), 5.00%, 1/01/27 | | $ | 1,645,000 | | | $ | 1,860,446 | |
| | |
TOTAL NEW JERSEY | | | | | | $ | 12,640,411 | |
| | |
NEW YORK – 7.7% | | | | | | | | |
| | |
AIRPORT – 0.8% | | | | | | | | |
| | |
Port Authority of New York & New Jersey, NY, Refunding Revenue Bonds, (175th Series), (Port, Airport & Marina Improvements), 5.00%, 12/01/23 | | | 2,000,000 | | | | 2,237,160 | |
| | |
DEDICATED TAX – 2.7% | | | | | | | | |
| | |
Metropolitan Transportation Authority, NY, Revenue Bonds, (Fuel Sales Tax Revenue), 5.00%, 11/15/22 | | | 3,000,000 | | | | 3,362,100 | |
| | |
New York City, Transitional Finance Authority, NY, Refunding Revenue Bonds, (Sub-series E), 5.00%, 11/01/22 | | | 4,125,000 | | | | 4,466,962 | |
| | |
TOTAL DEDICATED TAX | | | | | | $ | 7,829,062 | |
| | |
GENERAL OBLIGATIONS – 3.5% | | | | | | | | |
| | |
County of Nassau NY, GO Limited, (Series B), 5.00%, 10/01/28 | | | 2,400,000 | | | | 2,775,768 | |
| | |
New York City, NY, GO Unlimited, Advance Refunding, (Series C), 5.00%, 8/01/23 | | | 1,000,000 | | | | 1,131,120 | |
| | |
New York City, NY, GO Unlimited, Public Improvements, (Sub-Series G-1), 5.00%, 4/01/25 | | | 5,790,000 | | | | 6,365,005 | |
| | |
TOTAL GENERAL OBLIGATIONS | | | | | | $ | 10,271,893 | |
| | |
HOUSING – 0.7% | | | | | | | | |
| | |
Amherst Development Corp., NY, Advance Refunding Revenue Bonds, (UBF Faculty- Student Housing Corp.), (AGM), 5.00%, 10/01/32 | | | 1,660,000 | | | | 1,924,587 | |
| | |
TOTAL NEW YORK | | | | | | $ | 22,262,702 | |
| | |
NORTH CAROLINA – 5.4% | | | | | | | | |
| | |
GENERAL OBLIGATIONS – 3.8% | | | | | | | | |
| | |
Wake County, NC, GO Unlimited, Refunding Revenue Notes, (Series A) | | | | | | | | |
| | |
5.00%, 3/01/23 | | | 6,985,000 | | | | 7,890,116 | |
| | |
5.00%, 3/01/31 | | | 2,500,000 | | | | 3,007,825 | |
| | |
TOTAL GENERAL OBLIGATIONS | | | | | | $ | 10,897,941 | |
| | |
SCHOOL DISTRICT – 1.6% | | | | | | | | |
| | |
Mecklenburg County, NC, GO Unlimited, Public Improvements, (Series A), 5.00%, 4/01/25 | | | 4,000,000 | | | | 4,678,280 | |
| | |
TOTAL NORTH CAROLINA | | | | | | $ | 15,576,221 | |
April 30, 2018 / ANNUAL REPORT
| | |
PORTFOLIOS OF INVESTMENTS Wilmington Municipal Bond Fund (continued) | | 44 |
| | | | | | | | |
Description | | Par Value | | | Value | |
| | |
OHIO – 1.5% | | | | | | | | |
| | |
TRANSPORTATION – 1.5% | | | | | | | | |
| | |
Ohio Turnpike & Infrastructure Commission, OH, Revenue Bonds, (Series A), Highway Improvements | | | | | | | | |
| | |
5.00%, 2/15/30 | | $ | 1,725,000 | | | $ | 2,018,819 | |
| | |
5.00%, 2/15/33 | | | 2,000,000 | | | | 2,305,780 | |
| | |
TOTAL TRANSPORTATION | | | | | | $ | 4,324,599 | |
| | |
TOTAL OHIO | | | | | | $ | 4,324,599 | |
| | |
PENNSYLVANIA – 8.6% | | | | | | | | |
| | |
DEDICATED TAX – 2.1% | | | | | | | | |
| | |
Pennsylvania Turnpike Commission, PA, Advance Refunding Revenue Bonds, (2nd Series), Motor License Fund Enhanced | | | | | | | | |
| | |
5.00%, 12/01/29 | | | 2,100,000 | | | | 2,415,336 | |
| | |
5.00%, 12/01/32 | | | 2,000,000 | | | | 2,264,980 | |
| | |
Pennsylvania Turnpike Commission, PA, Advance Refunding Revenue Bonds, (3rd Series), Motor License Fund Enhanced, 5.00%, 12/01/30 | | | 1,250,000 | | | | 1,426,600 | |
| | |
TOTAL DEDICATED TAX | | | | | | $ | 6,106,916 | |
| | |
HIGHER EDUCATION – 2.8% | | | | | | | | |
| | |
Lackawanna County Industrial Development Authority, PA, Advance Refunding Revenue Bonds, (Scranton University), 5.00%, 11/01/30 | | | 1,000,000 | | | | 1,134,150 | |
| | |
Pennsylvania Higher Educational Facilities Authority, PA, Current Refunding Revenue Bonds, (Series A), (University of Sciences, Philadelphia), 5.00%, 11/01/28 | | | 2,330,000 | | | | 2,612,536 | |
| | |
Pennsylvania State University, PA, Refunding Revenue Bonds, (Series B), 5.25%, 8/15/22 | | | 1,865,000 | | | | 2,103,720 | |
| | |
Philadelphia Authority for Industrial Development, PA, Current Refunding Revenue Bonds, La Salle University, 5.00%, 5/01/22 | | | 1,920,000 | | | | 2,100,749 | |
| | |
TOTAL HIGHER EDUCATION | | | | | | $ | 7,951,155 | |
| | |
MEDICAL – 0.6% | | | | | | | | |
| | |
Allegheny County Hospital Development Authority, PA, Revenue Bonds, (Series A), (UPMC, OBG), 5.00%, 10/15/22 | | | 1,605,000 | | | | 1,783,091 | |
| | |
SCHOOL DISTRICT – 0.8% | | | | | | | | |
| | |
Hempfield Area School District, Westmoreland County, PA, GO Unlimited, Current Refunding, (Series B), (BAM State Aid Withholding), 5.00%, 3/15/21 | | | 2,240,000 | | | | 2,406,947 | |
| | |
WATER – 2.3% | | | | | | | | |
| | |
Philadelphia PA Water & Wastewater, PA, Advance Refunding Revenue Bonds, (Series B), 5.00%, 11/01/31 | | | 5,655,000 | | | | 6,573,485 | |
| | |
TOTAL PENNSYLVANIA | | | | | | $ | 24,821,594 | |
| | | | | | | | |
Description | | Par Value | | | Value | |
| | |
TEXAS – 7.2% | | | | | | | | |
| | |
AIRPORT – 0.9% | | | | | | | | |
| | |
Dallas/Fort Worth International Airport, TX, Refunding Revenue Bonds, (Series D), 5.25%, 11/01/23 | | $ | 2,500,000 | | | $ | 2,752,650 | |
| | |
GENERAL OBLIGATIONS – 2.2% | | | | | | | | |
| | |
Dallas, TX, GO, Refunding Revenue Notes, (Series A), 5.00%, 2/15/25 | | | 2,260,000 | | | | 2,505,752 | |
| | |
State of Texas, TX, GO Unlimited, Highway Improvements, (Transportation Commission), 5.00%, 4/01/21 | | | 3,440,000 | | | | 3,727,584 | |
| | |
TOTAL GENERAL OBLIGATIONS | | | | | | $ | 6,233,336 | |
| | |
HIGHER EDUCATION – 1.2% | | | | | | | | |
| | |
Permanent University Fund – University of Texas System, TX, Refunding Revenue Notes, (Series A), 5.00%, 7/01/26 | | | 3,110,000 | | | | 3,614,753 | |
| | |
MEDICAL – 2.4% | | | | | | | | |
| | |
Tarrant County Cultural Education Facilities Finance Corp., TX, Revenue Bonds, (Methodist Hospital of Dallas, OBG), 5.00%, 10/01/25 | | | 6,110,000 | | | | 6,862,385 | |
| | |
WATER & SEWER – 0.5% | | | | | | | | |
| | |
City of Houston Utility System, TX, Refunding Revenue Bonds, (Series C), (Comb-First Lien), 5.00%, 5/15/21 | | | 1,250,000 | | | | 1,355,300 | |
| | |
TOTAL TEXAS | | | | | | $ | 20,818,424 | |
| | |
UTAH – 0.8% | | | | | | | | |
| | |
DEDICATED TAX – 0.4% | | | | | | | | |
| | |
Salt Lake County, UT, GO, Revenue Bonds, 5.00%, 2/01/22 | | | 1,000,000 | | | | 1,105,850 | |
| | |
MEDICAL – 0.4% | | | | | | | | |
| | |
County of Utah, UT, Revenue Bonds, (IHC Health Services Inc., OBG), 5.00%, 5/15/25 | | | 1,165,000 | | | | 1,264,934 | |
| | |
TOTAL UTAH | | | | | | $ | 2,370,784 | |
| | |
VIRGINIA – 1.7% | | | | | | | | |
| | |
GENERAL OBLIGATIONS – 1.7% | | | | | | | | |
| | |
City of Alexandria, VA, GO Unlimited, Advance Refunding, (Series D), (State Aid Withholding), 5.00%, 7/01/30 | | | 3,885,000 | | | | 4,828,900 | |
| | |
TOTAL VIRGINIA | | | | | | $ | 4,828,900 | |
| | |
WASHINGTON – 0.7% | | | | | | | | |
| | |
MEDICAL – 0.7% | | | | | | | | |
| | |
Washington Health Care Facilities Authority, WA, Advance Refunding Revenue Bonds, Overlake Hospital, 5.00%, 7/01/33 | | | 1,750,000 | | | | 1,974,297 | |
| | |
TOTAL WASHINGTON | | | | | | $ | 1,974,297 | |
| | |
TOTAL MUNICIPAL BONDS (COST $281,361,631) | | | | | | $ | 279,361,638 | |
ANNUAL REPORT / April 30, 2018
| | |
| 45 | | PORTFOLIOS OF INVESTMENTS Wilmington Municipal Bond Fund (concluded) |
| | | | | | | | |
| Description | | Number of Shares | | | Value | |
| | |
MONEY MARKET FUND – 1.2% | | | | | | | | |
| | |
Dreyfus Government Cash Management | | | | | | | | |
Fund, Institutional Shares, 1.60%^ | | | 3,347,901 | | | $ | 3,347,901 | |
| | | | | | | | |
| | |
TOTAL MONEY MARKET FUND (COST $3,347,901) | | | | | | $ | 3,347,901 | |
| | | | | | | | |
| | |
TOTAL INVESTMENTS – 97.8% (COST $284,709,532) | | | | | | $ | 282,709,539 | |
| | |
OTHER ASSETS LESS LIABILITIES – 2.2% | | | | | | | 6,333,846 | |
| | | | | | | | |
| | |
TOTAL NET ASSETS – 100.0% | | | | | | $ | 289,043,385 | |
| | | | | | | | |
Cost of investments for Federal income tax purposes is $284,709,532. The net unrealized appreciation/(depreciation) of investments was $(1,999,993). This consists of net unrealized appreciation from investment for those securities having an excess of value over cost of $2,235,528 and net unrealized depreciation from investments for those securities having an excess of cost over value of $(4,235,521).
Various inputs are used in determining the value of the Fund’s investments. These inputs are summarized in the three broad levels listed below.
Level 1 — quoted prices in active markets for identical securities
Level 2 — other significant observable inputs (including quoted prices for similar securities, interest rates, prepayment speeds, credit risk, etc.)
Level 3 — significant unobservable inputs (including the Fund’s own assumptions in determining the fair value of investments)
The following is a summary of the inputs used as of April 30, 2018 in valuing the Fund’s assets carried at fair value:
| | | | | | | | | | | | | | | | | | | | | | | | | | | | |
| | | Level 1 | | | | | | Level 2 | | | | | | Level 3 | | | | | | Total | |
| | | | | | | |
Investments in Securities | | | | | | | | | | | | | | | | | | | | | | | | | | | | |
| | | | | | | |
Municipal Bonds | | $ | — | | | | | | | $ | 279,361,638 | | | | | | | $ | — | | | | | | | $ | 279,361,638 | |
| | | | | | | |
Money Market Fund | | | 3,347,901 | | | | | | | | — | | | | | | | | — | | | | | | | | 3,347,901 | |
| | | | | | | | | | | | | | | | | | | | | | | | | | | | |
| | | | | | | |
Total | | $ | 3,347,901 | | | | | | | $ | 279,361,638 | | | | | | | $ | — | | | | | | | $ | 282,709,539 | |
| | | | | | | | | | | | | | | | | | | | | | | | | | | | |
The following acronyms are used throughout this Fund:
AGM Assured Guaranty Municipal
BAM Build America Mutual Assurance Company
GO General Obligation
NATL-RE National Public Finance Guarantee Corporation
OBG Obligation
Q-SBLF Qualified School Bond Loan Fund
University of Georgia Athletic Association
UGAAP Project
UPMC University of Pittsburgh Medical Center
See Notes which are an integral part of the Financial Statements
April 30, 2018 / ANNUAL REPORT
PORTFOLIO OF INVESTMENTS SUMMARY TABLE
Wilmington New York Municipal Bond Fund
At April 30, 2018, the Fund’s portfolio classifications were as follows (unaudited):
| | | | | |
| | | Percentage of |
| | | Total Net Assets |
Dedicated Tax | | | | 23.1 | % |
General Obligations | | | | 18.7 | % |
Higher Education | | | | 12.3 | % |
Transportation | | | | 9.4 | % |
Airport | | | | 8.0 | % |
Medical | | | | 6.2 | % |
Power | | | | 5.6 | % |
School District | | | | 4.6 | % |
Water & Sewer | | | | 4.4 | % |
Lease | | | | 3.3 | % |
Housing | | | | 1.6 | % |
Cash Equivalents1 | | | | 1.5 | % |
Other Assets and Liabilities – Net2 | | | | 1.3 | % |
| | | | | |
| |
TOTAL | | | | 100.0 | % |
| | | | | |
| | | | | |
| | | Percentage of |
| Credit Quality Diversification3 | | Total Net Assets |
AAA / Aaa | | | | 3.6 | % |
AA / Aa | | | | 59.2 | % |
A / A | | | | 28.2 | % |
BBB / Baa | | | | 6.2 | % |
Not Rated | | | | 1.5 | % |
Other Assets and Liabilities – Net2 | | | | 1.3 | % |
| | | | | |
| |
TOTAL | | | | 100.0 | % |
| | | | | |
| (1) | Cash Equivalents include investments in a money market fund. |
| (2) | Assets, other than investments in securities, less liabilities. See Statements of Assets and Liabilities. |
| (3) | For financial reporting purposes, the Credit Quality Diversification table reflects the lowest rating assigned by either Moody’s Investors Service or Standard and Poor’s if the ratings differ. These rating agencies are independent, nationally recognized statistical rating organizations and are widely used. Investment grade ratings are credit ratings of BBB/Baa or higher. Below investment grade ratings are credit ratings of BB/Ba or lower. Investments designated as “Not Rated” are not rated by either rating agency and do not necessarily indicate low credit quality. Credit quality ratings are subject to change. |
PORTFOLIO OF INVESTMENTS
April 30, 2018
| | | | | | | | |
Description | | Par Value | | | Value | |
| | |
MUNICIPAL BONDS – 97.2% | | | | | | | | |
| | |
NEW YORK – 97.2% | | | | | | | | |
| | |
AIRPORT – 8.0% | | | | | | | | |
| | |
Port Authority of New York & New Jersey, NY, Refunding Revenue Bonds, Port, Airport & Marina Improvements, (175th Series), 5.00%, 12/01/23 | | $ | 3,000,000 | | | $ | 3,355,740 | |
| | |
Port Authority of New York & New Jersey, NY, Revenue Bonds, Airport & Marina Improvements, (194th Series), 5.00%, 10/15/30 | | | 1,000,000 | | | | 1,159,440 | |
| | |
Port Authority of New York & New Jersey, NY, Revenue Bonds, Port, Airport & Marina Improvements, (205th Series), 5.00%, 11/15/32 | | | 1,000,000 | | | | 1,172,940 | |
| | |
TOTAL AIRPORT | | | | | | $ | 5,688,120 | |
| | | | | | | | |
Description | | Par Value | | | Value | |
| | |
DEDICATED TAX – 23.1% | | | | | | | | |
| | |
Nassau County Interim Finance Authority, NY, Refunding Revenue Bonds, (Series A) | | | | | | | | |
| | |
5.00%, 11/15/21 | | $ | 1,000,000 | | | $ | 1,102,640 | |
| | |
5.00%, 11/15/23 | | | 1,305,000 | | | | 1,467,316 | |
| | |
New York City, NY, Transitional Finance Authority, Advance Refunding Revenue Bonds, (Series C), 5.00%, 11/01/30 | | | 2,000,000 | | | | 2,340,880 | |
| | |
New York City, NY, Transitional Finance Authority, Current Refunding, Revenue Bonds, (Series S-4A), (State Aid Withholding), 5.00%, 7/15/33 | | | 1,000,000 | | | | 1,168,870 | |
| | |
New York State Dormitory Authority, NY, Revenue Bonds, Public Improvements, 5.00%, 3/15/30 | | | 2,000,000 | | | | 2,337,580 | |
ANNUAL REPORT / April 30, 2018
| | |
| 47 | | PORTFOLIOS OF INVESTMENTS Wilmington New York Municipal Bond Fund (continued) |
| | | | | | | | |
Description | | Par Value | | | Value | |
| | |
New York State Dormitory Authority, NY, Revenue Bonds, Public Improvements, (Series A), 5.00%, 3/15/32 | | $ | 2,000,000 | | | $ | 2,311,660 | |
| | |
New York State Dormitory Authority, NY, Revenue Bonds, Public Improvements, (Series B), 5.00%, 2/15/33 | | | 1,000,000 | | | | 1,160,130 | |
| | |
New York State Dormitory Authority, NY, Revenue Bonds, School Improvements, (Series A), 5.00%, 3/15/33 | | | 1,000,000 | | | | 1,158,920 | |
| | |
Sales Tax Asset Receivable Corp., NY, Refunding Revenue Bonds, (Series A), 5.00%, 10/15/26 | | | 3,000,000 | | | | 3,461,730 | |
| | |
TOTAL DEDICATED TAX | | | | | | $ | 16,509,726 | |
| | |
GENERAL OBLIGATIONS – 18.7% | | | | | | | | |
| | |
Monroe County, NY, GO, Public Improvements, AD Valorem Property Tax, (AGM), 5.00%, 6/01/22 | | | 2,070,000 | | | | 2,285,611 | |
| | |
Nassau County, NY, AD Valorem Property Tax, GO, Public Improvements, (Series B), 5.00%, 10/01/29 | | | 2,875,000 | | | | 3,311,253 | |
| | |
Nassau County, NY, AD Valorem Property Tax, GO, Public Improvements, (Series C), (BAM-TCRS), 5.00%, 4/01/26 | | | 1,000,000 | | | | 1,163,650 | |
| | |
New York City, NY, AD Valorem Property Tax, GO Unlimited, Advance Refunding, (Series A), 5.00%, 8/01/21 | | | 1,540,000 | | | | 1,679,940 | |
| | |
New York City, NY, AD Valorem Property Tax, GO Unlimited, Advance Refunding, (Series C), 5.00%, 8/01/23 | | | 2,000,000 | | | | 2,262,240 | |
| | |
New York State, NY, GO Unlimited, Highway Improvements, (Series E), (State Aid Withholding), 5.00%, 12/15/21 | | | 1,090,000 | | | | 1,205,213 | |
| | |
Saratoga County, NY, GO, Economic Defeasance, AD Valorem Property Tax, 5.00%, 7/15/31 | | | 1,150,000 | | | | 1,433,360 | |
| | |
TOTAL GENERAL OBLIGATIONS | | | | | | $ | 13,341,267 | |
| | |
HIGHER EDUCATION – 12.3% | | | | | | | | |
| | |
City of Albany Capital Resource Corp., NY, Refunding Bonds, Albany Law School of Union University | | | | | | | | |
| | |
4.00%, 7/01/22 | | | 600,000 | | | | 630,744 | |
| | |
4.00%, 7/01/23 | | | 725,000 | | | | 765,817 | |
| | |
4.00%, 7/01/25 | | | 865,000 | | | | 917,497 | |
| | |
4.00%, 7/01/26 | | | 765,000 | | | | 805,262 | |
| | |
5.00%, 7/01/29 | | | 1,195,000 | | | | 1,341,411 | |
| | |
Monroe County Industrial Development Corp., NY, University of Rochester Project, Revenue Bonds, University & College Improvements, (Series B), 5.00%, 7/01/23 | | | 1,000,000 | | | | 1,130,730 | |
| | |
New York State Dormitory Authority, NY, Barnard College, Revenue Bonds, University & College Improvements, (Series A), 5.00%, 7/01/21 | | | 1,000,000 | | | | 1,087,330 | |
| | | | | | | | |
Description | | Par Value | | | Value | |
| | |
New York State Dormitory Authority, NY, New York University, Advance Refunding, University & College Improvements, (Series A), 5.00%, 7/01/22 | | $ | 1,890,000 | | | $ | 2,108,182 | |
| | | | | | | | |
| | |
TOTAL HIGHER EDUCATION | | | | | | $ | 8,786,973 | |
| | |
HOUSING – 1.6% | | | | | | | | |
| | |
Amherst Development Corp., NY, Advance Refunding Revenue Bonds, UBF Facility Student Housing Corp., (AGM), 5.00%, 10/01/31 | | | 1,000,000 | | | | 1,163,840 | |
| | |
LEASE – 3.3% | | | | | | | | |
| | |
Erie County, NY, IDA, Refunding Revenue Bonds, School Improvements, (State Aid Withholding), 5.00%, 5/01/30 | | | 2,000,000 | | | | 2,350,520 | |
| | |
MEDICAL – 6.2% | | | | | | | | |
| | |
New York State Dormitory Authority, NY, Current Refunding, Revenue Bonds, North Shore-long Jewish Obligated Group, 5.00%, 5/01/24 | | | 1,000,000 | | | | 1,140,820 | |
| | |
New York State Dormitory Authority, NY, Refunding Revenue Bonds, Health, Hospital, Nursing Home Revenue (Mount Sinai Hospital), (Series A), 5.00%, 7/01/23 | | | 1,000,000 | | | | 1,058,390 | |
| | |
New York State Dormitory Authority, NY, Refunding Revenue Bonds, Health, Hospital, Nursing Home Revenue (NYU Hospitals Center), 5.00%, 7/01/27 | | | 2,000,000 | | | | 2,271,680 | |
| | | | | | | | |
| | |
TOTAL MEDICAL | | | | | | $ | 4,470,890 | |
| | |
POWER – 5.6% | | | | | | | | |
| | |
Long Island Power Authority, NY, Electric System Improvements, Refunding Revenue Bonds, (Series B), 5.00%, 9/01/25 | | | 1,000,000 | | | | 1,152,000 | |
| | |
New York State Power Authority (The), NY, Revenue Refunding Bonds, (Series A), 5.00%, 11/15/22 | | | 2,575,000 | | | | 2,889,356 | |
| | | | | | | | |
| | |
TOTAL POWER | | | | | | $ | 4,041,356 | |
| | |
SCHOOL DISTRICT – 4.6% | | | | | | | | |
| | |
Bay Shore Union Free School District, NY, GO Unlimited, Current Refunding, AD Valorem Property Tax, (State Aid Withholding), 5.00%, 1/15/22 | | | 1,710,000 | | | | 1,890,234 | |
| | |
Lockport City School District, NY, GO Unlimited, Refunding Notes, AD Valorem Property Tax, (State Aid Withholding), 5.00%, 8/01/24 | | | 1,210,000 | | | | 1,402,874 | |
| | | | | | | | |
| | |
TOTAL SCHOOL DISTRICT | | | | | | $ | 3,293,108 | |
| | |
TRANSPORTATION – 9.4% | | | | | | | | |
| | |
Metropolitan Transportation Authority, NY, Revenue Green Bonds, (Series C-1), 5.00%, 11/15/24 | | | 2,000,000 | | | | 2,290,680 | |
April 30, 2018 / ANNUAL REPORT
| | |
PORTFOLIOS OF INVESTMENTS Wilmington New York Municipal Bond Fund (concluded) | | 48 |
| | | | | | | | |
| | |
Description | | Par Value | | | Value | |
| | |
New York State Thruway Authority, NY, Current Refunding, Revenue Bonds, (Series L), 5.00%, 1/01/21 | | $ | 3,000,000 | | | $ | 3,228,210 | |
| | |
Triborough Bridge & Tunnel Authority, NY, Refunding Revenue Bonds, (Series C-1), 5.00%, 11/15/25 | | | 1,000,000 | | | | 1,180,520 | |
| | | | | | | | |
| | |
TOTAL TRANSPORTATION | | | | | | $ | 6,699,410 | |
| | |
WATER & SEWER – 4.4% | | | | | | | | |
| | |
New York City Water & Sewer System, NY, Current Refunding, Municipal Water Finance, 5.00%, 6/15/28 | | | 1,150,000 | | | | 1,329,101 | |
| | |
New York City Water & Sewer System, NY, Refunding Revenue Bonds, (Series EE), 5.00%, 6/15/28 | | | 1,595,000 | | | | 1,814,105 | |
| | | | | | | | |
| | |
TOTAL WATER & SEWER | | | | | | $ | 3,143,206 | |
| | |
TOTAL NEW YORK | | | | | | $ | 69,488,416 | |
| | |
TOTAL MUNICIPAL BONDS (COST $70,535,811) | | | | | | $ | 69,488,416 | |
| | | | | | | | |
| | |
| Description | | Number of
Shares | | | Value | |
| | |
MONEY MARKET FUND – 1.5% | | | | | | | | |
| | |
Dreyfus Government Cash Management Fund, Institutional Shares, 1.60%^ | | | 1,094,213 | | | $ | 1,094,213 | |
| | | | | | | | |
| | |
TOTAL MONEY MARKET FUND (COST $1,094,213) | | | | | | $ | 1,094,213 | |
| | | | | | | | |
| | |
TOTAL INVESTMENTS – 98.7% (COST $71,630,024) | | | | | | $ | 70,582,629 | |
| | |
OTHER ASSETS LESS LIABILITIES – 1.3% | | | | | | | 906,423 | |
| | | | | | | | |
| | |
TOTAL NET ASSETS – 100.0% | | | | | | $ | 71,489,052 | |
| | | | | | | | |
Cost of investments for Federal income tax purposes is $71,630,024. The net unrealized appreciation/(depreciation) of investments was $(1,047,395). This consists of net unrealized appreciation from investment for those securities having an excess of value over cost of $291,540 and net unrealized depreciation from investments for those securities having an excess of cost over value of $(1,338,935).
Various inputs are used in determining the value of the Fund’s investments. These inputs are summarized in the three broad levels listed below.
Level 1 – quoted prices in active markets for identical securities
Level 2 – other significant observable inputs (including quoted prices for similar securities, interest rates, prepayment speeds, credit risk, etc.)
Level 3 – significant unobservable inputs (including the Fund’s own assumptions in determining the fair value of investments)
The following is a summary of the inputs used as of April 30, 2018 in valuing the Fund’s assets carried at fair value:
| | | | | | | | | | | | | | | | | | | | | | | | | | | | |
| | | | | | | |
| | | Level 1 | | | | | | Level 2 | | | | | | Level 3 | | | | | | Total | |
| | | | | | | |
Investments in Securities | | | | | | | | | | | | | | | | | | | | | | | | | | | | |
| | | | | | | |
Municipal Bonds | | $ | — | | | | | | | $ | 69,488,416 | | | | | | | $ | — | | | | | | | $ | 69,488,416 | |
| | | | | | | |
Money Market Fund | | | 1,094,213 | | | | | | | | — | | | | | | | | — | | | | | | | | 1,094,213 | |
| | | | | | | | | | | | | | | | | | | | | | | | | | | | |
| | | | | | | |
Total | | $ | 1,094,213 | | | | | | | $ | 69,488,416 | | | | | | | $ | — | | | | | | | $ | 70,582,629 | |
| | | | | | | | | | | | | | | | | | | | | | | | | | | | |
| | | | |
| | The following acronyms are used throughout this Fund: |
| | |
| | AGM | | Assured Guaranty Municipal |
| | BAM-TCRS | | Build America Mutual-Tax Credit Reporting Service |
| | GO | | General Obligation |
| | IDA | | Industrial Development Authority/Agency |
See Notes which are an integral part of the Financial Statements
ANNUAL REPORT / April 30, 2018
| | |
| 49 | | STATEMENTS OF ASSETS AND LIABILITIES |
| | | | | | | | | | | | | | | | | |
| April 30, 2018 | | | | Wilmington Broad Market Bond Fund | | Wilmington Intermediate-Term Bond Fund | | Wilmington Short-Term Bond Fund |
ASSETS: | | | | | | | | | | | | | | | | | |
Investments, at identified cost | | | | | $ | 544,998,574 | | | | $ | 86,565,265 | | | | $ | 57,456,254 | |
| | | | | | | | | | | | | | | | | |
Investments in securities, at value (Including $19,405,183, $1,139,612, and $4,783,585 of securities on loan, respectively) (Note 2) | | | | | $ | 534,298,683 | | | | $ | 84,966,879 | | | | $ | 56,984,236 | |
Income receivable | | | | | | 3,300,546 | | | | | 558,065 | | | | | 265,013 | |
Receivable for shares sold | | | | | | 1,931,106 | | | | | 82,861 | | | | | 110,722 | |
Receivable for investments sold | | | | | | — | | | | | — | | | | | 129 | |
Prepaid assets | | | | | | 21,681 | | | | | 19,974 | | | | | 17,814 | |
| | | | | | | | | | | | | | | | | |
TOTAL ASSETS | | | | | | 539,552,016 | | | | | 85,627,779 | | | | | 57,377,914 | |
| | | | | | | | | | | | | | | | | |
LIABILITIES: | | | | | | | | | | | | | | | | | |
Payable for investments purchased | | | | | | 7,143,875 | | | | | — | | | | | — | |
Collateral for securities on loan | | | | | | 19,839,811 | | | | | 1,164,823 | | | | | 4,894,101 | |
Income distribution payable | | | | | | 1,044,730 | | | | | 149,111 | | | | | 76,781 | |
Payable for shares redeemed | | | | | | 339,392 | | | | | 11,237 | | | | | 29,850 | |
Payable for Trustees’ fees | | | | | | 6,410 | | | | | 6,410 | | | | | 6,410 | |
Payable for distribution services fee | | | | | | 844 | | | | | 396 | | | | | 1,229 | |
Payable for shareholder services fee | | | | | | 338 | | | | | 159 | | | | | — | |
Other accrued expenses | | | | | | 163,114 | | | | | 82,345 | | | | | 87,278 | |
| | | | | | | | | | | | | | | | | |
TOTAL LIABILITIES | | | | | | 28,538,514 | | | | | 1,414,481 | | | | | 5,095,649 | |
| | | | | | | | | | | | | | | | | |
NET ASSETS | | | | | $ | 511,013,502 | | | | $ | 84,213,298 | | | | $ | 52,282,265 | |
| | | | | | | | | | | | | | | | | |
NET ASSETS CONSIST OF: | | | | | | | | | | | | | | | | | |
Paid-in capital | | | | | $ | 523,560,480 | | | | $ | 85,795,121 | | | | $ | 54,127,091 | |
Undistributed (distributions in excess of) net investment income | | | | | | 14,868 | | | | | 1,178 | | | | | 6,699 | |
Accumulated net realized gain (loss) on investments | | | | | | (1,861,955 | ) | | | | 15,385 | | | | | (1,379,507 | ) |
Net unrealized appreciation (depreciation) of investments | | | | | | (10,699,891 | ) | | | | (1,598,386 | ) | | | | (472,018 | ) |
| | | | | | | | | | | | | | | | | |
TOTAL NET ASSETS | | | | | $ | 511,013,502 | | | | $ | 84,213,298 | | | | $ | 52,282,265 | |
| | | | | | | | | | | | | | | | | |
COMPUTATION OF NET ASSET VALUE AND OFFERING PRICE: | | | | | | | | | | | | | | | | | |
Class A | | | | | | | | | | | | | | | | | |
Net Assets | | | | | $ | 4,073,582 | | | | $ | 1,912,306 | | | | $ | 5,972,915 | |
| | | | | | | | | | | | | | | | | |
Shares outstanding (unlimited shares authorized) | | | | | | 428,345 | | | | | 199,612 | | | | | 606,645 | |
| | | | | | | | | | | | | | | | | |
Net Asset Value per share | | | | | $ | 9.51 | | | | $ | 9.58 | | | | $ | 9.85 | |
| | | | | | | | | | | | | | | | | |
Offering price per share* | | | | | $ | 9.96 | *** | | | $ | 10.03 | *** | | | $ | 10.03 | ** |
| | | | | | | | | | | | | | | | | |
Class I | | | | | | | | | | | | | | | | | |
Net Assets | | | | | $ | 506,939,920 | | | | $ | 82,300,992 | | | | $ | 46,309,350 | |
| | | | | | | | | | | | | | | | | |
Shares outstanding (unlimited shares authorized) | | | | | | 54,216,037 | | | | | 8,585,134 | | | | | 4,702,757 | |
| | | | | | | | | | | | | | | | | |
Net Asset Value per share | | | | | $ | 9.35 | | | | $ | 9.59 | | | | $ | 9.85 | |
| | | | | | | | | | | | | | | | | |
| * | See “How are Shares Priced?” in the Prospectus. |
| ** | Computation of offering price per share: 100/98.25 of net asset value. |
| *** | Computation of offering price per share: 100/95.50 of net asset value. |
See Notes which are an integral part of the Financial Statements
April 30, 2018 / ANNUAL REPORT
| | |
STATEMENTS OF ASSETS AND LIABILITIES (concluded) | | 50 |
| | | | | | | | | | | | | | | |
| | | |
| April 30, 2018 | | | | Wilmington Municipal Bond Fund | | Wilmington New York Municipal Bond Fund |
ASSETS: | | | | | | | | | | | | | | | |
Investments, at identified cost | | | | | | | | $ | 284,709,532 | | | | $ | 71,630,024 | |
| | | | | | | | | | | | | | | |
Investments in securities, at value | | | | | | | | $ | 282,709,539 | | | | $ | 70,582,629 | |
Cash | | | | | | | | | 4,712,382 | | | | | — | |
Interest receivable | | | | | | | | | 3,776,498 | | | | | 937,170 | |
Receivable for shares sold | | | | | | | | | 543,823 | | | | | 135,734 | |
Prepaid assets | | | | | | | | | 25,720 | | | | | 15,008 | |
| | | | | | | | | | | | | | | |
TOTAL ASSETS | | | | | | | | | 291,767,962 | | | | | 71,670,541 | |
| | | | | | | | | | | | | | | |
LIABILITIES: | | | | | | | | | | | | | | | |
Payable for investments purchased | | | | | | | | | 2,102,065 | | | | | — | |
Income distribution payable | | | | | | | | | 498,028 | | | | | 96,364 | |
Payable for shares redeemed | | | | | | | | | 8,700 | | | | | 609 | |
Payable for Trustees’ fees | | | | | | | | | 6,410 | | | | | 6,410 | |
Payable for distribution services fee | | | | | | | | | 6,046 | | | | | 3,074 | |
Other accrued expenses | | | | | | | | | 103,328 | | | | | 75,032 | |
| | | | | | | | | | | | | | | |
TOTAL LIABILITIES | | | | | | | | | 2,724,577 | | | | | 181,489 | |
| | | | | | | | | | | | | | | |
NET ASSETS | | | | | | | | $ | 289,043,385 | | | | $ | 71,489,052 | |
| | | | | | | | | | | | | | | |
NET ASSETS CONSIST OF: | | | | | | | | | | | | | | | |
Paid-in capital | | | | | | | | $ | 291,724,164 | | | | $ | 71,871,484 | |
Undistributed (distributions in excess of) net investment income | | | | | | | | | (1,555 | ) | | | | (60 | ) |
Accumulated net realized gain (loss) on investments | | | | | | | | | (679,231 | ) | | | | 665,023 | |
Net unrealized appreciation (depreciation) of investments | | | | | | | | | (1,999,993 | ) | | | | (1,047,395 | ) |
| | | | | | | | | | | | | | | |
TOTAL NET ASSETS | | | | | | | | $ | 289,043,385 | | | | $ | 71,489,052 | |
| | | | | | | | | | | | | | | |
COMPUTATION OF NET ASSET VALUE AND OFFERING PRICE: | | | | | | | | | | | | | | | |
Class A | | | | | | | | | | | | | | | |
Net Assets | | | | | | | | $ | 29,109,617 | | | | $ | 14,862,561 | |
| | | | | | | | | | | | | | | |
Shares outstanding (unlimited shares authorized) | | | | | | | | | 2,277,274 | | | | | 1,460,076 | |
| | | | | | | | | | | | | | | |
Net Asset Value per share | | | | | | | | $ | 12.78 | | | | $ | 10.18 | |
| | | | | | | | | | | | | | | |
Offering price per share* | | | | | | | | $ | 13.38 | *** | | | $ | 10.66 | *** |
| | | | | | | | | | | | | | | |
Class I | | | | | | | | | | | | | | | |
Net Assets | | | | | | | | $ | 259,933,768 | | | | $ | 56,626,491 | |
| | | | | | | | | | | | | | | |
Shares outstanding (unlimited shares authorized) | | | | | | | | | 20,327,036 | | | | | 5,559,734 | |
| | | | | | | | | | | | | | | |
Net Asset Value per share | | | | | | | | $ | 12.79 | | | | $ | 10.19 | |
| | | | | | | | | | | | | | | |
| * | See “How are Shares Priced?” in the Prospectus. |
| *** | Computation of offering price per share: 100/95.50 of net asset value. |
See Notes which are an integral part of the Financial Statements
ANNUAL REPORT / April 30, 2018
| | |
| 51 | | STATEMENTS OF OPERATIONS |
| | | | | | | | | | | | | | | | | |
| | | | |
| Year Ended April 30, 2018 | | | | Wilmington Broad Market Bond Fund | | Wilmington Intermediate-Term Bond Fund | | Wilmington Short-Term Bond Fund |
INVESTMENT INCOME: | | | | | | | | | | | | | | | | | |
Dividends | | | | | $ | 26,780 | | | | $ | 7,895 | | | | $ | 1,083 | |
Interest | | | | | | 13,623,463 | | | | | 2,349,652 | | | | | 1,232,764 | |
Securities lending income | | | | | | 12,856 | | | | | 6,640 | | | | | 6,010 | |
| | | | | | | | | | | | | | | | | |
TOTAL INVESTMENT INCOME | | | | | | 13,663,099 | | | | | 2,364,187 | | | | | 1,239,857 | |
| | | | | | | | | | | | | | | | | |
EXPENSES: | | | | | | | | | | | | | | | | | |
Investment advisory fee | | | | | | 2,266,126 | | | | | 428,565 | | | | | 255,620 | |
Administrative personnel and services fees | | | | | | 163,493 | | | | | 30,948 | | | | | 20,754 | |
Portfolio accounting and administration fees | | | | | | 136,637 | | | | | 43,715 | | | | | 31,900 | |
Transfer and dividend disbursing agent fees and expenses | | | | | | 103,114 | | | | | 5,616 | | | | | 30,069 | |
Trustees’ fees | | | | | | 62,231 | | | | | 62,231 | | | | | 62,231 | |
Professional fees | | | | | | 80,582 | | | | | 79,581 | | | | | 77,974 | |
Distribution services fee—Class A | | | | | | 10,851 | | | | | 6,104 | | | | | 15,685 | |
Shareholder services fee—Class A | | | | | | 10,851 | | | | | 6,104 | | | | | 15,685 | |
Shareholder services fee— Class I | | | | | | 1,248,105 | | | | | 231,987 | | | | | 144,077 | |
Share registration costs | | | | | | 33,219 | | | | | 31,043 | | | | | 30,166 | |
Printing and postage | | | | | | 25,967 | | | | | 5,438 | | | | | 6,623 | |
Custodian fees | | | | | | 17,202 | | | | | 6,158 | | | | | 6,181 | |
Miscellaneous | | | | | | 63,248 | | | | | 32,415 | | | | | 29,576 | |
| | | | | | | | | | | | | | | | | |
TOTAL EXPENSES | | | | | | 4,221,626 | | | | | 969,905 | | | | | 726,541 | |
| | | | | | | | | | | | | | | | | |
WAIVERS AND REIMBURSEMENTS: | | | | | | | | | | | | | | | | | |
Waiver/reimbursement by investment advisor | | | | | | (281,338 | ) | | | | (231,909 | ) | | | | (244,349 | ) |
Waiver of shareholder services fee—Class A | | | | | | (7,196 | ) | | | | (4,603 | ) | | | | (15,685 | ) |
Waiver of shareholder services fee—Class I | | | | | | (1,248,105 | ) | | | | (231,987 | ) | | | | (144,077 | ) |
| | | | | | | | | | | | | | | | | |
TOTAL WAIVERS AND REIMBURSEMENTS | | | | | | (1,536,639 | ) | | | | (468,499 | ) | | | | (404,111 | ) |
| | | | | | | | | | | | | | | | | |
Net expenses | | | | | | 2,684,987 | | | | | 501,406 | | | | | 322,430 | |
| | | | | | | | | | | | | | | | | |
Net investment income | | | | | | 10,978,112 | | | | | 1,862,781 | | | | | 917,427 | |
| | | | | | | | | | | | | | | | | |
REALIZED AND UNREALIZED GAIN (LOSS) ON INVESTMENTS: | | | | | | | | | | | | | | | | | |
Net realized gain (loss) on investments | | | | | | 175,633 | | | | | 230,533 | | | | | (144,918 | ) |
Net change in unrealized appreciation (depreciation) of investments | | | | | | (13,772,908 | ) | | | | (2,489,840 | ) | | | | (647,355 | ) |
| | | | | | | | | | | | | | | | | |
Net realized and unrealized gain (loss) on investments | | | | | | (13,597,275 | ) | | | | (2,259,307 | ) | | | | (792,273 | ) |
| | | | | | | | | | | | | | | | | |
Change in net assets resulting from operations | | | | | $ | (2,619,163 | ) | | | $ | (396,526 | ) | | | $ | 125,154 | |
| | | | | | | | | | | | | | | | | |
See Notes which are an integral part of the Financial Statements
April 30, 2018 / ANNUAL REPORT
| | |
STATEMENTS OF OPERATIONS (concluded) | | 52 |
| | | | | | | | | | | | |
| | | | | | | Wilmington |
| | | | | Wilmington | | New York |
| | | | | Municipal Bond | | Municipal Bond |
| Year Ended April 30, 2018 | | | | Fund | | Fund |
INVESTMENT INCOME: | | | | | | | | | | | | |
Dividends | | | | | $ | 82,491 | | | | $ | 26,527 | |
Interest | | | | | | 7,086,963 | | | | | 1,773,449 | |
| | | | | | | | | | | | |
TOTAL INVESTMENT INCOME | | | | | | 7,169,454 | | | | | 1,799,976 | |
| | | | | | | | | | | | |
EXPENSES: | | | | | | | | | | | | |
Investment advisory fee | | | | | | 1,321,009 | | | | | 357,651 | |
Administrative personnel and services fees | | | | | | 95,294 | | | | | 25,809 | |
Portfolio accounting and administration fees | | | | | | 88,548 | | | | | 31,968 | |
Transfer and dividend disbursing agent fees and expenses | | | | | | 22,051 | | | | | 15,000 | |
Trustees’ fees | | | | | | 62,231 | | | | | 62,230 | |
Professional fees | | | | | | 73,962 | | | | | 74,337 | |
Distribution services fee—Class A | | | | | | 78,343 | | | | | 40,126 | |
Shareholder services fee—Class A | | | | | | 78,343 | | | | | 40,126 | |
Shareholder services fee— Class I | | | | | | 655,549 | | | | | 158,568 | |
Share registration costs | | | | | | 32,369 | | | | | 11,730 | |
Printing and postage | | | | | | 8,532 | | | | | 7,870 | |
Custodian fees | | | | | | 4,932 | | | | | 1,797 | |
Miscellaneous | | | | | | 47,088 | | | | | 30,570 | |
| | | | | | | | | | | | |
TOTAL EXPENSES | | | | | | 2,568,251 | | | | | 857,782 | |
| | | | | | | | | | | | |
Waiver/reimbursement by investment advisor | | | | | | (317,583 | ) | | | | (152,428 | ) |
Waiver of shareholder services fee—Class A | | | | | | (78,343 | ) | | | | (40,126 | ) |
Waiver of shareholder services fee—Class I | | | | | | (655,549 | ) | | | | (158,568 | ) |
| | | | | | | | | | | | |
TOTAL WAIVERS AND REIMBURSEMENTS | | | | | | (1,051,475 | ) | | | | (351,122 | ) |
| | | | | | | | | | | | |
Net expenses | | | | | | 1,516,776 | | | | | 506,660 | |
| | | | | | | | | | | | |
Net investment income | | | | | | 5,652,678 | | | | | 1,293,316 | |
| | | | | | | | | | | | |
REALIZED AND UNREALIZED GAIN (LOSS) ON INVESTMENTS: | | | | | | | | | | | | |
Net realized gain (loss) on investments | | | | | | 2,469,760 | | | | | 1,340,727 | |
Net change in unrealized appreciation (depreciation) of investments | | | | | | (8,301,500 | ) | | | | (2,892,970 | ) |
| | | | | | | | | | | | |
Net realized and unrealized gain (loss) on investments | | | | | | (5,831,740 | ) | | | | (1,552,243 | ) |
| | | | | | | | | | | | |
Change in net assets resulting from operations | | | | | $ | (179,062 | ) | | | $ | (258,927 | ) |
| | | | | | | | | | | | |
See Notes which are an integral part of the Financial Statements
ANNUAL REPORT / April 30, 2018
| | |
| 53 | | STATEMENTS OF CHANGES IN NET ASSETS |
| | | | | | | | | | | | | | | | | | | | |
| | | Wilmington | | Wilmington |
| | | Broad Market Bond Fund | | Intermediate-Term Bond Fund |
| | | | |
| | | Year Ended | | Year Ended | | Year Ended | | Year Ended |
| | | April 30, | | April 30, | | April 30, | | April 30, |
| | | 2018 | | 2017 | | 2018 | | 2017 |
OPERATIONS: | | | | | | | | | | | | | | | | | | | | |
Net investment income | | | $ | 10,978,112 | | | | $ | 9,735,682 | | | | $ | 1,862,781 | | | | $ | 2,176,062 | |
Net realized gain (loss) on investments | | | | 175,633 | | | | | 317,333 | | | | | 230,533 | | | | | 300,634 | |
Net change in unrealized appreciation (depreciation) of investments | | | | (13,772,908 | ) | | | | (7,764,099 | ) | | | | (2,489,840 | ) | | | | (1,854,852 | ) |
| | | | | | | | | | | | | | | | | | | | |
Change in net assets resulting from operations | | | | (2,619,163 | ) | | | | 2,288,916 | | | | | (396,526 | ) | | | | 621,844 | |
| | | | | | | | | | | | | | | | | | | | |
DISTRIBUTIONS TO SHAREHOLDERS: | | | | | | | | | | | | | | | | | | | | |
Distributions from net investment income | | | | | | | | | | | | | | | | | | | | |
Class A | | | | (86,221 | ) | | | | (88,674 | ) | | | | (40,394 | ) | | | | (41,156 | ) |
Class I | | | | (11,604,433 | ) | | | | (10,729,750 | ) | | | | (1,824,838 | ) | | | | (2,138,110 | ) |
Distributions from net realized gain on investments | | | | | | | | | | | | | | | | | | | | |
Class A | | | | — | | | | | — | | | | | (5,956 | ) | | | | (4,184 | ) |
Class I | | | | — | | | | | — | | | | | (232,850 | ) | | | | (179,465 | ) |
| | | | | | | | | | | | | | | | | | | | |
Change in net assets resulting from distributions to shareholders | | | | (11,690,654 | ) | | | | (10,818,424 | ) | | | | (2,104,038 | ) | | | | (2,362,915 | ) |
| | | | | | | | | | | | | | | | | | | | |
SHARE TRANSACTIONS: | | | | | | | | | | | | | | | | | | | | |
Proceeds from sale of shares | | | | | | | | | | | | | | | | | | | | |
Class A | | | | 26,255 | | | | | 48,174 | | | | | 3,512 | | | | | 1,774 | |
Class I | | | | 123,823,977 | | | | | 230,617,419 | | | | | 22,853,505 | | | | | 60,818,336 | |
Distributions reinvested | | | | | | | | | | | | | | | | | | | | |
Class A | | | | 68,328 | | | | | 68,265 | | | | | 37,201 | | | | | 37,289 | |
Class I | | | | 6,925,421 | | | | | 6,528,748 | | | | | 798,968 | | | | | 1,054,059 | |
Cost of shares redeemed | | | | | | | | | | | | | | | | | | | | |
Class A | | | | (405,179 | ) | | | | (747,073 | ) | | | | (828,533 | ) | | | | (743,135 | ) |
Class I | | | | (112,802,914 | ) | | | | (135,479,448 | ) | | | | (66,019,261 | ) | | | | (53,474,057 | ) |
| | | | | | | | | | | | | | | | | | | | |
Change in net assets resulting from share transactions | | | | 17,635,888 | | | | | 101,036,085 | | | | | (43,154,608 | ) | | | | 7,694,266 | |
| | | | | | | | | | | | | | | | | | | | |
Change in net assets | | | | 3,326,071 | | | | | 92,506,577 | | | | | (45,655,172 | ) | | | | 5,953,195 | |
NET ASSETS: | | | | | | | | | | | | | | | | | | | | |
Beginning of year | | | | 507,687,431 | | | | | 415,180,854 | | | | | 129,868,470 | | | | | 123,915,275 | |
| | | | | | | | | | | | | | | | | | | | |
End of year | | | $ | 511,013,502 | | | | $ | 507,687,431 | | | | $ | 84,213,298 | | | | $ | 129,868,470 | |
| | | | | | | | | | | | | | | | | | | | |
Undistributed (distributions in excess of) net investment income included in net assets at end of year | | | $ | 14,868 | | | | $ | 22,868 | | | | $ | 1,178 | | | | $ | 1,005 | |
| | | | | | | | | | | | | | | | | | | | |
| | | | |
SHARES OF BENEFICIAL INTEREST: | | | | | | | | | | | | | | | | | | | | |
Shares sold | | | | | | | | | | | | | | | | | | | | |
Class A | | | | 2,723 | | | | | 4,793 | | | | | 356 | | | | | 178 | |
Class I | | | | 12,923,853 | | | | | 23,628,508 | | | | | 2,336,918 | | | | | 6,102,828 | |
Distributions reinvested | | | | | | | | | | | | | | | | | | | | |
Class A | | | | 7,009 | | | | | 6,899 | | | | | 3,792 | | | | | 3,749 | |
Class I | | | | 722,909 | | | | | 671,428 | | | | | 81,408 | | | | | 105,977 | |
Shares redeemed | | | | | | | | | | | | | | | | | | | | |
Class A | | | | (41,597 | ) | | | | (75,015 | ) | | | | (84,494 | ) | | | | (74,369 | ) |
Class I | | | | (11,735,987 | ) | | | | (13,924,822 | ) | | | | (6,691,958 | ) | | | | (5,367,645 | ) |
| | | | | | | | | | | | | | | | | | | | |
Net change in shares outstanding | | | | 1,878,910 | | | | | 10,311,791 | | | | | (4,353,978 | ) | | | | 770,718 | |
| | | | | | | | | | | | | | | | | | | | |
| | | | | | | | | | | | | | | | | | | | |
See Notes which are an integral part of the Financial Statements
April 30, 2018 / ANNUAL REPORT
| | |
STATEMENTS OF CHANGES IN NET ASSETS (continued) | | 54 |
| | | | | | | | | | | | | | | | | | | | |
| | | Wilmington | | Wilmington |
| | | Short-Term Bond Fund | | Municipal Bond Fund |
| | | | |
| | | Year Ended | | Year Ended | | Year Ended | | Year Ended |
| | | April 30, | | April 30, | | April 30, | | April 30, |
| | | 2018 | | 2017 | | 2018 | | 2017 |
OPERATIONS: | | | | | | | | | | | | | | | | | | | | |
Net investment income | | | $ | 917,427 | | | | $ | 1,154,399 | | | | $ | 5,652,678 | | | | $ | 5,695,928 | |
Net realized gain (loss) on investments | | | | (144,918 | ) | | | | 253,519 | | | | | 2,469,760 | | | | | 866,344 | |
Net change in unrealized appreciation (depreciation) of investments | | | | (647,355 | ) | | | | (666,354 | ) | | | | (8,301,500 | ) | | | | (8,426,840 | ) |
| | | | | | | | | | | | | | | | | | | | |
Change in net assets resulting from operations | | | | 125,154 | | | | | 741,564 | | | | | (179,062 | ) | | | | (1,864,568 | ) |
| | | | | | | | | | | | | | | | | | | | |
DISTRIBUTIONS TO SHAREHOLDERS: | | | | | | | | | | | | | | | | | | | | |
Distributions from net investment income | | | | | | | | | | | | | | | | | | | | |
Class A | | | | (86,368 | ) | | | | (85,741 | ) | | | | (532,549 | ) | | | | (560,888 | ) |
Class I | | | | (934,204 | ) | | | | (1,337,526 | ) | | | | (5,119,823 | ) | | | | (5,135,036 | ) |
Distributions from net realized gain on investments | | | | | | | | | | | | | | | | | | | | |
Class A | | | | — | | | | | — | | | | | (246,324 | ) | | | | (240,362 | ) |
Class I | | | | — | | | | | — | | | | | (2,052,845 | ) | | | | (1,970,473 | ) |
| | | | | | | | | | | | | | | | | | | | |
Change in net assets resulting from distributions to shareholders | | | | (1,020,572 | ) | | | | (1,423,267 | ) | | | | (7,951,541 | ) | | | | (7,906,759 | ) |
| | | | | | | | | | | | | | | | | | | | |
SHARE TRANSACTIONS: | | | | | | | | | | | | | | | | | | | | |
Proceeds from sale of shares | | | | | | | | | | | | | | | | | | | | |
Class A | | | | 140,002 | | | | | 224,054 | | | | | 211,194 | | | | | 152,526 | |
Class I | | | | 9,622,841 | | | | | 14,520,284 | | | | | 60,767,426 | | | | | 80,366,577 | |
Distributions reinvested | | | | | | | | | | | | | | | | | | | | |
Class A | | | | 55,187 | | | | | 58,870 | | | | | 568,746 | | | | | 602,054 | |
Class I | | | | 679,152 | | | | | 752,694 | | | | | 2,872,039 | | | | | 2,786,214 | |
Cost of shares redeemed | | | | | | | | | | | | | | | | | | | | |
Class A | | | | (760,111 | ) | | | | (1,398,588 | ) | | | | (2,780,928 | ) | | | | (5,934,497 | ) |
Class I | | | | (27,893,172 | ) | | | | (110,478,733 | ) | | | | (60,240,237 | ) | | | | (78,471,180 | ) |
| | | | | | | | | | | | | | | | | | | | |
Change in net assets resulting from share transactions | | | | (18,156,101 | ) | | | | (96,321,419 | ) | | | | 1,398,240 | | | | | (498,306 | ) |
| | | | | | | | | | | | | | | | | | | | |
Change in net assets | | | | (19,051,519 | ) | | | | (97,003,122 | ) | | | | (6,732,363 | ) | | | | (10,269,633 | ) |
NET ASSETS: | | | | | | | | | | | | | | | | | | | | |
Beginning of year | | | | 71,333,784 | | | | | 168,336,906 | | | | | 295,775,748 | | | | | 306,045,381 | |
| | | | | | | | | | | | | | | | | | | | |
End of year | | | $ | 52,282,265 | | | | $ | 71,333,784 | | | | $ | 289,043,385 | | | | $ | 295,775,748 | |
| | | | | | | | | | | | | | | | | | | | |
Undistributed (distributions in excess of) net investment income included in net assets at end of year | | | $ | 6,699 | | | | $ | 9,807 | | | | $ | (1,555 | ) | | | $ | (108 | ) |
| | | | | | | | | | | | | | | | | | | | |
| | | | |
SHARES OF BENEFICIAL INTEREST: | | | | | | | | | | | | | | | | | | | | |
Shares sold | | | | | | | | | | | | | | | | | | | | |
Class A | | | | 14,071 | | | | | 22,404 | | | | | 15,956 | | | | | 11,480 | |
Class I | | | | 967,243 | | | | | 1,448,952 | | | | | 4,629,922 | | | | | 6,033,791 | |
Distributions reinvested | | | | | | | | | | | | | | | | | | | | |
Class A | | | | 5,552 | | | | | 5,869 | | | | | 43,335 | | | | | 45,682 | |
Class I | | | | 68,301 | | | | | 75,030 | | | | | 218,695 | | | | | 213,107 | |
Shares redeemed | | | | | | | | | | | | | | | | | | | | |
Class A | | | | (76,385 | ) | | | | (139,321 | ) | | | | (213,100 | ) | | | | (445,735 | ) |
Class I | | | | (2,807,714 | ) | | | | (10,994,293 | ) | | | | (4,587,719 | ) | | | | (5,954,323 | ) |
| | | | | | | | | | | | | | | | | | | | |
Net change in shares outstanding | | | | (1,828,932 | ) | | | | (9,581,359 | ) | | | | 107,089 | | | | | (95,998 | ) |
| | | | | | | | | | | | | | | | | | | | |
| | | | | | | | | | | | | | | | | | | | |
See Notes which are an integral part of the Financial Statements
ANNUAL REPORT / April 30, 2018
| | |
| 55 | | STATEMENTS OF CHANGES IN NET ASSETS (concluded) |
| | | | | | | | | | |
| | | Wilmington New York Municipal Bond Fund |
| | |
| | | Year Ended
April 30, 2018 | | Year Ended
April 30, 2017 |
OPERATIONS: | | | | | | | | | | |
Net investment income | | | $ | 1,293,316 | | | | $ | 1,465,100 | |
Net realized gain (loss) on investments | | | | 1,340,727 | | | | | 859,871 | |
Net change in unrealized appreciation (depreciation) of investments | | | | (2,892,970 | ) | | | | (2,829,526 | ) |
| | | | | | | | | | |
Change in net assets resulting from operations | | | | (258,927 | ) | | | | (504,555 | ) |
| | | | | | | | | | |
DISTRIBUTIONS TO SHAREHOLDERS: | | | | | | | | | | |
Distributions from net investment income | | | | | | | | | | |
Class A | | | | (229,001 | ) | | | | (282,541 | ) |
Class I | | | | (1,064,406 | ) | | | | (1,182,549 | ) |
Distributions from net realized gain on investments | | | | | | | | | | |
Class A | | | | (234,152 | ) | | | | (172,832 | ) |
Class I | | | | (944,746 | ) | | | | (618,377 | ) |
| | | | | | | | | | |
Change in net assets resulting from distributions to shareholders | | | | (2,472,305 | ) | | | | (2,256,299 | ) |
| | | | | | | | | | |
SHARE TRANSACTIONS: | | | | | | | | | | |
Proceeds from sale of shares | | | | | | | | | | |
Class A | | | | 225,092 | | | | | 100,841 | |
Class I | | | | 10,139,776 | | | | | 20,000,921 | |
Distributions reinvested | | | | | | | | | | |
Class A | | | | 305,080 | | | | | 303,265 | |
Class I | | | | 1,344,922 | | | | | 1,164,646 | |
Cost of shares redeemed | | | | | | | | | | |
Class A | | | | (2,665,312 | ) | | | | (2,418,986 | ) |
Class I | | | | (20,674,090 | ) | | | | (14,746,019 | ) |
| | | | | | | | | | |
Change in net assets resulting from share transactions | | | | (11,324,532 | ) | | | | 4,404,668 | |
| | | | | | | | | | |
Change in net assets | | | | (14,055,764 | ) | | | | 1,643,814 | |
NET ASSETS: | | | | | | | | | | |
Beginning of year | | | | 85,544,816 | | | | | 83,901,002 | |
| | | | | | | | | | |
End of year | | | $ | 71,489,052 | | | | $ | 85,544,816 | |
| | | | | | | | | | |
Undistributed (distributions in excess of) net investment income included in net assets at end of year | | | $ | (60 | ) | | | $ | 31 | |
| | | | | | | | | | |
SHARES OF BENEFICIAL INTEREST: | | | | | | | | | | |
Shares sold | | | | | | | | | | |
Class A | | | | 21,343 | | | | | 9,390 | |
Class I | | | | 962,120 | | | | | 1,863,546 | |
Distributions reinvested | | | | | | | | | | |
Class A | | | | 29,127 | | | | | 28,657 | |
Class I | | | | 128,330 | | | | | 110,131 | |
Shares redeemed | | | | | | | | | | |
Class A | | | | (252,490 | ) | | | | (226,497 | ) |
Class I | | | | (1,964,972 | ) | | | | (1,373,629 | ) |
| | | | | | | | | | |
Net change in shares outstanding | | | | (1,076,542 | ) | | | | 411,598 | |
| | | | | | | | | | |
| | | | | | | | | | |
See Notes which are an integral part of the Financial Statements
April 30, 2018 / ANNUAL REPORT
For a share outstanding throughout each year ended April 30, unless otherwise noted:
| | | | | | | | | | | | | | | | | | | | | | | | | | | | | | | | | | | | |
WILMINGTON BROAD MARKET BOND FUND | |
| | | | | | | | | | | | | | | | | | | |
| | | Year Ended | | | | Year Ended | | | | Year Ended | | | | Year Ended | | | | Year Ended |
| CLASS A | | April 30, 2018 | | | | April 30, 2017 | | | | April 30, 2016 | | | | April 30, 2015 | | | | April 30, 2014 |
Net Asset Value, Beginning of Year | | | $9.78 | | | | | | | | $9.94 | | | | | | | | $9.95 | | | | | | | | $9.80 | | | | | | | | $10.19 | |
Income (Loss) From Operations: | | | | | | | | | | | | | | | | | | | | | | | | | | | | | | | | | | | | |
Net Investment Income(a) | | | 0.18 | | | | | | | | 0.16 | | | | | | | | 0.18 | | | | | | | | 0.17 | | | | | | | | 0.20 | |
Net Realized and Unrealized Gain (Loss) on Investments | | | (0.26 | ) | | | | | | | (0.14 | ) | | | | | | | 0.02 | | | | | | | | 0.19 | | | | | | | | (0.21 | ) |
| | | | |
Total Income (Loss) From Operations | | | (0.08 | ) | | | | | | | 0.02 | | | | | | | | 0.20 | | | | | | | | 0.36 | | | | | | | | (0.01 | ) |
| | | | |
Less Distributions From: | | | | | | | | | | | | | | | | | | | | | | | | | | | | | | | | | | | | |
Net Investment Income | | | (0.19 | ) | | | | | | | (0.18 | ) | | | | | | | (0.20 | ) | | | | | | | (0.19 | ) | | | | | | | (0.23 | ) |
Net Realized Gains | | | — | | | | | | | | — | | | | | | | | (0.01 | ) | | | | | | | (0.02 | ) | | | | | | | (0.15 | ) |
| | | | |
| Total Distributions | | | (0.19 | ) | | | | | | | (0.18 | ) | | | | | | | (0.21 | ) | | | | | | | (0.21 | ) | | | | | | | (0.38 | ) |
| | | | |
Net Asset Value, End of Year | | | $9.51 | | | | | | | | $9.78 | | | | | | | | $9.94 | | | | | | | | $9.95 | | | | | | | | $9.80 | |
| | | | |
Total Return(b) | | | (0.81 | )% | | | | | | | 0.22 | % | | | | | | | 2.03 | % | | | | | | | 3.69 | % | | | | | | | (0.03 | )% |
Net Assets, End of Year (000’s) | | | $4,074 | | | | | | | | $4,503 | | | | | | | | $5,206 | | | | | | | | $5,726 | | | | | | | | $5,983 | |
Ratios to Average Net Assets | | | | | | | | | | | | | | | | | | | | | | | | | | | | | | | | | | | | |
Gross Expense | | | 1.09 | % | | | | | | | 1.09 | % | | | | | | | 1.10 | % | | | | | | | 1.12 | % | | | | | | | 1.15 | % |
Net Expenses(c) | | | 0.87 | % | | | | | | | 0.89 | % | | | | | | | 0.88 | % | | | | | | | 0.94 | % | | | | | | | 0.98 | % |
Net Investment Income | | | 1.82 | % | | | | | | | 1.62 | % | | | | | | | 1.85 | % | | | | | | | 1.74 | % | | | | | | | 2.09 | % |
Portfolio Turnover Rate | | | 34 | % | | | | | | | 32 | % | | | | | | | 44 | % | | | | | | | 45 | % | | | | | | | 113 | % |
| | | | | | | | | | | | | | | | | | | |
| | | Year Ended | | | | Year Ended | | | | Year Ended | | | | Year Ended | | | | Year Ended |
| CLASS I | | April 30, 2018 | | | | April 30, 2017 | | | | April 30, 2016 | | | | April 30, 2015 | | | | April 30, 2014 |
Net Asset Value, Beginning of Year | | | $9.62 | | | | | | | | $9.78 | | | | | | | | $9.79 | | | | | | | | $9.63 | | | | | | | | $10.03 | |
Income (Loss) From Operations: | | | | | | | | | | | | | | | | | | | | | | | | | | | | | | | | | | | | |
Net Investment Income(a) | | | 0.21 | | | | | | | | 0.19 | | | | | | | | 0.21 | | | | | | | | 0.20 | | | | | | | | 0.23 | |
Net Realized and Unrealized Gain (Loss) on Investments | | | (0.26 | ) | | | | | | | (0.14 | ) | | | | | | | 0.02 | | | | | | | | 0.20 | | | | | | | | (0.22 | ) |
| | | | |
Total Income (Loss) From Operations | | | (0.05 | ) | | | | | | | 0.05 | | | | | | | | 0.23 | | | | | | | | 0.40 | | | | | | | | 0.01 | |
| | | | |
Less Distributions From: | | | | | | | | | | | | | | | | | | | | | | | | | | | | | | | | | | | | |
Net Investment Income | | | (0.22 | ) | | | | | | | (0.21 | ) | | | | | | | (0.23 | ) | | | | | | | (0.22 | ) | | | | | | | (0.26 | ) |
Net Realized Gains | | | — | | | | | | | | — | | | | | | | | (0.01 | ) | | | | | | | (0.02 | ) | | | | | | | (0.15 | ) |
| | | | |
Total Distributions | | | (0.22 | ) | | | | | | | (0.21 | ) | | | | | | | (0.24 | ) | | | | | | | (0.24 | ) | | | | | | | (0.41 | ) |
| | | | |
Net Asset Value, End of Year | | | $9.35 | | | | | | | | $9.62 | | | | | | | | $9.78 | | | | | | | | $9.79 | | | | | | | | $9.63 | |
| | | | |
Total Return(b) | | | (0.52 | )% | | | | | | | 0.54 | % | | | | | | | 2.38 | % | | | | | | | 4.19 | % | | | | | | | 0.16 | % |
Net Assets, End of Year (000’s) | | | $506,940 | | | | | | | | $503,184 | | | | | | | | $409,975 | | | | | | | | $413,310 | | | | | | | | $246,525 | |
Ratios to Average Net Assets | | | | | | | | | | | | | | | | | | | | | | | | | | | | | | | | | | | | |
Gross Expense | | | 0.84 | % | | | | | | | 0.84 | % | | | | | | | 0.85 | % | | | | | | | 0.88 | % | | | | | | | 0.92 | % |
Net Expenses(c) | | | 0.53 | % | | | | | | | 0.55 | % | | | | | | | 0.55 | % | | | | | | | 0.60 | % | | | | | | | 0.65 | % |
Net Investment Income | | | 2.18 | % | | | | | | | 1.96 | % | | | | | | | 2.15 | % | | | | | | | 2.07 | % | | | | | | | 2.41 | % |
Portfolio Turnover Rate | | | 34 | % | | | | | | | 32 | % | | | | | | | 44 | % | | | | | | | 45 | % | | | | | | | 113 | % |
| (a) | Per share numbers have been calculated using the average shares method. |
| (b) | Based on net asset value, which does not reflect the sales charge or contingent deferred sales charge, if applicable. Total returns for periods of less than one year, if any, are not annualized. |
| (c) | The investment advisor and other service providers waived or reimbursed a portion of their fees. |
See Notes which are an integral part of the Financial Statements
ANNUAL REPORT / April 30, 2018
| | |
| 57 | | FINANCIAL HIGHLIGHTS (continued) For a share outstanding throughout each year ended April 30, unless otherwise noted: |
|
WILMINGTON INTERMEDIATE-TERM BOND FUND |
| | | | | | | | | | | | | | | | | | | | | | | | | |
| | | | | |
| CLASS A | | Year Ended April 30, 2018 | | Year Ended April 30, 2017 | | Year Ended April 30, 2016 | | Year Ended April 30, 2015 | | Year Ended April 30, 2014 |
Net Asset Value, Beginning of Year | | | | $9.88 | | | | | $10.01 | | | | | $10.02 | | | | | $10.10 | | | | | $10.60 | |
Income (Loss) From Operations: | | | | | | | | | | | | | | | | | | | | | | | | | |
Net Investment Income(a) | | | | 0.16 | | | | | 0.13 | | | | | 0.13 | | | | | 0.13 | | | | | 0.14 | |
Net Realized and Unrealized Gain (Loss) on Investments | | | | (0.27 | ) | | | | (0.12 | ) | | | | 0.03 | | | | | 0.09 | | | | | (0.19 | ) |
| | | | | |
Total Income (Loss) From Operations | | | | (0.11 | ) | | | | 0.01 | | | | | 0.16 | | | | | 0.22 | | | | | (0.05 | ) |
| | | | | |
Less Distributions From: | | | | | | | | | | | | | | | | | | | | | | | | | |
Net Investment Income | | | | (0.16 | ) | | | | (0.13 | ) | | | | (0.13 | ) | | | | (0.13 | ) | | | | (0.15 | ) |
Net Realized Gains | | | | (0.03 | ) | | | | (0.01 | ) | | | | (0.04 | ) | | | | (0.17 | ) | | | | (0.30 | ) |
| | | | | |
Total Distributions | | | | (0.19 | ) | | | | (0.14 | ) | | | | (0.17 | ) | | | | (0.30 | ) | | | | (0.45 | ) |
| | | | | |
Net Asset Value, End of Year | | | | $9.58 | | | | | $9.88 | | | | | $10.01 | | | | | $10.02 | | | | | $10.10 | |
| | | | | |
Total Return(b) | | | | (1.14 | )% | | | | 0.16 | % | | | | 1.62 | % | | | | 2.14 | % | | | | (0.40 | )% |
Net Assets, End of Year (000’s) | | | | $1,912 | | | | | $2,765 | | | | | $3,509 | | | | | $4,389 | | | | | $5,279 | |
Ratios to Average Net Assets | | | | | | | | | | | | | | | | | | | | | | | | | |
Gross Expense | | | | 1.26 | % | | | | 1.18 | % | | | | 1.18 | % | | | | 1.15 | % | | | | 1.12 | % |
Net Expenses(c) | | | | 0.83 | % | | | | 0.86 | % | | | | 0.85 | % | | | | 0.89 | % | | | | 0.91 | % |
Net Investment Income | | | | 1.65 | % | | | | 1.32 | % | | | | 1.34 | % | | | | 1.25 | % | | | | 1.38 | % |
Portfolio Turnover Rate | | | | 30 | % | | | | 39 | % | | | | 32 | % | | | | 45 | % | | | | 43 | % |
| | | | | | | | | | | | | | | | | | | | | | | | | |
| | | | | |
| CLASS I | | Year Ended April 30, 2018 | | Year Ended April 30, 2017 | | Year Ended April 30, 2016 | | Year Ended April 30, 2015 | | Year Ended April 30, 2014 |
Net Asset Value, Beginning of Year | | | | $9.88 | | | | | $10.02 | | | | | $10.03 | | | | | $10.10 | | | | | $10.60 | |
Income (Loss) From Operations: | | | | | | | | | | | | | | | | | | | | | | | | | |
Net Investment Income(a) | | | | 0.19 | | | | | 0.17 | | | | | 0.17 | | | | | 0.16 | | | | | 0.17 | |
Net Realized and Unrealized Gain (Loss) on Investments | | | | (0.26 | ) | | | | (0.13 | ) | | | | 0.03 | | | | | 0.10 | | | | | (0.18 | ) |
| | | | | |
Total Income (Loss) From Operations | | | | (0.07 | ) | | | | 0.04 | | | | | 0.20 | | | | | 0.26 | | | | | (0.01 | ) |
| | | | | |
Less Distributions From: | | | | | | | | | | | | | | | | | | | | | | | | | |
Net Investment Income | | | | (0.19 | ) | | | | (0.17 | ) | | | | (0.17 | ) | | | | (0.16 | ) | | | | (0.19 | ) |
Net Realized Gains | | | | (0.03 | ) | | | | (0.01 | ) | | | | (0.04 | ) | | | | (0.17 | ) | | | | (0.30 | ) |
| | | | | |
Total Distributions | | | | (0.22 | ) | | | | (0.18 | ) | | | | (0.21 | ) | | | | (0.33 | ) | | | | (0.49 | ) |
| | | | | |
Net Asset Value, End of Year | | | | $9.59 | | | | | $9.88 | | | | | $10.02 | | | | | $10.03 | | | | | $10.10 | |
| | | | | |
Total Return(b) | | | | (0.72 | )% | | | | 0.40 | % | | | | 1.94 | % | | | | 2.57 | % | | | | (0.09 | )% |
Net Assets, End of Year (000’s) | | | | $82,301 | | | | | $127,103 | | | | | $120,406 | | | | | $126,574 | | | | | $136,516 | |
Ratios to Average Net Assets | | | | | | | | | | | | | | | | | | | | | | | | | |
Gross Expense | | | | 1.01 | % | | | | 0.93 | % | | | | 0.93 | % | | | | 0.93 | % | | | | 0.91 | % |
Net Expenses(c) | | | | 0.52 | % | | | | 0.53 | % | | | | 0.53 | % | | | | 0.57 | % | | | | 0.60 | % |
Net Investment Income | | | | 1.96 | % | | | | 1.66 | % | | | | 1.66 | % | | | | 1.57 | % | | | | 1.69 | % |
| Portfolio Turnover Rate | | | | 30 | % | | | | 39 | % | | | | 32 | % | | | | 45 | % | | | | 43 | % |
| (a) | Per share numbers have been calculated using the average shares method. |
| (b) | Based on net asset value, which does not reflect the sales charge or contingent deferred sales charge, if applicable. Total returns for periods of less than one year, if any, are not annualized. |
| (c) | The investment advisor and other service providers waived or reimbursed a portion of their fees. |
See Notes which are an integral part of the Financial Statements
April 30, 2018 / ANNUAL REPORT
| | |
FINANCIAL HIGHLIGHTS (continued) For a share outstanding throughout each year ended April 30, unless otherwise noted: | | 58 |
|
WILMINGTON SHORT-TERM BOND FUND |
| | | | | | | | | | | | | | | | | | | | | | | | | |
CLASS A | | Year Ended April 30, 2018 | | Year Ended April 30, 2017 | | Year Ended April 30, 2016 | | Year Ended April 30, 2015 | | Year Ended April 30, 2014 |
Net Asset Value, Beginning of Year | | | | $9.99 | | | | | $10.07 | | | | | $10.10 | | | | | $10.23 | | | | | $10.33 | |
Income (Loss) From Operations: | | | | | | | | | | | | | | | | | | | | | | | | | |
Net Investment Income(a) | | | | 0.12 | | | | | 0.10 | | | | | 0.07 | | | | | 0.07 | | | | | 0.07 | |
Net Realized and Unrealized Gain (Loss) on Investments | | | | (0.12 | ) | | | | (0.06 | ) | | | | 0.02 | | | | | (0.02 | ) | | | | 0.00 | (b) |
Total Income (Loss) From Operations | | | | 0.00 | (b) | | | | 0.04 | | | | | 0.09 | | | | | 0.05 | | | | | 0.07 | |
Less Distributions From: | | | | | | | | | | | | | | | | | | | | | | | | | |
Net Investment Income | | | | (0.14 | ) | | | | (0.12 | ) | | | | (0.10 | ) | | | | (0.06 | ) | | | | (0.08 | ) |
Net Realized Gains | | | | — | | | | | — | | | | | (0.02 | ) | | | | (0.12 | ) | | | | (0.09 | ) |
Total Distributions | | | | (0.14 | ) | | | | (0.12 | ) | | | | (0.12 | ) | | | | (0.18 | ) | | | | (0.17 | ) |
Net Asset Value, End of Year | | | | $9.85 | | | | | $9.99 | | | | | $10.07 | | | | | $10.10 | | | | | $10.23 | |
| | | | | | | | | | | | | | | | | | | | | | | | | |
Total Return(c) | | | | (0.03 | )% | | | | 0.43 | % | | | | 0.87 | % | | | | 0.51 | % | | | | 0.68 | % |
Net Assets, End of Year (000’s) | | | | $5,973 | | | | | $6,628 | | | | | $7,796 | | | | | $10,495 | | | | | $2,785 | |
Ratios to Average Net Assets | | | | | | | | | | | | | | | | | | | | | | | | | |
Gross Expense | | | | 1.37 | % | | | | 1.23 | % | | | | 1.11 | % | | | | 1.17 | % | | | | 1.19 | % |
Net Expenses(d) | | | | 0.73 | % | | | | 0.73 | % | | | | 0.73 | % | | | | 0.78 | % | | | | 0.83 | % |
Net Investment Income | | | | 1.22 | % | | | | 0.96 | % | | | | 0.71 | % | | | | 0.71 | % | | | | 0.64 | % |
Portfolio Turnover Rate | | | | 42 | % | | | | 72 | % | | | | 104 | % | | | | 138 | % | | | | 196 | % |
| | | | | | | | | | | | | | | | | | | | | | | | | |
CLASS I | | Year Ended April 30, 2018 | | Year Ended April 30, 2017 | | Year Ended April 30, 2016 | | Year Ended April 30, 2015 | | Year Ended April 30, 2014 |
Net Asset Value, Beginning of Year | | | | $9.99 | | | | | $10.07 | | | | | $10.10 | | | | | $10.23 | | | | | $10.33 | |
Income (Loss) From Operations: | | | | | | | | | | | | | | | | | | | | | | | | | |
Net Investment Income(a) | | | | 0.15 | | | | | 0.12 | | | | | 0.10 | | | | | 0.08 | | | | | 0.09 | |
Net Realized and Unrealized Gain (Loss) on Investments | | | | (0.13 | ) | | | | (0.05 | ) | | | | 0.01 | | | | | 0.00 | (b) | | | | 0.00 | (b) |
Total Income (Loss) From Operations | | | | 0.02 | | | | | 0.07 | | | | | 0.11 | | | | | 0.08 | | | | | 0.09 | |
Less Distributions From: | | | | | | | | | | | | | | | | | | | | | | | | | |
Net Investment Income | | | | (0.16 | ) | | | | (0.15 | ) | | | | (0.12 | ) | | | | (0.09 | ) | | | | (0.10 | ) |
Net Realized Gains | | | | — | | | | | — | | | | | (0.02 | ) | | | | (0.12 | ) | | | | (0.09 | ) |
Total Distributions | | | | (0.16 | ) | | | | (0.15 | ) | | | | (0.14 | ) | | | | (0.21 | ) | | | | (0.19 | ) |
Net Asset Value, End of Year | | | | $9.85 | | | | | $9.99 | | | | | $10.07 | | | | | $10.10 | | | | | $10.23 | |
| | | | | | | | | | | | | | | | | | | | | | | | | |
Total Return(c) | | | | 0.22 | % | | | | 0.68 | % | | | | 1.12 | % | | | | 0.76 | % | | | | 0.90 | % |
Net Assets, End of Year (000’s) | | | | $46,309 | | | | | $64,706 | | | | | $160,541 | | | | | $166,939 | | | | | $165,057 | |
Ratios to Average Net Assets | | | | | | | | | | | | | | | | | | | | | | | | | |
Gross Expense | | | | 1.11 | % | | | | 0.98 | % | | | | 0.86 | % | | | | 0.96 | % | | | | 0.97 | % |
Net Expenses(d) | | | | 0.48 | % | | | | 0.48 | % | | | | 0.48 | % | | | | 0.56 | % | | | | 0.61 | % |
Net Investment Income | | | | 1.46 | % | | | | 1.19 | % | | | | 0.97 | % | | | | 0.81 | % | | | | 0.86 | % |
Portfolio Turnover Rate | | | | 42 | % | | | | 72 | % | | | | 104 | % | | | | 138 | % | | | | 196 | % |
| (a) | Per share numbers have been calculated using the average shares method. |
| (b) | Represents less than $0.005. |
| (c) | Based on net asset value, which does not reflect the sales charge or contingent deferred sales charge, if applicable. Total returns for periods of less than one year, if any, are not annualized. |
| (d) | The investment advisor and other service providers waived or reimbursed a portion of their fees. |
See Notes which are an integral part of the Financial Statements
ANNUAL REPORT / April 30, 2018
| | |
| 59 | | FINANCIAL HIGHLIGHTS (continued) For a share outstanding throughout each year ended April 30, unless otherwise noted: |
|
WILMINGTON MUNICIPAL BOND FUND |
| | | | | | | | | | | | | | | | | | | | | | | | | |
CLASS A | | Year Ended April 30, 2018 | | Year Ended April 30, 2017 | | Year Ended April 30, 2016 | | Year Ended April 30, 2015 | | Year Ended April 30, 2014 |
Net Asset Value, Beginning of Year | | | | $13.14 | | | | | $13.54 | | | | | $13.41 | | | | | $13.40 | | | | | $13.75 | |
Income (Loss) From Operations: | | | | | | | | | | | | | | | | | | | | | | | | | |
Net Investment Income(a) | | | | 0.22 | | | | | 0.22 | | | | | 0.23 | | | | | 0.25 | | | | | 0.27 | |
Net Realized and Unrealized Gain (Loss) on Investments | | | | (0.26 | ) | | | | (0.31 | ) | | | | 0.37 | | | | | 0.13 | | | | | (0.23 | ) |
Total Income (Loss) From Operations | | | | (0.04 | ) | | | | (0.09 | ) | | | | 0.60 | | | | | 0.38 | | | | | 0.04 | |
Less Distributions From: | | | | | | | | | | | | | | | | | | | | | | | | | |
Net Investment Income | | | | (0.22 | ) | | | | (0.22 | ) | | | | (0.23 | ) | | | | (0.25 | ) | | | | (0.27 | ) |
Net Realized Gains | | | | (0.10 | ) | | | | (0.09 | ) | | | | (0.24 | ) | | | | (0.12 | ) | | | | (0.12 | ) |
Total Distributions | | | | (0.32 | ) | | | | (0.31 | ) | | | | (0.47 | ) | | | | (0.37 | ) | | | | (0.39 | ) |
Net Asset Value, End of Year | | | | $12.78 | | | | | $13.14 | | | | | $13.54 | | | | | $13.41 | | | | | $13.40 | |
| | | | | | | | | | | | | | | | | | | | | | | | | |
Total Return(b) | | | | (0.29 | )% | | | | (0.65 | )% | | | | 4.55 | % | | | | 2.83 | % | | | | 0.37 | % |
Net Assets, End of Year (000’s) | | | | $29,109 | | | | | $31,951 | | | | | $38,182 | | | | | $41,607 | | | | | $17,128 | |
Ratios to Average Net Assets | | | | | | | | | | | | | | | | | | | | | | | | | |
Gross Expense | | | | 1.10 | % | | | | 1.09 | % | | | | 1.09 | % | | | | 1.12 | % | | | | 1.14 | % |
Net Expenses(c) | | | | 0.74 | % | | | | 0.74 | % | | | | 0.74 | % | | | | 0.79 | % | | | | 0.86 | % |
Net Investment Income | | | | 1.70 | % | | | | 1.62 | % | | | | 1.69 | % | | | | 1.84 | % | | | | 2.00 | % |
Portfolio Turnover Rate | | | | 79 | % | | | | 40 | % | | | | 32 | % | | | | 50 | % | | | | 38 | % |
| | | | | | | | | | | | | | | | | | | | | | | | | |
CLASS I | | Year Ended April 30, 2018 | | Year Ended April 30, 2017 | | Year Ended April 30, 2016 | | Year Ended April 30, 2015 | | Year Ended April 30, 2014 |
Net Asset Value, Beginning of Year | | | | $13.15 | | | | | $13.55 | | | | | $13.42 | | | | | $13.40 | | | | | $13.76 | |
Income (Loss) From Operations: | | | | | | | | | | | | | | | | | | | | | | | | | |
Net Investment Income(a) | | | | 0.26 | | | | | 0.25 | | | | | 0.26 | | | | | 0.28 | | | | | 0.30 | |
Net Realized and Unrealized Gain (Loss) on Investments | | | | (0.26 | ) | | | | (0.31 | ) | | | | 0.37 | | | | | 0.15 | | | | | (0.24 | ) |
Total Income (Loss) From Operations | | | | 0.00 | (d) | | | | (0.06 | ) | | | | 0.63 | | | | | 0.43 | | | | | 0.06 | |
Less Distributions From: | | | | | | | | | | | | | | | | | | | | | | | | | |
Net Investment Income | | | | (0.26 | ) | | | | (0.25 | ) | | | | (0.26 | ) | | | | (0.29 | ) | | | | (0.30 | ) |
Net Realized Gains | | | | (0.10 | ) | | | | (0.09 | ) | | | | (0.24 | ) | | | | (0.12 | ) | | | | (0.12 | ) |
Total Distributions | | | | (0.36 | ) | | | | (0.34 | ) | | | | (0.50 | ) | | | | (0.41 | ) | | | | (0.42 | ) |
Net Asset Value, End of Year | | | | $12.79 | | | | | $13.15 | | | | | $13.55 | | | | | $13.42 | | | | | $13.40 | |
| | | | | | | | | | | | | | | | | | | | | | | | | |
Total Return(b) | | | | (0.03 | )% | | | | (0.39 | )% | | | | 4.81 | % | | | | 3.17 | % | | | | 0.55 | % |
Net Assets, End of Year (000’s) | | | | $259,934 | | | | | $263,825 | | | | | $267,864 | | | | | $259,904 | | | | | $199,503 | |
Ratios to Average Net Assets | | | | | | | | | | | | | | | | | | | | | | | | | |
Gross Expense | | | | 0.85 | % | | | | 0.84 | % | | | | 0.84 | % | | | | 0.88 | % | | | | 0.89 | % |
Net Expenses(c) | | | | 0.49 | % | | | | 0.49 | % | | | | 0.49 | % | | | | 0.55 | % | | | | 0.61 | % |
Net Investment Income | | | | 1.95 | % | | | | 1.87 | % | | | | 1.94 | % | | | | 2.11 | % | | | | 2.25 | % |
Portfolio Turnover Rate | | | | 79 | % | | | | 40 | % | | | | 32 | % | | | | 50 | % | | | | 38 | % |
| (a) | Per share numbers have been calculated using the average shares method. |
| (b) | Based on net asset value, which does not reflect the sales charge or contingent deferred sales charge, if applicable. Total returns for periods of less than one year, if any, are not annualized. |
| (c) | The investment advisor and other service providers waived or reimbursed a portion of their fees. |
| (d) | Represents less than $0.005. |
See Notes which are an integral part of the Financial Statements.
April 30, 2018 / ANNUAL REPORT
| | |
FINANCIAL HIGHLIGHTS (concluded) For a share outstanding throughout each year ended April 30, unless otherwise noted: | | 60 |
|
WILMINGTON NEW YORK MUNICIPAL BOND FUND |
| | | | | | | | | | | | | | | | | | | | | | | | | |
| CLASS A | | Year Ended
April 30, 2018 | | Year Ended
April 30, 2017 | | Year Ended
April 30, 2016 | | Year Ended
April 30, 2015 | | Year Ended
April 30, 2014 |
Net Asset Value, Beginning of Year | | | $ | 10.56 | | | | $ | 10.91 | | | | $ | 10.66 | | | | $ | 10.56 | | | | $ | 10.75 | |
Income (Loss) From Operations: | | | | | | | | | | | | | | | | | | | | | | | | | |
Net Investment Income(a) | | | | 0.15 | | | | | 0.16 | | | | | 0.19 | | | | | 0.21 | | | | | 0.19 | |
Net Realized and Unrealized Gain (Loss) on Investments | | | | (0.22 | ) | | | | (0.25 | ) | | | | 0.27 | | | | | 0.10 | | | | | (0.19 | ) |
Total Income (Loss) From Operations | | | | (0.07 | ) | | | | (0.09 | ) | | | | 0.46 | | | | | 0.31 | | | | | 0.00 | |
Less Distributions From: | | | | | | | | | | | | | | | | | | | | | | | | | |
Net Investment Income | | | | (0.15 | ) | | | | (0.16 | ) | | | | (0.19 | ) | | | | (0.21 | ) | | | | (0.19 | ) |
Net Realized Gains | | | | (0.16 | ) | | | | (0.10 | ) | | | | (0.02 | ) | | | | — | | | | | — | |
Total Distributions | | | | (0.31 | ) | | | | (0.26 | ) | | | | (0.21 | ) | | | | (0.21 | ) | | | | (0.19 | ) |
Net Asset Value, End of Year | | | $ | 10.18 | | | | $ | 10.56 | | | | $ | 10.91 | | | | $ | 10.66 | | | | $ | 10.56 | |
| | | | | | | | | | | | | | | | | | | | | | | | | |
Total Return(b) | | | | (0.75 | )% | | | | (0.81 | )% | | | | 4.32 | % | | | | 2.91 | % | | | | 0.04 | % |
Net Assets, End of Year (000’s) | | | $ | 14,863 | | | | $ | 17,554 | | | | $ | 20,197 | | | | $ | 22,691 | | | | $ | 24,301 | |
Ratios to Average Net Assets | | | | | | | | | | | | | | | | | | | | | | | | | |
Gross Expense | | | | 1.28 | % | | | | 1.24 | % | | | | 1.22 | % | | | | 1.22 | % | | | | 1.21 | % |
Net Expenses(c) | | | | 0.84 | % | | | | 0.84 | % | | | | 0.84 | % | | | | 0.84 | % | | | | 0.84 | % |
Net Investment Income | | | | 1.43 | % | | | | 1.50 | % | | | | 1.76 | % | | | | 1.93 | % | | | | 1.79 | % |
Portfolio Turnover Rate | | | | 64 | % | | | | 32 | % | | | | 24 | % | | | | 31 | % | | | | 34 | % |
| CLASS I | | Year Ended
April 30, 2018 | | Year Ended
April 30, 2017 | | Year Ended
April 30, 2016 | | Year Ended
April 30, 2015 | | Year Ended
April 30, 2014 |
Net Asset Value, Beginning of Year | | | $ | 10.57 | | | | $ | 10.92 | | | | $ | 10.67 | | | | $ | 10.57 | | | | $ | 10.76 | |
Income (Loss) From Operations: | | | | | | | | | | | | | | | | | | | | | | | | | |
Net Investment Income(a) | | | | 0.18 | | | | | 0.19 | | | | | 0.22 | | | | | 0.23 | | | | | 0.21 | |
Net Realized and Unrealized Gain (Loss) on Investments | | | | (0.22 | ) | | | | (0.25 | ) | | | | 0.27 | | | | | 0.10 | | | | | (0.18 | ) |
Total Income (Loss) From Operations | | | | (0.04 | ) | | | | (0.06 | ) | | | | 0.49 | | | | | 0.33 | | | | | 0.03 | |
Less Distributions From: | | | | | | | | | | | | | | | | | | | | | | | | | |
Net Investment Income | | | | (0.18 | ) | | | | (0.19 | ) | | | | (0.22 | ) | | | | (0.23 | ) | | | | (0.22 | ) |
Net Realized Gains | | | | (0.16 | ) | | | | (0.10 | ) | | | | (0.02 | ) | | | | — | | | | | — | |
Total Distributions | | | | (0.34 | ) | | | | (0.29 | ) | | | | (0.24 | ) | | | | (0.23 | ) | | | | (0.22 | ) |
Net Asset Value, End of Year | | | $ | 10.19 | | | | $ | 10.57 | | | | $ | 10.92 | | | | $ | 10.67 | | | | $ | 10.57 | |
| | | | | | | | | | | | | | | | | | | | | | | | | |
Total Return(b) | | | | (0.50 | )% | | | | (0.55 | )% | | | | 4.58 | % | | | | 3.17 | % | | | | 0.30 | % |
Net Assets, End of Year (000’s) | | | $ | 56,626 | | | | $ | 67,991 | | | | $ | 63,704 | | | | $ | 63,702 | | | | $ | 69,325 | |
Ratios to Average Net Assets | | | | | | | | | | | | | | | | | | | | | | | | | |
Gross Expense | | | | 1.03 | % | | | | 0.99 | % | | | | 0.98 | % | | | | 0.97 | % | | | | 0.96 | % |
Net Expenses(c) | | | | 0.59 | % | | | | 0.59 | % | | | | 0.59 | % | | | | 0.59 | % | | | | 0.59 | % |
Net Investment Income | | | | 1.68 | % | | | | 1.75 | % | | | | 2.01 | % | | | | 2.18 | % | | | | 2.05 | % |
Portfolio Turnover Rate | | | | 64 | % | | | | 32 | % | | | | 24 | % | | | | 31 | % | | | | 34 | % |
| (a) | Per share numbers have been calculated using the average shares method. |
| (b) | Based on net asset value, which does not reflect the sales charge or contingent deferred sales charge, if applicable. Total returns for periods of less than one year, if any, are not annualized. |
| (c) | The investment advisor and other service providers waived or reimbursed a portion of their fees. |
See Notes which are an integral part of the Financial Statements
ANNUAL REPORT / April 30, 2018
| | |
| 61 | | NOTES TO FINANCIAL STATEMENTS |
Wilmington Funds
April 30, 2018
Wilmington Funds (the “Trust”) is registered under the Investment Company Act of 1940, as amended (the “Act”), as an open-end management investment company. The Trust consists of 12 portfolios, 5 of which are presented herein (individually referred to as a “Fund” or collectively as the “Funds”). The remaining 7 funds are presented in separate reports.
| | |
Fund | | Investment Goal |
Wilmington Broad Market Bond Fund (“Broad Market Bond Fund”)(d) | | The Fund seeks to provide current income and secondarily, capital growth. |
| |
Wilmington Intermediate-Term Bond Fund (“Intermediate-Term Bond Fund”)(d) | | The Fund seeks to provide current income and secondarily, capital growth. |
| |
Wilmington Short-Term Bond Fund (“Short-Term Bond Fund”)(d) | | The Fund seeks to provide current income. |
| |
Wilmington Municipal Bond Fund (“Municipal Bond Fund”)(d) | | The Fund seeks a high level of income exempt from federal income tax, consistent with the preservation of capital. |
| |
Wilmington New York Municipal Bond Fund (“New York Municipal Bond Fund”)(n) | | The Fund seeks to provide current income that is exempt from both federal and New York personal income taxes. |
(d) Diversified
(n) Non-diversified
The Trust offers 6 classes of shares: Class A, Service Class, Select Class, Administrative Class, Class I and Institutional Class. Service Class, Select Class, Administrative Class and Institutional Class are not available for the Funds. All shares of the Trust have equal rights with respect to voting, except on class-specific matters.
The assets of each portfolio are segregated and a shareholder’s interest is limited to the portfolio in which shares are held.
In the normal course of business, the Funds may enter into contracts that provide general indemnifications. The Funds’ maximum exposure under these arrangements is dependent on claims that may be made against the Funds in the future, and, therefore, cannot be estimated; however, based on experience, the risk of material loss from such claims is considered remote.
| 2. | SUMMARY OF SIGNIFICANT ACCOUNTING POLICIES |
The following is a summary of significant accounting policies consistently followed by the Funds in the preparation of their financial statements. These policies are in conformity with U.S. generally accepted accounting principles (“GAAP”). The Trust is an investment company and follows accounting and reporting guidance under Financial Accounting Standards Board (“FASB”) Accounting Standards Codification (“ASC”) Topic 946, “Financial Services - Investment Companies.” The preparation of financial statements in conformity with GAAP requires management to make estimates and assumptions that affect the amounts of assets, liabilities, expenses and revenues reported in the financial statements. Actual results could differ from those estimated.
Investment Valuation – The Funds utilize a fair value approach. The fair value of the Funds’ portfolio securities are determined as follows:
| | • | | investments in open-end regulated investment companies are valued at net asset value (“NAV”); |
| | • | | for fixed income securities, according to prices as furnished by an independent pricing service, except that fixed income securities with remaining maturities of less than 60 days at the time of purchase are valued at amortized cost provided such amount approximates fair value; and |
| | • | | for all other securities at fair value as determined in accordance with procedures established by and under the general supervision of the Board of Trustees (“Trustees”). |
The Trust follows the authoritative guidance (GAAP) for fair value measurements. The guidance establishes a framework for measuring fair value and a hierarchy for inputs and techniques used in measuring fair value that maximizes the use of observable inputs and minimizes the use of unobservable inputs and techniques by requiring that the most observable inputs be used when available. The guidance establishes three tiers of inputs that may be used to measure fair value. The three tiers of inputs are summarized at the end of each Fund’s Portfolio of Investments. The inputs or techniques used for valuing securities are not necessarily an indication of the risk associated with investing in those securities.
The Funds’ policy is to disclose transfers between levels based on valuations at the beginning of the reporting period. Each portfolio may hold securities which are periodically fair valued in accordance with the Funds’ fair value procedures. This may result in movements between Levels 1, 2 and 3 throughout the year. As of April 30, 2018, there were no transfers between Levels 1, 2 and 3 assets and liabilities, based on levels assigned to securities at the beginning of the period. Pursuant to the Funds’ fair value procedures noted previously, investments in open-end regulated investment companies are generally categorized as Level 1 securities in the fair value hierarchy. Fixed income securities, non-exchange traded derivatives and money market instruments are generally categorized as Level 2 securities in the fair value hierarchy.
April 30, 2018 / ANNUAL REPORT
| | |
| NOTES TO FINANCIAL STATEMENTS (continued) | | 62 |
Investments for which there are no such quotations, or for which quotations do not appear reliable, are valued at fair value as determined in accordance with procedures established by and under the general supervision of the Trustees. These valuations are typically categorized as Level 2 or Level 3 securities in the fair value hierarchy.
Repurchase Agreements – Repurchase agreements are transactions in which a Fund buys a security from a dealer or bank and agrees to sell the security back at a mutually agreed upon time and price. The repurchase price exceeds the sale price, reflecting the Fund’s return on the transaction. It is each Fund’s policy to require the counterparty to a repurchase agreement to transfer to the Funds’ custodian or sub-custodian eligible securities or cash with a market value (after transaction costs) at least equal to the repurchase price to be paid under the repurchase agreement. The eligible securities are transferred to accounts with the custodian or sub-custodian in which the Funds hold a “securities entitlement” and exercise “control” as those terms are defined in the Uniform Commercial Code. The Funds have established procedures for monitoring the market value of the transferred securities and requiring the transfer of additional eligible securities if necessary to equal at least the repurchase price. These procedures also allow the counterparty to require securities to be transferred from the account to the extent that their market value exceeds the repurchase price or in exchange for other eligible securities of equivalent market value.
The insolvency of the counterparty or other failure to repurchase the securities may delay the disposition of the underlying securities or cause the Funds to receive less than the full repurchase price.
Repurchase agreements are entered into by the Funds under Master Repurchase Agreements (“MRA”) which permit the Funds, under certain circumstances including an event of default (such as bankruptcy or insolvency), to offset payables and/or receivables under the MRA with collateral held and/or posted to the counterparty and create one single net payment due to or from the Fund.
At April 30, 2018, the open repurchase agreements by counterparty which are subject to a MRA on a net payment basis are as follows:
| | | | | | | | | | | | | | | | | | | | | | | | | | | | | | | | | | | | | | | | | | | | | | | | |
| | | | | | | | | | | | |
| Fund/Counterparty | | | | | Repurchase
Agreements | | | | | | | | | Fair Value of
Non-Cash Collateral
Received(1) | | | | | | | | | Cash Collateral
Received(1) | | | | | | | | | Net Amount(2) | | | | |
Broad Market Bond Fund | | | | | | | | | | | | | | | | | | | | | | | | | | | | | | | | | | | | | | | | | | | | | | | | |
Barclays Capital, Inc. | | | | | | $ | 977,141 | | | | | | | | | | | $ | 977,141 | | | | | | | | | | | $ | — | | | | | | | | | | | $ | — | | | | | |
Daiwa Capital Markets America | | | | | | | 3,772,534 | | | | | | | | | | | | 3,772,534 | | | | | | | | | | | | — | | | | | | | | | | | | — | | | | | |
HSBC Securities USA, Inc. | | | | | | | 3,772,534 | | | | | | | | | | | | 3,772,534 | | | | | | | | | | | | — | | | | | | | | | | | | — | | | | | |
NBC Global Finance Ltd. | | | | | | | 3,772,534 | | | | | | | | | | | | 3,772,534 | | | | | | | | | | | | — | | | | | | | | | | | | — | | | | | |
Nomura Securities International, Inc. | | | | | | | 3,772,534 | | | | | | | | | | | | 3,772,534 | | | | | | | | | | | | — | | | | | | | | | | | | — | | | | | |
RBC Dominion Securities, Inc. | | | | | | | 3,772,534 | | | | | | | | | | | | 3,772,534 | | | | | | | | | | | | — | | | | | | | | | | | | — | | | | | |
| | | | | | | | | | | | | | | | | | | | | | | | | | | | | | | | | | | | | | | | | | | | | | | | |
| | | | | | | | | | | | |
| | | | | | $ | 19,839,811 | | | | | | | | | | | $ | 19,839,811 | | | | | | | | | | | $ | — | | | | | | | | | | | $ | — | | | | | |
| | | | | | | | | | | | | | | | | | | | | | | | | | | | | | | | | | | | | | | | | | | | | | | | |
Intermediate-Term Bond Fund | | | | | | | | | | | | | | | | | | | | | | | | | | | | | | | | | | | | | | | | | | | | | | | | |
Barclays Capital, Inc. | | | | | | | 56,128 | | | | | | | | | | | | 56,128 | | | | | | | | | | | | — | | | | | | | | | | | | — | | | | | |
Daiwa Capital Markets America | | | | | | | 221,739 | | | | | | | | | | | | 221,739 | | | | | | | | | | | | — | | | | | | | | | | | | — | | | | | |
NBC Global Finance Ltd. | | | | | | | 221,739 | | | | | | | | | | | | 221,739 | | | | | | | | | | | | — | | | | | | | | | | | | — | | | | | |
Nomura Securities International, Inc. | | | | | | | 221,739 | | | | | | | | | | | | 221,739 | | | | | | | | | | | | — | | | | | | | | | | | | — | | | | | |
RBC Dominion Securities, Inc. | | | | | | | 221,739 | | | | | | | | | | | | 221,739 | | | | | | | | | | | | — | | | | | | | | | | | | — | | | | | |
TD Securities, Inc. | | | | | | | 221,739 | | | | | | | | | | | | 221,739 | | | | | | | | | | | | — | | | | | | | | | | | | — | | | | | |
| | | | | | | | | | | | | | | | | | | | | | | | | | | | | | | | | | | | | | | | | | | | | | | | |
| | | | | | | | | | | | |
| | | | | | $ | 1,164,823 | | | | | | | | | | | $ | 1,164,823 | | | | | | | | | | | $ | — | | | | | | | | | | | $ | — | | | | | |
| | | | | | | | | | | | | | | | | | | | | | | | | | | | | | | | | | | | | | | | | | | | | | | | |
Short-Term Bond Fund | | | | | | | | | | | | | | | | | | | | | | | | | | | | | | | | | | | | | | | | | | | | | | | | |
Barclays Capital, Inc. | | | | | | | 241,616 | | | | | | | | | | | | 241,616 | | | | | | | | | | | | — | | | | | | | | | | | | — | | | | | |
Daiwa Capital Markets America | | | | | | | 930,497 | | | | | | | | | | | | 930,497 | | | | | | | | | | | | — | | | | | | | | | | | | — | | | | | |
NBC Global Finance Ltd. | | | | | | | 930,497 | | | | | | | | | | | | 930,497 | | | | | | | | | | | | — | | | | | | | | | | | | — | | | | | |
Nomura Securities International, Inc. | | | | | | | 930,497 | | | | | | | | | | | | 930,497 | | | | | | | | | | | | — | | | | | | | | | | | | — | | | | | |
RBC Dominion Securities, Inc. | | | | | | | 930,497 | | | | | | | | | | | | 930,497 | | | | | | | | | | | | — | | | | | | | | | | | | — | | | | | |
TD Securities, Inc. | | | | | | | 930,497 | | | | | | | | | | | | 930,497 | | | | | | | | | | | | — | | | | | | | | | | | | — | | | | | |
| | | | | | | | | | | | | | | | | | | | | | | | | | | | | | | | | | | | | | | | | | | | | | | | |
| | | | | | | | | | | | |
| | | | | | $ | 4,894,101 | | | | | | | | | | | $ | 4,894,101 | | | | | | | | | | | $ | — | | | | | | | | | | | $ | — | | | | | |
| | | | | | | | | | | | | | | | | | | | | | | | | | | | | | | | | | | | | | | | | | | | | | | | |
(1)The amount of collateral reflected in the table does not include any over-collateralization received by the Fund.
(2)Net amount represents the net amount receivable due from the counterparty in the event of default.
ANNUAL REPORT / April 30, 2018
| | |
| 63 | | NOTES TO FINANCIAL STATEMENTS (continued) |
Investment Income, Gains and Losses, Expenses and Distributions – Interest income and expenses are accrued daily. All premiums and discounts on fixed income securities are amortized/accreted for financial statement purposes. Gains and losses realized on principal payment of mortgage-backed securities (paydown gains and losses) are classified as part of investment income. Dividends and distributions to shareholders are recorded on the ex-dividend date. Non-cash dividends included in dividend income, if any, are recorded at fair value. Foreign dividends are recorded on the ex-dividend date or when the Funds are informed of the ex-dividend date. Investment transactions are accounted for on a trade date basis for financial reporting purposes. Realized gains and losses from investment transactions are recorded on an identified cost basis.
Expenses of the Trust, which are directly identifiable to a specific Fund, are applied to that Fund. Expenses which are not identifiable to a specific Fund are allocated in such a manner as deemed equitable, taking into consideration the nature and type of expense.
All Funds offer multiple classes of shares. Investment income, realized and unrealized gains and losses, and certain fund-level expenses are allocated to each class based on relative daily net assets, except that each class bears certain expenses unique to that class such as distribution and shareholder services fees. Distributions are declared separately for each class. No class has preferential distribution rights; differences in per share distributions rates are generally due to differences in class specific expenses. Distributions from net realized gains, if any, are declared and paid to shareholders annually. Distributions from net investment income are declared daily and paid monthly.
Federal Taxes – It is the Funds’ policy to comply with the Subchapter M provision of the Internal Revenue Code of 1986, as amended (the “Code”), and to distribute to shareholders each year substantially all of their income. Accordingly, no provisions for Federal income tax or excise tax are necessary.
Withholding taxes and where appropriate, deferred withholding taxes, on foreign interest, dividends and capital gains have been provided for in accordance with the applicable country’s tax rules and rates.
The Funds recognize interest and penalties, if any, related to unrecognized tax benefits as income tax expense on the Statement of Operations. During the year ended April 30, 2018, the Funds did not incur any interest or penalties.
When-Issued and Delayed Delivery Transactions – The Funds may engage in when-issued or delayed delivery transactions. The Funds record when-issued securities on the trade date and maintain security positions such that sufficient liquid assets will be available to make payment for the securities purchased. Securities purchased on a when-issued or delayed delivery basis are marked to market daily and begin earning interest on the settlement date. Losses may occur on these transactions due to changes in market conditions or the failure of counterparties to perform under the contract.
Restricted Securities – Restricted securities are securities that either (a) cannot be offered for public sale without first being registered, or being able to take advantage of an exemption from registration, under the Securities Act of 1933, as amended, or (b) are subject to contractual restrictions on public sales. In some cases, when a security cannot be offered for public sale without first being registered, the issuer of the restricted security has agreed to register such securities for resale, at the issuer’s expense, either upon demand by the Funds or in connection with another registered offering of the securities. Many such restricted securities may be resold in the secondary market in transactions exempt from registration. Restricted securities may be determined to be liquid under criteria established by the Trustees. A Fund will not incur any registration costs upon such resales. The Fund’s restricted securities are valued at the price provided by dealers in the secondary market or, if no market prices are available, at the fair value as determined in accordance with procedures established by and under the general supervision of the Trustees.
Dollar Roll Transactions – The Intermediate-Term Bond Fund and Broad Market Bond Fund may enter into dollar roll transactions, with respect to mortgage securities issued by GNMA, FNMA, and FHLMC, in which the Funds sell mortgage securities to financial institutions and simultaneously agree to accept substantially similar (same type, coupon, maturity) securities at a later date at an agreed upon price. Dollar roll transactions, which are treated as purchases and sales, will not exceed 12 months. There were no dollar roll transactions outstanding during the year ended April 30, 2018.
Lending of Portfolio Securities – The Trust has entered into an agreement with its custodian whereby the custodian may lend securities owned by the Funds to brokers, dealers and other financial organizations. Any increase or decrease in the fair value of securities loaned and any interest or dividends earned on those securities during the term of the loan would be for the account of the Fund. In exchange for lending securities under the terms of the agreement with their custodian, the Funds receive a lender’s fee. Fees earned by the Funds on securities lending are recorded as income. Loans of securities by the Funds are collateralized by cash, U.S. government securities or money market instruments that are maintained at all times in an amount at least equal to the current market value of the loaned securities plus a margin which varies depending on the type of securities owned. The custodian establishes and maintains the collateral in a segregated account. The Funds have the right under the lending agreement to recover the securities from the borrower on demand. The market value of the loaned securities is determined at the close of business of the Fund and any additional required collateral is delivered to the Fund on the next business day.
Investments purchased with cash collateral are presented on the portfolios of investments under the caption “Cash Collateral Invested for Securities on Loan.”
The Funds maintain the risk of any loss on the securities on loan as well as the potential loss on investments purchased with cash collateral received from securities lending.
April 30, 2018 / ANNUAL REPORT
| | |
| NOTES TO FINANCIAL STATEMENTS (continued) | | 64 |
Securities lending transactions are entered into by the Funds under Master Securities Lending Agreements (“MSLA”) which permit the Funds, under certain circumstances including an event of default (such as bankruptcy or insolvency), to offset amounts payable by the Fund to the same counterparty against amounts to be received and create one single net payment due to or from the Fund.
At April 30, 2018, the securities loaned which are subject to a MSLA on a net payment basis are as follows:
| | | | | | | | | | |
| | | |
| Fund | | Value of Securities on Loan | | | Cash Collateral
Received(1) | | | Net Amount(2) |
Broad Market Bond Fund | | $ | 19,405,183 | | | $ | 19,405,183 | | | $— |
Intermediate-Term Bond Fund | | | 1,139,612 | | | | 1,139,612 | | | — |
Short-Term Bond Fund | | | 4,783,585 | | | | 4,783,585 | | | — |
(1)Collateral with a value of $19,839,811, $1,164,823 and $4,894,101, respectively, has been received in connection with securities lending transactions.
(2)Net amount represents the net amount receivable due from the counterparty in the event of default.
| 3. | FEDERAL TAX INFORMATION |
As of April 30, 2018, there are no uncertain tax positions that would require financial statement recognition, de-recognition or disclosure. The Funds’ federal tax returns filed for the years ended 2017, 2016, and 2015, as well as the current tax year, remain subject to examination by the Internal Revenue Service.
The timing and character of income and capital gain distributions are determined in accordance with income tax regulations, which may differ from GAAP. These differences are due in part to the tax treatment of reclassifications of distributions, amortization on debt securities and capital gain or loss as a result of paydown activity. GAAP requires that permanent differences in net investment income and realized gains and losses due to differences between financial reporting and tax reporting be reclassified between various components of net assets and have no effect on the net assets nor the NAV of the Funds.
For the year ended April 30, 2018, permanent differences identified and reclassified among the components of net assets were as follows:
| | | | | | | | | | | | | | | |
| | | |
| Fund | | Paid-in
Capital | | Increase (Decrease)
Undistributed Net
Investment Income | | Accumulated
Net Realized
Gain (Loss) |
Broad Market Bond Fund | | | $ | — | | | | $ | 704,542 | | | | $ | (704,542 | ) |
Intermediate-Term Bond Fund | | | | — | | | | | 2,624 | | | | | (2,624 | ) |
Short-Term Bond Fund | | | | (108,426 | ) | | | | 100,037 | | | | | 8,389 | |
Municipal Bond Fund | | | | — | | | | | (1,753 | ) | | | | 1,753 | |
The permanent differences identified and reclassified were primarily attributable to the tax treatment of distributions and the expiration of capital loss carryforwards.
The tax character of distributions for the corresponding fiscal year ends were as follows:
| | | | | | | | | | | | | | | | | | | | | | | | | | | | | | |
| | | | | | |
| Fund | | Ordinary
Income* | | 2018 Tax Exempt
Income | | Long-Term
Capital Gains | | Ordinary
Income* | | 2017 Tax Exempt
Income | | Long-Term
Capital Gains |
Broad Market Bond Fund | | | $ | 11,690,654 | | | | $ | — | | | | $ | — | | | | $ | 10,818,424 | | | | $ | — | | | | $ | — | |
Intermediate-Term Bond Fund | | | | 1,865,232 | | | | | — | | | | | 238,806 | | | | | 2,311,341 | | | | | — | | | | | 51,574 | |
Short-Term Bond Fund | | | | 1,020,572 | | | | | — | | | | | — | | | | | 1,423,267 | | | | | — | | | | | — | |
Municipal Bond Fund | | | | 72,377 | | | | | 5,581,748 | | | | | 2,297,416 | | | | | 508,734 | | | | | 5,683,961 | | | | | 1,714,064 | |
New York Municipal Bond Fund | | | | 86,820 | | | | | 1,270,962 | | | | | 1,114,523 | | | | | 29,552 | | | | | 1,456,787 | | | | | 769,960 | |
* For tax purposes, short-term capital gain distributions are considered ordinary income distributions.
ANNUAL REPORT / April 30, 2018
| | |
| 65 | | NOTES TO FINANCIAL STATEMENTS (continued) |
As of April 30, 2018, the components of distributable earnings on a tax basis were as follows:
| | | | | | | | | | | | | | | | | | | | | | | | | | | | | | | | | | | |
| Fund | | Undistributed Ordinary Income | | Undistributed Tax-Exempt Income | | Undistributed Long-Term Capital Gains | | Other Timing Differences | | Unrealized Appreciation/ (Depreciation) | | Capital Loss
Carryforwards | | Late Year Loss Deferrals |
Broad Market | | | | | | | | | | | | | | | | | | | | | | | | | | | | | | | | | | | |
Bond Fund | | | $ | 1,059,598 | | | | $ | — | | | | $ | — | | | | $ | (1,044,730 | ) | | | $ | (10,699,891 | ) | | | $ | (1,861,955 | ) | | | $ | — | |
Intermediate-Term | | | | | | | | | | | | | | | | | | | | | | | | | | | | | | | | | | | |
Bond Fund | | | | 150,289 | | | | | — | | | | | 31,638 | | | | | (149,111 | ) | | | | (1,614,639 | ) | | | | — | | | | | — | |
Short-Term | | | | | | | | | | | | | | | | | | | | | | | | | | | | | | | | | | | |
Bond Fund | | | | 83,480 | | | | | — | | | | | — | | | | | (76,781 | ) | | | | (475,601 | ) | | | | (1,375,924 | ) | | | | — | |
Municipal Bond | | | | | | | | | | | | | | | | | | | | | | | | | | | | | | | | | | | |
Fund | | | | — | | | | | 496,473 | | | | | — | | | | | (498,028 | ) | | | | (1,999,993 | ) | | | | — | | | | | (679,231 | ) |
New York Municipal | | | | | | | | | | | | | | | | | | | | | | | | | | | | | | | | | | | |
Bond Fund | | | | — | | | | | 96,304 | | | | | 719,746 | | | | | (96,367 | ) | | | | (1,047,395 | ) | | | | — | | | | | (54,720 | ) |
| | | | | | | | | | | | | | | | | | | | | | | | | | | | | | | | | | | | |
Under current tax regulations, capital losses on securities transactions realized after October 31 may be deferred and treated as occurring on the first day of the following fiscal year. Under the Regulated Investment Company Modernization Act of 2010, the Funds are permitted to defer taxable ordinary income losses incurred after December 31 and treat as occurring on the first day of the following fiscal year. Post-October, Post-December and Late Year losses deferred to May 1, 2018 are as follows:
| | | | | | |
| | | | |
| Fund | | Ordinary
Post-December
Losses | | Short-Term
Post-October/
Late Year
Capital
Losses | | Long-Term
Post-October/
Late Year
Capital
Losses |
Municipal Bond Fund | | $— | | $897,921 | | $(218,690) |
New York Municipal Bond | | | | | | |
Fund | | — | | 54,720 | | — |
At April 30, 2018, the following Funds had capital loss carryforwards which will reduce each Fund’s taxable income arising from future net realized gain on investments, if any, to the extent permitted by the (“Code”) and thus will reduce the amount of distributions to shareholders which would otherwise be necessary to relieve the Fund of any liability for federal income tax.
| | | | | | |
| | | | |
| Fund | | Short-Term
No Expiration | | Long-Term
No Expiration | | Total Capital
Loss
Carryforwards |
Broad Market Bond Fund | | $544,356 | | $1,317,599 | | $1,861,955 |
Short-Term Bond Fund | | 621,402 | | 754,522 | | 1,375,924 |
The following Fund had capital loss carryforwards expired during the year ended April 30, 2018:
| | |
| | |
| Fund | | Capital Loss
Carryforwards
Expired |
Short-Term Bond Fund
| | $108,426 |
| 4. | ADVISORY FEES, SERVICING FEES, AND OTHER SERVICE PROVIDERS |
Investment Advisor – Wilmington Funds Management Corporation (“WFMC” or the “Advisor”) serves as the Investment Advisor to each of the Funds. Wilmington Trust Investment Advisors, Inc. (“WTIA”) provides sub-advisory services to the Funds. WFMC and WTIA are wholly-owned subsidiaries of M&T Bank Corporation. For its services, the Funds pay WFMC an annual investment advisory fee, accrued and paid daily, based on a percentage of each Fund’s average daily net assets as described below. WFMC, not the Funds, pays WTIA for its services.
| | |
| | |
| Fund | | Advisory Fee
Annual Rate |
Broad Market Bond Fund | | 0.45% |
Intermediate-Term Bond Fund | | 0.45% |
Short-Term Bond Fund | | 0.40% |
Municipal Bond Fund | | 0.45% |
New York Municipal Bond Fund | | 0.45% |
April 30, 2018 / ANNUAL REPORT
| | |
| NOTES TO FINANCIAL STATEMENTS (continued) | | 66 |
WFMC and the Funds’ shareholder service providers have contractually agreed to waive their fees and/or reimburse expenses so that total annual fund operating expenses paid by the Funds (not including the effects of dividends or interest on short positions, acquired fund fees and expenses, taxes, or other extraordinary expenses expressed as an annualized percentage of average daily net assets), will not exceed the expense limitations set forth below. Neither WFMC nor the Funds’ distributor will recoup previously waived fees/expenses in subsequent years.
Effective January 2, 2018, the contractual expense limitations are as follows:
| | | | |
Fund | | Contractual
Expense Limitations |
| | Class A | | Class I |
Broad Market Bond Fund | | 0.84% | | 0.49% |
Intermediate-Term Bond Fund | | 0.84% | | 0.49% |
Short-Term Bond Fund | | 0.73% | | 0.48% |
Municipal Bond Fund | | 0.74% | | 0.49% |
New York Municipal Bond Fund | | 0.83% | | 0.58% |
Prior to January 2, 2018, the contractual expense limitations were as follows:
| | | | |
| Fund | | Contractual
Expense Limitations |
| | Class A | | Class I |
Broad Market Bond Fund | | 0.90% | | 0.55% |
Intermediate-Term Bond Fund | | 0.88% | | 0.53% |
Short-Term Bond Fund | | 0.73% | | 0.48% |
Municipal Bond Fund | | 0.74% | | 0.49% |
New York Municipal Bond Fund | | 0.84% | | 0.59% |
Administrative Fees – The Bank of New York Mellon (“BNYM”) provides the Trust with fund administration services. The fees as described in the table below are a component of “Portfolio accounting and administration fees” as disclosed in the Statements of Operations. WFMC, in its role as Co-Administrator, provides the Funds with certain administrative personnel and services necessary to operate the Funds. Effective October 1, 2017, the fees as described in the table below are accrued and paid daily and are disclosed on the Statement of Operations as “Administrative personnel and services fees.”
| | | | | | |
| Administrator | | Maximum
Fee | | | Average Aggregate Daily Net Assets of the Trust |
WFMC | | | 0.040 | % | | on the first $5 billion |
| | | 0.030 | % | | on the next $2 billion |
| | | 0.025 | % | | on the next $3 billion |
| | | 0.018 | % | | on assets in excess of $10 billion |
BNYM | | | 0.0175 | % | | on the first $15 billion |
| | | 0.0150 | % | | on the next $10 billion |
| | | 0.0125 | % | | on assets in excess of $25 billion |
Prior to October 1, 2017, the administrative fees were as follows:
| | | | | | |
| Administrator | | Maximum
Fee | | | Average Aggregate Daily Net Assets of the Trust |
WFMC | | | 0.040 | % | | on the first $5 billion |
| | | 0.030 | % | | on the next $2 billion |
| | | 0.025 | % | | on the next $3 billion |
| | | 0.018 | % | | on assets in excess of $10 billion |
BNYM | | | 0.0285 | % | | on the first $500 million |
| | | 0.0280 | % | | on the next $500 million |
| | | 0.0275 | % | | on assets in excess of $1 billion |
WFMC and BNYM may voluntarily choose to waive any portion of their fee and can add, modify or terminate a voluntary wavier at any time at their sole discretion. Neither WFMC nor BNYM will recoup previously waived fees/expenses in subsequent years. For the year ended April 30, 2018, neither WFMC nor BNYM waived any administrative fees.
ANNUAL REPORT / April 30, 2018
| | |
| 67 | | NOTES TO FINANCIAL STATEMENTS (continued) |
Distribution Services Fee – The Trust has adopted a Distribution Services Plan (the “Plan”) pursuant to Rule 12b-1 under the Act. The Plan allows the Funds to pay fees to financial intermediaries, which may be paid through ALPS Distributors, Inc. (“ALPS”), the principal distributor, at an annual rate of up to 0.25% of the average daily net assets of the Funds’ Class A shares, for the sale, distribution, administration, customer servicing and record keeping of these shares.
The Trust may reduce the maximum amount of distribution services fees it pays from time to time at its sole discretion. In addition, a financial intermediary (including ALPS, the Advisor or their affiliates), may voluntarily waive or reduce any fees to which they are entitled.
For the year ended April 30, 2018, M&T Securities, Inc. and Manufacturers and Traders Trust Company (together “M&T”), affiliates of the Advisor, received a portion of the fees paid by the Funds which are listed below:
| | | | | |
| Fund | | Distribution
Fees |
Broad Market Bond Fund | | | | $ 7,621 | |
Intermediate-Term Bond Fund | | | | 3,358 | |
Short-Term Bond Fund | | | | 10,907 | |
Municipal Bond Fund | | | | 68,763 | |
New York Municipal Bond Fund | | | | 36,150 | |
Sales Charges – The Class A shares of all the Funds bear front-end sales charges.
For the year ended April 30, 2018, M&T received the amounts listed below from sales charges on the sale of Class A shares.
| | | | | |
| Fund | | Sales Charges from Class A |
Broad Market Bond Fund | | | | $ 374 | |
Short-Term Bond Fund | | | | 407 | |
Municipal Bond Fund | | | | 1,794 | |
New York Municipal Bond Fund | | | | 6,221 | |
Shareholder Services Fee – Pursuant to a Shareholder Services Plan adopted by the Funds and administered by ALPS, the Funds may pay up to 0.25% of the average daily net assets of each Fund’s Class A and Class I shares to financial intermediaries (which may include ALPS, the Advisor or their affiliates) for providing shareholder services and maintaining shareholder accounts. M&T has entered into a Shareholders Services Agreement with ALPS, under which it is entitled to receive up to 0.25% of the average daily net assets of each Fund’s shares for whom M&T provides shareholder services. The Funds may reduce the maximum amount of shareholder service fees it pays from time to time at its sole discretion. In addition, a financial intermediary (including M&T) may waive or reduce any fees to which they are entitled.
For the year ended April 30, 2018, M&T received a portion of the fees paid by the following Funds which are listed below:
| | | | | |
| Fund | | Shareholder Services Fee |
Broad Market Bond Fund | | | | $2,701 | |
Intermediate-Term Bond Fund | | | | 1,114 | |
| | | | | |
| | | | | |
Other Service Providers – Foreside Management Services, LLC (“FMS”) provides a Principal Executive Officer and Principal Financial Officer to the Trust. FMS has no role in determining the investment policies or which securities are to be sold or purchased by the Trust or its Funds.
BNYM provides custody services to the Trust.
BNY Mellon Investment Servicing (U.S.) Inc. provides fund accounting and transfer agency services to the Trust.
General – Certain Officers of the Trust are also Officers or employees of the above companies that provide services to the Funds, and during their terms of office, receive no compensation from the Funds. The Trust’s Statement of Additional Information includes additional information about the Trustees.
April 30, 2018 / ANNUAL REPORT
| | |
| NOTES TO FINANCIAL STATEMENTS (continued) | | 68 |
| 5. | INVESTMENT TRANSACTIONS |
Purchases and sales of investments, excluding short-term obligations, U.S. Government Securities and in-kind transactions, for the year ended April 30, 2018 were as follows:
| | | | | | | | | | |
| | | Investments |
| Fund | | Purchases | | Sales |
Broad Market Bond Fund | | | $ | 155,592,020 | | | | $ | 160,404,046 | |
Intermediate-Term Bond Fund | | | | 18,049,682 | | | | | 43,380,146 | |
Short-Term Bond Fund | | | | 9,591,598 | | | | | 22,384,316 | |
Municipal Bond Fund | | | | 223,977,999 | | | | | 222,153,220 | |
New York Municipal Bond Fund | | | | 48,731,501 | | | | | 57,468,650 | |
Purchases and sales of investments of U.S. Government Securities for the year ended April 30, 2018 were as follows:
| | | | | | | | | | |
| | | U.S. Government Securities |
| Fund | | Purchases | | Sales |
Broad Market Bond Fund | | | $ | 25,986,219 | | | | $ | 7,257,501 | |
Intermediate-Term Bond Fund | | | | 10,000,968 | | | | | 29,220,875 | |
Short-Term Bond Fund | | | | 16,499,595 | | | | | 17,982,284 | |
Since New York Municipal Bond Fund invests a substantial portion of its assets in issuers located in one state, it will be more susceptible to factors adversely affecting issuers of that state than would be a comparable tax-exempt mutual fund that invests nationally. In order to reduce the credit risk associated with such factors, at April 30, 2018, 6.5% of New York Municipal Bond Fund’s total market value of the securities in the portfolio of investments are backed by bond insurance of various financial institutions and financial guaranty assurance agencies.
Effective April 6, 2017, the Trust is participating in a $10,000,000 unsecured, committed revolving line of credit (“LOC”) agreement with BNYM. The LOC is available for extraordinary or emergency purposes, primarily for financing redemption payments. Borrowings are charged interest at a rate of 1.25% per annum over the greater of the Federal Funds Rate or the overnight LIBOR. The LOC includes a commitment fee of 0.15% per annum on the daily unused portion. The termination date of the current LOC is April 5, 2019.
The Funds did not utilize the LOC during the year ended April 30, 2018.
| 8. | RECENT REGULATORY UPDATES |
On October 13, 2016, the Securities and Exchange Commission (the “SEC”) adopted new rules and forms and amended existing rules and forms which are intended to modernize and enhance the reporting and disclosure of information by registered investment companies and to improve the quality of information that funds provide to investors, including modifications to Regulation S-X which would require standardized, enhanced disclosure about derivatives in investment company financial statements. The new rules also enhance disclosure regarding fund liquidity and redemption practices. The compliance dates of the modifications to Regulation S-X was August 1, 2017 and other amendments and rules are generally June 1, 2018 and December 1, 2018. The financial statements presented are in compliance with the most recent Regulation S-X amendments.
| 9. | RECENT ACCOUNTING PRONOUNCEMENTS |
In March 2017, the Financial Accounting Standards Board issued an Accounting Standards Update, ASU 2017-08, Receivables – Nonrefundable Fees and Other Costs (Subtopic 310-20), Premium Amortization on Purchased Callable Debt Securities (the “ASU”) which amends the amortization period for certain purchased callable debt securities held at a premium, shortening such period to the earliest call date. The ASU does not require any accounting change for debt securities held at a discount; the discount continues to be amortized to maturity. The ASU is effective for fiscal years, and interim periods within those fiscal years, beginning after December 15, 2018. At this time, management is evaluating the implications of these changes on the financial statements.
Management has evaluated events and transactions for potential recognition or disclosure in the financial statements through the date the financial statements were issued. Management has determined that there are no additional material events that would require recognition or disclosure in the Funds’ financial statements through this date.
ANNUAL REPORT / April 30, 2018
REPORT OF INDEPENDENT REGISTERED PUBLIC ACCOUNTING FIRM
TO THE SHAREHOLDERS WILMINGTON BROAD MARKET BOND FUND, WILMINGTON INTERMEDIATE-TERM BOND FUND, WILMINGTON SHORT-TERM BOND FUND, WILMINGTON MUNICIPAL BOND FUND AND WILMINGTON NEW YORK MUNICIPAL BOND FUND AND BOARD OF TRUSTEES OF WILMINGTON FUNDS
Opinion on the Financial Statements
We have audited the accompanying statements of assets and liabilities of the Wilmington Broad Market Bond Fund, Wilmington Intermediate-Term Bond Fund, Wilmington Short-Term Bond Fund, Wilmington Municipal Bond Fund and Wilmington New York Municipal Bond Fund (collectively referred to as the “Funds”) (five of the funds constituting the Wilmington Funds (the “Trust”)), including the portfolios of investments, as of April 30, 2018, and the related statements of operations for the year then ended, the statements of changes in net assets for each of the two years in the period then ended, the financial highlights for each of the five years in the period then ended and the related notes (collectively referred to as the “financial statements”). In our opinion, the financial statements present fairly, in all material respects, the financial position of each of the Funds (five of the funds constituting the Wilmington Funds) at April 30, 2018, the results of their operations for the year then ended, the changes in their net assets for each of the two years in the period then ended and their financial highlights for each of the five years in the period then ended, in conformity with U.S. generally accepted accounting principles.
Basis for Opinion
These financial statements are the responsibility of the Trust’s management. Our responsibility is to express an opinion on each of the Funds’ financial statements based on our audits. We are a public accounting firm registered with the Public Company Accounting Oversight Board (United States) (“PCAOB”) and are required to be independent with respect to the Trust in accordance with the U.S. federal securities laws and the applicable rules and regulations of the Securities and Exchange Commission and the PCAOB.
We conducted our audits in accordance with the standards of the PCAOB. Those standards require that we plan and perform the audit to obtain reasonable assurance about whether the financial statements are free of material misstatement, whether due to error or fraud. The Trust is not required to have, nor were we engaged to perform, an audit of the Trust’s internal control over financial reporting. As part of our audits, we are required to obtain an understanding of internal control over financial reporting, but not for the purpose of expressing an opinion on the effectiveness of the Trust’s internal control over financial reporting. Accordingly, we express no such opinion.
Our audits included performing procedures to assess the risks of material misstatement of the financial statements, whether due to error or fraud, and performing procedures that respond to those risks. Such procedures included examining, on a test basis, evidence regarding the amounts and disclosures in the financial statements. Our procedures included confirmation of securities owned as of April 30, 2018, by correspondence with the custodian and brokers or by other appropriate auditing procedures where replies from brokers were not received. Our audits also included evaluating the accounting principles used and significant estimates made by management, as well as evaluating the overall presentation of the financial statements. We believe that our audits provide a reasonable basis for our opinion.

We have served as the auditor of one or more Wilmington Funds’ investment companies since 1986.
Philadelphia, Pennsylvania
June 27, 2018
April 30, 2018 / ANNUAL REPORT
| | |
| BOARD OF TRUSTEES AND TRUST OFFECERS | | 70 |
BOARD OF TRUSTEES AND TRUST OFFICERS
The following tables give information about each Trustee and the senior officers of the Trust. The tables separately list Trustee members who are “interested persons” of the Fund (i.e., “Interested” Trustees) and those who are not (i.e., “Independent” Trustees). The Trust is comprised of 12 funds. Unless otherwise noted, the business address of each Trustee and senior officer is 111 South Calvert Street, 26th floor, Baltimore, Maryland 21202. Each Trustee oversees all portfolios of the Trust and serves for an indefinite term. The Trust’s Statement of Additional Information includes additional information about the Trustees and is available, without charge and upon request, by calling 1-800-836-2211.
INTERESTED TRUSTEES BACKGROUND
| | |
| |
Name Address Birth Year Position With Trust Date Service Began | | Principal Occupations and Other Directorships Held for Past Five Years |
| |
Donald E. Foley* Birth year: 1951 TRUSTEE Began serving: December 2015 | | Principal Occupations: Director, BioSig Technologies (2015 to present); Director, AXA Equitable’s VIP Mutual Funds (2017 to present); Director, AXA Equitable (variable annuity) (2013 to present); Director, 1290 Mutual Funds (retail funds) (2013 to present); and Chairman and Director, Burke Rehabilitation Hospital Foundation (private hospital, research institute) (2005 to present). |
| |
| | Other Directorships Held: Director, M&T Bank Corporation (commercial bank) (2011 to 2012); Chairman and Director, Wilmington Trust Corporation (commercial and trust bank) (2007 to 2011); Chairman, Director and President’s Council, Union College (private college) (2011 to 2015). |
| |
| | Previous Positions: Advisory Member, Trust and Investment Committee, M&T Bank, Wilmington Trust, National Association, and Wilmington Trust Company (through 2016); Director of M&T Bank Corporation and M&T Bank (2011 to 2012); Chairman and Chief Executive Officer of Wilmington Trust Corporation (2010 to 2011); Senior Vice President and Treasurer at ITT Corporation (1996 to 2010); Assistant Treasurer at International Paper (1989 to 1996). |
| | |
Christopher D. Randall* Birth year: 1965 TRUSTEE Began serving: September 2015 PRESIDENT Began serving: September 2014 | | Principal Occupations: Senior Vice President, Wilmington Trust Corporation (2015 to present); Chief Operating Officer, Wilmington Trust Corporation (2012 to present); Senior Vice President, M&T Bank. Other Directorships Held: Trustee, Hilbert College (2015 to present). Previous Positions: President, Wilmington Retirement (2012 to 2015); President and Chief Executive Officer of Wilmington Trust Investment Advisors, Inc. and President of Wilmington Trust Investment Management, LLC (2014-2015); President, Mid-Atlantic Region Wealth Advisory Services, M&T Bank (2011 to 2013) |
| * | Christopher D. Randall is “interested” due to the positions he currently holds with the Funds, Wilmington Trust’s Wealth and Institutional Services Division, M&T Bank, the parent of the Fund’s Advisor, and previous positions held with WTIA and WFMC. Donald E. Foley is “interested” due to the positions he previously held with Wilmington Trust Corporation, M&T Bank Corporation and M&T Bank, the parent of the Fund’s Advisor. |
ANNUAL REPORT / April 30, 2018 (unaudited)
| | |
| 71 | | BOARD OF TRUSTEES AND TRUST OFFICERS |
INDEPENDENT TRUSTEES BACKGROUND
| | |
| |
Name Birth Year Position with Trust Date Service Began | | Principal Occupations and Other Directorships Held for Past Five Years |
| |
Nicholas A. Giordano Birth year: 1943 CHAIRMAN and TRUSTEE Began serving: March 2012 | | Principal Occupations: Consultant, financial services organizations (1997 to present). Other Directorships Held: Kalmar Pooled Investment Trust (through 6/17); The RBB Fund Inc. (19 portfolios) (registered investment companies); Independence Blue Cross; IntriCon Corporation (body-worn products) Previous Positions: Interim President, LaSalle University (1998 to 1999); President and Chief Executive Officer, Philadelphia Stock Exchange (1981 to 1997). |
| |
Robert H. Arnold Birth year: 1944 TRUSTEE Began serving: March 2012 | | Principal Occupations: Managing Director, R.H. Arnold & Co, Inc. (financial management consulting) (6/89 to present). Other Directorships Held: Trustee, First Potomac Realty Trust (real estate investment trust) (5/03 to present); Director, Treasury Strategies, Inc. (private treasury consulting services) (6/01 to 6/16). |
| |
Gregory P. Chandler Birth year: 1966 TRUSTEE Began serving: July 2017 | | Principal Occupations: Chief Financial Officer Emtec, Inc. (information technology services) (4/09 to present); President, GCVC Consulting (corporate governance consulting) (2008 to present). Other Directorships Held: Trustee, RBB Fund Series Trust (19 portfolios) (registered investment companies) (2012 to present); Director, Emtec, Inc. (8/2005 to present); Director, FS Investment Corporation (business development company) (2007 to present); Trustee, FS Energy Partners (business development company) (2009 to present). Previous Positions: Managing Director, Head of Business Services and IT Services Practice, Janney Montgomery Scott LLC (investment banking/brokerage) (2003 to 2009). |
| |
John S. Cramer Birth year: 1942 TRUSTEE Began serving: December 2000 | | Principal Occupations: Retired. Other Directorships Held: Chairman and Director, CI Supply Corp. (medical supplies and equipment) (1/14 to 1/15); Director, Check Med Corp. (medical supplies and equipment) (6/08 to 1/14); Director, Highmark Blue Shield (health insurance) (2/01 to 6/10). Previous Positions: Consultant, Yaffe & Co. (compensation consultants) (6/02 to 6/12); President and Chief Executive Officer, Pinnacle Health Systems (nonprofit hospital and health care system in Central Pennsylvania) (through 2012). |
| |
Daniel R. Gernatt, Jr. Birth year: 1940 TRUSTEE Began serving: February 1988 | | Principal Occupations: President and CEO, Gernatt Asphalt Products, Inc. (asphalt, sand and gravel products) (1979 to present). Other Directorships Held: Director, Roswell Park Alliance (2008 to 2016); Trustee, Gernatt Family Foundation. |
| |
Richard B. Seidel Birth year: 1941 TRUSTEE Began serving: September 2003 | | Principal Occupations: Chairman, Seidel & Associates (legal consulting) (1/14 to present); Chairman, Girard Private Investment Group (registered investment adviser) (1/14 to present). Other Directorships Held: Director, Tristate Capital Holdings (9/07 to present). Previous Positions: Chairman, Girard Capital (broker-dealer) (1/10 to 2016); Chairman, Girard Partners, Ltd. (1/10 to 2016). |
April 30, 2018 (unaudited) / ANNUAL REPORT
| | |
| BOARD OF TRUSTEES AND TRUST OFFICERS | | 72 |
OFFICERS
| | |
| |
Name Address Birth Year Positions with Trust | | Principal Occupations for Past Five Years and Previous Positions |
| |
Jeffrey M. Seling Birth year: 1970 ASSISTANT TREASURER Began serving: June 2013 VICE PRESIDENT Began serving: June 2007 | | Principal Occupations: Administrative Vice President, M&T Bank and Wilmington Trust Investment Advisors, Inc.; Assistant Treasurer, Wilmington Funds. Previous Positions: Vice President, MSD&T; Assistant Vice President, Wells Fargo Bank; Assistant Vice President, JP Morgan Chase Bank. |
| |
John C. McDonnell Birth year: 1966 CHIEF OPERATIONS OFFICER Began serving: June 2017 | | Principal Occupations: Chief Operations Officer, Wilmington Funds and Wilmington Trust Investment Advisors, Inc.; Vice President, Wilmington Funds Management Corporation (2005 to present); Vice President, Wilmington Trust Investment Advisors, Inc. (2012 to present). Previous Positions: Vice President, Wilmington Trust Investment Management, LLC (2005 to 2012); Audit Senior, Deloitte LLP (2004 to 2005); Assistant Vice President, 1838 Investment Advisors, LP (1999 to 2004). |
| |
Lisa Druelinger Birth year: 1978 CHIEF COMPLIANCE OFFICER and AML COMPLIANCE OFFICER. Began serving: November 2017 | | Principal Occupations: Chief Compliance Officer and Anti-Money Laundering Officer, Wilmington Funds; Vice President, M&T Bank. Previous Positions: Vice President and Senior Compliance Officer, Wilmington Trust Investment Advisors, Inc. (2015-2017); Wilmington Funds Product Manager, Wilmington Trust Investment Advisors, Inc. (2013-2015); Institutional and Retirement Services Product Manager, Wilmington Trust (2011-2013); Trust Compliance and Risk Management at M&T Bank (2006- 2011). |
| |
John J. Kelley Birth year: 1959 VICE PRESIDENT Began serving: December 2016 | | Principal Occupations: President, Wilmington Funds Management Corporation; Group Vice President and Chief Administrative Officer, Wilmington Trust Investment Advisors, Inc. Previous Positions: Vice President, BNY Mellon Investment Servicing (formerly PNC Global Investment Servicing), (1/05 to 7/05); Vice President of Administration, 1838 Investment Advisors, LP (1999 to 2005); Chief Compliance Officer, 1838 Investment Advisors, LP (2004 to 2005). |
| |
Ralph V. Partlow, III 25 South Charles Street, 22nd floor Baltimore, MD 21201 Birth year: 1957 VICE PRESIDENT Began serving: June 2010 | | Principal Occupation: Administrative Vice President and Deputy General Counsel, M&T Bank (2003 to present). Previous Positions: Vice President and Senior Counsel, Allfirst Bank (1995 to 2003). |
| |
Christopher W. Roleke 10 High Street, Suite 302 Boston, MA 02110 Birth year: 1972 CHIEF FINANCIAL OFFICER AND TREASURER Began serving: July 2013 | | Principal Occupation: Managing Director and Fund Principal Financial Officer, Foreside Management Services, LLC (2011 to present). Previous Positions: Assistant Vice President, JP Morgan Investor Services Co. (2006 to 2011). |
| |
Lisa R. Grosswirth Atlantic Terminal Office Tower, 2 Hanson Place, 12th Floor Brooklyn, NY 11217 Birth year: 1963 SECRETARY Began serving: September 2007 | | Principal Occupation: Vice President, BNY Mellon Asset Servicing (2004 to present). Previous Positions: Supervisory Paralegal, The Dreyfus Corporation (1998 to 2004). |
ANNUAL REPORT / April 30, 2018 (unaudited)
| | |
| 73 | | BOARD OF TRUSTEES AND TRUST OFFICERS |
| | |
| |
Name Address Birth Year Positions with Trust | | Principal Occupations for Past Five Years and Previous Positions |
| |
Richard J. Berthy Three Canal Plaza, Suite 100 Portland, ME 04101 Birth year: 1958 CHIEF EXECUTIVE OFFICER Began serving: September 2007 | | Principal Occupation: Chief Executive Officer, Foreside Financial Group, LLC (2012 to present). Previous Positions: President, Foreside Financial Group, LLC (2008 to 2012); Chief Administrative Officer, Foreside Financial Group, LLC (2005 to 2008); President and Secretary, Bainbridge Capital Management, LLC (2003 to 2006); Vice President, Bainbridge Capital Management (2002 to 2004). |
April 30, 2018 (unaudited) / ANNUAL REPORT
Shares of the Wilmington Funds are not FDIC insured or otherwise protected by the U.S. government, are not deposits or other obligations of, or guaranteed by, Manufacturers and Traders Trust Company, and are subject to investment risks, including possible loss of the principal amount invested.
VOTING PROXIES ON FUND PORTFOLIO SECURITIES
A description of the policies and procedures that the Funds use to determine how to vote proxies relating to securities held in the Funds’ portfolios is available, without charge and upon request, by calling 1-800-836-2211. A report on how the Funds voted any such proxies during the most recent 12-month period ended June 30 is available through Wilmington Funds’ website. Go to www.wilmingtonfunds.com select “Proxy Voting Record” to access the link. This information is also available from the Edgar database on the SEC’s website at www.sec.gov.
QUARTERLY PORTFOLIO SCHEDULE
The Funds file with the SEC a complete schedule of their portfolio holdings, as of the close of the first and third quarters of their fiscal year, on Form N-Q. These filings are available on the SEC’s website at www.sec.gov and may be reviewed and copied at the SEC’s Public Reference Room in Washington DC. (Call 1-800-SEC-0330 for information on the operation of the Public Reference Room.)
Electronic Delivery
Wilmington Funds encourages you to sign up for electronic delivery of investor materials. By doing so you will receive information faster, help lower shareholder costs, and reduce the impact to the environment. To enroll in electronic delivery:
| | 1.) | Go to www.wilmingtonfunds.com and select “Individual Investors” 2.) Click on the link “Sign up for Electronic Delivery” |
| | 3.) | Login to your account or create new user ID |
| | 4.) | Select E-Delivery Consent from the available options, and |
| | 5.) | Complete the information requested, including providing the email address where you would like to receive notification for electronic documents. |
* If you hold your account through a financial intermediary, please contact your advisor to request electronic delivery of investor materials.
Householding
In an effort to reduce volume of mail you receive, only one copy of the prospectus, annual/semi-annual report, SAI and proxy statements will be sent to shareholders who are part of the same family and share the same address.
If you would like to request additional copies of the prospectus, annual/semi-annual report or SAI, or wish to opt out of householding mailings, please contact Shareholder Services at 1-800-836-2211, or write to Wilmington Funds, P.O. Box 9828, Providence, RI 02940-8025.
ANNUAL REPORT / April 30, 2018
PRIVACY POLICY AND NOTICE
OF THE FUNDS AND THEIR DISTRIBUTOR
June 8, 2012
The Wilmington Funds, their distributor and their agents (referred to as “the Funds”, “we” or “us”) recognize that consumers (referred to as “you” or “your”) expect us to protect both your assets and financial information. We respect your right to privacy and your expectation that all personal information about you or your account will be maintained in a secure manner. We are committed to maintaining the confidentiality, security and integrity of client and shareholder information. We want you to understand the Funds’ policy that governs the handling of your information, how the Funds gather information, how that information is used and how it is kept secure.
Information The Funds Collect:
The Funds collect nonpublic personal information about you from the following sources:
| | • | | We may receive information from you, or from your financial representative, on account applications, other forms or electronically (such as through the Funds’ website or other electronic trading mechanisms). Examples of this information include your name, address, social security number, assets and income. |
| | • | | We may receive information from you, or from your financial representative, through transactions with us or others, correspondence and other communications. Examples of this information include specific investments and your account balances. |
| | • | | We may obtain other personal information from you in connection with providing you a financial product or service. Examples of this information include depository, debit or credit account numbers. |
Information Sharing Policy
The Funds may share nonpublic personal information about you, as described above, with financial or non-financial companies or other entities, including companies that may be affiliated with the Funds and other nonaffiliated third parties, for the following purposes:
| | • | | We may share information when it is necessary and required to process a transaction or to service a customer relationship. For example, information may be shared with a company that provides account record keeping services or a company that provides proxy services to shareholders. |
| | • | | We may share information when it is required or permitted by law. For example, information may be shared in response to a subpoena or to protect you against fraud or with someone who has established a legal beneficial interest, such as a power of attorney. |
| | • | | We may disclose some or all of the information described above to companies that perform marketing or other services on our behalf. For example, we may share information about you with the financial intermediary (bank, investment bank or broker-dealer) through whom you purchased the Funds’ products or services, or with providers of marketing, legal, accounting or other professional services. The Funds will not, however, disclose a consumer’s account number or similar form of access number or access code for credit card, deposit or transaction accounts to any nonaffiliated third party for use in telemarketing, direct mail or other marketing purposes. |
Except as described above, the Funds do not share customer information. We will not rent, sell, trade, or otherwise release or disclose any personal information about you. Any information you provide to us is for the Funds’ use only. If you decide to close your account(s) or become an inactive customer, we will adhere to the privacy policies and practices as described in this notice.
Information Security:
When the Funds share nonpublic customer information with third parties hired to facilitate the delivery of certain products or services to our customers, such information is made available for limited purposes and under controlled circumstances designed to protect our customers’ privacy. We require third parties to comply with our standards regarding security and confidentiality of such information. We do not permit them to use that information for their own or any other purposes, or rent, sell, trade or otherwise release or disclose the information to any other party. These requirements are reflected in written agreements between the Funds and the third party service providers.
The Funds protect your personal information in several ways. We maintain physical, electronic, and procedural safeguards to guard your nonpublic personal information. In addition, the Funds’ Transfer Agent and Shareholder Servicing Agent have procedures in place for the appropriate disposal of nonpublic personal information when they are no longer required to maintain the information.
Each of the following sections explains an aspect of the Funds’ commitment to protecting your personal information and respecting your privacy.
Employee Access to Information:
Our Code of Ethics, which applies to all employees, restricts the use of customer information and requires that it be held in the strictest of confidence. Employee access to customer information is authorized for business purposes only, and the degree of access is based on the sensitivity of the information and on an employee’s or agent’s need to know the information in order to service a customer’s account or comply with legal requirements.
Visiting The Funds’ Website:
The Funds’ website gathers and maintains statistics about the number of visitors as well as what information is viewed most frequently. This information is used to improve the content and level of service we provide to our clients and shareholders.
April 30, 2018 / ANNUAL REPORT
| | • | | Information or data entered into a website will be retained. |
| | • | | Where registration to a website or re-entering personal information on a website is required, “cookies” are used to improve your online experience. A cookie is a way for websites to recognize whether or not you have visited the site before. It is a small file that is stored on your computer that identifies you each time you re-visit our site so you don’t have to resubmit personal information. Cookies provide faster access into the website. |
| | • | | We may also collect non-personally identifiable Internet Protocol (“IP”) addresses for all other visitors to monitor the number of visitors to the site. These non-personally identifiable IP addresses are never shared with any third party. |
E-mail:
If you have opted to receive marketing information from the Funds by e-mail, it is our policy to include instructions in all marketing messages on how to unsubscribe from subsequent e-mail programs. Some products or services from the Funds are intended to be delivered and serviced electronically. E-mail communication may be utilized in such cases. If you participate in an employer-sponsored retirement plan administered by the Funds, we may, at your employer’s request, send you e-mail on matters pertaining to the retirement plan.
Please do not provide any account or personal information such as social security numbers, account numbers, or account balances within your e-mail correspondence to us. We cannot use e-mail to execute transaction instructions, provide personal account information, or change account registration. We can, however, use e-mail to provide you with the necessary forms or you may contact customer service toll-free at 1-800-836-2211.
Surveys/Aggregate Data:
Periodically, the Funds may conduct surveys about financial products and services or review elements of customer information in an effort to forecast future business needs. The Funds then generate reports that include aggregate data regarding its customers. Aggregate data classifies customer information in various ways but that does not identify individual customers. These reports may also include information on website traffic patterns and related information. These reports are used for the Funds’ planning, statistical and other corporate purposes. Aggregate data may also be shared with external parties, such as marketing organizations. However, no information is shared by which any individual customer could be identified.
Changes to Our Privacy Statement:
The effective date of this policy is June 8, 2012. We reserve the right to modify this policy at any time. When it is revised or materially changed, we will update the effective date. You can determine whether there have been changes since the last time you reviewed by simply checking the effective date.
Notice will be provided to you in advance of any changes that would affect your rights under this policy statement
ANNUAL REPORT / April 30, 2018
[This Page Intentionally Left Blank]
[This Page Intentionally Left Blank]
[This Page Intentionally Left Blank]
[This Page Intentionally Left Blank]


wilmington funds
april 30,2018
PRESIDENT’S MESSAGE AND
Annual Report
WILMINGTON FUNDS
Money Market Funds
Wilmington U.S. Government Money Market Fund Wilmington U.S. Treasury Money Market Fund
Wilmington U.S. Government Money Market Fund (“U.S. Government Money Market Fund”)
Wilmington U.S. Treasury Money Market Fund (“U.S. Treasury Money Market Fund”)
|
 |
CONTENTS |
|
[This Page Intentionally Left Blank]
i
Esteemed Shareholder:
I am pleased to present the Annual Report of the Wilmington Funds (the “Trust”), covering the Trust’s annual fiscal year of May 1, 2017, through April 30, 2018. Inside you will find a comprehensive review of the Trust’s holdings and financial statements.
The economy and financial markets in review
Wilmington Funds Management Corporation and Wilmington Trust Investment Advisors, Inc. (the Trust’s investment advisor and subadvisor, respectively), have provided the following review of the economy, bond markets, and stock markets for the Trust’s annual fiscal year period.
The economy
The U.S. economy has shown strength over the past year, with the second, third, and fourth quarters of 2018 exhibiting the strongest growth since 2015. Following the disappointment of Congress’s inability to pass comprehensive healthcare reform, Republicans redeemed themselves by passing the Tax Cuts and Jobs Act in December of 2017, which contributed to surging confidence from consumers and businesses alike. The Institute of Supply Management (“ISM”) Manufacturing Purchasing Managers Index (“PMI”)1 peaked at 60.8 in February 2018—the highest level since 2004. Also in February, the Conference Board’s measure of consumer confidence reached the highest levels since 2000. Yet against this euphoric backdrop, Core Personal Consumption Expenditure (“PCE”) inflation held below the Federal Reserve’s 2% target and has only recently accelerated. As a result, the “goldilocks” (not too hot, not too cold) characterization of the U.S. economy has continued to ring true, with economic data for much of the fiscal year meeting or exceeding expectations, but not coming in so strong as to force the hand of the Federal Reserve into accelerating monetary policy tightening. In our estimation, the U.S. economy will grow at a pace of approximately 3% in 2018, with 0.5–0.75% of that attributable to tax cuts.
We are increasingly aware that the U.S. is closer to the end of the business cycle than to the beginning. The U.S. economic expansion is officially the second-longest on record. The labor market is tight by multiple measures, and the Federal Reserve is in the midst of a rate-hiking campaign (although it continues to move gradually). This has led short-maturity interest rates higher and contributed to the flattening of the yield curve; at the time of writing, the yield curve is less than 45 basis points (0.45%) away from inverting. (An inverted yield curve has preceded each of the last five recessions.) We do not view a U.S. recession as imminent but consider the U.S. economy in the later stages of the economic cycle.
Moving beyond U.S. borders, the past year has marked a period of synchronized global growth. The eurozone far surpassed growth expectations in 2017, with measures of loan growth, business expansion, and consumer confidence accelerating in the second half of 2017. Japan has printed a string of eight positive quarters of GDP growth, the longest such stretch since the 1990s. Emerging markets have also benefited from robust global demand and rising oil prices, which have increased nearly 50% over the past year. Some of this momentum cooled as the calendar turned on the new year. We still see economic growth as having legs, but the pace of growth across the board has decelerated, particularly relative to elevated expectations. We are watching carefully for signs of a more sustained slowdown, which would challenge our overall view.
Bond markets
The past year has been a challenging one for bond investors. For the fiscal year through January, bonds were holding their value and even posting modest single-digit total returns. However, inflationary fears began to emerge in the first quarter of 2018, sending the yield on the 10-year U.S. Treasury above 3% by the end of April. This was the first time the 10-year yield breached 3% since the end of 2013. The upward move in the short end of the yield curve has been even more dramatic and, as mentioned above, the yield curve has flattened alongside three rate hikes from the Fed (in June, December, and March). Higher yields have weighed on the price return of bonds, particularly for short-to-intermediate maturities. The Bloomberg Barclays U.S. Treasury Bond Index2 has returned -1.07% over the period.
Investment-grade credit spreads remain tight but have increased in 2018. Spread stabilization and lower supply in coming months should support valuations. High-yield bond credit spreads to Treasuries remain quite low relative to history, despite higher volatility in 2018 and fund outflows from the asset class. Defaults are expected to remain low in the coming year.
For the 12-month period May 1, 2017 to April 30, 2018, certain Bloomberg indices performed as follows3:
| | | | | | | | |
Bloomberg Barclays U.S. Treasury Bond Index | | Bloomberg Barclays U.S. Aggregate Bond Index4 | | Bloomberg Barclays U.S.
Credit Bond Index5 | | Bloomberg Barclays Municipal Bond Index6 | | Bloomberg Barclays U.S. Corporate High Yield
Bond Index7 |
-1.07% | | -0.32% | | 0.65% | | 1.56% | | 3.26% |
PRESIDENT’S MESSAGE / April 30, 2018 (unaudited)
ii
Equity markets
The synchronized global growth discussed earlier acted as a rising tide lifting all equity boats for most of the year, and equity markets enjoyed extremely low levels of volatility through January. U.S. equities were propelled by a healthy consumer, low inflation, a weakening dollar, and tax cuts. As strong as U.S. equity returns were, those of developed international and emerging economies were even better, particularly in U.S. dollar terms. However, equity markets experienced several hiccups in recent months. Concerns have mounted regarding higher inflation, regulations on technology companies, and protectionism, all of which have weighed on global equities and contributed to higher volatility in 2018. Additionally, the positive tailwind for U.S. and emerging markets equities coming from a weaker dollar will fade, as the U.S. dollar has reversed this year’s weakness. The dollar is 0.4% stronger year to date through April and increased 2.7% in the last two weeks of April alone. Equity markets have been choppier of late, but valuations are not overly concerning (though they are higher than 10-year averages across a number of regions), and we continue to believe the economic fundamentals are encouraging going forward. Therefore, we maintain our preference for stocks over bonds.
For the 12-month period May 1, 2017 to April 30, 2018, certain stock market indices performed as follows:
| | | | | | |
S&P 500® Index8 | | Russell 2000® Index9 | | MSCI EAFE (Net) Index10 | | MSCI Emerging Markets (Net) Index11 |
13.27% | | 11.54% | | 14.51% | | 21.71% |
Despite growing uncertainty in financial markets, we remain focused on managing risk and growing our clients’ capital to help achieve their long-term goals.
Sincerely,

|
Christopher D. Randall |
President |
May 25, 2018 |
April 30, 2018 (unaudited) / PRESIDENT’S MESSAGE
iii
Must be preceded or accompanied by a prospectus.
Past performance is no guarantee of future results. The index performance quoted is for illustrative purposes only and is not representative of any specific investment. Diversification does not ensure a profit nor protect against loss.
All investments involve risk, including the possible loss of principal. Equity Securities are subject to price fluctuation and possible loss of principal. Small- and mid-cap stocks involve greater risks and volatility than large-cap stocks. International investments are subject to special risks, including currency fluctuations, social, economic, and political uncertainties, which could increase volatility. These risks are magnified in emerging markets.
High-yield, lower-rated securities generally entail greater market, credit, and liquidity risks than investment grade securities and may include higher volatility and higher risk of default.
You could lose money by investing in the money market funds. Although the money market funds seek to preserve the value of your investment at $1.00 per share, it cannot guarantee it will do so. An investment in money market funds is not a deposit of M&T Bank and is not insured or guaranteed by the Federal Deposit Insurance Corporation or any other government agency. The investment advisor has no legal obligation to provide financial support to the Fund, and you should not expect that the investment advisor will provide financial support to the Fund at any time.
1. ISM Manufacturing PMI Report on Business is based on data compiled from monthly replies to questions asked of purchasing and supply executives in over 400 industrial companies. For each of the indicators measured (New Orders, Backlog of Orders, New Export Orders, Imports, Production, Supplier Deliveries, Inventories, Customers Inventories, Employment, and Prices), this report shows the percentage reporting each response, the net difference between the number of responses in the positive economic direction and the negative economic direction and the diffusion index. Responses are raw data and are never changed.
2. Bloomberg Barclays U.S. Treasury Bond Index is a market capitalization weighted index that includes all publicly issued, U.S. Treasury securities that have a remaining maturity of at least one year, are rated investment-grade, and have $250 million or more of outstanding face value. The index is unmanaged and investments cannot be made directly in an index.
3. Bond prices are sensitive to changes in interest rates and a rise in interest rates can cause decline in their prices.
4. Bloomberg Barclays U.S. Aggregate Bond Index is widely used benchmark index for the domestic investment-grade bond market composed of securities from the Barclays Government/Corporate Bond Index, Mortgage-Backed Securities Index and Asset-Backed Securities Index. The index typically includes fixed income securities with overall intermediate- to long-term average maturities. The index is unmanaged and investments cannot be made directly in an index.
5. Bloomberg Barclays U.S. Credit Bond Index tracks the performance of domestic investment-grade corporate bonds and is composed of all publicly issued, fixed-rate, nonconvertible, investment-grade corporate debt. The index is unmanaged and investments cannot be made directly in an index.
6. Bloomberg Barclays Municipal Bond Index tracks the performance of long-term, tax-exempt, investment-grade bond market. To be included in the index, bonds must have an outstanding par balance of at least $7 million and be issued as part of a transaction of at least $75 million. The index is unmanaged and investments cannot be made directly in an index.
7. Bloomberg Barclays U.S. Corporate High Yield Bond Index measures the USD-denominated, high yield, fixed-rate corporate bond market. Securities are classified as high yield if the middle rating of Moody’s, Fitch, and S&P is Ba1/BB+/BB+ or below. Bonds from issuers with an emerging markets country of risk, based on the Bloomberg Barclays EM country definition, are excluded. The U.S. Corporate High Yield Bond Index is a component of the U.S. Universal and Global High Yield Indices. An investment cannot be made directly in an index.
8. The S&P 500® Index is a capitalization-weighted index of 500 stocks designed to measure performance of the broad domestic economy through changes in the aggregate market value of 500 stocks representing all major industries. The index is unmanaged and investments cannot be made directly in an index.
9. The Russell 2000® Index measures the performance of the 2,000 smallest companies in the Russell 3000 Index, which represents approximately 8% of the total market capitalization of the Russell 3000 Index. As of its latest reconstitution, the index had a total market capitalization range of approximately $128 million to $1.3 billion.
10. MSCI EAFE (Net) Index is a free float-adjusted market capitalization index that is designed to measure equity market performance of developed markets, excluding the U.S. & Canada. The index consisted of the following 21 developed market country indices: Australia, Austria, Belgium, Denmark, Finland, France, Germany, Hong Kong, Ireland, Israel, Italy, Japan, Netherlands, New Zealand, Norway, Portugal, Singapore, Spain, Sweden, Switzerland and the United Kingdom. The index is unmanaged and investments cannot be made directly in an index. The performance of this index is reduced by the taxes on dividends paid by the international securities issuers in the index.
11. MSCI Emerging Markets (Net) Index is a free float-adjusted market capitalization index that is designed to measure equity market performance of emerging markets. The MSCI Emerging Markets Index consisted of the following 24 emerging market country indices: Brazil, Chile, China, Colombia, Czech Republic, Egypt, Greece, Hungary, India, Indonesia, Korea, Malaysia, Mexico, Pakistan, Peru, Philippines, Poland, Qatar, Russia, South Africa, Taiwan, Thailand, Turkey and United Arab Emirates. The index is unmanaged and investments cannot be made directly in an index. The performance of this index is reduced by the taxes on dividends paid by the international securities issuers in the index.
PRESIDENT’S MESSAGE / April 30, 2018 (unaudited)
1
WILMINGTON MONEY MARKET FUNDS
Management’s Discussion of Fund Performance
The Federal Reserve (“The Fed”) continued to “normalize” short-term interest rates by raising the Fed Funds target three times over the past fiscal year. The target now stands at 1.5% to 1.75%, which is 3/4 of a percent higher than this time last year. The Fed has acknowledged that the economic outlook has strengthened and that inflation is expected to move higher, and then stabilize around their 2% objective. The economy expanded for the 8th consecutive year as Gross Domestic Product (“GDP”) increased at a 2.9% rate for the year ended March 31, 2018, marking the fastest pace of growth since 2015. Equipment investment by corporations aided economic growth. The consumer continued to benefit from the strong job market. The unemployment rate declined to its lowest level since 2000, to a rate of 3.9% this past month. However, wage pressure remains moderate with wages only increasing at a 2.6% rate over the past year. The core Consumer Price Index (“CPI”) has recently started to move higher and is now at 2.1%.
In response to the Fed tightening monetary policy and the expectation for the Fed to raise interest rates at least two more times in 2018, interest rates have moved higher. The yield curve has also flattened over the past year. The 3-Month London Interbank Offered Rate (“LIBOR”) climbed nearly 120 basis points to 2.37% while the 2-year Treasury yield almost doubled rising to a yield of 2.49% as of April 30, 2018, its highest yield since 2008. The 10-year Treasury yield rose by 2/3 of a percent to 2.95%, its highest yield since 2014.
Looking forward, we expect the Fed to raise interest rates either two or three additional times in 2018 and for the yield curve to continue to flatten with shorter-term interest rates moving higher than longer-term interest rates.
The change in key interest rates over the last twelve months is presented below.
| | | | | | |
| | | 4/30/17 | | 10/31/17 | | 4/30/18 |
| | | | |
Federal Fund Target | | 0.75% - 1.00% | | 1.00% - 1.25% | | 1.50% - 1.75% |
| | | | |
3-Month LIBOR | | 1.172% | | 1.385% | | 2.363% |
| | | | |
2-Year Treasury Note | | 1.28% | | 1.60% | | 2.49% |
| | | | |
10-Year Treasury Note | | 2.29% | | 2.38% | | 2.95% |
Basis Points (“BPS”) is a unit that is equal to 1/100th of 1% and is used to denote the change in a financial instrument. The basis point is commonly used for calculating changes in interest rates, equity indices and the yield of a fixed-income security.
The following is a comparison of the performance of the Wilmington U.S. Government Money Market Fund and Wilmington U.S. Treasury Money Market Fund versus their respective iMoneyNet and Lipper peer group average returns for the fiscal April 30, 2018:
| | | | |
| Wilmington U.S. Government Money Market Fund – Administrative Class | | | 0.56 | % |
Wilmington U.S. Government Money Market Fund – Institutional Class | | | 0.91 | % |
Wilmington U.S. Government Money Market Fund –
Select Class | | | 0.81 | % |
Wilmington U.S. Government Money Market Fund –
Service Class | | | 0.41 | % |
| iMoneyNet, Inc. Government & Agency Institutional Average | | | 0.85 | % |
Lipper U.S. Government Money Market Funds Average | | | 0.79 | % |
Wilmington U.S. Treasury Money Market Fund – Administrative Class | | | 0.57 | % |
Wilmington U.S. Treasury Money Market Fund –
Select Class | | | 0.82 | % |
Wilmington U.S. Treasury Money Market Fund –
Service Class | | | 0.42 | % |
| iMoneyNet, Inc. Treasury and Repo Institutional Average | | | 0.84 | % |
| Lipper U.S. Treasury Money Market Funds Average | | | 0.59 | % |
| |
Source: iMoneyNet, Inc. and Lipper | | | | |
April 30, 2018 (unaudited) / ANNUAL REPORT
2
Performance shown represents past performance and does not guarantee future results. Investment return will fluctuate. The total return shown assumes the reinvestment of all distributions and does not reflect the deduction of taxes that a shareholder would pay on Fund distributions. Shares, when redeemed, may be worth more or less than their original cost. Current performance may be lower or higher than that shown here. You should consider the investment objectives, risks, charges and expenses of the Funds carefully before investing. A prospectus with this and other information may be obtained by calling 800-836-2211 or visiting the Funds’ web site at
www.wilmingtonfunds.com. The prospectus should be read before investing.
The Funds’ shares are not bank deposits and are not insured by, guaranteed by, endorsed by or obligations of the Federal Deposit Insurance Corporation, the Federal Reserve Board, any government agency or any bank. Although the Funds seek to preserve the value of your investment at $1.00 per share, it is possible to lose money by investing in the Funds.
During the fiscal year ended April 30, 2018, Wilmington Funds Management Corporation has voluntarily agreed to reduce its advisory fee and/or reimburse certain of the
Funds’ operating expenses, and/or certain class-specific fees and expenses, in an effort to maintain the current yield of each share class at or above zero. The fee waiver does not take into consideration acquired fund fees and expenses, taxes or extraordinary items. Any such waiver or expense reimbursement may be modified or discontinued at any time without notice.
Gross Domestic Product (“GDP”) is the monetary value of all the finished goods and services produced within a country’s borders in a specific time period, though GDP is usually calculated on an annual basis. It includes all of private and public consumption, government outlays, investments and exports less imports that occur within a defined territory.
Consumer Price Index (“CPI”) is a measure that examines the weighted average of prices of a basket of consumer goods and services, such as transportation, food and medical care. The CPI is calculated by taking price changes for each item in the predetermined basket of goods and averaging them; the goods are weighted according to their importance. Changes in CPI are used to assess price changes associated with the cost of living.
London Interbank Offered Rate (“LIBOR”) is a benchmark rate that some of the world’s leading banks charge each other for short-term loans. It serves as the first step to calculating interest rates on various loans throughout the world.
ANNUAL REPORT / April 30, 2018 (unaudited)
3
SHAREHOLDER EXPENSE EXAMPLE (unaudited)
As a shareholder of the Funds, you incur two types of costs: (1) transaction costs, including sales charges (loads) on purchase payments, reinvested dividends, or other distributions; and redemption fees; and (2) ongoing costs, including management fees; distribution and/or service (12b-1) fees; and other Fund expenses. This Example is intended to help you to understand your ongoing costs (in dollars) of investing in the Funds and to compare these costs with the ongoing costs of investing in other mutual funds. It is based on an investment of $1,000 invested at the beginning of the period and held for the entire period from November 1, 2017 to April 30, 2018.
Actual Expenses
This section of the following table provides information about actual account values and actual expenses. You may use the information in this section, together with the amount you invested, to estimate the expenses that you incurred over the period. Simply divide your account value by $1,000 (for example, an $8,600 account value divided by $1,000 = 8.6), then multiply the result by the number in the first section under the heading entitled “Expenses Paid During Period” to estimate the expenses attributable to your investment during this period.
Hypothetical Example for
Comparison Purposes
This section of the following table provides information about hypothetical account values and hypothetical expenses based on the Funds’ actual expense ratios and assumed rates of return of 5% per year before expenses, which are not the Funds’ actual returns. Thus, you should not use the hypothetical account values and expenses to estimate the actual ending account balance or your expenses for the period. Rather, these figures are required to be provided to enable you to compare the ongoing costs of investing in the Funds with other funds. To do so, compare this 5% hypothetical example with the 5% hypothetical examples that appear in the shareholder reports of the other funds.
Please note that the expenses shown in the table are meant to highlight your ongoing costs only. Therefore, the Annualized Net Expense Ratio section of the table is useful in comparing ongoing costs only, and will not help you determine the relative total costs of owning different funds.
The Annualized Net Expense Ratios may be different from the net expense ratios in the Financial Highlights which are for the fiscal year ended April 30, 2018.
| | | | | | | | | | | | | | | | |
| | | Beginning
Account Value
11/01/17 | | | Ending
Account Value
4/30/18 | | | Expenses Paid
During Period1 | | | Annualized Net
Expense Ratio | |
WILMINGTON U.S. GOVERNMENT MONEY MARKET FUND | | | | | | | | | | | | | | | | |
| | | | |
Actual | | | | | | | | | | | | | | | | |
| | | | |
Administrative Class | | | $1,000.00 | | | | $1,003.80 | | | | $3.08 | | | | 0.62% | |
| | | | |
Institutional Class | | | $1,000.00 | | | | $1,005.50 | | | | $1.34 | | | | 0.27% | |
| | | | |
Select Class | | | $1,000.00 | | | | $1,005.00 | | | | $1.84 | | | | 0.37% | |
| | | | |
Service Class | | | $1,000.00 | | | | $1,003.00 | | | | $3.82 | | | | 0.77% | |
| | | | |
Hypothetical (assuming a 5% return before expenses) | | | | | | | | | | | | | | | | |
| | | | |
Administrative Class | | | $1,000.00 | | | | $1,021.72 | | | | $3.11 | | | | 0.62% | |
| | | | |
Institutional Class | | | $1,000.00 | | | | $1,023.46 | | | | $1.35 | | | | 0.27% | |
| | | | |
Select Class | | | $1,000.00 | | | | $1,022.96 | | | | $1.86 | | | | 0.37% | |
| | | | |
Service Class | | | $1,000.00 | | | | $1,020.98 | | | | $3.86 | | | | 0.77% | |
| | | | |
WILMINGTON U.S. TREASURY MONEY MARKET FUND | | | | | | | | | | | | | | | | |
| | | | |
Actual | | | | | | | | | | | | | | | | |
| | | | |
Administrative Class | | | $1,000.00 | | | | $1,003.80 | | | | $2.98 | | | | 0.60% | |
| | | | |
Select Class | | | $1,000.00 | | | | $1,005.00 | | | | $1.74 | | | | 0.35% | |
| | | | |
Service Class | | | $1,000.00 | | | | $1,003.10 | | | | $3.68 | | | | 0.74% | |
| | | | |
Hypothetical (assuming a 5% return before expenses) | | | | | | | | | | | | | | | | |
| | | | |
Administrative Class | | | $1,000.00 | | | | $1,021.82 | | | | $3.01 | | | | 0.60% | |
| | | | |
Select Class | | | $1,000.00 | | | | $1,023.06 | | | | $1.76 | | | | 0.35% | |
| | | | |
Service Class | | | $1,000.00 | | | | $1,021.12 | | | | $3.71 | | | | 0.74% | |
| (1) | Expenses are equal to the Funds’ annualized net expense ratios, multiplied by the average account value over the period, multiplied by 181/365 (to reflect the most recent one-half year period). |
April 30, 2018 (unaudited) / ANNUAL REPORT
4
PORTFOLIO OF INVESTMENTS SUMMARY TABLE
Wilmington U.S. Government Money Market Fund
At April 30, 2018, the Fund’s portfolio composition was as follows (unaudited):
| | | | | |
| | | Percentage of |
| | | Total Net Assets |
U.S. Government Agency Obligations | | | | 49.9 | % |
U.S. Treasury Obligations | | | | 26.3 | % |
Repurchase Agreements | | | | 24.7 | % |
Other Assets and Liabilities – Net1 | | | | (0.9 | )% |
| | | | | |
| |
TOTAL | | | | 100.0 | % |
| | | | | |
| (1) | Assets, other than investments in securities, less liabilities. See Statement of Assets and Liabilities. |
PORTFOLIO OF INVESTMENTS
April 30, 2018
| | | | | | | | |
Description | | Par Value | | | Value | |
U.S. GOVERNMENT AGENCY OBLIGATIONS – 49.9% | |
|
FEDERAL FARM CREDIT BANK (FFCB) – 11.6% | |
| | |
(1 month USD LIBOR - 0.17%), 1.72%, 5/03/18D | | $ | 100,000,000 | | | $ | 99,999,981 | |
| | |
1.69%, 6/05/18‡ | | | 20,000,000 | | | | 19,967,917 | |
| | |
1.69%, 6/07/18‡ | | | 25,000,000 | | | | 24,957,604 | |
| | |
(1 month USD LIBOR - 0.12%), 1.78%, 7/23/18D | | | 70,000,000 | | | | 70,004,849 | |
| | |
(1 month USD LIBOR + 0.06%), 1.96%, 9/24/18D | | | 29,700,000 | | | | 29,695,335 | |
| | |
(1 month USD LIBOR + 0.02%), 1.90%, 10/03/18D | | | 25,000,000 | | | | 25,016,672 | |
| | |
(1 month USD LIBOR - 0.09%), 1.81%, 10/22/18D | | | 60,000,000 | | | | 60,012,287 | |
| | |
(1 month USD LIBOR - 0.14%), 1.76%, 10/30/18D | | | 75,000,000 | | | | 75,000,000 | |
| | |
(1 month USD LIBOR - 0.11%), 1.78%, 12/03/18D | | | 50,000,000 | | | | 49,999,091 | |
| | |
2.11%, 1/14/19‡ | | | 35,000,000 | | | | 34,488,300 | |
| | |
2.24%, 1/23/19‡ | | | 25,000,000 | | | | 24,597,646 | |
| | |
2.14%, 2/05/19‡ | | | 75,000,000 | | | | 73,792,500 | |
| | |
2.14%, 2/15/19‡ | | | 50,000,000 | | | | 49,166,250 | |
| | |
(1 month USD LIBOR - 0.09%), 1.82%, 5/30/19D | | | 25,000,000 | | | | 24,990,865 | |
| | |
(1 month USD LIBOR - 0.10%), 1.80%, 9/25/19D | | | 50,000,000 | | | | 49,997,890 | |
| | |
(1 month USD LIBOR - 0.07%), 1.82%, 10/02/19D | | | 36,000,000 | | | | 36,000,005 | |
| | | | | | | | |
| |
TOTAL FEDERAL FARM CREDIT BANK (FFCB) | | | $ | 747,687,192 | |
| | | | | | | | |
Description | | Par Value | | | Value | |
|
FEDERAL HOME LOAN BANK (FHLB) – 32.8% | |
| | |
1.64%, 5/02/18‡ | | $ | 105,000,000 | | | $ | 104,995,326 | |
| | |
1.59%, 5/04/18‡ | | | 50,000,000 | | | | 49,993,542 | |
| | |
(3 month USD LIBOR - 0.35%), 1.45%, 5/09/18D | | | 50,000,000 | | | | 50,000,000 | |
| | |
1.69%, 5/09/18‡ | | | 115,100,000 | | | | 115,057,797 | |
| | |
1.62%, 5/11/18‡ | | | 30,000,000 | | | | 29,986,833 | |
| | |
1.67%, 5/14/18‡ | | | 30,000,000 | | | | 29,982,342 | |
| | |
1.60%, 5/18/18‡ | | | 244,893,000 | | | | 244,711,904 | |
| | |
1.68%, 5/21/18‡ | | | 50,000,000 | | | | 49,954,444 | |
| | |
1.71%, 5/23/18‡ | | | 212,058,000 | | | | 211,841,498 | |
| | |
1.69%, 6/11/18‡ | | | 100,000,000 | | | | 99,807,528 | |
| | |
1.84%, 6/15/18‡ | | | 105,000,000 | | | | 104,765,194 | |
| | |
1.78%, 6/22/18‡ | | | 200,000,000 | | | | 199,497,622 | |
| | |
(1 month USD LIBOR - 0.14%), 1.76%, 6/26/18D | | | 25,000,000 | | | | 24,999,576 | |
| | |
1.80%, 6/27/18‡ | | | 75,000,000 | | | | 74,791,475 | |
| | |
1.79%, 7/13/18‡ | | | 50,000,000 | | | | 49,823,076 | |
| | |
1.90%, 7/27/18‡ | | | 92,500,000 | | | | 92,086,001 | |
| | |
(1 month USD LIBOR - 0.16%), 1.73%, 8/01/18D | | | 100,000,000 | | | | 100,000,000 | |
| | |
(1 month USD LIBOR - 0.15%), 1.75%, 8/15/18D | | | 50,000,000 | | | | 50,000,000 | |
| | |
1.96%, 9/26/18‡ | | | 25,000,000 | | | | 24,803,900 | |
| | |
(1 month USD LIBOR - 0.14%), 1.76%, 10/15/18D | | | 50,000,000 | | | | 50,000,000 | |
| | |
2.06%, 10/23/18‡ | | | 50,000,000 | | | | 49,513,889 | |
ANNUAL REPORT / April 30, 2018
5 PORTFOLIOS OF INVESTMENTS
Wilmington U.S. Government Money Market Fund (continued)
| | | | | | | | |
Description | | Par Value | | | Value | |
| | |
(1 month USD LIBOR - 0.08%), 1.82%, 11/13/18D | | $ | 100,000,000 | | | $ | 100,000,000 | |
| | |
(1 month USD LIBOR - 0.14%), 1.75%, 1/02/19D | | | 50,000,000 | | | | 50,000,000 | |
| | |
(1 month USD LIBOR - 0.11%), 1.79%, 1/25/19D | | | 100,000,000 | | | | 100,000,000 | |
| | |
(1 month USD LIBOR - 0.13%), 1.77%, 2/12/19D | | | 50,000,000 | | | | 50,000,000 | |
| | | | | | | | |
| |
TOTAL FEDERAL HOME LOAN BANK (FHLB) | | | $ | 2,106,611,947 | |
|
FEDERAL HOME LOAN MORTGAGE CORPORATION (FHLMC) – 3.9% | |
| | |
1.67%, 5/21/18‡ | | | 100,000,000 | | | | 99,909,500 | |
| | |
1.85%, 7/30/18‡ | | | 50,000,000 | | | | 49,774,125 | |
| | |
(1 month USD LIBOR - 0.15%), 1.75%, 8/22/18D | | | 50,000,000 | | | | 50,000,000 | |
| | |
(1 month USD LIBOR - 0.10%), 1.80%, 6/28/19D | | | 50,000,000 | | | | 50,000,000 | |
| | | | | | | | |
TOTAL FEDERAL HOME LOAN MORTGAGE CORPORATION (FHLMC) | | | $ | 249,683,625 | |
|
FEDERAL NATIONAL MORTGAGE ASSOCIATION (FNMA) – 1.6% | |
| | |
1.58%, 5/09/18‡ | | | 50,000,000 | | | | 49,982,889 | |
| | |
1.71%, 6/18/18‡ | | | 25,000,000 | | | | 24,944,333 | |
| | |
1.73%, 6/25/18‡ | | | 25,000,000 | | | | 24,935,451 | |
| | | | | | | | |
| |
TOTAL FEDERAL NATIONAL MORTGAGE ASSOCIATION (FNMA) | | | $ | 99,862,673 | |
| | | | | | | | |
| |
| TOTAL U.S. GOVERNMENT AGENCY OBLIGATIONS (COST $3,203,845,437) | | | $ | 3,203,845,437 | |
| |
| U.S. TREASURY OBLIGATIONS – 26.3% | | | | | |
| |
U.S. TREASURY BILLS – 22.1% | | | | | |
| | |
1.29%, 5/03/18‡ | | | 125,000,000 | | | | 124,991,250 | |
| | |
1.43%, 5/10/18‡ | | | 265,000,000 | | | | 264,907,714 | |
| | |
1.45%, 5/24/18‡ | | | 50,000,000 | | | | 49,954,767 | |
| | |
1.50%, 6/14/18‡ | | | 125,000,000 | | | | 124,776,944 | |
| | |
1.52%, 6/21/18‡ | | | 175,000,000 | | | | 174,632,340 | |
| | |
1.62%, 7/05/18‡ | | | 90,000,000 | | | | 89,744,063 | |
| | |
1.62%, 7/12/18‡ | | | 23,000,000 | | | | 22,927,550 | |
| | |
1.75%, 7/26/18‡ | | | 150,000,000 | | | | 149,387,907 | |
| | |
1.88%, 8/02/18‡ | | | 50,000,000 | | | | 49,768,076 | |
| | |
1.86%, 8/09/18‡ | | | 150,000,000 | | | | 149,245,069 | |
| | |
1.95%, 9/27/18‡ | | | 120,000,000 | | | | 119,058,817 | |
| | |
1.94%, 10/11/18‡ | | | 100,000,000 | | | | 99,146,514 | |
| | | | | | | | |
| |
TOTAL U.S. TREASURY BILLS | | | $ | 1,418,541,011 | |
| |
U.S. TREASURY NOTES – 4.2% | | | | | |
| | |
0.88%, 5/31/18 | | | 50,000,000 | | | | 49,964,489 | |
| | |
1.25%, 10/31/18 | | | 100,000,000 | | | | 99,615,962 | |
| | |
(U.S. Treasury 3 month Bill Money Market Yield + 0.07%), 1.91%, 4/30/19D | | | 100,000,000 | | | | 100,055,498 | |
| | | | | | | | |
Description | | Par Value | | | Value | |
| | |
(U.S. Treasury 3 month Bill Money Market Yield + 0.00%), 1.84%, 1/31/20D | | $ | 25,000,000 | | | $ | 24,998,211 | |
| | | | | | | | |
| |
TOTAL U.S. TREASURY NOTES | | | $ | 274,634,160 | |
| | | | | | | | |
| |
TOTAL U.S. TREASURY OBLIGATIONS (COST $1,693,175,171) | | | $ | 1,693,175,171 | |
| |
REPURCHASE AGREEMENTS – 24.7% | | | | | |
| | |
Credit Suisse First Boston LLC, 1.70%, dated 4/30/18, due 5/01/18, repurchase price $395,018,653, collateralized by U.S. Treasury Securities, 1.38% to 2.50%, maturing 5/31/21 to 1/31/25; total market value of $402,900,069. | | | 395,000,000 | | | | 395,000,000 | |
| | |
Deutsche Bank Securities, Inc., 1.72%, dated 4/30/18, due 5/01/18, repurchase price $50,002,389, collateralized by U.S. Treasury Security, 2.38%, maturing 5/15/27; total market value of $51,000,049. | | | 50,000,000 | | | | 50,000,000 | |
| | |
Mizuho Securities USA, Inc., 1.73%, dated 4/30/18, due 5/01/18, repurchase price $350,016,819, collateralized by U.S. Government Securities, 3.00% to 4.50%, maturing 1/01/27 to 4/01/48; total market value of $357,000,001. | | | 350,000,000 | | | | 350,000,000 | |
| | |
RBC Capital Markets LLC, 1.72%, dated 4/30/18, due 5/01/18, repurchase price $330,015,767, collateralized by U.S. Treasury Securities, 0.00% to 3.63%, maturing 4/25/19 to 4/15/28; total market value of $336,600,043. | | | 330,000,000 | | | | 330,000,000 | |
| | |
RBC Capital Markets LLC, 1.73%, dated 4/30/18, due 5/01/18, repurchase price $75,003,604, collateralized by U.S. Government Securities, 2.66% to 4.50%, maturing 12/01/29 to 1/01/48; total market value of $76,500,001. | | | 75,000,000 | | | | 75,000,000 | |
| | |
TD Securities, Inc., 1.74%, dated 4/30/18, due 5/01/18, repurchase price $385,018,608, collateralized by U.S. Government Securities, 3.00% to 4.50%, maturing 6/01/26 to 8/01/47; total market value of $396,550,000. | | | 385,000,000 | | | | 385,000,000 | |
| | | | | | | | |
| |
TOTAL REPURCHASE AGREEMENTS (COST $1,585,000,000) | | | $ | 1,585,000,000 | |
| | | | | | | | |
| |
TOTAL INVESTMENTS – 100.9% (COST $6,482,020,608) | | | $ | 6,482,020,608 | |
| |
| OTHER LIABILITIES LESS ASSETS – (0.9)% | | | | (56,770,959 | ) |
| | | | | | | | |
| |
| TOTAL NET ASSETS – 100.0% | | | $ | 6,425,249,649 | |
| | | | | | | | |
April 30, 2018 / ANNUAL REPORT
PORTFOLIOS OF INVESTMENTS 6
Wilmington U.S. Government Money Market Fund (concluded)
Various inputs are used in determining the value of the Fund’s investments. These inputs are summarized in the three broad levels listed below.
Level 1 – quoted prices in active markets for identical securities
Level 2 – other significant observable inputs (including quoted prices for similar securities, interest rates, prepayment speeds, credit risk, etc.)
Level 3 – significant unobservable inputs (including the Fund’s own assumptions in determining the fair value of investments)
The following is a summary of the inputs used as of April 30, 2018 in valuing the Fund’s assets carried at fair value:
| | | | | | | | | | | | | | | | |
| | | | |
| | | Level 1 | | | Level 2 | | | Level 3 | | | Total | |
Investments in Securities | | | | | | | | | | | | | | | | |
U.S. Government Agency Obligations | | $ | — | | | $ | 3,203,845,437 | | | $ | — | | | $ | 3,203,845,437 | |
U.S. Treasury Obligations | | | — | | | | 1,693,175,171 | | | | — | | | | 1,693,175,171 | |
Repurchase Agreements | | | — | | | | 1,585,000,000 | | | | — | | | | 1,585,000,000 | |
| | | | | | | | | | | | | | | | |
| | | | |
Total | | $ | — | | | $ | 6,482,020,608 | | | $ | — | | | $ | 6,482,020,608 | |
| | | | | | | | | | | | | | | | |
| D | Variable rate security. The rate disclosed is the rate in effect on the report date, and the date shown is the final maturity date, not the next reset or put date. Information in parenthesis represents the benchmark and reference rate for each relevant security and the rate floats based upon the reference rate and spread. The security may be further subject to interest rate floors and caps. |
| ‡ | The rate shown reflects the effective yield at purchase date. |
| | The following acronyms are used throughout this Fund: |
| | | | |
| | |
| | FFCB | | Federal Farm Credit Bank |
| | |
| | FHLB | | Federal Home Loan Bank |
| | |
| | FHLMC | | Federal Home Loan Mortgage Corporation |
| | |
| | FNMA | | Federal National Mortgage Association |
| | |
| | LIBOR | | London Interbank Offered Rate |
| | |
| | LLC | | Limited Liability Corporation |
See Notes which are an integral part of the Financial Statements
ANNUAL REPORT / April 30, 2018
7
PORTFOLIO OF INVESTMENTS SUMMARY TABLE
Wilmington U.S. Treasury Money Market Fund
At April 30, 2018, the Fund’s portfolio composition was as follows (unaudited):
| | | | | |
| | | Percentage of |
| | | Total Net Assets |
U.S. Treasury Obligations | | | | 79.0 | % |
Repurchase Agreements | | | | 24.5 | % |
Money Market Fund | | | | 1.0 | % |
Other Assets and Liabilities – Net1 | | | | (4.5 | )% |
| | | | | |
| |
TOTAL | | | | 100.0 | % |
| | | | | |
| (1) | Assets, other than investments in securities, less liabilities. See Statement of Assets and Liabilities. |
PORTFOLIO OF INVESTMENTS
April 30, 2018
| | | | | | | | |
| Description | | Par Value | | | Value | |
| |
U.S. TREASURY OBLIGATIONS – 79.0% | | | | | |
| |
U.S. TREASURY BILLS – 66.1% | | | | | |
| | |
1.43%, 5/03/18‡ | | $ | 125,000,000 | | | $ | 124,990,321 | |
| | |
1.47%, 5/10/18‡ | | | 135,000,000 | | | | 134,951,555 | |
| | |
1.67%, 5/17/18‡ | | | 74,000,000 | | | | 73,946,249 | |
| | |
1.50%, 6/07/18‡ | | | 28,135,000 | | | | 28,092,754 | |
| | |
1.62%, 6/14/18‡ | | | 60,000,000 | | | | 59,884,057 | |
| | |
1.53%, 6/21/18‡ | | | 25,000,000 | | | | 24,947,335 | |
| | |
1.74%, 7/05/18‡ | | | 75,000,000 | | | | 74,770,053 | |
| | |
1.72%, 7/12/18‡ | | | 30,320,000 | | | | 30,218,242 | |
| | |
1.81%, 7/26/18‡ | | | 50,000,000 | | | | 49,789,121 | |
| | |
1.88%, 8/02/18‡ | | | 50,000,000 | | | | 49,768,076 | |
| | |
1.95%, 9/27/18‡ | | | 30,000,000 | | | | 29,764,704 | |
| | |
1.94%, 10/11/18‡ | | | 25,000,000 | | | | 24,786,402 | |
| | |
2.00%, 10/18/18‡ | | | 42,255,000 | | | | 41,866,899 | |
| | | | | | | | |
| |
TOTAL U.S. TREASURY BILLS | | | $ | 747,775,768 | |
| |
U.S. TREASURY NOTES – 12.9% | | | | | |
| | |
0.88%, 5/31/18 | | | 50,000,000 | | | | 49,964,489 | |
| | |
(U.S. Treasury 3 month Bill Money Market Yield + 0.17%), 2.01%, 7/31/18D | | | 25,000,000 | | | | 25,006,852 | |
| | |
1.25%, 10/31/18 | | | 21,500,000 | | | | 21,417,432 | |
| | |
(U.S. Treasury 3 month Bill Money Market Yield + 0.07%), 1.91%, 4/30/19D | | | 25,000,000 | | | | 25,014,000 | |
| | |
(U.S. Treasury 3 month Bill Money Market Yield + 0.00%), 1.84%, 1/31/20D | | | 25,000,000 | | | | 24,997,999 | |
| | | | | | | | |
| |
TOTAL U.S. TREASURY NOTES | | | $ | 146,400,772 | |
| | | | | | | | |
| |
TOTAL U.S. TREASURY OBLIGATIONS (COST $894,176,540) | | | $ | 894,176,540 | |
| | | | | | | | |
| Description | | Number of
Shares | | | Value | |
| |
MONEY MARKET FUND – 1.0% | | | | | |
| | |
Blackrock Liquidity Funds T-Fund Institutional Shares, 1.56%^ | | | 11,055,680 | | | $ | 11,055,680 | |
| | | | | | | | |
| |
TOTAL MONEY MARKET FUND | | | | | |
(COST $11,055,680) | | | | | | $ | 11,055,680 | |
| | | | | | | | |
| | |
| | | Par Value | | | | |
| |
REPURCHASE AGREEMENTS – 24.5% | | | | | |
| | |
Credit Suisse First Boston LLC, 1.70%, dated 4/30/18, due 5/01/18, repurchase price $185,008,736, collateralized by U.S. Treasury Security, 1.38%, maturing 2/28/19; total market value of $188,703,988. | | $ | 185,000,000 | | | | 185,000,000 | |
| | |
Deutsche Bank Securities, Inc., 1.72%, dated 4/30/18, due 5/01/18, repurchase price $52,002,484, collateralized by U.S. Treasury Securities, 0.00% to 9.13%, maturing 5/15/18 to 11/15/47; total market value of $53,040,071. | | | 52,000,000 | | | | 52,000,000 | |
| | |
RBC Capital Markets LLC, 1.72%, dated 4/30/18, due 5/01/18, repurchase price $40,001,911, collateralized by U.S. Treasury Security, 0.25%, maturing 1/15/25; total market value of $40,800,076. | | | 40,000,000 | | | | 40,000,000 | |
| | | | | | | | |
| |
TOTAL REPURCHASE AGREEMENTS (COST $277,000,000) | | | $ | 277,000,000 | |
April 30, 2018 / ANNUAL REPORT
PORTFOLIOS OF INVESTMENTS 8
Wilmington U.S. Treasury Money Market Fund (concluded)
| | | | |
Description | | Value | |
| |
TOTAL INVESTMENTS – 104.5% | | | | |
(COST $1,182,232,220) | | $ | 1,182,232,220 | |
| |
OTHER LIABILITIES LESS ASSETS – (4.5%) | | | (51,193,637 | ) |
| | | | |
| |
TOTAL NET ASSETS – 100.0% | | $ | 1,131,038,583 | |
| | | | |
Cost of investments for Federal income tax purposes is the same as for financial statement purposes.
Various inputs are used in determining the value of the Fund’s investments. These inputs are summarized in the three broad levels listed below.
| | | | |
| Level 1 | | – | | quoted prices in active markets for identical securities |
| Level 2 | | – | | other significant observable inputs (including quoted prices for similar securities, interest rates, prepayment speeds, credit risk, etc.) |
| Level 3 | | – | | significant unobservable inputs (including the Fund’s own assumptions in determining the fair value of investments) |
The following is a summary of the inputs used as of April 30, 2018 in valuing the Fund’s assets carried at fair value:
| | | | | | | | | | | | | | | | |
| | | | |
| | | Level 1 | | | Level 2 | | | Level 3 | | | Total | |
Investments in Securities | | | | | | | | | | | | | | | | |
U.S. Treasury Obligations | | $ | — | | | $ | 894,176,540 | | | $ | — | | | $ | 894,176,540 | |
Money Market Fund | | | 11,055,680 | | | | — | | | | — | | | | 11,055,680 | |
Repurchase Agreements | | | — | | | | 277,000,000 | | | | — | | | | 277,000,000 | |
| | | | | | | | | | | | | | | | |
| | | | |
Total | | $ | 11,055,680 | | | $ | 1,171,176,540 | | | $ | — | | | $ | 1,182,232,220 | |
| | | | | | | | | | | | | | | | |
| D | Variable rate security. The rate disclosed is the rate in effect on the report date, and the date shown in the final maturity date, not the next reset or put date. Information in parenthesis represents the benchmark and reference rate for each relevant security and the rate floats based upon the reference rate and spread. The security may be further subject to interest rate floors and caps. |
| ‡ | The rate shown reflects the effective yield at purchase date. |
| | The following acronym is used throughout this Fund: |
| | LLC Limited Liability Corporation |
See Notes which are an integral part of the Financial Statements
ANNUAL REPORT / April 30, 2018
9 STATEMENTS OF ASSETS AND LIABILITIES
| | | | | | | | | | | | | | | | | | | | |
| April 30, 2018 | | | | | Wilmington U.S. Government
Money Market Fund | | | Wilmington U.S. Treasury Money Market Fund | |
ASSETS: | | | | | | | | | | | | | | | | | | | | |
Investments, at identified cost | | | | | | $ | 6,482,020,608 | | | | | | | $ | 1,182,232,220 | | | | | |
| | | | | | | | | | | | | | | | | | | | |
Investments in repurchase agreements, at value | | | | | | $ | 1,585,000,000 | | | | | | | $ | 277,000,000 | | | | | |
Investments in securities, at value | | | | | | | 4,897,020,608 | | | | | | | | 905,232,220 | | | | | |
| | | | | | | | | | | | | | | | | | | | |
| | | | | |
TOTAL INVESTMENTS | | | | | | | 6,482,020,608 | | | | | | | | 1,182,232,220 | | | | | |
| | | | | | | | | | | | | | | | | | | | |
Cash | | | | | | | — | | | | | | | | 103,427 | | | | | |
Interest receivable | | | | | | | 1,347,954 | | | | | | | | 218,657 | | | | | |
Receivable for shares sold | | | | | | | 592,507 | | | | | | | | 145,609 | | | | | |
Prepaid assets | | | | | | | 98,582 | | | | | | | | 34,017 | | | | | |
| | | | | | | | | | | | | | | | | | | | |
| | | | | |
TOTAL ASSETS | | | | | | | 6,484,059,651 | | | | | | | | 1,182,733,930 | | | | | |
| | | | | | | | | | | | | | | | | | | | |
LIABILITIES: | | | | | | | | | | | | | | | | | | | | |
Payable to custodian | | | | | | | 127,909 | | | | | | | | — | | | | | |
Payable for investments purchased | | | | | | | 50,021,240 | | | | | | | | 49,768,076 | | | | | |
Income distribution payable | | | | | | | 6,660,455 | | | | | | | | 1,042,484 | | | | | |
Payable for shares redeemed | | | | | | | — | | | | | | | | 539,743 | | | | | |
Payable for Trustees’ fees | | | | | | | 6,410 | | | | | | | | 6,410 | | | | | |
Payable for distribution services fee | | | | | | | 508,157 | | | | | | | | 68,049 | | | | | |
Payable for shareholder services fee | | | | | | | 654,032 | | | | | | | | 87,603 | | | | | |
Other accrued expenses | | | | | | | 831,799 | | | | | | | | 182,982 | | | | | |
| | | | | | | | | | | | | | | | | | | | |
| | | | | |
TOTAL LIABILITIES | | | | | | | 58,810,002 | | | | | | | | 51,695,347 | | | | | |
| | | | | | | | | | | | | | | | | | | | |
| | | | | |
NET ASSETS | | | | | | $ | 6,425,249,649 | | | | | | | $ | 1,131,038,583 | | | | | |
| | | | | | | | | | | | | | | | | | | | |
| | | | | |
NET ASSETS CONSIST OF: | | | | | | | | | | | | | | | | | | | | |
Paid-in capital | | | | | | $ | 6,425,251,201 | | | | | | | $ | 1,131,045,444 | | | | | |
Undistributed (distributions in excess of) net investment income | | | | | | | (22 | ) | | | | | | | (11 | ) | | | | |
Accumulated net realized gain (loss) on investments | | | | | | | (1,530 | ) | | | | | | | (6,850 | ) | | | | |
| | | | | | | | | | | | | | | | | | | | |
| | | | | |
TOTAL NET ASSETS | | | | | | $ | 6,425,249,649 | | | | | | | $ | 1,131,038,583 | | | | | |
| | | | | | | | | | | | | | | | | | | | |
COMPUTATION OF NET ASSET VALUE AND OFFERING PRICE: | | | | | | | | | | | | | | | | | | | | |
Administrative Class | | | | | | | | | | | | | | | | | | | | |
Net Assets | | | | | | $ | 1,196,675,684 | | | | | | | $ | 340,788,243 | | | | | |
| | | | | | | | | | | | | | | | | | | | |
Shares outstanding (unlimited shares authorized) | | | | | | | 1,196,922,809 | | | | | | | | 340,829,090 | | | | | |
| | | | | | | | | | | | | | | | | | | | |
Net Asset Value per share | | | | | | $ | 1.00 | | | | | | | $ | 1.00 | | | | | |
| | | | | | | | | | | | | | | | | | | | |
Institutional Class | | | | | | | | | | | | | | | | | | | | |
Net Assets | | | | | | $ | 704,434,863 | | | | | | | $ | — | | | | | |
| | | | | | | | | | | | | | | | | | | | |
Shares outstanding (unlimited shares authorized) | | | | | | | 704,501,073 | | | | | | | | — | | | | | |
| | | | | | | | | | | | | | | | | | | | |
Net Asset Value per share | | | | | | $ | 1.00 | | | | | | | $ | — | | | | | |
| | | | | | | | | | | | | | | | | | | | |
Select Class | | | | | | | | | | | | | | | | | | | | |
Net Assets | | | | | | $ | 3,273,958,369 | | | | | | | $ | 790,206,993 | | | | | |
| | | | | | | | | | | | | | | | | | | | |
Shares outstanding (unlimited shares authorized) | | | | | | | 3,274,419,622 | | | | | | | | 790,227,890 | | | | | |
| | | | | | | | | | | | | | | | | | | | |
Net Asset Value per share | | | | | | $ | 1.00 | | | | | | | $ | 1.00 | | | | | |
| | | | | | | | | | | | | | | | | | | | |
Service Class | | | | | | | | | | | | | | | | | | | | |
Net Assets | | | | | | $ | 1,250,180,733 | | | | | | | $ | 43,347 | | | | | |
| | | | | | | | | | | | | | | | | | | | |
Shares outstanding (unlimited shares authorized) | | | | | | | 1,250,140,092 | | | | | | | | 43,346 | | | | | |
| | | | | | | | | | | | | | | | | | | | |
Net Asset Value per share | | | | | | $ | 1.00 | | | | | | | $ | 1.00 | | | | | |
| | | | | | | | | | | | | | | | | | | | |
See Notes which are an integral part of the Financial Statements
April 30, 2018 / ANNUAL REPORT
STATEMENTS OF OPERATIONS 10
| | | | | | | | | | | | | | | | | | | | |
| Year Ended April 30, 2018 | | | | | Wilmington
U.S. Government
Money Market Fund | | | Wilmington
U.S. Treasury
Money Market Fund | |
INVESTMENT INCOME: | | | | | | | | | | | | | | | | | | | | |
Dividends | | | | | | $ | 451,300 | | | | | | | $ | 190,371 | | | | | |
Interest | | | | | | | 82,713,939 | | | | | | | | 11,549,812 | | | | | |
| | | | | | | | | | | | | | | | | | | | |
| | | | | |
TOTAL INVESTMENT INCOME | | | | | | | 83,165,239 | | | | | | | | 11,740,183 | | | | | |
| | | | | | | | | | | | | | | | | | | | |
EXPENSES: | | | | | | | | | | | | | | | | | | | | |
Investment advisory fee | | | | | | | 17,671,873 | | | | | | | | 2,478,972 | | | | | |
Administrative personnel and services fees | | | | | | | 2,297,832 | | | | | | | | 321,000 | | | | | |
Portfolio accounting and administration fees | | | | | | | 1,561,115 | | | | | | | | 230,033 | | | | | |
Transfer and dividend disbursing agent fees and expenses | | | | | | | 71,340 | | | | | | | | 3,255 | | | | | |
Custodian fees | | | | | | | 150,096 | | | | | | | | 32,294 | | | | | |
Trustees’ fees | | | | | | | 62,230 | | | | | | | | 62,231 | | | | | |
Professional fees | | | | | | | 83,321 | | | | | | | | 76,555 | | | | | |
Distribution services fee—Administrative Class | | | | | | | 3,501,248 | | | | | | | | 1,291,928 | | | | | |
Distribution services fee—Service Class | | | | | | | 3,359,672 | | | | | | | | 80 | | | | | |
Shareholder services fee— Administrative Class | | | | | | | 3,501,248 | | | | | | | | 1,291,928 | | | | | |
Shareholder services fee— Select Class | | | | | | | 9,424,797 | | | | | | | | 1,186,958 | | | | | |
Shareholder services fee— Service Class | | | | | | | 3,359,672 | | | | | | | | 80 | | | | | |
Share registration costs | | | | | | | 69,941 | | | | | | | | 30,276 | | | | | |
Printing and postage | | | | | | | 171,522 | | | | | | | | 8,222 | | | | | |
Miscellaneous | | | | | | | 371,353 | | | | | | | | 107,785 | | | | | |
| | | | | | | | | | | | | | | | | | | | |
| | | | | |
TOTAL EXPENSES | | | | | | | 45,657,260 | | | | | | | | 7,121,597 | | | | | |
| | | | | | | | | | | | | | | | | | | | |
Waiver/reimbursement by investment advisor | | | | | | | (3,437,755 | ) | | | | | | | (853,807 | ) | | | | |
Waiver of distribution services fee—Administrative Class | | | | | | | (1,728 | ) | | | | | | | (12,904 | ) | | | | |
Waiver of shareholder services fee—Administrative Class | | | | | | | (2,098,813 | ) | | | | | | | (774,035 | ) | | | | |
Waiver of shareholder services fee—Select Class | | | | | | | (5,656,414 | ) | | | | | | | (720,539 | ) | | | | |
Waiver of shareholder services fee—Service Class | | | | | | | (16,279 | ) | | | | | | | (1 | ) | | | | |
| | | | | | | | | | | | | | | | | | | | |
| | | | | |
TOTAL WAIVERS AND REIMBURSEMENTS | | | | | | | (11,210,989 | ) | | | | | | | (2,361,286 | ) | | | | |
| | | | | | | | | | | | | | | | | | | | |
Net expenses | | | | | | | 34,446,271 | | | | | | | | 4,760,311 | | | | | |
| | | | | | | | | | | | | | | | | | | | |
Net investment income | | | | | | | 48,718,968 | | | | | | | | 6,979,872 | | | | | |
| | | | | | | | | | | | | | | | | | | | |
REALIZED GAIN (LOSS) ON INVESTMENTS: | | | | | | | | | | | | | | | | | | | | |
Net realized gain (loss) on investments | | | | | | | 46,188 | | | | | | | | 432 | | | | | |
| | | | | | | | | | | | | | | | | | | | |
Net realized gain (loss) on investments | | | | | | | 46,188 | | | | | | | | 432 | | | | | |
| | | | | | | | | | | | | | | | | | | | |
Change in net assets resulting from operations | | | | | | $ | 48,765,156 | | | | | | | $ | 6,980,304 | | | | | |
| | | | | | | | | | | | | | | | | | | | |
See Notes which are an integral part of the Financial Statements
ANNUAL REPORT / April 30, 2018
11 STATEMENTS OF CHANGES IN NET ASSETS
| | | | | | | | | | | | | | | | | | | | | | | | | | | | | | | | | | | | |
| | | | | | Wilmington U.S. Government Money Market Fund | | | | | | Wilmington U.S. Treasury Money Market Fund | | | | |
| | | | | | | | | | | | | | | | | | | | | | | | | | | | |
| | | | | | Year Ended
April 30, 2018 | | | | | | Year Ended
April 30, 2017 | | | | | | Year Ended
April 30, 2018 | | | | | | Year Ended
April 30, 2017 | | | | |
OPERATIONS: | | | | | | | | | | | | | | | | | | | | | | | | | | | | | | | | | | | | |
Net investment income | | | | | | $ | 48,718,968 | | | | | | | $ | 5,824,798 | | | | | | | $ | 6,979,872 | | | | | | | $ | 549,020 | | | | | |
Net realized gain (loss) on investments | | | | | | | 46,188 | | | | | | | | (40,404 | ) | | | | | | | 432 | | | | | | | | 27,664 | | | | | |
| | | | | | | | | | | | | | | | | | | | | | | | | | | | | | | | | | | | |
Change in net assets resulting from operations | | | | | | | 48,765,156 | | | | | | | | 5,784,394 | | | | | | | | 6,980,304 | | | | | | | | 576,684 | | | | | |
| | | | | | | | | | | | | | | | | | | | | | | | | | | | | | | | | | | | |
DISTRIBUTIONS TO SHAREHOLDERS: | | | | | | | | | | | | | | | | | | | | | | | | | | | | | | | | | | | | |
Distributions from net investment income | | | | | | | | | | | | | | | | | | | | | | | | | | | | | | | | | | | | |
Administrative Class | | | | | | | (7,531,047 | ) | | | | | | | (632,310 | ) | | | | | | | (2,756,740 | ) | | | | | | | (180,326 | ) | | | | |
Institutional Class | | | | | | | (5,400,177 | ) | | | | | | | (665,254 | ) | | | | | | | — | | | | | | | | — | | | | | |
Select Class | | | | | | | (30,337,703 | ) | | | | | | | (4,414,350 | ) | | | | | | | (4,223,288 | ) | | | | | | | (367,894 | ) | | | | |
Service Class | | | | | | | (5,438,777 | ) | | | | | | | (124,817 | ) | | | | | | | (141 | ) | | | | | | | (4 | ) | | | | |
| | | | | | | | | | | | | | | | | | | | | | | | | | | | | | | | | | | | |
Change in net assets resulting from distributions to shareholders | | | | | | | (48,707,704 | ) | | | | | | | (5,836,731 | ) | | | | | | | (6,980,169 | ) | | | | | | | (548,224 | ) | | | | |
| | | | | | | | | | | | | | | | | | | | | | | | | | | | | | | | | | | | |
SHARE TRANSACTIONS: | | | | | | | | | | | | | | | | | | | | | | | | | | | | | | | | | | | | |
Proceeds from sale of shares | | | | | | | | | | | | | | | | | | | | | | | | | | | | | | | | | | | | |
Administrative Class | | | | | | | 5,018,186,327 | | | | | | | | 4,359,929,007 | | | | | | | | 1,146,973,936 | | | | | | | | 1,456,907,456 | | | | | |
Institutional Class | | | | | | | 2,592,337,356 | | | | | | | | 1,867,489,404 | | | | | | | | — | | | | | | | | — | | | | | |
Select Class | | | | | | | 6,638,056,625 | | | | | | | | 4,840,610,360 | | | | | | | | 2,492,174,259 | | | | | | | | 1,558,933,919 | | | | | |
Service Class | | | | | | | 2,715,449,789 | | | | | | | | 2,051,789,717 | | | | | | | | 12,000 | | | | | | | | 113,092 | | | | | |
Proceeds from shares issued in connection with Reorganizations (Note 6) | | | | | | | | | | | | | | | | | | | | | | | | | | | | | | | | | | | | |
Administrative Class | | | | | | | — | | | | | | | | 384,941,821 | | | | | | | | — | | | | | | | | — | | | | | |
Institutional Class | | | | | | | — | | | | | | | | 320,775,976 | | | | | | | | — | | | | | | | | — | | | | | |
Select Class | | | | | | | — | | | | | | | | 2,724,737,598 | | | | | | | | — | | | | | | | | — | | | | | |
Service Class | | | | | | | — | | | | | | | | 792,316,095 | | | | | | | | — | | | | | | | | — | | | | | |
Distributions reinvested | | | | | | | | | | | | | | | | | | | | | | | | | | | | | | | | | | | | |
Administrative Class | | | | | | | 149 | | | | | | | | 68 | | | | | | | | 8,188 | | | | | | | | 727 | | | | | |
Institutional Class | | | | | | | 154,193 | | | | | | | | 28,389 | | | | | | | | — | | | | | | | | — | | | | | |
Select Class | | | | | | | 1,874,684 | | | | | | | | 288,879 | | | | | | | | 703,485 | | | | | | | | 120,785 | | | | | |
Service Class | | | | | | | 1,488,778 | | | | | | | | 33,998 | | | | | | | | 141 | | | | | | | | 4 | | | | | |
Cost of shares redeemed | | | | | | | | | | | | | | | | | | | | | | | | | | | | | | | | | | | | |
Administrative Class | | | | | | | (5,337,668,906 | ) | | | | | | | (4,848,392,448 | ) | | | | | | | (1,285,477,864 | ) | | | | | | | (1,623,991,505 | ) | | | | |
Institutional Class | | | | | | | (2,247,584,997 | ) | | | | | | | (1,841,596,374 | ) | | | | | | | — | | | | | | | | — | | | | | |
Select Class | | | | | | | (7,037,694,255 | ) | | | | | | | (4,870,212,072 | ) | | | | | | | (2,014,486,130 | ) | | | | | | | (1,489,846,115 | ) | | | | |
Service Class | | | | | | | (2,830,878,413 | ) | | | | | | | (2,274,974,200 | ) | | | | | | | — | | | | | | | | (108,094 | ) | | | | |
| | | | | | | | | | | | | | | | | | | | | | | | | | | | | | | | | | | | |
Change in net assets resulting from share transactions | | | | | | | (486,278,670 | ) | | | | | | | 3,507,766,218 | | | | | | | | 339,908,015 | | | | | | | | (97,869,731 | ) | | | | |
| | | | | | | | | | | | | | | | | | | | | | | | | | | | | | | | | | | | |
Change in net assets | | | | | | | (486,221,218 | ) | | | | | | | 3,507,713,881 | | | | | | | | 339,908,150 | | | | | | | | (97,841,271 | ) | | | | |
NET ASSETS: | | | | | | | | | | | | | | | | | | | | | | | | | | | | | | | | | | | | |
Beginning of year | | | | | | | 6,911,470,867 | | | | | | | | 3,403,756,986 | | | | | | | | 791,130,433 | | | | | | | | 888,971,704 | | | | | |
| | | | | | | | | | | | | | | | | | | | | | | | | | | | | | | | | | | | |
End of year | | | | | | $ | 6,425,249,649 | | | | | | | $ | 6,911,470,867 | | | | | | | $ | 1,131,038,583 | | | | | | | $ | 791,130,433 | | | | | |
| | | | | | | | | | | | | | | | | | | | | | | | | | | | | | | | | | | | |
Undistributed (distributions in excess of) net investment income included in net assets at end of year | | | | | | $ | (22 | ) | | | | | | $ | (11,286 | ) | | | | | | $ | (11 | ) | | | | | | $ | 297 | | | | | |
| | | | | | | | | | | | | | | | | | | | | | | | | | | | | | | | | | | | |
April 30, 2018 / ANNUAL REPORT
STATEMENTS OF CHANGES IN NET ASSETS (concluded) 12
| | | | | | | | | | | | | | | | | | | | | | | | | | | | | | | | | | |
| | | | | Wilmington U.S. Government Money Market Fund | | | | | | Wilmington U.S. Treasury Money Market Fund | | | | |
| | | | | | | | | |
| | | | | Year Ended
April 30, 2018 | | | | | | Year Ended
April 30, 2017 | | | | | | Year Ended
April 30, 2018 | | | | | | Year Ended
April 30, 2017 | | | | |
SHARES OF BENEFICIAL INTEREST: | | | | | | | | | | | | | | | | | | | | | | | | | | | | | | | | | | |
Shares sold | | | | | | | | | | | | | | | | | | | | | | | | | | | | | | | | | | |
Administrative Class | | | | | 5,018,186,327 | | | | | | | | 4,359,929,009 | | | | | | | | 1,146,973,936 | | | | | | | | 1,456,907,456 | | | | | |
Institutional Class | | | | | 2,592,337,356 | | | | | | | | 1,867,489,404 | | | | | | | | — | | | | | | | | — | | | | | |
Select Class | | | | | 6,638,056,625 | | | | | | | | 4,840,610,359 | | | | | | | | 2,492,174,259 | | | | | | | | 1,558,933,919 | | | | | |
Service Class | | | | | 2,715,449,789 | | | | | | | | 2,051,789,717 | | | | | | | | 12,000 | | | | | | | | 113,092 | | | | | |
Shares issued in connection with Reorganizations (Note 6) | | | | | | | | | | | | | | | | | | | | | | | | | | | | | | | | | | |
Administrative Class | | | | | — | | | | | | | | 384,995,266 | | | | | | | | — | | | | | | | | — | | | | | |
Institutional Class | | | | | — | | | | | | | | 320,831,015 | | | | | | | | — | | | | | | | | — | | | | | |
Select Class | | | | | — | | | | | | | | 2,725,077,645 | | | | | | | | — | | | | | | | | — | | | | | |
Service Class | | | | | — | | | | | | | | 792,293,499 | | | | | | | | — | | | | | | | | — | | | | | |
Distributions reinvested | | | | | | | | | | | | | | | | | | | | | | | | | | | | | | | | | | |
Administrative Class | | | | | 149 | | | | | | | | 67 | | | | | | | | 8,188 | | | | | | | | 727 | | | | | |
Institutional Class | | | | | 154,193 | | | | | | | | 28,389 | | | | | | | | — | | | | | | | | — | | | | | |
Select Class | | | | | 1,874,684 | | | | | | | | 288,879 | | | | | | | | 703,485 | | | | | | | | 120,785 | | | | | |
Service Class | | | | | 1,488,778 | | | | | | | | 33,998 | | | | | | | | 141 | | | | | | | | 4 | | | | | |
Shares redeemed | | | | | | | | | | | | | | | | | | | | | | | | | | | | | | | | | | |
Administrative Class | | | | | (5,337,668,906 | ) | | | | | | | (4,848,392,448 | ) | | | | | | | (1,285,477,864 | ) | | | | | | | (1,623,991,505 | ) | | | | |
Institutional Class | | | | | (2,247,584,997 | ) | | | | | | | (1,841,596,374 | ) | | | | | | | — | | | | | | | | — | | | | | |
Select Class | | | | | (7,037,694,255 | ) | | | | | | | (4,870,212,072 | ) | | | | | | | (2,014,486,130 | ) | | | | | | | (1,489,846,115 | ) | | | | |
Service Class | | | | | (2,830,878,413 | ) | | | | | | | (2,274,974,200 | ) | | | | | | | — | | | | | | | | (108,094 | ) | | | | |
| | | | | | | | | | | | | | | | | | | | | | | | | | | | | | | | | | |
Net change in shares outstanding | | | | | (486,278,670 | ) | | | | | | | 3,508,192,153 | | | | | | | | 339,908,015 | | | | | | | | (97,869,731 | ) | | | | |
| | | | | | | | | | | | | | | | | | | | | | | | | | | | | | | | | | |
| |
See Notes which are an integral part of the Financial Statements | | | | | |
ANNUAL REPORT / April 30, 2018
13 FINANCIAL HIGHLIGHTS
For a share outstanding throughout each year ended April 30, unless otherwise noted:
| | | | | | | | | | | | | | | | | | | | | | | | |
| |
| WILMINGTON U.S. GOVERNMENT MONEY MARKET FUND | | | | |
| | | | | | | | | | | | | | | | | | | | | | | | |
| | | | | | | | | | | | | | | | | | | | | | | | |
| ADMINISTRATIVE CLASS | | Year Ended
April 30, 2018 | | Year Ended
April 30, 2017 | | | Year Ended
April 30, 2016 | | | Year Ended
April 30, 2015 | | | Year Ended
April 30, 2014 | | | | |
Net Asset Value, Beginning of year | | | $1.000 | | | | $1.000 | | | | $1.000 | | | | $1.000 | | | | $1.000 | | | | | |
Income (Loss) From Operations: | | | | | | | | | | | | | | | | | | | | | | | | |
Net Investment Income | | | 0.006 | | | | 0.000 | (a) | | | 0.000 | (a) | | | 0.000 | (a) | | | 0.000 | (a) | | | | |
Net Realized Gain (Loss) on Investments | | | 0.000 | (a) | | | (0.000 | )(a) | | | 0.000 | (a) | | | 0.000 | (a) | | | 0.000 | (a) | | | | |
| | | | |
Total Income (Loss) From Operations | | | 0.006 | | | | 0.000 | | | | 0.000 | | | | 0.000 | | | | 0.000 | | | | | |
| | | | |
Less Distributions From: | | | | | | | | | | | | | | | | | | | | | | | | |
Net Investment Income | | | (0.006 | ) | | | (0.000 | )(a) | | | (0.000 | )(a) | | | (0.000 | )(a) | | | (0.000 | )(a) | | | | |
| | | | |
Net Asset Value, End of year | | | $1.000 | | | | $1.000 | | | | $1.000 | | | | $1.000 | | | | $1.000 | | | | | |
| | | | |
Total Return | | | 0.56 | % | | | 0.04 | % | | | 0.02 | % | | | 0.01 | % | | | 0.01 | % | | | | |
Net Assets, End of year (000’s) | | | $1,196,676 | | | | $1,516,147 | | | | $1,619,679 | | | | $1,556,286 | | | | $1,673,462 | | | | | |
Ratios to Average Net Assets | | | | | | | | | | | | | | | | | | | | | | | | |
Gross Expense | | | 0.82 | % | | | 0.89 | % | | | 0.97 | % | | | 0.97 | % | | | 0.97 | % | | | | |
Net Expenses(b) | | | 0.62 | % | | | 0.42 | % | | | 0.18 | % | | | 0.07 | % | | | 0.08 | % | | | | |
Net Investment Income | | | 0.54 | % | | | 0.04 | % | | | 0.02 | % | | | 0.01 | % | | | 0.01 | % | | | | |
| | | | | | | | | | | | | | | | | | | | | | | | |
| | | | | | |
| INSTITUTIONAL CLASS | | Year Ended
April 30, 2018 | | Year Ended
April 30, 2017 | | | Year Ended
April 30, 2016 | | | Year Ended
April 30, 2015 | | | Year Ended
April 30, 2014 | | | | |
Net Asset Value, Beginning of Year | | | $1.000 | | | | $1.000 | | | | $1.000 | | | | $1.000 | | | | $1.000 | | | | | |
Income (Loss) From Operations: | | | | | | | | | | | | | | | | | | | | | | | | |
Net Investment Income | | | 0.009 | | | | 0.001 | | | | 0.000 | (a) | | | 0.000 | (a) | | | 0.000 | (a) | | | | |
Net Realized Gain (Loss) on Investments | | | 0.000 | (a) | | | (0.000 | )(a) | | | 0.000 | (a) | | | 0.000 | (a) | | | 0.000 | (a) | | | | |
| | | | |
Total Income (Loss) From Operations | | | 0.009 | | | | 0.001 | | | | 0.000 | | | | 0.000 | | | | 0.000 | | | | | |
| | | | |
Less Distributions From: | | | | | | | | | | | | | | | | | | | | | | | | |
Net Investment Income | | | (0.009 | ) | | | (0.001 | ) | | | (0.000 | )(a) | | | (0.000 | )(a) | | | (0.000 | )(a) | | | | |
| | | | |
Net Asset Value, End of Year | | | $1.000 | | | | $1.000 | | | | $1.000 | | | | $1.000 | | | | $1.000 | | | | | |
| | | | |
Total Return | | | 0.91 | % | | | 0.17 | % | | | 0.02 | % | | | 0.01 | % | | | 0.01 | % | | | | |
Net Assets, End of Year (000’s) | | | $704,435 | | | | $359,524 | | | | $12,840 | | | | $26,079 | | | | $83,595 | | | | | |
Ratios to Average Net Assets | | | | | | | | | | | | | | | | | | | | | | | | |
Gross Expense | | | 0.32 | % | | | 0.34 | % | | | 0.47 | % | | | 0.47 | % | | | 0.47 | % | | | | |
Net Expenses(b) | | | 0.27 | % | | | 0.27 | % | | | 0.13 | % | | | 0.07 | % | | | 0.08 | % | | | | |
Net Investment Income | | | 0.97 | % | | | 0.21 | % | | | 0.01 | % | | | 0.01 | % | | | 0.01 | % | | | | |
| | | | | | | | | | | | | | | | | | | | | | | | |
| | | | | | |
| SELECT CLASS | | Year Ended
April 30, 2018 | | Year Ended
April 30, 2017 | | | Year Ended
April 30, 2016 | | | Year Ended
April 30, 2015 | | | Year Ended
April 30, 2014 | | | | |
Net Asset Value, Beginning of Year | | | $1.000 | | | | $1.000 | | | | $1.000 | | | | $1.000 | | | | $1.000 | | | | | |
Income (Loss) From Operations: | | | | | | | | | | | | | | | | | | | | | | | | |
Net Investment Income | | | 0.008 | | | | 0.001 | | | | 0.000 | (a) | | | 0.000 | (a) | | | 0.000 | (a) | | | | |
Net Realized Gain (Loss) on Investments | | | 0.000 | (a) | | | (0.000 | )(a) | | | 0.000 | (a) | | | 0.000 | (a) | | | 0.000 | (a) | | | | |
| | | | |
Total Income (Loss) From Operations | | | 0.008 | | | | 0.001 | | | | 0.000 | | | | 0.000 | | | | 0.000 | | | | | |
| | | | |
Less Distributions From: | | | | | | | | | | | | | | | | | | | | | | | | |
Net Investment Income | | | (0.008 | ) | | | (0.001 | ) | | | (0.000 | )(a) | | | (0.000 | )(a) | | | (0.000 | )(a) | | | | |
| | | | |
Net Asset Value, End of Year | | | $1.000 | | | | $1.000 | | | | $1.000 | | | | $1.000 | | | | $1.000 | | | | | |
| | | | |
Total Return | | | 0.81 | % | | | 0.13 | % | | | 0.02 | % | | | 0.01 | % | | | 0.01 | % | | | | |
Net Assets, End of Year (000’s) | | | $3,273,958 | | | | $3,671,694 | | | | $976,287 | | | | $1,005,503 | | | | $889,158 | | | | | |
Ratios to Average Net Assets | | | | | | | | | | | | | | | | | | | | | | | | |
Gross Expense | | | 0.57 | % | | | 0.61 | % | | | 0.72 | % | | | 0.72 | % | | | 0.72 | % | | | | |
Net Expenses(b) | | | 0.37 | % | | | 0.33 | % | | | 0.18 | % | | | 0.07 | % | | | 0.08 | % | | | | |
Net Investment Income | | | 0.80 | % | | | 0.15 | % | | | 0.02 | % | | | 0.01 | % | | | 0.01 | % | | | | |
April 30, 2018 / ANNUAL REPORT
FINANCIAL HIGHLIGHTS 14
| | | | | | | | | | | | | | | | | | | | | | | | |
SERVICE CLASS | | Year Ended April 30, 2018 | | Year Ended April 30, 2017 | | | Year Ended April 30, 2016 | | | Year Ended April 30, 2015 | | | Year Ended April 30, 2014 | | | | |
Net Asset Value, Beginning of Year | | | $1.000 | | | | $1.000 | | | | $1.000 | | | | $1.000 | | | | $1.000 | | | | | |
Income (Loss) From Operations: | | | | | | | | | | | | | | | | | | | | | | | | |
Net Investment Income | | | 0.004 | | | | 0.000 | (a) | | | 0.000 | (a) | | | 0.000 | (a) | | | 0.000 | (a) | | | | |
Net Realized Gain (Loss) on Investments | | | 0.000 | (a) | | | (0.000 | )(a) | | | 0.000 | (a) | | | 0.000 | (a) | | | 0.000 | (a) | | | | |
| | | | |
Total Income (Loss) From Operations | | | 0.004 | | | | 0.000 | | | | 0.000 | | | | 0.000 | | | | 0.000 | | | | | |
| | | | |
Less Distributions From: | | | | | | | | | | | | | | | | | | | | | | | | |
Net Investment Income | | | (0.004 | ) | | | (0.000 | )(a) | | | (0.000 | )(a) | | | (0.000 | )(a) | | | (0.000 | )(a) | | | | |
| | | | |
Net Asset Value, End of Year | | | $1.000 | | | | $1.000 | | | | $1.000 | | | | $1.000 | | | | $1.000 | | | | | |
| | | | |
Total Return | | | 0.41 | % | | | 0.01 | % | | | 0.01 | % | | | 0.01 | % | | | 0.01 | % | | | | |
Net Assets, End of Year (000’s) | | | $1,250,181 | | | | $1,364,106 | | | | $794,950 | | | | $1,352,274 | | | | $1,371,495 | | | | | |
Ratios to Average Net Assets | | | | | | | | | | | | | | | | | | | | | | | | |
Gross Expense | | | 0.82 | % | | | 0.88 | % | | | 0.97 | % | | | 0.97 | % | | | 0.97 | % | | | | |
Net Expenses(b) | | | 0.77 | % | | | 0.46 | % | | | 0.18 | % | | | 0.07 | % | | | 0.08 | % | | | | |
Net Investment Income | | | 0.41 | % | | | 0.01 | % | | | 0.01 | % | | | 0.01 | % | | | 0.01 | % | | | | |
| (a) | Represents less than $0.001. |
| (b) | The investment manager and other service providers voluntarily waived a portion of their fees. |
See Notes which are an integral part of the Financial Statements
ANNUAL REPORT / April 30, 2018
15 FINANCIAL HIGHLIGHTS (concluded)
For a share outstanding throughout each year ended April 30, unless otherwise noted:
| | | | | | | | | | |
|
| WILMINGTON U.S. TREASURY MONEY MARKET FUND |
| | | | | | | | | | | | | | | | | | | | | | | | |
| ADMINISTRATIVE CLASS | | Year Ended
April 30, 2018 | | Year Ended
April 30, 2017 | | | Year Ended
April 30, 2016 | | | Year Ended
April 30, 2015 | | | Year Ended
April 30, 2014 | | | | |
Net Asset Value, Beginning of Year | | | $1.000 | | | | $1.000 | | | | $1.000 | | | | $1.000 | | | | $1.000 | | | | | |
Income (Loss) From Operations: | | | | | | | | | | | | | | | | | | | | | | | | |
Net Investment Income | | | 0.006 | | | | 0.000 | (a) | | | 0.000 | (a) | | | 0.000 | (a) | | | 0.000 | (a) | | | | |
Net Realized Gain (Loss) on Investments | | | 0.000 | (a) | | | 0.000 | (a) | | | 0.000 | (a) | | | 0.000 | (a) | | | 0.000 | (a) | | | | |
| | | | |
Total Income (Loss) From Operations | | | 0.006 | | | | 0.000 | | | | 0.000 | | | | 0.000 | | | | 0.000 | | | | | |
| | | | |
Less Distributions From: | | | | | | | | | | | | | | | | | | | | | | | | |
Net Investment Income | | | (0.006 | ) | | | (0.000 | )(a) | | | (0.000 | )(a) | | | (0.000 | )(a) | | | (0.000 | )(a) | | | | |
| | | | |
Net Asset Value, End of Year | | | $1.000 | | | | $1.000 | | | | $1.000 | | | | $1.000 | | | | $1.000 | | | | | |
| | | | |
Total Return | | | 0.57 | % | | | 0.03 | % | | | 0.01 | % | | | 0.00 | %(b) | | | 0.01 | % | | | | |
Net Assets, End of Year (000’s) | | | $340,788 | | | | $479,284 | | | | $646,349 | | | | $631,472 | | | | $782,360 | | | | | |
Ratios to Average Net Assets | | | | | | | | | | | | | | | | | | | | | | | | |
Gross Expense | | | 0.84 | % | | | 0.91 | % | | | 0.99 | % | | | 0.98 | % | | | 0.97 | % | | | | |
Net Expenses(c) | | | 0.60 | % | | | 0.39 | % | | | 0.15 | % | | | 0.06 | % | | | 0.06 | % | | | | |
Net Investment Income | | | 0.53 | % | | | 0.03 | % | | | 0.01 | % | | | 0.00 | %(b) | | | 0.01 | % | | | | |
| SELECT CLASS | | Year Ended
April 30, 2018 | | Year Ended
April 30, 2017 | | | Year Ended
April 30, 2016 | | | Year Ended
April 30, 2015 | | | Year Ended
April 30, 2014 | | | | |
Net Asset Value, Beginning of Year | | | $1.000 | | | | $1.000 | | | | $1.000 | | | | $1.000 | | | | $1.000 | | | | | |
Income (Loss) From Operations: | | | | | | | | | | | | | | | | | | | | | | | | |
Net Investment Income | | | 0.008 | | | | 0.001 | | | | 0.000 | (a) | | | 0.000 | (a) | | | 0.000 | (a) | | | | |
Net Realized Gain (Loss) on Investments | | | 0.000 | (a) | | | 0.000 | (a) | | | 0.000 | (a) | | | 0.000 | (a) | | | 0.000 | (a) | | | | |
| | | | |
Total Income (Loss) From Operations | | | 0.008 | | | | 0.001 | | | | 0.000 | | | | 0.000 | | | | 0.000 | | | | | |
| | | | |
Less Distributions From: | | | | | | | | | | | | | | | | | | | | | | | | |
Net Investment Income | | | (0.008 | ) | | | (0.001 | ) | | | (0.000 | )(a) | | | (0.000 | )(a) | | | (0.000 | )(a) | | | | |
| | | | |
Net Asset Value, End of Year | | | $1.000 | | | | $1.000 | | | | $1.000 | | | | $1.000 | | | | $1.000 | | | | | |
| | | | |
Total Return | | | 0.82 | % | | | 0.12 | % | | | 0.01 | % | | | 0.00 | %(b) | | | 0.01 | % | | | | |
Net Assets, End of Year (000’s) | | | $790,207 | | | | $311,815 | | | | $242,597 | | | | $264,955 | | | | $314,375 | | | | | |
Ratios to Average Net Assets | | | | | | | | | | | | | | | | | | | | | | | | |
Gross Expense | | | 0.59 | % | | | 0.66 | % | | | 0.74 | % | | | 0.74 | % | | | 0.72 | % | | | | |
Net Expenses(c) | | | 0.35 | % | | | 0.31 | % | | | 0.15 | % | | | 0.06 | % | | | 0.06 | % | | | | |
Net Investment Income | | | 0.89 | % | | | 0.13 | % | | | 0.01 | % | | | 0.00 | %(b) | | | 0.01 | % | | | | |
| | | | | | | | | | | | | | | | | | | | | | | | |
| SERVICE CLASS | | Year Ended
April 30, 2018 | | Year Ended
April 30, 2017 | | | Year Ended
April 30, 2016 | | | Year Ended
April 30, 2015 | | | Year Ended
April 30, 2014 | | | | |
Net Asset Value, Beginning of Year | | | $1.000 | | | | $1.000 | | | | $1.000 | | | | $1.000 | | | | $1.000 | | | | | |
Income (Loss) From Operations: | | | | | | | | | | | | | | | | | | | | | | | | |
Net Investment Income | | | 0.004 | | | | 0.000 | (a) | | | 0.000 | (a) | | | 0.000 | (a) | | | 0.000 | (a) | | | | |
Net Realized Gain (Loss) on Investments | | | 0.000 | (a) | | | 0.000 | (a) | | | 0.000 | (a) | | | 0.000 | (a) | | | 0.000 | (a) | | | | |
| | | | |
Total Income (Loss) From Operations | | | 0.004 | | | | 0.000 | | | | 0.000 | | | | 0.000 | | | | 0.000 | | | | | |
| | | | |
Less Distributions From: | | | | | | | | | | | | | | | | | | | | | | | | |
Net Investment Income | | | (0.004 | ) | | | (0.000 | )(a) | | | (0.000 | )(a) | | | (0.000 | )(a) | | | (0.000 | )(a) | | | | |
| | | | |
Net Asset Value, End of Year | | | $1.000 | | | | $1.000 | | | | $1.000 | | | | $1.000 | | | | $1.000 | | | | | |
| | | | |
Total Return | | | 0.42 | % | | | 0.01 | % | | | 0.01 | % | | | 0.00 | %(b) | | | 0.01 | % | | | | |
Net Assets, End of Year (000’s) | | | $44 | | | | $31 | | | | $26 | | | | $18 | | | | $6 | | | | | |
Ratios to Average Net Assets | | | | | | | | | | | | | | | | | | | | | | | | |
Gross Expense | | | 0.84 | % | | | 0.90 | % | | | 0.97 | % | | | 0.99 | % | | | 0.97 | % | | | | |
Net Expenses(c) | | | 0.74 | % | | | 0.42 | % | | | 0.17 | % | | | 0.06 | % | | | 0.06 | % | | | | |
Net Investment Income | | | 0.44 | % | | | 0.01 | % | | | 0.01 | % | | | 0.00 | %(b) | | | 0.01 | % | | | | |
| (a) | Represents less than $0.001. |
| (b) | Represents less than 0.01%. |
| (c) | The investment manager and other service providers voluntarily waived a portion of their fees. |
See Notes which are an integral part of the Financial Statements
April 30, 2018 / ANNUAL REPORT
NOTES TO FINANCIAL STATEMENTS 16
Wilmington Funds
April 30, 2018
1. ORGANIZATION
Wilmington Funds (the “Trust”) is registered under the Investment Company Act of 1940, as amended (the “Act”), as an open-end management investment company. The Trust consists of 12 portfolios, 2 of which are presented herein (individually referred to as a “Fund” or collectively as the “Funds”). The remaining 10 funds are presented in separate reports.
| | | | |
| | |
| Fund | | Investment Goal | | |
Wilmington U.S. Government Money Market Fund (“U.S. Government Money Market Fund”)(d) | | The Fund seeks to provide current income while maintaining liquidity and stability of principal. | | |
| | |
Wilmington U.S. Treasury Money Market Fund (“U.S. Treasury Money Market Fund”)(d) | | The Fund seeks to provide current income while maintaining liquidity and stability of principal. | | |
(d) Diversified
The Trust offers 6 classes of shares: Class A, Service Class, Select Class, Administrative Class, Class I, and Institutional Class. Class A and Class I are not available for the Funds. All shares of the Trust have equal rights with respect to voting, except on class-specific matters
The assets of each portfolio are segregated and a shareholder’s interest is limited to the portfolio in which shares are held.
In the normal course of business, the Funds may enter into contracts that provide general indemnifications. The Funds’ maximum exposure under these arrangements is dependent on claims that may be made against the Funds in the future, and, therefore, cannot be estimated; however, based on experience, the risk of material loss from such claims is considered remote.
2. SUMMARY OF SIGNIFICANT ACCOUNTING POLICIES
The following is a summary of significant accounting policies consistently followed by the Funds in the preparation of their financial statements. These policies are in conformity with U.S. generally accepted accounting principles (“GAAP”). The Trust is an investment company and follows accounting and reporting guidance under Financial Accounting Standards Board (“FASB”) Accounting Standards Codification (“ASC”) Topic 946, “Financial Services—Investment Companies.” The preparation of financial statements in conformity with GAAP requires management to make estimates and assumptions that affect the amounts of assets, liabilities, expenses and revenues reported in the financial statements. Actual results could differ from those estimated.
Computation of Net Asset Value – It is each Fund’s policy to maintain a continuous net asset value of $1.00 per share for each class. Each Fund has adopted certain investment, portfolio valuation and dividend and distribution policies to enable it to do so. There is no assurance, however, that each Fund will be able to maintain a stable net asset value of $1.00 per share. The net asset value (‘‘NAV’’) per share for each of the Funds is computed by dividing the total current value of the assets of a Fund, less its liabilities, by the total number of shares outstanding at the time of such computation. Each Fund’s NAV per share is computed as of 4:00 p.m. (Eastern Time), on days when the New York Stock Exchange (“NYSE”) is open for regular trading and the Federal Reserve Bank of New York (the ‘‘Fed’’) is open. In addition, the Funds may elect, in their discretion if it is determined to be in shareholders’ best interests, to be open on days when the NYSE is open but the Fed is closed or to be open on days when the Fed is open but the NYSE is closed, except for Good Friday.
Investment Valuation – The Funds use the amortized cost method to value their portfolio securities, when it represents the best estimate of fair value in accordance with Rule 2a-7 under the Act.
The Trust follows the authoritative guidance (GAAP) for fair value measurements. The guidance establishes a framework for measuring fair value and a hierarchy for inputs and techniques used in measuring fair value that maximizes the use of observable inputs and minimizes the use of unobservable inputs and techniques by requiring that the most observable inputs be used when available. The guidance establishes three tiers of inputs that may be used to measure fair value. The three tiers of inputs are summarized at the end of each Fund’s Portfolio of Investments. The inputs or techniques used for valuing securities are not necessarily an indication of the risk associated with investing in those securities.
The Funds’ policy is to disclose transfers between levels based on valuations at the beginning of the reporting period. Each portfolio may hold securities which are periodically fair valued in accordance with the Funds’ fair value procedures. This may result in movements between Levels 1, 2 and 3 throughout the period. As of April 30, 2018, there were no transfers between Levels 1, 2 and 3 assets and liabilities based on levels assigned to securities at the beginning of the period. Pursuant to the Funds’ fair value procedures noted previously, open-end regulated investment companies are generally categorized as Level 1 securities in the fair value hierarchy. Fixed income securities and money market instruments are generally categorized as Level 2 securities in the fair value hierarchy.
ANNUAL REPORT / April 30, 2018
17 NOTES TO FINANCIAL STATEMENTS (continued)
Repurchase Agreements – Repurchase agreements are transactions in which a Fund buys a security from a dealer or bank and agrees to sell the security back at a mutually agreed upon time and price. The repurchase price exceeds the sale price, reflecting the Fund’s return on the transaction. It is each Fund’s policy to require the counterparty to a repurchase agreement to transfer to the Funds’ custodian or sub-custodian eligible securities or cash with a market value (after transaction costs) at least equal to the repurchase price to be paid under the repurchase agreement. The eligible securities are transferred to accounts with the custodian or sub-custodian in which the Funds hold a “securities entitlement” and exercise “control” as those terms are defined in the Uniform Commercial Code. The Funds have established procedures for monitoring the market value of the transferred securities and requiring the transfer of additional eligible securities if necessary to equal at least the repurchase price. These procedures also allow the counterparty to require securities to be transferred from the account to the extent that their market value exceeds the repurchase price or in exchange for other eligible securities of equivalent market value.
The insolvency of the counterparty or other failure to repurchase the securities may delay the disposition of the underlying securities or cause the Funds to receive less than the full repurchase price.
Repurchase agreements are entered into by the Funds under Master Repurchase Agreements (“MRA”) which permit the Funds, under certain circumstances including an event of default (such as bankruptcy or insolvency), to offset payables and/or receivables under the MRA with collateral held and/or posted to the counterparty and create one single net payment due to or from the Fund.
At April 30, 2018, the open repurchase agreements by counterparty which are subject to a MRA on a net payment basis are as follows:
| | | | | | | | | | | | | | | | | | | | | | | | | | | | | | | | | | | | |
| | | | | | | | | | |
| | | Fund/Counterparty | | | | Repurchase
Agreements | | | | | | Fair Value of
Non-Cash Collateral
Received(1) | | | | | | Cash Collateral
Received(1) | | | | | | Net Amount(2) | | | | |
| | U.S. Government Money Market Fund | | | | | | | | | | | | | | | | | | | | | | | | | | | | | | | | | | |
| | Credit Suisse First Boston LLC | | | | $ | 395,000,000 | | | | | | | $ | 395,000,000 | | | | | | | $ | — | | | | | | | $ | — | | | | | |
| | Deutsche Bank Securities, Inc. | | | | | 50,000,000 | | | | | | | | 50,000,000 | | | | | | | | — | | | | | | | | — | | | | | |
| | Mizuho Securities USA, Inc. | | | | | 350,000,000 | | | | | | | | 350,000,000 | | | | | | | | — | | | | | | | | — | | | | | |
| | RBC Capital Markets LLC | | | | | 330,000,000 | | | | | | | | 330,000,000 | | | | | | | | — | | | | | | | | — | | | | | |
| | RBC Capital Markets LLC | | | | | 75,000,000 | | | | | | | | 75,000,000 | | | | | | | | — | | | | | | | | — | | | | | |
| | TD Securities, Inc. | | | | | 385,000,000 | | | | | | | | 385,000,000 | | | | | | | | — | | | | | | | | — | | | | | |
| | | | | | | | | | | | | | | | | | | | | | | | | | | | | | | | | | | | |
| | | | | | | | | | |
| | | | | | $ | 1,585,000,000 | | | | | | | $ | 1,585,000,000 | | | | | | | $ | — | | | | | | | $ | — | | | | | |
| | | | | | | | | | | | | | | | | | | | | | | | | | | | | | | | | | | | |
| | U.S. Treasury Money Market Fund | | | | | | | | | | | | | | | | | | | | | | | | | | | | | | | | | | |
| | Credit Suisse First Boston LLC | | | | | 185,000,000 | | | | | | | | 185,000,000 | | | | | | | | — | | | | | | | | — | | | | | |
| | Deutsche Bank Securities, Inc. | | | | | 52,000,000 | | | | | | | | 52,000,000 | | | | | | | | — | | | | | | | | — | | | | | |
| | RBC Capital Markets LLC | | | | | 40,000,000 | | | | | | | | 40,000,000 | | | | | | | | — | | | | | | | | — | | | | | |
| | | | | | | | | | | | | | | | | | | | | | | | | | | | | | | | | | | | |
| | | | | | | | | | |
| | | | | | $ | 277,000,000 | | | | | | | $ | 277,000,000 | | | | | | | $ | — | | | | | | | $ | — | | | | | |
| | | | | | | | | | | | | | | | | | | | | | | | | | | | | | | | | | | | |
| | (1) | The amount of collateral reflected in the table does not include any over-collateralization received by the Fund. |
| | (2) | Net amount represents the net amount receivable due from the counterparty in the event of default. |
Investment Income, Gains and Losses, Expenses and Distributions – Interest income and expenses are accrued daily. All premiums and discounts on fixed income securities are amortized/accreted for financial statement purposes. Dividends and distributions to shareholders are recorded on the ex-dividend date. Investment transactions are accounted for on a trade date basis for financial reporting purposes. Realized gains and losses from investment transactions are recorded on an identified cost basis
Expenses of the Trust, which are directly identifiable to a specific Fund, are applied to that Fund. Expenses which are not identifiable to a specific Fund are allocated in such a manner as deemed equitable, taking into consideration the nature and type of expense.
All Funds offer multiple classes of shares. Investment income, realized gains and losses, and certain fund-level expenses are allocated to each class based on relative daily net assets, except that each class bears certain expenses unique to that class such as distribution and shareholder services fees. Distributions are declared separately for each class. No class has preferential distribution rights; differences in per share distributions rates are generally due to differences in class specific expenses. Distributions from net realized gains, if any, are declared and paid to shareholders annually. Distributions from net investment income are declared daily and paid monthly.
Federal Taxes – It is the Funds’ policy to comply with the Subchapter M provision of the Internal Revenue Code of 1986, as amended (the “Code”), and to distribute to shareholders each year substantially all of their income. Accordingly, no provisions for Federal income tax or excise tax are necessary.
The Funds recognize interest and penalties, if any, related to unrecognized tax benefits as income tax expense on the Statement of Operations. During the year ended April 30, 2018, the Funds did not incur any interest or penalties.
April 30, 2018 / ANNUAL REPORT
NOTES TO FINANCIAL STATEMENTS (continued) 18
3. FEDERAL TAX INFORMATION
As of April 30, 2018, there are no uncertain tax positions that would require financial statement recognition, de-recognition or disclosure. The Funds’ federal tax returns filed for the years ended 2017, 2016 and 2015, as well as the current tax year, remain subject to examination by the Internal Revenue Service.
The timing and character of income and capital gain distributions are determined in accordance with income tax regulations, which may differ from GAAP. These differences are due in part to the tax treatment of expiring capital loss carryforwards. GAAP requires that permanent differences in net investment income and realized gains and losses due to differences between financial reporting and tax reporting be reclassified between various components of net assets and have no effect on the net assets nor the NAV of the Funds.
For the year ended April 30, 2018, permanent differences identified and reclassified among the components of net assets were as follows:
| | | | | | | | | | | | | | | | | | | | | | | | | | |
| Fund | | | | Paid-in
Capital | | | | | | Increase (Decrease)
Undistributed Net
Investment Income | | | | | | Accumulated
Net Realized
Gain (Loss) | | | | |
U.S. Treasury Money Market Fund | | | | | — | | | | | | | | (11 | ) | | | | | | | 11 | | | | | |
The permanent differences identified and reclassified were primarily attributable to the tax treatment of distributions received from money market funds.
The tax character of distributions for the corresponding fiscal year ends were as follows:
| | | | | | | | | | | | | | | | | | | | | | | | | | | | | | |
| | | | | 2018 | | | 2017 | |
| Fund | | | | Ordinary
Income* | | | | | | Long-Term
Capital Gains | | | Ordinary
Income* | | | | | | Long-Term
Capital Gains | | | | |
U.S. Government Money Market Fund | | | | $ | 48,707,704 | | | | | | | $ | — | | | $ | 5,836,731 | | | | | | | $ | — | | | | | |
U.S. Treasury Money Market Fund | | | | | 6,980,169 | | | | | | | | — | | | | 548,224 | | | | | | | | — | | | | | |
* For tax purposes, short-term capital gain distributions are considered ordinary income distributions.
As of April 30, 2018, the components of distributable earnings on a tax basis were as follows:
| | | | | | | | | | | | | | | | | | | | | | | | | | | | | | | | | | | | | | | | | | | | | | | | | | |
| Fund | | | | Undistributed
Ordinary
Income | | | | | | Undistributed
Long-Term
Capital Gains | | | | | | Other Timing
Differences | | | | | | Unrealized
Appreciation/
(Depreciation) | | | | | | Capital Loss
Carryforwards | | | | | | Late Year
Loss
Deferrals | | | | |
U.S. Government Money Market Fund | | | | $ | 6,660,433 | | | | | | | $ | — | | | | | | | $ | (6,660,455 | ) | | | | | | $ | — | | | | | | | $ | (1,530 | ) | | | | | | $ | — | | | | | |
U.S. Treasury Money Market Fund | | | | | 1,042,473 | | | | | | | | — | | | | | | | | (1,042,484 | ) | | | | | | | — | | | | | | | | (6,850 | ) | | | | | | | — | | | | | |
Under current tax regulations, capital losses on securities transactions realized after October 31 may be deferred and treated as occurring on the first day of the following fiscal year. Under the Regulated Investment Company Modernization Act of 2010, the Funds are permitted to defer taxable ordinary income losses incurred after December 31 and treat as occurring on the first day of the following fiscal year. At April 30, 2018, none of the Funds have any losses deferred to May 1, 2018.
At April 30, 2018, the following Funds had capital loss carryforwards which will reduce each Fund’s taxable income arising from future net realized gain on investments, if any, to the extent permitted by the (“Code”) and thus will reduce the amount of distributions to shareholders which would otherwise be necessary to relieve the Fund of any liability for federal income tax.
| | | | | | | | | | | | | | | | | | | | | | | | |
| Fund | | | | | Short-Term
No Expiration | | | | �� | | Long-Term
No Expiration | | | | | | Total Capital Loss Carryforwards | |
U.S. Government Money Market Fund | | | | | | $ | 1,530 | | | | | | | $ | — | | | | | | | $ | 1,530 | |
U.S. Treasury Money Market Fund | | | | | | | 6,850 | | | | | | | | — | | | | | | | | 6,850 | |
The Funds utilized capital loss carryforwards as follows to offset taxable capital gains realized during the year ended April 30, 2018:
| | | | |
| Fund | | | | Capital Loss
Carryforwards
Utilized |
U.S. Government Money Market Fund | | | | $46,188 |
U.S. Treasury Money Market Fund | | | | 443 |
4. ADVISORY FEES, SERVICING FEES, AND OTHER SERVICE PROVIDERS
Investment Advisor – Wilmington Funds Management Corporation (“WFMC” or the “Advisor”) serves as the Investment Advisor to each of the Funds. Wilmington Trust Investment Advisors, Inc. (“WTIA”) provides sub-advisory services to the Funds. WFMC and WTIA are wholly-owned subsidiaries of M&T Bank Corporation.
ANNUAL REPORT / April 30, 2018
19 NOTES TO FINANCIAL STATEMENTS (continued)
The Funds pay WFMC an annual investment advisory fee, accrued and paid daily, based on a percentage of each Fund’s average daily net assets as described below. WFMC, not the Funds, pays WTIA for its services.
| | |
| Fund | | Advisory Fee
Annual Rate |
U.S. Government Money Market Fund | | 0.25% |
U.S. Treasury Money Market Fund | | 0.25% |
During the year ended April 30, 2018, WFMC has agreed to reduce its advisory fee and/or reimburse certain of the Funds’ operating expenses, and/or certain class-specific fees and expenses, in an effort to maintain the current yield of each share class at or above zero. The fee waiver does not take into consideration acquired fund fees and expenses, taxes or extraordinary items. Any such waiver or expense reimbursement may be modified or discontinued at any time without notice.
WFMC and the Funds’ distributor and shareholder service providers have contractually agreed to waive their fees and/or reimburse expenses through August 31, 2018, so that total annual fund operating expenses paid by the Funds (not including the effects of acquired fund fees and expenses, taxes, or other extraordinary expenses expressed as an annualized percentage of average daily net assets), will not exceed the expense limitations set forth below. Neither WFMC, nor the Fund’s distributor, will recoup previously waived fees/expenses in subsequent years.
| | | | | | | | | | | | | | | | | | |
| | | | | Contractual Current Expense Limitations | | |
| Fund | | | | Administrative
Class | | | | Institutional
Class | | | | Select
Class | | | | Service
Class | | |
U.S. Government Money Market Fund | | | | 0.62% | | | | 0.27% | | | | 0.37% | | | | 0.77% | | |
| | | | | | | | | |
U.S. Treasury Money Market Fund | | | | 0.60% | | | | N/A | | | | 0.35% | | | | 0.75% | | |
Administrative Fees – The Bank of New York Mellon (“BNYM”) provides the Trust with fund administration services. The fees as described in the table below are a component of “Portfolio accounting and administration fees” as disclosed in the Statements of Operations. WFMC, in its role as Co-Administrator, provides the Funds with certain administrative personnel and services necessary to operate the Funds. Effective October 1, 2017, the fees as described in the table below are accrued and paid daily and are disclosed on the Statement of Operations as “Administrative personnel and services fees.”
| | | | | | | | |
Administrator | | | | Maximum
Fee | | | | Average Aggregate Daily Net Assets of the Trust |
WFMC | | | | 0.040% | | | | on the first $5 billion |
| | | | 0.030% | | | | on the next $2 billion |
| | | | 0.025% | | | | on the next $3 billion |
| | | | 0.018% | | | | on assets in excess of $10 billion |
| | | | |
BNYM | | | | 0.0175% | | | | on the first $15 billion |
| | | | 0.0150% | | | | on the next $10 billion |
| | | | 0.0125% | | | | on assets in excess of $25 billion |
Prior to October 1, 2017, the administrative fees were as follows.
| | | | | | | | |
Administrator | | | | Maximum
Fee | | | | Average Aggregate Daily Net Assets of the Trust |
WFMC | | | | 0.040% | | | | on the first $5 billion |
| | | | 0.030% | | | | on the next $2 billion |
| | | | 0.025% | | | | on the next $3 billion |
| | | | 0.018% | | | | on assets in excess of $10 billion |
| | | | |
BNYM | | | | 0.0285% | | | | on the first $500 million |
| | | | 0.0280% | | | | on the next $500 million |
| | | | 0.0275% | | | | on assets in excess of $1 billion |
WFMC and BNYM may voluntarily choose to waive any portion of their fee and can add, modify or terminate a voluntary wavier at any time at their sole discretion. Neither WFMC, nor BNYM, will recoup previously waived fees/expenses in subsequent years. For the year ended April 30, 2018, neither WFMC nor BNYM waived any administrative fees.
April 30, 2018 / ANNUAL REPORT
NOTES TO FINANCIAL STATEMENTS (continued) 20
Distribution Services Fee – The Trust has adopted a Distribution Services Plan (the “Plan”) pursuant to Rule 12b-1 under the Act. The Plan allows the Funds to pay fees to financial intermediaries, which may be paid through ALPS Distributors, Inc. (“ALPS”), the principal distributor, at an annual rate of up to 0.25% of the average daily net assets of the Funds’ Administrative Class and Service Class shares for the sale, distribution, administration, customer servicing and record keeping of these shares.
The Trust may reduce the maximum amount of distribution services fees it pays from time to time at its sole discretion. In addition, a financial intermediary (including ALPS, the Advisor or their affiliates), may voluntarily waive or reduce any fees to which they are entitled.
For the year ended April 30, 2018, M&T Securities, Inc. and Manufacturers and Traders Trust Company (together “M&T”), affiliates of the Advisor, received a portion of the fees paid by the following Funds which are listed below:
| | | | | | | | | | |
| Fund | | | | Distribution
Fees | | | | |
U.S. Government Money Market Fund | | | | | $6,820,016 | | | | | |
U.S. Treasury Money Market Fund | | | | | 1,276,313 | | | | | |
Shareholder Services Fee – Pursuant to a Shareholder Services Plan adopted by the Funds and administered by ALPS, the Funds may pay up to 0.25% of the average daily net assets of each Fund’s Administrative Class, Select Class and Service Class shares to financial intermediaries (which may include ALPS, the Advisor or their affiliates) for providing shareholder services and maintaining shareholder accounts. M&T has entered into a Shareholders Services Agreement with ALPS, under which it is entitled to receive up to 0.25% of the average daily net assets of each Fund’s shares for whom M&T provides shareholder services. The Funds may reduce the maximum amount of shareholder service fees it pays from time to time at its sole discretion. In addition, a financial intermediary (including M&T) may waive or reduce any fees to which they are entitled.
For the year ended April 30, 2018, M&T received a portion of the fees paid by the following Funds which are listed below:
| | | | | | | | |
| Fund | | | | Shareholder Services
Fee | | | |
U.S. Government Money Market Fund | | | | $8,481,416 | | | | |
U.S. Treasury Money Market Fund | | | | 982,716 | | | | |
Other Service Providers – Foreside Management Services, LLC (“FMS”) provides a Principal Executive Officer and Principal Financial Officer to the Trust. FMS has no role in determining the investment policies or which securities are to be sold or purchased by the Trust or its Funds.
BNYM provides custody services to the Trust.
BNY Mellon Investment Servicing (U.S.) Inc. provides fund accounting and transfer agency services to the Trust.
General – Certain Officers of the Trust are also Officers or employees of the above companies that provide services to the Funds, and during their terms of office, receive no compensation from the Funds. The Trust’s Statement of Additional Information includes additional information about the Trustees.
5. LINE OF CREDIT
Effective April 6, 2017, the Trust is participating in a $10,000,000 unsecured, committed revolving line of credit (“LOC”) agreement with BNYM. The LOC is available for extraordinary or emergency purposes, primarily for financing redemption payments. Borrowings are charged interest at a rate of 1.25% per annum over the greater of the Federal Funds Rate or the overnight LIBOR. The LOC includes a commitment fee of 0.15% per annum on the daily unused portion. The termination date of the current LOC is April 5, 2019.
The Funds did not utilize the LOC during the year ended April 30, 2018.
6. REORGANIZATION
REORGANIZATION - FISCAL YEAR 2017
On March 15, 2016, the Board approved an Agreement and Plans of Reorganization (the “Reorganizations”) which provided for the transfer of all the assets of the Tax-Exempt Money Market Fund and the Prime Money Market Fund, each a series of the Trust (the “Acquired Funds”), for shares of the U.S. Government Money Market Fund (the “Acquiring Fund”), respectively. The shareholders approved the Tax-Exempt Money Market Fund Reorganization at a meeting held on August 10, 2016 and the Reorganization closed on August 22, 2016. The shareholders of the Prime Money Market Fund, under applicable law, were not required to vote on the Reorganization. Therefore, the Reorganization closed on August 15, 2016. The acquisitions were accomplished through tax-free exchanges of assets and shares. For financial reporting purposes, the Acquiring Fund, the U.S. Government Money Market Fund, is deemed to be the accounting survivor.
ANNUAL REPORT / April 30, 2018
21 NOTES TO FINANCIAL STATEMENTS (continued)
| | | | | | | | | | | | | | | | |
| | | Value of Shares | | | Acquired Fund
Shares Prior to
Reorganization | | | Shares Issued
by Acquiring
Fund | | | Net Assets on
Date of
Reorganization | |
Acquiring Fund | | | | | | | | | | | | | | | | |
Wilmington U.S. Government Money Market Fund | | | | | | | | | | | | | | $ | 3,080,145,214 | |
Acquired Funds | | | | | | | | | | | | | | | | |
Wilmington Tax-Exempt Money Market Fund | | | | | | | | | | | | | | | 499,487,643 | |
Administrative Class shares in exchange for
Administrative Class shares | | $ | 52,603,411 | | | | 52,606,533 | | | | 52,606,533 | | | | | |
Select Class shares in exchange for Select Class shares | | | 385,623,982 | | | | 385,673,201 | | | | 385,673,201 | | | | | |
Service Class shares in exchange for Service Class shares | | | 61,260,250 | | | | 61,258,312 | | | | 61,258,312 | | | | | |
Wilmington Prime Money Market Fund | | | | | | | | | | | | | | | 3,723,283,847 | |
Administrative Class shares in exchange for
Administrative Class shares | | | 332,338,410 | | | | 332,388,733 | | | | 332,388,733 | | | | | |
Institutional Class shares in exchange for
Institutional Class shares | | | 320,775,976 | | | | 320,831,015 | | | | 320,831,015 | | | | | |
Select Class shares in exchange for Select Class shares | | | 2,339,113,616 | | | | 2,339,404,444 | | | | 2,339,404,444 | | | | | |
Service Class shares in exchange for Service Class shares | | | 731,055,845 | | | | 731,035,187 | | | | 731,035,187 | | | | | |
| | | | | | | | | | | | | | | | |
| | | | |
| | | | | | | | | | | | | | $ | 7,302,916,704 | |
| | | | | | | | | | | | | | | | |
The financial statements of the Acquiring Fund reflect the operations of the Acquiring Fund for the period prior to the Reorganizations and the combined fund for the period subsequent to the Reorganizations. Because each of the combined investment portfolios had been managed as a single integrated portfolio since the Reorganizations were completed, it is not practicable to separate the amounts of revenue and earnings of each Acquired Fund that had been included in the combined Fund’s Statement of Operations since the Reorganizations were completed. Assuming the Reorganizations had been completed on May 1, 2016, the pro forma net investment income, net realized gain on investments and net increase in net assets from operations for the twelve months through April, 2017 would have been $8,337,470, ($15,054) and $8,322,416.
7. RECENT REGULATORY UPDATES
On October 13, 2016, the Securities and Exchange Commission (the “SEC”) adopted new rules and forms and amended existing rules and forms which are intended to modernize and enhance the reporting and disclosure of information by registered investment companies and to improve the quality of information that funds provide to investors, including modifications to Regulation S-X which would require standardized, enhanced disclosure about derivatives in investment company financial statements. The new rules also enhance disclosure regarding fund liquidity and redemption practices. The compliance dates of the modifications to Regulation S-X was August 1, 2017 and other amendments and rules are generally June 1, 2018 and December 1, 2018. The financial statements presented are in compliance with the most recent Regulation S-X amendments.
8. SUBSEQUENT EVENTS
Management has evaluated events and transactions for potential recognition or disclosure in the financial statements through the date the financial statements were issued. Management has determined that there are no additional material events that would require recognition or disclosure in the Funds’ financial statements through this date.
April 30, 2018 / ANNUAL REPORT
22
REPORT OF INDEPENDENT REGISTERED PUBLIC ACCOUNTING FIRM
TO THE SHAREHOLDERS OF THE WILMINGTON U.S. GOVERNMENT MONEY MARKET FUND AND WILMINGTON U.S. TREASURY MONEY MARKET FUND AND THE BOARD OF TRUSTEES OF WILMINGTON FUNDS
Opinion on the Financial Statement
We have audited the accompanying statements of assets and liabilities of the Wilmington U.S. Government Money Market Fund and Wilmington U.S. Treasury Money Market Fund (the “Funds”) (two of the funds constituting the Wilmington Funds (the “Trust”)), including the portfolios of investments, as of April 30, 2018, and the related statements of operations for the year then ended, the statements of changes in net assets for each of the two years in the period then ended, the financial highlights for each of the five years in the period then ended and the related notes (collectively referred to as the “financial statements”). In our opinion, the financial statements present fairly, in all material respects, the financial position of each of the Funds (two of the funds constituting the Wilmington Funds) at April 30, 2018, the results of their operations for the year then ended, the changes in their net assets for each of the two years in the period then ended and their financial highlights for each of the five years in the period then ended, in conformity with U.S. generally accepted accounting principles.
Basis for Opinion
These financial statements are the responsibility of the Trust’s management. Our responsibility is to express an opinion on each of the Funds’ financial statements based on our audits. We are a public accounting firm registered with the Public Company Accounting Oversight Board (United States) (“PCAOB”) and are required to be independent with respect to the Trust in accordance with the U.S. federal securities laws and the applicable rules and regulations of the Securities and Exchange Commission and the PCAOB.
We conducted our audits in accordance with the standards of the PCAOB. Those standards require that we plan and perform the audit to obtain reasonable assurance about whether the financial statements are free of material misstatement, whether due to error or fraud. The Trust is not required to have, nor were we engaged to perform, an audit of the Trust’s internal control over financial reporting. As part of our audits, we are required to obtain an understanding of internal control over financial reporting but not for the purpose of expressing an opinion on the effectiveness of the Trust’s internal control over financial reporting. Accordingly, we express no such opinion
Our audits included performing procedures to assess the risks of material misstatement of the financial statements, whether due to error or fraud, and performing procedures that respond to those risks. Such procedures included examining, on a test basis, evidence regarding the amounts and disclosures in the financial statements. Our procedures included confirmation of securities owned as of April 30, 2018, by correspondence with the custodian and brokers or by other appropriate auditing procedures where replies from brokers were not received. Our audits also included evaluating the accounting principles used and significant estimates made by management, as well as evaluating the overall presentation of the financial statements. We believe that our audits provide a reasonable basis for our opinion.

We have served as the auditor of one or more Wilmington Funds’ investment companies since 1986.
Philadelphia, Pennsylvania
June 27, 2018
ANNUAL REPORT / April 30, 2018
23 BOARD OF TRUSTEES AND TRUST OFFICERS
BOARD OF TRUSTEES AND TRUST OFFICERS
The following tables give information about each Trustee and the senior officers of the Trust. The tables separately list Trustee members who are “interested persons” of the Fund (i.e., “Interested” Trustees) and those who are not (i.e., “Independent” Trustees). The Trust is comprised of 12 funds. Unless otherwise noted, the business address of each Trustee and senior officer is 111 South Calvert Street, 26th floor, Baltimore, Maryland 21202. Each Trustee oversees all portfolios of the Trust and serves for an indefinite term. The Trust’s Statement of Additional Information includes additional information about the Trustees and is available, without charge and upon request, by calling 1-800-836-2211.
INTERESTED TRUSTEES BACKGROUND
| | |
Name Address Birth Year Position With Trust Date Service Began | | Principal Occupations and Other Directorships Held for Past Five Years |
| |
Donald E. Foley* Birth year: 1951 TRUSTEE Began serving: December 2015 | | Principal Occupations: Director, BioSig Technologies (2015 to present); Director, AXA Equitable’s VIP Mutual Funds (2017 to present); Director, AXA Equitable (variable annuity) (2013 to present); Director, 1290 Mutual Funds (retail funds) (2013 to present); and Chairman and Director, Burke Rehabilitation Hospital Foundation (private hospital, research institute) (2005 to present). Other Directorships Held: Director, M&T Bank Corporation (commercial bank) (2011 to 2012); Chairman and Director, Wilmington Trust Corporation (commercial and trust bank) (2007 to 2011); Chairman, Director and President’s Council, Union College (private college) (2011 to 2015). Previous Positions: Advisory Member, Trust and Investment Committee, M&T Bank, Wilmington Trust, National Association, and Wilmington Trust Company (through 2016); Director of M&T Bank Corporation and M&T Bank (2011 to 2012); Chairman and Chief Executive Officer of Wilmington Trust Corporation (2010 to 2011); Senior Vice President and Treasurer at ITT Corporation (1996 to 2010); Assistant Treasurer at International Paper (1989 to 1996). |
Christopher D. Randall* Birth year: 1965 TRUSTEE Began serving: September 2015 PRESIDENT Began serving: September 2014 | | Principal Occupations: Senior Vice President, Wilmington Trust Corporation (2015 to present); Chief Operating Officer, Wilmington Trust Corporation (2012 to present); Senior Vice President, M&T Bank. Other Directorships Held: Trustee, Hilbert College (2015 to present). Previous Positions: President, Wilmington Retirement (2012 to 2015); President and Chief Executive Officer of Wilmington Trust Investment Advisors, Inc. and President of Wilmington Trust Investment Management, LLC (2014-2015); President, Mid-Atlantic Region Wealth Advisory Services, M&T Bank (2011 to 2013) |
| * | Christopher D. Randall is “interested” due to the positions he currently holds with the Funds, Wilmington Trust’s Wealth and Institutional Services Division, M&T Bank, the parent of the Fund’s Advisor, and previous positions held with WTIA and WFMC. Donald E. Foley is “interested” due to the positions he previously held with Wilmington Trust Corporation, M&T Bank Corporation and M&T Bank, the parent of the Fund’s Advisor. |
April 30, 2018 (unaudited) / ANNUAL REPORT
BOARD OF TRUSTEES AND TRUST OFFICERS 24
INDEPENDENT TRUSTEES BACKGROUND
| | |
Name Birth Year Position with Trust Date Service Began | | Principal Occupations and Other Directorships Held for Past Five Years |
| |
Nicholas A. Giordano Birth year: 1943 CHAIRMAN and TRUSTEE Began serving: March 2012 | | Principal Occupations: Consultant, financial services organizations (1997 to present). Other Directorships Held: Kalmar Pooled Investment Trust (through 6/17); The RBB Fund Inc. (19 portfolios) (registered investment companies); Independence Blue Cross; IntriCon Corporation (body-worn products) Previous Positions: Interim President, LaSalle University (1998 to 1999); President and Chief Executive Officer, Philadelphia Stock Exchange (1981 to 1997). |
Robert H. Arnold Birth year: 1944 TRUSTEE Began serving: March 2012 | | Principal Occupations: Managing Director, R.H. Arnold & Co, Inc. (financial management consulting) (6/89 to present). Other Directorships Held: Trustee, First Potomac Realty Trust (real estate investment trust) (5/03 to present); Director, Treasury Strategies, Inc. (private treasury consulting services) (6/01 to 6/16). |
Gregory P. Chandler Birth year: 1966 TRUSTEE Began serving: July 2017 | | Principal Occupations: Chief Financial Officer Emtec, Inc. (information technology services) (4/09 to present); President, GCVC Consulting (corporate governance consulting) (2008 to present). Other Directorships Held: Trustee, RBB Fund Series Trust (19 portfolios) (registered investment companies) (2012 to present); Director, Emtec, Inc. (8/2005 to present); Director, FS Investment Corporation (business development company) (2007 to present); Trustee, FS Energy Partners (business development company) (2009 to present). Previous Positions: Managing Director, Head of Business Services and IT Services Practice, Janney Montgomery Scott LLC (investment banking/brokerage) (2003 to 2009). |
John S. Cramer Birth year: 1942 TRUSTEE Began serving: December 2000 | | Principal Occupations: Retired. Other Directorships Held: Chairman and Director, CI Supply Corp. (medical supplies and equipment) (1/14 to 1/15); Director, Check Med Corp. (medical supplies and equipment) (6/08 to 1/14); Director, Highmark Blue Shield (health insurance) (2/01 to 6/10). Previous Positions: Consultant, Yaffe & Co. (compensation consultants) (6/02 to 6/12); President and Chief Executive Officer, Pinnacle Health Systems (nonprofit hospital and health care system in Central Pennsylvania) (through 2012). |
Daniel R. Gernatt, Jr. Birth year: 1940 TRUSTEE Began serving: February 1988 | | Principal Occupations: President and CEO, Gernatt Asphalt Products, Inc. (asphalt, sand and gravel products) (1979 to present). Other Directorships Held: Director, Roswell Park Alliance (2008 to 2016); Trustee, Gernatt Family Foundation. |
Richard B. Seidel Birth year: 1941 TRUSTEE Began serving: September 2003 | | Principal Occupations: Chairman, Seidel & Associates (legal consulting) (1/14 to present); Chairman, Girard Private Investment Group (registered investment adviser) (1/14 to present). Other Directorships Held: Director, Tristate Capital Holdings (9/07 to present). Previous Positions: Chairman, Girard Capital (broker-dealer) (1/10 to 2016); Chairman, Girard Partners, Ltd. (1/10 to 2016). |
ANNUAL REPORT / April 30, 2018 (unaudited)
25 BOARD OF TRUSTEES AND TRUST OFFICERS
OFFICERS
| | |
Name Address Birth Year Positions with Trust | | Principal Occupations for Past Five Years and Previous Positions |
Jeffrey M. Seling Birth year: 1970 ASSISTANT TREASURER Began serving: June 2013 VICE PRESIDENT Began serving: June 2007 | | Principal Occupations: Administrative Vice President, M&T Bank and Wilmington Trust Investment Advisors, Inc.; Assistant Treasurer, Wilmington Funds. Previous Positions: Vice President, MSD&T; Assistant Vice President, Wells Fargo Bank; Assistant Vice President, JP Morgan Chase Bank. |
John C. McDonnell Birth year: 1966 CHIEF OPERATIONS OFFICER Began serving: June 2017 | | Principal Occupations: Chief Operations Officer, Wilmington Funds and Wilmington Trust Investment Advisors, Inc.; Vice President, Wilmington Funds Management Corporation (2005 to present); Vice President, Wilmington Trust Investment Advisors, Inc. (2012 to present). Previous Positions: Vice President, Wilmington Trust Investment Management, LLC (2005 to 2012); Audit Senior, Deloitte LLP (2004 to 2005); Assistant Vice President, 1838 Investment Advisors, LP (1999 to 2004). |
Lisa Druelinger Birth year: 1978 CHIEF COMPLIANCE OFFICER and AML
COMPLIANCE OFFICER. Began serving: November 2017 | | Principal Occupations: Chief Compliance Officer and Anti-Money Laundering Officer, Wilmington Funds; Vice President, M&T Bank. Previous Positions: Vice President and Senior Compliance Officer, Wilmington Trust Investment Advisors, Inc. (2015-2017); Wilmington Funds Product Manager, Wilmington Trust Investment Advisors, Inc. (2013-2015); Institutional and Retirement Services Product Manager, Wilmington Trust (2011-2013); Trust Compliance and Risk Management at M&T Bank (2006- 2011). |
John J. Kelley Birth year: 1959 VICE PRESIDENT Began serving: December 2016 | | Principal Occupations: President, Wilmington Funds Management Corporation; Group Vice President and Chief Administrative Officer, Wilmington Trust Investment Advisors, Inc. Previous Positions: Vice President, BNY Mellon Investment Servicing (formerly PNC Global Investment Servicing), (1/05 to 7/05); Vice President of Administration, 1838 Investment Advisors, LP (1999 to 2005); Chief Compliance Officer, 1838 Investment Advisors, LP (2004 to 2005). |
Ralph V. Partlow, III 25 South Charles Street, 22nd floor Baltimore, MD 21201 Birth year: 1957 VICE PRESIDENT Began serving: June 2010 | | Principal Occupation: Administrative Vice President and Deputy General Counsel, M&T Bank (2003 to present). Previous Positions: Vice President and Senior Counsel, Allfirst Bank (1995 to 2003). |
Christopher W. Roleke 10 High Street, Suite 302 Boston, MA 02110 Birth year: 1972 CHIEF FINANCIAL OFFICER AND TREASURER Began serving: July 2013 | | Principal Occupation: Managing Director and Fund Principal Financial Officer, Foreside Management Services, LLC (2011 to present). Previous Positions: Assistant Vice President, JP Morgan Investor Services Co. (2006 to 2011). |
Lisa R. Grosswirth Atlantic Terminal Office Tower, 2 Hanson Place, 12th Floor Brooklyn, NY 11217 Birth year: 1963 SECRETARY Began serving: September 2007 | | Principal Occupation: Vice President, BNY Mellon Asset Servicing (2004 to present). Previous Positions: Supervisory Paralegal, The Dreyfus Corporation (1998 to 2004). |
April 30, 2018 (unaudited) / ANNUAL REPORT
BOARD OF TRUSTEES AND TRUST OFFICERS 26
| | |
Name Address Birth Year Positions with Trust | | Principal Occupations for Past Five Years and Previous Positions |
Richard J. Berthy Three Canal Plaza, Suite 100 Portland, ME 04101 Birth year: 1958 CHIEF EXECUTIVE OFFICER Began serving: September 2007 | | Principal Occupation: Chief Executive Officer, Foreside Financial Group, LLC (2012 to present). Previous Positions: President, Foreside Financial Group, LLC (2008 to 2012); Chief Administrative Officer, Foreside Financial Group, LLC (2005 to 2008); President and Secretary, Bainbridge Capital Management, LLC (2003 to 2006); Vice President, Bainbridge Capital Management (2002 to 2004). |
ANNUAL REPORT / April 30, 2018 (unaudited)
27
Shares of the Wilmington Funds are not FDIC insured or otherwise protected by the U.S. government, are not deposits or other obligations of, or guaranteed by, Manufacturers and Traders Trust Company, and are subject to investment risks, including possible loss of the principal amount invested.
VOTING PROXIES ON FUND PORTFOLIO SECURITIES
A description of the policies and procedures that the Funds use to determine how to vote proxies relating to securities held in the Funds’ portfolios is available, without charge and upon request, by calling 1-800-836-2211. A report on how the Funds voted any such proxies during the most recent 12-month period ended June 30 is available through Wilmington Funds’ website. Go to www.wilmingtonfunds.com select “Proxy Voting Record” to access the link. This information is also available from the Edgar database on the SEC’s website at www.sec.gov.
QUARTERLY PORTFOLIO SCHEDULE
The Funds file with the SEC a complete schedule of their portfolio holdings, as of the close of the first and third quarters of their fiscal year, on Form N-Q. These filings are available on the SEC’s website at www.sec.gov and may be reviewed and copied at the SEC’s Public Reference Room in Washington DC. (Call 1-800-SEC-0330 for information on the operation of the Public Reference Room.)
Electronic Delivery
Wilmington Funds encourages you to sign up for electronic delivery of investor materials. By doing so you will receive information faster, help lower shareholder costs, and reduce the impact to the environment. To enroll in electronic delivery:
| | 1.) | Go to www.wilmingtonfunds.com and select “Individual Investors” |
| | 2.) | Click on the link “Sign up for Electronic Delivery” |
| | 3.) | Login to your account or create new user ID |
| | 4.) | Select E-Delivery Consent from the available options, and |
| | 5.) | Complete the information requested, including providing the email address where you would like to receive notification for electronic documents. |
| * | If you hold your account through a financial intermediary, please contact your advisor to request electronic delivery of investor materials. |
Householding
In an effort to reduce volume of mail you receive, only one copy of the prospectus, annual/semi-annual report, SAI and proxy statements will be sent to shareholders who are part of the same family and share the same address.
If you would like to request additional copies of the prospectus, annual/semi-annual report or SAI, or wish to opt out of householding mailings, please contact Shareholder Services at 1-800-836-2211, or write to Wilmington Funds, P.O. Box 9828, Providence, RI 02940-8025.
April 30, 2018 / ANNUAL REPORT
28
PRIVACY POLICY AND NOTICE
OF THE FUNDS AND THEIR DISTRIBUTOR
June 8, 2012
The Wilmington Funds, their distributor and their agents (referred to as “the Funds”, “we” or “us”) recognize that consumers (referred to as “you” or “your”) expect us to protect both your assets and financial information. We respect your right to privacy and your expectation that all personal information about you or your account will be maintained in a secure manner. We are committed to maintaining the confidentiality, security and integrity of client and shareholder information. We want you to understand the Funds’ policy that governs the handling of your information, how the Funds gather information, how that information is used and how it is kept secure.
Information The Funds Collect:
The Funds collect nonpublic personal information about you from the following sources:
• We may receive information from you, or from your financial representative, on account applications, other forms or electronically (such as through the Funds’ website or other electronic trading mechanisms). Examples of this information include your name, address, social security number, assets and income.
• We may receive information from you, or from your financial representative, through transactions with us or others, correspondence and other communications. Examples of this information include specific investments and your account balances.
• We may obtain other personal information from you in connection with providing you a financial product or service. Examples of this information include depository, debit or credit account numbers.
Information Sharing Policy
The Funds may share nonpublic personal information about you, as described above, with financial or non-financial companies or other entities, including companies that may be affiliated with the Funds and other nonaffiliated third parties, for the following purposes:
• We may share information when it is necessary and required to process a transaction or to service a customer relationship. For example, information may be shared with a company that provides account record keeping services or a company that provides proxy services to shareholders.
• We may share information when it is required or permitted by law. For example, information may be shared in response to a subpoena or to protect you against fraud or with someone who has established a legal beneficial interest, such as a power of attorney.
• We may disclose some or all of the information described above to companies that perform marketing or other services on our behalf. For example, we may share information about you with the financial intermediary (bank, investment bank or broker-dealer) through whom you purchased the Funds’ products or services, or with providers of marketing, legal, accounting or other professional services. The Funds will not, however, disclose a consumer’s account number or similar form of access number or access code for credit card, deposit or transaction accounts to any nonaffiliated third party for use in telemarketing, direct mail or other marketing purposes.
Except as described above, the Funds do not share customer information. We will not rent, sell, trade, or otherwise release or disclose any personal information about you. Any information you provide to us is for the Funds’ use only. If you decide to close your account(s) or become an inactive customer, we will adhere to the privacy policies and practices as described in this notice.
Information Security:
When the Funds share nonpublic customer information with third parties hired to facilitate the delivery of certain products or services to our customers, such information is made available for limited purposes and under controlled circumstances designed to protect our customers’ privacy. We require third parties to comply with our standards regarding security and confidentiality of such information. We do not permit them to use that information for their own or any other purposes, or rent, sell, trade or otherwise release or disclose the information to any other party. These requirements are reflected in written agreements between the Funds and the third party service providers.
The Funds protect your personal information in several ways. We maintain physical, electronic, and procedural safeguards to guard your nonpublic personal information. In addition, the Funds’ Transfer Agent and Shareholder Servicing Agent have procedures in place for the appropriate disposal of nonpublic personal information when they are no longer required to maintain the information.
Each of the following sections explains an aspect of the Funds’ commitment to protecting your personal information and respecting your privacy.
Employee Access to Information:
Our Code of Ethics, which applies to all employees, restricts the use of customer information and requires that it be held in the strictest of confidence. Employee access to customer information is authorized for business purposes only, and the degree of access is based on the sensitivity of the information and on an employee’s or agent’s need to know the information in order to service a customer’s account or comply with legal requirements.
Visiting The Funds’ Website:
The Funds’ website gathers and maintains statistics about the number of visitors as well as what information is viewed most frequently. This information is used to improve the content and level of service we provide to our clients and shareholders.
ANNUAL REPORT / April 30, 2018
29
• Information or data entered into a website will be retained.
• Where registration to a website or re-entering personal information on a website is required, “cookies” are used to improve your online experience. A cookie is a way for websites to recognize whether or not you have visited the site before. It is a small file that is stored on your computer that identifies you each time you re-visit our site so you don’t have to resubmit personal information. Cookies provide faster access into the website.
• We may also collect non-personally identifiable Internet Protocol (“IP”) addresses for all other visitors to monitor the number of visitors to the site. These non-personally identifiable IP addresses are never shared with any third party.
E-mail:
If you have opted to receive marketing information from the Funds by e-mail, it is our policy to include instructions in all marketing messages on how to unsubscribe from subsequent e-mail programs. Some products or services from the Funds are intended to be delivered and serviced electronically. E-mail communication may be utilized in such cases. If you participate in an employer-sponsored retirement plan administered by the Funds, we may, at your employer’s request, send you e-mail on matters pertaining to the retirement plan.
Please do not provide any account or personal information such as social security numbers, account numbers, or account balances within your e-mail correspondence to us. We cannot use e-mail to execute transaction instructions, provide personal account information, or change account registration. We can, however, use e-mail to provide you with the necessary forms or you may contact customer service toll-free at 1-800-836-2211.
Surveys/Aggregate Data:
Periodically, the Funds may conduct surveys about financial products and services or review elements of customer information in an effort to forecast future business needs. The Funds then generate reports that include aggregate data regarding its customers. Aggregate data classifies customer information in various ways but that does not identify individual customers. These reports may also include information on website traffic patterns and related information. These reports are used for the Funds’ planning, statistical and other corporate purposes. Aggregate data may also be shared with external parties, such as marketing organizations. However, no information is shared by which any individual customer could be identified.
Changes to Our Privacy Statement:
The effective date of this policy is June 8, 2012. We reserve the right to modify this policy at any time. When it is revised or materially changed, we will update the effective date. You can determine whether there have been changes since the last time you reviewed by simply checking the effective date.
Notice will be provided to you in advance of any changes that would affect your rights under this policy statement
April 30, 2018 / ANNUAL REPORT
[This Page Intentionally Left Blank]
[This Page Intentionally Left Blank]
[This Page Intentionally Left Blank]
Investment Advisor Distributor
Wilmington Funds Management Corp. ALPS Distributors, Inc. 1100 North Market Street 1290 Broadway, Suite 1100 Wilmington, DE 19890 Denver, CO 80203
Sub-Advisor Fund Accountant, Co-Administrator, Transfer Agent
Wilmington Trust Investment Advisors and Dividend Disbursing Agent
111 South Calvert Street 26th Floor BNY Mellon Investment Servicing (U.S.) Inc. Baltimore, MD 21202 301 Bellevue Parkway Co-Administrator Wilmington, DE 19809 Wilmington Funds Management Corp. Independent Registered Public Accounting Firm
1100 North Market Street Ernst & Young LLP Wilmington, DE 19890 One Commerce Square Custodian 2005 Market Street, Suite 700 The Bank of New York Mellon Philadelphia, PA 19103 225 Liberty Street New York, NY 10286
WT-AR-MM-0418
Wilmington Funds | 1-800-836-2211 | www.wilmingtonfunds.com
We are pleased to send you this shareholder report for the Wilmington Funds. This report contains important information about your investments in the funds.
Item 2. Code of Ethics.
| | (a) | As of the end of the period covered by this report, the registrant has adopted a code of ethics (the “Section 406 Standards for Investment Companies—Ethical Standards for Principal Executive and Financial Officers”) that applies to the registrant’s Principal Executive Officer and Principal Financial Officer; the registrant’s Principal Financial Officer also serves as the Principal Accounting Officer |
| | (b) | There have been no amendments to the registrant’s code of ethics that apply to its Principal Executive Officer or Principal Financial Officer. |
| | (c) | There have been no amendments to the Funds’ code of ethics during the reporting period for this Form N-CSR. |
| | (d) | The registrant has not granted any waivers, including an implicit waiver, from any provisions of its code of ethics during the reporting period for this Form N-CSR. |
| | (f)(3) | The registrant hereby undertakes to provide any person, without charge, upon request, a copy of the code of ethics. To request a copy of the code of ethics, contact the registrant at 1-800-836-2211, and ask for a copy of the Section 406 Standards for Investment Companies—Ethical Standards for Principal Executive and Financial Officers. |
Item 3. Audit Committee Financial Expert.
The registrant’s Board has determined that each member of the Board’s Audit Committee is an “audit committee financial expert,” and that each such member is “independent,” for purposes of this Item. The Audit Committee consists of the following Board members: Gregory Chandler, Nicholas A. Giordano and John S. Cramer.
Item 4. Principal Accountant Fees and Services.
| | (a) | The Audit Fees. The aggregate fees billed for each of the last two fiscal years for professional services rendered by the principal accountant for the audit of the Registrant’s annual financial statements or services that are normally provided by the accountant in connection with statutory and regulatory filings or engagements were as follows: |
Fiscal year ended 2018—$458,863
Fiscal year ended 2017—$415,763
| | (b) | Audit-Related Fees. The aggregate fees billed for each of the last two fiscal years for professional services rendered by the principal accountant for assurance and related services by the principal accountant that are reasonably related to the performance of the audit of the Registrant’s financial statements and are not reported above in Item 4(a) were as follows: |
Fiscal year ended 2018—$0
Fiscal year ended 2017—$0
Amount requiring approval of the registrant’s audit committee pursuant to paragraph (c)(7)(ii) of Rule 2-01 of Regulation S-X, $0 and $0 respectively.
| | (c) | Tax Fees. The aggregate fees billed for each of the last two fiscal years for professional services rendered by the principal accountant for tax compliance, tax advice and tax planning were as follows: |
Fiscal year ended 2018—$169,194
Fiscal year ended 2017—$170,058
These tax services included review of federal and state income tax returns, federal excise returns, review of estimated excise distributions calculations and PFIC analyzer services.
Amount requiring approval of the registrant’s audit committee pursuant to paragraph (c)(7)(ii) of Rule 2-01 of Regulation S-X, $169,194 and $170,058 respectively.
| | (d) | All Other Fees. The aggregate fees billed in each of the last two fiscal years for products and services provided by the principal accountant, other than the services reported in paragraphs (a) and (c) of this Item were as follows: |
Fiscal year ended 2018—$0
Fiscal year ended 2017—$0
Amount requiring approval of the registrant’s audit committee pursuant to paragraph (c)(7)(ii) of Rule 2-01 of Regulation S-X, $0 and $0 respectively.
| (e)(1) | Audit Committee Policies regarding Pre-approval of Services. |
The Audit Committee is required to pre-approve audit and non-audit services performed by the independent auditor in order to assure that the provision of such services do not impair the auditor’s independence. Unless a type of service to be provided by the independent auditor has received general pre-approval, it will require specific pre-approval by the Audit Committee. Any proposed services exceeding pre-approved cost levels will require specific pre- approval by the Audit Committee.
Certain services have the general pre-approval of the Audit Committee. The term of the general pre-approval is 12 months from the date of pre-approval, unless the Audit Committee specifically provides for a different period. The Audit Committee will annually review the services that may be provided by the independent auditor without obtaining specific pre-approval from the Audit Committee and may grant general pre-approval for such services. The Audit Committee will revise the list of general pre-approved services from time to time, based on subsequent determinations. The Audit Committee will not delegate its responsibilities to pre-approve services performed by the independent auditor to management.
The Audit Committee has delegated pre-approval authority to its Chairman. The Chairman will report any pre-approval decisions to the Audit Committee at its next scheduled meeting. The Committee will designate another member with such pre-approval authority when the Chairman is unavailable.
AUDIT SERVICES
The annual Audit services engagement terms and fees will be subject to the specific pre-approval of the Audit Committee. The Audit Committee must approve any changes in terms, conditions and fees resulting from changes in audit scope, registered investment company (RIC) structure or other matters.
In addition to the annual Audit services engagement specifically approved by the Audit Committee, the Audit Committee may grant general pre-approval for other Audit Services, which are those services that only the independent auditor reasonably can provide. The Audit Committee has pre-approved certain Audit services, all other Audit services must be specifically pre-approved by the Audit Committee.
AUDIT-RELATED SERVICES
Audit-related services are assurance and related services that are reasonably related to the performance of the audit or review of the Company’s financial statements or that are traditionally performed by the independent auditor. The Audit Committee believes that the provision of Audit-related services does not impair the independence of the auditor, and has pre-approved certain Audit-related services, all other Audit-related services must be specifically pre-approved by the Audit Committee.
TAX SERVICES
The Audit Committee believes that the independent auditor can provide Tax services to the Company such as tax compliance, tax planning and tax advice without impairing the auditor’s independence. However, the Audit Committee will not permit the retention of the independent auditor in connection with a transaction initially recommended by the independent auditor, the purpose of which may be tax avoidance and the tax treatment of which may not be supported in the Internal Revenue Code and related regulations. The Audit Committee has pre-approved certain Tax services, all Tax services involving large and complex transactions must be specifically pre-approved by the Audit Committee.
ALL OTHER SERVICES
With respect to the provision of services other than audit, review or attest services the pre-approval requirement is waived if:
| | (1) | The aggregate amount of all such services provided constitutes no more than five percent of the total amount of revenues paid by the registrant, the registrant’s adviser (not including any sub-adviser whose role is primarily portfolio management and is subcontracted with or overseen by another investment adviser), and any entity controlling, controlled by, or under common control with the investment adviser that provides ongoing services to the registrant or to its accountant during the fiscal year in which the services are provided; |
| | (2) | Such services were not recognized by the registrant, the registrant’s adviser (not including any sub-adviser whose role is primarily portfolio management and is subcontracted with or overseen by another investment adviser), and any entity controlling, controlled by, or under common control with the investment adviser that provides ongoing services to the registrant at the time of the engagement to be non-audit services; and |
| | (3) | Such services are promptly brought to the attention of the Audit Committee of the issuer and approved prior to the completion of the audit by the Audit Committee or by one or more members of the Audit Committee who are members of the board of directors to whom authority to grant such approvals has been delegated by the Audit Committee. |
The Audit Committee may grant general pre-approval to those permissible non-audit services classified as All Other services that it believes are routine and recurring services, and would not impair the independence of the auditor.
The SEC’s rules and relevant guidance should be consulted to determine the precise definitions of prohibited non-audit services and the applicability of exceptions to certain of the prohibitions.
PRE-APPROVAL FEE LEVELS
Pre-approval fee levels for all services to be provided by the independent auditor will be established annually by the Audit Committee. Any proposed services exceeding these levels will require specific pre-approval by the Audit Committee.
PROCEDURES
Requests or applications to provide services that require specific approval by the Audit Committee will be submitted to the Audit Committee by both the independent auditor and the Principal Accounting Officer and/or Internal Auditor, and must include a joint statement as to whether, in their view, the request or application is consistent with the SEC’s rules on auditor independence.
| (e)(2) | Percentage of services identified in items 4(b) through 4(d) that were approved by the registrants audit committee pursuant to paragraph (c)(7)(i)(C) of Rule 2-01 of Regulation S-X: |
4(b)
Fiscal year ended 2018 – 0%
Fiscal year ended 2017 – 0%
Percentage of services provided to the registrant’s investment adviser and any entity controlling, controlled by, or under common control with the investment adviser that provides ongoing services to the registrant that were approved by the registrant’s audit committee pursuant to paragraph (c)(7)(i)(C) of Rule 2-01 of Regulation S-X, 0% and 0% respectively.
4(c)
Fiscal year ended 2018 – 0%
Fiscal year ended 2017 – 0%
Percentage of services provided to the registrant’s investment adviser and any entity controlling, controlled by, or under common control with the investment adviser that provides ongoing services to the registrant that were approved by the registrant’s audit committee pursuant to paragraph (c)(7)(i)(C) of Rule 2-01 of Regulation S-X, 0% and 0% respectively.
4(d)
Fiscal year ended 2018 – 0%
Fiscal year ended 2017 – 0%
Percentage of services provided to the registrant’s investment adviser and any entity controlling, controlled by, or under common control with the investment adviser that provides ongoing services to the registrant that were approved by the registrant’s audit committee pursuant to paragraph (c)(7)(i)(C) of Rule 2-01 of Regulation S-X, 0% and 0% respectively.
| (g) | Non-Audit Fees billed to the registrant, the registrant’s investment adviser, and certain entities controlling, controlled by or under common control with the investment adviser that provide ongoing services to the registrant: |
Fiscal year ended 2018 – $169,194
Fiscal year ended 2017 – $170,058
| (h) | The registrant’s Audit Committee has considered that the provision of non-audit services that were rendered to the registrant’s adviser (not including any sub-adviser whose role is primarily portfolio management and is subcontracted with or overseen by another investment adviser), and any entity controlling, controlled by, or under common control with the investment adviser that provides ongoing services to the registrant that were not pre-approved pursuant to paragraph (c)(7)(ii) of Rule 2-01 of Regulation S-X is compatible with maintaining the principal accountant’s independence. |
Item 5. Audit Committee of Listed Registrants.
Not applicable.
Item 6. Investments.
| (a) | Schedule of Investments in securities of unaffiliated issuers as of the close of the reporting period is included as part of the report to shareholders filed under Item 1 of this form. |
Item 7. Disclosure of Proxy Voting Policies and Procedures for Closed-End Management Investment Companies.
Not applicable.
Item 8. Portfolio Managers of Closed-End Management Investment Companies.
Not applicable.
Item 9. Purchases of Equity Securities by Closed-End Management Investment Company and Affiliated Purchasers.
Not applicable.
Item 10. Submission of Matters to a Vote of Security Holders.
No changes to report.
Item 11. Controls and Procedures.
| | (a) | The registrant’s principal executive officer and principal financial officer have concluded that the registrant’s disclosure controls and procedures (as defined in Rule 30a-3(c) under the Investment Company Act of 1940 (the “1940 Act”)) are effective, based on an evaluation of those controls and procedures made as of a date within 90 days of the filing date of this report as required by Rule 30a-3(b) under the 1940 Act and Rule 13a-15(b) under the Exchange Act. |
| | (b) | There has been no change in the registrant’s internal control over financial reporting (as defined in Rule 30a-3(d) under the 1940 Act) that occurred during the last fiscal quarter that has materially affected, or is reasonably likely to materially affect, the registrant’s internal control over financial reporting. |
Item 12. Disclosure of Securities Lending Activities for Closed-End Management Investment Companies.
Not applicable.
Item 13. Exhibits.
| | |
(a)(1) | | Not applicable. |
| |
(a)(2) | | Certifications pursuant to Rule 30a-2(a) under the 1940 Act and Section 302 of the Sarbanes-Oxley Act of 2002 are attached hereto. |
| |
(a)(3) | | Not applicable. |
| |
(a)(4) | | Not applicable. |
| |
(b) | | Certifications pursuant to Rule 30a-2(b) under the 1940 Act and Section 906 of the Sarbanes-Oxley Act of 2002 are attached hereto. |
SIGNATURES
Pursuant to the requirements of the Securities Exchange Act of 1934 and the Investment Company Act of 1940, the registrant has duly caused this report to be signed on its behalf by the undersigned, thereunto duly authorized.
| | |
| (Registrant) | | Wilmington Funds |
| | |
| |
| By (Signature and Title)* | | /s/ Richard J. Berthy |
| | Richard J. Berthy |
| | (Principal Executive Officer) |
Pursuant to the requirements of the Securities Exchange Act of 1934 and the Investment Company Act of 1940, this report has been signed below by the following persons on behalf of the registrant and in the capacities and on the dates indicated.
| | |
| By (Signature and Title)* | | /s/ Richard J. Berthy |
| | Richard J. Berthy |
| | (Principal Executive Officer) |
| | |
| |
| By (Signature and Title)* | | /s/ Christopher W. Roleke |
| | Christopher W. Roleke |
| | (Principal Financial Officer) |
| * | Print the name and title of each signing officer under his or her signature. |