UNITED STATES
SECURITIES AND EXCHANGE COMMISSION
Washington, D.C. 20549
FORMN-CSR
CERTIFIED SHAREHOLDER REPORT OF REGISTERED
MANAGEMENT INVESTMENT COMPANIES
Investment Company Act file number:811-05514
Wilmington Funds
(Exact name of registrant as specified in charter)
Wilmington Funds Management Corporation
Rodney Square North
1100 North Market Street
Wilmington, DE 19890
(Address of principal executive offices) (Zip code)
John McDonnell
Wilmington Funds Management Corporation
Rodney Square North
1100 North Market Street
Wilmington, DE 19890
(Name and address of agent for service)
Registrant’s telephone number, including area code:302-651-8409
Date of fiscal year end: April 30
Date of reporting period: April 30, 2020
FormN-CSR is to be used by management investment companies to file reports with the Commission not later than 10 days after the transmission to stockholders of any report that is required to be transmitted to stockholders under Rule30e-1 under the Investment Company Act of 1940 (17 CFR270.30e-1). The Commission may use the information provided on FormN-CSR in its regulatory, disclosure review, inspection, and policymaking roles.
A registrant is required to disclose the information specified by FormN-CSR, and the Commission will make this information public. A registrant is not required to respond to the collection of information contained in FormN-CSR unless the Form displays a currently valid Office of Management and Budget (“OMB”) control number. Please direct comments concerning the accuracy of the information collection burden estimate and any suggestions for reducing the burden to Secretary, Securities and Exchange Commission, 450 Fifth Street, NW, Washington, DC 20549-0609. The OMB has reviewed this collection of information under the clearance requirements of 44 U.S.C. § 3507.
Item 1. Reports to Stockholders.
The Report to Shareholders is attached herewith.

Wilmington International Fund (“International Fund”)
Wilmington Global Alpha Equities Fund (“Global Alpha Equities Fund”)
Wilmington Real Asset Fund (“Real Asset Fund”)
Wilmington Diversified Income Fund (“Diversified Income Fund”)

[This Page Intentionally Left Blank]
Esteemed Shareholder:
I am pleased to present the Annual Report of the Wilmington Funds (the “Trust”), covering the Trust’s annual fiscal year period of May 1, 2019, through April 30, 2020. Inside you will find a comprehensive review of the Trust’s holdings and financial statements.
The economy and financial markets in review
Wilmington Funds Management Corporation and Wilmington Trust Investment Advisors, Inc. (the Trust’s investment advisor and subadvisor, respectively), have provided the following review of the economy, bond markets, and stock markets for the Trust’s annual fiscal year period.
The economy
The last year brought a tale of two narratives for the global economy. During 2019 the global economy centered on trade, as escalating frictions between the U.S. and China disrupted global supply chains and weighed heavily on sentiment. The announcement of a phase one trade deal between the two sides in October, and progression toward the deal’s completion in December, fueled hopes for the possibility of a cyclical recovery in early 2020. Despite weakness in business investment, a byproduct of the trade war, the U.S. recorded Gross Domestic Product (“GDP”) growth of 2.3% (seasonally adjusted) in 2019, thanks to notable strength in consumer spending. Optimism abruptly reversed course in late February of 2020 asCOVID-19, the infectious disease caused by the most recently discovered coronavirus, evolved from an outbreak to a global pandemic. Governments worldwide implemented strict lockdown measures to curb the virus’s spread, relegating consumers to their homes and forcingnon-essential businesses to shutter. With economic activity grinding to a near standstill by the end of March, U.S. GDP declined by 4.8% (seasonally adjusted annualized rate) in the first quarter, providing an early glimpse into what is expected to be a materially weaker second quarter. As demand receded in April, gauges of manufacturing and services activity tumbled into contraction territory, core inflation dropped by a record 0.4% (month-over-month) and the U.S. unemployment rate spiked to 14.7%, its highest level since the Great Depression.
The fiscal and monetary response in the U.S. has been unparalleled historically, in its scale and speed of implementation. After delivering three rate cuts in 2019, the Federal Reserve (the “Fed”) lowered rates further by a cumulative 150 basis points1 in the first quarter of 2020 and moved to open-ended purchases of Treasuries and agency Mortgage-Backed Securities/Collateralized Mortgage-Backed Securities. Additionally, the Fed introduced a plethora of accommodations to support financial markets, businesses and governments. The Fed entered uncharted territory by creating new facilities to purchase corporate debt and fixed income ETFs, and later broadened their scope to include segments of the high yield market. The Federal government introduced roughly $3 trillion of fiscal stimulus through three pieces of legislation to provide direct support to consumers, businesses and governments, cushion the pandemic’s economic impact and accelerate the nation’s healthcare response.
Emerging and international developed economies, which are more export dependent than the U.S., were hit particularly hard by the trade war in 2019, with the global manufacturing sector moving into contraction in the third quarter, before showing signs of life towards the end of the year. A cyclical rebound appeared to be picking up steam in China, beforeCOVID-19 emerged in its central province of Wuhan. As the first economy affected, China offered a preview to the rest of the world of the virus’s potential impact. After GDP growth decelerated in 2019, to its slowest pace in 30 years, China registered a record decline in the first quarter 2020. The Euro zone and UK economies suffered a tremendous economic toll as countrywide lockdown orders were set into motion and GDP contracted in the first quarter. Central banks outside the U.S. followed the Fed’s lead, in introducing record volumes of accommodation, while the fiscal response across international economies has been massive in scale.
Bond markets
The 2019 calendar year marked a strong period for bond markets, particularly for investment grade corporates, which posted their best annual performance since 2002 as rates fell precipitously and spreads compressed to near decade lows. However, the first quarter of 2020 brought one of the most volatile quarters in recent memory as theCOVID-19 pandemic challenged corporate balance sheets and severely hampered liquidity. Taxable corporate credit spreads (interest rate in excess of the risk-free rate) and the ratio of high gradetax-exempt yields to Treasuries of equivalent maturity surged to decade highs. The10-year Treasury yield plummeted to anall-time low as the Federal Reserve slashed rates to zero and investors sought safety. The Federal Reserve moved to open-ended quantitative easing and arranged a broad menu of facilities to enhance market liquidity and expand access to credit. The Fed’s pledge to provide direct support to corporate bond markets, for the first time in history, helped drive taxable spreads materially lower and boosted performance through the end of April. The energy sector weighed heavily on performance for corporates as the price of oil plunged to a historic record low. The more vulnerable high yield sector saw fundamentals deteriorate asymmetrically and lagged high grade peers in therisk-off environment.
PRESIDENT’S MESSAGE / April 30, 2020 (unaudited)
ii
For the12-month period May 1, 2019 to April 30, 2020, certain Bloomberg Barclays indices performed as follows:2
| | | | | | | | |
Bloomberg Barclays U.S. Treasury Bond Index3 | | Bloomberg Barclays
U.S. Aggregate Bond Index4 | | Bloomberg Barclays
U.S. Credit Bond Index5 | | Bloomberg Barclays
Municipal Bond Index6 | | Bloomberg Barclays
U.S. Corporate High
Yield Bond Index7 |
14.27% | | 10.84% | | 9.37% | | 2.16% | | -4.11% |
Past performance is no guarantee of future results. Short term performance may not be indicative of long term results.
Source: Lipper. You cannot invest directly in an index.
Equity markets
The past year brought a continuation of the predominant equity market trends observed in the second half of 2018, namely the dominance of U.S. over international equities, developed over emerging markets, growth over value and large over small cap. U.S. large cap equities capped off their second best annual performance of the decade in the 2019 calendar year and benefitted from corporate earnings that came in better than feared, supportive monetary policy and trade optimism from October through January. International developed and emerging market equities, which are more leveraged to global trade, suffered disproportionately throughout theUS-China tariff disaster, while persistent dollar strength and investors’ preference for safe-haven assets presented additional headwinds for the international group. Risk appetite prevailed through January but was abruptly derailed as theCOVID-19 outbreak escalated rapidly to a global pandemic and brought the longest bull market in history to a painful end. The selloff that transpired from February to late March was indiscriminate, affecting all regions with unsettling speed and magnitude, although winners and losers emerged during the subsequent rebound from March lows. Notably, U.S. small cap companies, which are more cyclical in nature, bore the brunt of the selloff, as the pandemic introduced a punishing blow to economic activity.Mega-cap technology stocks emerged as relative safe havens and proved more resilient than the broader market with earnings less impacted by the economic damage.
For the12-month period May 1, 2019 to April 30, 2020, certain stock market indices performed as follows:
| | | | | | |
| S&P 500 Index8 | | Russell 2000 Index9 | | MSCI EAFE (Net) Index10 | | MSCI Emerging Markets (Net) Index11 |
0.86% | | -16.39% | | -11.34% | | -12.00% |
Past performance is no guarantee of future results. Short term performance may not be indicative of long term results.
Source: Lipper. You cannot invest directly in an index.
As investors know all too well, uncertainty in financial markets is certain. Other ongoing certainties include our fiduciary, clients-first mindset as we strive to manage risk in your portfolio’s assets. Another constant is our disciplined yet flexibleeconomics-led investment process that is delivered through innovative multi-asset class solutions and is designed to help you achieve your long-term objectives.
Sincerely,

Dominick J. D’Eramo, CFA
President
May 15, 2020
April 30, 2020 (unaudited) / PRESIDENT’S MESSAGE
Must be preceded or accompanied by a prospectus.
Past performance is no guarantee of future results. The index performance quoted is for illustrative purposes only and is not representative of any specific investment. Diversification does not ensure a profit nor protect against loss.
All investments involve risk, including the possible loss of principal. Equity Securities are subject to price fluctuation and possible loss of principal. Small- andmid-cap stocks involve greater risks and volatility thanlarge-cap stocks. International investments are subject to special risks, including currency fluctuations, social, economic, and political uncertainties, which could increase volatility. These risks are magnified in emerging markets.
High-yield, lower-rated securities generally entail greater market, credit, and liquidity risks than investment grade securities and may include higher volatility and higher risk of default.
1. Basis Points (“BPS”) is a unit that is equal to 1/100th of 1% and is used to denote the change in a financial instrument. The basis point is commonly used for calculating changes in interest rates, equity indices and the yield of a fixed-income security.
2. Bond prices are sensitive to changes in interest rates and a rise in interest rates can cause decline in their prices.
3. Bloomberg Barclays U.S. Treasury Bond Index is a market capitalization weighted index that includes all publicly issued, U.S. Treasury securities that have a remaining maturity of at least one year, are rated investment-grade, and have $250 million or more of outstanding face value. The index is unmanaged and investments cannot be made directly in an index.
4. Bloomberg Barclays U.S. Aggregate Bond Index is widely used benchmark index for the domestic investment-grade bond market composed of securities from the Barclays Government/Corporate Bond Index, Mortgage-Backed Securities Index and Asset-Backed Securities Index. The index typically includes fixed income securities with overall intermediate- to long-term average maturities. The index is unmanaged and investments cannot be made directly in an index.
5. Bloomberg Barclays U.S. Credit Bond Index tracks the performance of domestic investment-grade corporate bonds and is composed of all publicly issued, fixed-rate, nonconvertible, investment-grade corporate debt. The index is unmanaged and investments cannot be made directly in an index.
6. Bloomberg Barclays Municipal Bond Index tracks the performance of long-term,tax-exempt, investment-grade bond market. To be included in the index, bonds must have an outstanding par balance of at least $7 million and be issued as part of a transaction of at least $75 million. The index is unmanaged and investments cannot be made directly in an index.
7. Bloomberg Barclays U.S. Corporate High Yield Bond Index measures theUSD-denominated, high yield, fixed-rate corporate bond market. Securities are classified as high yield if the middle rating of Moody’s, Fitch, and S&P is Ba1/BB+/BB+ or below. Bonds from issuers with an emerging markets country of risk, based on the Bloomberg Barclays EM country definition, are excluded. The U.S. Corporate High Yield Bond Index is a component of the U.S. Universal and Global High Yield Indices. An investment cannot be made directly in an index.
8. The S&P 500 Index is a capitalization-weighted index of 500 stocks designed to measure performance of the broad domestic economy through changes in the aggregate market value of 500 stocks representing all major industries. The index is unmanaged and investments cannot be made directly in an index.
9. The Russell 2000 Index measures the performance of the 2,000 smallest companies in the Russell 3000 Index, which represents approximately 8% of the total market capitalization of the Russell 3000 Index. As of its latest reconstitution, the index had a total market capitalization range of $152.3 million to $5 billion.
10. MSCI EAFE (Net) Index is a free float-adjusted market capitalization index that is designed to measure equity market performance of developed markets, excluding the U.S. & Canada. The MSCI EAFE Index is an equity index which captures large andmid-cap representation across 21 Developed Market countries: Australia, Austria, Belgium, Denmark, Finland, France, Germany, Hong Kong, Ireland, Israel, Italy, Japan, Netherlands, New Zealand, Norway, Portugal, Singapore, Spain, Sweden, Switzerland and the United Kingdom. The index is unmanaged and investments cannot be made directly in an index. The performance of this index is reduced by the taxes on dividends paid by the international securities issuers in the index.
11. MSCI Emerging Markets (Net) Index is a free float-adjusted market capitalization index that is designed to measure equity market performance of emerging markets. The MSCI Emerging Markets Index captures large andmid-cap representation across 26 Emerging Market countries: Argentina, Brazil, Chile, China, Colombia, Czech Republic, Egypt, Greece, Hungary, India, Indonesia, Korea, Malaysia, Mexico, Pakistan, Peru, Philippines, Poland, Qatar, Russia, Saudi Arabia, South Africa, Taiwan, Thailand, Turkey, and United Arab Emirates. The index is unmanaged and investments cannot be made directly in an index. The performance of this index is reduced by the taxes on dividends paid by the international securities issuers in the index.
PRESIDENT’S MESSAGE / April 30, 2020 (unaudited)
1
WILMINGTON INTERNATIONAL FUND
Management’s Discussion of Fund Performance
For the fiscal year ended April 30, 2020, Wilmington International Fund (the “Fund”) had a total return of-12.35%* for Class A Shares and-12.28%* for Class I Shares, versus its benchmark, the MSCI – All Country Worldex-US Index (Net, USD) ( MSCI ACW Iex-US)** which had a total return of-11.51%. The MSCI ACWIex-US is a free float-adjusted market capitalization index that is designed to measure developed and emerging market equity performance, excluding the United States.
International equity markets exhibited considerable volatility during May through December 2019, mainly due to uncertainty around U.S. – China trade negotiations. Then, inmid-January 2020,COVID-19 burst out of Wuhan, rapidly spreading to elsewhere in Asia, Europe, and North America. Country after country imposed severe public health measures, with adverse economic impacts. Anticipating an acute global recession, international equity markets plunged in late February, reaching a trough in late March, before stabilizing. As the fiscal year ended, markets had partially recovered, on optimism that public health measures were beginning to work, and that economies couldre-open.
Global investors favored technology stocks over energy and financial stocks throughout the fiscal year, particularly during theCOVID-19 market drawdown. Share prices for energy stocks collapsed due to the combination of falling oil demand and conflict between Saudi Arabia and Russia over supply constraints. Share prices for European banks sharply dropped as regulatory authorities ordered dividend and buyback suspensions. The Fund’s slight overweight to technology stocks, and slight underweights to energy and financial stocks, made a significant positive contribution to excess return. However, the Fund’s underweight to consumer staples stocks, which tend to outperform during market downturns, hurt performance.
Likewise, investors favored stocks offering high-quality, sustainable earnings growth. This was particularly the case during the market drawdown, as investors grappled with uncertainty over the likely depth and duration of the emergent global recession. The Fund’s modest tilt toward high-quality growth stocks made a significant positive contribution to its excess return. However, the Fund’s tilt toward smaller capitalization stocks, which tend to underperform during market downturns, detracted from performance.
Global investors preferred stocks domiciled in Japan and Asiaex-Japan over those domiciled in Europe. Japanese stocks benefitted during the market drawdown, as well as during the preceding volatility, as investors sought the perceived “safe haven” ofyen-denominated assets. The Fund’s slight overweight to Japan was helpful. By the end of the fiscal year, much of Asiaex-Japan had already emerged from lockdown, with Europe still contemplating plans forre-opening. The Fund was slightly overweight to each Asiaex-Japan and Europe, so the regional performance difference was not impactful.
The emergent global recession weighed heavily on the stock markets and currencies of commodity producing countries, namely Australia, Brazil, Canada, and South Africa. The Fund had meaningful underweights to such stocks, which contributed to the portfolio’s excess return.
It should be noted that reported fiscal year performance was impacted by the application of fair valuation to calculation of the Fund’s Net Asset Value on April 30th, the last day of the fiscal year. The intraday decline in the Russell 1000 (U.S. large cap) index met the threshold for triggering a downward adjustment to the Fund’s Net Asset Value.
| | * | Performance data quoted represents past performance, which is no guarantee of future results. Investment return and principal value will fluctuate so that an investor’s shares, when redeemed, may be worth more or less than their original cost. The total return shown assumes the reinvestment of all distributions and does not reflect the deduction of taxes that a shareholder would pay on fund distributions or the redemption of shares. The total return for Class A Shares was-17.21%, adjusted for the Fund’s maximum sales charge of 5.50%. Mutual fund performance changes over time and current performance may be lower or higher than what is stated. For the most recentmonth-end performance, please visit www.wilmingtonfunds.com or call1-800-836-2211. |
| | ** | The MSCI All Country Worldex-US Index (Net, USD) (MSCI ACWIex-US) is a free float-adjusted market capitalization weighted index that is designed to measure the equity market performance of developed and emerging markets, excluding the United States. The MSCI ACWIex-US consists of 48 country indices comprising 22 developed and 26 emerging market country indices. The developed market country indices included are: Australia, Austria, Belgium, Canada, Denmark, Finland, France, Germany, Hong Kong, Ireland, Israel, Italy, Japan, Netherlands, New Zealand, Norway, Portugal, Singapore, Spain, Sweden, Switzerland, and the United Kingdom. The emerging market country indices included are: Argentina, Brazil, Chile, China, Colombia, Czech Republic, Egypt, Greece, Hungary, India, Indonesia, Korea, Malaysia, Mexico, Pakistan, Peru, Philippines, Poland, Qatar, Russia, Saudi Arabia, South Africa, Taiwan, Thailand, Turkey and United Arab Emirates. The index is unmanaged and it is not possible to invest directly in an index. |
International investing involves special risks including currency risks, increased volatility of foreign securities, political risks and differences in auditing and other financial standards.
April 30, 2020 (unaudited) / ANNUAL REPORT
WILMINGTON INTERNATIONAL FUND
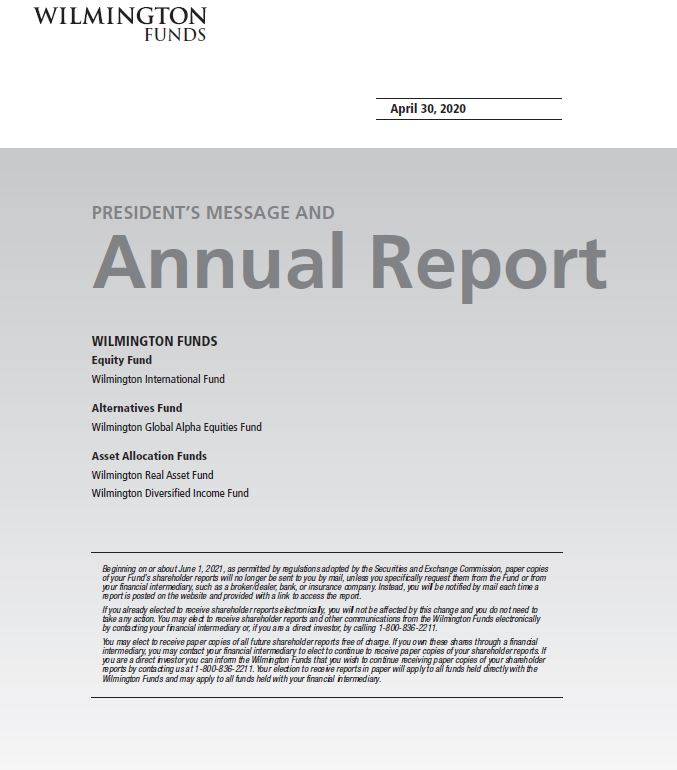
The graphs below illustrate the hypothetical investment of $10,0001 in the Class A Shares and $1,000,0001 in the Class I Shares of Wilmington International Fund from April 30, 2010 to April 30, 2020, compared to the MSCI ACWIex-US Net Index2.
VALUE OF A HYPOTHETICAL $10,000 INVESTMENT
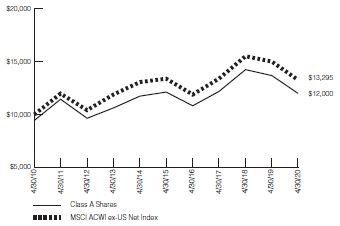
VALUE OF A HYPOTHETICAL $10,000,000 INVESTMENT
Performance data quoted represents past performance, which is no guarantee of future results. Investment return and principal value will fluctuate so that an investor’s shares, when redeemed, may be worth more or less than their original cost. The total return shown assumes the reinvestment of all distributions and does not reflect the deduction of taxes that a shareholder would pay on fund distributions or the redemption of shares. The total return for Class A Shares was-17.21%, adjusted for the Fund’s maximum sales charge of 5.50%. Mutual fund performance changes over time and current performance may be lower or higher than what is stated. For the most recentmonth-end performance, please visit www.wilmingtonfunds.com or call1-800-836-2211.
| | | | | | |
| | | Average Annual Total Returns for the Periods Ended 4/30/20 |
| | | | |
| | | 1 Year | | 5 Years | | 10 Years |
| | | |
Class A^ | | -17.21% | | -1.36% | | 1.84% |
| | | |
Class I^ | | -12.28% | | -0.10% | | 2.57% |
| | | |
MSCI ACWIex-US Net Index2 | | -11.51% | | -0.17% | | 2.89% |
^Expense Ratios Before Waivers and Expense Ratios After Waivers for Class A are 1.53% and 1.00%, respectively. Expense Ratios Before Waivers and Expense Ratios After Waivers for Class I are 1.28% and 0.87%, respectively. Expense Ratios Before Waiver represent the operating costs borne by the Fund, expressed as a percentage of the Fund’s average net assets, as shown in the Fees and Expenses table in the Fund’s current prospectus (under “Total Annual Fund Operating Expenses”). Current information regarding the Fund’s Operating Expenses can be found in the Fund’s Financial Highlights.
| 1 | Represents a hypothetical investment of $10,000 in Class A of the Fund after deducting the maximum sales charge of 5.50% ($10,000 investment minus $550 sales charge = $9,450) and $1,000,000 in Class I of the Fund and assumes the reinvestment of all dividends and distributions. |
| 2 | The performance for the MSCI ACWIex-US Net Index assumes the reinvestment of all dividends and distributions but does not reflect the deduction of a sales charge required for the Fund’s performance by the Securities and Exchange Commission. The performance of this index is reduced by the taxes on dividends paid by the international securities issuers in the index. It is not possible to invest directly in an index and the represented index is unmanaged. |
ANNUAL REPORT / April 30, 2020 (unaudited)
3
WILMINGTON GLOBAL ALPHA EQUITIES FUND
Management’s Discussion of Fund Performance
For the fiscal year ended April 30, 2020, the Wilmington Global Alpha Equities Fund (the “Fund”) had a total return of-2.57%* for Class A Shares and-2.31%* for Class I Shares, versus its benchmark, the HFRX Equity Hedge Fund Index**, which had a total return of-6.00%. The Fund also outperformed its Morningstar peer group (US Long-Short Equity), which returned-4.86%.
During the fiscal year that ended April 30, 2020, the Fund had strong risk-adjusted performance and met its objective of providing downside protected, hedged equity exposure.
The Fund outperformed both its benchmark and its peers, reducing the amount capital decreased during a volatile period. The Fund had a maximum peak to trough drawdown during the period of only 15.4% versus 20.4% for the peer group and nearly 34% for the MSCI ACWI.
The Fund is a portfolio of long only equity strategies run by Wellington’s different portfolio management teams overseen and hedged with market futures by Wellington’s Investment Strategy and Risk Team.
For the year, the long only equity strategies performed roughlyin-line with Global Equities as represented by the MSCI ACWI Index. The Fund was helped by stock selection, though it was hurt considerably by sector selection, where the Fund was underweight tech and overweight industrials. Country selection was slightly negative, as the Fund was hurt by its overweight to Europe and underweight to US, but was helped by its overweight to Japan.
From an underlying strategy perspective four Portfolio Managers outperformed significantly, three underperformed and the rest were roughlyin-line with their benchmarks. The top performer was a manager who focused on high quality companies with an overweight to U.S. markets. The poorest performer was an international value manager – a style that was very out of favor.
The Fund uses equity index futures to reduce the Fund’s net long exposure to the global equity market. The use of equity index futures contributed significantly to performance as the hedges were highly profitable during the first quarter of 2020.
| | * | Performance data quoted represents past performance, which is no guarantee of future results. Investment return and principal value will fluctuate so that an investor’s shares, when redeemed, may be worth more or less than their original cost. The total return shown assumes the reinvestment of all distributions and does not reflect the deduction of taxes that a shareholder would pay on fund distributions or the redemption of shares. The total return for Class A Shares was-7.96%, adjusted for the Fund’s maximum sales charge of 5.50%. Mutual fund performance changes over time and current performance may be lower or higher than what is stated. For the most recentmonth-end performance, please visit www.wilmingtonfunds.com or call1-800-836-2211. |
| | ** | The HFRX Equity Hedge Fund Index measures the performance of hedge fund strategies that primarily maintain long and short positions in equity and equity derivative securities. Equity Hedge managers typically maintain at least 50%, and in some cases may be entirely invested in equity-related securities, both long and short. Managers may employ a broad range of processes and strategies, including both quantitative and fundamental techniques, as well as net exposures, level of concentration, use of leverage, holding periods, and market capitalizations. The Index is weighted by asset size among reporting funds, which must have at least $50 million in assets or have been active for at least 12 months. The index is unmanaged and it is not possible to invest directly in an index. |
Investing involves risk and you may incur a profit or a loss. Investments such as mutual funds which focus on alternative strategies are subject to increased risk and loss of principal and are not suitable for all investors. Diversification does not ensure a profit or guarantee against a loss. There is no assurance that any investment strategy will be successful. Any investment in the Fund should be part of an overall investment program rather than, in itself, a complete program. Because the Fund invests in underlying mutual funds or other managed strategies, an investor in the Fund will bear the management fees and operating expenses of the “Underlying Strategies” in which the Fund invests. The total expenses borne by an investor in the Fund will be higher than if the investor invested directly in the Underlying Strategies, and the returns may therefore be lower.
The Fund, theSub-Advisers, and the Underlying Strategies may use aggressive investment strategies, which are riskier than those used by typical mutual funds. If the Fund andSub-Advisers are unsuccessful in applying these investment strategies, the Fund and you may lose more money than if you had invested in another fund that did not invest aggressively. The Fund is subject to risks associated with theSub-Advisers making trading decisions independently, investing in other investment companies, using a particular style or set of styles, basing investment decisions on historical relationships and correlations, trading frequently, using leverage, making short sales, beingnon-diversified, and investing in securities with low correlation to the market. The use of leverage may magnify losses.
The Fund is also subject to risks associated with investments in foreign markets, emerging market securities, small cap companies, debt securities, derivatives, commodity-linked instruments, illiquid securities, asset-backed securities, and Collaterized Mortgage Obligations (“CMO”). Please see the prospectus and summary prospectus for information on these as well as other risk considerations.
April 30, 2020 (unaudited) / ANNUAL REPORT
WILMINGTON GLOBAL ALPHA EQUITIES FUND
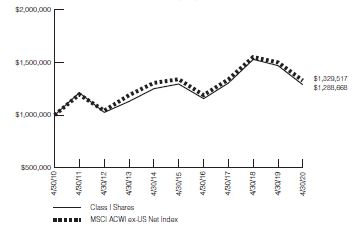
The graphs below illustrate the hypothetical investment of $10,0001 in the Class A Shares and $1,000,0001 in the Class I Shares of the Wilmington Global Alpha Equities Fund from January 12, 2012 (start of performance) to April 30, 2020 compared to the HFRX Equity Hedge Fund Index2.
| | |
VALUE OF A HYPOTHETICAL $10,000 INVESTMENT | | VALUE OF A HYPOTHETICAL $1,000,000 INVESTMENT |
Performance data quoted represents past performance, which is no guarantee of future results. Investment return and principal value will fluctuate so that an investor’s shares, when redeemed, may be worth more or less than their original cost. The total return shown assumes the reinvestment of all distributions and does not reflect the deduction of taxes that a shareholder would pay on fund distributions or the redemption of shares. The total return for Class A Shares was-7.96%, adjusted for the Fund’s maximum sales charge of 5.50%. Mutual fund performance changes over time and current performance may be lower or higher than what is stated. For the most recentmonth-end performance, please visit www.wilmingtonfunds.com or call1-800-836-2211.
| | | | | | |
| | | Average Annual Total Returns for the Periods Ended 4/30/20 |
| | | | |
| | | 1 Year | | 5 Year | | Start of Performance (1/12/2012) |
| | | |
Class A^ | | -7.96% | | 0.07% | | 1.49% |
| | | |
Class I^ | | -2.31% | | 1.49% | | 2.45% |
| | | |
HFRX Equity Hedge Fund Index2 | | -6.00% | | -1.14% | | 1.60% |
^Expense Ratios Before Waivers and Expense Ratios After Waivers for Class A are 2.37% and 1.50%, respectively. Expense Ratios Before Waivers and Expense Ratios After Waivers for Class I are 2.12% and 1.25%, respectively. Expense Ratios Before Waiver represent the operating costs borne by the Fund, expressed as a percentage of the Fund’s average net assets, as shown in the Fees and Expenses table in the Fund’s current prospectus (under “Total Annual Fund Operating Expenses”). Current information regarding the Fund’s Operating Expenses can be found in the Fund’s Financial Highlights.
| 1 | Represents a hypothetical investment of $10,000 in Class A of the Fund after deducting the maximum sales charge of 5.50% ($10,000 investment minus $550 sales charge = $9,450) and $1,000,000 in Class I of the Fund and assumes the reinvestment of all dividends and distributions. |
| 2 | The performance for the HFRX Equity Hedge Fund Index assumes the reinvestment of all dividends and distributions but does not reflect the deduction of a sales charge required for the Fund’s performance by the Securities and Exchange Commission. It is not possible to invest directly in an index and the represented index is unmanaged. |
ANNUAL REPORT / April 30, 2020 (unaudited)
5
WILMINGTON REAL ASSET FUND
Management’s Discussion of Fund Performance
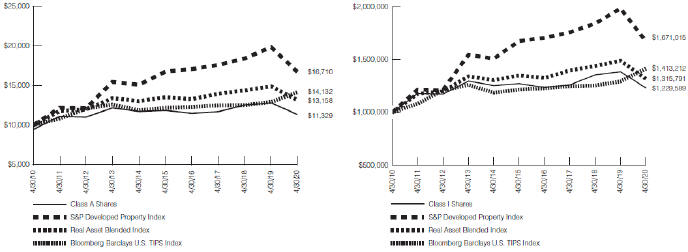
For the fiscal year ended April 30, 2020, Wilmington Real Asset Fund (the “Fund”) had a total return of-11.35%* for Class A Shares and-11.13%* for Class I Shares, versus its benchmark, the S&P Developed Property Index**, the Bloomberg Barclays U.S. Treasury Inflation Protected Securities Index (“Bloomberg Barclays U.S. TIPS Index”)***, and the Real Asset Blended Index, which had total returns of-15.73%, 9.46% and-11.53%, respectively.
Effective January 1, 2020, the Real Asset Blended Index is a mix of 37.5% S&P Developed Property Index, 37.5% Bloomberg Commodity Index (Total Return)****, and 25% Bloomberg Barclays U.S. TIPS Index. During this period, the Fund was hurt by its underweight to TIPS and overweight to Real Estate, but this was offset by its underweight to Commodities/Other Real Assets.
U.S. inflation-linked bond (“ILB”) markets posted strong returns for the fiscal year as real yields fell across the curve, first due to the end and reversal of the Federal Reserve (the “Fed”) hiking cycle and then with accelerated rate cuts, and flight to quality as the virus wreaked havoc to risk assets worldwide. ILB’s trailed nominal bonds, however, as already low inflation expectations plummeted in Q1 2020, which saw 10 year inflation expectations fall to 50 basis points inmid-March down from 1.8% to begin the year. The Fund reduced its TIPS exposure to zero on the view that with low nominal yields and little to no inflation for the foreseeable future, forward looking returns for TIPS are not compelling. The Fund’s TIPS exposure trailed the index slightly as TIPS continued to rally after the Fund began reducing its exposure.
Global real estate securities, as measured by the S&P Developed Property Index, were down around 16% for the fiscal year. After a strong 2019, real estate saw a dramatic fall in February and March of 2020, before recovering somewhat in April. The U.S. slightly outperformed international markets as U.S. risk assets continued to outperform foreign assets, and the strong U.S. dollar further hurt international markets. The Fund’s real estate sleeve slightly under-performed the index, as the Fund was overweight international for much of the period and also had some exposure to emerging markets real estate, which trailed developed markets.
Commodities fell over 20% during the fiscal year, with 100% of the losses occurring in the first 4 months of 2020. Energy led the decline, falling over 50%, on virus induced demand shock as well as price war between Saudi Arabia and Russia. Industrial metals also saw a steep decline on reduced demand. Precious metals were the only positive category, as gold jumped 30%. The Fund’s commodities/ other real assets exposure slightly outperformed the Bloomberg Commodity Index, as its overweight gold more than offset its energy and master limited partnership exposures.
The Fund uses derivatives, which include interest rate/inflation options, interest rate futures, interest rate/inflation swaps, and credit default swaps, to enhance returns of the Fund and to hedge (or protect) against adverse movements in interest rates and movements in the bond markets. During the fiscal year, the Fund’s use of derivatives had a moderately negative impact on the relative performance of the Fund’s exposure to inflation protected securities versus the asset
class benchmark due to swap rates underperforming government cash bond rates, while synthetic credit outperformed cash corporate bonds.
| | * | Performance data quoted represents past performance, which is no guarantee of future results. Investment return and principal value will fluctuate so that an investor’s shares, when redeemed, may be worth more or less than their original cost. The total return shown assumes the reinvestment of all distributions and does not reflect the deduction of taxes that a shareholder would pay on fund distributions or the redemption of shares. The total return for Class A Shares was-16.23%, adjusted for the Fund’s maximum sales charge of 5.50%. Mutual fund performance changes over time and current performance may be lower or higher than what is stated. For the most recentmonth-end performance, please visit www.wilmingtonfunds.com or call1-800-836-2211. |
| | ** | S&P Developed Property Index defines and measures the investable universe of publicly traded property companies in developed global markets. |
| | *** | The Bloomberg Barclays U.S. Treasury Inflation Protected Securities Index measures the performance of the U.S. Treasury Inflation Protected Securities market. Federal Reserve holdings of US TIPS are not index eligible and are excluded from the face amount outstanding of each bond in the index. |
| | **** | Bloomberg Commodity Index (Total Return) is designed to be a diversified benchmark for commodities as an asset class, and reflects the returns that are potentially available through an unleveraged investment in the futures contracts on physical commodities comprising the Index plus the rate of interest that could be earned on cash collateral invested in specified Treasury Bills. The Index is currently composed of futures contracts on 20 physical commodities. |
International investing involves special risks including currency risks, increased volatility of foreign securities, political risks and differences in auditing and other financial standards.
April 30, 2020 (unaudited) / ANNUAL REPORT
WILMINGTON REAL ASSET FUND
The graphs below illustrate the hypothetical investment of $10,0001 in the Class A Shares and $1,000,0001 in the Class I Shares of the Wilmington Real Asset Fund from April 30, 2010 to April 30, 2020 compared to the S&P Developed Property Index2, the Bloomberg Barclays U.S. TIPS Index2, and the Real Asset Blended Index3.
| | |
VALUE OF A HYPOTHETICAL $10,000 INVESTMENT | | VALUE OF A HYPOTHETICAL $1,000,000 INVESTMENT |
Performance data quoted represents past performance, which is no guarantee of future results. Investment return and principal value will fluctuate so that an investor’s shares, when redeemed, may be worth more or less than their original cost. The total return shown assumes the reinvestment of all distributions and does not reflect the deduction of taxes that a shareholder would pay on fund distributions or the redemption of shares. The total return for Class A Shares was-16.23%, adjusted for the Fund’s maximum sales charge of 5.50%. Mutual fund performance changes over time and current performance may be lower or higher than what is stated. For the most recentmonth-end performance, please visit www.wilmingtonfunds.com or call1-800-836-2211.
| | | | | | |
| | | Average Annual Total Returns for the Periods Ended 4/30/20 |
| | | | |
| | | 1 Year | | 5 Years | | 10 Years |
| | | |
Class A^ | | -16.23% | | -2.02% | | 1.26% |
| | | |
Class I^ | | -11.13% | | -0.66% | | 2.09% |
| | | |
Bloomberg Barclays U.S. TIPS Index2 | | 9.46% | | 3.08% | | 3.52% |
| | | |
S&P Developed Property Index2 | | -15.73% | | -0.04% | | 5.27% |
| | | |
Real Asset Blended Index3 | | -11.53% | | -0.50% | | 2.78% |
^Expense Ratios Before Waivers and Expense Ratios After Waivers for Class A are 1.46% and 1.10%, respectively. Expense Ratios Before Waivers and Expense Ratios After Waivers for Class I are 1.21% and 0.85%, respectively. Expense Ratios Before Waiver represent the operating costs borne by the Fund, expressed as a percentage of the Fund’s average net assets, as shown in the Fees and Expenses table in the Fund’s current prospectus (under “Total Annual Fund Operating Expenses”). Current information regarding the Fund’s Operating Expenses can be found in the Fund’s Financial Highlights.
| 1 | Represents a hypothetical investment of $10,000 in Class A of the Fund after deducting the maximum sales charge of 5.50% ($10,000 investment minus $550 sales charge = $9,450) and $1,000,000 in Class I of the Fund and assumes the reinvestment of all dividends and distributions. |
| 2 | The performance for the Bloomberg Barclays U.S. TIPS Index and the S&P Developed Property Index assumes the reinvestment of all dividends and distributions but does not reflect the deduction of a sales charge required for the Fund’s performance by the Securities and Exchange Commission. It is not possible to invest directly in an index and the represented index is unmanaged. |
| 3 | The Real Asset Blended Index is calculated by the investment advisor and is currently based on a weighting of the following indices: 37.5% S&P Developed Property Index, 37.5% Bloomberg Commodity Index (Total Return) and 25% Bloomberg Barclays U.S. Tips Index. Prior to January 1, 2020, it consisted of: 60% S&P Developed Property Index, 20% Bloomberg Barclays U.S. TIPS Index, and 20% Bloomberg Commodity Index (Total Return). |
ANNUAL REPORT / April 30, 2020 (unaudited)
7
WILMINGTON DIVERSIFIED INCOME FUND
Management’s Discussion of Fund Performance
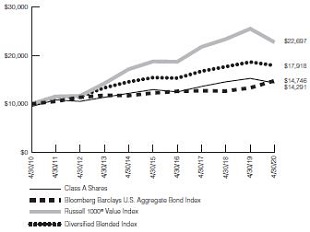
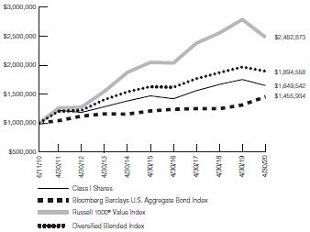
For the fiscal year ended April 30, 2020, Wilmington Diversified Income Fund (the “Fund”) had a total return of-6.17%* for Class A Shares and-5.83%* for Class I Shares, versus its benchmarks, the Russell 1000® Value Index**, Barclays US Aggregate Bond Index**, and the Diversified Blended Index**, which had total returns of-11.01%, 10.84%, and-3.83% respectively.
The Wilmington Diversified Income Fund seeks to achieve a high level of total return consistent with a moderate level of risk, with added emphasis on providing an attractive level of current income. The Fund is diversified across asset classes and geographies, with a philosophy that focuses on strategic positioning, minimizing tactical allocation shifts, and restrained turnover.
The fiscal year began with a market focused on one set of challenges, and ended the year firmly fixated on another. Much of the market’s focus during calendar 2019 revolved around theon-againoff-again progress of the U.S. reaching a phase one trade deal with China. The imposition of tariffs precipitated a drag on global economic activity, and the announcement of a phase one agreement early in the fourth quarter was welcomed by the markets. The deal, coupled with the Federal Reserve’s (the “Fed”) decision to lower rates in the back half of the calendar year, propelled equity markets higher, with the S&P 500, MSCI EAFE, and Russell 1000 Value indices all posting returns for calendar year 2019 that were well north of 20 percent.
Against this backdrop of strength, your Fund posted calendar 2019 returns of 17.42% for Class A Shares and 17.71% for Class I Shares, very strong relative to our long-term expectations for the Fund. Throughout 2019 the market continued to favor the growth investing style to the more value-oriented style of the Fund, a trend that weighed on our peer rankings but did nothing to diminish the strong absolute returns and attractive income level delivered by the strategy. Turn the calendar to 2020 and enter the unseen enemy – COVID-19.
The year 2020 began in relatively uneventful fashion, with the trade agreement largely resolved and the prospect of a presidential election becoming a more significant influence on markets going forward. Early in the quarter, word of a new SARs-like virus impacting China began to garner more headlines. As the aggressive nature of the coronavirus became more apparent and the disease quickly spread to Europe and eventually the U.S., late February proved a time of reckoning. The virus had completed its stealth-like diffusion, successfully setting the stage for an ambush of the global economy.
March witnessed an abrupt and historic cessation of economic activity globally as societies across the world took shelter and looked to bolster the medical capabilities needed to combat this new foe. Your Fund, which is designed to pursue its goals across a normal business cycle provedill-suited to defend in this global pandemic scenario. The sudden halt to global economic activity cast an immediate spotlight on balance sheet strength and, more precisely, cash on hand of businesses. A multitude of companies drew down credit lines to bolster cash positions in hopes of “getting to the other side” of the pandemic. Suspension of dividends (as well as share buybacks)
became commonplace, motivated by a desire to preserve precious cash or, in some cases, as a regulatory imperative given numerous stimulus packages launching globally.
Against this backdrop, several of the Fund’s asset classes that are typically defensive in market downturns were not in theCOVID-19 era. Our dividend-oriented equity strategies, the Enhanced Dividend Income Strategy (“EDIS”) and the iShares International Select Dividend ETF (“IDV”) posted steep declines. In the downturn, IDV lagged the MSCI EAFE Index by a wide margin as the strategy’s overweight to Europe, an active zone for dividend suspensions, and underweight to Japan, which proved more defensive in the downturn, was a poor combination. Real Estate Investment Trusts (“REITs”), another asset class with traditionally defensive behavior, suffered as cash-strapped consumers and businesses withheld rent and mortgage payments, while numerous office and retail clients failed.
Our overweight to the Wilmington Trust Core Bond allocation was a bright spot during the crisis, as our actively managed fixed income allocation was able to defend in the downturn, deliveringmid-single digit positive returns on ayear-to-date basis, and delivering a double-digit return for the full fiscal year. Portions of the fixed income markets struggled early in the crisis, with some segments of the market essentially frozen due to lack of liquidity. Federal Reserve intervention proved effective, however, providing liquidity and unlocking the broader fixed income market to the benefit of all participants, including our Fund. While high yield fixed income declined in the downturn and posted a negative return for the full fiscal year, the asset class seemed to hold up better than expected, possibly owing to the perception of a Fed backstop.
Summarizing results for the fiscal year versus the Fund’s primary benchmarks, the Fund’s broad diversification helped in limiting the Fund’s downside versus the Russell 1000 Value benchmark but hurt when compared to the double-digit positive return of the more defensive Bloomberg Barclays US Aggregate Bond Index. The Fund lagged its Diversified Blended Index in the fiscal year primarily due to the aforementioned underperformance of IDV versus the MSCI EAFE Index component of the blended benchmark.
So, what is the path forward? The Fund currently has a large overweight to the Wilmington Trust Core Bond allocation compared to its neutral target weight, ison-target to slightly overweight the domestic equity allocation and is underweight to most other asset classes that comprise the portfolio. Most of these weight differentials are market-driven and reflect the relative performance differential of the asset classes during the sudden market downturn. The Fund is designed to provide stable allocations over time, with minimal turnover. Our process defines three principal motivations to spend turnover: 1) rebalance to targets, 2) mitigate risk, and 3) upgrade holdings. In a typical market environment, the first of these tends to dominate, but in the current environment all three are in play. Moving forward, in a manner consistent with this process, we intend to move toward target weights in measured fashion considering the risk of the individual asset classes and the individual products used to fulfill these allocations. As always, the Fund’s long-term goals will be our compass.
April 30, 2020 (unaudited) / ANNUAL REPORT
| * | Performance data quoted represents past performance, which is no guarantee of future results. Investment return and principal value will fluctuate so that an investor’s shares, when redeemed, may be worth more or less than their original cost. The total return shown assumes the reinvestment of all distributions and does not reflect the deduction of taxes that a shareholder would pay on fund distributions or the redemption of shares. The total return for Class A Shares was-11.30%, adjusted for the Fund’s maximum sales charge of 5.50%. Mutual fund performance changes over time and current performance may be lower or higher than what is stated. For the most recentmonth-end performance, please visit www.wilmingtonfunds.com or call1-800-836-2211. |
| ** | The Russell 1000® Value Index measures the performance of those Russell 1000® Index companies with lowerprice-to-book ratios and lower forecasted growth values. The Bloomberg Barclays US Aggregate Bond Index is an index measuring both the capital price changes and income provided by the underlying universe of securities, comprised of U.S. Treasury obligations, U.S. investment grade corporate debt and mortgage backed obligations. |
The Diversified Blended Index is calculated by the investment advisor and represents the weighted returns of the following indices: 36.0% Russell 1000® Value Index; 24.0% Bloomberg Barclays US Aggregate Bond Index; 17.0% MSCI EAFE Index; 7.0% Bloomberg Barclays US Corporate High Yield Bond Index; 7.0%, Bloomberg Barclays US Government Inflation-Linked Bond Index; 4.5% Dow Jones Globalex-US Select Real Estate Securities Index; 2.5% S&P US REIT Index; and 2.0% Ibbotson Associates SBBI30-Day UST-Bill Index.
The Bloomberg Barclays US Government Inflation-linked Bond Index includes publicly issued, U.S. Treasury inflation protected securities that have at least 1 year remaining to maturity on index rebalancing date, with an issue size equal to or in excess of $500 million.
The Dow Jones Globalex-US Select Real Estate Securities Index is a float adjusted market capitalization index designed to measure the performance of publicly traded real estate securities in developed and emerging countries excluding the United States.
The S&P US REIT Index measures the investable U.S. real estate investment trust market and maintains a constituency that reflects the market’s overall composition.
The Ibbotson Associates SBBI 30 DayT-Bill Total Return Index is an index that reflects U.S. Treasury bill returns. Data from the Wall Street Journal are used for 1977-present; the CRSP U.S. Government Bond File is the source from 1926 to 1976. Each month a one bill portfolio containing the shortest-term bill having not less than one month to maturity is constructed.
International investing involves special risks including currency risk, political risks, increased volatility of foreign securities, and differences in auditing and other financial standards.
Bond prices are sensitive to changes in interest rates and a rise in short-term interest rates could cause a decline in bond prices.
Due to its strategy of investing in other mutual funds, this Fund may incur certain additional expenses and tax results that would not be present with a direct investment in the underlying funds.
ANNUAL REPORT / April 30, 2020 (unaudited)
9
WILMINGTON DIVERSIFIED INCOME FUND
The graphs below illustrate the hypothetical investment of $10,0001 in the Class A Shares and $1,000,0001 in the Class I Shares of the Wilmington Diversified Income Fund from April 30, 2010 to April 30, 2020 and June 11, 2010 (start of performance) to April 30, 2020, respectively, compared to the Russell 1000® Value Index2, the Bloomberg Barclays U.S. Aggregate Bond Index2 and the Diversified Blended Index2,3.
VALUE OF A HYPOTHETICAL $10,000 INVESTMENT
VALUE OF A HYPOTHETICAL $1,000,000 INVESTMENT
Performance data quoted represents past performance, which is no guarantee of future results. Investment return and principal value will fluctuate so that an investor’s shares, when redeemed, may be worth more or less than their original cost. The total return shown assumes the reinvestment of all distributions and does not reflect the deduction of taxes that a shareholder would pay on fund distributions or the redemption of shares. The total return for Class A Shares was-11.30%, adjusted for the Fund’s maximum sales charge of 5.50%. Mutual fund performance changes over time and current performance may be lower or higher than what is stated. For the most recentmonth-end performance, please visit www.wilmingtonfunds.com or call1-800-836-2211.
| | | | | | |
| | |
| | | Average Annual Total Returns for the Periods Ended 4/30/20 |
| | | | |
| | | 1 Year | | 5 Years | | 10 Years |
| | | | |
Class A^ | | -11.30% | | 0.90% | | 3.64% |
| | | | |
Class I^ | | -5.83% | | 2.31% | | 5.19%4 |
| | | | |
Russell 1000®Value Index2 | | -11.01% | | 3.91% | | 8.54% |
| | | | |
Bloomberg Barclays U.S. Aggregate Bond Index2 | | 10.84% | | 3.80% | | 3.96% |
| | | | |
Diversified Blended Index2,3 | | -3.83% | | 3.04% | | 6.00% |
^Expense Ratios Before Waivers and Expense Ratios After Waivers for Class A are 1.82% and 0.75%, respectively. Expense Ratios Before Waivers and Expense Ratios After Waivers for Class I are 1.57% and 0.50%, respectively. Expense Ratios Before Waiver represent the operating costs borne by the Fund, expressed as a percentage of the Fund’s average net assets, as shown in the Fees and Expenses table in the Fund’s current prospectus (under “Total Annual Fund Operating Expenses”). Current information regarding the Fund’s Operating Expenses can be found in the Fund’s Financial Highlights.
| 1 | Represents a hypothetical investment of $10,000 in Class A of the Fund after deducting the maximum sales charge of 5.50% ($10,000 investment minus $550 sales charge = $9,450) and $1,000,000 in Class I of the Fund and assumes the reinvestment of all dividends and distributions. |
| 2 | The performance for the Russell 1000® Value Index, the Bloomberg Barclays U.S. Aggregate Bond Index and the Diversified Blended Index assumes the reinvestment of all dividends and distributions but does not reflect the deduction of a sales charge required for the Fund’s performance by the Securities and Exchange Commission. It is not possible to invest directly in an index and the represented indices are unmanaged. |
| 3 | The Diversified Blended Index is calculated by the investment advisor and represents the weighted returns of the following indices: 36.0% Russell 1000® Value Index; 24.0% Bloomberg Barclays U.S. Aggregate Bond Index; 17.0% MSCI EAFE Index; 7.0% Bloomberg Barclays |
April 30, 2020 (unaudited) / ANNUAL REPORT
| | U.S. Corporate High Yield Bond Index; 7.0%, Bloomberg Barclays U.S. Government Inflation-Linked Bond Index; 4.5% Dow Jones Globalex-U.S. Select Real Estate Securities Index; 2.5% S&P U.S. REIT Index; and 2.0% Ibbotson Associates SBBI30-Day U.ST-Bill Index. |
| 4 | Represents the average total return for Class I Shares from June 11, 2010 (start of performance) to April 30, 2020. |
ANNUAL REPORT / April 30, 2020 (unaudited)
11
SHAREHOLDER EXPENSE EXAMPLE (unaudited)
As a shareholder of the Funds, you incur two types of costs: (1) transaction costs, including sales charges (loads) on purchase payments, reinvested dividends, or other distributions; and redemption fees; and (2) ongoing costs, including management fees; distribution and/or service(12b-1) fees; and other Fund expenses. This Example is intended to help you to understand your ongoing costs (in dollars) of investing in the Funds and to compare these costs with the ongoing costs of investing in other mutual funds. It is based on an investment of $1,000 invested at the beginning of the period and held for the entire period from November 1, 2019 to April 30, 2020.
Actual Expenses
This section of the following table provides information about actual account values and actual expenses. You may use the information in this section, together with the amount you invested, to estimate the expenses that you incurred over the period. Simply divide your account value by $1,000 (for example, an $8,600 account value divided by $1,000 = 8.6), then multiply the result by the number in the first section under the heading entitled “Expenses Paid During Period” to estimate the expenses attributable to your investment during this period.
Hypothetical Example for Comparison Purposes
This section of the following table provides information about hypothetical account values and hypothetical expenses based on the Fund’s actual expense ratios and assumed rates of return of 5% per year before expenses, which are not the Fund’s actual returns. Thus, you should not use the hypothetical account values and expenses to estimate the actual ending account balance or your expenses for the period. Rather, these figures are required to be provided to enable you to compare the ongoing costs of investing in the Funds with other funds. To do so, compare this 5% hypothetical example with the 5% hypothetical examples that appear in the shareholder reports of the other funds.
Please note that the expenses shown in the table are meant to highlight your ongoing costs only. Therefore, the Annualized Net Expense Ratio section of the table is useful in comparing ongoing costs only, and will not help you determine the relative total costs of owning different funds.
The Annualized Net Expense Ratios may be different from the net expense ratios in the Financial Highlights which are for the fiscal year ended April 30, 2020.
| | | | | | | | | | | | | | | | |
| | | | |
| | | Beginning Account Value
11/01/19 | | | Ending Account Value 4/30/20 | | | Expenses Paid
During Period1 | | | Annualized Net
Expense Ratio2 | |
| | | | |
WILMINGTON INTERNATIONAL FUND | | | | | | | | | | | | | | | | |
Actual | | | | | | | | | | | | | | | | |
Class A | | | $1,000.00 | | | | $ 873.90 | | | | $4.57 | | | | 0.98% | |
Class I | | | $1,000.00 | | | | $ 874.00 | | | | $3.96 | | | | 0.85% | |
Hypothetical (assuming a 5% return before expense) | | | | | | | | | | | | | | | | |
Class A | | | $1,000.00 | | | | $1,019.99 | | | | $4.92 | | | | 0.98% | |
Class I | | | $1,000.00 | | | | $1,020.64 | | | | $4.27 | | | | 0.85% | |
| | | | |
WILMINGTON GLOBAL ALPHA EQUITIES FUND | | | | | | | | | | | | | | | | |
Actual | | | | | | | | | | | | | | | | |
Class A | | | $1,000.00 | | | | $ 946.60 | | | | $7.21 | | | | 1.49% | |
Class I | | | $1,000.00 | | | | $ 947.80 | | | | $6.01 | | | | 1.24% | |
Hypothetical (assuming a 5% return before expense) | | | | | | | | | | | | | | | | |
Class A | | | $1,000.00 | | | | $1,017.45 | | | | $7.47 | | | | 1.49% | |
Class I | | | $1,000.00 | | | | $1,018.70 | | | | $6.22 | | | | 1.24% | |
| | | | |
WILMINGTON REAL ASSET FUND | | | | | | | | | | | | | | | | |
Actual | | | | | | | | | | | | | | | | |
Class A | | | $1,000.00 | | | | $ 845.50 | | | | $4.40 | | | | 0.96% | |
Class I | | | $1,000.00 | | | | $ 846.30 | | | | $3.26 | | | | 0.71% | |
Hypothetical (assuming a 5% return before expense) | | | | | | | | | | | | | | | | |
Class A | | | $1,000.00 | | | | $1,020.09 | | | | $4.82 | | | | 0.96% | |
Class I | | | $1,000.00 | | | | $1,021.33 | | | | $3.57 | | | | 0.71% | |
April 30, 2020 (unaudited) / ANNUAL REPORT
| | | | | | | | | | | | | | | | |
| | | | |
| | | Beginning Account Value
11/01/19 | | | Ending Account Value
4/30/20 | | | Expenses Paid
During Period1 | | | Annualized Net
Expense Ratio2 | |
| | | | |
WILMINGTON DIVERSIFIED INCOME FUND | | | | | | | | | | | | | | | | |
Actual | | | | | | | | | | | | | | | | |
Class A | | | $1,000.00 | | | | $ 899.10 | | | | $2.83 | | | | 0.60% | |
Class I | | | $1,000.00 | | | | $ 900.40 | | | | $1.65 | | | | 0.35% | |
Hypothetical (assuming a 5% return before expense) | | | | | | | | | | | | | | | | |
Class A | | | $1,000.00 | | | | $1,021.88 | | | | $3.02 | | | | 0.60% | |
Class I | | | $1,000.00 | | | | $1,023.12 | | | | $1.76 | | | | 0.35% | |
| (1) | Expenses are equal to the Funds’ annualized net expense ratios, multiplied by the average account value over the period, multiplied by 182/366 (to reflect the most recentone-half year period). |
| (2) | Expense ratio does not reflect the indirect expenses of the underlying funds in which it invests. |
ANNUAL REPORT / April 30, 2020 (unaudited)
13
PORTFOLIO OF INVESTMENTS SUMMARY TABLE
Wilmington International Fund
At April 30, 2020, the Fund’s sector classifications and country allocations were as follows (unaudited):
| | | | | | | | | | | | |
| | | Percentage of Total Net Assets | |
Common Stocks | | | | | | | | | | | | |
Industrials | | | | | | | 13.8 | % | | | | |
Information Technology | | | | | | | 13.4 | % | | | | |
Financials | | | | | | | 11.5 | % | | | | |
Health Care | | | | | | | 11.4 | % | | | | |
Consumer Discretionary | | | | | | | 11.3 | % | | | | |
Communication Services | | | | | | | 7.3 | % | | | | |
Consumer Staples | | | | | | | 5.0 | % | | | | |
Materials | | | | | | | 5.0 | % | | | | |
Utilities | | | | | | | 2.8 | % | | | | |
Real Estate | | | | | | | 2.5 | % | | | | |
Energy | | | | | | | 1.8 | % | | | | |
Investment Company | | | | | | | 4.5 | % | | | | |
Warrants | | | | | | | 0.8 | % | | | | |
Preferred Stock | | | | | | | 0.1 | % | | | | |
Cash Equivalents1 | | | | | | | 13.0 | % | | | | |
Other Assets and Liabilities – Net2 | | | | | | | (4.2 | )% | | | | |
| | | | | | | | | | | | |
TOTAL | | | | | | | 100.0 | % | | | | |
| | | | | | | | | | | | |
| (1) | Cash Equivalents include investments in a money market fund and repurchase agreements. |
| (2) | Assets, other than investments in securities, less liabilities. See Statements of Assets and Liabilities. |
| | | | | | | | | | | | |
| Country Allocation | | Percentage of Total Net Assets | |
Common Stocks | | | | | | | | | | | | |
Japan | | | | | | | 20.6 | % | | | | |
Cayman Islands | | | | | | | 7.3 | % | | | | |
France | | | | | | | 7.1 | % | | | | |
Germany | | | | | | | 6.5 | % | | | | |
United Kingdom | | | | | | | 5.7 | % | | | | |
Switzerland | | | | | | | 5.4 | % | | | | |
Sweden | | | | | | | 3.6 | % | | | | |
Hong Kong | | | | | | | 3.3 | % | | | | |
Denmark | | | | | | | 3.1 | % | | | | |
Australia | | | | | | | 2.9 | % | | | | |
Netherlands | | | | | | | 2.8 | % | | | | |
Taiwan | | | | | | | 2.5 | % | | | | |
South Korea | | | | | | | 2.2 | % | | | | |
Ireland | | | | | | | 2.0 | % | | | | |
Italy | | | | | | | 1.8 | % | | | | |
Spain | | | | | | | 1.6 | % | | | | |
China | | | | | | | 1.2 | % | | | | |
Norway | | | | | | | 1.1 | % | | | | |
All other countries less than 1.0% | | | | | | | 5.1 | % | | | | |
Investment Company | | | | | | | 4.5 | % | | | | |
Warrants | | | | | | | 0.8 | % | | | | |
Preferred Stock | | | | | | | 0.1 | % | | | | |
Cash Equivalents1 | | | | | | | 13.0 | % | | | | |
Other Assets and Liabilities – Net2 | | | | | | | (4.2 | )% | | | | |
| | | | | | | | | | | | |
TOTAL | | | | | | | 100.0 | % | | | | |
| | | | | | | | | | | | |
PORTFOLIO OF INVESTMENTS
April 30, 2020
| | | | | | | | |
| | |
| Description | | Number of Shares | | | Value | |
| | |
COMMON STOCKS – 85.8% | | | | | | | | |
| | |
AUSTRALIA – 2.9% | | | | | | | | |
| | |
Australia & New Zealand Banking Group Ltd. | | | 91,026 | | | $ | 988,764 | |
| | |
BHP Group Ltd.# | | | 129,812 | | | | 2,650,016 | |
| | |
Brambles Ltd. | | | 225,545 | | | | 1,612,093 | |
| | |
Cochlear Ltd. | | | 12,032 | | | | 1,430,570 | |
| | |
CSL Ltd. | | | 18,567 | | | | 3,700,902 | |
| | |
Incitec Pivot Ltd. | | | 845,964 | | | | 1,308,374 | |
| | |
Rio Tinto Ltd. | | | 39,738 | | | | 2,239,675 | |
| | |
Westpac Banking Corp. | | | 111,833 | | | | 1,163,524 | |
| | | | | | | | |
| | |
TOTAL AUSTRALIA | | | | | | $ | 15,093,918 | |
| | |
AUSTRIA – 0.0%** | | | | | | | | |
| | |
OMV AG | | | 1,429 | | | | 46,660 | |
| | | | | | | | |
| | |
| Description | | Number of Shares | | | Value | |
| | |
BELGIUM – 0.9% | | | | | | | | |
| | |
Ageas | | | 6,810 | | | $ | 245,462 | |
| | |
bpost SA | | | 8,503 | | | | 59,330 | |
| | |
Colruyt SA | | | 1,070 | | | | 64,127 | |
| | |
KBC Group NV | | | 3,489 | | | | 189,248 | |
| | |
Proximus SADP | | | 6,700 | | | | 143,002 | |
| | |
UCB SA | | | 17,200 | | | | 1,576,197 | |
| | |
Xior Student Housing NV | | | 51,301 | | | | 2,376,216 | |
| | | | | | | | |
| | |
TOTAL BELGIUM | | | | | | $ | 4,653,582 | |
| | |
BERMUDA – 0.6% | | | | | | | | |
| | |
Jardine Matheson Holdings Ltd. | | | 42,300 | | | | 1,852,789 | |
| | |
Johnson Electric Holdings Ltd. | | | 671,017 | | | | 1,126,708 | |
| | | | | | | | |
| | |
TOTAL BERMUDA | | | | | | $ | 2,979,497 | |
April 30, 2020 / ANNUAL REPORT
| | |
| PORTFOLIOS OF INVESTMENTS | | 14 |
Wilmington International Fund (continued)
| | | | | | | | |
| | |
| Description | | Number of Shares | | | Value | |
| | |
BRITISH VIRGIN ISLANDS – 0.3% | | | | | | | | |
| | |
Hollysys Automation Technologies Ltd. | | | 91,280 | | | $ | 1,308,955 | |
| | |
BULGARIA – 0.0%** | | | | | | | | |
| | |
Petrol AD*,(a) | | | 2,384 | | | | — | |
| | |
CAYMAN ISLANDS – 7.3% | | | | | | | | |
| | |
Alibaba Group Holding Ltd.* | | | 78,528 | | | | 1,992,980 | |
| | |
Alibaba Group Holding Ltd. ADR* | | | 37,686 | | | | 7,637,822 | |
| | |
ASM Pacific Technology Ltd. | | | 150,400 | | | | 1,519,748 | |
| | |
Budweiser Brewing Co. APAC Ltd.* | | | 364,600 | | | | 990,773 | |
| | |
China Resources Medical Holdings Co. Ltd. | | | 21,000 | | | | 10,667 | |
| | |
Haitian International Holdings Ltd. | | | 666,000 | | | | 1,178,383 | |
| | |
Huazhu Group Ltd. ADR | | | 64,723 | | | | 2,330,675 | |
| | |
Hutchison China MediTech Ltd. ADR* | | | 95,986 | | | | 2,064,659 | |
| | |
JD.com, Inc. ADR* | | | 40,431 | | | | 1,742,576 | |
| | |
NetEase, Inc. ADR | | | 4,358 | | | | 1,503,336 | |
| | |
New Oriental Education & Technology | | | | | | | | |
| | |
Group, Inc. ADR* | | | 29,398 | | | | 3,752,949 | |
| | |
Sands China Ltd. | | | 603,600 | | | | 2,443,673 | |
| | |
Shenzhou International Group Holdings Ltd. | | | 115,600 | | | | 1,334,213 | |
| | |
Tencent Holdings Ltd. | | | 176,900 | | | | 9,299,533 | |
| | | | | | | | |
| | |
TOTAL CAYMAN ISLANDS | | | | | | $ | 37,801,987 | |
| | |
CHINA – 1.2% | | | | | | | | |
| | |
China Pacific Insurance Group Co. Ltd., | | | | | | | | |
| | |
Class H | | | 896,200 | | | | 2,965,017 | |
| | |
China Petroleum & Chemical Corp., Class H | | | 2,842,000 | | | | 1,416,489 | |
| | |
Ping An Insurance Group Co. of China Ltd., | | | | | | | | |
| | |
Class H | | | 197,000 | | | | 2,004,723 | |
| | | | | | | | |
| | |
TOTAL CHINA | | | | | | $ | 6,386,229 | |
| | |
DENMARK – 3.1% | | | | | | | | |
| | |
Ambu A/S, Class B# | | | 69,258 | | | | 2,169,317 | |
| | |
Carlsberg A/S, Class B | | | 12,900 | | | | 1,627,374 | |
| | |
Chr Hansen Holding A/S | | | 6,832 | | | | 589,080 | |
| | |
Coloplast A/S, Class B# | | | 14,699 | | | | 2,318,384 | |
| | |
Danske Bank A/S* | | | 6,140 | | | | 72,901 | |
| | |
DSV Panalpina A/S | | | 28,178 | | | | 2,927,700 | |
| | |
Genmab A/S* | | | 6,600 | | | | 1,586,539 | |
| | |
Novo Nordisk A/S, Class B | | | 50,665 | | | | 3,231,922 | |
| | |
Vestas Wind Systems A/S | | | 18,300 | | | | 1,571,479 | |
| | | | | | | | |
| | |
TOTAL DENMARK | | | | | | $ | 16,094,696 | |
| | |
FINLAND – 0.2% | | | | | | | | |
| | |
Kesko OYJ, Class B | | | 11,396 | | | | 185,688 | |
| | |
Neste OYJ | | | 1,650 | | | | 58,271 | |
| | |
Nokian Renkaat OYJ | | | 6,300 | | | | 133,846 | |
| | |
Sampo OYJ, Class A | | | 7,730 | | | | 256,231 | |
| | |
TietoEVRY OYJ* | | | 1,820 | | | | 44,347 | |
| | | | | | | | |
| | |
| Description | | Number of Shares | | | Value | |
| | |
UPM-Kymmene OYJ | | | 4,898 | | | $ | 134,329 | |
| | |
Valmet OYJ | | | 9,824 | | | | 224,667 | |
| | | | | | | | |
| | |
TOTAL FINLAND | | | | | | $ | 1,037,379 | |
| | |
FRANCE – 7.1% | | | | | | | | |
| | |
Amundi SA* | | | 1,090 | | | | 72,348 | |
| | |
AXA SA | | | 27,058 | | | | 480,998 | |
| | |
Beneteau SA | | | 136,456 | | | | 864,039 | |
| | |
BNP Paribas SA* | | | 14,494 | | | | 455,350 | |
| | |
Bouygues SA* | | | 12,294 | | | | 378,266 | |
| | |
Carrefour SA | | | 103,500 | | | | 1,537,110 | |
| | |
Casino Guichard Perrachon SA# | | | 1,858 | | | | 69,744 | |
| | |
CNP Assurances* | | | 11,286 | | | | 116,435 | |
| | |
Credit Agricole SA | | | 17,123 | | | | 137,729 | |
| | |
Dassault Systemes SA | | | 8,018 | | | | 1,174,405 | |
| | |
Edenred | | | 64,350 | | | | 2,592,231 | |
| | |
Elior Group SA | | | 124,185 | | | | 820,217 | |
| | |
Engie SA* | | | 13,686 | | | | 148,488 | |
| | |
Eurazeo SE | | | 34,209 | | | | 1,638,384 | |
| | |
Eutelsat Communications SA | | | 4,320 | | | | 48,368 | |
| | |
Faurecia SE | | | 8,892 | | | | 318,615 | |
| | |
Hermes International | | | 120 | | | | 87,729 | |
| | |
ID Logistics Group* | | | 6,522 | | | | 1,214,063 | |
| | |
Legrand SA | | | 8,172 | | | | 547,875 | |
| | |
L’Oreal SA | | | 5,044 | | | | 1,466,505 | |
| | |
LVMH Moet Hennessy Louis Vuitton SA | | | 9,359 | | | | 3,618,138 | |
| | |
Natixis SA | | | 41,370 | | | | 97,666 | |
| | |
Neoen SA#,* | | | 40,091 | | | | 1,516,633 | |
| | |
Orange SA | | | 126,300 | | | | 1,534,430 | |
| | |
Pernod Ricard SA | | | 10,300 | | | | 1,572,772 | |
| | |
Peugeot SA | | | 16,390 | | | | 232,340 | |
| | |
Publicis Groupe SA | | | 2,420 | | | | 71,436 | |
| | |
Renault SA* | | | 4,184 | | | | 82,445 | |
| | |
Sanofi# | | | 32,315 | | | | 3,156,340 | |
| | |
Sartorius Stedim Biotech | | | 9,305 | | | | 2,231,099 | |
| | |
Schneider Electric SE# | | | 1,970 | | | | 182,053 | |
| | |
SCOR SE | | | 24,761 | | | | 697,637 | |
| | |
Seb SA | | | 5,005 | | | | 600,240 | |
| | |
Societe BIC SA | | | 700 | | | | 35,016 | |
| | |
Societe Generale SA | | | 20,313 | | | | 318,693 | |
| | |
SPIE SA* | | | 59,746 | | | | 900,651 | |
| | |
Teleperformance | | | 7,400 | | | | 1,657,674 | |
| | |
TOTAL SA | | | 27,023 | | | | 959,115 | |
| | |
Vinci SA | | | 2,033 | | | | 166,548 | |
| | |
Virbac SA* | | | 5,955 | | | | 1,174,299 | |
| | |
Vivendi SA | | | 70,200 | | | | 1,517,250 | |
| | | | | | | | |
| | |
TOTAL FRANCE | | | | | | $ | 36,491,374 | |
ANNUAL REPORT / April 30, 2020
| | |
| 15 | | PORTFOLIOS OF INVESTMENTS |
|
| Wilmington International Fund (continued) |
| | | | | | | | |
| | |
| Description | | Number of Shares | | | Value | |
| | |
GERMANY – 6.5% | | | | | | | | |
| | |
Aareal Bank AG | | | 2,300 | | | $ | 37,465 | |
| | |
adidas AG | | | 4,002 | | | | 916,192 | |
| | |
alstria office REIT AG | | | 119,381 | | | | 1,789,493 | |
| | |
BASF SE | | | 7,940 | | | | 406,343 | |
| | |
Bayer AG | | | 14,500 | | | | 953,660 | |
| | |
Bayerische Motoren Werke AG | | | 2,098 | | | | 123,416 | |
| | |
Covestro AG | | | 5,189 | | | | 174,305 | |
| | |
CTS Eventim AG & Co. KGaA | | | 1,360 | | | | 56,538 | |
| | |
Daimler AG | | | 10,645 | | | | 364,093 | |
| | |
Deutsche Lufthansa AG# | | | 14,873 | | | | 133,154 | |
| | |
Deutsche Pfandbriefbank AG* | | | 4,690 | | | | 34,472 | |
| | |
Deutsche Telekom AG | | | 162,586 | | | | 2,376,957 | |
| | |
E.ON SE | | | 181,230 | | | | 1,815,439 | |
| | |
Evotec SE#,* | | | 54,854 | | | | 1,353,553 | |
| | |
Fielmann AG | | | 31,398 | | | | 2,064,588 | |
| | |
Freenet AG | | | 6,422 | | | | 121,830 | |
| | |
Fresenius Medical Care AG & Co. KGaA | | | 21,000 | | | | 1,645,789 | |
| | |
Fresenius SE & Co. KGaA | | | 30,425 | | | | 1,317,801 | |
| | |
GRENKE AG# | | | 12,955 | | | | 904,206 | |
| | |
Hannover Rueck SE | | | 1,230 | | | | 195,982 | |
| | |
Hypoport SE* | | | 3,302 | | | | 1,164,095 | |
| | |
Infineon Technologies AG | | | 137,879 | | | | 2,563,310 | |
| | |
Jenoptik AG | | | 43,543 | | | | 896,766 | |
| | |
LEG Immobilien AG | | | 1,080 | | | | 123,990 | |
| | |
Merck KGaA | | | 14,000 | | | | 1,624,826 | |
| | |
MTU Aero Engines AG | | | 6,551 | | | | 892,089 | |
| | |
Muenchener Rueckversicherungs AG | | | 520 | | | | 113,893 | |
| | |
Nemetschek SE | | | 37,411 | | | | 2,353,719 | |
| | |
New Work SE | | | 7,755 | | | | 1,843,146 | |
| | |
SAP SE | | | 29,969 | | | | 3,569,541 | |
| | |
Siemens AG | | | 5,420 | | | | 500,177 | |
| | |
TUI AG | | | 5,106 | | | | 20,742 | |
| | |
Zalando SE* | | | 25,181 | | | | 1,234,219 | |
| | | | | | | | |
| | |
TOTAL GERMANY | | | | | | $ | 33,685,789 | |
| | |
GREECE – 0.2% | | | | | | | | |
| | |
JUMBO SA | | | 55,467 | | | | 868,058 | |
| | |
HONG KONG – 3.3% | | | | | | | | |
| | |
AIA Group Ltd. | | | 596,800 | | | | 5,477,293 | |
| | |
BOC Hong Kong Holdings Ltd. | | | 354,000 | | | | 1,086,473 | |
| | |
China Mobile Ltd. | | | 182,000 | | | | 1,463,109 | |
| | |
CNOOC Ltd. | | | 1,372,000 | | | | 1,516,914 | |
| | |
Hong Kong Exchanges & Clearing Ltd. | | | 47,800 | | | | 1,532,572 | |
| | |
Swire Properties Ltd. | | | 825,000 | | | | 2,313,933 | |
| | |
Techtronic Industries Co. Ltd. | | | 478,500 | | | | 3,628,231 | |
| | | | | | | | |
| | |
TOTAL HONG KONG | | | | | | $ | 17,018,525 | |
| | | | | | | | |
| | |
| Description | | Number of Shares | | | Value | |
| | |
INDIA – 0.9% | | | | | | | | |
| | |
HDFC Bank Ltd. ADR | | | 108,930 | | | $ | 4,722,115 | |
| | |
IRELAND – 2.0% | | | | | | | | |
| | |
DCC PLC | | | 26,403 | | | | 1,877,478 | |
| | |
James Hardie Industries PLC | | | 183,805 | | | | 2,638,624 | |
| | |
Kerry Group PLC, Class A | | | 11,591 | | | | 1,334,220 | |
| | |
Kingspan Group PLC | | | 41,300 | | | | 2,104,473 | |
| | |
Ryanair Holdings PLC ADR* | | | 16,350 | | | | 1,037,735 | |
| | |
UDG Healthcare PLC | | | 195,079 | | | | 1,539,643 | |
| | | | | | | | |
| | |
TOTAL IRELAND | | | | | | $ | 10,532,173 | |
| | |
ITALY – 1.8% | | | | | | | | |
| | |
Assicurazioni Generali SpA | | | 17,157 | | | | 244,774 | |
| | |
ASTM SpA | | | 1,290 | | | | 25,229 | |
| | |
Atlantia SpA | | | 13,270 | | | | 217,539 | |
| | |
Banca Generali SpA | | | 2,480 | | | | 61,654 | |
| | |
Banca Mediolanum SpA | | | 7,010 | | | | 42,835 | |
| | |
Enel SpA | | | 339,989 | | | | 2,322,287 | |
| | |
Eni SpA | | | 26,745 | | | | 254,783 | |
| | |
FinecoBank Banca Fineco SpA* | | | 227,876 | | | | 2,538,920 | |
| | |
Intesa Sanpaolo SpA | | | 235,828 | | | | 368,248 | |
| | |
Salvatore Ferragamo SpA# | | | 95,534 | | | | 1,185,972 | |
| | |
Snam SpA | | | 370,700 | | | | 1,662,927 | |
| | |
Unipol Gruppo SpA | | | 16,890 | | | | 58,277 | |
| | |
UnipolSai Assicurazioni SpA | | | 51,470 | | | | 126,162 | |
| | | | | | | | |
| | |
TOTAL ITALY | | | | | | $ | 9,109,607 | |
| | |
JAPAN – 20.6% | | | | | | | | |
| | |
AEON Financial Service Co. Ltd. | | | 51,600 | | | | 536,602 | |
| | |
Air Water, Inc. | | | 34,700 | | | | 467,816 | |
| | |
Aisin Seiki Co. Ltd. | | | 16,900 | | | | 486,710 | |
| | |
Alps Alpine Co. Ltd. | | | 36 | | | | 371 | |
| | |
Amano Corp. | | | 16,900 | | | | 346,979 | |
| | |
Anritsu Corp.# | | | 70,400 | | | | 1,433,027 | |
| | |
AOI Electronics Co. Ltd. | | | 1,000 | | | | 20,152 | |
| | |
Ariake Japan Co. Ltd. | | | 11,400 | | | | 657,428 | |
| | |
Aruhi Corp.# | | | 177,400 | | | | 2,050,634 | |
| | |
Central Japan Railway Co. | | | 2,100 | | | | 330,444 | |
| | |
Chubu Electric Power Co., Inc. | | | 134,900 | | | | 1,824,385 | |
| | |
cocokara fine, Inc. | | | 6,700 | | | | 315,980 | |
| | |
COMSYS Holdings Corp. | | | 42,800 | | | | 1,176,903 | |
| | |
Dai-ichi Life Holdings, Inc. | | | 31,400 | | | | 393,512 | |
| | |
Daikin Industries Ltd. | | | 14,700 | | | | 1,886,465 | |
| | |
Daiwa House Industry Co. Ltd. | | | 21,900 | | | | 554,953 | |
| | |
Denka Co. Ltd. | | | 9,100 | | | | 219,854 | |
| | |
Denki Kogyo Co. Ltd. | | | 39,200 | | | | 904,479 | |
| | |
Ebara Corp. | | | 35,800 | | | | 789,264 | |
April 30, 2020 / ANNUAL REPORT
| | |
| PORTFOLIOS OF INVESTMENTS | | 16 |
Wilmington International Fund (continued)
| | | | | | | | |
| | |
| Description | | Number of
Shares | | | Value | |
| | |
Electric Power Development Co. Ltd., | | | | | | | | |
| | |
Class C | | | 26,100 | | | $ | 522,369 | |
| | |
Fast Retailing Co. Ltd. | | | 1,400 | | | | 663,946 | |
| | |
FCC Co. Ltd. | | | 45,100 | | | | 641,691 | |
| | |
Fuji Electric Co. Ltd. | | | 28,700 | | | | 684,563 | |
| | |
FUJIFILM Holdings Corp. | | | 17,000 | | | | 809,754 | |
| | |
Fujitsu General Ltd. | | | 18,000 | | | | 298,011 | |
| | |
Fuso Chemical Co. Ltd. | | | 23,900 | | | | 707,840 | |
| | |
Hitachi Ltd. | | | 57,800 | | | | 1,715,471 | |
| | |
Hitachi Metals Ltd. | | | 64,400 | | | | 620,541 | |
| | |
Honda Motor Co. Ltd. | | | 69,700 | | | | 1,692,607 | |
| | |
IHI Corp. | | | 21,100 | | | | 261,527 | |
| | |
Inpex Corp. | | | 68,700 | | | | 443,465 | |
| | |
Isetan Mitsukoshi Holdings Ltd.# | | | 82,400 | | | | 501,275 | |
| | |
ITOCHU Corp. | | | 76,600 | | | | 1,501,752 | |
| | |
Iwatani Corp. | | | 700 | | | | 23,971 | |
| | |
Japan Airlines Co. Ltd. | | | 36,400 | | | | 649,296 | |
| | |
JGC Holdings Corp. | | | 32,000 | | | | 309,017 | |
| | |
JXTG Holdings, Inc. | | | 116,000 | | | | 411,262 | |
| | |
KDDI Corp. | | | 29,800 | | | | 863,136 | |
| | |
Kintetsu World Express, Inc. | | | 203,400 | | | | 2,960,644 | |
| | |
Komatsu Ltd. | | | 24,600 | | | | 465,455 | |
| | |
Konami Holdings Corp.# | | | 10,400 | | | | 326,552 | |
| | |
Kumagai Gumi Co. Ltd. | | | 9,100 | | | | 199,384 | |
| | |
Kyosan Electric Manufacturing Co. Ltd.# | | | 171,400 | | | | 812,502 | |
| | |
Lintec Corp. | | | 46,700 | | | | 1,002,156 | |
| | |
Matsuda Sangyo Co. Ltd. | | | 12,300 | | | | 150,461 | |
| | |
Mirait Holdings Corp. | | | 79,800 | | | | 1,030,839 | |
| | |
Mitsubishi Corp. | | | 45,500 | | | | 964,964 | |
| | |
Mitsubishi Electric Corp. | | | 102,000 | | | | 1,255,074 | |
| | |
Mitsubishi UFJ Financial Group, Inc. | | | 382,100 | | | | 1,543,684 | |
| | |
Mitsui Fudosan Co. Ltd. | | | 101,000 | | | | 1,857,082 | |
| | |
Mitsui Mining & Smelting Co. Ltd. | | | 38,600 | | | | 720,169 | |
| | |
Murata Manufacturing Co. Ltd. | | | 22,800 | | | | 1,284,712 | |
| | |
Nakanishi, Inc. | | | 35,400 | | | | 483,101 | |
| | |
NEC Networks & System Integration Corp. | | | 46,100 | | | | 1,983,767 | |
| | |
Nexon Co. Ltd. | | | 32,200 | | | | 519,901 | |
| | |
NGK Insulators Ltd. | | | 63,200 | | | | 826,834 | |
| | |
Nintendo Co. Ltd. | | | 5,000 | | | | 2,064,622 | |
| | |
Nippo Corp. | | | 58,600 | | | | 1,317,830 | |
| | |
Nippon Densetsu Kogyo Co. Ltd. | | | 15,400 | | | | 300,160 | |
| | |
Nippon Steel Corp. | | | 43,200 | | | | 363,469 | |
| | |
Nippon Telegraph & Telephone Corp. | | | 90,700 | | | | 2,065,569 | |
| | |
Nitori Holdings Co. Ltd. | | | 4,500 | | | | 689,741 | |
| | |
NSK Ltd. | | | 69,800 | | | | 483,131 | |
| | |
NTT Data Corp. | | | 124,800 | | | | 1,273,481 | |
| | |
NTT DOCOMO, Inc. | | | 34,400 | | | | 1,013,810 | |
| | | | | | | | |
| | |
| Description | | Number of
Shares | | | Value | |
| | |
Olympus Corp.* | | | 165,000 | | | $ | 2,618,033 | |
| | |
ORIX Corp. | | | 50,100 | | | | 589,552 | |
| | |
Osaka Gas Co. Ltd. | | | 9,500 | | | | 176,907 | |
| | |
OSJB Holdings Corp. | | | 333,600 | | | | 716,949 | |
| | |
Otsuka Corp. | | | 41,800 | | | | 1,892,608 | |
| | |
Outsourcing, Inc. | | | 50,300 | | | | 237,784 | |
| | |
Pacific Industrial Co. Ltd. | | | 47,500 | | | | 402,520 | |
| | |
Pan Pacific International Holdings Corp. | | | 55,100 | | | | 1,067,491 | |
| | |
Panasonic Corp. | | | 58,800 | | | | 448,232 | |
| | |
Pilot Corp. | | | 32,500 | | | | 1,088,837 | |
| | |
Rakuten, Inc. | | | 14,600 | | | | 123,797 | |
| | |
Recruit Holdings Co. Ltd. | | | 38,200 | | | | 1,114,340 | |
| | |
Rohm Co. Ltd. | | | 25,200 | | | | 1,593,240 | |
| | |
San-A Co. Ltd.# | | | 30,300 | | | | 1,220,674 | |
| | |
Santen Pharmaceutical Co. Ltd. | | | 121,100 | | | | 2,143,667 | |
| | |
SCREEN Holdings Co. Ltd. | | | 37,400 | | | | 1,806,383 | |
| | |
Seino Holdings Co. Ltd. | | | 137,700 | | | | 1,639,331 | |
| | |
Seven & i Holdings Co. Ltd. | | | 46,200 | | | | 1,530,008 | |
| | |
Shionogi & Co. Ltd. | | | 21,100 | | | | 1,165,301 | |
| | |
SMC Corp. | | | 1,300 | | | | 587,629 | |
| | |
SoftBank Group Corp. | | | 46,300 | | | | 1,984,540 | |
| | |
Sompo Holdings, Inc. | | | 19,300 | | | | 626,006 | |
| | |
Sony Corp. | | | 41,100 | | | | 2,644,954 | |
| | |
Sumitomo Bakelite Co. Ltd. | | | 11,500 | | | | 297,029 | |
| | |
Sumitomo Corp. | | | 33,700 | | | | 381,221 | |
| | |
Sumitomo Metal Mining Co. Ltd. | | | 62,500 | | | | 1,557,690 | |
| | |
Sumitomo Mitsui Financial Group, Inc. | | | 44,800 | | | | 1,178,116 | |
| | |
Sumitomo Rubber Industries Ltd. | | | 49,200 | | | | 477,562 | |
| | |
Sumitomo Warehouse Co Ltd. (The) | | | 54,700 | | | | 624,388 | |
| | |
Suzuki Motor Corp. | | | 13,700 | | | | 437,239 | |
| | |
T&D Holdings, Inc. | | | 16,700 | | | | 144,351 | |
| | |
Tamura Corp. | | | 180,900 | | | | 741,688 | |
| | |
Tatsuta Electric Wire & Cable Co. Ltd. | | | 204,900 | | | | 994,452 | |
| | |
TDK Corp. | | | 17,800 | | | | 1,534,496 | |
| | |
Terumo Corp. | | | 46,800 | | | | 1,552,946 | |
| | |
THK Co. Ltd. | | | 78,200 | | | | 1,869,358 | |
| | |
Toagosei Co. Ltd. | | | 38,400 | | | | 351,335 | |
| | |
Tokio Marine Holdings, Inc. | | | 20,600 | | | | 966,464 | |
| | |
Tokyo Dome Corp. | | | 105,200 | | | | 768,548 | |
| | |
Tokyo Tatemono Co. Ltd.# | | | 38,300 | | | | 430,745 | |
| | |
Tokyu Fudosan Holdings Corp. | | | 235,400 | | | | 1,151,629 | |
| | |
Toray Industries, Inc. | | | 96,400 | | | | 441,966 | |
| | |
Toyo Suisan Kaisha Ltd. | | | 22,500 | | | | 1,081,954 | |
| | |
Toyota Motor Corp. | | | 38,800 | | | | 2,398,882 | |
| | |
Trend Micro, Inc. | | | 34,500 | | | | 1,750,249 | |
| | |
Tsumura & Co. | | | 14,900 | | | | 412,169 | |
| | |
Tsurumi Manufacturing Co. Ltd. | | | 43,100 | | | | 753,712 | |
| | |
West Japan Railway Co. | | | 11,700 | | | | 723,032 | |
ANNUAL REPORT / April 30, 2020
| | |
| 17 | | PORTFOLIOS OF INVESTMENTS |
|
| Wilmington International Fund(continued) |
| | | | | | | | |
| | |
| Description | | Number of
Shares | | | Value | |
| | |
Z Holdings Corp. | | | 132,400 | | | $ | 510,975 | |
| | | | | | | | |
| | |
TOTAL JAPAN | | | | | | $ | 106,627,525 | |
| | |
JERSEY – 0.1% | | | | | | | | |
| | |
Ferguson PLC | | | 2,290 | | | | 165,113 | |
| | |
Man Group PLC | | | 36,120 | | | | 60,515 | |
| | |
WPP PLC | | | 20,060 | | | | 155,647 | |
| | | | | | | | |
| | |
TOTAL JERSEY | | | | | | $ | 381,275 | |
| | |
LUXEMBOURG – 0.2% | | | | | | | | |
| | |
APERAM SA | | | 4,040 | | | | 104,680 | |
| | |
Aroundtown SA | | | 10,500 | | | | 56,478 | |
| | |
Millicom International Cellular SA SDR* | | | 2,330 | | | | 60,548 | |
| | |
Samsonite International SA | | | 821,986 | | | | 699,202 | |
| | | | | | | | |
| | |
TOTAL LUXEMBOURG | | | | | | $ | 920,908 | |
| | |
NETHERLANDS – 2.8% | | | | | | | | |
| | |
ABN AMRO Bank NV* | | | 5,512 | | | | 42,390 | |
| | |
Aegon NV | | | 66,526 | | | | 172,080 | |
| | |
ASML Holding NV | | | 18,432 | | | | 5,383,741 | |
| | |
ASR Nederland NV | | | 5,427 | | | | 145,440 | |
| | |
BE Semiconductor Industries NV | | | 4,580 | | | | 189,548 | |
| | |
Heineken NV | | | 18,700 | | | | 1,591,624 | |
| | |
IMCD NV | | | 20,883 | | | | 1,844,063 | |
| | |
ING Groep NV | | | 78,627 | | | | 440,532 | |
| | |
Koninklijke Ahold Delhaize NV | | | 67,210 | | | | 1,631,890 | |
| | |
Koninklijke Philips NV | | | 35,300 | | | | 1,538,822 | |
| | |
NN Group NV# | | | 9,069 | | | | 262,345 | |
| | |
Randstad NV | | | 2,170 | | | | 87,333 | |
| | |
Unilever NV | | | 22,263 | | | | 1,108,687 | |
| | | | | | | | |
| | |
TOTAL NETHERLANDS | | | | | | $ | 14,438,495 | |
| | |
NORWAY – 1.1% | | | | | | | | |
| | |
DNB ASA | | | 17,690 | | | | 214,189 | |
| | |
Equinor ASA | | | 9,240 | | | | 127,945 | |
| | |
Gjensidige Forsikring ASA* | | | 2,940 | | | | 51,876 | |
| | |
Mowi ASA | | | 7,842 | | | | 134,310 | |
| | |
Telenor ASA | | | 122,470 | | | | 1,878,573 | |
| | |
TGS Nopec Geophysical Co. ASA | | | 56,225 | | | | 861,049 | |
| | |
Tomra Systems ASA# | | | 74,901 | | | | 2,488,722 | |
| | | | | | | | |
| | |
TOTAL NORWAY | | | | | | $ | 5,756,664 | |
| | |
PHILIPPINES – 0.2% | | | | | | | | |
| | |
Ayala Land, Inc. | | | 1,838,600 | | | | 1,147,879 | |
| | |
SINGAPORE – 0.7% | | | | | | | | |
| | |
Jardine Cycle & Carriage Ltd. | | | 51,700 | | | | 735,066 | |
| | |
Oversea-Chinese Banking Corp. Ltd. | | | 404,624 | | | | 2,581,628 | |
| | | | | | | | |
| | |
TOTAL SINGAPORE | | | | | | $ | 3,316,694 | |
| | |
SOUTH AFRICA – 0.0%** | | | | | | | | |
| | |
African Phoenix Investments Ltd.* | | | 36,266 | | | | 704 | |
| | | | | | | | |
| | |
| Description | | Number of
Shares | | | Value | |
| | |
SOUTH KOREA – 2.2% | | | | | | | | |
| | |
Samsung Electronics Co. Ltd. | | | 206,952 | | | $ | 8,509,362 | |
| | |
Samsung Fire & Marine Insurance Co. Ltd. | | | 8,706 | | | | 1,365,383 | |
| | |
SK Materials Co. Ltd. | | | 11,479 | | | | 1,488,977 | |
| | | | | | | | |
| | |
TOTAL SOUTH KOREA | | | | | | $ | 11,363,722 | |
| | |
SPAIN – 1.6% | | | | | | | | |
| | |
ACS Actividades de Construccion y Servicios SA# | | | 7,875 | | | | 196,926 | |
| | |
Amadeus IT Group SA | | | 27,340 | | | | 1,305,012 | |
| | |
Banco Bilbao Vizcaya Argentaria SA | | | 108,593 | | | | 354,968 | |
| | |
Banco Santander SA# | | | 198,336 | | | | 443,162 | |
| | |
Bankinter SA | | | 194,320 | | | | 802,200 | |
| | |
CaixaBank SA | | | 65,650 | | | | 118,113 | |
| | |
Enagas SA | | | 8,600 | | | | 200,740 | |
| | |
Iberdrola SA | | | 251,023 | | | | 2,497,134 | |
| | |
Industria de Diseno Textil SA | | | 42,451 | | | | 1,087,277 | |
| | |
International Consolidated Airlines Group SA | | | 13,740 | | | | 38,392 | |
| | |
Mapfre SA | | | 24,282 | | | | 44,558 | |
| | |
Mediaset Espana Comunicacion SA | | | 20,100 | | | | 72,025 | |
| | |
Repsol SA | | | 43,064 | | | | 390,886 | |
| | |
Telefonica SA | | | 96,849 | | | | 442,843 | |
| | | | | | | | |
| | |
TOTAL SPAIN | | | | | | $ | 7,994,236 | |
| | |
SWEDEN – 3.6% | | | | | | | | |
| | |
Assa Abloy AB, Class B# | | | 85,107 | | | | 1,523,580 | |
| | |
Atlas Copco AB, Class A# | | | 49,867 | | | | 1,718,640 | |
| | |
Avanza Bank Holding AB | | | 147,577 | | | | 1,782,997 | |
| | |
Boliden AB# | | | 9,390 | | | | 189,278 | |
| | |
Epiroc AB, Class A | | | 80,939 | | | | 810,008 | |
| | |
Fabege AB | | | 108,045 | | | | 1,279,892 | |
| | |
Hennes & Mauritz AB, Class B# | | | 13,050 | | | | 178,388 | |
| | |
Hexagon AB, Class B#,* | | | 34,019 | | | | 1,669,378 | |
| | |
Hexpol AB* | | | 63,313 | | | | 454,856 | |
| | |
Investor AB, Class A | | | 1,080 | | | | 53,280 | |
| | |
Peab AB, Class B | | | 17,629 | | | | 134,297 | |
| | |
Skandinaviska Enskilda Banken AB, Class A | | | 35,781 | | | | 294,566 | |
| | |
Skanska AB, Class B* | | | 10,490 | | | | 199,580 | |
| | |
SSAB AB, Class B#,* | | | 20,560 | | | | 47,518 | |
| | |
Sweco AB, Class B | | | 58,455 | | | | 1,997,087 | |
| | |
Tele2 AB, Class B | | | 200,100 | | | | 2,580,214 | |
| | |
Telefonaktiebolaget LM Ericsson, Class B | | | 179,300 | | | | 1,531,789 | |
| | |
Telia Co. AB | | | 457,600 | | | | 1,591,059 | |
| | |
Trelleborg AB, Class B* | | | 46,977 | | | | 598,201 | |
| | |
Volvo AB, Class B | | | 11,030 | | | | 141,345 | |
| | | | | | | | |
| | |
TOTAL SWEDEN | | | | | | $ | 18,775,953 | |
| | |
SWITZERLAND – 5.4% | | | | | | | | |
| | |
ABB Ltd. | | | 2,520 | | | | 47,835 | |
April 30, 2020 / ANNUAL REPORT
| | |
| PORTFOLIOS OF INVESTMENTS | | 18 |
Wilmington International Fund (continued)
| | | | | | | | |
| | |
| Description | | Number of
Shares | | | Value | |
| | |
Alcon, Inc.* | | | 29,000 | | | $ | 1,530,534 | |
| | |
BKW AG | | | 7,161 | | | | 580,870 | |
| | |
Cembra Money Bank AG | | | 10,870 | | | | 1,033,388 | |
| | |
Chocoladefabriken Lindt & Spruengli AG# | | | 139 | | | | 1,082,809 | |
| | |
Cie Financiere Richemont SA | | | 13,230 | | | | 750,584 | |
| | |
Comet Holding AG# | | | 9,031 | | | | 1,210,394 | |
| | |
Emmi AG | | | 1,865 | | | | 1,713,101 | |
| | |
Galenica AG | | | 8,300 | | | | 594,366 | |
| | |
Huber + Suhner AG | | | 11,052 | | | | 705,773 | |
| | |
Landis+Gyr Group AG* | | | 690 | | | | 46,596 | |
| | |
Lonza Group AG* | | | 1,782 | | | | 778,138 | |
| | |
Novartis AG | | | 30,643 | | | | 2,615,027 | |
| | |
Partners Group Holding AG | | | 2,603 | | | | 2,051,269 | |
| | |
Roche Holding AG | | | 4,900 | | | | 1,696,857 | |
| | |
Siegfried Holding AG* | | | 2,507 | | | | 1,142,726 | |
| | |
Sika AG# | | | 15,402 | | | | 2,547,633 | |
| | |
Straumann Holding AG | | | 1,961 | | | | 1,491,983 | |
| | |
Swiss Life Holding AG | | | 1,170 | | | | 414,909 | |
| | |
Swisscom AG | | | 2,800 | | | | 1,454,859 | |
| | |
Temenos AG* | | | 6,318 | | | | 818,696 | |
| | |
UBS Group AG* | | | 55,490 | | | | 594,159 | |
| | |
VAT Group AG* | | | 3,625 | | | | 598,275 | |
| | |
Zurich Insurance Group AG | | | 7,157 | | | | 2,269,158 | |
| | | | | | | | |
| | |
TOTAL SWITZERLAND | | | | | | $ | 27,769,939 | |
| | |
TAIWAN – 2.5% | | | | | | | | |
| | |
Largan Precision Co. Ltd. | | | 3,000 | | | | 408,941 | |
| | |
MediaTek, Inc. | | | 63,000 | | | | 869,932 | |
| | |
Merida Industry Co. Ltd. | | | 243,000 | | | | 1,240,988 | |
| | |
Taiwan Semiconductor Manufacturing Co. Ltd. | | | 1,044,000 | | | | 10,531,663 | |
| | | | | | | | |
| | |
TOTAL TAIWAN | | | | | | $ | 13,051,524 | |
| | |
THAILAND – 0.2% | | | | | | | | |
| | |
Kasikornbank PCL | | | 470,000 | | | | 1,232,198 | |
| | |
UNITED KINGDOM – 5.7% | | | | | | | | |
| | |
3i Group PLC | | | 21,520 | | | | 211,408 | |
| | |
Admiral Group PLC | | | 8,380 | | | | 244,532 | |
| | |
Anglo American PLC | | | 13,450 | | | | 239,208 | |
| | |
ASOS PLC* | | | 11,808 | | | | 356,267 | |
| | |
AstraZeneca PLC | | | 15,300 | | | | 1,600,251 | |
| | |
Aviva PLC | | | 115,173 | | | | 348,296 | |
| | |
Barclays PLC | | | 252,770 | | | | 337,522 | |
| | |
Barratt Developments PLC | | | 28,477 | | | | 185,651 | |
| | |
Berkeley Group Holdings PLC | | | 3,197 | | | | 167,820 | |
| | |
BHP Group PLC | | | 29,772 | | | | 499,720 | |
| | |
BP PLC | | | 255,757 | | | | 1,007,784 | |
| | |
British American Tobacco PLC | | | 73,420 | | | | 2,829,904 | |
| | |
BT Group PLC | | | 189,245 | | | | 275,827 | |
| | | | | | | | |
| | |
| Description | | Number of
Shares | | | Value | |
| | |
Compass Group PLC | | | 82,147 | | | $ | 1,382,314 | |
| | |
Croda International PLC | | | 37,200 | | | | 2,281,082 | |
| | |
Direct Line Insurance Group PLC | | | 52,598 | | | | 179,203 | |
| | |
Evraz PLC | | | 9,310 | | | | 30,851 | |
| | |
GB Group PLC | | | 91,341 | | | | 774,088 | |
| | |
GlaxoSmithKline PLC | | | 119,530 | | | | 2,493,693 | |
| | |
HSBC Holdings PLC | | | 266,940 | | | | 1,372,055 | |
| | |
Imperial Brands PLC | | | 17,130 | | | | 360,387 | |
| | |
Legal & General Group PLC | | | 105,913 | | | | 272,301 | |
| | |
Lloyds Banking Group PLC | | | 398,629 | | | | 161,288 | |
| | |
M&G PLC | | | 11,580 | | | | 19,198 | |
| | |
Marks & Spencer Group PLC | | | 38,860 | | | | 45,274 | |
| | |
Micro Focus International PLC | | | 3,090 | | | | 18,320 | |
| | |
National Grid PLC | | | 48,482 | | | | 568,146 | |
| | |
Pagegroup PLC | | | 1,020 | | | | 4,828 | |
| | |
Persimmon PLC | | | 7,451 | | | | 206,438 | |
| | |
Prudential PLC | | | 5,960 | | | | 84,080 | |
| | |
Reckitt Benckiser Group PLC | | | 3,054 | | | | 254,396 | |
| | |
Rightmove PLC | | | 6,840 | | | | 42,766 | |
| | |
Rio Tinto PLC | | | 18,156 | | | | 842,773 | |
| | |
Royal Dutch Shell PLC, Class A | | | 51,780 | | | | 865,478 | |
| | |
Royal Dutch Shell PLC, Class B | | | 50,552 | | | | 809,265 | |
| | |
Serco Group PLC* | | | 1,089,551 | | | | 1,763,637 | |
| | |
Smith & Nephew PLC | | | 4,720 | | | | 92,366 | |
| | |
Spirax-Sarco Engineering PLC | | | 5,047 | | | | 552,338 | |
| | |
Spirent Communications PLC | | | 20,360 | | | | 61,588 | |
| | |
SSE PLC | | | 29,453 | | | | 461,979 | |
| | |
St. James’s Place PLC | | | 76,713 | | | | 816,850 | |
| | |
Taylor Wimpey PLC | | | 23,838 | | | | 44,025 | |
| | |
Tesco PLC | | | 510,600 | | | | 1,510,255 | |
| | |
Trainline PLC* | | | 300,540 | | | | 1,436,396 | |
| | |
Travis Perkins PLC | | | 95,791 | | | | 1,250,783 | |
| | |
Vodafone Group PLC | | | 76,480 | | | | 107,888 | |
| | | | | | | | |
| | |
TOTAL UNITED KINGDOM | | | | | | $ | 29,470,519 | |
| | |
UNITED STATES – 0.6% | | | | | | | | |
| | |
ResMed, Inc. CDI | | | 129,514 | | | | 1,962,463 | |
| | |
Yum China Holdings, Inc. | | | 24,267 | | | | 1,175,979 | |
| | | | | | | | |
| | |
TOTAL UNITED STATES | | | | | | $ | 3,138,442 | |
| | | | | | | | |
| | |
TOTAL COMMON STOCKS (COST $434,790,813) | | | | | | $ | 443,217,221 | |
| | |
| INVESTMENT COMPANY – 4.5% | | | | | | | | |
| | |
iShares S&P/TSX 60 Index ETF# | | | 1,435,000 | | | | 23,268,041 | |
| | | | | | | | |
| | |
TOTAL INVESTMENT COMPANY (COST $23,572,566) | | | | | | $ | 23,268,041 | |
ANNUAL REPORT / April 30, 2020
| | |
| 19 | | PORTFOLIOS OF INVESTMENTS |
|
| Wilmington International Fund(continued) |
| | | | | | | | |
| | |
| Description | | Number of Shares | | | Value | |
| | |
PREFERRED STOCK – 0.1% | | | | | | | | |
| | |
GERMANY – 0.1% | | | | | | | | |
| | |
Volkswagen AG 4.86% | | | 3,092 | | | $ | 430,196 | |
| | | | | | | | |
| | |
TOTAL PREFERRED STOCK (COST $596,757) | | | | | | $ | 430,196 | |
| | |
| MONEY MARKET FUND – 7.3% | | | | | | | | |
| | |
Dreyfus Government Cash Management Fund, Institutional Shares, 0.17%^ | | | 37,624,361 | | | | 37,624,361 | |
| | | | | | | | |
| | |
TOTAL MONEY MARKET FUND (COST $37,624,361) | | | | | | $ | 37,624,361 | |
| | |
| WARRANTS – 0.8% | | | | | | | | |
| | |
SWITZERLAND – 0.8% | | | | | | | | |
| | |
Midea Group Co. Ltd., Expire 5/20/20* | | | 338,353 | | | | 2,580,517 | |
| | |
Zhejiang Sanhua Intelligent Controls Co. Ltd., Expire 11/27/20* | | | 527,241 | | | | 1,648,103 | |
| | | | | | | | |
| | |
TOTAL WARRANTS (COST $3,583,024) | | | | | | $ | 4,228,620 | |
| | | | | | | | |
| |
TOTAL INVESTMENTS IN SECURITIES – 98.5% (COST $500,167,521) | | | $ | 508,768,439 | |
| | |
| | | Par Value | | | | |
|
CASH COLLATERAL INVESTED FOR SECURITIES ON LOAN – 5.7% | |
|
REPURCHASE AGREEMENTS – 5.7% | |
| | |
Bank of America Securities, Inc., 0.04%, dated 4/30/20, due 5/01/20, repurchase price $1,473,290 collateralized by U.S. Government Agency Securities, 2.00% to 5.00%, maturing 8/01/23 to 4/01/59; total market value of $1,502,754. | | $ | 1,473,288 | | | $ | 1,473,288 | |
| | |
Citigroup Global Markets Ltd., 0.04%, dated 4/30/20, due 5/01/20, repurchase price $5,598,565 collateralized by U.S. Government Agency & Treasury Securities, 0.50% to 6.50%, maturing 5/31/20 to 2/01/57; total market value of $5,710,530. | | | 5,598,559 | | | | 5,598,559 | |
| | |
Daiwa Capital Markets America, 0.05%, dated 4/30/20, due 5/01/20, repurchase price $5,598,567 collateralized by U.S. Government Agency & Treasury Securities, 0.00% to 6.50%, maturing 5/07/20 to 3/01/52; total market value of $5,710,530. | | | 5,598,559 | | | | 5,598,559 | |
| | | | | | | | |
| | |
| Description | | Par Value | | | Value | |
| | |
Deutsche Bank Securities, Inc., 0.03%, dated 4/30/20, due 5/01/20, repurchase price $5,598,564 collateralized by U.S. Government Agency & Treasury Securities, 0.43% to 8.75%, maturing 8/15/20 to 4/01/50; total market value of $5,710,531. | | $ | 5,598,559 | | | $ | 5,598,559 | |
| | |
HSBC Securities USA, Inc., 0.03%, dated 4/30/20, due 5/01/20, repurchase price $5,598,564 collateralized by U.S. Government Agency Securities, 2.45% to 5.00%, maturing 2/20/49 to 4/15/55; total market value of $5,710,530. | | | 5,598,559 | | | | 5,598,559 | |
| | |
RBC Dominion Securities, Inc., 0.04%, dated 4/30/20, due 5/01/20, repurchase price $5,598,565 collateralized by U.S. Government Agency & Treasury Securities, 0.00% to 6.00%, maturing 7/15/24 to 5/01/50; total market value of $5,710,530. | | | 5,598,559 | | | | 5,598,559 | |
| |
TOTAL REPURCHASE AGREEMENTS
(COST $29,466,083) | | | $ | 29,466,083 | |
| | | | | | | | |
| |
TOTAL CASH COLLATERAL INVESTED FOR SECURITIES ON LOAN (COST $29,466,083) | | | $ | 29,466,083 | |
| | | | | | | | |
| |
TOTAL INVESTMENTS – 104.2% (COST $529,633,604) | | | $ | 538,234,522 | |
| |
| COLLATERAL FOR SECURITIES ON LOAN – (5.7%) | | | | (29,466,083 | ) |
| |
| OTHER ASSETS LESS LIABILITIES – 1.5% | | | | 7,907,715 | |
| | | | | | | | |
| |
| TOTAL NET ASSETS – 100.0% | | | $ | 516,676,154 | |
| | | | | | | | |
Cost of investments and derivatives for Federal income tax purposes is $533,030,914. The net unrealized appreciation/(depreciation) of investments and derivatives was $5,203,007. This consists of net unrealized appreciation from investment for those securities and derivatives having an excess of value over cost of $63,331,423 and net unrealized depreciation from investments for those securities and derivatives having an excess of cost over value of $(58,128,416).
Various inputs are used in determining the value of the Fund’s investments. These inputs are summarized in the three broad levels listed below.
Level 1 – quoted prices in active markets for identical securities
Level 2 – other significant observable inputs (including quoted prices for similar securities, interest rates, prepayment speeds, credit risk, etc.)
Level 3 – significant unobservable inputs (including the Fund’s own assumptions in determining the fair value of investments)
April 30, 2020 / ANNUAL REPORT
| | |
| PORTFOLIOS OF INVESTMENTS | | 20 |
Wilmington International Fund (continued)
The following is a summary of the inputs used as of April 30, 2020 in valuing the Fund’s assets carried at fair value:
| | | | | | | | | | | | | | | | | | | | | | | | | | | | |
| | | | | | | |
| | | Level 1 | | | | | | Level 2 | | | | | | Level 3 | | | | | | Total | |
Assets | | | | | | | | | | | | | | | | | | | | | | | | | | | | |
| | | | | | | |
Investments in Securities | | | | | | | | | | | | | | | | | | | | | | | | | | | | |
| | | | | | | |
Common Stocks | | | | | | | | | | | | | | | | | | | | | | | | | | | | |
| | | | | | | |
Australia | | $ | — | | | | | | | $ | 15,093,918 | | | | | | | $ | — | | | | | | | $ | 15,093,918 | |
| | | | | | | |
Austria | | | — | | | | | | | | 46,660 | | | | | | | | — | | | | | | | | 46,660 | |
| | | | | | | |
Belgium | | | — | | | | | | | | 4,653,582 | | | | | | | | — | | | | | | | | 4,653,582 | |
| | | | | | | |
Bermuda | | | 1,852,789 | | | | | | | | 1,126,708 | | | | | | | | — | | | | | | | | 2,979,497 | |
| | | | | | | |
British Virgin Islands | | | 1,308,955 | | | | | | | | — | | | | | | | | — | | | | | | | | 1,308,955 | |
| | | | | | | |
Bulgaria | | | — | | | | | | | | — | | | | | | | | — | | | | | | | | — | |
| | | | | | | |
Cayman Islands | | | 19,032,017 | | | | | | | | 18,769,970 | | | | | | | | — | | | | | | | | 37,801,987 | |
| | | | | | | |
China | | | — | | | | | | | | 6,386,229 | | | | | | | | — | | | | | | | | 6,386,229 | |
| | | | | | | |
Denmark | | | — | | | | | | | | 16,094,696 | | | | | | | | — | | | | | | | | 16,094,696 | |
| | | | | | | |
Finland | | | — | | | | | | | | 1,037,379 | | | | | | | | — | | | | | | | | 1,037,379 | |
| | | | | | | |
France | | | — | | | | | | | | 36,491,374 | | | | | | | | — | | | | | | | | 36,491,374 | |
| | | | | | | |
Germany | | | — | | | | | | | | 33,685,789 | | | | | | | | — | | | | | | | | 33,685,789 | |
| | | | | | | |
Greece | | | — | | | | | | | | 868,058 | | | | | | | | — | | | | | | | | 868,058 | |
| | | | | | | |
Hong Kong | | | — | | | | | | | | 17,018,525 | | | | | | | | — | | | | | | | | 17,018,525 | |
| | | | | | | |
India | | | 4,722,115 | | | | | | | | — | | | | | | | | — | | | | | | | | 4,722,115 | |
| | | | | | | |
Ireland | | | 1,037,735 | | | | | | | | 9,494,438 | | | | | | | | — | | | | | | | | 10,532,173 | |
| | | | | | | |
Italy | | | — | | | | | | | | 9,109,607 | | | | | | | | — | | | | | | | | 9,109,607 | |
| | | | | | | |
Japan | | | 23,971 | | | | | | | | 106,603,554 | | | | | | | | — | | | | | | | | 106,627,525 | |
| | | | | | | |
Jersey | | | — | | | | | | | | 381,275 | | | | | | | | — | | | | | | | | 381,275 | |
| | | | | | | |
Luxembourg | | | — | | | | | | | | 920,908 | | | | | | | | — | | | | | | | | 920,908 | |
| | | | | | | |
Netherlands | | | — | | | | | | | | 14,438,495 | | | | | | | | — | | | | | | | | 14,438,495 | |
| | | | | | | |
Norway | | | — | | | | | | | | 5,756,664 | | | | | | | | — | | | | | | | | 5,756,664 | |
| | | | | | | |
Philippines | | | — | | | | | | | | 1,147,879 | | | | | | | | — | | | | | | | | 1,147,879 | |
| | | | | | | |
Singapore | | | — | | | | | | | | 3,316,694 | | | | | | | | — | | | | | | | | 3,316,694 | |
| | | | | | | |
South Africa | | | — | | | | | | | | 704 | | | | | | | | — | | | | | | | | 704 | |
| | | | | | | |
South Korea | | | — | | | | | | | | 11,363,722 | | | | | | | | — | | | | | | | | 11,363,722 | |
| | | | | | | |
Spain | | | — | | | | | | | | 7,994,236 | | | | | | | | — | | | | | | | | 7,994,236 | |
| | | | | | | |
Sweden | | | — | | | | | | | | 18,775,953 | | | | | | | | — | | | | | | | | 18,775,953 | |
| | | | | | | |
Switzerland | | | — | | | | | | | | 27,769,939 | | | | | | | | — | | | | | | | | 27,769,939 | |
| | | | | | | |
Taiwan | | | — | | | | | | | | 13,051,524 | | | | | | | | — | | | | | | | | 13,051,524 | |
| | | | | | | |
Thailand | | | — | | | | | | | | 1,232,198 | | | | | | | | — | | | | | | | | 1,232,198 | |
| | | | | | | |
United Kingdom | | | — | | | | | | | | 29,470,519 | | | | | | | | — | | | | | | | | 29,470,519 | |
| | | | | | | |
United States | | | 1,175,979 | | | | | | | | 1,962,463 | | | | | | | | — | | | | | | | | 3,138,442 | |
| | | | | | | |
Investment Company | | | 23,268,041 | | | | | | | | — | | | | | | | | — | | | | | | | | 23,268,041 | |
| | | | | | | |
Preferred Stock | | | | | | | | | | | | | | | | | | | | | | | | | | | | |
| | | | | | | |
Germany | | | — | | | | | | | | 430,196 | | | | | | | | — | | | | | | | | 430,196 | |
| | | | | | | |
Money Market Fund | | | 37,624,361 | | | | | | | | — | | | | | | | | — | | | | | | | | 37,624,361 | |
| | | | | | | |
Warrants | | | | | | | | | | | | | | | | | | | | | | | | | | | | |
| | | | | | | |
Switzerland | | | — | | | | | | | | 4,228,620 | | | | | | | | — | | | | | | | | 4,228,620 | |
| | | | | | | |
Repurchase Agreements | | | — | | | | | | | | 29,466,083 | | | | | | | | — | | | | | | | | 29,466,083 | |
| | | | | | | | | | | | | | | | | | | | | | | | | | | | |
Total Investments in Securities | | $ | 90,045,963 | | | | | | | $ | 448,188,559 | | | | | | | $ | — | | | | | | | $ | 538,234,522 | |
| | | | | | | | | | | | | | | | | | | | | | | | | | | | |
| | | | | | | |
Other Financial Instruments! | | | | | | | | | | | | | | | | | | | | | | | | | | | | |
| | | | | | | |
Financial Futures Contracts | | $ | 339,278 | | | | | | | $ | — | | | | | | | $ | — | | | | | | | $ | 339,278 | |
| | | | | | | | | | | | | | | | | | | | | | | | | | | | |
| | | | | | | |
Total Assets - Other Financial Instruments | | $ | 339,278 | | | | | | | $ | — | | | | | | | $ | — | | | | | | | $ | 339,278 | |
| | | | | | | | | | | | | | | | | | | | | | | | | | | | |
ANNUAL REPORT / April 30, 2020
| | |
| 21 | | PORTFOLIOS OF INVESTMENTS |
|
| Wilmington International Fund(continued) |
| | | | | | | | | | | | | | | | | | | | |
| | | | |
| | | Level 1 | | Level 2 | | Level 3 | | Total |
Liabilities | | | | | | | | | | | | | | | | | | | | |
| | | | |
Other Financial Instruments! | | | | | | | | | | | | | | | | | | | | |
| | | | |
Forward Foreign Currency Contracts | | | $ | — | | | | $ | (601 | ) | | | $ | — | | | | $ | (601 | ) |
| | | | | | | | | | | | | | | | | | | | |
| | | | |
Total Liabilities - Other Financial Instruments | | | $ | — | | | | $ | (601 | ) | | | $ | — | | | | $ | (601 | ) |
| | | | | | | | | | | | | | | | | | | | |
| | ! | Other financial instruments are derivative instruments, such as forward foreign currency contracts and financial future contracts, which are valued at the unrealized appreciation (depreciation) on the instrument. |
As a result of utilizing international fair value pricing at April 30, 2020, a majority portion of the Fund’s common stock investments were categorized as Level 2.
Security valued at zero on the Portfolios of Investments is considered to be Level 3 investments in this table.
| # | Security, or a portion thereof, is on loan. See Note 2 in Notes to Financial Statements. |
| * | Non-income producing security. |
| (a) | The value of this security was determined using significant unobservable inputs and is reported as a Level 3 security in the Valuation Hierachy table located at the end of the Portfolio of Investments. |
| ** | Represents less than 0.05%. |
The following acronyms are used throughout this Fund:
| | |
ADR | | American Depositary Receipt |
CDI | | CREST Depository Interest |
ETF | | Exchange-Traded Fund |
MSCI | | Morgan Stanley Capital International |
OYJ | | Public Limited Company |
PCL | | Public Company Limited |
PLC | | Public Limited Company |
REIT | | Real Estate Investment Trust |
SDR | | Swedish Depository Receipt |
| | | | |
Currency Code | | Currency | | |
| CHF | | Swiss Franc | | |
| EUR | | Euro | | |
| GBP | | British Pound Sterling | | |
| HKD | | Hong Kong Dollar | | |
| SEK | | Swedish Krona | | |
| USD | | United States Dollar | | |
At April 30, 2020, the International Fund had the following outstanding forward foreign currency contracts, which contractually obligates the Fund to deliver or receive currencies at specified future dates:
| | | | | | | | | | | | | | | | | | |
| | | | | | |
| Settlement Date | | Counterparty | | Contracts to Deliver/Receive | | Contract Amount | | | Contract at Value | | | Unrealized Appreciation | | | Unrealized (Depreciation) |
CONTRACTS PURCHASED |
5/5/2020 | | Bank of New York Mellon | | 1,581,757 HKD | | | $204,098 | | | | $204,032 | | | | $— | | | $(66) |
CONTRACTS SOLD | | | | | | | | | | | | | | | | | | |
5/4/2020 | | Bank of New York Mellon | | 148,351 SEK | | | 14,989 | | | | 15,207 | | | | — | | | (218) |
5/4/2020 | | Bank of New York Mellon | | 147,178 SEK | | | 14,870 | | | | 15,086 | | | | — | | | (216) |
5/4/2020 | | Bank of New York Mellon | | 6,851 SEK | | | 692 | | | | 702 | | | | — | | | (10) |
5/4/2020 | | Bank of New York Mellon | | 4,208 CHF | | | 4,310 | | | | 4,360 | | | | — | | | (50) |
5/4/2020 | | Bank of New York Mellon | | 2,652 CHF | | | 2,716 | | | | 2,747 | | | | — | | | (31) |
5/4/2020 | | Bank of New York Mellon | | 550 GBP | | | 686 | | | | 692 | | | | — | | | (6) |
5/4/2020 | | Bank of New York Mellon | | 311 EUR | | | 337 | | | | 341 | | | | — | | | (4) |
NET UNREALIZED APPRECIATION (DEPRECIATION) ON FORWARD FOREIGN CURRENCY CONTRACTS | | | | | | | | | | | | | $— | | | $(601) |
April 30, 2020 / ANNUAL REPORT
| | |
| PORTFOLIOS OF INVESTMENTS | | 22 |
Wilmington International Fund (concluded)
At April 30, 2020, the International Fund had open financial futures contracts as follows:
| | | | | | | | | | | | | | | | | | | | | | | | |
| | | | | | | |
| Underlying Contracts to Buy/Sell | | Expiration Date | | Number of Contracts | | | Contract Amount | | | Notional Value | | | Unrealized Appreciation(a) | | | Unrealized (Depreciation)(a) | | | |
LONG POSITIONS: | | | | | | | | | | | | | | | | | | | | | | | | |
MSCI India NTR Index | | June 2020 | | | 121 | | | $ | 6,325,402 | | | $ | 6,664,680 | | | | $339,278 | | | | $— | | | |
NET UNREALIZED APPRECIATION (DEPRECIATION) ON FINANCIAL FUTURES CONTRACTS | | | | | | | | | | | | $339,278 | | | | $— | | | |
| | (a) | The unrealized appreciation (depreciation) presented above is the cumulative change in unrealized appreciation (depreciation) from the date the contract was open through April 30, 2020. Only current day variation margin is reported on the Fund’s Statement of assets and liabilities. |
See Notes which are an integral part of the Financial Statements
ANNUAL REPORT / April 30, 2020
PORTFOLIO OF INVESTMENTS SUMMARY TABLE
Wilmington Global Alpha Equities Fund
At April 30, 2020, the Fund’s portfolio composition was as follows (unaudited):
| | | | | |
| | | Percentage of
Total Net Assets |
Common Stocks | | | | | |
Insurance | | | | 6.8 | % |
Pharmaceuticals | | | | 6.1 | % |
IT Services | | | | 5.8 | % |
Health Care Equipment & Supplies | | | | 4.4 | % |
Real Estate Investment Trusts | | | | 3.0 | % |
Oil, Gas & Consumable Fuels | | | | 2.7 | % |
Commercial Banks | | | | 2.6 | % |
Machinery | | | | 2.6 | % |
Hotels, Restaurants & Leisure | | | | 2.5 | % |
Food Products | | | | 2.4 | % |
Software | | | | 2.4 | % |
Commercial Services & Supplies | | | | 2.3 | % |
Diversified Telecommunication Services | | | | 2.2 | % |
Beverages | | | | 2.0 | % |
Diversified Financial Services | | | | 2.0 | % |
Road & Rail | | | | 2.0 | % |
Capital Markets | | | | 1.9 | % |
Specialty Retail | | | | 1.9 | % |
Household Products | | | | 1.8 | % |
Semiconductors & Semiconductor Equipment | | | | 1.8 | % |
Aerospace & Defense | | | | 1.6 | % |
Health Care Providers & Services | | | | 1.5 | % |
Construction & Engineering | | | | 1.4 | % |
Multi-Utilities | | | | 1.4 | % |
Communications Equipment | | | | 1.2 | % |
Trading Companies & Distributors | | | | 1.2 | % |
Wireless Telecommunication Services | | | | 1.1 | % |
Air Freight & Logistics | | | | 1.0 | % |
Chemicals | | | | 1.0 | % |
Internet & Catalog Retail | | | | 1.0 | % |
Media | | | | 1.0 | % |
Automobiles | | | | 0.9 | % |
Building Products | | | | 0.9 | % |
Electric Utilities | | | | 0.9 | % |
Electrical Equipment | | | | 0.9 | % |
Entertainment | | | | 0.9 | % |
Household Durables | | | | 0.8 | % |
Metals & Mining | | | | 0.8 | % |
Technology Hardware, Storage & Peripherals | | | | 0.8 | % |
Food & Staples Retailing | | | | 0.7 | % |
Interactive Media & Services | | | | 0.7 | % |
Containers & Packaging | | | | 0.6 | % |
Electronic Equipment, Instruments & Components | | | | 0.6 | % |
Gas Utilities | | | | 0.6 | % |
Textiles, Apparel & Luxury Goods | | | | 0.6 | % |
Auto Components | | | | 0.5 | % |
Life Sciences Tools & Services | | | | 0.5 | % |
Professional Services | | | | 0.5 | % |
| | | | | |
| | | Percentage of Total Net Assets |
Common Stocks | | | | | |
Real Estate Management & Development | | | | 0.5 | % |
Tobacco | | | | 0.5 | % |
Multiline Retail | | | | 0.4 | % |
Water Utilities | | | | 0.4 | % |
Consumer Finance | | | | 0.3 | % |
Diversified Consumer Services | | | �� | 0.3 | % |
Health Care Technology | | | | 0.3 | % |
Personal Products | | | | 0.3 | % |
Biotechnology | | | | 0.2 | % |
Distributors | | | | 0.2 | % |
Marine | | | | 0.2 | % |
Construction Materials | | | | 0.1 | % |
Leisure Equipment & Products | | | | 0.1 | % |
Airlines | | | | 0.0 | %3 |
Energy Equipment & Services | | | | 0.0 | %3 |
Independent Power & Renewable Electricity Producers | | | | 0.0 | %3 |
Industrial Conglomerates | | | | 0.0 | %3 |
Transportation Infrastructure | | | | 0.0 | %3 |
Preferred Stocks | | | | 0.2 | % |
Investment Companies | | | | 0.1 | % |
Right | | | | 0.0 | %3 |
Cash Equivalents1 | | | | 3.9 | % |
Other Assets and Liabilities – Net2 | | | | 7.2 | % |
| | | | | |
TOTAL | | | | 100.0 | % |
| | | | | |
April 30, 2020 / ANNUAL REPORT
| | |
PORTFOLIOS OF INVESTMENTS Wilmington Global Alpha Equities Fund (continued) | | 24 |
| | | | | |
| | | Percentage of Total Net Assets |
Country Allocation | | | | | |
Common Stocks | | | | | |
United States | | | | 44.6 | % |
Japan | | | | 10.1 | % |
United Kingdom | | | | 5.9 | % |
Canada | | | | 5.4 | % |
France | | | | 4.9 | % |
Switzerland | | | | 4.3 | % |
Netherlands | | | | 1.8 | % |
Hong Kong | | | | 1.8 | % |
Ireland | | | | 1.4 | % |
China | | | | 1.4 | % |
Taiwan | | | | 1.3 | % |
Germany | | | | 1.0 | % |
All other countries less than 1.0% | | | | 4.7 | % |
Preferred Stocks | | | | 0.2 | % |
Investment Companies | | | | 0.1 | % |
Right | | | | 0.0 | %3 |
Cash Equivalents1 | | | | 3.9 | % |
Other Assets and Liabilities – Net2 | | | | 7.2 | % |
| | | | | |
TOTAL | | | | 100.0 | % |
| | | | | |
| (1) | Cash Equivalent includes investment in a money market fund. |
| (2) | Assets, other than investments in securities, less liabilities. See Statements of Assets and Liabilities. |
| (3) | Represents less than 0.05%. |
PORTFOLIO OF INVESTMENTS
April 30, 2020
| | | | | | | | |
| | |
| Description | | Number of Shares | | | Value | |
COMMON STOCKS – 88.6% | | | | | | | | |
| | |
AEROSPACE & DEFENSE – 1.6% | | | | | | | | |
| | |
BAE Systems PLC | | | 119,553 | | | $ | 762,557 | |
| | |
BWX Technologies, Inc. | | | 15,632 | | | | 829,434 | |
| | |
Lockheed Martin Corp. | | | 3,109 | | | | 1,209,588 | |
| | |
Meggitt PLC | | | 9,505 | | | | 33,283 | |
| | |
Raytheon Technologies Corp. | | | 8,357 | | | | 541,617 | |
| | | | | | | | |
| | |
TOTAL AEROSPACE & DEFENSE | | | | | | $ | 3,376,479 | |
| | |
AIR FREIGHT & LOGISTICS – 1.0% | | | | | | | | |
| | |
bpost SA | | | 3,651 | | | | 25,475 | |
| | |
C.H. Robinson Worldwide, Inc. | | | 6,187 | | | | 438,658 | |
| | |
Expeditors International of Washington, Inc. | | | 14,468 | | | | 1,035,981 | |
| | |
PostNL NV | | | 39,002 | | | | 67,203 | |
| | |
United Parcel Service, Inc., Class B | | | 4,713 | | | | 446,133 | |
| | | | | | | | |
| | |
TOTAL AIR FREIGHT & LOGISTICS | | | | | | $ | 2,013,450 | |
| | |
AIRLINES – 0.0%** | | | | | | | | |
| | |
Japan Airlines Co. Ltd. | | | 4,470 | | | | 79,735 | |
| | | | | | | | |
| | |
| Description | | Number of Shares | | | Value | |
| | |
AUTO COMPONENTS – 0.5% | | | | | | | | |
| | |
Aisan Industry Co. Ltd. | | | 2,565 | | | $ | 13,602 | |
| | |
Bridgestone Corp. | | | 5,286 | | | | 164,539 | |
| | |
Denso Corp. | | | 2,310 | | | | 81,201 | |
| | |
Exedy Corp. | | | 4,735 | | | | 76,291 | |
| | |
Hankook Tire & Technology Co. Ltd. | | | 3,351 | | | | 58,792 | |
| | |
NOK Corp. | | | 8,585 | | | | 99,980 | |
| | |
Sumitomo Electric Industries Ltd. | | | 5,657 | | | | 58,202 | |
| | |
Sumitomo Riko Co. Ltd. | | | 6,530 | | | | 34,922 | |
| | |
Tachi-S Co. Ltd. | | | 4,260 | | | | 37,271 | |
| | |
Tokai Rika Co. Ltd. | | | 10,707 | | | | 136,403 | |
| | |
Toyoda Gosei Co. Ltd. | | | 4,915 | | | | 91,543 | |
| | |
Toyota Boshoku Corp. | | | 3,600 | | | | 44,945 | |
| | |
TS Tech Co. Ltd. | | | 2,432 | | | | 65,943 | |
| | |
Unipres Corp. | | | 6,680 | | | | 58,580 | |
| | | | | | | | |
| | |
TOTAL AUTO COMPONENTS | | | | | | $ | 1,022,214 | |
ANNUAL REPORT / April 30, 2020
| | |
| 25 | | PORTFOLIOS OF INVESTMENTS |
|
| Wilmington Global Alpha Equities Fund (continued) |
| | | | | | | | |
| | |
| Description | | Number of Shares | | | Value | |
| | |
AUTOMOBILES – 0.9% | | | | | | | | |
| | |
Daimler AG | | | 4,810 | | | $ | 164,517 | |
| | |
Dongfeng Motor Group Co. Ltd., Class H | | | 187,920 | | | | 124,640 | |
| | |
Honda Motor Co. Ltd. | | | 19,485 | | | | 473,177 | |
| | |
Isuzu Motors Ltd. | | | 61,240 | | | | 465,397 | |
| | |
Mitsubishi Motors Corp. | | | 18,370 | | | | 52,058 | |
| | |
Nissan Motor Co. Ltd. | | | 22,480 | | | | 76,517 | |
| | |
Renault SA* | | | 3,065 | | | | 60,395 | |
| | |
Suzuki Motor Corp. | | | 2,974 | | | | 94,916 | |
| | |
Toyota Motor Corp. | | | 7,498 | | | | 463,578 | |
| | | | | | | | |
| | |
TOTAL AUTOMOBILES | | | | | | $ | 1,975,195 | |
| | |
BEVERAGES – 2.0% | | | | | | | | |
| | |
Anadolu Efes Biracilik Ve Malt Sanayii AS | | | 13,649 | | | | 35,806 | |
| | |
Asahi Group Holdings Ltd. | | | 3,091 | | | | 106,285 | |
| | |
Boston Beer Co., Inc. (The), Class A* | | | 959 | | | | 447,383 | |
| | |
Carlsberg A/S, Class B | | | 788 | | | | 99,409 | |
| | |
Coca-Cola Co. (The) | | | 15,439 | | | | 708,496 | |
| | |
Coca-Cola Icecek AS | | | 8,913 | | | | 47,152 | |
| | |
Diageo PLC | | | 25,013 | | | | 861,189 | |
| | |
Heineken Holding NV | | | 311 | | | | 24,231 | |
| | |
Heineken NV | | | 10,826 | | | | 921,439 | |
| | |
PepsiCo., Inc. | | | 5,016 | | | | 663,567 | |
| | |
Pernod Ricard SA | | | 959 | | | | 146,436 | |
| | |
Suntory Beverage & Food Ltd. | | | 2,281 | | | | 85,899 | |
| | | | | | | | |
| | |
TOTAL BEVERAGES | | | | | | $ | 4,147,292 | |
| | |
BIOTECHNOLOGY – 0.2% | | | | | | | | |
| | |
Galapagos NV* | | | 712 | | | | 157,301 | |
| | |
Zai Lab Ltd. ADR* | | | 3,320 | | | | 208,230 | |
| | | | | | | | |
| | |
TOTAL BIOTECHNOLOGY | | | | | | $ | 365,531 | |
| | |
BUILDING PRODUCTS – 0.9% | | | | | | | | |
| | |
Assa Abloy AB, Class B | | | 24,016 | | | | 429,933 | |
| | |
Cie de Saint-Gobain | | | 8,562 | | | | 227,818 | |
| | |
Lennox International, Inc. | | | 4,388 | | | | 819,152 | |
| | |
Trane Technologies PLC | | | 4,602 | | | | 402,307 | |
| | | | | | | | |
| | |
TOTAL BUILDING PRODUCTS | | | | | | $ | 1,879,210 | |
| | |
CAPITAL MARKETS – 1.9% | | | | | | | | |
| | |
Ares Management Corp., Class A | | | 9,343 | | | | 313,458 | |
| | |
Blackstone Group, Inc. (The), Class A | | | 5,064 | | | | 264,543 | |
| | |
Charles Schwab Corp. (The) | | | 24,611 | | | | 928,327 | |
| | |
Deutsche Boerse AG | | | 646 | | | | 100,155 | |
| | |
FactSet Research Systems, Inc. | | | 632 | | | | 173,800 | |
| | |
GAM Holding AG* | | | 5,282 | | | | 11,089 | |
| | |
Ichiyoshi Securities Co. Ltd. | | | 5,710 | | | | 23,908 | |
| | |
Jafco Co. Ltd. | | | 1,490 | | | | 47,731 | |
| | |
Julius Baer Group Ltd. | | | 2,069 | | | | 81,260 | |
| | | | | | | | |
| | |
| Description | | Number of Shares | | | Value | |
| | |
Moody’s Corp. | | | 1,474 | | | $ | 359,509 | |
| | |
Nomura Holdings, Inc. | | | 24,900 | | | | 103,325 | |
| | |
Partners Group Holding AG | | | 13 | | | | 10,245 | |
| | |
TD Ameritrade Holding Corp. | | | 14,839 | | | | 582,727 | |
| | |
UBS Group AG* | | | 85,377 | | | | 914,174 | |
| | |
Uranium Participation Corp.* | | | 11,839 | | | | 41,676 | |
| | | | | | | | |
| | |
TOTAL CAPITAL MARKETS | | | | | | $ | 3,955,927 | |
| | |
CHEMICALS – 1.0% | | | | | | | | |
| | |
ADEKA Corp. | | | 5,071 | | | | 63,677 | |
| | |
BASF SE | | | 362 | | | | 18,526 | |
| | |
China BlueChemical Ltd., Class H | | | 236,683 | | | | 35,327 | |
| | |
Croda International PLC | | | 382 | | | | 23,424 | |
| | |
EMS-Chemie Holding AG | | | 29 | | | | 18,753 | |
| | |
Givaudan SA | | | 13 | | | | 43,593 | |
| | |
JSR Corp. | | | 5,700 | | | | 107,223 | |
| | |
Linde PLC | | | 4,131 | | | | 760,063 | |
| | |
Mitsubishi Gas Chemical Co., Inc. | | | 5,700 | | | | 69,830 | |
| | |
Nitto Denko Corp. | | | 2,000 | | | | 99,907 | |
| | |
Sherwin-Williams Co. (The) | | | 1,337 | | | | 717,127 | |
| | |
Shin-Etsu Chemical Co. Ltd. | | | 1,667 | | | | 183,874 | |
| | | | | | | | |
| | |
TOTAL CHEMICALS | | | | | | $ | 2,141,324 | |
| | |
COMMERCIAL BANKS – 2.6% | | | | | | | | |
| | |
ABN AMRO Bank NV* | | | 12,943 | | | | 99,539 | |
| | |
AIB Group PLC* | | | 58,110 | | | | 80,414 | |
| | |
Bank of Ireland Group PLC* | | | 41,229 | | | | 84,606 | |
| | |
Bank of Nova Scotia (The) | | | 19,499 | | | | 782,690 | |
| | |
Bank of Nova Scotia (The) | | | 14,965 | | | | 599,912 | |
| | |
BPER Banca | | | 9,355 | | | | 23,129 | |
| | |
CaixaBank SA | | | 65,567 | | | | 117,964 | |
| | |
Dah Sing Financial Holdings Ltd. | | | 15,705 | | | | 51,807 | |
| | |
DGB Financial Group, Inc.* | | | 11,326 | | | | 49,166 | |
| | |
DNB ASA | | | 36,834 | | | | 445,983 | |
| | |
Erste Group Bank AG* | | | 2,840 | | | | 61,551 | |
| | |
First Citizens BancShares, Inc., Class A | | | 527 | | | | 201,314 | |
| | |
First Republic Bank | | | 5,518 | | | | 575,472 | |
| | |
Japan Post Bank Co. Ltd. | | | 8,037 | | | | 74,625 | |
| | |
KB Financial Group, Inc. ADR* | | | 4,557 | | | | 128,234 | |
| | |
Nordea Bank Abp | | | 1,962 | | | | 12,584 | |
| | |
PNC Financial Services Group, Inc. (The) | | | 7,095 | | | | 756,824 | |
| | |
Resona Holdings, Inc. | | | 63,230 | | | | 197,470 | |
| | |
Sberbank of Russia PJSC ADR | | | 5,717 | | | | 60,086 | |
| | |
Shinhan Financial Group Co. Ltd. ADR* | | | 4,802 | | | | 122,547 | |
| | |
Standard Chartered PLC | | | 99,013 | | | | 505,923 | |
| | |
Sumitomo Mitsui Trust Holdings, Inc. | | | 7,486 | | | | 217,968 | |
| | |
Tochigi Bank Ltd. (The) | | | 13,130 | | | | 18,942 | |
April 30, 2020 / ANNUAL REPORT
| | |
| PORTFOLIOS OF INVESTMENTS | | 26 |
Wilmington Global Alpha Equities Fund (continued)
| | | | | | | | |
| | |
| Description | | Number of Shares | | | Value | |
| | |
Unicaja Banco SA | | | 85,468 | | | $ | 46,245 | |
| | |
UniCredit SpA* | | | 16,920 | | | | 130,670 | |
| | | | | | | | |
TOTAL COMMERCIAL BANKS | | | | | | $ | 5,445,665 | |
| |
COMMERCIAL SERVICES & SUPPLIES – 2.3% | | | | | |
| | |
Aeon Delight Co. Ltd. | | | 2,789 | | | | 79,877 | |
| | |
Babcock International Group PLC | | | 15,061 | | | | 79,773 | |
| | |
Cintas Corp. | | | 4,697 | | | | 1,041,935 | |
| | |
Clean Harbors, Inc.* | | | 4,314 | | | | 230,497 | |
| | |
Copart, Inc.* | | | 17,390 | | | | 1,393,113 | |
| | |
G4S PLC | | | 21,613 | | | | 29,670 | |
| | |
ISS A/S* | | | 1,800 | | | | 26,761 | |
| | |
Prosegur Cia de Seguridad SA | | | 15,581 | | | | 34,363 | |
| | |
Republic Services, Inc. | | | 4,788 | | | | 375,092 | |
| | |
Secom Co. Ltd. | | | 3,209 | | | | 267,051 | |
| | |
Toppan Forms Co. Ltd. | | | 5,895 | | | | 51,789 | |
| | |
Waste Connections, Inc. | | | 9,734 | | | | 836,248 | |
| | |
Waste Connections, Inc. | | | 4,578 | | | | 393,880 | |
| | | | | | | | |
| | |
TOTAL COMMERCIAL SERVICES & SUPPLIES | | | | | | $ | 4,840,049 | |
|
COMMUNICATIONS EQUIPMENT – 1.2% | |
| | |
Accton Technology Corp. | | | 42,000 | | | | 304,461 | |
| | |
Cisco Systems, Inc. | | | 23,207 | | | | 983,513 | |
| | |
Motorola Solutions, Inc. | | | 8,141 | | | | 1,170,757 | |
| | |
Nokia OYJ* | | | 44,302 | | | | 159,707 | |
| | | | | | | | |
| | |
TOTAL COMMUNICATIONS EQUIPMENT | | | | | | $ | 2,618,438 | |
|
CONSTRUCTION & ENGINEERING – 1.4% | |
| | |
China Machinery Engineering Corp., Class H | | | 130,413 | | | | 35,782 | |
| | |
Chiyoda Corp.* | | | 8,700 | | | | 19,593 | |
| | |
Eiffage SA | | | 548 | | | | 44,784 | |
| | |
Hazama Ando Corp. | | | 15,883 | | | | 98,915 | |
| | |
Implenia AG | | | 890 | | | | 36,403 | |
| | |
JGC Holdings Corp. | | | 19,061 | | | | 184,068 | |
| | |
Kumagai Gumi Co. Ltd. | | | 4,476 | | | | 98,071 | |
| | |
Kyowa Exeo Corp. | | | 3,276 | | | | 79,809 | |
| | |
Raubex Group Ltd. | | | 27,517 | | | | 25,460 | |
| | |
Taisei Corp. | | | 5,801 | | | | 180,829 | |
| | |
Toyo Engineering Corp.* | | | 6,259 | | | | 21,899 | |
| | |
Vinci SA | | | 26,075 | | | | 2,136,125 | |
| | | | | | | | |
| | |
TOTAL CONSTRUCTION & ENGINEERING | | | | | | $ | 2,961,738 | |
|
CONSTRUCTION MATERIALS – 0.1% | |
| | |
Imerys SA | | | 1,748 | | | | 54,839 | |
| | |
LafargeHolcim Ltd.* | | | 5,074 | | | | 210,738 | |
| | |
Vicat SA | | | 1,630 | | | | 45,745 | |
| | | | | | | | |
| | |
TOTAL CONSTRUCTION MATERIALS | | | | | | $ | 311,322 | |
|
CONSUMER FINANCE – 0.3% | |
| | |
Credit Acceptance Corp.* | | | 2,128 | | | | 663,021 | |
| | | | | | | | |
| | |
| Description | | Number of Shares | | | Value | |
| | |
Provident Financial PLC | | | 17,260 | | | $ | 42,089 | |
| | | | | | | | |
| | |
TOTAL CONSUMER FINANCE | | | | | | $ | 705,110 | |
|
CONTAINERS & PACKAGING – 0.6% | |
| | |
AMVIG Holdings Ltd. | | | 70,970 | | | | 13,566 | |
| | |
Ball Corp. | | | 18,790 | | | | 1,232,436 | |
| | |
Nampak Ltd.* | | | 91,405 | | | | 8,214 | |
| | | | | | | | |
| |
TOTAL CONTAINERS & PACKAGING | | | $ | 1,254,216 | |
| | |
DISTRIBUTORS – 0.2% | | | | | | | | |
| | |
Genuine Parts Co. | | | 5,033 | | | | 399,016 | |
| |
DIVERSIFIED CONSUMER SERVICES – 0.3% | | | | | |
| | |
Benesse Holdings, Inc. | | | 995 | | | | 28,335 | |
| | |
Chegg, Inc.* | | | 12,843 | | | | 549,038 | |
| | | | | | | | |
| | |
TOTAL DIVERSIFIED CONSUMER SERVICES | | | | | | $ | 577,373 | |
|
DIVERSIFIED FINANCIAL SERVICES – 2.0% | |
| | |
Bank of America Corp. | | | 26,861 | | | | 646,007 | |
| | |
Berkshire Hathaway, Inc., Class B* | | | 7,257 | | | | 1,359,672 | |
| | |
BNP Paribas SA* | | | 4,958 | | | | 155,763 | |
| | |
G-Resources Group Ltd.* | | | 1,840,560 | | | | 10,464 | |
| | |
HSBC Holdings PLC | | | 4,685 | | | | 24,081 | |
| | |
ING Groep NV | | | 25,809 | | | | 144,603 | |
| | |
Kasikornbank PCL NVDR | | | 31,450 | | | | 82,452 | |
| | |
Mitsubishi UFJ Financial Group, Inc. | | | 226,204 | | | | 913,864 | |
| | |
Royal Bank of Canada | | | 7,192 | | | | 442,438 | |
| | |
Societe Generale SA | | | 6,735 | | | | 105,666 | |
| | |
Standard Life Aberdeen PLC | | | 2,403 | | | | 6,655 | |
| | |
Sumitomo Mitsui Financial Group, Inc. | | | 12,395 | | | | 325,954 | |
| | | | | | | | |
| | |
TOTAL DIVERSIFIED FINANCIAL SERVICES | | | | | | $ | 4,217,619 | |
|
DIVERSIFIED TELECOMMUNICATION SERVICES – 2.2% | |
| | |
AT&T, Inc. | | | 11,524 | | | | 351,136 | |
| | |
BT Group PLC | | | 66,791 | | | | 97,349 | |
| | |
Cellnex Telecom SA* | | | 8,808 | | | | 460,702 | |
| | |
China Telecom Corp. Ltd., Class H | | | 388,727 | | | | 134,266 | |
| | |
China Tower Corp. Ltd., Class H | | | 1,536,154 | | | | 341,862 | |
| | |
China Unicom Hong Kong Ltd. | | | 203,679 | | | | 131,726 | |
| | |
Deutsche Telekom AG | | | 3,879 | | | | 56,710 | |
| | |
Hellenic Telecommunications Organization SA | | | 40,657 | | | | 537,142 | |
| | |
Koninklijke KPN NV | | | 211,413 | | | | 486,958 | |
| | |
KT Corp. ADR | | | 12,947 | | | | 127,010 | |
| | |
Magyar Telekom Telecommunications PLC ADR | | | 9,961 | | | | 63,551 | |
| | |
Nippon Telegraph & Telephone Corp. | | | 19,730 | | | | 449,324 | |
| | |
Swisscom AG | | | 55 | | | | 28,578 | |
| | |
Telefonica Deutschland Holding AG | | | 9,941 | | | | 28,280 | |
| | |
Telenor ASA | | | 1,739 | | | | 26,675 | |
ANNUAL REPORT / April 30, 2020
| | |
| 27 | | PORTFOLIOS OF INVESTMENTS |
|
| Wilmington Global Alpha Equities Fund (continued) |
| | | | | | | | |
| | |
| Description | | Number of Shares | | | Value | |
| | |
Telia Co. AB | | | 6,918 | | | $ | 24,054 | |
| | |
Verizon Communications, Inc. | | | 21,595 | | | | 1,240,633 | |
| | | | | | | | |
| | |
TOTAL DIVERSIFIED TELECOMMUNICATION SERVICES | | | | | | $ | 4,585,956 | |
|
ELECTRIC UTILITIES – 0.9% | |
| | |
Alliant Energy Corp. | | | 4,170 | | | | 202,453 | |
| | |
Avangrid, Inc. | | | 11,277 | | | | 484,911 | |
| | |
Chugoku Electric Power Co., Inc. (The) | | | 5,332 | | | | 71,742 | |
| | |
Edison International | | | 8,621 | | | | 506,139 | |
| | |
Fortum OYJ | | | 447 | | | | 7,407 | |
| | |
Iberdrola SA | | | 25,343 | | | | 252,108 | |
| | |
Red Electrica Corp. SA | | | 405 | | | | 7,129 | |
| | |
SSE PLC | | | 670 | | | | 10,509 | |
| | |
Xcel Energy, Inc. | | | 5,935 | | | | 377,229 | |
| | | | | | | | |
| | |
TOTAL ELECTRIC UTILITIES | | | | | | $ | 1,919,627 | |
|
ELECTRICAL EQUIPMENT – 0.9% | |
| | |
ABB Ltd. | | | 5,294 | | | | 100,492 | |
| | |
AMETEK, Inc. | | | 5,704 | | | | 478,394 | |
| | |
Cosel Co. Ltd. | | | 4,260 | | | | 35,652 | |
| | |
Emerson Electric Co. | | | 9,003 | | | | 513,441 | |
| | |
Mitsubishi Electric Corp. | | | 10,570 | | | | 130,060 | |
| | |
Nissin Electric Co. Ltd. | | | 7,600 | | | | 70,601 | |
| | |
Schneider Electric SE | | | 6,374 | | | | 589,039 | |
| | |
Ushio, Inc. | | | 4,680 | | | | 49,349 | |
| | |
Zumtobel Group AG* | | | 6,342 | | | | 40,967 | |
| | | | | | | | |
| | |
TOTAL ELECTRICAL EQUIPMENT | | | | | | $ | 2,007,995 | |
| |
ELECTRONIC EQUIPMENT, INSTRUMENTS & COMPONENTS – 0.6% | | | | | |
| | |
Ai Holdings Corp. | | | 3,700 | | | | 45,708 | |
| | |
Canon Marketing Japan, Inc. | | | 4,431 | | | | 85,282 | |
| | |
Citizen Watch Co. Ltd. | | | 22,250 | | | | 78,528 | |
| | |
Enplas Corp. | | | 1,420 | | | | 29,813 | |
| | |
FLIR Systems, Inc. | | | 4,796 | | | | 208,146 | |
| | |
Foxconn Technology Co. Ltd. | | | 44,453 | | | | 85,354 | |
| | |
Hirose Electric Co. Ltd. | | | 684 | | | | 75,101 | |
| | |
Innolux Corp. | | | 338,556 | | | | 73,536 | |
| | |
Keyence Corp. | | | 891 | | | | 318,098 | |
| | |
Kyocera Corp. | | | 2,147 | | | | 114,715 | |
| | |
Maruwa Co. Ltd. | | | 300 | | | | 21,161 | |
| | |
Nichicon Corp. | | | 10,805 | | | | 71,209 | |
| | |
NipponChemi-Con Corp. | | | 4,520 | | | | 50,981 | |
| | | | | | | | |
| | |
TOTAL ELECTRONIC EQUIPMENT, INSTRUMENTS & COMPONENTS | | | | | | $ | 1,257,632 | |
|
ENERGY EQUIPMENT & SERVICES – 0.0%** | |
| | |
Drilling Co. of 1972 A/S (The)* | | | 299 | | | | 7,035 | |
| | |
Fugro NV* | | | 5,604 | | | | 20,992 | |
| | |
Saipem SpA* | | | 22,447 | | | | 57,614 | |
| | | | | | | | |
| | |
| Description | | Number of Shares | | | Value | |
| | |
Trican Well Service Ltd.* | | | 26,999 | | | $ | 11,250 | |
| | | | | | | | |
| | |
TOTAL ENERGY EQUIPMENT & SERVICES | | | | | | $ | 96,891 | |
|
ENTERTAINMENT – 0.9% | |
| | |
Avex, Inc. | | | 5,445 | | | | 41,213 | |
| | |
CTS Eventim AG & Co. KGaA | | | 6,572 | | | | 273,211 | |
| | |
DeNA Co. Ltd. | | | 6,255 | | | | 77,000 | |
| | |
Netflix, Inc.* | | | 1,147 | | | | 481,568 | |
| | |
Nexon Co. Ltd. | | | 27,520 | | | | 444,338 | |
| | |
Spotify Technology SA* | | | 3,357 | | | | 508,820 | |
| | | | | | | | |
| | |
TOTAL ENTERTAINMENT | | | | | | $ | 1,826,150 | |
|
FOOD & STAPLES RETAILING – 0.7% | |
| | |
Cawachi Ltd. | | | 1,660 | | | | 39,253 | |
| | |
Colruyt SA | | | 506 | | | | 30,326 | |
| | |
J Sainsbury PLC | | | 72,053 | | | | 179,324 | |
| | |
Jeronimo Martins SGPS SA | | | 3,060 | | | | 51,878 | |
| | |
Kato Sangyo Co. Ltd. | | | 1,200 | | | | 40,704 | |
| | |
Koninklijke Ahold Delhaize NV | | | 1,711 | | | | 41,544 | |
| | |
Lawson, Inc. | | | 1,161 | | | | 60,348 | |
| | |
METRO AG | | | 2,784 | | | | 24,325 | |
| | |
Performance Food Group Co.* | | | 19,732 | | | | 579,134 | |
| | |
Sundrug Co. Ltd. | | | 3,843 | | | | 131,578 | |
| | |
Tesco PLC | | | 14,838 | | | | 43,888 | |
| | |
Walmart, Inc. | | | 2,972 | | | | 361,247 | |
| | | | | | | | |
| | |
TOTAL FOOD & STAPLES RETAILING | | | | | | $ | 1,583,549 | |
|
FOOD PRODUCTS – 2.4% | |
| | |
Barry Callebaut AG | | | 10 | | | | 19,580 | |
| | |
Calbee, Inc. | | | 2,006 | | | | 60,697 | |
| | |
Campbell Soup Co. | | | 3,618 | | | | 180,828 | |
| | |
Chocoladefabriken Lindt & Spruengli AG | | | 6 | | | | 46,740 | |
| | |
Danone SA | | | 2,446 | | | | 170,480 | |
| | |
General Mills, Inc. | | | 6,890 | | | | 412,642 | |
| | |
Hershey Co. (The) | | | 2,876 | | | | 380,869 | |
| | |
Hormel Foods Corp. | | | 8,910 | | | | 417,433 | |
| | |
Kellogg Co. | | | 14,974 | | | | 980,797 | |
| | |
MEIJI Holdings Co. Ltd. | | | 1,507 | | | | 104,667 | |
| | |
Mowi ASA | | | 1,225 | | | | 20,981 | |
| | |
Nestle SA | | | 12,848 | | | | 1,360,732 | |
| | |
Nissin Foods Holdings Co. Ltd. | | | 1,021 | | | | 83,930 | |
| | |
Nomad Foods Ltd.* | | | 16,972 | | | | 349,793 | |
| | |
Orkla ASA | | | 2,476 | | | | 22,365 | |
| | |
Perusahaan Perkebunan London Sumatra Indonesia Tbk PT | | | 297,293 | | | | 14,070 | |
| | |
Toyo Suisan Kaisha Ltd. | | | 1,612 | | | | 77,516 | |
| | |
Viscofan SA | | | 7,172 | | | | 459,643 | |
| | | | | | | | |
| | |
TOTAL FOOD PRODUCTS | | | | | | $ | 5,163,763 | |
April 30, 2020 / ANNUAL REPORT
| | |
| PORTFOLIOS OF INVESTMENTS | | 28 |
Wilmington Global Alpha Equities Fund (continued)
| | | | | | | | |
| | |
| Description | | Number of Shares | | | Value | |
|
GAS UTILITIES – 0.6% | |
| | |
Enagas SA | | | 272 | | | $ | 6,349 | |
| | |
Naturgy Energy Group SA | | | 333 | | | | 5,883 | |
| | |
Osaka Gas Co. Ltd. | | | 5,218 | | | | 97,169 | |
| | |
Rubis SCA | | | 16,496 | | | | 739,065 | |
| | |
UGI Corp. | | | 14,436 | | | | 435,678 | |
| | | | | | | | |
| | |
TOTAL GAS UTILITIES | | | | | | $ | 1,284,144 | |
| |
HEALTH CARE EQUIPMENT & SUPPLIES – 4.4% | | | | | |
| | |
Abbott Laboratories | | | 4,901 | | | | 451,333 | |
| | |
Baxter International, Inc. | | | 7,738 | | | | 686,980 | |
| | |
Becton Dickinson & Co. | | | 1,665 | | | | 420,462 | |
| | |
Coloplast A/S, Class B | | | 234 | | | | 36,907 | |
| | |
Danaher Corp. | | | 7,137 | | | | 1,166,614 | |
| | |
DexCom, Inc.* | | | 1,432 | | | | 480,006 | |
| | |
Hologic, Inc.* | | | 12,390 | | | | 620,739 | |
| | |
Insulet Corp.* | | | 2,443 | | | | 487,916 | |
| | |
Intuitive Surgical, Inc.* | | | 319 | | | | 162,971 | |
| | |
Koninklijke Philips NV | | | 28,325 | | | | 1,234,763 | |
| | |
Medtronic PLC | | | 14,357 | | | | 1,401,674 | |
| | |
Smith & Nephew PLC | | | 26,755 | | | | 523,569 | |
| | |
Sonova Holding AG | | | 291 | | | | 52,559 | |
| | |
STERIS PLC | | | 1,271 | | | | 181,117 | |
| | |
Sysmex Corp. | | | 5,073 | | | | 350,480 | |
| | |
Tandem Diabetes Care, Inc.* | | | 6,106 | | | | 487,137 | |
| | |
West Pharmaceutical Services, Inc. | | | 2,770 | | | | 524,250 | |
| | | | | | | | |
| | |
TOTAL HEALTH CARE EQUIPMENT & SUPPLIES | | | | | | $ | 9,269,477 | |
|
HEALTH CARE PROVIDERS & SERVICES – 1.5% | |
| | |
Anthem, Inc. | | | 1,326 | | | | 372,248 | |
| | |
HCA Healthcare, Inc. | | | 5,976 | | | | 656,643 | |
| | |
Laboratory Corp. of America Holdings* | | | 2,358 | | | | 387,773 | |
| | |
Medipal Holdings Corp. | | | 6,008 | | | | 115,901 | |
| | |
Quest Diagnostics, Inc. | | | 3,555 | | | | 391,441 | |
| | |
Suzuken Co. Ltd. | | | 1,600 | | | | 61,661 | |
| | |
UnitedHealth Group, Inc. | | | 4,123 | | | | 1,205,854 | |
| | | | | | | | |
| | |
TOTAL HEALTH CARE PROVIDERS & SERVICES | | | | | | $ | 3,191,521 | |
|
HEALTH CARE TECHNOLOGY – 0.3% | |
| | |
AGFA-Gevaert NV* | | | 10,096 | | | | 39,994 | |
| | |
Cerner Corp. | | | 6,329 | | | | 439,169 | |
| | |
Veeva Systems, Inc., Class A* | | | 1,092 | | | | 208,354 | |
| | | | | | | | |
| | |
TOTAL HEALTH CARE TECHNOLOGY | | | | | | $ | 687,517 | |
|
HOTELS, RESTAURANTS & LEISURE – 2.5% | |
| | |
Choice Hotels International, Inc. | | | 11,525 | | | | 864,951 | |
| | |
Compass Group PLC | | | 95,457 | | | | 1,606,286 | |
| | |
McDonald’s Corp. | | | 6,934 | | | | 1,300,541 | |
| | |
Planet Fitness, Inc., Class A* | | | 5,497 | | | | 331,634 | |
| | |
Sands China Ltd. | | | 76,800 | | | | 310,925 | |
| | | | | | | | |
| | |
| Description | | Number of Shares | | | Value | |
| | |
Sodexo SA | | | 594 | | | $ | 47,488 | |
| | |
Yum China Holdings, Inc. | | | 9,403 | | | | 455,669 | |
| | |
Yum! Brands, Inc. | | | 5,405 | | | | 467,154 | |
| | | | | | | | |
| | |
TOTAL HOTELS, RESTAURANTS & LEISURE | | | | | | $ | 5,384,648 | |
|
HOUSEHOLD DURABLES – 0.8% | |
| | |
Funai Electric Co. Ltd.* | | | 8,690 | | | | 35,946 | |
| | |
Lennar Corp., Class A | | | 5,496 | | | | 275,185 | |
| | |
Nikon Corp. | | | 8,415 | | | | 78,275 | |
| | |
NVR, Inc.* | | | 373 | | | | 1,156,300 | |
| | |
Persimmon PLC | | | 308 | | | | 8,533 | |
| | |
Sekisui Chemical Co. Ltd. | | | 8,572 | | | | 108,642 | |
| | | | | | | | |
| | |
TOTAL HOUSEHOLD DURABLES | | | | | | $ | 1,662,881 | |
|
HOUSEHOLD PRODUCTS – 1.8% | |
| | |
Clorox Co. (The) | | | 2,103 | | | | 392,083 | |
| | |
Colgate-Palmolive Co. | | | 15,003 | | | | 1,054,261 | |
| | |
Essity AB, Class B* | | | 1,128 | | | | 36,540 | |
| | |
Procter & Gamble Co. (The) | | | 8,408 | | | | 991,051 | |
| | |
Reckitt Benckiser Group PLC | | | 14,284 | | | | 1,189,848 | |
| | |
Unicharm Corp. | | | 3,843 | | | | 141,628 | |
| | | | | | | | |
| | |
TOTAL HOUSEHOLD PRODUCTS | | | | | | $ | 3,805,411 | |
| |
INDEPENDENT POWER & RENEWABLE ELECTRICITY PRODUCERS – 0.0%** | | | | | |
| | |
Uniper SE | | | 718 | | | | 19,316 | |
|
INDUSTRIAL CONGLOMERATES – 0.0%** | |
| | |
Siemens AG | | | 254 | | | | 23,440 | |
| | |
Smiths Group PLC | | | 3,069 | | | | 47,785 | |
| | | | | | | | |
| | |
TOTAL INDUSTRIAL CONGLOMERATES | | | | | | $ | 71,225 | |
|
INSURANCE – 6.8% | |
| | |
Admiral Group PLC | | | 229 | | | | 6,682 | |
| | |
Ageas | | | 2,748 | | | | 99,050 | |
| | |
AIA Group Ltd. | | | 266,540 | | | | 2,446,243 | |
| | |
Alleghany Corp. | | | 377 | | | | 201,209 | |
| | |
Allianz SE | | | 127 | | | | 23,372 | |
| | |
Aon PLC | | | 1,694 | | | | 292,503 | |
| | |
Arthur J. Gallagher & Co. | | | 9,912 | | | | 778,092 | |
| | |
Assicurazioni Generali SpA | | | 6,144 | | | | 87,655 | |
| | |
Aviva PLC | | | 2,941 | | | | 8,894 | |
| | |
AXA SA | | | 68,970 | | | | 1,226,050 | |
| | |
Chubb Ltd. | | | 6,250 | | | | 675,062 | |
| | |
CNP Assurances* | | | 347 | | | | 3,580 | |
| | |
Dai-ichi Life Holdings, Inc. | | | 8,545 | | | | 107,088 | |
| | |
Enstar Group Ltd.* | | | 3,330 | | | | 481,585 | |
| | |
Globe Life, Inc. | | | 7,146 | | | | 588,402 | |
| | |
Intact Financial Corp. | | | 18,376 | | | | 1,748,819 | |
| | |
Legal & General Group PLC | | | 4,272 | | | | 10,983 | |
ANNUAL REPORT / April 30, 2020
| | |
| 29 | | PORTFOLIOS OF INVESTMENTS |
|
| Wilmington Global Alpha Equities Fund (continued) |
| | | | | | | | |
| | |
| Description | | Number of Shares | | | Value | |
| | |
Mapfre SA | | | 2,099 | | | $ | 3,852 | |
| | |
Markel Corp.* | | | 1,528 | | | | 1,323,004 | |
| | |
Marsh & McLennan Cos., Inc. | | | 4,054 | | | | 394,576 | |
| | |
MS&AD Insurance Group Holdings, Inc. | | | 10,622 | | | | 306,021 | |
| | |
Muenchener Rueckversicherungs AG | | | 73 | | | | 15,989 | |
| | |
Progressive Corp. (The) | | | 18,924 | | | | 1,462,825 | |
| | |
Sampo OYJ, Class A | | | 316 | | | | 10,475 | |
| | |
SCOR SE | | | 1,553 | | | | 43,755 | |
| | |
Shin Kong Financial Holding Co. Ltd. | | | 160,527 | | | | 45,700 | |
| | |
Sony Financial Holdings, Inc. | | | 36,379 | | | | 689,624 | |
| | |
Swiss Re AG | | | 174 | | | | 12,644 | |
| | |
T&D Holdings, Inc. | | | 30,258 | | | | 261,543 | |
| | |
Tokio Marine Holdings, Inc. | | | 15,174 | | | | 711,900 | |
| | |
Tongyang Life Insurance Co. Ltd. | | | 10,200 | | | | 24,798 | |
| | |
White Mountains Insurance Group Ltd. | | | 430 | | | | 418,390 | |
| | |
Zurich Insurance Group AG | | | 55 | | | | 17,438 | |
| | | | | | | | |
| | |
TOTAL INSURANCE | | | | | | $ | 14,527,803 | |
|
INTERACTIVE MEDIA & SERVICES – 0.7% | |
| | |
Auto Trader Group PLC | | | 7,265 | | | | 41,821 | |
| | |
Facebook, Inc., Class A* | | | 2,336 | | | | 478,203 | |
| | |
Gree, Inc. | | | 23,610 | | | | 92,818 | |
| | |
Match Group, Inc.* | | | 3,236 | | | | 249,043 | |
| | |
Tencent Holdings Ltd. | | | 10,453 | | | | 549,508 | |
| | |
Z Holdings Corp. | | | 29,006 | | | | 111,944 | |
| | | | | | | | |
| | |
TOTAL INTERACTIVE MEDIA & SERVICES | | | | | | $ | 1,523,337 | |
|
INTERNET & CATALOG RETAIL – 1.0% | |
| | |
Alibaba Group Holding Ltd. ADR* | | | 3,229 | | | | 654,421 | |
| | |
Amazon.com, Inc.* | | | 444 | | | | 1,098,456 | |
| | |
Etsy, Inc.* | | | 4,198 | | | | 272,324 | |
| | |
Qliro Group AB* | | | 17,409 | | | | 7,856 | |
| | | | | | | | |
| | |
TOTAL INTERNET & CATALOG RETAIL | | | | | | $ | 2,033,057 | |
|
IT SERVICES – 5.8% | |
| | |
Accenture PLC, Class A | | | 5,973 | | | | 1,106,140 | |
| | |
Automatic Data Processing, Inc. | | | 3,551 | | | | 520,896 | |
| | |
Black Knight, Inc.* | | | 16,982 | | | | 1,198,420 | |
| | |
Capgemini SE | | | 9,701 | | | | 912,002 | |
| | |
DTS Corp. | | | 5,036 | | | | 96,519 | |
| | |
Edenred | | | 10,415 | | | | 419,551 | |
| | |
EPAM Systems, Inc.* | | | 1,577 | | | | 348,344 | |
| | |
Fidelity National Information Services, Inc. | | | 11,178 | | | | 1,474,266 | |
| | |
Fiserv, Inc.* | | | 4,233 | | | | 436,253 | |
| | |
FleetCor Technologies, Inc.* | | | 1,909 | | | | 460,546 | |
| | |
Fujitsu Ltd. | | | 748 | | | | 72,667 | |
| | |
Global Payments, Inc. | | | 2,211 | | | | 367,070 | |
| | |
GoDaddy, Inc., Class A* | | | 8,251 | | | | 572,867 | |
| | | | | | | | |
| | |
| Description | | Number of Shares | | | Value | |
| | |
International Business Machines Corp. | | | 3,694 | | | $ | 463,819 | |
| | |
Leidos Holdings, Inc. | | | 5,984 | | | | 591,279 | |
| | |
NS Solutions Corp. | | | 4,247 | | | | 107,278 | |
| | |
Paychex, Inc. | | | 6,027 | | | | 412,970 | |
| | |
PayPal Holdings, Inc.* | | | 5,438 | | | | 668,874 | |
| | |
Sopra Steria Group | | | 190 | | | | 22,496 | |
| | |
Square, Inc., Class A* | | | 11,886 | | | | 774,254 | |
| | |
Visa, Inc., Class A | | | 2,852 | | | | 509,709 | |
| | |
Western Union Co. (The) | | | 18,247 | | | | 347,970 | |
| | |
Worldline SA* | | | 6,754 | | | | 457,446 | |
| | | | | | | | |
| | |
TOTAL IT SERVICES | | | | | | $ | 12,341,636 | |
|
LEISURE EQUIPMENT & PRODUCTS – 0.1% | |
| | |
BRP, Inc. | | | 5,491 | | | | 164,341 | |
|
LIFE SCIENCES TOOLS & SERVICES – 0.5% | |
| | |
CMIC Holdings Co. Ltd. | | | 990 | | | | 14,253 | |
| | |
QIAGEN NV* | | | 1,242 | | | | 51,674 | |
| | |
Thermo Fisher Scientific, Inc. | | | 3,084 | | | | 1,032,153 | |
| | | | | | | | |
| | |
TOTAL LIFE SCIENCES TOOLS & SERVICES | | | | | | $ | 1,098,080 | |
|
MACHINERY – 2.6% | |
| | |
Alfa Laval AB* | | | 2,403 | | | | 44,905 | |
| | |
Amada Co. Ltd. | | | 5,985 | | | | 54,099 | |
| | |
Fortive Corp. | | | 33,289 | | | | 2,130,496 | |
| | |
Hisaka Works Ltd. | | | 4,230 | | | | 29,017 | |
| | |
IDEX Corp. | | | 7,527 | | | | 1,156,373 | |
| | |
Japan Steel Works Ltd. (The) | | | 11,785 | | | | 144,682 | |
| | |
Kone OYJ, Class B | | | 615 | | | | 37,241 | |
| | |
Mitsubishi Heavy Industries Ltd. | | | 2,202 | | | | 56,467 | |
| | |
OKUMA Corp. | | | 2,140 | | | | 80,688 | |
| | |
Otis Worldwide Corp.* | | | 4,178 | | | | 212,702 | |
| | |
PACCAR, Inc. | | | 10,842 | | | | 750,592 | |
| | |
Schindler Holding AG | | | 328 | | | | 72,998 | |
| | |
Schindler Holding AG | | | 233 | | | | 50,106 | |
| | |
Shibaura Machine Co. Ltd. | | | 1,238 | | | | 24,355 | |
| | |
Star Micronics Co. Ltd. | | | 3,900 | | | | 43,056 | |
| | |
Takuma Co. Ltd. | | | 9,610 | | | | 103,900 | |
| | |
THK Co. Ltd. | | | 5,790 | | | | 138,409 | |
| | |
WABCO Holdings, Inc.* | | | 2,899 | | | | 389,568 | |
| | |
Wartsila OYJ Abp | | | 4,332 | | | | 31,798 | |
| | | | | | | | |
| | |
TOTAL MACHINERY | | | | | | $ | 5,551,452 | |
| | |
MARINE – 0.2% | | | | | | | | |
AP Moeller – Maersk A/S, Class B | | | 146 | | | | 145,307 | |
D/S Norden A/S* | | | 5,556 | | | | 78,090 | |
Kuehne + Nagel International AG | | | 477 | | | | 68,231 | |
Pacific Basin Shipping Ltd. | | | 405,548 | | | | 49,684 | |
| | | | | | | | |
| | |
TOTAL MARINE | | | | | | $ | 341,312 | |
April 30, 2020 / ANNUAL REPORT
| | |
| PORTFOLIOS OF INVESTMENTS | | 30 |
Wilmington Global Alpha Equities Fund (continued)
| | | | | | | | |
| | |
| Description | | Number of Shares | | | Value | |
| | |
MEDIA – 1.0% | | | | | | | | |
| | |
Charter Communications, Inc., Class A* | | | 1,084 | | | $ | 536,829 | |
| | |
Comcast Corp., Class A | | | 15,589 | | | | 586,614 | |
| | |
Criteo SA ADR* | | | 3,972 | | | | 39,442 | |
| | |
Fuji Media Holdings, Inc. | | | 4,125 | | | | 40,976 | |
| | |
Gendai Agency, Inc. | | | 1,300 | | | | 3,063 | |
| | |
Informa PLC | | | 1,275 | | | | 7,043 | |
| | |
Metropole Television SA | | | 5,013 | | | | 55,799 | |
| | |
Nippon Television Holdings, Inc. | | | 13,537 | | | | 151,212 | |
| | |
Omnicom Group, Inc. | | | 5,869 | | | | 334,709 | |
| | |
RTL Group SA* | | | 2,036 | | | | 67,780 | |
| | |
Television Francaise 1* | | | 13,272 | | | | 64,980 | |
| | |
TV Asahi Holdings Corp. | | | 5,005 | | | | 74,297 | |
| | |
WPP PLC | | | 23,986 | | | | 186,109 | |
| | | | | | | | |
| | |
TOTAL MEDIA | | | | | | $ | 2,148,853 | |
|
METALS & MINING – 0.8% | |
| | |
Anglo American PLC | | | 5,864 | | | | 104,291 | |
| | |
Asahi Holdings, Inc. | | | 9,968 | | | | 225,237 | |
| | |
Barrick Gold Corp. | | | 7,632 | | | | 196,454 | |
| | |
Centerra Gold, Inc. | | | 10,921 | | | | 87,324 | |
| | |
Chubu Steel Plate Co. Ltd. | | | 1,610 | | | | 9,468 | |
| | |
Eldorado Gold Corp.* | | | 5,997 | | | | 56,792 | |
| | |
Gold Fields Ltd. | | | 9,774 | | | | 72,754 | |
| | |
Harmony Gold Mining Co. Ltd. ADR* | | | 16,743 | | | | 60,610 | |
| | |
IAMGOLD Corp.* | | | 7,924 | | | | 27,813 | |
| | |
Impala Platinum Holdings Ltd.* | | | 6,322 | | | | 37,706 | |
| | |
Kinross Gold Corp.* | | | 13,359 | | | | 88,303 | |
| | |
Kyoei Steel Ltd. | | | 5,475 | | | | 69,572 | |
| | |
Nakayama Steel Works Ltd. | | | 8,090 | | | | 28,333 | |
| | |
Neturen Co. Ltd. | | | 2,865 | | | | 15,541 | |
| | |
Norsk Hydro ASA | | | 42,697 | | | | 108,316 | |
| | |
Northern Dynasty Minerals Ltd.* | | | 2,242 | | | | 1,289 | |
| | |
Pacific Metals Co. Ltd. | | | 2,207 | | | | 34,024 | |
| | |
Resolute Mining Ltd.* | | | 47,189 | | | | 28,115 | |
| | |
Salzgitter AG | | | 4,793 | | | | 64,036 | |
| | |
SEMAFO, Inc.* | | | 23,682 | | | | 59,547 | |
| | |
Tokyo Steel Manufacturing Co. Ltd. | | | 12,840 | | | | 81,748 | |
| | |
Western Areas Ltd. | | | 35,963 | | | | 50,694 | |
| | |
Yamato Kogyo Co. Ltd. | | | 8,668 | | | | 170,107 | |
| | |
Yodogawa Steel Works Ltd. | | | 980 | | | | 15,419 | |
| | | | | | | | |
| | |
TOTAL METALS & MINING | | | | | | $ | 1,693,493 | |
|
MULTILINE RETAIL – 0.4% | |
Dollar General Corp. | | | 2,824 | | | | 495,047 | |
Marks & Spencer Group PLC | | | 32,704 | | | | 38,102 | |
Marui Group Co. Ltd. | | | 24,460 | | | | 400,384 | |
| | | | | | | | |
| | |
TOTAL MULTILINE RETAIL | | | | | | $ | 933,533 | |
| | | | | | | | |
| | |
| Description | | Number of Shares | | | Value | |
|
MULTI-UTILITIES – 1.4% | |
| | |
Centrica PLC | | | 86,928 | | | $ | 43,477 | |
| | |
CMS Energy Corp. | | | 4,601 | | | | 262,671 | |
| | |
Consolidated Edison, Inc. | | | 4,488 | | | | 353,654 | |
| | |
E.ON SE | | | 44,564 | | | | 446,412 | |
| | |
Engie SA* | | | 14,983 | | | | 162,560 | |
| | |
National Grid PLC | | | 115,871 | | | | 1,357,857 | |
| | |
WEC Energy Group, Inc. | | | 3,888 | | | | 352,058 | |
| | | | | | | | |
| | |
TOTAL MULTI-UTILITIES | | | | | | $ | 2,978,689 | |
|
OIL, GAS & CONSUMABLE FUELS – 2.7% | |
| | |
Advantage Oil & Gas Ltd.* | | | 18,823 | | | | 30,561 | |
| | |
ARC Resources Ltd. | | | 9,527 | | | | 40,176 | |
| | |
BP PLC | | | 64,543 | | | | 254,325 | |
| | |
Cameco Corp. | | | 5,973 | | | | 59,389 | |
| | |
Enbridge, Inc. | | | 21,967 | | | | 673,079 | |
| | |
Eni SpA | | | 21,499 | | | | 204,807 | |
| | |
Equinor ASA | | | 9,664 | | | | 133,816 | |
| | |
Galp Energia SGPS SA | | | 47,976 | | | | 553,699 | |
| | |
Gazprom PJSC ADR | | | 17,796 | | | | 89,870 | |
| | |
Idemitsu Kosan Co. Ltd. | | | 5,302 | | | | 120,477 | |
| | |
Imperial Oil Ltd. | | | 27,215 | | | | 439,718 | |
| | |
Inpex Corp. | | | 17,760 | | | | 114,642 | |
| | |
Japan Petroleum Exploration Co. Ltd. | | | 1,850 | | | | 31,797 | |
| | |
LUKOIL PJSC ADR | | | 461 | | | | 29,767 | |
| | |
OMV AG | | | 167 | | | | 5,453 | |
| | |
Ovintiv, Inc. | | | 5,208 | | | | 32,551 | |
| | |
Repsol SA | | | 1,089 | | | | 9,885 | |
| | |
Royal Dutch Shell PLC, Class A | | | 1,407 | | | | 23,165 | |
| | |
Royal Dutch Shell PLC, Class B | | | 19,184 | | | | 307,108 | |
| | |
Surgutneftegas PJSC ADR | | | 15,452 | | | | 74,942 | |
| | |
TC Energy Corp. | | | 16,737 | | | | 770,266 | |
| | |
TOTAL SA | | | 44,072 | | | | 1,564,228 | |
| | |
Tourmaline Oil Corp. | | | 4,594 | | | | 45,546 | |
| | |
YPF SA ADR | | | 5,483 | | | | 21,055 | |
| | | | | | | | |
| | |
TOTAL OIL, GAS & CONSUMABLE FUELS | | | | | | $ | 5,630,322 | |
|
PERSONAL PRODUCTS – 0.3% | |
Beiersdorf AG | | | 248 | | | | 25,948 | |
Kao Corp. | | | 2,898 | | | | 223,483 | |
L’Oreal SA | | | 241 | | | | 70,069 | |
Unilever NV | | | 4,759 | | | | 236,996 | |
Unilever PLC | | | 1,600 | | | | 82,387 | |
| | | | | | | | |
| | |
TOTAL PERSONAL PRODUCTS | | | | | | $ | 638,883 | |
|
PHARMACEUTICALS – 6.1% | |
Astellas Pharma, Inc. | | | 13,936 | | | | 230,490 | |
AstraZeneca PLC ADR | | | 22,979 | | | | 1,201,342 | |
AstraZeneca PLC | | | 5,789 | | | | 605,481 | |
ANNUAL REPORT / April 30, 2020
| | |
| 31 | | PORTFOLIOS OF INVESTMENTS |
|
| Wilmington Global Alpha Equities Fund (continued) |
| | | | | | | | |
| | |
| Description | | Number of
Shares | | | Value | |
| | |
Eisai Co. Ltd. | | | 4,705 | | | $ | 328,461 | |
| | |
GlaxoSmithKline PLC | | | 5,589 | | | | 116,600 | |
| | |
Johnson & Johnson | | | 11,082 | | | | 1,662,743 | |
| | |
Kyowa Kirin Co. Ltd. | | | 5,803 | | | | 134,686 | |
| | |
Merck & Co., Inc. | | | 20,033 | | | | 1,589,418 | |
| | |
Nippon Shinyaku Co. Ltd. | | | 5,200 | | | | 365,163 | |
| | |
Novartis AG | | | 41,671 | | | | 3,556,139 | |
| | |
Novo Nordisk A/S, Class B | | | 1,401 | | | | 89,370 | |
| | |
Ono Pharmaceutical Co. Ltd. | | | 7,023 | | | | 169,200 | |
| | |
Orion OYJ, Class B | | | 860 | | | | 43,704 | |
| | |
Pfizer, Inc. | | | 34,494 | | | | 1,323,190 | |
| | |
Roche Holding AG | | | 3,800 | | | | 1,315,930 | |
| | |
Takeda Pharmaceutical Co. Ltd. | | | 6,945 | | | | 250,447 | |
| | |
Vifor Pharma AG | | | 305 | | | | 45,757 | |
| | | | | | | | |
| | |
TOTAL PHARMACEUTICALS | | | | | | $ | 13,028,121 | |
| | |
PROFESSIONAL SERVICES – 0.5% | | | | | | | | |
| | |
Adecco Group AG | | | 4,100 | | | | 179,419 | |
| | |
BeNEXT Group, Inc. | | | 6,500 | | | | 40,608 | |
| | |
Bureau Veritas SA | | | 1,844 | | | | 38,281 | |
| | |
Experian PLC | | | 15,368 | | | | 461,504 | |
| | |
Hays PLC | | | 56,410 | | | | 76,854 | |
| | |
JAC Recruitment Co. Ltd. | | | 2,300 | | | | 24,091 | |
| | |
Pagegroup PLC | | | 12,420 | | | | 58,783 | |
| | |
RELX PLC | | | 5,207 | | | | 117,479 | |
| | |
SGS SA | | | 39 | | | | 87,972 | |
| | |
SThree PLC | | | 10,114 | | | | 27,399 | |
| | |
Verisk Analytics, Inc. | | | 29 | | | | 4,432 | |
| | |
Wolters Kluwer NV | | | 521 | | | | 38,373 | |
| | | | | | | | |
| | |
TOTAL PROFESSIONAL SERVICES | | | | | | $ | 1,155,195 | |
|
REAL ESTATE INVESTMENT TRUSTS – 3.0% | |
| | |
American Tower Corp. | | | 10,272 | | | | 2,444,736 | |
| | |
British Land Co. PLC (The) | | | 11,932 | | | | 60,868 | |
| | |
Covivio | | | 63 | | | | 3,956 | |
| | |
Daiwa Securities Living Investments Corp. | | | 72 | | | | 60,168 | |
| | |
Equity LifeStyle Properties, Inc. | | | 6,470 | | | | 390,206 | |
| | |
Extra Space Storage, Inc. | | | 4,179 | | | | 368,755 | |
| | |
Klepierre SA | | | 232 | | | | 4,710 | |
| | |
Land Securities Group PLC | | | 7,299 | | | | 60,867 | |
| | |
LaSalle Logiport REIT | | | 79 | | | | 110,593 | |
| | |
Medical Properties Trust, Inc. | | | 55,467 | | | | 950,704 | |
| | |
Public Storage | | | 7,951 | | | | 1,474,513 | |
| | |
Realty Income Corp. | | | 1,304 | | | | 71,616 | |
| | |
Sun Communities, Inc. | | | 2,898 | | | | 389,491 | |
| | | | | | | | |
| | |
TOTAL REAL ESTATE INVESTMENT TRUSTS | | | | | | $ | 6,391,183 | |
|
REAL ESTATE MANAGEMENT & DEVELOPMENT – 0.5% | |
| | |
CK Asset Holdings Ltd. | | | 16,867 | | | | 106,578 | |
| | | | | | | | |
| | |
| Description | | Number of
Shares | | | Value | |
| | |
Daito Trust Construction Co. Ltd. | | | 738 | | | $ | 70,173 | |
| | |
Mitsubishi Estate Co. Ltd. | | | 20,004 | | | | 323,627 | |
| | |
Nexity SA | | | 15,624 | | | | 479,249 | |
| | | | | | | | |
| |
TOTAL REAL ESTATE MANAGEMENT & DEVELOPMENT | | | $ | 979,627 | |
| | |
ROAD & RAIL – 2.0% | | | | | | | | |
| | |
AMERCO | | | 2,038 | | | | 570,905 | |
| | |
Canadian National Railway Co. | | | 30,395 | | | | 2,513,573 | |
| | |
East Japan Railway Co. | | | 2,464 | | | | 179,921 | |
| | |
Go-Ahead Group PLC (The) | | | 1,668 | | | | 28,149 | |
| | |
Hankyu Hanshin Holdings, Inc. | | | 3,175 | | | | 108,626 | |
| | |
Kyushu Railway Co. | | | 2,900 | | | | 78,019 | |
| | |
Nagoya Railroad Co. Ltd. | | | 3,034 | | | | 86,821 | |
| | |
Seino Holdings Co. Ltd. | | | 4,500 | | | | 53,573 | |
| | |
Tokyu Corp. | | | 6,722 | | | | 101,179 | |
| | |
Uber Technologies, Inc.* | | | 11,895 | | | | 360,062 | �� |
| | |
West Japan Railway Co. | | | 1,856 | | | | 114,696 | |
| | | | | | | | |
| | |
TOTAL ROAD & RAIL | | | | | | $ | 4,195,524 | |
|
SEMICONDUCTORS & SEMICONDUCTOR EQUIPMENT – 1.8% | |
| | |
Advanced Micro Devices, Inc.* | | | 6,251 | | | | 327,490 | |
| | |
ASML Holding NV | | | 428 | | | | 123,448 | |
| | |
Marvell Technology Group Ltd. | | | 18,051 | | | | 482,684 | |
| | |
MediaTek, Inc. | | | 41,000 | | | | 566,146 | |
| | |
Miraial Co. Ltd. | | | 1,750 | | | | 17,718 | |
| | |
NVIDIA Corp. | | | 370 | | | | 108,144 | |
| | |
Realtek Semiconductor Corp. | | | 49,000 | | | | 419,603 | |
| | |
Taiwan Semiconductor Manufacturing Co. | | | | | | | | |
| | |
Ltd. | | | 77,000 | | | | 776,761 | |
| | |
Taiwan Semiconductor Manufacturing Co. | | | | | | | | |
| | |
Ltd. ADR | | | 5,211 | | | | 276,860 | |
| | |
Texas Instruments, Inc. | | | 4,551 | | | | 528,235 | |
| | |
Tokyo Seimitsu Co. Ltd. | | | 2,785 | | | | 90,086 | |
| | | | | | | | |
| |
TOTAL SEMICONDUCTORS & SEMICONDUCTOR EQUIPMENT | | | $ | 3,717,175 | |
| | |
SOFTWARE – 2.4% | | | | | | | | |
| | |
ANSYS, Inc.* | | | 606 | | | | 158,669 | |
| | |
CDK Global, Inc. | | | 10,565 | | | | 414,993 | |
| | |
Constellation Software, Inc. | | | 1,347 | | | | 1,295,305 | |
| | |
Guidewire Software, Inc.* | | | 3,544 | | | | 321,937 | |
| | |
Microsoft Corp. | | | 5,306 | | | | 950,888 | |
| | |
Oracle Corp. | | | 3,144 | | | | 166,538 | |
| | |
Paycom Software, Inc.* | | | 950 | | | | 247,969 | |
| | |
RingCentral, Inc., Class A* | | | 1,056 | | | | 241,328 | |
| | |
Sage Group PLC (The) | | | 6,633 | | | | 53,346 | |
| | |
Slack Technologies, Inc., Class A* | | | 9,017 | | | | 240,664 | |
| | |
Splunk, Inc.* | | | 3,643 | | | | 511,331 | |
| | |
Trade Desk, Inc. (The), Class A* | | | 96 | | | | 28,088 | |
| | |
Workday, Inc., Class A* | | | 2,856 | | | | 439,538 | |
| | | | | | | | |
| | |
TOTAL SOFTWARE | | | | | | $ | 5,070,594 | |
April 30, 2020 / ANNUAL REPORT
| | |
| PORTFOLIOS OF INVESTMENTS | | 32 |
Wilmington Global Alpha Equities Fund (continued)
| | | | | | | | |
| | |
| Description | | Number of
Shares | | | Value | |
| | |
SPECIALTY RETAIL – 1.9% | | | | | | | | |
| | |
ABC-Mart, Inc. | | | 1,077 | | | $ | 54,732 | |
| | |
AutoZone, Inc.* | | | 385 | | | | 392,823 | |
| | |
CarMax, Inc.* | | | 8,007 | | | | 589,716 | |
| | |
CECONOMY AG* | | | 13,385 | | | | 34,263 | |
| | |
Five Below, Inc.* | | | 3,795 | | | | 342,157 | |
| | |
Halfords Group PLC | | | 22,363 | | | | 30,499 | |
| | |
Home Depot, Inc. (The) | | | 3,678 | | | | 808,535 | |
| | |
Kingfisher PLC | | | 48,353 | | | | 95,922 | |
| | |
Nishimatsuya Chain Co. Ltd. | | | 7,330 | | | | 57,989 | |
| | |
Nitori Holdings Co. Ltd. | | | 885 | | | | 135,649 | |
| | |
PAL GROUP Holdings Co. Ltd. | | | 3,000 | | | | 35,093 | |
| | |
Ross Stores, Inc. | | | 2,826 | | | | 258,183 | |
| | |
Shimamura Co. Ltd. | | | 1,850 | | | | 116,636 | |
| | |
TJX Cos., Inc. (The) | | | 18,516 | | | | 908,210 | |
| | |
USS Co. Ltd. | | | 4,701 | | | | 74,440 | |
| | |
Xebio Holdings Co. Ltd. | | | 6,785 | | | | 56,102 | |
| | | | | | | | |
| | |
TOTAL SPECIALTY RETAIL | | | | | | $ | 3,990,949 | |
|
TECHNOLOGY HARDWARE, STORAGE & PERIPHERALS – 0.8% | |
| | |
Acer, Inc. | | | 150,480 | | | | 83,313 | |
| | |
Apple, Inc. | | | 2,839 | | | | 834,098 | |
| | |
Canon, Inc. | | | 3,405 | | | | 71,625 | |
| | |
Compal Electronics, Inc. GDR | | | 45,202 | | | | 145,166 | |
| | |
HP, Inc. | | | 25,364 | | | | 393,396 | |
| | |
Maxell Holdings Ltd. | | | 4,460 | | | | 41,029 | |
| | |
Melco Holdings, Inc. | | | 390 | | | | 9,061 | |
| | |
Quadient | | | 3,889 | | | | 53,707 | |
| | | | | | | | |
| |
TOTAL TECHNOLOGY HARDWARE, STORAGE & PERIPHERALS | | | $ | 1,631,395 | |
|
TEXTILES, APPAREL & LUXURY GOODS – 0.6% | |
| | |
361 Degrees International Ltd. | | | 192,840 | | | | 29,258 | |
| | |
ANTA Sports Products Ltd. | | | 42,000 | | | | 357,674 | |
| | |
Daphne International Holdings Ltd.* | | | 175,110 | | | | 2,945 | |
| | |
Hermes International | | | 51 | | | | 37,285 | |
| | |
NIKE, Inc., Class B | | | 8,801 | | | | 767,271 | |
| | |
Sanyo Shokai Ltd.* | | | 3,360 | | | | 28,057 | |
| | | | | | | | |
| | |
TOTAL TEXTILES, APPAREL & LUXURY GOODS | | | | | | $ | 1,222,490 | |
| | |
TOBACCO – 0.5% | | | | | | | | |
| | |
Imperial Brands PLC | | | 4,601 | | | | 96,798 | |
| | |
Japan Tobacco, Inc. | | | 14,596 | | | | 271,822 | |
| | |
Philip Morris International, Inc. | | | 9,291 | | | | 693,109 | |
| | |
Swedish Match AB | | | 925 | | | | 57,162 | |
| | | | | | | | |
| | |
TOTAL TOBACCO | | | | | | $ | 1,118,891 | |
| |
TRADING COMPANIES & DISTRIBUTORS – 1.2% | | | | | |
| | |
Brenntag AG | | | 14,445 | | | | 654,043 | |
| | |
Fastenal Co. | | | 13,191 | | | | 477,778 | |
| | |
Ferguson PLC | | | 3,586 | | | | 258,557 | |
| | | | | | | | |
| | |
| Description | | Number of
Shares | | | Value | |
| | |
ITOCHU Corp. | | | 8,053 | | | $ | 157,880 | |
| | |
Mitsubishi Corp. | | | 16,430 | | | | 348,447 | |
| | |
Rexel SA | | | 13,791 | | | | 128,806 | |
| | |
SIG PLC | | | 29,112 | | | | 8,781 | |
| | |
Triton International Ltd. | | | 13,709 | | | | 424,705 | |
| | | | | | | | |
| | |
TOTAL TRADING COMPANIES & DISTRIBUTORS | | | | | | $ | 2,458,997 | |
|
TRANSPORTATION INFRASTRUCTURE – 0.0%** | |
| | |
Fraport AG Frankfurt Airport Services | | | | | | | | |
| | |
Worldwide | | | 507 | | | | 22,208 | |
| | |
Getlink SE | | | 3,209 | | | | 40,931 | |
| | |
Hamburger Hafen und Logistik AG | | | 1,439 | | | | 23,413 | |
| | | | | | | | |
| | |
TOTAL TRANSPORTATION INFRASTRUCTURE | | | | | | $ | 86,552 | |
| | |
WATER UTILITIES – 0.4% | | | | | | | | |
| | |
Guangdong Investment Ltd. | | | 400,503 | | | | 832,432 | |
| |
WIRELESS TELECOMMUNICATION SERVICES – 1.1% | | | | | |
| | |
China Mobile Ltd. | | | 20,807 | | | | 167,269 | |
| | |
KDDI Corp. | | | 44,264 | | | | 1,282,076 | |
| | |
Millicom International Cellular SA SDR* | | | 11,433 | | | | 297,099 | |
| | |
MTN Group Ltd. | | | 10,646 | | | | 27,976 | |
| | |
NTT DOCOMO, Inc. | | | 7,976 | | | | 235,062 | |
| | |
Orange Belgium SA | | | 3,754 | | | | 62,447 | |
| | |
Softbank Corp. | | | 14,002 | | | | 190,679 | |
| | |
VEON Ltd. ADR | | | 43,667 | | | | 74,670 | |
| | | | | | | | |
| |
TOTAL WIRELESS TELECOMMUNICATION SERVICES | | | $ | 2,337,278 | |
| | | | | | | | |
| | |
TOTAL COMMON STOCKS (COST $185,511,774) | | | | | | $ | 187,925,800 | |
| | |
| INVESTMENT COMPANIES – 0.1% | | | | | | | | |
| | |
EQUITY FUNDS – 0.1% | | | | | | | | |
| | |
iShares Core MSCI EAFE ETF | | | 1,820 | | | | 96,515 | |
| | |
Nomura TOPIX ETF | | | 7,890 | | | | 111,645 | |
| | | | | | | | |
| | |
TOTAL INVESTMENT COMPANIES (COST $192,284) | | | | | | $ | 208,160 | |
| | |
| PREFERRED STOCKS – 0.2% | | | | | | | | |
| |
CONSUMER DISCRETIONARY – 0.2% | | | | | |
| | |
Volkswagen AG 4.86% | | | 3,187 | | | | 443,413 | |
| | |
CONSUMER STAPLES – 0.0%** | | | | | | | | |
| | |
Henkel AG & Co. KGaA 0.00% | | | 376 | | | | 33,384 | |
| | | | | | | | |
| | |
TOTAL PREFERRED STOCKS
(COST $537,936) | | | | | | $ | 476,797 | |
| | |
| RIGHT – 0.0%** | | | | | | | | |
| | |
Shin Kong Financial Holding Co. Ltd.* | | | 4,000 | | | | 100 | |
| | | | | | | | |
| | |
TOTAL RIGHT
(COST $0) | | | | | | $ | 100 | |
| | |
| MONEY MARKET FUNDS – 3.9% | | | | | | | | |
| | |
Dreyfus Cash Management Fund, Institutional Shares, 1.71%^ | | | 135 | | | | 135 | |
ANNUAL REPORT / April 30, 2020
| | |
| 33 | | PORTFOLIOS OF INVESTMENTS |
|
| Wilmington Global Alpha Equities Fund (continued) |
| | | | | | | | |
| | |
| Description | | Number of
Shares | | | Value | |
| | |
Dreyfus Government Cash Management Fund, Institutional Shares, 0.17%^ | | | 8,244,259 | | | $ | 8,244,259 | |
| | | | | | | | |
| | |
TOTAL MONEY MARKET FUNDS
(COST $8,244,394) | | | | | | $ | 8,244,394 | |
| | | | | | | | |
| | |
Description | | | | | Value | |
| | |
TOTAL INVESTMENTS – 92.8%
(COST $194,486,388) | | | | | | $ | 196,855,251 | |
| | |
| OTHER ASSETS LESS LIABILITIES – 7.2% | | | | | | | 15,263,877 | |
| | | | | | | | |
| | |
| TOTAL NET ASSETS – 100.0% | | | | | | $ | 212,119,128 | |
| | | | | | | | |
Cost of investments and derivatives for Federal income tax purposes is $199,630,410. The net unrealized appreciation/(depreciation) of investments and derivatives was $(7,433,735). This consists of net unrealized appreciation from investment for those securities and derivatives having an excess of value over cost of $8,414,198 and net unrealized depreciation from investments for those securities and derivatives having an excess of cost over value of $(15,847,933).
Various inputs are used in determining the value of the Fund’s investments. These inputs are summarized in the three broad levels listed below.
Level 1 – quoted prices in active markets for identical securities
Level 2 – other significant observable inputs (including quoted prices for similar securities, interest rates, prepayment speeds, credit risk, etc.)
Level 3 – significant unobservable inputs (including the Fund’s own assumptions in determining the fair value of investments)
The following is a summary of the inputs used as of April 30, 2020 in valuing the Fund’s assets carried at fair value:
| | | | | | | | | | | | | | | | |
| | | | |
| | | Level 1 | | | Level 2 | | | Level 3 | | | Total | |
Assets | | | | | | | | | | | | | | | | |
| | | | |
Investments in Securities | | | | | | | | | | | | | | | | |
| | | | |
Common Stocks | | | | | | | | | | | | | | | | |
| | | | |
Aerospace & Defense | | $ | 2,580,639 | | | $ | 795,840 | | | $ | — | | | $ | 3,376,479 | |
| | | | |
Air Freight & Logistics | | | 1,920,772 | | | | 92,678 | | | | — | | | | 2,013,450 | |
| | | | |
Airlines | | | — | | | | 79,735 | | | | — | | | | 79,735 | |
| | | | |
Auto Components | | | — | | | | 1,022,214 | | | | — | | | | 1,022,214 | |
| | | | |
Automobiles | | | — | | | | 1,975,195 | | | | — | | | | 1,975,195 | |
| | | | |
Beverages | | | 1,819,446 | | | | 2,327,846 | | | | — | | | | 4,147,292 | |
| | | | |
Biotechnology | | | 208,230 | | | | 157,301 | | | | — | | | | 365,531 | |
| | | | |
Building Products | | | 1,221,459 | | | | 657,751 | | | | — | | | | 1,879,210 | |
| | | | |
Capital Markets | | | 2,664,040 | | | | 1,291,887 | | | | — | | | | 3,955,927 | |
| | | | |
Chemicals | | | 1,477,190 | | | | 664,134 | | | | — | | | | 2,141,324 | |
| | | | |
Commercial Banks | | | 3,227,079 | | | | 2,218,586 | | | | — | | | | 5,445,665 | |
| | | | |
Commercial Services & Supplies | | | 4,270,765 | | | | 569,284 | | | | — | | | | 4,840,049 | |
| | | | |
Communications Equipment | | | 2,154,270 | | | | 464,168 | | | | — | | | | 2,618,438 | |
| | | | |
Construction & Engineering | | | — | | | | 2,961,738 | | | | — | | | | 2,961,738 | |
| | | | |
Construction Materials | | | — | | | | 311,322 | | | | — | | | | 311,322 | |
| | | | |
Consumer Finance | | | 663,021 | | | | 42,089 | | | | — | | | | 705,110 | |
| | | | |
Containers & Packaging | | | 1,232,436 | | | | 21,780 | | | | — | | | | 1,254,216 | |
| | | | |
Distributors | | | 399,016 | | | | — | | | | — | | | | 399,016 | |
| | | | |
Diversified Consumer Services | | | 549,038 | | | | 28,335 | | | | — | | | | 577,373 | |
| | | | |
Diversified Financial Services | | | 2,448,117 | | | | 1,769,502 | | | | — | | | | 4,217,619 | |
| | | | |
Diversified Telecommunication Services | | | 1,782,330 | | | | 2,803,626 | | | | — | | | | 4,585,956 | |
| | | | |
Electric Utilities | | | 1,570,732 | | | | 348,895 | | | | — | | | | 1,919,627 | |
| | | | |
Electrical Equipment | | | 991,835 | | | | 1,016,160 | | | | — | | | | 2,007,995 | |
| | | | |
Electronic Equipment, Instruments & Components | | | 208,146 | | | | 1,049,486 | | | | — | | | | 1,257,632 | |
| | | | |
Energy Equipment & Services | | | 11,250 | | | | 85,641 | | | | — | | | | 96,891 | |
| | | | |
Entertainment | | | 990,388 | | | | 835,762 | | | | — | | | | 1,826,150 | |
| | | | |
Food & Staples Retailing | | | 940,381 | | | | 643,168 | | | | — | | | | 1,583,549 | |
| | | | |
Food Products | | | 2,722,362 | | | | 2,441,401 | | | | — | | | | 5,163,763 | |
| | | | |
Gas Utilities | | | 435,678 | | | | 848,466 | | | | — | | | | 1,284,144 | |
April 30, 2020 / ANNUAL REPORT
| | |
| PORTFOLIOS OF INVESTMENTS | | 34 |
Wilmington Global Alpha Equities Fund (continued)
| | | | | | | | | | | | | | | | |
| | | | |
| | | Level 1 | | | Level 2 | | | Level 3 | | | Total | |
| | | | |
Health Care Equipment & Supplies | | | 7,071,199 | | | | 2,198,278 | | | | — | | | | 9,269,477 | |
| | | | |
Health Care Providers & Services | | $ | 3,013,959 | | | $ | 177,562 | | | $ | — | | | $ | 3,191,521 | |
| | | | |
Health Care Technology | | | 647,523 | | | | 39,994 | | | | — | | | | 687,517 | |
| | | | |
Hotels, Restaurants & Leisure | | | 3,419,949 | | | | 1,964,699 | | | | — | | | | 5,384,648 | |
| | | | |
Household Durables | | | 1,431,485 | | | | 231,396 | | | | — | | | | 1,662,881 | |
| | | | |
Household Products | | | 2,437,395 | | | | 1,368,016 | | | | — | | | | 3,805,411 | |
| | | | |
Independent Power & Renewable Electricity Producers | | | — | | | | 19,316 | | | | — | | | | 19,316 | |
| | | | |
Industrial Conglomerates | | | — | | | | 71,225 | | | | — | | | | 71,225 | |
| | | | |
Insurance | | | 8,364,467 | | | | 6,163,336 | | | | — | | | | 14,527,803 | |
| | | | |
Interactive Media & Services | | | 727,246 | | | | 796,091 | | | | — | | | | 1,523,337 | |
| | | | |
Internet & Catalog Retail | | | 2,025,201 | | | | 7,856 | | | | — | | | | 2,033,057 | |
| | | | |
IT Services | | | 10,253,677 | | | | 2,087,959 | | | | — | | | | 12,341,636 | |
| | | | |
Leisure Equipment & Products | | | 164,341 | | | | — | | | | — | | | | 164,341 | |
| | | | |
Life Sciences Tools & Services | | | 1,032,153 | | | | 65,927 | | | | — | | | | 1,098,080 | |
| | | | |
Machinery | | | 4,639,731 | | | | 911,721 | | | | — | | | | 5,551,452 | |
| | | | |
Marine | | | — | | | | 341,312 | | | | — | | | | 341,312 | |
| | | | |
Media | | | 1,497,594 | | | | 651,259 | | | | — | | | | 2,148,853 | |
| | | | |
Metals & Mining | | | 578,132 | | | | 1,115,361 | | | | — | | | | 1,693,493 | |
| | | | |
Multiline Retail | | | 495,047 | | | | 438,486 | | | | — | | | | 933,533 | |
| | | | |
Multi-Utilities | | | 968,383 | | | | 2,010,306 | | | | — | | | | 2,978,689 | |
| | | | |
Oil, Gas & Consumable Fuels | | | 2,306,920 | | | | 3,323,402 | | | | — | | | | 5,630,322 | |
| | | | |
Personal Products | | | — | | | | 638,883 | | | | — | | | | 638,883 | |
| | | | |
Pharmaceuticals | | | 5,776,693 | | | | 7,251,428 | | | | — | | | | 13,028,121 | |
| | | | |
Professional Services | | | 4,432 | | | | 1,150,763 | | | | — | | | | 1,155,195 | |
| | | | |
Real Estate Investment Trusts | | | 6,090,021 | | | | 301,162 | | | | — | | | | 6,391,183 | |
| | | | |
Real Estate Management & Development | | | — | | | | 979,627 | | | | — | | | | 979,627 | |
| | | | |
Road & Rail | | | 3,444,540 | | | | 750,984 | | | | — | | | | 4,195,524 | |
| | | | |
Semiconductors & Semiconductor Equipment | | | 1,846,861 | | | | 1,870,314 | | | | — | | | | 3,717,175 | |
| | | | |
Software | | | 5,017,248 | | | | 53,346 | | | | — | | | | 5,070,594 | |
| | | | |
Specialty Retail | | | 3,299,624 | | | | 691,325 | | | | — | | | | 3,990,949 | |
| | | | |
Technology Hardware, Storage & Peripherals | | | 1,372,660 | | | | 258,735 | | | | — | | | | 1,631,395 | |
| | | | |
Textiles, Apparel & Luxury Goods | | | 767,271 | | | | 455,219 | | | | — | | | | 1,222,490 | |
| | | | |
Tobacco | | | 693,109 | | | | 425,782 | | | | — | | | | 1,118,891 | |
| | | | |
Trading Companies & Distributors | | | 902,483 | | | | 1,556,514 | | | | — | | | | 2,458,997 | |
| | | | |
Transportation Infrastructure | | | — | | | | 86,552 | | | | — | | | | 86,552 | |
| | | | |
Water Utilities | | | — | | | | 832,432 | | | | — | | | | 832,432 | |
| | | | |
Wireless Telecommunication Services | | | 74,670 | | | | 2,262,608 | | | | — | | | | 2,337,278 | |
| | | | |
Investment Companies | | | 96,515 | | | | 111,645 | | | | — | | | | 208,160 | |
| | | | |
Preferred Stocks | | | — | | | | 476,797 | | | | — | | | | 476,797 | |
| | | | |
Right | | | — | | | | 100 | | | | — | | | | 100 | |
| | | | |
Money Market Funds | | | 8,244,394 | | | | — | | | | — | | | | 8,244,394 | |
| | | | |
| | | | | | | | | | | | | | | | |
| | | | |
Total Investments in Securities | | $ | 125,193,543 | | | $ | 71,661,708 | | | $ | — | | | $ | 196,855,251 | |
| | | | | | | | | | | | | | | | |
| | | | |
Other Financial Instruments! | | | | | | | | | | | | | | | | |
| | | | |
Forward Foreign Currency Contracts | | $ | — | | | $ | 322,676 | | | $ | — | | | $ | 322,676 | |
| | | | |
| | | | | | | | | | | | | | | | |
| | | | |
Total Assets - Other Financial Instruments | | $ | — | | | $ | 322,676 | | | $ | — | | | $ | 322,676 | |
| | | | |
| | | | | | | | | | | | | | | | |
| | | | |
Liabilities | | | | | | | | | | | | | | | | |
| | | | |
Other Financial Instruments! | | | | | | | | | | | | | | | | |
| | | | |
Forward Foreign Currency Contracts | | $ | — | | | $ | (67,736 | ) | | $ | — | | | $ | (67,736 | ) |
| | | | |
Financial Futures Contracts | | | (13,964,282 | ) | | | — | | | | — | | | | (13,964,282 | ) |
ANNUAL REPORT / April 30, 2020
| | |
| 35 | | PORTFOLIOS OF INVESTMENTS |
|
| Wilmington Global Alpha Equities Fund (continued) |
| | | | | | | | | | | | | | | | |
| | | | |
| | | Level 1 | | | Level 2 | | | Level 3 | | | Total | |
| | | | |
Total Liabilities - Other Financial Instruments | | $ | (13,964,282 | ) | | $ | (67,736 | ) | | $ | — | | | $ | (14,032,018 | ) |
| | | | | | | | | | | | | | | | |
| | ! | Other financial instruments are derivative instruments, such as forward foreign currency contracts and financial futures contracts, which are valued at the unrealized appreciation (depreciation) on the instrument. |
As a result of utilizing international fair value pricing at April 30, 2020, a portion of the Fund’s common stock investments were categorized as Level 2.
| * | Non-income producing security. |
| ** | Represents less than 0.05%. |
| | |
| The following acronyms are used throughout this Fund: |
ADR | | American Depositary Receipt |
EAFE | | Europe, Australasia and the Far East |
ETF | | Exchange-Traded Fund |
GDR | | Global Depositary Receipt |
LLC | | Limited Liability Corporation |
MSCI | | Morgan Stanley Capital International |
NVDR | | Non-Voting Depositary Receipt |
OYJ | | Public Limited Company |
PCL | | Public Company Limited |
PLC | | Public Limited Company |
REIT | | Real Estate Investment Trust |
SCA | | Limited Partnership with Share Capital |
SDR | | Swedish Depositary Receipt |
| | | | |
Currency Code | | Currency | | |
CAD | | Canadian Dollar | | |
CHF | | Swiss Franc | | |
EUR | | Euro | | |
GBP | | British Pound Sterling | | |
HKD | | Hong Kong Dollar | | |
JPY | | Japanese Yen | | |
USD | | United States Dollar | | |
At April 30, 2020, the Global Alpha Equities Fund had the following outstanding forward foreign currency contracts, which contractually obligates the Fund to deliver or receive currencies at specified future dates:
| | | | | | | | | | | | | | | | | | | | | | |
| | | | | | |
| Settlement Date | | Counterparty | | Contracts to
Deliver/Receive | | | Contract
Amount | | | Contract at Value | | | Unrealized
Appreciation | | | Unrealized
(Depreciation) | |
CONTRACTS PURCHASED | | | | | | | | | | | | | | | | | | | | |
5/1/2020 | | HSBC Bank USA, N.A. | | | 590,175 JPY | | | $ | 5,532 | | | $ | 5,500 | | | $ | — | | | $ | (32 | ) |
5/4/2020 | | Morgan Stanley Capital Services LLC | | | 587,223 HKD | | | | 75,768 | | | | 75,746 | | | | — | | | | (22 | ) |
5/5/2020 | | JP Morgan Chase Bank, N.A. | | | 23,008 EUR | | | | 25,193 | | | | 25,214 | | | | 21 | | | | — | |
5/7/2020 | | State Street Corp. | | | 66,840 JPY | | | | 627 | | | | 623 | | | | — | | | | (4 | ) |
6/17/2020 | | Deutsche Bank AG | | | 418,000,000 JPY | | | | 3,805,487 | | | | 3,897,947 | | | | 92,460 | | | | — | |
CONTRACTS SOLD | | | | | | | | | | | | | | | | | | | | |
5/1/2020 | | Morgan Stanley Capital Services LLC | | | 10,080,000 JPY | | | | 93,951 | | | | 93,929 | | | | 22 | | | | — | |
5/1/2020 | | Bank of New York Mellon | | | 77,942 JPY | | | | 730 | | | | 726 | | | | 4 | | | | — | |
5/1/2020 | | HSBC Bank USA, N.A. | | | 59,262 JPY | | | | 555 | | | | 552 | | | | 3 | | | | — | |
5/1/2020 | | Bank of New York Mellon | | | 12,288 CAD | | | | 8,807 | | | | 8,828 | | | | — | | | | (21 | ) |
5/4/2020 | | Goldman Sachs Bank USA | | | 23,059 EUR | | | | 25,042 | | | | 25,271 | | | | — | | | | (229 | ) |
5/4/2020 | | Bank of New York Mellon | | | 22,548 CHF | | | | 23,163 | | | | 23,360 | | | | — | | | | (197 | ) |
5/4/2020 | | Bank of New York Mellon | | | 595 GBP | | | | 750 | | | | 750 | | | | — | | | | — | |
5/4/2020 | | Bank of New York Mellon | | | 132 EUR | | | | 143 | | | | 144 | | | | — | | | | (1 | ) |
5/5/2020 | | JP Morgan Chase Bank, N.A. | | | 27,300 EUR | | | | 29,893 | | | | 29,917 | | | | — | | | | (24 | ) |
5/5/2020 | | Bank of New York Mellon | | | 416 EUR | | | | 455 | | | | 457 | | | | — | | | | (2 | ) |
5/7/2020 | | State Street Corp. | | | 4,012,711 JPY | | | | 37,617 | | | | 37,392 | | | | 225 | | | | — | |
6/17/2020 | | Canadian Imperial Bank of Commerce | | | 745,000,000 JPY | | | | 7,095,123 | | | | 6,947,298 | | | | 147,825 | | | | — | |
6/17/2020 | | Morgan Stanley Capital Services LLC | | | 5,505,000 CAD | | | | 3,964,377 | | | | 3,955,264 | | | | 9,113 | | | | — | |
6/17/2020 | | Toronto Dominion Bank | | | 3,470,000 CAD | | | | 2,438,250 | | | | 2,493,146 | | | | — | | | | (54,896 | ) |
6/17/2020 | | Deutsche Bank AG | | | 3,187,000 EUR | | | | 3,568,962 | | | | 3,495,959 | | | | 73,003 | | | | — | |
April 30, 2020 / ANNUAL REPORT
| | |
| PORTFOLIOS OF INVESTMENTS | | 36 |
Wilmington Global Alpha Equities Fund (concluded)
| | | | | | | | | | | | | | | | | | | | | | | | | | |
| | | | | | | |
| | | Settlement Date | | Counterparty | | | Contracts to
Deliver/Receive | | | Contract
Amount | | | Contract at Value | | | Unrealized
Appreciation | | | Unrealized
(Depreciation) | |
| | CONTRACTS SOLD (continued) | | | | | | | | | | | | | | | | | | | | | | | | |
| | 6/17/2020 | | | Bank of Montreal | | | | 2,266,000 GBP | | | | $2,842,323 | | | | $2,854,631 | | | | $ — | | | | $(12,308 | ) |
| | NET UNREALIZED APPRECIATION (DEPRECIATION) ON FORWARD FOREIGN CURRENCY CONTRACTS | | | | | | | | | | | | | | | | | | | $322,676 | | | | $(67,736 | ) |
At April 30, 2020, the Global Alpha Equities Fund had open financial futures contracts as follows:
| | | | | | | | | | | | | | | | | | | | | | | | | | |
| | | | | | | |
| | | Underlying Contracts to Buy/Sell | | Expiration
Date | | | Number of
Contracts | | | Contract
Amount | | | Notional
Value | | | Unrealized
Appreciation(a) | | | Unrealized
Depreciation(a) | |
| | SHORT POSITIONS: | | | | | | | | | | | | | | | | | | | | | | | | |
| | E-Mini Russell 2000 Index | | | June 2020 | | | | 120 | | | $ | 6,448,667 | | | $ | 7,840,200 | | | | $— | | | $ | (1,391,533 | ) |
| | E-Mini S&P 500 Index | | | June 2020 | | | | 172 | | | | 21,690,852 | | | | 24,960,640 | | | | — | | | | (3,269,788 | ) |
| | E-Mini S&P Mid 400 Index | | | June 2020 | | | | 106 | | | | 14,833,473 | | | | 17,397,780 | | | | — | | | | (2,564,307 | ) |
| | Euro STOXX 50 Index | | | June 2020 | | | | 215 | | | | 5,522,956 | | | | 6,846,516 | | | | — | | | | (1,323,560 | ) |
| | FTSE 100 Index | | | June 2020 | | | | 67 | | | | 4,001,087 | | | | 4,758,079 | | | | — | | | | (756,992 | ) |
| | MSCI EAFE Index | | | June 2020 | | | | 380 | | | | 28,190,140 | | | | 31,127,700 | | | | — | | | | (2,937,560 | ) |
| | S&P TSX 60 Index | | | June 2020 | | | | 40 | | | | 4,126,602 | | | | 5,032,473 | | | | — | | | | (905,871 | ) |
| | TOPIX Index | | | June 2020 | | | | 72 | | | | 9,323,810 | | | | 10,138,481 | | | | — | | | | (814,671 | ) |
| | NET UNREALIZED APPRECIATION (DEPRECIATION) ON FINANCIAL FUTURES CONTRACTS | | | | | | | | | | | | | | | | | | | $— | | | $ | (13,964,282 | ) |
| (a) | The unrealized appreciation (depreciation) presented above is the cumulative change in unrealized appreciation (depreciation) from the date the contract was open through April 30, 2020. Only current day variation margin is reported on the Fund’s Statement of assets and liabilities. |
See Notes which are an integral part of the Financial Statements
ANNUAL REPORT / April 30, 2020
PORTFOLIO OF INVESTMENTS SUMMARY TABLE
Wilmington Real Asset Fund
At April 30, 2020, the Fund’s portfolio composition was as follows (unaudited):
| | | | | |
| | | Percentage of
Total Net Assets |
Real Estate Related Securities: | | | | | |
| |
Exchange-Traded Funds | | | | 32.8 | % |
| |
Real Estate Investment Trusts | | | | 30.4 | % |
| |
Common Stocks | | | | 8.9 | % |
| |
Investment Companies | | | | 3.9 | % |
Commodity Related Securities: | | | | | |
| |
Exchange-Traded Commodity Funds | | | | 16.6 | % |
| |
Investment Company Commodity Fund | | | | 3.0 | % |
| |
Cash Equivalents1 | | | | 5.3 | % |
| |
Other Assets and Liabilities – Net2 | | | | (0.9 | )% |
| | | | | |
| |
TOTAL | | | | 100.0 | % |
| | | | | |
| (1) | Cash Equivalents include investments in a money market fund and repurchase agreements. |
| (2) | Assets, other than investments in securities, less liabilities. See Statements of Assets and Liabilities. |
PORTFOLIO OF INVESTMENTS
April 30, 2020
| | | | | | | | |
| | |
| Description | | Number of
Shares | | | Value | |
|
REAL ESTATE RELATED SECURITIES – 76.0% | |
|
COMMON STOCKS – 8.9% | |
|
DIVERSIFIED REAL ESTATE ACTIVITIES – 4.2% | |
| | |
Airport City Ltd.* | | | 4,669 | | | $ | 70,837 | |
| | |
Allreal Holding AG* | | | 764 | | | | 141,907 | |
| | |
CapitaLand Ltd. | | | 159,400 | | | | 338,209 | |
| | |
Chinese Estates Holdings Ltd. | | | 75,000 | | | | 35,838 | |
| | |
City Developments Ltd. | | | 39,000 | | | | 218,000 | |
| | |
Consolidated-Tomoka Land Co. | | | 326 | | | | 13,702 | |
| | |
Daito Trust Construction Co. Ltd. | | | 3,400 | | | | 323,291 | |
| | |
Daiwa House Industry Co. Ltd. | | | 33,900 | | | | 859,037 | |
| | |
DIC Asset AG | | | 3,489 | | | | 46,241 | |
| | |
Far East Consortium International Ltd. | | | 78,000 | | | | 27,670 | |
| | |
Hang Lung Properties Ltd. | | | 87,000 | | | | 186,111 | |
| | |
Heiwa Real Estate Co. Ltd. | | | 4,300 | | | | 115,459 | |
| | |
Henderson Land Development Co. Ltd. | | | 99,735 | | | | 406,481 | |
| | |
K Wah International Holdings Ltd. | | | 85,000 | | | | 38,949 | |
| | |
Kerry Properties Ltd. | | | 45,500 | | | | 125,670 | |
| | |
Lendlease Group | | | 28,456 | | | | 226,675 | |
| | |
Leopalace21 Corp.* | | | 9,900 | | | | 21,994 | |
| | | | | | | | |
| | |
| Description | | Number of
Shares | | | Value | |
| | |
Mitsubishi Estate Co. Ltd. | | | 69,700 | | | $ | 1,127,616 | |
| | |
Mitsui Fudosan Co. Ltd. | | | 47,900 | | | | 880,735 | |
| | |
Mobimo Holding AG* | | | 348 | | | | 95,927 | |
| | |
Nomura Real Estate Holdings, Inc. | | | 9,000 | | | | 146,342 | |
| | |
OUE Ltd. | | | 18,100 | | | | 14,369 | |
| | |
SAMTY Co. Ltd. | | | 1,400 | | | | 18,112 | |
| | |
Shinoken Group Co. Ltd. | | | 4,300 | | | | 31,820 | |
| | |
Star Mica Holdings Co. Ltd. | | | 2,000 | | | | 27,288 | |
| | |
Sumitomo Realty & Development Co. Ltd. | | | 26,700 | | | | 715,094 | |
| | |
Sun Frontier Fudousan Co. Ltd. | | | 1,700 | | | | 13,505 | |
| | |
Sun Hung Kai Properties Ltd. | | | 78,000 | | | | 1,066,559 | |
| | |
Tokyo Tatemono Co. Ltd. | | | 13,100 | | | | 147,331 | |
| | |
Tokyu Fudosan Holdings Corp. | | | 25,300 | | | | 123,773 | |
| | |
Tricon Capital Group, Inc. | | | 7,268 | | | | 42,242 | |
| | |
UOL Group Ltd. | | | 32,700 | | | | 157,276 | |
| | |
Wharf Holdings Ltd. (The) | | | 75,000 | | | | 142,071 | |
| | |
Wheelock & Co. Ltd. | | | 55,000 | | | | 403,094 | |
| | | | | | | | |
| | |
TOTAL DIVERSIFIED REAL ESTATE ACTIVITIES | | | | | | $ | 8,349,225 | |
| | |
OFFICE – 0.0%** | | | | | | | | |
| | |
Precinct Properties New Zealand Ltd. | | | 84,495 | | | | 82,082 | |
April 30, 2020 / ANNUAL REPORT
| | |
| PORTFOLIOS OF INVESTMENTS | | 38 |
Wilmington Real Asset Fund (continued)
| | | | | | | | |
| | |
| Description | | Number of Shares | | | Value | |
|
REAL ESTATE DEVELOPMENT – 0.9% | |
| | |
Buwog AG Escrow Shares(a) | | | 3,077 | | | $ | — | |
| | |
Cedar Woods Properties Ltd. | | | 4,976 | | | | 13,637 | |
| | |
CK Asset Holdings Ltd. | | | 134,000 | | | | 846,712 | |
| | |
DREAM Unlimited Corp., Class A | | | 9,069 | | | | 57,139 | |
| | |
Forestar Group, Inc.* | | | 1,558 | | | | 20,550 | |
| | |
Goldcrest Co. Ltd. | | | 1,500 | | | | 22,628 | |
| | |
Greenland Hong Kong Holdings Ltd. | | | 101,000 | | | | 37,633 | |
| | |
Helical PLC | | | 12,067 | | | | 54,813 | |
| | |
Howard Hughes Corp. (The)* | | | 2,279 | | | | 123,431 | |
| | |
Katitas Co. Ltd. | | | 2,600 | | | | 45,376 | |
| | |
Nexity SA | | | 2,227 | | | | 68,311 | |
| | |
Road King Infrastructure Ltd. | | | 34,000 | | | | 52,551 | |
| | |
Selvaag Bolig ASA | | | 6,948 | | | | 28,791 | |
| | |
Sino Land Co. Ltd. | | | 132,000 | | | | 184,474 | |
| | |
St. Modwen Properties PLC | | | 19,519 | | | | 90,454 | |
| | |
TAG Immobilien AG* | | | 10,923 | | | | 239,255 | |
| | |
Tosei Corp. | | | 2,300 | | | | 22,321 | |
| | | | | | | | |
| | |
TOTAL REAL ESTATE DEVELOPMENT | | | | | | $ | 1,908,076 | |
|
REAL ESTATE MANAGEMENT & DEVELOPMENT – 0.1% | |
| | |
ADO Properties SA | | | 1,203 | | | | 33,703 | |
| | |
Aeon Mall Co. Ltd. | | | 5,400 | | | | 67,882 | |
| | |
Urban & Civic PLC | | | 6,245 | | | | 17,886 | |
| | | | | | | | |
| | |
TOTAL REAL ESTATE MANAGEMENT & DEVELOPMENT | | | | | | $ | 119,471 | |
|
REAL ESTATE OPERATING COMPANIES – 3.7% | |
| | |
Alony Hetz Properties & Investments Ltd. | | | 7,307 | | | | 87,948 | |
| | |
Amot Investments Ltd. | | | 8,779 | | | | 49,308 | |
| | |
Aroundtown SA | | | 56,773 | | | | 305,376 | |
| | |
Azrieli Group Ltd. | | | 2,722 | | | | 161,179 | |
| | |
Big Shopping Centers Ltd. | | | 209 | | | | 16,720 | |
| | |
CA Immobilien Anlagen AG | | | 5,378 | | | | 170,738 | |
| | |
Castellum AB | | | 13,543 | | | | 237,542 | |
| | |
Catena AB | | | 1,465 | | | | 46,616 | |
| | |
Chip Eng Seng Corp. Ltd. | | | 44,200 | | | | 16,214 | |
| | |
Daibiru Corp. | | | 5,100 | | | | 46,668 | |
| | |
Deutsche Wohnen SE | | | 18,969 | | | | 768,782 | |
| | |
Dios Fastigheter AB | | | 6,443 | | | | 39,675 | |
| | |
Entra ASA | | | 5,914 | | | | 74,462 | |
| | |
Fabege AB | | | 17,964 | | | | 212,800 | |
| | |
Fastighets AB Balder, Class B* | | | 5,984 | | | | 236,471 | |
| | |
Grainger PLC | | | 32,354 | | | | 108,700 | |
| | |
Grand City Properties SA | | | 3,165 | | | | 66,187 | |
| | |
Hang Lung Group Ltd. | | | 8,000 | | | | 18,273 | |
| | |
Hongkong Land Holdings Ltd. | | | 44,000 | | | | 184,058 | |
| | |
Hufvudstaden AB, Class A | | | 3,483 | | | | 44,630 | |
| | |
Hulic Co. Ltd. | | | 22,300 | | | | 220,546 | |
| | | | | | | | |
| | |
| Description | | Number of
Shares | | | Value | |
| | |
Hysan Development Co. Ltd. | | | 11,001 | | | $ | 36,701 | |
| | |
Ichigo, Inc. | | | 4,800 | | | | 12,292 | |
| | |
IMMOFINANZ AG* | | | 2,937 | | | | 54,234 | |
| | |
Intershop Holding AG | | | 103 | | | | 52,876 | |
| | |
Keihanshin Building Co. Ltd. | | | 9,300 | | | | 120,065 | |
| | |
Kennedy-Wilson Holdings, Inc. | | | 6,295 | | | | 89,074 | |
| | |
Klovern AB, Class B | | | 42,277 | | | | 57,106 | |
| | |
Kungsleden AB | | | 9,447 | | | | 71,943 | |
| | |
LEG Immobilien AG | | | 4,359 | | | | 500,437 | |
| | |
Melisron Ltd. | | | 1,293 | | | | 52,044 | |
| | |
Nyfosa AB* | | | 11,802 | | | | 72,261 | |
| | |
PSP Swiss Property AG | | | 2,810 | | | | 326,430 | |
| | |
S IMMO AG | | | 4,007 | | | | 74,402 | |
| | |
Samhallsbyggnadsbolaget i Norden AB | | | 81,389 | | | | 157,614 | |
| | |
Swire Properties Ltd. | | | 55,600 | | | | 155,945 | |
| | |
Swiss Prime Site AG* | | | 3,484 | | | | 331,700 | |
| | |
Takara Leben Co. Ltd. | | | 7,200 | | | | 23,578 | |
| | |
Unizo Holdings Co. Ltd.* | | | 2,500 | | | | 139,105 | |
| | |
Vonovia SE | | | 30,451 | | | | 1,505,773 | |
| | |
Wallenstam AB, Class B | | | 6,496 | | | | 67,366 | |
| | |
Wharf Real Estate Investment Co. Ltd. | | | 50,000 | | | | 211,674 | |
| | |
Wihlborgs Fastigheter AB | | | 8,624 | | | | 123,057 | |
| | | | | | | | |
| | |
TOTAL REAL ESTATE OPERATING COMPANIES | | | | | | $ | 7,348,570 | |
| | |
RETAIL – 0.0%** | | | | | | | | |
| | |
Kiwi Property Group Ltd. | | | 25,687 | | | | 15,039 | |
| | | | | | | | |
| |
TOTAL COMMON STOCKS (COST $15,559,746) | | | $ | 17,822,463 | |
|
EXCHANGE-TRADED FUNDS – 32.8% | |
|
EQUITY FUNDS – 32.8% | |
| | |
Schwab U.S. REIT ETF# | | | 957,500 | | | | 33,771,025 | |
| | |
Vanguard Globalex-U.S. Real Estate ETF | | | 712,000 | | | | 31,790,800 | |
| | | | | | | | |
| | |
TOTAL EQUITY FUNDS | | | | | | $ | 65,561,825 | |
| | | | | | | | |
| |
TOTAL EXCHANGE-TRADED FUNDS (COST $76,571,648) | | | $ | 65,561,825 | |
| | |
INVESTMENT COMPANIES – 3.9% | | | | | | | | |
| | |
DIVERSIFIED – 3.9% | | | | | | | | |
| | |
Tortoise MLP & Pipeline Fund | | | 973,466 | | | | 7,865,608 | |
|
REAL ESTATE OPERATING COMPANIES – 0.0%** | |
| | |
BMO Commercial Property Trust Ltd. | | | 13,224 | | | | 12,678 | |
| | | | | | | | |
| | |
TOTAL INVESTMENT COMPANIES (COST $12,912,522) | | | | | | $ | 7,878,286 | |
|
REAL ESTATE INVESTMENT TRUSTS – 30.4% | |
| | |
DIVERSIFIED – 4.9% | | | | | | | | |
| | |
Abacus Property Group | | | 21,546 | | | | 35,141 | |
| | |
Activia Properties, Inc. | | | 17 | | | | 49,594 | |
| | |
American Assets Trust, Inc. | | | 2,528 | | | | 71,593 | |
ANNUAL REPORT / April 30, 2020
| | |
| 39 | | PORTFOLIOS OF INVESTMENTS |
|
| Wilmington Real Asset Fund (continued) |
| | | | | | | | |
| | |
| Description | | Number of
Shares | | | Value | |
| | |
American Finance Trust, Inc. | | | 5,633 | | | $ | 43,430 | |
| | |
Charter Hall Group | | | 34,892 | | | | 172,420 | |
| | |
Charter Hall Long Wale REIT | | | 18,790 | | | | 54,469 | |
| | |
Cofinimmo SA | | | 897 | | | | 124,703 | |
| | |
Colony Capital, Inc. | | | 31,235 | | | | 72,153 | |
| | |
Cominar REIT | | | 2,682 | | | | 16,358 | |
| | |
Covivio | | | 3,213 | | | | 201,782 | |
| | |
Daiwa House REIT Investment Corp. | | | 70 | | | | 169,372 | |
| | |
Empire State Realty Trust, Inc., Class A | | | 11,473 | | | | 95,914 | |
| | |
Equinix, Inc. | | | 4,414 | | | | 2,980,333 | |
| | |
Gecina SA | | | 2,892 | | | | 379,464 | |
| | |
Gladstone Commercial Corp. | | | 1,116 | | | | 17,633 | |
| | |
Global Net Lease, Inc. | | | 4,719 | | | | 67,906 | |
| | |
Goodman Property Trust | | | 95,209 | | | | 130,592 | |
| | |
GPT Group (The) | | | 101,604 | | | | 279,235 | |
| | |
Growthpoint Properties Australia Ltd. | | | 18,802 | | | | 37,721 | |
| | |
H&R REIT | | | 11,787 | | | | 83,494 | |
| | |
Hankyu Hanshin REIT, Inc. | | | 60 | | | | 64,659 | |
| | |
Heiwa REIT, Inc. | | | 76 | | | | 67,031 | |
| | |
Hulic REIT, Inc. | | | 26 | | | | 29,019 | |
| | |
ICADE | | | 2,288 | | | | 175,753 | |
| | |
Kenedix Office Investment Corp. | | | 30 | | | | 148,206 | |
| | |
Land Securities Group PLC | | | 34,437 | | | | 287,171 | |
| | |
Lar Espana Real Estate Socimi SA | | | 2,557 | | | | 10,481 | |
| | |
Lexington Realty Trust | | | 13,070 | | | | 136,582 | |
| | |
LondonMetric Property PLC | | | 53,050 | | | | 129,612 | |
| | |
LXI REIT PLC | | | 19,555 | | | | 26,041 | |
| | |
Mapletree North Asia Commercial Trust | | | 138,100 | | | | 91,718 | |
| | |
Merlin Properties Socimi SA | | | 20,539 | | | | 190,605 | |
| | |
Mirvac Group | | | 240,328 | | | | 349,218 | |
| | |
NIPPON REIT Investment Corp. | | | 35 | | | | 104,250 | |
| | |
Nomura Real Estate Master Fund, Inc. | | | 253 | | | | 287,715 | |
| | |
NSI NV | | | 1,341 | | | | 54,017 | |
| | |
One Liberty Properties, Inc. | | | 2,568 | | | | 40,369 | |
| | |
Picton Property Income Ltd. (The) | | | 63,920 | | | | 55,299 | |
| | |
Premier Investment Corp. | | | 106 | | | | 106,444 | |
| | |
PS Business Parks, Inc. | | | 694 | | | | 89,588 | |
| | |
REIT 1 Ltd. | | | 11,700 | | | | 58,245 | |
| | |
Sakura Sogo REIT Investment Corp. | | | 24 | | | | 16,479 | |
| | |
Samty Residential Investment Corp. | | | 22 | | | | 18,929 | |
| | |
Sekisui House REIT, Inc. | | | 215 | | | | 131,333 | |
| | |
Soilbuild Business Space REIT | | | 12 | | | | 3 | |
| | |
Star Asia Investment Corp. | | | 40 | | | | 31,662 | |
| | |
Stockland | | | 98,962 | | | | 183,763 | |
| | |
STORE Capital Corp. | | | 11,268 | | | | 226,149 | |
| | |
Sunlight REIT | | | 139,000 | | | | 71,608 | |
| | |
Suntec REIT | | | 82,900 | | | | 81,882 | |
| | |
Tokyu REIT, Inc. | | | 87 | | | | 115,248 | |
| | | | | | | | |
| | |
| Description | | Number of
Shares | | | Value | |
| | |
Tosei REIT Investment Corp. | | | 15 | | | $ | 13,356 | |
| | |
United Urban Investment Corp. | | | 134 | | | | 134,436 | |
| | |
VEREIT, Inc. | | | 61,783 | | | | 338,571 | |
| | |
Washington REIT | | | 4,250 | | | | 99,110 | |
| | |
WP Carey, Inc. | | | 9,707 | | | | 638,526 | |
| | |
XYMAX REIT Investment Corp. | | | 19 | | | | 16,127 | |
| | |
Yuexiu REIT | | | 95,000 | | | | 46,598 | |
| | | | | | | | |
| | |
TOTAL DIVERSIFIED | | | | | | $ | 9,749,110 | |
|
DIVERSIFIED REAL ESTATE ACTIVITIES – 0.0%** | |
| | |
Sella Capital Real Estate Ltd. | | | 10,469 | | | | 21,772 | |
| | |
INDUSTRIALS – 4.7% | | | | | | | | |
| | |
Americold Realty Trust | | | 8,811 | | | | 269,528 | |
| | |
APN Industria REIT | | | 12,124 | | | | 16,371 | |
| | |
Ascendas REIT | | | 173,100 | | | | 362,001 | |
| | |
Dream Industrial REIT | | | 7,428 | | | | 54,324 | |
| | |
Duke Realty Corp. | | | 17,333 | | | | 601,455 | |
| | |
EastGroup Properties, Inc. | | | 1,420 | | | | 150,520 | |
| | |
First Industrial Realty Trust, Inc. | | | 4,348 | | | | 164,224 | |
| | |
Frasers Logistics & Industrial Trust | | | 187,320 | | | | 140,195 | |
| | |
GLPJ-REIT | | | 153 | | | | 197,254 | |
| | |
Goodman Group | | | 95,183 | | | | 810,694 | |
| | |
Granite REIT | | | 1,863 | | | | 85,123 | |
| | |
Industrial & Infrastructure Fund Investment Corp. | | | 95 | | | | 132,337 | |
| | |
Industrial Logistics Properties Trust | | | 5,261 | | | | 98,328 | |
| | |
Innovative Industrial Properties, Inc.# | | | 658 | | | | 51,627 | |
| | |
Japan Logistics Fund, Inc. | | | 48 | | | | 112,835 | |
| | |
LaSalle Logiport REIT | | | 96 | | | | 134,392 | |
| | |
Mapletree Industrial Trust | | | 103,300 | | | | 185,460 | |
| | |
Mapletree Logistics Trust | | | 158,250 | | | | 200,460 | |
| | |
Mitsubishi Estate Logistics REIT Investment Corp. | | | 19 | | | | 61,875 | |
| | |
Mitsui Fudosan Logistics Park, Inc. | | | 27 | | | | 106,195 | |
| | |
Monmouth Real Estate Investment Corp. | | | 5,189 | | | | 70,519 | |
| | |
Montea CVA | | | 593 | | | | 52,122 | |
| | |
Nippon Prologis REIT, Inc. | | | 123 | | | | 340,500 | |
| | |
Prologis, Inc. | | | 38,140 | | | | 3,403,233 | |
| | |
Rexford Industrial Realty, Inc. | | | 3,932 | | | | 160,111 | |
| | |
Segro PLC | | | 66,395 | | | | 695,918 | |
| | |
STAG Industrial, Inc. | | | 7,013 | | | | 184,091 | |
| | |
Summit Industrial Income REIT | | | 2,802 | | | | 20,895 | |
| | |
Terreno Realty Corp. | | | 2,213 | | | | 121,317 | |
| | |
Tritax Big Box REIT PLC | | | 82,699 | | | | 125,521 | |
| | |
Warehouses De Pauw CVA | | | 10,234 | | | | 280,756 | |
| | | | | | | | |
| | |
TOTAL INDUSTRIALS | | | | | | $ | 9,390,181 | |
| | |
OFFICE – 4.5% | | | | | | | | |
| | |
Alexandria Real Estate Equities, Inc. | | | 5,896 | | | | 926,203 | |
April 30, 2020 / ANNUAL REPORT
| | |
| PORTFOLIOS OF INVESTMENTS | | 40 |
Wilmington Real Asset Fund (continued)
| | | | | | | | |
| | |
| Description | | Number of
Shares | | | Value | |
| | |
Allied Properties REIT | | | 4,391 | | | $ | 140,568 | |
| | |
alstria office REIT AG | | | 7,735 | | | | 115,946 | |
| | |
Befimmo SA | | | 330 | | | | 14,730 | |
| | |
Boston Properties, Inc. | | | 7,583 | | | | 736,916 | |
| | |
Brandywine Realty Trust | | | 9,291 | | | | 103,688 | |
| | |
CapitaLand Commercial Trust | | | 146,500 | | | | 166,475 | |
| | |
Champion REIT | | | 160,000 | | | | 94,854 | |
| | |
City Office REIT, Inc. | | | 2,823 | | | | 28,512 | |
| | |
Columbia Property Trust, Inc. | | | 8,546 | | | | 122,122 | |
| | |
Corporate Office Properties Trust | | | 5,911 | | | | 156,169 | |
| | |
Cousins Properties, Inc. | | | 7,741 | | | | 233,546 | |
| | |
Cromwell Property Group | | | 99,187 | | | | 50,555 | |
| | |
Daiwa Office Investment Corp. | | | 18 | | | | 99,580 | |
| | |
Derwent London PLC | | | 7,299 | | | | 285,202 | |
| | |
Dexus | | | 63,973 | | | | 379,764 | |
| | |
Douglas Emmett, Inc. | | | 7,065 | | | | 215,412 | |
| | |
Dream Office REIT | | | 3,839 | | | | 59,904 | |
| | |
Easterly Government Properties, Inc. | | | 3,911 | | | | 105,245 | |
| | |
Equity Commonwealth | | | 9,474 | | | | 321,642 | |
| | |
Franklin Street Properties Corp. | | | 5,659 | | | | 30,785 | |
| | |
GDI Property Group | | | 37,938 | | | | 25,646 | |
| | |
Global One Real Estate Investment Corp. | | | 77 | | | | 65,106 | |
| | |
Great Portland Estates PLC | | | 16,267 | | | | 138,550 | |
| | |
Hibernia REIT PLC | | | 36,138 | | | | 47,008 | |
| | |
Highwoods Properties, Inc. | | | 5,470 | | | | 212,291 | |
| | |
Hudson Pacific Properties, Inc. | | | 8,172 | | | | 200,868 | |
| | |
Ichigo Office REIT Investment Corp. | | | 99 | | | | 62,410 | |
| | |
Inmobiliaria Colonial Socimi SA | | | 20,649 | | | | 199,448 | |
| | |
Intervest Offices & Warehouses NV | | | 685 | | | | 16,959 | |
| | |
Invesco OfficeJ-REIT, Inc. | | | 690 | | | | 91,494 | |
| | |
Japan Excellent, Inc. | | | 65 | | | | 69,718 | |
| | |
Japan Prime Realty Investment Corp. | | | 48 | | | | 132,960 | |
| | |
Japan Real Estate Investment Corp. | | | 64 | | | | 345,680 | |
| | |
JBG SMITH Properties | | | 6,514 | | | | 221,150 | |
| | |
Keppel REIT | | | 134,000 | | | | 100,086 | |
| | |
Kilroy Realty Corp. | | | 5,144 | | | | 320,265 | |
| | |
Mack-Cali Realty Corp. | | | 6,689 | | | | 108,295 | |
| | |
Manulife US REIT | | | 29,035 | | | | 20,879 | |
| | |
MCUBS MidCity Investment Corp. | | | 153 | | | | 106,192 | |
| | |
Mirai Corp. | | | 138 | | | | 46,467 | |
| | |
Mori Hills REIT Investment Corp. | | | 84 | | | | 107,480 | |
| | |
Mori Trust Sogo REIT, Inc. | | | 51 | | | | 56,356 | |
| | |
Nippon Building Fund, Inc. | | | 82 | | | | 488,986 | |
| | |
Office Properties Income Trust | | | 2,541 | | | | 69,623 | |
| | |
One REIT, Inc. | | | 16 | | | | 34,956 | |
| | |
Orix JREIT, Inc. | | | 184 | | | | 219,970 | |
| | | | | | | | |
| | |
| Description | | Number of
Shares | | | Value | |
| | |
OUE Commercial Real Estate Investment Trust | | | 118,851 | | | $ | 33,877 | |
| | |
Paramount Group, Inc. | | | 14,237 | | | | 137,387 | |
| | |
Piedmont Office Realty Trust, Inc., Class A | | | 6,634 | | | | 115,100 | |
| | |
Prosperity REIT | | | 65,000 | | | | 20,854 | |
| | |
Regional REIT Ltd. | | | 31,547 | | | | 30,793 | |
| | |
SL Green Realty Corp. | | | 4,299 | | | | 228,062 | |
| | |
Vornado Realty Trust | | | 9,105 | | | | 398,981 | |
| | |
Workspace Group PLC | | | 10,595 | | | | 104,355 | |
| | | | | | | | |
| | |
TOTAL OFFICE | | | | | | $ | 8,966,070 | |
|
REAL ESTATE OPERATING COMPANIES – 0.0%** | |
| | |
Capital & Counties Properties PLC | | | 26,301 | | | | 54,927 | |
| | |
RESIDENTIAL – 4.6% | | | | | | | | |
| | |
Advance Residence Investment Corp. | | | 73 | | | | 223,983 | |
| | |
American Campus Communities, Inc. | | | 8,335 | | | | 294,142 | |
| | |
American Homes 4 Rent, Class A | | | 11,054 | | | | 266,844 | |
| | |
Apartment Investment and Management Co., Class A | | | 8,258 | | | | 311,079 | |
| | |
AvalonBay Communities, Inc. | | | 7,510 | | | | 1,223,755 | |
| | |
Bluerock Residential Growth REIT, Inc. | | | 2,866 | | | | 16,680 | |
| | |
Camden Property Trust | | | 5,106 | | | | 449,685 | |
| | |
Canadian Apartment Properties REIT | | | 5,526 | | | | 190,162 | |
| | |
Civitas Social Housing PLC | | | 32,796 | | | | 40,295 | |
| | |
Comforia Residential REIT, Inc. | | | 47 | | | | 139,552 | |
| | |
Daiwa Securities Living Investments Corp. | | | 122 | | | | 101,952 | |
| | |
Empiric Student Property PLC | | | 15,749 | | | | 12,344 | |
| | |
Equity LifeStyle Properties, Inc. | | | 8,446 | | | | 509,378 | |
| | |
Equity Residential | | | 18,409 | | | | 1,197,690 | |
| | |
Essex Property Trust, Inc. | | | 3,485 | | | | 850,689 | |
| | |
Front Yard Residential Corp. | | | 2,160 | | | | 24,646 | |
| | |
Independence Realty Trust, Inc. | | | 2,017 | | | | 20,311 | |
| | |
Ingenia Communities Group | | | 24,221 | | | | 58,519 | |
| | |
InterRent REIT | | | 6,334 | | | | 66,118 | |
| | |
Investors Real Estate Trust | | | 389 | | | | 24,363 | |
| | |
Invitation Homes, Inc. | | | 26,091 | | | | 617,052 | |
| | |
Irish Residential Properties REIT PLC | | | 33,709 | | | | 47,224 | |
| | |
Kenedix Residential Next Investment Corp. | | | 76 | | | | 119,936 | |
| | |
Killam Apartment REIT | | | 2,717 | | | | 32,656 | |
| | |
Mid-America Apartment Communities, Inc. | | | 5,426 | | | | 607,278 | |
| | |
NexPoint Residential Trust, Inc. | | | 608 | | | | 18,283 | |
| | |
Nippon Accommodations Fund, Inc. | | | 36 | | | | 213,812 | |
| | |
Northview Apartment REIT | | | 2,317 | | | | 58,593 | |
| | |
Preferred Apartment Communities, Inc., Class A | | | 5,454 | | | | 40,414 | |
| | |
Starts Proceed Investment Corp. | | | 19 | | | | 32,330 | |
| | |
Sun Communities, Inc. | | | 4,345 | | | | 583,968 | |
| | |
UDR, Inc. | | | 13,808 | | | | 517,386 | |
| | |
UMH Properties, Inc. | | | 2,326 | | | | 30,215 | |
ANNUAL REPORT / April 30, 2020
| | |
| 41 | | PORTFOLIOS OF INVESTMENTS |
|
| Wilmington Real Asset Fund (continued) |
| | | | | | | | |
| | |
| Description | | Number of Shares | | | Value | |
| | |
UNITE Group PLC (The) | | | 21,760 | | | $ | 240,277 | |
| | | | | | | | |
| | |
TOTAL RESIDENTIAL | | | | | | $ | 9,181,611 | |
|
RETAIL – 4.3% | |
| | |
Acadia Realty Trust | | | 6,544 | | | | 81,080 | |
| | |
AEON REIT Investment Corp. | | | 79 | | | | 78,569 | |
| | |
Agree Realty Corp. | | | 2,237 | | | | 145,651 | |
| | |
Alexander’s, Inc. | | | 245 | | | | 77,239 | |
| | |
Altarea SCA | | | 156 | | | | 19,096 | |
| | |
British Land Co. PLC (The) | | | 42,410 | | | | 216,343 | |
| | |
Brixmor Property Group, Inc. | | | 15,303 | | | | 175,219 | |
| | |
Brookfield Property REIT, Inc., Class A# | | | 2,242 | | | | 21,960 | |
| | |
BWP Trust | | | 45,660 | | | | 104,345 | |
| | |
CapitaLand Mall Trust | | | 168,900 | | | | 224,722 | |
| | |
CapitaLand Retail China Trust | | | 16,985 | | | | 16,152 | |
| | |
Cedar Realty Trust, Inc. | | | 15,941 | | | | 16,738 | |
| | |
Charter Hall Retail REIT | | | 6,721 | | | | 13,830 | |
| | |
Choice Properties REIT | | | 12,370 | | | | 112,152 | |
| | |
Essential Properties Realty Trust, Inc. | | | 2,565 | | | | 37,680 | |
| | |
Eurocommercial Properties NV | | | 1,066 | | | | 11,877 | |
| | |
Federal Realty Investment Trust | | | 3,704 | | | | 308,432 | |
| | |
First Capital Real Estate Investment Trust | | | 1,322 | | | | 13,629 | |
| | |
Fortune REIT | | | 101,000 | | | | 95,112 | |
| | |
Frasers Centrepoint Trust | | | 44,023 | | | | 66,142 | |
| | |
Frontier Real Estate Investment Corp. | | | 5 | | | | 14,027 | |
| | |
Fukuoka REIT Corp. | | | 12 | | | | 12,069 | |
| | |
Getty Realty Corp. | | | 2,065 | | | | 56,085 | |
| | |
Hammerson PLC | | | 14,444 | | | | 12,798 | |
| | |
Japan Retail Fund Investment Corp. | | | 91 | | | | 99,211 | |
| | |
Kenedix Retail REIT Corp. | | | 14 | | | | 21,947 | |
| | |
Kimco Realty Corp. | | | 22,269 | | | | 242,955 | |
| | |
Kite Realty Group Trust | | | 3,650 | | | | 37,340 | |
| | |
Klepierre SA | | | 8,409 | | | | 170,711 | |
| | |
Link REIT | | | 120,500 | | | | 1,074,167 | |
| | |
Macerich Co. (The)# | | | 7,744 | | | | 57,848 | |
| | |
Mapletree Commercial Trust | | | 150,023 | | | | 206,579 | |
| | |
National Retail Properties, Inc. | | | 9,051 | | | | 295,425 | |
| | |
NewRiver REIT PLC | | | 19,204 | | | | 16,145 | |
| | |
Pennsylvania Real Estate Investment Trust# | | | 3,915 | | | | 3,954 | |
| | |
Realty Income Corp. | | | 17,189 | | | | 944,020 | |
| | |
Regency Centers Corp. | | | 9,639 | | | | 423,248 | |
| | |
Retail Estates NV | | | 459 | | | | 24,809 | |
| | |
Retail Opportunity Investments Corp. | | | 9,001 | | | | 87,355 | |
| | |
Retail Properties of America, Inc., Class A | | | 11,268 | | | | 69,862 | |
| | |
Retail Value, Inc. | | | 979 | | | | 14,166 | |
| | |
RioCan REIT | | | 3,304 | | | | 37,741 | |
| | |
RPT Realty | | | 4,239 | | | | 28,910 | |
| | | | | | | | |
| | |
| Description | | Number of Shares | | | Value | |
| | |
Sasseur Real Estate Investment Trust | | | 34,300 | | | $ | 17,790 | |
| | |
Saul Centers, Inc. | | | 797 | | | | 25,998 | |
| | |
Scentre Group | | | 243,566 | | | | 365,895 | |
| | |
Seritage Growth Properties, Class A#,* | | | 2,469 | | | | 26,122 | |
| | |
Shaftesbury PLC | | | 8,605 | | | | 64,990 | |
| | |
Shopping Centres Australasia Property Group | | | 49,146 | | | | 71,237 | |
| | |
Simon Property Group, Inc. | | | 16,527 | | | | 1,103,508 | |
| | |
SITE Centers Corp. | | | 7,871 | | | | 47,698 | |
| | |
Spirit Realty Capital, Inc. | | | 5,259 | | | | 161,767 | |
| | |
Tanger Factory Outlet Centers, Inc.# | | | 10,635 | | | | 79,975 | |
| | |
Taubman Centers, Inc. | | | 4,397 | | | | 189,511 | |
| | |
True North Commercial Real Estate Investment Trust | | | 3,946 | | | | 16,811 | |
| | |
Unibail-Rodamco-Westfield | | | 6,612 | | | | 391,508 | |
| | |
Urban Edge Properties | | | 6,074 | | | | 69,851 | |
| | |
Urstadt Biddle Properties, Inc., Class A | | | 1,922 | | | | 28,080 | |
| | |
Vastned Retail NV | | | 1,224 | | | | 22,576 | |
| | |
Vicinity Centres | | | 112,014 | | | | 107,234 | |
| | |
Washington Prime Group, Inc.# | | | 9,843 | | | | 8,463 | |
| | |
Weingarten Realty Investors | | | 7,102 | | | | 129,185 | |
| | |
Whitestone REIT | | | 2,143 | | | | 14,530 | |
| | | | | | | | |
| | |
TOTAL RETAIL | | | | | | $ | 8,730,069 | |
|
SPECIALIZED – 7.4% | |
| | |
Aedifica SA | | | 1,769 | | | | 171,449 | |
| | |
Apple Hospitality REIT, Inc. | | | 17,422 | | | | 168,645 | |
| | |
Arena REIT | | | 17,467 | | | | 25,598 | |
| | |
Ascott Residence Trust | | | 176,183 | | | | 110,832 | |
| | |
Ashford Hospitality Trust, Inc. | | | 22,623 | | | | 18,603 | |
| | |
Assura PLC | | | 126,635 | | | | 121,462 | |
| | |
Big Yellow Group PLC | | | 10,056 | | | | 135,358 | |
| | |
Braemar Hotels & Resorts, Inc. | | | 2,261 | | | | 7,077 | |
| | |
CareTrust REIT, Inc. | | | 5,040 | | | | 83,059 | |
| | |
CDL Hospitality Trusts | | | 63,800 | | | | 43,861 | |
| | |
Charter Hall Social Infrastructure REIT | | | 30,135 | | | | 47,699 | |
| | |
Chatham Lodging Trust | | | 5,297 | | | | 39,780 | |
| | |
CoreCivic, Inc. | | | 8,048 | | | | 105,590 | |
| | |
CorePoint Lodging, Inc. | | | 2,059 | | | | 8,957 | |
| | |
CoreSite Realty Corp. | | | 1,686 | | | | 204,326 | |
| | |
CubeSmart | | | 10,208 | | | | 257,242 | |
| | |
CyrusOne, Inc. | | | 5,971 | | | | 418,866 | |
| | |
DiamondRock Hospitality Co. | | | 15,284 | | | | 95,219 | |
| | |
Digital Realty Trust, Inc. | | | 13,940 | | | | 2,083,891 | |
| | |
Diversified Healthcare Trust | | | 15,288 | | | | 47,546 | |
| | |
EPR Properties | | | 4,853 | | | | 142,775 | |
| | |
Extra Space Storage, Inc. | | | 7,332 | | | | 646,976 | |
| | |
Farmland Partners, Inc. | | | 2,902 | | | | 19,037 | |
April 30, 2020 / ANNUAL REPORT
| | |
| PORTFOLIOS OF INVESTMENTS | | 42 |
Wilmington Real Asset Fund (continued)
| | | | | | | | |
| | |
| Description | | Number of Shares | | | Value | |
| | |
Four Corners Property Trust, Inc. | | | 3,633 | | | $ | 81,343 | |
| | |
Gaming and Leisure Properties, Inc. | | | 10,755 | | | | 303,721 | |
| | |
GEO Group, Inc. (The) | | | 9,652 | | | | 122,387 | |
| | |
Gladstone Land Corp. | | | 1,517 | | | | 20,358 | |
| | |
Health Care & Medical Investment Corp. | | | 17 | | | | 18,250 | |
| | |
Healthcare Realty Trust, Inc. | | | 7,053 | | | | 207,288 | |
| | |
Healthcare Trust of America, Inc., Class A | | | 10,924 | | | | 269,058 | |
| | |
Healthpeak Properties, Inc. | | | 26,102 | | | | 682,306 | |
| | |
Hersha Hospitality Trust | | | 4,701 | | | | 24,586 | |
| | |
Host Hotels & Resorts, Inc. | | | 37,823 | | | | 465,601 | |
| | |
Ichigo Hotel REIT Investment Corp. | | | 16 | | | | 8,769 | |
| | |
Invincible Investment Corp. | | | 322 | | | | 82,388 | |
| | |
Iron Mountain, Inc.# | | | 15,775 | | | | 381,440 | |
| | |
Japan Hotel REIT Investment Corp. | | | 175 | | | | 58,083 | |
| | |
Keppel DC REIT | | | 87,295 | | | | 144,757 | |
| | |
Life Storage, Inc. | | | 2,460 | | | | 215,471 | |
| | |
LTC Properties, Inc. | | | 3,212 | | | | 114,347 | |
| | |
Medical Properties Trust, Inc. | | | 28,187 | | | | 483,125 | |
| | |
National Health Investors, Inc. | | | 2,938 | | | | 161,766 | |
| | |
National Storage Affiliates Trust | | | 3,129 | | | | 89,114 | |
| | |
National Storage REIT | | | 33,137 | | | | 37,219 | |
| | |
NorthWest Healthcare Properties REIT | | | 2,862 | | | | 20,068 | |
| | |
Omega Healthcare Investors, Inc. | | | 11,525 | | | | 335,954 | |
| | |
Ooedo Onsen REIT Investment Corp. | | | 20 | | | | 10,970 | |
| | |
Park Hotels & Resorts, Inc. | | | 14,652 | | | | 139,341 | |
| | |
Parkway Life REIT | | | 17,000 | | | | 39,718 | |
| | |
Pebblebrook Hotel Trust | | | 8,860 | | | | 104,902 | |
| | |
Physicians Realty Trust | | | 9,773 | | | | 150,700 | |
| | |
Primary Health Properties PLC | | | 77,644 | | | | 150,385 | |
| | |
Public Storage | | | 8,156 | | | | 1,512,530 | |
| | |
QTS Realty Trust, Inc., Class A | | | 2,146 | | | | 134,189 | |
| | |
RLJ Lodging Trust | | | 11,928 | | | | 110,811 | |
| | |
Rural Funds Group | | | 14,991 | | | | 18,930 | |
| | |
Ryman Hospitality Properties, Inc. | | | 2,319 | | | | 81,953 | |
| | |
Sabra Health Care REIT, Inc. | | | 11,566 | | | | 148,276 | |
| | |
Safestore Holdings PLC | | | 15,484 | | | | 140,068 | |
| | |
Service Properties Trust | | | 10,802 | | | | 74,858 | |
| | |
Summit Hotel Properties, Inc. | | | 9,756 | | | | 59,121 | |
| | |
Sunstone Hotel Investors, Inc. | | | 15,597 | | | | 143,336 | |
| | |
Universal Health Realty Income Trust | | | 726 | | | | 77,653 | |
| | |
Ventas, Inc. | | | 20,456 | | | | 661,752 | |
| | |
VICI Properties, Inc. | | | 25,125 | | | | 437,677 | |
| | |
Vital Healthcare Property Trust | | | 24,302 | | | | 35,696 | |
| | |
Welltower, Inc. | | | 22,005 | | | | 1,127,316 | |
| | | | | | | | |
| | |
| Description | | Number of Shares | | | Value | |
| | |
Xenia Hotels & Resorts, Inc. | | | 5,942 | | | $ | 57,637 | |
| | | | | | | | |
| | |
TOTAL SPECIALIZED | | | | | | $ | 14,749,066 | |
| | | | | | | | |
| |
TOTAL REAL ESTATE INVESTMENT TRUSTS (COST $66,052,666) | | | $ | 60,842,806 | |
| | | | | | | | |
| |
TOTAL REAL ESTATE RELATED SECURITIES
(COST $171,096,582) | | | $ | 152,105,380 | |
| |
| COMMODITY RELATED SECURITIES – 19.6% | | | | | |
| |
EXCHANGE-TRADED COMMODITY FUNDS – 16.6% | | | | | |
| | |
iShares Commodities Select Strategy ETF# | | | 375,100 | | | | 8,270,955 | |
| | |
iShares Gold Trust* | | | 941,650 | | | | 15,169,981 | |
| | |
iShares Silver Trust* | | | 144,100 | | | | 2,014,518 | |
| | |
SPDR S&P Global Natural Resources ETF# | | | 221,000 | | | | 7,776,990 | |
| | | | | | | | |
| |
TOTAL EXCHANGE-TRADED COMMODITY FUNDS
(COST $38,974,376) | | | $ | 33,232,444 | |
| |
INVESTMENT COMPANY COMMODITY FUND – 3.0% | | | | | |
| | |
Vanguard Commodity Strategy Fund | | | 295,567 | | | | 6,020,690 | |
| | | | | | | | |
| |
TOTAL INVESTMENT COMPANY COMMODITY FUND
(COST $6,000,000) | | | $ | 6,020,690 | |
| | | | | | | | |
| |
TOTAL COMMODITY RELATED SECURITIES
(COST $44,974,376) | | | $ | 39,253,134 | |
| |
| SHORT-TERM INVESTMENTS – 4.2% | | | | | |
| | |
MONEY MARKET FUND – 4.2% | | | | | | | | |
| | |
Dreyfus Government Cash Management Fund, Institutional Shares, 0.17%^ | | | 8,331,906 | | | | 8,331,906 | |
| |
TOTAL SHORT-TERM INVESTMENT
(COST $8,331,906) | | | $ | 8,331,906 | |
ANNUAL REPORT / April 30, 2020
| | |
| 43 | | PORTFOLIOS OF INVESTMENTS |
|
| Wilmington Real Asset Fund (continued) |
| | | | | | | | |
| | |
| Description | | Par Value | | | Value | |
|
| CASH COLLATERAL INVESTED FOR SECURITIES ON LOAN – 1.1% | |
| | |
REPURCHASE AGREEMENTS – 1.1% | | | | | | | | |
| | |
BNP Paribas SA, 0.05%, dated 4/30/20, due 5/01/20, repurchase price $410,912 collateralized by U.S. Government Agency & Treasury Securities, 0.00% to 7.50%, maturing 5/15/20 to 4/20/50; total market value of $419,129. | | $ | 410,911 | | | $ | 410,911 | |
| | |
Citigroup Global Markets Ltd., 0.04%, dated 4/30/20, due 5/01/20, repurchase price $410,911 collateralized by U.S. Government Agency & Treasury Securities, 0.50% to 6.50%, maturing 5/31/20 to 2/01/57; total market value of $419,129. | | | 410,911 | | | | 410,911 | |
| | |
Daiwa Capital Markets America, 0.05%, dated 4/30/20, due 5/01/20, repurchase price $410,912 collateralized by U.S. Government Agency & Treasury Securities, 0.00% to 6.50%, maturing 5/07/20 to 3/01/52; total market value of $419,129. | | | 410,911 | | | | 410,911 | |
| | |
Deutsche Bank Securities, Inc., 0.03%, dated 4/30/20, due 5/01/20, repurchase price $163,584 collateralized by U.S. Government Agency & Treasury Securities, 0.43% to 8.75%, maturing 8/15/20 to 4/01/50; total market value of $166,856. | | | 163,584 | | | | 163,584 | |
| | |
HSBC Securities USA, Inc., 0.03%, dated 4/30/20, due 5/01/20, repurchase price $410,911 collateralized by U.S. Government Agency Securities, 2.45% to 5.00%, maturing 2/20/49 to 4/15/55; total market value of $419,129. | | | 410,911 | | | | 410,911 | |
| | |
RBC Dominion Securities, Inc., 0.04%, dated 4/30/20, due 5/01/20, repurchase price $410,911 collateralized by U.S. Government Agency & Treasury Securities, 0.00% to 6.00%, maturing 7/15/24 to 5/01/50; total market value of $419,129. | | | 410,911 | | | | 410,911 | |
| | | | | | | | |
| |
TOTAL REPURCHASE AGREEMENTS
(COST $2,218,139) | | | $ | 2,218,139 | |
| | | | | | | | |
| |
TOTAL CASH COLLATERAL INVESTED FOR SECURITIES ON LOAN
(COST $2,218,139) | | | $ | 2,218,139 | |
| | | | | | | | |
| | | | | | | | |
| | |
| Description | | | | | Value | |
| | |
TOTAL INVESTMENTS IN SECURITIES 100.9%
(COST $226,621,003) | | | | | | $ | 201,908,559 | |
| | |
| COLLATERAL FOR SECURITIES ON LOAN – (1.1%) | | | | | | | (2,218,139 | ) |
| | |
| OTHER ASSETS LESS LIABILITIES – 0.2% | | | | | | | 356,928 | |
| | | | | | | | |
| | |
| TOTAL NET ASSETS – 100.0% | | | | | | $ | 200,047,348 | |
| | | | | | | | |
Cost of investments for Federal income tax purposes is $233,473,743. The net unrealized appreciation/(depreciation) of investments was $(31,565,184). This consists of net unrealized appreciation from investment for those securities having an excess of value over cost of $11,837,674 and net unrealized depreciation from investments for those securities having an excess of cost over value of $(43,402,858).
Various inputs are used in determining the value of the Fund’s investments. These inputs are summarized in the three broad levels listed below.
Level 1 – quoted prices in active markets for identical securities
Level 2 – other significant observable inputs (including quoted prices for similar securities, interest rates, prepayment speeds, credit risk, etc.)
Level 3 – significant unobservable inputs (including the Fund’s own assumptions in determining the fair value of investments)
April 30, 2020 / ANNUAL REPORT
| | |
| PORTFOLIOS OF INVESTMENTS | | 44 |
Wilmington Real Asset Fund (concluded)
The following is a summary of the inputs used as of April 30, 2020 in valuing the Fund’s assets carried at fair value:
| | | | | | | | | | | | | | | | |
| | | | |
| | | Level 1 | | | Level 2 | | | Level 3 | | | Total | |
Investments in Securities | | | | | | | | | | | | | | | | |
Real Estate Related Securities | | | | | | | | | | | | | | | | |
Common Stocks | | | | | | | | | | | | | | | | |
Diversified Real Estate Activities | | $ | 55,944 | | | $ | 8,293,281 | | | $ | — | | | $ | 8,349,225 | |
Office | | | — | | | | 82,082 | | | | — | | | | 82,082 | |
Real Estate Development | | | 201,120 | | | | 1,706,956 | | | | — | | | | 1,908,076 | |
Real Estate Management & Development | | | — | | | | 119,471 | | | | — | | | | 119,471 | |
Real Estate Operating Companies | | | 89,074 | | | | 7,259,496 | | | | — | | | | 7,348,570 | |
Retail | | | — | | | | 15,039 | | | | — | | | | 15,039 | |
Exchange-Traded Funds | | | | | | | | | | | | | | | | |
Equity Funds | | | 65,561,825 | | | | — | | | | — | | | | 65,561,825 | |
Investment Companies | | | | | | | | | | | | | | | | |
Diversified | | | 7,865,608 | | | | — | | | | — | | | | 7,865,608 | |
Real Estate Operating Companies | | | — | | | | 12,678 | | | | — | | | | 12,678 | |
Real Estate Investment Trusts | | | | | | | | | | | | | | | | |
Diversified | | | 5,017,709 | | | | 4,731,401 | | | | — | | | | 9,749,110 | |
Diversified Real Estate Activities | | | — | | | | 21,772 | | | | — | | | | 21,772 | |
Industrials | | | 5,435,295 | | | | 3,954,886 | | | | — | | | | 9,390,181 | |
Office | | | 5,192,734 | | | | 3,773,336 | | | | — | | | | 8,966,070 | |
Real Estate Operating Companies | | | — | | | | 54,927 | | | | — | | | | 54,927 | |
Residential | | | 7,951,387 | | | | 1,230,224 | | | | — | | | | 9,181,611 | |
Retail | | | 5,190,188 | | | | 3,539,881 | | | | — | | | | 8,730,069 | |
Specialized | | | 13,347,574 | | | | 1,401,492 | | | | — | | | | 14,749,066 | |
Commodity Related Securities | | | | | | | | | | | | | | | | |
Exchange-Traded Commodity Funds | | | 33,232,444 | | | | — | | | | — | | | | 33,232,444 | |
Investment Company Commodity Fund | | | 6,020,690 | | | | — | | | | — | | | | 6,020,690 | |
Money Market Fund | | | 8,331,906 | | | | — | | | | — | | | | 8,331,906 | |
Repurchase Agreements | | | — | | | | 2,218,139 | | | | — | | | | 2,218,139 | |
| | | | | | | | | | | | | | | | |
| | | | |
Total Investments in Securities | | $ | 163,493,498 | | | $ | 38,415,061 | | | $ | — | | | $ | 201,908,559 | |
| | | | | | | | | | | | | | | | |
As a result of utilizing international fair value pricing at April 30, 2020, a portion of the Fund’s common stock investments were categorized as Level 2.
| # | Security, or a portion thereof, is on loan. See Note 2 in Notes to Financial Statements |
| (a) | The value of this security was determined using significant unobservable inputs and is reported as a Level 3 security in the Valuation Hierachy table located at the end of the Portfolio of Investments. |
| * | Non-income producing security. |
| ** | Represents less than 0.05%. |
The following acronyms are used throughout this Fund:
| | |
CVA | | Dutch Certification |
ETF | | Exchange-Traded Fund |
J-REIT | | Japanese Real Estate Investment Trust |
| | |
PLC | | Public Limited Company |
REIT | | Real Estate Investment Trust |
SCA | | Limited Partnership With Share Capital |
SPDR | | Standard & Poor’s Depository Receipts |
See Notes which are an integral part of the Financial Statements
ANNUAL REPORT / April 30, 2020
| | |
| 45 | | |
|
| PORTFOLIO OF INVESTMENTS SUMMARY TABLE |
Wilmington Diversified Income Fund
At April 30, 2020, the Fund’s portfolio composition was as follows (unaudited):
| | | | | |
| | | Percentage of
Total Net Assets |
Investment Companies: | | | | | |
Exchange-Traded Funds | | | | 25.6 | % |
Inflation-Protected Securities Fund | | | | 3.6 | % |
Common Stocks | | | | 36.3 | % |
U.S. Treasury | | | | 12.5 | % |
Corporate Bonds | | | | 11.8 | % |
Mortgage-Backed Securities | | | | 7.6 | % |
Collateralized Mortgage Obligations | | | | 0.3 | % |
Government Agencies | | | | 0.1 | % |
Enhanced Equipment Trust Certificates | | | | 0.1 | % |
Cash Equivalents1 | | | | 5.3 | % |
Other Assets and Liabilities – Net2 | | | | (3.2 | )% |
| | | | | |
TOTAL | | | | 100.0 | % |
| | | | | |
| (1) | Cash Equivalents include investments in a money market fund and repurchase agreements. |
| (2) | Assets, other than investments in securities, less liabilities. See Statements of Assets and Liabilities. |
PORTFOLIO OF INVESTMENTS
April 30, 2020
| | | | | | | | |
| | |
| Description | | Number of
Shares | | | Value | |
INVESTMENT COMPANIES – 29.2% | | | | | | | | |
| | |
EXCHANGE-TRADED FUNDS – 25.6% | | | | | | | | |
iShares iBoxx High Yield Corporate Bond ETF | | | 21,300 | | | $ | 1,713,159 | |
iShares International Select Dividend ETF# | | | 200,100 | | | | 4,783,391 | |
SPDR Dow Jones International | | | | | | | | |
Real Estate ETF# | | | 42,625 | | | | 1,193,926 | |
Vanguard REIT ETF | | | 10,700 | | | | 814,377 | |
| | | | | | | | |
| | |
TOTAL EXCHANGE-TRADED FUNDS | | | | | | $ | 8,504,853 | |
| |
INFLATION-PROTECTED SECURITIES FUND – 3.6% | | | | | |
| | |
Vanguard Inflation-Protected Securities | | | | | | | | |
Fund, Admiral Shares | | | 44,260 | | | | 1,194,580 | |
| | | | | | | | |
| | |
TOTAL INVESTMENT COMPANIES
(COST $12,285,757) | | | | | | $ | 9,699,433 | |
| | | | | | | | |
| | |
| | | Par Value | | | | |
COLLATERALIZED MORTGAGE OBLIGATIONS – 0.3% | | | | | |
|
FEDERAL NATIONAL MORTGAGE ASSOCIATION (FNMA) – 0.3% | |
| | |
Series2012-114, Class VM, 3.50%, 10/25/25 | | $ | 93,871 | | | $ | 99,158 | |
| | | | | | | | |
| | |
| Description | | Par Value | | | Value | |
| | |
WHOLE LOAN – 0.0%** | | | | | | | | |
| | |
Banc of America Mortgage Securities, Inc.,
Series2004-A, Class 2A1, 3.87%, 2/25/34D | | $ | 9,702 | | | $ | 9,301 | |
IndyMac INDA Mortgage Loan Trust,
Series2005-AR1, Class 2A1, 3.97%, 11/25/35D | | | 1,763 | | | | 1,662 | |
| | | | | | | | |
| | |
TOTAL WHOLE LOAN | | | | | | $ | 10,963 | |
| | | | | | | | |
| |
TOTAL COLLATERALIZED MORTGAGE OBLIGATIONS
(COST $116,317) | | | $ | 110,121 | |
| | |
| CORPORATE BONDS – 11.8% | | | | | | | | |
| | |
AEROSPACE & DEFENSE – 0.1% | | | | | | | | |
L3Harris Technologies, Inc.,
Sr. Unsecured, 2.90%, 12/15/29 | | | 15,000 | | | | 15,558 | |
Rockwell Collins, Inc.,
Sr. Unsecured, 3.50%, 3/15/27 | | | 25,000 | | | | 26,677 | |
| | | | | | | | |
| | |
TOTAL AEROSPACE & DEFENSE | | | | | | $ | 42,235 | |
| | |
AUTOMOTIVE – 0.3% | | | | | | | | |
General Motors Financial Co., Inc.,
Company Guaranteed, 3.20%, 7/06/21 | | | 40,000 | | | | 39,132 | |
April 30, 2020 / ANNUAL REPORT
| | |
| PORTFOLIOS OF INVESTMENTS | | 46 |
Wilmington Diversified Income Fund (continued)
| | | | | | | | |
| | |
| Description | | Par Value | | | Value | |
PACCAR Financial Corp., Sr. Unsecured, MTN, 2.65%, 5/10/22 | | $ | 55,000 | | | $ | 56,217 | |
| | | | | | | | |
| | |
TOTAL AUTOMOTIVE | | | | | | $ | 95,349 | |
| | |
BEVERAGES – 0.2% | | | | | | | | |
| | |
Anheuser-Busch InBev Finance, Inc., Company Guaranteed, 4.90%, 2/01/46 | | | 20,000 | | | | 22,855 | |
| | |
Keurig Dr. Pepper, Inc., Company Guaranteed, 2.70%, 11/15/22 | | | 40,000 | | | | 40,872 | |
| | |
Keurig Dr. Pepper, Inc., Company Guaranteed, 3.20%, 5/01/30 | | | 15,000 | | | | 15,966 | |
| | | | | | | | |
| | |
TOTAL BEVERAGES | | | | | | $ | 79,693 | |
| | |
BIOTECHNOLOGY – 0.1% | | | | | | | | |
| | |
Amgen, Inc., Sr. Unsecured, 4.40%, 5/01/45 | | | 25,000 | | | | 30,661 | |
| | |
CAPITAL MARKETS – 0.4% | | | | | | | | |
| | |
Goldman Sachs Group, Inc. (The), Sr. Unsecured, (3 Month USD LIBOR + 1.20%), 3.27%, 9/29/25D | | | 55,000 | | | | 57,549 | |
| | |
Goldman Sachs Group, Inc. (The), Sr. Unsecured, (3 Month USD LIBOR + 1.51%), 3.69%, 6/05/28D | | | 35,000 | | | | 37,310 | |
| | |
Morgan Stanley, Sr. Unsecured, MTN, (SOFRRATE + 3.12%), 3.62%, 4/01/31D | | | 20,000 | | | | 22,030 | |
| | |
Morgan Stanley, Subordinated, GMTN, 4.35%, 9/08/26 | | | 10,000 | | | | 11,029 | |
| | |
TD Ameritrade Holding Corp., Sr. Unsecured, 2.95%, 4/01/22 | | | 18,000 | | | | 18,483 | |
| | | | | | | | |
| | |
TOTAL CAPITAL MARKETS | | | | | | $ | 146,401 | |
| | |
CHEMICALS – 0.1% | | | | | | | | |
| | |
DuPont de Nemours, Inc., Sr. Unsecured, 3.77%, 11/15/20 | | | 15,000 | | | | 15,150 | |
| | |
DuPont de Nemours, Inc., Sr. Unsecured, 2.17%, 5/01/23 | | | 20,000 | | | | 20,167 | |
| | | | | | | | |
| | |
TOTAL CHEMICALS | | | | | | $ | 35,317 | |
| | |
COMMERCIAL BANKS – 0.7% | | | | | | | | |
| | |
Fifth Third Bancorp, Sr. Unsecured, 3.50%, 3/15/22 | | | 100,000 | | | | 103,456 | |
| | |
Fifth Third Bancorp, Sr. Unsecured, 2.55%, 5/05/27 | | | 15,000 | | | | 14,985 | |
| | |
Fifth Third Bancorp, Subordinated, 4.30%, 1/16/24 | | | 20,000 | | | | 21,453 | |
| | |
Huntington Bancshares, Inc., Sr. Unsecured, 2.63%, 8/06/24 | | | 25,000 | | | | 25,678 | |
| | |
Truist Financial Corp., Sr. Unsecured, 2.90%, 3/03/21 | | | 30,000 | | | | 30,403 | |
| | |
U.S. Bancorp, Series V, Sr. Unsecured, MTN, 2.63%, 1/24/22 | | | 45,000 | | | | 46,334 | |
| | | | | | | | |
| | |
TOTAL COMMERCIAL BANKS | | | | | | $ | 242,309 | |
| | | | | | | | |
| | |
| Description | | Par Value | | | Value | |
|
COMMERCIAL SERVICES & SUPPLIES – 0.2% | |
| | |
Global Payments, Inc., Sr. Unsecured, 3.75%, 6/01/23 | | $ | 50,000 | | | $ | 52,328 | |
| | |
COMPUTERS – 0.2% | | | | | | | | |
| | |
Hewlett Packard Enterprise Co., Sr. Unsecured, 3.50%, 10/05/21 | | | 50,000 | | | | 50,990 | |
| | |
CONSUMER FINANCE – 0.1% | | | | | | | | |
| | |
Capital One Financial Corp., Sr. Unsecured, 2.40%, 10/30/20 | | | 25,000 | | | | 25,074 | |
| |
DIVERSIFIED FINANCIAL SERVICES – 1.3% | | | | | |
| | |
Bank of America Corp., Sr. Unsecured, MTN, 3.25%, 10/21/27 | | | 20,000 | | | | 21,414 | |
| | |
BlackRock, Inc., Sr. Unsecured, 3.38%, 6/01/22 | | | 38,000 | | | | 39,922 | |
| | |
Citigroup, Inc., Sr. Unsecured, (3 Month USD LIBOR + 0.95%), 2.88%, 7/24/23D | | | 35,000 | | | | 35,821 | |
| | |
FMR LLC, Sr. Unsecured, 6.45%, 11/15/39W | | | 100,000 | | | | 143,751 | |
| | |
JPMorgan Chase & Co., Sr. Unsecured, MTN, 2.30%, 8/15/21 | | | 100,000 | | | | 100,247 | |
| | |
Wells Fargo & Co., Sr. Unsecured, (SOFRRATE + 2.00%), 2.19%, 4/30/26D | | | 25,000 | | | | 25,135 | |
| | |
Wells Fargo & Co., Subordinated, MTN, 4.40%, 6/14/46 | | | 40,000 | | | | 45,631 | |
| | |
Wells Fargo & Co., Series M, Subordinated, MTN, 3.45%, 2/13/23 | | | 35,000 | | | | 36,500 | |
| | | | | | | | |
| | |
TOTAL DIVERSIFIED FINANCIAL SERVICES | | | | | | $ | 448,421 | |
| | |
ELECTRIC – 0.7% | | | | | | | | |
| | |
DTE Energy Co., Series F, Sr. Unsecured, 3.85%, 12/01/23 | | | 10,000 | | | | 10,630 | |
| | |
Entergy Corp., Sr. Unsecured, 5.13%, 9/15/20 | | | 90,000 | | | | 90,811 | |
| | |
WEC Energy Group, Inc., Sr. Unsecured, 3.38%, 6/15/21 | | | 70,000 | | | | 71,808 | |
| | |
WEC Energy Group, Inc., Sr. Unsecured, 3.10%, 3/08/22 | | | 45,000 | | | | 46,238 | |
| | | | | | | | |
| | |
TOTAL ELECTRIC | | | | | | $ | 219,487 | |
| |
ENVIRONMENTAL CONTROL – 0.2% | | | | | |
| | |
Waste Management, Inc., Company Guaranteed, 3.50%, 5/15/24 | | | 35,000 | | | | 37,638 | |
| | |
Waste Management, Inc., Company Guaranteed, 4.10%, 3/01/45 | | | 25,000 | | | | 30,755 | |
| | | | | | | | |
| | |
TOTAL ENVIRONMENTAL CONTROL | | | | | | $ | 68,393 | |
| |
FOOD & STAPLES RETAILING – 0.7% | | | | | |
| | |
Campbell Soup Co., Sr. Unsecured, 3.30%, 3/19/25 | | | 40,000 | | | | 42,616 | |
ANNUAL REPORT / April 30, 2020
| | |
| 47 | | PORTFOLIOS OF INVESTMENTS |
|
| Wilmington Diversified Income Fund (continued) |
| | | | | | | | |
| | |
| Description | | Par Value | | | Value | |
| | |
Conagra Brands, Inc., Sr. Unsecured, 4.60%, 11/01/25 | | $ | 40,000 | | | $ | 44,590 | |
| | |
Kroger Co. (The), Sr. Unsecured, 2.80%, 8/01/22 | | | 35,000 | | | | 36,025 | |
| | |
Kroger Co. (The), Sr. Unsecured, 5.40%, 1/15/49 | | | 50,000 | | | | 65,838 | |
| | |
McCormick & Co., Inc., Sr. Unsecured, 2.50%, 4/15/30 | | | 35,000 | | | | 35,922 | |
| | | | | | | | |
| | |
TOTAL FOOD & STAPLES RETAILING | | | | | | $ | 224,991 | |
| | |
FOOD PRODUCTS – 0.1% | | | | | | | | |
| | |
Archer-Daniels-Midland Co., Sr. Unsecured, 3.25%, 3/27/30 | | | 20,000 | | | | 22,018 | |
| |
FOREST PRODUCTS & PAPER – 0.2% | | | | | |
| | |
International Paper Co., Sr. Unsecured, 4.40%, 8/15/47 | | | 50,000 | | | | 56,314 | |
| |
HEALTH CARE EQUIPMENT & SUPPLIES – 0.1% | | | | | |
| | |
DH Europe Finance II Sarl, Company Guaranteed, 2.20%, 11/15/24 | | | 45,000 | | | | 46,272 | |
| |
HEALTH CARE PROVIDERS & SERVICES – 0.3% | | | | | |
| | |
Anthem, Inc., Sr. Unsecured, 3.65%, 12/01/27 | | | 30,000 | | | | 32,806 | |
| | |
Cigna Corp., Company Guaranteed, 4.13%, 9/15/20W | | | 19,000 | | | | 19,169 | |
| | |
UnitedHealth Group, Inc., Sr. Unsecured, 2.75%, 2/15/23 | | | 25,000 | | | | 26,122 | |
| | |
UnitedHealth Group, Inc., Sr. Unsecured, 2.95%, 10/15/27 | | | 25,000 | | | | 26,983 | |
| | | | | | | | |
| |
TOTAL HEALTH CARE PROVIDERS & SERVICES | | | $ | 105,080 | |
| | |
HOME FURNISHINGS – 0.2% | | | | | | | | |
| | |
Whirlpool Corp., Sr. Unsecured, 4.70%, 6/01/22 | | | 65,000 | | | | 68,606 | |
| |
HOTELS, RESTAURANTS & LEISURE – 0.0%** | | | | | |
| | |
McDonald’s Corp., Sr. Unsecured, MTN, 1.45%, 9/01/25 | | | 15,000 | | | | 15,028 | |
| | |
HOUSEHOLD PRODUCTS – 0.0%** | | | | | | | | |
| | |
Church & Dwight Co., Inc., Sr. Unsecured, 3.95%, 8/01/47 | | | 15,000 | | | | 16,756 | |
| | |
INSURANCE – 0.8% | | | | | | | | |
| | |
American International Group, Inc., Sr. Unsecured, 3.30%, 3/01/21 | | | 60,000 | | | | 60,956 | |
| | |
Aon PLC, Company Guaranteed, 4.00%, 11/27/23 | | | 40,000 | | | | 42,378 | |
| | |
CNA Financial Corp., Sr. Unsecured, 3.95%, 5/15/24 | | | 35,000 | | | | 36,555 | |
| | |
Lincoln National Corp., Sr. Unsecured, 3.63%, 12/12/26 | | | 25,000 | | | | 26,553 | |
| | |
WR Berkley Corp., Sr. Unsecured, 4.63%, 3/15/22 | | | 60,000 | | | | 62,466 | |
| | |
WR Berkley Corp., Sr. Unsecured, 4.75%, 8/01/44 | | | 45,000 | | | | 49,974 | |
| | | | | | | | |
| | |
TOTAL INSURANCE | | | | | | $ | 278,882 | |
| | | | | | | | |
| | |
| Description | | Par Value | | | Value | |
| | |
MACHINERY – 0.1% | | | | | | | | |
| | |
Caterpillar, Inc., Sr. Unsecured, 2.60%, 4/09/30 | | $ | 25,000 | | | $ | 26,509 | |
| | |
MEDIA – 0.4% | | | | | | | | |
| | |
Comcast Corp., Company Guaranteed, 4.70%, 10/15/48 | | | 35,000 | | | | 45,807 | |
| | |
ViacomCBS, Inc., Company Guaranteed, 4.60%, 1/15/45 | | | 75,000 | | | | 74,024 | |
| | |
Walt Disney Co. (The) / TWDC Enterprises 18 Corp., Company Guaranteed, GMTN, 4.13%, 6/01/44 | | | 10,000 | | | | 12,062 | |
| | | | | | | | |
| | |
TOTAL MEDIA | | | | | | $ | 131,893 | |
| |
MISCELLANEOUS MANUFACTURING – 0.4% | | | | | |
| | |
Illinois Tool Works, Inc., Sr. Unsecured, 3.50%, 3/01/24 | | | 45,000 | | | | 48,982 | |
| | |
Ingersoll-Rand Luxembourg Finance SA, Company Guaranteed, 3.50%, 3/21/26 | | | 55,000 | | | | 58,076 | |
| | |
Textron, Inc., Sr. Unsecured, 3.65%, 3/01/21 | | | 20,000 | | | | 20,042 | |
| | | | | | | | |
| | |
TOTAL MISCELLANEOUS MANUFACTURING | | | | | | $ | 127,100 | |
| | |
MULTI-UTILITIES – 0.2% | | | | | | | | |
| | |
Sempra Energy, Sr. Unsecured, 2.85%, 11/15/20 | | | 55,000 | | | | 54,975 | |
| | |
OIL & GAS – 0.8% | | | | | | | | |
| | |
BP Capital Markets PLC, Company Guaranteed, 2.50%, 11/06/22 | | | 50,000 | | | | 51,074 | |
| | |
Marathon Oil Corp., Sr. Unsecured, 4.40%, 7/15/27 | | | 70,000 | | | | 54,409 | |
| | |
Marathon Petroleum Corp., Sr. Unsecured, 3.63%, 9/15/24 | | | 20,000 | | | | 19,288 | |
| | |
Occidental Petroleum Corp., Sr. Unsecured, 2.70%, 8/15/22# | | | 35,000 | | | | 30,499 | |
| | |
Phillips 66, Company Guaranteed, 4.30%, 4/01/22 | | | 20,000 | | | | 20,898 | |
| | |
Phillips 66, Company Guaranteed, 3.85%, 4/09/25 | | | 10,000 | | | | 10,483 | |
| | |
Shell International Finance BV, Company Guaranteed, 3.25%, 5/11/25 | | | 25,000 | | | | 26,762 | |
| | |
Valero Energy Corp., Sr. Unsecured, 4.00%, 4/01/29 | | | 30,000 | | | | 30,773 | |
| | |
Valero Energy Corp., Sr. Unsecured, 4.90%, 3/15/45 | | | 10,000 | | | | 10,815 | |
| | | | | | | | |
| | |
TOTAL OIL & GAS | | | | | | $ | 255,001 | |
| | |
PHARMACEUTICALS – 0.6% | | | | | | | | |
| | |
AbbVie, Inc., Sr. Unsecured, 2.50%, 5/14/20 | | | 30,000 | | | | 30,008 | |
| | |
AbbVie, Inc., Sr. Unsecured, 4.25%, 11/14/28 | | | 25,000 | | | | 28,811 | |
| | |
AbbVie, Inc., Sr. Unsecured, 4.40%, 11/06/42 | | | 20,000 | | | | 23,208 | |
April 30, 2020 / ANNUAL REPORT
| | |
| PORTFOLIOS OF INVESTMENTS | | 48 |
Wilmington Diversified Income Fund (continued)
| | | | | | | | |
| | |
| Description | | Par Value | | | Value | |
| | |
Bristol-Myers Squibb Co., Sr. Unsecured, 2.75%, 2/15/23W | | $ | 25,000 | | | $ | 25,688 | |
| | |
Bristol-Myers Squibb Co., Sr. Unsecured, 4.55%, 2/20/48W | | | 45,000 | | | | 61,415 | |
| | |
Zoetis, Inc., Sr. Unsecured, 3.95%, 9/12/47 | | | 20,000 | | | | 23,686 | |
| | | | | | | | |
| | |
TOTAL PHARMACEUTICALS | | | | | | $ | 192,816 | |
| | |
PIPELINES – 0.7% | | | | | | | | |
| | |
Energy Transfer Operating LP, Company Guaranteed, 3.60%, 2/01/23 | | | 35,000 | | | | 33,994 | |
| | |
Energy Transfer Operating LP, Company Guaranteed, 4.20%, 4/15/27 | | | 40,000 | | | | 37,109 | |
| | |
Energy Transfer Operating LP, Company Guaranteed, 3.75%, 5/15/30 | | | 15,000 | | | | 13,857 | |
| | |
Kinder Morgan, Inc., Company Guaranteed, 5.20%, 3/01/48 | | | 40,000 | | | | 45,397 | |
| | |
MPLX LP, Sr. Unsecured, 4.00%, 3/15/28 | | | 30,000 | | | | 27,804 | |
| | |
ONEOK Partners LP, Company Guaranteed, 6.20%, 9/15/43 | | | 45,000 | | | | 41,655 | |
| | |
Spectra Energy Partners LP, Company Guaranteed, 4.50%, 3/15/45 | | | 25,000 | | | | 25,220 | |
| | | | | | | | |
| | |
TOTAL PIPELINES | | | | | | $ | 225,036 | |
|
REAL ESTATE INVESTMENT TRUSTS – 0.5% | |
| | |
American Tower Corp., Sr. Unsecured, 5.00%, 2/15/24 | | | 15,000 | | | | 16,800 | |
| | |
AvalonBay Communities, Inc., Sr. Unsecured, MTN, 3.35%, 5/15/27 | | | 25,000 | | | | 26,699 | |
| | |
Healthcare Realty Trust, Inc., Sr. Unsecured, 3.75%, 4/15/23 | | | 40,000 | | | | 40,457 | |
| | |
Healthcare Realty Trust, Inc., Sr. Unsecured, 3.88%, 5/01/25 | | | 15,000 | | | | 15,208 | |
| | |
Welltower, Inc., Sr. Unsecured, 3.63%, 3/15/24 | | | 55,000 | | | | 55,937 | |
| | | | | | | | |
| |
TOTAL REAL ESTATE INVESTMENT TRUSTS | | | $ | 155,101 | |
| | |
SEMICONDUCTORS – 0.3% | | | | | | | | |
| | |
Intel Corp., Sr. Unsecured, 2.70%, 12/15/22 | | | 35,000 | | | | 36,816 | |
| | |
Texas Instruments, Inc., Sr. Unsecured, 1.75%, 5/04/30 | | | 70,000 | | | | 69,908 | |
| | | | | | | | |
| | |
TOTAL SEMICONDUCTORS | | | | | | $ | 106,724 | |
| | |
TELECOMMUNICATIONS – 0.1% | | | | | | | | |
| | |
AT&T, Inc., Sr. Unsecured, 4.50%, 5/15/35 | | | 15,000 | | | | 16,682 | |
| | |
AT&T, Inc., Sr. Unsecured, 4.85%, 7/15/45 | | | 25,000 | | | | 29,310 | |
| | | | | | | | |
| | |
TOTAL TELECOMMUNICATIONS | | | | | | $ | 45,992 | |
| | |
TRANSPORTATION – 0.3% | | | | | | | | |
| | |
FedEx Corp., Company Guaranteed, 3.88%, 8/01/42 | | | 30,000 | | | | 28,576 | |
| | | | | | | | |
| | |
| Description | | Par Value | | | Value | |
| | |
FedEx Corp., Company Guaranteed, 4.10%, 2/01/45 | | $ | 15,000 | | | $ | 14,778 | |
| | |
Ryder System, Inc., Sr. Unsecured, MTN, 2.50%, 9/01/22 | | | 10,000 | | | | 9,996 | |
| | |
Union Pacific Corp., Sr. Unsecured, 3.15%, 3/01/24 | | | 45,000 | | | | 48,089 | |
| | | | | | | | |
| | |
TOTAL TRANSPORTATION | | | | | | $ | 101,439 | |
| | |
TRUCKING & LEASING – 0.1% | | | | | | | | |
| | |
GATX Corp., Sr. Unsecured, 5.20%, 3/15/44 | | | 20,000 | | | | 23,518 | |
| | |
UTILITIES – 0.3% | | | | | | | | |
| | |
FirstEnergy Corp., Sr. Unsecured, 2.05%, 3/01/25 | | | 100,000 | | | | 100,737 | |
| | | | | | | | |
| | |
TOTAL CORPORATE BONDS (COST $3,726,318) | | | | | | $ | 3,917,446 | |
| | |
| | | Number of
Shares | | | | |
| | |
COMMON STOCKS – 36.3% | | | | | | | | |
|
COMMUNICATION SERVICES – 2.1% | |
|
DIVERSIFIED TELECOMMUNICATION SERVICES – 2.1% | |
| | |
AT&T, Inc. | | | 13,475 | | | $ | 410,583 | |
| | |
Verizon Communications, Inc. | | | 4,675 | | | | 268,579 | |
| | | | | | | | |
| | |
TOTAL COMMUNICATION SERVICES | | | | | | $ | 679,162 | |
|
CONSUMER DISCRETIONARY – 2.1% | |
|
HOTELS, RESTAURANTS & LEISURE – 0.5% | |
| | |
McDonald’s Corp. | | | 850 | | | | 159,426 | |
| | |
MULTILINE RETAIL – 1.0% | | | | | | | | |
| | |
Target Corp. | | | 3,000 | | | | 329,220 | |
| | |
SPECIALTY RETAIL – 0.6% | | | | | | | | |
| | |
Home Depot, Inc. (The) | | | 1,000 | | | | 219,830 | |
| | | | | | | | |
| |
TOTAL CONSUMER DISCRETIONARY | | | $ | 708,476 | |
|
CONSUMER STAPLES – 3.5% | |
| | |
BEVERAGES – 1.6% | | | | | | | | |
| | |
Coca-Cola Co. (The) | | | 6,050 | | | | 277,635 | |
| | |
PepsiCo., Inc. | | | 1,976 | | | | 261,405 | |
| | | | | | | | |
| | |
| | | | | | $ | 539,040 | |
|
HOUSEHOLD PRODUCTS – 1.1% | |
| | |
Procter & Gamble Co. (The) | | | 3,100 | | | | 365,397 | |
| | |
TOBACCO – 0.8% | | | | | | | | |
| | |
Philip Morris International, Inc. | | | 3,600 | | | | 268,560 | |
| | | | | | | | |
| | |
TOTAL CONSUMER STAPLES | | | | | | $ | 1,172,997 | |
| | |
ENERGY – 2.8% | | | | | | | | |
|
OIL, GAS & CONSUMABLE FUELS – 2.8% | |
| | |
BP PLC ADR# | | | 6,225 | | | | 148,155 | |
ANNUAL REPORT / April 30, 2020
| | |
| 49 | | PORTFOLIOS OF INVESTMENTS |
|
| Wilmington Diversified Income Fund (continued) |
| | | | | | | | |
| | |
| Description | | Number of Shares | | | Value | |
| | |
Chevron Corp. | | | 3,525 | | | $ | 324,300 | |
| | |
ConocoPhillips | | | 5,500 | | | | 231,550 | |
| | |
Exxon Mobil Corp. | | | 2,525 | | | | 117,337 | |
| | |
Valero Energy Corp. | | | 1,740 | | | | 110,229 | |
| | | | | | | | |
| | |
TOTAL ENERGY | | | | | | $ | 931,571 | |
| | |
FINANCIALS – 7.4% | | | | | | | | |
| | |
CAPITAL MARKETS – 1.3% | | | | | | | | |
| | |
BlackRock, Inc. | | | 510 | | | | 256,040 | |
| | |
Main Street Capital Corp. | | | 60 | | | | 1,565 | |
| | |
Morgan Stanley | | | 4,600 | | | | 181,378 | |
| | | | | | | | |
| | |
| | | | | | $ | 438,983 | |
| | |
COMMERCIAL BANKS – 2.2% | | | | | | | | |
| | |
First Hawaiian, Inc. | | | 6,325 | | | | 111,257 | |
| | |
Toronto-Dominion Bank (The) | | | 4,925 | | | | 205,717 | |
| | |
U.S. Bancorp | | | 5,500 | | | | 200,750 | |
| | |
United Bankshares, Inc. | | | 6,950 | | | | 208,222 | |
| | | | | | | | |
| | |
| | | | | | $ | 725,946 | |
| |
DIVERSIFIED FINANCIAL SERVICES – 2.6% | | | | | |
| | |
Citigroup, Inc. | | | 3,650 | | | | 177,244 | |
| | |
JPMorgan Chase & Co. | | | 4,625 | | | | 442,890 | |
| | |
Wells Fargo & Co. | | | 8,675 | | | | 252,009 | |
| | | | | | | | |
| | |
| | | | | | $ | 872,143 | |
| | |
INSURANCE – 1.3% | | | | | | | | |
| | |
MetLife, Inc. | | | 6,100 | | | | 220,088 | |
| | |
Old Republic International Corp. | | | 12,950 | | | | 206,552 | |
| | | | | | | | |
| | |
| | | | | | $ | 426,640 | |
| | | | | | | | |
| | |
TOTAL FINANCIALS | | | | | | $ | 2,463,712 | |
| | |
HEALTH CARE – 5.6% | | | | | | | | |
| | |
BIOTECHNOLOGY – 0.6% | | | | | | | | |
| | |
Amgen, Inc. | | | 800 | | | | 191,376 | |
|
HEALTH CARE PROVIDERS & SERVICES – 0.8% | |
| | |
CVS Health Corp. | | | 4,675 | | | | 287,746 | |
| | |
PHARMACEUTICALS – 4.2% | | | | | | | | |
| | |
Bristol-Myers Squibb Co. | | | 4,550 | | | | 276,686 | |
| | |
Johnson & Johnson | | | 3,000 | | | | 450,120 | |
| | |
Merck & Co., Inc. | | | 3,575 | | | | 283,641 | |
| | |
Pfizer, Inc. | | | 9,875 | | | | 378,805 | |
| | | | | | | | |
| | |
| | | | | | $ | 1,389,252 | |
| | | | | | | | |
| | |
TOTAL HEALTH CARE | | | | | | $ | 1,868,374 | |
| | |
INDUSTRIALS – 3.3% | | | | | | | | |
| | |
AEROSPACE & DEFENSE – 1.3% | | | | | | | | |
| | |
Lockheed Martin Corp. | | | 1,075 | | | | 418,240 | |
| | |
AIR FREIGHT & LOGISTICS – 0.8% | | | | | | | | |
| | |
United Parcel Service, Inc., Class B | | | 2,675 | | | | 253,215 | |
| | | | | | | | |
| | |
| Description | | Number of Shares | | | Value | |
| | |
BUILDING PRODUCTS – 0.5% | | | | | | | | |
| | |
Johnson Controls International PLC | | | 6,175 | | | $ | 179,754 | |
| | |
ELECTRICAL EQUIPMENT – 0.7% | | | | | | | | |
| | |
Emerson Electric Co. | | | 4,375 | | | | 249,506 | |
| | | | | | | | |
| | |
TOTAL INDUSTRIALS | | | | | | $ | 1,100,715 | |
| | |
INFORMATION TECHNOLOGY – 4.1% | | | | | | | | |
| | |
COMMUNICATIONS EQUIPMENT – 1.2% | | | | | | | | |
| | |
Cisco Systems, Inc. | | | 9,450 | | | | 400,491 | |
| | |
IT SERVICES – 0.7% | | | | | | | | |
| | |
International Business Machines Corp. | | | 1,850 | | | | 232,286 | |
|
SEMICONDUCTORS & SEMICONDUCTOR EQUIPMENT – 2.2% | |
| | |
Broadcom, Inc. | | | 1,100 | | | | 298,782 | |
| | |
QUALCOMM, Inc. | | | 5,250 | | | | 413,017 | |
| | | | | | | | |
| | |
| | | | | | $ | 711,799 | |
| | | | | | | | |
| |
TOTAL INFORMATION TECHNOLOGY | | | $ | 1,344,576 | |
| | |
MATERIALS – 1.5% | | | | | | | | |
| | |
CHEMICALS – 1.5% | | | | | | | | |
| | |
Dow, Inc. | | | 7,250 | | | | 266,003 | |
| | |
Nutrien Ltd. | | | 6,750 | | | | 241,042 | |
| | | | | | | | |
| | |
TOTAL MATERIALS | | | | | | $ | 507,045 | |
| | |
REAL ESTATE – 0.6% | | | | | | | | |
|
REAL ESTATE INVESTMENT TRUST – 0.6% | |
| | |
Crown Castle International Corp. | | | 1,135 | | | | 180,953 | |
| | |
UTILITIES – 3.3% | | | | | | | | |
| | |
ELECTRIC UTILITIES – 3.3% | | | | | | | | |
| | |
American Electric Power Co., Inc. | | | 2,975 | | | | 247,252 | |
| | |
Duke Energy Corp. | | | 2,275 | | | | 192,602 | |
| | |
FirstEnergy Corp. | | | 6,725 | | | | 277,541 | |
| | |
NextEra Energy, Inc. | | | 1,550 | | | | 358,236 | |
| | | | | | | | |
| | |
TOTAL UTILITIES | | | | | | $ | 1,075,631 | |
| | | | | | | | |
| |
TOTAL COMMON STOCKS (COST $11,835,683) | | | $ | 12,033,212 | |
| | |
| | | Par Value | | | | |
|
ENHANCED EQUIPMENT TRUST CERTIFICATE – 0.1% | |
| | |
AIRLINES – 0.1% | | | | | | | | |
| | |
Delta Air Lines,2007-1, Series A, Pass-Through Certificates, 6.82%, 8/10/22 | | $ | 31,717 | | | $ | $30,337 | |
| | | | | | | | |
| |
TOTAL ENHANCED EQUIPMENT TRUST CERTIFICATE (COST $30,765) | | | $ | 30,337 | |
April 30, 2020 / ANNUAL REPORT
| | |
| PORTFOLIOS OF INVESTMENTS | | 50 |
Wilmington Diversified Income Fund (continued)
| | | | | | | | |
| | |
| Description | | Par Value | | | Value | |
| | |
GOVERNMENT AGENCY – 0.1% | | | | | | | | |
| |
FEDERAL HOME LOAN BANK (FHLB) – 0.1% | | | | | |
| | |
3.25%, 11/16/28# | | $ | 35,000 | | | $ | 41,330 | |
| | | | | | | | |
| | |
TOTAL GOVERNMENT AGENCY (COST $34,652) | | | | | | $ | 41,330 | |
| |
MORTGAGE-BACKED SECURITIES – 7.6% | | | | | |
|
FEDERAL HOME LOAN MORTGAGE CORPORATION (FHLMC) – 3.4% | |
| | |
Pool C00478, 8.50%, 9/01/26 | | | 853 | | | | 973 | |
| | |
Pool A15865, 5.50%, 11/01/33 | | | 24,430 | | | | 27,486 | |
| | |
Pool A19412, 5.00%, 3/01/34 | | | 52,172 | | | | 59,612 | |
| | |
Pool G05774, 5.00%, 1/01/40 | | | 130,215 | | | | 145,523 | |
| | |
Pool C03517, 4.50%, 9/01/40 | | | 16,880 | | | | 18,715 | |
| | |
Pool C03849, 3.50%, 4/01/42 | | | 32,457 | | | | 34,911 | |
| | |
Pool C04305, 3.00%, 11/01/42 | | | 124,170 | | | | 132,122 | |
| | |
Pool C09020, 3.50%, 11/01/42 | | | 103,858 | | | | 111,783 | |
| | |
Pool G07889, 3.50%, 8/01/43 | | | 23,332 | | | | 25,115 | |
| | |
Pool Q23891, 4.00%, 12/01/43 | | | 23,953 | | | | 25,960 | |
| | |
Pool G60038, 3.50%, 1/01/44 | | | 83,124 | | | | 89,388 | |
| | |
Pool SD8000, 3.00%, 7/01/49 | | | 65,928 | | | | 69,658 | |
| | |
Pool SD8011, 3.50%, 9/01/49 | | | 95,545 | | | | 100,973 | |
| | |
Pool SD8012, 4.00%, 9/01/49 | | | 2,588 | | | | 2,758 | |
| | |
Pool QA5249, 3.00%, 12/01/49 | | | 109,494 | | | | 115,662 | |
| | |
Pool SD8037, 2.50%, 1/01/50 | | | 159,489 | | | | 166,161 | |
| | | | | | | | |
| |
TOTAL FEDERAL HOME LOAN MORTGAGE CORPORATION (FHLMC) | | | $ | 1,126,800 | |
|
FEDERAL NATIONAL MORTGAGE ASSOCIATION (FNMA) – 4.2% | |
| | |
Pool AB4089, 3.00%, 12/01/26 | | | 14,493 | | | | 15,322 | |
| | |
Pool 533246, 7.50%, 4/01/30 | | | 2,461 | | | | 2,547 | |
| | |
Pool AJ4050, 4.00%, 10/01/41 | | | 54,219 | | | | 59,342 | |
| | |
Pool AX5302, 4.00%, 1/01/42 | | | 18,101 | | | | 19,812 | |
| | |
Pool AT7899, 3.50%, 7/01/43 | | | 44,662 | | | | 47,912 | |
| | |
Pool AS0302, 3.00%, 8/01/43 | | | 53,155 | | | | 56,539 | |
| | |
Pool AL6325, 3.00%, 10/01/44 | | | 47,564 | | | | 50,588 | |
| | |
Pool BC0830, 3.00%, 4/01/46 | | | 58,634 | | | | 62,354 | |
| | |
Pool BC9468, 3.00%, 6/01/46 | | | 16,928 | | | | 18,003 | |
| | |
Pool BE1899, 3.00%, 11/01/46 | | | 87,824 | | | | 93,402 | |
| | |
Pool BD7166, 4.50%, 4/01/47 | | | 53,036 | | | | 57,375 | |
| | |
Pool BE3625, 3.50%, 5/01/47 | | | 108,928 | | | | 115,809 | |
| | |
Pool BE3702, 4.00%, 6/01/47 | | | 141,929 | | | | 151,934 | |
| | |
Pool BE3767, 3.50%, 7/01/47 | | | 11,881 | | | | 12,634 | |
| | |
Pool BH9215, 3.50%, 1/01/48 | | | 30,545 | | | | 32,482 | |
| | |
Pool BJ0650, 3.50%, 3/01/48 | | | 186,560 | | | | 197,735 | |
| | |
Pool BJ9169, 4.00%, 5/01/48 | | | 76,181 | | | | 81,216 | |
| | |
Pool BK4764, 4.00%, 8/01/48 | | | 61,053 | | | | 65,089 | |
| | |
Pool MA3444, 4.50%, 8/01/48 | | | 37,592 | | | | 40,572 | |
| | | | | | | | |
| | |
| Description | | Par Value | | | Value | |
| | |
Pool BN1628, 4.50%, 11/01/48 | | $ | 19,064 | | | $ | 20,560 | |
| | |
Pool BN3956, 4.00%, 1/01/49 | | | 31,384 | | | | 33,458 | |
| | |
Pool BN6683, 3.50%, 6/01/49 | | | 70,863 | | | | 74,889 | |
| | |
Pool MA3871, 3.00%, 12/01/49 | | | 72,121 | | | | 76,187 | |
| | | | | | | | |
| |
TOTAL FEDERAL NATIONAL MORTGAGE ASSOCIATION (FNMA) | | | $ | 1,385,761 | |
|
GOVERNMENT NATIONAL MORTGAGE ASSOCIATION (GNMA) – 0.0%** | |
| | |
Pool 354677, 7.50%, 10/15/23 | | | 4,350 | | | | 4,804 | |
| | |
Pool 354765, 7.00%, 2/15/24 | | | 6,931 | | | | 7,720 | |
| | |
Pool 354827, 7.00%, 5/15/24 | | | 5,014 | | | | 5,590 | |
| | | | | | | | |
| | |
TOTAL GOVERNMENT NATIONAL MORTGAGE ASSOCIATION (GNMA) | | | | | | $ | 18,114 | |
| | | | | | | | |
| | |
TOTAL MORTGAGE-BACKED SECURITIES (COST $2,428,854) | | | | | | $ | 2,530,675 | |
| | |
U.S. TREASURY – 12.5% | | | | | | | | |
| | |
U.S. TREASURY BONDS – 3.1% | | | | | | | | |
| | |
2.00%, 2/15/50 | | | 100,000 | | | | 117,620 | |
| | |
2.50%, 2/15/46 | | | 65,000 | | | | 82,226 | |
| | |
2.75%, 8/15/47 | | | 70,000 | | | | 93,414 | |
| | |
3.00%, 11/15/44 | | | 53,000 | | | | 72,255 | |
| | |
3.00%, 11/15/45# | | | 8,000 | | | | 11,007 | |
| | |
3.00%, 2/15/47 | | | 21,000 | | | | 29,216 | |
| | |
3.00%, 5/15/47 | | | 30,000 | | | | 41,779 | |
| | |
3.13%, 8/15/44 | | | 11,000 | | | | 15,251 | |
| | |
3.38%, 5/15/44 | | | 139,000 | | | | 199,773 | |
| | |
3.63%, 2/15/44 | | | 87,000 | | | | 129,336 | |
| | |
4.38%, 5/15/40 | | | 120,000 | | | | 190,905 | |
| | |
4.75%, 2/15/37 | | | 21,000 | | | | 33,730 | |
| | | | | | | | |
| | |
TOTAL U.S. TREASURY BONDS | | | | | | $ | 1,016,512 | |
| | |
U.S. TREASURY NOTES – 9.4% | | | | | | | | |
| | |
1.13%, 2/28/21 | | | 250,000 | | | | 252,003 | |
| | |
1.50%, 8/15/26 | | | 90,000 | | | | 95,569 | |
| | |
1.63%, 11/15/22 | | | 96,000 | | | | 99,379 | |
| | |
1.63%, 5/15/26 | | | 195,000 | | | | 208,314 | |
| | |
1.75%, 5/15/23 | | | 405,000 | | | | 423,256 | |
| | |
1.75%, 7/31/24 | | | 30,000 | | | | 31,792 | |
| | |
2.00%, 10/31/21 | | | 165,000 | | | | 169,447 | |
| | |
2.00%, 4/30/24 | | | 170,000 | | | | 181,324 | |
| | |
2.00%, 2/15/25 | | | 115,000 | | | | 123,905 | |
| | |
2.00%, 8/15/25 | | | 35,000 | | | | 37,908 | |
| | |
2.13%, 6/30/22 | | | 175,000 | | | | 182,248 | |
| | |
2.13%, 11/30/23 | | | 215,000 | | | | 229,035 | |
| | |
2.13%, 5/15/25 | | | 140,000 | | | | 152,155 | |
| | |
2.25%, 11/15/24 | | | 80,000 | | | | 86,819 | |
| | |
2.25%, 11/15/25 | | | 5,000 | | | | 5,495 | |
| | |
2.25%, 8/15/27 | | | 460,000 | | | | 516,310 | |
| | |
2.38%, 8/15/24 | | | 140,000 | | | | 152,106 | |
ANNUAL REPORT / April 30, 2020
| | |
| 51 | | PORTFOLIOS OF INVESTMENTS |
|
| Wilmington Diversified Income Fund (continued) |
| | | | | | | | |
| | |
| Description | | Par Value | | | Value | |
| | |
2.38%, 5/15/29 | | $ | 150,000 | | | $ | 173,134 | |
| | | | | | | | |
| | |
TOTAL U.S. TREASURY NOTES | | | | | | $ | 3,120,199 | |
| | | | | | | | |
| |
TOTAL U.S. TREASURY
(COST $3,683,012) | | | $ | 4,136,711 | |
| | |
| | | | | | | | |
| | |
| | | Number of
Shares | | | | |
| | |
MONEY MARKET FUND – 2.4% | | | | | | | | |
| | |
Dreyfus Government Cash Management Fund, Institutional Shares, 0.17%^ | | | 805,284 | | | $ | 805,284 | |
| | | | | | | | |
| |
TOTAL MONEY MARKET FUND (COST $805,284) | | | $ | 805,284 | |
| | | | | | | | |
| |
TOTAL INVESTMENTS IN SECURITIES – 100.3% (COST $34,946,642) | | | $ | 33,304,549 | |
| | | | | | | | |
| | |
| | | Par Value | | | | |
|
CASH COLLATERAL INVESTED FOR SECURITIES ON LOAN – 2.9% | |
| |
REPURCHASE AGREEMENTS – 2.9% | | | | | |
| | |
BNP Paribas SA, 0.05%, dated 4/30/20, due 5/01/20, repurchase price $181,264 collateralized by U.S. Government Agency & Treasury Securities, 0.00% to 7.50%, maturing 5/15/20 to 4/20/50; total market value of $184,889. | | $ | 181,264 | | | $ | $181,264 | |
| | |
Citigroup Global Markets Ltd., 0.04%, dated 4/30/20, due 5/01/20, repurchase price $181,264 collateralized by U.S. Government Agency & Treasury Securities, 0.50% to 6.50%, maturing 5/31/20 to 2/01/57; total market value of $184,889. | | | 181,264 | | | | 181,264 | |
| | |
Daiwa Capital Markets America, 0.05%, dated 4/30/20, due 5/01/20, repurchase price $181,264 collateralized by U.S. Government Agency & Treasury Securities, 0.00% to 6.50%, maturing 5/07/20 to 3/01/52; total market value of $184,889. | | | 181,264 | | | | 181,264 | |
| | |
Deutsche Bank Securities, Inc., 0.03%, dated 4/30/20, due 5/01/20, repurchase price $72,145 collateralized by U.S. Government Agency & Treasury Securities, 0.43% to 8.75%, maturing 8/15/20 to 4/01/50; total market value of $73,588. | | | 72,145 | | | | 72,145 | |
| | |
HSBC Securities USA, Inc., 0.03%, dated 4/30/20, due 5/01/20, repurchase price $181,264 collateralized by U.S. Government Agency Securities, 2.45% to 5.00%, maturing 2/20/49 to 4/15/55; total market value of $184,889. | | | 181,264 | | | | 181,264 | |
| | | | | | | | |
| | |
| Description | | Par Value | | | Value | |
| | |
RBC Dominion Securities, Inc., 0.04%, dated 4/30/20, due 5/01/20, repurchase price $181,264 collateralized by U.S. Government Agency & Treasury Securities, 0.00% to 6.00%, maturing 7/15/24 to 5/01/50; total market value of $184,889. | | $ | 181,264 | | | $ | 181,264 | |
| | | | | | | | |
| | |
TOTAL REPURCHASE AGREEMENTS
(COST $978,465) | | | | | | $ | 978,465 | |
| | | | | | | | |
| |
TOTAL CASH COLLATERAL INVESTED FOR SECURITIES ON LOAN
(COST $978,465) | | | $ | 978,465 | |
| | | | | | | | |
| | |
TOTAL INVESTMENTS – 103.2% (COST $35,925,107) | | | | | | $ | 34,283,014 | |
| |
| COLLATERAL FOR SECURITIES ON LOAN – (2.9%) | | | | (978,465 | ) |
| | |
| OTHER LIABILITIES LESS ASSETS – (0.3%) | | | | | | | (98,629 | ) |
| | | | | | | | |
| | |
| TOTAL NET ASSETS – 100.0% | | | | | | $ | 33,205,920 | |
| | | | | | | | |
April 30, 2020 / ANNUAL REPORT
| | |
| PORTFOLIOS OF INVESTMENTS | | 52 |
Wilmington Diversified Income Fund (concluded)
Cost of investments for Federal income tax purposes is $35,921,714. The net unrealized appreciation/(depreciation) of investments was $(1,638,700). This consists of net unrealized appreciation from investment for those securities having an excess of value over cost of $2,226,845 and net unrealized depreciation from investments for those securities having an excess of cost over value of $(3,865,545).
Various inputs are used in determining the value of the Fund’s investments. These inputs are summarized in the three broad levels listed below.
Level 1 – quoted prices in active markets for identical securities
Level 2 – other significant observable inputs (including quoted prices for similar securities, interest rates, prepayment speeds, credit risk, etc.)
Level 3 – significant unobservable inputs (including the Fund’s own assumptions in determining the fair value of investments)
The following is a summary of the inputs used as of April 30, 2020 in valuing the Fund’s assets carried at fair value:
| | | | | | | | | | | | | | | | | | | | |
| | | | |
| | | Level 1 | | Level 2 | | Level 3 | | Total |
Investments in Securities | | | | | | | | | | | | | | | | | | | | |
| | | | |
Investment Companies | | | $ | 9,699,433 | | | | $ | — | | | | $ | — | | | | $ | 9,699,433 | |
| | | | |
Collateralized Mortgage Obligations | | | | — | | | | | 110,121 | | | | | — | | | | | 110,121 | |
| | | | |
Corporate Bonds | | | | — | | | | | 3,917,446 | | | | | — | | | | | 3,917,446 | |
| | | | |
Common Stocks | | | | 12,033,212 | | | | | — | | | | | — | | | | | 12,033,212 | |
| | | | |
Enhanced Equipment Trust Certificate | | | | — | | | | | 30,337 | | | | | — | | | | | 30,337 | |
| | | | |
Government Agency | | | | — | | | | | 41,330 | | | | | — | | | | | 41,330 | |
| | | | |
Mortgage-Backed Securities | | | | — | | | | | 2,530,675 | | | | | — | | | | | 2,530,675 | |
| | | | |
U.S. Treasury | | | | — | | | | | 4,136,711 | | | | | — | | | | | 4,136,711 | |
| | | | |
Money Market Fund | | | | 805,284 | | | | | — | | | | | — | | | | | 805,284 | |
| | | | |
Repurchase Agreements | | | | — | | | | | 978,465 | | | | | — | | | | | 978,465 | |
| | | | | | | | | | | | | | | | | | | | |
| | | | |
Total | | | $ | 22,537,929 | | | | $ | 11,745,085 | | | | $ | — | | | | $ | 34,283,014 | |
| | | | | | | | | | | | | | | | | | | | |
| # | Security, or a portion thereof, is on loan. See Note 2 in Notes to Financial Statements. |
| D | Variable rate security. The rate disclosed is the rate in effect on the report date. The information in parenthesis represents the benchmark and reference rate for each relevant security and the rate floats based upon the reference rate and spread. The security may be further subject to interest rate floor and caps. Certain variable rate securities are not based on a published reference rate and spread, but are determined by the issuer or agent and are based on current market conditions, or, for mortgage-backed securities, are impacted by the individual mortgages which are paying off over time. These securities do not indicate a reference rate and spread in their descriptions. |
| W | Denotes a restricted security that may be resold without restriction to “qualified institutional buyers” as defined in Rule 144A under the Securities Act of 1933 and that the Fund has determined to be liquid under criteria established by the Fund’s Board of Trustees. At April 30, 2020, these liquid restricted securities amounted to $250,023 representing 0.75% of total net assets. |
| ** | Represents less than 0.05%. |
| | | | | | |
| The following acronyms are used throughout this Fund: | | | | PLC Public Limited Company |
| | | |
ADR ETF GMTN LIBOR LLC LP MTN | | American Depositary Receipt Exchange-Traded Fund Global Medium Term Note London Interbank Offered Rate Limited Liability Corporation Limited Partnership Medium Term Note | | | | REIT Real Estate Investment Trust SOFRRATE Secured Overnight Financing Rate Standard & Poor’s Depository SPDR Receipts Currency Code Currency USD United States Dollar |
| | |
| | |
| | |
See Notes which are an integral part of the Financial Statements
ANNUAL REPORT / April 30, 2020
| | |
| 53 | | STATEMENTS OF ASSETS AND LIABILITIES |
| | | | | | | | | | | | | | | | | | | | |
| | | | |
| April 30, 2020 | | | | Wilmington
International
Fund | | Wilmington
Global Alpha
Equities Fund | | |
ASSETS: | | | | | | | | | | | | | | | | | | | | |
Investments, at identified cost | | | | | | | | $ | 529,633,604 | | | | $ | 194,486,388 | | | | | | |
| | | | | | | | | | | | | | | | | | | | |
Investments in securities, at value (Including $27,665,931 and $0 of securities on loan, respectively) (Note 2) | | | | | | | | $ | 538,234,522 | | | | $ | 196,855,251 | | | | | | |
Cash | | | | | | | | | 9,193 | | | | | — | | | | | | |
Deposits for financial futures contracts | | | | | | | | | 2,176,544 | | | | | 11,794,162 | | | | | | |
Cash denominated in foreign currencies | | | | | | | | | 3,174,246 | (a) | | | | 54,512 | (a) | | | | | |
Variation margin receivable for financial futures contracts | | | | | | | | | 233,530 | | | | | 2,439,242 | | | | | | |
Income receivable | | | | | | | | | 1,768,139 | | | | | 456,202 | | | | | | |
Foreign tax reclaim receivable | | | | | | | | | 1,485,001 | | | | | 208,502 | | | | | | |
Receivable for shares sold | | | | | | | | | 248,720 | | | | | 569,773 | | | | | | |
Unrealized appreciation on forward foreign currency contracts | | | | | | | | | — | | | | | 322,676 | | | | | | |
Receivable for investments sold | | | | | | | | | 269,704 | | | | | 1,108,570 | | | | | | |
Prepaid assets | | | | | | | | | 23,164 | | | | | 27,115 | | | | | | |
| | | | | | | | | | | | | | | | | | | | |
TOTAL ASSETS | | | | | | | | | 547,622,763 | | | | | 213,836,005 | | | | | | |
| | | | | | | | | | | | | | | | | | | | |
LIABILITIES: | | | | | | | | | | | | | | | | | | | | |
Payable for investments purchased | | | | | | | | | 599,424 | | | | | 1,324,651 | | | | | | |
Collateral for securities on loan | | | | | | | | | 29,466,083 | | | | | — | | | | | | |
Unrealized depreciation on forward foreign currency contracts | | | | | | | | | 601 | | | | | 67,736 | | | | | | |
Payable for shares redeemed | | | | | | | | | 315,886 | | | | | 4,484 | | | | | | |
Payable tosub-advisors | | | | | | | | | 139,647 | | | | | 91,503 | | | | | | |
Payable for Trustees’ fees | | | | | | | | | 8,973 | | | | | 8,972 | | | | | | |
Payable for administration fees | | | | | | | | | 12,021 | | | | | 4,969 | | | | | | |
Payable for distribution services fees | | | | | | | | | 596 | | | | | 40 | | | | | | |
Payable for shareholder services fees | | | | | | | | | 48,017 | | | | | — | | | | | | |
Payable for investment advisory fees | | | | | | | | | 77,790 | | | | | 69,703 | | | | | | |
Other accrued expenses | | | | | | | | | 277,571 | | | | | 144,819 | | | | | | |
| | | | | | | | | | | | | | | | | | | | |
TOTAL LIABILITIES | | | | | | | | | 30,946,609 | | | | | 1,716,877 | | | | | | |
| | | | | | | | | | | | | | | | | | | | |
NET ASSETS | | | | | | | | $ | 516,676,154 | | | | $ | 212,119,128 | | | | | | |
| | | | | | | | | | | | | | | | | | | | |
NET ASSETS CONSIST OF: | | | | | | | | | | | | | | | | | | | | |
Paid-in capital | | | | | | | | $ | 542,967,414 | | | | $ | 215,860,456 | | | | | | |
Distributable earnings (loss) | | | | | | | | | (26,291,260 | ) | | | | (3,741,328 | ) | | | | | |
| | | | | | | | | | | | | | | | | | | | |
TOTAL NET ASSETS | | | | | | | | $ | 516,676,154 | | | | $ | 212,119,128 | | | | | | |
| | | | | | | | | | | | | | | | | | | | |
COMPUTATION OF NET ASSET VALUE AND OFFERING PRICE: | | | | | | | | | | | | | | | | | | | | |
Class A | | | | | | | | | | | | | | | | | | | | |
Net Assets | | | | | | | | $ | 3,036,386 | | | | $ | 208,201 | | | | | | |
| | | | | | | | | | | | | | | | | | | | |
Shares outstanding (unlimited shares authorized) | | | | | | | | | 412,894 | | | | | 19,152 | | | | | | |
| | | | | | | | | | | | | | | | | | | | |
Net Asset Value per share | | | | | | | | $ | 7.35 | | | | $ | 10.87 | | | | | | |
| | | | | | | | | | | | | | | | | | | | |
Offering Price per share* | | | | | | | | $ | 7.78 | ** | | | $ | 11.50 | ** | | | | | |
| | | | | | | | | | | | | | | | | | | | |
Class I | | | | | | | | | | | | | | | | | | | | |
Net Assets | | | | | | | | $ | 513,639,768 | | | | $ | 211,910,927 | | | | | | |
| | | | | | | | | | | | | | | | | | | | |
Shares outstanding (unlimited shares authorized) | | | | | | | | | 69,284,707 | | | | | 19,247,262 | | | | | | |
| | | | | | | | | | | | | | | | | | | | |
Net Asset Value and Offering Price per share | | | | | | | | $ | 7.41 | | | | $ | 11.01 | | | | | | |
| | | | | | | | | | | | | | | | | | | | |
| | | | | | | | | | | | | | | | | | | | |
| (a) | Cost of cash denominated in foreign currencies was $3,189,081 and $53,412, respectively. |
| * | See “How are Shares Priced?” in the Prospectus. |
| ** | Computation of offering price per share: 100/94.50 of net asset value. |
See Notes which are an integral part of the Financial Statements
April 30, 2020 / ANNUAL REPORT
| | |
| STATEMENTS OF ASSETS AND LIABILITIES (concluded) | | 54 |
| | | | | | | | | | | | | | |
| | |
| April 30, 2020 | | Wilmington Real Asset Fund | | | Wilmington Diversified Income Fund | |
ASSETS: | | | | | | | | | | | | | | |
Investments, at identified cost | | | | $ | 226,621,003 | | | | | | | $ | 35,925,107 | |
| | | | | | | | | | | | | | |
Investments in securities, at value (Including $2,102,569 and $937,927 of securities on loan, respectively) (Note 2) | | | | $ | 201,908,559 | | | | | | | $ | 34,283,014 | |
Cash | | | | | 7,299 | | | | | | | | — | |
Cash denominated in foreign currencies | | | | | 82,196 | (a) | | | | | | | — | |
Income receivable | | | | | 196,509 | | | | | | | | 87,493 | |
Foreign tax reclaim receivable | | | | | 203,023 | | | | | | | | — | |
Due from advisor | | | | | — | | | | | | | | 10,372 | |
Receivable for shares sold | | | | | 356,715 | | | | | | | | 1,253 | |
Receivable for investments sold | | | | | 21,867,688 | | | | | | | | — | |
Prepaid assets | | | | | 26,477 | | | | | | | | 16,086 | |
| | | | | | | | | | | | | | |
TOTAL ASSETS | | | | | 224,648,466 | | | | | | | | 34,398,218 | |
| | | | | | | | | | | | | | |
LIABILITIES: | | | | | | | | | | | | | | |
Payable for investments purchased | | | | | 21,665,526 | | | | | | | | 104,893 | |
Collateral for securities on loan | | | | | 2,218,139 | | | | | | | | 978,465 | |
Payable for shares redeemed | | | | | 431,043 | | | | | | | | 8,647 | |
Payable tosub-advisors | | | | | 12,981 | | | | | | | | — | |
Payable for Trustees’ fees | | | | | 8,972 | | | | | | | | 8,880 | |
Payable for administration fees | | | | | 5,444 | | | | | | | | 881 | |
Payable for distribution services fees | | | | | 188 | | | | | | | | 6,521 | |
Payable for investment advisory fees | | | | | 68,008 | | | | | | | | — | |
Other accrued expenses | | | | | 190,817 | | | | | | | | 84,011 | |
| | | | | | | | | | | | | | |
TOTAL LIABILITIES | | | | | 24,601,118 | | | | | | | | 1,192,298 | |
| | | | | | | | | | | | | | |
NET ASSETS | | | | $ | 200,047,348 | | | | | | | $ | 33,205,920 | |
| | | | | | | | | | | | | | |
NET ASSETS CONSIST OF: | | | | | | | | | | | | | | |
Paid-in capital | | | | $ | 248,616,438 | | | | | | | $ | 35,640,503 | |
Distributable earnings (loss) | | | | | (48,569,090 | ) | | | | | | | (2,434,583 | ) |
| | | | | | | | | | | | | | |
TOTAL NET ASSETS | | | | $ | 200,047,348 | | | | | | | $ | 33,205,920 | |
| | | | | | | | | | | | | | |
COMPUTATION OF NET ASSET VALUE AND OFFERING PRICE: | | | | | | | | | | | | | | |
Class A | | | | | | | | | | | | | | |
Net Assets | | | | $ | 932,398 | | | | | | | $ | 32,708,283 | |
| | | | | | | | | | | | | | |
Shares outstanding (unlimited shares authorized) | | | | | 75,645 | | | | | | | | 3,426,772 | |
| | | | | | | | | | | | | | |
Net Asset Value per share | | | | $ | 12.33 | | | | | | | $ | 9.54 | |
| | | | | | | | | | | | | | |
Offering Price per share* | | | | $ | 13.05 | ** | | | | | | $ | 10.10 | ** |
| | | | | | | | | | | | | | |
Class I | | | | | | | | | | | | | | |
Net Assets | | | | $ | 199,114,950 | | | | | | | $ | 497,637 | |
| | | | | | | | | | | | | | |
Shares outstanding (unlimited shares authorized) | | | | | 15,968,704 | | | | | | | | 52,092 | |
| | | | | | | | | | | | | | |
Net Asset Value and Offering Price per share | | | | $ | 12.47 | | | | | | | $ | 9.55 | |
| | | | | | | | | | | | | | |
| | | | | | | | | | | | | | |
| (a) | Cost of cash denominated in foreign currencies was $80,899. |
| * | See “How are Shares Priced?” in the Prospectus. |
| ** | Computation of offering price per share: 100/94.50 of net asset value. |
See Notes which are an integral part of the Financial Statements
ANNUAL REPORT / April 30, 2020
| | |
| 55 | | STATEMENTS OF OPERATIONS |
| | | | | | | | | | | | | | |
| | |
| Year Ended April 30, 2020 | | Wilmington International
Fund | | | Wilmington Global Alpha Equities Fund | |
INVESTMENT INCOME: | | | | | | | | | | | | | | |
Dividends | | | | $ | 13,186,871 | (a) | | | | | | $ | 3,930,722 | (a) |
Interest | | | | | 11,484 | | | | | | | | 65,744 | |
Securities lending income, net | | | | | 260,331 | | | | | | | | — | |
| | | | | | | | | | | | | | |
TOTAL INVESTMENT INCOME | | | | | 13,458,686 | | | | | | | | 3,996,466 | |
| | | | | | | | | | | | | | |
EXPENSES: | | | | | | | | | | | | | | |
Investment advisory fees | | | | | 4,519,611 | | | | | | | | 2,912,867 | |
Administration fees | | | | | 170,501 | | | | | | | | 59,631 | |
Portfolio accounting and administration fees | | | | | 200,552 | | | | | | | | 72,576 | |
Custodian fees | | | | | 163,358 | | | | | | | | 60,452 | |
Transfer and dividend disbursing agent fees and expenses | | | | | 109,727 | | | | | | | | 85,232 | |
Trustees’ fees | | | | | 54,329 | | | | | | | | 56,915 | |
Professional fees | | | | | 211,112 | | | | | | | | 137,034 | |
Distribution services fee—Class A | | | | | 8,994 | | | | | | | | 370 | |
Shareholder services fee—Class A | | | | | 8,994 | | | | | | | | 370 | |
Shareholder services fee— Class I | | | | | 1,376,826 | | | | | | | | 485,108 | |
Share registration costs | | | | | 31,024 | | | | | | | | 36,333 | |
Printing and postage | | | | | 21,803 | | | | | | | | 16,289 | |
Miscellaneous | | | | | 65,374 | | | | | | | | 41,081 | |
| | | | | | | | | | | | | | |
TOTAL EXPENSES | | | | | 6,942,205 | | | | | | | | 3,964,258 | |
| | | | | | | | | | | | | | |
WAIVERS AND REIMBURSEMENTS: | | | | | | | | | | | | | | |
Waiver/reimbursement by investment advisor/subadvisors | | | | | (1,500,796 | ) | | | | | | | (1,070,441 | ) |
Waiver of shareholder services fee—Class A | | | | | (8,994 | ) | | | | | | | (370 | ) |
Waiver of shareholder services fee—Class I | | | | | (734,307 | ) | | | | | | | (485,108 | ) |
| | | | | | | | | | | | | | |
TOTAL WAIVERS AND REIMBURSEMENTS | | | | | (2,244,097 | ) | | | | | | | (1,555,919 | ) |
| | | | | | | | | | | | | | |
Net expenses | | | | | 4,698,108 | | | | | | | | 2,408,339 | |
| | | | | | | | | | | | | | |
Net investment income (loss) | | | | | 8,760,578 | | | | | | | | 1,588,127 | |
| | | | | | | | | | | | | | |
REALIZED AND UNREALIZED GAIN (LOSS) ON INVESTMENTS: | | | | | | | | | | | | | | |
Net realized gain (loss) on investments | | | | | (24,512,743 | ) | | | | | | | (7,898,336 | ) |
Net realized gain (loss) on forward foreign currency contracts | | | | | (227,865 | ) | | | | | | | 310,721 | |
Net realized gain (loss) on foreign currency transactions | | | | | (494,457 | ) | | | | | | | (45,080 | ) |
Net realized gain (loss) on financial futures contracts | | | | | (2,191,298 | ) | | | | | | | 21,455,459 | |
Litigation proceeds | | | | | 1,368 | (b) | | | | | | | 804 | (b) |
Net change in unrealized appreciation (depreciation) on investments | | | | | (44,879,685 | ) | | | | | | | (12,343,473 | ) |
Net change in unrealized appreciation (depreciation) on forward foreign currency contracts | | | | | 595 | | | | | | | | 154,217 | |
Net change in unrealized appreciation (depreciation) on foreign currency transactions | | | | | 1,185 | | | | | | | | 797 | |
Net change in unrealized appreciation (depreciation) on financial futures contracts | | | | | (103,122 | ) | | | | | | | (10,503,265 | ) |
| | | | | | | | | | | | | | |
Net realized and unrealized gain (loss) on investments | | | | | (72,406,022 | ) | | | | | | | (8,868,156 | ) |
| | | | | | | | | | | | | | |
Change in net assets resulting from operations | | | | $ | (63,645,444 | ) | | | | | | $ | (7,280,029 | ) |
| | | | | | | | | | | | | | |
| (a) | Net of foreign withholding taxes withheld of $1,470,107 and $292,069, respectively. |
| (b) | The Litigation proceeds represent a class action settlement received by the Fund. |
See Notes which are an integral part of the Financial Statements
April 30, 2020 / ANNUAL REPORT
| | |
| STATEMENTS OF OPERATIONS (concluded) | | 56 |
| | | | | | | | | | |
| | | |
| Year Ended April 30, 2020 | | | | Wilmington Real Asset Fund | | | Wilmington
Diversified
Income Fund | |
INVESTMENT INCOME: | | | | | | | | | | |
Dividends | | | | $ | 10,602,553 | (a) | | $ | 1,341,053 | (a) |
Interest | | | | | 1,936,301 | (b) | | | 286,610 | |
Securities lending income, net | | | | | 123,610 | | | | 66,458 | |
| | | | | | | | | | |
TOTAL INVESTMENT INCOME | | | | | 12,662,464 | | | | 1,694,121 | |
| | | | | | | | | | |
EXPENSES: | | | | | | | | | | |
Investment advisory fees | | | | | 1,716,145 | | | | 152,092 | |
Administration fees | | | | | 94,483 | | | | 11,699 | |
Portfolio accounting and administration fees | | | | | 140,163 | | | | 26,449 | |
Custodian fees | | | | | 113,378 | | | | 2,915 | |
Transfer and dividend disbursing agent fees and expenses | | | | | 87,708 | | | | 45,028 | |
Trustees’ fees | | | | | 55,346 | | | | 54,269 | |
Professional fees | | | | | 140,361 | | | | 100,921 | |
Distribution services fee—Class A | | | | | 2,796 | | | | 93,586 | |
Shareholder services fee—Class A | | | | | 2,796 | | | | 93,586 | |
Shareholder services fee— Class I | | | | | 764,825 | | | | 1,471 | |
Share registration costs | | | | | 34,185 | | | | 20,079 | |
Printing and postage | | | | | 23,481 | | | | 7,527 | |
Miscellaneous | | | | | 49,306 | | | | 28,614 | |
| | | | | | | | | | |
TOTAL EXPENSES | | | | | 3,224,973 | | | | 638,236 | |
| | | | | | | | | | |
WAIVERS AND REIMBURSEMENTS: | | | | | | | | | | |
Waiver/reimbursement by investment advisor/subadvisors | | | | | (274,512 | ) | | | (317,846 | ) |
Waiver of shareholder services fee—Class A | | | | | (2,796 | ) | | | (93,586 | ) |
Waiver of shareholder services fee—Class I | | | | | (764,825 | ) | | | (1,471 | ) |
| | | | | | | | | | |
TOTAL WAIVERS AND REIMBURSEMENTS | | | | | (1,042,133 | ) | | | (412,903 | ) |
| | | | | | | | | | |
Net expenses | | | | | 2,182,840 | | | | 225,333 | |
| | | | | | | | | | |
Net investment income (loss) | | | | | 10,479,624 | | | | 1,468,788 | |
| | | | | | | | | | |
REALIZED AND UNREALIZED GAIN (LOSS) ON INVESTMENTS: | | | | | | | | | | |
Net realized gain (loss) on investments | | | | | 1,459,141 | | | | (753,079 | ) |
Net realized gain (loss) on forward foreign currency contracts | | | | | 654,797 | | | | — | |
Net realized gain (loss) on foreign currency transactions | | | | | 9,551 | | | | — | |
Net realized gain (loss) on financial futures contracts | | | | | (992,260 | ) | | | — | |
Net realized gain (loss) on swap agreements | | | | | (551,965 | ) | | | — | |
Net realized gain (loss) on purchased options | | | | | 389,891 | | | | — | |
Net realized gain (loss) on written options | | | | | (147,446 | ) | | | — | |
Net realized gain (loss) on securities sold short | | | | | 3,754 | | | | — | |
Net realized gain (loss) on TBA sale commitments | | | | | (8,244 | ) | | | — | |
Litigation proceeds | | | | | 1,551 | (c) | | | 3,734 | (c) |
Net change in unrealized appreciation (depreciation) on investments | | | | | (46,829,926 | ) | | | (2,792,079 | ) |
Net change in unrealized appreciation (depreciation) on forward foreign currency contracts | | | | | (42,730 | ) | | | — | |
Net change in unrealized appreciation (depreciation) on foreign currency transactions | | | | | 543 | | | | — | |
Net change in unrealized appreciation (depreciation) on financial futures contracts | | | | | 121,029 | | | | — | |
Net change in unrealized appreciation (depreciation) on swap agreements | | | | | (23,947 | ) | | | — | |
Net change in unrealized appreciation (depreciation) on purchased options | | | | | (14,201 | ) | | | — | |
Net change in unrealized appreciation (depreciation) on written options | | | | | (102,942 | ) | | | — | |
Net change in unrealized appreciation (depreciation) on TBA Sale Commitments | | | | | (398 | ) | | | — | |
| | | | | | | | | | |
Net realized and unrealized gain (loss) on investments | | | | | (46,073,802 | ) | | | (3,541,424 | ) |
| | | | | | | | | | |
Change in net assets resulting from operations | | | | $ | (35,594,178 | ) | | $ | (2,072,636 | ) |
| | | | | | | | | | |
| (a) | Net of foreign withholding taxes withheld of $273,129 and $5,508, respectively. |
| (b) | Net of foreign withholding taxes withheld of $1,507. |
| (c) | The Litigation proceeds represent a class action settlement received by the Fund. |
See Notes which are an integral part of the Financial Statements
ANNUAL REPORT / April 30, 2020
| | |
| 57 | | STATEMENTS OF CHANGES IN NET ASSETS |
| | | | | | | | | | | | | | | | |
| | | Wilmington
International
Fund | | | Wilmington
Global Alpha
Equities Fund | |
| | | | |
| | | Year Ended
April 30, 2020 | | | Year Ended
April 30, 2019 | | | Year Ended
April 30, 2020 | | | Year Ended
April 30, 2019 | |
OPERATIONS: | | | | | | | | | | | | | | | | |
Net investment income (loss) | | $ | 8,760,578 | | | $ | 11,572,244 | | | $ | 1,588,127 | | | $ | 1,552,008 | |
Net realized gain (loss) on investments | | | (27,424,995 | )(a) | | | (8,855,386 | )(a) | | | 13,823,568 | (a) | | | 7,085,522 | |
Net change in unrealized appreciation (depreciation) of investments | | | (44,981,027 | ) | | | (34,360,384 | ) | | | (22,691,724 | ) | | | (2,290,177 | ) |
| | | | | | | | | | | | | | | | |
Change in net assets resulting from operations | | | (63,645,444 | ) | | | (31,643,526 | ) | | | (7,280,029 | ) | | | 6,347,353 | |
| | | | | | | | | | | | | | | | |
DISTRIBUTIONS TO SHAREHOLDERS: | | | | | | | | | | | | | | | | |
Class A | | | (58,590 | ) | | | (128,833 | ) | | | (1,405 | ) | | | (1,370 | ) |
Class I | | | (9,522,428 | ) | | | (15,513,143 | ) | | | (2,321,797 | ) | | | (1,792,762 | ) |
| | | | | | | | | | | | | | | | |
| | | | |
Total distributions to shareholders | | | (9,581,018 | ) | | | (15,641,976 | ) | | | (2,323,202 | ) | | | (1,794,132 | ) |
| | | | | | | | | | | | | | | | |
SHARE TRANSACTIONS: | | | | | | | | | | | | | | | | |
Proceeds from sale of shares | | | | | | | | | | | | | | | | |
Class A | | | 13,474 | | | | 4,104,757 | | | | 140,958 | | | | 31,867 | |
Class I | | | 141,661,987 | | | | 97,827,356 | | | | 100,727,971 | | | | 36,618,293 | |
Distributions reinvested | | | | | | | | | | | | | | | | |
Class A | | | 50,869 | | | | 116,719 | | | | 1,373 | | | | 1,369 | |
Class I | | | 2,358,908 | | | | 9,005,482 | | | | 941,789 | | | | 908,620 | |
Cost of shares redeemed | | | | | | | | | | | | | | | | |
Class A | | | (1,346,018 | ) | | | (4,391,015 | ) | | | (53,284 | ) | | | (43,932 | ) |
Class I | | | (128,456,761 | ) | | | (145,040,239 | ) | | | (48,360,296 | ) | | | (30,246,425 | ) |
| | | | | | | | | | | | | | | | |
Change in net assets resulting from share transactions | | | 14,282,459 | | | | (38,376,940 | ) | | | 53,398,511 | | | | 7,269,792 | |
| | | | | | | | | | | | | | | | |
Change in net assets | | | (58,944,003 | ) | | | (85,662,442 | ) | | | 43,795,280 | | | | 11,823,013 | |
NET ASSETS: | | | | | | | | | | | | | | | | |
Beginning of year | | | 575,620,157 | | | | 661,282,599 | | | | 168,323,848 | | | | 156,500,835 | |
| | | | | | | | | | | | | | | | |
End of year | | $ | 516,676,154 | | | $ | 575,620,157 | | | $ | 212,119,128 | | | $ | 168,323,848 | |
| | | | | | | | | | | | | | | | |
SHARES OF BENEFICIAL INTEREST: | | | | | | | | | | | | | | | . | |
Shares sold | | | | | | | | | | | | | | | | |
Class A | | | 1,663 | | | | 468,542 | | | | 12,575 | | | | 2,887 | |
Class I | | | 18,263,863 | | | | 11,729,961 | | | | 8,757,708 | | | | 3,291,770 | |
Distributions reinvested | | | | | | | | | | | | | | | | |
Class A | | | 6,089 | | | | 14,101 | | | | 117 | | | | 131 | |
Class I | | | 280,142 | | | | 1,105,103 | | | | 79,610 | | | | 85,800 | |
Shares redeemed | | | | | | | | | | | | | | | | |
Class A | | | (166,540 | ) | | | (511,897 | ) | | | (4,592 | ) | | | (4,003 | ) |
Class I | | | (15,738,820 | ) | | | (17,804,419 | ) | | | (4,342,370 | ) | | | (2,732,033 | ) |
| | | | | | | | | | | | | | | | |
Net change resulting from share transactions | | | 2,646,397 | | | | (4,998,609 | ) | | | 4,503,048 | | | | 644,552 | |
| | | | | | | | | | | | | | | | |
| (a) | Includes Litigation settlement. |
See Notes which are an integral part of the Financial Statements
April 30, 2020 / ANNUAL REPORT
| | |
| STATEMENTS OF CHANGES IN NET ASSETS (concluded) | | 58 |
| | | | | | | | | | | | | | | | |
| | | Wilmington
Real Asset
Fund | | | Wilmington
Diversified Income
Fund | |
| | | | |
| | | Year Ended
April 30, 2020 | | | Year Ended
April 30, 2019 | | | Year Ended
April 30, 2020 | | | Year Ended
April 30, 2019 | |
OPERATIONS: | | | | | | | | | | | | | | | | |
Net investment income (loss) | | $ | 10,479,624 | | | $ | 8,185,949 | | | $ | 1,468,788 | | | $ | 1,395,222 | |
Net realized gain (loss) on investments | | | 818,770 | (a) | | | 589,320 | | | | (749,345 | )(a) | | | (196,436 | ) |
Net change in unrealized appreciation (depreciation) of investments | | | (46,892,572 | ) | | | (2,015,552 | ) | | | (2,792,079 | ) | | | 576,437 | |
| | | | | | | | | | | | | | | | |
Change in net assets resulting from operations | | | (35,594,178 | ) | | | 6,759,717 | | | | (2,072,636 | ) | | | 1,775,223 | |
| | | | | | | | | | | | | | | | |
DISTRIBUTIONS TO SHAREHOLDERS: | | | | | | | | | | | | | | | | |
Class A | | | (38,272 | ) | | | (26,933 | ) | | | (1,350,031 | ) | | | (1,493,560 | ) |
Class I | | | (11,252,467 | ) | | | (7,962,044 | ) | | | (24,433 | ) | | | (41,768 | ) |
| | | | | | | | | | | | | | | | |
Total distributions to shareholders | | | (11,290,739 | ) | | | (7,988,977 | ) | | | (1,374,464 | ) | | | (1,535,328 | ) |
| | | | | | | | | | | | | | | | |
SHARE TRANSACTIONS: | | | | | | | | | | | | | | | | |
Proceeds from sale of shares | | | | | | | | | | | | | | | | |
Class A | | | 200,308 | | | | 145,265 | | | | 390,191 | | | | 514,241 | |
Class I | | | 63,422,482 | | | | 46,788,531 | | | | 129,029 | | | | 181,372 | |
Distributions reinvested | | | | | | | | | | | | | | | | |
Class A | | | 26,100 | | | | 17,826 | | | | 1,247,276 | | | | 1,390,842 | |
Class I | | | 5,458,098 | | | | 3,897,423 | | | | 11,930 | | | | 10,364 | |
Cost of shares redeemed | | | | | | | | | | | | | | | | |
Class A | | | (305,579 | ) | | | (285,091 | ) | | | (4,457,443 | ) | | | (4,202,605 | ) |
Class I | | | (132,696,076 | ) | | | (47,538,762 | ) | | | (248,138 | ) | | | (656,037 | ) |
| | | | | | | | | | | | | | | | |
Change in net assets resulting from share transactions | | | (63,894,667 | ) | | | 3,025,192 | | | | (2,927,155 | ) | | | (2,761,823 | ) |
| | | | | | | | | | | | | | | | |
Change in net assets | | | (110,779,584 | ) | | | 1,795,932 | | | | (6,374,255 | ) | | | (2,521,928 | ) |
NET ASSETS: | | | | | | | | | | | | | | | | |
Beginning of year | | | 310,826,932 | | | | 309,031,000 | | | | 39,580,175 | | | | 42,102,103 | |
| | | | | | | | | | | | | | | | |
End of year | | $ | 200,047,348 | | | $ | 310,826,932 | | | $ | 33,205,920 | | | $ | 39,580,175 | |
| | | | | | | | | | | | | | | | |
SHARES OF BENEFICIAL INTEREST: | | | | | | | | | | | | | | | | |
Shares sold | | | | | | | | | | | | | | | | |
Class A | | | 13,863 | | | | 10,277 | | | | 37,841 | | | | 49,657 | |
Class I | | | 4,840,601 | | | | 3,289,145 | | | | 13,122 | | | | 17,119 | |
Distributions reinvested | | | | | | | | | | | | | | | | |
Class A | | | 1,862 | | | | 1,317 | | | | 118,944 | | | | 137,475 | |
Class I | | | 387,546 | | | | 284,472 | | | | 1,152 | | | | 1,034 | |
Shares redeemed | | | | | | | | | | | | | | | | |
Class A | | | (21,519 | ) | | | (19,747 | ) | | | (426,388 | ) | | | (405,265 | ) |
Class I | | | (10,521,157 | ) | | | (3,348,357 | ) | | | (22,657 | ) | | | (63,484 | ) |
| | | | | | | | | | | | | | | | |
Net change resulting from share transactions | | | (5,298,804 | ) | | | 217,107 | | | | (277,986 | ) | | | (263,464 | ) |
| | | | | | | | | | | | | | | | | |
| (a) | Includes Litigation settlement. |
See Notes which are an integral part of the Financial Statements
ANNUAL REPORT / April 30, 2020
For a share outstanding throughout each year ended April 30, unless otherwise noted:
| | | | | | | | | | | | | | | | | | | | | | | | |
|
| WILMINGTON INTERNATIONAL FUND | |
| | | | | | | | | | | | | | | | | | | | | | | | |
| | | | | | |
| CLASS A | | Year Ended
April 30, 2020 | | Year Ended
April 30, 2019 | | Year Ended
April 30, 2018 | | Year Ended
April 30, 2017 | | Year Ended
April 30, 2016 | | | |
Net Asset Value, Beginning of Year | | | $8.52 | | | | $9.11 | | | | $7.86 | | | | $7.08 | | | | $8.04 | | | | | |
Income (Loss) From Operations: | | | | | | | | | | | | | | | | | | | | | | | | |
Net Investment Income (Loss)(a) | | | 0.13 | | | | 0.14 | | | | 0.08 | | | | 0.08 | | | | 0.08 | | | | | |
Net Realized and Unrealized Gain (Loss) on Investments and Foreign Currency | | | (1.17 | )(b) | | | (0.51 | )(b) | | | 1.26 | (b) | | | 0.79 | (c) | | | (0.95 | ) | | | | |
Total Income (Loss) From Operations | | | (1.04 | ) | | | (0.37 | ) | | | 1.34 | | | | 0.87 | | | | (0.87 | ) | | | | |
Less Distributions From: | | | | | | | | | | | | | | | | | | | | | | | | |
Net Investment Income | | | (0.13 | ) | | | (0.14 | ) | | | (0.09 | ) | | | (0.09 | ) | | | (0.09 | ) | | | | |
Net Realized Gains | | | — | | | | (0.08 | ) | | | — | | | | — | | | | — | | | | | |
Total Distributions | | | (0.13 | ) | | | (0.22 | ) | | | (0.09 | ) | | | (0.09 | ) | | | (0.09 | ) | | | | |
Net Asset Value, End of Year | | | $7.35 | | | | $8.52 | | | | $9.11 | | | | $7.86 | | | | $7.08 | | | | | |
| | | | | | | | | | | | | | | | | | | | | | | | |
Total Return(d) | | | (12.35 | )% | | | (4.07 | )% | | | 17.18 | % | | | 12.52 | % | | | (10.82 | )% | | | | |
Net Assets, End of Year (000’s) | | | $3,036 | | | | $4,871 | | | | $5,473 | | | | $4,913 | | | | $4,810 | | | | | |
Ratios to Average Net Assets | | | | | | | | | | | | | | | | | | | | | | | | |
Gross Expense(e) | | | 1.50 | % | | | 1.50 | % | | | 1.48 | % | | | 1.79 | % | | | 1.87 | % | | | | |
Net Expenses(e)(f) | | | 0.98 | % | | | 1.00 | % | | | 1.04 | % | | | 1.22 | % | | | 1.31 | % | | | | |
Net Investment Income (Loss) | | | 1.57 | % | | | 1.69 | % | | | 0.93 | % | | | 1.16 | % | | | 1.15 | % | | | | |
Portfolio Turnover Rate | | | 79 | % | | | 70 | % | | | 75 | % | | | 177 | % | | | 71 | % | | | | |
| | | | | | | | | | | | | | | | | | | | | | | | |
| | | | | | |
| CLASS I | | Year Ended
April 30, 2020 | | Year Ended
April 30, 2019 | | Year Ended
April 30, 2018 | | Year Ended
April 30, 2017 | | Year Ended
April 30, 2016 | | | |
Net Asset Value, Beginning of Year | | | $8.59 | | | | $9.18 | | | | $7.92 | | | | $7.13 | | | | $8.09 | | | | | |
Income (Loss) From Operations: | | | | | | | | | | | | | | | | | | | | | | | | |
Net Investment Income (Loss)(a) | | | 0.13 | | | | 0.17 | | | | 0.09 | | | | 0.09 | | | | 0.09 | | | | | |
Net Realized and Unrealized Gain (Loss) on Investments and Foreign Currency | | | (1.17 | )(b) | | | (0.53 | )(b) | | | 1.27 | (b) | | | 0.80 | (c) | | | (0.95 | ) | | | | |
Total Income (Loss) From Operations | | | (1.04 | ) | | | (0.36 | ) | | | 1.36 | | | | 0.89 | | | | (0.86 | ) | | | | |
Less Distributions From: | | | | | | | | | | | | | | | | | | | | | | | | |
Net Investment Income | | | (0.14 | ) | | | (0.15 | ) | | | (0.10 | ) | | | (0.10 | ) | | | (0.10 | ) | | | | |
Net Realized Gains | | | — | | | | (0.08 | ) | | | — | | | | — | | | | — | | | | | |
| Total Distributions | | | (0.14 | ) | | | (0.23 | ) | | | (0.10 | ) | | | (0.10 | ) | | | (0.10 | ) | | | | |
Net Asset Value, End of Year | | | $7.41 | | | | $8.59 | | | | $9.18 | | | | $7.92 | | | | $7.13 | | | | | |
| | | | | | | | | | | | | | | | | | | | | | | | |
Total Return(d) | | | (12.28 | )% | | | (3.91 | )% | | | 17.29 | % | | | 12.69 | % | | | (10.70 | )% | | | | |
Net Assets, End of Year (000’s) | | | $513,640 | | | | $570,749 | | | | $655,810 | | | | $438,974 | | | | $411,357 | | | | | |
Ratios to Average Net Assets | | | | | | | | | | | | | | | | | | | | | | | | |
Gross Expense(e) | | | 1.25 | % | | | 1.26 | % | | | 1.23 | % | | | 1.54 | % | | | 1.62 | % | | | | |
Net Expenses(e)(f) | | | 0.85 | % | | | 0.87 | % | | | 0.91 | % | | | 1.09 | % | | | 1.18 | % | | | | |
Net Investment Income (Loss) | | | 1.58 | % | | | 1.95 | % | | | 1.06 | % | | | 1.28 | % | | | 1.28 | % | | | | |
Portfolio Turnover Rate | | | 79 | % | | | 70 | % | | | 75 | % | | | 177 | % | | | 71 | % | | | | |
| (a) | Per share numbers have been calculated using the average shares method. |
| (b) | Amount includes anon-recurring payment for Litigation proceeds which represents proceeds from securities litigation by the Fund. The litigation proceeds impacted the realized and unrealized gain (loss) per share by $0.00 and $0.00 for Class A and Class I, respectively. |
| (c) | Amount includes anon-recurring payment for Litigation proceeds which represents a class action settlement received by the Fund related to best execution of foreign exchange transactions. The litigation proceeds impacted the realized and unrealized gain (loss) per share by $0.01 and $0.01 for Class A and Class I, respectively. |
| (d) | Based on net asset value, which does not reflect the sales charge or contingent deferred sales charge, if applicable. Total returns for periods of less than one year, if any, are not annualized. |
| (e) | The Fund invests in other underlying funds and indirectly bears its proportionate share of fees and expenses incurred by the underlying funds in which the Fund is invested. This ratio does not include these indirect fees and expenses. |
| (f) | The investment advisor and other service providers waived or reimbursed a portion of their fees. |
See Notes which are an integral part of the Financial Statements
April 30, 2020 / ANNUAL REPORT
| | |
| FINANCIAL HIGHLIGHTS (continued) | | 60 |
For a share outstanding throughout each year ended April 30, unless otherwise noted:
|
| WILMINGTON GLOBAL ALPHA EQUITIES FUND |
| | | | | | | | | | | | | | | | | | | | | | | | | |
| | | | | |
| CLASS A | | Year Ended April 30, 2020 | | Year Ended
April 30, 2019 | | Year Ended
April 30, 2018 | | Year Ended
April 30, 2017 | | Year Ended
April 30, 2016 |
Net Asset Value, Beginning of Year | | | | $11.28 | | | | | $10.99 | | | | | $10.54 | | | | | $9.82 | | | | | $10.86 | |
Income (Loss) From Operations: | | | | | | | | | | | | | | | | | | | | | | | | | |
Net Investment Income (Loss)(a) | | | | 0.07 | | | | | 0.09 | | | | | 0.05 | | | | | (0.01 | ) | | | | (0.05 | ) |
Net Realized and Unrealized Gain (Loss) on Investments and Foreign Currency | | | | (0.35 | )(b) | | | | 0.33 | | | | | 0.52 | (b) | | | | 0.75 | | | | | (0.75 | ) |
Total Income (Loss) From Operations | | | | (0.28 | ) | | | | 0.42 | | | | | 0.57 | | | | | 0.74 | | | | | (0.80 | ) |
Less Distributions From: | | | | | | | | | | | | | | | | | | | | | | | | | |
Net Investment Income | | | | (0.13 | ) | | | | (0.13 | ) | | | | (0.12 | ) | | | | (0.02 | ) | | | | (0.24 | ) |
Total Distributions | | | | (0.13 | ) | | | | (0.13 | ) | | | | (0.12 | ) | | | | (0.02 | ) | | | | (0.24 | ) |
Net Asset Value, End of Year | | | | $10.87 | | | | | $11.28 | | | | | $10.99 | | | | | $10.54 | | | | | $9.82 | |
| | | | | | | | | | | | | | | | | | | | | | | | | |
Total Return(c) | | | | (2.57 | )% | | | | 3.87 | % | | | | 5.41 | % | | | | 7.59 | % | | | | (7.48 | )% |
Net Assets, End of Year (000’s) | | | | $208 | | | | | $125 | | | | | $132 | | | | | $180 | | | | | $1,290 | |
Ratios to Average Net Assets | | | | | | | | | | | | | | | | | | | | | | | | | |
Gross Expense(d) | | | | 2.29 | % | | | | 2.36 | % | | | | 2.46 | % | | | | 3.06 | % | | | | 2.89 | % |
Net Expenses(d)(e) | | | | 1.49 | % | | | | 1.49 | % | | | | 1.50 | % | | | | 2.48 | %(f) | | | | 2.46 | %(f) |
Net Investment Income (Loss) | | | | 0.63 | % | | | | 0.78 | % | | | | 0.42 | % | | | | (0.06 | )% | | | | (0.44 | )% |
Portfolio Turnover Rate | | | | 84 | % | | | | 61 | % | | | | 58 | %(g) | | | | 367 | % | | | | 387 | % |
| | | | | |
| CLASS I | | Year Ended April 30, 2020 | | Year Ended
April 30, 2019 | | Year Ended
April 30, 2018 | | Year Ended
April 30, 2017 | | Year Ended
April 30, 2016 |
Net Asset Value, Beginning of Year | | | | $11.40 | | | | | $11.08 | | | | | $10.61 | | | | | $9.86 | | | | | $10.88 | |
Income (Loss) From Operations: | | | | | | | | | | | | | | | | | | | | | | | | | |
Net Investment Income (Loss)(a) | | | | 0.09 | | | | | 0.11 | | | | | 0.11 | | | | | 0.03 | | | | | (0.02 | ) |
Net Realized and Unrealized Gain (Loss) on Investments and Foreign Currency | | | | (0.34 | )(b) | | | | 0.34 | | | | | 0.49 | (b) | | | | 0.75 | | | | | (0.76 | ) |
Total Income (Loss) From Operations | | | | (0.25 | ) | | | | 0.45 | | | | | 0.60 | | | | | 0.78 | | | | | (0.78 | ) |
Less Distributions From: | | | | | | | | | | | | | | | | | | | | | | | | | |
Net Investment Income | | | | (0.14 | ) | | | | (0.13 | ) | | | | (0.13 | ) | | | | (0.03 | ) | | | | (0.24 | ) |
Total Distributions | | | | (0.14 | ) | | | | (0.13 | ) | | | | (0.13 | ) | | | | (0.03 | ) | | | | (0.24 | ) |
Net Asset Value, End of Year | | | | $11.01 | | | | | $11.40 | | | | | $11.08 | | | | | $10.61 | | | | | $9.86 | |
| | | | | | | | | | | | | | | | | | | | | | | | | |
Total Return(c) | | | | (2.31 | )% | | | | 4.18 | % | | | | 5.63 | % | | | | 7.93 | % | | | | (7.22 | )% |
Net Assets, End of Year (000’s) | | | | $211,911 | | | | | $168,199 | | | | | $156,369 | | | | | $103,768 | | | | | $158,200 | |
Ratios to Average Net Assets | | | | | | | | | | | | | | | | | | | | | | | | | |
Gross Expense(d) | | | | 2.04 | % | | | | 2.11 | % | | | | 2.21 | % | | | | 2.82 | % | | | | 2.64 | % |
Net Expenses(d)(e) | | | | 1.24 | % | | | | 1.24 | % | | | | 1.25 | % | | | | 2.12 | %(f) | | | | 2.21 | %(f) |
Net Investment Income (Loss) | | | | 0.82 | % | | | | 1.02 | % | | | | 1.03 | % | | | | 0.32 | % | | | | (0.16 | )% |
Portfolio Turnover Rate | | | | 84 | % | | | | 61 | % | | | | 58 | %(g) | | | | 367 | % | | | | 387 | % |
| (a) | Per share numbers have been calculated using the average shares method. |
| (b) | Amount includes anon-recurring payment for Litigation proceeds which represents proceeds from securities litigation by the Fund. The litigation proceeds impacted the realized and unrealized gain (loss) per share by $0.00 and $0.00 for Class A and Class I, respectively. |
| (c) | Based on net asset value, which does not reflect the sales charge or contingent deferred sales charge, if applicable. Total returns for periods of less than one year, if any, are not annualized. |
| (d) | The Fund invests in other underlying funds and indirectly bears its proportionate share of fees and expenses incurred by the underlying funds in which the Fund is invested. This ratio does not include these indirect fees and expenses. |
| (e) | The investment advisor and other service providers waived or reimbursed a portion of their fees. |
| (f) | Expense ratio includes dividend and interest expense related to securities sold short. Excluding such dividend and interest expense, the ratio of expenses to average net assets for the years and the periods presented would be: |
| | | | | | | | |
| | |
| | | Class A | | | Class I | |
| | |
April 30, 2017 | | | 2.06% | | | | 1.77% | |
| | |
April 30, 2016 | | | 2.15% | | | | 1.90% | |
| (g) | In January 2017, the Fund transitioned to a singlesub-advisor strategy. As a result, the portfolio turnover rate for the fiscal year ended April 30, 2018 was significantly lower than that of previous fiscal years. |
See Notes which are an integral part of the Financial Statements
ANNUAL REPORT / April 30, 2020
| | |
| 61 | | FINANCIAL HIGHLIGHTS (continued) |
For a share outstanding throughout each year ended April 30, unless otherwise noted:
|
| WILMINGTON REAL ASSET FUND |
| | | | | | | | | | | | | | | | | | | | | | | | | |
| | | | | |
| CLASS A | | Year Ended
April 30, 2020 | | Year Ended
April 30, 2019 | | Year Ended
April 30, 2018 | | Year Ended
April 30, 2017 | | Year Ended
April 30, 2016 |
Net Asset Value, Beginning of Year | | | | $14.40 | | | | | $14.48 | | | | | $13.87 | | | | | $13.63 | | | | | $14.77 | |
Income (Loss) From Operations: | | | | | | | | | | | | | | | | | | | | | | | | | |
Net Investment Income (Loss)(a) | | | | 0.45 | | | | | 0.34 | | | | | 0.35 | | | | | 0.23 | | | | | 0.21 | |
Net Realized and Unrealized Gain (Loss) on Investments and Foreign Currency | | | | (2.03 | )(b) | | | | (0.07 | ) | | | | 0.63 | | | | | 0.01 | | | | | (0.68 | ) |
Total Income (Loss) From Operations | | | | (1.58 | ) | | | | 0.27 | | | | | 0.98 | | | | | 0.24 | | | | | (0.47 | ) |
Less Distributions From: | | | | | | | | | | | | | | | | | | | | | | | | | |
Net Investment Income | | | | (0.49 | ) | | | | (0.35 | ) | | | | (0.37 | ) | | | | — | | | | | (0.67 | ) |
Total Distributions | | | | (0.49 | ) | | | | (0.35 | ) | | | | (0.37 | ) | | | | — | | | | | (0.67 | ) |
Net Asset Value, End of Year | | | | $12.33 | | | | | $14.40 | | | | | $14.48 | | | | | $13.87 | | | | | $13.63 | |
| | | | | | | | | | | | | | | | | | | | | | | | | |
Total Return(c) | | | | (11.35 | )% | | | | 2.05 | % | | | | 7.11 | % | | | | 1.76 | % | | | | (3.09 | )% |
Net Assets, End of Year (000’s) | | | | $932 | | | | | $1,173 | | | | | $1,297 | | | | | $1,643 | | | | | $1,762 | |
Ratios to Average Net Assets | | | | | | | | | | | | | | | | | | | | | | | | | |
Gross Expense(d) | | | | 1.30 | % | | | | 1.32 | % | | | | 1.32 | % | | | | 1.45 | % | | | | 1.48 | % |
Net Expenses(d)(e)(f) | | | | 0.96 | % | | | | 0.96 | % | | | | 0.99 | % | | | | 1.20 | % | | | | 1.23 | % |
Net Investment Income (Loss) | | | | 3.16 | % | | | | 2.44 | % | | | | 2.46 | % | | | | 1.68 | % | | | | 1.53 | % |
Portfolio Turnover Rate | | | | 411 | % | | | | 347 | % | | | | 438 | % | | | | 593 | % | | | | 418 | % |
| | | | | |
| CLASS I | | Year Ended
April 30, 2020 | | Year Ended
April 30, 2019 | | Year Ended
April 30, 2018 | | Year Ended
April 30, 2017 | | Year Ended
April 30, 2016 |
Net Asset Value, Beginning of Year | | | | $14.56 | | | | | $14.63 | | | | | $14.01 | | | | | $13.73 | | | | | $14.86 | |
Income (Loss) From Operations: | | | | | | | | | | | | | | | | | | | | | | | | | |
Net Investment Income (Loss)(a) | | | | 0.49 | | | | | 0.38 | | | | | 0.40 | | | | | 0.27 | | | | | 0.24 | |
Net Realized and Unrealized Gain (Loss) on Investments and Foreign Currency | | | | (2.06 | )(b) | | | | (0.07 | ) | | | | 0.62 | | | | | 0.01 | | | | | (0.67 | ) |
Total Income (Loss) From Operations | | | | (1.57 | ) | | | | 0.31 | | | | | 1.02 | | | | | 0.28 | | | | | (0.43 | ) |
Less Distributions From: | | | | | | | | | | | | | | | | | | | | | | | | | |
Net Investment Income | | | | (0.52 | ) | | | | (0.38 | ) | | | | (0.40 | ) | | | | — | | | | | (0.70 | ) |
Total Distributions | | | | (0.52 | ) | | | | (0.38 | ) | | | | (0.40 | ) | | | | — | | | | | (0.70 | ) |
Net Asset Value, End of Year | | | | $12.47 | | | | | $14.56 | | | | | $14.63 | | | | | $14.01 | | | | | $13.73 | |
| | | | | | | | | | | | | | | | | | | | | | | | | |
Total Return(c) | | | | (11.13 | )% | | | | 2.29 | % | | | | 7.31 | % | | | | 2.11 | % | | | | (2.89 | )% |
Net Assets, End of Year (000’s) | | | | $199,115 | | | | | $309,654 | | | | | $307,734 | | | | | $345,787 | | | | | $453,171 | |
Ratios to Average Net Assets | | | | | | | | | | | | | | | | | | | | | | | | | |
Gross Expense(d) | | | | 1.05 | % | | | | 1.07 | % | | | | 1.07 | % | | | | 1.20 | % | | | | 1.23 | % |
Net Expenses(d)(e)(f) | | | | 0.71 | % | | | | 0.71 | % | | | | 0.74 | % | | | | 0.95 | % | | | | 0.98 | % |
Net Investment Income (Loss) | | | | 3.41 | % | | | | 2.69 | % | | | | 2.74 | % | | | | 1.97 | % | | | | 1.75 | % |
Portfolio Turnover Rate | | | | 411 | % | | | | 347 | % | | | | 438 | % | | | | 593 | % | | | | 418 | % |
| (a) | Per share numbers have been calculated using the average shares method. |
| (b) | Amount includes anon-recurring payment for Litigation proceeds which represents proceeds from securities litigation by the Fund. The litigation proceeds impacted the realized and unrealized gain (loss) per share by $0.00 and $0.00 for Class A and Class I, respectively. |
| (c) | Based on net asset value, which does not reflect the sales charge or contingent deferred sales charge, if applicable. Total returns for periods of less than one year, if any, are not annualized. |
| (d) | The Fund invests in other underlying funds and indirectly bears its proportionate share of fees and expenses incurred by the underlying funds in which the Fund is invested. This ratio does not include these indirect fees and expenses. |
| (e) | The investment advisor and other service providers waived or reimbursed a portion of their fees. |
| (f) | Expense ratio includes interest expense related to securities sold short, reverse repurchase agreements and/or TBA sale commitments. Interest expense related to securities sold short, reverse repurchase agreements and/or TBA sale commitments had no impact on the ratio of expenses to average net assets for the years ended April 30, 2019, April 30, 2018 and April 30, 2017. |
See Notes which are an integral part of the Financial Statements
April 30, 2020 / ANNUAL REPORT
| | |
| FINANCIAL HIGHLIGHTS (concluded) | | 62 |
For a share outstanding throughout each year ended April 30, unless otherwise noted:
|
| WILMINGTON DIVERSIFIED INCOME FUND |
| | | | | | | | | | | | | | | | | | | | |
| | | | | |
| CLASS A | | Year Ended April 30, 2020 | | Year Ended April 30, 2019 | | Year Ended April 30, 2018 | | Year Ended April 30, 2017 | | Year Ended April 30, 2016 |
Net Asset Value, Beginning of Year | | | $10.54 | | | | $10.47 | | | | $11.24 | | | | $10.40 | | | | $10.98 | |
Income (Loss) From Operations: | | | | | | | | | | | | | | | | | | | | |
Net Investment Income (Loss)(a) | | | 0.40 | | | | 0.36 | | | | 0.26 | | | | 0.12 | | | | 0.12 | |
Net Realized and Unrealized Gain (Loss) on Investments | | | (1.02 | )(b) | | | 0.11 | | | | 0.52 | | | | 0.85 | | | | (0.53 | ) |
Total Income (Loss) From Operations | | | (0.62 | ) | | | 0.47 | | | | 0.78 | | | | 0.97 | | | | (0.41 | ) |
Less Distributions From: | | | | | | | | | | | | | | | | | | | | |
Net Investment Income | | | (0.38 | ) | | | (0.36 | ) | | | (0.23 | ) | | | (0.13 | ) | | | (0.15 | ) |
Net Realized Gains | | | — | | | | (0.04 | ) | | | (1.32 | ) | | | — | | | | (0.02 | ) |
Total Distributions | | | (0.38 | ) | | | (0.40 | ) | | | (1.55 | ) | | | (0.13 | ) | | | (0.17 | ) |
Net Asset Value, End of Year | | | $9.54 | | | | $10.54 | | | | $10.47 | | | | $11.24 | | | | $10.40 | |
| | | | |
Total Return(c) | | | (6.17 | )% | | | 4.66 | % | | | 6.99 | % | | | 9.38 | % | | | (3.70 | )% |
Net Assets, End of Year (000’s) | | | $32,708 | | | | $38,943 | | | | $40,993 | | | | $42,878 | | | | $44,607 | |
Ratios to Average Net Assets | | | | | | | | | | | | | | | | | | | | |
Gross Expense(d) | | | 1.68 | % | | | 1.67 | % | | | 1.72 | % | | | 1.59 | % | | | 1.52 | % |
Net Expenses(d)(e) | | | 0.60 | % | | | 0.60 | % | | | 0.66 | % | | | 0.74 | % | | | 0.74 | % |
Net Investment Income (Loss) | | | 3.86 | % | | | 3.45 | % | | | 2.30 | % | | | 1.16 | % | | | 1.14 | % |
Portfolio Turnover Rate | | | 14 | % | | | 14 | % | | | 85 | % | | | 9 | % | | | 52 | % |
| | | | | | | | | | | | | | | | | | | | |
| | | | | |
| CLASS I | | Year Ended April 30, 2020 | | Year Ended
April 30, 2019 | | Year Ended
April 30, 2018 | | Year Ended
April 30, 2017 | | Year Ended
April 30, 2016 |
Net Asset Value, Beginning of Year | | | $10.54 | | | | $10.48 | | | | $11.25 | | | | $10.41 | | | | $10.98 | |
Income (Loss) From Operations: | | | | | | | | | | | | | | | | | | | | |
Net Investment Income (Loss)(a) | | | 0.44 | | | | 0.39 | | | | 0.29 | | | | 0.15 | | | | 0.15 | |
Net Realized and Unrealized Gain (Loss) on Investments | | | (1.02 | )(b) | | | 0.10 | | | | 0.52 | | | | 0.85 | | | | (0.53 | ) |
Total Income (Loss) From Operations | | | (0.58 | ) | | | 0.49 | | | | 0.81 | | | | 1.00 | | | | (0.38 | ) |
Less Distributions From: | | | | | | | | | | | | | | | | | | | | |
Net Investment Income | | | (0.41 | ) | | | (0.39 | ) | | | (0.26 | ) | | | (0.16 | ) | | | (0.17 | ) |
Net Realized Gains | | | — | | | | (0.04 | ) | | | (1.32 | ) | | | — | | | | (0.02 | ) |
Total Distributions | | | (0.41 | ) | | | (0.43 | ) | | | (1.58 | ) | | | (0.16 | ) | | | (0.19 | ) |
Net Asset Value, End of Year | | | $9.55 | | | | $10.54 | | | | $10.48 | | | | $11.25 | | | | $10.41 | |
| | | | |
Total Return(c) | | | (5.83 | )% | | | 4.82 | % | | | 7.24 | % | | | 9.64 | % | | | (3.42 | )% |
Net Assets, End of Year (000’s) | | | $498 | | | | $637 | | | | $1,109 | | | | $725 | | | | $1,129 | |
Ratios to Average Net Assets | | | | | | | | | | | | | | | | | | | | |
Gross Expense(d) | | | 1.44 | % | | | 1.40 | % | | | 1.48 | % | | | 1.34 | % | | | 1.27 | % |
Net Expenses(d)(e) | | | 0.35 | % | | | 0.35 | % | | | 0.41 | % | | | 0.49 | % | | | 0.49 | % |
Net Investment Income (Loss) | | | 4.20 | % | | | 3.72 | % | | | 2.62 | % | | | 1.44 | % | | | 1.39 | % |
Portfolio Turnover Rate | | | 14 | % | | | 14 | % | | | 85 | % | | | 9 | % | | | 52 | % |
| (a) | Per share numbers have been calculated using the average shares method. |
| (b) | Amount includes anon-recurring payment for Litigation proceeds which represents proceeds from securities litigation by the Fund. The litigation proceeds impacted the realized and unrealized gain (loss) per share by $0.00 and $0.00 for Class A and Class I, respectively. |
| (c) | Based on net asset value, which does not reflect the sales charge or contingent deferred sales charge, if applicable. Total returns for periods of less than one year, if any, are not annualized. |
| (d) | The Fund invests in other underlying funds and indirectly bears its proportionate share of fees and expenses incurred by the underlying funds in which the Fund is invested. This ratio does not include these indirect fees and expenses. |
| (e) | The investment advisor and other service providers waived or reimbursed a portion of their fees. |
See Notes which are an integral part of the Financial Statements
ANNUAL REPORT / April 30, 2020
| | |
| 63 | | NOTES TO FINANCIAL STATEMENTS |
Wilmington Funds
April 30, 2020
Wilmington Funds (the “Trust”) is registered under the Investment Company Act of 1940, as amended (the “Act”), as anopen-end management investment company. The Trust consists of 12 portfolios, 4 of which are presented herein (individually referred to as a “Fund” or collectively as the “Funds”). The remaining 8 funds are presented in separate reports.
| | |
| |
| Fund | | Investment Goal |
Wilmington International Fund (“International Fund”)(d) | | The Fund seeks to provide long-term capital appreciation primarily through a diversified portfolio ofnon-U.S. equity securities. |
| |
Wilmington Global Alpha Equities Fund (“Global Alpha Equities Fund”)(d) | | The Fund seeks to achieve long-term growth of capital with lower volatility than broader equity markets. |
| |
Wilmington Real Asset Fund (“Real Asset Fund”)(d) | | The Fund seeks to achieve long-term preservation of capital with current income. |
| |
Wilmington Diversified Income Fund (“Diversified Income Fund“)(d) | | The Fund seeks a high level of total return consistent with a moderate level of risk. |
The Trust offers 6 classes of shares: Class A, Service Class, Select Class, Administrative Class, Class I and Institutional Class. Service Class, Select Class, Administrative Class and Institutional Class are not available for the Funds. All shares of the Trust have equal rights with respect to voting, except on class-specific matters.
The assets of each portfolio are segregated and a shareholder’s interest is limited to the portfolio in which shares are held.
| 2. | SUMMARY OF SIGNIFICANT ACCOUNTING POLICIES |
The following is a summary of significant accounting policies consistently followed by the Funds in the preparation of their financial statements. These policies are in conformity with U.S. generally accepted accounting principles (“GAAP”). The Trust is an investment company and follows accounting and reporting guidance under Financial Accounting Standards Board (“FASB”) Accounting Standards Codification (“ASC”) Topic 946, “Financial Services - Investment Companies.” The preparation of financial statements in conformity with GAAP requires management to make estimates and assumptions that affect the amounts of assets, liabilities, expenses and revenues reported in the financial statements. Actual results could differ from those estimated and the differences could be material.
Investment Valuation– The Funds utilize a Fair Value approach. The fair value of the Funds’ portfolio securities are determined as follows:
| | • | | for equity securities, according to the last sale price or official closing price reported in the market in which they are primarily traded (either a national securities exchange or theover-the-counter market), if available; |
| | • | | in the absence of recorded sales for equity securities, according to the mean between the last closing bid and asked prices; |
| | • | | financial futures contracts and options are generally valued at market values established by the exchanges on which they are traded at the close of trading on such exchanges. Options traded in theover-the-counter market are generally valued according to the mean between the last bid and the last asked price for the option as provided by an investment dealer or other financial institution that deals in the option. The Board of Trustees (“Trustees”) may determine in good faith that another method of valuing such investments is necessary to appraise their fair value; |
| | • | | forward foreign currency contracts are valued at the mean between the last bid and asked prices; |
| | • | | investments inopen-end regulated investment companies are valued at net asset value (“NAV”); |
| | • | | for fixed income securities, according to prices as furnished by an independent pricing service, except that fixed income securities with remaining maturities of less than 60 days at the time of purchase are valued at amortized cost provided such amount approximates fair value; |
| | • | | price information on listed securities, including underlying Exchange Traded Funds (“ETFs”) and Exchange Traded Notes (“ETNs”), is taken from the exchange where the security is primarily traded; |
| | • | | swap agreements are valued daily based upon the terms specific to each agreement with its counterparty; and |
| | • | | for all other securities at fair value as determined in accordance with procedures established by and under the general supervision of the Board of Trustees (“Trustees”). |
Trading in foreign securities may be completed at times which vary from the closing of the New York Stock Exchange (“NYSE”). In computing their NAV, the Funds value foreign securities using the latest closing price on the primary exchange on which they are traded immediately prior to the closing of the NYSE. Certain foreign currency exchange rates are generally determined at the latest rate prior to the closing of the NYSE. Foreign securities quoted in foreign currencies are translated into U.S. dollars at current rates. Events that affect these
April 30, 2020 / ANNUAL REPORT
| | |
| NOTES TO FINANCIAL STATEMENTS (continued) | | 64 |
values and exchange rates may occur between the times at which they are determined and the closing of the NYSE. If such events materially affect the value of portfolio securities, these securities may be valued at their fair value as determined in good faith by the Trustees, although the actual calculation may be done by others. An event is considered material if there is both an affirmative expectation that the security’s value will change in response to the event and a reasonable basis for quantifying the resulting change in value. In determining whether market quotations are readily available or fair valuation will be used, various factors will be taken into consideration, such as market closures or suspension of trading in a security. Each Fund may use fair value pricing more frequently for securities traded primarily innon-US markets because, among other things, most foreign markets close well before each Fund values its securities, generally as of 4:00pm Eastern time. The earlier close of these foreign markets gives rise to the possibility that significant events, including broad market moves, government actions or pronouncements, aftermarket trading, or news events may have occurred in the interim. Whenever such a significant event occurs, each Fund may value foreign securities using fair value prices based on third-party vendor modeling tools (Systematic International Fair Value Pricing (“SIFVP”)).
The Trust follows the authoritative guidance (GAAP) for fair value measurements. The guidance establishes a framework for measuring fair value and a hierarchy for inputs and techniques used in measuring fair value that maximizes the use of observable inputs and minimizes the use of unobservable inputs and techniques by requiring that the most observable inputs be used when available. The guidance establishes three tiers of inputs that may be used to measure fair value. The three tiers of inputs are summarized at the end of each Fund’s Portfolio of Investments. The inputs or techniques used for valuing securities are not necessarily an indication of the risk associated with investing in those securities.
Pursuant to the Funds’ fair value procedures noted previously, equity securities (including exchange traded securities and otheropen-end regulated investment companies) and exchange traded derivatives are generally categorized as Level 1 securities in the fair value hierarchy. The Wilmington International Fund, the Wilmington Global Alpha Equities and the Wilmington Real Asset Fund may utilize SIFVP which could result in certain equity securities being categorized as level 2. Fixed income securities,non-exchange traded derivatives and money market instruments are generally categorized as Level 2 securities in the fair value hierarchy.
Investments for which there are no such quotations, or for which quotations do not appear reliable, are valued at fair value as determined in accordance with procedures established by and under the general supervision of the Trustees. These valuations are typically categorized as Level 2 or Level 3 securities in the fair value hierarchy.
Repurchase Agreements– Repurchase agreements are transactions in which a fund buys a security from a dealer or bank and agrees to sell the security back at a mutually agreed upon time and price. The repurchase price exceeds the sale price, reflecting each Fund’s return on the transaction. It is each Fund’s policy to require the counterparty to a repurchase agreement to transfer to the Funds’ custodian orsub-custodian eligible securities or cash with a market value (after transaction costs) at least equal to the repurchase price to be paid under the repurchase agreement. The eligible securities are transferred to accounts with the custodian orsub-custodian in which the Funds hold a “securities entitlement” and exercise “control” as those terms are defined in the Uniform Commercial Code. The Funds have established procedures for monitoring the market value of the transferred securities and requiring the transfer of additional eligible securities, if necessary, to equal at least the repurchase price. These procedures also allow the counterparty to require securities to be transferred from the account to the extent that their market value exceeds the repurchase price or in exchange for other eligible securities of equivalent market value.
The insolvency of the counterparty or other failure to repurchase the securities may delay the disposition of the underlying securities or cause the Funds to receive less than the full repurchase price.
Repurchase agreements are entered into by the Funds under Master Repurchase Agreements (“MRA”) which permit the Funds, under certain circumstances including an event of default (such as bankruptcy or insolvency), to offset payables and/or receivables under the MRA with collateral held and/or posted to the counterparty and create one single net payment due to or from each Fund.
At April 30, 2020, the open repurchase agreements by counterparty which are subject to a MRA on a net payment basis are as follows:
| | | | | | | | | | | | | | | | |
| | | | |
| Fund/Counterparty | | Repurchase
Agreements | | | Fair Value of Non-Cash Collateral Received(1) | | | Cash Collateral Received(1) | | | Net Exposure(2) | |
International Fund | | | | | | | | | | | | | | | | |
Bank of America Securities, Inc. | | $ | 1,473,288 | | | $ | 1,473,288 | | | $ | — | | | $ | — | |
Citigroup Global Markets Ltd. | | | 5,598,559 | | | | 5,598,559 | | | | — | | | | — | |
Daiwa Capital Markets America | | | 5,598,559 | | | | 5,598,559 | | | | — | | | | — | |
Deutsche Bank Securities, Inc. | | | 5,598,559 | | | | 5,598,559 | | | | — | | | | — | |
HSBC Securities USA, Inc. | | | 5,598,559 | | | | 5,598,559 | | | | — | | | | — | |
RBC Dominion Securities, Inc. | | | 5,598,559 | | | | 5,598,559 | | | | — | | | | — | |
| | | | | | | | | | | | | | | | |
| | $ | 29,466,083 | | | $ | 29,466,083 | | | $ | — | | | $ | — | |
| | | | | | | | | | | | | | | | |
| | | | | | | | | | | | | | | | |
ANNUAL REPORT / April 30, 2020
| | |
| 65 | | NOTES TO FINANCIAL STATEMENTS (continued) |
| | | | | | | | | | | | | | | | |
| | | | |
| Fund/Counterparty | | Repurchase
Agreements | | | Fair Value of Non-Cash Collateral Received(1) | | | Cash Collateral Received(1) | | | Net Exposure(2) | |
Real Asset Fund | | | | | | | | | | | | | | | | |
BNP Paribas SA | | $ | 410,911 | | | $ | 410,911 | | | $ | — | | | $ | — | |
Citigroup Global Markets Ltd. | | | 410,911 | | | | 410,911 | | | | — | | | | — | |
Daiwa Capital Markets America | | | 410,911 | | | | 410,911 | | | | — | | | | — | |
Deutsche Bank Securities, Inc. | | | 163,584 | | | | 163,584 | | | | — | | | | — | |
HSBC Securities USA, Inc. | | | 410,911 | | | | 410,911 | | | | — | | | | — | |
RBC Dominion Securities, Inc. | | | 410,911 | | | | 410,911 | | | | — | | | | — | |
| | | | | | | | | | | | | | | | |
| | $ | 2,218,139 | | | $ | 2,218,139 | | | $ | — | | | $ | — | |
| | | | | | | | | | | | | | | | |
Diversified Income Fund | | | | | | | | | | | | | | | | |
BNP Paribas SA | | $ | 181,264 | | | $ | 181,264 | | | $ | — | | | $ | — | |
Citigroup Global Markets Ltd. | | | 181,264 | | | | 181,264 | | | | — | | | | — | |
Daiwa Capital Markets America | | | 181,264 | | | | 181,264 | | | | — | | | | — | |
Deutsche Bank Securities, Inc. | | | 72,145 | | | | 72,145 | | | | — | | | | — | |
HSBC Securities USA, Inc. | | | 181,264 | | | | 181,264 | | | | — | | | | — | |
RBC Dominion Securities, Inc. | | | 181,264 | | | | 181,264 | | | | — | | | | — | |
| | | | | | | | | | | | | | | | |
| | $ | 978,465 | | | $ | 978,465 | | | $ | — | | | $ | — | |
| | | | | | | | | | | | | | | | |
| | (1) | The amount of collateral reflected in the table does not include any over-collateralization received by the Fund. |
| | (2) | Net exposure represents the receivable (payable) due from (to) the counterparty in the event of default. |
Investment Income, Gains and Losses, Expenses and Distributions– Interest income and expenses are accrued daily. All premiums and discounts on fixed income securities are amortized/accreted for financial statement purposes. Gains and losses realized on principal payment of mortgage-backed securities (paydown gains and losses) are classified as part of investment income. Dividends and distributions to shareholders are recorded on theex-dividend date.Non-cash dividends included in dividend income, if any, are recorded at fair value. Foreign dividends are recorded on theex-dividend date or when the Funds are informed of theex-dividend date. Investment transactions are accounted for on a trade date basis for financial reporting purposes. Realized gains and losses from investment transactions are recorded on an identified cost basis.
Expenses of the Trust, which are directly identifiable to a specific fund, are applied to that fund. Expenses which are not identifiable to a specific fund are allocated in such a manner as deemed equitable, taking into consideration the nature and type of expense.
All Funds offer multiple classes of shares. Investment income, realized and unrealized gains and losses, and certain fund-level expenses are allocated to each class based on relative daily net assets, except that each class bears certain expenses unique to that class such as distribution and shareholder services fees. Distributions are declared separately for each class. No class has preferential distribution rights; differences in per share distributions rates are generally due to differences in class specific expenses. Distributions from net realized gains, if any, are declared and paid to shareholders annually. Distributions from net investment income are declared and paid quarterly for the Funds, with the exception of the Global Alpha Equities Fund, which is paid annually.
Real Estate Investment Trusts– The Funds may invest in real estate investment trusts (“REITs”) that involve risks not associated with investing in stocks. Risks include declines in the value of real estate, general and economic conditions, changes in the value of the underlying property and defaults by borrowers. The value of assets in the real estate industry may go through cycles of relative underperformance and outperformance in comparison to equity securities markets in general. Dividend income is recorded using management’s estimate of the income included in distributions received from REIT investments. The actual amounts of income, return of capital and capital gains are only determined by each REIT after its fiscalyear-end and may differ from the estimated amount. Estimates of income are adjusted to the actual amounts when the amounts are determined.
Federal Taxes– It is the Funds’ policy to comply with the Subchapter M provision of the Internal Revenue Code of 1986, as amended (the “Code”), and to distribute to shareholders each year substantially all their income. Accordingly, no provisions for Federal income tax or excise tax are necessary.
Withholding taxes and where appropriate, deferred withholding taxes, on foreign interest, dividends and capital gains have been provided for in accordance with the applicable country’s tax rules and rates.
The Funds recognize interest and penalties, if any, related to unrecognized tax benefits as income tax expense on the Statements of Operations. During the year ended April 30, 2020, the Funds did not incur any interest or penalties.
Warrants and Rights– Certain Funds hold warrants and rights acquired either through a direct purchase, including as part of private placement, or pursuant to corporate actions. Warrants and rights entitle the holder to buy a proportionate amount of common stock at a specific price and time through the expiration dates. Such warrants and rights are held as long positions by the Funds until exercised, sold or expired.
April 30, 2020 / ANNUAL REPORT
| | |
| NOTES TO FINANCIAL STATEMENTS (continued) | | 66 |
Equity-linked warrants are purchased in order to own local exposure to certain countries in which the Funds are not locally registered. Warrants and rights are valued at fair value in accordance with the Trustees’ approved fair value procedures.
Foreign Currency Translation– The accounting records of the Funds are maintained in U.S. dollars. All assets and liabilities denominated in foreign currencies (“FCs”) are translated into U.S. dollars based on the rates of exchange of such currencies against U.S. dollars on the date of valuation. Purchases and sales of securities, income and expenses are translated at the rate of exchange quoted on the respective date that such transactions are recorded. The Funds do not isolate that portion of results of operations resulting from changes in foreign exchange rates on investments from fluctuations arising from changes in the net realized and unrealized gain or loss on investments.
Reported net realized foreign exchange gains or losses arise from sales of portfolio securities, sales and maturities of short-term securities, sales of FCs, currency gains or losses realized between the trade and settlement dates on securities transactions, the difference between the amounts of dividends, interest, and foreign withholding taxes recorded on the Funds’ books and the U.S. dollar equivalent of the amounts actually received or paid. Net unrealized foreign exchange gains and losses arise from changes in the value of assets and liabilities other than investments in securities at period end, resulting from changes in the exchange rates.
Restricted Securities– Restricted securities are securities that either (a) cannot be offered for public sale without first being registered, or being able to take advantage of an exemption from registration, under the Securities Act of 1933, as amended, or (b) are subject to contractual restrictions on public sales. In some cases, when a security cannot be offered for public sale without first being registered, the issuer of the restricted security has agreed to register such securities for resale, at the issuer’s expense, either upon demand by the Funds or in connection with another registered offering of the securities. Many such restricted securities may be resold in the secondary market in transactions exempt from registration. Restricted securities may be determined to be liquid under criteria established by the Trustees. A Fund will not incur any registration costs upon such resales. The Funds’ restricted securities are valued at the price provided by dealers in the secondary market or, if no market prices are available, at the fair value as determined in accordance with procedures established by and under the general supervision of the Trustees.
Dollar Roll Transactions –The Diversified Income Fund may enter into dollar roll transactions, with respect to mortgage securities issued by GNMA, FNMA, and FHLMC, in which the Fund sells mortgage securities to financial institutions and simultaneously agree to accept substantially similar (same type, coupon, maturity) securities at a later date at an agreed upon price. Dollar roll transactions, which are treated as purchases and sales, will not exceed 12 months.
Securities Sold Short– Certain Funds may sell securities short. A short sale is a transaction in which the Fund sells a security it does not own in anticipation of a decline in market price. To sell a security short, the Fund must borrow the security. The Fund’s obligation to replace the security borrowed and sold short will be fully collateralized at all times by the proceeds from the short sale retained by the broker and by cash and securities deposited in a segregated account with the Fund’s custodian. If the price of the security sold short increases between the time of the short sale and the time the Fund replaces the borrowed security, the Fund will realize a loss, and if the price declines during the period, the Fund will realize a gain. Any realized gain will be decreased, and any realized loss increased, by the amount of transaction costs. The Funds are required to pay the lender any dividends declared on short positions. Such amounts are recorded on theex-dividend date as dividends expense on securities sold short on the Statements of Operations.
In accordance with the terms of its prime brokerage agreement, the Funds may be charged a fee on borrowed securities. Such fees are calculated on a daily basis based upon the market value of each borrowed security and a variable rate that is dependent upon the availability of such security. The Funds are required to maintain margin cash balances at the prime broker sufficiently to satisfy their short sales positions on a daily basis. The Funds are charged interest expense at the Fed Funds open rate plus 50 basis points on the amount of any shortfall in the required cash margin. The Funds record these prime broker charges on a net basis as Prime Broker interest expense on securities sold short on the Statements of Operations.
Lending of Portfolio Securities– The Trust has entered into an agreement with its custodian whereby the custodian may lend securities owned by the Funds to brokers, dealers and other financial organizations. Any increase or decrease in the fair value of securities loaned and any interest or dividends earned on those securities during the term of the loan would be for the account of the Funds. In exchange for lending securities under the terms of the agreement with their custodian, the Funds receive a lender’s fee. Fees earned by the Funds on securities lending are recorded as income. Loans of securities by the Funds are collateralized by cash, U.S. government securities or money market instruments that are maintained at all times in an amount at least equal to the current market value of the loaned securities plus a margin which varies depending on the type of securities owned. The custodian establishes and maintains the collateral in a segregated account. The Funds have the right under the lending agreement to recover the securities from the borrower on demand. The market value of the loaned securities is determined at the close of business of the Funds and any additional required collateral is delivered to the Funds on the next business day.
Investments purchased with cash collateral are presented on the portfolios of investments under the caption “Cash Collateral Invested for Securities on Loan.”
The Funds maintain the risk of any loss on the securities on loan as well as the potential loss on investments purchased with cash collateral received from securities lending.
ANNUAL REPORT / April 30, 2020
| | |
| 67 | | NOTES TO FINANCIAL STATEMENTS (continued) |
Securities lending transactions are entered into by the Funds under Master Securities Lending Agreements (“MSLA”) which permit the Funds, under certain circumstances including an event of default (such as bankruptcy or insolvency), to offset amounts payable by the Funds to the same counterparty against amounts to be received and create one single net payment due to or from the Funds.
At April 30, 2020, the securities loaned which are subject to a MSLA on a net payment basis are as follows:
| | | | | | | | | | |
| | | |
| Fund | | Value of Securities on Loan | | | Cash Collateral Received(1) | | | Net Exposure(2) |
International Fund | | | $27,665,931 | | | | $27,665,931 | | | $— |
Real Asset Fund | | | 2,102,569 | | | | 2,102,569 | | | — |
Diversified Income Fund | | | 937,927 | | | | 937,927 | | | — |
| | (1) | Collateral with a value of $29,466,083, $2,218,139 and $978,465, respectively, has been received in connection with securities lending transactions. |
| | (2) | Net exposure represents the receivable (payable) due from (to) the counterparty in the event of default. |
TBA Commitments– “TBA” (to be announced) commitments are commitments to purchase or sell mortgage-backed securities for a fixed price at a future date, typically not exceeding 45 days. TBAs may be considered securities in themselves and involve a risk of loss if the value of the TBA changes relative to the Funds’ “basis” in the position prior to the settlement date. Unsettled TBAs are valued according to the procedures described in the section entitled “Investment Valuation.”
| 3. | DERIVATIVE FINANCIAL INSTRUMENTS |
Disclosures about derivative instruments and hedging activities are intended to improve financial reporting for derivative instruments by enabling investors to understand how and why an entity uses derivatives, how derivatives are accounted for, and how derivative instruments affect an entity’s results of operations and financial position. Risk of loss on derivatives, including written options, forward foreign currency contracts, financial futures contracts and swaps, may exceed amounts recognized on the Statements of Assets and Liabilities.
Options– Certain Funds may either purchase or write options in order to hedge against adverse market movements or fluctuations in value caused by changes in prevailing interest rates, value of equities or foreign exchange rates, with respect to securities which the Fund currently owns or intends to purchase. A Fund’s principal reason for writing options is to realize, through receipt of premiums, a greater current return than would be realized on the underlying security alone. When a Fund purchases an option, it pays a premium and an amount equal to that premium is recorded as an asset. When a Fund writes an option, it receives a premium and an amount equal to that premium is recorded as a liability. The asset or liability is adjusted daily to reflect the current market value of the option. If an option expires unexercised, a Fund realizes a gain or loss to the extent of the premium received or paid. If an option is exercised, the premium received or paid is recorded as an adjustment to the proceeds from the sale or the cost of the purchase in determining whether a Fund has realized a gain or loss. The difference between the premium and the amount received or paid on effecting a closing purchase or sale transaction is also treated as a realized gain or loss. Gain or loss on purchased options is included in net realized gain or loss on investment transactions. Gain or loss on written options is presented separately as net realized gain or loss on options written. A Fund, as writer of options, may have no control over whether the underlying securities may be sold (called) or purchased (put). As a result, a Fund bears the market risk of an unfavorable change in the price of the security underlying the written option. A Fund, as purchaser ofover-the-counter options, bears the risk of the potential inability of the counterparties to meet the terms of their contracts.
The Real Asset Fund used interest rate options and options on swaps to enhance returns, and manage interest rate risk, inflation risk, credit risk and volatility exposures. The Real Asset Fund used foreign currency options as a short or long hedge against possible variations in foreign exchange rates or as a means to gain exposure to foreign currencies.
Forward Foreign Currency Contracts– Certain Funds may enter into foreign currency commitments or foreign currency exchange transactions. A Fund may enter into foreign currency contract transactions to protect assets against adverse changes in foreign currency exchange rates or exchange control regulations. Purchased contracts are used to acquire exposure to foreign currencies; whereas, contracts to sell are used to hedge a Fund’s securities against currency fluctuations. Risks may arise upon entering into these transactions from the potential inability of counterparties to meet the terms of their commitments and from unanticipated movements in security prices or foreign exchange rates. The foreign currency transactions are adjusted by the daily exchange rate of the underlying currency and any gains or losses are recorded for financial statement purposes as unrealized until the settlement date. The International Fund entered into forward foreign currency contracts in connection with settling planned purchases or sales of securities. The Real Asset Fund and the Global Alpha Equities Fund entered into forward foreign currency contracts in connection with settling planned purchases or sales of securities, to hedge the currency exposure associated with some or all of the portfolio’s securities or as a means to express a view on the direction of a currency’s value as a part of the broader investment strategy.
Financial Futures Contracts– The Funds may invest in financial futures contracts to hedge their existing portfolios, manage cash flows, enhance yield and to potentially reduce transaction costs. Upon entering into a futures contract with a broker, the Fund is required to deposit in a segregated account a specified amount of cash or U.S. government securities. Futures contracts are valued daily and unrealized gains or losses are recorded in a “variation margin” account. Daily, and prior to computing its NAV, the Fund receives from or pays to the broker a specified amount of cash based upon changes in the variation margin account. When a contract is closed, the Fund recognizes a realized gain
April 30, 2020 / ANNUAL REPORT
| | |
| NOTES TO FINANCIAL STATEMENTS (continued) | | 68 |
or loss. Futures contracts have market risks, including the risk that the change in the value of the contract may not correlate with the changes in the value of the underlying securities. The Global Alpha Equities Fund used foreign exchange futures contracts to gain exposure to the foreign currency markets both on a long and short strategy. The Global Alpha Equities Fund also used equity index futures contracts to manage equity market net and gross exposure. The Real Asset Fund used futures contracts to manage interest rate exposure, adjust duration and curve exposure and to gain exposure to foreign interest rates. The Real Asset Fund also used money market futures during the period in order to adjust the portfolio’s interest rate exposure on thefront-end of the yield curve and to adjust the overall duration positioning of the portfolio.
Swap Agreements– Certain Funds may enter into credit default, interest rate, total return and other forms of swap agreements. A swap agreement is an agreement to exchange the return generated by one instrument for the return generated by another instrument. The swap agreements are valued daily at current market value and any change in value is included in the net unrealized appreciation or depreciation on investments. Payments received or paid by the Fund are recorded as realized gains or losses upon termination or maturity of the swap. Swap agreements outstanding at period end, if any, are listed on the Portfolio of Investments.
Centrally cleared swap agreements are agreements executed through a broker but are cleared through a central counterparty (the “CCP”) and a Fund’s counterparty on the swap becomes the CCP. The Fund is required to interface with the CCP through a broker and upon entering into a centrally cleared swap is required to deposit initial margin with the broker in the form of cash or securities in an amount that varies depending on the size and risk profile of a particular swap. Centrally cleared swaps are subject to general market risks and to liquidity risk. Pursuant to the swap agreement, the Fund agrees to pay to or receive from the counterparty an amount of cash equal to the daily fluctuation in the value of the swap (“variation margin”). Such payments are recorded by the Fund as unrealized gains or losses until the contract is closed or settled at which point the gain or loss is realized.
The Fund may utilize swap agreements in an attempt to gain exposure to the securities in a market without actually purchasing those securities, or to hedge a position.
Interest rate swap agreements– Interest rate swaps represent an agreement between counterparties to exchange cash flows based on the difference between two interest rates, applied to a notional principal amount for a specified period. The Fund is subject to interest rate risk exposure in the normal course of pursuing its investment objectives. The Fund may use interest rate swaps to either maintain its ability to generate steady cash flow by receiving a stream of fixed rate payments or to increase exposure to prevailing market rates by receiving floating rate payments using interest rate swap contracts. The Fund’s maximum risk of loss from counterparty credit risk is the discounted net value of the cash flows to be received from the counterparty over the contract’s remaining life. This risk may be mitigated by having a master netting arrangement between the Fund and the counterparty which may permit the Fund to offset amounts payable by the Fund to the same counterparty against amounts to be received; and by the receipt of collateral from the counterparty by the Fund, to cover the Fund’s exposure to the counterparty. However, there is no assurance that such mitigating factors are easily enforceable. The Real Asset Fund is subject to interest rate risk exposure in the normal course of pursuing its investment objectives. Because the portfolio holds fixed rate bonds, the value of these bonds may decrease if interest rates rise. To help hedge against this risk and to maintain its ability to generate income at prevailing market rates, the portfolio entered into interest rate swap agreements. Additionally, the portfolio invested in interest rate swaps as a risk-neutral substitute for physical securities, to obtain exposure in markets where no physical securities were available, and to refine the risk exposure in the portfolio (i.e. duration, inflation, credit, maturity mix, etc.).
Credit default swap agreements– Credit default swap agreements involve one party making a stream of payments (referred to as the buyer of protection) to another party (the seller of protection) in exchange for the right to receive a specified return in the event of a default or other credit event for the referenced entity, obligation or index. As a seller of protection on credit default swap agreements, a Fund will generally receive from the buyer of protection a fixed rate of income throughout the term of the swap provided that there is no credit event. As the seller, a Fund would effectively add leverage to its portfolio because, in addition to its total net assets, a Fund would be subject to investment exposure on the notional amount of the swap.
If a Fund is a seller of protection and a credit event occurs, as defined under the terms of that particular swap agreement, a Fund will either (i) pay to the buyer of protection an amount equal to the notional amount of the swap and take delivery of the referenced obligation, other deliverable obligations or underlying securities comprising the referenced index or (ii) pay a net settlement amount in the form of cash or securities equal to the notional amount of the swap less the recovery value of the referenced obligation or underlying securities comprising the referenced index. If a Fund is a buyer of protection and a credit event occurs, as defined under the terms of that particular swap agreement, a Fund will either (i) receive from the seller of protection an amount equal to the notional amount of the swap and deliver the referenced obligation, other deliverable obligations or underlying securities comprising the referenced index or (ii) receive a net settlement amount in the form of cash or securities equal to the notional amount of the swap less the recovery value of the referenced obligation or underlying securities comprising the referenced index. Recovery values are estimated by market makers considering either industry standard recovery rates or entity specific factors and considerations until a credit event occurs. If a credit event has occurred, the recovery value is determined by a facilitated auction whereby a minimum number of allowable broker bids, together with a specified valuation method, are used to calculate the settlement value.
Credit default swap agreements on corporate issues, sovereign issues of an emerging country or U.S. municipal issues involve one party making a stream of payments to another party in exchange for the right to receive a specified return in the event of a default or other credit event. If a credit event occurs and cash settlement is not elected, a variety of other deliverable obligations may be delivered in lieu of the
ANNUAL REPORT / April 30, 2020
| | |
| 69 | | NOTES TO FINANCIAL STATEMENTS (continued) |
specific referenced obligation. The ability to deliver other obligations may result in acheapest-to deliver option (the buyer of protection’s right to choose the deliverable obligation with the lowest value following a credit event). A Fund may use credit default swaps on corporate issues, sovereign issues of an emerging country or U.S. municipal issues to provide a measure of protection against defaults of the issuers (i.e., to reduce risk where a Fund owns or has exposure to the referenced obligation) or to take an active long or short position with respect to the likelihood of a particular issuer’s default.
Credit default swap agreements on credit indices involve one party making a stream of payments to another party in exchange for the right to receive a specified return in the event of a write-down, principal shortfall, interest shortfall or default of all or part of the referenced entities comprising the credit index. A credit index is a basket of credit instruments or exposures designed to be representative of some part of the credit market as a whole. These indices are made up of reference credits that are judged by a poll of dealers to be the most liquid entities in the credit default swap market based on the sector of the index. Components of the indices may include, but are not limited to, investment grade securities, high yield securities, asset-backed securities, emerging markets, and/or various credit ratings within each sector. Credit indices are traded using credit default swaps with standardized terms including a fixed spread and standard maturity dates. An index credit default swap references all the names in the index, and if there is a default, the credit event is settled based on that name’s weight in the index. The composition of the indices changes periodically, usually every six months, and for most indices, each name has an equal weight in the index. A Fund may use credit default swaps on credit indices to hedge a portfolio of credit default swaps or bonds, which is less expensive than it would be to buy many credit default swaps to achieve a similar effect. Credit default swaps on indices are benchmarks for protecting investors owning bonds against default, and traders use them to speculate on changes in credit quality. Implied credit spreads, represented in absolute terms, utilized in determining the market value of credit default swap agreements on corporate issues, sovereign issues of an emerging country or U.S. municipal issues as of period end are disclosed in the footnotes to the Portfolios of Investments and serve as an indicator of the current status of the payment/performance risk and represent the likelihood or risk of default for the credit derivative. The implied credit spread of a particular referenced entity reflects the cost of buying/selling protection and may include upfront payments required to be made to enter into the agreement. For credit default swap agreements on credit indices, the quoted market prices and resulting values serve as the indicator of the current status of the payment/performance risk. Wider credit spreads represent a deterioration of the referenced entity’s credit soundness and a greater likelihood or risk of default or other credit event occurring as defined under the terms of the agreement. The maximum potential amount of future payments (undiscounted) that a Fund as a seller of protection could be required to make under a credit default swap agreement would be an amount equal to the notional amount of the agreement. The Real Asset Fund used credit default swaps on corporate and sovereign issues to take an active long position with respect to the likelihood of a particular issuer’s default. The Real Asset Fund also used credit default swaps on credit indices to adjust the portfolio’s overall credit exposure.
The following is a summary of the location of derivatives on the Funds’ Statements of Assets and Liabilities as of April 30, 2020.
| | | | |
| | | Location on the Statement of Assets and Liabilities |
| | |
| Derivative Type | | Asset Derivatives | | Liability Derivatives |
Equity contracts | | Variation margin receivable for financial futures contracts* | | Variation margin payable for financial futures contracts* |
| | |
Foreign exchange contracts | | Unrealized appreciation on forward foreign currency contracts** | | Unrealized depreciation on forward foreign currency contracts** |
*The variation margin shown on the Statements of Assets and Liabilities is the daily change in the unrealized appreciation (depreciation) for financial futures contracts. The amount presented on the next pages is the cumulative unrealized appreciation (depreciation) from the date the contract was opened until April 30, 2020.
**The amounts shown represent the unrealized appreciation (depreciation) from the date the contract was open.
April 30, 2020 / ANNUAL REPORT
| | |
| NOTES TO FINANCIAL STATEMENTS (continued) | | 70 |
| | | | | | | | | | | | | | | | | | | | | | | | | | | | | | | | | | | | | | | | | | |
| | | | | Asset Derivative Fair Value |
| Fund | | | | Total Value | | | | | | Equity
Contracts | | | | | | Foreign
Exchange
Contracts | | |
International Fund | | | | | | | | | | | | | | | | | | | | | | | | | | | | | | | | | | | | | | | | | | |
Financial Futures Contracts | | | | | | | | $ | 339,278 | | | | | | | | | | | | | | $ | 339,278 | | | | | | | | | | | $ | — | | | | | | |
| | | | | | | | | | | | | | | | | | | | | | | | | | | | | | | | | | | | | | | | | | |
| | | | | | | | | |
Totals | | | | | | | | $ | 339,278 | | | | | | | | | | | | | | $ | 339,278 | | | | | | | | | | | $ | — | | | | | | |
| | | | | | | | | | | | | | | | | | | | | | | | | | | | | | | | | | | | | | | | | | |
Global Alpha Equities Fund | | | | | | | | | | | | | | | | | | | | | | | | | | | | | | | | | | | | | | | | | | |
Forward Foreign Currency Contracts | | | | | | | | $ | 322,676 | | | | | | | | | | | | | | $ | — | | | | | | | | | | | $ | 322,676 | | | | | | |
| | | | | | | | | | | | | | | | | | | | | | | | | | | | | | | | | | | | | | | | | | |
| | | | | | | | | |
Totals | | | | | | | | $ | 322,676 | | | | | | | | | | | | | | $ | — | | | | | | | | | | | $ | 322,676 | | | | | | |
| | | | | | | | | | | | | | | | | | | | | | | | | | | | | | | | | | | | | | | | | | |
| | | | | | | | | | | | | | | | | | | | | | | | | | | | | | | | | | | | | | | |
| | | | | Liability Derivative Fair Value |
| Fund | | | | Total Value | | | | | | Equity
Contracts | | | | | | Foreign
Exchange
Contracts | | |
International Fund | | | | | | | | | | | | | | | | | | | | | | | | | | | | | | | | | | | | | | | |
Forward Foreign Currency Contracts | | | | | | | | $ | 601 | | | | | | | | | | | $ | — | | | | | | | | | | | $ | 601 | | | | | | |
| | | | | | | | | | | | | | | | | | | | | | | | | | | | | | | | | | | | | | | |
| | | | | | | | | |
Totals | | | | | | | | $ | 601 | | | | | | | | | | | $ | — | | | | | | | | | | | $ | 601 | | | | | | |
| | | | | | | | | | | | | | | | | | | | | | | | | | | | | | | | | | | | | | | |
Global Alpha Equities Fund | | | | | | | | | | | | | | | | | | | | | | | | | | | | | | | | | | | | | | | |
Financial Futures Contracts | | | | | | | | $ | 13,964,282 | | | | | | | | | | | $ | 13,964,282 | | | | | | | | | | | $ | — | | | | | | |
Forward Foreign Currency Contracts | | | | | | | | | 67,736 | | | | | | | | | | | | — | | | | | | | | | | | | 67,736 | | | | | | |
| | | | | | | | | | | | | | | | | | | | | | | | | | | | | | | | | | | | | | | |
| | | | | | | | | |
Totals | | | | | | | | $ | 14,032,018 | | | | | | | | | | | $ | 13,964,282 | | | | | | | | | | | $ | 67,736 | | | | | | |
| | | | | | | | | | | | | | | | | | | | | | | | | | | | | | | | | | | | | | | |
The effect of derivative instruments on the Statements of Operations for the year ended April 30, 2020 are as follows:
| | |
| |
Derivative Type | | Location on the Statements of Operations |
Equity contracts | | Net realized gain (loss) on financial futures contracts. |
| | Net change in unrealized appreciation (depreciation) on financial futures contracts. |
| |
Foreign exchange contracts | | Net realized gain (loss) on forward foreign currency contracts. |
| | Net change in unrealized appreciation (depreciation) on forward foreign currency contracts. |
| |
Interest rate contracts | | Net realized gain (loss) on financial futures contracts, purchased options, written options and swap agreements. |
| | Net change in unrealized appreciation (depreciation) on financial futures contracts, purchased options, written options and swap agreements. |
| |
Credit contracts | | Net realized gain (loss) on purchased options, written options and swap agreements. |
| | Net change in unrealized appreciation (depreciation) on written options and swap agreements. |
ANNUAL REPORT / April 30, 2020
| | |
| 71 | | NOTES TO FINANCIAL STATEMENTS (continued) |
| | | | | | | | | | | | | | | | | | | | |
| |
| | | Total Realized Gain (Loss) on Derivatives Recognized in Results from Operations | |
| | | | | |
| Fund | | Total | | | Equity
Contracts | | | Foreign
Exchange
Contracts | | | Interest Rate
Contracts | | | Credit
Contracts | |
International Fund | | | | | | | | | | | | | | | | | | | | |
Financial Futures Contracts | | $ | (2,191,298 | ) | | $ | (2,191,298 | ) | | $ | — | | | $ | — | | | $ | — | |
Forward Foreign Currency Contracts | | | (227,865 | ) | | | — | | | | (227,865 | ) | | | — | | | | — | |
| | | | | | | | | | | | | | | | | | | | |
| | | | | |
Totals | | $ | (2,419,163 | ) | | $ | (2,191,298 | ) | | $ | (227,865 | ) | | $ | — | | | $ | — | |
| | | | | | | | | | | | | | | | | | | | |
| | | | | |
Global Alpha Equities Fund | | | | | | | | | | | | | | | | | | | | |
Financial Futures Contracts | | $ | 21,455,459 | | | $ | 21,455,459 | | | $ | — | | | $ | — | | | $ | — | |
Forward Foreign Currency Contracts | | | 310,721 | | | | — | | | | 310,721 | | | | — | | | | — | |
| | | | | | | | | | | | | | | | | | | | |
| | | | | |
Totals | | $ | 21,766,180 | | | $ | 21,455,459 | | | $ | 310,721 | | | $ | — | | | $ | — | |
| | | | | | | | | | | | | | | | | | | | |
| | | | | |
Real Asset Fund | | | | | | | | | | | | | | | | | | | | |
Financial Futures Contracts | | $ | (992,260 | ) | | $ | — | | | $ | — | | | $ | (992,260 | ) | | $ | — | |
Forward Foreign Currency Contracts | | | 654,797 | | | | — | | | | 654,797 | | | | — | | | | — | |
Purchased Options | | | 389,891 | | | | — | | | | — | | | | 390,061 | | | | (170 | ) |
Written Options | | | (147,446 | ) | | | — | | | | — | | | | (91,802 | ) | | | (55,644 | ) |
Swap Agreements | | | (551,965 | ) | | | — | | | | — | | | | (698,781 | ) | | | 146,816 | |
| | | | | | | | | | | | | | | | | | | | |
| | | | | |
Totals | | $ | (646,983 | ) | | $ | — | | | $ | 654,797 | | | $ | (1,392,782 | ) | | $ | 91,002 | |
| | | | | | | | | | | | | | | | | | | | |
| | | | | | | | | | | | | | | | | | | | |
| |
| | | Change in Unrealized Appreciation (Depreciation) on Derivatives Recognized in Results from Operations | |
| | | | | |
| Fund | | Total | | | Equity
Contracts | | | Foreign
Exchange
Contracts | | | Interest Rate
Contracts | | | Credit
Contracts | |
International Fund | | | | | | | | | | | | | | | | | | | | |
Financial Futures Contracts | | $ | (103,122 | ) | | $ | (103,122 | ) | | $ | — | | | $ | — | | | $ | — | |
Forward Foreign Currency Contracts | | | 595 | | | | — | | | | 595 | | | | — | | | | — | |
| | | | | | | | | | | | | | | | | | | | |
| | | | | |
Totals | | $ | (102,527 | ) | | $ | (103,122 | ) | | $ | 595 | | | $ | — | | | $ | — | |
| | | | | | | | | | | | | | | | | | | | |
| | | | | |
Global Alpha Equities Fund | | | | | | | | | | | | | | | | | | | | |
Financial Futures Contracts | | $ | (10,503,265 | ) | | $ | (10,503,265 | ) | | $ | — | | | $ | — | | | $ | — | |
Forward Foreign Currency Contracts | | | 154,217 | | | | — | | | | 154,217 | | | | — | | | | — | |
| | | | | | | | | | | | | | | | | | | | |
| | | | | |
Totals | | $ | (10,349,048 | ) | | $ | (10,503,265 | ) | | $ | 154,217 | | | $ | — | | | $ | — | |
| | | | | | | | | | | | | | | | | | | | |
| | | | | |
Real Asset Fund | | | | | | | | | | | | | | | | | | | | |
Financial Futures Contracts | | $ | 121,029 | | | $ | — | | | $ | — | | | $ | 121,029 | | | $ | — | |
Forward Foreign Currency Contracts | | | (42,730 | ) | | | — | | | | (42,730 | ) | | | — | | | | — | |
Purchased Options | | | (14,201 | ) | | | — | | | | — | | | | (14,201 | ) | | | — | |
Written Options | | | (102,942 | ) | | | — | | | | — | | | | (102,014 | ) | | | (928 | ) |
Swap Agreements | | | (23,947 | ) | | | — | | | | — | | | | 14,891 | | | | (38,838 | ) |
| | | | | | | | | | | | | | | | | | | | |
| | | | | |
Totals | | $ | (62,791 | ) | | $ | — | | | $ | (42,730 | ) | | $ | 19,705 | | | $ | (39,766 | ) |
| | | | | | | | | | | | | | | | | | | | |
The average quarterly volume of derivative activities for the year ended April 30, 2020 are as follows.
| | | | | | | | | | | | |
| |
| | | Asset Derivative Volume | |
| | | |
| Fund | | Purchased
Options1 | | | Financial
Futures
Contracts1 | | | Forward
Foreign
Currency
Contracts1 | |
| | | |
International Fund | | $ | — | | | $ | 6,309,606 | | | $ | 6,117,114 | |
Global Alpha Equities Fund | | | — | | | | — | | | | 980,750 | |
Real Asset Fund | | | 49,820 | | | | 8,962,796 | | | | 7,332,745 | |
April 30, 2020 / ANNUAL REPORT
| | |
| NOTES TO FINANCIAL STATEMENTS (continued) | | 72 |
| | | | | | | | | | | | |
| |
| | | Liability Derivative Volume | |
| | | |
| Fund | | Written
Options2 | | | Financial
Futures
Contracts1 | | | Forward
Foreign
Currency
Contracts1 | |
| | | |
International Fund | | $ | — | | | $ | 1,612,794 | | | $ | 5,081,163 | |
Global Alpha Equities Fund | | | — | | | | 96,514,216 | | | | 16,178,425 | |
Real Asset Fund | | | 140,681 | | | | 21,122,619 | | | | 13,408,677 | |
| | | |
| | | | | | | | | | | | |
| | | |
| Fund | | Interest Rate Swap
Agreements3 | | | Swap Volume
Credit Default
Swap
Agreements
(purchase
protection)3 | | | Credit Default
Swap
Agreements
(sell
protection)3 | |
| | | |
Real Asset Fund | | $ | 53,528,000 | | | $ | 1,389,000 | | | $ | 760,000 | |
1Cost.
2Premiums Received.
3Notional Amount.
Certain Funds are parties to International Swap and Derivatives Association, Inc. (“ISDA”) Master Agreements (“MA”) with various counterparties that governover-the-counter derivative and foreign exchange contracts entered into from time to time. The ISDA MA may contain provisions regarding, among other things, the parties’ general obligations, representations, agreements, collateral requirements, events of default and early termination. With respect to certain counterparties, in accordance with the terms of the ISDA MA, collateral posted to each Fund is held in a segregated account by each Fund’s custodian and with respect to those amounts which can be sold or repledged, are presented in the Fund’s portfolio or Statements of Assets and Liabilities.
At April 30, 2020, derivative assets and liabilities (by type) held by the Funds are as follows:
| | | | | | | | |
| | |
| Fund | | Assets | | | Liabilities | |
International Fund | | | | | | | | |
Derivative Financial Instruments: | | | | | | | | |
Financial futures contracts | | $ | 233,530 | | | $ | — | |
Forward foreign currency contracts | | | — | | | | 601 | |
| | | | | | | | |
Total derivative assets and liabilities in the | | | | | | | | |
Statements of Assets and Liabilities | | | 233,530 | | | | 601 | |
Derivatives not subject to a MA or similar agreement | | | 233,530 | | | | — | |
| | | | | | | | |
Total assets and liabilities subject to a MA | | $ | — | | | $ | 601 | |
| | | | | | | | |
Global Alpha Equities Fund | | | | | | | | |
Derivative Financial Instruments: | | | | | | | | |
Financial futures contracts | | $ | 2,439,242 | | | $ | — | |
Forward foreign currency contracts | | | 322,676 | | | | 67,736 | |
| | | | | | | | |
Total derivative assets and liabilities in the | | | | | | | | |
Statements of Assets and Liabilities | | | 2,761,918 | | | | 67,736 | |
Derivatives not subject to a MA or similar agreement | | | 2,439,242 | | | | — | |
| | | | | | | | |
Total assets and liabilities subject to a MA | | $ | 322,676 | | | $ | 67,736 | |
| | | | | | | | |
ANNUAL REPORT / April 30, 2020
| | |
| 73 | | NOTES TO FINANCIAL STATEMENTS (continued) |
At April 30, 2020, derivative assets and liabilities by counterparty net of amounts available for offset under a MA and net of the related collateral received by each Fund are as follows:
| | | | | | | | | | | | | | | | | | | | | | | | | | | | | | | | | | | | | | | | | | | | | | | |
| | | | | | | | | | |
| Fund/Counterparty | | | | Derivative Liabilities Subject to a MA | | | | Derivatives
Available for
Offset | | | | Non-Cash
Collateral
Pledged(1) | | | | Cash
Collateral
Pledged(1) | | | | Net Exposure
of Derivative
Liabilities(2) |
International Fund | | | | | | | | | | | | | | | | | | | | | | | | | | | | | | | | | | | | | | | | | | | | | | | |
| | | | | | | | | | |
Bank of New York Mellon | | | | | $ | (601 | ) | | | | | | | | $ | — | | | | | | | | | $ | — | | | | | | | | | $ | — | | | | | | | | | $ | (601 | ) |
| | | | | | | | | | | | | | | | | | | | | | | | | | | | | | | | | | | | | | | | | | | | | | | |
Total Derivative Liabilities | | | | | $ | (601 | ) | | | | | | | | $ | — | | | | | | | | | $ | — | | | | | | | | | $ | — | | | | | | | | | $ | (601 | ) |
| | | | | | | | | | | | | | | | | | | | | | | | | | | | | | | | | | | | | | | | | | | | | | | |
| | | | | | | | | | | | | | | | | | | | | | | | | | | | | | | | | | | | | | | | | | | | | | | |
| | | | | | | | | | |
| Fund/Counterparty | | | | Derivative Assets Subject to
a MA | | | | Derivatives
Available for
Offset | | | | Non-Cash
Collateral
Received(3) | | | | Cash
Collateral
Received(3) | | | | Net Exposure of Derivative
Assets(2) |
Global Alpha Equities Fund | | | | | | | | | | | | | | | | | | | | | | | | | | | | | | | | | | | | | | | | | | | | | | | |
| | | | | | | | | | |
Bank of New York Mellon | | | | | $ | 4 | | | | | | | | | $ | (4 | ) | | | | | | | | $ | — | | | | | | | | | $ | — | | | | | | | | | $ | — | |
Canadian Imperial Bank of Commerce | | | | | | 147,825 | | | | | | | | | | | | | | | | | | | | — | | | | | | | | | | — | | | | | | | | | | 147,825 | |
Deutsche Bank AG | | | | | | 165,463 | | | | | | | | | | — | | | | | | | | | | — | | | | | | | | | | — | | | | | | | | | | 165,463 | |
HSBC Bank USA, N.A. | | | | | | 3 | | | | | | | | | | (3 | ) | | | | | | | | | — | | | | | | | | | | — | | | | | | | | | | — | |
JP Morgan Chase Bank, N.A. | | | | | | 21 | | | | | | | | | | (21 | ) | | | | | | | | | — | | | | | | | | | | — | | | | | | | | | | — | |
Morgan Stanley Capital Services LLC | | | | | | 9,135 | | | | | | | | | | (22 | ) | | | | | | | | | — | | | | | | | | | | — | | | | | | | | | | 9,113 | |
State Street Corp. | | | | | | 225 | | | | | | | | | | (4 | ) | | | | | | | | | — | | | | | | | | | | — | | | | | | | | | | 221 | |
| | | | | | | | | | | | | | | | | | �� | | | | | | | | | | | | | | | | | | | | | | | | | | | | | |
Total Derivative Assets | | | | | $ | 322,676 | | | | | | | | | $ | (54 | ) | | | | | | | | $ | — | | | | | | | | | $ | — | | | | | | | | | $ | 322,622 | |
| | | | | | | | | | | | | | | | | | | | | | | | | | | | | | | | | | | | | | | | | | | | | | | |
| | | | | | | | | | | | | | | | | | | | | | | | | | | | | | | | | | | | | | | | | | | | | | | |
| | | | | | | | | | |
| | | | | Derivative
Liabilities Subject to
a MA | | | | Derivatives
Available for
Offset | | | | Non-Cash
Collateral
Pledged(1) | | | | Cash
Collateral
Pledged(1) | | | | Net Exposure of Derivative
Liabilities(2) |
| | | | | | | | | | |
Bank of Montreal | | | | | $ | (12,308 | ) | | | | | | | | $ | — | | | | | | | | | $ | — | | | | | | | | | $ | — | | | | | | | | | $ | (12,308 | ) |
Bank of New York Mellon | | | | | | (221 | ) | | | | | | | | | 4 | | | | | | | | | | — | | | | | | | | | | — | | | | | | | | | | (217 | ) |
Goldman Sachs Bank USA | | | | | | (229 | ) | | | | | | | | | | | | | | | | | | | — | | | | | | | | | | — | | | | | | | | | | (229 | ) |
HSBC Bank USA, N.A. | | | | | | (32 | ) | | | | | | | | | 3 | | | | | | | | | | — | | | | | | | | | | — | | | | | | | | | | (29 | ) |
JP Morgan Chase Bank, N.A. | | | | | | (24 | ) | | | | | | | | | 21 | | | | | | | | | | — | | | | | | | | | | — | | | | | | | | | | (3 | ) |
Morgan Stanley Capital Services LLC | | | | | | (22 | ) | | | | | | | | | 22 | | | | | | | | | | — | | | | | | | | | | — | | | | | | | | | | — | |
State Street Corp. | | | | | | (4 | ) | | | | | | | | | 4 | | | | | | | | | | — | | | | | | | | | | — | | | | | | | | | | — | |
Toronto Dominion Bank | | | | | | (54,896 | ) | | | | | | | | | — | | | | | | | | | | — | | | | | | | | | | — | | | | | | | | | | (54,896 | ) |
| | | | | | | | | | | | | | | | | | | | | | | | | | | | | | | | | | | | | | | | | | | | | | | |
Total Derivative Liabilities | | | | | $ | (67,736 | ) | | | | | | | | $ | 54 | | | | | | | | | $ | — | | | | | | | | | $ | — | | | | | | | | | $ | (67,682 | ) |
| | | | | | | | | | | | | | | | | | | | | | | | | | | | | | | | | | | | | | | | | | | | | | | |
(1) Excess of collateral pledged is not shown for financial reporting purposes.
(2) Net exposure represents the receivable (payable) due from (to) the counterparty in the event of default.
(3) Excess of collateral received is not shown for financial reporting purposes.
| 4. | FEDERAL TAX INFORMATION |
As of April 30, 2020, there were no uncertain tax positions that would require financial statement recognition,de-recognition or disclosure. The Funds’ federal tax returns filed for the years ended 2019, 2018, and 2017, as well as the current tax year, remain subject to examination by the Internal Revenue Service.
For financial reporting purposes, book basis capital accounts are adjusted to reflect the tax character of permanent book/tax differences. Permanent reclassifications can arise from differing treatment of certain income and gain transactions and nondeductible current year net operating losses. Permanent book and tax basis differences relating to shareholder distributions will result in reclassifications to capital paid in on shares of beneficial interest. The reclassifications have no impact on the net assets or NAVs of the Funds. As of April 30, 2020, the following Funds recorded reclassifications to increase (decrease) the accounts as listed below:
| | | | |
| | |
| Fund | | Paid-in
Capital | | Distributable
Earnings (Loss) |
Global Alpha Equities Fund | | $96,891 | | $(96,891) |
Real Asset Fund | | 55,065 | | (55,065) |
April 30, 2020 / ANNUAL REPORT
| | |
| NOTES TO FINANCIAL STATEMENTS (continued) | | 74 |
The timing and character of income and capital gain distributions are determined in accordance with income tax regulations, which may differ from GAAP.
The tax character of distributions for the corresponding fiscal year ends were as follows:
| | | | | | | | | | | | | | | | | | | | |
| | |
| | | 2020 | | 2019 |
| | | | |
| Fund | | Ordinary
Income* | | Long-Term
Capital Gains | | Ordinary
Income* | | Long-Term Capital Gains |
International Fund | | | $ | 9,581,018 | | | | $ | — | | | | $ | 10,380,986 | | | | $ | 5,260,990 | |
Global Alpha Equities Fund | | | | 2,323,202 | | | | | — | | | | | 1,794,132 | | | | | — | |
Real Asset Fund | | | | 11,290,739 | | | | | — | | | | | 7,988,977 | | | | | — | |
Diversified Income Fund | | | | 1,374,464 | | | | | — | | | | | 1,481,925 | | | | | 53,403 | |
| | * | For tax purposes, short-term capital gain distributions are considered ordinary income distributions. |
As of April 30, 2020, the components of distributable earnings on a tax basis were as follows:
| | | | | | | | | | | | | | | | | | | | | | | | | | | | | | |
| | | | | | |
| Fund | | Undistributed Ordinary Income | | Undistributed
Long-Term
Capital Gains | | Other Timing
Differences | | Unrealized
Appreciation/
(Depreciation) | | Capital Loss
Carryforwards | | Late Year
Deferrals |
International Fund | | | $ | 3,436,717 | | | | $ | — | | | | $ | — | | | | $ | 5,163,012 | | | | $ | (34,890,989 | ) | | | $ | — | |
Global Alpha Equities Fund | | | | 630,489 | | | | | 3,068,934 | | | | | 2 | | | | | (7,440,753 | ) | | | | — | | | | | — | |
Real Asset Fund | | | | 1,693,903 | | | | | — | | | | | 1 | | | | | (31,565,147 | ) | | | | (18,697,847 | ) | | | | — | |
Diversified Income Fund | | | | 252,083 | | | | | — | | | | | 1 | | | | | (1,638,700 | ) | | | | (1,047,967 | ) | | | | — | |
The differences between the book and tax basis components of distributable earnings relate principally to the timing of recognition of income and gains for federal income tax purposes.
At April 30, 2020, the following Funds had capital loss carryforwards which will reduce each Fund’s taxable income arising from future net realized gain on investments, if any, to the extent permitted by the (“Code”) and thus will reduce the amount of distributions to shareholders which would otherwise be necessary to relieve the Fund of any liability for federal income tax.
Under current tax regulations, capital losses on securities transactions realized after October 31 may be deferred and treated as occurring on the first day of the following fiscal year. Under the Regulated Investment Company Modernization Act of 2010, the Funds are permitted to defer taxable ordinary income losses incurred after December 31 and treat as occurring on the first day of the following fiscal year.
| | | | | | | | | | | | | | | |
| | | |
| Fund | | Short-Term No Expiration | | Long-Term No Expiration | | Total Capital Loss
Carryforwards |
International Fund | | | $ | 22,337,319 | | | | $ | 12,553,670 | | | | $ | 34,890,989 | |
Real Asset Fund | | | | 5,403,015 | | | | | 13,294,832 | | | | | 18,697,847 | |
Diversified Income Fund | | | | 149,419 | | | | | 898,548 | | | | | 1,047,967 | |
The following Funds utilized capital loss carryforwards as follows to offset taxable capital gains realized during the year ended April 30, 2020:
| | | | |
| |
| Fund | | Capital Loss
Carryforwards
Utilized | |
Global Alpha Equities Fund | | $ | 8,469,266 | |
Real Asset Fund | | | 1,589,987 | |
ANNUAL REPORT / April 30, 2020
| | |
| 75 | | NOTES TO FINANCIAL STATEMENTS (continued) |
| 5. | ADVISORY FEES, SERVICING FEES, AND OTHER SERVICE PROVIDERS |
Investment Advisor– Wilmington Funds Management Corporation (“WFMC” or the “Advisor”) serves as the Investment Advisor to each of the Funds. Wilmington Trust Investment Advisors, Inc. (“WTIA”) providessub-advisory services to the Funds. WFMC and WTIA are wholly-owned subsidiaries of M&T Bank Corporation. For its services, the Funds pay WFMC an annual investment advisory fee, accrued daily and paid monthly, based on a percentage of each Fund’s average daily net assets as described below. WFMC, not the Funds, pays WTIA for its services.
| | | | |
| |
| Fund | | Advisory Fee Annual Rate |
International Fund | | | 0.45 | % |
Global Alpha Equities Fund | | | 0.95 | % |
Real Asset Fund | | | 0.45 | % |
Diversified Income Fund | | | 0.40 | % |
The International Fund, Global Alpha Equities Fund and Real Asset Fund, utilize asub-advisor strategy, whereby WFMC allocates all or a portion of the Funds’ assets among one or moresub-advisors and strategies. For their services, the Funds pay eachsub-advisor fees, accrued daily and paid monthly, as described below.
| | | | | | | | | | | | | | | | |
| | | | | |
| Fund | | Gross Fees | | | | Fees Waived/ Reimbursed | | | | Current Fee as a % of average net asset of the Fund/ Allocated Net Assets forSub-advisors |
International Fund | | | | | | | | | | | | | | | | |
WFMC | | | $ | 2,494,480 | | | | | | $ | (1,500,796) | | | | | 0.45% |
Sub-advisors: | | | | | | | | | | | | | | | | |
Allianz Global Investors U.S. LLC | | | | 261,992 | | | | | | | — | | | | | 0.38% on the first $100 million; 0.33% on the next $100; and 28% on assets in excess of $200 million on assets allocated to the Europe Equity Growth Select Strategy; |
| | | | 141,309 | | | | | | | — | | | | | 0.25% on assets allocated to the High Dividend Europe Strategy. |
AXA Investment Managers, Inc. | | | | 347,114 | | | | | | | — | | | | | 0.43% on the first $150 million; and |
| | | | | | | | | | | | | | | | 0.41% on assets in excess of $150 million |
Berenberg Asset Management LLC | | | | 181,863 | | | | | | | — | | | | | 0.27% |
Nikko Asset Management Americas, Inc. | | | | 356,620 | | | | | | | — | | | | | 0.32% |
Schroder Investment Management North America, Inc. | | | | 736,233 | | | | | | | — | | | | | 0.50% |
| | | | | | | | | | | | | | | | |
Total(a) | | | $ | 4,519,611 | | | | | | $ | (1,500,796) | | | | | |
| | | | | | | | | | | | | | | | |
| | | | | |
Global Alpha Equities Fund | | | | | | | | | | | | | | | | |
WFMC | | | $ | 1,844,817 | | | | | | $ | (1,070,441) | | | | | 0.95% |
Sub-advisor: | | | | | | | | | | | | | | | | |
Wellington Management Company LLP | | | | 1,068,050 | | | | | | | — | | | | | 0.55% |
| | | | | | | | | | | | | | | | |
Total(b) | | | $ | 2,912,867 | | | | | | $ | (1,070,441) | | | | | |
| | | | | | | | | | | | | | | | |
| | | | | |
Real Asset Fund | | | | | | | | | | | | | | | | |
WFMC | | | $ | 1,381,720 | | | | | | $ | (274,512) | | | | | 0.45% on all Assets except assets allocated to the inflation-protected and fixed-income securities (“TIPS”) strategy or the Enhanced Cash Strategy. The fee for assets allocated to the TIPS strategy: 0.52% of the first $25 million; 0.49% of the next $25 million; and 0.47% of Assets over $50 million. The fee for assets allocated to the Enhanced Cash strategy is 0.53% on the assets. |
Sub-advisors: | | | | | | | | | | | | | | | | |
Pacific Investment Management Company LLC | | | | 162,331 | | | | | | | — | | | | | 0.25% |
Parametric Portfolio Associates LLC | | | | 172,094 | | | | | | | — | | | | | 0.25% on the first $20 million in assets; |
| | | | | | | | | | | | | | | | 0.20% of the next $20 million in assets; and |
| | | | | | | | | | | | | | | | 0.15% of assets in excess of $40 million |
| | | | | | | | | | | | | | | | |
Total(c) | | | $ | 1,716,145 | | | | | | $ | (274,512) | | | | | |
| | | | | | | | | | | | | | | | |
Diversified Income Fund | | | | | | | | | | | | | | | | |
WFMC | | | $ | 152,092 | | | | | | $ | (317,846) | | | | | 0.40% |
| | | | | | | | | | | | | | | | |
| | | | | | | | | | | | | | | | |
(a) The total gross advisory andsub-advisory fees during the period were 0.82% for the International Fund.
(b) The total gross advisory andsub-advisory fees during the period were 1.50% for the Global Alpha Equities Fund.
(c) The total gross advisory andsub-advisory fees during the period were 0.56% for the Real Asset Fund.
April 30, 2020 / ANNUAL REPORT
| | |
| NOTES TO FINANCIAL STATEMENTS (continued) | | 76 |
WFMC and the Funds’ distributor and shareholder service provider have contractually agreed to waive their fees and/or reimburse expenses through August 31, 2020, so that total annual fund operating expenses paid by the Funds (not including the effects of dividends or interest on short positions, acquired fund fees and expenses, taxes, or other extraordinary expenses expressed as an annualized percentage of average daily net assets), will not exceed the expense limitations set forth below. Neither WFMC nor the Funds’ distributor and shareholder service provider will recoup previously waived fees/expenses in subsequent years.
The contractual expense limitations are as follows:
| | | | | | | | |
| |
| | | Current Contractual Expense Limitations | |
| Fund | | Class A | | | Class I | |
| | |
International Fund | | | 0.98% | | | | 0.85% | |
| | |
Global Alpha Equities Fund | | | 1.49% | | | | 1.24% | |
| | |
Real Asset Fund | | | 0.96% | | | | 0.71% | |
| | |
Diversified Income Fund* | | | 0.60% | | | | 0.35% | |
| | * | Prior to August 31, 2019, the Diversified Income Fund’s contractual expense limitation was 0.59% and 0.34% for Class A and Class I, respectively. |
Administrative Fees– The Bank of New York Mellon (“BNYM”) provides the Trust with fund administration services. The fees as described in the table below are a component of “Portfolio accounting and administration fees” as disclosed in the Statements of Operations. WFMC, in its role asCo-Administrator, provides the Funds with certain administrative personnel and services necessary to operate the Funds. The fees as described in the table below are accrued daily and paid monthly, and are disclosed on the Statements of Operations as “Administration fees.”
| | | | | | |
| | |
| Administrator | | Maximum Fee | | | Average Aggregate Daily Net Assets of the Trust |
| | |
WFMC | | | 0.040% | | | on the first $5 billion |
| | |
| | | 0.030% | | | on the next $2 billion |
| | |
| | | 0.025% | | | on the next $3 billion |
| | |
| | | 0.018% | | | on assets in excess of $10 billion |
| | |
BNYM | | | 0.0175% | | | on the first $15 billion |
| | |
| | | 0.0150% | | | on the next $10 billion |
| | |
| | | 0.0125% | | | on assets in excess of $25 billion |
WFMC and BNYM may voluntarily choose to waive any portion of their fee and can add, modify or terminate a voluntary wavier at any time at their sole discretion. Neither WFMC nor BNYM will recoup previously waived fees/expenses in subsequent years. For the year ended April 30, 2020, neither WFMC nor BNYM waived any administrative fees.
Distribution Services Fee–The Trust has adopted a Distribution Services Plan (the “Plan”) pursuant to Rule12b-1 under the Act. The Plan allows the Funds to pay fees to financial intermediaries, which may be paid through ALPS Distributors, Inc. (“ALPS”), the principal distributor, at an annual rate of up to 0.25% of the average daily net assets of the Funds’ Class A shares, for the sale, distribution, administration, customer servicing and record keeping of these shares.
The Trust may reduce the maximum amount of distribution services fees it pays from time to time at its sole discretion. In addition, a financial intermediary (including ALPS, the Advisor or their affiliates), may voluntarily waive or reduce any fees to which they are entitled.
For the year ended April 30, 2020, M&T Securities, Inc., Manufacturers and Traders Trust Company, and Wilmington Trust, NA (together “M&T”), affiliates of the Advisor, received a portion of the fees paid by the Funds which are listed below:
| | | | |
| |
| Fund | | Distribution Fees from Class A | |
| |
International Fund | | | $ 4,345 | |
| |
Global Alpha Equities Fund | | | 199 | |
| |
Real Asset Fund | | | 1,886 | |
| |
Diversified Income Fund | | | 86,170 | |
ANNUAL REPORT / April 30, 2020
| | |
| 77 | | NOTES TO FINANCIAL STATEMENTS (continued) |
Sales Charges– The Class A shares of all the Funds bearfront-end sales charges.
For the year ended April 30, 2020, M&T received the amounts listed below from sales charges on the sale of Class A shares.
| | | | |
| |
| Fund | | Sales Charges from Class A | |
| |
International Fund | | | $ 116 | |
| |
Global Alpha Equities Fund | | | 2,661 | |
| |
Real Asset Fund | | | 1,318 | |
| |
Diversified Income Fund | | | 13,033 | |
Shareholder Services Fee– Pursuant to a Shareholder Services Plan adopted by the Funds and administered by ALPS, the Funds may pay up to 0.25% of the average daily net assets of each Fund’s Class A and Class I shares to financial intermediaries (which may include ALPS, the Advisor or their affiliates) for providing shareholder services and maintaining shareholder accounts. M&T has entered into a Shareholders Services Agreement with ALPS, under which it is entitled to receive up to 0.25% of the average daily net assets of each Fund’s shares for whom M&T provides shareholder services. The Funds may reduce the maximum amount of shareholder service fees it pays from time to time at its sole discretion. In addition, a financial intermediary (including M&T) may waive or reduce any fees to which they are entitled.
For the year ended April 30, 2020, M&T received a portion of the fees paid by the following Fund which is listed below:
| | | | |
| |
| Fund | | Shareholder Services Fee | |
| |
International Fund | | | $630,592 | |
Other Service Providers– Foreside Management Services, LLC (“FMS”) provides a Principal Executive Officer and Principal Financial Officer to the Trust. FMS has no role in determining the investment policies or which securities are to be sold or purchased by the Trust or its funds.
BNYM provides custody services to the Trust.
BNY Mellon Investment Servicing (U.S.) Inc. provides fund accounting and transfer agency services to the Trust.
General– Certain Officers of the Trust are also Officers or employees of the above companies that provide services to the Funds, and during their terms of office, receive no compensation from the Funds. The Trust’s Statement of Additional Information includes additional information about the Trustees.
Certain Funds may execute trades for security purchase and sale transactions through brokers that are affiliates of the Advisor orsub-advisors. Commissions paid on those trades for the year ended April 30, 2020 were as follows:
| | | | |
| |
| Fund | | Commissions | |
| |
Global Alpha Equities Fund | | | $ 6 | |
| |
Diversified Income Fund | | | 52 | |
| 6. | INVESTMENT TRANSACTIONS |
Purchases and sales of investments, excluding short-term obligations and U.S. Government Securities for the year ended April 30, 2020 were as follows:
| | | | | | | | |
| |
| | | Investments | |
| | |
| Fund | | Purchases | | | Sales | |
| | |
International Fund | | $ | 403,914,472 | | | $ | 410,063,840 | |
| | |
Global Alpha Equities Fund | | | 205,995,670 | | | | 147,731,373 | |
| | |
Real Asset Fund | | | 294,677,924 | | | | 318,240,516 | |
| | |
Diversified Income Fund | | | 3,993,918 | | | | 6,670,154 | |
Purchases and sales of investments of U.S. Government Securities for the year ended April 30, 2020 were as follows:
| | | | | | | | |
| |
| | | U.S. Government Securities | |
| | |
| Fund | | Purchases | | | Sales | |
| | |
Real Asset Fund | | | $1,012,959,859 | | | | $1,081,001,063 | |
| | |
Diversified Income Fund | | | 1,041,996 | | | | 523,812 | |
April 30, 2020 / ANNUAL REPORT
| | |
| NOTES TO FINANCIAL STATEMENTS (continued) | | 78 |
Market risk is the risk that one or more markets in which a Fund invests will go down in value, including the possibility that the markets will go down sharply and unpredictably. The value of a security or other asset may decline due to changes in general market conditions, economic trends or events that are not specifically related to the issuer of the security or other asset, or factors that affect a particular issuer or issuers, exchange, country, group of countries, region, market, industry, group of industries, sector or asset class. Local, regional or global events such as war, acts of terrorism, the spread of infectious illnesses or other public health issues, recessions, natural disasters or other events could have a significant impact on a Fund and its investments.
Beginning in January 2020, global financial markets have experienced and may continue to experience significant volatility resulting from the spread of a novel coronavirus known asCOVID-19. The outbreak ofCOVID-19 has resulted in travel and border restrictions, quarantines, supply chain disruptions, lower consumer demand and general market uncertainty. The effects ofCOVID-19 have and may continue to adversely affect the global economy, the economies of certain nations and individual issuers. The impact of the outbreak may be short term or may last for an extended period of time, which may have an unpredictable impact on Fund performance.
The United Kingdom’s Financial Conduct Authority, which regulates the London Interbank Offered Rate (“LIBOR”), has announced plans to phase out the use of LIBOR by the end of 2021. There remains uncertainty regarding the future use of LIBOR and the nature of any replacement rate. The transition process away from LIBOR may involve, among other things, increased volatility or illiquidity in markets for instruments that currently rely on LIBOR. The transition process may also result in a reduction in the value of certain instruments held by a Fund or reduce the effectiveness of related Fund transactions such as hedges. Volatility, the potential reduction in value, and/or the hedge effectiveness of financial instruments may be heightened for financial instruments that do not include fallback provisions that address the cessation of LIBOR. Any potential effects of the transition away from LIBOR on any of the Funds or on financial instruments in which a Fund invests, as well as other unforeseen effects, could result in losses to a Fund.
| 9. | CONTRACTUAL OBLIGATIONS |
In the normal course of business, the Funds may enter into contracts that provide general indemnifications. The funds’ maximum exposure under these arrangements is dependent on claims that may be made against the Funds in the future, and therefore, cannot be estimated; however, based on experience, the risk of material loss from such claims is considered remote.
The Trust participates in a $10,000,000 unsecured, committed revolving line of credit (“LOC”) agreement with BNYM. The LOC was available for extraordinary or emergency purposes, primarily for financing redemption payments. Borrowings were charged interest at a rate of 1.25% per annum over the greater of the Federal Funds Rate or the overnight LIBOR. The LOC included a commitment fee of 0.15% per annum on the daily unused portion. The LOC expired on April 2, 2020.
On April 2, 2020, the Trust entered into an amendment to the credit agreement for a $10,000,000 unsecured, committed revolving LOC. The LOC is to be used as described above and to be operated in substantially the same manner as the original agreement. The LOC expires on April 1, 2021.
The Trust did not utilize the LOC for the year ended April 30, 2020.
| 11. | RECENT ACCOUNTING PRONOUNCEMENTS |
In March 2017, the Financial Accounting Standards Board (“FASB”) issued Accounting Standards Update (“ASU”), ASU2017-08, Receivables – Nonrefundable Fees and Other Costs (Subtopic310-20), Premium Amortization on Purchased Callable Debt Securities which amends the amortization period for certain callable debt securities held at a premium, shortening such period to the earliest call date. This ASU does not require any accounting change for debt securities held at a discount; the discount continues to be amortized to maturity. This ASU is effective for fiscal years, and interim periods within those fiscal years, beginning after December 15, 2018. Management has implemented the ASU2017-08 and determined that the impact of this guidance to each Fund’s net assets at April 30, 2020 is not material.
In August 2018, FASB issued an ASU2018-13, (“ASU2018-13”), which changes certain fair value measurement disclosure requirements. The ASU2018-13, in addition to other modifications and additions, removes the requirement to disclose the amount and reasons for transfers between Level 1 and Level 2 of the fair value hierarchy, the policy for the timing of transfers between levels and the valuation process for Level fair value measurements. The ASU2018-13 is effective for fiscal years, and interim periods within those fiscal years, beginning after December 15, 2019. Management has evaluated the implications of certain provisions of ASU2018-13 and has elected to early adopt all aspects related to the removal and modification of certain fair value measurement disclosures.
In March 2020, the FASB issued ASUNo. 2020-04 (“ASU2020-04”), Reference Rate Reform (Topic 848) - Facilitation of the Effects of Reference Rate Reform on Financial Reporting. The amendments in ASU2020-04 provides optional temporary financial reporting relief from the effect of certain types of contract modifications due to the planned discontinuation of the LIBOR and other interbank-offered based reference rates as of the end of 2021. ASU2020-04 is effective for certain reference rate-related contract modifications that occur during the
ANNUAL REPORT / April 30, 2020
| | |
| 79 | | NOTES TO FINANCIAL STATEMENTS (continued) |
period March 12, 2020 through December 31, 2022. Management is currently evaluating the impact, if any, of applying ASU2020-04.
| 12. | OTHER FUND INFORMATION |
At a meeting held on June 5, 2019, the Trustees, upon recommendation of the Audit Committee, selected PricewaterhouseCoopers LLP (“PwC”) to serve as the independent registered public accounting firm for the Trust for the fiscal year ending April 30, 2020. PwC affirmed their independence as an independent registered public accounting firm on June 19, 2019. During the fiscal years ended April 30, 2019 and 2018, Ernst & Young LLP (“E&Y”) audit reports’ on the financial statements of each Fund in the Trust did not contain any adverse opinion or disclaimer of opinion, nor were they qualified or modified as to uncertainty, audit scope, or accounting principles. In addition, there were no disagreements between the Trust and E&Y on accounting principles, financial statements disclosures or audit scope, which, if not resolved to the satisfaction of E&Y, would have caused them to make reference to the disagreement in their reports. Neither the Trust nor anyone on its behalf has consulted with PwC at any time prior to their selection with respect to the application of accounting principles to a specified transaction, either completed or proposed or the type of audit opinion that might be rendered on each Fund’s financial statements.
Management has evaluated events and transactions for potential recognition or disclosure in the financial statements through the date the financial statements were issued. Management has determined that there are no material events that would require recognition or disclosure in the Funds’ financial statements through this date.
April 30, 2020 / ANNUAL REPORT
Report of Independent Registered Public Accounting Firm
To the Board of Trustees of Wilmington Funds and Shareholders of Wilmington International Fund, Wilmington Global Alpha Equities Fund, Wilmington Real Asset Fund and Wilmington Diversified Income Fund
Opinions on the Financial Statements
We have audited the accompanying statements of assets and liabilities, including the portfolios of investments, of Wilmington International Fund, Wilmington Global Alpha Equities Fund, Wilmington Real Asset Fund and Wilmington Diversified Income Fund (four of the funds constituting Wilmington Funds, hereafter collectively referred to as the “Funds”) as of April 30, 2020, the related statements of operations and changes in net assets, including the related notes, and the financial highlights for the year then ended (collectively referred to as the “financial statements”). In our opinion, the financial statements present fairly, in all material respects, the financial position of each of the Funds as of April 30, 2020, and the results of each of their operations, changes in each of their net assets, and each of the financial highlights for the year then ended in conformity with accounting principles generally accepted in the United States of America.
The financial statements of the Funds as of and for the year ended April 30, 2019 and the financial highlights for each of the periods ended on or prior to April 30, 2019 (not presented herein, other than the statements of changes in net assets and the financial highlights) were audited by other auditors whose report dated June 27, 2019 expressed unqualified opinions on those financial statements and financial highlights.
Basis for Opinions
These financial statements are the responsibility of the Funds’ management. Our responsibility is to express an opinion on the Funds’ financial statements based on our audits. We are a public accounting firm registered with the Public Company Accounting Oversight Board (United States) (PCAOB) and are required to be independent with respect to the Funds in accordance with the U.S. federal securities laws and the applicable rules and regulations of the Securities and Exchange Commission and the PCAOB.
We conducted our audits of these financial statements in accordance with the standards of the PCAOB. Those standards require that we plan and perform the audit to obtain reasonable assurance about whether the financial statements are free of material misstatement, whether due to error or fraud.
Our audits included performing procedures to assess the risks of material misstatement of the financial statements, whether due to error or fraud, and performing procedures that respond to those risks. Such procedures included examining, on a test basis, evidence regarding the amounts and disclosures in the financial statements. Our audits also included evaluating the accounting principles used and significant estimates made by management, as well as evaluating the overall presentation of the financial statements. Our procedures included confirmation of securities owned as of April 30, 2020 by correspondence with the custodian, transfer agent and brokers; when replies were not received from brokers, we performed other auditing procedures. We believe that our audits provide a reasonable basis for our opinions.
/s/ PricewaterhouseCoopers LLP
Philadelphia, Pennsylvania
June 24, 2020
We have served as the auditor of one or more investment companies in Wilmington Funds since 2019.
ANNUAL REPORT / April 30, 2020
FEDERAL TAX INFORMATION (UNAUDITED)
Complete information regarding the tax status of distributions will be reported on Forms 1099.
Of the ordinary income (including short-term capital gain) distributions made by the Fund during the fiscal year ended April 30, 2020, the Fund designates the following percentage, or such greater percentage that constitute the maximum amount allowable pursuant to Code Sections Section 243 and 854(b)(2), as qualifying for the corporate dividends received deduction:
| | | | |
| |
Fund | | | |
International Fund | | | 0.38 | % |
Global Alpha Equities Fund | | | 50.82 | % |
Real Asset Fund | | | 2.27 | % |
Diversified Income Fund | | | 31.44 | % |
For the fiscal year ended April 30, 2020, the Fund designates the following percentage of the ordinary income dividends, or such greater percentage that constitute the maximum amount allowable pursuant to Code Sections 1(h)(11) and 854(b)(2), as qualified dividend income which may be subject to a maximum rate of federal income tax of 15%:
| | | | |
| |
Fund | | | |
International Fund | | | 90.65 | % |
Global Alpha Equities Fund | | | 100.00 | % |
Real Asset Fund | | | 24.82 | % |
Diversified Income Fund | | | 46.38 | % |
If the Fund meets the requirements of Section 853 of the Code, the Fund will pass through to shareholders credits of foreign taxes paid.
April 30, 2020 / ANNUAL REPORT
| | |
| BOARD OF TRUSTEES AND TRUST OFFICERS | | 82 |
BOARD OF TRUSTEES AND TRUST OFFICERS
The following tables give information about each Trustee and the senior officers of the Trust. The tables separately list Trustee members who are “interested persons” of the Fund (i.e., “Interested” Trustees) and those who are not (i.e., “Independent” Trustees). The Trust is comprised of 12 funds. Unless otherwise noted, the business address of each Trustee and senior officer is 1100 North Market Street, 9th Floor, Wilmington, DE 19890. Each Trustee oversees all portfolios of the Trust and serves for an indefinite term. The Trust’s Statement of Additional Information includes additional information about the Trustees and is available, without charge and upon request, by calling1-800-836-2211.
INTERESTED TRUSTEES BACKGROUND
| | |
| |
Name Address Birth Year Position with Trust Date Service Began | | Principal Occupations and Other Directorships Held for Past Five Years |
| |
Dominick J. D’Eramo* Birth year: 1964 TRUSTEE Began serving: November 2018 PRESIDENT Began serving: June 2018 | | Principal Occupations:Senior Vice President, Wilmington Trust Investment Advisors, Inc. and Head of Fixed Income. Previous Positions:Group Vice President, Wilmington Trust Investment Advisor, Inc. (WTIA) (2014-2017); Administrative Vice President, WTIA (2012-2014). |
|
|
|
|
|
* Dominick J. D’Eramo is “interested” due to his employment with WTIA and his position with WFMC, investment Advisors to the Funds.
INDEPENDENT TRUSTEES BACKGROUND
| | |
| |
Name Birth Year Position with Trust Date Service Began | | Principal Occupations and Other Directorships Held for Past Five Years |
| |
Nicholas A. Giordano Birth year: 1943 CHAIRMAN and TRUSTEE Began serving: March 2012 | | Principal Occupations:Consultant, financial services organizations (1997 to present). Other Directorships Held:The RBB Fund Inc. (19 portfolios) (registered investment companies); Independence Blue Cross; IntriCon Corporation (body-worn products). Previous Positions:Director, Kalmar Pooled Investment Trust (through 6/17); Interim President, LaSalle University (1998 to 1999); President and Chief Executive Officer, Philadelphia Stock Exchange (1981 to 1997). |
| |
Robert H. Arnold Birth year: 1944 TRUSTEE Began serving: March 2012 | | Principal Occupations:Managing Director, R.H. Arnold & Co, Inc. (financial management consulting) (6/89 to present). Other Directorships Held:None. |
|
|
| | | Previous Positions:Trustee, First Potomac Realty Trust (real estate investment trust) (5/03 to 12/17); Director, Treasury Strategies, Inc. (private treasury consulting services) (6/01 to 6/16). |
| |
Gregory P. Chandler Birth year: 1966 TRUSTEE Began serving: July 2017 | | Principal Occupations:Chief Financial Officer, Avocado Systems, Inc. (cybersecurity software) (3/20 to present); Other Directorships Held:Trustee, RBB Fund Series Trust (32 portfolios) (registered investment companies) (2012 to present); Trustee, FS Energy Partners (business development company) (2009 to present); Director, Emtec, Inc. (2005 to 2019); Director, FS Investment Corporation (business development company) (2007 to 2018); |
| |
| | | Previous Positions:Chief Financial Officer, Emtec, Inc. (information technology services) (2009 to 2020); Managing Director, Janney Montgomery Scott LLC (investment banking) (1999 to 2009); Consulting Manager, PwC (1997 to 1999), Manager, Business Assurance, Coopers & Lybrand (audit services) (1995 – 1997); Captain, US Army (1989 to 1994). |
ANNUAL REPORT / April 30, 2020 (unaudited)
| | |
| 83 | | BOARD OF TRUSTEES AND TRUST OFFICERS |
| | |
| |
Name Birth Year Position with Trust Date Service Began | | Principal Occupations and Other Directorships Held for Past Five Years |
| |
Donald E. Foley Birth year: 1951 TRUSTEE Began serving: December 2015 | | Principal Occupations:Director, BioSig Technologies (2015 to present); Director, AXA Equitable’s VIP Mutual Funds (2017 to present); Director, AXA Equitable (variable annuity) (2013 to present); Director, 1290 Mutual Funds (retail funds) (2013 to present); and Chairman and Director, Burke Rehabilitation Hospital Foundation (private hospital, research institute) (2005 to present). |
| |
| | Other Directorships Held:Director, M&T Bank Corporation (commercial bank) (2011 to 2012); Chairman and Director, Wilmington Trust Corporation (commercial and trust bank) (2007 to 2011); Chairman, Director and President’s Council, Union College (private college) (2011 to 2015). |
| |
| | | Previous Positions:Advisory Member, Trust and Investment Committee, M&T Bank, Wilmington Trust, National Association, and Wilmington Trust Company (through 2016); Chairman and Chief Executive Officer of Wilmington Trust Corporation (2010 to 2011); Senior Vice President and Treasurer at ITT Corporation (1996 to 2010); Assistant Treasurer at International Paper (1989 to 1996). |
| |
Richard B. Seidel Birth year: 1941 TRUSTEE Began serving: September 2003 | | Principal Occupations:Chairman, Seidel & Associates (legal consulting) (1/14 to present); Chairman, Liberty Private Client, LLC (registered investment adviser) (1/14 to present). Other Directorships Held:Director, Chartwell Investment Partners (9/15 to present); Director, Tristate Capital Holdings (9/07 to 4/20). |
| |
| | | Previous Positions:Chairman, Girard Capital (broker-dealer) (3/05 to 1/14); Chairman, Girard Partners, Ltd. (6/96 to 1/14). |
| |
Valerie J. Sill Birth year: 1962 TRUSTEE Began serving: April 2020 | | Principal Occupations:President, Chief Executive Officer and Chief Investment Officer, DuPont Capital Management (asset management) (2004 to present). Other Directorships Held:Trustee, Longwood Gardens (2005 to present); Trustee of the Christiana Care Health System (2012 to present); and Advisory Counsel, Federal Reserve Bank of Philadelphia’s Economic Advisory Council (2010 to 2013). |
| |
| | | Previous Positions:Executive Vice President at The Boston Company (1994 to 2004). |
OFFICERS
| | |
| |
Name Address Birth Year Positions with Trust | | Principal Occupations for Past Five Years and Previous Positions |
| |
John C. McDonnell Birth year: 1966 CHIEF OPERATIONS OFFICER Began serving: June 2017 VICE PRESIDENT Began serving: June 2012 | | Principal Occupations:Chief Operations Officer, Wilmington Funds; Vice President, Wilmington Funds Management Corporation (2005 to present); Vice President, Wilmington Trust Investment Advisors, Inc. (2012 to present). Previous Positions:Vice President, Wilmington Trust Investment Management, LLC (2005 to 2012). |
| |
Lisa Druelinger Birth year: 1978 CHIEF COMPLIANCE OFFICER and AML COMPLIANCE OFFICER. Began serving: November 2017 | | Principal Occupations:Chief Compliance Officer and Anti-Money Laundering Officer, Wilmington Funds; Administrative Vice President, M&T Bank. Previous Positions:Vice President and Senior Compliance Officer, Wilmington Trust Investment Advisors, Inc. (2015-2017); Wilmington Funds Product Manager, Wilmington Trust Investment Advisors, Inc. (2013-2015); Institutional and Retirement Services Product Manager, Wilmington Trust (2011-2013); Trust Compliance and Risk Management at M&T Bank (2006- 2011). |
April 30, 2020 (unaudited) / ANNUAL REPORT
| | |
| BOARD OF TRUSTEES AND TRUST OFFICERS | | 84 |
| | |
| |
Name Address Birth Year Positions with Trust | | Principal Occupations for Past Five Years and Previous Positions |
| |
John J. Kelley Birth year: 1959 VICE PRESIDENT Began serving: December 2016 | | Principal Occupations:President of Wilmington Funds Management Corporation; Group Vice President and Chief Administrative Officer, Wilmington Trust Investment Advisors, Inc. Previous Positions:Vice President, BNY Mellon Investment Servicing (formerly, PNC Global Investment Servicing) from (1/05 to 7/05); Vice President of Administration, 1838 Investment Advisors, LP (1999 to 2005); Chief Compliance Officer, 1838 Investment Advisors, LP (2004 to 2005). |
| |
Robert L. Tuleya Birth year: 1974 VICE PRESIDENT and ASSISTANT SECRETARY Began serving: September 2018 | | Principal Occupations:Vice President and Assistant Secretary, Wilmington Funds; Vice President and Assistant Secretary, Wilmington Funds Management Corporation (2018 to present); Vice President and Assistant Secretary, Wilmington Trust Investment Advisors, Inc. (2018 to present); Vice President and Assistant Secretary, Wilmington Trust Investment Management, LLC (2018 to present); Vice President and Assistant General Counsel, M&T Bank (2018 to present). Previous Positions:Vice President and Counsel, M&T Bank (2017 to 2018); Senior Counsel, PNC Bank (2014 to 2017). |
| |
Christopher W. Roleke 10 High Street, Suite 302 Boston, MA 02110 Birth year: 1972 CHIEF FINANCIAL OFFICER AND TREASURER Began serving: July 2013 | | Principal Occupation:Managing Director and Fund Principal Financial Officer, Foreside Management Services, LLC (2011 to present). Previous Positions:Assistant Vice President, JP Morgan Investor Services Co. (2006 to 2011). |
| |
Lisa R. Grosswirth Atlantic Terminal Office Tower, 2 Hanson Place, 12th Floor Brooklyn, NY 11217 Birth year: 1963 SECRETARY Began serving: September 2007 | | Principal Occupation:Vice President, BNY Mellon Asset Servicing (2004 to present). Previous Positions:Supervisory Paralegal, The Dreyfus Corporation (1998 to 2004). |
| |
Richard J. Berthy Three Canal Plaza, Suite 100 Portland, ME 04101 Birth year: 1958 CHIEF EXECUTIVE OFFICER Began serving: September 2007 | | Principal Occupation:Chief Executive Officer, Foreside Financial Group, LLC (2012 to present). Previous Positions:President, Foreside Financial Group, LLC (2008 to 2012); Chief Administrative Officer, Foreside Financial Group, LLC (2005 to 2008); President and Secretary, Bainbridge Capital Management, LLC (2003 to 2006); Vice President, Bainbridge Capital Management (2002 to 2004). |
ANNUAL REPORT / April 30, 2020 (unaudited)
Board Approval of Liquidity Risk Management Program
To promote effective liquidity risk management throughout the fund industry and to enhance disclosure regarding fund liquidity and redemption practices, the Securities and Exchange Commission (the “Commission”) adopted Rule22e-4 under the Investment Company Act of 1940, as amended. The rule requires every registeredopen-end management company to establish a liquidity risk management program that, among other things, provides for the assessment, management and review of liquidity risk, the classification of a fund’s portfolio investments into one of four liquidity buckets based upon the number of days that such investments may reasonably be expected to be converted into cash or otherwise disposed of without significantly impacting their price, the establishment of a highly liquid investment minimum where required, and the establishment of a 15% limitation on illiquid investments. Additionally, the Commission adopted Rule30b1-10 and FormN-LIQUID, which generally requires a fund to notify the Commission when certain liquidity-related events occur.
The Wilmington Funds Board of Trustees (the “Board”) approved the appointment of the Funds’ Liquidity Risk Management Committee (“Liquidity Committee”) as the administrator of the liquidity risk management program (the “LRMP”) for the Funds on September 6, 2018 and the Funds’ final LRMP on March 5, 2019. At the regular meeting of the Board on March 10, 2020, the Trust’s Chief Operations Officer, as a member of the Liquidity Committee, provided a report to the Board on the operation and effectiveness of the LRMP after its first year of operation. The Liquidity Committee managed liquidity risks associated with the Funds’ investments by monitoring cash and cash equivalents, the use of derivatives, the concentration of investments and the appropriateness of portfolio strategies foropen-end funds, and by classifying each investment of a Fund as either highly liquid, moderately liquid, less liquid or illiquid on at least a monthly basis. To assist with the classification of each Fund’s investments, the Liquidity Committee utilized a third party provider of liquidity monitoring services. The Liquidity Committee supplied portfolio-level data and certain assumptions to the provider which then used the information to determine the liquidity classification of each security position held by the Funds. The liquidity classifications as of each month end were reviewed by the Liquidity Committee on at least a quarterly basis and would be reviewed more often if market conditions warranted. For assets managed by a third partysub-adviser the Liquidity Committee would takesub-adviser input into account where appropriate in determining the liquidity classifications.
The LRMP effectively managed the Funds’ liquidity risks for the twelve month period ended April 30, 2020. During this period, each Fund held more than 50% of its total net assets in highly liquid investments and due to the fact that each Fund is deemed to consist primarily of highly liquid investments, no highly liquid investment minimum was required to be established for any Fund. All Funds holding assets deemed to be illiquid were well under the illiquid investment limitation. Additionally, no events occurred that required the filing of FormN-LIQUID.
April 30, 2020 (unaudited) / ANNUAL REPORT
Shares of the Wilmington Funds are not FDIC insured or otherwise protected by the U.S. government, are not deposits or other obligations of, or guaranteed by, Manufacturers and Traders Trust Company, and are subject to investment risks, including possible loss of the principal amount invested.
VOTING PROXIES ON FUND PORTFOLIO SECURITIES
A description of the policies and procedures that the Funds use to determine how to vote proxies relating to securities held in the Funds’ portfolios is available, without charge and upon request, by calling1-800-836-2211. A report on how the Funds voted any such proxies during the most recent12-month period ended June 30 is available through Wilmington Funds’ website. Go to www.wilmingtonfunds.com select “Proxy Voting Record” to access the link. This information is also available from the Edgar database on the SEC’s website at www.sec.gov.
QUARTERLY PORTFOLIO SCHEDULE
For periods prior to the quarter ending July 31, 2019, the Funds have filed a complete schedule of portfolio holdings with the SEC for the first and third quarters of each fiscal year on FormN-Q. The Funds’ FormN-Qs are available on the SEC’s website at www.sec.gov.
Effective July 31, 2019, the Funds file a complete schedule of portfolio holdings with the SEC for the first and third quarters of each fiscal year as an exhibit to its reports on FormN-PORT. FormN-PORT is available on the SEC’s website at www.sec.gov.
Electronic Delivery
Wilmington Funds encourages you to sign up for electronic delivery of investor materials. By doing so you will receive information faster, help lower shareholder costs, and reduce the impact to the environment. To enroll in electronic delivery:
| | 1.) | Go to www.wilmingtonfunds.com and select “Individual Investors” |
| | 2.) | Click on the link “Sign up for Electronic Delivery” |
| | 3.) | Login to your account or create new user ID |
| | 4.) | SelectE-Delivery Consent from the available options, and |
| | 5.) | Complete the information requested, including providing the email address where you would like to receive notification for electronic documents. |
* If you hold your account through a financial intermediary, please contact your advisor to request electronic delivery of investor materials.
Householding
In an effort to reduce volume of mail you receive, only one copy of the prospectus, annual/semi-annual report, SAI and proxy statements will be sent to shareholders who are part of the same family and share the same address.
If you would like to request additional copies of the prospectus, annual/semi-annual report or SAI, or wish to opt out of householding mailings, please contact Shareholder Services at1-800-836-2211, or write to Wilmington Funds, P.O. Box 9828, Providence, RI 02940-8025.
ANNUAL REPORT / April 30, 2020
PRIVACY POLICY AND NOTICE
OF THE FUNDS AND THEIR DISTRIBUTOR
June 8, 2012
The Wilmington Funds, their distributor and their agents (referred to as “the Funds”, “we” or “us”) recognize that consumers (referred to as “you” or “your”) expect us to protect both your assets and financial information. We respect your right to privacy and your expectation that all personal information about you or your account will be maintained in a secure manner. We are committed to maintaining the confidentiality, security and integrity of client and shareholder information. We want you to understand the Funds’ policy that governs the handling of your information, how the Funds gather information, how that information is used and how it is kept secure.
Information The Funds Collect:
The Funds collect nonpublic personal information about you from the following sources:
| | • | | We may receive information from you, or from your financial representative, on account applications, other forms or electronically (such as through the Funds’ website or other electronic trading mechanisms). Examples of this information include your name, address, social security number, assets and income. |
| | • | | We may receive information from you, or from your financial representative, through transactions with us or others, correspondence and other communications. Examples of this information include specific investments and your account balances. |
| | • | | We may obtain other personal information from you in connection with providing you a financial product or service. Examples of this information include depository, debit or credit account numbers. |
Information Sharing Policy
The Funds may share nonpublic personal information about you, as described above, with financial ornon-financial companies or other entities, including companies that may be affiliated with the Funds and other nonaffiliated third parties, for the following purposes:
| | • | | We may share information when it is necessary and required to process a transaction or to service a customer relationship. For example, information may be shared with a company that provides account record keeping services or a company that provides proxy services to shareholders. |
| | • | | We may share information when it is required or permitted by law. For example, information may be shared in response to a subpoena or to protect you against fraud or with someone who has established a legal beneficial interest, such as a power of attorney. |
| | • | | We may disclose some or all of the information described above to companies that perform marketing or other services on our behalf. For example, we may share information about you with the financial intermediary (bank, investment bank or broker-dealer) through whom you purchased the Funds’ products or services, or with providers of marketing, legal, accounting or other professional services. The Funds will not, however, disclose a consumer’s account number or similar form of access number or access code for credit card, deposit or transaction accounts to any nonaffiliated third party for use in telemarketing, direct mail or other marketing purposes. |
Except as described above, the Funds do not share customer information. We will not rent, sell, trade, or otherwise release or disclose any personal information about you. Any information you provide to us is for the Funds’ use only. If you decide to close your account(s) or become an inactive customer, we will adhere to the privacy policies and practices as described in this notice.
Information Security:
When the Funds share nonpublic customer information with third parties hired to facilitate the delivery of certain products or services to our customers, such information is made available for limited purposes and under controlled circumstances designed to protect our customers’ privacy. We require third parties to comply with our standards regarding security and confidentiality of such information. We do not permit them to use that information for their own or any other purposes, or rent, sell, trade or otherwise release or disclose the information to any other party. These requirements are reflected in written agreements between the Funds and the third party service providers.
The Funds protect your personal information in several ways. We maintain physical, electronic, and procedural safeguards to guard your nonpublic personal information. In addition, the Funds’ Transfer Agent and Shareholder Servicing Agent have procedures in place for the appropriate disposal of nonpublic personal information when they are no longer required to maintain the information.
Each of the following sections explains an aspect of the Funds’ commitment to protecting your personal information and respecting your privacy.
Employee Access to Information:
Our Code of Ethics, which applies to all employees, restricts the use of customer information and requires that it be held in the strictest of confidence. Employee access to customer information is authorized for business purposes only, and the degree of access is based on the sensitivity of the information and on an employee’s or agent’s need to know the information in order to service a customer’s account or comply with legal requirements.
Visiting The Funds’ Website:
The Funds’ website gathers and maintains statistics about the number of visitors as well as what information is viewed most frequently. This information is used to improve the content and level of service we provide to our clients and shareholders.
April 30, 2020 / ANNUAL REPORT
| | • | | Information or data entered into a website will be retained. |
| | • | | Where registration to a website orre-entering personal information on a website is required, “cookies” are used to improve your online experience. A cookie is a way for websites to recognize whether or not you have visited the site before. It is a small file that is stored on your computer that identifies you each time youre-visit our site so you don’t have to resubmit personal information. Cookies provide faster access into the website. |
| | • | | We may also collectnon-personally identifiable Internet Protocol (“IP”) addresses for all other visitors to monitor the number of visitors to the site. Thesenon-personally identifiable IP addresses are never shared with any third party. |
E-mail:
If you have opted to receive marketing information from the Funds bye-mail, it is our policy to include instructions in all marketing messages on how to unsubscribe from subsequente-mail programs. Some products or services from the Funds are intended to be delivered and serviced electronically.E-mail communication may be utilized in such cases. If you participate in an employer-sponsored retirement plan administered by the Funds, we may, at your employer’s request, send youe-mail on matters pertaining to the retirement plan.
Please do not provide any account or personal information such as social security numbers, account numbers, or account balances within youre-mail correspondence to us. We cannot usee-mail to execute transaction instructions, provide personal account information, or change account registration. We can, however, usee-mail to provide you with the necessary forms or you may contact customer service toll-free at1-800-836-2211.
Surveys/Aggregate Data:
Periodically, the Funds may conduct surveys about financial products and services or review elements of customer information in an effort to forecast future business needs. The Funds then generate reports that include aggregate data regarding its customers. Aggregate data classifies customer information in various ways but that does not identify individual customers. These reports may also include information on website traffic patterns and related information. These reports are used for the Funds’ planning, statistical and other corporate purposes. Aggregate data may also be shared with external parties, such as marketing organizations. However, no information is shared by which any individual customer could be identified.
Changes to Our Privacy Statement:
The effective date of this policy is June 8, 2012. We reserve the right to modify this policy at any time. When it is revised or materially changed, we will update the effective date. You can determine whether there have been changes since the last time you reviewed by simply checking the effective date.
Notice will be provided to you in advance of any changes that would affect your rights under this policy statement
ANNUAL REPORT / April 30, 2020
[This Page Intentionally Left Blank]
[This Page Intentionally Left Blank]
[This Page Intentionally Left Blank]
[This Page Intentionally Left Blank]


WilmingtonLarge-Cap Strategy Fund(“Large-Cap Strategy Fund”)

[This Page Intentionally Left Blank]
Esteemed Shareholder:
I am pleased to present the Annual Report of the Wilmington Funds (the “Trust”), covering the Trust’s annual fiscal year period of May 1, 2019, through April 30, 2020. Inside you will find a comprehensive review of the Trust’s holdings and financial statements.
The economy and financial markets in review
Wilmington Funds Management Corporation and Wilmington Trust Investment Advisors, Inc. (the Trust’s investment advisor and subadvisor, respectively), have provided the following review of the economy, bond markets, and stock markets for the Trust’s annual fiscal year period.
The economy
The last year brought a tale of two narratives for the global economy. During 2019 the global economy centered on trade, as escalating frictions between the U.S. and China disrupted global supply chains and weighed heavily on sentiment. The announcement of a phase one trade deal between the two sides in October, and progression toward the deal’s completion in December, fueled hopes for the possibility of a cyclical recovery in early 2020. Despite weakness in business investment, a byproduct of the trade war, the U.S. recorded Gross Domestic Product (“GDP”) growth of 2.3% (seasonally adjusted) in 2019, thanks to notable strength in consumer spending. Optimism abruptly reversed course in late February of 2020 asCOVID-19, the infectious disease caused by the most recently discovered coronavirus, evolved from an outbreak to a global pandemic. Governments worldwide implemented strict lockdown measures to curb the virus’s spread, relegating consumers to their homes and forcingnon-essential businesses to shutter. With economic activity grinding to a near standstill by the end of March, U.S. GDP declined by 4.8% (seasonally adjusted annualized rate) in the first quarter, providing an early glimpse into what is expected to be a materially weaker second quarter. As demand receded in April, gauges of manufacturing and services activity tumbled into contraction territory, core inflation dropped by a record 0.4% (month-over-month) and the U.S. unemployment rate spiked to 14.7%, its highest level since the Great Depression.
The fiscal and monetary response in the U.S. has been unparalleled historically, in its scale and speed of implementation. After delivering three rate cuts in 2019, the Federal Reserve (the “Fed”) lowered rates further by a cumulative 150 basis points1 in the first quarter of 2020 and moved to open-ended purchases of Treasuries and agency Mortgage-Backed Securities/Collateralized Mortgage-Backed Securities. Additionally, the Fed introduced a plethora of accommodations to support financial markets, businesses and governments. The Fed entered uncharted territory by creating new facilities to purchase corporate debt and fixed income ETFs, and later broadened their scope to include segments of the high yield market. The Federal government introduced roughly $3 trillion of fiscal stimulus through three pieces of legislation to provide direct support to consumers, businesses and governments, cushion the pandemic’s economic impact and accelerate the nation’s healthcare response.
Emerging and international developed economies, which are more export dependent than the U.S., were hit particularly hard by the trade war in 2019, with the global manufacturing sector moving into contraction in the third quarter, before showing signs of life towards the end of the year. A cyclical rebound appeared to be picking up steam in China, beforeCOVID-19 emerged in its central province of Wuhan. As the first economy affected, China offered a preview to the rest of the world of the virus’s potential impact. After GDP growth decelerated in 2019, to its slowest pace in 30 years, China registered a record decline in the first quarter 2020. The Euro zone and UK economies suffered a tremendous economic toll as countrywide lockdown orders were set into motion and GDP contracted in the first quarter. Central banks outside the U.S. followed the Fed’s lead, in introducing record volumes of accommodation, while the fiscal response across international economies has been massive in scale.
Bond markets
The 2019 calendar year marked a strong period for bond markets, particularly for investment grade corporates, which posted their best annual performance since 2002 as rates fell precipitously and spreads compressed to near decade lows. However, the first quarter of 2020 brought one of the most volatile quarters in recent memory as theCOVID-19 pandemic challenged corporate balance sheets and severely hampered liquidity. Taxable corporate credit spreads (interest rate in excess of the risk-free rate) and the ratio of high gradetax-exempt yields to Treasuries of equivalent maturity surged to decade highs. The10-year Treasury yield plummeted to anall-time low as the Federal Reserve slashed rates to zero and investors sought safety. The Federal Reserve moved to open-ended quantitative easing and arranged a broad menu of facilities to enhance market liquidity and expand access to credit. The Fed’s pledge to provide direct support to corporate bond markets, for the first time in history, helped drive taxable spreads materially lower and boosted performance through the end of April. The energy sector weighed heavily on performance for corporates as the price of oil plunged to a historic record low. The more vulnerable high yield sector saw fundamentals deteriorate asymmetrically and lagged high grade peers in therisk-off environment.
PRESIDENT’S MESSAGE / April 30, 2020 (unaudited)
For the12-month period May 1, 2019 to April 30, 2020, certain Bloomberg Barclays indices performed as follows:2
| | | | | | | | |
| | | | |
Bloomberg Barclays U.S. Treasury Bond Index3 | | Bloomberg Barclays
U.S. Aggregate Bond Index4 | | Bloomberg Barclays U.S. Credit Bond
Index5 | | Bloomberg Barclays Municipal Bond Index6 | | Bloomberg Barclays
U.S. Corporate High Yield Bond Index7 |
| 14.27% | | 10.84% | | 9.37% | | 2.16% | | -4.11% |
Past performance is no guarantee of future results. Short term performance may not be indicative of long term results.
Source: Lipper. You cannot invest directly in an index.
Equity markets
The past year brought a continuation of the predominant equity market trends observed in the second half of 2018, namely the dominance of U.S. over international equities, developed over emerging markets, growth over value and large over small cap. U.S. large cap equities capped off their second best annual performance of the decade in the 2019 calendar year and benefitted from corporate earnings that came in better than feared, supportive monetary policy and trade optimism from October through January. International developed and emerging market equities, which are more leveraged to global trade, suffered disproportionately throughout theUS-China tariff disaster, while persistent dollar strength and investors’ preference for safe-haven assets presented additional headwinds for the international group. Risk appetite prevailed through January but was abruptly derailed as theCOVID-19 outbreak escalated rapidly to a global pandemic and brought the longest bull market in history to a painful end. The selloff that transpired from February to late March was indiscriminate, affecting all regions with unsettling speed and magnitude, although winners and losers emerged during the subsequent rebound from March lows. Notably, U.S. small cap companies, which are more cyclical in nature, bore the brunt of the selloff, as the pandemic introduced a punishing blow to economic activity.Mega-cap technology stocks emerged as relative safe havens and proved more resilient than the broader market with earnings less impacted by the economic damage.
For the12-month period May 1, 2019 to April 30, 2020, certain stock market indices performed as follows:
| | | | | | |
| | | |
| S&P 500 Index8 | | Russell 2000 Index9 | | MSCI EAFE (Net)
Index10 | | MSCI Emerging Markets (Net) Index11 |
| 0.86% | | -16.39% | | -11.34% | | -12.00% |
Past performance is no guarantee of future results. Short term performance may not be indicative of long term results.
Source: Lipper. You cannot invest directly in an index.
As investors know all too well, uncertainty in financial markets is certain. Other ongoing certainties include our fiduciary, clients-first mindset as we strive to manage risk in your portfolio’s assets. Another constant is our disciplined yet flexibleeconomics-led investment process that is delivered through innovative multi-asset class solutions and is designed to help you achieve your long-term objectives.
Sincerely,

Dominick J. D’Eramo, CFA
President
May 15, 2020
April 30, 2020 (unaudited) / PRESIDENT’S MESSAGE
Must be preceded or accompanied by a prospectus.
Past performance is no guarantee of future results. The index performance quoted is for illustrative purposes only and is not representative of any specific investment. Diversification does not ensure a profit nor protect against loss.
All investments involve risk, including the possible loss of principal. Equity Securities are subject to price fluctuation and possible loss of principal. Small- andmid-cap stocks involve greater risks and volatility thanlarge-cap stocks. International investments are subject to special risks, including currency fluctuations, social, economic, and political uncertainties, which could increase volatility. These risks are magnified in emerging markets.
High-yield, lower-rated securities generally entail greater market, credit, and liquidity risks than investment grade securities and may include higher volatility and higher risk of default.
1. Basis Points (“BPS”) is a unit that is equal to 1/100th of 1% and is used to denote the change in a financial instrument. The basis point is commonly used for calculating changes in interest rates, equity indices and the yield of a fixed-income security.
2. Bond prices are sensitive to changes in interest rates and a rise in interest rates can cause decline in their prices .
3. Bloomberg Barclays U.S. Treasury Bond Index is a market capitalization weighted index that includes all publicly issued, U.S. Treasury securities that have a remaining maturity of at least one year, are rated investment-grade, and have $250 million or more of outstanding face value. The index is unmanaged and investments cannot be made directly in an index.
4. Bloomberg Barclays U.S. Aggregate Bond Index is widely used benchmark index for the domestic investment-grade bond market composed of securities from the Barclays Government/Corporate Bond Index, Mortgage-Backed Securities Index and Asset-Backed Securities Index. The index typically includes fixed income securities with overall intermediate- to long-term average maturities. The index is unmanaged and investments cannot be made directly in an index.
5. Bloomberg Barclays U.S. Credit Bond Index tracks the performance of domestic investment-grade corporate bonds and is composed of all publicly issued, fixed-rate, nonconvertible, investment-grade corporate debt. The index is unmanaged and investments cannot be made directly in an index.
6. Bloomberg Barclays Municipal Bond Index tracks the performance of long-term,tax-exempt, investment-grade bond market. To be included in the index, bonds must have an outstanding par balance of at least $7 million and be issued as part of a transaction of at least $75 million. The index is unmanaged and investments cannot be made directly in an index.
7. Bloomberg Barclays U.S. Corporate High Yield Bond Index measures theUSD-denominated, high yield, fixed-rate corporate bond market. Securities are classified as high yield if the middle rating of Moody’s, Fitch, and S&P is Ba1/BB+/BB+ or below. Bonds from issuers with an emerging markets country of risk, based on the Bloomberg Barclays EM country definition, are excluded. The U.S. Corporate High Yield Bond Index is a component of the U.S. Universal and Global High Yield Indices. An investment cannot be made directly in an index.
8. The S&P 500 Index is a capitalization-weighted index of 500 stocks designed to measure performance of the broad domestic economy through changes in the aggregate market value of 500 stocks representing all major industries. The index is unmanaged and investments cannot be made directly in an index.
9. The Russell 2000 Index measures the performance of the 2,000 smallest companies in the Russell 3000 Index, which represents approximately 8% of the total market capitalization of the Russell 3000 Index. As of its latest reconstitution, the index had a total market capitalization range of $152.3 million to $5 billion.
10. MSCI EAFE (Net) Index is a free float-adjusted market capitalization index that is designed to measure equity market performance of developed markets, excluding the U.S. & Canada. The MSCI EAFE Index is an equity index which captures large andmid-cap representation across 21 Developed Market countries: Australia, Austria, Belgium, Denmark, Finland, France, Germany, Hong Kong, Ireland, Israel, Italy, Japan, Netherlands, New Zealand, Norway, Portugal, Singapore, Spain, Sweden, Switzerland and the United Kingdom. The index is unmanaged and investments cannot be made directly in an index. The performance of this index is reduced by the taxes on dividends paid by the international securities issuers in the index.
11. MSCI Emerging Markets (Net) Index is a free float-adjusted market capitalization index that is designed to measure equity market performance of emerging markets. The MSCI Emerging Markets Index captures large andmid-cap representation across 26 Emerging Market countries: Argentina, Brazil, Chile, China, Colombia, Czech Republic, Egypt, Greece, Hungary, India, Indonesia, Korea, Malaysia, Mexico, Pakistan, Peru, Philippines, Poland, Qatar, Russia, Saudi Arabia, South Africa, Taiwan, Thailand, Turkey, and United Arab Emirates. The index is unmanaged and investments cannot be made directly in an index. The performance of this index is reduced by the taxes on dividends paid by the international securities issuers in the index.
PRESIDENT’S MESSAGE / April 30, 2020 (unaudited)
1
WILMINGTONLARGE-CAP STRATEGY FUND
Management’s Discussion of Fund Performance
For the fiscal year ended April 30, 2020, WilmingtonLarge-Cap Strategy Fund (the “Fund”) had a total return of 0.09%* for Class I Shares, versus its benchmark, the Russell 1000® Index**, which had a total return of 0.09%.
The sector positioning of the Fund added approximately 25 basis points of performance versus the Russell 1000® gross of fees. Over the last year, the Fund has generally had apro-cyclical view of the market with over-weighted positions in the technology, consumer discretionary, financials, industrials, energy, communication services and healthcare sectors and underweights to the more defensive utilities, consumer staples, and real estate sectors. The overweight positions in financials, healthcare and communications services more than offset the underperformance of the utilities and consumer staples sectors which were underweight over this time period.
| * | Performance data quoted represents past performance, which is no guarantee of future results. Investment return and principal value will fluctuate so that an investor’s shares, when redeemed, may be worth more or less than their original cost. The total return shown assumes thereinvestment of all distributions and does not reflect the deduction of taxes that a shareholder would pay on fund distributions or the redemption of shares. Mutual fund performance changes over time and current performance may be lower or higher than what is stated. For the most recentmonth-end performance, please visit www.wilmingtonfunds.com or call1-800-836-2211. |
| ** | The Russell 1000® Index measures the performance of thelarge-cap segment of the U.S. equity universe. It is subset of the Russell 3000® Index and includes approximately 1,000 of the largest securities based on a combination of their market cap and current index membership. The Russell 1000® Index represents approximately 92% of the U.S. market and is constructed to provide a comprehensive and unbiased barometer for thelarge-cap segment and is completely reconstituted annually to ensure new and growing equities are reflected. The Russell 3000® Index measures the performance of the largest 3,000 U.S. companies representing approximately 98% of the investable U.S. equity market. Russell 1000® Growth Index measures the performance of those Russell 1000 companies with higherprice-to-book ratios and higher forecasted growth values. Russell 1000® Value Index measures the performance of those Russell 1000 companies with lowerprice-to-book ratios and lower forecasted growth values. |
Basis Points (“BPS”) is a unit that is equal to 1/100th of 1% and is used to denote the change in a financial instrument.
April 30, 2020 (unaudited) / ANNUAL REPORT
2
WILMINGTONLARGE-CAP STRATEGY FUND
The graph below illustrates the hypothetical investment of $1,000,0001 in the Class I Shares of the WilmingtonLarge-Cap Strategy Fund from April 30, 2010 to April 30, 2020, compared to the Russell 1000® Index.2
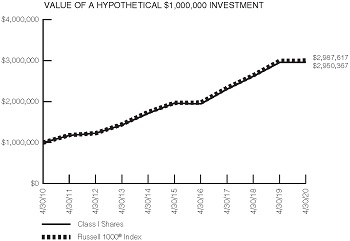
Performance data quoted represents past performance which is no guarantee of future results. Returns shown do not reflect the deduction of taxes that a shareholder would pay on Fund distributions or the redemption of Fund shares. Investment return and principal value will fluctuate so that an investor’s shares, when redeemed, may be worth more or less than their original cost. Mutual Funds are not obligations of or guaranteed by any bank and are not federally insured. Mutual fund performance changes over time and current performance may be lower or higher than what is stated. For current to the most recent month end performance, visit www.wilmingtonfunds.com or call1-800-836-2211.
| | | | | | |
| |
| | | Average Annual Total Returns for the Periods Ended 4/30/20 |
| | | |
| | | 1 Year | | 5 Years | | 10 Years |
| | | |
Class I^ | | 0.09% | | 8.56% | | 11.43% |
| | | |
Russell 1000® Index | | 0.09% | | 8.74% | | 11.57% |
^Expense Ratios Before Waivers and Expense Ratios After Waivers for Class I are 0.89% and 0.25%, respectively.
Expense Ratios Before Waiver represent the operating costs borne by the Fund, expressed as a percentage of the Fund’s average net assets, as shown in the Fees and Expenses table in the Fund’s current prospectus (under “Total Annual Fund Operating Expenses”). Current information regarding the Fund’s Operating Expenses can be found in the Fund’s Financial Highlights.
| 1 | Represents a hypothetical investment of $1,000,000 in Class I and assumes the reinvestment of all dividends and distributions. |
| 2 | The Russell 1000® Index measures the performance of the 1,000 largest companies in the Russell 3000® Index, which represents approximately 92% of the total market capitalization of the Russell 3000® Index. Please note that an investor cannot invest directly in an index. |
ANNUAL REPORT / April 30, 2020 (unaudited)
3
SHAREHOLDER EXPENSE EXAMPLE (unaudited)
As a shareholder of the Fund, you incur two types of costs: (1) transaction costs, including sales charges (loads) on purchase payments, reinvested dividends, or other distributions; and redemption fees; and (2) ongoing costs, including management fees; distribution and/or service(12b-1) fees; and other Fund expenses. This Example is intended to help you to understand your ongoing costs (in dollars) of investing in the Fund and to compare these costs with the ongoing costs of investing in other mutual funds. It is based on an investment of $1,000 invested at the beginning of the period and held for the entire period from November 1, 2019 to April 30, 2020.
Actual Expenses
This section of the following table provides information about actual account values and actual expenses. You may use the information in this section, together with the amount you invested, to estimate the expenses that you incurred over the period. Simply divide your account value by $1,000 (for example, an $8,600 account value divided by $1,000 = 8.6), then multiply the result by the number in the first section under the heading entitled “Expenses Paid During Period” to estimate the expenses attributable to your investment during this period.
Hypothetical Example for Comparison Purposes
This section of the following table provides information about hypothetical account values and hypothetical expenses based on the Fund’s actual expense ratios and assumed rates of return of 5% per year before expenses, which are not the Fund’s actual returns. Thus, you should not use the hypothetical account values and expenses to estimate the actual ending account balance or your expenses for the period. Rather, these figures are required to be provided to enable you to compare the ongoing costs of investing in the Fund with other funds. To do so, compare this 5% hypothetical example with the 5% hypothetical examples that appear in the shareholder reports of the other funds.
Please note that the expenses shown in the table are meant to highlight your ongoing costs only. Therefore, the Annualized Net Expense Ratio section of the table is useful in comparing ongoing costs only, and will not help you determine the relative total costs of owning different funds.
The Annualized Net Expense Ratios may be different from the net expense ratios in the Financial Highlights which is for the year ended April 30, 2020.
| | | | | | | | |
| | | | |
| | | Beginning Account Value 11/01/19 | | Ending Account Value 4/30/20 | | Expenses Paid During Period1 | | Annualized Net Expense Ratio2 |
WILMINGTON LARGE-CAP STRATEGY FUND | | | | | | | | |
Actual | | | | | | | | |
Class I | | $1,000.00 | | $966.90 | | $1.22 | | 0.25% |
Hypothetical (assuming a 5% return before expense) | | | | | | | | |
Class I | | $1,000.00 | | $1,023.62 | | $1.26 | | 0.25% |
| (1) | Expenses are equal to the Fund’s annualized net expense ratios, multiplied by the average account value over the period, multiplied by 182/366 (to reflect the most recentone-half year period). |
| (2) | Expense ratio does not reflect the indirect expenses of the underlying funds in which it invests. |
April 30, 2020 (unaudited) / ANNUAL REPORT
4
PORTFOLIO OF INVESTMENTS SUMMARY TABLE
WilmingtonLarge-Cap Strategy Fund
At April 30, 2020, the Fund’s sector classifications were as follows (unaudited):
| | | | | |
| | | Percentage of Total Net Assets |
Common Stocks | | | | | |
Information Technology | | | | 25.2 | % |
Health Care | | | | 15.3 | % |
Consumer Discretionary | | | | 10.8 | % |
Financials | | | | 10.7 | % |
Communication Services | | | | 10.4 | % |
Industrials | | | | 8.4 | % |
Consumer Staples | | | | 6.9 | % |
Real Estate | | | | 3.5 | % |
Utilities | | | | 3.2 | % |
Energy | | | | 2.9 | % |
Materials | | | | 2.6 | % |
Investment Companies | | | | 0.1 | % |
Rights | | | | 0.0 | %3 |
Warrant | | | | 0.0 | %3 |
Cash Equivalents1 | | | | 0.8 | % |
Other Assets and Liabilities – Net2 | | | | (0.8 | )% |
| | | | | |
TOTAL | | | | 100.0 | % |
| | | | | |
| (1) | Cash Equivalents include investments in repurchase agreements. |
| (2) | Assets, other than investments in securities, less liabilities. See Statement of Assets and Liabilities. |
| (3) | Represent less than 0.05%. |
PORTFOLIO OF INVESTMENTS
April 30, 2020
| | | | | | | | |
| | |
| Description | | Number of Shares | | | Value | |
| | |
COMMON STOCKS – 99.9% | | | | | | | | |
| | |
COMMUNICATION SERVICES – 10.4% | | | | | | | | |
|
DIVERSIFIED TELECOMMUNICATION SERVICES — 1.8% | |
| | |
AT&T, Inc. | | | 130,702 | | | $ | 3,982,490 | |
| | |
CenturyLink, Inc. | | | 18,785 | | | | 199,497 | |
| | |
GCI Liberty, Inc., Class A* | | | 1,761 | | | | 107,122 | |
| | |
Verizon Communications, Inc. | | | 74,000 | | | | 4,251,300 | |
| | | | | | | | |
| | |
| | | | | | $ | 8,540,409 | |
| | |
ENTERTAINMENT – 2.0% | | | | | | | | |
| | |
Activision Blizzard, Inc. | | | 13,670 | | | | 871,189 | |
| | |
Cinemark Holdings, Inc. | | | 1,700 | | | | 24,276 | |
| | |
Electronic Arts, Inc.* | | | 5,110 | | | | 583,869 | |
| | |
Liberty Media Corp. - Liberty Formula One, Class A* | | | 105 | | | | 3,176 | |
| | |
Liberty Media Corp. - Liberty Formula One, Class C* | | | 2,885 | | | | 92,868 | |
| | | | | | | | |
| | |
| Description | | Number of Shares | | | Value | |
| | |
Lions Gate Entertainment Corp., Class B* | | | 2,400 | | | $ | 16,032 | |
| | |
Live Nation Entertainment, Inc.* | | | 2,670 | | | | 119,803 | |
| | |
Madison Square Garden Entertainment Corp.* | | | 329 | | | | 27,208 | |
| | |
Madison Square Garden Sports Co., Class A (The)* | | | 29 | | | | 4,968 | |
| | |
Netflix, Inc.* | | | 7,500 | | | | 3,148,875 | |
| | |
Roku, Inc.* | | | 1,500 | | | | 181,845 | |
| | |
Spotify Technology SA* | | | 1,900 | | | | 287,983 | |
| | |
Take-Two Interactive Software, Inc.* | | | 1,800 | | | | 217,890 | |
| | |
Walt Disney Co. (The) | | | 31,233 | | | | 3,377,849 | |
| | |
World Wrestling Entertainment, Inc., Class A | | | 1,000 | | | | 44,470 | |
| | |
Zynga, Inc., Class A* | | | 11,300 | | | | 85,202 | |
| | | | | | | | |
| | |
| | | | | | $ | 9,087,503 | |
|
INTERACTIVE MEDIA & SERVICES – 5.1% | |
| | |
Alphabet, Inc., Class A* | | | 5,295 | | | | 7,130,777 | |
ANNUAL REPORT / April 30, 2020
| | |
| 5 | | PORTFOLIO OF INVESTMENTS |
Wilmington Large-Cap Strategy Fund (continued)
| | | | | | | | |
| | |
| Description | | Number of Shares | | | Value | |
| | |
Alphabet, Inc., Class C* | | | 5,379 | | | $ | 7,254,442 | |
| | |
Facebook, Inc., Class A* | | | 42,480 | | | | 8,696,081 | |
| | |
IAC/Interactivecorp* | | | 1,300 | | | | 290,524 | |
| | |
Match Group, Inc.#,* | | | 1,100 | | | | 84,656 | |
| | |
TripAdvisor, Inc. | | | 1,300 | | | | 25,961 | |
| | |
Twitter, Inc.* | | | 13,610 | | | | 390,335 | |
| | |
Zillow Group, Inc., Class A* | | | 2,100 | | | | 91,434 | |
| | |
Zillow Group, Inc., Class C#,* | | | 1,345 | | | | 59,126 | |
| | | | | | | | |
| | |
| | | | | | $ | 24,023,336 | |
| | |
MEDIA – 1.4% | | | | | | | | |
| | |
Altice USA, Inc., Class A* | | | 4,800 | | | | 124,656 | |
| | |
AMC Networks, Inc., Class A* | | | 1,285 | | | | 30,647 | |
| | |
Cable One, Inc. | | | 40 | | | | 76,514 | |
| | |
Charter Communications, Inc., Class A* | | | 2,702 | | | | 1,338,111 | |
| | |
Comcast Corp., Class A | | | 80,800 | | | | 3,040,504 | |
| | |
Discovery, Inc., Class A* | | | 4,100 | | | | 91,922 | |
| | |
Discovery, Inc., Class C* | | | 3,400 | | | | 69,394 | |
| | |
DISH Network Corp., Class A* | | | 4,796 | | | | 119,972 | |
| | |
Fox Corp., Class A | | | 4,476 | | | | 115,794 | |
| | |
Fox Corp., Class B | | | 1,200 | | | | 30,672 | |
| | |
Interpublic Group of Cos., Inc. (The) | | | 6,218 | | | | 105,582 | |
| | |
John Wiley & Sons, Inc., Class A | | | 200 | | | | 7,510 | |
| | |
Liberty Broadband Corp., Class A* | | | 735 | | | | 88,215 | |
| | |
Liberty Broadband Corp., Class C* | | | 1,571 | | | | 192,730 | |
| | |
Liberty Media Corp. - Liberty SiriusXM, | | | | | | | | |
| | |
Class A* | | | 843 | | | | 28,418 | |
| | |
Liberty Media Corp. - Liberty SiriusXM, | | | | | | | | |
| | |
Class C* | | | 3,786 | | | | 128,989 | |
| | |
New York Times Co. (The), Class A | | | 2,400 | | | | 78,048 | |
| | |
News Corp., Class A | | | 6,857 | | | | 67,953 | |
| | |
News Corp., Class B | | | 1,448 | | | | 14,799 | |
| | |
Nexstar Media Group, Inc., Class A | | | 650 | | | | 45,526 | |
| | |
Omnicom Group, Inc. | | | 3,790 | | | | 216,144 | |
| | |
Sinclair Broadcast Group, Inc., Class A | | | 900 | | | | 15,885 | |
| | |
Sirius XM Holdings, Inc.# | | | 28,740 | | | | 169,853 | |
| | |
ViacomCBS, Inc., Class A# | | | 900 | | | | 17,667 | |
| | |
ViacomCBS, Inc., Class B | | | 9,846 | | | | 169,942 | |
| | | | | | | | |
| | |
| | | | | | $ | 6,385,447 | |
|
WIRELESS TELECOMMUNICATION SERVICES — 0.1% | |
| | |
Telephone & Data Systems, Inc. | | | 1,550 | | | | 30,411 | |
| | |
T-Mobile US, Inc.* | | | 6,569 | | | | 576,758 | |
| | | | | | | | |
| | |
| | | | | | $ | 607,169 | |
| | | | | | | | |
| |
TOTAL COMMUNICATION SERVICES | | | $ | 48,643,864 | |
| | |
CONSUMER DISCRETIONARY – 10.8% | | | | | | | | |
| | |
AUTO COMPONENTS — 0.2% | | | | | | | | |
| | |
Adient PLC* | | | 300 | | | | 4,494 | |
| | | | | | | | |
| | |
| Description | | Number of Shares | | | Value | |
| | |
Aptiv PLC | | | 4,450 | | | $ | 309,497 | |
| | |
BorgWarner, Inc. | | | 4,380 | | | | 125,137 | |
| | |
Garrett Motion, Inc.* | | | 1,577 | | | | 8,595 | |
| | |
Gentex Corp. | | | 4,680 | | | | 113,443 | |
| | |
Goodyear Tire & Rubber Co. (The) | | | 6,100 | | | | 43,737 | |
| | |
Lear Corp. | | | 1,500 | | | | 146,475 | |
| | |
Visteon Corp.* | | | 500 | | | | 30,150 | |
| | | | | | | | |
| | |
| | | | | | $ | 781,528 | |
| | |
AUTOMOBILES — 0.6% | | | | | | | | |
| | |
Ford Motor Co. | | | 62,000 | | | | 315,580 | |
| | |
General Motors Co. | | | 22,500 | | | | 501,525 | |
| | |
Harley-Davidson, Inc. | | | 3,970 | | | | 86,665 | |
| | |
Tesla, Inc.* | | | 2,518 | | | | 1,968,774 | |
| | |
Thor Industries, Inc.# | | | 500 | | | | 33,100 | |
| | | | | | | | |
| | |
| | | | | | $ | 2,905,644 | |
| | |
DISTRIBUTORS — 0.1% | | | | | | | | |
| | |
Genuine Parts Co. | | | 2,920 | | | | 231,498 | |
| | |
LKQ Corp.* | | | 3,918 | | | | 102,456 | |
| | |
Pool Corp. | | | 300 | | | | 63,498 | |
| | | | | | | | |
| | |
| | | | | | $ | 397,452 | |
|
DIVERSIFIED CONSUMER SERVICES — 0.1% | |
| | |
Bright Horizons Family Solutions, Inc.* | | | 533 | | | | 62,068 | |
| | |
frontdoor, Inc.* | | | 1,100 | | | | 42,581 | |
| | |
Graham Holdings Co., Class B | | | 140 | | | | 54,601 | |
| | |
Grand Canyon Education, Inc.* | | | 600 | | | | 51,612 | |
| | |
H&R Block, Inc. | | | 2,500 | | | | 41,625 | |
| | |
Service Corp. International | | | 3,370 | | | | 123,814 | |
| | |
ServiceMaster Global Holdings, Inc.* | | | 2,318 | | | | 78,928 | |
| | | | | | | | |
| | |
| | | | | | $ | 455,229 | |
|
HOTELS, RESTAURANTS & LEISURE — 1.7% | |
| | |
Aramark | | | 2,833 | | | | 77,369 | |
| | |
Caesars Entertainment Corp.* | | | 11,600 | | | | 112,056 | |
| | |
Carnival Corp.# | | | 2,900 | | | | 46,110 | |
| | |
Chipotle Mexican Grill, Inc.* | | | 400 | | | | 351,420 | |
| | |
Choice Hotels International, Inc. | | | 910 | | | | 68,296 | |
| | |
Darden Restaurants, Inc. | | | 1,600 | | | | 118,064 | |
| | |
Domino’s Pizza, Inc. | | | 700 | | | | 253,351 | |
| | |
Dunkin’ Brands Group, Inc. | | | 2,100 | | | | 131,964 | |
| | |
Extended Stay America, Inc. | | | 3,800 | | | | 41,306 | |
| | |
Hilton Grand Vacations, Inc.* | | | 986 | | | | 20,312 | |
| | |
Hilton Worldwide Holdings, Inc. | | | 4,353 | | | | 329,566 | |
| | |
Hyatt Hotels Corp., Class A# | | | 1,400 | | | | 78,764 | |
| | |
International Game Technology PLC# | | | 1,173 | | | | 8,844 | |
| | |
Las Vegas Sands Corp. | | | 6,320 | | | | 303,486 | |
| | |
Marriott International, Inc., Class A | | | 5,036 | | | | 457,974 | |
April 30, 2020 / ANNUAL REPORT
| | |
| PORTFOLIO OF INVESTMENTS | | 6 |
Wilmington Large-Cap Strategy Fund (continued)
| | | | | | | | |
| | |
| Description | | Number of Shares | | | Value | |
| | |
McDonald’s Corp. | | | 13,349 | | | $ | 2,503,738 | |
| | |
MGM Resorts International | | | 10,310 | | | | 173,517 | |
| | |
Norwegian Cruise Line Holdings Ltd.* | | | 2,500 | | | | 41,000 | |
| | |
Planet Fitness, Inc., Class A* | | | 1,178 | | | | 71,069 | |
| | |
Restaurant Brands International LP | | | 47 | | | | 2,325 | |
| | |
Royal Caribbean Cruises Ltd. | | | 3,380 | | | | 158,083 | |
| | |
Six Flags Entertainment Corp. | | | 2,100 | | | | 42,021 | |
| | |
Starbucks Corp. | | | 21,290 | | | | 1,633,582 | |
| | |
Vail Resorts, Inc. | | | 628 | | | | 107,388 | |
| | |
Wendy’s Co. (The) | | | 2,115 | | | | 42,004 | |
| | |
Wyndham Destinations, Inc. | | | 2,160 | | | | 55,231 | |
| | |
Wyndham Hotels & Resorts, Inc. | | | 1,860 | | | | 70,141 | |
| | |
Wynn Resorts Ltd. | | | 768 | | | | 65,687 | |
| | |
Yum China Holdings, Inc. | | | 6,750 | | | | 327,105 | |
| | |
Yum! Brands, Inc. | | | 5,750 | | | | 496,972 | |
| | | | | | | | |
| | |
| | | | | | $ | 8,188,745 | |
| | |
HOUSEHOLD DURABLES — 0.3% | | | | | | | | |
| | |
DR Horton, Inc. | | | 5,070 | | | | 239,405 | |
| | |
Garmin Ltd. | | | 1,690 | | | | 137,160 | |
| | |
Leggett & Platt, Inc. | | | 3,570 | | | | 125,414 | |
| | |
Lennar Corp., Class A | | | 3,310 | | | | 165,732 | |
| | |
Lennar Corp., Class B | | | 1,276 | | | | 48,679 | |
| | |
Mohawk Industries, Inc.* | | | 855 | | | | 75,001 | |
| | |
Newell Brands, Inc. | | | 7,569 | | | | 105,058 | |
| | |
NVR, Inc.* | | | 30 | | | | 93,000 | |
| | |
PulteGroup, Inc. | | | 5,790 | | | | 163,683 | |
| | |
Tempur Sealy International, Inc.* | | | 1,000 | | | | 53,750 | |
| | |
Toll Brothers, Inc. | | | 3,250 | | | | 78,065 | |
| | |
Whirlpool Corp. | | | 985 | | | | 110,064 | |
| | | | | | | | |
| | |
| | | | | | $ | 1,395,011 | |
| | |
INTERNET & CATALOG RETAIL — 4.4% | | | | | | | | |
| | |
Amazon.com, Inc.* | | | 7,360 | | | | 18,208,640 | |
| | |
Booking Holdings, Inc.* | | | 730 | | | | 1,080,816 | |
| | |
eBay, Inc. | | | 14,390 | | | | 573,154 | |
| | |
Etsy, Inc.* | | | 2,200 | | | | 142,714 | |
| | |
Expedia Group, Inc. | | | 2,352 | | | | 166,945 | |
| | |
GrubHub, Inc.* | | | 1,610 | | | | 76,942 | |
| | |
Qurate Retail, Inc., Class A* | | | 5,900 | | | | 47,525 | |
| | |
Wayfair, Inc., Class A#,* | | | 948 | | | | 117,590 | |
| | | | | | | | |
| | |
| | | | | | $ | 20,414,326 | |
| |
LEISURE EQUIPMENT & PRODUCTS — 0.1% | | | | | |
| | |
Brunswick Corp. | | | 1,100 | | | | 52,492 | |
| | |
Hasbro, Inc. | | | 2,390 | | | | 172,582 | |
| | |
Mattel, Inc.* | | | 5,050 | | | | 44,036 | |
| | |
Polaris, Inc. | | | 1,300 | | | | 92,209 | |
| | | | | | | | |
| | |
| | | | | | $ | 361,319 | |
| | | | | | | | |
| | |
| Description | | Number of Shares | | | Value | |
| | |
MULTILINE RETAIL — 0.5% | | | | | | | | |
| | |
Dollar General Corp. | | | 4,600 | | | $ | 806,380 | |
| | |
Dollar Tree, Inc.* | | | 4,362 | | | | 347,521 | |
| | |
Kohl’s Corp. | | | 1,510 | | | | 27,875 | |
| | |
Macy’s, Inc.# | | | 6,180 | | | | 36,215 | |
| | |
Nordstrom, Inc.# | | | 1,780 | | | | 33,428 | |
| | |
Ollie’s Bargain Outlet Holdings, Inc.#,* | | | 673 | | | | 45,703 | |
| | |
Target Corp. | | | 8,860 | | | | 972,296 | |
| | | | | | | | |
| | |
| | | | | | $ | 2,269,418 | |
| | |
SPECIALTY RETAIL — 2.2% | | | | | | | | |
| | |
Advance Auto Parts, Inc. | | | 1,450 | | | | 175,320 | |
| | |
AutoNation, Inc.* | | | 830 | | | | 30,909 | |
| | |
AutoZone, Inc.* | | | 460 | | | | 469,347 | |
| | |
Best Buy Co., Inc. | | | 4,180 | | | | 320,731 | |
| | |
Burlington Stores, Inc.* | | | 1,300 | | | | 237,497 | |
| | |
CarMax, Inc.* | | | 3,100 | | | | 228,315 | |
| | |
Carvana Co.#,* | | | 800 | | | | 64,088 | |
| | |
Dick’s Sporting Goods, Inc. | | | 400 | | | | 11,756 | |
| | |
Five Below, Inc.* | | | 678 | | | | 61,128 | |
| | |
Floor & Decor Holdings, Inc., Class A* | | | 810 | | | | 34,344 | |
| | |
Foot Locker, Inc. | | | 1,610 | | | | 41,264 | |
| | |
Gap, Inc. (The) | | | 3,450 | | | | 28,014 | |
| | |
Home Depot, Inc. (The) | | | 19,350 | | | | 4,253,711 | |
| | |
L Brands, Inc. | | | 4,310 | | | | 51,246 | |
| | |
Lowe’s Cos., Inc. | | | 13,800 | | | | 1,445,550 | |
| | |
O’Reilly Automotive, Inc.* | | | 1,400 | | | | 540,876 | |
| | |
Ross Stores, Inc. | | | 6,440 | | | | 588,358 | |
| | |
Tiffany & Co. | | | 2,150 | | | | 271,975 | |
| | |
TJX Cos., Inc. (The) | | | 21,380 | | | | 1,048,689 | |
| | |
Tractor Supply Co. | | | 1,600 | | | | 162,288 | |
| | |
Ulta Beauty, Inc.* | | | 1,100 | | | | 239,712 | |
| | |
Urban Outfitters, Inc.#,* | | | 2,700 | | | | 46,818 | |
| | |
Williams-Sonoma, Inc.# | | | 1,110 | | | | 68,642 | |
| | | | | | | | |
| | |
| | | | | | $ | 10,420,578 | |
|
TEXTILES, APPAREL & LUXURY GOODS — 0.6% | |
| | |
Capri Holdings Ltd* | | | 2,000 | | | | 30,500 | |
| | |
Carter’s, Inc. | | | 1,200 | | | | 93,840 | |
| | |
Columbia Sportswear Co. | | | 468 | | | | 34,113 | |
| | |
Hanesbrands, Inc. | | | 6,100 | | | | 60,634 | |
| | |
Kontoor Brands, Inc. | | | 764 | | | | 14,829 | |
| | |
Lululemon Athletica, Inc.* | | | 2,000 | | | | 446,960 | |
| | |
NIKE, Inc., Class B | | | 20,640 | | | | 1,799,395 | |
| | |
PVH Corp. | | | 670 | | | | 32,984 | |
| | |
Ralph Lauren Corp. | | | 735 | | | | 54,228 | |
| | |
Skechers USA, Inc., Class A* | | | 1,843 | | | | 51,936 | |
| | |
Tapestry, Inc. | | | 3,480 | | | | 51,782 | |
ANNUAL REPORT / April 30, 2020
| | |
| 7 | | PORTFOLIO OF INVESTMENTS |
Wilmington Large-Cap Strategy Fund (continued)
| | | | | | | | |
| | |
| Description | | Number of Shares | | | Value | |
| | |
Under Armour, Inc., Class A#,* | | | 3,078 | | | $ | 32,073 | |
| | |
Under Armour, Inc., Class C* | | | 3,077 | | | | 28,524 | |
| | |
VF Corp. | | | 5,850 | | | | 339,885 | |
| | | | | | | | |
| | |
| | | | | | $ | 3,071,683 | |
| | | | | | | | |
| | |
TOTAL CONSUMER DISCRETIONARY | | | | | | $ | 50,660,933 | |
| | |
CONSUMER STAPLES — 6.9% | | | | | | | | |
| | |
BEVERAGES — 1.6% | | | | | | | | |
| | |
Brown-Forman Corp., Class A | | | 900 | | | | 51,048 | |
| | |
Brown-Forman Corp., Class B | | | 3,225 | | | | 200,595 | |
| | |
Coca-Cola Co. (The) | | | 67,500 | | | | 3,097,575 | |
| | |
Constellation Brands, Inc., Class A | | | 2,700 | | | | 444,663 | |
| | |
Keurig Dr. Pepper, Inc. | | | 2,200 | | | | 58,212 | |
| | |
Molson Coors Beverage Co., Class B | | | 3,800 | | | | 155,838 | |
| | |
Monster Beverage Corp.* | | | 6,900 | | | | 426,489 | |
| | |
PepsiCo., Inc. | | | 24,600 | | | | 3,254,334 | |
| | | | | | | | |
| | |
| | | | | | $ | 7,688,754 | |
|
FOOD & STAPLES RETAILING — 1.5% | |
| | |
Casey’s General Stores, Inc. | | | 535 | | | | 81,004 | |
| | |
Costco Wholesale Corp. | | | 7,700 | | | | 2,333,100 | |
| | |
Grocery Outlet Holding Corp.* | | | 1,100 | | | | 36,597 | |
| | |
Kroger Co. (The) | | | 14,600 | | | | 461,506 | |
| | |
Sprouts Farmers Market, Inc.* | | | 4,100 | | | | 85,198 | |
| | |
Sysco Corp. | | | 7,000 | | | | 393,890 | |
| | |
U.S. Foods Holding Corp.* | | | 3,750 | | | | 80,625 | |
| | |
Walgreens Boots Alliance, Inc. | | | 12,000 | | | | 519,480 | |
| | |
Walmart, Inc. | | | 24,400 | | | | 2,965,820 | |
| | | | | | | | |
| | |
| | | | | | $ | 6,957,220 | |
| | |
FOOD PRODUCTS — 1.2% | | | | | | | | |
| | |
Archer-Daniels-Midland Co. | | | 10,600 | | | | 393,684 | |
| | |
Beyond Meat, Inc.#,* | | | 900 | | | | 89,091 | |
| | |
Bunge Ltd. | | | 1,395 | | | | 55,340 | |
| | |
Campbell Soup Co. | | | 3,100 | | | | 154,938 | |
| | |
Conagra Brands, Inc. | | | 9,700 | | | | 324,368 | |
| | |
Flowers Foods, Inc. | | | 3,600 | | | | 80,208 | |
| | |
General Mills, Inc. | | | 9,800 | | | | 586,922 | |
| | |
Hain Celestial Group, Inc. (The)* | | | 2,200 | | | | 56,848 | |
| | |
Hershey Co. (The) | | | 2,800 | | | | 370,804 | |
| | |
Hormel Foods Corp. | | | 5,500 | | | | 257,675 | |
| | |
Ingredion, Inc. | | | 1,700 | | | | 138,040 | |
| | |
JM Smucker Co. (The) | | | 2,200 | | | | 252,802 | |
| | |
Kellogg Co. | | | 3,500 | | | | 229,250 | |
| | |
Kraft Heinz Co. (The) | | | 11,900 | | | | 360,927 | |
| | |
Lamb Weston Holdings, Inc. | | | 2,700 | | | | 165,672 | |
| | |
McCormick & Co., Inc. | | | 2,100 | | | | 329,364 | |
| | |
Mondelez International, Inc., Class A | | | 24,400 | | | | 1,255,136 | |
| | | | | | | | |
| | |
| Description | | Number of Shares | | | Value | |
| | |
Pilgrim’s Pride Corp.* | | | 1,000 | | | $ | 22,000 | |
| | |
Post Holdings, Inc.* | | | 1,038 | | | | 95,340 | |
| | |
TreeHouse Foods, Inc.* | | | 1,200 | | | | 62,076 | |
| | |
Tyson Foods, Inc., Class A | | | 4,100 | | | | 254,979 | |
| | | | | | | | |
| | |
| | | | | | $ | 5,535,464 | |
| | |
HOUSEHOLD PRODUCTS — 1.7% | | | | | | | | |
| | |
Church & Dwight Co., Inc. | | | 4,300 | | | | 300,957 | |
| | |
Clorox Co. (The) | | | 2,300 | | | | 428,812 | |
| | |
Colgate-Palmolive Co. | | | 15,000 | | | | 1,054,050 | |
| | |
Energizer Holdings, Inc.# | | | 1,400 | | | | 54,544 | |
| | |
Kimberly-Clark Corp. | | | 6,000 | | | | 830,880 | |
| | |
Procter & Gamble Co. (The) | | | 42,600 | | | | 5,021,262 | |
| | |
Spectrum Brands Holdings, Inc. | | | 875 | | | | 37,677 | |
| | | | | | | | |
| | |
| | | | | | $ | 7,728,182 | |
| | |
PERSONAL PRODUCTS — 0.2% | | | | | | | | |
| | |
Coty, Inc., Class A | | | 4,740 | | | | 25,833 | |
| | |
Estee Lauder Cos., Inc., Class A (The) | | | 3,500 | | | | 617,400 | |
| | |
Herbalife Nutrition Ltd.* | | | 2,800 | | | | 104,580 | |
| | |
Nu Skin Enterprises, Inc., Class A | | | 2,300 | | | | 67,183 | |
| | | | | | | | |
| | |
| | | | | | $ | 814,996 | |
| | |
TOBACCO — 0.7% | | | | | | | | |
| | |
Altria Group, Inc. | | | 32,900 | | | | 1,291,325 | |
| | |
Philip Morris International, Inc. | | | 27,600 | | | | 2,058,960 | |
| | | | | | | | |
| | |
| | | | | | $ | 3,350,285 | |
| | | | | | | | |
| | |
TOTAL CONSUMER STAPLES | | | | | | $ | 32,074,901 | |
| | |
ENERGY — 2.9% | | | | | | | | |
|
ENERGY EQUIPMENT & SERVICES — 0.2% | |
| | |
Apergy Corp.* | | | 1,080 | | | | 9,947 | |
| | |
Baker Hughes Co. | | | 10,300 | | | | 143,685 | |
| | |
Halliburton Co. | | | 12,013 | | | | 126,137 | |
| | |
Helmerich & Payne, Inc. | | | 3,460 | | | | 68,404 | |
| | |
National Oilwell Varco, Inc. | | | 4,848 | | | | 61,279 | |
| | |
Patterson-UTI Energy, Inc. | | | 11,500 | | | | 42,435 | |
| | |
Schlumberger Ltd. | | | 21,146 | | | | 355,676 | |
| | | | | | | | |
| | |
| | | | | | $ | 807,563 | |
| | |
OIL, GAS & CONSUMABLE FUELS — 2.7% | | | | | | | | |
| | |
Antero Midstream Corp.# | | | 9,900 | | | | 47,025 | |
| | |
Apache Corp. | | | 8,140 | | | | 106,471 | |
| | |
Cabot Oil & Gas Corp. | | | 7,700 | | | | 166,474 | |
| | |
Cheniere Energy, Inc.* | | | 4,830 | | | | 225,513 | |
| | |
Chevron Corp. | | | 33,620 | | | | 3,093,040 | |
| | |
Cimarex Energy Co. | | | 1,650 | | | | 41,943 | |
| | |
Concho Resources, Inc. | | | 3,800 | | | | 215,536 | |
| | |
ConocoPhillips | | | 19,460 | | | | 819,266 | |
| | |
Continental Resources, Inc.# | | | 1,115 | | | | 18,275 | |
April 30, 2020 / ANNUAL REPORT
| | |
| PORTFOLIO OF INVESTMENTS | | 8 |
Wilmington Large-Cap Strategy Fund (continued)
| | | | | | | | |
| | |
| Description | | Number of Shares | | | Value | |
| | |
Devon Energy Corp. | | | 6,585 | | | $ | 82,115 | |
| | |
Diamondback Energy, Inc. | | | 3,597 | | | | 156,613 | |
| | |
EOG Resources, Inc. | | | 8,580 | | | | 407,636 | |
| | |
EQT Corp. | | | 6,300 | | | | 91,917 | |
| | |
Equitrans Midstream Corp.# | | | 3,900 | | | | 32,682 | |
| | |
Exxon Mobil Corp. | | | 74,593 | | | | 3,466,337 | |
| | |
Hess Corp. | | | 4,690 | | | | 228,122 | |
| | |
HollyFrontier Corp. | | | 3,540 | | | | 116,962 | |
| | |
Kinder Morgan, Inc. | | | 33,355 | | | | 507,997 | |
| | |
Kosmos Energy Ltd. | | | 11,400 | | | | 18,810 | |
| | |
Marathon Oil Corp. | | | 14,600 | | | | 89,352 | |
| | |
Marathon Petroleum Corp. | | | 12,500 | | | | 401,000 | |
| | |
Murphy Oil Corp.# | | | 4,100 | | | | 48,626 | |
| | |
Noble Energy, Inc. | | | 5,475 | | | | 53,710 | |
| | |
Occidental Petroleum Corp. | | | 13,160 | | | | 218,456 | |
| | |
ONEOK, Inc. | | | 6,760 | | | | 202,327 | |
| | |
Parsley Energy, Inc., Class A | | | 3,600 | | | | 34,020 | |
| | |
PBF Energy, Inc., Class A | | | 3,800 | | | | 43,320 | |
| | |
Phillips 66 | | | 8,190 | | | | 599,262 | |
| | |
Pioneer Natural Resources Co. | | | 3,250 | | | | 290,258 | |
| | |
Targa Resources Corp. | | | 4,500 | | | | 58,320 | |
| | |
Valero Energy Corp. | | | 7,720 | | | | 489,062 | |
| | |
Williams Cos., Inc. (The) | | | 21,270 | | | | 412,000 | |
| | |
WPX Energy, Inc.* | | | 5,617 | | | | 34,432 | |
| | | | | | | | |
| | |
| | | | | | $ | 12,816,879 | |
| | | | | | | | |
| | |
TOTAL ENERGY | | | | | | $ | 13,624,442 | |
| | |
FINANCIALS — 10.7% | | | | | | | | |
| | |
CAPITAL MARKETS — 2.6% | | | | | | | | |
| | |
Affiliated Managers Group, Inc. | | | 870 | | | | 60,865 | |
| | |
Ameriprise Financial, Inc. | | | 2,440 | | | | 280,454 | |
| | |
Bank of New York Mellon Corp. (The) | | | 14,520 | | | | 545,081 | |
| | |
BlackRock, Inc. | | | 2,060 | | | | 1,034,202 | |
| | |
Cboe Global Markets, Inc. | | | 2,200 | | | | 218,636 | |
| | |
Charles Schwab Corp. (The) | | | 20,950 | | | | 790,234 | |
| | |
CME Group, Inc. | | | 6,300 | | | | 1,122,723 | |
| | |
E*TRADE Financial Corp. | | | 5,000 | | | | 203,050 | |
| | |
Eaton Vance Corp. | | | 1,723 | | | | 63,234 | |
| | |
FactSet Research Systems, Inc. | | | 740 | | | | 203,500 | |
| | |
Franklin Resources, Inc. | | | 3,620 | | | | 68,201 | |
| | |
Goldman Sachs Group, Inc. (The) | | | 5,740 | | | | 1,052,831 | |
| | |
Interactive Brokers Group, Inc., Class A | | | 998 | | | | 40,918 | |
| | |
Intercontinental Exchange, Inc. | | | 9,890 | | | | 884,661 | |
| | |
Invesco Ltd. | | | 4,370 | | | | 37,669 | |
| | |
Janus Henderson Group PLC | | | 1,500 | | | | 26,850 | |
| | |
Lazard Ltd., Class A | | | 1,600 | | | | 44,000 | |
| | |
Legg Mason, Inc. | | | 1,285 | | | | 64,032 | |
| | |
LPL Financial Holdings, Inc. | | | 1,500 | | | | 90,330 | |
| | | | | | | | |
| | |
| Description | | Number of Shares | | | Value | |
| | |
MarketAxess Holdings, Inc. | | | 600 | | | $ | 273,006 | |
| | |
Moody’s Corp. | | | 2,940 | | | | 717,066 | |
| | |
Morgan Stanley | | | 21,246 | | | | 837,730 | |
| | |
Morningstar, Inc. | | | 600 | | | | 93,576 | |
| | |
MSCI, Inc. | | | 1,520 | | | | 497,040 | |
| | |
Nasdaq, Inc. | | | 2,330 | | | | 255,531 | |
| | |
Northern Trust Corp. | | | 3,280 | | | | 259,645 | |
| | |
Raymond James Financial, Inc. | | | 2,710 | | | | 178,643 | |
| | |
S&P Global, Inc. | | | 4,390 | | | | 1,285,743 | |
| | |
SEI Investments Co. | | | 2,840 | | | | 144,726 | |
| | |
State Street Corp. | | | 6,070 | | | | 382,653 | |
| | |
T. Rowe Price Group, Inc. | | | 3,680 | | | | 425,518 | |
| | |
TD Ameritrade Holding Corp. | | | 4,250 | | | | 166,897 | |
| | |
Virtu Financial, Inc., Class A | | | 900 | | | | 21,033 | |
| | | | | | | | |
| | |
| | | | | | $ | 12,370,278 | |
| | |
COMMERCIAL BANKS — 1.2% | | | | | | | | |
| | |
Associated Banc-Corp. | | | 4,885 | | | | 69,074 | |
| | |
Bank of Hawaii Corp. | | | 670 | | | | 45,681 | |
| | |
Bank OZK | | | 1,700 | | | | 38,454 | |
| | |
BOK Financial Corp. | | | 1,020 | | | | 52,826 | |
| | |
CIT Group, Inc. | | | 1,500 | | | | 28,470 | |
| | |
Citizens Financial Group, Inc. | | | 8,650 | | | | 193,674 | |
| | |
Commerce Bancshares, Inc. | | | 1,177 | | | | 72,021 | |
| | |
Cullen/Frost Bankers, Inc. | | | 1,440 | | | | 103,478 | |
| | |
East West Bancorp, Inc. | | | 2,523 | | | | 88,482 | |
| | |
Fifth Third Bancorp | | | 13,750 | | | | 256,988 | |
| | |
First Citizens BancShares, Inc., Class A | | | 100 | | | | 38,200 | |
| | |
First Horizon National Corp. | | | 6,334 | | | | 57,513 | |
| | |
First Republic Bank | | | 3,400 | | | | 354,586 | |
| | |
FNB Corp. | | | 5,250 | | | | 42,473 | |
| | |
Huntington Bancshares, Inc. | | | 16,541 | | | | 152,839 | |
| | |
KeyCorp | | | 18,644 | | �� | | 217,203 | |
| | |
M&T Bank Corp.§ | | | 1,610 | | | | 180,449 | |
| | |
PacWest Bancorp | | | 1,239 | | | | 25,077 | |
| | |
People’s United Financial, Inc. | | | 7,150 | | | | 90,734 | |
| | |
Pinnacle Financial Partners, Inc. | | | 1,150 | | | | 46,288 | |
| | |
PNC Financial Services Group, Inc. (The) | | | 7,960 | | | | 849,093 | |
| | |
Popular, Inc. | | | 838 | | | | 32,338 | |
| | |
Prosperity Bancshares, Inc. | | | 1,373 | | | | 82,284 | |
| | |
Regions Financial Corp. | | | 17,956 | | | | 193,027 | |
| | |
Signature Bank | | | 1,000 | | | | 107,180 | |
| | |
SVB Financial Group* | | | 1,000 | | | | 193,170 | |
| | |
Synovus Financial Corp. | | | 2,144 | | | | 45,045 | |
| | |
TCF Financial Corp. | | | 2,433 | | | | 72,236 | |
| | |
Texas Capital Bancshares, Inc.* | | | 700 | | | | 19,446 | |
| | |
Truist Financial Corp. | | | 21,407 | | | | 798,909 | |
| | |
U.S. Bancorp | | | 22,470 | | | | 820,155 | |
ANNUAL REPORT / April 30, 2020
| | |
| 9 | | PORTFOLIO OF INVESTMENTS |
Wilmington Large-Cap Strategy Fund (continued)
| | | | | | | | |
| | |
| Description | | Number of Shares | | | Value | |
| | |
Umpqua Holdings Corp. | | | 3,200 | | | $ | 40,080 | |
| | |
Webster Financial Corp. | | | 1,350 | | | | 38,137 | |
| | |
Western Alliance Bancorp | | | 1,545 | | | | 55,435 | |
| | |
Wintrust Financial Corp. | | | 850 | | | | 35,615 | |
| | |
Zions Bancorp NA | | | 3,590 | | | | 113,480 | |
| | | | | | | | |
| | |
| | | | | | $ | 5,650,140 | |
| | |
CONSUMER FINANCE — 0.5% | | | | | | | | |
| | |
Ally Financial, Inc. | | | 5,663 | | | | 92,817 | |
| | |
American Express Co. | | | 11,940 | | | | 1,089,525 | |
| | |
Capital One Financial Corp. | | | 7,000 | | | | 453,320 | |
| | |
Credit Acceptance Corp.#,* | | | 250 | | | | 77,893 | |
| | |
Discover Financial Services | | | 6,480 | | | | 278,446 | |
| | |
LendingTree, Inc.#,* | | | 100 | | | | 24,937 | |
| | |
Navient Corp. | | | 3,060 | | | | 23,317 | |
| | |
OneMain Holdings, Inc. | | | 900 | | | | 21,789 | |
| | |
Santander Consumer USA Holdings, Inc.# | | | 1,650 | | | | 25,723 | |
| | |
SLM Corp. | | | 5,760 | | | | 48,038 | |
| | |
Synchrony Financial | | | 9,600 | | | | 189,984 | |
| | | | | | | | |
| | |
| | | | | | $ | 2,325,789 | |
|
DIVERSIFIED FINANCIAL SERVICES — 4.1% | |
| | |
Bank of America Corp. | | | 140,250 | | | | 3,373,013 | |
| | |
Berkshire Hathaway, Inc., Class B* | | | 33,996 | | | | 6,369,491 | |
| | |
Citigroup, Inc. | | | 37,682 | | | | 1,829,838 | |
| | |
Comerica, Inc. | | | 3,830 | | | | 133,514 | |
| | |
Equitable Holdings, Inc. | | | 5,193 | | | | 95,136 | |
| | |
Jefferies Financial Group, Inc. | | | 2,948 | | | | 40,447 | |
| | |
JPMorgan Chase & Co. | | | 54,620 | | | | 5,230,411 | |
| | |
Voya Financial, Inc. | | | 1,930 | | | | 87,178 | |
| | |
Wells Fargo & Co. | | | 62,675 | | | | 1,820,709 | |
| | | | | | | | |
| | |
| | | | | | $ | 18,979,737 | |
| | |
INSURANCE — 2.2% | | | | | | | | |
| | |
Aflac, Inc. | | | 13,500 | | | | 502,740 | |
| | |
Alleghany Corp. | | | 176 | | | | 93,933 | |
| | |
Allstate Corp. (The) | | | 5,880 | | | | 598,114 | |
| | |
American Financial Group, Inc. | | | 1,600 | | | | 105,984 | |
| | |
American International Group, Inc. | | | 13,580 | | | | 345,339 | |
| | |
American National Insurance Co. | | | 300 | | | | 24,150 | |
| | |
Aon PLC | | | 4,100 | | | | 707,947 | |
| | |
Arch Capital Group Ltd.* | | | 7,170 | | | | 172,295 | |
| | |
Arthur J. Gallagher & Co. | | | 3,680 | | | | 288,880 | |
| | |
Assurant, Inc. | | | 1,130 | | | | 120,051 | |
| | |
Assured Guaranty Ltd. | | | 2,650 | | | | 78,784 | |
| | |
Athene Holding Ltd., Class A* | | | 2,010 | | | | 54,270 | |
| | |
Axis Capital Holdings Ltd. | | | 2,280 | | | | 83,448 | |
| | |
Brighthouse Financial, Inc.* | | | 2,200 | | | | 56,562 | |
| | |
Brown & Brown, Inc. | | | 5,240 | | | | 188,168 | |
| | | | | | | | |
| | |
| Description | | Number of Shares | | | Value | |
| | |
Chubb Ltd. | | | 8,147 | | | $ | 879,957 | |
| | |
Cincinnati Financial Corp. | | | 3,106 | | | | 204,375 | |
| | |
CNA Financial Corp. | | | 1,050 | | | | 33,159 | |
| | |
Erie Indemnity Co., Class A | | | 670 | | | | 119,300 | |
| | |
Everest Re Group Ltd. | | | 870 | | | | 150,623 | |
| | |
Fidelity National Financial, Inc. | | | 5,341 | | | | 144,474 | |
| | |
First American Financial Corp. | | | 1,128 | | | | 52,023 | |
| | |
Globe Life, Inc. | | | 1,743 | | | | 143,519 | |
| | |
Hanover Insurance Group, Inc. (The) | | | 1,100 | | | | 110,418 | |
| | |
Hartford Financial Services Group, Inc. (The) | | | 5,090 | | | | 193,369 | |
| | |
Kemper Corp. | | | 1,028 | | | | 69,102 | |
| | |
Lincoln National Corp. | | | 3,258 | | | | 115,561 | |
| | |
Loews Corp. | | | 5,050 | | | | 175,033 | |
| | |
Markel Corp.* | | | 180 | | | | 155,851 | |
| | |
Marsh & McLennan Cos., Inc. | | | 8,890 | | | | 865,264 | |
| | |
MetLife, Inc. | | | 12,351 | | | | 445,624 | |
| | |
Old Republic International Corp. | | | 2,568 | | | | 40,960 | |
| | |
Primerica, Inc. | | | 473 | | | | 49,149 | |
| | |
Principal Financial Group, Inc. | | | 4,290 | | | | 156,199 | |
| | |
Progressive Corp. (The) | | | 10,330 | | | | 798,509 | |
| | |
Prudential Financial, Inc. | | | 6,130 | | | | 382,328 | |
| | |
Reinsurance Group of America, Inc. | | | 1,490 | | | | 155,973 | |
| | |
RenaissanceRe Holdings Ltd. | | | 578 | | | | 84,394 | |
| | |
Travelers Cos., Inc. (The) | | | 4,780 | | | | 483,784 | |
| | |
Unum Group | | | 6,010 | | | | 104,874 | |
| | |
White Mountains Insurance Group Ltd. | | | 60 | | | | 58,380 | |
| | |
Willis Towers Watson PLC | | | 2,300 | | | | 410,067 | |
| | |
WR Berkley Corp. | | | 3,270 | | | | 176,580 | |
| | | | | | | | |
| | |
| | | | | | $ | 10,179,514 | |
|
MORTGAGE REAL ESTATE INVESTMENT TRUSTS — 0.1% | |
| | |
AGNC Investment Corp. | | | 7,985 | | | | 99,174 | |
| | |
Annaly Capital Management, Inc. | | | 18,580 | | | | 116,125 | |
| | |
Chimera Investment Corp.# | | | 6,840 | | | | 53,147 | |
| | |
MFA Financial, Inc. | | | 4,400 | | | | 7,700 | |
| | |
New Residential Investment Corp.# | | | 5,600 | | | | 34,104 | |
| | |
Starwood Property Trust, Inc. | | | 918 | | | | 11,879 | |
| | | | | | | | |
| | |
| | | | | | $ | 322,129 | |
|
THRIFTS & MORTGAGE FINANCE — 0.0%** | |
| | |
MGIC Investment Corp. | | | 5,100 | | | | 37,281 | |
| | |
New York Community Bancorp, Inc. | | | 6,283 | | | | 68,233 | |
| | |
TFS Financial Corp. | | | 305 | | | | 4,163 | |
| | | | | | | | |
| | |
| | | | | | $ | 109,677 | |
| | | | | | | | |
| | |
TOTAL FINANCIALS | | | | | | $ | 49,937,264 | |
| | |
HEALTH CARE — 15.3% | | | | | | | | |
| | |
BIOTECHNOLOGY — 2.6% | | | | | | | | |
| | |
AbbVie, Inc. | | | 26,478 | | | | 2,176,492 | |
April 30, 2020 / ANNUAL REPORT
| | |
| PORTFOLIO OF INVESTMENTS | | 10 |
Wilmington Large-Cap Strategy Fund (continued)
| | | | | | | | |
| | |
| Description | | Number of Shares | | | Value | |
| | |
Agios Pharmaceuticals, Inc.* | | | 1,050 | | | $ | 43,197 | |
| | |
Alexion Pharmaceuticals, Inc.* | | | 3,690 | | | | 396,564 | |
| | |
Alkermes PLC* | | | 2,650 | | | | 36,331 | |
| | |
Alnylam Pharmaceuticals, Inc.* | | | 1,900 | | | | 250,230 | |
| | |
Amgen, Inc. | | | 10,464 | | | | 2,503,198 | |
| | |
Biogen, Inc.* | | | 3,100 | | | | 920,173 | |
| | |
BioMarin Pharmaceutical, Inc.* | | | 2,700 | | | | 248,454 | |
| | |
Bluebird Bio, Inc.* | | | 800 | | | | 43,104 | |
| | |
Exact Sciences Corp.* | | | 1,700 | | | | 134,266 | |
| | |
Exelixis, Inc.* | | | 2,600 | | | | 64,207 | |
| | |
Gilead Sciences, Inc. | | | 22,944 | | | | 1,927,296 | |
| | |
Incyte Corp.* | | | 3,260 | | | | 318,372 | |
| | |
Ionis Pharmaceuticals, Inc.* | | | 2,300 | | | | 127,719 | |
| | |
Moderna, Inc.#,* | | | 3,400 | | | | 156,366 | |
| | |
Neurocrine Biosciences, Inc.* | | | 1,800 | | | | 176,652 | |
| | |
Regeneron Pharmaceuticals, Inc.* | | | 1,500 | | | | 788,820 | |
| | |
Sage Therapeutics, Inc.* | | | 950 | | | | 37,031 | |
| | |
Sarepta Therapeutics, Inc.* | | | 1,215 | | | | 143,224 | |
| | |
Seattle Genetics, Inc.* | | | 2,000 | | | | 274,460 | |
| | |
United Therapeutics Corp.* | | | 1,140 | | | | 124,898 | |
| | |
Vertex Pharmaceuticals, Inc.* | | | 4,643 | | | | 1,166,322 | |
| | | | | | | | |
| | |
| | | | | | $ | 12,057,376 | |
|
HEALTH CARE EQUIPMENT & SUPPLIES — 3.7% | |
| | |
Abbott Laboratories | | | 30,745 | | | | 2,831,307 | |
| | |
ABIOMED, Inc.* | | | 500 | | | | 95,625 | |
| | |
Align Technology, Inc.* | | | 1,060 | | | | 227,741 | |
| | |
Baxter International, Inc. | | | 8,630 | | | | 766,171 | |
| | |
Becton Dickinson & Co. | | | 4,834 | | | | 1,220,730 | |
| | |
Boston Scientific Corp.* | | | 25,000 | | | | 937,000 | |
| | |
Cantel Medical Corp.# | | | 650 | | | | 24,050 | |
| | |
Cooper Cos., Inc. (The) | | | 950 | | | | 272,365 | |
| | |
Danaher Corp. | | | 11,080 | | | | 1,811,137 | |
| | |
DENTSPLY SIRONA, Inc. | | | 3,779 | | | | 160,381 | |
| | |
DexCom, Inc.* | | | 1,600 | | | | 536,320 | |
| | |
Edwards Lifesciences Corp.* | | | 3,672 | | | | 798,660 | |
| | |
Envista Holdings Corp.* | | | 2,250 | | | | 43,808 | |
| | |
Hill-Rom Holdings, Inc. | | | 1,260 | | | | 141,737 | |
| | |
Hologic, Inc.* | | | 4,540 | | | | 227,454 | |
| | |
ICU Medical, Inc.* | | | 400 | | | | 87,724 | |
| | |
IDEXX Laboratories, Inc.* | | | 1,580 | | | | 438,608 | |
| | |
Insulet Corp.* | | | 1,000 | | | | 199,720 | |
| | |
Integra LifeSciences Holdings Corp.* | | | 748 | | | | 38,185 | |
| | |
Intuitive Surgical, Inc.* | | | 2,000 | | | | 1,021,760 | |
| | |
Masimo Corp.* | | | 800 | | | | 171,128 | |
| | |
Medtronic PLC | | | 23,626 | | | | 2,306,606 | |
| | |
Penumbra, Inc.* | | | 700 | | | | 124,124 | |
| | | | | | | | |
| | |
| Description | | Number of Shares | | | Value | |
| | |
ResMed, Inc. | | | 2,520 | | | $ | 391,406 | |
| | |
STERIS PLC | | | 1,400 | | | | 199,500 | |
| | |
Stryker Corp. | | | 6,200 | | | | 1,155,866 | |
| | |
Teleflex, Inc. | | | 860 | | | | 288,444 | |
| | |
Varian Medical Systems, Inc.* | | | 1,850 | | | | 211,603 | |
| | |
West Pharmaceutical Services, Inc. | | | 1,200 | | | | 227,112 | |
| | |
Zimmer Biomet Holdings, Inc. | | | 3,110 | | | | 372,267 | |
| | | | | | | | |
| | |
| | | | | | $ | 17,328,539 | |
|
HEALTH CARE PROVIDERS & SERVICES — 2.9% | |
| | |
Acadia Healthcare Co., Inc.* | | | 1,100 | | | | 26,411 | |
| | |
AmerisourceBergen Corp. | | | 2,570 | | | | 230,426 | |
| | |
Anthem, Inc. | | | 4,510 | | | | 1,266,092 | |
| | |
Cardinal Health, Inc. | | | 4,120 | | | | 203,858 | |
| | |
Centene Corp.* | | | 9,930 | | | | 661,139 | |
| | |
Chemed Corp. | | | 300 | | | | 124,971 | |
| | |
Cigna Corp. | | | 6,592 | | | | 1,290,582 | |
| | |
Covetrus, Inc.* | | | 2,308 | | | | 27,442 | |
| | |
CVS Health Corp. | | | 22,471 | | | | 1,383,090 | |
| | |
DaVita, Inc.* | | | 1,988 | | | | 157,072 | |
| | |
Encompass Health Corp. | | | 1,480 | | | | 98,050 | |
| | |
Five Star Senior Living, Inc.* | | | 189 | | | | 620 | |
| | |
Guardant Health, Inc.* | | | 535 | | | | 41,174 | |
| | |
HCA Healthcare, Inc. | | | 5,000 | | | | 549,400 | |
| | |
Henry Schein, Inc.* | | | 2,720 | | | | 148,403 | |
| | |
Humana, Inc. | | | 2,430 | | | | 927,823 | |
| | |
Laboratory Corp. of America Holdings* | | | 1,857 | | | | 305,384 | |
| | |
McKesson Corp. | | | 3,000 | | | | 423,750 | |
| | |
MEDNAX, Inc.* | | | 1,190 | | | | 17,279 | |
| | |
Molina Healthcare, Inc.#,* | | | 1,200 | | | | 196,764 | |
| | |
Premier, Inc., Class A* | | | 1,000 | | | | 33,160 | |
| | |
Quest Diagnostics, Inc. | | | 2,450 | | | | 269,770 | |
| | |
UnitedHealth Group, Inc. | | | 16,720 | | | | 4,890,098 | |
| | |
Universal Health Services, Inc., Class B | | | 1,580 | | | | 166,990 | |
| | | | | | | | |
| | |
| | | | | | $ | 13,439,748 | |
| | |
HEALTH CARE TECHNOLOGY — 0.2% | | | | | | | | |
| | |
Cerner Corp. | | | 5,840 | | | | 405,238 | |
| | |
Change Healthcare, Inc.* | | | 3,200 | | | | 37,248 | |
| | |
Veeva Systems, Inc., Class A* | | | 2,320 | | | | 442,656 | |
| | | | | | | | |
| | |
| | | | | | $ | 885,142 | |
| |
LIFE SCIENCES TOOLS & SERVICES — 1.2% | | | | | |
| | |
Adaptive Biotechnologies Corp.* | | | 1,300 | | | | 41,613 | |
| | |
Agilent Technologies, Inc. | | | 5,490 | | | | 420,863 | |
| | |
Avantor, Inc.* | | | 2,945 | | | | 49,505 | |
| | |
Bio-Rad Laboratories, Inc., Class A* | | | 390 | | | | 171,639 | |
| | |
Bio-Techne Corp. | | | 500 | | | | 112,500 | |
ANNUAL REPORT / April 30, 2020
| | |
| 11 | | PORTFOLIO OF INVESTMENTS |
Wilmington Large-Cap Strategy Fund (continued)
| | | | | | | | |
| | |
| Description | | Number of Shares | | | Value | |
| | |
Bruker Corp. | | | 1,800 | | | $ | 70,776 | |
| | |
Charles River Laboratories | | | | | | | | |
| | |
International, Inc.* | | | 1,120 | | | | 162,030 | |
| | |
Illumina, Inc.* | | | 2,640 | | | | 842,239 | |
| | |
IQVIA Holdings, Inc.* | | | 2,680 | | | | 382,141 | |
| | |
Mettler-Toledo International, Inc.* | | | 420 | | | | 302,375 | |
| | |
PerkinElmer, Inc. | | | 1,970 | | | | 178,344 | |
| | |
PPD, Inc.* | | | 243 | | | | 5,808 | |
| | |
PRA Health Sciences, Inc.* | | | 475 | | | | 45,838 | |
| | |
QIAGEN NV* | | | 3,300 | | | | 137,577 | |
| | |
Thermo Fisher Scientific, Inc. | | | 7,020 | | | | 2,349,454 | |
| | |
Waters Corp.* | | | 1,310 | | | | 244,970 | |
| | | | | | | | |
| | |
| | | | | | $ | 5,517,672 | |
| | |
PHARMACEUTICALS — 4.7% | | | | | | | | |
| | |
Allergan PLC | | | 5,985 | | | | 1,121,230 | |
| | |
Bristol-Myers Squibb Co. | | | 41,026 | | | | 2,494,791 | |
| | |
Catalent, Inc.* | | | 2,400 | | | | 165,960 | |
| | |
Elanco Animal Health, Inc.* | | | 4,700 | | | | 116,137 | |
| | |
Eli Lilly & Co. | | | 15,130 | | | | 2,339,703 | |
| | |
Horizon Therapeutics PLC* | | | 3,200 | | | | 115,328 | |
| | |
Jazz Pharmaceuticals PLC* | | | 960 | | | | 105,840 | |
| | |
Johnson & Johnson | | | 46,900 | | | | 7,036,876 | |
| | |
Merck & Co., Inc. | | | 45,266 | | | | 3,591,404 | |
| | |
Mylan NV* | | | 8,288 | | | | 138,990 | |
| | |
Nektar Therapeutics#,* | | | 2,900 | | | | 55,680 | |
| | |
Perrigo Co. PLC | | | 958 | | | | 51,061 | |
| | |
Pfizer, Inc. | | | 98,803 | | | | 3,790,083 | |
| | |
Zoetis, Inc. | | | 8,681 | | | | 1,122,540 | |
| | | | | | | | |
| | |
| | | | | | $ | 22,245,623 | |
| | | | | | | | |
| | |
TOTAL HEALTH CARE | | | | | | $ | 71,474,100 | |
| | |
INDUSTRIALS — 8.4% | | | | | | | | |
| | |
AEROSPACE & DEFENSE — 1.8% | | | | | | | | |
| | |
Boeing Co. (The) | | | 9,540 | | | | 1,345,331 | |
| | |
BWX Technologies, Inc. | | | 1,655 | | | | 87,814 | |
| | |
Curtiss-Wright Corp. | | | 715 | | | | 74,110 | |
| | |
General Dynamics Corp. | | | 4,330 | | | | 565,585 | |
| | |
HEICO Corp. | | | 350 | | | | 30,660 | |
| | |
HEICO Corp., Class A | | | 1,952 | | | | 141,188 | |
| | |
Hexcel Corp. | | | 2,400 | | | | 83,016 | |
| | |
Howmet Aerospace, Inc. | | | 6,766 | | | | 88,432 | |
| | |
Huntington Ingalls Industries, Inc. | | | 845 | | | | 161,741 | |
| | |
L3Harris Technologies, Inc. | | | 3,882 | | | | 751,943 | |
| | |
Lockheed Martin Corp. | | | 4,350 | | | | 1,692,411 | |
| | |
Northrop Grumman Corp. | | | 2,770 | | | | 915,956 | |
| | |
Raytheon Technologies Corp. | | | 26,104 | | | | 1,691,800 | |
| | |
Spirit AeroSystems Holdings, Inc., Class A | | | 1,940 | | | | 42,990 | |
| | |
Teledyne Technologies, Inc.* | | | 600 | | | | 195,402 | |
| | | | | | | | |
| | |
| Description | | Number of Shares | | | Value | |
| | |
Textron, Inc. | | | 3,453 | | | $ | 91,021 | |
| | |
TransDigm Group, Inc. | | | 890 | | | | 323,141 | |
| | | | | | | | |
| | |
| | | | | | $ | 8,282,541 | |
|
AIR FREIGHT & LOGISTICS — 0.5% | |
| | |
C.H. Robinson Worldwide, Inc. | | | 1,984 | | | | 140,666 | |
| | |
Expeditors International of Washington, Inc. | | | 2,680 | | | | 191,901 | |
| | |
FedEx Corp. | | | 4,160 | | | | 527,363 | |
| | |
United Parcel Service, Inc., Class B | | | 12,130 | | | | 1,148,226 | |
| | |
XPO Logistics, Inc.* | | | 1,400 | | | | 93,436 | |
| | | | | | | | |
| | |
| | | | | | $ | 2,101,592 | |
| | |
AIRLINES — 0.2% | | | | | | | | |
| | |
Alaska Air Group, Inc. | | | 1,875 | | | | 60,975 | |
| | |
American Airlines Group, Inc.# | | | 5,243 | | | | 62,968 | |
| | |
Copa Holdings SA, Class A | | | 700 | | | | 30,947 | |
| | |
Delta Air Lines, Inc. | | | 8,990 | | | | 232,931 | |
| | |
JetBlue Airways Corp.* | | | 3,400 | | | | 33,116 | |
| | |
Southwest Airlines Co. | | | 8,730 | | | | 272,812 | |
| | |
United Airlines Holdings, Inc.* | | | 4,883 | | | | 144,439 | |
| | | | | | | | |
| | |
| | | | | | $ | 838,188 | |
| | |
BUILDING PRODUCTS — 0.4% | | | | | | | | |
| | |
A.O. Smith Corp. | | | 3,100 | | | | 131,378 | |
| | |
Allegion PLC | | | 2,033 | | | | 204,398 | |
| | |
Armstrong World Industries, Inc. | | | 778 | | | | 59,968 | |
| | |
Carrier Global Corp.* | | | 13,450 | | | | 238,200 | |
| | |
Fortune Brands Home & Security, Inc. | | | 3,160 | | | | 152,312 | |
| | |
Johnson Controls International PLC | | | 12,431 | | | | 361,866 | |
| | |
Lennox International, Inc. | | | 600 | | | | 112,008 | |
| | |
Masco Corp. | | | 5,830 | | | | 239,263 | |
| | |
Owens Corning | | | 1,148 | | | | 49,777 | |
| | |
Resideo Technologies, Inc.* | | | 1,928 | | | | 9,891 | |
| | |
Trane Technologies PLC | | | 4,650 | | | | 406,503 | |
| | | | | | | | |
| | |
| | | | | | $ | 1,965,564 | |
|
COMMERCIAL SERVICES & SUPPLIES — 0.4% | |
| | |
ADT, Inc.# | | | 410 | | | | 2,349 | |
| | |
Cintas Corp. | | | 1,620 | | | | 359,365 | |
| | |
Clean Harbors, Inc.* | | | 850 | | | | 45,416 | |
| | |
Copart, Inc.* | | | 3,600 | | | | 288,396 | |
| | |
IAA, Inc.* | | | 1,668 | | | | 64,385 | |
| | |
KAR Auction Services, Inc. | | | 3,300 | | | | 49,434 | |
| | |
Republic Services, Inc. | | | 3,740 | | | | 292,992 | |
| | |
Rollins, Inc. | | | 1,700 | | | | 68,000 | |
| | |
Stericycle, Inc.* | | | 1,485 | | | | 72,468 | |
| | |
Waste Management, Inc. | | | 7,440 | | | | 744,149 | |
| | | | | | | | |
| | |
| | | | | | $ | 1,986,954 | |
| | |
CONSTRUCTION & ENGINEERING — 0.1% | | | | | | | | |
| | |
AECOM* | | | 2,225 | | | | 80,679 | |
April 30, 2020 / ANNUAL REPORT
| | |
| PORTFOLIO OF INVESTMENTS | | 12 |
Wilmington Large-Cap Strategy Fund (continued)
| | | | | | | | |
| | |
| Description | | Number of Shares | | | Value | |
| | |
Arcosa, Inc. | | | 800 | | | $ | 29,816 | |
| | |
Fluor Corp. | | | 3,150 | | | | 36,855 | |
| | |
Jacobs Engineering Group, Inc. | | | 2,450 | | | | 202,738 | |
| | |
Quanta Services, Inc. | | | 1,388 | | | | 50,468 | |
| | |
Valmont Industries, Inc. | | | 660 | | | | 77,378 | |
| | | | | | | | |
| | |
| | | | | | $ | 477,934 | |
| | |
ELECTRICAL EQUIPMENT — 0.5% | | | | | | | | |
| | |
Acuity Brands, Inc. | | | 700 | | | | 60,613 | |
| | |
AMETEK, Inc. | | | 3,860 | | | | 323,738 | |
| | |
Eaton Corp. PLC | | | 7,478 | | | | 624,413 | |
| | |
Emerson Electric Co. | | | 10,540 | | | | 601,096 | |
| | |
GrafTech International Ltd.# | | | 1,250 | | | | 10,150 | |
| | |
Hubbell, Inc. | | | 1,290 | | | | 160,515 | |
| | |
nVent Electric PLC | | | 2,916 | | | | 54,383 | |
| | |
Regal Beloit Corp. | | | 600 | | | | 42,606 | |
| | |
Rockwell Automation, Inc. | | | 2,120 | | | | 401,698 | |
| | |
Sensata Technologies Holding PLC* | | | 2,098 | | | | 76,325 | |
| | | | | | | | |
| | |
| | | | | | $ | 2,355,537 | |
|
INDUSTRIAL CONGLOMERATES — 1.1% | |
| | |
3M Co. | | | 9,860 | | | | 1,497,931 | |
| | |
Carlisle Cos., Inc. | | | 1,090 | | | | 131,846 | |
| | |
General Electric Co. | | | 153,120 | | | | 1,041,216 | |
| | |
Honeywell International, Inc. | | | 12,770 | | | | 1,812,063 | |
| | |
Roper Technologies, Inc. | | | 1,900 | | | | 647,957 | |
| | | | | | | | |
| | |
| | | | | | $ | 5,131,013 | |
| | |
MACHINERY — 1.6% | | | | | | | | |
| | |
AGCO Corp. | | | 995 | | | | 52,576 | |
| | |
Allison Transmission Holdings, Inc. | | | 2,000 | | | | 72,680 | |
| | |
Caterpillar, Inc. | | | 9,400 | | | | 1,093,972 | |
| | |
Colfax Corp.#,* | | | 2,000 | | | | 51,580 | |
| | |
Crane Co. | | | 1,200 | | | | 65,340 | |
| | |
Cummins, Inc. | | | 2,580 | | | | 421,830 | |
| | |
Deere & Co. | | | 4,990 | | | | 723,849 | |
| | |
Donaldson Co., Inc. | | | 3,210 | | | | 140,694 | |
| | |
Dover Corp. | | | 2,860 | | | | 267,839 | |
| | |
Flowserve Corp. | | | 2,198 | | | | 61,918 | |
| | |
Fortive Corp. | | | 5,740 | | | | 367,360 | |
| | |
Gates Industrial Corp. PLC* | | | 1,200 | | | | 10,308 | |
| | |
Graco, Inc. | | | 2,720 | | | | 121,475 | |
| | |
IDEX Corp. | | | 1,520 | | | | 233,518 | |
| | |
Illinois Tool Works, Inc. | | | 5,700 | | | | 926,250 | |
| | |
Ingersoll Rand, Inc.* | | | 4,544 | | | | 132,140 | |
| | |
ITT, Inc. | | | 2,235 | | | | 117,829 | |
| | |
Lincoln Electric Holdings, Inc. | | | 1,400 | | | | 112,714 | |
| | |
Middleby Corp. (The)* | | | 850 | | | | 47,286 | |
| | |
Nordson Corp. | | | 900 | | | | 144,819 | |
| | |
Oshkosh Corp. | | | 1,390 | | | | 93,867 | |
| | | | | | | | |
| | |
| Description | | Number of Shares | | | Value | |
| | |
Otis Worldwide Corp.* | | | 6,725 | | | $ | 342,370 | |
| | |
PACCAR, Inc. | | | 5,790 | | | | 400,842 | |
| | |
Parker-Hannifin Corp. | | | 2,460 | | | | 388,975 | |
| | |
Pentair PLC | | | 1,764 | | | | 61,017 | |
| | |
Snap-on, Inc. | | | 980 | | | | 127,684 | |
| | |
Stanley Black & Decker, Inc. | | | 3,020 | | | | 332,804 | |
| | |
Timken Co. (The) | | | 1,000 | | | | 37,580 | |
| | |
Toro Co. (The) | | | 2,180 | | | | 139,106 | |
| | |
Trinity Industries, Inc.# | | | 1,200 | | | | 23,148 | |
| | |
WABCO Holdings, Inc.* | | | 850 | | | | 114,223 | |
| | |
Welbilt, Inc.* | | | 1,310 | | | | 6,458 | |
| | |
Westinghouse Air Brake Technologies Corp. | | | 3,065 | | | | 172,927 | |
| | |
Woodward, Inc. | | | 525 | | | | 31,794 | |
| | |
Xylem, Inc. | | | 3,210 | | | | 230,799 | |
| | | | | | | | |
| | |
| | | | | | $ | 7,669,571 | |
| | |
MARINE — 0.0%** | | | | | | | | |
| | |
Kirby Corp.* | | | 600 | | | | 32,052 | |
| | |
PROFESSIONAL SERVICES — 0.5% | | | | | | | | |
| | |
CoreLogic, Inc.* | | | 900 | | | | 34,578 | |
| | |
CoStar Group, Inc.* | | | 700 | | | | 453,782 | |
| | |
Equifax, Inc. | | | 2,060 | | | | 286,134 | |
| | |
IHS Markit Ltd. | | | 6,687 | | | | 450,035 | |
| | |
ManpowerGroup, Inc. | | | 1,160 | | | | 86,118 | |
| | |
Nielsen Holdings PLC | | | 4,400 | | | | 64,812 | |
| | |
Robert Half International, Inc. | | | 1,298 | | | | 61,356 | |
| | |
TransUnion | | | 3,300 | | | | 260,007 | |
| | |
Verisk Analytics, Inc. | | | 2,800 | | | | 427,924 | |
| | | | | | | | |
| | |
| | | | | | $ | 2,124,746 | |
| | |
ROAD & RAIL — 1.1% | | | | | | | | |
| | |
AMERCO | | | 113 | | | | 31,655 | |
| | |
CSX Corp. | | | 13,200 | | | | 874,236 | |
| | |
JB Hunt Transport Services, Inc. | | | 1,680 | | | | 169,882 | |
| | |
Kansas City Southern | | | 1,980 | | | | 258,489 | |
| | |
Knight-Swift Transportation Holdings, Inc. | | | 1,735 | | | | 64,507 | |
| | |
Landstar System, Inc. | | | 690 | | | | 71,284 | |
| | |
Lyft, Inc., Class A#,* | | | 3,100 | | | | 101,773 | |
| | |
Norfolk Southern Corp. | | | 4,660 | | | | 797,326 | |
| | |
Old Dominion Freight Line, Inc. | | | 1,700 | | | | 246,993 | |
| | |
Ryder System, Inc. | | | 1,090 | | | | 38,586 | |
| | |
Schneider National, Inc., Class B | | | 923 | | | | 20,223 | |
| | |
Uber Technologies, Inc.* | | | 16,200 | | | | 490,374 | |
| | |
Union Pacific Corp. | | | 12,270 | | | | 1,960,623 | |
| | | | | | | | |
| | |
| | | | | | $ | 5,125,951 | |
|
TRADING COMPANIES & DISTRIBUTORS — 0.2% | |
| | |
Air Lease Corp. | | | 1,100 | | | | 28,765 | |
ANNUAL REPORT / April 30, 2020
| | |
| 13 | | PORTFOLIO OF INVESTMENTS |
Wilmington Large-Cap Strategy Fund (continued)
| | | | | | | | |
| | |
| Description | | Number of Shares | | | Value | |
| | |
Fastenal Co. | | | 9,640 | | | $ | 349,161 | |
| | |
HD Supply Holdings, Inc.* | | | 1,803 | | | | 53,513 | |
| | |
MSC Industrial Direct Co., Inc., Class A | | | 1,090 | | | | 65,008 | |
| | |
United Rentals, Inc.* | | | 1,320 | | | | 169,620 | |
| | |
Univar Solutions, Inc.* | | | 3,200 | | | | 46,464 | |
| | |
Watsco, Inc. | | | 550 | | | | 88,544 | |
| | |
WESCO International, Inc.* | | | 400 | | | | 10,348 | |
| | |
WW Grainger, Inc. | | | 840 | | | | 231,487 | |
| | | | | | | | |
| | |
| | | | | | $ | 1,042,910 | |
| |
TRANSPORTATION INFRASTRUCTURE — 0.0%** | | | | | |
| | |
Macquarie Infrastructure Corp. | | | 1,400 | | | | 38,626 | |
| | | | | | | | |
| | |
TOTAL INDUSTRIALS | | | | | | $ | 39,173,179 | |
| | |
INFORMATION TECHNOLOGY — 25.2% | | | | | | | | |
| | |
COMMUNICATIONS EQUIPMENT — 0.9% | | | | | | | | |
| | |
Arista Networks, Inc.* | | | 1,000 | | | | 219,300 | |
| | |
Ciena Corp.* | | | 2,323 | | | | 107,439 | |
| | |
Cisco Systems, Inc. | | | 76,550 | | | | 3,244,189 | |
| | |
CommScope Holding Co., Inc.* | | | 3,000 | | | | 33,030 | |
| | |
EchoStar Corp., Class A* | | | 620 | | | | 19,561 | |
| | |
F5 Networks, Inc.* | | | 1,013 | | | | 141,070 | |
| | |
Juniper Networks, Inc. | | | 2,590 | | | | 55,944 | |
| | |
Motorola Solutions, Inc. | | | 3,030 | | | | 435,744 | |
| | |
Ubiquiti, Inc. | | | 100 | | | | 16,203 | |
| | |
ViaSat, Inc.* | | | 900 | | | | 38,160 | |
| | | | | | | | |
| | |
| | | | | | $ | 4,310,640 | |
|
ELECTRONIC EQUIPMENT, INSTRUMENTS & COMPONENTS — 0.5% | |
| | |
Amphenol Corp., Class A | | | 5,100 | | | | 450,126 | |
| | |
Arrow Electronics, Inc.* | | | 1,285 | | | | 80,852 | |
| | |
Avnet, Inc. | | | 1,600 | | | | 48,032 | |
| | |
CDW Corp. | | | 2,890 | | | | 320,212 | |
| | |
Cognex Corp. | | | 3,300 | | | | 182,292 | |
| | |
Coherent, Inc.* | | | 500 | | | | 63,935 | |
| | |
Corning, Inc. | | | 15,170 | | | | 333,892 | |
| | |
Dolby Laboratories, Inc., Class A | | | 990 | | | | 59,430 | |
| | |
FLIR Systems, Inc. | | | 1,200 | | | | 52,080 | |
| | |
IPG Photonics Corp.* | | | 700 | | | | 90,531 | |
| | |
Jabil, Inc. | | | 1,358 | | | | 38,622 | |
| | |
Keysight Technologies, Inc.* | | | 2,500 | | | | 241,925 | |
| | |
Littelfuse, Inc. | | | 93 | | | | 13,507 | |
| | |
National Instruments Corp. | | | 2,020 | | | | 77,608 | |
| | |
SYNNEX Corp. | | | 593 | | | | 51,923 | |
| | |
Trimble, Inc.* | | | 4,380 | | | | 151,679 | |
| | |
Zebra Technologies Corp., Class A* | | | 600 | | | | 137,796 | |
| | | | | | | | |
| | |
| | | | | | $ | 2,394,442 | |
| | | | | | | | |
| | |
| Description | | Number of Shares | | | Value | |
| | |
IT SERVICES — 5.6% | | | | | | | | |
| | |
Accenture PLC, Class A | | | 11,350 | | | $ | 2,101,906 | |
| | |
Akamai Technologies, Inc.* | | | 3,050 | | | | 298,016 | |
| | |
Alliance Data Systems Corp. | | | 1,290 | | | | 64,590 | |
| | |
Amdocs Ltd. | | | 2,620 | | | | 168,833 | |
| | |
Automatic Data Processing, Inc. | | | 7,730 | | | | 1,133,914 | |
| | |
Black Knight, Inc.* | | | 2,037 | | | | 143,751 | |
| | |
Booz Allen Hamilton Holding Corp. | | | 1,900 | | | | 139,536 | |
| | |
Broadridge Financial Solutions, Inc. | | | 2,330 | | | | 270,280 | |
| | |
CACI International, Inc., Class A* | | | 253 | | | | 63,285 | |
| | |
Cognizant Technology Solutions Corp., | | | | | | | | |
| | |
Class A | | | 10,410 | | | | 603,988 | |
| | |
DXC Technology Co. | | | 4,426 | | | | 80,243 | |
| | |
EPAM Systems, Inc.* | | | 900 | | | | 198,801 | |
| | |
Euronet Worldwide, Inc.* | | | 665 | | | | 61,020 | |
| | |
Fidelity National Information Services, Inc. | | | 11,150 | | | | 1,470,574 | |
| | |
Fiserv, Inc.* | | | 10,410 | | | | 1,072,855 | |
| | |
FleetCor Technologies, Inc.* | | | 1,600 | | | | 386,000 | |
| | |
Gartner, Inc.* | | | 1,600 | | | | 190,096 | |
| | |
Genpact Ltd. | | | 1,495 | | | | 51,473 | |
| | |
Global Payments, Inc. | | | 5,513 | | | | 915,268 | |
| | |
GoDaddy, Inc., Class A* | | | 2,350 | | | | 163,161 | |
| | |
International Business Machines Corp. | | | 15,360 | | | | 1,928,602 | |
| | |
Jack Henry & Associates, Inc. | | | 1,600 | | | | 261,680 | |
| | |
Leidos Holdings, Inc. | | | 2,200 | | | | 217,382 | |
| | |
Mastercard, Inc., Class A | | | 15,670 | | | | 4,308,780 | |
| | |
MongoDB, Inc.* | | | 715 | | | | 115,923 | |
| | |
Okta, Inc.* | | | 1,900 | | | | 287,470 | |
| | |
Paychex, Inc. | | | 5,670 | | | | 388,508 | |
| | |
PayPal Holdings, Inc.* | | | 20,965 | | | | 2,578,695 | |
| | |
Sabre Corp. | | | 4,050 | | | | 29,443 | |
| | |
Square, Inc., Class A* | | | 5,600 | | | | 364,784 | |
| | |
Switch, Inc., Class A | | | 500 | | | | 8,585 | |
| | |
Twilio, Inc., Class A* | | | 1,900 | | | | 213,370 | |
| | |
VeriSign, Inc.* | | | 1,950 | | | | 408,505 | |
| | |
Visa, Inc., Class A | | | 30,470 | | | | 5,445,598 | |
| | |
Western Union Co. (The) | | | 3,340 | | | | 63,694 | |
| | |
WEX, Inc.* | | | 715 | | | | 94,609 | |
| | | | | | | | |
| | |
| | | | | | $ | 26,293,218 | |
|
SEMICONDUCTORS & SEMICONDUCTOR EQUIPMENT — 4.4% | |
| | |
Advanced Micro Devices, Inc.* | | | 18,700 | | | | 979,693 | |
| | |
Analog Devices, Inc. | | | 6,452 | | | | 707,139 | |
| | |
Applied Materials, Inc. | | | 16,980 | | | | 843,566 | |
| | |
Broadcom, Inc. | | | 6,833 | | | | 1,855,979 | |
| | |
Cree, Inc.* | | | 1,675 | | | | 72,243 | |
| | |
Entegris, Inc. | | | 1,700 | | | | 92,191 | |
| | |
First Solar, Inc.* | | | 1,900 | | | | 83,619 | |
April 30, 2020 / ANNUAL REPORT
| | |
| PORTFOLIO OF INVESTMENTS | | 14 |
Wilmington Large-Cap Strategy Fund (continued)
| | | | | | | | |
| | |
| Description | | Number of Shares | | | Value | |
| | |
Intel Corp. | | | 76,370 | | | $ | 4,580,673 | |
| | |
KLA Corp. | | | 3,050 | | | | 500,475 | |
| | |
Lam Research Corp. | | | 2,680 | | | | 684,150 | |
| | |
Marvell Technology Group Ltd. | | | 11,453 | | | | 306,253 | |
| | |
Maxim Integrated Products, Inc. | | | 3,520 | | | | 193,530 | |
| | |
Microchip Technology, Inc.# | | | 4,339 | | | | 380,660 | |
| | |
Micron Technology, Inc.* | | | 20,200 | | | | 967,378 | |
| | |
MKS Instruments, Inc. | | | 683 | | | | 68,457 | |
| | |
Monolithic Power Systems, Inc. | | | 480 | | | | 95,957 | |
| | |
NVIDIA Corp. | | | 10,480 | | | | 3,063,094 | |
| | |
NXP Semiconductors NV | | | 400 | | | | 39,828 | |
| | |
ON Semiconductor Corp.* | | | 4,878 | | | | 78,268 | |
| | |
Qorvo, Inc.* | | | 2,250 | | | | 220,568 | |
| | |
QUALCOMM, Inc. | | | 20,280 | | | | 1,595,428 | |
| | |
Skyworks Solutions, Inc. | | | 3,200 | | | | 332,416 | |
| | |
Teradyne, Inc. | | | 3,650 | | | | 228,271 | |
| | |
Texas Instruments, Inc. | | | 16,600 | | | | 1,926,762 | |
| | |
Universal Display Corp. | | | 800 | | | | 120,096 | |
| | |
Xilinx, Inc. | | | 4,800 | | | | 419,520 | |
| | | | | | | | |
| | |
| | | | | | $ | 20,436,214 | |
| | |
SOFTWARE — 8.9% | | | | | | | | |
| | |
2U, Inc.* | | | 1,000 | | | | 23,750 | |
| | |
Adobe, Inc.* | | | 8,660 | | | | 3,062,522 | |
| | |
Alteryx, Inc., Class A* | | | 800 | | | | 90,544 | |
| | |
Anaplan, Inc.* | | | 968 | | | | 39,552 | |
| | |
ANSYS, Inc.* | | | 1,380 | | | | 361,325 | |
| | |
Aspen Technology, Inc.* | | | 893 | | | | 91,309 | |
| | |
Atlassian Corp. PLC, Class A* | | | 2,100 | | | | 326,529 | |
| | |
Autodesk, Inc.* | | | 4,030 | | | | 754,134 | |
| | |
Avalara, Inc.* | | | 733 | | | | 65,508 | |
| | |
Cadence Design Systems, Inc.* | | | 5,410 | | | | 438,913 | |
| | |
CDK Global, Inc. | | | 3,276 | | | | 128,681 | |
| | |
Cerence, Inc.* | | | 700 | | | | 14,812 | |
| | |
Ceridian HCM Holding, Inc.* | | | 1,375 | | | | 81,084 | |
| | |
Citrix Systems, Inc. | | | 2,290 | | | | 332,073 | |
| | |
Coupa Software, Inc.* | | | 1,000 | | | | 176,090 | |
| | |
DocuSign, Inc.* | | | 3,000 | | | | 314,250 | |
| | |
Dropbox, Inc., Class A* | | | 3,200 | | | | 67,264 | |
| | |
Dynatrace, Inc.* | | | 2,073 | | | | 61,879 | |
| | |
Elastic NV* | | | 800 | | | | 51,312 | |
| | |
Fair Isaac Corp.* | | | 400 | | | | 141,176 | |
| | |
FireEye, Inc.* | | | 2,400 | | | | 27,624 | |
| | |
Fortinet, Inc.* | | | 2,400 | | | | 258,576 | |
| | |
Guidewire Software, Inc.* | | | 1,300 | | | | 118,092 | |
| | |
HubSpot, Inc.* | | | 553 | | | | 93,252 | |
| | |
Intuit, Inc. | | | 4,500 | | | | 1,214,145 | |
| | | | | | | | |
| | |
| Description | | Number of Shares | | | Value | |
| | |
LogMeIn, Inc. | | | 657 | | | $ | 56,147 | |
| | |
Manhattan Associates, Inc.* | | | 873 | | | | 61,931 | |
| | |
Medallia, Inc.#,* | | | 950 | | | | 20,406 | |
| | |
Microsoft Corp. | | | 133,149 | | | | 23,861,632 | |
| | |
New Relic, Inc.* | | | 500 | | | | 26,845 | |
| | |
NortonLifeLock, Inc. | | | 9,620 | | | | 204,617 | |
| | |
Nuance Communications, Inc.* | | | 3,855 | | | | 77,871 | |
| | |
Nutanix, Inc., Class A* | | | 1,800 | | | | 36,882 | |
| | |
Oracle Corp. | | | 35,660 | | | | 1,888,910 | |
| | |
PagerDuty, Inc.* | | | 650 | | | | 13,722 | |
| | |
Palo Alto Networks, Inc.* | | | 1,690 | | | | 332,102 | |
| | |
Paycom Software, Inc.* | | | 900 | | | | 234,918 | |
| | |
Paylocity Holding Corp.* | | | 525 | | | | 60,128 | |
| | |
Pegasystems, Inc. | | | 620 | | | | 51,844 | |
| | |
Pluralsight, Inc., Class A#,* | | | 1,150 | | | | 18,906 | |
| | |
Proofpoint, Inc.* | | | 453 | | | | 55,144 | |
| | |
PTC, Inc.* | | | 2,100 | | | | 145,425 | |
| | |
RealPage, Inc.* | | | 935 | | | | 60,298 | |
| | |
RingCentral, Inc., Class A* | | | 1,200 | | | | 274,236 | |
| | |
salesforce.com, Inc.* | | | 15,084 | | | | 2,442,854 | |
| | |
ServiceNow, Inc.* | | | 3,400 | | | | 1,195,236 | |
| | |
Smartsheet, Inc., Class A* | | | 1,205 | | | | 63,528 | |
| | |
SolarWinds Corp.#,* | | | 173 | | | | 2,938 | |
| | |
Splunk, Inc.* | | | 2,800 | | | | 393,008 | |
| | |
SS&C Technologies Holdings, Inc. | | | 3,500 | | | | 193,060 | |
| | |
Synopsys, Inc.* | | | 2,600 | | | | 408,512 | |
| | |
Teradata Corp.* | | | 1,520 | | | | 37,377 | |
| | |
Trade Desk, Inc. (The), Class A* | | | 700 | | | | 204,806 | |
| | |
Tyler Technologies, Inc.* | | | 500 | | | | 160,345 | |
| | |
VMware, Inc., Class A#,* | | | 1,510 | | | | 198,595 | |
| | |
Workday, Inc., Class A* | | | 2,550 | | | | 392,445 | |
| | |
Zendesk, Inc.* | | | 1,765 | | | | 135,693 | |
| | |
Zscaler, Inc.* | | | 1,100 | | | | 73,788 | |
| | | | | | | | |
| | |
| | | | | | $ | 41,718,545 | |
|
TECHNOLOGY HARDWARE, STORAGE & PERIPHERALS — 4.9% | |
| | |
Apple, Inc. | | | 72,560 | | | | 21,318,128 | |
| | |
Dell Technologies, Inc., Class C* | | | 3,069 | | | | 131,016 | |
| | |
Hewlett Packard Enterprise Co. | | | 27,690 | | | | 278,561 | |
| | |
HP, Inc. | | | 28,590 | | | | 443,431 | |
| | |
NCR Corp.* | | | 2,070 | | | | 42,476 | |
| | |
NetApp, Inc. | | | 3,053 | | | | 133,630 | |
| | |
Pure Storage, Inc., Class A* | | | 2,795 | | | | 40,248 | |
| | |
Western Digital Corp. | | | 5,583 | | | | 257,265 | |
| | |
Xerox Holdings Corp. | | | 2,803 | | | | 51,267 | |
| | | | | | | | |
| | |
| | | | | | $ | 22,696,022 | |
| | | | | | | | |
| | |
TOTAL INFORMATION TECHNOLOGY | | | | | | $ | 117,849,081 | |
ANNUAL REPORT / April 30, 2020
| | |
| 15 | | PORTFOLIO OF INVESTMENTS |
Wilmington Large-Cap Strategy Fund (continued)
| | | | | | | | |
| | |
| Description | | Number of Shares | | | Value | |
| | |
MATERIALS — 2.6% | | | | | | | | |
| | |
CHEMICALS — 1.8% | | | | | | | | |
| | |
Air Products & Chemicals, Inc. | | | 4,000 | | | $ | 902,320 | |
| | |
Albemarle Corp.# | | | 2,100 | | | | 129,003 | |
| | |
Ashland Global Holdings, Inc. | | | 1,000 | | | | 61,690 | |
| | |
Axalta Coating Systems Ltd.* | | | 3,310 | | | | 65,339 | |
| | |
Cabot Corp. | | | 700 | | | | 23,723 | |
| | |
Celanese Corp. | | | 2,600 | | | | 215,982 | |
| | |
CF Industries Holdings, Inc. | | | 4,000 | | | | 110,000 | |
| | |
Chemours Co. (The) | | | 3,300 | | | | 38,709 | |
| | |
Corteva, Inc. | | | 11,512 | | | | 301,499 | |
| | |
Dow, Inc. | | | 12,279 | | | | 450,517 | |
| | |
DuPont de Nemours, Inc. | | | 12,612 | | | | 593,016 | |
| | |
Eastman Chemical Co. | | | 3,100 | | | | 187,581 | |
| | |
Ecolab, Inc. | | | 4,300 | | | | 832,050 | |
| | |
Element Solutions, Inc.* | | | 3,700 | | | | 37,925 | |
| | |
FMC Corp. | | | 2,600 | | | | 238,940 | |
| | |
Huntsman Corp. | | | 4,400 | | | | 73,964 | |
| | |
International Flavors & Fragrances, Inc.# | | | 1,700 | | | | 222,751 | |
| | |
Linde PLC | | | 9,300 | | | | 1,711,107 | |
| | |
Livent Corp.#,* | | | 47 | | | | 291 | |
| | |
LyondellBasell Industries NV, Class A | | | 3,800 | | | | 220,210 | |
| | |
Mosaic Co. (The) | | | 5,565 | | | | 64,053 | |
| | |
NewMarket Corp. | | | 100 | | | | 41,144 | |
| | |
Olin Corp.# | | | 5,000 | | | | 66,750 | |
| | |
PPG Industries, Inc. | | | 3,900 | | | | 354,237 | |
| | |
RPM International, Inc. | | | 2,700 | | | | 179,307 | |
| | |
ScottsMiracle-Gro Co. (The) | | | 545 | | | | 67,596 | |
| | |
Sherwin-Williams Co. (The) | | | 1,500 | | | | 804,555 | |
| | |
Valvoline, Inc. | | | 3,300 | | | | 56,727 | |
| | |
Westlake Chemical Corp. | | | 1,000 | | | | 43,450 | |
| | |
WR Grace & Co. | | | 800 | | | | 37,784 | |
| | | | | | | | |
| | |
| | | | | | $ | 8,132,220 | |
| | |
CONSTRUCTION MATERIALS — 0.1% | | | | | | | | |
| | |
Eagle Materials, Inc. | | | 1,000 | | | | 61,010 | |
| | |
Martin Marietta Materials, Inc. | | | 1,200 | | | | 228,276 | |
| | |
Vulcan Materials Co. | | | 1,700 | | | | 192,049 | |
| | | | | | | | |
| | |
| | | | | | $ | 481,335 | |
| | |
CONTAINERS & PACKAGING — 0.3% | | | | | | | | |
| | |
AptarGroup, Inc. | | | 565 | | | | 60,500 | |
| | |
Ardagh Group SA | | | 2,100 | | | | 26,124 | |
| | |
Avery Dennison Corp. | | | 900 | | | | 99,351 | |
| | |
Ball Corp. | | | 5,700 | | | | 373,863 | |
| | |
Berry Global Group, Inc.* | | | 1,293 | | | | 51,448 | |
| | |
Crown Holdings, Inc.* | | | 1,368 | | | | 88,113 | |
| | |
Graphic Packaging Holding Co. | | | 3,955 | | | | 52,799 | |
| | | | | | | | |
| | |
| Description | | Number of Shares | | | Value | |
| | |
International Paper Co. | | | 8,000 | | | $ | 274,000 | |
| | |
O-I Glass, Inc. | | | 1,800 | | | | 14,832 | |
| | |
Packaging Corp. of America | | | 2,000 | | | | 193,300 | |
| | |
Sealed Air Corp. | | | 3,100 | | | | 88,629 | |
| | |
Silgan Holdings, Inc. | | | 305 | | | | 10,522 | |
| | |
Sonoco Products Co. | | | 880 | | | | 42,979 | |
| | |
Westrock Co. | | | 5,600 | | | | 180,264 | |
| | | | | | | | |
| | |
| | | | | | $ | 1,556,724 | |
| | |
METALS & MINING — 0.4% | | | | | | | | |
| | |
Alcoa Corp.* | | | 6,600 | | | | 53,790 | |
| | |
Arconic Corp.* | | | 1,691 | | | | 14,746 | |
| | |
Freeport-McMoRan, Inc. | | | 26,100 | | | | 230,463 | |
| | |
Newmont Corp. | | | 14,100 | | | | 838,668 | |
| | |
Nucor Corp. | | | 6,000 | | | | 247,140 | |
| | |
Reliance Steel & Aluminum Co. | | | 1,300 | | | | 116,454 | |
| | |
Royal Gold, Inc. | | | 958 | | | | 117,384 | |
| | |
Southern Copper Corp. | | | 1,150 | | | | 37,306 | |
| | |
Steel Dynamics, Inc. | | | 3,900 | | | | 94,653 | |
| | |
United States Steel Corp.# | | | 6,000 | | | | 46,080 | |
| | | | | | | | |
| | |
| | | | | | $ | 1,796,684 | |
|
PAPER & FOREST PRODUCTS — 0.0%** | |
| | |
Domtar Corp. | | | 3,000 | | | | 70,080 | |
| | | | | | | | |
| | |
TOTAL MATERIALS | | | | | | $ | 12,037,043 | |
| | |
REAL ESTATE — 3.5% | | | | | | | | |
| |
REAL ESTATE INVESTMENT TRUSTS — 3.4% | | | | | |
| | |
Alexandria Real Estate Equities, Inc. | | | 2,315 | | | | 363,663 | |
| | |
American Campus Communities, Inc. | | | 3,600 | | | | 127,044 | |
| | |
American Homes 4 Rent, Class A | | | 2,290 | | | | 55,281 | |
| | |
American Tower Corp. | | | 7,660 | | | | 1,823,080 | |
| | |
Americold Realty Trust | | | 2,940 | | | | 89,935 | |
Apartment Investment and Management | | | | | | | | |
| | |
Co., Class A | | | 3,571 | | | | 134,520 | |
| | |
Apple Hospitality REIT, Inc. | | | 6,300 | | | | 60,984 | |
| | |
AvalonBay Communities, Inc. | | | 2,422 | | | | 394,665 | |
| | |
Boston Properties, Inc. | | | 2,350 | | | | 228,373 | |
| | |
Brandywine Realty Trust | | | 5,000 | | | | 55,800 | |
| | |
Brixmor Property Group, Inc. | | | 4,400 | | | | 50,380 | |
| | |
Brookfield Property REIT, Inc., Class A# | | | 6,100 | | | | 59,750 | |
| | |
Camden Property Trust | | | 2,070 | | | | 182,305 | |
| | |
Colony Capital, Inc. | | | 20,600 | | | | 47,586 | |
| | |
CoreSite Realty Corp. | | | 700 | | | | 84,833 | |
| | |
Corporate Office Properties Trust | | | 3,400 | | | | 89,828 | |
| | |
Cousins Properties, Inc. | | | 1,433 | | | | 43,234 | |
| | |
Crown Castle International Corp. | | | 7,440 | | | | 1,186,159 | |
| | |
CubeSmart | | | 2,233 | | | | 56,272 | |
| | |
CyrusOne, Inc. | | | 1,848 | | | | 129,637 | |
| | |
Digital Realty Trust, Inc. | | | 4,510 | | | | 674,200 | |
April 30, 2020 / ANNUAL REPORT
| | |
| PORTFOLIO OF INVESTMENTS | | 16 |
Wilmington Large-Cap Strategy Fund (continued)
| | | | | | | | |
| | |
| Description | | Number of Shares | | | Value | |
| | |
Douglas Emmett, Inc. | | | 4,110 | | | $ | 125,314 | |
| | |
Duke Realty Corp. | | | 7,610 | | | | 264,067 | |
| | |
Equinix, Inc. | | | 1,481 | | | | 999,971 | |
| | |
Equity Commonwealth | | | 3,292 | | | | 111,763 | |
| | |
Equity LifeStyle Properties, Inc. | | | 3,600 | | | | 217,116 | |
| | |
Equity Residential | | | 5,750 | | | | 374,095 | |
| | |
Essex Property Trust, Inc. | | | 1,073 | | | | 261,919 | |
| | |
Extra Space Storage, Inc. | | | 2,500 | | | | 220,600 | |
| | |
Federal Realty Investment Trust | | | 1,048 | | | | 87,267 | |
| | |
Gaming and Leisure Properties, Inc. | | | 3,292 | | | | 92,966 | |
| | |
Healthcare Trust of America, Inc., Class A | | | 3,580 | | | | 88,175 | |
| | |
Healthpeak Properties, Inc. | | | 7,530 | | | | 196,834 | |
| | |
Highwoods Properties, Inc. | | | 390 | | | | 15,136 | |
| | |
Host Hotels & Resorts, Inc. | | | 9,030 | | | | 111,159 | |
| | |
Hudson Pacific Properties, Inc. | | | 1,453 | | | | 35,715 | |
| | |
Invitation Homes, Inc. | | | 8,700 | | | | 205,755 | |
| | |
Iron Mountain, Inc.# | | | 4,556 | | | | 110,164 | |
| | |
JBG SMITH Properties | | | 1,121 | | | | 38,058 | |
| | |
Kilroy Realty Corp. | | | 2,425 | | | | 150,981 | |
| | |
Kimco Realty Corp. | | | 9,980 | | | | 108,882 | |
| | |
Lamar Advertising Co., Class A | | | 2,200 | | | | 126,830 | |
| | |
Life Storage, Inc. | | | 1,000 | | | | 87,590 | |
| | |
Macerich Co. (The)# | | | 7,500 | | | | 56,025 | |
| | |
Medical Properties Trust, Inc. | | | 6,900 | | | | 118,266 | |
| | |
Mid-America Apartment Communities, Inc. | | | 2,371 | | | | 265,362 | |
| | |
National Retail Properties, Inc. | | | 2,615 | | | | 85,354 | |
| | |
Omega Healthcare Investors, Inc. | | | 4,800 | | | | 139,920 | |
| | |
Outfront Media, Inc. | | | 2,300 | | | | 36,087 | |
| | |
Park Hotels & Resorts, Inc. | | | 5,100 | | | | 48,501 | |
| | |
Prologis, Inc. | | | 13,217 | | | | 1,179,353 | |
| | |
Public Storage | | | 2,760 | | | | 511,842 | |
| | |
Rayonier, Inc. | | | 3,715 | | | | 89,271 | |
| | |
Realty Income Corp. | | | 6,510 | | | | 357,529 | |
| | |
Regency Centers Corp. | | | 2,233 | | | | 98,051 | |
| | |
Retail Value, Inc. | | �� | 419 | | | | 6,063 | |
| | |
SBA Communications Corp. | | | 2,050 | | | | 594,336 | |
| | |
Service Properties Trust | | | 4,500 | | | | 31,185 | |
| | |
Simon Property Group, Inc. | | | 5,793 | | | | 386,799 | |
| | |
SITE Centers Corp. | | | 4,500 | | | | 27,270 | |
| | |
SL Green Realty Corp. | | | 1,990 | | | | 105,569 | |
| | |
Spirit Realty Capital, Inc. | | | 1,800 | | | | 55,368 | |
| | |
STORE Capital Corp. | | | 2,005 | | | | 40,240 | |
| | |
Sun Communities, Inc. | | | 1,900 | | | | 255,360 | |
| | |
Taubman Centers, Inc. | | | 1,200 | | | | 51,720 | |
| | |
UDR, Inc. | | | 5,980 | | | | 224,071 | |
| | |
Ventas, Inc. | | | 5,386 | | | | 174,237 | |
| | |
VEREIT, Inc. | | | 19,133 | | | | 104,849 | |
| | |
VICI Properties, Inc.# | | | 6,388 | | | | 111,279 | |
| | | | | | | | |
| | |
| Description | | Number of Shares | | | Value | |
| | |
Vornado Realty Trust | | | 2,526 | | | $ | 110,689 | |
| | |
Weingarten Realty Investors | | | 1,510 | | | | 27,467 | |
| | |
Welltower, Inc. | | | 6,470 | | | | 331,458 | |
| | |
Weyerhaeuser Co. | | | 12,342 | | | | 269,920 | |
| | |
WP Carey, Inc. | | | 2,100 | | | | 138,138 | |
| | | | | | | | |
| | |
| | | | | | $ | 15,999,465 | |
|
REAL ESTATE MANAGEMENT & DEVELOPMENT — 0.1% | |
| | |
CBRE Group, Inc., Class A* | | | 5,510 | | | | 236,544 | |
| | |
Howard Hughes Corp. (The)* | | | 658 | | | | 35,637 | |
| | |
Jones Lang LaSalle, Inc. | | | 828 | | | | 87,420 | |
| | | | | | | | |
| | |
| | | | | | $ | 359,601 | |
| | | | | | | | |
| | |
TOTAL REAL ESTATE | | | | | | $ | 16,359,066 | |
| | |
UTILITIES — 3.2% | | | | | | | | |
| | |
ELECTRIC UTILITIES — 1.9% | | | | | | | | |
| | |
Alliant Energy Corp. | | | 3,800 | | | | 184,490 | |
| | |
American Electric Power Co., Inc. | | | 8,500 | | | | 706,435 | |
| | |
Avangrid, Inc. | | | 1,200 | | | | 51,600 | |
| | |
Duke Energy Corp. | | | 12,700 | | | | 1,075,182 | |
| | |
Edison International | | | 6,300 | | | | 369,873 | |
| | |
Entergy Corp. | | | 3,700 | | | | 353,387 | |
| | |
Evergy, Inc. | | | 4,200 | | | | 245,406 | |
| | |
Eversource Energy | | | 5,800 | | | | 468,060 | |
| | |
Exelon Corp. | | | 17,600 | | | | 652,608 | |
| | |
FirstEnergy Corp. | | | 9,400 | | | | 387,938 | |
| | |
Hawaiian Electric Industries, Inc. | | | 2,900 | | | | 114,463 | |
| | |
IDACORP, Inc. | | | 1,200 | | | | 110,136 | |
| | |
NextEra Energy, Inc. | | | 8,600 | | | | 1,987,632 | |
| | |
OGE Energy Corp. | | | 3,363 | | | | 106,002 | |
| | |
PG&E Corp.* | | | 10,400 | | | | 110,656 | |
| | |
Pinnacle West Capital Corp. | | | 2,500 | | | | 192,475 | |
| | |
PPL Corp. | | | 14,500 | | | | 368,590 | |
| | |
Southern Co. (The) | | | 18,200 | | | | 1,032,486 | |
| | |
Xcel Energy, Inc. | | | 8,900 | | | | 565,684 | |
| | | | | | | | |
| | |
| | | | | | $ | 9,083,103 | |
GAS UTILITIES — 0.1% | | | | | | | | |
| | |
Atmos Energy Corp. | | | 1,600 | | | | 163,152 | |
| | |
National Fuel Gas Co. | | | 2,400 | | | | 98,400 | |
| | |
UGI Corp. | | | 4,400 | | | | 132,792 | |
| | | | | | | | |
| | |
| | | | | | $ | 394,344 | |
| |
INDEPENDENT POWER & RENEWABLE ELECTRICITY PRODUCERS — 0.1% | | | | | |
| | |
AES Corp. (The) | | | 12,200 | | | | 161,650 | |
| | |
NRG Energy, Inc. | | | 5,000 | | | | 167,650 | |
| | |
Vistra Energy Corp. | | | 4,000 | | | | 78,160 | |
| | | | | | | | |
| | |
| | | | | | $ | 407,460 | |
ANNUAL REPORT / April 30, 2020
| | |
| 17 | | PORTFOLIO OF INVESTMENTS |
Wilmington Large-Cap Strategy Fund (continued)
| | | | | | | | |
| | |
| Description | | Number of Shares | | | Value | |
| | |
MULTI-UTILITIES – 1.0% | | | | | | | | |
| | |
Ameren Corp. | | | 4,000 | | | $ | 291,000 | |
| | |
CenterPoint Energy, Inc. | | | 10,800 | | | | 183,924 | |
| | |
CMS Energy Corp. | | | 5,500 | | | | 313,995 | |
| | |
Consolidated Edison, Inc. | | | 5,600 | | | | 441,280 | |
| | |
Dominion Energy, Inc. | | | 14,343 | | | | 1,106,276 | |
| | |
DTE Energy Co. | | | 2,900 | | | | 300,846 | |
| | |
MDU Resources Group, Inc. | | | 4,000 | | | | 89,840 | |
| | |
NiSource, Inc. | | | 7,600 | | | | 190,836 | |
| | |
Public Service Enterprise Group, Inc. | | | 8,600 | | | | 436,106 | |
| | |
Sempra Energy | | | 4,700 | | | | 582,095 | |
| | |
WEC Energy Group, Inc. | | | 5,500 | | | | 498,025 | |
| | | | | | | | |
| | |
| | | | | | $ | 4,434,223 | |
| | |
WATER UTILITIES – 0.1% | | | | | | | | |
| | |
American Water Works Co., Inc. | | | 2,800 | | | | 340,732 | |
| | |
Essential Utilities, Inc. | | | 3,600 | | | | 150,444 | |
| | | | | | | | |
| | |
| | | | | | $ | 491,176 | |
| | | | | | | | |
| | |
TOTAL UTILITIES | | | | | | $ | 14,810,306 | |
| | | | | | | | |
TOTAL COMMON STOCKS (COST $208,333,008) | | | | | | $ | 466,644,179 | |
| | |
INVESTMENT COMPANIES – 0.1% | | | | | | | | |
| | |
EQUITY FUNDS – 0.1% | | | | | | | | |
| | |
iShares Russell 1000 ETF | | | 1,900 | | | | 304,399 | |
| | |
iShares Russell 1000 Growth ETF | | | 800 | | | | 138,224 | |
| | |
iShares Russell 1000 Value ETF | | | 1,300 | | | | 143,351 | |
| | | | | | | | |
| | |
TOTAL EQUITY FUNDS | | | | | | $ | 585,974 | |
| | | | | | | | |
TOTAL INVESTMENT COMPANIES (COST $557,865) | | | | | | $ | 585,974 | |
| | |
RIGHTS – 0.0%** | | | | | | | | |
| | |
Bristol-Myers Squibb Co.* | | | 13,166 | | | | 59,379 | |
| | |
Bristol-Myers Squibb Co. | | | 89 | | | | 40 | |
| | | | | | | | |
TOTAL RIGHTS (COST $30,282) | | | | | | $ | 59,419 | |
| | |
WARRANT – 0.0%** | | | | | | | | |
| | |
American International Group, Inc. CW21, Expire 1/19/21* | | | 2,055 | | | | 1,541 | |
| | | | | | | | |
| | |
TOTAL WARRANT (COST $34,935) | | | | | | $ | 1,541 | |
| | | | | | | | |
| |
TOTAL INVESTMENTS IN SECURITIES – 100.0% (COST $208,956,090) | | | $ | 467,291,113 | |
| | | | | | | | |
| | |
| Description | | Par Value | | | Value | |
|
CASH COLLATERAL INVESTED FOR SECURITIES ON LOAN – 0.8% | |
| | |
REPURCHASE AGREEMENTS – 0.8% | | | | | | | | |
| | |
BNP Paribas SA, 0.05%, dated 4/30/20, due 5/01/20, repurchase price $692,861 collateralized by U.S. Government Agency & Treasury Securities, 0.00% to 7.50%, maturing 5/15/20 to 4/20/50; total market value of $706,717. | | $ | 692,860 | | | $ | 692,860 | |
| | |
Daiwa Capital Markets America, 0.05%, dated 4/30/20, due 5/01/20, repurchase price $692,861 collateralized by U.S. Government Agency & Treasury Securities, 0.00% to 6.50%, maturing 5/07/20 to 3/01/52; total market value of $706,717. | | | 692,860 | | | | 692,860 | |
| | |
Deutsche Bank Securities, Inc., 0.03%, dated 4/30/20, due 5/01/20, repurchase price $692,861 collateralized by U.S. Government Agency & Treasury Securities, 0.43% to 8.75%, maturing 8/15/20 to 4/01/50; total market value of $706,717. | | | 692,860 | | | | 692,860 | |
| | |
HSBC Securities USA, Inc., 0.03%, dated 4/30/20, due 5/01/20, repurchase price $692,861 collateralized by U.S. Government Agency Securities, 2.45% to 5.00%, maturing 2/20/49 to 4/15/55; total market value of $706,717. | | | 692,860 | | | | 692,860 | |
| | |
Nomura Securities International, Inc., 0.04%, dated 4/30/20, due 5/01/20, repurchase price $275,826 collateralized by U.S. Government Agency & Treasury Securities, 0.00% to 8.00%, maturing 5/15/20 to 1/20/70; total market value of $281,342. | | | 275,826 | | | | 275,826 | |
| | |
RBC Dominion Securities, Inc., 0.04%, dated 4/30/20, due 5/01/20, repurchase price $692,861 collateralized by U.S. Government Agency & Treasury Securities, 0.00% to 6.00%, maturing 7/15/24 to 5/01/50; total market value of $706,717. | | | 692,860 | | | | 692,860 | |
| | | | | | | | |
| | |
TOTAL REPURCHASE AGREEMENTS
(COST $3,740,126) | | | | | | $ | 3,740,126 | |
| | | | | | | | |
| |
| TOTAL CASH COLLATERAL INVESTED FOR SECURITIES ON LOAN | | | | | |
(COST $3,740,126) | | | | | | $ | 3,740,126 | |
| | | | | | | | |
| | |
TOTAL INVESTMENTS – 100.8% | | | | | | | | |
(COST $212,696,216) | | | | | | $ | 471,031,239 | |
| |
COLLATERAL FOR SECURITIES ON LOAN – (0.8%) | | | | (3,740,126 | ) |
| |
OTHER ASSETS LESS LIABILITIES – 0.0%** | | | | 101,154 | |
| | | | | | | | |
| | |
TOTAL NET ASSETS – 100.0% | | | | | | $ | 467,392,267 | |
| | | | | | | | |
April 30, 2020 / ANNUAL REPORT
| | |
| PORTFOLIO OF INVESTMENTS | | 18 |
Wilmington Large-Cap Strategy Fund (concluded)
Cost of investments for Federal income tax purposes is $224,151,390. The net unrealized appreciation/(depreciation) of investments was $246,879,849. This consists of net unrealized appreciation from investment for those securities having an excess of value over cost of $255,887,416 and net unrealized depreciation from investments for those securities having an excess of cost over value of $(9,007,567).
Various inputs are used in determining the value of the Fund’s investments. These inputs are summarized in the three broad levels listed below.
Level 1 – quoted prices in active markets for identical securities
Level 2 – other significant observable inputs (including quoted prices for similar securities, interest rates, prepayment speeds, credit risk, etc.)
Level 3 – significant unobservable inputs (including the Fund’s own assumptions in determining the fair value of investments)
The following is a summary of the inputs used as of April 30, 2020 in valuing the Fund’s assets carried at fair value:
| | | | | | | | | | | | | | | | |
| | | | |
| | | Level 1 | | | Level 2 | | | Level 3 | | | Total | |
Investments in Securities | | | | | | | | | | | | | | | | |
Common Stocks | | $ | 466,644,179 | | | $ | — | | | $ | — | | | $ | 466,644,179 | |
Investment Companies | | | 585,974 | | | | — | | | | — | | | | 585,974 | |
Rights | | | 59,419 | | | | — | | | | — | | | | 59,419 | |
Warrant | | | 1,541 | | | | — | | | | — | | | | 1,541 | |
Repurchase Agreements | | | — | | | | 3,740,126 | | | | — | | | | 3,740,126 | |
| | | | | | | | | | | | | | | | |
Total | | $ | 467,291,113 | | | $ | 3,740,126 | | | $ | — | | | $ | 471,031,239 | |
| | | | | | | | | | | | | | | | |
| # | Security, or a portion thereof, is on loan. See Note 2 in Notes to Financial Statements. |
| * | Non-income producing security. |
| § | Affiliated company. See Note 4 in Notes to Financial Statements. |
| ** | Represents less than 0.05%. |
The following acronyms are used throughout this Fund:
| | |
| ETF | | Exchange-Traded Fund |
| LP | | Limited Partnership |
| PLC | | Public Limited Company |
| REIT | | Real Estate Investment Trust |
See Notes which are an integral part of the Financial Statements
ANNUAL REPORT / April 30, 2020
| | |
| 19 | | STATEMENT OF ASSETS AND LIABILITIES |
| | | | | | | | | | | | |
| | | |
| April 30, 2020 | | | | | | | | Wilmington
Large-Cap
Strategy Fund | |
ASSETS: | | | | | | | | | | | | |
Investments, at identified cost | | | | | | | | | | $ | 212,696,216 | (a) |
| | | | | | | | | | | | |
Investments in securities, at value (Including $3,484,447 of securities on loan) (Note 2) | | | | | | | | | | $ | 471,031,239 | (b) |
Income receivable | | | | | | | | | | | 391,709 | |
Receivable for shares sold | | | | | | | | | | | 141,461 | |
Receivable for investments sold | | | | | | | | | | | 770,502 | |
Prepaid assets | | | | | | | | | | | 24,666 | |
| | | | | | | | | | | | |
TOTAL ASSETS | | | | | | | | | | | 472,359,577 | |
| | | | | | | | | | | | |
LIABILITIES: | | | | | �� | | | | | | | |
Due to custodian | | | | | | | | | | | 517,577 | |
Collateral for securities on loan | | | | | | | | | | | 3,740,126 | |
Payable for shares redeemed | | | | | | | | | | | 471,848 | |
Payable for Trustees’ fees | | | | | | | | | | | 8,880 | |
Payable for administration fees | | | | | | | | | | | 10,873 | |
Payable for investment advisory fees | | | | | | | | | | | 71,485 | |
Other accrued expenses | | | | | | | | | | | 146,521 | |
| | | | | | | | | | | | |
TOTAL LIABILITIES | | | | | | | | | | | 4,967,310 | |
| | | | | | | | | | | | |
NET ASSETS | | | | | | | | | | $ | 467,392,267 | |
| | | | | | | | | | | | |
NET ASSETS CONSIST OF: | | | | | | | | | | | | |
Paid-in capital | | | | | | | | | | $ | 201,124,361 | |
Distributable earnings (loss) | | | | | | | | | | | 266,267,906 | |
| | | | | | | | | | | | |
TOTAL NET ASSETS | | | | | | | | | | $ | 467,392,267 | |
| | | | | | | | | | | | |
COMPUTATION OF NET ASSET VALUE AND OFFERING PRICE: | | | | | | | | | | | | |
Class I | | | | | | | | | | | | |
Net Assets | | | | | | | | | | $ | 467,392,267 | |
| | | | | | | | | | | | |
Shares outstanding (unlimited shares authorized) | | | | | | | | | | | 21,164,094 | |
| | | | | | | | | | | | |
Net Asset Value and Offering Price per share | | | | | | | | | | $ | 22.08 | |
| | | | | | | | | | | | |
(a) Includes $127,293 of investments in affiliated issuers.
(b) Includes $180,449 of investments in affiliated issuers.
See Notes which are an integral part of the Financial Statements
April 30, 2020 / ANNUAL REPORT
| | |
| STATEMENT OF OPERATIONS | | 20 |
| | | | | | | | | | | | |
| | | |
| Year Ended April 30, 2020 | | | | | | | | Wilmington Large-Cap Strategy Fund | |
INVESTMENT INCOME: | | | | | | | | | | | | |
Dividends | | | | | | | | | | $ | 9,910,315 | (a)(b) |
Securities lending income, net | | | | | | | | | | | 23,501 | |
| | | | | | | | | | | | |
TOTAL INVESTMENT INCOME | | | | | | | | | | | 9,933,816 | |
| | | | | | | | | | | | |
EXPENSES: | | | | | | | | | | | | |
Investment advisory fees | | | | | | | | | | | 2,555,024 | |
Administration fees | | | | | | | | | | | 157,179 | |
Portfolio accounting and administration fees | | | | | | | | | | | 111,825 | |
Custodian fees | | | | | | | | | | | 9,703 | |
Transfer and dividend disbursing agent fees and expenses | | | | | | | | | | | 84,666 | |
Trustees’ fees | | | | | | | | | | | 54,269 | |
Professional fees | | | | | | | | | | | 80,118 | |
Shareholder services fee— Class I | | | | | | | | | | | 1,277,512 | |
Share registration costs | | | | | | | | | | | 15,463 | |
Printing and postage | | | | | | | | | | | 26,193 | |
Miscellaneous | | | | | | | | | | | 38,485 | |
| | | | | | | | | | | | |
TOTAL EXPENSES | | | | | | | | | | | 4,410,437 | |
| | | | | | | | | | | | |
WAIVERS AND REIMBURSEMENTS: | | | | | | | | | | | | |
Waiver/reimbursement by investment advisor | | | | | | | | | | | (1,855,413 | ) |
Waiver of shareholder services fee—Class I | | | | | | | | | | | (1,277,512 | ) |
| | | | | | | | | | | | |
TOTAL WAIVERS AND REIMBURSEMENTS | | | | | | | | | | | (3,132,925 | ) |
| | | | | | | | | | | | |
Net expenses | | | | | | | | | | | 1,277,512 | |
| | | | | | | | | | | | |
Net investment income | | | | | | | | | | | 8,656,304 | |
| | | | | | | | | | | | |
REALIZED AND UNREALIZED GAIN (LOSS) ON INVESTMENTS: | | | | | | | | | | | | |
Net realized gain (loss) on investments | | | | | | | | | | | 33,340,874 | |
Litigation proceeds | | | | | | | | | | | 49,158 | (c) |
Net change in unrealized appreciation (depreciation) of unaffiliated investments | | | | | | | | | | | (37,788,046 | ) |
Net change in unrealized appreciation (depreciation) of affiliated investments | | | | | | | | | | | (93,364 | ) |
| | | | | | | | | | | | |
Net realized and unrealized gain (loss) on investments | | | | | | | | | | | (4,491,378 | ) |
| | | | | | | | | | | | |
Change in net assets resulting from operations | | | | | | | | | | $ | 4,164,926 | |
| | | | | | | | | | | | |
(a) Net of foreign withholding taxes withheld of $913.
(b) Includes $6,762 received from affiliated issuers.
(c) The Litigation proceeds represent a class action settlement received by the Fund.
See Notes which are an integral part of the Financial Statements
ANNUAL REPORT / April 30, 2020
| | |
| 21 | | STATEMENTS OF CHANGES IN NET ASSETS |
| | | | | | | | | | | | | | | | | | | | |
| | |
| | | | | | Wilmington Large-Cap Strategy Fund | |
| | | | | |
| | | | | | Year Ended April 30, 2020 | | | | | | | | | Year Ended April 30, 2019 | |
OPERATIONS: | | | | | | | | | | | | | | | | | | | | |
Net investment income | | | | | | $ | 8,656,304 | | | | | | | | | | | $ | 8,345,207 | |
Net realized gain (loss) on investments(a) | | | | | | | 33,390,032 | | | | | | | | | | | | 16,510,751 | |
Net change in unrealized appreciation (depreciation) of investments | | | | | | | (37,881,410 | ) | | | | | | | | | | | 37,629,472 | |
| | | | | | | | | | | | | | | | | | | | |
Change in net assets resulting from operations | | | | | | | 4,164,926 | | | | | | | | | | | | 62,485,430 | |
| | | | | | | | | | | | | | | | | | | | |
DISTRIBUTIONS TO SHAREHOLDERS: | | | | | | | | | | | | | | | | | | | | |
Class I | | | | | | | (29,545,889 | ) | | | | | | | | | | | (28,934,670 | ) |
| | | | | | | | | | | | | | | | | | | | |
| | | | | |
Total distributions to shareholders: | | | | | | | (29,545,889 | ) | | | | | | | | | | | (28,934,670 | ) |
| | | | | | | | | | | | | | | | | | | | |
SHARE TRANSACTIONS: | | | | | | | | | | | | | | | | | | | | |
Proceeds from sale of shares | | | | | | | | | | | | | | | | | | | | |
Class I | | | | | | | 54,361,316 | | | | | | | | | | | | 51,608,401 | |
Distributions reinvested | | | | | | | | | | | | | | | | | | | | |
Class I | | | | | | | 18,763,388 | | | | | | | | | | | | 18,522,932 | |
Cost of shares redeemed | | | | | | | | | | | | | | | | | | | | |
Class I | | | | | | | (108,169,702 | ) | | | | | | | | | | | (79,877,605 | ) |
| | | | | | | | | | | | | | | | | | | | |
Change in net assets resulting from share transactions | | | | | | | (35,044,998 | ) | | | | | | | | | | | (9,746,272 | ) |
| | | | | | | | | | | | | | | | | | | | |
Change in net assets | | | | | | | (60,425,961 | ) | | | | | | | | | | | 23,804,488 | |
NET ASSETS: | | | | | | | | | | | | | | | | | | | | |
Beginning of year | | | | | | | 527,818,228 | | | | | | | | | | | | 504,013,740 | |
| | | | | | | | | | | | | | | | | | | | |
End of year | | | | | | $ | 467,392,267 | | | | | | | | | | | $ | 527,818,228 | |
| | | | | | | | | | | | | | | | | | | | |
SHARES OF BENEFICIAL INTEREST: | | | | | | | | | | | | | | | | | | | | |
Shares sold | | | | | | | | | | | | | | | | | | | | |
Class I | | | | | | | 2,532,501 | | | | | | | | | | | | 2,338,158 | |
Distributions reinvested | | | | | | | | | | | | | | | | | | | | |
Class I | | | | | | | 795,091 | | | | | | | | | | | | 882,373 | |
Shares redeemed | | | | | | | | | | | | | | | | | | | | |
Class I | | | | | | | (4,756,535 | ) | | | | | | | | | | | (3,560,522 | ) |
| | | | | | | | | | | | | | | | | | | | |
Net change resulting from share transactions | | | | | | | (1,428,943 | ) | | | | | | | | | | | (339,991 | ) |
| | | | | | | | | | | | | | | | | | | | |
| (a) | Includes Litigation settlement. |
See Notes which are an integral part of the Financial Statements
April 30, 2020 / ANNUAL REPORT
For a share outstanding throughout each year ended April 30, unless otherwise noted:
| | | | | | | | | | | | | | | | | | | | |
|
| WILMINGTONLARGE-CAP STRATEGY FUND | |
| |
| | | | | |
| CLASS I | | Year Ended April 30, 2020 | | | Year Ended April 30, 2019 | | | Year Ended April 30, 2018 | | | Year Ended April 30, 2017 | | | Year Ended April 30, 2016 | |
Net Asset Value, Beginning of Year | | | $23.36 | | | | $21.98 | | | | $19.65 | | | | $16.91 | | | | $18.46 | |
Income (Loss) From Operations: | | | | | | | | | | | | | | | | | | | | |
Net Investment Income(a) | | | 0.39 | | | | 0.37 | | | | 0.34 | | | | 0.32 | | | | 0.29 | |
Net Realized and Unrealized Gain (Loss) on Investments | | | (0.32 | )(b) | | | 2.32 | (b) | | | 2.34 | (c) | | | 2.75 | | | | (0.42 | ) |
| | | | | | | | | | | | | | | | | | | | |
Total Income (Loss) From Operations | | | 0.07 | | | | 2.69 | | | | 2.68 | | | | 3.07 | | | | (0.13 | ) |
| | | | | | | | | | | | | | | | | | | | |
Less Distributions From: | | | | | | | | | | | | | | | | | | | | |
Net Investment Income | | | (0.41 | ) | | | (0.38 | ) | | | (0.35 | ) | | | (0.33 | ) | | | (0.28 | ) |
Net Realized Gains | | | (0.94 | ) | | | (0.93 | ) | | | — | | | | — | | | | (1.14 | ) |
| | | | | | | | | | | | | | | | | | | | |
Total Distributions | | | (1.35 | ) | | | (1.31 | ) | | | (0.35 | ) | | | (0.33 | ) | | | (1.42 | ) |
| | | | | | | | | | | | | | | | | | | | |
Net Asset Value, End of Year | | | $22.08 | | | | $23.36 | | | | $21.98 | | | | $19.65 | | | | $16.91 | |
| | | | | | | | | | | | | | | | | | | | |
Total Return | | | 0.09 | % | | | 12.93 | % | | | 13.71 | %(c) | | | 18.32 | % | | | (0.87 | )% |
Net Assets, End of Year (000’s) | | | $467,392 | | | | $527,818 | | | | $504,014 | | | | $554,810 | | | | $606,908 | |
Ratios to Average Net Assets | | | | | | | | | | | | | | | | | | | | |
Gross Expense(d) | | | 0.86 | % | | | 0.89 | % | | | 0.90 | % | | | 0.90 | % | | | 0.89 | % |
Net Expenses(d)(e) | | | 0.25 | % | | | 0.25 | % | | | 0.25 | % | | | 0.25 | % | | | 0.25 | % |
Net Investment Income | | | 1.69 | % | | | 1.65 | % | | | 1.62 | % | | | 1.75 | % | | | 1.68 | % |
Portfolio Turnover Rate | | | 26 | % | | | 13 | % | | | 15 | % | | | 18 | % | | | 81 | % |
| (a) | Per share numbers have been calculated using the average shares method. |
| (b) | Amount includes anon-recurring payment for Litigation proceeds which represents proceeds from securities litigation by the Fund. The litigation proceeds impacted the realized and unrealized gain (loss) per share by $0.00 for Class I. |
| (c) | Amount includes anon-recurring settlement paid by the Fund related to the Fund’s prior investment in Tribune Company. The settlement payment impacted the realized (loss) per share by $0.00 for Class I. Total return was not impacted. |
| (d) | The Fund invests in other underlying funds and indirectly bears its proportionate share of fees and expenses incurred by the underlying funds in which the Fund is invested. This ratio does not include these indirect fees and expenses. |
| (e) | The investment advisor and other service providers waived or reimbursed a portion of their fees. |
See Notes which are an integral part of the Financial Statements
ANNUAL REPORT / April 30, 2020
| | |
| 23 | | NOTES TO FINANCIAL STATEMENTS |
Wilmington Funds
April 30, 2020
Wilmington Funds (the “Trust”) is registered under the Investment Company Act of 1940, as amended (the “Act”), as anopen-end management investment company. The Trust consists of 12 portfolios, 1 of which is presented herein (referred to as the “Fund”). The remaining 11 funds are presented in separate reports.
| | |
| |
| Fund | | Investment Goal |
WilmingtonLarge-Cap Strategy Fund(“Large-Cap Strategy Fund”)(d) | | The Fund seeks to achieve long-term capital appreciation. |
(d) Diversified
The Trust offers 6 classes of shares: Class A, Service Class, Select Class, Administrative Class, Class I and Institutional Class. Class A, Service Class, Select Class, Administrative Class and Institutional Class are not available for the Fund. All shares of the Trust have equal rights with respect to voting, except on class-specific matters.
The assets of each portfolio are segregated and a shareholder’s interest is limited to the portfolio in which shares are held.
| 2. | SUMMARY OF SIGNIFICANT ACCOUNTING POLICIES |
The following is a summary of significant accounting policies consistently followed by the Fund in the preparation of its financial statements. These policies are in conformity with U.S. generally accepted accounting principles (“GAAP”). The Trust is an investment company and follows accounting and reporting guidance under Financial Accounting Standards Board (“FASB”) Accounting Standards Codification (“ASC”) Topic 946, “Financial Services - Investment Companies.” The preparation of financial statements in conformity with GAAP requires management to make estimates and assumptions that affect the amounts of assets, liabilities, expenses and revenues reported in the financial statements. Actual results could differ from those estimated and the differences could be material.
Investment Valuation– The Fund utilizes a fair value approach. The Fair Value of the Fund’s portfolio securities are determined as follows:
| | • | for equity securities, according to the last sale price or official closing price reported in the market in which they are primarily traded (either a national securities exchange or theover-the-counter market), if available; |
| | • | in the absence of recorded sales for equity securities, according to the mean between the last closing bid and asked prices; |
| | • | investments inopen-end regulated investment companies are valued at net asset value (“NAV”); |
| | • | for fixed income securities, according to prices as furnished by an independent pricing service, except that fixed income securities with remaining maturities of less than 60 days at the time of purchase are valued at amortized cost, provided such amount approximates fair value; and |
| | • | for all other securities at fair value as determined in accordance with procedures established by and under the general supervision of the Board of Trustees (“Trustees”). |
Trading in foreign securities may be completed at times which vary from the closing of the New York Stock Exchange (“NYSE”). In computing its NAV, the Fund values foreign securities using the latest closing price on the primary exchange on which they are traded immediately prior to the closing of the NYSE. Certain foreign currency exchange rates are generally determined at the latest rate prior to the closing of the NYSE. Foreign securities quoted in foreign currencies are translated into U.S. dollars at current rates. Events that affect these values and exchange rates may occur between the times at which they are determined and the closing of the NYSE. If such events materially affect the value of portfolio securities, these securities may be valued at their fair value as determined in good faith by the Trustees, although the actual calculation may be done by others. An event is considered material if there is both an affirmative expectation that the security’s value will change in response to the event and a reasonable basis for quantifying the resulting change in value. In determining whether market quotations are readily available or fair valuation will be used, various factors will be taken into consideration, such as market closures or suspension of trading in a security. Each Fund may use fair value pricing more frequently for securities traded primarily innon-US markets because, among other things, most foreign markets close well before each Fund values its securities, generally as of 4:00pm Eastern time. The earlier close of these foreign markets gives rise to the possibility that significant events, including broad market moves, government actions or pronouncements, aftermarket trading, or news events may have occurred in the interim. Whenever such a significant event occurs, each Fund may value foreign securities using fair value prices based on third-party vendor modeling tools (Systematic International Fair Value Pricing (“SIFVP”)).
The Trust follows the authoritative guidance (GAAP) for fair value measurements. The guidance establishes a framework for measuring fair value and a hierarchy for inputs and techniques used in measuring fair value that maximizes the use of observable inputs and minimizes the use of unobservable inputs and techniques by requiring that the most observable inputs be used when available. The guidance establishes three tiers of inputs that may be used to measure fair value. The three tiers of inputs are summarized at the end of the Fund’s Portfolio of Investments. The inputs or techniques used for valuing securities are not necessarily an indication of the risk associated with investing in those securities.
April 30, 2020 / ANNUAL REPORT
| | |
| NOTES TO FINANCIAL STATEMENTS (continued) | | 24 |
Pursuant to the Fund’s fair value procedures noted previously, equity securities (including exchange traded securities and otheropen-end regulated investment companies) and exchange traded derivatives are generally categorized as Level 1 securities in the fair value hierarchy. The Fund may utilize SIFVP which could result in certain equity securities being categorized as Level 2. Fixed income securities,non-exchange traded derivatives and money market instruments are generally categorized as Level 2 securities in the fair value hierarchy.
Investments for which there are no such quotations, or for which quotations do not appear reliable, are valued at fair value as determined in accordance with procedures established by and under the general supervision of the Trustees. These valuations are typically categorized as Level 2 or Level 3 securities in the fair value hierarchy.
Repurchase Agreements- Repurchase agreements are transactions in which a fund buys a security from a dealer or bank and agrees to sellthe security back at a mutually agreed upon time and price. The repurchase price exceeds the sale price, reflecting the Fund’s return on the transaction. It is the Fund’s policy to require the counterparty to a repurchase agreement to transfer to the Fund’s custodian orsub-custodian eligible securities or cash with a market value (after transaction costs) at least equal to the repurchase price to be paid under the repurchase agreement. The eligible securities are transferred to accounts with the custodian orsub-custodian in which the Fund holds a “securities entitlement” and exercise “control” as those terms are defined in the Uniform Commercial Code. The Fund has established procedures for monitoring the market value of the transferred securities and requiring the transfer of additional eligible securities, if necessary, to equal at least the repurchase price. These procedures also allow the counterparty to require securities to be transferred from the account to the extent that their market value exceeds the repurchase price or in exchange for other eligible securities of equivalent market value.
The insolvency of the counterparty or other failure to repurchase the securities may delay the disposition of the underlying securities or cause the Fund to receive less than the full repurchase price.
Repurchase agreements are entered into by the Fund under Master Repurchase Agreements (“MRA”) which permit the Fund, under certain circumstances including an event of default (such as bankruptcy or insolvency), to offset payables and/or receivables under the MRA with collateral held and/or posted to the counterparty and create one single net payment due to or from the Fund.
At April 30, 2020, the open repurchase agreements by counterparty which are subject to a MRA on a net payment basis are as follows:
| | | | | | | | | | | | | | | | | | | | | | | | | | | | | | | | | | | | | | | | | | | | |
| | | | | | | | | | | |
| Fund/Counterparty | | | | | Repurchase Agreements | | | | | | | | | Fair Value of Non-cash Collateral Received(1) | | | | | | | | | Cash Collateral Received(1) | | | | | | | | | Net Exposure(2) | |
Large-Cap Strategy Fund | | | | | | | | | | | | | | | | | | | | | | | | | | | | | | | | | | | | | | | | | | | | |
BNP Paribas SA | | | | | | $ | 692,860 | | | | | | | | | | | $ | 692,860 | | | | | | | | | | | $ | — | | | | | | | | | | | $ | — | |
Daiwa Capital Markets America | | | | | | | 692,860 | | | | | | | | | | | | 692,860 | | | | | | | | | | | | — | | | | | | | | | | | | — | |
Deutsche Bank Securities, Inc. | | | | | | | 692,860 | | | | | | | | | | | | 692,860 | | | | | | | | | | | | — | | | | | | | | | | | | — | |
HSBC Securities USA, Inc. | | | | | | | 692,860 | | | | | | | | | | | | 692,860 | | | | | | | | | | | | — | | | | | | | | | | | | — | |
Nomura Securities International, Inc. | | | | | | | 275,826 | | | | | | | | | | | | 275,826 | | | | | | | | | | | | — | | | | | | | | | | | | — | |
RBC Dominion Securities, Inc. | | | | | | | 692,860 | | | | | | | | | | | | 692,860 | | | | | | | | | | | | — | | | | | | | | | | | | — | |
| | | | | | | | | | | | | | | | | | | | | | | | | | | | | | | | | | | | | | | | | | | | |
| | | | | | $ | 3,740,126 | | | | | | | | | | | $ | 3,740,126 | | | | | | | | | | | $ | — | | | | | | | | | | | $ | — | |
| | | | | | | | | | | | | | | | | | | | | | | | | | | | | | | | | | | | | | | | | | | | |
| (1) | The amount of collateral reflected in the table does not include any over-collateralization received by the Fund. |
| (2) | Net exposure represents the receivable (payable) due from (to) the counterparty in the event of default. |
Investment Income, Gains and Losses, Expenses and Distributions– Interest income and expenses are accrued daily. Dividends and distributions to shareholders are recorded on theex-dividend date.Non-cash dividends included in dividend income, if any, are recorded at fair value. Foreign dividends are recorded on theex-dividend date or when the Fund is informed of theex-dividend date. Investment transactions are accounted for on a trade date basis for financial reporting purposes. Realized gains and losses from investment transactions are recorded on an identified cost basis.
Expenses of the Trust, which are directly identifiable to a specific fund, are applied to that fund. Expenses which are not identifiable to a specific fund are allocated in such a manner as deemed equitable, taking into consideration the nature and type of expense.
Distributions from net realized gains, if any, are declared and paid to shareholders annually. Distributions from net investment income, if any, are declared and paid quarterly.
Real Estate Investment Trusts –The Fund may invest in real estate investment trusts (“REITs”) that involve risks not associated withinvesting in stocks. Risks include declines in the value of real estate, general and economic conditions, changes in the value of the underlying property and defaults by borrowers. The value of assets in the real estate industry may go through cycles of relative underperformance and outperformance in comparison to equity securities markets in general. Dividend income is recorded using management’s estimate of the income included in distributions received from REIT investments. The actual amounts of income, return of capital and capital gains are only determined by each REIT after its fiscalyear-end and may differ from the estimated amount. Estimates of income are adjusted to the actual amounts when the amounts are determined.
ANNUAL REPORT / April 30, 2020
| | |
| 25 | | NOTES TO FINANCIAL STATEMENTS (continued) |
Federal Taxes– It is the Fund’s policy to comply with the Subchapter M provision of the Internal Revenue Code of 1986, as amended (the“Code”), and to distribute to shareholders each year substantially all its income. Accordingly, no provisions for Federal income tax or excise tax are necessary.
Withholding taxes and where appropriate, deferred withholding taxes, on foreign interest, dividends and capital gains have been provided for in accordance with the applicable country’s tax rules and rates.
The Fund recognizes interest and penalties, if any, related to unrecognized tax benefits as income tax expense on the Statement of Operations. During the year ended April 30, 2020, the Fund did not incur any interest or penalties.
Warrants and Rights– The Fund may hold warrants and rights acquired either through a direct purchase, including as part of private placement, or pursuant to corporate actions. Warrants and rights entitle the holder to buy a proportionate amount of common stock at a specific price and time through the expiration dates. Such warrants and rights are held as long positions by the Fund until exercised, sold or expired. Warrants and rights are valued at fair value in accordance with the Trustees’ approved fair value procedures.
Lending of Portfolio Securities– The Trust has entered into an agreement with its custodian whereby the custodian may lend securitiesowned by the Fund to brokers, dealers and other financial organizations. Any increase or decrease in the fair value of securities loaned and any interest or dividends earned on those securities during the term of the loan would be for the account of the Fund. In exchange for lending securities under the terms of the agreement with its custodian, the Fund receives a lender’s fee. Fees earned by the Fund on securities lending are recorded as income. Loans of securities by the Fund are collateralized by cash, U.S. government securities or money market instruments that are maintained at all times in an amount at least equal to the current market value of the loaned securities plus a margin which varies depending on the type of securities owned. The custodian establishes and maintains the collateral in a segregated account. The Fund has the right under the lending agreement to recover the securities from the borrower on demand. The market value of the loaned securities is determined at the close of business of the Fund and any additional required collateral is delivered to the Fund on the next business day.
Investments purchased with cash collateral are presented on the portfolio of investments under the caption “Cash Collateral Invested for Securities on Loan.”
The Fund maintains the risk of any loss on the securities on loan as well as the potential loss on investments purchased with cash collateral received from securities lending.
Securities lending transactions are entered into by the Fund under Master Securities Lending Agreements (“MSLA”) which permit the Fund, under certain circumstances including an event of default (such as bankruptcy or insolvency), to offset amounts payable by the Fund to the same counterparty against amounts to be received and create one single net payment due to or from the Fund.
At April 30, 2020, the securities loaned which are subject to a MSLA on a net payment basis are as follows:
| | | | | | | | | | | | | | | | | | | | | | | | | | | | | | | | |
| | | | | | | | |
| Fund | | | | | Value of Securities
on Loan | | | | | | | | | Cash Collateral Received(1) | | | | | | | | | Net Exposure(2) | |
Large-Cap Strategy Fund | | | | | | $ | 3,484,447 | | | | | | | | | | | $ | 3,484,447 | | | | | | | | | | | | $— | |
| | | | | | | | | | | | | | | | | | | | | | | | | | | | | | | | |
(1) Collateral with a value of $3,740,126 has been received in connection with securities lending transactions. | |
(2) Net exposure represents the receivable (payable) due from (to) the counterparty in the event of default. | |
| 3. | FEDERAL TAX INFORMATION |
As of April 30, 2020, there were no uncertain tax positions that would require financial statement recognition,de-recognition or disclosure. The Fund’s federal tax returns filed for the years ended 2019, 2018, and 2017, as well as the current tax year, remain subject to examination by the Internal Revenue Service.
For financial reporting purposes, book basis capital accounts are adjusted to reflect the tax character of permanent book/tax differences. Permanent reclassifications can arise from differing treatment of certain income and gain transactions and nondeductible current year net operating losses. Permanent book and tax basis differences relating to shareholder distributions will result in reclassifications to capital paid in on shares of beneficial interest. The reclassifications have no impact on the net assets or NAVs of the Funds. As of April 30, 2020, there were no reclassifications.
The timing and character of income and capital gain distributions are determined in accordance with income tax regulations, which may differ from GAAP. The tax character of distributions for the corresponding fiscal year ends were as follows:
| | | | | | | | | | | | | | | | | | | | | | | | | | | | | | | | | | | | | | | | | | | | |
| | | | |
| | | | | | 2020 | | | | | | 2019 | |
| | | | | | | | | | | |
| Fund | | | | | Ordinary Income* | | | | | | | | | Long-Term Capital Gains | | | | | | | | | Ordinary Income* | | | | | | | | | Long-Term Capital Gains | |
Large-Cap Strategy Fund | | | | | | $ | 9,083,834 | | | | | | | | | | | | $20,462,055 | | | | | | | | | | | $ | 8,459,201 | | | | | | | | | | | $ | 20,475,469 | |
* For tax purposes, short-term capital gain distributions are considered ordinary income distributions. | |
April 30, 2020 / ANNUAL REPORT
| | |
| NOTES TO FINANCIAL STATEMENTS (continued) | | 26 |
As of April 30, 2020 the components of distributable earnings on a tax basis were as follows:
| | | | | | | | | | | | |
| | | | | | |
| Fund | | Undistributed Ordinary Income | | Undistributed Long-Term Capital Gains | | Other Timing Differences | | Unrealized Appreciation/ (Depreciation) | | Capital Loss Carryforwards | | Late Year Loss Deferrals |
Large-Cap Strategy Fund | | $784,193 | | $18,603,864 | | $— | | $246,879,849 | | $— | | $— |
The differences between the book and tax basis components of distributable earnings relate principally to the timing of recognition of income and gains for federal income tax purposes.
Under current tax regulations, capital losses on securities transactions realized after October 31 may be deferred and treated as occurring on the first day of the following fiscal year. Under the Regulated Investment Company Modernization Act of 2010, the Fund is permitted to defer taxable ordinary income losses incurred after December 31 and treat as occurring on the first day of the following fiscal year. At April 30, 2020, the Fund had no losses deferred to May 1, 2020.
| 4. | ADVISORY FEES, SERVICING FEES, AND OTHER SERVICE PROVIDERS |
Investment Advisor– Wilmington Funds Management Corporation (“WFMC” or the “Advisor”) serves as the Investment Advisor to theFund. Wilmington Trust Investment Advisors, Inc. (“WTIA”) providessub-advisory services to the Fund. WFMC and WTIA are whollyowned subsidiaries of M&T Bank Corporation. For its services, the Fund pays WFMC an annual investment advisory fee, accrued daily and paid monthly, based on a percentage of the Fund’s average daily net assets as described below. WFMC, not the Fund, pays WTIA for its services.
| | | | |
| |
| Fund | | Advisory Fee
Annual Rate | |
Large-Cap Strategy Fund | | | 0.50 | % |
WFMC and the Fund’s distributor and shareholder service provider have contractually agreed to waive their fees and/or reimburse expenses through August 31, 2020 so that total annual fund operating expenses paid by the Fund (not including the effects of dividends or interest on short positions, acquired fund fees and expenses, taxes, or other extraordinary expenses expressed as an annualized percentage of average daily net assets), will not exceed 0.25% for the Fund’s Class I Shares. Neither WFMC nor the Fund’s distributor and shareholder service provider will recoup previously waived fees/expenses in subsequent years.
Administrative Fees– The Bank of New York Mellon (“BNYM”) provides the Trust with fund administration services. The fees as describedin the table below are a component of “Portfolio accounting and administration fees” as disclosed in the Statement of Operations. WFMC, in its role asCo-Administrator, provides the Fund with certain administrative personnel and services necessary to operate the Fund. The fees as described in the table below are accrued daily and paid monthly, and are disclosed on the Statement of Operations as “Administration fees.”
| | | | | | |
| | |
| Administrator | | Maximum Fee | | | Average Aggregate Daily Net Assets of the Trust |
WFMC | | | 0.040% | | | on the first $5 billion |
| | | 0.030% | | | on the next $2 billion |
| | | 0.025% | | | on the next $3 billion |
| | | 0.018% | | | on assets in excess of $10 billion |
BNYM | | | 0.0175% | | | on the first $15 billion |
| | | 0.0150% | | | on the next $10 billion |
| | | 0.0125% | | | on assets in excess of $25 billion |
WFMC and BNYM may voluntarily choose to waive any portion of their fee and can add, modify or terminate a voluntary wavier at any time at their sole discretion. Neither WFMC nor BNYM will recoup previously waived fees/expenses in subsequent years. For the year ended April 30, 2020, neither WFMC nor BNYM waived any administrative fees.
Shareholder Services Fee– Pursuant to a Shareholder Services Plan adopted by the Fund and administered by ALPS Distributors, Inc.(“ALPS”), the Fund may pay up to 0.25% of the average daily net assets of the Fund’s Class I shares to financial intermediaries (which may include ALPS, the Advisor or their affiliates) for providing shareholder services and maintaining shareholder accounts. M&T Securities, Inc., Manufacturers and Traders Trust and Company, and Wilmington Trust, NA (together “M&T”) has entered into a Shareholders Services Agreement with ALPS, under which it is entitled to receive up to 0.25% of the average daily net assets of the Fund’s shares for whom M&T provides shareholder services. The Fund may reduce the maximum amount of shareholder service fees it pays from time to time at its sole discretion. In addition, a financial intermediary (including M&T) may waive or reduce any fees to which they are entitled. For the year ended April 30, 2020, no affiliates of the Advisor received these fees.
ANNUAL REPORT / April 30, 2020
| | |
| 27 | | NOTES TO FINANCIAL STATEMENTS (continued) |
Other Service Providers– Foreside Management Services, LLC (“FMS”) provides a Principal Executive Officer and Principal FinancialOfficer to the Trust. FMS has no role in determining the investment policies or which securities are to be sold or purchased by the Trust or its funds.
BNYM provides custody services to the Trust.
BNY Mellon Investment Servicing (U.S.) Inc. provides fund accounting and transfer agency services to the Trust.
General– Certain Officers of the Trust are also Officers or employees of the above companies that provide services to the Fund, and duringtheir terms of office, receive no compensation from the Fund. The Trust’s Statement of Additional Information includes additional information about the Trustees.
Other Affiliated Parties and Transactions– Affiliated holdings are securities and mutual funds which are managed by the Advisor or anaffiliate of the Advisor or which are distributed by an affiliate of the Fund’s distributor. Transactions with affiliated companies during the year ended April 30, 2020 are as follows:
| | | | | | | | | | | | | | | | | | | | | | | | | | | | | | | | | | | | | | | | | | | | | |
| | | | | | | | | |
Fund/ Affiliated Investment Name | | Value 4/30/19 | | Purchases | | Sales | | Net Realized Gain/(Loss) | | Net Change in Unrealized Appreciation/ Depreciation | | Value 4/30/20 | | Number of Shares 4/30/20 | | Dividend Income | | Capital Gain Distributions |
Large-Cap Strategy Fund | | | | | | | | | | | | | | | | | | | | | | | | | | | | | | | | | | | | | | | | | | | | | |
Common Stock - 0.0%* | | | | | | | | | | | | | | | | | | | | | | | | | | | | | | | | | | | | | | | | | | | | | |
M&T Bank Corp. | | | $ | 273,813 | | | | $ | — | | | | $ | — | | | | $ | — | | | | $ | (93,364 | ) | | | $ | 180,449 | | | | | 1,610 | | | | $ | 6,762 | | | | $ | — | |
| | | | | | | | | | | | | | | | | | | | | | | | | | | | | | | | | | | | | | | | | | | | | |
| | * | As a percentage of Net Assets as of April 30, 2020. |
The Fund may execute trades for security purchase and sale transactions through brokers that are affiliates of the Advisor orsub-advisors. Commissions paid on those trades for the year ended April 30, 2020 were as follows:
| | |
| |
| Fund | | Commissions |
Large-Cap Strategy Fund | | $71,873 |
| 5. | INVESTMENT TRANSACTIONS |
Purchases and sales of securities for the Fund (excluding U.S. Government and agency securities, and short-term securities) during the year ended April 30, 2020 were $131,356,962 and $187,014,221, respectively.
Market risk is the risk that one or more markets in which a Fund invests will go down in value, including the possibility that the markets will go down sharply and unpredictably. The value of a security or other asset may decline due to changes in general market conditions, economic trends or events that are not specifically related to the issuer of the security or other asset, or factors that affect a particular issuer or issuers, exchange, country, group of countries, region, market, industry, group of industries, sector or asset class. Local, regional or global events such as war, acts of terrorism, the spread of infectious illnesses or other public health issues, recessions, natural disasters or other events could have a significant impact on the Fund and its investments.
Beginning in January 2020, global financial markets have experienced and may continue to experience significant volatility resulting from the spread of a novel coronavirus known asCOVID-19. The outbreak ofCOVID-19 has resulted in travel and border restrictions, quarantines, supply chain disruptions, lower consumer demand and general market uncertainty. The effects ofCOVID-19 have and may continue to adversely affect the global economy, the economies of certain nations and individual issuers. The impact of the outbreak may be short term or may last for an extended period of time, which may have an unpredictable impact on Fund performance.
| 7. | CONTRACTUAL OBLIGATIONS |
In the normal course of business, the Fund may enter into contracts that provide general indemnifications. The Fund’s maximum exposure under these arrangements is dependent on claims that may be made against the Fund in the future, and, therefore, cannot be estimated; however, based on experience, the risk of material loss from such claims is considered remote.
The Trust participates in a $10,000,000 unsecured, committed revolving line of credit (“LOC”) agreement with BNYM. The LOC was available for extraordinary or emergency purposes, primarily for financing redemption payments. Borrowings were charged interest at a rate of 1.25% per annum over the greater of the Federal Funds Rate or the London Interbank Offered Rate (“LIBOR”). The LOC included a commitment fee of 0.15% per annum on the daily unused portion. The LOC expired on April 2, 2020.
April 30, 2020 / ANNUAL REPORT
| | |
| NOTES TO FINANCIAL STATEMENTS (continued) | | 28 |
On April 2, 2020, the Trust entered into an amendment to the credit agreement for a $10,000,000 unsecured, committed revolving LOC. The LOC is to be used as described above and to be operated in substantially the same manner as the original agreement. The LOC expires on April 1, 2021.
The Trust did not utilize the LOC during the year ended April 30, 2020.
| 9. | RECENT ACCOUNTING PRONOUNCEMENTS |
In August 2018, the Financial Accounting Standards Board (“FASB”) issued an Accounting Standards Update2018-13, (the “ASU”), which changes certain fair value measurement disclosure requirements. The ASU, in addition to other modifications and additions, removes the requirement to disclose the amount and reasons for transfers between Level 1 and Level 2 of the fair value hierarchy, the policy for the timing of transfers between levels and the valuation process for Level fair value measurements. The ASU is effective for fiscal years, and interim periods within those fiscal years, beginning after December 15, 2019. Management has evaluated the implications of certain provisions of ASUNo. 2018-13 and has elected to early adopt all aspects related to the removal and modification of certain fair value measurement disclosures.
In March 2020, the FASB issued ASUNo. 2020-04 (“ASU2020-04”), Reference Rate Reform (Topic 848) - Facilitation of the Effects of Reference Rate Reform on Financial Reporting. The amendments in ASU2020-04 provides optional temporary financial reporting relief from the effect of certain types of contract modifications due to the planned discontinuation of the LIBOR and other interbank-offered based reference rates as of the end of 2021. ASU2020-04 is effective for certain reference rate-related contract modifications that occur during the period March 12, 2020 through December 31, 2022. Management is currently evaluating the impact, if any, of applying ASU2020-04.
| 10. | OTHER FUND INFORMATION |
At a meeting held on June 5, 2019, the Trustees, upon recommendation of the Audit Committee, selected PricewaterhouseCoopers LLP (“PwC”) to serve as the independent registered public accounting firm for the Trust for the fiscal year ending April 30, 2020. PwC affirmed their independence as an independent registered public accounting firm on June 19, 2019. During the fiscal years ended April 30, 2019 and 2018, Ernst & Young LLP (“E&Y”) audit reports’ on the financial statements of each Fund in the Trust did not contain any adverse opinion or disclaimer of opinion, nor were they qualified or modified as to uncertainty, audit scope, or accounting principles. In addition, there were no disagreements between the Trust and E&Y on accounting principles, financial statements disclosures or audit scope, which, if not resolved to the satisfaction of E&Y, would have caused them to make reference to the disagreement in their reports. Neither the Trust nor anyone on its behalf has consulted with PwC at any time prior to their selection with respect to the application of accounting principles to a specified transaction, either completed or proposed or the type of audit opinion that might be rendered on each Fund’s financial statements.
Management has evaluated events and transactions for potential recognition or disclosure in the financial statements through the date the financial statements were issued. Management has determined that there are no material events that would require recognition or disclosure in the Fund’s financial statements through this date.
ANNUAL REPORT / April 30, 2020
Report of Independent Registered Public Accounting Firm
To the Board of Trustees of Wilmington Funds and Shareholders of WilmingtonLarge-Cap Strategy Fund
Opinion on the Financial Statements
We have audited the accompanying statement of assets and liabilities, including the portfolio of investments, of WilmingtonLarge-Cap Strategy Fund (one of the funds constituting Wilmington Funds, referred to hereafter as the “Fund”) as of April 30, 2020, and the related statements of operations and changes in net assets, including the related notes, and the financial highlights for the year then ended (collectively referred to as the “financial statements”). In our opinion, the financial statements present fairly, in all material respects, the financial position of the Fund as of April 30, 2020, and the results of its operations, changes in its net assets, and the financial highlights for the year then ended in conformity with accounting principles generally accepted in the United States of America.
The financial statements of the Fund as of and for the year ended April 30, 2019 and the financial highlights for each of the periods ended on or prior to April 30, 2019 (not presented herein, other than the statement of changes in net assets and the financial highlights) were audited by other auditors whose report dated June 27, 2019 expressed an unqualified opinion on those financial statements and financial highlights.
Basis for Opinion
These financial statements are the responsibility of the Fund’s management. Our responsibility is to express an opinion on the Fund’s financial statements based on our audit. We are a public accounting firm registered with the Public Company Accounting Oversight Board (United States) (PCAOB) and are required to be independent with respect to the Fund in accordance with the U.S. federal securities laws and the applicable rules and regulations of the Securities and Exchange Commission and the PCAOB.
We conducted our audit of these financial statements in accordance with the standards of the PCAOB. Those standards require that we plan and perform the audit to obtain reasonable assurance about whether the financial statements are free of material misstatement, whether due to error or fraud.
Our audit included performing procedures to assess the risks of material misstatement of the financial statements, whether due to error or fraud, and performing procedures that respond to those risks. Such procedures included examining, on a test basis, evidence regarding the amounts and disclosures in the financial statements. Our audit also included evaluating the accounting principles used and significant estimates made by management, as well as evaluating the overall presentation of the financial statements. Our procedures included confirmation of securities owned as of April 30, 2020 by correspondence with the custodian and brokers; when replies were not received from brokers, we performed other auditing procedures. We believe that our audit provides a reasonable basis for our opinion.
/s/ PricewaterhouseCoopers LLP
Philadelphia, Pennsylvania
June 24, 2020
We have served as the auditor of one or more investment companies in Wilmington Funds since 2019.
April 30, 2020 / ANNUAL REPORT
FEDERAL TAX INFORMATION (UNAUDITED)
Complete information regarding the tax status of distributions will be reported on Forms 1099.
Of the ordinary income (including short-term capital gain) distributions made by the Fund during the fiscal year ended April 30, 2020, the Fund designates the following percentage, or such greater percentage that constitute the maximum amount allowable pursuant to Code Sections Section 243 and 854(b)(2), as qualifying for the corporate dividends received deduction:
| | | | |
| |
| Fund | | | |
Large-Cap Strategy Fund | | | 99.44 | % |
For the fiscal year ended April 30, 2020, the Fund designates the following percentage of the ordinary income dividends, or such greater percentage that constitute the maximum amount allowable pursuant to Code Sections 1(h)(11) and 854(b)(2), as qualified dividend income which may be subject to a maximum rate of federal income tax of 15%:
| | | | |
| |
| Fund | | | |
Large-Cap Strategy Fund | | | 100.00 | % |
If the Fund meets the requirements of Section 853 of the Code, the Fund will pass through to shareholders credits of foreign taxes paid.
ANNUAL REPORT / April 30, 2020
| | |
| 31 | | BOARD OF TRUSTEES AND TRUST OFFICERS |
BOARD OF TRUSTEES AND TRUST OFFICERS
The following tables give information about each Trustee and the senior officers of the Trust. The tables separately list Trustee members who are “interested persons” of the Fund (i.e., “Interested” Trustees) and those who are not (i.e., “Independent” Trustees). The Trust is comprised of 12 funds. Unless otherwise noted, the business address of each Trustee and senior officer is 1100 North Market Street, 9th Floor, Wilmington, DE 19890. Each Trustee oversees all portfolios of the Trust and serves for an indefinite term. The Trust’s Statement of Additional Information includes additional information about the Trustees and is available, without charge and upon request, by calling1-800-836-2211.
INTERESTED TRUSTEES BACKGROUND
| | |
| |
Name Address Birth Year Position with Trust Date Service Began | | Principal Occupations and Other Directorships Held for Past Five Years |
| |
Dominick J. D’Eramo* Birth year: 1964 TRUSTEE Began serving: November 2018 PRESIDENT Began serving: June 2018 | | Principal Occupations:Senior Vice President, Wilmington Trust Investment Advisors, Inc. and Head of Fixed Income. Previous Positions:Group Vice President, Wilmington Trust Investment Advisor, Inc. (WTIA) (2014-2017); Administrative Vice President, WTIA (2012-2014). |
| * | Dominick J. D’Eramo is “interested” due to his employment with WTIA and his position with WFMC, investment Advisors to the Funds. |
INDEPENDENT TRUSTEES BACKGROUND
| | |
| |
Name Birth Year Position with Trust Date Service Began | | Principal Occupations and Other Directorships Held for Past Five Years |
| |
Nicholas A. Giordano Birth year: 1943 CHAIRMAN and TRUSTEE Began serving: March 2012 | | Principal Occupations:Consultant, financial services organizations (1997 to present). Other Directorships Held:The RBB Fund Inc. (19 portfolios) (registered investment companies); Independence Blue Cross; IntriCon Corporation (body-worn products). Previous Positions:Director, Kalmar Pooled Investment Trust (through 6/17); Interim President, LaSalle University (1998 to 1999); President and Chief Executive Officer, Philadelphia Stock Exchange (1981 to 1997). |
| |
Robert H. Arnold Birth year: 1944 TRUSTEE Began serving: March 2012 | | Principal Occupations:Managing Director, R.H. Arnold & Co, Inc. (financial management consulting) (6/89 to present). Other Directorships Held:None. Previous Positions:Trustee, First Potomac Realty Trust (real estate investment trust) (5/03 to 12/17); Director, Treasury Strategies, Inc. (private treasury consulting services) (6/01 to 6/16). |
| |
Gregory P. Chandler Birth year: 1966 TRUSTEE Began serving: July 2017 | | Principal Occupations:Chief Financial Officer, Avocado Systems, Inc. (cybersecurity software) (3/20 to present); Other Directorships Held:Trustee, RBB Fund Series Trust (32 portfolios) (registered investment companies) (2012 to present); Trustee, FS Energy Partners (business development company) (2009 to present); Director, Emtec, Inc. (2005 to 2019); Director, FS Investment Corporation (business development company) (2007 to 2018); Previous Positions:Chief Financial Officer, Emtec, Inc. (information technology services) (2009 to 2020); Managing Director, Janney Montgomery Scott LLC (investment banking) (1999 to 2009); Consulting Manager, PwC (1997 to 1999), Manager, Business Assurance, Coopers & Lybrand (audit services) (1995 – 1997); Captain, US Army (1989 to 1994). |
April 30, 2020 (unaudited) / ANNUAL REPORT
| | |
| BOARD OF TRUSTEES AND TRUST OFFICERS | | 32 |
| | |
| |
Name Birth Year Position with Trust Date Service Began | | Principal Occupations and Other Directorships Held for Past Five Years |
| |
Donald E. Foley Birth year: 1951 TRUSTEE Began serving: December 2015 | | Principal Occupations:Director, BioSig Technologies (2015 to present); Director, AXA Equitable’s VIP Mutual Funds (2017 to present); Director, AXA Equitable (variable annuity) (2013 to present); Director, 1290 Mutual Funds (retail funds) (2013 to present); and Chairman and Director, Burke Rehabilitation Hospital Foundation (private hospital, research institute) (2005 to present). Other Directorships Held:Director, M&T Bank Corporation (commercial bank) (2011 to 2012); Chairman and Director, Wilmington Trust Corporation (commercial and trust bank) (2007 to 2011); Chairman, Director and President’s Council, Union College (private college) (2011 to 2015). Previous Positions:Advisory Member, Trust and Investment Committee, M&T Bank, Wilmington Trust, National Association, and Wilmington Trust Company (through 2016); Chairman and Chief Executive Officer of Wilmington Trust Corporation (2010 to 2011); Senior Vice President and Treasurer at ITT Corporation (1996 to 2010); Assistant Treasurer at International Paper (1989 to 1996). |
| |
Richard B. Seidel Birth year: 1941 TRUSTEE Began serving: September 2003 | | Principal Occupations:Chairman, Seidel & Associates (legal consulting) (1/14 to present); Chairman, Liberty Private Client, LLC (registered investment adviser) (1/14 to present). Other Directorships Held:Director, Chartwell Investment Partners (9/15 to present); Director, Tristate Capital Holdings (9/07 to 4/20). Previous Positions:Chairman, Girard Capital (broker-dealer) (3/05 to 1/14); Chairman, Girard Partners, Ltd. (6/96 to 1/14). |
| |
Valerie J. Sill Birth year: 1962 TRUSTEE Began serving: April 2020 | | Principal Occupations:President, Chief Executive Officer and Chief Investment Officer, DuPont Capital Management (asset management) (2004 to present). Other Directorships Held:Trustee, Longwood Gardens (2005 to present); Trustee of the Christiana Care Health System (2012 to present); and Advisory Counsel, Federal Reserve Bank of Philadelphia’s Economic Advisory Council (2010 to 2013). Previous Positions:Executive Vice President at The Boston Company (1994 to 2004). |
| |
| OFFICERS | | |
| |
Name Address Birth Year Positions with Trust | | Principal Occupations for Past Five Years and Previous Positions |
| |
John C. McDonnell Birth year: 1966 CHIEF OPERATIONS OFFICER Began serving: June 2017 VICE PRESIDENT Began serving: June 2012 | | Principal Occupations:Chief Operations Officer, Wilmington Funds; Vice President, Wilmington Funds Management Corporation (2005 to present); Vice President, Wilmington Trust Investment Advisors, Inc. (2012 to present). Previous Positions:Vice President, Wilmington Trust Investment Management, LLC (2005 to 2012). |
| |
Lisa Druelinger Birth year: 1978 CHIEF COMPLIANCE OFFICER and AML COMPLIANCE OFFICER. Began serving: November 2017 | | Principal Occupations:Chief Compliance Officer and Anti-Money Laundering Officer, Wilmington Funds; Administrative Vice President, M&T Bank. Previous Positions:Vice President and Senior Compliance Officer, Wilmington Trust Investment Advisors, Inc. (2015-2017); Wilmington Funds Product Manager, Wilmington Trust Investment Advisors, Inc. (2013-2015); Institutional and Retirement Services Product Manager, Wilmington Trust (2011-2013); Trust Compliance and Risk Management at M&T Bank (2006- 2011). |
ANNUAL REPORT / April 30, 2020 (unaudited)
| | |
| 33 | | BOARD OF TRUSTEES AND TRUST OFFICERS |
| | |
| |
Name Address Birth Year Positions with Trust | | Principal Occupations for Past Five Years and Previous Positions |
| |
John J. Kelley Birth year: 1959 VICE PRESIDENT Began serving: December 2016 | | Principal Occupations:President of Wilmington Funds Management Corporation; Group Vice President and Chief Administrative Officer, Wilmington Trust Investment Advisors, Inc. Previous Positions:Vice President, BNY Mellon Investment Servicing (formerly, PNC Global Investment Servicing) from (1/05 to 7/05); Vice President of Administration, 1838 Investment Advisors, LP (1999 to 2005); Chief Compliance Officer, 1838 Investment Advisors, LP (2004 to 2005). |
| |
Robert L. Tuleya Birth year: 1974 VICE PRESIDENT and ASSISTANT SECRETARY Began serving: September 2018 | | Principal Occupations:Vice President and Assistant Secretary, Wilmington Funds; Vice President and Assistant Secretary, Wilmington Funds Management Corporation (2018 to present); Vice President and Assistant Secretary, Wilmington Trust Investment Advisors, Inc. (2018 to present); Vice President and Assistant Secretary, Wilmington Trust Investment Management, LLC (2018 to present); Vice President and Assistant General Counsel, M&T Bank (2018 to present). Previous Positions:Vice President and Counsel, M&T Bank (2017 to 2018); Senior Counsel, PNC Bank (2014 to 2017). |
| |
Christopher W. Roleke 10 High Street, Suite 302 Boston, MA 02110 Birth year: 1972 CHIEF FINANCIAL OFFICER AND TREASURER Began serving: July 2013 | | Principal Occupation:Managing Director and Fund Principal Financial Officer, Foreside Management Services, LLC (2011 to present). Previous Positions:Assistant Vice President, JP Morgan Investor Services Co. (2006 to 2011). |
| |
Lisa R. Grosswirth Atlantic Terminal Office Tower, 2 Hanson Place, 12th Floor Brooklyn, NY 11217 Birth year: 1963 SECRETARY Began serving: September 2007 | | Principal Occupation:Vice President, BNY Mellon Asset Servicing (2004 to present). Previous Positions:Supervisory Paralegal, The Dreyfus Corporation (1998 to 2004). |
| |
Richard J. Berthy Three Canal Plaza, Suite 100 Portland, ME 04101 Birth year: 1958 CHIEF EXECUTIVE OFFICER Began serving: September 2007 | | Principal Occupation:Chief Executive Officer, Foreside Financial Group, LLC (2012 to present). Previous Positions:President, Foreside Financial Group, LLC (2008 to 2012); Chief Administrative Officer, Foreside Financial Group, LLC (2005 to 2008); President and Secretary, Bainbridge Capital Management, LLC (2003 to 2006); Vice President, Bainbridge Capital Management (2002 to 2004). |
April 30, 2020 (unaudited) / ANNUAL REPORT
Board Approval of Liquidity Risk Management Program
To promote effective liquidity risk management throughout the fund industry and to enhance disclosure regarding fund liquidity and redemption practices, the Securities and Exchange Commission (the “Commission”) adopted Rule22e-4 under the Investment Company Act of 1940, as amended. The rule requires every registeredopen-end management company to establish a liquidity risk management program that, among other things, provides for the assessment, management and review of liquidity risk, the classification of a fund’s portfolio investments into one of four liquidity buckets based upon the number of days that such investments may reasonably be expected to be converted into cash or otherwise disposed of without significantly impacting their price, the establishment of a highly liquid investment minimum where required, and the establishment of a 15% limitation on illiquid investments. Additionally, the Commission adopted Rule30b1-10 and FormN-LIQUID, which generally requires a fund to notify the Commission when certain liquidity-related events occur.
The Wilmington Funds Board of Trustees (the “Board”) approved the appointment of the Funds’ Liquidity Risk Management Committee (“Liquidity Committee”) as the administrator of the liquidity risk management program (the “LRMP”) for the Funds on September 6, 2018 and the Funds’ final LRMP on March 5, 2019. At the regular meeting of the Board on March 10, 2020, the Trust’s Chief Operations Officer, as a member of the Liquidity Committee, provided a report to the Board on the operation and effectiveness of the LRMP after its first year of operation. The Liquidity Committee managed liquidity risks associated with the Funds’ investments by monitoring cash and cash equivalents, the use of derivatives, the concentration of investments and the appropriateness of portfolio strategies foropen-end funds, and by classifying each investment of a Fund as either highly liquid, moderately liquid, less liquid or illiquid on at least a monthly basis. To assist with the classification of each Fund’s investments, the Liquidity Committee utilized a third party provider of liquidity monitoring services. The Liquidity Committee supplied portfolio-level data and certain assumptions to the provider which then used the information to determine the liquidity classification of each security position held by the Funds. The liquidity classifications as of each month end were reviewed by the Liquidity Committee on at least a quarterly basis and would be reviewed more often if market conditions warranted. For assets managed by a third partysub-adviser the Liquidity Committee would takesub-adviser input into account where appropriate in determining the liquidity classifications.
The LRMP effectively managed the Funds’ liquidity risks for the twelve month period ended April 30, 2020. During this period, each Fund held more than 50% of its total net assets in highly liquid investments and due to the fact that each Fund is deemed to consist primarily of highly liquid investments, no highly liquid investment minimum was required to be established for any Fund. All Funds holding assets deemed to be illiquid were well under the illiquid investment limitation. Additionally, no events occurred that required the filing of FormN-LIQUID.
ANNUAL REPORT / April 30, 2020 (unaudited)
Shares of the Wilmington Funds are not FDIC insured or otherwise protected by the U.S. government, are not deposits or other obligations of, or guaranteed by, Manufacturers and Traders Trust Company, and are subject to investment risks, including possible loss of the principal amount invested.
VOTING PROXIES ON FUND PORTFOLIO SECURITIES
A description of the policies and procedures that the Funds use to determine how to vote proxies relating to securities held in the Funds’ portfolios is available, without charge and upon request, by calling1-800-836-2211. A report on how the Funds voted any such proxies during the most recent12-month period ended June 30 is available through Wilmington Funds’ website. Go to www.wilmingtonfunds.com select “Proxy Voting Record” to access the link. This information is also available from the Edgar database on the SEC’s website at www.sec.gov.
QUARTERLY PORTFOLIO SCHEDULE
For periods prior to the quarter ending July 31, 2019, the Funds have filed a complete schedule of portfolio holdings with the SEC for the first and third quarters of each fiscal year on FormN-Q. The Funds’ FormN-Qs are available on the SEC’s website at www.sec.gov.
Effective July 31, 2019, the Funds file a complete schedule of portfolio holdings with the SEC for the first and third quarters of each fiscal year as an exhibit to its reports on FormN-PORT. FormN-PORT is available on the SEC’s website at www.sec.gov.
Electronic Delivery
Wilmington Funds encourages you to sign up for electronic delivery of investor materials. By doing so you will receive information faster, help lower shareholder costs, and reduce the impact to the environment. To enroll in electronic delivery:
| | 1.) | Go to www.wilmingtonfunds.com and select “Individual Investors” 2.) Click on the link “Sign up for Electronic Delivery” |
| | 3.) | Login to your account or create new user ID |
| | 4.) | SelectE-Delivery Consent from the available options, and |
| | 5.) | Complete the information requested, including providing the email address where you would like to receive notification for electronic documents. |
| * | If you hold your account through a financial intermediary, please contact your advisor to request electronic delivery of investor materials. |
Householding
In an effort to reduce volume of mail you receive, only one copy of the prospectus, annual/semi-annual report, SAI and proxy statements will be sent to shareholders who are part of the same family and share the same address.
If you would like to request additional copies of the prospectus, annual/semi-annual report or SAI, or wish to opt out of householding mailings, please contact Shareholder Services at1-800-836-2211, or write to Wilmington Funds, P.O. Box 9828, Providence, RI 02940-8025.
April 30, 2020 / ANNUAL REPORT
PRIVACY POLICY AND NOTICE
OF THE FUNDS AND THEIR DISTRIBUTOR
June 8, 2012
The Wilmington Funds, their distributor and their agents (referred to as “the Funds”, “we” or “us”) recognize that consumers (referred to as “you” or “your”) expect us to protect both your assets and financial information. We respect your right to privacy and your expectation that all personal information about you or your account will be maintained in a secure manner. We are committed to maintaining the confidentiality, security and integrity of client and shareholder information. We want you to understand the Funds’ policy that governs the handling of your information, how the Funds gather information, how that information is used and how it is kept secure.
Information The Funds Collect:
The Funds collect nonpublic personal information about you from the following sources:
| | • | We may receive information from you, or from your financial representative, on account applications, other forms or electronically (such as through the Funds’ website or other electronic trading mechanisms). Examples of this information include your name, address, social security number, assets and income. |
| | • | We may receive information from you, or from your financial representative, through transactions with us or others, correspondence and other communications. Examples of this information include specific investments and your account balances. |
| | • | We may obtain other personal information from you in connection with providing you a financial product or service. Examples of this information include depository, debit or credit account numbers. |
Information Sharing Policy
The Funds may share nonpublic personal information about you, as described above, with financial ornon-financial companies or other entities, including companies that may be affiliated with the Funds and other nonaffiliated third parties, for the following purposes:
| | • | We may share information when it is necessary and required to process a transaction or to service a customer relationship. For example, information may be shared with a company that provides account record keeping services or a company that provides proxy services to shareholders. |
| | • | We may share information when it is required or permitted by law. For example, information may be shared in response to a subpoena or to protect you against fraud or with someone who has established a legal beneficial interest, such as a power of attorney. |
| | • | We may disclose some or all of the information described above to companies that perform marketing or other services on our behalf. For example, we may share information about you with the financial intermediary (bank, investment bank or broker-dealer) through whom you purchased the Funds’ products or services, or with providers of marketing, legal, accounting or other professional services. The Funds will not, however, disclose a consumer’s account number or similar form of access number or access code for credit card, deposit or transaction accounts to any nonaffiliated third party for use in telemarketing, direct mail or other marketing purposes. |
Except as described above, the Funds do not share customer information. We will not rent, sell, trade, or otherwise release or disclose any personal information about you. Any information you provide to us is for the Funds’ use only. If you decide to close your account(s) or become an inactive customer, we will adhere to the privacy policies and practices as described in this notice.
Information Security:
When the Funds share nonpublic customer information with third parties hired to facilitate the delivery of certain products or services to our customers, such information is made available for limited purposes and under controlled circumstances designed to protect our customers’ privacy. We require third parties to comply with our standards regarding security and confidentiality of such information. We do not permit them to use that information for their own or any other purposes, or rent, sell, trade or otherwise release or disclose the information to any other party. These requirements are reflected in written agreements between the Funds and the third party service providers.
The Funds protect your personal information in several ways. We maintain physical, electronic, and procedural safeguards to guard your nonpublic personal information. In addition, the Funds’ Transfer Agent and Shareholder Servicing Agent have procedures in place for the appropriate disposal of nonpublic personal information when they are no longer required to maintain the information.
Each of the following sections explains an aspect of the Funds’ commitment to protecting your personal information and respecting your privacy.
Employee Access to Information:
Our Code of Ethics, which applies to all employees, restricts the use of customer information and requires that it be held in the strictest of confidence. Employee access to customer information is authorized for business purposes only, and the degree of access is based on the sensitivity of the information and on an employee’s or agent’s need to know the information in order to service a customer’s account or comply with legal requirements.
Visiting The Funds’ Website:
The Funds’ website gathers and maintains statistics about the number of visitors as well as what information is viewed most frequently. This information is used to improve the content and level of service we provide to our clients and shareholders.
ANNUAL REPORT / April 30, 2020
| | • | Information or data entered into a website will be retained. |
| | • | Where registration to a website orre-entering personal information on a website is required, “cookies” are used to improve your online experience. A cookie is a way for websites to recognize whether or not you have visited the site before. It is a small file that is stored on your computer that identifies you each time youre-visit our site so you don’t have to resubmit personal information. Cookies provide faster access into the website. |
| | • | We may also collectnon-personally identifiable Internet Protocol (“IP”) addresses for all other visitors to monitor the number of visitors to the site. Thesenon-personally identifiable IP addresses are never shared with any third party. |
E-mail:
If you have opted to receive marketing information from the Funds bye-mail, it is our policy to include instructions in all marketing messages on how to unsubscribe from subsequente-mail programs. Some products or services from the Funds are intended to be delivered and serviced electronically.E-mail communication may be utilized in such cases. If you participate in an employer-sponsored retirement plan administered by the Funds, we may, at your employer’s request, send youe-mail on matters pertaining to the retirement plan.
Please do not provide any account or personal information such as social security numbers, account numbers, or account balances within youre-mail correspondence to us. We cannot usee-mail to execute transaction instructions, provide personal account information, or change account registration. We can, however, usee-mail to provide you with the necessary forms or you may contact customer service toll-free at1-800-836-2211.
Surveys/Aggregate Data:
Periodically, the Funds may conduct surveys about financial products and services or review elements of customer information in an effort to forecast future business needs. The Funds then generate reports that include aggregate data regarding its customers. Aggregate data classifies customer information in various ways but that does not identify individual customers. These reports may also include information on website traffic patterns and related information. These reports are used for the Funds’ planning, statistical and other corporate purposes. Aggregate data may also be shared with external parties, such as marketing organizations. However, no information is shared by which any individual customer could be identified.
Changes to Our Privacy Statement:
The effective date of this policy is June 8, 2012. We reserve the right to modify this policy at any time. When it is revised or materially changed, we will update the effective date. You can determine whether there have been changes since the last time you reviewed by simply checking the effective date.
Notice will be provided to you in advance of any changes that would affect your rights under this policy statement.
April 30, 2020 / ANNUAL REPORT
[This Page Intentionally Left Blank]
[This Page Intentionally Left Blank]
[This Page Intentionally Left Blank]

WILMINGTON FUNDS April 30, 2020 PRESIDENT’S MESSAGE AND Annual Report WILMINGTON FUNDS Fixed Income Funds Wilmington Broad Market Bond Fund Wilmington Intermediate-Term Bond Fund Wilmington Short-Term Bond Fund Wilmington Municipal Bond Fund Wilmington New York Municipal Bond Fund Beginning on or about June 1, 2021, as permitted by regulations adopted by the Securities and Exchange Commission, paper copies of your Fund’s shareholder reports will no longer be sent to you by mail, unless you specifically request them from the Fund or from your financial intermediary, such as a broker/dealer, bank, or insurance company. Instead, you will be notified by mail each time a report is posted on the website and provided with a link to access the report. If you already elected to receive shareholder reports electronically, you will not be affected by this change and you do not need to take any action. You may elect to receive shareholder reports and other communications from the Wilmington Funds electronically by contacting your financial intermediary or, if you are a direct investor, by calling 1-800-836-2211. You may elect to receive paper copies of all future shareholder reports free of charge. If you own these shares through a financial intermediary, you may contact your financial intermediary to elect to continue to receive paper copies of your shareholder reports. If you are a direct investor you can inform the Wilmington Funds that you wish to continue receiving paper copies of your shareholder reports by contacting us at 1-800-836-2211. Your election to receive reports in paper will apply to all funds held directly with the Wilmington Funds and may apply to all funds held with your financial intermediary.

Wilmington Broad Market Bond Fund (“Broad Market Bond Fund”)
Wilmington Intermediate-Term Bond Fund (“Intermediate-Term Bond Fund”)
Wilmington Short-Term Bond Fund (“Short-Term Bond Fund”)
Wilmington Municipal Bond Fund (“Municipal Bond Fund”)
Wilmington New York Municipal Bond Fund (“New York Municipal Bond Fund”)

[This Page Intentionally Left Blank]
Esteemed Shareholder:
I am pleased to present the Annual Report of the Wilmington Funds (the “Trust”), covering the Trust’s annual fiscal year period of May 1, 2019, through April 30, 2020. Inside you will find a comprehensive review of the Trust’s holdings and financial statements.
The economy and financial markets in review
Wilmington Funds Management Corporation and Wilmington Trust Investment Advisors, Inc. (the Trust’s investment advisor and subadvisor, respectively), have provided the following review of the economy, bond markets, and stock markets for the Trust’s annual fiscal year period.
The economy
The last year brought a tale of two narratives for the global economy. During 2019 the global economy centered on trade, as escalating frictions between the U.S. and China disrupted global supply chains and weighed heavily on sentiment. The announcement of a phase one trade deal between the two sides in October, and progression toward the deal’s completion in December, fueled hopes for the possibility of a cyclical recovery in early 2020. Despite weakness in business investment, a byproduct of the trade war, the U.S. recorded Gross Domestic Product (“GDP”) growth of 2.3% (seasonally adjusted) in 2019, thanks to notable strength in consumer spending. Optimism abruptly reversed course in late February of 2020 as COVID-19, the infectious disease caused by the most recently discovered coronavirus, evolved from an outbreak to a global pandemic. Governments worldwide implemented strict lockdown measures to curb the virus’s spread, relegating consumers to their homes and forcing non-essential businesses to shutter. With economic activity grinding to a near standstill by the end of March, U.S. GDP declined by 4.8% (seasonally adjusted annualized rate) in the first quarter, providing an early glimpse into what is expected to be a materially weaker second quarter. As demand receded in April, gauges of manufacturing and services activity tumbled into contraction territory, core inflation dropped by a record 0.4% (month-over-month) and the U.S. unemployment rate spiked to 14.7%, its highest level since the Great Depression.
The fiscal and monetary response in the U.S. has been unparalleled historically, in its scale and speed of implementation. After delivering three rate cuts in 2019, the Federal Reserve (the “Fed”) lowered rates further by a cumulative 150 basis points1 in the first quarter of 2020 and moved to open-ended purchases of Treasuries and agency Mortgage-Backed Securities/Collateralized Mortgage-Backed Securities. Additionally, the Fed introduced a plethora of accommodations to support financial markets, businesses and governments. The Fed entered uncharted territory by creating new facilities to purchase corporate debt and fixed income ETFs, and later broadened their scope to include segments of the high yield market. The Federal government introduced roughly $3 trillion of fiscal stimulus through three pieces of legislation to provide direct support to consumers, businesses and governments, cushion the pandemic’s economic impact and accelerate the nation’s healthcare response.
Emerging and international developed economies, which are more export dependent than the U.S., were hit particularly hard by the trade war in 2019, with the global manufacturing sector moving into contraction in the third quarter, before showing signs of life towards the end of the year. A cyclical rebound appeared to be picking up steam in China, before COVID-19 emerged in its central province of Wuhan. As the first economy affected, China offered a preview to the rest of the world of the virus’s potential impact. After GDP growth decelerated in 2019, to its slowest pace in 30 years, China registered a record decline in the first quarter 2020. The Euro zone and UK economies suffered a tremendous economic toll as countrywide lockdown orders were set into motion and GDP contracted in the first quarter. Central banks outside the U.S. followed the Fed’s lead, in introducing record volumes of accommodation, while the fiscal response across international economies has been massive in scale.
Bond markets
The 2019 calendar year marked a strong period for bond markets, particularly for investment grade corporates, which posted their best annual performance since 2002 as rates fell precipitously and spreads compressed to near decade lows. However, the first quarter of 2020 brought one of the most volatile quarters in recent memory as the COVID-19 pandemic challenged corporate balance sheets and severely hampered liquidity. Taxable corporate credit spreads (interest rate in excess of the risk-free rate) and the ratio of high grade tax-exempt yields to Treasuries of equivalent maturity surged to decade highs. The 10-year Treasury yield plummeted to an all-time low as the Federal Reserve slashed rates to zero and investors sought safety. The Federal Reserve moved to open-ended quantitative easing and arranged a broad menu of facilities to enhance market liquidity and expand access to credit. The Fed’s pledge to provide direct support to corporate bond markets, for the first time in history, helped drive taxable spreads materially lower and boosted performance through the end of April. The energy sector weighed heavily on performance for corporates as the price of oil plunged to a historic record low. The more vulnerable high yield sector saw fundamentals deteriorate asymmetrically and lagged high grade peers in the risk-off environment.
PRESIDENT’S MESSAGE / April 30, 2020 (unaudited)
For the 12-month period May 1, 2019 to April 30, 2020, certain Bloomberg Barclays indices performed as follows:2
| | | | | | | | |
Bloomberg Barclays
U.S. Treasury Bond Index3 | | Bloomberg Barclays
U.S. Aggregate Bond Index4 | | Bloomberg Barclays
U.S. Credit Bond Index5 | | Bloomberg Bloomberg Barclays
Municipal
Bond Index6 | | Bloomberg Barclays
U.S. Corporate High
Yield Bond Index7 |
| | | | |
14.27% | | 10.84% | | 9.37% | | 2.16% | | -4.11% |
Past performance is no guarantee of future results. Short term performance may not be indicative of long term results.
Source: Lipper. You cannot invest directly in an index.
Equity markets
The past year brought a continuation of the predominant equity market trends observed in the second half of 2018, namely the dominance of U.S. over international equities, developed over emerging markets, growth over value and large over small cap. U.S. large cap equities capped off their second best annual performance of the decade in the 2019 calendar year and benefitted from corporate earnings that came in better than feared, supportive monetary policy and trade optimism from October through January. International developed and emerging market equities, which are more leveraged to global trade, suffered disproportionately throughout the US-China tariff disaster, while persistent dollar strength and investors’ preference for safe-haven assets presented additional headwinds for the international group. Risk appetite prevailed through January but was abruptly derailed as the COVID-19 outbreak escalated rapidly to a global pandemic and brought the longest bull market in history to a painful end. The selloff that transpired from February to late March was indiscriminate, affecting all regions with unsettling speed and magnitude, although winners and losers emerged during the subsequent rebound from March lows. Notably, U.S. small cap companies, which are more cyclical in nature, bore the brunt of the selloff, as the pandemic introduced a punishing blow to economic activity. Mega-cap technology stocks emerged as relative safe havens and proved more resilient than the broader market with earnings less impacted by the economic damage.
For the 12-month period May 1, 2019 to April 30, 2020, certain stock market indices performed as follows:
| | | | | | |
| | | |
| S&P 500 Index8 | | Russell 2000 Index9 | | MSCI EAFE (Net) Index10 | | MSCI Emerging Markets (Net) Index11 |
| | | |
0.86% | | -16.39% | | -11.34% | | -12.00% |
Past performance is no guarantee of future results. Short term performance may not be indicative of long term results.
Source: Lipper. You cannot invest directly in an index.
As investors know all too well, uncertainty in financial markets is certain. Other ongoing certainties include our fiduciary, clients-first mindset as we strive to manage risk in your portfolio’s assets. Another constant is our disciplined yet flexible economics-led investment process that is delivered through innovative multi-asset class solutions and is designed to help you achieve your long-term objectives.
Sincerely,

Dominick J. D’Eramo, CFA
President
May 15, 2020
April 30, 2020 (unaudited) / PRESIDENT’S MESSAGE
Must be preceded or accompanied by a prospectus.
Past performance is no guarantee of future results. The index performance quoted is for illustrative purposes only and is not representative of any specific investment. Diversification does not ensure a profit nor protect against loss.
All investments involve risk, including the possible loss of principal. Equity Securities are subject to price fluctuation and possible loss of principal. Small- and mid-cap stocks involve greater risks and volatility than large-cap stocks. International investments are subject to special risks, including currency fluctuations, social, economic, and political uncertainties, which could increase volatility. These risks are magnified in emerging markets.
High-yield, lower-rated securities generally entail greater market, credit, and liquidity risks than investment grade securities and may include higher volatility and higher risk of default.
1. Basis Points (“BPS”) is a unit that is equal to 1/100th of 1% and is used to denote the change in a financial instrument. The basis point is commonly used for calculating changes in interest rates, equity indices and the yield of a fixed-income security.
2. Bond prices are sensitive to changes in interest rates and a rise in interest rates can cause decline in their prices.
3. Bloomberg Barclays U.S. Treasury Bond Index is a market capitalization weighted index that includes all publicly issued, U.S. Treasury securities that have a remaining maturity of at least one year, are rated investment-grade, and have $250 million or more of outstanding face value. The index is unmanaged and investments cannot be made directly in an index.
4. Bloomberg Barclays U.S. Aggregate Bond Index is widely used benchmark index for the domestic investment-grade bond market composed of securities from the Barclays Government/Corporate Bond Index, Mortgage-Backed Securities Index and Asset-Backed Securities Index. The index typically includes fixed income securities with overall intermediate- to long-term average maturities. The index is unmanaged and investments cannot be made directly in an index.
5. Bloomberg Barclays U.S. Credit Bond Index tracks the performance of domestic investment-grade corporate bonds and is composed of all publicly issued, fixed-rate, nonconvertible, investment-grade corporate debt. The index is unmanaged and investments cannot be made directly in an index.
6. Bloomberg Barclays Municipal Bond Index tracks the performance of long-term, tax-exempt, investment-grade bond market. To be included in the index, bonds must have an outstanding par balance of at least $7 million and be issued as part of a transaction of at least $75 million. The index is unmanaged and investments cannot be made directly in an index.
7. Bloomberg Barclays U.S. Corporate High Yield Bond Index measures the USD-denominated, high yield, fixed-rate corporate bond market. Securities are classified as high yield if the middle rating of Moody’s, Fitch, and S&P is Ba1/BB+/BB+ or below. Bonds from issuers with an emerging markets country of risk, based on the Bloomberg Barclays EM country definition, are excluded. The U.S. Corporate High Yield Bond Index is a component of the U.S. Universal and Global High Yield Indices. An investment cannot be made directly in an index.
8. The S&P 500 Index is a capitalization-weighted index of 500 stocks designed to measure performance of the broad domestic economy through changes in the aggregate market value of 500 stocks representing all major industries. The index is unmanaged and investments cannot be made directly in an index.
9. The Russell 2000 Index measures the performance of the 2,000 smallest companies in the Russell 3000 Index, which represents approximately 8% of the total market capitalization of the Russell 3000 Index. As of its latest reconstitution, the index had a total market capitalization range of $152.3 million to $5 billion.
10. MSCI EAFE (Net) Index is a free float-adjusted market capitalization index that is designed to measure equity market performance of developed markets, excluding the U.S. & Canada. The MSCI EAFE Index is an equity index which captures large and mid-cap representation across 21 Developed Market countries: Australia, Austria, Belgium, Denmark, Finland, France, Germany, Hong Kong, Ireland, Israel, Italy, Japan, Netherlands, New Zealand, Norway, Portugal, Singapore, Spain, Sweden, Switzerland and the United Kingdom. The index is unmanaged and investments cannot be made directly in an index. The performance of this index is reduced by the taxes on dividends paid by the international securities issuers in the index.
11. MSCI Emerging Markets (Net) Index is a free float-adjusted market capitalization index that is designed to measure equity market performance of emerging markets. The MSCI Emerging Markets Index captures large and mid-cap representation across 26 Emerging Market countries: Argentina, Brazil, Chile, China, Colombia, Czech Republic, Egypt, Greece, Hungary, India, Indonesia, Korea, Malaysia, Mexico, Pakistan, Peru, Philippines, Poland, Qatar, Russia, Saudi Arabia, South Africa, Taiwan, Thailand, Turkey, and United Arab Emirates. The index is unmanaged and investments cannot be made directly in an index. The performance of this index is reduced by the taxes on dividends paid by the international securities issuers in the index.
PRESIDENT’S MESSAGE / April 30, 2020 (unaudited)
WILMINGTON BROAD MARKET BOND FUND
Management’s Discussion of Fund Performance
For the fiscal year ended April 30, 2020, Wilmington Broad Market Bond Fund (the “Fund”) had a total return of 9.35%* for Class A Shares and 9.74%* for Class I Shares, versus its benchmark, the Bloomberg Barclays U.S. Aggregate Bond Index**, which had a total return of 10.84%, and its peer group, the Lipper CorporateA-Rated Debt Funds Average***, which had a total return of 9.95%.
We understand the growing concern associated with the pandemic and its effect on the global economy and in the towns that we live and work. Our thoughts are with those that have been infected by the coronavirus. We are grateful for all the health care workers that are serving our communities. Your fixed income team is meeting “virtually” daily to review current events and set strategy. We continue to utilize our disciplined relative value investment process. We continue to emphasize our guiding philosophies of maintaining well diversified and liquid portfolios. We continue to conduct our own independent credit analysis. Most importantly in these uncertain times we draw upon our experienced team. As always, our disciplined risk management efforts guide our investment decisions.
Prior to the pandemic the Federal Reserve (the “Fed”) had cut interest rates three times in 2019. These were the first rate cuts since the financial crisis. The Fed had acknowledged that the trade tensions between China and the United States were causing weak global economic growth and inflation pressures were muted. The Fed wanted some insurance to keep the longest economic expansion going.
As the pandemic spread around the globe leading to “stay at home orders” the economy experienced its worst crisis since the great depression. The unemployment rate rose from a 50 year low to 14.7% as 20.5 million jobs were destroyed in April. As businesses closed and consumers stayed home retail sales fell by a staggering 16.4% in April after falling by 8.3% in March. In response to the economic crisis the Fed has cut interest rates to zero and provided liquidity to the treasury, mortgage backed, commercial paper and asset backed markets just as it did during the financial crisis. The Fed also announced on March 23rd that they will begin buying corporate and municipal bonds, which the Fed did not undertake during the financial crisis. Congress has also provided several stimulus programs to ease the economic pain.
Interest rates declined rapidly in response to the Fed cutting interest rates. The unparalleled “flight to quality” led to record low treasury yields. The 2-year treasury yield fell by 2% over the past year to a yield of 0.2%. The 10-year treasury yield sank to an all-time low of 0.31% in March before rising to a yield of 0.64% on April 30. The total return of the 10-year treasury bond was 20% for the fiscal year while the 30-year treasury bond returned 45% as inflation expectations declined as oil prices plummeted from $64 a year ago to $19 per barrel on a price war started by Saudi Arabia and as demand evaporated as the world was told to stay home.
The corporate sector severely underperformed. For the fiscal year the sector produced -7% of excess return. March was the worst performing month ever for the corporate sector surpassing the prior worst month of September 2008. The underperformance can be attributed to expectations of global recession, the collapse of oil prices, fears of credit rating downgrades and a spike in bankruptcies. The
sector did rebound somewhat in April in response to the Fed announcing they will begin supporting the market. The average risk premium for the Bloomberg Barclays U.S. Investment Grade Corporate Index**** widened from a low of 93 basis points at year end 2019 to a high of 373 basis points before ending at 202 basis points on April 30.
Looking forward the expectation is for the Fed to maintain a zero-interest rate policy until the economy recovers from the pandemic. The market is anticipating no change in the Fed Funds target before 2023. Longer term interest rates will be determined by news of a vaccine and whether the economy starts to recover. The corporate sector should benefit from the Fed’s bond buying program.
The Fund’s performance versus the peer group and index can be attributed to the Fund maintaining a shorter duration than the peer group which has funds with a duration that are twice the Fund’s duration. We also maintained a duration that was shorter than the index for most of the fiscal year. Our yield curve strategy of maintaining an equal allocation to the longer end of the yield curve aided performance as this portion of the yield curve outperformed. Our overweight allocation to the corporate sector also detracted from performance versus the index as the corporate sector underperformed.
| * | Performance data quoted represents past performance, which is no guarantee of future results. Investment return and principal value will fluctuate so that an investor’s shares, when redeemed, may be worth more or less than their original cost. The total return shown assumes the reinvestment of all distributions and does not reflect the deduction of taxes that a shareholder would pay on fund distributions or the redemption of shares. The total return for Class A Shares was 4.41%, adjusted for the Fund’s maximum sales charge of 4.50%. Mutual fund performance changes over time and current performance may be lower or higher than what is stated. For the most recent month-end performance, please visit www.wilmingtonfunds.com or call 1-800-836-2211. |
| ** | The Bloomberg Barclays U.S. Aggregate Bond Index is an index measuring both the capital price changes and income provided by the underlying universe of securities, comprised of U.S. Treasury obligations, U.S. investment grade corporate debt and mortgage-backed obligations. The index is unmanaged and it is not possible to invest directly in an index. |
| *** | Lipper figures represent the average of the total returns reported by all of the mutual funds designated by Lipper, Inc. as falling into the respective category indicated. These figures do not reflect sales charges. |
| **** | The Bloomberg Barclays U.S. Investment Grade Corporate Index measures the investment grade, fixed-rate, taxable corporate bond market. The index is unmanaged and it is not possible to invest directly in an index. |
Bond prices are sensitive to changes in interest rates and a rise in short-term interest rates could cause a decline in bond prices
Excess Return is a security or sector’s return minus the return from a U.S. Treasury of similar maturity or duration.
April 30, 2020 (unaudited) / ANNUAL REPORT
Basis Points (“BPS”) is a unit that is equal to 1/100th of 1% and is used to denote the change in a financial instrument. The basis point is commonly used for calculating changes in interest rates, equity indices and the yield of a fixed-income security.
Yield curve is a line that plots interest rates of bonds having equal credit quality but differing maturity dates.
Duration is a measure of a security’s price sensitivity to changes in interest rates. Securities with longer durations are more sensitive to changes in interest rates than securities of shorter durations.
ANNUAL REPORT / April 30, 2020 (unaudited)
WILMINGTON BROAD MARKET BOND FUND
The graphs below illustrate the hypothetical investment of $10,0001 in the Class A Shares and $1,000,0001 in the Class I Shares of the Wilmington Broad Market Bond Fund; from April 30, 2010 to April 30, 2020, compared to the Bloomberg Barclays U.S. Aggregate Bond Index.2
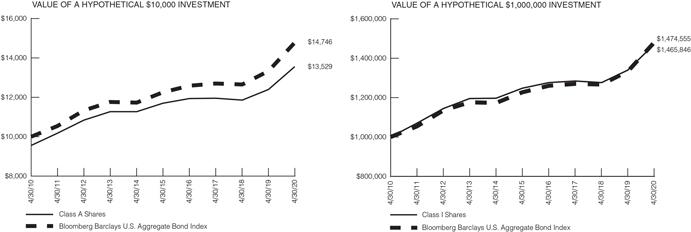
Performance data quoted represents past performance, which is no guarantee of future results. Investment return and principal value will fluctuate so that an investor’s shares, when redeemed, may be worth more or less than their original cost. The total return shown assumes the reinvestment of all distributions and does not reflect the deduction of taxes that a shareholder would pay on fund distributions or the redemption of shares. The total return for Class A Shares was 4.41%, adjusted for the Fund’s maximum sales charge of 4.50%. Mutual fund performance changes over time and current performance may be lower or higher than what is stated. For the most recent month-end performance, please visit www.wilmingtonfunds.com or call1-800-836-2211.
| | | | | | |
| |
| | | Average Annual Total Returns for the Periods Ended 4/30/20 |
| | | |
| | | 1 Year | | 5 Years | | 10 Years |
| | | | |
Class A^ | | 4.41% | | 2.04% | | 3.07% |
| | | | |
Class I^ | | 9.74% | | 3.33% | | 3.90% |
| | | | |
Bloomberg Barclays U.S. Aggregate Bond Index2 | | 10.84% | | 3.80% | | 3.96% |
^Expense Ratios Before Waivers and Expense Ratios After Waivers for Class A are 1.08% and 0.84%, respectively. Expense Ratios Before Waivers and Expense Ratios After Waivers for Class I are 0.83% and 0.49%, respectively. Expense Ratios Before Waiver represent the operating costs borne by the Fund, expressed as a percentage of the Fund’s average net assets, as shown in the Fees and Expenses table in the Fund’s current prospectus (under “Total Annual Fund Operating Expenses”). Current information regarding the Fund’s Operating Expenses can be found in the Fund’s Financial Highlights.
| 1 | Represents a hypothetical investment of $10,000 in Class A of the Fund after deducting the maximum sales charge of 4.50% ($10,000 investment minus $450 sales charge = $9,550) and $1,000,000 in Class I of the Fund and assumes the reinvestment of all dividends and distributions. |
| 2 | The performance for the Bloomberg Barclays U.S. Aggregate Bond Index assumes the reinvestment of all dividends and distributions but does not reflect the deduction of a sales charge required for the Fund’s performance by the Securities and Exchange Commission. It is not possible to invest directly in an index, and the represented index is unmanaged. |
April 30, 2020 (unaudited) / ANNUAL REPORT
WILMINGTON INTERMEDIATE-TERM BOND FUND
Management’s Discussion of Fund Performance
For the fiscal year ended April 30, 2020, Wilmington Intermediate-Term Bond Fund (the “Fund”) had a total return of 6.49%* for Class A Shares, and 6.92%* for Class I Shares, versus its benchmark, the Bloomberg Barclays Intermediate U.S. Government/Credit Bond Index**, which had a total return of 8.18% and its peer group, the Lipper Short-Intermediate Investment Grade Debt Funds Average***, which had a total return of 4.03%.
We understand the growing concern associated with the pandemic and its effect on the global economy and in the towns that we live and work. Our thoughts are with those that have been infected by the coronavirus. We are grateful for all the health care workers that are serving our communities. Your fixed income team is meeting “virtually” daily to review current events and set strategy. We continue to utilize our disciplined relative value investment process. We continue to emphasize our guiding philosophies of maintaining well diversified and liquid portfolios. We continue to conduct our own independent credit analysis. Most importantly in these uncertain times we draw upon our experienced team. As always, our disciplined risk management efforts guide our investment decisions.
Prior to the pandemic the Federal Reserve (the “Fed”) had cut interest rates three times in 2019. These were the first rate cuts since the financial crisis. The Fed had acknowledged that the trade tensions between China and the United States were causing weak global economic growth and inflation pressures were muted. The Fed wanted some insurance to keep the longest economic expansion going.
As the pandemic spread around the globe leading to “stay at home orders” the economy experienced its worst crisis since the great depression. The unemployment rate rose from a 50 year low to 14.7% as 20.5 million jobs were destroyed in April. As businesses closed and consumers stayed home retail sales fell by a staggering 16.4% in April after falling by 8.3% in March. In response to the economic crisis the Fed has cut interest rates to zero and provided liquidity to the treasury, mortgage backed, commercial paper and asset backed markets just as it did during the financial crisis. The Fed also announced on March 23rd that they will begin buying corporate and municipal bonds, which the Fed did not undertake during the financial crisis. Congress has also provided several stimulus programs to ease the economic pain.
Interest rates declined rapidly in response to the Fed cutting interest rates. The unparalleled “flight to quality” led to record low treasury yields. The 2-year treasury yield fell by 2% over the past year to a yield of 0.2%. The 10-year treasury yield sank to an all-time low of 0.31% in March before rising to a yield of 0.64% on April 30. The total return of the 10 -year treasury bond was 20% for the fiscal year while the 30-year treasury bond returned 45% as inflation expectations declined as oil prices plummeted from $64 a year ago to $19 per barrel on a price war started by Saudi Arabia and as demand evaporated as the world was told to stay home.
The corporate sector severely underperformed. For the fiscal year the sector produced -7% of excess return. March was the worst performing month ever for the corporate sector surpassing the prior worst month of September 2008. The underperformance can be attributed to expectations of global recession, the collapse of oil prices,
fears of credit rating downgrades and a spike in bankruptcies. The sector did rebound somewhat in April in response to the Fed announcing they will begin supporting the market. The average risk premium for the Bloomberg Barclays U.S. Investment Grade Corporate Index**** widened from a low of 93 basis points at year end 2019 to a high of 373 basis points before ending at 202 basis points on April 30.
Looking forward the expectation is for the Fed to maintain a zero-interest rate policy until the economy recovers from the pandemic. The market is anticipating no change in the Fed Funds target before 2023. Longer term interest rates will be determined by news of a vaccine and whether the economy starts to recover. The corporate sector should benefit from the Fed’s bond buying program. Despite significantly outperforming the peer group, the Fund did perform below its benchmark. This is mostly attributable to sector allocation as the Fund was overweight corporate bonds. As described above, corporate bonds meaningfully underperformed over the time period primarily due to the economic fallout from the COVID-19 crisis. In addition, the Fund’s underweight position in Treasuries relative to the benchmark also contributed to under-performance. The price of Treasury Bonds increased significantly as the Fed lowered rates to combat the economic impact of the virus.
The Fund maintains a significant overweight to corporate bonds. Price dislocations during the month of March have partially corrected in April as the Fed has implemented programs to support the credit markets. As economic activity increases, we expect credit spreads (interest rate in excess of the risk-free rate) will move tighter. Duration positioning is neutral, and the Fund maintains a slight overweight to the 7-10 year part of the yield curve.
| * | Performance data quoted represents past performance, which is no guarantee of future results. Investment return and principal value will fluctuate so that an investor’s shares, when redeemed, may be worth more or less than their original cost. The total return shown assumes the reinvestment of all distributions and does not reflect the deduction of taxes that a shareholder would pay on fund distributions or the redemption of shares. The total return for Class A Shares was 1.72%, adjusted for the Fund’s maximum sales charge of 4.50%. Mutual fund performance changes over time and current performance may be lower or higher than what is stated. For the most recent month-end performance, please visit www.wilmingtonfunds.com or call 1-800-836-2211. |
| ** | The Bloomberg Barclays Intermediate U.S. Government/Credit Bond Index is a widely recognized, market value weighted index of U.S. Treasury securities, U.S. government agency obligations, corporate debt securities, Yankee bonds and non-convertible corporate debt securities issued by or guaranteed by foreign governments and agencies. The index is unmanaged and it is not possible to invest directly in an index. |
| *** | Lipper figures represent the average of the total returns reported by all of the mutual funds designated by Lipper, Inc. as falling into the respective category indicated. These figures do not reflect sales charges. |
ANNUAL REPORT / April 30, 2020 (unaudited)
| **** | The Bloomberg Barclays U.S. Investment Grade Corporate Index measures the investment grade, fixed-rate, taxable corporate bond market. The index is unmanaged and it is not possible to invest directly in an index. |
Bond prices are sensitive to changes in interest rates and a rise in short-term interest rates could cause a decline in bond prices.
Excess Return is a security or sector’s return minus the return from a U.S. Treasury of similar maturity or duration.
Basis Points (“BPS”) is a unit that is equal to 1/100th of 1% and is used to denote the change in a financial instrument. The basis point is commonly used for calculating changes in interest rates, equity indices and the yield of a fixed-income security.
Duration is a measure of a security’s price sensitivity to changes in interest rates. Securities with longer durations are more sensitive to changes in interest rates than securities of shorter durations.
April 30, 2020 (unaudited) / ANNUAL REPORT
WILMINGTON INTERMEDIATE-TERM BOND FUND
The graphs below illustrate the hypothetical investment of $10,0001 in the Class A Shares and $1,000,0001 in the Class I Shares of the Wilmington Intermediate-Term Bond Fund from April 30, 2010 to April 30, 2020 compared to the Bloomberg Barclays Intermediate U.S. Government/Credit Bond Index.2
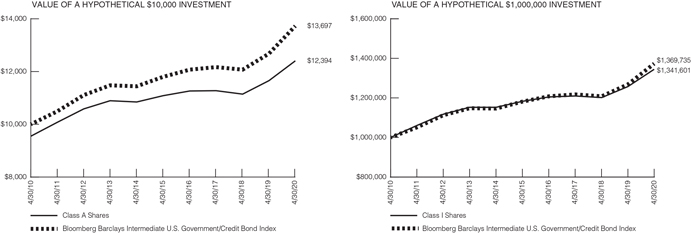
Performance data quoted represents past performance, which is no guarantee of future results. Investment return and principal value will fluctuate so that an investor’s shares, when redeemed, may be worth more or less than their original cost. The total return shown assumes the reinvestment of all distributions and does not reflect the deduction of taxes that a shareholder would pay on fund distributions or the redemption of shares. The total return for Class A Shares was 1.72%, adjusted for the Fund’s maximum sales charge of 4.50%. Mutual fund performance changes over time and current performance may be lower or higher than what is stated. For the most recent month-end performance, please visit www.wilmingtonfunds.com or call1-800-836-2211.
| | | | | | |
| |
| | | Average Annual Total Returns for the Periods Ended 4/30/20 |
| | | |
| | | 1 Year | | 5 Years | | 10 Years |
| | | | |
Class A^ | | 1.72% | | 1.35% | | 2.17% |
| | | | |
Class I^ | | 6.92% | | 2.61% | | 2.98% |
| | | | |
Bloomberg Barclays Intermediate U.S. Government/Credit Bond Index2 | | 8.18% | | 3.06% | | 3.20% |
^Expense Ratios Before Waivers and Expense Ratios After Waivers for Class A are 1.32% and 0.84%, respectively. Expense Ratios Before Waivers and Expense Ratios After Waivers for Class I are 1.07% and 0.49%, respectively. Expense Ratios Before Waiver represent the operating costs borne by the Fund, expressed as a percentage of the Fund’s average net assets, as shown in the Fees and Expenses table in the Fund’s current prospectus (under “Total Annual Fund Operating Expenses”). Current information regarding the Fund’s Operating Expenses can be found in the Fund’s Financial Highlights.
| 1 | Represents a hypothetical investment of $10,000 in Class A of the Fund after deducting the maximum sales charge of 4.50% ($10,000 investment minus $450 sales charge = $9,550) and $1,000,000 in Class I of the Fund and assumes the reinvestment of all dividends and distributions. |
| 2 | The performance for the Bloomberg Barclays Intermediate U.S. Government/Credit Bond Index assumes the reinvestment of all dividends and distributions but does not reflect the deduction of a sales charge required for the Fund’s performance by the Securities and Exchange Commission. It is not possible to invest directly in an index and the represented index is unmanaged. |
ANNUAL REPORT / April 30, 2020 (unaudited)
WILMINGTON SHORT-TERM BOND FUND
Management’s Discussion of Fund Performance
For the fiscal year ended April 30, 2020, Wilmington Short-Term Bond Fund (the “Fund”) had a total return of 3.78%* for Class A Shares and 4.04%* for Class I Shares, versus its benchmark, the Bloomberg Barclays 1-3 Year U.S. Government/Credit Bond Index**, which had a total return of 4.94%, and its peer group, the Lipper Short Investment Grade Debt Funds Average***, which had a total return of 1.61%.
We understand the growing concern associated with the pandemic and its effect on the global economy and in the towns that we live and work. Our thoughts are with those that have been infected by the coronavirus. We are grateful for all the health care workers that are serving our communities. Your fixed income team is meeting “virtually” daily to review current events and set strategy. We continue to utilize our disciplined relative value investment process. We continue to emphasize our guiding philosophies of maintaining well diversified and liquid portfolios. We continue to conduct our own independent credit analysis. Most importantly in these uncertain times we draw upon our experienced team. As always, our disciplined risk management efforts guide our investment decisions.
Prior to the pandemic the Federal Reserve (the “Fed”) had cut interest rates three times in 2019. These were the first rate cuts since the financial crisis. The Fed had acknowledged that the trade tensions between China and the United States were causing weak global economic growth and inflation pressures were muted. The Fed wanted some insurance to keep the longest economic expansion going.
As the pandemic spread around the globe leading to “stay at home orders” the economy experienced its worst crisis since the great depression. The unemployment rate rose from a 50 year low to 14.7% as 20.5 million jobs were destroyed in April. As businesses closed and consumers stayed home retail sales fell by a staggering 16.4% in April after falling by 8.3% in March. In response to the economic crisis the Fed has cut interest rates to zero and provided liquidity to the treasury, mortgage backed, commercial paper and asset backed markets just as it did during the financial crisis. The Fed also announced on March 23rd that they will begin buying corporate and municipal bonds, which the Fed did not undertake during the financial crisis. Congress has also provided several stimulus programs to ease the economic pain.
Interest rates declined rapidly in response to the Fed cutting interest rates. The unparalleled “flight to quality” led to record low treasury yields. The 2-year treasury yield fell by 2% over the past year to a yield of 0.2%. The 10-year treasury yield sank to an all-time low of 0.31% in March before rising to a yield of 0.64% on April 30. The total return of the 10-year treasury bond was 20% for the fiscal year while the 30-year treasury bond returned 45% as inflation expectations declined as oil prices plummeted from $64 a year ago to $19 per barrel on a price war started by Saudi Arabia and as demand evaporated as the world was told to stay home.
The corporate sector severely underperformed. For the fiscal year the sector produced -7% of excess return. March was the worst performing month ever for the corporate sector surpassing the prior worst month of September 2008. The underperformance can be
attributed to expectations of global recession, the collapse of oil prices, fears of credit rating downgrades and a spike in bankruptcies. The sector did rebound somewhat in April in response to the Fed announcing they will begin supporting the market. The average risk premium for the Bloomberg Barclays U.S. Investment Grade Corporate Index**** widened from a low of 93 basis points at year end 2019 to a high of 373 basis points before ending at 202 basis points on April 30.
Looking forward the expectation is for the Fed to maintain a zero-interest rate policy until the economy recovers from the pandemic. The market is anticipating no change in the Fed Funds target before 2023. Longer term interest rates will be determined by news of a vaccine and whether the economy starts to recover. The corporate sector should benefit from the Fed’s bond buying program. Despite significantly outperforming the peer group, the Fund did perform below its benchmark. This is mostly attributable to sector allocation as the Fund was overweight corporate bonds. As described above, corporate bonds meaningfully underperformed over the time period primarily due to the economic fallout from the COVID-19 crisis. In addition, the Fund’s underweight position in Treasuries relative to the benchmark also contributed to under-performance. The price of Treasury Bonds increased significantly as the Fed lowered rates to combat the economic impact of the virus.
Over the fiscal year the primary driver of the Fund’s relative performance to the Index came from its overweight in corporate securities. The historically volatile period over the final fiscal quarter resulted in a very challenging environment for the corporate bond market. The Fund had significantly more of its market value invested in corporate bonds versus the Index. While the Fund’s overall duration emanating from the corporate sector was greater relative to the Index, its duration contrition overweight was significantly less than its market value overweight, ameliorating its underperformance to the Index. Conversely the Fund was significantly underweighted in the best performing sector: U.S. Treasuries and U.S. Government agencies. However, relative to the Fund’s peer group, the Fund’s more defensive positioning in the corporate bond market was the primary driver to excess peer group returns. In addition, the Fund had a greater position in more liquid fixed income securities than the peer group.
| * | Performance data quoted represents past performance, which is no guarantee of future results. Investment return and principal value will fluctuate so that an investor’s shares, when redeemed, may be worth more or less than their original cost. The total return shown assumes the reinvestment of all distributions and does not reflect the deduction of taxes that a shareholder would pay on fund distributions or the redemption of shares. The total return for Class A Shares was 1.94%, adjusted for the Fund’s maximum sales charge of 1.75%. Mutual fund performance changes over time and current performance may be lower or higher than what is stated. For the most recent month-end performance, please visit www.wilmingtonfunds.com or call 1-800-836-2211. |
April 30, 2020 (unaudited) / ANNUAL REPORT
| ** | The Bloomberg Barclays 1-3 Year U.S. Government/Credit Bond Index is an index that captures funds with exposures to both government and commercial credit. The index is unmanaged and it is not possible to invest directly in an index. |
| *** | Lipper figures represent the average of the total returns reported by all of the mutual funds designated by Lipper, Inc. as falling into the respective category indicated. These figures do not reflect sales charges. |
| **** | The Bloomberg Barclays U.S. Investment Grade Corporate Index measures the investment grade, fixed-rate, taxable corporate bond market. The index is unmanaged and it is not possible to invest directly in an index. |
Bond prices are sensitive to changes in interest rates and a rise in short-term interest rates could cause a decline in bond prices.
Excess Return is a security or sector’s return minus the return from a U.S. Treasury of similar maturity or duration.
Basis Points (“BPS”) is a unit that is equal to 1/100th of 1% and is used to denote the change in a financial instrument. The basis point is commonly used for calculating changes in interest rates, equity indices and the yield of a fixed-income security.
Duration is a measure of a security’s price sensitivity to changes in interest rates. Securities with longer durations are more sensitive to changes in interest rates than securities of shorter durations.
ANNUAL REPORT / April 30, 2020 (unaudited)
WILMINGTON SHORT-TERM BOND FUND
The graphs below illustrate the hypothetical investment of $10,0001 in the Class A Shares and $1,000,0001 in the Class I Shares of the Wilmington Short-Term Bond Fund from April 30, 2010 to April 30, 2020 compared to the Bloomberg Barclays 1-3 Year U.S. Government/ Credit Bond Index.2
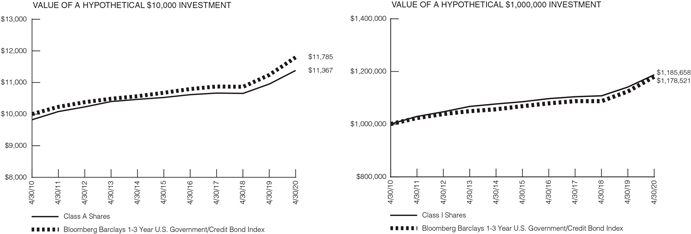
Performance data quoted represents past performance, which is no guarantee of future results. Investment return and principal value will fluctuate so that an investor’s shares, when redeemed, may be worth more or less than their original cost. The total return shown assumes the reinvestment of all distributions and does not reflect the deduction of taxes that a shareholder would pay on fund distributions or the redemption of shares. The total return for Class A Shares was 1.94%, adjusted for the Fund’s maximum sales charge of 1.75%. Mutual fund performance changes over time and current performance may be lower or higher than what is stated. For the most recent month-end performance, please visit www.wilmingtonfunds.com or call1-800-836-2211.
| | | | | | |
| |
| | | Average Annual Total Returns for the Periods Ended 4/30/20 |
| | | |
| | | 1 Year | | 5 Years | | 10 Years |
| | | |
Class A^ | | 1.94% | | 1.20% | | 1.29% |
| | | |
Class I^ | | 4.04% | | 1.81% | | 1.72% |
| | | |
Bloomberg Barclays 1-3 Year U.S. Government/Credit Bond Index2 | | 4.94% | | 2.01% | | 1.66% |
^Expense Ratios Before Waivers and Expense Ratios After Waivers for Class A are 1.42% and 0.73%, respectively. Expense Ratios Before Waivers and Expense Ratios After Waivers for Class I are 1.17% and 0.48%, respectively. Expense Ratios Before Waiver represent the operating costs borne by the Fund, expressed as a percentage of the Fund’s average net assets, as shown in the Fees and Expenses table in the Fund’s current prospectus (under “Total Annual Fund Operating Expenses”). Current information regarding the Fund’s Operating Expenses can be found in the Fund’s Financial Highlights.
| 1 | Represents a hypothetical investment of $10,000 in Class A of the Fund after deducting the maximum sales charge of 1.75% ($10,000 investment minus $175 sales charge = $9,825) and $1,000,000 in Class I of the Fund and assumes the reinvestment of all dividends and distributions. |
| 2 | The performance for the Bloomberg Barclays 1-3 Year U.S. Government/Credit Bond Index assumes the reinvestment of all dividends and distributions but does not reflect the deduction of a sales charge required for the Fund’s performance by the Securities and Exchange Commission. It is not possible to invest directly in an index and the represented index is unmanaged. |
April 30, 2020 (unaudited) / ANNUAL REPORT
WILMINGTON MUNICIPAL BOND FUND
Management’s Discussion of Fund Performance
For the fiscal year ended April 30, 2020, Wilmington Municipal Bond Fund (the “Fund”) had a total return of -0.36%* for Class A Shares and -0.10%* for Class I Shares, versus its benchmark, the S&P Municipal Bond Intermediate Index**, which had a total return of 2.54%, and its peer group, the Lipper Intermediate Municipal Debt Funds Average***, which had a total return of 0.58%.
Strong fund flows, lower rates and a stable credit environment drove municipal fixed income returns throughout 2019 and into early 2020. The S&P Municipal Bond Index generated a strong return of 4.00% from May 1 to December 31, 2019 compared to 2.70% for the same period in 2018. While returns were strongest early in 2019, every month but September contributed positive performance.
In the first four months of 2020, the municipal market witnessed historical levels of volatility. January and February experienced traditional municipal returns and new inflows from investors looking to take advantage of the high level of credit quality and after-tax income and returns that municipals provide. As effects of the COVID-19 pandemic began to creep up on the equity and Treasury markets in early March, the municipal market began to experience selling pressure. Shareholders began to redeem shares in investment-grade and high-yield mutual funds and exchange-traded funds on March 11 and continued through the end of the quarter, reaching approximately $30 billion in total outflows for the month, according to Lipper. Outflows over this three-week period were the fastest and most sudden in municipal history. By the end of March, the S&P Municipal Bond Index returned -3.30% for the month and -0.58% year to date with the index yield rising 0.73% in March to 2.10%.
April results steadied somewhat with fund outflows slower but still high at -$16.6 billion for the month as federal stimulus and Federal Reserve (the “Fed”) lending programs restored some confidence to the municipal market. The S&P Municipal Bond Index return remained negative at -1.20%, bringing four-month returns through April 30th to -1.70%.
One market-wide measure of valuation is to compare the yield on AAA-rated municipals to the yield available on a Treasury maturing in the same timeframe. Generally, tax-exempt municipal yields trade at a discount to U.S. Treasuries due to the preferential tax treatment. On December 31 the five-year AAA municipal bond yielded 66% compared to the five-year U.S. Treasury. Market volatility and the global flight to quality brought the U.S. Treasury much lower at the end of March. The yield on a five-year AAA bond was 300% of the five-year U.S. Treasury on March 31 (the five-year AAA municipal yield was 1.15% compared to the five-year U.S. Treasury, which yielded 0.38%). April saw some tightening with the five-year AAA municipal bond at 291% of the five-year U.S. Treasury.
While we expect continued recovery in the municipal market, the depth and duration of the COVID-19 outbreak will remain the key determinant of market direction.
Fiscal year return performance for the Fund’s Class I Shares of -0.10% was below the S&P Municipal Bond Intermediate Index return of 2.54%. The Fund’s overweight to BBB-rated bonds and credit sectors such as higher education, healthcare and industrial development bonds drove much of the underperformance for the year, mostly in the months of March and April 2020. The ensuing flight to
quality in the municipal market after the March volatility has caused the credit spreads between these kinds of credits to remain wide versus recent averages.
The Fund’s Class I Shares fiscal year return of -0.10% slightly under-performed relative to the Lipper peer group return of 0.58%. The underperformance was due mostly to the overweight to BBB-rated bonds and credit sectors mentioned above.
| | * | Performance data quoted represents past performance, which is no guarantee of future results. Investment return and principal value will fluctuate so that an investor’s shares, when redeemed, may be worth more or less than their original cost. The total return shown assumes the reinvestment of all distributions and does not reflect the deduction of taxes that a shareholder would pay on fund distributions or the redemption of shares. The total return for Class A Shares was -4.82%, adjusted for the Fund’s maximum sales charge of 4.50%. Mutual fund performance changes over time and current performance may be lower or higher than what is stated. For the most recent month-end performance, please visit www.wilmingtonfunds.com or call 1-800-836-2211. |
| | ** | Standard & Poor’s (“S&P”) Municipal Bond Intermediate Index consists of bonds in the S&P Municipal Bond Index with a minimum maturity of three years and a maximum maturity of up to, but not including, 15 years as measured from the Rebalancing Date. The S&P Municipal Bond Index is a broad, market value-weighted index that seeks to measure the performance of the U.S. municipal bond market. All bonds in the index are exempt from U.S. federal income taxes or subject to the Alternative Minimum Tax (“AMT”). The indices include general obligation bonds, revenue bonds, insured bonds and pre-refunded bonds. Indices are unmanaged and it is not possible to invest directly in an index. |
| | *** | Lipper figures represent the average of the total returns reported by all of the mutual funds designated by Lipper, Inc. as falling into the respective category indicated. These figures do not reflect sales charges. |
Duration is a measure of a security’s price sensitivity to changes in interest rates. Securities with longer durations are more sensitive to changes in interest rates than securities of shorter durations.
High yield, lower-rated securities generally entail greater market, credit and liquidity risks than investment grade securities and may include higher volatility and higher risk of default.
Credit ratings pertain only to the securities in the portfolio and do not protect fund shares against market risk.
Bond prices are sensitive to changes in interest rates and a rise in short-term interest rates could cause a decline in bond prices.
Basis Points (“BPS”) is a unit that is equal to 1/100th of 1% and is used to denote the change in a financial instrument. The basis point is commonly used for calculating changes in interest rates, equity indices and the yield of a fixed-income security.
Credit ratings are measured on a scale that generally ranges from AAA (highest) to D (lowest). All Fund securities except for those labeled “Not Rated” and “Other” have been rated by Moody’s, S&P or Fitch, which are each a Nationally
ANNUAL REPORT / April 30, 2020 (unaudited)
Recognized Statistical Rating Organization (“NRSRO”). All Index securities except for those labeled “Not Rated” have been rated by Moody’s or S&P. Credit ratings are subject to change. One cannot invest directly into an index.
Income may be subject to the federal AMT.
April 30, 2020 (unaudited) / ANNUAL REPORT
WILMINGTON MUNICIPAL BOND FUND
The graphs below illustrate the hypothetical investment of $10,0001 in the Class A Shares and $1,000,0001 in the Class I Shares of the Wilmington Municipal Bond Fund from April 30, 2010 to April 30, 2020 compared to the S&P Municipal Bond Intermediate Index.2
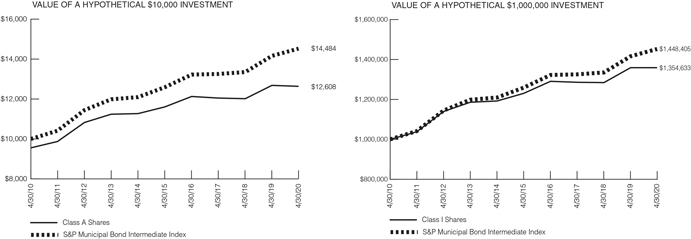
Performance data quoted represents past performance, which is no guarantee of future results. Investment return and principal value will fluctuate so that an investor’s shares, when redeemed, may be worth more or less than their original cost. The total return shown assumes the reinvestment of all distributions and does not reflect the deduction of taxes that a shareholder would pay on fund distributions or the redemption of shares. The total return for Class A Shares was -4.82%, adjusted for the Fund’s maximum sales charge of 4.50%. Mutual fund performance changes over time and current performance may be lower or higher than what is stated. For the most recent month-end performance, please visit www.wilmingtonfunds.com or call1-800-836-2211.
| | | | | | |
| |
| | | Average Annual Total Returns for the Periods Ended 4/30/20 |
| | | |
| | | 1 Year | | 5 Years | | 10 Years |
| | | |
Class A^ | | -4.82% | | 0.79% | | 2.34% |
| | | |
Class I^ | | -0.10% | | 1.98% | | 3.08% |
| | | |
S&P Municipal Bond Intermediate Index2 | | 2.54% | | 2.90% | | 3.77% |
^Expense Ratios Before Waivers and Expense Ratios After Waivers for Class A are 1.10% and 0.74%, respectively. Expense Ratios Before Waivers and Expense Ratios After Waivers for Class I are 0.85% and 0.49%, respectively. Expense Ratios Before Waiver represent the operating costs borne by the Fund, expressed as a percentage of the Fund’s average net assets, as shown in the Fees and Expenses table in the Fund’s current prospectus (under “Total Annual Fund Operating Expenses”). Current information regarding the Fund’s Operating Expenses can be found in the Fund’s Financial Highlights.
| 1 | Represents a hypothetical investment of $10,000 in Class A of the Fund after deducting the maximum sales charge of 4.50% ($10,000 investment minus $450 sales charge = $9,550) and $1,000,000 in Class I of the Fund and assumes the reinvestment of all dividends and distributions. |
| 2 | The performance for the S&P Municipal Bond Intermediate Index assumes the reinvestment of all dividends and distributions but does not reflect the deduction of a sales charge required for the Fund’s performance by the Securities and Exchange Commission. It is not possible to invest directly in an index and the represented index is unmanaged. |
ANNUAL REPORT / April 30, 2020 (unaudited)
WILMINGTON NEW YORK MUNICIPAL BOND FUND
Management’s Discussion of Fund Performance
For the fiscal year ended April 30, 2020, Wilmington New York Municipal Bond Fund (the “Fund”) had a total return of -0.12%* for Class A Shares and 0.13%* for Class I Shares, versus its benchmark, the S&P Municipal Bond Intermediate Index**, which had a total return of 2.54%, and its peer group, the Lipper New York Intermediate Municipal Debt Funds Average***, which had a total return of -0.10%.
Strong fund flows, lower rates and a stable credit environment drove municipal fixed income returns throughout 2019 and into early 2020. The S&P Municipal Bond Index generated a strong return of 4.00% from May 1 to December 31, 2019 compared to 2.70% for the same period in 2018. While returns were strongest early in 2019, every month but September contributed positive performance.
In the first four months of 2020, the municipal market witnessed historical levels of volatility. January and February experienced traditional municipal returns and new inflows from investors looking to take advantage of the high level of credit quality and after-tax income and returns that municipals provide. As effects of the COVID-19 pandemic began to creep up on the equity and Treasury markets in early March, the municipal market began to experience selling pressure. Shareholders began to redeem shares in investment-grade and high-yield mutual funds and exchange-traded funds on March 11 and continued through the end of the quarter, reaching approximately $30 billion in total outflows for the month, according to Lipper. Outflows over this three-week period were the fastest and most sudden in municipal history. By the end of March, the S&P Municipal Bond Index returned -3.30% for the month and -0.58% year to date with the index yield rising 0.73% in March to 2.10%.
April results steadied somewhat with fund outflows slower but still high at -$16.6 billion for the month as federal stimulus and Federal Reserve (the “Fed”) lending programs restored some confidence to the municipal market. The S&P Municipal Bond Index return remained negative at -1.20%, bringing four-month returns through April 30th to -1.70%.
One market-wide measure of valuation is to compare the yield on AAA-rated municipals to the yield available on a Treasury maturing in the same timeframe. Generally, tax-exempt municipal yields trade at a discount to U.S. Treasuries due to the preferential tax treatment. On December 31 the five-year AAA municipal bond yielded 66% compared to the five-year U.S. Treasury. Market volatility and the global flight to quality brought the U.S. Treasury much lower at the end of March. The yield on a five-year AAA bond was 300% of the five-year U.S. Treasury on March 31 (the five-year AAA municipal yield was 1.15% compared to the five-year U.S. Treasury, which yielded 0.38%). April saw some tightening with the five-year AAA municipal bond at 291% of the five-year U.S. Treasury.
While we expect continued recovery in the municipal market, the depth and duration of the COVID-19 outbreak will remain the key determinant of market direction.
Fiscal year return performance for the Fund’s Class I Shares of 0.13% was below the S&P Municipal Bond Intermediate Index return of 2.54%. The Fund’s overweight to BBB-rated bonds and credit sectors such as higher education, transportation and healthcare drove
much of the underperformance for the year, mostly in the months of March and April 2020. The ensuing flight to quality in the municipal market after the March volatility has caused the credit spreads between these kinds of credits to remain wide versus recent averages.
The Fund’s Class I Shares fiscal year return of 0.13% slightly outperformed relative to the Lipper peer group return of -0.10%.
| | * | Performance data quoted represents past performance, which is no guarantee of future results. Investment return and principal value will fluctuate so that an investor’s shares, when redeemed, may be worth more or less than their original cost. The total return shown assumes the reinvestment of all distributions and does not reflect the deduction of taxes that a shareholder would pay on fund distributions or the redemption of shares. The total return for Class A Shares was -4.60%, adjusted for the Fund’s maximum sales charge of 4.50%. Mutual fund performance changes over time and current performance may be lower or higher than what is stated. For the most recent month-end performance, please visit www.wilmingtonfunds.com or call1-800-836-2211. |
| | ** | Standard & Poor’s (“S&P”) Municipal Bond Intermediate Index consists of bonds in the S&P Municipal Bond Index with a minimum maturity of three years and a maximum maturity of up to, but not including, 15 years as measured from the Rebalancing Date. The S&P Municipal Bond Index is a broad, market value-weighted index that seeks to measure the performance of the U.S. municipal bond market. All bonds in the index are exempt from U.S. federal income taxes or subject to the Alternative Minimum Tax (“AMT”). The indices include general obligation bonds, revenue bonds, insured bonds and pre-refunded bonds. Indices are unmanaged and it is not possible to invest directly in an index. |
| | *** | Lipper figures represent the average of the total returns reported by all of the mutual funds designated by Lipper, Inc. as falling into the respective category indicated. These figures do not reflect sales charges. |
Duration is a measure of a security’s price sensitivity to changes in interest rates. Securities with longer durations are more sensitive to changes in interest rates than securities of shorter durations.
High yield, lower-rated securities generally entail greater market, credit and liquidity risks than investment grade securities and may include higher volatility and higher risk of default.
Credit ratings pertain only to the securities in the portfolio and do not protect fund shares against market risk.
Bond prices are sensitive to changes in interest rates and a rise in short-term interest rates could cause a decline in bond prices.
Basis Points (“BPS”) is a unit that is equal to 1/100th of 1% and is used to denote the change in a financial instrument. The basis point is commonly used for calculating changes in interest rates, equity indices and the yield of a fixed-income security.
Credit ratings are measured on a scale that generally ranges from AAA (highest) to D (lowest). All Fund securities except for those labeled “Not Rated” and “Other” have been rated by Moody’s, S&P or Fitch, which are each a Nationally
April 30, 2020 (unaudited) / ANNUAL REPORT
Recognized Statistical Rating Organization (“NRSRO”). All Index securities except for those labeled “Not Rated” have been rated by Moody’s or S&P. Credit ratings are subject to change. One cannot invest directly into an index.
Income may be subject to the federal AMT.
ANNUAL REPORT / April 30, 2020 (unaudited)
WILMINGTON NEW YORK MUNICIPAL BOND FUND
The graphs below illustrate the hypothetical investment of $10,0001 in the Class A Shares and $1,000,0001 in the Class I Shares of the Wilmington New York Municipal Bond Fund from April 30, 2010 to April 30, 2020 compared to the S&P Municipal Bond Intermediate Index.2
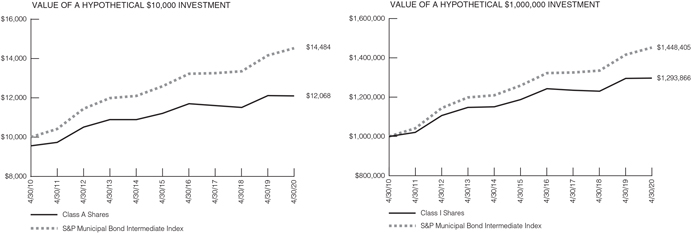
Performance data quoted represents past performance, which is no guarantee of future results. Investment return and principal value will fluctuate so that an investor’s shares, when redeemed, may be worth more or less than their original cost. The total return shown assumes the reinvestment of all distributions and does not reflect the deduction of taxes that a shareholder would pay on fund distributions or the redemption of shares. The total return for Class A Shares was -4.60%, adjusted for the Fund’s maximum sales charge of 4.50%. Mutual fund performance changes over time and current performance may be lower or higher than what is stated. For the most recent month-end performance, please visit www.wilmingtonfunds.com or call1-800-836-2211.
| | | | | | |
| |
| | | Average Annual Total Returns for the Periods Ended 4/30/20 |
| | | |
| | | 1 Year | | 5 Years | | 10 Years |
| | | |
Class A^ | | -4.60% | | 0.60% | | 1.90% |
| | | |
Class I^ | | 0.13% | | 1.76% | | 2.61% |
| | | |
S&P Municipal Bond Intermediate Index2 | | 2.54% | | 2.90% | | 3.77% |
^Expense Ratios Before Waivers and Expense Ratios After Waivers for Class A are 1.35% and 0.83%, respectively. Expense Ratios Before Waivers and Expense Ratios After Waivers for Class I are 1.10% and 0.58%, respectively. Expense Ratios Before Waiver represent the operating costs borne by the Fund, expressed as a percentage of the Fund’s average net assets, as shown in the Fees and Expenses table in the Fund’s current prospectus (under “Total Annual Fund Operating Expenses”). Current information regarding the Fund’s Operating Expenses can be found in the Fund’s Financial Highlights.
| 1 | Represents a hypothetical investment of $10,000 in Class A of the Fund after deducting the maximum sales charge of 4.50% ($10,000 investment minus $450 sales charge = $9,550) and $1,000,000 in Class I of the Fund and assumes the reinvestment of all dividends and distributions. |
| 2 | The performance for the S&P Municipal Bond Intermediate Index assumes the reinvestment of all dividends and distributions but does not reflect the deduction of a sales charge required for the Fund’s performance by the Securities and Exchange Commission. It is not possible to invest directly in an index and the represented index is unmanaged. |
April 30, 2020 (unaudited) / ANNUAL REPORT
SHAREHOLDER EXPENSE EXAMPLE (unaudited)
As a shareholder of the Funds, you incur two types of costs: (1) transaction costs, including sales charges (loads) on purchase payments, reinvested dividends, or other distributions; and redemption fees; and (2) ongoing costs, including management fees; distribution and/or service (12b-1) fees; and other Fund expenses. This Example is intended to help you to understand your ongoing costs (in dollars) of investing in the Funds and to compare these costs with the ongoing costs of investing in other mutual funds. It is based on an investment of $1,000 invested at the beginning of the period and held for the entire period from November 1, 2019 to April 30, 2020.
Actual Expenses
This section of the following table provides information about actual account values and actual expenses. You may use the information in this section, together with the amount you invested, to estimate the expenses that you incurred over the period. Simply divide your account value by $1,000 (for example, an $8,600 account value divided by $1,000 = 8.6), then multiply the result by the number in the first section under the heading entitled “Expenses Paid During Period” to estimate the expenses attributable to your investment during this period.
Hypothetical Example for
Comparison Purposes
This section of the following table provides information about hypothetical account values and hypothetical expenses based on the Fund’s actual expense ratios and assumed rates of return of 5% per year before expenses, which are not the Fund’s actual returns. Thus, you should not use the hypothetical account values and expenses to estimate the actual ending account balance or your expenses for the period. Rather, these figures are required to be provided to enable you to compare the ongoing costs of investing in the Funds with other funds. To do so, compare this 5% hypothetical example with the 5% hypothetical examples that appear in the shareholder reports of the other funds.
Please note that the expenses shown in the table are meant to highlight your ongoing costs only. Therefore, the Annualized Net Expense Ratio section of the table is useful in comparing ongoing costs only, and will not help you determine the relative total costs of owning different funds.
The Annualized Net Expense Ratios may be different from the net expense ratios in the Financial Highlights which are for the fiscal year ended April 30, 2020.
| | | | | | | | | | | | | | | | |
| | | Beginning
Account Value
11/01/19 | | Ending
Account Value
4/30/20 | | Expenses Paid
During Period1 | | Annualized Net
Expense Ratio2 |
| | | | |
WILMINGTON BROAD MARKET BOND FUND | | | | | | | | | | | | | | | | |
| | | | |
Actual | | | | | | | | | | | | | | | | |
| | | | |
Class A | | | $1,000.00 | | | | $1,039.60 | | | | $4.21 | | | | 0.83% | |
| | | | |
Class I | | | $1,000.00 | | | | $1,041.90 | | | | $2.49 | | | | 0.49% | |
| | | | |
Hypothetical (assuming a 5% return before expense) | | | | | | | | | | | | | | | | |
| | | | |
Class A | | | $1,000.00 | | | | $1,020.74 | | | | $4.17 | | | | 0.83% | |
| | | | |
Class I | | | $1,000.00 | | | | $1,022.43 | | | | $2.46 | | | | 0.49% | |
| | | | |
WILMINGTON INTERMEDIATE-TERM BOND FUND | | | | | | | | | | | | | | | | |
| | | | |
Actual | | | | | | | | | | | | | | | | |
| | | | |
Class A | | | $1,000.00 | | | | $1,026.30 | | | | $4.03 | | | | 0.80% | |
| | | | |
Class I | | | $1,000.00 | | | | $1,027.90 | | | | $2.47 | | | | 0.49% | |
| | | | |
Hypothetical (assuming a 5% return before expense) | | | | | | | | | | | | | | | | |
| | | | |
Class A | | | $1,000.00 | | | | $1,020.89 | | | | $4.02 | | | | 0.80% | |
| | | | |
Class I | | | $1,000.00 | | | | $1,022.43 | | | | $2.46 | | | | 0.49% | |
| | | | |
WILMINGTON SHORT-TERM BOND FUND | | | | | | | | | | | | | | | | |
| | | | |
Actual | | | | | | | | | | | | | | | | |
| | | | |
Class A | | | $1,000.00 | | | | $1,016.00 | | | | $3.66 | | | | 0.73% | |
| | | | |
Class I | | | $1,000.00 | | | | $1,017.20 | | | | $2.41 | | | | 0.48% | |
| | | | |
Hypothetical (assuming a 5% return before expense) | | | | | | | | | | | | | | | | |
| | | | |
Class A | | | $1,000.00 | | | | $1,021.23 | | | | $3.67 | | | | 0.73% | |
| | | | |
Class I | | | $1,000.00 | | | | $1,022.48 | | | | $2.41 | | | | 0.48% | |
ANNUAL REPORT / April 30, 2020 (unaudited)
| | | | | | | | | | | | | | | | |
| | | Beginning
Account Value
11/01/19 | | Ending
Account Value
4/30/20 | | Expenses Paid
During Period1 | | Annualized Net
Expense Ratio2 |
| | | | |
WILMINGTON MUNICIPAL BOND FUND | | | | | | | | | | | | | | | | |
| | | | |
Actual | | | | | | | | | | | | | | | | |
| | | | |
Class A | | | $1,000.00 | | | | $ 964.10 | | | | $3.61 | | | | 0.74% | |
| | | | |
Class I | | | $1,000.00 | | | | $ 965.40 | | | | $2.39 | | | | 0.49% | |
| | | | |
Hypothetical (assuming a 5% return before expense) | | | | | | | | | | | | | | | | |
| | | | |
Class A | | | $1,000.00 | | | | $1,021.18 | | | | $3.72 | | | | 0.74% | |
| | | | |
Class I | | | $1,000.00 | | | | $1,022.43 | | | | $2.46 | | | | 0.49% | |
| | | | |
WILMINGTON NEW YORK MUNICIPAL BOND FUND | | | | | | | | | | | | | | | | |
| | | | |
Actual | | | | | | | | | | | | | | | | |
| | | | |
Class A | | | $1,000.00 | | | | $ 971.10 | | | | $4.02 | | | | 0.82% | |
| | | | |
Class I | | | $1,000.00 | | | | $ 971.40 | | | | $2.79 | | | | 0.57% | |
| | | | |
Hypothetical (assuming a 5% return before expense) | | | | | | | | | | | | | | | | |
| | | | |
Class A | | | $1,000.00 | | | | $1,020.79 | | | | $4.12 | | | | 0.82% | |
| | | | |
Class I | | | $1,000.00 | | | | $1,022.03 | | | | $2.87 | | | | 0.57% | |
| (1) | Expenses are equal to the Funds’ annualized net expense ratios, multiplied by the average account value over the period, multiplied by 182/366 (to reflect the most recent one-half year period). |
| (2) | Expense ratio does not reflect the indirect expenses of the underlying funds in which it invests. |
April 30, 2020 (unaudited) / ANNUAL REPORT
PORTFOLIO OF INVESTMENTS SUMMARY TABLE
Wilmington Broad Market Bond Fund
At April 30, 2020, the Fund’s portfolio composition was as follows (unaudited):
| | |
| | | Percentage of
Total Net Assets |
| | | | |
Corporate Bonds | | | 41.1 | % |
U.S. Treasury | | | 27.7 | % |
Mortgage-Backed Securities | | | 24.1 | % |
Commercial Paper | | | 3.4 | % |
Collateralized Mortgage Obligations | | | 1.8 | % |
Investment Company | | | 1.7 | % |
Government Agencies | | | 0.8 | % |
Municipal Bond | | | 0.5 | % |
Enhanced Equipment Trust Certificates | | | 0.1 | % |
Asset-Backed Security | | | 0.0 | %4 |
Cash Equivalents1 | | | 4.0 | % |
Other Assets and Liabilities – Net2 | | | (5.2 | )% |
| | | | |
| |
TOTAL | | | 100.0 | % |
| | | | |
| | |
| Credit Quality Diversification3 | | Percentage of
Total Net Assets |
| | | | |
U.S. Government Agency Securities | | | 26.7 | % |
U.S. Treasury | | | 27.7 | % |
AA / Aa | | | 0.1 | % |
A / A | | | 8.9 | % |
BBB / Baa | | | 30.2 | % |
BB / Ba | | | 2.4 | % |
Not Rated | | | 9.2 | % |
Other Assets and Liabilities – Net2 | | | (5.2 | )% |
| | | | |
| |
TOTAL | | | 100.0 | % |
| | | | |
| (1) | Cash Equivalents include investments in a money market fund and repurchase agreements. |
| (2) | Assets, other than investments in securities, less liabilities. See Statements of Assets and Liabilities. |
| (3) | For financial reporting purposes, the Credit Quality Diversification table reflects the lowest rating assigned by either Moody’s Investors Service or Standard and Poor’s if the ratings differ. These rating agencies are independent, nationally recognized statistical rating organizations and are widely used. Investment grade ratings are credit ratings of BBB/Baa or higher. Below investment grade ratings are credit ratings of BB/Ba or lower. Investments designated as “Not Rated” are not rated by either rating agency and do not necessarily indicate low credit quality. Credit quality ratings are subject to change. |
| (4) | Represent less than 0.05%. |
PORTFOLIO OF INVESTMENTS
April 30, 2020
| | | | | | | | |
| | |
| Description | | Par Value | | | Value | |
| | |
ASSET-BACKED SECURITY – 0.0%** | | | | | | | | |
|
FINANCIAL SERVICES – 0.0%** | |
| | |
LA Arena Funding LLC, | | | | | | | | |
Series 1999-1, Class A, 7.66%, 12/15/26W | | $ | 216,222 | | | $ | 212,409 | |
| | | | | | | | |
| | |
TOTAL ASSET-BACKED SECURITY (COST $216,222) | | | | | | $ | 212,409 | |
|
COLLATERALIZED MORTGAGE OBLIGATIONS – 1.8% | |
|
FEDERAL HOME LOAN MORTGAGE CORPORATION (FHLMC) – 1.5% | |
| | |
3.50%, 9/01/49 | | | 3,611,273 | | | | 3,816,425 | |
| | |
3.00%, 12/01/49 | | | 4,236,344 | | | | 4,474,990 | |
| | | | | | | | |
| |
TOTAL FEDERAL HOME LOAN MORTGAGE CORPORATION (FHLMC) | | | $ | 8,291,415 | |
| | | | | | | | |
| | |
| Description | | Par Value | | | Value | |
|
FEDERAL NATIONAL MORTGAGE ASSOCIATION (FNMA) – 0.3% | |
| | |
Series 2005-29, Class WC, 4.75%, 4/25/35 | | $ | 14,758 | | | $ | 16,266 | |
| | |
Series 2012-114, Class VM, | | | | | | | | |
3.50%, 10/25/25 | | | 1,267,258 | | | | 1,338,638 | |
| | | | | | | | |
| |
TOTAL FEDERAL NATIONAL MORTGAGE ASSOCIATION (FNMA) | | | $ | 1,354,904 | |
| | |
WHOLE LOAN – 0.0%** | | | | | | | | |
| | |
Banc of America Mortgage Securities, Inc., | | | | | | | | |
Series 2004-A, Class 2A1, 3.87%, 2/25/34D | | | 48,164 | | | | 46,172 | |
ANNUAL REPORT / April 30, 2020
| | |
| 19 | | PORTFOLIOS OF INVESTMENTS Wilmington Broad Market Bond Fund (continued) |
| | | | | | | | |
| | |
| Description | | Par Value | | | Value | |
| | |
CHL Mortgage Pass-Through Trust, | | | | | | | | |
Series 2004-8, Class 2A1, 4.50%, 6/25/19 | | $ | 4,798 | | | $ | 4,780 | |
| | |
IndyMac INDA Mortgage Loan Trust, | | | | | | | | |
Series 2005-AR1, Class 2A1,
3.97%, 11/25/35D | | | 35,258 | | | | 33,234 | |
| | |
TOTAL WHOLE LOAN | | | | | | $ | 84,186 | |
| |
TOTAL COLLATERALIZED MORTGAGE OBLIGATIONS (COST $9,515,904) | | | $ | 9,730,505 | |
| | |
COMMERCIAL PAPER – 3.4%◆ | | | | | | | | |
| | |
ABB Treasury Center, Inc., | | | | | | | | |
1.60%, 5/28/20W | | | 4,000,000 | | | | 3,995,022 | |
| | |
DuPont de Nemours, Inc., | | | | | | | | |
1.25%, 5/13/20W | | | 4,500,000 | | | | 4,497,969 | |
| | |
Mondelez International, Inc., | | | | | | | | |
1.15%, 5/27/20W | | | 5,000,000 | | | | 4,995,687 | |
| | |
Phillips 66, | | | | | | | | |
1.20%, 5/08/20W | | | 5,000,000 | | | | 4,998,667 | |
| |
TOTAL COMMERCIAL PAPER (COST $18,488,003) | | | $ | 18,487,345 | |
| | |
CORPORATE BONDS – 41.1% | | | | | | | | |
|
AEROSPACE & DEFENSE – 1.1% | |
| | |
L3Harris Technologies, Inc., | | | | | | | | |
Sr. Unsecured, 2.90%, 12/15/29 | | | 835,000 | | | | 866,067 | |
| | |
Northrop Grumman Corp., | | | | | | | | |
Sr. Unsecured, 2.93%, 1/15/25 | | | 1,000,000 | | | | 1,063,369 | |
| | |
Northrop Grumman Corp., | | | | | | | | |
Sr. Unsecured, 4.03%, 10/15/47 | | | 1,765,000 | | | | 2,123,741 | |
| | |
Rockwell Collins, Inc., | | | | | | | | |
Sr. Unsecured, 3.50%, 3/15/27 | | | 1,600,000 | | | | 1,707,339 | |
| | |
TOTAL AEROSPACE & DEFENSE | | | | | | $ | 5,760,516 | |
|
AUTOMOTIVE – 1.6% | |
| | |
Daimler Finance North America LLC, | | | | | | | | |
Company Guaranteed, 3.88%, 9/15/21W | | | 250,000 | | | | 251,779 | |
| | |
Ford Motor Co., | | | | | | | | |
Sr. Unsecured, 8.50%, 4/21/23 | | | 800,000 | | | | 794,540 | |
| | |
Ford Motor Credit Co. LLC, | | | | | | | | |
Sr. Unsecured, 5.75%, 2/01/21 | | | 500,000 | | | | 492,133 | |
| | |
Ford Motor Credit Co. LLC, | | | | | | | | |
Sr. Unsecured, 4.25%, 9/20/22 | | | 450,000 | | | | 418,884 | |
| | |
Ford Motor Credit Co. LLC, | | | | | | | | |
Sr. Unsecured, 5.58%, 3/18/24 | | | 1,000,000 | | | | 946,812 | |
| | |
General Motors Co., | | | | | | | | |
Sr. Unsecured, 6.25%, 10/02/43 | | | 1,000,000 | | | | 862,791 | |
| | |
General Motors Financial Co., Inc., | | | | | | | | |
Sr. Unsecured, 4.20%, 11/06/21 | | | 1,650,000 | | | | 1,616,687 | |
| | |
PACCAR Financial Corp., | | | | | | | | |
Sr. Unsecured, MTN, 2.65%, 5/10/22 | | | 3,045,000 | | | | 3,112,395 | |
| | |
TOTAL AUTOMOTIVE | | | | | | $ | 8,496,021 | |
|
BEVERAGES – 0.7% | |
| | |
Anheuser-Busch Cos., LLC, | | | | | | | | |
Company Guaranteed, 4.90%, 2/01/46 | | | 1,125,000 | | | | 1,288,167 | |
| | | | | | | | |
| | |
| Description | | Par Value | | | Value | |
| | |
Keurig Dr. Pepper, Inc., | | | | | | | | |
Company Guaranteed, 2.53%, 11/15/21 | | $ | 1,000,000 | | | $ | 1,010,005 | |
| | |
Keurig Dr. Pepper, Inc., | | | | | | | | |
Company Guaranteed, 3.20%, 5/01/30 | | | 775,000 | | | | 824,889 | |
| | |
Keurig Dr. Pepper, Inc., | | | | | | | | |
Company Guaranteed, 5.09%, 5/25/48# | | | 700,000 | | | | 890,628 | |
| | |
TOTAL BEVERAGES | | | | | | $ | 4,013,689 | |
|
BIOTECHNOLOGY – 0.4% | |
| | |
Amgen, Inc., | | | | | | | | |
Sr. Unsecured, 2.13%, 5/01/20 | | | 2,000,000 | | | | 2,000,010 | |
|
BUILDING PRODUCTS – 0.6% | |
| | |
Carrier Global Corp., | | | | | | | | |
Sr. Unsecured, 2.24%, 2/15/25W | | | 3,000,000 | | | | 2,992,553 | |
| | |
Johnson Controls International PLC, | | | | | | | | |
Sr. Unsecured, 4.63%, 7/02/44 | | | 100,000 | | | | 112,050 | |
| | |
TOTAL BUILDING PRODUCTS | | | | | | $ | 3,104,603 | |
|
CAPITAL MARKETS – 1.7% | |
| | |
Bank of New York Mellon Corp. (The), | | | | | | | | |
Subordinated, MTN, 3.00%, 10/30/28 | | | 775,000 | | | | 816,191 | |
| | |
Goldman Sachs Group, Inc. (The), | | | | | | | | |
Sr. Unsecured, (3 Month USD LIBOR + | | | | | | | | |
1.20%), 1.94%, 9/15/20D | | | 1,425,000 | | | | 1,427,069 | |
| | |
Goldman Sachs Group, Inc. (The), | | | | | | | | |
Sr. Unsecured, 3.00%, 4/26/22 | | | 915,000 | | | | 927,278 | |
| | |
Goldman Sachs Group, Inc. (The), | | | | | | | | |
Sr. Unsecured, (3 Month USD LIBOR + | | | | | | | | |
1.20%), 3.27%, 9/29/25D | | | 800,000 | | | | 837,076 | |
| | |
Goldman Sachs Group, Inc. (The), | | | | | | | | |
Sr. Unsecured, (3 Month USD LIBOR + | | | | | | | | |
1.51%), 3.69%, 6/05/28D | | | 2,080,000 | | | | 2,217,261 | |
| | |
Morgan Stanley, | | | | | | | | |
Sr. Unsecured, MTN, 3.13%, 7/27/26 | | | 340,000 | | | | 359,898 | |
| | |
Morgan Stanley, | | | | | | | | |
Sr. Unsecured, MTN, (SOFRRATE + 3.12%), | | | | | | | | |
3.62%, 4/01/31D | | | 890,000 | | | | 980,353 | |
| | |
Morgan Stanley, | | | | | | | | |
Subordinated, GMTN, 4.35%, 9/08/26 | | | 505,000 | | | | 556,956 | |
| | |
TD Ameritrade Holding Corp., | | | | | | | | |
Sr. Unsecured, 2.95%, 4/01/22 | | | 847,000 | | | | 869,723 | |
| | |
TOTAL CAPITAL MARKETS | | | | | | $ | 8,991,805 | |
|
CHEMICALS – 0.3% | |
| | |
DuPont de Nemours, Inc., | | | | | | | | |
Sr. Unsecured, 3.77%, 11/15/20 | | | 735,000 | | | | 742,340 | |
| | |
DuPont de Nemours, Inc., | | | | | | | | |
Sr. Unsecured, 2.17%, 5/01/23 | | | 890,000 | | | | 897,419 | |
| | |
TOTAL CHEMICALS | | | | | | $ | 1,639,759 | |
|
COMMERCIAL BANKS – 3.9% | |
| | |
Credit Suisse AG, | | | | | | | | |
Sr. Unsecured, 2.10%, 11/12/21 | | | 1,785,000 | | | | 1,805,099 | |
| | |
Fifth Third Bancorp, | | | | | | | | |
Sr. Unsecured, 3.50%, 3/15/22 | | | 1,250,000 | | | | 1,293,198 | |
| | |
Fifth Third Bancorp, | | | | | | | | |
Sr. Unsecured, 2.55%, 5/05/27 | | | 780,000 | | | | 779,208 | |
April 30, 2020 / ANNUAL REPORT
| | |
PORTFOLIOS OF INVESTMENTS Wilmington Broad Market Bond Fund (continued) | | 20 |
| | | | | | | | |
| | |
| Description | | Par Value | | | Value | |
| | |
Fifth Third Bancorp, | | | | | | | | |
Subordinated, 4.30%, 1/16/24 | | $ | 530,000 | | | $ | 568,511 | |
| | |
Huntington Bancshares, Inc., | | | | | | | | |
Sr. Unsecured, 2.63%, 8/06/24 | | | 1,325,000 | | | | 1,360,923 | |
| | |
KeyBank NA, | | | | | | | | |
Sr. Unsecured, BKNT, 3.30%, 2/01/22 | | | 615,000 | | | | 635,648 | |
| | |
KeyBank NA, | | | | | | | | |
Sr. Unsecured, BKNT, 1.25%, 3/10/23 | | | 2,000,000 | | | | 2,001,430 | |
| | |
KeyCorp, | | | | | | | | |
Sr. Unsecured, MTN, 2.90%, 9/15/20 | | | 750,000 | | | | 753,833 | |
| | |
PNC Bank NA, | | | | | | | | |
Subordinated, BKNT, 2.95%, 1/30/23 | | | 350,000 | | | | 350,181 | |
| | |
PNC Bank NA, | | | | | | | | |
Subordinated, BKNT, 2.70%, 10/22/29 | | | 1,125,000 | | | | 1,152,962 | |
| | |
PNC Financial Services Group, Inc. (The), | | | | | | | | |
Subordinated, 3.90%, 4/29/24 | | | 1,500,000 | | | | 1,630,430 | |
| | |
Truist Bank, | | | | | | | | |
Subordinated, BKNT, 2.25%, 3/11/30 | | | 1,850,000 | | | | 1,805,147 | |
| | |
Truist Bank, | | | | | | | | |
Subordinated, BKNT, 3.80%, 10/30/26 | | | 1,000,000 | | | | 1,099,773 | |
| | |
Truist Financial Corp., | | | | | | | | |
Sr. Unsecured, 2.90%, 3/03/21 | | | 1,475,000 | | | | 1,494,809 | |
| | |
Truist Financial Corp., | | | | | | | | |
Sr. Unsecured, MTN, (3 Month USD LIBOR + | | | | | | | | |
0.65%), 2.08%, 4/01/22D | | | 2,000,000 | | | | 1,990,181 | |
| | |
U.S. Bancorp, | | | | | | | | |
Subordinated, MTN, 2.95%, 7/15/22 | | | 2,000,000 | | | | 2,067,772 | |
| | | | | | | | |
| |
TOTAL COMMERCIAL BANKS | | | $ | 20,789,105 | |
|
COMMERCIAL SERVICES & SUPPLIES – 0.5% | |
| | |
Global Payments, Inc., | | | | | | | | |
Sr. Unsecured, 3.75%, 6/01/23 | | | 2,570,000 | | | | 2,689,658 | |
|
COMPUTERS – 0.4% | |
| | |
Hewlett Packard Enterprise Co., | | | | | | | | |
Sr. Unsecured, 3.60%, 10/15/20 | | | 2,350,000 | | | | 2,367,146 | |
|
CONSUMER FINANCE – 0.2% | |
| | |
Capital One Financial Corp., | | | | | | | | |
Sr. Unsecured, 2.40%, 10/30/20 | | | 1,365,000 | | | | 1,369,023 | |
|
DIVERSIFIED FINANCIAL SERVICES – 2.9% | |
| | |
Bank of America Corp., | | | | | | | | |
Sr. Unsecured, MTN, 3.25%, 10/21/27 | | | 1,095,000 | | | | 1,172,398 | |
| | |
Bank of America Corp., | | | | | | | | |
Subordinated, MTN, 4.25%, 10/22/26 | | | 1,000,000 | | | | 1,098,389 | |
| | |
Berkshire Hathaway Finance Corp., | | | | | | | | |
Company Guaranteed, 4.30%, 5/15/43 | | | 425,000 | | | | 533,432 | |
| | |
Charles Schwab Corp. (The), | | | | | | | | |
Sr. Unsecured, 4.45%, 7/22/20 | | | 250,000 | | | | 251,370 | |
| | |
Citibank NA, | | | | | | | | |
Sr. Unsecured, BKNT, 3.40%, 7/23/21 | | | 1,400,000 | | | | 1,437,379 | |
| | |
Citigroup, Inc., | | | | | | | | |
Sr. Unsecured, (3 Month USD LIBOR + | | | | | | | | |
0.95%), 2.88%, 7/24/23D | | | 2,060,000 | | | | 2,108,345 | |
| | |
Citigroup, Inc., | | | | | | | | |
Subordinated, 4.13%, 7/25/28 | | | 1,650,000 | | | | 1,787,637 | |
| | | | | | | | |
| | |
| Description | | Par Value | | | Value | |
| | |
FMR LLC, | | | | | | | | |
Sr. Unsecured, 6.45%, 11/15/39W | | $ | 1,000,000 | | | $ | 1,437,512 | |
| | |
JPMorgan Chase & Co., | | | | | | | | |
Sr. Unsecured, 4.63%, 5/10/21 | | | 100,000 | | | | 103,638 | |
| | |
JPMorgan Chase & Co., | | | | | | | | |
Sr. Unsecured, MTN, 2.30%, 8/15/21 | | | 700,000 | | | | 701,733 | |
| | |
JPMorgan Chase & Co., | | | | | | | | |
Series W, Jr. Subordinated, (3 Month USD | | | | | | | | |
LIBOR + 1.00%), 2.69%, 5/15/47D | | | 1,000,000 | | | | 770,623 | |
| | |
Wells Fargo & Co., | | | | | | | | |
Sr. Unsecured, 2.10%, 7/26/21 | | | 2,000,000 | | | | 2,019,400 | |
| | |
Wells Fargo & Co., | | | | | | | | |
Sr. Unsecured, (SOFRRATE + 2.00%), | | | | | | | | |
2.19%, 4/30/26D | | | 1,170,000 | | | | 1,176,338 | |
| | |
Wells Fargo & Co., | | | | | | | | |
Subordinated, MTN, 4.40%, 6/14/46 | | | 1,000,000 | | | | 1,140,775 | |
| | | | | | | | |
| |
TOTAL DIVERSIFIED FINANCIAL SERVICES | | | $ | 15,738,969 | |
|
ELECTRIC – 2.9% | |
| | |
Baltimore Gas & Electric Co., | | | | | | | | |
Sr. Unsecured, 3.50%, 8/15/46 | | | 1,550,000 | | | | 1,739,734 | |
| | |
Commonwealth Edison Co., | | | | | | | | |
1st Mortgage, 3.80%, 10/01/42 | | | 1,000,000 | | | | 1,169,882 | |
| | |
Consolidated Edison, Inc., | | | | | | | | |
Sr. Unsecured, 2.00%, 5/15/21 | | | 750,000 | | | | 755,247 | |
| | |
DTE Energy Co., | | | | | | | | |
Series F, Sr. Unsecured, 3.85%, 12/01/23 | | | 305,000 | | | | 324,203 | |
| | |
Entergy Arkansas LLC, | | | | | | | | |
1st Mortgage, 4.95%, 12/15/44 | | | 1,000,000 | | | | 1,072,560 | |
| | |
Entergy Corp., | | | | | | | | |
Sr. Unsecured, 5.13%, 9/15/20 | | | 1,300,000 | | | | 1,311,719 | |
| | |
Entergy Louisiana LLC, | | | | | | | | |
1st Mortgage, 2.90%, 3/15/51 | | | 1,000,000 | | | | 1,068,678 | |
| | |
Exelon Corp., | | | | | | | | |
Sr. Unsecured, 4.70%, 4/15/50 | | | 2,000,000 | | | | 2,597,696 | |
| | |
FirstEnergy Corp., | | | | | | | | |
Series B, Sr. Unsecured, 3.90%, 7/15/27 | | | 800,000 | | | | 876,545 | |
| | |
NextEra Energy Capital Holdings, Inc., | | | | | | | | |
Company Guaranteed, 4.50%, 6/01/21 | | | 3,000,000 | | | | 3,081,106 | |
| | |
System Energy Resources, Inc., | | | | | | | | |
1st Mortgage, 4.10%, 4/01/23 | | | 500,000 | | | | 533,840 | |
| | |
WEC Energy Group, Inc., | | | | | | | | |
Sr. Unsecured, 3.38%, 6/15/21 | | | 1,000,000 | | | | 1,025,827 | |
| | | | | | | | |
| |
TOTAL ELECTRIC | | | $ | 15,557,037 | |
|
ELECTRICAL EQUIPMENT MANUFACTURING – 0.0%** | |
| | |
General Electric Co., | | | | | | | | |
Subordinated, MTN, 5.30%, 2/11/21 | | | 250,000 | | | | 255,404 | |
|
ENVIRONMENTAL CONTROL – 0.6% | |
| | |
Waste Management, Inc., | | | | | | | | |
Company Guaranteed, 3.50%, 5/15/24 | | | 1,255,000 | | | | 1,349,581 | |
| | |
Waste Management, Inc., | | | | | | | | |
Company Guaranteed, 4.10%, 3/01/45 | | | 1,520,000 | | | | 1,869,933 | |
| | | | | | | | |
| |
TOTAL ENVIRONMENTAL CONTROL | | | $ | 3,219,514 | |
ANNUAL REPORT / April 30, 2020
| | |
| 21 | | PORTFOLIOS OF INVESTMENTS Wilmington Broad Market Bond Fund (continued) |
| | | | | | | | |
| | |
| Description | | Par Value | | | Value | |
|
FOOD & STAPLES RETAILING – 1.9% | |
| | |
Campbell Soup Co., | | | | | | | | |
Sr. Unsecured, 3.30%, 3/19/25 | | $ | 2,050,000 | | | $ | 2,184,079 | |
| | |
Conagra Brands, Inc., | | | | | | | | |
Sr. Unsecured, 5.40%, 11/01/48 | | | 665,000 | | | | 883,804 | |
| | |
Kroger Co. (The), | | | | | | | | |
Sr. Unsecured, 2.95%, 11/01/21 | | | 1,750,000 | | | | 1,794,653 | |
| | |
Kroger Co. (The), | | | | | | | | |
Sr. Unsecured, 2.80%, 8/01/22 | | | 2,060,000 | | | | 2,120,334 | |
| | |
Kroger Co. (The), | | | | | | | | |
Sr. Unsecured, 5.40%, 1/15/49 | | | 1,640,000 | | | | 2,159,491 | |
| | |
Kroger Co. (The), | | | | | | | | |
Sr. Unsecured, 3.95%, 1/15/50 | | | 1,000,000 | | | | 1,121,942 | |
| | | | | | | | |
| |
TOTAL FOOD & STAPLES RETAILING | | | $ | 10,264,303 | |
|
FOREST PRODUCTS & PAPER – 0.3% | |
| | |
International Paper Co., | | | | | | | | |
Sr. Unsecured, 4.40%, 8/15/47 | | | 1,500,000 | | | | 1,689,429 | |
|
HEALTH CARE EQUIPMENT & SUPPLIES – 1.5% | |
| | |
Becton Dickinson & Co., | | | | | | | | |
Sr. Unsecured, 2.40%, 6/05/20 | | | 4,500,000 | | | | 4,497,397 | |
| | |
DH Europe Finance II Sarl, | | | | | | | | |
Company Guaranteed, 2.20%, 11/15/24 | | | 2,330,000 | | | | 2,395,859 | |
| | |
Zimmer Biomet Holdings, Inc., | | | | | | | | |
Sr. Unsecured, (3 Month USD LIBOR + | | | | | | | | |
0.75%), 1.80%, 3/19/21D | | | 1,000,000 | | | | 989,664 | |
| | | | | | | | |
| |
TOTAL HEALTH CARE EQUIPMENT & SUPPLIES | | | $ | 7,882,920 | |
|
HEALTH CARE PROVIDERS & SERVICES – 2.8% | |
| | |
Anthem, Inc., | | | | | | | | |
Sr. Unsecured, 3.65%, 12/01/27 | | | 1,650,000 | | | | 1,804,320 | |
| | |
Cardinal Health, Inc., | | | | | | | | |
Sr. Unsecured, 4.50%, 11/15/44 | | | 650,000 | | | | 678,120 | |
| | |
Cigna Corp., | | | | | | | | |
Company Guaranteed, 4.13%, 9/15/20W | | | 940,000 | | | | 948,354 | |
| | |
Cigna Corp., | | | | | | | | |
Company Guaranteed, 3.20%, 9/17/20 | | | 2,000,000 | | | | 2,010,043 | |
| | |
Cigna Corp., | | | | | | | | |
Company Guaranteed, 3.75%, 7/15/23 | | | 500,000 | | | | 533,875 | |
| | |
Cigna Corp., | | | | | | | | |
Company Guaranteed, 4.80%, 7/15/46W | | | 1,000,000 | | | | 1,257,690 | |
| | |
CommonSpirit Health, | | | | | | | | |
Sr. Secured, 2.76%, 10/01/24 | | | 3,140,000 | | | | 3,090,614 | |
| | |
Elanco Animal Health, Inc., | | | | | | | | |
Sr. Unsecured, 5.65%, 8/28/28 | | | 2,000,000 | | | | 2,220,910 | |
| | |
NYU Langone Hospitals, | | | | | | | | |
Secured, 3.38%, 7/01/55 | | | 1,000,000 | | | | 911,143 | |
| | |
UnitedHealth Group, Inc., | | | | | | | | |
Sr. Unsecured, 2.95%, 10/15/27 | | | 1,350,000 | | | | 1,457,102 | |
| | |
UnitedHealth Group, Inc., | | | | | | | | |
Sr. Unsecured, 3.95%, 10/15/42 | | | 290,000 | | | | 344,878 | |
| | | | | | | | |
| |
TOTAL HEALTH CARE PROVIDERS & SERVICES | | | $ | 15,257,049 | |
|
HOME FURNISHINGS – 0.3% | |
| | |
Whirlpool Corp., | | | | | | | | |
Sr. Unsecured, 4.70%, 6/01/22 | | | 1,500,000 | | | | 1,583,217 | |
| | | | | | | | |
| | |
| Description | | Par Value | | | Value | |
|
HOUSEHOLD PRODUCTS – 0.2% | |
| | |
Church & Dwight Co., Inc., | | | | | | | | |
Sr. Unsecured, 3.95%, 8/01/47 | | $ | 870,000 | | | $ | 971,844 | |
|
INSURANCE – 2.5% | |
| | |
American International Group, Inc., | | | | | | | | |
Sr. Unsecured, 3.30%, 3/01/21 | | | 3,000,000 | | | | 3,047,784 | |
| | |
American International Group, Inc., | | | | | | | | |
Sr. Unsecured, 4.20%, 4/01/28 | | | 1,000,000 | | | | 1,093,066 | |
| | |
Aon PLC, | | | | | | | | |
Company Guaranteed, 4.00%, 11/27/23 | | | 1,450,000 | | | | 1,536,205 | |
| | |
CNA Financial Corp., | | | | | | | | |
Sr. Unsecured, 5.75%, 8/15/21 | | | 1,000,000 | | | | 1,048,826 | |
| | |
CNA Financial Corp., | | | | | | | | |
Sr. Unsecured, 3.95%, 5/15/24 | | | 950,000 | | | | 992,198 | |
| | |
Lincoln National Corp., | | | | | | | | |
Sr. Unsecured, 4.20%, 3/15/22 | | | 1,000,000 | | | | 1,035,251 | |
| | |
Lincoln National Corp., | | | | | | | | |
Sr. Unsecured, 3.63%, 12/12/26 | | | 1,380,000 | | | | 1,465,747 | |
| | |
Principal Financial Group, Inc., | | | | | | | | |
Company Guaranteed, 3.30%, 9/15/22 | | | 250,000 | | | | 258,301 | |
| | |
WR Berkley Corp., | | | | | | | | |
Sr. Unsecured, 4.63%, 3/15/22 | | | 1,000,000 | | | | 1,041,100 | |
| | |
WR Berkley Corp., | | | | | | | | |
Sr. Unsecured, 4.75%, 8/01/44 | | | 1,715,000 | | | | 1,904,580 | |
| | | | | | | | |
| |
TOTAL INSURANCE | | | $ | 13,423,058 | |
|
MEDIA – 1.1% | |
| | |
Charter Communications Operating LLC, | | | | | | | | |
Sr. Secured, 3.58%, 7/23/20 | | | 1,500,000 | | | | 1,501,985 | |
| | |
Comcast Corp., | | | | | | | | |
Company Guaranteed, 4.95%, 10/15/58 | | | 1,500,000 | | | | 2,150,456 | |
| | |
Discovery Communications LLC, | | | | | | | | |
Company Guaranteed, 3.95%, 3/20/28 | | | 1,000,000 | | | | 1,049,181 | |
| | |
ViacomCBS, Inc., | | | | | | | | |
Company Guaranteed, 4.60%, 1/15/45 | | | 1,100,000 | | | | 1,085,690 | |
| | | | | | | | |
| |
TOTAL MEDIA | | | $ | 5,787,312 | |
|
METALS & MINING – 0.2% | |
| | |
Barrick Gold Corp., | | | | | | | | |
Sr. Unsecured, 5.25%, 4/01/42 | | | 1,000,000 | | | | 1,298,924 | |
|
MISCELLANEOUS MANUFACTURING – 0.2% | |
| | |
Textron, Inc., | | | | | | | | |
Sr. Unsecured, 3.65%, 3/01/21 | | | 480,000 | | | | 481,003 | |
| | |
Textron, Inc., | | | | | | | | |
Sr. Unsecured, 3.88%, 3/01/25 | | | 750,000 | | | | 783,804 | |
| | | | | | | | |
| |
TOTAL MISCELLANEOUS MANUFACTURING | | | $ | 1,264,807 | |
|
MULTI-UTILITIES – 1.0% | |
| | |
Sempra Energy, | | | | | | | | |
Sr. Unsecured, 2.85%, 11/15/20 | | | 2,870,000 | | | | 2,868,700 | |
| | |
Sempra Energy, | | | | | | | | |
Sr. Unsecured, 2.90%, 2/01/23 | | | 760,000 | | | | 786,610 | |
| | |
Southern Co. Gas Capital Corp., | | | | | | | | |
Company Guaranteed, 3.95%, 10/01/46 | | | 1,425,000 | | | | 1,538,498 | |
| | | | | | | | |
| |
TOTAL MULTI-UTILITIES | | | $ | 5,193,808 | |
April 30, 2020 / ANNUAL REPORT
| | |
PORTFOLIOS OF INVESTMENTS Wilmington Broad Market Bond Fund (continued) | | 22 |
| | | | | | | | |
| | |
| Description | | Par Value | | | Value | |
| | |
OIL & GAS – 1.5% | | | | | | | | |
| | |
Marathon Oil Corp., | | | | | | | | |
Sr. Unsecured, 4.40%, 7/15/27 | | $ | 2,000,000 | | | $ | 1,554,539 | |
| | |
Marathon Petroleum Corp., | | | | | | | | |
Sr. Unsecured, 3.63%, 9/15/24 | | | 745,000 | | | | 718,492 | |
| | |
Occidental Petroleum Corp., | | | | | | | | |
Sr. Unsecured, 2.70%, 8/15/22# | | | 1,690,000 | | | | 1,472,650 | |
| | |
Phillips 66, | | | | | | | | |
Company Guaranteed, 4.30%, 4/01/22 | | | 1,450,000 | | | | 1,515,125 | |
| | |
Phillips 66, | | | | | | | | |
Company Guaranteed, 3.85%, 4/09/25 | | | 575,000 | | | | 602,773 | |
| | |
Valero Energy Corp., | | | | | | | | |
Sr. Unsecured, 4.00%, 4/01/29 | | | 1,580,000 | | | | 1,620,696 | |
| | |
Valero Energy Corp., | | | | | | | | |
Sr. Unsecured, 4.90%, 3/15/45 | | | 563,000 | | | | 608,857 | |
| | |
TOTAL OIL & GAS | | | | | | $ | 8,093,132 | |
|
PHARMACEUTICALS – 2.4% | |
| | |
AbbVie, Inc., | | | | | | | | |
Sr. Unsecured, 2.50%, 5/14/20 | | | 1,485,000 | | | | 1,485,383 | |
| | |
AbbVie, Inc., | | | | | | | | |
Sr. Unsecured, 2.95%, 11/21/26W | | | 1,875,000 | | | | 1,987,431 | |
| | |
AbbVie, Inc., | | | | | | | | |
Sr. Unsecured, 4.25%, 11/14/28 | | | 1,235,000 | | | | 1,423,254 | |
| | |
AbbVie, Inc., | | | | | | | | |
Sr. Unsecured, 4.40%, 11/06/42 | | | 460,000 | | | | 533,783 | |
| | |
AbbVie, Inc., | | | | | | | | |
Sr. Unsecured, 4.88%, 11/14/48 | | | 1,000,000 | | | | 1,238,878 | |
| | |
AbbVie, Inc., | | | | | | | | |
Sr. Unsecured, 4.25%, 11/21/49W | | | 1,000,000 | | | | 1,155,380 | |
| | |
Bristol-Myers Squibb Co., | | | | | | | | |
Sr. Unsecured, (3 Month USD LIBOR + | | | | | | | | |
0.38%), 2.07%, 5/16/22D,W | | | 665,000 | | | | 660,492 | |
| | |
Bristol-Myers Squibb Co., | | | | | | | | |
Sr. Unsecured, 2.75%, 2/15/23W | | | 1,305,000 | | | | 1,340,891 | |
| | |
Bristol-Myers Squibb Co., | | | | | | | | |
Sr. Unsecured, 3.40%, 7/26/29W | | | 1,000,000 | | | | 1,144,643 | |
| | |
Pfizer, Inc., | | | | | | | | |
Sr. Unsecured, 2.63%, 4/01/30 | | | 650,000 | | | | 702,435 | |
| | |
Zoetis, Inc., | | | | | | | | |
Sr. Unsecured, 3.95%, 9/12/47 | | | 1,005,000 | | | | 1,190,206 | |
| | |
TOTAL PHARMACEUTICALS | | | | | | $ | 12,862,776 | |
|
PIPELINES – 2.3% | |
| | |
Energy Transfer Operating LP, | | | | | | | | |
Company Guaranteed, 3.60%, 2/01/23 | | | 870,000 | | | | 844,988 | |
| | |
Energy Transfer Operating LP, | | | | | | | | |
Company Guaranteed, 3.75%, 5/15/30 | | | 715,000 | | | | 660,502 | |
| | |
Energy Transfer Operating LP, | | | | | | | | |
Company Guaranteed, 5.30%, 4/15/47 | | | 1,250,000 | | | | 1,112,188 | |
| | |
Enterprise Products Operating LLC, | | | | | | | | |
Company Guaranteed, 2.80%, 2/15/21 | | | 1,075,000 | | | | 1,081,842 | |
| | |
Enterprise Products Operating LLC, | | | | | | | | |
Company Guaranteed, 4.20%, 1/31/50 | | | 1,120,000 | | | | 1,129,477 | |
| | | | | | | | |
| | |
| Description | | Par Value | | | Value | |
| | |
Enterprise Products Operating LLC, | | | | | | | | |
Company Guaranteed, 4.95%, 10/15/54 | | $ | 500,000 | | | $ | 515,480 | |
| | |
Kinder Morgan Energy Partners LP, | | | | | | | | |
Company Guaranteed, 5.40%, 9/01/44 | | | 1,000,000 | | | | 1,116,522 | |
| | |
Kinder Morgan, Inc., | | | | | | | | |
Company Guaranteed, 5.20%, 3/01/48 | | | 2,040,000 | | | | 2,315,232 | |
| | |
MPLX LP, | | | | | | | | |
Sr. Unsecured, (3 Month USD LIBOR + | | | | | | | | |
1.10%), 2.10%, 9/09/22D | | | 470,000 | | | | 417,598 | |
| | |
MPLX LP, | | | | | | | | |
Sr. Unsecured, 4.70%, 4/15/48 | | | 1,000,000 | | | | 905,452 | |
| | |
ONEOK Partners LP, | | | | | | | | |
Company Guaranteed, 6.20%, 9/15/43 | | | 1,000,000 | | | | 925,671 | |
| | |
Plains All American Pipeline LP, | | | | | | | | |
Sr. Unsecured, 3.85%, 10/15/23 | | | 500,000 | | | | 480,229 | |
| | |
Spectra Energy Partners LP, | | | | | | | | |
Company Guaranteed, 3.50%, 3/15/25 | | | 670,000 | | | | 684,685 | |
| | |
TOTAL PIPELINES | | | | | | $ | 12,189,866 | |
|
REAL ESTATE INVESTMENT TRUSTS – 2.1% | |
| | |
American Tower Corp., | | | | | | | | |
Sr. Unsecured, 3.45%, 9/15/21 | | | 500,000 | | | | 514,452 | |
| | |
American Tower Corp., | | | | | | | | |
Sr. Unsecured, 5.00%, 2/15/24 | | | 415,000 | | | | 464,807 | |
| | |
American Tower Corp., | | | | | | | | |
Sr. Unsecured, 3.13%, 1/15/27 | | | 1,000,000 | | | | 1,060,691 | |
| | |
AvalonBay Communities, Inc., | | | | | | | | |
Sr. Unsecured, MTN, 3.35%, 5/15/27 | | | 1,420,000 | | | | 1,516,520 | |
| | |
Digital Realty Trust LP, | | | | | | | | |
Company Guaranteed, 3.63%, 10/01/22 | | | 1,100,000 | | | | 1,131,448 | |
| | |
Healthcare Realty Trust, Inc., | | | | | | | | |
Sr. Unsecured, 3.75%, 4/15/23 | | | 695,000 | | | | 702,946 | |
| | |
Healthcare Realty Trust, Inc., | | | | | | | | |
Sr. Unsecured, 3.88%, 5/01/25 | | | 915,000 | | | | 927,704 | |
| | |
Healthcare Realty Trust, Inc., | | | | | | | | |
Sr. Unsecured, 3.63%, 1/15/28 | | | 800,000 | | | | 802,827 | |
| | |
Welltower, Inc., | | | | | | | | |
Sr. Unsecured, 4.00%, 6/01/25 | | | 3,000,000 | | | | 3,093,620 | |
| | |
Welltower, Inc., | | | | | | | | |
Sr. Unsecured, 4.95%, 9/01/48 | | | 1,000,000 | | | | 1,110,492 | |
| | |
TOTAL REAL ESTATE INVESTMENT TRUSTS | | | | | | $ | 11,325,507 | |
|
RETAIL – 0.1% | |
| | |
Nordstrom, Inc., | | | | | | | | |
Sr. Unsecured, 5.00%, 1/15/44 | | | 1,000,000 | | | | 712,021 | |
|
SEMICONDUCTORS – 0.6% | |
| | |
Texas Instruments, Inc., | | | | | | | | |
Sr. Unsecured, 1.75%, 5/04/30 | | | 3,365,000 | | | | 3,360,597 | |
|
TELECOMMUNICATIONS – 0.4% | |
| | |
AT&T, Inc., | | | | | | | | |
Sr. Unsecured, 4.50%, 5/15/35 | | | 845,000 | | | | 939,730 | |
| | |
AT&T, Inc., | | | | | | | | |
Sr. Unsecured, 4.85%, 7/15/45 | | | 1,190,000 | | | | 1,395,158 | |
| | |
TOTAL TELECOMMUNICATIONS | | | | | | $ | 2,334,888 | |
ANNUAL REPORT / April 30, 2020
| | |
| 23 | | PORTFOLIOS OF INVESTMENTS Wilmington Broad Market Bond Fund (continued) |
| | | | | | | | |
| | |
| Description | | Par Value | | | Value | |
|
TRANSPORTATION – 1.3% | |
| | |
Ryder System, Inc., | | | | | | | | |
Sr. Unsecured, MTN, 3.50%, 6/01/21 | | $ | 500,000 | | | $ | 502,848 | |
| | |
Ryder System, Inc., | | | | | | | | |
Sr. Unsecured, MTN, 2.50%, 9/01/22 | | | 980,000 | | | | 979,624 | |
| | |
Ryder System, Inc., | | | | | | | | |
Sr. Unsecured, MTN, 3.65%, 3/18/24 | | | 1,670,000 | | | | 1,714,414 | |
| | |
Union Pacific Corp., | | | | | | | | |
Sr. Unsecured, 3.15%, 3/01/24 | | | 2,565,000 | | | | 2,741,062 | |
| | |
Union Pacific Corp., | | | | | | | | |
Sr. Unsecured, 4.30%, 3/01/49 | | | 675,000 | | | | 822,795 | |
| | | | | | | | |
| | |
TOTAL TRANSPORTATION | | | | | | $ | 6,760,743 | |
|
TRUCKING & LEASING – 0.6% | |
| | |
GATX Corp., | | | | | | | | |
Sr. Unsecured, 3.25%, 9/15/26# | | | 1,065,000 | | | | 1,101,303 | |
| | |
GATX Corp., | | | | | | | | |
Sr. Unsecured, 3.85%, 3/30/27 | | | 1,500,000 | | | | 1,579,809 | |
| | |
GATX Corp., | | | | | | | | |
Sr. Unsecured, 5.20%, 3/15/44 | | | 640,000 | | | | 752,561 | |
| | | | | | | | |
| | |
TOTAL TRUCKING & LEASING | | | | | | $ | 3,433,673 | |
| | | | | | | | |
| |
TOTAL CORPORATE BONDS (COST $211,519,487) | | | $ | 221,682,133 | |
|
ENHANCED EQUIPMENT TRUST CERTIFICATES – 0.1% | |
|
AIRLINES – 0.1% | |
| | |
American Airlines 2011-1, | | | | | | | | |
Series A, Pass-Through Certificates, | | | | | | | | |
5.25%, 1/31/21 | | | 162,729 | | | | 156,423 | |
| | |
Delta Air Lines, 2007-1, | | | | | | | | |
Series A, Pass-Through Certificates, | | | | | | | | |
6.82%, 8/10/22 | | | 198,228 | | | | 189,605 | |
| | | | | | | | |
| | |
TOTAL AIRLINES | | | | | | $ | 346,028 | |
| | | | | | | | |
| |
TOTAL ENHANCED EQUIPMENT TRUST CERTIFICATES (COST $360,957) | | | $ | 346,028 | |
|
GOVERNMENT AGENCIES – 0.8% | |
|
FEDERAL HOME LOAN BANK (FHLB) – 0.5% | |
| | |
3.25%, 11/16/28# | | | 1,960,000 | | | | 2,314,479 | |
|
FEDERAL HOME LOAN MORTGAGE CORPORATION (FHLMC) – 0.0%** | |
| | |
2.38%, 1/13/22 | | | 125,000 | | | | 129,404 | |
|
FEDERAL NATIONAL MORTGAGE ASSOCIATION (FNMA) – 0.3% | |
| | |
6.25%, 5/15/29 | | | 750,000 | | | | 1,079,075 | |
| | |
7.25%, 5/15/30 | | | 400,000 | | | | 631,336 | |
| | | | | | | | |
| |
TOTAL FEDERAL NATIONAL MORTGAGE ASSOCIATION (FNMA) | | | $ | 1,710,411 | |
| | | | | | | | |
| | |
TOTAL GOVERNMENT AGENCIES (COST $3,385,721) | | | | | | $ | 4,154,294 | |
|
MORTGAGE-BACKED SECURITIES – 24.1% | |
|
FEDERAL HOME LOAN MORTGAGE CORPORATION (FHLMC) – 9.0% | |
| | |
Pool G12709, 5.00%, 7/01/22 | | | 11,876 | | | | 12,382 | |
| | | | | | | | |
| | |
| Description | | Par Value | | | Value | |
| | |
Pool C00478, 8.50%, 9/01/26 | | $ | 7,674 | | | $ | 8,758 | |
| | |
Pool E09010, 2.50%, 9/01/27 | | | 569,475 | | | | 596,898 | |
| | |
Pool G18497, 3.00%, 1/01/29 | | | 73,115 | | | | 77,258 | |
| | |
Pool C01272, 6.00%, 12/01/31 | | | 15,799 | | | | 18,623 | |
| | |
Pool A13990, 4.50%, 10/01/33 | | | 9,736 | | | | 10,705 | |
| | |
Pool G01625, 5.00%, 11/01/33 | | | 22,181 | | | | 24,964 | |
| | |
Pool G08097, 6.50%, 11/01/35 | | | 10,895 | | | | 12,958 | |
| | |
Pool G02296, 5.00%, 6/01/36 | | | 112,344 | | | | 125,707 | |
| | |
Pool G02390, 6.00%, 9/01/36 | | | 3,920 | | | | 4,630 | |
| | |
Pool G05317, 5.00%, 4/01/37 | | | 465,208 | | | | 521,303 | |
| | |
Pool G03703, 5.50%, 12/01/37 | | | 12,505 | | | | 14,199 | |
| | |
Pool G04776, 5.50%, 7/01/38 | | | 39,908 | | | | 44,448 | |
| | |
Pool G05500, 5.00%, 5/01/39 | | | 408,529 | | | | 458,975 | |
| | |
Pool A93415, 4.00%, 8/01/40 | | | 1,052,627 | | | | 1,153,284 | |
| | |
Pool A93505, 4.50%, 8/01/40 | | | 826,312 | | | | 916,500 | |
| | |
Pool A93996, 4.50%, 9/01/40 | | | 632,480 | | | | 701,270 | |
| | |
Pool G06222, 4.00%, 1/01/41 | | | 1,187,853 | | | | 1,300,733 | |
| | |
Pool A97047, 4.50%, 2/01/41 | | | 627,619 | | | | 696,111 | |
| | |
Pool G06956, 4.50%, 8/01/41 | | | 619,208 | | | | 686,698 | |
| | |
Pool C03750, 3.50%, 2/01/42 | | | 281,491 | | | | 302,945 | |
| | |
Pool C03849, 3.50%, 4/01/42 | | | 129,826 | | | | 139,645 | |
| | |
Pool Q08305, 3.50%, 5/01/42 | | | 761,522 | | | | 831,465 | |
| | |
Pool C04305, 3.00%, 11/01/42 | | | 2,187,710 | | | | 2,327,808 | |
| | |
Pool C09020, 3.50%, 11/01/42 | | | 1,964,339 | | | | 2,114,229 | |
| | |
Pool G07266, 4.00%, 12/01/42 | | | 1,675,811 | | | | 1,830,805 | |
| | |
Pool C04444, 3.00%, 1/01/43 | | | 78,881 | | | | 83,866 | |
| | |
Pool C09029, 3.00%, 3/01/43 | | | 361,369 | | | | 384,481 | |
| | |
Pool G08534, 3.00%, 6/01/43 | | | 451,510 | | | | 480,385 | |
| | |
Pool Q19476, 3.50%, 6/01/43 | | | 789,181 | | | | 848,321 | |
| | |
Pool C09044, 3.50%, 7/01/43 | | | 932,387 | | | | 1,002,287 | |
| | |
Pool G07889, 3.50%, 8/01/43 | | | 804,681 | | | | 866,172 | |
| | |
Pool G07624, 4.00%, 12/01/43 | | | 752,725 | | | | 821,121 | |
| | |
Pool G60038, 3.50%, 1/01/44 | | | 4,227,118 | | | | 4,545,660 | |
| | |
Pool G07680, 4.00%, 4/01/44 | | | 1,231,927 | | | | 1,341,941 | |
| | |
Pool G07943, 4.50%, 8/01/44 | | | 84,602 | | | | 92,040 | |
| | |
Pool G08607, 4.50%, 9/01/44 | | | 538,976 | | | | 591,515 | |
| | |
Pool Q33547, 3.50%, 5/01/45 | | | 775,985 | | | | 834,627 | |
| | |
Pool Q36970, 4.00%, 10/01/45 | | | 376,210 | | | | 407,505 | |
| | |
Pool G60384, 4.50%, 12/01/45 | | | 59,293 | | | | 65,016 | |
| | |
Pool Q39644, 3.50%, 3/01/46 | | | 3,642,212 | | | | 3,888,782 | |
| | |
Pool Q39438, 4.00%, 3/01/46 | | | 2,604,813 | | | | 2,805,675 | |
| | |
Pool G08705, 3.00%, 5/01/46 | | | 257,653 | | | | 274,388 | |
| | |
Pool G08708, 4.50%, 5/01/46 | | | 451,253 | | | | 487,719 | |
| | |
Pool SD8037, 2.50%, 1/01/50 | | | 7,998,101 | | | | 8,332,703 | |
| | |
Pool RA2341, 2.50%, 4/01/50 | | | 5,000,000 | | | | 5,222,290 | |
| | | | | | | | |
| |
TOTAL FEDERAL HOME LOAN MORTGAGE CORPORATION (FHLMC) | | | $ | 48,309,795 | |
April 30, 2020 / ANNUAL REPORT
| | |
PORTFOLIOS OF INVESTMENTS Wilmington Broad Market Bond Fund (continued) | | 24 |
| | | | | | | | |
| | |
| Description | | Par Value | | | Value | |
|
FEDERAL NATIONAL MORTGAGE ASSOCIATION (FNMA) – 15.1% | |
| | |
Pool 975207, 5.00%, 3/01/23 | | $ | 13,172 | | | $ | 13,597 | |
| | |
Pool AE2520, 3.00%, 1/01/26 | | | 208,413 | | | | 220,132 | |
| | |
Pool 329794, 7.00%, 2/01/26 | | | 10,937 | | | | 12,016 | |
| | |
Pool 256639, 5.00%, 2/01/27 | | | 7,947 | | | | 8,663 | |
| | |
Pool 256752, 6.00%, 6/01/27 | | | 13,567 | | | | 15,441 | |
| | |
Pool 402255, 6.50%, 12/01/27 | | | 935 | | | | 1,032 | |
| | |
Pool AB8997, 2.50%, 4/01/28 | | | 126,834 | | | | 133,241 | |
| | |
Pool AS4480, 2.50%, 2/01/30 | | | 838,085 | | | | 879,029 | |
| | |
Pool AS7462, 2.50%, 6/01/31 | | | 332,195 | | | | 348,107 | |
| | |
Pool 254007, 6.50%, 10/01/31 | | | 8,947 | | | | 10,631 | |
| | |
Pool 638023, 6.50%, 4/01/32 | | | 46,072 | | | | 51,362 | |
| | |
Pool 642345, 6.50%, 5/01/32 | | | 37,040 | | | | 41,294 | |
| | |
Pool 651292, 6.50%, 7/01/32 | | | 58,217 | | | | 64,903 | |
| | |
Pool 686398, 6.00%, 3/01/33 | | | 132,912 | | | | 153,070 | |
| | |
Pool 745412, 5.50%, 12/01/35 | | | 15,648 | | | | 17,803 | |
| | |
Pool 888789, 5.00%, 7/01/36 | | | 178,452 | | | | 200,713 | |
| | |
Pool 256515, 6.50%, 12/01/36 | | | 9,572 | | | | 11,298 | |
| | |
Pool AE0217, 4.50%, 8/01/40 | | | 100,630 | | | | 112,235 | |
| | |
Pool AB1796, 3.50%, 11/01/40 | | | 671,502 | | | | 724,217 | |
| | |
Pool AH5583, 4.50%, 2/01/41 | | | 290,181 | | | | 321,259 | |
| | |
Pool 890551, 4.50%, 8/01/41 | | | 61,879 | | | | 67,722 | |
| | |
Pool AL0658, 4.50%, 8/01/41 | | | 359,587 | | | | 398,174 | |
| | |
Pool AL1319, 4.50%, 10/01/41 | | | 617,058 | | | | 682,874 | |
| | |
Pool AL6302, 4.50%, 10/01/41 | | | 638,184 | | | | 706,679 | |
| | |
Pool AX5302, 4.00%, 1/01/42 | | | 1,095,052 | | | | 1,198,559 | |
| | |
Pool AK4523, 4.00%, 3/01/42 | | | 1,320,737 | | | | 1,444,755 | |
| | |
Pool AL2034, 4.50%, 4/01/42 | �� | | 151,303 | | | | 168,093 | |
| | |
Pool AB7936, 3.00%, 2/01/43 | | | 1,355,605 | | | | 1,433,023 | |
| | |
Pool AL3761, 4.50%, 2/01/43 | | | 206,952 | | | | 227,464 | |
| | |
Pool MA1458, 3.00%, 6/01/43 | | | 402,972 | | | | 428,576 | |
| | |
Pool AT7899, 3.50%, 7/01/43 | | | 2,312,383 | | | | 2,480,663 | |
| | |
Pool AS0302, 3.00%, 8/01/43 | | | 3,823,903 | | | | 4,067,343 | |
| | |
Pool AU4279, 3.00%, 9/01/43 | | | 722,046 | | | | 767,964 | |
| | |
Pool AL5537, 4.50%, 4/01/44 | | | 290,465 | | | | 321,119 | |
| | |
Pool AS3155, 4.00%, 8/01/44 | | | 74,882 | | | | 81,235 | |
| | |
Pool AX0833, 3.50%, 9/01/44 | | | 730,137 | | | | 791,589 | |
| | |
Pool AL6325, 3.00%, 10/01/44 | | | 2,410,630 | | | | 2,563,899 | |
| | |
Pool AS5136, 4.00%, 6/01/45 | | | 318,515 | | | | 340,685 | |
| | |
Pool AZ7362, 4.00%, 11/01/45 | | | 852,907 | | | | 922,792 | |
| | |
Pool AZ9565, 3.50%, 12/01/45 | | | 1,506,355 | | | | 1,614,273 | |
| | |
Pool BC0326, 3.50%, 12/01/45 | | | 1,174,043 | | | | 1,258,258 | |
| | |
Pool BC0245, 3.00%, 2/01/46 | | | 665,930 | | | | 708,208 | |
| | |
Pool BC0830, 3.00%, 4/01/46 | | | 977,226 | | | | 1,039,228 | |
| | |
Pool AS7568, 4.50%, 7/01/46 | | | 152,439 | | | | 164,530 | |
| | |
Pool BC4764, 3.00%, 10/01/46 | | | 1,169,634 | | | | 1,243,951 | |
| | | | | | | | |
| | |
| Description | | Par Value | | | Value | |
| | |
Pool MA2771, 3.00%, 10/01/46 | | $ | 401,257 | | | $ | 426,715 | |
| | |
Pool AS8276, 3.00%, 11/01/46 | | | 1,390,908 | | | | 1,479,250 | |
| | |
Pool BC9003, 3.00%, 11/01/46 | | | 1,238,905 | | | | 1,317,558 | |
| | |
Pool BE1899, 3.00%, 11/01/46 | | | 4,521,909 | | | | 4,809,076 | |
| | |
Pool BE3767, 3.50%, 7/01/47 | | | 1,681,950 | | | | 1,788,484 | |
| | |
Pool BH2618, 3.50%, 8/01/47 | | | 471,024 | | | | 500,860 | |
| | |
Pool MA3088, 4.00%, 8/01/47 | | | 1,532,678 | | | | 1,640,699 | |
| | |
Pool BH4010, 4.50%, 9/01/47 | | | 1,356,843 | | | | 1,491,563 | |
| | |
Pool BH9215, 3.50%, 1/01/48 | | | 2,189,869 | | | | 2,328,734 | |
| | |
Pool BJ0650, 3.50%, 3/01/48 | | | 9,239,033 | | | | 9,792,473 | |
| | |
Pool BJ0639, 4.00%, 3/01/48 | | | 597,954 | | | | 637,475 | |
| | |
Pool BJ9169, 4.00%, 5/01/48 | | | 3,152,316 | | | | 3,360,662 | |
| | |
Pool BK4764, 4.00%, 8/01/48 | | | 3,182,029 | | | | 3,392,342 | |
| | |
Pool BN1628, 4.50%, 11/01/48 | | | 1,504,303 | | | | 1,622,279 | |
| | |
Pool MA3871, 3.00%, 12/01/49 | | | 6,053,327 | | | | 6,394,595 | |
| | |
Pool CA5306, 3.00%, 3/01/50 | | | 4,466,940 | | | | 4,735,520 | |
| | |
Pool TBA, 5.00%, 6/01/50‡ | | | 6,700,000 | | | | 7,286,773 | |
| | | | | | | | |
| |
TOTAL FEDERAL NATIONAL MORTGAGE ASSOCIATION (FNMA) | | | $ | 81,466,757 | |
|
GOVERNMENT NATIONAL MORTGAGE ASSOCIATION (GNMA) – 0.0%** | |
| | |
Pool 354677, 7.50%, 10/15/23 | | | 6,919 | | | | 7,641 | |
| | |
Pool 354713, 7.50%, 12/15/23 | | | 4,374 | | | | 4,684 | |
| | |
Pool 354765, 7.00%, 2/15/24 | | | 12,145 | | | | 13,527 | |
| | |
Pool 354827, 7.00%, 5/15/24 | | | 8,355 | | | | 9,316 | |
| | |
Pool 385623, 7.00%, 5/15/24 | | | 14,207 | | | | 15,894 | |
| | |
Pool 360869, 7.50%, 5/15/24 | | | 12,244 | | | | 13,093 | |
| | |
Pool 2077, 7.00%, 9/20/25 | | | 4,479 | | | | 4,952 | |
| | |
Pool 503405, 6.50%, 4/15/29 | | | 15,303 | | | | 16,031 | |
| | | | | | | | |
| |
TOTAL GOVERNMENT NATIONAL MORTGAGE ASSOCIATION (GNMA) | | | $ | 85,138 | |
| | | | | | | | |
| |
TOTAL MORTGAGE-BACKED SECURITIES
(COST $125,357,304) | | | $ | 129,861,690 | |
| | |
MUNICIPAL BOND – 0.5% | | | | | | | | |
| | |
GENERAL – 0.5% | | | | | | | | |
| | |
New Jersey Transportation Trust Fund Authority, Current Refunding Revenue Bonds
(Series B),
4.13%, 6/15/42 | | | 2,500,000 | | | | 2,435,250 | |
| | | | | | | | |
| |
TOTAL MUNICIPAL BOND
(COST $2,500,000) | | | $ | 2,435,250 | |
| | |
U.S. TREASURY – 27.7% | | | | | | | | |
|
U.S. TREASURY BONDS – 9.1% | |
| | |
1.50%, 2/15/30# | | | 5,000,000 | | | | 5,408,723 | |
| | |
2.00%, 2/15/50 | | | 2,700,000 | | | | 3,175,746 | |
| | |
2.50%, 2/15/45 | | | 2,135,000 | | | | 2,684,348 | |
| | |
2.50%, 2/15/46 | | | 280,000 | | | | 354,202 | |
| | |
2.75%, 11/15/47 | | | 2,235,000 | | | | 2,988,199 | |
ANNUAL REPORT / April 30, 2020
| | |
| 25 | | PORTFOLIOS OF INVESTMENTS Wilmington Broad Market Bond Fund (continued) |
| | | | | | | | |
| | |
| Description | |
Par Value | | | Value | |
| | |
2.88%, 8/15/45 | | $ | 300,000 | | | $ | 403,324 | |
| | |
3.00%, 5/15/42 | | | 500,000 | | | | 673,232 | |
| | |
3.00%, 11/15/44 | | | 2,000,000 | | | | 2,726,594 | |
| | |
3.00%, 5/15/45 | | | 2,000,000 | | | | 2,736,330 | |
| | |
3.00%, 11/15/45# | | | 765,000 | | | | 1,052,524 | |
| | |
3.00%, 2/15/47 | | | 1,098,000 | | | | 1,527,567 | |
| | |
3.00%, 5/15/47 | | | 1,695,000 | | | | 2,360,531 | |
| | |
3.00%, 2/15/48 | | | 4,000,000 | | | | 5,594,465 | |
| | |
3.13%, 8/15/44 | | | 6,637,000 | | | | 9,201,699 | |
| | |
3.63%, 8/15/43 | | | 881,000 | | | | 1,304,181 | |
| | |
3.63%, 2/15/44 | | | 2,106,000 | | | | 3,130,817 | |
| | |
3.75%, 11/15/43 | | | 365,000 | | | | 551,228 | |
| | |
5.25%, 2/15/29 | | | 500,000 | | | | 699,088 | |
| | |
5.38%, 2/15/31 | | | 600,000 | | | | 895,895 | |
| | |
6.25%, 5/15/30# | | | 500,000 | | | | 773,439 | |
| | |
6.38%, 8/15/27# | | | 450,000 | | | | 638,283 | |
| | | | | | | | |
| |
TOTAL U.S. TREASURY BONDS | | | $ | 48,880,415 | |
|
U.S. TREASURY NOTES – 18.6% | |
| | |
1.63%, 8/15/22 | | | 6,000,000 | | | | 6,194,174 | |
| | |
1.63%, 11/15/22 | | | 1,928,000 | | | | 1,995,854 | |
| | |
1.63%, 5/31/23 | | | 12,400,000 | | | | 12,918,298 | |
| | |
1.63%, 2/15/26 | | | 8,000,000 | | | | 8,531,116 | |
| | |
1.63%, 5/15/26 | | | 4,695,000 | | | | 5,015,561 | |
| | |
1.63%, 8/15/29 | | | 5,000,000 | | | | 5,453,145 | |
| | |
1.75%, 5/15/22 | | | 380,000 | | | | 391,875 | |
| | |
1.75%, 5/15/23 | | | 2,000,000 | | | | 2,090,153 | |
| | |
1.75%, 7/31/24 | | | 1,900,000 | | | | 2,013,523 | |
| | |
2.00%, 11/15/21 | | | 1,000,000 | | | | 1,027,734 | |
| | |
2.00%, 4/30/24 | | | 10,195,000 | | | | 10,874,111 | |
| | |
2.00%, 2/15/25 | | | 4,655,000 | | | | 5,015,460 | |
| | |
2.00%, 8/15/25 | | | 295,000 | | | | 319,510 | |
| | |
2.00%, 11/15/26 | | | 4,180,000 | | | | 4,579,818 | |
| | |
2.13%, 6/30/22 | | | 6,615,000 | | | | 6,888,967 | |
| | |
2.13%, 5/15/25 | | | 2,500,000 | | | | 2,717,059 | |
| | |
2.25%, 11/15/25 | | | 230,000 | | | | 252,779 | |
| | |
2.38%, 8/15/24 | | | 5,600,000 | | | | 6,084,250 | |
| | |
2.38%, 5/15/29 | | | 2,500,000 | | | | 2,885,563 | |
| | |
2.50%, 3/31/23 | | | 7,000,000 | | | | 7,458,771 | |
| | |
2.50%, 8/15/23 | | | 200,000 | | | | 214,614 | |
| | |
2.63%, 11/15/20 | | | 500,000 | | | | 506,654 | |
| | |
2.75%, 2/15/28 | | | 6,000,000 | | | | 6,998,114 | |
| | | | | | | | |
| |
TOTAL U.S. TREASURY NOTES | | | $ | 100,427,103 | |
| | | | | | | | |
| |
TOTAL U.S. TREASURY
(COST $131,196,152) | | | $ | 149,307,518 | |
| | | | | | | | |
| | |
| Description | | Number of
Shares | | | Value | |
|
INVESTMENT COMPANY – 1.7% | |
|
EXCHANGE-TRADED FUND – 1.7% | |
| | |
iShares iBoxx High Yield Corporate Bond | | | | | | | | |
ETF# | | | 113,960 | | | $ | 9,165,803 | |
| | | | | | | | |
| |
TOTAL INVESTMENT COMPANY
(COST $10,009,301) | | | $ | 9,165,803 | |
|
| MONEY MARKET FUND – 0.4% | |
| | |
Dreyfus Government Cash Management | | | | | | | | |
Fund, Institutional Shares, 0.17%^ | | | 2,129,601 | | | $ | 2,129,601 | |
| | | | | | | | |
| |
TOTAL MONEY MARKET FUND
(COST $2,129,601) | | | $ | 2,129,601 | |
| | | | | | | | |
| |
TOTAL INVESTMENTS IN SECURITIES – 101.6%
(COST $514,678,652) | | | $ | 547,512,576 | |
| | | | | | | | |
| | | | | | | | |
| | |
| | | Par Value | | | | |
|
CASH COLLATERAL INVESTED FOR SECURITIES ON LOAN – 3.6% | |
|
REPURCHASE AGREEMENTS – 3.6% | |
| | |
Bank of America Securities, Inc., 0.04%, dated 4/30/20, due 5/01/20, repurchase price $986,866 collateralized by U.S. Government Agency Securities, 2.00% to 5.00%, maturing 8/01/23 to 4/01/59; total market value of $1,006,602. | | $ | 986,865 | | | $ | 986,865 | |
| | |
Citigroup Global Markets Ltd., 0.04%, dated 4/30/20, due 5/01/20, repurchase price $3,750,153 collateralized by U.S. Government Agency & Treasury Securities, 0.50% to 6.50%, maturing 5/31/20 to 2/01/57; total market value of $3,825,152. | | | 3,750,149 | | | | 3,750,149 | |
| | |
Daiwa Capital Markets America, 0.05%, dated 4/30/20, due 5/01/20, repurchase price $3,750,154 collateralized by U.S. Government Agency & Treasury Securities, 0.00% to 6.50%, maturing 5/07/20 to 3/01/52; total market value of $3,825,152. | | | 3,750,149 | | | | 3,750,149 | |
| | |
Deutsche Bank Securities, Inc., 0.03%, dated 4/30/20, due 5/01/20, repurchase price $3,750,152 collateralized by U.S. Government Agency & Treasury Securities, 0.43% to 8.75%, maturing 8/15/20 to 4/01/50; total market value of $3,825,152. | | | 3,750,149 | | | | 3,750,149 | |
| | |
HSBC Securities USA, Inc., 0.03%, dated 4/30/20, due 5/01/20, repurchase price $3,750,152 collateralized by U.S. Government Agency Securities, 2.45% to 5.00%, maturing 2/20/49 to 4/15/55; total market value of $3,825,152. | | | 3,750,149 | | | | 3,750,149 | |
April 30, 2020 / ANNUAL REPORT
| | |
PORTFOLIOS OF INVESTMENTS Wilmington Broad Market Bond Fund (continued) | | 26 |
| | | | | | | | |
| | |
| Description | | Par Value | | | Value | |
| | |
RBC Dominion Securities, Inc., 0.04%, dated 4/30/20, due 5/01/20, repurchase price $3,750,153 collateralized by U.S. Government Agency & Treasury Securities, 0.00% to 6.00%, maturing 7/15/24 to 5/01/50; total market value of $3,825,152. | | $ | 3,750,149 | | | $ | 3,750,149 | |
| | | | | | | | |
| | |
TOTAL REPURCHASE AGREEMENTS
(COST $19,737,610) | | | | | | $ | 19,737,610 | |
| | | | | | | | |
|
TOTAL CASH COLLATERAL INVESTED FOR SECURITIES ON | |
LOAN | | | | | | | | |
(COST $19,737,610) | | | | | | $ | 19,737,610 | |
| | | | | | | | |
| | | | | | | | |
| | |
| Description | | | | | Value | |
| |
TOTAL INVESTMENTS – 105.2% (COST $534,416,262) | | | $ | 567,250,186 | |
| |
COLLATERAL FOR SECURITIES ON LOAN – (3.6%) | | | | (19,737,610 | ) |
| | |
OTHER LIABILITIES LESS ASSETS – (1.6%) | | | | | | | (8,445,798 | ) |
| | | | | | | | |
| | |
TOTAL NET ASSETS – 100.0% | | | | | | $ | 539,066,778 | |
| | | | | | | | |
Cost of investments for Federal income tax purposes is $534,460,543. The net unrealized appreciation/(depreciation) of investments was $32,789,643. This consists of net unrealized appreciation from investment for those securities having an excess of value over cost of $36,001,427 and net unrealized depreciation from investments for those securities having an excess of cost over value of $(3,211,784).
Various inputs are used in determining the value of the Fund’s investments. These inputs are summarized in the three broad levels listed below.
Level 1 – quoted prices in active markets for identical securities
Level 2 – other significant observable inputs (including quoted prices for similar securities, interest rates, prepayment speeds, credit risk, etc.)
Level 3 – significant unobservable inputs (including the Fund’s own assumptions in determining the fair value of investments)
The following is a summary of the inputs used as of April 30, 2020 in valuing the Fund’s assets carried at fair value:
| | | | | | | | | | | | | | | | |
| | | | |
| | | Level 1 | | | Level 2 | | | Level 3 | | | Total | |
| | | | |
Investments in Securities | | | | | | | | | | | | | | | | |
| | | | |
Investment Company | | $ | 9,165,803 | | | $ | — | | | $ | — | | | $ | 9,165,803 | |
| | | | |
Asset-Backed Security | | | — | | | | 212,409 | | | | — | | | | 212,409 | |
| | | | |
Collateralized Mortgage Obligations | | | — | | | | 9,730,505 | | | | — | | | | 9,730,505 | |
| | | | |
Commercial Paper | | | — | | | | 18,487,345 | | | | — | | | | 18,487,345 | |
| | | | |
Corporate Bonds | | | — | | | | 221,682,133 | | | | — | | | | 221,682,133 | |
| | | | |
Enhanced Equipment Trust Certificates | | | — | | | | 346,028 | | | | — | | | | 346,028 | |
| | | | |
Government Agencies | | | — | | | | 4,154,294 | | | | — | | | | 4,154,294 | |
| | | | |
Mortgage-Backed Securities | | | — | | | | 129,861,690 | | | | — | | | | 129,861,690 | |
| | | | |
Municipal Bond | | | — | | | | 2,435,250 | | | | — | | | | 2,435,250 | |
| | | | |
U.S. Treasury | | | — | | | | 149,307,518 | | | | — | | | | 149,307,518 | |
| | | | |
Money Market Fund | | | 2,129,601 | | | | — | | | | — | | | | 2,129,601 | |
| | | | |
Repurchase Agreements | | | — | | | | 19,737,610 | | | | — | | | | 19,737,610 | |
| | | | |
| | | | | | | | | | | | | | | | |
| | | | |
Total | | $ | 11,295,404 | | | $ | 555,954,782 | | | $ | — | | | $ | 567,250,186 | |
| | | | | | | | | | | | | | | | |
| # | Security, or a portion thereof, is on loan. See Note 2 in Notes to Financial Statements. |
| D | Variable rate security. The rate disclosed is the rate in effect on the report date. The information in parenthesis represents the benchmark and reference rate for each relevant security and the rate floats based upon the reference rate and spread. The security may be further subject to interest rate floor and caps. Certain variable rate securities are not based on a published reference rate and spread, but are determined by the issuer or agent and are based on current market conditions, or, for mortgage-backed securities, are impacted by the individual mortgages which are paying off over time. These securities do not indicate a reference rate and spread in their descriptions. |
| ◆ | The rate shown reflects the effective yield at purchase date. |
| W | Denotes a restricted security that may be resold without restriction to “qualified institutional buyers” as defined in Rule 144A under the Securities Act of 1933 and that the Fund has determined to be liquid under criteria established by the Fund’s Board of Trustees. At April 30, 2020, these liquid restricted securities amounted to $31,876,479 representing 5.91% of total net assets. |
| ‡ | Delayed delivery security. |
| ** | Represents less than 0.05%. |
ANNUAL REPORT / April 30, 2020
| | |
| 27 | | PORTFOLIOS OF INVESTMENTS Wilmington Broad Market Bond Fund (concluded) |
| | | | | | | | |
| The following acronyms are used throughout this Fund: | | MTN | | Medium Term Note |
| | | | |
| BKNT | | Bank Note | | | | NA | | National Association |
| | | | |
| ETF | | Exchange-Traded Fund | | | | PLC | | Public Limited Company |
| | | | |
| GMTN | | Global Medium Term Note | | | | SOFRRATE | | Secured Overnight Financing Rate |
| | | | |
| LIBOR | | London Interbank Offered Rate | | | | TBA | | To Be Announced Security |
| | | | |
| LLC | | Limited Liability Corporation | | | | USD | | United States Dollar |
| | | | |
| LP | | Limited Partnership | | | | | | |
See Notes which are an integral part of the Financial Statements
April 30, 2020 / ANNUAL REPORT
PORTFOLIO OF INVESTMENTS SUMMARY TABLE
Wilmington Intermediate-Term Bond Fund
At April 30, 2020, the Fund’s portfolio composition was as follows (unaudited):
| | | | | |
| | | Percentage of |
| | | Total Net Assets |
| |
Corporate Bonds | | | | 66.5 | % |
| |
U.S. Treasury | | | | 29.9 | % |
| |
Mortgage-Backed Securities | | | | 1.4 | % |
| |
Government Agency | | | | 1.0 | % |
| |
Investment Company | | | | 1.0 | % |
| |
Adjustable Rate Mortgage | | | | 0.0 | %4 |
| |
Cash Equivalents1 | | | | 3.4 | % |
| |
Other Assets and Liabilities – Net2 | | | | (3.2 | )% |
| |
| | | | | |
| |
TOTAL | | | | 100.0 | % |
| | | | | |
| (1) | Cash Equivalents include investments in a money market fund and repurchase agreements. |
| (2) | Assets, other than investments in securities, less liabilities. See Statements of Assets and Liabilities. |
| (3) | For financial reporting purposes, the Credit Quality Diversification table reflects the lowest rating assigned by either Moody’s Investors Service or Standard and Poor’s if the ratings differ. These rating agencies are independent, nationally recognized statistical rating organizations and are widely used. Investment grade ratings are credit ratings of BBB/Baa or higher. Below investment grade ratings are credit ratings of BB/Ba or lower. Investments designated as “Not Rated” are not rated by either rating agency and do not necessarily indicate low credit quality. Credit quality ratings are subject to change. |
| (4) | Represent less than 0.05%. |
| | | | | |
| | | Percentage of |
| |
| Credit Quality Diversification3 | | Total Net Assets |
| |
U.S. Government Agency Securities | | | | 2.4 | % |
| |
U.S. Treasury | | | | 29.9 | % |
| |
A / A | | | | 15.9 | % |
| |
BBB / Baa | | | | 47.7 | % |
| |
BB / Ba | | | | 2.9 | % |
| |
Not Rated | | | | 4.4 | % |
| |
Other Assets and Liabilities – Net2 | | | | (3.2 | )% |
| |
| | | | | |
| |
TOTAL | | | | 100.0 | % |
| | | | | |
PORTFOLIO OF INVESTMENTS
April 30, 2020
| | | | | | | | |
| | |
| Description | | Par Value | | | Value | |
|
ADJUSTABLE RATE MORTGAGE – 0.0%** | |
|
FEDERAL NATIONAL MORTGAGE ASSOCIATION
(FNMA) – 0.0%** | |
| | |
Pool 612514, (12 Month USD LIBOR +
1.72%, Cap 8.82%, Floor 1.72),
4.59%, 5/01/33D | | $ | 13,272 | | | $ | 14,090 | |
| | | | | | | | |
| |
TOTAL ADJUSTABLE RATE MORTGAGE | | | | | |
(COST $13,254) | | | | | | $ | 14,090 | |
|
CORPORATE BONDS – 66.5% | |
|
AEROSPACE & DEFENSE – 0.5% | |
| | |
Boeing Co. (The),
Sr. Unsecured, 3.20%, 3/01/29 | | | 150,000 | | | | 131,871 | |
| | |
L3Harris Technologies, Inc.,
Sr. Unsecured, 2.90%, 12/15/29 | | | 100,000 | | | | 103,721 | |
| | | | | | | | |
| |
TOTAL AEROSPACE & DEFENSE | | | $ | 235,592 | |
| | |
AUTOMOTIVE – 2.1% | | | | | | | | |
| | |
Ford Motor Co.,
Sr. Unsecured, 9.00%, 4/22/25 | | | 250,000 | | | | 243,763 | |
| | | | | | | | |
| | |
| Description | | Par Value | | | Value | |
| | |
Ford Motor Credit Co. LLC,
Sr. Unsecured, 5.58%, 3/18/24 | | $ | 250,000 | | | $ | 236,703 | |
| | |
General Motors Financial Co., Inc.,
Sr. Unsecured, 4.20%, 11/06/21 | | | 375,000 | | | | 367,429 | |
| | |
General Motors Financial Co., Inc.,
Sr. Unsecured, 2.90%, 2/26/25 | | | 230,000 | | | | 208,608 | |
| | | | | | | | |
| |
TOTAL AUTOMOTIVE | | | $ | 1,056,503 | |
| |
BEVERAGES – 0.9% | | | | | |
| | |
Keurig Dr. Pepper, Inc.,
Company Guaranteed, 3.55%, 5/25/21 | | | 300,000 | | | | 306,454 | |
| | |
PepsiCo, Inc.,
Sr. Unsecured, 2.75%, 3/19/30 | | | 120,000 | | | | 130,575 | |
| | | | | | | | |
| |
TOTAL BEVERAGES | | | $ | 437,029 | |
| |
BIOTECHNOLOGY – 1.0% | | | | | |
| | |
Amgen, Inc.,
Sr. Unsecured, 2.20%, 5/11/20 | | | 270,000 | | | | 270,064 | |
ANNUAL REPORT / April 30, 2020
| | |
| 29 | | PORTFOLIOS OF INVESTMENTS Wilmington Intermediate-Term Bond Fund (continued) |
| | | | | | | | |
| | |
| Description | | Par Value | | | Value | |
| | |
Amgen, Inc., | | | | | | | | |
Sr. Unsecured, 2.25%, 8/19/23# | | $ | 225,000 | | | $ | 232,533 | |
| | | | | | | | |
| | |
TOTAL BIOTECHNOLOGY | | | | | | $ | 502,597 | |
|
BUILDING PRODUCTS – 1.3% | |
| | |
Carrier Global Corp., | | | | | | | | |
Sr. Unsecured, 2.49%, 2/15/27W | | | 250,000 | | | | 239,973 | |
| | |
Johnson Controls International PLC, | | | | | | | | |
(Current rate until maturity), Sr. Unsecured, | | | | | | | | |
3.63%, 7/02/24ÿ | | | 373,000 | | | | 385,963 | |
| | | | | | | | |
| | |
TOTAL BUILDING PRODUCTS | | | | | | $ | 625,936 | |
|
CAPITAL MARKETS – 1.5% | |
| | |
Goldman Sachs Group, Inc. (The), | | | | | | | | |
Sr. Unsecured, (3 Month USD LIBOR + | | | | | | | | |
1.20%), 3.27%, 9/29/25D | | | 210,000 | | | | 219,733 | |
| | |
State Street Corp., | | | | | | | | |
Subordinated, 3.10%, 5/15/23 | | | 250,000 | | | | 262,503 | |
| | |
TD Ameritrade Holding Corp., | | | | | | | | |
Sr. Unsecured, 2.95%, 4/01/22 | | | 250,000 | | | | 256,707 | |
| | | | | | | | |
| | |
TOTAL CAPITAL MARKETS | | | | | | $ | 738,943 | |
| | |
CHEMICALS – 0.4% | | | | | | | | |
| | |
DuPont de Nemours, Inc., | | | | | | | | |
Sr. Unsecured, 2.17%, 5/01/23 | | | 200,000 | | | | 201,667 | |
| | |
COMMERCIAL BANKS – 5.7% | | | | | | | | |
| | |
Fifth Third Bancorp, | | | | | | | | |
Subordinated, 4.30%, 1/16/24 | | | 250,000 | | | | 268,166 | |
| | |
Huntington Bancshares, Inc., | | | | | | | | |
Sr. Unsecured, 2.63%, 8/06/24 | | | 120,000 | | | | 123,253 | |
| | |
KeyBank NA, | | | | | | | | |
Sr. Unsecured, BKNT, 1.25%, 3/10/23 | | | 250,000 | | | | 250,179 | |
| | |
PNC Financial Services Group, Inc. (The), | | | | | | | | |
Sr. Unsecured, 3.45%, 4/23/29 | | | 100,000 | | | | 109,692 | |
| | |
PNC Financial Services Group, Inc. (The), | | | | | | | | |
Subordinated, 3.90%, 4/29/24 | | | 200,000 | | | | 217,391 | |
| | |
Toronto-Dominion Bank (The), | | | | | | | | |
Sr. Unsecured, GMTN, 3.25%, 3/11/24 | | | 275,000 | | | | 291,692 | |
| | |
Truist Bank, | | | | | | | | |
Sr. Unsecured, BKNT, 3.20%, 4/01/24 | | | 175,000 | | | | 186,621 | |
| | |
Truist Bank, | | | | | | | | |
Subordinated, BKNT, 3.63%, 9/16/25 | | | 250,000 | | | | 268,782 | |
| | |
Truist Financial Corp., | | | | | | | | |
Sr. Unsecured, 2.70%, 1/27/22 | | | 250,000 | | | | 255,612 | |
| | |
Truist Financial Corp., | | | | | | | | |
Sr. Unsecured, MTN, (3 Month USD LIBOR + | | | | | | | | |
0.65%), 2.08%, 4/01/22D | | | 345,000 | | | | 343,306 | |
| | |
U.S. Bancorp, | | | | | | | | |
Subordinated, MTN, 3.00%, 7/30/29 | | | 500,000 | | | | 527,436 | |
| | | | | | | | |
| | |
TOTAL COMMERCIAL BANKS | | | | | | $ | 2,842,130 | |
|
COMMERCIAL SERVICES & SUPPLIES – 1.2% | |
| | |
Global Payments, Inc., | | | | | | | | |
Sr. Unsecured, 3.80%, 4/01/21 | | | 300,000 | | | | 303,770 | |
| | | | | | | | |
| | |
| Description | | Par Value | | | Value | |
| | |
Global Payments, Inc., Sr. Unsecured, 2.65%, 2/15/25 | | $ | 275,000 | | | $ | 282,917 | |
| | | | | | | | |
| |
TOTAL COMMERCIAL SERVICES & SUPPLIES | | | $ | 586,687 | |
| |
COMPUTERS – 1.9% | | | | | |
| | |
Hewlett Packard Enterprise Co.,
Sr. Unsecured, 4.40%, 10/15/22 | | | 425,000 | | | | 446,695 | |
| | |
International Business Machines Corp.,
Sr. Unsecured, 2.85%, 5/13/22 | | | 480,000 | | | | 499,167 | |
| | | | | | | | |
| | |
TOTAL COMPUTERS | | | | | | $ | 945,862 | |
|
CONSUMER FINANCE – 1.7% | |
| | |
American Express Co.,
Sr. Unsecured, (3 Month USD LIBOR + 0.53%), 2.22%, 5/17/21D | | | 165,000 | | | | 163,808 | |
| | |
American Express Co.,
Sr. Unsecured, 3.13%, 5/20/26 | | | 150,000 | | | | 160,837 | |
| | |
Capital One Financial Corp.,
Sr. Unsecured, (3 Month USD LIBOR + 0.95%), 1.95%, 3/09/22D | | | 250,000 | | | | 246,016 | |
| | |
Capital One Financial Corp.,
Sr. Unsecured, 3.90%, 1/29/24 | | | 250,000 | | | | 260,333 | |
| | | | | | | | |
| | |
TOTAL CONSUMER FINANCE | | | | | | $ | 830,994 | |
|
DIVERSIFIED FINANCIAL SERVICES – 4.5% | |
| | |
Bank of America Corp.,
Sr. Unsecured, MTN, 2.50%, 10/21/22 | | | 415,000 | | | | 423,545 | |
| | |
Bank of Montreal,
Sr. Unsecured, MTN, (3 Month USD LIBOR + 0.34%), 1.65%, 7/13/20D | | | 125,000 | | | | 124,915 | |
| | |
Bank of Montreal,
Sr. Unsecured, MTN, 1.90%, 8/27/21# | | | 180,000 | | | | 182,123 | |
| | |
Charles Schwab Corp. (The),
Sr. Unsecured, (3 Month USD LIBOR + 0.32%), 2.02%, 5/21/21D | | | 155,000 | | | | 153,389 | |
| | |
Charles Schwab Corp. (The),
Sr. Unsecured, 3.20%, 3/02/27 | | | 315,000 | | | | 334,157 | |
| | |
JPMorgan Chase & Co.,
Sr. Unsecured, 2.55%, 10/29/20 | | | 250,000 | | | | 251,253 | |
| | |
JPMorgan Chase & Co.,
Subordinated, 3.88%, 9/10/24 | | | 300,000 | | | | 323,121 | |
| | |
National Rural Utilities Cooperative Finance Corp.,
3.70%, 3/15/29 | | | 260,000 | | | | 293,000 | |
| | |
Wells Fargo & Co.,
Sr. Unsecured, MTN, (3 Month USD LIBOR + 0.75%), 2.16%, 2/11/26D | | | 140,000 | | | | 140,474 | |
| | | | | | | | |
| |
TOTAL DIVERSIFIED FINANCIAL SERVICES | | | $ | 2,225,977 | |
| |
ELECTRIC – 4.9% | | | | | |
| | |
DTE Energy Co.,
Series C, Sr. Unsecured, 3.50%, 6/01/24 | | | 250,000 | | | | 263,607 | |
| | |
DTE Energy Co.,
Series D, Sr. Unsecured, 3.70%, 8/01/23 | | | 300,000 | | | | 316,933 | |
| | |
Entergy Corp.,
Sr. Unsecured, 2.95%, 9/01/26 | | | 255,000 | | | | 266,859 | |
April 30, 2020 / ANNUAL REPORT
| | |
PORTFOLIOS OF INVESTMENTS Wilmington Intermediate-Term Bond Fund (continued) | | 30 |
| | | | | | | | |
| | |
| Description | | Par Value | | | Value | |
| | |
FirstEnergy Corp., | | | | | | | | |
Sr. Unsecured, 2.65%, 3/01/30 | | $ | 225,000 | | | $ | 230,840 | |
| | |
Southern Co. (The), | | | | | | | | |
Sr. Unsecured, 2.35%, 7/01/21 | | | 500,000 | | | | 506,663 | |
| | |
Union Electric Co., | | | | | | | | |
1st Mortgage, 3.50%, 3/15/29 | | | 220,000 | | | | 248,176 | |
| | |
WEC Energy Group, Inc., | | | | | | | | |
Sr. Unsecured, 2.45%, 6/15/20 | | | 300,000 | | | | 300,072 | |
| | |
WEC Energy Group, Inc., | | | | | | | | |
Sr. Unsecured, 3.38%, 6/15/21 | | | 290,000 | | | | 297,490 | |
| | | | | | | | |
| | |
TOTAL ELECTRIC | | | | | | $ | 2,430,640 | |
|
ENVIRONMENTAL CONTROL – 0.3% | |
| | |
Waste Management, Inc., | | | | | | | | |
Company Guaranteed, 2.40%, 5/15/23 | | | 160,000 | | | | 165,957 | |
|
FOOD & STAPLES RETAILING – 2.8% | |
| | |
Archer-Daniels-Midland Co., | | | | | | | | |
Sr. Unsecured, 2.75%, 3/27/25 | | | 250,000 | | | | 265,915 | |
| | |
Conagra Brands, Inc., | | | | | | | | |
Sr. Unsecured, 3.80%, 10/22/21 | | | 200,000 | | | | 206,317 | |
| | |
Kroger Co. (The), | | | | | | | | |
Sr. Unsecured, 2.95%, 11/01/21# | | | 250,000 | | | | 256,379 | |
| | |
McCormick & Co., Inc., | | | | | | | | |
Sr. Unsecured, 2.50%, 4/15/30 | | | 175,000 | | | | 179,611 | |
| | |
Mondelez International, | | | | | | | | |
1.50%, 5/04/20 | | | 500,000 | | | | 497,320 | |
| | | | | | | | |
| | |
TOTAL FOOD & STAPLES RETAILING | | | | | | $ | 1,405,542 | |
|
HEALTH CARE EQUIPMENT & SUPPLIES – 0.5% | |
| | |
DH Europe Finance II Sarl, | | | | | | | | |
Company Guaranteed, 2.60%, 11/15/29 | | | 225,000 | | | | 236,384 | |
|
HEALTH CARE PROVIDERS & SERVICES – 3.9% | |
| | |
Anthem, Inc., | | | | | | | | |
Sr. Unsecured, 3.65%, 12/01/27 | | | 235,000 | | | | 256,979 | |
| | |
Cardinal Health, Inc., | | | | | | | | |
Sr. Unsecured, 3.20%, 3/15/23 | | | 350,000 | | | | 361,086 | |
| | |
Cigna Corp., | | | | | | | | |
Company Guaranteed, 4.13%, 9/15/20W | | | 250,000 | | | | 252,222 | |
| | |
CommonSpirit Health, | | | | | | | | |
Sr. Secured, 2.76%, 10/01/24 | | | 110,000 | | | | 108,270 | |
| | |
CommonSpirit Health, | | | | | | | | |
Sr. Secured, 3.35%, 10/01/29 | | | 150,000 | | | | 145,967 | |
| | |
CVS Health Corp., | | | | | | | | |
Sr. Unsecured, 3.70%, 3/09/23 | | | 250,000 | | | | 265,126 | |
| | |
Elanco Animal Health, Inc., | | | | | | | | |
Sr. Unsecured, 4.66%, 8/27/21 | | | 250,000 | | | | 254,835 | |
| | |
UnitedHealth Group, Inc., | | | | | | | | |
Sr. Unsecured, 2.38%, 10/15/22 | | | 300,000 | | | | 309,643 | |
| | | | | | | | |
| |
TOTAL HEALTH CARE PROVIDERS & SERVICES | | | $ | 1,954,128 | |
|
HOTELS, RESTAURANTS & LEISURE – 0.6% | |
| | |
McDonald’s Corp., | | | | | | | | |
Sr. Unsecured, MTN, 3.30%, 7/01/25 | | | 250,000 | | | | 272,644 | |
| | | | | | | | |
| | |
| Description | | Par Value | | | Value | |
|
HOUSEHOLD PRODUCTS – 0.5% | |
| | |
Church & Dwight Co., Inc., | | | | | | | | |
Sr. Unsecured, 2.45%, 8/01/22 | | $ | 225,000 | | | $ | 230,498 | |
|
INSURANCE – 1.5% | |
| | |
American International Group, Inc., | | | | | | | | |
Sr. Unsecured, 3.30%, 3/01/21 | | | 250,000 | | | | 253,982 | |
| | |
Aon PLC, | | | | | | | | |
Company Guaranteed, 2.80%, 3/15/21 | | | 240,000 | | | | 242,434 | |
| | |
Aon PLC, | | | | | | | | |
Company Guaranteed, 4.00%, 11/27/23 | | | 250,000 | | | | 264,863 | |
| | | | | | | | |
| | |
TOTAL INSURANCE | | | | | | $ | 761,279 | |
|
MACHINERY – 0.9% | |
| | |
Roper Technologies, Inc., | | | | | | | | |
Sr. Unsecured, 3.13%, 11/15/22 | | | 125,000 | | | | 128,992 | |
| | |
Roper Technologies, Inc., | | | | | | | | |
Sr. Unsecured, 3.80%, 12/15/26 | | | 300,000 | | | | 322,332 | |
| | | | | | | | |
| | |
TOTAL MACHINERY | | | | | | $ | 451,324 | |
|
MEDIA – 2.0% | |
| | |
Discovery Communications LLC, | | | | | | | | |
Company Guaranteed, 3.30%, 5/15/22 | | | 250,000 | | | | 256,525 | |
| | |
Discovery Communications LLC, | | | | | | | | |
Company Guaranteed, 4.13%, 5/15/29 | | | 350,000 | | | | 369,448 | |
| | |
ViacomCBS, Inc., | | | | | | | | |
Company Guaranteed, 3.38%, 3/01/22 | | | 350,000 | | | | 357,925 | |
| | | | | | | | |
| | |
TOTAL MEDIA | | | | | | $ | 983,898 | |
|
MISCELLANEOUS MANUFACTURING – 2.6% | |
| | |
3M Co., | | | | | | | | |
Sr. Unsecured, 2.65%, 4/15/25 | | | 250,000 | | | | 265,781 | |
| | |
Ingersoll-Rand Global Holding Co. Ltd., | | | | | | | | |
Company Guaranteed, 4.25%, 6/15/23 | | | 330,000 | | | | 355,857 | |
| | |
Textron, Inc., | | | | | | | | |
Sr. Unsecured, 3.65%, 3/01/21 | | | 125,000 | | | | 125,261 | |
| | |
Textron, Inc., | | | | | | | | |
Sr. Unsecured, 4.30%, 3/01/24 | | | 500,000 | | | | 523,911 | |
| | | | | | | | |
| |
TOTAL MISCELLANEOUS MANUFACTURING | | | $ | 1,270,810 | |
|
OIL & GAS – 4.2% | |
| | |
Dominion Energy Gas Holdings LLC, | | | | | | | | |
Series B, Sr. Unsecured, 3.00%, 11/15/29 | | | 500,000 | | | | 494,993 | |
| | |
Marathon Oil Corp., | | | | | | | | |
Sr. Unsecured, 2.80%, 11/01/22 | | | 450,000 | | | | 420,120 | |
| | |
Marathon Petroleum Corp., | | | | | | | | |
Sr. Unsecured, 3.63%, 9/15/24 | | | 125,000 | | | | 120,552 | |
| | |
Occidental Petroleum Corp., | | | | | | | | |
Sr. Unsecured, 2.60%, 8/13/21 | | | 390,000 | | | | 365,093 | |
| | |
Phillips 66, | | | | | | | | |
Company Guaranteed, 4.30%, 4/01/22 | | | 400,000 | | | | 417,966 | |
| | |
Valero Energy Corp., | | | | | | | | |
Sr. Unsecured, 4.00%, 4/01/29 | | | 250,000 | | | | 256,439 | |
| | | | | | | | |
| | |
TOTAL OIL & GAS | | | | | | $ | 2,075,163 | |
ANNUAL REPORT / April 30, 2020
| | |
| 31 | | PORTFOLIOS OF INVESTMENTS Wilmington Intermediate-Term Bond Fund (continued) |
| | | | | | | | |
| | |
| Description | | Par Value | | | Value | |
|
PHARMACEUTICALS – 2.9% | |
| | |
AbbVie, Inc., | | | | | | | | |
Sr. Unsecured, 3.75%, 11/14/23 | | $ | 150,000 | | | $ | 161,717 | |
| | |
AbbVie, Inc., | | | | | | | | |
Sr. Unsecured, 3.60%, 5/14/25 | | | 550,000 | | | | 597,608 | |
| | |
Bristol-Myers Squibb Co., | | | | | | | | |
Sr. Unsecured, 2.75%, 2/15/23W | | | 260,000 | | | | 267,151 | |
| | |
Pfizer, Inc., | | | | | | | | |
Sr. Unsecured, 2.63%, 4/01/30 | | | 250,000 | | | | 270,167 | |
| | |
Zoetis, Inc., | | | | | | | | |
Sr. Unsecured, 3.00%, 9/12/27 | | | 125,000 | | | | 134,947 | |
| | | | | | | | |
| |
TOTAL PHARMACEUTICALS | | | $ | 1,431,590 | |
|
PIPELINES – 5.7% | |
| | |
Energy Transfer Operating LP, | | | | | | | | |
Company Guaranteed, 2.90%, 5/15/25 | | | 550,000 | | | | 513,369 | |
| | |
Enterprise Products Operating LLC, | | | | | | | | |
Company Guaranteed, 2.80%, 2/15/21 | | | 225,000 | | | | 226,432 | |
| | |
Kinder Morgan Energy Partners LP, | | | | | | | | |
Company Guaranteed, 4.25%, 9/01/24 | | | 500,000 | | | | 529,375 | |
| | |
Kinder Morgan, Inc., | | | | | | | | |
Company Guaranteed, 6.50%, 9/15/20 | | | 300,000 | | | | 303,218 | |
| | |
MPLX LP, | | | | | | | | |
Sr. Unsecured, (3 Month USD LIBOR + | | | | | | | | |
0.90%), 1.90%, 9/09/21D | | | 500,000 | | | | 482,354 | |
| | |
ONEOK Partners LP, | | | | | | | | |
Company Guaranteed, 3.38%, 10/01/22 | | | 450,000 | | | | 436,435 | |
| | |
Plains All American Pipeline LP, | | | | | | | | |
Sr. Unsecured, 3.85%, 10/15/23 | | | 366,000 | | | | 351,527 | |
| | | | | | | | |
| |
TOTAL PIPELINES | | | $ | 2,842,710 | |
|
REAL ESTATE INVESTMENT TRUSTS – 4.0% | |
| | |
American Tower Corp., | | | | | | | | |
Sr. Unsecured, 3.45%, 9/15/21 | | | 250,000 | | | | 257,226 | |
| | |
American Tower Corp., | | | | | | | | |
Sr. Unsecured, 5.00%, 2/15/24 | | | 250,000 | | | | 280,005 | |
| | |
Digital Realty Trust LP, | | | | | | | | |
Company Guaranteed, 3.60%, 7/01/29 | | | 100,000 | | | | 107,611 | |
| | |
Healthcare Realty Trust, Inc., | | | | | | | | |
Sr. Unsecured, 3.88%, 5/01/25 | | | 300,000 | | | | 304,165 | |
| | |
Healthcare Realty Trust, Inc., | | | | | | | | |
Sr. Unsecured, 3.63%, 1/15/28 | | | 300,000 | | | | 301,060 | |
| | |
Healthpeak Properties, Inc., | | | | | | | | |
Sr. Unsecured, 3.25%, 7/15/26 | | | 110,000 | | | | 110,586 | |
| | |
Ventas Realty LP, | | | | | | | | |
Company Guaranteed, 3.25%, 8/15/22 | | | 125,000 | | | | 125,281 | |
| | |
Ventas Realty LP, | | | | | | | | |
Company Guaranteed, 4.00%, 3/01/28 | | | 250,000 | | | | 247,864 | |
| | |
Welltower, Inc., | | | | | | | | |
Sr. Unsecured, 3.63%, 3/15/24 | | | 250,000 | | | | 254,259 | |
| | | | | | | | |
| |
TOTAL REAL ESTATE INVESTMENT TRUSTS | | | $ | 1,988,057 | |
|
RETAIL – 1.5% | |
| | |
Home Depot, Inc. (The), | | | | | | | | |
Sr. Unsecured, 2.13%, 9/15/26 | | | 225,000 | | | | 236,770 | |
| | | | | | | | |
| | |
| Description | | Par Value | | | Value | |
| | |
Lowe’s Cos., Inc., | | | | | | | | |
Sr. Unsecured, 3.65%, 4/05/29 | | $ | 200,000 | | | $ | 219,447 | |
| | |
Target Corp., | | | | | | | | |
Sr. Unsecured, 2.25%, 4/15/25 | | | 250,000 | | | | 263,135 | |
| | | | | | | | |
| |
TOTAL RETAIL | | | $ | 719,352 | |
|
SEMICONDUCTORS – 0.3% | |
| | |
QUALCOMM, Inc., | | | | | | | | |
Sr. Unsecured, 3.25%, 5/20/27 | | | 150,000 | | | | 163,282 | |
|
SOFTWARE – 0.6% | |
| | |
Oracle Corp., | | | | | | | | |
Sr. Unsecured, 1.90%, 9/15/21 | | | 250,000 | | | | 252,984 | |
| | |
Oracle Corp., | | | | | | | | |
Sr. Unsecured, 2.50%, 4/01/25 | | | 50,000 | | | | 52,783 | |
| | | | | | | | |
| |
TOTAL SOFTWARE | | | $ | 305,767 | |
|
TELECOMMUNICATIONS – 1.4% | |
| | |
AT&T, Inc.,
Sr. Unsecured, (3 Month USD LIBOR + 0.93%), 2.30%, 6/30/20D | | | 500,000 | | | | 500,313 | |
| | |
AT&T, Inc., | | | | | | | | |
Sr. Unsecured, 2.95%, 7/15/26 | | | 200,000 | | | | 206,633 | |
| | | | | | | | |
| |
TOTAL TELECOMMUNICATIONS | | | $ | 706,946 | |
|
TRANSPORTATION – 1.6% | |
| | |
Ryder System, Inc., | | | | | | | | |
Sr. Unsecured, MTN, 2.50%, 9/01/22 | | | 265,000 | | | | 264,898 | |
| | |
Ryder System, Inc., | | | | | | | | |
Sr. Unsecured, MTN, 3.40%, 3/01/23 | | | 500,000 | | | | 503,229 | |
| | | | | | | | |
| |
TOTAL TRANSPORTATION | | | $ | 768,127 | |
|
TRUCKING & LEASING – 1.1% | |
| | |
GATX Corp., | | | | | | | | |
Sr. Unsecured, 3.25%, 9/15/26 | | | 505,000 | | | | 522,214 | |
| | | | | | | | |
| |
TOTAL CORPORATE BONDS
(COST $32,308,174) | | | $ | 32,916,229 | |
|
GOVERNMENT AGENCY – 1.0% | |
|
FEDERAL NATIONAL MORTGAGE ASSOCIATION (FNMA) – 1.0% | |
| | |
0.63%, 4/22/25 | | | 500,000 | | | | 501,984 | |
| | | | | | | | |
| |
TOTAL GOVERNMENT AGENCY
(COST $498,970) | | | $ | 501,984 | |
| |
| | | | | |
| | |
| | | Number of Shares | | | | |
|
INVESTMENT COMPANY – 1.0% | |
|
EXCHANGE-TRADED FUND – 1.0% | |
| | |
iShares 0-5 Year High Yield Corporate Bond ETF | | | 12,000 | | | $ | 506,640 | |
| | | | | | | | |
| |
TOTAL INVESTMENT COMPANY
(COST $556,843) | | | $ | 506,640 | |
April 30, 2020 / ANNUAL REPORT
| | |
PORTFOLIOS OF INVESTMENTS Wilmington Intermediate-Term Bond Fund (continued) | | 32 |
| | | | | | | | |
| | |
| Description | | Par Value | | | Value | |
|
MORTGAGE-BACKED SECURITIES – 1.4% | |
|
FEDERAL HOME LOAN MORTGAGE CORPORATION (FHLMC) – 0.2% | |
| | |
Pool C90504, 6.50%, 12/01/21 | | $ | 3,400 | | | $ | 3,548 | |
| | |
Pool G01625, 5.00%, 11/01/33 | | | 22,181 | | | | 24,964 | |
| | |
Pool A18401, 6.00%, 2/01/34 | | | 21,861 | | | | 25,490 | |
| | |
Pool G08097, 6.50%, 11/01/35 | | | 17,631 | | | | 20,970 | |
| | |
Pool G02390, 6.00%, 9/01/36 | | | 6,859 | | | | 8,102 | |
| | |
Pool G08193, 6.00%, 4/01/37 | | | 19,919 | | | | 23,558 | |
| | | | | | | | |
| |
TOTAL FEDERAL HOME LOAN MORTGAGE CORPORATION (FHLMC) | | | $ | 106,632 | |
|
FEDERAL NATIONAL MORTGAGE ASSOCIATION (FNMA) – 0.8% | |
| | |
Pool 839291, 5.00%, 9/01/20 | | | 38 | | | | 38 | |
| | |
Pool AE2520, 3.00%, 1/01/26 | | | 264,372 | | | | 279,237 | |
| | |
Pool 256639, 5.00%, 2/01/27 | | | 15,894 | | | | 17,326 | |
| | |
Pool 256752, 6.00%, 6/01/27 | | | 16,959 | | | | 19,301 | |
| | |
Pool 257007, 6.00%, 12/01/27 | | | 27,671 | | | | 31,494 | |
| | |
Pool 254240, 7.00%, 3/01/32 | | | 25,633 | | | | 29,463 | |
| | |
Pool 745412, 5.50%, 12/01/35 | | | 15,774 | | | | 17,946 | |
| | | | | | | | |
| |
TOTAL FEDERAL NATIONAL MORTGAGE ASSOCIATION (FNMA) | | | $ | 394,805 | |
|
GOVERNMENT NATIONAL MORTGAGE ASSOCIATION (GNMA) – 0.4% | |
| | |
Pool 780825, 6.50%, 7/15/28 | | | 40,036 | | | | 45,882 | |
| | |
Pool 2616, 7.00%, 7/20/28 | | | 24,136 | | | | 29,099 | |
| | |
Pool 2701, 6.50%, 1/20/29 | | | 49,182 | | | | 57,696 | |
| | |
Pool 426727, 7.00%, 2/15/29 | | | 4,808 | | | | 5,497 | |
| | |
Pool 781231, 7.00%, 12/15/30 | | | 22,564 | | | | 27,520 | |
| | | | | | | | |
| |
TOTAL GOVERNMENT NATIONAL MORTGAGE ASSOCIATION (GNMA) | | | $ | 165,694 | |
| | | | | | | | |
| |
TOTAL MORTGAGE-BACKED SECURITIES (COST $601,024) | | | $ | 667,131 | |
|
U.S. TREASURY – 29.9% | |
| | |
U.S. TREASURY NOTES – 29.9% | | | | | | | | |
| | |
1.13%, 2/28/27# | | | 250,000 | | | | 260,086 | |
| | |
1.38%, 5/31/21 | | | 80,000 | | | | 81,029 | |
| | |
1.50%, 8/15/22 | | | 150,000 | | | | 154,386 | |
| | |
1.63%, 5/31/23 | | | 200,000 | | | | 208,360 | |
| | |
1.63%, 10/31/23# | | | 490,000 | | | | 512,870 | |
| | |
1.63%, 5/15/26 | | | 775,000 | | | | 827,915 | |
| | |
1.75%, 5/15/23 | | | 250,000 | | | | 261,269 | |
| | |
1.88%, 7/31/22 | | | 125,000 | | | | 129,670 | |
| | |
2.00%, 2/15/23 | | | 400,000 | | | | 419,586 | |
| | |
2.00%, 8/15/25 | | | 900,000 | | | | 974,777 | |
| | |
2.00%, 11/15/26 | | | 500,000 | | | | 547,825 | |
| | |
2.13%, 6/30/21 | | | 100,000 | | | | 102,256 | |
| | |
2.13%, 5/15/25 | | | 300,000 | | | | 326,047 | |
| | | | | | | | |
| | |
| Description | | Par Value | | | Value | |
| | |
2.25%, 1/31/24 | | $ | 650,000 | | | $ | 697,111 | |
| | |
2.25%, 11/15/25 | | | 1,250,000 | | | | 1,373,798 | |
| | |
2.25%, 2/15/27 | | | 30,000 | | | | 33,461 | |
| | |
2.25%, 11/15/27 | | | 500,000 | | | | 562,697 | |
| | |
2.38%, 8/15/24 | | | 750,000 | | | | 814,855 | |
| | |
2.38%, 5/15/29 | | | 400,000 | | | | 461,690 | |
| | |
2.50%, 3/31/23 | | | 400,000 | | | | 426,215 | |
| | |
2.50%, 8/15/23 | | | 500,000 | | | | 536,534 | |
| | |
2.50%, 5/15/24 | | | 500,000 | | | | 543,543 | |
| | |
2.75%, 5/31/23 | | | 200,000 | | | | 215,298 | |
| | |
2.75%, 11/15/23 | | | 550,000 | | | | 597,504 | |
| | |
2.75%, 2/15/28 | | | 750,000 | | | | 874,764 | |
| | |
2.88%, 11/30/25 | | | 800,000 | | | | 907,487 | |
| | |
2.88%, 5/15/28 | | | 1,000,000 | | | | 1,180,118 | |
| | |
3.13%, 11/15/28 | | | 650,000 | | | | 786,394 | |
| | | | | | | | |
| |
TOTAL U.S. TREASURY NOTES | | | $ | 14,817,545 | |
| | | | | | | | |
| |
TOTAL U.S. TREASURY
(COST $13,428,910) | | | $ | 14,817,545 | |
| | | | | | | | |
| | | Number of
Shares | | | | |
|
MONEY MARKET FUND – 1.2% | |
| | |
Dreyfus Government Cash Management Fund, Institutional Shares, 0.17%^ | | | 608,771 | | | $ | 608,771 | |
| | | | | | | | |
| |
TOTAL MONEY MARKET FUND
(COST $608,771) | | | $ | 608,771 | |
| | | | | | | | |
| |
TOTAL INVESTMENTS IN SECURITIES – 101.0%
(COST $48,015,946) | | | $ | 50,032,390 | |
| | | | | | | | |
| | | | | | | | |
| | |
| | | Par Value | | | | |
|
CASH COLLATERAL INVESTED FOR SECURITIES ON LOAN – 2.2% | |
|
REPURCHASE AGREEMENTS – 2.2% | |
| | |
Bank of America Securities, Inc., 0.04%, dated 4/30/20, due 5/01/20, repurchase price $53,946 collateralized by U.S. Government Agency Securities, 2.00% to 5.00%, maturing 8/01/23 to 4/01/59; total market value of $55,025. | | $ | 53,946 | | | $ | 53,946 | |
| | |
Citigroup Global Markets Ltd., 0.04%, dated 4/30/20, due 5/01/20, repurchase price $205,003 collateralized by U.S. Government Agency & Treasury Securities, 0.50% to 6.50%, maturing 5/31/20 to 2/01/57; total market value of $209,103. | | | 205,003 | | | | 205,003 | |
| | |
Daiwa Capital Markets America, 0.05%, dated 4/30/20, due 5/01/20, repurchase price $205,003 collateralized by U.S. Government Agency & Treasury Securities, 0.00% to 6.50%, maturing 5/07/20 to 3/01/52; total market value of $209,103. | | | 205,003 | | | | 205,003 | |
ANNUAL REPORT / April 30, 2020
| | |
| 33 | | PORTFOLIOS OF INVESTMENTS Wilmington Intermediate-Term Bond Fund (continued) |
| | | | | | | | |
| | |
| Description | | Par Value | | | Value | |
| | |
Deutsche Bank Securities, Inc., 0.03%, dated 4/30/20, due 5/01/20, repurchase price $205,003 collateralized by U.S. Government Agency & Treasury Securities, 0.43% to 8.75%, maturing 8/15/20 to 4/01/50; total market value of $209,103. | | $ | 205,003 | | | $ | 205,003 | |
| | |
HSBC Securities USA, Inc., 0.03%, dated 4/30/20, due 5/01/20, repurchase price $205,003 collateralized by U.S. Government Agency Securities, 2.45% to 5.00%, maturing 2/20/49 to 4/15/55; total market value of $209,103. | | | 205,003 | | | | 205,003 | |
| | |
RBC Dominion Securities, Inc., 0.04%, dated 4/30/20, due 5/01/20, repurchase price $205,003 collateralized by U.S. Government Agency & Treasury Securities, 0.00% to 6.00%, maturing 7/15/24 to 5/01/50; total market value of $209,103. | | | 205,003 | | | | 205,003 | |
| | | | | | | | |
| | |
TOTAL REPURCHASE AGREEMENTS (COST $1,078,961) | | | | | | $ | 1,078,961 | |
| | | | | | | | |
| |
TOTAL CASH COLLATERAL INVESTED FOR SECURITIES ON | | | | | |
LOAN | | | | | | | | |
(COST $1,078,961) | | | | | | $ | 1,078,961 | |
| | | | | | | | |
| |
TOTAL INVESTMENTS – 103.2% (COST $49,094,907) | | | $ | 51,111,351 | |
| |
COLLATERAL FOR SECURITIES ON LOAN – (2.2%) | | | | (1,078,961 | ) |
| | |
OTHER LIABILITIES LESS ASSETS – (1.0%) | | | | | | | (521,609 | ) |
| | | | | | | | |
| | |
TOTAL NET ASSETS – 100.0% | | | | | | $ | 49,510,781 | |
| | | | | | | | |
Cost of investments for Federal income tax purposes is $49,094,907. The net unrealized appreciation/(depreciation) of investments was $2,016,444. This consists of net unrealized appreciation from investment for those securities having an excess of value over cost of $2,352,485 and net unrealized depreciation from investments for those securities having an excess of cost over value of $(336,041).
Various inputs are used in determining the value of the Fund’s investments. These inputs are summarized in the three broad levels listed below.
Level 1 – quoted prices in active markets for identical securities
Level 2 – other significant observable inputs (including quoted prices for similar securities, interest rates, prepayment speeds, credit risk, etc.)
Level 3 – significant unobservable inputs (including the Fund’s own assumptions in determining the fair value of investments)
The following is a summary of the inputs used as of April 30, 2020 in valuing the Fund’s assets carried at fair value:
| | | | | | | | | | | | | | | | |
| | | | |
| | | Level 1 | | | Level 2 | | | Level 3 | | | Total | |
| | | | |
Investments in Securities | | | | | | | | | | | | | | | | |
| | | | |
Adjustable Rate Mortgage | | $ | — | | | $ | 14,090 | | | $ | — | | | $ | 14,090 | |
| | | | |
Corporate Bonds | | | — | | | | 32,916,229 | | | | — | | | | 32,916,229 | |
| | | | |
Government Agency | | | — | | | | 501,984 | | | | — | | | | 501,984 | |
| | | | |
Investment Company | | | 506,640 | | | | — | | | | — | | | | 506,640 | |
| | | | |
Mortgage-Backed Securities | | | — | | | | 667,131 | | | | — | | | | 667,131 | |
| | | | |
U.S. Treasury | | | — | | | | 14,817,545 | | | | — | | | | 14,817,545 | |
| | | | |
Money Market Fund | | | 608,771 | | | | — | | | | — | | | | 608,771 | |
| | | | |
Repurchase Agreements | | | — | | | | 1,078,961 | | | | — | | | | 1,078,961 | |
| | | | |
| | | | | | | | | | | | | | | | |
| | | | |
Total | | $ | 1,115,411 | | | $ | 49,995,940 | | | $ | — | | | $ | 51,111,351 | |
| | | | | | | | | | | | | | | | |
April 30, 2020 / ANNUAL REPORT
| | |
PORTFOLIOS OF INVESTMENTS Wilmington Intermediate-Term Bond Fund (concluded) | | 34 |
| # | Security, or a portion thereof, is on loan. See Note 2 in Notes to Financial Statements. |
| D | Variable rate security. The rate disclosed is the rate in effect on the report date. The information in parenthesis represents the benchmark and reference rate for each relevant security and the rate floats based upon the reference rate and spread. The security may be further subject to interest rate floor and caps. Certain variable rate securities are not based on a published reference rate and spread, but are determined by the issuer or agent and are based on current market conditions, or, for mortgage-backed securities, are impacted by the individual mortgages which are paying off over time. These securities do not indicate a reference rate and spread in their descriptions. |
| W | Denotes a restricted security that may be resold without restriction to “qualified institutional buyers” as defined in Rule 144A under the Securities Act of 1933 and that the Fund has determined to be liquid under criteria established by the Fund’s Board of Trustees. At April 30, 2020, these liquid restricted securities amounted to $759,346 representing 1.53% of total net assets. |
| ÿ | Step coupon security. The rate disclosed is the rate in effect on the report date. |
| ** | Represents less than 0.05%. |
| | | | |
| | The following acronyms are used throughout this Fund: |
| | |
| | BKNT | | Bank Note |
| | |
| | ETF | | Exchange-Traded Fund |
| | |
| | GMTN | | Global Medium Term Note |
| | |
| | LIBOR | | London Interbank Offered Rate |
| | |
| | LLC | | Limited Liability Corporation |
| | |
| | LP | | Limited Partnership |
| | |
| | MTN | | Medium Term Note |
| | |
| | PLC | | Public Limited Company |
| | |
| | USD | | United States Dollar |
See Notes which are an integral part of the Financial Statements
ANNUAL REPORT / April 30, 2020
PORTFOLIO OF INVESTMENTS SUMMARY TABLE
Wilmington Short-Term Bond Fund
At April 30, 2020, the Fund’s portfolio composition was as follows (unaudited):
| | | | | |
| | | Percentage of
Total Net Assets |
| |
U.S. Treasury Notes | | | | 34.7 | % |
| |
Health Care Providers & Services | | | | 7.5 | % |
| |
Commercial Paper | | | | 5.1 | % |
| |
Food & Staples Retailing | | | | 4.0 | % |
| |
Electric | | | | 3.7 | % |
| |
Automotive | | | | 3.4 | % |
| |
Federal National Mortgage Association (FNMA) | | | | 3.2 | % |
| |
Commercial Banks | | | | 2.9 | % |
| |
Transportation | | | | 2.9 | % |
| |
Real Estate Investment Trusts | | | | 2.2 | % |
| |
Computers | | | | 2.1 | % |
| |
Diversified Financial Services | | | | 2.1 | % |
| |
Biotechnology | | | | 2.1 | % |
| |
Consumer Finance | | | | 2.1 | % |
| |
Pharmaceuticals | | | | 2.0 | % |
| |
Investment Company | | | | 1.9 | % |
| |
Telecommunications | | | | 1.8 | % |
| |
Federal Home Loan Mortgage Corporation (FHLMC) | | | | 1.8 | % |
| |
Oil & Gas | | | | 1.6 | % |
| |
Pipelines | | | | 1.5 | % |
| |
Media | | | | 1.1 | % |
| |
Health Care Equipment & Supplies | | | | 1.0 | % |
| |
Retail | | | | 0.6 | % |
| |
Aerospace & Defense | | | | 0.6 | % |
| |
Semiconductors | | | | 0.6 | % |
| |
Capital Markets | | | | 0.5 | % |
| |
Commercial Services & Supplies | | | | 0.5 | % |
| |
Building Products | | | | 0.5 | % |
| |
Government National Mortgage Association (GNMA) | | | | 0.5 | % |
| | | | | |
| | | Percentage of
Total Net Assets |
| |
Whole Loan | | | | 0.2 | % |
| |
Insurance | | | | 0.1 | % |
| |
Cash Equivalents1 | | | | 5.3 | % |
| |
Other Assets and Liabilities – Net2 | | | | (0.1 | )% |
| |
| | | | | |
| |
TOTAL | | | | 100.0 | % |
| | | | | |
| |
| Credit Quality Diversification3 | | Percentage of
Total Net Assets |
| |
U.S. Government Agency Securities | | | | 5.5 | % |
| |
U.S. Treasury | | | | 34.7 | % |
| |
A / A | | | | 11.7 | % |
| |
BBB / Baa | | | | 31.2 | % |
| |
BB / Ba | | | | 4.6 | % |
| |
Not Rated | | | | 12.4 | % |
| |
Other Assets and Liabilities – Net2 | | | | (0.1 | )% |
| |
| | | | | |
| |
TOTAL | | | | 100.0 | % |
| | | | | |
| (1) | Cash Equivalents include investments in a money market fund and repurchase agreements. |
| (2) | Assets, other than investments in securities, less liabilities. See Statements of Assets and Liabilities. |
| (3) | For financial reporting purposes, the Credit Quality Diversification table reflects the lowest rating assigned by either Moody’s Investors Service or Standard and Poor’s if the ratings differ. These rating agencies are independent, nationally recognized statistical rating organizations and are widely used. Investment grade ratings are credit ratings of BBB/Baa or higher. Below investment grade ratings are credit ratings of BB/Ba or lower. Investments designated as “Not Rated” are not rated by either rating agency and do not necessarily indicate low credit quality. Credit quality ratings are subject to change. |
PORTFOLIO OF INVESTMENTS
April 30, 2020
| | | | | | | | |
| | |
| Description | | Par Value | | | Value | |
| |
ADJUSTABLE RATE MORTGAGE – 0.0%** | | | | | |
|
FEDERAL NATIONAL MORTGAGE ASSOCIATION
(FNMA) – 0.0%** | |
| | |
Pool 399251, (UST Yield Curve CMT 1 Year + 2.07%, Cap 11.19%, Floor 2.07 %), 4.07%, 9/01/27D | | $ | 35 | | | $ | 36 | |
|
TOTAL ADJUSTABLE RATE MORTGAGE | |
(COST $35) | | | | | | $ | 36 | |
|
COLLATERALIZED MORTGAGE OBLIGATIONS – 1.8% | |
|
FEDERAL HOME LOAN MORTGAGE CORPORATION (FHLMC) – 0.0%** | |
| | |
Series 1993-1577, Class PK,
6.50%, 9/15/23 | | | 5,650 | | | | 6,069 | |
| | | | | | | | |
| | |
| Description | | Par Value | | | Value | |
| | |
Series 1993-1644, Class K,
6.75%, 12/15/23 | | $ | 4,338 | | | $ | 4,637 | |
| | |
Series 1994-1686, Class PJ,
5.00%, 2/15/24 | | | 455 | | | | 477 | |
| | |
Series 2011-3799, Class GK,
2.75%, 1/15/21 | | | 5,769 | | | | 5,794 | |
| |
TOTAL FEDERAL HOME LOAN MORTGAGE CORPORATION
(FHLMC) | | | $ | 16,977 | |
|
FEDERAL NATIONAL MORTGAGE ASSOCIATION (FNMA) – 1.6% | |
| | |
Series 1993-113, Class PK, 6.50%, 7/25/23 | | | 7,065 | | | | 7,571 | |
| | |
Series 1993-127, Class H, 6.50%, 7/25/23 | | | 7,165 | | | | 7,625 | |
| | |
Series 1993-202, Class J, 6.50%, 11/25/23 | | | 4,620 | | | | 4,982 | |
April 30, 2020 / ANNUAL REPORT
| | |
PORTFOLIOS OF INVESTMENT Wilmington Short-Term Bond Fund (continued) | | 36 |
| | | | | | | | |
| | |
| Description | | Par Value | | | Value | |
| | |
Series 1994-3, Class PL, 5.50%, 1/25/24 | | $ | 8,108 | | | $ | 8,588 | |
| | |
Series 1994-55, Class H, 7.00%, 3/25/24 | | | 9,088 | | | | 9,776 | |
| | |
Series 2011-66, Class QE, 2.00%, 7/25/21 | | | 37,961 | | | | 38,195 | |
| | |
Series 2011-81, Class PA, 3.50%, 8/25/26 | | | 659,123 | | | | 695,057 | |
| |
TOTAL FEDERAL NATIONAL MORTGAGE ASSOCIATION (FNMA) | | | $ | 771,794 | |
| | |
WHOLE LOAN – 0.2% | | | | | | | | |
| | |
Banc of America Mortgage Securities, Inc., | | | | | | | | |
Series 2004-A, Class 2A1, 3.87%, 2/25/34D | | | 51,630 | | | | 49,493 | |
| | |
IndyMac INDA Mortgage Loan Trust, | | | | | | | | |
Series 2005-AR1, Class 2A1,
3.97%, 11/25/35D | | | 58,763 | | | | 55,390 | |
| | |
TOTAL WHOLE LOAN | | | | | | $ | 104,883 | |
| | |
TOTAL COLLATERALIZED MORTGAGE OBLIGATIONS
(COST $896,738) | | | | | | $ | 893,654 | |
| | |
COMMERCIAL PAPER – 5.1%◆ | | | | | | | | |
| | |
ABB Treasury Center USA, Inc., | | | | | | | | |
1.60%, 5/28/20W | | | 1,000,000 | | | | 998,756 | |
| | |
Dupont De Nemours, Inc., | | | | | | | | |
1.25%, 5/13/20W | | | 1,500,000 | | | | 1,499,323 | |
| | |
TOTAL COMMERCIAL PAPER (COST $2,498,175) | | | | | | $ | 2,498,079 | |
| | |
CORPORATE BONDS – 47.4% | | | | | | | | |
| | |
AEROSPACE & DEFENSE – 0.6% | | | | | | | | |
| | |
General Dynamics Corp., | | | | | | | | |
Company Guaranteed, 3.25%, 4/01/25 | | | 285,000 | | | | 311,014 | |
| | |
AUTOMOTIVE – 3.4% | | | | | | | | |
| | |
Ford Motor Co., | | | | | | | | |
Sr. Unsecured, 8.50%, 4/21/23 | | | 200,000 | | | | 198,635 | |
| | |
Ford Motor Credit Co. LLC, | | | | | | | | |
Sr. Unsecured, 5.58%, 3/18/24 | | | 250,000 | | | | 236,703 | |
| | |
General Motors Financial Co., Inc., | | | | | | | | |
Company Guaranteed, 3.20%, 7/13/20 | | | 500,000 | | | | 498,195 | |
| | |
PACCAR Financial Corp., | | | | | | | | |
Sr. Unsecured, MTN, 2.65%, 5/10/22 | | | 340,000 | | | | 347,525 | |
| | |
PACCAR Financial Corp., | | | | | | | | |
Sr. Unsecured, MTN, 2.65%, 4/06/23 | | | 130,000 | | | | 134,923 | |
| | |
PACCAR Financial Corp., | | | | | | | | |
Sr. Unsecured, MTN, 1.80%, 2/06/25 | | | 250,000 | | | | 252,050 | |
| | |
TOTAL AUTOMOTIVE | | | | | | $ | 1,668,031 | |
| | |
BIOTECHNOLOGY – 2.1% | | | | | | | | |
| | |
Amgen, Inc., | | | | | | | | |
Sr. Unsecured, 2.20%, 5/11/20 | | | 1,000,000 | | | | 1,000,235 | |
| | |
BUILDING PRODUCTS – 0.5% | | | | | | | | |
| | |
Carrier Global Corp., | | | | | | | | |
Sr. Unsecured, 1.92%, 2/15/23W | | | 250,000 | | | | 251,085 | |
| | |
CAPITAL MARKETS – 0.5% | | | | | | | | |
| | |
Morgan Stanley, | | | | | | | | |
Sr. Unsecured, GMTN, 5.50%, 7/24/20 | | | 265,000 | | | | 267,463 | |
| | | | | | | | |
| | |
| Description | | Par Value | | | Value | |
| | |
COMMERCIAL BANKS – 2.9% | | | | | | | | |
| | |
Credit Suisse AG, | | | | | | | | |
Sr. Unsecured, 2.10%, 11/12/21 | | $ | 390,000 | | | $ | 394,391 | |
| | |
Toronto-Dominion Bank (The), | | | | | | | | |
Sr. Unsecured, MTN, 2.65%, 6/12/24 | | | 1,000,000 | | | | 1,041,114 | |
| | |
TOTAL COMMERCIAL BANKS | | | | | | $ | 1,435,505 | |
|
COMMERCIAL SERVICES & SUPPLIES – 0.5% | |
| | |
Global Payments, Inc., | | | | | | | | |
Sr. Unsecured, 2.65%, 2/15/25 | | | 250,000 | | | | 257,197 | |
| | |
COMPUTERS – 2.1% | | | | | | | | |
| | |
Hewlett Packard Enterprise Co., | | | | | | | | |
Sr. Unsecured, 3.60%, 10/15/20 | | | 1,000,000 | | | | 1,007,296 | |
| | |
CONSUMER FINANCE – 2.1% | | | | | | | | |
| | |
Capital One Financial Corp., | | | | | | | | |
Sr. Unsecured, (3 Month USD LIBOR + 0.76%), 2.47%, 5/12/20D | | | 1,000,000 | | | | 1,000,232 | |
|
DIVERSIFIED FINANCIAL SERVICES – 2.1% | |
| | |
Wells Fargo & Co., | | | | | | | | |
Sr. Unsecured, MTN, 3.00%, 1/22/21 | | | 500,000 | | | | 506,751 | |
| | |
Wells Fargo Bank NA, | | | | | | | | |
Sr. Unsecured, BKNT, (3 Month USD LIBOR + 0.66%), 1.66%, 9/09/22D | | | 500,000 | | | | 494,041 | |
| |
TOTAL DIVERSIFIED FINANCIAL SERVICES | | | $ | 1,000,792 | |
| | |
ELECTRIC – 3.7% | | | | | | | | |
| | |
Ameren Corp., | | | | | | | | |
Sr. Unsecured, 2.70%, 11/15/20 | | | 300,000 | | | | 302,363 | |
| | |
Consolidated Edison Co. of New York, Inc., | | | | | | | | |
Sr. Unsecured, 4.45%, 6/15/20 | | | 500,000 | | | | 501,806 | |
| | |
WEC Energy Group, Inc., | | | | | | | | |
Sr. Unsecured, 2.45%, 6/15/20 | | | 1,000,000 | | | | 1,000,242 | |
| | |
TOTAL ELECTRIC | | | | | | $ | 1,804,411 | |
|
FOOD & STAPLES RETAILING – 4.0% | |
| | |
Campbell Soup Co., | | | | | | | | |
Sr. Unsecured, 3.30%, 3/19/25 | | | 200,000 | | | | 213,081 | |
| | |
Conagra Brands, Inc., | | | | | | | | |
Sr. Unsecured, (3 Month USD LIBOR + 0.75%), 1.85%, 10/22/20D | | | 190,000 | | | | 189,942 | |
| | |
Conagra Brands, Inc., | | | | | | | | |
Sr. Unsecured, 3.80%, 10/22/21 | | | 500,000 | | | | 515,792 | |
| | |
Kroger Co. (The), | | | | | | | | |
Sr. Unsecured, 2.80%, 8/01/22 | | | 1,000,000 | | | | 1,029,288 | |
| | |
TOTAL FOOD & STAPLES RETAILING | | | | | | $ | 1,948,103 | |
|
HEALTH CARE EQUIPMENT & SUPPLIES – 1.0% | |
| | |
Becton Dickinson & Co., | | | | | | | | |
Sr. Unsecured, 2.40%, 6/05/20 | | | 500,000 | | | | 499,711 | |
|
HEALTH CARE PROVIDERS & SERVICES – 7.5% | |
| | |
Cigna Corp., | | | | | | | | |
Company Guaranteed, 3.20%, 9/17/20 | | | 700,000 | | | | 703,515 | |
ANNUAL REPORT / April 30, 2020
| | |
| 37 | | PORTFOLIOS OF INVESTMENT Wilmington Short-Term Bond Fund (continued) |
| | | | | | | | |
| | |
| Description | | Par Value | | | Value | |
| | |
CVS Health Corp., | | | | | | | | |
Sr. Unsecured, 2.80%, 7/20/20 | | $ | 500,000 | | | $ | 501,111 | |
| | |
Elanco Animal Health, Inc., | | | | | | | | |
Sr. Unsecured, 4.66%, 8/27/21 | | | 500,000 | | | | 509,670 | |
| | |
McKesson Corp., | | | | | | | | |
Sr. Unsecured, 3.65%, 11/30/20 | | | 445,000 | | | | 450,564 | |
| | |
UnitedHealth Group, Inc., | | | | | | | | |
Sr. Unsecured, 1.95%, 10/15/20 | | | 1,500,000 | | | | 1,500,221 | |
| | |
TOTAL HEALTH CARE PROVIDERS & SERVICES | | | | | | $ | 3,665,081 | |
| | |
INSURANCE – 0.1% | | | | | | | | |
| | |
WR Berkley Corp., | | | | | | | | |
Sr. Unsecured, 4.63%, 3/15/22 | | | 44,000 | | | | 45,808 | |
| | |
MEDIA – 1.1% | | | | | | | | |
| | |
Discovery Communications LLC, | | | | | | | | |
Company Guaranteed, 3.30%, 5/15/22 | | | 500,000 | | | | 513,051 | |
| | |
OIL & GAS – 1.6% | | | | | | | | |
| | |
Occidental Petroleum Corp., | | | | | | | | |
Sr. Unsecured, 4.85%, 3/15/21# | | | 822,000 | | | | 789,766 | |
| | |
PHARMACEUTICALS – 2.0% | | | | | | | | |
| | |
AbbVie, Inc., | | | | | | | | |
Sr. Unsecured, 3.38%, 11/14/21 | | | 350,000 | | | | 361,778 | |
| | |
AbbVie, Inc., | | | | | | | | |
Sr. Unsecured, 2.30%, 11/21/22W | | | 500,000 | | | | 512,354 | |
| | |
Bristol-Myers Squibb Co., | | | | | | | | |
Sr. Unsecured, (3 Month USD LIBOR + | | | | | | | | |
0.38%), 2.07%, 5/16/22DW | | | 85,000 | | | | 84,424 | |
| | |
TOTAL PHARMACEUTICALS | | | | | | $ | 958,556 | |
| | |
PIPELINES – 1.5% | | | | | | | | |
| | |
Enterprise Products Operating LLC, | | | | | | | | |
Company Guaranteed, 3.35%, 3/15/23 | | | 500,000 | | | | 517,828 | |
| | |
MPLX LP, | | | | | | | | |
Sr. Unsecured, (3 Month USD LIBOR +
1.10%), 2.10%, 9/09/22D | | | 250,000 | | | | 222,127 | |
| | |
TOTAL PIPELINES | | | | | | $ | 739,955 | |
|
REAL ESTATE INVESTMENT TRUSTS – 2.2% | |
| | |
American Tower Corp., | | | | | | | | |
Sr. Unsecured, 5.00%, 2/15/24 | | | 500,000 | | | | 560,009 | |
| | |
Welltower, Inc., | | | | | | | | |
Sr. Unsecured, 4.50%, 1/15/24 | | | 500,000 | | | | 518,597 | |
| | |
TOTAL REAL ESTATE INVESTMENT TRUSTS | | | | | | $ | 1,078,606 | |
| | |
RETAIL – 0.6% | | | | | | | | |
| | |
Target Corp., | | | | | | | | |
Sr. Unsecured, 2.25%, 4/15/25 | | | 300,000 | | | | 315,762 | |
| | |
SEMICONDUCTORS – 0.6% | | | | | | | | |
| | |
QUALCOMM, Inc., | | | | | | | | |
Sr. Unsecured, 2.90%, 5/20/24 | | | 275,000 | | | | 293,986 | |
| | |
TELECOMMUNICATIONS – 1.8% | | | | | | | | |
| | |
AT&T, Inc., | | | | | | | | |
Sr. Unsecured, (3 Month USD LIBOR + | | | | | | | | |
0.93%), 2.30%, 6/30/20D | | | 900,000 | | | | 900,562 | |
| | | | | | | | |
| | |
| Description | | Par Value | | | Value | |
| | |
TRANSPORTATION – 2.9% | | | | | | | | |
| | |
Union Pacific Corp., | | | | | | | | |
Sr. Unsecured, 3.20%, 6/08/21 | | $ | 1,375,000 | | | $ | 1,404,351 | |
| | |
TOTAL CORPORATE BONDS
(COST $22,979,348) | | | | | | $ | 23,156,559 | |
| | |
| | | | | | | | |
| | |
| | | Number of
Shares | | | | |
| | |
INVESTMENT COMPANY – 1.9% | | | | | | | | |
| | |
EXCHANGE-TRADED FUND – 1.9% | | | | | | | | |
| | |
iShares 0-5 Year High Yield Corporate Bond ETF | | | 21,500 | | | $ | 907,730 | |
| | |
TOTAL INVESTMENT COMPANY
(COST $997,677) | | | | | | $ | 907,730 | |
| | |
| | | | | | | | |
| | |
| | | Par Value | | | | |
|
MORTGAGE-BACKED SECURITIES – 3.9% | |
|
FEDERAL HOME LOAN MORTGAGE CORPORATION (FHLMC) – 1.8% | |
| | |
Pool G12709, 5.00%, 7/01/22 | | $ | 18,121 | | | $ | 18,893 | |
| | |
Pool C80328, 7.50%, 7/01/25 | | | 9,574 | | | | 10,701 | |
| | |
Pool G14695, 4.50%, 6/01/26 | | | 84,038 | | | | 88,547 | |
| | |
Pool G01425, 7.50%, 5/01/32 | | | 34,403 | | | | 39,888 | |
| | |
Pool C78010, 5.50%, 4/01/33 | | | 386,194 | | | | 437,779 | |
| | |
Pool A18401, 6.00%, 2/01/34 | | | 180,162 | | | | 210,064 | |
| | |
Pool G01831, 6.00%, 5/01/35 | | | 55,337 | | | | 64,406 | |
| |
TOTAL FEDERAL HOME LOAN MORTGAGE CORPORATION (FHLMC) | | | $ | 870,278 | |
|
FEDERAL NATIONAL MORTGAGE ASSOCIATION (FNMA) – 1.6% | |
| | |
Pool MA0909, 3.00%, 11/01/21 | | | 61,688 | | | | 62,828 | |
| | |
Pool 334593, 7.00%, 5/01/24 | | | 20,558 | | | | 24,094 | |
| | |
Pool AE2520, 3.00%, 1/01/26 | | | 88,124 | | | | 93,079 | |
| | |
Pool 436746, 6.50%, 8/01/28 | | | 18,333 | | | | 21,388 | |
| | |
Pool 440401, 6.50%, 8/01/28 | | | 53,176 | | | | 60,161 | |
| | |
Pool 323419, 6.00%, 12/01/28 | | | 21,108 | | | | 24,728 | |
| | |
Pool 485678, 6.50%, 3/01/29 | | | 11,542 | | | | 13,264 | |
| | |
Pool 252439, 6.50%, 5/01/29 | | | 9,549 | | | | 11,100 | |
| | |
Pool 545051, 6.00%, 9/01/29 | | | 22,602 | | | | 26,191 | |
| | |
Pool 725418, 6.50%, 5/01/34 | | | 59,111 | | | | 70,321 | |
| | |
Pool 833143, 5.50%, 9/01/35 | | | 278,815 | | | | 315,000 | |
| | |
Pool 843323, 5.50%, 10/01/35 | | | 14,536 | | | | 16,532 | |
| | |
Pool 255933, 5.50%, 11/01/35 | | | 48,593 | | | | 55,682 | |
| |
TOTAL FEDERAL NATIONAL MORTGAGE ASSOCIATION (FNMA) | | | $ | 794,368 | |
|
GOVERNMENT NATIONAL MORTGAGE ASSOCIATION (GNMA) – 0.5% | |
| | |
Pool 306066, 8.50%, 7/15/21 | | | 487 | | | | 507 | |
| | |
Pool 1061, 9.00%, 4/20/23 | | | 4,503 | | | | 4,795 | |
| | |
Pool 346572, 7.00%, 5/15/23 | | | 2,000 | | | | 2,187 | |
April 30, 2020 / ANNUAL REPORT
| | |
PORTFOLIOS OF INVESTMENT Wilmington Short-Term Bond Fund (continued) | | 38 |
| | | | | | | | |
| | |
| Description | | Par Value | | | Value | |
| | |
Pool 484269, 7.00%, 9/15/28 | | $ | 17,646 | | | $ | 19,328 | |
| | |
Pool 592505, 6.00%, 4/15/33 | | | 119,757 | | | | 140,447 | |
| | |
Pool 581522, 6.00%, 5/15/33 | | | 51,708 | | | | 60,635 | |
| |
TOTAL GOVERNMENT NATIONAL MORTGAGE ASSOCIATION (GNMA) | | | $ | 227,899 | |
| |
TOTAL MORTGAGE-BACKED SECURITIES (COST $1,721,841) | | | $ | 1,892,545 | |
| | |
U.S. TREASURY – 34.7% | | | | | | | | |
| | |
U.S. TREASURY NOTES – 34.7% | | | | | | | | |
| | |
1.13%, 8/31/21 | | | 495,000 | | | | 501,143 | |
| | |
1.13%, 2/28/25 | | | 3,540,000 | | | | 3,672,509 | |
| | |
1.38%, 1/31/25 | | | 200,000 | | | | 209,611 | |
| | |
1.63%, 6/30/21 | | | 440,000 | | | | 447,382 | |
| | |
1.75%, 6/30/22 | | | 1,150,000 | | | | 1,188,284 | |
| | |
1.75%, 7/15/22 | | | 3,000,000 | | | | 3,101,287 | |
| | |
1.75%, 12/31/24 | | | 1,500,000 | | | | 1,596,922 | |
| | |
1.88%, 7/31/22 | | | 1,000,000 | | | | 1,037,360 | |
| | |
2.50%, 1/15/22 | | | 1,000,000 | | | | 1,038,994 | |
| | |
2.75%, 9/15/21 | | | 4,000,000 | | | | 4,140,906 | |
| | |
TOTAL U.S. TREASURY NOTES | | | | | | $ | 16,934,398 | |
| |
TOTAL U.S. TREASURY (COST $16,377,054) | | | $ | 16,934,398 | |
| | |
| | | | | | | | |
| | |
| | | Number of
Shares | | | | |
| | |
MONEY MARKET FUND – 4.9% | | | | | | | | |
| | |
Dreyfus Government Cash Management Fund, Institutional Shares, 0.17%^ | | | 2,393,035 | | | $ | 2,393,035 | |
| |
TOTAL MONEY MARKET FUND (COST $2,393,035) | | | $ | 2,393,035 | |
| |
TOTAL INVESTMENTS IN SECURITIES – 99.7% (COST $47,863,903) | | | $ | 48,676,036 | |
| | |
| | | | | | | | |
| | |
| | | Par Value | | | | |
|
CASH COLLATERAL INVESTED FOR SECURITIES ON LOAN – 0.4% | |
| | |
REPURCHASE AGREEMENTS – 0.4% | | | | | | | | |
| | |
Bank of America Securities, Inc., 0.04%, dated 4/30/20, due 5/01/20, repurchase price $8,676 collateralized by U.S. Government Agency Securities, 2.00% to 5.00%, maturing 8/01/23 to 4/01/59; total market value of $8,850. | | $ | 8,676 | | | $ | 8,676 | |
| | | | | | | | |
| | |
| Description | | Par Value | | | Value | |
| | |
Citigroup Global Markets Ltd., 0.04%, dated 4/30/20, due 5/01/20, repurchase price $32,964 collateralized by U.S. Government Agency & Treasury Securities, 0.50% to 6.50%, maturing 5/31/20 to 2/01/57; total market value of $33,623. | | $ | 32,964 | | | $ | 32,964 | |
| | |
Daiwa Capital Markets America, 0.05%, dated 4/30/20, due 5/01/20, repurchase price $32,964 collateralized by U.S. Government Agency & Treasury Securities, 0.00% to 6.50%, maturing 5/07/20 to 3/01/52; total market value of $33,623. | | | 32,964 | | | | 32,964 | |
| | |
Deutsche Bank Securities, Inc., 0.03%, dated 4/30/20, due 5/01/20, repurchase price $32,964 collateralized by U.S. Government Agency & Treasury Securities, 0.43% to 8.75%, maturing 8/15/20 to 4/01/50; total market value of $33,623. | | | 32,964 | | | | 32,964 | |
| | |
HSBC Securities USA, Inc., 0.03%, dated 4/30/20, due 5/01/20, repurchase price $32,964 collateralized by U.S. Government Agency Securities, 2.45% to 5.00%, maturing 2/20/49 to 4/15/55; total market value of $33,623. | | | 32,964 | | | | 32,964 | |
| | |
RBC Dominion Securities, Inc., 0.04%, dated 4/30/20, due 5/01/20, repurchase price $32,964 collateralized by U.S. Government Agency & Treasury Securities, 0.00% to 6.00%, maturing 7/15/24 to 5/01/50; total market value of $33,623. | | | 32,964 | | | | 32,964 | |
| | | | | | | | |
| | |
TOTAL REPURCHASE AGREEMENTS
(COST $173,496) | | | | | | $ | 173,496 | |
| | | | | | | | |
| |
TOTAL CASH COLLATERAL INVESTED FOR SECURITIES ON LOAN (COST $173,496) | | | $ | 173,496 | |
| | | | | | | | |
| | |
TOTAL INVESTMENTS – 100.1%
(COST $48,037,399) | | | | | | $ | 48,849,532 | |
| |
COLLATERAL FOR SECURITIES ON LOAN – (0.4%) | | | | (173,496 | ) |
| | |
OTHER ASSETS LESS LIABILITIES – 0.3% | | | | | | | 131,368 | |
| | | | | | | | |
| | |
TOTAL NET ASSETS – 100.0% | | | | | | $ | 48,807,404 | |
| | | | | | | | |
Cost of investments for Federal income tax purposes is $48,040,815. The net unrealized appreciation/(depreciation) of investments was $808,717. This consists of net unrealized appreciation from investment for those securities having an excess of value over cost of $1,023,113 and net unrealized depreciation from investments for those securities having an excess of cost over value of $(214,396).
ANNUAL REPORT / April 30, 2020
| | |
| 39 | | PORTFOLIOS OF INVESTMENT Wilmington Short-Term Bond Fund (concluded) |
Various inputs are used in determining the value of the Fund’s investments. These inputs are summarized in the three broad levels listed below.
Level 1 – quoted prices in active markets for identical securities
Level 2 – other significant observable inputs (including quoted prices for similar securities, interest rates, prepayment speeds, credit risk, etc.)
Level 3 – significant unobservable inputs (including the Fund’s own assumptions in determining the fair value of investments)
The following is a summary of the inputs used as of April 30, 2020 in valuing the Fund’s assets carried at fair value:
| | | | | | | | | | | | | | | | |
| | | | |
| | | Level 1 | | | Level 2 | | | Level 3 | | | Total | |
| | | | |
Investments in Securities | | | | | | | | | | | | | | | | |
| | | | |
Adjustable Rate Mortgage | | $ | — | | | $ | 36 | | | $ | — | | | $ | 36 | |
| | | | |
Collateralized Mortgage Obligations | | | — | | | | 893,654 | | | | — | | | | 893,654 | |
| | | | |
Commercial Paper | | | — | | | | 2,498,079 | | | | — | | | | 2,498,079 | |
| | | | |
Corporate Bonds | | | — | | | | 23,156,559 | | | | — | | | | 23,156,559 | |
| | | | |
Investment Company | | | 907,730 | | | | — | | | | — | | | | 907,730 | |
| | | | |
Mortgage-Backed Securities | | | — | | | | 1,892,545 | | | | — | | | | 1,892,545 | |
| | | | |
U.S. Treasury | | | — | | | | 16,934,398 | | | | — | | | | 16,934,398 | |
| | | | |
Money Market Fund | | | 2,393,035 | | | | — | | | | — | | | | 2,393,035 | |
| | | | |
Repurchase Agreements | | | — | | | | 173,496 | | | | — | | | | 173,496 | |
| | | | |
| | | | | | | | | | | | | | | | |
| | | | |
Total | | $ | 3,300,765 | | | $ | 45,548,767 | | | $ | — | | | $ | 48,849,532 | |
| | | | | | | | | | | | | | | | |
| # | Security, or a portion thereof, is on loan. See Note 2 in Notes to Financial Statements. |
| D | Variable rate security. The rate disclosed is the rate in effect on the report date. The information in parenthesis represents the benchmark and reference rate for each relevant security and the rate floats based upon the reference rate and spread. The security may be further subject to interest rate floor and caps. Certain variable rate securities are not based on a published reference rate and spread, but are determined by the issuer or agent and are based on current market conditions, or, for mortgage-backed securities, are impacted by the individual mortgages which are paying off over time. These securities do not indicate a reference rate and spread in their descriptions. |
| W | Denotes a restricted security that may be resold without restriction to “qualified institutional buyers” as defined in Rule 144A under the Securities Act of 1933 and that the Fund has determined to be liquid under criteria established by the Fund’s Board of Trustees. At April 30, 2020, these liquid restricted securities amounted to $3,345,942 representing 6.86% of total net assets. |
| ◆ | The rate shown reflects the effective yield at purchase date. |
| ** | Represents less than 0.05%. |
| | | | |
| | | The following acronyms are used throughout this Fund: |
| | | BKNT | | Bank Note |
| | |
| | CMT | | Constant Maturity Treasury |
| | |
| | ETF | | Exchange-Traded Fund |
| | |
| | GMTN | | Global Medium Term Note |
| | |
| | LIBOR | | London Interbank Offered Rate |
| | | | |
| | LLC | | Limited Liability Corporation |
| | |
| | LP | | Limited Partnership |
| | |
| | MTN | | Medium Term Note |
| | |
| | NA | | National Association |
| | |
| | USD | | United States Dollar |
| | |
| | UST | | U.S. Treasury |
See Notes which are an integral part of the Financial Statements
April 30, 2020 / ANNUAL REPORT
PORTFOLIO OF INVESTMENTS SUMMARY TABLE
Wilmington Municipal Bond Fund
At April 30, 2020, the Fund’s portfolio composition was as follows (unaudited):
| | | | | |
| | | Percentage of
Total Net Assets |
| |
General Obligations | | | | 23.2 | % |
| |
Housing | | | | 18.0 | % |
| |
Higher Education | | | | 8.9 | % |
| |
Development | | | | 6.9 | % |
| |
Dedicated Tax | | | | 6.4 | % |
| |
Airport | | | | 6.3 | % |
| |
Water | | | | 6.3 | % |
| |
Medical | | | | 4.6 | % |
| |
Lease | | | | 3.1 | % |
| |
Hospital | | | | 2.6 | % |
| |
Transportation | | | | 2.6 | % |
| |
School District | | | | 2.2 | % |
| |
Utilities | | | | 1.8 | % |
| |
Student Loan | | | | 1.7 | % |
| |
Education | | | | 1.6 | % |
| |
Power | | | | 0.3 | % |
| |
Facilities | | | | 0.3 | % |
| |
Cash Equivalents1 | | | | 4.2 | % |
| |
Other Assets and Liabilities – Net2 | | | | (1.0 | )% |
| |
| | | | | |
| |
TOTAL | | | | 100.0 | % |
| | | | | |
| (1) | Cash Equivalents include investments in a money market fund. |
| (2) | Assets, other than investments in securities, less liabilities. See Statements of Assets and Liabilities. |
| (3) | For financial reporting purposes, the Credit Quality Diversification table reflects the lowest rating assigned by either Moody’s Investors Service or Standard and Poor’s if the ratings differ. These rating agencies are independent, nationally recognized statistical rating organizations and are widely used. Investment grade ratings are credit ratings of BBB/Baa or higher. Below investment grade ratings are credit ratings of BB/Ba or lower. Investments designated as “Not Rated” are not rated by either rating agency and do not necessarily indicate low credit quality. Credit quality ratings are subject to change. |
| | | | | |
| Credit Quality Diversification3 | | Percentage of
Total Net Assets |
| |
AAA / Aaa | | | | 18.3 | % |
| |
AA / Aa | | | | 37.4 | % |
| |
A / A | | | | 23.0 | % |
| |
BBB / Baa | | | | 14.6 | % |
| |
Not Rated | | | | 7.7 | % |
| |
Other Assets and Liabilities – Net2 | | | | (1.0 | )% |
| |
| | | | | |
| |
TOTAL | | | | 100.0 | % |
| | | | | |
PORTFOLIO OF INVESTMENTS
April 30, 2020
| | | | | | | | |
| | |
| Description | | Par Value | | | Value | |
| | |
MUNICIPAL BONDS – 96.8% | | | | | | | | |
| | |
ALABAMA – 1.0% | | | | | | | | |
|
GENERAL OBLIGATIONS – 0.1% | |
| | |
State of Alabama, AL, GO Unlimited, Refunding Bonds, (Series A), 5.00%, 8/01/22 | | $ | 250,000 | | | $ | 272,055 | |
| | | | | | | | |
| | |
| Description | | Par Value | | | Value | |
|
HIGHER EDUCATION – 0.3% | |
| | |
University of South Alabama, AL, Advance Refunding Revenue Bonds, (AGM), 5.00%, 11/01/31 | | $ | 1,000,000 | | | $ | 1,165,730 | |
| | |
WATER – 0.6% | | | | | | | | |
| | |
Huntsville Water Revenue Warrants, AL, Revenue Bonds, 5.00%, 11/01/34 | | | 1,840,000 | | | | 2,119,459 | |
| | | | | | | | |
| | |
TOTAL ALABAMA | | | | | | $ | 3,557,244 | |
ANNUAL REPORT / April 30, 2020
| | |
| 41 | | PORTFOLIOS OF INVESTMENTS Wilmington Municipal Bond Fund (continued) |
| | | | | | | | |
| | |
| Description | | Par Value | | | Value | |
| | |
ALASKA – 0.6% | | | | | | | | |
| | |
HIGHER EDUCATION – 0.6% | | | | | | | | |
| | |
University of Alaska, AK, Revenue Bonds,
(Series T), 5.00%, 10/01/29 | | $ | 1,810,000 | | | $ | 1,951,379 | |
| | | | | | | | |
| | |
TOTAL ALASKA | | | | | | $ | 1,951,379 | |
| | |
ARIZONA – 3.7% | | | | | | | | |
| | |
DEVELOPMENT – 1.7% | | | | | | | | |
| | |
Chandler Industrial Development Authority, AZ, Revenue Bonds, (Intel Corporation Project), 5.00%, 6/01/49D | | | 5,000,000 | | | | 5,570,100 | |
| | |
Industrial Development Authority of the City of Phoenix (The), AZ, Stadium Revenue Bonds, (Bank One Ballpark Project), (AMBAC), 6.85%, 12/01/25 | | | 155,000 | | | | 179,030 | |
| | | | | | | | |
| | |
TOTAL DEVELOPMENT | | | | | | $ | 5,749,130 | |
| | |
EDUCATION – 1.4% | | | | | | | | |
| | |
Arizona Industrial Development Authority, AZ, Revenue Bonds, (Equitable School Revolving Fund) | | | | | | | | |
| | |
5.00%, 11/01/26 | | | 1,000,000 | | | | 1,201,800 | |
| | |
5.00%, 11/01/30 | | | 1,000,000 | | | | 1,220,000 | |
| | |
5.00%, 11/01/32 | | | 865,000 | | | | 1,037,732 | |
| | |
La Paz County Industrial Development Authority, AZ, Revenue Bonds, (Charter School Solutions - Harmony Public Schools Project), (Series A), 5.00%, 2/15/28 | | | 1,300,000 | | | | 1,410,760 | |
| | | | | | | | |
| | |
TOTAL EDUCATION | | | | | | $ | 4,870,292 | |
| | |
HOUSING – 0.6% | | | | | | | | |
| | |
Industrial Development Authority of the County of Pima (The), AZ, Revenue Bonds, 8.20%, 9/01/21 | | | 1,740,000 | | | | 1,845,079 | |
| | | | | | | | |
| | |
TOTAL ARIZONA | | | | | | $ | 12,464,501 | |
| | |
ARKANSAS – 1.3% | | | | | | | | |
| | |
DEDICATED TAX – 0.8% | | | | | | | | |
| | |
Fayetteville City, AR, Revenue Bonds, (Sales and Use Tax), (Series A), 2.00%, 11/01/29 | | | 2,565,000 | | | | 2,611,478 | |
| | |
SCHOOL DISTRICT – 0.5% | | | | | | | | |
| | |
Siloam Springs School District No. 21 of Benton County, AR, GO Limited, Current Refunding Bonds, AD Valorem Property Tax, 2.00%, 6/01/24 | | | 1,720,000 | | | | 1,765,511 | |
| | | | | | | | |
| | |
TOTAL ARKANSAS | | | | | | $ | 4,376,989 | |
| | |
CALIFORNIA – 2.1% | | | | | | | | |
| | |
GENERAL OBLIGATIONS – 1.2% | | | | | | | | |
| | |
California State Public Works Board, CA, Current Refunding Revenue Bonds, (Series F), 5.00%, 5/01/20 | | | 1,165,000 | | | | 1,165,085 | |
| | |
State of California, CA, GO Unlimited Current Refunding, 5.00%, 4/01/32 | | | 2,250,000 | | | | 2,963,273 | |
| | | | | | | | |
| | |
TOTAL GENERAL OBLIGATIONS | | | | | | $ | 4,128,358 | |
| | | | | | | | |
| | |
| Description | | Par Value | | | Value | |
| | |
HIGHER EDUCATION – 0.0%** | | | | | | | | |
| | |
California Educational Facilities Authority, CA, Revenue Bonds, (Pooled College and University Projects), (1999 Series B), 5.25%, 4/01/24 | | $ | 10,000 | | | $ | 10,875 | |
| | |
HOUSING – 0.0%** | | | | | | | | |
| | |
California Statewide Communities Development Authority, CA, Multi Family Revenue Bonds, (Series N), (Affordable - Village II Apartments), 4.38%, 1/01/23 | | | 45,000 | | | | 46,303 | |
| | |
POWER – 0.3% | | | | | | | | |
| | |
M-S-R Public Power Agency, CA, Revenue Bonds, (Series E), (NATL), 6.00%, 7/01/22 | | | 175,000 | | | | 185,297 | |
| | |
Redding City Electric System Revenue, CA, Revenue Bonds, (NATL), 6.37%, 7/01/22 | | | 800,000 | | | | 841,496 | |
| | | | | | | | |
| | |
TOTAL POWER | | | | | | $ | 1,026,793 | |
| | |
SCHOOL DISTRICT – 0.4% | | | | | | | | |
| | |
Los Angeles Unified School District, CA, GO Unlimited, AD Valorem Property Tax, (Series RYQ), 5.00%, 7/01/25 | | | 1,000,000 | | | | 1,180,420 | |
| | |
WATER – 0.2% | | | | | | | | |
| | |
Metropolitan Water District of Southern California, CA, Unrefunded Revenue Bonds, (Series A), (FGIC-TCRS), 5.75%, 7/01/21 | | | 820,000 | | | | 833,407 | |
| | | | | | | | |
| | |
TOTAL CALIFORNIA | | | | | | $ | 7,226,156 | |
| | |
COLORADO – 2.2% | | | | | | | | |
| | |
AIRPORT – 0.9% | | | | | | | | |
| | |
City & County of Denver, CO, Airport System Revenue Bonds, (Sub-Series A), 5.00%, 12/01/31 | | | 2,500,000 | | | | 2,958,250 | |
| | |
HOUSING – 0.6% | | | | | | | | |
| | |
Colorado Housing & Finance Authority, CO, Single Family Revenue Bonds, (Series B), 3.75%, 5/01/50 | | | 2,000,000 | | | | 2,123,680 | |
| | |
MEDICAL – 0.7% | | | | | | | | |
| | |
Colorado Health Facilities Authority, CO, Revenue Bonds, (CommonSpirit Health), (Series B-2), 5.00%, 8/01/49D | | | 2,000,000 | | | | 2,263,460 | |
| | | | | | | | |
| | |
TOTAL COLORADO | | | | | | $ | 7,345,390 | |
| | |
CONNECTICUT – 3.3% | | | | | | | | |
|
GENERAL OBLIGATIONS – 0.5% | |
| | |
State of Connecticut, CT, GO Unlimited, (Series E), 5.00%, 10/15/23 | | | 1,035,000 | | | | 1,142,557 | |
| | |
State of Connecticut, CT, GO Unlimited, Refunding Notes, (Series E), 5.00%, 9/15/27 | | | 500,000 | | | | 591,025 | |
| | | | | | | | |
| | |
TOTAL GENERAL OBLIGATIONS | | | | | | $ | 1,733,582 | |
April 30, 2020 / ANNUAL REPORT
| | |
PORTFOLIOS OF INVESTMENTS Wilmington Municipal Bond Fund (continued) | | 42 |
| | | | | | | | |
| | |
| Description | | Par Value | | | Value | |
| | |
HIGHER EDUCATION – 1.3% | | | | | | | | |
| | |
Connecticut State Health & Educational Facilities Authority, CT, Advance Refunding Revenue Bonds, (Series R), Fairfield University, 5.00%, 7/01/31 | | $ | 1,385,000 | | | $ | 1,551,048 | |
| | |
University of Connecticut, CT, Revenue Bonds, (Series A) | | | | | | | | |
| | |
5.00%, 3/15/31 | | | 1,480,000 | | | | 1,736,055 | |
| | |
5.00%, 1/15/33 | | | 1,000,000 | | | | 1,139,620 | |
| | | | | | | | |
| | |
TOTAL HIGHER EDUCATION | | | | | | $ | 4,426,723 | |
| | |
HOUSING – 1.5% | | | | | | | | |
| | |
Connecticut Housing Finance Authority, CT, Current Refunding Revenue Bonds, (Home Mortgage Finance Program), (Sub-Series D-1), 4.00%, 11/15/49 | | | 3,000,000 | | | | 3,249,390 | |
| | |
Connecticut Housing Finance Authority, CT, Revenue Bonds, (Sub-Series A-2), 4.00%, 11/15/41 | | | 1,730,000 | | | | 1,828,264 | |
| | | | | | | | |
| | |
TOTAL HOUSING | | | | | | $ | 5,077,654 | |
| | | | | | | | |
| | |
TOTAL CONNECTICUT | | | | | | $ | 11,237,959 | |
| | |
DELAWARE – 0.7% | | | | | | | | |
| | |
GENERAL OBLIGATIONS – 0.7% | | | | | | | | |
| | |
State of Delaware, DE, GO Unlimited, (Series A), 5.00%, 1/01/29 | | | 1,810,000 | | | | 2,348,511 | |
| | | | | | | | |
| | |
TOTAL DELAWARE | | | | | | $ | 2,348,511 | |
| | |
DISTRICT OF COLUMBIA – 0.7% | | | | | | | | |
| | |
GENERAL OBLIGATIONS – 0.7% | | | | | | | | |
| | |
District of Columbia, DC, GO Unlimited, Current Refunding, AD Valorem Property Tax, (Series A), 5.00%, 6/01/31 | | | 2,080,000 | | | | 2,540,512 | |
| | | | | | | | |
| | |
TOTAL DISTRICT OF COLUMBIA | | | | | | $ | 2,540,512 | |
| | |
FLORIDA – 5.7% | | | | | | | | |
| | |
AIRPORT – 1.0% | | | | | | | | |
| | |
Broward County, FL, Airport System Revenue Bonds, 5.00%, 10/01/27 | | | 1,500,000 | | | | 1,767,630 | |
| | |
Miami-Dade County, FL, Seaport Department, Revenue Bonds, (Series B), 6.00%, 10/01/24 | | | 1,500,000 | | | | 1,727,205 | |
| | | | | | | | |
| | |
TOTAL AIRPORT | | | | | | $ | 3,494,835 | |
| | |
GENERAL OBLIGATIONS – 0.5% | | | | | | | | |
| | |
Broward County, FL, GO Unlimited, Refunding Bonds, (Parks and Land Preservation Project), AD Valorem Property Tax, 5.00%, 1/01/24 | | | 1,500,000 | | | | 1,597,605 | |
| | |
Miami-Dade County, FL, Revenue Bonds, (Sports Franchise Facilities), (NATL), 5.25%, 10/01/30 | | | 65,000 | | | | 83,141 | |
| | | | | | | | |
| | |
TOTAL GENERAL OBLIGATIONS | | | | | | $ | 1,680,746 | |
| | | | | | | | |
| | |
| Description | | Par Value | | | Value | |
| | |
HIGHER EDUCATION – 1.5% | | | | | | | | |
| | |
Davie Florida Education Facilities, FL, Revenue Bonds, (Nova Southeastern University Project) | | | | | | | | |
| | |
5.00%, 4/01/28 | | $ | 750,000 | | | $ | 849,923 | |
| | |
5.00%, 4/01/30 | | | 750,000 | | | | 840,052 | |
| | |
5.00%, 4/01/31 | | | 750,000 | | | | 835,665 | |
| | |
5.00%, 4/01/33 | | | 750,000 | | | | 819,832 | |
| | |
Florida Higher Educational Facilities Financial Authority, FL, Revenue Bonds, (Educational Facilities Ringling College Project), 5.00%, 3/01/28 | | | 1,600,000 | | | | 1,681,920 | |
| | | | | | | | |
| | |
TOTAL HIGHER EDUCATION | | | | | | $ | 5,027,392 | |
| | |
HOUSING – 1.7% | | | | | | | | |
| | |
Capital Trust Agency, Inc., FL, Multi Family Revenue Bonds, (Mission Springs Apartments Project), 5.38%, 12/01/52 | | | 415,000 | | | | 470,261 | |
| | |
Capital Trust Agency, Inc., FL, Multi Family Revenue Bonds, (Mission Springs Apartments Project), (Series A), 3.25%, 12/01/27 | | | 500,000 | | | | 541,225 | |
| | |
Florida Gulf Coast University Financing Corp., FL, Current Refunding Revenue Bonds, (Housing Project) | | | | | | | | |
| | |
5.00%, 2/01/25 | | | 500,000 | | | | 557,205 | |
| | |
5.00%, 2/01/26 | | | 500,000 | | | | 565,805 | |
| | |
Pinellas County Housing Finance Authority, FL, Single Family Revenue Bonds, (Series A), 4.00%, 3/01/50 | | | 3,400,000 | | | | 3,638,884 | |
| | | | | | | | |
| | |
TOTAL HOUSING | | | | | | $ | 5,773,380 | |
| | |
WATER – 1.0% | | | | | | | | |
| | |
Miami-Dade County, FL, Water & Sewer System Revenue, Advance Refunding Revenue Bonds, (Series B), 5.00%, 10/01/30 | | | 2,645,000 | | | | 3,086,503 | |
| | |
Village of Royal Palm Beach Utility System Revenue, FL, Revenue Bonds, Public Improvements, (NATL), 4.50%, 10/01/22 | | | 185,000 | | | | 192,439 | |
| | | | | | | | |
| | |
TOTAL WATER | | | | | | $ | 3,278,942 | |
| | | | | | | | |
| | |
TOTAL FLORIDA | | | | | | $ | 19,255,295 | |
| | |
GEORGIA – 0.6% | | | | | | | | |
| | |
GENERAL OBLIGATIONS – 0.1% | | | | | | | | |
| | |
Cobb-Marietta Coliseum & Exhibit Hall Authority, GA, Refunding Revenue Bonds, (NATL), 5.63%, 10/01/26 | | | 220,000 | | | | 230,067 | |
| | |
HIGHER EDUCATION – 0.5% | | | | | | | | |
| | |
Development Authority of Bulloch County, GA, Advance Refunding Revenue Bonds, (Georgia Southern University Housing Foundation Four, LLC Project), 5.00%, 7/01/31 | | | 1,575,000 | | | | 1,830,701 | |
| | | | | | | | |
| | |
TOTAL GEORGIA | | | | | | $ | 2,060,768 | |
ANNUAL REPORT / April 30, 2020
| | |
| 43 | | PORTFOLIOS OF INVESTMENTS Wilmington Municipal Bond Fund (continued) |
| | | | | | | | |
| | |
| Description | | Par Value | | | Value | |
| | |
HAWAII – 0.4% | | | | | | | | |
| | |
GENERAL OBLIGATIONS – 0.4% | | | | | | | | |
| | |
State of Hawaii, HI, GO Unlimited, (Series FT), 5.00%, 1/01/26 | | $ | 1,075,000 | | | $ | 1,287,560 | |
| | | | | | | | |
| | |
TOTAL HAWAII | | | | | | $ | 1,287,560 | |
| | |
ILLINOIS – 16.5% | | | | | | | | |
| | |
AIRPORT – 0.7% | | | | | | | | |
| | |
Chicago Midway International Airport, IL, Current Refunding Revenue Bonds, (Second Lien), (Series A), 5.00%, 1/01/29 | | | 2,250,000 | | | | 2,401,875 | |
| | |
DEDICATED TAX – 1.2% | | | | | | | | |
| | |
Regional Transportation Authority, IL, Revenue Bonds, (Series B), 5.00%, 6/01/33 | | | 1,450,000 | | | | 1,750,657 | |
| | |
Sales Tax Securitization Corp., IL, Current Refunding Revenue Bonds, (Second Lien), (Series A), 5.00%, 1/01/26 | | | 2,000,000 | | | | 2,217,940 | |
| | | | | | | | |
| | |
TOTAL DEDICATED TAX | | | | | | $ | 3,968,597 | |
| | |
GENERAL OBLIGATIONS – 12.0% | | | | | | | | |
| | |
Chester City, IL, GO Unlimited Current Refunding, AD Valorem Property Tax, (BAM), 2.10%, 5/01/21 | | | 195,000 | | | | 195,530 | |
| | |
Chicago Park District, IL, GO Unlimited Current Refunding, AD Valorem Property Tax, (Series D) | | | | | | | | |
| | |
5.00%, 1/01/26 | | | 1,250,000 | | | | 1,332,050 | |
| | |
5.00%, 1/01/27 | | | 3,455,000 | | | | 3,682,546 | |
| | |
Chicago, IL, GO Limited, (Lakefront Millennium Parking Facilities), (NATL), 5.75%, 1/01/23 | | | 50,000 | | | | 54,303 | |
| | |
Chicago, IL, GO Unlimited Current Refunding, AD Valorem Property Tax, (Series A), 5.00%, 1/01/25 | | | 3,000,000 | | | | 3,074,700 | |
| | |
Cook County, IL, GO Unlimited, Current Refunding, AD Valorem Property Tax, (Series A), (AGM), 5.00%, 11/15/26 | | | 2,050,000 | | | | 2,455,941 | |
| | |
Metropolitan Pier & Exposition Authority, IL, Revenue Bonds, Public Improvements, (McCormick Place Convention), 7.00%, 7/01/26 | | | 11,750,000 | | | | 13,894,257 | |
| | |
Metropolitan Water Reclamation District of Greater Chicago, IL, GO Limited, (Water Utility & Sewer Improvements), AD Valorem Property Tax, (Series C-Green Bond), 5.00%, 12/01/28 | | | 7,040,000 | | | | 7,919,366 | |
| | |
State of Illinois, IL, GO Unlimited, Public Improvements, (Series B), 5.00%, 12/01/25 | | | 7,935,000 | | | | 7,801,692 | |
| | |
Village of Matteson, IL, Revenue Bonds, Public Improvements, (Capital Appreciation Debt Certificates), 8.00%, 12/01/29 | | | 255,000 | | | | 284,611 | |
| | | | | | | | |
| | |
TOTAL GENERAL OBLIGATIONS | | | | | | $ | 40,694,996 | |
| | |
HOUSING – 2.5% | | | | | | | | |
| | |
Illinois Housing Development Authority, IL, Multi Family Revenue Bonds, 7.00%, 7/01/23 | | | 245,000 | | | | 257,382 | |
| | | | | | | | |
| | |
| Description | | Par Value | | | Value | |
| | |
Illinois Housing Development Authority, IL, Multi Family Revenue Bonds, (Marshall Field Garden Apartment Homes), 1.22%, 5/15/50D | | $ | 925,000 | | | $ | 926,665 | |
| | |
Illinois Housing Development Authority, IL, Single Family Revenue Bonds, (Series A), 3.75%, 4/01/50 | | | 2,850,000 | | | | 3,041,691 | |
| | |
Illinois Housing Development Authority, IL, Single Family Revenue Bonds, (Series D), 3.75%, 4/01/50 | | | 3,975,000 | | | | 4,232,659 | |
| | | | | | | | |
| | |
TOTAL HOUSING | | | | | | $ | 8,458,397 | |
| | |
MEDICAL – 0.1% | | | | | | | | |
| | |
Illinois Health Facilities Authority, IL, Refunding Revenue Bonds, (Franciscan Sisters Health Care), (NATL), 6.25%, 9/01/21 | | | 35,000 | | | | 36,421 | |
| | |
Illinois Health Facilities Authority, IL, Refunding Revenue Bonds, (Series A), (Evangelical Hospital), 6.25%, 4/15/22 | | | 300,000 | | | | 320,826 | |
| | |
Illinois Health Facilities Authority, IL, Revenue Bonds, (Series B), (Ancilla Systems Inc.), (NATL), 5.25%, 7/01/22 | | | 120,000 | | | | 125,480 | |
| | | | | | | | |
| | |
TOTAL MEDICAL | | | | | | $ | 482,727 | |
| | |
WATER – 0.0%** | | | | | | | | |
| | |
Chicago City, Waterworks Revenue, IL, Refunding Revenue Bonds, (Second Lien), (BHAC-CR AMBAC), 5.75%, 11/01/30 | | | 50,000 | | | | 62,827 | |
| | | | | | | | |
| | |
TOTAL ILLINOIS | | | | | | $ | 56,069,419 | |
| | |
INDIANA – 2.8% | | | | | | | | |
| | |
DEVELOPMENT – 2.1% | | | | | | | | |
| | |
Whiting City, IN, Current Refunding Revenue Bonds, (BP Products North America Inc. Project), 5.00%, 12/01/44D | | | 6,500,000 | | | | 7,239,440 | |
| | |
HOUSING – 0.7% | | | | | | | | |
| | |
Indiana Housing & Community Development Authority, IN, Current Refunding Revenue Bonds, (Series C-2), 4.00%, 1/01/37 | | | 1,505,000 | | | | 1,552,889 | |
| | |
Indiana Housing & Community Development Authority, IN, Revenue Bonds, (Series A), 3.90%, 7/01/43 | | | 805,000 | | | | 843,576 | |
| | | | | | | | |
| | |
TOTAL HOUSING | | | | | | $ | 2,396,465 | |
| | | | | | | | |
| | |
TOTAL INDIANA | | | | | | $ | 9,635,905 | |
| | |
IOWA – 1.1% | | | | | | | | |
| | |
HOUSING – 1.1% | | | | | | | | |
| | |
Iowa Finance Authority, IA, Revenue Bonds, (Series D), 3.50%, 1/01/49 | | | 3,490,000 | | | | 3,697,341 | |
| | | | | | | | |
| | |
TOTAL IOWA | | | | | | $ | 3,697,341 | |
April 30, 2020 / ANNUAL REPORT
| | |
PORTFOLIOS OF INVESTMENTS Wilmington Municipal Bond Fund (continued) | | 44 |
| | | | | | | | |
| | |
| Description | | Par Value | | | Value | |
| | |
KANSAS – 0.2% | | | | | | | | |
| | |
UTILITIES – 0.2% | | | | | | | | |
| | |
Wichita City, Water & Sewer Utility Revenue, KS, Refunding Revenue Bonds, (Series A), 5.00%, 10/01/23 | | $ | 500,000 | | | $ | 528,840 | |
| | | | | | | | |
| | |
TOTAL KANSAS | | | | | | $ | 528,840 | |
| | |
KENTUCKY – 1.1% | | | | | | | | |
| | |
AIRPORT – 0.4% | | | | | | | | |
| | |
Lexington-Fayette Urban County Airport Board Corp., KY, Current Refunding Revenue Bonds, (Series A), 5.00%, 7/01/30 | | | 1,350,000 | | | | 1,452,343 | |
| | |
LEASE – 0.7% | | | | | | | | |
| | |
Kentucky State Property & Building Commission, KY, Revenue Bonds, Public Improvements, (Project No. 119), 5.00%, 5/01/25 | | | 2,000,000 | | | | 2,234,780 | |
| | | | | | | | |
| | |
TOTAL KENTUCKY | | | | | | $ | 3,687,123 | |
| | |
LOUISIANA – 1.6% | | | | | | | | |
| | |
DEVELOPMENT – 1.6% | | | | | | | | |
| | |
Parish of St. John the Baptist, LA, Current Refunding Revenue Bonds, (Marathon Oil Corporation Project), 2.00%, 6/01/37D | | | 6,000,000 | | | | 5,381,340 | |
| | | | | | | | |
| | |
TOTAL LOUISIANA | | | | | | $ | 5,381,340 | |
| | |
MARYLAND – 2.4% | | | | | | | | |
| | |
DEDICATED TAX – 0.2% | | | | | | | | |
| | |
Maryland State Department of Transportation, MD, Highways Improvement Revenue Bonds, 4.00%, 5/01/30 | | | 500,000 | | | | 587,120 | |
| | |
GENERAL OBLIGATIONS – 1.1% | | | | | | | | |
| | |
Anne Arundel County, MD, GO Limited, AD Valorem Property Tax, 5.00%, 10/01/25 | | | 3,000,000 | | | | 3,596,100 | |
| | |
MEDICAL – 0.0%** | | | | | | | | |
| | |
Maryland Health & Higher Educational Facilities Authority, MD, Refunding Revenue Bonds, (Helix Health Issue), (AMBAC), 5.00%, 7/01/27 | | | 100,000 | | | | 116,185 | |
| | |
WATER – 1.1% | | | | | | | | |
| | |
Washington Suburban Sanitary Commission, MD, Revenue Bonds, (Consolidated Public Improvement Bonds), 5.00%, 6/01/33 | | | 3,000,000 | | | | 3,707,070 | |
| | | | | | | | |
| | |
TOTAL MARYLAND | | | | | | $ | 8,006,475 | |
| | |
MASSACHUSETTS – 3.5% | | | | | | | | |
| | |
HIGHER EDUCATION – 1.4% | | | | | | | | |
| | |
Massachusetts Development Finance Agency, MA, Advance Refunding Revenue Bonds, (Series A), (Emerson College), 5.00%, 1/01/32 | | | 2,000,000 | | | | 2,190,120 | |
| | |
Massachusetts Development Finance Agency, MA, Current Refunding Revenue Bonds, (Series L), (Simmons University) 5.00%, 10/01/30 | | | 1,180,000 | | | | 1,319,323 | |
| | | | | | | | |
| | |
| Description | | Par Value | | | Value | |
| | |
5.00%, 10/01/31 | | $ | 1,000,000 | | | $ | 1,109,670 | |
| | | | | | | | |
| | |
TOTAL HIGHER EDUCATION | | | | | | $ | 4,619,113 | |
| | |
HOSPITAL – 0.8% | | | | | | | | |
| | |
Massachusetts Development Finance Agency, MA, Advance Refunding Revenue Bonds, (Partners Healthcare System), 5.00%, 7/01/33 | | | 2,455,000 | | | | 2,836,163 | |
| | |
HOUSING – 0.1% | | | | | | | | |
| | |
Massachusetts Housing Finance Agency, MA, Multi Family Revenue Bonds, 7.00%, 4/01/21 | | | 10,000 | | | | 10,548 | |
| | |
Massachusetts Housing Finance Agency, MA, Multi Family Revenue Bonds, (Series B), 3.95%, 12/01/26 | | | 195,000 | | | | 199,553 | |
| | | | | | | | |
| | |
TOTAL HOUSING | | | | | | $ | 210,101 | |
| | |
MEDICAL – 0.1% | | | | | | | | |
| | |
Massachusetts Health & Educational Facilities Authority, MA, Refunding Revenue Bonds, (Partners Healthcare System), (Series F1), (AGM), 1.45%, 7/01/40D | | | 500,000 | | | | 500,000 | |
| | |
STUDENT LOAN – 0.7% | | | | | | | | |
| | |
Massachusetts Educational Financing Authority, MA, Revenue Bonds, (Issue K), (Series A), 5.00%, 7/01/25 | | | 2,200,000 | | | | 2,447,038 | |
| | |
WATER – 0.4% | | | | | | | | |
| | |
Massachusetts Water Resources Authority, MA, Refunding Revenue Bonds, (Series B), (AGM), 5.25%, 8/01/33 | | | 1,000,000 | | | | 1,384,610 | |
| | | | | | | | |
| | |
TOTAL MASSACHUSETTS | | | | | | $ | 11,997,025 | |
| | |
MICHIGAN – 3.7% | | | | | | | | |
| | |
DEDICATED TAX – 1.8% | | | | | | | | |
| | |
Michigan Finance Authority, MI, Revenue Bonds, (Series H-1), 5.00%, 10/01/25 | | | 5,215,000 | | | | 6,080,377 | |
| | |
HOSPITAL – 1.2% | | | | | | | | |
| | |
Kalamazoo Hospital Finance Authority, MI, Advance Refunding Revenue Bonds, (Bronson Healthcare Group), 5.00%, 5/15/30 | | | 2,055,000 | | | | 2,320,568 | |
| | |
Michigan Finance Authority, MI, Advance Refunding Revenue Bonds, (Series A), (Beaumont Health Credit Group), 5.00%, 8/01/31 | | | 1,655,000 | | | | 1,801,914 | |
| | | | | | | | |
| | |
TOTAL HOSPITAL | | | | | | $ | 4,122,482 | |
| | |
HOUSING – 0.2% | | | | | | | | |
| | |
Michigan State Housing Development Authority, MI, Multi Family Revenue Bonds, (Series A), 3.80%, 10/01/38 | | | 300,000 | | | | 317,841 | |
| | |
Michigan State Housing Development Authority, MI, Multi Family Revenue Bonds, (Series A-1), 2.88%, 10/01/34 | | | 375,000 | | | | 382,189 | |
| | | | | | | | |
| | |
TOTAL HOUSING | | | | | | $ | 700,030 | |
ANNUAL REPORT / April 30, 2020
| | |
| 45 | | PORTFOLIOS OF INVESTMENTS Wilmington Municipal Bond Fund (continued) |
| | | | | | | | |
| | |
| Description | | Par Value | | | Value | |
| | |
WATER – 0.5% | | | | | | | | |
| | |
Michigan Finance Authority, MI, Current Refunding Revenue Bonds, (Series C), (Local Government Loan Program), 5.00%, 7/01/34 | | $ | 1,450,000 | | | $ | 1,664,034 | |
| | | | | | | | |
| | |
TOTAL MICHIGAN | | | | | | $ | 12,566,923 | |
| | |
MINNESOTA – 1.9% | | | | | | | | |
| | |
HOUSING – 1.9% | | | | | | | | |
| | |
Coon Rapids City, MN, Multi Family Revenue Bonds, (Galway Place Community Plaza Projects), (Series A), 2.70%, 8/01/35 | | | 2,724,572 | | | | 2,696,345 | |
| | |
Minnesota Housing Finance Agency, MN, Revenue Bonds, (Series F), 3.75%, 1/01/50 | | | 3,480,000 | | | | 3,692,002 | |
| | | | | | | | |
| | |
TOTAL HOUSING | | | | | | $ | 6,388,347 | |
| | | | | | | | |
| | |
TOTAL MINNESOTA | | | | | | $ | 6,388,347 | |
| | |
NEBRASKA – 2.8% | | | | | | | | |
| | |
GENERAL OBLIGATIONS – 1.9% | | | | | | | | |
| | |
Central Plains Energy Project, NE, Current Refunding Revenue Bonds, 4.00%, 12/01/49D | | | 6,000,000 | | | | 6,494,400 | |
| | |
HOUSING – 0.9% | | | | | | | | |
| | |
Nebraska Investment Finance Authority, NE, Revenue Bonds, (Series E), 3.75%, 9/01/49 | | | 2,950,000 | | | | 3,113,902 | |
| | | | | | | | |
| | |
TOTAL NEBRASKA | | | | | | $ | 9,608,302 | |
| | |
NEW JERSEY – 3.0% | | | | | | | | |
| | |
HIGHER EDUCATION – 1.3% | | | | | | | | |
| | |
Gloucester County Improvement Authority, NJ, Advance Refunding Revenue Bonds, (Series B), (Rowan University Project), 5.00%, 7/01/27 | | | 2,000,000 | | | | 2,215,300 | |
| | |
New Jersey Educational Facilities Authority, NJ, Current Refunding Revenue Bonds, (Series B), (Montclair State University), 5.00%, 7/01/30 | | | 1,000,000 | | | | 1,115,490 | |
| | |
New Jersey Educational Facilities Authority, NJ, Revenue Bonds, (Series A), (Stevens Institute of Technology), 5.00%, 7/01/31 | | | 1,000,000 | | | | 1,094,360 | |
| | | | | | | | |
| | |
TOTAL HIGHER EDUCATION | | | | | | $ | 4,425,150 | |
| | |
HOUSING – 0.1% | | | | | | | | |
| | |
New Jersey Housing & Mortgage Finance Agency, NJ, Current Refunding Revenue Bonds, (Series A), 3.60%, 11/01/33 | | | 400,000 | | | | 418,396 | |
| | |
New Jersey Housing & Mortgage Finance Agency, NJ, Multi Family Revenue Bonds, (Series A), 6.00%, 11/01/23 | | | 30,000 | | | | 31,595 | |
| | | | | | | | |
| | |
TOTAL HOUSING | | | | | | $ | 449,991 | |
| | |
LEASE – 0.9% | | | | | | | | |
| | |
New Jersey Economic Development Authority, NJ, Advance Refunding Revenue Bonds, (Series B), 5.00%, 11/01/23 | | | 1,305,000 | | | | 1,343,902 | |
| | | | | | | | |
| | |
| Description | | Par Value | | | Value | |
| | |
New Jersey Sports & Exposition Authority, NJ, Current Refunding Revenue Bonds, (Series A), 5.00%, 9/01/24 | | $ | 1,685,000 | | | $ | 1,741,380 | |
| | | | | | | | |
| | |
TOTAL LEASE | | | | | | $ | 3,085,282 | |
| | |
MEDICAL – 0.0%** | | | | | | | | |
| | |
New Jersey Health Care Facilities Financing Authority, NJ, Current Refunding Revenue Bonds, (Kennedy Health System), 3.75%, 7/01/27 | | | 60,000 | | | | 65,723 | |
| | |
New Jersey Health Care Facilities Financing Authority, NJ, Refunding Revenue Bonds, (Series A), (Saint Clare’s Hospital, Inc.), (AGC), 4.75%, 7/01/25 | | | 90,000 | | | | 102,190 | |
| | | | | | | | |
| | |
TOTAL MEDICAL | | | | | | $ | 167,913 | |
| | |
TRANSPORTATION – 0.7% | | | | | | | | |
| | |
New Jersey Transportation Trust Fund Authority, NJ, Current Refunding Revenue Bonds, (Series A), (Transportation System), 5.00%, 12/15/28 | | | 2,135,000 | | | | 2,212,885 | |
| | | | | | | | |
| | |
TOTAL NEW JERSEY | | | | | | $ | 10,341,221 | |
| | |
NEW MEXICO – 1.0% | | | | | | | | |
| | |
GENERAL OBLIGATIONS – 1.0% | | | | | | | | |
| | |
New Mexico Municipal Energy Acquisition Authority, NM, Revenue Bonds, (Series A), 5.00%, 11/01/39D | | | 3,065,000 | | | | 3,450,056 | |
| | |
HIGHER EDUCATION – 0.0%** | | | | | | | | |
| | |
University of New Mexico (The), NM, Revenue Bonds, 6.50%, 6/01/21 | | | 100,000 | | | | 100,570 | |
| | | | | | | | |
| | |
TOTAL NEW MEXICO | | | | | | $ | 3,550,626 | |
| | |
NEW YORK – 4.8% | | | | | | | | |
| | |
AIRPORT – 1.0% | | | | | | | | |
| | |
Port Authority of New York & New Jersey, NY, Refunding Revenue Bonds, (207th Series), 5.00%, 9/15/31 | | | 2,500,000 | | | | 2,903,050 | |
| | |
Port Authority of New York & New Jersey, NY, Revenue Bonds, (85th Series), 5.38%, 3/01/28 | | | 520,000 | | | | 598,842 | |
| | | | | | | | |
| | |
TOTAL AIRPORT | | | | | | $ | 3,501,892 | |
| | |
DEDICATED TAX – 0.2% | | | | | | | | |
| | |
New York City, NY, Transitional Finance Authority Future Tax Secured Revenue, Revenue Bonds, Public Improvements, (Sub-Series-C-3), (AGM), 1.50%, 11/01/27D | | | 725,000 | | | | 725,000 | |
| | |
GENERAL OBLIGATIONS – 0.6% | | | | | | | | |
| | |
New York City, NY, GO Unlimited, Refunding Bonds, AD Valorem Property Tax, (Sub-Series A-2), (AGM), 1.50%, 8/01/26D | | | 1,000,000 | | | | 1,000,000 | |
April 30, 2020 / ANNUAL REPORT
| | |
PORTFOLIOS OF INVESTMENTS Wilmington Municipal Bond Fund (continued) | | 46 |
| | | | | | | | |
| | |
| Description | | Par Value | | | Value | |
| | |
New York City, NY, GO Unlimited, Refunding Bonds, AD Valorem Property Tax, (Sub-Series A-4), (AGM), 1.50%, 8/01/26D | | $ | 500,000 | | | $ | 500,000 | |
| | |
New York City, NY, GO Unlimited, Refunding Bonds, AD Valorem Property Tax, (Sub-Series A-5), (AGM), 1.50%, 8/01/26D | | | 500,000 | | | | 500,000 | |
| | | | | | | | |
| | |
TOTAL GENERAL OBLIGATIONS | | | | | | $ | 2,000,000 | |
| | |
HOUSING – 2.4% | | | | | | | | |
| | |
Amherst Development Corp., NY, Advance Refunding Revenue Bonds, (Series A), (UBF Faculty-Student Housing Corp.), (AGM), 5.00%, 10/01/32 | | | 1,660,000 | | | | 2,002,475 | |
| | |
New York City, NY, Housing Development Corp., Multi Family Revenue Bonds, (Sustainable Neighborhood Bonds), 1.75%, 5/01/59D | | | 5,000,000 | | | | 5,007,300 | |
| | |
New York State Mortgage Agency, NY, Single Family Refunding Revenue Bonds, (Series 183), 3.75%, 4/01/23 | | | 1,000,000 | | | | 1,055,650 | |
| | | | | | | | |
| | |
TOTAL HOUSING | | | | | | $ | 8,065,425 | |
| | |
MEDICAL – 0.6% | | | | | | | | |
| | |
New York State Dormitory Authority, NY, Revenue Bonds, (Memorial Sloan-Kettering Cancer Center), (NATL), 5.50%, 7/01/23 | | | 1,915,000 | | | | 2,082,084 | |
| | | | | | | | |
| | |
TOTAL NEW YORK | | | | | | $ | 16,374,401 | |
| | |
NORTH CAROLINA – 0.5% | | | | | | | | |
| | |
MEDICAL – 0.1% | | | | | | | | |
| | |
North Carolina Medical Care Commission, NC, Revenue Bonds, (First Mortgage), (Whitestone Project), (Series A), 6.25%, 3/01/21 | | | 15,000 | | | | 15,644 | |
| | |
Wake County, NC, Refunding Revenue Bonds, Hospital System, (NATL), 5.13%, 10/01/26 | | | 100,000 | | | | 112,497 | |
| | | | | | | | |
| | |
TOTAL MEDICAL | | | | | | $ | 128,141 | |
| | |
POWER – 0.0%** | | | | | | | | |
| | |
North Carolina Eastern Municipal Power Agency, NC, Revenue Bonds, (Series A), 6.40%, 1/01/21 | | | 35,000 | | | | 36,293 | |
| | |
TRANSPORTATION – 0.4% | | | | | | | | |
| | |
North Carolina Turnpike Authority, NC, Current Refunding Revenue Bonds, (Senior Lien), (AGM), 5.00%, 1/01/32 | | | 1,250,000 | | | | 1,475,925 | |
| | | | | | | | |
| | |
TOTAL NORTH CAROLINA | | | | | | $ | 1,640,359 | |
| | |
OHIO – 4.2% | | | | | | | | |
| | |
DEVELOPMENT – 0.6% | | | | | | | | |
| | |
Ohio Air Quality Development Authority, OH, Refunding Revenue Bonds, (American Electric Power Company Project), 2.10%, 7/01/28D | | | 2,000,000 | | | | 1,937,740 | |
| | |
HOUSING – 1.3% | | | | | | | | |
| | |
Ohio Housing Finance Agency, OH, Revenue Bonds, (Series B), 4.50%, 3/01/50 | | | 3,970,000 | | | | 4,332,540 | |
| | | | | | | | |
| | |
| Description | | Par Value | | | Value | |
| | |
LEASE – 0.3% | | | | | | | | |
| | |
Buckeye Tobacco Settlement Financing Authority, OH, Revenue Bonds, (Senior Convertible Capital Appreciation Assets), 6.25%, 6/01/37 | | $ | 1,000,000 | | | $ | 1,112,800 | |
| | |
MEDICAL – 1.0% | | | | | | | | |
| | |
Mahoning, County, OH, Hospital Improvement Revenue Bonds, (Western Reserve Care System Project), (NATL), 5.50%, 10/15/25 | | | 55,000 | | | | 61,573 | |
| | |
Montgomery County, OH, Current Refunding Revenue Bonds, (Premier Health Partners Obligated Group), 5.00%, 11/15/28 | | | 3,035,000 | | | | 3,232,761 | |
| | |
Montgomery County, OH, Hospital Improvement Revenue Bonds, (Unrefunded - Catholic Health Initiatives), 5.25%, 5/01/29 | | | 10,000 | | | | 11,188 | |
| | | | | | | | |
| | |
TOTAL MEDICAL | | | | | | $ | 3,305,522 | |
| | |
TRANSPORTATION – 0.6% | | | | | | | | |
| | |
Ohio Turnpike & Infrastructure Commission, OH, Refunding Revenue Bonds, (Series A), (NATL), 5.50%, 2/15/24 | | | 1,985,000 | | | | 2,203,529 | |
| | |
WATER – 0.4% | | | | | | | | |
| | |
Ohio Water Development Authority Water Pollution Control Loan Fund, OH, Lease Revenue Bonds, (Series A), 5.00%, 12/01/31 | | | 1,000,000 | | | | 1,298,880 | |
| | | | | | | | |
| | |
TOTAL OHIO | | | | | | $ | 14,191,011 | |
| | |
OREGON – 0.7% | | | | | | | | |
| | |
SCHOOL DISTRICT – 0.7% | | | | | | | | |
| | |
Multnomah County, School District No. 1 Portland Public Schools, OR, GO Unlimited, AD Valorem Property Tax, 5.00%, 6/15/24 | | | 2,000,000 | | | | 2,311,720 | |
| | | | | | | | |
| | |
TOTAL OREGON | | | | | | $ | 2,311,720 | |
| | |
PENNSYLVANIA – 6.7% | | | | | | | | |
| | |
AIRPORT – 0.5% | | | | | | | | |
| | |
Philadelphia Airport, PA, Refunding Revenue Bonds, (Series B), 5.00%, 7/01/30 | | | 1,500,000 | | | | 1,709,985 | |
| | |
DEDICATED TAX – 0.7% | | | | | | | | |
| | |
Pennsylvania Turnpike Commission, PA, Advance Refunding Revenue Bonds, (2nd Series), Motor License Fund Enhanced, 5.00%, 12/01/32 | | | 2,000,000 | | | | 2,366,520 | |
| | |
DEVELOPMENT – 0.9% | | | | | | | | |
| | |
Pennsylvania Economic Development Financing Authority, PA, Revenue Bonds, (Waste Management Inc., Project), 1.75%, 8/01/38D | | | 3,000,000 | | | | 2,882,940 | |
| | |
EDUCATION – 0.2% | | | | | | | | |
| | |
Bucks County Industrial Development Authority, PA, Current Refunding Revenue Bonds, (George School Project) 5.00%, 9/15/32 | | | 180,000 | | | | 227,180 | |
ANNUAL REPORT / April 30, 2020
| | |
| 47 | | PORTFOLIOS OF INVESTMENTS Wilmington Municipal Bond Fund (continued) |
| | | | | | | | |
| | |
| Description | | Par Value | | | Value | |
| | |
5.00%, 9/15/33 | | $ | 125,000 | | | $ | 156,911 | |
| | |
5.00%, 9/15/34 | | | 130,000 | | | | 162,687 | |
| | | | | | | | |
| | |
TOTAL EDUCATION | | | | | | $ | 546,778 | |
| | |
FACILITIES – 0.3% | | | | | | | | |
| | |
Delaware Valley Regional Finance Authority, PA, Revenue Bonds, (Series C), 0.75%, 9/01/48D | | | 1,000,000 | | | | 989,350 | |
| | |
GENERAL OBLIGATIONS – 0.2% | | | | | | | | |
| | |
Bethlehem Authority, PA, Revenue Bonds, Public Improvements, (Guaranteed Lease Revenue Bonds), (Series A), (AGM), 5.13%, 12/01/21 | | | 20,000 | | | | 20,624 | |
| | |
Commonwealth of Pennsylvania, PA, GO Unlimited, Current Refunding, AD Valorem Property Tax, (Series 1), 5.00%, 1/01/27 | | | 660,000 | | | | 803,913 | |
| | | | | | | | |
| | |
TOTAL GENERAL OBLIGATIONS | | | | | | $ | 824,537 | |
| | |
HIGHER EDUCATION – 1.0% | | | | | | | | |
| | |
Lackawanna County Industrial Development Authority, PA, Advance Refunding Revenue Bonds, (Scranton University), 5.00%, 11/01/30 | | | 1,000,000 | | | | 1,048,250 | |
| | |
Pennsylvania Higher Educational Facilities Authority, PA, Advance Refunding Revenue Bonds, (Series A), (University of Sciences, Philadelphia), 5.00%, 11/01/28 | | | 2,330,000 | | | | 2,339,553 | |
| | | | | | | | |
| | |
TOTAL HIGHER EDUCATION | | | | | | $ | 3,387,803 | |
| | |
LEASE – 0.3% | | | | | | | | |
| | |
Commonwealth Financing Authority, PA, Revenue Bonds, (Tobacco Master Settlement Payment), 5.00%, 6/01/34 | | | 1,000,000 | | | | 1,131,860 | |
| | |
MEDICAL – 0.5% | | | | | | | | |
| | |
Dauphin County General Authority, PA, Revenue Bonds, (HAPSCO Group, Inc. Tax Loan Program-Western PA Hospital Project), (Series A), (NATL), 5.50%, 7/01/23 | | | 315,000 | | | | 337,019 | |
| | |
Pottsville Hospital Authority, PA, Current Refunding Revenue Bonds, (Schuylkill Health System Project), 6.50%, 7/01/28 | | | 1,260,000 | | | | 1,505,700 | |
| | | | | | | | |
| | |
TOTAL MEDICAL | | | | | | $ | 1,842,719 | |
| | |
WATER – 2.1% | | | | | | | | |
| | |
Philadelphia Water & Wastewater, PA, Advance Refunding Revenue Bonds, (Series B), 5.00%, 11/01/31 | | | 5,655,000 | | | | 6,789,676 | |
| | |
Pittsburgh Water & Sewer Authority, PA, Current Refunding Revenue Bonds, (Sub-Series B), (AGM), 5.00%, 9/01/33 | | | 340,000 | | | | 452,894 | |
| | | | | | | | |
| | |
TOTAL WATER | | | | | | $ | 7,242,570 | |
| | | | | | | | |
| | |
TOTAL PENNSYLVANIA | | | | | | $ | 22,925,062 | |
| | | | | | | | |
| | |
| Description | | Par Value | | | Value | |
| | |
RHODE ISLAND – 1.0% | | | | | | | | |
| | |
STUDENT LOAN – 1.0% | | | | | | | | |
| | |
Rhode Island Student Loan Authority, RI, Revenue Bonds, (Series A) | | | | | | | | |
| | |
4.00%, 12/01/27 | | $ | 1,995,000 | | | $ | 2,073,723 | |
| | |
5.00%, 12/01/23 | | | 1,200,000 | | | | 1,319,652 | |
| | | | | | | | |
| | |
TOTAL STUDENT LOAN | | | | | | $ | 3,393,375 | |
| | | | | | | | |
| | |
TOTAL RHODE ISLAND | | | | | | $ | 3,393,375 | |
| | |
SOUTH CAROLINA – 1.3% | | | | | | | | |
| | |
HOUSING – 0.4% | | | | | | | | |
| | |
South Carolina State Housing Finance & Development Authority, SC, Revenue Bonds, (Series B-2), 4.00%, 7/01/43 | | | 1,455,000 | | | | 1,527,910 | |
| | |
LEASE – 0.9% | | | | | | | | |
| | |
Tobacco Settlement Revenue Management Authority, SC, Revenue Bonds, (Series B), 6.38%, 5/15/30 | | | 2,190,000 | | | | 2,957,726 | |
| | | | | | | | |
| | |
TOTAL SOUTH CAROLINA | | | | | | $ | 4,485,636 | |
| | |
SOUTH DAKOTA – 0.6% | | | | | | | | |
| | |
HOUSING – 0.6% | | | | | | | | |
| | |
South Dakota Housing Development Authority, SD, Single Family Refunding Revenue Bonds, (Series A), 3.75%, 11/01/50 | | | 2,000,000 | | | | 2,132,020 | |
| | | | | | | | |
| | |
TOTAL SOUTH DAKOTA | | | | | | $ | 2,132,020 | |
| | |
TENNESSEE – 0.5% | | | | | | | | |
| | |
HOUSING – 0.5% | | | | | | | | |
| | |
Metropolitan Government Nashville & Davidson County Health & Educational Facility Board, TN, Multi Family Revenue Bonds, (Collateralized Multifamily Housing Bonds Hermitage Flats Apartments Project), 1.50%, 7/01/20 | | | 1,750,000 | | | | 1,750,980 | |
| | | | | | | | |
| | |
TOTAL TENNESSEE | | | | | | $ | 1,750,980 | |
| | |
TEXAS – 6.4% | | | | | | | | |
| | |
DEDICATED TAX – 0.3% | | | | | | | | |
| | |
Texas Transportation Commission State Highway Fund, TX, Refunding Revenue Bonds, (Series A), 5.00%, 4/01/22 | | | 915,000 | | | | 985,629 | |
| | |
GENERAL OBLIGATIONS – 1.1% | | | | | | | | |
| | |
Collin County Community College District, TX, GO Limited, AD Valorem Property Tax, (Series A) | | | | | | | | |
| | |
5.00%, 8/15/27 | | | 1,000,000 | | | | 1,244,930 | |
| | |
5.00%, 8/15/33 | | | 2,000,000 | | | | 2,518,700 | |
| | | | | | | | |
| | |
TOTAL GENERAL OBLIGATIONS | | | | | | $ | 3,763,630 | |
| | |
HIGHER EDUCATION – 1.0% | | | | | | | | |
| | |
Clifton Higher Education Finance Corp., TX, Revenue Bonds, (Idea Public Schools) 5.00%, 8/15/27 | | | 1,000,000 | | | | 1,241,030 | |
April 30, 2020 / ANNUAL REPORT
| | |
PORTFOLIOS OF INVESTMENTS Wilmington Municipal Bond Fund (continued) | | 48 |
| | | | | | | | |
| | |
| Description | | Par Value | | | Value | |
| | |
5.00%, 8/15/29 | | $ | 1,000,000 | | | $ | 1,252,680 | |
| | |
5.00%, 8/15/31 | | | 835,000 | | | | 985,918 | |
| | | | | | | | |
| | |
TOTAL HIGHER EDUCATION | | | | | | $ | 3,479,628 | |
| | |
HOUSING – 0.9% | | | | | | | | |
| | |
Texas Department of Housing & Community Affairs, TX, Revenue Bonds, (Series A), 4.00%, 3/01/50 | | | 2,730,000 | | | | 2,956,508 | |
| | |
MEDICAL – 0.0%** | | | | | | | | |
| | |
North Central Texas Health Facility Development Corp., TX, Refunding Revenue Bonds, (Presbyterian Healthcare System), (Series B), (NATL), 5.50%, 6/01/21 | | | 40,000 | | | | 40,986 | |
| | |
Tarrant County Health Facilities Development Corp., TX, Revenue Bonds, (Harris Methodist Health System), (AMBAC), 6.00%, 9/01/24 | | | 35,000 | | | | 39,220 | |
| | |
Tarrant County Health Facilities Development Corp., TX, Revenue Bonds, (Harris Methodist Health System), (FGIC), 6.00%, 9/01/24 | | | 45,000 | | | | 50,425 | |
| | |
Tarrant County Health Facilities Development Corp., TX, Revenue Bonds, (Harris Methodist Health System), (NATL-IBC), 6.00%, 9/01/24 | | | 30,000 | | | | 33,617 | |
| | | | | | | | |
| | |
TOTAL MEDICAL | | | | | | $ | 164,248 | |
| | |
SCHOOL DISTRICT – 0.6% | | | | | | | | |
| | |
Beaumont Independent School District, TX, GO Unlimited Current Refunding, AD Valorem Property Tax, 4.00%, 2/15/31 | | | 1,000,000 | | | | 1,139,520 | |
| | |
Carroll Independent School District, TX, GO Unlimited, AD Valorem Property Tax, 5.00%, 2/15/23 | | | 250,000 | | | | 277,010 | |
| | |
Fort Worth Independent School District, TX, GO Unlimited, Advance Refunding, AD Valorem Property Tax, 5.00%, 2/15/24 | | | 350,000 | | | | 399,241 | |
| | |
Northside Independent School District, TX, GO Unlimited, Advance Refunding, AD Valorem Property Tax, 5.00%, 8/15/23 | | | 300,000 | | | | 338,499 | |
| | | | | | | | |
| | |
TOTAL SCHOOL DISTRICT | | | | | | $ | 2,154,270 | |
| | |
TRANSPORTATION – 0.9% | | | | | | | | |
| | |
Central Texas Regional Mobility Authority, TX, Revenue Bonds, (Senior Lien), 5.00%, 1/01/33 | | | 1,470,000 | | | | 1,612,590 | |
| | |
Central Texas Turnpike System, TX, Revenue Bonds, (Series C), 5.00%, 8/15/32 | | | 1,225,000 | | | | 1,287,267 | |
| | | | | | | | |
| | |
TOTAL TRANSPORTATION | | | | | | $ | 2,899,857 | |
| | |
UTILITIES – 1.6% | | | | | | | | |
| | |
Austin, TX, Refunding Revenue Bonds, (BHAC-CR NATL-RE), 5.25%, 5/15/25 | | | 5,000,000 | | | | 5,536,700 | |
| | | | | | | | |
| | |
TOTAL TEXAS | | | | | | $ | 21,940,470 | |
| | | | | | | | |
| | |
| Description | | Par Value | | | Value | |
| | |
UTAH – 3.5% | | | | | | | | |
| | |
AIRPORT – 1.8% | | | | | | | | |
| | |
Salt Lake City Corp., UT, Revenue Bonds, (Series A) | | | | | | | | |
| | |
5.00%, 7/01/32 | | $ | 3,000,000 | | | $ | 3,422,190 | |
| | |
5.00%, 7/01/33 | | | 2,500,000 | | | | 2,836,450 | |
| | | | | | | | |
| | |
TOTAL AIRPORT | | | | | | $ | 6,258,640 | |
| |
GENERAL OBLIGATIONS – 0.4% | | | | | |
| | |
State of Utah, UT, GO Unlimited, | | | | | | | | |
5.00%, 7/01/26 | | | 1,000,000 | | | | 1,225,790 | |
| | |
MEDICAL – 1.3% | | | | | | | | |
| | |
Salt Lake County, UT, Revenue Bonds, (IHC | | | | | | | | |
Health Services), (AMBAC) | | | | | | | | |
| | |
5.13%, 2/15/33 | | | 3,490,000 | | | | 3,978,740 | |
| | |
5.40%, 2/15/28 | | | 500,000 | | | | 579,345 | |
| | | | | | | | |
| | |
TOTAL MEDICAL | | | | | | $ | 4,558,085 | |
| | | | | | | | |
| | |
TOTAL UTAH | | | | | | $ | 12,042,515 | |
| | |
VIRGINIA – 0.7% | | | | | | | | |
| |
GENERAL OBLIGATIONS – 0.7% | | | | | |
| | |
Virginia Public Building Authority, VA, Advance Refunding Revenue Bonds, (Series B), 5.00%, 8/01/24 | | | 2,055,000 | | | | 2,383,389 | |
| | | | | | | | |
| | |
TOTAL VIRGINIA | | | | | | $ | 2,383,389 | |
| | |
WASHINGTON – 1.8% | | | | | | | | |
| | |
DEDICATED TAX – 1.2% | | | | | | | | |
| | |
Central Puget Sound Regional Transit Authority, WA, Revenue Bonds, (NATL), 4.75%, 2/01/28 | | | 3,820,000 | | | | 4,306,057 | |
| | |
HOSPITAL – 0.6% | | | | | | | | |
| | |
Washington Health Care Facilities Authority, WA, Advance Refunding Revenue Bonds, Overlake Hospital Medical Center, 5.00%, 7/01/33 | | | 1,750,000 | | | | 1,982,925 | |
| | | | | | | | |
| | |
TOTAL WASHINGTON | | | | | | $ | 6,288,982 | |
| | |
WISCONSIN – 0.2% | | | | | | | | |
| |
GENERAL OBLIGATIONS – 0.0%** | | | | | |
| | |
State of Wisconsin, WI, GO Unlimited, Advance Refunding, AD Valorem Property Tax, (Series 1), 5.00%, 11/01/21 | | | 180,000 | | | | 191,133 | |
| | |
MEDICAL – 0.2% | | | | | | | | |
| | |
Wisconsin Health & Educational Facilities Authority, WI, Current Refunding Revenue Bonds, (Aurora Health Care, Inc.), (Series A), 5.13%, 4/15/31 | | | 500,000 | | | | 560,060 | |
| | | | | | | | |
| | |
TOTAL WISCONSIN | | | | | | $ | 751,193 | |
| | | | | | | | |
| | |
TOTAL MUNICIPAL BONDS (COST $333,186,934) | | | | | | $ | 329,722,264 | |
ANNUAL REPORT / April 30, 2020
| | |
| 49 | | PORTFOLIOS OF INVESTMENTS Wilmington Municipal Bond Fund (concluded) |
| | | | | | | | |
| | |
| Description | | Number of
Shares | | | Value | |
| | |
MONEY MARKET FUND – 4.2% | | | | | | | | |
| | |
Dreyfus Government Cash Management Fund, Institutional Shares, 0.17%^ | | | 14,260,829 | | | $ | 14,260,829 | |
| | |
TOTAL MONEY MARKET FUND
(COST $14,260,829) | | | | | | $ | 14,260,829 | |
| | | | | | | | |
| | |
| Description | | | | | Value | |
| | |
TOTAL INVESTMENTS – 101.0%
(COST $347,447,763) | | | | | | $ | 343,983,093 | |
| | |
| OTHER LIABILITIES LESS ASSETS – (1.0%) | | | | | | | (3,314,332 | ) |
| | |
TOTAL NET ASSETS – 100.0% | | | | | | $ | 340,668,761 | |
Cost of investments for Federal income tax purposes is $347,449,696. The net unrealized appreciation/(depreciation) of investments was $(3,466,603). This consists of net unrealized appreciation from investment for those securities having an excess of value over cost of $3,092,838 and net unrealized depreciation from investments for those securities having an excess of cost over value of $(6,559,441).
Various inputs are used in determining the value of the Fund’s investments. These inputs are summarized in the three broad levels listed below.
Level 1 – quoted prices in active markets for identical securities
Level 2 – other significant observable inputs (including quoted prices for similar securities, interest rates, prepayment speeds, credit risk, etc.)
Level 3 – significant unobservable inputs (including the Fund’s own assumptions in determining the fair value of investments)
The following is a summary of the inputs used as of April 30, 2020 in valuing the Fund’s assets carried at fair value:
| | | | | | | | | | | | | | | | |
| | | | |
| | | Level 1 | | | Level 2 | | | Level 3 | | | Total | |
Investments in Securities | | | | | | | | | | | | | | | | |
| | | | |
Municipal Bonds | | $ | — | | | $ | 329,722,264 | | | $ | — | | | $ | 329,722,264 | |
| | | | |
Money Market Fund | | | 14,260,829 | | | | — | | | | — | | | | 14,260,829 | |
| | | | | | | | | | | | | | | | |
| | | | |
Total | | $ | 14,260,829 | | | $ | 329,722,264 | | | $ | — | | | $ | 343,983,093 | |
| | | | | | | | | | | | | | | | |
| D | Variable rate security. The rate disclosed is the rate in effect on the report date. The information in parenthesis represents the benchmark and reference rate for each relevant security and the rate floats based upon the reference rate and spread. The security may be further subject to interest rate floor and caps. Certain variable rate securities are not based on a published reference rate and spread, but are determined by the issuer or agent and are based on current market conditions, or, for mortgage-backed securities, are impacted by the individual mortgages which are paying off over time. These securities do not indicate a reference rate and spread in their descriptions. |
| ** | Represents less than 0.05%. |
| | | | |
| | The following acronyms are used throughout this Fund: |
| | |
| | AGC | | Assured Guaranty Corporation |
| | AGM | | Assured Guaranty Municipal |
| | AMBAC | | American Bond Assurance Corporation |
| | BAM | | Build America Mutual Assurance Company |
| | BHAC | | Berkshire Hathaway Assurance Corporation |
| | CR | | Custodial Receipts |
| | | | |
| | |
| | FGIC | | Financial Guarantee Insurance Company |
| | GO | | General Obligation |
| | IBC | | International Bancshares Corporation |
| | LLC | | Limited Liability Corporation |
| | NATL | | National Public Finance Guarantee Corporation |
| | TCRS | | Tax Credit Reporting Service |
See Notes which are an integral part of the Financial Statements
April 30, 2020 / ANNUAL REPORT
PORTFOLIO OF INVESTMENTS SUMMARY TABLE
Wilmington New York Municipal Bond Fund
At April 30, 2020, the Fund’s portfolio composition was as follows (unaudited):
| | | | | |
| | | Percentage of
Total Net Assets |
| |
Higher Education | | | | 21.0 | % |
| |
Housing | | | | 19.6 | % |
| |
Dedicated Tax | | | | 15.0 | % |
| |
General Obligations | | | | 9.5 | % |
| |
Medical | | | | 7.4 | % |
| |
Airport | | | | 7.2 | % |
| |
Transportation | | | | 4.4 | % |
| |
Lease | | | | 2.8 | % |
| |
Development | | | | 2.1 | % |
| |
Student Housing | | | | 1.9 | % |
| |
Power | | | | 1.9 | % |
| |
Water & Sewer | | | | 1.6 | % |
| |
Facilities | | | | 0.3 | % |
| |
Cash Equivalents1 | | | | 3.3 | % |
| |
Other Assets and Liabilities – Net2 | | | | 2.0 | % |
| | | | | |
TOTAL | | | | 100.0 | % |
| | | | | |
| (1) | Cash Equivalents include investments in a money market fund. |
| (2) | Assets, other than investments in securities, less liabilities. See Statements of Assets and Liabilities. |
| (3) | For financial reporting purposes, the Credit Quality Diversification table reflects the lowest rating assigned by either Moody’s Investors Service or Standard and Poor’s if the ratings differ. These rating agencies are independent, nationally recognized statistical rating organizations and are widely used. Investment grade ratings are credit ratings of BBB/Baa or higher. Below investment grade ratings are credit ratings of BB/Ba or lower. Investments designated as “Not Rated” are not rated by either rating agency and do not necessarily indicate low credit quality. Credit quality ratings are subject to change. |
| | | | | |
| Credit Quality Diversification3 | | Percentage of
Total Net Assets |
| |
AAA / Aaa | | | | 0.3 | % |
| |
AA / Aa | | | | 54.6 | % |
| |
A / A | | | | 23.4 | % |
| |
BBB / Baa | | | | 16.4 | % |
| |
Not Rated | | | | 3.3 | % |
| |
Other Assets and Liabilities – Net2 | | | | 2.0 | % |
| | | | | |
TOTAL | | | | 100.0 | % |
| | | | | |
PORTFOLIO OF INVESTMENTS
April 30, 2020
| | | | | | | | |
| | |
| Description | | Par Value | | | Value | |
| | |
MUNICIPAL BONDS – 94.7% | | | | | | | | |
| | |
NEW YORK – 94.7% | | | | | | | | |
| | |
AIRPORT – 7.2% | | | | | | | | |
| | |
Port Authority of New York & New Jersey, NY, Current Refunding Revenue Bonds, Port, Airport & Marina Improvements, (205th Series), 5.00%, 11/15/32 | | $ | 1,000,000 | | | $ | 1,172,010 | |
| | | | | | | | |
| | |
| Description | | Par Value | | | Value | |
| | |
Port Authority of New York & New Jersey, NY, Current Refunding Revenue Bonds, Port, Airport & Marina Improvements, (207th Series), 5.00%, 9/15/23 | | $ | 3,000,000 | | | $ | 3,304,920 | |
| | | | | | | | |
| | |
TOTAL AIRPORT | | | | | | $ | 4,476,930 | |
| | |
DEDICATED TAX – 15.0% | | | | | | | | |
| | |
Hudson Yards Infrastructure Corp., NY, Current Refunding Revenue Bonds, (Series A), 5.00%, 2/15/33 | | | 1,175,000 | | | | 1,380,049 | |
ANNUAL REPORT / April 30, 2020
| | |
| 51 | | PORTFOLIOS OF INVESTMENTS Wilmington New York Municipal Bond Fund (continued) |
| | | | | | | | |
| | |
| Description | | Par Value | | | Value | |
| | |
New York City, NY, Transitional Finance Authority Future Tax Secured Revenue, Revenue Bonds, Public Improvements, (Sub-Series C-1), 5.00%, 11/01/25 | | $ | 500,000 | | | $ | 589,705 | |
| | |
New York City, NY, Transitional Finance Authority Future Tax Secured Revenue, Revenue Bonds, Public Improvements, (Sub-Series A-1), 5.00%, 5/01/34 | | | 1,300,000 | | | | 1,503,398 | |
| | |
New York State Dormitory Authority, NY, Advance Refunding Revenue Bonds, (Series D), 5.00%, 2/15/27 | | | 945,000 | | | | 1,132,932 | |
| | |
New York State Dormitory Authority, NY, Refunding Revenue Bonds, (NATL-IBC), 5.25%, 5/15/21 | | | 10,000 | | | | 10,233 | |
| | |
New York State Dormitory Authority, NY, Revenue Bonds, Public Improvements, (Series A), 5.00%, 3/15/32 | | | 2,000,000 | | | | 2,342,860 | |
| | |
New York State Urban Development Corp., NY, Advance Refunding Revenue Bonds, (Series A), 5.00%, 3/15/25 | | | 540,000 | | | | 628,738 | |
| | |
Sales Tax Asset Receivable Corp., NY, Current Refunding Revenue Bonds, (Series A), 5.00%, 10/15/31 | | | 1,500,000 | | | | 1,725,540 | |
| | | | | | | | |
| | |
TOTAL DEDICATED TAX | | | | | | $ | 9,313,455 | |
| | |
DEVELOPMENT – 2.1% | | | | | | | | |
| | |
New York Liberty Development Corp., NY,, Refunding Revenue Bonds, Goldman Sachs Headquarters, 5.25%, 10/01/35 | | | 1,045,000 | | | | 1,305,236 | |
| | |
FACILITIES – 0.3% | | | | | | | | |
| | |
United Nations Development Corp.,, Revenue Bonds, Public Improvements, 5.90%, 5/01/23 | | | 155,000 | | | | 165,476 | |
| | |
GENERAL OBLIGATIONS – 9.5% | | | | | | | | |
| | |
Monroe County, NY, GO, Public Improvements, AD Valorem Property Tax, (AGM), 5.00%, 6/01/22 | | | 1,070,000 | | | | 1,156,873 | |
| | |
Nassau County, NY, GO, Public Improvements, AD Valorem Property Tax, (Series C), (BAM), 5.00%, 4/01/26 | | | 1,000,000 | | | | 1,203,860 | |
| | |
Newburgh, NY, GO, Refunding Notes, AD Valorem Property Tax, (Series A), 5.25%, 6/15/27 | | | 1,010,000 | | | | 1,105,354 | |
| | |
Yonkers, NY, GO, Refunding Notes, AD Valorem Property Tax, (Series A), (BAM) 5.00%, 5/01/26 | | | 1,000,000 | | | | 1,189,830 | |
| | |
5.00%, 5/01/30 | | | 1,000,000 | | | | 1,278,800 | |
| | | | | | | | |
| | |
TOTAL GENERAL OBLIGATIONS | | | | | | $ | 5,934,717 | |
| | |
HIGHER EDUCATION – 21.0% | | | | | | | | |
| | |
City of Albany Capital Resource Corp., NY, Refunding Revenue Bonds, Albany Law School of Union University Project | | | | | | | | |
| | |
4.00%, 7/01/22 | | | 600,000 | | | | 607,260 | |
| | |
4.00%, 7/01/23 | | | 725,000 | | | | 734,316 | |
| | |
4.00%, 7/01/25 | | | 865,000 | | | | 872,379 | |
| | | | | | | | |
| | |
| Description | | Par Value | | | Value | |
| | |
4.00%, 7/01/26 | | $ | 800,000 | | | $ | 804,880 | |
| | |
5.00%, 7/01/29 | | | 1,195,000 | | | | 1,263,999 | |
| | |
Dutchess County Local Development Corp., NY, Current Refunding Revenue Bonds, The Culinary Institute of America, 5.00%, 7/01/32 | | | 1,040,000 | | | | 1,111,822 | |
| | |
New York City Trust for Cultural Resources, NY, Current Refunding Revenue Bonds, The Juilliard School, (Series A), 5.00%, 1/01/33 | | | 1,025,000 | | | | 1,288,497 | |
| | |
New York State Dormitory Authority, NY, Current Refunding Revenue Bonds, Brooklyn Law School, (Series A), 5.00%, 7/01/33 | | | 1,200,000 | | | | 1,314,492 | |
| | |
New York State Dormitory Authority, NY, Refunding Revenue Notes, 3rd General Resolution, (Series E), 5.00%, 5/15/27 | | | 1,740,000 | | | | 1,873,667 | |
| | |
New York State Dormitory Authority, NY, Revenue Bonds, University & College Improvements, (Series A), (NATL), 5.75%, 7/01/27 | | | 2,700,000 | | | | 3,202,794 | |
| | | | | | | | |
| | |
TOTAL HIGHER EDUCATION | | | | | | $ | 13,074,106 | |
| | |
HOUSING – 19.6% | | | | | | | | |
| | |
New York City, NY, Housing Development Corp., Multi Family Revenue Bonds, Sustainable Neighborhood Bonds, 1.75%, 5/01/59D | | | 2,000,000 | | | | 2,002,920 | |
| | |
New York City, NY, Housing Development Corp., Revenue Bonds, (Series C-1A), 3.50%, 11/01/33 | | | 2,000,000 | | | | 2,093,360 | |
| | |
New York City, NY, Housing Development Corp., Revenue Bonds, Sustainable Neighborhood Bonds | | | | | | | | |
| | |
2.45%, 5/01/31 | | | 500,000 | | | | 505,010 | |
| | |
3.10%, 11/01/34 | | | 890,000 | | | | 920,207 | |
| | |
New York State Housing Finance Agency, NY, Multi Family Revenue Bonds, Climate Bond Certified/Sustainability Bonds (Series P), 1.60%, 11/01/24 | | | 1,000,000 | | | | 994,180 | |
| | |
New York State Mortgage Agency, NY, Current Refunding Revenue Bonds, (221th Series), 3.50%, 10/01/32 | | | 2,000,000 | | | | 2,079,340 | |
| | |
New York State Mortgage Agency, NY, Refunding Revenue Bonds, (186th Series), 3.65%, 10/01/23 | | | 500,000 | | | | 532,660 | |
| | |
New York State Mortgage Agency, NY, Refunding Revenue Bonds, (196th Series), 2.70%, 4/01/26 | | | 465,000 | | | | 484,051 | |
| | |
New York State Mortgage Agency, NY, Single Family Revenue Bonds, (223th Series), 3.50%, 4/01/49 | | | 1,500,000 | | | | 1,567,320 | |
| | |
New York State Mortgage Agency, NY, Single Family Revenue Bonds, (226th Series), 3.50%, 10/01/50 | | | 1,000,000 | | | | 1,047,430 | |
| | | | | | | | |
| | |
TOTAL HOUSING | | | | | | $ | 12,226,478 | |
April 30, 2020 / ANNUAL REPORT
| | |
PORTFOLIOS OF INVESTMENTS Wilmington New York Municipal Bond Fund (continued) | | 52 |
| | | | | | | | |
| | |
| Description | | Par Value | | | Value | |
| | |
LEASE – 2.8% | | | | | | | | |
| | |
Syracuse, NY, IDA, Revenue Bonds, Syracuse City School District Project, School Improvements, (Series B), (State Aid Withholding), 5.00%, 5/01/32 | | $ | 1,435,000 | | | $ | 1,725,545 | |
| | |
MEDICAL – 7.4% | | | | | | | | |
| | |
New York State Dormitory Authority, NY, Advance Refunding Revenue Bonds, Health, Hospital, Nursing Home Revenue (NYU Hospitals Center), 5.00%, 7/01/27 | | | 2,000,000 | | | | 2,214,040 | |
| | |
New York State Dormitory Authority, NY, Current Refunding Revenue Bonds, Health, Hospital, Nursing Home Revenue (Montefiore Obligated Group), (Series A), 5.00%, 9/01/29 | | | 1,000,000 | | | | 1,093,620 | |
| | |
New York State Dormitory Authority, NY, Current Refunding Revenue Bonds, Health, Hospital, Nursing Home Revenue (North Shore-Long Island Jewish Obligated Group), (Series A), 5.00%, 5/01/24 | | | 1,160,000 | | | | 1,288,354 | |
| | |
TOTAL MEDICAL | | | | | | $ | 4,596,014 | |
| | |
POWER – 1.9% | | | | | | | | |
| | |
Long Island Power Authority, NY, Electric, Light and Power Improvements, Revenue Bonds, (Series B), 5.00%, 9/01/25 | | | 1,000,000 | | | | 1,160,330 | |
| | |
STUDENT HOUSING – 1.9% | | | | | | | | |
| | |
Amherst Development Corp., NY, Advance Refunding Revenue Bonds, UBF Facility Student Housing Corp., (AGM), 5.00%, 10/01/31 | | | 1,000,000 | | | | 1,215,290 | |
| | |
TRANSPORTATION – 4.4% | | | | | | | | |
| | |
Metropolitan Transportation Authority, NY, Revenue Bonds, (Series D-1), 5.00%, 9/01/22 | | | 1,500,000 | | | | 1,491,885 | |
| | |
Metropolitan Transportation Authority, NY, Revenue Green Bonds, (Series C-1), 5.00%, 11/15/24 | | | 1,000,000 | | | | 1,004,000 | |
| | |
Triborough Bridge & Tunnel Authority, NY, Current Refunding Revenue Bonds, Highway Revenue Tools, (Series B), 5.00%, 11/15/29 | | | 200,000 | | | | 216,564 | |
| | |
TOTAL TRANSPORTATION | | | | | | $ | 2,712,449 | |
| | |
WATER & SEWER – 1.6% | | | | | | | | |
| | |
New York City Water & Sewer System, NY, Current Refunding Revenue Bonds, 2nd General Resolution, (Series FF), 5.00%, 6/15/25 | | | 1,000,000 | | | | 1,004,450 | |
| | |
TOTAL NEW YORK | | | | | | $ | 58,910,476 | |
| | |
TOTAL MUNICIPAL BONDS (COST $59,305,271) | | | | | | $ | 58,910,476 | |
| | | | | | | | |
| | |
| Description | | Number of
Shares | | | Value | |
| | |
MONEY MARKET FUND – 3.3% | | | | | | | | |
| | |
Dreyfus Government Cash Management Fund, Institutional Shares, 0.17%^ | | | 2,053,774 | | | $ | 2,053,774 | |
| | | | | | | | |
| | |
TOTAL MONEY MARKET FUND (COST $2,053,774) | | | | | | $ | 2,053,774 | |
| | | | | | | | |
| | |
TOTAL INVESTMENTS – 98.0% (COST $61,359,045) | | | | | | $ | 60,964,250 | |
| | |
OTHER ASSETS LESS LIABILITIES – 2.0% | | | | | | | 1,266,062 | |
| | | | | | | | |
| | |
TOTAL NET ASSETS – 100.0% | | | | | | $ | 62,230,312 | |
| | | | | | | | |
ANNUAL REPORT / April 30, 2020
| | |
| 53 | | PORTFOLIOS OF INVESTMENTS Wilmington New York Municipal Bond Fund (concluded) |
Cost of investments for Federal income tax purposes is $61,359,045. The net unrealized appreciation/(depreciation) of investments was $(394,795). This consists of net unrealized appreciation from investment for those securities having an excess of value over cost of $775,230 and net unrealized depreciation from investments for those securities having an excess of cost over value of $(1,170,025).
Various inputs are used in determining the value of the Fund’s investments. These inputs are summarized in the three broad levels listed below.
Level 1 – quoted prices in active markets for identical securities
Level 2 – other significant observable inputs (including quoted prices for similar securities, interest rates, prepayment speeds, credit risk, etc.)
Level 3 – significant unobservable inputs (including the Fund’s own assumptions in determining the fair value of investments)
The following is a summary of the inputs used as of April 30, 2020 in valuing the Fund’s assets carried at fair value:
| | | | | | | | | | | | | | | | | | | | | | | | | | | | |
| | | | | | | |
| | | Level 1 | | | | | | Level 2 | | | | | | Level 3 | | | | | | Total | |
| | | | | | | |
Investments in Securities | | | | | | | | | | | | | | | | | | | | | | | | | | | | |
| | | | | | | |
Municipal Bonds | | $ | — | | | | | | | $ | 58,910,476 | | | | | | | $ | — | | | | | | | $ | 58,910,476 | |
| | | | | | | |
Money Market Fund | | | 2,053,774 | | | | | | | | — | | | | | | | | — | | | | | | | | 2,053,774 | |
| | | | | | | |
| | | | | | | | | | | | | | | | | | | | | | | | | | | | |
| | | | | | | |
Total | | $ | 2,053,774 | | | | | | | $ | 58,910,476 | | | | | | | $ | — | | | | | | | $ | 60,964,250 | |
| | | | | | | | | | | | | | | | | | | | | | | | | | | | |
| D | Variable rate security. The rate disclosed is the rate in effect on the report date. The information in parenthesis represents the benchmark and reference rate for each relevant security and the rate floats based upon the reference rate and spread. The security may be further subject to interest rate floor and caps. Certain variable rate securities are not based on a published reference rate and spread, but are determined by the issuer or agent and are based on current market conditions, or, for mortgage-backed securities, are impacted by the individual mortgages which are paying off over time. These securities do not indicate a reference rate and spread in their descriptions. |
| | | | |
| | | The following acronyms are used throughout this Fund: |
| | |
| | AGM | | Assured Guaranty Municipal |
| | BAM | | Build America Mutual Assurance Company |
| | GO | | General Obligation |
| | IBC | | International Bancshares Corporation |
| | IDA | | Industrial Development Authority/Agency |
| | NATL | | National Public Finance Guarantee Corporation |
See Notes which are an integral part of the Financial Statements
April 30, 2020 / ANNUAL REPORT
| | |
| STATEMENTS OF ASSETS AND LIABILITIES | | 54 |
| | | | | | | | | | | | | | | | | | | | | | |
| | | | | | |
| April 30, 2020 | | | | Wilmington
Broad Market
Bond Fund | | | | | | Wilmington
Intermediate-
Term
Bond Fund | | | | | | Wilmington
Short-Term
Bond Fund | |
ASSETS: | | | | | | | | | | | | | | | | | | | | | | |
Investments, at identified cost | | | | | $534,416,262 | | | | | | | | $49,094,907 | | | | | | | | $48,037,399 | |
| | | | | | | | | | | | | | | | | | | | | | |
Investments in securities, at value (Including $19,240,657, $1,052,824, and $170,059 of securities on loan, respectively) (Note 2) | | | | | $567,250,186 | | | | | | | | $51,111,351 | | | | | | | | $48,849,532 | |
Income receivable | | | | | 2,991,743 | | | | | | | | 338,617 | | | | | | | | 250,389 | |
Receivable for shares sold | | | | | 2,266,246 | | | | | | | | 65,149 | | | | | | | | 76,030 | |
Receivable for investments sold | | | | | 7,298,464 | | | | | | | | — | | | | | | | | — | |
Prepaid assets | | | | | 17,487 | | | | | | | | 16,104 | | | | | | | | 13,449 | |
| | | | | | | | | | | | | | | | | | | | | | |
TOTAL ASSETS | | | | | 579,824,126 | | | | | | | | 51,531,221 | | | | | | | | 49,189,400 | |
| | | | | | | | | | | | | | | | | | | | | | |
LIABILITIES: | | | | | | | | | | | | | | | | | | | | | | |
Payable for investments purchased | | | | | 19,583,418 | | | | | | | | 697,320 | | | | | | | | — | |
Collateral for securities on loan | | | | | 19,737,610 | | | | | | | | 1,078,961 | | | | | | | | 173,496 | |
Income distribution payable | | | | | 1,065,310 | | | | | | | | 92,294 | | | | | | | | 78,780 | |
Payable for shares redeemed | | | | | 67,369 | | | | | | | | 58,219 | | | | | | | | 36,856 | |
Payable for Trustees’ fees | | | | | 8,880 | | | | | | | | 8,959 | | | | | | | | 8,972 | |
Payable for administration fees | | | | | 12,819 | | | | | | | | 1,221 | | | | | | | | 1,229 | |
Payable for distribution services fees | | | | | 618 | | | | | | | | 330 | | | | | | | | 1,249 | |
Payable for shareholder services fees | | | | | 247 | | | | | | | | 132 | | | | | | | | — | |
Payable for investment advisory fees | | | | | 163,642 | | | | | | | | 3,723 | | | | | | | | 303 | |
Other accrued expenses | | | | | 117,435 | | | | | | | | 79,281 | | | | | | | | 81,111 | |
| | | | | | | | | | | | | | | | | | | | | | |
TOTAL LIABILITIES | | | | | 40,757,348 | | | | | | | | 2,020,440 | | | | | | | | 381,996 | |
| | | | | | | | | | | | | | | | | | | | | | |
NET ASSETS | | | | | $539,066,778 | | | | | | | | $49,510,781 | | | | | | | | $48,807,404 | |
| | | | | | | | | | | | | | | | | | | | | | |
NET ASSETS CONSIST OF: | | | | | | | | | | | | | | | | | | | | | | |
Paid-in capital | | | | | $506,117,649 | | | | | | | | $46,975,137 | | | | | | | | $49,160,146 | |
Distributable earnings (loss) | | | | | 32,949,129 | | | | | | | | 2,535,644 | | | | | | | | (352,742 | ) |
| | | | | | | | | | | | | | | | | | | | | | |
TOTAL NET ASSETS | | | | | $539,066,778 | | | | | | | | $49,510,781 | | | | | | | | $48,807,404 | |
| | | | | | | | | | | | | | | | | | | | | | |
COMPUTATION OF NET ASSET VALUE AND OFFERING PRICE: | | | | | | | | | | | | | | | | | | | | | | |
Class A | | | | | | | | | | | | | | | | | | | | | | |
Net Assets | | | | | $ 3,241,840 | | | | | | | | $ 1,549,894 | | | | | | | | $ 6,093,979 | |
| | | | | | | | | | | | | | | | | | | | | | |
Shares outstanding (unlimited shares authorized) | | | | | 312,003 | | | | | | | | 152,070 | | | | | | | | 600,932 | |
| | | | | | | | | | | | | | | | | | | | | | |
Net Asset Value per share | | | | | $ 10.39 | | | | | | | | $ 10.19 | | | | | | | | $ 10.14 | |
| | | | | | | | | | | | | | | | | | | | | | |
Offering Price per share* | | | | | $ 10.88 | ** | | | | | | | $ 10.67 | ** | | | | | | | $ 10.32 | *** |
| | | | | | | | | | | | | | | | | | | | | | |
Class I | | | | | | | | | | | | | | | | | | | | | | |
Net Assets | | | | | $535,824,938 | | | | | | | | $47,960,887 | | | | | | | | $42,713,425 | |
| | | | | | | | | | | | | | | | | | | | | | |
Shares outstanding (unlimited shares authorized) | | | | | 52,450,084 | | | | | | | | 4,702,642 | | | | | | | | 4,211,325 | |
| | | | | | | | | | | | | | | | | | | | | | |
Net Asset Value and Offering Price per share | | | | | $10.22 | | | | | | | | $10.20 | | | | | | | | $10.14 | |
| | | | | | | | | | | | | | | | | | | | | | |
| * | See “How are Shares Priced?” in the Prospectus. |
| ** | Computation of offering price per share: 100/95.50 of net asset value. |
| *** | Computation of offering price per share: 100/98.25 of net asset value. |
See Notes which are an integral part of the Financial Statements
ANNUAL REPORT / April 30, 2020
| | |
| 55 | | STATEMENTS OF ASSETS AND LIABILITIES (concluded) |
| | | | | | | | | | | | | | |
| | | | | Wilmington | | | | Wilmington |
| | | | | Municipal | | | | New York |
| | | | | Bond | | | | Municipal Bond |
| April 30, 2020 | | | | Fund | | | | Fund |
ASSETS: | | | | | | | | | | | | | | |
Investments, at identified cost | | | | | $ | 347,447,763 | | | | | | $ | 61,359,045 | |
| | | | | | | | | | | | | | |
Investments in securities, at value | | | | | $ | 343,983,093 | | | | | | $ | 60,964,250 | |
Income receivable | | | | | | 4,079,940 | | | | | | | 731,973 | |
Receivable for shares sold | | | | | | 571,278 | | | | | | | 700,093 | |
Prepaid assets | | | | | | 23,150 | | | | | | | 13,452 | |
| | | | | | | | | | | | | | |
| | | | |
TOTAL ASSETS | | | | | | 348,657,461 | | | | | | | 62,409,768 | |
LIABILITIES: | | | | | | | | | | | | | | |
Payable for investments purchased | | | | | | 6,965,582 | | | | | | | — | |
Income distribution payable | | | | | | 554,039 | | | | | | | 80,732 | |
Payable for shares redeemed | | | | | | 272,332 | | | | | | | 3 | |
Payable for Trustees’ fees | | | | | | 8,880 | | | | | | | 8,880 | |
Payable for administration fees | | | | | | 8,218 | | | | | | | 1,506 | |
Payable for distribution services fees | | | | | | 4,998 | | | | | | | 1,500 | |
Payable for investment advisory fees | | | | | | 99,818 | | | | | | | 10,194 | |
Other accrued expenses | | | | | | 74,833 | | | | | | | 76,641 | |
| | | | | | | | | | | | | | |
TOTAL LIABILITIES | | | | | | 7,988,700 | | | | | | | 179,456 | |
| | | | |
NET ASSETS | | | | | $ | 340,668,761 | | | | | | $ | 62,230,312 | |
NET ASSETS CONSIST OF: | | | | | | | | | | | | | | |
Paid-in capital | | | | | $ | 344,600,299 | | | | | | $ | 62,502,131 | |
Distributable earnings (loss) | | | | | | (3,931,538 | ) | | | | | | (271,819 | ) |
| | | | | | | | | | | | | | |
| | | | |
TOTAL NET ASSETS | | | | | $ | 340,668,761 | | | | | | $ | 62,230,312 | |
COMPUTATION OF NET ASSET VALUE AND OFFERING PRICE: | | | | | | | | | | | | | | |
Class A | | | | | | | | | | | | | | |
Net Assets | | | | | $ | 24,051,729 | | | | | | $ | 7,251,651 | |
| | | | | | | | | | | | | | |
Shares outstanding (unlimited shares authorized) | | | | | | 1,890,181 | | | | | | | 711,170 | |
| | | | | | | | | | | | | | |
Net Asset Value per share | | | | | $ | 12.72 | | | | | | $ | 10.20 | |
| | | | | | | | | | | | | | |
Offering Price per share* | | | | | $ | 13.32 | ** | | | | | $ | 10.68 | ** |
| | | | | | | | | | | | | | |
Class I | | | | | | | | | | | | | | |
Net Assets | | | | | $ | 316,617,032 | | | | | | $ | 54,978,661 | |
| | | | | | | | | | | | | | |
Shares outstanding (unlimited shares authorized) | | | | | | 24,872,195 | | | | | | | 5,388,257 | |
| | | | | | | | | | | | | | |
Net Asset Value and Offering Price per share | | | | | $ | 12.73 | | | | | | $ | 10.20 | |
| | | | | | | | | | | | | | |
| * | See “How are Shares Priced?” in the Prospectus. |
| ** | Computation of offering price per share: 100/95.50 of net asset value. |
See Notes which are an integral part of the Financial Statements
April 30, 2020 / ANNUAL REPORT
| | |
| STATEMENTS OF OPERATIONS | | 56 |
| | | | | | | | | | | | | | | | | | | | | | | | |
| | | | | Wilmington | | | | Wilmington | | | | Wilmington |
| | | | | Broad Market | | | | Intermediate-Term | | | | Short-Term |
| Year Ended April 30, 2020 | | | | Bond Fund | | | | Bond Fund | | | | Bond Fund |
INVESTMENT INCOME: | | | | | | | | | | | | | | | | | | | | | | | | |
Dividends | | | | | $ | 246,802 | | | | | | $ | 20,807 | | | | | | | | | $ | 23,076 | |
Interest | | | | | | 14,749,975 | | | | | | | 1,581,280 | | | | | | | | | | 1,208,431 | |
Securities lending income, net | | | | | | 30,955 | | | | | | | 2,362 | | | | | | | | | | 4,287 | |
| | | | | | | | | | | | | | | | | | | | | | | | |
| | | | | | |
TOTAL INVESTMENT INCOME | | | | | | 15,027,732 | | | | | | | 1,604,449 | | | | | | | | | | 1,235,794 | |
EXPENSES: | | | | | | | | | | | | | | | | | | | | | | | | |
Investment advisory fees | | | | | | 2,342,403 | | | | | | | 265,364 | | | | | | | | | | 198,715 | |
Administration fees | | | | | | 160,074 | | | | | | | 18,166 | | | | | | | | | | 15,277 | |
Portfolio accounting and administration fees | | | | | | 114,153 | | | | | | | 32,484 | | | | | | | | | | 29,556 | |
Transfer and dividend disbursing agent fees and expenses | | | | | | 84,252 | | | | | | | 2,799 | | | | | | | | | | 5,529 | |
Trustees’ fees | | | | | | 54,269 | | | | | | | 54,346 | | | | | | | | | | 54,359 | |
Professional fees | | | | | | 89,408 | | | | | | | 88,979 | | | | | | | | | | 88,747 | |
Distribution services fee—Class A | | | | | | 7,373 | | | | | | | 4,268 | | | | | | | | | | 14,159 | |
Shareholder services fee—Class A | | | | | | 7,373 | | | | | | | 4,268 | | | | | | | | | | 14,159 | |
Shareholder services fee— Class I | | | | | | 1,293,960 | | | | | | | 143,156 | | | | | | | | | | 110,038 | |
Share registration costs | | | | | | 39,557 | | | | | | | 32,518 | | | | | | | | | | 34,416 | |
Printing and postage | | | | | | 18,025 | | | | | | | 3,460 | | | | | | | | | | 3,808 | |
Custodian fees | | | | | | 12,047 | | | | | | | 3,174 | | | | | | | | | | 6,168 | |
Miscellaneous | | | | | | 61,671 | | | | | | | 29,915 | | | | | | | | | | 28,134 | |
| | | | | | | | | | | | | | | | | | | | | | | | |
| | | | | | |
TOTAL EXPENSES | | | | | | 4,284,565 | | | | | | | 682,897 | | | | | | | | | | 603,065 | |
WAIVERS AND REIMBURSEMENTS: | | | | | | | | | | | | | | | | | | | | | | | | |
Waiver/reimbursement by investment advisor | | | | | | (425,246 | ) | | | | | | (242,253 | ) | | | | | | | | | (226,251 | ) |
Waiver of shareholder services fee—Class A | | | | | | (4,730 | ) | | | | | | (3,300 | ) | | | | | | | | | (14,159 | ) |
Waiver of shareholder services fee—Class I | | | | | | (1,293,960 | ) | | | | | | (143,156 | ) | | | | | | | | | (110,038 | ) |
| | | | | | | | | | | | | | | | | | | | | | | | |
| | | | | | |
TOTAL WAIVERS AND REIMBURSEMENTS | | | | | | (1,723,936 | ) | | | | | | (388,709 | ) | | | | | | | | | (350,448 | ) |
Net expenses | | | | | | 2,560,629 | | | | | | | 294,188 | | | | | | | | | | 252,617 | |
| | | | | | | | | | | | | | | | | | | | | | | | |
Net investment income | | | | | | 12,467,103 | | | | | | | 1,310,261 | | | | | | | | | | 983,177 | |
| | | | | | | | | | | | | | | | | | | | | | | | |
REALIZED AND UNREALIZED GAIN (LOSS) ON INVESTMENTS: | | | | | | | | | | | | | | | | | | | | | | | | |
Net realized gain (loss) on investments | | | | | | 3,339,184 | | | | | | | 980,351 | | | | | | | | | | 321,471 | |
Net change in unrealized appreciation (depreciation) of investments | | | | | | 31,263,726 | | | | | | | 1,645,505 | | | | | | | | | | 686,722 | |
| | | | | | | | | | | | | | | | | | | | | | | | |
Net realized and unrealized gain (loss) on investments | | | | | | 34,602,910 | | | | | | | 2,625,856 | | | | | | | | | | 1,008,193 | |
| | | | | | | | | | | | | | | | | | | | | | | | |
Change in net assets resulting from operations | | | | | $ | 47,070,013 | | | | | | $ | 3,936,117 | | | | | | | | | $ | 1,991,370 | |
| | | | | | | | | | | | | | | | | | | | | | | | |
See Notes which are an integral part of the Financial Statements
ANNUAL REPORT / April 30, 2020
| | |
| 57 | | STATEMENTS OF OPERATIONS (concluded) |
| | | | | | | | | | | | |
| | | |
| Year Ended April 30, 2020 | | | | Wilmington
Municipal Bond
Fund | | Wilmington
New York
Municipal Bond
Fund |
INVESTMENT INCOME: | | | | | | | | | | | | |
Dividends | | | | | $ | 174,576 | | | | $ | 40,124 | |
Interest | | | | | | 7,702,104 | | | | | 1,373,302 | |
| | | | | | | | | | | | |
| | | |
TOTAL INVESTMENT INCOME | | | | | | 7,876,680 | | | | | 1,413,426 | |
| | | | | | | | | | | | |
EXPENSES: | | | | | | | | | | | | |
Investment advisory fees | | | | | | 1,345,922 | | | | | 282,714 | |
Administration fees | | | | | | 91,926 | | | | | 19,319 | |
Portfolio accounting and administration fees | | | | | | 75,516 | | | | | 28,058 | |
Transfer and dividend disbursing agent fees and expenses | | | | | | 15,109 | | | | | 10,668 | |
Trustees’ fees | | | | | | 54,269 | | | | | 54,269 | |
Professional fees | | | | | | 89,625 | | | | | 87,461 | |
Distribution services fee—Class A | | | | | | 64,707 | | | | | 20,177 | |
Shareholder services fee—Class A | | | | | | 64,707 | | | | | 20,177 | |
Shareholder services fee— Class I | | | | | | 683,026 | | | | | 136,886 | |
Share registration costs | | | | | | 33,676 | | | | | 11,288 | |
Printing and postage | | | | | | 6,765 | | | | | 5,651 | |
Custodian fees | | | | | | 5,683 | | | | | 1,533 | |
Miscellaneous | | | | | | 44,893 | | | | | 28,918 | |
| | | | | | | | | | | | |
| | | |
TOTAL EXPENSES | | | | | | 2,575,824 | | | | | 707,119 | |
| | | | | | | | | | | | |
WAIVERS AND REIMBURSEMENTS: | | | | | | | | | | | | |
Waiver/reimbursement by investment advisor | | | | | | (297,827 | ) | | | | (169,621 | ) |
Waiver of shareholder services fee—Class A | | | | | | (64,707 | ) | | | | (20,177 | ) |
Waiver of shareholder services fee—Class I | | | | | | (683,026 | ) | | | | (136,886 | ) |
| | | | | | | | | | | | |
| | | |
TOTAL WAIVERS AND REIMBURSEMENTS | | | | | | (1,045,560 | ) | | | | (326,684 | ) |
| | | | | | | | | | | | |
Net expenses | | | | | | 1,530,264 | | | | | 380,435 | |
| | | | | | | | | | | | |
Net investment income | | | | | | 6,346,416 | | | | | 1,032,991 | |
| | | | | | | | | | | | |
REALIZED AND UNREALIZED GAIN (LOSS) ON INVESTMENTS: | | | | | | | | | | | | |
Net realized gain (loss) on investments | | | | | | 6,015,567 | | | | | 714,111 | |
Net change in unrealized appreciation (depreciation) of investments | | | | | | (12,257,840 | ) | | | | (1,682,471 | ) |
| | | | | | | | | | | | |
Net realized and unrealized gain (loss) on investments | | | | | | (6,242,273 | ) | | | | (968,360 | ) |
| | | | | | | | | | | | |
Change in net assets resulting from operations | | | | | $ | 104,143 | | | | $ | 64,631 | |
| | | | | | | | | | | | |
See Notes which are an integral part of the Financial Statements
April 30, 2020 / ANNUAL REPORT
| | |
| STATEMENTS OF CHANGES IN NET ASSETS | | 58 |
| | | | | | | | | | | | | | | | | | | | |
| | | Wilmington | | Wilmington |
| | | Broad Market Bond Fund | | Intermediate-Term Bond Fund |
| | | | |
| | | Year Ended | | Year Ended | | Year Ended | | Year Ended |
| | | April 30, | | April 30, | | April 30, | | April 30, |
| | | 2020 | | 2019 | | 2020 | | 2019 |
OPERATIONS: | | | | | | | | | | | | | | | | | | | | |
Net investment income | | | $ | 12,467,103 | | | | $ | 13,175,485 | | | | $ | 1,310,261 | | | | $ | 1,811,963 | |
Net realized gain (loss) on investments | | | | 3,339,184 | | | | | (210,718 | ) | | | | 980,351 | | | | | (117,168 | ) |
Net change in unrealized appreciation (depreciation) of investments | | | | 31,263,726 | | | | | 12,270,089 | | | | | 1,645,505 | | | | | 1,969,325 | |
| | | | | | | | | | | | | | | | | | | | |
Change in net assets resulting from operations | | | | 47,070,013 | | | | | 25,234,856 | | | | | 3,936,117 | | | | | 3,664,120 | |
| | | | | | | | | | | | | | | | | | | | |
DISTRIBUTIONS TO SHAREHOLDERS: | | | | | | | | | | | | | | | | | | | | |
Class A | | | | (64,387 | ) | | | | (87,962 | ) | | | | (42,342 | ) | | | | (36,299 | ) |
Class I | | | | (13,059,554 | ) | | | | (13,596,859 | ) | | | | (1,594,387 | ) | | | | (1,809,742 | ) |
| | | | | | | | | | | | | | | | | | | | |
| | | | |
Total distributions to shareholders | | | | (13,123,941 | ) | | | | (13,684,821 | ) | | | | (1,636,729 | ) | | | | (1,846,041 | ) |
| | | | | | | | | | | | | | | | | | | | |
SHARE TRANSACTIONS: | | | | | | | | | | | | | | | | | | | | |
Proceeds from sale of shares | | | | | | | | | | | | | | | | | | | | |
Class A | | | | 535,517 | | | | | 15,826 | | | | | — | | | | | 359 | |
Class I | | | | 173,643,574 | | | | | 111,038,909 | | | | | 8,082,186 | | | | | 12,729,774 | |
Distributions reinvested | | | | | | | | | | | | | | | | | | | | |
Class A | | | | 46,198 | | | | | 69,504 | | | | | 33,152 | | | | | 28,655 | |
Class I | | | | 7,046,793 | | | | | 8,173,357 | | | | | 786,619 | | | | | 616,863 | |
Cost of shares redeemed | | | | | | | | | | | | | | | | | | | | |
Class A | | | | (1,044,490 | ) | | | | (731,398 | ) | | | | (312,432 | ) | | | | (219,873 | ) |
Class I | | | | (222,700,202 | ) | | | | (93,536,419 | ) | | | | (39,612,198 | ) | | | | (20,953,089 | ) |
| | | | | | | | | | | | | | | | | | | | |
Change in net assets resulting from share transactions | | | | (42,472,610 | ) | | | | 25,029,779 | | | | | (31,022,673 | ) | | | | (7,797,311 | ) |
| | | | | | | | | | | | | | | | | | | | |
Change in net assets | | | | (8,526,538 | ) | | | | 36,579,814 | | | | | (28,723,285 | ) | | | | (5,979,232 | ) |
NET ASSETS: | | | | | | | | | | | | | | | | | | | | |
Beginning of year | | | | 547,593,316 | | | | | 511,013,502 | | | | | 78,234,066 | | | | | 84,213,298 | |
| | | | | | | | | | | | | | | | | | | | |
End of year | | | $ | 539,066,778 | | | | $ | 547,593,316 | | | | $ | 49,510,781 | | | | $ | 78,234,066 | |
| | | | | | | | | | | | | | | | | | | | |
SHARES OF BENEFICIAL INTEREST: | | | | | | | | | | | | | | | | | | | | |
Shares sold | | | | | | | | | | | | | | | | | | | | |
Class A | | | | 52,652 | | | | | 1,685 | | | | | — | | | | | 37 | |
Class I | | | | 17,484,936 | | | | | 11,871,262 | | | | | 805,727 | | | | | 1,322,236 | |
Distributions reinvested | | | | | | | | | | | | | | | | | | | | |
Class A | | | | 4,567 | | | | | 7,288 | | | | | 3,303 | | | | | 2,972 | |
Class I | | | | 709,331 | | | | | 871,124 | | | | | 78,410 | | | | | 63,957 | |
Shares redeemed | | | | | | | | | | | | | | | | | | | | |
Class A | | | | (105,610 | ) | | | | (76,924 | ) | | | | (31,017 | ) | | | | (22,837 | ) |
Class I | | | | (22,708,456 | ) | | | | (9,994,150 | ) | | | | (3,974,501 | ) | | | | (2,178,321 | ) |
| | | | | | | | | | | | | | | | | | | | |
Net change in shares outstanding | | | | (4,562,580 | ) | | | | 2,680,285 | | | | | (3,118,078 | ) | | | | (811,956 | ) |
| | | | | | | | | | | | | | | | | | | | |
See Notes which are an integral part of the Financial Statements
ANNUAL REPORT / April 30, 2020
| | |
| 59 | | STATEMENTS OF CHANGES IN NET ASSETS (continued) |
| | | | | | | | | | | | | | | | | | | | |
| | | Wilmington Short-Term Bond Fund | | Wilmington Municipal Bond Fund |
| | | | |
| | | Year Ended
April 30, 2020 | | Year Ended April 30, 2019 | | Year Ended
April 30, 2020 | | Year Ended
April 30, 2019 |
OPERATIONS: | | | | | | | | | | | | | | | | | | | | |
Net investment income | | | $ | 983,177 | | | | $ | 952,231 | | | | $ | 6,346,416 | | | | $ | 6,416,840 | |
Net realized gain (loss) on investments | | | | 321,471 | | | | | (38,585 | ) | | | | 6,015,567 | | | | | (1,107,171 | ) |
Net change in unrealized appreciation (depreciation) of investments | | | | 686,722 | | | | | 597,429 | | | | | (12,257,840 | ) | | | | 10,793,163 | |
| | | | | | | | | | | | | | | | | | | | |
Change in net assets resulting from operations | | | | 1,991,370 | | | | | 1,511,075 | | | | | 104,143 | | | | | 16,102,832 | |
| | | | | | | | | | | | | | | | | | | | |
DISTRIBUTIONS TO SHAREHOLDERS: | | | | | | | | | | | | | | | | | | | | |
Class A | | | | (103,114 | ) | | | | (99,944 | ) | | | | (897,121 | ) | | | | (563,006 | ) |
Class I | | | | (911,687 | ) | | | | (895,616 | ) | | | | (10,143,822 | ) | | | | (5,853,785 | ) |
| | | | | | | | | | | | | | | | | | | | |
Total distributions to shareholders | | | | (1,014,801 | ) | | | | (995,560 | ) | | | | (11,040,943 | ) | | | | (6,416,791 | ) |
| | | | | | | | | | | | | | | | | | | | |
SHARE TRANSACTIONS: | | | | | | | | | | | | | | | | | | | | |
Proceeds from sale of shares | | | | | | | | | | | | | | | | | | | | |
Class A | | | | 1,023,822 | | | | | 74,892 | | | | | 1,158,841 | | | | | 1,699,985 | |
Class I | | | | 9,978,636 | | | | | 5,708,451 | | | | | 125,486,757 | | | | | 63,656,782 | |
Distributions reinvested | | | | | | | | | | | | | | | | | | | | |
Class A | | | | 55,577 | | | | | 58,683 | | | | | 612,894 | | | | | 388,942 | |
Class I | | | | 683,168 | | | | | 670,649 | | | | | 4,834,614 | | | | | 1,213,440 | |
Cost of shares redeemed | | | | | | | | | | | | | | | | | | | | |
Class A | | | | (589,051 | ) | | | | (669,577 | ) | | | | (5,875,324 | ) | | | | (3,105,599 | ) |
Class I | | | | (13,511,420 | ) | | | | (8,450,775 | ) | | | | (64,462,561 | ) | | | | (72,732,636 | ) |
| | | | | | | | | | | | | | | | | | | | |
Change in net assets resulting from share transactions | | | | (2,359,268 | ) | | | | (2,607,677 | ) | | | | 61,755,221 | | | | | (8,879,086 | ) |
| | | | | | | | | | | | | | | | | | | | |
Change in net assets | | | | (1,382,699 | ) | | | | (2,092,162 | ) | | | | 50,818,421 | | | | | 806,955 | |
NET ASSETS: | | | | | | | | | | | | | | | | | | | | |
Beginning of year | | | | 50,190,103 | | | | | 52,282,265 | | | | | 289,850,340 | | | | | 289,043,385 | |
| | | | | | | | | | | | | | | | | | | | |
End of year | | | $ | 48,807,404 | | | | $ | 50,190,103 | | | | $ | 340,668,761 | | | | $ | 289,850,340 | |
| | | | | | | | | | | | | | | | | | | | |
SHARES OF BENEFICIAL INTEREST: | | | | | | | | | | | | | | | | | | | | |
Shares sold | | | | | | | | | | | | | | | | | | | | |
Class A | | | | 101,662 | | | | | 7,559 | | | | | 86,244 | | | | | 130,470 | |
Class I | | | | 992,906 | | | | | 578,127 | | | | | 9,669,481 | | | | | 4,924,521 | |
Distributions reinvested | | | | | | | | | | | | | | | | | | | | |
Class A | | | | 5,524 | | | | | 5,942 | | | | | 45,846 | | | | | 30,050 | |
Class I | | | | 67,892 | | | | | 67,894 | | | | | 362,237 | | | | | 93,733 | |
Shares redeemed | | | | | | | | | | | | | | | | | | | | |
Class A | | | | (58,587 | ) | | | | (67,813 | ) | | | | (438,848 | ) | | | | (240,855 | ) |
Class I | | | | (1,341,738 | ) | | | | (856,513 | ) | | | | (4,875,090 | ) | | | | (5,629,723 | ) |
| | | | | | | | | | | | | | | | | | | | |
Net change in shares outstanding | | | | (232,341 | ) | | | | (264,804 | ) | | | | 4,849,870 | | | | | (691,804 | ) |
| | | | | | | | | | | | | | | | | | | | |
See Notes which are an integral part of the Financial Statements
April 30, 2020 / ANNUAL REPORT
| | |
| STATEMENTS OF CHANGES IN NET ASSETS (concluded) | | 60 |
| | | | | | | | | | | | | | | |
| | | Wilmington New York Municipal Bond Fund |
| | | |
| | | Year Ended
April 30, 2020 | | | | Year Ended April 30, 2019 |
OPERATIONS: | | | | | | | | | | | | | | | |
Net investment income | | | $ | 1,032,991 | | | | | | | | | $ | 1,137,338 | |
Net realized gain (loss) on investments | | | | 714,111 | | | | | | | | | | (111,847 | ) |
Net change in unrealized appreciation (depreciation) of investments | | | | (1,682,471 | ) | | | | | | | | | 2,335,071 | |
| | | | | | | | | | | | | | | |
Change in net assets resulting from operations | | | | 64,631 | | | | | | | | | | 3,360,562 | |
| | | | | | | | | | | | | | | |
DISTRIBUTIONS TO SHAREHOLDERS: | | | | | | | | | | | | | | | |
Class A | | | | (168,791 | ) | | | | | | | | | (299,755 | ) |
Class I | | | | (1,288,518 | ) | | | | | | | | | (1,557,516 | ) |
| | | | | | | | | | | | | | | |
Total distributions to shareholders | | | | (1,457,309 | ) | | | | | | | | | (1,857,271 | ) |
| | | | | | | | | | | | | | | |
SHARE TRANSACTIONS: | | | | | | | | | | | | | | | |
Proceeds from sale of shares | | | | | | | | | | | | | | | |
Class A | | | | 79,147 | | | | | | | | | | 9,751 | |
Class I | | | | 13,716,192 | | | | | | | | | | 9,899,212 | |
Distributions reinvested | | | | | | | | | | | | | | | |
Class A | | | | 120,538 | | | | | | | | | | 214,690 | |
Class I | | | | 919,727 | | | | | | | | | | 1,113,821 | |
Cost of shares redeemed | | | | | | | | | | | | | | | |
Class A | | | | (1,430,945 | ) | | | | | | | | | (6,678,046 | ) |
Class I | | | | (11,791,130 | ) | | | | | | | | | (15,542,310 | ) |
| | | | | | | | | | | | | | | |
Change in net assets resulting from share transactions | | | | 1,613,529 | | | | | | | | | | (10,982,882 | ) |
| | | | | | | | | | | | | | | |
Change in net assets | | | | 220,851 | | | | | | | | | | (9,479,591 | ) |
NET ASSETS: | | | | | | | | | | | | | | | |
Beginning of year | | | | 62,009,461 | | | | | | | | | | 71,489,052 | |
| | | | | | | | | | | | | | | |
End of year | | | $ | 62,230,312 | | | | | | | | | $ | 62,009,461 | |
| | | | | | | | | | | | | | | |
SHARES OF BENEFICIAL INTEREST: | | | | | | | | | | | | | | | |
Shares sold | | | | | | | | | | | | | | | |
Class A | | | | 7,486 | | | | | | | | | | 951 | |
Class I | | | | 1,308,297 | | | | | | | | | | 963,442 | |
Distributions reinvested | | | | | | | | | | | | | | | |
Class A | | | | 11,368 | | | | | | | | | | 21,050 | |
Class I | | | | 86,687 | | | | | | | | | | 109,095 | |
Shares redeemed | | | | | | | | | | | | | | | |
Class A | | | | (135,330 | ) | | | | | | | | | (654,431 | ) |
Class I | | | | (1,122,548 | ) | | | | | | | | | (1,516,450 | ) |
| | | | | | | | | | | | | | | |
Net change in shares outstanding | | | | 155,960 | | | | | | | | | | (1,076,343 | ) |
| | | | | | | | | | | | | | | |
See Notes which are an integral part of the Financial Statements
ANNUAL REPORT / April 30, 2020
For a share outstanding throughout each year ended April 30, unless otherwise noted:
|
WILMINGTON BROAD MARKET BOND FUND |
| | | | | | | | | | | | | | | | | | | | |
| CLASS A | | Year Ended
April 30, 2020 | | Year Ended
April 30, 2019 | | Year Ended
April 30, 2018 | | Year Ended
April 30, 2017 | | Year Ended April 30, 2016 |
Net Asset Value, Beginning of Year | | | $9.71 | | | | $9.51 | | | | $9.78 | | | | $9.94 | | | | $9.95 | |
Income (Loss) From Operations: | | | | | | | | | | | | | | | | | | | | |
Net Investment Income(a) | | | 0.21 | | | | 0.21 | | | | 0.18 | | | | 0.16 | | | | 0.18 | |
Net Realized and Unrealized Gain (Loss) on Investments | | | 0.69 | | | | 0.21 | | | | (0.26 | ) | | | (0.14 | ) | | | 0.02 | |
Total Income (Loss) From Operations | | | 0.90 | | | | 0.42 | | | | (0.08 | ) | | | 0.02 | | | | 0.20 | |
Less Distributions From: | | | | | | | | | | | | | | | | | | | | |
Net Investment Income | | | (0.22 | ) | | | (0.22 | ) | | | (0.19 | ) | | | (0.18 | ) | | | (0.20 | ) |
Net Realized Gains | | | — | | | | — | | | | — | | | | — | | | | (0.01 | ) |
Total Distributions | | | (0.22 | ) | | | (0.22 | ) | | | (0.19 | ) | | | (0.18 | ) | | | (0.21 | ) |
Net Asset Value, End of Year | | | $10.39 | | | | $9.71 | | | | $9.51 | | | | $9.78 | | | | $9.94 | |
| | | | | | | | | | | | | | | | | | | | |
Total Return(b) | | | 9.35 | % | | | 4.45 | % | | | (0.81 | )% | | | 0.22 | % | | | 2.03 | % |
Net Assets, End of Year (000’s) | | | $3,242 | | | | $3,501 | | | | $4,074 | | | | $4,503 | | | | $5,206 | |
Ratios to Average Net Assets | | | | | | | | | | | | | | | | | | | | |
Gross Expense(c) | | | 1.07 | % | | | 1.08 | % | | | 1.09 | % | | | 1.09 | % | | | 1.10 | % |
Net Expenses(c)(d) | | | 0.83 | % | | | 0.83 | % | | | 0.87 | % | | | 0.89 | % | | | 0.88 | % |
Net Investment Income | | | 2.06 | % | | | 2.18 | % | | | 1.82 | % | | | 1.62 | % | | | 1.85 | % |
Portfolio Turnover Rate | | | 46 | % | | | 36 | % | | | 34 | % | | | 32 | % | | | 44 | % |
| | | | | | | | | | | | | | | | | | | | |
| CLASS I | | Year Ended
April 30, 2020 | | Year Ended
April 30, 2019 | | Year Ended
April 30, 2018 | | Year Ended
April 30, 2017 | | Year Ended
April 30, 2016 |
Net Asset Value, Beginning of Year | | | $9.55 | | | | $9.35 | | | | $9.62 | | | | $9.78 | | | | $9.79 | |
Income (Loss) From Operations: | | | | | | | | | | | | | | | | | | | | |
Net Investment Income(a) | | | 0.24 | | | | 0.24 | | | | 0.21 | | | | 0.19 | | | | 0.21 | |
Net Realized and Unrealized Gain (Loss) on Investments | | | 0.68 | | | | 0.21 | | | | (0.26 | ) | | | (0.14 | ) | | | 0.02 | |
Total Income (Loss) From Operations | | | 0.92 | | | | 0.45 | | | | (0.05 | ) | | | 0.05 | | | | 0.23 | |
Less Distributions From: | | | | | | | | | | | | | | | | | | | | |
Net Investment Income | | | (0.25 | ) | | | (0.25 | ) | | | (0.22 | ) | | | (0.21 | ) | | | (0.23 | ) |
Net Realized Gains | | | — | | | | — | | | | — | | | | — | | | | (0.01 | ) |
Total Distributions | | | (0.25 | ) | | | (0.25 | ) | | | (0.22 | ) | | | (0.21 | ) | | | (0.24 | ) |
Net Asset Value, End of Year | | | $10.22 | | | | $9.55 | | | | $9.35 | | | | $9.62 | | | | $9.78 | |
| | | | | | | | | | | | | | | | | | | | |
Total Return(b) | | | 9.74 | % | | | 4.84 | % | | | (0.52 | )% | | | 0.54 | % | | | 2.38 | % |
Net Assets, End of Year (000’s) | | | $535,825 | | | | $544,092 | | | | $506,940 | | | | $503,184 | | | | $409,975 | |
Ratios to Average Net Assets | | | | | | | | | | | | | | | | | | | | |
Gross Expense(c) | | | 0.82 | % | | | 0.83 | % | | | 0.84 | % | | | 0.84 | % | | | 0.85 | % |
Net Expenses(c)(d) | | | 0.49 | % | | | 0.49 | % | | | 0.53 | % | | | 0.55 | % | | | 0.55 | % |
Net Investment Income | | | 2.40 | % | | | 2.52 | % | | | 2.18 | % | | | 1.96 | % | | | 2.15 | % |
Portfolio Turnover Rate | | | 46 | % | | | 36 | % | | | 34 | % | | | 32 | % | | | 44 | % |
| (a) | Per share numbers have been calculated using the average shares method. |
| (b) | Based on net asset value, which does not reflect the sales charge or contingent deferred sales charge, if applicable. Total returns for periods of less than one year, if any, are not annualized. |
| (c) | The Fund invests in other underlying funds and indirectly bears its proportionate share of fees and expenses incurred by the underlying funds in which the Fund is invested. This ratio does not include these indirect fees and expenses. |
| (d) | The investment advisor and other service providers waived or reimbursed a portion of their fees. |
See Notes which are an integral part of the Financial Statements
April 30, 2020 / ANNUAL REPORT
| | |
| FINANCIAL HIGHLIGHTS (continued) | | 62 |
For a share outstanding throughout each year ended April 30, unless otherwise noted:
| | | | | | | | | | |
WILMINGTON INTERMEDIATE-TERM BOND FUND |
| | | | | | | | | | | | | | | | | | | | |
| CLASS A | | Year Ended
April 30, 2020 | | Year Ended
April 30, 2019 | | Year Ended
April 30, 2018 | | Year Ended
April 30, 2017 | | Year Ended
April 30, 2016 |
Net Asset Value, Beginning of Year | | | $9.81 | | | | $9.58 | | | | $9.88 | | | | $10.01 | | | | $10.02 | |
Income (Loss) From Operations: | | | | | | | | | | | | | | | | | | | | |
Net Investment Income(a) | | | 0.19 | | | | 0.19 | | | | 0.16 | | | | 0.13 | | | | 0.13 | |
Net Realized and Unrealized Gain (Loss) on Investments | | | 0.44 | | | | 0.23 | | | | (0.27 | ) | | | (0.12 | ) | | | 0.03 | |
Total Income (Loss) From Operations | | | 0.63 | | | | 0.42 | | | | (0.11 | ) | | | 0.01 | | | | 0.16 | |
Less Distributions From: | | | | | | | | | | | | | | | | | | | | |
Net Investment Income | | | (0.19 | ) | | | (0.19 | ) | | | (0.16 | ) | | | (0.13 | ) | | | (0.13 | ) |
Net Realized Gains | | | (0.06 | ) | | | 0.00 | (b) | | | (0.03 | ) | | | (0.01 | ) | | | (0.04 | ) |
Total Distributions | | | (0.25 | ) | | | (0.19 | ) | | | (0.19 | ) | | | (0.14 | ) | | | (0.17 | ) |
Net Asset Value, End of Year | | | $10.19 | | | | $9.81 | | | | $9.58 | | | | $9.88 | | | | $10.01 | |
| | | | | | | | | | | | | | | | | | | | |
Total Return(c) | | | 6.49 | % | | | 4.47 | % | | | (1.14 | )% | | | 0.16 | % | | | 1.62 | % |
Net Assets, End of Year (000’s) | | | $1,550 | | | | $1,763 | | | | $1,912 | | | | $2,765 | | | | $3,509 | |
Ratios to Average Net Assets | | | | | | | | | | | | | | | | | | | | |
Gross Expense(d) | | | 1.40 | % | | | 1.32 | % | | | 1.26 | % | | | 1.18 | % | | | 1.18 | % |
Net Expenses(d)(e) | | | 0.80 | % | | | 0.80 | % | | | 0.83 | % | | | 0.86 | % | | | 0.85 | % |
Net Investment Income | | | 1.92 | % | | | 1.96 | % | | | 1.65 | % | | | 1.32 | % | | | 1.34 | % |
Portfolio Turnover Rate | | | 35 | % | | | 25 | % | | | 30 | % | | | 39 | % | | | 32 | % |
| | | | | | | | | | | | | | | | | | | | |
| CLASS I | | Year Ended
April 30, 2020 | | Year Ended
April 30, 2019 | | Year Ended
April 30, 2018 | | Year Ended
April 30, 2017 | | Year Ended
April 30, 2016 |
Net Asset Value, Beginning of Year | | | $9.81 | | | | $9.59 | | | | $9.88 | | | | $10.02 | | | | $10.03 | |
Income (Loss) From Operations: | | | | | | | | | | | | | | | | | | | | |
Net Investment Income(a) | | | 0.22 | | | | 0.22 | | | | 0.19 | | | | 0.17 | | | | 0.17 | |
Net Realized and Unrealized Gain (Loss) on Investments | | | 0.45 | | | | 0.22 | | | | (0.26 | ) | | | (0.13 | ) | | | 0.03 | |
Total Income (Loss) From Operations | | | 0.67 | | | | 0.44 | | | | (0.07 | ) | | | 0.04 | | | | 0.20 | |
Less Distributions From: | | | | | | | | | | | | | | | | | | | | |
Net Investment Income | | | (0.22 | ) | | | (0.22 | ) | | | (0.19 | ) | | | (0.17 | ) | | | (0.17 | ) |
Net Realized Gains | | | (0.06 | ) | | | 0.00 | (b) | | | (0.03 | ) | | | (0.01 | ) | | | (0.04 | ) |
Total Distributions | | | (0.28 | ) | | | (0.22 | ) | | | (0.22 | ) | | | (0.18 | ) | | | (0.21 | ) |
Net Asset Value, End of Year | | | $10.20 | | | | $9.81 | | | | $9.59 | | | | $9.88 | | | | $10.02 | |
| | | | | | | | | | | | | | | | | | | | |
Total Return(c) | | | 6.92 | % | | | 4.68 | % | | | (0.72 | )% | | | 0.40 | % | | | 1.94 | % |
Net Assets, End of Year (000’s) | | | $47,961 | | | | $76,471 | | | | $82,301 | | | | $127,103 | | | | $120,406 | |
Ratios to Average Net Assets | | | | | | | | | | | | | | | | | | | | |
Gross Expense(d) | | | 1.15 | % | | | 1.07 | % | | | 1.01 | % | | | 0.93 | % | | | 0.93 | % |
Net Expenses(d)(e) | | | 0.49 | % | | | 0.49 | % | | | 0.52 | % | | | 0.53 | % | | | 0.53 | % |
Net Investment Income | | | 2.23 | % | | | 2.26 | % | | | 1.96 | % | | | 1.66 | % | | | 1.66 | % |
Portfolio Turnover Rate | | | 35 | % | | | 25 | % | | | 30 | % | | | 39 | % | | | 32 | % |
| (a) | Per share numbers have been calculated using the average shares method. |
| (b) | Represents less than $0.005. |
| (c) | Based on net asset value, which does not reflect the sales charge or contingent deferred sales charge, if applicable. Total returns for periods of less than one year, if any, are not annualized. |
| (d) | The Fund invests in other underlying funds and indirectly bears its proportionate share of fees and expenses incurred by the underlying funds in which the Fund is invested. This ratio does not include these indirect fees and expenses. |
| (e) | The investment advisor and other service providers waived or reimbursed a portion of their fees. |
See Notes which are an integral part of the Financial Statements
ANNUAL REPORT / April 30, 2020
| | |
| 63 | | FINANCIAL HIGHLIGHTS (continued) |
For a share outstanding throughout each year ended April 30, unless otherwise noted:
| | | | | | | | | | | | | | | | | | | | | | | | | |
WILMINGTON SHORT-TERM BOND FUND | |
| | | | | | | | | | | | | | | | | | | | | | | | | |
| CLASS A | | Year Ended
April 30, 2020 | | Year Ended
April 30, 2019 | | Year Ended
April 30, 2018 | | Year Ended
April 30, 2017 | | Year Ended
April 30, 2016 |
Net Asset Value, Beginning of Year | | | | $9.95 | | | | | $9.85 | | | | | $9.99 | | | | | $10.07 | | | | | $10.10 | |
Income (Loss) From Operations: | | | | | | | | | | | | | | | | | | | | | | | | | |
Net Investment Income(a) | | | | 0.18 | | | | | 0.16 | | | | | 0.12 | | | | | 0.10 | | | | | 0.07 | |
Net Realized and Unrealized Gain (Loss) on Investments | | | | 0.19 | | | | | 0.11 | | | | | (0.12 | ) | | | | (0.06 | ) | | | | 0.02 | |
Total Income (Loss) From Operations | | | | 0.37 | | | | | 0.27 | | | | | 0.00 | (b) | | | | 0.04 | | | | | 0.09 | |
Less Distributions From: | | | | | | | | | | | | | | | | | | | | | | | | | |
Net Investment Income | | | | (0.18 | ) | | | | (0.17 | ) | | | | (0.14 | ) | | | | (0.12 | ) | | | | (0.10 | ) |
Net Realized Gains | | | | — | | | | | — | | | | | — | | | | | — | | | | | (0.02 | ) |
Total Distributions | | | | (0.18 | ) | | | | (0.17 | ) | | | | (0.14 | ) | | | | (0.12 | ) | | | | (0.12 | ) |
Net Asset Value, End of Year | | | | $10.14 | | | | | $9.95 | | | | | $9.85 | | | | | $9.99 | | | | | $10.07 | |
| | | | | |
Total Return(c) | | | | 3.78 | % | | | | 2.79 | % | | | | (0.03 | )% | | | | 0.43 | % | | | | 0.87 | % |
Net Assets, End of Year (000’s) | | | | $6,094 | | | | | $5,494 | | | | | $5,973 | | | | | $6,628 | | | | | $7,796 | |
Ratios to Average Net Assets | | | | | | | | | | | | | | | | | | | | | | | | | |
Gross Expense(d) | | | | 1.43 | % | | | | 1.42 | % | | | | 1.37 | % | | | | 1.23 | % | | | | 1.11 | % |
Net Expenses(d)(e) | | | | 0.73 | % | | | | 0.73 | % | | | | 0.73 | % | | | | 0.73 | % | | | | 0.73 | % |
Net Investment Income | | | | 1.76 | % | | | | 1.65 | % | | | | 1.22 | % | | | | 0.96 | % | | | | 0.71 | % |
Portfolio Turnover Rate | | | | 140 | %(f) | | | | 67 | % | | | | 42 | % | | | | 72 | % | | | | 104 | % |
| CLASS I | | Year Ended
April 30, 2020 | | Year Ended
April 30, 2019 | | Year Ended
April 30, 2018 | | Year Ended
April 30, 2017 | | Year Ended
April 30, 2016 |
Net Asset Value, Beginning of Year | | | | $9.95 | | | | | $9.85 | | | | | $9.99 | | | | | $10.07 | | | | | $10.10 | |
Income (Loss) From Operations: | | | | | | | | | | | | | | | | | | | | | | | | | |
Net Investment Income(a) | | | | 0.20 | | | | | 0.19 | | | | | 0.15 | | | | | 0.12 | | | | | 0.10 | |
Net Realized and Unrealized Gain (Loss)on Investments | | | | 0.20 | | | | | 0.11 | | | | | (0.13 | ) | | | | (0.05 | ) | | | | 0.01 | |
Total Income (Loss) From Operations | | | | 0.40 | | | | | 0.30 | | | | | 0.02 | | | | | 0.07 | | | | | 0.11 | |
Less Distributions From: | | | | | | | | | | | | | | | | | | | | | | | | | |
Net Investment Income | | | | (0.21 | ) | | | | (0.20 | ) | | | | (0.16 | ) | | | | (0.15 | ) | | | | (0.12 | ) |
Net Realized Gains | | | | — | | | | | — | | | | | — | | | | | — | | | | | (0.02 | ) |
Total Distributions | | | | (0.21 | ) | | | | (0.20 | ) | | | | (0.16 | ) | | | | (0.15 | ) | | | | (0.14 | ) |
Net Asset Value, End of Year | | | | $10.14 | | | | | $9.95 | | | | | $9.85 | | | | | $9.99 | | | | | $10.07 | |
| | | | | |
Total Return(c) | | | | 4.04 | % | | | | 3.04 | % | | | | 0.22 | % | | | | 0.68 | % | | | | 1.12 | % |
Net Assets, End of Year (000’s) | | | | $42,713 | | | | | $44,696 | | | | | $46,309 | | | | | $64,706 | | | | | $160,541 | |
Ratios to Average Net Assets | | | | | | | | | | | | | | | | | | | | | | | | | |
Gross Expense(d) | | | | 1.19 | % | | | | 1.17 | % | | | | 1.11 | % | | | | 0.98 | % | | | | 0.86 | % |
Net Expenses(d)(e) | | | | 0.48 | % | | | | 0.48 | % | | | | 0.48 | % | | | | 0.48 | % | | | | 0.48 | % |
Net Investment Income | | | | 2.01 | % | | | | 1.90 | % | | | | 1.46 | % | | | | 1.19 | % | | | | 0.97 | % |
Portfolio Turnover Rate | | | | 140 | %(f) | | | | 67 | % | | | | 42 | % | | | | 72 | % | | | | 104 | % |
| (a) | Per share numbers have been calculated using the average shares method. |
| (b) | Represents less than $0.005. |
| (c) | Based on net asset value, which does not reflect the sales charge or contingent deferred sales charge, if applicable. Total returns for periods of less than one year, if any, are not annualized. |
| (d) | The Fund invests in other underlying funds and indirectly bears its proportionate share of fees and expenses incurred by the underlying funds in which the Fund is invested. This ratio does not include these indirect fees and expenses. |
| (e) | The investment advisor and other service providers waived or reimbursed a portion of their fees. |
| (f) | The rate for the fiscal year ended April 30, 2020 increased due to elevated trading activity required to take advantage of changing market conditions in the short-term fixed income market. |
See Notes which are an integral part of the Financial Statements
April 30, 2020 / ANNUAL REPORT
| | |
| FINANCIAL HIGHLIGHTS (continued) | | 64 |
For a share outstanding throughout each year ended April 30, unless otherwise noted:
|
WILMINGTON MUNICIPAL BOND FUND |
| | | | | | | | | | | | | | | | | | | | |
| CLASS A | | Year Ended
April 30, 2020 | | Year Ended
April 30, 2019 | | Year Ended
April 30, 2018 | | Year Ended
April 30, 2017 | | Year Ended
April 30, 2016 |
Net Asset Value, Beginning of Year | | | $13.22 | | | | $12.78 | | | | $13.14 | | | | $13.54 | | | | $13.41 | |
Income (Loss) From Operations: | | | | | | | | | | | | | | | | | | | | |
Net Investment Income(a) | | | 0.25 | | | | 0.26 | | | | 0.22 | | | | 0.22 | | | | 0.23 | |
Net Realized and Unrealized Gain (Loss) on Investments | | | (0.28 | ) | | | 0.44 | | | | (0.26 | ) | | | (0.31 | ) | | | 0.37 | |
Total Income (Loss) From Operations | | | (0.03 | ) | | | 0.70 | | | | (0.04 | ) | | | (0.09 | ) | | | 0.60 | |
Less Distributions From: | | | | | | | | | | | | | | | | | | | | |
Net Investment Income | | | (0.25 | ) | | | (0.26 | ) | | | (0.22 | ) | | | (0.22 | ) | | | (0.23 | ) |
Net Realized Gains | | | (0.22 | ) | | | — | | | | (0.10 | ) | | | (0.09 | ) | | | (0.24 | ) |
Total Distributions | | | (0.47 | ) | | | (0.26 | ) | | | (0.32 | ) | | | (0.31 | ) | | | (0.47 | ) |
Net Asset Value, End of Year | | | $12.72 | | | | $13.22 | | | | $12.78 | | | | $13.14 | | | | $13.54 | |
| | | | | | | | | | | | | | | | | | | | |
Total Return(b) | | | (0.36 | )% | | | 5.52 | % | | | (0.29 | )% | | | (0.65 | )% | | | 4.55 | % |
Net Assets, End of Year (000’s) | | | $24,052 | | | | $29,050 | | | | $29,109 | | | | $31,951 | | | | $38,182 | |
Ratios to Average Net Assets | | | | | | | | | | | | | | | | | | | | |
Gross Expense(c) | | | 1.09 | % | | | 1.10 | % | | | 1.10 | % | | | 1.09 | % | | | 1.09 | % |
Net Expenses(c)(d) | | | 0.74 | % | | | 0.74 | % | | | 0.74 | % | | | 0.74 | % | | | 0.74 | % |
Net Investment Income | | | 1.90 | % | | | 1.99 | % | | | 1.70 | % | | | 1.62 | % | | | 1.69 | % |
Portfolio Turnover Rate | | | 81 | % | | | 83 | % | | | 79 | % | | | 40 | % | | | 32 | % |
| | | | | | | | | | | | | | | | | | | | |
| CLASS I | | Year Ended
April 30, 2020 | | Year Ended
April 30, 2019 | | Year Ended
April 30, 2018 | | Year Ended
April 30, 2017 | | Year Ended
April 30, 2016 |
Net Asset Value, Beginning of Year | | | $13.23 | | | | $12.79 | | | | $13.15 | | | | $13.55 | | | | $13.42 | |
Income (Loss) From Operations: | | | | | | | | | | | | | | | | | | | | |
Net Investment Income(a) | | | 0.29 | | | | 0.29 | | | | 0.26 | | | | 0.25 | | | | 0.26 | |
Net Realized and Unrealized Gain (Loss)on Investments | | | (0.28 | ) | | | 0.44 | | | | (0.26 | ) | | | (0.31 | ) | | | 0.37 | |
Total Income (Loss) From Operations | | | 0.01 | | | | 0.73 | | | | 0.00 | (e) | | | (0.06 | ) | | | 0.63 | |
Less Distributions From: | | | | | | | | | | | | | | | | | | | | |
Net Investment Income | | | (0.29 | ) | | | (0.29 | ) | | | (0.26 | ) | | | (0.25 | ) | | | (0.26 | ) |
Net Realized Gains | | | (0.22 | ) | | | — | | | | (0.10 | ) | | | (0.09 | ) | | | (0.24 | ) |
Total Distributions | | | (0.51 | ) | | | (0.29 | ) | | | (0.36 | ) | | | (0.34 | ) | | | (0.50 | ) |
Net Asset Value, End of Year | | | $12.73 | | | | $13.23 | | | | $12.79 | | | | $13.15 | | | | $13.55 | |
| | | | | | | | | | | | | | | | | | | | |
Total Return(b) | | | (0.10 | )% | | | 5.78 | % | | | (0.03 | )% | | | (0.39 | )% | | | 4.81 | % |
Net Assets, End of Year (000’s) | | | $316,617 | | | | $260,800 | | | | $259,934 | | | | $263,825 | | | | $267,864 | |
Ratios to Average Net Assets | | | | | | | | | | | | | | | | | | | | |
Gross Expense(c) | | | 0.84 | % | | | 0.85 | % | | | 0.85 | % | | | 0.84 | % | | | 0.84 | % |
Net Expenses(c)(d) | | | 0.49 | % | | | 0.49 | % | | | 0.49 | % | | | 0.49 | % | | | 0.49 | % |
Net Investment Income | | | 2.14 | % | | | 2.24 | % | | | 1.95 | % | | | 1.87 | % | | | 1.94 | % |
Portfolio Turnover Rate | | | 81 | % | | | 83 | % | | | 79 | % | | | 40 | % | | | 32 | % |
| (a) | Per share numbers have been calculated using the average shares method. |
| (b) | Based on net asset value, which does not reflect the sales charge or contingent deferred sales charge, if applicable. Total returns for periods of less than one year, if any, are not annualized. |
| (c) | The Fund invests in other underlying funds and indirectly bears its proportionate share of fees and expenses incurred by the underlying funds in which the Fund is invested. This ratio does not include these indirect fees and expenses. |
| (d) | The investment advisor and other service providers waived or reimbursed a portion of their fees. |
| (e) | Represents less than $0.005. |
See Notes which are an integral part of the Financial Statements
ANNUAL REPORT / April 30, 2020
| | |
| 65 | | FINANCIAL HIGHLIGHTS (concluded) |
For a share outstanding throughout each year ended April 30, unless otherwise noted:
|
WILMINGTON NEW YORK MUNICIPAL BOND FUND |
| | | | | | | | | | | | | | | | | | | | |
| CLASS A | | Year Ended
April 30, 2020 | | Year Ended
April 30, 2019 | | Year Ended
April 30, 2018 | | Year Ended
April 30, 2017 | | Year Ended
April 30, 2016 |
Net Asset Value, Beginning of Year | | | $10.43 | | | | $10.18 | | | | $10.56 | | | | $10.91 | | | | $10.66 | |
Income (Loss) From Operations: | | | | | | | | | | | | | | | | | | | | |
Net Investment Income(a) | | | 0.15 | | | | 0.15 | | | | 0.15 | | | | 0.16 | | | | 0.19 | |
Net Realized and Unrealized Gain (Loss)on Investments | | | (0.16 | ) | | | 0.36 | | | | (0.22 | ) | | | (0.25 | ) | | | 0.27 | |
Total Income (Loss) From Operations | | | (0.01 | ) | | | 0.51 | | | | (0.07 | ) | | | (0.09 | ) | | | 0.46 | |
Less Distributions From: | | | | | | | | | | | | | | | | | | | | |
Net Investment Income | | | (0.15 | ) | | | (0.15 | ) | | | (0.15 | ) | | | (0.16 | ) | | | (0.19 | ) |
Net Realized Gains | | | (0.07 | ) | | | (0.11 | ) | | | (0.16 | ) | | | (0.10 | ) | | | (0.02 | ) |
Total Distributions | | | (0.22 | ) | | | (0.26 | ) | | | (0.31 | ) | | | (0.26 | ) | | | (0.21 | ) |
Net Asset Value, End of Year | | | $10.20 | | | | $10.43 | | | | $10.18 | | | | $10.56 | | | | $10.91 | |
| | | | | | | | | | | | | | | | | | | | |
Total Return(b) | | | (0.12 | )% | | | 5.16 | % | | | (0.75 | )% | | | (0.81 | )% | | | 4.32 | % |
Net Assets, End of Year (000’s) | | | $7,251 | | | | $8,630 | | | | $14,863 | | | | $17,554 | | | | $20,197 | |
Ratios to Average Net Assets | | | | | | | | | | | | | | | | | | | | |
Gross Expense(c) | | | 1.34 | % | | | 1.33 | % | | | 1.28 | % | | | 1.24 | % | | | 1.22 | % |
Net Expenses(c)(d) | | | 0.82 | % | | | 0.83 | % | | | 0.84 | % | | | 0.84 | % | | | 0.84 | % |
Net Investment Income | | | 1.43 | % | | | 1.50 | % | | | 1.43 | % | | | 1.50 | % | | | 1.76 | % |
Portfolio Turnover Rate | | | 60 | % | | | 45 | % | | | 64 | % | | | 32 | % | | | 24 | % |
| | | | | | | | | | | | | | | | | | | | |
| CLASS I | | Year Ended
April 30, 2020 | | Year Ended
April 30, 2019 | | Year Ended
April 30, 2018 | | Year Ended
April 30, 2017 | | Year Ended
April 30, 2016 |
Net Asset Value, Beginning of Year | | | $10.43 | | | | $10.19 | | | | $10.57 | | | | $10.92 | | | | $10.67 | |
Income (Loss) From Operations: | | | | | | | | | | | | | | | | | | | | |
Net Investment Income(a) | | | 0.18 | | | | 0.18 | | | | 0.18 | | | | 0.19 | | | | 0.22 | |
Net Realized and Unrealized Gain (Loss)on Investments | | | (0.16 | ) | | | 0.35 | | | | (0.22 | ) | | | (0.25 | ) | | | 0.27 | |
Total Income (Loss) From Operations | | | 0.02 | | | | 0.53 | | | | (0.04 | ) | | | (0.06 | ) | | | 0.49 | |
Less Distributions From: | | | | | | | | | | | | | | | | | | | | |
Net Investment Income | | | (0.18 | ) | | | (0.18 | ) | | | (0.18 | ) | | | (0.19 | ) | | | (0.22 | ) |
Net Realized Gains | | | (0.07 | ) | | | (0.11 | ) | | | (0.16 | ) | | | (0.10 | ) | | | (0.02 | ) |
Total Distributions | | | (0.25 | ) | | | (0.29 | ) | | | (0.34 | ) | | | (0.29 | ) | | | (0.24 | ) |
Net Asset Value, End of Year | | | $10.20 | | | | $10.43 | | | | $10.19 | | | | $10.57 | | | | $10.92 | |
| | | | | | | | | | | | | | | | | | | | |
Total Return(b) | | | 0.13 | % | | | 5.32 | % | | | (0.50 | )% | | | (0.55 | )% | | | 4.58 | % |
Net Assets, End of Year (000’s) | | | $54,979 | | | | $53,379 | | | | $56,626 | | | | $67,991 | | | | $63,704 | |
Ratios to Average Net Assets | | | | | | | | | | | | | | | | | | | | |
Gross Expense(c) | | | 1.09 | % | | | 1.09 | % | | | 1.03 | % | | | 0.99 | % | | | 0.98 | % |
Net Expenses(c)(d) | | | 0.57 | % | | | 0.58 | % | | | 0.59 | % | | | 0.59 | % | | | 0.59 | % |
Net Investment Income | | | 1.68 | % | | | 1.76 | % | | | 1.68 | % | | | 1.75 | % | | | 2.01 | % |
Portfolio Turnover Rate | | | 60 | % | | | 45 | % | | | 64 | % | | | 32 | % | | | 24 | % |
| (a) | Per share numbers have been calculated using the average shares method. |
| (b) | Based on net asset value, which does not reflect the sales charge or contingent deferred sales charge, if applicable. Total returns for periods of less than one year, if any, are not annualized. |
| (c) | The Fund invests in other underlying funds and indirectly bears its proportionate share of fees and expenses incurred by the underlying funds in which the Fund is invested. This ratio does not include these indirect fees and expenses. |
| (d) | The investment advisor and other service providers waived or reimbursed a portion of their fees. |
See Notes which are an integral part of the Financial Statements
April 30, 2020 / ANNUAL REPORT
| | |
| NOTES TO FINANCIAL STATEMENTS | | 66 |
Wilmington Funds
April 30, 2020
Wilmington Funds (the “Trust”) is registered under the Investment Company Act of 1940, as amended (the “Act”), as an open-end management investment company. The Trust consists of 12 portfolios, 5 of which are presented herein (individually referred to as a “Fund” or collectively as the “Funds”). The remaining 7 funds are presented in separate reports.
| | |
Fund | | Investment Goal |
Wilmington Broad Market Bond Fund | | The Fund seeks to provide current income and secondarily, capital growth. |
(“Broad Market Bond Fund”)(d) | | |
| |
Wilmington Intermediate-Term Bond Fund | | The Fund seeks to provide current income and secondarily, capital growth. |
(“Intermediate-Term Bond Fund”)(d) | | |
| |
Wilmington Short-Term Bond Fund | | The Fund seeks to provide current income. |
(“Short-Term Bond Fund”)(d) | | |
| |
Wilmington Municipal Bond Fund (“Municipal Bond Fund”)(d) | | The Fund seeks a high level of income exempt from federal income tax,
consistent with the preservation of capital. |
| |
Wilmington New York Municipal Bond Fund (“New York Municipal Bond Fund”)(n) | | The Fund seeks to provide current income that is exempt from both federal and
New York personal income taxes. |
The Trust offers 6 classes of shares: Class A, Service Class, Select Class, Administrative Class, Class I and Institutional Class. Service Class, Select Class, Administrative Class and Institutional Class are not available for the Funds. All shares of the Trust have equal rights with respect to voting, except on class-specific matters.
The assets of each portfolio are segregated and a shareholder’s interest is limited to the portfolio in which shares are held.
| 2. | SUMMARY OF SIGNIFICANT ACCOUNTING POLICIES |
The following is a summary of significant accounting policies consistently followed by the Funds in the preparation of their financial statements. These policies are in conformity with U.S. generally accepted accounting principles (“GAAP”). The Trust is an investment company and follows accounting and reporting guidance under Financial Accounting Standards Board (“FASB”) Accounting Standards Codification (“ASC”) Topic 946, “Financial Services - Investment Companies.” The preparation of financial statements in conformity with GAAP requires management to make estimates and assumptions that affect the amounts of assets, liabilities, expenses and revenues reported in the financial statements. Actual results could differ from those estimated and the differences could be material.
Investment Valuation– The Funds utilize a Fair Value approach. The fair value of the Funds’ portfolio securities are determined as follows:
•investments in open-end regulated investment companies are valued at net asset value (“NAV”);
•for fixed income securities, according to prices as furnished by an independent pricing service, except that fixed income securities with remaining maturities of less than 60 days at the time of purchase are valued at amortized cost provided such amount approximates fair value; and
•for all other securities at fair value as determined in accordance with procedures established by and under the general supervision of the Board of Trustees (“Trustees”).
The Trust follows the authoritative guidance (GAAP) for fair value measurements. The guidance establishes a framework for measuring fair value and a hierarchy for inputs and techniques used in measuring fair value that maximizes the use of observable inputs and minimizes the use of unobservable inputs and techniques by requiring that the most observable inputs be used when available. The guidance establishes three tiers of inputs that may be used to measure fair value. The three tiers of inputs are summarized at the end of each Fund’s Portfolio of Investments. The inputs or techniques used for valuing securities are not necessarily an indication of the risk associated with investing in those securities.
Pursuant to the Funds’ fair value procedures noted previously, investments in open-end regulated investment companies are generally categorized as Level 1 securities in the fair value hierarchy. Fixed income securities, non-exchange traded derivatives and money market instruments are generally categorized as Level 2 securities in the fair value hierarchy.
Investments for which there are no such quotations, or for which quotations do not appear reliable, are valued at fair value as determined in accordance with procedures established by and under the general supervision of the Trustees. These valuations are typically categorized as Level 2 or Level 3 securities in the fair value hierarchy.
Repurchase Agreements– Repurchase agreements are transactions in which a fund buys a security from a dealer or bank and agrees to sell the security back at a mutually agreed upon time and price. The repurchase price exceeds the sale price, reflecting each Fund’s return on the
ANNUAL REPORT / April 30, 2020
| | |
| 67 | | NOTES TO FINANCIAL STATEMENTS (continued) |
transaction. It is each Fund’s policy to require the counterparty to a repurchase agreement to transfer to the Funds’ custodian or sub-custodian eligible securities or cash with a market value (after transaction costs) at least equal to the repurchase price to be paid under the repurchase agreement. The eligible securities are transferred to accounts with the custodian or sub-custodian in which the Funds hold a “securities entitlement” and exercise “control” as those terms are defined in the Uniform Commercial Code. The Funds have established procedures for monitoring the market value of the transferred securities and requiring the transfer of additional eligible securities, if necessary, to equal at least the repurchase price. These procedures also allow the counterparty to require securities to be transferred from the account to the extent that their market value exceeds the repurchase price or in exchange for other eligible securities of equivalent market value.
The insolvency of the counterparty or other failure to repurchase the securities may delay the disposition of the underlying securities or cause the Funds to receive less than the full repurchase price.
Repurchase agreements are entered into by the Funds under Master Repurchase Agreements (“MRA”) which permit the Funds, under certain circumstances including an event of default (such as bankruptcy or insolvency), to offset payables and/or receivables under the MRA with collateral held and/or posted to the counterparty and create one single net payment due to or from each Fund.
At April 30, 2020, the open repurchase agreements by counterparty which are subject to a MRA on a net payment basis are as follows:
| | | | | | | | | | | | | | | | |
| | | | |
| Fund/Counterparty | | Repurchase
Agreements | | | Fair Value of
Non-Cash Collateral
Received(1) | | | Cash Collateral
Received(1) | | | Net Exposure (2) | |
Broad Market Bond Fund | | | | | | | | | | | | | | | | |
Bank of America Securities, Inc. | | $ | 986,865 | | | $ | 986,865 | | | $ | — | | | $ | — | |
Citigroup Global Markets Ltd. | | | 3,750,149 | | | | 3,750,149 | | | | — | | | | — | |
Daiwa Capital Markets America | | | 3,750,149 | | | | 3,750,149 | | | | — | | | | — | |
Deutsche Bank Securities, Inc. | | | 3,750,149 | | | | 3,750,149 | | | | — | | | | — | |
HSBC Securities USA, Inc. | | | 3,750,149 | | | | 3,750,149 | | | | — | | | | — | |
RBC Dominion Securities, Inc. | | | 3,750,149 | | | | 3,750,149 | | | | — | | | | — | |
| | | | | | | | | | | | | | | | |
| | | | |
| | $ | 19,737,610 | | | $ | 19,737,610 | | | $ | — | | | $ | — | |
| | | | | | | | | | | | | | | | |
Intermediate-Term Bond Fund | | | | | | | | | | | | | | | | |
Bank of America Securities, Inc. | | | 53,946 | | | | 53,946 | | | | — | | | | — | |
Citigroup Global Markets Ltd. | | | 205,003 | | | | 205,003 | | | | — | | | | — | |
Daiwa Capital Markets America | | | 205,003 | | | | 205,003 | | | | — | | | | — | |
Deutsche Bank Securities, Inc. | | | 205,003 | | | | 205,003 | | | | — | | | | — | |
HSBC Securities USA, Inc. | | | 205,003 | | | | 205,003 | | | | — | | | | — | |
RBC Dominion Securities, Inc. | | | 205,003 | | | | 205,003 | | | | — | | | | — | |
| | | | | | | | | | | | | | | | |
| | | | |
| | $ | 1,078,961 | | | $ | 1,078,961 | | | $ | — | | | $ | — | |
| | | | | | | | | | | | | | | | |
Short-Term Bond Fund | | | | | | | | | | | | | | | | |
Bank of America Securities, Inc. | | | 8,676 | | | | 8,676 | | | | — | | | | — | |
Citigroup Global Markets Ltd. | | | 32,964 | | | | 32,964 | | | | — | | | | — | |
Daiwa Capital Markets America | | | 32,964 | | | | 32,964 | | | | — | | | | — | |
Deutsche Bank Securities, Inc. | | | 32,964 | | | | 32,964 | | | | — | | | | — | |
HSBC Securities USA, Inc. | | | 32,964 | | | | 32,964 | | | | — | | | | — | |
RBC Dominion Securities, Inc. | | | 32,964 | | | | 32,964 | | | | — | | | | — | |
| | | | | | | | | | | | | | | | |
| | | | |
| | $ | 173,496 | | | $ | 173,496 | | | $ | — | | | $ | — | |
| | | | | | | | | | | | | | | | |
(1)The amount of collateral reflected in the table does not include any over-collateralization received by the Fund.
(2)Net exposure represents the receivable (payable) due from (to) the counterparty in the event of default.
Investment Income, Gains and Losses, Expenses and Distributions– Interest income and expenses are accrued daily. All premiums and discounts on fixed income securities are amortized/accreted for financial statement purposes. Gains and losses realized on principal payment of mortgage-backed securities (paydown gains and losses) are classified as part of investment income. Dividends and distributions to shareholders are recorded on the ex-dividend date. Non-cash dividends included in dividend income, if any, are recorded at fair value. Foreign dividends are recorded on the ex-dividend date or when the Funds are informed of the ex-dividend date. Investment transactions are accounted for on a trade date basis for financial reporting purposes. Realized gains and losses from investment transactions are recorded on an identified cost basis.
Expenses of the Trust, which are directly identifiable to a specific fund, are applied to that fund. Expenses which are not identifiable to a specific fund are allocated in such a manner as deemed equitable, taking into consideration the nature and type of expense.
April 30, 2020 / ANNUAL REPORT
| | |
| NOTES TO FINANCIAL STATEMENTS (continued) | | 68 |
All Funds offer multiple classes of shares. Investment income, realized and unrealized gains and losses, and certain fund-level expenses are allocated to each class based on relative daily net assets, except that each class bears certain expenses unique to that class such as distribution and shareholder services fees. Distributions are declared separately for each class. No class has preferential distribution rights; differences in per share distributions rates are generally due to differences in class specific expenses. Distributions from net realized gains, if any, are declared and paid to shareholders annually. Distributions from net investment income are declared daily and paid monthly.
Federal Taxes– It is the Funds’ policy to comply with the Subchapter M provision of the Internal Revenue Code of 1986, as amended (the “Code”), and to distribute to shareholders each year substantially all their income. Accordingly, no provisions for Federal income tax or excise tax are necessary.
Withholding taxes and where appropriate, deferred withholding taxes, on foreign interest, dividends and capital gains have been provided for in accordance with the applicable country’s tax rules and rates.
The Funds recognize interest and penalties, if any, related to unrecognized tax benefits as income tax expense on the Statements of Operations. During the year ended April 30, 2020, the Funds did not incur any interest or penalties.
When-Issued and Delayed Delivery Transactions –The Funds may engage in when-issued or delayed delivery transactions. The Funds record when-issued securities on the trade date and maintain security positions such that sufficient liquid assets will be available to make payment for the securities purchased. Securities purchased on a when-issued or delayed delivery basis are marked to market daily and begin earning interest on the settlement date. Losses may occur on these transactions due to changes in market conditions or the failure of counterparties to perform under the contract.
Restricted Securities– Restricted securities are securities that either (a) cannot be offered for public sale without first being registered, or being able to take advantage of an exemption from registration, under the Securities Act of 1933, as amended, or (b) are subject to contractual restrictions on public sales. In some cases, when a security cannot be offered for public sale without first being registered, the issuer of the restricted security has agreed to register such securities for resale, at the issuer’s expense, either upon demand by the Funds or in connection with another registered offering of the securities. Many such restricted securities may be resold in the secondary market in transactions exempt from registration. Restricted securities may be determined to be liquid under criteria established by the Trustees. A Fund will not incur any registration costs upon such resales. The Funds’ restricted securities are valued at the price provided by dealers in the secondary market or, if no market prices are available, at the fair value as determined in accordance with procedures established by and under the general supervision of the Trustees.
Dollar Roll Transactions –The Intermediate-Term Bond Fund and Broad Market Bond Fund may enter into dollar roll transactions, with respect to mortgage securities issued by GNMA, FNMA, and FHLMC, in which the Funds sell mortgage securities to financial institutions and simultaneously agree to accept substantially similar (same type, coupon, maturity) securities at a later date at an agreed upon price. Dollar roll transactions, which are treated as purchases and sales, will not exceed 12 months. There were no dollar roll transactions outstanding during the year ended April 30, 2020.
Lending of Portfolio Securities– The Trust has entered into an agreement with its custodian whereby the custodian may lend securities owned by the Funds to brokers, dealers and other financial organizations. Any increase or decrease in the fair value of securities loaned and any interest or dividends earned on those securities during the term of the loan would be for the account of the Funds. In exchange for lending securities under the terms of the agreement with their custodian, the Funds receive a lender’s fee. Fees earned by the Funds on securities lending are recorded as income. Loans of securities by the Funds are collateralized by cash, U.S. government securities or money market instruments that are maintained at all times in an amount at least equal to the current market value of the loaned securities plus a margin which varies depending on the type of securities owned. The custodian establishes and maintains the collateral in a segregated account. The Funds have the right under the lending agreement to recover the securities from the borrower on demand. The market value of the loaned securities is determined at the close of business of the Funds and any additional required collateral is delivered to the Funds on the next business day.
Investments purchased with cash collateral are presented on the portfolios of investments under the caption “Cash Collateral Invested for Securities on Loan.”
The Funds maintain the risk of any loss on the securities on loan as well as the potential loss on investments purchased with cash collateral received from securities lending.
Securities lending transactions are entered into by the Funds under Master Securities Lending Agreements (“MSLA”) which permit the Funds, under certain circumstances including an event of default (such as bankruptcy or insolvency), to offset amounts payable by the Funds to the same counterparty against amounts to be received and create one single net payment due to or from the Funds.
At April 30, 2020, the securities loaned which are subject to a MSLA on a net payment basis are as follows:
| | | | | | | | | | |
| Fund | | Value of Securities
on Loan | | | Cash Collateral
Received(1) | | | Net Exposure(2) |
| | | |
Broad Market Bond Fund | | | $19,240,657 | | | | $19,240,657 | | | $— |
| | | |
Intermediate-Term Bond Fund | | | 1,052,824 | | | | 1,052,824 | | | — |
ANNUAL REPORT / April 30, 2020
| | |
| 69 | | NOTES TO FINANCIAL STATEMENTS (continued) |
| | | | | | | | | | | | | | | |
| Fund | | Value of
Securities
on Loan | | Cash
Collateral
Received(1) | | Net Exposure(2) |
| | | |
Short-Term Bond Fund | | | | 170,059 | | | | | 170,059 | | | — | |
|
(1)Collateral with a value of $19,737,610, $1,078,961 and $173,496, respectively, has been received in connection with securities lending transactions. |
|
(2)Net exposure represents the receivable (payable) due from (to) the counterparty in the event of default. |
| 3. | FEDERAL TAX INFORMATION |
As of April 30, 2020 there are no uncertain tax positions that would require financial statement recognition, de-recognition or disclosure. The Funds’ federal tax returns filed for the years ended 2019, 2018 and 2017, as well as the current tax year, remain subject to examination by the Internal Revenue Service.
For financial reporting purposes, book basis capital accounts are adjusted to reflect the tax character of permanent book/tax differences. Permanent reclassifications can arise from differing treatment of certain income and gain transactions and nondeductible current year net operating losses. Permanent book and tax basis differences relating to shareholder distributions will result in reclassifications to capital paid in on shares of beneficial interest. The reclassifications have no impact on the net assets or NAVs of the Funds. As of April 30, 2020, there were no reclassifications.
The timing and character of income and capital gain distributions are determined in accordance with income tax regulations, which may differ from GAAP. The tax character of distributions for the corresponding fiscal year ends were as follows:
| | | | | | | | | | | | | | | | | | | | | | | | | | | | | | |
| | | | | | |
| Fund | | Ordinary
Income* | | 2020
Tax Exempt
Income | | Long-Term
Capital Gains | | Ordinary
Income* | | 2019
Tax Exempt
Income | | Long-Term
Capital Gains |
| | | | | | |
Broad Market Bond Fund | | | $ | 13,123,941 | | | | $ | — | | | | $ | — | | | | $ | 13,684,821 | | | | $ | — | | | | $ | — | |
| | | | | | |
Intermediate-Term Bond Fund | | | | 1,443,833 | | | | | — | | | | | 192,896 | | | | | 1,814,403 | | | | | — | | | | | 31,638 | |
| | | | | | |
Short-Term Bond Fund | | | | 1,014,801 | | | | | — | | | | | — | | | | | 995,560 | | | | | — | | | | | — | |
| | | | | | |
Municipal Bond Fund | | | | 1,145,984 | | | | | 6,195,042 | | | | | 3,699,917 | | | | | 105,114 | | | | | 6,311,677 | | | | | — | |
| | | | | | |
New York Municipal Bond Fund | | | | 33,820 | | | | | 999,116 | | | | | 424,373 | | | | | 40,199 | | | | | 1,097,326 | | | | | 719,746 | |
* For tax purposes, short-term capital gain distributions are considered ordinary income distributions.
As of April 30, 2020 the components of distributable earnings on a tax basis were as follows:
| | | | | | | | | | | | | | | | | | | | | | | | | | | | | | | | | | | |
| | | | | | | | |
| Fund | | Undistributed
Ordinary
Income | | Undistributed
Tax-Exempt
Income | | Undistributed
Long-Term
Capital Gains | | Other
Timing
Differences | | Unrealized
Appreciation/
(Depreciation) | | Capital Loss
Carryforwards | | Late Year
Loss
Deferrals |
Broad Market | | | | | | | | | | | | | | | | | | | | | | | | | | | | | | | | | | | |
Bond Fund | | | $ | 1,224,796 | | | | $ | — | | | | $ | — | | | | $ | (1,065,310 | ) | | | $ | 32,789,643 | | | | $ | — | | | | $ | — | |
| | | | | | | | |
Intermediate-Term | | | | | | | | | | | | | | | | | | | | | | | | | | | | | | | | | | | |
Bond Fund | | | | 47,817 | | | | | — | | | | | 563,677 | | | | | (92,294 | ) | | | | 2,016,444 | | | | | — | | | | | — | |
| | | | | | | | |
Short-Term | | | | | | | | | | | | | | | | | | | | | | | | | | | | | | | | | | | |
Bond Fund | | | | 88,126 | | | | | — | | | | | — | | | | | (78,780 | ) | | | | 808,717 | | | | | (1,170,805 | ) | | | | — | |
| | | | | | | | |
Municipal Bond | | | | | | | | | | | | | | | | | | | | | | | | | | | | | | | | | | | |
Fund | | | | — | | | | | 550,782 | | | | | — | | | | | (554,039 | ) | | | | (3,466,603 | ) | | | | — | | | | | (461,678 | ) |
| | | | | | | | |
New York Municipal | | | | | | | | | | | | | | | | | | | | | | | | | | | | | | | | | | | |
Bond Fund | | | | — | | | | | 80,540 | | | | | 123,171 | | | | | (80,735 | ) | | | | (394,795 | ) | | | | — | | | | | — | |
The differences between the book and tax basis components of distributable earnings relate principally to the timing of recognition of income and gains for federal income tax purposes.
Under current tax regulations, capital losses on securities transactions realized after October 31 may be deferred and treated as occurring on the first day of the following fiscal year. Under the Regulated Investment Company Modernization Act of 2010, the Funds are permitted to defer taxable ordinary income losses incurred after December 31 and treat as occurring on the first day of the following fiscal year.
At April 30, 2020 the following Fund had capital loss carryforwards which will reduce the Fund’s taxable income arising from future net realized gain on investments, if any, to the extent permitted by the (“Code”) and thus will reduce the amount of distributions to shareholders which would otherwise be necessary to relieve the Fund of any liability for federal income tax.
April 30, 2020 / ANNUAL REPORT
| | |
| NOTES TO FINANCIAL STATEMENTS (continued) | | 70 |
| | | | | | | | | | | | | | | |
| Fund | | Short-Term
No Expiration | | Long-Term
No Expiration | | Total Capital
Loss
Carryforwards |
| | | |
Short-Term Bond Fund | | | $ | 244,634 | | | | $ | 926,171 | | | | | 1,170,805 | |
The following Funds utilized capital loss carryforwards to offset taxable capital gains realized during the year ended April 30, 2020:
| | | | | |
| |
| Fund | | Capital Loss
Carryforwards
Utilized |
| |
Broad Market Bond Fund | | | | $2,591,828 | |
| |
Intermediate-Term Bond Fund | | | | 118,974 | |
| |
Short-Term Bond Fund | | | | 285,516 | |
| |
Municipal Bond Fund | | | | 1,786,402 | |
| |
New York Municipal Bond Fund | | | | 131,098 | |
| 4. | ADVISORY FEES, SERVICING FEES, AND OTHER SERVICE PROVIDERS |
Investment Advisor– Wilmington Funds Management Corporation (“WFMC” or the “Advisor”) serves as the Investment Advisor to each of the Funds. Wilmington Trust Investment Advisors, Inc. (“WTIA”) provides sub-advisory services to the Funds. WFMC and WTIA are wholly-owned subsidiaries of M&T Bank Corporation. For its services, the Funds pay WFMC an annual investment advisory fee, accrued daily and paid monthly, based on a percentage of each Fund’s average daily net assets as described below. WFMC, not the Funds, pays WTIA for its services.
| | | | |
| Fund | | Advisory Fee
Annual Rate |
| |
Broad Market Bond Fund | | | 0.45 | % |
| |
Intermediate-Term Bond Fund | | | 0.45 | % |
| |
Short-Term Bond Fund | | | 0.40 | % |
| |
Municipal Bond Fund | | | 0.45 | % |
| |
New York Municipal Bond Fund | | | 0.45 | % |
WFMC and the Funds’ distributor and shareholder service provider have contractually agreed to waive their fees and/or reimburse expenses through August 31, 2020, so that total annual fund operating expenses paid by the Funds (not including the effects of dividends or interest on short positions, acquired fund fees and expenses, taxes, or other extraordinary expenses expressed as an annualized percentage of average daily net assets), will not exceed the expense limitations set forth below. Neither WFMC nor the Funds’ distributor and shareholder service provider will recoup previously waived fees/expenses in subsequent years.
The contractual expense limitations are as follows:
| | | | | | |
| |
| | | Contractual
Expense Limitations |
| Fund | | Class A | | | Class I |
| | |
Broad Market Bond Fund | | | 0.84 | % | | 0.49% |
| | |
Intermediate-Term Bond Fund | | | 0.84 | % | | 0.49% |
| | |
Short-Term Bond Fund | | | 0.73 | % | | 0.48% |
| | |
Municipal Bond Fund | | | 0.74 | % | | 0.49% |
| | |
New York Municipal Bond Fund* | | | 0.82 | % | | 0.57% |
* Prior to August 31, 2019, the New York Municipal Bond Fund’s contractual expense limitation was 0.83% and 0.58% for Class A and Class I, respectively.
Administrative Fees– The Bank of New York Mellon (“BNYM”) provides the Trust with fund administration services. The fees as described in the table below are a component of “Portfolio accounting and administration fees” as disclosed in the Statements of Operations. WFMC, in its role as Co-Administrator, provides the Funds with certain administrative personnel and services necessary to operate the Funds. The fees as described in the table below are accrued daily and paid monthly, and are disclosed on the Statements of Operations as “Administration fees.”
| | | | | | |
| | |
| Administrator | | Maximum
Fee | | | Average Aggregate Daily Net
Assets of the Trust |
| | |
WFMC | | | 0.040 | % | | on the first $5 billion |
| | |
| | | 0.030 | % | | on the next $2 billion |
| | |
| | | 0.025 | % | | on the next $3 billion |
ANNUAL REPORT / April 30, 2020
| | |
| 71 | | NOTES TO FINANCIAL STATEMENTS (continued) |
| | | | | | |
| | |
| Administrator | | Maximum
Fee | | | Average Aggregate Daily Net Assets of the Trust |
| | |
| | | 0.018 | % | | on assets in excess of $10 billion |
| | |
BNYM | | | 0.0175 | % | | on the first $15 billion |
| | |
| | | 0.0150 | % | | on the next $10 billion |
| | |
| | | 0.0125 | % | | on assets in excess of $25 billion |
WFMC and BNYM may voluntarily choose to waive any portion of their fee and can add, modify or terminate a voluntary wavier at any time at their sole discretion. Neither WFMC nor BNYM will recoup previously waived fees/expenses in subsequent years. For the year ended April 30, 2020, neither WFMC nor BNYM waived any administrative fees.
Distribution Services Fee– The Trust has adopted a Distribution Services Plan (the “Plan”) pursuant to Rule 12b-1 under the Act. The Plan allows the Funds to pay fees to financial intermediaries, which may be paid through ALPS Distributors, Inc. (“ALPS”), the principal distributor, at an annual rate of up to 0.25% of the average daily net assets of the Funds’ Class A shares, for the sale, distribution, administration, customer servicing and record keeping of these shares.
The Trust may reduce the maximum amount of distribution services fees it pays from time to time at its sole discretion. In addition, a financial intermediary (including ALPS, the Advisor or their affiliates), may voluntarily waive or reduce any fees to which they are entitled.
For the year ended April 30, 2020, M&T Securities, Inc., Manufacturers and Traders Trust Company, and Wilmington Trust, NA (together “M&T”), affiliates of the Advisor, received a portion of the fees paid by the Funds which are listed below:
| | | | | |
| Fund | | Distribution Fees from Class A |
| |
Broad Market Bond Fund | | | $ | 5,942 | |
| |
Intermediate-Term Bond Fund | | | | 2,077 | |
| |
Short-Term Bond Fund | | | | 9,523 | |
| |
Municipal Bond Fund | | | | 54,151 | |
| |
New York Municipal Bond Fund | | | | 17,015 | |
Sales Charges– The Class A shares of all the Funds bear front-end sales charges.
For the year ended April 30, 2020, M&T received the amounts listed below from sales charges on the sale of Class A shares.
| | | | | |
| Fund | | Sales Charges
from Class A |
| |
Broad Market Bond Fund | | | $ | 544 | |
| |
Short-Term Bond Fund | | | | 483 | |
| |
Municipal Bond Fund | | | | 3,387 | |
| |
New York Municipal Bond Fund | | | | 1,379 | |
Shareholder Services Fee– Pursuant to a Shareholder Services Plan adopted by the Funds and administered by ALPS, the Funds may pay up to 0.25% of the average daily net assets of each Fund’s Class A and Class I shares to financial intermediaries (which may include ALPS, the Advisor or their affiliates) for providing shareholder services and maintaining shareholder accounts. M&T has entered into a Shareholders Services Agreement with ALPS, under which it is entitled to receive up to 0.25% of the average daily net assets of each Fund’s shares for whom M&T provides shareholder services. The Funds may reduce the maximum amount of shareholder service fees it pays from time to time at its sole discretion. In addition, a financial intermediary (including M&T) may waive or reduce any fees to which they are entitled.
For the year ended April 30, 2020, M&T received a portion of the fees paid by the following Funds which are listed below:
| | | | | |
| Fund | | Shareholder Services
Fee |
| |
Broad Market Bond Fund | | | $ | 2,178 | |
| |
Intermediate-Term Bond Fund | | | | 727 | |
Other Service Providers– Foreside Management Services, LLC (“FMS”) provides a Principal Executive Officer and Principal Financial Officer to the Trust. FMS has no role in determining the investment policies or which securities are to be sold or purchased by the Trust or its funds.
BNYM provides custody services to the Trust.
BNY Mellon Investment Servicing (U.S.) Inc. provides fund accounting and transfer agency services to the Trust.
April 30, 2020 / ANNUAL REPORT
| | |
| NOTES TO FINANCIAL STATEMENTS (continued) | | 72 |
General– Certain Officers of the Trust are also Officers or employees of the above companies that provide services to the Funds, and during their terms of office, receive no compensation from the Funds. The Trust’s Statement of Additional Information includes additional information about the Trustees.
Certain Funds may execute trades for security purchase and sale transactions through brokers that are affiliates of the Advisor or sub-advisors. Commissions paid on those trades for April 30, 2020 were as follows:
| | | | | |
| Fund | | Commissions |
| |
Intermediate-Term Bond Fund | | | $ | 1,170 | |
| |
Short-Term Bond Fund | | | | 699 | |
| 5. | INVESTMENT TRANSACTIONS |
Purchases and sales of investments, excluding short-term obligations and U.S. Government Securities, for the year ended April 30, 2020 were as follows:
| | | | | | | | | | |
| | | Investments |
| Fund | | Purchases | | Sales |
| | |
Broad Market Bond Fund | | | $ | 196,779,744 | | | | $ | 210,830,386 | |
| | |
Intermediate-Term Bond Fund | | | | 17,542,848 | | | | | 31,430,443 | |
| | |
Short-Term Bond Fund | | | | 18,504,294 | | | | | 18,062,198 | |
| | |
Municipal Bond Fund | | | | 292,312,628 | | | | | 238,098,019 | |
| | |
New York Municipal Bond Fund | | | | 38,707,238 | | | | | 36,372,715 | |
Purchases and sales of investments of U.S. Government Securities for the year ended April 30, 2020 were as follows:
| | | | | | | | | | |
| |
| | | U.S. Government Securities |
| Fund | | Purchases | | Sales |
| | |
Broad Market Bond Fund | | | $ | 32,181,221 | | | | $ | 47,295,727 | |
| | |
Intermediate-Term Bond Fund | | | | 2,944,503 | | | | | 19,857,597 | |
| | |
Short-Term Bond Fund | | | | 41,563,913 | | | | | 46,477,777 | |
Market risk is the risk that one or more markets in which a Fund invests will go down in value, including the possibility that the markets will go down sharply and unpredictably. The value of a security or other asset may decline due to changes in general market conditions, economic trends or events that are not specifically related to the issuer of the security or other asset, or factors that affect a particular issuer or issuers, exchange, country, group of countries, region, market, industry, group of industries, sector or asset class. Local, regional or global events such as war, acts of terrorism, the spread of infectious illnesses or other public health issues, recessions, natural disasters or other events could have a significant impact on a Fund and its investments.
Beginning in January 2020, global financial markets have experienced and may continue to experience significant volatility resulting from the spread of a novel coronavirus known as COVID-19. The outbreak of COVID-19 has resulted in travel and border restrictions, quarantines, supply chain disruptions, lower consumer demand and general market uncertainty. The effects of COVID-19 have and may continue to adversely affect the global economy, the economies of certain nations and individual issuers. The impact of the outbreak may be short term or may last for an extended period of time, which may have an unpredictable impact on Fund performance.
The value of the Municipal Bond Fund and New York Municipal Bond Fund investments may be adversely affected by new legislation within the US states or territories, regional or local economic conditions, and differing levels of supply and demand for municipal bonds. Many municipalities insure repayment for their obligations. Although bond insurance reduces the risk of loss due to default by an issuer, such bonds remain subject to the risk that value may fluctuate for other reasons, and there is no certainty that the insurance company will meet its obligations. A real or perceived decline in creditworthiness of a bond insurer can have an adverse impact on the value of insured bonds held in each Fund.
ANNUAL REPORT / April 30, 2020
| | |
| 73 | | NOTES TO FINANCIAL STATEMENTS (continued) |
At April 30, 2020, the percentages of each Fund’s net assets insured by bond issuers are listed below :
| | | | | | | | | | |
| Fund | | Municipal Bond
Fund | | New York Municipal
Bond Fund |
| | |
American Bond Assurance Corporation | | | | 1.45 | % | | | | — | |
| | |
Assured Guaranty Corporation | | | | 0.03 | % | | | | — | |
| | |
Assured Guaranty Municipal Corporation | | | | 3.58 | % | | | | 3.81 | % |
| | |
Build America Mutual Assurance Company | | | | 0.06 | % | | | | 5.90 | % |
| | |
Financial Guarantee Insurance Company | | | | 0.26 | % | | | | — | |
| | |
National Public Finance Guarantee Corporation | | | | 4.83 | % | | | | 5.16 | % |
| | | | | | | | | | |
| | |
Total | | | | 10.21 | % | | | | 14.87 | % |
| | | | | | | | | | |
The United Kingdom’s Financial Conduct Authority, which regulates the London Interbank Offered Rate (“LIBOR”), has announced plans to phase out the use of LIBOR by the end of 2021. There remains uncertainty regarding the future use of LIBOR and the nature of any replacement rate. The transition process away from LIBOR may involve, among other things, increased volatility or illiquidity in markets for instruments that currently rely on LIBOR. The transition process may also result in a reduction in the value of certain instruments held by a Fund or reduce the effectiveness of related Fund transactions such as hedges. Volatility, the potential reduction in value, and/or the hedge effectiveness of financial instruments may be heightened for financial instruments that do not include fallback provisions that address the cessation of LIBOR. Any potential effects of the transition away from LIBOR on any of the Funds or on financial instruments in which a Fund invests, as well as other unforeseen effects, could result in losses to a Fund.
| 9. | CONTRACTUAL OBLIGATIONS |
In the normal course of business, the Funds may enter into contracts that provide general indemnifications. The Funds’ maximum exposure under these arrangements is dependent on claims that may be made against the Funds in the future, and, therefore, cannot be estimated; however, based on experience, the risk of material loss from such claims is considered remote.
The Trust participates in a $10,000,000 unsecured, committed revolving line of credit (“LOC”) agreement with BNYM. The LOC was available for extraordinary or emergency purposes, primarily for financing redemption payments. Borrowings were charged interest at a rate of 1.25% per annum over the greater of the Federal Funds Rate or the overnight LIBOR. The LOC included a commitment fee of 0.15% per annum on the daily unused portion. The LOC expired on April 2, 2020.
On April 2, 2020, the Trust entered into an amendment to the credit agreement for a $10,000,000 unsecured, committed revolving LOC. The LOC is to be used as described above and to be operated in substantially the same manner as the original agreement. The LOC expires on April 1, 2021.
The Trust did not utilize the LOC for the year ended April 30, 2020.
| 11. | RECENT ACCOUNTING PRONOUNCEMENTS |
In March 2017, the Financial Accounting Standards Board (“FASB”) issued Accounting Standards Update (“ASU”), ASU 2017-08, Receivables – Nonrefundable Fees and Other Costs (Subtopic 310-20), Premium Amortization on Purchased Callable Debt Securities which amends the amortization period for certain callable debt securities held at a premium, shortening such period to the earliest call date. This ASU does not require any accounting change for debt securities held at a discount; the discount continues to be amortized to maturity. This ASU is effective for fiscal years, and interim periods within those fiscal years, beginning after December 15, 2018. Management has implemented the ASU 2017-08 and determined that the impact of this guidance to each Fund’s net assets at April 30, 2020 is not material.
In August 2018, FASB issued an ASU 2018-13, (“ASU 2018-13”), which changes certain fair value measurement disclosure requirements. The ASU 2018-13, in addition to other modifications and additions, removes the requirement to disclose the amount and reasons for transfers between Level 1 and Level 2 of the fair value hierarchy, the policy for the timing of transfers between levels and the valuation process for Level fair value measurements. The ASU 2018-13 is effective for fiscal years, and interim periods within those fiscal years, beginning after December 15, 2019. Management has evaluated the implications of certain provisions of ASU 2018-13 and has elected to early adopt all aspects related to the removal and modification of certain fair value measurement disclosures.
In March 2020, the FASB issued ASU No. 2020-04 (“ASU 2020-04”), Reference Rate Reform (Topic 848) - Facilitation of the Effects of Reference Rate Reform on Financial Reporting. The amendments in ASU 2020-04 provides optional temporary financial reporting relief from
April 30, 2020 / ANNUAL REPORT
| | |
| NOTES TO FINANCIAL STATEMENTS (continued) | | 74 |
the effect of certain types of contract modifications due to the planned discontinuation of the LIBOR and other interbank-offered based reference rates as of the end of 2021. ASU 2020-04 is effective for certain reference rate-related contract modifications that occur during the period March 12, 2020 through December 31, 2022. Management is currently evaluating the impact, if any, of applying ASU 2020-04.
| 12. | OTHER FUND INFORMATION |
At a meeting held on June 5, 2019, the Trustees, upon recommendation of the Audit Committee, selected PricewaterhouseCoopers LLP (“PwC”) to serve as the independent registered public accounting firm for the Trust for the fiscal year ending April 30, 2020. PwC affirmed their independence as an independent registered public accounting firm on June 19, 2019. During the fiscal years ended April 30, 2019 and 2018, Ernst & Young LLP (“E&Y”) audit reports’ on the financial statements of each Fund in the Trust did not contain any adverse opinion or disclaimer of opinion, nor were they qualified or modified as to uncertainty, audit scope, or accounting principles. In addition, there were no disagreements between the Trust and E&Y on accounting principles, financial statements disclosures or audit scope, which, if not resolved to the satisfaction of E&Y, would have caused them to make reference to the disagreement in their reports. Neither the Trust nor anyone on its behalf has consulted with PwC at any time prior to their selection with respect to the application of accounting principles to a specified transaction, either completed or proposed or the type of audit opinion that might be rendered on each Fund’s financial statements.
Management has evaluated events and transactions for potential recognition or disclosure in the financial statements through the date the financial statements were issued. Management has determined that there are no material events that would require recognition or disclosure in the Funds’ financial statements through this date.
ANNUAL REPORT / April 30, 2020
Report of Independent Registered Public Accounting Firm
To the Board of Trustees of Wilmington Funds and Shareholders of Wilmington Broad Market Bond Fund, Wilmington Intermediate-Term Bond Fund, Wilmington Short-Term Bond Fund, Wilmington Municipal Bond Fund and Wilmington New York Municipal Bond Fund
Opinions on the Financial Statements
We have audited the accompanying statements of assets and liabilities, including the portfolios of investments, of Wilmington Broad Market Bond Fund, Wilmington Intermediate-Term Bond Fund, Wilmington Short-Term Bond Fund, Wilmington Municipal Bond Fund and Wilmington New York Municipal Bond Fund (five of the funds constituting Wilmington Funds, hereafter collectively referred to as the “Funds”) as of April 30, 2020, the related statements of operations and changes in net assets, including the related notes, and the financial highlights for the year then ended (collectively referred to as the “financial statements”). In our opinion, the financial statements present fairly, in all material respects, the financial position of each of the Funds as of April 30, 2020, and the results of each of their operations, changes in each of their net assets, and each of the financial highlights for the year then ended in conformity with accounting principles generally accepted in the United States of America.
The financial statements of the Funds as of and for the year ended April 30, 2019 and the financial highlights for each of the periods ended on or prior to April 30, 2019 (not presented herein, other than the statements of changes in net assets and the financial highlights) were audited by other auditors whose report dated June 27, 2019 expressed unqualified opinions on those financial statements and financial highlights.
Basis for Opinions
These financial statements are the responsibility of the Funds’ management. Our responsibility is to express an opinion on the Funds’ financial statements based on our audits. We are a public accounting firm registered with the Public Company Accounting Oversight Board (United States) (PCAOB) and are required to be independent with respect to the Funds in accordance with the U.S. federal securities laws and the applicable rules and regulations of the Securities and Exchange Commission and the PCAOB.
We conducted our audits of these financial statements in accordance with the standards of the PCAOB. Those standards require that we plan and perform the audit to obtain reasonable assurance about whether the financial statements are free of material misstatement, whether due to error or fraud.
Our audits included performing procedures to assess the risks of material misstatement of the financial statements, whether due to error or fraud, and performing procedures that respond to those risks. Such procedures included examining, on a test basis, evidence regarding the amounts and disclosures in the financial statements. Our audits also included evaluating the accounting principles used and significant estimates made by management, as well as evaluating the overall presentation of the financial statements. Our procedures included confirmation of securities owned as of April 30, 2020 by correspondence with the custodian, transfer agent and brokers; when replies were not received from brokers, we performed other auditing procedures. We believe that our audits provide a reasonable basis for our opinions.
/s/PricewaterhouseCoopers LLP
Philadelphia, Pennsylvania
June 24, 2020
We have served as the auditor of one or more investment companies in Wilmington Funds since 2019.
April 30, 2020 / ANNUAL REPORT
| | |
| BOARD OF TRUSTEES AND TRUST OFFICERS | | 76 |
BOARD OF TRUSTEES AND TRUST OFFICERS
The following tables give information about each Trustee and the senior officers of the Trust. The tables separately list Trustee members who are “interested persons” of the Fund (i.e., “Interested” Trustees) and those who are not (i.e., “Independent” Trustees). The Trust is comprised of 12 funds. Unless otherwise noted, the business address of each Trustee and senior officer is 1100 North Market Street, 9th Floor, Wilmington, DE 19890. Each Trustee oversees all portfolios of the Trust and serves for an indefinite term. The Trust’s Statement of Additional Information includes additional information about the Trustees and is available, without charge and upon request, by calling 1-800-836-2211.
INTERESTED TRUSTEES BACKGROUND
| | | | |
| | |
| | | Name Address Birth Year Position with Trust Date Service Began | | Principal Occupations and Other Directorships Held for Past Five Years |
| | |
| | Dominick J. D’Eramo* Birth year: 1964 | | Principal Occupations:Senior Vice President, Wilmington Trust Investment Advisors, Inc. and Head of Fixed Income. |
| | TRUSTEE | | Previous Positions:Group Vice President, Wilmington Trust Investment Advisor, Inc. (WTIA) |
| | Began serving: November 2018 |
| | (2014-2017); Administrative Vice President, WTIA (2012-2014). |
| | PRESIDENT |
| | Began serving: June 2018 | | |
| * | Dominick J. D’Eramo is “interested” due to his employment with WTIA and his position with WFMC, investment Advisors to the Funds. |
INDEPENDENT TRUSTEES BACKGROUND
| | | | |
| | |
| | | Name Birth Year Position with Trust Date Service Began | | Principal Occupations and Other Directorships Held for Past Five Years |
| | |
| | | Nicholas A. Giordano Birth year: 1943 CHAIRMAN and TRUSTEE Began serving: March 2012 | | Principal Occupations:Consultant, financial services organizations (1997 to present). Other Directorships Held:The RBB Fund Inc. (19 portfolios) (registered investment companies); Independence Blue Cross; IntriCon Corporation (body-worn products). Previous Positions:Director, Kalmar Pooled Investment Trust (through 6/17); Interim President, LaSalle University (1998 to 1999); President and Chief Executive Officer, Philadelphia Stock Exchange (1981 to 1997). |
| | |
| | Robert H. Arnold Birth year: 1944 TRUSTEE Began serving: March 2012 | | Principal Occupations:Managing Director, R.H. Arnold & Co, Inc. (financial management consulting) (6/89 to present). Other Directorships Held:None. Previous Positions: Trustee, First Potomac Realty Trust (real estate investment trust) (5/03 to 12/17); Director, Treasury Strategies, Inc. (private treasury consulting services) (6/01 to 6/16). |
| | | |
| | | Gregory P. Chandler Birth year: 1966 TRUSTEE Began serving: July 2017 | | Principal Occupations: Chief Financial Officer, Avocado Systems, Inc. (cybersecurity software) (3/20 to present); Other Directorships Held:Trustee, RBB Fund Series Trust (32 portfolios) (registered investment companies) (2012 to present); Trustee, FS Energy Partners (business development company) (2009 to present); Director, Emtec, Inc. (2005 to 2019); Director, FS Investment Corporation (business development company) (2007 to 2018); Previous Positions:Chief Financial Officer, Emtec, Inc. (information technology services) (2009 to 2020); Managing Director, Janney Montgomery Scott LLC (investment banking) (1999 to 2009); Consulting Manager, PwC (1997 to 1999), Manager, Business Assurance, Coopers & Lybrand (audit services) (1995 – 1997); Captain, US Army (1989 to 1994). |
ANNUAL REPORT / April 30, 2020(unaudited)
| | |
| 77 | | BOARD OF TRUSTEES AND TRUST OFFICERS |
| | | | |
| | |
| | | Name Birth Year Position with Trust Date Service Began | | Principal Occupations and Other Directorships Held for Past Five Years |
| | |
| | Donald E. Foley Birth year: 1951 TRUSTEE Began serving: December 2015 | | Principal Occupations:Director, BioSig Technologies (2015 to present); Director, AXA Equitable’s VIP Mutual Funds (2017 to present); Director, AXA Equitable (variable annuity) (2013 to present); Director, 1290 Mutual Funds (retail funds) (2013 to present); and Chairman and Director, Burke Rehabilitation Hospital Foundation (private hospital, research institute) (2005 to present). Other Directorships Held:Director, M&T Bank Corporation (commercial bank) (2011 to 2012); Chairman and Director, Wilmington Trust Corporation (commercial and trust bank) (2007 to 2011); Chairman, Director and President’s Council, Union College (private college) (2011 to 2015). Previous Positions:Advisory Member, Trust and Investment Committee, M&T Bank, Wilmington Trust, National Association, and Wilmington Trust Company (through 2016); Chairman and Chief Executive Officer of Wilmington Trust Corporation (2010 to 2011); Senior Vice President and Treasurer at ITT Corporation (1996 to 2010); Assistant Treasurer at International Paper (1989 to 1996). |
| | | |
| | Richard B. Seidel Birth year: 1941 TRUSTEE Began serving: September 2003 | | Principal Occupations:Chairman, Seidel & Associates (legal consulting) (1/14 to present); Chairman, Liberty Private Client, LLC (registered investment adviser) (1/14 to present). Other Directorships Held:Director, Chartwell Investment Partners (9/15 to present); Director, Tristate Capital Holdings (9/07 to 4/20). Previous Positions:Chairman, Girard Capital (broker-dealer) (3/05 to 1/14); Chairman, Girard Partners, Ltd. (6/96 to 1/14). |
| | | |
| | | Valerie J. Sill Birth year: 1962 TRUSTEE Began serving: April 2020 | | Principal Occupations:President, Chief Executive Officer and Chief Investment Officer, DuPont Capital Management (asset management) (2004 to present). Other Directorships Held:Trustee, Longwood Gardens (2005 to present); Trustee of the Christiana Care Health System (2012 to present); and Advisory Counsel, Federal Reserve Bank of Philadelphia’s Economic Advisory Council (2010 to 2013). Previous Positions:Executive Vice President at The Boston Company (1994 to 2004). |
OFFICERS
| | | | |
| | |
| | | Name Address Birth Year Positions with Trust | | Principal Occupations for Past Five Years and Previous Positions |
| | |
| | John C. McDonnell Birth year: 1966 CHIEF OPERATIONS OFFICER Began serving: June 2017 VICE PRESIDENT Began serving: June 2012 | | Principal Occupations:Chief Operations Officer, Wilmington Funds; Vice President, Wilmington Funds Management Corporation (2005 to present); Vice President, Wilmington Trust Investment Advisors, Inc. (2012 to present). Previous Positions:Vice President, Wilmington Trust Investment Management, LLC (2005 to 2012). |
| | | |
| | | Lisa Druelinger Birth year: 1978 CHIEF COMPLIANCE OFFICER and AML COMPLIANCE OFFICER. Began serving: November 2017 | | Principal Occupations:Chief Compliance Officer and Anti-Money Laundering Officer, Wilmington Funds; Administrative Vice President, M&T Bank. Previous Positions:Vice President and Senior Compliance Officer, Wilmington Trust Investment Advisors, Inc. (2015-2017); Wilmington Funds Product Manager, Wilmington Trust Investment Advisors, Inc. (2013-2015); Institutional and Retirement Services Product Manager, Wilmington Trust (2011-2013); Trust Compliance and Risk Management at M&T Bank (2006-2011). |
April 30, 2020 (unaudited) / ANNUAL REPORT
| | |
| BOARD OF TRUSTEES AND TRUST OFFICERS | | 78 |
| | | | |
| | |
| | | Name Address Birth Year Positions with Trust | | Principal Occupations for Past Five Years and Previous Positions |
| | | |
| | | John J. Kelley Birth year: 1959 VICE PRESIDENT Began serving: December 2016 | | Principal Occupations:President of Wilmington Funds Management Corporation; Group Vice President and Chief Administrative Officer, Wilmington Trust Investment Advisors, Inc. Previous Positions:Vice President, BNY Mellon Investment Servicing (formerly, PNC Global Investment Servicing) from (1/05 to 7/05); Vice President of Administration, 1838 Investment Advisors, LP (1999 to 2005); Chief Compliance Officer, 1838 Investment Advisors, LP (2004 to 2005). |
| | Robert L. Tuleya Birth year: 1974 VICE PRESIDENT and ASSISTANT SECRETARY Began serving: September 2018 | | Principal Occupations:Vice President and Assistant Secretary, Wilmington Funds; Vice President and Assistant Secretary, Wilmington Funds Management Corporation (2018 to present); Vice President and Assistant Secretary, Wilmington Trust Investment Advisors, Inc. (2018 to present); Vice President and Assistant Secretary, Wilmington Trust Investment Management, LLC (2018 to present); Vice President and Assistant General Counsel, M&T Bank (2018 to present). Previous Positions:Vice President and Counsel, M&T Bank (2017 to 2018); Senior Counsel, PNC Bank (2014 to 2017). |
| | | Christopher W. Roleke 10 High Street, Suite 302 Boston, MA 02110 Birth year: 1972 CHIEF FINANCIAL OFFICER AND TREASURER Began serving: July 2013 | | Principal Occupation:Managing Director and Fund Principal Financial Officer, Foreside Management Services, LLC (2011 to present). Previous Positions:Assistant Vice President, JP Morgan Investor Services Co. (2006 to 2011). |
| | | Lisa R. Grosswirth Atlantic Terminal Office Tower, 2 Hanson Place, 12th Floor Brooklyn, NY 11217 Birth year: 1963 SECRETARY Began serving: September 2007 | | Principal Occupation:Vice President, BNY Mellon Asset Servicing (2004 to present). Previous Positions:Supervisory Paralegal, The Dreyfus Corporation (1998 to 2004). |
| | | Richard J. Berthy Three Canal Plaza, Suite 100 Portland, ME 04101 Birth year: 1958 CHIEF EXECUTIVE OFFICER Began serving: September 2007 | | Principal Occupation:Chief Executive Officer, Foreside Financial Group, LLC (2012 to present). Previous Positions:President, Foreside Financial Group, LLC (2008 to 2012); Chief Administrative Officer, Foreside Financial Group, LLC (2005 to 2008); President and Secretary, Bainbridge Capital Management, LLC (2003 to 2006); Vice President, Bainbridge Capital Management (2002 to 2004). |
ANNUAL REPORT / April 30, 2020 (unaudited)
Board Approval of Liquidity Risk Management Program
To promote effective liquidity risk management throughout the fund industry and to enhance disclosure regarding fund liquidity and redemption practices, the Securities and Exchange Commission (the “Commission”) adopted Rule 22e-4 under the Investment Company Act of 1940, as amended. The rule requires every registered open-end management company to establish a liquidity risk management program that, among other things, provides for the assessment, management and review of liquidity risk, the classification of a fund’s portfolio investments into one of four liquidity buckets based upon the number of days that such investments may reasonably be expected to be converted into cash or otherwise disposed of without significantly impacting their price, the establishment of a highly liquid investment minimum where required, and the establishment of a 15% limitation on illiquid investments. Additionally, the Commission adopted Rule 30b1-10 and Form N-LIQUID, which generally requires a fund to notify the Commission when certain liquidity-related events occur.
The Wilmington Funds Board of Trustees (the “Board”) approved the appointment of the Funds’ Liquidity Risk Management Committee (“Liquidity Committee”) as the administrator of the liquidity risk management program (the “LRMP”) for the Funds on September 6, 2018 and the Funds’ final LRMP on March 5, 2019. At the regular meeting of the Board on March 10, 2020, the Trust’s Chief Operations Officer, as a member of the Liquidity Committee, provided a report to the Board on the operation and effectiveness of the LRMP after its first year of operation. The Liquidity Committee managed liquidity risks associated with the Funds’ investments by monitoring cash and cash equivalents, the use of derivatives, the concentration of investments and the appropriateness of portfolio strategies for open-end funds, and by classifying each investment of a Fund as either highly liquid, moderately liquid, less liquid or illiquid on at least a monthly basis. To assist with the classification of each Fund’s investments, the Liquidity Committee utilized a third party provider of liquidity monitoring services. The Liquidity Committee supplied portfolio-level data and certain assumptions to the provider which then used the information to determine the liquidity classification of each security position held by the Funds. The liquidity classifications as of each month end were reviewed by the Liquidity Committee on at least a quarterly basis and would be reviewed more often if market conditions warranted. For assets managed by a third party sub-adviser the Liquidity Committee would take sub-adviser input into account where appropriate in determining the liquidity classifications.
The LRMP effectively managed the Funds’ liquidity risks for the twelve month period ended April 30, 2020. During this period, each Fund held more than 50% of its total net assets in highly liquid investments and due to the fact that each Fund is deemed to consist primarily of highly liquid investments, no highly liquid investment minimum was required to be established for any Fund. All Funds holding assets deemed to be illiquid were well under the illiquid investment limitation. Additionally, no events occurred that required the filing of Form N-LIQUID.
April 30, 2020 (unaudited) / ANNUAL REPORT
Shares of the Wilmington Funds are not FDIC insured or otherwise protected by the U.S. government, are not deposits or other obligations of, or guaranteed by, Manufacturers and Traders Trust Company, and are subject to investment risks, including possible loss of the principal amount invested.
VOTING PROXIES ON FUND PORTFOLIO SECURITIES
A description of the policies and procedures that the Funds use to determine how to vote proxies relating to securities held in the Funds’ portfolios is available, without charge and upon request, by calling 1-800-836-2211. A report on how the Funds voted any such proxies during the most recent 12-month period ended June 30 is available through Wilmington Funds’ website. Go to www.wilmingtonfunds.com select “Proxy Voting Record” to access the link. This information is also available from the Edgar database on the SEC’s website at www.sec.gov.
QUARTERLY PORTFOLIO SCHEDULE
For periods prior to the quarter ending July 31, 2019, the Funds have filed a complete schedule of portfolio holdings with the SEC for the first and third quarters of each fiscal year on Form N-Q. The Funds’ Form N-Qs are available on the SEC’s website at www.sec.gov.
Effective July 31, 2019, the Funds file a complete schedule of portfolio holdings with the SEC for the first and third quarters of each fiscal year as an exhibit to its reports on Form N-PORT. Form N-PORT is available on the SEC’s website at www.sec.gov.
Electronic Delivery
Wilmington Funds encourages you to sign up for electronic delivery of investor materials. By doing so you will receive information faster, help lower shareholder costs, and reduce the impact to the environment. To enroll in electronic delivery:
| | 1.) | Go to www.wilmingtonfunds.com and select “Individual Investors” |
| | 2.) | Click on the link “Sign up for Electronic Delivery” |
| | 3.) | Login to your account or create new user ID |
| | 4.) | Select E-Delivery Consent from the available options, and |
| | 5.) | Complete the information requested, including providing the email address where you would like to receive notification for electronic documents. |
* If you hold your account through a financial intermediary, please contact your advisor to request electronic delivery of investor materials.
Householding
In an effort to reduce volume of mail you receive, only one copy of the prospectus, annual/semi-annual report, SAI and proxy statements will be sent to shareholders who are part of the same family and share the same address.
If you would like to request additional copies of the prospectus, annual/semi-annual report or SAI, or wish to opt out of householding mailings, please contact Shareholder Services at 1-800-836-2211, or write to Wilmington Funds, P.O. Box 9828, Providence, RI 02940-8025.
ANNUAL REPORT / April 30, 2020
PRIVACY POLICY AND NOTICE
OF THE FUNDS AND THEIR DISTRIBUTOR
June 8, 2012
The Wilmington Funds, their distributor and their agents (referred to as “the Funds”, “we” or “us”) recognize that consumers (referred to as “you” or “your”) expect us to protect both your assets and financial information. We respect your right to privacy and your expectation that all personal information about you or your account will be maintained in a secure manner. We are committed to maintaining the confidentiality, security and integrity of client and shareholder information. We want you to understand the Funds’ policy that governs the handling of your information, how the Funds gather information, how that information is used and how it is kept secure.
Information The Funds Collect:
The Funds collect nonpublic personal information about you from the following sources:
•We may receive information from you, or from your financial representative, on account applications, other forms or electronically (such as through the Funds’ website or other electronic trading mechanisms). Examples of this information include your name, address, social security number, assets and income.
•We may receive information from you, or from your financial representative, through transactions with us or others, correspondence and other communications. Examples of this information include specific investments and your account balances.
•We may obtain other personal information from you in connection with providing you a financial product or service. Examples of this information include depository, debit or credit account numbers.
Information Sharing Policy
The Funds may share nonpublic personal information about you, as described above, with financial or non-financial companies or other entities, including companies that may be affiliated with the Funds and other nonaffiliated third parties, for the following purposes:
•We may share information when it is necessary and required to process a transaction or to service a customer relationship. For example, information may be shared with a company that provides account record keeping services or a company that provides proxy services to shareholders.
•We may share information when it is required or permitted by law. For example, information may be shared in response to a subpoena or to protect you against fraud or with someone who has established a legal beneficial interest, such as a power of attorney.
•We may disclose some or all of the information described above to companies that perform marketing or other services on our behalf. For example, we may share information about you with the financial intermediary (bank, investment bank or broker-dealer) through whom you purchased the Funds’ products or services, or with providers of marketing, legal, accounting or other professional services. The Funds will not, however, disclose a consumer’s account number or similar form of access number or access code for credit card, deposit or transaction accounts to any nonaffiliated third party for use in telemarketing, direct mail or other marketing purposes.
Except as described above, the Funds do not share customer information. We will not rent, sell, trade, or otherwise release or disclose any personal information about you. Any information you provide to us is for the Funds’ use only. If you decide to close your account(s) or become an inactive customer, we will adhere to the privacy policies and practices as described in this notice.
Information Security:
When the Funds share nonpublic customer information with third parties hired to facilitate the delivery of certain products or services to our customers, such information is made available for limited purposes and under controlled circumstances designed to protect our customers’ privacy. We require third parties to comply with our standards regarding security and confidentiality of such information. We do not permit them to use that information for their own or any other purposes, or rent, sell, trade or otherwise release or disclose the information to any other party. These requirements are reflected in written agreements between the Funds and the third party service providers.
The Funds protect your personal information in several ways. We maintain physical, electronic, and procedural safeguards to guard your nonpublic personal information. In addition, the Funds’ Transfer Agent and Shareholder Servicing Agent have procedures in place for the appropriate disposal of nonpublic personal information when they are no longer required to maintain the information.
Each of the following sections explains an aspect of the Funds’ commitment to protecting your personal information and respecting your privacy.
Employee Access to Information:
Our Code of Ethics, which applies to all employees, restricts the use of customer information and requires that it be held in the strictest of confidence. Employee access to customer information is authorized for business purposes only, and the degree of access is based on the sensitivity of the information and on an employee’s or agent’s need to know the information in order to service a customer’s account or comply with legal requirements.
Visiting The Funds’ Website:
The Funds’ website gathers and maintains statistics about the number of visitors as well as what information is viewed most frequently. This information is used to improve the content and level of service we provide to our clients and shareholders.
April 30, 2020 / ANNUAL REPORT
•Information or data entered into a website will be retained.
•Where registration to a website or re-entering personal information on a website is required, “cookies” are used to improve your online experience. A cookie is a way for websites to recognize whether or not you have visited the site before. It is a small file that is stored on your computer that identifies you each time you re-visit our site so you don’t have to resubmit personal information. Cookies provide faster access into the website.
•We may also collect non-personally identifiable Internet Protocol (“IP”) addresses for all other visitors to monitor the number of visitors to the site. These non-personally identifiable IP addresses are never shared with any third party.
E-mail:
If you have opted to receive marketing information from the Funds by e-mail, it is our policy to include instructions in all marketing messages on how to unsubscribe from subsequent e-mail programs. Some products or services from the Funds are intended to be delivered and serviced electronically. E-mail communication may be utilized in such cases. If you participate in an employer-sponsored retirement plan administered by the Funds, we may, at your employer’s request, send you e-mail on matters pertaining to the retirement plan.
Please do not provide any account or personal information such as social security numbers, account numbers, or account balances within your e-mail correspondence to us. We cannot use e-mail to execute transaction instructions, provide personal account information, or change account registration. We can, however, use e-mail to provide you with the necessary forms or you may contact customer service toll-free at 1-800-836-2211.
Surveys/Aggregate Data:
Periodically, the Funds may conduct surveys about financial products and services or review elements of customer information in an effort to forecast future business needs. The Funds then generate reports that include aggregate data regarding its customers. Aggregate data classifies customer information in various ways but that does not identify individual customers. These reports may also include information on website traffic patterns and related information. These reports are used for the Funds’ planning, statistical and other corporate purposes. Aggregate data may also be shared with external parties, such as marketing organizations. However, no information is shared by which any individual customer could be identified.
Changes to Our Privacy Statement:
The effective date of this policy is June 8, 2012. We reserve the right to modify this policy at any time. When it is revised or materially changed, we will update the effective date. You can determine whether there have been changes since the last time you reviewed by simply checking the effective date.
Notice will be provided to you in advance of any changes that would affect your rights under this policy statement
ANNUAL REPORT / April 30, 2020
[This Page Intentionally Left Blank]
[This Page Intentionally Left Blank]

WILMINGTON FUNDS Investment Advisor Distributor Wilmington Funds Management Corp. ALPS Distributors, Inc. 1100 North Market Street 1290 Broadway, Suite 1100 9th Floor Denver, CO 80203 Wilmington, DE 19890 Fund Accountant, Co-Administrator, Transfer Agent Sub-Advisor and Dividend Disbursing Agent Wilmington Trust Investment Advisors, Inc. BNY Mellon Investment Servicing (U.S.) Inc. 1100 North Market Street 301 Bellevue Parkway 9th Floor Wilmington, DE 19809 Wilmington, DE 19890 Independent Registered Public Accounting Firm Co-Administrator PricewaterhouseCoopers LLP Wilmington Funds Management Corp. Two Commerce Square 1100 North Market Street 2001 Market Street, Suite 1800 9th Floor Philadelphia, PA 19103 Wilmington, DE 19890 Custodian The Bank of New York Mellon 225 Liberty Street New York, NY 10286 WT-AR-FI-0420 Wilmington Funds | 1-800-836-2211 | www.wilmingtonfunds.com We are pleased to send you this shareholder report for the Wilmington Funds. This report contains important information about your investments in the funds.
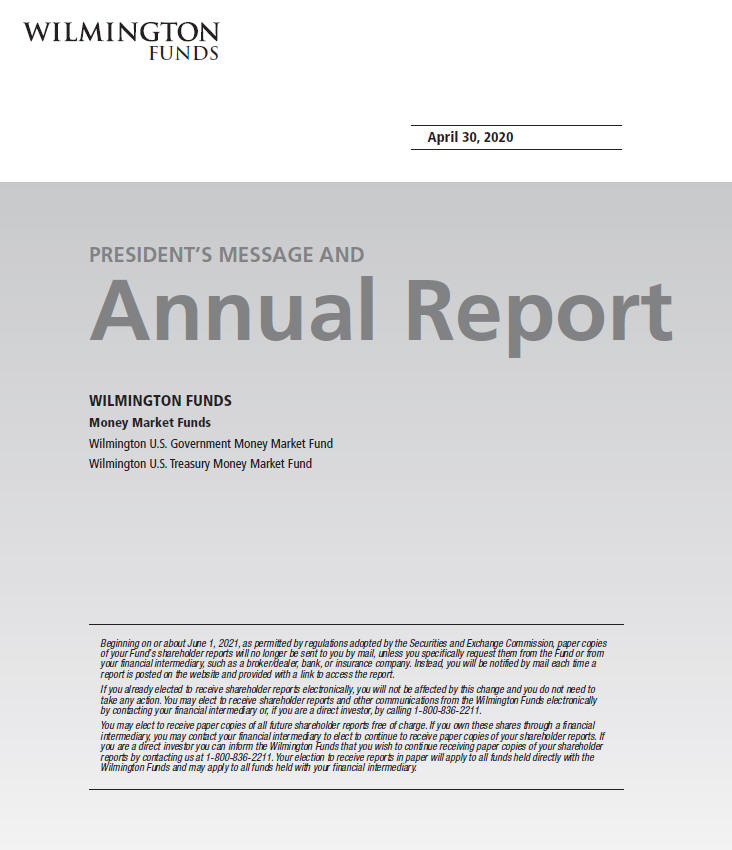
WILMINGTON FUNDS
April 30, 2020
PRESIDENT’S MESSAGE AND
Annual Report
WILMINGTON FUNDS
Money Market Funds
Wilmington U.S. Government Money Market Fund Wilmington U.S. Treasury Money Market Fund
Beginning on or about June 1, 2021, as permitted by regulations adopted by the Securities and Exchange Commission, paper copies of your Fund’s shareholder reports will no longer be sent to you by mail, unless you specifically request them from the Fund or from your financial intermediary, such as a broker/dealer, bank, or insurance company. Instead, you will be notified by mail each time a report is posted on the website and provided with a link to access the report.
If you already elected to receive shareholder reports electronically, you will not be affected by this change and you do not need to take any action. You may elect to receive shareholder reports and other communications from the Wilmington Funds electronically by contacting your financial intermediary or, if you are a direct investor, by calling1-800-836-2211.
You may elect to receive paper copies of all future shareholder reports free of charge. If you own these shares through a financial intermediary, you may contact your financial intermediary to elect to continue to receive paper copies of your shareholder reports. If you are a direct investor you can inform the Wilmington Funds that you wish to continue receiving paper copies of your shareholder reports by contacting us at1-800-836-2211. Your election to receive reports in paper will apply to all funds held directly with the Wilmington Funds and may apply to all funds held with your financial intermediary.

Wilmington U.S. Government Money Market Fund (“U.S. Government Money Market Fund”)
Wilmington U.S. Treasury Money Market Fund (“U.S. Treasury Money Market Fund”)

CONTENTS

[This Page Intentionally Left Blank]
Esteemed Shareholder:
I am pleased to present the Annual Report of the Wilmington Funds (the “Trust”), covering the Trust’s annual fiscal year period of May 1, 2019, through April 30, 2020. Inside you will find a comprehensive review of the Trust’s holdings and financial statements.
The economy and financial markets in review
Wilmington Funds Management Corporation and Wilmington Trust Investment Advisors, Inc. (the Trust’s investment advisor and subadvisor, respectively), have provided the following review of the economy, bond markets, and stock markets for the Trust’s annual fiscal year period.
The economy
The last year brought a tale of two narratives for the global economy. During 2019 the global economy centered on trade, as escalating frictions between the U.S. and China disrupted global supply chains and weighed heavily on sentiment. The announcement of a phase one trade deal between the two sides in October, and progression toward the deal’s completion in December, fueled hopes for the possibility of a cyclical recovery in early 2020. Despite weakness in business investment, a byproduct of the trade war, the U.S. recorded Gross Domestic Product (“GDP”) growth of 2.3% (seasonally adjusted) in 2019, thanks to notable strength in consumer spending. Optimism abruptly reversed course in late February of 2020 asCOVID-19, the infectious disease caused by the most recently discovered coronavirus, evolved from an outbreak to a global pandemic. Governments worldwide implemented strict lockdown measures to curb the virus’s spread, relegating consumers to their homes and forcingnon-essential businesses to shutter. With economic activity grinding to a near standstill by the end of March, U.S. GDP declined by 4.8% (seasonally adjusted annualized rate) in the first quarter, providing an early glimpse into what is expected to be a materially weaker second quarter. As demand receded in April, gauges of manufacturing and services activity tumbled into contraction territory, core inflation dropped by a record 0.4% (month-over-month) and the U.S. unemployment rate spiked to 14.7%, its highest level since the Great Depression.
The fiscal and monetary response in the U.S. has been unparalleled historically, in its scale and speed of implementation. After delivering three rate cuts in 2019, the Federal Reserve (the “Fed”) lowered rates further by a cumulative 150 basis points1 in the first quarter of 2020 and moved to open-ended purchases of Treasuries and agency Mortgage-Backed Securities/Collateralized Mortgage-Backed Securities. Additionally, the Fed introduced a plethora of accommodations to support financial markets, businesses and governments. The Fed entered uncharted territory by creating new facilities to purchase corporate debt and fixed income ETFs, and later broadened their scope to include segments of the high yield market. The Federal government introduced roughly $3 trillion of fiscal stimulus through three pieces of legislation to provide direct support to consumers, businesses and governments, cushion the pandemic’s economic impact and accelerate the nation’s healthcare response.
Emerging and international developed economies, which are more export dependent than the U.S., were hit particularly hard by the trade war in 2019, with the global manufacturing sector moving into contraction in the third quarter, before showing signs of life towards the end of the year. A cyclical rebound appeared to be picking up steam in China, beforeCOVID-19 emerged in its central province of Wuhan. As the first economy affected, China offered a preview to the rest of the world of the virus’s potential impact. After GDP growth decelerated in 2019, to its slowest pace in 30 years, China registered a record decline in the first quarter 2020. The Euro zone and UK economies suffered a tremendous economic toll as countrywide lockdown orders were set into motion and GDP contracted in the first quarter. Central banks outside the U.S. followed the Fed’s lead, in introducing record volumes of accommodation, while the fiscal response across international economies has been massive in scale.
Bond markets
The 2019 calendar year marked a strong period for bond markets, particularly for investment grade corporates, which posted their best annual performance since 2002 as rates fell precipitously and spreads compressed to near decade lows. However, the first quarter of 2020 brought one of the most volatile quarters in recent memory as theCOVID-19 pandemic challenged corporate balance sheets and severely hampered liquidity. Taxable corporate credit spreads (interest rate in excess of the risk-free rate) and the ratio of high gradetax-exempt yields to Treasuries of equivalent maturity surged to decade highs. The10-year Treasury yield plummeted to anall-time low as the Federal Reserve slashed rates to zero and investors sought safety. The Federal Reserve moved to open-ended quantitative easing and arranged a broad menu of facilities to enhance market liquidity and expand access to credit. The Fed’s pledge to provide direct support to corporate bond markets, for the first time in history, helped drive taxable spreads materially lower and boosted performance through the end of April. The energy sector weighed heavily on performance for corporates as the price of oil plunged to a historic record low. The more vulnerable high yield sector saw fundamentals deteriorate asymmetrically and lagged high grade peers in therisk-off environment.
PRESIDENT’S MESSAGE / April 30, 2020 (unaudited)
For the12-month period May 1, 2019 to April 30, 2020, certain Bloomberg Barclays indices performed as follows:2
| | | | | | | | |
| | | | |
Bloomberg Barclays U.S. Treasury Bond
Index3 | | Bloomberg Barclays
U.S. Aggregate
Bond Index4 | | Bloomberg Barclays
U.S. Credit Bond
Index5 | | Bloomberg Barclays Municipal Bond Index6 | | Bloomberg Barclays U.S. Corporate High Yield Bond Index7 |
14.27% | | 10.84% | | 9.37% | | 2.16% | | -4.11% |
Past performance is no guarantee of future results. Short term performance may not be indicative of long term results.
Source: Lipper. You cannot invest directly in an index.
Equity markets
The past year brought a continuation of the predominant equity market trends observed in the second half of 2018, namely the dominance of U.S. over international equities, developed over emerging markets, growth over value and large over small cap. U.S. large cap equities capped off their second best annual performance of the decade in the 2019 calendar year and benefitted from corporate earnings that came in better than feared, supportive monetary policy and trade optimism from October through January. International developed and emerging market equities, which are more leveraged to global trade, suffered disproportionately throughout theUS-China tariff disaster, while persistent dollar strength and investors’ preference for safe-haven assets presented additional headwinds for the international group. Risk appetite prevailed through January but was abruptly derailed as theCOVID-19 outbreak escalated rapidly to a global pandemic and brought the longest bull market in history to a painful end. The selloff that transpired from February to late March was indiscriminate, affecting all regions with unsettling speed and magnitude, although winners and losers emerged during the subsequent rebound from March lows. Notably, U.S. small cap companies, which are more cyclical in nature, bore the brunt of the selloff, as the pandemic introduced a punishing blow to economic activity.Mega-cap technology stocks emerged as relative safe havens and proved more resilient than the broader market with earnings less impacted by the economic damage.
For the12-month period May 1, 2019 to April 30, 2020, certain stock market indices performed as follows:
| | | | | | |
| | | |
| S&P 500 Index8 | | Russell 2000
Index9 | | MSCI EAFE (Net)
Index10 | | MSCI Emerging
Markets (Net) Index11 |
0.86% | | -16.39% | | -11.34% | | -12.00% |
Past performance is no guarantee of future results. Short term performance may not be indicative of long term results.
Source: Lipper. You cannot invest directly in an index.
As investors know all too well, uncertainty in financial markets is certain. Other ongoing certainties include our fiduciary, clients-first mindset as we strive to manage risk in your portfolio’s assets. Another constant is our disciplined yet flexibleeconomics-led investment process that is delivered through innovative multi-asset class solutions and is designed to help you achieve your long-term objectives.
Sincerely,

Dominick J. D’Eramo, CFA
President
May 15, 2020
April 30, 2020 (unaudited) / PRESIDENT’S MESSAGE
Must be preceded or accompanied by a prospectus.
Past performance is no guarantee of future results. The index performance quoted is for illustrative purposes only and is not representative of any specific investment. Diversification does not ensure a profit nor protect against loss.
All investments involve risk, including the possible loss of principal. Equity Securities are subject to price fluctuation and possible loss of principal. Small- andmid-cap stocks involve greater risks and volatility thanlarge-cap stocks. International investments are subject to special risks, including currency fluctuations, social, economic, and political uncertainties, which could increase volatility. These risks are magnified in emerging markets.
High-yield, lower-rated securities generally entail greater market, credit, and liquidity risks than investment grade securities and may include higher volatility and higher risk of default.
You could lose money by investing in the money market funds. Although the money market funds seek to preserve the value of your investment at $1.00 per share, it cannot guarantee it will do so. An investment in money market funds is not a deposit of M&T Bank and is not insured or guaranteed by the Federal Deposit Insurance Corporation or any other government agency. The investment advisor has no legal obligation to provide financial support to the Fund, and you should not expect that the investment advisor will provide financial support to the Fund at any time.
1. Basis Points (“BPS”) is a unit that is equal to 1/100th of 1% and is used to denote the change in a financial instrument. The basis point is commonly used for calculating changes in interest rates, equity indices and the yield of a fixed-income security.
2. Bond prices are sensitive to changes in interest rates and a rise in interest rates can cause decline in their prices.
3. Bloomberg Barclays U.S. Treasury Bond Index is a market capitalization weighted index that includes all publicly issued, U.S. Treasury securities that have a remaining maturity of at least one year, are rated investment-grade, and have $250 million or more of outstanding face value. The index is unmanaged and investments cannot be made directly in an index.
4. Bloomberg Barclays U.S. Aggregate Bond Index is widely used benchmark index for the domestic investment-grade bond market composed of securities from the Barclays Government/Corporate Bond Index, Mortgage-Backed Securities Index and Asset-Backed Securities Index. The index typically includes fixed income securities with overall intermediate- to long-term average maturities. The index is unmanaged and investments cannot be made directly in an index.
5. Bloomberg Barclays U.S. Credit Bond Index tracks the performance of domestic investment-grade corporate bonds and is composed of all publicly issued, fixed-rate, nonconvertible, investment-grade corporate debt. The index is unmanaged and investments cannot be made directly in an index.
6. Bloomberg Barclays Municipal Bond Index tracks the performance of long-term,tax-exempt, investment-grade bond market. To be included in the index, bonds must have an outstanding par balance of at least $7 million and be issued as part of a transaction of at least $75 million. The index is unmanaged and investments cannot be made directly in an index.
7. Bloomberg Barclays U.S. Corporate High Yield Bond Index measures theUSD-denominated, high yield, fixed-rate corporate bond market. Securities are classified as high yield if the middle rating of Moody’s, Fitch, and S&P is Ba1/BB+/BB+ or below. Bonds from issuers with an emerging markets country of risk, based on the Bloomberg Barclays EM country definition, are excluded. The U.S. Corporate High Yield Bond Index is a component of the U.S. Universal and Global High Yield Indices. An investment cannot be made directly in an index.
8. The S&P 500 Index is a capitalization-weighted index of 500 stocks designed to measure performance of the broad domestic economy through changes in the aggregate market value of 500 stocks representing all major industries. The index is unmanaged and investments cannot be made directly in an index.
9. The Russell 2000 Index measures the performance of the 2,000 smallest companies in the Russell 3000 Index, which represents approximately 8% of the total market capitalization of the Russell 3000 Index. As of its latest reconstitution, the index had a total market capitalization range of $152.3 million to $5 billion.
10. MSCI EAFE (Net) Index is a free float-adjusted market capitalization index that is designed to measure equity market performance of developed markets, excluding the U.S. & Canada. The MSCI EAFE Index is an equity index which captures large andmid-cap representation across 21 Developed Market countries: Australia, Austria, Belgium, Denmark, Finland, France, Germany, Hong Kong, Ireland, Israel, Italy, Japan, Netherlands, New Zealand, Norway, Portugal, Singapore, Spain, Sweden, Switzerland and the United Kingdom. The index is unmanaged and investments cannot be made directly in an index. The performance of this index is reduced by the taxes on dividends paid by the international securities issuers in the index.
11. MSCI Emerging Markets (Net) Index is a free float-adjusted market capitalization index that is designed to measure equity market performance of emerging markets. The MSCI Emerging Markets Index captures large andmid-cap representation across 26 Emerging Market countries: Argentina, Brazil, Chile, China, Colombia, Czech Republic, Egypt, Greece, Hungary, India, Indonesia, Korea, Malaysia, Mexico, Pakistan, Peru, Philippines, Poland, Qatar, Russia, Saudi Arabia, South Africa, Taiwan, Thailand, Turkey, and United Arab Emirates. The index is unmanaged and investments cannot be made directly in an index. The performance of this index is reduced by the taxes on dividends paid by the international securities issuers in the index.
PRESIDENT’S MESSAGE / April 30, 2020 (unaudited)
WILMINGTON MONEY MARKET FUNDS
Management’s Discussion of Fund Performance
We understand the growing concern associated with the pandemic and its effect on the global economy and in the towns that we live and work. Our thoughts are with those that have been infected by the coronavirus. We are grateful for all the health care workers that are serving our communities. Your fixed income team is meeting “virtually” daily to review current events and set strategy. We continue to utilize our disciplined relative value investment process. We continue to emphasize our guiding philosophies of maintaining well diversified and liquid portfolios. We continue to conduct our own independent credit analysis. Most importantly in these uncertain times we draw upon our experienced team. As always, our disciplined risk management efforts guide our investment decisions.
Prior to the pandemic the Federal Reserve (the “Fed”) had cut interest rates three times in 2019. These were the first rate cuts since the financial crisis. The Fed had acknowledged that the trade tensions between China and the United States were causing weak global economic growth and inflation pressures were muted. The Fed wanted some insurance to keep the longest economic expansion going.
As the pandemic spread around the globe leading to “stay at home orders” the economy experienced its worst crisis since the great depression. The unemployment rate rose from a 50 year low to 14.7% as 20.5 million jobs were destroyed in April. As businesses closed and consumers stayed home retail sales fell by a staggering 16.4% in April after falling by 8.3% in March. In response to the economic crisis the Fed has cut interest rates to zero and provided liquidity to the treasury, mortgage backed, commercial paper and asset backed markets just as it did during the financial crisis. The Fed also announced on March 23rd that they will begin buying corporate and municipal bonds, which the Fed did not undertake during the financial crisis. Congress has also provided several stimulus programs to ease the economic pain.
Interest rates declined rapidly in response to the Fed cutting interest rates. The unparalleled “flight to quality” led to record low treasury yields. The2-year treasury yield fell by 2% over the past year to a yield of 0.2%. The10-year treasury yield sank to anall-time low of 0.31% in March before rising to a yield of 0.64% on April 30.
Looking forward the expectation is for the Fed to maintain azero-interest rate policy until the economy recovers from the pandemic. The market is anticipating no change in the Fed Funds target before 2023. Longer term interest rates will be determined by news of a vaccine and whether the economy starts to recover.
The change in key interest rates over the last twelve months is presented below.
| | | | | | |
| | | | |
| | | 4/30/19 | | 10/31/19 | | 4/30/20 |
| | | | |
Federal Fund Target | | 2.25% - 2.50% | | 1.50% - 1.75% | | 0.00% - 0.25% |
| | | | |
3-Month LIBOR | | 2.576% | | 1.902% | | 0.556% |
| | | | |
2-Year Treasury Note | | 2.27% | | 1.52% | | 0.20% |
| | | | |
10-Year Treasury Note | | 2.51% | | 1.69% | | 0.64% |
The following is a comparison of the performance of the Wilmington U.S. Government Money Market Fund and Wilmington U.S. Treasury Money Market Fund versus their respective iMoneyNet and Lipper peer group average returns for the fiscal year ended April 30, 2020:
| | | | |
| Wilmington U.S. Government Money Market Fund – Administrative Class | | | 1.21 | % |
| Wilmington U.S. Government Money Market Fund – Institutional Class | | | 1.56 | % |
Wilmington U.S. Government Money Market Fund – Select Class | | | 1.46 | % |
Wilmington U.S. Government Money Market Fund – Service Class | | | 1.08 | % |
iMoneyNet, Inc. Government & Agency Institutional Average | | | 1.49 | % |
Lipper U.S. Government Money Market Funds Average | | | 1.45 | % |
| |
| Wilmington U.S. Treasury Money Market Fund – Administrative Class | | | 1.20 | % |
Wilmington U.S. Treasury Money Market Fund – Institutional Class* | | | 0.61 | % |
Wilmington U.S. Treasury Money Market Fund – Select Class | | | 1.44 | % |
Wilmington U.S. Treasury Money Market Fund – Service Class | | | 1.07 | % |
iMoneyNet, Inc. Treasury and Repo Institutional Average | | | 1.45 | % |
Lipper U.S. Treasury Money Market Funds Average | | | 1.28 | % |
* Since Inception (October 16, 2019) Return is not annualized
Source: iMoneyNet, Inc. and Lipper
April 30, 2020 (unaudited) / ANNUAL REPORT
Performance shown represents past performance and does not guarantee future results. Investment return will fluctuate. The total return shown assumes the reinvestment of all distributions and does not reflect the deduction of taxes that a shareholder would pay on Fund distributions. Shares, when redeemed, may be worth more or less than their original cost. Current performance may be lower or higher than that shown here. You should consider the investment objectives, risks, charges and expenses of the Funds carefully before investing. A prospectus with this and other information may be obtained by calling1-800-836-2211 or visiting the Funds’ web site at www.wilmingtonfunds.com. The prospectus should be read before investing.
The Funds’ shares are not bank deposits and are not insured by, guaranteed by, endorsed by or obligations of the Federal Deposit Insurance Corporation, the Federal Reserve Board, any government agency or any bank. Although the Funds seek to preserve the value of
your investment at $1.00 per share, it is possible to lose money by investing in the Funds.
During the fiscal year ended April 30, 2020, Wilmington Funds Management Corporation has voluntarily agreed to reduce their advisory fee and/or reimburse certain of the Funds’ operating expenses, and/or certain class-specific fees and expenses, in an effort to maintain the current yield of each share class at or above zero. The fee waiver does not take into consideration acquired fund fees and expenses, taxes or extraordinary items. Any such waiver or expense reimbursement may be modified or discontinued at any time without notice.
London Interbank Offered Rate (“LIBOR”) is a benchmark rate that some of the world’s leading banks charge each other for short-term loans. It serves as the first step to calculating interest rates on various loans throughout the world.
ANNUAL REPORT / April 30, 2020 (unaudited)
SHAREHOLDER EXPENSE EXAMPLE (unaudited)
As a shareholder of the Funds, you incur two types of costs: (1) transaction costs, including sales charges (loads) on purchase payments, reinvested dividends, or other distributions; and redemption fees; and (2) ongoing costs, including management fees; distribution and/or service(12b-1) fees; and other Fund expenses. This Example is intended to help you to understand your ongoing costs (in dollars) of investing in the Funds and to compare these costs with the ongoing costs of investing in other mutual funds. It is based on an investment of $1,000 invested at the beginning of the period and held for the entire period from November 1, 2019 to April 30, 2020.
Actual Expenses
This section of the following table provides information about actual account values and actual expenses. You may use the information in this section, together with the amount you invested, to estimate the expenses that you incurred over the period. Simply divide your account value by $1,000 (for example, an $8,600 account value divided by $1,000 = 8.6), then multiply the result by the number in the first section under the heading entitled “Expenses Paid During Period” to estimate the expenses attributable to your investment during this period.
Hypothetical Example for Comparison Purposes
This section of the following table provides information about hypothetical account values and hypothetical expenses based on the Funds’ actual expense ratios and assumed rates of return of 5% per year before expenses, which are not the Funds’ actual returns. Thus, you should not use the hypothetical account values and expenses to estimate the actual ending account balance or your expenses for the period. Rather, these figures are required to be provided to enable you to compare the ongoing costs of investing in the Funds with other funds. To do so, compare this 5% hypothetical example with the 5% hypothetical examples that appear in the shareholder reports of the other funds.
Please note that the expenses shown in the table are meant to highlight your ongoing costs only. Therefore, the Annualized Net Expense Ratio section of the table is useful in comparing ongoing costs only, and will not help you determine the relative total costs of owning different funds.
The Annualized Net Expense Ratios may be different from the net expense ratios in the Financial Highlights which are for the fiscal year ended April 30, 2020.
| | | | | | | | | | | | | | | | | | | | |
| | | | |
| | | Beginning
Account Value
11/01/19 | | Ending
Account Value
4/30/20 | | Expenses Paid
During Period1 | | Annualized Net
Expense Ratio2 |
WILMINGTON U.S. GOVERNMENT MONEY MARKET FUND | | | | | | | | | | | | | | | | | | | | |
Actual | | | | | | | | | | | | | | | | | | | | |
Administrative Class | | | $ | 1,000.00 | | | | $ | 1,003.80 | | | | $ | 2.99 | | | | | 0.60 | % |
Institutional Class | | | $ | 1,000.00 | | | | $ | 1,005.40 | | | | $ | 1.35 | | | | | 0.27 | % |
Select Class | | | $ | 1,000.00 | | | | $ | 1,004.90 | | | | $ | 1.84 | | | | | 0.37 | % |
Service Class | | | $ | 1,000.00 | | | | $ | 1,003.20 | | | | $ | 3.54 | | | | | 0.71 | % |
Hypothetical (assuming a 5% return before expenses) | | | | | | | | | | | | | | | | | | | | |
Administrative Class | | | $ | 1,000.00 | | | | $ | 1,021.88 | | | | $ | 3.02 | | | | | 0.60 | % |
Institutional Class | | | $ | 1,000.00 | | | | $ | 1,023.52 | | | | $ | 1.36 | | | | | 0.27 | % |
Select Class | | | $ | 1,000.00 | | | | $ | 1,023.02 | | | | $ | 1.86 | | | | | 0.37 | % |
Service Class | | | $ | 1,000.00 | | | | $ | 1,021.33 | | | | $ | 3.57 | | | | | 0.71 | % |
WILMINGTON U.S. TREASURY MONEY MARKET FUND | | | | | | | | | | | | | | | | | | | | |
Actual | | | | | | | | | | | | | | | | | | | | |
Administrative Class | | | $ | 1,000.00 | | | | $ | 1,003.80 | | | | $ | 2.84 | | | | | 0.57 | % |
Institutional Class | | | $ | 1,000.00 | | | | $ | 1,005.40 | | | | $ | 1.25 | | | | | 0.25 | % |
Select Class | | | $ | 1,000.00 | | | | $ | 1,004.90 | | | | $ | 1.74 | | | | | 0.35 | % |
Service Class | | | $ | 1,000.00 | | | | $ | 1,003.20 | | | | $ | 3.29 | | | | | 0.66 | % |
Hypothetical (assuming a 5% return before expenses) | | | | | | | | | | | | | | | | | | | | |
Administrative Class | | | $ | 1,000.00 | | | | $ | 1,022.03 | | | | $ | 2.87 | | | | | 0.57 | % |
Institutional Class | | | $ | 1,000.00 | | | | $ | 1,023.62 | | | | $ | 1.26 | | | | | 0.25 | % |
Select Class | | | $ | 1,000.00 | | | | $ | 1,023.12 | | | | $ | 1.76 | | | | | 0.35 | % |
Service Class | | | $ | 1,000.00 | | | | $ | 1,021.58 | | | | $ | 3.32 | | | | | 0.66 | % |
| (1) | Expenses are equal to the Funds’ annualized net expense ratios, multiplied by the average account value over the period, multiplied by 182/366 (to reflect the most recentone-half year period). |
| (2) | Expense ratio does not reflect the indirect expenses of the underlying funds in which it invests. |
April 30, 2020 (unaudited) / ANNUAL REPORT
PORTFOLIO OF INVESTMENTS SUMMARY TABLE
Wilmington U.S. Government Money Market Fund
At April 30, 2020, the Fund’s portfolio composition was as follows (unaudited):
| | | | | |
| | | Percentage of Total Net Assets |
U.S. Government Agency Obligations | | | | 48.4 | % |
Repurchase Agreements | | | | 26.5 | % |
U.S. Treasury Obligations | | | | 19.9 | % |
Money Market Funds | | | | 5.2 | % |
Other Assets and Liabilities – Net1 | | | | (0.0 | )%2 |
| | | | | |
| |
TOTAL | | | | 100.0 | % |
| | | | | |
| (1) | Assets, other than investments in securities, less liabilities. See Statements of Assets and Liabilities. |
| (2) | Represents less than 0.05%. |
PORTFOLIO OF INVESTMENTS
April 30, 2020
| | | | | | | | |
| | |
Description | | Par Value | | | Value | |
| |
U.S. GOVERNMENT AGENCY OBLIGATIONS – 48.4% | | | | | |
| |
FEDERAL FARM CREDIT BANK (FFCB) – 11.7% | | | | | |
| | |
0.51%, 5/19/20‡ | | $ | 50,000,000 | | | $ | 49,987,500 | |
| | |
0.51%, 6/01/20‡ | | | 50,000,000 | | | | 49,978,472 | |
| | |
0.51%, 6/12/20‡ | | | 50,000,000 | | | | 49,970,833 | |
| | |
1.60%, 7/01/20‡ | | | 19,000,000 | | | | 18,949,777 | |
| | |
0.36%, 7/23/20‡ | | | 185,000,000 | | | | 184,850,715 | |
| | |
(1 Month USD LIBOR - 0.01%),
0.80%, 9/15/20D | | | 50,000,000 | | | | 49,999,265 | |
| | |
0.51%, 10/05/20‡ | | | 50,000,000 | | | | 49,890,972 | |
| | |
0.65%, 10/13/20 | | | 22,300,000 | | | | 22,302,749 | |
| | |
(3 Month USD LIBOR - 0.13%),
1.56%, 11/16/20D | | | 50,000,000 | | | | 49,997,958 | |
| | |
0.54%, 11/18/20‡ | | | 50,000,000 | | | | 49,852,042 | |
| | |
1.58%, 11/25/20‡ | | | 41,000,000 | | | | 40,637,560 | |
| | |
(1 Month USD LIBOR + 0.50%),
0.83%, 1/12/21D | | | 50,000,000 | | | | 49,998,264 | |
| | |
(SOFRRATE + 0.11%), 0.12%, 1/15/21D | | | 20,000,000 | | | | 20,000,000 | |
| | |
0.31%, 1/27/21‡ | | | 125,000,000 | | | | 124,717,708 | |
| | |
0.49%, 2/05/21‡ | | | 90,000,000 | | | | 89,664,000 | |
| | |
0.49%, 2/17/21‡ | | | 75,000,000 | | | | 74,708,000 | |
| | |
(SOFRRATE + 0.28%), 0.29%, 4/01/21D | | | 50,000,000 | | | | 50,000,000 | |
| | |
0.45%, 4/08/21 | | | 20,000,000 | | | | 20,000,000 | |
| | |
(U.S. Treasury 3 Month Bill Money Market Yield + 0.23%), 0.35%, 5/26/21D | | | 25,000,000 | | | | 25,000,000 | |
| | | | | | | | |
| | |
Description | | Par Value | | | Value | |
| | |
(U.S. Treasury 3 Month Bill Money Market Yield + 0.30%), 0.42%, 8/02/21D | | $ | 25,000,000 | | | $ | 25,000,000 | |
| | | | | | | | |
| | |
TOTAL FEDERAL FARM CREDIT BANK (FFCB) | | | | | | $ | 1,095,505,815 | |
| |
FEDERAL HOME LOAN BANK (FHLB) – 25.2% | | | | | |
| | |
1.61%, 5/01/20‡ | | | 54,000,000 | | | | 54,000,000 | |
| | |
0.78%, 5/04/20‡ | | | 175,000,000 | | | | 174,988,854 | |
| | |
0.90%, 5/06/20‡ | | | 190,000,000 | | | | 189,976,688 | |
| | |
1.60%, 5/13/20‡ | | | 100,000,000 | | | | 99,947,900 | |
| | |
(SOFRRATE + 0.02%), 0.03%, 5/22/20D | | | 25,000,000 | | | | 25,000,000 | |
| | |
1.04%, 5/26/20‡ | | | 25,000,000 | | | | 24,982,292 | |
| | |
1.40%, 5/29/20‡ | | | 123,789,000 | | | | 123,657,544 | |
| | |
1.43%, 6/04/20‡ | | | 100,000,000 | | | | 99,867,778 | |
| | |
(SOFRRATE + 0.02%), 0.03%, 6/05/20D | | | 15,000,000 | | | | 15,000,000 | |
| | |
(3 Month USD LIBOR - 0.22%),
0.78%, 6/08/20D | | | 50,000,000 | | | | 50,000,000 | |
| | |
0.49%, 6/10/20‡ | | | 50,000,000 | | | | 49,973,333 | |
| | |
1.06%, 6/12/20‡ | | | 61,513,000 | | | | 61,438,403 | |
| | |
0.17%, 6/15/20‡ | | | 100,000,000 | | | | 99,978,750 | |
| | |
0.17%, 7/08/20‡ | | | 150,000,000 | | | | 149,952,117 | |
| | |
1.13%, 7/15/20‡ | | | 89,020,000 | | | | 88,814,822 | |
| | |
(SOFRRATE + 0.10%), 0.11%, 7/17/20D | | | 30,000,000 | | | | 30,000,000 | |
| | |
1.61%, 7/31/20‡ | | | 75,000,000 | | | | 74,702,354 | |
| | |
0.16%, 8/03/20‡ | | | 125,000,000 | | | | 124,947,778 | |
| | |
(SOFRRATE + 0.03%), 0.04%, 8/05/20D | | | 50,000,000 | | | | 50,000,000 | |
| | |
1.58%, 8/12/20‡ | | | 49,795,000 | | | | 49,575,598 | |
| | |
(SOFRRATE + 0.04%), 0.05%, 8/25/20D | | | 26,000,000 | | | | 26,000,000 | |
ANNUAL REPORT / April 30, 2020
| | |
| 5 PORTFOLIOS OF INVESTMENTS |
|
| Wilmington U.S. Government Money Market Fund (continued) |
| | | | | | | | |
| | |
| Description | | Par Value | | | Value | |
| | |
0.94%, 9/02/20‡ | | $ | 73,000,000 | | | $ | 72,769,670 | |
| | |
0.53%, 9/18/20 | | | 50,000,000 | | | | 49,991,632 | |
| | |
(3 Month USD LIBOR - 0.20%),
1.65%, 11/16/20D | | | 50,000,000 | | | | 50,000,000 | |
| | |
(1 Month USD LIBOR - 0.02%),
0.47%, 11/27/20D | | | 100,000,000 | | | | 100,000,000 | |
| | |
0.43%, 12/14/20‡ | | | 100,000,000 | | | | 99,735,167 | |
| | |
(SOFRRATE + 0.10%), 0.11%, 12/23/20D | | | 90,400,000 | | | | 90,400,000 | |
| | |
(3 Month USD LIBOR - 0.17%),
1.15%, 1/08/21D | | | 100,000,000 | | | | 100,000,000 | |
| | |
(SOFRRATE + 0.04%), 0.05%, 2/09/21D | | | 30,000,000 | | | | 30,000,000 | |
| | |
(SOFRRATE + 0.23%), 0.24%, 4/13/21D | | | 25,000,000 | | | | 25,000,000 | |
| | |
(3 Month USD LIBOR - 0.14%),
0.90%, 4/23/21D | | | 50,000,000 | | | | 50,000,000 | |
| | |
(SOFRRATE + 0.15%), 0.16%, 9/03/21D | | | 23,000,000 | | | | 23,000,000 | |
| | | | | | | | |
| | |
TOTAL FEDERAL HOME LOAN BANK (FHLB) | | | | | | $ | 2,353,700,680 | |
|
FEDERAL HOME LOAN MORTGAGE CORPORATION (FHLMC) – 7.2% | |
| | |
(SOFRRATE + 0.01%), 0.02%, 5/13/20D | | | 50,000,000 | | | | 50,000,000 | |
| | |
1.59%, 5/19/20‡ | | | 50,000,000 | | | | 49,961,000 | |
| | |
0.69%, 7/17/20‡ | | | 100,000,000 | | | | 99,854,556 | |
| | |
0.13%, 7/20/20‡ | | | 50,000,000 | | | | 49,985,778 | |
| | |
(SOFRRATE + 0.01%), 0.02%, 7/22/20D | | | 100,000,000 | | | | 100,000,000 | |
| | |
0.12%, 8/19/20‡ | | | 100,000,000 | | | | 99,963,333 | |
| | |
(SOFRRATE + 0.03%), 0.04%, 8/21/20D | | | 100,000,000 | | | | 100,000,000 | |
| | |
(SOFRRATE + 0.04%), 0.05%, 12/04/20D | | | 50,000,000 | | | | 50,000,000 | |
| | |
(SOFRRATE + 0.05%), 0.06%, 3/05/21D | | | 25,000,000 | | | | 25,000,000 | |
| | |
(SOFRRATE + 0.32%), 0.33%, 9/23/21D | | | 50,000,000 | | | | 50,000,000 | |
| | | | | | | | |
| |
TOTAL FEDERAL HOME LOAN MORTGAGE CORPORATION (FHLMC) | | | $ | 674,764,667 | |
|
FEDERAL NATIONAL MORTGAGE ASSOCIATION (FNMA) – 4.3% | |
| | |
0.30%, 6/22/20 | | | 31,919,000 | | | | 31,973,220 | |
| | |
0.20%, 7/15/20‡ | | | 60,000,000 | | | | 59,975,000 | |
| | |
0.10%, 7/22/20‡ | | | 34,000,000 | | | | 33,992,256 | |
| | |
0.22%, 8/14/20‡ | | | 25,000,000 | | | | 24,983,958 | |
| | |
0.22%, 9/02/20‡ | | | 148,500,000 | | | | 148,387,470 | |
| | |
(SOFRRATE + 0.30%), 0.31%, 1/07/22D | | | 25,000,000 | | | | 25,000,000 | |
| | |
(SOFRRATE + 0.39%), 0.40%, 4/15/22D | | | 50,000,000 | | | | 50,000,000 | |
| | |
(SOFRRATE + 0.32%), 0.33%, 4/27/22D | | | 25,000,000 | | | | 25,000,000 | |
| | | | | | | | |
| |
TOTAL FEDERAL NATIONAL MORTGAGE ASSOCIATION (FNMA) | | | $ | 399,311,904 | |
| | |
TOTAL U.S. GOVERNMENT AGENCY OBLIGATIONS (COST $4,523,283,066) | | | | | | $ | 4,523,283,066 | |
| | |
U.S. TREASURY OBLIGATIONS – 19.9% | | | | | | | | |
| | |
U.S. TREASURY BILLS – 16.1% | | | | | | | | |
| | |
0.11%, 5/05/20‡ | | | 100,000,000 | | | | 99,998,828 | |
| | |
0.10%, 5/07/20‡ | | | 50,000,000 | | | | 49,999,167 | |
| | |
0.10%, 5/12/20‡ | | | 150,000,000 | | | | 149,995,493 | |
| | | | | | | | |
| | |
| Description | | Par Value | | | Value | |
| | |
0.07%, 5/19/20‡ | | $ | 200,000,000 | | | $ | 199,993,475 | |
| | |
0.08%, 5/26/20‡ | | | 200,000,000 | | | | 199,989,444 | |
| | |
0.12%, 5/28/20‡ | | | 200,000,000 | | | | 199,982,525 | |
| | |
0.08%, 6/04/20‡ | | | 250,000,000 | | | | 249,981,206 | |
| | |
0.07%, 6/09/20‡ | | | 100,000,000 | | | | 99,992,958 | |
| | |
0.09%, 6/23/20‡ | | | 200,000,000 | | | | 199,975,248 | |
| | |
0.11%, 8/11/20‡ | | | 50,000,000 | | | | 49,984,983 | |
| | | | | | | | |
| | |
TOTAL U.S. TREASURY BILLS | | | | | | $ | 1,499,893,327 | |
| | |
U.S. TREASURY NOTES – 3.8% | | | | | | | | |
| | |
1.65%, 5/31/20 | | | 50,000,000 | | | | 49,989,030 | |
| | |
1.63%, 7/15/20 | | | 75,000,000 | | | | 74,980,025 | |
| | |
(U.S. Treasury 3 Month Bill Money Market Yield + 0.05%), 0.17%, 10/31/20D | | | 60,570,000 | | | | 60,570,000 | |
| | |
(U.S. Treasury 3 Month Bill Money Market Yield + 0.14%), 0.26%, 4/30/21D | | | 125,000,000 | | | | 124,993,466 | |
| | |
(U.S. Treasury 3 Month Bill Money Market Yield + 0.22%), 0.35%, 7/31/21D | | | 49,934,000 | | | | 49,943,165 | |
| | | | | | | | |
| | |
TOTAL U.S. TREASURY NOTES | | | | | | $ | 360,475,686 | |
| | | | | | | | |
| | |
TOTAL U.S. TREASURY OBLIGATIONS (COST $1,860,369,013) | | | | | | $ | 1,860,369,013 | |
| | |
| | | Number of
Shares | | | | |
| | |
MONEY MARKET FUNDS – 5.2% | | | | | | | | |
| | |
Blackrock Liquidity FedFund Institutional Shares,
0.21%^ | | | 266,386,786 | | | $ | 266,386,786 | |
| | |
Dreyfus Government Cash Management Fund, Institutional Shares, 0.17%^ | | | 166,902,610 | | | | 166,902,610 | |
| | |
Federated Treasury Obligations Fund, Institutional Shares, 0.16%^ | | | 32,688,721 | | | | 32,688,721 | |
| | |
Goldman Sachs Financial Square Funds Treasury Obligations Fund, Institutional Shares, 0.21%^ | | | 15,228,923 | | | | 15,228,923 | |
| | | | | | | | |
| | |
TOTAL MONEY MARKET FUNDS (COST $481,207,040) | | | | | | $ | 481,207,040 | |
| | |
| | |
Par Value | | | | |
| | |
REPURCHASE AGREEMENTS – 26.5% | | | | | | | | |
| | |
Canadian Imperial Bank, 0.02%, dated 4/30/20, due 5/01/20, repurchase price $200,000,111, collateralized by U.S. Treasury Securities, 0.75% to 3.63%, maturing 5/15/21 to 2/15/49; total market value of $200,000,042. | | $ | 200,000,000 | | | $ | 200,000,000 | |
April 30, 2020 / ANNUAL REPORT
| | |
PORTFOLIOS OF INVESTMENTS 6 |
Wilmington U.S. Government Money Market Fund (concluded)
| | | | | | | | |
| | |
| Description | | Par Value | | | Value | |
| | |
Credit Suisse First Boston LLC, 0.02%, dated 4/30/20, due 5/01/20, repurchase price $55,000,031, collateralized by U.S. Treasury Securities, 0.00% to 2.63%, maturing 2/28/21 to 1/15/29; total market value of $56,100,032. | | $ | 55,000,000 | | | $ | 55,000,000 | |
| | |
Deutsche Bank Securities, Inc., 0.02%, dated 4/30/20, due 5/01/20, repurchase price $278,000,154, collateralized by U.S. Treasury Securities, 0.00% to 2.25%, maturing 1/28/21 to 11/15/27; total market value of $283,560,002. | | | 278,000,000 | | | | 278,000,000 | |
| | |
FICC Bank of New York, 0.03%, dated 4/30/20, due 5/01/20, repurchase price $250,000,208, collateralized by U.S. Treasury Securities, 2.13% to 2.88%, maturing 3/31/24 to 8/15/28; total market value of $255,000,068. | | | 250,000,000 | | | | 250,000,000 | |
| | |
Mizuho Securities USA, 0.03%, dated 4/30/20, due 5/01/20, repurchase price $150,000,125, collateralized by U.S. Government Agency & U.S. Treasury Securities, 0.00% to 6.00%, maturing 5/22/20 to 9/01/49; total market value of $153,000,071. | | | 150,000,000 | | | | 150,000,000 | |
| | | | | | | | |
| | |
| Description | | Par Value | | | Value | |
| | |
RBC Capital Markets LLC, 0.03%, dated 4/30/20, due 5/01/20, repurchase price $1,100,000,917, collateralized by U.S. Government Agency Securities, 2.14% to 5.50%, maturing 12/01/20 to 9/20/63; total market value of $1,122,000,000. | | $ | 1,100,000,000 | | | $ | 1,100,000,000 | |
| | |
TD Securities, Inc., 0.04%, dated 4/30/20, due 5/01/20, repurchase price $440,000,489, collateralized by U.S. Government Agency Securities, 3.00% to 3.50%, maturing 11/01/49 to 4/01/50; total market value of $453,200,001. | | | 440,000,000 | | | | 440,000,000 | |
| | | | | | | | |
| | |
TOTAL REPURCHASE AGREEMENTS (COST $2,473,000,000) | | | | | | $ | 2,473,000,000 | |
| | | | | | | | |
| | |
TOTAL INVESTMENTS – 100.0% (COST $9,337,859,119) | | | | | | $ | 9,337,859,119 | |
| | |
OTHER LIABILITIES LESS ASSETS – 0.0%** | | | | | | | (1,970,342 | ) |
| | | | | | | | |
| | |
TOTAL NET ASSETS – 100.0% | | | | | | $ | 9,335,888,777 | |
| | | | | | | | |
Cost of investments for Federal income tax purposes is the same as for financial statement purposes.
Various inputs are used in determining the value of the Fund’s investments. These inputs are summarized in the three broad levels listed below.
Level 1 – quoted prices in active markets for identical securities
Level 2 – other significant observable inputs (including quoted prices for similar securities, interest rates, prepayment speeds, credit risk, etc.)
Level 3 – significant unobservable inputs (including the Fund’s own assumptions in determining the fair value of investments)
The following is a summary of the inputs used as of April 30, 2020 in valuing the Fund’s assets carried at fair value:
| | | | | | | | | | | | | | | | | | | | | | | | | | | | |
| | | | | | | |
| | | Level 1 | | | | | | Level 2 | | | | | | Level 3 | | | | | | Total | |
| | | | | | | |
Investments in Securities | | | | | | | | | | | | | | | | | | | | | | | | | | | | |
| | | | | | | |
U.S. Government Agency Obligations | | $ | — | | | | | | | $ | 4,523,283,066 | | | | | | | $ | — | | | | | | | $ | 4,523,283,066 | |
| | | | | | | |
U.S. Treasury Obligations | | | — | | | | | | | | 1,860,369,013 | | | | | | | | — | | | | | | | | 1,860,369,013 | |
| | | | | | | |
Money Market Funds | | | 481,207,040 | | | | | | | | — | | | | | | | | — | | | | | | | | 481,207,040 | |
| | | | | | | |
Repurchase Agreements | | | — | | | | | | | | 2,473,000,000 | | | | | | | | — | | | | | | | | 2,473,000,000 | |
| | | | | | | | | | | | | | | | | | | | | | | | | | | | |
| | | | | | | |
Total | | $ | 481,207,040 | | | | | | | $ | 8,856,652,079 | | | | | | | $ | — | | | | | | | $ | 9,337,859,119 | |
| | | | | | | | | | | | | | | | | | | | | | | | | | | | |
| D | Variable rate security. The rate disclosed is the rate in effect on the report date, and the date shown is the final maturity date, not the next reset or put date. Information in parenthesis represents the benchmark and reference rate for each relevant security and the rate floats based upon the reference rate and spread. The security may be further subject to interest rate floors and caps. |
| ‡ | The rate shown reflects the effective yield at purchase date. |
| ** | Represents less than 0.05%. |
The following acronyms are used throughout this Fund:
| | | | |
| | LIBOR | | London Interbank Offered Rate |
| | LLC | | Limited Liability Corporation |
| | SOFRRATE | | Secured Overnight Financing Rate |
| | USD | | United States Dollar |
See Notes which are an integral part of the Financial Statements
ANNUAL REPORT / April 30, 2020
PORTFOLIO OF INVESTMENTS SUMMARY TABLE
Wilmington U.S. Treasury Money Market Fund
At April 30, 2020, the Fund’s portfolio composition was as follows (unaudited):
| | | | |
| | | Percentage of
Total Net Assets | |
U.S. Treasury Obligations | | | 53.5 | % |
Repurchase Agreements | | | 38.6 | % |
Money Market Funds | | | 7.9 | % |
Other Assets and Liabilities – Net1 | | | (0.0 | %)2 |
| | | | |
| |
TOTAL | | | 100.0 | % |
| | | | |
| (1) | Assets, other than investments in securities, less liabilities. See Statements of Assets and Liabilities. |
| (2) | Represents less than 0.05%. |
PORTFOLIO OF INVESTMENTS
April 30, 2020
| | | | | | | | |
| | |
| Description | | Par Value | | | Value | |
| | |
U.S. TREASURY OBLIGATIONS – 53.5% | | | | | | | | |
| | |
U.S. TREASURY BILLS – 39.2% | | | | | | | | |
| | |
0.83%, 5/05/20‡ | | $ | 100,000,000 | | | $ | 99,990,889 | |
| | |
1.57%, 5/07/20‡ | | | 25,000,000 | | | | 24,993,604 | |
| | |
1.59%, 5/14/20‡ | | | 50,000,000 | | | | 49,972,014 | |
| | |
1.56%, 6/11/20‡ | | | 50,000,000 | | | | 49,913,302 | |
| | |
0.09%, 6/23/20‡ | | | 75,000,000 | | | | 74,990,615 | |
| | |
0.16%, 7/28/20‡ | | | 50,000,000 | | | | 49,980,322 | |
| | |
1.56%, 8/06/20‡ | | | 75,000,000 | | | | 74,692,833 | |
| | |
0.11%, 8/11/20‡ | | | 25,000,000 | | | | 24,992,492 | |
| | |
0.41%, 9/10/20‡ | | | 100,000,000 | | | | 99,850,767 | |
| | | | | | | | |
| | |
TOTAL U.S. TREASURY BILLS | | | | | | $ | 549,376,838 | |
| | |
U.S. TREASURY NOTES – 14.3% | | | | | | | | |
| | |
1.63%, 7/15/20 | | | 20,130,000 | | | | 20,124,639 | |
| | |
(U.S. Treasury 3 Month Bill Money Market Yield + 0.04%), 0.17%, 7/31/20D | | | 50,000,000 | | | | 49,964,467 | |
| | |
(U.S. Treasury 3 Month Bill Money Market Yield + 0.05%), 0.17%, 10/31/20D | | | 6,000,000 | | | | 6,000,000 | |
| | |
(U.S. Treasury 3 Month Bill Money Market Yield + 0.14%), 0.26%, 4/30/21D | | | 100,000,000 | | | | 99,962,952 | |
| | |
(U.S. Treasury 3 Month Bill Money Market Yield + 0.15%), 0.28%, 1/31/22D | | | 25,000,000 | | | | 25,015,071 | |
| | | | | | | | |
| | |
TOTAL U.S. TREASURY NOTES | | | | | | $ | 201,067,129 | |
| | | | | | | | |
| | |
TOTAL U.S. TREASURY OBLIGATIONS (COST $750,443,967) | | | | | | $ | 750,443,967 | |
| | | | | | | | |
| | |
| Description | | Number of
Shares | | | Value | |
| | |
MONEY MARKET FUNDS – 7.9% | | | | | | | | |
| | |
Blackrock Liquidity FundsT-Fund Institutional Shares, 0.12%^ | | | 36,701,393 | | | $ | 36,701,393 | |
| | |
Federated Treasury Obligations Fund, Institutional Shares, 0.16%^ | | | 37,035,089 | | | | 37,035,089 | |
| | |
Goldman Sachs Financial Square Funds Treasury Obligations Fund, Institutional Shares, 0.21%^ | | | 37,708,097 | | | | 37,708,097 | |
| | | | | | | | |
| | |
TOTAL MONEY MARKET FUNDS (COST $111,444,579) | | | | | | $ | 111,444,579 | |
| | |
| | | Par Value | | | | |
| | |
REPURCHASE AGREEMENTS – 38.6% | | | | | | | | |
| | |
Credit Suisse First Boston LLC, 0.02%, dated 4/30/20, due 5/1/20, repurchase price $40,000,022 collateralized by U.S. Treasury Securities, 0.00% to 8.75%, maturing 5/15/20 to 2/15/43; total market value of $40,800,024. | | $ | 40,000,000 | | | $ | 40,000,000 | |
April 30, 2020 / ANNUAL REPORT
| | |
PORTFOLIOS OF INVESTMENTS 8 |
Wilmington U.S. Treasury Money Market Fund (concluded)
| | | | | | | | |
| | |
| Description | |
Par Value | | | Value | |
| | |
Deutsche Bank Securities, Inc., 0.02%, dated 4/30/20, due 5/1/20, repurchase price $22,000,012, collateralized by U.S. Treasury Securities, 0.00% to 0.24%, maturing 8/13/20 to 1/31/21; total market value of $22,440,088. | | $ | 22,000,000 | | | $ | 22,000,000 | |
| | |
RBC Capital Markets LLC, 0.02%, dated 4/30/20, due 5/1/20, repurchase price $480,000,267 collateralized by U.S. Treasury Securities, 0.13% to 3.75%, maturing 4/15/22 to 5/15/46; total market value of $489,600,131. | | | 480,000,000 | | | | 480,000,000 | |
| | | | | | | | |
| | |
TOTAL REPURCHASE AGREEMENTS (COST $542,000,000) | | | | | | $ | 542,000,000 | |
| | | | | | | | |
| | | | |
| |
| Description | | Value | |
TOTAL INVESTMENTS – 100.0% (COST $1,403,888,546) | | $ | 1,403,888,546 | |
| |
OTHER LIABILITIES LESS ASSETS – 0.0%** | | | (244,140 | ) |
| | | | |
| |
TOTAL NET ASSETS – 100.0% | | $ | 1,403,644,406 | |
| | | | |
Cost of investments for Federal income tax purposes is the same as for financial statement purposes.
Various inputs are used in determining the value of the Fund’s investments. These inputs are summarized in the three broad levels listed below.
Level 1 – quoted prices in active markets for identical securities
Level 2 – other significant observable inputs (including quoted prices for similar securities, interest rates, prepayment speeds, credit risk, etc.)
Level 3 – significant unobservable inputs (including the Fund’s own assumptions in determining the fair value of investments)
The following is a summary of the inputs used as of April 30, 2020 in valuing the Fund’s assets carried at fair value:
| | | | | | | | | | | | | | | | | | | | | | | | | | | | |
| | | | | | | |
| | | Level 1 | | | | | | Level 2 | | | | | | Level 3 | | | | | | Total | |
Investments in Securities | | | | | | | | | | | | | | | | | | | | | | | | | | | | |
| | | | | | | |
U.S. Treasury Obligations | | $ | — | | | | | | | $ | 750,443,967 | | | | | | | $ | — | | | | | | | $ | 750,443,967 | |
| | | | | | | |
Money Market Funds | | | 111,444,579 | | | | | | | | — | | | | | | | | — | | | | | | | | 111,444,579 | |
| | | | | | | |
Repurchase Agreements | | | — | | | | | | | | 542,000,000 | | | | | | | | — | | | | | | | | 542,000,000 | |
| | | | | | | | | | | | | | | | | | | | | | | | | | | | |
| | | | | | | |
Total | | $ | 111,444,579 | | | | | | | $ | 1,292,443,967 | | | | | | | $ | — | | | | | | | $ | 1,403,888,546 | |
| | | | | | | | | | | | | | | | | | | | | | | | | | | | |
| D | Variable rate security. The rate disclosed is the rate in effect on the report date, and the date shown in the final maturity date, not the next reset or put date. Information in parenthesis represents the benchmark and reference rate for each relevant security and the rate floats based upon the reference rate and spread. The security may be further subject to interest rate floors and caps. |
| ‡ | The rate shown reflects the effective yield at purchase date. |
| ** | Represents less than 0.05%. |
| | The following acronym is used throughout this Fund: |
LLC Limited Liability Corporation
See Notes which are an integral part of the Financial Statements
ANNUAL REPORT / April 30, 2020
| | |
| 9 STATEMENTS OF ASSETS AND LIABILITIES |
| | | | | | | | | | | | | | | | | | | | | |
| | | | | | |
| April 30, 2020 | | | | Wilmington U.S. Government
Money Market Fund | | | | Wilmington U.S. Treasury
Money Market Fund | | | | |
ASSETS: | | | | | | | | | | | | | | | | | | | | | |
Investments, at identified cost | | | | | $ | 9,337,859,119 | | | | | | | | | $ | 1,403,888,546 | | | | | |
| | | | | | | | | | | | | | | | | | | | | |
Investments in repurchase agreements, at value | | | | | $ | 2,473,000,000 | | | | | | | | | $ | 542,000,000 | | | | | |
Investments in securities, at value | | | | | | 6,864,859,119 | | | | | | | | | | 861,888,546 | | | | | |
| | | | | | | | | | | | | | | | | | | | | |
| | | | | | |
TOTAL INVESTMENTS | | | | | | 9,337,859,119 | | | | | | | | | | 1,403,888,546 | | | | | |
| | | | | | | | | | | | | | | | | | | | | |
Cash | | | | | | 96,898 | | | | | | | | | | 96,898 | | | | | |
Income receivable | | | | | | 2,114,255 | | | | | | | | | | 107,366 | | | | | |
Receivable for shares sold | | | | | | 452,585 | | | | | | | | | | 260,140 | | | | | |
Prepaid assets | | | | | | 81,479 | | | | | | | | | | 29,221 | | | | | |
| | | | | | | | | | | | | | | | | | | | | |
| | | | | | |
TOTAL ASSETS | | | | | | 9,340,604,336 | | | | | | | | | | 1,404,382,171 | | | | | |
| | | | | | | | | | | | | | | | | | | | | |
LIABILITIES: | | | | | | | | | | | | | | | | | | | | | |
Income distribution payable | | | | | | 917,211 | | | | | | | | | | 155,753 | | | | | |
Payable for shares redeemed | | | | | | 529,167 | | | | | | | | | | 64,252 | | | | | |
Payable for Trustees’ fees | | | | | | 8,973 | | | | | | | | | | 8,973 | | | | | |
Payable for administration fees | | | | | | 226,823 | | | | | | | | | | 33,863 | | | | | |
Payable for distribution services fees | | | | | | 162,841 | | | | | | | | | | 45,112 | | | | | |
Payable for shareholder services fees | | | | | | 641,167 | | | | | | | | | | 104,219 | | | | | |
Payable for investment advisory fees | | | | | | 1,597,727 | | | | | | | | | | 146,087 | | | | | |
Other accrued expenses | | | | | | 631,650 | | | | | | | | | | 179,506 | | | | | |
| | | | | | | | | | | | | | | | | | | | | |
| | | | | | |
TOTAL LIABILITIES | | | | | | 4,715,559 | | | | | | | | | | 737,765 | | | | | |
| | | | | | | | | | | | | | | | | | | | | |
| | | | | | |
NET ASSETS | | | | | $ | 9,335,888,777 | | | | | | | | | $ | 1,403,644,406 | | | | | |
| | | | | | | | | | | | | | | | | | | | | |
| | | | | | |
NET ASSETS CONSIST OF: | | | | | | | | | | | | | | | | | | | | | |
Paid-in capital | | | | | $ | 9,335,888,813 | | | | | | | | | $ | 1,403,642,417 | | | | | |
Distributable earnings (loss) | | | | | | (36 | ) | | | | | | | | | 1,989 | | | | | |
| | | | | | | | | | | | | | | | | | | | | |
| | | | | | |
TOTAL NET ASSETS | | | | | $ | 9,335,888,777 | | | | | | | | | $ | 1,403,644,406 | | | | | |
| | | | | | | | | | | | | | | | | | | | | |
COMPUTATION OF NET ASSET VALUE AND OFFERING PRICE: | | | | | | | | | | | | | | | | | | | | | |
Administrative Class | | | | | | | | | | | | | | | | | | | | | |
Net Assets | | | | | $ | 1,509,321,598 | | | | | | | | | $ | 360,462,816 | | | | | |
| | | | | | | | | | | | | | | | | | | | | |
Shares outstanding (unlimited shares authorized) | | | | | | 1,509,567,677 | | | | | | | | | | 360,501,145 | | | | | |
| | | | | | | | | | | | | | | | | | | | | |
Net Asset Value and Offering Price per share | | | | | $ | 1.000 | | | | | | | | | $ | 1.000 | | | | | |
| | | | | | | | | | | | | | | | | | | | | |
Institutional Class | | | | | | | | | | | | | | | | | | | | | |
Net Assets | | | | | $ | 1,745,742,440 | | | | | | | | | $ | 50,788,587 | | | | | |
| | | | | | | | | | | | | | | | | | | | | |
Shares outstanding (unlimited shares authorized) | | | | | | 1,745,809,449 | | | | | | | | | | 50,788,919 | | | | | |
| | | | | | | | | | | | | | | | | | | | | |
Net Asset Value and Offering Price per share | | | | | $ | 1.000 | | | | | | | | | $ | 1.000 | | | | | |
| | | | | | | | | | | | | | | | | | | | | |
Select Class | | | | | | | | | | | | | | | | | | | | | |
Net Assets | | | | | $ | 4,912,640,023 | | | | | | | | | $ | 992,204,853 | | | | | |
| | | | | | | | | | | | | | | | | | | | | |
Shares outstanding (unlimited shares authorized) | | | | | | 4,913,100,845 | | | | | | | | | | 992,219,087 | | | | | |
| | | | | | | | | | | | | | | | | | | | | |
Net Asset Value and Offering Price per share | | | | | $ | 1.000 | | | | | | | | | $ | 1.000 | | | | | |
| | | | | | | | | | | | | | | | | | | | | |
Service Class | | | | | | | | | | | | | | | | | | | | | |
Net Assets | | | | | $ | 1,168,184,716 | | | | | | | | | $ | 188,150 | | | | | |
| | | | | | | | | | | | | | | | | | | | | |
Shares outstanding (unlimited shares authorized) | | | | | | 1,168,143,236 | | | | | | | | | | 188,148 | | | | | |
| | | | | | | | | | | | | | | | | | | | | |
Net Asset Value and Offering Price per share | | | | | $ | 1.000 | | | | | | | | | $ | 1.000 | | | | | |
| | | | | | | | | | | | | | | | | | | | | |
See Notes which are an integral part of the Financial Statements
April 30, 2020
| | |
| STATEMENTS OF OPERATIONS 10 |
| | | | | | | | | | | | | | | | |
| | | | |
| Year Ended April 30, 2020 | | | | Wilmington U.S. Government Money Market Fund | | | | Wilmington U.S. Treasury Money Market Fund |
INVESTMENT INCOME: | | | | | | | | | | | | | | | | |
Dividends | | | | | $ | 1,252,311 | | | | | | $ | 452,854 | | | |
Interest | | | | | | 139,681,689 | | | | | | | 28,773,246 | | | |
| | | | | | | | | | | | | | | | |
| | | | | |
TOTAL INVESTMENT INCOME | | | | | | 140,934,000 | | | | | | | 29,226,100 | | | |
| | | | | | | | | | | | | | | | |
EXPENSES: | | | | | | | | | | | | | | | | |
Investment advisory fees | | | | | | 19,841,275 | | | | | | | 4,111,897 | | | |
Administration fees | | | | | | 2,438,532 | | | | | | | 506,213 | | | |
Portfolio accounting and administration fees | | | | | | 1,397,724 | | | | | | | 296,910 | | | |
Transfer and dividend disbursing agent fees and expenses | | | | | | 61,548 | | | | | | | 12,994 | | | |
Custodian fees | | | | | | 177,258 | | | | | | | 75,318 | | | |
Trustees’ fees | | | | | | 54,369 | | | | | | | 54,369 | | | |
Professional fees | | | | | | 101,809 | | | | | | | 123,647 | | | |
Distribution services fee—Administrative Class | | | | | | 3,318,889 | | | | | | | 733,778 | | | |
Distribution services fee—Service Class | | | | | | 2,795,862 | | | | | | | 285 | | | |
Shareholder services fee— Administrative Class | | | | | | 3,318,889 | | | | | | | 733,778 | | | |
Shareholder services fee— Select Class | | | | | | 10,855,150 | | | | | | | 3,282,966 | | | |
Shareholder services fee— Service Class | | | | | | 2,795,862 | | | | | | | 285 | | | |
Share registration costs | | | | | | 55,334 | | | | | | | 59,777 | | | |
Printing and postage | | | | | | 177,809 | | | | | | | 30,336 | | | |
Miscellaneous | | | | | | 318,792 | | | | | | | 136,637 | | | |
| | | | | | | | | | | | | | | | |
| | | | | |
TOTAL EXPENSES | | | | | | 47,709,102 | | | | | | | 10,159,190 | | | |
| | | | | | | | | | | | | | | | |
Waiver/reimbursement by investment advisor | | | | | | (3,195,872 | ) | | | | | | (1,296,200 | ) | | |
Waiver of distribution services fee—Administrative Class | | | | | | (166,180 | ) | | | | | | (38,969 | ) | | |
Waiver of distribution services fee—Service Class | | | | | | (275,521 | ) | | | | | | (51 | ) | | |
Waiver of shareholder services fee—Administrative Class | | | | | | (1,990,440 | ) | | | | | | (439,872 | ) | | |
Waiver of shareholder services fee—Select Class | | | | | | (6,580,503 | ) | | | | | | (1,975,624 | ) | | |
Waiver of shareholder services fee—Service Class | | | | | | (45,736 | ) | | | | | | (4 | ) | | |
| | | | | | | | | | | | | | | | |
| | | | | |
TOTAL WAIVERS AND REIMBURSEMENTS | | | | | | (12,254,252 | ) | | | | | | (3,750,720 | ) | | |
| | | | | | | | | | | | | | | | |
Net expenses | | | | | | 35,454,850 | | | | | | | 6,408,470 | | | |
| | | | | | | | | | | | | | | | |
Net investment income | | | | | | 105,479,150 | | | | | | | 22,817,630 | | | |
| | | | | | | | | | | | | | | | |
REALIZED GAIN (LOSS) ON INVESTMENTS: | | | | | | | | | | | | | | | | |
Net realized gain (loss) on investments | | | | | | 26,362 | | | | | | | 9,003 | | | |
| | | | | | | | | | | | | | | | |
Net realized gain (loss) on investments | | | | | | 26,362 | | | | | | | 9,003 | | | |
| | | | | | | | | | | | | | | | |
Change in net assets resulting from operations | | | | | $ | 105,505,512 | | | | | | $ | 22,826,633 | | | |
| | | | | | | | | | | | | | | | |
See Notes which are an integral part of the Financial Statements
ANNUAL REPORT / April 30, 2020
| | |
| 11 STATEMENTS OF CHANGES IN NET ASSETS |
| | | | | | | | | | | | | | | | | | | | | | |
| | | Wilmington U.S. Government
Money Market Fund | | Wilmington U.S. Treasury
Money Market Fund | |
| | | | | | | |
| | | Year Ended
April 30, 2020 | | | | | Year Ended
April 30, 2019 | | | | | Year Ended
April 30, 2020 | | | | | Year Ended
April 30, 2019 | |
OPERATIONS: | | | | | | | | | | | | | | | | | | | | | | |
Net investment income | | $ | 105,479,150 | | | | | $ | 112,042,656 | | | | | $ | 22,817,630 | | | | | $ | 22,930,187 | |
Net realized gain (loss) on investments | | | 26,362 | | | | | | 6,231 | | | | | | 9,003 | | | | | | 6,288 | |
| | | | | | | | | | | | | | | | | | | | | | |
Change in net assets resulting from operations | | | 105,505,512 | | | | | | 112,048,887 | | | | | | 22,826,633 | | | | | | 22,936,475 | |
| | | | | | | | | | | | | | | | | | | | | | |
DISTRIBUTIONS TO SHAREHOLDERS: | | | | | | | | | | | | | | | | | | | | | | |
Administrative Class | | | (15,638,028 | ) | | | | | (22,569,370 | ) | | | | | (3,367,609 | ) | | | | | (4,975,018 | ) |
Institutional Class | | | (16,010,624 | ) | | | | | (10,428,860 | ) | | | | | (449,968 | ) | | | | | — | |
Select Class | | | (61,857,851 | ) | | | | | (61,807,693 | ) | | | | | (19,005,385 | ) | | | | | (17,954,316 | ) |
Service Class | | | (12,003,710 | ) | | | | | (17,236,747 | ) | | | | | (1,108 | ) | | | | | (854 | ) |
| | | | | | | | | | | | | | | | | | | | | | |
| | | | | | | |
Total distributions to shareholders | | | (105,510,213 | ) | | | | | (112,042,670 | ) | | | | | (22,824,070 | ) | | | | | (22,930,188 | ) |
| | | | | | | | | | | | | | | | | | | | | | |
SHARE TRANSACTIONS: | | | | | | | | | | | | | | | | | | | | | | |
Proceeds from sale of shares | | | | | | | | | | | | | | | | | | | | | | |
Administrative Class | | | 5,654,548,559 | | | | | | 5,088,350,602 | | | | | | 1,037,961,294 | | | | | | 1,131,372,451 | |
Institutional Class | | | 3,880,022,217 | | | | | | 1,585,136,902 | | | | | | 1,100,749,168 | | | | | | — | |
Select Class | | | 9,865,138,562 | | | | | | 9,292,845,289 | | | | | | 2,938,441,833 | | | | | | 3,897,796,606 | |
Service Class | | | 2,868,472,912 | | | | | | 3,125,890,676 | | | | | | 203,585 | | | | | | 151,887 | |
Distributions reinvested | | | | | | | | | | | | | | | | | | | | | | |
Administrative Class | | | 741 | | | | | | 1,085 | | | | | | 35,569 | | | | | | 24,993 | |
Institutional Class | | | 187,667 | | | | | | 399,301 | | | | | | — | | | | | | — | |
Select Class | | | 5,448,805 | | | | | | 5,136,312 | | | | | | 1,329,643 | | | | | | 1,891,396 | |
Service Class | | | 3,850,166 | | | | | | 4,965,924 | | | | | | 1,108 | | | | | | 842 | |
Cost of shares redeemed | | | | | | | | | | | | | | | | | | | | | | |
Administrative Class | | | (5,442,512,780 | ) | | | | | (4,987,743,339 | ) | | | | | (960,858,127 | ) | | | | | (1,188,864,124 | ) |
Institutional Class | | | (2,561,580,453 | ) | | | | | (1,862,857,258 | ) | | | | | (1,049,960,250 | ) | | | | | — | |
Select Class | | | (9,368,060,263 | ) | | | | | (8,161,827,482 | ) | | | | | (3,151,207,591 | ) | | | | | (3,486,260,690 | ) |
Service Class | | | (2,895,348,366 | ) | | | | | (3,189,828,167 | ) | | | | | (101,585 | ) | | | | | (111,035 | ) |
| | | | | | | | | | | | | | | | | | | | | | |
Change in net assets resulting from share transactions | | | 2,010,167,767 | | | | | | 900,469,845 | | | | | | (83,405,353 | ) | | | | | 356,002,326 | |
| | | | | | | | | | | | | | | | | | | | | | |
Change in net assets | | | 2,010,163,066 | | | | | | 900,476,062 | | | | | | (83,402,790 | ) | | | | | 356,008,613 | |
NET ASSETS: | | | | | | | | | | | | | | | | | | | | | | |
Beginning of year | | | 7,325,725,711 | | | | | | 6,425,249,649 | | | | | | 1,487,047,196 | | | | | | 1,131,038,583 | |
| | | | | | | | | | | | | | | | | | | | | | |
End of year | | $ | 9,335,888,777 | | | | | $ | 7,325,725,711 | | | | | $ | 1,403,644,406 | | | | | $ | 1,487,047,196 | |
| | | | | | | | | | | | | | | | | | | | | | |
April 30, 2020
| | |
| STATEMENTS OF CHANGES IN NET ASSETS (concluded) 12 |
| | | | | | | | | | | | | | | | | | | | | | |
| | | Wilmington U.S. Government
Money Market Fund | | Wilmington U.S. Treasury
Money Market Fund | |
| | | | | | | |
| | | Year Ended April 30, 2020 | | | | | Year Ended April 30, 2019 | | | | | Year Ended April 30, 2020 | | | | | Year Ended April 30, 2019 | |
SHARES OF BENEFICIAL INTEREST: | | | | | | | | | | | | | | | | | | | | | | |
Shares sold | | | | | | | | | | | | | | | | | | | | | | |
Administrative Class | | | 5,654,548,559 | | | | | | 5,088,350,602 | | | | | | 1,037,961,293 | | | | | | 1,131,372,451 | |
Institutional Class | | | 3,880,022,217 | | | | | | 1,585,136,902 | | | | | | 1,100,749,168 | | | | | | — | |
Select Class | | | 9,865,138,562 | | | | | | 9,292,845,289 | | | | | | 2,938,441,833 | | | | | | 3,897,796,606 | |
Service Class | | | 2,868,472,911 | | | | | | 3,125,890,676 | | | | | | 203,585 | | | | | | 151,887 | |
Distributions reinvested | | | | | | | | | | | | | | | | | | | | | | |
Administrative Class | | | 741 | | | | | | 1,085 | | | | | | 35,569 | | | | | | 24,993 | |
Institutional Class | | | 187,667 | | | | | | 399,301 | | | | | | — | | | | | | — | |
Select Class | | | 5,448,805 | | | | | | 5,136,312 | | | | | | 1,329,643 | | | | | | 1,891,396 | |
Service Class | | | 3,850,166 | | | | | | 4,965,924 | | | | | | 1,108 | | | | | | 842 | |
Shares redeemed | | | | | | | | | | | | | | | | | | | | | | |
Administrative Class | | | (5,442,512,780 | ) | | | | | (4,987,743,339 | ) | | | | | (960,858,127 | ) | | | | | (1,188,864,124 | ) |
Institutional Class | | | (2,561,580,453 | ) | | | | | (1,862,857,258 | ) | | | | | (1,049,960,249 | ) | | | | | — | |
Select Class | | | (9,368,060,263 | ) | | | | | (8,161,827,482 | ) | | | | | (3,151,207,591 | ) | | | | | (3,486,260,690 | ) |
Service Class | | | (2,895,348,366 | ) | | | | | (3,189,828,167 | ) | | | | | (101,585 | ) | | | | | (111,035 | ) |
| | | | | | | | | | | | | | | | | | | | | | |
Net change in shares outstanding | | | 2,010,167,766 | | | | | | 900,469,845 | | | | | | (83,405,353 | ) | | | | | 356,002,326 | |
| | | | | | | | | | | | | | | | | | | | | | |
See Notes which are an integral part of the Financial Statements
ANNUAL REPORT / April 30, 2020
For a share outstanding throughout each year ended April 30, unless otherwise noted:
| | | | | | | | | | |
WILMINGTON U.S. GOVERNMENT MONEY MARKET FUND | | |
| | | | | | | | | | | | | | | | | | | | | | | | | |
| | | | | | |
| | | Year Ended | | Year Ended | | Year Ended | | Year Ended | | Year Ended |
| ADMINISTRATIVE CLASS | | April 30, 2020 | | April 30, 2019 | | April 30, 2018 | | April 30, 2017 | | April 30, 2016 |
| | | | | |
Net Asset Value, Beginning of Year | | | | $1.000 | | | | | $1.000 | | | | | $1.000 | | | | | $1.000 | | | | | $1.000 | |
Income (Loss) From Operations: | | | | | | | | | | | | | | | | | | | | | | | | | |
Net Investment Income | | | | 0.013 | | | | | 0.016 | | | | | 0.006 | | | | | 0.000 | (a) | | | | 0.000 | (a) |
Net Realized Gain (Loss) on Investments | | | | 0.000 | (a) | | | | 0.000 | (a) | | | | 0.000 | (a) | | | | (0.000 | )(a) | | | | 0.000 | (a) |
Total Income (Loss) From Operations | | | | 0.013 | | | | | 0.016 | | | | | 0.006 | | | | | 0.000 | | | | | 0.000 | |
Less Distributions From: | | | | | | | | | | | | | | | | | | | | | | | | | |
Net Investment Income | | | | (0.013 | ) | | | | (0.016 | ) | | | | (0.006 | ) | | | | (0.000 | )(a) | | | | (0.000 | )(a) |
Net Asset Value, End of Year | | | | $1.000 | | | | | $1.000 | | | | | $1.000 | | | | | $1.000 | | | | | $1.000 | |
| | | | | |
Total Return | | | | 1.21 | % | | | | 1.57 | % | | | | 0.56 | % | | | | 0.04 | % | | | | 0.02 | % |
Net Assets, End of Year (000’s) | | | | $1,509,322 | | | | | $1,297,285 | | | | | $1,196,676 | | | | | $1,516,147 | | | | | $1,619,679 | |
Ratios to Average Net Assets | | | | | | | | | | | | | | | | | | | | | | | | | |
Gross Expense(b) | | | | 0.81 | % | | | | 0.82 | % | | | | 0.82 | % | | | | 0.89 | % | | | | 0.97 | % |
Net Expenses(b)(c) | | | | 0.61 | % | | | | 0.62 | % | | | | 0.62 | % | | | | 0.42 | % | | | | 0.18 | % |
Net Investment Income | | | | 1.18 | % | | | | 1.57 | % | | | | 0.54 | % | | | | 0.04 | % | | | | 0.02 | % |
| | | | | |
| | | Year Ended | | Year Ended | | Year Ended | | Year Ended | | Year Ended |
| INSTITUTIONAL CLASS | | April 30, 2020 | | April 30, 2019 | | April 30, 2018 | | April 30, 2017 | | April 30, 2016 |
| | | | | |
Net Asset Value, Beginning of Year | | | | $1.000 | | | | | $1.000 | | | | | $1.000 | | | | | $1.000 | | | | | $1.000 | |
Income (Loss) From Operations: | | | | | | | | | | | | | | | | | | | | | | | | | |
Net Investment Income | | | | 0.016 | | | | | 0.019 | | | | | 0.009 | | | | | 0.001 | | | | | 0.000 | (a) |
Net Realized Gain (Loss) on Investments | | | | 0.000 | (a) | | | | 0.000 | (a) | | | | 0.000 | (a) | | | | (0.000 | )(a) | | | | 0.000 | (a) |
Total Income (Loss) From Operations | | | | 0.016 | | | | | 0.019 | | | | | 0.009 | | | | | 0.001 | | | | | 0.000 | |
Less Distributions From: | | | | | | | | | | | | | | | | | | | | | | | | | |
Net Investment Income | | | | (0.016 | ) | | | | (0.019 | ) | | | | (0.009 | ) | | | | (0.001 | ) | | | | (0.000 | )(a) |
Net Asset Value, End of Year | | | | $1.000 | | | | | $1.000 | | | | | $1.000 | | | | | $1.000 | | | | | $1.000 | |
| | | | | |
Total Return | | | | 1.56 | % | | | | 1.92 | % | | | | 0.91 | % | | | | 0.17 | % | | | | 0.02 | % |
Net Assets, End of Year (000’s) | | | | $1,745,742 | | | | | $427,114 | | | | | $704,435 | | | | | $359,524 | | | | | $12,840 | |
Ratios to Average Net Assets | | | | | | | | | | | | | | | | | | | | | | | | | |
Gross Expense(b) | | | | 0.31 | % | | | | 0.32 | % | | | | 0.32 | % | | | | 0.34 | % | | | | 0.47 | % |
Net Expenses(b)(c) | | | | 0.27 | % | | | | 0.27 | % | | | | 0.27 | % | | | | 0.27 | % | | | | 0.13 | % |
Net Investment Income | | | | 1.39 | % | | | | 1.92 | % | | | | 0.97 | % | | | | 0.21 | % | | | | 0.01 | % |
| | | | | |
| | | Year Ended | | Year Ended | | Year Ended | | Year Ended | | Year Ended |
| SELECT CLASS | | April 30, 2020 | | April 30, 2019 | | April 30, 2018 | | April 30, 2017 | | April 30, 2016 |
| | | | | |
Net Asset Value, Beginning of Year | | | | $1.000 | | | | | $1.000 | | | | | $1.000 | | | | | $1.000 | | | | | $1.000 | |
Income (Loss) From Operations: | | | | | | | | | | | | | | | | | | | | | | | | | |
Net Investment Income | | | | 0.015 | | | | | 0.018 | | | | | 0.008 | | | | | 0.001 | | | | | 0.000 | (a) |
Net Realized Gain (Loss) on Investments | | | | 0.000 | (a) | | | | 0.000 | (a) | | | | 0.000 | (a) | | | | (0.000 | )(a) | | | | 0.000 | (a) |
Total Income (Loss) From Operations | | | | 0.015 | | | | | 0.018 | | | | | 0.008 | | | | | 0.001 | | | | | 0.000 | |
Less Distributions From: | | | | | | | | | | | | | | | | | | | | | | | | | |
Net Investment Income | | | | (0.015 | ) | | | | (0.018 | ) | | | | (0.008 | ) | | | | (0.001 | ) | | | | (0.000 | )(a) |
Net Asset Value, End of Year | | | | $1.000 | | | | | $1.000 | | | | | $1.000 | | | | | $1.000 | | | | | $1.000 | |
| | | | | |
Total Return | | | | 1.46 | % | | | | 1.82 | % | | | | 0.81 | % | | | | 0.13 | % | | | | 0.02 | % |
Net Assets, End of Year (000’s) | | | | $4,912,640 | | | | | $4,410,116 | | | | | $3,273,958 | | | | | $3,671,694 | | | | | $976,287 | |
Ratios to Average Net Assets | | | | | | | | | | | | | | | | | | | | | | | | | |
Gross Expense(b) | | | | 0.56 | % | | | | 0.57 | % | | | | 0.57 | % | | | | 0.61 | % | | | | 0.72 | % |
Net Expenses(b)(c) | | | | 0.37 | % | | | | 0.37 | % | | | | 0.37 | % | | | | 0.33 | % | | | | 0.18 | % |
Net Investment Income | | | | 1.42 | % | | | | 1.82 | % | | | | 0.80 | % | | | | 0.15 | % | | | | 0.02 | % |
April 30, 2020 / ANNUAL REPORT
| | | | | | | | | | | | | | | | | | | | | | | | | |
| | | | | |
| | | Year Ended | | Year Ended | | Year Ended | | Year Ended | | Year Ended |
| SERVICE CLASS | | April 30, 2020 | | April 30, 2019 | | April 30, 2018 | | April 30, 2017 | | April 30, 2016 |
Net Asset Value, Beginning of Year | | | | $1.000 | | | | | $1.000 | | | | | $1.000 | | | | | $1.000 | | | | | $1.000 | |
Income (Loss) From Operations: | | | | | | | | | | | | | | | | | | | | | | | | | |
Net Investment Income | | | | 0.011 | | | | | 0.014 | | | | | 0.004 | | | | | 0.000 | (a) | | | | 0.000 | (a) |
Net Realized Gain (Loss) on Investments | | | | 0.000 | (a) | | | | 0.000 | (a) | | | | 0.000 | (a) | | | | (0.000 | )(a) | | | | 0.000 | (a) |
Total Income (Loss) From Operations | | | | 0.011 | | | | | 0.014 | | | | | 0.004 | | | | | 0.000 | | | | | 0.000 | |
Less Distributions From: | | | | | | | | | | | | | | | | | | | | | | | | | |
Net Investment Income | | | | (0.011 | ) | | | | (0.014 | ) | | | | (0.004 | ) | | | | (0.000 | )(a) | | | | (0.000 | )(a) |
Net Asset Value, End of Year | | | | $1.000 | | | | | $1.000 | | | | | $1.000 | | | | | $1.000 | | | | | $1.000 | |
| | | | | |
Total Return | | | | 1.08 | % | | | | 1.42 | % | | | | 0.41 | % | | | | 0.01 | % | | | | 0.01 | % |
Net Assets, End of Year (000’s) | | | | $1,168,185 | | | | | $1,191,211 | | | | | $1,250,181 | | | | | $1,364,106 | | | | | $794,950 | |
Ratios to Average Net Assets | | | | | | | | | | | | | | | | | | | | | | | | | |
Gross Expense(b) | | | | 0.81 | % | | | | 0.82 | % | | | | 0.82 | % | | | | 0.88 | % | | | | 0.97 | % |
Net Expenses(b)(c) | | | | 0.74 | % | | | | 0.77 | % | | | | 0.77 | % | | | | 0.46 | % | | | | 0.18 | % |
Net Investment Income | | | | 1.07 | % | | | | 1.41 | % | | | | 0.41 | % | | | | 0.01 | % | | | | 0.01 | % |
| (a) | Represents less than $0.001. |
| (b) | The Fund invests in other underlying funds and indirectly bears its proportionate share of fees and expenses incurred by the underlying funds in which the Fund is invested. This ratio does not include these indirect fees and expenses. |
| (c) | The investment manager and other service providers voluntarily waived a portion of their fees. |
See Notes which are an integral part of the Financial Statements
ANNUAL REPORT / April 30, 2020
For a share outstanding throughout each year ended April 30, unless otherwise noted:
| | | | | | | | | | |
WILMINGTON U.S. TREASURY MONEY MARKET FUND |
| | | | | | | | | | | | | | | | | | | | | | | | | |
| | | | | | |
| | | Year Ended | | Year Ended | | Year Ended | | Year Ended | | Year Ended |
| ADMINISTRATIVE CLASS | | April 30, 2020 | | April 30, 2019 | | April 30, 2018 | | April 30, 2017 | | April 30, 2016 |
| | | | | |
Net Asset Value, Beginning of Year | | | | $1.000 | | | | | $1.000 | | | | | $1.000 | | | | | $1.000 | | | | | $1.000 | |
Income (Loss) From Operations: | | | | | | | | | | | | | | | | | | | | | | | | | |
Net Investment Income | | | | 0.013 | | | | | 0.016 | | | | | 0.006 | | | | | 0.000 | (a) | | | | 0.000 | (a) |
Net Realized Gain (Loss) on Investments | | | | 0.000 | (a) | | | | 0.000 | (a) | | | | 0.000 | (a) | | | | 0.000 | (a) | | | | 0.000 | (a) |
Total Income (Loss) From Operations | | | | 0.013 | | | | | 0.016 | | | | | 0.006 | | | | | 0.000 | | | | | 0.000 | |
Less Distributions From: | | | | | | | | | | | | | | | | | | | | | | | | | |
Net Investment Income | | | | (0.013 | ) | | | | (0.016 | ) | | | | (0.006 | ) | | | | (0.000 | )(a) | | | | (0.000 | )(a) |
Net Asset Value, End of Year | | | | $1.000 | | | | | $1.000 | | | | | $1.000 | | | | | $1.000 | | | | | $1.000 | |
| | | | | |
Total Return | | | | 1.20 | % | | | | 1.58 | % | | | | 0.57 | % | | | | 0.03 | % | | | | 0.01 | % |
Net Assets, End of Year (000’s) | | | | $360,463 | | | | | $283,323 | | | | | $340,788 | | | | | $479,284 | | | | | $646,349 | |
Ratios to Average Net Assets | | | | | | | | | | | | | | | | | | | | | | | | | |
Gross Expense(c) | | | | 0.83 | % | | | | 0.83 | % | | | | 0.84 | % | | | | 0.91 | % | | | | 0.99 | % |
Net Expenses(c)(d) | | | | 0.59 | % | | | | 0.60 | % | | | | 0.60 | % | | | | 0.39 | % | | | | 0.15 | % |
Net Investment Income | | | | 1.15 | % | | | | 1.54 | % | | | | 0.53 | % | | | | 0.03 | % | | | | 0.01 | % |
| | | | | |
| INSTITUTIONAL CLASS | | For the Period October 16, 2019* through April 30, 2020 | | | | | | | | |
| | | | | |
Net Asset Value, Beginning of Period | | | | $1.000 | | | | | | | | | | | | | | | | | | | | | |
Income (Loss) From Operations: | | | | | | | | | | | | | | | | | | | | | | | | | |
Net Investment Income | | | | 0.007 | | | | | | | | | | | | | | | | | | | | | |
Net Realized Gain (Loss) on Investments | | | | 0.000 | (a) | | | | | | | | | | | | | | | | | | | | |
Total Income (Loss) From Operations | | | | 0.007 | | | | | | | | | | | | | | | | | | | | | |
Less Distributions From: | | | | | | | | | | | | | | | | | | | | | | | | | |
Net Investment Income | | | | (0.007 | ) | | | | | | | | | | | | | | | | | | | | |
Net Asset Value, End of Period | | | | $1.000 | | | | | | | | | | | | | | | | | | | | | |
| | | | | | | | | | | | | | | | | | | | | | | | | |
Total Return | | | | 0.61 | %(e) | | | | | | | | | | | | | | | | | | | | |
Net Assets, End of Period (000’s) | | | | $50,788 | | | | | | | | | | | | | | | | | | | | | |
Ratios to Average Net Assets | | | | | | | | | | | | | | | | | | | | | | | | | |
Gross Expense(c) | | | | 0.32 | %(f) | | | | | | | | | | | | | | | | | | | | |
Net Expenses(c)(d) | | | | 0.25 | %(f) | | | | | | | | | | | | | | | | | | | | |
Net Investment Income | | | | 1.18 | %(f) | | | | | | | | | | | | | | | | | | | | |
| | | | | |
| | | Year Ended | | Year Ended | | Year Ended | | Year Ended | | Year Ended |
| SELECT CLASS | | April 30, 2020 | | April 30, 2019 | | April 30, 2018 | | April 30, 2017 | | April 30, 2016 |
| | | | | |
Net Asset Value, Beginning of Year | | | | $1.000 | | | | | $1.000 | | | | | $1.000 | | | | | $1.000 | | | | | $1.000 | |
Income (Loss) From Operations: | | | | | | | | | | | | | | | | | | | | | | | | | |
Net Investment Income | | | | 0.015 | | | | | 0.018 | | | | | 0.008 | | | | | 0.001 | | | | | 0.000 | (a) |
Net Realized Gain (Loss) on Investments | | | | 0.000 | (a) | | | | 0.000 | (a) | | | | 0.000 | (a) | | | | 0.000 | (a) | | | | 0.000 | (a) |
Total Income (Loss) From Operations | | | | 0.015 | | | | | 0.018 | | | | | 0.008 | | | | | 0.001 | | | | | 0.000 | |
Less Distributions From: | | | | | | | | | | | | | | | | | | | | | | | | | |
Net Investment Income | | | | (0.015 | ) | | | | (0.018 | ) | | | | (0.008 | ) | | | | (0.001 | ) | | | | (0.000 | )(a) |
Net Asset Value, End of Year | | | | $1.000 | | | | | $1.000 | | | | | $1.000 | | | | | $1.000 | | | | | $1.000 | |
| | | | | |
Total Return | | | | 1.44 | % | | | | 1.83 | % | | | | 0.82 | % | | | | 0.12 | % | | | | 0.01 | % |
Net Assets, End of Year (000’s) | | | | $992,205 | | | | | $1,203,639 | | | | | $790,207 | | | | | $311,815 | | | | | $242,597 | |
Ratios to Average Net Assets | | | | | | | | | | | | | | | | | | | | | | | | | |
Gross Expense(c) | | | | 0.58 | % | | | | 0.58 | % | | | | 0.59 | % | | | | 0.66 | % | | | | 0.74 | % |
Net Expenses(c)(d) | | | | 0.35 | % | | | | 0.35 | % | | | | 0.35 | % | | | | 0.31 | % | | | | 0.15 | % |
Net Investment Income | | | | 1.45 | % | | | | 1.85 | % | | | | 0.89 | % | | | | 0.13 | % | | | | 0.01 | % |
April 30, 2020 / ANNUAL REPORT
| | |
| FINANCIAL HIGHLIGHTS (concluded) 16 |
| | | | | | | | | | | | | | | | | | | | | | | | | |
| | | | | |
| | | Year Ended | | Year Ended | | Year Ended | | Year Ended | | Year Ended |
| SERVICE CLASS(a) | | April 30, 2020 | | April 30, 2019 | | April 30, 2018 | | April 30, 2017 | | April 30, 2016 |
Net Asset Value, Beginning of Year | | | | $1.000 | | | | | $1.000 | | | | | $1.000 | | | | | $1.000 | | | | | $1.000 | |
Income (Loss) From Operations: | | | | | | | | | | | | | | | | | | | | | | | | | |
Net Investment Income | | | | 0.011 | | | | | 0.014 | | | | | 0.004 | | | | | 0.000 | (a) | | | | 0.000 | (a) |
Net Realized Gain (Loss) on Investments | | | | 0.000 | (a) | | | | 0.000 | (a) | | | | 0.000 | (a) | | | | 0.000 | (a) | | | | 0.000 | (a) |
Total Income (Loss) From Operations | | | | 0.011 | | | | | 0.014 | | | | | 0.004 | | | | | 0.000 | | | | | 0.000 | |
Less Distributions From: | | | | | | | | | | | | | | | | | | | | | | | | | |
Net Investment Income | | | | (0.011 | ) | | | | (0.014 | ) | | | | (0.004 | ) | | | | (0.000 | )(a) | | | | (0.000 | )(a) |
Net Asset Value, End of Year | | | | $1.000 | | | | | $1.000 | | | | | $1.000 | | | | | $1.000 | | | | | $1.000 | |
| | | | | |
Total Return | | | | 1.07 | % | | | | 1.43 | % | | | | 0.42 | % | | | | 0.01 | % | | | | 0.01 | % |
Net Assets, End of Year (000’s) | | | | $188 | | | | | $85 | | | | | $44 | | | | | $31 | | | | | $26 | |
Ratios to Average Net Assets | | | | | | | | | | | | | | | | | | | | | | | | | |
Gross Expense(c) | | | | 0.84 | % | | | | 0.83 | % | | | | 0.84 | % | | | | 0.90 | % | | | | 0.97 | % |
Net Expenses(c)(d) | | | | 0.70 | % | | | | 0.75 | % | | | | 0.74 | % | | | | 0.42 | % | | | | 0.17 | % |
Net Investment Income | | | | 0.97 | % | | | | 1.40 | % | | | | 0.44 | % | | | | 0.01 | % | | | | 0.01 | % |
| (a) | Represents less than $0.001. |
| (b) | Represents less than 0.01%. |
| (c) | The Fund invests in other underlying funds and indirectly bears its proportionate share of fees and expenses incurred by the underlying funds in which the Fund is invested. This ratio does not include these indirect fees and expenses. |
| (d) | The investment manager and other service providers voluntarily waived a portion of their fees. |
| (e) | Total returns for periods of less than one year, if any, are not annualized. |
| (f) | Annualized for periods less than one year. |
| * | Commencement of operations. |
See Notes which are an integral part of the Financial Statements
ANNUAL REPORT / April 30, 2020
| | |
| 17 NOTES TO FINANCIAL STATEMENTS |
Wilmington Funds
April 30, 2020
Wilmington Funds (the “Trust”) is registered under the Investment Company Act of 1940, as amended (the “Act”), as anopen-end management investment company. The Trust consists of 12 portfolios, 2 of which are presented herein (individually referred to as a “Fund” or collectively as the “Funds”). The remaining 10 funds are presented in separate reports.
| | |
| |
| Fund | | Investment Goal |
Wilmington U.S. Government Money Market Fund (“U.S. Government Money Market Fund”)(d) | | The Fund seeks to provide current income while maintaining liquidity and stability of principal. |
Wilmington U.S. Treasury Money Market Fund (“U.S. Treasury Money Market Fund”)(d) | | The Fund seeks to provide current income while maintaining liquidity and stability of principal. |
(d) Diversified
The Trust offers 6 classes of shares: Class A, Service Class, Select Class, Administrative Class, Class I, and Institutional Class. Class A and Class I are not available for the Funds. All shares of the Trust have equal rights with respect to voting, except on class-specific matters.
The assets of each portfolio are segregated and a shareholder’s interest is limited to the portfolio in which shares are held.
| 2. | SUMMARY OF SIGNIFICANT ACCOUNTING POLICIES |
The following is a summary of significant accounting policies consistently followed by the Funds in the preparation of their financial statements. These policies are in conformity with U.S. generally accepted accounting principles (“GAAP”). The Trust is an investment company and follows accounting and reporting guidance under Financial Accounting Standards Board (“FASB”) Accounting Standards Codification (“ASC”) Topic 946, “Financial Services - Investment Companies.” The preparation of financial statements in conformity with GAAP requires management to make estimates and assumptions that affect the amounts of assets, liabilities, expenses and revenues reported in the financial statements. Actual results could differ from those estimated and the differences could be material.
Computation of Net Asset Value– It is each Fund’s policy to maintain a continuous net asset value of $1.00 per share for each class. Each Fund has adopted certain investment, portfolio valuation and dividend and distribution policies to enable it to do so. There is no assurance, however, that each Fund will be able to maintain a stable net asset value of $1.00 per share. The net asset value (‘‘NAV’’) per share for each of the Funds is computed by dividing the total current value of the assets of a Fund, less its liabilities, by the total number of shares outstanding at the time of such computation. Each Fund’s NAV per share is computed as of 4:00 p.m. (Eastern Time), on days when the New York Stock Exchange (“NYSE”) is open for regular trading and the Federal Reserve Bank of New York (the ‘‘Fed’’) is open. In addition, the Funds may elect, in their discretion if it is determined to be in shareholders’ best interests, to be open on days when the NYSE is open but the Fed is closed or to be open on days when the Fed is open but the NYSE is closed, except for Good Friday.
Investment Valuation– The Funds use the amortized cost method to value their portfolio securities, when it represents the best estimate of fair value in accordance with Rule2a-7 under the Act.
The Trust follows the authoritative guidance (GAAP) for fair value measurements. The guidance establishes a framework for measuring fair value and a hierarchy for inputs and techniques used in measuring fair value that maximizes the use of observable inputs and minimizes the use of unobservable inputs and techniques by requiring that the most observable inputs be used when available. The guidance establishes three tiers of inputs that may be used to measure fair value. The three tiers of inputs are summarized at the end of each Fund’s Portfolio of Investments. The inputs or techniques used for valuing securities are not necessarily an indication of the risk associated with investing in those securities.
Pursuant to the Funds’ fair value procedures noted previously,open-end regulated investment companies are generally categorized as Level 1 securities in the fair value hierarchy. Fixed income securities and money market instruments are generally categorized as Level 2 securities in the fair value hierarchy.
Repurchase Agreements– Repurchase agreements are transactions in which a fund buys a security from a dealer or bank and agrees to sell the security back at a mutually agreed upon time and price. The repurchase price exceeds the sale price, reflecting each Fund’s return on the transaction. It is each Fund’s policy to require the counterparty to a repurchase agreement to transfer to the Funds’ custodian orsub-custodian eligible securities or cash with a market value (after transaction costs) at least equal to the repurchase price to be paid under the repurchase agreement. The eligible securities are transferred to accounts with the custodian orsub-custodian in which the Funds hold a “securities entitlement” and exercise “control” as those terms are defined in the Uniform Commercial Code. The Funds have established procedures for monitoring the market value of the transferred securities and requiring the transfer of additional eligible securities, if necessary, to equal at least the repurchase price. These procedures also allow the counterparty to require securities to be transferred from the account to the extent that their market value exceeds the repurchase price or in exchange for other eligible securities of equivalent market value.
The insolvency of the counterparty or other failure to repurchase the securities may delay the disposition of the underlying securities or cause the Funds to receive less than the full repurchase price.
April 30, 2020 / ANNUAL REPORT
| | |
| NOTES TO FINANCIAL STATEMENTS (continued) 18 |
Repurchase agreements are entered into by the Funds under Master Repurchase Agreements (“MRA”) which permit the Funds, under certain circumstances including an event of default (such as bankruptcy or insolvency), to offset payables and/or receivables under the MRA with collateral held and/or posted to the counterparty and create one single net payment due to or from each Fund.
At April 30, 2020, the open repurchase agreements by counterparty which are subject to a MRA on a net payment basis are as follows:
| | | | | | | | | | | | | | | | |
| | | | |
| Fund/Counterparty | | Repurchase
Agreements | | | Fair Value of Non-Cash Collateral Received(1) | | | Cash Collateral Received(1) | | | Net Exposure (2) | |
U.S. Government Money Market Fund | | | | | | | | | | | | | | | | |
Canadian Imperial Bank | | $ | 200,000,000 | | | $ | 200,000,000 | | | $ | — | | | $ | — | |
Credit Suisse First Boston LLC | | | 55,000,000 | | | | 55,000,000 | | | | — | | | | — | |
Deutsche Bank Securities, Inc. | | | 278,000,000 | | | | 278,000,000 | | | | — | | | | — | |
FICC Bank of New York | | | 250,000,000 | | | | 250,000,000 | | | | — | | | | — | |
Mizuho Securities USA | | | 150,000,000 | | | | 150,000,000 | | | | — | | | | — | |
RBC Capital Markets LLC | | | 1,100,000,000 | | | | 1,100,000,000 | | | | — | | | | — | |
TD Securities, Inc. | | | 440,000,000 | | | | 440,000,000 | | | | — | | | | — | |
| | | | | | | | | | | | | | | | |
| | $ | 2,473,000,000 | | | $ | 2,473,000,000 | | | $ | — | | | $ | — | |
| | | | | | | | | | | | | | | | |
U.S. Treasury Money Market Fund | | | | | | | | | | | | | | | | |
Credit Suisse First Boston LLC | | | 40,000,000 | | | | 40,000,000 | | | | — | | | | — | |
Deutsche Bank Securities, Inc. | | | 22,000,000 | | | | 22,000,000 | | | | — | | | | — | |
RBC Capital Markets LLC | | | 480,000,000 | | | | 480,000,000 | | | | — | | | | — | |
| | | | | | | | | | | | | | | | |
| | $ | 542,000,000 | | | $ | 542,000,000 | | | $ | — | | | $ | — | |
| | | | | | | | | | | | | | | | |
(1) The amount of collateral reflected in the table does not include any over-collateralization received by the Fund.
(2) Net exposure represents the receivable (payable) due from (to) the counterparty in the event of default.
Investment Income, Gains and Losses, Expenses and Distributions– Interest income and expenses are accrued daily. All premiums and discounts on fixed income securities are amortized/accreted for financial statement purposes. Dividends and distributions to shareholders are recorded on theex-dividend date. Investment transactions are accounted for on a trade date basis for financial reporting purposes. Realized gains and losses from investment transactions are recorded on an identified cost basis.
Expenses of the Trust, which are directly identifiable to a specific fund, are applied to that fund. Expenses which are not identifiable to a specific fund are allocated in such a manner as deemed equitable, taking into consideration the nature and type of expense.
All Funds offer multiple classes of shares. Investment income, realized gains and losses, and certain fund-level expenses are allocated to each class based on relative daily net assets, except that each class bears certain expenses unique to that class such as distribution and shareholder services fees. Distributions are declared separately for each class. No class has preferential distribution rights; differences in per share distributions rates are generally due to differences in class specific expenses. Distributions from net realized gains, if any, are declared and paid to shareholders annually. Distributions from net investment income are declared daily and paid monthly.
Federal Taxes– It is the Funds’ policy to comply with the Subchapter M provision of the Internal Revenue Code of 1986, as amended (the “Code”), and to distribute to shareholders each year substantially all their income. Accordingly, no provisions for Federal income tax or excise tax are necessary.
The Funds recognize interest and penalties, if any, related to unrecognized tax benefits as income tax expense on the Statements of Operations. During the year ended April 30, 2020, the Funds did not incur any interest or penalties.
| 3. | FEDERAL TAX INFORMATION |
As of April 30, 2020 there are no uncertain tax positions that would require financial statement recognition,de-recognition or disclosure. The Funds’ federal tax returns filed for the years ended 2019, 2018, and 2017, as well as the current tax year, remain subject to examination by the Internal Revenue Service.
For financial reporting purposes, book basis capital accounts are adjusted to reflect the tax character of permanent book/tax differences. Permanent reclassifications can arise from differing treatment of certain income and gain transactions and nondeductible current year net operating losses. Permanent book and tax basis differences relating to shareholder distributions will result in reclassifications to capital paid in on shares of beneficial interest. The reclassifications have no impact on the net assets or NAVs of the Funds. As of April 30, 2020, there were no reclassifications.
The timing and character of income and capital gain distributions are determined in accordance with income tax regulations, which may differ from GAAP.
The tax character of distributions for the corresponding fiscal year ends were as follows:
ANNUAL REPORT / April 30, 2020
| | |
| 19 NOTES TO FINANCIAL STATEMENTS (continued) |
| | | | | | | | |
| | |
| | | 2020 | | 2019 |
| | | | |
| Fund | | Ordinary Income* | | Long-Term Capital Gains | | Ordinary Income* | | Long-Term Capital Gains |
U.S. Government Money Market Fund | | $105,510,213 | | $— | | $112,042,670 | | $— |
U.S. Treasury Money Market Fund | | 22,824,070 | | — | | 22,930,188 | | — |
* For tax purposes, short-term capital gain distributions are considered ordinary income distributions.
As of April 30, 2020 the components of distributable earnings on a tax basis were as follows:
| | | | | | | | | | | | |
| | | | | | |
| Fund | | Undistributed Ordinary Income | | Undistributed Long-Term Capital Gains | | Other Timing Differences | | Unrealized Appreciation/ (Depreciation) | | Capital Loss Carryforwards | | Late Year Loss Deferrals |
U.S. Government Money Market Fund | | $917,175 | | $ — | | $(917,211) | | $— | | $— | | $— |
U.S. Treasury Money Market Fund | | 155,741 | | 2,001 | | (155,753) | | — | | — | | — |
The differences between the book and tax basis components of distributable earnings relate principally to the timing of recognition of income and gains for federal income tax purposes.
Under current tax regulations, capital losses on securities transactions realized after October 31 may be deferred and treated as occurring on the first day of the following fiscal year. Under the Regulated Investment Company Modernization Act of 2010, the Funds are permitted to defer taxable ordinary income losses incurred after December 31 and treat as occurring on the first day of the following fiscal year. At April 30, 2020, none of the Funds have any losses deferred to May 1, 2020.
The Funds utilized capital loss carryforwards as follows to offset taxable capital gains realized during the year ended April 30, 2020:
| | |
| |
| Fund | | Capital Loss Carryforwards
Utilized |
U.S. Treasury Money Market Fund | | $562 |
| 4. | ADVISORY FEES, SERVICING FEES, AND OTHER SERVICE PROVIDERS |
Investment Advisor– Wilmington Funds Management Corporation (“WFMC” or the “Advisor”) serves as the Investment Advisor to each of the Funds. Wilmington Trust Investment Advisors, Inc. (“WTIA”) providessub-advisory services to the Funds. WFMC and WTIA are wholly-owned subsidiaries of M&T Bank Corporation. For its services, the Funds pay WFMC an annual investment advisory fee, accrued daily and paid monthly, based on a percentage of each Fund’s average daily net assets as described below. WFMC, not the Funds, pays WTIA for its services.
| | |
| |
| Fund | | Advisory Fee Annual Rate |
U.S. Government Money Market Fund | | 0.25% |
U.S. Treasury Money Market Fund | | 0.25% |
During the year ended April 30, 2020, WFMC has agreed to reduce its advisory fee and/or reimburse certain of the Funds’ operating expenses, and/or certain class-specific fees and expenses, in an effort to maintain the current yield of each share class at or above zero. The fee waiver does not take into consideration acquired fund fees and expenses, taxes or extraordinary items. Any such waiver or expense reimbursement may be modified or discontinued at any time without notice.
WFMC and the Funds’ distributor and shareholder service providers have contractually agreed to waive their fees and/or reimburse expenses through August 31, 2020, so that total annual fund operating expenses paid by the Funds (not including the effects of acquired fund fees and expenses, taxes, or other extraordinary expenses expressed as an annualized percentage of average daily net assets), will not exceed the expense limitations set forth below. Neither WFMC nor the Fund’s distributor and shareholder service provider will recoup previously waived fees/expenses in subsequent years.
| | | | | | | | | | | | | | | | |
| |
| | | Current Contractual Expense Limitations | |
| | | | |
| Fund | | Administrative Class | | | Institutional
Class | | | Select
Class | | | Service Class | |
| | | | | |
| U.S. Government Money | | | | | | | | | | | | | | | | |
| Market Fund | | | 0.62% | | | | 0.27% | | | | 0.37% | | | | 0.77% | |
| | | | | |
| U.S. Treasury Money | | | | | | | | | | | | | | | | |
| Market Fund* | | | 0.60% | | | | 0.25% | | | | 0.35% | | | | 0.75% | |
* Effective October 16, 2019, the U.S. Treasury Money Market Fund launched a new Institutional Class.
April 30, 2020 / ANNUAL REPORT
| | |
| NOTES TO FINANCIAL STATEMENTS (continued) 20 |
Administrative Fees– The Bank of New York Mellon (“BNYM”) provides the Trust with fund administration services. The fees as described in the table below are a component of “Portfolio accounting and administration fees” as disclosed in the Statements of Operations. WFMC, in its role asCo-Administrator, provides the Funds with certain administrative personnel and services necessary to operate the Funds. The fees as described in the table below are accrued daily and paid monthly, and are disclosed on the Statements of Operations as “Administration fees.”
| | | | | | | |
| | |
| Administrator | | Maximum
Fee | | Average Aggregate Daily Net Assets of the Trust |
| | |
WFMC | | | | 0.040 | % | | on the first $5 billion |
| | |
| | | | 0.030 | % | | on the next $2 billion |
| | |
| | | | 0.025 | % | | on the next $3 billion |
| | |
| | | | 0.018 | % | | on assets in excess of $10 billion |
| | |
BNYM | | | | 0.0175 | % | | on the first $15 billion |
| | |
| | | | 0.0150 | % | | on the next $10 billion |
| | |
| | | | 0.0125 | % | | on assets in excess of $25 billion |
WFMC and BNYM may voluntarily choose to waive any portion of their fee and can add, modify or terminate a voluntary wavier at any time at their sole discretion. Neither WFMC nor BNYM will recoup previously waived fees/expenses in subsequent years. For the year ended April 30, 2020, neither WFMC nor BNYM waived any administrative fees.
Distribution Services Fee– The Trust has adopted a Distribution Services Plan (the “Plan”) pursuant to Rule12b-1 under the Act. The Plan allows the Funds to pay fees to financial intermediaries, which may be paid through ALPS Distributors, Inc. (“ALPS”), the principal distributor, at an annual rate of up to 0.25% of the average daily net assets of the Funds’ Administrative Class and Service Class shares for the sale, distribution, administration, customer servicing and record keeping of these shares.
The Trust may reduce the maximum amount of distribution services fees it pays from time to time at its sole discretion. In addition, a financial intermediary (including ALPS, the Advisor or their affiliates), may voluntarily waive or reduce any fees to which they are entitled.
For the year ended April 30, 2020, M&T Securities, Inc., Manufacturers and Traders Trust Company, and Wilmington Trust, NA (together “M&T”), affiliates of the Advisor, received a portion of the fees paid by the following Funds which are listed below:
| | | | | |
| |
| Fund | | Distribution Fees |
U.S. Government Money Market Fund | | | $ | 5,665,239 | |
U.S. Treasury Money Market Fund | | | | 695,594 | |
Shareholder Services Fee– Pursuant to a Shareholder Services Plan adopted by the Funds and administered by ALPS, the Funds may pay up to 0.25% of the average daily net assets of each Fund’s Administrative Class, Select Class and Service Class shares to financial intermediaries (which may include ALPS, the Advisor or their affiliates) for providing shareholder services and maintaining shareholder accounts. M&T has entered into a Shareholders Services Agreement with ALPS, under which it is entitled to receive up to 0.25% of the average daily net assets of each Fund’s shares for whom M&T provides shareholder services. The Funds may reduce the maximum amount of shareholder service fees it pays from time to time at its sole discretion. In addition, a financial intermediary (including M&T) may waive or reduce any fees to which they are entitled.
For the year ended April 30, 2020, M&T received a portion of the fees paid by the following Funds which are listed below:
| | |
| |
| Fund | | Shareholder Services Fee |
U.S. Government Money Market Fund | | $8,364,093 |
U.S. Treasury Money Market Fund | | 1,562,190 |
Other Service Providers– Foreside Management Services, LLC (“FMS”) provides a Principal Executive Officer and Principal Financial Officer to the Trust. FMS has no role in determining the investment policies or which securities are to be sold or purchased by the Trust or its funds.
BNYM provides custody services to the Trust.
BNY Mellon Investment Servicing (U.S.) Inc. provides fund accounting and transfer agency services to the Trust.
General– Certain Officers of the Trust are also Officers or employees of the above companies that provide services to the Funds, and during their terms of office, receive no compensation from the Funds. The Trust’s Statement of Additional Information includes additional information about the Trustees.
ANNUAL REPORT / April 30, 2020
| | |
| 21 NOTES TO FINANCIAL STATEMENTS (continued) |
Market risk is the risk that one or more markets in which a Fund invests will go down in value, including the possibility that the markets will go down sharply and unpredictably. The value of a security or other asset may decline due to changes in general market conditions, economic trends or events that are not specifically related to the issuer of the security or other asset, or factors that affect a particular issuer or issuers, exchange, country, group of countries, region, market, industry, group of industries, sector or asset class. Local, regional or global events such as war, acts of terrorism, the spread of infectious illnesses or other public health issues, recessions, natural disasters or other events could have a significant impact on a Fund and its investments.
Beginning in January 2020, global financial markets have experienced and may continue to experience significant volatility resulting from the spread of a novel coronavirus known asCOVID-19. The outbreak ofCOVID-19 has resulted in travel and border restrictions, quarantines, supply chain disruptions, lower consumer demand and general market uncertainty. The effects ofCOVID-19 have and may continue to adversely affect the global economy, the economies of certain nations and individual issuers. The impact of the outbreak may be short term or may last for an extended period of time, which may have an unpredictable impact on Fund performance.
The United Kingdom’s Financial Conduct Authority, which regulates the London Interbank Offered Rate (“LIBOR”), has announced plans to phase out the use of LIBOR by the end of 2021. There remains uncertainty regarding the future use of LIBOR and the nature of any replacement rate. The transition process away from LIBOR may involve, among other things, increased volatility or illiquidity in markets for instruments that currently rely on LIBOR. The transition process may also result in a reduction in the value of certain instruments held by a Fund or reduce the effectiveness of related Fund transactions such as hedges. Volatility, the potential reduction in value, and/or the hedge effectiveness of financial instruments may be heightened for financial instruments that do not include fallback provisions that address the cessation of LIBOR. Any potential effects of the transition away from LIBOR on any of the Funds or on financial instruments in which a Fund invests, as well as other unforeseen effects, could result in losses to a Fund.
| 7. | CONTRACTUAL OBLIGATIONS |
In the normal course of business, the Funds may enter into contracts that provide general indemnifications. The Funds’ maximum exposure under these arrangements is dependent on claims that may be made against the Funds in the future, and, therefore, cannot be estimated; however, based on experience, the risk of material loss from such claims is considered remote.
The Trust participates in a $10,000,000 unsecured, committed revolving line of credit (“LOC”) agreement with BNYM. The LOC was available for extraordinary or emergency purposes, primarily for financing redemption payments. Borrowings were charged interest at a rate of 1.25% per annum over the greater of the Federal Funds Rate or the overnight LIBOR. The LOC included a commitment fee of 0.15% per annum on the daily unused portion. The LOC expired on April 2, 2020.
On April 2, 2020, the Trust entered into an amendment to the credit agreement for a $10,000,000 unsecured, committed revolving LOC. The LOC is to be used as described above and to be operated in substantially the same manner as the original agreement. The LOC expires on April 1, 2021.
The Trust did not utilize the LOC during the year ended April 30, 2020.
| 9. | RECENT ACCOUNTING PRONOUNCEMENTS |
In August 2018, the Financial Accounting Standards Board (“FASB”) issued an Accounting Standards Update2018-13, (the “ASU”), which changes certain fair value measurement disclosure requirements. The ASU, in addition to other modifications and additions, removes the requirement to disclose the amount and reasons for transfers between Level 1 and Level 2 of the fair value hierarchy, the policy for the timing of transfers between levels and the valuation process for Level fair value measurements. The ASU is effective for fiscal years, and interim periods within those fiscal years, beginning after December 15, 2019. Management has evaluated the implications of certain provisions of ASUNo. 2018-13 and has elected to early adopt all aspects related to the removal and modification of certain fair value measurement disclosures.
In March 2020, the FASB issued ASUNo. 2020-04 (“ASU2020-04”), Reference Rate Reform (Topic 848) - Facilitation of the Effects of Reference Rate Reform on Financial Reporting. The amendments in ASU2020-04 provides optional temporary financial reporting relief from the effect of certain types of contract modifications due to the planned discontinuation of the LIBOR and other interbank-offered based reference rates as of the end of 2021. ASU2020-04 is effective for certain reference rate-related contract modifications that occur during the period March 12, 2020 through December 31, 2022. Management is currently evaluating the impact, if any, of applying ASU2020-04.
| 10. | OTHER FUND INFORMATION |
At a meeting held on June 5, 2019, the Trustees, upon recommendation of the Audit Committee, selected PricewaterhouseCoopers LLP (“PwC”) to serve as the independent registered public accounting firm for the Trust for the fiscal year ending April 30, 2020. PwC affirmed
April 30, 2020 / ANNUAL REPORT
| | |
| NOTES TO FINANCIAL STATEMENTS (continued) 22 |
their independence as an independent registered public accounting firm on June 19, 2019. During the fiscal years ended April 30, 2019 and 2018, Ernst & Young LLP (“E&Y”) audit reports’ on the financial statements of each Fund in the Trust did not contain any adverse opinion or disclaimer of opinion, nor were they qualified or modified as to uncertainty, audit scope, or accounting principles. In addition, there were no disagreements between the Trust and E&Y on accounting principles, financial statements disclosures or audit scope, which, if not resolved to the satisfaction of E&Y, would have caused them to make reference to the disagreement in their reports. Neither the Trust nor anyone on its behalf has consulted with PwC at any time prior to their selection with respect to the application of accounting principles to a specified transaction, either completed or proposed or the type of audit opinion that might be rendered on each Fund’s financial statements.
Management has evaluated events and transactions for potential recognition or disclosure in the financial statements through the date the financial statements were issued. Management has determined that there are no material events that would require recognition or disclosure in the Funds’ financial statements through this date.
ANNUAL REPORT / April 30, 2020
Report of Independent Registered Public Accounting Firm
To the Board of Trustees of Wilmington Funds and Shareholders of Wilmington U.S. Government Money Market Fund and Wilmington U.S. Treasury Money Market Fund
Opinions on the Financial Statements
We have audited the accompanying statements of assets and liabilities, including the portfolios of investments, of Wilmington U.S. Government Money Market Fund and Wilmington U.S. Treasury Money Market Fund (two of the funds constituting Wilmington Funds, hereafter collectively referred to as the “Funds”) as of April 30, 2020, the related statements of operations and changes in net assets for the year ended April 30, 2020, including the related notes, and the financial highlights for the year ended April 30, 2020 and for the period October 16, 2019 (commencement of operations for the Institutional Class of Wilmington U.S. Treasury Money Market Fund) through April 30, 2020 (collectively referred to as the “financial statements”). In our opinion, the financial statements present fairly, in all material respects, the financial position of each of the Funds as of April 30, 2020, the results of each of their operations and changes in each of their net assets for the year then ended, and each of the financial highlights for the year ended April 30, 2020 and for the period October 16, 2019 (commencement of operations for the Institutional Class of Wilmington U.S. Treasury Money Market Fund) through April 30, 2020 in conformity with accounting principles generally accepted in the United States of America.
The financial statements of the Funds as of and for the year ended April 30, 2019 and the financial highlights for each of the periods ended on or prior to April 30, 2019 (not presented herein, other than the statements of changes in net assets and the financial highlights) were audited by other auditors whose report dated June 27, 2019 expressed unqualified opinions on those financial statements and financial highlights.
Basis for Opinions
These financial statements are the responsibility of the Funds’ management. Our responsibility is to express an opinion on the Funds’ financial statements based on our audits. We are a public accounting firm registered with the Public Company Accounting Oversight Board (United States) (PCAOB) and are required to be independent with respect to the Funds in accordance with the U.S. federal securities laws and the applicable rules and regulations of the Securities and Exchange Commission and the PCAOB.
We conducted our audits of these financial statements in accordance with the standards of the PCAOB. Those standards require that we plan and perform the audit to obtain reasonable assurance about whether the financial statements are free of material misstatement, whether due to error or fraud.
Our audits included performing procedures to assess the risks of material misstatement of the financial statements, whether due to error or fraud, and performing procedures that respond to those risks. Such procedures included examining, on a test basis, evidence regarding the amounts and disclosures in the financial statements. Our audits also included evaluating the accounting principles used and significant estimates made by management, as well as evaluating the overall presentation of the financial statements. Our procedures included confirmation of securities owned as of April 30, 2020 by correspondence with the custodian, transfer agents and brokers; when replies were not received from brokers, we performed other auditing procedures. We believe that our audits provide a reasonable basis for our opinions.
/s/ PricewaterhouseCoopers LLP
Philadelphia, Pennsylvania
June 24, 2020
We have served as the auditor of one or more investment companies in Wilmington Funds since 2019.
April 30, 2020 / ANNUAL REPORT
| | |
| BOARD OF TRUSTEES AND TRUST OFFICERS | | 24 |
BOARD OF TRUSTEES AND TRUST OFFICERS
The following tables give information about each Trustee and the senior officers of the Trust. The tables separately list Trustee members who are “interested persons” of the Fund (i.e., “Interested” Trustees) and those who are not (i.e., “Independent” Trustees). The Trust is comprised of 12 funds. Unless otherwise noted, the business address of each Trustee and senior officer is 1100 North Market Street, 9th Floor, Wilmington, DE 19890. Each Trustee oversees all portfolios of the Trust and serves for an indefinite term. The Trust’s Statement of Additional Information includes additional information about the Trustees and is available, without charge and upon request, by calling1-800-836-2211.
INTERESTED TRUSTEES BACKGROUND
| | |
| |
Name Address Birth Year Position with Trust Date Service Began | | Principal Occupations and Other Directorships Held for Past Five Years |
| |
Dominick J. D’Eramo* Birth year: 1964 TRUSTEE Began serving: November 2018 PRESIDENT Began serving: June 2018 | | Principal Occupations:Senior Vice President, Wilmington Trust Investment Advisors, Inc. and Head of Fixed Income. Previous Positions:Group Vice President, Wilmington Trust Investment Advisor, Inc. (WTIA) (2014-2017); Administrative Vice President, WTIA (2012-2014). |
| * | Dominick J. D’Eramo is “interested” due to his employment with WTIA and his position with WFMC, investment Advisors to the Funds. |
INDEPENDENT TRUSTEES BACKGROUND
| | |
| |
Name Birth Year Position with Trust Date Service Began | | Principal Occupations and Other Directorships Held for Past Five Years |
| |
Nicholas A. Giordano Birth year: 1943 CHAIRMAN and TRUSTEE Began serving: March 2012 | | Principal Occupations:Consultant, financial services organizations (1997 to present). Other Directorships Held:The RBB Fund Inc. (19 portfolios) (registered investment companies); Independence Blue Cross; IntriCon Corporation (body-worn products). Previous Positions:Director, Kalmar Pooled Investment Trust (through 6/17); Interim President, LaSalle University (1998 to 1999); President and Chief Executive Officer, Philadelphia Stock Exchange (1981 to 1997). |
| |
Robert H. Arnold Birth year: 1944 TRUSTEE Began serving: March 2012 | | Principal Occupations:Managing Director, R.H. Arnold & Co, Inc. (financial management consulting) (6/89 to present). Other Directorships Held:None. Previous Positions:Trustee, First Potomac Realty Trust (real estate investment trust) (5/03 to 12/17); Director, Treasury Strategies, Inc. (private treasury consulting services) (6/01 to 6/16). |
| |
Gregory P. Chandler Birth year: 1966 TRUSTEE Began serving: July 2017 | | Principal Occupations:Chief Financial Officer, Avocado Systems, Inc. (cybersecurity software) (3/20 to present); Other Directorships Held:Trustee, RBB Fund Series Trust (32 portfolios) (registered investment companies) (2012 to present); Trustee, FS Energy Partners (business development company) (2009 to present); Director, Emtec, Inc. (2005 to 2019); Director, FS Investment Corporation (business development company) (2007 to 2018); Previous Positions:Chief Financial Officer, Emtec, Inc. (information technology services) (2009 to 2020); Managing Director, Janney Montgomery Scott LLC (investment banking) (1999 to 2009); Consulting Manager, PwC (1997 to 1999), Manager, Business Assurance, Coopers & Lybrand (audit services) (1995 – 1997); Captain, US Army (1989 to 1994). |
ANNUAL REPORT / April 30, 2020 (unaudited)
| | |
| 25 BOARD OF TRUSTEES AND TRUST OFFICERS |
| | |
| |
Name Birth Year Position with Trust Date Service Began | | Principal Occupations and Other Directorships Held for Past Five Years |
| |
Donald E. Foley Birth year: 1951 TRUSTEE Began serving: December 2015 | | Principal Occupations:Director, BioSig Technologies (2015 to present); Director, AXA Equitable’s VIP Mutual Funds (2017 to present); Director, AXA Equitable (variable annuity) (2013 to present); Director, 1290 Mutual Funds (retail funds) (2013 to present); and Chairman and Director, Burke Rehabilitation Hospital Foundation (private hospital, research institute) (2005 to present). Other Directorships Held:Director, M&T Bank Corporation (commercial bank) (2011 to 2012); Chairman and Director, Wilmington Trust Corporation (commercial and trust bank) (2007 to 2011); Chairman, Director and President’s Council, Union College (private college) (2011 to 2015). Previous Positions:Advisory Member, Trust and Investment Committee, M&T Bank, Wilmington Trust, National Association, and Wilmington Trust Company (through 2016); Chairman and Chief Executive Officer of Wilmington Trust Corporation (2010 to 2011); Senior Vice President and Treasurer at ITT Corporation (1996 to 2010); Assistant Treasurer at International Paper (1989 to 1996). |
| |
Richard B. Seidel Birth year: 1941 TRUSTEE Began serving: September 2003 | | Principal Occupations:Chairman, Seidel & Associates (legal consulting) (1/14 to present); Chairman, Liberty Private Client, LLC (registered investment adviser) (1/14 to present). Other Directorships Held:Director, Chartwell Investment Partners (9/15 to present); Director, Tristate Capital Holdings (9/07 to 4/20). Previous Positions:Chairman, Girard Capital (broker-dealer) (3/05 to 1/14); Chairman, Girard Partners, Ltd. (6/96 to 1/14). |
| |
Valerie J. Sill Birth year: 1962 TRUSTEE Began serving: April 2020 | | Principal Occupations:President, Chief Executive Officer and Chief Investment Officer, DuPont Capital Management (asset management) (2004 to present). Other Directorships Held:Trustee, Longwood Gardens (2005 to present); Trustee of the Christiana Care Health System (2012 to present); and Advisory Counsel, Federal Reserve Bank of Philadelphia’s Economic Advisory Council (2010 to 2013). Previous Positions:Executive Vice President at The Boston Company (1994 to 2004). |
OFFICERS
| | |
| |
Name Address Birth Year Positions with Trust | | Principal Occupations for Past Five Years and Previous Positions |
| |
John C. McDonnell Birth year: 1966 CHIEF OPERATIONS OFFICER Began serving: June 2017 VICE PRESIDENT Began serving: June 2012 | | Principal Occupations:Chief Operations Officer, Wilmington Funds; Vice President, Wilmington Funds Management Corporation (2005 to present); Vice President, Wilmington Trust Investment Advisors, Inc. (2012 to present). Previous Positions:Vice President, Wilmington Trust Investment Management, LLC (2005 to 2012). |
| |
Lisa Druelinger Birth year: 1978 CHIEF COMPLIANCE OFFICER and AML COMPLIANCE OFFICER. Began serving: November 2017 | | Principal Occupations:Chief Compliance Officer and Anti-Money Laundering Officer, Wilmington Funds; Administrative Vice President, M&T Bank. Previous Positions:Vice President and Senior Compliance Officer, Wilmington Trust Investment Advisors, Inc. (2015-2017); Wilmington Funds Product Manager, Wilmington Trust Investment Advisors, Inc. (2013-2015); Institutional and Retirement Services Product Manager, Wilmington Trust (2011-2013); Trust Compliance and Risk Management at M&T Bank (2006- 2011). |
April 30, 2020 (unaudited) / ANNUAL REPORT
| | |
| BOARD OF TRUSTEES AND TRUST OFFICERS | | 26 |
| | |
| |
Name Address Birth Year Position with Trust | | Principal Occupations for Past Five Years and Previous Positions |
| |
John J. Kelley Birth year: 1959 VICE PRESIDENT Began serving: December 2016 | | Principal Occupations:President of Wilmington Funds Management Corporation; Group Vice President and Chief Administrative Officer, Wilmington Trust Investment Advisors, Inc. Previous Positions:Vice President, BNY Mellon Investment Servicing (formerly, PNC Global Investment Servicing) from (1/05 to 7/05); Vice President of Administration, 1838 Investment Advisors, LP (1999 to 2005); Chief Compliance Officer, 1838 Investment Advisors, LP (2004 to 2005). |
| |
Robert L. Tuleya Birth year: 1974 VICE PRESIDENT and ASSISTANT SECRETARY Began serving: September 2018 | | Principal Occupations:Vice President and Assistant Secretary, Wilmington Funds; Vice President and Assistant Secretary, Wilmington Funds Management Corporation (2018 to present); Vice President and Assistant Secretary, Wilmington Trust Investment Advisors, Inc. (2018 to present); Vice President and Assistant Secretary, Wilmington Trust Investment Management, LLC (2018 to present); Vice President and Assistant General Counsel, M&T Bank (2018 to present). Previous Positions:Vice President and Counsel, M&T Bank (2017 to 2018); Senior Counsel, PNC Bank (2014 to 2017). |
| |
Christopher W. Roleke 10 High Street, Suite 302 Boston, MA 02110 Birth year: 1972 CHIEF FINANCIAL OFFICER AND TREASURER Began serving: July 2013 | | Principal Occupation:Managing Director and Fund Principal Financial Officer, Foreside Management Services, LLC (2011 to present). Previous Positions:Assistant Vice President, JP Morgan Investor Services Co. (2006 to 2011). |
| |
Lisa R. Grosswirth Atlantic Terminal Office Tower, 2 Hanson Place, 12th Floor Brooklyn, NY 11217 Birth year: 1963 SECRETARY Began serving: September 2007 | | Principal Occupation:Vice President, BNY Mellon Asset Servicing (2004 to present). Previous Positions:Supervisory Paralegal, The Dreyfus Corporation (1998 to 2004). |
| |
Richard J. Berthy Three Canal Plaza, Suite 100 Portland, ME 04101 Birth year: 1958 CHIEF EXECUTIVE OFFICER Began serving: September 2007 | | Principal Occupation:Chief Executive Officer, Foreside Financial Group, LLC (2012 to present). Previous Positions:President, Foreside Financial Group, LLC (2008 to 2012); Chief Administrative Officer, Foreside Financial Group, LLC (2005 to 2008); President and Secretary, Bainbridge Capital Management, LLC (2003 to 2006); Vice President, Bainbridge Capital Management (2002 to 2004). |
ANNUAL REPORT / April 30, 2020 (unaudited)
Board Approval of Liquidity Risk Management Program
To promote effective liquidity risk management throughout the fund industry and to enhance disclosure regarding fund liquidity and redemption practices, the Securities and Exchange Commission (the “Commission”) adopted Rule22e-4 under the Investment Company Act of 1940, as amended. The rule requires every registeredopen-end management company to establish a liquidity risk management program that, among other things, provides for the assessment, management and review of liquidity risk, the classification of a fund’s portfolio investments into one of four liquidity buckets based upon the number of days that such investments may reasonably be expected to be converted into cash or otherwise disposed of without significantly impacting their price, the establishment of a highly liquid investment minimum where required, and the establishment of a 15% limitation on illiquid investments. Additionally, the Commission adopted Rule30b1-10 and FormN-LIQUID, which generally requires a fund to notify the Commission when certain liquidity-related events occur.
The Wilmington Funds Board of Trustees (the “Board”) approved the appointment of the Funds’ Liquidity Risk Management Committee (“Liquidity Committee”) as the administrator of the liquidity risk management program (the “LRMP”) for the Funds on September 6, 2018 and the Funds’ final LRMP on March 5, 2019. At the regular meeting of the Board on March 10, 2020, the Trust’s Chief Operations Officer, as a member of the Liquidity Committee, provided a report to the Board on the operation and effectiveness of the LRMP after its first year of operation. The Liquidity Committee managed liquidity risks associated with the Funds’ investments by monitoring cash and cash equivalents, the use of derivatives, the concentration of investments and the appropriateness of portfolio strategies foropen-end funds, and by classifying each investment of a Fund as either highly liquid, moderately liquid, less liquid or illiquid on at least a monthly basis. To assist with the classification of each Fund’s investments, the Liquidity Committee utilized a third party provider of liquidity monitoring services. The Liquidity Committee supplied portfolio-level data and certain assumptions to the provider which then used the information to determine the liquidity classification of each security position held by the Funds. The liquidity classifications as of each month end were reviewed by the Liquidity Committee on at least a quarterly basis and would be reviewed more often if market conditions warranted. For assets managed by a third partysub-adviser the Liquidity Committee would takesub-adviser input into account where appropriate in determining the liquidity classifications.
The LRMP effectively managed the Funds’ liquidity risks for the twelve month period ended April 30, 2020. During this period, each Fund held more than 50% of its total net assets in highly liquid investments and due to the fact that each Fund is deemed to consist primarily of highly liquid investments, no highly liquid investment minimum was required to be established for any Fund. All Funds holding assets deemed to be illiquid were well under the illiquid investment limitation. Additionally, no events occurred that required the filing of FormN-LIQUID.
April 30, 2020 (unaudited) / ANNUAL REPORT
Shares of the Wilmington Funds are not FDIC insured or otherwise protected by the U.S. government, are not deposits or other obligations of, or guaranteed by, Manufacturers and Traders Trust Company, and are subject to investment risks, including possible loss of the principal amount invested.
VOTING PROXIES ON FUND PORTFOLIO SECURITIES
A description of the policies and procedures that the Funds use to determine how to vote proxies relating to securities held in the Funds��� portfolios is available, without charge and upon request, by calling1-800-836-2211. A report on how the Funds voted any such proxies during the most recent12-month period ended June 30 is available through Wilmington Funds’ website. Go to www.wilmingtonfunds.com select “Proxy Voting Record” to access the link. This information is also available from the Edgar database on the SEC’s website at www.sec.gov.
QUARTERLY PORTFOLIO SCHEDULE
For periods prior to the quarter ending July 31, 2019, the Funds have filed a complete schedule of portfolio holdings with the SEC for the first and third quarters of each fiscal year on FormN-Q. The Funds’ FormN-Qs are available on the SEC’s website at www.sec.gov.
Effective July 31, 2019, the Funds file a complete schedule of portfolio holdings with the SEC for the first and third quarters of each fiscal year as an exhibit to its reports on FormN-PORT. FormN-PORT is available on the SEC’s website at www.sec.gov.
Electronic Delivery
Wilmington Funds encourages you to sign up for electronic delivery of investor materials. By doing so you will receive information faster, help lower shareholder costs, and reduce the impact to the environment. To enroll in electronic delivery:
| | 1.) | Go to www.wilmingtonfunds.com and select “Individual Investors” |
| | 2.) | Click on the link “Sign up for Electronic Delivery” |
| | 3.) | Login to your account or create new user ID |
| | 4.) | SelectE-Delivery Consent from the available options, and |
| | 5.) | Complete the information requested, including providing the email address where you would like to receive notification for electronic documents. |
* If you hold your account through a financial intermediary, please contact your advisor to request electronic delivery of investor materials.
Householding
In an effort to reduce volume of mail you receive, only one copy of the prospectus, annual/semi-annual report, SAI and proxy statements will be sent to shareholders who are part of the same family and share the same address.
If you would like to request additional copies of the prospectus, annual/semi-annual report or SAI, or wish to opt out of householding mailings, please contact Shareholder Services at1-800-836-2211, or write to Wilmington Funds, P.O. Box 9828, Providence, RI 02940-8025.
ANNUAL REPORT / April 30, 2020
PRIVACY POLICY AND NOTICE
OF THE FUNDS AND THEIR DISTRIBUTOR
June 8, 2012
The Wilmington Funds, their distributor and their agents (referred to as “the Funds”, “we” or “us”) recognize that consumers (referred to as “you” or “your”) expect us to protect both your assets and financial information. We respect your right to privacy and your expectation that all personal information about you or your account will be maintained in a secure manner. We are committed to maintaining the confidentiality, security and integrity of client and shareholder information. We want you to understand the Funds’ policy that governs the handling of your information, how the Funds gather information, how that information is used and how it is kept secure.
Information The Funds Collect:
The Funds collect nonpublic personal information about you from the following sources:
• We may receive information from you, or from your financial representative, on account applications, other forms or electronically (such as through the Funds’ website or other electronic trading mechanisms). Examples of this information include your name, address, social security number, assets and income.
• We may receive information from you, or from your financial representative, through transactions with us or others, correspondence and other communications. Examples of this information include specific investments and your account balances.
• We may obtain other personal information from you in connection with providing you a financial product or service. Examples of this information include depository, debit or credit account numbers.
Information Sharing Policy
The Funds may share nonpublic personal information about you, as described above, with financial ornon-financial companies or other entities, including companies that may be affiliated with the Funds and other nonaffiliated third parties, for the following purposes:
• We may share information when it is necessary and required to process a transaction or to service a customer relationship. For example, information may be shared with a company that provides account record keeping services or a company that provides proxy services to shareholders.
• We may share information when it is required or permitted by law. For example, information may be shared in response to a subpoena or to protect you against fraud or with someone who has established a legal beneficial interest, such as a power of attorney.
• We may disclose some or all of the information described above to companies that perform marketing or other services on our behalf. For example, we may share information about you with the financial intermediary (bank, investment bank or broker-dealer) through whom you purchased the Funds’ products or services, or with providers of marketing, legal, accounting or other professional services. The Funds will not, however, disclose a consumer’s account number or similar form of access number or access code for credit card, deposit or transaction accounts to any nonaffiliated third party for use in telemarketing, direct mail or other marketing purposes.
Except as described above, the Funds do not share customer information. We will not rent, sell, trade, or otherwise release or disclose any personal information about you. Any information you provide to us is for the Funds’ use only. If you decide to close your account(s) or become an inactive customer, we will adhere to the privacy policies and practices as described in this notice.
Information Security:
When the Funds share nonpublic customer information with third parties hired to facilitate the delivery of certain products or services to our customers, such information is made available for limited purposes and under controlled circumstances designed to protect our customers’ privacy. We require third parties to comply with our standards regarding security and confidentiality of such information. We do not permit them to use that information for their own or any other purposes, or rent, sell, trade or otherwise release or disclose the information to any other party. These requirements are reflected in written agreements between the Funds and the third party service providers.
The Funds protect your personal information in several ways. We maintain physical, electronic, and procedural safeguards to guard your nonpublic personal information. In addition, the Funds’ Transfer Agent and Shareholder Servicing Agent have procedures in place for the appropriate disposal of nonpublic personal information when they are no longer required to maintain the information.
Each of the following sections explains an aspect of the Funds’ commitment to protecting your personal information and respecting your privacy.
Employee Access to Information:
Our Code of Ethics, which applies to all employees, restricts the use of customer information and requires that it be held in the strictest of confidence. Employee access to customer information is authorized for business purposes only, and the degree of access is based on the sensitivity of the information and on an employee’s or agent’s need to know the information in order to service a customer’s account or comply with legal requirements.
Visiting The Funds’ Website:
The Funds’ website gathers and maintains statistics about the number of visitors as well as what information is viewed most frequently. This information is used to improve the content and level of service we provide to our clients and shareholders.
April 30, 2020 / ANNUAL REPORT
• Information or data entered into a website will be retained.
• Where registration to a website orre-entering personal information on a website is required, “cookies” are used to improve your online experience. A cookie is a way for websites to recognize whether or not you have visited the site before. It is a small file that is stored on your computer that identifies you each time youre-visit our site so you don’t have to resubmit personal information. Cookies provide faster access into the website.
• We may also collectnon-personally identifiable Internet Protocol (“IP”) addresses for all other visitors to monitor the number of visitors to the site. Thesenon-personally identifiable IP addresses are never shared with any third party.
E-mail:
If you have opted to receive marketing information from the Funds bye-mail, it is our policy to include instructions in all marketing messages on how to unsubscribe from subsequente-mail programs. Some products or services from the Funds are intended to be delivered and serviced electronically.E-mail communication may be utilized in such cases. If you participate in an employer-sponsored retirement plan administered by the Funds, we may, at your employer’s request, send youe-mail on matters pertaining to the retirement plan.
Please do not provide any account or personal information such as social security numbers, account numbers, or account balances within youre-mail correspondence to us. We cannot usee-mail to execute transaction instructions, provide personal account information, or change account registration. We can, however, usee-mail to provide you with the necessary forms or you may contact customer service toll-free at1-800-836-2211.
Surveys/Aggregate Data:
Periodically, the Funds may conduct surveys about financial products and services or review elements of customer information in an effort to forecast future business needs. The Funds then generate reports that include aggregate data regarding its customers. Aggregate data classifies customer information in various ways but that does not identify individual customers. These reports may also include information on website traffic patterns and related information. These reports are used for the Funds’ planning, statistical and other corporate purposes. Aggregate data may also be shared with external parties, such as marketing organizations. However, no information is shared by which any individual customer could be identified.
Changes to Our Privacy Statement:
The effective date of this policy is June 8, 2012. We reserve the right to modify this policy at any time. When it is revised or materially changed, we will update the effective date. You can determine whether there have been changes since the last time you reviewed by simply checking the effective date.
Notice will be provided to you in advance of any changes that would affect your rights under this policy statement.
ANNUAL REPORT / April 30, 2020
[This Page Intentionally Left Blank]
[This Page Intentionally Left Blank]

Investment Advisor
Wilmington Funds Management Corp. 1100 North Market Street 9th Floor Wilmington, DE 19890
Sub-Advisor
Wilmington Trust Investment Advisors, Inc. 1100 North Market Street 9th Floor Wilmington, DE 19890
Co-Administrator
Wilmington Funds Management Corp. 1100 North Market Street 9th Floor Wilmington, DE 19890
Custodian
The Bank of New York Mellon 225 Liberty Street New York, NY 10286
Distributor
ALPS Distributors, Inc. 1290 Broadway, Suite 1100 Denver, CO 80203
Fund Accountant,Co-Administrator, Transfer Agent and Dividend Disbursing Agent
BNY Mellon Investment Servicing (U.S.) Inc. 301 Bellevue Parkway Wilmington, DE 19809
Independent Registered Public Accounting Firm
PricewaterhouseCoopers LLP Two Commerce Square 2001 Market Street, Suite 1800 Philadelphia, PA 19103
WT-AR-MM-0420
Wilmington Funds |1-800-836-2211 | www.wilmingtonfunds.com
We are pleased to send you this shareholder report for the Wilmington Funds. This report contains important information about your investments in the funds.
Item 2. Code of Ethics.
| | (a) | As of the end of the period covered by this report, the registrant has adopted a code of ethics (the “Section 406 Standards for Investment Companies—Ethical Standards for Principal Executive and Financial Officers”) that applies to the registrant’s Principal Executive Officer and Principal Financial Officer; the registrant’s Principal Financial Officer also serves as the Principal Accounting Officer |
| | (b) | There have been no amendments to the registrant’s code of ethics that apply to its Principal Executive Officer or Principal Financial Officer. |
| | (c) | There have been no amendments to the Funds’ code of ethics during the reporting period for this FormN-CSR. |
| | (d) | The registrant has not granted any waivers, including an implicit waiver, from any provisions of its code of ethics during the reporting period for this FormN-CSR. |
| | (f)(3) | The registrant hereby undertakes to provide any person, without charge, upon request, a copy of the code of ethics. To request a copy of the code of ethics, contact the registrant at1-800-836-2211, and ask for a copy of the Section 406 Standards for Investment Companies—Ethical Standards for Principal Executive and Financial Officers. |
Item 3. Audit Committee Financial Expert.
The registrant’s Board has determined that each member of the Board’s Audit Committee is an “audit committee financial expert,” and that each such member is “independent,” for purposes of this Item. The Audit Committee consists of the following Board members: Gregory P. Chandler, Nicholas A. Giordano, Donald E Foley.
Item 4. Principal Accountant Fees and Services.
| | (a) | The Audit Fees. The aggregate fees billed for each of the last two fiscal years for professional services rendered by the principal accountant for the audit of the Registrant’s annual financial statements or services that are normally provided by the accountant in connection with statutory and regulatory filings or engagements were as follows: |
Fiscal year ended 2020 - $441,000
Fiscal year ended 2019 - $479,363
| | (b) | Audit-Related Fees. The aggregate fees billed for each of the last two fiscal years for professional services rendered by the principal accountant for assurance and related services by the principal accountant that are reasonably related to the performance of the audit of the Registrant’s financial statements and are not reported above in Item 4(a) were as follows: |
Fiscal year ended 2020 - $0
Fiscal year ended 2019 - $0
Amount requiring approval of the registrant’s audit committee pursuant to paragraph (c)(7)(ii) of Rule2-01 of RegulationS-X, $0 and $0 respectively.
| | (c) | Tax Fees. The aggregate fees billed for each of the last two fiscal years for professional services rendered by the principal accountant for tax compliance, tax advice and tax planning were as follows: |
Fiscal year ended 2020 - $145,524
Fiscal year ended 2019 - $125,963
Amount requiring approval of the registrant’s audit committee pursuant to paragraph (c)(7)(ii) of Rule2-01 of RegulationS-X, $145,524 and $125,963, respectively.
| | (d) | All Other Fees. The aggregate fees billed in each of the last two fiscal years for products and services provided by the principal accountant, other than the services reported in paragraphs (a) and (c) of this Item were as follows: |
Fiscal year ended 2020 - $0
Fiscal year ended 2019 - $0
Amount requiring approval of the registrant’s audit committee pursuant to paragraph (c)(7)(ii) of Rule2-01 of RegulationS-X, $0and $0 respectively.
| | (e)(1) | Audit Committee Policies regardingPre-approval of Services. |
The Audit Committee is required topre-approve audit andnon-audit services performed by the independent auditor in order to assure that the provision of such services do not impair the auditor’s independence. Unless a type of service to be provided by the independent auditor has received generalpre-approval, it will require specificpre-approval by the Audit Committee. Any proposed services exceedingpre-approved cost levels will require specificpre- approval by the Audit Committee.
Certain services have the generalpre-approval of the Audit Committee. The term of the generalpre-approval is 12 months from the date ofpre-approval, unless the Audit Committee specifically provides for a different period. The Audit Committee will annually review the services that may be provided by the independent auditor without obtaining specificpre-approval from the Audit Committee and may grant generalpre-approval for such services. The Audit Committee will revise the list of generalpre-approved services from time to time, based on subsequent determinations. The Audit Committee will not delegate its responsibilities topre-approve services performed by the independent auditor to management.
The Audit Committee has delegatedpre-approval authority to its Chairman. The Chairman will report anypre-approval decisions to the Audit Committee at its next scheduled meeting. The Committee will designate another member with suchpre-approval authority when the Chairman is unavailable.
AUDIT SERVICES
The annual Audit services engagement terms and fees will be subject to the specificpre-approval of the Audit Committee. The Audit Committee must approve any changes in terms, conditions and fees resulting from changes in audit scope, registered investment company (RIC) structure or other matters.
In addition to the annual Audit services engagement specifically approved by the Audit Committee, the Audit Committee may grant generalpre-approval for other Audit Services, which are those services that only the independent auditor reasonably can provide. The Audit Committee haspre-approved certain Audit services, all other Audit services must be specificallypre-approved by the Audit Committee.
AUDIT-RELATED SERVICES
Audit-related services are assurance and related services that are reasonably related to the performance of the audit or review of the Company’s financial statements or that are traditionally performed by the independent auditor. The Audit Committee believes that the provision of Audit-related services does not impair the independence of the auditor, and haspre-approved certain Audit-related services, all other Audit-related services must be specificallypre-approved by the Audit Committee.
TAX SERVICES
The Audit Committee believes that the independent auditor can provide Tax services to the Company such as tax compliance, tax planning and tax advice without impairing the auditor’s independence. However, the Audit Committee will not permit the retention of the independent auditor in connection with a transaction initially recommended by the independent auditor, the purpose of which may be tax avoidance and the tax treatment of which may not be supported in the Internal Revenue Code and related regulations. The Audit Committee haspre-approved certain Tax services, all Tax services involving large and complex transactions must be specificallypre-approved by the Audit Committee.
ALL OTHER SERVICES
With respect to the provision of services other than audit, review or attest services thepre-approval requirement is waived if:
| | (1) | The aggregate amount of all such services provided constitutes no more than five percent of the total amount of revenues paid by the registrant, the registrant’s adviser (not including anysub-adviser whose role is primarily portfolio management and is subcontracted with or overseen by another investment adviser), and any entity controlling, controlled by, or under common control with the investment adviser that provides ongoing services to the registrant or to its accountant during the fiscal year in which the services are provided; |
| | (2) | Such services were not recognized by the registrant, the registrant’s adviser (not including anysub-adviser whose role is primarily portfolio management and is subcontracted with or overseen by another investment adviser), and any entity controlling, controlled by, or under common control with the investment adviser that provides ongoing services to the registrant at the time of the engagement to benon-audit services; and |
| | (3) | Such services are promptly brought to the attention of the Audit Committee of the issuer and approved prior to the completion of the audit by the Audit Committee or by one or more members of the Audit Committee who are members of the board of directors to whom authority to grant such approvals has been delegated by the Audit Committee. |
The Audit Committee may grant generalpre-approval to those permissiblenon-audit services classified as All Other services that it believes are routine and recurring services, and would not impair the independence of the auditor.
The SEC’s rules and relevant guidance should be consulted to determine the precise definitions of prohibitednon-audit services and the applicability of exceptions to certain of the prohibitions.
PRE-APPROVAL FEE LEVELS
Pre-approval fee levels for all services to be provided by the independent auditor will be established annually by the Audit Committee. Any proposed services exceeding these levels will require specificpre-approval by the Audit Committee.
PROCEDURES
Requests or applications to provide services that require specific approval by the Audit Committee will be submitted to the Audit Committee by both the independent auditor and the Principal Accounting Officer and/or Internal Auditor, and must include a joint statement as to whether, in their view, the request or application is consistent with the SEC’s rules on auditor independence.
| (e)(2) | Percentage of services identified in items 4(b) through 4(d) that were approved by the registrants audit committee pursuant to paragraph (c)(7)(i)(C) of Rule2-01 of RegulationS-X: |
4(b)
Fiscal year ended 2020 – 0%
Fiscal year ended 2019 – 0%
Percentage of services provided to the registrant’s investment adviser and any entity controlling, controlled by, or under common control with the investment adviser that provides ongoing services to the registrant that were approved by the registrant’s audit committee pursuant to paragraph (c)(7)(i)(C) of Rule2-01 of RegulationS-X, 0% and 0% respectively.
4(c)
Fiscal year ended 2020 – 0%
Fiscal year ended 2019 – 0%
Percentage of services provided to the registrant’s investment adviser and any entity controlling, controlled by, or under common control with the investment adviser that provides ongoing services to the registrant that were approved by the registrant’s audit committee pursuant to paragraph (c)(7)(i)(C) of Rule2-01 of RegulationS-X, 0% and 0% respectively.
4(d)
Fiscal year ended 2020 – 0%
Fiscal year ended 2019 – 0%
Percentage of services provided to the registrant’s investment adviser and any entity controlling, controlled by, or under common control with the investment adviser that provides ongoing services to the registrant that were approved by the registrant’s audit committee pursuant to paragraph (c)(7)(i)(C) of Rule2-01 of RegulationS-X, 0% and 0% respectively.
Not Applicable
| (g) | Non-Audit Fees billed to the registrant, the registrant’s investment adviser, and certain entities controlling, controlled by or under common control with the investment adviser that provide ongoing services to the registrant: |
Fiscal year ended 2020 – $145,524
Fiscal year ended 2019 – $125,963
| (h) | The registrant’s Audit Committeehas considered that the provision ofnon-audit services that were rendered to the registrant’s adviser (not including anysub-adviser whose role is primarily portfolio management and is subcontracted with or overseen by another investment adviser), and any entity controlling, controlled by, or under common control with the investment adviser that provides ongoing services to the registrant that were notpre-approved pursuant to paragraph (c)(7)(ii) of Rule2-01 of RegulationS-X is compatible with maintaining the principal accountant’s independence. |
Item 5. Audit Committee of Listed Registrants.
Not applicable.
Item 6. Investments.
| (a) | Schedule of Investments in securities of unaffiliated issuers as of the close of the reporting period is included as part of the report to shareholders filed under Item 1 of this form. |
Item 7. Disclosure of Proxy Voting Policies and Procedures forClosed-End Management Investment Companies.
Not applicable.
Item 8. Portfolio Managers ofClosed-End Management Investment Companies.
Not applicable.
Item 9. Purchases of Equity Securities byClosed-End Management Investment Company and Affiliated Purchasers.
Not applicable.
Item 10. Submission of Matters to a Vote of Security Holders.
No changes to report.
Item 11. Controls and Procedures.
| | (a) | The registrant’s principal executive officer and principal financial officer have concluded that the registrant’s disclosure controls and procedures (as defined in Rule30a-3(c) under the Investment Company Act of 1940 (the “1940 Act”)) are effective, based on an evaluation of those controls and procedures made as of a date within 90 days of the filing date of this report as required by Rule30a-3(b) under the 1940 Act and Rule13a-15(b) under the Exchange Act. |
| | (b) | There has been no change in the registrant’s internal control over financial reporting (as defined in Rule30a-3(d) under the 1940 Act) that occurred during the period covered by this report that has materially affected, or is reasonably likely to materially affect, the registrant’s internal control over financial reporting. |
Item 12. Disclosure of Securities Lending Activities forClosed-End Management Investment Companies.
Not applicable.
Item 13. Exhibits.
(12.other) Not applicable.
SIGNATURES
Pursuant to the requirements of the Securities Exchange Act of 1934 and the Investment Company Act of 1940, the registrant has duly caused this report to be signed on its behalf by the undersigned, thereunto duly authorized.
(Registrant): Wilmington Funds
| | |
By (Signature and Title)* | | /s/ Richard J. Berthy |
| | Richard J. Berthy |
| | (Principal Executive Officer) |
Date: July 2, 2020
Pursuant to the requirements of the Securities Exchange Act of 1934 and the Investment Company Act of 1940, this report has been signed below by the following persons on behalf of the registrant and in the capacities and on the dates indicated.
| | |
By (Signature and Title)* | | /s/ Richard J. Berthy |
| | Richard J. Berthy |
| | (Principal Executive Officer) |
Date: July 2, 2020
| | |
By (Signature and Title)* | | /s/ Christopher W. Roleke |
| | Christopher W. Roleke |
| | (Principal Financial Officer) |
Date: July 2, 2020
| * | Print the name and title of each signing officer under his or her signature. |