UNITED STATES
SECURITIES AND EXCHANGE COMMISSION
Washington, D.C. 20549
FORM N-CSR
CERTIFIED SHAREHOLDER REPORT OF REGISTERED
MANAGEMENT INVESTMENT COMPANIES
Investment Company Act file number 811-05514
Wilmington Funds
(Exact name of registrant as specified in charter)
Wilmington Funds Management Corporation
Rodney Square North
1100 North Market Street
Wilmington, DE 19890
(Address of principal executive offices) (Zip code)
John McDonnell
Wilmington Funds Management Corporation
Rodney Square North
1100 North Market Street
Wilmington, DE 19890
(Name and address of agent for service)
Registrant’s telephone number, including area code: 302-651-8409
Date of fiscal year end: April 30
Date of reporting period: April 30, 2021
Form N-CSR is to be used by management investment companies to file reports with the Commission not later than 10 days after the transmission to stockholders of any report that is required to be transmitted to stockholders under Rule 30e-1 under the Investment Company Act of 1940 (17 CFR 270.30e-1). The Commission may use the information provided on Form N-CSR in its regulatory, disclosure review, inspection, and policymaking roles.
A registrant is required to disclose the information specified by Form N-CSR, and the Commission will make this information public. A registrant is not required to respond to the collection of information contained in Form N-CSR unless the Form displays a currently valid Office of Management and Budget (“OMB”) control number. Please direct comments concerning the accuracy of the information collection burden estimate and any suggestions for reducing the burden to Secretary, Securities and Exchange Commission, 450 Fifth Street, NW, Washington, DC 20549-0609. The OMB has reviewed this collection of information under the clearance requirements of 44 U.S.C. § 3507.
Item 1. Reports to Stockholders.
| | (a) | The Report to Shareholders is attached herewith. |
WILMINGTON FUNDS April 30, 2021 PRESIDENT’S MESSAGE AND Annual Report WILMINGTON FUNDS Equity Fund Wilmington International Fund Alternatives Fund Wilmington Global Alpha Equities Fund Asset Allocation Funds Wilmington Real Asset Fund Wilmington Diversified Income Fund

Wilmington International Fund (“International Fund”)
Wilmington Global Alpha Equities Fund (“Global Alpha Equities Fund”)
Wilmington Real Asset Fund (“Real Asset Fund”)
Wilmington Diversified Income Fund (“Diversified Income Fund”)

[This Page Intentionally Left Blank]
PRESIDENT’S MESSAGE (unaudited)
Esteemed Shareholder:
I am pleased to present the Annual Report of the Wilmington Funds (the “Trust”), covering the Trust’s annual fiscal year of May 1, 2020, through April 30, 2021. Inside you will find a comprehensive review of the Trust’s holdings and financial statements.
The economy and financial markets in review
Wilmington Funds Management Corporation and Wilmington Trust Investment Advisors, Inc. (the Trust’s investment advisor and subadvisor, respectively), have provided the following review of the economy, bond markets, and stock markets for the Trust’s annual fiscal year.
The economy
The last year was one for the history books and captured both the worst of the COVID-19 pandemic’s impact on global output, as well as the early stages of recovery as vaccines and unprecedented volumes of fiscal and monetary stimulus helped the global economy get back on its feet. The U.S. began the period with one of the steepest quarterly declines on record in Q2 2020 as strict lockdown measures imposed to contain the virus abruptly brought in-person activity to a near halt.
The pace and magnitude of the economic rebound that followed was comparably profound as the approval and distribution of highly effective vaccines and rising COVID-19 vaccination rates across the world in 2021 provided investors with a much-needed light at the end of the tunnel. The federal government’s provision of direct checks to many Americans and extended unemployment benefits padded consumer savings, more than offsetting wages lost by low income consumers, and helped to fuel a robust rebound in spending on goods. Spending on services, which depends more on in person interaction, has still yet to recover to pre-pandemic levels but showed signs of picking up in 1Q 2021 as a growing number of states peeled back virus restrictions. The labor market recovered considerably in the period, as the unemployment rate dropped from 14.7% in April 2020, the highest observed since the Great Depression, to 6.1% one year later. The Federal Reserve (the “Fed”) upgraded its outlook for economic activity and inflation, but still guided for rates to remain near zero for years to come and for monthly purchases of treasuries and mortgage-backed securities to continue for the time being.
Economic activity outside the U.S. varied between regions depending on the success of virus containment and vaccination efforts. The eurozone was bogged down by weakness in the services sector for much of the period. Gross Domestic Product (“GDP”) growth contracted in the region for a second consecutive quarter in 1Q 2021 as many of the largest economies kept tight mobility restrictions in place in response to a resurgence of infections and the looming threat of new virus variants. However, notable strength on the industrial side of the economy provided some offset as manufacturing activity benefitted from strength in global goods demand. After a rocky start, vaccination efforts in many European countries began to accelerate in March and April of 2021 paving the way for renewed reopening efforts.
The virus remained a persistent threat for many developing economies, where vaccination campaigns broadly lagged the developed world by a substantial margin. Brazil and India in particular, emerged as virus epicenters in early 2021 after witnessing sharp spikes in infection rates, providing a grim reminder of the need for vaccination efforts to broaden in the emerging world. China was first in and first out of the COVID-19 pandemic after controlling infection rates more effectively and far earlier than most countries and was the only major economy to record positive GDP growth in 2020. Chinese manufacturing activity expanded at a feverish pace for much of the period, benefitting from goods exports and government investment. The services side of the economy lagged but began to narrow the gap later in the period as a brief rise in virus cases was brought under control.
Bond markets
Fixed income performance was mixed over the past year as spreads compressed materially across taxable and tax-exempt credit from extreme levels recorded in early 2020. However, rising long-term rates served as a headwind later in the period. The U.S. 10-year Treasury yield surged over 80 basis points1 in 1Q 2021 for its largest quarterly rise since 2016, buttressed by an improving growth outlook and expectations for higher inflation later in the year. Upward rate pressure weighed heavily on investment grade taxable bonds, as the Bloomberg Barclays U.S. Aggregate Bond Index suffered its worst quarter in several decades in 1Q, more than offsetting gains booked in much of 2020. In investment grade, tax-exempt held up better than taxable peers as strong demand for yield offset more muted new supply, helping to overshadow the rise in rates. Municipals also benefitted from the American Recovery Plan passed by the federal government in March 2021, which included $350 billion of funding for state and local governments. High-yield credit outperformed investment grade in both the taxable and tax-exempt spaces substantially as spreads continued to normalize from more elevated levels, and investors embraced riskier assets.
PRESIDENT’S MESSAGE / April 30, 2021 (unaudited)
For the 12-month period May 1, 2020 to April 30, 2021, certain Bloomberg Barclays indices performed as follows:2
| | | | | | | | | | | | | | | | | | | | |
Bloomberg Barclays U.S. Treasury Bond Index3 | | Bloomberg Barclays U.S. Aggregate Bond Index4 | | Bloomberg Barclays U.S. Credit Bond Index5 | | Bloomberg
Barclays
Municipal Bond
Index6 | | Bloomberg Barclays U.S. Corporate High Yield Bond Index7 |
| | | | |
-4.32% | | -0.27% | | 4.25% | | 7.75% | | 19.67% |
Past performance is no guarantee of future results. Short-term performance may not be indicative of long-term results.
Source: Lipper. You cannot invest directly in an index.
Equity markets
Global equities recorded historically strong performance over the past 12-months as concerns over the initial spread of COVID-19 gave way to optimism over the pace of subsequent recovery. After suffering a -33% market rout in February and March of 2020, the S&P 500 reclaimed its pre-pandemic peak by August of that year, marking the fastest bear market recovery on record. U.S. large cap outperformed from April through November as mega-cap growth stocks that benefitted most from the “stay- at- home” environment prevailed.
November brought an immense shift in leadership, as positive vaccine developments and growing optimism for a swifter return to normal fueled a powerful rotation into economically sensitive areas of the market. U.S. small-cap and value stocks, which carry a heavier weighting toward cyclical sectors, were notable beneficiaries of this trend.
Emerging market equities recorded solid gains in the reflationary environment but saw some weakness in February as certain regions struggled with new outbreaks of COVID-19. In addition, Chinese equities, which comprise a significant share of the MSCI Emerging Markets Index, were weighed down by a mix of regulatory headwinds and concerns over policy tightening. International developed equities also performed well and benefitted from a tilt toward segments that benefit most from rising interest rates and inflation. Equities in Europe picked up momentum towards the end of the period amidst an improving economic outlook for many of the region’s largest countries as vaccinations ramped up.
For the 12-month period May 1, 2020 to April 30, 2021, certain stock market indices performed as follows:
| | | | | | | | | | | | | | | |
| | | |
S&P 500®
Index8 | | Russel
2000®
Index9 | | MSCI EAFE
(Net)
Index10 | | MSCI Emerging
Markets (Net)
Index11 |
| | | |
45.98% | | 74.91% | | 39.88% | | 48.71% |
Past performance is no guarantee of future results. Short-term performance may not be indicative of long-term results.
Source: Lipper. You cannot invest directly in an index.
Although we have begun a new fiscal year, we will never forget the daunting damage that the pandemic has wrought on multiple levels. Still, there is much in the world that is positive, hopeful, and strong. I am referring to our trusted partnership with our clients, our desire to stay close to what’s important to them, and our fervent dedication to helping them achieve their long-term investment objectives. On that—as well as our fiduciary, clients-first mindset—you can always count.
Sincerely,

Dominick J. D’Eramo, CFA
President
May 14, 2021
April 30, 2021 (unaudited) / PRESIDENT’S MESSAGE
Must be preceded or accompanied by a prospectus.
Past performance is no guarantee of future results. The index performance quoted is for illustrative purposes only and is not representative of any specific investment. Diversification does not ensure a profit nor protect against loss.
All investments involve risk, including the possible loss of principal. Equity securities are subject to price fluctuation and possible loss of principal. Small- and mid-cap stocks involve greater risks and volatility than large-cap stocks. International investments are subject to special risks, including currency fluctuations, social, economic, and political uncertainties, which could increase volatility. These risks are magnified in emerging markets.
High-yield, lower-rated securities generally entail greater market, credit, and liquidity risks than investment grade securities and may include higher volatility and higher risk of default.
| 1. | Basis Points (“BPS”) is a unit that is equal to 1/100th of 1% and is used to denote the change in a financial instrument. The basis point is commonly used for calculating changes in interest rates, equity indices and the yield of a fixed-income security. |
| 2. | Bond prices are sensitive to changes in interest rates and a rise in interest rates can cause decline in their prices. |
| 3. | Bloomberg Barclays U.S. Treasury Bond Index is a market capitalization weighted index that includes all publicly issued U.S. Treasury securities that have a remaining maturity of at least one year, are rated investment-grade, and have $250 million or more of outstanding face value. The index is unmanaged and investments cannot be made directly in an index. |
| 4. | Bloomberg Barclays U.S. Aggregate Bond Index is a widely used benchmark index for the domestic investment-grade bond market composed of securities from the Barclays Government/Corporate Bond Index, Mortgage-Backed Securities Index and Asset-Backed Securities Index. The index typically includes fixed income securities with overall intermediate- to long-term average maturities. The index is unmanaged and investments cannot be made directly in an index. |
| 5. | Bloomberg Barclays U.S. Credit Bond Index tracks the performance of domestic investment-grade corporate bonds and is composed of all publicly issued, fixed-rate, nonconvertible, investment-grade corporate debt. The index is unmanaged and investments cannot be made directly in an index. |
| 6. | Bloomberg Barclays Municipal Bond Index tracks the performance of the long-term, tax-exempt, investment-grade bond market. To be included in the index, bonds must have an outstanding par balance of at least $7 million and be issued as part of a transaction of at least $75 million. The index is unmanaged and investments cannot be made directly in an index. |
| 7. | Bloomberg Barclays U.S. Corporate High Yield Bond Index measures the USD-denominated, high yield, fixed-rate corporate bond market. Securities are classified as high yield if the middle rating of Moody’s, Fitch, and S&P is Ba1/BB+/BB+ or below. Bonds from issuers with an emerging markets country of risk, based on the Bloomberg Barclays EM country definition, are excluded. The U.S. Corporate High Yield Bond Index is a component of the U.S. Universal and Global High Yield Indices. An investment cannot be made directly in an index. |
| 8. | The S&P 500® Index is a capitalization-weighted index of 500 stocks designed to measure performance of the broad domestic economy through changes in the aggregate market value of 500 stocks representing all major industries. The index is unmanaged and investments cannot be made directly in an index. |
| 9. | The Russell 2000® Index measures the performance of the 2,000 smallest companies in the Russell 3000® Index, which represents approximately 8% of the total market capitalization of the Russell 3000® Index. As of its latest reconstitution, the index had a total market capitalization range of $152.3 million to $5 billion. The index is unmanaged and investments cannot be made directly in an index. |
| 10. | MSCI EAFE (Net) Index is a free float-adjusted market capitalization index that is designed to measure equity market performance of developed markets, excluding the U.S. & Canada. The MSCI EAFE (Net) Index is an equity index which captures large and mid-cap representation across 21 Developed Markets countries: Australia, Austria, Belgium, Denmark, Finland, France, Germany, Hong Kong, Ireland, Israel, Italy, Japan, the Netherlands, New Zealand, Norway, Portugal, Singapore, Spain, Sweden, Switzerland and the United Kingdom. The index is unmanaged and investments cannot be made directly in an index. The performance of this index is reduced by the taxes on dividends paid by the international securities issuers in the index. |
| 11. | MSCI Emerging Markets (Net) Index is a free float-adjusted market capitalization index that is designed to measure equity market performance of emerging markets. The MSCI Emerging Markets (Net) Index captures large and mid-cap representation across 27 Emerging Markets countries: Argentina, Brazil, Chile, China, Colombia, Czech Republic, Egypt, Greece, Hungary, India, Indonesia, Korea, Kuwait, Malaysia, Mexico, Pakistan, Peru, Philippines, Poland, Qatar, Russia, Saudi Arabia, South Africa, Taiwan, Thailand, Turkey and United Arab Emirates. The index is unmanaged and investments cannot be made directly in an index. The performance of this index is reduced by the taxes on dividends paid by the international securities issuers in the index. |
PRESIDENT’S MESSAGE / April 30, 2021 (unaudited)
WILMINGTON INTERNATIONAL FUND
Management’s Discussion of Fund Performance (Unaudited)
For the fiscal year ended April 30, 2021, Wilmington International Fund (the “Fund”) had a total return of 44.67%* for Class A Shares and 44.92%* for Class I Shares, versus its benchmark, the MSCI –All Country World ex-US Index (Net, USD) (MSCI ACWI ex-US)** which had a total return of 42.98%.
The Fund’s fiscal-year performance can be divided into three time periods. During the six months from May 1st through October 31st, 2020, uncertainty over the course of the COVID-19 pandemic and associated economic damage dominated investors’ calculations. Markets favored quality growth stocks over more volatile cyclical value stocks. They also favored technology over financials and energy. The Fund enjoyed strong performance tailwinds due to its quality growth tilt, technology overweight, and financials and energy underweights. During those six months, the Fund (Class I shares) returned 15.99% versus 12.22% for the benchmark, producing a 3.77% excess return.
During November 2020, Pfizer and Moderna announced surprisingly high efficacy findings for their COVID-19 vaccines. Perceiving a light at the end of the tunnel, global investors sharply repriced stocks. For instance, the Fund’s benchmark index rose by 13.45% just in November. Investors particularly favored higher-beta cyclical stocks, particularly in the financials and energy sectors. Investors rewarded “junky” stocks, those with low profitability, higher leverage, and higher earnings variability. Now encountering stiff headwinds, the Fund gave back some of the prior six months’ positive excess return. During November 2020, the Fund (Class I shares) returned 10.81% versus 13.45% for the benchmark, trailing the benchmark return by 2.64%.
From December 1st, 2020 through April 30th, 2021, global investors continued to reprice stocks. The Fund’s benchmark rose by another 12.30% during those five months. There were several bursts of cyclical value outperformance during these five months, but such bursts were short-lived. The Fund was able to slightly outperform its benchmark. From December 1st, 2020 through April 30th, 2021, the Fund returned 12.75% versus 12.30% for the benchmark, producing a 0.45% excess return.
| * | Performance data quoted represents past performance, which is no guarantee of future results. Investment return and principal value will fluctuate so that an investor’s shares, when redeemed, may be worth more or less than their original cost. The total return shown assumes the reinvestment of all distributions and does not reflect the deduction of taxes that a shareholder would pay on fund distributions or the redemption of shares. The total return for Class A Shares was 36.67%, adjusted for the Fund’s maximum sales charge of 5.50%. Mutual fund performance changes over time and current performance may be lower or higher than what is stated. For the most recent month-end performance, please visit www.wilmingtonfunds.com or call 1-800-836-2211. |
| ** | The MSCI All Country World ex-US Index (Net, USD) (MSCI ACWI ex-US) is a free float-adjusted market capitalization weighted index that is designed to measure the equity market performance of developed and emerging markets, excluding the United States. The MSCI ACWI ex-US consists of 49 country indices comprising 22 developed and 27 emerging market country indices. The developed market country indices included are: Australia,Austria, Belgium, Canada, Denmark, Finland, France, Germany, Hong Kong, Ireland, Israel, Italy, Japan, Netherlands, New Zealand, Norway, Portugal, Singapore, Spain, Sweden, Switzerland, and the United Kingdom. The emerging market country indices included are: Argentina, Brazil, Chile, China, Colombia, Czech Republic, Egypt, Greece, Hungary, India, Indonesia, Korea, Kuwait, Malaysia, Mexico, Morocco, Peru, Philippines, Poland, Qatar, Russia, Saudi Arabia, South Africa, Taiwan, Thailand, Turkey and United Arab Emirates. The index is unmanaged and it is not possible to invest directly in an index. |
International investing involves special risks including currency risks, increased volatility of foreign securities, political risks and differences in auditing and other financial standards.
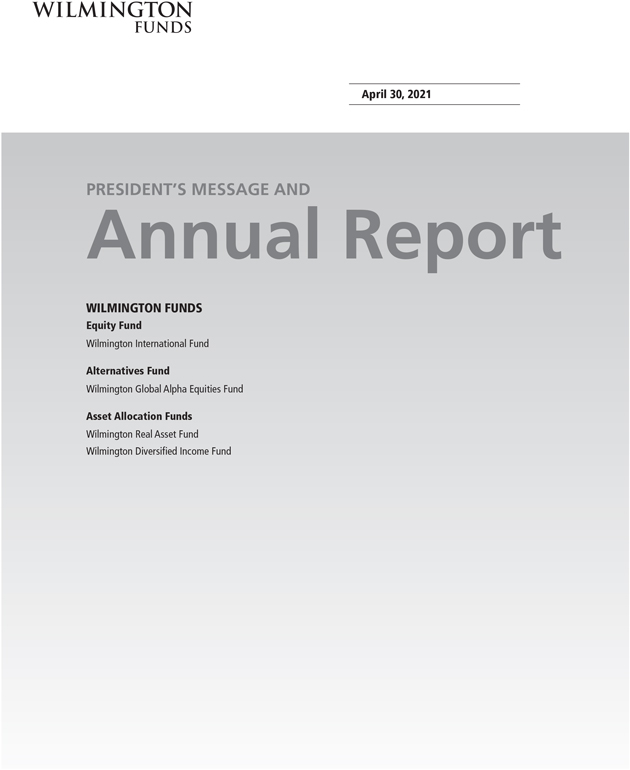
April 30, 2021 (unaudited) / ANNUAL REPORT
WILMINGTON INTERNATIONAL FUND
The graphs below illustrate the hypothetical investment of $10,0001 in the Class A Shares and $1,000,0001 in the Class I Shares of Wilmington International Fund from April 30, 2011 to April 30, 2021, compared to the MSCI ACWI ex-US Net Index2.
| | |
VALUE OF A HYPOTHETICAL $10,000 INVESTMENT | | VALUE OF A HYPOTHETICAL $1,000,000 INVESTMENT |
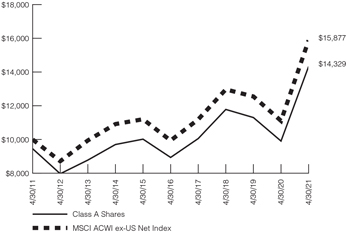
| | 
|
Performance data quoted represents past performance, which is no guarantee of future results. Investment return and principal value will fluctuate so that an investor’s shares, when redeemed, may be worth more or less than their original cost. The total return shown assumes the reinvestment of all distributions and does not reflect the deduction of taxes that a shareholder would pay on fund distributions or the redemption of shares. The total return for Class A Shares was 36.67%, adjusted for the Fund’s maximum sales charge of 5.50%. Mutual fund performance changes over time and current performance may be lower or higher than what is stated. For the most recent month-end performance, please visit www.wilmingtonfunds.com or call 1-800-836-2211.
| | | | | | |
| |
| | | Average Annual Total Returns for the Periods Ended 4/30/21 |
| | | |
| | | 1 Year | | 5 Years | | 10 Years |
| | | | |
Class A^ | | 36.67% | | 8.68% | | 3.66% |
| | | | |
Class I^ | | 44.92% | | 10.05% | | 4.41% |
| | | | |
MSCI ACWI ex-US Net Index2 | | 42.98% | | 9.83% | | 4.73% |
| ^ | Expense Ratios Before Waivers and Expense Ratios After Waivers for Class A are 1.51% and 1.11%, respectively. Expense Ratios Before Waivers and Expense Ratios After Waivers for Class I are 1.01% and 0.86%, respectively. Expense Ratios Before Waiver represent the operating costs borne by the Fund, expressed as a percentage of the Fund’s average net assets, as shown in the Fees and Expenses table in the Fund’s current prospectus (under “Total Annual Fund Operating Expenses”). Current information regarding the Fund’s Operating Expenses can be found in the Fund’s Financial Highlights. |
| 1 | Represents a hypothetical investment of $10,000 in Class A of the Fund after deducting the maximum sales charge of 5.50% ($10,000 investment minus $550 sales charge = $9,450) and $1,000,000 in Class I of the Fund and assumes the reinvestment of all dividends and distributions. |
| 2 | The performance for the MSCI ACWI ex-US Net Index assumes the reinvestment of all dividends and distributions but does not reflect the deduction of a sales charge required for the Fund’s performance by the Securities and Exchange Commission. The performance of this index is reduced by the taxes on dividends paid by the international securities issuers in the index. It is not possible to invest directly in an index and the represented index is unmanaged. |
ANNUAL REPORT / April 30, 2021 (unaudited)
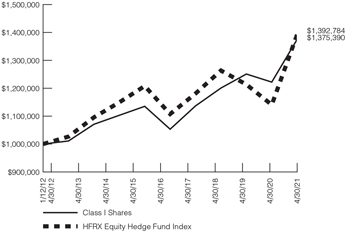
WILMINGTON GLOBAL ALPHA EQUITIES FUND
Management’s Discussion of Fund Performance (Unaudited)
For the fiscal year ended April 30, 2021, the Wilmington Global Alpha Equities Fund (the “Fund”) had a total return of 12.27%* for Class A Shares and 12.46%* for Class I Shares, versus its benchmark, the HFRX Equity Hedge Fund Index**, which had a total return of 22.11%.
During the fiscal year ended April 30, 2021, the Fund had positive returns, but failed to keep up with its benchmark during the violent recovery from the coronavirus induced selloff of early 2020. Despite trailing for the fiscal year, the Fund has outpaced the HFRX by over 60 basis points annualized with a lower max drawdown, lower beta, and lower volatility since Wellington Company LLP (“Wellington”) was installed as the sole subadvisor in 2017.
The Fund is a portfolio of long only equity strategies run by Wellington’s different portfolio management teams overseen by Wellington’s Fundamental Factor Team, which also has a long factor overlay sleeve and hedges the portfolio with equity index futures.
For the year, the long only equity strategies trailed Global Equities as represented by the MSCI– All Country World ex-US Index (Net, USD) (MSCI ACWI ex-US) ***. The Fund was hurt by its defensive posture, which results in the portfolio favoring securities with lower beta to equity markets. While low beta typically lags broad markets during up markets (as beta is a measure of market sensitivity), during 2020 and the early months of 2021, low beta stocks underperformed by a much larger degree than would be predicted by historical performance. Roughly 70% of the Fund’s underperformance is due to limited exposure to higher beta names.
From an underlying strategy perspective, four Portfolio Managers (“PM”) outperformed the MSCI ACWI while five underperformed. The top performer was the funds growth manager, while the poorest performer was the quality manager, which is unsurprising as the rally was fueled my lower quality names, especially during the period after the announcement of the Pfizer vaccines efficacy in early November 2020. The factor portfolio was also a significant detractor, given its low vol and quality biases.
The Fund uses equity index futures to reduce the Fund’s net long exposure to the global equity market. Equity index futures performance was in line with the MSCI ACWI ex-US, but detracted significantly as the markets rose.
| | * | Performance data quoted represents past performance, which is no guarantee of future results. Investment return and principal value will fluctuate so that an investor’s shares, when redeemed, may be worth more or less than their original cost. The total return shown assumes the reinvestment of all distributions and does not reflect the deduction of taxes that a shareholder would pay on fund distributions or the redemption of shares. The total return for Class A Shares was 6.12%, adjusted for the Fund’s maximum sales charge of 5.50%. Mutual fund performance changes over time and current performance may be lower or higher than what is stated. For the most recent month-end performance, please visit www.wilmingtonfunds.com or call 1-800-836-2211. |
| ** | The HFRX Equity Hedge Fund Index measures the performance of hedge fund strategies that primarily maintain long and short positions in equity and equity derivative securities. Equity Hedge managers typically maintain at least 50%, and in some cases may be entirely invested in equity-related securities, both long and short. Managers may employ a broad range of processes and strategies, including both quantitative and fundamental techniques, as well as net exposures, level of concentration, use of leverage, holding periods, and market capitalizations. The Index is weighted by asset size among reporting funds, which must have at least $50 million in assets or have been active for at least 12 months. The index is unmanaged and it is not possible to invest directly in an index. |
| *** | The MSCI All Country World ex-US Index (Net, USD) (MSCI ACWI ex-US) is a free float-adjusted market capitalization weighted index that is designed to measure the equity market performance of developed and emerging markets, excluding the United States. The MSCI ACWI ex-US consists of 49 country indices comprising 22 developed and 27 emerging market country indices. The developed market country indices included are:Australia,Austria, Belgium, Canada, Denmark, Finland, France, Germany, Hong Kong, Ireland, Israel, Italy, Japan, Netherlands, New Zealand, Norway, Portugal, Singapore, Spain, Sweden, Switzerland, and the United Kingdom. The emerging market country indices included are: Argentina, Brazil, Chile, China, Colombia, Czech Republic, Egypt, Greece, Hungary, India, Indonesia, Korea, Kuwait, Malaysia, Mexico, Morocco, Peru, Philippines, Poland, Qatar, Russia, Saudi Arabia, South Africa, Taiwan, Thailand, Turkey and United Arab Emirates. The index is unmanaged and it is not possible to invest directly in an index. |
Investing involves risk and you may incur a profit or a loss. Investments such as mutual funds which focus on alternative strategies are subject to increased risk and loss of principal and are not suitable for all investors. Diversification does not ensure a profit or guarantee against a loss. There is no assurance that any investment strategy will be successful. Any investment in the Fund should be part of an overall investment program rather than, in itself, a complete program. Because the Fund invests in underlying mutual funds or other managed strategies, an investor in the Fund will bear the management fees and operating expenses of the “Underlying Strategies” in which the Fund invests. The total expenses borne by an investor in the Fund will be higher than if the investor invested directly in the Underlying Strategies, and the returns may therefore be lower.
The Fund, the Sub-Advisers, and the Underlying Strategies may use aggressive investment strategies, which are riskier than those used by typical mutual funds. If the Fund and Sub-Advisers are unsuccessful in applying these investment strategies, the Fund and you may lose more money than if you had invested in another fund that did not invest aggressively. The Fund is subject to risks associated with the Sub-Advisers making trading decisions independently, investing in other investment companies, using a particular style or set of styles, basing investment decisions on historical relationships and correlations, trading frequently, using leverage, making short sales, being non-diversified, and investing in securities with low correlation to the market. The use of leverage may magnify losses.
The Fund is also subject to risks associated with investments in foreign markets, emerging market securities, small cap companies, derivatives, and illiquid securities. Please see the prospectus and summary prospectus for information on these as well as other risk considerations.
April 30, 2021 (unaudited) / ANNUAL REPORT
WILMINGTON GLOBAL ALPHA EQUITIES FUND
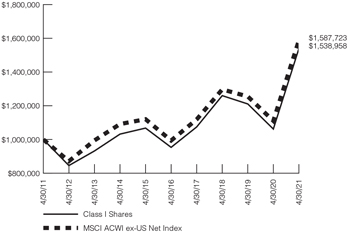
The graphs below illustrate the hypothetical investment of $10,0001 in the Class A Shares and $1,000,0001 in the Class I Shares of the Wilmington Global Alpha Equities Fund from January 12, 2012 (start of performance) to April 30, 2021 compared to the HFRX Equity Hedge Fund Index2.
| | |
VALUE OF A HYPOTHETICAL $10,000 INVESTMENT | | VALUE OF A HYPOTHETICAL $1,000,000 INVESTMENT |
| | 
|
Performance data quoted represents past performance, which is no guarantee of future results. Investment return and principal value will fluctuate so that an investor’s shares, when redeemed, may be worth more or less than their original cost. The total return shown assumes the reinvestment of all distributions and does not reflect the deduction of taxes that a shareholder would pay on fund distributions or the redemption of shares. The total return for Class A Shares was 6.12%, adjusted for the Fund’s maximum sales charge of 5.50%. Mutual fund performance changes over time and current performance may be lower or higher than what is stated. For the most recent month-end performance, please visit www.wilmingtonfunds.com or call 1-800-836-2211.
| | | | | | |
| |
| | | Average Annual Total Returns for the Periods Ended 4/30/21 |
| | | |
| | | 1 Year | | 5 Years | | Start of Performance
(1/12/2012) |
| | | | |
Class A^ | | 6.12% | | 4.02% | | 2.60% |
| | | | |
Class I^ | | 12.46% | | 5.47% | | 3.48% |
| | | | |
HFRX Equity Hedge Fund Index2 | | 22.11% | | 4.69% | | 3.63% |
| ^ | Expense Ratios Before Waivers and Expense Ratios After Waivers for Class A are 2.30% and 1.50%, respectively. Expense Ratios Before Waivers and Expense Ratios After Waivers for Class I are 1.80% and 1.25%, respectively. Expense Ratios Before Waiver represent the operating costs borne by the Fund, expressed as a percentage of the Fund’s average net assets, as shown in the Fees and Expenses table in the Fund’s current prospectus (under “Total Annual Fund Operating Expenses”). Current information regarding the Fund’s Operating Expenses can be found in the Fund’s Financial Highlights. |
| 1 | Represents a hypothetical investment of $10,000 in Class A of the Fund after deducting the maximum sales charge of 5.50% ($10,000 investment minus $550 sales charge = $9,450) and $1,000,000 in Class I of the Fund and assumes the reinvestment of all dividends and distributions. |
| 2 | The performance for the HFRX Equity Hedge Fund Index assumes the reinvestment of all dividends and distributions but does not reflect the deduction of a sales charge required for the Fund’s performance by the Securities and Exchange Commission. It is not possible to invest directly in an index and the represented index is unmanaged. |
ANNUAL REPORT / April 30, 2021 (unaudited)
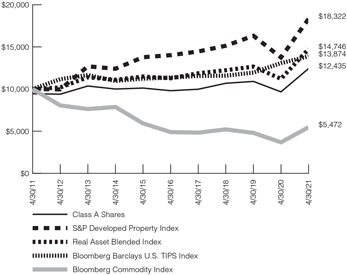
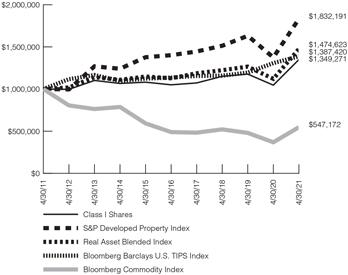
WILMINGTON REAL ASSET FUND
Management’s Discussion of Fund Performance (Unaudited)
For the fiscal year ended April 30, 2021, Wilmington Real Asset Fund (the “Fund”) had a total return of 28.65%* for Class A Shares and 29.00%* for Class I Shares, versus its benchmark, the S&P Developed Property Index**, the Bloomberg Barclays U.S. Treasury Inflation Protected Securities Index (“Bloomberg Barclays U.S. TIPS Index”)***, the Bloomberg Commodity Index****, and the Real Asset Blended Index, which had total returns of 33.28%, 6.09%, 48.52% and 31.51%, respectively.
The Blended Index is a mix of 37.5% S&P Developed Property Index, 37.5% Bloomberg Commodity Index (Total Return), and 25% Bloomberg Barclays U.S. TIPS Index. During the fiscal year, the Fund was helped by its underweight to TIPS and overweight to Real Estate, but hurt by its underweight to Commodities/Other Real Assets for much of the year. Selection and interaction within commodities also detracted.
U.S. inflation-linked bonds (“ILB”) markets posted strong returns for the fiscal year as inflation expectations increased substantially across the curve, though more pronounced at the short end, even as real yields stayed low. During the year, the 10-year inflation expectations increased over 120 basis points and five-year expectations jumped almost 200 basis points, reaching its highest point since before the global financial crisis year. Given the increased outlook for inflation, the Fund reintroduced Treasury Inflation Protected Securities (“TIPS”) into the portfolio in late December, though still below its target given the strong outlook for commodities and real estate.
Global real estate securities, as measured by the S&P Developed Property Index, were up 33% for the fiscal year. While this was a strong result, Real Estate performed considerably worse than equities during the fiscal year, as well as during the calendar year 2020. This was due to the nature of the crisis which left many commercial real estate properties vacant and increased future uncertainty, especially for sectors like hospitality, office and retail. U.S. real estate outperformed international, and especially outperformed emerging markets, with China in particular experiencing poor relative performance. The Fund benefitted from being overweight real estate much of the year, in particular shifting assets into real estate near market lows in the spring of 2020. Selection was slightly negative as the Fund had some exposure to emerging markets real estate.
Commodities gained nearly 50% during the fiscal year. Commodities rebounded post crisis along with other risk assets and performance for most contracts, in particular industrial metals, agriculture, and
energy, accelerated in 2021 on shortages and increase in demand expectations from economies reopening. Precious metals, particularly gold, lagged the broader commodity complex as the optimism around a faster than expected recovery and higher yields increased the opportunity cost of holding gold. The Fund benefitted from increasing exposure to commodities in late 2020, but suffered due to overweight positioning in gold and silver.
| * | Performance data quoted represents past performance, which is no guarantee of future results. Investment return and principal value will fluctuate so that an investor’s shares, when redeemed, may be worth more or less than their original cost. The total return shown assumes the reinvestment of all distributions and does not reflect the deduction of taxes that a shareholder would pay on fund distributions or the redemption of shares. The total return for Class A Shares was 21.55%, adjusted for the Fund’s maximum sales charge of 5.50%. Mutual fund performance changes over time and current performance may be lower or higher than what is stated. For the most recent month-end performance, please visit www.wilmingtonfunds.com or call 1-800-836-2211. |
| ** | S&P Developed Property Index defines and measures the investable universe of publicly traded property companies in developed global markets. |
| *** | The Bloomberg Barclays U.S. Treasury Inflation Protected Securities Index measures the performance of the U.S. Treasury Inflation Protected Securities market. Federal Reserve holdings of US TIPS are not index eligible and are excluded from the face amount outstanding of each bond in the index. |
| **** | Bloomberg Commodity Index (Total Return) is designed to be a diversified benchmark for commodities as an asset class, and reflects the returns that are potentially available through an unleveraged investment in the futures contracts on physical commodities comprising the Index plus the rate of interest that could be earned on cash collateral invested in specified Treasury Bills. The Index is currently composed of futures contracts on 20 physical commodities. |
International investing involves special risks including currency risks, increased volatility of foreign securities, political risks and differences in auditing and other financial standards.
April 30, 2021 (unaudited) / ANNUAL REPORT
WILMINGTON REAL ASSET FUND
The graphs below illustrate the hypothetical investment of $10,0001 in the Class A Shares and $1,000,0001 in the Class I Shares of the Wilmington Real Asset Fund from April 30, 2011 to April 30, 2021 compared to the S&P Developed Property Index2, the Bloomberg Barclays U.S. TIPS Index2, the Bloomberg Commodity Index2, and the Real Asset Blended Index3.
| | |
VALUE OF A HYPOTHETICAL $10,000 INVESTMENT | | VALUE OF A HYPOTHETICAL $1,000,000 INVESTMENT |
| | 
|
Performance data quoted represents past performance, which is no guarantee of future results. Investment return and principal value will fluctuate so that an investor’s shares, when redeemed, may be worth more or less than their original cost. The total return shown assumes the reinvestment of all distributions and does not reflect the deduction of taxes that a shareholder would pay on fund distributions or the redemption of shares. The total return for Class A Shares was 21.55%, adjusted for the Fund’s maximum sales charge of 5.50%. Mutual fund performance changes over time and current performance may be lower or higher than what is stated. For the most recent month-end performance, please visit www.wilmingtonfunds.com or call 1-800-836-2211.
| | | | | | |
| |
| | | Average Annual Total Returns for the Periods Ended 4/30/21 |
| | | |
| | | 1 Year | | 5 Years | | 10 Years |
| | | | |
Class A^ | | 21.55% | | 3.70% | | 2.20% |
| | | | |
Class I^ | | 29.00% | | 5.14% | | 3.04% |
| | | | |
Bloomberg Barclays U.S. TIPS Index2 | | 6.09% | | 4.08% | | 3.33% |
| | | | |
S&P Developed Property Index2 | | 33.28% | | 5.50% | | 6.24% |
| | | | |
Bloomberg Commodity Index2 | | 48.52% | | 2.26% | | -5.85% |
| | | | |
Real Asset Blended Index3 | | 31.51% | | 5.51% | | 3.96% |
| ^ | Expense Ratios Before Waivers and Expense Ratios After Waivers for Class A are 1.42% and 1.08%, respectively. Expense Ratios Before Waivers and Expense Ratios After Waivers for Class I are 0.92% and 0.83%, respectively. Expense Ratios Before Waiver represent the operating costs borne by the Fund, expressed as a percentage of the Fund’s average net assets, as shown in the Fees and Expenses table in the Fund’s current prospectus (under “Total Annual Fund Operating Expenses”). Current information regarding the Fund’s Operating Expenses can be found in the Fund’s Financial Highlights. |
| 1 | Represents a hypothetical investment of $10,000 in Class A of the Fund after deducting the maximum sales charge of 5.50% ($10,000 investment minus $550 sales charge = $9,450) and $1,000,000 in Class I of the Fund and assumes the reinvestment of all dividends and distributions. |
| 2 | The performance for the Bloomberg Barclays U.S. TIPS Index, S&P Developed Property Index and the Bloomberg Commodity Index assumes the reinvestment of all dividends and distributions but does not reflect the deduction of a sales charge required for the Fund’s performance by the Securities and Exchange Commission. It is not possible to invest directly in an index and the represented index is unmanaged. |
| 3 | The Real Asset Blended Index is calculated by the investment advisor and is currently based on a weighting of the following indices: 37.5% S&P Developed Property Index, 37.5% Bloomberg Commodity Index (Total Return) and 25% Bloomberg Barclays U.S. Tips Index. |
ANNUAL REPORT / April 30, 2021 (unaudited)
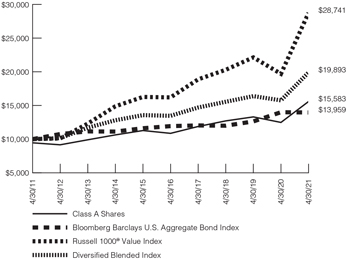
WILMINGTON DIVERSIFIED INCOME FUND
Management’s Discussion of Fund Performance (Unaudited)
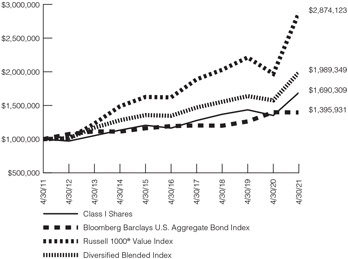
For the fiscal year ended April 30, 2021, Wilmington Diversified Income Fund (the “Fund”) had a total return of 24.86%* for Class A Shares and 25.09%* for Class I Shares, versus its benchmarks, the Russell 1000® Value Index**, Bloomberg Barclays US Aggregate Bond Index***, and the Diversified Blended Index****, which had total returns of 45.92%, -0.27% and 26.25%, respectively.
The Wilmington Diversified Income Fund seeks to achieve a high level of total return consistent with a moderate level of risk, with added emphasis on providing an attractive level of current income. The Fund is diversified across asset classes and geographies, with a philosophy that focuses on strategic positioning, minimizing tactical allocation shifts, and restrained turnover.
The beginning of the fiscal year marked a turning point for equity markets. Progress in the battle against the coronavirus boosted markets early in the 2nd quarter of 2020, with infection rates, hospitalizations, and deaths beginning to decline in early April in New York and other hard-hit areas. The CARES Act, the $2.2 Trillion economic stimulus package passed in late March of 2020, began to flow through the domestic economy and provide a lifeline to many negatively impacted businesses and individuals. Similar historically sized stimulus packages were rolling out globally.
Despite the positive impact of the stimulus and some early progress in the containment of virus spread, the market recognized that early progress was not a solution. The complexion of the markets reflected this as companies aligned with the new work-at-home, shop-at-home, learn-at-home, entertain-at-home environment prospered, while more economically sensitive companies lagged. The former group resides squarely in the realm of growth investing and witnessed a dramatic pull-forward in business gains with many companies capturing years of projected growth in a manner of months. The latter group resides more in the realm of value investing and is more closely aligned with the typical holdings of your Fund.
Hence, in the first half of the fiscal year, your Fund participated in the market rebound by posting low single-digit gains, certainly respectable but somewhat overshadowed by gains in core equity benchmarks driven by marked outperformance of growth stocks. Enter the scientific breakthroughs.
On November 9, 2020, Pfizer and Biontech announced their vaccine candidate against Covid-19 achieved success in the first interim analysis from phase 3 study results, displaying 90% efficacy in preventing Covid-19. Just a week later, on November 16, Moderna announced equally positive results on their vaccine, displaying efficacy of 94.5%. With solutions in sight, the market witnessed an abrupt change in leadership, as companies aligned with an economic reopen scenario surged forward. The value style assumed leadership from growth, setting the stage for attractive returns in your Fund in the second half of the fiscal year.
In the second half of the fiscal year, returns in the Fund moved sharply higher, with both share classes of the Fund posting 6-month returns that exceeded 20%. The net result was full fiscal year returns of 24.86%* for Class A Shares and 25.09%* for Class I Shares. These full year results trailed the pure equity Russell 1000® Value benchmark and
also the Fund’s Diversified Blended Index benchmark. The Fund topped the Barclays US Aggregate Bond Index, which posted a slight negative return for the full year.
The Fund’s broad diversification hurt in limiting the Fund’s upside versus the Russell 1000® Value benchmark but helped when compared to the modest negative return of the Bloomberg Barclays US Aggregate Bond Index. The Fund lagged its Diversified Blended Index in the fiscal year primarily due to the higher quality mandate of our domestic dividend-oriented equity strategy, the Enhanced Dividend Income Strategy (“EDIS”). The rally in value stocks that followed the positive vaccine news was a typical early cycle surge, with broad participation from economically sensitive stocks, many of which have high debt levels, limited earnings, and other lower quality metrics that make them unattractive candidates for the EDIS process. Basically, in the post-vaccine rebound, many of the stocks that were most beaten down led the Russell 1000® Value benchmark higher. Against this backdrop, EDIS posted impressive returns, but could simply not keep pace with the surging value benchmark that is a large component of the Diversified Blended Index.
The modest negative full fiscal year return of the Bloomberg Barclays US Aggregate Bond Index is worthy of mention, as the decline is a recent phenomenon. During the first quarter of 2021, the Biden administration achieved the passage of the USD 1.9 trillion American Rescue Plan Act. Passage of this stimulus package fueled growth hopes but also worries about potential inflation, driving a sharp rise in bond yields that periodically weighed on sentiment. This selloff in bonds drove fixed income returns to negative territory for the fiscal year. The questions of how much stimulus is too much stimulus, and what is the impact in terms of inflation will be topics that are closely watched in the new fiscal year. In that regard, our underweight position to fixed income helped during this decline, as did the outperformance of the Wilmington Trust Core Bond allocation.
Moving forward, as we navigate the improving economic climate, we’ll continue to pursue our goals for your Fund, seeking a high level of total return that includes an attractive level of current income.
| * | Performance data quoted represents past performance, which is no guarantee of future results. Investment return and principal value will fluctuate so that an investor’s shares, when redeemed, may be worth more or less than their original cost. The total return shown assumes the reinvestment of all distributions and does not reflect the deduction of taxes that a shareholder would pay on fund distributions or the redemption of shares. The total return for Class A Shares was 17.94%, adjusted for the Fund’s maximum sales charge of 5.50%. Mutual fund performance changes over time and current performance may be lower or higher than what is stated. For the most recent month-end performance, please visit www.wilmingtonfunds.com or call 1-800-836-2211. |
| ** | The Russell 1000® Value Index measures the performance of those Russell 1000® Index companies with lower price-to-book ratios and lower forecasted growth values. The Bloomberg Barclays US Aggregate Bond Index is an index measuring both the capital price changes and income provided |
April 30, 2021 (unaudited) / ANNUAL REPORT
| | by the underlying universe of securities, comprised of U.S. Treasury obligations, U.S. investment grade corporate debt and mortgage backed obligations. |
| *** | Bloomberg Barclays US Aggregate Bond Index is a widely used benchmark index for the domestic investment-grade bond market composed of securities from the Barclays Government/Corporate Bond Index, Mortgage-Backed Securities Index and Asset-Backed Securities Index. The index typically includes fixed income securities with overall intermediate- to long-term average maturities. The index is unmanaged and investments cannot be made directly in an index. |
| **** | The Diversified Blended Index is calculated by the investment advisor and represents the weighted returns of the following indices: 36.0% Russell 1000® Value Index; 24.0% Bloomberg Barclays US Aggregate Bond Index; 17.0% MSCI EAFE (Net) Index; 7.0% Bloomberg Barclays US Corporate High Yield Bond Index; 7.0%, Bloomberg Barclays US Government Inflation-Linked Bond Index; 4.5% Dow Jones Global ex-US Select Real Estate Securities Index; 2.5% S&P US REIT Index; and 2.0% Ibbotson Associates SBBI 30-Day US T-Bill Index. |
MSCI EAFE (Net) Index is a free float-adjusted market capitalization index that is designed to measure equity market performance of developed markets, excluding the U.S. & Canada. The MSCI EAFE (Net) Index is an equity index which captures large and mid-cap representation across 21 Developed Markets countries: Australia, Austria, Belgium, Denmark, Finland, France, Germany, Hong Kong, Ireland, Israel, Italy, Japan, the Netherlands, New Zealand, Norway, Portugal, Singapore, Spain, Sweden, Switzerland and the United Kingdom. The index is unmanaged and investments cannot be made directly in an index. The performance of this index is reduced by the taxes on dividends paid by the international securities issuers in the index.
The Bloomberg Barclays US Government Inflation-Linked Bond Index includes publicly issued, U.S. Treasury inflation protected securities that have at least 1 year remaining to maturity on index rebalancing date, with an issue size equal to or in excess of $500 million.
Bloomberg Barclays US Corporate High Yield Bond Index measures the USD-denominated, high yield, fixed-rate corporate bond market. Securities are classified as high yield if the middle rating of Moody’s, Fitch, and S&P is Ba1/BB+/BB+ or below. Bonds from issuers with an emerging markets country of risk, based on the Bloomberg Barclays EM country definition, are excluded. The U.S. Corporate High Yield Bond Index is a component of the U.S. Universal and Global High Yield Indices. An investment cannot be made directly in an index.
The Dow Jones Global ex-US Select Real Estate Securities Index is a float adjusted market capitalization index designed to measure the performance of publicly traded real estate securities in developed and emerging countries excluding the United States.
The S&P US REIT Index measures the investable U.S. real estate investment trust market and maintains a constituency that reflects the market’s overall composition.
The Ibbotson Associates SBBI 30 Day T-Bill Total Return Index is an index that reflects U.S. Treasury bill returns. Data from the Wall Street Journal are used for 1977-present; the CRSP U.S. Government Bond File is the source from 1926 to 1976. Each month a one bill portfolio containing the shortest-term bill having not less than one month to maturity is constructed.
International investing involves special risks including currency risk, political risks, increased volatility of foreign securities, and differences in auditing and other financial standards.
Bond prices are sensitive to changes in interest rates and a rise in short-term interest rates could cause a decline in bond prices.
Due to its strategy of investing in other mutual funds, this Fund may incur certain additional expenses and tax results that would not be present with a direct investment in the underlying funds.
ANNUAL REPORT / April 30, 2021 (unaudited)
WILMINGTON DIVERSIFIED INCOME FUND
The graphs below illustrate the hypothetical investment of $10,0001 in the Class A Shares and $1,000,0001 in the Class I Shares of the Wilmington Diversified Income Fund from April 30, 2011 to April 30, 2021 compared to the Russell 1000® Value Index2, the Bloomberg Barclays U.S. Aggregate Bond Index2 and the Diversified Blended Index2,3.
| | |
VALUE OF A HYPOTHETICAL $10,000 INVESTMENT | | VALUE OF A HYPOTHETICAL $1,000,000 INVESTMENT |
| | 
|
Performance data quoted represents past performance, which is no guarantee of future results. Investment return and principal value will fluctuate so that an investor’s shares, when redeemed, may be worth more or less than their original cost. The total return shown assumes the reinvestment of all distributions and does not reflect the deduction of taxes that a shareholder would pay on fund distributions or the redemption of shares. The total return for Class A Shares was 17.94%, adjusted for the Fund’s maximum sales charge of 5.50%. Mutual fund performance changes over time and current performance may be lower or higher than what is stated. For the most recent month-end performance, please visit www.wilmingtonfunds.com or call 1-800-836-2211.
| | | | | | |
| |
| | | Average Annual Total Returns for the Periods Ended 4/30/21 |
| | | |
| | | 1 Year | | 5 Years | | 10 Years |
| | | | |
Class A^ | | 17.94% | | 6.27% | | 4.54% |
| | | | |
Class I^ | | 25.09% | | 7.74% | | 5.39% |
| | | | |
Russell 1000® Value Index2 | | 45.92% | | 12.15% | | 11.13% |
| | | | |
Bloomberg Barclays U.S. Aggregate Bond Index2 | | -0.27% | | 3.19% | | 3.39% |
| | | | |
Diversified Blended Index2, 3 | | 26.25% | | 8.12% | | 7.12% |
| ^ | Expense Ratios Before Waivers and Expense Ratios After Waivers for Class A are 1.83% and 0.75%, respectively. Expense Ratios Before Waivers and Expense Ratios After Waivers for Class I are 1.33% and 0.50%, respectively. Expense Ratios Before Waiver represent the operating costs borne by the Fund, expressed as a percentage of the Fund’s average net assets, as shown in the Fees and Expenses table in the Fund’s current prospectus (under “Total Annual Fund Operating Expenses”). Current information regarding the Fund’s Operating Expenses can be found in the Fund’s Financial Highlights. |
| 1 | Represents a hypothetical investment of $10,000 in Class A of the Fund after deducting the maximum sales charge of 5.50% ($10,000 investment minus $550 sales charge = $9,450) and $1,000,000 in Class I of the Fund and assumes the reinvestment of all dividends and distributions. |
| 2 | The performance for the Russell 1000® Value Index, the Bloomberg Barclays U.S. Aggregate Bond Index and the Diversified Blended Index assumes the reinvestment of all dividends and distributions but does not reflect the deduction of a sales charge required for the Fund’s performance by the Securities and Exchange Commission. It is not possible to invest directly in an index and the represented indices are unmanaged. |
| 3 | The Diversified Blended Index is calculated by the investment advisor and represents the weighted returns of the following indices: 36.0% Russell 1000® Value Index; 24.0% Bloomberg Barclays U.S. Aggregate Bond Index; 17.0% MSCI EAFE (Net) Index; 7.0% Bloomberg Barclays U.S. Corporate High Yield Bond Index; 7.0%, Bloomberg Barclays U.S. Government Inflation-Linked Bond Index; 4.5% Dow Jones Global ex-U.S. Select Real Estate Securities Index; 2.5% S&P U.S. REIT Index; and 2.0% Ibbotson Associates SBBI 30-Day U.S T-Bill Index. |
April 30, 2021 (unaudited) / ANNUAL REPORT
SHAREHOLDER EXPENSE EXAMPLE (unaudited)
As a shareholder of a Fund, you incur two types of costs: (1) transaction costs, including sales charges (loads) on purchase payments, reinvested dividends, or other distributions; and redemption fees; and (2) ongoing costs, including management fees; distribution and/or service (12b-1) fees; and other Fund expenses. This Example is intended to help you to understand your ongoing costs (in dollars) of investing in the Funds and to compare these costs with the ongoing costs of investing in other mutual funds. It is based on an investment of $1,000 invested at the beginning of the period and held for the entire period from November 1, 2020 to April 30, 2021.
Actual Expenses
This section of the following table provides information about actual account values and actual expenses. You may use the information in this section, together with the amount you invested, to estimate the expenses that you incurred over the period. Simply divide your account value by $1,000 (for example, an $8,600 account value divided by $1,000 = 8.6), then multiply the result by the number in the first section under the heading entitled “Expenses Paid During Period” to estimate the expenses attributable to your investment during this period.
Hypothetical Example for
Comparison Purposes
This section of the following table provides information about hypothetical account values and hypothetical expenses based on the Funds’ actual expense ratios and assumed rates of return of 5% per year before expenses, which are not the Funds’ actual returns. Thus, you should not use the hypothetical account values and expenses to estimate the actual ending account balance or your expenses for the period. Rather, these figures are required to be provided to enable you to compare the ongoing costs of investing in the Funds with other funds. To do so, compare this 5% hypothetical example with the 5% hypothetical examples that appear in the shareholder reports of the other funds.
Please note that the expenses shown in the table are meant to highlight your ongoing costs only. Therefore, the Annualized Net Expense Ratio section of the table is useful in comparing ongoing costs only, and will not help you determine the relative total costs of owning different funds.
The Annualized Net Expense Ratios may be different from the net expense ratios in the Financial Highlights which are for the fiscal year ended April 30, 2021.
| | | | | | | | | | | | | | | | |
| | | Beginning
Account Value
11/01/20 | | Ending Account Value
4/30/21 | | Expenses
Paid
During Period(1) | | Annualized
Net
Expense Ratio(2) |
| | | | |
WILMINGTON INTERNATIONAL FUND | | | | | | | | | | | | | | | | |
| | | | |
Actual | | | | | | | | | | | | | | | | |
| | | | |
Class A | | | $1,000.00 | | | | $1,248.50 | | | | $6.13 | | | | 1.10% | |
| | | | |
Class I | | | $1,000.00 | | | | $1,249.40 | | | | $4.74 | | | | 0.85% | |
| | | | |
Hypothetical (assuming a 5% return before expenses) | | | | | | | | | | | | | | | | |
| | | | |
Class A | | | $1,000.00 | | | | $1,019.34 | | | | $5.51 | | | | 1.10% | |
| | | | |
Class I | | | $1,000.00 | | | | $1,020.58 | | | | $4.26 | | | | 0.85% | |
| | | | |
WILMINGTON GLOBAL ALPHA EQUITIES FUND | | | | | | | | | | | | | | | | |
| | | | |
Actual | | | | | | | | | | | | | | | | |
| | | | |
Class A | | | $1,000.00 | | | | $1,071.40 | | | | $7.65 | | | | 1.49% | |
| | | | |
Class I | | | $1,000.00 | | | | $1,072.00 | | | | $6.37 | | | | 1.24% | |
| | | | |
Hypothetical (assuming a 5% return before expenses) | | | | | | | | | | | | | | | | |
| | | | |
Class A | | | $1,000.00 | | | | $1,017.41 | | | | $7.45 | | | | 1.49% | |
| | | | |
Class I | | | $1,000.00 | | | | $1,018.65 | | | | $6.21 | | | | 1.24% | |
| | | | |
WILMINGTON REAL ASSET FUND | | | | | | | | | | | | | | | | |
| | | | |
Actual | | | | | | | | | | | | | | | | |
| | | | |
Class A | | | $1,000.00 | | | | $1,246.40 | | | | $5.35 | | | | 0.96% | |
| | | | |
Class I | | | $1,000.00 | | | | $1,247.70 | | | | $3.96 | | | | 0.71% | |
| | | | |
Hypothetical (assuming a 5% return before expenses) | | | | | | | | | | | | | | | | |
| | | | |
Class A | | | $1,000.00 | | | | $1,020.03 | | | | $4.81 | | | | 0.96% | |
| | | | |
Class I | | | $1,000.00 | | | | $1,021.27 | | | | $3.56 | | | | 0.71% | |
| | | | |
WILMINGTON DIVERSIFIED INCOME FUND | | | | | | | | | | | | | | | | |
| | | | |
Actual | | | | | | | | | | | | | | | | |
| | | | |
Class A | | | $1,000.00 | | | | $1,205.30 | | | | $3.28 | | | | 0.60% | |
| | | | |
Class I | | | $1,000.00 | | | | $1,206.10 | | | | $1.91 | | | | 0.35% | |
| | | | |
Hypothetical (assuming a 5% return before expenses) | | | | | | | | | | | | | | | | |
| | | | |
Class A | | | $1,000.00 | | | | $1,021.82 | | | | $3.01 | | | | 0.60% | |
| | | | |
Class I | | | $1,000.00 | | | | $1,023.06 | | | | $1.76 | | | | 0.35% | |
| (1) | Expenses are equal to the Funds’ annualized net expense ratios, multiplied by the average account value over the period, multiplied by 181/365 (to reflect the most recent one-half year period). |
| (2) | Expense ratio does not reflect the indirect expenses of the underlying funds in which the Funds invest. |
ANNUAL REPORT / April 30, 2021 (unaudited)
PORTFOLIO OF INVESTMENTS SUMMARY TABLE
Wilmington International Fund
At April 30, 2021, the Fund’s sector classifications and country allocations were as follows (unaudited):
| | |
| | | Percentage of
Total Net Assets |
| | | | |
Common Stocks | | | | |
Information Technology | | | 16.0 | % |
Industrials | | | 15.7 | % |
Consumer Discretionary | | | 13.7 | % |
Financials | | | 13.4 | % |
Materials | | | 8.4 | % |
Health Care | | | 8.0 | % |
Communication Services | | | 6.0 | % |
Consumer Staples | | | 3.5 | % |
Real Estate | | | 2.8 | % |
Energy | | | 2.1 | % |
Utilities | | | 1.5 | % |
Investment Companies | | | 3.5 | % |
Warrants | | | 1.1 | % |
Preferred Stocks | | | 0.4 | % |
Cash Equivalents(1) | | | 2.9 | % |
Cash Collateral Invested for Securities on Loan(2) | | | 3.5 | % |
Other Assets and Liabilities – Net(3) | | | (2.5 | )% |
| | | | |
| |
TOTAL | | | 100.0 | % |
| | | | |
| | |
| Country Allocation | | Percentage of
Total Net Assets |
| | | | |
Common Stocks | | | | |
Japan | | | 17.8 | % |
China | | | 8.7 | % |
France | | | 7.4 | % |
Germany | | | 7.0 | % |
United Kingdom | | | 6.3 | % |
Switzerland | | | 5.6 | % |
Sweden | | | 5.1 | % |
Taiwan | | | 4.5 | % |
Hong Kong | | | 4.2 | % |
Australia | | | 3.8 | % |
South Korea | | | 3.6 | % |
Netherlands | | | 3.3 | % |
Denmark | | | 2.9 | % |
United States | | | 2.0 | % |
Italy | | | 1.4 | % |
Spain | | | 1.4 | % |
India | | | 1.0 | % |
Finland | | | 1.0 | % |
All other countries less than 1.0% | | | 4.1 | % |
Investment Companies | | | 3.5 | % |
Warrants | | | 1.1 | % |
Preferred Stocks | | | 0.4 | % |
Cash Equivalents(1) | | | 2.9 | % |
Cash Collateral Invested for Securities on Loan(2) | | | 3.5 | % |
Other Assets and Liabilities – Net(3) | | | (2.5 | )% |
| | | | |
| |
TOTAL | | | 100.0 | % |
| | | | |
| (1) | Cash Equivalents include investments in a money market fund. |
| (2) | Cash Collateral Invested for Securities on Loan include investments in money market funds and repurchase agreements. |
| (3) | Assets, other than investments in securities, less liabilities. See Statements of Assets and Liabilities. |
PORTFOLIO OF INVESTMENTS¢
| | | | | | | | |
| | |
| Description | | Number of
Shares | | | Value | |
| | |
COMMON STOCKS – 91.1% | | | | | | | | |
|
AUSTRALIA – 3.8% | |
Australia & New Zealand Banking Group Ltd. | | | 145,412 | | | $ | 3,208,411 | |
BHP Group Ltd. | | | 136,241 | | | | 4,958,610 | |
BHP Group PLC | | | 74,142 | | | | 2,232,773 | |
Brambles Ltd. | | | 141,272 | | | | 1,131,719 | |
Cochlear Ltd. | | | 13,569 | | | | 2,322,738 | |
CSL Ltd. | | | 18,567 | | | | 3,878,542 | |
Incitec Pivot Ltd.* | | | 1,156,938 | | | | 2,348,481 | |
Rio Tinto Ltd. | | | 42,218 | | | | 3,923,948 | |
Rio Tinto PLC | | | 37,086 | | | | 3,106,222 | |
| | | | | | | | |
| |
TOTAL AUSTRALIA | | | $ | 27,111,444 | |
| | | | | | | | |
| | |
| Description | | Number of
Shares | | | Value | |
|
BELGIUM – 0.5% | |
Ageas SA | | | 13,570 | | | $ | 820,712 | |
Bpost SA* | | | 12,003 | | | | 127,565 | |
KBC Group NV* | | | 3,640 | | | | 282,423 | |
Proximus SADP# | | | 9,110 | | | | 194,088 | |
UCB SA | | | 1,370 | | | | 126,859 | |
Xior Student Housing NV# | | | 32,940 | | | | 1,840,711 | |
| | | | | | | | |
| |
TOTAL BELGIUM | | | $ | 3,392,358 | |
|
BULGARIA – 0.0%** | |
Petrol AD*,(1) | | | 2,384 | | | | — | |
|
CHINA – 8.7% | |
Alibaba Group Holding Ltd.* | | | 78,528 | | | | 2,270,065 | |
Alibaba Group Holding Ltd., ADR* | | | 33,377 | | | | 7,708,418 | |
April 30, 2021 / ANNUAL REPORT
| | |
PORTFOLIOS OF INVESTMENTS Wilmington International Fund (continued) | | 12 |
| | | | | | | | |
| | |
| Description | | Number of
Shares | | | Value | |
Baozun, Inc., Class A* | | | 191,800 | | | $ | 2,230,851 | |
Budweiser Brewing Co. APAC Ltd.# | | | 695,200 | | | | 2,190,648 | |
China Pacific Insurance Group Co. Ltd., Class H | | | 896,200 | | | | 3,225,664 | |
China Petroleum & Chemical Corp., Class H | | | 5,284,000 | | | | 2,606,099 | |
China Resources Land Ltd. | | | 388,000 | | | | 1,816,644 | |
China Resources Medical Holdings Co. Ltd. | | | 21,000 | | | | 18,225 | |
Haitian International Holdings Ltd. | | | 812,000 | | | | 3,303,697 | |
Hollysys Automation Technologies Ltd. | | | 91,280 | | | | 1,237,757 | |
Huazhu Group Ltd., ADR*,# | | | 54,264 | | | | 3,199,406 | |
JD.com, Inc., Class A* | | | 91,884 | | | | 3,548,427 | |
Kuaishou Technology*,# | | | 16,800 | | | | 568,813 | |
NetEase, Inc., ADR | | | 14,905 | | | | 1,670,254 | |
New Oriental Education & Technology Group, Inc., ADR* | | | 306,780 | | | | 4,681,463 | |
Ping An Insurance Group Co. of China Ltd., Class H | | | 243,500 | | | | 2,654,704 | |
Shenzhou International Group Holdings Ltd. | | | 115,600 | | | | 2,543,084 | |
Tencent Holdings Ltd. | | | 176,900 | | | | 14,111,674 | |
Yum China Holdings, Inc. | | | 30,248 | | | | 1,903,204 | |
Yum China Holdings, Inc. | | | 17,800 | | | | 1,120,136 | |
| | | | | | | | |
| |
TOTAL CHINA | | | $ | 62,609,233 | |
|
DENMARK – 2.9% | |
Ambu A/S, Class B | | | 73,873 | | | | 4,134,723 | |
Carlsberg AS, Class B | | | 2,150 | | | | 377,196 | |
Chr Hansen Holding A/S* | | | 6,762 | | | | 620,802 | |
Coloplast A/S, Class B | | | 15,126 | | | | 2,505,464 | |
DSV Panalpina A/S | | | 27,886 | | | | 6,212,731 | |
Netcompany Group A/S | | | 15,310 | | | | 1,596,734 | |
Novo Nordisk A/S, Class B | | | 53,143 | | | | 3,920,225 | |
Tryg A/S | | | 56,385 | | | | 1,289,351 | |
| | | | | | | | |
| | |
TOTAL DENMARK | | | | | | $ | 20,657,226 | |
|
FINLAND – 1.0% | |
Elisa OYJ | | | 4,420 | | | | 250,558 | |
Fortum OYJ | | | 4,090 | | | | 107,480 | |
Kesko OYJ, Class B# | | | 21,106 | | | | 642,665 | |
Kojamo OYJ | | | 76,265 | | | | 1,651,601 | |
Neles OYJ | | | 1,800 | | | | 26,190 | |
Neste OYJ | | | 2,450 | | | | 148,153 | |
Nokia OYJ* | | | 262,900 | | | | 1,245,346 | |
Nokian Renkaat OYJ | | | 3,410 | | | | 126,960 | |
Nordea Bank Abp | | | 38,370 | | | | 397,689 | |
Sampo OYJ, Class A | | | 12,190 | | | | 578,228 | |
TietoEVRY OYJ | | | 7,260 | | | | 251,429 | |
UPM-Kymmene OYJ | | | 33,668 | | | | 1,316,660 | |
Valmet OYJ | | | 10,184 | | | | 425,359 | |
| | | | | | | | |
| | |
TOTAL FINLAND | | | | | | $ | 7,168,318 | |
|
FRANCE – 7.4% | |
Amundi SA* | | | 1,410 | | | | 125,657 | |
AXA SA# | | | 46,578 | | | | 1,315,598 | |
BNP Paribas SA* | | | 20,574 | | | | 1,319,158 | |
Bouygues SA# | | | 12,204 | | | | 523,008 | |
Cie Generale des Etablissements Michelin SCA | | | 7,800 | | | | 1,128,665 | |
CNP Assurances | | | 11,166 | | | | 195,302 | |
Credit Agricole SA* | | | 103,953 | | | | 1,607,968 | |
| | | | | | | | |
| | |
| Description | | Number of
Shares | | | Value | |
Dassault Systemes SA | | | 12,017 | | | $ | 2,787,616 | |
Edenred | | | 58,816 | | | | 3,334,367 | |
Engie SA* | | | 27,516 | | | | 409,863 | |
Esker SA | | | 5,497 | | | | 1,532,921 | |
EssilorLuxottica SA | | | 550 | | | | 91,542 | |
Eurazeo SE | | | 30,204 | | | | 2,516,578 | |
Eutelsat Communications SA | | | 21,030 | | | | 266,108 | |
Faurecia SE* | | | 33,566 | | | | 1,813,473 | |
ID Logistics Group* | | | 7,102 | | | | 1,964,880 | |
Legrand SA | | | 15,526 | | | | 1,511,299 | |
L’Oreal SA | | | 7,126 | | | | 2,917,886 | |
LVMH Moet Hennessy Louis Vuitton SE | | | 9,234 | | | | 6,956,438 | |
Natixis SA* | | | 31,460 | | | | 153,619 | |
Neoen SA*,# | | | 40,091 | | | | 1,835,707 | |
Orange SA | | | 48,560 | | | | 604,728 | |
Publicis Groupe SA | | | 4,450 | | | | 288,004 | |
Sanofi# | | | 27,255 | | | | 2,857,479 | |
Sartorius Stedim Biotech | | | 4,699 | | | | 2,158,186 | |
Schneider Electric SE | | | 17,310 | | | | 2,761,913 | |
SCOR SE* | | | 46,265 | | | | 1,494,890 | |
SEB SA | | | 5,505 | | | | 1,002,543 | |
Societe BIC SA | | | 1,980 | | | | 139,923 | |
Societe Generale SA* | | | 12,593 | | | | 358,236 | |
Technip Energies NV* | | | 93,424 | | | | 1,330,419 | |
Teleperformance | | | 2,900 | | | | 1,119,819 | |
TOTAL SE# | | | 66,643 | | | | 2,945,475 | |
Vinci SA# | | | 813 | | | | 89,210 | |
Virbac SA* | | | 6,015 | | | | 1,952,418 | |
| | | | | | | | |
| | |
TOTAL FRANCE | | | | | | $ | 53,410,896 | |
|
GERMANY – 7.0% | |
adidas AG* | | | 10,126 | | | | 3,127,526 | |
alstria office REIT AG | | | 119,381 | | | | 2,137,492 | |
ArcelorMittal SA* | | | 39,400 | | | | 1,145,383 | |
Aroundtown SA | | | 66,440 | | | | 511,595 | |
BASF SE | | | 9,650 | | | | 777,707 | |
Bayer AG | | | 5,970 | | | | 386,309 | |
Bayerische Motoren Werke AG | | | 19,358 | | | | 1,939,870 | |
Covestro AG | | | 2,819 | | | | 184,361 | |
Daimler AG | | | 25,805 | | | | 2,296,613 | |
Deutsche Bank AG* | | | 96,600 | | | | 1,345,760 | |
Deutsche Post AG | | | 34,340 | | | | 2,022,529 | |
Deutsche Telekom AG | | | 42,646 | | | | 820,725 | |
Deutsche Wohnen SE | | | 20,800 | | | | 1,125,252 | |
E.ON SE | | | 38,900 | | | | 469,050 | |
Evotec SE* | | | 48,613 | | | | 2,022,137 | |
Fielmann AG* | | | 19,496 | | | | 1,484,398 | |
Freenet AG | | | 10,052 | | | | 244,431 | |
Hannover Rueck SE | | | 1,830 | | | | 337,930 | |
Hypoport SE* | | | 3,302 | | | | 1,989,942 | |
Infineon Technologies AG | | | 136,453 | | | | 5,471,842 | |
LEG Immobilien SE | | | 3,530 | | | | 491,147 | |
Merck KGaA | | | 6,500 | | | | 1,141,949 | |
MTU Aero Engines AG | | | 7,023 | | | | 1,772,306 | |
Muenchener Rueckversicherungs AG | | | 1,580 | | | | 456,516 | |
Nemetschek SE | | | 34,023 | | | | 2,536,202 | |
New Work SE | | | 6,445 | | | | 1,956,337 | |
ANNUAL REPORT / April 30, 2021
| | |
| 13 | | PORTFOLIOS OF INVESTMENTS |
Wilmington International Fund (continued)
| | | | | | | | |
| | |
| Description | | Number of
Shares | | | Value | |
Rheinmetall AG | | | 2,920 | | | $ | 304,670 | |
SAP SE | | | 27,147 | | | | 3,801,142 | |
Siemens AG | | | 15,740 | | | | 2,625,982 | |
Vonovia SE | | | 26,080 | | | | 1,713,579 | |
Zalando SE* | | | 33,042 | | | | 3,436,322 | |
| | | | | | | | |
| |
TOTAL GERMANY | | | $ | 50,077,004 | |
|
HONG KONG – 4.2% | |
AIA Group Ltd. | | | 596,800 | | | | 7,574,929 | |
ASM Pacific Technology Ltd. | | | 150,400 | | | | 2,271,556 | |
Hong Kong Exchanges & Clearing Ltd. | | | 47,800 | | | | 2,882,868 | |
Hutchison China MediTech Ltd., ADR* | | | 101,171 | | | | 2,862,128 | |
Jardine Matheson Holdings Ltd. | | | 46,400 | | | | 3,115,722 | |
Johnson Electric Holdings Ltd. | | | 822,436 | | | | 2,185,605 | |
Swire Properties Ltd. | | | 901,800 | | | | 2,691,108 | |
Techtronic Industries Co. Ltd. | | | 353,500 | | | | 6,414,177 | |
| | | | | | | | |
| |
TOTAL HONG KONG | | | $ | 29,998,093 | |
|
INDIA – 1.0% | |
HDFC Bank Ltd., ADR* | | | 102,976 | | | | 7,237,153 | |
|
IRELAND – 0.8% | |
CRH PLC | | | 32,960 | | | | 1,555,193 | |
Kerry Group PLC, Class A | | | 11,472 | | | | 1,487,021 | |
Kingspan Group PLC | | | 30,308 | | | | 2,695,749 | |
| | | | | | | | |
| |
TOTAL IRELAND | | | $ | 5,737,963 | |
|
ITALY – 1.4% | |
A2A SpA | | | 106,130 | | | | 207,587 | |
Assicurazioni Generali SpA* | | | 22,067 | | | | 441,703 | |
ASTM SpA* | | | 1,290 | | | | 39,970 | |
Enel SpA | | | 167,269 | | | | 1,660,869 | |
Eni SpA | | | 116,955 | | | | 1,393,039 | |
FinecoBank Banca Fineco SpA* | | | 147,148 | | | | 2,530,917 | |
Intesa Sanpaolo SpA* | | | 330,708 | | | | 921,986 | |
Iren SpA | | | 32,640 | | | | 97,423 | |
Mediobanca Banca di Credito Finanziario SpA* | | | 44,190 | | | | 499,104 | |
Salvatore Ferragamo SpA*,# | | | 95,534 | | | | 2,045,404 | |
Societa Cattolica Di Assicurazione SPA* | | | 10,240 | | | | 60,698 | |
UnipolSai Assicurazioni SpA | | | 99,460 | | | | 308,884 | |
| | | | | | | | |
| |
TOTAL ITALY | | | $ | 10,207,584 | |
|
JAPAN – 17.8% | |
ABC-Mart, Inc. | | | 38,400 | | | | 2,057,490 | |
AEON Financial Service Co. Ltd. | | | 57,300 | | | | 652,267 | |
AGC, Inc. | | | 52,200 | | | | 2,380,284 | |
Air Water, Inc.# | | | 74,000 | | | | 1,224,015 | |
Amada Co. Ltd. | | | 157,400 | | | | 1,707,224 | |
Amano Corp. | | | 30,000 | | | | 815,097 | |
Anritsu Corp.# | | | 84,600 | | | | 1,643,743 | |
Ariake Japan Co. Ltd. | | | 10,200 | | | | 590,507 | |
Aruhi Corp. | | | 123,400 | | | | 1,991,398 | |
Asahi Group Holdings Ltd. | | | 43,100 | | | | 1,802,144 | |
Astellas Pharma, Inc. | | | 39,300 | | | | 591,507 | |
Central Japan Railway Co. | | | 5,200 | | | | 761,862 | |
Chubu Electric Power Co., Inc. | | | 113,900 | | | | 1,380,286 | |
cocokara fine, Inc.# | | | 7,800 | | | | 528,886 | |
COMSYS Holdings Corp. | | | 37,800 | | | | 1,173,540 | |
| | | | | | | | |
| | |
| Description | | Number of
Shares | | | Value | |
Dai-ichi Life Holdings, Inc. | | | 51,100 | | | $ | 922,716 | |
Daikin Industries Ltd. | | | 7,200 | | | | 1,452,347 | |
Daiseki Co. Ltd. | | | 51,900 | | | | 1,955,906 | |
Denso Corp. | | | 19,800 | | | | 1,280,129 | |
DKK Co. Ltd. | | | 22,800 | | | | 522,706 | |
Doutor Nichires Holdings Co. Ltd. | | | 20,800 | | | | 310,545 | |
East Japan Railway Co. | | | 11,100 | | | | 760,213 | |
ENEOS Holdings, Inc. | | | 137,600 | | | | 591,806 | |
FCC Co. Ltd. | | | 40,600 | | | | 653,404 | |
Fuji Electric Co. Ltd. | | | 24,800 | | | | 1,129,088 | |
FUJIFILM Holdings Corp. | | | 11,500 | | | | 744,916 | |
Fujitsu Ltd. | | | 7,400 | | | | 1,175,549 | |
Furukawa Electric Co. Ltd. | | | 35,800 | | | | 949,590 | |
Fuso Chemical Co. Ltd. | | | 18,400 | | | | 662,586 | |
Hino Motors Ltd. | | | 67,000 | | | | 562,338 | |
Hitachi Ltd. | | | 69,800 | | | | 3,454,941 | |
Honda Motor Co. Ltd. | | | 84,100 | | | | 2,507,848 | |
Horiba Ltd. | | | 6,900 | | | | 449,440 | |
IHI Corp.* | | | 34,400 | | | | 694,698 | |
Isetan Mitsukoshi Holdings Ltd. | | | 65,600 | | | | 459,633 | |
ITOCHU Corp. | | | 66,200 | | | | 2,066,681 | |
Iwatani Corp. | | | 8,400 | | | | 526,457 | |
J Front Retailing Co. Ltd. | | | 44,900 | | | | 428,720 | |
Japan Airlines Co. Ltd.* | | | 10,100 | | | | 216,363 | |
JGC Holdings Corp. | | | 76,300 | | | | 872,230 | |
JSP Corp. | | | 29,100 | | | | 473,612 | |
Kamigumi Co. Ltd. | | | 64,500 | | | | 1,256,719 | |
Kaneka Corp. | | | 53,800 | | | | 2,095,391 | |
KDDI Corp. | | | 28,100 | | | | 849,448 | |
KH Neochem Co. Ltd. | | | 33,800 | | | | 804,121 | |
Kintetsu World Express, Inc. | | | 46,600 | | | | 1,124,341 | |
Komatsu Ltd. | | | 22,100 | | | | 649,842 | |
Kumagai Gumi Co. Ltd. | | | 14,500 | | | | 403,824 | |
Kureha Corp. | | | 14,500 | | | | 980,736 | |
Mabuchi Motor Co. Ltd. | | | 19,800 | | | | 793,043 | |
Mirait Holdings Corp. | | | 56,600 | | | | 915,206 | |
Mitsubishi Chemical Holdings Corp. | | | 106,000 | | | | 789,115 | |
Mitsubishi Corp. | | | 83,800 | | | | 2,317,130 | |
Mitsubishi Electric Corp. | | | 90,800 | | | | 1,399,078 | |
Mitsubishi UFJ Financial Group, Inc. | | | 351,500 | | | | 1,870,014 | |
Mitsui Fudosan Co. Ltd. | | | 56,300 | | | | 1,223,922 | |
Mitsui Mining & Smelting Co. Ltd. | | | 18,000 | | | | 612,756 | |
Mitsui OSK Lines Ltd. | | | 46,900 | | | | 1,885,573 | |
Murata Manufacturing Co. Ltd. | | | 19,400 | | | | 1,542,444 | |
NEC Networks & System Integration Corp. | | | 67,300 | | | | 1,157,740 | |
Nexon Co. Ltd. | | | 5,800 | | | | 191,848 | |
NGK Insulators Ltd. | | | 63,800 | | | | 1,166,037 | |
Nihon Kohden Corp. | | | 14,200 | | | | 429,387 | |
Nintendo Co. Ltd. | | | 4,400 | | | | 2,524,075 | |
Nippon Steel Corp. | | | 65,400 | | | | 1,142,864 | |
Nippon Telegraph & Telephone Corp. | | | 62,100 | | | | 1,565,720 | |
Nitori Holdings Co. Ltd. | | | 4,200 | | | | 752,243 | |
NOK Corp. | | | 153,200 | | | | 1,974,430 | |
NTT Data Corp. | | | 91,900 | | | | 1,430,971 | |
Olympus Corp. | | | 82,800 | | | | 1,704,150 | |
Organo Corp. | | | 9,300 | | | | 622,683 | |
ORIX Corp. | | | 41,900 | | | | 676,428 | |
April 30, 2021 / ANNUAL REPORT
| | |
PORTFOLIOS OF INVESTMENTS Wilmington International Fund (continued) | | 14 |
| | | | | | | | |
| | |
| Description | | Number of
Shares | | | Value | |
Osaka Gas Co. Ltd. | | | 14,600 | | | $ | 282,597 | |
Otsuka Corp. | | | 43,100 | | | | 2,168,086 | |
Pacific Industrial Co. Ltd. | | | 58,300 | | | | 627,034 | |
Pan Pacific International Holdings Corp. | | | 63,100 | | | | 1,360,142 | |
Panasonic Corp. | | | 61,800 | | | | 725,656 | |
Recruit Holdings Co. Ltd. | | | 30,900 | | | | 1,393,204 | |
Relia, Inc. | | | 48,000 | | | | 571,269 | |
Resona Holdings, Inc. | | | 68,400 | | | | 281,578 | |
Saizeriya Co. Ltd. | | | 18,700 | | | | 410,447 | |
San-A Co. Ltd. | | | 24,200 | | | | 929,357 | |
Santen Pharmaceutical Co. Ltd. | | | 102,200 | | | | 1,308,945 | |
SBI Holdings, Inc. | | | 28,900 | | | | 816,853 | |
SCREEN Holdings Co. Ltd. | | | 16,100 | | | | 1,533,310 | |
Seino Holdings Co. Ltd. | | | 57,400 | | | | 789,275 | |
Seria Co. Ltd. | | | 20,800 | | | | 753,773 | |
Shibaura Machine Co. Ltd. | | | 55,100 | | | | 1,314,095 | |
SoftBank Group Corp. | | | 37,000 | | | | 3,334,094 | |
Sompo Holdings, Inc. | | | 19,100 | | | | 709,854 | |
Sony Group Corp. | | | 32,700 | | | | 3,269,311 | |
SUMCO Corp. | | | 20,300 | | | | 525,002 | |
Sumitomo Electric Industries Ltd. | | | 79,200 | | | | 1,178,488 | |
Sumitomo Metal Mining Co. Ltd. | | | 48,300 | | | | 2,044,943 | |
Sumitomo Mitsui Financial Group, Inc. | | | 39,400 | | | | 1,384,072 | |
Sumitomo Rubber Industries Ltd. | | | 36,200 | | | | 448,440 | |
Suzuki Motor Corp. | | | 12,800 | | | | 485,715 | |
Tatsuta Electric Wire & Cable Co. Ltd. | | | 55,900 | | | | 304,956 | |
TDK Corp. | | | 16,800 | | | | 2,278,298 | |
Terumo Corp. | | | 17,600 | | | | 665,495 | |
THK Co. Ltd. | | | 40,200 | | | | 1,371,409 | |
Toagosei Co. Ltd. | | | 8,800 | | | | 98,547 | |
Tokio Marine Holdings, Inc. | | | 18,600 | | | | 891,998 | |
Tokyu Fudosan Holdings Corp. | | | 76,500 | | | | 425,794 | |
Tomy Co. Ltd. | | | 36,100 | | | | 309,982 | |
Topcon Corp. | | | 161,800 | | | | 2,207,511 | |
Torii Pharmaceutical Co. Ltd. | | | 31,600 | | | | 745,398 | |
Toyo Tanso Co. Ltd. | | | 33,200 | | | | 651,367 | |
Toyota Motor Corp. | | | 57,700 | | | | 4,317,355 | |
Trend Micro, Inc. | | | 22,500 | | | | 1,070,975 | |
Tsumura & Co. | | | 37,000 | | | | 1,232,237 | |
Welcia Holdings Co. Ltd. | | | 17,300 | | | | 539,707 | |
Z Holdings Corp. | | | 70,800 | | | | 326,549 | |
| | | | | | | | |
| |
TOTAL JAPAN | | | $ | 128,059,109 | |
|
LUXEMBOURG – 0.0%** | |
APERAM SA | | | 4,390 | | | | 227,215 | |
|
MACAO – 0.4% | |
Galaxy Entertainment Group Ltd.* | | | 227,000 | | | | 1,992,634 | |
Sands China Ltd.* | | | 212,000 | | | | 1,003,197 | |
| | | | | | | | |
| |
TOTAL MACAO | | | $ | 2,995,831 | |
|
NETHERLANDS – 3.3% | |
Aalberts NV | | | 37,739 | | | | 2,038,884 | |
ABN AMRO Bank NV* | | | 5,512 | | | | 71,172 | |
Adyen NV* | | | 657 | | | | 1,616,939 | |
Aegon NV | | | 78,886 | | | | 365,583 | |
ASML Holding NV | | | 11,894 | | | | 7,720,895 | |
ASR Nederland NV | | | 7,497 | | | | 327,435 | |
| | | | | | | | |
| | |
| Description | | Number of
Shares | | | Value | |
BE Semiconductor Industries NV | | | 1,570 | | | $ | 126,801 | |
IMCD NV | | | 18,569 | | | | 2,697,136 | |
ING Groep NV | | | 133,367 | | | | 1,703,763 | |
Koninklijke Ahold Delhaize NV | | | 53,580 | | | | 1,441,941 | |
Koninklijke Philips NV* | | | 18,651 | | | | 1,054,586 | |
NN Group NV | | | 32,119 | | | | 1,602,047 | |
Royal Dutch Shell PLC, Class A | | | 79,920 | | | | 1,503,797 | |
Royal Dutch Shell PLC, Class B | | | 27,972 | | | | 500,522 | |
Wolters Kluwer NV | | | 12,300 | | | | 1,112,548 | |
| | | | | | | | |
| |
TOTAL NETHERLANDS | | | $ | 23,884,049 | |
|
NORWAY – 0.9% | |
Equinor ASA | | | 83,470 | | | | 1,685,491 | |
Kahoot! ASA* | | | 63,635 | | | | 668,505 | |
Orkla ASA | | | 33,280 | | | | 339,227 | |
Telenor ASA | | | 13,100 | | | | 233,376 | |
TOMRA Systems ASA | | | 64,020 | | | | 3,198,274 | |
| | | | | | | | |
| |
TOTAL NORWAY | | | $ | 6,124,873 | |
|
PHILIPPINES – 0.2% | |
Ayala Land, Inc. | | | 1,838,600 | | | | 1,226,631 | |
|
RUSSIAN FEDERATION – 0.0%** | |
Evraz PLC | | | 35,040 | | | | 310,746 | |
|
SINGAPORE – 0.6% | |
Oversea-Chinese Banking Corp. Ltd. | | | 441,761 | | | | 4,038,373 | |
|
SOUTH AFRICA – 0.3% | |
Anglo American PLC | | | 52,360 | | | | 2,220,088 | |
Investec PLC | | | 33,220 | | | | 133,674 | |
| | | | | | | | |
| |
TOTAL SOUTH AFRICA | | | $ | 2,353,762 | |
|
SOUTH KOREA – 3.6% | |
LG Chem Ltd. | | | 1,577 | | | | 1,316,461 | |
NAVER Corp. | | | 11,557 | | | | 3,721,609 | |
Samsung Electronics Co. Ltd. | | | 206,952 | | | | 15,083,795 | |
SK Hynix, Inc. | | | 17,721 | | | | 2,021,636 | |
SK Materials Co. Ltd. | | | 12,216 | | | | 3,680,802 | |
| | | | | | | | |
| |
TOTAL SOUTH KOREA | | | $ | 25,824,303 | |
|
SPAIN – 1.4% | |
ACS Actividades de Construccion y Servicios SA# | | | 18,623 | | | | 606,751 | |
Amadeus IT Group SA* | | | 4,830 | | | | 328,914 | |
Banco Bilbao Vizcaya Argentaria SA* | | | 61,233 | | | | 342,879 | |
Banco Santander SA*,# | | | 300,394 | | | | 1,158,787 | |
Bankinter SA | | | 316,086 | | | | 1,728,532 | |
Cellnex Telecom SA | | | 20,200 | | | | 1,142,594 | |
Enagas SA | | | 7,500 | | | | 163,279 | |
Iberdrola SA | | | 106,130 | | | | 1,434,237 | |
Industria de Diseno Textil SA# | | | 28,693 | | | | 1,020,917 | |
Linea Directa Aseguradora SA Cia de Seguros y Reaseguros* | | | 316,086 | | | | 619,424 | |
Mediaset Espana Comunicacion SA* | | | 37,460 | | | | 238,441 | |
Naturgy Energy Group SA | | | 9,480 | | | | 243,537 | |
Telefonica SA | | | 202,012 | | | | 936,189 | |
| | | | | | | | |
| |
TOTAL SPAIN | | | $ | 9,964,481 | |
ANNUAL REPORT / April 30, 2021
| | |
| 15 | | PORTFOLIOS OF INVESTMENTS |
Wilmington International Fund (continued)
| | | | | | | | |
| | |
| Description | | Number of
Shares | | | Value | |
|
SWEDEN – 5.1% | |
AddLife AB, Class B | | | 52,314 | | | $ | 1,448,663 | |
Annehem Fastigheter AB, Class B* | | | 6,045 | | | | 21,154 | |
Assa Abloy AB, Class B# | | | 97,453 | | | | 2,778,345 | |
Atlas Copco AB, Class A# | | | 49,351 | | | | 2,992,648 | |
Avanza Bank Holding AB | | | 69,122 | | | | 2,481,152 | |
Boliden AB*,# | | | 13,640 | | | | 530,562 | |
Epiroc AB, Class A# | | | 88,600 | | | | 1,917,083 | |
EQT AB | | | 34,300 | | | | 1,155,994 | |
Fabege AB | | | 108,045 | | | | 1,610,868 | |
GARO AB*,# | | | 22,518 | | | | 1,773,848 | |
Hexagon AB, Class B | | | 33,667 | | | | 3,215,836 | |
Hexpol AB | | | 62,658 | | | | 768,212 | |
Investor AB, Class A | | | 2,230 | | | | 189,406 | |
JM AB | | | 44,545 | | | | 1,650,207 | |
Paradox Interactive AB# | | | 70,417 | | | | 1,649,819 | |
Peab AB, Class B* | | | 26,199 | | | | 377,936 | |
Sinch AB* | | | 8,280 | | | | 1,293,063 | |
Skandinaviska Enskilda Banken AB, Class A | | | 49,971 | | | | 640,286 | |
SKF AB, Class B | | | 7,820 | | | | 202,036 | |
Sweco AB, Class B# | | | 175,365 | | | | 3,118,166 | |
Swedbank AB, Class A | | | 89,250 | | | | 1,566,794 | |
Swedish Match AB | | | 16,330 | | | | 1,336,848 | |
Tele2 AB, Class B# | | | 31,500 | | | | 406,863 | |
Telefonaktiebolaget LM Ericsson, Class B | | | 80,600 | | | | 1,106,972 | |
Trelleborg AB, Class B | | | 41,057 | | | | 1,068,132 | |
Volvo AB, Class B | | | 67,190 | | | | 1,640,819 | |
| | | | | | | | |
| |
TOTAL SWEDEN | | | $ | 36,941,712 | |
|
SWITZERLAND – 5.6% | |
ABB Ltd. | | | 72,440 | | | | 2,353,009 | |
BKW AG | | | 8,022 | | | | 898,412 | |
Chocoladefabriken Lindt & Spruengli AG* | | | 137 | | | | 1,271,555 | |
Cie Financiere Richemont SA | | | 11,100 | | | | 1,139,157 | |
Comet Holding AG | | | 7,692 | | | | 1,972,324 | |
Emmi AG | | | 1,777 | | | | 1,845,492 | |
EMS-Chemie Holding AG | | | 80 | | | | 74,697 | |
Geberit AG | | | 340 | | | | 223,723 | |
Julius Baer Group Ltd. | | | 18,300 | | | | 1,151,755 | |
Kuehne + Nagel International AG | | | 950 | | | | 284,045 | |
LafargeHolcim Ltd.* | | | 23,620 | | | | 1,457,536 | |
Landis+Gyr Group AG* | | | 1,070 | | | | 74,171 | |
Logitech International SA | | | 2,470 | | | | 274,922 | |
Lonza Group AG* | | | 2,589 | | | | 1,645,864 | |
Nestle SA | | | 1,850 | | | | 220,762 | |
Novartis AG | | | 40,673 | | | | 3,470,887 | |
Partners Group Holding AG | | | 2,906 | | | | 4,139,501 | |
Siegfried Holding AG* | | | 2,507 | | | | 2,305,602 | |
Sika AG | | | 14,966 | | | | 4,469,784 | |
Straumann Holding AG | | | 1,961 | | | | 2,802,607 | |
Swiss Life Holding AG | | | 1,510 | | | | 735,720 | |
Swiss Prime Site AG | | | 910 | | | | 88,560 | |
Swisscom AG | | | 2,200 | | | | 1,194,488 | |
Temenos AG* | | | 6,914 | | | | 1,016,496 | |
UBS Group AG | | | 111,810 | | | | 1,707,407 | |
VAT Group AG | | | 3,208 | | | | 916,090 | |
Zur Rose Group AG* | | | 4,706 | | | | 1,566,218 | |
| | | | | | | | |
| | |
| Description | | Number of
Shares | | | Value | |
Zurich Insurance Group AG | | | 2,947 | | | $ | 1,209,032 | |
| | | | | | | | |
| |
TOTAL SWITZERLAND | | | $ | 40,509,816 | |
|
TAIWAN – 4.5% | |
Hon Hai Precision Industry Co. Ltd. | | | 531,000 | | | | 2,182,966 | |
MediaTek, Inc. | | | 130,000 | | | | 5,449,937 | |
Merida Industry Co. Ltd. | | | 277,000 | | | | 3,295,175 | |
Taiwan Semiconductor Manufacturing Co. Ltd. | | | 1,000,000 | | | | 21,059,624 | |
| | | | | | | | |
| |
TOTAL TAIWAN | | | $ | 31,987,702 | |
|
THAILAND – 0.4% | |
Kasikornbank PCL | | | 602,400 | | | | 2,549,785 | |
|
UNITED KINGDOM – 6.3% | |
3i Group PLC | | | 21,540 | | | | 381,512 | |
Admiral Group PLC | | | 12,450 | | | | 537,949 | |
Ashtead Group PLC | | | 17,900 | | | | 1,150,092 | |
Aviva PLC | | | 55,133 | | | | 304,806 | |
Barclays PLC | | | 454,700 | | | | 1,100,816 | |
Barratt Developments PLC | | | 39,237 | | | | 418,355 | |
Berkeley Group Holdings PLC | | | 4,737 | | | | 302,735 | |
BP PLC | | | 468,757 | | | | 1,962,381 | |
British American Tobacco PLC | | | 32,440 | | | | 1,203,633 | |
BT Group PLC* | | | 175,855 | | | | 401,116 | |
Clipper Logistics PLC | | | 164,748 | | | | 1,565,574 | |
Croda International PLC | | | 30,734 | | | | 2,871,169 | |
CVS Group PLC* | | | 54,954 | | | | 1,694,548 | |
DCC PLC | | | 23,160 | | | | 2,009,572 | |
Dechra Pharmaceuticals PLC | | | 28,135 | | | | 1,567,176 | |
easyJet PLC* | | | 108,260 | | | | 1,547,777 | |
Future PLC | | | 66,577 | | | | 2,169,334 | |
GB Group PLC | | | 125,367 | | | | 1,555,859 | |
GlaxoSmithKline PLC | | | 80,060 | | | | 1,479,490 | |
Hargreaves Lansdown PLC# | | | 10,310 | | | | 244,777 | |
Hill & Smith Holdings PLC | | | 82,834 | | | | 1,684,449 | |
HSBC Holdings PLC | | | 247,140 | | | | 1,543,072 | |
IG Group Holdings PLC | | | 11,060 | | | | 139,920 | |
Imperial Brands PLC | | | 20,440 | | | | 426,042 | |
Kingfisher PLC* | | | 102,000 | | | | 503,540 | |
Legal & General Group PLC | | | 135,843 | | | | 510,035 | |
Lloyds Banking Group PLC | | | 3,239,699 | | | | 2,031,549 | |
Marshalls PLC* | | | 89,742 | | | | 901,069 | |
National Grid PLC | | | 108,722 | | | | 1,370,501 | |
Natwest Group PLC | | | 96,820 | | | | 262,751 | |
Ninety One PLC | | | 16,720 | | | | 56,508 | |
Pennon Group PLC | | | 3,910 | | | | 55,850 | |
Persimmon PLC | | | 19,291 | | | | 834,539 | |
Reckitt Benckiser Group PLC | | | 4,230 | | | | 376,629 | |
Rightmove PLC# | | | 15,420 | | | | 130,719 | |
Softcat PLC | | | 4,090 | | | | 108,292 | |
Spirax-Sarco Engineering PLC | | | 4,994 | | | | 815,141 | |
Spirent Communications PLC | | | 30,180 | | | | 106,838 | |
SSE PLC | | | 14,763 | | | | 299,298 | |
St. James’s Place PLC# | | | 75,919 | | | | 1,427,911 | |
Synthomer PLC | | | 12,060 | | | | 84,691 | |
Tate & Lyle PLC | | | 16,070 | | | | 177,775 | |
Tesco PLC | | | 119,549 | | | | 364,931 | |
April 30, 2021 / ANNUAL REPORT
| | |
PORTFOLIOS OF INVESTMENTS Wilmington International Fund (continued) | | 16 |
| | | | | | | | |
| | |
| Description | | Number of
Shares | | | Value | |
Trainline PLC* | | | 37,838 | | | $ | 238,340 | |
Travis Perkins PLC* | | | 79,450 | | | | 1,687,153 | |
Unilever PLC | | | 37,835 | | | | 2,209,233 | |
UNITE Group PLC (The) | | | 79,855 | | | | 1,284,710 | |
Vodafone Group PLC | | | 264,580 | | | | 499,316 | |
WPP PLC | | | 17,960 | | | | 242,139 | |
| | | | | | | | |
| |
TOTAL UNITED KINGDOM | | | $ | 44,841,612 | |
|
UNITED STATES – 2.0% | |
Ferguson PLC | | | 4,950 | | | | 624,324 | |
James Hardie Industries PLC* | | | 191,815 | | | | 6,321,141 | |
ResMed, Inc. | | | 140,341 | | | | 2,832,140 | |
Samsonite International SA* | | | 1,351,486 | | | | 2,501,235 | |
Stellantis NV | | | 50,850 | | | | 843,498 | |
Stellantis NV | | | 66,300 | | | | 1,098,559 | |
| | | | | | | | |
| |
TOTAL UNITED STATES | | | $ | 14,220,897 | |
| | | | | | | | |
| |
TOTAL COMMON STOCKS
(Cost $458,936,286) | | | $ | 653,668,169 | |
|
INVESTMENT COMPANIES – 3.5% | |
iShares MSCI ACWI ex U.S. ETF | | | 71,600 | | | | 4,051,844 | |
iShares MSCI Canada ETF# | | | 372,800 | | | | 13,275,408 | |
iShares MSCI EAFE Growth ETF# | | | 37,600 | | | | 3,931,456 | |
iShares MSCI Europe Financials ETF | | | 179,500 | | | | 3,598,975 | |
| | | | | | | | |
| |
TOTAL INVESTMENT COMPANIES
(Cost $23,472,688) | | | $ | 24,857,683 | |
|
PREFERRED STOCKS – 0.4% | |
| | |
GERMANY – 0.4% | | | | | | | | |
Henkel AG & Co. KGaA, 1.85% | | | 4,360 | | | | 500,832 | |
Volkswagen AG, 4.86% | | | 9,952 | | | | 2,591,099 | |
| | | | | | | | |
| |
TOTAL PREFERRED STOCKS
(Cost $2,298,946) | | | $ | 3,091,931 | |
|
WARRANTS – 1.1% | |
| | |
CHINA – 1.1% | | | | | | | | |
Midea Group Co. Ltd., Expire 05/27/21* | | | 308,131 | | | | 3,817,897 | |
Shanghai Kelai Mechatronics Engineering Co. Ltd., Expire 03/3/22* | | | 435,800 | | | | 1,830,012 | |
Zhejiang Sanhua Intelligent Controls Co. Ltd., Expire 10/29/21* | | | 745,704 | | | | 2,468,653 | |
| | | | | | | | |
| |
TOTAL WARRANTS
(Cost $7,354,515) | | | $ | 8,116,562 | |
|
MONEY MARKET FUND – 2.9% | |
Dreyfus Government Cash Management | | | | | | | | |
Fund, Institutional Shares, 0.03%^ | | | 20,524,201 | | | | 20,524,201 | |
| | | | | | | | |
| |
TOTAL MONEY MARKET FUND
(Cost $20,524,201) | | | $ | 20,524,201 | |
|
CASH COLLATERAL INVESTED FOR SECURITIES ON LOAN – 3.5% | |
| | |
MONEY MARKET FUNDS – 1.8% | | | | | | | | |
Fidelity Investments Money Market Funds, Government Portfolio, Institutional Class, 0.01%^ | | | 2,020,000 | | | | 2,020,000 | |
| | | | | | | | |
| | |
| Description | | Number of
Shares | | | Value | |
Morgan Stanley Liquidity Funds, Government Portfolio, Institutional Class, 0.03%^ | | | 2,220,000 | | | $ | 2,220,000 | |
Invesco STIT, Government & Agency Portfolio, 0.03%^ | | | 1,510,000 | | | | 1,510,000 | |
Blackrock Liquidity Fed Fund, Institutional Shares, 0.03%^ | | | 2,280,000 | | | | 2,280,000 | |
JPMorgan U.S. Government Money Market Fund, Capital Class, 0.03%^ | | | 1,550,000 | | | | 1,550,000 | |
Federated Hermes Government Obligations Fund, Premier Shares, 0.02%^ | | | 1,290,000 | | | | 1,290,000 | |
Goldman Sachs Financial Square Government Fund, Institutional Shares, 0.03%^ | | | 2,280,000 | | | | 2,280,000 | |
| | | | | | | | |
| |
TOTAL MONEY MARKET FUNDS
(Cost $13,150,000) | | | $ | 13,150,000 | |
| | |
| | | Par Value | | | | |
|
REPURCHASE AGREEMENTS – 1.7% | |
Bank of America Securities, Inc., 0.01%, dated 4/30/21, due 5/03/21, repurchase price $2,552,308 collateralized by U.S. Government Agency Securities, 1.00% to 5.50%, maturing 11/01/28 to 5/01/51; total market value of $2,603,352. | | $ | 2,552,306 | | | | 2,552,306 | |
Daiwa Capital Markets America, 0.01%, dated 4/30/21, due 5/03/21, repurchase price $4,812,002 collateralized by U.S. Government Agency & Treasury Securities, 0.00% to 8.00%, maturing 6/30/21 to 5/01/51; total market value of $4,908,238. | | | 4,811,998 | | | | 4,811,998 | |
RBC Dominion Securities, Inc., 0.01%, dated 4/30/21, due 5/03/21, repurchase price $4,812,002 collateralized by U.S. Government Agency & Treasury Securities, 0.00% to 6.50%, maturing 6/01/21 to 12/15/60; total market value of $4,908,238. | | | 4,811,998 | | | | 4,811,998 | |
| | | | | | | | |
| | |
TOTAL REPURCHASE AGREEMENTS
(Cost $12,176,302) | | | | | | $ | 12,176,302 | |
| | | | | | | | |
| |
TOTAL CASH COLLATERAL INVESTED FOR SECURITIES ON LOAN
(Cost $25,326,302) | | | $ | 25,326,302 | |
| | | | | | | | |
| |
TOTAL INVESTMENTS – 102.5%
(Cost $537,912,938) | | | $ | 735,584,848 | |
| |
COLLATERAL FOR SECURITIES ON LOAN – (3.5%) | | | | (25,326,302 | ) |
| | |
OTHER ASSETS LESS LIABILITIES – 1.0% | | | | | | | 7,219,212 | |
| | | | | | | | |
| | |
TOTAL NET ASSETS – 100.0% | | | | | | $ | 717,477,758 | |
| | | | | | | | |
ANNUAL REPORT / April 30, 2021
| | |
| 17 | | PORTFOLIOS OF INVESTMENTS Wilmington International Fund (continued) |
Various inputs are used in determining the value of the Fund’s investments. These inputs are summarized in the three broad levels listed below.
Level 1 – quoted prices in active markets for identical securities
Level 2 – other significant observable inputs (including quoted prices for similar securities, interest rates, prepayment speeds, credit risk, etc.)
Level 3 – significant unobservable inputs (including the Fund’s own assumptions in determining the fair value of investments)
The following is a summary of the inputs used as of April 30, 2021 in valuing the Fund’s assets and liabilities carried at fair value:
| | | | | | | | | | | | | | | | |
| | | Level 1 | | | Level 2 | | | Level 3 | | | Total | |
| | | | |
Assets | | | | | | | | | | | | | | | | |
| | | | |
Investments in Securities | | | | | | | | | | | | | | | | |
| | | | |
Common Stocks | | | | | | | | | | | | | | | | |
| | | | |
Australia | | $ | — | | | $ | 27,111,444 | | | | $ — | | | $ | 27,111,444 | |
| | | | |
Belgium | | | — | | | | 3,392,358 | | | | — | | | | 3,392,358 | |
| | | | |
Bulgaria | | | — | | | | — | | | | — | (a) | | | — | |
| | | | |
China | | | 20,969,315 | | | | 41,639,918 | | | | — | | | | 62,609,233 | |
| | | | |
Denmark | | | — | | | | 20,657,226 | | | | — | | | | 20,657,226 | |
| | | | |
Finland | | | — | | | | 7,168,318 | | | | — | | | | 7,168,318 | |
| | | | |
France | | | 1,330,419 | | | | 52,080,477 | | | | — | | | | 53,410,896 | |
| | | | |
Germany | | | — | | | | 50,077,004 | | | | — | | | | 50,077,004 | |
| | | | |
Hong Kong | | | 2,862,128 | | | | 27,135,965 | | | | — | | | | 29,998,093 | |
| | | | |
India | | | 7,237,153 | | | | — | | | | — | | | | 7,237,153 | |
| | | | |
Ireland | | | — | | | | 5,737,963 | | | | — | | | | 5,737,963 | |
| | | | |
Italy | | | — | | | | 10,207,584 | | | | — | | | | 10,207,584 | |
| | | | |
Japan | | | — | | | | 128,059,109 | | | | — | | | | 128,059,109 | |
| | | | |
Luxembourg | | | — | | | | 227,215 | | | | — | | | | 227,215 | |
| | | | |
Macao | | | — | | | | 2,995,831 | | | | — | | | | 2,995,831 | |
| | | | |
Netherlands | | | — | | | | 23,884,049 | | | | — | | | | 23,884,049 | |
| | | | |
Norway | | | — | | | | 6,124,873 | | | | — | | | | 6,124,873 | |
| | | | |
Philippines | | | — | | | | 1,226,631 | | | | — | | | | 1,226,631 | |
| | | | |
Russian Federation | | | — | | | | 310,746 | | | | — | | | | 310,746 | |
| | | | |
Singapore | | | — | | | | 4,038,373 | | | | — | | | | 4,038,373 | |
| | | | |
South Africa | | | — | | | | 2,353,762 | | | | — | | | | 2,353,762 | |
| | | | |
South Korea | | | — | | | | 25,824,303 | | | | — | | | | 25,824,303 | |
| | | | |
Spain | | | 619,424 | | | | 9,345,057 | | | | — | | | | 9,964,481 | |
| | | | |
Sweden | | | — | | | | 36,941,712 | | | | — | | | | 36,941,712 | |
| | | | |
Switzerland | | | — | | | | 40,509,816 | | | | — | | | | 40,509,816 | |
| | | | |
Taiwan | | | — | | | | 31,987,702 | | | | — | | | | 31,987,702 | |
| | | | |
Thailand | | | — | | | | 2,549,785 | | | | — | | | | 2,549,785 | |
| | | | |
United Kingdom | | | — | | | | 44,841,612 | | | | — | | | | 44,841,612 | |
| | | | |
United States | | | — | | | | 14,220,897 | | | | — | | | | 14,220,897 | |
| | | | |
Investment Companies | | | 24,857,683 | | | | — | | | | — | | | | 24,857,683 | |
| | | | |
Preferred Stocks | | | | | | | | | | | | | | | | |
| | | | |
Germany | | | — | | | | 3,091,931 | | | | — | | | | 3,091,931 | |
| | | | |
Warrants | | | | | | | | | | | | | | | | |
| | | | |
China | | | — | | | | 8,116,562 | | | | — | | | | 8,116,562 | |
| | | | |
Money Market Funds | | | 33,674,201 | | | | — | | | | — | | | | 33,674,201 | |
| | | | |
Repurchase Agreements | | | — | | | | 12,176,302 | | | | — | | | | 12,176,302 | |
| | | | | | | | | | | | | | | | |
| | | | |
Total Investments in Securities | | | $91,550,323 | | | | $644,034,525 | | | | $— | | | | $735,584,848 | |
| | | | | | | | | | | | | | | | |
April 30, 2021 / ANNUAL REPORT
| | |
PORTFOLIOS OF INVESTMENTS Wilmington International Fund (concluded) | | 18 |
| | | | | | | | | | | | | | | | |
| | | Level 1 | | | Level 2 | | | Level 3 | | | Total | |
| | | | |
Liabilities | | | | | | | | | | | | | | | | |
| | | | |
Other Financial Instruments! | | | | | | | | | | | | | | | | |
| | | | |
Financial Futures Contracts | | $ | (609,275) | | | $ | — | | | $ | — | | | | $(609,275) | |
| | | | | | | | | | | | | | | | |
| | | | |
Total Liabilities - Other Financial Instruments | | $ | (609,275 | ) | | $ | — | | | $ | — | | | | $(609,275) | |
| | | | | | | | | | | | | | | | |
| (a) | Includes internally fair valued securities currently priced at zero ($0). |
| ! | Other financial instruments are derivative instruments, such as financial future contracts, which are valued at the unrealized appreciation (depreciation) on the instrument. |
As a result of utilizing international fair value pricing at April 30, 2021, a majority portion of the Fund’s common stock investments were categorized as Level 2.
| ¢ | Country classifications are based on primary country of risk. |
| * | Non-income producing security. |
| # | Security, or a portion thereof, is on loan. See Note 2 in Notes to Financial Statements. |
| ** | Represents less than 0.05%. |
| (1) | The value of this security was determined using significant unobservable inputs and is reported as a Level 3 security in the Valuation Hierarchy table located at the end of the Portfolio of Investments. |
The following acronyms are used throughout this Fund:
| ADR | American Depositary Receipt |
| MSCI | Morgan Stanley Capital International |
| OYJ | Public Limited Company |
| PCL | Public Company Limited |
| PLC | Public Limited Company |
| REIT | Real Estate Investment Trust |
| SCA | Limited Partnership With Share Capital |
At April 30, 2021, the International Fund had open financial futures contracts as follows:
| | | | | | | | | | | | | | | | | | | | | | | | |
| | | | | | |
Underlying Contracts to Buy/Sell | | Expiration
Date | | | Number of
Contracts | | | Notional
Amount | | | Notional
Value | | | Unrealized Appreciation(a) | | | Unrealized (Depreciation)(a) | |
LONG POSITIONS: | | | | | | | | | | | | | | | | | | | | | | | | |
EXCHANGE-TRADED: | | | | | | | | | | | | | | | | | | | | | | | | |
MSCI India NTR Index | | | June 2021 | | | | 154 | | | $ | 13,438,461 | | | $ | 12,829,186 | | | | $— | | | | $(609,275) | |
UNREALIZED APPRECIATION (DEPRECIATION) ON FINANCIAL FUTURES CONTRACTS | | | | | | | | | | | | | | | | | | | $— | | | | $(609,275) | |
| (a) | The unrealized appreciation (depreciation) presented above is the cumulative change in unrealized appreciation (depreciation) from the date the contract was open through April 30, 2021. Only current day variation margin is reported on the Fund’s Statement of Assets and Liabilities. |
See Notes which are an integral part of the Financial Statements
ANNUAL REPORT / April 30, 2021
PORTFOLIO OF INVESTMENTS SUMMARY TABLE
Wilmington Global Alpha Equities Fund
At April 30, 2021, the Fund’s portfolio composition was as follows (unaudited):
| | | | |
Common Stocks | |
| Percentage of
Total Net Assets |
|
Insurance | | | 6.8 | % |
IT Services | | | 4.4 | % |
Pharmaceuticals | | | 4.2 | % |
Health Care Equipment & Supplies | | | 3.6 | % |
Machinery | | | 3.5 | % |
Software | | | 3.5 | % |
Interactive Media & Services | | | 3.4 | % |
Banks | | | 3.1 | % |
Hotels, Restaurants & Leisure | | | 2.9 | % |
Internet & Direct Marketing Retail | | | 2.6 | % |
Diversified Financial Services | | | 2.5 | % |
Capital Markets | | | 2.5 | % |
Commercial Services & Supplies | | | 2.3 | % |
Real Estate Investment Trusts | | | 2.2 | % |
Aerospace & Defense | | | 2.1 | % |
Beverages | | | 2.1 | % |
Professional Services | | | 2.0 | % |
Oil, Gas & Consumable Fuels | | | 1.9 | % |
Specialty Retail | | | 1.9 | % |
Trading Companies & Distributors | | | 1.9 | % |
Health Care Providers & Services | | | 1.9 | % |
Diversified Telecommunication Services | | | 1.8 | % |
Semiconductors & Semiconductor Equipment | | | 1.8 | % |
Food Products | | | 1.7 | % |
Technology Hardware, Storage & Peripherals | | | 1.6 | % |
Air Freight & Logistics | | | 1.5 | % |
Road & Rail | | | 1.4 | % |
Communications Equipment | | | 1.2 | % |
Household Products | | | 1.2 | % |
Chemicals | | | 1.2 | % |
Metals & Mining | | | 1.1 | % |
Household Durables | | | 1.1 | % |
Electric Utilities | | | 1.0 | % |
Building Products | | | 1.0 | % |
Automobiles | | | 1.0 | % |
Construction & Engineering | | | 0.9 | % |
Multi-Utilities | | | 0.9 | % |
Electronic Equipment, Instruments & Components | | | 0.9 | % |
Food & Staples Retailing | | | 0.9 | % |
Gas Utilities | | | 0.8 | % |
Multiline Retail | | | 0.8 | % |
Wireless Telecommunication Services | | | 0.7 | % |
Media | | | 0.7 | % |
Consumer Finance | | | 0.6 | % |
Life Sciences Tools & Services | | | 0.5 | % |
Electrical Equipment | | | 0.5 | % |
Real Estate Management & Development | | | 0.5 | % |
Entertainment | | | 0.4 | % |
Textiles, Apparel & Luxury Goods | | | 0.4 | % |
Diversified Consumer Services | | | 0.4 | % |
Auto Components | | | 0.3 | % |
Leisure Products | | | 0.3 | % |
| | | | |
Common Stocks | |
| Percentage of
Total Net Assets |
|
Tobacco | | | 0.3 | % |
Health Care Technology | | | 0.2 | % |
Marine | | | 0.2 | % |
Containers & Packaging | | | 0.2 | % |
Water Utilities | | | 0.2 | % |
Construction Materials | | | 0.2 | % |
Biotechnology | | | 0.2 | % |
Distributors | | | 0.1 | % |
Transportation Infrastructure | | | 0.1 | % |
Personal Products | | | 0.1 | % |
Energy Equipment & Services | | | 0.1 | % |
Airlines | | | 0.1 | % |
Preferred Stock | | | 0.2 | % |
Investment Companies | | | 0.0 | %(1) |
Cash Equivalents(2) | | | 3.3 | % |
Other Assets and Liabilities - Net(3) | | | 4.1 | % |
| | | | |
TOTAL | | | 100.0 | % |
| | | | |
April 30, 2021 / ANNUAL REPORT
| | |
PORTFOLIOS OF INVESTMENTS Wilmington Global Alpha Equities Fund (continued) | | 20 |
| | | | |
Country Allocation | |
| Percentage of
Total Net Assets |
|
| |
Common Stocks | | | | |
United States | | | 48.4 | % |
Japan | | | 8.5 | % |
United Kingdom | | | 5.8 | % |
France | | | 5.6 | % |
Canada | | | 4.9 | % |
China | | | 4.4 | % |
Switzerland | | | 3.2 | % |
Netherlands | | | 1.7 | % |
Hong Kong | | | 1.3 | % |
Taiwan | | | 1.3 | % |
Germany | | | 1.2 | % |
Sweden | | | 1.0 | % |
All other countries less than 1.0% | | | 5.1 | % |
Preferred Stocks | | | 0.2 | % |
Investment Companies | | | 0.0 | %(1) |
Cash Equivalents(2) | | | 3.3 | % |
Other Assets and Liabilities - Net(3) | | | 4.1 | % |
| | | | |
TOTAL | | | 100.0 | % |
| | | | |
| (1) | Represents less than 0.05%. |
| (2) | Cash Equivalents include investments in a money market fund. |
| (3) | Assets, other than investments in securities, less liabilities. See Statements of Assets and Liabilities. |
PORTFOLIO OF INVESTMENTS
April 30, 2021
| | | | | | | | |
| | |
| Description | | Number of
Shares | | | Value | |
| | |
COMMON STOCKS – 92.4% | | | | | | | | |
| | |
AEROSPACE & DEFENSE – 2.1% | | | | | | | | |
| | |
BAE Systems PLC | | | 141,080 | | | $ | 985,477 | |
| | |
BWX Technologies, Inc. | | | 10,233 | | | | 684,792 | |
| | |
CAE, Inc.* | | | 14,999 | | | | 469,806 | |
| | |
Dassault Aviation SA* | | | 55 | | | | 59,919 | |
| | |
Lockheed Martin Corp. | | | 2,626 | | | | 999,351 | |
| | |
Raytheon Technologies Corp. | | | 7,427 | | | | 618,223 | |
| | |
Safran SA* | | | 3,855 | | | | 575,585 | |
| | | | | | | | |
| | |
TOTAL AEROSPACE & DEFENSE | | | | | | $ | 4,393,153 | |
| | |
AIR FREIGHT & LOGISTICS – 1.5% | | | | | | | | |
| | |
Bpost SA* | | | 2,832 | | | | 30,098 | |
| | |
C.H. Robinson Worldwide, Inc. | | | 1,969 | | | | 191,151 | |
| | |
DSV Panalpina A/S | | | 2,354 | | | | 524,448 | |
| | |
Expeditors International of Washington, Inc. | | | 7,420 | | | | 815,161 | |
| | |
FedEx Corp. | | | 2,247 | | | | 652,327 | |
| | |
PostNL NV | | | 12,787 | | | | 66,792 | |
| | |
SG Holdings Co. Ltd. | | | 2,825 | | | | 64,153 | |
| | |
United Parcel Service, Inc., Class B | | | 3,056 | | | | 622,996 | |
| | |
ZTO Express Cayman, Inc., ADR | | | 5,661 | | | | 182,058 | |
| | | | | | | | |
| | |
TOTAL AIR FREIGHT & LOGISTICS | | | | | | $ | 3,149,184 | |
| | |
AIRLINES – 0.1% | | | | | | | | |
| | |
Japan Airlines Co. Ltd.* | | | 5,000 | | | | 107,110 | |
| | |
AUTO COMPONENTS – 0.3% | | | | | | | | |
| | |
Aisan Industry Co. Ltd. | | | 1,965 | | | | 13,899 | |
| | | | | | | | |
| | |
| Description | | Number of
Shares | | | Value | |
| | |
Continental AG* | | | 379 | | | $ | 51,218 | |
| | |
Exedy Corp. | | | 2,795 | | | | 40,130 | |
| | |
Hankook Tire & Technology Co. Ltd. | | | 1,620 | | | | 69,902 | |
| | |
NOK Corp. | | | 6,655 | | | | 85,769 | |
| | |
Sumitomo Electric Industries Ltd. | | | 3,657 | | | | 54,416 | |
| | |
Sumitomo Riko Co. Ltd. | | | 3,150 | | | | 20,448 | |
| | |
Tachi-S Co. Ltd. | | | 3,340 | | | | 34,741 | |
| | |
Tokai Rika Co. Ltd. | | | 7,857 | | | | 127,194 | |
| | |
Toyota Boshoku Corp. | | | 4,960 | | | | 92,536 | |
| | |
TS Tech Co. Ltd. | | | 4,364 | | | | 60,846 | |
| | |
Unipres Corp. | | | 5,180 | | | | 49,723 | |
| | | | | | | | |
| | |
TOTAL AUTO COMPONENTS | | | | | | $ | 700,822 | |
| | |
AUTOMOBILES – 1.0% | | | | | | | | |
| | |
Daimler AG | | | 2,238 | | | | 199,179 | |
| | |
Dongfeng Motor Group Co. Ltd., Class H | | | 117,711 | | | | 102,302 | |
| | |
Ferrari NV | | | 1,870 | | | | 400,586 | |
| | |
Honda Motor Co. Ltd. | | | 14,465 | | | | 431,344 | |
| | |
Isuzu Motors Ltd. | | | 54,853 | | | | 556,985 | |
| | |
Mitsubishi Motors Corp.* | | | 9,550 | | | | 25,875 | |
| | |
Nissan Motor Co. Ltd.* | | | 17,480 | | | | 87,749 | |
| | |
Renault SA* | | | 2,012 | | | | 81,100 | |
| | |
Suzuki Motor Corp. | | | 2,773 | | | | 105,226 | |
| | | | | | | | |
| | |
TOTAL AUTOMOBILES | | | | | | $ | 1,990,346 | |
| | |
BANKS – 3.1% | | | | | | | | |
| | |
ABN AMRO Bank NV* | | | 8,912 | | | | 115,073 | |
| | |
AIB Group PLC* | | | 45,067 | | | | 131,662 | |
ANNUAL REPORT / April 30, 2021
| | |
| 21 | | PORTFOLIOS OF INVESTMENTS Wilmington Global Alpha Equities Fund (continued) |
| | | | | | | | |
| | |
| Description | | Number of
Shares | | | Value | |
| | |
Bank Mandiri Persero Tbk PT | | | 69,746 | | | $ | 29,695 | |
| | |
Bank of Ireland Group PLC* | | | 29,030 | | | | 170,111 | |
| | |
Bank of Nova Scotia (The) | | | 10,638 | | | | 677,408 | |
| | |
Bank of Nova Scotia (The) | | | 9,779 | | | | 622,824 | |
| | |
BPER Banca* | | | 30,060 | | | | 68,492 | |
| | |
CaixaBank SA | | | 50,851 | | | | 162,671 | |
| | |
Dah Sing Financial Holdings Ltd. | | | 12,181 | | | | 39,340 | |
| | |
DGB Financial Group, Inc. | | | 8,784 | | | | 69,880 | |
| | |
DNB ASA | | | 22,324 | | | | 478,766 | |
| | |
Erste Group Bank AG* | | | 2,202 | | | | 78,264 | |
| | |
First Citizens BancShares, Inc., Class A | | | 493 | | | | 427,658 | |
| | |
First Republic Bank | | | 3,100 | | | | 568,044 | |
| | |
KB Financial Group, Inc., ADR | | | 3,534 | | | | 172,883 | |
| | |
PNC Financial Services Group, Inc. (The) | | | 4,600 | | | | 859,970 | |
| | |
Popular, Inc. | | | 5,054 | | | | 373,794 | |
| | |
Resona Holdings, Inc. | | | 68,540 | | | | 282,154 | |
| | |
Sberbank of Russia PJSC, ADR | | | 3,664 | | | | 57,781 | |
| | |
Shinhan Financial Group Co. Ltd., ADR | | | 4,123 | | | | 147,356 | |
| | |
Standard Chartered PLC | | | 72,089 | | | | 517,162 | |
| | |
Sumitomo Mitsui Trust Holdings, Inc. | | | 3,570 | | | | 121,675 | |
| | |
Tochigi Bank Ltd. (The) | | | 10,150 | | | | 16,168 | |
| | |
Unicaja Banco SA | | | 66,285 | | | | 65,325 | |
| | |
UniCredit SpA | | | 14,407 | | | | 147,989 | |
| | | | | | | | |
| | |
TOTAL BANKS | | | | | | $ | 6,402,145 | |
| | |
BEVERAGES – 2.1% | | | | | | | | |
| | |
Anadolu Efes Biracilik Ve Malt Sanayii AS | | | 22,309 | | | | 62,834 | |
| | |
Asahi Group Holdings Ltd. | | | 3,144 | | | | 131,460 | |
| | |
Boston Beer Co., Inc. (The), Class A* | | | 381 | | | | 463,483 | |
| | |
Coca-Cola Co. (The) | | | 9,996 | | | | 539,584 | |
| | |
Coca-Cola Icecek AS | | | 6,913 | | | | 65,701 | |
| | |
Constellation Brands, Inc., Class A | | | 3,591 | | | | 862,989 | |
| | |
Diageo PLC | | | 18,589 | | | | 834,487 | |
| | |
Heineken NV | | | 6,727 | | | | 780,329 | |
| | |
PepsiCo., Inc. | | | 3,620 | | | | 521,859 | |
| | | | | | | | |
| | |
TOTAL BEVERAGES | | | | | | $ | 4,262,726 | |
| | |
BIOTECHNOLOGY – 0.2% | | | | | | | | |
| | |
Zai Lab Ltd., ADR* | | | 2,025 | | | | 336,575 | |
| | |
BUILDING PRODUCTS – 1.0% | | | | | | | | |
| | |
Assa Abloy AB, Class B | | | 14,372 | | | | 409,739 | |
| | |
Cie de Saint-Gobain* | | | 4,267 | | | | 269,227 | |
| | |
Geberit AG | | | 90 | | | | 59,221 | |
| | |
Johnson Controls International PLC | | | 7,220 | | | | 450,095 | |
| | |
Lennox International, Inc. | | | 2,691 | | | | 902,400 | |
| | | | | | | | |
| | |
TOTAL BUILDING PRODUCTS | | | | | | $ | 2,090,682 | |
| | |
CAPITAL MARKETS – 2.5% | | | | | | | | |
| | |
Ares Management Corp., Class A | | | 9,486 | | | | 498,205 | |
| | |
Charles Schwab Corp. (The) | | | 27,679 | | | | 1,948,601 | |
| | |
CSC Financial Co. Ltd., Class H | | | 63,500 | | | | 73,935 | |
| | |
GAM Holding AG* | | | 4,097 | | | | 10,616 | |
| | |
Hong Kong Exchanges & Clearing Ltd. | | | 3,700 | | | | 223,151 | |
| | |
Ichiyoshi Securities Co. Ltd. | | | 4,430 | | | | 25,132 | |
| | |
Intercontinental Exchange, Inc. | | | 1,654 | | | | 194,692 | |
| | |
Intermediate Capital Group PLC | | | 17,051 | | | | 514,767 | |
| | |
Julius Baer Group Ltd. | | | 1,058 | | | | 66,588 | |
| | | | | | | | |
| | |
| Description | | Number of
Shares | | | Value | |
| | |
MarketAxess Holdings, Inc. | | | 341 | | | $ | 166,565 | |
| | |
Moody’s Corp. | | | 990 | | | | 323,443 | |
| | |
Nomura Holdings, Inc. | | | 10,382 | | | | 55,805 | |
| | |
Partners Group Holding AG | | | 98 | | | | 139,598 | |
| | |
UBS Group AG | | | 50,656 | | | | 773,548 | |
| | |
Uranium Participation Corp.* | | | 9,181 | | | | 40,111 | |
| | | | | | | | |
| | |
TOTAL CAPITAL MARKETS | | | | | | $ | 5,054,757 | |
| | |
CHEMICALS – 1.2% | | | | | | | | |
| | |
ADEKA Corp. | | | 6,571 | | | | 127,881 | |
| | |
Air Liquide SA | | | 453 | | | | 76,286 | |
| | |
China BlueChemical Ltd., Class H | | | 179,584 | | | | 50,773 | |
| | |
Croda International PLC | | | 1,147 | | | | 107,153 | |
| | |
EMS-Chemie Holding AG | | | 109 | | | | 101,775 | |
| | |
Fujimi, Inc. | | | 1,000 | | | | 41,819 | |
| | |
Givaudan SA | | | 27 | | | | 113,135 | |
| | |
Koninklijke DSM NV | | | 582 | | | | 104,353 | |
| | |
Linde PLC | | | 2,675 | | | | 764,622 | |
| | |
Lintec Corp. | | | 3,200 | | | | 69,632 | |
| | |
Nissan Chemical Corp. | | | 146 | | | | 7,506 | |
| | |
Sanyo Chemical Industries Ltd. | | | 1,200 | | | | 57,006 | |
| | |
Sherwin-Williams Co. (The) | | | 2,516 | | | | 689,057 | |
| | |
Symrise AG | | | 806 | | | | 104,083 | |
| | | | | | | | |
| | |
TOTAL CHEMICALS | | | | | | $ | 2,415,081 | |
| | |
COMMERCIAL SERVICES & SUPPLIES – 2.3% | | | | | | | | |
| | |
Aeon Delight Co. Ltd. | | | 4,873 | | | | 148,683 | |
| | |
Babcock International Group PLC* | | | 17,672 | | | | 70,337 | |
| | |
Cintas Corp. | | | 2,691 | | | | 928,772 | |
| | |
Clean Harbors, Inc.* | | | 5,254 | | | | 467,396 | |
| | |
Copart, Inc.* | | | 14,423 | | | | 1,795,808 | |
| | |
Prosegur Cia de Seguridad SA | | | 20,797 | | | | 64,685 | |
| | |
Rollins, Inc. | | | 4,624 | | | | 172,383 | |
| | |
Secom Co. Ltd. | | | 2,483 | | | | 206,919 | |
| | |
Toppan Forms Co. Ltd. | | | 4,585 | | | | 48,406 | |
| | |
Toppan Printing Co. Ltd. | | | 3,480 | | | | 59,430 | |
| | |
Waste Connections, Inc. | | | 6,451 | | | | 768,379 | |
| | | | | | | | |
| | |
TOTAL COMMERCIAL SERVICES & SUPPLIES | | | | | | $ | 4,731,198 | |
| | |
COMMUNICATIONS EQUIPMENT – 1.2% | | | | | | | | |
| | |
Accton Technology Corp. | | | 59,000 | | | | 668,062 | |
| | |
Cisco Systems, Inc. | | | 9,772 | | | | 497,493 | |
| | |
Motorola Solutions, Inc. | | | 6,223 | | | | 1,171,791 | |
| | |
Nokia OYJ* | | | 36,549 | | | | 173,131 | |
| | | | | | | | |
| | |
TOTAL COMMUNICATIONS EQUIPMENT | | | | | | $ | 2,510,477 | |
| | |
CONSTRUCTION & ENGINEERING – 0.9% | | | | | | | | |
| | |
China Machinery Engineering Corp., Class H | | | 94,953 | | | | 42,484 | |
| | |
Chiyoda Corp.* | | | 6,760 | | | | 31,449 | |
| | |
Implenia AG* | | | 1,286 | | | | 37,484 | |
| | |
JGC Holdings Corp. | | | 19,631 | | | | 224,414 | |
| | |
Kumagai Gumi Co. Ltd. | | | 2,676 | | | | 74,526 | |
| | |
Kyowa Exeo Corp. | | | 3,514 | | | | 93,476 | |
| | |
Raubex Group Ltd. | | | 16,850 | | | | 30,669 | |
| | |
Taisei Corp. | | | 2,401 | | | | 88,713 | |
| | |
Toyo Engineering Corp.* | | | 2,309 | | | | 14,800 | |
| | |
Vinci SA | | | 11,911 | | | | 1,306,991 | |
| | | | | | | | |
| | |
TOTAL CONSTRUCTION & ENGINEERING | | | | | | $ | 1,945,006 | |
April 30, 2021 / ANNUAL REPORT
| | |
PORTFOLIOS OF INVESTMENTS Wilmington Global Alpha Equities Fund (continued) | | 22 |
| | | | | | | | |
| | |
| Description | | Number of
Shares | | | Value | |
|
CONSTRUCTION MATERIALS – 0.2% | |
Imerys SA | | | 1,436 | | | $ | 74,644 | |
LafargeHolcim Ltd.* | | | 3,565 | | | | 219,988 | |
Taiheiyo Cement Corp. | | | 2,820 | | | | 70,801 | |
Vicat SA | | | 1,263 | | | | 63,481 | |
| | | | | | | | |
| |
TOTAL CONSTRUCTION MATERIALS | | | $ | 428,914 | |
|
CONSUMER FINANCE – 0.6% | |
American Express Co. | | | 2,914 | | | | 446,862 | |
Credit Acceptance Corp.* | | | 1,664 | | | | 656,931 | |
Provident Financial PLC* | | | 13,385 | | | | 45,264 | |
| | | | | | | | |
| |
TOTAL CONSUMER FINANCE | | | $ | 1,149,057 | |
|
CONTAINERS & PACKAGING – 0.2% | |
Ball Corp. | | | 4,772 | | | | 446,850 | |
Nampak Ltd.* | | | 56,917 | | | | 12,077 | |
| | | | | | | | |
| |
TOTAL CONTAINERS & PACKAGING | | | $ | 458,927 | |
|
DISTRIBUTORS – 0.1% | |
Genuine Parts Co. | | | 1,719 | | | | 214,823 | |
PALTAC Corp. | | | 1,250 | | | | 65,128 | |
| | | | | | | | |
| |
TOTAL DISTRIBUTORS | | | $ | 279,951 | |
|
DIVERSIFIED CONSUMER SERVICES – 0.4% | |
Benesse Holdings, Inc. | | | 425 | | | | 9,385 | |
Chegg, Inc.* | | | 6,622 | | | | 598,165 | |
New Oriental Education & Technology Group, | | | | | | | | |
Inc., ADR* | | | 4,276 | | | | 65,252 | |
TAL Education Group, ADR* | | | 2,896 | | | | 164,927 | |
| | | | | | | | |
| |
TOTAL DIVERSIFIED CONSUMER SERVICES | | | $ | 837,729 | |
|
DIVERSIFIED FINANCIAL SERVICES – 2.5% | |
Bank of America Corp. | | | 20,267 | | | | 821,422 | |
Berkshire Hathaway, Inc., Class B* | | | 4,852 | | | | 1,334,057 | |
BNP Paribas SA* | | | 3,601 | | | | 230,888 | |
G-Resources Group Ltd.* | | | 1,133,619 | | | | 7,014 | |
ING Groep NV | | | 20,016 | | | | 255,704 | |
Investor AB, Class B | | | 1,388 | | | | 117,823 | |
JPMorgan Chase & Co. | | | 3,495 | | | | 537,566 | |
Kasikornbank PCL | | | 28,456 | | | | 120,446 | |
Mitsubishi UFJ Financial Group, Inc. | | | 127,364 | | | | 677,589 | |
Royal Bank of Canada | | | 5,101 | | | | 486,839 | |
Societe Generale SA* | | | 5,223 | | | | 148,580 | |
Sumitomo Mitsui Financial Group, Inc. | | | 11,685 | | | | 410,479 | |
| | | | | | | | |
| |
TOTAL DIVERSIFIED FINANCIAL SERVICES | | | $ | 5,148,407 | |
|
DIVERSIFIED TELECOMMUNICATION SERVICES – 1.8% | |
AT&T, Inc. | | | 6,304 | | | | 198,009 | |
BT Group PLC* | | | 51,800 | | | | 118,153 | |
Cellnex Telecom SA | | | 10,363 | | | | 586,173 | |
Hellenic Telecommunications Organization SA | | | 31,988 | | | | 542,441 | |
Koninklijke KPN NV | | | 136,570 | | | | 471,114 | |
KT Corp., ADR | | | 10,041 | | | | 126,517 | |
Magyar Telekom Telecommunications PLC, | | | | | | | | |
ADR | | | 7,725 | | | | 53,901 | |
Nippon Telegraph & Telephone Corp. | | | 11,058 | | | | 278,804 | |
Orange SA | | | 10,666 | | | | 132,826 | |
Proximus SADP | | | 4,907 | | | | 104,543 | |
Swisscom AG | | | 193 | | | | 104,789 | |
| | | | | | | | |
| | |
| Description | | Number of
Shares | | | Value | |
Telenor ASA | | | 4,920 | | | $ | 87,650 | |
Telia Co. AB | | | 23,584 | | | | 97,728 | |
Turk Telekomunikasyon AS | | | 63,667 | | | | 48,944 | |
Verizon Communications, Inc. | | | 13,758 | | | | 795,075 | |
| | | | | | | | |
| |
TOTAL DIVERSIFIED TELECOMMUNICATION SERVICES | | | $ | 3,746,667 | |
|
ELECTRIC UTILITIES – 1.0% | |
American Electric Power Co., Inc. | | | 134 | | | | 11,887 | |
Chugoku Electric Power Co., Inc. (The) | | | 5,624 | | | | 62,943 | |
Duke Energy Corp. | | | 5,248 | | | | 528,421 | |
Edison International | | | 6,115 | | | | 363,537 | |
Exelon Corp. | | | 7,927 | | | | 356,239 | |
Iberdrola SA | | | 7,545 | | | | 101,963 | |
Pinnacle West Capital Corp. | | | 7,482 | | | | 633,351 | |
Red Electrica Corp. SA | | | 5,109 | | | | 93,791 | |
| | | | | | | | |
| |
TOTAL ELECTRIC UTILITIES | | | $ | 2,152,132 | |
|
ELECTRICAL EQUIPMENT – 0.5% | |
Cosel Co. Ltd. | | | 4,590 | | | | 44,599 | |
Mitsubishi Electric Corp. | | | 11,570 | | | | 178,275 | |
Nippon Carbon Co. Ltd. | | | 1,500 | | | | 62,917 | |
Nissin Electric Co. Ltd. | | | 4,500 | | | | 49,620 | |
Schneider Electric SE | | | 3,261 | | | | 520,312 | |
Ushio, Inc. | | | 10,740 | | | | 142,242 | |
Zumtobel Group AG* | | | 2,714 | | | | 27,503 | |
| | | | | | | | |
| |
TOTAL ELECTRICAL EQUIPMENT | | | $ | 1,025,468 | |
|
ELECTRONIC EQUIPMENT, INSTRUMENTS & COMPONENTS – 0.9% | |
Ai Holdings Corp. | | | 3,900 | | | | 74,456 | |
Amphenol Corp., Class A | | | 2,247 | | | | 151,313 | |
Canon Marketing Japan, Inc. | | | 3,731 | | | | 90,074 | |
Citizen Watch Co. Ltd. | | | 17,280 | | | | 58,144 | |
Enplas Corp. | | | 390 | | | | 14,973 | |
Foxconn Technology Co. Ltd. | | | 27,760 | | | | 68,181 | |
Halma PLC | | | 2,815 | | | | 100,587 | |
Hon Hai Precision Industry Co. Ltd. | | | 24,925 | | | | 102,468 | |
II-VI, Inc.* | | | 5,925 | | | | 397,804 | |
Keyence Corp. | | | 147 | | | | 70,568 | |
Kyocera Corp. | | | 1,740 | | | | 105,641 | |
Maruwa Co. Ltd. | | | 513 | | | | 52,867 | |
Nichicon Corp. | | | 2,445 | | | | 24,002 | |
Nippon Chemi-Con Corp.* | | | 3,490 | | | | 54,872 | |
PAX Global Technology Ltd. | | | 66,276 | | | | 73,340 | |
Sunny Optical Technology Group Co. Ltd. | | | 18,300 | | | | 443,632 | |
| | | | | | | | |
| |
TOTAL ELECTRONIC EQUIPMENT, INSTRUMENTS & COMPONENTS | | | $ | 1,882,922 | |
|
ENERGY EQUIPMENT & SERVICES – 0.1% | |
Drilling Co. of 1972 A/S (The)* | | | 232 | | | | 9,709 | |
Fugro NV* | | | 4,012 | | | | 41,765 | |
Saipem SpA | | | 17,409 | | | | 40,140 | |
Trican Well Service Ltd.* | | | 20,938 | | | | 35,943 | |
| | | | | | | | |
| |
TOTAL ENERGY EQUIPMENT & SERVICES | | | $ | 127,557 | |
|
ENTERTAINMENT – 0.4% | |
Bilibili, Inc., ADR* | | | 675 | | | | 74,831 | |
Bilibili, Inc., Class Z* | | | 200 | | | | 22,941 | |
DeNA Co. Ltd.* | | | 4,815 | | | | 98,512 | |
ANNUAL REPORT / April 30, 2021
| | |
| 23 | | PORTFOLIOS OF INVESTMENTS Wilmington Global Alpha Equities Fund (continued) |
| | | | | | | | |
| | |
| Description | | Number of
Shares | | | Value | |
NetEase, Inc., ADR | | | 2,495 | | | $ | 279,590 | |
Nexon Co. Ltd. | | | 2,540 | | | | 84,016 | |
Nintendo Co. Ltd. | | | 138 | | | | 79,164 | |
Tencent Music Entertainment Group, ADR* | | | 15,234 | | | | 265,376 | |
| | | | | | | | |
| |
TOTAL ENTERTAINMENT | | | $ | 904,430 | |
|
FOOD & STAPLES RETAILING – 0.9% | |
Cosmos Pharmaceutical Corp. | | | 415 | | | | 59,564 | |
Costco Wholesale Corp. | | | 480 | | | | 178,603 | |
J Sainsbury PLC | | | 77,491 | | | | 254,519 | |
Jeronimo Martins SGPS SA | | | 5,955 | | | | 108,735 | |
Kato Sangyo Co. Ltd. | | | 1,300 | | | | 38,139 | |
Koninklijke Ahold Delhaize NV | | | 3,654 | | | | 98,336 | |
METRO AG | | | 2,159 | | | | 23,601 | |
Performance Food Group Co.* | | | 10,157 | | | | 596,216 | |
Sundrug Co. Ltd. | | | 2,573 | | | | 87,684 | |
Tesco PLC | | | 26,505 | | | | 80,908 | |
Walmart, Inc. | | | 1,219 | | | | 170,550 | |
Wm Morrison Supermarkets PLC | | | 43,671 | | | | 104,884 | |
| | | | | | | | |
| |
TOTAL FOOD & STAPLES RETAILING | | | $ | 1,801,739 | |
|
FOOD PRODUCTS – 1.7% | |
Astral Foods Ltd. | | | 3,519 | | | | 33,520 | |
Barry Callebaut AG | | | 46 | | | | 101,564 | |
Calbee, Inc. | | | 2,511 | | | | 60,225 | |
China Feihe Ltd. | | | 42,000 | | | | 119,339 | |
Chocoladefabriken Lindt & Spruengli AG* | | | 11 | | | | 102,096 | |
General Mills, Inc. | | | 2,369 | | | | 144,177 | |
Hormel Foods Corp. | | | 3,725 | | | | 172,095 | |
Kellogg Co. | | | 9,207 | | | | 574,701 | |
MEIJI Holdings Co. Ltd. | | | 710 | | | | 44,058 | |
Nestle SA | | | 8,614 | | | | 1,027,915 | |
Nissin Foods Holdings Co. Ltd. | | | 854 | | | | 60,515 | |
Nomad Foods Ltd.* | | | 18,318 | | | | 534,153 | |
Perusahaan Perkebunan London Sumatra | | | | | | | | |
Indonesia Tbk PT | | | 230,566 | | | | 20,796 | |
Toyo Suisan Kaisha Ltd. | | | 1,998 | | | | 81,468 | |
Viscofan SA | | | 5,166 | | | | 353,040 | |
Yamazaki Baking Co. Ltd. | | | 2,263 | | | | 35,871 | |
Yihai International Holding Ltd. | | | 6,000 | | | | 58,362 | |
| | | | | | | | |
| |
TOTAL FOOD PRODUCTS | | | $ | 3,523,895 | |
|
GAS UTILITIES – 0.8% | |
Atmos Energy Corp. | | | 1,789 | | | | 185,322 | |
ENN Energy Holdings Ltd. | | | 14,600 | | | | 249,143 | |
Osaka Gas Co. Ltd. | | | 1,635 | | | | 31,647 | |
Rubis SCA | | | 9,047 | | | | 424,692 | |
Toho Gas Co. Ltd. | | | 1,307 | | | | 72,842 | |
Tokyo Gas Co. Ltd. | | | 2,434 | | | | 49,395 | |
UGI Corp. | | | 13,418 | | | | 586,501 | |
| | | | | | | | |
| |
TOTAL GAS UTILITIES | | | $ | 1,599,542 | |
|
HEALTH CARE EQUIPMENT & SUPPLIES – 3.6% | |
Abbott Laboratories | | | 980 | | | | 117,678 | |
Align Technology, Inc.* | | | 1,210 | | | | 720,591 | |
Asahi Intecc Co. Ltd. | | | 2,260 | | | | 60,832 | |
Baxter International, Inc. | | | 7,373 | | | | 631,792 | |
Becton Dickinson & Co. | | | 1,790 | | | | 445,370 | |
| | | | | | | | |
| | |
| Description | | Number of
Shares | | | Value | |
Coloplast A/S, Class B | | | 708 | | | $ | 117,273 | |
Danaher Corp. | | | 4,395 | | | | 1,116,066 | |
DexCom, Inc.* | | | 992 | | | | 383,011 | |
DiaSorin SpA | | | 496 | | | | 84,240 | |
Hologic, Inc.* | | | 3,736 | | | | 244,895 | |
Hoya Corp. | | | 594 | | | | 67,517 | |
Insulet Corp.* | | | 1,112 | | | | 328,285 | |
Koninklijke Philips NV* | | | 13,096 | | | | 740,489 | |
Medtronic PLC | | | 9,127 | | | | 1,194,907 | |
Shandong Weigao Group Medical Polymer Co. | | | | | | | | |
Ltd., Class H | | | 8,000 | | | | 17,910 | |
Siemens Healthineers AG | | | 2,134 | | | | 121,951 | |
Smith & Nephew PLC | | | 22,149 | | | | 479,388 | |
STERIS PLC | | | 86 | | | | 18,148 | |
Sysmex Corp. | | | 744 | | | | 74,313 | |
Teleflex, Inc. | | | 1,088 | | | | 459,658 | |
| | | | | | | | |
| |
TOTAL HEALTH CARE EQUIPMENT & SUPPLIES | | | $ | 7,424,314 | |
|
HEALTH CARE PROVIDERS & SERVICES – 1.9% | |
agilon health, Inc.* | | | 1,400 | | | | 44,142 | |
BML, Inc. | | | 1,600 | | | | 55,353 | |
Fresenius SE & Co. KGaA | | | 3,663 | | | | 180,034 | |
HCA Healthcare, Inc. | | | 3,714 | | | | 746,737 | |
Humana, Inc. | | | 1,401 | | | | 623,781 | |
Laboratory Corp. of America Holdings* | | | 1,501 | | | | 399,071 | |
Medipal Holdings Corp. | | | 2,539 | | | | 46,719 | |
Suzuken Co. Ltd. | | | 2,059 | | | | 74,201 | |
UnitedHealth Group, Inc. | | | 4,116 | | | | 1,641,461 | |
| | | | | | | | |
| |
TOTAL HEALTH CARE PROVIDERS & SERVICES | | | $ | 3,811,499 | |
|
HEALTH CARE TECHNOLOGY – 0.2% | |
AGFA-Gevaert NV* | | | 7,829 | | | | 38,544 | |
Cerner Corp. | | | 2,422 | | | | 181,771 | |
M3, Inc. | | | 947 | | | | 65,419 | |
Multiplan Corp.* | | | 24,595 | | | | 182,741 | |
| | | | | | | | |
| |
TOTAL HEALTH CARE TECHNOLOGY | | | $ | 468,475 | |
|
HOTELS, RESTAURANTS & LEISURE – 2.9% | |
Booking Holdings, Inc.* | | | 281 | | | | 692,968 | |
Choice Hotels International, Inc.* | | | 6,951 | | | | 791,024 | |
Compass Group PLC* | | | 61,244 | | | | 1,332,319 | |
DraftKings, Inc., Class A* | | | 3,886 | | | | 220,181 | |
Evolution Gaming Group AB | | | 1,298 | | | | 256,237 | |
Food & Life Cos Ltd. | | | 5,000 | | | | 223,006 | |
Galaxy Entertainment Group Ltd.* | | | 5,124 | | | | 44,979 | |
Huazhu Group Ltd., ADR* | | | 5,343 | | | | 315,023 | |
McDonald’s Corp. | | | 3,967 | | | | 936,529 | |
McDonald’s Holdings Co. Japan Ltd. | | | 1,525 | | | | 69,629 | |
Penn National Gaming, Inc.* | | | 1,747 | | | | 155,693 | |
Planet Fitness, Inc., Class A* | | | 5,759 | | | | 483,698 | |
Sands China Ltd.* | | | 100,800 | | | | 476,992 | |
| | | | | | | | |
| |
TOTAL HOTELS, RESTAURANTS & LEISURE | | | $ | 5,998,278 | |
|
HOUSEHOLD DURABLES – 1.1% | |
Funai Electric Co. Ltd.* | | | 4,290 | | | | 35,888 | |
Garmin Ltd. | | | 1,446 | | | | 198,449 | |
Lennar Corp., Class A | | | 3,064 | | | | 317,430 | |
Nikon Corp. | | | 6,515 | | | | 61,345 | |
April 30, 2021 / ANNUAL REPORT
| | |
PORTFOLIOS OF INVESTMENTS Wilmington Global Alpha Equities Fund (continued) | | 24 |
| | | | | | | | |
| | |
| Description | | Number of
Shares | | | Value | |
NVR, Inc.* | | | 245 | | | $ | 1,229,435 | |
Persimmon PLC | | | 2,253 | | | | 97,466 | |
Rinnai Corp. | | | 669 | | | | 67,177 | |
Sekisui Chemical Co. Ltd. | | | 3,672 | | | | 64,023 | |
Sekisui House Ltd. | | | 3,800 | | | | 76,960 | |
Tamron Co. Ltd. | | | 810 | | | | 17,565 | |
| | | | | | | | |
| |
TOTAL HOUSEHOLD DURABLES | | | $ | 2,165,738 | |
|
HOUSEHOLD PRODUCTS – 1.2% | |
Clorox Co. (The) | | | 930 | | | | 169,725 | |
Colgate-Palmolive Co. | | | 8,370 | | | | 675,459 | |
Procter & Gamble Co. (The) | | | 5,443 | | | | 726,205 | |
Reckitt Benckiser Group PLC | | | 9,183 | | | | 817,633 | |
Unicharm Corp. | | | 1,478 | | | | 57,450 | |
| | | | | | | | |
| |
TOTAL HOUSEHOLD PRODUCTS | | | $ | 2,446,472 | |
|
INSURANCE – 6.8% | |
Admiral Group PLC | | | 2,598 | | | | 112,256 | |
Ageas SA | | | 2,131 | | | | 128,883 | |
AIA Group Ltd. | | | 166,536 | | | | 2,113,771 | |
Arthur J. Gallagher & Co. | | | 5,228 | | | | 757,798 | |
Assicurazioni Generali SpA* | | | 7,283 | | | | 145,780 | |
AXA SA | | | 51,233 | | | | 1,447,079 | |
Brown & Brown, Inc. | | | 3,865 | | | | 205,541 | |
China Reinsurance Group Corp., Class H | | | 714,150 | | | | 74,381 | |
Chubb Ltd. | | | 4,046 | | | | 694,253 | |
Dai-ichi Life Holdings, Inc. | | | 9,725 | | | | 175,605 | |
Enstar Group Ltd.* | | | 1,870 | | | | 469,707 | |
Globe Life, Inc. | | | 6,600 | | | | 676,434 | |
Intact Financial Corp. | | | 13,988 | | | | 1,859,301 | |
Markel Corp.* | | | 908 | | | | 1,068,189 | |
Marsh & McLennan Cos., Inc. | | | 4,506 | | | | 611,464 | |
MS&AD Insurance Group Holdings, Inc. | | | 8,403 | | | | 238,398 | |
Old Mutual Ltd. | | | 96,171 | | | | 83,712 | |
Phoenix Group Holdings PLC | | | 341 | | | | 3,345 | |
Progressive Corp. (The) | | | 11,393 | | | | 1,147,731 | |
Sampo OYJ, Class A | | | 2,223 | | | | 105,447 | |
SCOR SE* | | | 2,403 | | | | 77,644 | |
Shin Kong Financial Holding Co. Ltd. | | | 124,497 | | | | 44,874 | |
Swiss Life Holding AG | | | 30 | | | | 14,617 | |
T&D Holdings, Inc. | | | 21,078 | | | | 258,675 | |
Tokio Marine Holdings, Inc. | | | 15,973 | | | | 766,016 | |
Tongyang Life Insurance Co. Ltd. | | | 7,703 | | | | 32,926 | |
White Mountains Insurance Group Ltd. | | | 289 | | | | 336,809 | |
Willis Towers Watson PLC | | | 809 | | | | 209,418 | |
Zurich Insurance Group AG | | | 265 | | | | 108,718 | |
| | | | | | | | |
| |
TOTAL INSURANCE | | | $ | 13,968,772 | |
|
INTERACTIVE MEDIA & SERVICES – 3.4% | |
Alphabet, Inc., Class A* | | | 1,001 | | | | 2,355,854 | |
Alphabet, Inc., Class C* | | | 411 | | | | 990,559 | |
Facebook, Inc., Class A* | | | 3,342 | | | | 1,086,417 | |
Gree, Inc. | | | 18,280 | | | | 95,633 | |
Match Group, Inc.* | | | 2,535 | | | | 394,522 | |
Tencent Holdings Ltd. | | | 26,500 | | | | 2,113,959 | |
| | | | | | | | |
| |
TOTAL INTERACTIVE MEDIA & SERVICES | | | $ | 7,036,944 | |
| | | | | | | | |
| | |
| Description | | Number of
Shares | | | Value | |
|
INTERNET & DIRECT MARKETING RETAIL – 2.6% | |
Alibaba Group Holding Ltd.* | | | 9,300 | | | $ | 268,842 | |
Alibaba Group Holding Ltd., ADR* | | | 4,723 | | | | 1,090,777 | |
Amazon.com, Inc.* | | | 875 | | | | 3,033,992 | |
Meituan, Class B* | | | 20,739 | | | | 793,771 | |
Trip.com Group Ltd., ADR* | | | 6,359 | | | | 248,510 | |
| | | | | | | | |
| |
TOTAL INTERNET & DIRECT MARKETING RETAIL | | | $ | 5,435,892 | |
|
IT SERVICES – 4.4% | |
Accenture PLC, Class A | | | 3,066 | | | | 889,048 | |
Automatic Data Processing, Inc. | | | 3,358 | | | | 627,912 | |
Black Knight, Inc.* | | | 6,466 | | | | 468,268 | |
Capgemini SE | | | 4,052 | | | | 742,517 | |
Cognizant Technology Solutions Corp., Class A | | | 1,125 | | | | 90,450 | |
DTS Corp. | | | 2,978 | | | | 70,010 | |
Edenred | | | 10,744 | | | | 609,093 | |
EPAM Systems, Inc.* | | | 292 | | | | 133,663 | |
Fidelity National Information Services, Inc. | | | 9,232 | | | | 1,411,573 | |
FleetCor Technologies, Inc.* | | | 2,039 | | | | 586,661 | |
Fujitsu Ltd. | | | 388 | | | | 61,637 | |
Future Corp. | | | 2,600 | | | | 48,144 | |
Global Payments, Inc. | | | 3,287 | | | | 705,489 | |
GoDaddy, Inc., Class A* | | | 7,296 | | | | 633,439 | |
Itochu Techno-Solutions Corp. | | | 2,005 | | | | 69,377 | |
Jack Henry & Associates, Inc. | | | 1,118 | | | | 182,044 | |
Nihon Unisys Ltd. | | | 2,793 | | | | 88,472 | |
Nomura Research Institute Ltd. | | | 2,266 | | | | 69,541 | |
NS Solutions Corp. | | | 3,503 | | | | 105,946 | |
Obic Co. Ltd. | | | 374 | | | | 72,080 | |
Otsuka Corp. | | | 1,758 | | | | 88,434 | |
Paychex, Inc. | | | 1,984 | | | | 193,420 | |
Sopra Steria Group SACA* | | | 148 | | | | 27,544 | |
Transcosmos, Inc. | | | 2,400 | | | | 68,548 | |
Visa, Inc., Class A | | | 1,846 | | | | 431,152 | |
Worldline SA* | | | 6,774 | | | | 665,059 | |
| | | | | | | | |
| |
TOTAL IT SERVICES | | | $ | 9,139,521 | |
|
LEISURE PRODUCTS – 0.3% | |
Bandai Namco Holdings, Inc. | | | 863 | | | | 63,328 | |
Polaris, Inc. | | | 3,064 | | | | 429,052 | |
Sega Sammy Holdings, Inc. | | | 5,240 | | | | 75,208 | |
Shimano, Inc. | | | 314 | | | | 71,798 | |
| | | | | | | | |
| |
TOTAL LEISURE PRODUCTS | | | $ | 639,386 | |
|
LIFE SCIENCES TOOLS & SERVICES – 0.5% | |
Agilent Technologies, Inc. | | | 1,326 | | | | 177,207 | |
CMIC Holdings Co. Ltd. | | | 1,480 | | | | 21,661 | |
EPS Holdings, Inc. | | | 4,940 | | | | 52,917 | |
Pharmaron Beijing Co. Ltd., Class H | | | 9,300 | | | | 192,014 | |
Sartorius Stedim Biotech | | | 270 | | | | 124,007 | |
Thermo Fisher Scientific, Inc. | | | 376 | | | | 176,807 | |
WuXi AppTec Co. Ltd., Class H | | | 3,900 | | | | 91,887 | |
Wuxi Biologics Cayman, Inc.* | | | 18,200 | | | | 255,488 | |
| | | | | | | | |
| |
TOTAL LIFE SCIENCES TOOLS & SERVICES | | | $ | 1,091,988 | |
|
MACHINERY – 3.5% | |
Alfa Laval AB | | | 21,228 | | | | 716,926 | |
Amada Co. Ltd. | | | 4,300 | | | | 46,640 | |
ANNUAL REPORT / April 30, 2021
| | |
| 25 | | PORTFOLIOS OF INVESTMENTS Wilmington Global Alpha Equities Fund (continued) |
| | | | | | | | |
| | |
| Description | | Number of
Shares | | | Value | |
Fortive Corp. | | | 25,586 | | | $ | 1,812,000 | |
Hino Motors Ltd. | | | 12,230 | | | | 102,648 | |
Hisaka Works Ltd. | | | 3,060 | | | | 23,342 | |
IDEX Corp. | | | 4,078 | | | | 914,288 | |
Ingersoll Rand, Inc.* | | | 12,859 | | | | 635,363 | |
Japan Steel Works Ltd. (The) | | | 2,045 | | | | 49,678 | |
Kone OYJ, Class B | | | 1,140 | | | | 89,539 | |
Middleby Corp. (The)* | | | 3,278 | | | | 594,367 | |
MISUMI Group, Inc. | | | 2,310 | | | | 65,243 | |
Mitsubishi Heavy Industries Ltd. | | | 1,722 | | | | 51,261 | |
Obara Group, Inc. | | | 1,600 | | | | 54,265 | |
OKUMA Corp. | | | 2,380 | | | | 128,502 | |
Otis Worldwide Corp. | | | 2,709 | | | | 210,950 | |
PACCAR, Inc. | | | 7,234 | | | | 650,192 | |
Sandvik AB | | | 15,429 | | | | 381,551 | |
Schindler Holding AG | | | 370 | | | | 102,951 | |
Schindler Holding AG | | | 368 | | | | 104,720 | |
Shibaura Machine Co. Ltd. | | | 548 | | | | 13,069 | |
SMC Corp. | | | 94 | | | | 54,621 | |
Spirax-Sarco Engineering PLC | | | 644 | | | | 105,116 | |
Star Micronics Co. Ltd. | | | 5,500 | | | | 82,897 | |
Sumitomo Heavy Industries Ltd. | | | 2,960 | | | | 86,155 | |
THK Co. Ltd. | | | 2,140 | | | | 73,005 | |
Weichai Power Co. Ltd., Class H | | | 68,000 | | | | 157,399 | |
| | | | | | | | |
| |
TOTAL MACHINERY | | | $ | 7,306,688 | |
|
MARINE – 0.2% | |
AP Moller - Maersk A/S, Class B | | | 44 | | | | 109,456 | |
D/S Norden A/S | | | 3,727 | | | | 96,105 | |
Kuehne + Nagel International AG | | | 482 | | | | 144,115 | |
Pacific Basin Shipping Ltd. | | | 338,384 | | | | 118,573 | |
| | | | | | | | |
| |
TOTAL MARINE | | | $ | 468,249 | |
|
MEDIA – 0.7% | |
China Literature Ltd.* | | | 9,000 | | | | 93,732 | |
Comcast Corp., Class A | | | 9,814 | | | | 551,056 | |
Criteo SA, ADR* | | | 2,303 | | | | 91,498 | |
Fuji Media Holdings, Inc. | | | 3,235 | | | | 39,365 | |
Gendai Agency, Inc.* | | | 670 | | | | 1,775 | |
Metropole Television SA* | | | 3,888 | | | | 86,390 | |
Nippon Television Holdings, Inc. | | | 11,397 | | | | 150,047 | |
RTL Group SA* | | | 1,907 | | | | 112,119 | |
Television Francaise 1* | | | 10,294 | | | | 101,565 | |
TV Asahi Holdings Corp. | | | 3,115 | | | | 57,090 | |
WPP PLC | | | 14,275 | | | | 192,457 | |
| | | | | | | | |
| |
TOTAL MEDIA | | | $ | 1,477,094 | |
|
METALS & MINING – 1.1% | |
Anglo American PLC | | | 4,547 | | | | 192,795 | |
Asahi Holdings, Inc. | | | 6,236 | | | | 125,970 | |
Barrick Gold Corp. | | | 4,923 | | | | 104,896 | |
Centerra Gold, Inc. | | | 4,464 | | | | 41,184 | |
Chubu Steel Plate Co. Ltd. | | | 1,442 | | | | 10,512 | |
Eldorado Gold Corp.* | | | 3,888 | | | | 38,375 | |
Endeavour Mining Corp. | | | 2,450 | | | | 51,007 | |
Gold Fields Ltd. | | | 5,577 | | | | 52,334 | |
Harmony Gold Mining Co. Ltd., ADR | | | 10,643 | | | | 48,319 | |
IAMGOLD Corp.* | | | 6,146 | | | | 19,237 | |
| | | | | | | | |
| | |
| Description | | Number of
Shares | | | Value | |
Impala Platinum Holdings Ltd. | | | 557 | | | $ | 10,408 | |
Kinross Gold Corp. | | | 8,767 | | | | 61,720 | |
Kyoei Steel Ltd. | | | 4,215 | | | | 58,976 | |
Maruichi Steel Tube Ltd. | | | 2,740 | | | | 68,585 | |
Nakayama Steel Works Ltd. | | | 5,740 | | | | 22,686 | |
Neturen Co. Ltd. | | | 2,165 | | | | 10,748 | |
Norsk Hydro ASA | | | 24,692 | | | | 157,233 | |
OceanaGold Corp.* | | | 22,116 | | | | 36,885 | |
Pacific Metals Co. Ltd. | | | 1,727 | | | | 34,291 | |
Resolute Mining Ltd.* | | | 36,598 | | | | 13,610 | |
Rio Tinto PLC | | | 9,282 | | | | 777,435 | |
Salzgitter AG* | | | 1,398 | | | | 44,465 | |
Tokyo Steel Manufacturing Co. Ltd. | | | 12,050 | | | | 117,004 | |
Western Areas Ltd. | | | 28,025 | | | | 49,582 | |
Yamato Kogyo Co. Ltd. | | | 6,048 | | | | 181,986 | |
Yodogawa Steel Works Ltd. | | | 760 | | | | 16,771 | |
| | | | | | | | |
| |
TOTAL METALS & MINING | | | $ | 2,347,014 | |
|
MULTILINE RETAIL – 0.8% | |
Dollar General Corp. | | | 927 | | | | 199,073 | |
Dollarama, Inc. | | | 11,366 | | | | 529,671 | |
Marks & Spencer Group PLC* | | | 25,364 | | | | 55,333 | |
Marui Group Co. Ltd. | | | 4,320 | | | | 81,191 | |
Ollie’s Bargain Outlet Holdings, Inc.* | | | 6,960 | | | | 642,199 | |
Pan Pacific International Holdings Corp. | | | 3,250 | | | | 70,055 | |
| | | | | | | | |
| |
TOTAL MULTILINE RETAIL | | | $ | 1,577,522 | |
|
MULTI-UTILITIES – 0.9% | |
Centrica PLC* | | | 67,417 | | | | 52,770 | |
Consolidated Edison, Inc. | | | 2,228 | | | | 172,470 | |
Dominion Energy, Inc. | | | 1,663 | | | | 132,874 | |
Engie SA* | | | 11,620 | | | | 173,085 | |
National Grid PLC | | | 95,174 | | | | 1,199,721 | |
WEC Energy Group, Inc. | | | 2,159 | | | | 209,790 | |
| | | | | | | | |
| |
TOTAL MULTI-UTILITIES | | | $ | 1,940,710 | |
|
OIL, GAS & CONSUMABLE FUELS – 1.9% | |
Advantage Oil & Gas Ltd.* | | | 14,598 | | | | 38,717 | |
ARC Resources Ltd. | | | 7,390 | | | | 46,475 | |
BP PLC | | | 67,862 | | | | 284,094 | |
Cameco Corp. | | | 4,632 | | | | 77,856 | |
Enbridge, Inc. | | | 15,580 | | | | 600,942 | |
Eni SpA | | | 15,554 | | | | 185,262 | |
Gazprom PJSC, ADR | | | 13,802 | | | | 84,054 | |
Inpex Corp. | | | 13,740 | | | | 93,501 | |
Japan Petroleum Exploration Co. Ltd. | | | 1,430 | | | | 26,511 | |
LUKOIL PJSC, ADR | | | 357 | | | | 27,575 | |
Ovintiv, Inc. | | | 2,766 | | | | 66,137 | |
Royal Dutch Shell PLC, Class B | | | 19,694 | | | | 352,398 | |
Surgutneftegas PJSC, ADR | | | 15,051 | | | | 67,579 | |
TC Energy Corp. | | | 11,870 | | | | 587,247 | |
TOTAL SE | | | 29,725 | | | | 1,313,780 | |
Tourmaline Oil Corp. | | | 2,295 | | | | 49,517 | |
YPF SA, ADR* | | | 4,253 | | | | 16,076 | |
| | | | | | | | |
| |
TOTAL OIL, GAS & CONSUMABLE FUELS | | | $ | 3,917,721 | |
|
PERSONAL PRODUCTS – 0.1% | |
Kobayashi Pharmaceutical Co. Ltd. | | | 698 | | | | 62,340 | |
April 30, 2021 / ANNUAL REPORT
| | |
PORTFOLIOS OF INVESTMENTS Wilmington Global Alpha Equities Fund (continued) | | 26 |
| | | | | | | | |
| | |
| Description | | Number of
Shares | | | Value | |
Unilever PLC | | | 1,549 | | | $ | 90,448 | |
| | | | | | | | |
| |
TOTAL PERSONAL PRODUCTS | | | $ | 152,788 | |
|
PHARMACEUTICALS – 4.2% | |
Astellas Pharma, Inc. | | | 15,958 | | | | 240,185 | |
AstraZeneca PLC | | | 6,721 | | | | 715,410 | |
AstraZeneca PLC, ADR | | | 7,822 | | | | 415,114 | |
Bristol-Myers Squibb Co. | | | 2,865 | | | | 178,833 | |
Daiichi Sankyo Co. Ltd. | | | 3,100 | | | | 79,175 | |
Eisai Co. Ltd. | | | 785 | | | | 51,199 | |
Eli Lilly & Co. | | | 901 | | | | 164,676 | |
Hutchison China MediTech Ltd., ADR* | | | 1,213 | | | | 34,316 | |
Johnson & Johnson | | | 6,441 | | | | 1,048,144 | |
Kyowa Kirin Co. Ltd. | | | 2,128 | | | | 64,772 | |
Merck & Co., Inc. | | | 12,786 | | | | 952,557 | |
Novartis AG | | | 24,878 | | | | 2,122,999 | |
Novo Nordisk A/S, Class B | | | 1,456 | | | | 107,405 | |
Ono Pharmaceutical Co. Ltd. | | | 7,798 | | | | 196,423 | |
Pfizer, Inc. | | | 35,717 | | | | 1,380,462 | |
Roche Holding AG | | | 1,993 | | | | 650,029 | |
Sanofi | | | 962 | | | | 100,858 | |
Takeda Pharmaceutical Co. Ltd. | | | 5,415 | | | | 180,864 | |
| | | | | | | | |
| |
TOTAL PHARMACEUTICALS | | | $ | 8,683,421 | |
|
PROFESSIONAL SERVICES – 2.0% | |
Adecco Group AG | | | 3,180 | | | | 215,539 | |
BeNext-Yumeshin Group Co. | | | 3,900 | | | | 50,903 | |
Booz Allen Hamilton Holding Corp. | | | 2,093 | | | | 173,614 | |
Bureau Veritas SA* | | | 35,250 | | | | 1,054,229 | |
CoStar Group, Inc.* | | | 408 | | | | 348,607 | |
Experian PLC | | | 8,009 | | | | 308,760 | |
Hays PLC* | | | 43,749 | | | | 98,748 | |
IHS Markit Ltd. | | | 1,496 | | | | 160,940 | |
Leidos Holdings, Inc. | | | 5,775 | | | | 584,892 | |
Meitec Corp. | | | 450 | | | | 25,061 | |
Pagegroup PLC* | | | 11,943 | | | | 92,406 | |
Science Applications International Corp. | | | 5,258 | | | | 470,170 | |
SGS SA | | | 34 | | | | 100,603 | |
SThree PLC* | | | 7,845 | | | | 43,477 | |
Wolters Kluwer NV | | | 4,987 | | | | 451,080 | |
| | | | | | | | |
| |
TOTAL PROFESSIONAL SERVICES | | | $ | 4,179,029 | |
|
REAL ESTATE INVESTMENT TRUSTS – 2.2% | |
American Tower Corp. | | | 3,995 | | | | 1,017,806 | |
Boston Properties, Inc. | | | 3,393 | | | | 371,024 | |
British Land Co. PLC (The) | | | 8,378 | | | | 60,038 | |
Daiwa House REIT Investment Corp. | | | 31 | | | | 83,024 | |
Daiwa Securities Living Investments Corp. | | | 52 | | | | 53,366 | |
Japan Real Estate Investment Corp. | | | 14 | | | | 86,775 | |
Land Securities Group PLC | | | 5,662 | | | | 56,422 | |
LaSalle Logiport REIT | | | 70 | | | | 113,599 | |
Medical Properties Trust, Inc. | | | 65,277 | | | | 1,439,358 | |
Nippon Building Fund, Inc. | | | 13 | | | | 85,319 | |
Public Storage | | | 4,448 | | | | 1,250,600 | |
| | | | | | | | |
| |
TOTAL REAL ESTATE INVESTMENT TRUSTS | | | $ | 4,617,331 | |
|
REAL ESTATE MANAGEMENT & DEVELOPMENT – 0.5% | |
CK Asset Holdings Ltd. | | | 18,020 | | | | 112,816 | |
| | | | | | | | |
| | |
| Description | | Number of
Shares | | | Value | |
Daito Trust Construction Co. Ltd. | | | 464 | | | $ | 49,339 | |
Mitsubishi Estate Co. Ltd. | | | 12,794 | | | | 210,575 | |
Nexity SA | | | 8,642 | | | | 468,342 | |
Swiss Prime Site AG | | | 1,063 | | | | 103,450 | |
| | | | | | | | |
| |
TOTAL REAL ESTATE MANAGEMENT & DEVELOPMENT | | | $ | 944,522 | |
|
ROAD &RAIL – 1.4% | |
AMERCO | | | 1,290 | | | | 769,653 | |
Canadian National Railway Co. | | | 19,758 | | | | 2,127,141 | |
Go-Ahead Group PLC (The)* | | | 2,291 | | | | 38,600 | |
| | | | | | | | |
| |
TOTAL ROAD & RAIL | | | $ | 2,935,394 | |
|
SEMICONDUCTORS & SEMICONDUCTOR EQUIPMENT – 1.8% | |
ACM Research, Inc., Class A* | | | 2,132 | | | | 168,321 | |
Disco Corp. | | | 71 | | | | 22,927 | |
Flat Glass Group Co. Ltd., Class H | | | 36,500 | | | | 112,109 | |
Intel Corp. | | | 3,032 | | | | 174,431 | |
Marvell Technology, Inc. | | | 12,731 | | | | 575,569 | |
MediaTek, Inc. | | | 15,000 | | | | 628,839 | |
Mimasu Semiconductor Industry Co. Ltd. | | | 900 | | | | 23,031 | |
Miraial Co. Ltd. | | | 2,210 | | | | 27,029 | |
Qorvo, Inc.* | | | 1,768 | | | | 332,685 | |
Realtek Semiconductor Corp. | | | 18,166 | | | | 342,700 | |
Taiwan Semiconductor Manufacturing Co. Ltd. | | | 32,000 | | | | 673,908 | |
Texas Instruments, Inc. | | | 2,715 | | | | 490,085 | |
Tokyo Seimitsu Co. Ltd. | | | 865 | | | | 40,887 | |
| | | | | | | | |
| |
TOTAL SEMICONDUCTORS & SEMICONDUCTOR EQUIPMENT | | | $ | 3,612,521 | |
|
SOFTWARE – 3.5% | |
ANSYS, Inc.* | | | 446 | | | | 163,084 | |
Constellation Software, Inc. | | | 1,064 | | | | 1,561,552 | |
Dassault Systemes SA | | | 551 | | | | 127,817 | |
Kingdee International Software Group Co. Ltd. | | | 43,552 | | | | 143,424 | |
Manhattan Associates, Inc.* | | | 3,214 | | | | 441,090 | |
Microsoft Corp. | | | 14,624 | | | | 3,687,880 | |
Oracle Corp. | | | 2,800 | | | | 212,212 | |
salesforce.com, Inc.* | | | 2,280 | | | | 525,130 | |
Topicus.com, Inc.* | | | 1,305 | | | | 97,677 | |
Tyler Technologies, Inc.* | | | 398 | | | | 169,094 | |
| | | | | | | | |
| |
TOTAL SOFTWARE | | | $ | 7,128,960 | |
|
SPECIALTY RETAIL – 1.9% | |
CarMax, Inc.* | | | 4,636 | | | | 617,701 | |
CECONOMY AG* | | | 10,380 | | | | 60,811 | |
China Meidong Auto Holdings Ltd. | | | 65,451 | | | | 326,379 | |
Five Below, Inc.* | | | 2,657 | | | | 534,774 | |
Hikari Tsushin, Inc. | | | 517 | | | | 104,000 | |
Home Depot, Inc. (The) | | | 1,090 | | | | 352,800 | |
Industria de Diseno Textil SA | | | 8,871 | | | | 315,636 | |
Kingfisher PLC* | | | 30,032 | | | | 148,258 | |
Nitori Holdings Co. Ltd. | | | 678 | | | | 121,433 | |
Shimamura Co. Ltd. | | | 1,762 | | | | 174,314 | |
TJX Cos., Inc. (The) | | | 14,259 | | | | 1,012,389 | |
USS Co. Ltd. | | | 3,449 | | | | 62,585 | |
Xebio Holdings Co. Ltd. | | | 5,265 | | | | 41,726 | |
| | | | | | | | |
| |
TOTAL SPECIALTY RETAIL | | | $ | 3,872,806 | |
ANNUAL REPORT / April 30, 2021
| | |
| 27 | | PORTFOLIOS OF INVESTMENTS Wilmington Global Alpha Equities Fund (continued) |
| | | | | | | | |
| | |
| Description | | Number of
Shares | | | Value | |
|
TECHNOLOGY HARDWARE, STORAGE & PERIPHERALS – 1.6% | |
Apple, Inc. | | | 22,596 | | | $ | 2,970,470 | |
Canon, Inc. | | | 6,930 | | | | 164,797 | |
Catcher Technology Co. Ltd. | | | 11,377 | | | | 80,285 | |
Maxell Holdings Ltd.* | | | 3,430 | | | | 40,427 | |
Quadient SA | | | 3,016 | | | | 82,433 | |
| | | | | | | | |
| |
TOTAL TECHNOLOGY HARDWARE, STORAGE & PERIPHERALS | | | $ | 3,338,412 | |
|
TEXTILES, APPAREL & LUXURY GOODS – 0.4% | |
Hermes International | | | 99 | | | | 124,256 | |
Lululemon Athletica, Inc.* | | | 211 | | | | 70,742 | |
NIKE, Inc., Class B | | | 5,000 | | | | 663,100 | |
Sanyo Shokai Ltd.* | | | 2,000 | | | | 14,232 | |
| | | | | | | | |
| |
TOTAL TEXTILES, APPAREL & LUXURY GOODS | | | $ | 872,330 | |
|
TOBACCO – 0.3% | |
Philip Morris International, Inc. | | | 6,590 | | | | 626,050 | |
|
TRADING COMPANIES & DISTRIBUTORS – 1.9% | |
AerCap Holdings NV* | | | 5,014 | | | | 292,066 | |
Brenntag SE | | | 18,386 | | | | 1,650,598 | |
Fastenal Co. | | | 12,003 | | | | 627,517 | |
Ferguson PLC | | | 1,786 | | | | 225,261 | |
Inaba Denki Sangyo Co. Ltd. | | | 2,100 | | | | 49,111 | |
ITOCHU Corp. | | | 5,733 | | | | 178,977 | |
Mitsubishi Corp. | | | 7,914 | | | | 218,828 | |
MonotaRO Co. Ltd. | | | 2,535 | | | | 64,370 | |
Rexel SA | | | 5,490 | | | | 107,918 | |
SIG PLC* | | | 22,578 | | | | 15,426 | |
Sumitomo Corp. | | | 6,209 | | | | 84,374 | |
Triton International Ltd. | | | 6,327 | | | | 317,426 | |
| | | | | | | | |
| |
TOTAL TRADING COMPANIES & DISTRIBUTORS | | | $ | 3,831,872 | |
|
TRANSPORTATION INFRASTRUCTURE – 0.1% | |
Hamburger Hafen und Logistik AG | | | 1,117 | | | | 27,510 | |
Kamigumi Co. Ltd. | | | 7,950 | | | | 154,898 | |
| | | | | | | | |
| |
TOTAL TRANSPORTATION INFRASTRUCTURE | | | $ | 182,408 | |
|
WATER UTILITIES – 0.2% | |
Cia de Saneamento Basico do Estado de Sao Paulo | | | 10,496 | | | | 82,584 | |
| | | | | | | | |
| | |
| Description | | Number of
Shares | | | Value | |
Guangdong Investment Ltd. | | | 170,503 | | | $ | 262,511 | |
Severn Trent PLC | | | 2,950 | | | | 100,979 | |
| | | | | | | | |
| |
TOTAL WATER UTILITIES | | | $ | 446,074 | |
|
WIRELESS TELECOMMUNICATION SERVICES – 0.7% | |
America Movil SAB de CV, Class L | | | 7,707 | | | | 107,436 | |
KDDI Corp. | | | 39,426 | | | | 1,191,827 | |
MTN Group* | | | 8,256 | | | | 52,233 | |
SoftBank Corp. | | | 6,274 | | | | 80,874 | |
Turkcell Iletisim Hizmetleri AS | | | 22,036 | | | | 39,442 | |
VEON Ltd., ADR* | | | 33,866 | | | | 60,959 | |
| | | | | | | | |
| |
TOTAL WIRELESS TELECOMMUNICATION SERVICES | | | $ | 1,532,771 | |
| | | | | | | | |
| |
TOTAL COMMON STOCKS
(Cost $ 141,753,772) | | | $ | 190,775,565 | |
|
INVESTMENT COMPANIES – 0.0%** | |
|
EQUITY FUNDS – 0.0%** | |
iShares Core MSCI EAFE ETF | | | 963 | | | | 71,561 | |
NEXT FUNDS TOPIX ETF | | | 690 | | | | 12,595 | |
| | | | | | | | |
| |
TOTAL INVESTMENT COMPANIES
(Cost $ 65,982) | | | $ | 84,156 | |
|
| PREFERRED STOCK – 0.2% | |
|
CONSUMER DISCRETIONARY – 0.2% | |
Volkswagen AG 4.86% | | | 1,694 | | | | 441,049 | |
| | | | | | | | |
| |
TOTAL PREFERRED STOCK
(Cost $ 242,662) | | | $ | 441,049 | |
|
| MONEY MARKET FUND – 3.3% | |
Dreyfus Government Cash Management Fund, | | | | | | | | |
Institutional Shares 0.03%^ | | | 6,723,646 | | | | 6,723,646 | |
| | | | | | | | |
| |
TOTAL MONEY MARKET FUND (Cost $ 6,723,646) | | | $ | 6,723,646 | |
| | | | | | | | |
| |
TOTAL INVESTMENTS – 95.9% (COST $ 148,786,062) | | | $ | 198,024,416 | |
| | |
OTHER ASSETS LESS LIABILITIES – 4.1% | | | | | | | 8,531,328 | |
| | | | | | | | |
| | |
TOTAL NET ASSETS – 100.0% | | | | | | $ | 206,555,744 | |
| | | | | | | | |
April 30, 2021 / ANNUAL REPORT
| | |
PORTFOLIOS OF INVESTMENTS Wilmington Global Alpha Equities Fund (continued) | | 28 |
Various inputs are used in determining the value of the Fund’s investments. These inputs are summarized in the three broad levels listed below.
Level 1 – quoted prices in active markets for identical securities
Level 2 – other significant observable inputs (including quoted prices for similar securities, interest rates, prepayment speeds, credit risk, etc.)
Level 3 – significant unobservable inputs (including the Fund’s own assumptions in determining the fair value of investments)
The following is a summary of the inputs used as of April 30, 2021 in valuing the Fund’s assets and liabilities carried at fair value:
| | | | | | | | | | | | | | | | |
| | | Level 1 | | | Level 2 | | | Level 3 | | | Total | |
| | | | |
Assets | | | | | | | | | | | | | | | | |
| | | | |
Investments in Securities | | | | | | | | | | | | | | | | |
| | | | |
Common Stocks | | | | | | | | | | | | | | | | |
| | | | |
Aerospace & Defense | | $ | 2,772,172 | | | $ | 1,620,981 | | | $ | — | | | $ | 4,393,153 | |
| | | | |
Air Freight & Logistics | | | 2,463,693 | | | | 685,491 | | | | — | | | | 3,149,184 | |
| | | | |
Airlines | | | — | | | | 107,110 | | | | — | | | | 107,110 | |
| | | | |
Auto Components | | | — | | | | 700,822 | | | | — | | | | 700,822 | |
| | | | |
Automobiles | | | — | | | | 1,990,346 | | | | — | | | | 1,990,346 | |
| | | | |
Banks | | | 3,907,718 | | | | 2,494,427 | | | | — | | | | 6,402,145 | |
| | | | |
Beverages | | | 2,387,915 | | | | 1,874,811 | | | | — | | | | 4,262,726 | |
| | | | |
Biotechnology | | | 336,575 | | | | — | | | | — | | | | 336,575 | |
| | | | |
Building Products | | | 1,352,495 | | | | 738,187 | | | | — | | | | 2,090,682 | |
| | | | |
Capital Markets | | | 3,171,617 | | | | 1,883,140 | | | | — | | | | 5,054,757 | |
| | | | |
Chemicals | | | 1,453,679 | | | | 961,402 | | | | — | | | | 2,415,081 | |
| | | | |
Commercial Services & Supplies | | | 4,132,738 | | | | 598,460 | | | | — | | | | 4,731,198 | |
| | | | |
Communications Equipment | | | 1,669,284 | | | | 841,193 | | | | — | | | | 2,510,477 | |
| | | | |
Construction & Engineering | | | — | | | | 1,945,006 | | | | — | | | | 1,945,006 | |
| | | | |
Construction Materials | | | — | | | | 428,914 | | | | — | | | | 428,914 | |
| | | | |
Consumer Finance | | | 1,103,793 | | | | 45,264 | | | | — | | | | 1,149,057 | |
| | | | |
Containers & Packaging | | | 446,850 | | | | 12,077 | | | | — | | | | 458,927 | |
| | | | |
Distributors | | | 214,823 | | | | 65,128 | | | | — | | | | 279,951 | |
| | | | |
Diversified Consumer Services | | | 828,344 | | | | 9,385 | | | | — | | | | 837,729 | |
| | | | |
Diversified Financial Services | | | 3,179,884 | | | | 1,968,523 | | | | — | | | | 5,148,407 | |
| | | | |
Diversified Telecommunication Services | | | 1,173,502 | | | | 2,573,165 | | | | — | | | | 3,746,667 | |
| | | | |
Electric Utilities | | | 1,893,435 | | | | 258,697 | | | | — | | | | 2,152,132 | |
| | | | |
Electrical Equipment | | | — | | | | 1,025,468 | | | | — | | | | 1,025,468 | |
| | | | |
Electronic Equipment, Instruments & Components | | | 549,117 | | | | 1,333,805 | | | | — | | | | 1,882,922 | |
| | | | |
Energy Equipment & Services | | | 35,943 | | | | 91,614 | | | | — | | | | 127,557 | |
| | | | |
Entertainment | | | 642,738 | | | | 261,692 | | | | — | | | | 904,430 | |
| | | | |
Food & Staples Retailing | | | 945,369 | | | | 856,370 | | | | — | | | | 1,801,739 | |
| | | | |
Food Products | | | 1,425,126 | | | | 2,098,769 | | | | — | | | | 3,523,895 | |
| | | | |
Gas Utilities | | | 771,823 | | | | 827,719 | | | | — | | | | 1,599,542 | |
| | | | |
Health Care Equipment & Supplies | | | 5,660,401 | | | | 1,763,913 | | | | — | | | | 7,424,314 | |
| | | | |
Health Care Providers & Services | | | 3,455,192 | | | | 356,307 | | | | — | | | | 3,811,499 | |
| | | | |
Health Care Technology | | | 364,512 | | | | 103,963 | | | | — | | | | 468,475 | |
| | | | |
Hotels, Restaurants & Leisure | | | 3,595,116 | | | | 2,403,162 | | | | — | | | | 5,998,278 | |
| | | | |
Household Durables | | | 1,745,314 | | | | 420,424 | | | | — | | | | 2,165,738 | |
| | | | |
Household Products | | | 1,571,389 | | | | 875,083 | | | | — | | | | 2,446,472 | |
| | | | |
Insurance | | | 8,036,645 | | | | 5,932,127 | | | | — | | | | 13,968,772 | |
| | | | |
Interactive Media & Services | | | 4,827,352 | | | | 2,209,592 | | | | — | | | | 7,036,944 | |
| | | | |
Internet & Direct Marketing Retail | | | 4,373,279 | | | | 1,062,613 | | | | — | | | | 5,435,892 | |
| | | | |
IT Services | | | 6,353,119 | | | | 2,786,402 | | | | — | | | | 9,139,521 | |
| | | | |
Leisure Products | | | 429,052 | | | | 210,334 | | | | — | | | | 639,386 | |
| | | | |
Life Sciences Tools & Services | | | 354,014 | | | | 737,974 | | | | — | | | | 1,091,988 | |
| | | | |
Machinery | | | 4,817,160 | | | | 2,489,528 | | | | — | | | | 7,306,688 | |
| | | | |
Marine | | | — | | | | 468,249 | | | | — | | | | 468,249 | |
| | | | |
Media | | | 642,554 | | | | 834,540 | | | | — | | | | 1,477,094 | |
| | | | |
Metals & Mining | | | 401,623 | | | | 1,945,391 | | | | — | | | | 2,347,014 | |
| | | | |
Multiline Retail | | | 1,370,943 | | | | 206,579 | | | | — | | | | 1,577,522 | |
| | | | |
Multi-Utilities | | | 515,134 | | | | 1,425,576 | | | | — | | | | 1,940,710 | |
| | | | |
Oil, Gas & Consumable Fuels | | | 1,662,175 | | | | 2,255,546 | | | | — | | | | 3,917,721 | |
| | | | |
Personal Products | | | — | | | | 152,788 | | | | — | | | | 152,788 | |
| | | | |
Pharmaceuticals | | | 4,174,102 | | | | 4,509,319 | | | | — | | | | 8,683,421 | |
ANNUAL REPORT / April 30, 2021
| | |
| 29 | | PORTFOLIOS OF INVESTMENTS Wilmington Global Alpha Equities Fund (continued) |
| | | | | | | | | | | | | | | | |
| | | | |
| | | Level 1 | | | Level 2 | | | Level 3 | | | Total | |
| | | | |
Professional Services | | $ | 1,738,223 | | | $ | 2,440,806 | | | $ | — | | | $ | 4,179,029 | |
| | | | |
Real Estate Investment Trusts | | | 4,078,788 | | | | 538,543 | | | | — | | | | 4,617,331 | |
| | | | |
Real Estate Management & Development | | | — | | | | 944,522 | | | | — | | | | 944,522 | |
| | | | |
Road & Rail | | | 2,896,794 | | | | 38,600 | | | | — | | | | 2,935,394 | |
| | | | |
Semiconductors & Semiconductor Equipment | | | 1,741,091 | | | | 1,871,430 | | | | — | | | | 3,612,521 | |
| | | | |
Software | | | 6,857,719 | | | | 271,241 | | | | — | | | | 7,128,960 | |
| | | | |
Specialty Retail | | | 2,517,664 | | | | 1,355,142 | | | | — | | | | 3,872,806 | |
| | | | |
Technology Hardware, Storage & Peripherals | | | 2,970,470 | | | | 367,942 | | | | — | | | | 3,338,412 | |
| | | | |
Textiles, Apparel & Luxury Goods | | | 733,842 | | | | 138,488 | | | | — | | | | 872,330 | |
| | | | |
Tobacco | | | 626,050 | | | | — | | | | — | | | | 626,050 | |
| | | | |
Trading Companies & Distributors | | | 1,237,009 | | | | 2,594,863 | | | | — | | | | 3,831,872 | |
| | | | |
Transportation Infrastructure | | | — | | | | 182,408 | | | | — | | | | 182,408 | |
| | | | |
Water Utilities | | | 82,584 | | | | 363,490 | | | | — | | | | 446,074 | |
| | | | |
Wireless Telecommunication Services | | | 168,395 | | | | 1,364,376 | | | | — | | | | 1,532,771 | |
| | | | |
Investment Companies | | | 71,561 | | | | 12,595 | | | | — | | | | 84,156 | |
| | | | |
Preferred Stock | | | — | | | | 441,049 | | | | — | | | | 441,049 | |
| | | | |
Money Market Fund | | | 6,723,646 | | | | — | | | | — | | | | 6,723,646 | |
| | | | | | | | | | | | | | | | |
| | | | |
Total Investments in Securities | | $ | 123,651,545 | | | $ | 74,372,871 | | | $ | — | | | $ | 198,024,416 | |
| | | | | | | | | | | | | | | | |
Other Financial Instruments! | | | | | | | | | | | | | | | | |
| | | | |
Forward Foreign Currency Contracts | | $ | — | | | $ | 24,948 | | | $ | — | | | $ | 24,948 | |
| | | | |
Financial Futures Contracts | | | 319,262 | | | | — | | | | — | | | | 319,262 | |
| | | | | | | | | | | | | | | | |
| | | | |
Total Assets - Other Financial Instruments | | $ | 319,262 | | | $ | 24,948 | | | $ | — | | | $ | 344,210 | |
| | | | | | | | | | | | | | | | |
| | | | |
Liabilities | | | | | | | | | | | | | | | | |
| | | | |
Other Financial Instruments! | | | | | | | | | | | | | | | | |
| | | | |
Forward Foreign Currency Contracts | | $ | — | | | $ | (229,936 | ) | | $ | — | | | $ | (229,936 | ) |
| | | | |
Financial Futures Contracts | | | (3,236,460 | ) | | | — | | | | — | | | | (3,236,460 | ) |
| | | | | | | | | | | | | | | | |
| | | | |
Total Liabilities - Other Financial Instruments | | $ | (3,236,460 | ) | | $ | (229,936 | ) | | $ | — | | | $ | (3,466,396 | ) |
| | | | | | | | | | | | | | | | |
| ! | Other financial instruments are derivative instruments, such as forward foreign currency contracts and financial future contracts, which are valued at the unrealized appreciation (depreciation) on the instrument. |
As a result of utilizing international fair value pricing at April 30, 2021, a portion of the Fund’s common stock investments were categorized as Level 2.
| * | Non-income producing security. |
| ** | Represents less than 0.05%. |
The following acronyms are used throughout this Fund:
| | | | |
| | |
| | ADR | | American Depositary Receipt |
| | |
| | CAD | | Canadian Dollar |
| | |
| | ETF | | Exchange-Traded Fund |
| | |
| | EUR | | Euro |
| | |
| | GBP | | British Pound Sterling |
| | |
| | JPY | | Japanese Yen |
| | |
| | MSCI | | Morgan Stanley Capital International |
| | |
| | OYJ | | Public Limited Company |
| | |
| | PCL | | Public Company Limited |
| | |
| | PLC | | Public Limited Company |
| | |
| | REIT | | Real Estate Investment Trust |
| | |
| | S&P | | Standards & Poor’s |
| | |
| | SCA | | Limited Partnership With Share Capital |
| | |
| | SpA | | Societa per Azioni |
April 30, 2021 / ANNUAL REPORT
| | |
PORTFOLIOS OF INVESTMENTS Wilmington Global Alpha Equities Fund (concluded) | | 30 |
At April 30, 2021, the Global Alpha Equities Fund had the following outstanding forward foreign currency contracts, which contractually obligates the Fund to deliver or receive currencies at specified future dates:
| | | | | | | | | | | | | | | | | | | | |
| | | | | | |
Settlement Date | | Counterparty | |
| Contracts to
Deliver/Receive |
| |
| Contract
Amount |
| |
| Contract at
Value |
| |
| Unrealized
Appreciation |
| | Unrealized (Depreciation) |
| | | | | |
CONTRACTS SOLD | | | | | | | | | | | | | | | | | | |
| | | | | | |
6/16/2021 | | Morgan Stanley | | | 3,187,000 EUR | | | | $3,801,074 | | | | $3,835,307 | | | | $ — | | | $(34,233) |
| | | | | | |
6/16/2021 | | BNP Paribas | | | 2,266,000 GBP | | | | 3,142,822 | | | | 3,129,857 | | | | 12,965 | | | — |
| | | | | | |
6/16/2021 | | Morgan Stanley | | | 327,000,000 JPY | | | | 3,005,176 | | | | 2,993,193 | | | | 11,983 | | | — |
| | | | | | |
6/16/2021 | | Morgan Stanley | | | 8,975,000 CAD | | | | 7,106,828 | | | | 7,302,531 | | | | — | | | (195,703) |
| | | | | |
| UNREALIZED APPRECIATION (DEPRECIATION) ON FORWARD FOREIGN CURRENCY CONTRACTS | | | | | | | | | | | | | | | $ 24,948 | | | $ (229,936) |
At April 30, 2021, the Global Alpha Equities Fund had open financial futures contracts as follows:
| | | | | | | | | | | | | | | | | | | | | | | | |
| | | | | | |
Underlying Contracts to Buy/Sell | |
| Expiration
Date |
| |
| Number of
Contracts |
| |
| Notional
Amount |
| |
| Notional
Value |
| |
| Unrealized
Appreciation |
(a) | |
| Unrealized
(Depreciation)(a) |
|
| | | | | |
SHORT POSITIONS: | | | | | | | | | | | | | | | | | | | | | |
| | | | | |
EXCHANGE-TRADED: | | | | | | | | | | | | | | | | | | | | | |
| | | | | | |
E-Mini S&P 500 Index | | | June 2021 | | | | 101 | | | | $19,833,144 | | | | $21,080,720 | | | | $ — | | | $ | (1,247,576) | |
| | | | | | |
E-Mini S&P Mid 400 Index | | | June 2021 | | | | 65 | | | | 17,004,131 | | | | 17,681,950 | | | | — | | | | (677,819) | |
| | | | | | |
HSCE Index | | | May 2021 | | | | 83 | | | | 5,821,168 | | | | 5,752,914 | | | | 68,254 | | | | — | |
| | | | | | |
MSCI EAFE Index | | | June 2021 | | | | 262 | | | | 28,721,891 | | | | 29,570,630 | | | | — | | | | (848,739) | |
| | | | | | |
S&P TSX 60 Index | | | June 2021 | | | | 16 | | | | 2,896,197 | | | | 2,955,929 | | | | — | | | | (59,732) | |
| | | | | | |
E-Mini Russell 2000 Index | | | June 2021 | | | | 71 | | | | 8,279,333 | | | | 8,028,325 | | | | 251,008 | | | | — | |
| | | | | | |
TOPIX Index | | | June 2021 | | | | 32 | | | | 5,509,766 | | | | 5,567,573 | | | | — | | | | (57,807) | |
| | | | | | |
Euro STOXX 50 Index | | | June 2021 | | | | 107 | | | | 4,865,605 | | | | 5,068,446 | | | | — | | | | (202,841) | |
| | | | | | |
FTSE 100 Index | | | June 2021 | | | | 48 | | | | 4,456,951 | | | | 4,598,897 | | | | — | | | | (141,946) | |
| | | | | |
| UNREALIZED APPRECIATION (DEPRECIATION) ON FINANCIAL FUTURES CONTRACTS | | | | | | | | | | | | | | | | $ 319,262 | | | $ | (3,236,460 | ) |
| (a) | The unrealized appreciation (depreciation) presented above is the cumulative change in unrealized appreciation (depreciation) from the date the contract was open through April 30, 2021. Only current day variation margin is reported on the Fund’s Statement of Assets and Liabilities. |
See Notes which are an integral part of the Financial Statements
ANNUAL REPORT / April 30, 2021
PORTFOLIO OF INVESTMENTS SUMMARY TABLE
Wilmington Real Asset Fund
At April 30, 2021, the Fund’s portfolio composition was as follows (unaudited):
| | |
| | | Percentage of
Total Net Assets |
| | | | |
Commodity Related Securities: | | | | |
Investment Company Commodity Fund | | | 33.1 | % |
Exchange-Traded Commodity Funds | | | 19.3 | % |
Real Estate Related Securities: | | | | |
Real Estate Investment Trusts | | | 17.6 | % |
Exchange-Traded Funds | | | 8.8 | % |
Common Stocks | | | 4.9 | % |
Investment Companies | | | 2.2 | % |
Rights | | | 0.0 | %(1) |
Inflation Related Securities: | | | | |
Exchange-Traded Funds | | | 10.1 | % |
Cash Equivalents(2) | | | 3.8 | % |
Cash Collateral Invested for Securities on Loan(3) | | | 1.5 | % |
Other Assets and Liabilities - Net(4) | | | (1.3 | )% |
| | | | |
| |
TOTAL | | | 100.0 | % |
| | | | |
| (1) | Represents less than 0.05%. |
| (2) | Cash Equivalents include investments in a money market fund. |
| (3) | Cash Collateral Invested for Securities on Loan include investments in money market funds and repurchase agreements. |
| (4) | Assets, other than investments in securities, less liabilities. See Statements of Assets and Liabilities. |
PORTFOLIO OF INVESTMENTS
April 30, 2021
| | | | | | | | |
| | |
| Description | | Number of
Shares | | | Value | |
|
INFLATION RELATED SECURITIES – 10.1% | |
|
EXCHANGE-TRADED FUNDS – 10.1% | |
|
INFLATION-PROTECTED SECURITIES FUND – 10.1% | |
Schwab U.S. TIPS ETF | | | 760,000 | | | $ | 47,051,600 | |
| | | | | | | | |
| |
TOTAL EXCHANGE-TRADED FUNDS
(COST $46,978,380) | | | $ | 47,051,600 | |
| | | | | | | | |
| |
TOTAL INFLATION RELATED SECURITIES (COST $46,978,380) | | | $ | 47,051,600 | |
|
REAL ESTATE RELATED SECURITIES – 33.5% | |
|
COMMON STOCKS – 4.9% | |
|
CONSTRUCTION & ENGINEERING – 0.0%** | |
Ashtrom Group Ltd. | | | 754 | | | | 16,238 | |
|
DIVERSIFIED – 0.0%** | |
Argosy Property Ltd. | | | 19,879 | | | | 21,099 | |
Centuria Capital Group | | | 25,310 | | | | 51,946 | |
| | | | | | | | |
TOTAL DIVERSIFIED | | | | | | $ | 73,045 | |
|
DIVERSIFIED REAL ESTATE ACTIVITIES – 2.0% | |
Airport City Ltd.* | | | 4,669 | | | | 77,528 | |
Allreal Holding AG | | | 730 | | | | 147,755 | |
CapitaLand Ltd. | | | 130,800 | | | | 364,626 | |
| | | | | | | | |
| | |
| Description | | Number of
Shares | | | Value | |
Chinese Estates Holdings Ltd. | | | 75,000 | | | $ | 37,082 | |
City Developments Ltd. | | | 26,000 | | | | 153,802 | |
Daito Trust Construction Co. Ltd. | | | 3,500 | | | | 372,165 | |
Daiwa House Industry Co. Ltd. | | | 34,200 | | | | 1,014,107 | |
DIC Asset AG | | | 3,489 | | | | 62,228 | |
Far East Consortium International Ltd. | | | 78,000 | | | | 27,593 | |
Gemdale Properties & Investment Corp. Ltd. | | | 358,000 | | | | 50,229 | |
Great Eagle Holdings Ltd. | | | 13,000 | | | | 45,786 | |
Hang Lung Properties Ltd. | | | 106,000 | | | | 289,191 | |
Heiwa Real Estate Co. Ltd. | | | 2,900 | | | | 98,755 | |
Kerry Properties Ltd. | | | 54,500 | | | | 183,627 | |
Lendlease Corp. Ltd. | | | 35,398 | | | | 345,899 | |
Mitsubishi Estate Co. Ltd. | | | 69,400 | | | | 1,142,247 | |
Mitsui Fudosan Co. Ltd. | | | 48,700 | | | | 1,058,704 | |
New World Development Co. Ltd. | | | 66,000 | | | | 349,250 | |
Nomura Real Estate Holdings, Inc. | | | 6,900 | | | | 170,103 | |
Property & Building Corp. Ltd. | | | 345 | | | | 41,127 | |
Shinoken Group Co. Ltd. | | | 3,200 | | | | 34,248 | |
St. Joe Co. (The) | | | 1,605 | | | | 73,493 | |
Starts Corp., Inc. | | | 700 | | | | 17,145 | |
Sumitomo Realty & Development Co. Ltd. | | | 24,500 | | | | 817,833 | |
Sun Hung Kai Properties Ltd. | | | 78,000 | | | | 1,173,304 | |
Tokyo Tatemono Co. Ltd. | | | 11,600 | | | | 171,742 | |
April 30, 2021 / ANNUAL REPORT
| | |
PORTFOLIOS OF INVESTMENTS Wilmington Real Asset Fund (continued) | | 32 |
| | | | | | | | |
| | |
| Description | | Number of
Shares | | | Value | |
Tokyu Fudosan Holdings Corp. | | | 31,100 | | | $ | 173,101 | |
UOL Group Ltd. | | | 29,900 | | | | 172,528 | |
Wharf Holdings Ltd. (The) | | | 78,000 | | | | 236,588 | |
YH Dimri Construction & Development Ltd. | | | 360 | | | | 21,387 | |
| | | | | | | | |
| |
TOTAL DIVERSIFIED REAL ESTATE ACTIVITIES | | | $ | 8,923,173 | |
|
OFFICE – 0.0%** | |
Precinct Properties New Zealand Ltd. | | | 65,609 | | | | 77,325 | |
|
REAL ESTATE DEVELOPMENT – 0.5% | |
Aedas Homes SA* | | | 962 | | | | 24,834 | |
BUWOG AG Escrow Shares*,(1) | | | 3,077 | | | | — | |
Cedar Woods Properties Ltd. | | | 3,874 | | | | 21,875 | |
Chip Eng Seng Corp. Ltd. | | | 44,200 | | | | 16,243 | |
CK Asset Holdings Ltd. | | | 125,500 | | | | 785,708 | |
Forestar Group, Inc.* | | | 1,558 | | | | 39,480 | |
Goldcrest Co. Ltd. | | | 1,500 | | | | 21,777 | |
Greenland Hong Kong Holdings Ltd. | | | 101,000 | | | | 35,113 | |
Henderson Land Development Co. Ltd. | | | 62,735 | | | | 278,840 | |
Howard Hughes Corp. (The)* | | | 2,114 | | | | 228,185 | |
Instone Real Estate Group AG* | | | 2,416 | | | | 71,836 | |
K Wah International Holdings Ltd. | | | 135,000 | | | | 67,180 | |
Katitas Co. Ltd. | | | 2,600 | | | | 77,891 | |
Lifestyle Communities Ltd. | | | 4,838 | | | | 52,127 | |
Nexity SA | | | 2,856 | | | | 154,777 | |
Road King Infrastructure Ltd. | | | 24,000 | | | | 31,892 | |
Selvaag Bolig ASA | | | 6,948 | | | | 50,991 | |
Sino Land Co. Ltd. | | | 170,000 | | | | 252,475 | |
St. Modwen Properties PLC | | | 17,514 | | | | 105,045 | |
Tosei Corp. | | | 2,300 | | | | 22,768 | |
Wing Tai Holdings Ltd. | | | 24,500 | | | | 35,301 | |
| | | | | | | | |
| |
TOTAL REAL ESTATE DEVELOPMENT | | | $ | 2,374,338 | |
|
REAL ESTATE OPERATING COMPANIES – 2.4% | |
ADO Properties SA* | | | 3,613 | | | | 106,710 | |
Aeon Mall Co. Ltd. | | | 5,000 | | | | 79,373 | |
Akelius Residential Property AB, Class D | | | 10,772 | | | | 20,990 | |
Alony Hetz Properties & Investments Ltd. | | | 5,823 | | | | 83,748 | |
Amot Investments Ltd. | | | 8,779 | | | | 57,242 | |
Aroundtown SA | | | 61,652 | | | | 474,727 | |
Ascendas India Trust | | | 33,200 | | | | 35,373 | |
Atrium Ljungberg AB, Class B | | | 2,330 | | | | 48,804 | |
Azrieli Group Ltd. | | | 3,961 | | | | 277,946 | |
Bayside Land Corp. Ltd. | | | 5,012 | | | | 45,925 | |
Big Shopping Centers Ltd.* | | | 276 | | | | 33,260 | |
Blue Square Real Estate Ltd. | | | 878 | | | | 64,451 | |
CA Immobilien Anlagen AG | | | 3,292 | | | | 144,264 | |
Castellum AB | | | 12,547 | | | | 305,546 | |
Catena AB | | | 1,357 | | | | 65,591 | |
Cibus Nordic Real Estate AB | | | 2,057 | | | | 43,453 | |
Citycon OYJ | | | 2,325 | | | | 20,417 | |
CLS Holdings PLC | | | 27,220 | | | | 93,561 | |
Daibiru Corp. | | | 5,100 | | | | 59,664 | |
Deutsche EuroShop AG* | | | 2,964 | | | | 68,419 | |
Deutsche Wohnen SE | | | 18,869 | | | | 1,020,788 | |
Dios Fastigheter AB | | | 4,885 | | | | 46,497 | |
Entra ASA | | | 5,788 | | | | 130,715 | |
Fabege AB | | | 13,425 | | | | 200,157 | |
Fastighets AB Balder, Class B* | | | 5,228 | | | | 301,226 | |
| | | | | | | | |
| | |
| Description | | Number of
Shares | | | Value | |
Gazit-Globe Ltd. | | | 8,975 | | | $ | 58,470 | |
Grainger PLC | | | 32,952 | | | | 130,085 | |
Grand City Properties SA | | | 5,578 | | | | 149,977 | |
Hang Lung Group Ltd. | | | 31,000 | | | | 81,322 | |
Helical PLC | | | 12,067 | | | | 70,627 | |
Hongkong Land Holdings Ltd. | | | 60,000 | | | | 296,713 | |
Hufvudstaden AB, Class A | | | 4,456 | | | | 71,027 | |
Hulic Co. Ltd. | | | 25,700 | | | | 293,200 | |
Hysan Development Co. Ltd. | | | 26,001 | | | | 97,883 | |
Ichigo, Inc. | | | 6,800 | | | | 21,254 | |
IMMOFINANZ AG* | | | 4,535 | | | | 94,362 | |
Intershop Holding AG | | | 64 | | | | 42,820 | |
Keihanshin Building Co. Ltd. | | | 4,900 | | | | 66,802 | |
Kennedy-Wilson Holdings, Inc. | | | 4,727 | | | | 97,140 | |
K-fast Holding AB* | | | 646 | | | | 23,536 | |
Klovern AB, Class B | | | 55,778 | | | | 107,962 | |
Kungsleden AB | | | 9,968 | | | | 115,895 | |
LEG Immobilien SE | | | 3,707 | | | | 515,774 | |
Mega Or Holdings Ltd. | | | 685 | | | | 22,671 | |
Melisron Ltd.* | | | 1,293 | | | | 78,066 | |
Mobimo Holding AG | | | 348 | | | | 110,584 | |
NP3 Fastigheter AB | | | 1,509 | | | | 27,707 | |
Nyfosa AB | | | 11,802 | | | | 141,979 | |
Platzer Fastigheter Holding AB, Class B | | | 3,083 | | | | 40,308 | |
PSP Swiss Property AG | | | 2,079 | | | | 256,541 | |
S IMMO AG | | | 4,007 | | | | 104,028 | |
Sagax AB, Class D | | | 19,966 | | | | 77,500 | |
Samhallsbyggnadsbolaget i Norden AB, Class D | | | 21,008 | | | | 74,802 | |
Samhallsbyggnadsbolaget i Norden AB | | | 81,389 | | | | 309,577 | |
Shurgard Self Storage SA | | | 1,183 | | | | 55,034 | |
Sirius Real Estate Ltd. | | | 54,139 | | | | 76,023 | |
Swire Properties Ltd. | | | 59,000 | | | | 176,065 | |
Swiss Prime Site AG | | | 3,906 | | | | 380,129 | |
TAG Immobilien AG | | | 7,764 | | | | 240,110 | |
Tricon Residential, Inc. | | | 9,173 | | | | 97,316 | |
VGP NV | | | 392 | | | | 68,424 | |
Vonovia SE | | | 29,101 | | | | 1,912,074 | |
Wallenstam AB, Class B | | | 10,637 | | | | 164,390 | |
Wharf Real Estate Investment Co. Ltd. | | | 84,000 | | | | 482,751 | |
Wihlborgs Fastigheter AB | | | 6,877 | | | | 140,580 | |
| | | | | | | | |
| | |
TOTAL REAL ESTATE OPERATING COMPANIES | | | | | | $ | 11,200,355 | |
|
RETAIL – 0.0%** | |
Kiwi Property Group Ltd. | | | 80,708 | | | | 73,237 | |
| | | | | | | | |
| | |
TOTAL COMMON STOCKS
(COST $17,427,889) | | | | | | $ | 22,737,711 | |
|
EXCHANGE-TRADED FUNDS – 8.8% | |
|
EQUITY FUNDS – 8.8% | |
Schwab U.S. REIT ETF# | | | 472,500 | | | | 20,974,275 | |
Vanguard Global ex-U.S. Real Estate ETF# | | | 345,000 | | | | 19,713,300 | |
| | | | | | | | |
TOTAL EQUITY FUNDS | | | | | | $ | 40,687,575 | |
| | | | | | | | |
| | |
TOTAL EXCHANGE-TRADED FUNDS
(COST $32,610,051) | | | | | | $ | 40,687,575 | |
ANNUAL REPORT / April 30, 2021
| | |
| 33 | | PORTFOLIOS OF INVESTMENTS Wilmington Real Asset Fund (continued) |
| | | | | | | | |
| | |
| Description | | Number of
Shares | | | Value | |
| | |
INVESTMENT COMPANIES – 2.2% | | | | | | | | |
| | |
EQUITY FUNDS – 2.2% | | | | | | | | |
Tortoise MLP & Pipeline Fund | | | 973,466 | | | $ | 10,211,663 | |
| | |
REAL ESTATE – 0.0%** | | | | | | | | |
BMO Commercial Property Trust Ltd. | | | 39,591 | | | | 43,585 | |
| | | | | | | | |
| |
TOTAL INVESTMENT COMPANIES
(COST $12,786,269) | | | $ | 10,255,248 | |
| | |
RIGHTS – 0.0%** | | | | | | | | |
HomeCo Daily Needs REIT*, Expire 05/07/21 | | | 8,727 | | | | — | |
| | | | | | | | |
| |
TOTAL RIGHTS
(COST $0) | | | $ | — | |
| |
REAL ESTATE INVESTMENT TRUSTS – 17.6% | | | | | |
| | |
DIVERSIFIED – 1.9% | | | | | | | | |
Abacus Property Group | | | 16,994 | | | | 39,633 | |
Activia Properties, Inc. | | | 35 | | | | 161,390 | |
Alexander & Baldwin, Inc. | | | 7,229 | | | | 132,508 | |
American Assets Trust, Inc. | | | 1,696 | | | | 59,445 | |
Armada Hoffler Properties, Inc. | | | 5,648 | | | | 76,982 | |
Artis REIT | | | 2,286 | | | | 20,216 | |
Broadstone Net Lease, Inc. | | | 1,074 | | | | 21,673 | |
Charter Hall Group | | | 21,646 | | | | 233,826 | |
Charter Hall Long Wale REIT | | | 30,820 | | | | 116,061 | |
Cofinimmo SA | | | 1,343 | | | | 205,900 | |
Colony Capital, Inc.*,# | | | 25,064 | | | | 175,448 | |
Cominar REIT | | | 2,658 | | | | 21,106 | |
CTO Realty Growth, Inc. | | | 76 | | | | 4,028 | |
Daiwa House REIT Investment Corp. | | | 104 | | | | 278,533 | |
Empire State Realty Trust, Inc., Class A | | | 16,562 | | | | 188,641 | |
Essential Properties Realty Trust, Inc. | | | 5,505 | | | | 144,176 | |
Gecina SA | | | 2,544 | | | | 372,385 | |
Gladstone Commercial Corp. | | | 2,455 | | | | 51,653 | |
Global Net Lease, Inc. | | | 11,392 | | | | 218,726 | |
Goodman Property Trust | | | 75,368 | | | | 120,129 | |
GPT Group (The) | | | 100,172 | | | | 356,540 | |
Growthpoint Properties Australia Ltd. | | | 18,802 | | | | 54,326 | |
H&R REIT | | | 7,113 | | | | 88,135 | |
Hankyu Hanshin REIT, Inc. | | | 37 | | | | 51,852 | |
Heiwa REIT, Inc. | | | 76 | | | | 114,520 | |
Hulic Reit, Inc. | | | 71 | | | | 113,318 | |
ICADE | | | 1,562 | | | | 121,552 | |
Irongate Group | | | 21,935 | | | | 23,591 | |
Kenedix Office Investment Corp. | | | 20 | | | | 147,271 | |
Land Securities Group PLC | | | 36,123 | | | | 359,968 | |
LondonMetric Property PLC | | | 49,777 | | | | 155,098 | |
LXI REIT PLC | | | 26,814 | | | | 50,575 | |
Mapletree North Asia Commercial Trust | | | 101,300 | | | | 82,990 | |
Merlin Properties Socimi SA | | | 17,152 | | | | 189,570 | |
Mirvac Group | | | 191,655 | | | | 397,112 | |
NIPPON REIT Investment Corp. | | | 32 | | | | 124,170 | |
Nomura Real Estate Master Fund, Inc. | | | 242 | | | | 382,374 | |
NTT UD REIT Investment Corp. | | | 97 | | | | 143,808 | |
One Liberty Properties, Inc. | | | 12 | | | | 298 | |
Picton Property Income Ltd. (The) | | | 63,920 | | | | 80,298 | |
PS Business Parks, Inc. | | | 809 | | | | 131,357 | |
RDI REIT PLC | | | 11,838 | | | | 19,840 | |
| | | | | | | | |
| | |
| Description | | Number of
Shares | | | Value | |
REIT 1 Ltd. | | | 11,700 | | | $ | 61,979 | |
Samty Residential Investment Corp. | | | 22 | | | | 23,764 | |
Sekisui House Reit, Inc. | | | 220 | | | | 183,057 | |
Star Asia Investment Corp. | | | 81 | | | | 41,467 | |
Stockland | | | 122,754 | | | | 442,365 | |
STORE Capital Corp. | | | 11,637 | | | | 416,488 | |
Sunlight REIT | | | 139,000 | | | | 76,424 | |
Suntec REIT | | | 110,400 | | | | 126,517 | |
Tokyu REIT, Inc. | | | 73 | | | | 123,822 | |
Tosei Reit Investment Corp. | | | 15 | | | | 18,381 | |
UK Commercial Property REIT Ltd. | | | 46,367 | | | | 51,524 | |
United Urban Investment Corp. | | | 161 | | | | 240,351 | |
VEREIT, Inc. | | | 11,018 | | | | 527,101 | |
Washington REIT | | | 2,685 | | | | 62,346 | |
WP Carey, Inc. | | | 8,528 | | | | 638,662 | |
Yuexiu REIT | | | 80,000 | | | | 40,237 | |
| | | | | | | | |
| |
TOTAL DIVERSIFIED | | | $ | 8,905,507 | |
|
DIVERSIFIED REAL ESTATE ACTIVITIES – 0.0%** | |
Sella Capital Real Estate Ltd. | | | 19,590 | | | | 49,906 | |
|
HEALTH CARE – 1.6% | |
Aedifica SA | | | 1,702 | | | | 207,914 | |
Arena REIT | | | 17,467 | | | | 43,518 | |
Assura PLC | | | 137,396 | | | | 141,443 | |
CareTrust REIT, Inc. | | | 6,068 | | | | 146,724 | |
Community Healthcare Trust, Inc. | | | 886 | | | | 45,115 | |
Diversified Healthcare Trust | | | 8,694 | | | | 38,384 | |
Health Care & Medical Investment Corp. | | | 17 | | | | 21,193 | |
Healthcare Realty Trust, Inc. | | | 6,136 | | | | 197,334 | |
Healthcare Trust of America, Inc., Class A | | | 10,497 | | | | 308,297 | |
Healthpeak Properties, Inc. | | | 26,806 | | | | 920,518 | |
Impact Healthcare REIT PLC | | | 12,583 | | | | 19,444 | |
LTC Properties, Inc. | | | 2,893 | | | | 123,039 | |
Medical Properties Trust, Inc. | | | 29,826 | | | | 657,663 | |
National Health Investors, Inc. | | | 2,416 | | | | 177,359 | |
New Senior Investment Group, Inc. | | | 6,765 | | | | 44,784 | |
NorthWest Healthcare Properties REIT | | | 4,866 | | | | 51,702 | |
Omega Healthcare Investors, Inc. | | | 11,311 | | | | 429,818 | |
Parkway Life REIT | | | 31,100 | | | | 97,426 | |
Physicians Realty Trust | | | 15,860 | | | | 297,058 | |
Primary Health Properties PLC | | | 66,777 | | | | 139,480 | |
Sabra Health Care REIT, Inc. | | | 10,574 | | | | 192,130 | |
Universal Health Realty Income Trust | | | 1,767 | | | | 118,301 | |
Ventas, Inc. | | | 19,267 | | | | 1,068,548 | |
Vital Healthcare Property Trust | | | 24,302 | | | | 51,037 | |
Welltower, Inc. | | | 21,426 | | | | 1,607,593 | |
| | | | | | | | |
| |
TOTAL HEALTH CARE | | | $ | 7,145,822 | |
|
HOTEL & RESORT – 0.6% | |
Apple Hospitality REIT, Inc. | | | 9,928 | | | | 157,458 | |
Ascott Residence Trust | | | 95,500 | | | | 75,870 | |
CDL Hospitality Trusts | | | 31,900 | | | | 29,923 | |
Chatham Lodging Trust* | | | 2,859 | | | | 39,654 | |
DiamondRock Hospitality Co.* | | | 14,037 | | | | 146,266 | |
Hersha Hospitality Trust* | | | 6,231 | | | | 72,030 | |
Hoshino Resorts REIT, Inc. | | | 11 | | | | 64,565 | |
Host Hotels & Resorts, Inc.* | | | 35,009 | | | | 635,763 | |
Invincible Investment Corp. | | | 270 | | | | 97,030 | |
April 30, 2021 / ANNUAL REPORT
| | |
PORTFOLIOS OF INVESTMENTS Wilmington Real Asset Fund (continued) | | 34 |
| | | | | | | | |
| | |
| Description | | Number of
Shares | | | Value | |
Japan Hotel REIT Investment Corp. | | | 200 | | | $ | 114,531 | |
Park Hotels & Resorts, Inc.* | | | 12,850 | | | | 286,684 | |
Pebblebrook Hotel Trust | | | 6,007 | | | | 143,447 | |
RLJ Lodging Trust | | | 10,153 | | | | 163,869 | |
Ryman Hospitality Properties, Inc.* | | | 2,708 | | | | 212,984 | |
Service Properties Trust | | | 10,529 | | | | 129,665 | |
Summit Hotel Properties, Inc.* | | | 3,569 | | | | 36,297 | |
Sunstone Hotel Investors, Inc.* | | | 9,213 | | | | 121,243 | |
Xenia Hotels & Resorts, Inc.* | | | 6,846 | | | | 133,018 | |
| | | | | | | | |
| |
TOTAL HOTEL & RESORT | | | $ | 2,660,297 | |
|
INDUSTRIAL – 3.0% | |
AIMS APAC REIT | | | 23,200 | | | | 24,411 | |
Americold Realty Trust | | | 12,978 | | | | 524,181 | |
APN Industria REIT | | | 12,124 | | | | 28,860 | |
ARA LOGOS Logistics Trust | | | 57,800 | | | | 33,602 | |
Ascendas REIT | | | 162,800 | | | | 379,376 | |
Centuria Industrial REIT | | | 23,836 | | | | 63,853 | |
CRE Logistics REIT, Inc. | | | 13 | | | | 21,513 | |
Dream Industrial REIT | | | 7,428 | | | | 82,369 | |
Duke Realty Corp. | | | 19,221 | | | | 894,161 | |
EastGroup Properties, Inc. | | | 2,507 | | | | 397,761 | |
First Industrial Realty Trust, Inc. | | | 5,859 | | | | 291,602 | |
Frasers Logistics & Commercial Trust | | | 148,720 | | | | 163,885 | |
GLP J-REIT | | | 223 | | | | 374,091 | |
Goodman Group | | | 86,453 | | | | 1,260,706 | |
Granite REIT | | | 1,863 | | | | 119,269 | |
Industrial & Infrastructure Fund Investment | | | | | | | | |
Corp. | | | 106 | | | | 191,937 | |
Industrial Logistics Properties Trust | | | 5,680 | | | | 140,864 | |
Innovative Industrial Properties, Inc.# | | | 1,231 | | | | 225,433 | |
Itochu Advance Logistics Investment Corp. | | | 16 | | | | 20,602 | |
Japan Logistics Fund, Inc. | | | 46 | | | | 131,547 | |
LaSalle Logiport REIT | | | 96 | | | | 155,793 | |
Lexington Realty Trust | | | 18,817 | | | | 230,320 | |
Mapletree Industrial Trust | | | 87,400 | | | | 185,418 | |
Mapletree Logistics Trust | | | 159,950 | | | | 238,747 | |
Mitsubishi Estate Logistics REIT Investment | | | | | | | | |
Corp. | | | 19 | | | | 78,596 | |
Mitsui Fudosan Logistics Park, Inc. | | | 27 | | | | 139,746 | |
Monmouth Real Estate Investment Corp. | | | 6,343 | | | | 117,219 | |
Montea CVA | | | 546 | | | | 59,836 | |
Nippon Prologis REIT, Inc. | | | 140 | | | | 448,627 | |
Plymouth Industrial REIT, Inc. | | | 1,334 | | | | 24,866 | |
Prologis, Inc. | | | 38,029 | | | | 4,431,519 | |
Rexford Industrial Realty, Inc. | | | 7,865 | | | | 436,901 | |
Segro PLC | | | 61,276 | | | | 851,282 | |
SOSiLA Logistics REIT, Inc. | | | 15 | | | | 19,580 | |
STAG Industrial, Inc. | | | 9,873 | | | | 360,463 | |
Summit Industrial Income REIT | | | 3,608 | | | | 45,821 | |
Terreno Realty Corp. | | | 4,147 | | | | 267,564 | |
Tritax Big Box REIT PLC | | | 88,407 | | | | 232,318 | |
Warehouses De Pauw CVA | | | 7,016 | | | | 247,442 | |
| | | | | | | | |
| |
TOTAL INDUSTRIAL | | | $ | 13,942,081 | |
|
OFFICE – 2.0% | |
Alexandria Real Estate Equities, Inc. | | | 6,537 | | | | 1,183,851 | |
Allied Properties REIT | | | 2,996 | | | | 103,958 | |
| | | | | | | | |
| | |
| Description | | Number of
Shares | | | Value | |
alstria office REIT AG | | | 8,939 | | | $ | 160,051 | |
Befimmo SA | | | 523 | | | | 22,236 | |
Boston Properties, Inc. | | | 6,998 | | | | 765,231 | |
Brandywine Realty Trust | | | 7,621 | | | | 103,112 | |
Centuria Office REIT | | | 12,820 | | | | 21,737 | |
Champion REIT | | | 160,000 | | | | 92,934 | |
City Office REIT, Inc. | | | 2,823 | | | | 30,855 | |
Columbia Property Trust, Inc. | | | 6,598 | | | | 118,830 | |
Corporate Office Properties Trust | | | 4,663 | | | | 130,751 | |
Cousins Properties, Inc. | | | 6,919 | | | | 253,720 | |
Covivio | | | 2,344 | | | | 209,111 | |
Cromwell Property Group | | | 70,423 | | | | 47,452 | |
Daiwa Office Investment Corp. | | | 20 | | | | 144,524 | |
Derwent London PLC | | | 6,282 | | | | 288,956 | |
Dexus | | | 55,850 | | | | 438,411 | |
Douglas Emmett, Inc. | | | 7,491 | | | | 251,248 | |
Dream Office REIT | | | 3,839 | | | | 65,995 | |
Easterly Government Properties, Inc. | | | 3,911 | | | | 83,813 | |
Equity Commonwealth | | | 6,256 | | | | 180,173 | |
GDI Property Group | | | 37,938 | | | | 31,111 | |
Global One Real Estate Investment Corp. | | | 60 | | | | 69,433 | |
Great Portland Estates PLC | | | 15,111 | | | | 144,641 | |
Hibernia REIT PLC | | | 32,408 | | | | 44,306 | |
Highwoods Properties, Inc. | | | 4,541 | | | | 203,391 | |
Hudson Pacific Properties, Inc. | | | 6,823 | | | | 191,795 | |
Ichigo Office REIT Investment Corp. | | | 84 | | | | 73,320 | |
Inmobiliaria Colonial Socimi SA | | | 17,931 | | | | 181,901 | |
Intervest Offices & Warehouses NV | | | 685 | | | | 18,287 | |
Invesco Office J-REIT, Inc. | | | 616 | | | | 113,638 | |
IREIT Global | | | 87,000 | | | | 42,131 | |
Japan Excellent, Inc. | | | 66 | | | | 92,290 | |
Japan Prime Realty Investment Corp. | | | 49 | | | | 198,911 | |
Japan Real Estate Investment Corp. | | | 71 | | | | 440,072 | |
JBG SMITH Properties | | | 4,693 | | | | 153,039 | |
Keppel Pacific Oak U.S. REIT | | | 54,800 | | | | 40,821 | |
Keppel REIT | | | 112,100 | | | | 104,325 | |
Kilroy Realty Corp. | | | 5,446 | | | | 373,269 | |
Mack-Cali Realty Corp. | | | 2,455 | | | | 40,164 | |
Manulife U.S. REIT | | | 72,500 | | | | 55,067 | |
Mirai Corp. | | | 43 | | | | 19,305 | |
Mori Hills REIT Investment Corp. | | | 84 | | | | 121,847 | |
Mori Trust Sogo REIT, Inc. | | | 49 | | | | 70,612 | |
Nippon Building Fund, Inc. | | | 85 | | | | 557,854 | |
NSI NV | | | 1,341 | | | | 54,517 | |
Office Properties Income Trust | | | 1,436 | | | | 39,849 | |
One REIT, Inc. | | | 16 | | | | 44,896 | |
Orix JREIT, Inc. | | | 152 | | | | 268,124 | |
Paramount Group, Inc. | | | 6,206 | | | | 65,846 | |
Piedmont Office Realty Trust, Inc., Class A | | | 4,742 | | | | 88,296 | |
Prime U.S. REIT | | | 23,700 | | | | 20,483 | |
SL Green Realty Corp.# | | | 3,267 | | | | 241,791 | |
True North Commercial REIT | | | 3,946 | | | | 22,858 | |
Vornado Realty Trust | | | 7,526 | | | | 344,314 | |
Workspace Group PLC | | | 10,610 | | | | 120,122 | |
| | | | | | | | |
| |
TOTAL OFFICE | | | $ | 9,389,575 | |
|
RESIDENTIAL – 2.5% | |
Advance Residence Investment Corp. | | | 71 | | | | 226,123 | |
ANNUAL REPORT / April 30, 2021
| | |
| 35 | | PORTFOLIOS OF INVESTMENTS Wilmington Real Asset Fund (continued) |
| | | | | | | | |
| | |
| Description | | Number of
Shares | | | Value | |
American Campus Communities, Inc. | | | 6,656 | | | $ | 300,918 | |
American Homes 4 Rent, Class A | | | 13,818 | | | | 511,819 | |
Apartment Income REIT Corp. | | | 8,212 | | | | 370,772 | |
Apartment Investment & Management Co., Class A | | | 8,212 | | | | 56,991 | |
AvalonBay Communities, Inc. | | | 7,175 | | | | 1,377,600 | |
Bluerock Residential Growth REIT, Inc. | | | 5,964 | | | | 56,539 | |
Boardwalk REIT | | | 1,785 | | | | 53,238 | |
Camden Property Trust | | | 5,017 | | | | 604,448 | |
Canadian Apartment Properties REIT | | | 4,891 | | | | 217,422 | |
Care Property Invest NV | | | 688 | | | | 20,856 | |
Centerspace | | | 389 | | | | 27,382 | |
Civitas Social Housing PLC | | | 32,010 | | | | 50,466 | |
Clipper Realty, Inc. | | | 9,929 | | | | 81,716 | |
Comforia Residential REIT, Inc. | | | 32 | | | | 102,544 | |
Daiwa Securities Living Investments Corp. | | | 98 | | | | 100,574 | |
Empiric Student Property PLC* | | | 17,727 | | | | 21,555 | |
Equity LifeStyle Properties, Inc. | | | 8,482 | | | | 588,651 | |
Equity Residential | | | 17,163 | | | | 1,274,009 | |
Essex Property Trust, Inc. | | | 3,296 | | | | 957,554 | |
GCP Student Living PLC | | | 19,492 | | | | 44,165 | |
Independence Realty Trust, Inc. | | | 3,834 | | | | 64,564 | |
Ingenia Communities Group | | | 24,221 | | | | 98,654 | |
InterRent REIT | | | 6,334 | | | | 79,101 | |
Invitation Homes, Inc. | | | 29,169 | | | | 1,022,665 | |
Irish Residential Properties REIT PLC | | | 33,709 | | | | 65,909 | |
Kenedix Residential Next Investment Corp. | | | 69 | | | | 142,326 | |
Killam Apartment REIT | | | 2,717 | | | | 41,866 | |
Mid-America Apartment Communities, Inc. | | | 5,882 | | | | 925,415 | |
NexPoint Residential Trust, Inc. | | | 608 | | | | 30,497 | |
Nippon Accommodations Fund, Inc. | | | 28 | | | | 166,106 | |
Starts Proceed Investment Corp. | | | 19 | | | | 39,478 | |
Sun Communities, Inc. | | | 5,740 | | | | 957,604 | |
UDR, Inc. | | | 14,454 | | | | 671,388 | |
UMH Properties, Inc. | | | 2,326 | | | | 50,079 | |
UNITE Group PLC (The) | | | 19,817 | | | | 318,817 | |
Xior Student Housing NV | | | 874 | | | | 48,840 | |
| | | | | | | | |
| |
TOTAL RESIDENTIAL | | | $ | 11,768,651 | |
|
RETAIL – 3.0% | |
Acadia Realty Trust | | | 4,930 | | | | 102,988 | |
AEON REIT Investment Corp. | | | 78 | | | | 107,255 | |
Agree Realty Corp. | | | 4,259 | | | | 299,663 | |
Altarea SCA | | | 107 | | | | 21,578 | |
American Finance Trust, Inc. | | | 10,965 | | | | 109,760 | |
Aventus Group | | | 19,965 | | | | 45,649 | |
British Land Co. PLC (The) | | | 47,539 | | | | 340,673 | |
Brixmor Property Group, Inc. | | | 14,204 | | | | 317,317 | |
BWP Trust | | | 35,261 | | | | 112,227 | |
Capital & Counties Properties PLC* | | | 35,360 | | | | 88,692 | |
CapitaLand China Trust | | | 50,000 | | | | 51,784 | |
CapitaLand Integrated Commercial Trust | | | 265,780 | | | | 428,800 | |
Carmila SA | | | 5,913 | | | | 99,259 | |
Charter Hall Retail REIT | | | 14,984 | | | | 42,960 | |
Choice Properties REIT | | | 6,632 | | | | 75,215 | |
CT REIT | | | 1,626 | | | | 21,893 | |
Eurocommercial Properties NV* | | | 3,899 | | | | 100,858 | |
Federal Realty Investment Trust | | | 3,328 | | | | 375,531 | |
| | | | | | | | |
| | |
| Description | | Number of
Shares | | | Value | |
First Capital REIT | | | 5,526 | | | $ | 79,620 | |
Fortune REIT | | | 64,000 | | | | 64,499 | |
Frasers Centrepoint Trust | | | 69,023 | | | | 125,773 | |
Frontier Real Estate Investment Corp. | | | 26 | | | | 113,597 | |
Fukuoka REIT Corp. | | | 37 | | | | 60,653 | |
Getty Realty Corp. | | | 3,846 | | | | 121,457 | |
Hamborner REIT AG | | | 1,873 | | | | 20,537 | |
Hammerson PLC | | | 272,124 | | | | 149,878 | |
Home Consortium Ltd. | | | 9,400 | | | | 36,174 | |
HomeCo Daily Needs REIT | | | 20,596 | | | | 20,751 | |
Japan Metropolitan Fund Invest | | | 359 | | | | 353,781 | |
Kenedix Retail REIT Corp. | | | 23 | | | | 58,911 | |
Kimco Realty Corp. | | | 22,126 | | | | 464,646 | |
Kite Realty Group Trust | | | 3,631 | | | | 75,561 | |
Klepierre SA | | | 9,718 | | | | 257,927 | |
Lendlease Global Commercial REIT | | | 33,300 | | | | 20,362 | |
Link REIT | | | 109,200 | | | | 1,030,091 | |
Macerich Co. (The)# | | | 9,529 | | | | 131,405 | |
Mapletree Commercial Trust | | | 114,123 | | | | 187,210 | |
Mercialys SA | | | 4,343 | | | | 55,572 | |
National Retail Properties, Inc. | | | 8,579 | | | | 398,237 | |
NewRiver REIT PLC* | | | 17,295 | | | | 24,277 | |
Realty Income Corp. | | | 19,201 | | | | 1,327,749 | |
Regency Centers Corp. | | | 7,636 | | | | 486,108 | |
Retail Estates NV | | | 943 | | | | 72,493 | |
Retail Opportunity Investments Corp. | | | 5,146 | | | | 90,570 | |
Retail Properties of America, Inc., Class A | | | 9,519 | | | | 111,658 | |
Retail Value, Inc. | | | 1,384 | | | | 25,784 | |
RioCan REIT | | | 5,653 | | | | 96,673 | |
RPT Realty | | | 7,659 | | | | 97,346 | |
Sasseur REIT | | | 29,500 | | | | 20,505 | |
Scentre Group | | | 266,908 | | | | 558,635 | |
Seritage Growth Properties, Class A*,# | | | 3,490 | | | | 60,028 | |
Shaftesbury PLC* | | | 15,609 | | | | 135,654 | |
Shopping Centres Australasia Property Group | | | 55,541 | | | | 106,748 | |
Simon Property Group, Inc. | | | 16,893 | | | | 2,056,554 | |
SITE Centers Corp. | | | 7,255 | | | | 107,011 | |
SmartCentres REIT | | | 7,835 | | | | 182,433 | |
SPH REIT | | | 137,600 | | | | 91,533 | |
Spirit Realty Capital, Inc. | | | 5,228 | | | | 248,539 | |
Supermarket Income REIT PLC | | | 41,671 | | | | 65,313 | |
Tanger Factory Outlet Centers, Inc.# | | | 5,839 | | | | 101,890 | |
Unibail-Rodamco-Westfield* | | | 6,943 | | | | 571,768 | |
Urban Edge Properties | | | 4,971 | | | | 93,703 | |
Urstadt Biddle Properties, Inc., Class A | | | 3,106 | | | | 56,436 | |
Vicinity Centres | | | 180,821 | | | | 220,974 | |
Waypoint REIT | | | 56,188 | | | | 107,983 | |
Weingarten Realty Investors | | | 5,920 | | | | 191,453 | |
Wereldhave NV | | | 1,145 | | | | 19,781 | |
| | | | | | | | |
| |
TOTAL RETAIL | | | $ | 13,898,343 | |
|
SPECIALIZED – 3.0% | |
Big Yellow Group PLC | | | 8,499 | | | | 140,631 | |
Charter Hall Social Infrastructure REIT | | | 35,768 | | | | 89,551 | |
CoreSite Realty Corp. | | | 2,126 | | | | 258,288 | |
CubeSmart | | | 10,990 | | | | 465,317 | |
CyrusOne, Inc. | | | 5,939 | | | | 432,537 | |
Digital Realty Trust, Inc. | | | 14,591 | | | | 2,251,537 | |
April 30, 2021 / ANNUAL REPORT
| | |
PORTFOLIOS OF INVESTMENTS Wilmington Real Asset Fund (continued) | | 36 |
| | | | | | | | |
| | |
| Description | | Number of
Shares | | | Value | |
EPR Properties* | | | 3,543 | | | $ | 169,037 | |
Equinix, Inc. | | | 4,591 | | | | 3,309,009 | |
Extra Space Storage, Inc. | | | 6,790 | | | | 1,009,605 | |
Farmland Partners, Inc. | | | 2,902 | | | | 38,684 | |
Four Corners Property Trust, Inc. | | | 6,477 | | | | 186,991 | |
Gaming and Leisure Properties, Inc. | | | 11,253 | | | | 523,152 | |
GEO Group, Inc. (The)# | | | 5,794 | | | | 31,925 | |
Gladstone Land Corp.# | | | 1,517 | | | | 31,842 | |
Iron Mountain, Inc.# | | | 14,832 | | | | 595,060 | |
Keppel DC REIT | | | 68,895 | | | | 139,079 | |
Life Storage, Inc. | | | 4,006 | | | | 384,816 | |
National Storage Affiliates Trust | | | 3,129 | | | | 142,182 | |
National Storage REIT | | | 48,147 | | | | 74,682 | |
Public Storage | | | 7,971 | | | | 2,241,126 | |
QTS Realty Trust, Inc., Class A | | | 2,885 | | | | 191,824 | |
Rural Funds Group | | | 17,455 | | | | 32,724 | |
Safehold, Inc. | | | 677 | | | | 47,871 | |
Safestore Holdings PLC | | | 13,213 | | | | 155,486 | |
VICI Properties, Inc. | | | 27,175 | | | | 861,447 | |
| | | | | | | | |
TOTAL SPECIALIZED | | | | | | $ | 13,804,403 | |
| | | | | | | | |
| |
TOTAL REAL ESTATE INVESTMENT TRUSTS
(COST $64,830,725) | | | $ | 81,564,585 | |
| | | | | | | | |
| |
TOTAL REAL ESTATE RELATED SECURITIES
(COST $127,654,934) | | | $ | 155,245,119 | |
|
COMMODITY RELATED SECURITIES – 52.4% | |
|
EXCHANGE-TRADED FUNDS – 19.3% | |
|
COMMODITY – 19.3% | |
Aberdeen Standard Bloomberg All Commodity Strategy K-1 Free ETF | | | 416,000 | | | | 10,483,200 | |
Invesco Optimum Yield Diversified Commodity Strategy No K-1 ETF | | | 2,170,000 | | | | 40,427,100 | |
iShares Gold Trust* | | | 886,100 | | | | 14,930,785 | |
iShares Silver Trust* | | | 144,100 | | | | 3,459,841 | |
SPDR S&P Global Natural Resources ETF# | | | 390,000 | | | | 20,358,000 | |
| | | | | | | | |
TOTAL COMMODITY | | | | | | $ | 89,658,926 | |
| | | | | | | | |
| |
TOTAL EXCHANGE-TRADED FUNDS
(COST $80,126,969) | | | $ | 89,658,926 | |
| | |
INVESTMENT COMPANIES – 33.1% | | | | | | | | |
| | |
COMMODITY – 33.1% | | | | | | | | |
Vanguard Commodity Strategy Fund | | | 808,253 | | | | 25,201,324 | |
DFA Commodity Strategy Portfolio | | | 11,661,926 | | | | 73,353,515 | |
Parametric Commodity Strategy Fund | | | 2,809,867 | | | | 18,123,646 | |
Credit Suisse Commodity Return Strategy Fund* | | | 7,019,673 | | | | 37,063,874 | |
| | | | | | | | |
TOTAL COMMODITY | | | | | | $ | 153,742,359 | |
| | | | | | | | |
| |
TOTAL INVESTMENT COMPANIES
(COST $136,439,488) | | | $ | 153,742,359 | |
| | | | | | | | |
| |
TOTAL COMMODITY RELATED SECURITIES
(COST $216,566,457) | | | $ | 243,401,285 | |
| | | | | | | | |
| | |
| Description | | Number of
Shares | | | Value | |
|
SHORT-TERM INVESTMENTS – 3.8% | |
| | |
MONEY MARKET FUND – 3.8% | | | | | | | | |
Dreyfus Government Cash Management Fund, Institutional Shares, 0.03%^ | | | 17,639,847 | | | $ | 17,639,847 | |
| | | | | | | | |
| |
TOTAL SHORT-TERM INVESTMENT
(COST $17,639,847) | | | $ | 17,639,847 | |
|
| CASH COLLATERAL INVESTED FOR SECURITIES ON LOAN – 1.5% | |
|
MONEY MARKET FUNDS – 0.7% | |
Fidelity Investments Money Market Funds, Government Portfolio, Institutional Class, 0.01%^ | | | 346,000 | | | | 346,000 | |
Morgan Stanley Liquidity Funds, Government Portfolio, Institutional Class, 0.03%^ | | | 640,000 | | | | 640,000 | |
Blackrock Liquidity Fed Fund, Institutional Shares, 0.03%^ | | | 627,000 | | | | 627,000 | |
JPMorgan U.S. Government Money Market Fund, Capital Class, 0.03%^ | | | 627,000 | | | | 627,000 | |
Federated Hermes Government Obligations Fund, Premier Shares, 0.02%^ | | | 580,000 | | | | 580,000 | |
Goldman Sachs Financial Square Government Fund, Institutional Shares, 0.03%^ | | | 627,000 | | | | 627,000 | |
| | | | | | | | |
TOTAL MONEY MARKET FUNDS
(COST $3,447,000) | | | $ | 3,447,000 | |
| | | | | |
| | |
| | | Par Value | | | | |
|
REPURCHASE AGREEMENTS – 0.8% | |
Bank of America Securities, Inc., 0.01%, dated 4/30/21, due 5/03/21, repurchase price $937,787 collateralized by U.S. Government Agency Securities, 1.00% to 5.50%, maturing 11/01/28 to 5/01/51; total market value of $956,542. | | $ | 937,786 | | | | 937,786 | |
Daiwa Capital Markets America, 0.01%, dated 4/30/21, due 5/03/21, repurchase price $1,290,362 collateralized by U.S. Government Agency & Treasury Securities, 0.00% to 8.00%, maturing 6/30/21 to 5/01/51; total market value of $1,316,168. | | | 1,290,361 | | | | 1,290,361 | |
RBC Dominion Securities, Inc., 0.01%, dated 4/30/21, due 5/03/21, repurchase price $1,290,362 collateralized by U.S. Government Agency & Treasury Securities, 0.00% to 6.50%, maturing 6/01/21 to 12/15/60; total market value of $1,316,168. | | | 1,290,361 | | | | 1,290,361 | |
| | | | | | | | |
| |
TOTAL REPURCHASE AGREEMENTS
(COST $3,518,508) | | | $ | 3,518,508 | |
| | | | | | | | |
| |
TOTAL CASH COLLATERAL INVESTED FOR SECURITIES ON LOAN
(COST $6,965,508) | | | $ | 6,965,508 | |
| | | | | | | | |
| |
TOTAL INVESTMENTS – 101.3%
(Cost $415,805,126) | | | $ | 470,303,359 | |
COLLATERAL FOR SECURITIES ON LOAN – (1.5%) | | | | (6,965,508 | ) |
OTHER ASSETS LESS LIABILITIES – 0.2% | | | | 860,115 | |
| | | | | | | | |
| |
TOTAL NET ASSETS – 100.0% | | | $ | 464,197,966 | |
| | | | | | | | |
ANNUAL REPORT / April 30, 2021
| | |
| 37 | | PORTFOLIOS OF INVESTMENTS Wilmington Real Asset Fund (continued) |
Various inputs are used in determining the value of the Fund’s investments. These inputs are summarized in the three broad levels listed below.
Level 1 – quoted prices in active markets for identical securities
Level 2 – other significant observable inputs (including quoted prices for similar securities, interest rates, prepayment speeds, credit risk, etc.)
Level 3 – significant unobservable inputs (including the Fund’s own assumptions in determining the fair value of investments)
The following is a summary of the inputs used as of April 30, 2021 in valuing the Fund’s assets carried at fair value:
| | | | | | | | | | | | | | | | |
| | | Level 1 | | | Level 2 | | | Level 3 | | | Total | |
| | | | |
Assets | | | | | | | | | | | | | | | | |
| | | | |
Investments in Securities | | | | | | | | | | | | | | | | |
| | | | |
Inflation Related Securities | | | | | | | | | | | | | | | | |
| | | | |
Exchange-Traded Funds | | $ | 47,051,600 | | | $ | — | | | $ | — | | | $ | 47,051,600 | |
| | | | |
Real Estate Related Securities | | | | | | | | | | | | | | | | |
| | | | |
Common Stocks | | | | | | | | | | | | | | | | |
| | | | |
Construction & Engineering | | | — | | | | 16,238 | | | | — | | | | 16,238 | |
| | | | |
Diversified | | | — | | | | 73,045 | | | | — | | | | 73,045 | |
| | | | |
Diversified Real Estate Activities | | | 73,493 | | | | 8,849,680 | | | | — | | | | 8,923,173 | |
| | | | |
Office | | | — | | | | 77,325 | | | | — | | | | 77,325 | |
| | | | |
Real Estate Development | | | 267,665 | | | | 2,106,673 | | | | — | (a) | | | 2,374,338 | |
| | | | |
Real Estate Operating Companies | | | 194,456 | | | | 11,005,899 | | | | — | | | | 11,200,355 | |
| | | | |
Retail | | | — | | | | 73,237 | | | | — | | | | 73,237 | |
| | | | |
Exchange-Traded Funds | | | 40,687,575 | | | | — | | | | — | | | | 40,687,575 | |
| | | | |
Investment Companies | | | 10,211,663 | | | | 43,585 | | | | — | | | | 10,255,248 | |
| | | | |
Real Estate Investment Trusts | | | | | | | | | | | | | | | | |
| | | | |
Diversified | | | 2,978,989 | | | | 5,926,518 | | | | — | | | | 8,905,507 | |
| | | | |
Diversified Real Estate Activities | | | — | | | | 49,906 | | | | — | | | | 49,906 | |
| | | | |
Health Care | | | 6,424,367 | | | | 721,455 | | | | — | | | | 7,145,822 | |
| | | | |
Hotel & Resort | | | 2,278,378 | | | | 381,919 | | | | — | | | | 2,660,297 | |
| | | | |
Industrial | | | 8,590,313 | | | | 5,351,768 | | | | — | | | | 13,942,081 | |
| | | | |
Office | | | 5,036,149 | | | | 4,353,426 | | | | — | | | | 9,389,575 | |
| | | | |
Residential | | | 10,322,238 | | | | 1,446,413 | | | | — | | | | 11,768,651 | |
| | | | |
Retail | | | 7,907,228 | | | | 5,991,115 | | | | — | | | | 13,898,343 | |
| | | | |
Specialized | | | 13,172,250 | | | | 632,153 | | | | — | | | | 13,804,403 | |
| | | | |
Rights | | | — | | | | — | (a) | | | — | | | | — | |
| | | | |
Commodity Related Securities | | | | | | | | | | | | | | | | |
| | | | |
Exchange-Traded Funds | | | 89,658,926 | | | | — | | | | — | | | | 89,658,926 | |
| | | | |
Investment Companies | | | 153,742,359 | | | | — | | | | — | | | | 153,742,359 | |
| | | | |
Money Market Funds | | | 21,086,847 | | | | — | | | | — | | | | 21,086,847 | |
| | | | |
Repurchase Agreements | | | — | | | | 3,518,508 | | | | — | | | | 3,518,508 | |
| | | | | | | | | | | | | | | | |
| | | | |
Total Investments in Securities | | $ | 419,684,496 | | | $ | 50,618,863 | | | $ | — | | | $ | 470,303,359 | |
| | | | | | | | | | | | | | | | |
| (a) | Includes internally fair valued securities currently priced at zero ($0). |
As a result of utilizing international fair value pricing at April 30, 2021, a portion of the Fund’s common stock investments were categorized as Level 2.
| ** | Represents less than 0.05%. |
| * | Non-income producing security. |
| # | Security, or a portion thereof, is on loan. See Note 2 in Notes to Financial Statements. |
| (1) | The value of this security was determined using significant unobservable inputs and is reported as a Level 3 security in the Valuation Hierarchy table located at the end of the Portfolio of Investments. |
April 30, 2021 / ANNUAL REPORT
| | |
PORTFOLIOS OF INVESTMENTS Wilmington Real Asset Fund (concluded) | | 38 |
| | |
The following acronyms are used throughout this Fund: |
| CVA | | Dutch Certification |
| |
| ETF | | Exchange-Traded Fund |
| |
| J-REIT | | Japanese Real Estate Investment Trust |
| |
| OYJ | | Public Limited Company |
| |
| PLC | | Public Limited Company |
| |
| REIT | | Real Estate Investment Trust |
| |
| SCA | | Limited Partnership With Share Capital |
| |
| SPDR | | Standard & Poor’s Depositary Receipt |
See Notes which are an integral part of the Financial Statements
ANNUAL REPORT / April 30, 2021
PORTFOLIO OF INVESTMENTS SUMMARY TABLE
Wilmington Diversified Income Fund
At April 30, 2021, the Fund’s portfolio composition was as follows (unaudited):
| | |
| | | Percentage of
Total Net Assets |
| | | | |
Common Stocks | | | 40.8 | % |
Investment Companies | | | 34.4 | % |
Corporate Bonds | | | 9.7 | % |
U.S. Treasury Obligations | | | 6.8 | % |
Mortgage-Backed Securities | | | 5.1 | % |
Government Agencies | | | 0.8 | % |
Collateralized Mortgage Obligations | | | 0.2 | % |
Enhanced Equipment Trust Certificate | | | 0.1 | % |
Cash Equivalents(1) | | | 2.0 | % |
Cash Collateral Invested for Securities on Loan(2) | | | 12.4 | % |
Other Assets and Liabilities - Net(3) | | | (12.3 | )% |
| | | | |
TOTAL | | | 100.0 | % |
| | | | |
| (1) | Cash Equivalents include investments in a money market fund. |
| (2) | Cash Collateral Invested for Securities on Loan include investments in repurchase agreements. |
| (3) | Assets, other than investments in securities, less liabilities. See Statements of Assets and Liabilities. |
PORTFOLIO OF INVESTMENTS
April 30, 2021
| | | | | | | | |
| | |
| Description | |
Par Value | | | Value | |
|
COLLATERALIZED MORTGAGE OBLIGATIONS – 0.2% | |
|
FEDERAL NATIONAL MORTGAGE ASSOCIATION (FNMA) –0.2% | |
Series 2012-114, Class VM, 3.50%, 10/25/25 | | $ | 77,658 | | | $ | 79,923 | |
|
WHOLE LOAN – 0.0%** | |
Banc of America Mortgage Securities, Inc.,
Series 2004-A, Class 2A1, 2.53%, 02/25/34D | | | 7,456 | | | | 7,165 | |
IndyMac INDA Mortgage Loan Trust,
Series 2005-AR1, Class 2A1, 2.88%, 11/25/35D | | | 1,564 | | | | 1,488 | |
| | | | | | | | |
TOTAL WHOLE LOAN | | | | | | $ | 8,653 | |
| | | | | | | | |
| TOTAL COLLATERALIZED MORTGAGE OBLIGATIONS (COST $95,761) | | | | | | $ | 88,576 | |
|
| CORPORATE BONDS – 9.7% | |
|
AEROSPACE & DEFENSE – 0.4% | |
Boeing Co. (The), Sr. Unsecured | | | | | | | | |
1.43%, 02/04/24 | | | 50,000 | | | | 50,172 | |
2.75%, 02/01/26 | | | 45,000 | | | | 46,720 | |
L3Harris Technologies, Inc., Sr. Unsecured,
2.90%, 12/15/29 | | | 15,000 | | | | 15,601 | |
Raytheon Technologies Corp., Sr. Unsecured,
3.50%, 03/15/27 | | | 25,000 | | | | 27,543 | |
| | | | | | | | |
| | |
TOTAL AEROSPACE & DEFENSE | | | | | | $ | 140,036 | |
|
AUTOMOTIVE – 0.3% | |
General Motors Financial Co., Inc., Company Guaranteed,
3.20%, 07/06/21 | | | 40,000 | | | | 40,056 | |
| | | | | | | | |
| | |
| Description | |
Par Value | | | Value | |
PACCAR Financial Corp., Sr. Unsecured, MTN,
2.65%, 05/10/22 | | $ | 55,000 | | | $ | 56,393 | |
| | | | | | | | |
| | |
TOTAL AUTOMOTIVE | | | | | | $ | 96,449 | |
|
BEVERAGES – 0.1% | |
Anheuser-Busch InBev Finance, Inc., Company Guaranteed,
4.90%, 02/01/46 | | | 20,000 | | | | 23,905 | |
Keurig Dr. Pepper, Inc., Company Guaranteed,
3.20%, 05/01/30 | | | 15,000 | | | | 15,981 | |
| | | | | | | | |
| | |
TOTAL BEVERAGES | | | | | | $ | 39,886 | |
|
BIOTECHNOLOGY – 0.1% | |
Amgen, Inc., Sr. Unsecured,
4.40%, 05/01/45 | | | 25,000 | | | | 28,972 | |
|
CAPITAL MARKETS – 0.8% | |
Goldman Sachs Group, Inc. (The), Sr. Unsecured
(3 Month USD LIBOR + 1.20%), 3.27%, 09/29/25D | | | 55,000 | | | | 59,032 | |
| | |
(3 Month USD LIBOR + 1.51%), 3.69%, 06/05/28D | | | 35,000 | | | | 38,633 | |
JPMorgan Chase & Co., Sr. Unsecured, (SOFR + 2.04%),
2.52%, 04/22/31D | | | 50,000 | | | | 50,585 | |
Morgan Stanley, Sr. Unsecured, MTN, (SOFR + 3.12%),
3.62%, 04/01/31D | | | 70,000 | | | | 76,941 | |
Morgan Stanley, Subordinated, GMTN,
4.35%, 09/08/26 | | | 10,000 | | | | 11,341 | |
April 30, 2021 / ANNUAL REPORT
| | |
PORTFOLIOS OF INVESTMENTS Wilmington Diversified Income Fund (continued) | | 40 |
| | | | | | | | |
| | |
| Description | | Par Value | | | Value | |
TD Ameritrade Holding Corp., Sr. Unsecured,
2.95%, 04/01/22 | | $ | 18,000 | | | $ | 18,364 | |
U.S. Bancorp, Series V, Sr. Unsecured,
2.63%, 01/24/22 | | | 45,000 | | | | 45,684 | |
| | | | | | | | |
TOTAL CAPITAL MARKETS | | | | | | $ | 300,580 | |
|
CHEMICALS – 0.2% | |
Nutrien Ltd., Sr. Unsecured,
1.90%, 05/13/23 | | | 80,000 | | | | 82,145 | |
|
COMMERCIAL SERVICES & SUPPLIES – 0.1% | |
Global Payments, Inc., Sr. Unsecured,
3.75%, 06/01/23 | | | 50,000 | | | | 52,958 | |
|
COMPUTERS – 0.1% | |
Hewlett Packard Enterprise Co., Sr.
Unsecured, 3.50%, 10/05/21 | | | 50,000 | | | | 50,516 | |
|
DIVERSIFIED FINANCIAL SERVICES – 1.6% | |
Bank of America Corp., Sr. Unsecured, MTN,
3.25%, 10/21/27 | | | 20,000 | | | | 21,669 | |
BlackRock, Inc., Sr. Unsecured,
3.38%, 06/01/22 | | | 38,000 | | | | 39,276 | |
Capital One Financial Corp., Sr. Unsecured,
2.60%, 05/11/23 | | | 30,000 | | | | 31,265 | |
Citigroup, Inc., Sr. Unsecured, (3 Month USD LIBOR + 0.95%),
2.88%, 07/24/23D | | | 35,000 | | | | 36,065 | |
Fifth Third Bancorp, Sr. Unsecured
3.50%, 03/15/22 | | | 100,000 | | | | 102,516 | |
2.55%, 05/05/27 | | | 15,000 | | | | 15,738 | |
Fifth Third Bancorp, Subordinated,
4.30%, 01/16/24 | | | 20,000 | | | | 21,850 | |
FMR LLC, Sr. Unsecured,
6.45%, 11/15/39W | | | 100,000 | | | | 141,213 | |
Huntington Bancshares, Inc., Sr. Unsecured
2.63%, 08/06/24 | | | 25,000 | | | | 26,481 | |
2.55%, 02/04/30 | | | 50,000 | | | | 50,741 | |
Wells Fargo & Co., Series M, Subordinated,
3.45%, 02/13/23 | | | 35,000 | | | | 36,941 | |
Wells Fargo & Co., Sr. Unsecured, (SOFR + 2.00%),
2.19%, 04/30/26D | | | 25,000 | | | | 25,978 | |
Wells Fargo & Co., Subordinated, MTN,
4.40%, 06/14/46 | | | 40,000 | | | | 45,662 | |
| | | | | | | | |
TOTAL DIVERSIFIED FINANCIAL SERVICES | | | $ | 595,395 | |
|
ELECTRIC – 0.5% | |
American Electric Power Co., Inc., Series M, Sr. Unsecured,
0.75%, 11/01/23 | | | 25,000 | | | | 25,065 | |
DTE Energy Co., Series F, Sr. Unsecured,
3.85%, 12/01/23 | | | 10,000 | | | | 10,737 | |
FirstEnergy Corp., Sr. Unsecured,
2.05%, 03/01/25 | | | 100,000 | | | | 100,878 | |
NextEra Energy Capital Holdings, Inc., Company Guaranteed,
0.65%, 03/01/23 | | | 35,000 | | | | 35,074 | |
| | | | | | | | |
TOTAL ELECTRIC | | | | | | $ | 171,754 | |
|
ENVIRONMENTAL CONTROL – 0.2% | |
Waste Management, Inc., Company Guaranteed
3.50%, 05/15/24 | | | 35,000 | | | | 37,762 | |
| | | | | | | | |
| | |
| Description | | Par Value | | | Value | |
4.10%, 03/01/45 | | $ | 25,000 | | | $ | 28,631 | |
| | | | | | | | |
TOTAL ENVIRONMENTAL CONTROL | | | | | | $ | 66,393 | |
|
FOOD & STAPLES RETAILING – 0.8% | |
Archer-Daniels-Midland Co., Sr. Unsecured,
3.25%, 03/27/30 | | | 20,000 | | | | 21,729 | |
Campbell Soup Co., Sr. Unsecured
3.30%, 03/19/25 | | | 40,000 | | | | 43,188 | |
3.13%, 04/24/50 | | | 50,000 | | | | 47,081 | |
Conagra Brands, Inc., Sr. Unsecured,
4.60%, 11/01/25 | | | 40,000 | | | | 45,729 | |
Kroger Co. (The), Sr. Unsecured
2.80%, 08/01/22# | | | 35,000 | | | | 36,017 | |
5.40%, 01/15/49 | | | 50,000 | | | | 65,490 | |
McCormick & Co., Inc., Sr. Unsecured,
2.50%, 04/15/30 | | | 35,000 | | | | 35,323 | |
| | | | | | | | |
TOTAL FOOD & STAPLES RETAILING | | | | | | $ | 294,557 | |
|
HEALTHCARE-PRODUCTS – 0.1% | |
DH Europe Finance II Sarl, Company Guaranteed,
2.20%, 11/15/24 | | | 45,000 | | | | 47,071 | |
|
HEALTHCARE-SERVICES – 0.2% | |
Anthem, Inc., Sr. Unsecured,
3.65%, 12/01/27 | | | 30,000 | | | | 33,364 | |
UnitedHealth Group, Inc., Sr. Unsecured
2.75%, 02/15/23 | | | 25,000 | | | | 25,994 | |
2.95%, 10/15/27 | | | 25,000 | | | | 27,133 | |
| | | | | | | | |
TOTAL HEALTHCARE-SERVICES | | | | | | $ | 86,491 | |
|
HOME FURNISHINGS – 0.3% | |
Whirlpool Corp., Sr. Unsecured
4.70%, 06/01/22 | | | 65,000 | | | | 67,927 | |
2.40%, 05/15/31 | | | 15,000 | | | | 14,935 | |
4.60%, 05/15/50 | | | 30,000 | | | | 35,631 | |
| | | | | | | | |
TOTAL HOME FURNISHINGS | | | | | | $ | 118,493 | |
|
HOUSEHOLD PRODUCTS/WARES – 0.0%** | |
Church & Dwight Co., Inc., Sr. Unsecured,
3.95%, 08/01/47 | | | 15,000 | | | | 16,821 | |
|
INSURANCE – 0.7% | |
Aon PLC, Company Guaranteed,
4.00%, 11/27/23 | | | 40,000 | | | | 43,174 | |
CNA Financial Corp., Sr. Unsecured,
3.95%, 05/15/24 | | | 35,000 | | | | 38,012 | |
Lincoln National Corp., Sr. Unsecured,
3.63%, 12/12/26 | | | 25,000 | | | | 27,670 | |
W.R. Berkley Corp., Sr. Unsecured
4.63%, 03/15/22 | | | 60,000 | | | | 62,231 | |
4.75%, 08/01/44 | | | 45,000 | | | | 54,039 | |
4.00%, 05/12/50 | | | 30,000 | | | | 33,218 | |
| | | | | | | | |
TOTAL INSURANCE | | | | | | $ | 258,344 | |
|
MACHINERY – 0.1% | |
Caterpillar, Inc., Sr. Unsecured,
2.60%, 04/09/30 | | | 25,000 | | | | 26,097 | |
Roper Technologies, Inc., Sr. Unsecured,
2.00%, 06/30/30 | | | 30,000 | | | | 28,890 | |
| | | | | | | | |
TOTAL MACHINERY | | | | | | $ | 54,987 | |
ANNUAL REPORT / April 30, 2021
| | |
| 41 | | PORTFOLIOS OF INVESTMENTS Wilmington Diversified Income Fund (continued) |
| | | | | | | | |
| | |
| Description | |
Par Value | | | Value | |
|
MEDIA – 0.3% | |
ViacomCBS, Inc., Sr. Unsecured
4.60%, 01/15/45 | | $ | 75,000 | | | $ | 83,684 | |
4.95%, 05/19/50# | | | 25,000 | | | | 29,249 | |
Walt Disney Co. (The) / TWDC Enterprises 18 Corp., Company Guaranteed, GMTN,
4.13%, 06/01/44 | | | 10,000 | | | | 11,601 | |
| | | | | | | | |
| | |
TOTAL MEDIA | | | | | | $ | 124,534 | |
|
MISCELLANEOUS MANUFACTURING – 0.3% | |
Illinois Tool Works, Inc., Sr. Unsecured,
3.50%, 03/01/24 | | | 45,000 | | | | 48,576 | |
Trane Technologies Luxembourg Finance SA, Company Guaranteed,
3.50%, 03/21/26 | | | 55,000 | | | | 60,358 | |
| | | | | | | | |
| |
TOTAL MISCELLANEOUS MANUFACTURING | | | $ | 108,934 | |
|
OIL & GAS – 0.4% | |
Marathon Petroleum Corp., Sr. Unsecured,
3.63%, 09/15/24 | | | 20,000 | | | | 21,632 | |
Phillips 66, Company Guaranteed
4.30%, 04/01/22 | | | 20,000 | | | | 20,807 | |
0.90%, 02/15/24 | | | 15,000 | | | | 15,021 | |
3.85%, 04/09/25 | | | 10,000 | | | | 10,978 | |
Pioneer Natural Resources Co., Sr. Unsecured
1.13%, 01/15/26 | | | 15,000 | | | | 14,822 | |
2.15%, 01/15/31# | | | 15,000 | | | | 14,173 | |
Shell International Finance BV, Company Guaranteed,
3.25%, 05/11/25 | | | 25,000 | | | | 27,262 | |
Valero Energy Corp., Sr. Unsecured
4.00%, 04/01/29 | | | 30,000 | | | | 32,805 | |
4.90%, 03/15/45# | | | 10,000 | | | | 11,433 | |
| | | | | | | | |
| | |
TOTAL OIL & GAS | | | | | | $ | 168,933 | |
|
PHARMACEUTICALS – 0.3% | |
AbbVie, Inc., Sr. Unsecured
4.25%, 11/14/28 | | | 25,000 | | | | 28,656 | |
4.40%, 11/06/42 | | | 20,000 | | | | 23,262 | |
Bristol-Myers Squibb Co., Sr. Unsecured,
2.75%, 02/15/23 | | | 25,000 | | | | 26,006 | |
Zoetis, Inc., Sr. Unsecured,
3.95%, 09/12/47 | | | 20,000 | | | | 22,430 | |
| | | | | | | | |
| | |
TOTAL PHARMACEUTICALS | | | | | | $ | 100,354 | |
|
PIPELINES – 0.7% | |
Energy Transfer LP, Sr. Unsecured
3.60%, 02/01/23 | | | 35,000 | | | | 36,427 | |
4.20%, 04/15/27 | | | 40,000 | | | | 43,778 | |
3.75%, 05/15/30 | | | 15,000 | | | | 15,629 | |
Kinder Morgan, Inc., Company Guaranteed
5.20%, 03/01/48 | | | 40,000 | | | | 47,633 | |
3.60%, 02/15/51 | | | 20,000 | | | | 19,260 | |
MPLX LP, Sr. Unsecured,
4.00%, 03/15/28 | | | 30,000 | | | | 33,180 | |
ONEOK Partners LP, Company Guaranteed,
6.20%, 09/15/43 | | | 45,000 | | | | 55,870 | |
| | | | | | | | |
| | |
| Description | |
Par Value | | | Value | |
Spectra Energy Partners LP, Company Guaranteed,
4.50%, 03/15/45 | | $ | 25,000 | | | $ | 28,029 | |
| | | | | | | | |
| | |
TOTAL PIPELINES | | | | | | $ | 279,806 | |
|
REAL ESTATE INVESTMENT TRUSTS – 0.4% | |
American Tower Corp., Sr. Unsecured,
5.00%, 02/15/24 | | | 15,000 | | | | 16,687 | |
AvalonBay Communities, Inc., Sr. Unsecured, MTN,
3.35%, 05/15/27 | | | 25,000 | | | | 27,306 | |
Healthcare Realty Trust, Inc., Sr. Unsecured,
3.88%, 05/01/25 | | | 15,000 | | | | 16,321 | |
Healthpeak Properties, Inc., Sr. Unsecured,
2.88%, 01/15/31# | | | 50,000 | | | | 51,283 | |
Welltower, Inc., Sr. Unsecured, 3.63%,
03/15/24 | | | 55,000 | | | | 59,371 | |
| | | | | | | | |
| |
TOTAL REAL ESTATE INVESTMENT TRUSTS | | | $ | 170,968 | |
|
RETAIL – 0.0%** | |
McDonald’s Corp., Sr. Unsecured, MTN,
1.45%, 09/01/25 | | | 15,000 | | | | 15,251 | |
|
TELECOMMUNICATIONS – 0.3% | |
AT&T, Inc., Sr. Unsecured
4.50%, 05/15/35 | | | 15,000 | | | | 17,039 | |
3.55%, 09/15/55W | | | 29,000 | | | | 26,799 | |
Verizon Communications, Inc., Sr. Unsecured
1.75%, 01/20/31 | | | 35,000 | | | | 32,944 | |
3.40%, 03/22/41 | | | 25,000 | | | | 25,440 | |
| | | | | | | | |
| | |
TOTAL TELECOMMUNICATIONS | | | | | | $ | 102,222 | |
|
TRANSPORTATION – 0.3% | |
FedEx Corp., Company Guaranteed
3.88%, 08/01/42 | | | 30,000 | | | | 32,008 | |
4.10%, 02/01/45 | | | 15,000 | | | | 16,326 | |
Ryder System, Inc., Sr. Unsecured, MTN,
2.50%, 09/01/22 | | | 10,000 | | | | 10,263 | |
Union Pacific Corp., Sr. Unsecured,
3.15%, 03/01/24 | | | 45,000 | | | | 48,081 | |
| | | | | | | | |
| | |
TOTAL TRANSPORTATION | | | | | | $ | 106,678 | |
|
TRUCKING & LEASING – 0.1% | |
GATX Corp., Sr. Unsecured,
5.20%, 03/15/44 | | | 20,000 | | | | 25,142 | |
| | | | | | | | |
| |
TOTAL CORPORATE BONDS
(COST $3,448,948) | | | $ | 3,704,670 | |
| | |
| | | Number of
Shares | | | | |
|
COMMON STOCKS – 40.8% | |
|
COMMUNICATION SERVICES – 2.5% | |
|
DIVERSIFIED TELECOMMUNICATION SERVICES – 1.7% | |
AT&T, Inc. | | | 12,570 | | | | 394,824 | |
Verizon Communications, Inc. | | | 4,390 | | | | 253,698 | |
| | | | | | | | |
| | |
| | | | | | $ | 648,522 | |
April 30, 2021 / ANNUAL REPORT
| | |
PORTFOLIOS OF INVESTMENTS Wilmington Diversified Income Fund (continued) | | 42 |
| | | | | | | | |
| | |
| Description | | Number of
Shares | | | Value | |
|
MEDIA – 0.8% | |
Omnicom Group, Inc. | | | 3,780 | | | $ | 310,943 | |
| | | | | | | | |
TOTAL COMMUNICATION SERVICES | | | | | | $ | 959,465 | |
|
CONSUMER DISCRETIONARY – 2.8% | |
|
HOTELS, RESTAURANTS & LEISURE – 1.2% | |
McDonald’s Corp. | | | 800 | | | | 188,864 | |
Restaurant Brands International, Inc. | | | 3,820 | | | | 262,090 | |
| | | | | | | | |
| | | | | | $ | 450,954 | |
|
MULTILINE RETAIL – 0.8% | |
Target Corp. | | | 1,510 | | | | 312,963 | |
|
SPECIALTY RETAIL – 0.8% | |
Home Depot, Inc. (The) | | | 920 | | | | 297,776 | |
| | | | | | | | |
TOTAL CONSUMER DISCRETIONARY | | | | | | $ | 1,061,693 | |
|
CONSUMER STAPLES – 2.6% | |
|
BEVERAGES – 0.7% | |
PepsiCo., Inc. | | | 1,855 | | | | 267,417 | |
|
HOUSEHOLD PRODUCTS – 1.0% | |
Procter & Gamble Co. (The) | | | 2,900 | | | | 386,918 | |
|
TOBACCO – 0.9% | |
Philip Morris International, Inc. | | | 3,375 | | | | 320,625 | |
| | | | | | | | |
TOTAL CONSUMER STAPLES | | | | | | $ | 974,960 | |
|
ENERGY – 2.8% | |
|
OIL, GAS & CONSUMABLE FUELS – 2.8% | |
Chevron Corp. | | | 3,315 | | | | 341,677 | |
ConocoPhillips | | | 6,020 | | | | 307,863 | |
Exxon Mobil Corp. | | | 3,410 | | | | 195,188 | |
Valero Energy Corp. | | | 2,650 | | | | 195,994 | |
| | | | | | | | |
TOTAL ENERGY | | | | | | $ | 1,040,722 | |
|
FINANCIALS – 9.4% | |
|
BANKS – 2.1% | |
KeyCorp. | | | 10,290 | | | | 223,910 | |
Toronto-Dominion Bank (The) | | | 4,625 | | | | 317,969 | |
United Bankshares, Inc. | | | 6,535 | | | | 256,630 | |
| | | | | | | | |
| | | | | | $ | 798,509 | |
|
CAPITAL MARKETS – 1.9% | |
BlackRock, Inc. | | | 472 | | | | 386,710 | |
Main Street Capital Corp. | | | 60 | | | | 2,555 | |
Morgan Stanley | | | 4,245 | | | | 350,425 | |
| | | | | | | | |
| | | | | | $ | 739,690 | |
|
DIVERSIFIED FINANCIAL SERVICES – 3.6% | |
Citigroup, Inc. | | | 4,395 | | | | 313,100 | |
JPMorgan Chase & Co. | | | 4,350 | | | | 669,073 | |
U.S. Bancorp | | | 6,670 | | | | 395,865 | |
| | | | | | | | |
| | | | | | $ | 1,378,038 | |
|
INSURANCE – 1.8% | |
MetLife, Inc. | | | 5,755 | | | | 366,190 | |
| | | | | | | | |
| | |
| Description | | Number of
Shares | | | Value | |
Old Republic International Corp. | | | 12,145 | | | $ | 299,010 | |
| | | | | | | | |
| | | | | | $ | 665,200 | |
| | | | | | | | |
TOTAL FINANCIALS | | | | | | $ | 3,581,437 | |
|
HEALTH CARE – 4.9% | |
|
BIOTECHNOLOGY – 0.5% | |
Amgen, Inc. | | | 760 | | | | 182,126 | |
|
HEALTH CARE PROVIDERS & SERVICES – 0.9% | |
CVS Health Corp. | | | 4,400 | | | | 336,160 | |
|
PHARMACEUTICALS – 3.5% | |
Bristol-Myers Squibb Co. | | | 4,255 | | | | 265,597 | |
Johnson & Johnson | | | 2,815 | | | | 458,085 | |
Merck & Co., Inc. | | | 3,300 | | | | 245,850 | |
Pfizer, Inc. | | | 9,315 | | | | 360,025 | |
| | | | | | | | |
| | | | | | $ | 1,329,557 | |
| | | | | | | | |
TOTAL HEALTH CARE | | | | | | $ | 1,847,843 | |
|
INDUSTRIALS – 5.6% | |
|
AEROSPACE & DEFENSE – 1.0% | |
Lockheed Martin Corp. | | | 1,010 | | | | 384,366 | |
|
AIR FREIGHT & LOGISTICS – 1.4% | |
United Parcel Service, Inc. | | | 2,530 | | | | 515,766 | |
|
BUILDING PRODUCTS – 0.9% | |
Johnson Controls International PLC | | | 5,820 | | | | 362,819 | |
|
ELECTRICAL EQUIPMENT – 1.6% | |
Emerson Electric Co. | | | 4,125 | | | | 373,271 | |
nVent Electric PLC | | | 7,710 | | | | 234,770 | |
| | | | | | | | |
| | | | | | $ | 608,041 | |
|
MACHINERY – 0.7% | |
Caterpillar, Inc. | | | 1,150 | | | | 262,326 | |
| | | | | | | | |
TOTAL INDUSTRIALS | | | | | | $ | 2,133,318 | |
|
INFORMATION TECHNOLOGY – 4.4% | |
|
COMMUNICATIONS EQUIPMENT – 1.2% | |
Cisco Systems, Inc. | | | 8,760 | | | | 445,971 | |
|
IT SERVICES – 0.6% | |
International Business Machines Corp. | | | 1,710 | | | | 242,615 | |
|
SEMICONDUCTORS & SEMICONDUCTOR EQUIPMENT – 2.6% | |
Broadcom, Inc. | | | 1,025 | | | | 467,605 | |
QUALCOMM, Inc. | | | 3,720 | | | | 516,336 | |
| | | | | | | | |
| | | | | | $ | 983,941 | |
| | | | | | | | |
TOTAL INFORMATION TECHNOLOGY | | | | | | $ | 1,672,527 | |
|
MATERIALS – 2.0% | |
|
CHEMICALS – 2.0% | |
Dow, Inc. | | | 6,710 | | | | 419,375 | |
Nutrien Ltd. | | | 6,240 | | | | 344,386 | |
| | | | | | | | |
TOTAL MATERIALS | | | | | | $ | 763,761 | |
|
REAL ESTATE – 1.3% | |
|
REAL ESTATE INVESTMENT TRUSTS – 1.3% | |
AvalonBay Communities, Inc. | | | 1,610 | | | | 309,120 | |
ANNUAL REPORT / April 30, 2021
| | |
| 43 | | PORTFOLIOS OF INVESTMENTS Wilmington Diversified Income Fund (continued) |
| | | | | | | | |
| | |
| Description | | Number of
Shares | | | Value | |
Crown Castle International Corp. | | | 1,050 | | | $ | 198,513 | |
| | | | | | | | |
TOTAL REAL ESTATE | | | | | | $ | 507,633 | |
|
UTILITIES – 2.5% | |
|
ELECTRIC UTILITIES – 2.5% | |
American Electric Power Co., Inc. | | | 2,800 | | | | 248,388 | |
Duke Energy Corp. | | | 2,130 | | | | 214,469 | |
FirstEnergy Corp. | | | 6,325 | | | | 239,844 | |
NextEra Energy, Inc. | | | 3,325 | | | | 257,721 | |
| | | | | | | | |
TOTAL UTILITIES | | | | | | $ | 960,422 | |
| | | | | | | | |
| |
TOTAL COMMON STOCKS
(COST $11,242,871) | | | $ | 15,503,781 | |
| |
| | | | | |
| | |
| | | Par Value | | | | |
|
ENHANCED EQUIPMENT TRUST CERTIFICATE – 0.1% | |
|
AIRLINES – 0.1% | |
Delta Air Lines, Series 2007-1, Class A, Pass-Through Certificates, 6.82%, 08/10/22 | | $ | 26,957 | | | | 28,188 | |
| | | | | | | | |
| |
TOTAL ENHANCED EQUIPMENT TRUST CERTIFICATE
(COST $26,433) | | | $ | 28,188 | |
|
GOVERNMENT AGENCIES – 0.8% | |
|
FEDERAL HOME LOAN BANK (FHLB) – 0.1% | |
3.25%, 11/16/28 | | | 35,000 | | | | 39,659 | |
|
FEDERAL HOME LOAN MORTGAGE CORPORATION (FHLMC) – 0.7% | |
0.36%, 05/15/24 | | | 270,000 | | | | 269,586 | |
| | | | | | | | |
| |
TOTAL GOVERNMENT AGENCIES
(COST $304,656) | | | $ | 309,245 | |
|
MORTGAGE-BACKED SECURITIES – 5.1% | |
|
FEDERAL HOME LOAN MORTGAGE CORPORATION (FHLMC) – 2.2% | |
Pool C00478, 8.50%, 09/01/26 | | | 613 | | | | 703 | |
Pool A15865, 5.50%, 11/01/33 | | | 16,633 | | | | 18,931 | |
Pool A19412, 5.00%, 03/01/34 | | | 38,462 | | | | 43,718 | |
Pool G05774, 5.00%, 01/01/40 | | | 96,277 | | | | 109,192 | |
Pool C03517, 4.50%, 09/01/40 | | | 10,737 | | | | 11,929 | |
Pool C03849, 3.50%, 04/01/42 | | | 21,324 | | | | 23,214 | |
Pool C04305, 3.00%, 11/01/42 | | | 93,484 | | | | 100,385 | |
Pool C09020, 3.50%, 11/01/42 | | | 70,736 | | | | 76,812 | |
Pool G07889, 3.50%, 08/01/43 | | | 16,417 | | | | 17,839 | |
Pool Q23891, 4.00%, 12/01/43 | | | 12,367 | | | | 13,439 | |
Pool G60038, 3.50%, 01/01/44 | | | 55,693 | | | | 60,496 | |
Pool ZS4693, 3.00%, 12/01/46 | | | 61,763 | | | | 65,382 | |
Pool SD8000, 3.00%, 07/01/49 | | | 24,890 | | | | 26,085 | |
Pool SD8012, 4.00%, 09/01/49 | | | 1,307 | | | | 1,408 | |
Pool SD8037, 2.50%, 01/01/50 | | | 91,509 | | | | 94,951 | |
Pool RA2480, 2.50%, 07/01/50 | | | 11,617 | | | | 12,086 | |
Pool SD8104, 1.50%, 11/01/50 | | | 45,669 | | | | 44,792 | |
Pool RA4349, 2.50%, 01/01/51 | | | 46,313 | | | | 48,323 | |
Pool SD8141, 2.50%, 04/01/51 | | | 56,807 | | | | 59,041 | |
| | | | | | | | |
TOTAL FEDERAL HOME LOAN MORTGAGE CORPORATION (FHLMC) | | | $ | 828,726 | |
|
FEDERAL NATIONAL MORTGAGE ASSOCIATION (FNMA) – 2.9% | |
Pool AB4089, 3.00%, 12/01/26 | | | 9,900 | | | | 10,430 | |
Pool 533246, 7.50%, 04/01/30 | | | 1,726 | | | | 1,760 | |
| | | | | | | | |
| | |
| Description | | Par Value | | | Value | |
Pool AJ4050, 4.00%, 10/01/41 | | $ | 33,367 | | | $ | 36,663 | |
Pool AX5302, 4.00%, 01/01/42 | | | 11,752 | | | | 12,953 | |
Pool AT7899, 3.50%, 07/01/43 | | | 30,946 | | | | 33,245 | |
Pool AS0302, 3.00%, 08/01/43 | | | 34,910 | | | | 37,231 | |
Pool AL6325, 3.00%, 10/01/44 | | | 32,686 | | | | 34,864 | |
Pool BC0830, 3.00%, 04/01/46 | | | 32,216 | | | | 34,113 | |
Pool BC9468, 3.00%, 06/01/46 | | | 12,201 | | | | 12,910 | |
Pool BE1899, 3.00%, 11/01/46 | | | 52,541 | | | | 55,636 | |
Pool BD7166, 4.50%, 04/01/47 | | | 31,920 | | | | 35,337 | |
Pool BE3625, 3.50%, 05/01/47 | | | 45,448 | | | | 48,564 | |
Pool BE3702, 4.00%, 06/01/47 | | | 66,233 | | | | 71,557 | |
Pool BE3767, 3.50%, 07/01/47 | | | 5,418 | | | | 5,794 | |
Pool BH9215, 3.50%, 01/01/48 | | | 14,658 | | | | 15,676 | |
Pool BJ0650, 3.50%, 03/01/48 | | | 87,130 | | | | 93,169 | |
Pool BJ9169, 4.00%, 05/01/48 | | | 32,611 | | | | 35,092 | |
Pool BK4764, 4.00%, 08/01/48 | | | 24,966 | | | | 26,866 | |
Pool MA3444, 4.50%, 08/01/48 | | | 18,285 | | | | 19,895 | |
Pool BN1628, 4.50%, 11/01/48 | | | 8,974 | | | | 9,781 | |
Pool BN3956, 4.00%, 01/01/49 | | | 12,428 | | | | 13,374 | |
Pool MA3871, 3.00%, 12/01/49 | | | 34,001 | | | | 35,633 | |
Pool CA5353, 3.50%, 03/01/50 | | | 96,547 | | | | 102,636 | |
Pool FM4994, 2.00%, 12/01/50 | | | 70,853 | | | | 71,826 | |
Pool MA4208, 2.00%, 12/01/50 | | | 46,863 | | | | 47,390 | |
Pool BQ4495, 2.00%, 02/01/51 | | | 97,423 | | | | 98,509 | |
Pool FM7188, 2.50%, 05/01/51 | | | 93,000 | | | | 98,087 | |
| | | | | | | | |
TOTAL FEDERAL NATIONAL MORTGAGE ASSOCIATION (FNMA) | | | $ | 1,098,991 | |
|
GOVERNMENT NATIONAL MORTGAGE ASSOCIATION (GNMA) – 0.0%** | |
Pool 354677, 7.50%, 10/15/23 | | | 2,886 | | | | 2,889 | |
Pool 354765, 7.00%, 02/15/24 | | | 5,043 | | | | 5,525 | |
Pool 354827, 7.00%, 05/15/24 | | | 3,333 | | | | 3,656 | |
| | | | | | | | |
TOTAL GOVERNMENT NATIONAL MORTGAGE ASSOCIATION (GNMA) | | | $ | 12,070 | |
| | | | | | | | |
| |
TOTAL MORTGAGE-BACKED SECURITIES
(COST $1,886,006) | | | $ | 1,939,787 | |
|
U.S. TREASURY OBLIGATIONS – 6.8% | |
|
U.S. TREASURY BONDS – 1.8% | |
4.75%, 02/15/37 | | | 21,000 | | | | 29,078 | |
4.38%, 05/15/40 | | | 120,000 | | | | 163,587 | |
3.63%, 02/15/44 | | | 87,000 | | | | 109,152 | |
3.38%, 05/15/44 | | | 139,000 | | | | 168,026 | |
3.13%, 08/15/44 | | | 11,000 | | | | 12,786 | |
3.00%, 11/15/44 | | | 53,000 | | | | 60,381 | |
3.00%, 11/15/45# | | | 8,000 | | | | 9,132 | |
3.00%, 02/15/47 | | | 21,000 | | | | 24,016 | |
3.00%, 05/15/47 | | | 30,000 | | | | 34,327 | |
2.00%, 02/15/50 | | | 50,000 | | | | 46,952 | |
| | | | | | | | |
TOTAL U.S. TREASURY BONDS | | | | | | $ | 657,437 | |
|
U.S. TREASURY NOTES – 5.0% | |
1.63%, 11/15/22 | | | 46,000 | | | | 47,053 | |
1.75%, 05/15/23 | | | 405,000 | | | | 417,951 | |
2.00%, 04/30/24 | | | 170,000 | | | | 178,420 | |
1.75%, 07/31/24 | | | 30,000 | | | | 31,313 | |
2.25%, 11/15/24 | | | 80,000 | | | | 84,990 | |
2.00%, 02/15/25 | | | 115,000 | | | | 121,347 | |
April 30, 2021 / ANNUAL REPORT
| | |
PORTFOLIOS OF INVESTMENTS Wilmington Diversified Income Fund (continued) | | 44 |
| | | | | | | | |
| | |
| Description | |
Par Value | | | Value | |
2.13%, 05/15/25 | | $ | 140,000 | | | $ | 148,505 | |
2.00%, 08/15/25 | | | 35,000 | | | | 36,984 | |
2.25%, 11/15/25 | | | 5,000 | | | | 5,340 | |
1.63%, 05/15/26 | | | 195,000 | | | | 202,372 | |
1.50%, 08/15/26 | | | 90,000 | | | | 92,658 | |
2.25%, 08/15/27 | | | 460,000 | | | | 490,619 | |
2.38%, 05/15/29 | | | 50,000 | | | | 53,541 | |
| | | | | | | | |
TOTAL U.S. TREASURY NOTES | | | | | | $ | 1,911,093 | |
| | | | | | | | |
| |
TOTAL U.S. TREASURY OBLIGATIONS
(COST $2,392,392) | | | $ | 2,568,530 | |
| |
| | | | | |
| | |
| | | Number of
Shares | | | | |
|
INVESTMENT COMPANIES – 34.4% | |
|
EXCHANGE-TRADED FUNDS – 31.1% | |
iShares iBoxx High Yield Corporate Bond ETF# | | | 21,300 | | | | 1,862,472 | |
iShares International Select Dividend ETF# | | | 227,000 | | | | 7,357,070 | |
SPDR Dow Jones International Real Estate ETF# | | | 42,625 | | | | 1,537,910 | |
Vanguard REIT ETF | | | 10,700 | | | | 1,060,156 | |
| | | | | | | | |
TOTAL EXCHANGE-TRADED FUNDS | | | | | | $ | 11,817,608 | |
|
INFLATION-PROTECTED SECURITIES FUND – 3.3% | |
Vanguard Inflation-Protected Securities Fund, Admiral Shares | | | 44,963 | | | | 1,270,200 | |
| | | | | | | | |
| |
TOTAL INVESTMENT COMPANIES
(COST $13,000,125) | | | $ | 13,087,808 | |
|
| MONEY MARKET FUND – 2.0% | |
Dreyfus Government Cash Management Fund, Institutional Shares, 0.03%^ | | | 756,230 | | | | 756,230 | |
| | | | | | | | |
| |
TOTAL MONEY MARKET FUND
(COST $756,230) | | | $ | 756,230 | |
| | | | | | | | |
| | |
| | |
Par Value | | | | |
|
CASH COLLATERAL INVESTED FOR SECURITIES ON LOAN – 12.4% | |
|
REPURCHASE AGREEMENTS – 12.4% | |
Bank of America Securities, Inc., 0.01%, dated 4/30/21, due 5/03/21, repurchase price $874,135 collateralized by U.S. Government Agency Securities, 1.00% to 5.50%, maturing 11/01/28 to 5/01/51; total market value of $891,617. | | $ | 874,134 | | | | 874,134 | |
| | | | | | | | |
| | |
| Description | |
Par Value | | | Value | |
BNP Paribas SA, 0.00%, dated 4/30/21, due 5/03/21, repurchase price $874,134 collateralized by U.S. Government Agency & Treasury Securities, 0.00% to 8.13%, maturing 5/15/21 to 2/01/56; total market value of $891,617. | | $ | 874,134 | | | $ | 874,134 | |
Citigroup Global Markets Ltd., 0.01%, dated 4/30/21, due 5/03/21, repurchase price $874,135 collateralized by U.S. Government Agency & Treasury Securities, 0.00% to 6.00%, maturing 5/15/21 to 4/20/51; total market value of $891,617. | | | 874,134 | | | | 874,134 | |
Daiwa Capital Markets America, 0.01%, dated 4/30/21, due 5/03/21, repurchase price $874,135 collateralized by U.S. Government Agency & Treasury Securities, 0.00% to 8.00%, maturing 6/30/21 to 5/01/51; total market value of $891,617. | | | 874,134 | | | | 874,134 | |
Deutsche Bank Securities, Inc., 0.01%, dated 4/30/21, due 5/03/21, repurchase price $347,985 collateralized by U.S. Government Agency & Treasury Securities, 0.00% to 4.00%, maturing 6/22/21 to 4/01/51; total market value of $354,945. | | | 347,985 | | | | 347,985 | |
RBC Dominion Securities, Inc., 0.01%, dated 4/30/21, due 5/03/21, repurchase price $874,135 collateralized by U.S. Government Agency & Treasury Securities, 0.00% to 6.50%, maturing 6/01/21 to 12/15/60; total market value of $891,617. | | | 874,134 | | | | 874,134 | |
| | | | | | | | |
| |
TOTAL REPURCHASE AGREEMENTS
(COST $4,718,655) | | | $ | 4,718,655 | |
| | | | | | | | |
| |
TOTAL CASH COLLATERAL INVESTED FOR SECURITIES ON LOAN
(COST $4,718,655) | | | $ | 4,718,655 | |
| | | | | | | | |
| |
TOTAL INVESTMENTS – 112.3%
(COST $37,872,077) | | | $ | 42,705,470 | |
| |
| COLLATERAL FOR SECURITIES ON LOAN – (12.4%) | | | | (4,718,655 | ) |
| |
| OTHER ASSETS LESS LIABILITIES – 0.1% | | | | 30,657 | |
| | | | | | | | |
| |
| TOTAL NET ASSETS – 100.0% | | | $ | 38,017,472 | |
| | | | | | | | |
ANNUAL REPORT / April 30, 2021
| | |
| 45 | | PORTFOLIOS OF INVESTMENTS Wilmington Diversified Income Fund (concluded) |
Various inputs are used in determining the value of the Fund’s investments. These inputs are summarized in the three broad levels listed below.
Level 1 – quoted prices in active markets for identical securities
Level 2 – other significant observable inputs (including quoted prices for similar securities, interest rates, prepayment speeds, credit risk, etc.)
Level 3 – significant unobservable inputs (including the Fund’s own assumptions in determining the fair value of investments)
The following is a summary of the inputs used as of April 30, 2021 in valuing the Fund’s assets carried at fair value:
| | | | | | | | | | | | | | | | |
| | | Level 1 | | | Level 2 | | | Level 3 | | | Total | |
| | | | |
Investments in Securities | | | | | | | | | | | | | | | | |
| | | | |
Collateralized Mortgage Obligations | | $ | — | | | $ | 88,576 | | | $ | — | | | $ | 88,576 | |
| | | | |
Corporate Bonds | | | — | | | | 3,704,670 | | | | — | | | | 3,704,670 | |
| | | | |
Common Stocks | | | 15,503,781 | | | | — | | | | — | | | | 15,503,781 | |
| | | | |
Enhanced Equipment Trust Certificate | | | — | | | | 28,188 | | | | — | | | | 28,188 | |
| | | | |
Government Agencies | | | — | | | | 309,245 | | | | — | | | | 309,245 | |
| | | | |
Mortgage-Backed Securities | | | — | | | | 1,939,787 | | | | — | | | | 1,939,787 | |
| | | | |
U.S. Treasury Obligations | | | — | | | | 2,568,530 | | | | — | | | | 2,568,530 | |
| | | | |
Investment Companies | | | 13,087,808 | | | | — | | | | — | | | | 13,087,808 | |
| | | | |
Money Market Fund | | | 756,230 | | | | — | | | | — | | | | 756,230 | |
| | | | |
Repurchase Agreements | | | — | | | | 4,718,655 | | | | — | | | | 4,718,655 | |
| | | | | | | | | | | | | | | | |
| | | | |
Total | | $ | 29,347,819 | | | $ | 13,357,651 | | | $ | — | | | $ | 42,705,470 | |
| | | | | | | | | | | | | | | | |
| ** | Represents less than 0.05%. |
| D | Variable rate security. The rate disclosed is the rate in effect on the report date. The information in parenthesis represents the benchmark and reference rate for each relevant security and the rate floats based upon the reference rate and spread. The security may be further subject to interest rate floor and caps. Certain variable rate securities are not based on a published reference rate and spread, but are determined by the issuer or agent and are based on current market conditions, or, for mortgage-backed securities, are impacted by the individual mortgages which are paying off over time. These securities do not indicate a reference rate and spread in their descriptions. |
| W | Denotes a restricted security that may be resold without restriction to “qualified institutional buyers” as defined in Rule 144A under the Securities Act of 1933 and that the Fund has determined to be liquid under criteria established by the Fund’s Board of Trustees. At April 30, 2021, these liquid restricted securities amounted to $168,012 representing 0.44% of total net assets. |
| # | Security, or a portion thereof, is on loan. See Note 2 in Notes to Financial Statements. |
The following acronyms are used throughout this Fund:
| GMTN | Global Medium Term Note |
| LIBOR | London Interbank Offered Rate |
| LLC | Limited Liability Corporation |
| PLC | Public Limited Company |
| REIT | Real Estate Investment Trust |
| SOFR | Secured Overnight Financing Rate |
| SPDR | Standard & Poor’s Depositary Receipt |
See Notes which are an integral part of the Financial Statements
April 30, 2021 / ANNUAL REPORT
| | |
| STATEMENTS OF ASSETS AND LIABILITIES | | 46 |
| | | | | | | | | | | | | | | | | | | | | | | | |
| | | | | | |
| | | | | | | | | | | | | | | Wilmington | | | | |
| | | | | | | | | Wilmington | | | | | | Global Alpha | | | | |
| | | | | | | | | International | | | | | | Equities | | | | |
| April 30, 2021 | | | | | | | | Fund | | | | | | Fund | | | | |
ASSETS: | | | | | | | | | | | | | | | | | | | | | | | | |
Investments, at identified cost | | | | | | | | | | $ | 537,912,938 | | | | | | | $ | 148,786,062 | | | | | |
| | | | | | | | | | | | | | | | | | | | | | | | |
Investments in securities, at value | | | | | | | | | | $ | 735,584,848 | (a) | | | | | | $ | 198,024,416 | | | | | |
Cash | | | | | | | | | | | 134,911 | | | | | | | | 754 | | | | | |
Deposits for financial futures contracts | | | | | | | | | | | 1,325,509 | | | | | | | | 6,451,972 | | | | | |
Cash denominated in foreign currencies | | | | | | | | | | | 3,450,171 | (b) | | | | | | | 184,969 | (b) | | | | |
Variation margin receivable for financial futures contracts | | | | | | | | | | | — | | | | | | | | 1,062,184 | | | | | |
Income receivable | | | | | | | | | | | 1,949,408 | | | | | | | | 351,833 | | | | | |
Foreign tax reclaim receivable | | | | | | | | | | | 1,403,855 | | | | | | | | 262,354 | | | | | |
Due from broker | | | | | | | | | | | 114,624 | | | | | | | | — | | | | | |
Receivable for shares sold | | | | | | | | | | | 826,961 | | | | | | | | 271,296 | | | | | |
Unrealized appreciation on forward foreign currency contracts | | | | | | | | | | | — | | | | | | | | 24,948 | | | | | |
Receivable for investments sold | | | | | | | | | | | 1,174,476 | | | | | | | | 993,594 | | | | | |
Prepaid and other assets | | | | | | | | | | | 27,265 | | | | | | | | 31,812 | | | | | |
| | | | | | | | | | | | | | | | | | | | | | | | |
TOTAL ASSETS | | | | | | | | | | | 745,992,028 | | | | | | | | 207,660,132 | | | | | |
| | | | | | | | | | | | | | | | | | | | | | | | |
LIABILITIES: | | | | | | | | | | | | | | | | | | | | | | | | |
Deferred foreign capital gains tax payable | | | | | | | | | | | 23,588 | | | | | | | | 2,390 | | | | | |
Payable for investments purchased | | | | | | | | | | | 2,316,272 | | | | | | | | 538,697 | | | | | |
Collateral for securities on loan | | | | | | | | | | | 25,326,302 | | | | | | | | — | | | | | |
Unrealized depreciation on forward foreign currency contracts | | | | | | | | | | | — | | | | | | | | 229,936 | | | | | |
Payable for shares redeemed | | | | | | | | | | | 123,572 | | | | | | | | 12,612 | | | | | |
Payable to sub-advisors | | | | | | | | | | | 221,198 | | | | | | | | 92,570 | | | | | |
Payable for Trustees’ fees | | | | | | | | | | | 9,263 | | | | | | | | 9,262 | | | | | |
Payable for administration fees | | | | | | | | | | | 17,648 | | | | | | | | 5,064 | | | | | |
Payable for distribution services fees | | | | | | | | | | | 828 | | | | | | | | 66 | | | | | |
Payable for investment advisory fees | | | | | | | | | | | 182,399 | | | | | | | | 60,363 | | | | | |
Other accrued expenses | | | | | | | | | | | 293,200 | | | | | | | | 153,428 | | | | | |
| | | | | | | | | | | | | | | | | | | | | | | | |
TOTAL LIABILITIES | | | | | | | | | | | 28,514,270 | | | | | | | | 1,104,388 | | | | | |
| | | | | | | | | | | | | | | | | | | | | | | | |
NET ASSETS | | | | | | | | | | $ | 717,477,758 | | | | | | | $ | 206,555,744 | | | | | |
| | | | | | | | | | | | | | | | | | | | | | | | |
NET ASSETS CONSIST OF: | | | | | | | | | | | | | | | | | | | | | | | | |
Paid-in capital | | | | | | | | | | $ | 528,702,053 | | | | | | | $ | 189,532,904 | | | | | |
Distributable earnings (loss) | | | | | | | | | | | 188,775,705 | | | | | | | | 17,022,840 | | | | | |
| | | | | | | | | | | | | | | | | | | | | | | | |
TOTAL NET ASSETS | | | | | | | | | | $ | 717,477,758 | | | | | | | $ | 206,555,744 | | | | | |
| | | | | | | | | | | | | | | | | | | | | | | | |
COMPUTATION OF NET ASSET VALUE AND OFFERING PRICE: | | | | | | | | | | | | | | | | | | | | | | | | |
Class A | | | | | | | | | | | | | | | | | | | | | | | | |
Net Assets | | | | | | | | | | $ | 4,014,499 | | | | | | | $ | 324,345 | | | | | |
| | | | | | | | | | | | | | | | | | | | | | | | |
Shares outstanding (unlimited shares authorized) | | | | | | | | | | | 383,442 | | | | | | | | 27,105 | | | | | |
| | | | | | | | | | | | | | | | | | | | | | | | |
Net Asset Value per share | | | | | | | | | | $ | 10.47 | | | | | | | $ | 11.97 | | | | | |
| | | | | | | | | | | | | | | | | | | | | | | | |
Offering Price per share* | | | | | | | | | | $ | 11.08 | ** | | | | | | $ | 12.67 | ** | | | | |
| | | | | | | | | | | | | | | | | | | | | | | | |
Class I | | | | | | | | | | | | | | | | | | | | | | | | |
Net Assets | | | | | | | | | | $ | 713,463,259 | | | | | | | $ | 206,231,399 | | | | | |
| | | | | | | | | | | | | | | | | | | | | | | | |
Shares outstanding (unlimited shares authorized) | | | | | | | | | | | 67,543,095 | | | | | | | | 16,981,184 | | | | | |
| | | | | | | | | | | | | | | | | | | | | | | | |
Net Asset Value and Offering Price per share | | | | | | | | | | $ | 10.56 | | | | | | | $ | 12.14 | | | | | |
| | | | | | | | | | | | | | | | | | | | | | | | |
| (a) | Including $23,456,143 of securities on loan (Note 2). |
| (b) | Cost of cash denominated in foreign currencies was $3,397,370 and $184,128, respectively . |
| * | See “How are Shares Priced?” in the Prospectus. |
| ** | Computation of offering price per share: 100/94.50 of net asset value. |
See Notes which are an integral part of the Financial Statements
ANNUAL REPORT / April 30, 2021
| | |
| 47 | | STATEMENTS OF ASSETS AND LIABILITIES (concluded) |
| | | | | | | | | | | | | | | | | | | | | | | | |
| | | | | | |
| | | | | | | | | | | | | | | Wilmington | | | | |
| | | | | | | | | Wilmington | | | | | | Diversified | | | | |
| | | | | | | | | Real Asset | | | | | | Income | | | | |
| April 30, 2021 | | | | | | | | Fund | | | | | | Fund | | | | |
ASSETS: | | | | | | | | | | | | | | | | | | | | | | | | |
Investments, at identified cost | | | | | | | | | | $ | 415,805,126 | | | | | | | $ | 37,872,076 | | | | | |
| | | | | | | | | | | | | | | | | | | | | | | | |
Investments in securities, at value (including repurchase agreements of $3,518,508 and $4,718,655, respectively) | | | | | | | | | | $ | 470,303,359 | (a) | | | | | | $ | 42,705,470 | (a) | | | | |
Cash denominated in foreign currencies | | | | | | | | | | | 66,098 | (b) | | | | | | | — | | | | | |
Income receivable | | | | | | | | | | | 276,327 | | | | | | | | 81,829 | | | | | |
Foreign tax reclaim receivable | | | | | | | | | | | 165,573 | | | | | | | | 137 | | | | | |
Due from advisor | | | | | | | | | | | — | | | | | | | | 11,298 | | | | | |
Receivable for shares sold | | | | | | | | | | | 735,925 | | | | | | | | 5,786 | | | | | |
Receivable for investments sold | | | | | | | | | | | 19,215 | | | | | | | | — | | | | | |
Prepaid and other assets | | | | | | | | | | | 54,040 | | | | | | | | 15,305 | | | | | |
| | | | | | | | | | | | | | | | | | | | | | | | |
TOTAL ASSETS | | | | | | | | | | | 471,620,537 | | | | | | | | 42,819,825 | | | | | |
| | | | | | | | | | | | | | | | | | | | | | | | |
LIABILITIES: | | | | | | | | | | | | | | | | | | | | | | | | |
Collateral for securities on loan | | | | | | | | | | | 6,965,508 | | | | | | | | 4,718,655 | | | | | |
Payable for shares redeemed | | | | | | | | | | | 14,988 | | | | | | | | 85 | | | | | |
Payable to sub-advisors | | | | | | | | | | | 14,604 | | | | | | | | — | | | | | |
Payable for Trustees’ fees | | | | | | | | | | | 8,755 | | | | | | | | 9,264 | | | | | |
Payable for administration fees | | | | | | | | | | | 10,942 | | | | | | | | 936 | | | | | |
Payable for distribution services fees | | | | | | | | | | | 197 | | | | | | | | 7,651 | | | | | |
Payable for investment advisory fees | | | | | | | | | | | 213,999 | | | | | | | | — | | | | | |
Other accrued expenses | | | | | | | | | | | 193,578 | | | | | | | | 65,762 | | | | | |
| | | | | | | | | | | | | | | | | | | | | | | | |
TOTAL LIABILITIES | | | | | | | | | | | 7,422,571 | | | | | | | | 4,802,353 | | | | | |
| | | | | | | | | | | | | | | | | | | | | | | | |
NET ASSETS | | | | | | | | | | $ | 464,197,966 | | | | | | | $ | 38,017,472 | | | | | |
| | | | | | | | | | | | | | | | | | | | | | | | |
NET ASSETS CONSIST OF: | | | | | | | | | | | | | | | | | | | | | | | | |
Paid-in capital | | | | | | | | | | $ | 443,591,472 | | | | | | | $ | 33,687,582 | | | | | |
Distributable earnings (loss) | | | | | | | | | | | 20,606,494 | | | | | | | | 4,329,890 | | | | | |
| | | | | | | | | | | | | | | | | | | | | | | | |
TOTAL NET ASSETS | | | | | | | | | | $ | 464,197,966 | | | | | | | $ | 38,017,472 | | | | | |
| | | | | | | | | | | | | | | | | | | | | | | | |
COMPUTATION OF NET ASSET VALUE AND OFFERING PRICE: | | | | | | | | | | | | | | | | | | | | | | | | |
Class A | | | | | | | | | | | | | | | | | | | | | | | | |
Net Assets | | | | | | | | | | $ | 994,637 | | | | | | | $ | 37,388,042 | | | | | |
| | | | | | | | | | | | | | | | | | | | | | | | |
Shares outstanding (unlimited shares authorized) | | | | | | | | | | | 63,833 | | | | | | | | 3,238,419 | | | | | |
| | | | | | | | | | | | | | | | | | | | | | | | |
Net Asset Value per share | | | | | | | | | | $ | 15.58 | | | | | | | $ | 11.55 | | | | | |
| | | | | | | | | | | | | | | | | | | | | | | | |
Offering Price per share* | | | | | | | | | | $ | 16.49 | ** | | | | | | $ | 12.22 | ** | | | | |
| | | | | | | | | | | | | | | | | | | | | | | | |
Class I | | | | | | | | | | | | | | | | | | | | | | | | |
Net Assets | | | | | | | | | | $ | 463,203,329 | | | | | | | $ | 629,430 | | | | | |
| | | | | | | | | | | | | | | | | | | | | | | | |
Shares outstanding (unlimited shares authorized) | | | | | | | | | | | 29,364,925 | | | | | | | | 54,449 | | | | | |
| | | | | | | | | | | | | | | | | | | | | | | | |
Net Asset Value and Offering Price per share | | | | | | | | | | $ | 15.77 | | | | | | | $ | 11.56 | | | | | |
| | | | | | | | | | | | | | | | | | | | | | | | |
| (a) | Including $6,780,909 and $4,591,658, respectively, of securities on loan (Note 2). |
| (b) | Cost of cash denominated in foreign currencies was $65,468. |
| * | See “How are Shares Priced?” in the Prospectus. |
| ** | Computation of offering price per share: 100/94.50 of net asset value. |
See Notes which are an integral part of the Financial Statements
April 30, 2021 / ANNUAL REPORT
| | |
| STATEMENTS OF OPERATIONS | | 48 |
| | | | | | | | | | | | |
| Year Ended April 30, 2021 | | | | | |
| Wilmington
International
Fund |
| |
| Wilmington
Global Alpha
Equities
Fund |
|
INVESTMENT INCOME: | | | | | | | | | | | | |
Dividends | | | | | | $ | 13,311,864 | (a) | | $ | 3,641,056 | (a) |
Interest | | | | | | | 77,421 | | | | 5,752 | |
Securities lending income, net | | | | | | | 156,056 | | | | — | |
| | | | | | | | | | | | |
TOTAL INVESTMENT INCOME | | | | | | | 13,545,341 | | | | 3,646,808 | |
| | | | | | | | | | | | |
| | | | | | | | | | | | | |
EXPENSES: | | | | | | | | | | | | |
Investment advisory fees | | | | | | | 5,098,190 | | | | 3,259,427 | |
Administration fees | | | | | | | 188,533 | | | | 65,665 | |
Portfolio accounting and administration fees | | | | | | | 189,991 | | | | 79,400 | |
Custodian fees | | | | | | | 182,680 | | | | 121,467 | |
Transfer and dividend disbursing agent fees and expenses | | | | | | | 107,788 | | | | 82,661 | |
Trustees’ fees | | | | | | | 56,884 | | | | 56,884 | |
Professional fees | | | | | | | 178,817 | | | | 162,280 | |
Distribution services fee—Class A | | | | | | | 9,011 | | | | 751 | |
Shareholder services fee—Class A | | | | | | | 9,011 | | | | 751 | |
Shareholder services fee—Class I | | | | | | | 1,121,924 | | | | 413,190 | |
Share registration costs | | | | | | | 32,085 | | | | 32,761 | |
Printing and postage | | | | | | | 21,352 | | | | 13,201 | |
Miscellaneous | | | | | | | 59,102 | | | | 32,078 | |
| | | | | | | | | | | | |
TOTAL EXPENSES | | | | | | | 7,255,368 | | | | 4,320,516 | |
| | | | | | | | | | | | |
| | | | | | | | | | | | | |
WAIVERS AND REIMBURSEMENTS: | | | | | | | | | | | | |
Waiver/reimbursement by investment advisor | | | | | | | (1,045,342 | ) | | | (1,211,350 | ) |
Waiver of shareholder services fee—Class A | | | | | | | (9,011 | ) | | | (751 | ) |
Waiver of shareholder services fee—Class I | | | | | | | (896,909 | ) | | | (413,190 | ) |
| | | | | | | | | | | | |
TOTAL WAIVERS AND REIMBURSEMENTS | | | | | | | (1,951,262 | ) | | | (1,625,291 | ) |
| | | | | | | | | | | | |
| | | | | | | | | | | | | |
Net expenses | | | | | | | 5,304,106 | | | | 2,695,225 | |
| | | | | | | | | | | | |
Net investment income | | | | | | | 8,241,235 | | | | 951,583 | |
| | | | | | | | | | | | |
REALIZED AND UNREALIZED GAIN (LOSS): | | | | | | | | | | | | |
Net realized gain (loss) on investments | | | | | | | 25,067,753 | (b) | | | 20,237,964 | (b) |
Net realized gain (loss) on forward foreign currency contracts | | | | | | | (152,695 | ) | | | (889,512 | ) |
Net realized gain (loss) on foreign currency transactions | | | | | | | (566,634 | ) | | | 53,790 | |
Net realized gain (loss) on financial futures contracts | | | | | | | 4,267,511 | | | | (52,761,632 | ) |
| | | | | | | | | | | | |
Net realized gain (loss) | | | | | | | 28,615,935 | | | | (33,359,390 | ) |
| | | | | | | | | | | | |
Net change in unrealized appreciation (depreciation) on investments | | | | | | | 189,047,404 | | | | 46,867,101 | |
Net change in unrealized appreciation (depreciation) on forward foreign currency contracts | | | | | | | 601 | | | | (459,928 | ) |
Net change in unrealized appreciation (depreciation) on foreign currency transactions | | | | | | | 175,372 | | | | 18,743 | |
Net change in unrealized appreciation (depreciation) on financial futures contracts | | | | | | | (948,553 | ) | | | 11,047,084 | |
| | | | | | | | | | | | |
Net change in unrealized appreciation (depreciation) | | | | | | | 188,274,824 | | | | 57,473,000 | |
| | | | | | | | | | | | |
Net realized and unrealized gain (loss) | | | | | | | 216,890,759 | | | | 24,113,610 | |
| | | | | | | | | | | | |
Change in net assets resulting from operations | | | | | | $ | 225,131,994 | | | $ | 25,065,193 | |
| | | | | | | | | | | | |
| (a) | Net of foreign withholding taxes of $1,225,394 and $296,330, respectively. |
| (b) | Net of change in deferred foreign capital gains tax payable of $23,588 and $2,390, respectively. |
See Notes which are an integral part of the Financial Statements
ANNUAL REPORT / April 30, 2021
| | |
| 49 | | STATEMENTS OF OPERATIONS (concluded) |
| | | | | | | | | | | | |
| Year Ended April 30, 2021 | | | | | |
| Wilmington
Real Asset
Fund |
| |
| Wilmington
Diversified
Income
Fund |
|
INVESTMENT INCOME: | | | | | | | | | | | | |
Dividends | | | | | | $ | 5,045,576 | (a) | | $ | 951,966 | (a) |
Interest | | | | | | | — | | | | 227,494 | |
Securities lending income, net | | | | | | | 68,041 | | | | 23,589 | |
| | | | | | | | | | | | |
TOTAL INVESTMENT INCOME | | | | | | | 5,113,617 | | | | 1,203,049 | |
| | | | | | | | | | | | |
| | | | | | | | | | | | | |
EXPENSES: | | | | | | | | | | | | |
Investment advisory fees | | | | | | | 1,372,694 | | | | 140,968 | |
Administration fees | | | | | | | 81,696 | | | | 10,650 | |
Portfolio accounting and administration fees | | | | | | | 118,447 | | | | 21,934 | |
Custodian fees | | | | | | | 76,814 | | | | 2,744 | |
Transfer and dividend disbursing agent fees and expenses | | | | | | | 82,809 | | | | 39,665 | |
Trustees’ fees | | | | | | | 56,884 | | | | 56,884 | |
Professional fees | | | | | | | 175,176 | | | | 97,179 | |
Distribution services fee—Class A | | | | | | | 2,362 | | | | 86,699 | |
Shareholder services fee—Class A | | | | | | | 2,362 | | | | 86,699 | |
Shareholder services fee—Class I | | | | | | | 430,535 | | | | 1,035 | |
Share registration costs | | | | | | | 34,723 | | | | 23,459 | |
Printing and postage | | | | | | | 39,302 | | | | 7,886 | |
Miscellaneous | | | | | | | 36,562 | | | | 19,633 | |
| | | | | | | | | | | | |
TOTAL EXPENSES | | | | | | | 2,510,366 | | | | 595,435 | |
| | | | | | | | | | | | |
| | | | | | | | | | | | | |
WAIVERS AND REIMBURSEMENTS: | | | | | | | | | | | | |
Waiver/reimbursement by investment advisor | | | | | | | (154,393 | ) | | | (297,655 | ) |
Waiver of shareholder services fee—Class A | | | | | | | (2,362 | ) | | | (86,699 | ) |
Waiver of shareholder services fee—Class I | | | | | | | (430,535 | ) | | | (1,035 | ) |
| | | | | | | | | | | | |
TOTAL WAIVERS AND REIMBURSEMENTS | | | | | | | (587,290 | ) | | | (385,389 | ) |
| | | | | | | | | | | | |
| | | | | | | | | | | | | |
Net expenses | | | | | | | 1,923,076 | | | | 210,046 | |
| | | | | | | | | | | | |
Net investment income | | | | | | | 3,190,541 | | | | 993,003 | |
| | | | | | | | | | | | |
REALIZED AND UNREALIZED GAIN (LOSS): | | | | | | | | | | | | |
Net realized gain (loss) on investments | | | | | | | (8,277,960 | ) | | | 367,883 | |
Net realized gain (loss) on forward foreign currency contracts | | | | | | | (385 | ) | | | — | |
Net realized gain (loss) on foreign currency transactions | | | | | | | 16,879 | | | | — | |
| | | | | | | | | | | | |
Net realized gain (loss) | | | | | | | (8,261,466 | ) | | | 367,883 | |
| | | | | | | | | | | | |
Net change in unrealized appreciation (depreciation) on investments | | | | | | | 79,210,677 | | | | 6,475,486 | |
Net change in unrealized appreciation (depreciation) on foreign currency transactions | | | | | | | 8,332 | | | | — | |
| | | | | | | | | | | | |
Net change in unrealized appreciation (depreciation) | | | | | | | 79,219,009 | | | | 6,475,486 | |
| | | | | | | | | | | | |
Net realized and unrealized gain (loss) | | | | | | | 70,957,543 | | | | 6,843,369 | |
| | | | | | | | | | | | |
Change in net assets resulting from operations | | | | | | $ | 74,148,084 | | | $ | 7,836,372 | |
| | | | | | | | | | | | |
| (a) | Net of foreign withholding taxes of $138,969 and $5,362, respectively. |
See Notes which are an integral part of the Financial Statements
April 30, 2021 / ANNUAL REPORT
| | |
| STATEMENTS OF CHANGES IN NET ASSETS | | 50 |
| | | | | | | | | | | | | | | | | | | | |
| | | Wilmington | | Wilmington |
| | | International
Fund | | Global Alpha
Equities Fund |
| | | | |
| | | Year Ended | | Year Ended | | Year Ended | | Year Ended |
| | | April 30, | | April 30, | | April 30, | | April 30, |
| | | 2021 | | 2020 | | 2021 | | 2020 |
OPERATIONS: | | | | | | | | | | | | | | | | | | | | |
Net investment income | | | $ | 8,241,235 | | | | $ | 8,760,578 | | | | $ | 951,583 | | | | $ | 1,588,127 | |
Net realized gain (loss) | | | | 28,615,935 | | | | | (27,424,995 | ) | | | | (33,359,390 | ) | | | | 13,823,568 | |
Net change in unrealized appreciation (depreciation) | | | | 188,274,824 | | | | | (44,981,027 | ) | | | | 57,473,000 | | | | | (22,691,724 | ) |
| | | | | | | | | | | | | | | | | | | | |
Change in net assets resulting from operations | | | | 225,131,994 | | | | | (63,645,444 | ) | | | | 25,065,193 | | | | | (7,280,029 | ) |
| | | | | | | | | | | | | | | | | | | | |
DISTRIBUTIONS TO SHAREHOLDERS: | | | | | | | | | | | | | | | | | | | | |
Class A | | | | (53,943 | ) | | | | (58,590 | ) | | | | (5,953 | ) | | | | (1,405 | ) |
Class I | | | | (10,011,086 | ) | | | | (9,522,428 | ) | | | | (4,303,804 | ) | | | | (2,321,797 | ) |
| | | | | | | | | | | | | | | | | | | | |
Total distributions to shareholders | | | | (10,065,029 | ) | | | | (9,581,018 | ) | | | | (4,309,757 | ) | | | | (2,323,202 | ) |
| | | | | | | | | | | | | | | | | | | | |
SHARE TRANSACTIONS: | | | | | | | | | | | | | | | | | | | | |
Proceeds from sale of shares | | | | | | | | | | | | | | | | | | | | |
Class A | | | | 67,944 | | | | | 13,474 | | | | | 101,389 | | | | | 140,958 | |
Class I | | | | 90,361,155 | | | | | 141,661,987 | | | | | 60,797,169 | | | | | 100,727,971 | |
Distributions reinvested | | | | | | | | | | | | | | | | | | | | |
Class A | | | | 46,666 | | | | | 50,869 | | | | | 5,059 | | | | | 1,373 | |
Class I | | | | 2,180,439 | | | | | 2,358,908 | | | | | 3,105,237 | | | | | 941,789 | |
Cost of shares redeemed | | | | | | | | | | | | | | | | | | | | |
Class A | | | | (377,606 | ) | | | | (1,346,018 | ) | | | | (19,709 | ) | | | | (53,284 | ) |
Class I | | | | (106,543,959 | ) | | | | (128,456,761 | ) | | | | (90,307,965 | ) | | | | (48,360,296 | ) |
| | | | | | | | | | | | | | | | | | | | |
Change in net assets resulting from share transactions | | | | (14,265,361 | ) | | | | 14,282,459 | | | | | (26,318,820 | ) | | | | 53,398,511 | |
| | | | | | | | | | | | | | | | | | | | |
Change in net assets | | | | 200,801,604 | | | | | (58,944,003 | ) | | | | (5,563,384 | ) | | | | 43,795,280 | |
NET ASSETS: | | | | | | | | | | | | | | | | | | | | |
Beginning of year | | | | 516,676,154 | | | | | 575,620,157 | | | | | 212,119,128 | | | | | 168,323,848 | |
| | | | | | | | | | | | | | | | | | | | |
End of year | | | $ | 717,477,758 | | | | $ | 516,676,154 | | | | $ | 206,555,744 | | | | $ | 212,119,128 | |
| | | | | | | | | | | | | | | | | | | | |
SHARES OF BENEFICIAL INTEREST: | | | | | | | | | | | | | | | | | | | | |
Shares sold | | | | | | | | | | | | | | | | | | | | |
Class A | | | | 6,920 | | | | | 1,663 | | | | | 9,228 | | | | | 12,575 | |
Class I | | | | 9,862,310 | | | | | 18,263,863 | | | | | 5,264,052 | | | | | 8,757,708 | |
Distributions reinvested | | | | | | | | | | | | | | | | | | | | |
Class A | | | | 5,369 | | | | | 6,089 | | | | | 438 | | | | | 117 | |
Class I | | | | 248,495 | | | | | 280,142 | | | | | 264,726 | | | | | 79,610 | |
Shares redeemed | | | | | | | | | | | | | | | | | | | | |
Class A | | | | (41,741 | ) | | | | (166,540 | ) | | | | (1,713 | ) | | | | (4,592 | ) |
Class I | | | | (11,852,417 | ) | | | | (15,738,820 | ) | | | | (7,794,856 | ) | | | | (4,342,370 | ) |
| | | | | | | | | | | | | | | | | | | | |
Net change resulting from share transactions | | | | (1,771,064 | ) | | | | 2,646,397 | | | | | (2,258,125 | ) | | | | 4,503,048 | |
| | | | | | | | | | | | | | | | | | | | |
See Notes which are an integral part of the Financial Statements
ANNUAL REPORT / April 30, 2021
| | |
| 51 | | STATEMENTS OF CHANGES IN NET ASSETS (concluded) |
| | | | | | | | | | | | | | | | | | | | |
| | | Wilmington | | Wilmington |
| | | Real Asset
Fund | | Diversified Income
Fund |
| | | | |
| | | Year Ended | | Year Ended | | Year Ended | | Year Ended |
| | | April 30, | | April 30, | | April 30, | | April 30, |
| | | 2021 | | 2020 | | 2021 | | 2020 |
OPERATIONS: | | | | | | | | | | | | | | | | | | | | |
Net investment income | | | $ | 3,190,541 | | | | $ | 10,479,624 | | | | $ | 993,003 | | | | $ | 1,468,788 | |
Net realized gain (loss) | | | | (8,261,466 | ) | | | | 818,770 | | | | | 367,883 | | | | | (749,345 | ) |
Net change in unrealized appreciation (depreciation) | | | | 79,219,009 | | | | | (46,892,572 | ) | | | | 6,475,486 | | | | | (2,792,079 | ) |
| | | | | | | | | | | | | | | | | | | | |
Change in net assets resulting from operations | | | | 74,148,084 | | | | | (35,594,178 | ) | | | | 7,836,372 | | | | | (2,072,636 | ) |
| | | | | | | | | | | | | | | | | | | | |
DISTRIBUTIONS TO SHAREHOLDERS: | | | | | | | | | | | | | | | | | | | | |
Class A | | | | (17,371 | ) | | | | (38,272 | ) | | | | (1,056,510 | ) | | | | (1,350,031 | ) |
Class I | | | | (5,009,481 | ) | | | | (11,252,467 | ) | | | | (18,230 | ) | | | | (24,433 | ) |
| | | | | | | | | | | | | | | | | | | | |
Total distributions to shareholders | | | | (5,026,852 | ) | | | | (11,290,739 | ) | | | | (1,074,740 | ) | | | | (1,374,464 | ) |
| | | | | | | | | | | | | | | | | | | | |
SHARE TRANSACTIONS: | | | | | | | | | | | | | | | | | | | | |
Proceeds from sale of shares | | | | | | | | | | | | | | | | | | | | |
Class A | | | | 74,933 | | | | | 200,308 | | | | | 451,605 | | | | | 390,191 | |
Class I | | | | 229,046,473 | | | | | 63,422,482 | | | | | 21,568 | | | | | 129,029 | |
Distributions reinvested | | | | | | | | | | | | | | | | | | | | |
Class A | | | | 11,639 | | | | | 26,100 | | | | | 969,611 | | | | | 1,247,276 | |
Class I | | | | 2,115,796 | | | | | 5,458,098 | | | | | 14,082 | | | | | 11,930 | |
Cost of shares redeemed | | | | | | | | | | | | | | | | | | | | |
Class A | | | | (240,445 | ) | | | | (305,579 | ) | | | | (3,393,587 | ) | | | | (4,457,443 | ) |
Class I | | | | (35,979,010 | ) | | | | (132,696,076 | ) | | | | (13,359 | ) | | | | (248,138 | ) |
| | | | | | | | | | | | | | | | | | | | |
Change in net assets resulting from share transactions | | | | 195,029,386 | | | | | (63,894,667 | ) | | | | (1,950,080 | ) | | | | (2,927,155 | ) |
| | | | | | | | | | | | | | | | | | | | |
Change in net assets | | | | 264,150,618 | | | | | (110,779,584 | ) | | | | 4,811,552 | | | | | (6,374,255 | ) |
NET ASSETS: | | | | | | | | | | | | | | | | | | | | |
Beginning of year | | | | 200,047,348 | | | | | 310,826,932 | | | | | 33,205,920 | | | | | 39,580,175 | |
| | | | | | | | | | | | | | | | | | | | |
End of year | | | $ | 464,197,966 | | | | $ | 200,047,348 | | | | $ | 38,017,472 | | | | $ | 33,205,920 | |
| | | | | | | | | | | | | | | | | | | | |
SHARES OF BENEFICIAL INTEREST: | | | | | | | | | | | | | | | | | | | | |
Shares sold | | | | | | | | | | | | | | | | | | | | |
Class A | | | | 5,600 | | | | | 13,863 | | | | | 42,975 | | | | | 37,841 | |
Class I | | | | 15,928,941 | | | | | 4,840,601 | | | | | 2,244 | | | | | 13,122 | |
Distributions reinvested | | | | | | | | | | | | | | | | | | | | |
Class A | | | | 879 | | | | | 1,862 | | | | | 95,193 | | | | | 118,944 | |
Class I | | | | 154,311 | | | | | 387,546 | | | | | 1,378 | | | | | 1,152 | |
Shares redeemed | | | | | | | | | | | | | | | | | | | | |
Class A | | | | (18,291 | ) | | | | (21,519 | ) | | | | (326,521 | ) | | | | (426,388 | ) |
Class I | | | | (2,687,031 | ) | | | | (10,521,157 | ) | | | | (1,265 | ) | | | | (22,657 | ) |
| | | | | | | | | | | | | | | | | | | | |
Net change resulting from share transactions | | | | 13,384,409 | | | | | (5,298,804 | ) | | | | (185,996 | ) | | | | (277,986 | ) |
| | | | | | | | | | | | | | | | | | | | |
See Notes which are an integral part of the Financial Statements
April 30, 2021 / ANNUAL REPORT
For a share outstanding throughout each year ended April 30, unless otherwise noted:
|
WILMINGTON INTERNATIONAL FUND |
| | | | | | | | | | | | | | | | | | | | | | | | | |
| | | Year Ended April 30, 2021 | | Year Ended April 30, 2020 | | Year Ended April 30, 2019 | | Year Ended April 30, 2018 | | Year Ended April 30, 2017 |
| CLASS A | | | | | | | | | | |
Net Asset Value, Beginning of Year | | | | $ 7.35 | | | | | $ 8.52 | | | | | $ 9.11 | | | | | $ 7.86 | | | | | $ 7.08 | |
Income (Loss) From Operations: | | | | | | | | | | | | | | | | | | | | | | | | | |
Net Investment Income(a) | | | | 0.10 | | | | | 0.13 | | | | | 0.14 | | | | | 0.08 | | | | | 0.08 | |
Net Realized and Unrealized Gain (Loss) | | | | 3.16 | | | | | (1.17 | ) | | | | (0.51 | ) | | | | 1.26 | | | | | 0.79 | (b) |
Total Income (Loss) From Operations | | | | 3.26 | | | | | (1.04 | ) | | | | (0.37 | ) | | | | 1.34 | | | | | 0.87 | |
Less Distributions From: | | | | | | | | | | | | | | | | | | | | | | | | | |
Net Investment Income | | | | (0.14 | ) | | | | (0.13 | ) | | | | (0.14 | ) | | | | (0.09 | ) | | | | (0.09 | ) |
Net Realized Gains | | | | — | | | | | — | | | | | (0.08 | ) | | | | — | | | | | — | |
Total Distributions | | | | (0.14 | ) | | | | (0.13 | ) | | | | (0.22 | ) | | | | (0.09 | ) | | | | (0.09 | ) |
Net Asset Value, End of Year | | | | $10.47 | | | | | $ 7.35 | | | | | $ 8.52 | | | | | $ 9.11 | | | | | $ 7.86 | |
| | | | | | | | | | | | | | | | | | | | | | | | | |
Total Return(c) | | | | 44.67 | % | | | | (12.35 | )% | | | | (4.07 | )% | | | | 17.18 | % | | | | 12.52 | % |
Net Assets, End of Year (000’s) | | | | $4,015 | | | | | $ 3,036 | | | | | $4,871 | | | | | $5,473 | | | | | $4,913 | |
Ratios to Average Net Assets | | | | | | | | | | | | | | | | | | | | | | | | | |
Gross Expense(d) | | | | 1.48 | % | | | | 1.50 | % | | | | 1.50 | % | | | | 1.48 | % | | | | 1.79 | % |
Net Expense(d),(e) | | | | 1.06 | % | | | | 0.98 | % | | | | 1.00 | % | | | | 1.04 | % | | | | 1.22 | % |
Net Investment Income | | | | 1.10 | % | | | | 1.57 | % | | | | 1.69 | % | | | | 0.93 | % | | | | 1.16 | % |
Portfolio Turnover Rate | | | | 74 | % | | | | 79 | % | | | | 70 | % | | | | 75 | % | | | | 177 | % |
| | | | | | | | | | | | | | | | | | | | | | | | | |
| | | Year Ended
April 30, 2021 | | Year Ended
April 30, 2020 | | Year Ended
April 30, 2019 | | Year Ended
April 30, 2018 | | Year Ended
April 30, 2017 |
| CLASS I | | | | | | | | | | |
Net Asset Value, Beginning of Year | | | $ | 7.41 | | | | $ | 8.59 | | | | $ | 9.18 | | | | $ | 7.92 | | | | $ | 7.13 | |
Income (Loss) From Operations: | | | | | | | | | | | | | | | | | | | | | | | | | |
Net Investment Income(a) | | | | 0.12 | | | | | 0.13 | | | | | 0.17 | | | | | 0.09 | | | | | 0.09 | |
Net Realized and Unrealized Gain (Loss) | | | | 3.18 | | | | | (1.17 | ) | | | | (0.53 | ) | | | | 1.27 | | | | | 0.80 | (b) |
Total Income (Loss) From Operations | | | | 3.30 | | | | | (1.04 | ) | | | | (0.36 | ) | | | | 1.36 | | | | | 0.89 | |
Less Distributions From: | | | | | | | | | | | | | | | | | | | | | | | | | |
Net Investment Income | | | | (0.15 | ) | | | | (0.14 | ) | | | | (0.15 | ) | | | | (0.10 | ) | | | | (0.10 | ) |
Net Realized Gains | | | | — | | | | | — | | | | | (0.08 | ) | | | | — | | | | | — | |
Total Distributions | | | | (0.15 | ) | | | | (0.14 | ) | | | | (0.23 | ) | | | | (0.10 | ) | | | | (0.10 | ) |
Net Asset Value, End of Year | | | $ | 10.56 | | | | $ | 7.41 | | | | $ | 8.59 | | | | $ | 9.18 | | | | $ | 7.92 | |
| | | | | | | | | | | | | | | | | | | | | | | | | |
Total Return(c) | | | | 44.92 | % | | | | (12.28 | )% | | | | (3.91 | )% | | | | 17.29 | % | | | | 12.69 | % |
Net Assets, End of Year (000’s) | | | $ | 713,463 | | | | $ | 513,640 | | | | $ | 570,749 | | | | $ | 655,810 | | | | $ | 438,974 | |
Ratios to Average Net Assets | | | | | | | | | | | | | | | | | | | | | | | | | |
Gross Expense(d) | | | | 1.16 | % | | | | 1.25 | % | | | | 1.26 | % | | | | 1.23 | % | | | | 1.54 | % |
Net Expense(d),(e) | | | | 0.85 | % | | | | 0.85 | % | | | | 0.87 | % | | | | 0.91 | % | | | | 1.09 | % |
Net Investment Income | | | | 1.32 | % | | | | 1.58 | % | | | | 1.95 | % | | | | 1.06 | % | | | | 1.28 | % |
Portfolio Turnover Rate | | | | 74 | % | | | | 79 | % | | | | 70 | % | | | | 75 | % | | | | 177 | % |
| (a) | Per share amounts have been calculated using the average shares method. |
| (b) | Amount includes a non-recurring payment for Litigation proceeds which represents a class action settlement received by the Fund related to best execution of foreign exchange transactions. The litigation proceeds impacted the realized and unrealized gain (loss) per share by $0.01 and $0.01 for Class A and Class I, respectively. |
| (c) | Based on net asset value, which does not reflect the sales charge, if applicable. Total returns for periods of less than one year, if any, are not annualized. |
| (d) | The Fund invests in other underlying funds and indirectly bears its proportionate share of fees and expenses incurred by the underlying funds. This ratio does not include these indirect fees and expenses. |
| (e) | The investment advisor and other service providers waived or reimbursed a portion of their fees. |
See Notes which are an integral part of the Financial Statements
ANNUAL REPORT / April 30, 2021
| | |
| 53 | | FINANCIAL HIGHLIGHTS (continued) |
For a share outstanding throughout each year ended April 30, unless otherwise noted:
|
WILMINGTON GLOBAL ALPHA EQUITIES FUND |
| | | | | | | | | | | | | | | | | | | | | | | | | |
| | | Year Ended April 30, 2021 | | Year Ended April 30, 2020 | | Year Ended April 30, 2019 | | Year Ended April 30, 2018 | | Year Ended April 30, 2017 |
| CLASS A | | | | | | | | | | |
Net Asset Value, Beginning of Year | | | | $10.87 | | | | | $11.28 | | | | | $10.99 | | | | | $10.54 | | | | | $ 9.82 | |
Income (Loss) From Operations: | | | | | | | | | | | | | | | | | | | | | | | | | |
Net Investment Income (Loss)(a) | | | | 0.02 | | | | | 0.07 | | | | | 0.09 | | | | | 0.05 | | | | | (0.01 | ) |
Net Realized and Unrealized Gain (Loss) | | | | 1.31 | | | | | (0.35 | ) | | | | 0.33 | | | | | 0.52 | | | | | 0.75 | |
Total Income (Loss) From Operations | | | | 1.33 | | | | | (0.28 | ) | | | | 0.42 | | | | | 0.57 | | | | | 0.74 | |
Less Distributions From: | | | | | | | | | | | | | | | | | | | | | | | | | |
Net Investment Income | | | | (0.06 | ) | | | | (0.13 | ) | | | | (0.13 | ) | | | | (0.12 | ) | | | | (0.02 | ) |
Net Realized Gains | | | | (0.17 | ) | | | | — | | | | | — | | | | | — | | | | | — | |
Total Distributions | | | | (0.23 | ) | | | | (0.13 | ) | | | | (0.13 | ) | | | | (0.12 | ) | | | | (0.02 | ) |
Net Asset Value, End of Year | | | | $11.97 | | | | | $10.87 | | | | | $11.28 | | | | | $10.99 | | | | | $10.54 | |
| | | | | | | | | | | | | | | | | | | | | | | | | |
Total Return(b) | | | | 12.27 | % | | | | (2.57 | )% | | | | 3.87 | % | | | | 5.41 | % | | | | 7.59 | % |
Net Assets, End of Year (000’s) | | | | $ 324 | | | | | $ 208 | | | | | $ 125 | | | | | $ 132 | | | | | $ 180 | |
Ratios to Average Net Assets | | | | | | | | | | | | | | | | | | | | | | | | | |
Gross Expense(c) | | | | 2.30 | % | | | | 2.29 | % | | | | 2.36 | % | | | | 2.46 | % | | | | 3.06 | % |
Net Expense(c),(d) | | | | 1.49 | % | | | | 1.49 | % | | | | 1.49 | % | | | | 1.50 | % | | | | 2.48 | %(e) |
Net Investment Income (Loss) | | | | 0.19 | % | | | | 0.63 | % | | | | 0.78 | % | | | | 0.42 | % | | | | (0.06 | )% |
Portfolio Turnover Rate | | | | 58 | % | | | | 84 | % | | | | 61 | % | | | | 58 | %(f) | | | | 367 | % |
| | | | | | | | | | | | | | | | | | | | | | | | | |
| | | Year Ended
April 30, 2021 | | Year Ended
April 30, 2020 | | Year Ended
April 30, 2019 | | Year Ended
April 30, 2018 | | Year Ended
April 30, 2017 |
| CLASS I | | | | | | | | | | |
Net Asset Value, Beginning of Year | | | $ | 11.01 | | | | $ | 11.40 | | | | $ | 11.08 | | | | $ | 10.61 | | | | $ | 9.86 | |
Income (Loss) From Operations: | | | | | | | | | | | | | | | | | | | | | | | | | |
Net Investment Income(a) | | | | 0.05 | | | | | 0.09 | | | | | 0.11 | | | | | 0.11 | | | | | 0.03 | |
Net Realized and Unrealized Gain (Loss) | | | | 1.31 | | | | | (0.34 | ) | | | | 0.34 | | | | | 0.49 | | | | | 0.75 | |
Total Income (Loss) From Operations | | | | 1.36 | | | | | (0.25 | ) | | | | 0.45 | | | | | 0.60 | | | | | 0.78 | |
Less Distributions From: | | | | | | | | | | | | | | | | | | | | | | | | | |
Net Investment Income | | | | (0.06 | ) | | | | (0.14 | ) | | | | (0.13 | ) | | | | (0.13 | ) | | | | (0.03 | ) |
Net Realized Gains | | | | (0.17 | ) | | | | — | | | | | — | | | | | — | | | | | — | |
Total Distributions | | | | (0.23 | ) | | | | (0.14 | ) | | | | (0.13 | ) | | | | (0.13 | ) | | | | (0.03 | ) |
Net Asset Value, End of Year | | | $ | 12.14 | | | | $ | 11.01 | | | | $ | 11.40 | | | | $ | 11.08 | | | | $ | 10.61 | |
| | | | | | | | | | | | | | | | | | | | | | | | | |
Total Return(b) | | | | 12.46 | % | | | | (2.31 | )% | | | | 4.18 | % | | | | 5.63 | % | | | | 7.93 | % |
Net Assets, End of Year (000’s) | | | $ | 206,232 | | | | $ | 211,911 | | | | $ | 168,199 | | | | $ | 156,369 | | | | $ | 103,768 | |
Ratios to Average Net Assets | | | | | | | | | | | | | | | | | | | | | | | | | |
Gross Expense(c) | | | | 1.99 | % | | | | 2.04 | % | | | | 2.11 | % | | | | 2.21 | % | | | | 2.82 | % |
Net Expense(c),(d) | | | | 1.24 | % | | | | 1.24 | % | | | | 1.24 | % | | | | 1.25 | % | | | | 2.12 | %(e) |
Net Investment Income | | | | 0.44 | % | | | | 0.82 | % | | | | 1.02 | % | | | | 1.03 | % | | | | 0.32 | % |
Portfolio Turnover Rate | | | | 58 | % | | | | 84 | % | | | | 61 | % | | | | 58 | %(f) | | | | 367 | % |
| (a) | Per share amounts have been calculated using the average shares method. |
| (b) | Based on net asset value, which does not reflect the sales charge, if applicable. Total returns for periods of less than one year, if any, are not annualized. |
| (c) | The Fund invests in other underlying funds and indirectly bears its proportionate share of fees and expenses incurred by the underlying funds. This ratio does not include these indirect fees and expenses. |
| (d) | The investment advisor and other service providers waived or reimbursed a portion of their fees. |
| (e) | Expense ratio includes dividend and interest expense related to securities sold short. Excluding such dividend and interest expense, the ratio of expenses to average net assets would be 2.06% and 1.77% for Class A and Class I, respectively. |
| (f) | In January 2017, the Fund transitioned to a single sub-advisor strategy. As a result, the portfolio turnover rate for the fiscal year ended April 30, 2018 was significantly lower than that of the prior fiscal year. |
See Notes which are an integral part of the Financial Statements
April 30, 2021 / ANNUAL REPORT
| | |
| FINANCIAL HIGHLIGHTS (continued) | | 54 |
For a share outstanding throughout each year ended April 30, unless otherwise noted:
|
WILMINGTON REAL ASSET FUND |
| | | | | | | | | | | | | | | | | | | | | | | | | |
| | | Year Ended April 30, 2021 | | Year Ended April 30, 2020 | | Year Ended April 30, 2019 | | Year Ended April 30, 2018 | | Year Ended April 30, 2017 |
| CLASS A | | | | | | | | | | |
Net Asset Value, Beginning of Year | | | | $12.33 | | | | | $ 14.40 | | | | | $14.48 | | | | | $13.87 | | | | | $13.63 | |
Income (Loss) From Operations: | | | | | | | | | | | | | | | | | | | | | | | | | |
Net Investment Income(a) | | | | 0.17 | | | | | 0.45 | | | | | 0.34 | | | | | 0.35 | | | | | 0.23 | |
Net Realized and Unrealized Gain (Loss) | | | | 3.32 | | | | | (2.03 | ) | | | | (0.07 | ) | | | | 0.63 | | | | | 0.01 | |
Total Income (Loss) From Operations | | | | 3.49 | | | | | (1.58 | ) | | | | 0.27 | | | | | 0.98 | | | | | 0.24 | |
Less Distributions From: | | | | | | | | | | | | | | | | | | | | | | | | | |
Net Investment Income | | | | (0.24 | ) | | | | (0.49 | ) | | | | (0.35 | ) | | | | (0.37 | ) | | | | — | |
Total Distributions | | | | (0.24 | ) | | | | (0.49 | ) | | | | (0.35 | ) | | | | (0.37 | ) | | | | — | |
Net Asset Value, End of Year | | | | $15.58 | | | | | $12.33 | | | | | $14.40 | | | | | $14.48 | | | | | $13.87 | |
| | | | | | | | | | | | | | | | | | | | | | | | | |
Total Return(b) | | | | 28.65 | % | | | | (11.35 | )% | | | | 2.05 | % | | | | 7.11 | % | | | | 1.76 | % |
Net Assets, End of Year (000’s) | | | | $ 995 | | | | | $ 932 | | | | | $1,173 | | | | | $1,297 | | | | | $1,643 | |
Ratios to Average Net Assets | | | | | | | | | | | | | | | | | | | | | | | | | |
Gross Expense(c) | | | | 1.30 | % | | | | 1.30 | % | | | | 1.32 | % | | | | 1.32 | % | | | | 1.45 | % |
Net Expense(c),(d) | | | | 0.96 | % | | | | 0.96 | % | | | | 0.96 | % | | | | 0.99 | % | | | | 1.20 | % |
Net Investment Income | | | | 1.25 | % | | | | 3.16 | % | | | | 2.44 | % | | | | 2.46 | % | | | | 1.68 | % |
Portfolio Turnover Rate | | | | 40 | %(e) | | | | 411 | % | | | | 347 | % | | | | 438 | % | | | | 593 | % |
| | | | | | | | | | | | | | | | | | | | | | | | | |
| | | Year Ended April 30, 2021 | | Year Ended April 30, 2020 | | Year Ended April 30, 2019 | | Year Ended April 30, 2018 | | Year Ended April 30, 2017 |
| CLASS I | | | | | | | | | | |
Net Asset Value, Beginning of Year | | | | $ 12.47 | | | | | $ 14.56 | | | | | $ 14.63 | | | | | $ 14.01 | | | | | $ 13.73 | |
Income (Loss) From Operations: | | | | | | | | | | | | | | | | | | | | | | | | | |
Net Investment Income(a) | | | | 0.17 | | | | | 0.49 | | | | | 0.38 | | | | | 0.40 | | | | | 0.27 | |
Net Realized and Unrealized Gain (Loss) | | | | 3.40 | | | | | (2.06 | ) | | | | (0.07 | ) | | | | 0.62 | | | | | 0.01 | |
Total Income (Loss) From Operations | | | | 3.57 | | | | | (1.57 | ) | | | | 0.31 | | | | | 1.02 | | | | | 0.28 | |
Less Distributions From: | | | | | | | | | | | | | | | | | | | | | | | | | |
Net Investment Income | | | | (0.27 | ) | | | | (0.52 | ) | | | | (0.38 | ) | | | | (0.40 | ) | | | | — | |
Total Distributions | | | | (0.27 | ) | | | | (0.52 | ) | | | | (0.38 | ) | | | | (0.40 | ) | | | | — | |
Net Asset Value, End of Year | | | | $ 15.77 | | | | | $ 12.47 | | | | | $ 14.56 | | | | | $ 14.63 | | | | | $ 14.01 | |
| | | | | | | | | | | | | | | | | | | | | | | | | |
Total Return(b) | | | | 29.00 | % | | | | (11.13 | )% | | | | 2.29 | % | | | | 7.31 | % | | | | 2.11 | % |
Net Assets, End of Year (000’s) | | | | $463,203 | | | | | $199,115 | | | | | $309,654 | | | | | $307,734 | | | | | $345,787 | |
Ratios to Average Net Assets | | | | | | | | | | | | | | | | | | | | | | | | | |
Gross Expense(c) | | | | 0.93 | % | | | | 1.05 | % | | | | 1.07 | % | | | | 1.07 | % | | | | 1.20 | % |
Net Expense(c),(d) | | | | 0.71 | % | | | | 0.71 | % | | | | 0.71 | % | | | | 0.74 | % | | | | 0.95 | % |
Net Investment Income | | | | 1.18 | % | | | | 3.41 | % | | | | 2.69 | % | | | | 2.74 | % | | | | 1.97 | % |
Portfolio Turnover Rate | | | | 40 | %(e) | | | | 411 | % | | | | 347 | % | | | | 438 | % | | | | 593 | % |
| (a) | Per share amounts have been calculated using the average shares method. |
| (b) | Based on net asset value, which does not reflect the sales charge, if applicable. Total returns for periods of less than one year, if any, are not annualized. |
| (c) | The Fund invests in other underlying funds and indirectly bears its proportionate share of fees and expenses incurred by the underlying funds. This ratio does not include these indirect fees and expenses. |
| (d) | The investment advisor and other service providers waived or reimbursed a portion of their fees. |
| (e) | In 2020, the Fund transitioned to a single sub-advisor strategy. As a result, the portfolio turnover rate for the year ended April 30, 2021 was significantly lower than that of previous fiscal years. |
See Notes which are an integral part of the Financial Statements
ANNUAL REPORT / April 30, 2021
| | |
| 55 | | FINANCIAL HIGHLIGHTS (concluded) |
For a share outstanding throughout each year ended April 30, unless otherwise noted:
|
WILMINGTON DIVERSIFIED INCOME FUND |
| | | | | | | | | | | | | | | | | | | | | | | | | |
| | | Year Ended April 30, 2021 | | Year Ended April 30, 2020 | | Year Ended April 30, 2019 | | Year Ended April 30, 2018 | | Year Ended April 30, 2017 |
| CLASS A | | | | | | | | | | |
Net Asset Value, Beginning of Year | | | | $ 9.54 | | | | | $ 10.54 | | | | | $ 10.47 | | | | | $ 11.24 | | | | | $ 10.40 | |
Income (Loss) From Operations: | | | | | | | | | | | | | | | | | | | | | | | | | |
Net Investment Income(a) | | | | 0.29 | | | | | 0.40 | | | | | 0.36 | | | | | 0.26 | | | | | 0.12 | |
Net Realized and Unrealized Gain (Loss) | | | | 2.04 | | | | | (1.02 | ) | | | | 0.11 | | | | | 0.52 | | | | | 0.85 | |
Total Income (Loss) From Operations | | | | 2.33 | | | | | (0.62 | ) | | | | 0.47 | | | | | 0.78 | | | | | 0.97 | |
Less Distributions From: | | | | | | | | | | | | | | | | | | | | | | | | | |
Net Investment Income | | | | (0.32 | ) | | | | (0.38 | ) | | | | (0.36 | ) | | | | (0.23 | ) | | | | (0.13 | ) |
Net Realized Gains | | | | — | | | | | — | | | | | (0.04 | ) | | | | (1.32 | ) | | | | — | |
Total Distributions | | | | (0.32 | ) | | | | (0.38 | ) | | | | (0.40 | ) | | | | (1.55 | ) | | | | (0.13 | ) |
Net Asset Value, End of Year | | | | $ 11.55 | | | | | $ 9.54 | | | | | $ 10.54 | | | | | $ 10.47 | | | | | $ 11.24 | |
| | | | | | | | | | | | | | | | | | | | | | | | | |
Total Return(b) | | | | 24.86 | % | | | | (6.17 | )% | | | | 4.66 | % | | | | 6.99 | % | | | | 9.38 | % |
Net Assets, End of Year (000’s) | | | | $37,388 | | | | | $32,708 | | | | | $38,943 | | | | | $40,993 | | | | | $42,878 | |
Ratios to Average Net Assets | | | | | | | | | | | | | | | | | | | | | | | | | |
Gross Expense(c) | | | | 1.69 | % | | | | 1.68 | % | | | | 1.67 | % | | | | 1.72 | % | | | | 1.59 | % |
Net Expense(c),(d) | | | | 0.60 | % | | | | 0.60 | % | | | | 0.60 | % | | | | 0.66 | % | | | | 0.74 | % |
Net Investment Income | | | | 2.81 | % | | | | 3.86 | % | | | | 3.45 | % | | | | 2.30 | % | | | | 1.16 | % |
Portfolio Turnover Rate | | | | 12 | % | | | | 14 | % | | | | 14 | % | | | | 85 | % | | | | 9 | % |
| | | | | | | | | | | | | | | | | | | | | | | | | |
| | | Year Ended April 30, 2021 | | Year Ended April 30, 2020 | | Year Ended April 30, 2019 | | Year Ended April 30, 2018 | | Year Ended April 30, 2017 |
| CLASS I | | | | | | | | | | |
Net Asset Value, Beginning of Year | | | | $ 9.55 | | | | | $10.54 | | | | | $10.48 | | | | | $11.25 | | | | | $10.41 | |
Income (Loss) From Operations: | | | | | | | | | | | | | | | | | | | | | | | | | |
Net Investment Income(a) | | | | 0.32 | | | | | 0.44 | | | | | 0.39 | | | | | 0.29 | | | | | 0.15 | |
Net Realized and Unrealized Gain (Loss) | | | | 2.03 | | | | | (1.02 | ) | | | | 0.10 | | | | | 0.52 | | | | | 0.85 | |
Total Income (Loss) From Operations | | | | 2.35 | | | | | (0.58 | ) | | | | 0.49 | | | | | 0.81 | | | | | 1.00 | |
Less Distributions From: | | | | | | | | | | | | | | | | | | | | | | | | | |
Net Investment Income | | | | (0.34 | ) | | | | (0.41 | ) | | | | (0.39 | ) | | | | (0.26 | ) | | | | (0.16 | ) |
Net Realized Gains | | | | — | | | | | — | | | | | (0.04 | ) | | | | (1.32 | ) | | | | — | |
Total Distributions | | | | (0.34 | ) | | | | (0.41 | ) | | | | (0.43 | ) | | | | (1.58 | ) | | | | (0.16 | ) |
Net Asset Value, End of Year | | | | $11.56 | | | | | $ 9.55 | | | | | $10.54 | | | | | $10.48 | | | | | $11.25 | |
| | | | | | | | | | | | | | | | | | | | | | | | | |
Total Return(b) | | | | 25.09 | % | | | | (5.83 | )% | | | | 4.82 | % | | | | 7.24 | % | | | | 9.64 | % |
Net Assets, End of Year (000’s) | | | | $ 629 | | | | | $ 498 | | | | | $ 637 | | | | | $1,109 | | | | | $ 725 | |
Ratios to Average Net Assets | | | | | | | | | | | | | | | | | | | | | | | | | |
Gross Expense(c) | | | | 1.38 | % | | | | 1.44 | % | | | | 1.40 | % | | | | 1.48 | % | | | | 1.34 | % |
Net Expense(c),(d) | | | | 0.35 | % | | | | 0.35 | % | | | | 0.35 | % | | | | 0.41 | % | | | | 0.49 | % |
Net Investment Income | | | | 3.06 | % | | | | 4.20 | % | | | | 3.72 | % | | | | 2.62 | % | | | | 1.44 | % |
Portfolio Turnover Rate | | | | 12 | % | | | | 14 | % | | | | 14 | % | | | | 85 | % | | | | 9 | % |
| (a) | Per share amounts have been calculated using the average shares method. |
| (b) | Based on net asset value, which does not reflect the sales charge, if applicable. Total returns for periods of less than one year, if any, are not annualized. |
| (c) | The Fund invests in other underlying funds and indirectly bears its proportionate share of fees and expenses incurred by the underlying funds. This ratio does not include these indirect fees and expenses. |
| (d) | The investment advisor and other service providers waived or reimbursed a portion of their fees. |
See Notes which are an integral part of the Financial Statements
April 30, 2021 / ANNUAL REPORT
| | |
| NOTES TO FINANCIAL STATEMENTS | | 56 |
Wilmington Funds
April 30, 2021
Wilmington Funds (the “Trust”) is registered under the Investment Company Act of 1940, as amended (the “Act”), as an open-end management investment company. The Trust consists of 12 funds, 4 of which are presented herein (individually referred to as a “Fund” or collectively as the “Funds”). The remaining 8 funds are presented in separate reports.
| | |
Fund | | Investment Goal |
Wilmington International Fund (“International Fund”)(d) | | The Fund seeks to provide long-term capital appreciation primarily through a diversified portfolio of non-U.S. equity securities. |
| |
Wilmington Global Alpha Equities Fund (“Global Alpha Equities Fund”)(d) | | The Fund seeks to achieve long-term growth of capital with lower volatility than broader equity markets. |
| |
Wilmington Real Asset Fund (“Real Asset Fund”)(d) | | The Fund seeks to achieve long-term preservation of capital with current income. |
| |
Wilmington Diversified Income Fund (“Diversified Income Fund”)(d) | | The Fund seeks a high level of total return consistent with a moderate level of risk. |
The Trust offers 6 classes of shares: Class A, Service Class, Select Class, Administrative Class, Class I and Institutional Class. Service Class, Select Class, Administrative Class and Institutional Class are not available for the Funds. All shares of the Trust have equal rights with respect to voting, except on class-specific matters.
The assets of each fund are segregated and a shareholder’s interest is limited to the fund in which shares are held.
| 2. | SUMMARY OF SIGNIFICANT ACCOUNTING POLICIES |
The following is a summary of significant accounting policies consistently followed by the Funds in the preparation of their financial statements. These policies are in conformity with U.S. generally accepted accounting principles (“GAAP”). The Trust is an investment company and follows accounting and reporting guidance under Financial Accounting Standards Board (“FASB”) Accounting Standards Codification (“ASC”) Topic 946, “Financial Services - Investment Companies.” The preparation of financial statements in conformity with GAAP requires management to make estimates and assumptions that affect the amounts of assets, liabilities, expenses and revenues reported in the financial statements. Actual results could differ from those estimated and the differences could be material.
Computation of Net Asset Value – The net asset value (‘‘NAV’’) per share for each class of a Fund is computed by dividing the total current value of the assets of the Fund, less its liabilities, attributable to the class by the total number of shares outstanding of the class at the time of such computation. The NAV per share for each class of a Fund is computed as of 4:00 p.m. (Eastern Time) on days when the New York Stock Exchange (“NYSE”) is open for regular trading.
Investment Valuation – The Funds utilize a fair value approach. The fair value of the Funds’ portfolio securities are determined as follows:
• for equity securities, according to the last sale price or official closing price reported in the market in which they are primarily traded (either a national securities exchange or the over-the-counter market), if available;
• in the absence of recorded sales for equity securities, according to the mean between the last closing bid and asked prices;
• financial futures contracts and options are generally valued at market values established by the exchanges on which they are traded at the close of trading on such exchanges. Options traded in the over-the-counter market are generally valued according to the mean between the last bid and the last asked price for the option as provided by an investment dealer or other financial institution that deals in the option. The Board of Trustees (“Trustees”) may determine in good faith that another method of valuing such investments is necessary to appraise their fair value;
• forward foreign currency contracts are valued at the mean between the last bid and asked prices;
• investments in open-end regulated investment companies are valued at net asset value (“NAV”);
• for fixed income securities, according to prices as furnished by an independent pricing service, except that fixed income securities with remaining maturities of less than 60 days at the time of purchase are valued at amortized cost provided such amount approximates fair value;
• price information on listed securities, including underlying Exchange Traded Funds (“ETFs”) and Exchange Traded Notes (“ETNs”), is taken from the exchange where the security is primarily traded; and
• for all other securities, at fair value as determined in accordance with procedures established by and under the general supervision of the Trustees.
Trading in foreign securities may be completed at times which vary from the closing of the New York Stock Exchange (“NYSE”). In computing their NAV, the Funds value foreign securities using the latest closing price on the primary exchange on which they are traded imme-
ANNUAL REPORT / April 30, 2021
| | |
| 57 | | NOTES TO FINANCIAL STATEMENTS (continued) |
diately prior to the closing of the NYSE. Certain foreign currency exchange rates are generally determined at the latest rate prior to the closing of the NYSE. Foreign securities quoted in foreign currencies are translated into U.S. dollars at current rates. Events that affect these values and exchange rates may occur between the times at which they are determined and the closing of the NYSE. If such events materially affect the value of portfolio securities, these securities may be valued at their fair value as determined in good faith by the Trustees, although the actual calculation may be done by others. An event is considered material if there is both an affirmative expectation that the security’s value will change in response to the event and a reasonable basis for quantifying the resulting change in value. In determining whether market quotations are readily available or fair valuation will be used, various factors will be taken into consideration, such as market closures or suspension of trading in a security. Each Fund may use fair value pricing more frequently for securities traded primarily in non-US markets because, among other things, most foreign markets close well before each Fund values its securities, generally as of 4:00pm Eastern time. The earlier close of these foreign markets gives rise to the possibility that significant events, including broad market moves, government actions or pronouncements, aftermarket trading, or news events may have occurred in the interim. Whenever such a significant event occurs, each Fund may value foreign securities using fair value prices based on third-party vendor modeling tools (Systematic International Fair Value Pricing (“SIFVP”)).
The Trust follows the authoritative guidance (GAAP) for fair value measurements. The guidance establishes a framework for measuring fair value and a hierarchy for inputs and techniques used in measuring fair value that maximizes the use of observable inputs and minimizes the use of unobservable inputs and techniques by requiring that the most observable inputs be used when available. The guidance establishes three tiers of inputs that may be used to measure fair value. The three tiers of inputs are summarized at the end of each Fund’s Portfolio of Investments. The inputs or techniques used for valuing securities are not necessarily an indication of the risk associated with investing in those securities.
Pursuant to the Funds’ fair value procedures noted previously, equity securities (including exchange traded securities and other open-end regulated investment companies) and exchange traded derivatives are generally categorized as Level 1 securities in the fair value hierarchy. The Wilmington International Fund, the Wilmington Global Alpha Equities and the Wilmington Real Asset Fund may utilize SIFVP which could result in certain equity securities being categorized as Level 2. Fixed income securities, non-exchange traded derivatives and money market instruments are generally categorized as Level 2 securities in the fair value hierarchy.
Investments for which there are no such quotations, or for which quotations do not appear reliable, are valued at fair value as determined in accordance with procedures established by and under the general supervision of the Trustees. These valuations are typically categorized as Level 2 or Level 3 securities in the fair value hierarchy.
Repurchase Agreements – Repurchase agreements are transactions in which a Fund buys a security from a dealer or bank and agrees to sell the security back at a mutually agreed upon time and price. The repurchase price exceeds the sale price, reflecting each Fund’s return on the transaction. It is each Fund’s policy to require the counterparty to a repurchase agreement to transfer to the Funds’ custodian or sub-custodian eligible securities or cash with a market value (after transaction costs) at least equal to the repurchase price to be paid under the repurchase agreement. The eligible securities are transferred to accounts with the custodian or sub-custodian in which the Funds hold a “securities entitlement” and exercise “control” as those terms are defined in the Uniform Commercial Code. The Funds have established procedures for monitoring the market value of the transferred securities and requiring the transfer of additional eligible securities, if necessary, to equal at least the repurchase price. These procedures also allow the counterparty to require securities to be transferred from the account to the extent that their market value exceeds the repurchase price or in exchange for other eligible securities of equivalent market value.
The insolvency of the counterparty or other failure to repurchase the securities may delay the disposition of the underlying securities or cause the Funds to receive less than the full repurchase price.
Repurchase agreements are entered into by the Funds under Master Repurchase Agreements (“MRA”) which permit the Funds, under certain circumstances including an event of default (such as bankruptcy or insolvency), to offset payables and/or receivables under the MRA with collateral held and/or posted to the counterparty and create one single net payment due to or from each Fund.
At April 30, 2021, the open repurchase agreements by counterparty which are subject to a MRA on a net payment basis are as follows:
| | | | | | | | | | | | | | | | | | | | |
| | | | | |
| Fund/Counterparty | | Repurchase
Agreements | | Fair Value of
Non-Cash Collateral
Received(1) | | Cash Collateral
Received(1) | | Net Exposure(2)
|
| | | | | |
International Fund | | | | | | | | | | | | | | | | | | | | |
Bank of America Securities, Inc. | | | $ | 2,552,306 | | | | $ | 2,552,306 | | | | $ | — | | | | $ | — | |
Daiwa Capital Markets America | | | | 4,811,998 | | | | | 4,811,998 | | | | | — | | | | | — | |
RBC Dominion Securities, Inc. | | | | 4,811,998 | | | | | 4,811,998 | | | | | — | | | | | — | |
| | | | | | | | | | | | | | | | | | | | | |
| | | | | |
| | | | $ | 12,176,302 | | | | $ | 12,176,302 | | | | $ | — | | | | $ | — | |
| | | | | | | | | | | | | | | | | | | | | |
Real Asset Fund | | | | | | | | | | | | | | | | | | | | |
Bank of America Securities, Inc. | | | $ | 937,786 | | | | $ | 937,786 | | | | $ | — | | | | $ | — | |
Daiwa Capital Markets America | | | | 1,290,361 | | | | | 1,290,361 | | | | | — | | | | | — | |
RBC Dominion Securities, Inc. | | | | 1,290,361 | | | | | 1,290,361 | | | | | — | | | | | — | |
| | | | | | | | | | | | | | | | | | | | | |
| | | | | |
| | | | $ | 3,518,508 | | | | $ | 3,518,508 | | | | $ | — | | | | $ | — | |
| | | | | | | | | | | | | | | | | | | | | |
Diversified Income Fund | | | | | | | | | | | | | | | | | | | | |
Bank of America Securities, Inc. | | | $ | 874,134 | | | | $ | 874,134 | | | | $ | — | | | | $ | — | |
BNP Paribas SA | | | | 874,134 | | | | | 874,134 | | | | | — | | | | | — | |
April 30, 2021 / ANNUAL REPORT
| | |
| NOTES TO FINANCIAL STATEMENTS (continued) | | 58 |
| | | | | | | | | | | | | | | | | | | | |
| | | | | |
| Fund/Counterparty | | Repurchase
Agreements | | Fair Value of
Non-Cash Collateral
Received(1) | | Cash Collateral
Received(1) | | Net Exposure(2)
|
Citigroup Global Markets Ltd. | | | $ | 874,134 | | | | $ | 874,134 | | | | $ | — | | | | $ | — | |
Daiwa Capital Markets America | | | | 874,134 | | | | | 874,134 | | | | | — | | | | | — | |
Deutsche Bank Securities, Inc. | | | | 347,985 | | | | | 347,985 | | | | | — | | | | | — | |
RBC Dominion Securities, Inc. | | | | 874,134 | | | | | 874,134 | | | | | — | | | | | — | |
| | | | | | | | | | | | | | | | | | | | | |
| | | | | |
| | | | $ | 4,718,655 | | | | $ | 4,718,655 | | | | $ | — | | | | $ | — | |
| | | | | | | | | | | | | | | | | | | | | |
(1) The amount of collateral reflected in the table does not include any over-collateralization received by the Fund.
(2) Net exposure represents the receivable (payable) due from (to) the counterparty in the event of default.
Investment Income, Gains and Losses, Expenses and Distributions – Interest income and expenses are accrued daily. All premiums and discounts on fixed income securities are amortized/accreted for financial reporting purposes. Gains and losses realized on principal payment of mortgage-backed securities (paydown gains and losses) are classified as part of investment income. Dividends and distributions to shareholders are recorded on the ex-dividend date. Non-cash dividends included in dividend income, if any, are recorded at fair value. Foreign dividends are recorded on the ex-dividend date or when the Funds are informed of the ex-dividend date. Investment transactions are accounted for on a trade date basis for financial reporting purposes. Realized gains and losses from investment transactions are recorded on an identified cost basis and includes proceeds from litigation, if any. Withholding taxes and, where appropriate, deferred withholding taxes on foreign interest, dividends and capital gains have been provided for in accordance with the applicable country’s tax rules and rates.
Expenses of the Trust, which are directly identifiable to a specific fund, are applied to that fund. Expenses which are not identifiable to a specific fund are allocated in such a manner as deemed equitable, taking into consideration the nature and type of expense.
Each Fund offers multiple classes of shares. Investment income, realized and unrealized gains and losses, and certain fund-level expenses are allocated to each class based on relative daily net assets, except that each class bears certain expenses unique to that class such as distribution and shareholder services fees. Distributions are declared separately for each class. No class has preferential distribution rights; differences in per share distributions rates are generally due to differences in class specific expenses. Distributions from net realized gains, if any, are declared and paid to shareholders annually. Distributions from net investment income are declared and paid quarterly for the Funds, with the exception of the Global Alpha Equities Fund, which is paid annually.
Real Estate Investment Trusts – The Funds may invest in real estate investment trusts (“REITs”) that involve risks not associated with investing in stocks. Risks include declines in the value of real estate, general and economic conditions, changes in the value of the underlying property and defaults by borrowers. The value of assets in the real estate industry may go through cycles of relative underperformance and outperformance in comparison to equity securities markets in general. Dividend income is recorded using management’s estimate of the income included in distributions received from REIT investments. The actual amounts of income, return of capital and capital gains are only determined by each REIT after its fiscal year-end and may differ from the estimated amount. Estimates of income are adjusted to the actual amounts when the amounts are determined.
Warrants and Rights – Certain Funds hold warrants and rights acquired either through a direct purchase, including as part of private placement, or pursuant to corporate actions. Warrants and rights entitle the holder to buy a proportionate amount of common stock at a specific price and time through the expiration dates. Such warrants and rights are held as long positions by the Funds until exercised, sold or expired. Equity-linked warrants are purchased in order to own local exposure to certain countries in which the Funds are not locally registered. Warrants and rights are valued at fair value in accordance with the Trustees’ approved fair value procedures.
Foreign Currency Translation – The accounting records of the Funds are maintained in U.S. dollars. All assets and liabilities denominated in foreign currencies are translated into U.S. dollars based on the rates of exchange of such currencies against U.S. dollars on the date of valuation. Purchases and sales of securities, income and expenses are translated at the rate of exchange quoted on the respective date that such transactions are recorded. The Funds do not isolate that portion of results of operations resulting from changes in foreign exchange rates on investments from fluctuations arising from changes in the net realized and unrealized gain or loss on investments.
Reported net realized foreign exchange gains or losses arise from sales of portfolio securities, sales and maturities of short-term securities, sales of foreign currencies, currency gains or losses realized between the trade and settlement dates on securities transactions, the difference between the amounts of dividends, interest, and foreign withholding taxes recorded on the Funds’ books and the U.S. dollar equivalent of the amounts actually received or paid. Net unrealized foreign exchange gains and losses arise from changes in the value of assets and liabilities, other than investments in securities at period end, resulting from changes in the exchange rates.
Restricted Securities – Restricted securities are securities that either (a) cannot be offered for public sale without first being registered, or being able to take advantage of an exemption from registration, under the Securities Act of 1933, as amended, or (b) are subject to contractual restrictions on public sales. In some cases, when a security cannot be offered for public sale without first being registered, the issuer of the restricted security has agreed to register such securities for resale, at the issuer’s expense, either upon demand by the Funds or in connection with another registered offering of the securities. Many such restricted securities may be resold in the secondary market in transactions exempt from registration. Restricted securities may be determined to be liquid under criteria established by the Trustees. A Fund will not incur any registration costs upon such resales. The Funds’ restricted securities are valued at the price provided by dealers in the secondary market or, if no market prices are available, at the fair value as determined in accordance with procedures established by and under the general supervision of the Trustees.
ANNUAL REPORT / April 30, 2021
| | |
| 59 | | NOTES TO FINANCIAL STATEMENTS (continued) |
Securities Sold Short – Certain Funds may sell securities short. A short sale is a transaction in which the Fund sells a security it does not own in anticipation of a decline in market price. To sell a security short, the Fund must borrow the security. The Fund’s obligation to replace the security borrowed and sold short will be fully collateralized at all times by the proceeds from the short sale retained by the broker and by cash and securities deposited in a segregated account with the Fund’s custodian. If the price of the security sold short increases between the time of the short sale and the time the Fund replaces the borrowed security, the Fund will realize a loss, and if the price declines during the period, the Fund will realize a gain. Any realized gain will be decreased, and any realized loss increased, by the amount of transaction costs. The Funds are required to pay the lender any dividends declared on short positions. Such amounts are recorded on the ex-dividend date as dividends expense on securities sold short on the Statements of Operations.
In accordance with the terms of its prime brokerage agreement, the Funds may be charged a fee on borrowed securities. Such fees are calculated on a daily basis based upon the market value of each borrowed security and a variable rate that is dependent upon the availability of such security. The Funds are required to maintain margin cash balances at the prime broker sufficiently to satisfy their short sales positions on a daily basis. The Funds are charged interest expense at the Fed Funds open rate plus 50 basis points on the amount of any shortfall in the required cash margin. The Funds record these prime broker charges on a net basis as Prime Broker interest expense on securities sold short on the Statements of Operations. During the year ended April 30, 2021, there was no short sales transactions.
Lending of Portfolio Securities – The Trust has entered into an agreement with its custodian whereby the custodian may lend securities owned by the Funds to brokers, dealers and other financial organizations. Any increase or decrease in the fair value of securities loaned and any interest or dividends earned on those securities during the term of the loan would be for the account of the Funds. In exchange for lending securities under the terms of the agreement with their custodian, the Funds receive a lender’s fee. Fees earned by the Funds on securities lending are recorded as income. Loans of securities by the Funds are collateralized by cash, U.S. government securities or money market instruments that are maintained at all times in an amount at least equal to the current market value of the loaned securities plus a margin which varies depending on the type of securities owned. The custodian establishes and maintains the collateral in a segregated account. The Funds have the right under the lending agreement to recover the securities from the borrower on demand. The market value of the loaned securities is determined at the close of business of the Funds and any additional required collateral is delivered to the Funds on the next business day.
Under the terms of the agreement, cash collateral received is invested in one or more approved investments. Investments purchased with cash collateral are presented on the Portfolios of Investments under the caption “Cash Collateral Invested for Securities on Loan.”
The Funds maintain the risk of any loss on the securities on loan as well as the potential loss on investments purchased with cash collateral received from securities lending.
Securities lending transactions are entered into by the Funds under Master Securities Lending Agreements (“MSLA”) which permit the Funds, under certain circumstances including an event of default (such as bankruptcy or insolvency), to offset amounts payable by the Funds to the same counterparty against amounts to be received and create one single net payment due to or from the Funds.
At April 30, 2021, the securities loaned which are subject to a MSLA on a net payment basis are as follows:
| | | | | | | | | | | | | | | |
| Fund | | Value of
Securities
on Loan | | Cash Collateral
Received(1) | | Net Exposure(2) |
| | | |
International Fund | | $23,456,143 | | $23,456,143 | | | $ | — | |
Real Asset Fund | | 6,780,909 | | 6,780,909 | | | | — | |
Diversified Income Fund | | 4,591,658 | | 4,591,658 | | | | — | |
| | (1) | Collateral with a value of $25,326,302, $6,965,508 and $4,718,655, respectively, has been received in connection with securities lending transactions. The amount of collateral reflected in the table does not include any over-collateralization received by the Fund. |
| | (2) | Net exposure represents the receivable (payable) due from (to) the counterparty in the event of default. |
TBA Commitments – “TBA” (to be announced) commitments are commitments to purchase or sell mortgage-backed securities for a fixed price at a future date, typically not exceeding 45 days. TBAs may be considered securities in themselves and involve a risk of loss if the value of the TBA changes relative to the Funds’ “basis” in the position prior to the settlement date. Unsettled TBAs are valued according to the procedures described in the section entitled “Investment Valuation.”
| 3. | DERIVATIVE FINANCIAL INSTRUMENTS |
Disclosures about derivative instruments and hedging activities are intended to improve financial reporting for derivative instruments by enabling investors to understand how and why an entity uses derivatives, how derivatives are accounted for, and how derivative instruments affect an entity’s results of operations and financial position. Risk of loss on derivatives, including written options, forward foreign currency contracts, and financial futures contracts, may exceed amounts recognized on the Statements of Assets and Liabilities.
Options – Certain Funds may either purchase or write options in order to hedge against adverse market movements or fluctuations in value caused by changes in prevailing interest rates, value of equities or foreign exchange rates, with respect to securities which the Fund currently owns or intends to purchase. A Fund’s principal reason for writing options is to realize, through receipt of premiums, a greater current return than would be realized on the underlying security alone. When a Fund purchases an option, it pays a premium and an amount equal to that premium is recorded as an asset. When a Fund writes an option, it receives a premium and an amount equal to that premium is recorded as
April 30, 2021 / ANNUAL REPORT
| | |
| NOTES TO FINANCIAL STATEMENTS (continued) | | 60 |
a liability. The asset or liability is adjusted daily to reflect the current market value of the option. If an option expires unexercised, a Fund realizes a gain or loss to the extent of the premium received or paid. If an option is exercised, the premium received or paid is recorded as an adjustment to the proceeds from the sale or the cost of the purchase in determining whether a Fund has realized a gain or loss. The difference between the premium and the amount received or paid on effecting a closing purchase or sale transaction is also treated as a realized gain or loss. A Fund, as writer of options, may have no control over whether the underlying securities may be sold (called) or purchased (put). As a result, a Fund bears the market risk of an unfavorable change in the price of the security underlying the written option. A Fund, as purchaser of over-the-counter options, bears the risk of the potential inability of the counterparties to meet the terms of their contracts.
For the year ended April 30, 2021, the Funds did not utilize options.
Forward Foreign Currency Contracts – Certain Funds may enter into foreign currency commitments or foreign currency exchange transactions. A Fund may enter into foreign currency contract transactions to protect assets against adverse changes in foreign currency exchange rates or exchange control regulations. Purchased contracts are used to acquire exposure to foreign currencies; whereas, contracts to sell are used to hedge a Fund’s securities against currency fluctuations. Risks may arise upon entering into these transactions from the potential inability of counterparties to meet the terms of their commitments and from unanticipated movements in security prices or foreign exchange rates. The foreign currency transactions are adjusted by the daily exchange rate of the underlying currency and any gains or losses are recorded for financial statement purposes as unrealized until the settlement date.
The International Fund entered into forward foreign currency contracts in connection with settling planned purchases or sales of securities. The Real Asset Fund and the Global Alpha Equities Fund entered into forward foreign currency contracts in connection with settling planned purchases or sales of securities, to hedge the currency exposure associated with some or all of the portfolio’s securities or as a means to express a view on the direction of a currency’s value as a part of the broader investment strategy.
Financial Futures Contracts – The Funds may invest in financial futures contracts to hedge their existing portfolios, manage cash flows, enhance yield and to potentially reduce transaction costs. Upon entering into a futures contract with a broker, the Fund is required to deposit in a segregated account a specified amount of cash or U.S. government securities. Futures contracts are valued daily and unrealized gains or losses are recorded in a “variation margin” account. Daily, and prior to computing its NAV, the Fund receives from or pays to the broker a specified amount of cash based upon changes in the variation margin account. When a contract is closed, the Fund recognizes a realized gain or loss. Futures contracts have market risks, including the risk that the change in the value of the contract may not correlate with the changes in the value of the underlying securities.
For the year ended April 30, 2021, the International Fund and Global Alpha Equities Fund used equity index futures contracts to manage equity market exposure.
The following is a summary of the location of derivatives on the Funds’ Statements of Assets and Liabilities as of April 30, 2021.
| | | | |
| |
| | | Location on the Statements of Assets and Liabilities |
| Derivative Type | | Asset Derivatives | | Liability Derivatives |
| | |
Equity contracts | | Variation margin receivable for financial futures contracts* | | Variation margin payable for financial futures contracts* |
| | |
Foreign exchange contracts | | Unrealized appreciation on forward foreign currency contracts** | | Unrealized depreciation on forward foreign currency contracts** |
| | * | The variation margin shown on the Statements of Assets and Liabilities is the daily change in the unrealized appreciation (depreciation) for financial futures contracts. The amount presented below is the cumulative unrealized appreciation (depreciation) from the date the contract was opened until April 30, 2021. |
| | ** | The amounts shown represent the unrealized appreciation (depreciation) from the date the contract was open. |
| | | | | | | | | | | | |
| |
| | | Asset Derivatives Fair Value | |
| | | |
| Fund | | Total Value | | | Equity
Contracts | | | Foreign
Exchange
Contracts | |
| | | |
Global Alpha Equities Fund | | | | | | | | | | | | |
Financial Futures Contracts | | $ | 319,262 | | | $ | 319,262 | | | $ | — | |
Forward Foreign Currency Contracts | | | 24,948 | | | | — | | | | 24,948 | |
| | | | | | | | | | | | |
Totals | | $ | 344,210 | | | $ | 319,262 | | | $ | 24,948 | |
| | | | | | | | | | | | |
| | | | | | | | | | | | |
| |
| | | Liability Derivatives Fair Value | |
| | | |
| Fund | | Total Value | | | Equity
Contracts | | | Foreign
Exchange
Contracts | |
| | | |
International Fund | | | | | | | | | | | | |
Financial Futures Contracts | | $ | (609,275 | ) | | $ | (609,275 | ) | | $ | — | |
| | | | | | | | | | | | |
Totals | | $ | (609,275 | ) | | $ | (609,275 | ) | | $ | — | |
| | | | | | | | | | | | |
ANNUAL REPORT / April 30, 2021
| | |
| 61 | | NOTES TO FINANCIAL STATEMENTS (continued) |
| | | | | | | | | | | | | | | | | | | | | | | | | | | | |
| | | Liability Derivatives Fair Value | |
| Fund | | | | | Total Value | | | | | | Equity
Contracts | | | | | | Foreign
Exchange
Contracts | | | | |
Global Alpha Equities Fund | | | | | | | | | | | | | | | | | | | | | | | | | | | | |
Financial Futures Contracts | | | | | | $ | (3,236,460 | ) | | | | | | $ | (3,236,460 | ) | | | | | | $ | — | | | | | |
Forward Foreign Currency Contracts | | | | | | | (229,936 | ) | | | | | | | — | | | | | | | | (229,936 | ) | | | | |
| | | | | | | | | | | | | | | | | | | | | | | | | | | | |
Totals | | | | | | $ | (3,466,396 | ) | | | | | | $ | (3,236,460 | ) | | | | | | $ | (229,936 | ) | | | | |
| | | | | | | | | | | | | | | | | | | | | | | | | | | | |
The effect of derivative instruments on the Statements of Operations for the year ended April 30, 2021 are as follows:
| | |
Derivative Type | | Location on the Statements of Operations |
Equity contracts | | Net realized gain (loss) on financial futures contracts. |
| | Net change in unrealized appreciation (depreciation) on financial futures contracts. |
| |
Foreign exchange contracts | | Net realized gain (loss) on forward foreign currency contracts. |
| | Net change in unrealized appreciation (depreciation) on forward foreign currency contracts. |
| | | | | | | | | | | | | | | | | | | | | | | | | | | | |
| | | Net Realized Gain (Loss) on Derivatives Recognized in Results
from Operations | |
| Fund | | | | | Total | | | | | | Equity
Contracts | | | | | | Foreign
Exchange
Contracts | | | | |
International Fund | | | | | | | | | | | | | | | | | | | | | | | | | | | | |
Financial Futures Contracts | | | | | | $ | 4,114,816 | | | | | | | $ | 4,267,511 | | | | | | | $ | (152,695 | ) | | | | |
| | | | | | | | | | | | | | | | | | | | | | | | | | | | |
Totals | | | | | | $ | 4,114,816 | | | | | | | $ | 4,267,511 | | | | | | | $ | (152,695 | ) | | | | |
| | | | | | | | | | | | | | | | | | | | | | | | | | | | |
| | | | | | | |
Global Alpha Equities Fund | | | | | | | | | | | | | | | | | | | | | | | | | | | | |
Financial Futures Contracts | | | | | | $ | (52,761,632 | ) | | | | | | $ | (52,761,632 | ) | | | | | | $ | — | | | | | |
Forward Foreign Currency Contracts | | | | | | | (889,512 | ) | | | | | | | — | | | | | | | | (889,512 | ) | | | | |
| | | | | | | | | | | | | | | | | | | | | | | | | | | | |
Totals | | | | | | $ | (53,651,144 | ) | | | | | | $ | (52,761,632 | ) | | | | | | $ | (889,512 | ) | | | | |
| | | | | | | | | | | | | | | | | | | | | | | | | | | | |
| | | | | | | |
Real Asset Fund | | | | | | | | | | | | | | | | | | | | | | | | | | | | |
Forward Foreign Currency Contracts | | | | | | $ | (385 | ) | | | | | | $ | — | | | | | | | $ | (385 | ) | | | | |
| | | | | | | | | | | | | | | | | | | | | | | | | | | | |
Totals | | | | | | $ | (385 | ) | | | | | | $ | — | | | | | | | $ | (385 | ) | | | | |
| | | | | | | | | | | | | | | | | | | | | | | | | | | | |
| | | | | | | | | | | | | | | | | | | | | | | | | | | | |
| | | Net Change in Unrealized Appreciation (Depreciation) on Derivatives Recognized in Results from Operations | |
| Fund | | | | | Total | | | | | | Equity
Contracts | | | | | | Foreign
Exchange
Contracts | | | | |
International Fund | | | | | | | | | | | | | | | | | | | | | | | | | | | | |
Financial Futures Contracts | | | | | | $ | (947,952 | ) | | | | | | $ | (948,553 | ) | | | | | | $ | 601 | | | | | |
| | | | | | | | | | | | | | | | | | | | | | | | | | | | |
Totals | | | | | | $ | (947,952 | ) | | | | | | $ | (948,553 | ) | | | | | | $ | 601 | | | | | |
| | | | | | | | | | | | | | | | | | | | | | | | | | | | |
| | | | | | | |
Global Alpha Equities Fund | | | | | | | | | | | | | | | | | | | | | | | | | | | | |
Financial Futures Contracts | | | | | | $ | 11,047,084 | | | | | | | $ | 11,047,084 | | | | | | | $ | — | | | | | |
Forward Foreign Currency Contracts | | | | | | | (459,928 | ) | | | | | | | — | | | | | | | | (459,928 | ) | | | | |
| | | | | | | | | | | | | | | | | | | | | | | | | | | | |
Totals | | | | | | $ | 10,587,156 | | | | | | | $ | 11,047,084 | | | | | | | $ | (459,928 | ) | | | | |
| | | | | | | | | | | | | | | | | | | | | | | | | | | | |
The average quarterly volume of derivative activities for the year ended April 30, 2021 are as follows.
| | | | | | | | | | | | | | | | | | | | |
| |
| | | Asset Derivative Volume | |
| Fund | | | | | Financial
Futures
Contracts(1) | | | | | | Forward
Foreign
Currency
Contracts(2) | | | | |
International Fund | | | | | | $ | 9,375,787 | | | | | | | $ | 106,320 | | | | | |
Global Alpha Equities Fund | | | | | | | — | | | | | | | | 804,060 | | | | | |
Real Asset Fund | | | | | | | — | | | | | | | | 13,189 | | | | | |
April 30, 2021 / ANNUAL REPORT
| | |
| NOTES TO FINANCIAL STATEMENTS (continued) | | 62 |
| | | | | | | | | | |
| |
| | | Liability Derivative Volume |
| | |
| Fund | | Financial Futures Contracts(1) | | Forward Foreign Currency Contracts(2) |
| | |
International Fund | | | $ | — | | | | $ | 2,172,576 | |
Global Alpha Equities Fund | | | | 102,594,807 | | | | | 17,490,362 | |
(1) Notional Amount.
(2) Contract Amount.
Certain Funds are parties to International Swap and Derivatives Association, Inc. (“ISDA”) Master Agreements (“MA”) with various counterparties that govern over-the-counter derivative and foreign exchange contracts entered into from time to time. The ISDA MA may contain provisions regarding, among other things, the parties’ general obligations, representations, agreements, collateral requirements, events of default and early termination. With respect to certain counterparties, in accordance with the terms of the ISDA MA, collateral posted to each Fund is held in a segregated account by each Fund’s custodian and, with respect to those amounts which can be sold or repledged, are presented in the Fund’s Portfolio of Investments or Statements of Assets and Liabilities.
At April 30, 2021, derivative assets and liabilities by counterparty net of amounts available for offset under a MA and net of the related collateral received by each Fund are as follows:
| | | | | | | | | | | | | | | | | | | | | | | | | |
| | | | | |
| Fund/Counterparty | | Derivative Assets Subject to a MA | | Derivatives Available for Offset | | Non-Cash Collateral Received(1) | | Cash Collateral Received(1) | | Net Exposure of Derivative Assets(2) |
Global Alpha Equities Fund | | | | | | | | | | | | | | | | | | | | | | | | | |
BNP Paribas | | | $ | 12,965 | | | | $ | — | | | | $ | — | | | | $ | — | | | | $ | 12,965 | |
Morgan Stanley | | | | 11,983 | | | | | (11,983 | ) | | | | — | | | | | — | | | | | — | |
| | | | | | | | | | | | | | | | | | | | | | | | | |
Total Derivative Assets | | | $ | 24,948 | | | | $ | (11,983 | ) | | | $ | — | | | | $ | — | | | | $ | 12,965 | |
| | | | | | | | | | | | | | | | | | | | | | | | | |
| | | | | | | | | | | | | | | | | | | | | | | | | |
| | | | | |
| | | Derivative Liabilities Subject to
a MA | | Derivatives Available for Offset | | Non-Cash Collateral Pledged(3) | | Cash Collateral Pledged(3) | | Net Exposure of Derivative Liabilities(2) |
Morgan Stanley | | | $ | (229,936 | ) | | | $ | 11,983 | | | | $ | — | | | | $ | — | | | | $ | (217,953 | ) |
| | | | | | | | | | | | | | | | | | | | | | | | | |
Total Derivative Liabilities | | | $ | (229,936 | ) | | | $ | 11,983 | | | | $ | — | | | | $ | — | | | | $ | (217,953 | ) |
| | | | | | | | | | | | | | | | | | | | | | | | | |
(1) Excess of collateral received is not shown for financial reporting purposes.
(2) Net exposure represents the receivable (payable) due from (to) the counterparty in the event of default.
(3) Excess of collateral pledged is not shown for financial reporting purposes.
| 4. | FEDERAL TAX INFORMATION |
No provision for federal income taxes has been made, as it is each Fund’s policy to comply with the Subchapter M provision of the Internal Revenue Code of 1986, as amended, and to distribute to shareholders each year all of its taxable income and realized gains.
Each Fund files U.S. federal, state, and local tax returns as required. The Fund’s tax returns are subject to examination by the relevant tax authorities until expiration of the applicable statute of limitations, which is generally three years after the tax returns are filed. The Funds recognize interest and penalties, if any, related to unrecognized tax benefits as income tax expense on the Statements of Operations. The Funds do not have any unrecognized tax benefits or uncertain tax positions that would require a provision for income tax. Accordingly, the Funds did not incur any interest or penalties for the year ended April 30, 2021.
The timing and character of income and capital gain distributions are determined in accordance with income tax regulations, which may differ from GAAP. These differences are primarily due to foreign currency transactions, mark-to-market of futures contracts, passive foreign investment companies, paydown gains (losses) on mortgage-backed securities and losses deferred due to wash sales. For financial reporting purposes, any permanent differences resulting from different book and tax treatment are reclassified between distributable earnings and paid-in capital in the period that the differences arise. Results of operations and net assets are not affected by these reclassifications. As of April 30, 2021, the following reclassifications were made on the Statements of Assets and Liabilities for permanent differences:
ANNUAL REPORT / April 30, 2021
| | |
| 63 | | NOTES TO FINANCIAL STATEMENTS (continued) |
| | | | | | | | |
| Fund | | Paid-in
Capital | | | Distributable
Earnings
(Loss) | |
Global Alpha Equities Fund | | $ | (8,732 | ) | | $ | 8,732 | |
Real Asset Fund | | | (54,352 | ) | | | 54,352 | |
Diversified Income Fund | | | (2,841 | ) | | | 2,841 | |
The tax character of distributions for the corresponding fiscal year ends were as follows:
| | | | | | | | | | |
| | | |
| Fund | | 2021 | | | 2020 |
| | Ordinary
Income* | | Long-Term
Capital Gains | | | Ordinary
Income* | | Long-Term
Capital Gains |
International Fund | | $10,065,029 | | $ | — | | | $ 9,581,018 | | $— |
Global Alpha Equities Fund | | 1,218,173 | | | 3,091,584 | | | 2,323,202 | | — |
Real Asset Fund | | 5,026,852 | | | — | | | 11,290,739 | | — |
Diversified Income Fund | | 1,074,740 | | | — | | | 1,374,464 | | — |
* For tax purposes, short-term capital gain distributions are considered ordinary income distributions.
As of April 30, 2021, the cost of investments and derivatives for U.S. federal income tax purposes, the aggregate gross unrealized appreciation for all investments and derivatives for which there was an excess of value over tax cost and the aggregate gross unrealized depreciation for all investments and derivatives for which there was an excess of tax cost over value, were as follows:
| | | | | | | | | | | | | | | | | | | | |
| | | | | |
| Fund | | Tax Cost | | Tax Unrealized
Appreciation | | Tax Unrealized
Depreciation | | Net Tax Unrealized Appreciation/ (Depreciation) |
International Fund | | | $ | 544,361,173 | | | | $ | 203,024,902 | | | | $ | (11,801,227 | ) | | | $ | 191,223,675 | |
Global Alpha Equities Fund | | | | 153,158,567 | | | | | 46,567,148 | | | | | (1,750,584 | ) | | | | 44,816,564 | |
Real Asset Fund | | | | 424,666,994 | | | | | 49,241,530 | | | | | (3,605,165 | ) | | | | 45,636,365 | |
Diversified Income Fund | | | | 37,864,281 | | | | | 5,200,236 | | | | | (359,047 | ) | | | | 4,841,189 | |
As of April 30, 2021, the components of distributable earnings on a tax basis were as follows:
| | | | | | | | | | | | | | | | | | | | | | | | | | | | | | | | | | | |
| | | | | | | | |
| Fund | | Undistributed
Ordinary
Income | | Undistributed
Long-Term
Capital Gains | | Other
Timing
Differences | | Unrealized
Appreciation/
(Depreciation) | | Capital Loss
Carryforwards | | Late Year
Loss
Deferrals | | Distributable
Earnings |
International Fund | | | $ | 6,927,934 | | | | $ | — | | | | $ | — | | | | $ | 191,353,926 | | | | $ | (9,506,155 | ) | | | $ | — | | | | $ | 188,775,705 | |
Global Alpha Equities Fund | | | | — | | | | | — | | | | | (7,325 | ) | | | | 44,825,788 | | | | | (27,702,622 | ) | | | | (93,001 | ) | | | | 17,022,840 | |
Real Asset Fund | | | | 1,970,245 | | | | | — | | | | | 1 | | | | | 45,644,734 | | | | | (27,008,486 | ) | | | | — | | | | | 20,606,494 | |
Diversified Income Fund | | | | 200,800 | | | | | — | | | | | 1 | | | | | 4,841,189 | | | | | (712,100 | ) | | | | — | | | | | 4,329,890 | |
Capital loss carryforwards represent realized losses that may be carried forward for an unlimited period and applied against future capital gains for U.S. federal income tax purposes. Such capital loss carryforwards will retain their character as either short-term or long-term capital losses. As of April 30, 2021, character of capital loss carryforwards were as follows:
| | | | | | | | | | | | | | | |
| Fund | | Short-Term
No Expiration | | Long-Term
No Expiration | | Total
Capital Loss
Carryforwards |
International Fund | | | $ | 6,118,734 | | | | $ | 3,387,421 | | | | $ | 9,506,155 | |
Global Alpha Equities Fund | | | | 8,841,083 | | | | | 18,861,539 | | | | | 27,702,622 | |
Real Asset Fund | | | | 10,976,666 | | | | | 16,031,820 | | | | | 27,008,486 | |
Diversified Income Fund | | | | 94,656 | | | | | 617,444 | | | | | 712,100 | |
For the year ended April 30, 2021, capital loss carryforwards utilized were as follows:
| | | | | |
| |
| Fund | | Capital Loss
Carryforwards
Utilized |
International Fund | | | | $25,384,834 | |
Diversified Income Fund | | | | 335,867 | |
April 30, 2021 / ANNUAL REPORT
| | |
| NOTES TO FINANCIAL STATEMENTS (continued) | | 64 |
Late year loss deferrals represent (1) net specified losses realized between November 1 and April 30 of each year and (2) ordinary losses realized between January 1 and April 30 of each year that the Fund has elected for U.S. federal income tax purposes to treat as occurring on the first day of the following tax year. As of April 30, 2021, late year loss deferrals were as follows:
| | | | | | | | | | | | | | | |
| | | |
| Fund | | Ordinary
Losses | | Short-Term
Capital
Losses | | Long-Term
Capital
Losses |
| | | |
Global Alpha Equities Fund | | | | $93,001 | | | | | $— | | | | | $— | |
| 5. | ADVISORY FEES, SERVICING FEES, AND OTHER SERVICE PROVIDERS |
Investment Advisor – Wilmington Funds Management Corporation (“WFMC” or the “Advisor”) serves as the Investment Advisor to each of the Funds. Wilmington Trust Investment Advisors, Inc. (“WTIA”) provides sub-advisory services to the Funds. WFMC and WTIA are wholly-owned subsidiaries of M&T Bank Corporation. For its services, the Funds pay WFMC an annual investment advisory fee, accrued daily and paid monthly, based on a percentage of each Fund’s average daily net assets as described below. WFMC, not the Funds, pays WTIA for its services.
The International Fund, Global Alpha Equities Fund and Real Asset Fund, utilize a sub-advisor strategy, whereby WFMC allocates all or a portion of the Funds’ assets among one or more sub-advisors and strategies. For their services, the Funds pay each sub-advisor fees, accrued daily and paid monthly, as described below.
| | | | | | | | | | |
| | | |
| Fund | | Gross Fees | | | Fees Waived/
Reimbursed | | | Current Fee as a % of average net asset
of the Fund/ Allocated Net Assets for Sub-advisors |
| | | |
International Fund | | | | | | | | | | |
WFMC | | $ | 2,807,880 | | | $ | (1,045,342 | ) | | 0.45% |
Sub-advisors: | | | | | | | | | | |
Allianz Global investors U.S. LLC | | | 279,986 | | | | — | | | 0.38% on the first $100 million; and 0.33% on the next |
| | | | | | | | | | $100 million; and 0.28% on assets in excess of $200 million |
| | | | | | | | | | allocated to the Europe Equity Growth Select Strategy |
| | | 153,831 | | | | — | | | 0.25% on assets allocated to the High Dividend Europe |
| | | | | | | | | | Strategy. |
AXA Investment Managers, Inc. | | | 371,158 | | | | — | | | 0.43% on the first $150 million; and |
| | | | | | | | | | 0.41% on assets in excess of $150 million |
Berenberg Asset Management LLC | | | 165,686 | | | | — | | | 0.27% |
Nikko Asset Management Americas, Inc. | | | 387,929 | | | | — | | | 0.32% |
Schroder Investment Management North America, Inc. | | | 931,720 | | | | — | | | 0.50% |
| | | | | | | | | | |
Total(a) | | $ | 5,098,190 | | | $ | (1,045,342 | ) | | |
| | | | | | | | | | |
Global Alpha Equities Fund | | | | | | | | | | |
WFMC | | $ | 2,064,314 | | | $ | (1,211,350 | ) | | 0.95% |
Sub-advisors: | | | | | | | | | | |
Wellington Management Company LP | | | 1,195,113 | | | | — | | | 0.55% |
| | | | | | | | | | |
Total(b) | | $ | 3,259,427 | | | $ | (1,211,350 | ) | | |
| | | | | | | | | | |
Real Asset Fund | | | | | | | | | | |
WFMC | | $ | 1,217,158 | | | $ | (154,393 | ) | | 0.45% on all Assets except Assets allocated to the inflation- protected and fixed-income securities (“TIPS”) strategy or the Enhanced Cash Strategy. The fee for assets allocated to the TIPS strategy: 0.52% of the first $25 million; 0.49% of the next $25 million; and 0.47% of Assets over $50 million. The fee for assets allocated to the Enhanced Cash strategy is 0.53% on the assets. |
Sub-advisors: | | | | | | | | | | |
Pacific Investment Management Company LLC (terminated 07/27/2020) | | | 84 | | | | — | | | 0.25% |
Parametric Portfolio Associates LLC | | | 155,452 | | | | — | | | 0.25% of the first $20 million in assets; |
| | | | | | | | | | 0.20% of the next $20 million in assets; and |
| | | | | | | | | | 0.15% of assets in excess of $40 million |
| | | | | | | | | | |
Total(c) | | $ | 1,372,694 | | | $ | (154,393 | ) | | |
| | | | | | | | | | |
Diversified Income Fund | | | | | | | | | | |
WFMC | | $ | 140,968 | | | $ | (297,655 | ) | | 0.40% |
| | | | | | | | | | |
| | (a) | The total gross advisory and sub-advisory fees during the period were 0.82% for the International Fund. |
| | (b) | The total gross advisory and sub-advisory fees during the period were 1.50% for the Global Alpha Equities Fund. |
| | (c) | The total gross advisory and sub-advisory fees during the period were 0.51% for the Real Asset Fund. |
ANNUAL REPORT / April 30, 2021
| | |
| 65 | | NOTES TO FINANCIAL STATEMENTS (continued) |
WFMC and the Funds’ distributor and shareholder service provider have contractually agreed to waive their fees and/or reimburse expenses through January 31, 2022 so that total annual fund operating expenses paid by the Funds (not including the effects of dividends or interest on short positions, acquired fund fees and expenses, taxes, or other extraordinary expenses expressed as an annualized percentage of average daily net assets), will not exceed the expense limitations set forth below. Neither WFMC nor the Funds’ distributor and shareholder service provider will recoup previously waived fees/expenses in subsequent years.
The contractual expense limitations are as follows:
| | | | |
| |
| | | Current Contractual
Expense Limitations |
| | |
| Fund | | Class A | | Class I |
| | |
International Fund* | | 1.10% | | 0.85% |
Global Alpha Equities Fund | | 1.49% | | 1.24% |
Real Asset Fund | | 0.96% | | 0.71% |
Diversified Income Fund | | 0.60% | | 0.35% |
| | * | Prior to August 31, 2020, the International Fund’s contractual expense limitation was 0.98% for Class A. |
Administrative Fees – The Bank of New York Mellon (“BNYM”) provides the Trust with fund administration services. The fees as described in the table below are a component of “Portfolio accounting and administration fees” as disclosed in the Statements of Operations. WFMC, in its role as Co-Administrator, provides the Funds with certain administrative personnel and services necessary to operate the Funds. The fees as described in the table below are accrued daily and paid monthly, and are disclosed on the Statements of Operations as “Administration fees.”
| | | | | | | |
| | |
| Administrator | | Maximum
Fee | | Average Aggregate Daily Net
Assets of the Trust |
| | |
WFMC | | | | 0.040 | % | | on the first $5 billion |
| | | | 0.030 | % | | on the next $2 billion |
| | | | 0.025 | % | | on the next $3 billion |
| | | | 0.018 | % | | on assets in excess of $10 billion |
| | |
BNYM | | | | 0.0175 | % | | on the first $15 billion |
| | | | 0.0150 | % | | on the next $10 billion |
| | | | 0.0125 | % | | on assets in excess of $25 billion |
WFMC and BNYM may voluntarily choose to waive any portion of their fee and can add, modify or terminate a voluntary wavier at any time at their sole discretion. Neither WFMC nor BNYM will recoup previously waived fees/expenses in subsequent years. For the year ended April 30, 2021, neither WFMC nor BNYM waived any administrative fees.
Distribution Services Fee – The Trust has adopted a Distribution Services Plan (the “Plan”) pursuant to Rule 12b-1 under the Act. The Plan allows the Funds to pay fees to financial intermediaries, which may be paid through ALPS Distributors, Inc. (“ALPS”), the principal distributor, at an annual rate of up to 0.25% of the average daily net assets of the Funds’ Class A shares, for the sale, distribution, administration, customer servicing and record keeping of these shares.
The Trust may reduce the maximum amount of distribution services fees it pays from time to time at its sole discretion. In addition, a financial intermediary (including ALPS, the Advisor or their affiliates), may voluntarily waive or reduce any fees to which they are entitled.
For the year ended April 30, 2021, M&T Securities, Inc., Manufacturers and Traders Trust Company, and Wilmington Trust, NA (together “M&T”), affiliates of the Advisor, received distribution services fees paid by the Funds as follows:
| | | | | |
| |
| Fund | | Distribution
Fees
from Class A |
| |
International Fund | | | $ | 4,570 | |
Global Alpha Equities Fund | | | | 390 | |
Real Asset Fund | | | | 1,819 | |
Diversified Income Fund | | | | 79,406 | |
April 30, 2021 / ANNUAL REPORT
| | |
| NOTES TO FINANCIAL STATEMENTS (continued) | | 66 |
Sales Charges – The Class A shares of all the Funds bear front-end sales charges.
For the year ended April 30, 2021, M&T received sales charges on the sale of Class A shares as follows:
| | | | |
| |
| Fund | | Sales Charges
from Class A | |
| |
International Fund | | $ | 149 | |
Global Alpha Equities Fund | | | 1,511 | |
Real Asset Fund | | | 55 | |
Diversified Income Fund | | | 12,113 | |
Shareholder Services Fee – Pursuant to a Shareholder Services Plan adopted by the Funds and administered by ALPS, the Funds may pay up to 0.25% of the average daily net assets of each Fund’s Class A shares to financial intermediaries (which may include ALPS, the Advisor or their affiliates) for providing shareholder services and maintaining shareholder accounts. Prior to January 31, 2021, the Funds’ Class I shares were included in the Shareholder Services Plan whereby the Funds could pay up to 0.25% of the average daily net assets of each Fund’s Class I shares to financial intermediaries (including ALPS, the Advisor or their affiliates) for providing shareholder services and maintaining shareholder accounts. Effective January 31, 2021, the Class I shares were removed from the Shareholder Services Plan. Accordingly, the 0.25% shareholder servicing fee was no longer charged to Class I shares after that date.
M&T has entered into a Shareholder Services Agreement with ALPS, under which it is entitled to receive up to 0.25% of the average daily net assets of each Fund’s Class A shares and, prior to January 31, 2021, Class I shares for whom M&T provides shareholder services. The Funds may reduce the maximum amount of shareholder service fees they pay from time to time at their sole discretion. In addition, a financial intermediary (including M&T) may waive or reduce any fees to which they are entitled.
For the year ended April 30, 2021, M&T received shareholder service fees, net of waivers, paid by the Fund as follows:
| | | | |
| |
| Fund | | Shareholder
Services
Fee | |
| |
International Fund | | | $213,050 | |
Global Alpha Equities Fund | | | — | |
Real Asset Fund | | | — | |
Diversified Income Fund | | | — | |
Other Service Providers – Foreside Management Services, LLC (“FMS”) provides a Principal Executive Officer and Principal Financial Officer to the Trust. FMS has no role in determining the investment policies or which securities are to be sold or purchased by the Trust or its funds.
BNYM provides custody services to the Trust.
BNY Mellon Investment Servicing (U.S.) Inc. provides fund accounting and transfer agency services to the Trust.
General – Certain Trustees and Officers of the Trust are also Officers or employees of the above companies that provide services to the Funds, and during their terms of office, receive no compensation from the Funds. The Trust’s Statement of Additional Information includes additional information about the Trustees.
| 6. | INVESTMENT TRANSACTIONS |
Purchases and sales of investments, excluding short-term obligations and U.S. Government Securities, for the year ended April 30, 2021 were as follows:
| | | | | | | | | | |
| | |
| Fund | | Purchases | | Sales |
| | |
International Fund | | | $ | 437,012,789 | | | | $ | 430,941,821 | |
Global Alpha Equities Fund | | | | 114,405,879 | | | | | 178,833,839 | |
Real Asset Fund | | | | 290,681,982 | | | | | 106,618,031 | |
Diversified Income Fund | | | | 4,117,188 | | | | | 4,784,418 | |
Purchases and sales of investments of U.S. Government Securities for the year ended April 30, 2021 were as follows:
| | | | | |
| |
| Fund | | Sales |
| |
Diversified Income Fund | | | $ | 1,376,842 | |
ANNUAL REPORT / April 30, 2021
| | |
| 67 | | NOTES TO FINANCIAL STATEMENTS (concluded) |
Market risk is the risk that one or more markets in which a Fund invests will go down in value, including the possibility that the markets will go down sharply and unpredictably. The value of a security or other asset may decline due to changes in general market conditions, economic trends or events that are not specifically related to the issuer of the security or other asset, or factors that affect a particular issuer or issuers, exchange, country, group of countries, region, market, industry, group of industries, sector or asset class. Local, regional or global events such as war, acts of terrorism, the spread of infectious illnesses or other public health issues, recessions, natural disasters or other events could have a significant impact on a Fund and its investments.
Recently, the global pandemic outbreak of an infectious respiratory illness caused by a novel coronavirus known as COVID-19 has resulted in substantial market volatility and global business disruption, impacting the global economy and the financial health of individual companies in significant and unforeseen ways. The duration and future impact of COVID-19 are currently unknown, which may exacerbate other types of risks that apply to the Funds and negatively impact Fund performance.
| 8. | CONTRACTUAL OBLIGATIONS |
In the normal course of business, the Funds may enter into contracts that provide general indemnifications. The Funds’ maximum exposure under these arrangements is dependent on claims that may be made against the Funds in the future, and, therefore, cannot be estimated; however, based on experience, the risk of material loss from such claims is considered remote.
The Trust participates in a $10,000,000 unsecured, committed revolving line of credit (“LOC”) agreement with BNYM, which was renewed effective April 1, 2021. The LOC is available for extraordinary or emergency purposes, primarily for financing redemption payments. Borrowings are charged interest at a rate of 1.25% per annum over the greater of the Federal Funds Rate or the one month London Interbank Offered Rate (“LIBOR”). The LOC includes a commitment fee of 0.20% per annum on the daily unused portion. Prior to April 1, 2021, the commitment fee was of 0.15% per annum on the daily unused portion. The LOC expires on March 31, 2022.
The Trust did not utilize the LOC during the year ended April 30, 2021.
| 10. | RECENT ACCOUNTING PRONOUNCEMENTS |
In August 2018, the Financial Accounting Standards Board (“FASB”) issued an Accounting Standards Update 2018-13 (“ASU 2018-13”), which changes certain fair value measurement disclosure requirements. ASU 2018-13, in addition to other modifications and additions, removes the requirement to disclose the amount and reasons for transfers between Level 1 and Level 2 of the fair value hierarchy, the policy for the timing of transfers between levels and the valuation process for Level fair value measurements. ASU 2018-13 is effective for fiscal years, and interim periods within those fiscal years, beginning after December 15, 2019. As of April 30, 2021, ASU 2018-13 has been fully adopted and the implementation did not have a material impact on the Funds’ financial statements.
In March 2020, the FASB issued ASU No. 2020-04 (“ASU 2020-04”), Reference Rate Reform (Topic 848)—Facilitation of the Effects of Reference Rate Reform on Financial Reporting. The amendments in ASU 2020-04 provides optional temporary financial reporting relief from the effect of certain types of contract modifications due to the planned discontinuation of the LIBOR and other interbank-offered based reference rates as of the end of 2021. ASU 2020-04 is effective for certain reference rate-related contract modifications that occur during the period March 12, 2020 through December 31, 2022. Management is currently evaluating the impact, if any, of applying ASU 2020-04.
Management has evaluated events and transactions for potential recognition or disclosure in the financial statements through the date the financial statements were issued. Management has determined that there are no material events that would require recognition or disclosure in the Funds’ financial statements through this date.
April 30, 2021 / ANNUAL REPORT
REPORT OF INDEPENDENT REGISTERED PUBLIC ACCOUNTING FIRM
To the Board of Trustees of Wilmington Funds and Shareholders of Wilmington International Fund, Wilmington Global Alpha Equities Fund, Wilmington Real Asset Fund and Wilmington Diversified Income Fund
Opinions on the Financial Statements
We have audited the accompanying statements of assets and liabilities, including the portfolios of investments, of Wilmington International Fund, Wilmington Global Alpha Equities Fund, Wilmington Real Asset Fund and Wilmington Diversified Income Fund (four of the funds constituting Wilmington Funds, hereafter collectively referred to as the “Funds”) as of April 30, 2021, the related statements of operations for the year ended April 30, 2021, the statements of changes in net assets for each of the two years in the period ended April 30, 2021, including the related notes, and the financial highlights for each of the two years in the period ended April 30, 2021 (collectively referred to as the “financial statements”). In our opinion, the financial statements present fairly, in all material respects, the financial position of each of the Funds as of April 30, 2021, the results of each of their operations for the year then ended, the changes in each of their net assets for each of the two years in the period ended April 30, 2021 and each of the financial highlights for each of the two years in the period ended April 30, 2021 in conformity with accounting principles generally accepted in the United States of America.
The financial statements of the Funds as of and for the year ended April 30, 2019 and the financial highlights for each of the periods ended on or prior to April 30, 2019 (not presented herein, other than the financial highlights) were audited by other auditors whose report dated June 27, 2019 expressed unqualified opinions on those financial statements and financial highlights.
Basis for Opinions
These financial statements are the responsibility of the Funds’ management. Our responsibility is to express an opinion on the Funds’ financial statements based on our audits. We are a public accounting firm registered with the Public Company Accounting Oversight Board (United States) (PCAOB) and are required to be independent with respect to the Funds in accordance with the U.S. federal securities laws and the applicable rules and regulations of the Securities and Exchange Commission and the PCAOB.
We conducted our audits of these financial statements in accordance with the standards of the PCAOB. Those standards require that we plan and perform the audit to obtain reasonable assurance about whether the financial statements are free of material misstatement, whether due to error or fraud.
Our audits included performing procedures to assess the risks of material misstatement of the financial statements, whether due to error or fraud, and performing procedures that respond to those risks. Such procedures included examining, on a test basis, evidence regarding the amounts and disclosures in the financial statements. Our audits also included evaluating the accounting principles used and significant estimates made by management, as well as evaluating the overall presentation of the financial statements. Our procedures included confirmation of securities owned as of April 30, 2021 by correspondence with the custodians, transfer agent and brokers; when replies were not received from brokers, we performed other auditing procedures. We believe that our audits provide a reasonable basis for our opinions.
/s/PricewaterhouseCoopers LLP
Philadelphia, Pennsylvania
June 24, 2021
We have served as the auditor of one or more investment companies in Wilmington Funds since 2019.
ANNUAL REPORT / April 30, 2021 (unaudited)
FEDERAL TAX INFORMATION (UNAUDITED)
Complete information regarding the tax status of distributions will be reported on Forms 1099.
Of the ordinary income (including short-term capital gain) distributions made by the Funds during the fiscal year ended April 30, 2021, the Funds designate the following percentages, or such greater percentages that constitute the maximum amount allowable pursuant to Code Sections Section 243 and 854(b)(2), as qualifying for the corporate dividends received deduction:
| | | | |
| |
| Fund | | | |
International Fund | | | 0.24 | % |
Global Alpha Equities Fund | | | 75.99 | % |
Real Asset Fund | | | 4.85 | % |
Diversified Income Fund | | | 58.42 | % |
For the fiscal year ended April 30, 2021, the Funds designate the following percentages of the ordinary income dividends, or such greater percentages that constitute the maximum amount allowable pursuant to Code Sections 1(h)(11) and 854(b)(2), as qualified dividend income which may be subject to a maximum rate of federal income tax of 20%:
| | | | |
| |
| Fund | | | |
International Fund | | | 72.76 | % |
Global Alpha Equities Fund | | | 100.00 | % |
Real Asset Fund | | | 22.80 | % |
Diversified Income Fund | | | 67.69 | % |
If the Funds meet the requirements of Section 853 of the Code, the Funds will pass through to shareholders credits of foreign taxes paid.
April 30, 2021 (unaudited) / ANNUAL REPORT
BOARD OF TRUSTEES AND TRUST OFFICERS
The following tables give information about each Trustee and the senior officers of the Trust. The tables separately list Trustee members who are “interested persons” of the Fund (i.e., “Interested” Trustees) and those who are not (i.e., “Independent” Trustees). The Trust is comprised of 12 funds. Unless otherwise noted, the business address of each Trustee and senior officer is 1100 North Market Street, 9th Floor, Wilmington, DE 19890. Each Trustee oversees all portfolios of the Trust and serves for an indefinite term. The Trust’s Statement of Additional Information includes additional information about the Trustees and is available, without charge and upon request, by calling 1-800-836-2211.
INTERESTED TRUSTEES BACKGROUND
| | | | |
| | |
| | | Name Birth Year Position with Trust Date Service Began | | Principal Occupations and Other Directorships Held for Past Five Years |
| | |
| | Dominick J. D’Eramo* Birth year: 1964 | | Principal Occupations: Senior Vice President, Wilmington Trust Investment Advisors, Inc. and Head of Fixed Income. |
| | TRUSTEE | | Previous Positions: Group Vice President, Wilmington Trust Investment Advisor, Inc. (WTIA) |
| | Began serving: November 2018 |
| | PRESIDENT | | (2014-2017); Administrative Vice President, WTIA (2012-2014). |
| | Began serving: June 2018 | | |
| * | Dominick J. D’Eramo is “interested” due to his employment with WTIA and his position with WFMC, investment Advisors to the Funds. |
INDEPENDENT TRUSTEES BACKGROUND
| | | | |
| | |
| | | Name Birth Year Position with Trust Date Service Began | | Principal Occupations and Other Directorships Held for Past Five Years |
| | |
| | | Nicholas A. Giordano Birth year: 1943 CHAIRMAN and TRUSTEE Began serving: March 2012 | | Principal Occupations: Consultant, financial services organizations (1997 to present). Other Directorships Held: The RBB Fund Inc. (34 portfolios) (registered investment companies); Independence Blue Cross; IntriCon Corporation (body-worn products). Previous Positions: Director, Kalmar Pooled Investment Trust (through 6/17). |
| | | Robert H. Arnold Birth year: 1944 TRUSTEE Began serving: March 2012 | | Principal Occupations: Managing Director, R.H. Arnold & Co, Inc. (financial management consulting) (6/89 to present). Other Directorships Held: None. Previous Positions: Trustee, First Potomac Realty Trust (real estate investment trust) (5/03 to 12/17); Director, Treasury Strategies, Inc. (private treasury consulting services) (6/01 to 6/16). |
| | | Gregory P. Chandler Birth year: 1966 TRUSTEE Began serving: July 2017 | | Principal Occupations: Chief Financial Officer, Avocado Systems, Inc. (cybersecurity software) (3/20 to present); President, GCVC Consulting (financial and corporate governance advisory) (2008 to present). Other Directorships Held: Trustee, RBB Fund Series Trust (34 portfolios) (registered investment companies) (2012 to present); Trustee, FS Energy Partners (business development company) (2009 to present); Director, Emtec, Inc. (2005 to 2019); Director, FS Investment Corporation (business development company) (2007 to 2019); Previous Positions: Chief Financial Officer, Emtec, Inc. (information technology services) (2009 to 2020); Managing Director, Janney Montgomery Scott LLC (investment banking) (1999 to 2009); Consulting Manager, PwC (1997 to 1999); Manager, Business Assurance, Coopers & Lybrand (audit services) (1995 – 1997). |
ANNUAL REPORT / April 30, 2021 (unaudited)
| | |
| 71 | | BOARD OF TRUSTEES AND TRUST OFFICERS |
| | | | |
| | |
| | | Name Birth Year Position with Trust Date Service Began | | Principal Occupations and Other Directorships Held for Past Five Years |
| | |
| | Donald E. Foley Birth year: 1951 TRUSTEE Began serving: December 2015 | | Principal Occupations: Director, BioSig Technologies (2015 to present); Trustee, AXA Premier VIP Trust (2017 to present); Trustee, EQ Advisors Trust (2014 to present); Trustee, 1290 Funds (retail funds) (2014 to present); Chairman and Director, Burke Rehabilitation Hospital Foundation (private hospital, research institute) (2005 to present); Trustee and Chairman of the President’s Council, Union College (private college) (2011 to present); Chairman and Trustee, New Beginning Family Academy (elementary charter school) (2016 to present). Other Directorships Held: Director, M&T Bank Corporation (commercial bank) (2011 to 2012); Chairman and Director, Wilmington Trust Corporation (commercial and trust bank) (2007 to 2011). Previous Positions: Advisory Member, Trust and Investment Committee, M&T Bank, Wilmington Trust, National Association, and Wilmington Trust Company (through 2016); Chairman and Chief Executive Officer of Wilmington Trust Corporation (2010 to 2011). |
| | | |
| | | Valerie J. Sill Birth year: 1962 TRUSTEE Began serving: April 2020 | | Principal Occupations: President, Chief Executive Officer and Chief Investment Officer, DuPont Capital Management (asset management) (2004 to present). Other Directorships Held: Trustee, Longwood Gardens (2005 to present); Trustee of the Christiana Care Health System (2012 to present); and Advisory Counsel, Federal Reserve Bank of Philadelphia’s Economic Advisory Council (2010 to 2013). Previous Positions: Executive Vice President at The Boston Company (1994 to 2004). |
OFFICERS
| | | | |
| | |
| | | Name Birth Year Positions with Trust | | Principal Occupations for Past Five Years and Previous Positions |
| | |
| | John C. McDonnell Birth year: 1966 CHIEF OPERATIONS OFFICER Began serving: June 2017 VICE PRESIDENT Began serving: June 2012 | | Principal Occupations: Chief Operations Officer, Wilmington Funds; Administrative Vice President, Wilmington Funds Management Corporation (2005 to present); Administrative Vice President, Wilmington Trust Investment Advisors, Inc. (2012 to present). Previous Positions: Vice President, Wilmington Trust Investment Management, LLC (2005 to 2012). |
| | | |
| | | Lisa Druelinger Birth year: 1978 CHIEF COMPLIANCE OFFICER and AML COMPLIANCE OFFICER. Began serving: November 2017 | | Principal Occupations: Chief Compliance Officer and Anti-Money Laundering Officer, Wilmington Funds; Administrative Vice President, M&T Bank. Previous Positions: Vice President and Senior Compliance Officer, Wilmington Trust Investment Advisors, Inc. (2015-2017); Wilmington Funds Product Manager, Wilmington Trust Investment Advisors, Inc. (2013-2015); Institutional and Retirement Services Product Manager, Wilmington Trust (2011-2013); Trust Compliance and Risk Management at M&T Bank (2006-2011). |
| | | |
| | | John J. Kelley Birth year: 1959 VICE PRESIDENT Began serving: December 2016 | | Principal Occupations: President of Wilmington Funds Management Corporation; Group Vice President and Chief Administrative Officer, Wilmington Trust Investment Advisors, Inc. Previous Positions: Vice President, BNY Mellon Investment Servicing (formerly, PNC Global Investment Servicing) from (1/05 to 7/05); Vice President of Administration, 1838 Investment Advisors, LP (1999 to 2005); Chief Compliance Officer, 1838 Investment Advisors, LP (2004 to 2005). |
April 30, 2021 (unaudited) / ANNUAL REPORT
| | |
| BOARD OF TRUSTEES AND TRUST OFFICERS | | 72 |
| | | | |
| | |
| | | Name Birth Year Positions with Trust | | Principal Occupations for Past Five Years and Previous Positions |
| | | |
| | | Robert L. Tuleya Birth year: 1974 VICE PRESIDENT and ASSISTANT SECRETARY Began serving: September 2018 | | Principal Occupations: Vice President and Assistant Secretary, Wilmington Funds; Vice President and Assistant Secretary, Wilmington Funds Management Corporation (2018 to present); Vice President and Assistant Secretary, Wilmington Trust Investment Advisors, Inc. (2018 to present); Vice President and Assistant Secretary, Wilmington Trust Investment Management, LLC (2018 to present); Vice President and Assistant General Counsel, M&T Bank (2018 to present). Previous Positions: Vice President and Counsel, M&T Bank (2017 to 2018); Senior Counsel, PNC Bank (2014 to 2017). |
| | | |
| | | Christopher W. Roleke 10 High Street, Suite 302 Boston, MA 02110 Birth year: 1972 CHIEF EXECUTIVE OFFICER Began serving: October 2020 | | Principal Occupation: Managing Director and Fund Principal Financial Officer, Foreside Management Services, LLC (2011 to present). Previous Positions: Assistant Vice President, JP Morgan Investor Services Co. (2006 to 2011). |
| | | |
| | | Arthur W. Jasion Three Canal Plaza, Suite 100 Portland, ME 04101 Birth year: 1965 CHIEF FINANCIAL OFFICER AND TREASURER Began serving: October 2020 | | Principal Occupation: Senior Director and Fund Principal Financial Officer, Foreside Management Services, LLC (2020 to present). Previous Positions: Partner, Ernst &Young LLP (2012 to 2020). |
| | | |
| | | Lisa R. Grosswirth 240 Greenwich Street, 22nd Floor New York, NY 10286 Birth year: 1963 SECRETARY Began serving: September 2007 | | Principal Occupation: Vice President, BNY Mellon Asset Servicing (2004 to present). Previous Positions: Supervisory Paralegal, The Dreyfus Corporation (1998 to 2004). |
ANNUAL REPORT / April 30, 2021 (unaudited)
Board Approval of Liquidity Risk Management Program
To promote effective liquidity risk management throughout the fund industry and to enhance disclosure regarding fund liquidity and redemption practices, the Securities and Exchange Commission (the “Commission”) adopted Rule 22e-4 under the Investment Company Act of 1940, as amended. The rule requires every registered open-end management company to establish a liquidity risk management program that, among other things, provides for the assessment, management and review of liquidity risk, the classification of a fund’s portfolio investments into one of four liquidity buckets based upon the number of days that such investments may reasonably be expected to be converted into cash or otherwise disposed of without significantly impacting their price, the establishment of a highly liquid investment minimum where required, and the establishment of a 15% limitation on illiquid investments. Additionally, the Commission adopted Rule 30b1-10 and Form N-LIQUID, which generally requires a fund to notify the Commission when certain liquidity-related events occur.
The Wilmington Funds Board of Trustees (the “Board”) approved the appointment of the Funds’ Liquidity Risk Management Committee (“Liquidity Committee”) as the administrator of the liquidity risk management program (the “LRMP”) for the Funds on September 6, 2018 and the Funds’ final LRMP on March 5, 2019. At the regular meeting of the Board on March 10, 2021, the Trust’s Chief Operations Officer, as a member of the Liquidity Committee, provided a report to the Board on the operation and effectiveness of the LRMP for the year of operation ending December 31, 2020. The Liquidity Committee managed liquidity risks associated with the Funds’ investments by monitoring cash and cash equivalents, the use of derivatives, the concentration of investments and the appropriateness of portfolio strategies for open-end funds, and by classifying each investment of a Fund as either highly liquid, moderately liquid, less liquid or illiquid on at least a monthly basis. To assist with the classification of each Fund’s investments, the Liquidity Committee utilized a third party provider of liquidity monitoring services. The Liquidity Committee supplied portfolio-level data and certain assumptions to the provider which then used the information to determine the liquidity classification of each security position held by the Funds. The liquidity classifications as of each month end were reviewed by the Liquidity Committee on at least a quarterly basis and would be reviewed more often if market conditions warranted. For assets managed by a third party sub-adviser the Liquidity Committee would take sub-adviser input into account where appropriate in determining the liquidity classifications.
The LRMP effectively managed the Funds’ liquidity risks for the twelve month period ended April 30, 2021. During this period, each Fund held more than 50% of its total net assets in highly liquid investments and due to the fact that each Fund is deemed to consist primarily of highly liquid investments, no highly liquid investment minimum was required to be established for any Fund. All Funds holding assets deemed to be illiquid were well under the illiquid investment limitation. Additionally, no events occurred that required the filing of Form N-LIQUID.
April 30, 2021 (unaudited) / ANNUAL REPORT
Shares of the Wilmington Funds are not FDIC insured or otherwise protected by the U.S. government, are not deposits or other obligations of, or guaranteed by, Manufacturers and Traders Trust Company, and are subject to investment risks, including possible loss of the principal amount invested.
VOTING PROXIES ON FUND PORTFOLIO SECURITIES
A description of the policies and procedures that the Funds use to determine how to vote proxies relating to securities held in the Funds’ portfolios is available, without charge and upon request, by calling 1-800-836-2211. A report on how the Funds voted any such proxies during the most recent 12-month period ended June 30 is available through Wilmington Funds’ website. Go to www.wilmingtonfunds.com select “Proxy Voting Record” to access the link. This information is also available from the Edgar database on the SEC’s website at www.sec.gov.
QUARTERLY PORTFOLIO SCHEDULE
The Funds file a complete schedule of portfolio holdings with the SEC for the first and third quarters of each fiscal year as an exhibit to its reports on Form N-PORT. Form N-PORT is available on the SEC’s website at www.sec.gov.
Important information about the access and delivery of shareholder reports
Beginning on June 1, 2021, as permitted by regulations adopted by the Securities and Exchange Commission, paper copies of your Fund’s shareholder reports will no longer be sent to you by mail, unless you specifically request them. You will be notified by mail each time a report is posted on the Funds’ website and you will be provided with a link to access the report.
If you have already elected to receive shareholder reports electronically, you will not be affected by this change and you do not need to take any action. You may elect to receive other communications electronically from the Fund by contacting your financial intermediary or, if you hold shares directly with the Fund, by calling 1-800-836-2211.
You may elect to receive paper copies of all future shareholder reports free of charge. If you own these shares through a financial intermediary, you may contact your financial intermediary to elect to receive paper copies of your shareholder reports. If you are a direct investor you can inform the Wilmington Funds that you wish to continue receiving paper copies of your shareholder reports by contacting us at 1-800-836-2211. Your election to receive paper reports will apply to all funds held directly with Wilmington Funds and may apply to all funds held with your financial intermediary.
ANNUAL REPORT / April 30, 2021 (unaudited)
PRIVACY POLICY AND NOTICE
OF THE FUNDS AND THEIR DISTRIBUTOR
June 8, 2012
The Wilmington Funds, their distributor and their agents (referred to as “the Funds”, “we” or “us”) recognize that consumers (referred to as “you” or “your”) expect us to protect both your assets and financial information. We respect your right to privacy and your expectation that all personal information about you or your account will be maintained in a secure manner. We are committed to maintaining the confidentiality, security and integrity of client and shareholder information. We want you to understand the Funds’ policy that governs the handling of your information, how the Funds gather information, how that information is used and how it is kept secure.
Information The Funds Collect:
The Funds collect nonpublic personal information about you from the following sources:
| | • | | We may receive information from you, or from your financial representative, on account applications, other forms or electronically (such as through the Funds’ website or other electronic trading mechanisms). Examples of this information include your name, address, social security number, assets and income. |
| | • | | We may receive information from you, or from your financial representative, through transactions with us or others, correspondence and other communications. Examples of this information include specific investments and your account balances. |
| | • | | We may obtain other personal information from you in connection with providing you a financial product or service. Examples of this information include depository, debit or credit account numbers. |
Information Sharing Policy:
The Funds may share nonpublic personal information about you, as described above, with financial or non-financial companies or other entities, including companies that may be affiliated with the Funds and other nonaffiliated third parties, for the following purposes:
| | • | | We may share information when it is necessary and required to process a transaction or to service a customer relationship. For example, information may be shared with a company that provides account record keeping services or a company that provides proxy services to shareholders. |
| | • | | We may share information when it is required or permitted by law. For example, information may be shared in response to a subpoena or to protect you against fraud or with someone who has established a legal beneficial interest, such as a power of attorney. |
| | • | | We may disclose some or all of the information described above to companies that perform marketing or other services on our behalf. For example, we may share information about you with the financial intermediary (bank, investment bank or broker-dealer) through whom you purchased the Funds’ products or services, or with providers of marketing, legal, accounting or other professional services. The Funds will not, however, disclose a consumer’s account number or similar form of access number or access code for credit card, deposit or transaction accounts to any nonaffiliated third party for use in telemarketing, direct mail or other marketing purposes. |
Except as described above, the Funds do not share customer information. We will not rent, sell, trade, or otherwise release or disclose any personal information about you. Any information you provide to us is for the Funds’ use only. If you decide to close your account(s) or become an inactive customer, we will adhere to the privacy policies and practices as described in this notice.
Information Security:
When the Funds share nonpublic customer information with third parties hired to facilitate the delivery of certain products or services to our customers, such information is made available for limited purposes and under controlled circumstances designed to protect our customers’ privacy. We require third parties to comply with our standards regarding security and confidentiality of such information. We do not permit them to use that information for their own or any other purposes, or rent, sell, trade or otherwise release or disclose the information to any other party. These requirements are reflected in written agreements between the Funds and the third party service providers.
The Funds protect your personal information in several ways. We maintain physical, electronic, and procedural safeguards to guard your nonpublic personal information. In addition, the Funds’ Transfer Agent and Shareholder Servicing Agent have procedures in place for the appropriate disposal of nonpublic personal information when they are no longer required to maintain the information.
Each of the following sections explains an aspect of the Funds’ commitment to protecting your personal information and respecting your privacy.
Employee Access to Information:
Our Code of Ethics, which applies to all employees, restricts the use of customer information and requires that it be held in the strictest of confidence. Employee access to customer information is authorized for business purposes only, and the degree of access is based on the sensitivity of the information and on an employee’s or agent’s need to know the information in order to service a customer’s account or comply with legal requirements.
Visiting The Funds’ Website:
The Funds’ website gathers and maintains statistics about the number of visitors as well as what information is viewed most frequently. This information is used to improve the content and level of service we provide to our clients and shareholders.
| | • | | Information or data entered into a website will be retained. |
April 30, 2021 (unaudited) / ANNUAL REPORT
| | • | | Where registration to a website or re-entering personal information on a website is required, “cookies” are used to improve your online experience. A cookie is a way for websites to recognize whether or not you have visited the site before. It is a small file that is stored on your computer that identifies you each time you re-visit our site so you don’t have to resubmit personal information. Cookies provide faster access into the website. |
| | • | | We may also collect non-personally identifiable Internet Protocol (“IP”) addresses for all other visitors to monitor the number of visitors to the site. These non-personally identifiable IP addresses are never shared with any third party. |
E-mail:
If you have opted to receive marketing information from the Funds by e-mail, it is our policy to include instructions in all marketing messages on how to unsubscribe from subsequent e-mail programs. Some products or services from the Funds are intended to be delivered and serviced electronically. E-mail communication may be utilized in such cases. If you participate in an employer-sponsored retirement plan administered by the Funds, we may, at your employer’s request, send you e-mail on matters pertaining to the retirement plan.
Please do not provide any account or personal information such as social security numbers, account numbers, or account balances within your e-mail correspondence to us. We cannot use e-mail to execute transaction instructions, provide personal account information, or change account registration. We can, however, use e-mail to provide you with the necessary forms or you may contact customer service toll-free at 1-800-836-2211.
Surveys/Aggregate Data:
Periodically, the Funds may conduct surveys about financial products and services or review elements of customer information in an effort to forecast future business needs. The Funds then generate reports that include aggregate data regarding its customers. Aggregate data classifies customer information in various ways but that does not identify individual customers. These reports may also include information on website traffic patterns and related information. These reports are used for the Funds’ planning, statistical and other corporate purposes. Aggregate data may also be shared with external parties, such as marketing organizations. However, no information is shared by which any individual customer could be identified.
Changes to Our Privacy Statement:
The effective date of this policy is June 8, 2012. We reserve the right to modify this policy at any time. When it is revised or materially changed, we will update the effective date. You can determine whether there have been changes since the last time you reviewed by simply checking the effective date.
Notice will be provided to you in advance of any changes that would affect your rights under this policy statement.
ANNUAL REPORT / April 30, 2021 (unaudited)
WILMINGTON FUNDS Investment Advisor Distributor Wilmington Funds Management Corp. ALPS Distributors, Inc. 1100 North Market Street 1290 Broadway, Suite 1100 9th Floor Denver, CO 80203 Wilmington, DE 19890 Fund Accountant, Co-Administrator, Transfer Agent Sub-Advisor and Dividend Disbursing Agent Wilmington Trust Investment Advisors, Inc. BNY Mellon Investment Servicing (U.S.) Inc. 1100 North Market Street 301 Bellevue Parkway 9th Floor Wilmington, DE 19809 Wilmington, DE 19890 Independent Registered Public Accounting Firm Additional Sub-Advisors to the PricewaterhouseCoopers LLP Wilmington International Fund Two Commerce Square Allianz Global Investors U.S. LLC 2001 Market Street, Suite 1800 1633 Broadway Philadelphia, PA 19103 New York, New York 10019 AXA Investment Managers, Inc. 100 West Putnam Avenue Greenwich, Connecticut 06830 Berenberg Asset Management LLC 1251 Avenue of the Americas, 53rd Floor New York, NY 10020 Nikko Asset Management Americas, Inc. 605 3rd Avenue, 38th Floor New York, New York 10158 Schroder Investment Management North America, Inc. 7 Bryant Park New York, New York 10018 Additional Sub-Advisors to the Wilmington Global Alpha Equities Fund Wellington Management Company LLP 280 Congress Street Boston, Massachusetts 02210 Additional Sub-Advisors to the Wilmington Real Asset Fund Parametric Portfolio Associates, LLC 800 Fifth Avenue, Suite 2800 Seattle, WA 98104 Co-Administrator Wilmington Funds Management Corp. 1100 North Market Street 9th Floor Wilmington, DE 19890 Custodian The Bank of New York Mellon 240 Greenwich Street New York, NY 10286 WT-AR-MMgr-0421 Wilmington Funds | 1-800-836-2211 | www.wilmingtonfunds.com We are pleased to send you this shareholder report for the Wilmington Funds. This report contains important information about your investments in the funds.

Wilmington Large-Cap Strategy Fund (“Large-Cap Strategy Fund”)

[This Page Intentionally Left Blank]
PRESIDENT’S MESSAGE (unaudited)
Esteemed Shareholder:
I am pleased to present the Annual Report of the Wilmington Funds (the “Trust”), covering the Trust’s annual fiscal year of May 1, 2020, through April 30, 2021. Inside you will find a comprehensive review of the Trust’s holdings and financial statements.
The economy and financial markets in review
Wilmington Funds Management Corporation and Wilmington Trust Investment Advisors, Inc. (the Trust’s investment advisor and subadvisor, respectively), have provided the following review of the economy, bond markets, and stock markets for the Trust’s annual fiscal year.
The economy
The last year was one for the history books and captured both the worst of the COVID-19 pandemic’s impact on global output, as well as the early stages of recovery as vaccines and unprecedented volumes of fiscal and monetary stimulus helped the global economy get back on its feet. The U.S. began the period with one of the steepest quarterly declines on record in Q2 2020 as strict lockdown measures imposed to contain the virus abruptly brought in-person activity to a near halt.
The pace and magnitude of the economic rebound that followed was comparably profound as the approval and distribution of highly effective vaccines and rising COVID-19 vaccination rates across the world in 2021 provided investors with a much-needed light at the end of the tunnel. The federal government’s provision of direct checks to many Americans and extended unemployment benefits padded consumer savings, more than offsetting wages lost by low income consumers, and helped to fuel a robust rebound in spending on goods. Spending on services, which depends more on in person interaction, has still yet to recover to pre-pandemic levels but showed signs of picking up in 1Q 2021 as a growing number of states peeled back virus restrictions. The labor market recovered considerably in the period, as the unemployment rate dropped from 14.7% in April 2020, the highest observed since the Great Depression, to 6.1% one year later. The Federal Reserve (the “Fed”) upgraded its outlook for economic activity and inflation, but still guided for rates to remain near zero for years to come and for monthly purchases of treasuries and mortgage-backed securities to continue for the time being.
Economic activity outside the U.S. varied between regions depending on the success of virus containment and vaccination efforts. The eurozone was bogged down by weakness in the services sector for much of the period. Gross Domestic Product (“GDP”) growth contracted in the region for a second consecutive quarter in 1Q 2021 as many of the largest economies kept tight mobility restrictions in place in response to a resurgence of infections and the looming threat of new virus variants. However, notable strength on the industrial side of the economy provided some offset as manufacturing activity benefitted from strength in global goods demand. After a rocky start, vaccination efforts in many European countries began to accelerate in March and April of 2021 paving the way for renewed reopening efforts.
The virus remained a persistent threat for many developing economies, where vaccination campaigns broadly lagged the developed world by a substantial margin. Brazil and India in particular, emerged as virus epicenters in early 2021 after witnessing sharp spikes in infection rates, providing a grim reminder of the need for vaccination efforts to broaden in the emerging world. China was first in and first out of the COVID-19 pandemic after controlling infection rates more effectively and far earlier than most countries and was the only major economy to record positive GDP growth in 2020. Chinese manufacturing activity expanded at a feverish pace for much of the period, benefitting from goods exports and government investment. The services side of the economy lagged but began to narrow the gap later in the period as a brief rise in virus cases was brought under control.
Bond markets
Fixed income performance was mixed over the past year as spreads compressed materially across taxable and tax-exempt credit from extreme levels recorded in early 2020. However, rising long-term rates served as a headwind later in the period. The U.S. 10-year Treasury yield surged over 80 basis points1 in 1Q 2021 for its largest quarterly rise since 2016, buttressed by an improving growth outlook and expectations for higher inflation later in the year. Upward rate pressure weighed heavily on investment grade taxable bonds, as the Bloomberg Barclays U.S. Aggregate Bond Index suffered its worst quarter in several decades in 1Q, more than offsetting gains booked in much of 2020. In investment grade, tax-exempt held up better than taxable peers as strong demand for yield offset more muted new supply, helping to overshadow the rise in rates. Municipals also benefitted from the American Recovery Plan passed by the federal government in March 2021, which included $350 billion of funding for state and local governments. High-yield credit outperformed investment grade in both the taxable and tax-exempt spaces substantially as spreads continued to normalize from more elevated levels, and investors embraced riskier assets.
PRESIDENT’S MESSAGE / April 30, 2021 (unaudited)
For the 12-month period May 1, 2020 to April 30, 2021, certain Bloomberg Barclays indices performed as follows:2
| | | | | | | | |
| | | | |
Bloomberg Barclays
U.S. Treasury Bond
Index3 | | Bloomberg Barclays
U.S. Aggregate
Bond Index4 | | Bloomberg Barclays
U.S. Credit Bond
Index5 | | Bloomberg Barclays
Municipal Bond Index6 | | Bloomberg Barclays
U.S. Corporate High
Yield Bond Index7 |
| -4.32% | | -0.27% | | 4.25% | | 7.75% | | 19.67% |
Past performance is no guarantee of future results. Short-term performance may not be indicative of long-term results.
Source: Lipper. You cannot invest directly in an index.
Equity markets
Global equities recorded historically strong performance over the past 12-months as concerns over the initial spread of COVID-19 gave way to optimism over the pace of subsequent recovery. After suffering a -33% market rout in February and March of 2020, the S&P 500 reclaimed its pre-pandemic peak by August of that year, marking the fastest bear market recovery on record. U.S. large cap outperformed from April through November as mega-cap growth stocks that benefitted most from the “stay- at- home” environment prevailed.
November brought an immense shift in leadership, as positive vaccine developments and growing optimism for a swifter return to normal fueled a powerful rotation into economically sensitive areas of the market. U.S. small-cap and value stocks, which carry a heavier weighting toward cyclical sectors, were notable beneficiaries of this trend.
Emerging market equities recorded solid gains in the reflationary environment but saw some weakness in February as certain regions struggled with new outbreaks of COVID-19. In addition, Chinese equities, which comprise a significant share of the MSCI Emerging Markets Index, were weighed down by a mix of regulatory headwinds and concerns over policy tightening. International developed equities also performed well and benefitted from a tilt toward segments that benefit most from rising interest rates and inflation. Equities in Europe picked up momentum towards the end of the period amidst an improving economic outlook for many of the region’s largest countries as vaccinations ramped up.
For the 12-month period May 1, 2020 to April 30, 2021, certain stock market indices performed as follows:
| | | | | | |
| | | |
| S&P 500® Index8 | | Russel 2000®
Index9 | | MSCI EAFE (Net)
Index10 | | MSCI Emerging
Markets (Net)
Index11 |
| 45.98% | | 74.91% | | 39.88% | | 48.71% |
Past performance is no guarantee of future results. Short-term performance may not be indicative of long-term results.
Source: Lipper. You cannot invest directly in an index.
Although we have begun a new fiscal year, we will never forget the daunting damage that the pandemic has wrought on multiple levels. Still, there is much in the world that is positive, hopeful, and strong. I am referring to our trusted partnership with our clients, our desire to stay close to what’s important to them, and our fervent dedication to helping them achieve their long-term investment objectives. On that—as well as our fiduciary, clients-first mindset—you can always count.
Sincerely,

Dominick J. D’Eramo, CFA
President
May 14, 2021
April 30, 2021 (unaudited) / PRESIDENT’S MESSAGE
Must be preceded or accompanied by a prospectus.
Past performance is no guarantee of future results. The index performance quoted is for illustrative purposes only and is not representative of any specific investment. Diversification does not ensure a profit nor protect against loss.
All investments involve risk, including the possible loss of principal. Equity securities are subject to price fluctuation and possible loss of principal. Small- and mid-cap stocks involve greater risks and volatility than large-cap stocks. International investments are subject to special risks, including currency fluctuations, social, economic, and political uncertainties, which could increase volatility. These risks are magnified in emerging markets.
High-yield, lower-rated securities generally entail greater market, credit, and liquidity risks than investment grade securities and may include higher volatility and higher risk of default.
| 1. | Basis Points (“BPS”) is a unit that is equal to 1/100th of 1% and is used to denote the change in a financial instrument. The basis point is commonly used for calculating changes in interest rates, equity indices and the yield of a fixed-income security. |
| 2. | Bond prices are sensitive to changes in interest rates and a rise in interest rates can cause decline in their prices. |
| 3. | Bloomberg Barclays U.S. Treasury Bond Index is a market capitalization weighted index that includes all publicly issued U.S. Treasury securities that have a remaining maturity of at least one year, are rated investment-grade, and have $250 million or more of outstanding face value. The index is unmanaged and investments cannot be made directly in an index. |
| 4. | Bloomberg Barclays U.S. Aggregate Bond Index is a widely used benchmark index for the domestic investment-grade bond market composed of securities from the Barclays Government/Corporate Bond Index, Mortgage-Backed Securities Index and Asset-Backed Securities Index. The index typically includes fixed income securities with overall intermediate- to long-term average maturities. The index is unmanaged and investments cannot be made directly in an index. |
| 5. | Bloomberg Barclays U.S. Credit Bond Index tracks the performance of domestic investment-grade corporate bonds and is composed of all publicly issued, fixed-rate, nonconvertible, investment-grade corporate debt. The index is unmanaged and investments cannot be made directly in an index. |
| 6. | Bloomberg Barclays Municipal Bond Index tracks the performance of the long-term, tax-exempt, investment-grade bond market. To be included in the index, bonds must have an outstanding par balance of at least $7 million and be issued as part of a transaction of at least $75 million. The index is unmanaged and investments cannot be made directly in an index. |
| 7. | Bloomberg Barclays U.S. Corporate High Yield Bond Index measures the USD-denominated, high yield, fixed-rate corporate bond market. Securities are classified as high yield if the middle rating of Moody’s, Fitch, and S&P is Ba1/BB+/BB+ or below. Bonds from issuers with an emerging markets country of risk, based on the Bloomberg Barclays EM country definition, are excluded. The U.S. Corporate High Yield Bond Index is a component of the U.S. Universal and Global High Yield Indices. An investment cannot be made directly in an index. |
| 8. | The S&P 500® Index is a capitalization-weighted index of 500 stocks designed to measure performance of the broad domestic economy through changes in the aggregate market value of 500 stocks representing all major industries. The index is unmanaged and investments cannot be made directly in an index. |
| 9. | The Russell 2000® Index measures the performance of the 2,000 smallest companies in the Russell 3000® Index, which represents approximately 8% of the total market capitalization of the Russell 3000® Index. As of its latest reconstitution, the index had a total market capitalization range of $152.3 million to $5 billion. The index is unmanaged and investments cannot be made directly in an index. |
| 10. | MSCI EAFE (Net) Index is a free float-adjusted market capitalization index that is designed to measure equity market performance of developed markets, excluding the U.S. & Canada. The MSCI EAFE (Net) Index is an equity index which captures large and mid-cap representation across 21 Developed Markets countries: Australia, Austria, Belgium, Denmark, Finland, France, Germany, Hong Kong, Ireland, Israel, Italy, Japan, the Netherlands, New Zealand, Norway, Portugal, Singapore, Spain, Sweden, Switzerland and the United Kingdom. The index is unmanaged and investments cannot be made directly in an index. The performance of this index is reduced by the taxes on dividends paid by the international securities issuers in the index. |
| 11. | MSCI Emerging Markets (Net) Index is a free float-adjusted market capitalization index that is designed to measure equity market performance of emerging markets. The MSCI Emerging Markets (Net) Index captures large and mid-cap representation across 27 Emerging Markets countries: Argentina, Brazil, Chile, China, Colombia, Czech Republic, Egypt, Greece, Hungary, India, Indonesia, Korea, Kuwait, Malaysia, Mexico, Pakistan, Peru, Philippines, Poland, Qatar, Russia, Saudi Arabia, South Africa, Taiwan, Thailand, Turkey and United Arab Emirates. The index is unmanaged and investments cannot be made directly in an index. The performance of this index is reduced by the taxes on dividends paid by the international securities issuers in the index. |
PRESIDENT’S MESSAGE / April 30, 2021 (unaudited)
1
WILMINGTON LARGE-CAP STRATEGY FUND
Management’s Discussion of Fund Performance (Unaudited)
For the fiscal year ended April 30, 2021, Wilmington Large-Cap Strategy Fund (the “Fund”) had a total return of 49.12%* for Class I Shares, versus its benchmark, the Russell 1000 Index**, which had a total return of 49.48%.
The Fund underperformed by approximately 10 basis points versus the Russell 1000 gross of fees. The Fund has generally had a neutral view of the market last year, transitioning to an over-weighted cyclical position emphasizing financials, industrials, energy, and materials early in 2021. The slight underperformance was attributable to frictional cash and trading costs.
| * | Performance data quoted represents past performance, which is no guarantee of future results. Investment return and principal value will fluctuate so that an investor’s shares, when redeemed, may be worth more or less than their original cost. The total return shown assumes the reinvestment of all distributions and does not reflect the deduction of taxes that a shareholder would pay on fund distributions or the redemption of shares. Mutual fund performance changes over time and current performance may be lower or higher than what is stated. For the most recent month-end performance, please visit www.wilmingtonfunds.com or call 1-800-836-2211. |
| ** | The Russell 1000 Index measures the performance of the large-cap segment of the U.S. equity universe. It is subset of the Russell 3000 Index and includes approximately 1,000 of the largest securities based on a combination of their market cap and current index membership. The Index represents approximately 92% of the U.S. market and is constructed to provide a comprehensive and unbiased barometer for the large-cap segment and is completely reconstituted annually to ensure new and growing equities are reflected. The Russell 3000 Index measures the performance of the largest 3,000 U.S. companies representing approximately 98% of the investable U.S. equity market. Russell 1000 Growth Index measures the performance of those Russell 1000 companies with higher price-to-book ratios and higher forecasted growth values. Russell 1000 Value Index measures the performance of those Russell 1000 companies with lower price-to-book ratios and lower forecasted growth values. |
Basis Points (“BPS”) is a unit that is equal to 1/100th of 1% and is used to denote the change in a financial instrument.
April 30, 2021 (unaudited) / ANNUAL REPORT
2
WILMINGTON LARGE-CAP STRATEGY FUND
The graph below illustrates the hypothetical investment of $1,000,0001 in the Class I Shares of the Wilmington Large-Cap Strategy Fund from April 30, 2011 to April 30, 2021, compared to the Russell 1000® Index.2
Performance data quoted represents past performance which is no guarantee of future results. Returns shown do not reflect the deduction of taxes that a shareholder would pay on Fund distributions or the redemption of Fund shares. Investment return and principal value will fluctuate so that an investor’s shares, when redeemed, may be worth more or less than their original cost. Mutual Funds are not obligations of or guaranteed by any bank and are not federally insured. Mutual fund performance changes over time and current performance may be lower or higher than what is stated. For current to the most recent month end performance, visit www.wilmingtonfunds.com or call 1-800-836-2211.
| | | | | | |
| |
| | | Average Annual Total Returns for the Periods Ended 4/30/21 |
| | | |
| | | 1 Year | | 5 Years | | 10 Years |
| | | |
Class I^ | | 49.12% | | 17.79% | | 14.13% |
| | | |
Russell 1000® Index2 | | 49.48% | | 17.76% | | 14.23% |
| ^ | Expense Ratios Before Waivers and Expense Ratios After Waivers for Class I are 0.61% and 0.25%, respectively. Expense Ratios Before Waiver represent the operating costs borne by the Fund, expressed as a percentage of the Fund’s average net assets, as shown in the Fees and Expenses table in the Fund’s current prospectus (under “Total Annual Fund Operating Expenses”). Current information regarding the Fund’s Operating Expenses can be found in the Fund’s Financial Highlights. |
| 1 | Represents a hypothetical investment of $1,000,000 in Class I and assumes the reinvestment of all dividends and distributions. |
| 2 | The Russell 1000® Index measures the performance of the 1,000 largest companies in the Russell 3000® Index, which represents approximately 92% of the total market capitalization of the Russell 3000® Index. Please note that an investor cannot invest directly in an index. |
ANNUAL REPORT / April 30, 2021 (unaudited)
3
SHAREHOLDER EXPENSE EXAMPLE (unaudited)
As a shareholder of a Fund, you incur two types of costs: (1) transaction costs, including sales charges (loads) on purchase payments, reinvested dividends, or other distributions; and redemption fees; and (2) ongoing costs, including management fees; distribution and/or service (12b-1) fees; and other Fund expenses. This Example is intended to help you to understand your ongoing costs (in dollars) of investing in the Fund and to compare these costs with the ongoing costs of investing in other mutual funds. It is based on an investment of $1,000 invested at the beginning of the period and held for the entire period from November 1, 2020 to April 30, 2021.
Actual Expenses
This section of the following table provides information about actual account values and actual expenses. You may use the information in this section, together with the amount you invested, to estimate the expenses that you incurred over the period. Simply divide your account value by $1,000 (for example, an $8,600 account value divided by $1,000 = 8.6), then multiply the result by the number in the first section under the heading entitled “Expenses Paid During Period” to estimate the expenses attributable to your investment during this period.
Hypothetical Example for Comparison Purposes
This section of the following table provides information about hypothetical account values and hypothetical expenses based on the Fund’s actual expense ratios and assumed rates of return of 5% per year before expenses, which are not the Fund’s actual returns. Thus, you should not use the hypothetical account values and expenses to estimate the actual ending account balance or your expenses for the period. Rather, these figures are required to be provided to enable you to compare the ongoing costs of investing in the Fund with other funds. To do so, compare this 5% hypothetical example with the 5% hypothetical examples that appear in the shareholder reports of the other funds.
Please note that the expenses shown in the table are meant to highlight your ongoing costs only. Therefore, the Annualized Net Expense Ratio section of the table is useful in comparing ongoing costs only, and will not help you determine the relative total costs of owning different funds.
The Annualized Net Expense Ratios may be different from the net expense ratios in the Financial Highlights which are for the fiscal year ended April 30, 2021.
| | | | | | | | | | | | | | |
| | | | | | | |
| | | Beginning Account Value 11/01/20 | | | | Ending Account Value 4/30/21 | | | | Expenses Paid During Period(1) | | | | Annualized Net Expense Ratio(2) |
WILMINGTON LARGE-CAP STRATEGY FUND | | | | | | | | | | | | | | |
Actual | | | | | | | | | | | | | | |
Class I | | $1,000.00 | | | | $1,299.60 | | | | $1.43 | | | | 0.25% |
Hypothetical (assuming a 5% return before expense) | | | | | | | | | | | | | | |
Class I | | $1,000.00 | | | | $1,023.55 | | | | $1.25 | | | | 0.25% |
| (1) | Expenses are equal to the Fund’s annualized net expense ratios, multiplied by the average account value over the period, multiplied by 181/365 (to reflect the most recent one-half year period). |
| (2) | Expense ratio does not reflect the indirect expenses of the underlying funds in which the Fund invests. |
April 30, 2021 (unaudited) / ANNUAL REPORT
4
PORTFOLIO OF INVESTMENTS SUMMARY TABLE
Wilmington Large-Cap Strategy Fund
At April 30, 2021, the Fund’s sector classifications were as follows (unaudited):
| | | | |
| | | Percentage of Total Net Assets | |
Common Stocks | | | | |
Information Technology | | | 26.5 | % |
Health Care | | | 12.9 | % |
Financials | | | 12.5 | % |
Consumer Discretionary | | | 12.3 | % |
Communication Services | | | 10.7 | % |
Industrials | | | 9.7 | % |
Consumer Staples | | | 4.6 | % |
Materials | | | 3.0 | % |
Energy | | | 2.7 | % |
Real Estate | | | 2.7 | % |
Utilities | | | 2.1 | % |
Investment Companies | | | 0.3 | % |
Warrants | | | 0.0 | %(1) |
Rights | | | 0.0 | %(1) |
Cash Collateral Invested for Securities on Loan(2) | | | 0.3 | % |
Other Assets and Liabilities - Net(3) | | | (0.3 | )% |
| | | | |
TOTAL | | | 100.0 | % |
| | | | |
| (1) | Represents less than 0.05%. |
| (2) | Cash Collateral Invested for Securities on Loan include investments in repurchase agreements. |
| (3) | Assets, other than investments in securities, less liabilities. See Statement of Assets and Liabilities. |
PORTFOLIO OF INVESTMENTS
April 30, 2021
| | | | | | | | |
| | |
| Description | | Number of Shares | | | Value | |
| | |
COMMON STOCKS – 99.7% | | | | | | | | |
| | |
COMMUNICATION SERVICES – 10.7% | | | | | | | | |
| |
DIVERSIFIED TELECOMMUNICATION SERVICES – 1.2% | | | | | |
| | |
AT&T, Inc. | | | 112,952 | | | $ | 3,547,822 | |
| | |
Lumen Technologies, Inc. | | | 16,385 | | | | 210,220 | |
| | |
Verizon Communications, Inc. | | | 65,650 | | | | 3,793,913 | |
| | | | | | | | |
| | |
| | | | | | $ | 7,551,955 | |
| | |
ENTERTAINMENT – 2.0% | | | | | | | | |
| | |
Activision Blizzard, Inc. | | | 12,020 | | | | 1,096,104 | |
| | |
Electronic Arts, Inc. | | | 4,510 | | | | 640,781 | |
| | |
Liberty Media Corp. – Liberty Formula One, Class A* | | | 55 | | | | 2,278 | |
| | |
Liberty Media Corp. – Liberty Formula One, Class C* | | | 3,085 | | | | 144,810 | |
| | |
Lions Gate Entertainment Corp., Class A*,# | | | 1,000 | | | | 14,470 | |
| | |
Lions Gate Entertainment Corp., Class B* | | | 2,400 | | | | 30,240 | |
| | |
Live Nation Entertainment, Inc.* | | | 2,170 | | | | 177,680 | |
| | |
Madison Square Garden Entertainment Corp.* | | | 329 | | | | 29,811 | |
| | |
Madison Square Garden Sports Corp.* | | | 29 | | | | 5,360 | |
| | |
Netflix, Inc.* | | | 6,700 | | | | 3,440,249 | |
| | |
Roku, Inc.* | | | 1,700 | | | | 583,049 | |
| | | | | | | | |
| | |
| Description | | Number of Shares | | | Value | |
| | |
Spotify Technology SA* | | | 2,100 | | | $ | 529,452 | |
| | |
Take-Two Interactive Software, Inc.* | | | 1,750 | | | | 306,915 | |
| | |
Walt Disney Co. (The)* | | | 28,433 | | | | 5,289,107 | |
| | |
World Wrestling Entertainment, Inc., Class A# | | | 650 | | | | 35,821 | |
| | |
Zynga, Inc., Class A* | | | 14,000 | | | | 151,480 | |
| | | | | | | | |
| | |
| | | | | | $ | 12,477,607 | |
| |
INTERACTIVE MEDIA & SERVICES – 5.9% | | | | | |
| | |
Alphabet, Inc., Class A* | | | 4,745 | | | | 11,167,358 | |
| | |
Alphabet, Inc., Class C* | | | 4,579 | | | | 11,035,939 | |
| | |
Facebook, Inc., Class A* | | | 37,780 | | | | 12,281,522 | |
| | |
IAC/InterActiveCorp* | | | 1,150 | | | | 291,491 | |
| | |
Match Group, Inc.* | | | 3,492 | | | | 543,460 | |
| | |
Pinterest, Inc., Class A* | | | 6,293 | | | | 417,666 | |
| | |
TripAdvisor, Inc.* | | | 1,600 | | | | 75,408 | |
| | |
Twitter, Inc.* | | | 12,160 | | | | 671,475 | |
| | |
Zillow Group, Inc., Class A* | | | 850 | | | | 113,348 | |
| | |
Zillow Group, Inc., Class C* | | | 2,295 | | | | 298,625 | |
| | | | | | | | |
| | |
| | | | | | $ | 36,896,292 | |
| | |
MEDIA – 1.4% | | | | | | | | |
| | |
Altice USA, Inc., Class A* | | | 4,150 | | | | 150,687 | |
ANNUAL REPORT / April 30, 2021
| | |
| 5 | | PORTFOLIO OF INVESTMENTS |
Wilmington Large-Cap Strategy Fund (continued)
| | | | | | | | |
| | |
| Description | | Number of Shares | | | Value | |
| | |
Cable One, Inc. | | | 90 | | | $ | 161,100 | |
| | |
Charter Communications, Inc., Class A* | | | 2,252 | | | | 1,516,609 | |
| | |
Comcast Corp., Class A | | | 71,800 | | | | 4,031,570 | |
| | |
Discovery, Inc., Class A*,# | | | 2,200 | | | | 82,852 | |
| | |
Discovery, Inc., Class C* | | | 4,900 | | | | 158,319 | |
| | |
DISH Network Corp., Class A* | | | 3,946 | | | | 176,741 | |
| | |
Fox Corp., Class A | | | 5,476 | | | | 204,912 | |
| | |
Fox Corp., Class B | | | 2,300 | | | | 83,674 | |
| | |
Interpublic Group of Cos., Inc. (The) | | | 6,218 | | | | 197,421 | |
| | |
John Wiley & Sons, Inc., Class A | | | 200 | | | | 11,388 | |
| | |
Liberty Broadband Corp., Class A* | | | 335 | | | | 52,819 | |
| | |
Liberty Broadband Corp., Class C* | | | 2,468 | | | | 401,593 | |
| | |
Liberty Media Corp. - Liberty SiriusXM, Class A* | | | 1,043 | | | | 47,133 | |
| | |
Liberty Media Corp. - Liberty SiriusXM, | | | | | | | | |
| | |
Class C* | | | 2,486 | | | | 112,442 | |
| | |
New York Times Co. (The), Class A | | | 2,550 | | | | 115,796 | |
| | |
News Corp., Class A | | | 5,907 | | | | 154,734 | |
| | |
News Corp., Class B | | | 1,448 | | | | 35,201 | |
| | |
Nexstar Media Group, Inc., Class A | | | 650 | | | | 95,817 | |
| | |
Omnicom Group, Inc. | | | 3,240 | | | | 266,522 | |
| | |
Sirius XM Holdings, Inc.# | | | 16,940 | | | | 103,334 | |
| | |
ViacomCBS, Inc., Class B | | | 8,596 | | | | 352,608 | |
| | | | | | | | |
| | |
| | | | | | $ | 8,513,272 | |
| |
WIRELESS TELECOMMUNICATION SERVICES – 0.2% | | | | | |
| | |
Telephone & Data Systems, Inc. | | | 1,550 | | | | 35,619 | |
| | |
T-Mobile US, Inc.* | | | 8,669 | | | | 1,145,435 | |
| | | | | | | | |
| | |
| | | | | | $ | 1,181,054 | |
| | | | | | | | |
| | |
TOTAL COMMUNICATION SERVICES | | | | | | $ | 66,620,180 | |
| | |
CONSUMER DISCRETIONARY – 12.3% | | | | | | | | |
| | |
AUTO COMPONENTS – 0.2% | | | | | | | | |
| | |
Aptiv PLC* | | | 4,250 | | | | 611,533 | |
| | |
BorgWarner, Inc. | | | 3,680 | | | | 178,774 | |
| | |
Gentex Corp. | | | 3,580 | | | | 125,944 | |
| | |
Lear Corp. | | | 1,000 | | | | 183,840 | |
| | | | | | | | |
| | |
| | | | | | $ | 1,100,091 | |
| | |
AUTOMOBILES – 1.7% | | | | | | | | |
| | |
Ford Motor Co.* | | | 61,250 | | | | 706,825 | |
| | |
General Motors Co.* | | | 19,750 | | | | 1,130,095 | |
| | |
Harley-Davidson, Inc. | | | 2,270 | | | | 109,800 | |
| | |
Tesla, Inc.* | | | 12,140 | | | | 8,612,602 | |
| | |
Thor Industries, Inc. | | | 750 | | | | 106,192 | |
| | | | | | | | |
| | |
| | | | | | $ | 10,665,514 | |
| | |
DISTRIBUTORS – 0.1% | | | | | | | | |
| | |
Genuine Parts Co. | | | 2,120 | | | | 264,936 | |
| | |
LKQ Corp.* | | | 4,618 | | | | 215,707 | |
| | |
Pool Corp. | | | 600 | | | | 253,512 | |
| | | | | | | | |
| | |
| | | | | | $ | 734,155 | |
| |
DIVERSIFIED CONSUMER SERVICES – 0.1% | | | | | |
| | |
Bright Horizons Family Solutions, Inc.* | | | 883 | | | | 127,885 | |
| | |
Chegg, Inc.* | | | 1,976 | | | | 178,492 | |
| | |
frontdoor, Inc.* | | | 1,100 | | | | 58,883 | |
| | |
Graham Holdings Co., Class B | | | 40 | | | | 25,424 | |
| | |
Grand Canyon Education, Inc.* | | | 600 | | | | 64,974 | |
| | | | | | | | |
| | |
| Description | | Number of Shares | | | Value | |
| | |
H&R Block, Inc. | | | 2,500 | | | $ | 55,650 | |
| | |
Service Corp. International | | | 2,420 | | | | 129,325 | |
| | |
Terminix Global Holdings, Inc.* | | | 2,318 | | | | 117,963 | |
| | | | | | | | |
| | |
| | | | | | $ | 758,596 | |
| |
HOTELS, RESTAURANTS & LEISURE – 2.1% | | | | | |
| | |
Aramark | | | 3,333 | | | | 129,554 | |
| | |
Booking Holdings, Inc.* | | | 680 | | | | 1,676,934 | |
| | |
Carnival Corp.* | | | 16,250 | | | | 454,350 | |
| | |
Chipotle Mexican Grill, Inc.* | | | 450 | | | | 671,413 | |
| | |
Choice Hotels International, Inc.* | | | 610 | | | | 69,418 | |
| | |
Darden Restaurants, Inc. | | | 2,100 | | | | 308,112 | |
| | |
Domino’s Pizza, Inc. | | | 600 | | | | 253,404 | |
| | |
Expedia Group, Inc.* | | | 2,152 | | | | 379,247 | |
| | |
Extended Stay America, Inc. | | | 2,600 | | | | 51,714 | |
| | |
Hilton Worldwide Holdings, Inc.* | | | 4,403 | | | | 566,666 | |
| | |
Hyatt Hotels Corp., Class A* | | | 550 | | | | 45,282 | |
| | |
Las Vegas Sands Corp.* | | | 5,070 | | | | 310,588 | |
| | |
Marriott International, Inc., Class A* | | | 4,186 | | | | 621,705 | |
| | |
McDonald’s Corp. | | | 11,849 | | | | 2,797,312 | |
| | |
MGM Resorts International | | | 7,310 | | | | 297,663 | |
| | |
Norwegian Cruise Line Holdings Ltd.*,# | | | 5,250 | | | | 163,013 | |
| | |
Planet Fitness, Inc., Class A* | | | 1,178 | | | | 98,940 | |
| | |
Restaurant Brands International LP | | | 47 | | | | 3,289 | |
| | |
Royal Caribbean Cruises Ltd.* | | | 3,030 | | | | 263,458 | |
| | |
Six Flags Entertainment Corp.* | | | 1,100 | | | | 51,678 | |
| | |
Starbucks Corp. | | | 18,590 | | | | 2,128,369 | |
| | |
Travel + Leisure Co. | | | 1,160 | | | | 74,855 | |
| | |
Vail Resorts, Inc.* | | | 628 | | | | 204,200 | |
| | |
Wendy’s Co. (The) | | | 2,515 | | | | 56,764 | |
| | |
Wyndham Hotels & Resorts, Inc. | | | 1,560 | | | | 114,052 | |
| | |
Wynn Resorts Ltd.* | | | 1,568 | | | | 201,331 | |
| | |
Yum China Holdings, Inc. | | | 6,300 | | | | 396,396 | |
| | |
Yum! Brands, Inc. | | | 4,700 | | | | 561,744 | |
| | | | | | | | |
| | |
| | | | | | $ | 12,951,451 | |
| | |
HOUSEHOLD DURABLES – 0.4% | | | | | | | | |
| | |
DR Horton, Inc. | | | 5,220 | | | | 513,074 | |
| | |
Garmin Ltd. | | | 2,290 | | | | 314,279 | |
| | |
Leggett & Platt, Inc. | | | 2,070 | | | | 102,817 | |
| | |
Lennar Corp., Class A | | | 4,410 | | | | 456,876 | |
| | |
Lennar Corp., Class B | | | 26 | | | | 2,095 | |
| | |
Mohawk Industries, Inc.* | | | 855 | | | | 175,702 | |
| | |
Newell Brands, Inc. | | | 5,769 | | | | 155,532 | |
| | |
NVR, Inc.* | | | 50 | | | | 250,905 | |
| | |
PulteGroup, Inc. | | | 3,940 | | | | 232,933 | |
| | |
Tempur Sealy International, Inc. | | | 2,900 | | | | 110,606 | |
| | |
Toll Brothers, Inc. | | | 1,600 | | | | 100,320 | |
| | |
Whirlpool Corp. | | | 935 | | | | 221,081 | |
| | | | | | | | |
| | |
| | | | | | $ | 2,636,220 | |
| |
INTERNET & DIRECT MARKETING RETAIL – 4.0% | | | | | |
| | |
Amazon.com, Inc.* | | | 6,710 | | | | 23,266,388 | |
| | |
eBay, Inc. | | | 10,390 | | | | 579,658 | |
| | |
Etsy, Inc.* | | | 1,850 | | | | 367,762 | |
| | |
Grubhub, Inc.* | | | 1,410 | | | | 95,936 | |
| | |
Qurate Retail, Inc., Class A | | | 5,900 | | | | 70,210 | |
April 30, 2021 / ANNUAL REPORT
| | |
| PORTFOLIO OF INVESTMENTS | | 6 |
Wilmington Large-Cap Strategy Fund (continued)
| | | | | | | | |
| | |
| Description | | Number of Shares | | | Value | |
| | |
Wayfair, Inc., Class A*,# | | | 1,098 | | | $ | 324,536 | |
| | | | | | | | |
| | |
| | | | | | $ | 24,704,490 | |
| | |
LEISURE PRODUCTS – 0.2% | | | | | | | | |
| | |
Brunswick Corp. | | | 1,100 | | | | 117,843 | |
| | |
Hasbro, Inc. | | | 1,990 | | | | 197,906 | |
| | |
Mattel, Inc.* | | | 5,050 | | | | 108,373 | |
| | |
Peloton Interactive, Inc., Class A* | | | 4,000 | | | | 393,400 | |
| | |
Polaris, Inc. | | | 900 | | | | 126,027 | |
| | | | | | | | |
| | |
| | | | | | $ | 943,549 | |
| | |
MULTILINE RETAIL – 0.5% | | | | | | | | |
| | |
Dollar General Corp. | | | 3,950 | | | | 848,262 | |
| | |
Dollar Tree, Inc.* | | | 3,662 | | | | 420,764 | |
| | |
Kohl’s Corp. | | | 2,410 | | | | 141,371 | |
| | |
Nordstrom, Inc.* | | | 1,780 | | | | 65,290 | |
| | |
Ollie’s Bargain Outlet Holdings, Inc.* | | | 873 | | | | 80,552 | |
| | |
Target Corp. | | | 7,910 | | | | 1,639,427 | |
| | | | | | | | |
| | |
| | | | | | $ | 3,195,666 | |
| | |
SPECIALTY RETAIL – 2.3% | | | | | | | | |
| | |
Advance Auto Parts, Inc. | | | 1,050 | | | | 210,168 | |
| | |
AutoNation, Inc.* | | | 830 | | | | 85,058 | |
| | |
AutoZone, Inc.* | | | 360 | | | | 527,083 | |
| | |
Best Buy Co., Inc. | | | 3,680 | | | | 427,874 | |
| | |
Burlington Stores, Inc.* | | | 1,000 | | | | 326,330 | |
| | |
CarMax, Inc.* | | | 2,600 | | | | 346,424 | |
| | |
Carvana Co.* | | | 900 | | | | 256,734 | |
| | |
Dick’s Sporting Goods, Inc. | | | 800 | | | | 66,064 | |
| | |
Five Below, Inc.* | | | 878 | | | | 176,715 | |
| | |
Floor & Decor Holdings, Inc., Class A* | | | 1,510 | | | | 167,489 | |
| | |
Foot Locker, Inc. | | | 1,610 | | | | 94,958 | |
| | |
Gap, Inc. (The) | | | 2,900 | | | | 95,990 | |
| | |
Home Depot, Inc. (The) | | | 17,100 | | | | 5,534,757 | |
| | |
L Brands, Inc.* | | | 3,610 | | | | 237,899 | |
| | |
Leslie’s, Inc.* | | | 600 | | | | 17,052 | |
| | |
Lowe’s Cos., Inc. | | | 11,800 | | | | 2,315,750 | |
| | |
O’Reilly Automotive, Inc.* | | | 1,150 | | | | 635,812 | |
| | |
Penske Automotive Group, Inc. | | | 400 | | | | 35,076 | |
| | |
Ross Stores, Inc. | | | 5,490 | | | | 718,861 | |
| | |
TJX Cos., Inc. (The) | | | 18,930 | | | | 1,344,030 | |
| | |
Tractor Supply Co. | | | 1,750 | | | | 330,050 | |
| | |
Ulta Beauty, Inc.* | | | 850 | | | | 279,947 | |
| | |
Vroom, Inc.*,# | | | 1,350 | | | | 62,465 | |
| | |
Williams-Sonoma, Inc. | | | 1,210 | | | | 206,607 | |
| | | | | | | | |
| | |
| | | | | | $ | 14,499,193 | |
| |
TEXTILES, APPAREL & LUXURY GOODS – 0.7% | | | | | |
| | |
Capri Holdings Ltd.* | | | 2,000 | | | | 110,160 | |
| | |
Carter’s, Inc.* | | | 550 | | | | 59,835 | |
| | |
Columbia Sportswear Co. | | | 318 | | | | 34,665 | |
| | |
Hanesbrands, Inc. | | | 5,200 | | | | 109,512 | |
| | |
Lululemon Athletica, Inc.* | | | 1,800 | | | | 603,486 | |
| | |
NIKE, Inc., Class B | | | 19,540 | | | | 2,591,395 | |
| | |
PVH Corp.* | | | 1,070 | | | | 121,103 | |
| | |
Ralph Lauren Corp.* | | | 735 | | | | 97,968 | |
| | |
Skechers USA, Inc., Class A* | | | 1,843 | | | | 89,367 | |
| | |
Tapestry, Inc.* | | | 4,330 | | | | 207,190 | |
| | |
Under Armour, Inc., Class A* | | | 2,428 | | | | 59,025 | |
| | | | | | | | |
| | |
| Description | | Number of Shares | | | Value | |
| | |
Under Armour, Inc., Class C* | | | 4,050 | | | $ | 80,635 | |
| | |
VF Corp. | | | 5,200 | | | | 455,832 | |
| | | | | | | | |
| | |
| | | | | | $ | 4,620,173 | |
| | | | | | | | |
| | |
TOTAL CONSUMER DISCRETIONARY | | | | | | $ | 76,809,098 | |
| | |
CONSUMER STAPLES – 4.6% | | | | | | | | |
| | |
BEVERAGES – 1.1% | | | | | | | | |
| | |
Boston Beer Co., Inc. (The), Class A* | | | 150 | | | | 182,474 | |
| | |
Brown-Forman Corp., Class A | | | 700 | | | | 49,945 | |
| | |
Brown-Forman Corp., Class B | | | 2,325 | | | | 177,351 | |
| | |
Coca-Cola Co. (The) | | | 50,350 | | | | 2,717,893 | |
| | |
Constellation Brands, Inc., Class A | | | 2,050 | | | | 492,656 | |
| | |
Keurig Dr. Pepper, Inc. | | | 8,650 | | | | 310,102 | |
| | |
Molson Coors Beverage Co., Class B* | | | 2,300 | | | | 126,385 | |
| | |
Monster Beverage Corp.* | | | 4,800 | | | | 465,840 | |
| | |
PepsiCo., Inc. | | | 18,050 | | | | 2,602,088 | |
| | | | | | | | |
| | |
| | | | | | $ | 7,124,734 | |
| | |
FOOD & STAPLES RETAILING – 1.0% | | | | | | | | |
| | |
Casey’s General Stores, Inc. | | | 535 | | | | 118,872 | |
| | |
Costco Wholesale Corp. | | | 5,750 | | | | 2,139,517 | |
| | |
Grocery Outlet Holding Corp.* | | | 1,100 | | | | 44,429 | |
| | |
Kroger Co. (The) | | | 10,050 | | | | 367,227 | |
| | |
Sprouts Farmers Market, Inc.* | | | 1,800 | | | | 46,098 | |
| | |
Sysco Corp. | | | 6,300 | | | | 533,799 | |
| | |
U.S. Foods Holding Corp.* | | | 2,850 | | | | 118,161 | |
| | |
Walgreens Boots Alliance, Inc. | | | 9,400 | | | | 499,140 | |
| | |
Walmart, Inc. | | | 18,000 | | | | 2,518,380 | |
| | | | | | | | |
| | |
| | | | | | $ | 6,385,623 | |
| | |
FOOD PRODUCTS – 0.8% | | | | | | | | |
| | |
Archer-Daniels-Midland Co. | | | 7,150 | | | | 451,379 | |
| | |
Beyond Meat, Inc.*,# | | | 700 | | | | 92,176 | |
| | |
Bunge Ltd. | | | 2,095 | | | | 176,860 | |
| | |
Campbell Soup Co. | | | 2,500 | | | | 119,375 | |
| | |
Conagra Brands, Inc. | | | 6,300 | | | | 233,667 | |
| | |
Flowers Foods, Inc. | | | 2,800 | | | | 67,088 | |
| | |
General Mills, Inc. | | | 7,850 | | | | 477,751 | |
| | |
Hain Celestial Group, Inc. (The)* | | | 1,200 | | | | 49,212 | |
| | |
Hershey Co. (The) | | | 1,900 | | | | 312,170 | |
| | |
Hormel Foods Corp. | | | 3,600 | | | | 166,320 | |
| | |
Ingredion, Inc. | | | 850 | | | | 79,399 | |
| | |
J.M. Smucker Co. (The) | | | 1,400 | | | | 183,386 | |
| | |
Kellogg Co. | | | 3,250 | | | | 202,865 | |
| | |
Kraft Heinz Co. (The) | | | 8,350 | | | | 344,771 | |
| | |
Lamb Weston Holdings, Inc. | | | 1,850 | | | | 148,925 | |
| | |
McCormick & Co., Inc. | | | 3,200 | | | | 289,152 | |
| | |
Mondelez International, Inc., Class A | | | 18,250 | | | | 1,109,782 | |
| | |
Pilgrim’s Pride Corp.* | | | 550 | | | | 13,178 | |
| | |
Post Holdings, Inc.* | | | 838 | | | | 95,348 | |
| | |
TreeHouse Foods, Inc.* | | | 600 | | | | 28,560 | |
| | |
Tyson Foods, Inc., Class A | | | 3,550 | | | | 274,948 | |
| | | | | | | | |
| | |
| | | | | | $ | 4,916,312 | |
| | |
HOUSEHOLD PRODUCTS – 1.0% | | | | | | | | |
| | |
Church & Dwight Co., Inc. | | | 3,200 | | | | 274,368 | |
| | |
Clorox Co. (The) | | | 1,600 | | | | 292,000 | |
| | |
Colgate-Palmolive Co. | | | 10,950 | | | | 883,665 | |
ANNUAL REPORT / April 30, 2021
| | |
| 7 | | PORTFOLIO OF INVESTMENTS |
Wilmington Large-Cap Strategy Fund (continued)
| | | | | | | | |
| | |
| Description | | Number of Shares | | | Value | |
| | |
Energizer Holdings, Inc. | | | 800 | | | $ | 39,440 | |
| | |
Kimberly-Clark Corp. | | | 4,400 | | | | 586,608 | |
| | |
Procter & Gamble Co. (The) | | | 31,550 | | | | 4,209,401 | |
| | |
Reynolds Consumer Products, Inc. | | | 500 | | | | 14,660 | |
| | |
Spectrum Brands Holdings, Inc. | | | 500 | | | | 44,070 | |
| | | | | | | | |
| | |
| | | | | | $ | 6,344,212 | |
| | |
PERSONAL PRODUCTS – 0.2% | | | | | | | | |
| | |
Coty, Inc., Class A* | | | 3,140 | | | | 31,431 | |
| | |
Estee Lauder Cos., Inc. (The), Class A | | | 2,950 | | | | 925,710 | |
| | |
Herbalife Nutrition Ltd.* | | | 1,550 | | | | 70,944 | |
| | |
Nu Skin Enterprises, Inc., Class A | | | 650 | | | | 34,359 | |
| | | | | | | | |
| | |
| | | | | | $ | 1,062,444 | |
| | |
TOBACCO – 0.5% | | | | | | | | |
| | |
Altria Group, Inc. | | | 24,100 | | | | 1,150,775 | |
| | |
Philip Morris International, Inc. | | | 20,150 | | | | 1,914,250 | |
| | | | | | | | |
| | |
| | | | | | $ | 3,065,025 | |
| | | | | | | | |
| | |
TOTAL CONSUMER STAPLES | | | | | | $ | 28,898,350 | |
| | |
ENERGY – 2.7% | | | | | | | | |
| | |
ENERGY EQUIPMENT & SERVICES – 0.2% | | | | | | | | |
| | |
Baker Hughes Co. | | | 11,100 | | | | 222,888 | |
| | |
ChampionX Corp.* | | | 80 | | | | 1,681 | |
| | |
Halliburton Co. | | | 14,913 | | | | 291,698 | |
| | |
Helmerich & Payne, Inc. | | | 1,710 | | | | 43,827 | |
| | |
NOV, Inc.* | | | 6,398 | | | | 95,650 | |
| | |
Schlumberger NV | | | 23,496 | | | | 635,567 | |
| | | | | | | | |
| | |
| | | | | | $ | 1,291,311 | |
| | |
OIL, GAS & CONSUMABLE FUELS – 2.5% | | | | | | | | |
| | |
Antero Midstream Corp.# | | | 4,200 | | | | 36,288 | |
| | |
APA Corp. | | | 5,740 | | | | 114,800 | |
| | |
Cabot Oil & Gas Corp. | | | 6,700 | | | | 111,689 | |
| | |
Cheniere Energy, Inc.* | | | 3,930 | | | | 304,654 | |
| | |
Chevron Corp. | | | 32,964 | | | | 3,397,599 | |
| | |
Cimarex Energy Co. | | | 1,650 | | | | 109,230 | |
| | |
ConocoPhillips | | | 23,078 | | | | 1,180,209 | |
| | |
Continental Resources, Inc.* | | | 1,115 | | | | 30,373 | |
| | |
Devon Energy Corp. | | | 9,386 | | | | 219,445 | |
| | |
Diamondback Energy, Inc. | | | 2,647 | | | | 216,339 | |
| | |
EOG Resources, Inc. | | | 9,880 | | | | 727,563 | |
| | |
EQT Corp.* | | | 4,300 | | | | 82,130 | |
| | |
Equitrans Midstream Corp. | | | 5,650 | | | | 46,104 | |
| | |
Exxon Mobil Corp. | | | 72,143 | | | | 4,129,465 | |
| | |
Hess Corp. | | | 4,640 | | | | 345,726 | |
| | |
HollyFrontier Corp. | | | 2,190 | | | | 76,650 | |
| | |
Kinder Morgan, Inc. | | | 32,905 | | | | 561,030 | |
| | |
Marathon Oil Corp. | | | 12,850 | | | | 144,691 | |
| | |
Marathon Petroleum Corp. | | | 10,850 | | | | 603,803 | |
| | |
Murphy Oil Corp. | | | 1,550 | | | | 26,242 | |
| | |
Occidental Petroleum Corp. | | | 14,110 | | | | 357,830 | |
| | |
ONEOK, Inc. | | | 7,460 | | | | 390,456 | |
| | |
Phillips 66 | | | 7,390 | | | | 597,925 | |
| | |
Pioneer Natural Resources Co. | | | 3,376 | | | | 519,330 | |
| | |
Targa Resources Corp. | | | 3,800 | | | | 131,822 | |
| | |
Valero Energy Corp. | | | 6,870 | | | | 508,105 | |
| | | | | | | | |
| | |
| Description | | Number of Shares | | | Value | |
| | |
Williams Cos., Inc. (The) | | | 20,520 | | | $ | 499,867 | |
| | | | | | | | |
| | |
| | | | | | $ | 15,469,365 | |
| | | | | | | | |
| | |
TOTAL ENERGY | | | | | | $ | 16,760,676 | |
| | |
FINANCIALS – 12.5% | | | | | | | | |
| | |
BANKS – 1.4% | | | | | | | | |
| | |
Associated Banc-Corp | | | 3,085 | | | | 67,531 | |
| | |
Bank of Hawaii Corp. | | | 670 | | | | 60,896 | |
| | |
Bank OZK | | | 2,050 | | | | 84,030 | |
| | |
BOK Financial Corp. | | | 620 | | | | 54,523 | |
| | |
Citizens Financial Group, Inc. | | | 7,000 | | | | 323,960 | |
| | |
Comerica, Inc. | | | 2,480 | | | | 186,397 | |
| | |
Commerce Bancshares, Inc. | | | 1,950 | | | | 151,729 | |
| | |
Cullen/Frost Bankers, Inc. | | | 990 | | | | 118,859 | |
| | |
East West Bancorp, Inc. | | | 2,473 | | | | 188,319 | |
| | |
Fifth Third Bancorp | | | 12,000 | | | | 486,480 | |
| | |
First Citizens BancShares, Inc., Class A# | | | 100 | | | | 86,746 | |
| | |
First Hawaiian, Inc. | | | 2,200 | | | | 60,412 | |
| | |
First Horizon Corp. | | | 9,484 | | | | 173,462 | |
| | |
First Republic Bank | | | 3,050 | | | | 558,882 | |
| | |
FNB Corp. | | | 6,200 | | | | 79,918 | |
| | |
Huntington Bancshares, Inc. | | | 16,541 | | | | 253,408 | |
| | |
KeyCorp. | | | 16,594 | | | | 361,085 | |
| | |
M&T Bank Corp.§ | | | 1,610 | | | | 253,881 | |
| | |
PacWest Bancorp | | | 2,039 | | | | 88,513 | |
| | |
People’s United Financial, Inc. | | | 7,750 | | | | 140,508 | |
| | |
Pinnacle Financial Partners, Inc. | | | 1,150 | | | | 100,786 | |
| | |
PNC Financial Services Group, Inc. (The) | | | 7,310 | | | | 1,366,604 | |
| | |
Popular, Inc. | | | 1,488 | | | | 110,052 | |
| | |
Prosperity Bancshares, Inc. | | | 1,523 | | | | 111,727 | |
| | |
Regions Financial Corp. | | | 16,456 | | | | 358,741 | |
| | |
Signature Bank | | | 900 | | | | 226,359 | |
| | |
Sterling Bancorp | | | 3,050 | | | | 76,647 | |
| | |
SVB Financial Group* | | | 850 | | | | 486,055 | |
| | |
Synovus Financial Corp. | | | 2,244 | | | | 105,154 | |
| | |
TCF Financial Corp. | | | 2,433 | | | | 110,750 | |
| | |
Truist Financial Corp. | | | 23,157 | | | | 1,373,442 | |
| | |
Umpqua Holdings Corp. | | | 4,150 | | | | 77,356 | |
| | |
Webster Financial Corp. | | | 1,550 | | | | 82,011 | |
| | |
Western Alliance Bancorp | | | 1,695 | | | | 178,094 | |
| | |
Wintrust Financial Corp. | | | 850 | | | | 65,535 | |
| | |
Zions Bancorp NA | | | 2,840 | | | | 158,472 | |
| | | | | | | | |
| | |
| | | | | | $ | 8,767,324 | |
| | |
CAPITAL MARKETS – 3.1% | | | | | | | | |
| | |
Affiliated Managers Group, Inc. | | | 870 | | | | 140,218 | |
| | |
Ameriprise Financial, Inc. | | | 2,040 | | | | 527,136 | |
| | |
Apollo Global Management, Inc. | | | 3,012 | | | | 166,774 | |
| | |
Ares Management Corp., Class A | | | 1,750 | | | | 91,910 | |
| | |
Bank of New York Mellon Corp. (The) | | | 13,770 | | | | 686,848 | |
| | |
BlackRock, Inc. | | | 2,560 | | | | 2,097,408 | |
| | |
Carlyle Group, Inc. (The) | | | 2,050 | | | | 87,453 | |
| | |
Cboe Global Markets, Inc. | | | 1,800 | | | | 187,866 | |
| | |
Charles Schwab Corp. (The) | | | 23,655 | | | | 1,665,312 | |
| | |
CME Group, Inc. | | | 6,050 | | | | 1,222,039 | |
| | |
Evercore, Inc., Class A | | | 700 | | | | 98,091 | |
| | |
FactSet Research Systems, Inc. | | | 590 | | | | 198,370 | |
April 30, 2021 / ANNUAL REPORT
| | |
| PORTFOLIO OF INVESTMENTS | | 8 |
Wilmington Large-Cap Strategy Fund (continued)
| | | | | | | | |
| | |
| Description | | Number of Shares | | | Value | |
| | |
Franklin Resources, Inc. | | | 4,670 | | | $ | 140,100 | |
| | |
Goldman Sachs Group, Inc. (The) | | | 5,690 | | | | 1,982,680 | |
| | |
Interactive Brokers Group, Inc., Class A | | | 1,248 | | | | 89,257 | |
| | |
Intercontinental Exchange, Inc. | | | 9,490 | | | | 1,117,068 | |
| | |
Invesco Ltd. | | | 6,820 | | | | 184,140 | |
| | |
KKR & Co., Inc. | | | 9,284 | | | | 525,289 | |
| | |
Lazard Ltd., Class A | | | 1,600 | | | | 71,984 | |
| | |
LPL Financial Holdings, Inc. | | | 1,400 | | | | 219,380 | |
| | |
MarketAxess Holdings, Inc. | | | 650 | | | | 317,499 | |
| | |
Moody’s Corp. | | | 2,740 | | | | 895,185 | |
| | |
Morgan Stanley | | | 24,026 | | | | 1,983,346 | |
| | |
Morningstar, Inc. | | | 350 | | | | 92,754 | |
| | |
MSCI, Inc. | | | 1,370 | | | | 665,505 | |
| | |
Nasdaq, Inc. | | | 1,930 | | | | 311,772 | |
| | |
Northern Trust Corp. | | | 3,280 | | | | 373,264 | |
| | |
Raymond James Financial, Inc. | | | 2,110 | | | | 275,946 | |
| | |
S&P Global, Inc. | | | 4,090 | | | | 1,596,695 | |
| | |
SEI Investments Co. | | | 1,840 | | | | 113,050 | |
| | |
State Street Corp. | | | 5,970 | | | | 501,182 | |
| | |
T Rowe Price Group, Inc. | | | 3,880 | | | | 695,296 | |
| | |
Tradeweb Markets, Inc., Class A | | | 1,400 | | | | 113,792 | |
| | |
Virtu Financial, Inc., Class A | | | 900 | | | | 26,667 | |
| | | | | | | | |
| | |
| | | | | | $ | 19,461,276 | |
| | |
CONSUMER FINANCE – 0.8% | | | | | | | | |
| | |
Ally Financial, Inc. | | | 6,513 | | | | 335,094 | |
| | |
American Express Co. | | | 11,240 | | | | 1,723,654 | |
| | |
Capital One Financial Corp. | | | 7,800 | | | | 1,162,824 | |
| | |
Credit Acceptance Corp.*,# | | | 200 | | | | 78,958 | |
| | |
Discover Financial Services | | | 5,280 | | | | 601,920 | |
| | |
LendingTree, Inc.*,# | | | 150 | | | | 30,973 | |
| | |
OneMain Holdings, Inc. | | | 1,300 | | | | 73,931 | |
| | |
Santander Consumer USA Holdings, Inc. | | | 1,250 | | | | 42,425 | |
| | |
SLM Corp. | | | 6,710 | | | | 131,919 | |
| | |
Synchrony Financial | | | 9,900 | | | | 433,026 | |
| | |
Upstart Holdings, Inc.*,# | | | 200 | | | | 21,804 | |
| | | | | | | | |
| | |
| | | | | | $ | 4,636,528 | |
| |
DIVERSIFIED FINANCIAL SERVICES – 4.7% | | | | | |
| | |
Bank of America Corp. | | | 132,250 | | | | 5,360,092 | |
| | |
Berkshire Hathaway, Inc., Class B* | | | 32,196 | | | | 8,852,290 | |
| | |
Citigroup, Inc. | | | 35,982 | | | | 2,563,358 | |
| | |
Equitable Holdings, Inc. | | | 6,943 | | | | 237,659 | |
| | |
Jefferies Financial Group, Inc. | | | 3,748 | | | | 121,847 | |
| | |
JPMorgan Chase & Co. | | | 51,870 | | | | 7,978,125 | |
| | |
U.S. Bancorp | | | 23,470 | | | | 1,392,944 | |
| | |
Voya Financial, Inc. | | | 2,080 | | | | 141,066 | |
| | |
Wells Fargo & Co. | | | 64,675 | | | | 2,913,609 | |
| | | | | | | | |
| | |
| | | | | | $ | 29,560,990 | |
| | |
INSURANCE – 2.4% | | | | | | | | |
| | |
Aflac, Inc. | | | 11,850 | | | | 636,700 | |
| | |
Alleghany Corp.* | | | 226 | | | | 153,447 | |
| | |
Allstate Corp. (The) | | | 5,080 | | | | 644,144 | |
| | |
American Financial Group, Inc. | | | 1,250 | | | | 153,575 | |
| | |
American International Group, Inc. | | | 14,730 | | | | 713,668 | |
| | |
American National Group, Inc. | | | 150 | | | | 17,003 | |
| | |
Aon PLC, Class A | | | 3,950 | | | | 993,188 | |
| | | | | | | | |
| | |
| Description | | Number of Shares | | | Value | |
| | |
Arch Capital Group Ltd.* | | | 6,520 | | | $ | 258,909 | |
| | |
Arthur J. Gallagher & Co. | | | 3,280 | | | | 475,436 | |
| | |
Assurant, Inc. | | | 980 | | | | 152,488 | |
| | |
Assured Guaranty Ltd. | | | 1,550 | | | | 78,818 | |
| | |
Athene Holding Ltd., Class A* | | | 1,660 | | | | 99,052 | |
| | |
Axis Capital Holdings Ltd. | | | 1,280 | | | | 71,424 | |
| | |
Brighthouse Financial, Inc.* | | | 1,550 | | | | 72,525 | |
| | |
Brown & Brown, Inc. | | | 4,040 | | | | 214,847 | |
| | |
Chubb Ltd. | | | 7,947 | | | | 1,363,626 | |
| | |
Cincinnati Financial Corp. | | | 2,556 | | | | 288,010 | |
| | |
CNA Financial Corp. | | | 500 | | | | 23,465 | |
| | |
Erie Indemnity Co., Class A | | | 420 | | | | 89,888 | |
| | |
Everest Re Group Ltd. | | | 620 | | | | 171,709 | |
| | |
Fidelity National Financial, Inc. | | | 4,641 | | | | 211,722 | |
| | |
First American Financial Corp. | | | 1,828 | | | | 117,906 | |
| | |
Globe Life, Inc. | | | 1,943 | | | | 199,138 | |
| | |
GoHealth, Inc., Class A* | | | 750 | | | | 8,948 | |
| | |
Hanover Insurance Group, Inc. (The) | | | 600 | | | | 82,986 | |
| | |
Hartford Financial Services Group, Inc. (The) | | | 6,240 | | | | 411,590 | |
| | |
Kemper Corp. | | | 1,028 | | | | 80,246 | |
| | |
Lemonade, Inc.*,# | | | 550 | | | | 49,720 | |
| | |
Lincoln National Corp. | | | 3,458 | | | | 221,762 | |
| | |
Loews Corp. | | | 4,450 | | | | 248,087 | |
| | |
Markel Corp.* | | | 230 | | | | 270,577 | |
| | |
Marsh & McLennan Cos., Inc. | | | 8,590 | | | | 1,165,663 | |
| | |
Mercury General Corp. | | | 300 | | | | 18,681 | |
| | |
MetLife, Inc. | | | 13,001 | | | | 827,254 | |
| | |
Old Republic International Corp. | | | 4,518 | | | | 111,233 | |
| | |
Primerica, Inc. | | | 623 | | | | 99,537 | |
| | |
Principal Financial Group, Inc. | | | 4,540 | | | | 289,970 | |
| | |
Progressive Corp. (The) | | | 9,880 | | | | 995,311 | |
| | |
Prudential Financial, Inc. | | | 6,830 | | | | 685,459 | |
| | |
Reinsurance Group of America, Inc. | | | 1,140 | | | | 148,804 | |
| | |
RenaissanceRe Holdings Ltd. | | | 778 | | | | 131,334 | |
| | |
Travelers Cos., Inc. (The) | | | 4,230 | | | | 654,212 | |
| | |
Unum Group | | | 4,310 | | | | 121,801 | |
| | |
W.R. Berkley Corp. | | | 2,370 | | | | 188,936 | |
| | |
White Mountains Insurance Group Ltd. | | | 60 | | | | 69,926 | |
| | |
Willis Towers Watson PLC | | | 2,250 | | | | 582,435 | |
| | | | | | | | |
| | |
| | | | | | $ | 14,665,160 | |
| |
MORTGAGE REAL ESTATE INVESTMENT TRUSTS (REITS) – 0.1% | | | | | |
| | |
AGNC Investment Corp. | | | 9,335 | | | | 167,377 | |
| | |
Annaly Capital Management, Inc. | | | 24,030 | | | | 218,192 | |
| | |
New Residential Investment Corp. | | | 7,050 | | | | 75,576 | |
| | |
Starwood Property Trust, Inc. | | | 4,768 | | | | 123,110 | |
| | | | | | | | |
| | |
| | | | | | $ | 584,255 | |
| | |
THRIFTS & MORTGAGE FINANCE – 0.0%** | | | | | | | | |
| | |
MGIC Investment Corp. | | | 5,100 | | | | 77,724 | |
| | |
New York Community Bancorp, Inc. | | | 7,783 | | | | 93,084 | |
| | |
Rocket Cos., Inc., Class A | | | 1,900 | | | | 42,655 | |
| | |
TFS Financial Corp. | | | 955 | | | | 18,680 | |
| | | | | | | | |
| | |
| | | | | | $ | 232,143 | |
| | | | | | | | |
| | |
TOTAL FINANCIALS | | | | | | $ | 77,907,676 | |
ANNUAL REPORT / April 30, 2021
| | |
| 9 | | PORTFOLIO OF INVESTMENTS |
Wilmington Large-Cap Strategy Fund (continued)
| | | | | | | | |
| | |
| Description | | Number of Shares | | | Value | |
| | |
HEALTH CARE – 12.9% | | | | | | | | |
| | |
BIOTECHNOLOGY – 2.0% | | | | | | | | |
| | |
AbbVie, Inc. | | | 27,711 | | | $ | 3,089,776 | |
| | |
ACADIA Pharmaceuticals, Inc.* | | | 1,650 | | | | 33,924 | |
| | |
Acceleron Pharma, Inc.* | | | 800 | | | | 99,976 | |
| | |
Agios Pharmaceuticals, Inc.* | | | 1,050 | | | | 58,590 | |
| | |
Alexion Pharmaceuticals, Inc.* | | | 3,390 | | | | 571,825 | |
| | |
Alkermes PLC* | | | 2,650 | | | | 58,313 | |
| | |
Alnylam Pharmaceuticals, Inc.* | | | 1,850 | | | | 260,184 | |
| | |
Amgen, Inc. | | | 9,164 | | | | 2,196,061 | |
| | |
Biogen, Inc.* | | | 2,400 | | | | 641,592 | |
| | |
BioMarin Pharmaceutical, Inc.* | | | 2,900 | | | | 225,968 | |
| | |
Bluebird Bio, Inc.* | | | 1,100 | | | | 33,000 | |
| | |
Exact Sciences Corp.* | | | 2,350 | | | | 309,777 | |
| | |
Exelixis, Inc.* | | | 4,700 | | | | 115,714 | |
| | |
Gilead Sciences, Inc. | | | 19,594 | | | | 1,243,631 | |
| | |
Global Blood Therapeutics, Inc.* | | | 900 | | | | 36,702 | |
| | |
Incyte Corp.* | | | 2,810 | | | | 239,918 | |
| | |
Ionis Pharmaceuticals, Inc.* | | | 2,050 | | | | 87,781 | |
| | |
Iovance Biotherapeutics, Inc.* | | | 2,050 | | | | 64,452 | |
| | |
Moderna, Inc.* | | | 4,400 | | | | 786,808 | |
| | |
Neurocrine Biosciences, Inc.* | | | 1,500 | | | | 141,735 | |
| | |
Regeneron Pharmaceuticals, Inc.* | | | 1,500 | | | | 721,950 | |
| | |
Sage Therapeutics, Inc.* | | | 800 | | | | 63,008 | |
| | |
Sarepta Therapeutics, Inc.* | | | 1,115 | | | | 78,987 | |
| | |
Seagen, Inc.* | | | 1,900 | | | | 273,144 | |
| | |
United Therapeutics Corp.* | | | 640 | | | | 128,998 | |
| | |
Vertex Pharmaceuticals, Inc.* | | | 4,043 | | | | 882,183 | |
| | | | | | | | |
| | |
| | | | | | $ | 12,443,997 | |
| |
HEALTH CARE EQUIPMENT & SUPPLIES – 3.5% | | | | | |
| | |
Abbott Laboratories | | | 27,145 | | | | 3,259,572 | |
| | |
ABIOMED, Inc.* | | | 700 | | | | 224,511 | |
| | |
Align Technology, Inc.* | | | 1,210 | | | | 720,591 | |
| | |
Baxter International, Inc. | | | 7,880 | | | | 675,237 | |
| | |
Becton Dickinson & Co. | | | 4,484 | | | | 1,115,664 | |
| | |
Boston Scientific Corp.* | | | 22,500 | | | | 981,000 | |
| | |
Cooper Cos., Inc. (The) | | | 750 | | | | 308,167 | |
| | |
Danaher Corp. | | | 9,830 | | | | 2,496,230 | |
| | |
DENTSPLY SIRONA, Inc. | | | 3,479 | | | | 234,867 | |
| | |
DexCom, Inc.* | | | 1,450 | | | | 559,845 | |
| | |
Edwards Lifesciences Corp.* | | | 9,766 | | | | 932,848 | |
| | |
Envista Holdings Corp.* | | | 2,500 | | | | 108,200 | |
| | |
Globus Medical, Inc., Class A* | | | 1,050 | | | | 75,359 | |
| | |
Haemonetics Corp.* | | | 750 | | | | 50,445 | |
| | |
Hill-Rom Holdings, Inc. | | | 1,110 | | | | 122,344 | |
| | |
Hologic, Inc.* | | | 4,040 | | | | 264,822 | |
| | |
ICU Medical, Inc.* | | | 300 | | | | 62,481 | |
| | |
IDEXX Laboratories, Inc.* | | | 1,330 | | | | 730,157 | |
| | |
Insulet Corp.* | | | 1,050 | | | | 309,981 | |
| | |
Integra LifeSciences Holdings Corp.* | | | 1,048 | | | | 77,636 | |
| | |
Intuitive Surgical, Inc.* | | | 1,850 | | | | 1,600,250 | |
| | |
Masimo Corp.* | | | 800 | | | | 186,136 | |
| | |
Medtronic PLC | | | 21,076 | | | | 2,759,270 | |
| | |
Novocure Ltd.*,# | | | 1,600 | | | | 326,560 | |
| | |
Penumbra, Inc.* | | | 500 | | | | 152,995 | |
| | |
Quidel Corp.* | | | 568 | | | | 59,521 | |
| | | | | | | | |
| | |
| Description | | Number of Shares | | | Value | |
| | |
ResMed, Inc. | | | 2,270 | | | $ | 426,692 | |
| | |
STERIS PLC | | | 1,400 | | | | 295,428 | |
| | |
Stryker Corp. | | | 5,500 | | | | 1,444,465 | |
| | |
Tandem Diabetes Care, Inc.* | | | 900 | | | | 82,710 | |
| | |
Teleflex, Inc. | | | 710 | | | | 299,961 | |
| | |
West Pharmaceutical Services, Inc. | | | 1,150 | | | | 377,798 | |
| | |
Zimmer Biomet Holdings, Inc. | | | 3,310 | | | | 586,400 | |
| | | | | | | | |
| | |
| | | | | | $ | 21,908,143 | |
| |
HEALTH CARE PROVIDERS & SERVICES – 2.6% | | | | | |
| | |
Acadia Healthcare Co., Inc.* | | | 1,250 | | | | 76,150 | |
| | |
Amedisys, Inc.* | | | 500 | | | | 134,925 | |
| | |
American Well Corp., Class A*,# | | | 600 | | | | 9,234 | |
| | |
AmerisourceBergen Corp. | | | 2,370 | | | | 286,296 | |
| | |
Anthem, Inc. | | | 3,910 | | | | 1,483,415 | |
| | |
Cardinal Health, Inc. | | | 4,820 | | | | 290,839 | |
| | |
Centene Corp.* | | | 8,930 | | | | 551,338 | |
| | |
Chemed Corp. | | | 250 | | | | 119,152 | |
| | |
Cigna Corp. | | | 5,592 | | | | 1,392,464 | |
| | |
CVS Health Corp. | | | 20,571 | | | | 1,571,624 | |
| | |
DaVita, Inc.* | | | 1,188 | | | | 138,438 | |
| | |
Encompass Health Corp. | | | 1,480 | | | | 125,593 | |
| | |
Guardant Health, Inc.* | | | 1,285 | | | | 204,289 | |
| | |
HCA Healthcare, Inc. | | | 4,250 | | | | 854,505 | |
| | |
Henry Schein, Inc.* | | | 2,270 | | | | 164,575 | |
| | |
Humana, Inc. | | | 2,080 | | | | 926,099 | |
| | |
Laboratory Corp. of America Holdings* | | | 1,557 | | | | 413,960 | |
| | |
McKesson Corp. | | | 2,550 | | | | 478,278 | |
| | |
Molina Healthcare, Inc.* | | | 900 | | | | 229,590 | |
| | |
Premier, Inc., Class A | | | 1,700 | | | | 60,095 | |
| | |
Quest Diagnostics, Inc. | | | 2,100 | | | | 276,948 | |
| | |
UnitedHealth Group, Inc. | | | 14,870 | | | | 5,930,156 | |
| | |
Universal Health Services, Inc., Class B | | | 1,180 | | | | 175,124 | |
| | | | | | | | |
| | |
| | | | | | $ | 15,893,087 | |
| | |
HEALTH CARE TECHNOLOGY – 0.2% | | | | | | | | |
| | |
Cerner Corp. | | | 4,940 | | | | 370,747 | |
| | |
Change Healthcare, Inc.* | | | 3,600 | | | | 82,620 | |
| | |
Teladoc Health, Inc.* | | | 1,677 | | | | 289,031 | |
| | |
Veeva Systems, Inc., Class A* | | | 2,120 | | | | 598,794 | |
| | | | | | | | |
| | |
| | | | | | $ | 1,341,192 | |
| |
LIFE SCIENCES TOOLS & SERVICES – 1.3% | | | | | |
| | |
10X Genomics, Inc., Class A* | | | 900 | | | | 178,020 | |
| | |
Adaptive Biotechnologies Corp.* | | | 1,150 | | | | 47,840 | |
| | |
Agilent Technologies, Inc. | | | 4,890 | | | | 653,500 | |
| | |
Avantor, Inc.* | | | 7,595 | | | | 243,344 | |
| | |
Berkeley Lights, Inc.* | | | 150 | | | | 7,367 | |
| | |
Bio-Rad Laboratories, Inc., Class A* | | | 340 | | | | 214,244 | |
| | |
Bio-Techne Corp. | | | 600 | | | | 256,494 | |
| | |
Bruker Corp. | | | 1,600 | | | | 109,632 | |
| | |
Charles River Laboratories International, Inc.* | | | 820 | | | | 272,609 | |
| | |
Illumina, Inc.* | | | 2,290 | | | | 899,604 | |
| | |
IQVIA Holdings, Inc.* | | | 2,980 | | | | 699,376 | |
| | |
Mettler-Toledo International, Inc.* | | | 370 | | | | 485,928 | |
| | |
PerkinElmer, Inc. | | | 1,770 | | | | 229,445 | |
| | |
PPD, Inc.* | | | 2,443 | | | | 112,867 | |
| | |
PRA Health Sciences, Inc.* | | | 975 | | | | 162,718 | |
April 30, 2021 / ANNUAL REPORT
| | |
| PORTFOLIO OF INVESTMENTS | | 10 |
Wilmington Large-Cap Strategy Fund (continued)
| | | | | | | | |
| | |
| Description | | Number of Shares | | | Value | |
| | |
QIAGEN NV* | | | 3,250 | | | $ | 156,422 | |
| | |
Repligen Corp.* | | | 800 | | | | 169,368 | |
| | |
Syneos Health, Inc.* | | | 1,150 | | | | 97,577 | |
| | |
Thermo Fisher Scientific, Inc. | | | 6,220 | | | | 2,924,831 | |
| | |
Waters Corp.* | | | 960 | | | | 287,875 | |
| | | | | | | | |
| | |
| | | | | | $ | 8,209,061 | |
| | |
PHARMACEUTICALS – 3.3% | | | | | | | | |
| | |
Bristol-Myers Squibb Co. | | | 35,526 | | | | 2,217,533 | |
| | |
Catalent, Inc.* | | | 2,550 | | | | 286,799 | |
| | |
Elanco Animal Health, Inc.* | | | 7,150 | | | | 226,727 | |
| | |
Eli Lilly & Co. | | | 13,230 | | | | 2,418,047 | |
| | |
Horizon Therapeutics PLC* | | | 3,200 | | | | 302,784 | |
| | |
Jazz Pharmaceuticals PLC* | | | 860 | | | | 141,384 | |
| | |
Johnson & Johnson | | | 41,550 | | | | 6,761,431 | |
| | |
Merck & Co., Inc. | | | 39,666 | | | | 2,955,117 | |
| | |
Nektar Therapeutics* | | | 2,900 | | | | 56,869 | |
| | |
Perrigo Co. PLC | | | 1,808 | | | | 75,267 | |
| | |
Pfizer, Inc. | | | 87,353 | | | | 3,376,193 | |
| | |
Reata Pharmaceuticals, Inc., Class A* | | | 400 | | | | 40,560 | |
| | |
Royalty Pharma PLC, Class A | | | 4,950 | | | | 217,800 | |
| | |
Viatris, Inc.* | | | 18,255 | | | | 242,792 | |
| | |
Zoetis, Inc. | | | 7,481 | | | | 1,294,437 | |
| | | | | | | | |
| | |
| | | | | | $ | 20,613,740 | |
| | | | | | | | |
| | |
TOTAL HEALTH CARE | | | | | | $ | 80,409,220 | |
| | |
INDUSTRIALS – 9.7% | | | | | | | | |
| | |
AEROSPACE & DEFENSE – 1.7% | | | | | | | | |
| | |
Axon Enterprise, Inc.* | | | 1,000 | | | | 151,610 | |
| | |
Boeing Co. (The)* | | | 8,790 | | | | 2,059,585 | |
| | |
BWX Technologies, Inc. | | | 1,505 | | | | 100,715 | |
| | |
Curtiss-Wright Corp. | | | 715 | | | | 91,448 | |
| | |
General Dynamics Corp. | | | 4,230 | | | | 804,673 | |
| | |
HEICO Corp. | | | 750 | | | | 105,600 | |
| | |
HEICO Corp., Class A | | | 1,302 | | | | 164,417 | |
| | |
Hexcel Corp.* | | | 1,350 | | | | 76,153 | |
| | |
Howmet Aerospace, Inc.* | | | 6,316 | | | | 201,859 | |
| | |
Huntington Ingalls Industries, Inc. | | | 645 | | | | 136,946 | |
| | |
L3Harris Technologies, Inc. | | | 3,482 | | | | 728,539 | |
| | |
Lockheed Martin Corp. | | | 4,150 | | | | 1,579,324 | |
| | |
Mercury Systems, Inc.* | | | 850 | | | | 63,954 | |
| | |
Northrop Grumman Corp. | | | 2,620 | | | | 928,633 | |
| | |
Raytheon Technologies Corp. | | | 23,904 | | | | 1,989,769 | |
| | |
Spirit AeroSystems Holdings, Inc., Class A | | | 1,690 | | | | 77,216 | |
| | |
Teledyne Technologies, Inc.* | | | 600 | | | | 268,650 | |
| | |
Textron, Inc. | | | 3,653 | | | | 234,669 | |
| | |
TransDigm Group, Inc.* | | | 890 | | | | 546,229 | |
| | |
Virgin Galactic Holdings, Inc.*,# | | | 1,150 | | | | 25,472 | |
| | | | | | | | |
| | |
| | | | | | $ | 10,335,461 | |
| | |
AIR FREIGHT & LOGISTICS – 0.7% | | | | | | | | |
| | |
C.H. Robinson Worldwide, Inc. | | | 2,184 | | | | 212,023 | |
| | |
Expeditors International of Washington, Inc. | | | 2,730 | | | | 299,918 | |
| | |
FedEx Corp. | | | 4,060 | | | | 1,178,658 | |
| | |
United Parcel Service, Inc., Class B | | | 12,030 | | | | 2,452,436 | |
| | |
XPO Logistics, Inc.* | | | 1,450 | | | | 201,724 | |
| | | | | | | | |
| | |
| | | | | | $ | 4,344,759 | |
| | | | | | | | |
| | |
| Description | | Number of Shares | | | Value | |
| | |
AIRLINES – 0.3% | | | | | | | | |
| | |
Alaska Air Group, Inc.* | | | 1,875 | | | $ | 129,638 | |
| | |
American Airlines Group, Inc.*,# | | | 9,643 | | | | 209,446 | |
| | |
Copa Holdings SA, Class A* | | | 400 | | | | 34,600 | |
| | |
Delta Air Lines, Inc.* | | | 10,490 | | | | 492,191 | |
| | |
JetBlue Airways Corp.* | | | 4,850 | | | | 98,746 | |
| | |
Southwest Airlines Co.* | | | 9,730 | | | | 610,849 | |
| | |
United Airlines Holdings, Inc.* | | | 4,883 | | | | 265,635 | |
| | | | | | | | |
| | |
| | | | | | $ | 1,841,105 | |
| | |
BUILDING PRODUCTS – 0.6% | | | | | | | | |
| | |
A.O. Smith Corp. | | | 2,100 | | | | 142,275 | |
| | |
Allegion PLC | | | 1,433 | | | | 192,567 | |
| | |
Armstrong World Industries, Inc. | | | 778 | | | | 80,640 | |
| | |
AZEK Co., Inc. (The)* | | | 1,150 | | | | 55,522 | |
| | |
Carrier Global Corp. | | | 14,550 | | | | 634,089 | |
| | |
Fortune Brands Home & Security, Inc. | | | 2,260 | | | | 237,255 | |
| | |
Johnson Controls International PLC | | | 12,031 | | | | 750,012 | |
| | |
Lennox International, Inc. | | | 600 | | | | 201,204 | |
| | |
Masco Corp. | | | 4,630 | | | | 295,764 | |
| | |
Owens Corning | | | 1,648 | | | | 159,543 | |
| | |
Trane Technologies PLC | | | 3,950 | | | | 686,628 | |
| | |
Trex Co., Inc.* | | | 1,894 | | | | 204,533 | |
| | | | | | | | |
| | |
| | | | | | $ | 3,640,032 | |
| |
COMMERCIAL SERVICES & SUPPLIES – 0.4% | | | | | |
| | |
ADT, Inc. | | | 2,560 | | | | 23,552 | |
| | |
Cintas Corp. | | | 1,420 | | | | 490,099 | |
| | |
Clean Harbors, Inc.* | | | 850 | | | | 75,616 | |
| | |
Copart, Inc.* | | | 3,300 | | | | 410,883 | |
| | |
IAA, Inc.* | | | 2,268 | | | | 142,453 | |
| | |
MSA Safety, Inc. | | | 550 | | | | 88,418 | |
| | |
Republic Services, Inc. | | | 3,390 | | | | 360,357 | |
| | |
Rollins, Inc. | | | 3,450 | | | | 128,616 | |
| | |
Stericycle, Inc.* | | | 1,485 | | | | 113,276 | |
| | |
Waste Management, Inc. | | | 7,040 | | | | 971,308 | |
| | | | | | | | |
| | |
| | | | | | $ | 2,804,578 | |
| | |
CONSTRUCTION & ENGINEERING – 0.1% | | | | | | | | |
| | |
AECOM* | | | 2,525 | | | | 167,736 | |
| | |
Quanta Services, Inc. | | | 2,238 | | | | 216,280 | |
| | |
Valmont Industries, Inc. | | | 310 | | | | 76,524 | |
| | | | | | | | |
| | |
| | | | | | $ | 460,540 | |
| | |
ELECTRICAL EQUIPMENT – 0.6% | | | | | | | | |
| | |
Acuity Brands, Inc. | | | 650 | | | | 120,588 | |
| | |
AMETEK, Inc. | | | 3,710 | | | | 500,590 | |
| | |
Array Technologies, Inc.* | | | 1,500 | | | | 42,240 | |
| | |
Eaton Corp. PLC | | | 6,628 | | | | 947,340 | |
| | |
Emerson Electric Co. | | | 9,890 | | | | 894,946 | |
| | |
Generac Holdings, Inc.* | | | 997 | | | | 322,978 | |
| | |
GrafTech International Ltd. | | | 1,950 | | | | 24,804 | |
| | |
Hubbell, Inc. | | | 890 | | | | 170,889 | |
| | |
nVent Electric PLC | | | 3,266 | | | | 99,450 | |
| | |
Regal Beloit Corp. | | | 600 | | | | 86,658 | |
| | |
Rockwell Automation, Inc. | | | 1,870 | | | | 494,166 | |
| | |
Sensata Technologies Holding PLC* | | | 2,398 | | | | 138,461 | |
ANNUAL REPORT / April 30, 2021
| | |
| 11 | | PORTFOLIO OF INVESTMENTS |
Wilmington Large-Cap Strategy Fund (continued)
| | | | | | | | |
| | |
| Description | | Number of Shares | | | Value | |
| | |
Vertiv Holdings Co. | | | 3,750 | | | $ | 85,125 | |
| | | | | | | | |
| | |
| | | | | | $ | 3,928,235 | |
| | |
INDUSTRIAL CONGLOMERATES – 1.2% | | | | | | | | |
| | |
3M Co. | | | 9,460 | | | | 1,864,944 | |
| | |
Carlisle Cos., Inc. | | | 890 | | | | 170,569 | |
| | |
General Electric Co. | | | 143,770 | | | | 1,886,262 | |
| | |
Honeywell International, Inc. | | | 11,820 | | | | 2,636,333 | |
| | |
Roper Technologies, Inc. | | | 1,700 | | | | 758,948 | |
| | | | | | | | |
| | |
| | | | | | $ | 7,317,056 | |
| | |
MACHINERY – 1.9% | | | | | | | | |
| | |
AGCO Corp. | | | 995 | | | | 145,190 | |
| | |
Allison Transmission Holdings, Inc. | | | 1,850 | | | | 76,720 | |
| | |
Caterpillar, Inc. | | | 9,050 | | | | 2,064,395 | |
| | |
Colfax Corp.* | | | 1,650 | | | | 74,564 | |
| | |
Crane Co. | | | 900 | | | | 84,654 | |
| | |
Cummins, Inc. | | | 2,430 | | | | 612,457 | |
| | |
Deere & Co. | | | 4,640 | | | | 1,720,744 | |
| | |
Donaldson Co., Inc. | | | 2,260 | | | | 142,109 | |
| | |
Dover Corp. | | | 2,360 | | | | 352,088 | |
| | |
Flowserve Corp. | | | 2,148 | | | | 85,147 | |
| | |
Fortive Corp. | | | 4,940 | | | | 349,851 | |
| | |
Gates Industrial Corp. PLC* | | | 1,200 | | | | 20,700 | |
| | |
Graco, Inc. | | | 2,720 | | | | 208,896 | |
| | |
IDEX Corp. | | | 1,220 | | | | 273,524 | |
| | |
Illinois Tool Works, Inc. | | | 5,250 | | | | 1,209,915 | |
| | |
Ingersoll Rand, Inc.* | | | 5,644 | | | | 278,870 | |
| | |
ITT, Inc. | | | 1,485 | | | | 140,050 | |
| | |
Lincoln Electric Holdings, Inc. | | | 900 | | | | 115,245 | |
| | |
Middleby Corp. (The)* | | | 850 | | | | 154,122 | |
| | |
Nordson Corp. | | | 950 | | | | 200,839 | |
| | |
Oshkosh Corp. | | | 1,090 | | | | 135,629 | |
| | |
Otis Worldwide Corp. | | | 6,675 | | | | 519,782 | |
| | |
PACCAR, Inc. | | | 5,590 | | | | 502,429 | |
| | |
Parker-Hannifin Corp. | | | 2,160 | | | | 677,830 | |
| | |
Pentair PLC | | | 2,564 | | | | 165,404 | |
| | |
Snap-on, Inc. | | | 880 | | | | 209,088 | |
| | |
Stanley Black & Decker, Inc. | | | 2,520 | | | | 521,060 | |
| | |
Timken Co. (The) | | | 1,000 | | | | 83,870 | |
| | |
Toro Co. (The) | | | 1,730 | | | | 198,258 | |
| | |
Trinity Industries, Inc. | | | 1,600 | | | | 44,224 | |
| | |
Westinghouse Air Brake Technologies Corp. | | | 3,065 | | | | 251,545 | |
| | |
Woodward, Inc. | | | 875 | | | | 109,384 | |
| | |
Xylem, Inc. | | | 2,910 | | | | 321,991 | |
| | | | | | | | |
| | |
| | | | | | $ | 12,050,574 | |
| | |
MARINE – 0.0%** | | | | | | | | |
| | |
Kirby Corp.* | | | 1,000 | | | | 63,700 | |
| | |
PROFESSIONAL SERVICES – 0.6% | | | | | | | | |
| | |
Booz Allen Hamilton Holding Corp. | | | 2,050 | | | | 170,048 | |
| | |
CACI International, Inc., Class A* | | | 353 | | | | 89,966 | |
| | |
CoreLogic, Inc. | | | 1,300 | | | | 103,610 | |
| | |
CoStar Group, Inc.* | | | 650 | | | | 555,379 | |
| | |
Dun & Bradstreet Holdings, Inc.* | | | 1,600 | | | | 38,016 | |
| | |
Equifax, Inc. | | | 1,960 | | | | 449,291 | |
| | |
FTI Consulting, Inc.* | | | 500 | | | | 69,425 | |
| | |
IHS Markit Ltd. | | | 6,587 | | | | 708,629 | |
| | | | | | | | |
| | |
| Description | | Number of Shares | | | Value | |
| | |
Jacobs Engineering Group, Inc. | | | 2,000 | | | $ | 267,220 | |
| | |
Leidos Holdings, Inc. | | | 2,200 | | | | 222,816 | |
| | |
ManpowerGroup, Inc. | | | 1,010 | | | | 122,099 | |
| | |
Nielsen Holdings PLC | | | 5,600 | | | | 143,640 | |
| | |
Robert Half International, Inc. | | | 1,848 | | | | 161,903 | |
| | |
Science Applications International Corp. | | | 800 | | | | 71,536 | |
| | |
TransUnion | | | 3,100 | | | | 324,229 | |
| | |
Verisk Analytics, Inc. | | | 2,550 | | | | 479,910 | |
| | | | | | | | |
| | |
| | | | | | $ | 3,977,717 | |
| | |
ROAD & RAIL – 1.3% | | | | | | | | |
| | |
AMERCO | | | 163 | | | | 97,251 | |
| | |
CSX Corp. | | | 12,750 | | | | 1,284,562 | |
| | |
JB Hunt Transport Services, Inc. | | | 1,430 | | | | 244,115 | |
| | |
Kansas City Southern | | | 1,480 | | | | 432,471 | |
| | |
Knight-Swift Transportation Holdings, Inc. | | | 2,085 | | | | 98,245 | |
| | |
Landstar System, Inc. | | | 590 | | | | 101,645 | |
| | |
Lyft, Inc., Class A* | | | 4,050 | | | | 225,423 | |
| | |
Norfolk Southern Corp. | | | 4,260 | | | | 1,189,562 | |
| | |
Old Dominion Freight Line, Inc. | | | 1,550 | | | | 399,606 | |
| | |
Ryder System, Inc. | | | 1,090 | | | | 87,026 | |
| | |
Schneider National, Inc., Class B | | | 923 | | | | 22,364 | |
| | |
Uber Technologies, Inc.* | | | 22,650 | | | | 1,240,541 | |
| | |
Union Pacific Corp. | | | 11,220 | | | | 2,491,850 | |
| | | | | | | | |
| | |
| | | | | | $ | 7,914,661 | |
| |
TRADING COMPANIES & DISTRIBUTORS – 0.3% | | | | | |
| | |
Air Lease Corp. | | | 1,700 | | | | 79,407 | |
| | |
Fastenal Co. | | | 9,340 | | | | 488,295 | |
| | |
MSC Industrial Direct Co., Inc., Class A | | | 940 | | | | 84,750 | |
| | |
United Rentals, Inc.* | | | 1,170 | | | | 374,342 | |
| | |
Univar Solutions, Inc.* | | | 2,700 | | | | 63,045 | |
| | |
Watsco, Inc. | | | 550 | | | | 161,073 | |
| | |
WW Grainger, Inc. | | | 740 | | | | 320,820 | |
| | | | | | | | |
| | |
| | | | | | $ | 1,571,732 | |
| |
TRANSPORTATION INFRASTRUCTURE – 0.0%** | | | | | |
| | |
Macquarie Infrastructure Corp. | | | 1,400 | | | | 46,634 | |
| | | | | | | | |
| | |
TOTAL INDUSTRIALS | | | | | | $ | 60,296,784 | |
| | |
INFORMATION TECHNOLOGY – 26.5% | | | | | | | | |
| | |
COMMUNICATIONS EQUIPMENT – 0.8% | | | | | | | | |
| | |
Arista Networks, Inc.* | | | 900 | | | | 283,653 | |
| | |
Ciena Corp.* | | | 2,423 | | | | 122,289 | |
| | |
Cisco Systems, Inc. | | | 66,850 | | | | 3,403,333 | |
| | |
CommScope Holding Co., Inc.* | | | 3,000 | | | | 49,350 | |
| | |
EchoStar Corp., Class A* | | | 170 | | | | 4,156 | |
| | |
F5 Networks, Inc.* | | | 963 | | | | 179,850 | |
| | |
Juniper Networks, Inc. | | | 4,640 | | | | 117,810 | |
| | |
Lumentum Holdings, Inc.* | | | 1,200 | | | | 102,060 | |
| | |
Motorola Solutions, Inc. | | | 2,630 | | | | 495,229 | |
| | |
Ubiquiti, Inc. | | | 100 | | | | 28,533 | |
| | |
Viasat, Inc.*,# | | | 800 | | | | 41,432 | |
| | | | | | | | |
| | |
| | | | | | $ | 4,827,695 | |
|
ELECTRONIC EQUIPMENT, INSTRUMENTS & COMPONENTS – 0.6% | |
| | |
Amphenol Corp., Class A | | | 9,400 | | | | 632,996 | |
| | |
Arrow Electronics, Inc.* | | | 1,085 | | | | 123,766 | |
| | |
Avnet, Inc. | | | 1,400 | | | | 61,488 | |
April 30, 2021 / ANNUAL REPORT
| | |
| PORTFOLIO OF INVESTMENTS | | 12 |
Wilmington Large-Cap Strategy Fund (continued)
| | | | | | | | |
| | |
| Description | | Number of Shares | | | Value | |
| | |
CDW Corp. | | | 2,290 | | | $ | 408,376 | |
| | |
Cognex Corp. | | | 2,700 | | | | 232,524 | |
| | |
Coherent, Inc.* | | | 350 | | | | 90,997 | |
| | |
Corning, Inc. | | | 11,920 | | | | 526,983 | |
| | |
Dolby Laboratories, Inc., Class A | | | 990 | | | | 100,455 | |
| | |
FLIR Systems, Inc. | | | 2,000 | | | | 119,940 | |
| | |
IPG Photonics Corp.* | | | 550 | | | | 119,411 | |
| | |
Jabil, Inc. | | | 2,158 | | | | 113,122 | |
| | |
Keysight Technologies, Inc.* | | | 2,900 | | | | 418,615 | |
| | |
Littelfuse, Inc. | | | 393 | | | | 104,239 | |
| | |
National Instruments Corp. | | | 2,020 | | | | 83,648 | |
| | |
SYNNEX Corp. | | | 543 | | | | 65,812 | |
| | |
Trimble, Inc.* | | | 3,980 | | | | 326,360 | |
| | |
Vontier Corp.* | | | 2,056 | | | | 64,435 | |
| | |
Zebra Technologies Corp., Class A* | | | 800 | | | | 390,192 | |
| | | | | | | | |
| | |
| | | | | | $ | 3,983,359 | |
| | |
IT SERVICES – 5.5% | | | | | | | | |
| | |
Accenture PLC, Class A | | | 10,100 | | | | 2,928,697 | |
| | |
Akamai Technologies, Inc.* | | | 2,500 | | | | 271,750 | |
| | |
Alliance Data Systems Corp. | | | 590 | | | | 69,532 | |
| | |
Amdocs Ltd. | | | 1,920 | | | | 147,341 | |
| | |
Automatic Data Processing, Inc. | | | 6,730 | | | | 1,258,443 | |
| | |
BigCommerce Holdings, Inc.* | | | 450 | | | | 26,973 | |
| | |
Black Knight, Inc.* | | | 2,337 | | | | 169,246 | |
| | |
Broadridge Financial Solutions, Inc. | | | 1,830 | | | | 290,293 | |
| | |
Cognizant Technology Solutions Corp., Class A | | | 8,410 | | | | 676,164 | |
| | |
Concentrix Corp.* | | | 693 | | | | 107,678 | |
| | |
DXC Technology Co.* | | | 3,526 | | | | 116,041 | |
| | |
EPAM Systems, Inc.* | | | 850 | | | | 389,087 | |
| | |
Euronet Worldwide, Inc.* | | | 765 | | | | 109,724 | |
| | |
Fastly, Inc., Class A*,# | | | 1,200 | | | | 76,644 | |
| | |
Fidelity National Information Services, Inc. | | | 9,700 | | | | 1,483,130 | |
| | |
Fiserv, Inc.* | | | 8,960 | | | | 1,076,275 | |
| | |
FleetCor Technologies, Inc.* | | | 1,300 | | | | 374,036 | |
| | |
Gartner, Inc.* | | | 1,400 | | | | 274,232 | |
| | |
Genpact Ltd. | | | 2,645 | | | | 125,717 | |
| | |
Global Payments, Inc. | | | 4,663 | | | | 1,000,820 | |
| | |
Globant SA* | | | 700 | | | | 160,426 | |
| | |
GoDaddy, Inc., Class A* | | | 2,650 | | | | 230,073 | |
| | |
International Business Machines Corp. | | | 13,960 | | | | 1,980,645 | |
| | |
Jack Henry & Associates, Inc. | | | 1,150 | | | | 187,255 | |
| | |
Mastercard, Inc., Class A | | | 13,970 | | | | 5,337,378 | |
| | |
MongoDB, Inc.* | | | 815 | | | | 242,430 | |
| | |
Okta, Inc.* | | | 1,800 | | | | 485,460 | |
| | |
Paychex, Inc. | | | 4,920 | | | | 479,651 | |
| | |
PayPal Holdings, Inc.* | | | 18,615 | | | | 4,882,528 | |
| | |
Sabre Corp.*,# | | | 4,050 | | | | 60,669 | |
| | |
Square, Inc., Class A* | | | 5,800 | | | | 1,419,956 | |
| | |
StoneCo Ltd., Class A* | | | 3,000 | | | | 193,920 | |
| | |
Switch, Inc., Class A | | | 800 | | | | 14,856 | |
| | |
Twilio, Inc., Class A* | | | 2,250 | | | | 827,550 | |
| | |
VeriSign, Inc.* | | | 1,550 | | | | 339,093 | |
| | |
Visa, Inc., Class A | | | 26,620 | | | | 6,217,367 | |
| | |
Western Union Co. (The) | | | 5,840 | | | | 150,438 | |
| | |
WEX, Inc.* | | | 715 | | | | 146,725 | |
| | | | | | | | |
| | |
| | | | | | $ | 34,328,243 | |
| | | | | | | | |
| | |
| Description | | Number of Shares | | | Value | |
|
SEMICONDUCTORS & SEMICONDUCTOR EQUIPMENT – 4.9% | |
| | |
Advanced Micro Devices, Inc.* | | | 18,750 | | | $ | 1,530,375 | |
| | |
Allegro MicroSystems, Inc.* | | | 350 | | | | 8,638 | |
| | |
Analog Devices, Inc. | | | 5,752 | | | | 880,976 | |
| | |
Applied Materials, Inc. | | | 14,430 | | | | 1,915,005 | |
| | |
Broadcom, Inc. | | | 6,233 | | | | 2,843,495 | |
| | |
Cirrus Logic, Inc.* | | | 850 | | | | 63,249 | |
| | |
Cree, Inc.* | | | 1,775 | | | | 176,471 | |
| | |
Enphase Energy, Inc.* | | | 1,650 | | | | 229,763 | |
| | |
Entegris, Inc. | | | 2,100 | | | | 236,418 | |
| | |
First Solar, Inc.* | | | 1,350 | | | | 103,316 | |
| | |
Intel Corp. | | | 64,670 | | | | 3,720,465 | |
| | |
KLA Corp. | | | 2,450 | | | | 772,607 | |
| | |
Lam Research Corp. | | | 2,280 | | | | 1,414,626 | |
| | |
Marvell Technology, Inc. | | | 12,811 | | | | 579,185 | |
| | |
Maxim Integrated Products, Inc. | | | 4,270 | | | | 401,380 | |
| | |
Microchip Technology, Inc. | | | 3,889 | | | | 584,478 | |
| | |
Micron Technology, Inc.* | | | 17,550 | | | | 1,510,528 | |
| | |
MKS Instruments, Inc. | | | 883 | | | | 158,154 | |
| | |
Monolithic Power Systems, Inc. | | | 680 | | | | 245,738 | |
| | |
NVIDIA Corp. | | | 9,330 | | | | 5,601,545 | |
| | |
ON Semiconductor Corp.* | | | 6,378 | | | | 248,742 | |
| | |
Qorvo, Inc.* | | | 1,750 | | | | 329,298 | |
| | |
QUALCOMM, Inc. | | | 17,680 | | | | 2,453,984 | |
| | |
Skyworks Solutions, Inc. | | | 2,650 | | | | 480,524 | |
| | |
SolarEdge Technologies, Inc.* | | | 775 | | | | 204,244 | |
| | |
Teradyne, Inc. | | | 2,650 | | | | 331,462 | |
| | |
Texas Instruments, Inc. | | | 14,450 | | | | 2,608,369 | |
| | |
Universal Display Corp. | | | 700 | | | | 156,583 | |
| | |
Xilinx, Inc. | | | 3,850 | | | | 492,646 | |
| | | | | | | | |
| | |
| | | | | | $ | 30,282,264 | |
| | |
SOFTWARE – 9.1% | | | | | | | | |
| | |
2U, Inc.*,# | | | 1,000 | | | | 39,250 | |
| | |
Adobe, Inc.* | | | 7,610 | | | | 3,868,467 | |
| | |
Alteryx, Inc., Class A* | | | 850 | | | | 69,488 | |
| | |
Anaplan, Inc.* | | | 2,068 | | | | 123,356 | |
| | |
ANSYS, Inc.* | | | 1,330 | | | | 486,328 | |
| | |
Aspen Technology, Inc.* | | | 1,093 | | | | 143,008 | |
| | |
Atlassian Corp. PLC, Class A* | | | 2,000 | | | | 475,120 | |
| | |
Autodesk, Inc.* | | | 3,430 | | | | 1,001,251 | |
| | |
Avalara, Inc.* | | | 1,333 | | | | 188,899 | |
| | |
Bill.com Holdings, Inc.* | | | 1,150 | | | | 177,825 | |
| | |
Cadence Design Systems, Inc.* | | | 4,360 | | | | 574,517 | |
| | |
CDK Global, Inc. | | | 1,926 | | | | 103,214 | |
| | |
Ceridian HCM Holding, Inc.* | | | 1,775 | | | | 167,702 | |
| | |
Citrix Systems, Inc. | | | 1,890 | | | | 234,076 | |
| | |
Cloudflare, Inc., Class A* | | | 1,650 | | | | 139,821 | |
| | |
Coupa Software, Inc.* | | | 1,100 | | | | 295,944 | |
| | |
Crowdstrike Holdings, Inc., Class A* | | | 2,369 | | | | 493,960 | |
| | |
Datadog, Inc., Class A* | | | 2,348 | | | | 201,388 | |
| | |
DocuSign, Inc.* | | | 2,850 | | | | 635,379 | |
| | |
Dropbox, Inc., Class A* | | | 3,600 | | | | 92,520 | |
| | |
Duck Creek Technologies, Inc.*,# | | | 850 | | | | 35,343 | |
| | |
Dynatrace, Inc.* | | | 2,773 | | | | 144,307 | |
| | |
Elastic NV* | | | 1,050 | | | | 126,651 | |
| | |
Everbridge, Inc.* | | | 550 | | | | 72,991 | |
| | |
Fair Isaac Corp.* | | | 500 | | | | 260,705 | |
ANNUAL REPORT / April 30, 2021
| | |
| 13 | | PORTFOLIO OF INVESTMENTS |
Wilmington Large-Cap Strategy Fund (continued)
| | | | | | | | |
| | |
| Description | | Number of Shares | | | Value | |
| | |
FireEye, Inc.* | | | 3,450 | | | $ | 68,569 | |
| | |
Five9, Inc.* | | | 943 | | | | 177,256 | |
| | |
Fortinet, Inc.* | | | 2,100 | | | | 428,883 | |
| | |
Guidewire Software, Inc.* | | | 1,300 | | | | 137,163 | |
| | |
HubSpot, Inc.* | | | 653 | | | | 343,772 | |
| | |
Intuit, Inc. | | | 3,950 | | | | 1,628,032 | |
| | |
Jamf Holding Corp.* | | | 350 | | | | 12,782 | |
| | |
Manhattan Associates, Inc.* | | | 973 | | | | 133,535 | |
| | |
Medallia, Inc.* | | | 1,400 | | | | 41,286 | |
| | |
Microsoft Corp. | | | 117,049 | | | | 29,517,417 | |
| | |
nCino, Inc.* | | | 550 | | | | 35,965 | |
| | |
New Relic, Inc.* | | | 800 | | | | 51,440 | |
| | |
NortonLifeLock, Inc. | | | 7,970 | | | | 172,232 | |
| | |
Nuance Communications, Inc.* | | | 4,355 | | | | 231,555 | |
| | |
Nutanix, Inc., Class A* | | | 2,950 | | | | 79,768 | |
| | |
Oracle Corp. | | | 29,610 | | | | 2,244,142 | |
| | |
PagerDuty, Inc.* | | | 1,050 | | | | 44,583 | |
| | |
Palo Alto Networks, Inc.* | | | 1,490 | | | | 526,551 | |
| | |
Paycom Software, Inc.* | | | 750 | | | | 288,307 | |
| | |
Paylocity Holding Corp.* | | | 575 | | | | 111,113 | |
| | |
Pegasystems, Inc. | | | 620 | | | | 78,703 | |
| | |
Proofpoint, Inc.* | | | 853 | | | | 146,810 | |
| | |
PTC, Inc.* | | | 1,700 | | | | 222,598 | |
| | |
RingCentral, Inc., Class A* | | | 1,250 | | | | 398,687 | |
| | |
salesforce.com, Inc.* | | | 13,834 | | | | 3,186,247 | |
| | |
ServiceNow, Inc.* | | | 3,050 | | | | 1,544,428 | |
| | |
Slack Technologies, Inc., Class A* | | | 7,506 | | | | 318,254 | |
| | |
Smartsheet, Inc., Class A* | | | 1,705 | | | | 101,107 | |
| | |
SolarWinds Corp.* | | | 873 | | | | 14,719 | |
| | |
Splunk, Inc.* | | | 2,550 | | | | 322,371 | |
| | |
SS&C Technologies Holdings, Inc. | | | 3,500 | | | | 259,770 | |
| | |
Synopsys, Inc.* | | | 2,400 | | | | 592,944 | |
| | |
Teradata Corp.* | | | 1,320 | | | | 65,300 | |
| | |
Trade Desk, Inc. (The), Class A* | | | 650 | | | | 474,051 | |
| | |
Tyler Technologies, Inc.* | | | 600 | | | | 254,916 | |
| | |
Unity Software, Inc.*,# | | | 400 | | | | 40,632 | |
| | |
VMware, Inc., Class A*,# | | | 1,310 | | | | 210,687 | |
| | |
Workday, Inc., Class A* | | | 2,800 | | | | 691,600 | |
| | |
Zendesk, Inc.* | | | 1,865 | | | | 272,570 | |
| | |
Zoom Video Communications, Inc., Class A* | | | 2,738 | | | | 874,983 | |
| | |
Zscaler, Inc.* | | | 1,150 | | | | 215,786 | |
| | | | | | | | |
| | |
| | | | | | $ | 56,713,024 | |
| |
TECHNOLOGY HARDWARE, STORAGE & PERIPHERALS – 5.6% | | | | | |
| | |
Apple, Inc. | | | 248,290 | | | | 32,640,203 | |
| | |
Dell Technologies, Inc., Class C* | | | 4,069 | | | | 400,105 | |
| | |
Hewlett Packard Enterprise Co. | | | 19,390 | | | | 310,628 | |
| | |
HP, Inc. | | | 21,490 | | | | 733,024 | |
| | |
NCR Corp.* | | | 1,870 | | | | 85,552 | |
| | |
NetApp, Inc. | | | 3,553 | | | | 265,374 | |
| | |
Pure Storage, Inc., Class A* | | | 3,845 | | | | 77,746 | |
| | |
Western Digital Corp.* | | | 4,633 | | | | 327,229 | |
| | |
Xerox Holdings Corp. | | | 2,350 | | | | 56,729 | |
| | | | | | | | |
| | |
| | | | | | $ | 34,896,590 | |
| | | | | | | | |
| | |
TOTAL INFORMATION TECHNOLOGY | | | | | | $ | 165,031,175 | |
| | | | | | | | |
| | |
| Description | | Number of Shares | | | Value | |
| | |
MATERIALS – 3.0% | | | | | | | | |
| | |
CHEMICALS – 2.0% | | | | | | | | |
| | |
Air Products & Chemicals, Inc. | | | 3,750 | | | $ | 1,081,800 | |
| | |
Albemarle Corp. | | | 1,950 | | | | 327,931 | |
| | |
Ashland Global Holdings, Inc. | | | 1,000 | | | | 86,210 | |
| | |
Axalta Coating Systems Ltd.* | | | 3,310 | | | | 105,556 | |
| | |
Cabot Corp. | | | 950 | | | | 52,136 | |
| | |
Celanese Corp. | | | 2,000 | | | | 313,300 | |
| | |
CF Industries Holdings, Inc. | | | 3,550 | | | | 172,636 | |
| | |
Chemours Co. (The) | | | 2,900 | | | | 87,580 | |
| | |
Corteva, Inc. | | | 12,562 | | | | 612,523 | |
| | |
Dow, Inc. | | | 12,379 | | | | 773,687 | |
| | |
DuPont de Nemours, Inc. | | | 9,162 | | | | 706,482 | |
| | |
Eastman Chemical Co. | | | 2,300 | | | | 265,397 | |
| | |
Ecolab, Inc. | | | 4,300 | | | | 963,716 | |
| | |
Element Solutions, Inc. | | | 3,700 | | | | 80,956 | |
| | |
FMC Corp. | | | 2,200 | | | | 260,128 | |
| | |
Huntsman Corp. | | | 3,350 | | | | 96,045 | |
| | |
International Flavors & Fragrances, Inc. | | | 4,350 | | | | 618,439 | |
| | |
Linde PLC | | | 8,900 | | | | 2,543,976 | |
| | |
LyondellBasell Industries NV, Class A | | | 4,450 | | | | 461,643 | |
| | |
Mosaic Co. (The) | | | 5,665 | | | | 199,295 | |
| | |
NewMarket Corp. | | | 100 | | | | 34,659 | |
| | |
Olin Corp. | | | 2,550 | | | | 109,727 | |
| | |
PPG Industries, Inc. | | | 4,100 | | | | 702,084 | |
| | |
RPM International, Inc. | | | 2,100 | | | | 199,164 | |
| | |
Scotts Miracle-Gro Co. (The) | | | 695 | | | | 160,656 | |
| | |
Sherwin-Williams Co. (The) | | | 4,200 | | | | 1,150,254 | |
| | |
Valvoline, Inc. | | | 3,050 | | | | 95,770 | |
| | |
W.R. Grace & Co. | | | 1,050 | | | | 72,167 | |
| | |
Westlake Chemical Corp. | | | 550 | | | | 51,640 | |
| | | | | | | | |
| | |
| | | | | | $ | 12,385,557 | |
| | |
CONSTRUCTION MATERIALS – 0.1% | | | | | | | | |
| | |
Eagle Materials, Inc.* | | | 750 | | | | 103,605 | |
| | |
Martin Marietta Materials, Inc. | | | 1,100 | | | | 388,432 | |
| | |
Vulcan Materials Co. | | | 2,300 | | | | 409,952 | |
| | | | | | | | |
| | |
| | | | | | $ | 901,989 | |
| | |
CONTAINERS & PACKAGING – 0.5% | | | | | | | | |
| | |
Amcor PLC | | | 28,951 | | | | 340,174 | |
| | |
AptarGroup, Inc. | | | 1,065 | | | | 160,613 | |
| | |
Avery Dennison Corp. | | | 1,400 | | | | 299,838 | |
| | |
Ball Corp. | | | 5,500 | | | | 515,020 | |
| | |
Berry Global Group, Inc.* | | | 2,243 | | | | 142,700 | |
| | |
Crown Holdings, Inc. | | | 2,218 | | | | 243,536 | |
| | |
Graphic Packaging Holding Co. | | | 4,555 | | | | 84,495 | |
| | |
International Paper Co. | | | 6,700 | | | | 388,600 | |
| | |
Packaging Corp. of America | | | 1,600 | | | | 236,240 | |
| | |
Sealed Air Corp. | | | 2,700 | | | | 133,380 | |
| | |
Silgan Holdings, Inc. | | | 1,305 | | | | 55,032 | |
| | |
Sonoco Products Co. | | | 1,580 | | | | 103,427 | |
| | |
Westrock Co. | | | 4,250 | | | | 236,937 | |
| | | | | | | | |
| | |
| | | | | | $ | 2,939,992 | |
| | |
METALS & MINING – 0.4% | | | | | | | | |
| | |
Freeport-McMoRan, Inc. | | | 24,300 | | | | 916,353 | |
| | |
Newmont Corp. | | | 13,450 | | | | 839,414 | |
April 30, 2021 / ANNUAL REPORT
| | |
| PORTFOLIO OF INVESTMENTS | | 14 |
Wilmington Large-Cap Strategy Fund (continued)
| | | | | | | | |
| | |
| Description | | Number of Shares | | | Value | |
| | |
Nucor Corp. | | | 5,150 | | | $ | 423,639 | |
| | |
Reliance Steel & Aluminum Co. | | | 1,050 | | | | 168,326 | |
| | |
Royal Gold, Inc. | | | 1,058 | | | | 118,348 | |
| | |
Southern Copper Corp. | | | 1,350 | | | | 93,704 | |
| | |
Steel Dynamics, Inc. | | | 3,300 | | | | 178,926 | |
| | | | | | | | |
| | |
| | | | | | $ | 2,738,710 | |
| | | | | | | | |
| | |
TOTAL MATERIALS | | | | | | $ | 18,966,248 | |
| | |
REAL ESTATE – 2.7% | | | | | | | | |
| |
REAL ESTATE INVESTMENT TRUSTS – 2.6% | | | | | |
| | |
Alexandria Real Estate Equities, Inc. | | | 1,765 | | | | 319,641 | |
| | |
American Campus Communities, Inc. | | | 1,850 | | | | 83,638 | |
| | |
American Homes 4 Rent, Class A | | | 3,990 | | | | 147,790 | |
| | |
American Tower Corp. | | | 6,010 | | | | 1,531,168 | |
| | |
Americold Realty Trust | | | 2,740 | | | | 110,669 | |
| | |
Apartment Income REIT Corp. | | | 2,854 | | | | 128,858 | |
| | |
Apartment Investment & Management Co., Class A | | | 2,854 | | | | 19,807 | |
| | |
Apple Hospitality REIT, Inc. | | | 2,950 | | | | 46,787 | |
| | |
AvalonBay Communities, Inc. | | | 1,872 | | | | 359,424 | |
| | |
Boston Properties, Inc. | | | 2,050 | | | | 224,167 | |
| | |
Brandywine Realty Trust | | | 2,150 | | | | 29,090 | |
| | |
Brixmor Property Group, Inc. | | | 3,750 | | | | 83,775 | |
| | |
Brookfield Property REIT, Inc., Class A | | | 6,100 | | | | 109,708 | |
| | |
Camden Property Trust | | | 1,270 | | | | 153,010 | |
| | |
CoreSite Realty Corp. | | | 550 | | | | 66,820 | |
| | |
Corporate Office Properties Trust | | | 1,400 | | | | 39,256 | |
| | |
Cousins Properties, Inc. | | | 1,833 | | | | 67,216 | |
| | |
Crown Castle International Corp. | | | 5,690 | | | | 1,075,751 | |
| | |
CubeSmart | | | 2,583 | | | | 109,364 | |
| | |
CyrusOne, Inc. | | | 1,598 | | | | 116,382 | |
| | |
Digital Realty Trust, Inc. | | | 3,710 | | | | 572,490 | |
| | |
Douglas Emmett, Inc. | | | 2,210 | | | | 74,123 | |
| | |
Duke Realty Corp. | | | 4,960 | | | | 230,739 | |
| | |
Empire State Realty Trust, Inc., Class A | | | 1,550 | | | | 17,655 | |
| | |
EPR Properties* | | | 800 | | | | 38,168 | |
| | |
Equinix, Inc. | | | 1,181 | | | | 851,218 | |
| | |
Equity Commonwealth | | | 1,692 | | | | 48,730 | |
| | |
Equity LifeStyle Properties, Inc. | | | 2,350 | | | | 163,090 | |
| | |
Equity Residential | | | 4,900 | | | | 363,727 | |
| | |
Essex Property Trust, Inc. | | | 873 | | | | 253,624 | |
| | |
Extra Space Storage, Inc. | | | 1,700 | | | | 252,773 | |
| | |
Federal Realty Investment Trust | | | 998 | | | | 112,614 | |
| | |
First Industrial Realty Trust, Inc. | | | 1,400 | | | | 69,678 | |
| | |
Gaming and Leisure Properties, Inc. | | | 2,959 | | | | 137,564 | |
| | |
Healthcare Trust of America, Inc., Class A | | | 2,930 | | | | 86,054 | |
| | |
Healthpeak Properties, Inc. | | | 7,230 | | | | 248,278 | |
| | |
Highwoods Properties, Inc. | | | 1,490 | | | | 66,737 | |
| | |
Host Hotels & Resorts, Inc.* | | | 9,780 | | | | 177,605 | |
| | |
Hudson Pacific Properties, Inc. | | | 2,053 | | | | 57,710 | |
| | |
Invitation Homes, Inc. | | | 7,650 | | | | 268,209 | |
| | |
Iron Mountain, Inc. | | | 4,106 | | | | 164,733 | |
| | |
JBG SMITH Properties | | | 1,721 | | | | 56,122 | |
| | |
Kilroy Realty Corp. | | | 1,525 | | | | 104,523 | |
| | |
Kimco Realty Corp. | | | 5,480 | | | | 115,080 | |
| | |
Lamar Advertising Co., Class A | | | 1,250 | | | | 123,800 | |
| | |
Life Storage, Inc. | | | 975 | | | | 93,658 | |
| | | | | | | | |
| | |
| Description | | Number of Shares | | | Value | |
| | |
Medical Properties Trust, Inc. | | | 7,100 | | | $ | 156,555 | |
| | |
Mid-America Apartment Communities, Inc. | | | 1,521 | | | | 239,299 | |
| | |
National Retail Properties, Inc. | | | 2,315 | | | | 107,462 | |
| | |
Omega Healthcare Investors, Inc. | | | 3,000 | | | | 114,000 | |
| | |
Outfront Media, Inc.* | | | 1,700 | | | | 41,429 | |
| | |
Paramount Group, Inc. | | | 1,850 | | | | 19,629 | |
| | |
Park Hotels & Resorts, Inc.* | | | 3,150 | | | | 70,277 | |
| | |
Prologis, Inc. | | | 9,867 | | | | 1,149,802 | |
| | |
Public Storage | | | 2,010 | | | | 565,132 | |
| | |
Rayonier, Inc. | | | 1,915 | | | | 69,476 | |
| | |
Realty Income Corp. | | | 4,860 | | | | 336,069 | |
| | |
Regency Centers Corp. | | | 2,233 | | | | 142,153 | |
| | |
Rexford Industrial Realty, Inc. | | | 1,450 | | | | 80,547 | |
| | |
SBA Communications Corp. | | | 1,450 | | | | 434,594 | |
| | |
Simon Property Group, Inc. | | | 4,293 | | | | 522,630 | |
| | |
SL Green Realty Corp. | | | 957 | | | | 70,828 | |
| | |
Spirit Realty Capital, Inc. | | | 1,450 | | | | 68,933 | |
| | |
STORE Capital Corp. | | | 3,355 | | | | 120,075 | |
| | |
Sun Communities, Inc. | | | 1,400 | | | | 233,562 | |
| | |
UDR, Inc. | | | 3,930 | | | | 182,548 | |
| | |
Ventas, Inc. | | | 4,986 | | | | 276,524 | |
| | |
VEREIT, Inc. | | | 3,306 | | | | 158,159 | |
| | |
VICI Properties, Inc. | | | 7,238 | | | | 229,445 | |
| | |
Vornado Realty Trust | | | 2,326 | | | | 106,414 | |
| | |
Weingarten Realty Investors | | | 1,510 | | | | 48,833 | |
| | |
Welltower, Inc. | | | 5,570 | | | | 417,917 | |
| | |
Weyerhaeuser Co. | | | 10,342 | | | | 400,959 | |
| | |
WP Carey, Inc. | | | 2,300 | | | | 172,247 | |
| | | | | | | | |
| | |
| | | | | | $ | 16,106,521 | |
| |
REAL ESTATE MANAGEMENT & DEVELOPMENT – 0.1% | | | | | |
| | |
CBRE Group, Inc., Class A* | | | 4,460 | | | | 379,992 | |
| | |
Howard Hughes Corp. (The)* | | | 558 | | | | 60,231 | |
| | |
Jones Lang LaSalle, Inc.* | | | 728 | | | | 136,798 | |
| | | | | | | | |
| | |
| | | | | | $ | 577,021 | |
| | | | | | | | |
| | |
TOTAL REAL ESTATE | | | | | | $ | 16,683,542 | |
| | |
UTILITIES – 2.1% | | | | | | | | |
| | |
ELECTRIC UTILITIES – 1.3% | | | | | | | | |
| | |
Alliant Energy Corp. | | | 3,300 | | | | 185,361 | |
| | |
American Electric Power Co., Inc. | | | 6,600 | | | | 585,486 | |
| | |
Avangrid, Inc. | | | 700 | | | | 35,630 | |
| | |
Duke Energy Corp. | | | 9,650 | | | | 971,658 | |
| | |
Edison International | | | 4,750 | | | | 282,388 | |
| | |
Entergy Corp. | | | 2,650 | | | | 289,618 | |
| | |
Evergy, Inc. | | | 2,950 | | | | 188,712 | |
| | |
Eversource Energy | | | 4,550 | | | | 392,301 | |
| | |
Exelon Corp. | | | 12,950 | | | | 581,973 | |
| | |
FirstEnergy Corp. | | | 7,200 | | | | 273,024 | |
| | |
Hawaiian Electric Industries, Inc. | | | 1,500 | | | | 64,590 | |
| | |
IDACORP, Inc. | | | 600 | | | | 61,488 | |
| | |
NextEra Energy, Inc. | | | 25,950 | | | | 2,011,384 | |
| | |
NRG Energy, Inc. | | | 3,250 | | | | 116,415 | |
| | |
OGE Energy Corp. | | | 2,613 | | | | 87,692 | |
| | |
PG&E Corp.* | | | 17,750 | | | | 200,930 | |
| | |
Pinnacle West Capital Corp. | | | 1,450 | | | | 122,743 | |
| | |
PPL Corp. | | | 10,200 | | | | 297,126 | |
ANNUAL REPORT / April 30, 2021
| | |
| 15 | | PORTFOLIO OF INVESTMENTS |
Wilmington Large-Cap Strategy Fund (continued)
| | | | | | | | |
| | |
| Description | | Number of Shares | | | Value | |
| | |
Southern Co. (The) | | | 13,900 | | | $ | 919,763 | |
| | |
Xcel Energy, Inc. | | | 7,000 | | | | 499,100 | |
| | | | | | | | |
| | |
| | | | | | $ | 8,167,382 | |
| | |
GAS UTILITIES – 0.1% | | | | | | | | |
| | |
Atmos Energy Corp. | | | 1,750 | | | | 181,282 | |
| | |
National Fuel Gas Co. | | | 1,400 | | | | 69,524 | |
| | |
UGI Corp. | | | 3,100 | | | | 135,501 | |
| | | | | | | | |
| | |
| | | | | | $ | 386,307 | |
|
INDEPENDENT POWER AND RENEWABLE ELECTRICITY PRODUCERS – 0.0%** | |
| | |
AES Corp. (The) | | | 8,900 | | | | 247,598 | |
| | |
Vistra Corp. | | | 6,450 | | | | 108,812 | |
| | | | | | | | |
| | |
| | | | | | $ | 356,410 | |
| | |
MULTI-UTILITIES – 0.6% | | | | | | | | |
| | |
Ameren Corp. | | | 3,250 | | | | 275,730 | |
| | |
CenterPoint Energy, Inc. | | | 6,700 | | | | 164,083 | |
| | |
CMS Energy Corp. | | | 3,800 | | | | 244,682 | |
| | |
Consolidated Edison, Inc. | | | 4,400 | | | | 340,604 | |
| | |
Dominion Energy, Inc. | | | 10,693 | | | | 854,371 | |
| | |
DTE Energy Co. | | | 2,550 | | | | 357,051 | |
| | |
MDU Resources Group, Inc. | | | 2,800 | | | | 93,688 | |
| | |
NiSource, Inc. | | | 5,050 | | | | 131,401 | |
| | |
Public Service Enterprise Group, Inc. | | | 6,700 | | | | 423,172 | |
| | |
Sempra Energy | | | 3,800 | | | | 522,766 | |
| | |
WEC Energy Group, Inc. | | | 4,200 | | | | 408,114 | |
| | | | | | | | |
| | |
| | | | | | $ | 3,815,662 | |
| | |
WATER UTILITIES – 0.1% | | | | | | | | |
| | |
American Water Works Co., Inc. | | | 2,450 | | | | 382,175 | |
| | |
Essential Utilities, Inc. | | | 3,100 | | | | 146,103 | |
| | | | | | | | |
| | |
| | | | | | $ | 528,278 | |
| | | | | | | | |
| | |
TOTAL UTILITIES | | | | | | $ | 13,254,039 | |
| | | | | | | | |
| | |
TOTAL COMMON STOCKS (COST $195,472,429) | | | | | | $ | 621,636,988 | |
| | |
RIGHTS – 0.0%** | | | | | | | | |
| | |
Bristol-Myers Squibb Co. CVR, Expire 12/31/30* | | | 89 | | | | 19 | |
| | | | | | | | |
| | |
TOTAL RIGHTS (COST $0) | | | | | | $ | 19 | |
| | |
WARRANTS – 0.0%** | | | | | | | | |
| | |
Occidental Petroleum Corp. CW27, Expire 08/03/27* | | | 1,645 | | | | 17,733 | |
| | | | | | | | |
| | |
TOTAL WARRANTS (COST $0) | | | | | | $ | 17,733 | |
| | |
INVESTMENT COMPANIES – 0.3% | | | | | | | | |
| | |
EQUITY FUNDS – 0.3% | | | | | | | | |
| | |
iShares Russell 1000 ETF | | | 3,400 | | | | 801,652 | |
| | |
iShares Russell 1000 Growth ETF | | | 1,560 | | | | 405,195 | |
| | |
iShares Russell 1000 Value ETF | | | 2,600 | | | | 409,630 | |
| | | | | | | | |
| | |
TOTAL EQUITY FUNDS | | | | | | $ | 1,616,477 | |
| | | | | | | | |
| | |
TOTAL INVESTMENT COMPANIES (COST $1,562,568) | | | | | | $ | 1,616,477 | |
| | | | | | | | |
| | |
| Description | | Number of Shares | | | Value | |
| | |
MONEY MARKET FUND – 0.0% | | | | | | | | |
| | |
Dreyfus Government Cash Management Fund, Institutional Shares, 0.03%^ | | | 125,502 | | | $ | 125,502 | |
| | | | | | | | |
TOTAL MONEY MARKET FUND (COST $125,502) | | | | | | $ | 125,502 | |
| | | | | | | | |
| | |
| | | Par Value | | | | |
CASH COLLATERAL INVESTED FOR SECURITIES ON LOAN – 0.3% | | | | | |
| | |
REPURCHASE AGREEMENTS – 0.3% | | | | | | | | |
| | |
Bank of America Securities, Inc., 0.01%, dated 4/30/21, due 5/03/21, repurchase price $416,338
collateralized by U.S. Government Agency Securities, 1.00% to 5.50%, maturing 11/01/28 to 5/01/51; total market value of $424,665. | | | $416,338 | | | | 416,338 | |
| | |
BNP Paribas SA, 0.00%, dated 4/30/21, due 5/03/21, repurchase price $416,338 collateralized by U.S. Government Agency & Treasury Securities, 0.00% to 8.13%, maturing 5/15/21 to 2/01/56; total market value of $424,665. | | | 416,338 | | | | 416,338 | |
| | |
Daiwa Capital Markets America, 0.01%, dated 4/30/21, due 5/03/21, repurchase price $416,338 collateralized by U.S. Government Agency & Treasury Securities, 0.00% to 8.00%, maturing 6/30/21 to 5/01/51; total market value of $424,665. | | | 416,338 | | | | 416,338 | |
| | |
Deutsche Bank Securities, Inc., 0.01%, dated 4/30/21, due 5/03/21, repurchase price $416,338 collateralized by U.S. Government Agency & Treasury Securities, 0.00% to 4.00%, maturing 6/22/21 to 4/01/51; total market value of $424,665. | | | 416,338 | | | | 416,338 | |
| | |
Morgan Stanley & Co. 0.01%, dated 4/30/21, due 5/03/21, repurchase price $165,749 collateralized by U.S. Government Agency Securities, 2.00% to 4.00%, maturing 4/01/36 to 5/01/51; total market value of $169,064. | | | 165,749 | | | | 165,749 | |
| | |
RBC Dominion Securities, Inc., 0.01%, dated 4/30/21, due 5/03/21, repurchase price $416,338 collateralized by U.S. Government Agency & Treasury Securities, 0.00% to 6.50%, maturing 6/01/21 to 12/15/60; total market value of $424,665. | | | 416,338 | | | | 416,338 | |
| | | | | | | | |
| | |
TOTAL REPURCHASE AGREEMENTS
(COST $2,247,439) | | | | | | $ | 2,247,439 | |
| | | | | | | | |
| |
TOTAL CASH COLLATERAL INVESTED FOR SECURITIES ON LOAN | | | | | |
| (COST $2,247,439) | | | | | | $ | 2,247,439 | |
| | | | | | | | |
| | |
TOTAL INVESTMENTS – 100.3% (COST $199,407,938) | | | | | | $ | 625,644,158 | |
| | |
COLLATERAL FOR SECURITIES ON LOAN – (0.3%) | | | | | | | (2,247,439 | ) |
| | |
OTHER ASSETS LESS LIABILITIES – 0.0%** | | | | | | | 141,702 | |
| | | | | | | | |
| | |
TOTAL NET ASSETS – 100.0% | | | | | | $ | 623,538,421 | |
| | | | | | | | |
April 30, 2021 / ANNUAL REPORT
| | |
| PORTFOLIO OF INVESTMENTS | | 16 |
Wilmington Large-Cap Strategy Fund (concluded)
Various inputs are used in determining the value of the Fund’s investments. These inputs are summarized in the three broad levels listed below.
Level 1 – quoted prices in active markets for identical securities
Level 2 – other significant observable inputs (including quoted prices for similar securities, interest rates, prepayment speeds, credit risk, etc.)
Level 3 – significant unobservable inputs (including the Fund’s own assumptions in determining the fair value of investments)
The following is a summary of the inputs used as of April 30, 2021 in valuing the Fund’s assets carried at fair value:
| | | | | | | | | | | | | | | | |
| | | | |
| | | Level 1 | | | Level 2 | | | Level 3 | | | Total | |
Investments in Securities | | | | | | | | | | | | | | | | |
Common Stocks | | $ | 621,636,988 | | | $ | — | | | $ | — | | | $ | 621,636,988 | |
Rights | | | 19 | | | | — | | | | — | | | | 19 | |
Warrants | | | 17,733 | | | | — | | | | — | | | | 17,733 | |
Investment Companies | | | 1,616,477 | | | | — | | | | — | | | | 1,616,477 | |
Money Market Fund | | | 125,502 | | | | — | | | | — | | | | 125,502 | |
Repurchase Agreements | | | — | | | | 2,247,439 | | | | — | | | | 2,247,439 | |
| | | | | | | | | | | | | | | | |
Total | | $ | 623,396,719 | | | $ | 2,247,439 | | | $ | — | | | $ | 625,644,158 | |
| | | | | | | | | | | | | | | | |
| * | Non-income producing security. |
| # | Security, or a portion thereof, is on loan. See Note 2 in Notes to Financial Statements. |
| § | Affiliated company. See Note 4 in Notes to Financial Statements. |
| ** | Represents less than 0.05%. |
The following acronyms are used throughout this Fund:
| | |
CVR | | Contingent Value Rights |
| |
ETF | | Exchange-Traded Fund |
| |
LP | | Limited Partnership |
| |
NA | | National Association |
| |
PLC | | Public Limited Company |
| |
REIT | | Real Estate Investment Trust |
See Notes which are an integral part of the Financial Statements
ANNUAL REPORT / April 30, 2021
| | |
| 17 | | STATEMENT OF ASSETS AND LIABILITIES |
| | | | | | | | | | | | |
| | | |
April 30, 2021 | | | | | | | | Wilmington
Large-Cap Strategy
Fund | |
ASSETS: | | | | | | | | | | | | |
Investments, at identified cost | | | | | | | | | | $ | 199,407,938 | (a) |
| | | | | | | | | | | | |
Investments in securities, at value | | | | | | | | | | $ | 625,644,158 | (b),(c) |
Income receivable | | | | | | | | | | | 402,144 | |
Receivable for shares sold | | | | | | | | | | | 236,211 | |
Prepaid assets | | | | | | | | | | | 18,946 | |
| | | | | | | | | | | | |
TOTAL ASSETS | | | | | | | | | | | 626,301,459 | |
| | | | | | | | | | | | |
LIABILITIES: | | | | | | | | | | | | |
Collateral for securities on loan | | | | | | | | | | | 2,247,439 | |
Payable for shares redeemed | | | | | | | | | | | 269,504 | |
Payable for Trustees’ fees | | | | | | | | | | | 9,264 | |
Payable for administration fees | | | | | | | | | | | 15,193 | |
Payable for investment advisory fees | | | | | | | | | | | 79,234 | |
Other accrued expenses | | | | | | | | | | | 142,404 | |
| | | | | | | | | | | | |
TOTAL LIABILITIES | | | | | | | | | | | 2,763,038 | |
| | | | | | | | | | | | |
NET ASSETS | | | | | | | | | | $ | 623,538,421 | |
| | | | | | | | | | | | |
NET ASSETS CONSIST OF: | | | | | | | | | | | | |
Paid-in capital | | | | | | | | | | $ | 191,318,097 | |
Distributable earnings (loss) | | | | | | | | | | | 432,220,324 | |
| | | | | | | | | | | | |
TOTAL NET ASSETS | | | | | | | | | | $ | 623,538,421 | |
| | | | | | | | | | | | |
COMPUTATION OF NET ASSET VALUE AND OFFERING PRICE: | | | | | | | | | | | | |
Class I | | | | | | | | | | | | |
Net Assets | | | | | | | | | | $ | 623,538,421 | |
| | | | | | | | | | | | |
Shares outstanding (unlimited shares authorized) | | | | | | | | | | | 20,730,623 | |
| | | | | | | | | | | | |
Net Asset Value and Offering Price per share | | | | | | | | | | $ | 30.08 | |
| | | | | | | | | | | | |
(a) Includes $127,293 of investments in affiliated issuers.
(b) Includes $253,881 of investments in affiliated issuers.
(c) Including $2,175,737 of securities on loan (Note 2).
See Notes which are an integral part of the Financial Statements
April 30, 2021 / ANNUAL REPORT
| | |
| STATEMENT OF OPERATIONS | | 18 |
| | | | | | | | | | | | |
| | | |
| Year Ended April 30, 2021 | | | | | | | | Wilmington
Large-Cap Strategy
Fund | |
INVESTMENT INCOME: | | | | | | | | | | | | |
Dividends | | | | | | | | | | $ | 8,502,488 | (a),(b) |
Securities lending income, net | | | | | | | | | | | 30,435 | |
| | | | | | | | | | | | |
TOTAL INVESTMENT INCOME | | | | | | | | | | | 8,532,923 | |
| | | | | | | | | | | | |
EXPENSES: | | | | | | | | | | | | |
Investment advisory fees | | | | | | | | | | | 2,692,715 | |
Administration fees | | | | | | | | | | | 162,732 | |
Portfolio accounting and administration fees | | | | | | | | | | | 126,123 | |
Custodian fees | | | | | | | | | | | 35,552 | |
Transfer and dividend disbursing agent fees and expenses | | | | | | | | | | | 81,312 | |
Trustees’ fees | | | | | | | | | | | 56,884 | |
Professional fees | | | | | | | | | | | 94,482 | |
Shareholder services fee—Class I | | | | | | | | | | | 985,348 | |
Share registration costs | | | | | | | | | | | 31,534 | |
Printing and postage | | | | | | | | | | | 19,316 | |
Miscellaneous | | | | | | | | | | | 19,873 | |
| | | | | | | | | | | | |
TOTAL EXPENSES | | | | | | | | | | | 4,305,871 | |
| | | | | | | | | | | | |
WAIVERS AND REIMBURSEMENTS: | | | | | | | | | | | | |
Waiver/reimbursement by investment advisor | | | | | | | | | | | (1,979,941 | ) |
Waiver of shareholder services fee—Class I | | | | | | | | | | | (985,348 | ) |
| | | | | | | | | | | | |
TOTAL WAIVERS AND REIMBURSEMENTS | | | | | | | | | | | (2,965,289 | ) |
| | | | | | | | | | | | |
Net expenses | | | | | | | | | | | 1,340,582 | |
| | | | | | | | | | | | |
Net investment income | | | | | | | | | | | 7,192,341 | |
| | | | | | | | | | | | |
REALIZED AND UNREALIZED GAIN (LOSS): | | | | | | | | | | | | |
Net realized gain (loss) on investments | | | | | | | | | | | 39,471,050 | |
Net change in unrealized appreciation (depreciation) on unaffiliated investments | | | | | | | | | | | 167,827,765 | |
Net change in unrealized appreciation (depreciation) of affiliated investments | | | | | | | | | | | 73,432 | |
| | | | | | | | | | | | |
Net change in unrealized appreciation (depreciation) | | | | | | | | | | | 167,901,197 | |
| | | | | | | | | | | | |
Net realized and unrealized gain (loss) | | | | | | | | | | | 207,372,247 | |
| | | | | | | | | | | | |
Change in net assets resulting from operations | | | | | | | | | | $ | 214,564,588 | |
| | | | | | | | | | | �� | |
(a) Includes $5,313 received from affiliated issuers.
(b) Net of foreign withholding taxes of $339.
See Notes which are an integral part of the Financial Statements
ANNUAL REPORT / April 30, 2021
| | |
| 19 | | STATEMENTS OF CHANGES IN NET ASSETS |
| | | | | | | | | | | | | | | | | | | | |
| | |
| | | | | | Wilmington Large-Cap Strategy Fund | |
| | | | | |
| | | | | | Year Ended
April 30, 2021 | | | | | | | | | Year Ended
April 30, 2020 | |
OPERATIONS: | | | | | | | | | | | | | | | | | | | | |
Net investment income | | | | | | $ | 7,192,341 | | | | | | | | | | | $ | 8,656,304 | |
Net realized gain (loss) | | | | | | | 39,471,050 | | | | | | | | | | | | 33,390,032 | |
Net change in unrealized appreciation (depreciation) | | | | | | | 167,901,197 | | | | | | | | | | | | (37,881,410 | ) |
| | | | | | | | | | | | | | | | | | | | |
Change in net assets resulting from operations | | | | | | | 214,564,588 | | | | | | | | | | | | 4,164,926 | |
| | | | | | | | | | | | | | | | | | | | |
DISTRIBUTIONS TO SHAREHOLDERS: | | | | | | | | | | | | | | | | | | | | |
Class I | | | | | | | (48,612,170 | ) | | | | | | | | | | | (29,545,889 | ) |
| | | | | | | | | | | | | | | | | | | | |
Total distributions to shareholders | | | | | | | (48,612,170 | ) | | | | | | | | | | | (29,545,889 | ) |
| | | | | | | | | | | | | | | | | | | | |
SHARE TRANSACTIONS: | | | | | | | | | | | | | | | | | | | | |
Proceeds from sale of shares | | | | | | | | | | | | | | | | | | | | |
Class I | | | | | | | 45,492,298 | | | | | | | | | | | | 54,361,316 | |
Distributions reinvested | | | | | | | | | | | | | | | | | | | | |
Class I | | | | | | | 35,222,149 | | | | | | | | | | | | 18,763,388 | |
Cost of shares redeemed | | | | | | | | | | | | | | | | | | | | |
Class I | | | | | | | (90,520,711 | ) | | | | | | | | | | | (108,169,702 | ) |
| | | | | | | | | | | | | | | | | | | | |
Change in net assets resulting from share transactions | | | | | | | (9,806,264 | ) | | | | | | | | | | | (35,044,998 | ) |
| | | | | | | | | | | | | | | | | | | | |
Change in net assets | | | | | | | 156,146,154 | | | | | | | | | | | | (60,425,961 | ) |
NET ASSETS: | | | | | | | | | | | | | | | | | | | | |
Beginning of year | | | | | | | 467,392,267 | | | | | | | | | | | | 527,818,228 | |
| | | | | | | | | | | | | | | | | | | | |
End of year | | | | | | $ | 623,538,421 | | | | | | | | | | | $ | 467,392,267 | |
| | | | | | | | | | | | | | | | | | | | |
SHARES OF BENEFICIAL INTEREST: | | | | | | | | | | | | | | | | | | | | |
Shares sold | | | | | | | | | | | | | | | | | | | | |
Class I | | | | | | | 1,709,202 | | | | | | | | | | | | 2,532,501 | |
Distributions reinvested | | | | | | | | | | | | | | | | | | | | |
Class I | | | | | | | 1,334,155 | | | | | | | | | | | | 795,091 | |
Shares redeemed | | | | | | | | | | | | | | | | | | | | |
Class I | | | | | | | (3,476,828 | ) | | | | | | | | | | | (4,756,535 | ) |
| | | | | | | | | | | | | | | | | | | | |
Net change resulting from share transactions | | | | | | | (433,471 | ) | | | | | | | | | | | (1,428,943 | ) |
| | | | | | | | | | | | | | | | | | | | |
See Notes which are an integral part of the Financial Statements
April 30, 2021 / ANNUAL REPORT
For a share outstanding throughout each year ended April 30, unless otherwise noted:
| | | | | | | | | | | | | | | | | | | | |
|
| WILMINGTON LARGE-CAP STRATEGY FUND | |
| |
| | | | | |
| CLASS I | | Year Ended
April 30, 2021 | | | Year Ended
April 30, 2020 | | | Year Ended
April 30, 2019 | | | Year Ended
April 30, 2018 | | | Year Ended
April 30, 2017 | |
Net Asset Value, Beginning of Year | | $ | 22.08 | | | $ | 23.36 | | | $ | 21.98 | | | $ | 19.65 | | | $ | 16.91 | |
Income (Loss) From Operations: | | | | | | | | | | | | | | | | | | | | |
Net Investment Income(a) | | | 0.35 | | | | 0.39 | | | | 0.37 | | | | 0.34 | | | | 0.32 | |
Net Realized and Unrealized Gain (Loss) | | | 10.11 | | | | (0.32 | ) | | | 2.32 | | | | 2.34 | | | | 2.75 | |
| | | | | | | | | | | | | | | | | | | | |
Total Income (Loss) From Operations | | | 10.46 | | | | 0.07 | | | | 2.69 | | | | 2.68 | | | | 3.07 | |
| | | | | | | | | | | | | | | | | | | | |
Less Distributions From: | | | | | | | | | | | | | | | | | | | | |
Net Investment Income | | | (0.37 | ) | | | (0.41 | ) | | | (0.38 | ) | | | (0.35 | ) | | | (0.33 | ) |
Net Realized Gains | | | (2.09 | ) | | | (0.94 | ) | | | (0.93 | ) | | | — | | | | — | |
| | | | | | | | | | | | | | | | | | | | |
Total Distributions | | | (2.46 | ) | | | (1.35 | ) | | | (1.31 | ) | | | (0.35 | ) | | | (0.33 | ) |
| | | | | | | | | | | | | | | | | | | | |
Net Asset Value, End of Year | | $ | 30.08 | | | $ | 22.08 | | | $ | 23.36 | | | $ | 21.98 | | | $ | 19.65 | |
| | | | | | | | | | | | | | | | | | | | |
Total Return | | | 49.12 | % | | | 0.09 | % | | | 12.93 | % | | | 13.71 | % | | | 18.32 | % |
Net Assets, End of Year (000’s) | | $ | 623,538 | | | $ | 467,392 | | | $ | 527,818 | | | $ | 504,014 | | | $ | 554,810 | |
Ratios to Average Net Assets | | | | | | | | | | | | | | | | | | | | |
Gross Expense(b) | | | 0.80 | % | | | 0.86 | % | | | 0.89 | % | | | 0.90 | % | | | 0.90 | % |
Net Expense(b),(c) | | | 0.25 | % | | | 0.25 | % | | | 0.25 | % | | | 0.25 | % | | | 0.25 | % |
Net Investment Income | | | 1.34 | % | | | 1.69 | % | | | 1.65 | % | | | 1.62 | % | | | 1.75 | % |
Portfolio Turnover Rate | | | 14 | % | | | 26 | % | | | 13 | % | | | 15 | % | | | 18 | % |
| (a) | Per share amounts have been calculated using the average shares method. |
| (b) | The Fund invests in other underlying funds and indirectly bears its proportionate share of fees and expenses incurred by the underlying funds. This ratio does not include these indirect fees and expenses. |
| (c) | The investment advisor and other service providers waived or reimbursed a portion of their fees. |
See Notes which are an integral part of the Financial Statements
ANNUAL REPORT / April 30, 2021
| | |
| 21 | | NOTES TO FINANCIAL STATEMENTS |
Wilmington Funds
April 30, 2021
Wilmington Funds (the “Trust”) is registered under the Investment Company Act of 1940, as amended (the “Act”), as an open-end management investment company. The Trust consists of 12 funds, 1 of which is presented herein (referred to as the “Fund”). The remaining 11 funds are presented in separate reports.
| | |
| |
| Fund | | Investment Goal |
| |
Wilmington Large-Cap Strategy Fund (“Large-Cap Strategy Fund”)(d) | | The Fund seeks to achieve long-term capital appreciation. |
(d) Diversified
The Trust offers 6 classes of shares: Class A, Service Class, Select Class, Administrative Class, Class I and Institutional Class. Class A, Service Class, Select Class, Administrative Class and Institutional Class are not available for the Fund. All shares of the Trust have equal rights with respect to voting, except on class-specific matters.
The assets of each fund are segregated and a shareholder’s interest is limited to the fund in which shares are held.
| 2. | SUMMARY OF SIGNIFICANT ACCOUNTING POLICIES |
The following is a summary of significant accounting policies consistently followed by the Fund in the preparation of its financial statements. These policies are in conformity with U.S. generally accepted accounting principles (“GAAP”). The Trust is an investment company and follows accounting and reporting guidance under Financial Accounting Standards Board (“FASB”) Accounting Standards Codification (“ASC”) Topic 946, “Financial Services - Investment Companies.” The preparation of financial statements in conformity with GAAP requires management to make estimates and assumptions that affect the amounts of assets, liabilities, expenses and revenues reported in the financial statements. Actual results could differ from those estimated and the differences could be material.
Computation of Net Asset Value – The net asset value (‘‘NAV’’) per share for each class of the Fund is computed by dividing the total current value of the assets of the Fund, less its liabilities, attributable to the class by the total number of shares outstanding of the class at the time of such computation. The NAV per share for each class of the Fund is computed as of 4:00 p.m. (Eastern Time) on days when the New York Stock Exchange (“NYSE”) is open for regular trading.
Investment Valuation – The Fund utilizes a fair value approach. The fair value of the Fund’s portfolio securities are determined as follows:
| | • | for equity securities, according to the last sale price or official closing price reported in the market in which they are primarily traded (either a national securities exchange or the over-the-counter market), if available; |
| | • | in the absence of recorded sales for equity securities, according to the mean between the last closing bid and asked prices; |
| | • | investments in open-end regulated investment companies are valued at NAV; |
| | • | for fixed income securities, according to prices as furnished by an independent pricing service, except that fixed income securities with remaining maturities of less than 60 days at the time of purchase are valued at amortized cost, provided such amount approximates fair value; and |
| | • | for all other securities, at fair value as determined in accordance with procedures established by and under the general supervision of the Board of Trustees (“Trustees”). |
Trading in foreign securities may be completed at times which vary from the closing of the NYSE. In computing its NAV, the Fund values foreign securities using the latest closing price on the primary exchange on which they are traded immediately prior to the closing of the NYSE. Certain foreign currency exchange rates are generally determined at the latest rate prior to the closing of the NYSE. Foreign securities quoted in foreign currencies are translated into U.S. dollars at current rates. Events that affect these values and exchange rates may occur between the times at which they are determined and the closing of the NYSE. If such events materially affect the value of portfolio securities, these securities may be valued at their fair value as determined in good faith by the Trustees, although the actual calculation may be done by others. An event is considered material if there is both an affirmative expectation that the security’s value will change in response to the event and a reasonable basis for quantifying the resulting change in value. In determining whether market quotations are readily available or fair valuation will be used, various factors will be taken into consideration, such as market closures or suspension of trading in a security. The Fund may use fair value pricing more frequently for securities traded primarily in non-US markets because, among other things, most foreign markets close well before the Fund values its securities, generally as of 4:00 p.m. Eastern time. The earlier close of these foreign markets gives rise to the possibility that significant events, including broad market moves, government actions or pronouncements, aftermarket trading, or news events may have occurred in the interim. Whenever such a significant event occurs, the Fund may value foreign securities using fair value prices based on third-party vendor modeling tools (Systematic International Fair Value Pricing (“SIFVP”)).
April 30, 2021 / ANNUAL REPORT
| | |
| NOTES TO FINANCIAL STATEMENTS (continued) | | 22 |
The Trust follows the authoritative guidance (GAAP) for fair value measurements. The guidance establishes a framework for measuring fair value and a hierarchy for inputs and techniques used in measuring fair value that maximizes the use of observable inputs and minimizes the use of unobservable inputs and techniques by requiring that the most observable inputs be used when available. The guidance establishes three tiers of inputs that may be used to measure fair value. The three tiers of inputs are summarized at the end of the Fund’s Portfolio of Investments. The inputs or techniques used for valuing securities are not necessarily an indication of the risk associated with investing in those securities.
Pursuant to the Fund’s fair value procedures noted previously, equity securities (including exchange traded securities and other open-end regulated investment companies) and exchange traded derivatives are generally categorized as Level 1 securities in the fair value hierarchy. The Fund may utilize SIFVP which could result in certain equity securities being categorized as Level 2. Fixed income securities, non-exchange traded derivatives and money market instruments are generally categorized as Level 2 securities in the fair value hierarchy.
Investments for which there are no such quotations, or for which quotations do not appear reliable, are valued at fair value as determined in accordance with procedures established by and under the general supervision of the Trustees. These valuations are typically categorized as Level 2 or Level 3 securities in the fair value hierarchy.
Repurchase Agreements – Repurchase agreements are transactions in which the Fund buys a security from a dealer or bank and agrees to sell the security back at a mutually agreed upon time and price. The repurchase price exceeds the sale price, reflecting the Fund’s return on the transaction. It is the Fund’s policy to require the counterparty to a repurchase agreement to transfer to the Fund’s custodian or sub-custodian eligible securities or cash with a market value (after transaction costs) at least equal to the repurchase price to be paid under the repurchase agreement. The eligible securities are transferred to accounts with the custodian or sub-custodian in which the Fund holds a “securities entitlement” and exercise “control” as those terms are defined in the Uniform Commercial Code. The Fund has established procedures for monitoring the market value of the transferred securities and requiring the transfer of additional eligible securities, if necessary, to equal at least the repurchase price. These procedures also allow the counterparty to require securities to be transferred from the account to the extent that their market value exceeds the repurchase price or in exchange for other eligible securities of equivalent market value.
The insolvency of the counterparty or other failure to repurchase the securities may delay the disposition of the underlying securities or cause the Fund to receive less than the full repurchase price.
Repurchase agreements are entered into by the Fund under Master Repurchase Agreements (“MRA”) which permit the Fund, under certain circumstances including an event of default (such as bankruptcy or insolvency), to offset payables and/or receivables under the MRA with collateral held and/or posted to the counterparty and create one single net payment due to or from the Fund.
At April 30, 2021, the open repurchase agreements by counterparty which are subject to a MRA on a net payment basis are as follows:
| | | | | | | | | | | | | | | | | | | | | | | | | | | | | | | | | | | | | | | | | | | | |
| | | | | | | | | | | |
| Fund/Counterparty | | | | | Repurchase
Agreements | | | | | | | | | Fair Value of
Non-Cash
Collateral
Received(1) | | | | | | | | | Cash Collateral
Received(1) | | | | | | | | | Net Exposure(2) | |
Large-Cap Strategy Fund | | | | | | | | | | | | | | | | | | | | | | | | | | | | | | $ | — | | | | | | | | | | | $ | — | |
Bank of America Securities, Inc. | | | | | | $ | 416,338 | | | | | | | | | | | $ | 416,338 | | | | | | | | | | | | — | | | | | | | | | | | | — | |
BNP Paribas SA | | | | | | | 416,338 | | | | | | | | | | | | 416,338 | | | | | | | | | | | | — | | | | | | | | | | | | — | |
Daiwa Capital Markets America | | | | | | | 416,338 | | | | | | | | | | | | 416,338 | | | | | | | | | | | | — | | | | | | | | | | | | — | |
Deutsche Bank Securities, Inc. | | | | | | | 416,338 | | | | | | | | | | | | 416,338 | | | | | | | | | | | | — | | | | | | | | | | | | — | |
Morgan Stanley & Co. | | | | | | | 165,749 | | | | | | | | | | | | 165,749 | | | | | | | | | | | | — | | | | | | | | | | | | — | |
RBC Dominion Securities, Inc. | | | | | | | 416,338 | | | | | | | | | | | | 416,338 | | | | | | | | | | | | — | | | | | | | | | | | | — | |
| | | | | | | | | | | | | | | | | | | | | | | | | | | | | | | | | | | | | | | | | | | | |
| | | | | | $ | 2,247,439 | | | | | | | | | | | $ | 2,247,439 | | | | | | | | | | | $ | — | | | | | | | | | | | $ | — | |
| | | | | | | | | | | | | | | | | | | | | | | | | | | | | | | | | | | | | | | | | | | | |
| | (1) | The amount of collateral reflected in the table does not include any over-collateralization received by the Fund. |
| | (2) | Net exposure represents the receivable (payable) due from (to) the counterparty in the event of default. |
Investment Income, Gains and Losses, Expenses and Distributions – Interest income and expenses are accrued daily. Dividends and distributions to shareholders are recorded on the ex-dividend date. Non-cash dividends included in dividend income, if any, are recorded at fair value. Foreign dividends are recorded on the ex-dividend date or when the Fund is informed of the ex-dividend date. Investment transactions are accounted for on a trade date basis for financial reporting purposes. Realized gains and losses from investment transactions are recorded on an identified cost basis and includes proceeds from litigation, if any. Withholding taxes and, where appropriate, deferred withholding taxes on foreign interest, dividends and capital gains have been provided for in accordance with the applicable country’s tax rules and rates.
Expenses of the Trust, which are directly identifiable to a specific fund, are applied to that fund. Expenses which are not identifiable to a specific fund are allocated in such a manner as deemed equitable, taking into consideration the nature and type of expense.
Distributions from net realized gains, if any, are declared and paid to shareholders annually. Distributions from net investment income, if any, are declared and paid quarterly.
Real Estate Investment Trusts – The Fund may invest in real estate investment trusts (“REITs”) that involve risks not associated with investing in stocks. Risks include declines in the value of real estate, general and economic conditions, changes in the value of the underlying property and defaults by borrowers. The value of assets in the real estate industry may go through cycles of relative underperformance and outperformance in comparison to equity securities markets in general. Dividend income is recorded using management’s estimate of the income included in distributions received from REIT investments. The actual amounts of income, return of capital and capital gains are only
ANNUAL REPORT / April 30, 2021
| | |
| 23 | | NOTES TO FINANCIAL STATEMENTS (continued) |
determined by each REIT after its fiscal year-end and may differ from the estimated amount. Estimates of income are adjusted to the actual amounts when the amounts are determined.
Warrants and Rights – The Fund may hold warrants and rights acquired either through a direct purchase, including as part of private placement, or pursuant to corporate actions. Warrants and rights entitle the holder to buy a proportionate amount of common stock at a specific price and time through the expiration dates. Such warrants and rights are held as long positions by the Fund until exercised, sold or expired. Warrants and rights are valued at fair value in accordance with the Trustees’ approved fair value procedures.
Lending of Portfolio Securities – The Trust has entered into an agreement with its custodian whereby the custodian may lend securities owned by the Fund to brokers, dealers and other financial organizations. Any increase or decrease in the fair value of securities loaned and any interest or dividends earned on those securities during the term of the loan would be for the account of the Fund. In exchange for lending securities under the terms of the agreement with its custodian, the Fund receives a lender’s fee. Fees earned by the Fund on securities lending are recorded as income. Loans of securities by the Fund are collateralized by cash, U.S. government securities or money market instruments that are maintained at all times in an amount at least equal to the current market value of the loaned securities plus a margin which varies depending on the type of securities owned. The custodian establishes and maintains the collateral in a segregated account. The Fund has the right under the lending agreement to recover the securities from the borrower on demand. The market value of the loaned securities is deter- mined at the close of business of the Fund and any additional required collateral is delivered to the Fund on the next business day.
Under the terms of the agreement, cash collateral received is invested in one or more approved investments. Investments purchased with cash collateral are presented on the Portfolio of Investments under the caption “Cash Collateral Invested for Securities on Loan.”
The Fund maintains the risk of any loss on the securities on loan as well as the potential loss on investments purchased with cash collateral received from securities lending.
Securities lending transactions are entered into by the Fund under Master Securities Lending Agreements (“MSLA”) which permit the Fund, under certain circumstances including an event of default (such as bankruptcy or insolvency), to offset amounts payable by the Fund to the same counterparty against amounts to be received and create one single net payment due to or from the Fund.
At April 30, 2021, the securities loaned which are subject to a MSLA on a net payment basis are as follows:
| | | | | | | | | | | | | | | | | | | | | | | | | | | | | | |
| | | | | | | | |
| Fund | | | | | Value of
Securities
on Loan | | | | | | | | | Cash
Collateral
Received(1)
| | | | | | | | | Net
Exposure(2) |
Large-Cap Strategy Fund | | | | | | $ | 2,175,737 | | | | | | | | | | | $ | 2,175,737 | | | | | | | | | | | $— |
| | (1) | Collateral with a value of $2,247,439 has been received in connection with securities lending transactions. The amount of collateral reflected in the table does not include any over-collateralization received by the Fund. |
| | (2) | Net exposure represents the receivable (payable) due from (to) the counterparty in the event of default. |
| 3. | FEDERAL TAX INFORMATION |
No provision for federal income taxes has been made, as it is the Fund’s policy to comply with the Subchapter M provision of the Internal Revenue Code of 1986, as amended, and to distribute to shareholders each year all of its taxable income and realized gains.
The Fund files U.S. federal, state, and local tax returns as required. The Fund’s tax returns are subject to examination by the relevant tax authorities until expiration of the applicable statute of limitations, which is generally three years after the tax returns are filed. The Fund recognizes interest and penalties, if any, related to unrecognized tax benefits as income tax expense on the Statement of Operations. The Fund does not have any unrecognized tax benefits or uncertain tax positions that would require a provision for income tax. Accordingly, the Fund did not incur any interest or penalties for the year ended April 30, 2021.
The timing and character of income and capital gain distributions are determined in accordance with income tax regulations, which may differ from GAAP. These differences are primarily due to losses deferred due to wash sales. For financial reporting purposes, any permanent differences resulting from different book and tax treatment are reclassified between distributable earnings and paid-in capital in the period that the differences arise. Results of operations and net assets are not affected by these reclassifications. As of April 30, 2021, there were no such reclassifications.
The tax character of distributions for the corresponding fiscal year ends were as follows:
| | | | | | | | | | | | | | | | | | | | | | | | | | | | | | | | | | | | | | | | | | | | |
| | | | |
| | | | | | 2021 | | | | | | 2020 | |
| | | | | | | | | | | |
| Fund | | | | | Ordinary
Income* | | | | | | | | | Long-Term
Capital
Gains | | | | | | | | | Ordinary
Income* | | | | | | | | | Long-Term
Capital
Gains | |
Large-Cap Strategy Fund | | | | | | $ | 7,821,252 | | | | | | | | | | | $ | 40,790,918 | | | | | | | | | | | $ | 9,083,834 | | | | | | | | | | | $ | 20,462,055 | |
|
* For tax purposes, short-term capital gain distributions are considered ordinary income distributions. | |
April 30, 2021/ ANNUAL REPORT
| | |
| NOTES TO FINANCIAL STATEMENTS (continued) | | 24 |
As of April 30, 2021, the cost of investments for U.S. federal income tax purposes, the aggregate gross unrealized appreciation for all investments for which there was an excess of value over tax cost and the aggregate gross unrealized depreciation for all investments for which there was an excess of tax cost over value, were as follows:
| | | | | | | | | | | | | | | | |
| | | | |
| Fund | | Tax Cost | | | Tax
Unrealized
Appreciation | | | Tax
Unrealized
Depreciation | | | Net Tax
Unrealized
Appreciation/
(Depreciation) | |
Large-Cap Strategy Fund | | $ | 210,490,944 | | | $ | 416,117,474 | | | $ | (964,260 | ) | | $ | 415,153,214 | |
As of April 30, 2021, the components of distributable earnings on a tax basis were as follows:
| | | | | | | | | | | | | | |
| | | | | | | |
| Fund | | Undistributed
Ordinary Income | | Undistributed
Long-Term
Capital Gains | | Other
Timing
Differences | | Unrealized
Appreciation/
(Depreciation) | | Capital Loss
Carryforwards | | Late Year Loss
Deferrals | | Distributable
Earnings |
Large-Cap Strategy Fund | | $1,332,209 | | $15,734,901 | | $— | | $415,153,214 | | $— | | $— | | $432,220,324 |
| 4. | ADVISORY FEES, SERVICING FEES, AND OTHER SERVICE PROVIDERS |
Investment Advisor – Wilmington Funds Management Corporation (“WFMC” or the “Advisor”) serves as the Investment Advisor to the Fund. Wilmington Trust Investment Advisors, Inc. (“WTIA”) provides sub-advisory services to the Fund. WFMC and WTIA are wholly-owned subsidiaries of M&T Bank Corporation. For its services, the Fund pays WFMC an annual investment advisory fee, accrued daily and paid monthly, based on a percentage of the Fund’s average daily net assets as described below. WFMC, not the Fund, pays WTIA for its services.
| | | | |
| |
| Fund | | Advisory Fee
Annual Rate | |
Large-Cap Strategy Fund | | | 0.50 | % |
WFMC and the Fund’s distributor and shareholder service provider have contractually agreed to waive their fees and/or reimburse expenses through January 31, 2022 so that total annual fund operating expenses paid by the Fund (not including the effects of dividends or interest on short positions, acquired fund fees and expenses, taxes, or other extraordinary expenses expressed as an annualized percentage of average daily net assets), will not exceed 0.25% for the Fund’s Class I Shares. Neither WFMC nor the Fund’s distributor and shareholder service provider will recoup previously waived fees/expenses in subsequent years.
Administrative Fees – The Bank of New York Mellon (“BNYM”) provides the Trust with fund administration services. The fees as described in the table below are a component of “Portfolio accounting and administration fees” as disclosed in the Statement of Operations. WFMC, in its role as Co-Administrator, provides the Fund with certain administrative personnel and services necessary to operate the Fund. The fees as described in the table below are accrued daily and paid monthly, and are disclosed on the Statement of Operations as “Administration fees.”
| | | | | | |
| | |
| Administrator | | Maximum
Fee | | | Average Aggregate Daily Net
Assets of the Trust |
WFMC | | | 0.040 | % | | on the first $5 billion |
| | | 0.030 | % | | on the next $2 billion |
| | | 0.025 | % | | on the next $3 billion |
| | | 0.018 | % | | on assets in excess of $10 billion |
BNYM | | | 0.0175 | % | | on the first $15 billion |
| | | 0.0150 | % | | on the next $10 billion |
| | | 0.0125 | % | | on assets in excess of $25 billion |
WFMC and BNYM may voluntarily choose to waive any portion of their fee and can add, modify or terminate a voluntary wavier at any time at their sole discretion. Neither WFMC nor BNYM will recoup previously waived fees/expenses in subsequent years. For the year ended April 30, 2021, neither WFMC nor BNYM waived any administrative fees.
Shareholder Services Fee – Pursuant to a Shareholder Services Plan adopted by the Fund and administered by ALPS Distributors, Inc. (“ALPS”), prior to January 31, 2021, the Fund could pay up to 0.25% of the average daily net assets of the Fund’s Class I shares to financial intermediaries (including ALPS, the Advisor or their affiliates) for providing shareholder services and maintaining shareholder accounts. M&T Securities, Inc., Manufacturers and Traders Trust and Company, and Wilmington Trust, NA (together “M&T”) has entered into a Shareholders Services Agreement with ALPS, under which it is entitled to receive up to 0.25% of the average daily net assets of the Fund’s shares for whom M&T provides shareholder services. The Fund may reduce the maximum amount of shareholder service fees it pays from time to time at its sole discretion. In addition, a financial intermediary (including M&T) may waive or reduce any fees to which they are entitled.
ANNUAL REPORT / April 30, 2021
| | |
| 25 | | NOTES TO FINANCIAL STATEMENTS (continued) |
Effective January 31, 2021, the Class I Shares of the Fund were removed from the Shareholder Services Plan. Accordingly, the 0.25% shareholder servicing fee was no longer charged to Class I shares after that date. For the year ended April 30, 2021, no affiliates of the Advisor received these fees.
Other Service Providers – Foreside Management Services, LLC (“FMS”) provides a Principal Executive Officer and Principal Financial Officer to the Trust. FMS has no role in determining the investment policies or which securities are to be sold or purchased by the Trust or its funds.
BNYM provides custody services to the Trust.
BNY Mellon Investment Servicing (U.S.) Inc. provides fund accounting and transfer agency services to the Trust.
General – Certain Trustees and Officers of the Trust are also Officers or employees of the above companies that provide services to the Fund, and during their terms of office, receive no compensation from the Fund. The Trust’s Statement of Additional Information includes additional information about the Trustees.
Other Affiliated Parties and Transactions – Affiliated holdings are securities and mutual funds which are managed by the Advisor or an affiliate of the Advisor or which are distributed by an affiliate of the Fund’s distributor. Transactions with affiliated companies during the year ended April 30, 2021 are as follows:
| | | | | | | | | | | | | | | | | | | | | | | | | | | | | | | | | | | | |
| | | | | | | | | |
/ Affiliated Investment Name | | Value
4/30/20 | | | Purchases | | | Sales | | | Net
Realized
Gain/
(Loss) | | | Net Change
in Unrealized
Appreciation/
Depreciation | | | Value
4/30/21 | | | Number of
Shares
4/30/21 | | | Dividend
Income | | | Capital Gain
Distributions | |
Large-Cap Strategy Fund | | | | | | | | | | | | | | | | | | | | | | | | | | | | | | | | | | | | |
| | | | | | | | | |
Common Stock -0.0%* | | | | | | | | | | | | | | | | | | | | | | | | | | | | | | | | | | | | |
M&T Bank Corp. | | $ | 180,449 | | | $ | — | | | $ | — | | | $ | — | | | $ | 73,432 | | | $ | 253,881 | | | | 1,610 | | | $ | 5,313 | | | $ | — | |
| | | | | | | | | | | | | | | | | | | | | | | | | | | | | | | | | | | | |
| | * | As a percentage of Net Assets as of April 30, 2021. |
The Fund may execute trades for security purchase and sale transactions through brokers that are affiliates of the Advisor or sub-advisors. Commissions paid on those trades for the year ended April 30, 2021 were as follows:
| | | | |
| |
| Fund | | Commissions | |
Large-Cap Strategy Fund | | $ | 23,721 | |
| 5. | INVESTMENT TRANSACTIONS |
Purchases and sales of securities for the Fund (excluding U.S. Government and agency securities and short-term securities) during the year ended April 30, 2021 were $72,791,796 and $123,946,423, respectively.
Market risk is the risk that one or more markets in which a Fund invests will go down in value, including the possibility that the markets will go down sharply and unpredictably. The value of a security or other asset may decline due to changes in general market conditions, economic trends or events that are not specifically related to the issuer of the security or other asset, or factors that affect a particular issuer or issuers, exchange, country, group of countries, region, market, industry, group of industries, sector or asset class. Local, regional or global events such as war, acts of terrorism, the spread of infectious illnesses or other public health issues, recessions, natural disasters or other events could have a significant impact on the Fund and its investments.
Recently, the global pandemic outbreak of an infectious respiratory illness caused by a novel coronavirus known as COVID-19 has resulted in substantial market volatility and global business disruption, impacting the global economy and the financial health of individual companies in significant and unforeseen ways. The duration and future impact of COVID-19 are currently unknown, which may exacerbate other types of risks that apply to the Fund and negatively impact Fund performance.
| 7. | CONTRACTUAL OBLIGATIONS |
In the normal course of business, the Fund may enter into contracts that provide general indemnifications. The Fund’s maximum exposure under these arrangements is dependent on claims that may be made against the Fund in the future, and, therefore, cannot be estimated; however, based on experience, the risk of material loss from such claims is considered remote.
April 30, 2021 / ANNUAL REPORT
| | |
| NOTES TO FINANCIAL STATEMENTS (continued) | | 26 |
The Trust participates in a $10,000,000 unsecured, committed revolving line of credit (“LOC”) agreement with BNYM, which was renewed effective April 1, 2021. The LOC is available for extraordinary or emergency purposes, primarily for financing redemption payments. Borrowings are charged interest at a rate of 1.25% per annum over the greater of the Federal Funds Rate or the one month London Interbank Offered Rate (“LIBOR”). The LOC includes a commitment fee of 0.20% per annum on the daily unused portion. Prior to April 1, 2021, the commitment fee was of 0.15% per annum on the daily unused portion. The LOC expires on March 31, 2022.
The Trust did not utilize the LOC during the year ended April 30, 2021.
| 9. | RECENT ACCOUNTING PRONOUNCEMENTS |
In August 2018, FASB issued an Accounting Standards Update 2018-13 (“ASU 2018-13”), which changes certain fair value measurement disclosure requirements. ASU 2018-13, in addition to other modifications and additions, removes the requirement to disclose the amount and reasons for transfers between Level 1 and Level 2 of the fair value hierarchy, the policy for the timing of transfers between levels and the valuation process for Level fair value measurements. ASU 2018-13 is effective for fiscal years, and interim periods within those fiscal years, beginning after December 15, 2019. As of April 30, 2021, ASU 2018-13 has been fully adopted and the implementation did not have a material impact on the Fund’s financial statements.
Management has evaluated events and transactions for potential recognition or disclosure in the financial statements through the date the financial statements were issued. Management has determined that there are no material events that would require recognition or disclosure in the Fund’s financial statements through this date.
ANNUAL REPORT / April 30, 2021
REPORT OF INDEPENDENT REGISTERED PUBLIC ACCOUNTING FIRM
To the Board of Trustees of Wilmington Funds and Shareholders of Wilmington Large-Cap Strategy Fund
Opinion on the Financial Statements
We have audited the accompanying statement of assets and liabilities, including the portfolio of investments, of Wilmington Large-Cap Strategy Fund (one of the funds constituting Wilmington Funds, referred to hereafter as the “Fund”) as of April 30, 2021, the related statement of operations for the year ended April 30, 2021, the statements of changes in net assets for each of the two years in the period ended April 30, 2021, including the related notes, and the financial highlights for each of the two years in the period ended April 30, 2021 (collectively referred to as the “financial statements”). In our opinion, the financial statements present fairly, in all material respects, the financial position of the Fund as of April 30, 2021, the results of its operations for the year then ended, the changes in its net assets for each of the two years in the period ended April 30, 2021 and the financial highlights for each of the two years in the period ended April 30, 2021 in conformity with accounting principles generally accepted in the United States of America.
The financial statements of the Fund as of and for the year ended April 30, 2019 and the financial highlights for each of the periods ended on or prior to April 30, 2019 (not presented herein, other than the financial highlights) were audited by other auditors whose report dated June 27, 2019 expressed an unqualified opinion on those financial statements and financial highlights.
Basis for Opinion
These financial statements are the responsibility of the Fund’s management. Our responsibility is to express an opinion on the Fund’s financial statements based on our audits. We are a public accounting firm registered with the Public Company Accounting Oversight Board (United States) (PCAOB) and are required to be independent with respect to the Fund in accordance with the U.S. federal securities laws and the applicable rules and regulations of the Securities and Exchange Commission and the PCAOB.
We conducted our audits of these financial statements in accordance with the standards of the PCAOB. Those standards require that we plan and perform the audit to obtain reasonable assurance about whether the financial statements are free of material misstatement, whether due to error or fraud.
Our audits included performing procedures to assess the risks of material misstatement of the financial statements, whether due to error or fraud, and performing procedures that respond to those risks. Such procedures included examining, on a test basis, evidence regarding the amounts and disclosures in the financial statements. Our audits also included evaluating the accounting principles used and significant estimates made by management, as well as evaluating the overall presentation of the financial statements. Our procedures included confirmation of securities owned as of April 30, 2021 by correspondence with the custodian, transfer agent and brokers; when replies were not received from brokers, we performed other auditing procedures. We believe that our audits provide a reasonable basis for our opinion.
/s/ PricewaterhouseCoopers LLP
Philadelphia, Pennsylvania
June 24, 2021
We have served as the auditor of one or more investment companies in Wilmington Funds since 2019.
April 30, 2021 / ANNUAL REPORT
FEDERAL TAX INFORMATION (UNAUDITED)
Complete information regarding the tax status of distributions will be reported on Forms 1099.
Of the ordinary income (including short-term capital gain) distributions made by the Fund during the fiscal year ended April 30, 2021, the Fund designates the following percentage, or such greater percentage that constitute the maximum amount allowable pursuant to Code Sections Section 243 and 854(b)(2), as qualifying for the corporate dividends received deduction:
| | | | |
| |
| Fund | | | |
Large-Cap Strategy Fund | | | 93.12 | % |
For the fiscal year ended April 30, 2021, the Fund designates the following percentage of the ordinary income dividends, or such greater percentage that constitute the maximum amount allowable pursuant to Code Sections 1(h)(11) and 854(b)(2), as qualified dividend income which may be subject to a maximum rate of federal income tax of 20%:
| | | | |
| |
| Fund | | | |
Large-Cap Strategy Fund | | | 100.00 | % |
If the Fund meets the requirements of Section 853 of the Code, the Fund will pass through to shareholders credits of foreign taxes paid.
ANNUAL REPORT / April 30, 2021 (unaudited)
BOARD OF TRUSTEES AND TRUST OFFICERS
The following tables give information about each Trustee and the senior officers of the Trust. The tables separately list Trustee members who are “interested persons” of the Fund (i.e., “Interested” Trustees) and those who are not (i.e., “Independent” Trustees). The Trust is comprised of 12 funds. Unless otherwise noted, the business address of each Trustee and senior officer is 1100 North Market Street, 9th Floor, Wilmington, DE 19890. Each Trustee oversees all portfolios of the Trust and serves for an indefinite term. The Trust’s Statement of Additional Information includes additional information about the Trustees and is available, without charge and upon request, by calling 1-800-836-2211.
INTERESTED TRUSTEES BACKGROUND
| | |
| |
Name Birth Year Position with Trust Date Service Began | | Principal Occupations and Other Directorships Held for Past Five Years |
| |
Dominick J. D’Eramo* Birth year: 1964 TRUSTEE Began serving: November 2018 PRESIDENT Began serving: June 2018 | | Principal Occupations: Senior Vice President, Wilmington Trust Investment Advisors, Inc. and Head of Fixed Income. Previous Positions: Group Vice President, Wilmington Trust Investment Advisor, Inc. (WTIA) (2014-2017); Administrative Vice President, WTIA (2012-2014). |
| * | Dominick J. D’Eramo is “interested” due to his employment with WTIA and his position with WFMC, investment Advisors to the Funds. |
INDEPENDENT TRUSTEES BACKGROUND
| | |
| |
Name Birth Year Position with Trust Date Service Began | | Principal Occupations and Other Directorships Held for Past Five Years |
| |
Nicholas A. Giordano Birth year: 1943 CHAIRMAN and TRUSTEE Began serving: March 2012 | | Principal Occupations: Consultant, financial services organizations (1997 to present). Other Directorships Held: The RBB Fund Inc. (34 portfolios) (registered investment companies); Independence Blue Cross; IntriCon Corporation (body-worn products). Previous Positions: Director, Kalmar Pooled Investment Trust (through 6/17). |
| |
Robert H. Arnold Birth year: 1944 TRUSTEE Began serving: March 2012 | | Principal Occupations: Managing Director, R.H. Arnold & Co, Inc. (financial management consulting) (6/89 to present). Other Directorships Held: None. Previous Positions: Trustee, First Potomac Realty Trust (real estate investment trust) (5/03 to 12/17); Director, Treasury Strategies, Inc. (private treasury consulting services) (6/01 to 6/16). |
| |
Gregory P. Chandler Birth year: 1966 TRUSTEE Began serving: July 2017 | | Principal Occupations: Chief Financial Officer, Avocado Systems, Inc. (cybersecurity software) (3/20 to present); President, GCVC Consulting (financial and corporate governance advisory) (2008 to present). Other Directorships Held: Trustee, RBB Fund Series Trust (34 portfolios) (registered investment companies) (2012 to present); Trustee, FS Energy Partners (business development company) (2009 to present); Director, Emtec, Inc. (2005 to 2019); Director, FS Investment Corporation (business development company) (2007 to 2019); Previous Positions: Chief Financial Officer, Emtec, Inc. (information technology services) (2009 to 2020); Managing Director, Janney Montgomery Scott LLC (investment banking) (1999 to 2009); Consulting Manager, PwC (1997 to 1999); Manager, Business Assurance, Coopers & Lybrand (audit services) (1995 – 1997) |
April 30, 2021 (unaudited) / ANNUAL REPORT
| | |
| BOARD OF TRUSTEES AND TRUST OFFICERS | | 30 |
| | |
| |
Name Birth Year Position with Trust Date Service Began | | Principal Occupations and Other Directorships Held for Past Five Years |
| |
Donald E. Foley Birth year: 1951 TRUSTEE Began serving: December 2015 | | Principal Occupations: Director, BioSig Technologies (2015 to present); Trustee, AXA Premier VIP Trust (2017 to present); Trustee, EQ Advisors Trust (2014 to present); Trustee, 1290 Funds (retail funds) (2014 to present); Chairman and Director, Burke Rehabilitation Hospital Foundation (private hospital, research institute) (2005 to present); Trustee and Chairman of the President’s Council, Union College (private college) (2011 to present); Chairman and Trustee, New Beginning Family Academy (elementary charter school) (2016 to present). Other Directorships Held: Director, M&T Bank Corporation (commercial bank) (2011 to 2012); Chairman and Director, Wilmington Trust Corporation (commercial and trust bank) (2007 to 2011). Previous Positions: Advisory Member, Trust and Investment Committee, M&T Bank, Wilmington Trust, National Association, and Wilmington Trust Company (through 2016); Chairman and Chief Executive Officer of Wilmington Trust Corporation (2010 to 2011). |
| |
Valerie J. Sill Birth year: 1962 TRUSTEE Began serving: April 2020 | | Principal Occupations: President, Chief Executive Officer and Chief Investment Officer, DuPont Capital Management (asset management) (2004 to present). Other Directorships Held: Trustee, Longwood Gardens (2005 to present); Trustee of the Christiana Care Health System (2012 to present); and Advisory Counsel, Federal Reserve Bank of Philadelphia’s Economic Advisory Council (2010 to 2013). Previous Positions: Executive Vice President at The Boston Company (1994 to 2004). |
OFFICERS
| | |
| |
Name Birth Year Positions with Trust | | Principal Occupations for Past Five Years and Previous Positions |
| |
John C. McDonnell Birth year: 1966 CHIEF OPERATIONS OFFICER Began serving: June 2017 VICE PRESIDENT Began serving: June 2012 | | Principal Occupations: Chief Operations Officer, Wilmington Funds; Administrative Vice President, Wilmington Funds Management Corporation (2005 to present); Administrative Vice President, Wilmington Trust Investment Advisors, Inc. (2012 to present). Previous Positions: Vice President, Wilmington Trust Investment Management, LLC (2005 to 2012). |
| |
Lisa Druelinger Birth year: 1978 CHIEF COMPLIANCE OFFICER and AML COMPLIANCE OFFICER. Began serving: November 2017 | | Principal Occupations: Chief Compliance Officer and Anti-Money Laundering Officer, Wilmington Funds; Administrative Vice President, M&T Bank. Previous Positions: Vice President and Senior Compliance Officer, Wilmington Trust Investment Advisors, Inc. (2015-2017); Wilmington Funds Product Manager, Wilmington Trust Investment Advisors, Inc. (2013-2015); Institutional and Retirement Services Product Manager, Wilmington Trust (2011-2013); Trust Compliance and Risk Management at M&T Bank (2006-2011). |
| |
John J. Kelley Birth year: 1959 VICE PRESIDENT Began serving: December 2016 | | Principal Occupations: President of Wilmington Funds Management Corporation; Group Vice President and Chief Administrative Officer, Wilmington Trust Investment Advisors, Inc. Previous Positions: Vice President, BNY Mellon Investment Servicing (formerly, PNC Global Investment Servicing) from (1/05 to 7/05); Vice President of Administration, 1838 Investment Advisors, LP (1999 to 2005); Chief Compliance Officer, 1838 Investment Advisors, LP (2004 to 2005). |
ANNUAL REPORT / April 30, 2021 (unaudited)
| | |
| 31 | | BOARD OF TRUSTEES AND TRUST OFFICERS |
| | |
| |
Name Birth Year Positions with Trust | | Principal Occupations for Past Five Years and Previous Positions |
| |
Robert L. Tuleya Birth year: 1974 VICE PRESIDENT and ASSISTANT SECRETARY Began serving: September 2018 | | Principal Occupations: Vice President and Assistant Secretary, Wilmington Funds; Vice President and Assistant Secretary, Wilmington Funds Management Corporation (2018 to present); Vice President and Assistant Secretary, Wilmington Trust Investment Advisors, Inc. (2018 to present); Vice President and Assistant Secretary, Wilmington Trust Investment Management, LLC (2018 to present); Vice President and Assistant General Counsel, M&T Bank (2018 to present). Previous Positions: Vice President and Counsel, M&T Bank (2017 to 2018); Senior Counsel, PNC Bank (2014 to 2017). |
| |
Christopher W. Roleke 10 High Street, Suite 302 Boston, MA 02110 Birth year: 1972 CHIEF EXECUTIVE OFFICER Began serving: October 2020 | | Principal Occupation: Managing Director and Fund Principal Financial Officer, Foreside Management Services, LLC (2011 to present). Previous Positions: Assistant Vice President, JP Morgan Investor Services Co. (2006 to 2011). |
| |
Arthur W. Jasion Three Canal Plaza, Suite 100 Portland, ME 04101 Birth year: 1965 CHIEF FINANCIAL OFFICER AND TREASURER Began serving: October 2020 | | Principal Occupation: Senior Director and Fund Principal Financial Officer, Foreside Management Services, LLC (2020 to present). Previous Positions: Partner, Ernst &Young LLP (2012 to 2020). |
| |
Lisa R. Grosswirth 240 Greenwich Street, 22nd Floor New York, NY 10286 Birth year: 1963 SECRETARY Began serving: September 2007 | | Principal Occupation: Vice President, BNY Mellon Asset Servicing (2004 to present). Previous Positions: Supervisory Paralegal, The Dreyfus Corporation (1998 to 2004). |
April 30, 2021 (unaudited) / ANNUAL REPORT
Board Approval of Liquidity Risk Management Program
To promote effective liquidity risk management throughout the fund industry and to enhance disclosure regarding fund liquidity and redemption practices, the Securities and Exchange Commission (the “Commission”) adopted Rule 22e-4 under the Investment Company Act of 1940, as amended. The rule requires every registered open-end management company to establish a liquidity risk management program that, among other things, provides for the assessment, management and review of liquidity risk, the classification of a fund’s portfolio investments into one of four liquidity buckets based upon the number of days that such investments may reasonably be expected to be converted into cash or otherwise disposed of without significantly impacting their price, the establishment of a highly liquid investment minimum where required, and the establishment of a 15% limitation on illiquid investments. Additionally, the Commission adopted Rule 30b1-10 and Form N-LIQUID, which generally requires a fund to notify the Commission when certain liquidity-related events occur.
The Wilmington Funds Board of Trustees (the “Board”) approved the appointment of the Funds’ Liquidity Risk Management Committee (“Liquidity Committee”) as the administrator of the liquidity risk management program (the “LRMP”) for the Funds on September 6, 2018 and the Funds’ final LRMP on March 5, 2019. At the regular meeting of the Board on March 10, 2021, the Trust’s Chief Operations Officer, as a member of the Liquidity Committee, provided a report to the Board on the operation and effectiveness of the LRMP for the year of operation ending December 31, 2020. The Liquidity Committee managed liquidity risks associated with the Funds’ investments by monitoring cash and cash equivalents, the use of derivatives, the concentration of investments and the appropriateness of portfolio strategies for open-end funds, and by classifying each investment of a Fund as either highly liquid, moderately liquid, less liquid or illiquid on at least a monthly basis. To assist with the classification of each Fund’s investments, the Liquidity Committee utilized a third party provider of liquidity monitoring services. The Liquidity Committee supplied portfolio-level data and certain assumptions to the provider which then used the information to determine the liquidity classification of each security position held by the Funds. The liquidity classifications as of each month end were reviewed by the Liquidity Committee on at least a quarterly basis and would be reviewed more often if market conditions warranted. For assets managed by a third party sub-adviser the Liquidity Committee would take sub-adviser input into account where appropriate in determining the liquidity classifications.
The LRMP effectively managed the Funds’ liquidity risks for the twelve month period ended April 30, 2021. During this period, each Fund held more than 50% of its total net assets in highly liquid investments and due to the fact that each Fund is deemed to consist primarily of highly liquid investments, no highly liquid investment minimum was required to be established for any Fund. All Funds holding assets deemed to be illiquid were well under the illiquid investment limitation. Additionally, no events occurred that required the filing of Form N-LIQUID.
ANNUAL REPORT / April 30, 2021 (unaudited)
Shares of the Wilmington Funds are not FDIC insured or otherwise protected by the U.S. government, are not deposits or other obligations of, or guaranteed by, Manufacturers and Traders Trust Company, and are subject to investment risks, including possible loss of the principal amount invested.
VOTING PROXIES ON FUND PORTFOLIO SECURITIES
A description of the policies and procedures that the Funds use to determine how to vote proxies relating to securities held in the Funds’ portfolios is available, without charge and upon request, by calling 1-800-836-2211. A report on how the Funds voted any such proxies during the most recent 12-month period ended June 30 is available through Wilmington Funds’ website. Go to www.wilmingtonfunds.com select “Proxy Voting Record” to access the link. This information is also available from the Edgar database on the SEC’s website at www.sec.gov.
QUARTERLY PORTFOLIO SCHEDULE
The Fund files a complete schedule of portfolio holdings with the SEC for the first and third quarters of each fiscal year as an exhibit to its reports on Form N-PORT. Form N-PORT is available on the SEC’s website at www.sec.gov.
Important information about the access and delivery of shareholder reports
Beginning on June 1, 2021, as permitted by regulations adopted by the Securities and Exchange Commission, paper copies of your Fund’s shareholder reports will no longer be sent to you by mail, unless you specifically request them. You will be notified by mail each time a report is posted on the Funds’ website and you will be provided with a link to access the report.
If you have already elected to receive shareholder reports electronically, you will not be affected by this change and you do not need to take any action. You may elect to receive other communications electronically from the Fund by contacting your financial intermediary or, if you hold shares directly with the Fund, by calling 1-800-836-2211.
You may elect to receive paper copies of all future shareholder reports free of charge. If you own these shares through a financial intermediary, you may contact your financial intermediary to elect to receive paper copies of your shareholder reports. If you are a direct investor you can inform the Wilmington Funds that you wish to continue receiving paper copies of your shareholder reports by contacting us at 1-800-836-2211. Your election to receive paper reports will apply to all funds held directly with Wilmington Funds and may apply to all funds held with your financial intermediary.
April 30, 2021 (unaudited) / ANNUAL REPORT
PRIVACY POLICY AND NOTICE
OF THE FUNDS AND THEIR DISTRIBUTOR
June 8, 2012
The Wilmington Funds, their distributor and their agents (referred to as “the Funds”, “we” or “us”) recognize that consumers (referred to as “you” or “your”) expect us to protect both your assets and financial information. We respect your right to privacy and your expectation that all personal information about you or your account will be maintained in a secure manner. We are committed to maintaining the confidentiality, security and integrity of client and shareholder information. We want you to understand the Funds’ policy that governs the handling of your information, how the Funds gather information, how that information is used and how it is kept secure.
Information The Funds Collect:
The Funds collect nonpublic personal information about you from the following sources:
| | • | We may receive information from you, or from your financial representative, on account applications, other forms or electronically (such as through the Funds’ website or other electronic trading mechanisms). Examples of this information include your name, address, social security number, assets and income. |
| | • | We may receive information from you, or from your financial representative, through transactions with us or others, correspondence and other communications. Examples of this information include specific investments and your account balances. |
| | • | We may obtain other personal information from you in connection with providing you a financial product or service. Examples of this information include depository, debit or credit account numbers. |
Information Sharing Policy:
The Funds may share nonpublic personal information about you, as described above, with financial or non-financial companies or other entities, including companies that may be affiliated with the Funds and other nonaffiliated third parties, for the following purposes:
| | • | We may share information when it is necessary and required to process a transaction or to service a customer relationship. For example, information may be shared with a company that provides account record keeping services or a company that provides proxy services to shareholders. |
| | • | We may share information when it is required or permitted by law. For example, information may be shared in response to a subpoena or to protect you against fraud or with someone who has established a legal beneficial interest, such as a power of attorney. |
| | • | We may disclose some or all of the information described above to companies that perform marketing or other services on our behalf. For example, we may share information about you with the financial intermediary (bank, investment bank or broker-dealer) through whom you purchased the Funds’ products or services, or with providers of marketing, legal, accounting or other professional services. The Funds will not, however, disclose a consumer’s account number or similar form of access number or access code for credit card, deposit or transaction accounts to any nonaffiliated third party for use in telemarketing, direct mail or other marketing purposes. |
Except as described above, the Funds do not share customer information. We will not rent, sell, trade, or otherwise release or disclose any personal information about you. Any information you provide to us is for the Funds’ use only. If you decide to close your account(s) or become an inactive customer, we will adhere to the privacy policies and practices as described in this notice.
Information Security:
When the Funds share nonpublic customer information with third parties hired to facilitate the delivery of certain products or services to our customers, such information is made available for limited purposes and under controlled circumstances designed to protect our customers’ privacy. We require third parties to comply with our standards regarding security and confidentiality of such information. We do not permit them to use that information for their own or any other purposes, or rent, sell, trade or otherwise release or disclose the information to any other party. These requirements are reflected in written agreements between the Funds and the third party service providers.
The Funds protect your personal information in several ways. We maintain physical, electronic, and procedural safeguards to guard your nonpublic personal information. In addition, the Funds’ Transfer Agent and Shareholder Servicing Agent have procedures in place for the appropriate disposal of nonpublic personal information when they are no longer required to maintain the information.
Each of the following sections explains an aspect of the Funds’ commitment to protecting your personal information and respecting your privacy.
Employee Access to Information:
Our Code of Ethics, which applies to all employees, restricts the use of customer information and requires that it be held in the strictest of confidence. Employee access to customer information is authorized for business purposes only, and the degree of access is based on the sensitivity of the information and on an employee’s or agent’s need to know the information in order to service a customer’s account or comply with legal requirements.
Visiting The Funds’ Website:
The Funds’ website gathers and maintains statistics about the number of visitors as well as what information is viewed most frequently. This information is used to improve the content and level of service we provide to our clients and shareholders.
| | • | Information or data entered into a website will be retained. |
ANNUAL REPORT / April 30, 2021 (unaudited)
| | • | Where registration to a website or re-entering personal information on a website is required, “cookies” are used to improve your online experience. A cookie is a way for websites to recognize whether or not you have visited the site before. It is a small file that is stored on your computer that identifies you each time you re-visit our site so you don’t have to resubmit personal information. Cookies provide faster access into the website. |
| | • | We may also collect non-personally identifiable Internet Protocol (“IP”) addresses for all other visitors to monitor the number of visitors to the site. These non-personally identifiable IP addresses are never shared with any third party. |
E-mail:
If you have opted to receive marketing information from the Funds by e-mail, it is our policy to include instructions in all marketing messages on how to unsubscribe from subsequent e-mail programs. Some products or services from the Funds are intended to be delivered and serviced electronically. E-mail communication may be utilized in such cases. If you participate in an employer-sponsored retirement plan administered by the Funds, we may, at your employer’s request, send you e-mail on matters pertaining to the retirement plan.
Please do not provide any account or personal information such as social security numbers, account numbers, or account balances within your e-mail correspondence to us. We cannot use e-mail to execute transaction instructions, provide personal account information, or change account registration. We can, however, use e-mail to provide you with the necessary forms or you may contact customer service toll-free at 1-800-836-2211.
Surveys/Aggregate Data:
Periodically, the Funds may conduct surveys about financial products and services or review elements of customer information in an effort to forecast future business needs. The Funds then generate reports that include aggregate data regarding its customers. Aggregate data classifies customer information in various ways but that does not identify individual customers. These reports may also include information on website traffic patterns and related information. These reports are used for the Funds’ planning, statistical and other corporate purposes. Aggregate data may also be shared with external parties, such as marketing organizations. However, no information is shared by which any individual customer could be identified.
Changes to Our Privacy Statement:
The effective date of this policy is June 8, 2012. We reserve the right to modify this policy at any time. When it is revised or materially changed, we will update the effective date. You can determine whether there have been changes since the last time you reviewed by simply checking the effective date.
Notice will be provided to you in advance of any changes that would affect your rights under this policy statement.
April 30, 2021 (unaudited) / ANNUAL REPORT
[This Page Intentionally Left Blank]
WILMINGTON
FUNDS
April 30, 2021
PRESIDENT’S MESSAGE AND
Annual Report
WILMINGTON FUNDS
Fixed Income Funds
Wilmington Broad Market Bond Fund
Wilmington Intermediate-Term Bond Fund
Wilmington Short-Term Bond Fund
Wilmington Municipal Bond Fund
Wilmington New York Municipal Bond Fund

Wilmington Broad Market Bond Fund (“Broad Market Bond Fund”)
Wilmington Intermediate-Term Bond Fund (“Intermediate-Term Bond Fund”)
Wilmington Short-Term Bond Fund (“Short-Term Bond Fund”)
Wilmington Municipal Bond Fund (“Municipal Bond Fund”)
Wilmington New York Municipal Bond Fund (“New York Municipal Bond Fund”)

[This Page Intentionally Left Blank]
PRESIDENT’S MESSAGE (unaudited)
Esteemed Shareholder:
I am pleased to present the Annual Report of the Wilmington Funds (the “Trust”), covering the Trust’s annual fiscal year of May 1, 2020, through April 30, 2021. Inside you will find a comprehensive review of the Trust’s holdings and financial statements.
The economy and financial markets in review
Wilmington Funds Management Corporation and Wilmington Trust Investment Advisors, Inc. (the Trust’s investment advisor and subadvisor, respectively), have provided the following review of the economy, bond markets, and stock markets for the Trust’s annual fiscal year.
The economy
The last year was one for the history books and captured both the worst of the COVID-19 pandemic’s impact on global output, as well as the early stages of recovery as vaccines and unprecedented volumes of fiscal and monetary stimulus helped the global economy get back on its feet. The U.S. began the period with one of the steepest quarterly declines on record in Q2 2020 as strict lockdown measures imposed to contain the virus abruptly brought in-person activity to a near halt.
The pace and magnitude of the economic rebound that followed was comparably profound as the approval and distribution of highly effective vaccines and rising COVID-19 vaccination rates across the world in 2021 provided investors with a much-needed light at the end of the tunnel. The federal government’s provision of direct checks to many Americans and extended unemployment benefits padded consumer savings, more than offsetting wages lost by low income consumers, and helped to fuel a robust rebound in spending on goods. Spending on services, which depends more on in person interaction, has still yet to recover to pre-pandemic levels but showed signs of picking up in 1Q 2021 as a growing number of states peeled back virus restrictions. The labor market recovered considerably in the period, as the unemployment rate dropped from 14.7% in April 2020, the highest observed since the Great Depression, to 6.1% one year later. The Federal Reserve (the “Fed”) upgraded its outlook for economic activity and inflation, but still guided for rates to remain near zero for years to come and for monthly purchases of treasuries and mortgage-backed securities to continue for the time being.
Economic activity outside the U.S. varied between regions depending on the success of virus containment and vaccination efforts. The eurozone was bogged down by weakness in the services sector for much of the period. Gross Domestic Product (“GDP”) growth contracted in the region for a second consecutive quarter in 1Q 2021 as many of the largest economies kept tight mobility restrictions in place in response to a resurgence of infections and the looming threat of new virus variants. However, notable strength on the industrial side of the economy provided some offset as manufacturing activity benefitted from strength in global goods demand. After a rocky start, vaccination efforts in many European countries began to accelerate in March and April of 2021 paving the way for renewed reopening efforts.
The virus remained a persistent threat for many developing economies, where vaccination campaigns broadly lagged the developed world by a substantial margin. Brazil and India in particular, emerged as virus epicenters in early 2021 after witnessing sharp spikes in infection rates, providing a grim reminder of the need for vaccination efforts to broaden in the emerging world. China was first in and first out of the COVID-19 pandemic after controlling infection rates more effectively and far earlier than most countries and was the only major economy to record positive GDP growth in 2020. Chinese manufacturing activity expanded at a feverish pace for much of the period, benefitting from goods exports and government investment. The services side of the economy lagged but began to narrow the gap later in the period as a brief rise in virus cases was brought under control.
Bond markets
Fixed income performance was mixed over the past year as spreads compressed materially across taxable and tax-exempt credit from extreme levels recorded in early 2020. However, rising long-term rates served as a headwind later in the period. The U.S. 10-year Treasury yield surged over 80 basis points1 in 1Q 2021 for its largest quarterly rise since 2016, buttressed by an improving growth outlook and expectations for higher inflation later in the year. Upward rate pressure weighed heavily on investment grade taxable bonds, as the Bloomberg Barclays U.S. Aggregate Bond Index suffered its worst quarter in several decades in 1Q, more than offsetting gains booked in much of 2020. In investment grade, tax-exempt held up better than taxable peers as strong demand for yield offset more muted new supply, helping to overshadow the rise in rates. Municipals also benefitted from the American Recovery Plan passed by the federal government in March 2021, which included $350 billion of funding for state and local governments. High-yield credit outperformed investment grade in both the taxable and tax-exempt spaces substantially as spreads continued to normalize from more elevated levels, and investors embraced riskier assets.
PRESIDENT’S MESSAGE / April 30, 2021 (unaudited)
For the 12-month period May 1, 2020 to April 30, 2021, certain Bloomberg Barclays indices performed as follows:2
| | | | | | | | |
| | | | |
Bloomberg Barclays U.S. Treasury Bond Index3 | | Bloomberg
Barclays U.S. Aggregate Bond Index4 | | Bloomberg
Barclays U.S. Credit Bond Index5 | | Bloomberg
Barclays Municipal Bond Index6 | | Bloomberg
Barclays U.S.
Corporate High Yield
Bond Index7 |
| | | | |
-4.32% | | -0.27% | | 4.25% | | 7.75% | | 19.67% |
Past performance is no guarantee of future results. Short-term performance may not be indicative of long-term results.
Source: Lipper. You cannot invest directly in an index.
Equity markets
Global equities recorded historically strong performance over the past 12-months as concerns over the initial spread of COVID-19 gave way to optimism over the pace of subsequent recovery. After suffering a -33% market rout in February and March of 2020, the S&P 500 reclaimed its pre-pandemic peak by August of that year, marking the fastest bear market recovery on record. U.S. large cap outperformed from April through November as mega-cap growth stocks that benefitted most from the “stay- at- home” environment prevailed.
November brought an immense shift in leadership, as positive vaccine developments and growing optimism for a swifter return to normal fueled a powerful rotation into economically sensitive areas of the market. U.S. small-cap and value stocks, which carry a heavier weighting toward cyclical sectors, were notable beneficiaries of this trend.
Emerging market equities recorded solid gains in the reflationary environment but saw some weakness in February as certain regions struggled with new outbreaks of COVID-19. In addition, Chinese equities, which comprise a significant share of the MSCI Emerging Markets Index, were weighed down by a mix of regulatory headwinds and concerns over policy tightening. International developed equities also performed well and benefitted from a tilt toward segments that benefit most from rising interest rates and inflation. Equities in Europe picked up momentum towards the end of the period amidst an improving economic outlook for many of the region’s largest countries as vaccinations ramped up.
For the 12-month period May 1, 2020 to April 30, 2021, certain stock market indices performed as follows:
| | | | | | |
| | | |
S&P 500® Index8 | | Russel 2000® Index9 | | MSCI EAFE (Net) Index10 | | MSCI Emerging Markets (Net) Index11 |
| | | |
45.98% | | 74.91% | | 39.88% | | 48.71% |
Past performance is no guarantee of future results. Short-term performance may not be indicative of long-term results.
Source: Lipper. You cannot invest directly in an index.
Although we have begun a new fiscal year, we will never forget the daunting damage that the pandemic has wrought on multiple levels. Still, there is much in the world that is positive, hopeful, and strong. I am referring to our trusted partnership with our clients, our desire to stay close to what’s important to them, and our fervent dedication to helping them achieve their long-term investment objectives. On that—as well as our fiduciary, clients-first mindset—you can always count.
Sincerely,

Dominick J. D’Eramo, CFA
President
May 14, 2021
April 30, 2021 (unaudited) / PRESIDENT’S MESSAGE
Must be preceded or accompanied by a prospectus.
Past performance is no guarantee of future results. The index performance quoted is for illustrative purposes only and is not representative of any specific investment. Diversification does not ensure a profit nor protect against loss.
All investments involve risk, including the possible loss of principal. Equity securities are subject to price fluctuation and possible loss of principal. Small- and mid-cap stocks involve greater risks and volatility than large-cap stocks. International investments are subject to special risks, including currency fluctuations, social, economic, and political uncertainties, which could increase volatility. These risks are magnified in emerging markets.
High-yield, lower-rated securities generally entail greater market, credit, and liquidity risks than investment grade securities and may include higher volatility and higher risk of default.
| 1. | | Basis Points (“BPS”) is a unit that is equal to 1/100th of 1% and is used to denote the change in a financial instrument. The basis point is commonly used for calculating changes in interest rates, equity indices and the yield of a fixed-income security. |
| 2. | | Bond prices are sensitive to changes in interest rates and a rise in interest rates can cause decline in their prices. |
| 3. | | Bloomberg Barclays U.S. Treasury Bond Index is a market capitalization weighted index that includes all publicly issued U.S. Treasury securities that have a remaining maturity of at least one year, are rated investment-grade, and have $250 million or more of outstanding face value. The index is unmanaged and investments cannot be made directly in an index. |
| 4. | | Bloomberg Barclays U.S. Aggregate Bond Index is a widely used benchmark index for the domestic investment-grade bond market composed of securities from the Barclays Government/Corporate Bond Index, Mortgage-Backed Securities Index and Asset-Backed Securities Index. The index typically includes fixed income securities with overall intermediate- to long-term average maturities. The index is unmanaged and investments cannot be made directly in an index. |
| 5. | | Bloomberg Barclays U.S. Credit Bond Index tracks the performance of domestic investment-grade corporate bonds and is composed of all publicly issued, fixed-rate, nonconvertible, investment-grade corporate debt. The index is unmanaged and investments cannot be made directly in an index. |
| 6. | | Bloomberg Barclays Municipal Bond Index tracks the performance of the long-term, tax-exempt, investment-grade bond market. To be included in the index, bonds must have an outstanding par balance of at least $7 million and be issued as part of a transaction of at least $75 million. The index is unmanaged and investments cannot be made directly in an index. |
| 7. | | Bloomberg Barclays U.S. Corporate High Yield Bond Index measures the USD-denominated, high yield, fixed-rate corporate bond market. Securities are classified as high yield if the middle rating of Moody’s, Fitch, and S&P is Ba1/BB+/BB+ or below. Bonds from issuers with an emerging markets country of risk, based on the Bloomberg Barclays EM country definition, are excluded. The U.S. Corporate High Yield Bond Index is a component of the U.S. Universal and Global High Yield Indices. An investment cannot be made directly in an index. |
| 8. | | The S&P 500® Index is a capitalization-weighted index of 500 stocks designed to measure performance of the broad domestic economy through changes in the aggregate market value of 500 stocks representing all major industries. The index is unmanaged and investments cannot be made directly in an index. |
| 9. | | The Russell 2000® Index measures the performance of the 2,000 smallest companies in the Russell 3000® Index, which represents approximately 8% of the total market capitalization of the Russell 3000® Index. As of its latest reconstitution, the index had a total market capitalization range of $152.3 million to $5 billion. The index is unmanaged and investments cannot be made directly in an index. |
| 10. | | MSCI EAFE (Net) Index is a free float-adjusted market capitalization index that is designed to measure equity market performance of developed markets, excluding the U.S. & Canada. The MSCI EAFE (Net) Index is an equity index which captures large and mid-cap representation across 21 Developed Markets countries: Australia, Austria, Belgium, Denmark, Finland, France, Germany, Hong Kong, Ireland, Israel, Italy, Japan, the Netherlands, New Zealand, Norway, Portugal, Singapore, Spain, Sweden, Switzerland and the United Kingdom. The index is unmanaged and investments cannot be made directly in an index. The performance of this index is reduced by the taxes on dividends paid by the international securities issuers in the index. |
| 11. | | MSCI Emerging Markets (Net) Index is a free float-adjusted market capitalization index that is designed to measure equity market performance of emerging markets. The MSCI Emerging Markets (Net) Index captures large and mid-cap representation across 27 Emerging Markets countries: Argentina, Brazil, Chile, China, Colombia, Czech Republic, Egypt, Greece, Hungary, India, Indonesia, Korea, Kuwait, Malaysia, Mexico, Pakistan, Peru, Philippines, Poland, Qatar, Russia, Saudi Arabia, South Africa, Taiwan, Thailand, Turkey and United Arab Emirates. The index is unmanaged and investments cannot be made directly in an index. The performance of this index is reduced by the taxes on dividends paid by the international securities issuers in the index. |
PRESIDENT’S MESSAGE / April 30, 2021 (unaudited)
WILMINGTON BROAD MARKET BOND FUND
Management’s Discussion of Fund Performance (Unaudited)
For the fiscal year ended April 30, 2021, Wilmington Broad Market Bond Fund (the “Fund”) had a total return of 0.51%* for Class A Shares and 0.83%* for Class I Shares, versus its benchmark, the Bloomberg Barclays U.S. Aggregate Bond Index**, which had a total return of -0.27%, and its peer group, the Lipper Corporate A-Rated Debt Funds Average***, which had a total return of 3.47%.
Thankfully, the economy is reopening as the vaccination rollout has been very successful. We are certainly in a much better place than we were a year ago. Your fixed income team continues to meet “virtually” daily to review current events and set strategy. We continue to utilize our disciplined relative value investment process. We emphasize our guiding philosophies of maintaining well diversified and liquid portfolios. We conduct our own independent credit analysis. Most importantly in these uncertain times, we draw upon our experienced team. As always, our disciplined risk management efforts guide our investment decisions.
We feel the economy is in a much better place than it was a year ago. The unemployment rate has fallen from 14.7% to 6.1%, although still above the pre-pandemic level of 3.5%. Economic growth as measured by Gross Domestic Product (“GDP”) has fully rebounded to pre-pandemic levels. 1st quarter GDP was up a robust 6.4%, the 2nd strongest quarterly growth rate since 2003. The catalysts for the economic rebound have been the various significant stimulus programs and extremely accommodative monetary policy. The Federal Reserve (the “Fed”) expects to maintain the zero interest rate policy through 2023 and will allow inflation to run moderately above 2%. The latest inflation data was concerning with the core Consumer Price Index (“CPI”) rising by 0.9% its largest increase since 1982. The price increases were driven by some of the sectors of the economy that are reopening. For example, airfares rose by 10.2%, hotel prices were up by 8.8%. The Fed has communicated that they expect the rise in inflation to be “transitory” and therefore will not look to react by raising interest rates unless inflation moves higher for a longer period.
Longer-term interest rates have moved higher on the better than expected economic growth and the expectations for higher inflation. The 10-year Treasury yield at fiscal year-end was 1.63%, up 1% over the past year. The total return for the 10-year Treasury for the fiscal year was -7.69% given the rise in interest rates. Short-term interest rates have been unchanged over the past year as they are anchored by the Fed’s expectation to maintain the very low interest rate policy. The 2-year Treasury had a yield of 0.16% on April 30, 2021.
The Corporate sector rebounded and outperformed for the fiscal year. For the fiscal year, the sector produced 10.19% of excess return. The average risk premium for the Bloomberg Barclays U.S. Investment Grade Corporate Index**** tightened from 202 basis points on April 30, 2020 to 88 basis points on April 30, 2021. The outperformance can be attributed to the global search for yield, the higher valuations to start the fiscal year and optimism on the economy rebounding. In particular, the energy sector dramatically outperformed as oil prices rebounded back to pre-pandemic levels.
The Fund’s outperformance versus the Bloomberg Barclays Aggregate Bond Index can be attributed to our Fund maintaining a shorter duration than the index, especially as interest rates have moved higher. Our
yield curve strategy of reducing our allocation to the longer end of the yield curve aided performance as this portion of the yield curve underperformed as the yield curve steepened. Our overweight allocation to the corporate sector also aided performance versus the index, as the corporate sector outperformed.
Looking forward, the expectation is for the Fed to maintain a zero interest rate policy until the economy recovers from the pandemic. The market is anticipating no change in the Fed Funds target before 2022. Longer-term interest rates will be determined by inflation expectations and anticipated Fed policy. The corporate sector should continue to benefit from the reopening of the economy. However, risk premiums are historically tight which will most likely lead to less outperformance in the upcoming fiscal year.
| * | Performance data quoted represents past performance, which is no guarantee of future results. Investment return and principal value will fluctuate so that an investor’s shares, when redeemed, may be worth more or less than their original cost. The total return shown assumes the reinvestment of all distributions and does not reflect the deduction of taxes that a shareholder would pay on fund distributions or the redemption of shares. The total return for Class A Shares was -4.01%, adjusted for the Fund’s maximum sales charge of 4.50%. Mutual fund performance changes over time and current performance may be lower or higher than what is stated. For the most recent month-end performance, please visit www.wilmingtonfunds.com or call 1-800-836-2211. |
| ** | The Bloomberg Barclays U.S. Aggregate Bond Index is an index measuring both the capital price changes and income provided by the underlying universe of securities, comprised of U.S. Treasury obligations, U.S. investment grade corporate debt and mortgage-backed obligations. The index is unmanaged and it is not possible to invest directly in an index. |
| *** | Lipper figures represent the average of the total returns reported by all of the mutual funds designated by Lipper, Inc. as falling into the respective category indicated. These figures do not reflect sales charges. |
| **** | The Bloomberg Barclays U.S. Investment Grade Corporate Index measures the investment grade, fixed-rate, taxable corporate bond market. The index is unmanaged and it is not possible to invest directly in an index. |
Bond prices are sensitive to changes in interest rates and a rise in short-term interest rates could cause a decline in bond prices.
Excess Return is a security or sector’s return minus the return from a U.S. Treasury of similar maturity or duration.
Basis Points (“BPS”) is a unit that is equal to 1/100th of 1% and is used to denote the change in a financial instrument. The basis point is commonly used for calculating changes in interest rates, equity indices and the yield of a fixed-income security.
Duration is a measure of a security’s price sensitivity to changes in interest rates. Securities with longer durations are more sensitive to changes in interest rates than securities of shorter durations.
April 30, 2021 (unaudited) / ANNUAL REPORT
WILMINGTON BROAD MARKET BOND FUND
The graphs below illustrate the hypothetical investment of $10,0001 in the Class A Shares and $1,000,0001 in the Class I Shares of the Wilmington Broad Market Bond Fund; from April 30, 2011 to April 30, 2021, compared to the Bloomberg Barclays U.S. Aggregate Bond Index.2
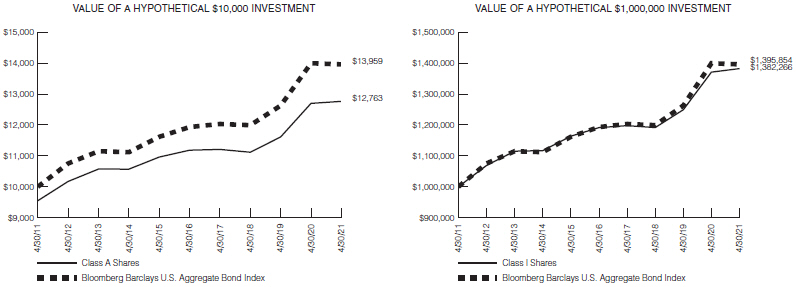
Performance data quoted represents past performance, which is no guarantee of future results. Investment return and principal value will fluctuate so that an investor’s shares, when redeemed, may be worth more or less than their original cost. The total return shown assumes the reinvestment of all distributions and does not reflect the deduction of taxes that a shareholder would pay on fund distributions or the redemption of shares. The total return for Class A Shares was -4.01%, adjusted for the Fund’s maximum sales charge of 4.50%. Mutual fund performance changes over time and current performance may be lower or higher than what is stated. For the most recent month-end performance, please visit www.wilmingtonfunds.com or call 1-800-836-2211.
| | | | | | |
| |
| | | Average Annual Total Returns for the Periods Ended 4/30/21 |
| | | |
| | | 1 Year | | 5 Years | | 10 Years |
| | | |
Class A^ | | -4.01% | | 1.73% | | 2.47% |
| | | |
Class I^ | | 0.83% | | 3.02% | | 3.29% |
| | | |
Bloomberg Barclays U.S. Aggregate Bond Index2 | | -0.27% | | 3.19% | | 3.39% |
| ^ | Expense Ratios Before Waivers and Expense Ratios After Waivers for Class A are 1.07% and 0.78%, respectively. Expense Ratios Before Waivers and Expense Ratios After Waivers for Class I are 0.57% and 0.43%, respectively. Expense Ratios Before Waiver represent the operating costs borne by the Fund, expressed as a percentage of the Fund’s average net assets, as shown in the Fees and Expenses table in the Fund’s current prospectus (under “Total Annual Fund Operating Expenses”). Current information regarding the Fund’s Operating Expenses can be found in the Fund’s Financial Highlights. |
��
| 1 | Represents a hypothetical investment of $10,000 in Class A of the Fund after deducting the maximum sales charge of 4.50% ($10,000 investment minus $450 sales charge = $9,550) and $1,000,000 in Class I of the Fund and assumes the reinvestment of all dividends and distributions. |
| 2 | The performance for the Bloomberg Barclays U.S. Aggregate Bond Index assumes the reinvestment of all dividends and distributions but does not reflect the deduction of a sales charge required for the Fund’s performance by the Securities and Exchange Commission. It is not possible to invest directly in an index, and the represented index is unmanaged. |
ANNUAL REPORT / April 30, 2021 (unaudited)
WILMINGTON INTERMEDIATE-TERM BOND FUND
Management’s Discussion of Fund Performance (Unaudited)
For the fiscal year ended April 30, 2021, Wilmington Intermediate-Term Bond Fund (the “Fund”) had a total return of 1.98%* for Class A Shares and 2.32%* for Class I Shares, versus its benchmark, the Bloomberg Barclays Intermediate U.S. Government/Credit Bond Index**, which had a total return of 1.09% and its peer group, the Lipper Short-Intermediate Investment Grade Debt Funds Average***, which had a total return of 3.56%.
Thankfully, the economy is reopening as the vaccination rollout has been very successful. We are certainly in a much better place than we were a year ago. Your fixed income team continues to meet “virtually” daily to review current events and set strategy. We continue to utilize our disciplined relative value investment process. We emphasize our guiding philosophies of maintaining well diversified and liquid portfolios. We conduct our own independent credit analysis. Most importantly in these uncertain times, we draw upon our experienced team. As always, our disciplined risk management efforts guide our investment decisions.
We feel the economy is in a much better place than it was a year ago. The unemployment rate has fallen from 14.7% to 6.1%, although still above the pre-pandemic level of 3.5%. Economic growth as measured by Gross Domestic Product (“GDP”) has fully rebounded to pre-pandemic levels. 1st quarter GDP was up a robust 6.4%, the 2nd strongest quarterly growth rate since 2003. The catalysts for the economic rebound have been the various significant stimulus programs and extremely accommodative monetary policy. The Federal Reserve (the “Fed”) expects to maintain the zero interest rate policy through 2023 and will allow inflation to run moderately above 2%. The latest inflation data was concerning with the core Consumer Price Index (“CPI”) rising by 0.9% its largest increase since 1982. The price increases were driven by some of the sectors of the economy that are reopening. For example, airfares rose by 10.2%, hotel prices were up by 8.8%. The Fed has communicated that they expect the rise in inflation to be “transitory” and therefore will not look to react by raising interest rates unless inflation moves higher for a longer period.
Longer-term interest rates have moved higher on the better than expected economic growth and the expectations for higher inflation. The 10-year Treasury yield at fiscal year-end was 1.63%, up 1% over the past year. The total return for the 10-year Treasury for the fiscal year was -7.69% given the rise in interest rates. Short-term interest rates have been unchanged over the past year as they are anchored by the Fed’s expectation to maintain the very low interest rate policy. The 2-year Treasury had a yield of 0.16% on April 30, 2021.
The Corporate sector rebounded and outperformed for the fiscal year. For the fiscal year, the sector produced 10.19% of excess return. The average risk premium for the Bloomberg Barclays U.S. Investment Grade Corporate Index**** tightened from 202 basis points on April 30, 2020 to 88 basis points on April 30, 2021. The outperformance can be attributed to the global search for yield, the higher valuations to start the fiscal year and optimism on the economy rebounding. In particular, the energy sector dramatically outperformed as oil prices rebounded back to pre-pandemic levels.
The Fund’s outperformance versus the Bloomberg Barclays Intermediate U.S. Government/Credit Bond Index can be attributed primarily to our Fund maintaining an overweight allocation to the corporate sector versus the index, as the corporate sector outperformed.
Looking forward, the expectation is for the Fed to maintain a zero interest rate policy until the economy recovers from the pandemic. The market is anticipating no change in the Fed Funds target before 2022. Longer-term interest rates will be determined by inflation expectations and anticipated Fed policy. The corporate sector should continue to benefit from the reopening of the economy. However, risk premiums are historically tight which will most likely lead to less outperformance in the upcoming fiscal year.
The Fund maintains an overweight to corporate bonds. Yield curve positioning is neutral and the Fund maintains a duration that is shorter than the benchmark. We anticipate modestly higher rates as the economic activity drives higher inflation.
At a meeting of the Board of Trustees (the “Board”) of the Wilmington Funds held on June 3, 2021, management proposed and the Board approved a plan of reorganization for the Fund. The plan of reorganization stated the Fund will merge with the Wilmington Broad Market Bond Fund with a proposed closing date in August 2021. A notice of the merger was provided to shareholders in June 2021 and an information statement providing further details about the merger will be mailed to shareholder in July 2021.
| * | Performance data quoted represents past performance, which is no guarantee of future results. Investment return and principal value will fluctuate so that an investor’s shares, when redeemed, may be worth more or less than their original cost. The total return shown assumes the reinvestment of all distributions and does not reflect the deduction of taxes that a shareholder would pay on fund distributions or the redemption of shares. The total return for Class A Shares was -2.61%, adjusted for the Fund’s maximum sales charge of 4.50%. Mutual fund performance changes over time and current performance may be lower or higher than what is stated. For the most recent month-end performance, please visit www.wilmingtonfunds.com or call 1-800-836-2211. |
| ** | The Bloomberg Barclays Intermediate U.S. Government/Credit Bond Index is a widely recognized, market value weighted index of U.S. Treasury securities, U.S. government agency obligations, corporate debt securities, Yankee bonds and non-convertible corporate debt securities issued by or guaranteed by foreign governments and agencies. The index is unmanaged and it is not possible to invest directly in an index. |
| *** | Lipper figures represent the average of the total returns reported by all of the mutual funds designated by Lipper, Inc. as falling into the respective category indicated. These figures do not reflect sales charges. |
| **** | The Bloomberg Barclays U.S. Investment Grade Corporate Index measures the investment grade, fixed-rate, taxable corporate bond market. The index is unmanaged and it is not possible to invest directly in an index. |
Bond prices are sensitive to changes in interest rates and a rise in short-term interest rates could cause a decline in bond prices.
Excess Return is a security or sector’s return minus the return from a U.S. Treasury of similar maturity or duration.
April 30, 2021 (unaudited) / ANNUAL REPORT
Basis Points (“BPS”) is a unit that is equal to 1/100th of 1% and is used to denote the change in a financial instrument. The basis point is commonly used for calculating changes in interest rates, equity indices and the yield of a fixed-income security.
Duration is a measure of a security’s price sensitivity to changes in interest rates. Securities with longer durations are more sensitive to changes in interest rates than securities of shorter durations.
Yield curve is a line that plots interest rates of bonds having equal credit quality but differing maturity dates.
ANNUAL REPORT / April 30, 2021 (unaudited)
WILMINGTON INTERMEDIATE-TERM BOND FUND
The graphs below illustrate the hypothetical investment of $10,0001 in the Class A Shares and $1,000,0001 in the Class I Shares of the Wilmington Intermediate-Term Bond Fund from April 30, 2011 to April 30, 2021 compared to the Bloomberg Barclays Intermediate U.S. Government/Credit Bond Index.2
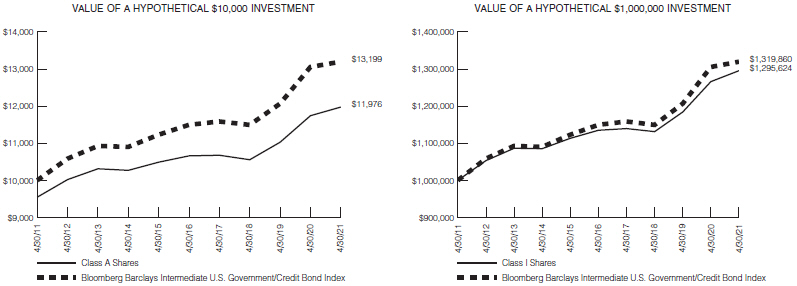
Performance data quoted represents past performance, which is no guarantee of future results. Investment return and principal value will fluctuate so that an investor’s shares, when redeemed, may be worth more or less than their original cost. The total return shown assumes the reinvestment of all distributions and does not reflect the deduction of taxes that a shareholder would pay on fund distributions or the redemption of shares. The total return for Class A Shares was -2.61%, adjusted for the Fund’s maximum sales charge of 4.50%. Mutual fund performance changes over time and current performance may be lower or higher than what is stated. For the most recent month-end performance, please visit www.wilmingtonfunds.com or call 1-800-836-2211.
| | | | | | |
| |
| | | Average Annual Total Returns for the Periods Ended 4/30/21 |
| | | |
| | | 1 Year | | 5 Years | | 10 Years |
| | | |
Class A^ | | -2.61% | | 1.42% | | 1.82% |
| | | |
Class I^ | | 2.32% | | 2.68% | | 2.62% |
| | | |
Bloomberg Barclays Intermediate U.S. Government/Credit Bond Index2 | | 1.09% | | 2.80% | | 2.81% |
| ^ | Expense Ratios Before Waivers and Expense Ratios After Waivers for Class A are 1.40% and 0.84%, respectively. Expense Ratios Before Waivers and Expense Ratios After Waivers for Class I are 0.90% and 0.49%, respectively. Expense Ratios Before Waiver represent the operating costs borne by the Fund, expressed as a percentage of the Fund’s average net assets, as shown in the Fees and Expenses table in the Fund’s current prospectus (under “Total Annual Fund Operating Expenses”). Current information regarding the Fund’s Operating Expenses can be found in the Fund’s Financial Highlights. |
| 1 | Represents a hypothetical investment of $10,000 in Class A of the Fund after deducting the maximum sales charge of 4.50% ($10,000 investment minus $450 sales charge = $9,550) and $1,000,000 in Class I of the Fund and assumes the reinvestment of all dividends and distributions. |
| 2 | The performance for the Bloomberg Barclays Intermediate U.S. Government/Credit Bond Index assumes the reinvestment of all dividends and distributions but does not reflect the deduction of a sales charge required for the Fund’s performance by the Securities and Exchange Commission. It is not possible to invest directly in an index and the represented index is unmanaged. |
April 30, 2021 (unaudited) / ANNUAL REPORT
WILMINGTON SHORT-TERM BOND FUND
Management’s Discussion of Fund Performance (Unaudited)
For the fiscal year ended April 30, 2021, Wilmington Short-Term Bond Fund (the “Fund”) had a total return of 1.34%* for Class A Shares and 1.59%* for Class I Shares, versus its benchmark, the Bloomberg Barclays 1-3 Year U.S. Government/Credit Bond Index**, which had a total return of 1.02%, and its peer group, the Lipper Short Investment Grade Debt Funds Average***, which had a total return of 4.83%.
Thankfully, the economy is reopening as the vaccination rollout has been very successful. We are certainly in a much better place than we were a year ago. Your fixed income team continues to meet “virtually” daily to review current events and set strategy. We continue to utilize our disciplined relative value investment process. We emphasize our guiding philosophies of maintaining well diversified and liquid portfolios. We conduct our own independent credit analysis. Most importantly in these uncertain times, we draw upon our experienced team. As always, our disciplined risk management efforts guide our investment decisions.
We feel the economy is in a much better place than it was a year ago. The unemployment rate has fallen from 14.7% to 6.1%, although still above the pre-pandemic level of 3.5%. Economic growth as measured by Gross Domestic Product (“GDP”) has fully rebounded to pre-pandemic levels. 1st quarter GDP was up a robust 6.4%, the 2nd strongest quarterly growth rate since 2003. The catalysts for the economic rebound have been the various significant stimulus programs and extremely accommodative monetary policy. The Federal Reserve (the “Fed”) expects to maintain the zero interest rate policy through 2023 and will allow inflation to run moderately above 2%. The latest inflation data was concerning with the core Consumer Price Index (“CPI”) rising by 0.9% its largest increase since 1982. The price increases were driven by some of the sectors of the economy that are reopening. For example, airfares rose by 10.2%, hotel prices were up by 8.8%. The Fed has communicated that they expect the rise in inflation to be “transitory” and therefore will not look to react by raising interest rates unless inflation moves higher for a longer period.
Longer-term interest rates have moved higher on the better than expected economic growth and the expectations for higher inflation. The 10-year Treasury yield at fiscal year-end was 1.63%, up 1% over the past year. The total return for the 10-year Treasury for the fiscal year was -7.69% given the rise in interest rates. Short-term interest rates have been unchanged over the past year as they are anchored by the Fed’s expectation to maintain the very low interest rate policy. The 2-year Treasury had a yield of 0.16% on April 30, 2021.
The Corporate sector rebounded and outperformed for the fiscal year. For the fiscal year, the sector produced 10.19% of excess return. The average risk premium for the Bloomberg Barclays U.S. Investment Grade Corporate Index**** tightened from 202 basis points on April 30, 2020 to 88 basis points on April 30, 2021. The outperformance can be attributed to the global search for yield, the higher valuations to start the fiscal year and optimism on the economy rebounding. In particular, the energy sector dramatically outperformed as oil prices rebounded back to pre-pandemic levels.
The Fed’s historic response to the negative effects of the pandemic and its repeated commitment to maintaining that accommodation for a significant period benefitted the corporate sector. With interest rates around the world at extremely low levels, investors searched for yield
and found it in the US corporate market. The Fund’s significant overweight to the credit sector was the primary reason for its outperformance to the index over the fiscal year. The Fund was overweight the credit sector on both a market value and contribution to duration basis. The Fund continued to be invested in more liquid and generally higher rated portions of both the credit and securitized sectors versus its peer group. This contributed to the Fund’s underperformance versus its peer group as those sectors dramatically outperformed investment grade corporate debt.
Looking forward, the expectation is for the Fed to maintain a zero interest rate policy until the economy recovers from the pandemic. The market is anticipating no change in the Fed Funds target before 2022. Longer-term interest rates will be determined by inflation expectations and anticipated Fed policy. The corporate sector should continue to benefit from the reopening of the economy. However, risk premiums are historically tight which will most likely lead to less outperformance in the upcoming fiscal year.
At a meeting of the Board of Trustees (the “Board”) of the Wilmington Funds held on June 3, 2021, management proposed and the Board approved a plan of liquidation for the Fund. The plan of liquidation stated the Fund will liquidate on July 22, 2021 and a notice of the liquidation was provided in June 2021 to shareholders.
| * | Performance data quoted represents past performance, which is no guarantee of future results. Investment return and principal value will fluctuate so that an investor’s shares, when redeemed, may be worth more or less than their original cost. The total return shown assumes the reinvestment of all distributions and does not reflect the deduction of taxes that a shareholder would pay on fund distributions or the redemption of shares. The total return for Class A Shares was -0.43%, adjusted for the Fund’s maximum sales charge of 1.75%. Mutual fund performance changes over time and current performance may be lower or higher than what is stated. For the most recent month-end performance, please visit www.wilmingtonfunds.com or call 1-800-836-2211. |
| ** | The Bloomberg Barclays 1-3 Year U.S. Government/Credit Bond Index is a market value-weighted of government fixed-rate debt securities and investment grade U.S. and foreign fixed-rate debt securities with average maturities of 1 to 3 years. The index is unmanaged and it is not possible to invest directly in an index. |
| *** | Lipper figures represent the average of the total returns reported by all of the mutual funds designated by Lipper, Inc. as falling into the respective category indicated. These figures do not reflect sales charges. |
| **** | The Bloomberg Barclays U.S. Investment Grade Corporate Index measures the investment grade, fixed-rate, taxable corporate bond market. The index is unmanaged and it is not possible to invest directly in an index. |
Bond prices are sensitive to changes in interest rates and a rise in short-term interest rates could cause a decline in bond prices.
Excess Return is a security or sector’s return minus the return from a U.S. Treasury of similar maturity or duration.
ANNUAL REPORT / April 30, 2021 (unaudited)
Basis Points (“BPS”) is a unit that is equal to 1/100th of 1% and is used to denote the change in a financial instrument. The basis point is commonly used for calculating changes in interest rates, equity indices and the yield of a fixed-income security.
Duration is a measure of a security’s price sensitivity to changes in interest rates. Securities with longer durations are more sensitive to changes in interest rates than securities of shorter durations.
April 30, 2021 (unaudited) / ANNUAL REPORT
WILMINGTON SHORT-TERM BOND FUND
The graphs below illustrate the hypothetical investment of $10,0001 in the Class A Shares and $1,000,0001 in the Class I Shares of the Wilmington Short-Term Bond Fund from April 30, 2011 to April 30, 2021 compared to the Bloomberg Barclays 1-3 Year U.S. Government/Credit Bond Index.2
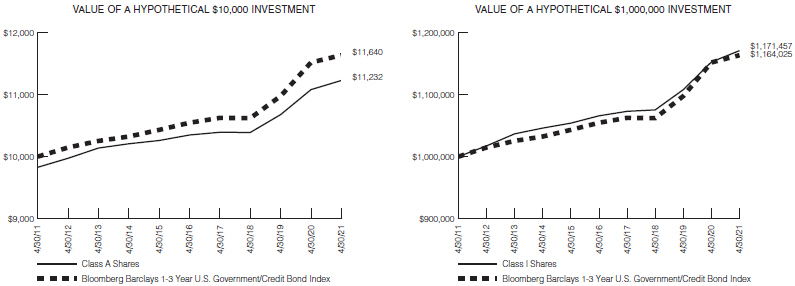
Performance data quoted represents past performance, which is no guarantee of future results. Investment return and principal value will fluctuate so that an investor’s shares, when redeemed, may be worth more or less than their original cost. The total return shown assumes the reinvestment of all distributions and does not reflect the deduction of taxes that a shareholder would pay on fund distributions or the redemption of shares. The total return for Class A Shares was -0.43%, adjusted for the Fund’s maximum sales charge of 1.75%. Mutual fund performance changes over time and current performance may be lower or higher than what is stated. For the most recent month-end performance, please visit www.wilmingtonfunds.com or call 1-800-836-2211.
| | | | | | |
| |
| | | Average Annual Total Returns for the Periods Ended 4/30/21 |
| | | |
| | | 1 Year | | 5 Years | | 10 Years |
| | | |
Class A^ | | -0.43% | | 1.29% | | 1.17% |
| | | |
Class I^ | | 1.59% | | 1.90% | | 1.60% |
| | | |
Bloomberg Barclays 1-3 Year U.S. Government/Credit Bond Index2 | | 1.02% | | 1.99% | | 1.53% |
| ^ | Expense Ratios Before Waivers and Expense Ratios After Waivers for Class A are 1.43% and 0.73%, respectively. Expense Ratios Before Waivers and Expense Ratios After Waivers for Class I are 0.93% and 0.48%, respectively. Expense Ratios Before Waiver represent the operating costs borne by the Fund, expressed as a percentage of the Fund’s average net assets, as shown in the Fees and Expenses table in the Fund’s current prospectus (under “Total Annual Fund Operating Expenses”). Current information regarding the Fund’s Operating Expenses can be found in the Fund’s Financial Highlights. |
| 1 | Represents a hypothetical investment of $10,000 in Class A of the Fund after deducting the maximum sales charge of 1.75% ($10,000 investment minus $175 sales charge = $9,825) and $1,000,000 in Class I of the Fund and assumes the reinvestment of all dividends and distributions. |
| 2 | The performance for the Bloomberg Barclays 1-3 Year U.S. Government/Credit Bond Index assumes the reinvestment of all dividends and distributions but does not reflect the deduction of a sales charge required for the Fund’s performance by the Securities and Exchange Commission. It is not possible to invest directly in an index and the represented index is unmanaged. |
ANNUAL REPORT / April 30, 2021 (unaudited)
WILMINGTON MUNICIPAL BOND FUND
Management’s Discussion of Fund Performance (Unaudited)
For the fiscal year ended April 30, 2021, Wilmington Municipal Bond Fund (the “Fund”) had a total return of 7.05%* for Class A Shares and 7.32%* for Class I Shares, versus its benchmark, the S&P Municipal Bond Intermediate Index** and the S&P Municipal Bond Investment Grade Intermediate Index***, which had a total return of 6.65%, and 6.39%, respectively, and its peer group, the Lipper Intermediate Municipal Debt Funds Average****, which had a total return of 8.15%.
The fiscal year ended April 30, 2021 was probably the most volatile in municipal history as the global pandemic and market fears led to a market wide sell-off and over $50 Billion in fund outflows – causing yields to spike drastically upward – to yields that through the end of the fiscal year are close to record lows. A 5-year AAA rated generic municipal bond yielded 1.09% at the end April 2020 while the same 5-year AAA rated municipal bond yielded 0.36% at the end of April 2021 (Thomson, Municipal Market Data). The standard municipal market valuations reached 14 times the normal standard deviation (a measurement of tail risk) when the same valuation measures were 4 times the normal standard deviation during the height of the global financial crisis in 2008.
The yield compression was driven by increased fund inflows, particularly since the November Presidential election was over, and improving credit fundamentals as tax revenues proved to be quite resilient and less impacted by the economic consequences of the pandemic than earlier feared by municipal investors and the rating agencies. Fund flows year to date are close to $40 Billion and are at pace to break all time record inflows of $96 Billion set in 2019. The lack of supply in tax-exempt municipals has reached critical levels as a tax change in 2016 limited the ability of municipals to refund older debt with new tax-exempt bonds (called advance refundings). Municipalities are now using taxable municipal debt to refund older tax-exempt debt as interest continue to stay low. The result is that there is less tax-exempt debt available for traditional municipal investors at a time when record inflows continue. This supply demand imbalance is called a net negative supply situation and results in further yield compression.
As we discussed in our last shareholder letter, one market-wide measure of valuation is to compare the yield on AAA-rated municipals to the yield available on a Treasury maturing in the same timeframe. Generally, tax-exempt municipal yields trade at a discount to U.S. Treasuries due to the preferential tax treatment. Due to the rise in municipal yields relative to U.S. Treasury yields, the ratio was over 290% at the end of April 2020. At the end of April 2021, the same 5-year ratio is down to 50% as Treasury yields are higher due to inflation fears and municipal yields are much lower due to strong demand.
The Fund outperformed the S&P Municipal Intermediate indices due to an overweight in the A-rated category and the Fund’s security selection in the credit sectors such as higher education, healthcare and appropriation (General Obligation debt that has a pledged revenue source). Those sectors were particularly affected by COVID-19 and the global pandemic and credit spreads and returns improved as the U.S. economy improved and vaccine rates increased. The Fund underperformed the Lipper average during the fiscal year due to the reduction in the Fund’s risk profile – particularly in BBB-rated sectors and duration neutral approach to the year – as the pandemic reached its peak in the spring of 2020. The Fund also does not currently hold
non-investment grade (municipal high yield) credits, which performed the best during the last fiscal year. Managers that held a percentage of high yield credits performed above the Lipper average.
| * | Performance data quoted represents past performance, which is no guarantee of future results. Investment return and principal value will fluctuate so that an investor’s shares, when redeemed, may be worth more or less than their original cost. The total return shown assumes the reinvestment of all distributions and does not reflect the deduction of taxes that a shareholder would pay on fund distributions or the redemption of shares. The total return for Class A Shares was 2.23%, adjusted for the Fund’s maximum sales charge of 4.50%. Mutual fund performance changes over time and current performance may be lower or higher than what is stated. For the most recent month-end performance, please visit www.wilmingtonfunds.com or call 1-800-836-2211. |
| ** | Standard & Poor’s (“S&P”) Municipal Bond Intermediate Index consists of bonds in the S&P Municipal Bond Index with a minimum maturity of three years and a maximum maturity of up to, but not including, 15 years as measured from the Rebalancing Date. The S&P Municipal Bond Index is a broad, market value-weighted index that seeks to measure the performance of the U.S. municipal bond market. All bonds in the index are exempt from U.S. federal income taxes or subject to the Alternative Minimum Tax (“AMT”). The indices include general obligation bonds, revenue bonds, insured bonds and pre-refunded bonds. Indices are unmanaged and it is not possible to invest directly in an index. |
| *** | Standard & Poor’s (“S&P”) Municipal Bond Investment Grade Intermediate Index consists of bonds in the S&P Municipal Bond Index that are rated at least BBB- by Standard & Poor’s, Baa3 by Moody’s or BBB- by Fitch Ratings. All bonds must have a minimum maturity of 3 years and a maximum maturity of up to, but not including, 15 years as measured from the Rebalancing Date. Please note that an investor cannot invest directly in an index. |
| **** | Lipper figures represent the average of the total returns reported by all of the mutual funds designated by Lipper, Inc. as falling into the respective category indicated. These figures do not reflect sales charges. |
Duration is a measure of a security’s price sensitivity to changes in interest rates. Securities with longer durations are more sensitive to changes in interest rates than securities of shorter durations.
High yield, lower-rated securities generally entail greater market, credit and liquidity risks than investment grade securities and may include higher volatility and higher risk of default.
Credit ratings pertain only to the securities in the portfolio and do not protect fund shares against market risk.
Bond prices are sensitive to changes in interest rates and a rise in short-term interest rates could cause a decline in bond prices.
Basis Points (“BPS”) is a unit that is equal to 1/100th of 1% and is used to denote the change in a financial instrument. The basis point is commonly used for calculating changes in interest rates, equity indices and the yield of a fixed-income security.
Credit ratings are measured on a scale that generally ranges from AAA (highest) to D (lowest). All Fund securities except for those labeled “Not Rated” and “Other” have been rated by Moody’s, S&P or Fitch, which are each a Nationally Recognized Statistical Rating Organization (“NRSRO”). All Index securities except for those labeled “Not Rated” have been rated
April 30, 2021 (unaudited) / ANNUAL REPORT
by Moody’s or S&P. Credit ratings are subject to change. One cannot invest directly into an index.
Income may be subject to the federal AMT.
ANNUAL REPORT / April 30, 2021 (unaudited)
WILMINGTON MUNICIPAL BOND FUND
The graphs below illustrate the hypothetical investment of $10,0001 in the Class A Shares and $1,000,0001 in the Class I Shares of the Wilmington Municipal Bond Fund from April 30, 2011 to April 30, 2021 compared to the S&P Municipal Bond Intermediate Index.2
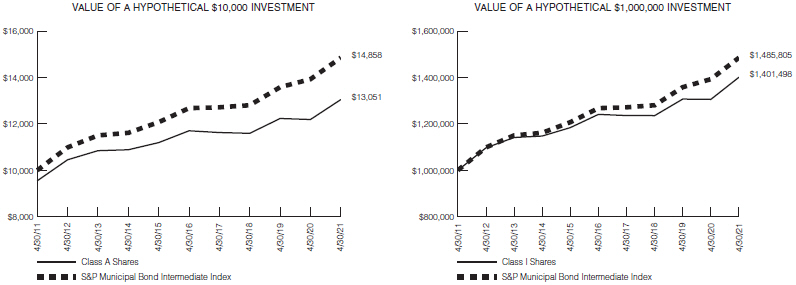
Performance data quoted represents past performance, which is no guarantee of future results. Investment return and principal value will fluctuate so that an investor’s shares, when redeemed, may be worth more or less than their original cost. The total return shown assumes the reinvestment of all distributions and does not reflect the deduction of taxes that a shareholder would pay on fund distributions or the redemption of shares. The total return for Class A Shares was 2.23%, adjusted for the Fund’s maximum sales charge of 4.50%. Mutual fund performance changes over time and current performance may be lower or higher than what is stated. For the most recent month-end performance, please visit www.wilmingtonfunds.com or call 1-800-836-2211.
| | | | | | |
| |
| | | Average Annual Total Returns for the Periods Ended 4/30/21 |
| | | |
| | | 1 Year | | 5 Years | | 10 Years |
| | | |
Class A^ | | 2.23% | | 1.26% | | 2.70% |
| | | |
Class I^ | | 7.32% | | 2.46% | | 3.43% |
| | | |
S&P Municipal Bond Intermediate Index2 | | 6.65% | | 3.22% | | 4.04% |
| ^ | Expense Ratios Before Waivers and Expense Ratios After Waivers for Class A are 1.10% and 0.75%, respectively. Expense Ratios Before Waivers and Expense Ratios After Waivers for Class I are 0.60% and 0.50%, respectively. Expense Ratios Before Waiver represent the operating costs borne by the Fund, expressed as a percentage of the Fund’s average net assets, as shown in the Fees and Expenses table in the Fund’s current prospectus (under “Total Annual Fund Operating Expenses”). Current information regarding the Fund’s Operating Expenses can be found in the Fund’s Financial Highlights. |
| 1 | Represents a hypothetical investment of $10,000 in Class A of the Fund after deducting the maximum sales charge of 4.50% ($10,000 investment minus $450 sales charge = $9,550) and $1,000,000 in Class I of the Fund and assumes the reinvestment of all dividends and distributions. |
| 2 | The performance for the S&P Municipal Bond Intermediate Index assumes the reinvestment of all dividends and distributions but does not reflect the deduction of a sales charge required for the Fund’s performance by the Securities and Exchange Commission. It is not possible to invest directly in an index and the represented index is unmanaged. |
April 30, 2021 (unaudited) / ANNUAL REPORT
WILMINGTON NEW YORK MUNICIPAL BOND FUND
Management’s Discussion of Fund Performance (Unaudited)
For the fiscal year ended April 30, 2021, Wilmington New York Municipal Bond Fund (the “Fund”) had a total return of 6.38%* for Class A Shares and 6.74%* for Class I Shares, versus its benchmark, the S&P Municipal Bond Intermediate Index** and the S&P Intermediate Term New York AMT-Free Municipal Bond Index***, which had a total return of 6.65% and 6.03%, respectively, and its peer group, the Lipper New York Intermediate Municipal Debt Funds Average****, which had a total return of 7.06%.
The fiscal year ended April 30, 2021 was probably the most volatile in municipal history as the global pandemic and market fears led to a market wide sell-off and over $50 Billion in fund outflows – causing yields to spike drastically upward – to yields that through the end of the fiscal year are close to record lows. A 5-year AAA rated generic municipal bond yielded 1.09% at the end April 2020 while the same 5-year AAA rated municipal bond yielded 0.36% at the end of April 2021 (Thomson, Municipal Market Data). The standard municipal market valuations reached 14 times the normal standard deviation (a measurement of tail risk) when the same valuation measures were 4 times the normal standard deviation during the height of the global financial crisis in 2008.
The yield compression was driven by increased fund inflows, particularly since the November Presidential election was over, and improving credit fundamentals as tax revenues proved to be quite resilient and less impacted by the economic consequences of the pandemic than earlier feared by municipal investors and the rating agencies. Fund flows year to date are close to $40 Billion and are at pace to break all time record inflows of $96 Billion set in 2019. The lack of supply in tax-exempt municipals has reached critical levels as a tax change in 2016 limited the ability of municipals to refund older debt with new tax-exempt bonds (called advance refundings). Municipalities are now using taxable municipal debt to refund older tax-exempt debt as interest continue to stay low. The result is that there is less tax-exempt debt available for traditional municipal investors at a time when record inflows continue. This supply demand imbalance is called a net negative supply situation and results in further yield compression.
As we discussed in our last shareholder letter, one market-wide measure of valuation is to compare the yield on AAA-rated municipals to the yield available on a Treasury maturing in the same timeframe. Generally, tax-exempt municipal yields trade at a discount to U.S. Treasuries due to the preferential tax treatment. Due to the rise in municipal yields relative to U.S. Treasury yields, the ratio was over 290% at the end of April 2020. At the end of April 2021, the same 5-year ratio is down to 50% as Treasury yields are higher due to inflation fears and municipal yields are much lower due to strong demand.
The Fund (Class I Shares) outperformed the S&P Municipal Intermediate indices due to an overweight in the A-rated and BBB-rated category and the Fund’s security selection in the credit sectors such as higher education, transportation, and dedicated taxes. Those sectors, especially in the State of New York and in the City, were particularly affected by COVID-19 and the global pandemic and credit spreads and returns improved as the U.S. economy improved and vaccine rates increased. Credits such as NY Metropolitan Transportation Authority (MTA) and the NY/NJ Port Authority (i.e., public transit, bridges, railroads, airports, ports) performed particularly well after undergoing extreme
duress as the reduction in public transit and work from home limited travel throughout the year. The Fund underperformed the NY Lipper average during the fiscal year due to the reduction in the Fund’s risk profile – particularly a duration neutral approach to the year – as the pandemic reached its peak in the spring of 2020. The Fund also does not currently hold non-investment grade (municipal high yield) credits, which performed the best during the last fiscal year. Managers that held a percentage of high yield credits performed above the Lipper average.
| * | Performance data quoted represents past performance, which is no guarantee of future results. Investment return and principal value will fluctuate so that an investor’s shares, when redeemed, may be worth more or less than their original cost. The total return shown assumes the reinvestment of all distributions and does not reflect the deduction of taxes that a shareholder would pay on fund distributions or the redemption of shares. The total return for Class A Shares was 1.60%, adjusted for the Fund’s maximum sales charge of 4.50%. Mutual fund performance changes over time and current performance may be lower or higher than what is stated. For the most recent month-end performance, please visit www.wilmingtonfunds.com or call 1-800-836-2211. |
| ** | Standard & Poor’s (“S&P”) Municipal Bond Intermediate Index consists of bonds in the S&P Municipal Bond Index with a minimum maturity of three years and a maximum maturity of up to, but not including, 15 years as measured from the Rebalancing Date. The S&P Municipal Bond Index is a broad, market value-weighted index that seeks to measure the performance of the U.S. municipal bond market. All bonds in the index are exempt from U.S. federal income taxes or subject to the Alternative Minimum Tax (“AMT”). The indices include general obligation bonds, revenue bonds, insured bonds and pre-refunded bonds. Indices are unmanaged and it is not possible to invest directly in an index. |
| *** | Standard & Poor’s (“S&P”) Intermediate Term New York AMT-Free Municipal Bond Index includes all bonds in the S&P National AMT-Free Municipal Bond Index that have a state code of New York (NY) and an effective maturity, as measured from the first business day of the month, that is at least 1 month and less than 20 years. The S&P National AMT-Free Municipal Bond Index is a broad, comprehensive, market value-weighted index designed to measure the performance of the investment-grade tax-exempt U.S. municipal bond market. Bonds issued by U.S. territories, including Puerto Rico, are excluded from this index. Please note that an investor cannot invest directly in an index. |
| **** | Lipper figures represent the average of the total returns reported by all of the mutual funds designated by Lipper, Inc. as falling into the respective category indicated. These figures do not reflect sales charges. |
Duration is a measure of a security’s price sensitivity to changes in interest rates. Securities with longer durations are more sensitive to changes in interest rates than securities of shorter durations.
High yield, lower-rated securities generally entail greater market, credit and liquidity risks than investment grade securities and may include higher volatility and higher risk of default.
Credit ratings pertain only to the securities in the portfolio and do not protect fund shares against market risk.
Bond prices are sensitive to changes in interest rates and a rise in short-term interest rates could cause a decline in bond prices.
ANNUAL REPORT / April 30, 2021 (unaudited)
Basis Points (“BPS”) is a unit that is equal to 1/100th of 1% and is used to denote the change in a financial instrument. The basis point is commonly used for calculating changes in interest rates, equity indices and the yield of a fixed-income security.
Credit ratings are measured on a scale that generally ranges from AAA (highest) to D (lowest). All Fund securities, except for those labeled “Not
Rated” and “Other”, have been rated by Moody’s, S&P or Fitch, which are each a Nationally Recognized Statistical Rating Organization (“NRSRO”). All Index securities, except for those labeled “Not Rated”, have been rated by Moody’s or S&P. Credit ratings are subject to change. One cannot invest directly into an index.
Income may be subject to the federal AMT.
April 30, 2021 (unaudited) / ANNUAL REPORT
WILMINGTON NEW YORK MUNICIPAL BOND FUND
The graphs below illustrate the hypothetical investment of $10,0001 in the Class A Shares and $1,000,0001 in the Class I Shares of the Wilmington New York Municipal Bond Fund from April 30, 2011 to April 30, 2021 compared to the S&P Municipal Bond Intermediate Index.2
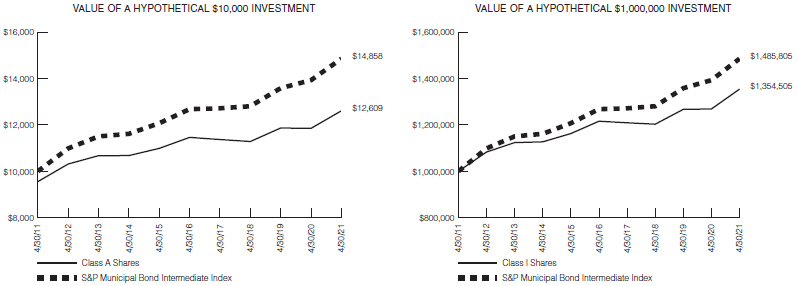
Performance data quoted represents past performance, which is no guarantee of future results. Investment return and principal value will fluctuate so that an investor’s shares, when redeemed, may be worth more or less than their original cost. The total return shown assumes the reinvestment of all distributions and does not reflect the deduction of taxes that a shareholder would pay on fund distributions or the redemption of shares. The total return for Class A Shares was 1.60%, adjusted for the Fund’s maximum sales charge of 4.50%. Mutual fund performance changes over time and current performance may be lower or higher than what is stated. For the most recent month-end performance, please visit www.wilmingtonfunds.com or call 1-800-836-2211.
| | | | | | |
| |
| | | Average Annual Total Returns for the Periods Ended 4/30/21 |
| | | |
| | | 1 Year | | 5 Years | | 10 Years |
| | | |
Class A^ | | 1.60% | | 1.00% | | 2.35% |
| | | |
Class I^ | | 6.74% | | 2.18% | | 3.08% |
| | | |
S&P Municipal Bond Intermediate Index2 | | 6.65% | | 3.22% | | 4.04% |
| ^ | Expense Ratios Before Waivers and Expense Ratios After Waivers for Class A are 1.35% and 0.83%, respectively. Expense Ratios Before Waivers and Expense Ratios After Waivers for Class I are 0.85% and 0.58%, respectively. Expense Ratios Before Waiver represent the operating costs borne by the Fund, expressed as a percentage of the Fund’s average net assets, as shown in the Fees and Expenses table in the Fund’s current prospectus (under “Total Annual Fund Operating Expenses”). Current information regarding the Fund’s Operating Expenses can be found in the Fund’s Financial Highlights. |
| 1 | Represents a hypothetical investment of $10,000 in Class A of the Fund after deducting the maximum sales charge of 4.50% ($10,000 investment minus $450 sales charge = $9,550) and $1,000,000 in Class I of the Fund and assumes the reinvestment of all dividends and distributions. |
| 2 | The performance for the S&P Municipal Bond Intermediate Index assumes the reinvestment of all dividends and distributions but does not reflect the deduction of a sales charge required for the Fund’s performance by the Securities and Exchange Commission. It is not possible to invest directly in an index and the represented index is unmanaged. |
ANNUAL REPORT / April 30, 2021 (unaudited)
SHAREHOLDER EXPENSE EXAMPLE (unaudited)
As a shareholder of a Fund, you incur two types of costs: (1) transaction costs, including sales charges (loads) on purchase payments, reinvested dividends, or other distributions; and redemption fees; and (2) ongoing costs, including management fees; distribution and/or service (12b-1) fees; and other Fund expenses. This Example is intended to help you to understand your ongoing costs (in dollars) of investing in the Funds and to compare these costs with the ongoing costs of investing in other mutual funds. It is based on an investment of $1,000 invested at the beginning of the period and held for the entire period from November 1, 2020 to April 30, 2021.
Actual Expenses
This section of the following table provides information about actual account values and actual expenses. You may use the information in this section, together with the amount you invested, to estimate the expenses that you incurred over the period. Simply divide your account value by $1,000 (for example, an $8,600 account value divided by $1,000 = 8.6), then multiply the result by the number in the first section under the heading entitled “Expenses Paid During Period” to estimate the expenses attributable to your investment during this period.
Hypothetical Example for Comparison Purposes
This section of the following table provides information about hypothetical account values and hypothetical expenses based on the Funds’ actual expense ratios and assumed rates of return of 5% per year before expenses, which are not the Funds’ actual returns. Thus, you should not use the hypothetical account values and expenses to estimate the actual ending account balance or your expenses for the period. Rather, these figures are required to be provided to enable you to compare the ongoing costs of investing in the Funds with other funds. To do so, compare this 5% hypothetical example with the 5% hypothetical examples that appear in the shareholder reports of the other funds.
Please note that the expenses shown in the table are meant to highlight your ongoing costs only. Therefore, the Annualized Net Expense Ratio section of the table is useful in comparing ongoing costs only, and will not help you determine the relative total costs of owning different funds.
The Annualized Net Expense Ratios may be different from the net expense ratios in the Financial Highlights which are for the fiscal year ended April 30, 2021.
| | | | | | | | | | | | | | | | |
| | | | |
| | | Beginning Account Value 11/01/20 | | | Ending Account Value 4/30/21 | | | Expenses Paid During Period(1) | | | Annualized Net Expense Ratio(2) | |
| | | | |
WILMINGTON BROAD MARKET BOND FUND | | | | | | | | | | | | | | | | |
| | | | |
Actual | | | | | | | | | | | | | | | | |
| | | | |
Class A | | | $1,000.00 | | | | $ 988.40 | | | | $3.85 | | | | 0.78% | |
| | | | |
Class I | | | $1,000.00 | | | | $ 990.70 | | | | $2.22 | | | | 0.45%(3) | |
| | | | |
Hypothetical (assuming a 5% return before expenses) | | | | | | | | | | | | | | | | |
| | | | |
Class A | | | $1,000.00 | | | | $1,020.93 | | | | $3.91 | | | | 0.78% | |
| | | | |
Class I | | | $1,000.00 | | | | $1,022.56 | | | | $2.26 | | | | 0.45%(3) | |
| | | | |
WILMINGTON INTERMEDIATE-TERM BOND FUND | | | | | | | | | | | | | | | | |
| | | | |
Actual | | | | | | | | | | | | | | | | |
| | | | |
Class A | | | $1,000.00 | | | | $ 991.30 | | | | $4.00 | | | | 0.81% | |
| | | | |
Class I | | | $1,000.00 | | | | $ 994.00 | | | | $2.42 | | | | 0.49% | |
| | | | |
Hypothetical (assuming a 5% return before expenses) | | | | | | | | | | | | | | | | |
| | | | |
Class A | | | $1,000.00 | | | | $1,020.78 | | | | $4.06 | | | | 0.81% | |
| | | | |
Class I | | | $1,000.00 | | | | $1,022.36 | | | | $2.46 | | | | 0.49% | |
| | | | |
WILMINGTON SHORT-TERM BOND FUND | | | | | | | | | | | | | | | | |
| | | | |
Actual | | | | | | | | | | | | | | | | |
| | | | |
Class A | | | $1,000.00 | | | | $1,002.10 | | | | $3.62 | | | | 0.73% | |
| | | | |
Class I | | | $1,000.00 | | | | $1,003.40 | | | | $2.38 | | | | 0.48% | |
| | | | |
Hypothetical (assuming a 5% return before expenses) | | | | | | | | | | | | | | | | |
| | | | |
Class A | | | $1,000.00 | | | | $1,021.17 | | | | $3.66 | | | | 0.73% | |
| | | | |
Class I | | | $1,000.00 | | | | $1,022.41 | | | | $2.41 | | | | 0.48% | |
| | | | |
WILMINGTON MUNICIPAL BOND FUND | | | | | | | | | | | | | | | | |
| | | | |
Actual | | | | | | | | | | | | | | | | |
| | | | |
Class A | | | $1,000.00 | | | | $1,017.30 | | | | $3.70 | | | | 0.74% | |
| | | | |
Class I | | | $1,000.00 | | | | $1,018.60 | | | | $2.45 | | | | 0.49% | |
| | | | |
Hypothetical (assuming a 5% return before expenses) | | | | | | | | | | | | | | | | |
| | | | |
Class A | | | $1,000.00 | | | | $1,021.12 | | | | $3.71 | | | | 0.74% | |
| | | | |
Class I | | | $1,000.00 | | | | $1,022.36 | | | | $2.46 | | | | 0.49% | |
April 30, 2021 (unaudited) / ANNUAL REPORT
| | | | | | | | | | | | | | | | |
| | | | |
| | | Beginning Account Value 11/01/20 | | | Ending Account Value 4/30/21 | | | Expenses Paid During Period(1) | | | Annualized Net Expense Ratio(2) | |
| | | | |
WILMINGTON NEW YORK MUNICIPAL BOND FUND | | | | | | | | | | | | | | | | |
| | | | |
Actual | | | | | | | | | | | | | | | | |
| | | | |
Class A | | | $1,000.00 | | | | $1,023.60 | | | | $4.11 | | | | 0.82% | |
| | | | |
Class I | | | $1,000.00 | | | | $1,024.80 | | | | $2.86 | | | | 0.57% | |
| | | | |
Hypothetical (assuming a 5% return before expenses) | | | | | | | | | | | | | | | | |
| | | | |
Class A | | | $1,000.00 | | | | $1,020.73 | | | | $4.11 | | | | 0.82% | |
| | | | |
Class I | | | $1,000.00 | | | | $1,021.97 | | | | $2.86 | | | | 0.57% | |
| (1) | Expenses are equal to the Funds’ annualized net expense ratios, multiplied by the average account value over the period, multiplied by 181/365 (to reflect the most recent one-half year period). |
| (2) | Expense ratio does not reflect the indirect expenses of the underlying funds in which the Funds invest. |
| (3) | Effective January 4, 2021, the contractual expense limitation for Class I of the Wilmington Broad Market Bond Fund changed from 0.49% to 0.43%. Had this change been in effect for the entire period from November 1, 2020 to April 30, 2021, the expense examples would have been as follows: |
| | | | | | | | | | | | | | | | |
| | | | |
| | | Beginning Account Value 11/01/20 | | | Ending Account Value 4/30/21 | | | Expenses Paid During Period(1) | | | Annualized Net Expense Ratio(2) | |
| | | | |
WILMINGTON BROAD MARKET BOND FUND CLASS I | | | | | | | | | | | | | | | | |
| | | | |
Actual | | | $1,000.00 | | | | $ 990.70 | | | | $2.12 | | | | 0.43% | |
| | | | |
Hypothetical (assuming a 5% return before expenses) | | | $1,000.00 | | | | $1,022.66 | | | | $2.16 | | | | 0.43% | |
ANNUAL REPORT / April 30, 2021 (unaudited)
PORTFOLIO OF INVESTMENTS SUMMARY TABLE
Wilmington Broad Market Bond Fund
At April 30, 2021, the Fund’s portfolio composition was as follows (unaudited):
| | | | | |
| | | Percentage of Total Net Assets |
| |
Corporate Bonds | | | | 47.8 | % |
| |
U.S. Treasury Obligations | | | | 22.1 | % |
| |
Mortgage-Backed Securities | | | | 21.9 | % |
| |
Government Agencies | | | | 3.0 | % |
| |
Investment Company | | | | 1.0 | % |
| |
Commercial Paper | | | | 0.8 | % |
| |
Municipal Bond | | | | 0.4 | % |
| |
Collateralized Mortgage Obligations | | | | 0.2 | % |
| |
Enhanced Equipment Trust Certificate | | | | 0.0 | %(1) |
| |
Asset-Backed Security | | | | 0.0 | %(1) |
| |
Cash Equivalents(2) | | | | 2.9 | % |
| |
Cash Collateral Invested for Securities on Loan(3) | | | | 6.0 | % |
| |
Other Assets and Liabilities - Net(4) | | | | (6.1 | )% |
| | | | | |
| |
TOTAL | | | | 100.0 | % |
| | | | | |
| | | | | |
Credit Quality Diversification(5) | | Percentage of Total Net Assets |
| |
U.S. Government Agency Securities | | | | 25.1 | % |
| |
U.S. Treasury | | | | 22.1 | % |
| |
AA / Aa | | | | 0.1 | % |
| |
A/ A | | | | 7.1 | % |
| |
BBB / Baa | | | | 38.6 | % |
| |
BB / Ba | | | | 1.9 | % |
| |
B/B | | | | 0.5 | % |
| |
Not Rated | | | | 10.7 | % |
| |
Other Assets and Liabilities - Net(4) | | | | (6.1 | )% |
| | | | | |
| |
TOTAL | | | | 100.0 | % |
| | | | | |
| (1) | Represents less than 0.05%. |
| (2) | Cash Equivalents include investments in a money market fund. |
| (3) | Cash Collateral Invested for Securities on Loan include investments in money market funds and repurchase agreements. |
| (4) | Assets, other than investments in securities, less liabilities. See Statements of Assets and Liabilities. |
| (5) | For financial reporting purposes, the Credit Quality Diversification table reflects the lowest rating assigned by either Moody’s Investors Service or Standard and Poor’s if the ratings differ. These rating agencies are independent, nationally recognized statistical rating organizations and are widely used. Investment grade ratings are credit ratings of BBB/Baa or higher. Below investment grade ratings are credit ratings of BB/Ba or lower. Investments designated as “Not Rated” are not rated by either rating agency and do not necessarily indicate low credit quality. Credit quality ratings are subject to change. |
PORTFOLIO OF INVESTMENTS
April 30, 2021
| | | | | | | | |
| | |
| Description | | Par Value | | | Value | |
| | |
ASSET-BACKED SECURITY – 0.0%** | | | | | | | | |
|
FINANCIAL SERVICES – 0.0%** | |
LA Arena Funding LLC, Series 1999-1, Class A, 7.66%, 12/15/26W | | $ | 113,365 | | | $ | 112,374 | |
| | | | | | | | |
| | |
TOTAL ASSET-BACKED SECURITY (COST $113,365) | | | | | | $ | 112,374 | |
|
COLLATERALIZED MORTGAGE OBLIGATIONS – 0.2% | |
|
FEDERAL NATIONAL MORTGAGE ASSOCIATION (FNMA) –0.2% | |
Series 2005-29, Class WC, 4.75%, 04/25/35 | | | 11,209 | | | | 12,275 | |
Series 2012-114, Class VM, 3.50%, 10/25/25 | | | 1,048,382 | | | | 1,078,969 | |
| | | | | | | | |
| |
TOTAL FEDERAL NATIONAL MORTGAGE ASSOCIATION (FNMA) | | | $ | 1,091,244 | |
|
WHOLE LOAN – 0.0%** | |
Banc of America Mortgage Securities, Inc., | | | | | | | | |
Series 2004-A, Class 2A1, 2.53%, 02/25/34D | | | 37,014 | | | | 35,569 | |
CHL Mortgage Pass-Through Trust, | | | | | | | | |
Series 2004-8, Class 2A1, 4.50%, 06/01/21 | | | 4,798 | | | | 5,072 | |
| | | | | | | | |
| | |
| Description | | Par Value | | | Value | |
| | |
IndyMac INDA Mortgage Loan Trust, | | | | | | | | |
Series 2005-AR1, Class 2A1, 2.88%, 11/25/35D | | $ | 31,288 | | | $ | 29,755 | |
| | | | | | | | |
| | |
TOTAL WHOLE LOAN | | | | | | $ | 70,396 | |
| | | | | | | | |
| |
TOTAL COLLATERALIZED MORTGAGE OBLIGATIONS (COST $1,254,980) | | | $ | 1,161,640 | |
|
COMMERCIAL PAPER – 0.8%◆ | |
General Motors Financial Co., Inc., 0.45%, 05/10/21W | | | 5,000,000 | | | | 4,999,490 | |
| | | | | | | | |
| |
TOTAL COMMERCIAL PAPER (COST $4,999,438) | | | $ | 4,999,490 | |
|
CORPORATE BONDS – 47.8% | |
|
AEROSPACE & DEFENSE – 2.1% | |
Boeing Co. (The), Sr. Unsecured 1.95%, 02/01/24 | | | 2,700,000 | | | | 2,772,391 | |
1.43%, 02/04/24 | | | 2,500,000 | | | | 2,508,630 | |
2.75%, 02/01/26 | | | 2,000,000 | | | | 2,076,444 | |
L3Harris Technologies, Inc., Sr. Unsecured, 2.90%, 12/15/29 | | | 835,000 | | | | 868,450 | |
April 30, 2021 / ANNUAL REPORT
| | |
PORTFOLIOS OF INVESTMENTS Wilmington Broad Market Bond Fund (continued) | | 18 |
| | | | | | | | |
| | |
| Description | | Par Value | | | Value | |
Northrop Grumman Corp., Sr. Unsecured | | | | | | | | |
2.93%, 01/15/25 | | $ | 1,000,000 | | | $ | 1,070,807 | |
4.03%, 10/15/47 | | | 1,765,000 | | | | 1,988,947 | |
Raytheon Technologies Corp., Sr. Unsecured, 3.50%, 03/15/27 | | | 1,600,000 | | | | 1,762,747 | |
| | | | | | | | |
| | |
TOTAL AEROSPACE & DEFENSE | | | | | | $ | 13,048,416 | |
| | |
AUTOMOTIVE – 2.8% | | | | | | | | |
American Honda Finance Corp., Sr. Unsecured, MTN, 0.65%, 09/08/23 | | | 1,790,000 | | | | 1,802,073 | |
Daimler Finance North America LLC, Company Guaranteed, 3.88%, 09/15/21W | | | 250,000 | | | | 253,132 | |
Daimler Finance North America LLC, Sr. Unsecured, 0.75%, 03/01/24W | | | 3,000,000 | | | | 2,991,198 | |
Ford Motor Co., Sr. Unsecured, 8.50%, 04/21/23 | | | 800,000 | | | | 897,648 | |
Ford Motor Credit Co. LLC, Sr. Unsecured 4.25%, 09/20/22 | | | 450,000 | | | | 465,829 | |
3.37%, 11/17/23 | | | 1,000,000 | | | | 1,034,602 | |
5.58%, 03/18/24 | | | 1,000,000 | | | | 1,092,099 | |
5.13%, 06/16/25 | | | 1,500,000 | | | | 1,641,961 | |
General Motors Co., Sr. Unsecured 5.40%, 10/02/23 | | | 335,000 | | | | 370,979 | |
6.25%, 10/02/43 | | | 1,000,000 | | | | 1,321,608 | |
General Motors Financial Co., Inc., Sr. Unsecured 4.20%, 11/06/21 | | | 1,650,000 | | | | 1,681,409 | |
1.25%, 01/08/26 | | | 1,000,000 | | | | 984,635 | |
PACCAR Financial Corp., Sr. Unsecured, MTN, 2.65%, 05/10/22 | | | 3,045,000 | | | | 3,122,141 | |
| | | | | | | | |
| | |
TOTAL AUTOMOTIVE | | | | | | $ | 17,659,314 | |
| | |
BEVERAGES – 0.7% | | | | | | | | |
Anheuser-Busch Cos., LLC, Company Guaranteed, 4.90%, 02/01/46 | | | 1,125,000 | | | | 1,347,314 | |
Keurig Dr. Pepper, Inc., Company Guaranteed 0.75%, 03/15/24 | | | 1,490,000 | | | | 1,489,868 | |
3.20%, 05/01/30 | | | 775,000 | | | | 825,680 | |
5.09%, 05/25/48 | | | 700,000 | | | | 894,934 | |
| | | | | | | | |
| | |
TOTAL BEVERAGES | | | | | | $ | 4,557,796 | |
| | |
BUILDING PRODUCTS – 0.5% | | | | | | | | |
Carrier Global Corp., Sr. Unsecured, 2.24%, 02/15/25 | | | 3,000,000 | | | | 3,134,088 | |
Johnson Controls International PLC, Sr. Unsecured, 4.63%, 07/02/44 | | | 100,000 | | | | 120,536 | |
| | | | | | | | |
| | |
TOTAL BUILDING PRODUCTS | | | | | | $ | 3,254,624 | |
| | |
CAPITAL MARKETS – 3.3% | | | | | | | | |
Bank of New York Mellon Corp. (The), Subordinated, MTN, 3.00%, 10/30/28 | | | 775,000 | | | | 827,577 | |
Credit Suisse AG, Sr. Unsecured 2.10%, 11/12/21 | | | 1,785,000 | | | | 1,801,892 | |
0.50%, 02/02/24 | | | 3,000,000 | | | | 2,977,597 | |
| | | | | | | | |
| | |
| Description | | Par Value | | | Value | |
Goldman Sachs Group, Inc. (The), Sr. Unsecured | | | | | | | | |
(3 Month USD LIBOR + 1.20%), 3.27%, 09/29/25D | | $ | 800,000 | | | $ | 858,643 | |
(3 Month USD LIBOR + 1.51%), 3.69%, 06/05/28D | | | 2,080,000 | | | | 2,295,933 | |
Morgan Stanley, Sr. Unsecured, (SOFR + 0.62%), 0.73%, 04/05/24D | | | 2,250,000 | | | | 2,254,004 | |
Morgan Stanley, Sr. Unsecured, MTN 2.63%, 11/17/21 | | | 4,000,000 | | | | 4,050,582 | |
(SOFR + 0.46%), 0.53%, 01/25/24D | | | 3,000,000 | | | | 2,999,031 | |
3.13%, 07/27/26 | | | 340,000 | | | | 367,757 | |
(SOFR + 3.12%), 3.62%, 04/01/31D | | | 890,000 | | | | 978,249 | |
Morgan Stanley, Subordinated, GMTN, 4.35%, 09/08/26 | | | 505,000 | | | | 572,737 | |
TD Ameritrade Holding Corp., Sr. Unsecured, 2.95%, 04/01/22 | | | 847,000 | | | | 864,124 | |
| | | | | | | | |
| | |
TOTAL CAPITAL MARKETS | | | | | | $ | 20,848,126 | |
| | |
CHEMICALS – 0.3% | | | | | | | | |
Nutrien Ltd., Sr. Unsecured, 1.90%, 05/13/23 | | | 2,000,000 | | | | 2,053,621 | |
| |
COMMERCIAL SERVICES & SUPPLIES – 0.6% | | | | | |
Global Payments, Inc., Sr. Unsecured 3.75%, 06/01/23 | | | 2,570,000 | | | | 2,722,062 | |
2.90%, 05/15/30 | | | 1,000,000 | | | | 1,024,822 | |
| | | | | | | | |
| | |
TOTAL COMMERCIAL SERVICES & SUPPLIES | | | | | | $ | 3,746,884 | |
| | |
COMPUTERS – 0.5% | | | | | | | | |
Hewlett Packard Enterprise Co., Sr. Unsecured, 2.25%, 04/01/23 | | | 3,000,000 | | | | 3,091,261 | |
| | |
DIVERSIFIED FINANCIAL SERVICES –7.1% | | | | | | | | |
Bank of America Corp., Sr. Unsecured, 5.70%, 01/24/22 | | | 3,000,000 | | | | 3,117,605 | |
Bank of America Corp., Sr. Unsecured, MTN 3.25%, 10/21/27 | | | 1,095,000 | | | | 1,186,388 | |
(SOFR + 1.88%), 2.83%, 10/24/51D | | | 250,000 | | | | 232,220 | |
Bank of America Corp., Subordinated, MTN, 4.25%, 10/22/26 | | | 1,000,000 | | | | 1,131,418 | |
Berkshire Hathaway Finance Corp., Company Guaranteed, 4.30%, 05/15/43 | | | 425,000 | | | | 509,479 | |
Capital One Financial Corp., Sr. Unsecured, 2.60%, 05/11/23 | | | 1,470,000 | | | | 1,531,990 | |
Citibank NA, Sr. Unsecured, BKNT, 3.40%, 07/23/21 | | | 1,400,000 | | | | 1,406,746 | |
Citigroup, Inc., Sr. Unsecured (3 Month USD LIBOR + 0.95%), 2.88%, 07/24/23D | | | 2,060,000 | | | | 2,122,700 | |
(SOFR + 0.77%), 1.12%, 01/28/27D | | | 2,750,000 | | | | 2,698,860 | |
Citigroup, Inc., Subordinated, 4.13%, 07/25/28 | | | 1,650,000 | | | | 1,850,563 | |
Fifth Third Bancorp, Sr. Unsecured 3.50%, 03/15/22 | | | 1,250,000 | | | | 1,281,454 | |
2.55%, 05/05/27 | | | 780,000 | | | | 818,387 | |
Fifth Third Bancorp, Subordinated, 4.30%, 01/16/24 | | | 530,000 | | | | 579,023 | |
FMR LLC, Sr. Unsecured, 6.45%, 11/15/39W | | | 1,000,000 | | | | 1,412,133 | |
ANNUAL REPORT / April 30, 2021
| | |
| 19 | | PORTFOLIOS OF INVESTMENTS Wilmington Broad Market Bond Fund (continued) |
| | | | | | | | |
| | |
| Description | | Par Value | | | Value | |
Huntington Bancshares, Inc., Sr. Unsecured, 2.63%, 08/06/24 | | $ | 4,325,000 | | | $ | 4,581,127 | |
JPMorgan Chase & Co., Series W, Jr. Subordinated, (3 Month USD LIBOR + 1.00%), 1.19%, 05/15/47D | | | 1,000,000 | | | | 869,788 | |
KeyBank NA, Sr. Unsecured, BKNT 3.30%, 02/01/22 | | | 615,000 | | | | 628,917 | |
1.25%, 03/10/23 | | | 2,000,000 | | | | 2,031,920 | |
Lloyds Banking Group PLC, Sr. Unsecured, (UST Yield Curve CMT 1 Year + 1.10%), 1.33%, 06/15/23D | | | 2,000,000 | | | | 2,019,116 | |
PNC Bank NA, Subordinated, BKNT 2.95%, 01/30/23 | | | 350,000 | | | | 364,665 | |
2.70%, 10/22/29 | | | 1,125,000 | | | | 1,160,364 | |
PNC Financial Services Group, Inc. (The), Subordinated, 3.90%, 04/29/24 | | | 1,500,000 | | | | 1,641,075 | |
Truist Bank, Subordinated, BKNT 3.80%, 10/30/26 | | | 1,000,000 | | | | 1,114,278 | |
2.25%, 03/11/30 | | | 1,850,000 | | | | 1,830,458 | |
Truist Financial Corp., Sr. Unsecured, MTN, (3 Month USD LIBOR + 0.65%), 0.85%, 04/01/22D | | | 2,000,000 | | | | 2,010,311 | |
U.S. Bancorp, Subordinated, MTN, 2.95%, 07/15/22 | | | 2,000,000 | | | | 2,058,135 | |
Wells Fargo & Co., Sr. Unsecured 2.10%, 07/26/21 | | | 2,000,000 | | | | 2,007,637 | |
(SOFR + 2.00%), 2.19%, 04/30/26D | | | 1,170,000 | | | | 1,215,746 | |
Wells Fargo & Co., Subordinated, MTN, 4.40%, 06/14/46 | | | 1,000,000 | | | | 1,141,560 | |
| | | | | | | | |
| |
TOTAL DIVERSIFIED FINANCIAL SERVICES | | | $ | 44,554,063 | |
|
ELECTRIC – 3.3% | |
American Electric Power Co., Inc., Series M, Sr. Unsecured, 0.75%, 11/01/23 | | | 1,620,000 | | | | 1,624,227 | |
Baltimore Gas and Electric Co., Sr. Unsecured, 3.50%, 08/15/46 | | | 1,550,000 | | | | 1,638,849 | |
Commonwealth Edison Co., 1st Mortgage, 3.80%, 10/01/42 | | | 1,000,000 | | | | 1,113,831 | |
Consolidated Edison, Inc., Sr. Unsecured, 2.00%, 05/15/21 | | | 750,000 | | | | 750,347 | |
Dominion Energy, Inc., Sr. Unsecured, 1.45%, 04/15/26 | | | 1,950,000 | | | | 1,949,635 | |
DTE Energy Co., Series F, Sr. Unsecured, 3.85%, 12/01/23 | | | 305,000 | | | | 327,475 | |
DTE Energy Co., Series H, Sr. Unsecured, 0.55%, 11/01/22 | | | 1,500,000 | | | | 1,503,471 | |
Entergy Arkansas LLC, 1st Mortgage, 4.95%, 12/15/44 | | | 1,000,000 | | | | 1,101,267 | |
Entergy Corp., Sr. Unsecured, 0.90%, 09/15/25 | | | 1,000,000 | | | | 981,781 | |
Entergy Louisiana LLC, 1st Mortgage, 2.90%, 03/15/51 | | | 1,000,000 | | | | 953,962 | |
Exelon Corp., Sr. Unsecured, 4.70%, 04/15/50 | | | 2,000,000 | | | | 2,439,279 | |
FirstEnergy Corp., Series A, Sr. Unsecured, 1.60%, 01/15/26 | | | 1,000,000 | | | | 979,014 | |
FirstEnergy Corp., Series B, Sr. Unsecured, 4.40%, 07/15/27 | | | 800,000 | | | | 880,013 | |
| | | | | | | | |
| | |
| Description | | Par Value | | | Value | |
NextEra Energy Capital Holdings, Inc., Company Guaranteed, 0.65%, 03/01/23 | | $ | 2,305,000 | | | $ | 2,309,836 | |
Sempra Energy, Sr. Unsecured, 2.90%, 02/01/23 | | | 760,000 | | | | 789,208 | |
System Energy Resources, Inc., 1st Mortgage, 4.10%, 04/01/23 | | | 500,000 | | | | 528,350 | |
WEC Energy Group, Inc., Sr. Unsecured, 1.38%, 10/15/27 | | | 750,000 | | | | 731,100 | |
| | | | | | | | |
| | |
TOTAL ELECTRIC | | | | | | $ | 20,601,645 | |
|
ENVIRONMENTAL CONTROL – 0.5% | |
Waste Management, Inc., Company Guaranteed 3.50%, 05/15/24 | | | 1,255,000 | | | | 1,354,038 | |
4.10%, 03/01/45 | | | 1,520,000 | | | | 1,740,791 | |
| | | | | | | | |
| | |
TOTAL ENVIRONMENTAL CONTROL | | | | | | $ | 3,094,829 | |
|
FOOD & STAPLES RETAILING – 2.8% | |
Campbell Soup Co., Sr. Unsecured 3.65%, 03/15/23 | | | 3,000,000 | | | | 3,172,962 | |
3.30%, 03/19/25 | | | 2,050,000 | | | | 2,213,396 | |
Conagra Brands, Inc., Sr. Unsecured, 5.40%, 11/01/48 | | | 665,000 | | | | 859,328 | |
Kroger Co. (The), Sr. Unsecured 2.95%, 11/01/21 | | | 1,750,000 | | | | 1,769,417 | |
2.80%, 08/01/22 | | | 2,060,000 | | | | 2,119,838 | |
5.40%, 01/15/49 | | | 1,640,000 | | | | 2,148,072 | |
3.95%, 01/15/50 | | | 1,000,000 | | | | 1,093,870 | |
McCormick & Co., Inc., Sr. Unsecured, 0.90%, 02/15/26 | | | 2,900,000 | | | | 2,838,012 | |
Mondelez International, Inc., Sr. Unsecured, 0.63%, 07/01/22 | | | 1,250,000 | | | | 1,253,913 | |
| | | | | | | | |
| | |
TOTAL FOOD & STAPLES RETAILING | | | | | | $ | 17,468,808 | |
|
FOREST PRODUCTS & PAPER – 0.3% | |
International Paper Co., Sr. Unsecured, 4.40%, 08/15/47 | | | 1,500,000 | | | | 1,774,150 | |
|
GAS – 0.2% | |
Southern Co. Gas Capital Corp., Company Guaranteed, 3.95%, 10/01/46 | | | 1,425,000 | | | | 1,540,202 | |
|
HEALTHCARE-PRODUCTS – 1.3% | |
Becton Dickinson and Co., Sr. Unsecured, 2.89%, 06/06/22 | | | 5,558,000 | | | | 5,701,919 | |
DH Europe Finance II Sarl, Company Guaranteed, 2.20%, 11/15/24 | | | 2,330,000 | | | | 2,437,229 | |
| | | | | | | | |
| | |
TOTAL HEALTHCARE-PRODUCTS | | | | | | $ | 8,139,148 | |
|
HEALTHCARE-SERVICES – 2.8% | |
Anthem, Inc., Sr. Unsecured, 3.65%, 12/01/27 | | | 1,650,000 | | | | 1,835,032 | |
Cardinal Health, Inc., Sr. Unsecured, 4.50%, 11/15/44 | | | 650,000 | | | | 720,426 | |
Cigna Corp., Company Guaranteed 3.75%, 07/15/23 | | | 272,000 | | | | 290,266 | |
4.80%, 07/15/46 | | | 1,000,000 | | | | 1,227,215 | |
CommonSpirit Health, Sr. Secured, 2.76%, 10/01/24 | | | 3,140,000 | | | | 3,322,491 | |
April 30, 2021 / ANNUAL REPORT
| | |
PORTFOLIOS OF INVESTMENTS Wilmington Broad Market Bond Fund (continued) | | 20 |
| | | | | | | | |
| | |
| Description | | Par Value | | | Value | |
CVS Health Corp., Sr. Unsecured, 2.13%, 06/01/21 | | $ | 5,000,000 | | | $ | 5,002,882 | |
Elanco Animal Health, Inc., Sr. Unsecured, 5.90%, 08/28/28 | | | 2,000,000 | | | | 2,285,054 | |
NYU Langone Hospitals, Secured, 3.38%, 07/01/55 | | | 1,000,000 | | | | 1,003,295 | |
UnitedHealth Group, Inc., Sr. Unsecured 2.95%, 10/15/27 | | | 1,350,000 | | | | 1,465,166 | |
3.95%, 10/15/42 | | | 290,000 | | | | 335,798 | |
| | | | | | | | |
| | |
TOTAL HEALTHCARE-SERVICES | | | | | | $ | 17,487,625 | |
|
HOME FURNISHINGS – 0.5% | |
Whirlpool Corp., Sr. Unsecured 4.70%, 06/01/22 | | | 1,500,000 | | | | 1,567,542 | |
4.60%, 05/15/50 | | | 1,405,000 | | | | 1,668,712 | |
| | | | | | | | |
| | |
TOTAL HOME FURNISHINGS | | | | | | $ | 3,236,254 | |
|
HOUSEHOLD PRODUCTS/WARES – 0.2% | |
Church & Dwight Co., Inc., Sr. Unsecured, 3.95%, 08/01/47 | | | 870,000 | | | | 975,606 | |
|
INSURANCE – 2.4% | |
American International Group, Inc., Sr. Unsecured, 4.20%, 04/01/28 | | | 1,000,000 | | | | 1,130,528 | |
Aon Corp., Company Guaranteed, 2.20%, 11/15/22 | | | 3,500,000 | | | | 3,593,532 | |
Aon PLC, Company Guaranteed, 4.00%, 11/27/23 | | | 1,450,000 | | | | 1,565,074 | |
CNA Financial Corp., Sr. Unsecured, 3.95%, 05/15/24 | | | 950,000 | | | | 1,031,742 | |
Lincoln National Corp., Sr. Unsecured 4.20%, 03/15/22 | | | 1,000,000 | | | | 1,033,547 | |
3.63%, 12/12/26 | | | 1,380,000 | | | | 1,527,377 | |
Principal Financial Group, Inc., Company Guaranteed, 3.30%, 09/15/22 | | | 250,000 | | | | 259,678 | |
W.R. Berkley Corp., Sr. Unsecured 4.63%, 03/15/22 | | | 1,000,000 | | | | 1,037,184 | |
4.75%, 08/01/44 | | | 1,715,000 | | | | 2,059,496 | |
4.00%, 05/12/50 | | | 1,425,000 | | | | 1,577,845 | |
| | | | | | | | |
| | |
TOTAL INSURANCE | | | | | | $ | 14,816,003 | |
|
MACHINERY – 0.4% | |
Roper Technologies, Inc., Sr. Unsecured 0.45%, 08/15/22 | | | 1,500,000 | | | | 1,501,984 | |
2.00%, 06/30/30 | | | 1,345,000 | | | | 1,295,258 | |
| | | | | | | | |
| | |
TOTAL MACHINERY | | | | | | $ | 2,797,242 | |
|
MEDIA – 1.6% | |
CCO Holdings LLC, Sr. Unsecured, 4.25%, 02/01/31W | | | 3,000,000 | | | | 3,007,500 | |
Comcast Corp., Company Guaranteed, 4.95%, 10/15/58 | | | 1,500,000 | | | | 2,008,106 | |
Discovery Communications LLC, Company Guaranteed 3.95%, 03/20/28 | | | 1,000,000 | | | | 1,099,799 | |
3.63%, 05/15/30 | | | 1,000,000 | | | | 1,072,031 | |
ViacomCBS, Inc., Sr. Unsecured 4.60%, 01/15/45 | | | 1,100,000 | | | | 1,227,360 | |
| | | | | | | | |
| | |
| Description | | Par Value | | | Value | |
4.95%, 05/19/50# | | $ | 1,185,000 | | | $ | 1,386,400 | |
| | | | | | | | |
| | |
TOTAL MEDIA | | | | | | $ | 9,801,196 | |
|
MINING – 0.2% | |
Barrick Gold Corp., Sr. Unsecured, 5.25%, 04/01/42 | | | 1,000,000 | | | | 1,261,606 | |
|
MISCELLANEOUS MANUFACTURING – 0.4% | |
Textron, Inc., Sr. Unsecured 3.88%, 03/01/25 | | | 750,000 | | | | 811,516 | |
2.45%, 03/15/31 | | | 2,000,000 | | | | 1,975,018 | |
| | | | | | | | |
| | |
TOTAL MISCELLANEOUS MANUFACTURING | | | | | | $ | 2,786,534 | |
|
OIL & GAS – 2.4% | |
Canadian Natural Resources Ltd., Sr. Unsecured, 2.95%, 01/15/23 | | | 3,000,000 | | | | 3,112,854 | |
Marathon Petroleum Corp., Sr. Unsecured, 3.63%, 09/15/24 | | | 745,000 | | | | 805,797 | |
Phillips 66, Company Guaranteed 4.30%, 04/01/22 | | | 1,450,000 | | | | 1,508,500 | |
0.90%, 02/15/24 | | | 1,065,000 | | | | 1,066,510 | |
3.85%, 04/09/25 | | | 575,000 | | | | 631,209 | |
Pioneer Natural Resources Co., Sr. Unsecured 1.13%, 01/15/26 | | | 1,000,000 | | | | 988,149 | |
1.90%, 08/15/30 | | | 1,700,000 | | | | 1,586,442 | |
2.15%, 01/15/31# | | | 1,000,000 | | | | 944,849 | |
Valero Energy Corp., Sr. Unsecured 2.15%, 09/15/27 | | | 1,800,000 | | | | 1,793,667 | |
4.00%, 04/01/29 | | | 1,580,000 | | | | 1,727,733 | |
4.90%, 03/15/45# | | | 563,000 | | | | 643,678 | |
| | | | | | | | |
| | |
TOTAL OIL & GAS | | | | | | $ | 14,809,388 | |
|
PHARMACEUTICALS – 2.1% | |
AbbVie, Inc., Sr. Unsecured 2.95%, 11/21/26 | | | 1,875,000 | | | | 2,014,977 | |
4.25%, 11/14/28 | | | 1,235,000 | | | | 1,415,590 | |
4.40%, 11/06/42 | | | 460,000 | | | | 535,031 | |
4.88%, 11/14/48 | | | 1,000,000 | | | | 1,232,522 | |
4.25%, 11/21/49 | | | 1,000,000 | | | | 1,150,787 | |
Bristol-Myers Squibb Co., Sr. Unsecured (3 Month USD LIBOR + 0.38%), 0.57%, 05/16/22D | | | 665,000 | | | | 667,013 | |
2.75%, 02/15/23 | | | 1,305,000 | | | | 1,357,542 | |
3.40%, 07/26/29 | | | 1,000,000 | | | | 1,103,341 | |
CVS Health Corp., Sr. Unsecured, 1.88%, 02/28/31# | | | 2,000,000 | | | | 1,889,816 | |
Pfizer, Inc., Sr. Unsecured, 2.63%, 04/01/30 | | | 650,000 | | | | 680,871 | |
Zoetis, Inc., Sr. Unsecured, 3.95%, 09/12/47 | | | 1,005,000 | | | | 1,127,085 | |
| | | | | | | | |
| | |
TOTAL PHARMACEUTICALS | | | | | | $ | 13,174,575 | |
|
PIPELINES – 2.4% | |
Enbridge, Inc., Company Guaranteed, (SOFR + 0.40%), 0.41%, 02/17/23D | | | 1,000,000 | | | | 1,001,538 | |
Energy Transfer LP, Sr. Unsecured 3.60%, 02/01/23 | | | 870,000 | | | | 905,461 | |
ANNUAL REPORT / April 30, 2021
| | |
| 21 | | PORTFOLIOS OF INVESTMENTS Wilmington Broad Market Bond Fund (continued) |
| | | | | | | | |
| | |
| Description | | Par Value | | | Value | |
3.75%, 05/15/30 | | $ | 715,000 | | | $ | 744,992 | |
5.30%, 04/15/47 | | | 1,250,000 | | | | 1,339,161 | |
Enterprise Products Operating LLC, Company Guaranteed 4.20%, 01/31/50 | | | 1,120,000 | | | | 1,206,713 | |
4.95%, 10/15/54 | | | 500,000 | | | | 594,480 | |
Kinder Morgan Energy Partners LP, Company Guaranteed, 5.40%, 09/01/44 | | | 1,000,000 | | | | 1,199,287 | |
Kinder Morgan, Inc., Company Guaranteed 5.20%, 03/01/48 | | | 2,040,000 | | | | 2,429,261 | |
3.60%, 02/15/51 | | | 1,315,000 | | | | 1,266,344 | |
MPLX LP, Sr. Unsecured (3 Month USD LIBOR + 1.10%), 1.29%, 09/09/22D | | | 470,000 | | | | 470,314 | |
4.70%, 04/15/48 | | | 1,000,000 | | | | 1,098,036 | |
ONEOK Partners LP, Company Guaranteed, 6.20%, 09/15/43 | | | 1,000,000 | | | | 1,241,556 | |
Plains All American Pipeline LP, Sr. Unsecured, 3.85%, 10/15/23 | | | 500,000 | | | | 529,524 | |
Spectra Energy Partners LP, Company Guaranteed, 3.50%, 03/15/25 | | | 670,000 | | | | 724,217 | |
| | |
TOTAL PIPELINES | | | | | | $ | 14,750,884 | |
|
REAL ESTATE INVESTMENT TRUSTS – 2.1% | |
American Tower Corp., Sr. Unsecured 5.00%, 02/15/24 | | | 415,000 | | | | 461,682 | |
3.13%, 01/15/27 | | | 1,000,000 | | | | 1,068,848 | |
3.10%, 06/15/50 | | | 1,500,000 | | | | 1,402,769 | |
AvalonBay Communities, Inc., Sr. Unsecured, MTN, 3.35%, 05/15/27 | | | 1,420,000 | | | | 1,551,000 | |
Healthcare Realty Trust, Inc., Sr. Unsecured 3.88%, 05/01/25 | | | 915,000 | | | | 995,577 | |
3.63%, 01/15/28# | | | 800,000 | | | | 867,141 | |
Healthpeak Properties, Inc., Sr. Unsecured, 2.88%, 01/15/31 | | | 2,350,000 | | | | 2,410,314 | |
Welltower, Inc., Sr. Unsecured 4.00%, 06/01/25 | | | 3,000,000 | | | | 3,327,885 | |
4.95%, 09/01/48 | | | 1,000,000 | | | | 1,215,737 | |
| |
TOTAL REAL ESTATE INVESTMENT TRUSTS | | | $ | 13,300,953 | |
| | |
RETAIL – 0.2% | | | | | | | | |
Nordstrom, Inc., Sr. Unsecured, 5.00%, 01/15/44 | | | 1,000,000 | | | | 969,479 | |
| | |
TELECOMMUNICATIONS – 1.6% | | | | | | | | |
AT&T, Inc., Sr. Unsecured 0.90%, 03/25/24# | | | 2,000,000 | | | | 2,002,142 | |
4.50%, 05/15/35 | | | 845,000 | | | | 959,850 | |
3.30%, 02/01/52 | | | 2,000,000 | | | | 1,828,285 | |
3.55%, 09/15/55W | | | 1,423,000 | | | | 1,315,033 | |
Verizon Communications, Inc., Sr. Unsecured 1.75%, 01/20/31 | | | 2,310,000 | | | | 2,174,290 | |
3.40%, 03/22/41 | | | 1,515,000 | | | | 1,541,675 | |
| | |
TOTAL TELECOMMUNICATIONS | | | | | | $ | 9,821,275 | |
| | | | | | | | |
| | |
| Description | | Par Value | | | Value | |
| | |
TRANSPORTATION – 1.4% | | | | | | | | |
FedEx Corp., Company Guaranteed, 2.40%, 05/15/31 | | $
|
2,500,000 |
| | $ | 2,473,300 | |
Ryder System, Inc., Sr. Unsecured, MTN 2.50%, 09/01/22 | | | 980,000 | | | | 1,005,805 | |
3.65%, 03/18/24 | | | 1,670,000 | | | | 1,801,964 | |
Union Pacific Corp., Sr. Unsecured 3.15%, 03/01/24 | | | 2,565,000 | | | | 2,740,595 | |
4.30%, 03/01/49 | | | 675,000 | | | | 793,342 | |
| | |
TOTAL TRANSPORTATION | | | | | | $ | 8,815,006 | |
| | |
TRUCKING & LEASING – 0.8% | | | | | | | | |
GATX Corp., Sr. Unsecured 3.25%, 09/15/26 | | | 1,065,000 | | | | 1,153,254 | |
3.85%, 03/30/27 | | | 1,500,000 | | | | 1,662,639 | |
4.00%, 06/30/30 | | | 1,000,000 | | | | 1,112,755 | |
5.20%, 03/15/44 | | | 640,000 | | | | 804,553 | |
| | |
TOTAL TRUCKING & LEASING | | | | | | $ | 4,733,201 | |
| | |
TOTAL CORPORATE BONDS | | | | | | | | |
(COST $283,831,461) | | | | | | $ | 298,969,714 | |
|
ENHANCED EQUIPMENT TRUST CERTIFICATE – 0.0%** | |
| | |
AIRLINES – 0.0%** | | | | | | | | |
Delta Air Lines, Series 2007-1, Class A, Pass-Through Certificates, 6.82%, 08/10/22 | | | 168,481 | | | | 176,175 | |
|
TOTAL ENHANCED EQUIPMENT TRUST CERTIFICATE | |
(COST $168,481) | | | | | | $ | 176,175 | |
| | |
GOVERNMENT AGENCIES – 3.0% | | | | | | | | |
|
FEDERAL HOME LOAN BANK (FHLB) – 1.3% | |
3.25%, 11/16/28# | | | 6,960,000 | | | | 7,886,560 | |
|
FEDERAL HOME LOAN MORTGAGE CORPORATION (FHLMC) – 1.4% | |
2.38%, 01/13/22 | | | 125,000 | | | | 127,022 | |
0.38%, 07/21/25# | | | 9,000,000 | | | | 8,881,970 | |
| |
TOTAL FEDERAL HOME LOAN MORTGAGE CORPORATION (FHLMC) | | | $ | 9,008,992 | |
|
FEDERAL NATIONAL MORTGAGE ASSOCIATION (FNMA) – 0.3% | |
6.25%, 05/15/29 | | | 750,000 | | | | 1,020,963 | |
7.25%, 05/15/30 | | | 400,000 | | | | 588,996 | |
| |
TOTAL FEDERAL NATIONAL MORTGAGE ASSOCIATION (FNMA) | | | $ | 1,609,959 | |
| | |
TOTAL GOVERNMENT AGENCIES | | | | | | | | |
(COST $18,243,118) | | | | | | $ | 18,505,511 | |
| | |
MORTGAGE-BACKED SECURITIES – 21.9% | | | | | | | | |
|
FEDERAL HOME LOAN MORTGAGE CORPORATION (FHLMC) – 7.1% | |
Pool G12709, 5.00%, 07/01/22 | | | 4,709 | | | | 4,813 | |
Pool C00478, 8.50%, 09/01/26 | | | 5,519 | | | | 6,323 | |
Pool E09010, 2.50%, 09/01/27 | | | 387,597 | | | | 405,743 | |
Pool G18497, 3.00%, 01/01/29 | | | 52,143 | | | | 55,075 | |
Pool C01272, 6.00%, 12/01/31 | | | 11,971 | | | | 14,065 | |
Pool A13990, 4.50%, 10/01/33 | | | 9,146 | | | | 10,035 | |
Pool G01625, 5.00%, 11/01/33 | | | 16,777 | | | | 19,142 | |
Pool QN1900, 3.00%, 04/01/35 | | | 1,619,108 | | | | 1,716,766 | |
Pool G08097, 6.50%, 11/01/35 | | | 8,982 | | | | 10,538 | |
Pool G02296, 5.00%, 06/01/36 | | | 86,469 | | | | 98,840 | |
April 30, 2021 / ANNUAL REPORT
| | |
PORTFOLIOS OF INVESTMENTS Wilmington Broad Market Bond Fund (continued) | | 22 |
| | | | | | | | |
| | |
| Description | | Par Value | | | Value | |
Pool G02390, 6.00%, 09/01/36 | | $ | 2,988 | | | $ | 3,478 | |
Pool G05317, 5.00%, 04/01/37 | | | 353,402 | | | | 403,022 | |
Pool G03703, 5.50%, 12/01/37 | | | 9,643 | | | | 11,151 | |
Pool G04776, 5.50%, 07/01/38 | | | 29,759 | | | | 34,159 | |
Pool G05500, 5.00%, 05/01/39 | | | 302,946 | | | | 346,719 | |
Pool A93415, 4.00%, 08/01/40 | | | 557,855 | | | | 612,886 | |
Pool A93505, 4.50%, 08/01/40 | | | 545,393 | | | | 612,838 | |
Pool A93996, 4.50%, 09/01/40 | | | 423,000 | | | | 470,479 | |
Pool G06222, 4.00%, 01/01/41 | | | 637,389 | | | | 699,872 | |
Pool A97047, 4.50%, 02/01/41 | | | 416,385 | | | | 465,462 | |
Pool G06956, 4.50%, 08/01/41 | | | 418,196 | | | | 464,665 | |
Pool C03750, 3.50%, 02/01/42 | | | 172,579 | | | | 187,377 | |
Pool C03849, 3.50%, 04/01/42 | | | 85,297 | | | | 92,855 | |
Pool Q08305, 3.50%, 05/01/42 | | | 599,471 | | | | 664,596 | |
Pool C04305, 3.00%, 11/01/42 | | | 1,647,056 | | | | 1,768,650 | |
Pool C09020, 3.50%, 11/01/42 | | | 1,337,868 | | | | 1,452,791 | |
Pool G07266, 4.00%, 12/01/42 | | | 1,185,337 | | | | 1,309,098 | |
Pool C04444, 3.00%, 01/01/43 | | | 56,787 | | | | 60,336 | |
Pool C09029, 3.00%, 03/01/43 | | | 240,393 | | | | 257,071 | |
Pool G08534, 3.00%, 06/01/43 | | | 298,742 | | | | 319,464 | |
Pool Q19476, 3.50%, 06/01/43 | | | 509,028 | | | | 553,605 | |
Pool C09044, 3.50%, 07/01/43 | | | 629,235 | | | | 687,260 | |
Pool G07889, 3.50%, 08/01/43 | | | 566,203 | | | | 615,232 | |
Pool G07624, 4.00%, 12/01/43 | | | 560,103 | | | | 615,188 | |
Pool G60038, 3.50%, 01/01/44 | | | 2,832,147 | | | | 3,076,415 | |
Pool G07680, 4.00%, 04/01/44 | | | 875,824 | | | | 970,144 | |
Pool G07943, 4.50%, 08/01/44 | | | 59,591 | | | | 66,666 | |
Pool G08607, 4.50%, 09/01/44 | | | 364,336 | | | | 409,703 | |
Pool Q33547, 3.50%, 05/01/45 | | | 514,717 | | | | 556,971 | |
Pool Q36970, 4.00%, 10/01/45 | | | 239,637 | | | | 261,225 | |
Pool G60384, 4.50%, 12/01/45 | | | 38,879 | | | | 43,339 | |
Pool Q39644, 3.50%, 03/01/46 | | | 1,671,205 | | | | 1,793,599 | |
Pool Q39438, 4.00%, 03/01/46 | | | 1,669,108 | | | | 1,822,030 | |
Pool G08705, 3.00%, 05/01/46 | | | 136,270 | | | | 144,310 | |
Pool G08708, 4.50%, 05/01/46 | | | 279,258 | | | | 304,625 | |
Pool ZS4671, 3.00%, 08/01/46 | | | 881,437 | | | | 933,092 | |
Pool Q44452, 3.00%, 11/01/46 | | | 1,238,913 | | | | 1,312,006 | |
Pool ZS4693, 3.00%, 12/01/46 | | | 2,366,886 | | | | 2,505,597 | |
Pool SD8037, 2.50%, 01/01/50 | | | 4,588,990 | | | | 4,761,614 | |
Pool RA2341, 2.50%, 04/01/50 | | | 3,912,410 | | | | 4,071,103 | |
Pool SD8104, 1.50%, 11/01/50 | | | 2,901,434 | | | | 2,845,736 | |
Pool RA4349, 2.50%, 01/01/51 | | | 1,815,065 | | | | 1,893,834 | |
Pool SD8141, 2.50%, 04/01/51 | | | 1,479,979 | | | | 1,538,174 | |
| | | | | | | | |
| |
TOTAL FEDERAL HOME LOAN MORTGAGE CORPORATION (FHLMC) | | | $ | 44,359,777 | |
|
FEDERAL NATIONAL MORTGAGE ASSOCIATION (FNMA) – 14.8% | |
Pool 975207, 5.00%, 03/01/23 | | | 8,320 | | | | 8,635 | |
Pool AE2520, 3.00%, 01/01/26 | | | 131,316 | | | | 137,536 | |
Pool 329794, 7.00%, 02/01/26 | | | 9,249 | | | | 9,992 | |
Pool 256639, 5.00%, 02/01/27 | | | 6,498 | | | | 7,128 | |
Pool 256752, 6.00%, 06/01/27 | | | 10,044 | | | | 11,396 | |
Pool 402255, 6.50%, 12/01/27 | | | 731 | | | | 798 | |
Pool AB8997, 2.50%, 04/01/28 | | | 97,373 | | | | 101,808 | |
Pool AS4480, 2.50%, 02/01/30 | | | 554,670 | | | | 582,286 | |
Pool AS7462, 2.50%, 06/01/31 | | | 237,310 | | | | 249,500 | |
Pool 254007, 6.50%, 10/01/31 | | | 6,872 | | | | 8,056 | |
Pool 638023, 6.50%, 04/01/32 | | | 42,542 | | | | 46,994 | |
| | | | | | | | |
| | |
| Description | | Par Value | | | Value | |
Pool 642345, 6.50%, 05/01/32 | | $ | 34,458 | | | $ | 38,063 | |
Pool 651292, 6.50%, 07/01/32 | | | 53,939 | | | | 59,588 | |
Pool 686398, 6.00%, 03/01/33 | | | 123,876 | | | | 142,245 | |
Pool BP6496, 2.00%, 07/01/35 | | | 1,212,654 | | | | 1,253,247 | |
Pool MA4095, 2.00%, 08/01/35 | | | 1,597,893 | | | | 1,650,971 | |
Pool 745412, 5.50%, 12/01/35 | | | 12,172 | | | | 14,107 | |
Pool 888789, 5.00%, 07/01/36 | | | 132,090 | | | | 151,672 | |
Pool 256515, 6.50%, 12/01/36 | | | 8,646 | | | | 9,948 | |
Pool AE0217, 4.50%, 08/01/40 | | | 66,797 | | | | 74,076 | |
Pool AB1796, 3.50%, 11/01/40 | | | 388,506 | | | | 421,657 | |
Pool AH5583, 4.50%, 02/01/41 | | | 189,417 | | | | 209,967 | |
Pool 890551, 4.50%, 08/01/41 | | | 43,040 | | | | 48,761 | |
Pool AL0658, 4.50%, 08/01/41 | | | 250,111 | | | | 283,641 | |
Pool AL1319, 4.50%, 10/01/41 | | | 316,490 | | | | 351,893 | |
Pool AL6302, 4.50%, 10/01/41 | | | 433,959 | | | | 492,286 | |
Pool AX5302, 4.00%, 01/01/42 | | | 710,988 | | | | 783,617 | |
Pool AK4523, 4.00%, 03/01/42 | | | 859,950 | | | | 943,999 | |
Pool AL2034, 4.50%, 04/01/42 | | | 110,755 | | | | 121,844 | |
Pool AB7936, 3.00%, 02/01/43 | | | 1,038,211 | | | | 1,113,776 | |
Pool AL3761, 4.50%, 02/01/43 | | | 143,884 | | | | 160,473 | |
Pool MA1458, 3.00%, 06/01/43 | | | 249,450 | | | | 266,019 | |
Pool AT7899, 3.50%, 07/01/43 | | | 1,602,230 | | | | 1,721,300 | |
Pool AS0302, 3.00%, 08/01/43 | | | 2,511,356 | | | | 2,678,325 | |
Pool AU4279, 3.00%, 09/01/43 | | | 519,191 | | | | 553,869 | |
Pool AL5537, 4.50%, 04/01/44 | | | 196,116 | | | | 220,134 | |
Pool AS3155, 4.00%, 08/01/44 | | | 34,728 | | | | 38,175 | |
Pool AX0833, 3.50%, 09/01/44 | | | 481,642 | | | | 521,759 | |
Pool AL6325, 3.00%, 10/01/44 | | | 1,656,568 | | | | 1,766,949 | |
Pool AS5136, 4.00%, 06/01/45 | | | 184,654 | | | | 203,497 | |
Pool AZ7362, 4.00%, 11/01/45 | | | 513,442 | | | | 565,750 | |
Pool AZ9565, 3.50%, 12/01/45 | | | 773,376 | | | | 835,875 | |
Pool BC0326, 3.50%, 12/01/45 | | | 618,266 | | | | 668,230 | |
Pool BC0245, 3.00%, 02/01/46 | | | 369,717 | | | | 391,490 | |
Pool BC0830, 3.00%, 04/01/46 | | | 536,932 | | | | 568,553 | |
Pool AS7568, 4.50%, 07/01/46 | | | 91,028 | | | | 99,186 | |
Pool BC4764, 3.00%, 10/01/46 | | | 705,591 | | | | 747,147 | |
Pool MA2771, 3.00%, 10/01/46 | | | 223,581 | | | | 236,749 | |
Pool AS8276, 3.00%, 11/01/46 | | | 732,916 | | | | 776,082 | |
Pool BC9003, 3.00%, 11/01/46 | | | 745,325 | | | | 789,221 | |
Pool BE1899, 3.00%, 11/01/46 | | | 2,705,256 | | | | 2,864,583 | |
Pool BE3767, 3.50%, 07/01/47 | | | 767,008 | | | | 820,268 | |
Pool BH2618, 3.50%, 08/01/47 | | | 220,409 | | | | 235,714 | |
Pool MA3088, 4.00%, 08/01/47 | | | 735,337 | | | | 794,438 | |
Pool BH4010, 4.50%, 09/01/47 | | | 780,435 | | | | 857,703 | |
Pool BH9215, 3.50%, 01/01/48 | | | 1,050,890 | | | | 1,123,864 | |
Pool BJ0650, 3.50%, 03/01/48 | | | 4,314,938 | | | | 4,614,033 | |
Pool BJ0639, 4.00%, 03/01/48 | | | 304,988 | | | | 330,063 | |
Pool BJ9169, 4.00%, 05/01/48 | | | 1,349,422 | | | | 1,452,092 | |
Pool BK4764, 4.00%, 08/01/48 | | | 1,301,203 | | | | 1,400,206 | |
Pool BN1628, 4.50%, 11/01/48 | | | 708,123 | | | | 771,806 | |
Pool BM5334, 3.50%, 01/01/49 | | | 936,672 | | | | 1,011,673 | |
Pool MA3871, 3.00%, 12/01/49 | | | 2,853,793 | | | | 2,990,796 | |
Pool CA5306, 3.00%, 03/01/50 | | | 2,677,568 | | | | 2,803,521 | |
Pool CA5353, 3.50%, 03/01/50 | | | 2,090,408 | | | | 2,222,239 | |
Pool MA4100, 2.00%, 08/01/50 | | | 1,763,142 | | | | 1,782,408 | |
Pool FM3989, 2.50%, 08/01/50 | | | 1,217,098 | | | | 1,263,275 | |
Pool MA4119, 2.00%, 09/01/50 | | | 1,300,766 | | | | 1,315,018 | |
ANNUAL REPORT / April 30, 2021
| | |
| 23 | | PORTFOLIOS OF INVESTMENTS Wilmington Broad Market Bond Fund (continued) |
| | | | | | | | |
| | |
| Description | | Par Value | | | Value | |
Pool BQ2999, 2.50%, 10/01/50 | | $ | 2,748,368 | | | $ | 2,866,929 | |
Pool CA7383, 3.00%, 10/01/50 | | | 2,556,547 | | | | 2,761,871 | |
Pool CA7734, 2.50%, 11/01/50 | | | 1,976,939 | | | | 2,056,689 | |
Pool FM5297, 3.00%, 11/01/50 | | | 3,009,223 | | | | 3,195,309 | |
Pool MA4208, 2.00%, 12/01/50 | | | 1,298,482 | | | | 1,313,084 | |
Pool CA8021, 2.50%, 12/01/50 | | | 5,353,742 | | | | 5,560,688 | |
Pool FM5166, 3.00%, 12/01/50 | | | 1,723,013 | | | | 1,814,338 | |
Pool BQ4495, 2.00%, 02/01/51 | | | 6,548,188 | | | | 6,621,239 | |
Pool CA8929, 2.00%, 02/01/51 | | | 3,168,778 | | | | 3,204,145 | |
Pool FM6426, 2.00%, 03/01/51 | | | 3,164,645 | | | | 3,220,959 | |
Pool FM7188, 2.50%, 05/01/51 | | | 3,892,000 | | | | 4,104,890 | |
Pool TBA, 2.00%, 06/01/51‡ | | | 4,000,000 | | | | 4,033,437 | |
| | | | | | | | |
| |
TOTAL FEDERAL NATIONAL MORTGAGE ASSOCIATION (FNMA) | | | $ | 92,545,548 | |
|
GOVERNMENT NATIONAL MORTGAGE ASSOCIATION (GNMA) – 0.0%** | |
Pool 354677, 7.50%, 10/15/23 | | | 4,590 | | | | 4,596 | |
Pool 354713, 7.50%, 12/15/23 | | | 1,490 | | | | 1,565 | |
Pool 354765, 7.00%, 02/15/24 | | | 8,839 | | | | 9,683 | |
Pool 354827, 7.00%, 05/15/24 | | | 5,555 | | | | 6,094 | |
Pool 385623, 7.00%, 05/15/24 | | | 10,234 | | | | 11,116 | |
Pool 360869, 7.50%, 05/15/24 | | | 8,810 | | | | 9,365 | |
Pool 2077, 7.00%, 09/20/25 | | | 2,793 | | | | 3,020 | |
Pool 503405, 6.50%, 04/15/29 | | | 13,631 | | | | 14,044 | |
| | | | | | | | |
| |
TOTAL GOVERNMENT NATIONAL MORTGAGE ASSOCIATION (GNMA) | | | $ | 59,483 | |
| | | | | | | | |
| | |
TOTAL MORTGAGE-BACKED SECURITIES | | | | | | | | |
(COST $134,510,228) | | | | | | $ | 136,964,808 | |
| | |
MUNICIPAL BOND – 0.4% | | | | | | | | |
| | |
GENERAL—0.4% | | | | | | | | |
New Jersey Transportation Trust Fund Authority, Current Refunding Revenue Bonds (Series B), 4.13%, 06/15/42 | | | 2,500,000 | | | | 2,662,322 | |
| | | | | | | | |
| | |
TOTAL MUNICIPAL BOND | | | | | | | | |
(COST $2,500,000) | | | | | | $ | 2,662,322 | |
| | |
U.S. TREASURY OBLIGATIONS – 22.1% | | | | | | | | |
| | |
U.S. TREASURY BONDS – 5.8% | | | | | | | | |
6.38%, 08/15/27# | | | 450,000 | | | | 593,377 | |
5.25%, 02/15/29 | | | 500,000 | | | | 642,606 | |
6.25%, 05/15/30# | | | 500,000 | | | | 701,119 | |
5.38%, 02/15/31# | | | 600,000 | | | | 807,410 | |
3.00%, 05/15/42 | | | 500,000 | | | | 570,455 | |
3.63%, 08/15/43 | | | 881,000 | | | | 1,103,654 | |
3.75%, 11/15/43 | | | 365,000 | | | | 465,865 | |
3.63%, 02/15/44 | | | 2,106,000 | | | | 2,642,232 | |
3.13%, 08/15/44 | | | 6,637,000 | | | | 7,714,839 | |
3.00%, 11/15/44 | | | 2,000,000 | | | | 2,278,536 | |
2.50%, 02/15/45 | | | 2,135,000 | | | | 2,230,749 | |
3.00%, 05/15/45 | | | 2,000,000 | | | | 2,279,192 | |
2.88%, 08/15/45 | | | 300,000 | | | | 334,940 | |
3.00%, 11/15/45 | | | 765,000 | | | | 873,238 | |
2.50%, 02/15/46 | | | 280,000 | | | | 292,171 | |
3.00%, 02/15/47 | | | 1,098,000 | | | | 1,255,676 | |
3.00%, 05/15/47 | | | 1,695,000 | | | | 1,939,475 | |
2.75%, 11/15/47 | | | 2,235,000 | | | | 2,445,938 | |
1.25%, 05/15/50 | | | 3,300,000 | | | | 2,562,524 | |
1.38%, 08/15/50 | | | 3,000,000 | | | | 2,407,400 | |
| | | | | | | | |
| | |
| Description | | Par Value | | | Value | |
1.63%, 11/15/50# | | $ | 2,500,000 | | | $ | 2,140,573 | |
| | | | | | | | |
| | |
TOTAL U.S. TREASURY BONDS | | | | | | $ | 36,281,969 | |
| | |
U.S. TREASURY NOTES – 16.3% | | | | | | | | |
2.00%, 11/15/21# | | | 1,000,000 | | | | 1,010,496 | |
1.75%, 05/15/22 | | | 380,000 | | | | 386,551 | |
2.13%, 06/30/22 | | | 6,615,000 | | | | 6,771,463 | |
1.63%, 08/15/22 | | | 6,000,000 | | | | 6,118,516 | |
1.63%, 11/15/22 | | | 1,928,000 | | | | 1,972,132 | |
2.50%, 03/31/23 | | | 7,000,000 | | | | 7,313,499 | |
1.75%, 05/15/23 | | | 2,000,000 | | | | 2,063,957 | |
1.63%, 05/31/23 | | | 12,400,000 | | | | 12,771,371 | |
2.50%, 08/15/23 | | | 200,000 | | | | 210,430 | |
2.00%, 04/30/24 | | | 10,195,000 | | | | 10,699,938 | |
1.75%, 07/31/24# | | | 1,900,000 | | | | 1,983,142 | |
2.38%, 08/15/24 | | | 5,600,000 | | | | 5,960,573 | |
2.00%, 02/15/25 | | | 4,655,000 | | | | 4,911,924 | |
2.13%, 05/15/25 | | | 2,500,000 | | | | 2,651,871 | |
2.00%, 08/15/25 | | | 295,000 | | | | 311,725 | |
2.25%, 11/15/25 | | | 230,000 | | | | 245,629 | |
1.63%, 02/15/26 | | | 8,000,000 | | | | 8,308,649 | |
1.63%, 05/15/26 | | | 4,695,000 | | | | 4,872,503 | |
2.00%, 11/15/26 | | | 4,180,000 | | | | 4,408,635 | |
2.75%, 02/15/28 | | | 6,000,000 | | | | 6,584,151 | |
2.38%, 05/15/29 | | | 2,500,000 | | | | 2,677,053 | |
1.63%, 08/15/29# | | | 5,000,000 | | | | 5,063,479 | |
1.50%, 02/15/30# | | | 5,000,000 | | | | 4,986,179 | |
| | | | | | | | |
| | |
TOTAL U.S. TREASURY NOTES | | | | | | $ | 102,283,866 | |
| | | | | | | | |
| | |
TOTAL U.S. TREASURY OBLIGATIONS | | | | | | | | |
(COST $131,715,966) | | | | | | $ | 138,565,835 | |
| | | | | | | | |
| | |
| | | Number of Shares | | | | |
| | |
INVESTMENT COMPANY – 1.0% | | | | | | | | |
| | |
EXCHANGE-TRADED FUND – 1.0% | | | | | | | | |
iShares iBoxx High Yield Corporate Bond ETF# | | | 68,340 | | | | 5,975,649 | |
| | | | | | | | |
| | |
TOTAL INVESTMENT COMPANY | | | | | | | | |
(COST $6,002,418) | | | | | | $ | 5,975,649 | |
| | |
MONEY MARKET FUND – 2.9% | | | | | | | | |
Dreyfus Government Cash Management Fund, Institutional Shares, 0.03%^ | | | 18,109,869 | | | | 18,109,869 | |
| | | | | | | | |
| | |
TOTAL MONEY MARKET FUND | | | | | | | | |
(COST $18,109,869) | | | | | | $ | 18,109,869 | |
|
CASH COLLATERAL INVESTED FOR SECURITIES ON LOAN – 6.0% | |
| | |
MONEY MARKET FUNDS – 2.0% | | | | | | | | |
Fidelity Investments Money Market Funds, Government Portfolio, Institutional Class, 0.01%^ | | | 1,490,000 | | | | 1,490,000 | |
Morgan Stanley Liquidity Funds, Government Portfolio, Institutional Class, 0.03%^ | | | 2,232,000 | | | | 2,232,000 | |
Blackrock Liquidity Fed Fund, Institutional Shares, 0.03%^ | | | 3,000,000 | | | | 3,000,000 | |
JPMorgan U.S. Government Money Market Fund, Capital Class, 0.03%^ | | | 2,120,000 | | | | 2,120,000 | |
Federated Hermes Government Obligations Fund, Premier Shares, 0.02%^ | | | 940,000 | | | | 940,000 | |
April 30, 2021 / ANNUAL REPORT
| | |
PORTFOLIOS OF INVESTMENTS Wilmington Broad Market Bond Fund (continued) | | 24 |
| | | | | | | | |
| | |
| Description | | Number of Shares | | | Value | |
| | |
Goldman Sachs Financial Square Government Fund, Institutional Shares, 0.03%^ | | | 2,670,000 | | | $ | 2,670,000 | |
| | | | | | | | |
| | |
TOTAL MONEY MARKET FUNDS (COST $12,452,000) | | | | | | $ | 12,452,000 | |
| | |
| | | Par Value | | | | |
| | |
REPURCHASE AGREEMENTS – 4.0% | | | | | | | | |
| | |
Bank of America Securities, Inc., 0.01%, dated 4/30/21, due 5/03/21, repurchase price $7,122,355 collateralized by U.S. Government Agency Securities, 1.00% to 5.50%, maturing 11/01/28 to 5/01/51; total market value of $7,264,796. | | $ | 7,122,349 | | | | 7,122,349 | |
| | |
Citigroup Global Markets Ltd., 0.01%, dated 4/30/21, due 5/03/21, repurchase price $3,666,996 collateralized by U.S. Government Agency & Treasury Securities, 0.00% to 6.00%, maturing 5/15/21 to 4/20/51; total market value of $3,740,333. | | | 3,666,993 | | | | 3,666,993 | |
| | |
Daiwa Capital Markets America, 0.01%, dated 4/30/21, due 5/03/21, repurchase price $7,122,355 collateralized by U.S. Government Agency & Treasury Securities, 0.00% to 8.00%, maturing 6/30/21 to 5/01/51; total market value of $7,264,796. | | | 7,122,349 | | | | 7,122,349 | |
| | | | | | | | |
| | |
| Description | | Par Value | | | Value | |
| | |
RBC Dominion Securities, Inc., 0.01%, dated 4/30/21, due 5/03/21, repurchase price $7,122,355 collateralized by U.S. Government Agency & Treasury Securities, 0.00% to 6.50%, maturing 6/01/21 to 12/15/60; total market value of $7,264,796. | | $ | 7,122,349 | | | $ | 7,122,349 | |
| | | | | | | | |
| | |
TOTAL REPURCHASE AGREEMENTS | | | | | | | | |
(COST $25,034,040) | | | | | | $ | 25,034,040 | |
| | | | | | | | |
| |
TOTAL CASH COLLATERAL INVESTED FOR SECURITIES ON LOAN (COST $37,486,040) | | | $ | 37,486,040 | |
| | | | | | | | |
| | |
| TOTAL INVESTMENTS – 106.1% | | | | | | | | |
| (COST $638,935,364) | | | | | | $ | 663,689,427 | |
| | |
| COLLATERAL FOR SECURITIES ON LOAN – (6.0%) | | | | | | | (37,486,040 | ) |
| | |
| OTHER ASSETS LESS LIABILITIES – (0.1)% | | | | | | | (413,480 | ) |
| | | | | | | | |
| | |
| TOTAL NET ASSETS – 100.0% | | | | | | $ | 625,789,907 | |
| | | | | | | | |
Various inputs are used in determining the value of the Fund’s investments. These inputs are summarized in the three broad levels listed below.
Level 1 – quoted prices in active markets for identical securities
Level 2 – other significant observable inputs (including quoted prices for similar securities, interest rates, prepayment speeds, credit risk, etc.)
Level 3 – significant unobservable inputs (including the Fund’s own assumptions in determining the fair value of investments)
The following is a summary of the inputs used as of April 30, 2021 in valuing the Fund’s assets carried at fair value:
| | | | | | | | | | | | | | | | |
| | | | |
| | | Level 1 | | | Level 2 | | | Level 3 | | | Total | |
| | | | |
Investments in Securities | | | | | | | | | | | | | | | | |
| | | | |
Asset-Backed Security | | $ | — | | | $ | 112,374 | | | | $— | | | $ | 112,374 | |
| | | | |
Collateralized Mortgage Obligations | | | — | | | | 1,161,640 | | | | — | | | | 1,161,640 | |
| | | | |
Commercial Paper | | | — | | | | 4,999,490 | | | | — | | | | 4,999,490 | |
| | | | |
Corporate Bonds | | | — | | | | 298,969,714 | | | | — | | | | 298,969,714 | |
| | | | |
Enhanced Equipment Trust Certificate | | | — | | | | 176,175 | | | | — | | | | 176,175 | |
| | | | |
Government Agencies | | | — | | | | 18,505,511 | | | | — | | | | 18,505,511 | |
| | | | |
Mortgage-Backed Securities | | | — | | | | 136,964,808 | | | | — | | | | 136,964,808 | |
| | | | |
Municipal Bond | | | — | | | | 2,662,322 | | | | — | | | | 2,662,322 | |
| | | | |
U.S. Treasury Obligations | | | — | | | | 138,565,835 | | | | — | | | | 138,565,835 | |
| | | | |
Investment Company | | | 5,975,649 | | | | — | | | | — | | | | 5,975,649 | |
| | | | |
Money Market Funds | | | 30,561,869 | | | | — | | | | — | | | | 30,561,869 | |
| | | | |
Repurchase Agreements | | | — | | | | 25,034,040 | | | | — | | | | 25,034,040 | |
| | | | | | | | | | | | | | | | |
| | | | |
Total | | $ | 36,537,518 | | | $ | 627,151,909 | | | | $— | | | $ | 663,689,427 | |
| | | | | | | | | | | | | | | | |
| ** | Represents less than 0.05%. |
| W | Denotes a restricted security that may be resold without restriction to “qualified institutional buyers” as defined in Rule 144A under the Securities Act of 1933 and that the Fund has determined to be liquid under criteria established by the Fund’s Board of Trustees. At April 30, 2021, these liquid restricted securities amounted to $14,090,859, representing 2.25% of total net assets. |
ANNUAL REPORT / April 30, 2021
| | |
| 25 | | PORTFOLIOS OF INVESTMENTS Wilmington Broad Market Bond Fund (concluded) |
| D | Variable rate security. The rate disclosed is the rate in effect on the report date. The information in parenthesis represents the benchmark and reference rate for each relevant security and the rate floats based upon the reference rate and spread. The security may be further subject to interest rate floor and caps. Certain variable rate securities are not based on a published reference rate and spread, but are determined by the issuer or agent and are based on current market conditions, or, for mortgage-backed securities, are impacted by the individual mortgages which are paying off over time. These securities do not indicate a reference rate and spread in their descriptions. |
| ◆ | The rate shown reflects the effective yield at purchase date. |
| # | Security, or a portion thereof, is on loan. See Note 2 in Notes to Financial Statements. |
| ‡ | Delayed delivery security. |
The following acronyms are used throughout this Fund:
| | |
| |
| BKNT | | Bank Notes |
| |
| CMT | | Constant Maturity Treasury |
| |
| ETF | | Exchange-Traded Fund |
| |
| GMTN | | Global Medium Term Note |
| |
| LIBOR | | London Interbank Offered Rate |
| |
| LLC | | Limited Liability Corporation |
| |
| LP | | Limited Partnership |
| |
| MTN | | Medium Term Note |
| |
| NA | | National Association |
| |
| PLC | | Public Limited Company |
| |
| SOFR | | Secured Overnight Financing Rate |
| |
| TBA | | To Be Announced Security |
| |
| USD | | United States Dollar |
| |
| UST | | United States Treasury |
See Notes which are an integral part of the Financial Statements
April 30, 2021 / ANNUAL REPORT
PORTFOLIO OF INVESTMENTS SUMMARY TABLE
Wilmington Intermediate-Term Bond Fund
At April 30, 2021, the Fund’s portfolio composition was as follows (unaudited):
| | | | | |
| | | Percentage of |
| | | Total Net Assets |
| |
Corporate Bonds | | | | 62.0 | % |
| |
U.S. Treasury Obligations | | | | 27.9 | % |
| |
Government Agencies | | | | 4.2 | % |
| |
Mortgage-Backed Securities | | | | 1.1 | % |
| |
Adjustable Rate Mortgage | | | | 0.0 | %(1) |
| |
Cash Equivalents(2) | | | | 4.7 | % |
| |
Cash Collateral Invested for Securities on Loan(3) | | | | 5.1 | % |
| |
Other Assets and Liabilities - Net(4) | | | | (5.0 | )% |
| |
| | | | | |
| |
TOTAL | | | | 100.0 | % |
| | | | | |
| | | | | |
| | | Percentage of |
| |
| Credit Quality Diversification(5) | | Total Net Assets |
| |
U.S. Government Agency Securities | | | | 5.3 | % |
| |
U.S. Treasury | | | | 27.9 | % |
| |
AA / Aa | | | | 0.2 | % |
| |
A / A | | | | 14.2 | % |
| |
BBB / Baa | | | | 43.2 | % |
| |
BB / Ba | | | | 3.3 | % |
| |
B/B | | | | 1.1 | % |
| |
Not Rated | | | | 9.8 | % |
| |
Other Assets and Liabilities - Net(4) | | | | (5.0 | )% |
| | | | | |
| |
TOTAL | | | | 100.0 | % |
| | | | | |
| (1) | Represents less than 0.05%. |
| (2) | Cash Equivalents include investments in a money market fund. |
| (3) | Cash Collateral Invested for Securities on Loan include investments in repurchase agreements. |
| (4) | Assets, other than investments in securities, less liabilities. See Statements of Assets and Liabilities. |
| (5) | For financial reporting purposes, the Credit Quality Diversification table reflects the lowest rating assigned by either Moody’s Investors Service or Standard and Poor’s if the ratings differ. These rating agencies are independent, nationally recognized statistical rating organizations and are widely used. Investment grade ratings are credit ratings of BBB/Baa or higher. Below investment grade ratings are credit ratings of BB/Ba or lower. Investments designated as “Not Rated” are not rated by either rating agency and do not necessarily indicate low credit quality. Credit quality ratings are subject to change. |
PORTFOLIO OF INVESTMENTS
April 30, 2021
| | | | | | | | |
| | |
| Description | | Par Value | | | Value | |
| |
ADJUSTABLE RATE MORTGAGE – 0.0%** | | | | | |
|
FEDERAL NATIONAL MORTGAGE ASSOCIATION (FNMA) – 0.0%** | |
| | |
Pool 612514, (12 Month USD LIBOR + 1.72%, Cap 8.96%, Floor 1.72%), 2.59%, 05/01/33D | | $ | 7,884 | | | $ | 8,278 | |
| | | | | | | | |
| |
TOTAL ADJUSTABLE RATE MORTGAGE (COST $7,873) | | | $ | 8,278 | |
|
CORPORATE BONDS – 62.0% | |
|
AEROSPACE & DEFENSE – 1.7% | |
| | |
Boeing Co. (The), Sr. Unsecured 1.17%, 02/04/23 | | | 250,000 | | | | 251,274 | |
| | |
1.95%, 02/01/24 | | | 350,000 | | | | 359,384 | |
| | |
3.20%, 03/01/29 | | | 150,000 | | | | 154,355 | |
| | | | | | | | |
| | |
TOTAL AEROSPACE & DEFENSE | | | | | | $ | 765,013 | |
| | |
AUTOMOTIVE – 4.0% | | | | | | | | |
| | |
Daimler Finance North America LLC, Sr. Unsecured, 0.75%, 03/01/24W | | | 500,000 | | | | 498,533 | |
| | |
Ford Motor Credit Co. LLC, Sr. Unsecured 5.58%, 03/18/24 | | | 250,000 | | | | 273,025 | |
| | |
2.90%, 02/16/28 | | | 250,000 | | | | 246,133 | |
| | | | | | | | |
| | |
| Description | | Par Value | | | Value | |
| | |
General Motors Financial Co., Inc., Sr. Unsecured 4.20%, 11/06/21 | | $ | 375,000 | | | $ | 382,138 | |
| | |
1.05%, 03/08/24 | | | 100,000 | | | | 100,270 | |
| | |
2.90%, 02/26/25 | | | 230,000 | | | | 243,031 | |
| | | | | | | | |
| | |
TOTAL AUTOMOTIVE | | | | | | $ | 1,743,130 | |
| | |
BIOTECHNOLOGY – 0.5% | | | | | | | | |
Amgen, Inc., Sr. Unsecured, 2.25%, 08/19/23 | | | 225,000 | | | | 233,501 | |
| | |
BUILDING PRODUCTS – 1.5% | | | | | | | | |
| | |
Carrier Global Corp., Sr. Unsecured, 2.49%, 02/15/27 | | | 250,000 | | | | 260,954 | |
| | |
Johnson Controls International PLC, Sr. Unsecured, 3.63%, 07/02/24ÿ | | | 373,000 | | | | 403,571 | |
| | | | | | | | |
| | |
TOTAL BUILDING PRODUCTS | | | | | | $ | 664,525 | |
| | |
CAPITAL MARKETS – 5.2% | | | | | | | | |
| | |
Bank of America Corp., Sr. Unsecured, MTN | | | | | | | | |
| | |
(SOFR + 0.74%), 0.81%, 10/24/24D | | | 120,000 | | | | 120,101 | |
| | |
(SOFR + 1.15%), 1.32%, 06/19/26D | | | 250,000 | | | | 250,213 | |
| | |
Goldman Sachs Group, Inc. (The), Sr. Unsecured 0.48%, 01/27/23 | | | 170,000 | | | | 170,046 | |
ANNUAL REPORT / April 30, 2021
| | |
| 27 | | PORTFOLIOS OF INVESTMENTS Wilmington Intermediate-Term Bond Fund (continued) |
| | | | | | | | |
| | |
| Description | | Par Value | | | Value | |
| | |
(3 Month USD LIBOR + 1.20%), 3.27%, 09/29/25D | | $ | 210,000 | | | $ | 225,394 | |
| | |
Morgan Stanley, Sr. Unsecured, (SOFR + 0.72%), 0.99%, 12/10/26D | | | 175,000 | | | | 171,603 | |
| | |
State Street Corp., Subordinated, 3.10%, 05/15/23 | | | 250,000 | | | | 264,183 | |
| | |
TD Ameritrade Holding Corp., Sr. Unsecured, 2.95%, 04/01/22 | | | 250,000 | | | | 255,055 | |
| | |
Toronto-Dominion Bank (The), Sr. Unsecured, GMTN, 3.25%, 03/11/24# | | | 275,000 | | | | 296,018 | |
| | |
U.S. Bancorp, Subordinated, MTN, 3.00%, 07/30/29 | | | 500,000 | | | | 530,611 | |
| | | | | | | | |
| | |
TOTAL CAPITAL MARKETS | | | | | | $ | 2,283,224 | |
|
COMMERCIAL SERVICES & SUPPLIES – 0.7% | |
| | |
Global Payments, Inc., Sr. Unsecured, 2.65%, 02/15/25 | | | 275,000 | | | | 290,348 | |
| | |
COMPUTERS – 2.7% | | | | | | | | |
| | |
Apple, Inc., Sr. Unsecured, 0.70%, 02/08/26# | | | 110,000 | | | | 108,597 | |
| | |
Hewlett Packard Enterprise Co., Sr. Unsecured 4.40%, 10/15/22 | | | 425,000 | | | | 446,033 | |
| | |
1.45%, 04/01/24 | | | 150,000 | | | | 152,937 | |
| | |
International Business Machines Corp., Sr. Unsecured, 2.85%, 05/13/22 | | | 480,000 | | | | 493,058 | |
| | | | | | | | |
| | |
TOTAL COMPUTERS | | | | | | $ | 1,200,625 | |
|
DIVERSIFIED FINANCIAL SERVICES – 9.3% | |
| | |
American Express Co., Sr. Unsecured, 3.13%, 05/20/26# | | | 150,000 | | | | 163,268 | |
| | |
Bank of Montreal, Sr. Unsecured, MTN, 1.90%, 08/27/21 | | | 180,000 | | | | 181,000 | |
| | |
Capital One Financial Corp., Sr. Unsecured (3 Month USD LIBOR + 0.95%), 1.14%, 03/09/22D 3.90%, 01/29/24 | |
| 250,000
250,000 |
| |
| 251,501
271,964 |
|
| | |
Charles Schwab Corp. (The), Sr. Unsecured (3 Month USD LIBOR + 0.32%), 0.50%, 05/21/21D 3.20%, 03/02/27 | |
| 155,000
315,000 |
| |
| 155,005
343,940 |
|
| | |
Citigroup, Inc., Subordinated, 4.13%, 07/25/28 | | | 250,000 | | | | 280,389 | |
| | |
Fifth Third Bancorp, Subordinated, 4.30%, 01/16/24 | | | 250,000 | | | | 273,124 | |
| | |
Huntington Bancshares, Inc., Subordinated, 4.35%, 02/04/23 | | | 150,000 | | | | 159,511 | |
| | |
JPMorgan Chase & Co., Sr. Unsecured, (SOFR + 1.59%), 2.01%, 03/13/26D | | | 150,000 | | | | 154,500 | |
| | |
JPMorgan Chase & Co., Subordinated, 3.88%, 09/10/24 | | | 300,000 | | | | 328,783 | |
| | |
PNC Financial Services Group, Inc. (The), Sr. Unsecured, 3.45%, 04/23/29 | | | 100,000 | | | | 110,218 | |
| | |
PNC Financial Services Group, Inc. (The), Subordinated, 3.90%, 04/29/24 | | | 200,000 | | | | 218,810 | |
| | |
Truist Bank, Sr. Unsecured, BNKT, 3.20%, 04/01/24 | | | 175,000 | | | | 188,046 | |
| | | | | | | | |
| | |
| Description | | Par Value | | | Value | |
| | |
Truist Bank, Subordinated, BKNT, 3.63%, 09/16/25 | | $ | 250,000 | | | $ | 273,883 | |
| | |
Truist Financial Corp., Sr. Unsecured, 2.70%, 01/27/22 | | | 250,000 | | | | 253,796 | |
| | |
Truist Financial Corp., Sr. Unsecured, MTN, (3 Month USD LIBOR + 0.65%), 0.85%, 04/01/22D | | | 345,000 | | | | 346,779 | |
| | |
Wells Fargo & Co., Sr. Unsecured, MTN, (3 Month USD LIBOR + 0.75%), 2.16%, 02/11/26D | | | 140,000 | | | | 145,260 | |
| | | | | | | | |
| |
TOTAL DIVERSIFIED FINANCIAL SERVICES | | | $ | 4,099,777 | |
| | |
ELECTRIC – 4.0% | | | | | | | | |
| | |
American Electric Power Co., Inc., Series M, Sr. Unsecured, 0.75%, 11/01/23 | | | 250,000 | | | | 250,652 | |
| | |
American Electric Power Co., Inc., Series N, Sr. Unsecured, 1.00%, 11/01/25 | | | 250,000 | | | | 247,104 | |
| | |
DTE Energy Co., Series C, Sr. Unsecured, 3.50%, 06/01/24 | | | 250,000 | | | | 267,602 | |
| | |
DTE Energy Co., Series D, Sr. Unsecured, 3.70%, 08/01/23 | | | 300,000 | | | | 319,442 | |
| | |
FirstEnergy Corp., Series A, Sr. Unsecured, 1.60%, 01/15/26 | | | 250,000 | | | | 244,753 | |
| | |
Southern Co. (The), Sr. Unsecured, 1.75%, 03/15/28 | | | 40,000 | | | | 39,125 | |
| | |
Union Electric Co., 1st Mortgage, 3.50%, 03/15/29 | | | 220,000 | | | | 242,903 | |
| | |
WEC Energy Group, Inc., Sr. Unsecured, 1.80%, 10/15/30 | | | 150,000 | | | | 141,789 | |
| | | | | | | | |
| | |
TOTAL ELECTRIC | | | | | | $ | 1,753,370 | |
| | |
ELECTRONICS – 0.4% | | | | | | | | |
| | |
Honeywell International, Inc., Sr. Unsecured, 0.48%, 08/19/22 | | | 175,000 | | | | 175,183 | |
| | |
FOOD & STAPLES RETAILING – 1.4% | | | | | | | | |
| | |
Conagra Brands, Inc., Sr. Unsecured, 1.38%, 11/01/27 | | | 200,000 | | | | 194,352 | |
| | |
Kroger Co. (The), Sr. Unsecured, 2.95%, 11/01/21 | | | 250,000 | | | | 252,774 | |
| | |
McCormick & Co., Inc., Sr. Unsecured, 0.90%, 02/15/26 | | | 150,000 | | | | 146,794 | |
| | | | | | | | |
| | |
TOTAL FOOD & STAPLES RETAILING | | | | | | $ | 593,920 | |
| | |
HEALTHCARE-PRODUCTS – 0.7% | | | | | | | | |
| | |
Zimmer Biomet Holdings, Inc., Sr. Unsecured, 3.55%, 03/20/30 | | | 300,000 | | | | 324,709 | |
| | |
HEALTHCARE-SERVICES – 1.1% | | | | | | | | |
| | |
CommonSpirit Health, Sr. Secured, 3.35%, 10/01/29 | | | 150,000 | | | | 160,380 | |
| | |
UnitedHealth Group, Inc., Sr. Unsecured, 2.38%, 10/15/22 | | | 300,000 | | | | 309,463 | |
| | | | | | | | |
| | |
TOTAL HEALTHCARE-SERVICES | | | | | | $ | 469,843 | |
| | |
HOUSEHOLD PRODUCTS/WARES – 0.5% | | | | | | | | |
| | |
Church & Dwight Co., Inc., Sr. Unsecured, 2.45%, 08/01/22 | | | 225,000 | | | | 230,542 | |
| | |
INSURANCE – 1.7% | | | | | | | | |
| | |
Aon PLC, Company Guaranteed, 4.00%, 11/27/23 | | | 250,000 | | | | 269,840 | |
April 30, 2021 / ANNUAL REPORT
| | |
PORTFOLIOS OF INVESTMENTS Wilmington Intermediate-Term Bond Fund (continued) | | 28 |
| | | | | | | | |
| | |
| Description | | Par Value | | | Value | |
| | |
CNA Financial Corp., Sr. Unsecured, 7.25%, 11/15/23 | | $ | 200,000 | | | $ | 232,820 | |
| | |
Principal Life Global Funding II, Secured, 1.63%, 11/19/30W | | | 250,000 | | | | 233,992 | |
| | | | | | | | |
| | |
TOTAL INSURANCE | | | | | | $ | 736,652 | |
| | |
MACHINERY – 1.2% | | | | | | | | |
| | |
Caterpillar Financial Services Corp., Sr. Unsecured, 0.65%, 07/07/23 | | | 50,000 | | | | 50,176 | |
| | |
Roper Technologies, Inc., Sr. Unsecured 3.13%, 11/15/22 | | | 125,000 | | | | 129,329 | |
| | |
3.80%, 12/15/26 | | | 300,000 | | | | 335,541 | |
| | | | | | | | |
| | |
TOTAL MACHINERY | | | | | | $ | 515,046 | |
| | |
MEDIA – 2.0% | | | | | | | | |
| | |
CCO Holdings LLC, Sr. Unsecured, 4.25%, 02/01/31W | | | 500,000 | | | | 501,250 | |
| | |
Discovery Communications LLC, Company Guaranteed, 4.13%, 05/15/29 | | | 350,000 | | | | 386,207 | |
| | | | | | | | |
| | |
TOTAL MEDIA | | | | | | $ | 887,457 | |
|
MISCELLANEOUS MANUFACTURING – 1.1% | |
| | |
Textron, Inc., Sr. Unsecured, 2.45%, 03/15/31 | | | 500,000 | | | | 493,754 | |
| | |
OIL & GAS – 2.6% | | | | | | | | |
| | |
Eastern Energy Gas Holdings LLC, Series B, Sr. Unsecured, 3.00%, 11/15/29 | | | 500,000 | | | | 524,332 | |
| | |
Phillips 66, Company Guaranteed, 4.30%, 04/01/22 | | | 400,000 | | | | 416,138 | |
| | |
Pioneer Natural Resources Co., Sr. Unsecured, 1.90%, 08/15/30 | | | 240,000 | | | | 223,968 | |
| | | | | | | | |
| | |
TOTAL OIL & GAS | | | | | | $ | 1,164,438 | |
| | |
PHARMACEUTICALS – 5.5% | | | | | | | | |
| | |
AbbVie, Inc., Sr. Unsecured 3.75%, 11/14/23 | | | 150,000 | | | | 160,971 | |
| | |
3.60%, 05/14/25 | | | 550,000 | | | | 601,473 | |
| | |
AstraZeneca PLC, Sr. Unsecured, 0.70%, 04/08/26 | | | 100,000 | | | | 97,320 | |
| | |
Becton Dickinson and Co., Sr. Unsecured, 1.96%, 02/11/31 | | | 100,000 | | | | 95,090 | |
| | |
Bristol-Myers Squibb Co., Sr. Unsecured, 2.75%, 02/15/23 | | | 260,000 | | | | 270,468 | |
| | |
Cardinal Health, Inc., Sr. Unsecured, 3.20%, 03/15/23 | | | 350,000 | | | | 366,975 | |
| | |
Cigna Corp., Sr. Unsecured, 2.38%, 03/15/31 | | | 250,000 | | | | 247,361 | |
| | |
CVS Health Corp., Sr. Unsecured 3.70%, 03/09/23 | | | 35,000 | | | | 37,043 | |
| | |
1.30%, 08/21/27 | | | 145,000 | | | | 141,330 | |
| | |
Elanco Animal Health, Inc., Sr. Unsecured, 4.91%, 08/27/21 | | | 250,000 | | | | 253,015 | |
| | |
Zoetis, Inc., Sr. Unsecured, 3.00%, 09/12/27 | | | 125,000 | | | | 133,909 | |
| | | | | | | | |
| | |
TOTAL PHARMACEUTICALS | | | | | | $ | 2,404,955 | |
| | | | | | | | |
| | |
| Description | | Par Value | | | Value | |
| | |
PIPELINES – 1.9% | | | | | | | | |
| | |
ONEOK Partners LP, Company Guaranteed, 3.38%, 10/01/22 | | $ | 450,000 | | | $ | 462,666 | |
| | |
Plains All American Pipeline LP, Sr. Unsecured, 3.85%, 10/15/23 | | | 366,000 | | | | 387,611 | |
| | | | | | | | |
| | |
TOTAL PIPELINES | | | | | | $ | 850,277 | |
| | |
REAL ESTATE INVESTMENT TRUSTS – 4.2% | | | | | | | | |
| | |
American Tower Corp., Sr. Unsecured, 5.00%, 02/15/24 | | | 250,000 | | | | 278,121 | |
| | |
Healthcare Realty Trust, Inc., Sr. Unsecured 3.88%, 05/01/25 | | | 300,000 | | | | 326,419 | |
| | |
3.63%, 01/15/28# | | | 300,000 | | | | 325,178 | |
| | |
Healthpeak Properties, Inc., Sr. Unsecured, 3.25%, 07/15/26 | | | 110,000 | | | | 119,770 | |
| | |
Simon Property Group LP, Sr. Unsecured, 2.20%, 02/01/31# | | | 250,000 | | | | 241,667 | |
| | |
Ventas Realty LP, Company Guaranteed, 4.00%, 03/01/28 | | | 250,000 | | | | 278,557 | |
| | |
Welltower, Inc., Sr. Unsecured, 3.63%, 03/15/24 | | | 250,000 | | | | 269,866 | |
| | | | | | | | |
| |
TOTAL REAL ESTATE INVESTMENT TRUSTS | | | $ | 1,839,578 | |
| | |
RETAIL-1.6% | | | | | | | | |
| | |
Amazon.com, Inc., Sr. Unsecured, 1.20%, 06/03/27 | | | 100,000 | | | | 99,379 | |
| | |
Home Depot, Inc. (The), Sr. Unsecured, 2.13%, 09/15/26 | | | 225,000 | | | | 235,874 | |
| | |
Lowe’s Cos., Inc., Sr. Unsecured, 3.65%, 04/05/29 | | | 200,000 | | | | 220,758 | |
| | |
Walgreens Boots Alliance, Inc., Sr. Unsecured, 3.20%, 04/15/30# | | | 150,000 | | | | 157,957 | |
| | | | | | | | |
| | |
TOTAL RETAIL | | | | | | $ | 713,968 | |
| | |
SEMICONDUCTORS – 0.4% | | | | | | | | |
| | |
QUALCOMM, Inc., Sr. Unsecured, 3.25%, 05/20/27# | | | 150,000 | | | | 165,752 | |
| | |
SOFTWARE – 1.3% | | | | | | | | |
| | |
Oracle Corp., Sr. Unsecured 2.50%, 04/01/25 | | | 50,000 | | | | 52,636 | |
| | |
2.30%, 03/25/28 | | | 500,000 | | | | 508,535 | |
| | | | | | | | |
| | |
TOTAL SOFTWARE | | | | | | $ | 561,171 | |
| | |
TELECOMMUNICATIONS – 1.8% | | | | | | | | |
| | |
AT&T, Inc., Sr. Unsecured 0.90%, 03/25/24# | | | 125,000 | | | | 125,134 | |
| | |
1.65%, 02/01/28 | | | 300,000 | | | | 292,309 | |
| | |
Verizon Communications, Inc., Sr. Unsecured 0.75%, 03/22/24# | | | 50,000 | | | | 50,146 | |
| | |
2.63%, 08/15/26 | | | 240,000 | | | | 255,303 | |
| | |
2.10%, 03/22/28 | | | 50,000 | | | | 50,485 | |
| | | | | | | | |
| | |
TOTAL TELECOMMUNICATIONS | | | | | | $ | 773,377 | |
| | |
TRANSPORTATION – 1.8% | | | | | | | | |
| | |
Ryder System, Inc., Sr. Unsecured, MTN 2.50%, 09/01/22 | | | 265,000 | | | | 271,978 | |
| | |
3.40%, 03/01/23 | | | 500,000 | | | | 525,608 | |
| | | | | | | | |
| | |
TOTAL TRANSPORTATION | | | | | | $ | 797,586 | |
ANNUAL REPORT / April 30, 2021
| | |
| 29 | | PORTFOLIOS OF INVESTMENTS Wilmington Intermediate-Term Bond Fund (continued) |
| | | | | | | | |
| | |
| Description | | Par Value | | | Value | |
| | |
TRUCKING & LEASING – 1.2% | | | | | | | | |
| | |
GATX Corp., Sr. Unsecured, 3.25%, 09/15/26 | | $ | 505,000 | | | $ | 546,848 | |
| | | | | | | | |
| | |
TOTAL CORPORATE BONDS (COST $26,415,265) | | | | | | $ | 27,278,569 | |
| | |
GOVERNMENT AGENCIES – 4.2% | | | | | | | | |
|
FEDERAL HOME LOAN MORTGAGE CORPORATION (FHLMC) – 2.0% | |
| | |
0.38%, 05/05/23 | | | 250,000 | | | | 250,929 | |
| | |
0.30%, 08/10/23 | | | 400,000 | | | | 400,178 | |
| | |
0.38%, 07/21/25# | | | 250,000 | | | | 246,721 | |
| | | | | | | | |
| |
TOTAL FEDERAL HOME LOAN MORTGAGE CORPORATION (FHLMC) | | | $ | 897,828 | |
|
FEDERAL NATIONAL MORTGAGE ASSOCIATION (FNMA) – 2.2% | |
| | |
0.25%, 05/22/23 | | | 200,000 | | | | 200,249 | |
| | |
0.63%, 04/22/25 | | | 750,000 | | | | 750,517 | |
| | | | | | | | |
| |
TOTAL FEDERAL NATIONAL MORTGAGE ASSOCIATION (FNMA) | | | $ | 950,766 | |
| | | | | | | | |
| | |
TOTAL GOVERNMENT AGENCIES | | | | | | | | |
(COST $1,848,947) | | | | | | $ | 1,848,594 | |
| | |
MORTGAGE-BACKED SECURITIES – 1.1% | | | | | | | | |
|
FEDERAL HOME LOAN MORTGAGE CORPORATION (FHLMC) – 0.2% | |
| | |
Pool C90504, 6.50%, 12/01/21 | | | 944 | | | | 959 | |
| | |
Pool G01625, 5.00%, 11/01/33 | | | 16,777 | | | | 19,142 | |
| | |
Pool A18401, 6.00%, 02/01/34 | | | 20,296 | | | | 23,165 | |
| | |
Pool G08097, 6.50%, 11/01/35 | | | 14,535 | | | | 17,053 | |
| | |
Pool G02390, 6.00%, 09/01/36 | | | 5,230 | | | | 6,086 | |
| | |
Pool G08193, 6.00%, 04/01/37 | | | 15,215 | | | | 17,572 | |
| | | | | | | | |
| |
TOTAL FEDERAL HOME LOAN MORTGAGE CORPORATION (FHLMC) | | | $ | 83,977 | |
|
FEDERAL NATIONAL MORTGAGE ASSOCIATION (FNMA) – 0.6% | |
| | |
Pool AE2520, 3.00%, 01/01/26 | | | 166,574 | | | | 174,464 | |
| | |
Pool 256639, 5.00%, 02/01/27 | | | 12,995 | | | | 14,257 | |
| | |
Pool 256752, 6.00%, 06/01/27 | | | 12,555 | | | | 14,245 | |
| | |
Pool 257007, 6.00%, 12/01/27 | | | 20,508 | | | | 23,264 | |
| | |
Pool 254240, 7.00%, 03/01/32 | | | 20,013 | | | | 22,567 | |
| | |
Pool 745412, 5.50%, 12/01/35 | | | 12,270 | | | | 14,220 | |
| | | | | | | | |
| |
TOTAL FEDERAL NATIONAL MORTGAGE ASSOCIATION (FNMA) | | | $ | 263,017 | |
|
GOVERNMENT NATIONAL MORTGAGE ASSOCIATION (GNMA) – 0.3% | |
| | |
Pool 780825, 6.50%, 07/15/28 | | | 30,776 | | | | 34,712 | |
| | |
Pool 2616, 7.00%, 07/20/28 | | | 18,298 | | | | 21,272 | |
| | |
Pool 2701, 6.50%, 01/20/29 | | | 38,630 | | | | 44,435 | |
| | |
Pool 426727, 7.00%, 02/15/29 | | | 4,139 | | | | 4,658 | |
| | |
Pool 781231, 7.00%, 12/15/30 | | | 17,193 | | | | 20,246 | |
| | | | | | | | |
| |
TOTAL GOVERNMENT NATIONAL MORTGAGE ASSOCIATION (GNMA) | | | $ | 125,323 | |
| | | | | | | | |
| | |
TOTAL MORTGAGE-BACKED SECURITIES | | | | | | | | |
(COST $428,512) | | | | | | $ | 472,317 | |
| | |
U.S. TREASURY OBLIGATIONS – 27.9% | | | | | | | | |
| | |
U.S. TREASURY NOTES – 27.9% | | | | | | | | |
| | |
1.88%, 07/31/22 | | | 125,000 | | | | 127,781 | |
| | |
1.50%, 08/15/22 | | | 150,000 | | | | 152,705 | |
| | |
2.00%, 02/15/23 | | | 200,000 | | | | 206,581 | |
| | |
2.50%, 03/31/23 | | | 150,000 | | | | 156,718 | |
| | | | | | | | |
| | |
| Description | | Par Value | | | Value | |
| | |
2.75%, 05/31/23 | | $ | 200,000 | | | $ | 210,646 | |
| | |
0.25%, 06/15/23 | | | 250,000 | | | | 250,339 | |
| | |
2.50%, 08/15/23 | | | 250,000 | | | | 263,037 | |
| | |
1.63%, 10/31/23# | | | 290,000 | | | | 300,005 | |
| | |
2.25%, 01/31/24 | | | 400,000 | | | | 421,556 | |
| | |
2.50%, 05/15/24 | | | 500,000 | | | | 532,656 | |
| | |
2.38%, 08/15/24 | | | 500,000 | | | | 532,194 | |
| | |
0.38%, 04/30/25 | | | 250,000 | | | | 247,803 | |
| | |
2.13%, 05/15/25 | | | 300,000 | | | | 318,225 | |
| | |
0.25%, 05/31/25 | | | 750,000 | | | | 738,488 | |
| | |
2.00%, 08/15/25 | | | 650,000 | | | | 686,851 | |
| | |
2.25%, 11/15/25 | | | 500,000 | | | | 533,976 | |
| | |
2.88%, 11/30/25 | | | 800,000 | | | | 876,739 | |
| | |
1.63%, 05/15/26 | | | 775,000 | | | | 804,300 | |
| | |
2.00%, 11/15/26 | | | 500,000 | | | | 527,349 | |
| | |
2.25%, 02/15/27 | | | 30,000 | | | | 32,040 | |
| | |
1.13%, 02/28/27 | | | 250,000 | | | | 251,058 | |
| | |
0.50%, 06/30/27 | | | 150,000 | | | | 144,256 | |
| | |
0.50%, 08/31/27 | | | 500,000 | | | | 479,293 | |
| | |
2.25%, 11/15/27 | | | 300,000 | | | | 319,642 | |
| | |
2.75%, 02/15/28 | | | 750,000 | | | | 823,019 | |
| | |
2.88%, 05/15/28 | | | 800,000 | | | | 885,017 | |
| | |
3.13%, 11/15/28 | | | 350,000 | | | | 394,035 | |
| | |
2.38%, 05/15/29 | | | 400,000 | | | | 428,329 | |
| | |
0.63%, 05/15/30 | | | 200,000 | | | | 184,032 | |
| | |
0.63%, 08/15/30# | | | 500,000 | | | | 458,285 | |
| | | | | | | | |
| | |
TOTAL U.S. TREASURY NOTES | | | | | | $ | 12,286,955 | |
| | | | | | | | |
TOTAL U.S. TREASURY OBLIGATIONS | | | | | | | | |
(COST $11,736,604) | | | | | | $ | 12,286,955 | |
| | | | | | | | |
| | |
| | | Number of Shares | | | | |
| | |
MONEY MARKET FUND – 4.7% | | | | | | | | |
| | |
Dreyfus Government Cash Management Fund, Institutional Shares, 0.03%^ | | | 2,057,488 | | | | 2,057,488 | |
| | | | | | | | |
| | |
TOTAL MONEY MARKET FUND | | | | | | | | |
(COST $2,057,488) | | | | | | $ | 2,057,488 | |
| | | | | | | | |
| | |
| | | Par Value | | | | |
|
CASH COLLATERAL INVESTED FOR SECURITIES ON LOAN – 5.1% | |
| | |
REPURCHASE AGREEMENTS – 5.1% | | | | | | | | |
| | |
Bank of America Securities, Inc., 0.01%, dated 4/30/21, due 5/03/21, repurchase price $426,771 collateralized by U.S. Government Agency Securities, 1.00% to 5.50%, maturing 11/01/28 to 5/01/51; total market value of $435,306. | | $ | 426,771 | | | | 426,771 | |
| | |
BNP Paribas SA, 0.00%, dated 4/30/21, due 5/03/21, repurchase price $426,771 collateralized by U.S. Government Agency & Treasury Securities, 0.00% to 8.13%, maturing 5/15/21 to 2/01/56; total market value of $435,306. | | | 426,771 | | | | 426,771 | |
April 30, 2021 / ANNUAL REPORT
| | |
PORTFOLIOS OF INVESTMENTS Wilmington Intermediate-Term Bond Fund (continued) | | 30 |
| | | | | | | | |
| | |
| Description | | Par Value | | | Value | |
| | |
Citigroup Global Markets Ltd., 0.01%, dated 4/30/21, due 5/03/21, repurchase price $426,771 collateralized by U.S. Government Agency & Treasury Securities, 0.00% to 6.00%, maturing 5/15/21 to 4/20/51; total market value of $435,306. | | $ | 426,771 | | | $ | 426,771 | |
| | |
Daiwa Capital Markets America, 0.01%, dated 4/30/21, due 5/03/21, repurchase price $426,771 collateralized by U.S. Government Agency & Treasury Securities, 0.00% to 8.00%, maturing 6/30/21 to 5/01/51; total market value of $435,306. | | | 426,771 | | | | 426,771 | |
| | |
Morgan Stanley & Co., 0.01%, dated 4/30/21, due 5/03/21, repurchase price $112,308 collateralized by U.S. Government Agency Securities, 2.00% to 4.00%, maturing 4/01/36 to 5/01/51; total market value of $114,554. | | | 112,308 | | | | 112,308 | |
| | |
RBC Dominion Securities, Inc., 0.01%, dated 4/30/21, due 5/03/21, repurchase price $426,771 collateralized by U.S. Government Agency & Treasury Securities, 0.00% to 6.50%, maturing 6/01/21 to 12/15/60; total market value of $435,306. | | | 426,771 | | | | 426,771 | |
| | | | | | | | |
| | |
TOTAL REPURCHASE AGREEMENTS | | | | | | | | |
| | |
(COST $2,246,163) | | | | | | $ | 2,246,163 | |
| | | | | | | | |
|
TOTAL CASH COLLATERAL INVESTED FOR SECURITIES ON LOAN | |
| | |
(COST $2,246,163) | | | | | | $ | 2,246,163 | |
| | | | | | | | |
| | |
TOTAL INVESTMENTS – 105.0% | | | | | | | | |
| | |
(COST $44,740,852) | | | | | | $ | 46,198,364 | |
| | |
COLLATERAL FOR SECURITIES ON LOAN – (5.1%) | | | | | | | (2,246,163 | ) |
| | |
OTHER ASSETS LESS LIABILITIES – 0.1% | | | | | | | 45,705 | |
| | | | | | | | |
| | |
TOTAL NET ASSETS – 100.0% | | | | | | $ | 43,997,906 | |
| | | | | | | | |
Various inputs are used in determining the value of the Fund’s investments. These inputs are summarized in the three broad levels listed below.
Level 1 – quoted prices in active markets for identical securities
Level 2 – other significant observable inputs (including quoted prices for similar securities, interest rates, prepayment speeds, credit risk, etc.)
Level 3 – significant unobservable inputs (including the Fund’s own assumptions in determining the fair value of investments)
The following is a summary of the inputs used as of April 30, 2021 in valuing the Fund’s assets carried at fair value:
| | | | | | | | | | | | | | | | |
| | | | |
| | | Level 1 | | | Level 2 | | | Level 3 | | | Total | |
| | | | |
Investments in Securities | | | | | | | | | | | | | | | | |
| | | | |
Adjustable Rate Mortgage | | $ | — | | | $ | 8,278 | | | | $— | | | $ | 8,278 | |
| | | | |
Corporate Bonds | | | — | | | | 27,278,569 | | | | — | | | | 27,278,569 | |
| | | | |
Government Agencies | | | — | | | | 1,848,594 | | | | — | | | | 1,848,594 | |
| | | | |
Mortgage-Backed Securities | | | — | | | | 472,317 | | | | — | | | | 472,317 | |
| | | | |
U.S. Treasury Obligations | | | — | | | | 12,286,955 | | | | — | | | | 12,286,955 | |
| | | | |
Money Market Fund | | | 2,057,488 | | | | — | | | | — | | | | 2,057,488 | |
| | | | |
Repurchase Agreements | | | — | | | | 2,246,163 | | | | — | | | | 2,246,163 | |
| | | | | | | | | | | | | | | | |
| | | | |
Total | | $ | 2,057,488 | | | $ | 44,140,876 | | | | $— | | | $ | 46,198,364 | |
| | | | | | | | | | | | | | | | |
| ** | Represents less than 0.05%. |
| D | Variable rate security. The rate disclosed is the rate in effect on the report date. The information in parenthesis represents the benchmark and reference rate for each relevant security and the rate floats based upon the reference rate and spread. The security may be further subject to interest rate floor and caps. Certain variable rate securities are not based on a published reference rate and spread, but are determined by the issuer or agent and are based on current market conditions, or, for mortgage-backed securities, are impacted by the individual mortgages which are paying off over time. These securities do not indicate a reference rate and spread in their descriptions. |
ANNUAL REPORT / April 30, 2021
| | |
| 31 | | PORTFOLIOS OF INVESTMENTS Wilmington Intermediate-Term Bond Fund (concluded) |
| W | Denotes a restricted security that may be resold without restriction to “qualified institutional buyers” as defined in Rule 144A under the Securities Act of 1933 and that the Fund has determined to be liquid under criteria established by the Fund’s Board of Trustees. At April 30, 2021, these liquid restricted securities amounted to $1,233,775, representing 2.80% of total net assets. |
| ÿ | Step coupon security. The rate disclosed is the rate in effect on the report date. |
| # | Security, or a portion thereof, is on loan. See Note 2 in Notes to Financial Statements. |
The following acronyms are used throughout this Fund:
| | |
| |
| BKNT | | Bank Notes |
| |
| GMTN | | Global Medium Term Note |
| |
| LIBOR | | London Interbank Offered Rate |
| |
| LLC | | Limited Liability Corporation |
| |
| LP | | Limited Partnership |
| |
| MTN | | Medium Term Note |
| |
| PLC | | Public Limited Company |
| |
| SOFR | | Secured Overnight Financing Rate |
| |
| USD | | United States Dollar |
See Notes which are an integral part of the Financial Statements
April 30, 2021 / ANNUAL REPORT
PORTFOLIO OF INVESTMENTS SUMMARY TABLE
Wilmington Short-Term Bond Fund
At April 30, 2021, the Fund’s portfolio composition was as follows (unaudited):
| | | | | |
| | | Percentage of |
| | | Total Net Assets |
| |
Corporate Bonds | | | | 66.6 | % |
| |
U.S. Treasury Obligations | | | | 26.0 | % |
| |
Mortgage-Backed Securities | | | | 3.1 | % |
| |
Collateralized Mortgage Obligations | | | | 1.3 | % |
| |
Commercial Paper | | | | 1.2 | % |
| |
Investment Company | | | | 1.0 | % |
| |
Adjustable Rate Mortgage | | | | 0.0 | %(1) |
| |
Cash Equivalents(2) | | | | 0.4 | % |
Cash Collateral Invested for Securities on Loan(3) | | | | 9.8 | % |
| |
Other Assets and Liabilities – Net(4) | | | | (9.4 | )% |
| |
| | | | | |
| |
TOTAL | | | | 100.0 | % |
| | | | | |
| | | | | |
| | | Percentage of |
| Credit Quality Diversification(5) | | Total Net Assets |
| |
U.S. Government Agency Securities | | | | 4.2 | % |
| |
U.S. Treasury | | | | 26.0 | % |
| |
A / A | | | | 16.8 | % |
| |
BBB / Baa | | | | 47.5 | % |
| |
BB / Ba | | | | 2.4 | % |
| |
Not Rated | | | | 12.5 | % |
| |
Other Assets and Liabilities – Net(4) | | | | (9.4 | )% |
| |
| | | | | |
| |
TOTAL | | | | 100.0 | % |
| | | | | |
| (1) | Represents less than 0.05%. |
| (2) | Cash Equivalents include investments in a money market fund. |
| (3) | Cash Collateral Invested for Securities on Loan include investments in money market funds and repurchase agreements. |
| (4) | Assets, other than investments in securities, less liabilities. See Statements of Assets and Liabilities. |
| (5) | For financial reporting purposes, the Credit Quality Diversification table reflects the lowest rating assigned by either Moody’s Investors Service or Standard and Poor’s if the ratings differ. These rating agencies are independent, nationally recognized statistical rating organizations and are widely used. Investment grade ratings are credit ratings of BBB/Baa or higher. Below investment grade ratings are credit ratings of BB/Ba or lower. Investments designated as “Not Rated” are not rated by either rating agency and do not necessarily indicate low credit quality. Credit quality ratings are subject to change. |
PORTFOLIO OF INVESTMENTS
April 30, 2021
| | | | | | | | |
| | |
| Description | | Par Value | | | Value | |
|
ADJUSTABLE RATE MORTGAGE – 0.0%** | |
|
FEDERAL NATIONAL MORTGAGE ASSOCIATION (FNMA) – 0.0%** | |
| | |
Pool 399251, (UST Yield Curve CMT 1 Year + 2.07%, Cap 11.19%, Floor 2.07%), 2.32%, 09/01/27D | | $ | 31 | | | $ | 31 | |
| | | | | | | | |
|
TOTAL ADJUSTABLE RATE MORTGAGE | |
| |
(COST $31) | | | $ | 31 | |
|
COLLATERALIZED MORTGAGE OBLIGATIONS – 1.3% | |
|
FEDERAL HOME LOAN MORTGAGE CORPORATION (FHLMC) – 0.0%** | |
| | |
Series 1577, Class PK, 6.50%, 09/15/23 | | | 3,077 | | | | 3,222 | |
| | |
Series 1644, Class K, 6.75%, 12/15/23 | | | 2,321 | | | | 2,446 | |
| | |
Series 1686, Class PJ, 5.00%, 02/15/24 | | | 222 | | | | 223 | |
| | | | | | | | |
| |
TOTAL FEDERAL HOME LOAN MORTGAGE CORPORATION (FHLMC) | | | $ | 5,891 | |
|
FEDERAL NATIONAL MORTGAGE ASSOCIATION (FNMA) – 1.1% | |
| | |
Series 1993-113, Class PK, 6.50%, 07/25/23 | | | 3,726 | | | | 3,922 | |
| | |
Series 1993-127, Class H, 6.50%, 07/25/23 | | | 4,010 | | | | 4,190 | |
| | |
Series 1993-202, Class J, 6.50%, 11/25/23 | | | 2,780 | | | | 2,913 | |
| | |
Series 1994-3, Class PL, 5.50%, 01/25/24 | | | 4,637 | | | | 4,841 | |
| | |
Series 1994-55, Class H, 7.00%, 03/25/24 | | | 5,375 | | | | 5,666 | |
| | |
Series 2011-66, Class QE, 2.00%, 07/25/21 | | | 1,278 | | | | 1,278 | |
| | | | | | | | |
| | |
| Description | | Par Value | | | Value | |
| | |
Series 2011-81, Class PA, 3.50%, 08/25/26 | | $ | 429,431 | | | $ | 440,902 | |
| | | | | | | | |
| |
TOTAL FEDERAL NATIONAL MORTGAGE ASSOCIATION (FNMA) | | | $ | 463,712 | |
| | |
WHOLE LOAN – 0.2% | | | | | | | | |
| | |
Banc of America Mortgage Securities, Inc., Series 2004-A, Class 2A1, 2.53%, 02/25/34D | | | 39,676 | | | | 38,128 | |
| | |
IndyMac INDA Mortgage Loan Trust, Series 2005-AR1, Class 2A1, 2.88%, 11/25/35D | | | 52,147 | | | | 49,592 | |
| | | | | | | | |
| | |
TOTAL WHOLE LOAN | | | | | | $ | 87,720 | |
| | | | | | | | |
|
TOTAL COLLATERALIZED MORTGAGE OBLIGATIONS | |
| | |
(COST $572,339) | | | | | | $ | 557,323 | |
| | |
COMMERCIAL PAPER – 1.2%◆ | | | | | | | | |
| | |
General Motors Financial Co., Inc., 0.35%, 05/12/21W | | | 500,000 | | | | 499,939 | |
| | | | | | | | |
|
TOTAL COMMERCIAL PAPER | |
| | |
(COST $499,947) | | | | | | $ | 499,939 | |
| | |
CORPORATE BONDS – 66.6% | | | | | | | | |
| | |
AEROSPACE & DEFENSE – 2.8% | | | | | | | | |
| | |
Boeing Co. (The), Sr. Unsecured 1.95%, 02/01/24 | | | 250,000 | | | | 256,703 | |
| | |
1.43%, 02/04/24 | | | 250,000 | | | | 250,863 | |
ANNUAL REPORT / April 30, 2021
| | |
| 33 | | PORTFOLIOS OF INVESTMENTS Wilmington Short-Term Bond Fund (continued) |
| | | | | | | | |
| | |
| Description | | Par Value | | | Value | |
| | |
Raytheon Technologies Corp., Sr. Unsecured, 2.80%, 03/15/22 | | $ | 680,000 | | | $ | 693,658 | |
| | | | | | | | |
| | |
TOTAL AEROSPACE & DEFENSE | | | | | | $ | 1,201,224 | |
| | |
AUTOMOTIVE – 2.7% | | | | | | | | |
| | |
Ford Motor Co., Sr. Unsecured, 8.50%, 04/21/23 | | | 200,000 | | | | 224,412 | |
| | |
Ford Motor Credit Co. LLC, Sr. Unsecured, 5.58%, 03/18/24 | | | 250,000 | | | | 273,025 | |
| | |
General Motors Co., Sr. Unsecured, 5.40%, 10/02/23 | | | 165,000 | | | | 182,721 | |
| | |
PACCAR Financial Corp., Sr. Unsecured, MTN 2.65%, 05/10/22 | | | 340,000 | | | | 348,613 | |
| | |
2.65%, 04/06/23 | | | 130,000 | | | | 136,022 | |
| | | | | | | | |
| | |
TOTAL AUTOMOTIVE | | | | | | $ | 1,164,793 | |
| | |
BEVERAGES – 0.6% | | | | | | | | |
| | |
Keurig Dr. Pepper, Inc., Company Guaranteed, 4.06%, 05/25/23 | | | 252,000 | | | | 269,727 | |
| | |
CAPITAL MARKETS – 10.1% | | | | | | | | |
| | |
Bank of America Corp., Sr. Unsecured, (3 Month USD LIBOR + 0.79%), 3.00%, 12/20/23D | | | 500,000 | | | | 519,652 | |
| | |
Bank of America Corp., Sr. Unsecured, MTN, (SOFR + 0.73%), 0.74%, 10/24/24D | | | 1,000,000 | | | | 1,003,804 | |
| | |
Capital One NA, Sr. Unsecured, BKNT, (3 Month USD LIBOR + 1.15%), 1.34%, 01/30/23D | | | 375,000 | | | | 377,291 | |
| | |
Credit Suisse AG, Sr. Unsecured 2.10%, 11/12/21 0.50%, 02/02/24 | |
| 390,000
250,000 |
| |
| 393,691
248,133 |
|
| | |
Goldman Sachs Group, Inc. (The), Sr. Unsecured 5.75%, 01/24/22 3.63%, 01/22/23 | |
| 500,000
750,000 |
| |
| 520,199
792,414 |
|
| | |
Morgan Stanley, Sr. Unsecured, GMTN, 3.13%, 01/23/23 | | | 500,000 | | | | 523,331 | |
| | | | | | | | |
| | |
TOTAL CAPITAL MARKETS | | | | | | $ | 4,378,515 | |
| | |
CHEMICALS – 0.6% | | | | | | | | |
| | |
DuPont de Nemours, Inc., Sr. Unsecured, 4.21%, 11/15/23 | | | 250,000 | | | | 271,417 | |
|
COMMERCIAL SERVICES & SUPPLIES – 0.6% | |
| | |
Global Payments, Inc., Sr. Unsecured, 2.65%, 02/15/25 | | | 250,000 | | | | 263,953 | |
| | |
COMPUTERS – 0.6% | | | | | | | | |
| | |
Hewlett Packard Enterprise Co., Sr. Unsecured, 1.45%, 04/01/24 | | | 240,000 | | | | 244,699 | |
|
DIVERSIFIED FINANCIAL SERVICES – 8.1% | |
| | |
Citigroup, Inc., Sr. Unsecured, 2.70%, 10/27/22 | | | 750,000 | | | | 774,619 | |
| | |
KeyBank NA, Sr. Unsecured, BKNT, 2.40%, 06/09/22 | | | 315,000 | | | | 322,065 | |
| | |
Lloyds Banking Group PLC, Sr. Unsecured, (UST Yield Curve CMT 1 Year + 1.10%), 1.33%, 06/15/23D | | | 500,000 | | | | 504,779 | |
| | |
Truist Bank, Sr. Unsecured, BKNT, 2.80%, 05/17/22 | | | 750,000 | | | | 768,881 | |
| | | | | | | | |
| | |
| Description | | Par Value | | | Value | |
| | |
U.S. Bancorp, Subordinated, MTN, 2.95%, 07/15/22 | | $ | 620,000 | | | $ | 638,022 | |
| | |
Wells Fargo Bank NA, Sr. Unsecured, BKNT, (3 Month USD LIBOR + 0.66%), 0.85%, 09/09/22D | | | 500,000 | | | | 501,078 | |
| | | | | | | | |
| |
TOTAL DIVERSIFIED FINANCIAL SERVICES | | | $ | 3,509,444 | |
| | |
ELECTRIC – 6.6% | | | | | | | | |
| | |
American Electric Power Co., Inc., Series M, Sr. Unsecured, 0.75%, 11/01/23 | | | 500,000 | | | | 501,305 | |
| | |
Consolidated Edison, Inc., Series A, Sr. Unsecured, 0.65%, 12/01/23 | | | 200,000 | | | | 200,052 | |
| | |
DTE Energy Co., Sr. Unsecured, 2.25%, 11/01/22 | | | 500,000 | | | | 513,526 | |
| | |
Duke Energy Corp., Sr. Unsecured, 3.95%, 10/15/23 | | | 500,000 | | | | 537,531 | |
| | |
Public Service Electric and Gas Co., Sr. Secured, MTN, 2.38%, 05/15/23 | | | 600,000 | | | | 621,223 | |
| | |
Southern Co. (The), Sr. Unsecured, 2.35%, 07/01/21 | | | 475,000 | | | | 475,785 | |
| | | | | | | | |
| | |
TOTAL ELECTRIC | | | | | | $ | 2,849,422 | |
|
ENVIRONMENTAL CONTROL – 1.2% | |
| | |
Waste Management, Inc., Company Guaranteed, 2.90%, 09/15/22 | | | 500,000 | | | | 514,546 | |
|
FOOD & STAPLES RETAILING – 4.6% | |
| | |
Campbell Soup Co., Sr. Unsecured, 3.30%, 03/19/25 | | | 300,000 | | | | 323,912 | |
| | |
Kroger Co. (The), Sr. Unsecured, 2.80%, 08/01/22# | | | 1,000,000 | | | | 1,029,047 | |
| | |
Mondelez International, Inc., Sr. Unsecured, 0.63%, 07/01/22 | | | 625,000 | | | | 626,957 | |
| | | | | | | | |
| |
TOTAL FOOD & STAPLES RETAILING | | | $ | 1,979,916 | |
| | |
GAS-2.5% | | | | | | | | |
| | |
Eastern Energy Gas Holdings LLC, Sr. Unsecured, 3.55%, 11/01/23 | | | 1,000,000 | | | | 1,068,050 | |
| | |
HEALTHCARE-SERVICES – 0.7% | | | | | | | | |
| | |
Cigna Corp., Company Guaranteed, 3.75%, 07/15/23 | | | 272,000 | | | | 290,266 | |
| | |
INSURANCE – 0.7% | | | | | | | | |
| | |
Lincoln National Corp., Sr. Unsecured, 4.00%, 09/01/23 | | | 225,000 | | | | 242,954 | |
| | |
W.R. Berkley Corp., Sr. Unsecured, 4.63%, 03/15/22 | | | 44,000 | | | | 45,636 | |
| | | | | | | | |
| | |
TOTAL INSURANCE | | | | | | $ | 288,590 | |
| | |
MACHINERY – 1.7% | | | | | | | | |
| | |
Caterpillar Financial Services Corp., Sr. Unsecured, 0.65%, 07/07/23 | | | 200,000 | | | | 200,703 | |
| | |
Caterpillar Financial Services Corp., Sr. Unsecured, MTN, 2.55%, 11/29/22 | | | 500,000 | | | | 518,055 | |
| | | | | | | | |
| | |
TOTAL MACHINERY | | | | | | $ | 718,758 | |
April 30, 2021 / ANNUAL REPORT
| | |
PORTFOLIOS OF INVESTMENTS Wilmington Short-Term Bond Fund (continued) | | 34 |
| | | | | | | | |
| | |
| Description | | Par Value | | | Value | |
| | |
MEDIA – 1.2% | | | | | | | | |
| | |
Discovery Communications LLC, Company Guaranteed,
3.90%, 11/15/24 | | $ | 475,000 | | | $ | 518,525 | |
| | |
OIL & GAS – 3.6% | | | | | | | | |
| | |
Phillips 66, Company Guaranteed,
0.90%, 02/15/24 | | | 625,000 | | | | 625,886 | |
| | |
Pioneer Natural Resources Co., Sr. Unsecured,
0.75%, 01/15/24 | | | 450,000 | | | | 450,091 | |
| | |
Valero Energy Corp., Sr. Unsecured,
1.20%, 03/15/24 | | | 500,000 | | | | 502,871 | |
| | | | | | | | |
| | |
TOTAL OIL & GAS | | | | | | $ | 1,578,848 | |
| | |
PHARMACEUTICALS – 8.5% | | | | | | | | |
| | |
AbbVie, Inc., Sr. Unsecured
3.38%, 11/14/21 | | | 350,000 | | | | 355,532 | |
| | |
2.30%, 11/21/22 | | | 500,000 | | | | 514,369 | |
| | |
Becton Dickinson and Co., Sr. Unsecured,
(3 Month USD LIBOR + 1.03%), 1.21%, 06/06/22D | | | 1,000,000 | | | | 1,009,422 | |
| | |
Bristol-Myers Squibb Co., Sr. Unsecured
(3 Month USD LIBOR + 0.38%), 0.57%, 05/16/22D | | | 85,000 | | | | 85,257 | |
| | |
0.54%, 11/13/23 | | | 650,000 | | | | 650,566 | |
| | |
CVS Health Corp., Sr. Unsecured,
3.70%, 03/09/23 | | | 500,000 | | | | 529,181 | |
| | |
Elanco Animal Health, Inc., Sr. Unsecured,
4.91%, 08/27/21 | | | 500,000 | | | | 506,031 | |
| | | | | | | | |
| | |
TOTAL PHARMACEUTICALS | | | | | | $ | 3,650,358 | |
| | |
PIPELINES – 3.2% | | | | | | | | |
| | |
Enbridge, Inc., Company Guaranteed,
(3 Month USD LIBOR + 0.50%), 0.69%, 02/18/22D | | | 600,000 | | | | 601,784 | |
| | |
Enterprise Products Operating LLC, Company Guaranteed,
3.35%, 03/15/23 | | | 500,000 | | | | 523,540 | |
| | |
MPLX LP, Sr. Unsecured,
(3 Month USD LIBOR + 1.10%), 1.29%, 09/09/22D | | | 250,000 | | | | 250,167 | |
| | | | | | | | |
| | |
TOTAL PIPELINES | | | | | | $ | 1,375,491 | |
| | |
REAL ESTATE INVESTMENT TRUSTS – 1.5% | | | | | | | | |
| | |
American Tower Corp., Sr. Unsecured
4.70%, 03/15/22 | | | 100,000 | | | | 103,777 | |
| | |
5.00%, 02/15/24 | | | 500,000 | | | | 556,243 | |
| | | | | | | | |
| | |
TOTAL REAL ESTATE INVESTMENT TRUSTS | | | | | | $ | 660,020 | |
| | |
SEMICONDUCTORS – 0.7% | | | | | | | | |
| | |
QUALCOMM, Inc., Sr. Unsecured,
2.90%, 05/20/24# | | | 275,000 | | | | 293,442 | |
| | |
TELECOMMUNICATIONS – 1.8% | | | | | | | | |
| | |
Verizon Communications, Inc., Sr. Unsecured,
2.45%, 11/01/22 | | | 750,000 | | | | 770,454 | |
| | |
TRANSPORTATION – 2.0% | | | | | | | | |
| | |
Ryder System, Inc., Sr. Unsecured, MTN,
2.88%, 06/01/22 | | | 500,000 | | | | 512,149 | |
| | | | | | | | |
| | |
| Description | | Par Value | | | Value | |
| | |
Union Pacific Corp., Sr. Unsecured,
3.20%, 06/08/21 | | $ | 375,000 | | | $ | 376,049 | |
| | | | | | | | |
| | |
TOTAL TRANSPORTATION | | | | | | $ | 888,198 | |
| | | | | | | | |
| | |
TOTAL CORPORATE BONDS (COST $28,404,113) | | | | | | $ | 28,748,656 | |
| | |
MORTGAGE-BACKED SECURITIES – 3.1% | | | | | | | | |
|
FEDERAL HOME LOAN MORTGAGE CORPORATION (FHLMC) – 1.6% | |
| | |
Pool G12709, 5.00%, 07/01/22 | | | 7,185 | | | | 7,343 | |
| | |
Pool C80328, 7.50%, 07/01/25 | | | 7,686 | | | | 8,453 | |
| | |
Pool G14695, 4.50%, 06/01/26 | | | 55,290 | | | | 57,944 | |
| | |
Pool G01425, 7.50%, 05/01/32 | | | 30,080 | | | | 34,417 | |
| | |
Pool C78010, 5.50%, 04/01/33 | | | 306,329 | | | | 353,904 | |
| | |
Pool A18401, 6.00%, 02/01/34 | | | 167,266 | | | | 190,904 | |
| | |
Pool G01831, 6.00%, 05/01/35 | | | 44,881 | | | | 52,082 | |
| | | | | | | | |
| |
TOTAL FEDERAL HOME LOAN MORTGAGE CORPORATION (FHLMC) | | | $ | 705,047 | |
|
FEDERAL NATIONAL MORTGAGE ASSOCIATION (FNMA) – 1.1% | |
| | |
Pool MA0909, 3.00%, 11/01/21 | | | 11,761 | | | | 11,833 | |
| | |
Pool 334593, 7.00%, 05/01/24 | | | 11,319 | | | | 13,040 | |
| | |
Pool AE2520, 3.00%, 01/01/26 | | | 55,525 | | | | 58,155 | |
| | |
Pool 436746, 6.50%, 08/01/28 | | | 16,639 | | | | 19,215 | |
| | |
Pool 440401, 6.50%, 08/01/28 | | | 46,629 | | | | 52,196 | |
| | |
Pool 323419, 6.00%, 12/01/28 | | | 13,315 | | | | 15,119 | |
| | |
Pool 485678, 6.50%, 03/01/29 | | | 9,018 | | | | 10,270 | |
| | |
Pool 252439, 6.50%, 05/01/29 | | | 8,124 | | | | 9,350 | |
| | |
Pool 545051, 6.00%, 09/01/29 | | | 16,584 | | | | 18,852 | |
| | |
Pool 725418, 6.50%, 05/01/34 | | | 46,554 | | | | 51,536 | |
| | |
Pool 833143, 5.50%, 09/01/35 | | | 127,165 | | | | 143,240 | |
| | |
Pool 843323, 5.50%, 10/01/35 | | | 6,877 | | | | 7,834 | |
| | |
Pool 255933, 5.50%, 11/01/35 | | | 36,297 | | | | 42,239 | |
| | | | | | | | |
| |
TOTAL FEDERAL NATIONAL MORTGAGE ASSOCIATION (FNMA) | | | $ | 452,879 | |
|
GOVERNMENT NATIONAL MORTGAGE ASSOCIATION (GNMA) – 0.4% | |
| | |
Pool 306066, 8.50%, 07/15/21 | | | 25 | | | | 25 | |
| | |
Pool 1061, 9.00%, 04/20/23 | | | 3,024 | | | | 3,211 | |
| | |
Pool 346572, 7.00%, 05/15/23 | | | 1,184 | | | | 1,273 | |
| | |
Pool 484269, 7.00%, 09/15/28 | | | 15,785 | | | | 17,000 | |
| | |
Pool 592505, 6.00%, 04/15/33 | | | 113,064 | | | | 132,094 | |
| | |
Pool 581522, 6.00%, 05/15/33 | | | 30,603 | | | | 36,085 | |
| | | | | | | | |
TOTAL GOVERNMENT NATIONAL MORTGAGE ASSOCIATION (GNMA) | | | $ | 189,688 | |
| | | | | | | | |
| | |
TOTAL MORTGAGE-BACKED SECURITIES (COST $1,226,204) | | | | | | $ | 1,347,614 | |
| | |
U.S. TREASURY OBLIGATIONS – 26.0% | | | | | | | | |
| | |
U.S. TREASURY NOTES – 26.0% | | | | | | | | |
| | |
1.75%, 07/15/22 | | | 2,360,000 | | | | 2,406,975 | |
| | |
1.88%, 07/31/22 | | | 1,000,000 | | | | 1,022,251 | |
| | |
0.13%, 02/15/24# | | | 4,000,000 | | | | 3,982,428 | |
| | |
2.00%, 05/31/24 | | | 3,600,000 | | | | 3,781,129 | |
| | | | | | | | |
| | |
TOTAL U.S. TREASURY NOTES | | | | | | $ | 11,192,783 | |
| | | | | | | | |
| | |
TOTAL U.S. TREASURY OBLIGATIONS (COST $11,118,243) | | | | | | $ | 11,192,783 | |
ANNUAL REPORT / April 30, 2021
| | |
| 35 | | PORTFOLIOS OF INVESTMENTS Wilmington Short-Term Bond Fund (continued) |
| | | | | | | | |
| | |
| Description | | Number of Shares | | | Value | |
| | |
INVESTMENT COMPANY – 1.0% | | | | | | | | |
| | |
EXCHANGE-TRADED FUND – 1.0% | | | | | | | | |
| | |
iShares 0-5 Year High Yield Corporate Bond ETF | | | 9,500 | | | $ | 436,335 | |
| | | | | | | | |
| | |
TOTAL INVESTMENT COMPANY (COST $440,834) | | | | | | $ | 436,335 | |
| | |
MONEY MARKET FUND – 0.4% | | | | | | | | |
| | |
Dreyfus Government Cash Management Fund, Institutional Shares, 0.03%^ | | | 148,635 | | | | 148,635 | |
| | | | | | | | |
| | |
TOTAL MONEY MARKET FUND (COST $148,635) | | | | | | $ | 148,635 | |
| |
CASH COLLATERAL INVESTED FOR SECURITIES ON LOAN – 9.8% | | | | | |
| | |
MONEY MARKET FUND – 0.7% | | | | | | | | |
| | |
Blackrock Liquidity Fed Fund, Institutional Shares, 0.03%^ | | | 300,000 | | | | 300,000 | |
| | | | | | | | |
| | |
TOTAL MONEY MARKET FUND
(COST $300,000) | | | | | | $ | 300,000 | |
| | |
| | | Par Value | | | | |
| | |
REPURCHASE AGREEMENTS – 9.1% | | | | | | | | |
| | |
Bank of America Securities, Inc., 0.01%, dated 4/30/21, due 5/03/21, repurchase price $805,598 collateralized by U.S. Government Agency Securities, 1.00% to 5.50%, maturing 11/01/28 to 5/01/51; total market value of $821,709. | | $ | 805,597 | | | | 805,597 | |
| | |
Citigroup Global Markets Ltd., 0.01%, dated 4/30/21, due 5/03/21, repurchase price $717,574 collateralized by U.S. Government Agency & Treasury Securities, 0.00% to 6.00%, maturing 5/15/21 to 4/20/51; total market value of $731,924. | | | 717,573 | | | | 717,573 | |
| | | | | | | | |
| | |
| Description | | Par Value | | | Value | |
| | |
Daiwa Capital Markets America, 0.01%, dated 4/30/21, due 5/03/21, repurchase price $805,598 collateralized by U.S. Government Agency & Treasury Securities, 0.00% to 8.00%, maturing 6/30/21 to 5/01/51; total market value of $821,709. | | $ | 805,597 | | | $ | 805,597 | |
| | |
HSBC Securities USA, Inc., 0.01%, dated 4/30/21, due 5/03/21, repurchase price $805,598 collateralized by a U.S. Government Agency Security, 2.50%, maturing 12/01/50; total market value of $821,709. | | | 805,597 | | | | 805,597 | |
| | |
RBC Dominion Securities, Inc., 0.01%, dated 4/30/21, due 5/03/21, repurchase price $805,598 collateralized by U.S. Government Agency & Treasury Securities, 0.00% to 6.50%, maturing 6/01/21 to 12/15/60; total market value of $821,709. | | | 805,597 | | | | 805,597 | |
| | | | | | | | |
| | |
TOTAL REPURCHASE AGREEMENTS
(COST $3,939,961) | | | | | | $ | 3,939,961 | |
| | | | | | | | |
| |
TOTAL CASH COLLATERAL INVESTED FOR SECURITIES ON LOAN (COST $4,239,961) | | | $ | 4,239,961 | |
| | | | | | | | |
| | |
TOTAL INVESTMENTS – 109.4% (COST $46,650,307) | | | | | | $ | 47,171,277 | |
| | |
COLLATERAL FOR SECURITIES ON LOAN – (9.8%) | | | | | | | (4,239,961 | ) |
| | |
OTHER ASSETS LESS LIABILITIES – 0.4% | | | | | | | 206,210 | |
| | | | | | | | |
| | |
TOTAL NET ASSETS – 100.0% | | | | | | $ | 43,137,526 | |
| | | | | | | | |
Various inputs are used in determining the value of the Fund’s investments. These inputs are summarized in the three broad levels listed below.
Level 1 – quoted prices in active markets for identical securities
Level 2 – other significant observable inputs (including quoted prices for similar securities, interest rates, prepayment speeds, credit risk, etc.)
Level 3 – significant unobservable inputs (including the Fund’s own assumptions in determining the fair value of investments)
The following is a summary of the inputs used as of April 30, 2021 in valuing the Fund’s assets carried at fair value:
| | | | | | | | | | | | | | | | |
| | | | |
| | | Level 1 | | | Level 2 | | | Level 3 | | | Total | |
Investments in Securities | | | | | | | | | | | | | | | | |
| | | | |
Adjustable Rate Mortgage | | $ | — | | | $ | 31 | | | $ | — | | | $ | 31 | |
| | | | |
Collateralized Mortgage Obligations | | | — | | | | 557,323 | | | | — | | | | 557,323 | |
| | | | |
Commercial Paper | | | — | | | | 499,939 | | | | — | | | | 499,939 | |
| | | | |
Corporate Bonds | | | — | | | | 28,748,656 | | | | — | | | | 28,748,656 | |
| | | | |
Mortgage-Backed Securities | | | — | | | | 1,347,614 | | | | — | | | | 1,347,614 | |
| | | | |
U.S. Treasury Obligations | | | — | | | | 11,192,783 | | | | — | | | | 11,192,783 | |
| | | | |
Investment Company | | | 436,335 | | | | — | | | | — | | | | 436,335 | |
| | | | |
Money Market Funds | | | 448,635 | | | | — | | | | — | | | | 448,635 | |
| | | | |
Repurchase Agreements | | | — | | | | 3,939,961 | | | | — | | | | 3,939,961 | |
| | | | | | | | | | | | | | | | |
Total | | $ | 884,970 | | | $ | 46,286,307 | | | $ | — | | | $ | 47,171,277 | |
| | | | | | | | | | | | | | | | |
April 30, 2021 / ANNUAL REPORT
| | |
PORTFOLIOS OF INVESTMENTS Wilmington Short-Term Bond Fund (concluded) | | 36 |
| ** | Represents less than 0.05%. |
| D | Variable rate security. The rate disclosed is the rate in effect on the report date. The information in parenthesis represents the benchmark and reference rate for each relevant security and the rate floats based upon the reference rate and spread. The security may be further subject to interest rate floor and caps. Certain variable rate securities are not based on a published reference rate and spread, but are determined by the issuer or agent and are based on current market conditions, or, for mortgage-backed securities, are impacted by the individual mortgages which are paying off over time. These securities do not indicate a reference rate and spread in their descriptions. |
| ◆ | The rate shown reflects the effective yield at purchase date. |
| W | Denotes a restricted security that may be resold without restriction to “qualified institutional buyers” as defined in Rule 144A under the Securities Act of 1933 and that the Fund has determined to be liquid under criteria established by the Fund’s Board of Trustees. At April 30, 2021, these liquid restricted securities amounted to $499,939, representing 1.16% of total net assets. |
| # | Security, or a portion thereof, is on loan. See Note 2 in Notes to Financial Statements. |
The following acronyms are used throughout this Fund:
| | |
| BKNT | | Bank Notes |
| |
| CMT | | Constant Maturity Treasury |
| |
| ETF | | Exchange-Traded Fund |
| |
| GMTN | | Global Medium Term Note |
| |
| LIBOR | | London Interbank Offered Rate |
| |
| LLC | | Limited Liability Corporation |
| |
| LP | | Limited Partnership |
| |
| MTN | | Medium Term Note |
| |
| NA | | National Association |
| |
| PLC | | Public Limited Company |
| |
| SOFR | | Secured Overnight Financing Rate |
| |
| USD | | United States Dollar |
| |
| UST | | United States Treasury |
See Notes which are an integral part of the Financial Statements
ANNUAL REPORT / April 30, 2021
PORTFOLIO OF INVESTMENTS SUMMARY TABLE
Wilmington Municipal Bond Fund
At April 30, 2021, the Fund’s portfolio composition was as follows (unaudited):
| | | | | |
| | | Percentage of Total Net Assets |
General Obligations | | | | 17.1 | % |
General | | | | 13.7 | % |
Housing | | | | 12.8 | % |
Medical | | | | 11.1 | % |
Water | | | | 8.2 | % |
Transportation | | | | 7.6 | % |
Higher Education | | | | 7.1 | % |
Airport | | | | 4.5 | % |
School District | | | | 3.8 | % |
Development | | | | 3.2 | % |
Education | | | | 2.8 | % |
Power | | | | 1.9 | % |
Utilities | | | | 1.9 | % |
Tobacco Settlement | | | | 1.6 | % |
Student Loan | | | | 1.1 | % |
Facilities | | | | 0.3 | % |
Cash Equivalents(1) | | | | 0.9 | % |
Other Assets and Liabilities - Net(2) | | | | 0.4 | % |
| | | | | |
TOTAL | | | | 100.0 | % |
| | | | | |
| | | | | |
| Credit Quality Diversification(3) | | Percentage of Total Net Assets |
AAA / Aaa | | | | 19.1 | % |
AA / Aa | | | | 31.2 | % |
A / A | | | | 30.4 | % |
BBB / Baa | | | | 13.4 | % |
Not Rated | | | | 5.5 | % |
Other Assets and Liabilities - Net(2) | | | | 0.4 | % |
| | | | | |
TOTAL | | | | 100.0 | % |
| | | | | |
| (1) | Cash Equivalents include investments in a money market fund. |
| (2) | Assets, other than investments in securities, less liabilities. See Statements of Assets and Liabilities. |
| (3) | For financial reporting purposes, the Credit Quality Diversification table reflects the lowest rating assigned by either Moody’s Investors Service or Standard and Poor’s if the ratings differ. These rating agencies are independent, nationally recognized statistical rating organizations and are widely used. Investment grade ratings are credit ratings of BBB/Baa or higher. Below investment grade ratings are credit ratings of BB/Ba or lower. Investments designated as “Not Rated” are not rated by either rating agency and do not necessarily indicate low credit quality. Credit quality ratings are subject to change. |
PORTFOLIO OF INVESTMENTS
April 30, 2021
| | | | | | | | |
| | |
| Description | | Par Value | | | Value | |
| | |
MUNICIPAL BONDS – 98.7% | | | | | | | | |
| | |
ALABAMA – 0.9% | | | | | | | | |
| | |
HIGHER EDUCATION – 0.3% | | | | | | | | |
| | |
University of South Alabama, AL, Advance Refunding Revenue Bonds, (AGM), 5.00%, 11/01/31 | | $ | 1,000,000 | | | $ | 1,203,110 | |
| | |
WATER – 0.6% | | | | | | | | |
| | |
Huntsville Water Revenue Warrants, AL, Revenue Bonds, 5.00%, 11/01/34 | | | 1,840,000 | | | | 2,153,044 | |
| | | | | | | | |
| | |
TOTAL ALABAMA | | | | | | $ | 3,356,154 | |
| | |
ALASKA – 0.6% | | | | | | | | |
| | |
HIGHER EDUCATION – 0.6% | | | | | | | | |
| | |
University of Alaska, AK, Revenue Bonds, (Series T), 5.00%, 10/01/29 | | | 1,810,000 | | | | 2,082,607 | |
| | | | | | | | |
| | |
TOTAL ALASKA | | | | | | $ | 2,082,607 | |
| | | | | | | | |
| | |
| Description | | Par Value | | | Value | |
| | |
ARIZONA – 2.5% | | | | | | | | |
| | |
DEVELOPMENT – 0.1% | | | | | | | | |
| | |
Industrial Development Authority of the City of Phoenix (The), AZ, Stadium Revenue Bonds, (Bank One Ballpark Project), (AMBAC), Prerefunded/ETM, 6.85%, 12/01/25 | | $ | 150,000 | | | $ | 171,925 | |
| | |
EDUCATION – 1.4% | | | | | | | | |
| | |
Arizona Industrial Development Authority, AZ, Revenue Bonds, (Equitable School Revolving Fund) | | | | | | | | |
| | |
5.00%, 11/01/26 | | | 1,000,000 | | | | 1,217,101 | |
| | |
5.00%, 11/01/30 | | | 1,000,000 | | | | 1,252,582 | |
| | |
5.00%, 11/01/32 | | | 865,000 | | | | 1,073,946 | |
April 30, 2021 / ANNUAL REPORT
| | |
PORTFOLIOS OF INVESTMENTS Wilmington Municipal Bond Fund (continued) | | 38 |
| | | | | | | | |
| | |
| Description | | Par Value | | | Value | |
| | |
La Paz County Industrial Development Authority, AZ, Revenue Bonds, (Charter School Solutions - Harmony Public Schools Project), (Series A), 5.00%, 02/15/28 | | $ | 1,300,000 | | | $ | 1,498,167 | |
| | | | | | | | |
| | |
TOTAL EDUCATION | | | | | | $ | 5,041,796 | |
| | |
HOUSING – 0.2% | | | | | | | | |
| | |
Industrial Development Authority of the County of Pima (The), AZ, Revenue Bonds, Prerefunded/ETM, 8.20%, 09/01/21 | | | 760,000 | | | | 779,355 | |
| | |
MEDICAL – 0.8% | | | | | | | | |
| | |
Maricopa County Industrial Development Authority, AZ, Revenue Bonds, (Series A) | | | | | | | | |
| | |
5.00%, 09/01/34 | | | 1,000,000 | | | | 1,323,029 | |
| | |
5.00%, 09/01/35 | | | 725,000 | | | | 956,763 | |
| | |
5.00%, 09/01/36 | | | 500,000 | | | | 658,121 | |
| | | | | | | | |
| | |
TOTAL MEDICAL | | | | | | $ | 2,937,913 | |
| | | | | | | | |
| | |
TOTAL ARIZONA | | | | | | $ | 8,930,989 | |
| | |
ARKANSAS – 1.4% | | | | | | | | |
| | |
SCHOOL DISTRICT – 0.5% | | | | | | | | |
| | |
Siloam Springs School District No. 21 of Benton County, AR, GO Limited, Current Refunding Bonds, AD Valorem Property Tax, 2.00%, 06/01/24 | | | 1,720,000 | | | | 1,806,257 | |
| | |
WATER – 0.9% | | | | | | | | |
| | |
Fort Smith, Water & Sewer, AR, Advance Refunding Revenue Bonds, (BAM), 5.00%, 10/01/28 | | | 2,815,000 | | | | 3,448,420 | |
| | | | | | | | |
| | |
TOTAL ARKANSAS | | | | | | $ | 5,254,677 | |
| | |
CALIFORNIA – 2.7% | | | | | | | | |
| | |
AIRPORT – 0.3% | | | | | | | | |
| | |
City of Los Angeles Department of Airports, CA, Current Refunding Revenue Bonds, Port, Airport & Marina Improvements, (Series B), 5.00%, 05/15/32 | | | 800,000 | | | | 1,001,507 | |
| | |
EDUCATION – 0.0%** | | | | | | | | |
| | |
Sulphur Springs Union School District, CA, Refunding Bonds, Certificates of Participation, Prerefunded/ETM, (AGM), 6.50%, 12/01/37 | | | 10,000 | | | | 11,065 | |
| | |
GENERAL – 0.5% | | | | | | | | |
| | |
Salinas Public Facilities, Inc., CA, Revenue Bonds, (City of Salinas Public Safety Building Project), 4.00%, 12/01/29 | | | 1,000,000 | | | | 1,165,860 | |
| | |
San Bernardino County, CA, Certificates of Participation, (Capital Facility Project), (Series B), Prerefunded/ETM, 6.88%, 08/01/24 | | | 415,000 | | | | 463,321 | |
| | | | | | | | |
| | |
TOTAL GENERAL | | | | | | $ | 1,629,181 | |
| | |
GENERAL OBLIGATIONS – 1.2% | | | | | | | | |
| | |
State of California, CA, GO Unlimited Current Refunding, 5.00%, 04/01/32 | | | 2,250,000 | | | | 3,121,528 | |
| | |
State of California, CA, GO Unlimited, Current Refunding, (AGM), 5.25%, 08/01/32 | | | 1,000,000 | | | | 1,405,627 | |
| | | | | | | | |
| | |
TOTAL GENERAL OBLIGATIONS | | | | | | $ | 4,527,155 | |
| | | | | | | | |
| | |
| Description | | Par Value | | | Value | |
| | |
HIGHER EDUCATION – 0.0%** | | | | | | | | |
| | |
California Educational Facilities Authority, CA, Revenue Bonds, (Pooled College and University Projects), (1999 Series B), Prerefunded/ETM, 5.25%, 04/01/24 | | $ | 5,000 | | | $ | 5,444 | |
| | |
POWER – 0.4% | | | | | | | | |
| | |
M-S-R Public Power Agency, CA, Revenue Bonds, (Series E), (NATL), Prerefunded/ETM, 6.00%, 07/01/22 | | | 120,000 | | | | 124,642 | |
| | |
Redding City Electric System Revenue, CA, Revenue Bonds, (NATL), Prerefunded/ETM, 6.37%, 07/01/22 | | | 545,000 | | | | 566,634 | |
| | |
Sacramento Municipal Utility District, CA, Revenue Bonds, (Series K-BHAC-CR), (BHAC-CR AMBAC), 5.25%, 07/01/24 | | | 600,000 | | | | 651,642 | |
| | | | | | | | |
| | |
TOTAL POWER | | | | | | $ | 1,342,918 | |
| | |
SCHOOL DISTRICT – 0.3% | | | | | | | | |
| | |
Los Angeles Unified School District, CA, GO Unlimited, AD Valorem Property Tax, (Series RYQ), 5.00%, 07/01/25 | | | 1,000,000 | | | | 1,192,712 | |
| | |
WATER – 0.0%** | | | | | | | | |
| | |
Metropolitan Water District of Southern California, CA, Unrefunded Revenue Bonds, (Series A), (FGIC-TCRS), 5.75%, 07/01/21 | | | 140,000 | | | | 140,000 | |
| | | | | | | | |
| | |
TOTAL CALIFORNIA | | | | | | $ | 9,849,982 | |
| | |
COLORADO – 2.7% | | | | | | | | |
| | |
AIRPORT – 0.8% | | | | | | | | |
| | |
City & County of Denver, CO, Airport System Revenue Bonds, (Sub-Series A), 5.00%, 12/01/31 | | | 2,500,000 | | | | 3,149,890 | |
| | |
HOUSING – 0.6% | | | | | | | | |
| | |
Colorado Housing and Finance Authority, CO, Single Family Revenue Bonds, (Series B), 3.75%, 05/01/50 | | | 1,865,000 | | | | 2,065,111 | |
| | |
MEDICAL – 0.7% | | | | | | | | |
| | |
Colorado Health Facilities Authority, CO, Advance Refunding Revenue Bonds, (NCMC, Inc. Project), Prerefunded/ETM, 5.00%, 05/15/26 | | | 100,000 | | | | 121,938 | |
| | |
Colorado Health Facilities Authority, CO, Revenue Bonds, (CommonSpirit Health), (Series B-2), 5.00%, 08/01/49D | | | 2,000,000 | | | | 2,398,412 | |
| | | | | | | | |
| | |
TOTAL MEDICAL | | | | | | $ | 2,520,350 | |
| | |
WATER – 0.6% | | | | | | | | |
| | |
City & County of Denver, CO, Board of Water Commissioners, Refunding Revenue Bonds, (Series B), 4.00%, 09/15/33 | | | 1,750,000 | | | | 2,180,691 | |
| | | | | | | | |
| | |
TOTAL COLORADO | | | | | | $ | 9,916,042 | |
| | |
CONNECTICUT – 4.4% | | | | | | | | |
| | |
GENERAL OBLIGATIONS – 1.0% | | | | | | | | |
| | |
State of Connecticut, CT, GO Unlimited, Public Improvements, AD Valorem Property Tax, (Series 2021 A), 3.00%, 01/15/35 | | | 2,900,000 | | | | 3,244,354 | |
ANNUAL REPORT / April 30, 2021
| | |
| 39 | | PORTFOLIOS OF INVESTMENTS Wilmington Municipal Bond Fund (continued) |
| | | | | | | | |
| | |
| Description | | Par Value | | | Value | |
| | |
State of Connecticut, CT, GO Unlimited, Refunding Notes, (Series E), 5.00%, 09/15/27 | | $ | 500,000 | | | $ | 633,404 | |
| | | | | | | | |
| | |
TOTAL GENERAL OBLIGATIONS | | | | | | $ | 3,877,758 | |
| | |
HIGHER EDUCATION – 1.3% | | | | | | | | |
| | |
Connecticut State Health & Educational Facilities Authority, CT, Advance Refunding Revenue Bonds, (Series R), Fairfield University, 5.00%, 07/01/31 | | | 1,385,000 | | | | 1,679,608 | |
| | |
University of Connecticut, CT, Revenue Bonds, (Series A) | | | | | | | | |
| | |
5.00%, 03/15/31 | | | 1,480,000 | | | | 1,774,549 | |
| | |
5.00%, 01/15/33 | | | 1,000,000 | | | | 1,220,344 | |
| | | | | | | | |
| | |
TOTAL HIGHER EDUCATION | | | | | | $ | 4,674,501 | |
| | |
HOUSING – 1.3% | | | | | | | | |
| | |
Connecticut Housing Finance Authority, CT, Current Refunding Revenue Bonds, (Home Mortgage Finance Program), (Sub-Series D-1), 4.00%, 11/15/49 | | | 2,795,000 | | | | 3,171,111 | |
| | |
Connecticut Housing Finance Authority, CT, Revenue Bonds, (Sub-Series A-2), 4.00%, 11/15/41 | | | 1,405,000 | | | | 1,532,658 | |
| | | | | | | | |
| | |
TOTAL HOUSING | | | | | | $ | 4,703,769 | |
| | |
MEDICAL – 0.6% | | | | | | | | |
| | |
Connecticut State Health & Educational Facilities Authority, CT, Current Refunding Revenue Bonds, (Stamford Hospital) | | | | | | | | |
| | |
4.00%, 07/01/28 | | | 685,000 | | | | 818,491 | |
| | |
4.00%, 07/01/29 | | | 500,000 | | | | 603,735 | |
| | |
4.00%, 07/01/30 | | | 600,000 | | | | 731,361 | |
| | | | | | | | |
| | |
TOTAL MEDICAL | | | | | | $ | 2,153,587 | |
| | |
TRANSPORTATION – 0.2% | | | | | | | | |
| | |
Connecticut State Special Tax Revenue, CT, Highways Improvement Revenue Bonds, 5.00%, 05/01/25 | | | 625,000 | | | | 738,972 | |
| | | | | | | | |
| | |
TOTAL CONNECTICUT | | | | | | $ | 16,148,587 | |
| | |
DISTRICT OF COLUMBIA – 1.4% | | | | | | | | |
| | |
GENERAL – 0.7% | | | | | | | | |
| | |
Washington Convention & Sports Authority, DC, Current Refunding Revenue Bonds, (Series A) | | | | | | | | |
| | |
5.00%, 10/01/30 | | | 610,000 | | | | 806,306 | |
| | |
5.00%, 10/01/31 | | | 875,000 | | | | 1,148,518 | |
| | |
5.00%, 10/01/32 | | | 500,000 | | | | 652,776 | |
| | | | | | | | |
| | |
TOTAL GENERAL | | | | | | $ | 2,607,600 | |
| | |
GENERAL OBLIGATIONS – 0.7% | | | | | | | | |
| | |
District of Columbia, DC, GO Unlimited, Current Refunding, AD Valorem Property Tax, (Series A), 5.00%, 06/01/31 | | | 2,080,000 | | | | 2,584,400 | |
| | | | | | | | |
| | |
TOTAL DISTRICT OF COLUMBIA | | | | | | $ | 5,192,000 | |
| | |
FLORIDA – 5.6% | | | | | | | | |
| | |
GENERAL – 0.0%** | | | | | | | | |
| | |
Miami-Dade County, FL, Revenue Bonds, (Sports Franchise Facilities), (NATL), Prerefunded/ETM, 5.25%, 10/01/30 | | | 65,000 | | | | 87,730 | |
| | | | | | | | |
| | |
| Description | | Par Value | | | Value | |
| | |
GENERAL OBLIGATIONS – 1.1% | | | | | | | | |
| | |
Broward County, FL, GO Unlimited, Refunding Bonds, (Parks & Land Preservation Project), AD Valorem Property Tax, 5.00%, 01/01/24 | | $ | 1,500,000 | | | $ | 1,548,467 | |
| | |
State of Florida, FL, GO Unlimited, Current Refunding, (Series D), 4.00%, 06/01/34 | | | 1,975,000 | | | | 2,412,584 | |
| | | | | | | | |
| | |
TOTAL GENERAL OBLIGATIONS | | | | | | $ | 3,961,051 | |
| | |
HIGHER EDUCATION – 1.5% | | | | | | | | |
| | |
Davie Florida Education Facilities, FL, Revenue Bonds, (Nova Southeastern University Project) | | | | | | | | |
| | |
5.00%, 04/01/28 | | | 750,000 | | | | 924,197 | |
| | |
5.00%, 04/01/30 | | | 750,000 | | | | 910,744 | |
| | |
5.00%, 04/01/31 | | | 750,000 | | | | 904,121 | |
| | |
5.00%, 04/01/33 | | | 750,000 | | | | 897,135 | |
| | |
Florida Higher Educational Facilities Financial Authority, FL, Revenue Bonds, (Educational Facilities Ringling College Project), 5.00%, 03/01/28 | | | 1,600,000 | | | | 1,869,040 | |
| | | | | | | | |
| | |
TOTAL HIGHER EDUCATION | | | | | | $ | 5,505,237 | |
| | |
HOUSING – 1.6% | | | | | | | | |
| | |
Capital Trust Agency, Inc., FL, Multi Family Revenue Bonds, (Mission Springs Apartments Project), (Series A), Prerefunded/ETM, 3.25%, 12/01/27 | | | 500,000 | | | | 543,820 | |
| | |
Capital Trust Agency, Inc., FL, Multi Family Revenue Bonds, (Mission Springs Apartments Project), Prerefunded/ETM, 5.38%, 12/01/52 | | | 415,000 | | | | 466,285 | |
| | |
Florida Gulf Coast University Financing Corp., FL, Current Refunding Revenue Bonds, (Housing Project) | | | | | | | | |
| | |
5.00%, 02/01/25 | | | 500,000 | | | | 580,455 | |
| | |
5.00%, 02/01/26 | | | 500,000 | | | | 598,680 | |
| | |
Pinellas County Housing Finance Authority, FL, Single Family Revenue Bonds, (Series A), 4.00%, 03/01/50 | | | 3,125,000 | | | | 3,475,720 | |
| | | | | | | | |
| | |
TOTAL HOUSING | | | | | | $ | 5,664,960 | |
| | |
TRANSPORTATION – 0.5% | | | | | | | | |
| | |
Miami-Dade County, FL, Seaport Department, Revenue Bonds, (Series B), 6.00%, 10/01/24 | | | 1,500,000 | | | | 1,684,501 | |
| | |
WATER – 0.9% | | | | | | | | |
| | |
Miami-Dade County, FL, Water & Sewer System Revenue, Advance Refunding Revenue Bonds, (Series B), 5.00%, 10/01/30 | | | 2,645,000 | | | | 3,154,671 | |
| | |
Village of Royal Palm Beach Utility System Revenue, FL, Revenue Bonds, Public Improvements, (NATL), Prerefunded/ ETM, 4.50%, 10/01/22 | | | 150,000 | | | | 155,497 | |
| | | | | | | | |
| | |
TOTAL WATER | | | | | | $ | 3,310,168 | |
| | | | | | | | |
| | |
TOTAL FLORIDA | | | | | | $ | 20,213,647 | |
April 30, 2021 / ANNUAL REPORT
| | |
PORTFOLIOS OF INVESTMENTS Wilmington Municipal Bond Fund (continued) | | 40 |
| | | | | | | | |
| | |
| Description | | Par Value | | | Value | |
| | |
GEORGIA – 0.6% | | | | | | | | |
| | |
GENERAL – 0.1% | | | | | | | | |
Georgia Local Government, GA, Certificates of Participation, (Grantor Trust), (Series A), (NATL), 4.75%, 06/01/28 | | $ | 249,000 | | | $ | 280,219 | |
| | |
HOUSING – 0.5% | | | | | | | | |
| | |
Development Authority of Bulloch County, GA, Advance Refunding Revenue Bonds, (Georgia Southern University Housing Foundation Four, LLC Project), Prerefunded, 5.00%, 07/01/31 | | | 315,000 | | | | 395,419 | |
| | |
Development Authority of Bulloch County, GA, Advance Refunding Revenue Bonds, (Georgia Southern University Housing Foundation Four, LLC Project), Unrefunded, 5.00%, 07/01/31 | | | 1,260,000 | | | | 1,550,594 | |
| | | | | | | | |
| | |
TOTAL HOUSING | | | | | | $ | 1,946,013 | |
| | | | | | | | |
| | |
TOTAL GEORGIA | | | | | | $ | 2,226,232 | |
| | |
HAWAII – 0.4% | | | | | | | | |
| | |
GENERAL OBLIGATIONS – 0.4% | | | | | | | | |
| | |
State of Hawaii, HI, GO Unlimited, (Series FT), 5.00%, 01/01/26 | | | 1,075,000 | | | | 1,298,815 | |
| | | | | | | | |
| | |
TOTAL HAWAII | | | | | | $ | 1,298,815 | |
| | |
ILLINOIS – 12.6% | | | | | | | | |
| | |
AIRPORT – 0.7% | | | | | | | | |
| | |
Chicago Midway International Airport, IL, Current Refunding Revenue Bonds, (Second Lien), (Series A), 5.00%, 01/01/29 | | | 2,250,000 | | | | 2,503,030 | |
| | |
GENERAL – 4.1% | | | | | | | | |
| | |
Metropolitan Pier & Exposition Authority, IL, Revenue Bonds, Public Improvements, (McCormick Place Convention), Prerefunded/ETM, 7.00%, 07/01/26 | | | 8,855,000 | | | | 10,470,621 | |
| | |
Regional Transportation Authority, IL, Revenue Bonds, (Series A), (BHAC-CR FGIC), 6.00%, 07/01/31 | | | 1,450,000 | | | | 1,946,127 | |
| | |
Sales Tax Securitization Corp., IL, Current Refunding Revenue Bonds, (Second Lien), (Series A), 5.00%, 01/01/26 | | | 2,000,000 | | | | 2,373,697 | |
| | |
Village of Matteson, IL, Revenue Bonds, Public Improvements, (Capital Appreciation Debt Certificates), Prerefunded/ETM, 8.00%, 12/01/29 | | | 240,000 | | | | 257,187 | |
| | | | | | | | |
| | |
TOTAL GENERAL | | | | | | $ | 15,047,632 | |
| | |
GENERAL OBLIGATIONS – 6.0% | | | | | | | | |
| | |
Chicago Park District, IL, GO Unlimited Current Refunding, AD Valorem Property Tax, (Series D) | | | | | | | | |
| | |
5.00%, 01/01/26 | | | 1,250,000 | | | | 1,380,984 | |
| | |
5.00%, 01/01/27 | | | 3,455,000 | | | | 3,805,480 | |
| | |
Chicago, IL, GO Limited, (Lakefront Millennium Parking Facilities), (NATL), Prerefunded/ETM, 5.75%, 01/01/23 | | | 50,000 | | | | 52,997 | |
| | |
Chicago, IL, GO Unlimited Current Refunding, AD Valorem Property Tax, (Series A), 5.00%, 01/01/25 | | | 3,000,000 | | | | 3,425,128 | |
| | | | | | | | |
| | |
| Description | | Par Value | | | Value | |
| | |
Cook County, IL, GO Unlimited, Current Refunding, AD Valorem Property Tax, (Series A), (AGM), 5.00%, 11/15/26 | | $ | 2,050,000 | | | $ | 2,522,334 | |
| | |
Metropolitan Water Reclamation District of Greater Chicago, IL, GO Limited, (Water Utility & Sewer Improvements), AD Valorem Property Tax, (Series C-Green Bond), 5.00%, 12/01/28 | | | 5,040,000 | | | | 5,850,364 | |
| | |
State of Illinois, IL, GO Unlimited, Public Improvements, (Series B), 5.00%, 12/01/25 | | | 3,935,000 | | | | 4,650,501 | |
| | | | | | | | |
| | |
TOTAL GENERAL OBLIGATIONS | | | | | | $ | 21,687,788 | |
| | |
HOUSING – 1.2% | | | | | | | | |
| | |
Illinois Housing Development Authority, IL, Multi Family Revenue Bonds, (Marshall Field Garden Apartment Homes), 1.06%, 05/15/50D | | | 925,000 | | | | 948,043 | |
| | |
Illinois Housing Development Authority, IL, Multi Family Revenue Bonds, Prerefunded/ETM , 7.00%, 07/01/23 | | | 210,000 | | | | 212,238 | |
| | |
Illinois Housing Development Authority, IL, Single Family Revenue Bonds, (Series A), 3.75%, 04/01/50 | | | 2,710,000 | | | | 3,027,599 | |
| | | | | | | | |
| | |
TOTAL HOUSING | | | | | | $ | 4,187,880 | |
| | |
MEDICAL – 0.1% | | | | | | | | |
| | |
Illinois Health Facilities Authority, IL, Refunding Revenue Bonds, (Franciscan Sisters Health Care), (NATL), Prerefunded/ETM, 6.25%, 09/01/21 | | | 20,000 | | | | 20,393 | |
| | |
Illinois Health Facilities Authority, IL, Refunding Revenue Bonds, (Series A), (Evangelical Hospital), Prerefunded/ETM, 6.25%, 04/15/22 | | | 175,000 | | | | 185,152 | |
| | |
Illinois Health Facilities Authority, IL, Revenue Bonds, (Series B), (Ancilla Systems Inc.), (NATL), Prerefunded/ETM, 5.25%, 07/01/22 | | | 90,000 | | | | 92,927 | |
| | |
Illinois Health Facilities Authority, IL, Revenue Bonds, (Series C), (Evangelical Hospital), Prerefunded/ETM, 6.25%, 04/15/22 | | | 5,000 | | | | 5,283 | |
| | | | | | | | |
| | |
TOTAL MEDICAL | | | | | | $ | 303,755 | |
| | |
TRANSPORTATION – 0.5% | | | | | | | | |
| | |
Regional Transportation Authority, IL, Revenue Bonds, (Series B), 5.00%, 06/01/33 | | | 1,450,000 | | | | 1,834,065 | |
| | | | | | | | |
| | |
TOTAL ILLINOIS | | | | | | $ | 45,564,150 | |
| | |
INDIANA – 2.5% | | | | | | | | |
| | |
DEVELOPMENT – 2.2% | | | | | | | | |
| | |
Whiting City, IN, Current Refunding Revenue Bonds, (BP Products North America Inc., Project), 5.00%, 12/01/44D | | | 6,500,000 | | | | 7,901,349 | |
| | |
HOUSING – 0.3% | | | | | | | | |
| | |
Indiana Housing & Community Development Authority, IN, Current Refunding Revenue Bonds, (Series C-2), 4.00%, 01/01/37 | | | 1,110,000 | | | | 1,156,806 | |
| | | | | | | | |
| | |
TOTAL INDIANA | | | | | | $ | 9,058,155 | |
ANNUAL REPORT / April 30, 2021
| | |
| 41 | | PORTFOLIOS OF INVESTMENTS Wilmington Municipal Bond Fund (continued) |
| | | | | | | | |
| | |
| Description | | Par Value | | | Value | |
| | |
IOWA – 1.0% | | | | | | | | |
| | |
HOUSING – 1.0% | | | | | | | | |
| | |
Iowa Finance Authority, IA, Revenue Bonds, (Series D), 3.50%, 01/01/49 | | $ | 3,280,000 | | | $ | 3,658,163 | |
| | | | | | | | |
| | |
TOTAL IOWA | | | | | | $ | 3,658,163 | |
| | |
KENTUCKY – 1.3% | | | | | | | | |
| | |
GENERAL – 1.3% | | | | | | | | |
| | |
Kentucky Public Energy Authority, KY, Revenue Bonds, (Series C), 4.00%, 02/01/50D | | | 2,000,000 | | | | 2,359,328 | |
| | |
Kentucky State Property & Building Commission, KY, Revenue Bonds, Public Improvements, (Project No. 119), 5.00%, 05/01/25 | | | 2,000,000 | | | | 2,350,794 | |
| | | | | | | | |
| | |
TOTAL KENTUCKY | | | | | | $ | 4,710,122 | |
| | |
MARYLAND – 2.3% | | | | | | | | |
| | |
GENERAL OBLIGATIONS – 2.0% | | | | | | | | |
| | |
Anne Arundel County, MD, GO Limited, AD Valorem Property Tax, 5.00%, 10/01/25 | | | 3,000,000 | | | | 3,607,125 | |
| | |
State of Maryland, MD, GO Unlimited, Current Refunding, AD Valorem Property Tax, (Series B Second Series), 5.00%, 08/01/27 | | | 3,000,000 | | | | 3,801,279 | |
| | | | | | | | |
| | |
TOTAL GENERAL OBLIGATIONS | | | | | | $ | 7,408,404 | |
| | |
MEDICAL – 0.1% | | | | | | | | |
| | |
Maryland Health & Higher Educational Facilities Authority, MD, Refunding Revenue Bonds, (Helix Health Issue), (AMBAC), Prerefunded/ETM, 5.00%, 07/01/27 | | | 140,000 | | | | 161,821 | |
| | |
TRANSPORTATION – 0.2% | | | | | | | | |
| | |
Maryland State Department of Transportation, MD, Highways Improvement Revenue Bonds, 4.00%, 05/01/30 | | | 500,000 | | | | 599,992 | |
| | | | | | | | |
| | |
TOTAL MARYLAND | | | | | | $ | 8,170,217 | |
| | |
MASSACHUSETTS – 4.1% | | | | | | | | |
| | |
GENERAL OBLIGATIONS – 1.0% | | | | | | | | |
| | |
Commonwealth of Massachusetts, MA, GO Limited, (Series B), 5.00%, 01/01/31 | | | 3,000,000 | | | | 3,810,109 | |
| | |
HIGHER EDUCATION – 0.8% | | | | | | | | |
| | |
Massachusetts Development Finance Agency, MA, Current Refunding Revenue Bonds, (Series L), (Simmons University) | | | | | | | | |
| | |
5.00%, 10/01/30 | | | 1,180,000 | | | | 1,480,136 | |
| | |
5.00%, 10/01/31 | | | 1,000,000 | | | | 1,247,982 | |
| | | | | | | | |
| | |
TOTAL HIGHER EDUCATION | | | | | | $ | 2,728,118 | |
| | |
MEDICAL – 1.2% | | | | | | | | |
| | |
Massachusetts Development Finance Agency, MA, Advance Refunding Revenue Bonds, (Partners Healthcare System), 5.00%, 07/01/33 | | | 2,455,000 | | | | 3,060,512 | |
| | |
Massachusetts Development Finance Agency, MA, Advance Refunding Revenue Bonds, Health, Hospital, Nursing Home Revenue (Care Group), (Series I), 5.00%, 07/01/33 | | | 1,000,000 | | | | 1,197,134 | |
| | | | | | | | |
| | |
TOTAL MEDICAL | | | | | | $ | 4,257,646 | |
| | | | | | | | |
| | |
| Description | | Par Value | | | Value | |
| | |
STUDENT LOAN – 0.7% | | | | | | | | |
| | |
Massachusetts Educational Financing Authority, MA, Revenue Bonds, (Issue K), (Series A), 5.00%, 07/01/25 | | $ | 2,200,000 | | | $ | 2,577,158 | |
| | |
WATER – 0.4% | | | | | | | | |
| | |
Massachusetts Water Resources Authority, MA, Refunding Revenue Bonds, (Series B), (AGM), 5.25%, 08/01/33 | | | 1,000,000 | | | | 1,458,936 | |
| | | | | | | | |
| | |
TOTAL MASSACHUSETTS | | | | | | $ | 14,831,967 | |
| | |
MICHIGAN – 3.8% | | | | | | | | |
| | |
GENERAL – 1.7% | | | | | | | | |
| | |
Michigan Finance Authority, MI, Revenue Bonds, (Series H-1), 5.00%, 10/01/25 | | | 5,215,000 | | | | 6,030,547 | |
| | |
HOUSING – 0.1% | | | | | | | | |
| | |
Michigan State Housing Development Authority, MI, Multi Family Revenue Bonds, (Series A-1), 2.88%, 10/01/34 | | | 375,000 | | | | 401,468 | |
| | |
MEDICAL – 1.2% | | | | | | | | |
| | |
Kalamazoo Hospital Finance Authority, MI, Advance Refunding Revenue Bonds, (Bronson Healthcare Group), 5.00%, 05/15/30 | | | 2,055,000 | | | | 2,453,836 | |
| | |
Michigan Finance Authority, MI, Advance Refunding Revenue Bonds, (Series A), (Beaumont Health Credit Group), 5.00%, 08/01/31 | | | 1,655,000 | | | | 1,891,915 | |
| | | | | | | | |
| | |
TOTAL MEDICAL | | | | | | $ | 4,345,751 | |
| | |
SCHOOL DISTRICT – 0.3% | | | | | | | | |
| | |
Saginaw City School District, MI, GO Unlimited, School Improvements, AD Valorem Property Tax, (Qualified School Bond Loan Fund), 4.00%, 05/01/35 | | | 1,000,000 | | | | 1,236,792 | |
| | |
WATER – 0.5% | | | | | | | | |
| | |
Detroit Sewage Disposal System, MI, Revenue Bonds, (Second Lien), (Series B), (AGC-ICC FGIC), 5.50%, 07/01/29 | | | 150,000 | | | | 186,134 | |
| | |
Michigan Finance Authority, MI, Current Refunding Revenue Bonds, (Series C), (Local Government Loan Program), 5.00%, 07/01/34 | | | 1,450,000 | | | | 1,699,231 | |
| | | | | | | | |
| | |
TOTAL WATER | | | | | | $ | 1,885,365 | |
| | | | | | | | |
| | |
TOTAL MICHIGAN | | | | | | $ | 13,899,923 | |
| | |
MINNESOTA – 0.8% | | | | | | | | |
| | |
HOUSING – 0.8% | | | | | | | | |
| | |
Coon Rapids City, MN, Multi Family Revenue Bonds, (Galway Place Community Plaza Projects), (Series A), 2.70%, 08/01/35 | | | 2,684,980 | | | | 2,887,206 | |
| | | | | | | | |
| | |
TOTAL MINNESOTA | | | | | | $ | 2,887,206 | |
| | |
NEBRASKA – 0.8% | | | | | | | | |
| | |
HOUSING – 0.8% | | | | | | | | |
| | |
Nebraska Investment Finance Authority, NE, Revenue Bonds, (Series E), 3.75%, 09/01/49 | | | 2,620,000 | | | | 2,835,919 | |
| | | | | | | | |
| | |
TOTAL NEBRASKA | | | | | | $ | 2,835,919 | |
April 30, 2021 / ANNUAL REPORT
| | |
PORTFOLIOS OF INVESTMENTS Wilmington Municipal Bond Fund (continued) | | 42 |
| | | | | | | | |
| | |
| Description | | Par Value | | | Value | |
| | |
NEW JERSEY – 4.8% | | | | | | | | |
| | |
EDUCATION – 0.4% | | | | | | | | |
| | |
New Jersey Economic Development Authority, NJ, Revenue Bonds, School Improvements, (Series DDD), 5.00%, 06/15/33 | | $ | 1,100,000 | | | $ | 1,321,857 | |
| | |
GENERAL – 2.9% | | | | | | | | |
| | |
Garden State Preservation Trust, NJ, Revenue Bonds, (2005 Series A), (AGM), 5.75%, 11/01/28 | | | 250,000 | | | | 310,020 | |
| | |
New Jersey Economic Development Authority, NJ, Advance Refunding Revenue Bonds, (Series B), 5.00%, 11/01/23 | | | 1,305,000 | | | | 1,455,767 | |
| | |
New Jersey Economic Development Authority, NJ, Current Refunding Revenue Bonds, (Series A), 5.00%, 06/15/24 | | | 225,000 | | | | 256,607 | |
| | |
New Jersey Sports & Exposition Authority, NJ, Current Refunding Revenue Bonds, (Series A), 5.00%, 09/01/24 | | | 1,685,000 | | | | 1,933,746 | |
| | |
New Jersey Transportation Trust Fund Authority, NJ, Current Refunding Revenue Bonds, (Series A), (Transportation System) | | | | | | | | |
| | |
5.00%, 12/15/28 | | | 2,135,000 | | | | 2,713,476 | |
| | |
5.00%, 12/15/34 | | | 3,000,000 | | | | 3,729,245 | |
| | | | | | | | |
| | |
TOTAL GENERAL | | | | | | $ | 10,398,861 | |
| | |
HIGHER EDUCATION – 1.3% | | | | | | | | |
| | |
Gloucester County Improvement Authority, NJ, Advance Refunding Revenue Bonds, (Series B), (Rowan University Project), 5.00%, 07/01/27 | | | 2,000,000 | | | | 2,345,659 | |
| | |
New Jersey Educational Facilities Authority, NJ, Current Refunding Revenue Bonds, (Series B), (Montclair State University), 5.00%, 07/01/30 | | | 1,000,000 | | | | 1,201,179 | |
| | |
New Jersey Educational Facilities Authority, NJ, Revenue Bonds, (Series A), (Stevens Institute of Technology), 5.00%, 07/01/31 | | | 1,000,000 | | | | 1,198,988 | |
| | | | | | | | |
| | |
TOTAL HIGHER EDUCATION | | | | | | $ | 4,745,826 | |
| | |
HOUSING – 0.1% | | | | | | | | |
| | |
New Jersey Housing & Mortgage Finance Agency, NJ, Current Refunding Revenue Bonds, (Series A), 3.60%, 11/01/33 | | | 400,000 | | | | 442,184 | |
| | |
New Jersey Housing & Mortgage Finance Agency, NJ, Multi Family Revenue Bonds, (Series A), Prerefunded/ETM, 6.00%, 11/01/23 | | | 20,000 | | | | 20,570 | |
| | | | | | | | |
| | |
TOTAL HOUSING | | | | | | $ | 462,754 | |
| | |
MEDICAL – 0.1% | | | | | | | | |
| | |
New Jersey Health Care Facilities Financing Authority, NJ, Current Refunding Revenue
Bonds, (Kennedy Health System), Prerefunded/ETM, 3.75%, 07/01/27 | | | 140,000 | | | | 157,343 | |
| | |
New Jersey Health Care Facilities Financing Authority, NJ, Refunding Revenue Bonds, (Series A), (Saint Clare’s Hospital, Inc.), (AGC), Prerefunded/ETM, 4.75%, 07/01/25 | | | 195,000 | | | | 223,580 | |
| | | | | | | | |
| | |
TOTAL MEDICAL | | | | | | $ | 380,923 | |
| | | | | | | | |
| | |
TOTAL NEW JERSEY | | | | | | $ | 17,310,221 | |
| | | | | | | | |
| | |
| Description | | Par Value | | | Value | |
| | |
NEW MEXICO – 1.0% | | | | | | | | |
| | |
GENERAL – 1.0% | | | | | | | | |
| | |
New Mexico Municipal Energy Acquisition Authority, NM, Revenue Bonds, (Series A), 5.00%, 11/01/39D | | $ | 3,065,000 | | | $ | 3,584,684 | |
| | |
HIGHER EDUCATION – 0.0%** | | | | | | | | |
| | |
University of New Mexico (The), NM, Revenue Bonds, Prerefunded/ETM, 6.50%, 06/01/21 | | | 50,000 | | | | 50,211 | |
| | | | | | | | |
| | |
TOTAL NEW MEXICO | | | | | | $ | 3,634,895 | |
| | |
NEW YORK – 7.1% | | | | | | | | |
| | |
GENERAL OBLIGATIONS – 0.3% | | | | | | | | |
| | |
New York City, NY, GO Unlimited, Refunding Bonds, AD Valorem Property Tax, (Series A-1), 5.00%, 08/01/24 | | | 1,000,000 | | | | 1,149,431 | |
| | |
HIGHER EDUCATION – 0.7% | | | | | | | | |
| | |
New York State Dormitory Authority, NY, Refunding Revenue Bonds, College & University, (Series C), (NATL), 5.25%, 07/01/30 | | | 1,040,000 | | | | 1,297,354 | |
| | |
Tompkins County Development Corp., NY, Current Refunding Revenue Bonds, (Ithaca College Project), 5.00%, 07/01/30 | | | 990,000 | | | | 1,231,198 | |
| | | | | | | | |
| | |
TOTAL HIGHER EDUCATION | | | | | | $ | 2,528,552 | |
| | |
HOUSING – 1.3% | | | | | | | | |
| | |
Amherst Development Corp., NY, Advance Refunding Revenue Bonds, (Series A), (UBF Faculty-Student Housing Corp.), (AGM), 5.00%, 10/01/32 | | | 1,660,000 | | | | 2,000,691 | |
| | |
New York City, NY, Housing Development Corp., Multi Family Revenue Bonds, (Sustainable Neighborhood Bonds), 1.75%, 05/01/59D | | | 2,500,000 | | | | 2,522,101 | |
| | | | | | | | |
| | |
TOTAL HOUSING | | | | | | $ | 4,522,792 | |
| | |
MEDICAL – 0.7% | | | | | | | | |
| | |
New York State Dormitory Authority, NY, Revenue Bonds, (Memorial Sloan-Kettering Cancer Center), (NATL), 5.50%, 07/01/23 | | | 2,230,000 | | | | 2,372,698 | |
| | |
TRANSPORTATION – 3.0% | | | | | | | | |
| | |
Metropolitan Transportation Authority, NY, Current Refunding Revenue Bonds, (Series F), 5.00%, 11/15/22 | | | 1,865,000 | | | | 1,999,961 | |
| | |
New York State Thruway Authority, NY, Refunding Revenue Bonds, Highway Revenue Tolls, (Series K), 5.00%, 01/01/30 | | | 3,000,000 | | | | 3,475,682 | |
| | |
Port Authority of New York & New Jersey, NY, Refunding Revenue Bonds, (207th Series), 5.00%, 09/15/31 | | | 2,500,000 | | | | 3,097,253 | |
| | |
Port Authority of New York & New Jersey, NY, Refunding Revenue Bonds, Port, Airport & Marina Improvements, (207th Series), 4.00%, 03/15/30 | | | 1,000,000 | | | | 1,175,765 | |
| | |
Port Authority of New York & New Jersey, NY, Revenue Bonds, (85th Series), 5.38%, 03/01/28 | | | 1,050,000 | | | | 1,239,422 | |
| | | | | | | | |
| | |
TOTAL TRANSPORTATION | | | | | | $ | 10,988,083 | |
ANNUAL REPORT / April 30, 2021
| | |
| 43 | | PORTFOLIOS OF INVESTMENTS Wilmington Municipal Bond Fund (continued) |
| | | | | | | | |
| | |
| Description | | Par Value | | | Value | |
| | |
WATER – 1.1% | | | | | | | | |
| | |
New York City Water & Sewer System, NY, Current Refunding Revenue Bonds, 2nd General Resolution, (Series EE), 5.00%, 06/15/31 | | $ | 3,000,000 | | | $ | 4,105,822 | |
| | | | | | | | |
| | |
TOTAL NEW YORK | | | | | | $ | 25,667,378 | |
| | |
NORTH CAROLINA – 2.0% | | | | | | | | |
| | |
MEDICAL – 0.1% | | | | | | | | |
| | |
Wake County, NC, Refunding Revenue Bonds, Hospital System, (NATL), Prerefunded/ETM, 5.13%, 10/01/26 | | | 185,000 | | | | 210,187 | |
| | |
POWER – 1.5% | | | | | | | | |
| | |
North Carolina Municipal Power Agency No. 1, NC, Current Refunding Revenue Bonds, (Series A), 5.00%, 01/01/32 | | | 4,250,000 | | | | 5,510,044 | |
| | |
TRANSPORTATION – 0.4% | | | | | | | | |
| | |
North Carolina Turnpike Authority, NC, Current Refunding Revenue Bonds, (Senior Lien), (AGM), 5.00%, 01/01/32 | | | 1,250,000 | | | | 1,593,543 | |
| | | | | | | | |
| | |
TOTAL NORTH CAROLINA | | | | | | $ | 7,313,774 | |
| | |
OHIO – 4.3% | | | | | | | | |
| | |
HIGHER EDUCATION – 0.3% | | | | | | | | |
| | |
Ohio Higher Educational Facility Commission, OH, Current Refunding Revenue Bonds, University & College Improvements, (University of Dayton 2020), 5.00%, 02/01/34 | | | 1,000,000 | | | | 1,278,307 | |
| | |
HOUSING – 1.2% | | | | | | | | |
| | |
Ohio Housing Finance Agency, OH, Revenue Bonds, (Series B), 4.50%, 03/01/50 | | | 3,715,000 | | | | 4,198,277 | |
| | |
MEDICAL – 1.5% | | | | | | | | |
| | |
Mahoning, County, OH, Hospital Improvement Revenue Bonds, (Western Reserve Care System Project), (NATL), Prerefunded/ETM, 5.50%, 10/15/25 | | | 70,000 | | | | 78,325 | |
| | |
Montgomery County, OH, Current Refunding Revenue Bonds, (Premier Health Partners Obligated Group), 5.00%, 11/15/28 | | | 3,035,000 | | | | 3,852,345 | |
| | |
Montgomery County, OH, Hospital Improvement Revenue Bonds, (Unrefunded - Catholic Health Initiatives), Prerefunded/ETM, 5.25%, 05/01/29 | | | 10,000 | | | | 11,152 | |
| | |
State of Ohio, OH, Refunding Revenue Bonds, 4.00%, 01/01/34 | | | 1,250,000 | | | | 1,467,636 | |
| | | | | | | | |
| | |
TOTAL MEDICAL | | | | | | $ | 5,409,458 | |
| | |
TRANSPORTATION – 0.6% | | | | | | | | |
| | |
Ohio Turnpike & Infrastructure Commission, OH, Refunding Revenue Bonds, (Series A), (NATL), 5.50%, 02/15/24 | | | 1,985,000 | | | | 2,172,570 | |
| | |
WATER – 0.7% | | | | | | | | |
| | |
Ohio Water Development Authority Water Pollution Control Loan Fund, OH, Lease Revenue Bonds, (Series A), 5.00%, 12/01/31 | | | 2,000,000 | | | | 2,677,085 | |
| | | | | | | | |
| | |
TOTAL OHIO | | | | | | $ | 15,735,697 | |
| | | | | | | | |
| | |
| Description | | Par Value | | | Value | |
| | |
OREGON – 0.4% | | | | | | | | |
| | |
GENERAL OBLIGATIONS – 0.4% | | | | | | | | |
| | |
Lane Community College, OR, GO Unlimited, AD Valorem Property Tax, (Series A), (SCH BD GTY), 5.00%, 06/15/30 | | $ | 1,000,000 | | | $ | 1,343,802 | |
| | | | | | | | |
| | |
TOTAL OREGON | | | | | | $ | 1,343,802 | |
| | |
PENNSYLVANIA – 6.2% | | | | | | | | |
| | |
AIRPORT – 0.5% | | | | | | | | |
| | |
Philadelphia Airport, PA, Refunding Revenue Bonds, (Series B), 5.00%, 07/01/30 | | | 1,500,000 | | | | 1,825,470 | |
| | |
DEVELOPMENT – 0.9% | | | | | | | | |
| | |
Pennsylvania Economic Development Financing Authority, PA, Revenue Bonds, (Waste Management Inc., Project), 1.75%, 08/01/38D | | | 3,000,000 | | | | 3,116,674 | |
| | |
FACILITIES – 0.3% | | | | | | | | |
| | |
Delaware Valley Regional Finance Authority, PA, Revenue Bonds, (Series C), 0.59%, 09/01/48D | | | 1,000,000 | | | | 999,126 | |
| | |
GENERAL OBLIGATIONS – 0.2% | | | | | | | | |
| | |
Bethlehem Authority, PA, Revenue Bonds, Public Improvements, (Guaranteed Lease Revenue Bonds), (Series A), (AGM), Prerefunded/ETM, 5.13%, 12/01/21 | | | 15,000 | | | | 15,056 | |
| | |
Commonwealth of Pennsylvania, PA, GO Unlimited, Current Refunding, AD Valorem Property Tax, (Series 1), 5.00%, 01/01/27 | | | 660,000 | | | | 819,824 | |
| | | | | | | | |
| | |
TOTAL GENERAL OBLIGATIONS | | | | | | $ | 834,880 | |
| | |
HIGHER EDUCATION – 0.3% | | | | | | | | |
| | |
Lackawanna County Industrial Development Authority, PA, Advance Refunding Revenue Bonds, (Scranton University), 5.00%, 11/01/30 | | | 1,000,000 | | | | 1,230,158 | |
| | |
MEDICAL – 0.5% | | | | | | | | |
| | |
Dauphin County General Authority, PA, Revenue Bonds, (HAPSCO Group, Inc., Tax Loan Program-Western PA Hospital Project), (Series A), (NATL), Prerefunded/ETM, 5.50%, 07/01/23 | | | 505,000 | | | | 535,091 | |
| | |
Pottsville Hospital Authority, PA, Current Refunding Revenue Bonds, (Schuylkill Health System Project), Prerefunded/ETM, 6.50%, 07/01/28 | | | 1,260,000 | | | | 1,487,434 | |
| | | | | | | | |
| | |
TOTAL MEDICAL | | | | | | $ | 2,022,525 | |
| | |
TOBACCO SETTLEMENT – 0.3% | | | | | | | | |
| | |
Commonwealth Financing Authority, PA, Revenue Bonds, (Tobacco Master Settlement Payment), 5.00%, 06/01/34 | | | 1,000,000 | | | | 1,227,901 | |
| | |
TRANSPORTATION – 0.7% | | | | | | | | |
| | |
Pennsylvania Turnpike Commission, PA, Advance Refunding Revenue Bonds, (2nd Series), Motor License Fund Enhanced, 5.00%, 12/01/32 | | | 2,000,000 | | | | 2,494,297 | |
| | |
UTILITIES – 0.4% | | | | | | | | |
| | |
Philadelphia Gas Works Co., PA, Revenue Bonds, (1998 General Ordinance), (15th Series), 5.00%, 08/01/26 | | | 1,100,000 | | | | 1,330,148 | |
April 30, 2021 / ANNUAL REPORT
| | |
PORTFOLIOS OF INVESTMENTS Wilmington Municipal Bond Fund (continued) | | 44 |
| | | | | | | | |
| | |
| Description | | Par Value | | | Value | |
| | |
WATER – 2.1% | | | | | | | | |
Philadelphia Water & Wastewater, PA, Advance Refunding Revenue Bonds, (Series B), 5.00%, 11/01/31 | | $ | 5,655,000 | | | $ | 7,097,378 | |
Pittsburgh Water & Sewer Authority, PA, Current Refunding Revenue Bonds, (Sub-Series B), (AGM), 5.00%, 09/01/33 | | | 340,000 | | | | 474,848 | |
| | | | | | | | |
| | |
TOTAL WATER | | | | | | $ | 7,572,226 | |
| | | | | | | | |
| | |
TOTAL PENNSYLVANIA | | | | | | $ | 22,653,405 | |
| | |
PUERTO RICO – 0.2% | | | | | | | | |
| | |
GENERAL – 0.2% | | | | | | | | |
Puerto Rico Public Finance Corp., PR, Refunding Revenue Bonds, (Commonwealth), (Series E), (AGC-ICC), Prerefunded/ETM, 6.00%, 08/01/26 | | | 510,000 | | | | 650,077 | |
| | | | | | | | |
| | |
TOTAL PUERTO RICO | | | | | | $ | 650,077 | |
| | |
RHODE ISLAND – 0.4% | | | | | | | | |
| | |
STUDENT LOAN – 0.4% | | | | | | | | |
Rhode Island Student Loan Authority, RI, Revenue Bonds, (Series A), 5.00%, 12/01/23 | | | 1,200,000 | | | | 1,333,921 | |
| | | | | | | | |
| | |
TOTAL RHODE ISLAND | | | | | | $ | 1,333,921 | |
| | |
SOUTH CAROLINA – 1.7% | | | | | | | | |
| | |
HOUSING – 0.4% | | | | | | | | |
South Carolina State Housing Finance & Development Authority, SC, Revenue Bonds, (Series B-2), 4.00%, 07/01/43 | | | 1,170,000 | | | | 1,248,621 | |
| | |
TOBACCO SETTLEMENT – 1.3% | | | | | | | | |
Tobacco Settlement Revenue Management Authority, SC, Revenue Bonds, (Series B), Prerefunded/ETM, 6.38%, 05/15/30 | | | 3,405,000 | | | | 4,776,562 | |
| | | | | | | | |
| | |
TOTAL SOUTH CAROLINA | | | | | | $ | 6,025,183 | |
| | |
SOUTH DAKOTA – 0.6% | | | | | | | | |
| | |
HOUSING – 0.6% | | | | | | | | |
South Dakota Housing Development Authority, SD, Single Family Refunding Revenue Bonds, (Series A), 3.75%, 11/01/50 | | | 1,920,000 | | | | 2,137,561 | |
| | | | | | | | |
| | |
TOTAL SOUTH DAKOTA | | | | | | $ | 2,137,561 | |
| | |
TENNESSEE – 0.1% | | | | | | | | |
| | |
MEDICAL – 0.1% | | | | | | | | |
Metropolitan Govt. Nashville & Davidson County Health & Educational Facility Board, TN, Refunding Revenue Bonds, (Series A), (NATL), 4.88%, 11/01/28 | | | 255,000 | | | | 298,715 | |
| | | | | | | | |
| | |
TOTAL TENNESSEE | | | | | | $ | 298,715 | |
| | |
TEXAS – 9.6% | | | | | | | | |
| | |
AIRPORT – 0.3% | | | | | | | | |
Dallas Fort Worth International Airport, TX, Current Refunding Revenue Bonds, Port, Airport & Marina Improvements, (Series A), 4.00%, 11/01/35 | | | 1,000,000 | | | | 1,221,694 | |
| | | | | | | | |
| | |
| Description | | Par Value | | | Value | |
| | |
EDUCATION – 1.0% | | | | | | | | |
Clifton Higher Education Finance Corp., TX, Revenue Bonds, (Idea Public Schools) | | | | | | | | |
5.00%, 08/15/27 | | $ | 1,000,000 | | | $ | 1,261,336 | |
5.00%, 08/15/29 | | | 1,000,000 | | | | 1,281,419 | |
5.00%, 08/15/31 | | | 835,000 | | | | 980,983 | |
| | | | | | | | |
| | |
TOTAL EDUCATION | | | | | | $ | 3,523,738 | |
| | |
GENERAL OBLIGATIONS – 2.5% | | | | | | | | |
Collin County Community College District, TX, GO Limited, AD Valorem Property Tax, (Series A) | | | | | | | | |
5.00%, 08/15/27 | | | 1,000,000 | | | | 1,266,251 | |
5.00%, 08/15/33 | | | 2,000,000 | | | | 2,617,930 | |
El Paso, TX, GO Limited, AD Valorem Property Tax, 4.00%, 08/15/33 | | | 2,300,000 | | | | 2,661,862 | |
State of Texas, TX, GO Unlimited, (College Student Loan), (Series A), 4.50%, 08/01/29 | | | 2,125,000 | | | | 2,685,109 | |
| | | | | | | | |
| | |
TOTAL GENERAL OBLIGATIONS | | | | | | $ | 9,231,152 | |
| | |
HOUSING – 0.8% | | | | | | | | |
Texas Department of Housing & Community Affairs, TX, Revenue Bonds, (Series A), 4.00%, 03/01/50 | | | 2,605,000 | | | | 2,959,698 | |
| | |
MEDICAL – 0.6% | | | | | | | | |
North Central Texas Health Facility Development Corp., TX, Refunding Revenue Bonds, (Presbyterian Healthcare System), (Series B), (NATL), Prerefunded/ETM, 5.50%, 06/01/21 | | | 25,000 | | | | 25,099 | |
Tarrant County Cultural Education Facilities Finance Corp., TX, Revenue Bonds, Health, Hospital, Nursing Home Revenue (Christus Health), (Series B), 5.00%, 07/01/32 | | | 1,465,000 | | | | 1,846,336 | |
Tarrant County Health Facilities Development Corp., TX, Revenue Bonds, (Harris Methodist Health System), (AMBAC-TCRS), Prerefunded/ETM, 6.00%, 09/01/24 | | | 85,000 | | | | 94,039 | |
Tarrant County Health Facilities Development Corp., TX, Revenue Bonds, (Harris Methodist Health System), (FGIC-TCRS), Prerefunded/ETM, 6.00%, 09/01/24 | | | 90,000 | | | | 99,570 | |
Tarrant County Health Facilities Development Corp., TX, Revenue Bonds, (Harris Methodist Health System), (NATL-IBC), Prerefunded/ETM, 6.00%, 09/01/24 | | | 60,000 | | | | 66,380 | |
| | | | | | | | |
| | |
TOTAL MEDICAL | | | | | | $ | 2,131,424 | |
| | |
SCHOOL DISTRICT – 1.4% | | | | | | | | |
Beaumont Independent School District, TX, GO Unlimited Current Refunding, AD Valorem Property Tax, 4.00%, 02/15/31 | | | 1,000,000 | | | | 1,160,005 | |
Fort Worth Independent School District, TX, GO Unlimited, Advance Refunding, AD Valorem Property Tax, 5.00%, 02/15/24 | | | 350,000 | | | | 396,441 | |
Lewisville Independent School District, TX, GO Unlimited, AD Valorem Property Tax, 4.00%, 08/15/34 | | | 3,000,000 | | | | 3,634,510 | |
| | | | | | | | |
| | |
TOTAL SCHOOL DISTRICT | | | | | | $ | 5,190,956 | |
ANNUAL REPORT / April 30, 2021
| | |
| 45 | | PORTFOLIOS OF INVESTMENTS Wilmington Municipal Bond Fund (continued) |
| | | | | | | | |
| | |
| Description | | Par Value | | | Value | |
| | |
TRANSPORTATION – 1.5% | | | | | | | | |
Central Texas Regional Mobility Authority, TX, Highways Improvement Revenue Bonds, (Senior Lien), 5.00%, 01/01/33 | | $ | 1,470,000 | | | $ | 1,800,256 | |
Central Texas Regional Mobility Authority, TX, Highways Improvement Revenue Bonds, (Series F), 5.00%, 01/01/25 | | | 1,000,000 | | | | 1,140,815 | |
Central Texas Turnpike System, TX, Revenue Bonds, (Series C), 5.00%, 08/15/32 | | | 1,225,000 | | | | 1,380,222 | |
Texas Transportation Commission State Highway Fund, TX, Refunding Revenue Bonds, (Series A), 5.00%, 04/01/22 | | | 915,000 | | | | 956,040 | |
| | | | | | | | |
| | |
TOTAL TRANSPORTATION | | | | | | $ | 5,277,333 | |
| | |
UTILITIES – 1.5% | | | | | | | | |
Austin, TX, Refunding Revenue Bonds, (BHAC-CR NATL-RE), 5.25%, 05/15/25 | | | 5,000,000 | | | | 5,456,846 | |
| | | | | | | | |
| | |
TOTAL TEXAS | | | | | | $ | 34,992,841 | |
| | |
UTAH – 4.3% | | | | | | | | |
| | |
AIRPORT – 1.9% | | | | | | | | |
Salt Lake City Corp., UT, Revenue Bonds, (Series A) | | | | | | | | |
5.00%, 07/01/32 | | | 3,000,000 | | | | 3,718,582 | |
5.00%, 07/01/33 | | | 2,500,000 | | | | 3,089,407 | |
| | | | | | | | |
| | |
TOTAL AIRPORT | | | | | | $ | 6,807,989 | |
| | |
GENERAL OBLIGATIONS – 0.3% | | | | | | | | |
State of Utah, UT, GO Unlimited, 5.00%, 07/01/26 | | | 1,000,000 | | | | 1,231,541 | |
| | |
MEDICAL – 2.1% | | | | | | | | |
Salt Lake County, UT, Revenue Bonds, (IHC Health Services), (AMBAC), Prerefunded/ETM | | | | | | | | |
5.40%, 02/15/28 | | | 2,500,000 | | | | 2,902,954 | |
5.13%, 02/15/33 | | | 4,110,000 | | | | 4,735,091 | |
| | | | | | | | |
| | |
TOTAL MEDICAL | | | | | | $ | 7,638,045 | |
| | | | | | | | |
| | |
TOTAL UTAH | | | | | | $ | 15,677,575 | |
| | |
WASHINGTON – 3.5% | | | | | | | | |
| | |
GENERAL – 1.2% | | | | | | | | |
Central Puget Sound Regional Transit Authority, WA, Revenue Bonds, (NATL), 4.75%, 02/01/28 | | | 3,885,000 | | | | 4,327,021 | |
| | | | | | | | |
| | |
| Description | | Par Value | | | Value | |
| | |
MEDICAL – 0.6% | | | | | | | | |
Washington Health Care Facilities Authority, WA, Advance Refunding Revenue Bonds, Overlake Hospital Medical Center, 5.00%, 07/01/33 | | $ | 1,750,000 | | | $ | 2,136,427 | |
| | |
SCHOOL DISTRICT – 1.3% | | | | | | | | |
Clark County School District No 114 Evergreen, WA, GO Unlimited, AD Valorem Property Tax, (SCH BD GTY), 4.00%, 12/01/33 | | | 3,000,000 | | | | 3,714,038 | |
King County School District No. 414 Lake Washington, WA, GO Limited, AD Valorem Property Tax, 4.00%, 12/01/23 | | | 1,000,000 | | | | 1,097,708 | |
| | | | | | | | |
| | |
TOTAL SCHOOL DISTRICT | | | | | | $ | 4,811,746 | |
| | |
WATER – 0.4% | | | | | | | | |
King County, Sewer, WA, Advance Refunding Revenue Bonds, 5.00%, 07/01/32 | | | 1,100,000 | | | | 1,358,212 | |
| | | | | | | | |
| | |
TOTAL WASHINGTON | | | | | | $ | 12,633,406 | |
| | |
WISCONSIN – 0.1% | | | | | | | | |
| | |
MEDICAL – 0.1% | | | | | | | | |
Wisconsin Health & Educational Facilities Authority, WI, Current Refunding Revenue Bonds, (Aurora Health Care, Inc.), (Series A), Prerefunded/ETM, 5.13%, 04/15/31 | | | 500,000 | | | | 547,112 | |
| | | | | | | | |
| | |
TOTAL WISCONSIN | | | | | | $ | 547,112 | |
| | | | | | | | |
| | |
TOTAL MUNICIPAL BONDS (Cost $343,686,562) | | | | | | $ | 358,041,117 | |
| | | | | | | | |
| | |
| | | Number of
Shares | | | | |
| | |
MONEY MARKET FUND – 0.9% | | | | | | | | |
Dreyfus Government Cash Management Fund, Institutional Shares, 0.03%^ | | | 3,124,744 | | | | 3,124,744 | |
| | | | | | | | |
| | |
TOTAL MONEY MARKET FUND (Cost $3,124,744) | | | | | | $ | 3,124,744 | |
| | | | | | | | |
| | |
TOTAL INVESTMENTS – 99.6% (Cost $346,811,306) | | | | | | $ | 361,165,861 | |
| | |
OTHER ASSETS LESS LIABILITIES – 0.4% | | | | | | | 1,501,925 | |
| | | | | | | | |
| | |
TOTAL NET ASSETS – 100.0% | | | | | | $ | 362,667,786 | |
| | | | | | | | |
Various inputs are used in determining the value of the Fund’s investments. These inputs are summarized in the three broad levels listed below.
Level 1 – quoted prices in active markets for identical securities
Level 2 – other significant observable inputs (including quoted prices for similar securities, interest rates, prepayment speeds, credit risk, etc.)
Level 3 – significant unobservable inputs (including the Fund’s own assumptions in determining the fair value of investments)
The following is a summary of the inputs used as of April 30, 2021 in valuing the Fund’s assets carried at fair value:
| | | | | | | | | | | | | | | | |
| | | | |
| | | Level 1 | | | Level 2 | | | Level 3 | | | Total | |
| | | | |
Investments in Securities | | | | | | | | | | | | | | | | |
Municipal Bonds | | $ | — | | | $ | 358,041,117 | | | | $— | | | $ | 358,041,117 | |
Money Market Fund | | | 3,124,744 | | | | — | | | | — | | | | 3,124,744 | |
| | | | | | | | | | | | | | | | |
| | | | |
Total | | $ | 3,124,744 | | | $ | 358,041,117 | | | | $— | | | $ | 361,165,861 | |
| | | | | | | | | | | | | | | | |
April 30, 2021 / ANNUAL REPORT
| | |
PORTFOLIOS OF INVESTMENTS Wilmington Municipal Bond Fund (concluded) | | 46 |
| ** | Represents less than 0.05%. |
| D | Variable rate security. The rate disclosed is the rate in effect on the report date. The information in parenthesis represents the benchmark and reference rate for each relevant security and the rate floats based upon the reference rate and spread. The security may be further subject to interest rate floor and caps. Certain variable rate securities are not based on a published reference rate and spread, but are determined by the issuer or agent and are based on current market conditions. These securities do not indicate a reference rate and spread in their descriptions. |
The following acronyms are used throughout this Fund:
| | |
| AGC | | Assured Guaranty Corporation |
| AGM | | Assured Guaranty Municipal |
| AMBAC | | American Municipal Bond Assurance Corporation |
| BAM | | Build America Mutual Assurance Company |
| BHAC | | Berkshire Hathaway Assurance Corporation |
| CR | | Custodial Receipts |
| ETM | | Escrowed to Maturity |
| FGIC | | Financial Guaranty Insurance Corporation |
| GO | | General Obligation |
| IBC | | International Bancshares Corporation |
| ICC | | Insured Custody Certificates |
| LLC | | Limited Liability Corporation |
| NATL | | National Public Finance Guarantee Corporation |
| RE | | Reinsurance |
| SCH BD GTY | | School Bond Guaranty |
| TCRS | | Tax Credit Reporting Service |
See Notes which are an integral part of the Financial Statements
ANNUAL REPORT / April 30, 2021
PORTFOLIO OF INVESTMENTS SUMMARY TABLE
Wilmington New York Municipal Bond Fund
At April 30, 2021, the Fund’s portfolio composition was as follows (unaudited):
| | | | | | |
| | | Percentage of Total Net Assets |
Higher Education | | | 23.1 | % | | |
Dedicated Tax | | | 16.1 | % | | |
Housing | | | 13.6 | % | | |
General Obligations | | | 9.4 | % | | |
Medical | | | 7.3 | % | | |
Transportation | | | 7.0 | % | | |
Airport | | | 5.2 | % | | |
Power | | | 3.2 | % | | |
Lease | | | 2.6 | % | | |
Development | | | 2.2 | % | | |
Student Housing | | | 1.8 | % | | |
Water | | | 1.5 | % | | |
Utilities | | | 1.5 | % | | |
Facilities | | | 0.2 | % | | |
Cash Equivalents(1) | | | 4.3 | % | | |
Other Assets and Liabilities - Net(2) | | | 1.0 | % | | |
| | | | | | |
TOTAL | | | 100.0 | % | | |
| | | | | | |
| | | | | | |
| Credit Quality Diversification(3) | | Percentage of Total Net Assets |
AAA / Aaa | | | 0.2 | % | | |
AA / Aa | | | 44.7 | % | | |
A/ A | | | 33.8 | % | | |
BBB / Baa | | | 16.0 | % | | |
Not Rated | | | 4.3 | % | | |
Other Assets and Liabilities - Net(2) | | | 1.0 | % | | |
| | | | | | |
TOTAL | | | 100.0 | % | | |
| | | | | | |
| (1) | Cash Equivalents include investments in a money market fund. |
| (2) | Assets, other than investments in securities, less liabilities. See Statements of Assets and Liabilities. |
| (3) | For financial reporting purposes, the Credit Quality Diversification table reflects the lowest rating assigned by either Moody’s Investors Service or Standard and Poor’s if the ratings differ. These rating agencies are independent, nationally recognized statistical rating organizations and are widely used. Investment grade ratings are credit ratings of BBB/Baa or higher. Below investment grade ratings are credit ratings of BB/Ba or lower. Investments designated as “Not Rated” are not rated by either rating agency and do not necessarily indicate low credit quality. Credit quality ratings are subject to change. |
PORTFOLIO OF INVESTMENTS
April 30, 2021
| | | | | | | | |
| | |
| Description | | Par Value | | | Value | |
| | |
MUNICIPAL BONDS – 94.7% | | | | | | | | |
| | |
NEW YORK – 94.7% | | | | | | | | |
| | |
AIRPORT – 5.2% | | | | | | | | |
Port Authority of New York & New Jersey, NY, Current Refunding Revenue Bonds, Port, Airport & Marina Improvements, (205th Series), 5.00%, 11/15/32 | | $ | 1,000,000 | | | $ | 1,247,833 | |
Port Authority of New York & New Jersey, NY, Current Refunding Revenue Bonds, Port, Airport & Marina Improvements, (207th Series), 5.00%, 09/15/23 | | | 2,000,000 | | | | 2,221,394 | |
| | | | | | | | |
| | |
TOTAL AIRPORT | | | | | | $ | 3,469,227 | |
| | |
DEDICATED TAX – 16.1% | | | | | | | | |
Hudson Yards Infrastructure Corp., NY, Current Refunding Revenue Bonds, (Series A), 5.00%, 02/15/33 | | | 1,175,000 | | | | 1,422,557 | |
New York City, NY, Transitional Finance Authority Future Tax Secured Revenue, Revenue Bonds, Public Improvements, (Sub-Series A-1), 5.00%, 05/01/34 | | | 1,300,000 | | | | 1,565,762 | |
| | | | | | | | |
| | |
| Description | | Par Value | | | Value | |
| | |
New York City, NY, Transitional Finance Authority Future Tax Secured Revenue, Revenue Bonds, Public Improvements, (Sub-Series C-1), 5.00%, 11/01/25 | | $ | 500,000 | | | $ | 601,123 | |
New York State Dormitory Authority, NY, Advance Refunding Revenue Bonds, (Series D), 5.00%, 02/15/27 | | | 945,000 | | | | 1,158,651 | |
New York State Dormitory Authority, NY, Revenue Bonds, Public Improvements, (Series A), 5.00%, 03/15/32 | | | 2,000,000 | | | | 2,443,749 | |
New York State Dormitory Authority, NY, Revenue Bonds, University & College Improvements, (Series A), 4.00%, 03/15/37 | | | 1,000,000 | | | | 1,193,012 | |
New York State Urban Development Corp., NY, Advance Refunding Revenue Bonds, (Series A), 5.00%, 03/15/25 | | | 540,000 | | | | 635,580 | |
Sales Tax Asset Receivable Corp., NY, Current Refunding Revenue Bonds, (Series A), 5.00%, 10/15/31 | | | 1,500,000 | | | | 1,731,822 | |
| | | | | | | | |
| | |
TOTAL DEDICATED TAX | | | | | | $ | 10,752,256 | |
April 30, 2021 / ANNUAL REPORT
| | |
PORTFOLIOS OF INVESTMENTS Wilmington New York Municipal Bond Fund (continued) | | 48 |
| | | | | | | | |
| | |
| Description | | Par Value | | | Value | |
| | |
DEVELOPMENT – 2.2% | | | | | | | | |
New York Liberty Development Corp., NY, Refunding Revenue Bonds, Goldman Sachs Headquarters, 5.25%, 10/01/35 | | $ | 1,045,000 | | | $ | 1,490,354 | |
| | |
FACILITIES – 0.2% | | | | | | | | |
United Nations Development Corp., NY, Revenue Bonds, Public Improvements, Prerefunded/ETM , 5.90%, 05/01/23 | | | 115,000 | | | | 121,387 | |
| | |
GENERAL OBLIGATIONS – 9.4% | | | | | | | | |
Nassau County, NY, GO, General Improvements, AD Valorem Property Tax, (Series C), (BAM), 5.00%, 10/01/31 | | | 545,000 | | | | 677,826 | |
Nassau County, NY, GO, Public Improvements, AD Valorem Property Tax, (Series C), (BAM), 5.00%, 04/01/26 | | | 1,000,000 | | | | 1,217,193 | |
Nassau County, NY, GO, Public Improvements, AD Valorem Property Tax, (Series B), (BAM), 5.00%, 04/01/32 | | | 415,000 | | | | 508,381 | |
New York, NY, GO Unlimited, (Series A-1), 5.00%, 08/01/31 | | | 1,000,000 | | | | 1,322,383 | |
Yonkers, NY, GO, Refunding Notes, AD Valorem Property Tax, (Series A), (BAM) | | | | | | | | |
5.00%, 05/01/26 | | | 1,000,000 | | | | 1,212,074 | |
5.00%, 05/01/30 | | | 1,000,000 | | | | 1,304,198 | |
| | | | | | | | |
| | |
TOTAL GENERAL OBLIGATIONS | | | | | | $ | 6,242,055 | |
| | |
HIGHER EDUCATION – 23.1% | | | | | | | | |
City of Albany Capital Resource Corp., NY, Refunding Revenue Bonds, Albany Law School of Union University Project | | | | | | | | |
4.00%, 07/01/23 | | | 725,000 | | | | 772,444 | |
4.00%, 07/01/25 | | | 865,000 | | | | 961,462 | |
4.00%, 07/01/26 | | | 800,000 | | | | 903,431 | |
5.00%, 07/01/29 | | | 1,195,000 | | | | 1,426,154 | |
Dutchess County Local Development Corp., NY, Current Refunding Revenue Bonds, The Culinary Institute of America, 5.00%, 07/01/32 | | | 1,040,000 | | | | 1,238,456 | |
New York City Trust for Cultural Resources, NY, Current Refunding Revenue Bonds, The Juilliard School, (Series A), 5.00%, 01/01/33 | | | 1,025,000 | | | | 1,311,059 | |
New York State Dormitory Authority, NY, Advance Refunding Revenue Bonds, St. John’s University, (Series A) , 5.00%, 07/01/30 | | | 800,000 | | | | 976,761 | |
New York State Dormitory Authority, NY, Current Refunding Revenue Bonds, Brooklyn Law School, (Series A), 5.00%, 07/01/33 | | | 1,200,000 | | | | 1,489,893 | |
New York State Dormitory Authority, NY, Refunding Revenue Bonds, (NATL-IBC), 5.25%, 05/15/21 | | | 5,000 | | | | 5,008 | |
New York State Dormitory Authority, NY, Refunding Revenue Bonds, School Districts Financing Program, School Improvements, (Series A), (AGM), 5.00%, 10/01/29 | | | 1,000,000 | | | | 1,287,432 | |
New York State Dormitory Authority, NY, Refunding Revenue Notes, 3rd General Resolution, (Series E), 5.00%, 05/15/27 | | | 1,740,000 | | | | 1,826,293 | |
| | | | | | | | |
| | |
| Description | | Par Value | | | Value | |
| | |
New York State Dormitory Authority, NY, Revenue Bonds, University & College Improvements, (Series A), (NATL), 5.75%, 07/01/27 | | $ | 2,725,000 | | | $ | 3,196,623 | |
| | | | | | | | |
| | |
TOTAL HIGHER EDUCATION | | | | | | $ | 15,395,016 | |
| | |
HOUSING – 13.6% | | | | | | | | |
New York City, NY, Housing Development Corp., Revenue Bonds, (Series C-1A), 3.50%, 11/01/33 | | | 2,000,000 | | | | 2,181,869 | |
New York City, NY, Housing Development Corp., Revenue Bonds, Sustainable Neighborhood Bonds | | | | | | | | |
2.45%, 05/01/31 | | | 500,000 | | | | 520,813 | |
3.10%, 11/01/34 | | | 890,000 | | | | 952,520 | |
New York State Housing Finance Agency, NY, Multi Family Revenue Bonds, Climate Bond Certified/Sustainability Bonds (Series P), 1.60%, 11/01/24 | | | 1,000,000 | | | | 1,007,116 | |
New York State Mortgage Agency, NY, Current Refunding Revenue Bonds, (221th Series), 3.50%, 10/01/32 | | | 1,855,000 | | | | 2,024,838 | |
New York State Mortgage Agency, NY, Single Family Revenue Bonds, (223th Series), 3.50%, 04/01/49 | | | 1,180,000 | | | | 1,271,799 | |
New York State Mortgage Agency, NY, Single Family Revenue Bonds, (226th Series), 3.50%, 10/01/50 | | | 980,000 | | | | 1,071,447 | |
| | | | | | | | |
| | |
TOTAL HOUSING | | | | | | $ | 9,030,402 | |
| | |
LEASE – 2.6% | | | | | | | | |
Syracuse, NY, IDA, Revenue Bonds, Syracuse City School District Project, School Improvements, (Series B), (State Aid Withholding), 5.00%, 05/01/32 | | | 1,435,000 | | | | 1,735,400 | |
| | |
MEDICAL – 7.3% | | | | | | | | |
New York State Dormitory Authority, NY, Advance Refunding Revenue Bonds, Health, Hospital, Nursing Home Revenue (NYU Hospitals Center), 5.00%, 07/01/27 | | | 2,000,000 | | | | 2,252,822 | |
New York State Dormitory Authority, NY, Current Refunding Revenue Bonds, Health, Hospital, Nursing Home Revenue (Montefiore Obligated Group), (Series A), 5.00%, 09/01/29 | | | 1,000,000 | | | | 1,281,964 | |
New York State Dormitory Authority, NY, Current Refunding Revenue Bonds, Health, Hospital, Nursing Home Revenue (North Shore-Long Island Jewish Obligated Group), (Series A), 5.00%, 05/01/24 | | | 1,160,000 | | | | 1,317,099 | |
| | | | | | | | |
| | |
TOTAL MEDICAL | | | | | | $ | 4,851,885 | |
| | |
POWER – 3.2% | | | | | | | | |
Long Island Power Authority, NY, Electric, Light and Power Improvements, Revenue Bonds, (Series A), 5.00%, 09/01/33 | | | 700,000 | | | | 931,827 | |
Long Island Power Authority, NY, Electric, Light and Power Improvements, Revenue Bonds, (Series B), 5.00%, 09/01/25 | | | 1,000,000 | | | | 1,196,163 | |
| | | | | | | | |
| | |
TOTAL POWER | | | | | | $ | 2,127,990 | |
ANNUAL REPORT / April 30, 2021
| | |
| 49 | | PORTFOLIOS OF INVESTMENTS Wilmington New York Municipal Bond Fund (concluded) |
| | | | | | | | |
| | |
| Description | | Par Value | | | Value | |
| | |
STUDENT HOUSING – 1.8% | | | | | | | | |
| | |
Amherst Development Corp., NY, Advance Refunding Revenue Bonds, UBF Facility Student Housing Corp., (AGM), 5.00%, 10/01/31 | | $ | 1,000,000 | | | $ | 1,210,594 | |
| | |
TRANSPORTATION – 7.0% | | | | | | | | |
| | |
Metropolitan Transportation Authority, NY, Revenue Bonds, (Series D-1), 5.00%, 09/01/22 | | | 1,500,000 | | | | 1,593,561 | |
| | |
Metropolitan Transportation Authority, NY, Revenue Green Bonds, (Series C-1), 5.00%, 11/15/24 | | | 1,000,000 | | | | 1,161,120 | |
| | |
New York State Thruway Authority, NY, Refunding Revenue Bonds, Highway Revenue Tolls, (Series K) | | | | | | | | |
| | |
5.00%, 01/01/29 | | | 105,000 | | | | 121,690 | |
| | |
5.00%, 01/01/30 | | | 700,000 | | | | 810,993 | |
| | |
Triborough Bridge & Tunnel Authority, NY, Advance Refunding Revenue Bonds, Highway Revenue Tools, (Series A), 5.00%, 11/15/26 | | | 650,000 | | | | 793,405 | |
| | |
Triborough Bridge & Tunnel Authority, NY, Current Refunding Revenue Bonds, Highway Revenue Tools, (Series B), 5.00%, 11/15/29 | | | 200,000 | | | | 214,505 | |
| | | | | | | | |
| | |
TOTAL TRANSPORTATION | | | | | | $ | 4,695,274 | |
| | |
UTILITIES –1.5% | | | | | | | | |
| | |
Long Island Power Authority, NY, Electric, Light and Power Improvements, Revenue Bonds, (Series A), 5.00%, 09/01/34 | | | 750,000 | | | | 993,813 | |
| | | | | | | | |
| | |
| Description | | Par Value | | | Value | |
| | |
WATER – 1.5% | | | | | | | | |
| | |
New York City Water & Sewer System, NY, Current Refunding Revenue Bonds, 2nd General Resolution, (Series EE), 5.00%, 06/15/31 | | $ | 750,000 | | | $ | 1,026,455 | |
| | | | | | | | |
| | |
TOTAL NEW YORK | | | | | | $ | 63,142,108 | |
| | | | | | | | |
| | |
TOTAL MUNICIPAL BONDS
(Cost $60,512,880) | | | | | | $ | 63,142,108 | |
| | |
| | | Number of
Shares | | | | |
| | |
MONEY MARKET FUND – 4.3% | | | | | | | | |
| | |
Dreyfus Government Cash Management Fund, Institutional Shares, 0.03%^ | | | 2,873,821 | | | | 2,873,821 | |
| | | | | | | | |
| | |
TOTAL MONEY MARKET FUND
(Cost $2,873,821) | | | | | | $ | 2,873,821 | |
| | | | | | | | |
| | |
TOTAL INVESTMENTS – 99.0%
(Cost $63,386,701) | | | | | | $ | 66,015,929 | |
| | |
| OTHER ASSETS LESS LIABILITIES – 1.0% | | | | | | | 660,324 | |
| | | | | | | | |
| | |
| TOTAL NET ASSETS – 100.0% | | | | | | $ | 66,676,253 | |
| | | | | | | | |
Various inputs are used in determining the value of the Fund’s investments. These inputs are summarized in the three broad levels listed below.
Level 1 – quoted prices in active markets for identical securities
Level 2 – other significant observable inputs (including quoted prices for similar securities, interest rates, prepayment speeds, credit risk, etc.)
Level 3 – significant unobservable inputs (including the Fund’s own assumptions in determining the fair value of investments)
The following is a summary of the inputs used as of April 30, 2021 in valuing the Fund’s assets carried at fair value:
| | | | | | | | | | | | | | | | |
| | | | |
| | | Level 1 | | | Level 2 | | | Level 3 | | | Total | |
| | | | |
Investments in Securities | | | | | | | | | | | | | | | | |
| | | | |
Municipal Bonds | | $ | — | | | $ | 63,142,108 | | | | $— | | | $ | 63,142,108 | |
| | | | |
Money Market Fund | | | 2,873,821 | | | | — | | | | — | | | | 2,873,821 | |
| | | | | | | | | | | | | | | | |
| | | | |
Total | | $ | 2,873,821 | | | $ | 63,142,108 | | | | $— | | | $ | 66,015,929 | |
| | | | | | | | | | | | | | | | |
The following acronyms are used throughout this Fund:
| | |
| AGM | | Assured Guaranty Municipal |
| |
| BAM | | Build America Mutual Assurance Company |
| |
| ETM | | Escrowed to Maturity |
| |
| GO | | General Obligation |
| |
| IBC | | International Bancshares Corporation |
| |
| IDA | | Industrial Development Authority/Agency |
| |
| NATL | | Public Finance Guarantee Corporation |
See Notes which are an integral part of the Financial Statements
April 30, 2021 / ANNUAL REPORT
| | |
| STATEMENTS OF ASSETS AND LIABILITIES | | 50 |
| | | | | | | | | | | | | | | | | | | | | | |
| | | | | | |
April 30, 2021 | | | | Wilmington Broad Market Bond Fund | | | | | | Wilmington Intermediate-Term Bond Fund | | | | | | Wilmington Short-Term Bond Fund | |
| | | | | | |
ASSETS: | | | | | | | | | | | | | | | | | | | | | | |
Investments, at identified cost | | | | $ | 638,935,364 | | | | | | | $ | 44,740,852 | | | | | | | $ | 46,650,307 | |
| | | | | | | | | | | | | | | | | | | | | | |
Investments in securities, at value | | | | $ | 663,689,427 | (a) | | | | | | $ | 46,198,364 | (a) | | | | | | $ | 47,171,277 | (a) |
Cash | | | | | 18 | | | | | | | | — | | | | | | | | — | |
Income receivable | | | | | 3,450,603 | | | | | | | | 257,886 | | | | | | | | 250,651 | |
Foreign tax reclaim receivable | | | | | 12,712 | | | | | | | | 1,749 | | | | | | | | 1,453 | |
Due from advisor | | | | | — | | | | | | | | 2,636 | | | | | | | | 1,712 | |
Receivable for shares sold | | | | | 1,000,570 | | | | | | | | 108 | | | | | | | | 40,175 | |
Receivable for investments sold | | | | | 4,037,354 | | | | | | | | — | | | | | | | | — | |
Prepaid assets | | | | | 23,395 | | | | | | | | 19,972 | | | | | | | | 18,971 | |
| | | | | | | | | | | | | | | | | | | | | | |
TOTAL ASSETS | | | | | 672,214,079 | | | | | | | | 46,480,715 | | | | | | | | 47,484,239 | |
| | | | | | | | | | | | | | | | | | | | | | |
LIABILITIES: | | | | | | | | | | | | | | | | | | | | | | |
Payable for investments purchased | | | | | 8,034,306 | | | | | | | | — | | | | | | | | — | |
Collateral for securities on loan | | | | | 37,486,040 | | | | | | | | 2,246,163 | | | | | | | | 4,239,961 | |
Income distribution payable | | | | | 507,172 | | | | | | | | 31,526 | | | | | | | | 5,542 | |
Payable for shares redeemed | | | | | 81,834 | | | | | | | | 130,800 | | | | | | | | 29,751 | |
Payable for Trustees’ fees | | | | | 9,264 | | | | | | | | 9,250 | | | | | | | | 9,262 | |
Payable for administration fees | | | | | 15,368 | | | | | | | | 1,097 | | | | | | | | 1,069 | |
Payable for distribution services fees | | | | | 460 | | | | | | | | 222 | | | | | | | | 776 | |
Payable for shareholder services fees | | | | | 184 | | | | | | | | 89 | | | | | | | | — | |
Payable for investment advisory fees | | | | | 171,518 | | | | | | | | — | | | | | | | | — | |
Other accrued expenses | | | | | 118,026 | | | | | | | | 63,662 | | | | | | | | 60,352 | |
| | | | | | | | | | | | | | | | | | | | | | |
TOTAL LIABILITIES | | | | | 46,424,172 | | | | | | | | 2,482,809 | | | | | | | | 4,346,713 | |
| | | | | | | | | | | | | | | | | | | | | | |
NET ASSETS | | | | $ | 625,789,907 | | | | | | | $ | 43,997,906 | | | | | | | $ | 43,137,526 | |
| | | | | | | | | | | | | | | | | | | | | | |
NET ASSETS CONSIST OF: | | | | | | | | | | | | | | | | | | | | | | |
Paid-in capital | | | | $ | 602,382,473 | | | | | | | $ | 42,063,918 | | | | | | | $ | 43,322,300 | |
Distributable earnings (loss) | | | | | 23,407,434 | | | | | | | | 1,933,988 | | | | | | | | (184,774 | ) |
| | | | | | | | | | | | | | | | | | | | | | |
TOTAL NET ASSETS | | | | $ | 625,789,907 | | | | | | | $ | 43,997,906 | | | | | | | $ | 43,137,526 | |
| | | | | | | | | | | | | | | | | | | | | | |
COMPUTATION OF NET ASSET VALUE AND OFFERING PRICE: | | | | | | | | | | | | | | | | | | | | | | |
Class A | | | | | | | | | | | | | | | | | | | | | | |
Net Assets | | | | $ | 2,233,938 | | | | | | | $ | 1,077,224 | | | | | | | $ | 3,773,502 | |
| | | | | | | | | | | | | | | | | | | | | | |
Shares outstanding (unlimited shares authorized) | | | | | 217,852 | | | | | | | | 107,151 | | | | | | | | 370,957 | |
| | | | | | | | | | | | | | | | | | | | | | |
Net Asset Value per share | | | | $ | 10.25 | | | | | | | $ | 10.05 | | | | | | | $ | 10.17 | |
| | | | | | | | | | | | | | | | | | | | | | |
Offering Price per share* | | | | $ | 10.73 | ** | | | | | | $ | 10.52 | ** | | | | | | $ | 10.35 | *** |
| | | | | | | | | | | | | | | | | | | | | | |
Class I | | | | | | | | | | | | | | | | | | | | | | |
Net Assets | | | | $ | 623,555,969 | | | | | | | $ | 42,920,682 | | | | | | | $ | 39,364,024 | |
| | | | | | | | | | | | | | | | | | | | | | |
Shares outstanding (unlimited shares authorized) | | | | | 61,852,933 | | | | | | | | 4,267,484 | | | | | | | | 3,868,808 | |
| | | | | | | | | | | | | | | | | | | | | | |
Net Asset Value and Offering Price per share | | | | $ | 10.08 | | | | | | | $ | 10.06 | | | | | | | $ | 10.17 | |
| | | | | | | | | | | | | | | | | | | | | | |
| (a) | Including $36,526,579, $2,184,902, and $4,151,798, respectively, of securities on loan (Note 2). |
| * | See “How are Shares Priced?” in the Prospectus. |
| ** | Computation of offering price per share: 100/95.50 of net asset value. |
| *** | Computation of offering price per share: 100/98.25 of net asset value. |
See Notes which are an integral part of the Financial Statements
ANNUAL REPORT / April 30, 2021
| | |
| 51 | | STATEMENTS OF ASSETS AND LIABILITIES (concluded) |
| | | | | | | | | | | | |
| | | | |
| | | | | | | | | | Wilmington | |
| | | | | Wilmington | | | | | New York | |
| | | | | Municipal Bond | | | | | Municipal Bond | |
April 30, 2021 | | | | Fund | | | | | Fund | |
| | | | |
ASSETS: | | | | | | | | | | | | |
Investments, at identified cost | | | | $ | 346,811,306 | | | | | $ | 63,386,701 | |
| | | | | | | | | | | | |
Investments in securities, at value | | | | $ | 361,165,861 | | | | | $ | 66,015,929 | |
Income receivable | | | | | 4,404,509 | | | | | | 730,830 | |
Receivable for shares sold | | | | | 375,785 | | | | | | 23,029 | |
Receivable for investments sold | | | | | 30,188 | | | | | | — | |
Prepaid assets | | | | | 27,559 | | | | | | 14,871 | |
| | | | | | | | | | | | |
| | | | |
TOTAL ASSETS | | | | | 366,003,902 | | | | | | 66,784,659 | |
LIABILITIES: | | | | | | | | | | | | |
Payable for investments purchased | | | | | 2,612,944 | | | | | | — | |
Income distribution payable | | | | | 393,154 | | | | | | 26,749 | |
Payable for shares redeemed | | | | | 97,489 | | | | | | 229 | |
Payable for Trustees’ fees | | | | | 9,264 | | | | | | 9,264 | |
Payable for administration fees | | | | | 8,960 | | | | | | 1,595 | |
Payable for distribution services fees | | | | | 4,897 | | | | | | 1,392 | |
Payable for investment advisory fees | | | | | 108,674 | | | | | | 11,017 | |
Other accrued expenses | | | | | 100,734 | | | | | | 58,160 | |
| | | | | | | | | | | | |
TOTAL LIABILITIES | | | | | 3,336,116 | | | | | | 108,406 | |
| | | | |
NET ASSETS | | | | $ | 362,667,786 | | | | | $ | 66,676,253 | |
NET ASSETS CONSIST OF: | | | | | | | | | | | | |
Paid-in capital | | | | $ | 348,134,668 | | | | | $ | 63,939,504 | |
Distributable earnings (loss) | | | | | 14,533,118 | | | | | | 2,736,749 | |
| | | | | | | | | | | | |
| | | | |
TOTAL NET ASSETS | | | | $ | 362,667,786 | | | | | $ | 66,676,253 | |
COMPUTATION OF NET ASSET VALUE AND OFFERING PRICE: | | | | | | | | | | | | |
Class A | | | | | | | | | | | | |
Net Assets | | | | $ | 23,716,113 | | | | | $ | 6,789,287 | |
| | | | | | | | | | | | |
Shares outstanding (unlimited shares authorized) | | | | | 1,768,242 | | | | | | 635,045 | |
| | | | | | | | | | | | |
Net Asset Value per share | | | | $ | 13.41 | | | | | $ | 10.69 | |
| | | | | | | | | | | | |
Offering Price per share* | | | | $ | 14.04 | ** | | | | $ | 11.19 | ** |
| | | | | | | | | | | | |
Class I | | | | | | | | | | | | |
Net Assets | | | | $ | 338,951,673 | | | | | $ | 59,886,966 | |
| | | | | | | | | | | | |
Shares outstanding (unlimited shares authorized) | | | | | 25,261,536 | | | | | | 5,597,973 | |
| | | | | | | | | | | | |
Net Asset Value and Offering Price per share | | | | $ | 13.42 | | | | | $ | 10.70 | |
| | | | | | | | | | | | |
| * | See ’How are Shares Priced?” in the Prospectus. |
| ** | Computation of offering price per share: 100/95.50 of net asset value. |
See Notes which are an integral part of the Financial Statements
April 30, 2021 / ANNUAL REPORT
| | |
| STATEMENTS OF OPERATIONS | | 52 |
| | | | | | | | | | | | | | | | | | | | |
| | | | | | |
| | | | | Wilmington | | | | | Wilmington | | | | | | Wilmington | |
| | | | | Broad Market | | | | | Intermediate-Term | | | | | | Short-Term | |
Year Ended April 30, 2021 | | | | Bond Fund | | | | | Bond Fund | | | | | | Bond Fund | |
| | | | | | |
INVESTMENT INCOME: | | | | | | | | | | | | | | | | | | | | |
Dividends | | | | $ | 297,150 | | | | | $ | 2,600 | | | | | | | $ | 24,508 | |
Interest | | | | | 13,028,628 | | | | | | 1,127,199 | | | | | | | | 763,784 | |
Securities lending income, net | | | | | 31,357 | | | | | | 1,721 | | | | | | | | 1,305 | |
| | | | | | | | | | | | | | | | | | | | |
| | | | | | |
TOTAL INVESTMENT INCOME | | | | | 13,357,135 | | | | | | 1,131,520 | | | | | | | | 789,597 | |
EXPENSES: | | | | | | | | | | | | | | | | | | | | |
Investment advisory fees | | | | | 2,662,687 | | | | | | 217,457 | | | | | | | | 183,646 | |
Administration fees | | | | | 178,804 | | | | | | 14,604 | | | | | | | | 13,876 | |
Portfolio accounting and administration fees | | | | | 122,520 | | | | | | 25,279 | | | | | | | | 20,039 | |
Custodian fees | | | | | 17,266 | | | | | | 166 | | | | | | | | 2,913 | |
Transfer and dividend disbursing agent fees and expenses | | | | | 81,142 | | | | | | 2,389 | | | | | | | | 4,987 | |
Trustees’ fees | | | | | 56,885 | | | | | | 56,884 | | | | | | | | 56,884 | |
Professional fees | | | | | 104,148 | | | | | | 99,217 | | | | | | | | 99,323 | |
Distribution services fee—Class A | | | | | 7,639 | | | | | | 3,343 | | | | | | | | 10,573 | |
Shareholder services fee—Class A | | | | | 7,639 | | | | | | 3,343 | | | | | | | | 10,573 | |
Shareholder services fee—Class I | | | | | 1,096,001 | | | | | | 90,613 | | | | | | | | 79,801 | |
Share registration costs | | | | | 35,250 | | | | | | 32,730 | | | | | | | | 30,911 | |
Printing and postage | | | | | 12,080 | | | | | | 5,217 | | | | | | | | 4,068 | |
Miscellaneous | | | | | 58,052 | | | | | | 22,067 | | | | | | | | 21,494 | |
| | | | | | | | | | | | | | | | | | | | |
| | | | | | |
TOTAL EXPENSES | | | | | 4,440,113 | | | | | | 573,309 | | | | | | | | 539,088 | |
WAIVERS AND REIMBURSEMENTS: | | | | | | | | | | | | | | | | | | | | |
Waiver/reimbursement by investment advisor | | | | | (548,373 | ) | | | | | (239,223 | ) | | | | | | | (217,765 | ) |
Waiver of shareholder services fee—Class A | | | | | (4,863 | ) | | | | | (2,509 | ) | | | | | | | (10,573 | ) |
Waiver of shareholder services fee—Class I | | | | | (1,096,001 | ) | | | | | (90,613 | ) | | | | | | | (79,801 | ) |
| | | | | | | | | | | | | | | | | | | | |
| | | | | | |
TOTAL WAIVERS AND REIMBURSEMENTS | | | | | (1,649,237 | ) | | | | | (332,345 | ) | | | | | | | (308,139 | ) |
Net expenses | | | | | 2,790,876 | | | | | | 240,964 | | | | | | | | 230,949 | |
| | | | | | | | | | | | | | | | | | | | |
Net investment income | | | | | 10,566,259 | | | | | | 890,556 | | | | | | | | 558,648 | |
| | | | | | | | | | | | | | | | | | | | |
REALIZED AND UNREALIZED GAIN (LOSS): | | | | | | | | | | | | | | | | | | | | |
Net realized gain (loss) on investments | | | | | 1,034,695 | | | | | | 851,602 | | | | | | | | 484,700 | |
Net change in unrealized appreciation (depreciation) on investments | | | | | (8,079,861 | ) | | | | | (558,932 | ) | | | | | | | (291,163 | ) |
| | | | | | | | | | | | | | | | | | | | |
Net realized and unrealized gain (loss) | | | | | (7,045,166 | ) | | | | | 292,670 | | | | | | | | 193,537 | |
| | | | | | | | | | | | | | | | | | | | |
Change in net assets resulting from operations | | | | $ | 3,521,093 | | | | | $ | 1,183,226 | | | | | | | $ | 752,185 | |
| | | | | | | | | | | | | | | | | | | | |
See Notes which are an integral part of the Financial Statements
ANNUAL REPORT / April 30, 2021
| | |
| 53 | | STATEMENTS OF OPERATIONS (concluded) |
| | | | | | | | | | |
| | | |
Year Ended April 30, 2021 | | | | Wilmington Municipal Bond Fund | | | Wilmington New York Municipal Bond Fund | |
| | | |
INVESTMENT INCOME: | | | | | | | | | | |
Dividends | | | | $ | 1,763 | | | $ | 479 | |
Interest | | | | | 8,224,448 | | | | 1,373,949 | |
| | | | | | | | | | |
| | | |
TOTAL INVESTMENT INCOME | | | | | 8,226,211 | | | | 1,374,428 | |
| | | | | | | | | | |
EXPENSES: | | | | | | | | | | |
Investment advisory fees | | | | | 1,629,012 | | | | 291,222 | |
Administration fees | | | | | 109,399 | | | | 19,557 | |
Portfolio accounting and administration fees | | | | | 103,611 | | | | 28,600 | |
Custodian fees | | | | | 6,106 | | | | 1,576 | |
Transfer and dividend disbursing agent fees and expenses | | | | | 77,084 | | | | 9,666 | |
Trustees’ fees | | | | | 56,884 | | | | 56,884 | |
Professional fees | | | | | 102,104 | | | | 94,560 | |
Distribution services fee—Class A | | | | | 61,309 | | | | 17,807 | |
Shareholder services fee—Class A | | | | | 61,309 | | | | 17,807 | |
Shareholder services fee—Class I | | | | | 636,533 | | | | 108,852 | |
Share registration costs | | | | | 37,105 | | | | 12,591 | |
Printing and postage | | | | | 21,493 | | | | 4,350 | |
Miscellaneous | | | | | 42,368 | | | | 22,702 | |
| | | | | | | | | | |
| | | |
TOTAL EXPENSES | | | | | 2,944,317 | | | | 686,174 | |
| | | | | | | | | | |
WAIVERS AND REIMBURSEMENTS: | | | | | | | | | | |
Waiver/reimbursement by investment advisor | | | | | (411,353 | ) | | | (172,827 | ) |
Waiver of shareholder services fee—Class A | | | | | (61,309 | ) | | | (17,807 | ) |
Waiver of shareholder services fee—Class I | | | | | (636,533 | ) | | | (108,852 | ) |
| | | | | | | | | | |
| | | |
TOTAL WAIVERS AND REIMBURSEMENTS | | | | | (1,109,195 | ) | | | (299,486 | ) |
| | | | | | | | | | |
Net expenses | | | | | 1,835,122 | | | | 386,688 | |
| | | | | | | | | | |
Net investment income | | | | | 6,391,089 | | | | 987,740 | |
| | | | | | | | | | |
REALIZED AND UNREALIZED GAIN (LOSS): | | | | | | | | | | |
Net realized gain (loss) on investments | | | | | 645,351 | | | | 107,719 | |
Net change in unrealized appreciation (depreciation) on investments | | | | | 17,819,225 | | | | 3,024,023 | |
| | | | | | | | | | |
Net realized and unrealized gain (loss) | | | | | 18,464,576 | | | | 3,131,742 | |
| | | | | | | | | | |
Change in net assets resulting from operations | | | | $ | 24,855,665 | | | $ | 4,119,482 | |
| | | | | | | | | | |
See Notes which are an integral part of the Financial Statements
April 30, 2021 / ANNUAL REPORT
| | |
| STATEMENTS OF CHANGES IN NET ASSETS | | 54 |
| | | | | | | | | | | | | | | | |
| | |
| | | Wilmington | | | Wilmington | |
| | | Broad Market Bond Fund | | | Intermediate-Term Bond Fund | |
| | | Year Ended | | | Year Ended | | | Year Ended | | | Year Ended | |
| | | April 30, | | | April 30, | | | April 30, | | | April 30, | |
| | | 2021 | | | 2020 | | | 2021 | | | 2020 | |
| | | | | | | | | | | | | |
OPERATIONS: | | | | | | | | | | | | | | | | |
Net investment income | | $ | 10,566,259 | | | $ | 12,467,103 | | | $ | 890,556 | | | $ | 1,310,261 | |
Net realized gain (loss) | | | 1,034,695 | | | | 3,339,184 | | | | 851,602 | | | | 980,351 | |
Net change in unrealized appreciation (depreciation) | | | (8,079,861 | ) | | | 31,263,726 | | | | (558,932 | ) | | | 1,645,505 | |
| | | | | | | | | | | | | | | | |
Change in net assets resulting from operations | | | 3,521,093 | | | | 47,070,013 | | | | 1,183,226 | | | | 3,936,117 | |
| | | | | | | | | | | | | | | | |
| | | | |
DISTRIBUTIONS TO SHAREHOLDERS: | | | | | | | | | | | | | | | | |
Class A | | | (57,237 | ) | | | (64,387 | ) | | | (46,774 | ) | | | (42,342 | ) |
Class I | | | (13,005,551 | ) | | | (13,059,554 | ) | | | (1,738,108 | ) | | | (1,594,387 | ) |
| | | | | | | | | | | | | | | | |
Total distributions to shareholders | | | (13,062,788 | ) | | | (13,123,941 | ) | | | (1,784,882 | ) | | | (1,636,729 | ) |
| | | | | | | | | | | | | | | | |
| | | | |
SHARE TRANSACTIONS: | | | | | | | | | | | | | | | | |
Proceeds from sale of shares | | | | | | | | | | | | | | | | |
Class A | | | 10,983 | | | | 535,517 | | | | — | | | | — | |
Class I | | | 161,501,172 | | | | 173,643,574 | | | | 5,680,360 | | | | 8,082,186 | |
Distributions reinvested | | | | | | | | | | | | | | | | |
Class A | | | 43,241 | | | | 46,198 | | | | 40,122 | | | | 33,152 | |
Class I | | | 6,841,724 | | | | 7,046,793 | | | | 1,186,329 | | | | 786,619 | |
Cost of shares redeemed | | | | | | | | | | | | | | | | |
Class A | | | (1,023,382 | ) | | | (1,044,490 | ) | | | (500,845 | ) | | | (312,432 | ) |
Class I | | | (71,108,914 | ) | | | (222,700,202 | ) | | | (11,317,185 | ) | | | (39,612,198 | ) |
| | | | | | | | | | | | | | | | |
Change in net assets resulting from share transactions | | | 96,264,824 | | | | (42,472,610 | ) | | | (4,911,219 | ) | | | (31,022,673 | ) |
| | | | | | | | | | | | | | | | |
| | | | |
Change in net assets | | | 86,723,129 | | | | (8,526,538 | ) | | | (5,512,875 | ) | | | (28,723,285 | ) |
NET ASSETS: | | | | | | | | | | | | | | | | |
Beginning of year | | | 539,066,778 | | | | 547,593,316 | | | | 49,510,781 | | | | 78,234,066 | |
| | | | | | | | | | | | | | | | |
| | | | |
End of year | | $ | 625,789,907 | | | $ | 539,066,778 | | | $ | 43,997,906 | | | $ | 49,510,781 | |
| | | | | | | | | | | | | | | | |
| | | | |
SHARES OF BENEFICIAL INTEREST: | | | | | | | | | | | | | | | | |
Shares sold | | | | | | | | | | | | | | | | |
Class A | | | 1,045 | | | | 52,652 | | | | — | | | | — | |
Class I | | | 15,668,630 | | | | 17,484,936 | | | | 550,449 | | | | 805,727 | |
Distributions reinvested | | | | | | | | | | | | | | | | |
Class A | | | 4,124 | | | | 4,567 | | | | 3,905 | | | | 3,303 | |
Class I | | | 664,400 | | | | 709,331 | | | | 115,516 | | | | 78,410 | |
Shares redeemed | | | | | | | | | | | | | | | | |
Class A | | | (99,320 | ) | | | (105,610 | ) | | | (48,824 | ) | | | (31,017 | ) |
Class I | | | (6,930,181 | ) | | | (22,708,456 | ) | | | (1,101,123 | ) | | | (3,974,501 | ) |
| | | | | | | | | | | | | | | | |
| | | | |
Net change resulting from share transactions | | | 9,308,698 | | | | (4,562,580 | ) | | | (480,077 | ) | | | (3,118,078 | ) |
| | | | | | | | | | | | | | | | |
See Notes which are an integral part of the Financial Statements
ANNUAL REPORT / April 30, 2021
| | |
| 55 | | STATEMENTS OF CHANGES IN NET ASSETS (continued) |
| | | | | | | | | | | | | | | | |
| | |
| | | Wilmington | | | Wilmington | |
| | | Short-Term Bond Fund | | | Municipal Bond Fund | |
| | | Year Ended | | | Year Ended | | | Year Ended | | | Year Ended | |
| | | April 30, | | | April 30, | | | April 30, | | | April 30, | |
| | | 2021 | | | 2020 | | | 2021 | | | 2020 | |
| | | | | | | | | | | | | |
OPERATIONS: | | | | | | | | | | | | | | | | |
Net investment income | | $ | 558,648 | | | $ | 983,177 | | | $ | 6,391,089 | | | $ | 6,346,416 | |
Net realized gain (loss) | | | 484,700 | | | | 321,471 | | | | 645,351 | | | | 6,015,567 | |
Net change in unrealized appreciation (depreciation) | | | (291,163 | ) | | | 686,722 | | | | 17,819,225 | | | | (12,257,840 | ) |
| | | | | | | | | | | | | | | | |
Change in net assets resulting from operations | | | 752,185 | | | | 1,991,370 | | | | 24,855,665 | | | | 104,143 | |
| | | | | | | | | | | | | | | | |
| | | | |
DISTRIBUTIONS TO SHAREHOLDERS: | | | | | | | | | | | | | | | | |
Class A | | | (45,162 | ) | | | (103,114 | ) | | | (375,628 | ) | | | (897,121 | ) |
Class I | | | (539,055 | ) | | | (911,687 | ) | | | (6,015,381 | ) | | | (10,143,822 | ) |
| | | | | | | | | | | | | | | | |
Total distributions to shareholders | | | (584,217 | ) | | | (1,014,801 | ) | | | (6,391,009 | ) | | | (11,040,943 | ) |
| | | | | | | | | | | | | | | | |
| | | | |
SHARE TRANSACTIONS: | | | | | | | | | | | | | | | | |
Proceeds from sale of shares | | | | | | | | | | | | | | | | |
Class A | | | 151,416 | | | | 1,023,822 | | | | 96,944 | | | | 1,158,841 | |
Class I | | | 8,595,743 | | | | 9,978,636 | | | | 91,294,870 | | | | 125,486,757 | |
Distributions reinvested | | | | | | | | | | | | | | | | |
Class A | | | 28,778 | | | | 55,577 | | | | 258,476 | | | | 612,894 | |
Class I | | | 418,042 | | | | 683,168 | | | | 1,159,039 | | | | 4,834,614 | |
Cost of shares redeemed | | | | | | | | | | | | | | | | |
Class A | | | (2,527,671 | ) | | | (589,051 | ) | | | (1,984,181 | ) | | | (5,875,324 | ) |
Class I | | | (12,504,154 | ) | | | (13,511,420 | ) | | | (87,290,779 | ) | | | (64,462,561 | ) |
| | | | | | | | | | | | | | | | |
Change in net assets resulting from share transactions | | | (5,837,846 | ) | | | (2,359,268 | ) | | | 3,534,369 | | | | 61,755,221 | |
| | | | | | | | | | | | | | | | |
| | | | |
Change in net assets | | | (5,669,878 | ) | | | (1,382,699 | ) | | | 21,999,025 | | | | 50,818,421 | |
| | | | |
NET ASSETS: | | | | | | | | | | | | | | | | |
Beginning of year | | | 48,807,404 | | | | 50,190,103 | | | | 340,668,761 | | | | 289,850,340 | |
| | | | | | | | | | | | | | | | |
| | | | |
End of year | | $ | 43,137,526 | | | $ | 48,807,404 | | | $ | 362,667,786 | | | $ | 340,668,761 | |
| | | | | | | | | | | | | | | | |
| | | | |
SHARES OF BENEFICIAL INTEREST: | | | | | | | | | | | | | | | | |
Shares sold | | | | | | | | | | | | | | | | |
Class A | | | 14,876 | | | | 101,662 | | | | 7,247 | | | | 86,244 | |
Class I | | | 842,309 | | | | 992,906 | | | | 6,855,359 | | | | 9,669,481 | |
Distributions reinvested | | | | | | | | | | | | | | | | |
Class A | | | 2,821 | | | | 5,524 | | | | 19,390 | | | | 45,846 | |
Class I | | | 40,966 | | | | 67,892 | | | | 86,913 | | | | 362,237 | |
Shares redeemed | | | | | | | | | | | | | | | | |
Class A | | | (247,672 | ) | | | (58,587 | ) | | | (148,576 | ) | | | (438,848 | ) |
Class I | | | (1,225,792 | ) | | | (1,341,738 | ) | | | (6,552,931 | ) | | | (4,875,090 | ) |
| | | | | | | | | | | | | | | | |
Net change resulting from share transactions | | | (572,492 | ) | | | (232,341 | ) | | | 267,402 | | | | 4,849,870 | |
| | | | | | | | | | | | | | | | |
See Notes which are an integral part of the Financial Statements
April 30, 2021 / ANNUAL REPORT
| | |
| STATEMENTS OF CHANGES IN NET ASSETS (concluded) | | 56 |
| | | | | | | | |
| |
| | | Wilmington New York Municipal Bond Fund | |
| | |
| | | Year Ended April 30, 2021 | | | Year Ended April 30, 2020 | |
| | |
| | | | | | | |
OPERATIONS: | | | | | | | | |
Net investment income | | $ | 987,740 | | | $ | 1,032,991 | |
Net realized gain (loss) | | | 107,719 | | | | 714,111 | |
Net change in unrealized appreciation (depreciation) | | | 3,024,023 | | | | (1,682,471 | ) |
| | | | | | | | |
Change in net assets resulting from operations | | | 4,119,482 | | | | 64,631 | |
| | | | | | | | |
| | |
DISTRIBUTIONS TO SHAREHOLDERS: | | | | | | | | |
Class A | | | (106,060 | ) | | | (168,791 | ) |
Class I | | | (1,004,854 | ) | | | (1,288,518 | ) |
| | | | | | | | |
Total distributions to shareholders | | | (1,110,914 | ) | | | (1,457,309 | ) |
| | | | | | | | |
| | |
SHARE TRANSACTIONS: | | | | | | | | |
Proceeds from sale of shares | | | | | | | | |
Class A | | | 15,098 | | | | 79,147 | |
Class I | | | 15,938,527 | | | | 13,716,192 | |
Distributions reinvested | | | | | | | | |
Class A | | | 72,107 | | | | 120,538 | |
Class I | | | 677,063 | | | | 919,727 | |
Cost of shares redeemed | | | | | | | | |
Class A | | | (894,498 | ) | | | (1,430,945 | ) |
Class I | | | (14,370,924 | ) | | | (11,791,130 | ) |
| | | | | | | | |
Change in net assets resulting from share transactions | | | 1,437,373 | | | | 1,613,529 | |
| | | | | | | | |
| | |
Change in net assets | | | 4,445,941 | | | | 220,851 | |
| | |
NET ASSETS: | | | | | | | | |
Beginning of year | | | 62,230,312 | | | | 62,009,461 | |
| | | | | | | | |
| | |
End of year | | $ | 66,676,253 | | | $ | 62,230,312 | |
| | | | | | | | |
| | |
SHARES OF BENEFICIAL INTEREST: | | | | | | | | |
Shares sold | | | | | | | | |
Class A | | | 1,425 | | | | 7,486 | |
Class I | | | 1,500,629 | | | | 1,308,297 | |
Distributions reinvested | | | | | | | | |
Class A | | | 6,798 | | | | 11,368 | |
Class I | | | 63,777 | | | | 86,687 | |
Shares redeemed | | | | | | | | |
Class A | | | (84,348 | ) | | | (135,330 | ) |
Class I | | | (1,354,690 | ) | | | (1,122,548 | ) |
| | | | | | | | |
Net change resulting from share transactions | | | 133,591 | | | | 155,960 | |
| | | | | | | | |
See Notes which are an integral part of the Financial Statements
ANNUAL REPORT / April 30, 2021
For a share outstanding throughout each year ended April 30, unless otherwise noted:
|
WILMINGTON BROAD MARKET BOND FUND |
| | | | | | | | | | |
| | | Year Ended April 30, 2021 | | Year Ended April 30, 2020 | | Year Ended April 30, 2019 | | Year Ended April 30, 2018 | | Year Ended April 30, 2017 |
| CLASS A | | | | | | | | | | |
Net Asset Value, Beginning of Year | | $10.39 | | $ 9.71 | | $ 9.51 | | $ 9.78 | | $ 9.94 |
Income (Loss) From Operations: | | | | | | | | | | |
Net Investment Income(a) | | 0.15 | | 0.21 | | 0.21 | | 0.18 | | 0.16 |
Net Realized and Unrealized Gain (Loss) | | (0.10) | | 0.69 | | 0.21 | | (0.26) | | (0.14) |
Total Income (Loss) From Operations | | 0.05 | | 0.90 | | 0.42 | | (0.08) | | 0.02 |
Less Distributions From: | | | | | | | | | | |
Net Investment Income | | (0.18) | | (0.22) | | (0.22) | | (0.19) | | (0.18) |
Net Realized Gains | | (0.01) | | — | | — | | — | | — |
Total Distributions | | (0.19) | | (0.22) | | (0.22) | | (0.19) | | (0.18) |
Net Asset Value, End of Year | | $10.25 | | $10.39 | | $ 9.71 | | $ 9.51 | | $ 9.78 |
| | | | | | | | | | |
Total Return(b) | | 0.51% | | 9.35% | | 4.45% | | (0.81)% | | 0.22% |
Net Assets, End of Year (000’s) | | $2,234 | | $3,242 | | $3,501 | | $4,074 | | $4,503 |
Ratios to Average Net Assets | | | | | | | | | | |
Gross Expense(c) | | 1.06% | | 1.07% | | 1.08% | | 1.09% | | 1.09% |
Net Expense(c),(d) | | 0.81% | | 0.83% | | 0.83% | | 0.87% | | 0.89% |
Net Investment Income | | 1.46% | | 2.06% | | 2.18% | | 1.82% | | 1.62% |
Portfolio Turnover Rate | | 34% | | 46% | | 36% | | 34% | | 32% |
| | | | | | | | | | |
| | | Year Ended April 30, 2021 | | Year Ended April 30, 2020 | | Year Ended April 30, 2019 | | Year Ended April 30, 2018 | | Year Ended April 30, 2017 |
| CLASS I | | | | | | | | | | |
Net Asset Value, Beginning of Year | | $ 10.22 | | $ 9.55 | | $ 9.35 | | $ 9.62 | | $ 9.78 |
Income (Loss) From Operations: | | | | | | | | | | |
Net Investment Income(a) | | 0.18 | | 0.24 | | 0.24 | | 0.21 | | 0.19 |
Net Realized and Unrealized Gain (Loss) | | (0.09) | | 0.68 | | 0.21 | | (0.26) | | (0.14) |
Total Income (Loss) From Operations | | 0.09 | | 0.92 | | 0.45 | | (0.05) | | 0.05 |
Less Distributions From: | | | | | | | | | | |
Net Investment Income | | (0.22) | | (0.25) | | (0.25) | | (0.22) | | (0.21) |
Net Realized Gains | | (0.01) | | — | | — | | — | | — |
Total Distributions | | (0.23) | | (0.25) | | (0.25) | | (0.22) | | (0.21) |
Net Asset Value, End of Year | | $ 10.08 | | $ 10.22 | | $ 9.55 | | $ 9.35 | | $ 9.62 |
Total Return(b) | | 0.83% | | 9.74% | | 4.84% | | (0.52)% | | 0.54% |
Total Return(b) | | 0.83% | | 9.74% | | 4.84% | | (0.52)% | | 0.54% |
Net Assets, End of Year (000’s) | | $623,556 | | $535,825 | | $544,092 | | $506,940 | | $503,184 |
Ratios to Average Net Assets | | | | | | | | | | |
Gross Expense(c) | | 0.75% | | 0.82% | | 0.83% | | 0.84% | | 0.84% |
Net Expense(c),(d) | | 0.47% | | 0.49% | | 0.49% | | 0.53% | | 0.55% |
Net Investment Income | | 1.79% | | 2.40% | | 2.52% | | 2.18% | | 1.96% |
Portfolio Turnover Rate | | 34% | | 46% | | 36% | | 34% | | 32% |
| (a) | Per share amounts have been calculated using the average shares method. |
| (b) | Based on net asset value, which does not reflect the sales charge, if applicable. Total returns for periods of less than one year, if any, are not annualized. |
| (c) | The Fund invests in other underlying funds and indirectly bears its proportionate share of fees and expenses incurred by the underlying funds. This ratio does not include these indirect fees and expenses. |
| (d) | The investment advisor and other service providers waived or reimbursed a portion of their fees. |
See Notes which are an integral part of the Financial Statements
April 30, 2021 / ANNUAL REPORT
| | |
| FINANCIAL HIGHLIGHTS (continued) | | 58 |
For a share outstanding throughout each year ended April 30, unless otherwise noted:
|
WILMINGTON INTERMEDIATE-TERM BOND FUND |
| | | | | | | | | | |
| | | Year Ended April 30, 2021 | | Year Ended April 30, 2020 | | Year Ended April 30, 2019 | | Year Ended April 30, 2018 | | Year Ended April 30, 2017 |
| CLASS A | | | | | | | | | | |
Net Asset Value, Beginning of Year | | $10.19 | | $ 9.81 | | $ 9.58 | | $ 9.88 | | $ 10.01 |
Income (Loss) From Operations: | | | | | | | | | | |
Net Investment Income(a) | | 0.16 | | 0.19 | | 0.19 | | 0.16 | | 0.13 |
Net Realized and Unrealized Gain (Loss) | | 0.05 | | 0.44 | | 0.23 | | (0.27) | | (0.12) |
Total Income (Loss) From Operations | | 0.21 | | 0.63 | | 0.42 | | (0.11) | | 0.01 |
Less Distributions From: | | | | | | | | | | |
Net Investment Income | | (0.16) | | (0.19) | | (0.19) | | (0.16) | | (0.13) |
Net Realized Gains | | (0.19) | | (0.06) | | 0.00(b) | | (0.03) | | (0.01) |
Total Distributions | | (0.35) | | (0.25) | | (0.19) | | (0.19) | | (0.14) |
Net Asset Value, End of Year | | $10.05 | | $10.19 | | $ 9.81 | | $ 9.58 | | $ 9.88 |
| | | | | | | | | | |
Total Return(c) | | 1.98% | | 6.48% | | 4.47% | | (1.14)% | | 0.16% |
Net Assets, End of Year (000’s) | | $1,077 | | $1,550 | | $1,763 | | $1,912 | | $2,765 |
Ratios to Average Net Assets | | | | | | | | | | |
Gross Expense(d) | | 1.49% | | 1.40% | | 1.32% | | 1.26% | | 1.18% |
Net Expense(d),(e) | | 0.80% | | 0.80% | | 0.80% | | 0.83% | | 0.86% |
Net Investment Income | | 1.54% | | 1.92% | | 1.96% | | 1.65% | | 1.32% |
| Portfolio Turnover Rate | | 35% | | 35% | | 25% | | 30% | | 39% |
| | | | | | | | | | |
| | | Year Ended April 30, 2021 | | Year Ended April 30, 2020 | | Year Ended April 30, 2019 | | Year Ended April 30, 2018 | | Year Ended April 30, 2017 |
| CLASS I | | | | | | | | | | |
Net Asset Value, Beginning of Year | | $ 10.20 | | $ 9.81 | | $ 9.59 | | $ 9.88 | | $ 10.02 |
Income (Loss) From Operations: | | | | | | | | | | |
Net Investment Income(a) | | 0.19 | | 0.22 | | 0.22 | | 0.19 | | 0.17 |
Net Realized and Unrealized Gain (Loss) | | 0.05 | | 0.45 | | 0.22 | | (0.26) | | (0.13) |
Total Income (Loss) From Operations | | 0.24 | | 0.67 | | 0.44 | | (0.07) | | 0.04 |
Less Distributions From: | | | | | | | | | | |
Net Investment Income | | (0.19) | | (0.22) | | (0.22) | | (0.19) | | (0.17) |
Net Realized Gains | | (0.19) | | (0.06) | | 0.00(b) | | (0.03) | | (0.01) |
Total Distributions | | (0.38) | | (0.28) | | (0.22) | | (0.22) | | (0.18) |
Net Asset Value, End of Year | | $ 10.06 | | $ 10.20 | | $ 9.81 | | $ 9.59 | | $ 9.88 |
| | | | | | | | | | |
Total Return(c) | | 2.32% | | 6.92% | | 4.68% | | (0.72)% | | 0.40% |
Net Assets, End of Year (000’s) | | $42,921 | | $47,961 | | $76,471 | | $82,301 | | $127,103 |
Ratios to Average Net Assets | | | | | | | | | | |
Gross Expense(d) | | 1.18% | | 1.15% | | 1.07% | | 1.01% | | 0.93% |
Net Expense(d),(e) | | 0.49% | | 0.49% | | 0.49% | | 0.52% | | 0.53% |
Net Investment Income | | 1.85% | | 2.23% | | 2.26% | | 1.96% | | 1.66% |
Portfolio Turnover Rate | | 35% | | 35% | | 25% | | 30% | | 39% |
| (a) | Per share amounts have been calculated using the average shares method. |
| (b) | Represents less than $0.005. |
| (c) | Based on net asset value, which does not reflect the sales charge, if applicable. Total returns for periods of less than one year, if any, are not annualized. |
| (d) | The Fund invests in other underlying funds and indirectly bears its proportionate share of fees and expenses incurred by the underlying funds. This ratio does not include these indirect fees and expenses. |
| (e) | The investment advisor and other service providers waived or reimbursed a portion of their fees. |
See Notes which are an integral part of the Financial Statements
ANNUAL REPORT / April 30, 2021
| | |
| 59 | | FINANCIAL HIGHLIGHTS (continued) |
For a share outstanding throughout each year ended April 30, unless otherwise noted:
|
WILMINGTON SHORT-TERM BOND FUND |
| | | | | | | | | | |
| | | Year Ended April 30, 2021 | | Year Ended April 30, 2020 | | Year Ended April 30, 2019 | | Year Ended April 30, 2018 | | Year Ended April 30, 2017 |
| CLASS A | | | | | | | | | | |
Net Asset Value, Beginning of Year | | $10.14 | | $ 9.95 | | $ 9.85 | | $ 9.99 | | $10.07 |
Income (Loss) From Operations: | | | | | | | | | | |
Net Investment Income(a) | | 0.10 | | 0.18 | | 0.16 | | 0.12 | | 0.10 |
Net Realized and Unrealized Gain (Loss) | | 0.04 | | 0.19 | | 0.11 | | (0.12) | | (0.06) |
Total Income (Loss) From Operations | | 0.14 | | 0.37 | | 0.27 | | 0.00(b) | | 0.04 |
Less Distributions From: | | | | | | | | | | |
Net Investment Income | | (0.11) | | (0.18) | | (0.17) | | (0.14) | | (0.12) |
Total Distributions | | (0.11) | | (0.18) | | (0.17) | | (0.14) | | (0.12) |
Net Asset Value, End of Year | | $10.17 | | $10.14 | | $ 9.95 | | $ 9.85 | | $ 9.99 |
| | | | | | | | | | |
Total Return(c) | | 1.34% | | 3.78% | | 2.79% | | (0.03)% | | 0.43% |
Net Assets, End of Year (000’s) | | $3,774 | | $6,094 | | $5,494 | | $5,973 | | $6,628 |
Ratios to Average Net Assets | | | | | | | | | | |
Gross Expense(d) | | �� 1.46% | | 1.43% | | 1.42% | | 1.37% | | 1.23% |
Net Expense(d),(e) | | 0.73% | | 0.73% | | 0.73% | | 0.73% | | 0.73% |
Net Investment Income | | 1.01% | | 1.76% | | 1.65% | | 1.22% | | 0.96% |
Portfolio Turnover Rate | | 92% | | 140%(f) | | 67% | | 42% | | 72% |
| | | | | | | | | | |
| | | Year Ended April 30, 2021 | | Year Ended April 30, 2020 | | Year Ended April 30, 2019 | | Year Ended April 30, 2018 | | Year Ended April 30, 2017 |
| CLASS I | | | | | | | | | | |
Net Asset Value, Beginning of Year | | $ 10.14 | | $ 9.95 | | $ 9.85 | | $ 9.99 | | $ 10.07 |
Income (Loss) From Operations: | | | | | | | | | | |
Net Investment Income(a) | | 0.13 | | 0.20 | | 0.19 | | 0.15 | | 0.12 |
Net Realized and Unrealized Gain (Loss) | | 0.03 | | 0.20 | | 0.11 | | (0.13) | | (0.05) |
Total Income (Loss) From Operations | | 0.16 | | 0.40 | | 0.30 | | 0.02 | | 0.07 |
Less Distributions From: | | | | | | | | | | |
Net Investment Income | | (0.13) | | (0.21) | | (0.20) | | (0.16) | | (0.15) |
Total Distributions | | (0.13) | | (0.21) | | (0.20) | | (0.16) | | (0.15) |
Net Asset Value, End of Year | | $ 10.17 | | $ 10.14 | | $ 9.95 | | $ 9.85 | | $ 9.99 |
| | | | | | | | | | |
Total Return(c) | | 1.59% | | 4.04% | | 3.04% | | 0.22% | | 0.68% |
Net Assets, End of Year (000’s) | | $39,364 | | $42,713 | | $44,696 | | $46,309 | | $64,706 |
Ratios to Average Net Assets | | | | | | | | | | |
Gross Expense(d) | | 1.15% | | 1.19% | | 1.17% | | 1.11% | | 0.98% |
Net Expense(d),(e) | | 0.48% | | 0.48% | | 0.48% | | 0.48% | | 0.48% |
Net Investment Income | | 1.24% | | 2.01% | | 1.90% | | 1.46% | | 1.19% |
Portfolio Turnover Rate | | 92% | | 140%(f) | | 67% | | 42% | | 72% |
| (a) | Per share amounts have been calculated using the average shares method. |
| (b) | Represents less than $0.005. |
| (c) | Based on net asset value, which does not reflect the sales charge, if applicable. Total returns for periods of less than one year, if any, are not annualized. |
| (d) | The Fund invests in other underlying funds and indirectly bears its proportionate share of fees and expenses incurred by the underlying funds. This ratio does not include these indirect fees and expenses. |
| (e) | The investment advisor and other service providers waived or reimbursed a portion of their fees. |
| (f) | The portfolio turnover rate for the fiscal year ended April 30, 2020 increased due to elevated trading activity required to take advantage of changing market conditions in the short-term fixed income market. |
See Notes which are an integral part of the Financial Statements
April 30, 2021 / ANNUAL REPORT
| | |
| FINANCIAL HIGHLIGHTS (continued) | | 60 |
For a share outstanding throughout each year ended April 30, unless otherwise noted:
|
WILMINGTON MUNICIPAL BOND FUND |
| | | | | | | | | | |
| | | Year Ended April 30, 2021 | | Year Ended April 30, 2020 | | Year Ended April 30, 2019 | | Year Ended April 30, 2018 | | Year Ended April 30, 2017 |
| CLASS A | | | | | | | | | | |
Net Asset Value, Beginning of Year | | $ 12.72 | | $ 13.22 | | $ 12.78 | | $ 13.14 | | $ 13.54 |
Income (Loss) From Operations: | | | | | | | | | | |
Net Investment Income(a) | | 0.20 | | 0.25 | | 0.26 | | 0.22 | | 0.22 |
Net Realized and Unrealized Gain (Loss) | | 0.70 | | (0.28) | | 0.44 | | (0.26) | | (0.31) |
Total Income (Loss) From Operations | | 0.90 | | (0.03) | | 0.70 | | (0.04) | | (0.09) |
Less Distributions From: | | | | | | | | | | |
Net Investment Income | | (0.21) | | (0.25) | | (0.26) | | (0.22) | | (0.22) |
Net Realized Gains | | — | | (0.22) | | — | | (0.10) | | (0.09) |
Total Distributions | | (0.21) | | (0.47) | | (0.26) | | (0.32) | | (0.31) |
Net Asset Value, End of Year | | $ 13.41 | | $ 12.72 | | $ 13.22 | | $ 12.78 | | $ 13.14 |
| | | | | | | | | | |
Total Return(b) | | 7.05% | | (0.36)% | | 5.52% | | (0.29)% | | (0.65)% |
Net Assets, End of Year (000’s) | | $23,716 | | $24,052 | | $29,050 | | $29,109 | | $31,951 |
Ratios to Average Net Assets | | | | | | | | | | |
Gross Expense(c) | | 1.10% | | 1.09% | | 1.10% | | 1.10% | | 1.09% |
Net Expense(c),(d) | | 0.74% | | 0.74% | | 0.74% | | 0.74% | | 0.74% |
Net Investment Income | | 1.53% | | 1.90% | | 1.99% | | 1.70% | | 1.62% |
Portfolio Turnover Rate | | 24% | | 81% | | 83% | | 79% | | 40% |
| | | | | | | | | | | |
| | | Year Ended April 30, 2021 | | Year Ended April 30, 2020 | | Year Ended April 30, 2019 | | Year Ended April 30, 2018 | | Year Ended April 30, 2017 |
| CLASS I | | | | | | | | | | |
Net Asset Value, Beginning of Year | | $ 12.73 | | $ 13.23 | | $ 12.79 | | $ 13.15 | | $ 13.55 |
Income (Loss) From Operations: | | | | | | | | | | |
Net Investment Income(a) | | 0.24 | | 0.29 | | 0.29 | | 0.26 | | 0.25 |
Net Realized and Unrealized Gain (Loss) | | 0.69 | | (0.28) | | 0.44 | | (0.26) | | (0.31) |
Total Income (Loss) From Operations | | 0.93 | | 0.01 | | 0.73 | | 0.00(e) | | (0.06) |
Less Distributions From: | | | | | | | | | | |
Net Investment Income | | (0.24) | | (0.29) | | (0.29) | | (0.26) | | (0.25) |
Net Realized Gains | | — | | (0.22) | | — | | (0.10) | | (0.09) |
Total Distributions | | (0.24) | | (0.51) | | (0.29) | | (0.36) | | (0.34) |
Net Asset Value, End of Year | | $ 13.42 | | $ 12.73 | | $ 13.23 | | $ 12.79 | | $ 13.15 |
| | |
Total Return(b) | | 7.32% | | (0.10)% | | 5.78% | | (0.03)% | | (0.39)% |
Net Assets, End of Year (000’s) | | $338,952 | | $316,617 | | $260,800 | | $259,934 | | $263,825 |
Ratios to Average Net Assets | | | | | | | | | | |
Gross Expense(c) | | 0.79% | | 0.84% | | 0.85% | | 0.85% | | 0.84% |
Net Expense(c),(d) | | 0.49% | | 0.49% | | 0.49% | | 0.49% | | 0.49% |
Net Investment Income | | 1.78% | | 2.14% | | 2.24% | | 1.95% | | 1.87% |
Portfolio Turnover Rate | | 24% | | 81% | | 83% | | 79% | | 40% |
| (a) | Per share amounts have been calculated using the average shares method. |
| (b) | Based on net asset value, which does not reflect the sales charge, if applicable. Total returns for periods of less than one year, if any, are not annualized. |
| (c) | The Fund invests in other underlying funds and indirectly bears its proportionate share of fees and expenses incurred by the underlying funds. This ratio does not include these indirect fees and expenses. |
| (d) | The investment advisor and other service providers waived or reimbursed a portion of their fees. |
| (e) | Represents less than $0.005. |
See Notes which are an integral part of the Financial Statements
ANNUAL REPORT / April 30, 2021
| | |
| 61 | | FINANCIAL HIGHLIGHTS (concluded) |
For a share outstanding throughout each year ended April 30, unless otherwise noted:
|
WILMINGTON NEW YORK MUNICIPAL BOND FUND |
| | | | | | | | | | |
| | | Year Ended April 30, 2021 | | Year Ended April 30, 2020 | | Year Ended April 30, 2019 | | Year Ended April 30, 2018 | | Year Ended April 30, 2017 |
| CLASS A | | | | | | | | | | |
Net Asset Value, Beginning of Year | | $10.20 | | $10.43 | | $10.18 | | $ 10.56 | | $ 10.91 |
Income (Loss) From Operations: | | | | | | | | | | |
Net Investment Income(a) | | 0.14 | | 0.15 | | 0.15 | | 0.15 | | 0.16 |
Net Realized and Unrealized Gain (Loss) | | 0.51 | | (0.16) | | 0.36 | | (0.22) | | (0.25) |
Total Income (Loss) From Operations | | 0.65 | | (0.01) | | 0.51 | | (0.07) | | (0.09) |
Less Distributions From: | | | | | | | | | | |
Net Investment Income | | (0.14) | | (0.15) | | (0.15) | | (0.15) | | (0.16) |
Net Realized Gains | | (0.02) | | (0.07) | | (0.11) | | (0.16) | | (0.10) |
Total Distributions | | (0.16) | | (0.22) | | (0.26) | | (0.31) | | (0.26) |
Net Asset Value, End of Year | | $10.69 | | $10.20 | | $10.43 | | $ 10.18 | | $ 10.56 |
| | |
Total Return(b) | | 6.38% | | (0.12)% | | 5.16% | | (0.75)% | | (0.81)% |
Net Assets, End of Year (000’s) | | $6,789 | | $7,251 | | $8,630 | | $14,863 | | $17,554 |
Ratios to Average Net Assets | | | | | | | | | | |
Gross Expense(c) | | 1.34% | | 1.34% | | 1.33% | | 1.28% | | 1.24% |
Net Expense(c),(d) | | 0.82% | | 0.82% | | 0.83% | | 0.84% | | 0.84% |
Net Investment Income | | 1.31% | | 1.43% | | 1.50% | | 1.43% | | 1.50% |
Portfolio Turnover Rate | | 14% | | 60% | | 45% | | 64% | | 32% |
| | | | | | | | | | |
| | | Year Ended April 30, 2021 | | Year Ended April 30, 2020 | | Year Ended April 30, 2019 | | Year Ended April 30, 2018 | | Year Ended April 30, 2017 |
| CLASS I | | | | | | | | | | |
Net Asset Value, Beginning of Year | | $ 10.20 | | $ 10.43 | | $ 10.19 | | $ 10.57 | | $ 10.92 |
Income (Loss) From Operations: | | | | | | | | | | |
Net Investment Income(a) | | 0.16 | | 0.18 | | 0.18 | | 0.18 | | 0.19 |
Net Realized and Unrealized Gain (Loss) | | 0.53 | | (0.16) | | 0.35 | | (0.22) | | (0.25) |
Total Income (Loss) From Operations | | 0.69 | | 0.02 | | 0.53 | | (0.04) | | (0.06) |
Less Distributions From: | | | | | | | | | | |
Net Investment Income | | (0.17) | | (0.18) | | (0.18) | | (0.18) | | (0.19) |
Net Realized Gains | | (0.02) | | (0.07) | | (0.11) | | (0.16) | | (0.10) |
Total Distributions | | (0.19) | | (0.25) | | (0.29) | | (0.34) | | (0.29) |
Net Asset Value, End of Year | | $ 10.70 | | $ 10.20 | | $ 10.43 | | $ 10.19 | | $ 10.57 |
| | |
Total Return(b) | | 6.74% | | 0.13% | | 5.32% | | (0.50)% | | (0.55)% |
Net Assets, End of Year (000’s) | | $59,887 | | $54,979 | | $53,379 | | $56,626 | | $67,991 |
Ratios to Average Net Assets | | | | | | | | | | |
Gross Expense(c) | | 1.03% | | 1.09% | | 1.09% | | 1.03% | | 0.99% |
Net Expense(c),(d) | | 0.57% | | 0.57% | | 0.58% | | 0.59% | | 0.59% |
Net Investment Income | | 1.55% | | 1.68% | | 1.76% | | 1.68% | | 1.75% |
Portfolio Turnover Rate | | 14% | | 60% | | 45% | | 64% | | 32% |
| (a) | Per share amounts have been calculated using the average shares method. |
| (b) | Based on net asset value, which does not reflect the sales charge, if applicable. Total returns for periods of less than one year, if any, are not annualized. |
| (c) | The Fund invests in other underlying funds and indirectly bears its proportionate share of fees and expenses incurred by the underlying funds. This ratio does not include these indirect fees and expenses. |
| (d) | The investment advisor and other service providers waived or reimbursed a portion of their fees. |
See Notes which are an integral part of the Financial Statements
April 30, 2021 / ANNUAL REPORT
| | |
| NOTES TO FINANCIAL STATEMENTS | | 62 |
Wilmington Funds
April 30, 2021
Wilmington Funds (the “Trust”) is registered under the Investment Company Act of 1940, as amended (the “Act”), as an open-end management investment company. The Trust consists of 12 funds, 5 of which are presented herein (individually referred to as a “Fund” or collectively as the “Funds”). The remaining 7 funds are presented in separate reports.
| | |
Fund | | Investment Goal |
Wilmington Broad Market Bond Fund (“Broad Market Bond Fund”)(d) | | The Fund seeks to provide current income and secondarily, capital growth. |
| |
Wilmington Intermediate-Term Bond Fund (“Intermediate-Term Bond Fund”)(d) | | The Fund seeks to provide current income and secondarily, capital growth. |
| |
Wilmington Short-Term Bond Fund (“Short-Term Bond Fund”)(d) | | The Fund seeks to provide current income. |
| |
Wilmington Municipal Bond Fund (“Municipal Bond Fund”)(d) | | The Fund seeks a high level of income exempt from federal income tax, consistent with the preservation of capital. |
| |
Wilmington New York Municipal Bond Fund (“New York Municipal Bond Fund”)(n) | | The Fund seeks to provide current income that is exempt from both federal and New York personal income taxes. |
The Trust offers 6 classes of shares: Class A, Service Class, Select Class, Administrative Class, Class I and Institutional Class. Service Class, Select Class, Administrative Class and Institutional Class are not available for the Funds. All shares of the Trust have equal rights with respect to voting, except on class-specific matters.
The assets of each fund are segregated and a shareholder’s interest is limited to the fund in which shares are held.
| 2. | SUMMARY OF SIGNIFICANT ACCOUNTING POLICIES |
The following is a summary of significant accounting policies consistently followed by the Funds in the preparation of their financial statements. These policies are in conformity with U.S. generally accepted accounting principles (“GAAP”). The Trust is an investment company and follows accounting and reporting guidance under Financial Accounting Standards Board (“FASB”) Accounting Standards Codification (“ASC”) Topic 946, “Financial Services - Investment Companies.” The preparation of financial statements in conformity with GAAP requires management to make estimates and assumptions that affect the amounts of assets, liabilities, expenses and revenues reported in the financial statements. Actual results could differ from those estimated and the differences could be material.
Computation of Net Asset Value – The net asset value (‘‘NAV’’) per share for each class of a Fund is computed by dividing the total current value of the assets of the Fund, less its liabilities, attributable to the class by the total number of shares outstanding of the class at the time of such computation. The NAV per share for each class of a Fund is computed as of 4:00 p.m. (Eastern Time) on days when the New York Stock Exchange (“NYSE”) is open for regular trading.
Investment Valuation – The Funds utilize a fair value approach. The fair value of the Funds’ portfolio securities are determined as follows:
| | • | | investments in open-end regulated investment companies are valued at NAV; |
| | • | | for fixed income securities, according to prices as furnished by an independent pricing service, except that fixed income securities with remaining maturities of less than 60 days at the time of purchase are valued at amortized cost provided such amount approximates fair value; and |
| | • | | for all other securities, at fair value as determined in accordance with procedures established by and under the general supervision of the Board of Trustees (“Trustees”). |
The Trust follows the authoritative guidance (GAAP) for fair value measurements. The guidance establishes a framework for measuring fair value and a hierarchy for inputs and techniques used in measuring fair value that maximizes the use of observable inputs and minimizes the use of unobservable inputs and techniques by requiring that the most observable inputs be used when available. The guidance establishes three tiers of inputs that may be used to measure fair value. The three tiers of inputs are summarized at the end of each Fund’s Portfolio of Investments. The inputs or techniques used for valuing securities are not necessarily an indication of the risk associated with investing in those securities.
Pursuant to the Funds’ fair value procedures noted previously, investments in open-end regulated investment companies are generally categorized as Level 1 securities in the fair value hierarchy. Fixed income securities and money market instruments are generally categorized as Level 2 securities in the fair value hierarchy.
ANNUAL REPORT / April 30, 2021
| | |
| 63 | | NOTES TO FINANCIAL STATEMENTS (continued) |
Investments for which there are no such quotations, or for which quotations do not appear reliable, are valued at fair value as determined in accordance with procedures established by and under the general supervision of the Trustees. These valuations are typically categorized as Level 2 or Level 3 securities in the fair value hierarchy.
Repurchase Agreements – Repurchase agreements are transactions in which a Fund buys a security from a dealer or bank and agrees to sell the security back at a mutually agreed upon time and price. The repurchase price exceeds the sale price, reflecting each Fund’s return on the transaction. It is each Fund’s policy to require the counterparty to a repurchase agreement to transfer to the Funds’ custodian or sub-custodian eligible securities or cash with a market value (after transaction costs) at least equal to the repurchase price to be paid under the repurchase agreement. The eligible securities are transferred to accounts with the custodian or sub-custodian in which the Funds hold a “securities entitlement” and exercise “control” as those terms are defined in the Uniform Commercial Code. The Funds have established procedures for monitoring the market value of the transferred securities and requiring the transfer of additional eligible securities, if necessary, to equal at least the repurchase price. These procedures also allow the counterparty to require securities to be transferred from the account to the extent that their market value exceeds the repurchase price or in exchange for other eligible securities of equivalent market value.
The insolvency of the counterparty or other failure to repurchase the securities may delay the disposition of the underlying securities or cause the Funds to receive less than the full repurchase price.
Repurchase agreements are entered into by the Funds under Master Repurchase Agreements (“MRA”) which permit the Funds, under certain circumstances including an event of default (such as bankruptcy or insolvency), to offset payables and/or receivables under the MRA with collateral held and/or posted to the counterparty and create one single net payment due to or from each Fund.
At April 30, 2021, the open repurchase agreements by counterparty which are subject to a MRA on a net payment basis are as follows:
| | | | | | | | | | | | | | | | |
| | | | |
| Fund/Counterparty | | Repurchase Agreements | | | Fair Value of Non-Cash Collateral Received(1) | | | Cash Collateral Received(1) | | | Net Exposure(2) | |
Broad Market Bond Fund | | | | | | | | | | | | | | | | |
Bank of America Securities, Inc. | | $ | 7,122,349 | | | $ | 7,122,349 | | | $ | — | | | $ | — | |
Citigroup Global Markets Ltd. | | | 3,666,993 | | | | 3,666,993 | | | | — | | | | — | |
Daiwa Capital Markets America | | | 7,122,349 | | | | 7,122,349 | | | | — | | | | — | |
RBC Dominion Securities, Inc. | | | 7,122,349 | | | | 7,122,349 | | | | — | | | | — | |
| | | | | | | | | | | | | | | | |
| | | | |
| | $ | 25,034,040 | | | $ | 25,034,040 | | | $ | — | | | $ | — | |
| | | | | | | | | | | | | | | | |
Intermediate-Term Bond Fund | | | | | | | | | | | | | | | | |
Bank of America Securities, Inc. | | $ | 426,771 | | | $ | 426,771 | | | $ | — | | | $ | — | |
BNP Paribas SA | | | 426,771 | | | | 426,771 | | | | — | | | | — | |
Citigroup Global Markets Ltd. | | | 426,771 | | | | 426,771 | | | | — | | | | — | |
Daiwa Capital Markets America | | | 426,771 | | | | 426,771 | | | | — | | | | — | |
Morgan Stanley & Co. | | | 112,308 | | | | 112,308 | | | | — | | | | — | |
RBC Dominion Securities, Inc. | | | 426,771 | | | | 426,771 | | | | — | | | | — | |
| | | | | | | | | | | | | | | | |
| | | | |
| | $ | 2,246,163 | | | $ | 2,246,163 | | | $ | — | | | $ | — | |
| | | | | | | | | | | | | | | | |
Short-Term Bond Fund | | | | | | | | | | | | | | | | |
Bank of America Securities, Inc. | | $ | 805,597 | | | $ | 805,597 | | | $ | — | | | $ | — | |
Citigroup Global Markets Ltd. | | | 717,573 | | | | 717,573 | | | | — | | | | — | |
Daiwa Capital Markets America | | | 805,597 | | | | 805,597 | | | | — | | | | — | |
HSBC Securities USA, Inc. | | | 805,597 | | | | 805,597 | | | | — | | | | — | |
RBC Dominion Securities, Inc. | | | 805,597 | | | | 805,597 | | | | — | | | | — | |
| | | | | | | | | | | | | | | | |
| | | | |
| | $ | 3,939,961 | | | $ | 3,939,961 | | | $ | — | | | $ | — | |
| | | | | | | | | | | | | | | | |
(1)The amount of collateral reflected in the table does not include any over-collateralization received by the Fund.
(2)Net exposure represents the receivable (payable) due from (to) the counterparty in the event of default.
Investment Income, Gains and Losses, Expenses and Distributions – Interest income and expenses are accrued daily. All premiums and discounts on fixed income securities are amortized/accreted for financial reporting purposes. Gains and losses realized on principal payment of mortgage-backed securities (paydown gains and losses) are classified as part of investment income. Dividends and distributions to shareholders are recorded on the ex-dividend date. Non-cash dividends included in dividend income, if any, are recorded at fair value. Investment transactions are accounted for on a trade date basis for financial reporting purposes. Realized gains and losses from investment transactions are recorded on an identified cost basis.
Expenses of the Trust, which are directly identifiable to a specific fund, are applied to that fund. Expenses which are not identifiable to a specific fund are allocated in such a manner as deemed equitable, taking into consideration the nature and type of expense.
Each Fund offers multiple classes of shares. Investment income, realized and unrealized gains and losses, and certain fund-level expenses are allocated to each class based on relative daily net assets, except that each class bears certain expenses unique to that class such as distribution and shareholder services fees. Distributions are declared separately for each class. No class has preferential distribution rights; differences in per share distributions rates are generally due to differences in class specific expenses. Distributions from net realized gains, if any, are declared and paid to shareholders annually. Distributions from net investment income are declared daily and paid monthly.
April 30, 2021 / ANNUAL REPORT
| | |
| NOTES TO FINANCIAL STATEMENTS (continued) | | 64 |
When-Issued and Delayed Delivery Transactions – The Funds may engage in when-issued or delayed delivery transactions. The Funds record when-issued securities on the trade date and maintain security positions such that sufficient liquid assets will be available to make payment for the securities purchased. Securities purchased on a when-issued or delayed delivery basis are marked to market daily and begin earning interest on the settlement date. Losses may occur on these transactions due to changes in market conditions or the failure of counterparties to perform under the contract.
Restricted Securities – Restricted securities are securities that either (a) cannot be offered for public sale without first being registered, or being able to take advantage of an exemption from registration, under the Securities Act of 1933, as amended, or (b) are subject to contractual restrictions on public sales. In some cases, when a security cannot be offered for public sale without first being registered, the issuer of the restricted security has agreed to register such securities for resale, at the issuer’s expense, either upon demand by the Funds or in connection with another registered offering of the securities. Many such restricted securities may be resold in the secondary market in transactions exempt from registration. Restricted securities may be determined to be liquid under criteria established by the Trustees. A Fund will not incur any registration costs upon such resales. The Funds’ restricted securities are valued at the price provided by dealers in the secondary market or, if no market prices are available, at the fair value as determined in accordance with procedures established by and under the general supervision of the Trustees.
Lending of Portfolio Securities – The Trust has entered into an agreement with its custodian whereby the custodian may lend securities owned by the Funds to brokers, dealers and other financial organizations. Any increase or decrease in the fair value of securities loaned and any interest or dividends earned on those securities during the term of the loan would be for the account of the Funds. In exchange for lending securities under the terms of the agreement with their custodian, the Funds receive a lender’s fee. Fees earned by the Funds on securities lending are recorded as income. Loans of securities by the Funds are collateralized by cash, U.S. government securities or money market instruments that are maintained at all times in an amount at least equal to the current market value of the loaned securities plus a margin which varies depending on the type of securities owned. The custodian establishes and maintains the collateral in a segregated account. The Funds have the right under the lending agreement to recover the securities from the borrower on demand. The market value of the loaned securities is determined at the close of business of the Funds and any additional required collateral is delivered to the Funds on the next business day.
Under the terms of the agreement, cash collateral received is invested in one or more approved investments. Investments purchased with cash collateral are presented on the Portfolios of Investments under the caption “Cash Collateral Invested for Securities on Loan.”
The Funds maintain the risk of any loss on the securities on loan as well as the potential loss on investments purchased with cash collateral received from securities lending.
Securities lending transactions are entered into by the Funds under Master Securities Lending Agreements (“MSLA”) which permit the Funds, under certain circumstances including an event of default (such as bankruptcy or insolvency), to offset amounts payable by the Funds to the same counterparty against amounts to be received and create one single net payment due to or from the Funds.
At April 30, 2021, the securities loaned which are subject to a MSLA on a net payment basis are as follows:
| | | | | | |
| Fund | | Value of Securities
on Loan | | Cash Collateral
Received(1) | | Net Exposure(2) |
| | | |
Broad Market Bond Fund | | $36,526,579 | | $36,526,579 | | $— |
| | | |
Intermediate-Term Bond Fund | | 2,184,902 | | 2,184,902 | | — |
| | | |
Short-Term Bond Fund | | 4,151,798 | | 4,151,798 | | — |
|
(1) Collateral with a value of $37,486,040, $2,246,163 and $4,239,961, respectively, has been received in connection with securities lending transactions. The amount of collateral reflected in the table does not include any over-collateralization received by the Fund. |
|
(2) Net exposure represents the receivable (payable) due from (to) the counterparty in the event of default. |
| 3. | FEDERAL TAX INFORMATION |
No provision for federal income taxes has been made, as it is each Fund’s policy to comply with the Subchapter M provision of the Internal Revenue Code of 1986, as amended, and to distribute to shareholders each year all of its taxable income and realized gains.
Each Fund files U.S. federal, state, and local tax returns as required. The Fund’s tax returns are subject to examination by the relevant tax authorities until expiration of the applicable statute of limitations, which is generally three years after the tax returns are filed. The Funds recognize interest and penalties, if any, related to unrecognized tax benefits as income tax expense on the Statements of Operations. The Funds do not have any unrecognized tax benefits or uncertain tax positions that would require a provision for income tax. Accordingly, the Funds did not incur any interest or penalties for the year ended April 30, 2021.
The timing and character of income and capital gain distributions are determined in accordance with income tax regulations, which may differ from GAAP. These differences are primarily due to paydown gains (losses) on mortgage-backed securities and premium amortization on callable debt securities. For financial reporting purposes, any permanent differences resulting from different book and tax treatment are reclassified
ANNUAL REPORT / April 30, 2021
| | |
| 65 | | NOTES TO FINANCIAL STATEMENTS (continued) |
between distributable earnings and paid-in capital in the period that the differences arise. Results of operations and net assets are not affected by these reclassifications. As of April 30, 2021, there were no such reclassifications.
The tax character of distributions for the corresponding fiscal year ends were as follows:
| | | | | | | | | | | | |
| | | | | | |
| Fund | | Ordinary
Income* | | 2021
Tax Exempt
Income | | Long-Term
Capital Gains | | Ordinary
Income* | | 2020
Tax Exempt
Income | | Long-Term
Capital Gains |
| | | | | | |
Broad Market Bond Fund | | $12,325,968 | | $ — | | $736,820 | | $13,123,941 | | $ — | | $ — |
Intermediate-Term Bond Fund | | 1,003,541 | | — | | 781,341 | | 1,443,833 | | — | | 192,896 |
Short-Term Bond Fund | | 584,217 | | — | | — | | 1,014,801 | | — | | — |
Municipal Bond Fund | | 43,993 | | 6,347,016 | | — | | 1,145,984 | | 6,195,042 | | 3,699,917 |
New York Municipal Bond Fund | | 997 | | 986,746 | | 123,171 | | 33,820 | | 999,116 | | 424,373 |
| | * | For tax purposes, short-term capital gain distributions are considered ordinary income distributions. |
As of April 30, 2021, the cost of investments for U.S. federal income tax purposes, the aggregate gross unrealized appreciation for all investments for which there was an excess of value over tax cost and the aggregate gross unrealized depreciation for all investments for which there was an excess of tax cost over value, were as follows:
| | | | | | | | |
| | | | |
| Fund | | Tax Cost | | Tax Unrealized Appreciation | | Tax Unrealized Depreciation | | Net Tax Unrealized Appreciation/ (Depreciation) |
| | | | |
Broad Market Bond Fund | | $638,943,660 | | $28,170,718 | | $(3,424,951) | | $24,745,767 |
Intermediate-Term Bond Fund | | 44,741,634 | | 1,660,043 | | (203,313) | | 1,456,730 |
Short-Term Bond Fund | | 46,659,516 | | 538,456 | | (26,695) | | 511,761 |
Municipal Bond Fund | | 346,815,145 | | 14,732,626 | | (381,910) | | 14,350,716 |
New York Municipal Bond Fund | | 63,386,701 | | 2,686,614 | | (57,386) | | 2,629,228 |
As of April 30, 2021, the components of distributable earnings on a tax basis were as follows:
| | | | | | | | | | | | | | | | |
| | | | | | | | |
| Fund | | Undistributed
Ordinary
Income | | Undistributed
Tax-Exempt
Income | | Undistributed
Long-Term
Capital Gains | | Other
Timing
Differences* | | Unrealized
Appreciation/
(Depreciation) | | Capital Loss
Carryforwards | | Late Year
Loss
Deferrals | | Distributable
Earnings |
| | | | | | | | |
Broad Market Bond Fund | | $785,790 | | $ — | | $ — | | $(507,172) | | $24,745,767 | | $ — | | $(1,616,951) | | $23,407,434 |
Intermediate-Term Bond Fund | | 105,118 | | — | | 403,666 | | (31,526) | | 1,456,730 | | — | | — | | 1,933,988 |
Short-Term Bond Fund | | 29,437 | | — | | — | | (5,542) | | 511,761 | | (720,430) | | — | | (184,774) |
Municipal Bond Fund | | — | | 389,977 | | 185,579 | | (393,154) | | 14,350,716 | | — | | — | | 14,533,118 |
New York Municipal Bond Fund | | 24,264 | | 26,554 | | 83,455 | | (26,752) | | 2,629,228 | | — | | — | | 2,736,749 |
| | * | Other timing differences are comprised primarily of dividends payable to Fund shareholders, which for tax reporting purposes are not recognized until paid. |
Capital loss carryforwards represent realized losses that may be carried forward for an unlimited period and applied against future capital gains for U.S. federal income tax purposes. Such capital loss carryforwards will retain their character as either short-term or long-term capital losses. As of April 30, 2021, character of capital loss carryforwards were as follows:
| | | | | | |
| | | |
| Fund | | Short-Term No Expiration | | Long-Term No Expiration | | Total Capital Loss Carryforwards |
| | | |
Short-Term Bond Fund | | $68,046 | | $652,384 | | $720,430 |
For the year ended April 30, 2021, capital loss carryforwards utilized were as follows:
| | |
| |
| Fund | | Capital Loss
Carryforwards
Utilized |
| |
Short-Term Bond Fund | | $450,375 |
Late year loss deferrals represent (1) net specified losses realized between November 1 and April 30 of each year and (2) ordinary losses realized between January 1 and April 30 of each year that the Fund has elected for U.S. federal income tax purposes to treat as occurring on the first day of the following tax year. As of April 30, 2021, late year loss deferrals were as follows:
April 30, 2021 / ANNUAL REPORT
| | |
| NOTES TO FINANCIAL STATEMENTS (continued) | | 66 |
| | | | | | | | | | | | | | | |
| | | |
| Fund | | Ordinary
Losses | | Short-Term Capital
Losses | | Long-Term Capital
Losses |
| | | |
Broad Market Bond Fund | | $— | | $1,076,944 | | $540,007 |
| 4. | ADVISORY FEES, SERVICING FEES, AND OTHER SERVICE PROVIDERS |
Investment Advisor – Wilmington Funds Management Corporation (“WFMC” or the “Advisor”) serves as the Investment Advisor to each of the Funds. Wilmington Trust Investment Advisors, Inc. (“WTIA”) provides sub-advisory services to the Funds. WFMC and WTIA are wholly-owned subsidiaries of M&T Bank Corporation. For its services, the Funds pay WFMC an annual investment advisory fee, accrued daily and paid monthly, based on a percentage of each Fund’s average daily net assets as described below. WFMC, not the Funds, pays WTIA for its services.
| | |
| |
| Fund | | Advisory Fee Annual Rate |
| |
Broad Market Bond Fund | | 0.45% |
Intermediate-Term Bond Fund | | 0.45% |
Short-Term Bond Fund | | 0.40% |
Municipal Bond Fund | | 0.45% |
New York Municipal Bond Fund | | 0.45% |
WFMC and the Funds’ distributor and shareholder service provider have contractually agreed to waive their fees and/or reimburse expenses through January 31, 2022 so that total annual fund operating expenses paid by the Funds (not including the effects of dividends or interest on short positions, acquired fund fees and expenses, taxes, or other extraordinary expenses expressed as an annualized percentage of average daily net assets), will not exceed the expense limitations set forth below. Neither WFMC nor the Funds’ distributor and shareholder service provider will recoup previously waived fees/expenses in subsequent years.
The contractual expense limitations are as follows:
| | | | |
| |
| | | Current Contractual Expense Limitations |
| Fund | | Class A | | Class I |
| | |
Broad Market Bond Fund* | | 0.78% | | 0.43% |
Intermediate-Term Bond Fund | | 0.84% | | 0.49% |
Short-Term Bond Fund | | 0.73% | | 0.48% |
Municipal Bond Fund | | 0.74% | | 0.49% |
New York Municipal Bond Fund | | 0.82% | | 0.57% |
| | * | Prior to January 4, 2021, the Broad Market Bond Fund’s contractual expense limitation was 0.84% and 0.49% for Class A and Class I, respectively. |
Administrative Fees – The Bank of New York Mellon (“BNYM”) provides the Trust with fund administration services. The fees as described in the table below are a component of “Portfolio accounting and administration fees” as disclosed in the Statements of Operations. WFMC, in its role as Co-Administrator, provides the Funds with certain administrative personnel and services necessary to operate the Funds. The fees as described in the table below are accrued daily and paid monthly, and are disclosed on the Statements of Operations as “Administration fees.”
| | | | |
| | |
| Administrator | | Maximum
Fee | | Average Aggregate Daily Net
Assets of the Trust |
| | |
WFMC | | 0.040% | | on the first $5 billion |
| | 0.030% | | on the next $2 billion |
| | 0.025% | | on the next $3 billion |
| | 0.018% | | on assets in excess of $10 billion |
| | |
BNYM | | 0.0175% | | on the first $15 billion |
| | 0.0150% | | on the next $10 billion |
| | 0.0125% | | on assets in excess of $25 billion |
WFMC and BNYM may voluntarily choose to waive any portion of their fee and can add, modify or terminate a voluntary wavier at any time at their sole discretion. Neither WFMC nor BNYM will recoup previously waived fees/expenses in subsequent years. For the year ended April 30, 2021, neither WFMC nor BNYM waived any administrative fees.
Distribution Services Fee – The Trust has adopted a Distribution Services Plan (the “Plan”) pursuant to Rule 12b-1 under the Act. The Plan allows the Funds to pay fees to financial intermediaries, which may be paid through ALPS Distributors, Inc. (“ALPS”), the principal distributor,
ANNUAL REPORT / April 30, 2021
| | |
| 67 | | NOTES TO FINANCIAL STATEMENTS (continued) |
at an annual rate of up to 0.25% of the average daily net assets of the Funds’ Class A shares, for the sale, distribution, administration, customer servicing and record keeping of these shares.
The Trust may reduce the maximum amount of distribution services fees it pays from time to time at its sole discretion. In addition, a financial intermediary (including ALPS, the Advisor or their affiliates), may voluntarily waive or reduce any fees to which they are entitled.
For the year ended April 30, 2021, M&T Securities, Inc., Manufacturers and Traders Trust Company, and Wilmington Trust, NA (together “M&T”), affiliates of the Advisor, received distribution services fees paid by the Funds as follows:
| | | | | |
| Fund | | Distribution Fees from Class A |
| |
Broad Market Bond Fund | | $ 6,284 |
Intermediate-Term Bond Fund | | 1,601 |
Short-Term Bond Fund | | 8,001 |
Municipal Bond Fund | | 51,498 |
New York Municipal Bond Fund | | 14,649 |
Sales Charges – The Class A shares of all the Funds bear front-end sales charges.
For the year ended April 30, 2021, M&T received sales charges on the sale of Class A shares as follows:
| | |
| Fund | | Sales Charges
from Class A |
| |
Broad Market Bond Fund | | $293 |
Intermediate-Term Bond Fund | | — |
Short-Term Bond Fund | | 121 |
Municipal Bond Fund | | 511 |
New York Municipal Bond Fund | | 713 |
Shareholder Services Fee – Pursuant to a Shareholder Services Plan adopted by the Funds and administered by ALPS, the Funds may pay up to 0.25% of the average daily net assets of each Fund’s Class A shares to financial intermediaries (which may include ALPS, the Advisor or their affiliates) for providing shareholder services and maintaining shareholder accounts. Prior to January 31, 2021, the Funds’ Class I shares were included in the Shareholder Services Plan whereby the Funds could pay up to 0.25% of the average daily net assets of each Fund’s Class I shares to financial intermediaries (including ALPS, the Advisor or their affiliates) for providing shareholder services and maintaining shareholder accounts. Effective January 31, 2021, the Class I shares were removed from the Shareholder Services Plan. Accordingly, the 0.25% shareholder servicing fee was no longer charged to Class I shares after that date.
M&T has entered into a Shareholder Services Agreement with ALPS, under which it is entitled to receive up to 0.25% of the average daily net assets of each Fund’s Class A shares and, prior to January 31, 2021, Class I shares for whom M&T provides shareholder services. The Funds may reduce the maximum amount of shareholder service fees they pay from time to time at their sole discretion. In addition, a financial intermediary (including M&T) may waive or reduce any fees to which they are entitled.
For the year ended April 30, 2021, M&T received shareholder service fees, net of waivers, paid by the Funds as follows:
| | |
| Fund | | Shareholder Services
Fee |
| |
Broad Market Bond Fund | | $2,376 |
Intermediate-Term Bond Fund | | 587 |
Short-Term Bond Fund | | — |
Municipal Bond Fund | | — |
New York Municipal Bond Fund | | — |
Other Service Providers – Foreside Management Services, LLC (“FMS”) provides a Principal Executive Officer and Principal Financial Officer to the Trust. FMS has no role in determining the investment policies or which securities are to be sold or purchased by the Trust or its funds.
BNYM provides custody services to the Trust.
BNY Mellon Investment Servicing (U.S.) Inc. provides fund accounting and transfer agency services to the Trust.
General – Certain Trustees and Officers of the Trust are also Officers or employees of the above companies that provide services to the Funds, and during their terms of office, receive no compensation from the Funds. The Trust’s Statement of Additional Information includes additional information about the Trustees.
April 30, 2021 / ANNUAL REPORT
| | |
| NOTES TO FINANCIAL STATEMENTS (continued) | | 68 |
| 5. | INVESTMENT TRANSACTIONS |
Purchases and sales of investments, excluding short-term obligations and U.S. Government Securities, for the year ended April 30, 2021 were as follows:
| | | | | | | | | | |
| | |
| Fund | | Purchases | | Sales |
| | |
Broad Market Bond Fund | | $265,265,523 | | $179,068,748 |
Intermediate-Term Bond Fund | | 13,890,307 | | 19,367,346 |
Short-Term Bond Fund | | 27,454,012 | | 20,544,714 |
Municipal Bond Fund | | 105,092,691 | | 84,950,124 |
New York Municipal Bond Fund | | 10,732,163 | | 8,540,470 |
Purchases and sales of investments of U.S. Government Securities for the year ended April 30, 2021 were as follows:
| | | | |
| | |
| Fund | | Purchases | | Sales |
| | |
Broad Market Bond Fund | | $13,926,255 | | $14,092,270 |
Intermediate-Term Bond Fund | | 2,582,898 | | 4,611,100 |
Short-Term Bond Fund | | 13,008,822 | | 18,526,187 |
Market risk is the risk that one or more markets in which a Fund invests will go down in value, including the possibility that the markets will go down sharply and unpredictably. The value of a security or other asset may decline due to changes in general market conditions, economic trends or events that are not specifically related to the issuer of the security or other asset, or factors that affect a particular issuer or issuers, exchange, country, group of countries, region, market, industry, group of industries, sector or asset class. Local, regional or global events such as war, acts of terrorism, the spread of infectious illnesses or other public health issues, recessions, natural disasters or other events could have a significant impact on a Fund and its investments.
Recently, the global pandemic outbreak of an infectious respiratory illness caused by a novel coronavirus known as COVID-19 has resulted in substantial market volatility and global business disruption, impacting the global economy and the financial health of individual companies in significant and unforeseen ways. The duration and future impact of COVID-19 are currently unknown, which may exacerbate other types of risks that apply to the Funds and negatively impact Fund performance.
| 7. | CONTRACTUAL OBLIGATIONS |
In the normal course of business, the Funds may enter into contracts that provide general indemnifications. The Funds’ maximum exposure under these arrangements is dependent on claims that may be made against the Funds in the future, and, therefore, cannot be estimated; however, based on experience, the risk of material loss from such claims is considered remote.
The Trust participates in a $10,000,000 unsecured, committed revolving line of credit (“LOC”) agreement with BNYM, which was renewed effective April 1, 2021. The LOC is available for extraordinary or emergency purposes, primarily for financing redemption payments. Borrowings are charged interest at a rate of 1.25% per annum over the greater of the Federal Funds Rate or the one month London Interbank Offered Rate (“LIBOR”). The LOC includes a commitment fee of 0.20% per annum on the daily unused portion. Prior to April 1, 2021, the commitment fee was of 0.15% per annum on the daily unused portion. The LOC expires on March 31, 2022.
The Trust did not utilize the LOC during the year ended April 30, 2021.
| 9. | RECENT ACCOUNTING PRONOUNCEMENTS |
In August 2018, the Financial Accounting Standards Board (“FASB”) issued an Accounting Standards Update 2018-13 (“ASU 2018-13”), which changes certain fair value measurement disclosure requirements. ASU 2018-13, in addition to other modifications and additions, removes the requirement to disclose the amount and reasons for transfers between Level 1 and Level 2 of the fair value hierarchy, the policy for the timing of transfers between levels and the valuation process for Level fair value measurements. ASU 2018-13 is effective for fiscal years, and interim periods within those fiscal years, beginning after December 15, 2019. As of April 30, 2021, ASU 2018-13 has been fully adopted and the implementation did not have a material impact on the Funds’ financial statements.
In March 2020, the FASB issued ASU No. 2020-04 (“ASU 2020-04”), Reference Rate Reform (Topic 848) - Facilitation of the Effects of Reference Rate Reform on Financial Reporting. The amendments in ASU 2020-04 provides optional temporary financial reporting relief from the effect of certain types of contract modifications due to the planned discontinuation of the LIBOR and other interbank-offered based reference
ANNUAL REPORT / April 30, 2021
| | |
| 69 | | NOTES TO FINANCIAL STATEMENTS (concluded) |
rates as of the end of 2021. ASU 2020-04 is effective for certain reference rate-related contract modifications that occur during the period March 12, 2020 through December 31, 2022. Management is currently evaluating the impact, if any, of applying ASU 2020-04.
Management has evaluated events and transactions for potential recognition or disclosure in the financial statements through the date the financial statements were issued. Management has determined that there are no material events that would require recognition or disclosure in the Funds’ financial statements through this date, except as follows:
At a meeting of the Board of Trustees (the “Board”) of the Wilmington Funds held on June 3, 2021, management proposed and the Board approved a plan of reorganization for the Intermediate-Term Bond Fund and a plan of liquidation for the Short-Term Bond Fund. The plan of reorganization stated the Intermediate-Term Bond Fund will merge with the Broad Market Bond Fund with a proposed closing date in August 2021. The plan of liquidation for the Short-Term Bond Fund stated the liquidation will occur on July 22, 2021. A notice of the liquidation and merger was provided to shareholders in June 2021 and an information statement providing further details about the merger will be mailed to shareholders in July 2021.
April 30, 2021 / ANNUAL REPORT
REPORT OF INDEPENDENT REGISTERED PUBLIC ACCOUNTING FIRM
To the Board of Trustees of Wilmington Funds and Shareholders of Wilmington Broad Market Bond Fund, Wilmington Intermediate-Term Bond Fund, Wilmington Short-Term Bond Fund, Wilmington Municipal Bond Fund and Wilmington New York Municipal Bond Fund
Opinions on the Financial Statements
We have audited the accompanying statements of assets and liabilities, including the portfolios of investments, of Wilmington Broad Market Bond Fund, Wilmington Intermediate-Term Bond Fund, Wilmington Short-Term Bond Fund, Wilmington Municipal Bond Fund and Wilmington New York Municipal Bond Fund (five of the funds constituting Wilmington Funds, hereafter collectively referred to as the “Funds”) as of April 30, 2021, the related statements of operations for the year ended April 30, 2021, the statements of changes in net assets for each of the two years in the period ended April 30, 2021, including the related notes, and the financial highlights for each of the two years in the period ended April 30, 2021 (collectively referred to as the “financial statements”). In our opinion, the financial statements present fairly, in all material respects, the financial position of each of the Funds as of April 30, 2021, the results of each of their operations for the year then ended, the changes in each of their net assets for each of the two years in the period ended April 30, 2021 and each of the financial highlights for each of the two years in the period ended April 30, 2021 in conformity with accounting principles generally accepted in the United States of America.
The financial statements of the Funds as of and for the year ended April 30, 2019 and the financial highlights for each of the periods ended on or prior to April 30, 2019 (not presented herein, other than the financial highlights) were audited by other auditors whose report dated June 27, 2019 expressed unqualified opinions on those financial statements and financial highlights.
Basis for Opinions
These financial statements are the responsibility of the Funds’ management. Our responsibility is to express an opinion on the Funds’ financial statements based on our audits. We are a public accounting firm registered with the Public Company Accounting Oversight Board (United States) (PCAOB) and are required to be independent with respect to the Funds in accordance with the U.S. federal securities laws and the applicable rules and regulations of the Securities and Exchange Commission and the PCAOB.
We conducted our audits of these financial statements in accordance with the standards of the PCAOB. Those standards require that we plan and perform the audit to obtain reasonable assurance about whether the financial statements are free of material misstatement, whether due to error or fraud.
Our audits included performing procedures to assess the risks of material misstatement of the financial statements, whether due to error or fraud, and performing procedures that respond to those risks. Such procedures included examining, on a test basis, evidence regarding the amounts and disclosures in the financial statements. Our audits also included evaluating the accounting principles used and significant estimates made by management, as well as evaluating the overall presentation of the financial statements. Our procedures included confirmation of securities owned as of April 30, 2021 by correspondence with the custodian, transfer agents and brokers; when replies were not received from brokers, we performed other auditing procedures. We believe that our audits provide a reasonable basis for our opinions.
/s/PricewaterhouseCoopers LLP
Philadelphia, Pennsylvania
June 24, 2021
We have served as the auditor of one or more investment companies in Wilmington Funds since 2019.
ANNUAL REPORT / April 30, 2021 (unaudited)
BOARD OF TRUSTEES AND TRUST OFFICERS
The following tables give information about each Trustee and the senior officers of the Trust. The tables separately list Trustee members who are “interested persons” of the Fund (i.e., “Interested” Trustees) and those who are not (i.e., “Independent” Trustees). The Trust is comprised of 12 funds. Unless otherwise noted, the business address of each Trustee and senior officer is 1100 North Market Street, 9th Floor, Wilmington, DE 19890. Each Trustee oversees all portfolios of the Trust and serves for an indefinite term. The Trust’s Statement of Additional Information includes additional information about the Trustees and is available, without charge and upon request, by calling 1-800-836-2211.
INTERESTED TRUSTEES BACKGROUND
| | |
| |
Name Birth Year Position with Trust Date Service Began | | Principal Occupations and Other Directorships Held for Past Five Years |
| |
Dominick J. D’Eramo* Birth year: 1964 | | Principal Occupations: Senior Vice President, Wilmington Trust Investment Advisors, Inc. and Head of Fixed Income. |
TRUSTEE Began serving: November 2018 PRESIDENT Began serving: June 2018 | | Previous Positions: Group Vice President, Wilmington Trust Investment Advisor, Inc. (WTIA) (2014-2017); Administrative Vice President, WTIA (2012-2014). |
|
|
| | |
| | * | Dominick J. D’Eramo is “interested” due to his employment with WTIA and his position with WFMC, investment Advisors to the Funds. |
INDEPENDENT TRUSTEES BACKGROUND
| | |
| |
Name Birth Year Position with Trust Date Service Began | | Principal Occupations and Other Directorships Held for Past Five Years |
| |
Nicholas A. Giordano Birth year: 1943 CHAIRMAN and TRUSTEE Began serving: March 2012 | | Principal Occupations: Consultant, financial services organizations (1997 to present). Other Directorships Held: The RBB Fund Inc. (34 portfolios) (registered investment companies); Independence Blue Cross; IntriCon Corporation (body-worn products). Previous Positions: Director, Kalmar Pooled Investment Trust (through 6/17). |
| |
Robert H. Arnold Birth year: 1944 TRUSTEE Began serving: March 2012 | | Principal Occupations: Managing Director, R.H. Arnold & Co, Inc. (financial management consulting) (6/89 to present). Other Directorships Held: None. Previous Positions: Trustee, First Potomac Realty Trust (real estate investment trust) (5/03 to 12/17); Director, Treasury Strategies, Inc. (private treasury consulting services) (6/01 to 6/16). |
| |
Gregory P. Chandler Birth year: 1966 TRUSTEE Began serving: July 2017 | | Principal Occupations: Chief Financial Officer, Avocado Systems, Inc. (cybersecurity software) (3/20 to present); President, GCVC Consulting (financial and corporate governance advisory) (2008 to present). Other Directorships Held: Trustee, RBB Fund Series Trust (34 portfolios) (registered investment companies) (2012 to present); Trustee, FS Energy Partners (business development company) (2009 to present); Director, Emtec, Inc. (2005 to 2019); Director, FS Investment Corporation (business development company) (2007 to 2019); Previous Positions: Chief Financial Officer, Emtec, Inc. (information technology services) (2009 to 2020); Managing Director, Janney Montgomery Scott LLC (investment banking) (1999 to 2009); Consulting Manager, PwC (1997 to 1999); Manager, Business Assurance, Coopers & Lybrand (audit services) (1995 – 1997). |
April 30, 2021 (unaudited) / ANNUAL REPORT
| | |
| BOARD OF TRUSTEES AND TRUST OFFICERS | | 72 |
| | |
| |
Name Birth Year Position with Trust Date Service Began | | Principal Occupations and Other Directorships Held for Past Five Years |
| | |
Donald E. Foley Birth year: 1951 TRUSTEE Began serving: December 2015 | | Principal Occupations: Director, BioSig Technologies (2015 to present); Trustee, AXA Premier VIP Trust (2017 to present); Trustee, EQ Advisors Trust (2014 to present); Trustee, 1290 Funds (retail funds) (2014 to present); Chairman and Director, Burke Rehabilitation Hospital Foundation (private hospital, research institute) (2005 to present); Trustee and Chairman of the President’s Council, Union College (private college) (2011 to present); Chairman and Trustee, New Beginning Family Academy (elementary charter school) (2016 to present). Other Directorships Held: Director, M&T Bank Corporation (commercial bank) (2011 to 2012); Chairman and Director, Wilmington Trust Corporation (commercial and trust bank) (2007 to 2011). Previous Positions: Advisory Member, Trust and Investment Committee, M&T Bank, Wilmington Trust, National Association, and Wilmington Trust Company (through 2016); Chairman and Chief Executive Officer of Wilmington Trust Corporation (2010 to 2011). |
| |
Valerie J. Sill Birth year: 1962 TRUSTEE Began serving: April 2020 | | Principal Occupations: President, Chief Executive Officer and Chief Investment Officer, DuPont Capital Management (asset management) (2004 to present). Other Directorships Held: Trustee, Longwood Gardens (2005 to present); Trustee of the Christiana Care Health System (2012 to present); and Advisory Counsel, Federal Reserve Bank of Philadelphia’s Economic Advisory Council (2010 to 2013). Previous Positions: Executive Vice President at The Boston Company (1994 to 2004). |
OFFICERS
| | |
| |
Name Birth Year Positions with Trust | | Principal Occupations for Past Five Years and Previous Positions |
| |
John C. McDonnell Birth year: 1966 CHIEF OPERATIONS OFFICER Began serving: June 2017 VICE PRESIDENT Began serving: June 2012 | | Principal Occupations: Chief Operations Officer, Wilmington Funds; Administrative Vice President, Wilmington Funds Management Corporation (2005 to present); Administrative Vice President, Wilmington Trust Investment Advisors, Inc. (2012 to present). Previous Positions: Vice President, Wilmington Trust Investment Management, LLC (2005 to 2012). |
| |
Lisa Druelinger Birth year: 1978 CHIEF COMPLIANCE OFFICER and AML COMPLIANCE OFFICER. Began serving: November 2017 | | Principal Occupations: Chief Compliance Officer and Anti-Money Laundering Officer, Wilmington Funds; Administrative Vice President, M&T Bank. Previous Positions: Vice President and Senior Compliance Officer, Wilmington Trust Investment Advisors, Inc. (2015-2017); Wilmington Funds Product Manager, Wilmington Trust Investment Advisors, Inc. (2013-2015); Institutional and Retirement Services Product Manager, Wilmington Trust (2011-2013); Trust Compliance and Risk Management at M&T Bank (2006-2011). |
| |
John J. Kelley Birth year: 1959 VICE PRESIDENT Began serving: December 2016 | | Principal Occupations: President of Wilmington Funds Management Corporation; Group Vice President and Chief Administrative Officer, Wilmington Trust Investment Advisors, Inc. Previous Positions: Vice President, BNY Mellon Investment Servicing (formerly, PNC Global Investment Servicing) from (1/05 to 7/05); Vice President of Administration, 1838 Investment Advisors, LP (1999 to 2005); Chief Compliance Officer, 1838 Investment Advisors, LP (2004 to 2005). |
ANNUAL REPORT / April 30, 2021 (unaudited)
| | |
| 73 | | BOARD OF TRUSTEES AND TRUST OFFICERS |
| | |
| |
Name Birth Year Positions with Trust | | Principal Occupations for Past Five Years and Previous Positions |
| |
Robert L. Tuleya Birth year: 1974 VICE PRESIDENT and ASSISTANT SECRETARY Began serving: September 2018 | | Principal Occupations: Vice President and Assistant Secretary, Wilmington Funds; Vice President and Assistant Secretary, Wilmington Funds Management Corporation (2018 to present); Vice President and Assistant Secretary, Wilmington Trust Investment Advisors, Inc. (2018 to present); Vice President and Assistant Secretary, Wilmington Trust Investment Management, LLC (2018 to present); Vice President and Assistant General Counsel, M&T Bank (2018 to present). Previous Positions: Vice President and Counsel, M&T Bank (2017 to 2018); Senior Counsel,PNC Bank (2014 to 2017). |
| |
Christopher W. Roleke 10 High Street, Suite 302 Boston, MA 02110 Birth year: 1972 CHIEF EXECUTIVE OFFICER Began serving: October 2020 | | Principal Occupation: Managing Director and Fund Principal Financial Officer, Foreside Management Services, LLC (2011 to present). Previous Positions: Assistant Vice President, JP Morgan Investor Services Co. (2006 to 2011). |
| |
Arthur W. Jasion Three Canal Plaza, Suite 100 Portland, ME 04101 Birth year: 1965 CHIEF FINANCIAL OFFICER AND TREASURER Began serving: October 2020 | | Principal Occupation: Senior Director and Fund Principal Financial Officer, Foreside Management Services, LLC (2020 to present). Previous Positions: Partner, Ernst &Young LLP (2012 to 2020). |
| |
Lisa R. Grosswirth 240 Greenwich Street, 22nd Floor New York, NY 10286 Birth year: 1963 SECRETARY Began serving: September 2007 | | Principal Occupation: Vice President, BNY Mellon Asset Servicing (2004 to present). Previous Positions: Supervisory Paralegal, The Dreyfus Corporation (1998 to 2004). |
April 30, 2021 (unaudited) / ANNUAL REPORT
Board Approval of Liquidity Risk Management Program
To promote effective liquidity risk management throughout the fund industry and to enhance disclosure regarding fund liquidity and redemption practices, the Securities and Exchange Commission (the “Commission”) adopted Rule 22e-4 under the Investment Company Act of 1940, as amended. The rule requires every registered open-end management company to establish a liquidity risk management program that, among other things, provides for the assessment, management and review of liquidity risk, the classification of a fund’s portfolio investments into one of four liquidity buckets based upon the number of days that such investments may reasonably be expected to be converted into cash or otherwise disposed of without significantly impacting their price, the establishment of a highly liquid investment minimum where required, and the establishment of a 15% limitation on illiquid investments. Additionally, the Commission adopted Rule 30b1-10 and Form N-LIQUID, which generally requires a fund to notify the Commission when certain liquidity-related events occur.
The Wilmington Funds Board of Trustees (the “Board”) approved the appointment of the Funds’ Liquidity Risk Management Committee (“Liquidity Committee”) as the administrator of the liquidity risk management program (the “LRMP”) for the Funds on September 6, 2018 and the Funds’ final LRMP on March 5, 2019. At the regular meeting of the Board on March 10, 2021, the Trust’s Chief Operations Officer, as a member of the Liquidity Committee, provided a report to the Board on the operation and effectiveness of the LRMP for the year of operation ending December 31, 2020. The Liquidity Committee managed liquidity risks associated with the Funds’ investments by monitoring cash and cash equivalents, the use of derivatives, the concentration of investments and the appropriateness of portfolio strategies for open-end funds, and by classifying each investment of a Fund as either highly liquid, moderately liquid, less liquid or illiquid on at least a monthly basis. To assist with the classification of each Fund’s investments, the Liquidity Committee utilized a third party provider of liquidity monitoring services. The Liquidity Committee supplied portfolio-level data and certain assumptions to the provider which then used the information to determine the liquidity classification of each security position held by the Funds. The liquidity classifications as of each month end were reviewed by the Liquidity Committee on at least a quarterly basis and would be reviewed more often if market conditions warranted. For assets managed by a third party sub-adviser the Liquidity Committee would take sub-adviser input into account where appropriate in determining the liquidity classifications.
The LRMP effectively managed the Funds’ liquidity risks for the twelve month period ended April 30, 2021. During this period, each Fund held more than 50% of its total net assets in highly liquid investments and due to the fact that each Fund is deemed to consist primarily of highly liquid investments, no highly liquid investment minimum was required to be established for any Fund. All Funds holding assets deemed to be illiquid were well under the illiquid investment limitation. Additionally, no events occurred that required the filing of Form N-LIQUID.
ANNUAL REPORT / April 30, 2021 (unaudited)
Shares of the Wilmington Funds are not FDIC insured or otherwise protected by the U.S. government, are not deposits or other obligations of, or guaranteed by, Manufacturers and Traders Trust Company, and are subject to investment risks, including possible loss of the principal amount invested.
VOTING PROXIES ON FUND PORTFOLIO SECURITIES
A description of the policies and procedures that the Funds use to determine how to vote proxies relating to securities held in the Funds’ portfolios is available, without charge and upon request, by calling 1-800-836-2211. A report on how the Funds voted any such proxies during the most recent 12-month period ended June 30 is available through Wilmington Funds’ website. Go to www.wilmingtonfunds.com select “Proxy Voting Record” to access the link. This information is also available from the Edgar database on the SEC’s website at www.sec.gov.
QUARTERLY PORTFOLIO SCHEDULE
The Funds file a complete schedule of portfolio holdings with the SEC for the first and third quarters of each fiscal year as an exhibit to its reports on Form N-PORT. Form N-PORT is available on the SEC’s website at www.sec.gov.
Important information about the access and delivery of shareholder reports
Beginning on June 1, 2021, as permitted by regulations adopted by the Securities and Exchange Commission, paper copies of your Fund’s shareholder reports will no longer be sent to you by mail, unless you specifically request them. You will be notified by mail each time a report is posted on the Funds’ website and you will be provided with a link to access the report.
If you have already elected to receive shareholder reports electronically, you will not be affected by this change and you do not need to take any action. You may elect to receive other communications electronically from the Fund by contacting your financial intermediary or, if you hold shares directly with the Fund, by calling 1-800-836-2211.
You may elect to receive paper copies of all future shareholder reports free of charge. If you own these shares through a financial intermediary, you may contact your financial intermediary to elect to receive paper copies of your shareholder reports. If you are a direct investor you can inform the Wilmington Funds that you wish to continue receiving paper copies of your shareholder reports by contacting us at 1-800-836-2211. Your election to receive paper reports will apply to all funds held directly with Wilmington Funds and may apply to all funds held with your financial intermediary.
April 30, 2021 (unaudited) / ANNUAL REPORT
PRIVACY POLICY AND NOTICE
OF THE FUNDS AND THEIR DISTRIBUTOR
June 8, 2012
The Wilmington Funds, their distributor and their agents (referred to as “the Funds”, “we” or “us”) recognize that consumers (referred to as “you” or “your”) expect us to protect both your assets and financial information. We respect your right to privacy and your expectation that all personal information about you or your account will be maintained in a secure manner. We are committed to maintaining the confidentiality, security and integrity of client and shareholder information. We want you to understand the Funds’ policy that governs the handling of your information, how the Funds gather information, how that information is used and how it is kept secure.
Information The Funds Collect:
The Funds collect nonpublic personal information about you from the following sources:
• We may receive information from you, or from your financial representative, on account applications, other forms or electronically (such as through the Funds’ website or other electronic trading mechanisms). Examples of this information include your name, address, social security number, assets and income.
• We may receive information from you, or from your financial representative, through transactions with us or others, correspondence and other communications. Examples of this information include specific investments and your account balances.
• We may obtain other personal information from you in connection with providing you a financial product or service. Examples of this information include depository, debit or credit account numbers.
Information Sharing Policy:
The Funds may share nonpublic personal information about you, as described above, with financial or non-financial companies or other entities, including companies that may be affiliated with the Funds and other nonaffiliated third parties, for the following purposes:
• We may share information when it is necessary and required to process a transaction or to service a customer relationship. For example, information may be shared with a company that provides account record keeping services or a company that provides proxy services to shareholders.
• We may share information when it is required or permitted by law. For example, information may be shared in response to a subpoena or to protect you against fraud or with someone who has established a legal beneficial interest, such as a power of attorney.
• We may disclose some or all of the information described above to companies that perform marketing or other services on our behalf. For example, we may share information about you with the financial intermediary (bank, investment bank or broker-dealer) through whom you purchased the Funds’ products or services, or with providers of marketing, legal, accounting or other professional services. The Funds will not, however, disclose a consumer’s account number or similar form of access number or access code for credit card, deposit or transaction accounts to any nonaffiliated third party for use in telemarketing, direct mail or other marketing purposes.
Except as described above, the Funds do not share customer information. We will not rent, sell, trade, or otherwise release or disclose any personal information about you. Any information you provide to us is for the Funds’ use only. If you decide to close your account(s) or become an inactive customer, we will adhere to the privacy policies and practices as described in this notice.
Information Security:
When the Funds share nonpublic customer information with third parties hired to facilitate the delivery of certain products or services to our customers, such information is made available for limited purposes and under controlled circumstances designed to protect our customers’ privacy. We require third parties to comply with our standards regarding security and confidentiality of such information. We do not permit them to use that information for their own or any other purposes, or rent, sell, trade or otherwise release or disclose the information to any other party. These requirements are reflected in written agreements between the Funds and the third party service providers.
The Funds protect your personal information in several ways. We maintain physical, electronic, and procedural safeguards to guard your nonpublic personal information. In addition, the Funds’ Transfer Agent and Shareholder Servicing Agent have procedures in place for the appropriate disposal of nonpublic personal information when they are no longer required to maintain the information.
Each of the following sections explains an aspect of the Funds’ commitment to protecting your personal information and respecting your privacy.
Employee Access to Information:
Our Code of Ethics, which applies to all employees, restricts the use of customer information and requires that it be held in the strictest of confidence. Employee access to customer information is authorized for business purposes only, and the degree of access is based on the sensitivity of the information and on an employee’s or agent’s need to know the information in order to service a customer’s account or comply with legal requirements.
Visiting The Funds’ Website:
The Funds’ website gathers and maintains statistics about the number of visitors as well as what information is viewed most frequently. This information is used to improve the content and level of service we provide to our clients and shareholders.
• Information or data entered into a website will be retained.
ANNUAL REPORT / April 30, 2021 (unaudited)
• Where registration to a website or re-entering personal information on a website is required, “cookies” are used to improve your online experience. A cookie is a way for websites to recognize whether or not you have visited the site before. It is a small file that is stored on your computer that identifies you each time you re-visit our site so you don’t have to resubmit personal information. Cookies provide faster access into the website.
• We may also collect non-personally identifiable Internet Protocol (“IP”) addresses for all other visitors to monitor the number of visitors to the site. These non-personally identifiable IP addresses are never shared with any third party.
E-mail:
If you have opted to receive marketing information from the Funds by e-mail, it is our policy to include instructions in all marketing messages on how to unsubscribe from subsequent e-mail programs. Some products or services from the Funds are intended to be delivered and serviced electronically. E-mail communication may be utilized in such cases. If you participate in an employer-sponsored retirement plan administered by the Funds, we may, at your employer’s request, send you e-mail on matters pertaining to the retirement plan.
Please do not provide any account or personal information such as social security numbers, account numbers, or account balances within your e-mail correspondence to us. We cannot use e-mail to execute transaction instructions, provide personal account information, or change account registration. We can, however, use e-mail to provide you with the necessary forms or you may contact customer service toll-free at 1-800-836-2211.
Surveys/Aggregate Data:
Periodically, the Funds may conduct surveys about financial products and services or review elements of customer information in an effort to forecast future business needs. The Funds then generate reports that include aggregate data regarding its customers. Aggregate data classifies customer information in various ways but that does not identify individual customers. These reports may also include information on website traffic patterns and related information. These reports are used for the Funds’ planning, statistical and other corporate purposes. Aggregate data may also be shared with external parties, such as marketing organizations. However, no information is shared by which any individual customer could be identified.
Changes to Our Privacy Statement:
The effective date of this policy is June 8, 2012. We reserve the right to modify this policy at any time. When it is revised or materially changed, we will update the effective date. You can determine whether there have been changes since the last time you reviewed by simply checking the effective date.
Notice will be provided to you in advance of any changes that would affect your rights under this policy statement.
April 30, 2021 (unaudited) / ANNUAL REPORT
[This Page Intentionally Left Blank]
[This Page Intentionally Left Blank]
[This Page Intentionally Left Blank]
WILMINGTON FUNDS Investment Advisor Wilmington Funds Management Corp. 1100 North Market Street 9th Floor Wilmington, DE 19890 Sub-Advisor Wilmington Trust Investment Advisors, Inc. 1100 North Market Street 9th Floor Wilmington, DE 19890 Co-Administrator Wilmington Funds Management Corp. 1100 North Market Street 9th Floor Wilmington, DE 19890 Custodian The Bank of New York Mellon 240 Greenwich Street New York, NY 10286 Distributor ALPS Distributors, Inc. 1290 Broadway, Suite 1100 Denver, CO 80203 Fund Accountant, Co-Administrator, Transfer Agent and Dividend Disbursing Agent BNY Mellon Investment Servicing (U.S.) Inc. 301 Bellevue Parkway Wilmington, DE 19809 Independent Registered Public Accounting Firm PricewaterhouseCoopers LLP Two Commerce Square 2001 Market Street, Suite 1800 Philadelphia, PA 19103 WT-AR-FI-0421 Wilmington Funds | 1-800-836-2211 | www.wilmingtonfunds.com We are pleased to send you this shareholder report for the Wilmington Funds. This report contains important information about your investments in the funds.
Wilmington FUNDS
April 30, 2021
PRESIDENT’S MESSAGE AND
Annual Report
WILMINGTON FUNDS
Money Market Funds
Wilmington U.S. Government Money Market Fund
Wilmington U.S. Treasury Money Market Fund

Wilmington U.S. Government Money Market Fund (“U.S. Government Money Market Fund”)
Wilmington U.S. Treasury Money Market Fund (“U.S. Treasury Money Market Fund”)

CONTENTS

[This Page Intentionally Left Blank]
PRESIDENT’S MESSAGE (unaudited)
Esteemed Shareholder:
I am pleased to present the Annual Report of the Wilmington Funds (the “Trust”), covering the Trust’s annual fiscal year of May 1, 2020, through April 30, 2021. Inside you will find a comprehensive review of the Trust’s holdings and financial statements.
The economy and financial markets in review
Wilmington Funds Management Corporation and Wilmington Trust Investment Advisors, Inc. (the Trust’s investment advisor and subadvisor, respectively), have provided the following review of the economy, bond markets, and stock markets for the Trust’s annual fiscal year.
The economy
The last year was one for the history books and captured both the worst of the COVID-19 pandemic’s impact on global output, as well as the early stages of recovery as vaccines and unprecedented volumes of fiscal and monetary stimulus helped the global economy get back on its feet. The U.S. began the period with one of the steepest quarterly declines on record in Q2 2020 as strict lockdown measures imposed to contain the virus abruptly brought in-person activity to a near halt.
The pace and magnitude of the economic rebound that followed was comparably profound as the approval and distribution of highly effective vaccines and rising COVID-19 vaccination rates across the world in 2021 provided investors with a much-needed light at the end of the tunnel. The federal government’s provision of direct checks to many Americans and extended unemployment benefits padded consumer savings, more than offsetting wages lost by low income consumers, and helped to fuel a robust rebound in spending on goods. Spending on services, which depends more on in person interaction, has still yet to recover to pre-pandemic levels but showed signs of picking up in 1Q 2021 as a growing number of states peeled back virus restrictions. The labor market recovered considerably in the period, as the unemployment rate dropped from 14.7% in April 2020, the highest observed since the Great Depression, to 6.1% one year later. The Federal Reserve (the “Fed”) upgraded its outlook for economic activity and inflation, but still guided for rates to remain near zero for years to come and for monthly purchases of treasuries and mortgage-backed securities to continue for the time being.
Economic activity outside the U.S. varied between regions depending on the success of virus containment and vaccination efforts. The eurozone was bogged down by weakness in the services sector for much of the period. Gross Domestic Product (“GDP”) growth contracted in the region for a second consecutive quarter in 1Q 2021 as many of the largest economies kept tight mobility restrictions in place in response to a resurgence of infections and the looming threat of new virus variants. However, notable strength on the industrial side of the economy provided some offset as manufacturing activity benefitted from strength in global goods demand. After a rocky start, vaccination efforts in many European countries began to accelerate in March and April of 2021 paving the way for renewed reopening efforts.
The virus remained a persistent threat for many developing economies, where vaccination campaigns broadly lagged the developed world by a substantial margin. Brazil and India in particular, emerged as virus epicenters in early 2021 after witnessing sharp spikes in infection rates, providing a grim reminder of the need for vaccination efforts to broaden in the emerging world. China was first in and first out of the COVID-19 pandemic after controlling infection rates more effectively and far earlier than most countries and was the only major economy to record positive GDP growth in 2020. Chinese manufacturing activity expanded at a feverish pace for much of the period, benefitting from goods exports and government investment. The services side of the economy lagged but began to narrow the gap later in the period as a brief rise in virus cases was brought under control.
Bond markets
Fixed income performance was mixed over the past year as spreads compressed materially across taxable and tax-exempt credit from extreme levels recorded in early 2020. However, rising long-term rates served as a headwind later in the period. The U.S. 10-year Treasury yield surged over 80 basis points1 in 1Q 2021 for its largest quarterly rise since 2016, buttressed by an improving growth outlook and expectations for higher inflation later in the year. Upward rate pressure weighed heavily on investment grade taxable bonds, as the Bloomberg Barclays U.S. Aggregate Bond Index suffered its worst quarter in several decades in 1Q, more than offsetting gains booked in much of 2020. In investment grade, tax-exempt held up better than taxable peers as strong demand for yield offset more muted new supply, helping to overshadow the rise in rates. Municipals also benefitted from the American Recovery Plan passed by the federal government in March 2021, which included $350 billion of funding for state and local governments. High-yield credit outperformed investment grade in both the taxable and tax-exempt spaces substantially as spreads continued to normalize from more elevated levels, and investors embraced riskier assets.
PRESIDENT’S MESSAGE / April 30, 2021 (unaudited)
For the 12-month period May 1, 2020 to April 30, 2021, certain Bloomberg Barclays indices performed as follows:2
| | | | | | | | |
| | | | |
Bloomberg Barclays U.S. Treasury Bond Index3 | | Bloomberg Barclays U.S. Aggregate Bond Index4 | | Bloomberg Barclays U.S. Credit Bond Index5 | | Bloomberg Barclays Municipal Bond Index6 | | Bloomberg Barclays U.S. Corporate High Yield Bond Index7 |
-4.32% | | -0.27% | | 4.25% | | 7.75% | | 19.67% |
Past performance is no guarantee of future results. Short-term performance may not be indicative of long-term results.
Source: Lipper. You cannot invest directly in an index.
Equity markets
Global equities recorded historically strong performance over the past 12-months as concerns over the initial spread of COVID-19 gave way to optimism over the pace of subsequent recovery. After suffering a -33% market rout in February and March of 2020, the S&P 500 reclaimed its pre-pandemic peak by August of that year, marking the fastest bear market recovery on record. U.S. large cap outperformed from April through November as mega-cap growth stocks that benefitted most from the “stay- at- home” environment prevailed.
November brought an immense shift in leadership, as positive vaccine developments and growing optimism for a swifter return to normal fueled a powerful rotation into economically sensitive areas of the market. U.S. small-cap and value stocks, which carry a heavier weighting toward cyclical sectors, were notable beneficiaries of this trend.
Emerging market equities recorded solid gains in the reflationary environment but saw some weakness in February as certain regions struggled with new outbreaks of COVID-19. In addition, Chinese equities, which comprise a significant share of the MSCI Emerging Markets Index, were weighed down by a mix of regulatory headwinds and concerns over policy tightening. International developed equities also performed well and benefitted from a tilt toward segments that benefit most from rising interest rates and inflation. Equities in Europe picked up momentum towards the end of the period amidst an improving economic outlook for many of the region’s largest countries as vaccinations ramped up.
For the 12-month period May 1, 2020 to April 30, 2021, certain stock market indices performed as follows:
| | | | | | | | | | | | | | | |
| | | |
S&P 500® Index8 | | Russel
2000® Index9 | | MSCI EAFE
(Net) Index10 | | MSCI Emerging
Markets (Net) Index11 |
45.98% | | 74.91% | | 39.88% | | 48.71% |
Past performance is no guarantee of future results. Short-term performance may not be indicative of long-term results.
Source: Lipper. You cannot invest directly in an index.
Although we have begun a new fiscal year, we will never forget the daunting damage that the pandemic has wrought on multiple levels. Still, there is much in the world that is positive, hopeful, and strong. I am referring to our trusted partnership with our clients, our desire to stay close to what’s important to them, and our fervent dedication to helping them achieve their long-term investment objectives. On that—as well as our fiduciary, clients-first mindset—you can always count.
Sincerely,

Dominick J. D’Eramo, CFA
President
May 14, 2021
April 30, 2021 (unaudited) / PRESIDENT’S MESSAGE
Must be preceded or accompanied by a prospectus.
Past performance is no guarantee of future results. The index performance quoted is for illustrative purposes only and is not representative of any specific investment. Diversification does not ensure a profit nor protect against loss.
All investments involve risk, including the possible loss of principal. Equity securities are subject to price fluctuation and possible loss of principal. Small- and mid-cap stocks involve greater risks and volatility than large-cap stocks. International investments are subject to special risks, including currency fluctuations, social, economic, and political uncertainties, which could increase volatility. These risks are magnified in emerging markets.
High-yield, lower-rated securities generally entail greater market, credit, and liquidity risks than investment grade securities and may include higher volatility and higher risk of default.
You could lose money by investing in the money market funds. Although the money market funds seek to preserve the value of your investment at $1.00 per share, it cannot guarantee it will do so. An investment in money market funds is not a deposit of M&T Bank and is not insured or guaranteed by the Federal Deposit Insurance Corporation or any other government agency. The investment advisor has no legal obligation to provide financial support to the Fund, and you should not expect that the investment advisor will provide financial support to the Fund at any time.
| 1. | Basis Points (“BPS”) is a unit that is equal to 1/100th of 1% and is used to denote the change in a financial instrument. The basis point is commonly used for calculating changes in interest rates, equity indices and the yield of a fixed-income security. |
| 2. | Bond prices are sensitive to changes in interest rates and a rise in interest rates can cause decline in their prices. |
| 3. | Bloomberg Barclays U.S. Treasury Bond Index is a market capitalization weighted index that includes all publicly issued U.S. Treasury securities that have a remaining maturity of at least one year, are rated investment-grade, and have $250 million or more of outstanding face value. The index is unmanaged and investments cannot be made directly in an index. |
| 4. | Bloomberg Barclays U.S. Aggregate Bond Index is a widely used benchmark index for the domestic investment-grade bond market composed of securities from the Barclays Government/Corporate Bond Index, Mortgage-Backed Securities Index and Asset-Backed Securities Index. The index typically includes fixed income securities with overall intermediate- to long-term average maturities. The index is unmanaged and investments cannot be made directly in an index. |
| 5. | Bloomberg Barclays U.S. Credit Bond Index tracks the performance of domestic investment-grade corporate bonds and is composed of all publicly issued, fixed-rate, nonconvertible, investment-grade corporate debt. The index is unmanaged and investments cannot be made directly in an index. |
| 6. | Bloomberg Barclays Municipal Bond Index tracks the performance of the long-term, tax-exempt, investment-grade bond market. To be included in the index, bonds must have an outstanding par balance of at least $7 million and be issued as part of a transaction of at least $75 million. The index is unmanaged and investments cannot be made directly in an index. |
| 7. | Bloomberg Barclays U.S. Corporate High Yield Bond Index measures the USD-denominated, high yield, fixed-rate corporate bond market. Securities are classified as high yield if the middle rating of Moody’s, Fitch, and S&P is Ba1/BB+/BB+ or below. Bonds from issuers with an emerging markets country of risk, based on the Bloomberg Barclays EM country definition, are excluded. The U.S. Corporate High Yield Bond Index is a component of the U.S. Universal and Global High Yield Indices. An investment cannot be made directly in an index. |
| 8. | The S&P 500® Index is a capitalization-weighted index of 500 stocks designed to measure performance of the broad domestic economy through changes in the aggregate market value of 500 stocks representing all major industries. The index is unmanaged and investments cannot be made directly in an index. |
| 9. | The Russell 2000® Index measures the performance of the 2,000 smallest companies in the Russell 3000® Index, which represents approximately 8% of the total market capitalization of the Russell 3000® Index. As of its latest reconstitution, the index had a total market capitalization range of $152.3 million to $5 billion. The index is unmanaged and investments cannot be made directly in an index. |
| 10. | MSCI EAFE (Net) Index is a free float-adjusted market capitalization index that is designed to measure equity market performance of developed markets, excluding the U.S. & Canada. The MSCI EAFE (Net) Index is an equity index which captures large and mid-cap representation across 21 Developed Markets countries: Australia, Austria, Belgium, Denmark, Finland, France, Germany, Hong Kong, Ireland, Israel, Italy, Japan, the Netherlands, New Zealand, Norway, Portugal, Singapore, Spain, Sweden, Switzerland and the United Kingdom. The index is unmanaged and investments cannot be made directly in an index. The performance of this index is reduced by the taxes on dividends paid by the international securities issuers in the index. |
| 11. | MSCI Emerging Markets (Net) Index is a free float-adjusted market capitalization index that is designed to measure equity market performance of emerging markets. The MSCI Emerging Markets (Net) Index captures large and mid-cap representation across 27 Emerging Markets countries: Argentina, Brazil, Chile, China, Colombia, Czech Republic, Egypt, Greece, Hungary, India, Indonesia, Korea, Kuwait, Malaysia, Mexico, Pakistan, Peru, Philippines, Poland, Qatar, Russia, Saudi Arabia, South Africa, Taiwan, Thailand, Turkey and United Arab Emirates. The index is unmanaged and investments cannot be made directly in an index. The performance of this index is reduced by the taxes on dividends paid by the international securities issuers in the index. |
PRESIDENT’S MESSAGE / April 30, 2021 (unaudited)
WILMINGTON MONEY MARKET FUNDS
Management’s Discussion of Fund Performance
Thankfully, the economy is reopening as the vaccination rollout has been very successful. We are certainly in a much better place than we were a year ago. Your fixed income team continues to meet “virtually” daily to review current events and set strategy. We continue to utilize our disciplined relative value investment process. We emphasize our guiding philosophies of maintaining well diversified and liquid portfolios. We conduct our own independent credit analysis. Most importantly in these uncertain times, we draw upon our experienced team. As always, our disciplined risk management efforts guide our investment decisions.
We feel the economy is in a much better place than it was a year ago. The unemployment rate has fallen from 14.7% to 6.1%, although still above the pre-pandemic level of 3.5%. Economic growth as measured by Gross Domestic Product (“GDP”) has fully rebounded to pre-pandemic levels. 1st quarter GDP was up a robust 6.4%, the 2nd strongest quarterly growth rate since 2003. The catalysts for the economic rebound have been the various significant stimulus programs and extremely accommodative monetary policy. The Federal Reserve (the “Fed”) expects to maintain the zero interest rate policy through 2023 and will allow inflation to run moderately above 2%. The latest inflation data was concerning with the core CPI (Consumer Price Index) rising by 0.9% its largest increase since 1982. The price increases were driven by some of the sectors of the economy that are reopening. For example, airfares rose by 10.2%, hotel prices were up by 8.8%. The Fed has communicated that they expect the rise in inflation to be “transitory” and therefore will not look to react by raising interest rates unless inflation moves higher for a longer period.
Longer-term interest rates have moved higher on the better than expected economic growth and the expectations for higher inflation. The 10-year Treasury yield at fiscal year end was 1.63%, up 1% over the past year. The total return for the 10-year Treasury for the fiscal year was -7.69% given the rise in interest rates. Short-term interest rates have been unchanged over the past year as they are anchored by the Fed’s expectation to maintain the very low interest rate policy. The 2-year Treasury had a yield of 0.16% on April 30, 2021.
Looking forward, the expectation is for the Fed to maintain a zero-interest rate policy until the economy recovers from the pandemic. The market is anticipating no change in the Fed Funds target before 2022. With the Fed Funds rate anchored at 0-25 basis points, rates in the short end will remain low, presenting a challenging environment for money market investors.
The change in key interest rates over the last twelve months is presented below.
| | | | | | |
| | | | |
| | | 04/30/20 | | 10/31/20 | | 04/30/21 |
| | | | |
Federal Fund Target | | 0.00% - 0.25% | | 0.00% - 0.25% | | 0.00% - 0.25% |
| | | | |
3-Month LIBOR | | 0.56% | | 0.22% | | 0.18% |
| | | | |
2-Year Treasury Note | | 0.20% | | 0.14% | | 0.16% |
| | | | |
10-Year Treasury Note | | 0.64% | | 0.88% | | 1.65% |
The following is a comparison of the performance of the Wilmington U.S. Government Money Market Fund and Wilmington U.S. Treasury Money Market Fund versus their respective iMoneyNet and Lipper peer group average returns for the fiscal April 30, 2021:
| | | | |
| Wilmington U.S. Government Money Market Fund – Administrative Class | | | 0.01 | % |
| |
| Wilmington U.S. Government Money Market Fund – Institutional Class | | | 0.02 | % |
| |
Wilmington U.S. Government Money Market Fund – Select Class | | | 0.02 | % |
| |
Wilmington U.S. Government Money Market Fund – Service Class | | | 0.01 | % |
| |
iMoneyNet, Inc. Government & Agency Institutional Average | | | 0.03 | % |
| |
Lipper U.S. Government Money Market Funds Average | | | 0.02 | % |
| |
| Wilmington U.S. Treasury Money Market Fund – Administrative Class | | | 0.01 | % |
| |
Wilmington U.S. Treasury Money Market Fund – Institutional Class | | | 0.02 | % |
| |
Wilmington U.S. Treasury Money Market Fund – Select Class | | | 0.02 | % |
| |
Wilmington U.S. Treasury Money Market Fund – Service Class | | | 0.01 | % |
| |
iMoneyNet, Inc. Treasury and Repo Institutional Average | | | 0.02 | % |
| |
Lipper U.S. Treasury Money Market Funds Average | | | 0.02 | % |
Source: iMoneyNet, Inc. and Lipper
April 30, 2021 (unaudited) / ANNUAL REPORT
Performance shown represents past performance and does not guarantee future results. Investment return will fluctuate. The total return shown assumes the reinvestment of all distributions and does not reflect the deduction of taxes that a shareholder would pay on Fund distributions. Shares, when redeemed, may be worth more or less than their original cost. Current performance may be lower or higher than that shown here. You should consider the investment objectives, risks, charges and expenses of the Funds carefully before investing. A prospectus with this and other information may be obtained by calling 1-800-836-2211 or visiting the Funds’ web site at www.wilmingtonfunds.com. The prospectus should be read before investing.
The Funds’ shares are not bank deposits and are not insured by, guaranteed by, endorsed by or obligations of the Federal Deposit Insurance Corporation, the Federal Reserve Board, any government agency or any bank. Although the Funds seek to preserve the value of your investment at $1.00 per share, it is possible to lose money by investing in the Funds.
During the fiscal year ended April 30, 2021, Wilmington Funds Management Corporation has voluntarily agreed to reduce their advisory fee and/or reimburse certain of the Funds’operating expenses, and/or certain class-specific fees and expenses, in an effort to maintain the current yield of each share class at or above zero. The fee waiver does not take into consideration acquired fund fees and expenses, taxes or extraordinary items. Any such waiver or expense reimbursement may be modified or discontinued at any time without notice.
London Interbank Offered Rate (LIBOR) is a benchmark rate that some of the world’s leading banks charge each other for short-term loans. It serves as the first step to calculating interest rates on various loans throughout the world.
ANNUAL REPORT / April 30, 2021 (unaudited)
SHAREHOLDER EXPENSE EXAMPLE (unaudited)
As a shareholder of a Fund, you incur two types of costs: (1) transaction costs, including sales charges (loads) on purchase payments, reinvested dividends, or other distributions; and redemption fees; and (2) ongoing costs, including management fees; distribution and/or service (12b-1) fees; and other Fund expenses. This Example is intended to help you to understand your ongoing costs (in dollars) of investing in the Funds and to compare these costs with the ongoing costs of investing in other mutual funds. It is based on an investment of $1,000 invested at the beginning of the period and held for the entire period from November 1, 2020 to April 30, 2021.
Actual Expenses
This section of the following table provides information about actual account values and actual expenses. You may use the information in this section, together with the amount you invested, to estimate the expenses that you incurred over the period. Simply divide your account value by $1,000 (for example, an $8,600 account value divided by $1,000 = 8.6), then multiply the result by the number in the first section under the heading entitled “Expenses Paid During Period” to estimate the expenses attributable to your investment during this period.
Hypothetical Example for Comparison Purposes
This section of the following table provides information about hypothetical account values and hypothetical expenses based on the Funds’ actual expense ratios and assumed rates of return of 5% per year before expenses, which are not the Funds’ actual returns. Thus, you should not use the hypothetical account values and expenses to estimate the actual ending account balance or your expenses for the period. Rather, these figures are required to be provided to enable you to compare the ongoing costs of investing in the Funds with other funds. To do so, compare this 5% hypothetical example with the 5% hypothetical examples that appear in the shareholder reports of the other funds.
Please note that the expenses shown in the table are meant to highlight your ongoing costs only. Therefore, the Annualized Net Expense Ratio section of the table is useful in comparing ongoing costs only, and will not help you determine the relative total costs of owning different funds.
The Annualized Net Expense Ratios may be different from the net expense ratios in the Financial Highlights which are for the fiscal year ended April 30, 2021.
| | | | | | | | | | | | | | | | | | | | |
| | | | |
| | | Beginning Account Value 11/01/20 | | Ending Account Value 4/30/21 | | Expenses Paid During Period(1) | | Annualized Net Expense Ratio(2) |
| | | | |
WILMINGTON U.S. GOVERNMENT MONEY MARKET FUND | | | | | | | | | | | | | | | | | | | | |
Actual | | | | | | | | | | | | | | | | | | | | |
Administrative Class | | | $ | 1,000.00 | | | | $ | 1,000.10 | | | | $ | 0.45 | | | | | 0.09 | % |
Institutional Class | | | $ | 1,000.00 | | | | $ | 1,000.10 | | | | $ | 0.45 | | | | | 0.09 | % |
Select Class | | | $ | 1,000.00 | | | | $ | 1,000.10 | | | | $ | 0.45 | | | | | 0.09 | % |
Service Class | | | $ | 1,000.00 | | | | $ | 1,000.10 | | | | $ | 0.45 | | | | | 0.09 | % |
Hypothetical (assuming a 5% return before expenses) | | | | | | | | | | | | | | | | | | | | |
Administrative Class | | | $ | 1,000.00 | | | | $ | 1,024.35 | | | | $ | 0.45 | | | | | 0.09 | % |
Institutional Class | | | $ | 1,000.00 | | | | $ | 1,024.35 | | | | $ | 0.45 | | | | | 0.09 | % |
Select Class | | | $ | 1,000.00 | | | | $ | 1,024.35 | | | | $ | 0.45 | | | | | 0.09 | % |
Service Class | | | $ | 1,000.00 | | | | $ | 1,024.35 | | | | $ | 0.45 | | | | | 0.09 | % |
| | | | |
WILMINGTON U.S. TREASURY MONEY MARKET FUND | | | | | | | | | | | | | | | | | | | | |
Actual | | | | | | | | | | | | | | | | | | | | |
Administrative Class | | | $ | 1,000.00 | | | | $ | 1,000.10 | | | | $ | 0.45 | | | | | 0.09 | % |
Institutional Class | | | $ | 1,000.00 | | | | $ | 1,000.10 | | | | $ | 0.45 | | | | | 0.09 | % |
Select Class | | | $ | 1,000.00 | | | | $ | 1,000.10 | | | | $ | 0.40 | | | | | 0.08 | % |
Service Class | | | $ | 1,000.00 | | | | $ | 1,000.10 | | | | $ | 0.45 | | | | | 0.09 | % |
Hypothetical (assuming a 5% return before expenses) | | | | | | | | | | | | | | | | | | | | |
Administrative Class | | | $ | 1,000.00 | | | | $ | 1,024.35 | | | | $ | 0.45 | | | | | 0.09 | % |
Institutional Class | | | $ | 1,000.00 | | | | $ | 1,024.35 | | | | $ | 0.45 | | | | | 0.09 | % |
Select Class | | | $ | 1,000.00 | | | | $ | 1,024.40 | | | | $ | 0.40 | | | | | 0.08 | % |
Service Class | | | $ | 1,000.00 | | | | $ | 1,024.35 | | | | $ | 0.45 | | | | | 0.09 | % |
| (1) | Expenses are equal to the Funds’ annualized net expense ratios, multiplied by the average account value over the period, multiplied by 181/365 (to reflect the most recent one-half year period). |
| (2) | Expense ratio does not reflect the indirect expenses of the underlying funds in which the Funds invest. |
April 30, 2021 (unaudited) / ANNUAL REPORT
PORTFOLIO OF INVESTMENTS SUMMARY TABLE
Wilmington U.S. Government Money Market Fund
At April 30, 2021, the Fund’s portfolio composition was as follows (unaudited):
| | | | | |
| | | Percentage of
Total Net Assets |
U.S. Treasury Obligations | | | | 57.6 | % |
Repurchase Agreements | | | | 18.1 | % |
U.S. Government Agency Obligations | | | | 15.6 | % |
Money Market Funds | | | | 8.7 | % |
Other Assets and Liabilities - Net(1) | | | | (0.0 | )%(2) |
| | | | | |
| |
TOTAL | | | | 100.0 | % |
| | | | | |
| (1) | Assets, other than investments in securities, less liabilities. See Statements of Assets and Liabilities. |
| (2) | Represents less than 0.05%. |
PORTFOLIO OF INVESTMENTS
April 30, 2021
| | | | | | | | |
| | |
| Description | | Par Value | | | Value | |
| |
U.S. GOVERNMENT AGENCY OBLIGATIONS – 15.6% | | | | | |
| |
FEDERAL FARM CREDIT BANK (FFCB) – 1.8% | | | | | |
| | |
0.01%, 05/19/21‡ | | $ | 20,000,000 | | | $ | 19,999,900 | |
| | |
(U.S. Treasury 3 Month Bill Money Market
Yield + 0.23%), 0.25%, 05/26/21D | | | 25,000,000 | | | | 25,000,000 | |
| | |
(U.S. Treasury 3 Month Bill Money Market
Yield + 0.30%), 0.32%, 08/02/21D | | | 25,000,000 | | | | 25,000,000 | |
| | |
(1 Month USD LIBOR + 0.02%), 0.13%, 11/26/21D | | | 25,000,000 | | | | 25,000,000 | |
| | |
(SOFR + 0.20%), 0.21%, 06/23/22D | | | 40,000,000 | | | | 40,000,000 | |
| | |
(SOFR + 0.06%), 0.07%, 10/21/22D | | | 10,000,000 | | | | 10,000,000 | |
| | |
(SOFR + 0.06%), 0.07%, 01/20/23D | | | 9,000,000 | | | | 9,000,000 | |
| | | | | | | | |
| | |
TOTAL FEDERAL FARM CREDIT BANK (FFCB) | | | | | | $ | 153,999,900 | |
| |
FEDERAL HOME LOAN BANK (FHLB) – 11.0% | | | | | |
| | |
0.01%, 05/07/21‡ | | | 25,000,000 | | | | 24,999,958 | |
| | |
0.03%, 05/19/21‡ | | | 46,000,000 | | | | 45,999,241 | |
| | |
0.09%, 05/21/21‡ | | | 25,000,000 | | | | 24,998,750 | |
| | |
0.04%, 06/02/21‡ | | | 25,000,000 | | | | 24,999,067 | |
| | |
0.04%, 06/04/21‡ | | | 91,000,000 | | | | 90,996,562 | |
| | |
0.09%, 06/09/21‡ | | | 25,000,000 | | | | 24,997,562 | |
| | |
0.02%, 06/16/21‡ | | | 100,000,000 | | | | 99,997,700 | |
| | |
0.02%, 07/07/21‡ | | | 67,705,000 | | | | 67,702,480 | |
| | |
0.02%, 07/09/21‡ | | | 50,000,000 | | | | 49,998,562 | |
| | |
0.02%, 07/21/21‡ | | | 175,000,000 | | | | 174,991,000 | |
| | |
0.02%, 07/23/21‡ | | | 40,000,000 | | | | 39,998,156 | |
| | |
0.01%, 07/28/21‡ | | | 75,000,000 | | | | 74,998,167 | |
| | |
0.05%, 08/11/21‡ | | | 50,000,000 | | | | 49,999,153 | |
| | |
(SOFR + 0.15%), 0.16%, 09/03/21D | | | 23,000,000 | | | | 23,000,000 | |
| | |
(SOFR + 0.06%), 0.07%, 11/18/22D | | | 50,000,000 | | | | 50,000,000 | |
| | |
(SOFR + 0.06%), 0.07%, 12/08/22D | | | 50,000,000 | | | | 50,000,000 | |
| | |
(SOFR + 0.06%), 0.07%, 12/16/22D | | | 50,000,000 | | | | 50,000,000 | |
| | | | | | | | |
| | |
TOTAL FEDERAL HOME LOAN BANK (FHLB) | | | | | | $ | 967,676,358 | |
| | | | | | | | |
| | |
| Description | | Par Value | | | Value | |
|
FEDERAL HOME LOAN MORTGAGE CORPORATION (FHLMC) – 1.1% | |
| | |
(SOFR + 0.32%), 0.33%, 09/23/21D | | $ | 50,000,000 | | | $ | 50,000,000 | |
| | |
(SOFR + 0.19%), 0.20%, 06/02/22D | | | 50,000,000 | | | | 50,000,000 | |
| | | | | | | | |
| |
TOTAL FEDERAL HOME LOAN MORTGAGE CORPORATION (FHLMC) | | | $ | 100,000,000 | |
|
FEDERAL NATIONAL MORTGAGE ASSOCIATION (FNMA) – 1.7% | |
| | |
(SOFR + 0.30%), 0.31%, 01/07/22D | | | 25,000,000 | | | | 25,000,000 | |
| | |
(SOFR + 0.39%), 0.40%, 04/15/22D | | | 50,000,000 | | | | 50,000,000 | |
| | |
(SOFR + 0.32%), 0.33%, 04/27/22D | | | 25,000,000 | | | | 25,000,000 | |
| | |
(SOFR + 0.20%), 0.21%, 06/15/22D | | | 50,000,000 | | | | 50,000,000 | |
| | | | | | | | |
| |
TOTAL FEDERAL NATIONAL MORTGAGE ASSOCIATION (FNMA) | | | $ | 150,000,000 | |
| | | | | | | | |
| |
TOTAL U.S. GOVERNMENT AGENCY OBLIGATIONS (COST $1,371,676,258) | | | $ | 1,371,676,258 | |
| | |
U.S. TREASURY OBLIGATIONS – 57.6% | | | | | | | | |
|
U.S. TREASURY BILLS – 53.6% | |
| | |
0.06%, 05/04/21‡ | | | 185,000,000 | | | | 184,999,044 | |
| | |
0.11%, 05/06/21‡ | | | 200,000,000 | | | | 199,996,945 | |
| | |
0.08%, 05/11/21‡ | | | 100,000,000 | | | | 99,997,722 | |
| | |
0.02%, 05/13/21‡ | | | 290,000,000 | | | | 289,998,293 | |
| | |
0.05%, 05/18/21‡ | | | 504,915,000 | | | | 504,902,868 | |
| | |
0.06%, 05/20/21‡ | | | 333,325,000 | | | | 333,315,060 | |
| | |
0.06%, 05/25/21‡ | | | 85,000,000 | | | | 84,996,883 | |
| | |
0.06%, 05/27/21‡ | | | 276,575,000 | | | | 276,562,074 | |
| | |
0.02%, 06/01/21‡ | | | 175,000,000 | | | | 174,996,534 | |
| | |
0.06%, 06/03/21‡ | | | 540,000,000 | | | | 539,968,283 | |
| | |
0.04%, 06/10/21‡ | | | 225,000,000 | | | | 224,988,861 | |
| | |
0.05%, 06/17/21‡ | | | 49,050,000 | | | | 49,046,798 | |
| | |
0.01%, 06/22/21‡ | | | 165,000,000 | | | | 164,997,140 | |
| | |
0.02%, 06/24/21‡ | | | 23,962,500 | | | | 23,961,961 | |
| | |
0.10%, 07/01/21‡ | | | 30,000,000 | | | | 29,994,917 | |
| | |
0.07%, 07/06/21‡ | | | 320,000,000 | | | | 319,956,917 | |
| | |
0.04%, 07/20/21‡ | | | 125,000,000 | | | | 124,988,889 | |
ANNUAL REPORT / April 30, 2021
| | |
| 5 PORTFOLIOS OF INVESTMENTS |
|
| Wilmington U.S. Government Money Market Fund (continued) |
| | | | | | | | |
| | |
| Description | | Par Value | | | Value | |
| | |
0.06%, 07/22/21‡ | | $ | 235,000,000 | | | $ | 234,967,234 | |
| | |
0.09%, 07/29/21‡ | | | 100,000,000 | | | | 99,978,986 | |
| | |
0.02%, 08/10/21‡ | | | 70,000,000 | | | | 69,995,090 | |
| | |
0.06%, 08/19/21‡ | | | 10,190,000 | | | | 10,188,132 | |
| | |
0.03%, 08/24/21‡ | | | 35,000,000 | | | | 34,997,205 | |
| | |
0.06%, 09/02/21‡ | | | 175,000,000 | | | | 174,963,833 | |
| | |
0.06%, 09/16/21‡ | | | 235,000,000 | | | | 234,950,454 | |
| | |
0.04%, 10/07/21‡ | | | 140,000,000 | | | | 139,978,358 | |
| | |
0.04%, 10/14/21‡ | | | 100,000,000 | | | | 99,981,556 | |
| | | | | | | | |
| | |
TOTAL U.S. TREASURY BILLS | | | | | | $ | 4,727,670,037 | |
| | |
U.S. TREASURY NOTES – 4.0% | | | | | | | | |
| | |
1.38%, 05/31/21 | | | 50,000,000 | | | | 50,054,754 | |
| | |
(U.S. Treasury 3 Month Bill Money Market Yield + 0.22%), 0.24%, 07/31/21D | | | 49,934,000 | | | | 49,935,829 | |
| | |
(U.S. Treasury 3 Month Bill Money Market Yield + 0.05%), 0.07%, 01/31/23D | | | 85,000,000 | | | | 85,006,039 | |
| | |
(U.S. Treasury 3 Month Bill Money Market Yield + 0.03%), 0.05%, 04/30/23D | | | 170,000,000 | | | | 170,001,518 | |
| | | | | | | | |
| | |
TOTAL U.S. TREASURY NOTES | | | | | | $ | 354,998,140 | |
| | | | | | | | |
| | |
TOTAL U.S. TREASURY OBLIGATIONS (COST $5,082,668,177) | | | | | | $ | 5,082,668,177 | |
| | |
| | | Number of
Shares | | | | |
| | |
MONEY MARKET FUNDS – 8.7% | | | | | | | | |
| | |
Blackrock Liquidity Fed Fund, Institutional Shares, 0.03%^ | | | 236,404,372 | | | | 236,404,372 | |
| | |
Blackrock Liquidity Funds T-Fund, Institutional Shares, 0.02%^ | | | 213,746,015 | | | | 213,746,015 | |
| | |
Dreyfus Government Cash Management Fund, Institutional Shares, 0.03%^ | | | 53,427,248 | | | | 53,427,248 | |
| | |
Goldman Sachs Financial Square Government Fund, Institutional Shares, 0.03%^ | | | 266,071,644 | | | | 266,071,644 | |
| | | | | | | | |
| | |
TOTAL MONEY MARKET FUNDS (COST $769,649,279) | | | | | | $ | 769,649,279 | |
| | | | | | | | |
| | |
| Description | | Par Value | | | Value | |
| | |
REPURCHASE AGREEMENTS – 18.1% | | | | | | | | |
| | |
CIBC World Market Corp., 0.01%, dated 4/30/21, due 5/03/21, repurchase price $100,000,083, collateralized by U.S. Government Agency Securities, 2.00% to 5.00%, maturing 2/01/25 to 3/01/51; total market value of $102,000,000. | | $ | 100,000,000 | | | $ | 100,000,000 | |
| | |
Federal Reserve Bank of New York, 0.00%, dated 4/30/21, due 5/03/21, repurchase price $300,000,000, collateralized by U.S. Treasury Security, 2.75%, maturing 2/15/24; total market value of $300,000,091. | | | 300,000,000 | | | | 300,000,000 | |
| | |
Mizuho Securities USA, 0.01%, dated 4/30/21, due 5/03/21, repurchase price $100,000,083, collateralized by U.S. Treasury Securities, 0.13% to 2.88%, maturing 3/31/22 to 11/30/25; total market value of $102,000,002. | | | 100,000,000 | | | | 100,000,000 | |
| | |
RBC Capital Markets LLC, 0.01%, dated 4/30/21, due 5/03/21, repurchase price $550,000,458, collateralized by U.S. Government Agency Securities, 1.93% to 6.50%, maturing 7/01/26 to 4/20/51; total market value of $561,000,000. | | | 550,000,000 | | | | 550,000,000 | |
| | |
TD Securities, Inc., 0.01%, dated 4/30/21, due 5/03/21, repurchase price $550,000,458, collateralized by U.S. Government Agency & Treasury Securities, 1.88% to 3.00%, maturing 3/31/22 to 6/20/45; total market value of $561,074,013. | | | 550,000,000 | | | | 550,000,000 | |
| | | | | | | | |
| | |
TOTAL REPURCHASE AGREEMENTS (COST $1,600,000,000) | | | | | | $ | 1,600,000,000 | |
| | | | | | | | |
| | |
TOTAL INVESTMENTS – 100.0% (COST $8,823,993,714) | | | | | | $ | 8,823,993,714 | |
| |
OTHER ASSETS LESS LIABILITIES – (0.0)%** | | | | (1,094,962 | ) |
| | | | | | | | |
| | |
TOTAL NET ASSETS – 100.0% | | | | | | $ | 8,822,898,752 | |
| | | | | | | | |
April 30, 2021 / ANNUAL REPORT
| | |
PORTFOLIOS OF INVESTMENTS 6 |
Wilmington U.S. Government Money Market Fund (concluded)
Various inputs are used in determining the value of the Fund’s investments. These inputs are summarized in the three broad levels listed below.
Level 1 – quoted prices in active markets for identical securities
Level 2 – other significant observable inputs (including quoted prices for similar securities, interest rates, prepayment speeds, credit risk, etc.)
Level 3 – significant unobservable inputs (including the Fund’s own assumptions in determining the fair value of investments)
The following is a summary of the inputs used as of April 30, 2021 in valuing the Fund’s assets carried at fair value:
| | | | | | | | | | | | | | | | | | | | | | | | | | | | | | | | | | | |
| | | | | | | |
| | | Level 1 | | | | Level 2 | | | | Level 3 | | | | Total |
| | | | | | | |
Investments in Securities | | | | | | | | | | | | | | | | | | | | | | | | | | | | | | | | | | | |
| | | | | | | |
U.S. Government Agency Obligations | | | $ | — | | | | | | | | | $ | 1,371,676,258 | | | | | | | | | $ | — | | | | | | | | | $ | 1,371,676,258 | |
| | | | | | | |
U.S. Treasury Obligations | | | | — | | | | | | | | | | 5,082,668,177 | | | | | | | | | | — | | | | | | | | | | 5,082,668,177 | |
| | | | | | | |
Money Market Funds | | | | 769,649,279 | | | | | | | | | | — | | | | | | | | | | — | | | | | | | | | | 769,649,279 | |
| | | | | | | |
Repurchase Agreements | | | | — | | | | | | | | | | 1,600,000,000 | | | | | | | | | | — | | | | | | | | | | 1,600,000,000 | |
| | | | | | | | | | | | | | | | | | | | | | | | | | | | | | | | | | | |
| | | | | | | |
Total | | | $ | 769,649,279 | | | | | | | | | $ | 8,054,344,435 | | | | | | | | | $ | — | | | | | | | | | $ | 8,823,993,714 | |
| | | | | | | | | | | | | | | | | | | | | | | | | | | | | | | | | | | |
| ‡ | The rate shown reflects the effective yield at purchase date. |
| D | Variable rate security. The rate disclosed is the rate in effect on the report date, and the date shown is the final maturity date, not the next reset or put date. Information in parenthesis represents the benchmark and reference rate for each relevant security and the rate floats based upon the reference rate and spread. The security may be further subject to interest rate floors and caps. |
| ** | Represents less than 0.05%. |
The following acronyms are used throughout this Fund:
| | |
| LIBOR | | London Interbank Offered Rate |
| |
| LLC | | Limited Liability Corporation |
| |
| SOFR | | Secured Overnight Financing Rate |
| |
| USD | | United States Dollar |
See Notes which are an integral part of the Financial Statements
ANNUAL REPORT / April 30, 2021
PORTFOLIO OF INVESTMENTS SUMMARY TABLE
Wilmington U.S. Treasury Money Market Fund
At April 30, 2021, the Fund’s portfolio composition was as follows (unaudited):
| | | | | |
| |
| | | Percentage of
Total Net Assets |
U.S. Treasury Obligations | | | | 94.4 | % |
Money Market Funds | | | | 5.6 | % |
Other Assets and Liabilities - Net(1) | | | | (0.0 | )%(2) |
| | | | | |
| |
TOTAL | | | | 100.0 | % |
| | | | | |
| (1) | Assets, other than investments in securities, less liabilities. See Statements of Assets and Liabilities. |
| (2) | Represents less than 0.05%. |
PORTFOLIO OF INVESTMENTS
April 30, 2021
| | | | | | | | |
| | |
| Description | | Par Value | | | Value | |
| | |
U.S. TREASURY OBLIGATIONS – 94.4% | | | | | | | | |
| | |
U.S. TREASURY BILLS – 83.9% | | | | | | | | |
| | |
0.04%, 05/04/21‡ | | $ | 90,000,000 | | | $ | 89,999,687 | |
| | |
0.09%, 05/06/21‡ | | | 65,000,000 | | | | 64,999,201 | |
| | |
0.08%, 05/11/21‡ | | | 50,000,000 | | | | 49,998,861 | |
| | |
0.02%, 05/13/21‡ | | | 40,000,000 | | | | 39,999,669 | |
| | |
0.05%, 05/18/21‡ | | | 75,000,000 | | | | 74,998,170 | |
| | |
0.03%, 05/20/21‡ | | | 35,000,000 | | | | 34,999,472 | |
| | |
0.01%, 05/25/21‡ | | | 82,725,000 | | | | 82,724,224 | |
| | |
0.03%, 05/27/21‡ | | | 73,370,000 | | | | 73,368,171 | |
| | |
0.02%, 06/01/21‡ | | | 45,400,000 | | | | 45,399,414 | |
| | |
0.06%, 06/03/21‡ | | | 73,247,500 | | | | 73,243,241 | |
| | |
0.02%, 06/10/21‡ | | | 175,000,000 | | | | 174,995,417 | |
| | |
0.01%, 06/22/21‡ | | | 10,000,000 | | | | 9,999,827 | |
| | |
0.03%, 07/01/21‡ | | | 32,770,000 | | | | 32,768,073 | |
| | |
0.07%, 07/06/21‡ | | | 64,610,000 | | | | 64,601,327 | |
| | |
0.05%, 07/13/21‡ | | | 50,000,000 | | | | 49,995,184 | |
| | |
0.04%, 07/20/21‡ | | | 25,000,000 | | | | 24,997,778 | |
| | |
0.10%, 07/22/21‡ | | | 15,000,000 | | | | 14,996,754 | |
| | |
0.09%, 07/29/21‡ | | | 43,130,000 | | | | 43,120,936 | |
| | |
0.03%, 08/10/21‡ | | | 14,375,000 | | | | 14,373,992 | |
| | |
0.03%, 08/24/21‡ | | | 6,720,000 | | | | 6,719,463 | |
| | |
0.06%, 09/02/21‡ | | | 25,000,000 | | | | 24,994,833 | |
| | |
0.06%, 09/16/21‡ | | | 15,000,000 | | | | 14,996,838 | |
| | |
0.04%, 09/23/21‡ | | | 20,000,000 | | | | 19,997,140 | |
| | |
0.04%, 10/07/21‡ | | | 31,045,000 | | | | 31,040,201 | |
| | | | | | | | |
| | |
TOTAL U.S. TREASURY BILLS | | | | | | $ | 1,157,327,873 | |
| | |
U.S. TREASURY NOTES – 10.5% | | | | | | | | |
| | |
(U.S. Treasury 3 Month Bill Money Market Yield + 0.15%), 0.17%, 01/31/22D | | | 25,000,000 | | | | 25,006,476 | |
| | | | | | | | |
| | |
| Description | | Par Value | | | Value | |
| | |
(U.S. Treasury 3 Month Bill Money Market Yield + 0.06%), 0.08%, 08/01/22D | | $ | 50,000,000 | | | $ | 49,999,999 | |
| | |
(U.S. Treasury 3 Month Bill Money Market Yield + 0.06%), 0.08%, 10/31/22D | | | 25,000,000 | | | | 25,004,750 | |
| | |
(U.S. Treasury 3 Month Bill Money Market Yield + 0.05%), 0.07%, 01/31/23D | | | 15,000,000 | | | | 15,001,066 | |
| | |
(U.S. Treasury 3 Month Bill Money Market Yield + 0.03%), 0.05%, 04/30/23D | | | 30,000,000 | | | | 30,000,000 | |
| | | | | | | | |
| | |
TOTAL U.S. TREASURY NOTES | | | | | | $ | 145,012,291 | |
| | | | | | | | |
| | |
TOTAL U.S. TREASURY OBLIGATIONS (COST $1,302,340,164) | | | | | | $ | 1,302,340,164 | |
| | |
| | | Number of
Shares | | | | |
| | |
MONEY MARKET FUNDS – 5.6% | | | | | | | | |
| | |
Blackrock Liquidity Funds T-Fund, Institutional Shares, 0.02%^ | | | 36,692,723 | | | | 36,692,723 | |
| | |
Goldman Sachs Financial Square Funds Treasury Obligations Fund, Institutional Shares, 0.02%^ | | | 40,855,411 | | | | 40,855,411 | |
| | | | | | | | |
| | |
TOTAL MONEY MARKET FUNDS (COST $77,548,134) | | | | | | $ | 77,548,134 | |
| | | | | | | | |
TOTAL INVESTMENTS – 100.0% (COST $1,379,888,298) | | | $ | 1,379,888,298 | |
| |
OTHER ASSETS LESS LIABILITIES – (0.0)%** | | | | (202,656 | ) |
| | | | | |
| |
TOTAL NET ASSETS – 100.0% | | | $ | 1,379,685,642 | |
| | | | | | | | |
April 30, 2021 / ANNUAL REPORT
| | |
PORTFOLIOS OF INVESTMENTS 8 |
Wilmington U.S. Treasury Money Market Fund (concluded)
Various inputs are used in determining the value of the Fund’s investments. These inputs are summarized in the three broad levels listed below.
Level 1 – quoted prices in active markets for identical securities
Level 2 – other significant observable inputs (including quoted prices for similar securities, interest rates, prepayment speeds, credit risk, etc.)
Level 3 – significant unobservable inputs (including the Fund’s own assumptions in determining the fair value of investments)
The following is a summary of the inputs used as of April 30, 2021 in valuing the Fund’s assets carried at fair value:
| | | | | | | | | | | | | | | | | | | | | | | | | | | | | | | | | | | |
| | | | | | | |
| | | Level 1 | | | | Level 2 | | | | Level 3 | | | | Total |
Investments in Securities | | | | | | | | | | | | | | | | | | | | | | | | | | | | | | | | | | | |
| | | | | | | |
U.S. Treasury Obligations | | | $ | — | | | | | | | | | $ | 1,302,340,164 | | | | | | | | | $ | — | | | | | | | | | $ | 1,302,340,164 | |
| | | | | | | |
Money Market Funds | | | | 77,548,134 | | | | | | | | | | — | | | | | | | | | | — | | | | | | | | | | 77,548,134 | |
| | | | | | | | | | | | | | | | | | | | | | | | | | | | | | | | | | | |
| | | | | | | |
Total | | | $ | 77,548,134 | | | | | | | | | $ | 1,302,340,164 | | | | | | | | | $ | — | | | | | | | | | $ | 1,379,888,298 | |
| | | | | | | | | | | | | | | | | | | | | | | | | | | | | | | | | | | |
| ‡ | The rate shown reflects the effective yield at purchase date. |
| D | Variable rate security. The rate disclosed is the rate in effect on the report date, and the date shown is the final maturity date, not the next reset or put date. Information in parenthesis represents the benchmark and reference rate for each relevant security and the rate floats based upon the reference rate and spread. The security may be further subject to interest rate floors and caps. |
| ** | Represents less than 0.05%. |
See Notes which are an integral part of the Financial Statements
ANNUAL REPORT / April 30, 2021
| | |
| 9 STATEMENTS OF ASSETS AND LIABILITIES |
| | | | | | | | | | | | | | | | | | | |
| | | | | |
| April 30, 2021 | | | | Wilmington U.S. Government Money Market Fund | | | | Wilmington U.S. Treasury Money Market Fund | | |
ASSETS: | | | | | | | | | | | | | | | | | | | |
Investments, at identified cost | | | | | $ | 8,823,993,714 | | | | | | | | | $ | 1,379,888,298 | | | |
| | | | | | | | | | | | | | | | | | | |
Investments in securities, at value (including repurchase agreements of $ 1,600,000,000 and $—, respectively) | | | | | $ | 8,823,993,714 | | | | | | | | | $ | 1,379,888,298 | | | |
Cash | | | | | | 84,255 | | | | | | | | | | 66,818 | | | |
Income receivable | | | | | | 437,529 | | | | | | | | | | 1,832 | | | |
Receivable for shares sold | | | | | | 33,593 | | | | | | | | | | 5,424 | | | |
Prepaid assets | | | | | | 99,910 | | | | | | | | | | 45,407 | | | |
| | | | | | | | | | | | | | | | | | | |
TOTAL ASSETS | | | | | | 8,824,649,001 | | | | | | | | | | 1,380,007,779 | | | |
| | | | | | | | | | | | | | | | | | | |
LIABILITIES: | | | | | | | | | | | | | | | | | | | |
Income distribution payable | | | | | | 61,616 | | | | | | | | | | 10,105 | | | |
Payable for shares redeemed | | | | | | 628,123 | | | | | | | | | | 10 | | | |
Payable for Trustees’ fees | | | | | | 9,358 | | | | | | | | | | 9,357 | | | |
Payable for administration fees | | | | | | 205,979 | | | | | | | | | | 33,252 | | | |
Payable for investment advisory fees | | | | | | 12,968 | | | | | | | | | | 47,668 | | | |
Other accrued expenses | | | | | | 832,205 | | | | | | | | | | 221,745 | | | |
| | | | | | | | | | | | | | | | | | | |
TOTAL LIABILITIES | | | | | | 1,750,249 | | | | | | | | | | 322,137 | | | |
| | | | | | | | | | | | | | | | | | | |
NET ASSETS | | | | | $ | 8,822,898,752 | | | | | | | | | $ | 1,379,685,642 | | | |
| | | | | | | | | | | | | | | | | | | |
NET ASSETS CONSIST OF: | | | | | | | | | | | | | | | | | | | |
Paid-in capital | | | | | $ | 8,822,916,934 | | | | | | | | | $ | 1,379,687,279 | | | |
Distributable earnings (loss) | | | | | | (18,182 | ) | | | | | | | | | (1,637 | ) | | |
| | | | | | | | | | | | | | | | | | | |
TOTAL NET ASSETS | | | | | $ | 8,822,898,752 | | | | | | | | | $ | 1,379,685,642 | | | |
| | | | | | | | | | | | | | | | | | | |
COMPUTATION OF NET ASSET VALUE AND OFFERING PRICE: | | | | | | | | | | | | | | | | | | | |
Administrative Class | | | | | | | | | | | | | | | | | | | |
Net Assets | | | | | $ | 1,728,081,105 | | | | | | | | | $ | 361,438,269 | | | |
| | | | | | | | | | | | | | | | | | | |
Shares outstanding (unlimited shares authorized) | | | | | | 1,728,329,954 | | | | | | | | | | 361,479,155 | | | |
| | | | | | | | | | | | | | | | | | | |
Net Asset Value and Offering Price per share | | | | | $ | 1.000 | | | | | | | | | $ | 1.000 | | | |
| | | | | | | | | | | | | | | | | | | |
Institutional Class | | | | | | | | | | | | | | | | | | | |
Net Assets | | | | | $ | 1,735,455,707 | | | | | | | | | $ | 201,156,601 | | | |
| | | | | | | | | | | | | | | | | | | |
Shares outstanding (unlimited shares authorized) | | | | | | 1,735,526,166 | | | | | | | | | | 201,158,388 | | | |
| | | | | | | | | | | | | | | | | | | |
Net Asset Value and Offering Price per share | | | | | $ | 1.000 | | | | | | | | | $ | 1.000 | | | |
| | | | | | | | | | | | | | | | | | | |
Select Class | | | | | | | | | | | | | | | | | | | |
Net Assets | | | | | $ | 4,168,651,236 | | | | | | | | | $ | 816,979,509 | | | |
| | | | | | | | | | | | | | | | | | | |
Shares outstanding (unlimited shares authorized) | | | | | | 4,169,121,980 | | | | | | | | | | 816,993,356 | | | |
| | | | | | | | | | | | | | | | | | | |
Net Asset Value and Offering Price per share | | | | | $ | 1.000 | | | | | | | | | $ | 1.000 | | | |
| | | | | | | | | | | | | | | | | | | |
Service Class | | | | | | | | | | | | | | | | | | | |
Net Assets | | | | | $ | 1,190,710,704 | | | | | | | | | $ | 111,263 | | | |
| | | | | | | | | | | | | | | | | | | |
Shares outstanding (unlimited shares authorized) | | | | | | 1,190,671,228 | | | | | | | | | | 111,262 | | | |
| | | | | | | | | | | | | | | | | | | |
Net Asset Value and Offering Price per share | | | | | $ | 1.000 | | | | | | | | | $ | 1.000 | | | |
| | | | | | | | | | | | | | | | | | | |
See Notes which are an integral part of the Financial Statements
April 30, 2021 / ANNUAL REPORT
| | |
| STATEMENTS OF OPERATIONS | | 10 |
| | | | | | | | | | | | | | | | |
| | | | |
| Year Ended April 30, 2021 | | | | Wilmington U.S. Government Money Market Fund | | | | Wilmington U.S. Treasury Money Market Fund |
INVESTMENT INCOME: | | | | | | | | | | | | | | | | |
Dividends | | | | | $ | 61,381 | | | | | | $ | 9,031 | | | |
Interest | | | | | | 13,507,339 | | | | | | | 2,143,496 | | | |
| | | | | | | | | | | | | | | | |
TOTAL INVESTMENT INCOME | | | | | | 13,568,720 | | | | | | | 2,152,527 | | | |
| | | | | | | | | | | | | | | | |
EXPENSES: | | | | | | | | | | | | | | | | |
Investment advisory fees | | | | | | 21,290,249 | | | | | | | 3,396,652 | | | |
Administration fees | | | | | | 2,577,347 | | | | | | | 410,878 | | | |
Portfolio accounting and administration fees | | | | | | 1,482,907 | | | | | | | 232,122 | | | |
Custodian fees | | | | | | 119,818 | | | | | | | 11,698 | | | |
Transfer and dividend disbursing agent fees and expenses | | | | | | 56,911 | | | | | | | 12,179 | | | |
Trustees’ fees | | | | | | 56,969 | | | | | | | 56,969 | | | |
Professional fees | | | | | | 176,967 | | | | | | | 108,465 | | | |
Distribution services fee—Administrative Class | | | | | | 3,642,554 | | | | | | | 921,445 | | | |
Distribution services fee—Service Class | | | | | | 2,773,724 | | | | | | | 306 | | | |
Shareholder services fee—Administrative Class | | | | | | 3,654,534 | | | | | | | 921,445 | | | |
Shareholder services fee—Select Class | | | | | | 10,858,017 | | | | | | | 1,979,495 | | | |
Shareholder services fee—Service Class | | | | | | 2,773,724 | | | | | | | 306 | | | |
Share registration costs | | | | | | 31,525 | | | | | | | 39,560 | | | |
Printing and postage | | | | | | 166,902 | | | | | | | 21,632 | | | |
Miscellaneous | | | | | | 327,973 | | | | | | | 115,373 | | | |
| | | | | | | | | | | | | | | | |
TOTAL EXPENSES | | | | | | 49,990,121 | | | | | | | 8,228,525 | | | |
| | | | | | | | | | | | | | | | |
WAIVERS AND REIMBURSEMENTS: | | | | | | | | | | | | | | | | |
Waiver/reimbursement by investment advisor | | | | | | (13,889,616 | ) | | | | | | (2,486,846 | ) | | |
Waiver of distribution services fee—Administrative Class | | | | | | (3,631,461 | ) | | | | | | (905,618 | ) | | |
Waiver of distribution services fee—Service Class | | | | | | (2,773,724 | ) | | | | | | (283 | ) | | |
Waiver of shareholder services fee—Administrative Class | | | | | | (3,654,534 | ) | | | | | | (899,218 | ) | | |
Waiver of shareholder services fee—Select Class | | | | | | (10,858,017 | ) | | | | | | (1,979,495 | ) | | |
Waiver of shareholder services fee—Service Class | | | | | | (2,655,249 | ) | | | | | | (288 | ) | | |
| | | | | | | | | | | | | | | | |
TOTAL WAIVERS AND REIMBURSEMENTS | | | | | | (37,462,601 | ) | | | | | | (6,271,748 | ) | | |
| | | | | | | | | | | | | | | | |
Net expenses | | | | | | 12,527,520 | | | | | | | 1,956,777 | | | |
| | | | | | | | | | | | | | | | |
Net investment income | | | | | | 1,041,200 | | | | | | | 195,750 | | | |
| | | | | | | | | | | | | | | | |
REALIZED GAIN (LOSS): | | | | | | | | | | | | | | | | |
Net realized gain (loss) on investments | | | | | | 7,426 | | | | | | | 2,545 | | | |
| | | | | | | | | | | | | | | | |
Net realized gain (loss) | | | | | | 7,426 | | | | | | | 2,545 | | | |
| | | | | | | | | | | | | | | | |
Change in net assets resulting from operations | | | | | $ | 1,048,626 | | | | | | $ | 198,295 | | | |
| | | | | | | | | | | | | | | | |
See Notes which are an integral part of the Financial Statements
ANNUAL REPORT / April 30, 2021
| | |
| 11 STATEMENTS OF CHANGES IN NET ASSETS |
| | | | | | | | | | | | | | | | | | | | | | |
| | | Wilmington U.S. Government
Money Market Fund | | Wilmington U.S. Treasury
Money Market Fund | |
| | | | | | | |
| | | Year Ended April 30, 2021 | | | | | Year Ended April 30, 2020 | | | | | Year Ended April 30, 2021 | | | | | Year Ended April 30, 2020 | |
OPERATIONS: | | | | | | | | | | | | | | | | | | | | | | |
Net investment income | | $ | 1,041,200 | | | | | $ | 105,479,150 | | | | | $ | 195,750 | | | | | $ | 22,817,630 | |
Net realized gain (loss) | | | 7,426 | | | | | | 26,362 | | | | | | 2,545 | | | | | | 9,003 | |
| | | | | | | | | | | | | | | | | | | | | | |
Change in net assets resulting from operations | | | 1,048,626 | | | | | | 105,505,512 | | | | | | 198,295 | | | | | | 22,826,633 | |
| | | | | | | | | | | | | | | | | | | | | | |
DISTRIBUTIONS TO SHAREHOLDERS: | | | | | | | | | | | | | | | | | | | | | | |
Administrative Class | | | (152,116 | ) | | | | | (15,638,028 | ) | | | | | (39,384 | ) | | | | | (3,367,609 | ) |
Institutional Class | | | (217,432 | ) | | | | | (16,010,624 | ) | | | | | (26,740 | ) | | | | | (449,968 | ) |
Select Class | | | (581,212 | ) | | | | | (61,857,851 | ) | | | | | (135,783 | ) | | | | | (19,005,385 | ) |
Service Class | | | (116,012 | ) | | | | | (12,003,710 | ) | | | | | (14 | ) | | | | | (1,108 | ) |
| | | | | | | | | | | | | | | | | | | | | | |
Total distributions to shareholders | | | (1,066,772 | ) | | | | | (105,510,213 | ) | | | | | (201,921 | ) | | | | | (22,824,070 | ) |
| | | | | | | | | | | | | | | | | | | | | | |
SHARE TRANSACTIONS: | | | | | | | | | | | | | | | | | | | | | | |
Proceeds from sale of shares | | | | | | | | | | | | | | | | | | | | | | |
Administrative Class | | | 4,472,553,609 | | | | | | 5,654,548,559 | | | | | | 1,029,083,011 | | | | | | 1,037,961,294 | |
Institutional Class | | | 3,861,185,995 | | | | | | 3,880,022,217 | | | | | | 726,904,905 | | | | | | 1,100,749,168 | |
Select Class | | | 7,402,591,546 | | | | | | 9,865,138,562 | | | | | | 1,884,749,795 | | | | | | 2,938,441,833 | |
Service Class | | | 2,526,880,455 | | | | | | 2,868,472,912 | | | | | | 25,100 | | | | | | 203,585 | |
Distributions reinvested | | | | | | | | | | | | | | | | | | | | | | |
Administrative Class | | | 8 | | | | | | 741 | | | | | | 265 | | | | | | 35,569 | |
Institutional Class | | | 1,945 | | | | | | 187,667 | | | | | | — | | | | | | — | |
Select Class | | | 58,331 | | | | | | 5,448,805 | | | | | | 19,429 | | | | | | 1,329,643 | |
Service Class | | | 41,767 | | | | | | 3,850,166 | | | | | | 14 | | | | | | 1,108 | |
Cost of shares redeemed | | | | | | | | | | | | | | | | | | | | | | |
Administrative Class | | | (4,253,791,340 | ) | | | | | (5,442,512,780 | ) | | | | | (1,028,105,266 | ) | | | | | (960,858,127 | ) |
Institutional Class | | | (3,871,471,223 | ) | | | | | (2,561,580,453 | ) | | | | | (576,535,436 | ) | | | | | (1,049,960,250 | ) |
Select Class | | | (8,146,628,742 | ) | | | | | (9,368,060,263 | ) | | | | | (2,059,994,955 | ) | | | | | (3,151,207,591 | ) |
Service Class | | | (2,504,394,230 | ) | | | | | (2,895,348,366 | ) | | | | | (102,000 | ) | | | | | (101,585 | ) |
| | | | | | | | | | | | | | | | | | | | | | |
Change in net assets resulting from share transactions | | | (512,971,879 | ) | | | | | 2,010,167,767 | | | | | | (23,955,138 | ) | | | | | (83,405,353 | ) |
| | | | | | | | | | | | | | | | | | | | | | |
Change in net assets | | | (512,990,025 | ) | | | | | 2,010,163,066 | | | | | | (23,958,764 | ) | | | | | (83,402,790 | ) |
NET ASSETS: | | | | | | | | | | | | | | | | | | | | | | |
Beginning of year | | | 9,335,888,777 | | | | | | 7,325,725,711 | | | | | | 1,403,644,406 | | | | | | 1,487,047,196 | |
| | | | | | | | | | | | | | | | | | | | | | |
End of year | | $ | 8,822,898,752 | | | | | $ | 9,335,888,777 | | | | | $ | 1,379,685,642 | | | | | $ | 1,403,644,406 | |
| | | | | | | | | | | | | | | | | | | | | | |
SHARES OF BENEFICIAL INTEREST: | | | | | | | | | | | | | | | | | | | | | | |
Shares sold | | | | | | | | | | | | | | | | | | | | | | |
Administrative Class | | | 4,472,553,609 | | | | | | 5,654,548,559 | | | | | | 1,029,083,011 | | | | | | 1,037,961,293 | |
Institutional Class | | | 3,861,185,995 | | | | | | 3,880,022,217 | | | | | | 726,904,905 | | | | | | 1,100,749,168 | |
Select Class | | | 7,402,591,546 | | | | | | 9,865,138,562 | | | | | | 1,884,749,795 | | | | | | 2,938,441,833 | |
Service Class | | | 2,526,880,455 | | | | | | 2,868,472,911 | | | | | | 25,100 | | | | | | 203,585 | |
Distributions reinvested | | | | | | | | | | | | | | | | | | | | | | |
Administrative Class | | | 8 | | | | | | 741 | | | | | | 265 | | | | | | 35,569 | |
Institutional Class | | | 1,945 | | | | | | 187,667 | | | | | | — | | | | | | — | |
Select Class | | | 58,331 | | | | | | 5,448,805 | | | | | | 19,429 | | | | | | 1,329,643 | |
Service Class | | | 41,767 | | | | | | 3,850,166 | | | | | | 14 | | | | | | 1,108 | |
Shares redeemed | | | | | | | | | | | | | | | | | | | | | | |
Administrative Class | | | (4,253,791,340 | ) | | | | | (5,442,512,780 | ) | | | | | (1,028,105,266 | ) | | | | | (960,858,127 | ) |
Institutional Class | | | (3,871,471,223 | ) | | | | | (2,561,580,453 | ) | | | | | (576,535,436 | ) | | | | | (1,049,960,249 | ) |
Select Class | | | (8,146,628,742 | ) | | | | | (9,368,060,263 | ) | | | | | (2,059,994,955 | ) | | | | | (3,151,207,591 | ) |
Service Class | | | (2,504,394,230 | ) | | | | | (2,895,348,366 | ) | | | | | (102,000 | ) | | | | | (101,585 | ) |
| | | | | | | | | | | | | | | | | | | | | | |
Net change resulting from share transactions | | | (512,971,879 | ) | | | | | 2,010,167,766 | | | | | | (23,955,138 | ) | | | | | (83,405,353 | ) |
| | | | | | | | | | | | | | | | | | | | | | |
See Notes which are an integral part of the Financial Statements
April 30, 2021 / ANNUAL REPORT
For a share outstanding throughout each year ended April 30, unless otherwise noted:
| | | | | | | | | | |
WILMINGTON U.S. GOVERNMENT MONEY MARKET FUND | | |
| | | | | | | | | | | | | | | | | | | | |
| | | Year Ended | | | Year Ended | | | Year Ended | | | Year Ended | | | Year Ended | |
| | | April 30, 2021 | | | April 30, 2020 | | | April 30, 2019 | | | April 30, 2018 | | | April 30, 2017 | |
| | | | | |
| ADMINISTRATIVE CLASS | | | | | | | | | | | | | | | |
| | | | | |
Net Asset Value, Beginning of Year | | | $ 1.000 | | | | $ 1.000 | | | | $ 1.000 | | | | $ 1.000 | | | | $ 1.000 | |
Income (Loss) From Operations: | | | | | | | | | | | | | | | | | | | | |
Net Investment Income | | | 0.000 | (a) | | | 0.013 | | | | 0.016 | | | | 0.006 | | | | 0.000 | (a) |
Net Realized Gain (Loss) | | | 0.000 | (a) | | | 0.000 | (a) | | | 0.000 | (a) | | | 0.000 | (a) | | | (0.000 | )(a) |
Total Income (Loss) From Operations | | | 0.000 | | | | 0.013 | | | | 0.016 | | | | 0.006 | | | | 0.000 | |
Less Distributions From: | | | | | | | | | | | | | | | | | | | | |
Net Investment Income | | | (0.000 | )(a) | | | (0.013 | ) | | | (0.016 | ) | | | (0.006 | ) | | | (0.000 | )(a) |
Net Asset Value, End of Year | | | $ 1.000 | | | | $ 1.000 | | | | $ 1.000 | | | | $ 1.000 | | | | $ 1.000 | |
| | | | |
Total Return | | | 0.01 | % | | | 1.21 | % | | | 1.57 | % | | | 0.56 | % | | | 0.04 | % |
Net Assets, End of Year (000’s) | | | $1,728,081 | | | | $1,509,322 | | | | $1,297,285 | | | | $1,196,676 | | | | $1,516,147 | |
Ratios to Average Net Assets | | | | | | | | | | | | | | | | | | | | |
Gross Expense(b) | | | 0.81 | % | | | 0.81 | % | | | 0.82 | % | | | 0.82 | % | | | 0.89 | % |
Net Expense(b),(c) | | | 0.15 | % | | | 0.61 | % | | | 0.62 | % | | | 0.62 | % | | | 0.42 | % |
Net Investment Income | | | 0.01 | % | | | 1.18 | % | | | 1.57 | % | | | 0.54 | % | | | 0.04 | % |
| | | | | |
| | | Year Ended | | | Year Ended | | | Year Ended | | | Year Ended | | | Year Ended | |
| | | April 30, 2021 | | | April 30, 2020 | | | April 30, 2019 | | | April 30, 2018 | | | April 30, 2017 | |
| | | | | |
| INSTITUTIONAL CLASS | | | | | | | | | | | | | | | |
| | | | | |
Net Asset Value, Beginning of Year | | | $ 1.000 | | | | $ 1.000 | | | | $ 1.000 | | | | $ 1.000 | | | | $ 1.000 | |
Income (Loss) From Operations: | | | | | | | | | | | | | | | | | | | | |
Net Investment Income | | | 0.000 | (a) | | | 0.016 | | | | 0.019 | | | | 0.009 | | | | 0.001 | |
Net Realized Gain (Loss) | | | 0.000 | (a) | | | 0.000 | (a) | | | 0.000 | (a) | | | 0.000 | (a) | | | (0.000 | )(a) |
Total Income (Loss) From Operations | | | 0.000 | | | | 0.016 | | | | 0.019 | | | | 0.009 | | | | 0.001 | |
Less Distributions From: | | | | | | | | | | | | | | | | | | | | |
Net Investment Income | | | (0.000 | )(a) | | | (0.016 | ) | | | (0.019 | ) | | | (0.009 | ) | | | (0.001 | ) |
Net Asset Value, End of Year | | | $ 1.000 | | | | $ 1.000 | | | | $ 1.000 | | | | $ 1.000 | | | | $ 1.000 | |
| | | | |
Total Return | | | 0.02 | % | | | 1.56 | % | | | 1.92 | % | | | 0.91 | % | | | 0.17 | % |
Net Assets, End of Year (000’s) | | | $1,735,456 | | | | $1,745,742 | | | | $ 427,114 | | | | $ 704,435 | | | | $ 359,524 | |
Ratios to Average Net Assets | | | | | | | | | | | | | | | | | | | | |
Gross Expense(b) | | | 0.31 | % | | | 0.31 | % | | | 0.32 | % | | | 0.32 | % | | | 0.34 | % |
Net Expense(b),(c) | | | 0.14 | % | | | 0.27 | % | | | 0.27 | % | | | 0.27 | % | | | 0.27 | % |
Net Investment Income | | | 0.01 | % | | | 1.39 | % | | | 1.92 | % | | | 0.97 | % | | | 0.21 | % |
| | | | | |
| | | Year Ended | | | Year Ended | | | Year Ended | | | Year Ended | | | Year Ended | |
| | | April 30, 2021 | | | April 30, 2020 | | | April 30, 2019 | | | April 30, 2018 | | | April 30, 2017 | |
| | | | | |
| SELECT CLASS | | | | | | | | | | | | | | | |
| | | | | |
Net Asset Value, Beginning of Year | | | $ 1.000 | | | | $ 1.000 | | | | $ 1.000 | | | | $ 1.000 | | | | $ 1.000 | |
Income (Loss) From Operations: | | | | | | | | | | | | | | | | | | | | |
Net Investment Income | | | 0.000 | (a) | | | 0.015 | | | | 0.018 | | | | 0.008 | | | | 0.001 | |
Net Realized Gain (Loss) | | | 0.000 | (a) | | | 0.000 | (a) | | | 0.000 | (a) | | | 0.000 | (a) | | | (0.000 | )(a) |
Total Income (Loss) From Operations | | | 0.000 | | | | 0.015 | | | | 0.018 | | | | 0.008 | | | | 0.001 | |
Less Distributions From: | | | | | | | | | | | | | | | | | | | | |
Net Investment Income | | | (0.000 | )(a) | | | (0.015 | ) | | | (0.018 | ) | | | (0.008 | ) | | | (0.001 | ) |
Net Asset Value, End of Year | | | $ 1.000 | | | | $ 1.000 | | | | $ 1.000 | | | | $ 1.000 | | | | $ 1.000 | |
| | | | |
Total Return | | | 0.02 | % | | | 1.46 | % | | | 1.82 | % | | | 0.81 | % | | | 0.13 | % |
Net Assets, End of Year (000’s) | | | $4,168,651 | | | | $4,912,640 | | | | $4,410,116 | | | | $3,273,958 | | | | $3,671,694 | |
Ratios to Average Net Assets | | | | | | | | | | | | | | | | | | | | |
Gross Expense(b) | | | 0.56 | % | | | 0.56 | % | | | 0.57 | % | | | 0.57 | % | | | 0.61 | % |
Net Expense(b),(c) | | | 0.15 | % | | | 0.37 | % | | | 0.37 | % | | | 0.37 | % | | | 0.33 | % |
Net Investment Income | | | 0.01 | % | | | 1.42 | % | | | 1.82 | % | | | 0.80 | % | | | 0.15 | % |
ANNUAL REPORT / April 30, 2021
| | |
| 13 FINANCIAL HIGHLIGHTS (continued) |
| | | | | | | | | | | | | | | | | | | | |
| | | | | |
| | | Year Ended | | | Year Ended | | | Year Ended | | | Year Ended | | | Year Ended | |
| | | April 30, 2021 | | | April 30, 2020 | | | April 30, 2019 | | | April 30, 2018 | | | April 30, 2017 | |
| | | | | |
| SERVICE CLASS | | | | | | | | | | | | | | | |
| | | | | |
Net Asset Value, Beginning of Year | | | $ 1.000 | | | | $ 1.000 | | | | $ 1.000 | | | | $ 1.000 | | | | $ 1.000 | |
Income (Loss) From Operations: | | | | | | | | | | | | | | | | | | | | |
Net Investment Income | | | 0.000 | (a) | | | 0.011 | | | | 0.014 | | | | 0.004 | | | | 0.000 | (a) |
Net Realized Gain (Loss) | | | 0.000 | (a) | | | 0.000 | (a) | | | 0.000 | (a) | | | 0.000 | (a) | | | (0.000 | )(a) |
Total Income (Loss) From Operations | | | 0.000 | | | | 0.011 | | | | 0.014 | | | | 0.004 | | | | 0.000 | |
Less Distributions From: | | | | | | | | | | | | | | | | | | | | |
Net Investment Income | | | (0.000 | )(a) | | | (0.011 | ) | | | (0.014 | ) | | | (0.004 | ) | | | (0.000 | )(a) |
Net Asset Value, End of Year | | | $ 1.000 | | | | $ 1.000 | | | | $ 1.000 | | | | $ 1.000 | | | | $ 1.000 | |
| | | | |
Total Return | | | 0.01 | % | | | 1.08 | % | | | 1.42 | % | | | 0.41 | % | | | 0.01 | % |
Net Assets, End of Year (000’s) | | | $1,190,711 | | | | $1,168,185 | | | | $1,191,211 | | | | $1,250,181 | | | | $1,364,106 | |
Ratios to Average Net Assets | | | | | | | | | | | | | | | | | | | | |
Gross Expense(b) | | | 0.81 | % | | | 0.81 | % | | | 0.82 | % | | | 0.82 | % | | | 0.88 | % |
Net Expense(b),(c) | | | 0.15 | % | | | 0.74 | % | | | 0.77 | % | | | 0.77 | % | | | 0.46 | % |
Net Investment Income | | | 0.01 | % | | | 1.07 | % | | | 1.41 | % | | | 0.41 | % | | | 0.01 | % |
| (a) | Represents less than $0.001. |
| (b) | The Fund invests in other underlying funds and indirectly bears its proportionate share of fees and expenses incurred by the underlying funds. This ratio does not include these indirect fees and expenses. |
| (c) | The investment manager and other service providers waived a portion of their fees. |
See Notes which are an integral part of the Financial Statements
April 30, 2021 / ANNUAL REPORT
| | |
| FINANCIAL HIGHLIGHTS (continued) 14 |
For a share outstanding throughout each year ended April 30, unless otherwise noted:
| | | | | | | | | | | | | | | | | | | | | | | | | |
WILMINGTON U.S. TREASURY MONEY MARKET FUND | | | | | | |
| | | | | | |
| | | Year Ended | | Year Ended | | Year Ended | | Year Ended | | Year Ended |
| ADMINISTRATIVE CLASS | | April 30, 2021 | | April 30, 2020 | | April 30, 2019 | | April 30, 2018 | | April 30, 2017 |
Net Asset Value, Beginning of Year | | | | $ 1.000 | | | | | $ 1.000 | | | | | $ 1.000 | | | | | $ 1.000 | | | | | $ 1.000 | |
Income (Loss) From Operations: | | | | | | | | | | | | | | | | | | | | | | | | | |
Net Investment Income | | | | 0.000 | (a) | | | | 0.013 | | | | | 0.016 | | | | | 0.006 | | | | | 0.000 | (a) |
Net Realized Gain (Loss) | | | | 0.000 | (a) | | | | 0.000 | (a) | | | | 0.000 | (a) | | | | 0.000 | (a) | | | | 0.000 | (a) |
Total Income (Loss) From Operations | | | | 0.000 | | | | | 0.013 | | | | | 0.016 | | | | | 0.006 | | | | | 0.000 | |
Less Distributions From: | | | | | | | | | | | | | | | | | | | | | | | | | |
Net Investment Income | | |
| (0.000
| )(a)
| | | | (0.013 | ) | | | | (0.016 | ) | | | | (0.006 | ) | | |
| (0.000
| )(a)
|
Net Asset Value, End of Year | | | | $ 1.000 | | | | | $ 1.000 | | | | | $ 1.000 | | | | | $ 1.000 | | | | | $ 1.000 | |
| | | | | |
Total Return | | | | 0.01 | % | | | | 1.20 | % | | | | 1.58 | % | | | | 0.57 | % | | | | 0.03 | % |
Net Assets, End of Year (000’s) | | | | $361,438 | | | | | $360,463 | | | | | $283,323 | | | | | $340,788 | | | | | $479,284 | |
Ratios to Average Net Assets | | | | | | | | | | | | | | | | | | | | | | | | | |
Gross Expense(b) | | | | 0.82 | % | | | | 0.83 | % | | | | 0.83 | % | | | | 0.84 | % | | | | 0.91 | % |
Net Expense(b),(c) | | | | 0.14 | % | | | | 0.59 | % | | | | 0.60 | % | | | | 0.60 | % | | | | 0.39 | % |
Net Investment Income | | | | 0.01 | % | | | | 1.15 | % | | | | 1.54 | % | | | | 0.53 | % | | | | 0.03 | % |
| | | | | For the Period | | | | | | |
| | | | | October 16, 2019* | | | | | | |
| | | Year Ended | | through | | | | | | |
| INSTITUTIONAL CLASS | | April 30, 2021 | | April 30, 2020 | | | | | | |
Net Asset Value, Beginning of Year | | | | $ 1.000 | | | | | $ 1.000 | | | | | | | | | | | | | | | | |
Income (Loss) From Operations: | | | | | | | | | | | | | | | | | | | | | | | | | |
Net Investment Income | | | | 0.000 | (a) | | | | 0.007 | | | | | | | | | | | | | | | | |
Net Realized Gain (Loss) | | | | 0.000 | (a) | | | | 0.000 | (a) | | | | | | | | | | | | | | | |
Total Income (Loss) From Operations | | | | 0.000 | | | | | 0.007 | | | | | | | | | | | | | | | | |
Less Distributions From: | | | | | | | | | | | | | | | | | | | | | | | | | |
Net Investment Income | | |
| (0.000
| )(a)
| | | | (0.007 | ) | | | | | | | | | | | | | | | |
Net Asset Value, End of Year | | | | $ 1.000 | | | | | $ 1.000 | | | | | | | | | | | | | | | | |
| | | | | | | | | | | | | | | | | | | | |
Total Return | | | | 0.02 | % | | | | 0.61 | %(d) | | | | | | | | | | | | | | | |
Net Assets, End of Year (000’s) | | | | $201,157 | | | | | $ 50,788 | | | | | | | | | | | | | | | | |
Ratios to Average Net Assets | | | | | | | | | | | | | | | | | | | | | | | | | |
Gross Expense | | | | 0.32 | % | | | | 0.32 | %(e) | | | | | | | | | | | | | | | |
Net Expense | | | | 0.12 | % | | | | 0.25 | %(e) | | | | | | | | | | | | | | | |
Net Investment Income | | | | 0.01 | % | | | | 1.18 | %(e) | | | | | | | | | | | | | | | |
| | | Year Ended | | Year Ended | | Year Ended | | Year Ended | | Year Ended |
| SELECT CLASS | | April 30, 2021 | | April 30, 2020 | | April 30, 2019 | | April 30, 2018 | | April 30, 2017 |
Net Asset Value, Beginning of Year | | | | $ 1.000 | | | | | $ 1.000 | | | | | $ 1.000 | | | | | $ 1.000 | | | | | $ 1.000 | |
Income (Loss) From Operations: | | | | | | | | | | | | | | | | | | | | | | | | | |
Net Investment Income | | | | 0.000 | (a) | | | | 0.015 | | | | | 0.018 | | | | | 0.008 | | | | | 0.001 | |
Net Realized Gain (Loss) | | | | 0.000 | (a) | | | | 0.000 | (a) | | | | 0.000 | (a) | | | | 0.000 | (a) | | | | 0.000 | (a) |
Total Income (Loss) From Operations | | | | 0.000 | | | | | 0.015 | | | | | 0.018 | | | | | 0.008 | | | | | 0.001 | |
Less Distributions From: | | | | | | | | | | | | | | | | | | | | | | | | | |
Net Investment Income | | |
| (0.000
| )(a)
| | | | (0.015 | ) | | | | (0.018 | ) | | | | (0.008 | ) | | | | (0.001 | ) |
Net Asset Value, End of Year | | | | $ 1.000 | | | | | $ 1.000 | | | | | $ 1.000 | | | | | $ 1.000 | | | | | $ 1.000 | |
| | | | | |
Total Return | | | | 0.02 | % | | | | 1.44 | % | | | | 1.83 | % | | | | 0.82 | % | | | | 0.12 | % |
Net Assets, End of Year (000’s) | | | | $816,980 | | | | | $992,205 | | | | | $1,203,639 | | | | | $790,207 | | | | | $311,815 | |
Ratios to Average Net Assets | | | | | | | | | | | | | | | | | | | | | | | | | |
Gross Expense(b) | | | | 0.57 | % | | | | 0.58 | % | | | | 0.58 | % | | | | 0.59 | % | | | | 0.66 | % |
Net Expense(b),(c) | | | | 0.15 | % | | | | 0.35 | % | | | | 0.35 | % | | | | 0.35 | % | | | | 0.31 | % |
Net Investment Income | | | | 0.02 | % | | | | 1.45 | % | | | | 1.85 | % | | | | 0.89 | % | | | | 0.13 | % |
ANNUAL REPORT / April 30, 2021
| | |
| 15 FINANCIAL HIGHLIGHTS (concluded) |
| | | | | | | | | | | | | | | | | | | | | | | | | |
| | | Year Ended | | Year Ended | | Year Ended | | Year Ended | | Year Ended |
| SERVICE CLASS | | April 30, 2021 | | April 30, 2020 | | April 30, 2019 | | April 30, 2018 | | April 30, 2017 |
Net Asset Value, Beginning of Year | | | | $1.000 | | | | | $1.000 | | | | | $1.000 | | | | | $1.000 | | | | | $1.000 | |
Income (Loss) From Operations: | | | | | | | | | | | | | | | | | | | | | | | | | |
Net Investment Income | | | | 0.000 | (a) | | | | 0.011 | | | | | 0.014 | | | | | 0.004 | | | | | 0.000 | (a) |
Net Realized Gain (Loss) | | | | 0.000 | (a) | | | | 0.000 | (a) | | | | 0.000 | (a) | | | | 0.000 | (a) | | | | 0.000 | (a) |
Total Income (Loss) From Operations | | | | 0.000 | | | | | 0.011 | | | | | 0.014 | | | | | 0.004 | | | | | 0.000 | |
Less Distributions From: | | | | | | | | | | | | | | | | | | | | | | | | | |
Net Investment Income | | | | (0.000 | )(a) | | | | (0.011 | ) | | | | (0.014 | ) | | | | (0.004 | ) | | | | (0.000 | )(a) |
Net Asset Value, End of Year | | | | $1.000 | | | | | $1.000 | | | | | $1.000 | | | | | $1.000 | | | | | $1.000 | |
| | | | | |
Total Return | | | | 0.01 | % | | | | 1.07 | % | | | | 1.43 | % | | | | 0.42 | % | | | | 0.01 | % |
Net Assets, End of Year (000’s) | | | | $ 111 | | | | | $ 188 | | | | | $ 85 | | | | | $ 44 | | | | | $ 31 | |
Ratios to Average Net Assets | | | | | | | | | | | | | | | | | | | | | | | | | |
Gross Expense(b) | | | | 0.83 | % | | | | 0.84 | % | | | | 0.83 | % | | | | 0.84 | % | | | | 0.90 | % |
Net Expense(b),(c) | | | | 0.17 | % | | | | 0.70 | % | | | | 0.75 | % | | | | 0.74 | % | | | | 0.42 | % |
Net Investment Income | | | | 0.01 | % | | | | 0.97 | % | | | | 1.40 | % | | | | 0.44 | % | | | | 0.01 | % |
| (a) | Represents less than $0.001. |
| (b) | The Fund invests in other underlying funds and indirectly bears its proportionate share of fees and expenses incurred by the underlying funds. This ratio does not include these indirect fees and expenses. |
| (c) | The investment manager and other service providers waived a portion of their fees. |
| (d) | Total return for periods of less than one year are not annualized. |
| (e) | Annualized for periods less than one year. |
| * | Commencement of operations. |
See Notes which are an integral part of the Financial Statements
April 30, 2021 / ANNUAL REPORT
| | |
| NOTES TO FINANCIAL STATEMENTS 16 |
Wilmington Funds
April 30, 2021
Wilmington Funds (the “Trust”) is registered under the Investment Company Act of 1940, as amended (the “Act”), as an open-end management investment company. The Trust consists of 12 funds, 2 of which are presented herein (individually referred to as a “Fund” or collectively as the “Funds”). The remaining 10 funds are presented in separate reports.
| | |
| |
| Fund | | Investment Goal |
Wilmington U.S. Government Money Market Fund (“U.S. Government Money Market
Fund”)(d) | | The Fund seeks to provide current income while maintaining liquidity and stability of principal. |
Wilmington U.S. Treasury Money Market Fund (“U.S. Treasury Money Market Fund”)(d) | | The Fund seeks to provide current income while maintaining liquidity and stability of principal. |
(d) Diversified
The Trust offers 6 classes of shares: Class A, Service Class, Select Class, Administrative Class, Class I, and Institutional Class. Class A and Class I are not available for the Funds. All shares of the Trust have equal rights with respect to voting, except on class-specific matters.
The assets of each fund are segregated and a shareholder’s interest is limited to the fund in which shares are held.
| 2. | SUMMARY OF SIGNIFICANT ACCOUNTING POLICIES |
The following is a summary of significant accounting policies consistently followed by the Funds in the preparation of their financial statements. These policies are in conformity with U.S. generally accepted accounting principles (“GAAP”). The Trust is an investment company and follows accounting and reporting guidance under Financial Accounting Standards Board (“FASB”) Accounting Standards Codification (“ASC”) Topic 946, “Financial Services - Investment Companies.” The preparation of financial statements in conformity with GAAP requires management to make estimates and assumptions that affect the amounts of assets, liabilities, expenses and revenues reported in the financial statements. Actual results could differ from those estimated and the differences could be material.
Computation of Net Asset Value – It is each Fund’s policy to maintain a continuous net asset value of $1.00 per share for each class. Each Fund has adopted certain investment, portfolio valuation and dividend and distribution policies to enable it to do so. There is no assurance, however, that each Fund will be able to maintain a stable net asset value of $1.00 per share. The net asset value (‘‘NAV’’) per share for each class of a Fund is computed by dividing the total current value of the assets of the Fund, less its liabilities, attributable to the class by the total number of shares of the class outstanding at the time of such computation. The NAV per share for each class of a Fund is computed as of 4:00 p.m. (Eastern Time) on days when the New York Stock Exchange (“NYSE”) is open for regular trading and the Federal Reserve Bank of New York (the ‘‘Fed’’) is open. In addition, the Funds may elect, in their discretion if it is determined to be in shareholders’ best interests, to be open on days when the NYSE is open but the Fed is closed or to be open on days when the Fed is open but the NYSE is closed, except for Good Friday.
Investment Valuation – The Funds use the amortized cost method to value their portfolio securities, when it represents the best estimate of fair value in accordance with Rule 2a-7 under the Act.
The Trust follows the authoritative guidance (GAAP) for fair value measurements. The guidance establishes a framework for measuring fair value and a hierarchy for inputs and techniques used in measuring fair value that maximizes the use of observable inputs and minimizes the use of unobservable inputs and techniques by requiring that the most observable inputs be used when available. The guidance establishes three tiers of inputs that may be used to measure fair value. The three tiers of inputs are summarized at the end of each Fund’s Portfolio of Investments. The inputs or techniques used for valuing securities are not necessarily an indication of the risk associated with investing in those securities.
Pursuant to the Funds’ fair value procedures noted previously, open-end regulated investment companies are generally categorized as Level 1 securities in the fair value hierarchy. Fixed income securities and money market instruments are generally categorized as Level 2 securities in the fair value hierarchy.
Repurchase Agreements – Repurchase agreements are transactions in which a Fund buys a security from a dealer or bank and agrees to sell the security back at a mutually agreed upon time and price. The repurchase price exceeds the sale price, reflecting each Fund’s return on the transaction. It is each Fund’s policy to require the counterparty to a repurchase agreement to transfer to the Funds’ custodian or sub-custodian eligible securities or cash with a market value (after transaction costs) at least equal to the repurchase price to be paid under the repurchase agreement. The eligible securities are transferred to accounts with the custodian or sub-custodian in which the Funds hold a “securities entitlement” and exercise “control” as those terms are defined in the Uniform Commercial Code. The Funds have established procedures for monitoring the market value of the transferred securities and requiring the transfer of additional eligible securities, if necessary, to equal at least the repurchase price. These procedures also allow the counterparty to require securities to be transferred from the account to the extent that their market value exceeds the repurchase price or in exchange for other eligible securities of equivalent market value.
ANNUAL REPORT / April 30, 2021
| | |
| 17 NOTES TO FINANCIAL STATEMENTS (continued) |
The insolvency of the counterparty or other failure to repurchase the securities may delay the disposition of the underlying securities or cause the Funds to receive less than the full repurchase price.
Repurchase agreements are entered into by the Funds under Master Repurchase Agreements (“MRA”) which permit the Funds, under certain circumstances including an event of default (such as bankruptcy or insolvency), to offset payables and/or receivables under the MRA with collateral held and/or posted to the counterparty and create one single net payment due to or from each Fund.
At April 30, 2021, the open repurchase agreements by counterparty which are subject to a MRA on a net payment basis are as follows:
| | | | | | | | | | | | | | | | |
| | | | |
| Fund/Counterparty | | Repurchase
Agreements | | | Fair Value of Non-Cash Collateral Received(1) | | | Cash Collateral Received(1) | | | Net Exposure(2) | |
U.S. Government Money Market Fund | | | | | | | | | | | | | | | | |
CIBC World Market Corp. | | $ | 100,000,000 | | | $ | 100,000,000 | | | $ | — | | | $ | — | |
Federal Reserve Bank of New York | | | 300,000,000 | | | | 300,000,000 | | | | — | | | | — | |
Mizuho Securities USA | | | 100,000,000 | | | | 100,000,000 | | | | — | | | | — | |
RBC Capital Markets LLC | | | 550,000,000 | | | | 550,000,000 | | | | — | | | | — | |
TD Securities, Inc. | | | 550,000,000 | | | | 550,000,000 | | | | — | | | | — | |
| | | | | | | | | | | | | | | | |
| | $ | 1,600,000,000 | | | $ | 1,600,000,000 | | | $ | — | | | $ | — | |
| | | | | | | | | | | | | | | | |
(1) The amount of collateral reflected in the table does not include any over-collateralization received by the Fund.
(2) Net exposure represents the receivable (payable) due from (to) the counterparty in the event of default.
Investment Income, Gains and Losses, Expenses and Distributions – Interest income and expenses are accrued daily. All premiums and discounts on fixed income securities are amortized/accreted for financial reporting purposes. Dividends and distributions to shareholders are recorded on the ex-dividend date. Investment transactions are accounted for on a trade date basis for financial reporting purposes. Realized gains and losses from investment transactions are recorded on an identified cost basis.
Expenses of the Trust, which are directly identifiable to a specific fund, are applied to that fund. Expenses which are not identifiable to a specific fund are allocated in such a manner as deemed equitable, taking into consideration the nature and type of expense.
Each Fund offers multiple classes of shares. Investment income, realized gains and losses, and certain fund-level expenses are allocated to each class based on relative daily net assets, except that each class bears certain expenses unique to that class such as distribution and shareholder services fees. Distributions are declared separately for each class. No class has preferential distribution rights; differences in per share distributions rates are generally due to differences in class specific expenses. Distributions from net realized gains, if any, are declared and paid to shareholders annually. Distributions from net investment income are declared daily and paid monthly.
| 3. | FEDERAL TAX INFORMATION |
No provision for federal income taxes has been made, as it is each Fund’s policy to comply with the Subchapter M provision of the Internal Revenue Code of 1986, as amended, and to distribute to shareholders each year all of its taxable income and realized gains.
Each Fund files U.S. federal, state, and local tax returns as required. The Fund’s tax returns are subject to examination by the relevant tax authorities until expiration of the applicable statute of limitations, which is generally three years after the tax returns are filed. The Funds recognize interest and penalties, if any, related to unrecognized tax benefits as income tax expense on the Statements of Operations. The Funds do not have any unrecognized tax benefits or uncertain tax positions that would require a provision for income tax. Accordingly, the Funds did not incur any interest or penalties for the year ended April 30, 2021.
The timing and character of income and capital gain distributions are determined in accordance with income tax regulations, which may differ from GAAP. For financial reporting purposes, any permanent differences resulting from different book and tax treatment are reclassified between distributable earnings and paid-in capital in the period that the differences arise. Results of operations and net assets are not affected by these reclassifications. As of April 30, 2021, there were no such reclassifications.
The tax character of distributions for the corresponding fiscal year ends were as follows:
| | | | | | | | | | | | | | | | | | | | |
| | |
| | | 2021 | | 2020 |
| | | | |
| Fund | | Ordinary Income* | | Long-Term Capital Gains | | Ordinary Income* | | Long-Term Capital Gains |
U.S. Government Money Market Fund | | | $ | 1,066,772 | | | | $ | — | | | | $ | 105,510,213 | | | | $ | — | |
U.S. Treasury Money Market Fund | | | | 199,920 | | | | | 2,001 | | | | | 22,824,070 | | | | | — | |
* For tax purposes, short-term capital gain distributions are considered ordinary income distributions.
Cost of investments for Federal income tax purposes is the same as for financial statement purposes.
April 30, 2021 / ANNUAL REPORT
| | |
| NOTES TO FINANCIAL STATEMENTS (continued) 18 |
As of April 30, 2021, the components of distributable earnings on a tax basis were as follows:
| | | | | | | | | | | | | | | | | | | | | | | | | | | | | | | | | | | |
| | | | | | | |
| Fund | | Undistributed Ordinary Income | | Undistributed Long-Term Capital Gains | | Other Timing Differences | | Unrealized Appreciation/ (Depreciation) | | Capital Loss Carryforwards | | Late Year Loss Deferrals | | Distributable Earnings |
U.S. Government Money Market Fund | | | $ | 43,434 | | | | $ | — | | | | $ | (61,616 | ) | | | $ | — | | | | $ | — | | | | $ | — | | | | $ | (18,182 | ) |
U.S. Treasury Money Market Fund | | | | 8,468 | | | | | — | | | | | (10,105 | ) | | | | — | | | | | — | | | | | — | | | | | (1,637 | ) |
| 4. | ADVISORY FEES, SERVICING FEES, AND OTHER SERVICE PROVIDERS |
Investment Advisor – Wilmington Funds Management Corporation (“WFMC” or the “Advisor”) serves as the Investment Advisor to each of the Funds. Wilmington Trust Investment Advisors, Inc. (“WTIA”) provides sub-advisory services to the Funds. WFMC and WTIA are wholly-owned subsidiaries of M&T Bank Corporation. For its services, the Funds pay WFMC an annual investment advisory fee, accrued daily and paid monthly, based on a percentage of each Fund’s average daily net assets as described below. WFMC, not the Funds, pays WTIA for its services.
| | |
| |
| Fund | | Advisory Fee
Annual Rate |
U.S. Government Money Market Fund | | 0.25% |
U.S. Treasury Money Market Fund | | 0.25% |
During the year ended April 30, 2021, WFMC has agreed to reduce its advisory fee and/or reimburse certain of the Funds’ operating expenses, and/or certain class-specific fees and expenses, in an effort to maintain the current yield of each share class at or above zero. The fee waiver does not take into consideration acquired fund fees and expenses, taxes or extraordinary items. Any such waiver or expense reimbursement may be modified or discontinued at any time without notice.
WFMC and the Funds’ distributor and shareholder service providers have contractually agreed to waive their fees and/or reimburse expenses through August 31, 2021, so that total annual fund operating expenses paid by the Funds (not including the effects of acquired fund fees and expenses, taxes, or other extraordinary expenses expressed as an annualized percentage of average daily net assets), will not exceed the expense limitations set forth below. Neither WFMC nor the Fund’s distributor and shareholder service provider will recoup previously waived fees/expenses in subsequent years.
| | | | | | | | | | | | | | | | | | | | |
| |
| | | Current Contractual Expense Limitations |
| | | | |
| Fund | | Administrative Class | | Institutional Class | | Select Class | | Service Class |
| | | | | |
| U.S. Government Money Market Fund | | | | 0.62 | % | | | | 0.27 | % | | | | 0.37 | % | | | | 0.77 | % |
| U.S. Treasury Money Market Fund | | | | 0.60 | % | | | | 0.25 | % | | | | 0.35 | % | | | | 0.75 | % |
Administrative Fees – The Bank of New York Mellon (“BNYM”) provides the Trust with fund administration services. The fees as described in the table below are a component of “Portfolio accounting and administration fees” as disclosed in the Statements of Operations. WFMC, in its role as Co-Administrator, provides the Funds with certain administrative personnel and services necessary to operate the Funds. The fees as described in the table below are accrued daily and paid monthly, and are disclosed on the Statements of Operations as “Administration fees.”
| | | | | | | |
| | |
| Administrator | | Maximum
Fee | | Average Aggregate Daily Net Assets of the Trust |
WFMC | | | | 0.040 | % | | on the first $5 billion |
| | | | 0.030 | % | | on the next $2 billion |
| | | | 0.025 | % | | on the next $3 billion |
| | | | 0.018 | % | | on assets in excess of $10 billion |
BNYM | | | | 0.0175 | % | | on the first $15 billion |
| | | | 0.0150 | % | | on the next $10 billion |
| | | | 0.0125 | % | | on assets in excess of $25 billion |
WFMC and BNYM may voluntarily choose to waive any portion of their fee and can add, modify or terminate a voluntary wavier at any time at their sole discretion. Neither WFMC nor BNYM will recoup previously waived fees/expenses in subsequent years. For the year ended April 30, 2021, neither WFMC nor BNYM waived any administrative fees.
Distribution Services Fee – The Trust has adopted a Distribution Services Plan (the “Plan”) pursuant to Rule 12b-1 under the Act. The Plan allows the Funds to pay fees to financial intermediaries, which may be paid through ALPS Distributors, Inc. (“ALPS”), the principal distributor,
ANNUAL REPORT / April 30, 2021
| | |
| 19 NOTES TO FINANCIAL STATEMENTS (continued) |
at an annual rate of up to 0.25% of the average daily net assets of the Funds’ Administrative Class and Service Class shares for the sale, distribution, administration, customer servicing and record keeping of these shares.
The Trust may reduce the maximum amount of distribution services fees it pays from time to time at its sole discretion. In addition, a financial intermediary (including ALPS, the Advisor or their affiliates), may voluntarily waive or reduce any fees to which they are entitled.
For the year ended April 30, 2021, M&T Securities, Inc., Manufacturers and Traders Trust Company, and Wilmington Trust, NA (together “M&T”), affiliates of the Advisor, received distribution services fees, net of waivers, paid by the Funds as follows:
| | | | | |
| |
| Fund | | Distribution Fees |
U.S. Government Money Market Fund | | | $ | — | |
U.S. Treasury Money Market Fund | | | | 1,800 | |
Shareholder Services Fee – Pursuant to a Shareholder Services Plan adopted by the Funds and administered by ALPS, the Funds may pay up to 0.25% of the average daily net assets of each Fund’s Administrative Class, Select Class and Service Class shares to financial intermediaries (which may include ALPS, the Advisor or their affiliates) for providing shareholder services and maintaining shareholder accounts. M&T has entered into a Shareholders Services Agreement with ALPS, under which it is entitled to receive up to 0.25% of the average daily net assets of each Fund’s shares for whom M&T provides shareholder services. The Funds may reduce the maximum amount of shareholder service fees it pays from time to time at its sole discretion. In addition, a financial intermediary (including M&T) may voluntarily waive or reduce any fees to which they are entitled.
For the year ended April 30, 2021, M&T received shareholder services fees, net of waivers, paid by the Funds as follows:
| | |
| |
| Fund | | Shareholder Services Fee |
U.S. Government Money Market Fund | | $88,842 |
U.S. Treasury Money Market Fund | | 26,011 |
Other Service Providers – Foreside Management Services, LLC (“FMS”) provides a Principal Executive Officer and Principal Financial Officer to the Trust. FMS has no role in determining the investment policies or which securities are to be sold or purchased by the Trust or its funds.
BNYM provides custody services to the Trust.
BNY Mellon Investment Servicing (U.S.) Inc. provides fund accounting and transfer agency services to the Trust.
General – Certain Trustees and Officers of the Trust are also Officers or employees of the above companies that provide services to the Funds, and during their terms of office, receive no compensation from the Funds. The Trust’s Statement of Additional Information includes additional information about the Trustees.
Market risk is the risk that one or more markets in which a Fund invests will go down in value, including the possibility that the markets will go down sharply and unpredictably. The value of a security or other asset may decline due to changes in general market conditions, economic trends or events that are not specifically related to the issuer of the security or other asset, or factors that affect a particular issuer or issuers, exchange, country, group of countries, region, market, industry, group of industries, sector or asset class. Local, regional or global events such as war, acts of terrorism, the spread of infectious illnesses or other public health issues, recessions, natural disasters or other events could have a significant impact on a Fund and its investments.
Recently, the global pandemic outbreak of an infectious respiratory illness caused by a novel coronavirus known as COVID-19 has resulted in substantial market volatility and global business disruption, impacting the global economy and the financial health of individual companies in significant and unforeseen ways. The duration and future impact of COVID-19 are currently unknown, which may exacerbate other types of risks that apply to the Funds and negatively impact Fund performance.
| 6. | CONTRACTUAL OBLIGATIONS |
In the normal course of business, the Funds may enter into contracts that provide general indemnifications. The Funds’ maximum exposure under these arrangements is dependent on claims that may be made against the Funds in the future, and, therefore, cannot be estimated; however, based on experience, the risk of material loss from such claims is considered remote.
April 30, 2021 / ANNUAL REPORT
| | |
| NOTES TO FINANCIAL STATEMENTS (concluded) | | 20 |
The Trust participates in a $10,000,000 unsecured, committed revolving line of credit (“LOC”) agreement with BNYM, which was renewed effective April 1, 2021. The LOC is available for extraordinary or emergency purposes, primarily for financing redemption payments. Borrowings are charged interest at a rate of 1.25% per annum over the greater of the Federal Funds Rate or the one month London Interbank Offered Rate (“LIBOR”). The LOC includes a commitment fee of 0.20% per annum on the daily unused portion. Prior to April 1, 2021, the commitment fee was of 0.15% per annum on the daily unused portion. The LOC expires on March 31, 2022.
The Trust did not utilize the LOC during the year ended April 30, 2021.
| 8. | RECENT ACCOUNTING PRONOUNCEMENT |
In August 2018, FASB issued an Accounting Standards Update 2018-13 (“ASU 2018-13”), which changes certain fair value measurement disclosure requirements. ASU 2018-13, in addition to other modifications and additions, removes the requirement to disclose the amount and reasons for transfers between Level 1 and Level 2 of the fair value hierarchy, the policy for the timing of transfers between levels and the valuation process for Level fair value measurements. ASU 2018-13 is effective for fiscal years, and interim periods within those fiscal years, beginning after December 15, 2019. As of April 30, 2021, ASU 2018-13 has been fully adopted and the implementation did not have a material impact on the Funds’ financial statements.
Management has evaluated events and transactions for potential recognition or disclosure in the financial statements through the date the financial statements were issued. Management has determined that there are no material events that would require recognition or disclosure in the Funds’ financial statements through this date.
ANNUAL REPORT / April 30, 2021
REPORT OF INDEPENDENT REGISTERED PUBLIC ACCOUNTING FIRM
To the Board of Trustees of Wilmington Funds and Shareholders of Wilmington U.S. Government Money Market Fund and Wilmington U.S. Treasury Money Market Fund
Opinions on the Financial Statements
We have audited the accompanying statements of assets and liabilities, including the portfolios of investments, of Wilmington U.S. Government Money Market Fund and Wilmington U.S. Treasury Money Market Fund (two of the funds constituting Wilmington Funds, hereafter collectively referred to as the “Funds”) as of April 30, 2021, the related statements of operations for the year ended April 30, 2021, the statements of changes in net assets for each of the two years in the period ended April 30, 2021, including the related notes, and the financial highlights for each of the two years in the period ended April 30, 2021 (collectively referred to as the “financial statements”). In our opinion, the financial statements present fairly, in all material respects, the financial position of each of the Funds as of April 30, 2021, the results of each of their operations for the year then ended, the changes in each of their net assets for each of the two years in the period ended April 30, 2021 and each of the financial highlights for each of the two years in the period ended April 30, 2021 in conformity with accounting principles generally accepted in the United States of America.
The financial statements of the Funds as of and for the year ended April 30, 2019 and the financial highlights for each of the periods ended on or prior to April 30, 2019 (not presented herein, other than the financial highlights) were audited by other auditors whose report dated June 27, 2019 expressed unqualified opinions on those financial statements and financial highlights.
Basis for Opinions
These financial statements are the responsibility of the Funds’ management. Our responsibility is to express an opinion on the Funds’ financial statements based on our audits. We are a public accounting firm registered with the Public Company Accounting Oversight Board (United States) (PCAOB) and are required to be independent with respect to the Funds in accordance with the U.S. federal securities laws and the applicable rules and regulations of the Securities and Exchange Commission and the PCAOB.
We conducted our audits of these financial statements in accordance with the standards of the PCAOB. Those standards require that we plan and perform the audit to obtain reasonable assurance about whether the financial statements are free of material misstatement, whether due to error or fraud.
Our audits included performing procedures to assess the risks of material misstatement of the financial statements, whether due to error or fraud, and performing procedures that respond to those risks. Such procedures included examining, on a test basis, evidence regarding the amounts and disclosures in the financial statements. Our audits also included evaluating the accounting principles used and significant estimates made by management, as well as evaluating the overall presentation of the financial statements. Our procedures included confirmation of securities owned as of April 30, 2021 by correspondence with the custodians, transfer agents and brokers. We believe that our audits provide a reasonable basis for our opinions.
/s/PricewaterhouseCoopers LLP
Philadelphia, Pennsylvania
June 24, 2021
We have served as the auditor of one or more investment companies in Wilmington Funds since 2019.
April 30, 2021 (unaudited) / ANNUAL REPORT
BOARD OF TRUSTEES AND TRUST OFFICERS
The following tables give information about each Trustee and the senior officers of the Trust. The tables separately list Trustee members who are “interested persons” of the Fund (i.e., “Interested” Trustees) and those who are not (i.e., “Independent” Trustees). The Trust is comprised of 12 funds. Unless otherwise noted, the business address of each Trustee and senior officer is 1100 North Market Street, 9th Floor, Wilmington, DE 19890. Each Trustee oversees all portfolios of the Trust and serves for an indefinite term. The Trust’s Statement of Additional Information includes additional information about the Trustees and is available, without charge and upon request, by calling 1-800-836-2211.
INTERESTED TRUSTEES BACKGROUND
| | |
| |
Name Birth Year Position with Trust Date Service Began | | Principal Occupations and Other Directorships Held for Past Five Years |
| |
Dominick J. D’Eramo* Birth year: 1964 TRUSTEE Began serving: November 2018 PRESIDENT Began serving: June 2018 | | Principal Occupations: Senior Vice President, Wilmington Trust Investment Advisors, Inc. and Head of Fixed Income. Previous Positions: Group Vice President, Wilmington Trust Investment Advisor, Inc. (WTIA) (2014-2017); Administrative Vice President, WTIA (2012-2014). |
| * | Dominick J. D’Eramo is “interested” due to his employment with WTIA and his position with WFMC, investment Advisors to the Funds. |
INDEPENDENT TRUSTEES BACKGROUND
| | |
| |
Name Birth Year Position with Trust Date Service Began | | Principal Occupations and Other Directorships Held for Past Five Years |
| |
Nicholas A. Giordano Birth year: 1943 CHAIRMAN and TRUSTEE Began serving: March 2012 | | Principal Occupations: Consultant, financial services organizations (1997 to present). Other Directorships Held: The RBB Fund Inc. (34 portfolios) (registered investment companies); Independence Blue Cross; IntriCon Corporation (body-worn products). Previous Positions: Director, Kalmar Pooled Investment Trust (through 6/17). |
| |
Robert H. Arnold Birth year: 1944 TRUSTEE Began serving: March 2012 | | Principal Occupations: Managing Director, R.H. Arnold & Co, Inc. (financial management consulting) (6/89 to present). Other Directorships Held: None. Previous Positions: Trustee, First Potomac Realty Trust (real estate investment trust) (5/03 to 12/17); Director, Treasury Strategies, Inc. (private treasury consulting services) (6/01 to 6/16). |
| |
Gregory P. Chandler Birth year: 1966 TRUSTEE Began serving: July 2017 | | Principal Occupations: Chief Financial Officer, Avocado Systems, Inc. (cybersecurity software) (3/20 to present); President, GCVC Consulting (financial and corporate governance advisory) (2008 to present). Other Directorships Held: Trustee, RBB Fund Series Trust (34 portfolios) (registered investment companies) (2012 to present); Trustee, FS Energy Partners (business development company) (2009 to present); Director, Emtec, Inc. (2005 to 2019); Director, FS Investment Corporation (business development company) (2007 to 2019); Previous Positions: Chief Financial Officer, Emtec, Inc. (information technology services) (2009 to 2020); Managing Director, Janney Montgomery Scott LLC (investment banking) (1999 to 2009); Consulting Manager, PwC (1997 to 1999); Manager, Business Assurance, Coopers & Lybrand (audit services) (1995 – 1997). |
ANNUAL REPORT / April 30, 2021 (unaudited)
| | |
| 23 | | BOARD OF TRUSTEES AND TRUST OFFICERS |
| | |
| |
Name Birth Year Position with Trust Date Service Began | | Principal Occupations and Other Directorships Held for Past Five Years |
| |
Donald E. Foley Birth year: 1951 TRUSTEE Began serving: December 2015 | | Principal Occupations: Director, BioSig Technologies (2015 to present); Trustee, AXA Premier VIP Trust (2017 to present); Trustee, EQ Advisors Trust (2014 to present); Trustee, 1290 Funds (retail funds) (2014 to present); Chairman and Director, Burke Rehabilitation Hospital Foundation (private hospital, research institute) (2005 to present); Trustee and Chairman of the President’s Council, Union College (private college) (2011 to present); Chairman and Trustee, New Beginning Family Academy (elementary charter school) (2016 to present). Other Directorships Held: Director, M&T Bank Corporation (commercial bank) (2011 to 2012); Chairman and Director, Wilmington Trust Corporation (commercial and trust bank) (2007 to 2011). Previous Positions: Advisory Member, Trust and Investment Committee, M&T Bank, Wilmington Trust, National Association, and Wilmington Trust Company (through 2016); Chairman and Chief Executive Officer of Wilmington Trust Corporation (2010 to 2011). |
| |
Valerie J. Sill Birth year: 1962 TRUSTEE Began serving: April 2020 | | Principal Occupations: President, Chief Executive Officer and Chief Investment Officer, DuPont Capital Management (asset management) (2004 to present). Other Directorships Held: Trustee, Longwood Gardens (2005 to present); Trustee of the Christiana Care Health System (2012 to present); and Advisory Counsel, Federal Reserve Bank of Philadelphia’s Economic Advisory Council (2010 to 2013). Previous Positions: Executive Vice President at The Boston Company (1994 to 2004). |
OFFICERS
| | |
| |
Name Birth Year Positions with Trust | | Principal Occupations for Past Five Years and Previous Positions |
| |
John C. McDonnell Birth year: 1966 CHIEF OPERATIONS OFFICER Began serving: June 2017 VICE PRESIDENT Began serving: June 2012 | | Principal Occupations: Chief Operations Officer, Wilmington Funds; Administrative Vice President, Wilmington Funds Management Corporation (2005 to present); Administrative Vice President, Wilmington Trust Investment Advisors, Inc. (2012 to present). Previous Positions: Vice President, Wilmington Trust Investment Management, LLC (2005 to 2012). |
| |
Lisa Druelinger Birth year: 1978 CHIEF COMPLIANCE OFFICER and AML COMPLIANCE OFFICER. Began serving: November 2017 | | Principal Occupations: Chief Compliance Officer and Anti-Money Laundering Officer, Wilmington Funds; Administrative Vice President, M&T Bank. Previous Positions: Vice President and Senior Compliance Officer, Wilmington Trust Investment Advisors, Inc. (2015-2017); Wilmington Funds Product Manager, Wilmington Trust Investment Advisors, Inc. (2013-2015); Institutional and Retirement Services Product Manager, Wilmington Trust (2011-2013); Trust Compliance and Risk Management at M&T Bank (2006-2011). |
| |
John J. Kelley Birth year: 1959 VICE PRESIDENT Began serving: December 2016 | | Principal Occupations: President of Wilmington Funds Management Corporation; Group Vice President and Chief Administrative Officer, Wilmington Trust Investment Advisors, Inc. Previous Positions: Vice President, BNY Mellon Investment Servicing (formerly, PNC Global Investment Servicing) from (1/05 to 7/05); Vice President of Administration, 1838 Investment Advisors, LP (1999 to 2005); Chief Compliance Officer, 1838 Investment Advisors, LP (2004 to 2005). |
April 30, 2021 (unaudited) / ANNUAL REPORT
| | |
| BOARD OF TRUSTEES AND TRUST OFFICERS | | 24 |
| | |
| |
Name Birth Year Positions with Trust | | Principal Occupations for Past Five Years and Previous Positions |
| |
Robert L. Tuleya Birth year: 1974 VICE PRESIDENT and ASSISTANT SECRETARY Began serving: September 2018 | | Principal Occupations: Vice President and Assistant Secretary, Wilmington Funds; Vice President and Assistant Secretary, Wilmington Funds Management Corporation (2018 to present); Vice President and Assistant Secretary, Wilmington Trust Investment Advisors, Inc. (2018 to present); Vice President and Assistant Secretary, Wilmington Trust Investment Management, LLC (2018 to present); Vice President and Assistant General Counsel, M&T Bank (2018 to present). Previous Positions: Vice President and Counsel, M&T Bank (2017 to 2018); Senior Counsel, PNC Bank (2014 to 2017). |
| |
Christopher W. Roleke 10 High Street, Suite 302 Boston,MA 02110 Birth year: 1972 CHIEF EXECUTIVE OFFICER Began serving: October 2020 | | Principal Occupation: Managing Director and Fund Principal Financial Officer, Foreside Management Services, LLC (2011 to present). Previous Positions: Assistant Vice President, JP Morgan Investor Services Co. (2006 to 2011). |
| |
Arthur W. Jasion Three Canal Plaza, Suite 100 Portland, ME 04101 Birth year: 1965 CHIEFFINANCIAL OFFICER AND TREASURER Began serving: October 2020 | | Principal Occupation: Senior Director and Fund Principal Financial Officer, Foreside Management Services, LLC (2020 to present). Previous Positions: Partner, Ernst &Young LLP (2012 to 2020). |
| |
Lisa R. Grosswirth 240 Greenwich Street, 22nd Floor New York, NY 10286 Birth year: 1963 SECRETARY Began serving: September 2007 | | Principal Occupation: Vice President, BNY Mellon Asset Servicing (2004 to present). Previous Positions: Supervisory Paralegal, The Dreyfus Corporation (1998 to 2004). |
ANNUAL REPORT / April 30, 2021 (unaudited)
Board Approval of Liquidity Risk Management Program
To promote effective liquidity risk management throughout the fund industry and to enhance disclosure regarding fund liquidity and redemption practices, the Securities and Exchange Commission (the “Commission”) adopted Rule 22e-4 under the Investment Company Act of 1940, as amended. The rule requires every registered open-end management company to establish a liquidity risk management program that, among other things, provides for the assessment, management and review of liquidity risk, the classification of a fund’s portfolio investments into one of four liquidity buckets based upon the number of days that such investments may reasonably be expected to be converted into cash or otherwise disposed of without significantly impacting their price, the establishment of a highly liquid investment minimum where required, and the establishment of a 15% limitation on illiquid investments. Additionally, the Commission adopted Rule 30b1-10 and Form N-LIQUID, which generally requires a fund to notify the Commission when certain liquidity-related events occur.
The Wilmington Funds Board of Trustees (the “Board”) approved the appointment of the Funds’ Liquidity Risk Management Committee (“Liquidity Committee”) as the administrator of the liquidity risk management program (the “LRMP”) for the Funds on September 6, 2018 and the Funds’ final LRMP on March 5, 2019. At the regular meeting of the Board on March 10, 2021, the Trust’s Chief Operations Officer, as a member of the Liquidity Committee, provided a report to the Board on the operation and effectiveness of the LRMP for the year of operation ending December 31, 2020. The Liquidity Committee managed liquidity risks associated with the Funds’ investments by monitoring cash and cash equivalents, the use of derivatives, the concentration of investments and the appropriateness of portfolio strategies for open-end funds, and by classifying each investment of a Fund as either highly liquid, moderately liquid, less liquid or illiquid on at least a monthly basis. To assist with the classification of each Fund’s investments, the Liquidity Committee utilized a third party provider of liquidity monitoring services. The Liquidity Committee supplied portfolio-level data and certain assumptions to the provider which then used the information to determine the liquidity classification of each security position held by the Funds. The liquidity classifications as of each month end were reviewed by the Liquidity Committee on at least a quarterly basis and would be reviewed more often if market conditions warranted. For assets managed by a third party sub-adviser the Liquidity Committee would take sub-adviser input into account where appropriate in determining the liquidity classifications.
The LRMP effectively managed the Funds’ liquidity risks for the twelve month period ended April 30, 2021. During this period, each Fund held more than 50% of its total net assets in highly liquid investments and due to the fact that each Fund is deemed to consist primarily of highly liquid investments, no highly liquid investment minimum was required to be established for any Fund. All Funds holding assets deemed to be illiquid were well under the illiquid investment limitation. Additionally, no events occurred that required the filing of Form N-LIQUID.
April 30, 2021 (unaudited) / ANNUAL REPORT
Shares of the Wilmington Funds are not FDIC insured or otherwise protected by the U.S. government, are not deposits or other obligations of, or guaranteed by, Manufacturers and Traders Trust Company, and are subject to investment risks, including possible loss of the principal amount invested.
VOTING PROXIES ON FUND PORTFOLIO SECURITIES
A description of the policies and procedures that the Funds use to determine how to vote proxies relating to securities held in the Funds’ portfolios is available, without charge and upon request, by calling 1-800-836-2211. A report on how the Funds voted any such proxies during the most recent 12-month period ended June 30 is available through Wilmington Funds’ website. Go to www.wilmingtonfunds.com select “Proxy Voting Record” to access the link. This information is also available from the Edgar database on the SEC’s website at www.sec.gov.
PORTFOLIO SCHEDULE
The Funds file a complete schedule of portfolio holdings with the SEC monthly on Form N-MFP. The Funds’ Form N-MFPs are available on the SEC’s website at www.sec.gov.
Important information about the access and delivery of shareholder reports
Beginning on June 1, 2021, as permitted by regulations adopted by the Securities and Exchange Commission, paper copies of your Fund’s shareholder reports will no longer be sent to you by mail, unless you specifically request them. You will be notified by mail each time a report is posted on the Funds’ website and you will be provided with a link to access the report.
If you have already elected to receive shareholder reports electronically, you will not be affected by this change and you do not need to take any action. You may elect to receive other communications electronically from the Fund by contacting your financial intermediary or, if you hold shares directly with the Fund, by calling 1-800-836-2211.
You may elect to receive paper copies of all future shareholder reports free of charge. If you own these shares through a financial intermediary, you may contact your financial intermediary to elect to receive paper copies of your shareholder reports. If you are a direct investor you can inform the Wilmington Funds that you wish to continue receiving paper copies of your shareholder reports by contacting us at 1-800-836-2211. Your election to receive paper reports will apply to all funds held directly with Wilmington Funds and may apply to all funds held with your financial intermediary.
ANNUAL REPORT / April 30, 2021 (unaudited)
PRIVACY POLICY AND NOTICE
OF THE FUNDS AND THEIR DISTRIBUTOR
June 8, 2012
The Wilmington Funds, their distributor and their agents (referred to as “the Funds”, “we” or “us”) recognize that consumers (referred to as “you” or “your”) expect us to protect both your assets and financial information. We respect your right to privacy and your expectation that all personal information about you or your account will be maintained in a secure manner. We are committed to maintaining the confidentiality, security and integrity of client and shareholder information. We want you to understand the Funds’ policy that governs the handling of your information, how the Funds gather information, how that information is used and how it is kept secure.
Information The Funds Collect:
The Funds collect nonpublic personal information about you from the following sources:
| | ● | | We may receive information from you, or from your financial representative, on account applications, other forms or electronically (such as through the Funds’ website or other electronic trading mechanisms). Examples of this information include your name, address, social security number, assets and income. |
| | ● | | We may receive information from you, or from your financial representative, through transactions with us or others, correspondence and other communications. Examples of this information include specific investments and your account balances. |
| | ● | | We may obtain other personal information from you in connection with providing you a financial product or service. Examples of this information include depository, debit or credit account numbers. |
Information Sharing Policy:
The Funds may share nonpublic personal information about you, as described above, with financial or non-financial companies or other entities, including companies that may be affiliated with the Funds and other nonaffiliated third parties, for the following purposes:
| | ● | | We may share information when it is necessary and required to process a transaction or to service a customer relationship. For example, information may be shared with a company that provides account record keeping services or a company that provides proxy services to shareholders. |
| | ● | | We may share information when it is required or permitted by law. For example, information may be shared in response to a subpoena or to protect you against fraud or with someone who has established a legal beneficial interest, such as a power of attorney. |
| | ● | | We may disclose some or all of the information described above to companies that perform marketing or other services on our behalf. For example, we may share information about you with the financial intermediary (bank, investment bank or broker-dealer) through whom you purchased the Funds’ products or services, or with providers of marketing, legal, accounting or other professional services. The Funds will not, however, disclose a consumer’s account number or similar form of access number or access code for credit card, deposit or transaction accounts to any nonaffiliated third party for use in telemarketing, direct mail or other marketing purposes. |
Except as described above, the Funds do not share customer information. We will not rent, sell, trade, or otherwise release or disclose any personal information about you. Any information you provide to us is for the Funds’ use only. If you decide to close your account(s) or become an inactive customer, we will adhere to the privacy policies and practices as described in this notice.
Information Security:
When the Funds share nonpublic customer information with third parties hired to facilitate the delivery of certain products or services to our customers, such information is made available for limited purposes and under controlled circumstances designed to protect our customers’ privacy. We require third parties to comply with our standards regarding security and confidentiality of such information. We do not permit them to use that information for their own or any other purposes, or rent, sell, trade or otherwise release or disclose the information to any other party. These requirements are reflected in written agreements between the Funds and the third party service providers.
The Funds protect your personal information in several ways. We maintain physical, electronic, and procedural safeguards to guard your nonpublic personal information. In addition, the Funds’ Transfer Agent and Shareholder Servicing Agent have procedures in place for the appropriate disposal of nonpublic personal information when they are no longer required to maintain the information.
Each of the following sections explains an aspect of the Funds’ commitment to protecting your personal information and respecting your privacy.
Employee Access to Information:
Our Code of Ethics, which applies to all employees, restricts the use of customer information and requires that it be held in the strictest of confidence. Employee access to customer information is authorized for business purposes only, and the degree of access is based on the sensitivity of the information and on an employee’s or agent’s need to know the information in order to service a customer’s account or comply with legal requirements.
Visiting The Funds’ Website:
The Funds’ website gathers and maintains statistics about the number of visitors as well as what information is viewed most frequently. This information is used to improve the content and level of service we provide to our clients and shareholders.
| ● | | Information or data entered into a website will be retained. |
April 30, 2021 (unaudited) / ANNUAL REPORT
| ● | | Where registration to a website or re-entering personal information on a website is required, “cookies” are used to improve your online experience. A cookie is a way for websites to recognize whether or not you have visited the site before. It is a small file that is stored on your computer that identifies you each time you re-visit our site so you don’t have to resubmit personal information. Cookies provide faster access into the website. |
| ● | | We may also collect non-personally identifiable Internet Protocol (“IP”) addresses for all other visitors to monitor the number of visitors to the site. These non-personally identifiable IP addresses are never shared with any third party. |
E-mail:
If you have opted to receive marketing information from the Funds by e-mail, it is our policy to include instructions in all marketing messages on how to unsubscribe from subsequent e-mail programs. Some products or services from the Funds are intended to be delivered and serviced electronically. E-mail communication may be utilized in such cases. If you participate in an employer-sponsored retirement plan administered by the Funds, we may, at your employer’s request, send you e-mail on matters pertaining to the retirement plan.
Please do not provide any account or personal information such as social security numbers, account numbers, or account balances within your e-mail correspondence to us. We cannot use e-mail to execute transaction instructions, provide personal account information, or change account registration. We can, however, use e-mail to provide you with the necessary forms or you may contact customer service toll-free at 1-800-836-2211.
Surveys/Aggregate Data:
Periodically, the Funds may conduct surveys about financial products and services or review elements of customer information in an effort to forecast future business needs. The Funds then generate reports that include aggregate data regarding its customers. Aggregate data classifies customer information in various ways but that does not identify individual customers. These reports may also include information on website traffic patterns and related information. These reports are used for the Funds’ planning, statistical and other corporate purposes. Aggregate data may also be shared with external parties, such as marketing organizations. However, no information is shared by which any individual customer could be identified.
Changes to Our Privacy Statement:
The effective date of this policy is June 8, 2012. We reserve the right to modify this policy at any time. When it is revised or materially changed, we will update the effective date. You can determine whether there have been changes since the last time you reviewed by simply checking the effective date.
Notice will be provided to you in advance of any changes that would affect your rights under this policy statement.
ANNUAL REPORT / April 30, 2021 (unaudited)
Investment Advisor Wilmington Funds Management Corp. 1100 North Market Street 9th Floor Wilmington, DE 19890 Sub-Advisor Wilmington Trust Investment Advisors, Inc. 1100 North Market Street 9th Floor Wilmington, DE 19890 Co-Administrator Wilmington Funds Management Corp. 1100 North Market Street 9th Floor Wilmington, DE 19890 Custodian The Bank of New York Mellon 240 Greenwich Street New York, NY 10286 Distributor ALPS Distributors, Inc. 1290 Broadway, Suite 1100 Denver, CO 80203 Fund Accountant, Co-Administrator, Transfer Agent and Dividend Disbursing Agent BNY Mellon Investment Servicing (U.S.) Inc. 301 Bellevue Parkway Wilmington, DE 19809 Independent Registered Public Accounting Firm PricewaterhouseCoopers LLP Two Commerce Square 2001 Market Street, Suite 1800 Philadelphia, PA 19103 WT-AR-MM-0421 Wilmington Funds | 1-800-836-2211 | www.wilmingtonfunds.com We are pleased to send you this shareholder report for the Wilmington Funds. This report contains important information about your investments in the funds.
Item 2. Code of Ethics.
| | (a) | As of the end of the period covered by this report, the registrant has adopted a code of ethics (the “Section 406 Standards for Investment Companies - Ethical Standards for Principal Executive and Financial Officers”) that applies to the registrant’s Principal Executive Officer and Principal Financial Officer; the registrant’s Principal Financial Officer also serves as the Principal Accounting Officer. |
| | (b) | There have been no amendments to the registrant’s code of ethics that apply to its Principal Executive Officer or Principal Financial Officer. |
| | (c) | There have been no amendments to the Funds’ code of ethics during the reporting period for this Form N-CSR. |
| | (d) | The registrant has not granted any waivers, including an implicit waiver, from any provisions of its code of ethics during the reporting period for this Form N-CSR. |
| | (f)(3) | The registrant hereby undertakes to provide any person, without charge, upon request, a copy of the code of ethics. To request a copy of the code of ethics, contact the registrant at 1-800-836-2211, and ask for a copy of the Section 406 Standards for Investment Companies - Ethical Standards for Principal Executive and Financial Officers. |
Item 3. Audit Committee Financial Expert.
The registrant’s Board has determined that each member of the Board’s Audit Committee is an “audit committee financial expert,” and that each such member is “independent,” for purposes of this Item. The Audit Committee consists of the following Board members: Gregory P. Chandler, Nicholas A. Giordano, Donald E. Foley.
Item 4. Principal Accountant Fees and Services.
| | (a) | The Audit Fees. The aggregate fees billed for each of the last two fiscal years for professional services rendered by the principal accountant for the audit of the Registrant’s annual financial statements or services that are normally provided by the accountant in connection with statutory and regulatory filings or engagements were as follows: |
Fiscal year ended 2021 - $460,000
Fiscal year ended 2020 - $441,000
| | (b) | Audit-Related Fees. The aggregate fees billed for each of the last two fiscal years for professional services rendered by the principal accountant for assurance and related services by the principal accountant that are reasonably related to the performance of the audit of the Registrant’s financial statements and are not reported above in Item 4(a) were as follows: |
Fiscal year ended 2021 - $0
Fiscal year ended 2020 - $0
Amount requiring approval of the registrant’s audit committee pursuant to paragraph (c)(7)(ii) of Rule 2-01 of Regulation S-X were $0 and $0, respectively.
| | (c) | Tax Fees. The aggregate fees billed for each of the last two fiscal years for professional services rendered by the principal accountant for tax compliance, tax advice and tax planning were as follows: |
Fiscal year ended 2021 - $138,100
Fiscal year ended 2020 - $145,524
Amount requiring approval of the registrant’s audit committee pursuant to paragraph (c)(7)(ii) of Rule 2-01 of Regulation S-X were $138,100 and $145,524, respectively.
| | (d) | All Other Fees. The aggregate fees billed in each of the last two fiscal years for products and services provided by the principal accountant, other than the services reported in paragraphs (a) through (c) of this Item were as follows: |
Fiscal year ended 2021 - $0
Fiscal year ended 2020 - $0
Amount requiring approval of the registrant’s audit committee pursuant to paragraph (c)(7)(ii) of Rule 2-01 of Regulation S-X were $0 and $0, respectively.
| | (e)(1) | Audit Committee Policies regarding Pre-approval of Services. |
The Audit Committee is required to pre-approve audit and non-audit services performed by the independent auditor in order to assure that the provision of such services do not impair the auditor’s independence. Unless a type of service to be provided by the independent auditor has received general pre-approval, it will require specific pre-approval by the Audit Committee. Any proposed services exceeding pre-approved cost levels will require specific pre-approval by the Audit Committee.
Certain services have the general pre-approval of the Audit Committee. The term of the general pre-approval is 12 months from the date of pre-approval, unless the Audit Committee specifically provides for a different period. The Audit Committee will annually review the services that may be provided by the independent auditor without obtaining specific pre-approval from the Audit Committee and may grant general pre-approval for such services. The Audit Committee will revise the
list of general pre-approved services from time to time, based on subsequent determinations. The Audit Committee will not delegate its responsibilities to pre-approve services performed by the independent auditor to management.
The Audit Committee has delegated pre-approval authority to its Chairman. The Chairman will report any pre-approval decisions to the Audit Committee at its next scheduled meeting. The Committee will designate another member with such pre-approval authority when the Chairman is unavailable.
AUDIT SERVICES
The annual Audit services engagement terms and fees will be subject to the specific pre-approval of the Audit Committee. The Audit Committee must approve any changes in terms, conditions and fees resulting from changes in audit scope, registered investment company (RIC) structure or other matters.
In addition to the annual Audit services engagement specifically approved by the Audit Committee, the Audit Committee may grant general pre-approval for other Audit Services, which are those services that only the independent auditor reasonably can provide. The Audit Committee has pre-approved certain Audit services. All other Audit services must be specifically pre-approved by the Audit Committee.
AUDIT-RELATED SERVICES
Audit-related services are assurance and related services that are reasonably related to the performance of the audit or review of the Company’s financial statements or that are traditionally performed by the independent auditor. The Audit Committee believes that the provision of Audit-related services does not impair the independence of the auditor, and has pre-approved certain Audit-related services. All other Audit-related services must be specifically pre-approved by the Audit Committee.
TAX SERVICES
The Audit Committee believes that the independent auditor can provide Tax services to the Company such as tax compliance, tax planning and tax advice without impairing the auditor’s independence. However, the Audit Committee will not permit the retention of the independent auditor in connection with a transaction initially recommended by the independent auditor, the purpose of which may be tax avoidance and the tax treatment of which may not be supported in the Internal Revenue Code and related regulations. The Audit Committee has pre-approved certain Tax services. All Tax services involving large and complex transactions must be specifically pre-approved by the Audit Committee.
ALL OTHER SERVICES
With respect to the provision of services other than audit, review or attest services, the pre-approval requirement is waived if:
| | (1) | The aggregate amount of all such services provided constitutes no more than five percent of the total amount of revenues paid by the registrant, the registrant’s adviser (not including any sub-adviser whose role is primarily portfolio management and is subcontracted with or overseen by another investment adviser), and any entity controlling, controlled by, or under common control with the investment adviser that provides ongoing services to the registrant or to its accountant during the fiscal year in which the services are provided; |
| | (2) | Such services were not recognized by the registrant, the registrant’s adviser (not including any sub-adviser whose role is primarily portfolio management and is subcontracted with or overseen by another investment adviser), and any entity controlling, controlled by, or under common control with the investment adviser that provides ongoing services to the registrant at the time of the engagement to be non-audit services; and |
| | (3) | Such services are promptly brought to the attention of the Audit Committee of the issuer and approved prior to the completion of the audit by the Audit Committee or by one or more members of the Audit Committee who are members of the board of directors to whom authority to grant such approvals has been delegated by the Audit Committee. |
The Audit Committee may grant general pre-approval to those permissible non-audit services classified as All Other services that it believes are routine and recurring services, and would not impair the independence of the auditor.
The SEC’s rules and relevant guidance should be consulted to determine the precise definitions of prohibited non-audit services and the applicability of exceptions to certain of the prohibitions.
PRE-APPROVAL FEE LEVELS
Pre-approval fee levels for all services to be provided by the independent auditor will be established annually by the Audit Committee. Any proposed services exceeding these levels will require specific pre-approval by the Audit Committee.
PROCEDURES
Requests or applications to provide services that require specific approval by the Audit Committee will be submitted to the Audit Committee by both the independent auditor and the Principal Accounting Officer and/or Internal Auditor, and must include a joint statement as to whether, in their view, the request or application is consistent with the SEC’s rules on auditor independence.
| (e)(2) | Percentage of services identified in items 4(b) through 4(d) that were approved by the registrants’ audit committee pursuant to paragraph (c)(7)(i)(C) of Rule 2-01 of Regulation S-X: |
4(b)
Fiscal year ended 2021 – 0%
Fiscal year ended 2020 – 0%
Percentage of services provided to the registrant’s investment adviser and any entity controlling, controlled by, or under common control with the investment adviser that provides ongoing services to the registrant that were approved by the registrant’s audit committee pursuant to paragraph (c)(7)(i)(C) of Rule 2-01 of Regulation S-X were 0% and 0%, respectively.
4(c)
Fiscal year ended 2021 – 0%
Fiscal year ended 2020 – 0%
Percentage of services provided to the registrant’s investment adviser and any entity controlling, controlled by, or under common control with the investment adviser that provides ongoing services to the registrant that were approved by the registrant’s audit committee pursuant to paragraph (c)(7)(i)(C) of Rule 2-01 of Regulation S-X were 0% and 0%, respectively.
4(d)
Fiscal year ended 2021 – 0%
Fiscal year ended 2020 – 0%
Percentage of services provided to the registrant’s investment adviser and any entity controlling, controlled by, or under common control with the investment adviser that provides ongoing services to the registrant that were approved by the registrant’s audit committee pursuant to paragraph (c)(7)(i)(C) of Rule 2-01 of Regulation S-X were 0% and 0%, respectively.
| (g) | Non-Audit Fees billed to the registrant, the registrant’s investment adviser, and certain entities controlling, controlled by or under common control with the investment adviser that provide ongoing services to the registrant: |
Fiscal year ended 2021 – $138,100
Fiscal year ended 2020 – $145,524
| (h) | The registrant’s Audit Committee has considered that the provision of non-audit services that were rendered to the registrant’s adviser (not including any sub-adviser whose role is primarily portfolio management and is subcontracted with or overseen by another investment adviser), and any entity controlling, controlled by, or under common control with the investment adviser that provides ongoing services to the registrant that were not pre-approved pursuant to paragraph (c)(7)(ii) of Rule 2-01 of Regulation S-X is compatible with maintaining the principal accountant’s independence. |
Item 5. Audit Committee of Listed Registrants.
Not applicable.
Item 6. Investments.
| (a) | Schedule of Investments in securities of unaffiliated issuers as of the close of the reporting period is included as part of the report to shareholders filed under Item 1 of this form. |
Item 7. Disclosure of Proxy Voting Policies and Procedures for Closed-End Management Investment Companies.
Not applicable.
Item 8. Portfolio Managers of Closed-End Management Investment Companies.
Not applicable.
Item 9. Purchases of Equity Securities by Closed-End Management Investment Company and Affiliated Purchasers.
Not applicable.
Item 10. Submission of Matters to a Vote of Security Holders.
No changes to report.
Item 11. Controls and Procedures.
| | (a) | The registrant’s principal executive officer and principal financial officer have concluded that the registrant’s disclosure controls and procedures (as defined in Rule 30a-3(c) under the Investment Company Act of 1940 (the “1940 Act”)) are effective, based on an evaluation of those controls and procedures made as of a date within 90 days of the filing date of this report as required by Rule 30a-3(b) under the 1940 Act and Rule 13a-15(b) under the Exchange Act. |
| | (b) | There has been no change in the registrant’s internal control over financial reporting (as defined in Rule 30a-3(d) under the 1940 Act) that occurred during the period covered by this report that has materially affected, or is reasonably likely to materially affect, the registrant’s internal control over financial reporting. |
Item 12. Disclosure of Securities Lending Activities for Closed-End Management Investment Companies.
Not applicable.
Item 13. Exhibits.
Pursuant to the requirements of the Securities Exchange Act of 1934 and the Investment Company Act of 1940, the registrant has duly caused this report to be signed on its behalf by the undersigned, thereunto duly authorized.
(Registrant): Wilmington Funds
| | |
| By (Signature and Title)* | | /s/ Christopher W. Roleke |
| | Christopher W. Roleke |
| | (Principal Executive Officer) |
Date: July 2, 2021
Pursuant to the requirements of the Securities Exchange Act of 1934 and the Investment Company Act of 1940, this report has been signed below by the following persons on behalf of the registrant and in the capacities and on the dates indicated.
| | |
| By (Signature and Title)* | | /s/ Christopher W. Roleke |
| | Christopher W. Roleke |
| | (Principal Executive Officer) |
Date: July 2, 2021
| | |
| By (Signature and Title)* | | /s/ Arthur W. Jasion |
| | Arthur W. Jasion |
| | (Principal Financial Officer) |
Date: July 2, 2021
* Print the name and title of each signing officer under his or her signature.