0000831001us-gaap:ExchangeTradedMemberc:TradingAccountsLiabilitiesMemberus-gaap:NondesignatedMemberus-gaap:EquityContractMember2020-06-300000831001c:MeasurementInputPriceToBookRatioMemberc:ValuationTechniqueModelbasedMembersrt:WeightedAverageMemberus-gaap:FairValueInputsLevel3Member2020-06-30
UNITED STATES
SECURITIES AND EXCHANGE COMMISSION
WASHINGTON, D.C. 20549
FORM 10-Q
(Mark One)
| | | | | |
| ☒ | QUARTERLY REPORT PURSUANT TO SECTION 13 OR 15(d) OF THE SECURITIES EXCHANGE ACT OF 1934 |
For the quarterly period ended June 30, 2020
OR
| | | | | |
| ☐ | TRANSITION REPORT PURSUANT TO SECTION 13 OR 15(d) OF THE SECURITIES EXCHANGE ACT OF 1934 |
For the transition period from to
Commission file number 1-9924
Citigroup Inc.
(Exact name of registrant as specified in its charter)
| | | | | | | | | | | | | | |
| Delaware | | | | 52-1568099 |
| (State or other jurisdiction of incorporation or organization) | | | | (I.R.S. Employer Identification No.) |
| 388 Greenwich Street, | New York | NY | | 10013 |
(Address of principal executive offices)
| | | | (Zip code) |
(212) 559-1000
(Registrant's telephone number, including area code)
Securities registered pursuant to Section 12(b) of the Securities Exchange Act of 1934 formatted in Inline XBRL: See Exhibit 99.01
Indicate by check mark whether the registrant (1) has filed all reports required to be filed by Section 13 or 15(d) of the Securities Exchange Act of 1934 during the preceding 12 months (or for such shorter period that the registrant was required to file such reports), and (2) has been subject to such filing requirements for the past 90 days. Yes ☒ No ☐
Indicate by check mark whether the registrant has submitted electronically every Interactive Data File required to be submitted pursuant to Rule 405 of Regulation S-T (§232.405 of this chapter) during the preceding 12 months (or for such shorter period that the registrant was required to submit such files). Yes ☒ No ☐
Indicate by check mark whether the registrant is a large accelerated filer, an accelerated filer, a non-accelerated filer, smaller reporting, or an emerging growth company. See the definitions of "large accelerated filer," "accelerated filer," "smaller reporting company" and “emerging growth company” in Rule 12b-2 of the Exchange Act.
| | | | | | | | | | | | | | | | | | | | | | | |
| Large accelerated filer | ☒ | Accelerated filer | ☐ | Non-accelerated filer | ☐ | Smaller reporting company | ☐ |
| | | | | | Emerging growth company | ☐ |
If an emerging growth company, indicate by check mark if the registrant has elected not to use the extended transition period for complying with any new or revised financial accounting standards provided pursuant to Section 13(a) of the Exchange Act. Yes ☐
Indicate by check mark whether the registrant is a shell company (as defined in Rule 12b-2 of the Exchange Act). Yes ☐ No ☒
Number of shares of Citigroup Inc. common stock outstanding on June 30, 2020: 2,081,864,894
Available on the web at www.citigroup.com
CITIGROUP’S SECOND QUARTER 2020—FORM 10-Q
| | | | | |
| OVERVIEW | |
MANAGEMENT’S DISCUSSION AND
ANALYSIS OF FINANCIAL CONDITION AND
RESULTS OF OPERATIONS | |
| Executive Summary | |
| COVID-19 Pandemic Overview | |
| RISK FACTORS | |
| Summary of Selected Financial Data | |
SEGMENT AND BUSINESS—INCOME (LOSS)
AND REVENUES | |
| SEGMENT BALANCE SHEET | |
| Global Consumer Banking (GCB) | |
| North America GCB | |
| Latin America GCB | |
| Asia GCB | |
| Institutional Clients Group | |
| Corporate/Other | |
| OFF-BALANCE SHEET ARRANGEMENTS | |
| CAPITAL RESOURCES | |
MANAGING GLOBAL RISK TABLE OF
CONTENTS | |
| MANAGING GLOBAL RISK | |
SIGNIFICANT ACCOUNTING POLICIES AND
SIGNIFICANT ESTIMATES | |
DISCLOSURE CONTROLS AND
PROCEDURES | |
DISCLOSURE PURSUANT TO SECTION 219 OF
THE IRAN THREAT REDUCTION AND SYRIA
HUMAN RIGHTS ACT | |
| FORWARD-LOOKING STATEMENTS | |
FINANCIAL STATEMENTS AND NOTES
TABLE OF CONTENTS | |
| CONSOLIDATED FINANCIAL STATEMENTS | |
NOTES TO CONSOLIDATED FINANCIAL
STATEMENTS (UNAUDITED) | |
UNREGISTERED SALES OF EQUITY SECURITIES,
REPURCHASES OF EQUITY SECURITIES AND
DIVIDENDS | |
OVERVIEW
This Quarterly Report on Form 10-Q should be read in conjunction with Citigroup’s Annual Report on Form 10-K for the year ended December 31, 2019 (2019 Annual Report on Form 10-K) and Citigroup’s Quarterly Report on Form 10-Q for the quarter ended March 31, 2020 (First Quarter of 2020 Form 10-Q).
Additional information about Citigroup is available on Citi’s website at www.citigroup.com. Citigroup’s annual reports on Form 10-K, quarterly reports on Form 10-Q and proxy statements, as well as other filings with the U.S. Securities and Exchange Commission (SEC), are available free of charge through Citi’s website by clicking on the “Investors” tab and selecting “SEC Filings,” then “Citigroup Inc.” The SEC’s website also contains current reports on Form 8-K and other information regarding Citi at www.sec.gov.
Certain reclassifications, including a realignment of certain businesses, have been made to the prior periods’ financial statements and disclosures to conform to the current period’s presentation. For additional information on certain recent reclassifications, see Note 1 to the Consolidated Financial Statements below and Notes 1 and 3 to the Consolidated Financial Statements in Citi’s 2019 Annual Report on Form 10-K.
Throughout this report, “Citigroup,” “Citi” and “the Company” refer to Citigroup Inc. and its consolidated subsidiaries.
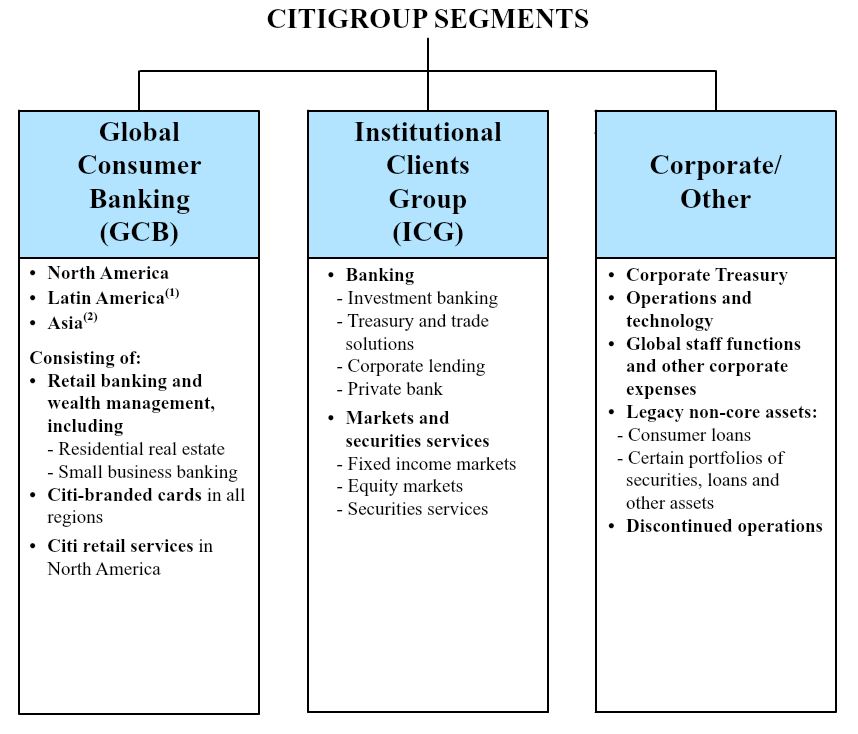
Citigroup is managed pursuant to two business segments: Global Consumer Banking and Institutional Clients Group, with the remaining operations in Corporate/Other.
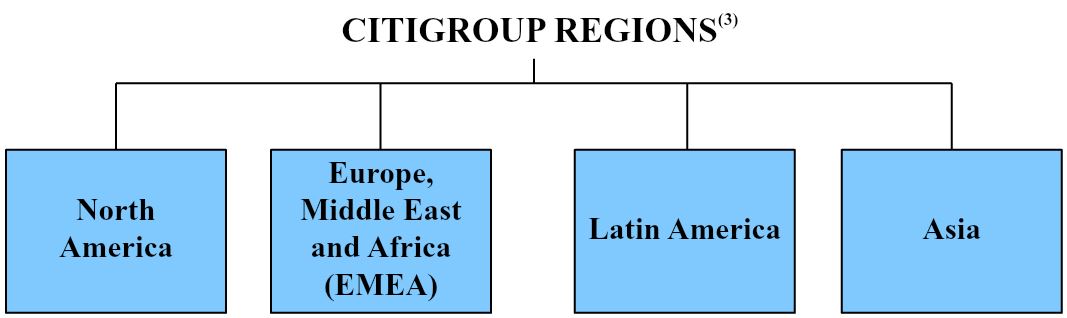
The following are the four regions in which Citigroup operates. The regional results are fully reflected in the segment results above.
(1) Latin America GCB consists of Citi’s consumer banking business in Mexico.
(2) Asia GCB includes the results of operations of GCB activities in certain EMEA countries for all periods presented.
(3) North America includes the U.S., Canada and Puerto Rico, Latin America includes Mexico and Asia includes Japan.
MANAGEMENT’S DISCUSSION AND ANALYSIS OF FINANCIAL CONDITION
AND RESULTS OF OPERATIONS
EXECUTIVE SUMMARY
Second Quarter of 2020—Results Demonstrated Continued Financial Strength and Operational Resilience in a Challenging Environment
As described further throughout this Executive Summary, during the second quarter of 2020, Citi demonstrated continued financial strength and operational resilience, despite a significant further deterioration in economic conditions during the quarter due to the COVID-19 pandemic:
•Citi’s earnings were substantially reduced by a higher allowance for credit loss (ACL) build (approximately $5.6 billion) during the quarter (see “Cost of Credit” below).
•Despite the challenging environment, Citi had solid revenue growth, as significantly higher revenues in Institutional Clients Group (ICG), primarily reflecting strong performance in fixed income markets and investment banking, were partially offset by lower revenues in Global Consumer Banking (GCB), reflecting lower loan volumes and lower interest rates.
•Citi demonstrated good expense discipline, resulting in a 1% decrease in expenses versus the prior year, as well as positive operating leverage and a 13% improvement in operating margin, while Citi continued to invest in its infrastructure and controls as well as digital capabilities.
•Citi maintained its focus on risk management, while continuing to support clients.
•Citi had broad-based deposit growth across ICG and GCB, reflecting strong client engagement, while also strengthening Citi’s available liquidity.
•Citi returned $1.1 billion of capital to its common shareholders in the form of dividends.
•Citi continues to support its employees, customers and clients as well as the broader economy during this challenging time (see “COVID-19 Pandemic Overview” below) and maintained strong regulatory capital and liquidity metrics.
•During the quarter, the Federal Reserve Board communicated that Citi’s interim Stress Capital Buffer (SCB) requirement would be 2.5% for the four-quarter window of fourth quarter of 2020 to third quarter of 2021 (the 2020 CCAR cycle). Consistent with the regulatory capital framework, Citi declared common dividends of $0.51 per share for the third quarter of 2020 on July 23, 2020, and intends to maintain its planned capital actions, which include common dividends of $0.51 per share in the four quarters covered by the 2020 CCAR cycle, subject to approval of Citi’s Board of Directors and the latest financial and macroeconomic conditions. For information on Citi’s interim and capital plan resubmission, see “Capital Resources—Stress Capital Buffer” and “—Capital Plan Resubmission and Related Limitations on Capital Distributions” below.
As a result of the pandemic, the economic outlook for 2020 has been lowered substantially, and continued uncertainties around the pandemic, including, among others, the duration and severity of the economic and public health impacts, have created a much more volatile operating environment that will likely continue to negatively impact Citi’s businesses and future results during the remainder of 2020.
For a discussion of risks and uncertainties related to the pandemic, see “COVID-19 Pandemic Overview,” “Risk Factors” and each respective business’s results of operations below. For a discussion of additional risks and uncertainties that could affect Citi, see “ Forward-Looking Statements” below as well as each respective business’s results of operations and “Managing Global Risk” and “Risk Factors” in Citi’s 2019 Annual Report on Form 10-K.
Second Quarter of 2020 Results Summary
Citigroup
Citigroup reported net income of $1.3 billion, or $0.50 per share, compared to net income of $4.8 billion, or $1.95 per share, in the prior-year period. Net income declined 73%, driven by the substantially higher ACL builds, partially offset by the higher revenues and a lower tax rate (see “Significant Accounting Policies and Significant Estimates—Income Taxes” below). Earnings per share decreased 74%, driven by the decline in net income.
Citigroup revenues of $19.8 billion in the second quarter of 2020 increased 5% from the prior-year period, primarily reflecting the higher revenues in ICG, including the higher revenues in fixed income markets and investment banking, partially offset by the lower revenues across regions in GCB.
Citigroup’s end-of-period loans were largely unchanged at $685 billion. Excluding the impact of foreign currency translation into U.S. dollars for reporting purposes (FX translation), Citigroup’s end-of-period loans grew 1%, with 5% growth in ICG partially offset by lower loans in GCB, reflecting the impact of lower spend activity and the continued wind-down of legacy assets in Corporate/Other. Citigroup’s end-of-period deposits increased 18% to $1.2 trillion. Excluding the impact of FX translation, Citigroup’s end-of-period deposits increased 20%, primarily driven by 22% growth in ICG and 15% growth in GCB. (Citi’s results of operations excluding the impact of FX translation are non-GAAP financial measures.)
Expenses
Citigroup operating expenses of $10.4 billion decreased 1% versus the prior-year period, as efficiency savings and lower marketing and other discretionary spend more than offset higher compensation costs, investments and pandemic-related expenses. Year-over-year, GCB and Corporate/Other operating expenses declined 10% and 2%, respectively, while ICG expenses increased 7%.
Cost of Credit
Citi’s total provisions for credit losses and for benefits and claims of $7.9 billion, compared to $2.1 billion in the prior-year period, reflect the ACL build and higher net credit losses. Citi’s ACL build increased to $5.6 billion, primarily reflecting a deterioration in Citi’s view of the macroeconomic outlook since the end of the first quarter of 2020 under the Current Expected Credit losses (CECL) standard, as well as downgrades in the corporate loan portfolio, in both cases driven by the continued impact of the pandemic. The reserve build also included an additional qualitative management adjustment to reflect the potential for a higher level of stress and/or a somewhat slower economic recovery. For further information on the drivers of Citi’s ACL build, see “Significant Accounting Policies and Significant Estimates—Allowance for Credit Losses” below.
Net credit losses of $2.2 billion increased 12%. Consumer net credit losses of $1.9 billion were largely unchanged, driven by higher net credit losses in GCB, primarily reflecting seasoning in the North America branded cards portfolio, as GCB had not yet incurred significant net credit losses related to the pandemic, offset by lower net credit losses in Corporate/Other. Corporate net credit losses increased to $324 million from $89 million in the prior-year period, primarily reflecting write-offs across various sectors in both North America and EMEA.
For additional information on Citi’s consumer and corporate credit costs and ACL, also see each respective business’s results of operations and “Credit Risk” below.
Capital
Citigroup’s Common Equity Tier 1 Capital ratio was 11.6% as of June 30, 2020, based on the Basel III Advanced Approaches framework for determining risk-weighted assets, compared to 11.9% as of June 30, 2019, based on the Basel III Standardized Approach for determining risk-weighted assets. The decline in the ratio primarily reflected an increase in risk-weighted assets.
Incorporating Citi’s interim SCB of 2.5%, and a GSIB surcharge of 3%, results in a minimum regulatory requirement of 10% for both Standardized (using SCB) and Advanced (using the Capital Conservation Buffer (CCB)) Approaches, relative to Citi’s Common Equity Tier 1 ratio of 11.6% using Advanced Approaches as of the second quarter of 2020.
Citigroup’s Supplementary Leverage ratio as of June 30, 2020 was 6.7%, primarily reflecting the benefit of temporary relief granted by the Federal Reserve Board, compared to 6.4% as of June 30, 2019. For additional information on Citi’s capital ratios and related components, see “Capital Resources” below.
Global Consumer Banking
GCB net loss of $0.4 billion compared to net income of $1.3 billion in the prior-year period, reflecting significantly higher cost of credit and lower revenues, partially offset by lower expenses. GCB operating expenses of $4.0 billion decreased 10%. Excluding the impact of FX translation, expenses decreased 8%, as efficiency savings, lower volume-related expenses and reductions in marketing and other discretionary
spending were partially offset by increases in pandemic-related expenses.
GCB revenues of $7.3 billion decreased 10%. Excluding the impact of FX translation, revenues decreased 7%, as lower loan volumes and lower interest rates across all regions more than offset strong deposit growth, each reflecting the continued impact of the pandemic. North America GCB revenues of $4.7 billion decreased 5%, as higher revenues in Citi-branded cards were more than offset by lower revenues in Citi retail services and retail banking. Citi-branded cards revenues of $2.2 billion increased 1%, as lower purchase sales and lower average loans were more than offset by a favorable mix shift toward interest earning balances, which supported net interest revenues. Citi retail services revenues of $1.4 billion decreased 13%, reflecting higher partner payments and lower average loans. Retail banking revenues of $1.1 billion decreased 3%, as the benefit of stronger deposit volumes and improvement in mortgage revenues were more than offset by lower deposit spreads.
North America GCB average deposits of $173 billion increased 14% year-over-year, average retail banking loans of $52 billion increased 9% year-over-year and assets under management of $69 billion increased 2%. Average Citi-branded card loans of $83 billion decreased 7% and Citi-branded card purchase sales of $74 billion decreased 21%, both driven by reduced customer activity related to the pandemic. Average Citi retail services loans of $46 billion decreased 6% and Citi retail services purchase sales of $17 billion decreased 25%, both driven by reduced customer activity and partner store closures related to the pandemic. For additional information on the results of operations of North America GCB for the second quarter of 2020, see “Global Consumer Banking—North America GCB” below.
International GCB revenues (consisting of Latin America GCB and Asia GCB (which includes the results of operations in certain EMEA countries)), of $2.6 billion declined 18% versus the prior-year period. Excluding the impact of FX translation, international GCB revenues declined 12%, largely reflecting the impact of the pandemic. On this basis, Latin America GCB revenues decreased 7%, driven by lower card purchase sales, a decline in loan volumes and lower deposit spreads, partially offset by deposit growth. Asia GCB revenues decreased 15%, reflecting lower card purchase sales, insurance volumes and deposit spreads, even as deposit growth remained strong. For additional information on the results of operations of Latin America GCB and Asia GCB for the second quarter of 2020, including the impact of FX translation, see “Global Consumer Banking—Latin America GCB” and “Global Consumer Banking—Asia GCB” below.
Year-over-year, international GCB average deposits of $129 billion increased 10%, average retail banking loans of $70 billion increased 4%, assets under management of $118 billion increased 4%, average card loans of $21 billion decreased 9% and card purchase sales of $18 billion decreased 30%, all excluding the impact of FX translation.
Institutional Clients Group
ICG net income of $1.9 billion decreased 45%, primarily driven by significantly higher cost of credit and higher expenses, partially offset by higher revenues. ICG operating expenses increased 7% to $5.9 billion, reflecting higher compensation costs, continued investments and volume-driven growth, partially offset by efficiency savings.
ICG revenues of $12.1 billion increased 21%, reflecting a 48% increase in Markets and securities services revenues, partially offset by a 3% decline in Banking revenues. The decrease in Banking revenues included the impact of $431 million of losses on loan hedges related to corporate lending and the private bank, compared to losses of $75 million related to corporate lending in the prior-year period.
Banking revenues of $5.7 billion (excluding the impact of losses on loan hedges) increased 4%, as increases in investment banking and the private bank were partially offset by declines in treasury and trade solutions and corporate lending. Investment banking revenues of $1.8 billion increased 37%, as strong growth in debt and equity underwriting was partially offset by modestly lower advisory revenues. Advisory revenues decreased 1% to $229 million, equity underwriting revenues increased 56% to $491 million and debt underwriting revenues increased 41% to $1.0 billion.
Treasury and trade solutions revenues of $2.3 billion declined 11%, and 7% excluding the impact of FX translation, as strong client engagement and growth in deposits were more than offset by the impact of lower interest rates and reduced commercial card spend. Private bank revenues of $956 million increased 10% (excluding the impact of losses on loan hedges), driven by increased capital markets activity and higher lending and deposit volumes, partially offset by lower deposit spreads, reflecting the impact of lower rates. Corporate lending revenues of $232 million decreased 64%. Excluding the impact of losses on loan hedges, corporate lending revenues decreased 11%, as higher loan volumes were more than offset by lower spreads.
Markets and securities services revenues of $6.9 billion increased 48%. Fixed income markets revenues of $5.6 billion increased 68%, reflecting strength in rates and currencies, spread products and commodities. Equity markets revenues of $770 million decreased 3%, as solid performance in cash equities was more than offset by lower revenues in derivatives and prime finance, reflecting a more challenging environment. Securities services revenues of $619 million decreased 9%, and 5% excluding the impact of FX translation, as higher deposit volumes were more than offset by lower spreads, given lower interest rates. For additional information on the results of operations of ICG for the second quarter of 2020, see “Institutional Clients Group” below.
Corporate/Other
Corporate/Other net loss was $163 million in the second quarter of 2020, compared to net income of $84 million in the prior-year period, driven by lower revenues and higher cost of credit, reflecting ACL builds under the CECL standard on Citi’s residual legacy portfolio, partially offset by a decrease in expenses. Operating expenses of $469 million declined 2%, reflecting the continued wind-down of legacy assets, partially offset by higher infrastructure costs as well as incremental costs associated with the pandemic. Corporate/Other revenues of $290 million declined 49%, reflecting the wind-down of legacy assets and the impact of lower interest rates, partially offset by available-for-sale (AFS) investment securities gains as well as positive marks on legacy securities, as spreads tightened during the quarter. For additional information on the results of operations of Corporate/Other for the second quarter of 2020, see “Corporate/Other” below.
COVID-19 PANDEMIC OVERVIEW
In addition to the widespread public health implications, the emergence of the COVID-19 pandemic has had an extraordinary impact on macroeconomic conditions in the U.S. and around the world. As discussed below and elsewhere throughout this Form 10-Q, Citi’s businesses, results of operations and financial condition have been impacted by economic dislocations caused by the pandemic. Citi had builds to its allowance for credit losses (ACL) of approximately $10.5 billion during the first six months of 2020, bringing its ACL to approximately $28.5 billion at June 30, 2020, with an Allowance for credit losses on loans (ACLL) reserve ratio of 3.89% on funded loans. For additional information, see “Covid-19 Pandemic Overview—Impact of CECL on Citi’s Allowance for Credit Losses” below.
Despite these impacts, Citi has remained well positioned from a capital and liquidity perspective, and has maintained strong business operations. At quarter end, Citi had a CET1 Capital ratio of 11.6%, a Supplementary Leverage ratio of 6.7% and a Liquidity Coverage ratio of 117%, each well above regulatory minimums, with $900 billion of available liquidity resources (see “Managing Global Risk—Liquidity Risk” below).
Governments and central banks globally have taken a series of aggressive actions to support the economy and mitigate the systemic impacts of the pandemic, and Citi continues to proactively assess and utilize these measures where appropriate. For additional information on Citi’s pandemic response and other pandemic-related information, see Citi’s First Quarter of 2020 Form 10-Q.
Citi’s COVID-19 Pandemic Response—Supporting Employees, Customers and Communities
The health and safety of Citi’s employees and their families, as well as Citi’s customers, clients and communities it serves, are of the utmost importance. As the public health crisis has unfolded, Citi has continued to take proactive measures to preserve their well-being while maintaining its ability to serve customers and clients.
Citi Employees
•The majority of Citi employees around the world are working remotely.
•Citi is pursuing a slow and measured reentry to its sites and a rapid retreat where necessary based on medical data and local conditions.
•Citi is offering enhanced flexibility and paid time off for colleagues directly and indirectly impacted by the pandemic.
•Citi is providing additional health and well-being resources for colleagues.
•In the first quarter of 2020, Citi provided more than 75,000 colleagues globally with extra compensation, including a $1,000 special payment to eligible colleagues in the U.S.
•Citi is delivering a virtual summer internship program globally and has guaranteed full-time employment offers for those interns meeting minimum requirements in hub locations.
•Extra cleaning protocols and protective supplies have been put in place at Citi sites, branches and ATMs, and staff has been educated on preventive measures.
Citi Communities
Citi, the Citi Foundation and Citi colleagues are supporting those immediately impacted by the crisis through a variety of efforts. To date, Citi and the Citi Foundation have committed over $100 million in support of pandemic community relief efforts. As part of this commitment, Citi is donating the net profits earned through its participation in the Paycheck Protection Program to the Citi Foundation. Initial proceeds of $25 million have been donated to the Citi Foundation and will be used to expand its pandemic U.S. Small Business Relief Program to support efforts by Community Development Financial Institutions to serve small, diverse entrepreneurs who may not fully qualify for federal government stimulus funding.
Citi Consumer Loan Relief Programs
As previously disclosed, Citi was one of the first banks in the U.S. to announce assistance measures for pandemic-impacted customers. Citi has offered a wide array of programs for different types of products, providing short- and medium-term relief to customers as a result of the pandemic. The relief provided has been primarily in the form of payment deferrals and fee waivers. These consumer relief programs have primarily been provided to GCB customers, with a small portion of customers reported within Corporate/Other. For further information on Citi’s measures to support its customers and clients in response to the pandemic, see “COVID-19 Overview” in the First Quarter of 2020 10-Q.
The table below provides information on the number of loan modifications and the associated balances at enrollment for Citi’s pandemic consumer relief programs for the three months ended June 30, 2020, excluding troubled debt restructurings (see “Troubled Debt Restructuring (TDR) Relief” below).
| | | | | | | | | | | | | | | | | |
| For the three months ended June 30, 2020 | | | | |
In millions of dollars,
except number of loans modified | Number of loans modified | Enrollment balance(1)(2) | % of total loan portfolio(3) | | Program details |
| North America | | | | | |
| Credit cards | 1,909,296 | | $ | 6,920 | | 5 | % | | Waivers on late fees and deferral of minimum payments for two payment cycles |
Residential first mortgages(4) | 6,866 | | 3,044 | | 6 | | | Extending existing payment deferral options and suspending foreclosures into the third quarter of 2020 |
Home equity loans(4) | 4,289 | | 536 | | 6 | | | Extending existing payment deferral options |
Personal, small business and other(5) | 16,626 | | 259 | | 5 | | | Waivers on fees including non-Citi ATM fees and monthly service fees as well as minimum payment deferrals for up to two months |
| Total North America | 1,937,077 | | $ | 10,759 | | 6 | % | | |
| International | | | | | |
| Asia | | | | | |
| Credit cards | 859,696 | | $ | 1,601 | | 10 | % | | Payment deferrals for up to three months, interest and fee waivers and reductions in minimum due payments |
| Residential first mortgages | 44,947 | | 3,334 | | 10 | | | Payment deferrals for up to 12 months, interest and fee waivers and reductions in minimum due payments |
| Personal, small business and other | 169,162 | | 1,368 | | 5 | | | Payment deferrals for up to three months for revolving products and overdrafts or up to 12 months for installment loans, interest and fee waivers and reductions in minimum due payments |
| Latin America | | | | | |
| Credit cards | 640,912 | | 1,089 | | 26 | | | Minimum payment deferrals for up to six months, temporary interest rate reductions and waivers on certain fees |
| Residential first mortgages | 19,363 | | 716 | | 21 | | | Minimum payment deferrals for up to six months, temporary interest rate reductions and waivers on certain fees |
| Personal, small business and other | 177,838 | | 1,165 | | 21 | | | Minimum payment deferrals for up to six months, temporary interest rate reductions and waivers on certain fees |
| Total international | 1,911,918 | | $ | 9,273 | | 10 | % | | |
| Total Consumer | 3,848,995 | | $ | 20,032 | | 7 | % | | |
(1) Reserves for these loans are calculated in accordance with the CECL standard.
(2) Enrollment balances represent the aggregate amounts enrolled during the second quarter of 2020. Ending balances as of June 30, 2020 may be lower.
(3) The percentage denominator is the total ending period loans balance for the respective product and region at June 30, 2020.
(4) Includes $183 million of residential first mortgage loans and $369 million of home equity loans reported in Corporate/Other.
(5) Includes $55 million of student loans reported in Corporate/Other.
As set forth in the table above, during the second quarter of 2020, consumer relief programs had more than 3.8 million loan modifications with approximately $20.0 billion of associated enrollment balances, excluding TDRs, representing approximately 7% of Citi’s total consumer loan balances.
In North America, credit card programs represented the largest volume of enrollments and loan balances. In the second quarter of 2020, approximately 45% of credit card customers made at least one payment during the time they were enrolled in the programs. In addition, Citi observed re-enrollment rates of 14% under these programs. As these credit card relief programs offered a deferral of minimum payments for two payment cycles, certain customers were able to complete the program before June 30, 2020. End-of-period loan balances for active enrolled customers as of June 30, 2020, were approximately $2.6 billion.
In Asia, auto-enrollment relief programs mandated by governments or regulators in Malaysia, Philippines and India programs represented the largest volume of enrollments and
loan balances. These programs accounted for approximately 67% of total enrollments during the second quarter.
Approximately 43% of credit cards, personal installment loans and mortgage customers made at least one payment during the time they were enrolled in the programs.
In Mexico, Citi participated in a government-sponsored debt relief program that was available until May 15, 2020. The program provided customers with a payment deferral for principal and interest for a period of four to six months on various products. Eligible customers included those who were current (less than 30 days past due) as of February 28, 2020, and given there was no proof of hardship required to apply for the program the application process was made frictionless. As a result, most major banks experienced high enrollment rates associated with the program. Specifically, during the second quarter Citi received a large number of applications and associated enrollment balances that represented approximately 22% of Citi`s consumer lending portfolio in Mexico. Customer payment behavior under the program was largely
driven by product type. Approximately 57% of customers enrolled in credit card programs made at least one payment during the month of June 2020.
Citi Corporate Loan Relief Programs
Citi has modified the contractual terms of corporate loans to certain borrowers impacted by the pandemic. These modifications consist primarily of deferrals in the payment of principal and/or interest that Citi has provided during the second quarter of 2020 in response to borrower requests, as well as those provided pursuant to government-mandated relief programs.
The table below shows Citi’s corporate loan modifications, excluding TDRs:
| | | | | | | | | | | |
| June 30, 2020 | | |
| In millions of dollars | Total credit exposure | Funded | Unfunded |
| Corporate loans | $ | 3,781 | | $ | 3,085 | | $ | 696 | |
| Private bank loans | 2,193 | | 2,190 | | 3 | |
| Total Corporate | $ | 5,974 | | $ | 5,275 | | $ | 699 | |
Citi’s Management of COVID-19 Pandemic Risks
Citi’s dedicated continuity of business and crisis management groups are managing Citi’s protocols in response to the pandemic. Among other things, the protocols address the prioritization of critical processing; ability of staff and third parties to support these processes from remote work locations; deployment of new hardware to support technology needs; and ongoing monitoring to assess controls and service levels. For additional information about Citi’s management of pandemic-related risks, see Citi’s First Quarter of 2020 Form 10-Q.
Citi expects that overall revenues in the near term, including GCB and ICG revenues, will likely continue to be adversely impacted by the lower interest rate environment as well as challenging macroeconomic and market conditions, including the effects related to the severity and duration of the pandemic as well as the responses of governments, customers and clients. In particular, each GCB region should continue to experience the adverse impacts from the pandemic on customer behavior, including lower purchase sales and loan volumes, while Latin America GCB is also likely to experience a more pronounced impact from macroeconomic weakness in Mexico. Citi also expects that ICG Markets and investment banking revenues should continue to reflect overall market conditions, including a normalization of business trends compared to the first half of 2020.
Citi’s operating expenses may be impacted by uncertainties related to the pandemic, including, among other things, the continued efforts to protect and support Citigroup’s employees and to support Citi’s customers and clients digitally.
Moreover, Citi, including GCB and ICG, expects to experience higher net credit losses on its existing portfolios going forward due to the pandemic. If Citi’s second quarter 2020 macro-economic forecast assumptions are realized, Citi does not expect significant additional reserve builds in the near term; however the overall level of reserves remains dependent on the evolving economic environment relative to
this forecast, with a deterioration potentially having a significant impact on the movement of the ACL going forward. For additional information about significant risks to Citi from the pandemic, see “Risk Factors” below.
Balance Sheet and Other Items Related to the COVID-19 Pandemic
Balance Sheet Trends
As of June 30, 2020, Citi’s end-of-period balance sheet grew 12% from the prior-year period (14% excluding the impact of FX translation) and 1% sequentially (largely unchanged excluding the impact of FX translation), as it continued to support both its consumer and institutional clients. Loans were unchanged from the prior-year period (up 1% excluding the impact of FX translation), while deposits grew 18% (20% excluding the impact of FX translation), reflecting significant deposit growth in both GCB and ICG driven by the continued impact of the pandemic. For additional information, see “Liquidity Risk” below.
Impact of CECL on Citi’s Allowance for Credit Losses (ACL)
The table below shows the impact of Citi’s adoption of CECL as of January 1, 2020 and the ACL during the first and second quarters of 2020. For information on the drivers of Citi’s ACL build in the second quarter, see “Significant Account Policies and Significant Estimates—Allowance for Credit Losses” below. For additional information on Citi’s accounting policy on accounting for credit losses under CECL, see Note 14 to the Consolidated Financial Statements and Note 1 in Citi’s First Quarter of 2020 Form 10-Q.
| | | | | | | | | | | | | | | | | | | | | | | | | | | | | |
| | Allowance for credit losses (ACL) | | | | | | | | |
| In millions of dollars | Balance December 31, 2019 | CECL transition impact | Build
in first quarter of 2020 | FX/Other in first quarter of 2020 | Balance March 31, 2020 | Build
in second quarter of 2020 | FX/Other in second quarter of 2020 | Balance June 30, 2020 | ACLL/EOP loans June 30, 2020(1) |
Cards(1) | $ | 8,419 | | $ | 4,456 | | $ | 2,420 | | $ | (215) | | $ | 15,080 | | $ | 1,572 | | $ | 50 | | $ | 16,702 | | 11.21 | % |
All other GCB | 1,200 | | 566 | | 413 | | (217) | | 1,962 | | 388 | | 36 | | 2,386 | | |
| Global Consumer Banking | $ | 9,619 | | $ | 5,022 | | $ | 2,833 | | $ | (432) | | $ | 17,042 | | $ | 1,960 | | $ | 86 | | $ | 19,088 | | 7.00 | % |
| Institutional Clients Group | 2,886 | | (717) | | 1,316 | | (34) | | 3,451 | | 3,370 | | 3 | | 6,824 | | 1.71 | |
| Corporate/Other | 278 | | (104) | | 187 | | (13) | | 348 | | 160 | | — | | 508 | | |
| Allowance for credit losses on loans (ACLL) | $ | 12,783 | | $ | 4,201 | | $ | 4,336 | | $ | (479) | | $ | 20,841 | | $ | 5,490 | | $ | 89 | | $ | 26,420 | | 3.89 | % |
| Allowance for credit losses on unfunded lending commitments | 1,456 | | (194) | | 557 | | (6) | | 1,813 | | 113 | | (67) | | 1,859 | | |
| Other | — | | 96 | | 2 | | 32 | | 130 | | 79 | | 8 | | 217 | | |
| Total allowance for credit losses (ACL) | $ | 14,239 | | $ | 4,103 | | $ | 4,895 | | $ | (453) | | $ | 22,784 | | $ | 5,682 | | $ | 30 | | $ | 28,496 | | |
(1) As of June 30, 2020, in North America GCB, Citi-branded cards ACLL/EOP loans was 10.1% and Citi retail services ACLL/EOP loans was 14.0%.
Accumulated Other Comprehensive Income (AOCI)
In the second quarter of 2020, Citi’s AOCI was a net after-tax loss of $0.8 billion, driven primarily by Citi’s own credit spreads narrowing, resulting in a $2.2 billion (after-tax) DVA loss on Citi’s debt accounted for under the fair value option. Net unrealized gains on AFS investment securities increased by $0.8 billion, driven by continued declines in interest rates. Currency fluctuations resulted in a $0.6 billion currency translation adjustment gain, driven by the weakening of the U.S. dollar against most currencies. The DVA loss does not have an impact on regulatory capital. For additional information on the components of Citi’s AOCI, see Note 17 to the Consolidated Financial Statements.
Common Stock Repurchases
As previously disclosed, on March 15, 2020, Citi joined other major U.S. banks in suspending stock repurchases to further bolster Citi’s capital and liquidity positions, in order to allow additional capacity to support clients in light of the pandemic. For additional information, see “Equity Security Repurchases” below.
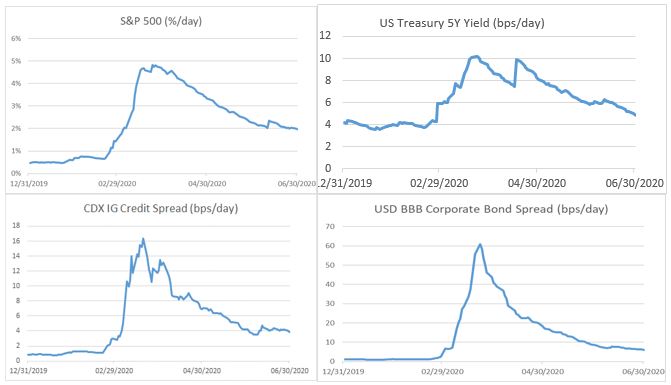
Principal Transactions Revenues
Global trading markets experienced continued increases in volatility, trading volumes and movements in the second quarter of 2020. Citi’s principal transactions revenues, recorded in ICG, were $3.9 billion in the current quarter, an increase of $2.0 billion from the prior-year period. For additional information on Citi’s trading results, see “Institutional Clients Group” and Note 6 to the Consolidated Financial Statements.
Capital Plan Resubmission and Related Limitations on Capital Distributions
In June 2020, the Federal Reserve Board (FRB) determined that changes in financial markets and macroeconomic outlooks related to the COVID-19 pandemic could have a material effect on the risk profile and financial condition of each firm subject to its capital plan rule, and therefore require updated capital plans. Accordingly, the FRB is requiring each firm, including Citi, to update and resubmit its capital plan within 45 days after the FRB provides updated scenarios. The FRB also established temporary limitations on capital distributions during the third quarter of 2020, which may be extended by the FRB. Citi declared common dividends of $0.51 per share
for the third quarter of 2020 on July 23, 2020, which would not be impacted by the Federal Reserve Board’s temporary limitations on capital distributions. For additional information about the capital plan resubmission and related limitations on capital distributions, see “Capital Resources” below.
Certain Key Government Actions in Support of the Economy
U.S. Government-Sponsored Liquidity Programs
During the first quarter of 2020, the FRB introduced several liquidity facilities in response to the funding market volatility caused by the pandemic. Citi has participated in several of the U.S. government-sponsored liquidity programs, including the Money Market Mutual Fund Liquidity Facility (MMLF), the Primary Dealer Credit Facility (PDCF) and Discount Window (DW) in order to facilitate client activity and support the FRB actions to provide additional liquidity into the market. Citi has also participated in the Paycheck Protection Program Lending Facility (PPPLF), which was established to facilitate lending under the SBA’s Paycheck Protection Program (see “Small Business Administration’s Paycheck Protection Program” below). The amounts Citi sourced from these facilities were not significant to Citi’s overall liquidity profile during the second quarter, which remains strong and highly liquid. For additional information about Citi’s liquidity resources, see “Managing Global Risk—Liquidity Risk” below.
U.S. Banking Agencies Regulatory Capital Relief
In response to the pandemic, during the first and second quarters of 2020, the U.S. banking agencies issued several interim final rules revising the current regulatory capital standards, to provide banking organizations with additional flexibility to support consumers and businesses. Those rules applicable to Citi include:
•Easing of capital distribution limits in the event of regulatory capital buffer breaches, which provides some flexibility to continue distributing capital under certain circumstances.
•Modification of the CECL transition provision to defer the January 1, 2020 capital impact to January 1, 2022 and to provide additional capital relief for ongoing increases in credit reserves. Citi’s reported Common Equity Tier 1 Capital ratio at June 30, 2020, reflecting the modified CECL transition provision, was 44 basis points higher than Citi’s Common Equity Tier 1 Capital ratio, reflecting the full impact of CECL on regulatory capital.
•Temporary Supplementary Leverage ratio (SLR) relief for bank holding companies, commencing in the second quarter of 2020, allowing Citigroup to temporarily expand its balance sheet by excluding U.S. Treasury securities and deposits with the FRB from the SLR denominator. Citigroup’s reported Supplementary Leverage ratio of 6.66% benefited 94 basis points during the second quarter of 2020 as a result of the temporary relief. Excluding the temporary relief, Citigroup’s Supplementary Leverage ratio would have been 5.72%, compared with a 5.0% effective minimum requirement.
•Assigning a 0% risk weight to loans originated under the
Paycheck Protection Program.
For additional information about regulatory capital relief provided by the U.S. banking agencies, see “Capital Resources” below.
Troubled Debt Restructuring (TDR) Relief
Under U.S. GAAP, banks are required to assess modifications to a loan’s terms for potential classification as a TDR. A loan to a borrower experiencing financial difficulty is classified as a TDR when a lender grants a concession that it would otherwise not consider, such as a payment deferral or interest concession. In order to encourage banks to work with impacted borrowers, the Coronavirus Aid, Relief, and Economic Security Act (CARES Act) and U.S. banking agencies have provided relief from TDR accounting. The main benefits of TDR relief include a capital benefit in the form of reduced risk-weighted assets, as TDRs are more heavily risk-weighted for capital purposes; aging of the loans is frozen, i.e., they will continue to be reported in the same delinquency bucket they were in at the time of modification; and the loans are generally not reported as non-accrual during the modification period. The loans included in the modification programs are included in Citi’s reserving process under the CECL standard.
Small Business Administration’s Paycheck Protection Program
The Paycheck Protection Program (the Program) authorizes the origination of forgivable loans to small businesses to pay their employees during the pandemic. Loan terms are the same for all businesses. Among other programs, Citi is participating in the Payment Protection Program and has funded approximately $3.8 billion in loans as of June 30, 2020. Citi remains committed to supporting small businesses. The processing of loan forgiveness requests under the Program is expected to begin in the third quarter of 2020 and the timing for processing will determine whether there is significant forgiveness in the second half of 2020.
RISK FACTORS
Macroeconomic and Other Challenges and Uncertainties Related to the COVID-19 Pandemic Will Likely Continue to Have Negative Impacts on Citi’s Businesses and Results of Operations and Financial Condition.
The COVID-19 pandemic has spread globally, affecting all of the countries and jurisdictions where Citi operates. The pandemic has had, and will likely continue to have, negative impacts on Citi’s businesses, revenues, expenses, credit costs and overall results of operations and financial condition, which could be material. The pandemic and responses to it have had, and will likely continue to have, a severe impact on global economic conditions, although the impacts will likely vary from time to time by country, state or region, largely depending upon the duration and severity of the public health consequences and availability of any effective therapeutic or vaccine. These impacts to global economic conditions include, among others:
•sharply reduced U.S. and global economic output and employment, resulting in loss of employment and lower consumer spending, cards purchase sales and loan volumes;
•disruption of global supply chains;
•significant disruption and volatility in financial markets;
•temporary closures, reduced activity and failures of many businesses, leading to loss of revenues and net losses; and
•the institution of social distancing and restrictions on movement in and among the United States and other countries.
The extent of the pandemic’s impact on Citi’s financial performance and operations, including its ability to execute its business initiatives and strategies, will continue to depend on future developments in the U.S. and globally, which are uncertain and cannot be predicted, including the duration and further spread of the disease, as well as the severity of the economic downturn or any delay or weakness in the economic recovery. The impact will in part be dependent on government and other actions taken to lessen the health and economic repercussions, such as medical investments and advances, restrictions on movement of people, transportation and businesses, and the effectiveness of past and any future fiscal, monetary and other governmental actions. Ongoing legislative and regulatory changes in the U.S. and globally to address the economic impact from the pandemic, such as consumer and corporate relief measures, could further affect Citi’s businesses, credit costs and results. Citi could also face challenges, including legal and reputational, and scrutiny in its implementation of and ongoing efforts to provide these relief measures. Such implementations and efforts have resulted in, and may continue to result in, litigation, including class actions, or regulatory and government actions and proceedings. Such actions may result in judgments, settlements, penalties and fines adverse to Citi. In addition, the different types of government actions could vary in scale and duration across jurisdictions and regions with varying degrees of effectiveness.
The impact of the pandemic on Citi’s consumer and corporate borrowers will also vary by region, sector or industry, with some borrowers experiencing greater stress levels, which could lead to increased pressure on the results of operations and financial condition of such borrowers, increased borrowings or credit ratings downgrades, thus likely leading to higher credit costs. In addition, stress levels ultimately experienced by Citi’s borrowers may be different from and more intense than assumptions made in earlier estimates or models used by Citi during or prior to the emergence of the pandemic, resulting in a further increase in Citi’s allowance for credit losses or net credit losses.
The pandemic may not be sufficiently contained for an extended period of time, due to a further emergence or re-emergence of widespread infections. A prolonged health crisis could continue to reduce economic activity in the U.S. and other countries, resulting in a further decline in employment and business and consumer confidence. These factors could further negatively impact global economic activity and Citi’s consumer customers and corporate clients; cause a continued decline in Citi’s revenues and the demand for its products and services; lead to a prolonged period of lower interest rates; and further increase Citi’s credit and other costs. These factors could also cause a continued increase in Citi’s balance sheet, risk-weighted assets and allowance for credit loss reserves, resulting in a decline in regulatory capital ratios or liquidity measures, as well as regulatory demands for higher capital levels and/or reductions in capital distributions. Moreover, any disruption or failure of Citi’s performance of, or its ability to perform, key business functions, as a result of the continued spread of COVID-19 or otherwise, could adversely affect Citi’s operations.
Any disruption to, breaches of or attacks on Citi’s information technology systems, including from cyber incidents, could have adverse effects on Citi’s businesses. These systems are supporting a substantial portion of Citi’s employees who have been affected by local pandemic restrictions and have been forced to work remotely. In addition, these systems interface with and depend on third-party systems, and Citi could experience service denials or disruptions if demand for such systems were to exceed capacity or if a third-party system fails or experiences any interruptions. Citi has also taken measures to maintain the health and safety of its employees; however, these measures could result in increased expenses, and widespread illness could negatively affect staffing within certain functions, businesses or geographies. In addition, Citi’s ability to recruit, hire and onboard employees in key areas could be negatively impacted by global pandemic restrictions.
Further, it is unclear how the macroeconomic business environment or societal norms may be impacted after the pandemic. The post-pandemic environment may undergo unexpected developments or changes in financial markets, the fiscal, tax and regulatory environments and consumer customer and corporate client behavior. These developments and changes could have an adverse impact on Citi’s results of operations and financial condition. Ongoing business and regulatory uncertainties and changes may make Citi’s longer-
term business, balance sheet and budget planning more difficult or costly. Citi, its management and its businesses may also experience increased or different competitive and other challenges in this environment. To the extent that it is not able to adapt or compete effectively, Citi could experience loss of business and its results of operations and financial condition could suffer.
For additional information about trends, uncertainties and risks related to the pandemic, as well as Citi’s management of pandemic-related risks, see “COVID-19 Pandemic Overview” above.
For information about the other most significant risks and uncertainties that could impact Citi’s businesses, results of operations and financial condition, which could be exacerbated or realized by the pandemic-related risks discussed above, see “Risk Factors” in Citi’s 2019 Annual Report on Form 10-K.
This page intentionally left blank.
RESULTS OF OPERATIONS
SUMMARY OF SELECTED FINANCIAL DATA—PAGE 1
Citigroup Inc. and Consolidated Subsidiaries
| | | | | | | | | | | | | | | | | | | | |
| Second Quarter | | | Six Months | | |
| In millions of dollars, except per share amounts | 2020 | 2019 | % Change | 2020 | 2019 | % Change |
| Net interest revenue | $ | 11,080 | | $ | 11,950 | | (7) | % | $ | 22,572 | | $ | 23,709 | | (5) | % |
| Non-interest revenue | 8,686 | | 6,808 | | 28 | | 17,925 | | 13,625 | | 32 | |
| Revenues, net of interest expense | $ | 19,766 | | $ | 18,758 | | 5 | % | $ | 40,497 | | $ | 37,334 | | 8 | % |
| Operating expenses | 10,415 | | 10,500 | | (1) | | 21,009 | | 21,084 | | — | |
| Provisions for credit losses and for benefits and claims | 7,903 | | 2,093 | | NM | 14,930 | | 4,073 | | NM |
| Income (loss) from continuing operations before income taxes | $ | 1,448 | | $ | 6,165 | | (77) | % | $ | 4,558 | | $ | 12,177 | | (63) | % |
| Income taxes | 131 | | 1,373 | | (90) | | 707 | | 2,648 | | (73) | |
| Income from continuing operations | $ | 1,317 | | $ | 4,792 | | (73) | % | $ | 3,851 | | $ | 9,529 | | (60) | % |
| Income (loss) from discontinued operations, net of taxes | (1) | | 17 | | NM | (19) | | 15 | | NM |
| Net income before attribution of noncontrolling interests | $ | 1,316 | | $ | 4,809 | | (73) | % | $ | 3,832 | | $ | 9,544 | | (60) | % |
| Net income attributable to noncontrolling interests | — | | 10 | | (100) | | (6) | | 35 | | NM |
| Citigroup’s net income | $ | 1,316 | | $ | 4,799 | | (73) | % | $ | 3,838 | | $ | 9,509 | | (60) | % |
| Earnings per share | | | | | | |
| Basic | | | | | | |
| Income from continuing operations | $ | 0.51 | | $ | 1.94 | | (74) | % | $ | 1.57 | | $ | 3.81 | | (59) | % |
| Net income | 0.51 | | 1.95 | | (74) | | 1.56 | | 3.82 | | (59) | |
| Diluted | | | | | | |
| Income from continuing operations | $ | 0.51 | | $ | 1.94 | | (74) | % | $ | 1.57 | | $ | 3.81 | | (59) | % |
| Net income | 0.50 | | 1.95 | | (74) | | 1.56 | | 3.82 | | (59) | |
| Dividends declared per common share | 0.51 | | 0.45 | | 13 | | 1.02 | | 0.90 | | 13 | |
| Common dividends | $ | 1,071 | | $ | 1,041 | | 3 | % | $ | 2,152 | | $ | 2,116 | | 2 | % |
Preferred dividends(1) | 253 | | 296 | | (15) | | 544 | | 558 | | (3) | |
| Common share repurchases | — | | 3,575 | | (100) | | 2,925 | | 7,630 | | (62) | |
Table continues on the next page, including footnotes.
SUMMARY OF SELECTED FINANCIAL DATA—PAGE 2
Citigroup Inc. and Consolidated Subsidiaries
| | | | | | | | | | | | | | | | | | | | |
| In millions of dollars, except per share amounts, ratios and direct staff | Second Quarter | | | Six Months | | |
| 2020 | 2019 | % Change | 2020 | 2019 | % Change |
| At June 30: | | | | | | |
| Total assets | $ | 2,232,715 | | $ | 1,988,226 | | 12 | % | | | |
| Total deposits | 1,233,660 | | 1,045,607 | | 18 | | | | |
| Long-term debt | 279,775 | | 252,189 | | 11 | | | | |
| Citigroup common stockholders’ equity | 173,642 | | 179,379 | | (3) | | | | |
| Total Citigroup stockholders’ equity | 191,622 | | 197,359 | | (3) | | | | |
| Average assets | 2,266,610 | | 1,979,124 | | 15 | | 2,173,165 | | $ | 1,959,271 | | 11 | % |
Direct staff (in thousands) | 204 | | 200 | | 2 | | | | |
| Performance metrics | | | | | | |
| Return on average assets | 0.23 | % | 0.97 | % | | 0.36 | % | 0.98 | % | |
Return on average common stockholders’ equity(2) | 2.4 | | 10.1 | | | 3.8 | | 10.2 | | |
Return on average total stockholders’ equity(2) | 2.7 | | 9.8 | | | 4.0 | | 9.8 | | |
Return on tangible common equity (RoTCE)(3) | 2.9 | | 11.9 | | | 4.5 | | 11.9 | | |
| Efficiency ratio (total operating expenses/total revenues) | 52.7 | | 56.0 | | | 51.9 | | 56.5 | | |
| Basel III ratios | | | | | | |
Common Equity Tier 1 Capital(4) | 11.59 | % | 11.89 | % | | | | |
Tier 1 Capital(4) | 13.08 | | 13.40 | | | | | |
Total Capital(4) | 15.56 | | 16.33 | | | | | |
| Supplementary Leverage ratio | 6.66 | | 6.36 | | | | | |
| Citigroup common stockholders’ equity to assets | 7.78 | % | 9.02 | % | | | | |
| Total Citigroup stockholders’ equity to assets | 8.58 | | 9.93 | | | | | |
Dividend payout ratio(5) | 100.8 | | 23.1 | | | 65.4 | % | 23.6 | % | |
Total payout ratio(6) | 100.8 | | 102.5 | | | 154.1 | | 108.9 | | |
| Book value per common share | $ | 83.41 | | $ | 79.40 | | 5 | % | | | |
Tangible book value (TBV) per share(3) | 71.15 | | 67.64 | | 5 | | | | |
(1) Certain series of preferred stock have semi-annual payment dates. See Note 9 to the Consolidated Financial Statements.
(2) The return on average common stockholders’ equity is calculated using net income less preferred stock dividends divided by average common stockholders’ equity. The return on average total Citigroup stockholders’ equity is calculated using net income divided by average Citigroup stockholders’ equity.
(3) For information on RoTCE and TBV, see “Capital Resources—Tangible Common Equity, Book Value Per Share, Tangible Book Value Per Share and Returns on Equity” below.
(4) Citi’s reportable Common Equity Tier 1 Capital and Tier 1 Capital ratios were derived under the Basel III Advanced Approaches framework as of June 30, 2020 and the Basel III Standardized Approach as of June 30, 2019, whereas Citi’s reportable Total Capital ratio was the lower derived under the Basel III Advanced Approaches framework for all periods presented. This reflects the U.S. Basel III requirement to report the lower of risk-based capital ratios under both the Standardized Approach and Advanced Approaches in accordance with the Collins Amendment of the Dodd-Frank Act.
(5) Dividends declared per common share as a percentage of net income per diluted share.
(6) Total common dividends declared plus common stock repurchases as a percentage of net income available to common shareholders (Net income, less preferred dividends). See “Consolidated Statement of Changes in Stockholders’ Equity,” Note 9 to the Consolidated Financial Statements and “Equity Security Repurchases” below for the component details.
NM Not meaningful
SEGMENT AND BUSINESS—INCOME (LOSS) AND REVENUES
CITIGROUP INCOME
| | | | | | | | | | | | | | | | | | | | |
| Second Quarter | | | Six Months | | |
| In millions of dollars | 2020 | 2019 | % Change | 2020 | 2019 | % Change |
| Income (loss) from continuing operations | | | | | | |
| Global Consumer Banking | | | | | | |
| North America | $ | (459) | | $ | 663 | | NM | $ | (1,369) | | $ | 1,370 | | NM |
| Latin America | 18 | | 234 | | (92) | % | (18) | | 450 | | NM |
Asia(1) | 43 | | 404 | | (89) | | 234 | | 801 | | (71) | % |
| Total | $ | (398) | | $ | 1,301 | | NM | $ | (1,153) | | $ | 2,621 | | NM |
| Institutional Clients Group | | | | | | |
| North America | $ | 660 | | $ | 1,050 | | (37) | % | $ | 1,556 | | $ | 1,798 | | (13) | % |
| EMEA | 493 | | 1,005 | | (51) | | 1,528 | | 2,130 | | (28) | |
| Latin America | (194) | | 519 | | NM | 332 | | 1,059 | | (69) | |
| Asia | 921 | | 851 | | 8 | | 2,090 | | 1,850 | | 13 | |
| Total | $ | 1,880 | | $ | 3,425 | | (45) | % | $ | 5,506 | | $ | 6,837 | | (19) | % |
| Corporate/Other | (165) | | 66 | | NM | (502) | | 71 | | NM |
| Income from continuing operations | $ | 1,317 | | $ | 4,792 | | (73) | % | $ | 3,851 | | $ | 9,529 | | (60) | % |
| Discontinued operations | $ | (1) | | $ | 17 | | NM | $ | (19) | | $ | 15 | | NM |
| Less: Net income attributable to noncontrolling interests | — | | 10 | | (100) | % | (6) | | 35 | | NM |
| Citigroup’s net income | $ | 1,316 | | $ | 4,799 | | (73) | % | $ | 3,838 | | $ | 9,509 | | (60) | % |
(1) Asia GCB includes the results of operations of GCB activities in certain EMEA countries for all periods presented.
NM Not meaningful
CITIGROUP REVENUES
| | | | | | | | | | | | | | | | | | | | |
| Second Quarter | | | Six Months | | |
| In millions of dollars | 2020 | 2019 | % Change | 2020 | 2019 | % Change |
| Global Consumer Banking | | | | | | |
| North America | $ | 4,742 | | $ | 4,966 | | (5) | % | $ | 9,966 | | $ | 9,966 | | — | % |
| Latin America | 1,050 | | 1,320 | | (20) | | 2,249 | | 2,592 | | (13) | |
Asia(1) | 1,547 | | 1,847 | | (16) | | 3,298 | | 3,665 | | (10) | |
| Total | $ | 7,339 | | $ | 8,133 | | (10) | % | $ | 15,513 | | $ | 16,223 | | (4) | % |
| Institutional Clients Group | | | | | | |
| North America | $ | 4,987 | | $ | 3,632 | | 37 | % | $ | 9,934 | | $ | 6,901 | | 44 | % |
| EMEA | 3,392 | | 2,960 | | 15 | | 6,862 | | 6,130 | | 12 | |
| Latin America | 1,207 | | 1,307 | | (8) | | 2,625 | | 2,575 | | 2 | |
| Asia | 2,551 | | 2,156 | | 18 | | 5,200 | | 4,467 | | 16 | |
| Total | $ | 12,137 | | $ | 10,055 | | 21 | % | $ | 24,621 | | $ | 20,073 | | 23 | % |
| Corporate/Other | 290 | | 570 | | (49) | | 363 | | 1,038 | | (65) | |
| Total Citigroup net revenues | $ | 19,766 | | $ | 18,758 | | 5 | % | $ | 40,497 | | $ | 37,334 | | 8 | % |
(1) Asia GCB includes the results of operations of GCB activities in certain EMEA countries for all periods presented.
SEGMENT BALANCE SHEET(1)—JUNE 30, 2020
| | | | | | | | | | | | | | | | | |
| In millions of dollars | Global
Consumer
Banking | Institutional
Clients
Group | Corporate/Other and consolidating eliminations(2) | Citigroup parent company- issued long-term debt and stockholders’ equity(3) | Total
Citigroup
consolidated |
| Assets | | | | | |
| Cash and deposits with banks, net of allowance | $ | 6,516 | | $ | 77,945 | | $ | 225,312 | | $ | — | | $ | 309,773 | |
| Securities borrowed and purchased under agreements to resell, net of allowance | 131 | | 282,489 | | 297 | | — | | 282,917 | |
| Trading account assets | 2,505 | | 348,212 | | 11,594 | | — | | 362,311 | |
| Investments, net of allowance | 991 | | 132,393 | | 299,869 | | — | | 433,253 | |
Loans, net of unearned income and allowance
for credit losses on loans | 253,512 | | 397,376 | | 7,984 | | — | | 658,872 | |
| Other assets, net of allowance | 36,593 | | 108,587 | | 40,409 | | — | | 185,589 | |
Net inter-segment liquid assets(4) | 122,633 | | 369,317 | | (491,950) | | — | | — | |
| Total assets | $ | 422,881 | | $ | 1,716,319 | | $ | 93,515 | | $ | — | | $ | 2,232,715 | |
| Liabilities and equity | | | | | |
| Total deposits | $ | 314,501 | | $ | 908,361 | | $ | 10,798 | | $ | — | | $ | 1,233,660 | |
Securities loaned and sold under agreements
to repurchase | 609 | | 215,108 | | 5 | | — | | 215,722 | |
| Trading account liabilities | 1,848 | | 147,013 | | 403 | | — | | 149,264 | |
| Short-term borrowings | 291 | | 27,866 | | 11,999 | | — | | 40,156 | |
Long-term debt(3) | 1,326 | | 70,658 | | 38,755 | | 169,036 | | 279,775 | |
| Other liabilities, net of allowance | 17,593 | | 81,612 | | 22,631 | | — | | 121,836 | |
Net inter-segment funding (lending)(3) | 86,713 | | 265,701 | | 8,244 | | (360,658) | | — | |
| Total liabilities | $ | 422,881 | | $ | 1,716,319 | | $ | 92,835 | | $ | (191,622) | | $ | 2,040,413 | |
Total stockholders’ equity(5) | — | | — | | 680 | | 191,622 | | 192,302 | |
| Total liabilities and equity | $ | 422,881 | | $ | 1,716,319 | | $ | 93,515 | | $ | — | | $ | 2,232,715 | |
(1)The supplemental information presented in the table above reflects Citigroup’s consolidated GAAP balance sheet by reporting segment as of June 30, 2020. The respective segment information depicts the assets and liabilities managed by each segment as of such date.
(2)Consolidating eliminations for total Citigroup and Citigroup parent company assets and liabilities are recorded within Corporate/Other.
(3)The total stockholders’ equity and the majority of long-term debt of Citigroup reside on the Citigroup parent company balance sheet. Citigroup allocates stockholders’ equity and long-term debt to its businesses through inter-segment allocations as shown above.
(4)Represents the attribution of Citigroup’s liquid assets (primarily consisting of cash, marketable equity securities and available-for-sale debt securities) to the various businesses based on Liquidity Coverage ratio (LCR) assumptions.
(5)Corporate/Other equity represents noncontrolling interests.
GLOBAL CONSUMER BANKING
Global Consumer Banking (GCB) consists of consumer banking businesses in North America, Latin America (consisting of Citi’s consumer banking business in Mexico) and Asia. GCB provides traditional banking services to retail customers through retail banking, Citi-branded cards and Citi retail services (for additional information on these businesses, see “Citigroup Segments” above). GCB is focused on its priority markets in the U.S., Mexico and Asia with 2,327 branches in 19 countries and jurisdictions as of June 30, 2020. At June 30, 2020, GCB had $423 billion in assets and $315 billion in retail banking deposits.
GCB’s overall strategy is to leverage Citi’s global footprint and be the pre-eminent bank for the affluent and emerging affluent consumers in large urban centers. In credit cards and in certain retail markets, Citi serves customers in a somewhat broader set of segments and geographies.
| | | | | | | | | | | | | | | | | | | | |
| Second Quarter | | | Six Months | | |
| In millions of dollars, except as otherwise noted | 2020 | 2019 | % Change | 2020 | 2019 | % Change |
| Net interest revenue | $ | 6,534 | | $ | 6,957 | | (6) | % | $ | 13,606 | | $ | 13,897 | | (2) | % |
| Non-interest revenue | 805 | | 1,176 | | (32) | | 1,907 | | 2,326 | | (18) | |
| Total revenues, net of interest expense | $ | 7,339 | | $ | 8,133 | | (10) | % | $ | 15,513 | | $ | 16,223 | | (4) | % |
| Total operating expenses | $ | 4,013 | | $ | 4,471 | | (10) | % | $ | 8,381 | | $ | 8,887 | | (6) | % |
| Net credit losses on loans | $ | 1,887 | | $ | 1,870 | | 1 | % | $ | 3,870 | | $ | 3,738 | | 4 | % |
| Credit reserve build (release) for loans | 1,960 | | 94 | | NM | 4,789 | | 190 | | NM |
| Provision (release) for credit losses on unfunded lending commitments | — | | — | | — | | (1) | | (3) | | 67 | |
| Provisions for benefits and claims, HTM debt securities and other assets | 38 | | 19 | | 100 | | 58 | | 31 | | 87 | |
| Provisions for credit losses and for benefits and claims (PBC) | $ | 3,885 | | $ | 1,983 | | 96 | % | $ | 8,716 | | $ | 3,956 | | NM |
| Income (loss) from continuing operations before taxes | $ | (559) | | $ | 1,679 | | NM | $ | (1,584) | | $ | 3,380 | | NM |
| Income taxes (benefits) | (161) | | 378 | | NM | (431) | | 759 | | NM |
| Income (loss) from continuing operations | $ | (398) | | $ | 1,301 | | NM | $ | (1,153) | | $ | 2,621 | | NM |
| Noncontrolling interests | (2) | | 1 | | NM | (3) | | 1 | | NM |
| Net income (loss) | $ | (396) | | $ | 1,300 | | NM | $ | (1,150) | | $ | 2,620 | | NM |
Balance Sheet data and ratios (in billions of dollars) | | | | | | |
| EOP assets | $ | 423 | | $ | 390 | | 8 | % | | | |
| Average assets | 418 | | 384 | | 9 | | $ | 412 | | $ | 382 | | 8 | % |
| Return on average assets | (0.38) | % | 1.36 | % | | (0.56) | % | 1.38 | % | |
| Efficiency ratio | 55 | | 55 | | | 54 | | 55 | | |
| Average retail banking deposits | $ | 301.9 | | $ | 275.2 | | 10 | | $ | 296.0 | | $ | 273.0 | | 8 | |
| Net credit losses as a percentage of average loans | 2.80 | % | 2.68 | % | | 2.77 | % | 2.69 | % | |
| Revenue by business | | | | | | |
| Retail banking | $ | 2,836 | | $ | 3,202 | | (11) | % | $ | 5,882 | | $ | 6,308 | | (7) | % |
Cards(1) | 4,503 | | 4,931 | | (9) | | 9,631 | | 9,915 | | (3) | |
| Total | $ | 7,339 | | $ | 8,133 | | (10) | % | $ | 15,513 | | $ | 16,223 | | (4) | % |
| Income (loss) from continuing operations by business | | | | | | |
| Retail banking | $ | 71 | | $ | 517 | | (86) | % | $ | 191 | | $ | 926 | | (79) | % |
Cards(1) | (469) | | 784 | | NM | (1,344) | | 1,695 | | NM |
| Total | $ | (398) | | $ | 1,301 | | NM | $ | (1,153) | | $ | 2,621 | | NM |
Table continues on the next page, including footnotes.
| | | | | | | | | | | | | | | | | | | | |
| Foreign currency (FX) translation impact | | | | | | |
| Total revenue—as reported | $ | 7,339 | | $ | 8,133 | | (10) | % | $ | 15,513 | | $ | 16,223 | | (4) | % |
Impact of FX translation(2) | — | | (228) | | | — | | (343) | | |
Total revenues—ex-FX(3) | $ | 7,339 | | $ | 7,905 | | (7) | % | $ | 15,513 | | $ | 15,880 | | (2) | % |
| Total operating expenses—as reported | $ | 4,013 | | $ | 4,471 | | (10) | % | $ | 8,381 | | $ | 8,887 | | (6) | % |
Impact of FX translation(2) | — | | (121) | | | — | | (186) | | |
Total operating expenses—ex-FX(3) | $ | 4,013 | | $ | 4,350 | | (8) | % | $ | 8,381 | | $ | 8,701 | | (4) | % |
| Total provisions for credit losses and PBC—as reported | $ | 3,885 | | $ | 1,983 | | 96 | % | $ | 8,716 | | $ | 3,956 | | NM |
Impact of FX translation(2) | — | | (57) | | | — | | (83) | | |
Total provisions for credit losses and PBC—ex-FX(3) | $ | 3,885 | | $ | 1,926 | | NM | $ | 8,716 | | $ | 3,873 | | NM |
| Net income—as reported | $ | (396) | | $ | 1,300 | | NM | $ | (1,150) | | $ | 2,620 | | NM |
Impact of FX translation(2) | — | | (33) | | | — | | (49) | | |
Net income—ex-FX(3) | $ | (396) | | $ | 1,267 | | NM | $ | (1,150) | | $ | 2,571 | | NM |
(1)Includes both Citi-branded cards and Citi retail services.
(2)Reflects the impact of FX translation into U.S. dollars at the second quarter of 2020 and year-to-date 2020 average exchange rates for all periods presented.
(3)Presentation of this metric excluding FX translation is a non-GAAP financial measure.
Note: For information on the impact of Citi’s January 1, 2020 adoption of the new accounting standard on credit losses (CECL), see Note 1 to the Consolidated Financial Statements.
NM Not meaningful
NORTH AMERICA GCB
North America GCB provides traditional retail banking and Citi-branded and Citi retail services card products to retail and small business customers in the U.S. North America GCB’s U.S. cards product portfolio includes its proprietary portfolio (including the Citi Double Cash, Thank You and Value cards) and co-branded cards (including, among others, American Airlines and Costco) within Citi-branded cards, as well as its co-brand and private label relationships (including, among others, Sears, The Home Depot, Best Buy and Macy’s) within Citi retail services.
At June 30, 2020, North America GCB had 687 retail bank branches concentrated in the six key metropolitan areas of New York, Chicago, Miami, Washington, D.C., Los Angeles and San Francisco. Also as of June 30, 2020, North America GCB had $53.1 billion in retail banking loans and $180.5 billion in retail banking deposits. In addition, North America GCB had $128.0 billion in outstanding card loan balances.
| | | | | | | | | | | | | | | | | | | | |
| Second Quarter | | | Six Months | | |
| In millions of dollars, except as otherwise noted | 2020 | 2019 | % Change | 2020 | 2019 | % Change |
| Net interest revenue | $ | 4,707 | | $ | 4,869 | | (3) | % | $ | 9,743 | | $ | 9,766 | | — | % |
| Non-interest revenue | 35 | | 97 | | (64) | | 223 | | 200 | | 12 | |
| Total revenues, net of interest expense | $ | 4,742 | | $ | 4,966 | | (5) | % | $ | 9,966 | | $ | 9,966 | | — | % |
| Total operating expenses | $ | 2,346 | | $ | 2,621 | | (10) | % | $ | 4,882 | | $ | 5,193 | | (6) | % |
| Net credit losses on loans | $ | 1,484 | | $ | 1,417 | | 5 | % | $ | 3,010 | | $ | 2,825 | | 7 | % |
| Credit reserve build for loans | 1,499 | | 81 | | NM | 3,861 | | 199 | | NM |
| Provision (release) for credit losses on unfunded lending commitments | — | | — | | — | | (1) | | (3) | | 67 | |
| Provisions for benefits and claims, HTM debt securities and other assets | 19 | | 6 | | NM | 24 | | 12 | | 100 | |
| Provisions for credit losses and for benefits and claims | $ | 3,002 | | $ | 1,504 | | 100 | % | $ | 6,894 | | $ | 3,033 | | NM |
| Income (loss) from continuing operations before taxes | $ | (606) | | $ | 841 | | NM | $ | (1,810) | | $ | 1,740 | | NM |
| Income taxes (benefits) | (147) | | 178 | | NM | (441) | | 370 | | NM |
| Income (loss) from continuing operations | $ | (459) | | $ | 663 | | NM | $ | (1,369) | | $ | 1,370 | | NM |
| Noncontrolling interests | — | | — | | — | % | — | | — | | — | % |
| Net income (loss) | $ | (459) | | $ | 663 | | NM | $ | (1,369) | | $ | 1,370 | | NM |
Balance Sheet data and ratios (in billions of dollars) | | | | | | |
| Average assets | $ | 264 | | $ | 229 | | 15 | % | $ | 255 | | $ | 228 | | 12 | % |
| Return on average assets | (0.70) | % | 1.16 | % | | (1.08) | % | 1.21 | % | |
| Efficiency ratio | 49 | | 53 | | | 49 | | 52 | | |
| Average retail banking deposits | $ | 172.5 | | $ | 151.6 | | 14 | | $ | 166.9 | | $ | 150.6 | | 11 | |
| Net credit losses as a percentage of average loans | 3.30 | % | 3.07 | % | | 3.23 | % | 3.07 | % | |
| Revenue by business | | | | | | |
| Retail banking | $ | 1,122 | | $ | 1,159 | | (3) | % | $ | 2,252 | | $ | 2,290 | | (2) | % |
| Citi-branded cards | 2,218 | | 2,197 | | 1 | | 4,565 | | 4,392 | | 4 | |
| Citi retail services | 1,402 | | 1,610 | | (13) | | 3,149 | | 3,284 | | (4) | |
| Total | $ | 4,742 | | $ | 4,966 | | (5) | % | $ | 9,966 | | $ | 9,966 | | — | % |
| Income (loss) from continuing operations by business | | | | | | |
| Retail banking | $ | (82) | | $ | 56 | | NM | $ | (155) | | $ | 77 | | NM |
| Citi-branded cards | (381) | | 364 | | NM | (910) | | 746 | | NM |
| Citi retail services | 4 | | 243 | | (98) | % | (304) | | 547 | | NM |
| Total | $ | (459) | | $ | 663 | | NM | $ | (1,369) | | $ | 1,370 | | NM |
NM Not meaningful
2Q20 vs. 2Q19
Net loss was $459 million in the second quarter of 2020, compared to Net income of $663 million in the prior-year period, reflecting significantly higher cost of credit and lower revenues, partially offset by lower expenses.
Revenues decreased 5%, as growth in Citi-branded cards was more than offset by lower revenues in both Citi retail services and retail banking, primarily reflecting the impact of the COVID-19 pandemic..
Retail banking revenues decreased 3%, as the benefit of stronger deposit volumes and improvement in mortgage revenues were more than offset by lower deposit spreads, reflecting lower interest rates. Average deposits increased 14%, driven by a combination of factors including the delay of tax payments, government stimulus payments and a reduction in overall consumer spending related to the pandemic, as well as continued strategic efforts to drive organic growth.
Cards revenues decreased 5%. Citi-branded cards revenues increased 1%, as lower purchase sales and lower average loans were more than offset by a favorable mix shift toward interest-earning balances, which supported net interest revenues. Average loans decreased 7% and purchase sales decreased 21%, reflecting the impact of the pandemic on customer behavior.
Citi retail services revenues decreased 13%, primarily reflecting lower average loans and higher contractual partner payments. Average loans were down 6% and purchase sales declined 25%, reflecting the impact of the pandemic on customer behavior and partner store closures.
Expenses decreased 10%, as efficiency savings and reductions in marketing and other discretionary expenses as well as lower volume-related costs more than offset incremental pandemic-related expenses.
Provisions of $3.0 billion increased $1.5 billion from the prior-year period, driven by a higher allowance for credit loss (ACL) build as well as higher net credit losses. Net credit losses increased 5%, primarily driven by higher net credit losses in Citi-branded cards (up 10% to $795 million), reflecting seasoning in the portfolio, while Citi retail services net credit losses were largely unchanged. The ACL build in the second quarter was $1.5 billion, reflecting a deterioration in Citi’s macroeconomic outlook, primarily driven by the pandemic, on estimated lifetime credit losses under CECL (compared to a build of $81 million in the prior-year period under prior accounting standards), partially offset by the impact of a change in accounting for third-party collection fees (see “Significant Accounting Policies and Significant Estimates” below).
For additional information on North America GCB’s retail banking, and its Citi-branded cards and Citi retail services portfolios, see “Credit Risk—Consumer Credit” below.
For additional information on CECL, see “Significant Accounting Policies and Significant Estimates” below, and Notes 1 and 14 to the Consolidated Financial Statements.
For additional information about trends, uncertainties and risks related to the pandemic, see “COVID-19 Pandemic Overview” and “Risk Factors” above.
2020 YTD vs. 2019 YTD
Year-to-date, North America GCB experienced similar trends to those described above. Net loss was $1.4 billion, compared to Net income of $1.4 billion in the prior-year period, as significantly higher cost of credit was partially offset by lower expenses.
Revenues were largely unchanged, as higher revenues in Citi-branded cards were offset by lower revenues in both Citi retail services and retail banking. Retail banking revenues decreased 2%, driven by the same factors described above. Cards revenues were largely unchanged. In Citi-branded cards, revenues increased 4%, driven by the same factors described above. Citi retail services revenues decreased 4%, driven by the same factors described above.
Expenses decreased 6%, driven by the same factors described above.
Provisions of $6.9 billion increased $3.9 billion from the prior-year period, driven by the same factors described above.
LATIN AMERICA GCB
Latin America GCB provides traditional retail banking and Citi-branded card products to retail and small business customers in Mexico through Citibanamex, one of Mexico’s largest banks.
At June 30, 2020, Latin America GCB had 1,406 retail branches in Mexico, with $9.0 billion in retail banking loans and $21.5 billion in deposits. In addition, the business had $4.2 billion in outstanding card loan balances.
| | | | | | | | | | | | | | | | | | | | |
| Second Quarter | | | Six Months | | % Change |
| In millions of dollars, except as otherwise noted | 2020 | 2019 | % Change | 2020 | 2019 | |
| Net interest revenue | $ | 755 | | $ | 918 | | (18) | % | $ | 1,642 | | $ | 1,795 | | (9) | % |
| Non-interest revenue | 295 | | 402 | | (27) | | 607 | | 797 | | (24) | |
| Total revenues, net of interest expense | $ | 1,050 | | $ | 1,320 | | (20) | % | $ | 2,249 | | $ | 2,592 | | (13) | % |
| Total operating expenses | $ | 604 | | $ | 704 | | (14) | % | $ | 1,303 | | $ | 1,377 | | (5) | % |
| Net credit losses on loans | $ | 209 | | $ | 279 | | (25) | % | $ | 486 | | $ | 575 | | (15) | % |
| Credit reserve build (release) for loans | 202 | | 3 | | NM | 467 | | 1 | | NM |
| Provision for credit losses on unfunded lending commitments | — | | — | | — | | — | | — | | — | |
| Provisions for benefits and claims, HTM debt securities and other assets | 16 | | 13 | | 23 | | 31 | | 19 | | 63 | |
| Provisions for credit losses and for benefits and claims (PBC) | $ | 427 | | $ | 295 | | 45 | % | $ | 984 | | $ | 595 | | 65 | % |
| Income (loss) from continuing operations before taxes | $ | 19 | | $ | 321 | | (94) | % | $ | (38) | | $ | 620 | | NM |
| Income taxes (benefits) | 1 | | 87 | | (99) | | (20) | | 170 | | NM |
| Income (loss) from continuing operations | $ | 18 | | $ | 234 | | (92) | % | $ | (18) | | $ | 450 | | NM |
| | | | | | |
| Net income (loss) | $ | 18 | | $ | 234 | | (92) | % | $ | (18) | | $ | 450 | | NM |
Balance Sheet data and ratios (in billions of dollars) | | | | | | |
| Average assets | $ | 30 | | $ | 34 | | (12) | % | $ | 33 | | $ | 34 | | (3) | % |
| Return on average assets | 0.24 | % | 2.76 | % | | (0.11) | % | 2.67 | % | |
| Efficiency ratio | 58 | | 53 | | | 58 | | 53 | | |
| Average deposits | $ | 20.6 | | $ | 22.8 | | (10) | | $ | 21.8 | | $ | 22.8 | | (4) | |
| Net credit losses as a percentage of average loans | 6.27 | % | 6.54 | % | | 6.47 | % | 6.74 | % | |
| Revenue by business | | | | | | |
| Retail banking | $ | 705 | | $ | 903 | | (22) | % | $ | 1,488 | | $ | 1,802 | | (17) | % |
| Citi-branded cards | 345 | | 417 | | (17) | | 761 | | 790 | | (4) | |
| Total | $ | 1,050 | | $ | 1,320 | | (20) | % | $ | 2,249 | | $ | 2,592 | | (13) | % |
| Income (loss) from continuing operations by business | | | | | | |
| Retail banking | $ | (2) | | $ | 164 | | NM | $ | (25) | | $ | 325 | | NM |
| Citi-branded cards | 20 | | 70 | | (71) | % | 7 | | 125 | | (94) | % |
| Total | $ | 18 | | $ | 234 | | (92) | % | $ | (18) | | $ | 450 | | NM |
| FX translation impact | | | | | | |
| Total revenues—as reported | $ | 1,050 | | $ | 1,320 | | (20) | % | $ | 2,249 | | $ | 2,592 | | (13) | % |
Impact of FX translation(1) | — | | (193) | | | — | | (266) | | |
Total revenues—ex-FX(2) | $ | 1,050 | | $ | 1,127 | | (7) | % | $ | 2,249 | | $ | 2,326 | | (3) | % |
| Total operating expenses—as reported | $ | 604 | | $ | 704 | | (14) | % | $ | 1,303 | | $ | 1,377 | | (5) | % |
Impact of FX translation(1) | — | | (97) | | | — | | (132) | | |
Total operating expenses—ex-FX(2) | $ | 604 | | $ | 607 | | — | % | $ | 1,303 | | $ | 1,245 | | 5 | % |
| Provisions for credit losses and PBC—as reported | $ | 427 | | $ | 295 | | 45 | % | $ | 984 | | $ | 595 | | 65 | % |
Impact of FX translation(1) | — | | (52) | | | — | | (70) | | |
Provisions for credit losses and PBC—ex-FX(2) | $ | 427 | | $ | 243 | | 76 | % | $ | 984 | | $ | 525 | | 87 | % |
| Net income (loss)—as reported | $ | 18 | | $ | 234 | | (92) | % | $ | (18) | | $ | 450 | | NM |
Impact of FX translation(1) | — | | (31) | | | — | | (44) | | |
Net income (loss)—ex-FX(2) | $ | 18 | | $ | 203 | | (91) | % | $ | (18) | | $ | 406 | | NM |
(1)Reflects the impact of FX translation into U.S. dollars at the second quarter of 2020 and year-to-date 2020 average exchange rates for all periods presented.
(2)Presentation of this metric excluding FX translation is a non-GAAP financial measure.
NM Not meaningful
The discussion of the results of operations for Latin America GCB below excludes the impact of FX translation for all periods presented. Presentations of the results of operations, excluding the impact of FX translation, are non-GAAP financial measures. For a reconciliation of certain of these metrics to the reported results, see the table above.
2Q20 vs. 2Q19
Net income decreased 91%, reflecting significantly higher cost of credit and lower revenues, while expenses were largely unchanged.
Revenues decreased 7%, reflecting lower retail banking and cards revenues, largely reflecting the impact of the pandemic.
Retail banking revenues decreased 8%, driven by a decline in loan volumes and lower deposit spreads, partially offset by deposit growth. Average deposits were up 9%, while average loans decreased 4% reflecting the ongoing slowdown in overall economic growth and industry volumes in Mexico, in addition to the impact of the pandemic.
Cards revenues decreased 4%, primarily driven by lower purchase sales (down 34%) and lower average loans (down 7%), reflecting the impact of the pandemic on customer behavior.
Expenses were largely unchanged, as efficiency savings were offset by ongoing investment spending and episodic items.
Provisions of $427 million increased $184 million from the prior-year period, driven by a higher allowance for credit loss (ACL) build, partially offset by lower net credit losses. Net credit losses decreased 11%, primarily driven by lower average loans. The ACL build in the second quarter was $202 million, reflecting a deterioration in Citi’s macroeconomic outlook, primarily driven by the pandemic, on estimated lifetime credit losses under CECL (compared to no build in the prior-year period under prior accounting standards).
For additional information on Latin America GCB’s retail banking and its Citi-branded cards portfolios, see “Credit Risk—Consumer Credit” below.
For additional information on CECL, see “Significant Accounting Policies and Significant Estimates” below, and Notes 1 and 14 to the Consolidated Financial Statements.
For additional information about trends, uncertainties and risks related to the pandemic, see “COVID-19 Pandemic Overview” and “Risk Factors” above.
2020 YTD vs. 2019 YTD
Net loss was $18 million, compared to Net income of $406 million in the prior-year period, reflecting significantly higher cost of credit, lower revenues and higher expenses.
Revenues decreased 3%. Excluding the impact of a residual gain (approximately $30 million) in the prior-year period on the sale of an asset management business, revenues decreased 2%, as lower revenues in retail banking were partially offset by higher cards revenues. Retail banking revenues decreased 6% (excluding the gain on sale in the prior-year period), driven by the same factors described above. Cards revenues increased 7%, primarily driven by improved spreads.
Expenses increased 5%, as ongoing investment spending and episodic items were partially offset by efficiency savings.
Provisions of $984 million increased 87% from the prior-year period, driven by the same factors described above.
ASIA GCB
Asia GCB provides traditional retail banking and Citi-branded card products to retail and small business customers. During the second quarter of 2020, Asia GCB’s most significant revenues in Asia were from Hong Kong, Singapore, South Korea, Taiwan, Australia, India, Philippines, Thailand, Indonesia and China. Included within Asia GCB, traditional retail banking and Citi-branded card products are also provided to retail customers in certain EMEA countries, primarily the United Arab Emirates, Russia and Poland.
At June 30, 2020, on a combined basis, the businesses had 234 retail branches, $61.5 billion in retail banking loans and $112.5 billion in deposits. In addition, the businesses had $16.8 billion in outstanding card loan balances.
| | | | | | | | | | | | | | | | | | | | |
| Second Quarter | | | Six Months | | % Change |
In millions of dollars, except as otherwise noted(1) | 2020 | 2019 | % Change | 2020 | 2019 | |
| Net interest revenue | $ | 1,072 | | $ | 1,170 | | (8) | % | $ | 2,221 | | $ | 2,336 | | (5) | % |
| Non-interest revenue | 475 | | 677 | | (30) | | 1,077 | | 1,329 | | (19) | |
| Total revenues, net of interest expense | $ | 1,547 | | $ | 1,847 | | (16) | % | $ | 3,298 | | $ | 3,665 | | (10) | % |
| Total operating expenses | $ | 1,063 | | $ | 1,146 | | (7) | % | $ | 2,196 | | $ | 2,317 | | (5) | % |
| Net credit losses on loans | $ | 194 | | $ | 174 | | 11 | % | $ | 374 | | $ | 338 | | 11 | % |
| Credit reserve build (release) for loans | 259 | | 10 | | NM | 461 | | (10) | | NM |
| Provisions for HTM debt securities and other assets | 3 | | — | | — | | 3 | | — | | — | |
| Provisions for credit losses | $ | 456 | | $ | 184 | | NM | $ | 838 | | $ | 328 | | NM |
| Income from continuing operations before taxes | $ | 28 | | $ | 517 | | (95) | % | $ | 264 | | $ | 1,020 | | (74) | % |
| Income taxes | (15) | | 113 | | NM | 30 | | 219 | | (86) | |
| Income from continuing operations | $ | 43 | | $ | 404 | | (89) | % | $ | 234 | | $ | 801 | | (71) | % |
| Noncontrolling interests | (2) | | 1 | | NM | (3) | | 1 | | NM |
| Net income | $ | 45 | | $ | 403 | | (89) | % | $ | 237 | | $ | 800 | | (70) | % |
Balance Sheet data and ratios (in billions of dollars) | | | | | | |
| Average assets | $ | 124 | | $ | 121 | | 2 | % | $ | 125 | | $ | 121 | | 3 | % |
| Return on average assets | 0.15 | % | 1.34 | % | | 0.38 | % | 1.33 | % | |
| Efficiency ratio | 69 | | 62 | | | 67 | | 63 | | |
| Average deposits | $ | 108.8 | | $ | 100.8 | | 8 | | $ | 107.4 | | $ | 100.1 | | 7 | |
| Net credit losses as a percentage of average loans | 1.01 | % | 0.90 | % | | 0.96 | % | 0.88 | % | |
| Revenue by business | | | | | | |
| Retail banking | $ | 1,009 | | $ | 1,140 | | (11) | % | $ | 2,142 | | $ | 2,216 | | (3) | % |
| Citi-branded cards | 538 | | 707 | | (24) | | 1,156 | | 1,449 | | (20) | |
| Total | $ | 1,547 | | $ | 1,847 | | (16) | % | $ | 3,298 | | $ | 3,665 | | (10) | % |
| Income from continuing operations by business | | | | | | |
| Retail banking | $ | 155 | | $ | 297 | | (48) | % | $ | 371 | | $ | 524 | | (29) | % |
| Citi-branded cards | (112) | | 107 | | NM | (137) | | 277 | | NM |
| Total | $ | 43 | | $ | 404 | | (89) | % | $ | 234 | | $ | 801 | | (71) | % |
| FX translation impact | | | | | | |
| Total revenues—as reported | $ | 1,547 | | $ | 1,847 | | (16) | % | $ | 3,298 | | $ | 3,665 | | (10) | % |
Impact of FX translation(2) | — | | (35) | | | — | | (77) | | |
Total revenues—ex-FX(3) | $ | 1,547 | | $ | 1,812 | | (15) | % | $ | 3,298 | | $ | 3,588 | | (8) | % |
| Total operating expenses—as reported | $ | 1,063 | | $ | 1,146 | | (7) | % | $ | 2,196 | | $ | 2,317 | | (5) | % |
Impact of FX translation(2) | — | | (24) | | | — | | (54) | | |
Total operating expenses—ex-FX(3) | $ | 1,063 | | $ | 1,122 | | (5) | % | $ | 2,196 | | $ | 2,263 | | (3) | % |
| Provisions for credit losses—as reported | $ | 456 | | $ | 184 | | NM | $ | 838 | | $ | 328 | | NM |
Impact of FX translation(2) | — | | (5) | | | — | | (13) | | |
Provisions for credit losses—ex-FX(3) | $ | 456 | | $ | 179 | | NM | $ | 838 | | $ | 315 | | NM |
| Net income—as reported | $ | 45 | | $ | 403 | | (89) | % | $ | 237 | | $ | 800 | | (70) | % |
Impact of FX translation(2) | — | | (2) | | | — | | (5) | | |
Net income—ex-FX(3) | $ | 45 | | $ | 401 | | (89) | % | $ | 237 | | $ | 795 | | (70) | % |
(1) Asia GCB includes the results of operations of GCB activities in certain EMEA countries for all periods presented.
(2) Reflects the impact of FX translation into U.S. dollars at the second quarter of 2020 and year-to-date 2020 average exchange rates for all periods presented.
(3) Presentation of this metric excluding FX translation is a non-GAAP financial measure.
The discussion of the results of operations for Asia GCB below excludes the impact of FX translation for all periods presented. Presentations of the results of operations, excluding the impact of FX translation, are non-GAAP financial measures. For a reconciliation of certain of these metrics to the reported results, see the table above.
2Q20 vs. 2Q19
Net income decreased 89%, reflecting significantly higher cost of credit and lower revenues, partially offset by lower expenses.
Revenues decreased 15%, reflecting lower cards and retail banking revenues, largely reflecting the impact of the pandemic.
Retail banking revenues decreased 10%, primarily driven by lower deposit spreads due to spread compression and lower insurance revenues, as well as a small one-time gain in the prior-year period, partially offset by stronger deposit volumes and higher retail lending revenue. Average deposits increased 10% and average loans increased 5%. Assets under management declined 4%, reflecting the impact of market movements, while investment sales increased 18%. Retail lending revenues increased 8%, reflecting growth in both personal loans and mortgages.
Cards revenues decreased 22%, primarily driven by lower purchase sales (down 29%) and lower average loans (down 9%), reflecting the impact of the pandemic on customer behavior, specifically from lower travel spend in the region, given Citi’s skew to an affluent client base and a greater proportion of fee revenues coming from travel-related interchange and foreign transaction fees.
Expenses decreased 5%, as efficiency savings, lower marketing and other discretionary expenses and lower volume-related costs more than offset ongoing investment spending.
Provisions of $456 million increased $277 million from the prior-year period, driven by a higher allowance for credit losses (ACL) build as well as higher net credit losses. Net credit losses increased 15%, as lockdowns and the deterioration in the macro-environment impacted credit performance. The ACL build in the second quarter was $259 million, reflecting a deterioration in Citi’s macroeconomic outlook, primarily driven by the pandemic, on estimated lifetime credit losses under CECL (compared to a build of $9 million in the prior-year period under prior accounting standards).
For additional information on Asia GCB’s retail banking portfolios and its Citi-branded cards portfolios, see “Credit Risk—Consumer Credit” below.
For additional information on CECL, see “Significant Accounting Policies and Significant Estimates” below, and Notes 1 and 14 to the Consolidated Financial Statements.
For additional information about trends, uncertainties and risks related to the pandemic, see “COVID-19 Pandemic Overview” and “Risk Factors” above.
2020 YTD vs. 2019 YTD
Year-to-date, Asia GCB experienced similar trends to those described above. Net income decreased 70%, driven by the same factors described above.
Revenues decreased 8%, driven by a decline in both retail banking and cards revenues. Retail banking revenues decreased 1%, as growth in deposits and higher fees on investments and foreign currency transactions due to higher volumes and volatility were more than offset by lower deposit spreads, insurance revenues and the one-time gain in the prior-year period. Cards revenues decreased 18%, driven by the same factors described above, as well as a small one-time gain in the prior-year period.
Expenses decreased 3%, driven by the same factors described above.
Provisions of $838 million increased $523 million from the prior-year period, driven by the same factors described above.
INSTITUTIONAL CLIENTS GROUP
Institutional Clients Group (ICG) includes Banking and Markets and securities services (for additional information on these businesses, see “Citigroup Segments” above). ICG provides corporate, institutional, public sector and high-net-worth clients around the world with a full range of wholesale banking products and services, including fixed income and equity sales and trading, foreign exchange, prime brokerage, derivative services, equity and fixed income research, corporate lending, investment banking and advisory services, private banking, cash management, trade finance and securities services. ICG transacts with clients in both cash instruments and derivatives, including fixed income, foreign currency, equity and commodity products. For more information on ICG’s business activities, see “Institutional Clients Group” in Citi’s 2019 Annual Report on Form 10-K.
ICG’s international presence is supported by trading floors in approximately 80 countries and a proprietary network in 97 countries and jurisdictions. At June 30, 2020, ICG had $1.7 trillion in assets and $908 billion in deposits, while two of its businesses—securities services and issuer services—managed $20.4 trillion in assets under custody compared to $20.3 trillion at December 31, 2019 and $18.7 trillion at March 31, 2020.
| | | | | | | | | | | | | | | | | | | | |
| Second Quarter | | | Six Months | | % Change |
| In millions of dollars, except as otherwise noted | 2020 | 2019 | % Change | 2020 | 2019 | |
| Commissions and fees | $ | 1,027 | | $ | 1,079 | | (5) | % | $ | 2,249 | | $ | 2,233 | | 1 | % |
| Administration and other fiduciary fees | 684 | | 709 | | (4) | | 1,375 | | 1,392 | | (1) | |
| Investment banking | 1,526 | | 1,101 | | 39 | | 2,757 | | 2,214 | | 25 | |
| Principal transactions | 3,909 | | 1,936 | | NM | 9,268 | | 4,574 | | NM |
Other(1) | 419 | | 721 | | (42) | | 305 | | 1,001 | | (70) | |
| Total non-interest revenue | $ | 7,565 | | $ | 5,546 | | 36 | % | $ | 15,954 | | $ | 11,414 | | 40 | % |
| Net interest revenue (including dividends) | 4,572 | | 4,509 | | 1 | | 8,667 | | 8,659 | | — | |
| Total revenues, net of interest expense | $ | 12,137 | | $ | 10,055 | | 21 | % | $ | 24,621 | | $ | 20,073 | | 23 | % |
| Total operating expenses | $ | 5,933 | | $ | 5,548 | | 7 | % | $ | 11,743 | | $ | 11,167 | | 5 | % |
| Net credit losses on loans | $ | 324 | | $ | 91 | | NM | $ | 451 | | $ | 169 | | NM |
| Credit reserve build (release) for loans | 3,370 | | 52 | | NM | 4,686 | | (22) | | NM |
| Provision for credit losses on unfunded lending commitments | 107 | | (11) | | NM | 660 | | 17 | | NM |
| Provisions for credit losses for HTM debt securities and other assets | 53 | | — | | NM | 61 | | — | | NM |
| Provisions for credit losses | $ | 3,854 | | $ | 132 | | NM | $ | 5,858 | | $ | 164 | | NM |
| Income from continuing operations before taxes | $ | 2,350 | | $ | 4,375 | | (46) | % | $ | 7,020 | | $ | 8,742 | | (20) | % |
| Income taxes | 470 | | 950 | | (51) | | 1,514 | | 1,905 | | (21) | |
| Income from continuing operations | $ | 1,880 | | $ | 3,425 | | (45) | % | $ | 5,506 | | $ | 6,837 | | (19) | % |
| Noncontrolling interests | 5 | | 10 | | (50) | | 4 | | 21 | | (81) | |
| Net income | $ | 1,875 | | $ | 3,415 | | (45) | % | $ | 5,502 | | $ | 6,816 | | (19) | % |
Balance Sheet data and ratios (in billions of dollars) | | | | | | |
EOP assets (in billions of dollars) | $ | 1,716 | | $ | 1,501 | | 14 | % | | | |
Average assets (in billions of dollars) | 1,756 | | 1,497 | | 17 | | $ | 1,668 | | $ | 1,479 | | 13 | % |
| Return on average assets | 0.43 | % | 0.91 | % | | 0.66 | % | 0.93 | % | |
| Efficiency ratio | 49 | | 55 | | | 48 | | 56 | | |
| Revenues by region | | | | | | |
| North America | $ | 4,987 | | $ | 3,632 | | 37 | % | $ | 9,934 | | $ | 6,901 | | 44 | % |
| EMEA | 3,392 | | 2,960 | | 15 | | 6,862 | | 6,130 | | 12 | |
| Latin America | 1,207 | | 1,307 | | (8) | | 2,625 | | 2,575 | | 2 | |
| Asia | 2,551 | | 2,156 | | 18 | | 5,200 | | 4,467 | | 16 | |
| Total | $ | 12,137 | | $ | 10,055 | | 21 | % | $ | 24,621 | | $ | 20,073 | | 23 | % |
| Income from continuing operations by region | | | | | | |
| North America | $ | 660 | | $ | 1,050 | | (37) | % | $ | 1,556 | | $ | 1,798 | | (13) | % |
| EMEA | 493 | | 1,005 | | (51) | | 1,528 | | 2,130 | | (28) | |
| Latin America | (194) | | 519 | | NM | 332 | | 1,059 | | (69) | |
| Asia | 921 | | 851 | | 8 | | 2,090 | | 1,850 | | 13 | |
| Total | $ | 1,880 | | $ | 3,425 | | (45) | % | $ | 5,506 | | $ | 6,837 | | (19) | % |
| | | | | | | | | | | | | | | | | | | | |
Average loans by region (in billions of dollars) | | | | | | |
| North America | $ | 215 | | $ | 188 | | 14 | % | $ | 205 | | $ | 185 | | 11 | % |
| EMEA | 91 | | 85 | | 7 | | 90 | | 85 | | 6 | |
| Latin America | 43 | | 41 | | 5 | | 41 | | 42 | | (2) | |
| Asia | 73 | | 73 | | — | | 73 | | 74 | | (1) | |
| Total | $ | 422 | | $ | 387 | | 9 | % | $ | 409 | | $ | 386 | | 6 | % |
EOP deposits by business (in billions of dollars) | | | | | | |
| Treasury and trade solutions | $ | 658 | | $ | 525 | | 25 | % | | | |
All other ICG businesses | 250 | | 227 | | 10 | | | | |
| Total | $ | 908 | | $ | 752 | | 21 | % | | | |
(1) The second quarter of 2019 includes an approximate $350 million gain on Citi’s investment in Tradeweb.
NM Not meaningful
ICG Revenue Details
| | | | | | | | | | | | | | | | | | | | |
| Second Quarter | | | Six Months | | % Change |
| In millions of dollars | 2020 | 2019 | % Change | 2020 | 2019 | |
Investment banking revenue details | | | | | | |
| Advisory | $ | 229 | | $ | 232 | | (1) | % | $ | 615 | | $ | 610 | | 1 | % |
| Equity underwriting | 491 | | 314 | | 56 | | 671 | | 486 | | 38 | |
| Debt underwriting | 1,039 | | 737 | | 41 | | 1,827 | | 1,541 | | 19 | |
| Total investment banking | $ | 1,759 | | $ | 1,283 | | 37 | % | $ | 3,113 | | $ | 2,637 | | 18 | % |
| Treasury and trade solutions | 2,307 | | 2,587 | | (11) | | 4,730 | | 5,126 | | (8) | |
Corporate lending—excluding gains (losses) on loan hedges(1) | 646 | | 725 | | (11) | | 1,094 | | 1,474 | | (26) | |
Private bank—excluding gains (losses) on loan hedges(1) | 956 | | 866 | | 10 | | 1,905 | | 1,746 | | 9 | |
Total Banking revenues (ex-gains (losses) on loan hedges) | $ | 5,668 | | $ | 5,461 | | 4 | % | $ | 10,842 | | $ | 10,983 | | (1) | % |
Gains (losses) on loan hedges(1) | $ | (431) | | $ | (75) | | NM | $ | 385 | | $ | (306) | | NM |
Total Banking revenues (including gains (losses) on loan hedges), net of interest expense | $ | 5,237 | | $ | 5,386 | | (3) | % | $ | 11,227 | | $ | 10,677 | | 5 | % |
Fixed income markets(2) | $ | 5,595 | | $ | 3,323 | | 68 | % | $ | 10,381 | | $ | 6,775 | | 53 | % |
| Equity markets | 770 | | 790 | | (3) | | 1,939 | | 1,632 | | 19 | |
| Securities services | 619 | | 682 | | (9) | | 1,264 | | 1,320 | | (4) | |
| Other | (84) | | (126) | | 33 | | (190) | | (331) | | 43 | |
Total Markets and securities services revenues, net of interest expense | $ | 6,900 | | $ | 4,669 | | 48 | % | $ | 13,394 | | $ | 9,396 | | 43 | % |
| Total revenues, net of interest expense | $ | 12,137 | | $ | 10,055 | | 21 | % | $ | 24,621 | | $ | 20,073 | | 23 | % |
| Commissions and fees | $ | 154 | | $ | 198 | | (22) | % | $ | 343 | | $ | 372 | | (8) | % |
Principal transactions(3) | 4,009 | | 1,870 | | NM | 7,558 | | 4,247 | | 78 | |
Other(2) | 234 | | 533 | | (56) | | 171 | | 683 | | (75) | |
| Total non-interest revenue | $ | 4,397 | | $ | 2,601 | | 69 | % | $ | 8,072 | | $ | 5,302 | | 52 | % |
| Net interest revenue | 1,198 | | 722 | | 66 | | 2,309 | | 1,473 | | 57 | |
Total fixed income markets(4) | $ | 5,595 | | $ | 3,323 | | 68 | % | $ | 10,381 | | $ | 6,775 | | 53 | % |
| Rates and currencies | $ | 3,582 | | $ | 2,118 | | 69 | % | $ | 7,616 | | $ | 4,520 | | 68 | % |
| Spread products/other fixed income | 2,013 | | 1,205 | | 67 | | 2,765 | | 2,255 | | 23 | |
| Total fixed income markets | $ | 5,595 | | $ | 3,323 | | 68 | % | $ | 10,381 | | $ | 6,775 | | 53 | % |
| Commissions and fees | $ | 305 | | $ | 274 | | 11 | % | $ | 667 | | $ | 567 | | 18 | % |
Principal transactions(3) | 193 | | 7 | | NM | 967 | | 403 | | NM |
| Other | 2 | | 10 | | (80) | | 10 | | 17 | | (41) | |
| Total non-interest revenue | $ | 500 | | $ | 291 | | 72 | % | $ | 1,644 | | $ | 987 | | 67 | % |
| Net interest revenue | 270 | | 499 | | (46) | | 295 | | 645 | | (54) | |
Total equity markets(4) | $ | 770 | | $ | 790 | | (3) | % | $ | 1,939 | | $ | 1,632 | | 19 | % |
(1) Credit derivatives are used to economically hedge a portion of the private bank and corporate loan portfolio that includes both accrual loans and loans at fair value. Gains (losses) on loan hedges include the mark-to-market on the credit derivatives and the mark-to-market on the loans in the portfolio that are at fair value. The fixed premium costs of these hedges are netted against the private bank and corporate lending revenues to reflect the cost of credit protection. Gains (losses) on loan hedges include $(414) million and $340 million related to the corporate loan portfolio and $(17) million and $45 million related to the private bank for the three and six months ended June 30, 2020, respectively. All of Gains (losses) on loan hedges are related to corporate loan portfolio for the three and six months ended June 30, 2019, respectively. Citigroup’s results of operations excluding the impact of gains (losses) on loan hedges are non-GAAP financial measures.
(2) The second quarter of 2019 includes an approximate $350 million gain on Citi’s investment in Tradeweb.
(3) Excludes principal transactions revenues of ICG businesses other than Markets, primarily treasury and trade solutions and the private bank.
(4) Citi assesses its Markets business performance on a total revenue basis, as offsets may occur across revenue line items. For example, securities that generate Net interest revenue may be risk managed by derivatives that are recorded in Principal transactions revenue. For a description of the composition of these revenue line items, see Notes 4, 5 and 6 to the Consolidated Financial Statements.
NM Not meaningful
The discussion of the results of operations for ICG below excludes (where noted) the impact of gains (losses) on hedges of accrual loans, which are non-GAAP financial measures. For a reconciliation of these metrics to the reported results, see the table above.
2Q20 vs. 2Q19
Net income decreased 45%, as significantly higher cost of credit and higher expenses were partially offset by higher revenues.
Revenues were up 21%, reflecting higher Markets and securities services revenues (increase of 48%), partially offset by lower Banking revenues (decline of 3% including the impact of losses on loan hedges). Excluding the impact of losses on loan hedges, Banking revenues were up 4%, driven by higher revenues in investment banking and the private bank, partially offset by lower revenues in treasury and trade solutions and corporate lending. Excluding the pretax gain of approximately $350 million on Citi’s investment in Tradeweb in the prior-year period, Markets and securities services revenues were up 60%, reflecting significantly higher revenues in fixed income markets, driven by increased client activity due to higher market volatility, primarily related to the impact of the COVID-19 pandemic, partially offset by lower revenues in equity markets and securities services.
Within Banking:
•Investment banking revenues were up 37%, as growth in debt and equity underwriting revenues was partially offset by modestly lower advisory revenues. The increase in revenues outperformed the overall growth in the market wallet. Advisory revenues decreased 1%, largely reflecting a decline in the market wallet. Equity underwriting revenues increased 56%, reflecting particular strength in North America and Asia, driven by an increase in the market wallet as well as share gains. Debt underwriting revenues increased 41%, with strength across all regions. The increase was driven by an increase in market wallet as well as share gains, including a 131% increase in investment-grade debt underwriting, as the business continued to assist clients with sourcing liquidity in the evolving environment.
•Treasury and trade solutions revenues decreased 11%. Excluding the impact of FX translation, revenues decreased 7%, reflecting a decline in both the cash and trade businesses. The decline in revenues in the cash business reflected the continued impact of lower interest rates and a slowdown in commercial cards spend driven by the impact of the pandemic, partially offset by strong deposit volumes. Average deposit balances increased 28% (30% excluding the impact of FX translation), reflecting strong client engagement and solid growth across all regions. In trade, revenues were impacted by a decline in
trade fees, reflecting an overall economic slowdown related to the pandemic, partially offset by improved trade spreads.
•Corporate lending revenues decreased $418 million to $232 million, reflecting higher losses on loan hedges, as credit spreads tightened during the quarter. Excluding the impact of losses on loan hedges, revenues decreased 11%, as lower loan spreads more than offset the impact of higher loan volumes, as the business assisted clients with sourcing liquidity in the evolving environment.
•Private bank revenues increased 8%. Excluding the impact of losses on loan hedges, revenues increased 10%, reflecting continued strength across all regions. The increase reflected strong client activity, which drove higher capital markets revenues and higher loan and deposit volumes, partially offset by lower deposit spreads due to the lower interest rate environment.
Within Markets and securities services:
•Fixed income markets revenues increased 68%. Excluding the Tradeweb gain in the prior-year period, revenues increased 89%, reflecting higher revenues across all regions, as well as strong performance across both rates and currencies and spread products, due to the impact of market conditions, including elevated volatility, related to the pandemic. Non-interest revenues increased, reflecting higher corporate and investor client activity, as volatility, volumes and spreads remained elevated, particularly in rates and currencies and commodities. Net interest revenues also increased, reflecting lower funding costs as well as a change in the mix of trading positions in support of client activity.
Rates and currencies revenues increased 69%, primarily driven by higher G10 rates revenues, as Citi assisted corporate and investor clients in repositioning their portfolios in a challenging market environment related to the impact of the pandemic, including elevated levels of volatility. Spread products and other fixed income revenues increased 67%. The increase was driven by higher revenues in commodities, reflecting increased volatility related to the impact of the pandemic, higher revenues in flow trading, reflecting higher client demand, and a more favorable market making environment, as evidenced by spread tightening. The increase was partially offset by lower securitization revenues, reflecting a more challenging environment.
•Equity markets revenues decreased 3%, as higher cash equities revenues across all regions were more than offset
by lower equity derivatives and prime finance revenues. The decline in equity derivatives revenues reflected a more challenging environment, as volatility declined, particularly in EMEA. The decline was partially offset by strong client activity, as clients continued to rebalance and hedge positions. The decline in prime finance revenues primarily reflected lower financing balances, particularly in North America and EMEA.
•Securities services revenues decreased 9%. Excluding the impact of FX translation, revenues decreased 5%, as higher deposit volumes were more than offset by lower deposit spreads as interest rates declined.
For additional information on trends in ICG’s deposit and trade loans, see “Managing Global Risk—Liquidity Risk—Loans” and “—Deposits” below.
Expenses were up 7%, reflecting higher compensation costs, continued investments and volume-driven growth, partially offset by efficiency savings.
Provisions increased to $3.9 billion, primarily reflecting a higher ACL build as well as higher net credit losses. Net credit losses were $324 million, compared to $91 million in the prior-year period, largely driven by write-offs across various sectors in both North America and EMEA, primarily reflecting smaller-sized energy and energy-related exposures.
The ACL build was $3.5 billion, compared to $41 million in the prior-year period under prior accounting standards. The increase reflected the impact of a deterioration in the macroeconomic outlook under the CECL standard, driven by the impact of the pandemic across multiple sectors, as well as downgrades in the portfolio. Sectors significantly impacted by the pandemic (including energy and energy-related, aviation, consumer retail, commercial real estate and autos) drove approximately half of the ACL reserve build during the quarter. The ACL build also included an increase in the qualitative management adjustment component of the reserve to reflect the potential for a higher level of stress and/or somewhat slower economic recovery. This management adjustment complements the primary forward-looking macroeconomic scenario used to estimate the credit reserve requirement.
As of June 30, 2020, reserves held on Citi’s balance sheet represented 1.71% of funded loans, compared to 0.80% as of March 31, 2020, including 4.9% of reserves held against the non-investment grade portion, compared to 2.1% as of March 31, 2020.
For additional information on ICG’s corporate credit portfolio, see “Managing Global Risk—Credit Risk—Corporate Credit” below.
For additional information on CECL, see “Significant Accounting Policies and Significant Estimates” below, and Notes 1, 13 and 14 to the Consolidated Financial Statements.
For additional information about trends, uncertainties and risks related to the pandemic, see “COVID-19 Pandemic Overview” and “Risk Factors” above.
2020 YTD vs. 2019 YTD
Net income decreased 19%, as significantly higher cost of credit and higher expenses were partially offset by higher revenues.
Revenues were up 23%, driven by a 43% increase in Markets and securities services as well as a 5% increase in Banking revenues (including the impact of gains (losses) on loan hedges). Excluding the impact of gains (losses) on loan hedges, Banking revenues declined 1%, as growth in investment banking and the private bank was more than offset by a decrease in treasury and trade solutions and corporate lending. Excluding the Tradeweb gain in the prior-year period, Markets and securities services revenues increased 48%, primarily driven by growth in both fixed income markets and equity markets revenues, partially offset by a decline in securities services.
Within Banking:
•Investment banking revenues increased 18%. Advisory revenues increased 1%, reflecting gains in wallet share despite a decline in the overall market wallet. Equity underwriting revenues increased 38%, primarily reflecting growth in the market wallet. Debt underwriting revenues increased 19%, reflecting market wallet growth and gains in share.
•Treasury and trade solutions revenues decreased 8%. Excluding the impact of FX translation, revenues decreased 5%, reflecting lower revenues in both cash and trade, driven by the same factors described above.
•Corporate lending revenues increased 23%, reflecting gains on loan hedges as credit spreads widened. Excluding the impact of gains (losses) on loan hedges, revenues decreased 26%, primarily driven by an adjustment to the residual value of a lease financing asset and lower loan spreads, partially offset by higher loan volumes.
•Private bank revenues increased 12%. Excluding the impact of gains on loan hedges in the current period, revenues increased 9%, reflecting strength across all regions, driven by the same factors described above.
Within Markets and securities services:
•Fixed income markets revenues increased 53%, primarily reflecting higher revenues in North America, Asia and EMEA. Rates and currencies revenues increased 68%, driven by the same factors described above. Spread products and other fixed income revenues increased 23%, driven by the same factors described above.
•Equity markets revenues increased 19%, driven by higher revenues in North America and Asia, reflecting higher revenues in both cash equities and equity derivatives revenues, partially offset by lower revenues in prime finance.
•Securities services revenues declined 4%. Excluding the impact of FX translation, revenues were largely unchanged, as higher client activity and deposit volumes were offset by lower interest revenues as interest rates declined.
Expenses were up 5%, reflecting higher compensation costs, continued investments and volume-driven growth, partially offset by efficiency savings.
Provisions increased to $5.9 billion, driven by net credit losses of $451 million, compared to $169 million in the prior-year period, and an ACL build of $5.4 billion compared to a minimal release in the prior-year period. The increase in net credit losses was driven by the same factors described above.
The increase in the ACL build primarily reflected the impact of deterioration in the macroeconomic outlook, driven by the pandemic across multiple sectors under the CECL standard, as well as downgrades in the portfolio and the qualitative management adjustment.
CORPORATE/OTHER
Corporate/Other includes certain unallocated costs of global staff functions (including finance, risk, human resources, legal and compliance), other corporate expenses and unallocated global operations and technology expenses and income taxes, as well as Corporate Treasury, certain North America legacy consumer loan portfolios, other legacy assets and discontinued operations (for additional information on Corporate/Other, see “Citigroup Segments” above). At June 30, 2020, Corporate/Other had $94 billion in assets.
| | | | | | | | | | | | | | | | | | | | |
| Second Quarter | | | Six Months | | % Change |
| In millions of dollars | 2020 | 2019 | % Change | 2020 | 2019 | |
| Net interest revenue | $ | (26) | | $ | 484 | | NM | $ | 299 | | $ | 1,153 | | (74) | % |
| Non-interest revenue | 316 | | 86 | | NM | 64 | | (115) | | NM |
| Total revenues, net of interest expense | $ | 290 | | $ | 570 | | (49) | % | $ | 363 | | $ | 1,038 | | (65) | % |
| Total operating expenses | $ | 469 | | $ | 481 | | (2) | % | $ | 885 | | $ | 1,030 | | (14) | % |
| Net credit losses (recoveries) on loans | $ | (5) | | $ | 2 | | NM | $ | (7) | | $ | 4 | | NM |
| Credit reserve build (release) for loans | 160 | | (20) | | NM | 351 | | (46) | | NM |
| Provision (release) for credit losses on unfunded lending commitments | 6 | | (4) | | NM | 11 | | (5) | | NM |
| Provisions for benefits and claims, HTM debt securities and other assets | 3 | | — | | NM | 1 | | — | | 100 | % |
| Provisions (release) for credit losses and for benefits and claims | $ | 164 | | $ | (22) | | NM | $ | 356 | | $ | (47) | | NM |
| Income (loss) from continuing operations before taxes | $ | (343) | | $ | 111 | | NM | $ | (878) | | $ | 55 | | NM |
| Income taxes (benefits) | (178) | | 45 | | NM | (376) | | (16) | | NM |
| Income (loss) from continuing operations | $ | (165) | | $ | 66 | | NM | $ | (502) | | $ | 71 | | NM |
| Income (loss) from discontinued operations, net of taxes | (1) | | 17 | | NM | (19) | | 15 | | NM |
| Net income (loss) before attribution of noncontrolling interests | $ | (166) | | $ | 83 | | NM | $ | (521) | | $ | 86 | | NM |
| Noncontrolling interests | (3) | | (1) | | NM | (7) | | 13 | | NM |
| Net income (loss) | $ | (163) | | $ | 84 | | NM | $ | (514) | | $ | 73 | | NM |
NM Not meaningful
2Q20 vs. 2Q19
Net loss was $163 million, compared to Net income of $84 million in the prior-year period, largely driven by lower revenues and significantly higher cost of credit, partially offset by lower expenses and income tax benefits.
Revenues decreased 49%, reflecting the wind-down of legacy assets and the impact of lower interest rates, partially offset by AFS investment securities gains, as well as positive marks on legacy securities, as spreads tightened during the quarter.
Expenses decreased 2%, primarily reflecting the wind-down of legacy assets, partially offset by higher infrastructure costs as well as incremental costs associated with the pandemic.
Provisions of $164 million increased $186 million, primarily driven by an ACL build on legacy assets (versus a release in the prior-year period under prior accounting standards). The ACL build reflected a deterioration in the macroeconomic outlook, primarily driven by the pandemic, on estimated lifetime credit losses under the CECL standard.
For additional information on CECL, see “Significant Accounting Policies and Significant Estimates” below, and Notes 1 and 14 to the Consolidated Financial Statements.
2020 YTD vs. 2019 YTD
Net loss was $514 million, compared to Net income of $73 million in the prior-year period, largely reflecting lower revenues and significantly higher cost of credit, partially offset by lower expenses and a lower tax rate (see “Significant Accounting Policies and Significant Estimates—Income Taxes” below).
Revenues decreased 65%, reflecting the wind-down of legacy assets and the impact of lower interest rates, partially offset by AFS gains.
Expenses decreased 14%, driven by the same factors described above.
Provisions of $356 million increased $403 million (versus a release in the prior-year period), driven by the same factors described above.
OFF-BALANCE SHEET ARRANGEMENTS
The table below shows where a discussion of Citi’s various off-balance sheet arrangements in this Form 10-Q may be found. For additional information, see “Off-Balance Sheet Arrangements” and Notes 1, 21 and 26 to the Consolidated Financial Statements in Citigroup’s 2019 Annual Report on Form 10-K.
Types of Off-Balance Sheet Arrangements Disclosures in this Form 10-Q
| | | | | |
| Variable interests and other obligations, including contingent obligations, arising from variable interests in nonconsolidated VIEs | See Note 18 to the Consolidated Financial Statements. |
| Letters of credit, and lending and other commitments | See Note 22 to the Consolidated Financial Statements. |
| Guarantees | See Note 22 to the Consolidated Financial Statements. |
CAPITAL RESOURCES
For additional information about capital resources, including Citi’s capital management, the stress testing component of capital planning, current regulatory capital standards and regulatory capital standards developments, see “Capital Resources” and “Risk Factors” in Citi’s 2019 Annual Report on Form 10-K.
During the second quarter of 2020, Citi returned a total of $1.1 billion of capital to common shareholders in the form of common share dividends. As discussed above, on March 15, 2020, Citi announced it had joined other major U.S. banks in suspending stock repurchases to support clients in light of the COVID-19 pandemic. For additional information, see “Unregistered Sales of Equity Securities, Repurchases of Equity Securities and Dividends—Equity Security Repurchases” below.
Common Equity Tier 1 Capital Ratio
Citi’s reportable Common Equity Tier 1 Capital ratio was 11.6% as of June 30, 2020, compared to 11.2% as of March 31, 2020, both under the Basel III Advanced Approaches framework. Citi’s reportable Common Equity Tier 1 Capital ratio was 11.8% under the Basel III Standardized Approach as of December 31, 2019. Citi’s Common Equity Tier 1 Capital ratio increased from March 31, 2020, largely driven by lower credit risk-weighted assets, beneficial net movements in Accumulated other comprehensive income (AOCI), net income of $1.3 billion and the relief provided by the modified CECL transition provision for the quarter, partially offset by the return of $1.1 billion of capital to common shareholders.
Citi’s Common Equity Tier 1 Capital ratio declined from year-end 2019, primarily due to a net increase in risk-weighted assets, the return of $5.1 billion of capital to common shareholders, partially offset by year-to-date net income of $3.8 billion and the relief of the modified CECL transition provision.
Regulatory Capital Relief Resulting from the COVID-19 Pandemic
The U.S. banking agencies issued several interim final rules during the second quarter of 2020 to revise the current regulatory capital standards applicable to Citi, in light of the pandemic. For additional information regarding interim final rules issued during the first quarter of 2020, see “Capital Resources” in Citi’s First Quarter of 2020 Form 10-Q.
Temporary Supplementary Leverage Ratio Relief
In April 2020, the Federal Reserve Board issued an interim final rule that temporarily changes the calculation of the Supplementary Leverage ratio for bank holding companies, including Citigroup, by excluding U.S. Treasuries and deposits at Federal Reserve Banks from Total Leverage Exposure. Repo-style transactions on U.S. Treasuries are not in scope for this relief. The Supplementary Leverage ratio is a non-risk-sensitive measure, and the temporary exclusion allows banking organizations to expand their balance sheet, as appropriate, to continue to serve as financial intermediaries and to provide credit to households and businesses during the pandemic. The interim final rule is effective for Citigroup’s
Supplementary Leverage ratio, as well as for Citigroup’s leverage-based Total Loss Absorbing Capacity (TLAC) and Long-Term Debt (LTD) requirements, beginning with the quarter ended June 30, 2020, and will continue through March 31, 2021. Citigroup’s reported Supplementary Leverage ratio of 6.66% benefited 94 basis points during the second quarter of 2020 as a result of the temporary relief. Excluding the temporary relief, Citigroup’s Supplementary Leverage ratio would have been 5.72%, compared with a 5.0% effective minimum requirement.
In June 2020, the U.S. banking agencies issued an interim final rule that permits depository institutions, including Citibank, to elect to temporarily exclude U.S. Treasuries and deposits at Federal Reserve Banks from Total Leverage Exposure, subject to the condition that the depository institution must receive approval from its primary federal banking regulator prior to paying dividends or making certain other capital distributions while the exclusion is in effect. Citibank did not elect to temporarily exclude U.S. Treasuries and deposits at Federal Reserve Banks from Total Leverage Exposure. Accordingly, the calculation methodology of Citibank’s Supplementary Leverage ratio was unchanged.
Regulatory Capital Impact of the Paycheck Protection Program
In April 2020, as part of the Coronavirus Aid, Relief, and Economic Security Act (CARES Act) and in recognition of the exigent circumstances faced by small businesses, Congress created the Paycheck Protection Program (PPP). PPP covered loans are fully guaranteed as to principal and accrued interest by the Small Business Administration (SBA). As a general matter, SBA guarantees are backed by the full faith and credit of the U.S. government.
In order to provide liquidity to small business lenders and the broader credit markets, and to help stabilize the financial system, the Federal Reserve Board authorized each of the Federal Reserve Banks to extend credit under the Paycheck Protection Program Lending Facility (PPPLF). Under the PPPLF, the Federal Reserve Banks may extend non-recourse loans to institutions that are eligible to originate PPP
covered loans, such as Citibank, with PPP loans that are originated or purchased by the institution pledged to the Federal Reserve as collateral to secure the PPPLF extensions of credit. The PPPLF began extending credit in April 2020, and will not extend new credit after September 30, 2020, unless the PPPLF is extended by the Federal Reserve Board and the U.S. Department of Treasury.
In April 2020, in recognition of CARES Act requirements, and to facilitate the use of the PPPLF, the U.S. banking agencies issued an interim final rule that allows banking organizations to neutralize certain regulatory capital effects of PPP loans. The interim final rule states that PPP covered loans originated by a banking organization under the PPP will be risk-weighted at 0% under the Standardized Approach and the Advanced Approaches. Additionally, the interim final rule permits banking organizations to exclude exposures pledged as collateral to the PPPLF from quarterly adjusted average total assets and Total Leverage Exposure.
The interim final rule was effective commencing with the quarter ended June 30, 2020.
Citigroup’s Capital Resources
The following tables set forth Citi’s capital components and ratios:
| | | | | | | | | | | | | | | | | | | | | | | |
| | Advanced Approaches | | | Standardized Approach | | |
| In millions of dollars, except ratios | Effective Minimum Requirement(1) | June 30, 2020 | March 31, 2020 | December 31, 2019 | June 30, 2020 | March 31, 2020 | December 31, 2019 |
Common Equity Tier 1 Capital(2) | | $ | 139,643 | | $ | 136,695 | | $ | 137,798 | | $ | 139,643 | | $ | 136,695 | | $ | 137,798 | |
| Tier 1 Capital | | 157,631 | | 154,304 | | 155,805 | | 157,631 | | 154,304 | | 155,805 | |
Total Capital (Tier 1 Capital + Tier 2 Capital)(2) | | 187,553 | | 184,362 | | 181,337 | | 196,452 | | 194,369 | | 193,682 | |
Total Risk-Weighted Assets(3)(4) | | 1,205,123 | | 1,224,136 | | 1,135,553 | | 1,187,331 | | 1,217,805 | | 1,166,523 | |
Credit Risk(2) | | $ | 809,748 | | $ | 839,490 | | $ | 771,508 | | $ | 1,092,943 | | $ | 1,136,874 | | $ | 1,107,775 | |
| Market Risk | | 91,496 | | 78,915 | | 57,317 | | 94,388 | | 80,931 | | 58,748 | |
| Operational Risk | | 303,879 | | 305,731 | | 306,728 | | — | | — | | — | |
Common Equity Tier 1 Capital ratio(5) | 10.0 | % | 11.59 | % | 11.17 | % | 12.13 | % | 11.76 | % | 11.22 | % | 11.81 | % |
Tier 1 Capital ratio(5) | 11.5 | | 13.08 | | 12.61 | | 13.72 | | 13.28 | | 12.67 | | 13.36 | |
Total Capital ratio(5) | 13.5 | | 15.56 | | 15.06 | | 15.97 | | 16.55 | | 15.96 | | 16.60 | |
| | | | | | | | | | | | | | |
| In millions of dollars, except ratios | Effective Minimum Requirement | June 30, 2020 | March 31, 2020 | December 31, 2019 |
Quarterly Adjusted Average Total Assets(2)(3)(6)(7) | | $ | 2,228,062 | | $ | 2,044,340 | | $ | 1,957,039 | |
Total Leverage Exposure(2)(3)(6)(8) | | 2,367,578 | | 2,585,730 | | 2,507,891 | |
| Tier 1 Leverage ratio | 4.0 | % | 7.07 | % | 7.55 | % | 7.96 | % |
| Supplementary Leverage ratio | 5.0 | | 6.66 | | 5.97 | | 6.21 | |
(1)Citi’s effective minimum risk-based capital requirements include the 2.5% Capital Conservation Buffer and the 3.0% GSIB surcharge (all of which must be composed of Common Equity Tier 1 Capital).
(2)Citi has elected to apply the modified transition provision related to the impact of the CECL accounting standard on regulatory capital, as provided by the U.S. banking agencies’ March 2020 interim final rule. Under the modified CECL transition provision, the changes in retained earnings (after-tax), deferred tax assets (DTAs) arising from temporary differences, and the allowance for credit losses upon the January 1, 2020 CECL adoption date have been deferred and will phase in to regulatory capital at 25% per year commencing January 1, 2022. For the ongoing impact of CECL, Citigroup is allowed to adjust retained earnings and the allowance for credit losses in an amount equal to 25% of the change in the allowance for credit losses recognized through earnings (pre-tax) for each period between January 1, 2020 and December 31, 2021. The cumulative adjustments to retained earnings and the allowance for credit losses between January 1, 2020 and December 31, 2021 will also phase in to regulatory capital at 25% per year commencing January 1, 2022, along with the deferred impacts related to the January 1, 2020 CECL adoption date. Corresponding adjustments to average on-balance sheet assets are reflected in quarterly adjusted average total assets and Total Leverage Exposure. Additionally, the increase in DTAs arising from temporary differences upon the January 1, 2020 adoption date has been deducted from risk-weighted assets (RWA) and will phase in to RWA at 25% per year commencing January 1, 2022.
(3)Commencing with the quarter ended March 31, 2020, exposures acquired pursuant to a non-recourse loan as part of the Money Market Mutual Fund Liquidity Facility are excluded from risk-weighted assets under the Advanced Approaches and Standardized Approach, as well as quarterly adjusted average total assets and Total Leverage Exposure.
(4)Commencing with the quarter ended June 30, 2020, loans originated under the Paycheck Protection Program receive a 0% risk weight under the Advanced Approaches and Standardized Approach.
(5)Citi’s reportable Common Equity Tier 1 Capital and Tier 1 Capital ratios were derived under the Basel III Advanced Approaches framework as of June 30, 2020 and March 31, 2020, and the Basel III Standardized Approach as of December 31, 2019, whereas Citi’s reportable Total Capital ratio was the lower derived under the Basel III Advanced Approaches framework for all periods presented.
(6)Commencing with the quarter ended June 30, 2020, exposures pledged as collateral pursuant to a non-recourse loan that is provided as part of the Paycheck Protection Program Lending Facility are excluded from quarterly adjusted average total assets and Total Leverage Exposure.
(7)Tier 1 Leverage ratio denominator. Represents quarterly average total assets less amounts deducted from Tier 1 Capital.
(8)Supplementary Leverage ratio denominator. Commencing with the second quarter of 2020, Citigroup’s Total Leverage Exposure temporarily excludes U.S. Treasuries and deposits at Federal Reserve Banks.
As indicated in the table above, Citigroup’s risk-based capital ratios at June 30, 2020 were in excess of the stated and effective minimum requirements under the U.S. Basel III rules. In addition, Citi was also “well capitalized” under current federal bank regulatory agency definitions as of June 30, 2020.
Components of Citigroup Capital
| | | | | | | | |
| In millions of dollars | June 30,
2020 | December 31,
2019 |
| Common Equity Tier 1 Capital | | |
Citigroup common stockholders’ equity(1) | $ | 173,793 | | $ | 175,414 | |
| Add: Qualifying noncontrolling interests | 145 | | 154 | |
| Regulatory capital adjustments and deductions: | | |
Add: CECL transition and 25% provision deferral(2) | 5,606 | | — | |
| Less: Accumulated net unrealized gains (losses) on cash flow hedges, net of tax | 2,094 | | 123 | |
Less: Cumulative unrealized net gain (loss) related to changes in fair value of financial liabilities attributable to own creditworthiness, net of tax | 393 | | (679) | |
| Less: Intangible assets: | | |
Goodwill, net of related DTLs(3) | 20,275 | | 21,066 | |
Identifiable intangible assets other than MSRs, net of related DTLs | 3,866 | | 4,087 | |
| Less: Defined benefit pension plan net assets | 960 | | 803 | |
Less: DTAs arising from net operating loss, foreign tax credit and general business credit carry-forwards(4) | 12,313 | | 12,370 | |
| Total Common Equity Tier 1 Capital (Advanced Approaches and Standardized Approach) | $ | 139,643 | | $ | 137,798 | |
| Additional Tier 1 Capital | | |
Qualifying noncumulative perpetual preferred stock(1) | $ | 17,829 | | $ | 17,828 | |
Qualifying trust preferred securities(5) | 1,392 | | 1,389 | |
| Qualifying noncontrolling interests | 37 | | 42 | |
| Regulatory capital deductions: | | |
Less: Permitted ownership interests in covered funds(6) | 1,244 | | 1,216 | |
Less: Minimum regulatory capital requirements of insurance underwriting subsidiaries(7) | 26 | | 36 | |
| Total Additional Tier 1 Capital (Advanced Approaches and Standardized Approach) | $ | 17,988 | | $ | 18,007 | |
Total Tier 1 Capital (Common Equity Tier 1 Capital + Additional Tier 1 Capital) (Advanced Approaches and Standardized Approach) | $ | 157,631 | | $ | 155,805 | |
| Tier 2 Capital | | |
| Qualifying subordinated debt | $ | 24,708 | | $ | 23,673 | |
Qualifying trust preferred securities(8) | 317 | | 326 | |
| Qualifying noncontrolling interests | 43 | | 46 | |
Excess of eligible credit reserves over expected credit losses(2)(9) | 4,880 | | 1,523 | |
| Regulatory capital deduction: | | |
Less: Minimum regulatory capital requirements of insurance underwriting subsidiaries(7) | 26 | | 36 | |
| Total Tier 2 Capital (Advanced Approaches) | $ | 29,922 | | $ | 25,532 | |
| Total Capital (Tier 1 Capital + Tier 2 Capital) (Advanced Approaches) | $ | 187,553 | | $ | 181,337 | |
Adjustment for eligible allowance for credit losses(2)(9) | $ | 8,899 | | $ | 12,345 | |
| Total Tier 2 Capital (Standardized Approach) | $ | 38,821 | | $ | 37,877 | |
| Total Capital (Tier 1 Capital + Tier 2 Capital) (Standardized Approach) | $ | 196,452 | | $ | 193,682 | |
(1)Issuance costs of $151 million as of June 30, 2020 and $152 million as of December 31, 2019 are related to outstanding noncumulative perpetual preferred stock, are excluded from common stockholders’ equity and are netted against such preferred stock in accordance with Federal Reserve Board regulatory reporting requirements, which differ from those under U.S. GAAP.
(2)Citi has elected to apply the modified transition provision related to the impact of the CECL accounting standard on regulatory capital, as provided by the U.S. banking agencies’ March 2020 interim final rule. Under the modified CECL transition provision, the changes in retained earnings (after-tax) and the allowance for credit losses upon the January 1, 2020 CECL adoption date have been deferred and will phase in to regulatory capital at 25% per year commencing January 1, 2022. For the ongoing impact of CECL, Citigroup is allowed to adjust retained earnings and the allowance for credit losses in an amount equal to 25% of the change in the allowance for credit losses recognized through earnings (pre-tax) for each period between January 1, 2020 and December 31, 2021. The cumulative adjustments to retained earnings and the allowance for credit losses between January 1, 2020 and December 31, 2021 will also phase in to regulatory capital at 25% per year commencing January 1, 2022, along with the deferred impacts related to the January 1, 2020 CECL adoption date.
(3)Includes goodwill “embedded” in the valuation of significant common stock investments in unconsolidated financial institutions.
Footnotes continue on the following page.
(4)Of Citi’s $23.9 billion of net DTAs at June 30, 2020, $14.2 billion was includable in Common Equity Tier 1 Capital pursuant to the U.S. Basel III rules, while $9.7 billion was excluded. Excluded from Citi’s Common Equity Tier 1 Capital as of June 30, 2020 was $12.3 billion of net DTAs arising from net operating loss, foreign tax credit and general business credit carry-forwards, which was reduced by $2.6 billion of net DTLs primarily associated with goodwill and certain other intangible assets. Separately, under the U.S. Basel III rules, goodwill and these other intangible assets are deducted net of associated DTLs in arriving at Common Equity Tier 1 Capital. DTAs arising from net operating loss, foreign tax credit and general business credit carry-forwards are required to be entirely deducted from Common Equity Tier 1 Capital under the U.S. Basel III rules. Citi’s DTAs arising from temporary differences are less than the 10% limitation under the U.S. Basel III rules and therefore not subject to deduction from Common Equity Tier 1 Capital, but are subject to risk weighting at 250%.
(5)Represents Citigroup Capital XIII trust preferred securities, which are permanently grandfathered as Tier 1 Capital under the U.S. Basel III rules.
(6)Banking entities are required to be in compliance with the Volcker Rule of the Dodd-Frank Act, which prohibits conducting certain proprietary investment activities and limits their ownership of, and relationships with, covered funds. The U.S. agencies issued a revised Volcker Rule 2.0 in November 2019 that removes permitted investments in third-party covered funds from capital deduction requirements, among other changes. Upon the removal of the capital deduction, permitted investments in third-party covered funds will be included in risk-weighted assets. Mandatory compliance with the revised Volcker Rule 2.0 is required by January 1, 2021, with early adoption permitted, in whole or in part, beginning January 1, 2020. Additionally, the U.S. agencies released a revised Volcker Rule 2.1 in June 2020 that improves and streamlines several “covered funds” requirements, with an effective date of October 1, 2020. Citi continues to deduct from Tier 1 Capital all permitted ownership interests in covered funds for all periods presented.
(7)50% of the minimum regulatory capital requirements of insurance underwriting subsidiaries must be deducted from each of Tier 1 Capital and Tier 2 Capital.
(8)Represents the amount of non-grandfathered trust preferred securities eligible for inclusion in Tier 2 Capital under the U.S. Basel III rules, which will be fully phased-out of Tier 2 Capital by January 1, 2022.
(9)Under the Advanced Approaches framework, eligible credit reserves that exceed expected credit losses are eligible for inclusion in Tier 2 Capital to the extent that the excess reserves do not exceed 0.6% of credit risk-weighted assets, which differs from the Standardized Approach, in which the allowance for credit losses is eligible for inclusion in Tier 2 Capital up to 1.25% of credit risk-weighted assets, with any excess allowance for credit losses being deducted in arriving at credit risk-weighted assets. The total amount of allowance for credit losses that were eligible for inclusion in Tier 2 Capital, subject to limitation, under the Standardized Approach framework was $13.8 billion and $13.9 billion at June 30, 2020 and December 31, 2019, respectively.
Citigroup Capital Rollforward
| | | | | | | | |
| In millions of dollars | Three Months Ended
June 30, 2020 | Six Months Ended
June 30, 2020 |
| Common Equity Tier 1 Capital, beginning of period | $ | 136,695 | | $ | 137,798 | |
| Net income | 1,316 | | 3,838 | |
| Common and preferred dividends declared | (1,324) | | (2,696) | |
| Net change in treasury stock | 4 | | (2,483) | |
| Net change in common stock and additional paid-in capital | 118 | | (173) | |
| Net change in foreign currency translation adjustment net of hedges, net of tax | 561 | | (3,548) | |
| Net decrease in unrealized losses on debt securities AFS, net of tax | 837 | | 3,965 | |
| Net increase in defined benefit plans liability adjustment, net of tax | (77) | | (363) | |
| Net change in adjustment related to change in fair value of financial liabilities attributable to own creditworthiness, net of tax | 213 | | (164) | |
| Net change in excluded component of fair value hedges | 13 | | 40 | |
| Net change in goodwill, net of related DTLs | (152) | | 791 | |
| Net decrease in identifiable intangible assets other than MSRs, net of related DTLs | 87 | | 221 | |
| Net change in defined benefit pension plan net assets | 92 | | (157) | |
| Net change in DTAs arising from net operating loss, foreign tax credit and general business credit carry-forwards | (54) | | 57 | |
| CECL 25% provision deferral | 1,306 | | 2,538 | |
| Other | 8 | | (21) | |
| Net increase in Common Equity Tier 1 Capital | $ | 2,948 | | $ | 1,845 | |
Common Equity Tier 1 Capital, end of period (Advanced Approaches and Standardized Approach) | $ | 139,643 | | $ | 139,643 | |
| Additional Tier 1 Capital, beginning of period | $ | 17,609 | | $ | 18,007 | |
| Net change in qualifying perpetual preferred stock | — | | 1 | |
| Net increase in qualifying trust preferred securities | 2 | | 3 | |
| Net change in permitted ownership interests in covered funds | 378 | | (28) | |
| Other | (1) | | 5 | |
| Net change in Additional Tier 1 Capital | $ | 379 | | $ | (19) | |
Tier 1 Capital, end of period (Advanced Approaches and Standardized Approach) | $ | 157,631 | | $ | 157,631 | |
| Tier 2 Capital, beginning of period (Advanced Approaches) | $ | 30,058 | | $ | 25,532 | |
| Net change in qualifying subordinated debt | (753) | | 1,035 | |
| Net increase in excess of eligible credit reserves over expected credit losses | 615 | | 3,357 | |
| Other | 2 | | (2) | |
| Net change in Tier 2 Capital (Advanced Approaches) | $ | (136) | | $ | 4,390 | |
| Tier 2 Capital, end of period (Advanced Approaches) | $ | 29,922 | | $ | 29,922 | |
| Total Capital, end of period (Advanced Approaches) | $ | 187,553 | | $ | 187,553 | |
| Tier 2 Capital, beginning of period (Standardized Approach) | $ | 40,065 | | $ | 37,877 | |
| Net change in qualifying subordinated debt | (753) | | 1,035 | |
| Net decrease in eligible allowance for credit losses | (493) | | (89) | |
| Other | 2 | | (2) | |
| Net change in Tier 2 Capital (Standardized Approach) | $ | (1,244) | | $ | 944 | |
| Tier 2 Capital, end of period (Standardized Approach) | $ | 38,821 | | $ | 38,821 | |
| Total Capital, end of period (Standardized Approach) | $ | 196,452 | | $ | 196,452 | |
Citigroup Risk-Weighted Assets Rollforward (Basel III Advanced Approaches)
| | | | | | | | |
| In millions of dollars | Three Months Ended
June 30, 2020 | Six Months Ended
June 30, 2020 |
| Total Risk-Weighted Assets, beginning of period | $ | 1,224,136 | | $ | 1,135,553 | |
| Changes in Credit Risk-Weighted Assets | | |
Retail exposures(1) | (11,571) | | (19,111) | |
Wholesale exposures(2) | 11,081 | | 32,962 | |
Repo-style transactions(3) | (4,121) | | 10,985 | |
| Securitization exposures | (320) | | (1,710) | |
| Equity exposures | 1,946 | | (481) | |
Over-the-counter (OTC) derivatives(4) | (6,099) | | 8,621 | |
Derivatives CVA(5) | (8,477) | | 11,652 | |
Other exposures(6) | (11,179) | | (6,385) | |
| Supervisory 6% multiplier | (1,002) | | 1,707 | |
| Net change in Credit Risk-Weighted Assets | $ | (29,742) | | $ | 38,240 | |
| Changes in Market Risk-Weighted Assets | | |
Risk levels(7) | $ | 8,876 | | $ | 22,121 | |
Model and methodology updates(7) | 3,705 | | 12,058 | |
| Net increase in Market Risk-Weighted Assets | $ | 12,581 | | $ | 34,179 | |
| Net decrease in Operational Risk-Weighted Assets | $ | (1,852) | | $ | (2,849) | |
| Total Risk-Weighted Assets, end of period | $ | 1,205,123 | | $ | 1,205,123 | |
(1)Retail exposures decreased during the three months and six months ended June 30, 2020 primarily driven by seasonal holiday spending repayments and lesser spending due to the pandemic.
(2)Wholesale exposures increased during the three months ended June 30, 2020 primarily due to increases in AFS and HTM securities and loan commitments. Wholesale exposures increased during the six months ended June 30, 2020 primarily due to commercial loan growth, increases in AFS and HTM securities and rating downgrades partially offset by annual model parameter updates reflecting Citi’s loss experiences.
(3)Repo-style transactions include repurchase and reverse repurchase transactions as well as securities borrowing and securities lending transactions. Repo-style transactions decreased during the three months ended June 30, 2020 mainly driven by market volatility. Repo-style transactions increased during the six months ended June 30, 2020 mainly driven by market volatility.
(4)OTC derivatives decreased during the three months ended June 30, 2020 primarily due to decreases in mark-to-market and notional for bilateral derivatives. OTC derivatives increased during the six months ended June 30, 2020 primarily due to increases in mark-to-market and notional for bilateral derivatives.
(5)Derivatives CVA decreased during the three months ended June 30, 2020 primarily due to narrowing credit spreads, market volatility and decreases in exposure. Derivatives CVA increased during the six months ended June 30, 2020 primarily due to widening credit spreads and market volatility.
(6)Other exposures include cleared transactions, unsettled transactions, assets other than those reportable in specific exposure categories and non-material portfolios. Other exposures decreased during the three months and six months ended June 30, 2020 primarily due to decreases in notional for client cleared derivatives and excess of credit reserves not included in Tier 2 capital eligible for RWA reduction.
(7)Market risk-weighted assets increased during the three months and six months ended June 30, 2020 primarily driven by increases in market volatility due to the pandemic.
As set forth in the table above, total risk-weighted assets under the Basel III Advanced Approaches increased from year-end 2019, primarily due to higher credit and market risk-weighted assets, slightly offset by a decrease in operational risk-weighted assets. The increase in credit risk-weighted assets was primarily due to increases in commercial loans and loan commitments, increases in derivatives CVA, attributable to widening of credit spreads and market volatility, repo-style transactions, and OTC derivatives trade activities, partially offset by a decrease in retail exposures, decreases in notional for client cleared derivatives and excess of credit reserves not included in Tier 2 capital eligible for RWA reduction. Market risk-weighted assets increased from year-end 2019, primarily driven by increases in market volatility due to the pandemic.
Citigroup Risk-Weighted Assets Rollforward (Basel III Standardized Approach)
| | | | | | | | |
| In millions of dollars | Three Months Ended
June 30, 2020 | Six Months Ended
June 30, 2020 |
| Total Risk-Weighted Assets, beginning of period | $ | 1,217,805 | | $ | 1,166,523 | |
| Changes in Credit Risk-Weighted Assets | | |
General credit risk exposures(1) | (34,067) | | (13,163) | |
Repo-style transactions(2) | 14,085 | | 17,590 | |
| Securitization exposures | (290) | | (1,208) | |
| Equity exposures | 1,752 | | (481) | |
Over-the-counter (OTC) derivatives(3) | (15,565) | | 8,303 | |
Other exposures(4) | (14,428) | | (13,075) | |
Off-balance sheet exposures(5) | 4,583 | | (12,797) | |
| Net decrease in Credit Risk-Weighted Assets | $ | (43,930) | | $ | (14,831) | |
| Net Increase in Market Risk-Weighted Assets | | |
Risk levels(6) | $ | 9,751 | | $ | 23,581 | |
Model and methodology updates(6) | 3,705 | | 12,058 | |
| Net increase in Market Risk-Weighted Assets | $ | 13,456 | | $ | 35,639 | |
| Total Risk-Weighted Assets, end of period | $ | 1,187,331 | | $ | 1,187,331 | |
(1)General credit risk exposures include cash and balances due from depository institutions, securities, and loans and leases. General credit risk exposures decreased during the three months and six months ended June 30, 2020 primarily due to reductions in commercial loans and consumer loans driven by seasonal holiday spending repayments and lesser spending due to COVID pandemic.
(2)Repo-style transactions include repurchase and reverse repurchase transactions as well as securities borrowing and securities lending transactions. Repo-style transactions increased during the three months and six months ended June 30, 2020, primarily due to volume and exposure driven increases.
(3)OTC derivatives decreased during the three months ended June 30, 2020, primarily due to decreases in mark-to-market and notional for bilateral derivatives. OTC derivatives increased during the six months ended June 30, 2020, primarily due to increases in mark-to-market and notional for bilateral derivatives.
(4)Other exposures include cleared transactions, unsettled transactions, and other assets. Other exposures decreased during the three months and six months ended June 30, 2020 primarily due to decreases in notional for client cleared derivatives and excess of credit reserves not included in Tier 2 capital eligible for RWA reduction.
(5)Off-balance sheet exposures increased during the three months ended June 30, 2020, primarily due to an increase in loan commitments. Off-balance sheet exposures decreased during the six months ended June 30, 2020 primarily due to a reduction in loan commitments.
(6)Market risk-weighted assets increased during the three months and six months ended June 30, 2020 primarily driven by increases in market volatility due to the pandemic.
As set forth in the table above, total risk-weighted assets under the Basel III Standardized Approach increased from year-end 2019, primarily due to higher market risk-weighted assets, partially offset by lower credit risk-weighted assets. Market risk-weighted assets increased from year-end 2019, primarily driven by increases in market volatility due to the pandemic. The decrease in credit risk-weighted assets was primarily driven by decreases in commercial loans, seasonal holiday spending repayments and lesser spending due to the pandemic, decreases in notional for client cleared derivatives, excess of credit reserves not included in Tier 2 capital eligible for RWA reduction, and decreases in off-balance sheet exposures due to a reduction in loan commitments, partially offset by increases in repo-style transactions.
Supplementary Leverage Ratio
The following table sets forth Citi’s Supplementary Leverage ratio and related components:
| | | | | | | | | | | |
| In millions of dollars, except ratios | June 30, 2020 | March 31, 2020 | December 31, 2019 |
| Tier 1 Capital | $ | 157,631 | | $ | 154,304 | | $ | 155,805 | |
| Total Leverage Exposure | | | |
On-balance sheet assets(1)(2)(3) | $ | 1,878,949 | | $ | 2,083,377 | | $ | 1,996,617 | |
Certain off-balance sheet exposures:(4) | | | |
| Potential future exposure on derivative contracts | 163,829 | | 169,296 | | 169,478 | |
Effective notional of sold credit derivatives, net(5) | 37,867 | | 38,910 | | 38,481 | |
Counterparty credit risk for repo-style transactions(6) | 20,641 | | 22,386 | | 23,715 | |
| Unconditionally cancellable commitments | 71,887 | | 71,472 | | 70,870 | |
| Other off-balance sheet exposures | 233,089 | | 239,326 | | 248,308 | |
| Total of certain off-balance sheet exposures | $ | 527,313 | | $ | 541,390 | | $ | 550,852 | |
| Less: Tier 1 Capital deductions | (38,684) | | (39,037) | | (39,578) | |
Total Leverage Exposure(3) | $ | 2,367,578 | | $ | 2,585,730 | | $ | 2,507,891 | |
| Supplementary Leverage ratio | 6.66 | % | 5.97 | % | 6.21 | % |
(1)Represents the daily average of on-balance sheet assets for the quarter.
(2)Citi has elected to apply the modified transition provision related to the impact of the CECL accounting standard on regulatory capital, as provided by the U.S. banking agencies’ March 2020 interim final rule. Under the modified CECL transition provision, the changes in DTAs arising from temporary differences and the allowance for credit losses upon the January 1, 2020 CECL adoption date have been deferred and will phase in to regulatory capital at 25% per year commencing January 1, 2022. For the ongoing impact of CECL, Citigroup is allowed to adjust the allowance for credit losses in an amount equal to 25% of the change in the allowance for credit losses recognized through earnings (pre-tax) for each period between January 1, 2020 and December 31, 2021. The cumulative adjustments to the allowance for credit losses between January 1, 2020 and December 31, 2021 will also phase in to regulatory capital at 25% per year commencing January 1, 2022, along with the deferred impacts related to the January 1, 2020 CECL adoption date. Corresponding adjustments to average on-balance sheet assets are reflected in Total Leverage Exposure.
(3)Commencing with the second quarter of 2020, Citigroup’s Total Leverage Exposure temporarily excludes U.S. Treasuries and deposits at Federal Reserve Banks.
(4)Represents the average of certain off-balance sheet exposures calculated as of the last day of each month in the quarter.
(5)Under the U.S. Basel III rules, banking organizations are required to include in Total Leverage Exposure the effective notional amount of sold credit derivatives, with netting of exposures permitted if certain conditions are met.
(6)Repo-style transactions include repurchase and reverse repurchase transactions as well as securities borrowing and securities lending transactions.
As set forth in the table above, Citigroup’s Supplementary Leverage ratio was 6.7% for the second quarter of 2020, compared to 6.0% for the first quarter of 2020, and 6.2% for the fourth quarter of 2019. The ratio increased from the first quarter of 2020 and the fourth quarter of 2019, primarily attributable to the 94 basis point benefit resulting from the Federal Reserve Board’s temporary Supplementary Leverage ratio relief, as discussed above.
Capital Resources of Citigroup’s Subsidiary U.S. Depository Institutions
Citigroup’s subsidiary U.S. depository institutions, including Citibank, are also subject to regulatory capital standards issued by their respective primary federal bank regulatory agencies, which are similar to the standards of the Federal Reserve Board.
The following tables set forth Citibank’s capital components and ratios:
| | | | | | | | | | | | | | | | | | | | | | | |
| | Advanced Approaches | | | Standardized Approach | | |
| In millions of dollars, except ratios | Effective Minimum Requirement(1) | June 30, 2020 | March 31, 2020 | December 31, 2019 | June 30, 2020 | March 31, 2020 | December 31, 2019 |
Common Equity Tier 1 Capital(2) | | $ | 137,476 | | $ | 134,835 | | $ | 130,720 | | $ | 137,476 | | $ | 134,835 | | $ | 130,720 | |
| Tier 1 Capital | | 139,560 | | 136,919 | | 132,847 | | 139,560 | | 136,919 | | 132,847 | |
Total Capital (Tier 1 Capital + Tier 2 Capital)(2)(3) | | 155,799 | | 152,865 | | 145,918 | | 163,574 | | 161,629 | | 157,253 | |
Total Risk-Weighted Assets(4) | | 983,824 | | 1,008,781 | | 931,743 | | 998,456 | | 1,058,427 | | 1,019,266 | |
Credit Risk(2) | | $ | 696,411 | | $ | 722,376 | | $ | 664,139 | | $ | 950,208 | | $ | 1,010,662 | | $ | 989,669 | |
| Market Risk | | 47,931 | | 47,579 | | 29,167 | | 48,248 | | 47,765 | | 29,597 | |
| Operational Risk | | 239,482 | | 238,826 | | 238,437 | | — | | — | | — | |
Common Equity Tier 1 Capital ratio(5)(6) | 7.0 | % | 13.97 | % | 13.37 | % | 14.03 | % | 13.77 | % | 12.74 | % | 12.82 | % |
Tier 1 Capital ratio(5)(6) | 8.5 | | 14.19 | | 13.57 | | 14.26 | | 13.98 | | 12.94 | | 13.03 | |
Total Capital ratio(5)(6) | 10.5 | | 15.84 | | 15.15 | | 15.66 | | 16.38 | | 15.27 | | 15.43 | |
| | | | | | | | | | | | | | |
| In millions of dollars, except ratios | Effective Minimum Requirement | June 30, 2020 | March 31, 2020 | December 31, 2019 |
Quarterly Adjusted Average Total Assets(2)(7)(8) | | $ | 1,643,724 | | $ | 1,512,382 | | $ | 1,459,780 | |
Total Leverage Exposure(2)(7)(9) | | 2,105,285 | | 1,994,180 | | 1,951,630 | |
Tier 1 Leverage ratio(6) | 5.0 | % | 8.49 | % | 9.05 | % | 9.10 | % |
Supplementary Leverage ratio(6) | 6.0 | | 6.63 | | 6.87 | | 6.81 | |
(1)Citibank’s effective minimum risk-based capital requirements include the 2.5% Capital Conservation Buffer (all of which must be composed of Common Equity Tier 1 Capital).
(2)Citibank has elected to apply the modified transition provision related to the impact of the CECL accounting standard on regulatory capital, as provided by the U.S. banking agencies’ March 2020 interim final rule. Under the modified CECL transition provision, the changes in retained earnings (after-tax), deferred tax assets (DTAs) arising from temporary differences, and the allowance for credit losses upon the January 1, 2020 CECL adoption date have been deferred and will phase in to regulatory capital at 25% per year commencing January 1, 2022. For the ongoing impact of CECL, Citibank is allowed to adjust retained earnings and the allowance for credit losses in an amount equal to 25% of the change in the allowance for credit losses recognized through earnings (pre-tax) for each period between January 1, 2020 and December 31, 2021. The cumulative adjustments to retained earnings and the allowance for credit losses between January 1, 2020 and December 31, 2021 will also phase in to regulatory capital at 25% per year commencing January 1, 2022, along with the deferred impacts related to the January 1, 2020 CECL adoption date. Corresponding adjustments to average on-balance sheet assets are reflected in quarterly adjusted average total assets and Total Leverage Exposure. Additionally, the increase in DTAs arising from temporary differences upon the January 1, 2020 adoption date has been deducted from risk-weighted assets (RWA) and will phase in to RWA at 25% per year commencing January 1, 2022.
(3)Under the Advanced Approaches framework, eligible credit reserves that exceed expected credit losses are eligible for inclusion in Tier 2 Capital to the extent that the excess reserves do not exceed 0.6% of credit risk-weighted assets, which differs from the Standardized Approach in which the allowance for credit losses is eligible for inclusion in Tier 2 Capital up to 1.25% of credit risk-weighted assets, with any excess allowance for credit losses being deducted in arriving at credit risk-weighted assets.
(4)Commencing with the quarter ended June 30, 2020, loans originated under the Paycheck Protection Program receive a 0% risk weight under the Advanced Approaches and Standardized Approach.
(5)Citibank’s reportable Total Capital ratio was derived under the Basel III Advanced Approaches framework as of June 30, 2020 and March 31, 2020, and the Basel III Standardized Approach as of December 31, 2019, whereas Citibank’s reportable Common Equity Tier 1 Capital and Tier 1 Capital ratios were the lower derived under the Basel III Standardized Approach framework for all periods presented.
(6)Citibank must maintain minimum Common Equity Tier 1 Capital, Tier 1 Capital, Total Capital and Tier 1 Leverage ratios of 6.5%, 8.0%, 10.0% and 5.0%, respectively, to be considered “well capitalized” under the revised Prompt Corrective Action (PCA) regulations applicable to insured depository institutions as established by the U.S. Basel III rules. Citibank must also maintain a minimum Supplementary Leverage ratio of 6.0% to be considered “well capitalized.” For additional information, see “Capital Resources—Current Regulatory Capital Standards—Prompt Corrective Action Framework” in Citigroup’s 2019 Annual Report on Form 10-K.
(7)Commencing with the quarter ended June 30, 2020, exposures pledged as collateral pursuant to a non-recourse loan that is provided as part of the Paycheck Protection Program Lending Facility are excluded from quarterly adjusted average total assets and Total Leverage Exposure.
(8)Tier 1 Leverage ratio denominator. Represents quarterly average total assets less amounts deducted from Tier 1 Capital.
(9)Supplementary Leverage ratio denominator. Citibank’s Total Leverage Exposure includes U.S. Treasuries and deposits at Federal Reserve Banks for all periods.
As indicated in the table above, Citibank’s capital ratios at June 30, 2020 were in excess of the stated and effective minimum requirements under the U.S. Basel III rules. In addition, Citibank was also “well capitalized” as of June 30, 2020.
Impact of Changes on Citigroup and Citibank Capital Ratios
The following tables present the estimated sensitivity of Citigroup’s and Citibank’s capital ratios to changes of $100 million in Common Equity Tier 1 Capital, Tier 1 Capital and Total Capital (numerator), and changes of $1 billion in
Advanced Approaches and Standardized Approach risk-weighted assets and quarterly adjusted average total assets, as well as Total Leverage Exposure (denominator), as of June 30, 2020. This information is provided for the purpose of analyzing the impact that a change in Citigroup’s or Citibank’s financial position or results of operations could have on these ratios. These sensitivities only consider a single change to either a component of capital, risk-weighted assets, quarterly adjusted average total assets or Total Leverage Exposure. Accordingly, an event that affects more than one factor may have a larger basis point impact than is reflected in these tables.
| | | | | | | | | | | | | | | | | | | | |
| Common Equity Tier 1 Capital ratio | | Tier 1 Capital ratio | | Total Capital ratio | |
| In basis points | Impact of $100 million change in Common Equity Tier 1 Capital | Impact of $1 billion change in risk- weighted assets | Impact of $100 million change in Tier 1 Capital | Impact of $1 billion change in risk- weighted assets | Impact of $100 million change in Total Capital | Impact of $1 billion change in risk- weighted assets |
| Citigroup | | | | | | |
| Advanced Approaches | 0.8 | 1.0 | 0.8 | 1.1 | 0.8 | 1.3 |
| Standardized Approach | 0.8 | 1.0 | 0.8 | 1.1 | 0.8 | 1.4 |
| Citibank | | | | | | |
| Advanced Approaches | 1.0 | 1.4 | 1.0 | 1.4 | 1.0 | 1.6 |
| Standardized Approach | 1.0 | 1.4 | 1.0 | 1.4 | 1.0 | 1.6 |
| | | | | | | | | | | | | | |
| Tier 1 Leverage ratio | | Supplementary Leverage ratio | |
| In basis points | Impact of $100 million change in Tier 1 Capital | Impact of $1 billion change in quarterly adjusted average total assets | Impact of $100 million change in Tier 1 Capital | Impact of $1 billion change in Total Leverage Exposure |
| Citigroup | 0.4 | 0.3 | 0.4 | 0.3 |
| Citibank | 0.6 | 0.5 | 0.5 | 0.3 |
Citigroup Broker-Dealer Subsidiaries
At June 30, 2020, Citigroup Global Markets Inc., a U.S. broker-dealer registered with the SEC that is an indirect wholly owned subsidiary of Citigroup, had net capital, computed in accordance with the SEC’s net capital rule, of $10.2 billion, which exceeded the minimum requirement by $6.2 billion.
Moreover, Citigroup Global Markets Limited, a broker-dealer registered with the United Kingdom’s Prudential Regulation Authority (PRA) that is also an indirect wholly owned subsidiary of Citigroup, had total capital of $21.2 billion at June 30, 2020, which exceeded the PRA's minimum regulatory capital requirements.
In addition, certain of Citi’s other broker-dealer subsidiaries are subject to regulation in the countries in which they do business, including requirements to maintain specified levels of net capital or its equivalent. Citigroup’s other principal broker-dealer subsidiaries were in compliance with their regulatory capital requirements at June 30, 2020.
Total Loss-Absorbing Capacity (TLAC)
The table below details Citi’s eligible external TLAC and long-term debt (LTD) amounts and ratios, and each effective minimum TLAC and LTD ratio requirement, as well as the surplus amount in dollars in excess of each requirement.
As of June 30, 2020, Citi exceeded each of the minimum TLAC and LTD requirements, resulting in a $31 billion surplus above its binding TLAC requirement of LTD as a percentage of Advanced Approaches risk-weighted assets.
| | | | | | | | |
| June 30, 2020 | |
| In billions of dollars, except ratios | External TLAC | LTD |
| Total eligible amount | $ | 304 | | $ | 140 | |
% of Advanced Approaches risk-
weighted assets | 25.2 | % | 11.6 | % |
Effective minimum requirement(1)(2) | 22.5 | % | 9.0 | % |
| Surplus amount | $ | 32 | | $ | 31 | |
% of Total Leverage Exposure(3) | 12.8 | % | 5.9 | % |
| Effective minimum requirement | 9.5 | % | 4.5 | % |
| Surplus amount | $ | 79 | | $ | 33 | |
(1) External TLAC includes Method 1 GSIB surcharge of 2.0%.
(2) LTD includes Method 2 GSIB surcharge of 3.0%.
(3) As discussed above, commencing with the second quarter of 2020, Citigroup’s Total Leverage Exposure temporarily excludes U.S. Treasuries and deposits at Federal Reserve Banks.
For additional information on Citi’s TLAC-related requirements, see “Liquidity Risk—Long-Term Debt—Total Loss-Absorbing Capacity (TLAC)” and “Risk Factors—Compliance, Conduct and Legal Risks” in Citi’s 2019 Annual Report on Form 10-K.
Capital Resources (Full Adoption of CECL, and Excluding Temporary Supplementary Leverage Ratio Relief for Citigroup)
The following tables set forth Citigroup’s and Citibank’s capital components and ratios reflecting the full impact of CECL, and excluding temporary Supplementary Leverage ratio relief for Citigroup, as of June 30, 2020:
| | | | | | | | | | | | | | |
| Citigroup | | Citibank | |
| Advanced Approaches | Standardized Approach | Advanced Approaches | Standardized Approach |
| Common Equity Tier 1 Capital ratio | 11.15 | % | 11.32 | % | 13.49 | % | 13.29 | % |
| Tier 1 Capital ratio | 12.65 | | 12.84 | | 13.70 | | 13.50 | |
| Total Capital ratio | 15.15 | | 16.13 | | 15.36 | | 15.92 | |
| | | | | | | | |
| Citigroup | Citibank |
| Tier 1 Leverage ratio | 6.84 | % | 8.19 | % |
Supplementary Leverage ratio(1) | 5.53 | | 6.39 | |
(1)Citigroup’s Supplementary Leverage ratio, as presented in the table above, reflects the full impact of CECL as well as the inclusion of U.S. Treasuries and deposits at Federal Reserve Banks in Total Leverage Exposure.
Stress Capital Buffer
In June 2020, the Federal Reserve Board communicated that Citi’s interim Stress Capital Buffer (SCB) requirement, which will be finalized by the end of August 2020, is 2.5%. Based on the interim SCB, beginning October 1, 2020, Citigroup will be required to maintain a 10.0% effective minimum Common Equity Tier 1 Capital ratio under the Standardized Approach, unchanged from Citigroup’s current effective minimum Common Equity Tier 1 Capital ratio under the Standardized Approach.
Citigroup’s SCB is based on the Federal Reserve Board’s March 2020 SCB final rule, which integrates the annual stress testing requirements with ongoing regulatory capital requirements. For Citigroup, the SCB rule replaces the fixed 2.5% Capital Conservation Buffer under the Standardized Approach, and equals the peak-to-trough Common Equity Tier 1 Capital ratio decline under the Supervisory Severely Adverse scenario used in the Comprehensive Capital Analysis and Review (CCAR) and Dodd-Frank Act Stress Testing (DFAST), plus four quarters of planned common stock dividends, subject to a floor of 2.5%. The fixed 2.5% Capital Conservation Buffer will continue to apply under the Advanced Approaches. SCB-based minimum capital requirements will be updated at least once per year as part of the CCAR process. Similar to the current Capital Conservation Buffer, a breach of the SCB will result in graduated limitations on capital distributions. For additional information regarding the SCB final rule, see “Capital Resources—Regulatory Capital Standards Developments—Stress Capital Buffer” in Citi’s First Quarter 2020 Form 10-Q. For additional information regarding CCAR and DFAST, see “Capital Resources—Current Regulatory Capital Standards—Stress Testing Component of Capital Planning” in Citi’s 2019 Annual Report on Form 10-K.
The SCB applies to Citigroup only. The regulatory capital framework applicable to Citibank, including the Capital Conservation Buffer, is unchanged by Citigroup’s SCB.
Capital Plan Resubmission and Related Limitations on Capital Distributions
In June 2020, the Federal Reserve Board determined that changes in financial markets and macroeconomic outlooks related to the COVID-19 pandemic could have a material effect on the risk profile and financial condition of each firm subject to its capital plan rule and, therefore, require updated capital plans. Accordingly, the Federal Reserve Board is requiring each firm, including Citi, to update and resubmit its capital plan within 45 days after the Federal Reserve Board provides updated scenarios. The Federal Reserve Board has indicated that it will provide updated scenarios between September 8, 2020 and September 30, 2020.
Requiring resubmission will generally prohibit each firm from making any capital distributions, unless otherwise approved by the Federal Reserve Board. Through the end of the third quarter of 2020, the Federal Reserve Board has authorized firms, including Citi, to pay common stock dividends that do not exceed an amount equal to the average of the firm’s net income for the four preceding calendar quarters, unless otherwise specified by the Federal Reserve Board, provided that the firm does not exceed the amount of common stock dividends paid in the second quarter of 2020. Additionally, through the end of the third quarter of 2020, the Federal Reserve Board has authorized firms to make share repurchases relating to issuances of common stock related to employee stock ownership plans, and to make scheduled payments on Additional Tier 1 Capital and Tier 2 Capital instruments. These limitations on capital distributions may be extended by the Federal Reserve Board.
On June 29, 2020, Citi announced that its planned capital actions include common dividends. Citi declared common dividends of $0.51 per share for the third quarter of 2020 on July 23, 2020, which would not be impacted by the Federal Reserve Board’s temporary limitations on capital distributions, as Citi’s average quarterly net income for the four preceding calendar quarters of $3.4 billion is more than sufficient under the four quarter average net income test.
The March 2020 SCB final rule provides that the Federal Reserve Board may, but is not required to, recalculate each firm’s SCB as a result of the capital plan resubmission.
Regulatory Capital Standards Developments
Targeted Revisions to the Credit Valuation Adjustment Framework
In July 2020, the Basel Committee on Banking Supervision (Basel Committee) issued a standard with targeted revisions to the credit valuation adjustment (CVA) risk framework, which was previously finalized in December 2017 and will become effective on January 1, 2023. The revisions align the revised CVA risk framework, in part, with the revised market risk capital framework that was finalized in January 2019. The Basel Committee also adjusted the overall calibration of capital requirements calculated under their CVA risk framework.
The U.S. agencies may consider revisions to the CVA risk framework under the U.S. Basel III rules in the future, based upon the revisions adopted by the Basel Committee.
Tangible Common Equity, Book Value Per Share, Tangible Book Value Per Share and Returns on Equity
Tangible common equity (TCE), as defined by Citi, represents common stockholders’ equity less goodwill and identifiable intangible assets (other than MSRs). Other companies may calculate TCE in a different manner. TCE, tangible book value (TBV) per share and returns on average TCE are non-GAAP financial measures.
| | | | | | | | |
| In millions of dollars or shares, except per share amounts | June 30,
2020 | December 31,
2019 |
| Total Citigroup stockholders’ equity | $ | 191,622 | | $ | 193,242 | |
| Less: Preferred stock | 17,980 | | 17,980 | |
| Common stockholders’ equity | $ | 173,642 | | $ | 175,262 | |
| Less: | | |
| Goodwill | 21,399 | | 22,126 | |
| Identifiable intangible assets (other than MSRs) | 4,106 | | 4,327 | |
| | |
| Tangible common equity (TCE) | $ | 148,137 | | $ | 148,809 | |
| Common shares outstanding (CSO) | 2,081.9 | | 2,114.1 | |
| Book value per share (common equity/CSO) | $ | 83.41 | | $ | 82.90 | |
| Tangible book value per share (TCE/CSO) | 71.15 | | 70.39 | |
| | | | | | | | | | | | | | |
| Three Months Ended June 30, | | Six Months Ended June 30, | |
| In millions of dollars | 2020 | 2019 | 2020 | 2019 |
| Net income available to common shareholders | $ | 1,063 | | $ | 4,503 | | $ | 3,294 | | $ | 8,951 | |
| Average common stockholders’ equity | 175,113 | | 178,257 | | 174,665 | | 177,814 | |
| Average TCE | 148,516 | | 152,193 | | 148,613 | | 151,821 | |
| Return on average common stockholders’ equity | 2.4 | % | 10.1 | % | 3.8 | | 10.2 | % |
Return on average TCE (RoTCE)(1) | 2.9 | | 11.9 | | 4.5 | | 11.9 | |
(1)RoTCE represents annualized net income available to common shareholders as a percentage of average TCE.
Managing Global Risk Table of Contents
| | | | | | | | |
| MANAGING GLOBAL RISK | | |
CREDIT RISK(1) | | |
| Consumer Credit | | |
| Corporate Credit | | |
| Additional Consumer and Corporate Credit Details | | |
| Loans Outstanding | | |
| Details of Credit Loss Experience | | |
| Allowance for Credit Losses on Loans | | 61 |
| Non-Accrual Loans and Assets and Renegotiated Loans | | |
| LIQUIDITY RISK | | |
| High-Quality Liquid Assets (HQLA) | | |
| Liquidity Coverage Ratio (LCR) | | |
| Loans | | 67 |
| Deposits | | 67 | |
| Long-Term Debt | | 68 | |
| Secured Funding Transactions and Short-Term Borrowings | | 70 | |
| Credit Ratings | | 71 | |
MARKET RISK(1) | | |
| Market Risk of Non-Trading Portfolios | | |
| Market Risk of Trading Portfolios | | |
| STRATEGIC RISK | | |
| Country Risk | | |
| Argentina | | |
(1) For additional information regarding certain credit risk, market risk and other quantitative and qualitative information, refer to Citi’s Pillar 3 Basel III Advanced Approaches Disclosures, as required by the rules of the Federal Reserve Board, on Citi’s Investor Relations website.
MANAGING GLOBAL RISK
For Citi, effective risk management is of primary importance to its overall operations. Accordingly, Citi’s risk management process has been designed to identify, monitor, evaluate and manage the principal risks it assumes in conducting its activities. Specifically, the activities that Citi engages in, and the risks those activities generate, must be consistent with Citi’s mission and value proposition, the key principles that guide it and Citi's risk appetite.
For more information on Citi’s management of global risk, including its three lines of defense, see “Managing Global Risk” in Citi’s 2019 Annual Report on Form 10-K.
CREDIT RISK
For more information on credit risk, including Citi’s credit risk management, measurement and stress testing, and Citi’s consumer and corporate credit portfolios, see “Credit Risk” and “Risk Factors” in Citi’s 2019 Annual Report on Form 10-K.
CONSUMER CREDIT
The following table shows Citi’s quarterly end-of-period consumer loans:(1)
| | | | | | | | | | | | | | | | | | |
| In billions of dollars | 2Q’19 | 3Q’19 | 4Q’19 | 1Q’20 | 2Q’20 | |
| Retail banking: | | | | | | |
| Mortgages | $ | 81.9 | | $ | 83.0 | | $ | 85.1 | | $ | 83.3 | | $ | 85.6 | | |
| Personal, small business and other | 37.8 | | 37.6 | | 39.7 | | 36.9 | | 38.0 | | |
| Total retail banking | $ | 119.7 | | $ | 120.6 | | $ | 124.8 | | $ | 120.2 | | $ | 123.6 | | |
| Cards: | | | | | | |
| Citi-branded cards | $ | 115.5 | | $ | 115.8 | | $ | 122.2 | | $ | 110.2 | | $ | 103.6 | | |
| Citi retail services | 49.6 | | 50.0 | | 52.9 | | 48.9 | | 45.4 | | |
| Total cards | $ | 165.1 | | $ | 165.8 | | $ | 175.1 | | $ | 159.1 | | $ | 149.0 | | |
Total GCB | $ | 284.8 | | $ | 286.4 | | $ | 299.9 | | $ | 279.3 | | $ | 272.6 | | |
GCB regional distribution: | | | | | | |
| North America | 66 | % | 66 | % | 66 | % | 67 | % | 66 | % | |
| Latin America | 6 | | 6 | | 6 | | 5 | | 5 | | |
Asia(2) | 28 | | 28 | | 28 | | 28 | | 29 | | |
Total GCB | 100 | % | 100 | % | 100 | % | 100 | % | 100 | % | |
Corporate/Other(3) | $ | 11.7 | | $ | 11.0 | | $ | 9.6 | | $ | 9.1 | | $ | 8.5 | | |
| Total consumer loans | $ | 296.5 | | $ | 297.4 | | $ | 309.5 | | $ | 288.4 | | $ | 281.1 | | |
(1)End-of-period loans include interest and fees on credit cards.
(2)Asia includes loans and leases in certain EMEA countries for all periods presented.
(3)Primarily consists of legacy assets, principally North America consumer mortgages.
For information on changes to Citi’s end-of-period consumer loans, see “Liquidity Risk—Loans” below.
Overall Consumer Credit Trends
GCB did not experience a significant net credit loss impact from the COVID-19 pandemic during the second quarter of 2020. Net credit loss rates were adversely impacted by lower loan balances primarily in credit cards, attributable to lower customer spending. The 90+ days past due delinquency rate declined sequentially despite the lower balances, as reduced spending, combined with the benefit of significant government stimulus and assistance packages as well as Citi’s consumer relief programs, generated liquidity that was used to make payments, particularly in North America. In addition, as discussed above, loans modified under Citi’s consumer relief programs continue to be reported in the same delinquency bucket they were in at the time of modification, and thus would not be reported as 90+ days past due for the duration of the programs (which have various durations, and certain of which may be renewed by the customer)
Citi expects that 90+ days past due delinquency and net credit loss rates in North America GCB, Latin America GCB and Asia GCB will be adversely impacted by the evolving macroeconomic and market conditions, including the severity and duration of the impact from the pandemic as these government stimulus and consumer relief programs expire.
For additional information about trends, uncertainties and risks related to the pandemic, see “COVID-19 Pandemic Overview” and “Risk Factors” above.
The following charts show the quarterly trends in delinquency rates (90+ days past due (90+ DPD) rate) and the net credit loss (NCL) rates across both retail banking and cards for total GCB and by region.
North America GCB provides mortgage, home equity, small business and personal loans through Citi’s retail banking network and card products through Citi-branded cards and Citi retail services businesses. The retail bank is concentrated in six major metropolitan cities in the United States (for additional information on the U.S. retail bank, see “North America GCB” above).
As of June 30, 2020, approximately 71% of North America GCB consumer loans consisted of Citi-branded and Citi retail services cards, which generally drives the overall credit performance of North America GCB (for additional information on North America GCB’s cards portfolios, including delinquency and net credit loss rates, see “Credit Card Trends” below).
As shown in the chart above, the net credit loss rate in North America GCB increased quarter-over-quarter, primarily driven by lower average loans in both cards portfolios, while the 90+ days past due delinquency rate decreased quarter-over-quarter, driven by the lower spending as well as the government stimulus and relief programs described above.
Year-over-year, the net credit loss rate increased, primarily driven by lower average loans and the seasoning of more recent vintages in Citi-branded cards. The increase in the 90+ days past due delinquency rate was mainly driven by lower end-of-period (EOP) loans.
Latin America GCB operates in Mexico through
Citibanamex, one of Mexico’s largest banks, and provides
credit cards, consumer mortgages and small business and personal loans. Latin America GCB serves a more mass-market segment in Mexico and focuses on developing multi-product relationships with customers.
As shown in the chart above, the net credit loss rate in Latin America GCB decreased quarter-over-quarter due to seasonality, partially offset by lower average loans. The 90+ days past due delinquency rate increased, as the pandemic significantly impacted the economy in Mexico and customers did not benefit from a similar level of government stimulus as the other regions.
The net credit loss rate decreased year-over-year, primarily due to growth in recent vintages for cards as well as a slower pace of acquisitions in the retail portfolios during 2019, while the 90+ days past due delinquency rate increased, due to lower EOP loans and the pandemic-related impact described above.
(1)Asia includes GCB activities in certain EMEA countries for all periods presented.
Asia GCB operates in 17 countries in Asia and EMEA
and provides credit cards, consumer mortgages and small business and personal loans.
As shown in the chart above, quarter-over-quarter, the net credit loss rate and 90+ days past due delinquency rate in Asia GCB increased, driven by the impact of the macroeconomic slowdown from the pandemic as the region was the first to be affected by the pandemic.
Year-over-year, the net credit loss rate and the 90+ days past due delinquency rate increased due to the pandemic-related macroeconomic impact.
The performance of Asia GCB’s portfolios reflects the strong credit profiles in the region’s target customer segments. Regulatory changes in many markets in Asia over the past few years have also improved credit quality.
For additional information on cost of credit, loan delinquency and other information for Citi’s consumer loan portfolios, see each respective business’s results of operations above and Note 13 to the Consolidated Financial Statements.
Credit Card Trends
The following charts show the quarterly trends in delinquencies and net credit losses for total GCB cards, North America Citi-branded cards and Citi retail services portfolios, as well as for Citi’s Latin America and Asia Citi-branded cards portfolios.
| | |
| North America Citi-Branded Cards |
North America GCB’s Citi-branded cards portfolio issues proprietary and co-branded cards. As shown in the chart above, the net credit loss rate in North America Citi-branded cards increased quarter-over-quarter, primarily driven by lower average loans due to lower spending, while the 90+ days past due delinquency rate decreased, driven by the lower spending and the impact of the government stimulus and relief programs described above.
The net credit loss rate and 90+ days past due delinquency rate increased year-over-year, primarily due to seasoning and lower average and EOP loans.
| | |
| North America Citi Retail Services |
Citi retail services partners directly with more than 20 retailers and dealers to offer private label and co-branded cards. Citi retail services’ target market focuses on select industry segments such as home improvement, specialty retail, consumer electronics and fuel.
Citi retail services continually evaluates opportunities to add partners within target industries that have strong loyalty, lending or payment programs and growth potential.
As shown in the chart above, the net credit loss rate increased quarter-over-quarter, primarily driven by lower average loans, while the 90+ days past due delinquency rate decreased, driven by lower spending as well as the impact of the government stimulus and relief programs described above.
The net credit loss rate and 90+ days past due delinquency rate increased year-over-year, primarily due to lower average and EOP loans.
| | |
| Latin America Citi-Branded Cards |
Latin America GCB issues proprietary and co-branded cards. As shown in the chart above, the net credit loss rate in Latin America Citi-branded cards increased quarter-over-quarter, primarily due to lower average loans, and the 90+ days past due delinquency rate increased, due to lower EOP loans as well as the significant impact the pandemic had on the economy in Mexico, as customers did not benefit from a similar level of government stimulus as other regions.
The net credit loss rate decreased year-over-year, primarily due to growth in recent vintages, and the 90+ days past due delinquency rate increased year-over-year, primarily due to lower EOP loans and the pandemic-related impact described above.
| | |
Asia Citi-Branded Cards(1) |
(1)Asia includes loans and leases in certain EMEA countries for all periods presented.
Asia GCB issues proprietary and co-branded cards. As set forth in the chart above, the net credit loss rate and the 90+ days past due delinquency rate increased in Asia Citi-branded cards quarter-over-quarter, primarily due to the macroeconomic slowdown related to the pandemic, which has started to impact credit ratios in Asia, the first region to be affected by the pandemic. The net credit loss rate and 90+ days past due delinquency rate increased year-over-year, mainly due to the macroeconomic slowdown related to the pandemic.
For additional information on cost of credit, delinquency and other information for Citi’s cards portfolios, see each respective business’s results of operations above and Note 13 to the Consolidated Financial Statements.
North America Cards FICO Distribution
The following tables show the current FICO score distributions for Citi’s North America cards portfolios based on end-of-period receivables. FICO scores are updated monthly for substantially all of the portfolio and on a quarterly basis for the remaining portfolio.
Citi-Branded Cards
| | | | | | | | | | | |
FICO distribution(1) | June 30, 2020 | March 31, 2020 | June 30, 2019 |
| > 760 | 41 | % | 39 | % | 42 | % |
| 680–760 | 41 | | 42 | | 41 | |
| < 680 | 18 | | 19 | | 17 | |
| Total | 100 | % | 100 | % | 100 | % |
Citi Retail Services
| | | | | | | | | | | |
FICO distribution(1) | June 30, 2020 | March 31, 2020 | June 30, 2019 |
| > 760 | 24 | % | 23 | % | 24 | % |
| 680–760 | 43 | | 42 | | 43 | |
| < 680 | 33 | | 35 | | 33 | |
| Total | 100 | % | 100 | % | 100 | % |
(1) The FICO bands in the tables are consistent with general industry peer presentations.
The FICO distribution of both cards portfolios remained broadly stable, compared to the prior quarter and prior year, demonstrating strong underlying credit quality, as well as a benefit from the impact of the government stimulus and relief programs described above and lower credit utilization due to reduced customer spending. For additional information on FICO scores, see Note 13 to the Consolidated Financial Statements.
Additional Consumer Credit Details
Consumer Loan Delinquencies Amounts and Ratios(1)
| | | | | | | | | | | | | | | | | | | | | | | |
| | EOP loans(2) | 90+ days past due(3) | | | 30–89 days past due(3) | | |
In millions of dollars,
except EOP loan amounts in billions | June 30,
2020 | June 30,
2020 | March 31,
2020 | June 30,
2019 | June 30,
2020 | March 31,
2020 | June 30,
2019 |
Global Consumer Banking(4)(5) | | | | | | | |
| Total | $ | 272.6 | | $ | 2,466 | | $ | 2,603 | | $ | 2,426 | | $ | 2,503 | | $ | 2,870 | | $ | 2,783 | |
| Ratio | | 0.91 | % | 0.93 | % | 0.85 | % | 0.92 | % | 1.03 | % | 0.98 | % |
| Retail banking | | | | | | | |
| Total | $ | 123.6 | | $ | 497 | | $ | 429 | | $ | 416 | | $ | 918 | | $ | 794 | | $ | 831 | |
| Ratio | | 0.40 | % | 0.36 | % | 0.35 | % | 0.75 | % | 0.66 | % | 0.70 | % |
| North America | 53.1 | | 182 | | 161 | | 133 | | 440 | | 298 | | 341 | |
| Ratio | | 0.35 | % | 0.32 | % | 0.28 | % | 0.84 | % | 0.59 | % | 0.72 | % |
| Latin America | 9.0 | | 121 | | 90 | | 108 | | 151 | | 140 | | 191 | |
| Ratio | | 1.34 | % | 0.98 | % | 0.95 | % | 1.68 | % | 1.52 | % | 1.68 | % |
Asia(6) | 61.5 | | 194 | | 178 | | 175 | | 327 | | 356 | | 299 | |
| Ratio | | 0.32 | % | 0.30 | % | 0.29 | % | 0.53 | % | 0.59 | % | 0.50 | % |
| Cards | | | | | | | |
| Total | $ | 149.0 | | $ | 1,969 | | $ | 2,174 | | $ | 2,010 | | $ | 1,585 | | $ | 2,076 | | $ | 1,952 | |
| Ratio | | 1.32 | % | 1.37 | % | 1.22 | % | 1.06 | % | 1.30 | % | 1.18 | % |
North America—Citi-branded | 82.6 | | 784 | | 891 | | 799 | | 594 | | 770 | | 705 | |
| Ratio | | 0.95 | % | 1.01 | % | 0.88 | % | 0.72 | % | 0.87 | % | 0.78 | % |
North America—Citi retail services | 45.4 | | 811 | | 958 | | 840 | | 611 | | 903 | | 831 | |
| Ratio | | 1.79 | % | 1.96 | % | 1.69 | % | 1.35 | % | 1.85 | % | 1.68 | % |
| Latin America | 4.2 | | 160 | | 121 | | 169 | | 111 | | 132 | | 159 | |
| Ratio | | 3.81 | % | 2.69 | % | 2.96 | % | 2.64 | % | 2.93 | % | 2.79 | % |
Asia(6) | 16.8 | | 214 | | 204 | | 202 | | 269 | | 271 | | 257 | |
| Ratio | | 1.27 | % | 1.18 | % | 1.05 | % | 1.60 | % | 1.57 | % | 1.34 | % |
Corporate/Other—Consumer(7) | | | | | | | |
| Total | $ | 8.5 | | $ | 295 | | $ | 281 | | $ | 327 | | $ | 261 | | $ | 252 | | $ | 334 | |
| Ratio | | 3.60 | % | 3.23 | % | 2.97 | % | 3.18 | % | 2.90 | % | 3.04 | % |
| | | | | | | |
| | | | | | | |
| | | | | | | |
| | | | | | | |
| Total Citigroup | $ | 281.1 | | $ | 2,761 | | $ | 2,884 | | $ | 2,753 | | $ | 2,764 | | $ | 3,122 | | $ | 3,117 | |
| Ratio | | 0.99 | % | 1.00 | % | 0.93 | % | 0.99 | % | 1.09 | % | 1.06 | % |
(1)As discussed above, loans modified under Citi’s consumer relief programs continue to be reported in the same delinquency bucket they were in at the time of modification, and thus almost all would not be reported as 30-89 or 90+ days past due for the duration of the programs (which have various durations, and certain of which may be renewed by the customer).
(2)End-of-period (EOP) loans include interest and fees on credit cards.
(3)The ratios of 90+ days past due and 30–89 days past due are calculated based on EOP loans, net of unearned income.
(4)The 90+ days past due balances for North America—Citi-branded and North America—Citi retail services are generally still accruing interest. Citigroup’s policy is generally to accrue interest on credit card loans until 180 days past due, unless notification of bankruptcy filing has been received earlier.
(5)The 90+ days past due and 30–89 days past due and related ratios for North America GCB exclude U.S. mortgage loans that are guaranteed by U.S. government-sponsored agencies since the potential loss predominantly resides with the U.S. government-sponsored agencies. The amounts excluded for loans 90+ days past due and (EOP loans) were $130 million ($0.5 billion), $124 million ($0.5 billion) and $162 million ($0.6 billion) as of June 30, 2020, March 31, 2020 and June 30, 2019, respectively. The amounts excluded for loans 30–89 days past due and (EOP loans) were $86 million ($0.5 billion), $64 million ($0.5 billion) and $89 million ($0.6 billion) as of June 30, 2020, December 31, 2019 and June 30, 2019, respectively.
(6)Asia includes delinquencies and loans in certain EMEA countries for all periods presented.
(7)The loans 90+ days past due and related ratios exclude U.S. mortgage loans that are guaranteed by U.S. government-sponsored agencies since the potential loss predominantly resides with the U.S. agencies. The amounts excluded for 90+ days past due and (EOP loans) for each period were $173 million ($0.4 billion), $167 million ($0.4 billion) and $273 million ($0.7 billion) as of June 30, 2020, March 31, 2020 and June 30, 2019, respectively. The amounts excluded for loans 30–89 days past due and (EOP loans) for each period were $57 million ($0.4 billion), $58 million ($0.4 billion) and $124 million ($0.7 billion) as of June 30, 2020 and June 30, 2019, respectively.
Consumer Loan Net Credit Losses and Ratios
| | | | | | | | | | | | | | |
| | Average loans(1) | Net credit losses(2) | | |
| In millions of dollars, except average loan amounts in billions | 2Q20 | 2Q20 | 1Q20 | 2Q19 |
| Global Consumer Banking | | | | |
| Total | $ | 271.5 | | $ | 1,887 | | $ | 1,983 | | $ | 1,870 | |
| Ratio | | 2.80 | % | 2.75 | % | 2.68 | % |
| Retail banking | | | | |
| Total | $ | 121.8 | | $ | 204 | | $ | 235 | | $ | 225 | |
| Ratio | | 0.67 | % | 0.77 | % | 0.76 | % |
| North America | 52.2 | | 33 | | 37 | | 40 | |
| Ratio | | 0.25 | % | 0.29 | % | 0.34 | % |
| Latin America | 9.1 | | 94 | | 130 | | 123 | |
| Ratio | | 4.15 | % | 4.71 | % | 4.29 | % |
Asia(3) | 60.5 | | 77 | | 68 | | 62 | |
| Ratio | | 0.51 | % | 0.44 | % | 0.42 | % |
| Cards | | | | |
| Total | $ | 149.7 | | $ | 1,683 | | $ | 1,748 | | $ | 1,645 | |
| Ratio | | 4.52 | % | 4.20 | % | 4.07 | % |
North America—Citi-branded | 82.6 | | 795 | | 795 | | 723 | |
| Ratio | | 3.87 | % | 3.46 | % | 3.28 | % |
North America—Citi retail services | 46.2 | | 656 | | 694 | | 654 | |
| Ratio | | 5.71 | % | 5.53 | % | 5.34 | % |
| Latin America | 4.3 | | 115 | | 147 | | 156 | |
| Ratio | | 10.76 | % | 10.56 | % | 11.17 | % |
Asia(3) | 16.6 | | 117 | | 112 | | 112 | |
| Ratio | | 2.83 | % | 2.40 | % | 2.38 | % |
Corporate/Other—Consumer | | | | |
| Total | $ | 8.9 | | $ | (5) | | $ | (2) | | $ | 4 | |
| Ratio | | (0.23) | % | (0.09) | % | 0.13 | % |
| | | | |
| | | | |
| | | | |
| | | | |
| | | | |
| Total Citigroup | $ | 280.4 | | $ | 1,882 | | $ | 1,981 | | $ | 1,874 | |
| Ratio | | 2.70 | % | 2.66 | % | 2.57 | % |
(1)Average loans include interest and fees on credit cards.
(2)The ratios of net credit losses are calculated based on average loans, net of unearned income.
(3)Asia includes NCLs and average loans in certain EMEA countries for all periods presented.
CORPORATE CREDIT
Overall Corporate Credit Trends
For information about Citi’s corporate credit trends, uncertainties and risks related to the COVID-19 pandemic, see “COVID-19 Pandemic Overview” and “Risk Factors” above. For additional information on CECL, see “Significant Accounting Policies and Significant Estimates” below, and Notes 1 and 14 to the Consolidated Financial Statements. For additional information on Citi’s corporate loan portfolios, see Note 13 to the Consolidated Financial Statements.
The following table details Citi’s corporate credit portfolio within ICG (excluding certain loans in the private bank, which are managed on a delinquency basis), and before consideration of collateral or hedges, by remaining tenor for the periods indicated:
| | | | | | | | | | | | | | | | | | | | | | | | | | | | | | | | | | | | | | |
| | June 30, 2020 | | | | March 31, 2020 | | | | December 31, 2019 | | | |
| In billions of dollars | Due
within
1 year | Greater
than 1 year
but within
5 years | Greater
than
5 years | Total
exposure | Due
within
1 year | Greater
than 1 year
but within
5 years | Greater
than
5 years | Total
exposure | Due
within
1 year | Greater
than 1 year
but within
5 years | Greater
than
5 years | Total
exposure |
Direct outstandings (on-balance sheet)(1) | $ | 184 | | $ | 156 | | $ | 24 | | $ | 364 | | $ | 195 | | $ | 175 | | $ | 24 | | $ | 394 | | $ | 184 | | $ | 142 | | $ | 25 | | $ | 351 | |
Unfunded lending commitments (off-balance sheet)(2) | 157 | | 250 | | 13 | | 420 | | 152 | | 231 | | 11 | | 394 | | 161 | | 266 | | 17 | | 444 | |
| Total exposure | $ | 341 | | $ | 406 | | $ | 37 | | $ | 784 | | $ | 347 | | $ | 406 | | $ | 35 | | $ | 788 | | $ | 345 | | $ | 408 | | $ | 42 | | $ | 795 | |
(1) Includes drawn loans, overdrafts, bankers’ acceptances and leases.
(2) Includes unused commitments to lend, letters of credit and financial guarantees.
Portfolio Mix—Geography and Counterparty
Citi’s corporate credit portfolio is diverse across geography and counterparty. The following table shows the percentage of this portfolio by region (excluding the delinquency-managed private bank portfolio) based on Citi’s internal management geography:
| | | | | | | | | | | |
| June 30,
2020 | March 31,
2020 | December 31,
2019 |
| North America | 58 | % | 57 | % | 57 | % |
| EMEA | 24 | | 25 | | 24 | |
| Asia | 12 | | 12 | | 12 | |
| Latin America | 6 | | 6 | | 7 | |
| Total | 100 | % | 100 | % | 100 | % |
The maintenance of accurate and consistent risk ratings across the corporate credit portfolio facilitates the comparison of credit exposure across all lines of business, geographic regions and products. Counterparty risk ratings reflect an estimated probability of default for a counterparty and are derived by leveraging validated statistical models, scorecard models and external agency ratings (under defined circumstances), in combination with consideration of factors specific to the obligor or market, such as management experience, competitive position, regulatory environment and commodity prices. Facility risk ratings are assigned that reflect the probability of default of the obligor and factors that affect
the loss given default of the facility, such as support or collateral. Internal obligor ratings that generally correspond to BBB and above are considered investment grade, while those below are considered non-investment grade.
Citigroup also has incorporated environmental factors like climate risk assessment and reporting criteria for certain obligors, as necessary. Factors evaluated include consideration of climate risk to an obligor’s business and physical assets and, when relevant, consideration of cost-effective options to reduce greenhouse gas emissions.
The following table presents the corporate credit portfolio (excluding the delinquency-managed private bank portfolio) by facility risk rating as a percentage of the total corporate credit portfolio:
| | | | | | | | | | | |
| | Total exposure | | |
| | June 30,
2020 | March 31,
2020 | December 31,
2019 |
| AAA/AA/A | 49 | % | 48 | % | 50 | % |
| BBB | 31 | | 33 | | 33 | |
| BB/B | 16 | | 17 | | 15 | |
| CCC or below | 4 | | 2 | | 2 | |
| Total | 100 | % | 100 | % | 100 | % |
Note: Total exposure includes direct outstandings and unfunded lending commitments.
In addition to the counterparty and facility risk ratings assigned to all exposures, Citi may classify exposures in the corporate credit portfolio. These classifications are consistent with Citi’s interpretation of the U.S. banking regulators’ definition of criticized exposures, which may categorize exposures as special mention, substandard or doubtful.
Risk ratings and classifications are reviewed regularly, and adjusted as appropriate. The credit review process incorporates quantitative and qualitative factors, including financial and non-financial disclosures or metrics, idiosyncratic events or changes to the competitive, regulatory or macroeconomic environment. This includes but is not limited to exposures in those sectors significantly impacted by the pandemic (including energy and energy-related, aviation, consumer retail, commercial real estate and autos).
Citigroup believes the corporate credit portfolio to be appropriately rated and classified as of June 30, 2020. During the course of the second quarter of 2020, and since the onset of the COVID-19 pandemic, Citigroup has taken action to adjust internal ratings and classifications of exposures as both the macroeconomic environment and obligor-specific factors have changed, particularly where additional stress has been seen.
As exposures are downgraded, the probability of default increases. Downgrades of exposures tend to result in a higher provision for credit losses. Additionally, downgrades may result in the purchase of additional credit derivatives or other risk mitigants to hedge the incremental credit risk, or may result in seeking to reduce exposure to an obligor or an industry sector. Citigroup will continue to review exposures to ensure the appropriate probability of default is incorporated into all risk assessments.
For additional information on Citi’s corporate credit portfolio, see Note 13 to the Consolidated Financial Statements.
Portfolio Mix—Industry
Citi’s corporate credit portfolio is diversified by industry. The following details the allocation of Citi’s total corporate credit portfolio by industry (excluding the delinquency-managed private bank portfolio):
| | | | | | | | | | | |
| | Total exposure | | |
| | June 30,
2020 | March 31,
2020 | December 31,
2019 |
| Transportation and industrials | 19 | % | 19 | % | 19 | % |
| Private bank | 13 | | 13 | | 13 | |
| Consumer retail | 11 | | 11 | | 10 | |
| Health | 4 | | 4 | | 4 | |
| Technology, media and telecom | 10 | | 10 | | 11 | |
| Power, chemicals, metals and mining | 8 | | 9 | | 9 | |
| Banks and finance companies | 7 | | 8 | | 7 | |
| Securities firms | — | | — | | — | |
| Real estate | 8 | | 7 | | 7 | |
| Energy and commodities | 7 | | 7 | | 7 | |
| Public sector | 3 | | 3 | | 3 | |
| Insurance | 3 | | 3 | | 3 | |
| Asset managers and funds | 3 | | 3 | | 3 | |
| Financial markets infrastructure | 2 | | 2 | | 2 | |
| Other industries | 2 | | 1 | | 2 | |
| Total | 100 | % | 100 | % | 100 | % |
The following table details Citi’s corporate credit portfolio by industry as of June 30, 2020:
| | | | | | | | | | | | | | | | | | | | | | | | | | | | | | | |
| | | | | Non-investment grade | | | | | Selected metrics | |
| In millions of dollars | Total credit exposure | Funded(1) | Unfunded(1) | Investment grade | Non-criticized | Criticized performing | Criticized non-performing(2) | | | Net charge-offs (recoveries)(3) | Credit derivative hedges(4) |
| Transportation and industrials | $ | 148,612 | | $ | 68,257 | | $ | 80,355 | | $ | 110,552 | | $ | 16,040 | | $ | 20,190 | | $ | 1,830 | | | | $ | 138 | | $ | (8,014) | |
Autos(5) | 51,074 | | 25,475 | | 25,599 | | 42,673 | | 3,938 | | 4,131 | | 332 | | | | 33 | | (3,223) | |
| Transportation | 30,027 | | 16,949 | | 13,078 | | 16,899 | | 2,801 | | 9,058 | | 1,269 | | | | 77 | | (1,135) | |
| Industrials | 67,511 | | 25,833 | | 41,678 | | 50,980 | | 9,301 | | 7,001 | | 229 | | | | 28 | | (3,656) | |
Private bank(1) | 104,139 | | 67,956 | | 36,183 | | 99,120 | | 2,343 | | 2,251 | | 425 | | | | 29 | | (1,080) | |
| Consumer retail | 82,007 | | 37,401 | | 44,606 | | 59,457 | | 11,292 | | 10,964 | | 294 | | | | 11 | | (4,878) | |
| Health | 32,518 | | 8,466 | | 24,052 | | 25,690 | | 4,838 | | 1,831 | | 159 | | | | 1 | | (1,814) | |
| Technology, media and telecom | 77,282 | | 32,831 | | 44,451 | | 59,961 | | 12,132 | | 4,800 | | 389 | | | | 39 | | (6,834) | |
| Power, chemicals, metals and mining | 66,089 | | 24,759 | | 41,330 | | 49,048 | | 11,736 | | 5,140 | | 165 | | | | 45 | | (5,164) | |
| Power | 27,625 | | 7,336 | | 20,289 | | 23,379 | | 3,136 | | 986 | | 124 | | | | 37 | | (2,385) | |
| Chemicals | 23,294 | | 9,650 | | 13,644 | | 17,028 | | 4,128 | | 2,130 | | 8 | | | | 5 | | (2,152) | |
| Metals and mining | 15,170 | | 7,773 | | 7,397 | | 8,641 | | 4,472 | | 2,024 | | 33 | | | | 3 | | (627) | |
| Banks and finance companies | 56,027 | | 34,274 | | 21,753 | | 46,421 | | 5,441 | | 4,000 | | 165 | | | | 1 | | (746) | |
| Securities firms | 1,423 | | 424 | | 999 | | 1,172 | | 176 | | 65 | | 10 | | | | — | | (6) | |
| Real estate | 58,912 | | 40,673 | | 18,239 | | 48,458 | | 5,323 | | 5,107 | | 24 | | | | 4 | | (560) | |
Energy and commodities(6) | 55,390 | | 18,769 | | 36,621 | | 39,365 | | 6,210 | | 8,493 | | 1,322 | | | | 129 | | (3,794) | |
| Public sector | 26,945 | | 14,470 | | 12,475 | | 22,016 | | 1,845 | | 3,065 | | 19 | | | | 7 | | (931) | |
| Insurance | 25,156 | | 1,454 | | 23,702 | | 24,112 | | 805 | | 239 | | — | | | | 1 | | (2,544) | |
| Asset managers and funds | 23,059 | | 5,151 | | 17,908 | | 21,946 | | 921 | | 192 | | — | | | | (1) | | (85) | |
| Financial markets infrastructure | 13,628 | | 28 | | 13,600 | | 13,609 | | 19 | | — | | — | | | | — | | (4) | |
| Other industries | 12,554 | | 9,052 | | 3,502 | | 7,134 | | 3,980 | | 1,288 | | 152 | | | | 40 | | (38) | |
| Total | $ | 783,741 | | $ | 363,965 | | $ | 419,776 | | $ | 628,061 | | $ | 83,101 | | $ | 67,625 | | $ | 4,954 | | | | $ | 444 | | $ | (36,492) | |
(1) Excludes $40,214 million and $4,208 million of funded and unfunded delinquency-managed private bank exposures at June 30, 2020, respectively.
(2) Includes non-accrual loan exposures and criticized unfunded exposures.
(3) Net charge-offs (recoveries) are for the six months ended June 30, 2020 and exclude delinquency-managed private bank charge-offs of $7 million.
(4) Represents the amount of purchased credit protection in the form of derivatives to economically hedge funded and unfunded exposures. Of the $36.5 billion of purchased credit protection, $34.5 billion represents the total notional of purchased credit derivatives on individual reference entities. The remaining $2.0 billion represents the first loss tranche of portfolios of purchased credit derivatives with a total notional of $16.1 billion, where the protection seller absorbs the first loss on the referenced loan portfolios.
(5) Autos total credit exposure includes securitization financing facilities secured by auto loans and leases extended mainly to the finance company subsidiaries of global auto manufacturers, bank subsidiaries and independent auto finance companies, of approximately $19.8 billion ($9 billion in funded, with more than 98% rated investment grade) as of June 30, 2020.
(6) In addition to this exposure, Citi has energy-related exposure within the public sector (e.g., energy-related state-owned entities) and the transportation and industrial sector (e.g., off-shore drilling entities) included in the table above. As of June 30, 2020, Citi’s total exposure to these energy-related entities remained largely consistent with December 31, 2019, at approximately $5.8 billion, of which approximately $3.4 billion consisted of direct outstanding funded loans.
The following table details Citi’s corporate credit portfolio by industry as of December 31, 2019:
| | | | | | | | | | | | | | | | | | | | | | | | | | | | | | |
| | | | | Non-investment grade | | | | Selected metrics | |
| In millions of dollars | Total credit exposure | Funded(1) | Unfunded(1) | Investment grade | Non-criticized | Criticized performing | Criticized non-performing(2) | | Net charge-offs (recoveries)(3) | Credit derivative hedges(4) |
| Transportation and industrials | $ | 146,643 | | $ | 59,726 | | $ | 86,917 | | $ | 120,777 | | $ | 19,433 | | $ | 5,725 | | $ | 706 | | | $ | 67 | | $ | (7,134) | |
Autos(5) | 48,604 | | 21,564 | | 27,040 | | 43,570 | | 3,582 | | 1,311 | | 140 | | | 5 | | (2,982) | |
| Transportation | 29,984 | | 14,550 | | 15,434 | | 23,021 | | 4,886 | | 1,652 | | 425 | | | 21 | | (725) | |
| Industrials | 68,055 | | 23,612 | | 44,443 | | 54,186 | | 10,965 | | 2,762 | | 141 | | | 41 | | (3,427) | |
Private bank(1) | 102,463 | | 68,798 | | 33,665 | | 100,017 | | 2,244 | | 171 | | 31 | | | 36 | | (1,080) | |
| Consumer retail | 81,338 | | 36,117 | | 45,221 | | 62,993 | | 15,131 | | 2,773 | | 441 | | | 38 | | (4,105) | |
| Health | 35,008 | | 8,790 | | 26,218 | | 27,791 | | 5,932 | | 1,180 | | 105 | | | 14 | | (1,588) | |
| Technology, media and telecom | 83,199 | | 31,333 | | 51,866 | | 63,845 | | 15,846 | | 3,305 | | 203 | | | 14 | | (6,181) | |
| Power, chemicals, metals and mining | 73,961 | | 24,377 | | 49,584 | | 58,670 | | 11,997 | | 2,963 | | 331 | | | 24 | | (4,763) | |
| Power | 34,349 | | 7,683 | | 26,666 | | 29,317 | | 4,051 | | 679 | | 302 | | | 19 | | (2,111) | |
| Chemicals | 23,721 | | 9,152 | | 14,569 | | 18,790 | | 3,905 | | 1,014 | | 12 | | | 1 | | (2,079) | |
| Metals and mining | 15,891 | | 7,542 | | 8,349 | | 10,563 | | 4,041 | | 1,270 | | 17 | | | 4 | | (573) | |
| Banks and finance companies | 52,036 | | 32,571 | | 19,465 | | 43,663 | | 4,661 | | 3,345 | | 39 | | | 12 | | (755) | |
| Securities firms | 1,151 | | 423 | | 728 | | 801 | | 304 | | 38 | | 8 | | | 13 | | — | |
| Real estate | 55,518 | | 38,058 | | 17,460 | | 49,461 | | 5,495 | | 525 | | 37 | | | (3) | | (573) | |
Energy and commodities(6) | 53,317 | | 17,428 | | 35,889 | | 42,996 | | 5,780 | | 3,627 | | 914 | | | 99 | | (2,808) | |
| Public sector | 27,194 | | 14,226 | | 12,968 | | 23,294 | | 1,637 | | 2,558 | | 33 | | | 1 | | (944) | |
| Insurance | 24,305 | | 1,658 | | 22,647 | | 23,370 | | 866 | | 69 | | — | | | 1 | | (2,218) | |
| Asset managers and funds | 24,763 | | 6,942 | | 17,821 | | 22,357 | | 2,276 | | 130 | | — | | | 31 | | (32) | |
| Financial markets infrastructure | 16,838 | | 22 | | 16,816 | | 16,838 | | — | | — | | — | | | — | | (2) | |
| Other industries | 16,842 | | 9,718 | | 7,214 | | 8,299 | | 7,383 | | 1,080 | | 80 | | | 42 | | 65 | |
| Total | $ | 794,576 | | $ | 350,187 | | $ | 444,479 | | $ | 665,172 | | $ | 98,985 | | $ | 27,489 | | $ | 2,928 | | | $ | 389 | | $ | (32,118) | |
(1) Excludes $39,748 million and $3,426 million of funded and unfunded delinquency-managed private bank exposures at December 31, 2019, respectively.
(2) Includes non-accrual loan exposures and criticized unfunded exposures.
(3) Net charge-offs (recoveries) are for the year ended December 31, 2019 and exclude delinquency-managed private bank charge-offs of $6 million.
(4) Represents the amount of purchased credit protection in the form of derivatives to economically hedge funded and unfunded exposures. Of the $32.1 billion of purchased credit protection, $30.5 billion represents the total notional of purchased credit derivatives on individual reference entities. The remaining $1.6 billion represents the first loss tranche of portfolios of purchased credit derivatives with a total notional of $13.8 billion, where the protection seller absorbs the first loss on the referenced loan portfolios.
(5) Autos total credit exposure includes securitization financing facilities secured by auto loans and leases extended mainly to the finance company subsidiaries of global auto manufacturers, bank subsidiaries and independent auto finance companies, of approximately $17.9 billion ($7.7 billion in funded) as of December 31, 2019, of which more than 99% were investment grade at December 31, 2019.
(6) In addition to this exposure, Citi has energy-related exposure within the public sector (e.g., energy-related state-owned entities) and transportation and industrial sector (e.g., off-shore drilling entities) included in the table above. As of December 31, 2019, Citi’s total exposure to these energy-related entities remained largely consistent with September 30, 2019, at approximately $6 billion, of which approximately $3 billion consisted of direct outstanding funded loans.
Credit Risk Mitigation
As part of its overall risk management activities, Citigroup uses credit derivatives and other risk mitigants to hedge portions of the credit risk in its corporate credit portfolio, in addition to outright asset sales. Citi may enter into partial-term hedges as well as full-term hedges. In advance of the expiration of partial-term hedges, Citi will determine, among other factors, the economic feasibility of hedging the remaining life of the instrument. The results of the mark-to-market and any realized gains or losses on credit derivatives are reflected primarily in Principal transactions in the Consolidated Statement of Income.
At June 30, 2020, March 31, 2020 and December 31, 2019, ICG (excluding the delinquency-managed private bank portfolio) had economic hedges on the corporate credit portfolio of $36.5 billion, $33.0 billion and $32.1 billion, respectively. Citigroup’s expected credit loss model used in the calculation of its loan loss reserve does not include the favorable impact of credit derivatives and other mitigants that are marked to market. In addition, the reported amounts of direct outstandings and unfunded lending commitments in the tables above do not reflect the impact of these hedging transactions. The credit protection was economically hedging underlying ICG (excluding the delinquency-managed private bank portfolio) corporate credit portfolio exposures with the following risk rating distribution:
Rating of Hedged Exposure
| | | | | | | | | | | |
| June 30,
2020 | March 31,
2020 | December 31,
2019 |
| AAA/AA/A | 30 | % | 32 | % | 36 | % |
| BBB | 53 | | 52 | | 51 | |
| BB/B | 14 | | 14 | | 12 | |
| CCC or below | 3 | | 2 | | 1 | |
| Total | 100 | % | 100 | % | 100 | % |
ADDITIONAL CONSUMER AND CORPORATE CREDIT DETAILS
Loans Outstanding
| | | | | | | | | | | | | | | | | |
| 2nd Qtr. | 1st Qtr. | 4th Qtr. | 3rd Qtr. | 2nd Qtr. |
| In millions of dollars | 2020 | 2020 | 2019 | 2019 | 2019 |
| Consumer loans | | | | | |
In North America offices(1) | | | | | |
Residential first mortgages(2) | $ | 48,167 | | $ | 47,260 | | $ | 47,008 | | $ | 46,337 | | $ | 45,474 | |
Home equity loans(2) | 8,524 | | 8,936 | | 9,223 | | 9,850 | | 10,404 | |
| Credit cards | 128,032 | | 137,316 | | 149,163 | | 141,560 | | 140,246 | |
| Personal, small business and other | 4,859 | | 3,675 | | 3,699 | | 3,793 | | 3,873 | |
| Total | $ | 189,582 | | $ | 197,187 | | $ | 209,093 | | $ | 201,540 | | $ | 199,997 | |
In offices outside North America(1) | | | | | |
Residential first mortgages(2) | $ | 36,745 | | $ | 35,400 | | $ | 37,686 | | $ | 36,644 | | $ | 36,580 | |
| Credit cards | 20,966 | | 21,801 | | 25,909 | | 24,367 | | 24,975 | |
| Personal, small business and other | 33,820 | | 34,042 | | 36,860 | | 34,849 | | 34,953 | |
| Total | $ | 91,531 | | $ | 91,243 | | $ | 100,455 | | $ | 95,860 | | $ | 96,508 | |
Consumer loans, net of unearned income(3) | $ | 281,113 | | $ | 288,430 | | $ | 309,548 | | $ | 297,400 | | $ | 296,505 | |
| Corporate loans | | | | | |
In North America offices(1) | | | | | |
| Commercial and industrial | $ | 70,755 | | $ | 81,231 | | $ | 55,929 | | $ | 59,645 | | $ | 64,601 | |
| Financial institutions | 53,860 | | 60,653 | | 53,922 | | 52,678 | | 47,610 | |
Mortgage and real estate(2) | 57,821 | | 55,428 | | 53,371 | | 52,972 | | 51,321 | |
| Installment and other | 25,602 | | 30,591 | | 31,238 | | 31,303 | | 33,555 | |
| Lease financing | 869 | | 988 | | 1,290 | | 1,314 | | 1,385 | |
| Total | $ | 208,907 | | $ | 228,891 | | $ | 195,750 | | $ | 197,912 | | $ | 198,472 | |
In offices outside North America(1) | | | | | |
| Commercial and industrial | $ | 115,471 | | $ | 121,703 | | $ | 112,668 | | $ | 120,900 | | $ | 117,759 | |
| Financial institutions | 35,173 | | 37,003 | | 40,211 | | 37,908 | | 37,523 | |
Mortgage and real estate(2) | 10,332 | | 9,639 | | 9,780 | | 7,811 | | 7,577 | |
| Installment and other | 30,678 | | 31,728 | | 27,303 | | 26,774 | | 27,333 | |
| Lease financing | 66 | | 72 | | 95 | | 80 | | 92 | |
| Governments and official institutions | 3,552 | | 3,554 | | 4,128 | | 2,958 | | 3,409 | |
| Total | $ | 195,272 | | $ | 203,699 | | $ | 194,185 | | $ | 196,431 | | $ | 193,693 | |
Corporate loans, net of unearned income(4) | $ | 404,179 | | $ | 432,590 | | $ | 389,935 | | $ | 394,343 | | $ | 392,165 | |
| Total loans—net of unearned income | $ | 685,292 | | $ | 721,020 | | $ | 699,483 | | $ | 691,743 | | $ | 688,670 | |
| Allowance for credit losses on loans (ACLL) | (26,420) | | (20,841) | | (12,783) | | (12,530) | | (12,466) | |
Total loans—net of unearned income
and ACLL | $ | 658,872 | | $ | 700,179 | | $ | 686,700 | | $ | 679,213 | | $ | 676,204 | |
ACLL as a percentage of total loans—
net of unearned income(5) | 3.89 | % | 2.91 | % | 1.84 | % | 1.82 | % | 1.82 | % |
ACLL for consumer loan losses as a percentage of
total consumer loans—net of unearned income(5) | 6.97 | % | 6.03 | % | 3.20 | % | 3.27 | % | 3.26 | % |
ACLL for corporate loan losses as a percentage of
total corporate loans—net of unearned income(5) | 1.71 | % | 0.81 | % | 0.75 | % | 0.72 | % | 0.72 | % |
(1)North America includes the U.S., Canada and Puerto Rico. Mexico is included in offices outside North America. The classification of corporate loans between offices in North America and outside North America is based on the domicile of the booking unit. The difference between the domicile of the booking unit and the domicile of the managing unit is not material.
(2)Loans secured primarily by real estate.
(3)Consumer loans are net of unearned income of $734 million, $771 million, $783 million, $783 million and $751 million at June 30, 2020, March 31, 2020, December 31, 2019, September 30, 2019 and June 30, 2019, respectively. Unearned income on consumer loans primarily represents unamortized origination fees and costs, premiums and discounts.
(4)Corporate loans include private bank loans and are net of unearned income of $(854) million, $(791) million, $(814) million, $(818) million and $(853) million at June 30, 2020, March 31, 2020, December 31, 2019, September 30, 2019 and June 30, 2019, respectively. Unearned income on corporate loans primarily represents interest received in advance, but not yet earned, on loans originated on a discounted basis.
(5)Because loans carried at fair value do not have an ACLL, they are excluded from the ACLL ratio calculation.
Details of Credit Loss Experience
| | | | | | | | | | | | | | | | | |
| 2nd Qtr. | 1st Qtr. | 4th Qtr. | 3rd Qtr. | 2nd Qtr. |
| In millions of dollars | 2020 | 2020 | 2019 | 2019 | 2019 |
| Allowance for credit losses on loans (ACLL) at beginning of period | $ | 20,841 | | $ | 12,783 | | $ | 12,530 | | $ | 12,466 | | $ | 12,329 | |
Adjustment to opening balance for CECL adoption(1) | — | | 4,201 | | — | | — | | — | |
| Adjusted ACLL at beginning of period | $ | 20,841 | | $ | 16,984 | | $ | 12,530 | | $ | 12,466 | | $ | 12,329 | |
| Provision for credit losses on loans (PCLL) | | | | | |
Consumer(2) | $ | 4,003 | | $ | 5,001 | | $ | 1,948 | | $ | 1,916 | | $ | 1,947 | |
| Corporate | 3,693 | | 1,443 | | 175 | | 146 | | 142 | |
| Total | $ | 7,696 | | $ | 6,444 | | $ | 2,123 | | $ | 2,062 | | $ | 2,089 | |
| Gross credit losses on loans | | | | | |
| Consumer | | | | | |
| In U.S. offices | $ | 1,675 | | $ | 1,763 | | $ | 1,672 | | $ | 1,564 | | $ | 1,659 | |
| In offices outside the U.S. | 506 | | 578 | | 535 | | 588 | | 591 | |
| Corporate | | | | | |
| In U.S. offices | 177 | | 116 | | 68 | | 98 | | 62 | |
| In offices outside the U.S. | 170 | | 22 | | 86 | | 31 | | 42 | |
| Total | $ | 2,528 | | $ | 2,479 | | $ | 2,361 | | $ | 2,281 | | $ | 2,354 | |
Credit recoveries on loans(3) | | | | | |
| Consumer | | | | | |
| In U.S. offices | $ | 199 | | $ | 239 | | $ | 249 | | $ | 231 | | $ | 253 | |
| In offices outside the U.S. | 100 | | 121 | | 128 | | 118 | | 123 | |
| Corporate | | | | | |
| In U.S. offices | 12 | | 6 | | 9 | | 13 | | 7 | |
| In offices outside the U.S. | 11 | | 5 | | 31 | | 6 | | 8 | |
| Total | $ | 322 | | $ | 371 | | $ | 417 | | $ | 368 | | $ | 391 | |
| Net credit losses on loans (NCLs) | | | | | |
| In U.S. offices | $ | 1,641 | | $ | 1,634 | | $ | 1,482 | | $ | 1,418 | | $ | 1,461 | |
| In offices outside the U.S. | 565 | | 474 | | 462 | | 495 | | 502 | |
| Total | $ | 2,206 | | $ | 2,108 | | $ | 1,944 | | $ | 1,913 | | $ | 1,963 | |
Other—net(4)(5)(6)(7)(8)(9) | $ | 89 | | $ | (479) | | $ | 74 | | $ | (85) | | $ | 11 | |
| Allowance for credit losses on loans (ACLL) at end of period | $ | 26,420 | | $ | 20,841 | | $ | 12,783 | | $ | 12,530 | | $ | 12,466 | |
ACLL as a percentage of EOP loans(10) | 3.89 | % | 2.91 | % | 1.84 | % | 1.82 | % | 1.82 | % |
Allowance for credit losses on unfunded lending commitments (ACLUC)(11)(12) | $ | 1,859 | | $ | 1,813 | | $ | 1,456 | | $ | 1,385 | | $ | 1,376 | |
| Total ACLL and ACLUC | $ | 28,279 | | $ | 22,654 | | $ | 14,239 | | $ | 13,915 | | $ | 13,842 | |
| Net consumer credit losses on loans | $ | 1,882 | | $ | 1,981 | | $ | 1,830 | | $ | 1,803 | | $ | 1,874 | |
| As a percentage of average consumer loans | 2.70 | % | 2.66 | % | 2.41 | % | 2.42 | % | 2.57 | % |
| Net corporate credit losses on loans | $ | 324 | | $ | 127 | | $ | 114 | | $ | 110 | | $ | 89 | |
| As a percentage of average corporate loans | 0.31 | % | 0.13 | % | 0.12 | % | 0.11 | % | 0.09 | % |
ACLL by type at end of period(13) | | | | | |
| Consumer | $ | 19,596 | | $ | 17,390 | | $ | 9,897 | | $ | 9,727 | | $ | 9,679 | |
| Corporate | 6,824 | | 3,451 | | 2,886 | | 2,803 | | 2,787 | |
| Total | $ | 26,420 | | $ | 20,841 | | $ | 12,783 | | $ | 12,530 | | $ | 12,466 | |
(1)On January 1, 2020, Citi adopted Accounting Standards Update (ASC) 326, Financial Instruments—Credit Losses (CECL). The ASU introduces a new credit loss methodology requiring earlier recognition of credit losses while also providing additional transparency about credit risk. On January 1, 2020, Citi recorded a $4.1 billion, or an approximate 29%, pretax increase in the Allowance for credit losses, along with a $3.1 billion after-tax decrease in Retained earnings and a deferred tax asset increase of $1.0 billion. This transition impact reflects (i) a $4.9 billion build to the Consumer allowance for credit losses due to longer estimated tenors than under the incurred loss methodology under prior U.S. GAAP, net of recoveries; and (ii) a $(0.8) billion decrease to the Corporate allowance for credit losses due to shorter remaining tenors, incorporation of recoveries and use of more specific historical loss data based on an increase in portfolio segmentation across industries and geographies. See Note 1 to the Consolidated Financial Statements for further discussion on the impact of Citi’s adoption of CECL.
(2)During the second quarter of 2020, Citi updated its ACLL estimate of lifetime credit losses resulting from a change in accounting for variable post-charge-off third-party agency collection costs in its U.S. Consumer businesses. After June 30, 2020, these costs will be recorded as operating expenses for future periods as they are incurred. The impact of this change in estimate effected by a change in accounting principle resulted in an approximate $426 million reduction in Citi's estimated ACLL at June 30, 2020. For additional information, see “Significant Accounting Policies and Significant Estimates” below.
(3)Recoveries have been reduced by certain collection costs that are incurred only if collection efforts are successful.
(4)Includes all adjustments to the allowance for credit losses, such as changes in the allowance from acquisitions, dispositions, securitizations, FX translation, purchase accounting adjustments, etc.
(5)The second quarter of 2020 includes an increase of approximately $88 million related to FX translation.
(6)The first quarter of 2020 includes a decrease of approximately $483 million related to FX translation.
(7)The fourth quarter of 2019 includes an increase of approximately $86 million related to FX translation.
(8)The third quarter of 2019 includes a decrease of approximately $65 million related to FX translation.
(9)The second quarter of 2019 includes an increase of approximately $13 million related to FX translation.
(10)June 30, 2020, March 31, 2020, December 31, 2019, September 30, 2019, and June 30, 2019, exclude $5.8 billion, $4.0 billion, $4.1 billion, $3.9 billion, and $3.8 billion, respectively, of loans that are carried at fair value.
(11)At June 30, 2020, the Corporate ACLUC includes a non-provision transfer of $68 million, representing reserves on performance guarantees as of March 31, 2020. The reserves on these contracts have been reclassified out of the allowance for credit losses on unfunded lending commitments and into other liabilities as of June 30, 2020.
(12)Represents additional credit reserves recorded as Other liabilities on the Consolidated Balance Sheet.
(13)See “Significant Accounting Policies and Significant Estimates” and Note 1 to the Consolidated Financial Statements. Attribution of the allowance is made for analytical purposes only and the entire allowance is available to absorb probable credit losses inherent in the overall portfolio.
Allowance for Credit Losses on Loans (ACLL)
The following tables detail information on Citi’s ACLL, loans and coverage ratios:
| | | | | | | | | | | |
| | June 30, 2020 | | |
| In billions of dollars | ACLL | EOP loans, net of
unearned income | ACLL as a percentage of EOP loans(1) |
North America cards(2) | $ | 14.7 | | $ | 128.0 | | 11.5 | % |
North America mortgages(3) | 0.9 | | 56.7 | | 1.6 | |
North America other | 0.3 | | 4.9 | | 6.1 | |
| International cards | 2.0 | | 21.0 | | 9.5 | |
International other(4) | 1.7 | | 70.5 | | 2.4 | |
| Total consumer | $ | 19.6 | | $ | 281.1 | | 7.0 | % |
| Total corporate | 6.8 | | 404.2 | | 1.7 | |
| Total Citigroup | $ | 26.4 | | $ | 685.3 | | 3.9 | % |
(1)Loans carried at fair value do not have an ACLL, they are excluded from the ACLL ratio calculation.
(2)Includes both Citi-branded cards and Citi retail services. The $14.7 billion of loan loss reserves represented approximately 30 months of coincident net credit loss coverage. As of June 30, 2020, North America Citi-branded cards ACLL as a percentage of EOP loans was 10.1% and North America Citi retail services ACLL as a percentage of EOP loans was 14.0%.
(3)Of the $0.9 billion, approximately $0.5 billion was allocated to North America mortgages in Corporate/Other, including approximately $0.7 billion and $0.2 billion determined in accordance with ASC 450-20 and ASC 310-10-35 (troubled debt restructurings), respectively. Of the $56.7 billion in loans, approximately $54.8 billion and $1.9 billion of the loans were evaluated in accordance with ASC 450-20 and ASC 310-10-35 (troubled debt restructurings), respectively. For additional information, see Note 14 to the Consolidated Financial Statements.
(4)Includes mortgages and other retail loans.
| | | | | | | | | | | |
| | December 31, 2019 | | |
| In billions of dollars | ACLL | EOP loans, net of
unearned income | ACLL as a percentage of EOP loans(1) |
North America cards(2) | $ | 7.0 | | $ | 149.2 | | 4.7 | % |
North America mortgages(3) | 0.3 | | 56.2 | | 0.5 | |
North America other | 0.1 | | 3.7 | | 2.7 | |
| International cards | 1.4 | | 25.9 | | 5.4 | |
International other(4) | 1.1 | | 74.6 | | 1.5 | |
| Total consumer | $ | 9.9 | | $ | 309.6 | | 3.2 | % |
| Total corporate | 2.9 | | 389.9 | | 0.7 | |
| Total Citigroup | $ | 12.8 | | $ | 699.5 | | 1.8 | % |
(1)Loans carried at fair value do not have an ACLL, they are excluded from the ACLL ratio calculation.
(2)Includes both Citi-branded cards and Citi retail services. The $7.0 billion of loan loss reserves represented approximately 15 months of coincident net credit loss coverage.
(3)Of the $0.3 billion, nearly all was allocated to North America mortgages in Corporate/Other, including $0.1 billion and $0.2 billion determined in accordance with ASC 450-20 and ASC 310-10-35 (troubled debt restructurings), respectively. Of the $56.2 billion in loans, approximately $54.2 billion and $2.0 billion of the loans were evaluated in accordance with ASC 450-20 and ASC 310-10-35 (troubled debt restructurings), respectively. For additional information, see Note 14 to the Consolidated Financial Statements.
(4)Includes mortgages and other retail loans.
The following table details Citi’s corporate credit allowance for credit losses on loans (ACLL) by industry exposure:
| | | | | | | | | | | |
| June 30, 2020 | | |
| In millions of dollars, except percentages | Funded exposure(1) | ACLL(2)(3) | ACLL as a % of funded exposure |
| Transportation and industrials | $ | 68,257 | | $ | 1,957 | | 2.87 | % |
| Private bank | 67,956 | | 345 | | 0.51 | |
| Consumer retail | 37,401 | | 773 | | 2.07 | |
| Health | 8,466 | | 180 | | 2.13 | |
| Technology, media and telecom | 32,831 | | 482 | | 1.47 | |
| Power, chemicals, metals and mining | 24,759 | | 543 | | 2.19 | |
| Banks and finance companies | 34,274 | | 323 | | 0.94 | |
| Securities firms | 424 | | 9 | | 2.12 | |
| Real estate | 40,673 | | 551 | | 1.35 | |
| Energy and commodities | 18,769 | | 841 | | 4.48 | |
| Public sector | 14,470 | | 251 | | 1.73 | |
| Insurance | 1,454 | | 9 | | 0.62 | |
| Asset managers and funds | 5,151 | | 29 | | 0.56 | |
| Financial markets infrastructure | 28 | | — | | — | |
| Other industries | 9,052 | | 181 | | 2.00 | |
| Total | $ | 363,965 | | $ | 6,474 | | 1.78 | % |
(1) Funded exposure includes $5,783 million of loans at fair value that are not subject to ACLL under the CECL standard.
(2) As of June 30, 2020, the ACLL shown above reflects coverage of 0.5% of funded investment grade exposure and 5.1% of funded non-investment grade exposure.
(3) Excludes $350 million of ACLL associated with approximately $40 billion of funded delinquency-managed private bank exposures at June 30, 2020. Including those reserves and exposures, the total ACLL is 1.71% of total funded exposure, including 0.6% of funded investment grade exposure and 4.9% of funded non-investment grade exposure.
Non-Accrual Loans and Assets and Renegotiated Loans
For additional information on Citi’s non-accrual loans and assets and renegotiated loans, see “Non-Accrual Loans and Assets and Renegotiated Loans” in Citi’s 2019 Annual Report on Form 10-K.
Non-Accrual Loans
The table below summarizes Citigroup’s non-accrual loans as of the periods indicated. Non-accrual loans may still be current
on interest payments. In situations where Citi reasonably expects that only a portion of the principal owed will ultimately be collected, all payments received are reflected as a reduction of principal and not as interest income. For all other non-accrual loans, cash interest receipts are generally recorded as revenue.
| | | | | | | | | | | | | | | | | |
| Jun. 30, | Mar. 31, | Dec. 31, | Sept. 30, | Jun. 30, |
| In millions of dollars | 2020 | 2020 | 2019 | 2019 | 2019 |
Corporate non-accrual loans(1)(2) | | | | | |
| North America | $ | 2,466 | | $ | 1,138 | | $ | 1,214 | | $ | 1,056 | | $ | 913 | |
| EMEA | 812 | | 720 | | 430 | | 307 | | 321 | |
| Latin America | 585 | | 447 | | 473 | | 399 | | 353 | |
| Asia | 153 | | 179 | | 71 | | 84 | | 80 | |
| Total corporate non-accrual loans | $ | 4,016 | | $ | 2,484 | | $ | 2,188 | | $ | 1,846 | | $ | 1,667 | |
Consumer non-accrual loans(3) | | | | | |
| North America | $ | 928 | | $ | 926 | | $ | 905 | | $ | 1,013 | | $ | 1,082 | |
| Latin America | 608 | | 489 | | 632 | | 595 | | 629 | |
Asia(4) | 293 | | 284 | | 279 | | 258 | | 260 | |
| Total consumer non-accrual loans | $ | 1,829 | | $ | 1,699 | | $ | 1,816 | | $ | 1,866 | | $ | 1,971 | |
| Total non-accrual loans | $ | 5,845 | | $ | 4,183 | | $ | 4,004 | | $ | 3,712 | | $ | 3,638 | |
(1)Approximately 63%, 45%, 44%, 41% and 48% of Citi’s corporate non-accrual loans were performing at June 30, 2020, March 31, 2020, December 31, 2019, September 30, 2019 and June 30, 2019, respectively.
(2)The June 30, 2020 corporate non-accrual loans represented 0.99% of total corporate loans, and approximately two-thirds were still making payments.
(3) Excludes purchased credit deteriorated loans, as they are generally accreting interest. The carrying value of these loans was $121 million at June 30, 2020, $129 million at March 31, 2020, $128 million at December 31, 2019, $117 million at September 30, 2019 and $123 million at June 30, 2019.
(4) Asia GCB includes balances in certain EMEA countries for all periods presented.
The changes in Citigroup’s non-accrual loans were as follows:
| | | | | | | | | | | | | | | | | | | | |
| Three Months Ended | | | Three Months Ended | | |
| June 30, 2020 | | | June 30, 2019 | | |
| In millions of dollars | Corporate | Consumer | Total | Corporate | Consumer | Total |
| Non-accrual loans at beginning of period | $ | 2,484 | | $ | 1,699 | | $ | 4,183 | | $ | 1,732 | | $ | 1,955 | | $ | 3,687 | |
| Additions | 2,414 | | 638 | | 3,052 | | 499 | | 823 | | 1,322 | |
| Sales and transfers to HFS | — | | (11) | | (11) | | — | | (22) | | (22) | |
| Returned to performing | (69) | | (113) | | (182) | | (11) | | (92) | | (103) | |
| Paydowns/settlements | (802) | | (109) | | (911) | | (499) | | (286) | | (785) | |
| Charge-offs | (41) | | (278) | | (319) | | (37) | | (406) | | (443) | |
| Other | 30 | | 3 | | 33 | | (17) | | (1) | | (18) | |
| Ending balance | $ | 4,016 | | $ | 1,829 | | $ | 5,845 | | $ | 1,667 | | $ | 1,971 | | $ | 3,638 | |
| | | | | | |
| Six Months Ended | | | Six Months Ended | | |
| June 30, 2020 | | | June 30, 2019 | | |
| In millions of dollars | Corporate | Consumer | Total | Corporate | Consumer | Total |
| Non-accrual loans at beginning of period | $ | 2,188 | | $ | 1,816 | | $ | 4,004 | | $ | 1,511 | | $ | 2,027 | | $ | 3,538 | |
| Additions | 3,230 | | 1,590 | | 4,820 | | 1,222 | | 1,545 | | 2,767 | |
| Sales and transfers to HFS | (1) | | (31) | | (32) | | (5) | | (56) | | (61) | |
| Returned to performing | (117) | | (204) | | (321) | | (39) | | (234) | | (273) | |
| Paydowns/settlements | (1,156) | | (433) | | (1,589) | | (983) | | (460) | | (1,443) | |
| Charge-offs | (132) | | (605) | | (737) | | (72) | | (808) | | (880) | |
| Other | 4 | | (304) | | (300) | | 33 | | (43) | | (10) | |
| Ending balance | $ | 4,016 | | $ | 1,829 | | $ | 5,845 | | $ | 1,667 | | $ | 1,971 | | $ | 3,638 | |
The table below summarizes Citigroup’s other real estate owned (OREO) assets. OREO is recorded on the Consolidated Balance Sheet within Other assets. This represents the carrying value of all real estate property acquired by foreclosure or other legal proceedings when Citi has taken possession of the collateral:
| | | | | | | | | | | | | | | | | |
| Jun. 30, | Mar. 31, | Dec. 31, | Sept. 30, | Jun. 30, |
| In millions of dollars | 2020 | 2020 | 2019 | 2019 | 2019 |
| OREO | | | | | |
| North America | $ | 32 | | $ | 35 | | $ | 39 | | $ | 51 | | $ | 47 | |
| EMEA | — | | 1 | | 1 | | 1 | | 1 | |
| Latin America | 6 | | 6 | | 14 | | 14 | | 14 | |
| Asia | 6 | | 8 | | 7 | | 6 | | 20 | |
| Total OREO | $ | 44 | | $ | 50 | | $ | 61 | | $ | 72 | | $ | 82 | |
| | | | | |
| Non-accrual assets | | | | | |
| Corporate non-accrual loans | $ | 4,016 | | $ | 2,484 | | $ | 2,188 | | $ | 1,846 | | $ | 1,667 | |
| Consumer non-accrual loans | 1,829 | | 1,699 | | 1,816 | | 1,866 | | 1,971 | |
| Non-accrual loans (NAL) | $ | 5,845 | | $ | 4,183 | | $ | 4,004 | | $ | 3,712 | | $ | 3,638 | |
| OREO | $ | 44 | | $ | 50 | | $ | 61 | | $ | 72 | | $ | 82 | |
| Non-accrual assets (NAA) | $ | 5,889 | | $ | 4,233 | | $ | 4,065 | | $ | 3,784 | | $ | 3,720 | |
| NAL as a percentage of total loans | 0.85 | % | 0.58 | % | 0.57 | % | 0.54 | % | 0.53 | % |
| NAA as a percentage of total assets | 0.26 | | 0.19 | | 0.21 | | 0.19 | | 0.19 | |
ACLL as a percentage of NAL(1) | 452 | % | 498 | % | 319 | % | 338 | % | 343 | % |
(1)The allowance for credit losses on loans includes the allowance for Citi’s credit card portfolios and purchased distressed loans, while the non-accrual loans exclude credit card balances (with the exception of certain international portfolios) and purchased credit deteriorated loans as these continue to accrue interest until charge-off.
Renegotiated Loans
The following table presents Citi’s loans modified in TDRs:
| | | | | | | | |
| In millions of dollars | Jun. 30, 2020 | Dec. 31, 2019 |
Corporate renegotiated loans(1) | | |
| In U.S. offices | | |
Commercial and industrial(2) | $ | 275 | | $ | 226 | |
| Mortgage and real estate | 60 | | 57 | |
| Financial institutions | — | | — | |
| Other | 8 | | 4 | |
| Total | $ | 343 | | $ | 287 | |
| In offices outside the U.S. | | |
Commercial and industrial(2) | $ | 131 | | $ | 200 | |
| Mortgage and real estate | 31 | | 22 | |
| Financial institutions | — | | — | |
| Other | 2 | | 40 | |
| Total | $ | 164 | | $ | 262 | |
| Total corporate renegotiated loans | $ | 507 | | $ | 549 | |
Consumer renegotiated loans(3) | | |
| In U.S. offices | | |
| Mortgage and real estate | $ | 1,895 | | $ | 1,956 | |
| Cards | 1,434 | | 1,464 | |
| Installment and other | 17 | | 17 | |
| Total | $ | 3,346 | | $ | 3,437 | |
| In offices outside the U.S. | | |
| Mortgage and real estate | $ | 289 | | $ | 305 | |
| Cards | 450 | | 466 | |
| Installment and other | 421 | | 400 | |
| Total | $ | 1,160 | | $ | 1,171 | |
| Total consumer renegotiated loans | $ | 4,506 | | $ | 4,608 | |
(1)Includes $472 million and $472 million of non-accrual loans included in the non-accrual loans table above at June 30, 2020 and December 31, 2019, respectively. The remaining loans are accruing interest.
(2)In addition to modifications reflected as TDRs at June 30, 2020 and December 31, 2019, Citi also modified $25 million and $26 million, respectively, of commercial loans risk rated “Substandard Non-Performing” or worse (asset category defined by banking regulators) in offices outside the U.S. These modifications were not considered TDRs because the modifications did not involve a concession or because the modifications qualified for exemptions from TDR accounting provided by the CARES Act or Interagency Guidance.
(3)Includes $794 million and $814 million of non-accrual loans included in the non-accrual loans table above at June 30, 2020 and December 31, 2019, respectively. The remaining loans were accruing interest.
LIQUIDITY RISK
For additional information on funding and liquidity at Citigroup, including its objectives, management and measurement, see “Liquidity Risk” and “Risk Factors” in Citi’s 2019 Annual Report on Form 10-K.
High-Quality Liquid Assets (HQLA)
| | | | | | | | | | | | | | | | | | | | | | | | | | | | | |
| Citibank | | | Citi non-bank and other entities | | | Total | | |
| In billions of dollars | Jun. 30, 2020 | Mar. 31, 2020 | Jun. 30, 2019 | Jun. 30, 2020 | Mar. 31, 2020 | Jun. 30, 2019 | Jun. 30, 2020 | Mar. 31, 2020 | Jun. 30, 2019 |
| Available cash | $ | 273.8 | | $ | 170.9 | | $ | 102.1 | | $ | 2.9 | | $ | 3.1 | | $ | 42.1 | | $ | 276.7 | | $ | 174.0 | | $ | 144.2 | |
| U.S. sovereign | 67.5 | | 92.1 | | 93.8 | | 42.2 | | 34.7 | | 37.0 | | 109.7 | | 126.8 | | 130.8 | |
| U.S. agency/agency MBS | 36.4 | | 52.4 | | 57.5 | | 7.0 | | 7.2 | | 4.8 | | 43.4 | | 59.6 | | 62.3 | |
Foreign government debt(1) | 46.6 | | 66.3 | | 61.9 | | 11.4 | | 12.7 | | 4.0 | | 58.0 | | 78.9 | | 65.9 | |
| Other investment grade | 1.3 | | 1.5 | | 3.1 | | 0.7 | | 1.1 | | 0.7 | | 2.0 | | 2.7 | | 3.8 | |
| Total HQLA (AVG) | $ | 425.6 | | $ | 383.2 | | $ | 318.4 | | $ | 64.2 | | $ | 58.8 | | $ | 88.6 | | $ | 489.8 | | $ | 442.0 | | $ | 407.0 | |
Note: The amounts set forth in the table above are presented on an average basis. For securities, the amounts represent the liquidity value that potentially could be realized and, therefore, exclude any securities that are encumbered and incorporate any haircuts applicable under the U.S. LCR rule. The table above incorporates various restrictions that could limit the transferability of liquidity between legal entities, including Section 23A of the Federal Reserve Act.
(1) Foreign government debt includes securities issued or guaranteed by foreign sovereigns, agencies and multilateral development banks. Foreign government debt securities are held largely to support local liquidity requirements and Citi’s local franchises and principally include government bonds from Japan, Mexico, Singapore, Hong Kong and Canada.
The table above includes average amounts of HQLA held at Citigroup’s operating entities that are eligible for inclusion in the calculation of Citigroup’s consolidated Liquidity Coverage ratio (LCR), pursuant to the U.S. LCR rules. These amounts include the HQLA needed to meet the minimum requirements at these entities and any amounts in excess of these minimums that are assumed to be transferable to other entities within Citigroup.
Citigroup’s HQLA increased quarter-over-quarter, reflecting long-term debt issuance and a portion of the deposit growth at Citibank. While this deposit growth significantly increased liquidity at Citibank, a significant amount of this liquidity was not assumed to be transferable to other entities within Citigroup and therefore not included in Citi’s consolidated HQLA.
As of June 30, 2020, Citigroup had approximately $900 billion of available liquidity resources to support client and business needs, including end-of-period HQLA assets; additional unencumbered securities, including excess liquidity held at bank entities that is non-transferable to other entities within Citigroup; and available assets not already accounted for within the Citi’s HQLA to support Federal Home Loan Bank (FHLB) and Federal Reserve Bank discount window borrowing capacity.
Short-Term Liquidity Measurement: Liquidity Coverage Ratio (LCR)
In addition to internal 30-day liquidity stress testing performed for Citi’s major entities, operating subsidiaries and countries, Citi also monitors its liquidity by reference to the LCR. The table below details the components of Citi’s LCR calculation and HQLA in excess of net outflows for the periods indicated:
| | | | | | | | | | | |
| In billions of dollars | Jun. 30, 2020 | Mar. 31, 2020 | Jun. 30, 2019 |
| HQLA | $ | 489.8 | | $ | 442.0 | | $ | 407.0 | |
| Net outflows | 420.1 | | 385.8 | | 353.5 | |
| LCR | 117 | % | 115 | % | 115 | % |
| HQLA in excess of net outflows | $ | 69.7 | | $ | 56.2 | | $ | 53.5 | |
Note: The amounts are presented on an average basis.
As of June 30, 2020, Citigroup’s average LCR increased modestly from the quarter ended March 31, 2020, primarily reflecting the issuance of long-term debt.
Loans
The table below details the average loans, by business and/or segment, and the total end-of-period loans for each of the periods indicated:
| | | | | | | | | | | |
| In billions of dollars | Jun. 30, 2020 | Mar. 31, 2020 | Jun. 30, 2019 |
| Global Consumer Banking | | | |
| North America | $ | 181.0 | | $ | 193.3 | | $ | 185.3 | |
| Latin America | 13.4 | | 16.7 | | 17.1 | |
Asia(1) | 77.1 | | 80.3 | | 77.7 | |
| Total | $ | 271.5 | | $ | 290.3 | | $ | 280.1 | |
| Institutional Clients Group | | | |
| Corporate lending | $ | 190.4 | | $ | 159.9 | | $ | 162.0 | |
| Treasury and trade solutions (TTS) | 71.0 | | 73.1 | | 73.2 | |
| Private bank | 108.9 | | 109.9 | | 101.2 | |
Markets and securities services and other | 52.0 | | 52.1 | | 50.6 | |
| Total | $ | 422.3 | | $ | 395.0 | | $ | 387.0 | |
Total Corporate/Other | $ | 9.0 | | $ | 9.4 | | $ | 12.5 | |
| Total Citigroup loans (AVG) | $ | 702.8 | | $ | 694.7 | | $ | 679.6 | |
| Total Citigroup loans (EOP) | $ | 685.3 | | $ | 721.0 | | $ | 688.7 | |
(1)Includes loans in certain EMEA countries for all periods presented.
End-of-period loans were largely unchanged year-over-year and declined 5% sequentially. Excluding the impact of FX translation, end-of-period loans increased 1% year-over-year and declined 6% sequentially.
On an average basis, loans increased 3% year-over-year and 1% sequentially. Excluding the impact of FX translation, average loans increased 5% year-over-year and 2% sequentially. On this basis, average GCB loans declined 1% year-over-year, reflecting the impact of lower customer spending activity in Citi’s cards businesses across regions related to the pandemic.
Excluding the impact of FX translation, average ICG loans increased 11% year-over-year. Loans in corporate lending grew 21% on an average basis, as Citi continued to provide new loans and facilitate draws for clients seeking to bolster liquidity. On an end-of-period basis, loans in corporate lending declined 12% sequentially, reflecting significant repayments as Citi assisted its clients in accessing the capital markets.
Average Corporate/Other loans continued to decline (down 28%), driven by the wind-down of legacy assets.
Deposits
The table below details the average deposits, by business and/or segment, and the total end-of-period deposits for each of the periods indicated:
| | | | | | | | | | | |
| In billions of dollars | Jun. 30, 2020 | Mar. 31, 2020 | Jun. 30, 2019 |
Global Consumer Banking(1) | | | |
| North America | $ | 172.5 | | $ | 161.3 | | $ | 151.6 | |
| Latin America | 20.6 | | 22.9 | | 22.8 | |
Asia(2) | 108.8 | | 105.9 | | 100.8 | |
| Total | $ | 301.9 | | $ | 290.1 | | $ | 275.2 | |
| Institutional Clients Group | | | |
| Treasury and trade solutions (TTS) | $ | 667.5 | | $ | 571.3 | | $ | 522.1 | |
Banking ex-TTS | 143.5 | | 140.1 | | 133.1 | |
| Markets and securities services | 108.2 | | 100.1 | | 93.9 | |
| Total | $ | 919.2 | | $ | 811.5 | | $ | 749.1 | |
| Corporate/Other | $ | 12.8 | | $ | 12.9 | | $ | 15.6 | |
| Total Citigroup deposits (AVG) | $ | 1,233.9 | | $ | 1,114.5 | | $ | 1,039.9 | |
| Total Citigroup deposits (EOP) | $ | 1,233.7 | | $ | 1,184.9 | | $ | 1,045.6 | |
(1)Reflects deposits within retail banking.
(2)Includes deposits in certain EMEA countries for all periods presented.
End-of-period deposits increased 18% year-over-year and 4% sequentially. Excluding the impact of FX translation, end-of-period deposits increased 20% year-over-year and 3% sequentially.
On an average basis, deposits increased 19% year-over-year and 11% sequentially. Excluding the impact of FX translation, average deposits grew 21% from the prior-year period and 12% sequentially.
On this basis, average deposits in GCB increased 12%, with strong growth across all regions. In North America GCB, average deposits grew 14% driven by a combination of factors, including the delay of tax payments, government stimulus payments and a reduction in overall spending, as well as Citi’s continued strategic efforts to drive organic growth.
Excluding the impact of FX translation, average deposits in ICG grew 25% year-over-year, primarily driven by 30% growth in TTS, as well as continued growth in the private bank and securities services.
Long-Term Debt
The weighted-average maturity of unsecured long-term debt issued by Citigroup and its affiliates (including Citibank) with a remaining life greater than one year was approximately 8.7 years as of June 30, 2020, compared to 8.5 years as of the prior year and 9.0 years as of the prior quarter. The weighted-average maturity is calculated based on the contractual maturity of each security. For securities that are redeemable prior to maturity at the option of the holder, the weighted-average maturity is calculated based on the earliest date an option becomes exercisable.
Citi’s long-term debt outstanding at the Citigroup parent company includes benchmark senior and subordinated debt and what Citi refers to as customer-related debt, consisting of structured notes, such as equity- and credit-linked notes, as well as non-structured notes. Citi’s issuance of customer-related debt is generally driven by customer demand and complements benchmark debt issuance as a source of funding for Citi’s non-bank entities. Citi’s long-term debt at the bank includes benchmark senior debt, FHLB advances and securitizations.
Long-Term Debt Outstanding
The following table sets forth Citi’s end-of-period total long-term debt outstanding for each of the dates indicated:
| | | | | | | | | | | |
| In billions of dollars | Jun. 30, 2020 | Mar. 31, 2020 | Jun. 30, 2019 |
Parent and other(1) | | | |
| Benchmark debt: | | | |
| Senior debt | $ | 126.9 | | $ | 115.5 | | $ | 111.2 | |
| Subordinated debt | 27.6 | | 27.5 | | 25.5 | |
| Trust preferred | 1.7 | | 1.7 | | 1.7 | |
| Customer-related debt | 60.4 | | 51.7 | | 47.9 | |
Local country and other(2) | 7.7 | | 7.3 | | 3.3 | |
| Total parent and other | $ | 224.3 | | $ | 203.7 | | $ | 189.6 | |
| Bank | | | |
| FHLB borrowings | $ | 15.0 | | $ | 16.0 | | $ | 7.7 | |
Securitizations(3) | 17.6 | | 20.8 | | 25.9 | |
| Citibank benchmark senior debt | 16.3 | | 22.2 | | 25.4 | |
Local country and other(2) | 6.6 | | 3.4 | | 3.6 | |
| Total bank | $ | 55.5 | | $ | 62.4 | | $ | 62.6 | |
| Total long-term debt | $ | 279.8 | | $ | 266.1 | | $ | 252.2 | |
Note: Amounts represent the current value of long-term debt on Citi’s Consolidated Balance Sheet that, for certain debt instruments, includes consideration of fair value, hedging impacts and unamortized discounts and premiums.
(1)Parent and other includes long-term debt issued to third parties by the parent holding company (Citigroup) and Citi’s non-bank subsidiaries (including broker-dealer subsidiaries) that are consolidated into Citigroup. As of June 30, 2020, parent and other included $55.3 billion of long-term debt issued by Citi’s broker-dealer and other subsidiaries, as well as certain Citigroup consolidated hedging activities.
(2)Local country and other includes debt issued by Citi’s affiliates in support of their local operations. Within parent and other, certain secured financing is also included. Within bank, borrowings under certain U.S. government-sponsored liquidity programs are also included.
(3)Predominantly credit card securitizations, primarily backed by Citi-branded credit card receivables.
Citi’s total long-term debt outstanding increased both year-over-year and sequentially, primarily driven by the issuance of unsecured benchmark senior debt and customer-related debt at the non-bank entities, partially offset by declines in unsecured benchmark senior debt and securitizations at the bank. Year-over-year, the increase in long-term debt was also driven by an increase in FHLB borrowings at the bank.
As part of its liability management, Citi has considered, and may continue to consider, opportunities to redeem or repurchase its long-term debt pursuant to open market purchases, tender offers or other means. Such redemptions and repurchases help reduce Citi’s overall funding costs. During the second quarter of 2020, Citi redeemed or repurchased an aggregate of approximately $7.1 billion of its outstanding long-term debt.
Long-Term Debt Issuances and Maturities
The table below details Citi’s long-term debt issuances and maturities (including repurchases and redemptions) during the periods presented:
| | | | | | | | | | | | | | | | | | | | |
| | 2Q20 | | 1Q20 | | 2Q19 | |
| In billions of dollars | Maturities | Issuances | Maturities | Issuances | Maturities | Issuances |
| Parent and other | | | | | | |
| Benchmark debt: | | | | | | |
| Senior debt | $ | — | | $ | 10.3 | | $ | 2.1 | | $ | 7.6 | | $ | 5.1 | | $ | 4.5 | |
| Subordinated debt | — | | — | | — | | — | | — | | — | |
| Trust preferred | — | | — | | — | | — | | — | | — | |
| Customer-related debt | 8.4 | | 10.3 | | 6.4 | | 13.0 | | 3.2 | | 7.5 | |
| Local country and other | 0.2 | | 0.3 | | 0.4 | | 0.3 | | 0.3 | | 0.2 | |
| Total parent and other | $ | 8.6 | | $ | 20.9 | | $ | 8.9 | | $ | 20.9 | | $ | 8.6 | | $ | 12.2 | |
| Bank | | | | | | |
| FHLB borrowings | $ | 1.0 | | $ | — | | $ | 2.4 | | $ | 12.9 | | $ | 2.8 | | $ | — | |
| Securitizations | 3.3 | | — | | 0.1 | | — | | 0.1 | | — | |
| Citibank benchmark senior debt | 6.0 | | — | | 1.0 | | — | | — | | 3.9 | |
| Local country and other | 0.4 | | 3.5 | | 0.6 | | 0.3 | | 0.4 | | 0.2 | |
| Total bank | $ | 10.7 | | $ | 3.5 | | $ | 4.1 | | $ | 13.2 | | $ | 3.3 | | $ | 4.1 | |
| Total | $ | 19.3 | | $ | 24.4 | | $ | 13.0 | | $ | 34.1 | | $ | 11.9 | | $ | 16.3 | |
The table below shows Citi’s aggregate long-term debt maturities (including repurchases and redemptions) year-to-date in 2020, as well as its aggregate expected remaining long-term debt maturities by year as of June 30, 2020:
| | | | | | | | | | | | | | | | | | | | | | | | | | | | | |
| | 2020 YTD | Maturities | | | | | | | |
| In billions of dollars | | 2020 | 2021 | 2022 | 2023 | 2024 | 2025 | Thereafter | Total |
| Parent and other | | | | | | | | | |
| Benchmark debt: | | | | | | | | | |
| Senior debt | $ | 2.1 | | $ | 4.4 | | $ | 14.3 | | $ | 11.5 | | $ | 12.7 | | $ | 8.6 | | $ | 7.6 | | $ | 67.9 | | $ | 126.9 | |
| Subordinated debt | — | | — | | — | | 0.7 | | 1.3 | | 1.1 | | 5.3 | | 19.2 | | 27.6 | |
| Trust preferred | — | | — | | — | | — | | — | | — | | — | | 1.7 | | 1.7 | |
| Customer-related debt | 14.8 | | 4.1 | | 7.7 | | 7.2 | | 5.2 | | 3.8 | | 3.0 | | 29.4 | | 60.4 | |
| Local country and other | 0.6 | | 0.8 | | 3.6 | | 1.5 | | 0.2 | | — | | — | | 1.5 | | 7.7 | |
| Total parent and other | $ | 17.5 | | $ | 9.3 | | $ | 25.6 | | $ | 20.9 | | $ | 19.4 | | $ | 13.5 | | $ | 15.9 | | $ | 119.7 | | $ | 224.3 | |
| Bank | | | | | | | | | |
| FHLB borrowings | $ | 3.4 | | $ | 2.1 | | $ | 7.7 | | $ | 5.3 | | $ | — | | $ | — | | $ | — | | $ | — | | $ | 15.0 | |
| Securitizations | 3.3 | | 1.1 | | 7.0 | | 2.2 | | 2.5 | | 1.1 | | 0.4 | | 3.3 | | 17.6 | |
| Citibank benchmark senior debt | 7.0 | | 2.8 | | 5.1 | | 5.6 | | — | | 2.8 | | — | | — | | 16.3 | |
| Local country and other | 1.1 | | 1.0 | | 0.5 | | 4.0 | | 0.2 | | 0.5 | | — | | 0.2 | | 6.6 | |
| Total bank | $ | 14.8 | | $ | 7.0 | | $ | 20.3 | | $ | 17.1 | | $ | 2.7 | | $ | 4.4 | | $ | 0.4 | | $ | 3.5 | | $ | 55.5 | |
| Total long-term debt | $ | 32.3 | | $ | 16.3 | | $ | 45.9 | | $ | 38.0 | | $ | 22.1 | | $ | 17.9 | | $ | 16.3 | | $ | 123.2 | | $ | 279.8 | |
Secured Funding Transactions and Short-Term Borrowings
Citi supplements its primary sources of funding with short-term financings that generally include (i) secured funding transactions consisting of securities loaned or sold under agreements to repurchase, i.e., repos, and (ii) to a lesser extent, short-term borrowings consisting of commercial paper and borrowings from the FHLB and other market participants.
Secured Funding Transactions
Secured funding is primarily accessed through Citi’s broker-dealer subsidiaries to fund efficiently both (i) secured lending activity and (ii) a portion of the securities inventory held in the context of market making and customer activities. Citi also executes a smaller portion of its secured funding transactions through its bank entities, which are typically collateralized by government debt securities. Generally, daily changes in the level of Citi’s secured funding are primarily due to fluctuations in secured lending activity in the matched book (as described below) and securities inventory.
Secured funding of $216 billion as of June 30, 2020 increased 19% from the prior-year period and declined 3% sequentially. Excluding the impact of FX translation, secured funding increased 22% from the prior-year period and declined 4% sequentially, both driven by normal business activity. The average balances for secured funding were approximately $225 billion for the quarter ended June 30, 2020.
The portion of secured funding in the broker-dealer subsidiaries that funds secured lending is commonly referred to as “matched book” activity. The majority of this activity is secured by high-quality liquid securities such as U.S. Treasury securities, U.S. agency securities and foreign government debt securities. Other secured funding is secured by less liquid securities, including equity securities, corporate bonds and asset-backed securities, the tenor of which is generally equal to or longer than the tenor of the corresponding matched book assets.
The remainder of the secured funding activity in the broker-dealer subsidiaries serves to fund securities inventory held in the context of market making and customer activities. To maintain reliable funding under a wide range of market conditions, including under periods of stress, Citi manages these activities by taking into consideration the quality of the underlying collateral and establishing minimum required funding tenors. The weighted average maturity of Citi’s secured funding of less liquid securities inventory was greater than 110 days as of June 30, 2020.
Citi manages the risks in its secured funding by conducting daily stress tests to account for changes in capacity, tenor, haircut, collateral profile and client actions. In addition, Citi maintains counterparty diversification by establishing concentration triggers and assessing counterparty reliability and stability under stress. Citi generally sources secured funding from more than 150 counterparties.
Short-Term Borrowings
Citi’s short-term borrowings of $40 billion decreased 5% year-over-year and 27% sequentially, primarily driven by a decline in FHLB advances (see Note 16 to the Consolidated Financial Statements for further information on Citigroup’s and its affiliates’ outstanding short-term borrowings).
Credit Ratings
While not included in the table below, the long-term and short-term ratings of Citigroup Global Markets Holdings Inc. (CGMHI) were BBB+/A-2 at Standard & Poor’s and A/F1 at Fitch as of June 30, 2020.
Ratings as of June 30, 2020
| | | | | | | | | | | | | | | | | | | | |
| Citigroup Inc. | | | Citibank, N.A. | | |
| | Senior
debt | Commercial
paper | Outlook | Long-
term | Short-
term | Outlook |
| Fitch Ratings (Fitch) | A | F1 | Negative | A+ | F1 | Negative |
| Moody’s Investors Service (Moody’s) | A3 | P-2 | Stable | Aa3 | P-1 | Stable |
| Standard & Poor’s (S&P) | BBB+ | A-2 | Stable | A+ | A-1 | Stable |
Potential Impacts of Ratings Downgrades
Ratings downgrades by Moody’s, Fitch or S&P could negatively impact Citigroup’s and/or Citibank’s funding and liquidity due to reduced funding capacity, including derivative triggers, which could take the form of cash obligations and collateral requirements.
The following information is provided for the purpose of analyzing the potential funding and liquidity impact to Citigroup and Citibank of a hypothetical simultaneous
ratings downgrade across all three major rating agencies. This analysis is subject to certain estimates, estimation methodologies, judgments and uncertainties. Uncertainties include potential ratings limitations that certain entities may have with respect to permissible counterparties, as well as general subjective counterparty behavior. For example, certain corporate customers and markets counterparties could re-evaluate their business relationships with Citi and limit transactions in certain contracts or market instruments with Citi. Changes in counterparty behavior could impact Citi’s funding and liquidity, as well as the results of operations of certain of its businesses. The actual impact to Citigroup or Citibank is unpredictable and may differ materially from the potential funding and liquidity impacts described below. For additional information on the impact of credit rating changes on Citi and its applicable subsidiaries, see “Risk Factors— Liquidity Risks” in Citi’s 2019 Annual Report on Form 10-K.
Citigroup Inc. and Citibank—Potential Derivative Triggers
As of June 30, 2020, Citi estimates that a hypothetical one-notch downgrade of the senior debt/long-term rating of Citigroup Inc. across all three major rating agencies could impact Citigroup’s funding and liquidity due to derivative triggers by approximately $0.5 billion, compared to $0.6 billion as of March 31, 2020. Other funding sources, such as secured financing transactions and other margin requirements, for which there are no explicit triggers, could also be adversely affected.
As of June 30, 2020, Citi estimates that a hypothetical one-notch downgrade of the senior debt/long-term rating of Citibank across all three major rating agencies could impact Citibank’s funding and liquidity due to derivative triggers by approximately $0.4 billion, compared to $0.6 billion as of March 31, 2020.
In total, as of June 30, 2020, Citi estimates that a one-notch downgrade of Citigroup and Citibank across all three major rating agencies could result in increased aggregate cash obligations and collateral requirements of approximately $1.0 billion, compared to $1.2 billion as of March 31, 2020 (see also Note 19 to the Consolidated Financial Statements). As detailed under “High-Quality Liquid Assets” above, Citigroup has various liquidity resources available to its bank and non-bank entities in part as a contingency for the potential events described above.
In addition, a broad range of mitigating actions are currently included in Citigroup’s and Citibank’s contingency funding plans. For Citigroup, these mitigating factors include, but are not limited to, accessing surplus funding capacity from existing clients, tailoring levels of secured lending and adjusting the size of select trading books and collateralized borrowings from certain Citibank subsidiaries. Mitigating actions available to Citibank include, but are not limited to, selling or financing highly liquid government securities, tailoring levels of secured lending, adjusting the size of select trading assets, reducing loan originations and renewals, raising additional deposits or borrowing from the FHLB or central banks. Citi believes these mitigating actions could substantially reduce the funding and liquidity risk, if any, of the potential downgrades described above.
Citibank—Additional Potential Impacts
In addition to the above derivative triggers, Citi believes that a potential downgrade of Citibank’s senior debt/long-term rating across any of the three major rating agencies could also have an adverse impact on the commercial paper/short-term rating of Citibank. As of June 30, 2020, Citibank had liquidity commitments of approximately $11.0 billion to consolidated asset-backed commercial paper conduits, compared to $12.2 billion as of March 31, 2020 (as referenced in Note 18 to the Consolidated Financial Statements).
In addition to the above-referenced liquidity resources of certain Citibank entities, Citibank could reduce the funding and liquidity risk, if any, of the potential downgrades described above through mitigating actions, including repricing or reducing certain commitments to commercial paper conduits. In the event of the potential downgrades described above, Citi believes that certain corporate customers could re-evaluate their deposit relationships with Citibank. This re-evaluation could result in clients’ adjusting their discretionary deposit levels or changing their depository institution, which could potentially reduce certain deposit levels at Citibank. However, Citi could choose to adjust pricing, offer alternative deposit products to its existing customers or seek to attract deposits from new customers, in addition to the mitigating actions referenced above.
MARKET RISK
Market risk emanates from both Citi’s trading and non-trading portfolios. For additional information on market risk and market risk management at Citi, see “Market Risk” and “Risk Factors” in Citi’s 2019 Annual Report on Form 10-K.
Market Risk of Non-Trading Portfolios
The following table sets forth the estimated impact to Citi’s net interest revenue, AOCI and the Common Equity Tier 1 Capital ratio (on a fully implemented basis), each assuming an unanticipated parallel instantaneous 100 basis point (bps) increase in interest rates:
| | | | | | | | | | | |
| In millions of dollars, except as otherwise noted | Jun. 30, 2020 | Mar. 31, 2020 | Jun. 30, 2019 |
| Estimated annualized impact to net interest revenue | | | |
U.S. dollar(1) | $ | 27 | | $ | (142) | | $ | 404 | |
| All other currencies | 683 | | 660 | | 659 | |
| Total | $ | 710 | | $ | 518 | | $ | 1,063 | |
| As a percentage of average interest-earning assets | 0.03 | % | 0.03 | % | 0.06 | % |
Estimated initial impact to AOCI (after-tax)(2) | $ | (5,705) | | $ | (5,746) | | $ | (3,738) | |
| Estimated initial impact on Common Equity Tier 1 Capital ratio (bps) | (35) | | (34) | | (23) | |
(1)Certain trading-oriented businesses within Citi have accrual-accounted positions that are excluded from the estimated impact to net interest revenue in the table, since these exposures are managed economically in combination with mark-to-market positions. The U.S. dollar interest rate exposure associated with these businesses was $(265) million for a 100 bps instantaneous increase in interest rates as of June 30, 2020.
(2)Includes the effect of changes in interest rates on AOCI related to investment securities, cash flow hedges and pension liability adjustments.
As shown in the table above, Citi increased its net interest revenue exposure to an increase in interest rates. The increase was predominantly in U.S. dollar exposure, which changed from a liability-sensitive $(142) million as of March 31, 2020 to a more asset-sensitive $27 million as of June 30, 2020, primarily driven by placement of a large increase in deposits into cash equivalents and investments.
The relatively small quarterly change in the estimated impact to AOCI primarily reflected a continuation of the positioning strategy of Citi Treasury’s investment securities and related interest rate derivatives portfolio. In the event of a parallel instantaneous 100 bps increase in interest rates, Citi expects that the negative impact to AOCI would be offset in stockholders’ equity through the expected recovery of the impact on AOCI through accretion of Citi’s investment portfolio over a period of time. As of June 30, 2020, Citi expects that the negative $5.7 billion impact to AOCI in such a scenario could potentially be offset over approximately 38 months.
The following table sets forth the estimated impact to Citi’s net interest revenue, AOCI and the Common Equity Tier 1 Capital ratio (on a fully implemented basis) under five different changes in interest rate scenarios for the U.S. dollar and Citi’s other currencies. The 100 bps downward rate scenarios are impacted by the low level of interest rates in several countries and the assumption that market interest rates, as well as rates paid to depositors and charged to borrowers, do not fall below zero (i.e., the “flooring assumption”). The rate scenarios are also impacted by convexity related to mortgage products.
Additionally, in the table below, the magnitude of the impact to Citi’s net interest revenue and AOCI is greater under Scenario 2 as compared to Scenario 3. This is because the combination of changes to Citi’s investment portfolio, partially offset by changes related to Citi’s pension liabilities, results in a net position that is more sensitive to rates at shorter- and intermediate-term maturities.
| | | | | | | | | | | | | | | | | |
| In millions of dollars, except as otherwise noted | Scenario 1 | Scenario 2 | Scenario 3 | Scenario 4 | Scenario 5 |
| Overnight rate change (bps) | 100 | | 100 | | — | | — | | (100) | |
| 10-year rate change (bps) | 100 | | — | | 100 | | (100) | | (100) | |
Estimated annualized impact to net interest revenue | | | | | |
| U.S. dollar | $ | 27 | | $ | 95 | | $ | 239 | | $ | (147) | | $ | (219) | |
| All other currencies | 683 | | 602 | | 37 | | (37) | | (354) | |
| Total | $ | 710 | | $ | 697 | | $ | 276 | | $ | (184) | | $ | (573) | |
Estimated initial impact to AOCI (after-tax)(1) | $ | (5,705) | | $ | (3,901) | | $ | (2,004) | | $ | 1,449 | | $ | 3,019 | |
| Estimated initial impact to Common Equity Tier 1 Capital ratio (bps) | (35) | | (24) | | (13) | | 8 | | 13 | |
Note: Each scenario assumes that the rate change will occur instantaneously. Changes in interest rates for maturities between the overnight rate and the 10-year rate are interpolated.
(1)Includes the effect of changes in interest rates on AOCI related to investment securities, cash flow hedges and pension liability adjustments.
Changes in Foreign Exchange Rates—Impacts on AOCI and Capital
As of June 30, 2020, Citi estimates that an unanticipated parallel instantaneous 5% appreciation of the U.S. dollar against all of the other currencies in which Citi has invested capital could reduce Citi’s tangible common equity (TCE) by approximately $1.4 billion, or 1.0%, as a result of changes to Citi’s foreign currency translation adjustment in AOCI, net of hedges. This impact would be primarily due to changes in the value of the Mexican peso, Indian rupee, Euro and Australian dollar.
This impact is also before any mitigating actions Citi may take, including ongoing management of its foreign currency translation exposure. Specifically, as currency movements change the value of Citi’s net investments in foreign currency-denominated capital, these movements also change the value of Citi’s risk-weighted assets denominated in those currencies. This, coupled with Citi’s foreign currency hedging strategies, such as foreign currency borrowings, foreign currency forwards and other currency hedging instruments, lessens the impact of foreign currency movements on Citi’s Common Equity Tier 1 Capital ratio. Changes in these hedging strategies, as well as hedging costs, divestitures and tax impacts, can further affect the actual impact of changes in foreign exchange rates on Citi’s capital as compared to an unanticipated parallel shock, as described above.
The effect of Citi’s ongoing management strategies with respect to changes in foreign exchange rates, and the impact of these changes on Citi’s TCE and Common Equity Tier 1 Capital ratio, are shown in the table below. For additional information on the changes in AOCI, see Note 17 to the Consolidated Financial Statements.
| | | | | | | | | | | |
| For the quarter ended | | |
| In millions of dollars, except as otherwise noted | Jun. 30, 2020 | Mar. 31, 2020 | Jun. 30, 2019 |
Change in FX spot rate(1) | 2.1 | % | (9.2) | % | 0.4 | % |
| Change in TCE due to FX translation, net of hedges | $ | 418 | | $ | (3,201) | | $ | 56 | |
| As a percentage of TCE | 0.3 | % | (2.1) | % | — | % |
Estimated impact to Common Equity Tier 1 Capital ratio (on a fully implemented basis) due
to changes in FX translation, net of hedges (bps) | (0.2) | | (5) | | — | |
(1) FX spot rate change is a weighted average based upon Citi’s quarterly average GAAP capital exposure to foreign countries.
Interest Revenue/Expense and Net Interest Margin (NIM)
| | | | | | | | | | | | | | | | | | | | | | | | | | |
| 2nd Qtr. | | 1st Qtr. | | 2nd Qtr. | | Change | |
| In millions of dollars, except as otherwise noted | 2020 | | 2020 | | 2019 | | 2Q20 vs. 2Q19 | |
Interest revenue(1) | $ | 14,632 | | | $ | 17,185 | | | $ | 19,761 | | | (26) | % | |
Interest expense(2) | 3,509 | | | 5,647 | | | 7,762 | | | (55) | | |
| Net interest revenue, taxable equivalent basis | $ | 11,123 | | | $ | 11,538 | | | $ | 11,999 | | | (7) | % | |
Interest revenue—average rate(3) | 2.85 | % | | 3.69 | % | | 4.40 | % | | (155) | | bps |
| Interest expense—average rate | 0.83 | | | 1.49 | | | 2.14 | | | (131) | | bps |
Net interest margin(3)(4) | 2.17 | | | 2.48 | | | 2.67 | | | (50) | | bps |
| Interest-rate benchmarks | | | | | | | | |
| Two-year U.S. Treasury note—average rate | 0.19 | % | | 1.08 | % | | 2.13 | % | | (194) | | bps |
| 10-year U.S. Treasury note—average rate | 0.69 | | | 1.37 | | | 2.34 | | | (165) | | bps |
| 10-year vs. two-year spread | 50 | | bps | 29 | | bps | 21 | | bps | | |
Note: All interest expense amounts include FDIC, as well as other similar deposit insurance assessments outside of the U.S.
(1)Net interest revenue includes the taxable equivalent adjustments related to the tax-exempt bond portfolio (based on the U.S. federal statutory tax rate of 21% of $43 million, $46 million and $49 million for the three months ended June 30, 2020, March 31, 2020, and June 30, 2019, respectively.
(2)Interest expense associated with certain hybrid financial instruments, which are classified as Long-term debt and accounted for at fair value, is reported together with any changes in fair value as part of Principal transactions in the Consolidated Statement of Income and is therefore not reflected in Interest expense in the table above.
(3)The average rate on interest revenue and net interest margin reflects the taxable equivalent gross-up adjustment. See footnote 1 on “Average Balances and Interest Rates—Assets” below.
(4)Citi’s net interest margin (NIM) is calculated by dividing net interest revenue by average interest-earning assets.
Net Interest Revenue Excluding ICG Markets
| | | | | | | | | | | | | | | | | | | | | | | |
| 2nd Qtr. | | 1st Qtr. | | 2nd Qtr. | | Change |
| In millions of dollars | 2020 | | 2020 | | 2019 | | 2Q20 vs. 2Q19 |
Net interest revenue—taxable equivalent basis(1) per above | $ | 11,123 | | | $ | 11,538 | | | $ | 11,999 | | | (7) | % |
ICG Markets net interest revenue—taxable equivalent basis(1) | 1,511 | | | 1,182 | | | 1,270 | | | 19 | |
Net interest revenue excluding ICG Markets—taxable equivalent basis(1) | $ | 9,612 | | | $ | 10,356 | | | $ | 10,729 | | | (10) | % |
(1)Net interest revenue includes the taxable equivalent adjustments related to the tax-exempt bond portfolio (based on the U.S. federal statutory tax rate of 21% of $43 million, $46 million and $49 million for the three months ended June 30, 2020, March 31, 2020, and June 30, 2019, respectively.
Citi’s net interest revenue in the second quarter of 2020 decreased 7% to $11.1 billion versus the prior-year period. Citi’s net interest revenue on a taxable equivalent basis also decreased 7% (as set forth in the table above). Excluding the impact of FX translation, net interest revenue declined year-over-year by approximately $580 million, as a decline of $810 million in net interest revenue excluding ICG Markets was partially offset by a $230 million increase in ICG Markets (fixed income markets and equity markets) net interest revenue. The decrease in net interest revenue excluding ICG Markets reflected the impact of lower rates and lower loan balances, partially offset by a favorable loan mix in North America Citi-branded cards. The increase in ICG Markets net interest revenue reflected a change in the mix of trading positions in support of client activity. Citi expects its net interest revenue to decline year-over-year in the third quarter 2020 due to the impact of lower interest rates and lower levels of customer activity related to the pandemic.
Citi’s NIM was 2.17% on a taxable equivalent basis in the second quarter of 2020, a decrease of 31 basis points from the prior quarter, with lower net interest revenues driving approximately one-third of the decline and the remainder representing growth in Citi’s balance sheet reflecting an increase in liquid assets driven by strong deposit growth.
Citi’s ICG Markets net interest revenues and net interest revenue excluding ICG Markets are non-GAAP financial measures. Citi reviews net interest revenue excluding ICG Markets to assess the performance of its lending, investing and deposit-raising activities. Citi believes disclosure of this metric assists in providing a meaningful depiction of the underlying fundamentals of its non-ICG Markets businesses.
Additional Interest Rate Details
Average Balances and Interest Rates—Assets(1)(2)(3)
Taxable Equivalent Basis
| | | | | | | | | | | | | | | | | | | | | | | | | | | | | |
| Quarterly—Assets | Average volume | | | Interest revenue | | | % Average rate | | |
| 2nd Qtr. | 1st Qtr. | 2nd Qtr. | 2nd Qtr. | 1st Qtr. | 2nd Qtr. | 2nd Qtr. | 1st Qtr. | 2nd Qtr. |
| In millions of dollars, except rates | 2020 | 2020 | 2019 | 2020 | 2020 | 2019 | 2020 | 2020 | 2019 |
Deposits with banks(4) | $ | 305,485 | | $ | 207,130 | | $ | 192,483 | | $ | 159 | | $ | 527 | | $ | 736 | | 0.21 | % | 1.02 | % | 1.53 | % |
Securities borrowed and purchased under agreements to resell(5) | | | | | | | | | |
| In U.S. offices | $ | 143,429 | | $ | 141,351 | | $ | 147,677 | | $ | 174 | | $ | 749 | | $ | 1,345 | | 0.49 | % | 2.13 | % | 3.65 | % |
In offices outside the U.S.(4) | 142,681 | | 127,549 | | 118,973 | | 227 | | 459 | | 552 | | 0.64 | | 1.45 | | 1.86 | |
| Total | $ | 286,110 | | $ | 268,900 | | $ | 266,650 | | $ | 401 | | $ | 1,208 | | $ | 1,897 | | 0.56 | % | 1.81 | % | 2.85 | % |
Trading account assets(6)(7) | | | | | | | | | |
| In U.S. offices | $ | 155,037 | | $ | 130,138 | | $ | 108,993 | | $ | 953 | | $ | 975 | | $ | 1,014 | | 2.47 | % | 3.01 | % | 3.73 | % |
In offices outside the U.S.(4) | 124,908 | | 122,320 | | 136,733 | | 722 | | 619 | | 1,129 | | 2.32 | | 2.04 | | 3.31 | |
| Total | $ | 279,945 | | $ | 252,458 | | $ | 245,726 | | $ | 1,675 | | $ | 1,594 | | $ | 2,143 | | 2.41 | % | 2.54 | % | 3.50 | % |
| Investments | | | | | | | | | |
| In U.S. offices | | | | | | | | | |
| Taxable | $ | 260,163 | | $ | 238,298 | | $ | 217,593 | | $ | 1,024 | | $ | 1,158 | | $ | 1,273 | | 1.58 | % | 1.95 | % | 2.35 | % |
| Exempt from U.S. income tax | 14,699 | | 14,170 | | 15,233 | | 126 | | 109 | | 196 | | 3.45 | | 3.09 | | 5.16 | |
In offices outside the U.S.(4) | 139,917 | | 128,867 | | 114,575 | | 971 | | 1,038 | | 1,060 | | 2.79 | | 3.24 | | 3.71 | |
| Total | $ | 414,779 | | $ | 381,335 | | $ | 347,401 | | $ | 2,121 | | $ | 2,305 | | $ | 2,529 | | 2.06 | % | 2.43 | % | 2.92 | % |
Loans (net of unearned income)(8) | | | | | | | | | |
| In U.S. offices | $ | 410,371 | | $ | 403,558 | | $ | 393,694 | | $ | 6,732 | | $ | 7,318 | | $ | 7,614 | | 6.60 | % | 7.29 | % | 7.76 | % |
In offices outside the U.S.(4) | 292,424 | | 291,117 | | 285,928 | | 3,434 | | 3,950 | | 4,385 | | 4.72 | | 5.46 | | 6.15 | |
| Total | $ | 702,795 | | $ | 694,675 | | $ | 679,622 | | $ | 10,166 | | $ | 11,268 | | $ | 11,999 | | 5.82 | % | 6.52 | % | 7.08 | % |
Other interest-earning assets(9) | $ | 75,287 | | $ | 68,737 | | $ | 67,885 | | $ | 110 | | $ | 283 | | $ | 457 | | 0.59 | % | 1.66 | % | 2.70 | % |
| Total interest-earning assets | $ | 2,064,401 | | $ | 1,873,235 | | $ | 1,799,767 | | $ | 14,632 | | $ | 17,185 | | $ | 19,761 | | 2.85 | % | 3.69 | % | 4.40 | % |
Non-interest-earning assets(6) | $ | 202,209 | | $ | 206,484 | | $ | 179,357 | | | | | | | |
| | | | | | | | | |
| Total assets | $ | 2,266,610 | | $ | 2,079,719 | | $ | 1,979,124 | | | | | | | |
| | | | | | | | | |
| | | | | | | | | |
| | | | | | | | | |
| | | | | | | | | |
| | | | | | | | | |
| | | | | | | | | |
| | | | | | | | | |
| | | | | | | | | |
| | | | | | | | | |
| | | | | | | | | |
| | | | | | | | | |
| | | | | | | | | | | | | | | | | | | | | | | | | | | | | |
| Six Months—Assets | Average volume | | | Interest revenue | | | % Average rate | | |
| Six Months | | Six Months | Six Months | | Six Months | Six Months | | Six Months |
| In millions of dollars, except rates | 2020 | | 2019 | 2020 | | 2019 | 2020 | | 2019 |
Deposits with banks(4) | $ | 256,308 | | | $ | 181,926 | | $ | 686 | | | $ | 1,343 | | 0.54 | % | | 1.49 | % |
Securities borrowed and purchased under agreements to resell(5) | | | | | | | | | |
| In U.S. offices | $ | 142,390 | | | $ | 150,104 | | $ | 923 | | | $ | 2,607 | | 1.30 | % | | 3.50 | % |
In offices outside the U.S.(4) | 135,115 | | | 121,041 | | 686 | | | 1,080 | | 1.02 | | | 1.80 | |
| Total | $ | 277,505 | | | $ | 271,145 | | $ | 1,609 | | | $ | 3,687 | | 1.17 | % | | 2.74 | % |
Trading account assets(6)(7) | | | | | | | | | |
| In U.S. offices | $ | 142,588 | | | $ | 102,449 | | $ | 1,928 | | | $ | 1,954 | | 2.72 | % | | 3.85 | % |
In offices outside the U.S.(4) | 123,614 | | | 130,703 | | 1,341 | | | 1,881 | | 2.18 | | | 2.90 | |
| Total | $ | 266,202 | | | $ | 233,152 | | $ | 3,269 | | | $ | 3,835 | | 2.47 | % | | 3.32 | % |
| Investments | | | | | | | | | |
| In U.S. offices | | | | | | | | | |
| Taxable | $ | 249,230 | | | $ | 221,663 | | $ | 2,182 | | | $ | 2,782 | | 1.76 | % | | 2.53 | % |
| Exempt from U.S. income tax | 14,435 | | | 15,760 | | 235 | | | 325 | | 3.27 | | | 4.16 | |
In offices outside the U.S.(4) | 134,392 | | | 111,782 | | 2,009 | | | 2,000 | | 3.01 | | | 3.61 | |
| Total | $ | 398,057 | | | $ | 349,205 | | $ | 4,426 | | | $ | 5,107 | | 2.24 | % | | 2.95 | % |
Loans (net of unearned income)(8) | | | | | | | | | |
| In U.S. offices | $ | 406,964 | | | $ | 393,546 | | $ | 14,050 | | | $ | 15,263 | | 6.94 | % | | 7.82 | % |
In offices outside the U.S.(4) | 291,771 | | | 285,870 | | 7,384 | | | 8,726 | | 5.09 | | | 6.16 | |
| Total | $ | 698,735 | | | $ | 679,416 | | $ | 21,434 | | | $ | 23,989 | | 6.17 | % | | 7.12 | % |
Other interest-earning assets(9) | $ | 72,012 | | | $ | 67,405 | | $ | 393 | | | $ | 940 | | 1.10 | % | | 2.81 | % |
| Total interest-earning assets | $ | 1,968,819 | | | $ | 1,782,249 | | $ | 31,817 | | | $ | 38,901 | | 3.25 | % | | 4.40 | % |
Non-interest-earning assets(6) | $ | 204,346 | | | $ | 177,022 | | | | | | | |
| | | | | | | | | |
| Total assets | $ | 2,173,165 | | | $ | 1,959,271 | | | | | | | |
(1)Net interest revenue includes the taxable equivalent adjustments related to the tax-exempt bond portfolio (based on the U.S. federal statutory tax rate of 21% of $89 million and $113 million for the six months ended June 30, 2020 and 2019, respectively.
(2)Interest rates and amounts include the effects of risk management activities associated with the respective asset categories.
(3)Monthly or quarterly averages have been used by certain subsidiaries where daily averages are unavailable.
(4)Average rates reflect prevailing local interest rates, including inflationary effects and monetary corrections in certain countries.
(5)Average volumes of securities borrowed or purchased under agreements to resell are reported net pursuant to ASC 210-20-45. However, Interest revenue excludes the impact of ASC 210-20-45.
(6)The fair value carrying amounts of derivative contracts are reported net, pursuant to ASC 815-10-45, in Non-interest-earning assets and Other non-interest-bearing liabilities.
(7)Interest expense on Trading account liabilities of ICG is reported as a reduction of Interest revenue. Interest revenue and Interest expense on cash collateral positions are reported in interest on Trading account assets and Trading account liabilities, respectively.
(8)Includes cash-basis loans.
(9)Includes Brokerage receivables.
Average Balances and Interest Rates—Liabilities and Equity, and Net Interest Revenue(1)(2)(3)
Taxable Equivalent Basis
| | | | | | | | | | | | | | | | | | | | | | | | | | | | | |
| Quarterly—Liabilities | Average volume | | | Interest expense | | | % Average rate | | |
| 2nd Qtr. | 1st Qtr. | 2nd Qtr. | 2nd Qtr. | 1st Qtr. | 2nd Qtr. | 2nd Qtr. | 1st Qtr. | 2nd Qtr. |
| In millions of dollars, except rates | 2020 | 2020 | 2019 | 2020 | 2020 | 2019 | 2020 | 2020 | 2019 |
| Deposits | | | | | | | | | |
In U.S. offices(4) | $ | 492,966 | | $ | 427,957 | | $ | 377,651 | | $ | 727 | | $ | 1,360 | | $ | 1,627 | | 0.59 | % | 1.28 | % | 1.73 | % |
In offices outside the U.S.(5) | 540,779 | | 506,494 | | 485,069 | | 742 | | 1,254 | | 1,657 | | 0.55 | | 1.00 | | 1.37 | |
| Total | $ | 1,033,745 | | $ | 934,451 | | $ | 862,720 | | $ | 1,469 | | $ | 2,614 | | $ | 3,284 | | 0.57 | % | 1.13 | % | 1.53 | % |
Securities loaned and sold under agreements to repurchase(6) | | | | | | | | | |
| In U.S. offices | $ | 150,055 | | $ | 128,499 | | $ | 112,386 | | $ | 240 | | $ | 718 | | $ | 1,149 | | 0.64 | % | 2.25 | % | 4.10 | % |
In offices outside the U.S.(5) | 74,720 | | 70,011 | | 76,659 | | 213 | | 367 | | 575 | | 1.15 | | 2.11 | | 3.01 | |
| Total | $ | 224,775 | | $ | 198,510 | | $ | 189,045 | | $ | 453 | | $ | 1,085 | | $ | 1,724 | | 0.81 | % | 2.20 | % | 3.66 | % |
Trading account liabilities(7)(8) | | | | | | | | | |
| In U.S. offices | $ | 38,468 | | $ | 36,453 | | $ | 35,939 | | $ | 62 | | $ | 138 | | $ | 215 | | 0.65 | % | 1.52 | % | 2.40 | % |
In offices outside the U.S.(5) | 54,396 | | 48,047 | | 59,065 | | 82 | | 101 | | 105 | | 0.61 | | 0.85 | | 0.71 | |
| Total | $ | 92,864 | | $ | 84,500 | | $ | 95,004 | | $ | 144 | | $ | 239 | | $ | 320 | | 0.62 | % | 1.14 | % | 1.35 | % |
Short-term borrowings and other interest-bearing liabilities(9) | | | | | | | | | |
| In U.S. offices | $ | 96,139 | | $ | 86,710 | | $ | 84,091 | | $ | 104 | | $ | 326 | | $ | 630 | | 0.44 | % | 1.51 | % | 3.00 | % |
In offices outside the U.S.(5) | 22,939 | | 19,850 | | 22,114 | | 36 | | 58 | | 85 | | 0.63 | | 1.18 | | 1.54 | |
| Total | $ | 119,078 | | $ | 106,560 | | $ | 106,205 | | $ | 140 | | $ | 384 | | $ | 715 | | 0.47 | % | 1.45 | % | 2.70 | % |
Long-term debt(10) | | | | | | | | | |
| In U.S. offices | $ | 217,676 | | $ | 198,006 | | $ | 197,578 | | $ | 1,298 | | $ | 1,318 | | $ | 1,685 | | 2.40 | % | 2.68 | % | 3.42 | % |
In offices outside the U.S.(5) | 3,848 | | 4,186 | | 4,946 | | 5 | | 7 | | 34 | | 0.52 | | 0.67 | | 2.76 | |
| Total | $ | 221,524 | | $ | 202,192 | | $ | 202,524 | | $ | 1,303 | | $ | 1,325 | | $ | 1,719 | | 2.37 | % | 2.64 | % | 3.40 | % |
| Total interest-bearing liabilities | $ | 1,691,986 | | $ | 1,526,213 | | $ | 1,455,498 | | $ | 3,509 | | $ | 5,647 | | $ | 7,762 | | 0.83 | % | 1.49 | % | 2.14 | % |
| Demand deposits in U.S. offices | $ | 30,847 | | $ | 26,709 | | $ | 29,929 | | | | | | | |
Other non-interest-bearing liabilities(7) | 350,060 | | 333,210 | | 296,747 | | | | | | | |
| | | | | | | | | |
| Total liabilities | $ | 2,072,893 | | $ | 1,886,132 | | $ | 1,782,174 | | | | | | | |
| Citigroup stockholders’ equity | $ | 193,093 | | $ | 192,946 | | $ | 196,237 | | | | | | | |
| Noncontrolling interests | 624 | | 641 | | 713 | | | | | | | |
| Total equity | $ | 193,717 | | $ | 193,587 | | $ | 196,950 | | | | | | | |
| Total liabilities and stockholders’ equity | $ | 2,266,610 | | $ | 2,079,719 | | $ | 1,979,124 | | | | | | | |
Net interest revenue as a percentage of average interest-earning assets(11) | | | | | | | | | |
| In U.S. offices | $ | 1,223,519 | | $ | 1,077,872 | | $ | 1,015,979 | | $ | 6,703 | | $ | 7,001 | | $ | 7,029 | | 2.20 | % | 2.61 | % | 2.77 | % |
In offices outside the U.S.(6) | 840,882 | | 795,362 | | 783,788 | | 4,420 | | 4,537 | | 4,970 | | 2.11 | | 2.29 | | 2.54 | |
| Total | $ | 2,064,401 | | $ | 1,873,235 | | $ | 1,799,767 | | $ | 11,123 | | $ | 11,538 | | $ | 11,999 | | 2.17 | % | 2.48 | % | 2.67 | % |
| | | | | | | | | |
| | | | | | | | | |
| | | | | | | | | |
| | | | | | | | | |
| | | | | | | | | |
| | | | | | | | | | | | | | | | | | | | | | | | | | | | | |
| Six Months—Liabilities | Average volume | | | Interest expense | | | % Average rate | | |
| Six Months | | Six Months | Six Months | | Six Months | Six Months | | Six Months |
| In millions of dollars, except rates | 2020 | | 2019 | 2020 | | 2019 | 2020 | | 2019 |
| Deposits | | | | | | | | | |
In U.S. offices(4) | $ | 460,461 | | | $ | 371,949 | | $ | 2,087 | | | $ | 3,118 | | 0.91 | % | | 1.69 | % |
In offices outside the U.S.(5) | 523,637 | | | 479,106 | | 1,996 | | | 3,193 | | 0.77 | | | 1.34 | |
| Total | $ | 984,098 | | | $ | 851,055 | | $ | 4,083 | | | $ | 6,311 | | 0.83 | % | | 1.50 | % |
Securities loaned and sold under agreements to repurchase(6) | | | | | | | | | |
| In U.S. offices | $ | 139,277 | | | $ | 111,709 | | $ | 958 | | | $ | 2,256 | | 1.38 | % | | 4.07 | % |
In offices outside the U.S.(5) | 72,366 | | | 74,782 | | 580 | | | 1,057 | | 1.61 | | | 2.85 | |
| Total | $ | 211,643 | | | $ | 186,491 | | $ | 1,538 | | | $ | 3,313 | | 1.46 | % | | 3.58 | % |
Trading account liabilities(7)(8) | | | | | | | | | |
| In U.S. offices | $ | 37,460 | | | $ | 38,051 | | $ | 200 | | | $ | 411 | | 1.07 | % | | 2.18 | % |
In offices outside the U.S.(5) | 51,222 | | | 57,096 | | 183 | | | 236 | | 0.72 | | | 0.83 | |
| Total | $ | 88,682 | | | $ | 95,147 | | $ | 383 | | | $ | 647 | | 0.87 | % | | 1.37 | % |
Short-term borrowings and other interest bearing liabilities(9) | | | | | | | | | |
| In U.S. offices | $ | 91,424 | | | $ | 79,766 | | $ | 430 | | | $ | 1,201 | | 0.95 | % | | 3.04 | % |
In offices outside the U.S.(5) | 21,395 | | | 22,927 | | 94 | | | 166 | | 0.88 | | | 1.46 | |
| Total | $ | 112,819 | | | $ | 102,693 | | $ | 524 | | | $ | 1,367 | | 0.93 | % | | 2.68 | % |
Long-term debt(10) | | | | | | | | | |
| In U.S. offices | $ | 207,841 | | | $ | 194,741 | | $ | 2,616 | | | $ | 3,370 | | 2.53 | % | | 3.49 | % |
In offices outside the U.S.(5) | 4,017 | | | 5,003 | | 12 | | | 71 | | 0.60 | | | 2.86 | |
| Total | $ | 211,858 | | | $ | 199,744 | | $ | 2,628 | | | $ | 3,441 | | 2.49 | % | | 3.47 | % |
| Total interest-bearing liabilities | $ | 1,609,100 | | | $ | 1,435,130 | | $ | 9,156 | | | $ | 15,079 | | 1.14 | % | | 2.12 | % |
| Demand deposits in U.S. offices | $ | 28,778 | | | $ | 28,411 | | | | | | | |
Other non-interest-bearing liabilities(7) | 341,634 | | | 299,003 | | | | | | | |
| | | | | | | | | |
| Total liabilities | $ | 1,979,512 | | | $ | 1,762,544 | | | | | | | |
| Citigroup stockholders’ equity | $ | 193,020 | | | $ | 195,971 | | | | | | | |
| Noncontrolling interests | 633 | | | 756 | | | | | | | |
| Total equity | $ | 193,653 | | | $ | 196,727 | | | | | | | |
| Total liabilities and stockholders’ equity | $ | 2,173,165 | | | $ | 1,959,271 | | | | | | | |
Net interest revenue as a percentage of average interest-earning assets(11) | | | | | | | | | |
| In U.S. offices | $ | 1,150,696 | | | $ | 1,006,273 | | $ | 13,704 | | | $ | 14,261 | | 2.39 | % | | 2.86 | % |
In offices outside the U.S.(6) | 818,122 | | | 775,974 | | 8,957 | | | 9,561 | | 2.20 | | | 2.48 | |
| Total | $ | 1,968,818 | | | $ | 1,782,247 | | $ | 22,661 | | | $ | 23,822 | | 2.31 | % | | 2.70 | % |
(1)Net interest revenue includes the taxable equivalent adjustments related to the tax-exempt bond portfolio (based on the U.S. federal statutory tax rate of 21% of $89 million and $113 million for the six months ended June 30, 2020 and 2019, respectively.
(2)Interest rates and amounts include the effects of risk management activities associated with the respective liability categories.
(3)Monthly or quarterly averages have been used by certain subsidiaries where daily averages are unavailable.
(4)Consists of other time deposits and savings deposits. Savings deposits are made up of insured money market accounts, NOW accounts and other savings deposits. The interest expense on savings deposits includes FDIC deposit insurance assessments.
(5)Average rates reflect prevailing local interest rates, including inflationary effects and monetary corrections in certain countries.
(6)Average volumes of securities sold under agreements to repurchase are reported net pursuant to ASC 210-20-45. However, Interest expense excludes the impact of ASC 210-20-45.
(7)The fair value carrying amounts of derivative contracts are reported net, pursuant to ASC 815-10-45, in Non-interest-earning assets and Other non-interest-bearing liabilities.
(8)Interest expense on Trading account liabilities of ICG is reported as a reduction of Interest revenue. Interest revenue and Interest expense on cash collateral positions are reported in interest on Trading account assets and Trading account liabilities, respectively.
(9)Includes Brokerage payables.
(10)Excludes hybrid financial instruments and beneficial interests in consolidated VIEs that are classified as Long-term debt, as the changes in fair value for these obligations are recorded in Principal transactions.
(11)Includes allocations for capital and funding costs based on the location of the asset.
Analysis of Changes in Interest Revenue(1)(2)(3)
| | | | | | | | | | | | | | | | | | | | |
| | 2Q20 vs. 1Q20 | | | 2Q20 vs. 2Q19 | | |
| | Increase (decrease)
due to change in: | | | Increase (decrease)
due to change in: | | |
| In millions of dollars | Average
volume | Average
rate | Net
change | Average
volume | Average
rate | Net
change |
Deposits with banks(3) | $ | 176 | | $ | (544) | | $ | (368) | | $ | 281 | | $ | (858) | | $ | (577) | |
| Securities borrowed and purchased under agreements to resell | | | | | | |
| In U.S. offices | $ | 11 | | $ | (586) | | $ | (575) | | $ | (38) | | $ | (1,132) | | $ | (1,170) | |
In offices outside the U.S.(3) | 49 | | (281) | | (232) | | 93 | | (418) | | (325) | |
| Total | $ | 60 | | $ | (867) | | $ | (807) | | $ | 55 | | $ | (1,550) | | $ | (1,495) | |
Trading account assets(4) | | | | | | |
| In U.S. offices | $ | 169 | | $ | (191) | | $ | (22) | | $ | 348 | | $ | (409) | | $ | (61) | |
In offices outside the U.S.(3) | 13 | | 90 | | 103 | | (91) | | (316) | | (407) | |
| Total | $ | 182 | | $ | (101) | | $ | 81 | | $ | 257 | | $ | (725) | | $ | (468) | |
Investments(1) | | | | | | |
| In U.S. offices | $ | 106 | | $ | (223) | | $ | (117) | | $ | 234 | | $ | (553) | | $ | (319) | |
In offices outside the U.S.(3) | 84 | | (151) | | (67) | | 207 | | (296) | | (89) | |
| Total | $ | 190 | | $ | (374) | | $ | (184) | | $ | 441 | | $ | (849) | | $ | (408) | |
Loans (net of unearned income)(5) | | | | | | |
| In U.S. offices | $ | 122 | | $ | (708) | | $ | (586) | | $ | 312 | | $ | (1,195) | | $ | (883) | |
In offices outside the U.S.(3) | 18 | | (534) | | (516) | | 98 | | (1,049) | | (951) | |
| Total | $ | 140 | | $ | (1,242) | | $ | (1,102) | | $ | 410 | | $ | (2,244) | | $ | (1,834) | |
Other interest-earning assets(6) | $ | 25 | | $ | (198) | | $ | (173) | | $ | 45 | | $ | (392) | | $ | (347) | |
| Total interest revenue | $ | 773 | | $ | (3,326) | | $ | (2,553) | | $ | 1,489 | | $ | (6,618) | | $ | (5,129) | |
(1)The taxable equivalent adjustments related to the tax-exempt bond portfolio, based on the U.S. federal statutory tax rate of 21% in 2020 and 2019, are included in this presentation.
(2)Rate/volume variance is allocated based on the percentage relationship of changes in volume and changes in rate to the total net change.
(3)Changes in average rates reflect changes in prevailing local interest rates, including inflationary effects and monetary corrections in certain countries.
(4)Interest expense on Trading account liabilities of ICG is reported as a reduction of Interest revenue. Interest revenue and Interest expense on cash collateral positions are reported in interest on Trading account assets and Trading account liabilities, respectively.
(5)Includes cash-basis loans.
(6)Includes Brokerage receivables.
Analysis of Changes in Interest Expense and Net Interest Revenue(1)(2)(3)
| | | | | | | | | | | | | | | | | | | | |
| | 2Q20 vs. 1Q20 | | | 2Q20 vs. 2Q19 | | |
| | Increase (decrease)
due to change in: | | | Increase (decrease)
due to change in: | | |
| In millions of dollars | Average
volume | Average
rate | Net
change | Average
volume | Average
rate | Net
change |
| Deposits | | | | | | |
| In U.S. offices | $ | 182 | | $ | (815) | | $ | (633) | | $ | 393 | | $ | (1,293) | | $ | (900) | |
In offices outside the U.S.(3) | 80 | | (592) | | (512) | | 172 | | (1,087) | | (915) | |
| Total | $ | 262 | | $ | (1,407) | | $ | (1,145) | | $ | 565 | | $ | (2,380) | | $ | (1,815) | |
| Securities loaned and sold under agreements to repurchase | | | | | | |
| In U.S. offices | $ | 104 | | $ | (582) | | $ | (478) | | $ | 293 | | $ | (1,202) | | $ | (909) | |
In offices outside the U.S.(3) | 23 | | (177) | | (154) | | (14) | | (348) | | (362) | |
| Total | $ | 127 | | $ | (759) | | $ | (632) | | $ | 279 | | $ | (1,550) | | $ | (1,271) | |
Trading account liabilities(4) | | | | | | |
| In U.S. offices | $ | 7 | | $ | (83) | | $ | (76) | | $ | 14 | | $ | (167) | | $ | (153) | |
In offices outside the U.S.(3) | 12 | | (31) | | (19) | | (8) | | (15) | | (23) | |
| Total | $ | 19 | | $ | (114) | | $ | (95) | | $ | 6 | | $ | (182) | | $ | (176) | |
Short-term borrowings and Other Interest Bearing Liabilities(5) | | | | | | |
| In U.S. offices | $ | 32 | | $ | (254) | | $ | (222) | | $ | 79 | | $ | (605) | | $ | (526) | |
In offices outside the U.S.(3) | 8 | | (30) | | (22) | | 3 | | (52) | | (49) | |
| Total | $ | 40 | | $ | (284) | | $ | (244) | | $ | 82 | | $ | (657) | | $ | (575) | |
| Long-term debt | | | | | | |
| In U.S. offices | $ | 125 | | $ | (145) | | $ | (20) | | $ | 158 | | $ | (545) | | $ | (387) | |
In offices outside the U.S.(3) | (1) | | (1) | | (2) | | (6) | | (23) | | (29) | |
| Total | $ | 124 | | $ | (146) | | $ | (22) | | $ | 152 | | $ | (568) | | $ | (416) | |
| Total interest expense | $ | 572 | | $ | (2,710) | | $ | (2,138) | | $ | 1,084 | | $ | (5,337) | | $ | (4,253) | |
| Net interest revenue | $ | 200 | | $ | (615) | | $ | (415) | | $ | 404 | | $ | (1,280) | | $ | (876) | |
(1)The taxable equivalent adjustments related to the tax-exempt bond portfolio, based on the U.S. federal statutory tax rate of 21% in 2020 and 2019, are included in this presentation.
(2)Rate/volume variance is allocated based on the percentage relationship of changes in volume and changes in rate to the total net change.
(3)Changes in average rates reflect changes in prevailing local interest rates, including inflationary effects and monetary corrections in certain countries.
(4)Interest expense on Trading account liabilities of ICG is reported as a reduction of Interest revenue. Interest revenue and Interest expense on cash collateral positions are reported in interest on Trading account assets and Trading account liabilities, respectively.
(5)Includes Brokerage payables.
Analysis of Changes in Interest Revenue(1)(2)(3)
| | | | | | | | | | | |
| | Six Months 2020 vs. Six Months 2019 | | |
| | Increase (decrease)
due to change in: | | |
| In millions of dollars | Average
volume | Average
rate | Net
change |
Deposits with banks(3) | $ | 412 | | $ | (1,069) | | $ | (657) | |
| Securities borrowed and purchased under agreements to resell | | | |
| In U.S. offices | $ | (128) | | $ | (1,556) | | $ | (1,684) | |
In offices outside the U.S.(3) | 114 | | (508) | | (394) | |
| Total | $ | (14) | | $ | (2,064) | | $ | (2,078) | |
Trading account assets(4) | | | |
| In U.S. offices | $ | 637 | | $ | (663) | | $ | (26) | |
In offices outside the U.S.(3) | (97) | | (443) | | (540) | |
| Total | $ | 540 | | $ | (1,106) | | $ | (566) | |
Investments(1) | | | |
| In U.S. offices | $ | 316 | | $ | (1,006) | | $ | (690) | |
In offices outside the U.S.(3) | 368 | | (359) | | 9 | |
| Total | $ | 684 | | $ | (1,365) | | $ | (681) | |
Loans (net of unearned income)(5) | | | |
| In U.S. offices | $ | 507 | | $ | (1,720) | | $ | (1,213) | |
In offices outside the U.S.(3) | 177 | | (1,519) | | (1,342) | |
| Total | $ | 684 | | $ | (3,239) | | $ | (2,555) | |
Other interest-earning assets(6) | $ | 60 | | $ | (607) | | $ | (547) | |
| Total interest revenue | $ | 2,366 | | $ | (9,450) | | $ | (7,084) | |
(1)The taxable equivalent adjustments related to the tax-exempt bond portfolio, based on the U.S. federal statutory tax rate of 21% in 2020 and 2019, are included in this presentation.
(2)Rate/volume variance is allocated based on the percentage relationship of changes in volume and changes in rate to the total net change.
(3)Changes in average rates reflect changes in prevailing local interest rates, including inflationary effects and monetary corrections in certain countries.
(4)Interest expense on Trading account liabilities of ICG is reported as a reduction of Interest revenue. Interest revenue and Interest expense on cash collateral positions are reported in interest on Trading account assets and Trading account liabilities, respectively.
(5)Includes cash-basis loans.
(6)Includes Brokerage receivables.
Analysis of Changes in Interest Expense and Net Interest Revenue(1)(2)(3)
| | | | | | | | | | | |
| | Six Months 2020 vs. Six Months 2019 | | |
| | Increase (decrease)
due to change in: | | |
| In millions of dollars | Average
volume | Average
rate | Net
change |
| Deposits | | | |
| In U.S. offices | $ | 626 | | $ | (1,655) | | $ | (1,029) | |
In offices outside the U.S.(3) | 274 | | (1,473) | | (1,199) | |
| Total | $ | 900 | | $ | (3,128) | | $ | (2,228) | |
| Securities loaned and sold under agreements to repurchase | | | |
| In U.S. offices | $ | 457 | | $ | (1,755) | | $ | (1,298) | |
In offices outside the U.S.(3) | (33) | | (444) | | (477) | |
| Total | $ | 424 | | $ | (2,199) | | $ | (1,775) | |
Trading account liabilities(4) | | | |
| In U.S. offices | $ | (6) | | $ | (205) | | $ | (211) | |
In offices outside the U.S.(3) | (23) | | (30) | | (53) | |
| Total | $ | (29) | | $ | (235) | | $ | (264) | |
Short-term borrowings and Other Interest Bearing Liabilities(5) | | | |
| In U.S. offices | $ | 154 | | $ | (925) | | $ | (771) | |
In offices outside the U.S.(3) | (10) | | (62) | | (72) | |
| Total | $ | 144 | | $ | (987) | | $ | (843) | |
| Long-term debt | | | |
| In U.S. offices | $ | 214 | | $ | (968) | | $ | (754) | |
In offices outside the U.S.(3) | (12) | | (47) | | (59) | |
| Total | $ | 202 | | $ | (1,015) | | $ | (813) | |
| Total interest expense | $ | 1,641 | | $ | (7,564) | | $ | (5,923) | |
| Net interest revenue | $ | 726 | | $ | (1,887) | | $ | (1,161) | |
(1)The taxable equivalent adjustments related to the tax-exempt bond portfolio, based on the U.S. federal statutory tax rate of 21% in 2020 and 2019, are included in this presentation.
(2)Rate/volume variance is allocated based on the percentage relationship of changes in volume and changes in rate to the total net change.
(3)Changes in average rates reflect changes in prevailing local interest rates, including inflationary effects and monetary corrections in certain countries.
(4)Interest expense on Trading account liabilities of ICG is reported as a reduction of Interest revenue. Interest revenue and Interest expense on cash collateral positions are reported in interest on Trading account assets and Trading account liabilities, respectively.
(5)Includes Brokerage payables.
Market Risk of Trading Portfolios
Value at Risk (VAR)
Citi believes its VAR model is conservatively calibrated to incorporate fat-tail scaling and the greater of short-term (approximately the most recent month) and long-term (three years) market volatility. As of June 30, 2020, Citi estimates the conservative features of the VAR calibration contribute an approximate 49% add-on to what would be a VAR estimated under the assumption of stable and normally distributed markets, compared to 348% at March 31, 2020.
The realized volatilities in June 2020 declined from March 2020 by 57%, 47%, 85%, and 68% for the S&P 500, the U.S. 5-year Treasury yield, the USD BBB Bond spread, and the CDX IG Credit spread, respectively, as illustrated below.
Such decline is also seen in the VIX index, which showed a quicker decline than in 2008.
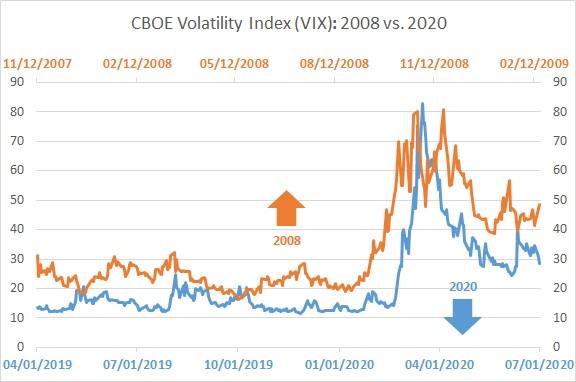
As set forth in the table below, Citi’s average trading VAR and average trading and credit portfolio VAR both increased during the second quarter of 2020 compared to the first quarter of 2020. The increases were primarily due to substantially higher market volatility related to the pandemic that occurred late in the first quarter and continued into the second quarter, despite declines in end-of-period VAR. As Citi uses a log normal distribution for credit spread risk rather than a normal modeling approach, the VAR increase for the credit spread risk contribution to the trading VAR was magnified by the increase in credit spread levels, as well the increase in realized volatilities (see USD BBB bond spread above). The proportionally higher increase in trading and credit portfolio VAR was also reflective of this modelling impact on the relative contribution of CVA exposures and mark-to-market CDS hedges of loan exposures accounted for under accrual methods.
Quarter-end and Average Trading VAR and Trading and Credit Portfolio VAR
| | | | | | | | | | | | | | | | | | | | |
| | Second Quarter | | First Quarter | | Second Quarter |
| In millions of dollars | June 30, 2020 | 2020 Average | March 31, 2020 | 2020 Average | June 30, 2019 | 2019 Average |
| Interest rate | $ | 95 | | $ | 78 | | $ | 78 | | $ | 38 | | $ | 40 | | $ | 36 | |
| Credit spread | 89 | | 137 | | 157 | | 55 | | 46 | | 43 | |
Covariance adjustment(1) | (60) | | (61) | | (55) | | (26) | | (24) | | (20) | |
Fully diversified interest rate and credit spread(2) | $ | 124 | | $ | 154 | | $ | 180 | | $ | 67 | | $ | 62 | | $ | 59 | |
| Foreign exchange | 23 | | 28 | | 29 | | 21 | | 29 | | 25 | |
| Equity | 27 | | 50 | | 92 | | 37 | | 22 | | 13 | |
| Commodity | 25 | | 27 | | 45 | | 16 | | 25 | | 25 | |
Covariance adjustment(1) | (73) | | (107) | | (155) | | (66) | | (69) | | (63) | |
Total trading VAR—all market risk factors, including general and specific risk (excluding credit portfolios)(2) | $ | 126 | | $ | 152 | | $ | 191 | | $ | 75 | | $ | 69 | | $ | 59 | |
Specific risk-only component(3) | $ | (20) | | $ | (9) | | $ | (16) | | $ | 7 | | $ | 2 | | $ | 2 | |
| Total trading VAR—general market risk factors only (excluding credit portfolios) | $ | 146 | | $ | 161 | | $ | 207 | | $ | 68 | | $ | 67 | | $ | 57 | |
Incremental impact of the credit portfolio(4) | $ | 16 | | $ | 93 | | $ | 217 | | $ | 44 | | $ | 7 | | $ | 10 | |
| Total trading and credit portfolio VAR | $ | 142 | | $ | 245 | | $ | 408 | | $ | 119 | | $ | 76 | | $ | 69 | |
(1)Covariance adjustment (also known as diversification benefit) equals the difference between the total VAR and the sum of the VARs tied to each risk type. The benefit reflects the fact that the risks within individual and across risk types are not perfectly correlated and, consequently, the total VAR on a given day will be lower than the sum of the VARs relating to each risk type. The determination of the primary drivers of changes to the covariance adjustment is made by an examination of the impact of both model parameter and position changes.
(2) The total trading VAR includes mark-to-market and certain fair value option trading positions in ICG, with the exception of hedges to the loan portfolio, fair value option loans and all CVA exposures. Available-for-sale and accrual exposures are not included.
(3) The specific risk-only component represents the level of equity and fixed income issuer-specific risk embedded in VAR.
(4) The credit portfolio is composed of mark-to-market positions associated with non-trading business units including Citi Treasury, the CVA relating to derivative counterparties and all associated CVA hedges. FVA and DVA are not included. The credit portfolio also includes hedges to the loan portfolio, fair value option loans and hedges to the leveraged finance pipeline within capital markets origination in ICG.
The table below provides the range of market factor VARs associated with Citi’s total trading VAR, inclusive of specific risk:
| | | | | | | | | | | | | | | | | | | | |
| | Second Quarter | | First Quarter | | Second Quarter | |
| 2020 | | 2020 | | 2019 | |
| In millions of dollars | Low | High | Low | High | Low | High |
| Interest rate | $ | 44 | | $ | 137 | | $ | 28 | | $ | 78 | | $ | 27 | | $ | 47 | |
| Credit spread | 89 | | 171 | | 36 | | 162 | | 39 | | 48 | |
| | | | | | |
| Fully diversified interest rate and credit spread | $ | 112 | | $ | 223 | | $ | 44 | | $ | 180 | | $ | 49 | | $ | 72 | |
| Foreign exchange | 20 | | 34 | | 14 | | 32 | | 20 | | 32 | |
| Equity | 23 | | 135 | | 13 | | 141 | | 7 | | 22 | |
| Commodity | 17 | | 64 | | 12 | | 45 | | 20 | | 33 | |
| | | | | | |
| Total trading | $ | 106 | | $ | 246 | | $ | 47 | | $ | 191 | | $ | 46 | | $ | 69 | |
| Total trading and credit portfolio | 120 | | 424 | | 58 | | 414 | | 59 | | 77 | |
Note: No covariance adjustment can be inferred from the above table as the high and low for each market factor will be from different close-of-business dates.
The following table provides the VAR for ICG, excluding the CVA relating to derivative counterparties, hedges of CVA, fair value option loans and hedges to the loan portfolio:
| | | | | |
| In millions of dollars | Jun. 30, 2020 |
Total—all market risk factors, including
general and specific risk | |
| Average—during quarter | $ | 147 | |
| High—during quarter | 236 | |
| Low—during quarter | 105 | |
Regulatory VAR Back-testing
In accordance with Basel III, Citi is required to perform back-testing to evaluate the effectiveness of its Regulatory VAR model. Regulatory VAR back-testing is the process in which the daily one-day VAR, at a 99% confidence interval, is compared to the buy-and-hold profit and loss (i.e., the profit and loss impact if the portfolio is held constant at the end of the day and re-priced the following day). Buy-and-hold profit and loss represents the daily mark-to-market profit and loss attributable to price movements in covered positions from the close of the previous business day. Buy-and-hold profit and loss excludes realized trading revenue, net interest, fees and commissions, intra-day trading profit and loss and changes in reserves.
Based on a 99% confidence level, Citi would expect two to three days in any one year where buy-and-hold losses exceed the Regulatory VAR. Given the conservative calibration of Citi’s VAR model (as a result of taking the greater of short- and long-term volatilities and fat-tail scaling of volatilities), Citi would expect fewer exceptions under normal and stable market conditions. Periods of unstable market conditions could increase the number of back-testing exceptions.
There were no back-testing exceptions during the second quarter of 2020. As of June 30, 2020, there were four back-testing exceptions observed for Citi’s Regulatory VAR for the prior 12 months. All of those exceptions occurred during March 2020 due to the significant market volatility in response to the pandemic.
STRATEGIC RISK
For additional information on strategic risk at Citi, see “Strategic Risk” in Citi’s 2019 Annual Report on Form 10-K.
Country Risk
Top 25 Country Exposures
The following table presents Citi’s top 25 exposures by country (excluding the U.S.) as of June 30, 2020. The total exposure as of June 30, 2020 to the top 25 countries disclosed below, in combination with the U.S., would represent approximately 95% of Citi’s exposure to all countries. For purposes of the table, loan amounts are reflected in the country where the loan is booked, which is generally based on the domicile of the borrower. For example, a loan to a Chinese subsidiary of a Switzerland-based corporation will generally be categorized as a loan in China. In addition, Citi has
developed regional booking centers in certain countries, most significantly in the United Kingdom (U.K.) and Ireland, in order to more efficiently serve its corporate customers. As an example, for U.K. exposure, only 35% of corporate loans presented in the table below are to U.K. domiciled entities (and 36% of unfunded lending commitments are to U.K. domiciled entities), with the balance of the loans predominately outstanding to European domiciled counterparties. Approximately 75% of the total U.K. funded loans and 88% of the total U.K. unfunded lending commitments were investment grade as of June 30, 2020. Trading account assets and investment securities are generally categorized based on the domicile of the issuer of the security of the underlying reference entity. For additional information on the assets included in the table, see the footnotes to the table below.
| | | | | | | | | | | | | | | | | | | | | | | | | | | | | | | | | | | | | | |
| In billions of dollars | ICG loans(1) | GCB loans | Other funded(2) | Unfunded(3) | Net MTM on derivatives/repos(4) | Total hedges (on loans and CVA) | Investment securities(5) | Trading account assets(6) | Total
as of
2Q20 | Total
as of
1Q20 | Total
as of
2Q19 | Total as a % of Citi as of 2Q20 |
| United Kingdom | $ | 41.8 | | $ | — | | $ | 2.9 | | $ | 47.5 | | $ | 19.0 | | $ | (5.6) | | $ | 4.3 | | $ | (0.2) | | $ | 109.7 | | $ | 118.9 | | $ | 117.7 | | 6.2 | % |
| Mexico | 17.9 | | 13.3 | | 0.2 | | 6.5 | | 3.2 | | (0.9) | | 14.3 | | 4.6 | | 59.1 | | 56.9 | | 66.8 | | 3.4 | |
| Hong Kong | 19.3 | | 12.8 | | 0.9 | | 6.6 | | 2.0 | | (0.9) | | 7.9 | | 0.5 | | 49.1 | | 49.3 | | 49.5 | | 2.8 | |
| Singapore | 14.7 | | 12.6 | | 0.1 | | 5.9 | | 4.3 | | (0.6) | | 8.9 | | 0.9 | | 46.8 | | 44.6 | | 42.7 | | 2.7 | |
| Ireland | 13.1 | | — | | 0.6 | | 27.0 | | 0.8 | | (0.1) | | — | | 0.6 | | 42.0 | | 40.5 | | 32.9 | | 2.4 | |
| South Korea | 3.3 | | 16.0 | | 0.1 | | 2.1 | | 1.1 | | (0.5) | | 9.6 | | 1.0 | | 32.7 | | 33.5 | | 31.6 | | 1.9 | |
| India | 6.2 | | 4.2 | | 0.5 | | 5.4 | | 2.3 | | (0.4) | | 9.7 | | 0.6 | | 28.5 | | 30.2 | | 31.3 | | 1.6 | |
| Brazil | 14.4 | | — | | — | | 1.6 | | 3.4 | | (0.9) | | 3.8 | | 3.1 | | 25.4 | | 26.2 | | 26.4 | | 1.4 | |
| Germany | 0.7 | | — | | — | | 5.7 | | 7.0 | | (4.4) | | 11.1 | | 4.5 | | 24.6 | | 21.5 | | 18.8 | | 1.4 | |
| Australia | 4.8 | | 8.8 | | — | | 6.2 | | 1.4 | | (0.6) | | 1.4 | | (1.8) | | 20.2 | | 22.6 | | 21.8 | | 1.2 | |
| China | 7.4 | | 3.3 | | 0.5 | | 3.2 | | 1.2 | | (0.7) | | 5.3 | | (1.0) | | 19.2 | | 21.5 | | 18.3 | | 1.1 | |
| Japan | 2.7 | | — | | 0.1 | | 3.0 | | 4.4 | | (1.9) | | 5.8 | | 4.4 | | 18.5 | | 20.5 | | 19.0 | | 1.1 | |
| Canada | 2.8 | | 0.5 | | 0.3 | | 7.2 | | 2.2 | | (1.0) | | 4.8 | | 1.0 | | 17.8 | | 18.2 | | 16.4 | | 1.0 | |
| Taiwan | 5.5 | | 7.8 | | 0.1 | | 1.2 | | 0.4 | | (0.1) | | 0.8 | | 1.0 | | 16.7 | | 16.6 | | 17.6 | | 1.0 | |
| Poland | 3.7 | | 1.9 | | — | | 2.6 | | 0.1 | | — | | 6.0 | | 0.8 | | 15.1 | | 14.7 | | 15.3 | | 0.9 | |
| United Arab Emirates | 8.5 | | 1.2 | | — | | 2.8 | | 0.5 | | (0.2) | | 0.1 | | — | | 12.9 | | 14.2 | | 11.8 | | 0.7 | |
| Jersey | 7.0 | | — | | 0.2 | | 5.1 | | — | | (0.3) | | — | | — | | 12.0 | | 11.7 | | 12.8 | | 0.7 | |
| Malaysia | 1.7 | | 3.7 | | 0.2 | | 0.9 | | 0.3 | | — | | 1.8 | | 0.5 | | 9.1 | | 8.6 | | 9.7 | | 0.5 | |
| Thailand | 1.0 | | 2.6 | | — | | 1.9 | | 0.1 | | — | | 2.0 | | 0.2 | | 7.8 | | 7.3 | | 8.5 | | 0.4 | |
| Luxembourg | 0.7 | | — | | — | | — | | 0.5 | | (0.1) | | 5.1 | | 0.5 | | 6.7 | | 6.1 | | 2.9 | | 0.4 | |
| Indonesia | 2.5 | | 0.7 | | — | | 1.2 | | — | | — | | 1.3 | | 0.2 | | 5.9 | | 5.3 | | 6.2 | | 0.3 | |
| Russia | 1.7 | | 0.8 | | — | | 0.7 | | 0.8 | | (0.1) | | 1.3 | | 0.2 | | 5.4 | | 5.1 | | 5.4 | | 0.3 | |
| Philippines | 1.0 | | 1.4 | | 0.1 | | 0.5 | | — | | — | | 2.3 | | 0.1 | | 5.4 | | 5.0 | | 5.2 | | 0.3 | |
| Netherlands | — | | — | | — | | — | | 1.7 | | (1.6) | | 1.8 | | 2.6 | | 4.5 | | 1.2 | | 1.9 | | 0.3 | |
| Italy | 0.2 | | — | | — | | 2.1 | | 5.1 | | (5.2) | | — | | 1.6 | | 3.8 | | 1.9 | | 6.1 | | 0.2 | |
| Total as a % of Citi’s total exposure | | | | | | | | | | | | 34.2 | % |
| Total as a % of Citi’s non-U.S. total exposure | | | | | | | | | | | | 89.4 | % |
(1) ICG loans reflect funded corporate loans and private bank loans, net of unearned income. As of June 30, 2020, private bank loans in the table above totaled $27.7 billion, concentrated in Hong Kong ($8.4 billion), Singapore ($6.6 billion) and the U.K. ($6.2 billion).
(2) Other funded includes other direct exposures such as accounts receivable, loans HFS, other loans in Corporate/Other and investments accounted for under the equity method.
(3) Unfunded exposure includes unfunded corporate lending commitments, letters of credit and other contingencies.
(4) Net mark-to-market counterparty risk on OTC derivatives and securities lending/borrowing transactions (repos). Exposures are shown net of collateral and inclusive of CVA. Includes margin loans.
(5) Investment securities include securities available-for-sale, recorded at fair market value, and securities held-to-maturity, recorded at historical cost.
(6) Trading account assets are shown on a net basis and include issuer risk on cash products and derivative exposure where the underlying reference entity/issuer is located in that country.
Argentina
As previously disclosed, Citi operates in Argentina through its ICG businesses. As of June 30, 2020, Citi’s net investment in its Argentine operations was approximately $900 million. Citi uses the U.S. dollar as the functional currency for its operations in Argentina because the Argentine economy is considered highly inflationary under U.S. GAAP. For additional information about Citi’s exposures in Argentina, see “Managing Global Risk—Country Risk—Argentina” in Citi’s 2019 Annual Report on Form 10-K.
In April 2020, the government of Argentina announced a postponement of debt payments related to foreign currency debt issued under foreign law, and the Argentine government has been negotiating a restructuring with the primary bondholders. In addition, the government of Argentina has continued to maintain certain capital and currency controls that restrict Citi’s ability to access U.S. dollars in Argentina and remit earnings from its Argentine operations.
Citi economically hedges the foreign currency risk in its net Argentine peso-denominated assets to the extent possible and prudent using non-deliverable forward (NDF) derivative instruments that are primarily executed outside of Argentina. As of June 30, 2020, the international NDF market had very limited liquidity, resulting in Citi being unable to economically hedge a significant portion of its Argentine peso exposure. To the extent that Citi is unable to execute additional NDF contracts in the future, devaluations on Citi’s net Argentine peso-denominated assets would be recorded in earnings, without any benefit from a change in the fair value of derivative positions used to economically hedge the exposure.
Citi continually evaluates its economic exposure to its Argentine counterparties and reserves for changes in credit risk and sovereign risk associated with its Argentine assets. Citi believes it has established appropriate loan loss reserves on its Argentine loans, and appropriate fair value adjustments on Argentine assets and liabilities measured at fair value, for such risks under U.S. GAAP as of June 30, 2020. However, given the recent events in Argentina, U.S. regulatory agencies may require Citi to record additional reserves in the future, increasing ICG’s cost of credit, based on the perceived country risk associated with its Argentine exposures. For additional information on emerging markets risks, see “Risk Factors—Strategic Risks” in Citi’s 2019 Annual Report on Form 10-K.
SIGNIFICANT ACCOUNTING POLICIES AND SIGNIFICANT ESTIMATES
This section contains a summary of Citi’s most significant accounting policies. Note 1 to the Consolidated Financial Statements in Citigroup’s 2019 Annual Report on Form 10-K and in Citigroup’s 2020 Report on Form 10-Q for the quarterly period ended March 31, 2020 contain a summary of all of Citigroup’s significant accounting policies. These policies, as well as estimates made by management, are integral to the presentation of Citi’s results of operations and financial condition. While all of these policies require a certain level of management judgment and estimates, this section highlights and discusses the significant accounting policies that require management to make highly difficult, complex or subjective judgments and estimates at times regarding matters that are inherently uncertain and susceptible to change (see also “Risk Factors—Operational Risks” in Citigroup’s 2019 Annual Report on Form 10-K). Management has discussed each of these significant accounting policies, the related estimates and its judgments with the Audit Committee of the Citigroup Board of Directors.
Valuations of Financial Instruments
Citigroup holds debt and equity securities, derivatives, retained interests in securitizations, investments in private equity and other financial instruments. A substantial majority of these assets and liabilities is reflected at fair value on Citi’s Consolidated Balance Sheet as Trading account assets, Available-for-sale securities and Trading account liabilities.
Citi purchases securities under agreements to resell (reverse repurchase agreements) and sells securities under agreements to repurchase (repurchase agreements), a majority of which are carried at fair value. In addition, certain loans, short-term borrowings, long-term debt and deposits, as well as certain securities borrowed and loaned positions that are collateralized with cash, are carried at fair value. Citigroup holds its investments, trading assets and liabilities, and resale and repurchase agreements on Citi’s Consolidated Balance Sheet to meet customer needs and to manage liquidity needs, interest rate risks and private equity investing.
When available, Citi generally uses quoted market prices to determine fair value and classifies such items within Level 1 of the fair value hierarchy established under ASC 820-10, Fair Value Measurement. If quoted market prices are not available, fair value is based upon internally developed valuation models that use, where possible, current market-based or independently sourced market parameters, such as interest rates, currency rates and option volatilities. Such models are often based on a discounted cash flow analysis. In addition, items valued using such internally generated valuation techniques are classified according to the lowest level input or value driver that is significant to the valuation. Thus, an item may be classified under the fair value hierarchy as Level 3 even though there may be some significant inputs that are readily observable.
Citi is required to exercise subjective judgments relating to the applicability and functionality of internal valuation models, the significance of inputs or value drivers to the
valuation of an instrument and the degree of illiquidity and subsequent lack of observability in certain markets. These judgments have the potential to impact the Company’s financial performance for instruments where the changes in fair value are recognized in either the Consolidated Statement of Income or in AOCI.
Losses on available-for-sale securities whose fair values are less than the amortized cost, where Citi intends to sell the security or could more-likely-than-not be required to sell the security, are recognized in earnings. Where Citi does not intend to sell the security nor could more-likely-than-not be required to sell the security, the portion of the loss related to credit is recognized as an allowance for credit losses with a corresponding provision for credit losses and the remainder of the loss is recognized in other comprehensive income. Such losses are capped at the difference between the fair value and amortized cost of the security.
For equity securities carried at cost or under the measurement alternative, decreases in fair value below the carrying value are recognized as impairment in the Consolidated Statement of Income. Moreover, for certain equity method investments, decreases in fair value are only recognized in earnings in the Consolidated Statement of Income if such decreases are judged to be an other-than-temporary impairment (OTTI). Adjudicating the temporary nature of fair value impairments is also inherently judgmental.
The fair value of financial instruments incorporates the effects of Citi’s own credit risk and the market view of counterparty credit risk, the quantification of which is also complex and judgmental. For additional information on Citi’s fair value analysis, see Notes 6, 20 and 21 to the Consolidated Financial Statements and Note 1 to the Consolidated Financial Statements in Citi’s 2019 Annual Report on Form 10-K.
Allowance for Credit Losses (ACL)
Citi provides reserves for an estimate of current expected credit losses in the funded loan portfolio and for the unfunded lending commitments, standby letters of credit and financial guarantees on the Consolidated Balance Sheet in Allowance for credit losses on loans (ACLL) and Other liabilities, respectively. In addition, Citi provides allowances for an estimate of current expected credit losses for other financial assets measured at amortized cost, including held-to-maturity securities, reverse repurchase agreements, securities borrowed, deposits with banks and other financial receivables carried at amortized cost (these allowances, together with the ACLL, are referred to as the ACL).
The ACL is composed of quantitative and qualitative components. For the quantitative component, Citi uses a single forward-looking macroeconomic forecast across the Company complemented by a qualitative component. This qualitative component reflects economic uncertainty related to a separate scenario and an alternative downside scenario, along with specific adjustments based on the associated portfolio for estimating the ACL.
Quantitative Component
Citi estimates expected credit losses based upon (i) its internal system of credit risk ratings, (ii) its comprehensive internal history and rating agency information regarding default rates and loss data, including internal data on the severity of losses in the event of default, and (iii) a reasonable and supportable forecast of future macroeconomic conditions.
Citi’s expected credit loss is determined primarily by utilizing models for the borrowers’ probability of default (PD), loss given default (LGD) and exposure at default (EAD). The loss likelihood and severity models use both internal and external information and are sensitive to changes in macroeconomic variables that inform the forecasts. Adjustments may be made to this data, including (i) statistically calculated estimates to cover the historical fluctuation of the default rates over the credit cycle, the historical variability of loss severity among defaulted loans and obligor concentrations in the global portfolio, and (ii) adjustments made for specifically known items, such as other current economic factors and credit trends.
In addition, Citi’s delinquency-managed portfolios containing smaller-balance homogeneous loans also use PD x LGD x EAD models to determine expected credit losses and reserve balances based on leading credit indicators, including loan delinquencies and changes in portfolio size, as well as economic trends, including housing prices, unemployment and gross domestic product (GDP). This methodology is applied separately for each product within each geographic region in which these portfolios exist.
This evaluation process is subject to numerous estimates and judgments. The frequency of default, risk ratings, loss recovery rates, size and diversity of individual large credits and ability of borrowers with foreign currency obligations to obtain the foreign currency necessary for orderly debt servicing, among other things, are all taken into account. Changes in these estimates could have a direct impact on Citi’s credit costs and the allowance in any period.
Qualitative Component
Any adjustments needed to the modeled expected losses in the quantitative calculations are addressed through a qualitative adjustment. The qualitative adjustment considers, among other things: the uncertainty of forward-looking scenarios based on the likelihood and severity of a possible recession, the uncertainty of economic conditions, certain portfolio characteristics and concentrations, collateral coverage, model limitations, idiosyncratic events and other relevant criteria under banking supervisory guidance for loan loss reserves. The qualitative adjustment also reflects the estimated impact of the COVID-19 pandemic on economic forecasts and the impact on credit loss estimates. The total ACL is composed of the quantitative and qualitative components.
Citi calculates a judgmental management adjustment, which is an alternative, more adverse scenario that only considers downside risk. The management adjustment incorporated this alternate pandemic downside scenario at a 15% likelihood, which contributed to an increase in the Provision for credit losses of approximately $0.8 billion and ending ACL reserves of $2.3 billion in the quarter.
Combined Quantitative and Qualitative Components
Citi built the ACL by $2.1 billion for its consumer portfolios and $3.5 billion for its corporate portfolios in the second quarter of 2020, primarily due to deterioration in macroeconomic conditions as a result of the pandemic. The ACL reflects both a quantitative component and a qualitative management adjustment based on Citi’s macroeconomic forecast as of June 22, 2020.
The quantitative and qualitative components of the ACL for the second quarter of 2020 reflect the estimated impact of the pandemic on economic forecasts and the impact on credit loss estimates, and include reserves for loans modified under the CARES Act and Interagency Guidance. The outlook around many of these metrics, such as GDP and unemployment, continues to evolve. Citi believes its analysis of the ACL reflects the forward view of the economic analysis as of June 30, 2020, based on the June 22, 2020 forecast. Citi expects a higher level of net credit losses during the remainder of 2020, partially offset by the release of existing reserves.
The extent of the pandemic’s ultimate impact will depend, among other things, upon (i) how consumers respond to the various consumer relief programs established by the federal government, as well as Citi’s own customer relief efforts, and how the federal government stimulus programs are implemented by small and medium-size businesses; (ii) the impact on unemployment, which is unclear; (iii) the timing and extent of the economic recovery; (iv) whether there is a resurgence of COVID-19 as businesses and schools reopen and the extent of that resurgence; and (v) the extent of market volatility.
Impact to ACL Estimate as a Result of a Voluntary Change in the Accounting for Variable Post-Charge-Off Third-Party Collection Costs
During the second quarter of 2020, there was a change in Citi`s ACL accounting estimate effected by a change in Citi`s accounting principle for variable post-charge-off third-party collection costs. These costs were previously accounted for as a reduction in credit recoveries. As a result of this change, beginning July 1, 2020, these costs are accounted for as an increase in operating expenses. Determining a preferable method of accounting for such costs is a judgmental matter; however, Citi concluded that such a change in the method of accounting is preferable in Citi’s circumstances as it better reflects the nature of these collection costs to investors. That is, these costs do not represent reduced payments from borrowers and are similar to Citi’s other executory third-party vendor contracts that are accounted for as operating expenses as incurred.
As a result of this accounting change, Citi`s estimate for the consumer ACL was impacted and resulted in a one-time ACL release of approximately $426 million in the second quarter of 2020. This one-time ACL release reflects the impact to Citi’s ACL estimate of the revised credit recoveries incorporated in the ACL models. This change in accounting will result in a reclassification of approximately $50 million of collection costs from credit recoveries to operating expenses each quarter, beginning with the third quarter of 2020.
Macroeconomic Variables
Citi uses a multitude of variables in its macroeconomic forecast, including both domestic and international variables for its various portfolios spanning Citi’s global portfolios and exposures. The two key macroeconomic variables that most significantly affect the estimation of the consumer and corporate ACL are Citi’s estimates of the U.S. unemployment rate and U.S. GDP growth rate. The tables below show these macroeconomic variables used for Citi’s 2Q20 and 1Q20 consumer and corporate ACL, comparing Citi’s forecasted (1) 4Q20, 2Q21 and 4Q21 quarterly average U.S. unemployment rate, and (2) cumulative U.S. GDP forecasted growth rate for 4Q20, 2Q21 and 4Q21:
| | | | | | | | | | | |
| Quarterly average | | |
| U.S. unemployment | 4Q20 | 2Q21 | 4Q21 |
| Citi forecast at 1Q20 | 7.1 | % | 6.7 | % | 6.5 | % |
| Citi forecast at 2Q20 | 8.9 | | 7.2 | | 5.9 | |
| | | | | | | | | | | |
| Cumulative growth rate from 4Q19 (pre-pandemic)(1) | | |
| U.S. GDP | 4Q20 | 2Q21 | 4Q21 |
| Citi forecast at 1Q20 | (2.4) | % | (0.9) | % | 0.1 | % |
| Citi forecast at 2Q20 | (4.0) | | (1.0) | | 0.7 | |
(1) The cumulative growth rate is the percentage change in the real (inflation adjusted) GDP level relative to 4Q19 level (pre-pandemic).
Consumer
The CECL impact for the consumer portfolio is largely driven by the cards businesses, where the receivables have longer estimated tenors under the CECL lifetime expected credit loss methodology, net of recoveries.
As discussed above, the total consumer (including Corporate/Other) ACL build of $2.1 billion in the second quarter of 2020 increased the ACL balance to $19.6 billion, or 6.97% of total consumer loans, and reflected the update of the macroeconomic forecast scenario for the second quarter. This ACL build resulted in an increase in reserves for credit cards to 11.21% of EOP loans at June 30, 2020 (this ACL build was reduced by $426 million for the change in accounting for third-party collection costs
discussed above), compared to 9.5% of EOP loans at March 31, 2020. For the remaining consumer exposures, the level of reserves relative to EOP loans increased to 2.2% at June 30, 2020, compared to 1.8% at March 31, 2020.
Corporate
The corporate ACLL build of $3.4 billion in the second quarter of 2020 increased the ACLL reserve balance to $6.8 billion, or 1.71% of total funded loans, and reflected the update of the macroeconomic forecast scenario for the second quarter of 2020 and the significant credit downgrades made through the end of the quarter.
Durables, transportation and logistics, and energy were key contributors to the increase in reserves, driven by the
combined impact of significant downgrades and changes in the macroeconomic scenario.
From a geography perspective, the U.S., E.U., Mexico and Brazil were the key contributors to the reserve build.
ACL Sensitivity
In the second quarter of 2020 ACL estimate, Citi employed a base set of economic variables in its CECL models and supplemented that with a more adverse scenario (qualitative adjustment). The adverse scenario, using a probability weighting of 15%, represents approximately $2.3 billion of the overall ACL balance of $28.5 billion at June 30, 2020. The adverse scenario incorporates more adverse economic variables (e.g., 400–500 bps in higher unemployment rates through 2021 and slower GDP recovery). To the extent that the probability of the adverse scenario increases, a corresponding increase in reserves would be expected.
It is important to note the following:
•The above cannot be used to estimate the overall impact on the ACL, as the amount of the qualitative component of the ACL (including, but not limited to, the economic uncertainty management adjustment) could be different under alternative macroeconomic scenarios and changes in the portfolio.
•The pandemic has had, and will likely continue to have, a severe impact on global economic conditions and the variability in macroeconomic variables, and their impacts on credit loss estimates could be material.
ACLL and Non-accrual Ratios
At June 30, 2020, the ratio of the allowance for credit losses to total funded loans was 3.89% (7.00% for consumer loans and 1.71% for corporate loans), compared to 2.91% at March 31, 2020 (6.10% for consumer loans and 0.81% for corporate loans).
Citi’s total non-accrual loans were $5.8 billion at June 30, 2020, up $1.7 billion from March 31, 2020. Consumer non-accrual loans increased to $1.8 billion at June 30, 2020 from $1.7 billion at March 31, 2020, while corporate non-accrual loans grew to $4.0 billion at June 30, 2020 from $2.5 billion at March 31, 2020. In addition, the ratio of non-accrual loans to total corporate loans was 0.99%, and 0.66% for total consumer loans, at June 30, 2020.
Regulatory Capital Impact
Citi has elected to phase in the CECL impact for regulatory capital purposes. The transition provisions were recently modified to defer the phase-in. After two years with no impact on capital, the CECL transition impact will phase in over a three-year transition period with 25% of the impact (net of deferred taxes) recognized on the first day of each subsequent year, commencing January 1, 2022, and will be fully implemented on January 1, 2025. In addition, 25% of the build (pretax) made in 2020 will be deferred and amortized through the same timeframe.
For a further description of the allowance for credit losses and related accounts, see Notes 1 and 14 to the Consolidated Financial Statements.
For a discussion of the recently adopted CECL accounting pronouncement, see Note 1 to the Consolidated Financial Statements.
Goodwill
Citi tests goodwill for impairment annually as of July 1 (the annual test) and through interim assessments between annual tests if an event occurs or circumstances change that would more-likely-than-not reduce the fair value of a reporting unit below its carrying amount, such as a significant adverse change in the business climate, a decision to sell or dispose of all or a significant portion of a reporting unit or a significant decline in Citi’s stock price.
Citi qualitatively assessed the environment in the second quarter of 2020, including the estimated impact of the COVID-19 pandemic on macroeconomic variables and economic forecasts and how those might impact the fair value of reporting units. There is significant uncertainty with how the pandemic will evolve, but Citi expects that it will continue to have a significant impact during the remainder of 2020. As discussed above the extent of the pandemic’s impact will depend upon (i) how consumers respond to the various consumer relief programs established by the federal government, as well as Citi’s own customer relief efforts, and how the federal corporate stimulus programs are implemented by small and medium-size businesses; (ii) the impact on unemployment, which is unclear; (iii) the timing and extent of the economic recovery; (iv) whether there is a resurgence of COVID-19 as businesses and schools reopen and the extent of that resurgence; and (v) the extent of market volatility.
After consideration of the current economic conditions, including the potential impact of the pandemic on business performance as mentioned above, the change in estimated market cost of equity, the actual and projected business performance and the results of the 2019 impairment test, Citi determined it was not more-likely-than-not that the fair value of any reporting unit was below book value as of June 30, 2020. See Note 15 to the Consolidated Financial Statements for a further discussion on goodwill.
Litigation Accruals
See the discussion in Note 23 to the Consolidated Financial Statements for information regarding Citi’s policies on establishing accruals for litigation and regulatory contingencies.
INCOME TAXES
Deferred Tax Assets
For additional information on Citi’s deferred tax assets (DTAs), see “Risk Factors—Strategic Risks,” “Significant Accounting Policies and Significant Estimates—Income Taxes” and Notes 1 and 9 to the Consolidated Financial Statements in Citi’s 2019 Annual Report on Form 10-K.
At June 30, 2020, Citigroup had recorded net DTAs of approximately $23.9 billion, an increase of $1.8 billion from March 31, 2020 and an increase of $0.8 billion from December 31, 2019. The increase for the quarter was primarily driven by the higher level of allowance for credit loss reserves recorded during the quarter.
The table below summarizes Citi’s net DTAs balance:
| | | | | | | | |
| Jurisdiction/Component | DTAs balance | |
| In billions of dollars | June 30,
2020 | December 31, 2019 |
| Total U.S. | $ | 22.0 | | $ | 21.0 | |
| Total foreign | 1.9 | | 2.1 | |
| Total | $ | 23.9 | | $ | 23.1 | |
Of Citi’s total net DTAs of $23.9 billion as of June 30, 2020, $9.7 billion (primarily relating to net operating losses, foreign tax credit and general business credit carry-forwards, which remained flat overall in the current quarter) was deducted in calculating Citi’s regulatory capital. Net DTAs arising from temporary differences are deducted from regulatory capital if in excess of the 10%/15% limitations (see “Capital Resources” above). For the quarter ended June 30, 2020, Citi did not have any such DTAs. Accordingly, the remaining $14.2 billion of net DTAs as of June 30, 2020 was not deducted in calculating regulatory capital pursuant to Basel III standards and was appropriately risk weighted under those rules.
DTA Realizability
Citi believes that the realization of the recognized net DTAs of $23.9 billion at June 30, 2020 is more-likely-than-not based upon management’s expectations as to future taxable income in the jurisdictions in which the DTAs arise, as well as consideration of available tax planning strategies (as defined in ASC Topic 740, Income Taxes).
In the second quarter of 2020, as part of the normal planning process, Citi updated its forecasts of operating income and its foreign source income. With respect to Citi’s general basket for foreign tax credits (FTCs), Citi’s revised forecast of lower pretax income, mitigated by actions around geographic and legal entity asset movements, enabled Citi to maintain a sufficient level of forecasted taxable income in U.S. locations derived from sources outside the U.S. The effect is no change in Citi’s general basket valuation allowance in the second quarter while resulting in an immaterial release of valuation allowance for non-U.S. branches with respect to current year activity. Moreover, the forecast updates did not require Citi to adjust its FTC valuation allowance for future years. In light of the COVID-19 pandemic, however, which adds additional uncertainty as to Citi’s ability to generate sufficient taxable income during the FTC carry-forwards period, Citi will continue to monitor its forecasts and mix of earnings, which could affect such valuation allowance.
Effective Tax Rate
Citi’s reported effective tax rate for the second quarter of 2020 was approximately 9%, compared to approximately 22% in the second quarter of 2019. The lower rate reflects the higher relative impact of tax-advantaged investments and tax benefits for non-U.S. branch-related FTCs discussed above, on a lower level and changing geographic mix of earnings before taxes.
DISCLOSURE CONTROLS AND PROCEDURES
Citi’s disclosure controls and procedures are designed to ensure that information required to be disclosed under the Securities Exchange Act of 1934, as amended, is recorded, processed, summarized and reported within the time periods specified in the SEC’s rules and forms, including without limitation that information required to be disclosed by Citi in its SEC filings is accumulated and communicated to management, including the Chief Executive Officer (CEO) and Chief Financial Officer (CFO), as appropriate, to allow for timely decisions regarding required disclosure.
Citi’s Disclosure Committee assists the CEO and CFO in their responsibilities to design, establish, maintain and evaluate the effectiveness of Citi’s disclosure controls and procedures. The Disclosure Committee is responsible for, among other things, the oversight, maintenance and implementation of the disclosure controls and procedures, subject to the supervision and oversight of the CEO and CFO.
Citi’s management, with the participation of its CEO and CFO, has evaluated the effectiveness of Citigroup’s disclosure controls and procedures (as defined in Rule 13a-15(e) under the Securities Exchange Act of 1934) as of June 30, 2020. Based on that evaluation, the CEO and CFO have concluded that at that date Citigroup’s disclosure controls and procedures were effective.
DISCLOSURE PURSUANT TO SECTION 219 OF THE IRAN THREAT REDUCTION AND SYRIA HUMAN RIGHTS ACT
Pursuant to Section 219 of the Iran Threat Reduction and Syria Human Rights Act of 2012, which added Section 13(r) to the Securities Exchange Act of 1934, as amended, Citi is required to disclose in its annual or quarterly reports, as applicable, whether it or any of its affiliates knowingly engaged in certain activities, transactions or dealings relating to Iran or with individuals or entities that are subject to sanctions under U.S. law. Disclosure is generally required even where the activities, transactions or dealings were conducted in compliance with applicable law. Citi had no reportable activities pursuant to Section 219 for the first quarter of 2020.
During the second quarter of 2020, Citi reported that between May 2018 and February 2020, the Kenyan branch of Citibank, N.A. inadvertently processed 110 non-dollar denominated transactions valued at approximately $41,000.00 on behalf of a client to a medical clinic in Kenya that may be controlled by the Government of Iran. Nominal fees were realized for the processing of these payments. The transactions were disclosed to the Office of Foreign Assets Control of the U.S. Department of the Treasury.
FORWARD-LOOKING STATEMENTS
Certain statements in this Form 10-Q, including but not limited to statements included within the Management’s Discussion and Analysis of Financial Condition and Results of Operations, are “forward-looking statements” within the meaning of the rules and regulations of the SEC. In addition, Citigroup also may make forward-looking statements in its other documents filed or furnished with the SEC, and its management may make forward-looking statements orally to analysts, investors, representatives of the media and others.
Generally, forward-looking statements are not based on historical facts but instead represent Citigroup’s and its management’s beliefs regarding future events. Such statements may be identified by words such as believe, expect, anticipate, intend, estimate, may increase, may fluctuate, target and illustrative, and similar expressions or future or conditional verbs such as will, should, would and could.
Such statements are based on management’s current expectations and are subject to risks, uncertainties and changes in circumstances. Actual results and capital and other financial conditions may differ materially from those included in these statements due to a variety of factors, including without limitation (i) the precautionary statements included within
each individual business’s discussion and analysis of its results of operations above and in Citi’s 2019 Annual Report on Form 10-K and other SEC filings; (ii) the factors listed and described under “Risk Factors” above and in Citi’s 2019 Annual Report on Form 10-K; and (iii) the risks and uncertainties summarized below:
•rapidly evolving macroeconomic and other challenges and uncertainties related to the COVID-19 pandemic, including the duration and further spread of the disease, the severity and duration of the related economic downturn or the pace of the economic recovery, and the potential impact on Citi’s businesses, revenues, expenses, credit costs, regulatory capital and liquidity, as well as overall results of operations and financial condition;
•the potential impact on Citi’s ability to return capital to common shareholders, consistent with its capital planning efforts and targets, due to, among other things, the ongoing or forecasted impact to Citi’s results of operations and financial condition, whether due to the pandemic or otherwise; regulatory requirements (including recent actions regarding stock buyback restrictions, stress tests and new dividend limitations); Citi’s effectiveness in managing its level of risk-weighted assets and GSIB surcharge; potential changes to the regulatory capital framework; the results of the CCAR process and regulatory stress tests, including regulatory determination of Citi’s “stress capital buffer” (SCB); and any resulting variability in the SCB and the impact on Citi’s estimated management buffer;
•the potential impact to Citi’s regulatory capital ratios under the Basel III Advanced Approaches framework for determining risk-weighted assets, given that credit risk-weighted assets calculated under the Advanced Approaches are more risk sensitive than those calculated under the Standardized Approach;
•the potential impact to Citi’s businesses, and results of operations and financial condition, as well as its macroeconomic outlook, due to macroeconomic and geopolitical and other challenges and uncertainties and volatilities, including, among others, election outcomes, protracted or widespread trade tensions, including changes in U.S. trade and sanctions policies and resulting retaliatory measures; geopolitical tensions and conflicts, natural disasters, pandemics, governmental fiscal and monetary actions, such as changes in interest rates; and the terms or conditions related to the U.K.’s withdrawal from the European Union;
•the ongoing regulatory and legislative uncertainties and changes faced by financial institutions, including Citi, in the U.S. and globally, such as potential fiscal, monetary, regulatory and other changes from the U.S. federal government and others, whether due to the pandemic or otherwise; potential changes to various aspects of the regulatory capital framework and the terms of and other uncertainties resulting from the U.K.’s exit from the European Union; and the potential impact these uncertainties and changes could have on Citi’s businesses, results of operations, financial condition, business planning and compliance risks and costs;
•Citi’s ability to achieve its projected or expected results from its continued investments and efficiency initiatives, such as revenue growth and expense savings, as part of Citi’s overall strategy to meet operational and financial objectives, including as a result of factors that Citi cannot control;
•the transition away from or discontinuance of LIBOR scheduled for December 31, 2021 or any other interest rate benchmark and the adverse consequences it could have for market participants, including Citi;
•Citi’s ability to utilize its DTAs (including the foreign tax credit component of its DTAs) and thus reduce the negative impact of the DTAs on Citi’s regulatory capital, including as a result of its ability to generate U.S. taxable income;
•the potential impact to Citi if its interpretation or application of the complex tax laws to which it is subject, such as the Tax Cuts and Jobs Act (Tax Reform), withholding, stamp, service and other non-income taxes, differs from those of the relevant governmental taxing authorities;
•the various risks faced by Citi as a result of its presence in the emerging markets, including, among others, limitations of hedges on foreign investments, foreign currency volatility, sovereign volatility, election outcomes, regulatory changes and political events; foreign exchange controls, limitations on foreign investment, sociopolitical instability (including from hyperinflation), fraud, nationalization or loss of licenses; business restrictions, sanctions or asset freezes; potential criminal charges; closure of branches or subsidiaries; and confiscation of assets;
•the potential impact to Citi if the economic situation in a non-U.S. jurisdiction where Citi operates were to deteriorate to below a certain level resulting in U.S.
regulators imposing mandatory loan loss or other reserve requirements on Citi;
•the potential impact from a deterioration in or failure to maintain Citi’s co-branding or private label credit card relationships, due to, among other things, the general economic environment, declining sales and revenues, partner store closures, government imposed business restrictions, or other operational difficulties of the retailer or merchant, termination of a particular relationship; or other factors, such as bankruptcies, liquidations, restructurings, consolidations or other similar events, whether due to the impact of the pandemic or otherwise;
•Citi’s ability in its resolution plan submissions to address any shortcomings or deficiencies identified or guidance provided by the Federal Reserve Board and FDIC;
•the potential impact on Citi’s performance and the performance of its individual businesses, including its competitive position and ability to effectively manage its businesses and continue to execute its strategies, if Citi is unable to attract, retain and motivate highly qualified employees;
•Citi’s ability to effectively compete with U.S. and non-U.S. financial services companies and others, including as a result of emerging technologies;
•the potential impact to Citi from a disruption of its operational systems, including as a result of, among other things, human error, fraud or malice, accidental technological failure, electrical or telecommunication outages or failure of computer servers or other similar damage to Citi’s property or assets, or failures by third parties with whom Citi does business, as well as disruptions in the operations of Citi’s clients, customers or other third parties;
•the increasing risk of continually evolving, sophisticated cybersecurity activities faced by financial institutions and others, including Citi and third parties with whom it does business, that could result in, among other things, theft, loss, misuse or disclosure of confidential client, customer or corporate information or assets and a disruption of computer, software or network systems; and the potential impact from such risks, including reputational damage, regulatory penalties, loss of revenues, additional costs (including repair, remediation and other costs), exposure to litigation and other financial losses;
•the potential impact of changes to or incorrect assumptions, judgments or estimates in Citi’s financial statements including the estimates of the allowance for credit losses, reserves related to litigation, regulatory and tax matters exposures, valuation of DTAs and the fair value of certain assets and liabilities, such as assessing goodwill for impairment;
•the potential impact from reclassification of any foreign currency translation adjustment (CTA) component of AOCI, including related hedges and taxes, into Citi’s earnings, due to the sale or substantial liquidation of any foreign entity, such as those related to its legacy businesses;
•the potential impact of a continuation of lower interest rates on Citi’s pension plan, including any required
settlement charge if lump sum payments to retirees were to exceed the interest cost of the plan;
•the impact of changes to financial accounting and reporting standards or interpretations, on how Citi records and reports its financial condition and results of operations, including the future impact from the CECL methodology, including due to changes in estimates of expected credit losses resulting from Citi’s CECL models and assumptions, existing and forecasted macroeconomic conditions, such as the unemployment rate and the GDP level, whether due to the impact of the pandemic or otherwise; and the credit quality, composition and other characteristics of Citi’s loan and other applicable portfolios;
•the potential impact to Citi’s results of operations and/or regulatory capital and capital ratios if Citi’s risk management and mitigation processes, strategies or models, including those related to its ability to manage and aggregate data, are deficient or ineffective, or require refinement, modification or enhancement, or any related action is taken by Citi’s U.S. banking regulators;
•the potential impact of credit risk and concentrations of risk on Citi’s results of operations, whether due to a default of or deterioration involving consumer, corporate or public sector borrowers or other counterparties in the U.S. or in various countries and jurisdictions globally, including from indemnification obligations in connection with various transactions, such as hedging or reinsurance arrangements related to those obligations, whether due to the COVID-19 pandemic or otherwise;
•the potential impact on Citi’s liquidity and/or costs of funding as a result of external factors, including, among others, the competitive environment for deposits, market disruptions and governmental fiscal and monetary policies as well as regulatory changes or negative investor perceptions of Citi’s creditworthiness, unexpected increases in cash or collateral requirements and the inability to monetize available liquidity resources, whether due to the COVID-19 pandemic or otherwise;
•the impact of a ratings downgrade of Citi or one or more of its more significant subsidiaries or issuing entities on Citi’s funding and liquidity as well as operations of certain of its businesses;
•the potential impact to Citi of ongoing interpretation and implementation of regulatory and legislative requirements and changes in the U.S. and globally, as well as heightened regulatory scrutiny and expectations for large financial institutions and their employees and agents, with respect to, among other things, governance and risk management practices and controls, including on Citi’s compliance, regulatory and other risks and costs, such as increased regulatory oversight and restrictions, enforcement proceedings, penalties and fines; and
•the potential outcomes of the extensive legal and regulatory proceedings, as well as regulatory examinations, investigations and other inquiries, to which Citi is or may be subject at any given time, particularly given the increased focus by regulators on conduct risk and controls and policies and procedures; as well as remediating deficiencies on a timely basis, together with
the heightened scrutiny and expectations generally from regulators, and the severity of the remedies sought, such as enforcement proceedings, and potential collateral consequences to Citi arising from such outcomes.
Any forward-looking statements made by or on behalf of Citigroup speak only as to the date they are made, and Citi does not undertake to update forward-looking statements to reflect the impact of circumstances or events that arise after the forward-looking statements were made.
FINANCIAL STATEMENTS AND NOTES TABLE OF CONTENTS
| | | | | |
| CONSOLIDATED FINANCIAL STATEMENTS | |
| Consolidated Statement of Income (Unaudited)—
For the Three and Six Months Ended June 30, 2020
and 2019 | |
| Consolidated Statement of Comprehensive Income (Unaudited)—For the Three and Six Months Ended June 30, 2020 and 2019 | |
| Consolidated Balance Sheet—June 30, 2020 (Unaudited) and December 31, 2019 | |
| Consolidated Statement of Changes in Stockholders’ Equity (Unaudited)—For the Three and Six Months Ended June 30, 2020 and 2019 | |
| Consolidated Statement of Cash Flows (Unaudited)—
For the Six Months Ended June 30, 2020 and 2019 | |
| | | | | |
| NOTES TO CONSOLIDATED FINANCIAL STATEMENTS (UNAUDITED) | |
Note 1—Basis of Presentation, Updated Accounting Policies
and Accounting Changes | |
| Note 2—Discontinued Operations and Significant Disposals | |
| Note 3—Business Segments | |
| Note 4—Interest Revenue and Expense | |
Note 5—Commissions and Fees; Administration and Other
Fiduciary Fees | |
| Note 6—Principal Transactions | |
| Note 7—Incentive Plans | |
| Note 8—Retirement Benefits | |
| Note 9—Earnings per Share | |
Note 10—Securities Borrowed, Loaned and
Subject to Repurchase Agreements | |
| Note 11—Brokerage Receivables and Brokerage Payables | |
| Note 12—Investments | |
| | | | | |
| |
| Note 13—Loans | |
| Note 14—Allowance for Credit Losses | |
| Note 15—Goodwill and Intangible Assets | |
| Note 16—Debt | |
Note 17—Changes in Accumulated Other Comprehensive
Income (Loss) (AOCI) | |
| Note 18—Securitizations and Variable Interest Entities | |
| Note 19—Derivatives | |
| Note 20—Fair Value Measurement | |
| Note 21—Fair Value Elections | |
| Note 22—Guarantees, Leases and Commitments | |
| Note 23—Contingencies | |
| Note 24—Condensed Consolidating Financial Statements | |
CONSOLIDATED FINANCIAL STATEMENTS
| | | | | | | | |
| CONSOLIDATED STATEMENT OF INCOME (UNAUDITED) | | Citigroup Inc. and Subsidiaries |
| | | | | | | | | | | | | | |
| | Three Months Ended June 30, | | Six Months Ended June 30, | |
| In millions of dollars, except per share amounts | 2020 | 2019 | 2020 | 2019 |
| Revenues | | | | |
| Interest revenue | $ | 14,589 | | $ | 19,712 | | $ | 31,728 | | $ | 38,788 | |
| Interest expense | 3,509 | | 7,762 | | 9,156 | | 15,079 | |
| Net interest revenue | $ | 11,080 | | $ | 11,950 | | $ | 22,572 | | $ | 23,709 | |
| Commissions and fees | $ | 2,933 | | $ | 2,881 | | $ | 5,954 | | $ | 5,807 | |
| Principal transactions | 4,157 | | 1,874 | | 9,418 | | 4,678 | |
| Administration and other fiduciary fees | 819 | | 869 | | 1,673 | | 1,708 | |
| Realized gains on sales of investments, net | 748 | | 468 | | 1,180 | | 598 | |
| Impairment losses on investments: | | | | |
| Impairment losses on investments and other assets | (69) | | (5) | | (124) | | (13) | |
Provision for credit losses on AFS debt securities(1) | (8) | | — | | (8) | | — | |
| | | | |
| Net impairment losses recognized in earnings | $ | (77) | | $ | (5) | | $ | (132) | | $ | (13) | |
| Other revenue (loss) | $ | 106 | | $ | 721 | | $ | (168) | | $ | 847 | |
| Total non-interest revenues | $ | 8,686 | | $ | 6,808 | | $ | 17,925 | | $ | 13,625 | |
| Total revenues, net of interest expense | $ | 19,766 | | $ | 18,758 | | $ | 40,497 | | $ | 37,334 | |
| Provisions for credit losses and for benefits and claims | | | | |
| Provision for credit losses on loans | $ | 7,696 | | $ | 2,089 | | $ | 14,140 | | $ | 4,033 | |
| Provision for credit losses on held-to-maturity (HTM) debt securities | 31 | | — | | 37 | | — | |
| Provision for credit losses on other assets | 48 | | — | | 44 | | — | |
| Policyholder benefits and claims | 15 | | 19 | | 39 | | 31 | |
| Provision for credit losses on unfunded lending commitments | 113 | | (15) | | 670 | | 9 | |
| Total provisions for credit losses and for benefits and claims | $ | 7,903 | | $ | 2,093 | | $ | 14,930 | | $ | 4,073 | |
| Operating expenses | | | | |
| Compensation and benefits | $ | 5,624 | | $ | 5,381 | | $ | 11,278 | | $ | 11,039 | |
| Premises and equipment | 562 | | 569 | | 1,127 | | 1,133 | |
| Technology/communication | 1,741 | | 1,724 | | 3,464 | | 3,444 | |
| Advertising and marketing | 299 | | 434 | | 627 | | 793 | |
| Other operating | 2,189 | | 2,392 | | 4,513 | | 4,675 | |
| Total operating expenses | $ | 10,415 | | $ | 10,500 | | $ | 21,009 | | $ | 21,084 | |
| Income from continuing operations before income taxes | $ | 1,448 | | $ | 6,165 | | $ | 4,558 | | $ | 12,177 | |
| Provision for income taxes | 131 | | 1,373 | | 707 | | 2,648 | |
| Income from continuing operations | $ | 1,317 | | $ | 4,792 | | $ | 3,851 | | $ | 9,529 | |
| Discontinued operations | | | | |
| Loss from discontinued operations | $ | (1) | | $ | (10) | | $ | (19) | | $ | (12) | |
| | | | |
| Benefit for income taxes | — | | (27) | | — | | (27) | |
| Income (loss) from discontinued operations, net of taxes | $ | (1) | | $ | 17 | | $ | (19) | | $ | 15 | |
| Net income before attribution of noncontrolling interests | $ | 1,316 | | $ | 4,809 | | $ | 3,832 | | $ | 9,544 | |
| Noncontrolling interests | — | | 10 | | (6) | | 35 | |
| Citigroup’s net income | $ | 1,316 | | $ | 4,799 | | $ | 3,838 | | $ | 9,509 | |
Basic earnings per share(2) | | | | |
| Income from continuing operations | $ | 0.51 | | $ | 1.94 | | $ | 1.57 | | $ | 3.81 | |
| Income from discontinued operations, net of taxes | — | | 0.01 | | (0.01) | | 0.01 | |
| Net income | $ | 0.51 | | $ | 1.95 | | $ | 1.56 | | $ | 3.82 | |
Weighted average common shares outstanding (in millions) | 2,081.7 | | 2,286.1 | | 2,089.8 | | 2,313.2 | |
Diluted earnings per share(2) | | | | |
| Income from continuing operations | $ | 0.51 | | $ | 1.94 | | $ | 1.57 | | $ | 3.81 | |
| Income (loss) from discontinued operations, net of taxes | — | | 0.01 | | (0.01) | | 0.01 | |
| Net income | $ | 0.50 | | $ | 1.95 | | $ | 1.56 | | $ | 3.82 | |
Adjusted weighted average common shares outstanding (in millions) | 2,084.3 | | 2,289.0 | | 2,103.0 | | 2,315.7 | |
(1) In accordance with ASC 326.
(2) Due to rounding, earnings per share on continuing operations and discontinued operations may not sum to earnings per share on net income.
The Notes to the Consolidated Financial Statements are an integral part of these Consolidated Financial Statements.
| | | | | | | | |
| CONSOLIDATED STATEMENT OF COMPREHENSIVE INCOME | | Citigroup Inc. and Subsidiaries |
| (UNAUDITED) | | |
| | | | | | | | | | | | | | |
| | Three Months Ended June 30, | | Six Months Ended June 30, | |
| In millions of dollars | 2020 | 2019 | 2020 | 2019 |
| Citigroup’s net income | $ | 1,316 | | $ | 4,799 | | $ | 3,838 | | $ | 9,509 | |
Add: Citigroup’s other comprehensive income(1) | | | | |
Net change in unrealized gains and losses on debt securities, net of taxes(1) | $ | 837 | | $ | 703 | | $ | 3,965 | | $ | 1,838 | |
Net change in debt valuation adjustment (DVA), net of taxes(2) | (2,232) | | 3 | | 908 | | (568) | |
| Net change in cash flow hedges, net of taxes | 74 | | 517 | | 1,971 | | 803 | |
| Benefit plans liability adjustment, net of taxes | (77) | | (253) | | (363) | | (317) | |
| Net change in foreign currency translation adjustment, net of taxes and hedges | 561 | | 91 | | (3,548) | | 149 | |
| Net change in excluded component of fair value hedges, net of taxes | 13 | | 44 | | 40 | | 62 | |
| Citigroup’s total other comprehensive income | $ | (824) | | $ | 1,105 | | $ | 2,973 | | $ | 1,967 | |
| Citigroup’s total comprehensive income | $ | 492 | | $ | 5,904 | | $ | 6,811 | | $ | 11,476 | |
Add: Other comprehensive income (loss) attributable to
noncontrolling interests | $ | 39 | | $ | 20 | | $ | (12) | | $ | 7 | |
| Add: Net income attributable to noncontrolling interests | — | | 10 | | (6) | | 35 | |
| Total comprehensive income | $ | 531 | | $ | 5,934 | | $ | 6,793 | | $ | 11,518 | |
(1)See Note 17 to the Consolidated Financial Statements.
(2)See Note 20 to the Consolidated Financial Statements.
The Notes to the Consolidated Financial Statements are an integral part of these Consolidated Financial Statements.
| | | | | | | | |
| CONSOLIDATED BALANCE SHEET | | Citigroup Inc. and Subsidiaries |
| | | | | | | | |
| June 30, | |
| 2020 | December 31, |
| In millions of dollars | (Unaudited) | 2019 |
| Assets | | |
| Cash and due from banks (including segregated cash and other deposits) | $ | 22,889 | | $ | 23,967 | |
| Deposits with banks, net of allowance | 286,884 | | 169,952 | |
| Securities borrowed and purchased under agreements to resell (including $174,558 and $153,193 as of June 30, 2020 and December 31, 2019, respectively, at fair value), net of allowance | 282,917 | | 251,322 | |
| Brokerage receivables, net of allowance | 51,633 | | 39,857 | |
| Trading account assets (including $172,192 and $120,236 pledged to creditors at June 30, 2020 and December 31, 2019, respectively) | 362,311 | | 276,140 | |
| Investments: | | |
| Available-for-sale debt securities (including $6,281 and $8,721 pledged to creditors as of June 30, 2020 and December 31, 2019, respectively), net of allowance | 342,256 | | 280,265 | |
| Held-to-maturity debt securities (including $488 and $1,923 pledged to creditors as of June 30, 2020 and December 31, 2019, respectively), net of allowance | 83,332 | | 80,775 | |
| Equity securities (including $1,079 and $1,162 at fair value as of June 30, 2020 and December 31, 2019, respectively) | 7,665 | | 7,523 | |
| Total investments | $ | 433,253 | | $ | 368,563 | |
| Loans: | | |
| Consumer (including $16 and $18 as of June 30, 2020 and December 31, 2019, respectively, at fair value) | 281,113 | | 309,548 | |
| Corporate (including $5,783 and $4,067 as of June 30, 2020 and December 31, 2019, respectively, at fair value) | 404,179 | | 389,935 | |
| Loans, net of unearned income | $ | 685,292 | | $ | 699,483 | |
| Allowance for credit losses on loans (ACLL) | (26,420) | | (12,783) | |
| Total loans, net | $ | 658,872 | | $ | 686,700 | |
| Goodwill | 21,399 | | 22,126 | |
| Intangible assets (including MSRs of $345 and $495 as of June 30, 2020 and December 31, 2019, at fair value) | 4,451 | | 4,822 | |
| Other assets (including $12,734 and $12,830 as of June 30, 2020 and December 31, 2019, respectively, at fair value), net of allowance | 108,106 | | 107,709 | |
| | |
| Total assets | $ | 2,232,715 | | $ | 1,951,158 | |
The following table presents certain assets of consolidated variable interest entities (VIEs), which are included on the Consolidated Balance Sheet above. The assets in the table below include those assets that can only be used to settle obligations of consolidated VIEs, presented on the following page, and are in excess of those obligations. In addition, the assets in the table below include third-party assets of consolidated VIEs only and exclude intercompany balances that eliminate in consolidation.
| | | | | | | | |
| June 30, | |
| 2020 | December 31, |
| In millions of dollars | (Unaudited) | 2019 |
| Assets of consolidated VIEs to be used to settle obligations of consolidated VIEs | | |
| Cash and due from banks | $ | 114 | | $ | 108 | |
| Trading account assets | 7,452 | | 6,719 | |
| Investments | 940 | | 1,295 | |
| Loans, net of unearned income | | |
| Consumer | 39,435 | | 46,977 | |
| Corporate | 16,490 | | 16,175 | |
| Loans, net of unearned income | $ | 55,925 | | $ | 63,152 | |
| Allowance for credit losses on loans (ACLL) | (4,059) | | (1,841) | |
| Total loans, net | $ | 51,866 | | $ | 61,311 | |
| Other assets | 52 | | 73 | |
| Total assets of consolidated VIEs to be used to settle obligations of consolidated VIEs | $ | 60,424 | | $ | 69,506 | |
Statement continues on the next page.
CONSOLIDATED BALANCE SHEET Citigroup Inc. and Subsidiaries
(Continued)
| | | | | | | | |
| June 30, | |
| 2020 | December 31, |
| In millions of dollars, except shares and per share amounts | (Unaudited) | 2019 |
| Liabilities | | |
| Non-interest-bearing deposits in U.S. offices | $ | 115,386 | | $ | 98,811 | |
| Interest-bearing deposits in U.S. offices (including $978 and $1,624 as of June 30, 2020 and December 31, 2019, respectively, at fair value) | 490,823 | | 401,418 | |
| Non-interest-bearing deposits in offices outside the U.S. | 87,479 | | 85,692 | |
| Interest-bearing deposits in offices outside the U.S. (including $1,494 and $695 as of June 30, 2020 and December 31, 2019, respectively, at fair value) | 539,972 | | 484,669 | |
| Total deposits | $ | 1,233,660 | | $ | 1,070,590 | |
| Securities loaned and sold under agreements to repurchase (including $59,445 and $40,651 as of June 30, 2020 and December 31, 2019, respectively, at fair value) | 215,722 | | 166,339 | |
| Brokerage payables | 60,567 | | 48,601 | |
| Trading account liabilities | 149,264 | | 119,894 | |
| Short-term borrowings (including $6,646 and $4,946 as of June 30, 2020 and December 31, 2019, respectively, at fair value) | 40,156 | | 45,049 | |
| Long-term debt (including $61,971 and $55,783 as of June 30, 2020 and December 31, 2019, respectively, at fair value) | 279,775 | | 248,760 | |
| Other liabilities (including $5,789 and $6,343 as of June 30, 2020 and December 31, 2019, respectively, at fair value), including allowance | 61,269 | | 57,979 | |
| | |
| Total liabilities | $ | 2,040,413 | | $ | 1,757,212 | |
| Stockholders’ equity | | |
Preferred stock ($1.00 par value; authorized shares: 30 million), issued shares: as of June 30, 2020—719,200 and as of December 31, 2019—719,200, at aggregate liquidation value | $ | 17,980 | | $ | 17,980 | |
Common stock ($0.01 par value; authorized shares: 6 billion), issued shares: as of June 30, 2020—3,099,763,661 and as of December 31, 2019—3,099,602,856 | 31 | | 31 | |
| Additional paid-in capital | 107,668 | | 107,840 | |
| Retained earnings | 163,431 | | 165,369 | |
Treasury stock, at cost: June 30, 2020—1,017,898,767 shares and
December 31, 2019—985,479,501 shares | (64,143) | | (61,660) | |
| Accumulated other comprehensive income (loss) (AOCI) | (33,345) | | (36,318) | |
| Total Citigroup stockholders’ equity | $ | 191,622 | | $ | 193,242 | |
| Noncontrolling interests | 680 | | 704 | |
| Total equity | $ | 192,302 | | $ | 193,946 | |
| Total liabilities and equity | $ | 2,232,715 | | $ | 1,951,158 | |
The following table presents certain liabilities of consolidated VIEs, which are included on the Consolidated Balance Sheet above. The liabilities in the table below include third-party liabilities of consolidated VIEs only and exclude intercompany balances that eliminate in consolidation. The liabilities also exclude amounts where creditors or beneficial interest holders have recourse to the general credit of Citigroup.
| | | | | | | | |
| June 30, | |
| 2020 | December 31, |
| In millions of dollars | (Unaudited) | 2019 |
Liabilities of consolidated VIEs for which creditors or beneficial interest holders do not have recourse to the general credit of Citigroup | | |
| Short-term borrowings | $ | 10,505 | | $ | 10,031 | |
| Long-term debt | 22,226 | | 25,582 | |
| Other liabilities | 664 | | 917 | |
Total liabilities of consolidated VIEs for which creditors or beneficial interest holders do not have recourse to the general credit of Citigroup | $ | 33,395 | | $ | 36,530 | |
The Notes to the Consolidated Financial Statements are an integral part of these Consolidated Financial Statements.
| | | | | | | | |
| CONSOLIDATED STATEMENT OF CHANGES IN STOCKHOLDERS’ EQUITY | | Citigroup Inc. and Subsidiaries |
| (UNAUDITED) | | |
| | | | | | | | | | | | | | |
| Three Months Ended June 30, | | Six Months Ended June 30, | |
| In millions of dollars | 2020 | 2019 | 2020 | 2019 |
| Preferred stock at aggregate liquidation value | | | | |
| Balance, beginning of period | $ | 17,980 | | $ | 17,980 | | $ | 17,980 | | $ | 18,460 | |
| Issuance of new preferred stock | — | | — | | 1,500 | | — | |
| Redemption of preferred stock | — | | — | | (1,500) | | (480) | |
| Balance, end of period | $ | 17,980 | | $ | 17,980 | | $ | 17,980 | | $ | 17,980 | |
| Common stock and additional paid-in capital | | | | |
| Balance, beginning of period | $ | 107,581 | | $ | 107,582 | | $ | 107,871 | | $ | 107,953 | |
| Employee benefit plans | 118 | | 112 | | (174) | | (270) | |
| Preferred stock issuance costs | — | | — | | 2 | | — | |
| Other | — | | (6) | | — | | 5 | |
| Balance, end of period | $ | 107,699 | | $ | 107,688 | | $ | 107,699 | | $ | 107,688 | |
| Retained earnings | | | | |
| Balance, beginning of period | $ | 163,438 | | $ | 154,859 | | $ | 165,369 | | $ | 151,347 | |
Adjustment to opening balance, net of taxes(1) | — | | — | | (3,076) | | 151 | |
| Adjusted balance, beginning of period | $ | 163,438 | | $ | 154,859 | | $ | 162,293 | | $ | 151,498 | |
| Citigroup’s net income | 1,316 | | 4,799 | | 3,838 | | 9,509 | |
Common dividends(2) | (1,071) | | (1,041) | | (2,152) | | (2,116) | |
| Preferred dividends | (253) | | (296) | | (544) | | (558) | |
| Other | 1 | | — | | (4) | | (12) | |
| Balance, end of period | $ | 163,431 | | $ | 158,321 | | $ | 163,431 | | $ | 158,321 | |
| Treasury stock, at cost | | | | |
| Balance, beginning of period | $ | (64,147) | | $ | (47,861) | | $ | (61,660) | | $ | (44,370) | |
Employee benefit plans(3) | 4 | | 9 | | 442 | | 573 | |
Treasury stock acquired(4) | — | | (3,575) | | (2,925) | | (7,630) | |
| Balance, end of period | $ | (64,143) | | $ | (51,427) | | $ | (64,143) | | $ | (51,427) | |
| Citigroup’s accumulated other comprehensive income (loss) | | | | |
| Balance, beginning of period | $ | (32,521) | | $ | (36,308) | | $ | (36,318) | | $ | (37,170) | |
| | | | |
| | | | |
| Citigroup’s total other comprehensive income | (824) | | 1,105 | | 2,973 | | 1,967 | |
| Balance, end of period | $ | (33,345) | | $ | (35,203) | | $ | (33,345) | | $ | (35,203) | |
| Total Citigroup common stockholders’ equity | $ | 173,642 | | $ | 179,379 | | $ | 173,642 | | $ | 179,379 | |
| Total Citigroup stockholders’ equity | $ | 191,622 | | $ | 197,359 | | $ | 191,622 | | $ | 197,359 | |
| Noncontrolling interests | | | | |
| Balance, beginning of period | $ | 651 | | $ | 763 | | $ | 704 | | $ | 854 | |
| | | | |
| Transactions between Citigroup and the noncontrolling-interest shareholders | — | | — | | (6) | | (99) | |
| Net income attributable to noncontrolling-interest shareholders | — | | 10 | | (6) | | 35 | |
| Distributions paid to noncontrolling-interest shareholders | — | | (33) | | — | | (37) | |
Other comprehensive income (loss) attributable to noncontrolling-interest shareholders | 39 | | 20 | | (12) | | 7 | |
| Other | (10) | | (9) | | — | | (9) | |
| Net change in noncontrolling interests | $ | 29 | | $ | (12) | | $ | (24) | | $ | (103) | |
| Balance, end of period | $ | 680 | | $ | 751 | | $ | 680 | | $ | 751 | |
| Total equity | $ | 192,302 | | $ | 198,110 | | $ | 192,302 | | $ | 198,110 | |
(1) See Note 1 to the Consolidated Financial Statements for additional details.
(2) Common dividends declared were $0.51 per share in the first and second quarters of 2020. Common dividends declared were $0.45 per share in the first and second quarters of 2019.
(3) Includes treasury stock related to (i) certain activity on employee stock option program exercises where the employee delivers existing shares to cover the option exercise, or (ii) under Citi’s employee restricted or deferred stock programs where shares are withheld to satisfy tax requirements.
(4) Primarily consists of open market purchases under Citi’s Board of Directors-approved common stock repurchase program.
The Notes to the Consolidated Financial Statements are an integral part of these Consolidated Financial Statements.
| | | | | | | | |
| CONSOLIDATED STATEMENT OF CASH FLOWS | | Citigroup Inc. and Subsidiaries |
| (UNAUDITED) | | |
| | | | | | | | |
| | Six Months Ended June 30, | |
| In millions of dollars | 2020 | 2019 |
| Cash flows from operating activities of continuing operations | | |
| Net income before attribution of noncontrolling interests | $ | 3,832 | | $ | 9,544 | |
| Net income attributable to noncontrolling interests | (6) | | 35 | |
| Citigroup’s net income | $ | 3,838 | | $ | 9,509 | |
| Loss from discontinued operations, net of taxes | (19) | | 15 | |
| | |
| Income from continuing operations—excluding noncontrolling interests | $ | 3,857 | | $ | 9,494 | |
| Adjustments to reconcile net income to net cash provided by (used in) operating activities of continuing operations | | |
| | |
| | |
| | |
| Depreciation and amortization | 1,853 | | 1,883 | |
| | |
| Provisions for credit losses on loans and unfunded lending commitments | 14,810 | | 4,042 | |
| Realized gains from sales of investments | (1,180) | | (598) | |
| Impairment losses on investments | 124 | | 13 | |
| Change in trading account assets | (86,203) | | (50,776) | |
| Change in trading account liabilities | 29,370 | | (8,011) | |
| Change in brokerage receivables net of brokerage payables | 190 | | (9,309) | |
| Change in loans HFS | (1,200) | | 1,029 | |
| Change in other assets | 1,585 | | (5,442) | |
| Change in other liabilities | 2,620 | | 6,462 | |
| Other, net | 14,966 | | 13,457 | |
| Total adjustments | $ | (23,065) | | $ | (47,250) | |
| Net cash used in operating activities of continuing operations | $ | (19,208) | | $ | (37,756) | |
| Cash flows from investing activities of continuing operations | | |
| Change in securities borrowed and purchased under agreements to resell | $ | (31,595) | | $ | 10,915 | |
| Change in loans | 7,943 | | (7,803) | |
| Proceeds from sales and securitizations of loans | 826 | | 2,249 | |
| Purchases of investments | (207,701) | | (118,132) | |
| Proceeds from sales of investments | 86,191 | | 63,595 | |
| Proceeds from maturities of investments | 53,909 | | 57,684 | |
| | |
| | |
| Capital expenditures on premises and equipment and capitalized software | (1,318) | | (3,349) | |
Proceeds from sales of premises and equipment, subsidiaries and affiliates and repossessed assets | 12 | | 68 | |
| Other, net | 44 | | 71 | |
| Net cash provided by (used in) investing activities of continuing operations | $ | (91,689) | | $ | 5,298 | |
| Cash flows from financing activities of continuing operations | | |
| Dividends paid | $ | (2,679) | | $ | (2,650) | |
| Issuance of preferred stock | 1,500 | | — | |
| Redemption of preferred stock | (1,500) | | (480) | |
| Treasury stock acquired | (2,925) | | (7,518) | |
| Stock tendered for payment of withholding taxes | (407) | | (359) | |
| Change in securities loaned and sold under agreements to repurchase | 49,383 | | 3,365 | |
| Issuance of long-term debt | 58,471 | | 31,849 | |
| Payments and redemptions of long-term debt | (32,297) | | (18,428) | |
| Change in deposits | 163,070 | | 32,437 | |
| Change in short-term borrowings | (4,893) | | 10,096 | |
| | | | | | | | |
| CONSOLIDATED STATEMENT OF CASH FLOWS | | |
| (UNAUDITED) (Continued) | | |
| Six Months Ended June 30, | |
| In millions of dollars | 2020 | 2019 |
| Net cash provided by financing activities of continuing operations | $ | 227,723 | | $ | 48,312 | |
| Effect of exchange rate changes on cash and due from banks | $ | (972) | | $ | (716) | |
| | |
| | |
| Change in cash, due from banks and deposits with banks | $ | 115,854 | | $ | 15,138 | |
| Cash, due from banks and deposits with banks at beginning of period | 193,919 | | 188,105 | |
| Cash, due from banks and deposits with banks at end of period | $ | 309,773 | | $ | 203,243 | |
| Cash and due from banks (including segregated cash and other deposits) | $ | 22,889 | | $ | 24,997 | |
| Deposits with banks, net of allowance | 286,884 | | 178,246 | |
| Cash, due from banks and deposits with banks at end of period | $ | 309,773 | | $ | 203,243 | |
| Supplemental disclosure of cash flow information for continuing operations | | |
| Cash paid during the period for income taxes | $ | 2,543 | | $ | 2,814 | |
| Cash paid during the period for interest | 8,751 | | 14,000 | |
Non-cash investing activities(1) | | |
| | |
| | |
| | |
| | |
| | |
| | |
Transfers to loans HFS (Other assets) from loans | $ | 1,036 | | $ | 3,600 | |
| | |
| | |
| | |
| | |
| | |
| | |
| | |
(1) Operating and finance lease right-of-use assets and lease liabilities represent non-cash investing and financing activities, respectively, and are not included in the non-cash investing activities presented here. See Note 22 to the Consolidated Financial Statements for more information and balances as of June 30, 2020.
The Notes to the Consolidated Financial Statements are an integral part of these Consolidated Financial Statements.
NOTES TO CONSOLIDATED FINANCIAL STATEMENTS (UNAUDITED)
1. BASIS OF PRESENTATION, UPDATED ACCOUNTING POLICIES AND ACCOUNTING CHANGES
Basis of Presentation
The accompanying unaudited Consolidated Financial Statements as of June 30, 2020 and for the three- and-six-month periods ended June 30, 2020 and 2019 include the accounts of Citigroup Inc. and its consolidated subsidiaries.
In the opinion of management, all adjustments, consisting of normal recurring adjustments, necessary for a fair presentation have been reflected. The accompanying unaudited Consolidated Financial Statements should be read in conjunction with the Consolidated Financial Statements and related notes included in Citigroup’s Annual Report on Form 10-K for the fiscal year ended December 31, 2019 (2019 Annual Report on Form 10-K) and Citigroup’s Quarterly Report on Form 10-Q for the quarter ended March 31, 2020 (First Quarter of 2020 Form 10-Q).
Certain financial information that is normally included in annual financial statements prepared in accordance with U.S. generally accepted accounting principles (GAAP), but is not required for interim reporting purposes, has been condensed or omitted.
Management must make estimates and assumptions that affect the Consolidated Financial Statements and the related footnote disclosures. While management uses its best judgment, actual results could differ from those estimates.
As noted above, the Notes to these Consolidated Financial Statements are unaudited.
Throughout these Notes, “Citigroup,” “Citi” and “the Company” refer to Citigroup Inc. and its consolidated subsidiaries.
Certain reclassifications have been made to the prior periods’ financial statements and notes to conform to the current period’s presentation.
SUMMARY OF SIGNIFICANT ACCOUNTING POLICIES
See Note 1 to the Consolidated Financial Statements in both Citigroup’s 2019 Annual Report on Form 10-K and Citigroup’s First Quarter of 2020 Form 10-Q for a summary of all of Citigroup’s significant accounting policies.
ACCOUNTING CHANGES
Accounting for Financial Instruments—Credit Losses
Overview
In June 2016, the Financial Accounting Standards Board (FASB) issued ASU No. 2016-13, Financial Instruments—Credit Losses (Topic 326). The ASU introduced a new credit loss methodology, the Current Expected Credit Losses (CECL) methodology, which requires earlier recognition of credit losses while also providing additional transparency about credit risk. Citi adopted the ASU as of January 1, 2020, which, as discussed below, resulted in an increase in Citi’s Allowance for credit losses and a decrease to opening Retained earnings, net of deferred income taxes, at January 1, 2020.
The CECL methodology utilizes a lifetime “expected credit loss” measurement objective for the recognition of credit losses for loans, held-to-maturity debt securities, receivables and other financial assets measured at amortized cost at the time the financial asset is originated or acquired. The allowance for credit losses is adjusted each period for changes in expected lifetime credit losses. The CECL methodology represents a significant change from prior U.S. GAAP and replaced the prior multiple existing impairment methods, which generally required that a loss be incurred before it was recognized. Within the life cycle of a loan or other financial asset, the methodology generally results in the earlier recognition of the provision for credit losses and the related allowance for credit losses than prior U.S. GAAP. For available-for-sale debt securities where fair value is less than cost that Citi intends to hold or more-likely-than-not will not be required to sell, credit-related impairment, if any, is recognized through an allowance for credit losses and adjusted each period for changes in credit risk.
January 1, 2020 CECL Transition (Day 1) Impact
The CECL methodology’s impact on expected credit losses, among other things, reflects Citi’s view of the current state of the economy, forecasted macroeconomic conditions and Citi’s portfolios. At the January 1, 2020 date of adoption, based on forecasts of macroeconomic conditions and exposures at that time, the aggregate impact to Citi was an approximate $4.1 billion, or an approximate 29%, pretax increase in the Allowance for credit losses, along with a $3.1 billion after-tax decrease in Retained earnings and a deferred tax asset increase of $1.0 billion. This transition impact reflects (i) a $4.9 billion build to the Allowance for credit losses for Citi’s consumer exposures, primarily driven by the impact on credit card receivables of longer estimated tenors under the CECL lifetime expected credit loss methodology (loss coverage of approximately 23 months) compared to shorter estimated tenors under the probable loss methodology under prior U.S. GAAP (loss coverage of approximately 14 months), net of recoveries; and (ii) a release of $0.8 billion of reserves primarily related to Citi’s corporate net loan loss exposures, largely due to more precise contractual maturities that result in
shorter remaining tenors, incorporation of recoveries and use of more specific historical loss data based on an increase in portfolio segmentation across industries and geographies.
Under the CECL methodology, the Allowance for credit losses consists of quantitative and qualitative components. Citi’s quantitative component of the Allowance for credit losses is model based and utilizes a single forward-looking macroeconomic forecast, complemented by the qualitative component described below, in estimating expected credit losses and discounts inputs for the corporate classifiably managed portfolios. Reasonable and supportable forecast periods vary by product. For example, Citi’s consumer models use a 13-quarter reasonable and supportable period and revert to historical loss experience thereafter, while its corporate loan models use a nine-quarter reasonable and supportable period followed by a three-quarter graduated transition to historical loss experience.
Citi’s qualitative component of the Allowance for credit losses considers (i) the uncertainty of forward-looking scenarios based on the likelihood and severity of a possible recession as another possible scenario; (ii) certain portfolio characteristics, such as portfolio concentration and collateral coverage; and (iii) model limitations as well as idiosyncratic events. Citi calculates a judgmental management adjustment, which is an alternative, more adverse scenario that only considers downside risk.
Subsequent Measurement of Goodwill
In January 2017, the FASB issued ASU No. 2017-04, Intangibles—Goodwill and Other (Topic 350): Simplifying the Test for Goodwill Impairment. The ASU simplifies the subsequent measurement of goodwill impairment by eliminating the requirement to calculate the implied fair value of goodwill (i.e., previously referred to as step 2 of the goodwill impairment test) to measure a goodwill impairment charge. Under the ASU, the impairment test is the comparison of the fair value of a reporting unit with its carrying amount, with the impairment charge being the deficit in fair value, but not exceeding the total amount of goodwill allocated to that reporting unit. The simplified one-step impairment test applies to all reporting units (including those with zero or negative carrying amounts).
The ASU was adopted by Citi as of January 1, 2020 with prospective application and did not impact the first or second quarters of 2020 results. The future impact of the ASU will depend upon the performance of Citi’s reporting units and the market conditions impacting the fair value of each reporting unit going forward.
Reference Rate Reform
In March 2020, the FASB issued ASU No. 2020-04, Reference Rate Reform (Topic 848): Facilitation of the Effects of Reference Rate Reform on Financial Reporting, which provides optional guidance to ease the potential burden in accounting for (or recognizing the effects of) reference rate reform on financial reporting. Specifically, the guidance permits an entity, when certain criteria are met, to consider amendments to contracts made to comply with reference rate reform to meet the definition of a modification under U.S. GAAP. It further allows hedge accounting to be maintained and a one-time transfer or sale of qualifying held-to-maturity securities. The expedients and exceptions provided by the amendments are permitted to be adopted any time through December 31, 2022 and do not apply to contract modifications made and hedging relationships entered into or evaluated after December 31, 2022, except for certain optional expedients elected for certain hedging relationships existing as of December 31, 2022. The ASU was adopted by Citi as of June 30, 2020 with prospective application and did not impact the second quarter of 2020 results.
Voluntary Change in the Accounting for Variable Post-Charge-Off Third-Party Collection Costs
During the second quarter of 2020, there was a change in Citi`s ACL accounting estimate effected by a change in Citi`s accounting principle for variable post-charge-off third-party collection costs. These costs were previously accounted for as a reduction in credit recoveries. As a result of this change, beginning July 1, 2020, these costs are accounted for as an increase in operating expenses. Determining a preferable method of accounting for such costs is a judgmental matter; however, Citi concluded that such a change in the method of accounting is preferable in Citi’s circumstances as it better reflects the nature of these collection costs to investors. That is, these costs do not represent reduced payments from borrowers and are similar to Citi’s other executory third-party vendor contracts that are accounted for as operating expenses as incurred.
As a result of this accounting change, Citi`s estimate for the consumer ACL was impacted and resulted in a one-time ACL release of approximately $426 million in the second quarter of 2020. This one-time ACL release reflects the impact to Citi’s ACL estimate of the revised credit recoveries incorporated in the ACL models. This change in accounting will result in a reclassification of approximately $50 million of collection costs from credit recoveries to operating expenses each quarter, beginning with the third quarter of 2020.
2. DISCONTINUED OPERATIONS AND SIGNIFICANT DISPOSALS
The Company’s results from Discontinued operations consisted of residual activities related to previously divested operations. All Discontinued operations results are recorded within Corporate/Other.
The following summarizes financial information for all Discontinued operations:
| | | | | | | | | | | | | | |
| Three Months Ended
June 30, | | Six Months Ended
June 30, | |
| In millions of dollars | 2020 | 2019 | 2020 | 2019 |
| Total revenues, net of interest expense | $ | — | | $ | — | | $ | — | | $ | — | |
Loss from discontinued operations(1) | $ | (1) | | $ | (10) | | $ | (19) | | $ | (12) | |
| | | | |
Benefit for income taxes(2) | — | | (27) | | — | | (27) | |
| Income (loss) from discontinued operations, net of taxes | $ | (1) | | $ | 17 | | $ | (19) | | $ | 15 | |
(1)Amounts in each period relate to the sale of the Egg Banking business in 2011.
(2)The benefit for income taxes, recorded in 2019, includes a settlement for a tax audit related to the German Retail banking operations, which were divested in 2008.
Cash flows from Discontinued operations were not material for the periods presented and there were no significant disposals during these periods. For a description of the Company’s significant disposal transactions in prior periods and financial impact, see Note 2 to the Consolidated Financial Statements in Citi’s 2019 Annual Report on Form 10-K.
3. BUSINESS SEGMENTS
Citigroup’s activities are conducted through the following business segments: Global Consumer Banking (GCB) and Institutional Clients Group (ICG). In addition, Corporate/Other includes activities not assigned to a specific business segment, as well as certain North America loan portfolios, discontinued operations and other legacy assets.
For additional information regarding Citigroup’s business segments, see Note 3 to the Consolidated Financial Statements in Citi’s 2019 Annual Report on Form 10-K.
The following table presents certain information regarding the Company’s continuing operations by segment:
| | | | | | | | | | | | | | | | | | | | | | | | | | |
| Three Months Ended June 30, | | | | | | | |
| Revenues,
net of interest expense(1) | | Provision (benefits)
for income taxes | | Income (loss) from
continuing operations(2) | | Identifiable assets | |
| In millions of dollars, except identifiable assets in billions | 2020 | 2019 | 2020 | 2019 | 2020 | 2019 | June 30,
2020 | December 31, 2019 |
| Global Consumer Banking | $ | 7,339 | | $ | 8,133 | | $ | (161) | | $ | 378 | | $ | (398) | | $ | 1,301 | | $ | 423 | | $ | 407 | |
| Institutional Clients Group | 12,137 | | 10,055 | | 470 | | 950 | | 1,880 | | 3,425 | | 1,716 | | 1,447 | |
| Corporate/Other | 290 | | 570 | | (178) | | 45 | | (165) | | 66 | | 94 | | 97 | |
| Total | $ | 19,766 | | $ | 18,758 | | $ | 131 | | $ | 1,373 | | $ | 1,317 | | $ | 4,792 | | $ | 2,233 | | $ | 1,951 | |
| | | | | | | | |
| Six Months Ended June 30, | | | | | | | |
| Revenues,
net of interest expense(3) | | Provision (benefits)
for income taxes | | Income (loss) from
continuing operations(4) | | | |
| In millions of dollars | 2020 | 2019 | 2020 | 2019 | 2020 | 2019 | | |
| Global Consumer Banking | $ | 15,513 | | $ | 16,223 | | $ | (431) | | $ | 759 | | $ | (1,153) | | $ | 2,621 | | | |
| Institutional Clients Group | 24,621 | | 20,073 | | 1,514 | | 1,905 | | 5,506 | | 6,837 | | | |
| Corporate/Other | 363 | | 1,038 | | (376) | | (16) | | (502) | | 71 | | | |
| Total | $ | 40,497 | | $ | 37,334 | | $ | 707 | | $ | 2,648 | | $ | 3,851 | | $ | 9,529 | | | |
(1) Includes total revenues, net of interest expense (excluding Corporate/Other), in North America of $9.7 billion and $8.6 billion; in EMEA of $3.4 billion and $3.0 billion; in Latin America of $2.3 billion and $2.6 billion and in Asia of $4.1 billion and $4.0 billion for the three months ended June 30, 2020 and 2019, respectively. These regional numbers exclude Corporate/Other, which largely operates within the U.S.
(2) Includes pretax provisions for credit losses and for benefits and claims in the GCB results of $3.9 billion and $2.0 billion; in the ICG results of $3.9 billion and $0.1 billion; and in the Corporate/Other results of $0.2 billion and $0.0 billion for the three months ended June 30, 2020 and 2019, respectively.
(3) Includes total revenues, net of interest expense, in North America of $19.9 billion and $16.9 billion; in EMEA of $6.9 billion and $6.1 billion; in Latin America of $4.9 billion and $5.2 billion; and in Asia of $8.5 billion and $8.1 billion for the six months ended June 30, 2020 and 2019, respectively. Regional numbers exclude Corporate/Other, which largely operates within the U.S.
(4) Includes pretax provisions for credit losses and for benefits and claims in the GCB results of $8.7 billion and $4.0 billion; in the ICG results of $5.9 billion and $0.2 billion; and in the Corporate/Other results of $356 million and $(47) million for the six months ended June 30, 2020 and 2019, respectively.
4. INTEREST REVENUE AND EXPENSE
Interest revenue and Interest expense consisted of the following:
| | | | | | | | | | | | | | | | | |
| Three Months Ended June 30, | | Six Months Ended June 30, | | |
| In millions of dollars | 2020 | 2019 | 2020 | 2019 | |
| Interest revenue | | | | | |
| Loan interest, including fees | $ | 10,149 | | $ | 11,981 | | $ | 21,399 | | $ | 23,949 | | |
| Deposits with banks | 159 | | 736 | | 686 | | 1,343 | | |
| Securities borrowed and purchased under agreements to resell | 401 | | 1,893 | | 1,609 | | 3,677 | | |
| Investments, including dividends | 2,097 | | 2,505 | | 4,378 | | 5,053 | | |
Trading account assets(1) | 1,673 | | 2,140 | | 3,263 | | 3,826 | | |
| Other interest | 110 | | 457 | | 393 | | 940 | | |
| Total interest revenue | $ | 14,589 | | $ | 19,712 | | $ | 31,728 | | $ | 38,788 | | |
| Interest expense | | | | | |
Deposits(2) | $ | 1,469 | | $ | 3,284 | | $ | 4,083 | | $ | 6,311 | | |
| Securities loaned and sold under agreements to repurchase | 453 | | 1,724 | | 1,538 | | 3,313 | | |
Trading account liabilities(1) | 144 | | 320 | | 383 | | 647 | | |
| Short-term borrowings and other interest-bearing liabilities | 140 | | 715 | | 524 | | 1,367 | | |
| Long-term debt | 1,303 | | 1,719 | | 2,628 | | $ | 3,441 | | |
| Total interest expense | $ | 3,509 | | $ | 7,762 | | $ | 9,156 | | $ | 15,079 | | |
| Net interest revenue | $ | 11,080 | | $ | 11,950 | | $ | 22,572 | | $ | 23,709 | | |
| Provision for credit losses on loans | 7,696 | | 2,089 | | 14,140 | | 4,033 | | |
| Net interest revenue after provision for credit losses on loans | $ | 3,384 | | $ | 9,861 | | $ | 8,432 | | $ | 19,676 | | |
(1)Interest expense on Trading account liabilities of ICG is reported as a reduction of Interest revenue. Interest revenue and Interest expense on cash collateral positions are reported in interest on Trading account assets and Trading account liabilities, respectively.
(2)Includes deposit insurance fees and charges of $270 million and $189 million for the three months ended June 30, 2020 and 2019, respectively, and $495 million and $382 million for the six months ended June 30, 2020 and 2019, respectively.
5. COMMISSIONS AND FEES; ADMINISTRATION AND OTHER FIDUCIARY FEES
For additional information on Citi’s commissions and fees, and administration and other fiduciary fees, see Note 5 to the Consolidated Financial Statements in Citi’s 2019 Annual Report on Form 10-K.
The following tables present Commissions and fees revenue:
| | | | | | | | | | | | | | | | | | | | | | | | | | |
| Three Months Ended June 30, | | | | Six Months Ended June 30, | | | |
| 2020 | | | | 2020 | | | |
| In millions of dollars | ICG | GCB | Corporate/Other | Total | ICG | GCB | Corporate/Other | Total |
| Investment banking | $ | 1,358 | | $ | — | | $ | — | | $ | 1,358 | | $ | 2,398 | | $ | — | | $ | — | | $ | 2,398 | |
| Brokerage commissions | 482 | | 204 | | — | | 686 | | 1,059 | | 453 | | — | | 1,512 | |
| Credit- and bank-card income | | | | | | | | |
| Interchange fees | 123 | | 1,505 | | — | | 1,628 | | 384 | | 3,422 | | — | | 3,806 | |
| Card-related loan fees | 3 | | 132 | | — | | 135 | | 14 | | 298 | | — | | 312 | |
| Card rewards and partner payments | (70) | | (1,745) | | — | | (1,815) | | (219) | | (3,838) | | — | | (4,057) | |
Deposit-related fees(1) | 220 | | 85 | | — | | 305 | | 453 | | 200 | | — | | 653 | |
| Transactional service fees | 215 | | 20 | | — | | 235 | | 442 | | 44 | | — | | 486 | |
Corporate finance(2) | 149 | | — | | — | | 149 | | 295 | | — | | — | | 295 | |
| Insurance distribution revenue | 1 | | 113 | | — | | 114 | | 5 | | 238 | | — | | 243 | |
| Insurance premiums | — | | 31 | | — | | 31 | | — | | 74 | | — | | 74 | |
| Loan servicing | 18 | | 11 | | 2 | | 31 | | 38 | | 22 | | 10 | | 70 | |
| Other | 27 | | 46 | | 3 | | 76 | | 57 | | 102 | | 3 | | 162 | |
Total commissions and fees(3) | $ | 2,526 | | $ | 402 | | $ | 5 | | $ | 2,933 | | $ | 4,926 | | $ | 1,015 | | $ | 13 | | $ | 5,954 | |
| | | | | | | | | | | | | | | | | | | | | | | | | | |
| Three Months Ended June 30, | | | | Six Months Ended June 30, | | | |
| 2019 | | | | 2019 | | | |
| In millions of dollars | ICG | GCB | Corporate/Other | Total | ICG | GCB | Corporate/Other | Total |
| Investment banking | $ | 941 | | $ | — | | $ | — | | $ | 941 | | $ | 1,855 | | $ | — | | $ | — | | $ | 1,855 | |
| Brokerage commissions | 438 | | 211 | | — | | 649 | | 909 | | 397 | | — | | 1,306 | |
| Credit- and bank-card income | | | | | | | | |
| Interchange fees | 314 | | 2,197 | | — | | 2,511 | | 593 | | 4,180 | | — | | 4,773 | |
| Card-related loan fees | 16 | | 183 | | — | | 199 | | 29 | | 343 | | — | | 372 | |
| Card rewards and partner payments | (175) | | (2,277) | | — | | (2,452) | | (328) | | (4,338) | | — | | (4,666) | |
Deposit-related fees(1) | 266 | | 120 | | — | | 386 | | 528 | | 242 | | — | | 770 | |
| Transactional service fees | 199 | | 30 | | — | | 229 | | 400 | | 60 | | — | | 460 | |
Corporate finance(2) | 151 | | — | | — | | 151 | | 330 | | — | | — | | 330 | |
| Insurance distribution revenue | 2 | | 129 | | — | | 131 | | 6 | | 261 | | — | | 267 | |
| Insurance premiums | — | | 45 | | — | | 45 | | — | | 92 | | — | | 92 | |
| Loan servicing | — | | 8 | | 3 | | 11 | | 50 | | 30 | | 9 | | 89 | |
| Other | 14 | | 66 | | — | | 80 | | 30 | | 128 | | 1 | | 159 | |
Total commissions and fees(3) | $ | 2,166 | | $ | 712 | | $ | 3 | | $ | 2,881 | | $ | 4,402 | | $ | 1,395 | | $ | 10 | | $ | 5,807 | |
(1)Includes overdraft fees of $20 million and $31 million for the three months ended June 30, 2020 and 2019, respectively, and $51 million and $61 million for the six months ended June 30, 2020 and 2019, respectively. Overdraft fees are accounted for under ASC 310.
(2)Consists primarily of fees earned from structuring and underwriting loan syndications or related financing activity. This activity is accounted for under ASC 310.
(3)Commissions and fees includes $(1,426) million and $(2,016) million not accounted for under ASC 606, Revenue from Contracts with Customers, for the three months ended June 30, 2020 and 2019, respectively, and $(3,228) million and $(3,719) million for the six months ended June 30, 2020 and 2019, respectively. Amounts reported in Commissions and fees accounted for under other guidance primarily include card-related loan fees, card reward programs and certain partner payments, corporate finance fees, insurance premiums and loan servicing fees.
The following table presents Administration and other fiduciary fees revenue:
| | | | | | | | | | | | | | | | | | | | | | | | | | |
| Three Months Ended June 30, | | | | Six Months Ended June 30, | | | |
| 2020 | | | | 2020 | | | |
| In millions of dollars | ICG | GCB | Corporate/Other | Total | ICG | GCB | Corporate/Other | Total |
| Custody fees | $ | 372 | | $ | 6 | | $ | 21 | | $ | 399 | | $ | 738 | | $ | 14 | | $ | 36 | | $ | 788 | |
| Fiduciary fees | 158 | | 132 | | — | | 290 | | 330 | | 288 | | — | | 618 | |
| Guarantee fees | 127 | | 1 | | 2 | | 130 | | 261 | | 3 | | 3 | | 267 | |
Total administration and other fiduciary fees(1) | $ | 657 | | $ | 139 | | $ | 23 | | $ | 819 | | $ | 1,329 | | $ | 305 | | $ | 39 | | $ | 1,673 | |
| | | | | | | | | | | | | | | | | | | | | | | | | | |
| Three Months Ended June 30, | | | | Six Months Ended June 30, | | | |
| 2019 | | | | 2019 | | | |
| In millions of dollars | ICG | GCB | Corporate/Other | Total | ICG | GCB | Corporate/Other | Total |
| Custody fees | $ | 383 | | $ | 4 | | $ | 18 | | $ | 405 | | $ | 747 | | $ | 7 | | $ | 34 | | $ | 788 | |
| Fiduciary fees | 162 | | 154 | | — | | 316 | | 314 | | 300 | | 12 | | 626 | |
| Guarantee fees | 144 | | 2 | | 2 | | 148 | | 286 | | 4 | | 4 | | 294 | |
Total administration and other fiduciary fees(1) | $ | 689 | | $ | 160 | | $ | 20 | | $ | 869 | | $ | 1,347 | | $ | 311 | | $ | 50 | | $ | 1,708 | |
(1) Administration and other fiduciary fees includes $130 million and $148 million for the three months ended June 30, 2020 and 2019, respectively, and $267 million and $294 million for the six months ended June 30, 2020 and 2019, respectively, that are not accounted for under ASC 606, Revenue from Contracts with Customers. These amounts include guarantee fees.
6. PRINCIPAL TRANSACTIONS
Principal transactions revenue consists of realized and unrealized gains and losses from trading activities. Trading activities include revenues from fixed income, equities, credit and commodities products and foreign exchange transactions that are managed on a portfolio basis characterized by primary risk. Not included in the table below is the impact of net interest revenue related to trading activities, which is an
integral part of trading activities’ profitability. See Note 4 to the Consolidated Financial Statements for information about net interest revenue related to trading activities. Principal transactions include CVA (credit valuation adjustments) and FVA (funding valuation adjustments) on over-the-counter derivatives, and gains (losses) on certain economic hedges on loans in ICG. These adjustments are discussed further in Note 20 to the Consolidated Financial Statements.
In certain transactions, Citi incurs fees and presents these fees paid to third parties in operating expenses.
The following table presents Principal transactions
revenue:
| | | | | | | | | | | | | | |
| Three Months Ended June 30, | | Six Months Ended June 30, | |
| In millions of dollars | 2020 | 2019 | 2020 | 2019 |
Interest rate risks(1) | $ | 1,843 | | $ | 1,320 | | $ | 3,820 | | $ | 3,038 | |
Foreign exchange risks(2) | 1,114 | | 427 | | 2,109 | | 900 | |
Equity risks(3) | 102 | | (1) | | 921 | | 455 | |
Commodity and other risks(4) | 370 | | 89 | | 697 | | 208 | |
Credit products and risks(5) | 728 | | 39 | | 1,871 | | 77 | |
| Total | $ | 4,157 | | $ | 1,874 | | $ | 9,418 | | $ | 4,678 | |
(1) Includes revenues from government securities and corporate debt, municipal securities, mortgage securities and other debt instruments. Also includes spot and forward trading of currencies and exchange-traded and over-the-counter (OTC) currency options, options on fixed income securities, interest rate swaps, currency swaps, swap options, caps and floors, financial futures, OTC options and forward contracts on fixed income securities.
(2) Includes revenues from foreign exchange spot, forward, option and swap contracts, as well as foreign currency translation (FX translation) gains and losses.
(3) Includes revenues from common, preferred and convertible preferred stock, convertible corporate debt, equity-linked notes and exchange-traded and OTC equity options and warrants.
(4) Primarily includes revenues from crude oil, refined oil products, natural gas and other commodities trades.
(5) Includes revenues from structured credit products.
7. INCENTIVE PLANS
For additional information on Citi’s incentive plans, see Note 7 to the Consolidated Financial Statements in Citi’s 2019 Annual Report on Form 10-K.
8. RETIREMENT BENEFITS
For additional information on Citi’s retirement benefits, see Note 8 to the Consolidated Financial Statements in Citi’s 2019 Annual Report on Form 10-K.
Net (Benefit) Expense
The following table summarizes the components of net (benefit) expense recognized in the Consolidated Statement of Income for the Company’s pension and postretirement plans for Significant Plans and All Other Plans:
| | | | | | | | | | | | | | | | | | | | | | | | | | | | | | |
| Three Months Ended June 30, | | | | | | | | | | | |
| | Pension plans | | | | | | Postretirement benefit plans | | | | | |
| | U.S. plans | | | Non-U.S. plans | | | U.S. plans | | | Non-U.S. plans | | |
| In millions of dollars | 2020 | 2019 | | 2020 | 2019 | | 2020 | 2019 | | 2020 | 2019 | |
| | | | | | | | | | | | |
| Benefits earned during the period | $ | — | | $ | — | | | $ | 34 | | $ | 35 | | | $ | — | | $ | — | | | $ | 2 | | $ | 2 | | |
| Interest cost on benefit obligation | 101 | | 123 | | | 61 | | 73 | | | 5 | | 6 | | | 22 | | 26 | | |
| Expected return on plan assets | (206) | | (202) | | | (56) | | (68) | | | (4) | | (4) | | | (18) | | (21) | | |
| Amortization of unrecognized: | | | | | | | | | | | | |
| Prior service benefit | — | | (1) | | | (2) | | (1) | | | — | | — | | | (2) | | (3) | | |
| Net actuarial loss | 53 | | 48 | | | 17 | | 15 | | | — | | — | | | 5 | | 6 | | |
| | | | | | | | | | | | |
Settlement loss(1) | — | | — | | | 3 | | 2 | | | — | | — | | | — | | — | | |
| | | | | | | | | | | | |
| | | | | | | | | | | | |
| | | | | | | | | | | | |
| | | | | | | | | | | | |
| Total net (benefit) expense | $ | (52) | | $ | (32) | | | $ | 57 | | $ | 56 | | | $ | 1 | | $ | 2 | | | $ | 9 | | $ | 10 | | |
(1) Losses due to settlement relate to repositioning and divestiture activities.
| | | | | | | | | | | | | | | | | | | | | | | | | | | | | | |
| Six Months Ended June 30, | | | | | | | | | | | |
| | Pension plans | | | | | | Postretirement benefit plans | | | | | |
| | U.S. plans | | | Non-U.S. plans | | | U.S. plans | | | Non-U.S. plans | | |
| In millions of dollars | 2020 | 2019 | | 2020 | 2019 | | 2020 | 2019 | | 2020 | 2019 | |
| | | | | | | | | | | | |
| Benefits earned during the period | $ | — | | $ | — | | | $ | 71 | | $ | 71 | | | $ | — | | $ | — | | | $ | 4 | | $ | 4 | | |
| Interest cost on benefit obligation | 207 | | 253 | | | 125 | | 148 | | | 10 | | 13 | | | 46 | | 52 | | |
| Expected return on plan assets | (414) | | (405) | | | (121) | | (136) | | | (9) | | (9) | | | (38) | | (42) | | |
| Amortization of unrecognized: | | | | | | | | | | | | |
| Prior service cost (benefit) | 1 | | — | | | (3) | | (2) | | | — | | — | | | (4) | | (5) | | |
| Net actuarial loss | 109 | | 92 | | | 34 | | 30 | | | — | | — | | | 10 | | 11 | | |
| | | | | | | | | | | | |
Settlement loss(1) | — | | — | | | 3 | | 2 | | | — | | — | | | — | | — | | |
| | | | | | | | | | | | |
| | | | | | | | | | | | |
| | | | | | | | | | | | |
| | | | | | | | | | | | |
| Total net (benefit) expense | $ | (97) | | $ | (60) | | | $ | 109 | | $ | 113 | | | $ | 1 | | $ | 4 | | | $ | 18 | | $ | 20 | | |
(1) Losses due to settlement relate to repositioning and divestiture activities.
Funded Status and Accumulated Other Comprehensive Income (AOCI)
The following table summarizes the funded status and amounts recognized on the Consolidated Balance Sheet for the Company’s
Significant Plans:
| | | | | | | | | | | | | | |
| | | | |
| Six Months Ended June 30, 2020 | | | |
| | Pension plans | | Postretirement benefit plans | |
| In millions of dollars | U.S. plans | Non-U.S. plans | U.S. plans | Non-U.S. plans |
| | | | |
| Change in projected benefit obligation | | | | |
| | | | |
| Projected benefit obligation at beginning of year | $ | 13,453 | | $ | 8,105 | | $ | 692 | | $ | 1,384 | |
| Plans measured annually | (26) | | (2,068) | | — | | (323) | |
| Projected benefit obligation at beginning of year—Significant Plans | $ | 13,427 | | $ | 6,037 | | $ | 692 | | $ | 1,061 | |
| First quarter activity | (78) | | (934) | | (13) | | (255) | |
| | | | |
| | | | |
| Projected benefit obligation at the March 31, 2020—Significant Plans | $ | 13,349 | | $ | 5,103 | | $ | 679 | | $ | 806 | |
| | | | |
| Benefits earned during the period | | 20 | | — | | 1 | |
| Interest cost on benefit obligation | 101 | | 51 | | 5 | | 19 | |
| Actuarial loss | 678 | | 466 | | 5 | | 84 | |
| Benefits paid, net of participants’ contributions and government subsidy | (268) | | (83) | | (10) | | (13) | |
| | | | |
| | | | |
| | | | |
| | | | |
| | | | |
| Foreign exchange impact and other | — | | 19 | | — | | 14 | |
| | | | |
| | | | |
| Projected benefit obligation at period end—Significant Plans | $ | 13,860 | | $ | 5,576 | | $ | 679 | | $ | 911 | |
| Change in plan assets | | | | |
| | | | |
| Plan assets at fair value at beginning of year | $ | 12,717 | | $ | 7,556 | | $ | 345 | | $ | 1,127 | |
| Plans measured annually | — | | (1,349) | | — | | (9) | |
| Plan assets at fair value at beginning of year—Significant Plans | $ | 12,717 | | $ | 6,207 | | $ | 345 | | $ | 1,118 | |
| First quarter activity | (864) | | (720) | | (24) | | (270) | |
| | | | |
| Plan assets at fair value at March 31, 2020—Significant Plans | $ | 11,853 | | $ | 5,487 | | $ | 321 | | $ | 848 | |
| | | | |
| Actual return on plan assets | 830 | | 439 | | 16 | | 94 | |
| Company contributions, net of reimbursements | 14 | | 15 | | (3) | | — | |
| | | | |
| Benefits paid, net of participants’ contributions and government subsidy | (268) | | (83) | | (10) | | (13) | |
| | | | |
| | | | |
| | | | |
| Foreign exchange impact and other | — | | 5 | | — | | 13 | |
| | | | |
| | | | |
| Plan assets at fair value at period end—Significant Plans | $ | 12,429 | | $ | 5,863 | | $ | 324 | | $ | 942 | |
| Funded status of the Significant Plans | | | | |
Qualified plans(1) | $ | (713) | | $ | 287 | | $ | (355) | | $ | 31 | |
| Nonqualified plans | (718) | | — | | — | | — | |
| Funded status of the plans at period end—Significant Plans | $ | (1,431) | | $ | 287 | | $ | (355) | | $ | 31 | |
| Net amount recognized at period end | | | | |
| Benefit asset | $ | — | | $ | 907 | | $ | — | | $ | 31 | |
| Benefit liability | (1,431) | | (620) | | (355) | | — | |
| Net amount recognized on the balance sheet—Significant Plans | $ | (1,431) | | $ | 287 | | $ | (355) | | $ | 31 | |
Amounts recognized in AOCI at period end | | | | |
| | | | |
| Prior service benefit | $ | — | | $ | 8 | | $ | — | | $ | 53 | |
| Net actuarial (loss) gain | (7,933) | | (854) | | 29 | | (296) | |
| Net amount recognized in equity (pretax)—Significant Plans | $ | (7,933) | | $ | (846) | | $ | 29 | | $ | (243) | |
| Accumulated benefit obligation at period end—Significant Plans | $ | 13,857 | | $ | 5,283 | | $ | 679 | | $ | 911 | |
(1)The U.S. qualified pension plan is fully funded pursuant to the Employee Retirement Income Security Act of 1974, as amended (ERISA), funding rules as of January 1, 2020 and no minimum required funding is expected for 2020.
The following table shows the change in AOCI related to the Company’s pension, postretirement and post employment plans:
| | | | | | | | |
| In millions of dollars | Three Months Ended June 30, 2020 | Six Months Ended
June 30, 2020 |
| | |
Beginning of period balance, net of tax(1)(2) | $ | (7,095) | | $ | (6,809) | |
| | |
| | |
| Actuarial assumptions changes and plan experience | (1,230) | | (800) | |
| Net asset gain (loss) due to difference between actual and expected returns | 1,106 | | (22) | |
| Net amortization | 72 | | 148 | |
| Prior service cost | 16 | | 16 | |
Curtailment/settlement gain(3) | 3 | | 3 | |
| Foreign exchange impact and other | (60) | | 144 | |
| Change in deferred taxes, net | 16 | | 148 | |
| Change, net of tax | $ | (77) | | $ | (363) | |
End of period balance, net of tax(1)(2) | $ | (7,172) | | $ | (7,172) | |
(1)See Note 17 to the Consolidated Financial Statements for further discussion of net AOCI balance.
(2)Includes net-of-tax amounts for certain profit-sharing plans outside the U.S.
(3)Curtailment and settlement relate to repositioning and divestiture activities.
Plan Assumptions
The discount rates utilized during the period in determining the pension and postretirement net (benefit) expense for the Significant Plans are as follows:
| | | | | | | | | |
| Net (benefit) expense assumed discount rates during the period | Three Months Ended | | |
| Jun. 30, 2020 | | Jun. 30, 2019 |
| U.S. plans | | | |
| Qualified pension | 3.20 | % | | 3.85 | % |
| Nonqualified pension | 3.25 | | | 3.90 | |
| Postretirement | 3.20 | | | 3.80 | |
| Non-U.S. plans | | | |
| Pension | 0.45-9.45 | | 0.45-10.30 |
| Weighted average | 4.38 | | | 4.74 | |
| Postretirement | 9.75 | | | 10.30 | |
The discount rates utilized at period-end in determining the pension and postretirement benefit obligations for the Significant Plans are as follows:
| | | | | | | | | | | | |
| Plan obligations assumed discount rates at period ended | Jun. 30, 2020 | Mar. 31, 2020 | Dec. 31, 2019 | |
| U.S. plans | | | | |
| Qualified pension | 2.60 | % | 3.20 | % | 3.25 | % | |
| Nonqualified pension | 2.55 | | 3.25 | | 3.25 | | |
| Postretirement | 2.45 | | 3.20 | | 3.15 | | |
| Non-U.S. plans | | | | |
| Pension | 0.20-8.40 | 0.45-9.45 | 0.20-8.95 | |
| Weighted average | 3.68 | | 4.38 | | 4.21 | | |
| Postretirement | 8.80 | | 9.75 | | 9.10 | | |
Sensitivities of Certain Key Assumptions
The following table summarizes the estimated effect on the Company’s Significant Plans quarterly expense of a one-percentage-point change in the discount rate:
| | | | | | | | | | |
| Three Months Ended June 30, 2020 | | | |
| In millions of dollars | One-percentage-point increase | | | One-percentage-point decrease |
| Pension | | | | |
| U.S. plans | $ | 8 | | | | $ | (11) | |
| Non-U.S. plans | (2) | | | | 3 | |
| Postretirement | | | | |
| U.S. plans | — | | | | (1) | |
| Non-U.S. plans | (2) | | | | 2 | |
For the U.S. pension plans, there were no required minimum cash contributions during the first six months of 2020. The Company made discretionary contributions of $425 million and $220 million to the U.S. qualified defined benefit plan and Mexico—Banco Nacional Healthcare Postretirement Plan, respectively, during the second quarter of 2019.
The following table summarizes the Company’s actual contributions for the six months ended June 30, 2020 and 2019, as well as expected Company contributions for the remainder of 2020 and the actual contributions made in 2019:
| | | | | | | | | | | | | | | | | | | | | | | | | | | | | | |
| | Pension plans | | | | | | Postretirement plans | | | | | |
| | U.S. plans(1) | | | Non-U.S. plans | | | U.S. plans | | | Non-U.S. plans | | |
| In millions of dollars | 2020 | 2019 | | 2020 | 2019 | | 2020 | 2019 | | 2020 | 2019 | |
Company contributions(2) for the six months ended June 30 | $ | 28 | | $ | 463 | | | $ | 72 | | $ | 64 | | | $ | — | | $ | — | | | $ | 5 | | $ | 223 | | |
Company contributions made during the remainder
of the year | — | | 18 | | | — | | 86 | | | — | | 4 | | | — | | 2 | | |
Company contributions expected to be made during
the remainder of the year | 32 | | — | | | 74 | | — | | | — | | — | | | 3 | | — | | |
| | | | | | | | | | | | |
| | | | | | | | | | | | |
| | | | | | | | | | | | |
(1)The U.S. plans include benefits paid directly by the Company for the nonqualified pension plans.
(2)Company contributions are composed of cash contributions made to the plans and benefits paid directly by the Company.
Defined Contribution Plans
The following table summarizes the Company’s contributions for the defined contribution plans:
| | | | | | | | | | | | | | | | |
| Three Months Ended June 30, | | Six Months Ended June 30, | | | |
| In millions of dollars | 2020 | 2019 | 2020 | 2019 | | |
| U.S. plans | $ | 101 | | $ | 99 | | $ | 203 | | 198 | | | |
| Non-U.S. plans | 74 | | 71 | | 150 | | 139 | | | |
Post Employment Plans
The following table summarizes the components of net expense recognized in the Consolidated Statement of Income for the Company’s U.S. post employment plans:
| | | | | | | | | | | | | | |
| Three Months Ended June 30, | | Six Months Ended June 30, | |
| In millions of dollars | 2020 | 2019 | 2020 | 2019 |
| Service-related expense | | | | |
| Interest cost on benefit obligation | $ | — | | $ | 1 | | $ | — | | $ | 1 | |
| Expected return on plan assets | — | | (1) | | — | | (1) | |
| Amortization of unrecognized: | | | | |
| | | | |
| Net actuarial loss | 1 | | — | | 1 | | 1 | |
| | | | |
| Total service-related expense | $ | 1 | | $ | — | | $ | 1 | | $ | 1 | |
| Non-service-related expense | $ | 3 | | $ | 2 | | $ | 8 | | $ | 6 | |
| Total net expense | $ | 4 | | $ | 2 | | $ | 9 | | $ | 7 | |
9. EARNINGS PER SHARE
The following table reconciles the income and share data used in the basic and diluted earnings per share (EPS) computations:
| | | | | | | | | | | | | | |
| Three Months Ended June 30, | | Six Months Ended June 30, | |
| In millions of dollars, except per share amounts | 2020 | 2019 | 2020 | 2019 |
| Earnings per common share | | | | |
| Income from continuing operations before attribution of noncontrolling interests | $ | 1,317 | | $ | 4,792 | | $ | 3,851 | | $ | 9,529 | |
| Less: Noncontrolling interests from continuing operations | — | | 10 | | (6) | | 35 | |
| Net income from continuing operations (for EPS purposes) | $ | 1,317 | | $ | 4,782 | | $ | 3,857 | | $ | 9,494 | |
| Loss from discontinued operations, net of taxes | (1) | | 17 | | (19) | | 15 | |
| Citigroup’s net income | $ | 1,316 | | $ | 4,799 | | $ | 3,838 | | $ | 9,509 | |
Less: Preferred dividends(1) | 253 | | 296 | | 544 | | 558 | |
| Net income available to common shareholders | $ | 1,063 | | $ | 4,503 | | $ | 3,294 | | $ | 8,951 | |
| Less: Dividends and undistributed earnings allocated to employee restricted and deferred shares with rights to dividends, applicable to basic EPS | 11 | | 50 | | 32 | | 109 | |
| Net income allocated to common shareholders for basic EPS | $ | 1,052 | | $ | 4,453 | | $ | 3,262 | | $ | 8,842 | |
Weighted-average common shares outstanding applicable to basic EPS (in millions) | 2,081.7 | | 2,286.1 | | 2,089.8 | | 2,313.2 | |
Basic earnings per share(2) | | | | |
| Income from continuing operations | $ | 0.51 | | $ | 1.94 | | $ | 1.57 | | $ | 3.81 | |
| Discontinued operations | — | | 0.01 | | (0.01) | | 0.01 | |
| Net income per share—basic | $ | 0.51 | | $ | 1.95 | | $ | 1.56 | | $ | 3.82 | |
| Diluted earnings per share | | | | |
| Net income allocated to common shareholders for basic EPS | $ | 1,052 | | $ | 4,453 | | $ | 3,262 | | $ | 8,842 | |
Add back: Dividends allocated to employee restricted and deferred shares with rights to dividends that are forfeitable(3) | — | | — | | 14 | | — | |
| Net income allocated to common shareholders for diluted EPS | $ | 1,052 | | $ | 4,453 | | $ | 3,276 | | $ | 8,842 | |
Weighted-average common shares outstanding applicable to basic EPS (in millions) | 2,081.7 | | 2,286.1 | | 2,089.8 | | 2,313.2 | |
| Effect of dilutive securities | | | | |
Options(4) | — | | — | | — | | 0.1 | |
Other employee plans(3) | 2.6 | | 2.9 | | 13.2 | | 2.4 | |
Adjusted weighted-average common shares outstanding applicable to diluted EPS (in millions)(5) | 2,084.3 | | 2,289.0 | | 2,103.0 | | 2,315.7 | |
Diluted earnings per share(2) | | | | |
| Income from continuing operations | $ | 0.51 | | $ | 1.94 | | $ | 1.57 | | $ | 3.81 | |
| Discontinued operations | — | | 0.01 | | (0.01) | | 0.01 | |
| Net income per share—diluted | $ | 0.50 | | $ | 1.95 | | $ | 1.56 | | $ | 3.82 | |
(1)On July 15, 2020, Citi declared preferred dividends of approximately $284 million for the third quarter of 2020. As of August 4, 2020, Citi estimates it will distribute preferred dividends of approximately $253 million in the fourth quarter of 2020, subject to such dividends being declared by the Citi Board of Directors. During the first quarter of 2020, in March, Citi redeemed all of its 1.5 million Series O preferred shares for $1.5 billion; in January, Citi also issued 1.5 million of Series V preferred shares for $1.5 billion.
(2)Due to rounding, earnings per share on continuing operations and discontinued operations may not sum to earnings per share on net income.
(3)Certain securities are excluded from the second quarter of 2020 (three month period) balances due to anti-dilution.
(4)During the second quarter of 2020 and 2019, no significant options to purchase shares of common stock were outstanding.
(5)Due to rounding, weighted-average common shares outstanding applicable to basic EPS and the effect of dilutive securities may not sum to weighted-average common shares outstanding applicable to diluted EPS.
10. SECURITIES BORROWED, LOANED AND SUBJECT TO REPURCHASE AGREEMENTS
For additional information on the Company’s resale and repurchase agreements and securities borrowing and lending agreements, see Note 11 to the Consolidated Financial Statements in Citi’s 2019 Annual Report on Form 10-K.
Securities borrowed and purchased under agreements to resell, at their respective carrying values, consisted of the following:
| | | | | | | | |
| In millions of dollars | June 30,
2020 | December 31, 2019 |
| Securities purchased under agreements to resell | $ | 181,887 | | $ | 169,874 | |
| Deposits paid for securities borrowed | 101,037 | | 81,448 | |
Total, net(1) | $ | 282,924 | | $ | 251,322 | |
Allowance for credit losses on securities purchased and borrowed(2) | (7) | | — | |
| Total, net of allowance | $ | 282,917 | | $ | 251,322 | |
Securities loaned and sold under agreements to repurchase, at their respective carrying values, consisted of the following:
| | | | | | | | |
| In millions of dollars | June 30,
2020 | December 31, 2019 |
| Securities sold under agreements to repurchase | $ | 203,819 | | $ | 155,164 | |
| Deposits received for securities loaned | 11,903 | | 11,175 | |
Total, net(1) | $ | 215,722 | | $ | 166,339 | |
(1) The above tables do not include securities-for-securities lending transactions of $5.8 billion and $6.3 billion at June 30, 2020 and December 31, 2019, respectively, where the Company acts as lender and receives securities that can be sold or pledged as collateral. In these transactions, the Company recognizes the securities received at fair value within Other assets and the obligation to return those securities as a liability within Brokerage payables.
(2) See Note 14 to the Consolidated Financial Statements for further information.
It is the Company’s policy to take possession of the underlying collateral, monitor its market value relative to the amounts due under the agreements and, when necessary, require prompt transfer of additional collateral in order to maintain contractual margin protection. For resale and repurchase agreements, when necessary, the Company posts additional collateral in order to maintain contractual margin protection.
A substantial portion of the resale and repurchase agreements is recorded at fair value, as described in Notes 20 and 21 to the Consolidated Financial Statements. The remaining portion is carried at the amount of cash initially advanced or received, plus accrued interest, as specified in the respective agreements.
A substantial portion of securities borrowing and lending agreements is recorded at the amount of cash advanced or received. The remaining portion is recorded at fair value as the Company elected the fair value option for certain securities borrowed and loaned portfolios, as described in Note 21 to the Consolidated Financial Statements. With respect to securities loaned, the Company receives cash collateral in an amount generally in excess of the market value of the securities loaned. The Company monitors the market value of securities borrowed and securities loaned on a daily basis and obtains or posts additional collateral in order to maintain contractual margin protection.
The following tables present the gross and net resale and repurchase agreements and securities borrowing and lending
agreements and the related offsetting amounts permitted under ASC 210-20-45. The tables also include amounts related to financial instruments that are not permitted to be offset under ASC 210-20-45, but would be eligible for offsetting to the extent that an event of default has occurred and a legal opinion supporting enforceability of the offsetting rights has been obtained. Remaining exposures continue to be secured by financial collateral, but the Company may not have sought or been able to obtain a legal opinion evidencing enforceability of the offsetting right.
| | | | | | | | | | | | | | | | | |
| | As of June 30, 2020 | | | | |
| In millions of dollars | Gross amounts
of recognized
assets | Gross amounts
offset on the
Consolidated
Balance Sheet(1) | Net amounts of
assets included on
the Consolidated
Balance Sheet | Amounts
not offset on the
Consolidated Balance
Sheet but eligible for
offsetting upon
counterparty default(2) | Net
amounts(3) |
| Securities purchased under agreements to resell | $ | 315,360 | | $ | 133,473 | | $ | 181,887 | | $ | 145,631 | | $ | 36,256 | |
| Deposits paid for securities borrowed | 105,098 | | 4,061 | | 101,037 | | 28,174 | | 72,863 | |
| Total | $ | 420,458 | | $ | 137,534 | | $ | 282,924 | | $ | 173,805 | | $ | 109,119 | |
| | | | | | | | | | | | | | | | | |
| In millions of dollars | Gross amounts
of recognized
liabilities | Gross amounts
offset on the
Consolidated
Balance Sheet(1) | Net amounts of
liabilities included on
the Consolidated
Balance Sheet | Amounts
not offset on the
Consolidated Balance
Sheet but eligible for
offsetting upon
counterparty default(2) | Net
amounts(3) |
| Securities sold under agreements to repurchase | $ | 337,292 | | $ | 133,473 | | $ | 203,819 | | $ | 116,042 | | $ | 87,777 | |
| Deposits received for securities loaned | 15,964 | | 4,061 | | 11,903 | | 3,475 | | 8,428 | |
| Total | $ | 353,256 | | $ | 137,534 | | $ | 215,722 | | $ | 119,517 | | $ | 96,205 | |
| | | | | | | | | | | | | | | | | |
| | As of December 31, 2019 | | | | |
| In millions of dollars | Gross amounts
of recognized
assets | Gross amounts
offset on the
Consolidated
Balance Sheet(1) | Net amounts of
assets included on
the Consolidated
Balance Sheet | Amounts
not offset on the
Consolidated Balance
Sheet but eligible for
offsetting upon
counterparty default(2) | Net
amounts(3) |
| Securities purchased under agreements to resell | $ | 281,274 | | $ | 111,400 | | $ | 169,874 | | $ | 134,150 | | $ | 35,724 | |
| Deposits paid for securities borrowed | 90,047 | | 8,599 | | 81,448 | | 27,067 | | 54,381 | |
| Total | $ | 371,321 | | $ | 119,999 | | $ | 251,322 | | $ | 161,217 | | $ | 90,105 | |
| | | | | | | | | | | | | | | | | |
| In millions of dollars | Gross amounts
of recognized
liabilities | Gross amounts
offset on the
Consolidated
Balance Sheet(1) | Net amounts of
liabilities included on
the Consolidated
Balance Sheet | Amounts
not offset on the
Consolidated Balance
Sheet but eligible for
offsetting upon
counterparty default(2) | Net
amounts(3) |
| Securities sold under agreements to repurchase | $ | 266,564 | | $ | 111,400 | | $ | 155,164 | | $ | 91,034 | | $ | 64,130 | |
| Deposits received for securities loaned | 19,774 | | 8,599 | | 11,175 | | 3,138 | | 8,037 | |
| Total | $ | 286,338 | | $ | 119,999 | | $ | 166,339 | | $ | 94,172 | | $ | 72,167 | |
(1)Includes financial instruments subject to enforceable master netting agreements that are permitted to be offset under ASC 210-20-45.
(2)Includes financial instruments subject to enforceable master netting agreements that are not permitted to be offset under ASC 210-20-45, but would be eligible for offsetting to the extent that an event of default has occurred and a legal opinion supporting enforceability of the offsetting right has been obtained.
(3)Remaining exposures continue to be secured by financial collateral, but the Company may not have sought or been able to obtain a legal opinion evidencing enforceability of the offsetting right.
The following tables present the gross amounts of liabilities associated with repurchase agreements and securities lending agreements by remaining contractual maturity:
| | | | | | | | | | | | | | | | | |
| As of June 30, 2020 | | | | |
| In millions of dollars | Open and overnight | Up to 30 days | 31–90 days | Greater than 90 days | Total |
| Securities sold under agreements to repurchase | $ | 175,461 | | $ | 87,421 | | $ | 39,723 | | $ | 34,687 | | $ | 337,292 | |
| Deposits received for securities loaned | 12,412 | | 190 | | 1,299 | | 2,063 | | 15,964 | |
| Total | $ | 187,873 | | $ | 87,611 | | $ | 41,022 | | $ | 36,750 | | $ | 353,256 | |
| | | | | | | | | | | | | | | | | |
| As of December 31, 2019 | | | | |
| In millions of dollars | Open and overnight | Up to 30 days | 31–90 days | Greater than 90 days | Total |
| Securities sold under agreements to repurchase | $ | 108,534 | | $ | 82,749 | | $ | 35,108 | | $ | 40,173 | | $ | 266,564 | |
| Deposits received for securities loaned | 15,758 | | 208 | | 1,789 | | 2,019 | | 19,774 | |
| Total | $ | 124,292 | | $ | 82,957 | | $ | 36,897 | | $ | 42,192 | | $ | 286,338 | |
The following tables present the gross amounts of liabilities associated with repurchase agreements and securities lending agreements by class of underlying collateral:
| | | | | | | | | | | |
| As of June 30, 2020 | | |
| In millions of dollars | Repurchase agreements | Securities lending agreements | Total |
| U.S. Treasury and federal agency securities | $ | 127,237 | | $ | — | | $ | 127,237 | |
| State and municipal securities | 1,117 | | 1 | | 1,118 | |
| Foreign government securities | 123,451 | | 192 | | 123,643 | |
| Corporate bonds | 20,922 | | 349 | | 21,271 | |
| Equity securities | 11,617 | | 14,652 | | 26,269 | |
| Mortgage-backed securities | 42,762 | | — | | 42,762 | |
| Asset-backed securities | 3,925 | | — | | 3,925 | |
| Other | 6,261 | | 770 | | 7,031 | |
| Total | $ | 337,292 | | $ | 15,964 | | $ | 353,256 | |
| | | | | | | | | | | |
| As of December 31, 2019 | | |
| In millions of dollars | Repurchase agreements | Securities lending agreements | Total |
| U.S. Treasury and federal agency securities | $ | 100,781 | | $ | 27 | | $ | 100,808 | |
| State and municipal securities | 1,938 | | 5 | | 1,943 | |
| Foreign government securities | 95,880 | | 272 | | 96,152 | |
| Corporate bonds | 18,761 | | 249 | | 19,010 | |
| Equity securities | 12,010 | | 19,069 | | 31,079 | |
| Mortgage-backed securities | 28,458 | | — | | 28,458 | |
| Asset-backed securities | 4,873 | | — | | 4,873 | |
| Other | 3,863 | | 152 | | 4,015 | |
| Total | $ | 266,564 | | $ | 19,774 | | $ | 286,338 | |
11. BROKERAGE RECEIVABLES AND BROKERAGE PAYABLES
The Company has receivables and payables for financial instruments sold to and purchased from brokers, dealers and customers, which arise in the ordinary course of business.
For additional information on these receivables and payables, see Note 12 to the Consolidated Financial Statements in Citi’s 2019 Annual Report on Form 10-K.
Brokerage receivables and Brokerage payables consisted of the following:
| | | | | | | | |
| In millions of dollars | June 30,
2020 | December 31, 2019 |
| Receivables from customers | $ | 17,145 | | $ | 15,912 | |
| Receivables from brokers, dealers and clearing organizations | 34,488 | | 23,945 | |
Total brokerage receivables(1) | $ | 51,633 | | $ | 39,857 | |
| Payables to customers | $ | 41,843 | | $ | 37,613 | |
| Payables to brokers, dealers and clearing organizations | 18,724 | | 10,988 | |
Total brokerage payables(1) | $ | 60,567 | | $ | 48,601 | |
(1) Includes brokerage receivables and payables recorded by Citi broker-dealer entities that are accounted for in accordance with the AICPA Accounting Guide for Brokers and Dealers in Securities as codified in ASC 940-320.
12. INVESTMENTS
For additional information regarding Citi’s investment portfolios, including evaluating investments for impairment, see Note 13 to the Consolidated Financial Statements
in Citi’s 2019 Annual Report on Form 10-K.
The following table presents Citi’s investments by category:
| | | | | | | | | |
| In millions of dollars | June 30,
2020 | December 31,
2019 | |
| | | |
| Debt securities available-for-sale (AFS) | $ | 342,256 | | $ | 280,265 | | |
Debt securities held-to-maturity (HTM)(1) | 83,332 | | 80,775 | | |
Marketable equity securities carried at fair value(2) | 593 | | 458 | | |
Non-marketable equity securities carried at fair value(2) | 486 | | 704 | | |
Non-marketable equity securities measured using the measurement alternative(3) | 771 | | 700 | | |
Non-marketable equity securities carried at cost(4) | 5,815 | | 5,661 | | |
| Total investments | $ | 433,253 | | $ | 368,563 | | |
(1)Carried at adjusted amortized cost basis, net of any allowance for credit losses.
(2)Unrealized gains and losses are recognized in earnings.
(3)Impairment losses and adjustments to the carrying value as a result of observable price changes are recognized in earnings. See ”Recognition and Measurement of Impairment” below.
(4) Represents shares issued by the Federal Reserve Bank, Federal Home Loan Banks and certain exchanges of which Citigroup is a member.
The following table presents interest and dividend income on investments:
| | | | | | | | | | | | | | |
| Three Months Ended June 30, | | Six Months Ended June 30, | |
| In millions of dollars | 2020 | 2019 | 2020 | 2019 |
| Taxable interest | $ | 1,984 | | $ | 2,324 | | $ | 4,163 | | $ | 4,696 | |
| Interest exempt from U.S. federal income tax | 70 | | 126 | | 146 | | 253 | |
| Dividend income | 43 | | 55 | | 69 | | 104 | |
| Total interest and dividend income | $ | 2,097 | | $ | 2,505 | | $ | 4,378 | | $ | 5,053 | |
The following table presents realized gains and losses on the sales of investments, which exclude impairment losses:
| | | | | | | | | | | | | | |
| Three Months Ended June 30, | | Six Months Ended June 30, | |
| In millions of dollars | 2020 | 2019 | 2020 | 2019 |
| Gross realized investment gains | $ | 785 | | $ | 474 | | $ | 1,250 | | $ | 642 | |
| Gross realized investment losses | (37) | | (6) | | (70) | | (44) | |
| Net realized gains on sale of investments | $ | 748 | | $ | 468 | | $ | 1,180 | | $ | 598 | |
Debt Securities Available-for-Sale
The amortized cost and fair value of AFS debt securities were as follows:
| | | | | | | | | | | | | | | | | | | | | | | | | | | | | |
| | June 30, 2020 | | | | | December 31, 2019 | | | |
| In millions of dollars | Amortized
cost | Gross
unrealized
gains | Gross
unrealized
losses | Allowance for credit losses | Fair
value | Amortized
cost | Gross
unrealized
gains | Gross
unrealized
losses | Fair
value |
| Debt securities AFS | | | | | | | | | |
Mortgage-backed securities(1) | | | | | | | | | |
| U.S. government-sponsored agency guaranteed | $ | 44,198 | | $ | 1,359 | | $ | 205 | | $ | — | | $ | 45,352 | | $ | 34,963 | | $ | 547 | | $ | 280 | | $ | 35,230 | |
| | | | | | | | | |
| | | | | | | | | |
| | | | | | | | | |
| Non-U.S. residential | 691 | | 4 | | — | | — | | 695 | | 789 | | 3 | | — | | 792 | |
| Commercial | 65 | | — | | — | | — | | 65 | | 75 | | — | | — | | 75 | |
| Total mortgage-backed securities | $ | 44,954 | | $ | 1,363 | | $ | 205 | | $ | — | | $ | 46,112 | | $ | 35,827 | | $ | 550 | | $ | 280 | | $ | 36,097 | |
| U.S. Treasury and federal agency securities | | | | | | | | | |
| U.S. Treasury | $ | 148,181 | | $ | 2,779 | | $ | 2 | | $ | — | | $ | 150,958 | | $ | 106,429 | | $ | 50 | | $ | 380 | | $ | 106,099 | |
| Agency obligations | 3,072 | | 27 | | — | | — | | 3,099 | | 5,336 | | 3 | | 20 | | 5,319 | |
| Total U.S. Treasury and federal agency securities | $ | 151,253 | | $ | 2,806 | | $ | 2 | | $ | — | | $ | 154,057 | | $ | 111,765 | | $ | 53 | | $ | 400 | | $ | 111,418 | |
| State and municipal | $ | 5,139 | | $ | 13 | | $ | 131 | | $ | — | | $ | 5,021 | | $ | 5,024 | | $ | 43 | | $ | 89 | | $ | 4,978 | |
| Foreign government | 119,405 | | 1,720 | | 182 | | 3 | | 120,940 | | 110,958 | | 586 | | 241 | | 111,303 | |
| Corporate | 11,178 | | 178 | | 132 | | 5 | | 11,219 | | 11,266 | | 52 | | 101 | | 11,217 | |
Asset-backed securities(1) | 287 | | 7 | | 7 | | — | | 287 | | 524 | | — | | 2 | | 522 | |
| Other debt securities | 4,614 | | 6 | | — | | — | | 4,620 | | 4,729 | | 1 | | — | | 4,730 | |
| | | | | | | | | |
| Total debt securities AFS | $ | 336,830 | | $ | 6,093 | | $ | 659 | | $ | 8 | | $ | 342,256 | | $ | 280,093 | | $ | 1,285 | | $ | 1,113 | | $ | 280,265 | |
(1)The Company invests in mortgage- and asset-backed securities. These securitizations are generally considered VIEs. The Company’s maximum exposure to loss from these VIEs is equal to the carrying amount of the securities, which is reflected in the table above. For mortgage- and asset-backed securitizations in which the Company has other involvement, see Note 18 to the Consolidated Financial Statements.
The following table shows the fair value of AFS debt securities that have been in an unrealized loss position:
| | | | | | | | | | | | | | | | | | | | |
| | Less than 12 months | | 12 months or longer | | Total | |
| In millions of dollars | Fair
value | Gross
unrealized
losses | Fair
value | Gross
unrealized
losses | Fair
value | Gross
unrealized
losses |
| June 30, 2020 | | | | | | |
| Debt securities AFS | | | | | | |
| Mortgage-backed securities | | | | | | |
| U.S. government-sponsored agency guaranteed | $ | 8,915 | | $ | 183 | | $ | 551 | | $ | 22 | | $ | 9,466 | | $ | 205 | |
| | | | | | |
| Non-U.S. residential | 129 | | — | | — | | — | | 129 | | — | |
| Commercial | 12 | | — | | 5 | | — | | 17 | | — | |
| Total mortgage-backed securities | $ | 9,056 | | $ | 183 | | $ | 556 | | $ | 22 | | $ | 9,612 | | $ | 205 | |
| U.S. Treasury and federal agency securities | | | | | | |
| U.S. Treasury | $ | 27,202 | | $ | 2 | | $ | — | | $ | — | | $ | 27,202 | | $ | 2 | |
| Agency obligations | — | | — | | 250 | | — | | 250 | | — | |
| Total U.S. Treasury and federal agency securities | $ | 27,202 | | $ | 2 | | $ | 250 | | $ | — | | $ | 27,452 | | $ | 2 | |
| State and municipal | $ | 4,607 | | $ | 109 | | $ | 234 | | $ | 22 | | $ | 4,841 | | $ | 131 | |
| Foreign government | 22,236 | | 121 | | 2,519 | | 61 | | 24,755 | | 182 | |
| Corporate | 1,599 | | 129 | | 27 | | 3 | | 1,626 | | 132 | |
| Asset-backed securities | 239 | | 7 | | 1 | | — | | 240 | | 7 | |
| Other debt securities | 341 | | — | | — | | — | | 341 | | — | |
| Total debt securities AFS | $ | 65,280 | | $ | 551 | | $ | 3,587 | | $ | 108 | | $ | 68,867 | | $ | 659 | |
| December 31, 2019 | | | | | | |
| Debt securities AFS | | | | | | |
| Mortgage-backed securities | | | | | | |
| U.S. government-sponsored agency guaranteed | $ | 9,780 | | $ | 242 | | $ | 1,877 | | $ | 38 | | $ | 11,657 | | $ | 280 | |
| | | | | | |
| Non-U.S. residential | 208 | | — | | 1 | | — | | 209 | | — | |
| Commercial | 16 | | — | | 27 | | — | | 43 | | — | |
| Total mortgage-backed securities | $ | 10,004 | | $ | 242 | | $ | 1,905 | | $ | 38 | | $ | 11,909 | | $ | 280 | |
| U.S. Treasury and federal agency securities | | | | | | |
| U.S. Treasury | $ | 45,484 | | $ | 248 | | $ | 26,907 | | $ | 132 | | $ | 72,391 | | $ | 380 | |
| Agency obligations | 781 | | 2 | | 3,897 | | 18 | | 4,678 | | 20 | |
| Total U.S. Treasury and federal agency securities | $ | 46,265 | | $ | 250 | | $ | 30,804 | | $ | 150 | | $ | 77,069 | | $ | 400 | |
| State and municipal | $ | 362 | | $ | 62 | | $ | 266 | | $ | 27 | | $ | 628 | | $ | 89 | |
| Foreign government | 35,485 | | 149 | | 8,170 | | 92 | | 43,655 | | 241 | |
| Corporate | 2,916 | | 98 | | 123 | | 3 | | 3,039 | | 101 | |
| Asset-backed securities | 112 | | 1 | | 166 | | 1 | | 278 | | 2 | |
| Other debt securities | 1,307 | | — | | — | | — | | 1,307 | | — | |
| Total debt securities AFS | $ | 96,451 | | $ | 802 | | $ | 41,434 | | $ | 311 | | $ | 137,885 | | $ | 1,113 | |
The following table presents the amortized cost and fair value of AFS debt securities by contractual maturity dates:
| | | | | | | | | | | | | | |
| | | | |
| | June 30, 2020 | | December 31, 2019 | |
| In millions of dollars | Amortized
cost | Fair
value | Amortized
cost | Fair
value |
Mortgage-backed securities(1) | | | | |
| Due within 1 year | $ | 290 | | $ | 290 | | $ | 20 | | $ | 20 | |
| After 1 but within 5 years | 609 | | 613 | | 573 | | 574 | |
| After 5 but within 10 years | 1,010 | | 1,086 | | 594 | | 626 | |
After 10 years(2) | 43,045 | | 44,123 | | 34,640 | | 34,877 | |
| Total | $ | 44,954 | | $ | 46,112 | | $ | 35,827 | | $ | 36,097 | |
| U.S. Treasury and federal agency securities | | | | |
| Due within 1 year | $ | 45,246 | | $ | 45,397 | | $ | 40,757 | | $ | 40,688 | |
| After 1 but within 5 years | 103,836 | | 106,417 | | 70,128 | | 69,850 | |
| After 5 but within 10 years | 1,899 | | 1,964 | | 854 | | 851 | |
After 10 years(2) | 272 | | 279 | | 26 | | 29 | |
| Total | $ | 151,253 | | $ | 154,057 | | $ | 111,765 | | $ | 111,418 | |
| State and municipal | | | | |
| Due within 1 year | $ | 391 | | $ | 392 | | $ | 932 | | $ | 932 | |
| After 1 but within 5 years | 559 | | 570 | | 714 | | 723 | |
| After 5 but within 10 years | 303 | | 329 | | 195 | | 215 | |
After 10 years(2) | 3,886 | | 3,730 | | 3,183 | | 3,108 | |
| Total | $ | 5,139 | | $ | 5,021 | | $ | 5,024 | | $ | 4,978 | |
| Foreign government | | | | |
| Due within 1 year | $ | 46,614 | | $ | 46,815 | | $ | 42,611 | | $ | 42,666 | |
| After 1 but within 5 years | 65,217 | | 66,383 | | 58,820 | | 59,071 | |
| After 5 but within 10 years | 5,567 | | 5,702 | | 8,192 | | 8,198 | |
After 10 years(2) | 2,007 | | 2,040 | | 1,335 | | 1,368 | |
| Total | $ | 119,405 | | $ | 120,940 | | $ | 110,958 | | $ | 111,303 | |
All other(3) | | | | |
| Due within 1 year | $ | 6,161 | | $ | 6,187 | | $ | 7,306 | | $ | 7,311 | |
| After 1 but within 5 years | 8,769 | | 8,841 | | 8,279 | | 8,275 | |
| After 5 but within 10 years | 1,005 | | 995 | | 818 | | 797 | |
After 10 years(2) | 144 | | 103 | | 116 | | 86 | |
| Total | $ | 16,079 | | $ | 16,126 | | $ | 16,519 | | $ | 16,469 | |
| Total debt securities AFS | $ | 336,830 | | $ | 342,256 | | $ | 280,093 | | $ | 280,265 | |
(1)Includes mortgage-backed securities of U.S. government-sponsored agencies.
(2)Investments with no stated maturities are included as contractual maturities of greater than 10 years. Actual maturities may differ due to call or prepayment rights.
(3)Includes corporate, asset-backed and other debt securities.
There were no purchased credit-deteriorated AFS debt securities held by the Company as of June 30, 2020.
Debt Securities Held-to-Maturity
The carrying value and fair value of debt securities HTM were as follows:
| | | | | | | | | | | | | | | | |
| In millions of dollars | | | Amortized cost, net(1) | Gross
unrealized
gains | Gross
unrealized
losses | Fair
value |
| June 30, 2020 | | | | | | |
| Debt securities HTM | | | | | | |
Mortgage-backed securities(2) | | | | | | |
| U.S. government-sponsored agency guaranteed | | | $ | 49,649 | | $ | 2,442 | | $ | 6 | | $ | 52,085 | |
| | | | | | |
| Non-U.S. residential | | | 1,083 | | — | | 6 | | 1,077 | |
| Commercial | | | 673 | | 1 | | 1 | | 673 | |
| Total mortgage-backed securities | | | $ | 51,405 | | $ | 2,443 | | $ | 13 | | $ | 53,835 | |
| State and municipal | | | $ | 9,152 | | $ | 650 | | $ | 16 | | $ | 9,786 | |
| Foreign government | | | 1,237 | | 78 | | — | | 1,315 | |
Asset-backed securities(2) | | | 21,538 | | 5 | | 471 | | 21,072 | |
| | | | | | |
| Total debt securities HTM, net | | | $ | 83,332 | | $ | 3,176 | | $ | 500 | | $ | 86,008 | |
| December 31, 2019 | | | | | | |
| Debt securities HTM | | | | | | |
Mortgage-backed securities(2) | | | | | | |
| U.S. government-sponsored agency guaranteed | | | $ | 46,637 | | $ | 1,047 | | $ | 21 | | $ | 47,663 | |
| | | | | | |
| | | | | | |
| | | | | | |
| Non-U.S. residential | | | 1,039 | | 5 | | — | | 1,044 | |
| Commercial | | | 582 | | 1 | | — | | 583 | |
| Total mortgage-backed securities | | | $ | 48,258 | | $ | 1,053 | | $ | 21 | | $ | 49,290 | |
| State and municipal | | | $ | 9,104 | | $ | 455 | | $ | 28 | | $ | 9,531 | |
| Foreign government | | | 1,934 | | 37 | | 1 | | 1,970 | |
Asset-backed securities(2) | | | 21,479 | | 12 | | 59 | | 21,432 | |
| Total debt securities HTM | | | $ | 80,775 | | $ | 1,557 | | $ | 109 | | $ | 82,223 | |
(1)Amortized cost is reported net of allowance for credit losses of $107 million at June 30, 2020. There was 0 allowance as of December 31, 2019.
(2)The Company invests in mortgage- and asset-backed securities. These securitizations are generally considered VIEs. The Company’s maximum exposure to loss from these VIEs is equal to the carrying amount of the securities, which is reflected in the table above. For mortgage- and asset-backed securitizations in which the Company has other involvement, see Note 18 to the Consolidated Financial Statements.
The table below shows the fair value of debt securities HTM that have been in an unrecognized loss position at December 31, 2019:
| | | | | | | | | | | | | | | | | | | | |
| | Less than 12 months | | 12 months or longer | | Total | |
| In millions of dollars | Fair
value | Gross
unrecognized
losses | Fair
value | Gross
unrecognized
losses | Fair
value | Gross
unrecognized
losses |
| December 31, 2019 | | | | | | |
| Debt securities held-to-maturity | | | | | | |
| Mortgage-backed securities | $ | 3,590 | | $ | 10 | | $ | 1,116 | | $ | 11 | | $ | 4,706 | | $ | 21 | |
| State and municipal | 34 | | 1 | | 1,125 | | 27 | | 1,159 | | 28 | |
| Foreign government | 1,970 | | 1 | | — | | — | | 1,970 | | 1 | |
| Asset-backed securities | 7,972 | | 11 | | 765 | | 48 | | 8,737 | | 59 | |
| Total debt securities held-to-maturity | $ | 13,566 | | $ | 23 | | $ | 3,006 | | $ | 86 | | $ | 16,572 | | $ | 109 | |
Note: Excluded from the gross unrecognized losses presented in the table above is $(582) million of net unrealized losses recorded in AOCI as of December 31, 2019, respectively, primarily related to the difference between the amortized cost and carrying value of HTM debt securities that were reclassified from AFS. Substantially all of these net unrecognized losses relate to securities that have been in a loss position for 12 months or longer at December 31, 2019.
The following table presents the carrying value and fair value of HTM debt securities by contractual maturity dates:
| | | | | | | | | | | | | | |
| | | | |
| | June 30, 2020 | | December 31, 2019 | |
| In millions of dollars | Amortized cost(1) | Fair value | Amortized cost | Fair value |
| Mortgage-backed securities | | | | |
| Due within 1 year | $ | 75 | | $ | 76 | | $ | 17 | | $ | 17 | |
| After 1 but within 5 years | 432 | | 449 | | 458 | | 463 | |
| After 5 but within 10 years | 1,585 | | 1,748 | | 1,662 | | 1,729 | |
After 10 years(2) | 49,313 | | 51,562 | | 46,121 | | 47,081 | |
| Total | $ | 51,405 | | $ | 53,835 | | $ | 48,258 | | $ | 49,290 | |
| State and municipal | | | | |
| Due within 1 year | $ | 7 | | $ | 7 | | $ | 2 | | $ | 26 | |
| After 1 but within 5 years | 81 | | 84 | | 123 | | 160 | |
| After 5 but within 10 years | 632 | | 666 | | 597 | | 590 | |
After 10 years(2) | 8,432 | | 9,029 | | 8,382 | | 8,755 | |
| Total | $ | 9,152 | | $ | 9,786 | | $ | 9,104 | | $ | 9,531 | |
| Foreign government | | | | |
| Due within 1 year | $ | 273 | | $ | 272 | | $ | 650 | | $ | 652 | |
| After 1 but within 5 years | 964 | | 1,043 | | 1,284 | | 1,318 | |
| After 5 but within 10 years | — | | — | | — | | — | |
After 10 years(2) | — | | — | | — | | — | |
| Total | $ | 1,237 | | $ | 1,315 | | $ | 1,934 | | $ | 1,970 | |
All other(3) | | | | |
| Due within 1 year | $ | — | | | $ | — | | $ | — | |
| After 1 but within 5 years | — | | | — | | — | |
| After 5 but within 10 years | 7,262 | | 7,123 | | 8,545 | | 8,543 | |
After 10 years(2) | 14,276 | | 13,949 | | 12,934 | | 12,889 | |
| Total | $ | 21,538 | | $ | 21,072 | | $ | 21,479 | | $ | 21,432 | |
| Total debt securities HTM | $ | 83,332 | | $ | 86,008 | | $ | 80,775 | | $ | 82,223 | |
(1)Amortized cost is reported net of allowance for credit losses of $107 million at June 30, 2020.
(2)Investments with no stated maturities are included as contractual maturities of greater than 10 years. Actual maturities may differ due to call or prepayment rights.
(3)Includes corporate and asset-backed securities.
HTM Debt Securities Delinquency and Non-Accrual Details
Citi did not have any HTM securities that were delinquent or on non-accrual status at June 30, 2020.
There were no purchased credit-deteriorated HTM debt securities held by the Company as of June 30, 2020.
Evaluating Investments for Impairment
AFS Debt Securities
Overview—AFS Debt Securities
The Company conducts periodic reviews of all AFS debt securities with unrealized losses to evaluate whether the impairment resulted from expected credit losses or from other factors and to evaluate the Company’s intent to sell such securities.
An AFS debt security is impaired when the current fair value of an individual AFS debt security is less than its amortized cost basis.
The Company recognizes the entire difference between amortized cost basis and fair value in earnings for impaired AFS debt securities that Citi has an intent to sell or for which Citi believes it will more-likely-than-not be required to sell prior to recovery of the amortized cost basis. However, for those AFS debt securities that the Company does not intend to sell and is not likely to be required to sell, only the credit-related impairment is recognized in earnings by recording an allowance for credit losses. Any remaining fair value decline for such securities is recorded in AOCI. The Company does not consider the length of time that the fair value of a security is below its amortized cost when determining if a credit loss exists.
For AFS debt securities, credit losses exist where Citi does not expect to receive contractual principal and interest cash flows sufficient to recover the entire amortized cost basis of a security. The allowance for credit losses is limited to the
amount by which the AFS debt security’s amortized cost basis exceeds its fair value. The allowance is increased or decreased if credit conditions subsequently worsen or improve. Reversals of credit losses are recognized in earnings.
The Company’s review for impairment of AFS debt securities generally entails:
•identification and evaluation of impaired investments;
•consideration of evidential matter, including an evaluation of factors or triggers that could cause individual positions to qualify as credit impaired and those that would not support credit impairment; and
•documentation of the results of these analyses, as required under business policies.
The sections below describe the Company’s process for identifying expected credit impairments for debt security types that have the most significant unrealized losses as of June 30, 2020.
Mortgage-Backed Securities
Citi records no allowances for credit losses on U.S. government-agency-guaranteed mortgage-backed securities, because the Company expects to incur no credit losses in the event of default due to a history of incurring no credit losses and due to the nature of the counterparties.
State and Municipal Securities
The process for estimating credit losses in Citigroup’s AFS state and municipal bonds is primarily based on a credit analysis that incorporates third-party credit ratings. Citi monitors the bond issuers and any insurers providing default protection in the form of financial guarantee insurance. The average external credit rating, ignoring any insurance, is Aa2/AA. In the event of an external rating downgrade or other indicator of credit impairment (i.e., based on instrument-specific estimates of cash flows or probability of issuer default), the subject bond is specifically reviewed for adverse changes in the amount or timing of expected contractual principal and interest payments.
For AFS state and municipal bonds with unrealized losses that Citi plans to sell, or would more-likely-than-not be required to sell, the full impairment is recognized in earnings. For AFS state and municipal bonds where Citi has no intent to sell and it is more-likely-than-not that the Company will not be required to sell, Citi records an allowance for expected credit losses for the amount it expects not to collect, capped at the difference between the bond’s amortized cost basis and fair value.
Equity Method Investments
Management assesses equity method investments that have fair values that are less than their respective carrying values for other-than-temporary impairment (OTTI). Fair value is measured as price multiplied by quantity if the investee has publicly listed securities. If the investee is not publicly listed, other methods are used (see Note 20 to the Consolidated Financial Statements).
For impaired equity method investments that Citi plans to sell prior to recovery of value or would more-likely-than-not be required to sell, with no expectation that the fair value will recover prior to the expected sale date, the full impairment is recognized in earnings as OTTI regardless of severity and duration. The measurement of the OTTI does not include partial projected recoveries subsequent to the balance sheet date.
For impaired equity method investments that management does not plan to sell and is not more-likely-than-not to be required to sell prior to recovery of value, the evaluation of whether an impairment is other-than-temporary is based on (i) whether and when an equity method investment will recover in value and (ii) whether the investor has the intent and ability to hold that investment for a period of time sufficient to recover the value. The determination of whether the impairment is considered other-than-temporary considers the following indicators:
•the cause of the impairment and the financial condition and near-term prospects of the issuer, including any specific events that may influence the operations of the issuer;
•the intent and ability to hold the investment for a period of time sufficient to allow for any anticipated recovery in market value; and
•the length of time and extent to which fair value has been less than the carrying value.
Recognition and Measurement of Impairment
The following tables present total impairment on Investments recognized in earnings:
| | | | | | | | | | | | | | | | | | | | | | | |
| Three Months Ended
June 30, 2020 | | | Three Months Ended
June 30, 2019 | | | |
| In millions of dollars | AFS | Other
assets | Total | AFS | HTM | Other assets | Total |
| Impairment losses related to debt securities that the Company does not intend to sell nor will likely be required to sell: | | | | | | | |
| Total impairment losses recognized during the period | $ | — | | $ | — | | $ | — | | $ | — | | $ | — | | $ | — | | $ | — | |
Less: portion of impairment loss recognized in AOCI (before taxes) | — | | — | | — | | — | | — | | — | | — | |
| Net impairment losses recognized in earnings for debt securities that the Company does not intend to sell nor will likely be required to sell | $ | — | | $ | — | | $ | — | | $ | — | | $ | — | | $ | — | | $ | — | |
| Impairment losses recognized in earnings for debt securities that the Company intends to sell, would more-likely-than-not be required to sell or will be subject to an issuer call deemed probable of exercise | 19 | | — | | 19 | | 2 | | — | | — | | 2 | |
| Total impairment losses recognized in earnings | $ | 19 | | $ | — | | $ | 19 | | $ | 2 | | $ | — | | $ | — | | $ | 2 | |
| | | | | | | |
| Six Months Ended
June 30, 2020 | | | Six Months Ended
June 30, 2019 | | | |
| In millions of dollars | AFS | Other
assets | Total | AFS | HTM | Other assets | Total |
| Impairment losses related to debt securities that the Company does not intend to sell nor will likely be required to sell: | | | | | | | |
| Total impairment losses recognized during the period | $ | — | | $ | — | | $ | — | | $ | — | | $ | — | | $ | — | | $ | — | |
Less: portion of impairment loss recognized in AOCI (before taxes) | — | | — | | — | | — | | — | | — | | — | |
| Net impairment losses recognized in earnings for debt securities that the Company does not intend to sell nor will likely be required to sell | $ | — | | $ | — | | $ | — | | $ | — | | $ | — | | $ | — | | $ | — | |
| Impairment losses recognized in earnings for debt securities that the Company intends to sell, would more-likely-than-not be required to sell or will be subject to an issuer call deemed probable of exercise | 71 | | — | | 71 | | 5 | | — | | — | | 5 | |
| Total impairment losses recognized in earnings | $ | 71 | | $ | — | | $ | 71 | | $ | 5 | | $ | — | | $ | — | | $ | 5 | |
| | | | | | | |
| | | | | | | |
| | | | | | | |
| | | | | | | |
| | | | | | | |
| | | | | | | |
| | | | | | | |
| | | | | | | |
The following are the three- and six-month rollforwards of the credit-related impairments recognized in earnings for AFS debt securities held that the Company does not intend to sell nor will likely be required to sell at June 30, 2019:
| | | | | | | | | | | | | | | | | |
| Cumulative OTTI credit losses recognized in earnings on debt securities still held | | | | |
| Three Months Ended June 30, 2019 | | | | | |
| In millions of dollars | March 31, 2019 balance | Credit
impairments
recognized in
earnings on
securities not
previously
impaired | Credit
impairments
recognized in
earnings on
securities that
have
been previously
impaired | Changes due to
credit-impaired
securities sold,
transferred or
matured | June 30, 2019 balance |
| AFS debt securities | | | | | |
Mortgage-backed securities(1) | $ | 1 | | $ | — | | $ | — | | $ | — | | $ | 1 | |
| State and municipal | — | | — | | — | | — | | — | |
| Foreign government securities | — | | — | | — | | — | | — | |
| Corporate | 4 | | — | | — | | — | | 4 | |
| All other debt securities | — | | — | | — | | — | | — | |
| Total OTTI credit losses recognized for AFS debt securities | $ | 5 | | $ | — | | $ | — | | $ | — | | $ | 5 | |
| HTM debt securities | | | | | |
| Mortgage-backed securities | $ | — | | $ | — | | $ | — | | $ | — | | $ | — | |
| State and municipal | — | | — | | — | | — | | — | |
| Total OTTI credit losses recognized for HTM debt securities | $ | — | | $ | — | | $ | — | | $ | — | | $ | — | |
| | | | | |
| Six Months Ended June 30, 2019 | | | | | |
| In millions of dollars | December 31, 2018 balance | Credit
impairments
recognized in
earnings on
securities not
previously
impaired | Credit
impairments
recognized in
earnings on
securities that
have
been previously
impaired | Changes due to
credit-impaired
securities sold,
transferred or
matured | June 30, 2019 balance |
| AFS debt securities | | | | | |
Mortgage-backed securities(1) | $ | 1 | | $ | — | | $ | — | | $ | — | | $ | 1 | |
| State and municipal | — | | — | | — | | — | | — | |
| Foreign government securities | — | | — | | — | | — | | — | |
| Corporate | 4 | | — | | — | | — | | 4 | |
| All other debt securities | — | | — | | — | | — | | — | |
| Total OTTI credit losses recognized for AFS debt securities | $ | 5 | | $ | — | | $ | — | | $ | — | | $ | 5 | |
| HTM debt securities | | | | | |
| Mortgage-backed securities | $ | — | | $ | — | | $ | — | | $ | — | | $ | — | |
| State and municipal | — | | — | | — | | — | | — | |
| Total OTTI credit losses recognized for HTM debt securities | $ | — | | $ | — | | $ | — | | $ | — | | $ | — | |
(1) Primarily consists of Prime securities.
Non-Marketable Equity Securities Not Carried at Fair Value
Non-marketable equity securities are required to be measured at fair value with changes in fair value recognized in earnings unless (i) the measurement alternative is elected or (ii) the investment represents Federal Reserve Bank and Federal Home Loan Bank stock or certain exchange seats that continue to be carried at cost.
The election to measure a non-marketable equity security using the measurement alternative is made on an instrument-by-instrument basis. Under the measurement alternative, an equity security is carried at cost plus or minus changes resulting from observable prices in orderly transactions for the identical or a similar investment of the same issuer. The carrying value of the equity security is adjusted to fair value on the date of an observed transaction. Fair value may differ from the observed transaction price due to a number of factors, including marketability adjustments and differences in rights and obligations when the observed transaction is not for the identical investment held by Citi.
Equity securities under the measurement alternative are also assessed for impairment. On a quarterly basis, management qualitatively assesses whether each equity security under the measurement alternative is impaired. Impairment indicators that are considered include, but are not limited to, the following:
•a significant deterioration in the earnings performance, credit rating, asset quality or business prospects of the investee;
•a significant adverse change in the regulatory, economic or technological environment of the investee;
•a significant adverse change in the general market condition of either the geographical area or the industry in which the investee operates;
•a bona fide offer to purchase, an offer by the investee to sell or a completed auction process for the same or similar investment for an amount less than the carrying amount of that investment; and
•factors that raise significant concerns about the investee’s ability to continue as a going concern, such as negative cash flows from operations, working capital deficiencies or noncompliance with statutory capital requirements or debt covenants.
When the qualitative assessment indicates that impairment exists, the investment is written down to fair value, with the full difference between the fair value of the investment and its carrying amount recognized in earnings.
Below is the carrying value of non-marketable equity securities measured using the measurement alternative at June 30, 2020 and December 31, 2019:
| | | | | | | | |
| In millions of dollars | June 30, 2020 | December 31, 2019 |
| Measurement alternative: | | |
| Carrying value | $ | 771 | | $ | 700 | |
Below are amounts recognized in earnings and life-to-date amounts for non-marketable equity securities measured using the measurement alternative:
| | | | | | | | | | | | | | |
| Three Months Ended
June 30, | | Six Months
Ended
June 30, | |
| In millions of dollars | 2020 | 2019 | 2020 | 2019 |
Measurement alternative(1): | | | | |
| Impairment losses | $ | 50 | | $ | 3 | | $ | 53 | | $ | 8 | |
| Downward changes for observable prices | 19 | | 12 | | 19 | | 12 | |
| Upward changes for observable prices | 17 | | 19 | | 42 | | 85 | |
(1) See Note 20 to the Consolidated Financial Statements for additional information on these nonrecurring fair value measurements.
| | | | | |
| Life-to-date amounts on securities still held |
| In millions of dollars | June 30, 2020 |
| Measurement alternative: | |
| Impairment losses | $ | 65 | |
| Downward changes for observable prices | 52 | |
| Upward changes for observable prices | 384 | |
A similar impairment analysis is performed for non-marketable equity securities carried at cost. For the three months ended June 30, 2020 and 2019, there was 0 impairment loss recognized in earnings for non-marketable equity securities carried at cost.
Investments in Alternative Investment Funds That Calculate Net Asset Value
The Company holds investments in certain alternative investment funds that calculate net asset value (NAV), or its equivalent, including private equity funds, funds of funds and real estate funds, as provided by third-party asset managers. Investments in such funds are generally classified as non-marketable equity securities carried at fair value. The fair values of these investments are estimated using the NAV of the Company’s ownership interest in the funds. Some of these investments are in “covered funds” for purposes of the Volcker Rule, which prohibits certain proprietary investment activities and limits the ownership of, and relationships with, covered funds. On April 21, 2017, Citi’s request for extension of the permitted holding period under the Volcker Rule for certain of its investments in illiquid funds was approved, allowing the Company to hold such investments until the earlier of five years from the July 21, 2017 expiration date of the general conformance period or the date such investments mature or are otherwise conformed with the Volcker Rule.
| | | | | | | | | | | | | | | | | | | | |
| Fair value | | Unfunded
commitments | | Redemption frequency
(if currently eligible)
monthly, quarterly, annually | Redemption
notice
period |
| In millions of dollars | June 30,
2020 | December 31, 2019 | June 30,
2020 | December 31, 2019 | | |
| Hedge funds | $ | — | | $ | — | | $ | — | | $ | — | | Generally quarterly | 10–95 days |
Private equity funds(1)(2) | 111 | | 134 | | 62 | | 62 | | — | — |
Real estate funds(2)(3) | 9 | | 10 | | 19 | | 18 | | — | — |
| Mutual/collective investment funds | 20 | | 26 | | — | | — | | — | — |
| Total | $ | 140 | | $ | 170 | | $ | 81 | | $ | 80 | | — | — |
(1)Private equity funds include funds that invest in infrastructure, emerging markets and venture capital.
(2)With respect to the Company’s investments in private equity funds and real estate funds, distributions from each fund will be received as the underlying assets held by these funds are liquidated. It is estimated that the underlying assets of these funds will be liquidated over a period of several years as market conditions allow. Private equity and real estate funds do not allow redemption of investments by their investors. Investors are permitted to sell or transfer their investments, subject to the approval of the general partner or investment manager of these funds, which generally may not be unreasonably withheld.
(3)Includes several real estate funds that invest primarily in commercial real estate in the U.S., Europe and Asia.
13. LOANS
Citigroup loans are reported in 2 categories: consumer and corporate. These categories are classified primarily according to the segment and subsegment that manage the loans. For additional information regarding Citi’s consumer and corporate loans, including related accounting policies, see Note 1 to the Consolidated Financial Statements and Notes 1 and 14 to the Consolidated Financial Statements in Citi’s 2019 Annual Report on Form 10-K.
Consumer Loans
Consumer loans represent loans and leases managed primarily by GCB and Corporate/Other.
Consumer Loans, Delinquencies and Non-Accrual Status at June 30, 2020
| | | | | | | | | | | | | | | | | | | | | | | | | | | | | |
| In millions of dollars | Total current(1)(2) | 30–89 days past due(3)(4) | ≥ 90 days past due(3)(4) | Past due government guaranteed(5) | Total loans | Non-accrual loans for which there are no loan loss reserves | Non-accrual loans for which there are loan loss reserves | Total
non-accrual | 90 days
past due
and accruing |
In North America offices(6) | | | | | | | | | |
Residential first mortgages(7) | $ | 46,923 | | $ | 541 | | $ | 258 | | $ | 445 | | $ | 48,167 | | $ | 115 | | $ | 409 | | $ | 524 | | $ | 282 | |
Home equity loans(8)(9) | 8,197 | | 122 | | 205 | | — | | 8,524 | | 84 | | 303 | | 387 | | — | |
| Credit cards | 125,232 | | 1,205 | | 1,595 | | — | | 128,032 | | — | | — | | — | | 1,595 | |
| Personal, small business and other | 4,807 | | 38 | | 14 | | — | | 4,859 | | 2 | | 15 | | 17 | | — | |
| Total | $ | 185,159 | | $ | 1,906 | | $ | 2,072 | | $ | 445 | | $ | 189,582 | | $ | 201 | | $ | 727 | | $ | 928 | | $ | 1,877 | |
In offices outside North America(6) | | | | | | | | | |
Residential first mortgages(7) | $ | 36,351 | | $ | 210 | | $ | 184 | | $ | — | | $ | 36,745 | | $ | — | | $ | 419 | | $ | 419 | | $ | — | |
| Credit cards | 20,212 | | 380 | | 374 | | — | | 20,966 | | 5 | | 265 | | 270 | | 272 | |
| Personal, small business and other | 33,421 | | 268 | | 131 | | — | | 33,820 | | 1 | | 211 | | 212 | | — | |
| Total | $ | 89,984 | | $ | 858 | | $ | 689 | | $ | — | | $ | 91,531 | | $ | 6 | | $ | 895 | | $ | 901 | | $ | 272 | |
Total Citigroup(10) | $ | 275,143 | | $ | 2,764 | | $ | 2,761 | | $ | 445 | | $ | 281,113 | | $ | 207 | | $ | 1,622 | | $ | 1,829 | | $ | 2,149 | |
(1)Loans less than 30 days past due are presented as current.
(2)Includes $16 million of residential first mortgages recorded at fair value.
(3)Excludes loans guaranteed by U.S. government-sponsored agencies.
(4)Loans modified under Citi’s consumer relief programs continue to be reported in the same delinquency bucket they were in at the time of modification, and thus almost all would not be reported as 30-89 or 90+ days past due for the duration of the programs (which have various durations, and certain of which may be renewed by the customer).
(5)Consists of residential first mortgages that are guaranteed by U.S. government-sponsored agencies that are 30–89 days past due of $0.1 billion and 90 days or more past due of $0.3 billion.
(6)North America includes the U.S., Canada and Puerto Rico. Mexico is included in offices outside North America.
(7)Includes approximately $0.1 billion of residential first mortgage loans in process of foreclosure.
(8)Includes approximately $0.1 billion of home equity loans in process of foreclosure.
(9)Fixed-rate home equity loans and loans extended under home equity lines of credit, which are typically in junior lien positions.
(10)Consumer loans are net of unearned income of $734 million. Unearned income on consumer loans primarily represents unamortized origination fees and costs, premiums and discounts.
Interest Income Recognized for Non-Accrual Consumer Loans
| | | | | | | | |
| Interest income | |
| In millions of dollars | Three Months Ended June 30, 2020 | Six Months Ended June 30, 2020 |
In North America offices(1) | | |
| Residential first mortgages | $ | 4 | | $ | 7 | |
| Home equity loans | 2 | | 4 | |
| Credit cards | — | | — | |
| Personal, small business and other | — | | — | |
| Total | $ | 6 | | $ | 11 | |
In offices outside North America(1) | | |
| Residential first mortgages | $ | — | | $ | — | |
| Credit cards | — | | — | |
| Personal, small business and other | — | | — | |
| Total | $ | — | | $ | — | |
| Total Citigroup | $ | 6 | | $ | 11 | |
(1)North America includes the U.S., Canada and Puerto Rico. Mexico is included in offices outside North America.
Consumer Loan, Delinquencies and Non-Accrual Status at December 31, 2019
| | | | | | | | | | | | | | | | | | | | | | | |
| In millions of dollars | Total current(1)(2) | 30–89 days past due(3) | ≥ 90 days past due(3) | Past due government guaranteed(4) | Total loans(2) | Total
non-accrual | 90 days
past due
and accruing |
In North America offices(5) | | | | | | | |
Residential first mortgages(6) | $ | 45,942 | | $ | 411 | | $ | 221 | | $ | 434 | | $ | 47,008 | | $ | 479 | | $ | 288 | |
Home equity loans(7)(8) | 8,860 | | 174 | | 189 | | — | | 9,223 | | 405 | | — | |
| Credit cards | 145,477 | | 1,759 | | 1,927 | | — | | 149,163 | | — | | 1,927 | |
| Personal, small business and other | 3,641 | | 44 | | 14 | | — | | 3,699 | | 21 | | — | |
| Total | $ | 203,920 | | $ | 2,388 | | $ | 2,351 | | $ | 434 | | $ | 209,093 | | $ | 905 | | $ | 2,215 | |
In offices outside North America(5) | | | | | | | |
Residential first mortgages(6) | $ | 37,316 | | $ | 210 | | $ | 160 | | $ | — | | $ | 37,686 | | $ | 421 | | $ | — | |
| Credit cards | 25,111 | | 426 | | 372 | | — | | 25,909 | | 310 | | 242 | |
| Personal, small business and other | 36,456 | | 272 | | 132 | | — | | 36,860 | | 180 | | — | |
| Total | $ | 98,883 | | $ | 908 | | $ | 664 | | $ | — | | $ | 100,455 | | $ | 911 | | $ | 242 | |
Total Citigroup(9) | $ | 302,803 | | $ | 3,296 | | $ | 3,015 | | $ | 434 | | $ | 309,548 | | $ | 1,816 | | $ | 2,457 | |
(1)Loans less than 30 days past due are presented as current.
(2)Includes $18 million of residential first mortgages recorded at fair value.
(3)Excludes loans guaranteed by U.S. government-sponsored agencies.
(4)Consists of residential first mortgages that are guaranteed by U.S. government-sponsored agencies that are 30–89 days past due of $0.1 billion and 90 days or more past due of $0.3 billion.
(5)North America includes the U.S., Canada and Puerto Rico. Mexico is included in offices outside North America.
(6)Includes approximately $0.1 billion of residential first mortgage loans in process of foreclosure.
(7)Includes approximately $0.1 billion of home equity loans in process of foreclosure.
(8)Fixed-rate home equity loans and loans extended under home equity lines of credit, which are typically in junior lien positions.
(9)Consumer loans are net of unearned income of $783 million. Unearned income on consumer loans primarily represents unamortized origination fees and costs, premiums and discounts.
During the three and six months ended June 30, 2020 and 2019, the Company sold and/or reclassified to HFS $12 million and $36 million and $392 million and $2,295 million, respectively, of consumer loans.
Consumer Credit Scores (FICO)
The following tables provide details on the Fair Isaac Corporation (FICO) scores for Citi’s U.S. consumer loan portfolio based on end-of-period receivables by year of origination. FICO scores are updated monthly for substantially all of the portfolio or, otherwise, on a quarterly basis for the remaining portfolio.
| | | | | | | | | | | | | | | | | |
FICO score distribution in U.S. portfolio(1) | June 30, 2020 | | | | |
| In millions of dollars | Less than
680 | 680 to 760 | Greater
than 760 | FICO not available | Total loans |
| Residential first mortgages | | | | | |
| 2020 | $ | 65 | | $ | 1,593 | | $ | 4,261 | | | |
| 2019 | 205 | | 2,384 | | 6,316 | | | |
| 2018 | 294 | | 784 | | 1,619 | | | |
| 2017 | 344 | | 973 | | 2,311 | | | |
| 2016 | 390 | | 1,523 | | 4,791 | | | |
| Prior | 2,130 | | 4,629 | | 11,968 | | | |
| Total residential first mortgages | $ | 3,428 | | $ | 11,886 | | $ | 31,266 | | $ | 1,587 | | $ | 48,167 | |
Credit cards(2) | $ | 28,942 | | $ | 52,825 | | $ | 43,745 | | $ | 1,984 | | $ | 127,496 | |
| | | | | |
| Home equity loans (pre-reset) | 337 | | 1,053 | | 1,738 | | | |
| Home equity loans (post-reset) | 1,435 | | 1,937 | | 1,826 | | | |
| Total home equity loans | $ | 1,772 | | $ | 2,990 | | $ | 3,564 | | $ | 198 | | $ | 8,524 | |
| Installment and other | | | | | |
| 2020 | $ | 18 | | $ | 42 | | $ | 55 | | | |
| 2019 | 113 | | 143 | | 164 | | | |
| 2018 | 125 | | 114 | | 106 | | | |
| 2017 | 43 | | 41 | | 43 | | | |
| 2016 | 21 | | 18 | | 16 | | | |
| Prior | 264 | | 425 | | 547 | | | |
| Personal, small business and other | $ | 584 | | $ | 783 | | $ | 931 | | $ | 2,561 | | $ | 4,859 | |
| Total | $ | 34,726 | | $ | 68,484 | | $ | 79,506 | | $ | 6,330 | | $ | 189,046 | |
(1)The FICO bands in the tables are consistent with general industry peer presentations.
(2)Excludes $536 million of balances related to Canada.
FICO Score Distribution in U.S. Portfolio
| | | | | | | | | | | | | | | | | |
FICO score distribution in U.S. portfolio(1) | December 31, 2019 | | | | |
In millions of dollars | Less than
680 | 680 to 760 | Greater
than 760 | FICO not available | Total loans |
| Residential first mortgages | $ | 3,608 | | $ | 13,264 | | $ | 28,442 | | $ | 1,694 | | $ | 47,008 | |
Credit cards (2) | 33,290 | | 59,536 | | 52,935 | | 2,773 | | 148,534 | |
| Home equity loans | 1,901 | | 3,530 | | 3,732 | | 60 | | 9,223 | |
| Personal, small business and other | 564 | | 907 | | 1,473 | | 755 | | 3,699 | |
| Total | $ | 39,363 | | $ | 77,237 | | $ | 86,582 | | $ | 5,282 | | $ | 208,464 | |
(1)The FICO bands in the tables are consistent with general industry peer presentations.
(2) Excludes $629 million of balances related to Canada.
Loan to Value (LTV) Ratios
The following tables provide details on the LTV ratios for Citi’s U.S. consumer mortgage portfolios by year of origination. LTV ratios are updated monthly using the most recent Core Logic Home Price Index data available for substantially all of the portfolio applied at the Metropolitan Statistical Area level, if available, or the state level if not. The remainder of the portfolio is updated in a similar manner using the Federal Housing Finance Agency indices.
| | | | | | | | | | | | | | | | | |
| LTV distribution in U.S. portfolio | June 30, 2020 | | | | |
| In millions of dollars | Less than or
equal to 80% | > 80% but less
than or equal to
100% | Greater
than
100% | LTV not available | Total |
| Residential first mortgages | | | | | |
| 2020 | $ | 5,362 | | $ | 560 | | $ | — | | | |
| 2019 | 8,309 | | 599 | | 3 | | | |
| 2018 | 2,080 | | 598 | | 26 | | | |
| 2017 | 3,206 | | 420 | | 8 | | | |
| 2016 | 6,570 | | 141 | | 3 | | | |
| Prior | 18,621 | | 129 | | 22 | | | |
| Total residential first mortgages | $ | 44,148 | | $ | 2,447 | | $ | 62 | | $ | 1,510 | | $ | 48,167 | |
| Home equity loans (pre-reset) | $ | 3,061 | | $ | 39 | | $ | 12 | | | |
| Home equity loans (post-reset) | 4,404 | | 601 | | 169 | | | |
| Total home equity loans | $ | 7,465 | | $ | 640 | | $ | 181 | | $ | 238 | | $ | 8,524 | |
| Total | $ | 51,613 | | $ | 3,087 | | $ | 243 | | $ | 1,748 | | $ | 56,691 | |
| | | | | | | | | | | | | | | | | |
| LTV distribution in U.S. portfolio | December 31, 2019 | | | | |
| In millions of dollars | Less than or
equal to 80% | > 80% but less
than or equal to
100% | Greater
than
100% | LTV not available | Total |
| Residential first mortgages | $ | 41,993 | | $ | 3,313 | | $ | 98 | | $ | 1,604 | | $ | 47,008 | |
| Home equity loans | 8,101 | | 829 | | 237 | | 56 | | 9,223 | |
| Total | $ | 50,094 | | $ | 4,142 | | $ | 335 | | $ | 1,660 | | $ | 56,231 | |
Impaired Consumer Loans
The following tables present information about impaired consumer loans and interest income recognized on impaired consumer loans:
| | | | | | | | | | | | | | | | | | | | | | | | | | | | |
| | | | | Three Months Ended
June 30, | | Six Months Ended
June 30, | | | |
| | Balance at June 30, 2020 | | | | 2020 | 2019 | 2020 | 2019 | | |
| In millions of dollars | Recorded investment(1)(2) | Unpaid
principal balance | Related specific allowance(3) | Average carrying value(4) | Interest income
recognized(5) | Interest income
recognized(5) | Interest income
recognized(5) | Interest income
recognized(5) | | |
| Mortgage and real estate | | | | | | | | | | |
| Residential first mortgages | $ | 1,624 | | $ | 1,798 | | $ | 152 | | $ | 1,700 | | $ | 15 | | $ | 18 | | $ | 29 | | $ | 35 | | | |
| Home equity loans | 556 | | 762 | | 61 | | 588 | | 4 | | 2 | | 7 | | 4 | | | |
| Credit cards | 1,884 | | 1,917 | | 887 | | 1,906 | | 25 | | 26 | | 51 | | 52 | | | |
| Personal, small business and other | 442 | | 477 | | 147 | | 518 | | 16 | | 6 | | 32 | | 11 | | | |
| Total | $ | 4,506 | | $ | 4,954 | | $ | 1,247 | | $ | 4,712 | | $ | 60 | | $ | 52 | | $ | 119 | | $ | 102 | | | |
(1)Recorded investment in a loan includes net deferred loan fees and costs, unamortized premium or discount and direct write-downs and includes accrued interest only on credit card loans.
(2) $212 million of residential first mortgages and $166 million of home equity loans do not have a specific allowance.
(3) Included in the Allowance for credit losses on loans.
(4) Average carrying value represents the average recorded investment ending balance for the last 4 quarters and does not include the related specific allowance.
(5) Includes amounts recognized on both an accrual and cash basis.
| | | | | | | | | | | | | | | |
| | Balance at December 31, 2019 | | | | |
| In millions of dollars | Recorded investment(1)(2) | Unpaid
principal balance | Related specific allowance(3) | Average carrying value(4) | |
| Mortgage and real estate | | | | | |
| Residential first mortgages | $ | 1,666 | | $ | 1,838 | | $ | 161 | | $ | 1,925 | | |
| Home equity loans | 592 | | 824 | | 123 | | 637 | | |
| Credit cards | 1,931 | | 2,288 | | 771 | | 1,890 | | |
| Personal, small business and other | 419 | | 455 | | 135 | | 683 | | |
| Total | $ | 4,608 | | $ | 5,405 | | $ | 1,190 | | $ | 5,135 | | |
(1)Recorded investment in a loan includes net deferred loan fees and costs, unamortized premium or discount and direct write-downs and includes accrued interest only on credit card loans.
(2)$405 million of residential first mortgages and $212 million of home equity loans do not have a specific allowance.
(3)Included in the Allowance for credit losses on loans.
(4)Average carrying value represents the average recorded investment ending balance for the last 4 quarters and does not include the related specific allowance.
Consumer Troubled Debt Restructurings(1)
| | | | | | | | | | | | | | | | | | | | |
| | For the Three Months Ended June 30, 2020 | | | | | |
| In millions of dollars, except number of loans modified | Number of
loans modified | Post-
modification
recorded
investment(2)(3) | Deferred
principal(4) | Contingent
principal
forgiveness(5) | Principal
forgiveness(6) | Average
interest rate
reduction |
| North America | | | | | | |
| Residential first mortgages | 298 | | $ | 51 | | $ | — | | $ | — | | $ | — | | — | % |
| Home equity loans | 83 | | 8 | | — | | — | | — | | — | |
| Credit cards | 50,891 | | 220 | | — | | — | | — | | 17 | |
| Personal, small business and other | 343 | | 3 | | — | | — | | — | | 4 | |
Total(7) | 51,615 | | $ | 282 | | $ | — | | $ | — | | $ | — | | |
| International | | | | | | |
| Residential first mortgages | 642 | | $ | 44 | | $ | — | | $ | — | | $ | — | | 4 | % |
| Credit cards | 21,276 | | 94 | | — | | — | | 3 | | 16 | |
| Personal, small business and other | 11,284 | | 77 | | — | | — | | 2 | | 10 | |
Total(7) | 33,202 | | $ | 215 | | $ | — | | $ | — | | $ | 5 | | |
| | | | | | |
| | | | | | |
| | | | | | |
| | | | | | |
| | | | | | |
| | | | | | |
| | | | | | |
| | | | | | |
| | | | | | |
| | | | | | |
| | | | | | |
| | | | | | |
| | | | | | |
| | | | | | | | | | | | | | | | | | | | |
| | For the Three Months Ended June 30, 2019 | | | | | |
| In millions of dollars, except number of loans modified | Number of
loans modified | Post- modification recorded investment(2)(8) | Deferred principal(4) | Contingent principal forgiveness(5) | Principal forgiveness(6) | Average
interest rate
reduction |
| North America | | | | | | |
| Residential first mortgages | 137 | | $ | 21 | | $ | — | | $ | — | | $ | — | | — | % |
| Home equity loans | 188 | | 22 | | 1 | | — | | — | | 1 | |
| Credit cards | 63,281 | | 273 | | — | | — | | — | | 17 | |
| Personal, small business and other | 347 | | 4 | | — | | — | | — | | 5 | |
Total(7) | 63,953 | | $ | 320 | | $ | 1 | | $ | — | | $ | — | | |
| International | | | | | | |
| Residential first mortgages | 638 | | $ | 17 | | $ | — | | $ | — | | $ | — | | — | % |
| Credit cards | 18,453 | | 73 | | — | | — | | 3 | | 16 | |
| Personal, small business and other | 7,154 | | 49 | | — | | — | | 2 | | 9 | |
Total(7) | 26,245 | | $ | 139 | | $ | — | | $ | — | | $ | 5 | | |
| | | | | | |
| | | | | | |
| | | | | | |
| | | | | | |
| | | | | | |
| | | | | | |
| | | | | | |
| | | | | | |
| | | | | | |
| | | | | | |
| | | | | | |
| | | | | | |
| | | | | | |
(1)The above tables do not include loan modifications that meet the TDR relief criteria in the Coronavirus Aid, Relief, and Economic Security Act (CARES Act) or the interagency guidance.
(2)Post-modification balances include past-due amounts that are capitalized at the modification date.
(3)Post-modification balances in North America include $3 million of residential first mortgages and $1 million of home equity loans to borrowers who have gone through Chapter 7 bankruptcy in the three months ended June 30, 2020. These amounts include $2 million of residential first mortgages and $1 million of home equity loans that were newly classified as TDRs in the three months ended June 30, 2020, based on previously received OCC guidance.
(4)Represents portion of contractual loan principal that is non-interest bearing, but still due from the borrower. Such deferred principal is charged off at the time of permanent modification to the extent that the related loan balance exceeds the underlying collateral value.
(5)Represents portion of contractual loan principal that is non-interest bearing and, depending upon borrower performance, eligible for forgiveness.
(6)Represents portion of contractual loan principal that was forgiven at the time of permanent modification.
(7) The above tables reflect activity for restructured loans that were considered TDRs as of the end of the reporting period.
(8) Post-modification balances in North America include $5 million of residential first mortgages and $2 million of home equity loans to borrowers who have gone through Chapter 7 bankruptcy in the three months ended June 30, 2019. These amounts include $3 million of residential first mortgages and $1 million of home equity loans that were newly classified as TDRs in the three months ended June 30, 2019, based on previously received OCC guidance.
Consumer Troubled Debt Restructurings(1)
| | | | | | | | | | | | | | | | | | | | |
| | For the Six Months Ended June 30, 2020 | | | | | |
| In millions of dollars, except number of loans modified | Number of
loans modified | Post-
modification
recorded
investment(2)(3) | Deferred
principal(4) | Contingent
principal
forgiveness(5) | Principal
forgiveness(6) | Average
interest rate
reduction |
| North America | | | | | | |
| Residential first mortgages | 575 | | $ | 95 | | $ | — | | $ | — | | $ | — | | — | % |
| Home equity loans | 165 | | 16 | | — | | — | | — | | 1 | |
| Credit cards | 118,173 | | 525 | | — | | — | | — | | 9 | |
| Personal, small business and other | 776 | | 7 | | — | | — | | — | | 3 | |
Total(7) | 119,689 | | $ | 643 | | $ | — | | $ | — | | $ | — | | |
| International | | | | | | |
| Residential first mortgages | 1,178 | | $ | 58 | | $ | — | | $ | — | | $ | — | | 4 | % |
| Credit cards | 40,591 | | 167 | | — | | — | | 5 | | 16 | |
| Personal, small business and other | 18,938 | | 128 | | — | | — | | 4 | | 10 | |
Total(7) | 60,707 | | $ | 353 | | $ | — | | $ | — | | $ | 9 | | |
| | | | | | |
| | | | | | |
| | | | | | |
| | | | | | |
| | | | | | |
| | | | | | |
| | | | | | |
| | | | | | |
| | | | | | |
| | | | | | |
| | | | | | |
| | | | | | |
| | | | | | |
| | | | | | | | | | | | | | | | | | | | |
| | For the Six Months Ended June 30, 2019 | | | | | |
| In millions of dollars, except number of loans modified | Number of
loans modified | Post- modification recorded investment(2)(8) | Deferred principal(4) | Contingent principal forgiveness(5) | Principal forgiveness(6) | Average
interest rate
reduction |
| North America | | | | | | |
| Residential first mortgages | 630 | | $ | 95 | | $ | — | | $ | — | | $ | — | | — | % |
| Home equity loans | 394 | | 42 | | 2 | | — | | — | | 1 | |
| Credit cards | 135,528 | | 578 | | — | | — | | — | | 17 | |
| Personal, small business and other | 703 | | 7 | | — | | — | | — | | 5 | |
Total(7) | 137,255 | | $ | 722 | | $ | 2 | | $ | — | | $ | — | | |
| International | | | | | | |
| Residential first mortgages | 1,363 | | $ | 37 | | $ | — | | $ | — | | $ | — | | — | % |
| Credit cards | 36,946 | | 148 | | — | | — | | 6 | | 16 | |
| Personal, small business and other | 14,798 | | 99 | | — | | — | | 3 | | 9 | |
Total(7) | 53,107 | | $ | 284 | | $ | — | | $ | — | | $ | 9 | | |
| | | | | | |
| | | | | | |
| | | | | | |
| | | | | | |
| | | | | | |
| | | | | | |
| | | | | | |
| | | | | | |
| | | | | | |
| | | | | | |
| | | | | | |
| | | | | | |
| | | | | | |
(1)The above tables do not include loan modifications that meet the TDR relief criteria in the CARES Act or the interagency guidance.
(2)Post-modification balances include past-due amounts that are capitalized at the modification date.
(3)Post-modification balances in North America include $7 million of residential first mortgages and $2 million of home equity loans to borrowers who have gone through Chapter 7 bankruptcy in the six months ended June 30, 2020. These amounts include $5 million of residential first mortgages and $1 million of home equity loans that were newly classified as TDRs in the six months ended June 30, 2020, based on previously received OCC guidance.
(4)Represents portion of contractual loan principal that is non-interest bearing, but still due from the borrower. Such deferred principal is charged off at the time of permanent modification to the extent that the related loan balance exceeds the underlying collateral value.
(5)Represents portion of contractual loan principal that is non-interest bearing and, depending upon borrower performance, eligible for forgiveness.
(6)Represents portion of contractual loan principal that was forgiven at the time of permanent modification.
(7) The above tables reflect activity for restructured loans that were considered TDRs as of the end of the reporting period.
(8) Post-modification balances in North America include $12 million of residential first mortgages and $4 million of home equity loans to borrowers who have gone through Chapter 7 bankruptcy in the six months ended June 30, 2019. These amounts include $7 million of residential first mortgages and $3 million of home equity loans that were newly classified as TDRs in the six months ended June 30, 2019, based on previously received OCC guidance.
The following table presents consumer TDRs that defaulted for which the payment default occurred within one year of a permanent modification. Default is defined as 60 days past due, except for classifiably managed commercial banking loans, where default is defined as 90 days past due.
| | | | | | | | | | | | | | |
| Three Months Ended June 30, | | Six Months Ended June 30, | |
| In millions of dollars | 2020 | 2019 | 2020 | 2019 |
| North America | | | | |
| Residential first mortgages | $ | 21 | | $ | 26 | | $ | 35 | | $ | 50 | |
| Home equity loans | 4 | | 4 | | 6 | | 7 | |
| Credit cards | 47 | | 73 | | 137 | | 144 | |
| Personal, small business and other | 1 | | 1 | | 3 | | 2 | |
| Total | $ | 73 | | $ | 104 | | $ | 181 | | $ | 203 | |
| International | | | | |
| Residential first mortgages | $ | 5 | | $ | 4 | | $ | 11 | | $ | 7 | |
| Credit cards | 38 | | 36 | | 71 | | 75 | |
| Personal, small business and other | 18 | | 20 | | 35 | | 38 | |
| Total | $ | 61 | | $ | 60 | | $ | 117 | | $ | 120 | |
Purchased Credit Deteriorated Assets
| | | | | | | | | | | |
| Three Months Ended June 30, 2020 | | |
| In millions of dollars | Credit
cards | Mortgages(1) | Installment and other |
| Purchase price | $ | — | | $ | 3 | | $ | — | |
| Allowance for credit losses at acquisition date | — | | — | | — | |
| Discount or premium attributable to non-credit factors | — | | — | | — | |
| Par value (amortized cost basis) | $ | — | | $ | 3 | | $ | — | |
(1) Includes loans sold to agencies that were bought back at par due to repurchase agreements.
Corporate Loans
Corporate loans represent loans and leases managed by ICG. The following table presents information by corporate loan type:
| | | | | | | | |
| In millions of dollars | June 30,
2020 | December 31,
2019 |
In North America offices(1) | | |
| Commercial and industrial | $ | 70,755 | | $ | 55,929 | |
| Financial institutions | 53,860 | | 53,922 | |
Mortgage and real estate(2) | 57,821 | | 53,371 | |
| Installment and other | 25,602 | | 31,238 | |
| Lease financing | 869 | | 1,290 | |
| Total | $ | 208,907 | | $ | 195,750 | |
In offices outside North America(1) | | |
| Commercial and industrial | $ | 115,471 | | $ | 112,668 | |
| Financial institutions | 35,173 | | 40,211 | |
Mortgage and real estate(2) | 10,332 | | 9,780 | |
| Installment and other | 30,678 | | 27,303 | |
| Lease financing | 66 | | 95 | |
| Governments and official institutions | 3,552 | | 4,128 | |
| Total | $ | 195,272 | | $ | 194,185 | |
Corporate loans, net of unearned income(3) | $ | 404,179 | | $ | 389,935 | |
(1)North America includes the U.S., Canada and Puerto Rico. Mexico is included in offices outside North America. The classification between offices in North America and outside North America is based on the domicile of the booking unit. The difference between the domicile of the booking unit and the domicile of the managing unit is not material.
(2)Loans secured primarily by real estate.
(3)Corporate loans are net of unearned income of ($854) million and ($791) million at June 30, 2020 and December 31, 2019, respectively. Unearned income on corporate loans primarily represents interest received in advance, but not yet earned, on loans originated on a discounted basis.
The Company sold and/or reclassified to held-for-sale $0.8 billion and $1.0 billion of corporate loans during the three and six months ended June 30, 2020, respectively, and $0.8 billion and $1.3 billion of corporate loans during the three and six months ended June 30, 2019, respectively. The Company did not have significant purchases of corporate loans classified as held-for-investment for the three and six months ended June 30, 2020 or 2019.
Corporate Loan Delinquencies and Non-Accrual Details at June 30, 2020
| | | | | | | | | | | | | | | | | | | | |
| In millions of dollars | 30–89 days past due and accruing(1) | ≥ 90 days past due and accruing(1) | Total past due
and accruing | Total non-accrual(2) | Total current(3) | Total loans(4) |
| Commercial and industrial | $ | 971 | | $ | 108 | | $ | 1,079 | | $ | 3,202 | | $ | 178,084 | | $ | 182,365 | |
| Financial institutions | 1,031 | | 67 | | 1,098 | | 244 | | 85,884 | | 87,226 | |
| Mortgage and real estate | 986 | | 221 | | 1,207 | | 455 | | 66,484 | | 68,146 | |
| Lease financing | — | | 3 | | 3 | | 36 | | 896 | | 935 | |
| Other | 143 | | 30 | | 173 | | 79 | | 59,472 | | 59,724 | |
| Loans at fair value | | | | | | 5,783 | |
| | | | | | |
| Total | $ | 3,131 | | $ | 429 | | $ | 3,560 | | $ | 4,016 | | $ | 390,820 | | $ | 404,179 | |
Corporate Loan Delinquencies and Non-Accrual Details at December 31, 2019
| | | | | | | | | | | | | | | | | | | | |
| In millions of dollars | 30–89 days past due and accruing(1) | ≥ 90 days past due and accruing(1) | Total past due
and accruing | Total non-accrual(2) | Total current(3) | Total loans(4) |
| Commercial and industrial | $ | 676 | | $ | 93 | | $ | 769 | | $ | 1,828 | | $ | 164,249 | | $ | 166,846 | |
| Financial institutions | 791 | | 3 | | 794 | | 50 | | 91,008 | | 91,852 | |
| Mortgage and real estate | 534 | | 4 | | 538 | | 188 | | 62,425 | | 63,151 | |
| Lease financing | 58 | | 9 | | 67 | | 41 | | 1,277 | | 1,385 | |
| Other | 190 | | 22 | | 212 | | 81 | | 62,341 | | 62,634 | |
| Loans at fair value | | | | | | 4,067 | |
| | | | | | |
| Total | $ | 2,249 | | $ | 131 | | $ | 2,380 | | $ | 2,188 | | $ | 381,300 | | $ | 389,935 | |
(1)Corporate loans that are 90 days past due are generally classified as non-accrual. Corporate loans are considered past due when principal or interest is contractually due but unpaid.
(2)Non-accrual loans generally include those loans that are 90 days or more past due or those loans for which Citi believes, based on actual experience and a forward-looking assessment of the collectability of the loan in full, that the payment of interest and/or principal is doubtful.
(3)Loans less than 30 days past due are presented as current.
(4)Total loans include loans at fair value, which are not included in the various delinquency columns.
Corporate Loans Credit Quality Indicators
| | | | | | | | | | | | | | | | | | | | | | | | | | | | | | |
| | Recorded investment in loans(1) | | | | | | | | | |
| Term loans by year of origination | | | | | | Revolving line of credit arrangements(2) | | Totals as of | |
| In millions of dollars | 2020 | 2019 | 2018 | 2017 | 2016 | Prior | | | June 30,
2020 | December 31,
2019 |
Investment grade(3) | | | | | | | | | | |
Commercial and industrial(4) | $ | 35,627 | | $ | 9,480 | | $ | 7,242 | | $ | 5,035 | | $ | 2,233 | | $ | 10,162 | | $ | 36,478 | | | $ | 106,257 | | $ | 110,797 | |
Financial institutions(4) | 8,131 | | 5,359 | | 4,125 | | 1,626 | | 1,458 | | 4,941 | | 47,425 | | | 73,065 | | 80,533 | |
| Mortgage and real estate | 3,614 | | 6,267 | | 5,622 | | 3,207 | | 1,436 | | 3,017 | | 3,086 | | | 26,249 | | 27,571 | |
Other(5) | 6,782 | | 3,597 | | 5,219 | | 1,312 | | 706 | | 5,845 | | 29,753 | | | 53,214 | | 58,155 | |
| Total investment grade | $ | 54,154 | | $ | 24,703 | | $ | 22,208 | | $ | 11,180 | | $ | 5,833 | | $ | 23,965 | | $ | 116,742 | | | $ | 258,785 | | $ | 277,056 | |
Non-investment grade(3) | | | | | | | | | | |
| Accrual | | | | | | | | | | |
Commercial and industrial(4) | $ | 18,097 | | $ | 7,045 | | $ | 5,922 | | $ | 3,431 | | $ | 1,061 | | $ | 6,022 | | $ | 31,045 | | | $ | 72,623 | | $ | 54,220 | |
Financial institutions(4) | 7,189 | | 1,343 | | 742 | | 337 | | 39 | | 1,562 | | 2,705 | | | 13,917 | | 11,269 | |
| Mortgage and real estate | 1,217 | | 1,193 | | 2,031 | | 1,025 | | 512 | | 941 | | 920 | | | 7,839 | | 3,811 | |
Other(5) | 1,179 | | 1,567 | | 603 | | 160 | | 197 | | 783 | | 2,840 | | | 7,329 | | 5,734 | |
| Non-accrual | | | | | | | | | | |
Commercial and industrial(4) | 207 | | 108 | | 54 | | 181 | | 72 | | 343 | | 2,237 | | | 3,202 | | 1,828 | |
| Financial institutions | — | | — | | — | | — | | — | | 26 | | 218 | | | 244 | | 50 | |
| Mortgage and real estate | 2 | | 4 | | 2 | | 10 | | 6 | | 52 | | 379 | | | 455 | | 188 | |
Other(5) | 13 | | 8 | | — | | 15 | | — | | 42 | | 37 | | | 115 | | 122 | |
| Total non-investment grade | $ | 27,904 | | $ | 11,268 | | $ | 9,354 | | $ | 5,159 | | $ | 1,887 | | $ | 9,771 | | $ | 40,381 | | | $ | 105,724 | | $ | 77,222 | |
Non-rated private bank loans managed on a delinquency basis(3)(6) | $ | 4,461 | | $ | 7,597 | | $ | 3,822 | | $ | 4,171 | | $ | 4,604 | | $ | 9,232 | | $ | — | | | $ | 33,887 | | $ | 31,590 | |
Loans at fair value(7) | | | | | | | | | 5,783 | | 4,067 | |
| Corporate loans, net of unearned income | $ | 86,519 | | $ | 43,568 | | $ | 35,384 | | $ | 20,510 | | $ | 12,324 | | $ | 42,968 | | $ | 157,123 | | | $ | 404,179 | | $ | 389,935 | |
(1)Recorded investment in a loan includes net deferred loan fees and costs, unamortized premium or discount, less any direct write-downs.
(2)There were no significant revolving line of credit arrangements that converted to term loans during the quarter.
(3)Held-for-investment loans are accounted for on an amortized cost basis.
(4)Includes certain short-term loans with less than one year in tenor.
(5)Other includes installment and other, lease financing and loans to government and official institutions.
(6)Non-rated private bank loans mainly include mortgage and real estate loans to private banking clients.
(7)Loans at fair value include loans to commercial and industrial, financial institutions, mortgage and real estate and other.
Non-Accrual Corporate Loans
The following tables present non-accrual loan information by corporate loan type and interest income recognized on non-accrual corporate loans:
| | | | | | | | | | | | | | | | | | | | |
| | June 30, 2020 | | | | Three Months Ended
June 30, 2020 | Six Months Ended
June 30, 2020 |
| In millions of dollars | Recorded investment(1) | Unpaid
principal balance | Related specific
allowance | Average carrying value(2) | Interest income recognized(3) | Interest income recognized(3) |
| Non-accrual corporate loans | | | | | | |
| Commercial and industrial | $ | 3,202 | | $ | 3,824 | | $ | 682 | | $ | 2,099 | | $ | 3 | | $ | 5 | |
| Financial institutions | 244 | | 283 | | 38 | | 90 | | — | | — | |
| Mortgage and real estate | 455 | | 455 | | 40 | | 255 | | — | | — | |
| Lease financing | 36 | | 36 | | — | | 30 | | — | | — | |
| Other | 79 | | 88 | | 8 | | 161 | | 1 | | 14 | |
| Total non-accrual corporate loans | $ | 4,016 | | $ | 4,686 | | $ | 768 | | $ | 2,635 | | $ | 4 | | $ | 19 | |
| | | | | | | | | | | | | | | |
| December 31, 2019 | | | | |
| In millions of dollars | Recorded investment(1) | Unpaid
principal balance | Related specific
allowance | Average carrying value(2) | |
| Non-accrual corporate loans | | | | | |
| Commercial and industrial | $ | 1,828 | | $ | 1,942 | | $ | 283 | | $ | 1,449 | | |
| Financial institutions | 50 | | 120 | | 2 | | 63 | | |
| Mortgage and real estate | 188 | | 362 | | 10 | | 192 | | |
| Lease financing | 41 | | 41 | | — | | 8 | | |
| Other | 81 | | 202 | | 4 | | 76 | | |
| Total non-accrual corporate loans | $ | 2,188 | | $ | 2,667 | | $ | 299 | | $ | 1,788 | | |
| | | | | | | | | | | | | | |
| | June 30, 2020 | | December 31, 2019 | |
| In millions of dollars | Recorded investment(1) | Related specific
allowance | Recorded investment(1) | Related specific
allowance |
| Non-accrual corporate loans with specific allowances | | | | |
| Commercial and industrial | $ | 1,840 | | $ | 682 | | $ | 714 | | $ | 283 | |
| Financial institutions | 216 | | 38 | | 40 | | 2 | |
| Mortgage and real estate | 277 | | 40 | | 48 | | 10 | |
| Lease financing | 36 | | — | | — | | — | |
| Other | 41 | | 8 | | 7 | | 4 | |
| Total non-accrual corporate loans with specific allowance | $ | 2,410 | | $ | 768 | | $ | 809 | | $ | 299 | |
| Non-accrual corporate loans without specific allowance | | | | |
| Commercial and industrial | $ | 1,362 | | | $ | 1,114 | | |
| Financial institutions | 28 | | | 10 | | |
| Mortgage and real estate | 178 | | | 140 | | |
| Lease financing | — | | | 41 | | |
| Other | 38 | | | 74 | | |
| Total non-accrual corporate loans without specific allowance | $ | 1,606 | | N/A | $ | 1,379 | | N/A |
(1)Recorded investment in a loan includes net deferred loan fees and costs, unamortized premium or discount, less any direct write-downs.
(2)Average carrying value represents the average recorded investment balance and does not include related specific allowance.
(3)Interest income recognized for the three and six months ended June 30, 2019 was $8 million and $24 million, respectively.
N/A Not applicable
Corporate Troubled Debt Restructurings(1)
Three and Six Months Ended June 30, 2020
| | | | | | | | | | | | | | | | |
| In millions of dollars | Carrying value of TDRs modified during the period | TDRs involving changes in the amount and/or timing of principal payments(2) | TDRs involving changes in the amount and/or timing of interest payments(3) | TDRs
involving changes
in the amount
and/or timing of
both principal and
interest payments | | |
| Three Months Ended June 30, 2020 | | | | | | |
| Commercial and industrial | $ | 86 | | $ | — | | $ | — | | $ | 86 | | | |
| | | | | | |
| Mortgage and real estate | 4 | | — | | — | | 4 | | | |
| Other | 4 | | 4 | | — | | — | | | |
| Total | $ | 94 | | $ | 4 | | $ | — | | $ | 90 | | | |
| Six Months Ended June 30, 2020 | | | | | | |
| Commercial and industrial | $ | 148 | | $ | — | | $ | — | | $ | 148 | | | |
| | | | | | |
| Mortgage and real estate | 8 | | — | | — | | 8 | | | |
| Other | 4 | | 4 | | — | | — | | | |
| Total | $ | 160 | | $ | 4 | | $ | — | | $ | 156 | | | |
Three and Six Months ended June 30, 2019:
| | | | | | | | | | | | | | | | |
| In millions of dollars | Carrying value of TDRs modified
during the period | TDRs involving changes in the amount and/or timing of principal payments(3) | TDRs involving changes in the amount and/or timing of interest payments(3) | TDRs
involving changes
in the amount
and/or timing of
both principal and
interest payments | | |
| Three Months Ended June 30, 2019 | | | | | | |
| Commercial and industrial | $ | 55 | | $ | 19 | | $ | — | | $ | 36 | | | |
| Mortgage and real estate | 3 | | — | | — | | 3 | | | |
| Other | 6 | | 6 | | — | | — | | | |
| | | | | | |
| Total | $ | 64 | | $ | 25 | | $ | — | | $ | 39 | | | |
| Six Months Ended June 30, 2019 | | | | | | |
| Commercial and industrial | $ | 135 | | $ | 19 | | $ | — | | $ | 116 | | | |
| Mortgage and real estate | 7 | | — | | — | | 7 | | | |
| Other | 6 | | 6 | | — | | — | | | |
| | | | | | |
| Total | $ | 148 | | $ | 25 | | $ | — | | $ | 123 | | | |
(1)The above tables do not include loan modifications that meet the TDR relief criteria in the CARES Act or the interagency guidance.
(2)TDRs involving changes in the amount or timing of principal payments may involve principal forgiveness or deferral of periodic and/or final principal payments. Because forgiveness of principal is rare for corporate loans, modifications typically have little to no impact on the loans’ projected cash flows and thus little to no impact on the allowance established for the loans. Charge-offs for amounts deemed uncollectable may be recorded at the time of the restructuring or may have already been recorded in prior periods such that no charge-off is required at the time of the modification.
(3)TDRs involving changes in the amount or timing of interest payments may involve a below-market interest rate.
The following table presents total corporate loans modified in a TDR as well as those TDRs that defaulted and for which the payment default occurred within one year of a permanent modification. Default is defined as 60 days past due, except for classifiably managed commercial banking loans, where default is defined as 90 days past due.
| | | | | | | | | | | | | | | | | | | | |
| | TDR loans in payment default | | | TDR loans in payment default | |
| In millions of dollars | TDR balances at June 30, 2020 | Three Months Ended
June 30, 2020 | Six Months Ended
June 30, 2020 | TDR balances at June 30, 2019 | Three Months Ended
June 30, 2019 | Six Months
Ended
June 30, 2019 |
| Commercial and industrial | $ | 406 | | $ | — | | $ | — | | $ | 601 | | $ | 21 | | $ | 21 | |
| Financial institutions | — | | — | | — | | 10 | | — | | — | |
| Mortgage and real estate | 91 | | — | | — | | 112 | | — | | — | |
| Other | 10 | | — | | — | | 6 | | — | | — | |
Total(1) | $ | 507 | | $ | — | | $ | — | | $ | 729 | | $ | 21 | | $ | 21 | |
(1)The above table reflects activity for loans outstanding that were considered TDRs as of the end of the reporting period.
14. ALLOWANCE FOR CREDIT LOSSES
| | | | | | | | | | | | | | |
| Three Months Ended June 30, | | Six Months Ended June 30, | |
| In millions of dollars | 2020 | 2019 | 2020 | 2019 |
| Allowance for credit losses on loans (ACLL) at beginning of period | $ | 20,841 | | $ | 12,329 | | $ | 12,783 | | $ | 12,315 | |
Adjustment to opening balance for CECL adoption(1) | — | | — | | 4,201 | | — | |
| Adjusted ACLL at beginning of period | $ | 20,841 | | $ | 12,329 | | $ | 16,984 | | $ | 12,315 | |
| Gross credit losses on loans | $ | (2,528) | | $ | (2,354) | | $ | (5,007) | | $ | (4,699) | |
Gross recoveries on loans(2) | 322 | | 391 | | 693 | | 788 | |
| Net credit losses on loans (NCLs) | $ | (2,206) | | $ | (1,963) | | $ | (4,314) | | $ | (3,911) | |
| NCLs | $ | 2,206 | | $ | 1,963 | | $ | 4,314 | | $ | 3,911 | |
Net reserve builds (releases) for loans(3) | 4,856 | | 53 | | 8,968 | | 120 | |
| Net specific reserve builds (releases) for loans | 634 | | 73 | | 858 | | 2 | |
| Total provision for credit losses on loans (PCLL) | $ | 7,696 | | $ | 2,089 | | $ | 14,140 | | $ | 4,033 | |
Initial allowance for credit losses on newly purchased credit
deteriorated assets during the period | — | | — | | 4 | — | |
| Other, net (see table below) | 89 | | 11 | | (394) | | 29 | |
| ACLL at end of period | $ | 26,420 | | $ | 12,466 | | $ | 26,420 | | $ | 12,466 | |
Allowance for credit losses on unfunded lending commitments (ACLUC) at beginning of period(4) | $ | 1,813 | | $ | 1,391 | | $ | 1,456 | | $ | 1,367 | |
Adjustment to opening balance for CECL adoption(1) | — | | — | | (194) | | — | |
| Provision (release) for credit losses on unfunded lending commitments | 113 | | (15) | | 670 | | 9 | |
Other, net(5) | (67) | | — | | (73) | | — | |
ACLUC at end of period(4) | $ | 1,859 | | $ | 1,376 | | $ | 1,859 | | $ | 1,376 | |
| Total allowance for credit losses on loans, leases and unfunded lending commitments | $ | 28,279 | | $ | 13,842 | | $ | 28,279 | | $ | 13,842 | |
| | | | | | | | | | | | | | |
| Other, net details | Three Months Ended June 30, | | Six Months Ended June 30, | |
| | | | |
| | | | |
| | | | |
| | | | |
| Sales or transfers of various consumer loan portfolios to HFS | $ | (1) | | $ | (4) | | $ | (4) | | $ | (4) | |
FX translation(6) | 88 | | 13 | | (395) | | 39 | |
| Other | 2 | | 2 | | 5 | | (6) | |
| Other, net | $ | 89 | | $ | 11 | | $ | (394) | | $ | 29 | |
(1)See Note 1 to the Consolidated Financial Statements for further discussion on the impact of Citi’s adoption of CECL.
(2)Recoveries have been reduced by certain collection costs that are incurred only if collection efforts are successful.
(3)During the second quarter of 2020, Citi updated its ACLL estimate of lifetime credit losses resulting from a change in accounting for variable post-charge-off third-party agency collection costs in its U.S. Consumer businesses. After June 30, 2020, these costs will be recorded as operating expenses for future periods as they are incurred. The impact of this change in estimate effected by a change in accounting principle resulted in an approximate $426 million reduction in Citi's estimated ACLL at June 30, 2020.
(4)Represents additional credit loss reserves for unfunded lending commitments and letters of credit recorded in Other liabilities on the Consolidated Balance Sheet.
(5)At June 30, 2020, the Corporate ACLUC includes a non-provision transfer of $68 million, representing reserves on performance guarantees as of March 31, 2020. The reserves on these contracts have been reclassified out of the allowance for credit losses on unfunded lending commitments and into other liabilities as of June 30, 2020.
(6)Primarily related to consumer. The corporate allowance is predominantly sourced in U.S. dollars.
Allowance for Credit Losses and End-of-Period Loans
| | | | | | | | | | | | | | | | | | | | |
| Three Months Ended | | | | | |
| June 30, 2020 | | | June 30, 2019 | | |
| In millions of dollars | Corporate | Consumer | Total | Corporate | Consumer | Total |
| ACLL at beginning of period | $ | 3,451 | | $ | 17,390 | | $ | 20,841 | | $ | 2,731 | | $ | 9,598 | | $ | 12,329 | |
| | | | | | |
| Charge-offs | (347) | | (2,181) | | (2,528) | | (104) | | (2,250) | | (2,354) | |
| Recoveries | 23 | | 299 | | 322 | | 15 | | 376 | | 391 | |
| Replenishment of net charge-offs | 324 | | 1,882 | | 2,206 | | 89 | | 1,874 | | 1,963 | |
| Net reserve builds (releases) | 2,883 | | 1,973 | | 4,856 | | 50 | | 3 | | 53 | |
| Net specific reserve builds (releases) | 486 | | 148 | | 634 | | 3 | | 70 | | 73 | |
| Initial allowance for credit losses on newly purchased credit deteriorated assets during the period | — | | — | | — | | — | | — | | — | |
| Other | 4 | | 85 | | 89 | | 3 | | 8 | | 11 | |
| Ending balance | $ | 6,824 | | $ | 19,596 | | $ | 26,420 | | $ | 2,787 | | $ | 9,679 | | $ | 12,466 | |
| Six Months Ended | | | | | |
| June 30, 2020 | | | June 30, 2019 | | |
| In millions of dollars | Corporate | Consumer | Total | Corporate | Consumer | Total |
| ACLL at beginning of period | $ | 2,886 | | $ | 9,897 | | $ | 12,783 | | $ | 2,811 | | $ | 9,504 | | $ | 12,315 | |
| Adjustment to opening balance for CECL adoption | (721) | | 4,922 | | 4,201 | | — | | — | | — | |
| Charge-offs | (485) | | (4,522) | | (5,007) | | (204) | | (4,495) | | (4,699) | |
| Recoveries | 34 | | 659 | | 693 | | 36 | | 752 | | 788 | |
| Replenishment of net charge-offs | 451 | | 3,863 | | 4,314 | | 168 | | 3,743 | | 3,911 | |
| Net reserve builds (releases) | 4,151 | | 4,817 | | 8,968 | | 54 | | 66 | | 120 | |
| Net specific reserve builds (releases) | 534 | | 324 | | 858 | | (76) | | 78 | | 2 | |
| Initial allowance for credit losses on newly purchased credit deteriorated assets during the period | — | | 4 | | 4 | | — | | — | | — | |
| Other | (26) | | (368) | | (394) | | (2) | | 31 | | 29 | |
| Ending balance | $ | 6,824 | | $ | 19,596 | | $ | 26,420 | | $ | 2,787 | | $ | 9,679 | | $ | 12,466 | |
| | | | | | | | | | | | | | | | | | | | |
| June 30, 2020 | | | December 31, 2019 | | |
| In millions of dollars | Corporate | Consumer | Total | Corporate | Consumer | Total |
| Allowance for credit losses on loans | | | | | | |
| Collectively evaluated | $ | 6,056 | | $ | 18,344 | | $ | 24,400 | | $ | 2,587 | | $ | 8,706 | | $ | 11,293 | |
| Individually evaluated | 768 | | 1,247 | | 2,015 | | 299 | | 1,190 | | 1,489 | |
| Purchased credit deteriorated | — | | 5 | | 5 | | — | | 1 | | 1 | |
| Total allowance for credit losses on loans | $ | 6,824 | | $ | 19,596 | | $ | 26,420 | | $ | 2,886 | | $ | 9,897 | | $ | 12,783 | |
| Loans, net of unearned income | | | | | | |
| Collectively evaluated | $ | 394,380 | | $ | 276,470 | | $ | 670,850 | | $ | 383,828 | | $ | 304,510 | | $ | 688,338 | |
| Individually evaluated | 4,016 | | 4,506 | | 8,522 | | 2,040 | | 4,892 | | 6,932 | |
| Purchased credit deteriorated | — | | 121 | | 121 | | — | | 128 | | 128 | |
| Held at fair value | 5,783 | | 16 | | 5,799 | | 4,067 | | 18 | | 4,085 | |
| Total loans, net of unearned income | $ | 404,179 | | $ | 281,113 | | $ | 685,292 | | $ | 389,935 | | $ | 309,548 | | $ | 699,483 | |
Allowance for Credit Losses on AFS Debt Securities
| | | | | | | | | | | | | | | | |
| | | | Three Months Ended June 30, 2020 | | | | |
| In millions of dollars | | | | Foreign government | | | Corporate | Total AFS |
| Allowance for credit losses at beginning of period | | | | $ | — | | | | $ | — | | $ | — | |
| Less: Write-offs | | | | — | | | | — | | — | |
| Recoveries of amounts written-off | | | | — | | | | — | | — | |
| Net credit losses (NCLs) | | | | $ | — | | | | $ | — | | $ | — | |
| NCLs | | | | $ | — | | | | $ | — | | $ | — | |
| Credit losses on securities without previous credit losses | | | | 3 | | | | 5 | | 8 | |
| | | | | | | | |
| | | | | | | | |
| | | | | | | | |
| Total provision for credit losses | | | | $ | 3 | | | | $ | 5 | | $ | 8 | |
| Initial allowance on newly purchased credit deteriorated securities during the period | | | | — | | | | — | | — | |
| Allowance for credit losses at end of period | | | | $ | 3 | | | | $ | 5 | | $ | 8 | |
| | | | Six Months Ended June 30, 2020 | | | | |
| In millions of dollars | | | | Foreign government | | | Corporate | Total AFS |
| Allowance for credit losses at beginning of period | | | | $ | — | | | | $ | — | | $ | — | |
| Adjustment to opening balance for CECL adoption | | | | — | | | | — | | — | |
| Less: Write-offs | | | | — | | | | — | | — | |
| Recoveries of amounts written-off | | | | — | | | | — | | — | |
| Net credit losses (NCLs) | | | | $ | — | | | | $ | — | | $ | — | |
| NCLs | | | | $ | — | | | | $ | — | | $ | — | |
| Credit losses on securities without previous credit losses | | | | 3 | | | | 5 | | 8 | |
| | | | | | | | |
| | | | | | | | |
| | | | | | | | |
| Total provision for credit losses | | | | $ | 3 | | | | $ | 5 | | $ | 8 | |
| Initial allowance on newly purchased credit deteriorated securities during the period | | | | — | | | | — | | — | |
| Allowance for credit losses at end of period | | | | $ | 3 | | | | $ | 5 | | $ | 8 | |
Allowance for Credit Losses on HTM Debt Securities
| | | | | | | | | | | | | | | | | | |
| | | Three Months Ended June 30, 2020 | | | | | |
| In millions of dollars | | | State and municipal | Foreign government | | Asset-backed | | Total HTM |
| Allowance for credit losses on HTM debt securities at beginning of period | | | $ | 66 | | $ | 4 | | | $ | 6 | | | $ | 76 | |
| | | | | | | | |
| | | | | | | | |
| Net credit losses (NCLs) | | | $ | — | | $ | — | | | $ | — | | | $ | — | |
| NCLs | | | $ | — | | $ | — | | | $ | — | | | $ | — | |
| Net reserve builds (releases) | | | 30 | | 2 | | | (1) | | | 31 | |
| Net specific reserve builds (releases) | | | — | | — | | | — | | | — | |
| Total provision for credit losses on HTM debt securities | | | $ | 30 | | $ | 2 | | | $ | (1) | | | $ | 31 | |
| Other, net | | | $ | 3 | | $ | — | | | $ | (3) | | | $ | — | |
| Initial allowance for credit losses on newly purchased credit deteriorated securities during the period | | | — | | — | | | — | | | — | |
| Allowance for credit losses on HTM debt securities at end of period | | | $ | 99 | | $ | 6 | | | $ | 2 | | | $ | 107 | |
| | | | | | | | |
| | | Six Months Ended June 30, 2020 | | | | | |
| In millions of dollars | | | State and municipal | Foreign government | | Asset-backed | | Total HTM |
| Allowance for credit losses on HTM debt securities at beginning of period | | | $ | — | | $ | — | | | $ | — | | | $ | — | |
| Adjustment to opening balance for CECL adoption | | | 61 | | 4 | | | 5 | | | 70 | |
| | | | | | | | |
| | | | | | | | |
| Net credit losses (NCLs) | | | $ | — | | $ | — | | | $ | — | | | $ | — | |
| NCLs | | | $ | — | | $ | — | | | $ | — | | | $ | — | |
| Net reserve builds (releases) | | | 35 | | 2 | | | — | | | 37 | |
| Net specific reserve builds (releases) | | | — | | — | | | — | | | — | |
| Total provision for credit losses on HTM debt securities | | | $ | 35 | | $ | 2 | | | $ | — | | | $ | 37 | |
| Other, net | | | $ | 3 | | $ | — | | | $ | (3) | | | $ | — | |
| Initial allowance for credit losses on newly purchased credit deteriorated securities during the period | | | — | | — | | | — | | | — | |
| Allowance for credit losses on HTM debt securities at end of period | | | $ | 99 | | $ | 6 | | | $ | 2 | | | $ | 107 | |
Allowance for Credit Losses on Other Assets
| | | | | | | | | | | | | | | | | | | | |
| Three Months Ended June 30, 2020 | | | | | |
| In millions of dollars | Cash and due from banks | Deposits with banks | Securities borrowed and purchased under agreements to resell | Brokerage receivables | All other assets(1) | Total |
| Allowance for credit losses at beginning of period | $ | — | | $ | 8 | | $ | 5 | | $ | — | | $ | 41 | | $ | 54 | |
| | | | | | |
| | | | | | |
| | | | | | |
| Net credit losses (NCLs) | $ | — | | $ | — | | $ | — | | $ | — | | $ | — | | $ | — | |
| NCLs | $ | — | | $ | — | | $ | — | | $ | — | | $ | — | | $ | — | |
| Net reserve builds (releases) | — | | 10 | | 2 | | — | | 36 | | 48 | |
| Total provision for credit losses | $ | — | | $ | 10 | | $ | 2 | | $ | — | | $ | 36 | | $ | 48 | |
| Other, net | $ | — | | $ | — | | $ | — | | $ | — | | $ | — | | $ | — | |
| Allowance for credit losses on Other assets at end of period | $ | — | | $ | 18 | | $ | 7 | | $ | — | | $ | 77 | | $ | 102 | |
| | | | | | |
| Six Months Ended June 30, 2020 | | | | | |
| In millions of dollars | Cash and due from banks | Deposits with banks | Securities borrowed and purchased under agreements to resell | Brokerage receivables | All other assets(1) | Total |
| Allowance for credit losses at beginning of period | $ | — | | $ | — | | $ | — | | $ | — | | $ | — | | $ | — | |
| Adjustment to opening balance for CECL adoption | 6 | | 14 | | 2 | | 1 | | 3 | | 26 | |
| | | | | | |
| | | | | | |
| Net credit losses (NCLs) | $ | — | | $ | — | | $ | — | | $ | — | | $ | — | | $ | — | |
| NCLs | $ | — | | $ | — | | $ | — | | $ | — | | $ | — | | $ | — | |
| Net reserve builds (releases) | (6) | | 4 | | 5 | | (1) | | 42 | | 44 | |
| Total provision for credit losses | $ | (6) | | $ | 4 | | $ | 5 | | $ | (1) | | $ | 42 | | $ | 44 | |
| Other, net | $ | — | | $ | — | | $ | — | | $ | — | | $ | 32 | | $ | 32 | |
| Allowance for credit losses on Other assets at end of period | $ | — | | $ | 18 | | $ | 7 | | $ | — | | $ | 77 | | $ | 102 | |
(1)Primarily accounts receivables.
15. GOODWILL AND INTANGIBLE ASSETS
Goodwill
The changes in Goodwill were as follows:
| | | | | | | | | | | |
| In millions of dollars | Global Consumer Banking | Institutional Clients Group | Total |
| Balance at December 31, 2019 | $ | 12,102 | | $ | 10,024 | | $ | 22,126 | |
| Foreign currency translation | (265) | | (597) | | (862) | |
| Balance at March 31, 2020 | $ | 11,837 | | $ | 9,427 | | $ | 21,264 | |
| Foreign currency translation | 39 | | 96 | | 135 | |
| Balance at June 30, 2020 | $ | 11,876 | | $ | 9,523 | | $ | 21,399 | |
| | | |
| | | |
| | | |
| | | |
| | | |
| | | |
Goodwill impairment testing is performed at the level below each business segment (referred to as a reporting unit). See Note 3 for further information on business segments.
During the three and six months ended June 30, 2020, Citi qualitatively assessed the current environment, including the estimated impact of the COVID-19 pandemic on macroeconomic variables and economic forecasts and how those might impact the fair value of reporting units. After consideration of the items above, the first and second quarter 2020 results, the results of the 2019 impairment test and latest available management forecasts, Citi determined it was not more-likely-than-not that the fair value of any reporting unit was below its book value as of June 30, 2020. For additional information regarding Citi’s goodwill impairment testing process, see Notes 1 and 16 to the Consolidated Financial Statements in Citi’s 2019 Annual Report on Form 10-K.
See Note 1 for Citi’s adoption of a new accounting standard regarding the subsequent measurement of goodwill.
Intangible Assets
The components of intangible assets were as follows:
| | | | | | | | | | | | | | | | | | | | |
| | June 30, 2020 | | | December 31, 2019 | | |
| In millions of dollars | Gross
carrying
amount | Accumulated
amortization | Net
carrying
amount | Gross
carrying
amount | Accumulated
amortization | Net
carrying
amount |
| Purchased credit card relationships | $ | 5,642 | | $ | 4,115 | | $ | 1,527 | | $ | 5,676 | | $ | 4,059 | | $ | 1,617 | |
Credit card contract-related intangibles(1) | 3,427 | | 1,192 | | 2,235 | | 5,393 | | 3,069 | | 2,324 | |
| Core deposit intangibles | 42 | | 42 | | — | | 434 | | 433 | | 1 | |
| Other customer relationships | 428 | | 289 | | 139 | | 424 | | 275 | | 149 | |
| Present value of future profits | 27 | | 25 | | 2 | | 34 | | 31 | | 3 | |
| Indefinite-lived intangible assets | 194 | | — | | 194 | | 228 | | — | | 228 | |
| Other | 67 | | 58 | | 9 | | 82 | | 77 | | 5 | |
| Intangible assets (excluding MSRs) | $ | 9,827 | | $ | 5,721 | | $ | 4,106 | | $ | 12,271 | | $ | 7,944 | | $ | 4,327 | |
Mortgage servicing rights (MSRs)(2) | 345 | | — | | 345 | | 495 | | — | | 495 | |
| Total intangible assets | $ | 10,172 | | $ | 5,721 | | $ | 4,451 | | $ | 12,766 | | $ | 7,944 | | $ | 4,822 | |
(1)Primarily reflects contract-related intangibles associated with the American Airlines, Costco, The Home Depot, and AT&T credit card program agreements, which represented 96% of the aggregate net carrying amount as of June 30, 2020 and December 31, 2019.
(2)For additional information on Citi’s MSRs, see Note 18 to the Consolidated Financial Statements.
The changes in intangible assets were as follows:
| | | | | | | | | | | | | | | | | | | | |
| Net carrying
amount at | | | | | Net carrying
amount at |
| In millions of dollars | December 31,
2019 | Acquisitions/
divestitures | Amortization | Impairments | FX translation and other | June 30,
2020 |
Purchased credit card relationships(1) | $ | 1,617 | | $ | 11 | | $ | (99) | | $ | — | | $ | (2) | | $ | 1,527 | |
Credit card contract-related intangibles(2) | 2,324 | | 14 | | (101) | | — | | (2) | | 2,235 | |
| Core deposit intangibles | 1 | | — | | (1) | | — | | — | | — | |
| Other customer relationships | 149 | | — | | (12) | | — | | 2 | | 139 | |
| Present value of future profits | 3 | | — | | — | | — | | (1) | | 2 | |
| Indefinite-lived intangible assets | 228 | | — | | — | | — | | (34) | | 194 | |
| Other | 5 | | 7 | | (3) | | — | | — | | 9 | |
| Intangible assets (excluding MSRs) | $ | 4,327 | | $ | 32 | | $ | (216) | | $ | — | | $ | (37) | | $ | 4,106 | |
Mortgage servicing rights (MSRs)(3) | 495 | | | | | | 345 | |
| Total intangible assets | $ | 4,822 | | | | | | $ | 4,451 | |
(1)Reflects intangibles for the value of cardholder relationships, which are discrete from partner contract-related intangibles and include credit card accounts primarily in the Costco and Macy’s portfolios.
(2)Primarily reflects contract-related intangibles associated with the American Airlines, Costco, The Home Depot, and AT&T credit card program agreements, which represented 96% of the aggregate net carrying amount at June 30, 2020 and December 31, 2019.
(3)For additional information on Citi’s MSRs, including the rollforward for the three and six months ended June 30, 2020, see Note 18 to the Consolidated Financial Statements.
16. DEBT
For additional information regarding Citi’s short-term borrowings and long-term debt, see Note 17 to the Consolidated Financial Statements in Citi’s 2019 Annual Report on Form 10-K.
Short-Term Borrowings
| | | | | | | | | |
| In millions of dollars | June 30,
2020 | December 31,
2019 | |
| Commercial paper | | | |
Bank(1) | $ | 10,953 | | $ | 10,155 | | |
Broker-dealer and other(2) | 6,972 | | 6,321 | | |
| Total commercial paper | $ | 17,925 | | $ | 16,476 | | |
Other borrowings(3) | 22,231 | | 28,573 | | |
| Total | $ | 40,156 | | $ | 45,049 | | |
(1)Represents Citibank entities as well as other bank entities.
(2)Represents broker-dealer and other non-bank subsidiaries that are consolidated into Citigroup Inc., the parent holding company.
(3)Includes borrowings from Federal Home Loan Banks and other market participants. At June 30, 2020 and December 31, 2019, collateralized short-term advances from the Federal Home Loan Banks were $12.0 billion and $17.6 billion, respectively.
Long-Term Debt
| | | | | | | | |
| In millions of dollars | June 30,
2020 | December 31, 2019 |
Citigroup Inc.(1) | $ | 169,036 | | $ | 150,477 | |
Bank(2) | 55,453 | | 53,340 | |
Broker-dealer and other(3) | 55,286 | | 44,943 | |
| Total | $ | 279,775 | | $ | 248,760 | |
(1)Represents the parent holding company.
(2)Represents Citibank entities as well as other bank entities. At June 30, 2020 and December 31, 2019, collateralized long-term advances from the Federal Home Loan Banks were $18.0 billion and $5.5 billion, respectively.
(3)Represents broker-dealer and other non-bank subsidiaries that are consolidated into Citigroup Inc., the parent holding company. Certain Citigroup consolidated hedging activities are also included in this line.
Long-term debt outstanding includes trust preferred securities with a balance sheet carrying value of $1.7 billion at both June 30, 2020 and December 31, 2019.
The following table summarizes Citi’s outstanding trust preferred securities at June 30, 2020:
| | | | | | | | | | | | | | | | | | | | | | | | | | |
| | | | | | | Junior subordinated debentures owned by trust | | |
| Trust | Issuance
date | Securities
issued | Liquidation value(1) | Coupon rate(2) | Common
shares
issued
to parent | Amount | Maturity | Redeemable
by issuer
beginning |
In millions of dollars, except securities and share amounts | | | | | | | | |
| Citigroup Capital III | Dec. 1996 | 194,053 | | $ | 194 | | 7.625 | % | 6,003 | | $ | 200 | | Dec. 1, 2036 | Not redeemable |
| Citigroup Capital XIII | Sept. 2010 | 89,840,000 | | 2,246 | | 3 mo LIBOR + 637 bps | 1,000 | | 2,246 | | Oct. 30, 2040 | Oct. 30, 2015 |
| Citigroup Capital XVIII | Jun. 2007 | 99,901 | | 124 | | 3 mo Sterling LIBOR + 88.75 bps | 50 | | 124 | | Jun. 28, 2067 | Jun. 28, 2017 |
| Total obligated | | | $ | 2,564 | | | | $ | 2,570 | | | |
Note: Distributions on the trust preferred securities and interest on the subordinated debentures are payable semiannually for Citigroup Capital III and Citigroup Capital XVIII and quarterly for Citigroup Capital XIII.
(1)Represents the notional value received by outside investors from the trusts at the time of issuance. This differs from Citi’s balance sheet carrying value due primarily to unamortized discount and issuance costs.
(2)In each case, the coupon rate on the subordinated debentures is the same as that on the trust preferred securities.
17. CHANGES IN ACCUMULATED OTHER COMPREHENSIVE INCOME (LOSS) (AOCI)
Changes in each component of Citigroup’s Accumulated other comprehensive income (loss) were as follows:
Three and Six Months Ended June 30, 2020
| | | | | | | | | | | | | | | | | | | | | | | |
| In millions of dollars | Net
unrealized
gains (losses)
on debt securities | Debt valuation adjustment (DVA)(1) | Cash flow hedges(2) | Benefit plans(3) | Foreign
currency
translation
adjustment (CTA), net of hedges(4) | Excluded component of fair value hedges | Accumulated
other
comprehensive income (loss) |
| Three Months Ended June 30, 2020 | | | | | | | |
| Balance, March 31, 2020 | $ | 2,863 | | $ | 2,196 | | $ | 2,020 | | $ | (7,095) | | $ | (32,500) | | $ | (5) | | $ | (32,521) | |
| | | | | | | |
| | | | | | | |
| | | | | | | |
Other comprehensive income before
reclassifications | 1,391 | | (2,204) | | 226 | | (132) | | 561 | | 13 | | (145) | |
Increase (decrease) due to amounts reclassified from AOCI | (554) | | (28) | | (152) | | 55 | | — | | — | | (679) | |
Change, net of taxes | $ | 837 | | $ | (2,232) | | $ | 74 | | $ | (77) | | $ | 561 | | $ | 13 | | $ | (824) | |
| Balance at June 30, 2020 | $ | 3,700 | | $ | (36) | | $ | 2,094 | | $ | (7,172) | | $ | (31,939) | | $ | 8 | | $ | (33,345) | |
| Six Months Ended June 30, 2020 | | | | | | | |
| Balance, December 31, 2019 | $ | (265) | | $ | (944) | | $ | 123 | | $ | (6,809) | | $ | (28,391) | | $ | (32) | | $ | (36,318) | |
| | | | | | | |
| | | | | | | |
| | | | | | | |
Other comprehensive income before
reclassifications | 4,795 | | 913 | | 2,124 | | (476) | | (3,548) | | 40 | | 3,848 | |
Increase (decrease) due to amounts reclassified from AOCI | (830) | | (5) | | (153) | | 113 | | — | | — | | (875) | |
| Change, net of taxes | $ | 3,965 | | $ | 908 | | $ | 1,971 | | $ | (363) | | $ | (3,548) | | $ | 40 | | $ | 2,973 | |
| Balance at June 30, 2020 | $ | 3,700 | | $ | (36) | | $ | 2,094 | | $ | (7,172) | | $ | (31,939) | | $ | 8 | | $ | (33,345) | |
Footnotes to the table above appear on the following page.
Three and Six Months Ended June 30, 2019
| | | | | | | | | | | | | | | | | | | | | | | |
| In millions of dollars | Net
unrealized
gains (losses)
on investment securities | Debt valuation adjustment (DVA)(1) | Cash flow hedges(2) | Benefit plans(3) | Foreign
currency
translation
adjustment (CTA), net of hedges(4) | Excluded component of fair value hedges | Accumulated
other
comprehensive income (loss) |
| Three Months Ended June 30, 2019 | | | | | | | |
| Balance, March 31, 2019 | $ | (1,115) | | $ | (379) | | $ | (442) | | $ | (6,321) | | $ | (28,012) | | $ | (39) | | $ | (36,308) | |
| | | | | | | |
| | | | | | | |
| | | | | | | |
Other comprehensive income before
reclassifications | 1,050 | | (14) | | 414 | | (305) | | 91 | | 44 | | 1,280 | |
Increase (decrease) due to amounts reclassified from AOCI | (347) | | 17 | | 103 | | 52 | | — | | — | | (175) | |
Change, net of taxes | $ | 703 | | $ | 3 | | $ | 517 | | $ | (253) | | $ | 91 | | $ | 44 | | $ | 1,105 | |
| Balance at June 30, 2019 | $ | (412) | | $ | (376) | | $ | 75 | | $ | (6,574) | | $ | (27,921) | | $ | 5 | | $ | (35,203) | |
| Six Months Ended June 30, 2019 | | | | | | | |
| Balance, December 31, 2019 | $ | (2,250) | | $ | 192 | | $ | (728) | | $ | (6,257) | | $ | (28,070) | | $ | (57) | | $ | (37,170) | |
| | | | | | | |
| | | | | | | |
| | | | | | | |
Other comprehensive income before
reclassifications | 2,276 | | (589) | | 600 | | (415) | | 149 | | 62 | | 2,083 | |
Increase (decrease) due to amounts reclassified from AOCI | (438) | | 21 | | 203 | | 98 | | — | | — | | (116) | |
| Change, net of taxes | $ | 1,838 | | $ | (568) | | $ | 803 | | $ | (317) | | $ | 149 | | $ | 62 | | $ | 1,967 | |
| Balance at June 30, 2019 | $ | (412) | | $ | (376) | | $ | 75 | | $ | (6,574) | | $ | (27,921) | | $ | 5 | | $ | (35,203) | |
(1)Reflects the after-tax valuation of Citi’s fair value options liabilities. See “Market Valuation Adjustments” in Note 20 to the Consolidated Financial Statements.
(2)Primarily driven by Citigroup’s pay fixed/receive floating interest rate swap programs that hedge the floating rates on liabilities.
(3)Primarily reflects adjustments based on the quarterly actuarial valuations of the Company’s significant pension and postretirement plans, annual actuarial valuations of all other plans and amortization of amounts previously recognized in other comprehensive income.
(4)Primarily reflects the movements in (by order of impact) the Australian dollar, South Korean won, Indonesian rupiah and Euro against the U.S. dollar and changes in related tax effects and hedges for the three months ended June 30, 2020. Primarily reflects the movements in (by order of impact) the Mexican peso, Brazilian real, Indian rupee and Chilean peso against the U.S. dollar and changes in related tax effects and hedges for the six months ended June 30, 2020. Primarily reflects the movements in (by order of impact) the Japanese yen, Mexican peso, Euro and Polish zloty against the U.S. dollar and changes in related tax effects and hedges for the three months ended June 30, 2019. Primarily reflects the movements in (by order of impact) the Mexican peso, Canadian dollar, Chilean peso and Russian ruble against the U.S. dollar and changes in related tax effects and hedges for the six months ended June 30, 2019. Amounts recorded in the CTA component of AOCI remain in AOCI until the sale or substantial liquidation of the foreign entity, at which point such amounts related to the foreign entity are reclassified into earnings.
The pretax and after-tax changes in each component of Accumulated other comprehensive income (loss) were as follows:
Three and Six Months Ended June 30, 2020
| | | | | | | | | | | |
| In millions of dollars | Pretax | Tax effect | After-tax |
| Three Months Ended June 30, 2020 | | | |
| Balance, March 31, 2020 | $ | (36,419) | | $ | 3,898 | | $ | (32,521) | |
| | | |
| | | |
| Change in net unrealized gains (losses) on debt securities | 1,178 | | (341) | | 837 | |
| Debt valuation adjustment (DVA) | (2,935) | | 703 | | (2,232) | |
| Cash flow hedges | 90 | | (16) | | 74 | |
| Benefit plans | (93) | | 16 | | (77) | |
| Foreign currency translation adjustment | 485 | | 76 | | 561 | |
| Excluded component of fair value hedges | 16 | | (3) | | 13 | |
| Change | $ | (1,259) | | $ | 435 | | $ | (824) | |
| Balance at June 30, 2020 | $ | (37,678) | | $ | 4,333 | | $ | (33,345) | |
| Six Months Ended June 30, 2020 | | | |
| Balance, December 31, 2019 | $ | (42,772) | | $ | 6,454 | | $ | (36,318) | |
| | | |
| | | |
| Change in net unrealized gains (losses) on debt securities | 5,298 | | (1,333) | | 3,965 | |
| Debt valuation adjustment (DVA) | 1,253 | | (345) | | 908 | |
| Cash flow hedges | 2,574 | | (603) | | 1,971 | |
| Benefit plans | (510) | | 147 | | (363) | |
| Foreign currency translation adjustment | (3,570) | | 22 | | (3,548) | |
| Excluded component of fair value hedges | 49 | | (9) | | 40 | |
| Change | $ | 5,094 | | $ | (2,121) | | $ | 2,973 | |
| Balance at June 30, 2020 | $ | (37,678) | | $ | 4,333 | | $ | (33,345) | |
Three and Six Months Ended June 30, 2019
| | | | | | | | | | | |
| In millions of dollars | Pretax | Tax effect | After-tax |
| Three Months Ended June 30, 2019 | | | |
| Balance, March 31, 2019 | $ | (42,904) | | $ | 6,596 | | $ | (36,308) | |
| | | |
| | | |
| Change in net unrealized gains (losses) on debt securities | 936 | | (233) | | 703 | |
| Debt valuation adjustment (DVA) | 3 | | — | | 3 | |
| Cash flow hedges | 680 | | (163) | | 517 | |
| Benefit plans | (329) | | 76 | | (253) | |
| Foreign currency translation adjustment | 83 | | 8 | | 91 | |
| Excluded component of fair value hedges | 59 | | (15) | | 44 | |
| Change | $ | 1,432 | | $ | (327) | | $ | 1,105 | |
| Balance, June 30, 2019 | $ | (41,472) | | $ | 6,269 | | $ | (35,203) | |
| Six Months Ended June 30, 2019 | | | |
| Balance, December 31, 2018 | $ | (44,082) | | $ | 6,912 | | $ | (37,170) | |
| | | |
| | | |
| Change in net unrealized gains (losses) on debt securities | 2,436 | | (598) | | 1,838 | |
| Debt valuation adjustment (DVA) | (722) | | 154 | | (568) | |
| Cash flow hedges | 1,058 | | (255) | | 803 | |
| Benefit plans | (397) | | 80 | | (317) | |
| Foreign currency translation adjustment | 152 | | (3) | | 149 | |
| Excluded component of fair value hedges | 83 | | (21) | | 62 | |
| Change | $ | 2,610 | | $ | (643) | | $ | 1,967 | |
| Balance, June 30, 2019 | $ | (41,472) | | $ | 6,269 | | $ | (35,203) | |
The Company recognized pretax gains (losses) related to amounts in AOCI reclassified to the Consolidated Statement of Income as follows:
| | | | | | | | | | | | | | |
| Increase (decrease) in AOCI due to
amounts reclassified to
Consolidated Statement of Income | | | |
| Three Months Ended June 30, | | Six Months Ended June 30, | |
| In millions of dollars | 2020 | 2019 | 2020 | 2019 |
| Realized (gains) losses on sales of investments | $ | (748) | | $ | (468) | | $ | (1,180) | | $ | (598) | |
| Gross impairment losses | 19 | | 2 | | 71 | | 5 | |
| Subtotal, pretax | $ | (729) | | $ | (466) | | $ | (1,109) | | $ | (593) | |
| Tax effect | 175 | | 119 | | 279 | | 155 | |
Net realized (gains) losses on investments after-tax(1) | $ | (554) | | $ | (347) | | $ | (830) | | $ | (438) | |
| Realized DVA (gains) losses on fair value option liabilities, pretax | $ | (37) | | $ | 22 | | $ | (6) | | $ | 27 | |
| Tax effect | 9 | | (5) | | 1 | | (6) | |
| Net realized debt valuation adjustment, after-tax | $ | (28) | | $ | 17 | | $ | (5) | | $ | 21 | |
| Interest rate contracts | $ | (200) | | $ | 134 | | $ | (203) | | $ | 264 | |
| Foreign exchange contracts | 1 | | 2 | | 2 | | 4 | |
| Subtotal, pretax | $ | (199) | | $ | 136 | | $ | (201) | | $ | 268 | |
| Tax effect | 47 | | (33) | | 48 | | (65) | |
Amortization of cash flow hedges, after-tax(2) | $ | (152) | | $ | 103 | | $ | (153) | | $ | 203 | |
| Amortization of unrecognized: | | | | |
| Prior service cost (benefit) | $ | (3) | | $ | (2) | | $ | (6) | | $ | (6) | |
| Net actuarial loss | 75 | | 69 | | 154 | | 134 | |
Curtailment/settlement impact(3) | 3 | | 2 | | 3 | | 2 | |
| Subtotal, pretax | $ | 75 | | $ | 69 | | $ | 151 | | $ | 130 | |
| Tax effect | (20) | | (17) | | (38) | | (32) | |
Amortization of benefit plans, after-tax(3) | $ | 55 | | $ | 52 | | $ | 113 | | $ | 98 | |
| Excluded component of fair value hedges, pretax | $ | — | | $ | — | | $ | — | | $ | — | |
| Tax effect | — | | — | | — | | — | |
| Excluded component of fair value hedges, after-tax | $ | — | | $ | — | | $ | — | | $ | — | |
| Foreign currency translation adjustment, pretax | $ | — | | $ | — | | $ | — | | $ | — | |
| Tax effect | — | | — | | — | | — | |
| Foreign currency translation adjustment, after-tax | $ | — | | $ | — | | $ | — | | $ | — | |
Total amounts reclassified out of AOCI, pretax | $ | (890) | | $ | (239) | | $ | (1,165) | | $ | (168) | |
| Total tax effect | 211 | | 64 | | 290 | | 52 | |
Total amounts reclassified out of AOCI, after-tax | $ | (679) | | $ | (175) | | $ | (875) | | $ | (116) | |
(1)The pretax amount is reclassified to Realized gains (losses) on sales of investments, net and Gross impairment losses in the Consolidated Statement of Income. See Note 12 to the Consolidated Financial Statements for additional details.
(2)See Note 19 to the Consolidated Financial Statements for additional details.
(3)See Note 8 to the Consolidated Financial Statements for additional details.
18. SECURITIZATIONS AND VARIABLE INTEREST ENTITIES
For additional information regarding Citi’s use of special purpose entities (SPEs) and variable interest entities (VIEs), see Note 21 to the Consolidated Financial Statements in Citi’s 2019 Annual Report on Form 10-K.
Citigroup’s involvement with consolidated and unconsolidated VIEs with which the Company holds significant variable interests or has continuing involvement through servicing a majority of the assets in a VIE is presented below:
| | | | | | | | | | | | | | | | | | | | | | | | | | |
| As of June 30, 2020 | | | | | | | |
| | | | Maximum exposure to loss in significant unconsolidated VIEs(1) | | | | |
| | | | Funded exposures(2) | | Unfunded exposures | | |
| In millions of dollars | Total
involvement
with SPE
assets | Consolidated
VIE/SPE assets | Significant unconsolidated VIE assets(3) | Debt
investments | Equity
investments | Funding
commitments | Guarantees
and
derivatives | Total |
| Credit card securitizations | $ | 33,838 | | $ | 33,838 | | $ | — | | $ | — | | $ | — | | $ | — | | $ | — | | $ | — | |
Mortgage securitizations(4) | | | | | | | | |
| U.S. agency-sponsored | 115,290 | | — | | 115,290 | | 2,103 | | — | | — | | 54 | | 2,157 | |
| Non-agency-sponsored | 43,493 | | 982 | | 42,511 | | 1,043 | | — | | — | | 1 | | 1,044 | |
| Citi-administered asset-backed commercial paper conduits | 16,028 | | 16,028 | | — | | — | | — | | — | | — | | — | |
| Collateralized loan obligations (CLOs) | 17,986 | | — | | 17,986 | | 4,272 | | — | | — | | — | | 4,272 | |
Asset-based financing(5) | 209,806 | | 7,660 | | 202,146 | | 26,129 | | 1,131 | | 10,302 | | — | | 37,562 | |
| Municipal securities tender option bond trusts (TOBs) | 4,747 | | 1,113 | | 3,634 | | 16 | | — | | 2,320 | | — | | 2,336 | |
| Municipal investments | 20,235 | | — | | 20,235 | | 2,736 | | 4,237 | | 2,906 | | — | | 9,879 | |
| Client intermediation | 742 | | 676 | | 66 | | 4 | | — | | — | | — | | 4 | |
| Investment funds | 515 | | 126 | | 389 | | 2 | | — | | 15 | | 1 | | 18 | |
| Other | 51 | | 1 | | 50 | | — | | — | | 50 | | — | | 50 | |
| Total | $ | 462,731 | | $ | 60,424 | | $ | 402,307 | | $ | 36,305 | | $ | 5,368 | | $ | 15,593 | | $ | 56 | | $ | 57,322 | |
| | | | | | | | | | | | | | | | | | | | | | | | | | |
| As of December 31, 2019 | | | | | | | |
| | | | Maximum exposure to loss in significant unconsolidated VIEs(1) | | | | |
| | | | Funded exposures(2) | | Unfunded exposures | | |
| In millions of dollars | Total
involvement
with SPE
assets | Consolidated
VIE/SPE assets | Significant unconsolidated VIE assets(3) | Debt
investments | Equity
investments | Funding
commitments | Guarantees
and
derivatives | Total |
| Credit card securitizations | $ | 43,534 | | $ | 43,534 | | $ | — | | $ | — | | $ | — | | $ | — | | $ | — | | $ | — | |
Mortgage securitizations(4) | | | | | | | | |
| U.S. agency-sponsored | 117,374 | | — | | 117,374 | | 2,671 | | — | | — | | 72 | | 2,743 | |
| Non-agency-sponsored | 39,608 | | 1,187 | | 38,421 | | 876 | | — | | — | | 1 | | 877 | |
| Citi-administered asset-backed commercial paper conduits | 15,622 | | 15,622 | | — | | — | | — | | — | | — | | — | |
| Collateralized loan obligations (CLOs) | 17,395 | | — | | 17,395 | | 4,199 | | — | | — | | — | | 4,199 | |
Asset-based financing(5) | 196,728 | | 6,139 | | 190,589 | | 23,756 | | 1,151 | | 9,524 | | — | | 34,431 | |
| Municipal securities tender option bond trusts (TOBs) | 6,950 | | 1,458 | | 5,492 | | 4 | | — | | 3,544 | | — | | 3,548 | |
| Municipal investments | 20,312 | | — | | 20,312 | | 2,636 | | 4,274 | | 3,034 | | — | | 9,944 | |
| Client intermediation | 1,455 | | 1,391 | | 64 | | 4 | | — | | — | | — | | 4 | |
| Investment funds | 827 | | 174 | | 653 | | 5 | | — | | 16 | | 1 | | 22 | |
| Other | 352 | | 1 | | 351 | | 169 | | — | | 39 | | — | | 208 | |
| Total | $ | 460,157 | | $ | 69,506 | | $ | 390,651 | | $ | 34,320 | | $ | 5,425 | | $ | 16,157 | | $ | 74 | | $ | 55,976 | |
(1) The definition of maximum exposure to loss is included in the text that follows this table.
(2) Included on Citigroup’s June 30, 2020 and December 31, 2019 Consolidated Balance Sheet.
(3) A significant unconsolidated VIE is an entity in which the Company has any variable interest or continuing involvement considered to be significant, regardless of the likelihood of loss.
(4) Citigroup mortgage securitizations also include agency and non-agency (private label) re-securitization activities. These SPEs are not consolidated. See “Re-securitizations” below for further discussion.
(5) Included within this line are loans to third-party sponsored private equity funds, which represent $70.4 and $69 billion in unconsolidated VIE assets and $710 and$711 million in maximum exposure to loss as of 6/30/20 and 12/31/19 respectively.
The previous tables do not include:
•certain venture capital investments made by some of the Company’s private equity subsidiaries, as the Company accounts for these investments in accordance with the Investment Company Audit Guide (codified in ASC 946);
•certain investment funds for which the Company provides investment management services and personal estate trusts for which the Company provides administrative, trustee and/or investment management services;
•certain third-party sponsored private equity funds to which the Company provides secured credit facilities. The Company has no decision-making power and does not consolidate these funds, some of which may meet the definition of a VIE. The Company’s maximum exposure to loss is generally limited to a loan or lending-related commitment. As of June 30, 2020 and December 31, 2019, the Company’s maximum exposure to loss related to these deals was $52.4 billion and $52.5 billion, respectively. (for more information on these positions, see Note 13 to the Consolidated Financial Statements and Note 26 to the Consolidated Financial Statements in Citigroup’s 2019 Annual Report on Form 10-K);
•certain VIEs structured by third parties in which the Company holds securities in inventory, as these investments are made on arm’s-length terms;
•certain positions in mortgage- and asset-backed securities held by the Company, which are classified as Trading account assets or Investments, in which the Company has no other involvement with the related securitization entity deemed to be significant (for more information on these positions, see Notes 13 and 20 to the Consolidated Financial Statements);
•certain representations and warranties exposures in legacy ICG-sponsored mortgage- and asset-backed securitizations in which the Company has no variable interest or continuing involvement as servicer. The outstanding balance of mortgage loans securitized during 2005 to 2008 in which the Company has no variable interest or continuing involvement as servicer was approximately $6 billion and $6 billion at June 30, 2020 and December 31, 2019, respectively;
•certain representations and warranties exposures in Citigroup residential mortgage securitizations, in which the original mortgage loan balances are no longer outstanding; and
•VIEs such as trust preferred securities trusts used in connection with the Company’s funding activities. The Company does not have a variable interest in these trusts.
The asset balances for consolidated VIEs represent the carrying amounts of the assets consolidated by the Company. The carrying amount may represent the amortized cost or the current fair value of the assets depending on the legal form of the asset (e.g., loan or security) and the Company’s standard accounting policies for the asset type and line of business.
The asset balances for unconsolidated VIEs in which the Company has significant involvement represent the most current information available to the Company. In most cases, the asset balances represent an amortized cost basis without regard to impairments, unless fair value information is readily available to the Company.
The maximum funded exposure represents the balance sheet carrying amount of the Company’s investment in the VIE. It reflects the initial amount of cash invested in the VIE, adjusted for any accrued interest and cash principal payments received. The carrying amount may also be adjusted for increases or declines in fair value or any impairment in value recognized in earnings. The maximum exposure of unfunded positions represents the remaining undrawn committed amount, including liquidity and credit facilities provided by the Company or the notional amount of a derivative instrument considered to be a variable interest. In certain transactions, the Company has entered into derivative instruments or other arrangements that are not considered variable interests in the VIE (e.g., interest rate swaps, cross-currency swaps or where the Company is the purchaser of credit protection under a credit default swap or total return swap where the Company pays the total return on certain assets to the SPE). Receivables under such arrangements are not included in the maximum exposure amounts.
Funding Commitments for Significant Unconsolidated VIEs—Liquidity Facilities and Loan Commitments
The following table presents the notional amount of liquidity facilities and loan commitments that are classified as funding commitments in the VIE tables above:
| | | | | | | | | | | | | | |
| June 30, 2020 | | December 31, 2019 | |
| In millions of dollars | Liquidity
facilities | Loan/equity
commitments | Liquidity
facilities | Loan/equity
commitments |
| Asset-based financing | $ | — | | $ | 10,302 | | $ | — | | $ | 9,524 | |
| Municipal securities tender option bond trusts (TOBs) | 2,320 | | — | | 3,544 | | — | |
| Municipal investments | — | | 2,906 | | — | | 3,034 | |
| Investment funds | — | | 15 | | — | | 16 | |
| Other | — | | 50 | | — | | 39 | |
| Total funding commitments | $ | 2,320 | | $ | 13,273 | | $ | 3,544 | | $ | 12,613 | |
Significant Interests in Unconsolidated VIEs—Balance Sheet Classification
The following table presents the carrying amounts and classification of significant variable interests in unconsolidated VIEs:
| | | | | | | | |
| In billions of dollars | June 30, 2020 | December 31, 2019 |
| Cash | $ | — | | $ | — | |
| Trading account assets | 2.1 | | 2.6 | |
| Investments | 10.0 | | 9.9 | |
| Total loans, net of allowance | 29.0 | | 26.7 | |
| Other | 0.5 | | 0.5 | |
| Total assets | $ | 41.6 | | $ | 39.7 | |
Credit Card Securitizations
Substantially all of the Company’s credit card securitization activity is through 2 trusts—Citibank Credit Card Master Trust (Master Trust) and Citibank Omni Master Trust (Omni
Trust), with the substantial majority through the Master Trust. These trusts are consolidated entities.
The following table reflects amounts related to the Company’s securitized credit card receivables:
| | | | | | | | |
| In billions of dollars | June 30, 2020 | December 31, 2019 |
| Ownership interests in principal amount of trust credit card receivables | | |
| Sold to investors via trust-issued securities | $ | 16.5 | | $ | 19.7 | |
| Retained by Citigroup as trust-issued securities | 5.3 | | 6.2 | |
| Retained by Citigroup via non-certificated interests | 14.6 | | 17.8 | |
| Total | $ | 36.4 | | $ | 43.7 | |
The following table summarizes selected cash flow information related to Citigroup’s credit card securitizations:
| | | | | | | | |
| Three Months Ended June 30, | |
| In billions of dollars | 2020 | 2019 |
| Proceeds from new securitizations | $ | — | | $ | — | |
| Pay down of maturing notes | (3.2) | | — | |
| | |
| | | | | | | | |
| Six Months Ended June 30, | |
| In billions of dollars | 2020 | 2019 |
| Proceeds from new securitizations | $ | 0.0 | | $ | 0.0 | |
| Pay down of maturing notes | (3.2) | | (2.5) | |
| | |
Master Trust Liabilities (at Par Value)
The weighted average maturity of the third-party term notes issued by the Master Trust was 3.1 years as of June 30, 2020 and 3.1 years as of December 31, 2019.
| | | | | | | | |
| In billions of dollars | Jun. 30, 2020 | Dec. 31, 2019 |
| Term notes issued to third parties | $ | 15.0 | | $ | 18.2 | |
| Term notes retained by Citigroup affiliates | 3.4 | | 4.3 | |
| Total Master Trust liabilities | $ | 18.4 | | $ | 22.5 | |
Omni Trust Liabilities (at Par Value)
The weighted average maturity of the third-party term notes issued by the Omni Trust was 1.2 years as of June 30, 2020 and 1.6 years as of December 31, 2019.
| | | | | | | | |
| In billions of dollars | Jun. 30, 2020 | Dec. 31, 2019 |
| Term notes issued to third parties | $ | 1.5 | | $ | 1.5 | |
| Term notes retained by Citigroup affiliates | 1.9 | | 1.9 | |
| Total Omni Trust liabilities | $ | 3.4 | | $ | 3.4 | |
The following tables summarize selected cash flow information and retained interests related to Citigroup mortgage securitizations:
| | | | | | | | | | | | | | |
| Three Months Ended June 30, | | | |
| 2020 | | 2019 | |
| In billions of dollars | U.S. agency-
sponsored
mortgages | Non-agency-
sponsored
mortgages(1) | U.S. agency-
sponsored
mortgages | Non-agency-
sponsored
mortgages |
| Principal securitized | $ | 2.4 | | $ | 0.9 | | $ | 1.1 | | $ | 6.1 | |
| Proceeds from new securitizations | 2.6 | | 0.9 | | 1.2 | | 6.1 | |
| Purchases of previously transferred financial assets | — | | — | | 0.1 | | — | |
| | | | |
| Six Months Ended June 30, | | | |
| 2020 | | 2019 | |
| In billions of dollars | U.S. agency-
sponsored
mortgages | Non-agency-
sponsored
mortgages | U.S. agency-
sponsored
mortgages | Non-agency-
sponsored
mortgages |
| Principal securitized | $ | 4.5 | | $ | 1.6 | | $ | 2.1 | | $ | 8.8 | |
| Proceeds from new securitizations | 4.7 | | 3.4 | | 2.2 | | 8.8 | |
| Purchases of previously transferred financial assets | 0.1 | | — | | 0.1 | | — | |
Note: Excludes re-securitization transactions.
(1) The principal securitized and proceeds from new securitizations in 2020 include $0.2 billion related to personal loan securitizations.
Gains recognized on the securitization of U.S. agency-sponsored mortgages were $2 million and $4 million for the three and six months ended June 30, 2020, respectively. For the three and six months ended June 30, 2020, gains recognized on the securitization of non-agency sponsored mortgages were $27 million and $65 million, respectively.
Gains recognized on the securitization of U.S. agency-sponsored mortgages were $5 million for the three and six months ended June 30, 2019. Gains recognized on the securitization of non-agency sponsored mortgages were $26 million and $43 million for the three and six months ended June 30, 2019, respectively.
| | | | | | | | | | | | | | | | | | | | |
| June 30, 2020 | | | December 31, 2019 | | |
| | Non-agency-sponsored mortgages(1) | | | Non-agency-sponsored mortgages(1) | |
| In millions of dollars | U.S. agency-
sponsored mortgages | Senior
interests(3) | Subordinated
interests | U.S. agency-
sponsored mortgages | Senior
interests | Subordinated
interests |
Carrying value of retained interests(2) | $ | 334 | | $ | 884 | | $ | 119 | | $ | 491 | | $ | 748 | | $ | 102 | |
(1) Disclosure of non-agency-sponsored mortgages as senior and subordinated interests is indicative of the interests’ position in the capital structure of the securitization.
(2) Retained interests consist of Level 2 and Level 3 assets depending on the observability of significant inputs. See Note 20 to the Consolidated Financial Statements for more information about fair value measurements.
(3) Senior interests in non-agency-sponsored mortgages include $119 million related to personal loan securitizations at June 30, 2020.
Key assumptions used in measuring the fair value of retained interests at the date of sale or securitization of mortgage receivables were as follows:
| | | | | | | | | | | |
| Three Months Ended June 30, 2020 | | |
| | | |
| | Non-agency-sponsored mortgages(1) | |
| U.S. agency-
sponsored mortgages | Senior
interests | Subordinated
interests |
| Weighted average discount rate | 3.5 | % | 6.2 | % | 3.0 | % |
| Weighted average constant prepayment rate | 28.7 | % | — | % | 25.0 | % |
Weighted average anticipated net credit losses(2) | NM | — | % | 0.5 | % |
| Weighted average life | 4.1 years | 9.8 years | 2.3 years |
| | | | | | | | | | | |
| Three Months Ended June 30, 2019 | | |
| | | |
| | Non-agency-sponsored mortgages(1) | |
| U.S. agency-
sponsored mortgages | Senior
interests | Subordinated
interests |
| Weighted average discount rate | 7.4 | % | 3.2 | % | 5.3 | % |
| Weighted average constant prepayment rate | 15.7 | % | 5.7 | % | 5.9 | % |
Weighted average anticipated net credit losses(2) | NM | 3.0 | % | 3.7 | % |
| Weighted average life | 5.9 years | 3.2 years | 15.6 years |
| | | | | | | | | | | |
| Six Months Ended June 30, 2020 | | |
| | | |
| | Non-agency-sponsored mortgages(1) | |
| U.S. agency- sponsored mortgages | Senior interests | Subordinated interests |
| Weighted average discount rate | 6.0 | % | 1.8 | % | 3.0 | % |
| Weighted average constant prepayment rate | 27.1 | % | 0.0 | % | 25.0 | % |
| Weighted average anticipated net credit losses(2) | NM | 1.6 | % | 0.5 | % |
| Weighted average life | 4.7 years | 4.8 years | 2.3 years |
| | | | | | | | | | | |
| Six Months Ended June 30, 2019 | | |
| | | |
| | Non-agency-sponsored mortgages(1) | |
| U.S. agency- sponsored mortgages | Senior interests | Subordinated interests |
| Weighted average discount rate | 7.0 | % | 3.5 | % | 5.5 | % |
| Weighted average constant prepayment rate | 14.8 | % | 5.8 | % | 5.9 | % |
| Weighted average anticipated net credit losses(2) | NM | 4.4 | % | 3.7 | % |
| Weighted average life | 6.0 years | 6.6 years | 16.1 years |
(1) Disclosure of non-agency-sponsored mortgages as senior and subordinated interests is indicative of the interests’ position in the capital structure of the securitization.
(2) Anticipated net credit losses represent estimated loss severity associated with defaulted mortgage loans underlying the mortgage securitizations disclosed above. Anticipated net credit losses, in this instance, do not represent total credit losses incurred to date, nor do they represent credit losses expected on retained interests in mortgage securitizations.
NM Anticipated net credit losses are not meaningful due to U.S. agency guarantees.
The interests retained by the Company range from highly rated and/or senior in the capital structure to unrated and/or residual interests. Key assumptions used in measuring the fair value of retained interests in securitizations of mortgage receivables at period end were as follows:
| | | | | | | | | | | |
| June 30, 2020 | | |
| | | |
| | Non-agency-sponsored mortgages(1) | |
| U.S. agency-
sponsored mortgages | Senior
interests | Subordinated
interests |
| Weighted average discount rate | 1.9 | % | 7.1 | % | 16.2 | % |
| Weighted average constant prepayment rate | 23.8 | % | 3.4 | % | 5.5 | % |
Weighted average anticipated net credit losses(2) | NM | 1.2 | % | 4.2 | % |
| Weighted average life | 4.0 years | 6.9 years | 7.5 years |
| | | | | | | | | | | |
| December 31, 2019 | | |
| | | |
| | Non-agency-sponsored mortgages(1) | |
| U.S. agency-
sponsored mortgages | Senior
interests | Subordinated
interests |
| Weighted average discount rate | 9.3 | % | 3.6 | % | 4.6 | % |
| Weighted average constant prepayment rate | 12.9 | % | 10.5 | % | 7.6 | % |
Weighted average anticipated net credit losses(2) | NM | 3.9 | % | 2.8 | % |
| Weighted average life | 6.6 years | 3.0 years | 11.4 years |
(1) Disclosure of non-agency-sponsored mortgages as senior and subordinated interests is indicative of the interests’ position in the capital structure of the securitization.
(2) Anticipated net credit losses represent estimated loss severity associated with defaulted mortgage loans underlying the mortgage securitizations disclosed above. Anticipated net credit losses, in this instance, do not represent total credit losses incurred to date, nor do they represent credit losses expected on retained interests in mortgage securitizations.
NM Anticipated net credit losses are not meaningful due to U.S. agency guarantees.
The sensitivity of the fair value to adverse changes of 10% and 20% in each of the key assumptions, are presented in the tables below. The negative effect of each change is calculated independently, holding all other assumptions constant. Because the key assumptions may not be independent, the net effect of simultaneous adverse changes in the key assumptions may be less than the sum of the individual effects shown below.
| | | | | | | | | | | |
| June 30, 2020 | | |
| | Non-agency-sponsored mortgages | |
| In millions of dollars | U.S. agency-
sponsored mortgages | Senior
interests | Subordinated
interests |
| Discount rate | | | |
| Adverse change of 10% | $ | (5) | | $ | — | | $ | — | |
| Adverse change of 20% | (9) | | (1) | | (1) | |
| Constant prepayment rate | | | |
| Adverse change of 10% | (26) | | — | | — | |
| Adverse change of 20% | (49) | | — | | — | |
| Anticipated net credit losses | | | |
| Adverse change of 10% | NM | — | | — | |
| Adverse change of 20% | NM | — | | — | |
| | | | | | | | | | | |
| December 31, 2019 | | |
| | Non-agency-sponsored mortgages | |
| In millions of dollars | U.S. agency-
sponsored mortgages | Senior
interests | Subordinated
interests |
| Discount rate | | | |
| Adverse change of 10% | $ | (18) | | $ | — | | $ | (1) | |
| Adverse change of 20% | (35) | | (1) | | (1) | |
| Constant prepayment rate | | | |
| Adverse change of 10% | (18) | | — | | — | |
| Adverse change of 20% | (35) | | — | | — | |
| Anticipated net credit losses | | | |
| Adverse change of 10% | NM | — | | — | |
| Adverse change of 20% | NM | — | | — | |
NM Anticipated net credit losses are not meaningful due to U.S. agency guarantees.
The following table includes information about loan delinquencies and liquidation losses for assets held in non-consolidated, non-agency-sponsored securitization entities:
| | | | | | | | | | | | | | | | | | | | | | | | | | |
| | | | | Liquidation losses | | | |
| Securitized assets | | 90 days past due | | Three Months Ended June 30, | | Six Months Ended June 30, | |
| In billions of dollars, except liquidation losses in millions | Jun. 30, 2020 | Dec. 31, 2019 | Jun. 30, 2020 | Dec. 31, 2019 | 2020 | 2019 | 2020 | 2019 |
| Securitized assets | | | | | | | | |
Residential mortgages(1) | $ | 11.8 | | $ | 11.7 | | $ | 0.4 | | $ | 0.4 | | $ | 7 | | $ | 9 | | $ | 18 | | $ | 20 | |
| Commercial and other | 21.0 | | 22.3 | | — | | — | | — | | — | | — | | — | |
| Total | $ | 32.8 | | $ | 34.0 | | $ | 0.4 | | $ | 0.4 | | $ | 7 | | $ | 9 | | $ | 18 | | $ | 20 | |
(1) Securitized assets include $0.2 billion of personal loan securitizations as of June 30, 2020.
Mortgage Servicing Rights (MSRs)
The fair value of Citi’s capitalized MSRs was $345 million and $508 million at June 30, 2020 and 2019, respectively. The MSRs correspond to principal loan balances of $57 billion and $60 billion as of June 30, 2020 and 2019, respectively. The following table summarizes the changes in capitalized MSRs:
| | | | | | | | |
| Three Months Ended June 30, | |
| In millions of dollars | 2020 | 2019 |
| Balance, beginning of year | $ | 367 | | $ | 551 | |
| Originations | 24 | | 16 | |
| Changes in fair value of MSRs due to changes in inputs and assumptions | (26) | | (37) | |
Other changes(1) | (20) | | (22) | |
| Sales of MSRs | — | | — | |
| Balance, as of June 30 | $ | 345 | | $ | 508 | |
| | | | | | | | |
| Six Months Ended
June 30, | |
| In millions of dollars | 2020 | 2019 |
| Balance, beginning of year | $ | 495 | | $ | 584 | |
| Originations | 56 | | 28 | |
| Changes in fair value of MSRs due to changes in inputs and assumptions | (169) | | (64) | |
Other changes(1) | (37) | | (40) | |
| Sales of MSRs | — | | — | |
| Balance, as of June 30 | $ | 345 | | $ | 508 | |
(1) Represents changes due to customer payments and passage of time.
The fair value of the MSRs is primarily affected by changes in prepayments of mortgages that result from shifts in mortgage interest rates. Specifically, higher interest rates tend to lead to declining prepayments, which causes the fair value of the MSRs to increase. In managing this risk, Citigroup economically hedges a significant portion of the value of its MSRs through the use of interest rate derivative contracts, forward purchase and sale commitments of mortgage-backed securities and purchased securities, all classified as Trading account assets.
The Company receives fees during the course of servicing previously securitized mortgages. The amounts of these fees were as follows:
| | | | | | | | | | | | | | |
| Three Months Ended June 30, | | Six Months Ended June 30, | |
| In millions of dollars | 2020 | 2019 | 2020 | 2019 |
| Servicing fees | $ | 34 | | $ | 35 | | $ | 73 | | $ | 76 | |
| Late fees | 1 | | 2 | | 3 | | 4 |
| Ancillary fees | — | | — | | — | | 1 |
| Total MSR fees | $ | 35 | | $ | 37 | | $ | 76 | | $ | 81 | |
In the Consolidated Statement of Income these fees are primarily classified as Commissions and fees, and changes in MSR fair values are classified as Other revenue.
Re-securitizations
The Company engages in re-securitization transactions in which debt securities are transferred to a VIE in exchange for new beneficial interests. Citi did not transfer non-agency (private label) securities to re-securitization entities during the three months ended June 30, 2020 and 2019. These securities are backed by either residential or commercial mortgages and are often structured on behalf of clients.
As of June 30, 2020 and December 31, 2019, Citi held 0 retained interests in private label re-securitization transactions structured by Citi.
The Company also re-securitizes U.S. government-agency guaranteed mortgage-backed (agency) securities. During the three and six months ended June 30, 2020, Citi transferred agency securities with a fair value of approximately $12 billion and $19.4 billion to re-securitization entities compared to approximately $6.9 billion and $14.5 billion for the three and six months ended June 30, 2019.
As of June 30, 2020, the fair value of Citi-retained interests in agency re-securitization transactions structured by Citi totaled approximately $1.8 billion (including $858.7 million related to re-securitization transactions executed in 2020) compared to $2.2 billion as of December 31, 2019 (including $1.3 billion related to re-securitization transactions executed in 2019), which is recorded in Trading account assets. The original fair values of agency re-securitization transactions in which Citi holds a retained interest as of June 30, 2020 and December 31, 2019 were approximately $71.8 billion and $73.5 billion, respectively.
As of June 30, 2020 and December 31, 2019, the Company did not consolidate any private label or agency re-securitization entities.
Citi-Administered Asset-Backed Commercial Paper Conduits
At June 30, 2020 and December 31, 2019, the commercial paper conduits administered by Citi had approximately $16 billion and $15.6 billion of purchased assets outstanding, respectively, and had incremental funding commitments with clients of approximately $17.9 billion and $16.3 billion, respectively.
Substantially all of the funding of the conduits is in the form of short-term commercial paper. At June 30, 2020 and December 31, 2019, the weighted average remaining lives of the commercial paper issued by the conduits were approximately 52 and 49 days, respectively.
The primary credit enhancement provided to the conduit investors is in the form of transaction-specific credit enhancements described above. In addition to the transaction-specific credit enhancements, the conduits, other than the government guaranteed loan conduit, have obtained a letter of credit from the Company, which is equal to at least 8% to 10% of the conduit’s assets with a minimum of $200 million. The letters of credit provided by the Company to the conduits total approximately $1.5 billion and $1.4 billion as of June 30, 2020 and December 31, 2019, respectively. The net result across multi-seller conduits administered by the Company is that, in the event that defaulted assets exceed the transaction-specific credit enhancements described above, any losses in each conduit are allocated first to the Company and then to the commercial paper investors.
At June 30, 2020 and December 31, 2019, the Company owned $5.1 billion and $5.5 billion, respectively, of the commercial paper issued by its administered conduits. The Company's investments were not driven by market illiquidity and the Company is not obligated under any agreement to purchase the commercial paper issued by the conduits.
Collateralized Loan Obligations (CLOs)
The following tables summarize selected cash flow information retained interests related to Citigroup CLOs:
| | | | | | | | |
| Three Months Ended June 30, | |
| In billions of dollars | 2020 | 2019 |
| Proceeds from new securitizations | $ | 0.1 | | $ | — | |
The key assumptions used to value retained interests in CLOs, and the sensitivity of the fair value to adverse changes of 10% and 20% are set forth in the tables below:
| | | | | | | | |
| Jun. 30, 2020 | Dec. 31, 2019 |
| Weighted average discount rate | 1.8 | % | 0.0 | % |
| Weighted average life | 4.2 years | 0 years |
| | | | | | | | |
| In millions of dollars | Jun. 30, 2020 | Dec. 31, 2019 |
| Carrying value of retained interests | $ | 1,608 | | $ | 1,404 | |
All of Citi’s retained interests were held-to-maturity securities as of June 30, 2020 and December 31, 2019.
Asset-Based Financing
The primary types of Citi’s asset-based financings, total assets of the unconsolidated VIEs with significant involvement and Citi’s maximum exposure to loss are shown below. For Citi to realize the maximum loss, the VIE (borrower) would have to default with no recovery from the assets held by the VIE.
| | | | | | | | |
| June 30, 2020 | |
| In millions of dollars | Total
unconsolidated
VIE assets | Maximum
exposure to
unconsolidated VIEs |
| Type | | |
| Commercial and other real estate | $ | 29,134 | | $ | 7,367 | |
| Corporate loans | 12,113 | | 8,219 | |
| Other (including investment funds, airlines and shipping) | 160,899 | | 21,977 | |
| Total | $ | 202,146 | | $ | 37,562 | |
| | | | | | | | |
| December 31, 2019 | |
| In millions of dollars | Total
unconsolidated
VIE assets | Maximum
exposure to
unconsolidated VIEs |
| Type | | |
| Commercial and other real estate | $ | 31,377 | | $ | 7,489 | |
| Corporate loans | 7,088 | | 5,802 | |
| Other (including investment funds, airlines and shipping) | 152,124 | | 21,140 | |
| Total | $ | 190,589 | | $ | 34,431 | |
Municipal Securities Tender Option Bond (TOB) Trusts
At June 30, 2020 and December 31, 2019, none of the municipal bonds owned by non-customer TOB trusts were subject to a credit guarantee provided by the Company.
At June 30, 2020 and December 31, 2019, liquidity agreements provided with respect to customer TOB trusts totaled $2.3 billion and $3.5 billion, respectively, of which $1.4 billion and $1.6 billion, respectively, were offset by reimbursement agreements. For the remaining exposure related to TOB transactions, where the residual owned by the customer was at least 25% of the bond value at the inception of the transaction, no reimbursement agreement was executed.
The Company also provides other liquidity agreements or letters of credit to customer-sponsored municipal investment funds, which are not variable interest entities, and municipality-related issuers that totaled $5 billion and $7 billion as of June 30, 2020 and December 31, 2019, respectively. These liquidity agreements and letters of credit are offset by reimbursement agreements with various term-out provisions.
19. DERIVATIVES
In the ordinary course of business, Citigroup enters into various types of derivative transactions. All derivatives are recorded in Trading account assets/Trading account liabilities on the Consolidated Balance Sheet. For additional information regarding Citi’s use of and accounting for derivatives, see Note 22 to the Consolidated Financial Statements in Citi’s 2019 Annual Report on Form 10-K.
Information pertaining to Citigroup’s derivatives activities, based on notional amounts, is presented in the table below. Derivative notional amounts are reference amounts from which contractual payments are derived and do not represent a complete measure of Citi’s exposure to derivative transactions. Citi’s derivative exposure arises primarily from market fluctuations (i.e., market risk), counterparty failure (i.e., credit risk) and/or periods of high volatility or financial stress (i.e., liquidity risk), as well as any market valuation adjustments that may be required on the transactions. Moreover, notional amounts do not reflect the netting of offsetting trades. For example, if Citi enters into a receive-fixed interest rate swap with $100 million notional, and offsets this risk with an identical but opposite pay-fixed position with a different counterparty, $200 million in derivative notionals is reported, although these offsetting positions may result in de minimis overall market risk.
In addition, aggregate derivative notional amounts can fluctuate from period to period in the normal course of business based on Citi’s market share, levels of client activity and other factors.
Derivative Notionals
| | | | | | | | | | | | | | | | |
| | Hedging instruments under
ASC 815 | | Trading derivative instruments | | | |
| In millions of dollars | June 30,
2020 | December 31,
2019 | June 30,
2020 | December 31,
2019 | | |
| Interest rate contracts | | | | | | |
| Swaps | $ | 346,007 | | $ | 318,089 | | $ | 17,622,599 | | $ | 17,063,272 | | | |
| Futures and forwards | — | | — | | 4,449,386 | | 3,636,658 | | | |
| Written options | — | | — | | 1,674,348 | | 2,114,511 | | | |
| Purchased options | — | | — | | 1,493,884 | | 1,857,770 | | | |
| Total interest rate contracts | $ | 346,007 | | $ | 318,089 | | $ | 25,240,217 | | $ | 24,672,211 | | | |
| Foreign exchange contracts | | | | | | |
| Swaps | $ | 66,733 | | $ | 63,104 | | $ | 6,150,239 | | $ | 6,063,853 | | | |
| Futures, forwards and spot | 38,997 | | 38,275 | | 4,241,268 | | 3,979,188 | | | |
| Written options | 1,428 | | 80 | | 972,083 | | 908,061 | | | |
| Purchased options | 1,487 | | 80 | | 985,024 | | 959,149 | | | |
| Total foreign exchange contracts | $ | 108,645 | | $ | 101,539 | | $ | 12,348,614 | | $ | 11,910,251 | | | |
| Equity contracts | | | | | | |
| Swaps | $ | — | | $ | — | | $ | 201,655 | | $ | 197,893 | | | |
| Futures and forwards | — | | — | | 76,743 | | 66,705 | | | |
| Written options | — | | — | | 449,807 | | 560,571 | | | |
| Purchased options | — | | — | | 332,262 | | 422,393 | | | |
| Total equity contracts | $ | — | | $ | — | | $ | 1,060,467 | | $ | 1,247,562 | | | |
| Commodity and other contracts | | | | | | |
| Swaps | $ | — | | $ | — | | $ | 77,244 | | $ | 69,445 | | | |
| Futures and forwards | 494 | | 1,195 | | 153,421 | | 137,192 | | | |
| Written options | — | | — | | 97,406 | | 91,587 | | | |
| Purchased options | — | | — | | 94,501 | | 86,631 | | | |
| Total commodity and other contracts | $ | 494 | | $ | 1,195 | | $ | 422,572 | | $ | 384,855 | | | |
Credit derivatives(1) | | | | | | |
| Protection sold | $ | — | | $ | — | | $ | 574,692 | | $ | 603,387 | | | |
| Protection purchased | — | | — | | 644,213 | | 703,926 | | | |
| Total credit derivatives | $ | — | | $ | — | | $ | 1,218,905 | | $ | 1,307,313 | | | |
| Total derivative notionals | $ | 455,146 | | $ | 420,823 | | $ | 40,290,775 | | $ | 39,522,192 | | | |
(1)Credit derivatives are arrangements designed to allow one party (protection purchaser) to transfer the credit risk of a “reference asset” to another party (protection seller). These arrangements allow a protection seller to assume the credit risk associated with the reference asset without directly purchasing that asset. The Company enters into credit derivative positions for purposes such as risk management, yield enhancement, reduction of credit concentrations and diversification of overall risk.
The following tables present the gross and net fair values of the Company’s derivative transactions and the related offsetting amounts as of June 30, 2020 and December 31, 2019. Gross positive fair values are offset against gross negative fair values by counterparty, pursuant to enforceable master netting agreements. Under ASC 815-10-45, payables and receivables in respect of cash collateral received from or paid to a given counterparty pursuant to a credit support annex are included in the offsetting amount if a legal opinion supporting the enforceability of netting and collateral rights has been obtained. GAAP does not permit similar offsetting for security collateral.
In addition, the following tables reflect rule changes adopted by clearing organizations that require or allow entities to treat certain derivative assets, liabilities and the related variation margin as settlement of the related derivative fair values for legal and accounting purposes, as opposed to presenting gross derivative assets and liabilities that are subject to collateral, whereby the counterparties would also record a related collateral payable or receivable. As a result, the tables reflect a reduction of approximately $290 billion and $180 billion as of June 30, 2020 and December 31, 2019, respectively, of derivative assets and derivative liabilities that previously would have been reported on a gross basis, but are now legally settled and not subject to collateral. The tables also present amounts that are not permitted to be offset, such as security collateral or cash collateral posted at third-party custodians, but which would be eligible for offsetting to the extent that an event of default has occurred and a legal opinion supporting enforceability of the netting and collateral rights has been obtained.
Derivative Mark-to-Market (MTM) Receivables/Payables
| | | | | | | | |
| In millions of dollars at June 30, 2020 | Derivatives classified in
Trading account assets/liabilities(1)(2) | |
| Derivatives instruments designated as ASC 815 hedges | Assets | Liabilities |
| Over-the-counter | $ | 1,735 | | $ | 269 | |
| Cleared | — | | 280 | |
| | |
| Interest rate contracts | $ | 1,735 | | $ | 549 | |
| Over-the-counter | $ | 1,893 | | $ | 1,247 | |
| Cleared | — | | 45 | |
| | |
| Foreign exchange contracts | $ | 1,893 | | $ | 1,292 | |
| | |
| | |
| | |
| | |
| Total derivatives instruments designated as ASC 815 hedges | $ | 3,628 | | $ | 1,841 | |
| Derivatives instruments not designated as ASC 815 hedges | | |
| Over-the-counter | $ | 243,492 | | $ | 222,515 | |
| Cleared | 14,255 | | 11,804 | |
| Exchange traded | 88 | | 1,092 | |
| Interest rate contracts | $ | 257,835 | | $ | 235,411 | |
| Over-the-counter | $ | 114,988 | | $ | 120,283 | |
| Cleared | 645 | | 768 | |
| Exchange traded | 3 | | 2 | |
| Foreign exchange contracts | $ | 115,636 | | $ | 121,053 | |
| Over-the-counter | $ | 17,699 | | $ | 26,019 | |
| Cleared | 41 | | 10 | |
| Exchange traded | 21,666 | | 22,360 | |
| Equity contracts | $ | 39,406 | | $ | 48,389 | |
| Over-the-counter | $ | 15,652 | | $ | 20,305 | |
| | |
| Exchange traded | 1,108 | | 1,259 | |
| Commodity and other contracts | $ | 16,760 | | $ | 21,564 | |
| Over-the-counter | $ | 10,403 | | $ | 10,099 | |
| Cleared | 1,279 | | 1,622 | |
| | |
| Credit derivatives | $ | 11,682 | | $ | 11,721 | |
| Total derivatives instruments not designated as ASC 815 hedges | $ | 441,319 | | $ | 438,138 | |
| Total derivatives | $ | 444,947 | | $ | 439,979 | |
Cash collateral paid/received(3) | $ | 26,598 | | $ | 14,295 | |
Less: Netting agreements(4) | (340,172) | | (340,172) | |
Less: Netting cash collateral received/paid(5) | (58,778) | | (53,704) | |
Net receivables/payables included on the Consolidated Balance Sheet(6) | $ | 72,595 | | $ | 60,398 | |
| Additional amounts subject to an enforceable master netting agreement, but not offset on the Consolidated Balance Sheet | | |
| | |
| Less: Cash collateral received/paid | $ | (894) | | $ | (302) | |
| Less: Non-cash collateral received/paid | (8,010) | | (14,522) | |
Total net receivables/payables(6) | $ | 63,691 | | $ | 45,574 | |
(1)The derivatives fair values are also presented in Note 20 to the Consolidated Financial Statements.
(2)Over-the-counter (OTC) derivatives are derivatives executed and settled bilaterally with counterparties without the use of an organized exchange or central clearing house. Cleared derivatives include derivatives executed bilaterally with a counterparty in the OTC market, but then novated to a central clearing house, whereby the central clearing house becomes the counterparty to both of the original counterparties. Exchange-traded derivatives include derivatives executed directly on an organized exchange that provides pre-trade price transparency.
(3)Reflects the net amount of the $80,302 million and $73,074 million of gross cash collateral paid and received, respectively. Of the gross cash collateral paid, $53,704 million was used to offset trading derivative liabilities. Of the gross cash collateral received, $58,778 million was used to offset trading derivative assets.
(4)Represents the netting of balances with the same counterparty under enforceable netting agreements. Approximately $317 billion, $2 billion and $21 billion of the netting against trading account asset/liability balances is attributable to each of the OTC, cleared and exchange-traded derivatives, respectively.
(5)Represents the netting of cash collateral paid and received by counterparties under enforceable credit support agreements. Substantially all netting of cash collateral received and paid is against OTC derivative assets and liabilities, respectively.
(6)The net receivables/payables include approximately $6 billion of derivative asset and $8 billion of derivative liability fair values not subject to enforceable master netting agreements, respectively.
| | | | | | | | |
| In millions of dollars at December 31, 2019 | Derivatives classified in
Trading account assets/liabilities(1)(2) | |
| Derivatives instruments designated as ASC 815 hedges | Assets | Liabilities |
| Over-the-counter | $ | 1,682 | | $ | 143 | |
| Cleared | 41 | | 111 | |
| | |
| Interest rate contracts | $ | 1,723 | | $ | 254 | |
| Over-the-counter | $ | 1,304 | | $ | 908 | |
| Cleared | — | | 2 | |
| | |
| Foreign exchange contracts | $ | 1,304 | | $ | 910 | |
| | |
| | |
| | |
| | |
| Total derivatives instruments designated as ASC 815 hedges | $ | 3,027 | | $ | 1,164 | |
| Derivatives instruments not designated as ASC 815 hedges | | |
| Over-the-counter | $ | 189,892 | | $ | 169,749 | |
| Cleared | 5,896 | | 7,472 | |
| Exchange traded | 157 | | 180 | |
| Interest rate contracts | $ | 195,945 | | $ | 177,401 | |
| Over-the-counter | $ | 105,401 | | $ | 108,807 | |
| Cleared | 862 | | 1,015 | |
| Exchange traded | 3 | | — | |
| Foreign exchange contracts | $ | 106,266 | | $ | 109,822 | |
| Over-the-counter | $ | 21,311 | | $ | 22,411 | |
| | |
| Exchange traded | 7,160 | | 8,075 | |
| Equity contracts | $ | 28,471 | | $ | 30,486 | |
| Over-the-counter | $ | 13,582 | | $ | 16,773 | |
| | |
| Exchange traded | 630 | | 542 | |
| Commodity and other contracts | $ | 14,212 | | $ | 17,315 | |
| Over-the-counter | $ | 8,896 | | $ | 8,975 | |
| Cleared | 1,513 | | 1,763 | |
| | |
| Credit derivatives | $ | 10,409 | | $ | 10,738 | |
| Total derivatives instruments not designated as ASC 815 hedges | $ | 355,303 | | $ | 345,762 | |
| Total derivatives | $ | 358,330 | | $ | 346,926 | |
Cash collateral paid/received(3) | $ | 17,926 | | $ | 14,391 | |
Less: Netting agreements(4) | (274,970) | | (274,970) | |
Less: Netting cash collateral received/paid(5) | (44,353) | | (38,919) | |
Net receivables/payables included on the Consolidated Balance Sheet(6) | $ | 56,933 | | $ | 47,428 | |
| Additional amounts subject to an enforceable master netting agreement, but not offset on the Consolidated Balance Sheet | | |
| | |
| Less: Cash collateral received/paid | $ | (861) | | $ | (128) | |
| Less: Non-cash collateral received/paid | (13,143) | | (7,308) | |
Total net receivables/payables(6) | $ | 42,929 | | $ | 39,992 | |
(1)The derivatives fair values are also presented in Note 20 to the Consolidated Financial Statements.
(2)Over-the-counter (OTC) derivatives are derivatives executed and settled bilaterally with counterparties without the use of an organized exchange or central clearing house. Cleared derivatives include derivatives executed bilaterally with a counterparty in the OTC market, but then novated to a central clearing house, whereby the central clearing house becomes the counterparty to both of the original counterparties. Exchange-traded derivatives include derivatives executed directly on an organized exchange that provides pre-trade price transparency.
(3)Reflects the net amount of the $56,845 million and $58,744 million of gross cash collateral paid and received, respectively. Of the gross cash collateral paid, $38,919 million was used to offset trading derivative liabilities. Of the gross cash collateral received, $44,353 million was used to offset trading derivative assets.
(4)Represents the netting of balances with the same counterparty under enforceable netting agreements. Approximately $262 billion, $6 billion and $7 billion of the netting against trading account asset/liability balances is attributable to each of the OTC, cleared and exchange-traded derivatives, respectively.
(5)Represents the netting of cash collateral paid and received by counterparties under enforceable credit support agreements. Substantially all netting of cash collateral received and paid is against OTC derivative assets and liabilities, respectively.
(6)The net receivables/payables include approximately $7 billion of derivative asset and $6 billion of derivative liability fair values not subject to enforceable master netting agreements, respectively.
For the three and six months ended June 30, 2020 and 2019, amounts recognized in Principal transactions in the Consolidated Statement of Income include certain derivatives not designated in a qualifying hedging relationship. Citigroup presents this disclosure by business classification, showing derivative gains and losses related to its trading activities together with gains and losses related to non-derivative instruments within the same trading portfolios, as this represents how these portfolios are risk managed. See Note 6 to the Consolidated Financial Statements for further information.
The amounts recognized in Other revenue in the Consolidated Statement of Income related to derivatives not designated in a qualifying hedging relationship are shown below. The table below does not include any offsetting gains (losses) on the economically hedged items to the extent that such amounts are also recorded in Other revenue.
| | | | | | | | | | | | | | |
| | Gains (losses) included in
Other revenue | | | |
| Three Months Ended June 30, | | Six Months Ended June 30, | |
| In millions of dollars | 2020 | 2019 | 2020 | 2019 |
| Interest rate contracts | $ | 19 | | $ | 35 | | $ | 174 | | $ | 62 | |
| Foreign exchange | (61) | | 71 | | (37) | | 13 | |
| Total | $ | (42) | | $ | 106 | | $ | 137 | | $ | 75 | |
Fair Value Hedges
Hedging of Benchmark Interest Rate Risk
Citigroup’s fair value hedges are primarily hedges of fixed-rate long-term debt or assets, such as available-for-sale debt securities or loans.
For qualifying fair value hedges of interest rate risk, the changes in the fair value of the derivative and the change in the fair value of the hedged item attributable to the hedged risk are presented within Interest revenue or Interest expense based on whether the hedged item is an asset or a liability.
Citigroup has executed a last-of-layer hedge, which permits an entity to hedge the interest rate risk of a stated portion of a closed portfolio of prepayable financial assets that are expected to remain outstanding for the designated tenor of the hedge. In accordance with ASC 815, an entity may exclude prepayment risk when measuring the change in fair value of the hedged item attributable to interest rate risk under the last-of-layer approach. Similar to other fair value hedges, where the hedged item is an asset, the fair value of the hedged item attributable to interest rate risk will be presented in Interest revenue along with the change in the fair value of the hedging instrument.
Hedging of Foreign Exchange Risk
Citigroup hedges the change in fair value attributable to foreign exchange rate movements in available-for-sale debt securities and long-term debt that are denominated in currencies other than the functional currency of the entity holding the securities or issuing the debt. The hedging instrument is generally a forward foreign exchange contract or a cross-currency swap contract. Citigroup considers the premium associated with forward contracts (i.e., the differential between the spot and contractual forward rates) as the cost of hedging; this amount is excluded from the assessment of hedge effectiveness and is generally reflected directly in earnings over the life of the hedge. Citi also excludes changes in cross-currency basis associated with cross-currency swaps from the assessment of hedge effectiveness and records it in Other comprehensive income.
Hedging of Commodity Price Risk
Citigroup hedges the change in fair value attributable to spot price movements in physical commodities inventories. The hedging instrument is a futures contract to sell the underlying commodity. In this hedge, the change in the value of the hedged inventory is reflected in earnings, which offsets the change in the fair value of the futures contract that is also reflected in earnings. Although the change in the fair value of the hedging instrument recorded in earnings includes changes in forward rates, Citigroup excludes the differential between the spot and the contractual forward rates under the futures contract from the assessment of hedge effectiveness and it is generally reflected directly in earnings over the life of the hedge. Citi also excludes changes in forward rates from the assessment of hedge effectiveness and records it in Other comprehensive income.
The following table summarizes the gains (losses) on the Company’s fair value hedges:
| | | | | | | | | | | | | | | | | | | | | | | | | | |
| | Gains (losses) on fair value hedges(1) | | | | | | | |
| Three Months Ended June 30, | | | | Six Months Ended June 30, | | | |
| 2020 | | 2019 | | 2020 | | 2019 | |
| In millions of dollars | Other revenue | Net interest revenue | Other revenue | Net interest revenue | Other
revenue | Net interest revenue | Other revenue | Net interest revenue |
| Gain (loss) on the hedging derivatives included in assessment of the effectiveness of fair value hedges | | | | | | | | |
| Interest rate hedges | $ | — | | $ | 239 | | $ | — | | $ | 1,853 | | $ | — | | $ | 7,086 | | $ | — | | $ | 2,816 | |
| Foreign exchange hedges | 434 | | — | | (180) | | — | | (1,477) | | — | | (12) | | — | |
| Commodity hedges | (381) | | — | | (172) | | — | | (91) | | — | | (102) | | — | |
| Total gain (loss) on the hedging derivatives included in assessment of the effectiveness of fair value hedges | $ | 53 | | $ | 239 | | $ | (352) | | $ | 1,853 | | $ | (1,568) | | $ | 7,086 | | $ | (114) | | $ | 2,816 | |
| Gain (loss) on the hedged item in designated and qualifying fair value hedges | | | | | | | | |
| Interest rate hedges | $ | — | | $ | (313) | | $ | — | | $ | (1,783) | | $ | — | | $ | (7,128) | | $ | — | | $ | (2,662) | |
| Foreign exchange hedges | (434) | | — | | 180 | | — | | 1,477 | | — | | 12 | | — | |
| Commodity hedges | 381 | | — | | 172 | | — | | 91 | | — | | 102 | | — | |
| Total gain (loss) on the hedged item in designated and qualifying fair value hedges | $ | (53) | | $ | (313) | | $ | 352 | | $ | (1,783) | | $ | 1,568 | | $ | (7,128) | | $ | 114 | | $ | (2,662) | |
| Net gain (loss) on the hedging derivatives excluded from assessment of the effectiveness of fair value hedges | | | | | | | | |
| Interest rate hedges | $ | — | | $ | (18) | | $ | — | | $ | (4) | | $ | — | | $ | (23) | | $ | — | | $ | (4) | |
Foreign exchange hedges(2) | 17 | | — | | (118) | | — | | (41) | | — | | (121) | | — | |
| Commodity hedges | 15 | | — | | 5 | | — | | (10) | | — | | 23 | | — | |
| Total net gain (loss) on the hedging derivatives excluded from assessment of the effectiveness of fair value hedges | $ | 32 | | $ | (18) | | $ | (113) | | $ | (4) | | $ | (51) | | $ | (23) | | $ | (98) | | $ | (4) | |
(1)Gain (loss) amounts for interest rate risk hedges are included in Interest income/Interest expense. The accrued interest income on fair value hedges is recorded in Net interest revenue and is excluded from this table.
(2)Amounts relate to the premium associated with forward contracts (differential between spot and contractual forward rates) that are excluded from the assessment of hedge effectiveness and are generally reflected directly in earnings. Amounts related to cross-currency basis, which are recognized in AOCI, are not reflected in the table above. The amount of cross-currency basis that was included in AOCI was $16 million and $49 million for the three and six months ended June 30, 2020 and $59 million and $83 million for the three and six months ended June 30, 2019, respectively.
Cumulative Basis Adjustment
Upon electing to apply ASC 815 fair value hedge accounting, the carrying value of the hedged item is adjusted to reflect the cumulative changes in the hedged risk. This cumulative hedge basis adjustment becomes part of the carrying value of the hedged item until the hedged item is derecognized from the balance sheet. The table below presents the carrying amount of Citi’s hedged assets and liabilities under qualifying fair value hedges at June 30, 2020 and December 31, 2019, along with the cumulative hedge basis adjustments included in the carrying value of those hedged assets and liabilities, that would reverse through earnings in future periods.
| | | | | | | | | | | |
| In millions of dollars | | | |
| Balance sheet line item in which hedged item is recorded | Carrying amount of hedged asset/ liability | Cumulative fair value hedging adjustment increasing (decreasing) the carrying amount | |
| | Active | De-designated |
| As of June 30, 2020 | | | |
Debt securities
AFS(1)(3) | $ | 107,047 | | $ | (75) | | $ | 526 | |
| Long-term debt | 173,038 | | 8,789 | | 4,049 | |
| As of December 31, 2019 | | | |
Debt securities
AFS(2)(3) | $ | 94,659 | | $ | (114) | | $ | 743 | |
| Long-term debt | 157,387 | | 2,334 | | 3,445 | |
(1)These amounts include a cumulative basis adjustment of $17 million for active hedges and $119 million for de-designated hedges as of June 30, 2020 related to certain prepayable financial assets previously designated as the hedged item in a fair value hedge using the last-of-layer approach. The Company designated approximately $1,905 million as the hedged amount (from a closed portfolio of prepayable financial assets with a carrying value of $16 billion as of June 30, 2020) in a last-of-layer hedging relationship.
(2)These amounts include a cumulative basis adjustment of $(8) million for active hedges and $157 million for de-designated hedges as of December 31, 2019 related to certain prepayable financial assets designated as the hedged item in a fair value hedge using the last-of-layer approach. The Company designated approximately $605 million as the hedged amount (from a closed portfolio of prepayable financial assets with a carrying value of $20 billion as of December 31, 2019) in a last-of-layer hedging relationship.
(3)Carrying amount represents the amortized cost.
Cash Flow Hedges
Citigroup hedges the variability of forecasted cash flows due to changes in contractually specified interest rates associated with floating-rate assets/liabilities and other forecasted transactions. These cash flow hedging relationships use either regression analysis or dollar-offset ratio analysis to assess whether the hedging relationships are highly effective at inception and on an ongoing basis.
For cash flow hedges, the entire change in the fair value of the hedging derivative is recognized in AOCI and then reclassified to earnings in the same period that the forecasted hedged cash flows impact earnings. The net gain (loss) associated with cash flow hedges expected to be reclassified from AOCI within 12 months of June 30, 2020 is approximately $1.1 billion. The maximum length of time over which forecasted cash flows are hedged is 10 years.
The pretax change in AOCI from cash flow hedges is presented below. The after-tax impact of cash flow hedges on AOCI is shown in Note 17 to the Consolidated Financial Statements.
| | | | | | | | | | | | | | | | | | | | | | | | | | |
| | Three Months Ended June 30, | | | | Six Months Ended June 30, | | | |
| In millions of dollars | 2020 | | 2019 | | 2020 | | 2019 | |
Amount of gain (loss) recognized in AOCI on derivatives | | | | | | | | |
| Interest rate contracts | $ | 294 | | | $ | 545 | | | $ | 2,791 | | | $ | 799 | | |
| Foreign exchange contracts | (5) | | | (1) | | | (16) | | | (9) | | |
Total gain (loss) recognized in AOCI | $ | 289 | | | $ | 544 | | | $ | 2,775 | | | $ | 790 | | |
Amount of gain (loss) reclassified from AOCI to earnings(1) | Other
revenue | Net interest
revenue | Other
revenue |
Net interest
revenue | Other
revenue | Net interest
revenue | Other
revenue | Net interest
revenue |
| Interest rate contracts | $ | — | | $ | 200 | | $ | — | | $ | (134) | | $ | — | | $ | 203 | | $ | — | | $ | (264) | |
| Foreign exchange contracts | (1) | | — | | (2) | | — | | (2) | | — | | (4) | | — | |
Total gain (loss) reclassified from AOCI into earnings | $ | (1) | | $ | 200 | | $ | (2) | | $ | (134) | | $ | (2) | | $ | 203 | | $ | (4) | | $ | (264) | |
Net pretax change in cash flow hedges included within AOCI | | $ | 90 | | | $ | 680 | | | $ | 2,574 | | | $ | 1,058 | |
(1)All amounts reclassified into earnings for interest rate contracts are included in Interest income/Interest expense (Net interest revenue). For all other hedges, the amounts reclassified to earnings are included primarily in Other revenue and Net interest revenue in the Consolidated Statement of Income.
Net Investment Hedges
The pretax gain (loss) recorded in Foreign currency translation adjustment within AOCI, related to net investment hedges, was $(741) million and $1,419 million for the three and six months ended June 30, 2020 and $(134) million and $(298) million for the three and six months ended June 30, 2019, respectively.
Credit Derivatives
The following tables summarize the key characteristics of Citi’s credit derivatives portfolio by counterparty and derivative form:
| | | | | | | | | | | | | | |
| Fair values | | Notionals | |
| In millions of dollars at June 30, 2020 | Receivable(1) | Payable(2) | Protection
purchased | Protection
sold |
| By industry of counterparty | | | | |
| Banks | $ | 3,701 | | $ | 3,874 | | $ | 141,649 | | $ | 149,162 | |
| Broker-dealers | 2,375 | | 1,793 | | 52,044 | | 50,646 | |
| Non-financial | 99 | | 103 | | 4,207 | | 2,375 | |
Insurance and other financial
institutions | 5,507 | | 5,951 | | 446,313 | | 372,509 | |
| Total by industry of counterparty | $ | 11,682 | | $ | 11,721 | | $ | 644,213 | | $ | 574,692 | |
| By instrument | | | | |
| Credit default swaps and options | $ | 11,005 | | $ | 10,606 | | $ | 632,273 | | $ | 570,417 | |
| Total return swaps and other | 677 | | 1,115 | | 11,940 | | 4,275 | |
| Total by instrument | $ | 11,682 | | $ | 11,721 | | $ | 644,213 | | $ | 574,692 | |
| By rating of reference entity | | | | |
| Investment grade | $ | 4,192 | | $ | 3,810 | | $ | 489,167 | | $ | 441,085 | |
| Non-investment grade | 7,490 | | 7,911 | | 155,046 | | 133,607 | |
| Total by rating of reference entity | $ | 11,682 | | $ | 11,721 | | $ | 644,213 | | $ | 574,692 | |
| By maturity | | | | |
| Within 1 year | $ | 1,517 | | $ | 1,898 | | $ | 170,140 | | $ | 153,138 | |
| From 1 to 5 years | 6,379 | | 6,371 | | 416,656 | | 375,894 | |
| After 5 years | 3,786 | | 3,452 | | 57,417 | | 45,660 | |
| Total by maturity | $ | 11,682 | | $ | 11,721 | | $ | 644,213 | | $ | 574,692 | |
(1)The fair value amount receivable is composed of $7,511 million under protection purchased and $4,171 million under protection sold.
(2)The fair value amount payable is composed of $5,181 million under protection purchased and $6,540 million under protection sold.
| | | | | | | | | | | | | | |
| | Fair values | | Notionals | |
| In millions of dollars at December 31, 2019 | Receivable(1) | Payable(2) | Protection
purchased | Protection
sold |
| By industry of counterparty | | | | |
| Banks | $ | 4,017 | | $ | 4,102 | | $ | 172,461 | | $ | 169,546 | |
| Broker-dealers | 1,724 | | 1,528 | | 54,843 | | 53,846 | |
| Non-financial | 92 | | 76 | | 2,601 | | 1,968 | |
Insurance and other financial
institutions | 4,576 | | 5,032 | | 474,021 | | 378,027 | |
| Total by industry of counterparty | $ | 10,409 | | $ | 10,738 | | $ | 703,926 | | $ | 603,387 | |
| By instrument | | | | |
| Credit default swaps and options | $ | 9,759 | | $ | 9,791 | | $ | 685,643 | | $ | 593,850 | |
| Total return swaps and other | 650 | | 947 | | 18,283 | | 9,537 | |
| Total by instrument | $ | 10,409 | | $ | 10,738 | | $ | 703,926 | | $ | 603,387 | |
| By rating of reference entity | | | | |
| Investment grade | $ | 4,579 | | $ | 4,578 | | $ | 560,806 | | $ | 470,778 | |
| Non-investment grade | 5,830 | | 6,160 | | 143,120 | | 132,609 | |
| Total by rating of reference entity | $ | 10,409 | | $ | 10,738 | | $ | 703,926 | | $ | 603,387 | |
| By maturity | | | | |
| Within 1 year | $ | 1,806 | | $ | 2,181 | | $ | 231,135 | | $ | 176,188 | |
| From 1 to 5 years | 7,275 | | 7,265 | | 414,237 | | 379,915 | |
| After 5 years | 1,328 | | 1,292 | | 58,554 | | 47,284 | |
| Total by maturity | $ | 10,409 | | $ | 10,738 | | $ | 703,926 | | $ | 603,387 | |
(1) The fair value amount receivable is composed of $3,415 million under protection purchased and $6,994 under protection sold.
(2) The fair value amount payable is composed of $7,793 million under protection purchased and $2,945 million under protection sold.
Credit Risk-Related Contingent Features in Derivatives
Certain derivative instruments contain provisions that require the Company to either post additional collateral or immediately settle any outstanding liability balances upon the occurrence of a specified event related to the credit risk of the Company. These events, which are defined by the existing derivative contracts, are primarily downgrades in the credit ratings of the Company and its affiliates.
The fair value (excluding CVA) of all derivative instruments with credit risk-related contingent features that were in a net liability position at both June 30, 2020 and December 31, 2019 was $29 billion and $30 billion, respectively. The Company posted $25 billion and $28 billion as collateral for this exposure in the normal course of business as of June 30, 2020 and December 31, 2019, respectively.
A downgrade could trigger additional collateral or cash settlement requirements for the Company and certain affiliates. In the event that Citigroup and Citibank were downgraded a single notch by all 3 major rating agencies as of June 30, 2020, the Company could be required to post an additional $0.8 billion as either collateral or settlement of the derivative transactions. In addition, the Company could be required to segregate with third-party custodians collateral previously received from existing derivative counterparties in the amount of $0.2 billion upon the single notch downgrade, resulting in aggregate cash obligations and collateral requirements of approximately $1 billion.
Derivatives Accompanied by Financial Asset Transfers
For transfers of financial assets accounted for as a sale by the Company and for which the Company has retained substantially all of the economic exposure to the transferred asset through a total return swap executed with the same counterparty in contemplation of the initial sale (and still outstanding), both the asset amounts derecognized and the gross cash proceeds received as of the date of derecognition were $2.8 billion and $5.8 billion as of June 30, 2020 and December 31, 2019, respectively.
At June 30, 2020, the fair value of these previously derecognized assets was $2.8 billion. The fair value of the total return swaps as of June 30, 2020 was $90 million recorded as gross derivative assets and $16 million recorded as gross derivative liabilities. At December 31, 2019, the fair value of these previously derecognized assets was $5.9 billion, and the fair value of the total return swaps was $117 million recorded as gross derivative assets and $43 million recorded as gross derivative liabilities.
The balances for the total return swaps are on a gross basis, before the application of counterparty and cash collateral netting, and are included primarily as equity derivatives in the tabular disclosures in this Note.
20. FAIR VALUE MEASUREMENT
For additional information regarding fair value measurement at Citi, see Note 24 to the Consolidated Financial Statements in Citi’s 2019 Annual Report on Form 10-K.
Market Valuation Adjustments
The table below summarizes the credit valuation adjustments (CVA) and funding valuation adjustments (FVA) applied to the fair value of derivative instruments at June 30, 2020 and December 31, 2019:
| | | | | | | | |
| | Credit and funding valuation adjustments
contra-liability (contra-asset) | |
| In millions of dollars | June 30,
2020 | December 31,
2019 |
| Counterparty CVA | $ | (1,243) | | $ | (705) | |
| Asset FVA | (839) | | (530) | |
| Citigroup (own-credit) CVA | 557 | | 341 | |
| Liability FVA | 195 | | 72 | |
| Total CVA—derivative instruments | $ | (1,330) | | $ | (822) | |
The table below summarizes pretax gains (losses) related to changes in CVA on derivative instruments, net of hedges, FVA on derivatives and debt valuation adjustments (DVA) on Citi’s own fair value option (FVO) liabilities for the periods indicated:
| | | | | | | | | | | | | | |
| | Credit/funding/debt valuation
adjustments gain (loss) | | | |
| Three Months Ended June 30, | | Six Months Ended June 30, | |
| In millions of dollars | 2020 | 2019 | 2020 | 2019 |
| Counterparty CVA | $ | 45 | | $ | 28 | | $ | (238) | | $ | 102 | |
| Asset FVA | 632 | | (39) | | (421) | | (19) | |
| Own-credit CVA | (271) | | (13) | | 262 | | (105) | |
| Liability FVA | (214) | | 18 | | 123 | | (30) | |
| Total CVA—derivative instruments | $ | 192 | | $ | (6) | | $ | (274) | | $ | (52) | |
DVA related to own FVO liabilities(1) | $ | (2,935) | | $ | 3 | | $ | 1,253 | | $ | (722) | |
| Total CVA and DVA | $ | (2,743) | | $ | (3) | | $ | 979 | | $ | (774) | |
(1) See Notes 1 and 17 to the Consolidated Financial Statements in Citi’s 2019 Annual Report on Form 10-K.
Fair Value Hierarchy
ASC 820-10 specifies a hierarchy of inputs based on whether the inputs are observable or unobservable. Observable inputs are developed using market data and reflect market participant assumptions, while unobservable inputs reflect the Company’s market assumptions. These two types of inputs have created the following fair value hierarchy:
•Level 1: Quoted prices for identical instruments in active markets.
•Level 2: Quoted prices for similar instruments in active markets, quoted prices for identical or similar instruments in markets that are not active and model-derived valuations in which all significant inputs and significant value drivers are observable in active markets.
•Level 3: Valuations derived from valuation techniques in which one or more significant inputs or significant value drivers are unobservable.
As required under the fair value hierarchy, the Company considers relevant and observable market inputs in its valuations where possible. The frequency of transactions, the size of the bid-ask spread and the amount of adjustment necessary when comparing similar transactions are all factors in determining the relevance of observed prices in those markets.
Items Measured at Fair Value on a Recurring Basis
The following tables present for each of the fair value hierarchy levels the Company’s assets and liabilities that are measured at fair value on a recurring basis at June 30, 2020 and December 31, 2019. The Company may hedge positions that have been classified in the Level 3 category with other
financial instruments (hedging instruments) that may be classified as Level 3, but also with financial instruments classified as Level 1 or Level 2 of the fair value hierarchy. The effects of these hedges are presented gross in the following tables:
Fair Value Levels
| | | | | | | | | | | | | | | | | | | | |
| In millions of dollars at June 30, 2020 | Level 1 | Level 2 | Level 3 | Gross
inventory | Netting(1) | Net
balance |
| Assets | | | | | | |
| Securities borrowed and purchased under agreements to resell | $ | — | | $ | 301,298 | | $ | 326 | | $ | 301,624 | | $ | (127,066) | | $ | 174,558 | |
| Trading non-derivative assets | | | | | | |
| Trading mortgage-backed securities | | | | | | |
| U.S. government-sponsored agency guaranteed | 1 | | 39,805 | | 96 | | 39,902 | | — | | 39,902 | |
| Residential | 7 | | 470 | | 433 | | 910 | | — | | 910 | |
| Commercial | — | | 1,248 | | 217 | | 1,465 | | — | | 1,465 | |
| Total trading mortgage-backed securities | $ | 8 | | $ | 41,523 | | $ | 746 | | $ | 42,277 | | $ | — | | $ | 42,277 | |
| U.S. Treasury and federal agency securities | $ | 79,893 | | $ | 2,442 | | $ | — | | $ | 82,335 | | $ | — | | $ | 82,335 | |
| State and municipal | — | | 1,224 | | 117 | | 1,341 | | — | | 1,341 | |
| Foreign government | 66,305 | | 17,001 | | 26 | | 83,332 | | — | | 83,332 | |
| Corporate | 1,362 | | 18,096 | | 399 | | 19,857 | | — | | 19,857 | |
| Equity securities | 35,235 | | 10,106 | | 92 | | 45,433 | | — | | 45,433 | |
| Asset-backed securities | 3 | | 711 | | 1,785 | | 2,499 | | — | | 2,499 | |
Other trading assets(2) | 375 | | 11,471 | | 797 | | 12,643 | | — | | 12,643 | |
| Total trading non-derivative assets | $ | 183,181 | | $ | 102,574 | | $ | 3,962 | | $ | 289,717 | | $ | — | | $ | 289,717 | |
| Trading derivatives | | | | | | |
| Interest rate contracts | $ | 97 | | $ | 255,703 | | $ | 3,770 | | $ | 259,570 | | | |
| Foreign exchange contracts | 1 | | 116,984 | | 544 | | 117,529 | | | |
| Equity contracts | 105 | | 38,709 | | 592 | | 39,406 | | | |
| Commodity contracts | — | | 15,774 | | 986 | | 16,760 | | | |
| Credit derivatives | — | | 10,147 | | 1,535 | | 11,682 | | | |
| Total trading derivatives | $ | 203 | | $ | 437,317 | | $ | 7,427 | | $ | 444,947 | | | |
Cash collateral paid(3) | | | | $ | 26,598 | | | |
| Netting agreements | | | | | $ | (340,172) | | |
| Netting of cash collateral received | | | | | (58,778) | | |
| Total trading derivatives | $ | 203 | | $ | 437,317 | | $ | 7,427 | | $ | 471,545 | | $ | (398,950) | | $ | 72,595 | |
| Investments | | | | | | |
| Mortgage-backed securities | | | | | | |
| U.S. government-sponsored agency guaranteed | $ | — | | $ | 45,322 | | $ | 30 | | $ | 45,352 | | $ | — | | $ | 45,352 | |
| Residential | — | | 695 | | — | | 695 | | — | | 695 | |
| Commercial | — | | 65 | | — | | 65 | | — | | 65 | |
| Total investment mortgage-backed securities | $ | — | | $ | 46,082 | | $ | 30 | | $ | 46,112 | | $ | — | | $ | 46,112 | |
| U.S. Treasury and federal agency securities | $ | 154,057 | | $ | — | | $ | — | | $ | 154,057 | | $ | — | | $ | 154,057 | |
| State and municipal | — | | 4,196 | | 825 | | 5,021 | | — | | 5,021 | |
| Foreign government | 70,654 | | 50,090 | | 196 | | 120,940 | | — | | 120,940 | |
| Corporate | 6,693 | | 4,425 | | 106 | | 11,224 | | — | | 11,224 | |
| Marketable equity securities | 273 | | 319 | | 1 | | 593 | | — | | 593 | |
| Asset-backed securities | — | | 281 | | 6 | | 287 | | — | | 287 | |
| Other debt securities | — | | 4,615 | | — | | 4,615 | | — | | 4,615 | |
Non-marketable equity securities(4) | — | | 14 | | 332 | | 346 | | — | | 346 | |
| Total investments | $ | 231,677 | | $ | 110,022 | | $ | 1,496 | | $ | 343,195 | | $ | — | | $ | 343,195 | |
Table continues on the next page.
| | | | | | | | | | | | | | | | | | | | |
| In millions of dollars at June 30, 2020 | Level 1 | Level 2 | Level 3 | Gross
inventory | Netting(1) | Net
balance |
| Loans | $ | — | | $ | 4,821 | | $ | 978 | | $ | 5,799 | | $ | — | | $ | 5,799 | |
| Mortgage servicing rights | — | | — | | 345 | | 345 | | — | | 345 | |
| | | | | | |
| | | | | | |
| | | | | | |
| Non-trading derivatives and other financial assets measured on a recurring basis | $ | 4,817 | | $ | 7,917 | | $ | — | | $ | 12,734 | | $ | — | | $ | 12,734 | |
| Total assets | $ | 419,878 | | $ | 963,949 | | $ | 14,534 | | $ | 1,424,959 | | $ | (526,016) | | $ | 898,943 | |
Total as a percentage of gross assets(5) | 30.0 | % | 68.9 | % | 1.0 | % | | | |
| Liabilities | | | | | | |
| Interest-bearing deposits | $ | — | | $ | 2,235 | | $ | 237 | | $ | 2,472 | | $ | — | | $ | 2,472 | |
| Securities loaned and sold under agreements to repurchase | — | | 144,802 | | 625 | | 145,427 | | (85,982) | | 59,445 | |
| Trading account liabilities | | | | | | |
| Securities sold, not yet purchased | 75,265 | | 13,458 | | 104 | | 88,827 | | — | | 88,827 | |
| Other trading liabilities | — | | 40 | | — | | 40 | | — | | 40 | |
| Total trading liabilities | $ | 75,265 | | $ | 13,498 | | $ | 104 | | $ | 88,867 | | $ | — | | $ | 88,867 | |
| Trading derivatives | | | | | | |
| Interest rate contracts | $ | 60 | | $ | 234,098 | | $ | 1,802 | | $ | 235,960 | | | |
| Foreign exchange contracts | 1 | | 121,774 | | 570 | | 122,345 | | | |
| Equity contracts | 98 | | 45,464 | | 2,827 | | 48,389 | | | |
| Commodity contracts | — | | 20,300 | | 1,264 | | 21,564 | | | |
| Credit derivatives | — | | 10,588 | | 1,133 | | 11,721 | | | |
| Total trading derivatives | $ | 159 | | $ | 432,225 | | $ | 7,596 | | $ | 439,979 | | | |
Cash collateral received(6) | | | | $ | 14,295 | | | |
| Netting agreements | | | | | $ | (340,172) | | |
| Netting of cash collateral paid | | | | | (53,704) | | |
| Total trading derivatives | $ | 159 | | $ | 432,225 | | $ | 7,596 | | $ | 454,274 | | $ | (393,876) | | $ | 60,398 | |
| Short-term borrowings | $ | — | | $ | 6,518 | | $ | 128 | | $ | 6,646 | | $ | — | | $ | 6,646 | |
| Long-term debt | — | | 40,338 | | 21,633 | | 61,971 | | — | | 61,971 | |
| | | | | | |
| | | | | | |
| | | | | | |
| | | | | | |
| Total non-trading derivatives and other financial liabilities measured on a recurring basis | $ | 5,569 | | $ | 220 | | $ | — | | $ | 5,789 | | $ | — | | $ | 5,789 | |
| Total liabilities | $ | 80,993 | | $ | 639,836 | | $ | 30,323 | | $ | 765,446 | | $ | (479,858) | | $ | 285,588 | |
Total as a percentage of gross liabilities(5) | 10.8 | % | 85.2 | % | 4.0 | % | | | |
(1)Represents netting of (i) the amounts due under securities purchased under agreements to resell and the amounts owed under securities sold under agreements to repurchase and (ii) derivative exposures covered by a qualifying master netting agreement and cash collateral offsetting.
(2)Includes positions related to investments in unallocated precious metals, as discussed in Note 21 to the Consolidated Financial Statements. Also includes physical commodities accounted for at the lower of cost or fair value and unfunded credit products.
(3)Reflects the net amount of $80,302 million of gross cash collateral paid, of which $53,704 million was used to offset trading derivative liabilities.
(4)Amounts exclude $0.1 billion of investments measured at net asset value (NAV) in accordance with ASU 2015-07, Fair Value Measurement (Topic 820): Disclosures for Investments in Certain Entities That Calculate Net Asset Value per Share (or Its Equivalent).
(5)Because the amount of the cash collateral paid/received has not been allocated to the Level 1, 2 and 3 subtotals, these percentages are calculated based on total assets and liabilities measured at fair value on a recurring basis, excluding the cash collateral paid/received on derivatives.
(6)Reflects the net amount of $73,073 million of gross cash collateral received, of which $58,778 million was used to offset trading derivative assets.
Fair Value Levels
| | | | | | | | | | | | | | | | | | | | |
| In millions of dollars at December 31, 2019 | Level 1 | Level 2 | Level 3 | Gross
inventory | Netting(1) | Net
balance |
| Assets | | | | | | |
| Securities borrowed and purchased under agreements to resell | $ | — | | $ | 254,253 | | $ | 303 | | $ | 254,556 | | $ | (101,363) | | $ | 153,193 | |
| Trading non-derivative assets | | | | | | |
| Trading mortgage-backed securities | | | | | | |
| U.S. government-sponsored agency guaranteed | — | | 27,661 | | 10 | | 27,671 | | — | | 27,671 | |
| Residential | — | | 573 | | 123 | | 696 | | — | | 696 | |
| Commercial | — | | 1,632 | | 61 | | 1,693 | | — | | 1,693 | |
| Total trading mortgage-backed securities | $ | — | | $ | 29,866 | | $ | 194 | | $ | 30,060 | | $ | — | | $ | 30,060 | |
| U.S. Treasury and federal agency securities | $ | 26,159 | | $ | 3,736 | | $ | — | | $ | 29,895 | | $ | — | | $ | 29,895 | |
| State and municipal | — | | 2,573 | | 64 | | 2,637 | | — | | 2,637 | |
| Foreign government | 50,948 | | 20,326 | | 52 | | 71,326 | | — | | 71,326 | |
| Corporate | 1,332 | | 17,246 | | 313 | | 18,891 | | — | | 18,891 | |
| Equity securities | 41,663 | | 9,878 | | 100 | | 51,641 | | — | | 51,641 | |
| Asset-backed securities | — | | 1,539 | | 1,177 | | 2,716 | | — | | 2,716 | |
Other trading assets(2) | 74 | | 11,412 | | 555 | | 12,041 | | — | | 12,041 | |
| Total trading non-derivative assets | $ | 120,176 | | $ | 96,576 | | $ | 2,455 | | $ | 219,207 | | $ | — | | $ | 219,207 | |
| Trading derivatives | | | | | | |
| Interest rate contracts | $ | 7 | | $ | 196,493 | | $ | 1,168 | | $ | 197,668 | | | |
| Foreign exchange contracts | 1 | | 107,022 | | 547 | | 107,570 | | | |
| Equity contracts | 83 | | 28,148 | | 240 | | 28,471 | | | |
| Commodity contracts | — | | 13,498 | | 714 | | 14,212 | | | |
| Credit derivatives | — | | 9,960 | | 449 | | 10,409 | | | |
| Total trading derivatives | $ | 91 | | $ | 355,121 | | $ | 3,118 | | $ | 358,330 | | | |
Cash collateral paid(3) | | | | $ | 17,926 | | | |
| Netting agreements | | | | | $ | (274,970) | | |
| Netting of cash collateral received | | | | | (44,353) | | |
| Total trading derivatives | $ | 91 | | $ | 355,121 | | $ | 3,118 | | $ | 376,256 | | $ | (319,323) | | $ | 56,933 | |
| Investments | | | | | | |
| Mortgage-backed securities | | | | | | |
| U.S. government-sponsored agency guaranteed | $ | — | | $ | 35,198 | | $ | 32 | | $ | 35,230 | | $ | — | | $ | 35,230 | |
| Residential | — | | 793 | | — | | 793 | | — | | 793 | |
| Commercial | — | | 74 | | — | | 74 | | — | | 74 | |
| Total investment mortgage-backed securities | $ | — | | $ | 36,065 | | $ | 32 | | $ | 36,097 | | $ | — | | $ | 36,097 | |
| U.S. Treasury and federal agency securities | $ | 106,103 | | $ | 5,315 | | $ | — | | $ | 111,418 | | $ | — | | $ | 111,418 | |
| State and municipal | — | | 4,355 | | 623 | | 4,978 | | — | | 4,978 | |
| Foreign government | 69,957 | | 41,196 | | 96 | | 111,249 | | — | | 111,249 | |
| Corporate | 5,150 | | 6,076 | | 45 | | 11,271 | | — | | 11,271 | |
| Marketable equity securities | 87 | | 371 | | — | | 458 | | — | | 458 | |
| Asset-backed securities | — | | 500 | | 22 | | 522 | | — | | 522 | |
| Other debt securities | — | | 4,730 | | — | | 4,730 | | — | | 4,730 | |
Non-marketable equity securities(4) | — | | 93 | | 441 | | 534 | | — | | 534 | |
| Total investments | $ | 181,297 | | $ | 98,701 | | $ | 1,259 | | $ | 281,257 | | $ | — | | $ | 281,257 | |
Table continues on the next page.
| | | | | | | | | | | | | | | | | | | | |
| In millions of dollars at December 31, 2019 | Level 1 | Level 2 | Level 3 | Gross
inventory | Netting(2) | Net
balance |
| Loans | $ | — | | $ | 3,683 | | $ | 402 | | $ | 4,085 | | $ | — | | $ | 4,085 | |
| Mortgage servicing rights | — | | — | | 495 | | 495 | | — | | 495 | |
| | | | | | |
| | | | | | |
| | | | | | |
| Non-trading derivatives and other financial assets measured on a recurring basis | $ | 5,628 | | $ | 7,201 | | $ | 1 | | $ | 12,830 | | $ | — | | $ | 12,830 | |
| Total assets | $ | 307,192 | | $ | 815,535 | | $ | 8,033 | | $ | 1,148,686 | | $ | (420,686) | | $ | 728,000 | |
Total as a percentage of gross assets(5) | 27.2 | % | 72.1 | % | 0.7 | % | | | |
| Liabilities | | | | | | |
| Interest-bearing deposits | $ | — | | $ | 2,104 | | $ | 215 | | $ | 2,319 | | $ | — | | $ | 2,319 | |
| Securities loaned and sold under agreements to repurchase | — | | 111,567 | | 757 | | 112,324 | | (71,673) | | 40,651 | |
| Trading account liabilities | | | | | | |
| Securities sold, not yet purchased | 60,429 | | 11,965 | | 48 | | 72,442 | | — | | 72,442 | |
| Other trading liabilities | — | | 24 | | — | | 24 | | — | | 24 | |
| Total trading liabilities | $ | 60,429 | | $ | 11,989 | | $ | 48 | | $ | 72,466 | | $ | — | | $ | 72,466 | |
| Trading account derivatives | | | | | | |
| Interest rate contracts | $ | 8 | | $ | 176,480 | | $ | 1,167 | | $ | 177,655 | | | |
| Foreign exchange contracts | — | | 110,180 | | 552 | | 110,732 | | | |
| Equity contracts | 144 | | 28,506 | | 1,836 | | 30,486 | | | |
| Commodity contracts | — | | 16,542 | | 773 | | 17,315 | | | |
| Credit derivatives | — | | 10,233 | | 505 | | 10,738 | | | |
| Total trading derivatives | $ | 152 | | $ | 341,941 | | $ | 4,833 | | $ | 346,926 | | | |
Cash collateral received(6) | | | | $ | 14,391 | | | |
| Netting agreements | | | | | $ | (274,970) | | |
| Netting of cash collateral paid | | | | | (38,919) | | |
| Total trading derivatives | $ | 152 | | $ | 341,941 | | $ | 4,833 | | $ | 361,317 | | $ | (313,889) | | $ | 47,428 | |
| Short-term borrowings | $ | — | | $ | 4,933 | | $ | 13 | | $ | 4,946 | | $ | — | | $ | 4,946 | |
| Long-term debt | — | | 38,614 | | 17,169 | | 55,783 | | — | | 55,783 | |
| | | | | | |
| | | | | | |
| | | | | | |
| Non-trading derivatives and other financial liabilities measured on a recurring basis | $ | 6,280 | | $ | 63 | | $ | — | | $ | 6,343 | | $ | — | | $ | 6,343 | |
| Total liabilities | $ | 66,861 | | $ | 511,211 | | $ | 23,035 | | $ | 615,498 | | $ | (385,562) | | $ | 229,936 | |
Total as a percentage of gross liabilities(5) | 11.1 | % | 85.0 | % | 3.8 | % | | | |
(1)Represents netting of (i) the amounts due under securities purchased under agreements to resell and the amounts owed under securities sold under agreements to repurchase and (ii) derivative exposures covered by a qualifying master netting agreement and cash collateral offsetting.
(2)Includes positions related to investments in unallocated precious metals, as discussed in Note 21 to the Consolidated Financial Statements. Also includes physical commodities accounted for at the lower of cost or fair value and unfunded credit products.
(3)Reflects the net amount of $56,845 million of gross cash collateral paid, of which $38,919 million was used to offset trading derivative liabilities.
(4)Amounts exclude $0.2 billion of investments measured at NAV in accordance with ASU 2015-07, Fair Value Measurement (Topic 820): Disclosures for Investments in Certain Entities That Calculate Net Asset Value per Share (or Its Equivalent).
(5)Because the amount of the cash collateral paid/received has not been allocated to the Level 1, 2 and 3 subtotals, these percentages are calculated based on total assets and liabilities measured at fair value on a recurring basis, excluding the cash collateral paid/received on derivatives.
(6)Reflects the net amount of $58,744 million of gross cash collateral received, of which $44,353 million was used to offset trading derivative assets.
Changes in Level 3 Fair Value Category
The following tables present the changes in the Level 3 fair value category for the three and six months ended June 30, 2020 and 2019. The gains and losses presented below include changes in the fair value related to both observable and unobservable inputs.
The Company often hedges positions with offsetting positions that are classified in a different level. For example,
the gains and losses for assets and liabilities in the Level 3 category presented in the tables below do not reflect the effect of offsetting losses and gains on hedging instruments that may be classified in the Level 1 or Level 2 categories. In addition, the Company hedges items classified in the Level 3 category with instruments also classified in Level 3 of the fair value hierarchy. The hedged items and related hedges are presented gross in the following tables:
Level 3 Fair Value Rollforward
| | | | | | | | | | | | | | | | | | | | | | | | | | | | | | | | | | | |
| | | Net realized/unrealized
gains/losses incl. in | | Transfers | | | | | | | Unrealized
gains/
losses
still held(3) |
| In millions of dollars | Mar. 31, 2020 | Principal
transactions | Other(1)(2) | into
Level 3 | out of
Level 3 | Purchases | Issuances | Sales | Settlements | Jun. 30, 2020 | |
| Assets | | | | | | | | | | | |
| Securities borrowed and purchased under agreements to resell | $ | 300 | | $ | 34 | | $ | — | | $ | — | | $ | — | | $ | 42 | | $ | — | | $ | — | | $ | (50) | | $ | 326 | | $ | 36 | |
| Trading non-derivative assets | | | | | | | | | | | |
| Trading mortgage-backed securities | | | | | | | | | | | |
| U.S. government-sponsored agency guaranteed | 85 | | 1 | | — | | 4 | | (6) | | 67 | | — | | (55) | | — | | 96 | | 4 | |
| Residential | 304 | | 14 | | — | | 144 | | (39) | | 96 | | — | | (86) | | — | | 433 | | 7 | |
| Commercial | 44 | | 4 | | — | | 140 | | (14) | | 62 | | — | | (19) | | — | | 217 | | 11 | |
| Total trading mortgage-backed securities | $ | 433 | | $ | 19 | | $ | — | | $ | 288 | | $ | (59) | | $ | 225 | | $ | — | | $ | (160) | | $ | — | | $ | 746 | | $ | 22 | |
| U.S. Treasury and federal agency securities | $ | — | | $ | — | | $ | — | | $ | — | | $ | — | | $ | — | | $ | — | | $ | — | | $ | — | | $ | — | | $ | — | |
| State and municipal | 92 | | — | | — | | 5 | | (1) | | 41 | | — | | (20) | | — | | 117 | | — | |
| Foreign government | 39 | | 57 | | — | | 2 | | (2) | | 18 | | — | | (88) | | — | | 26 | | 54 | |
| Corporate | 412 | | (12) | | — | | 64 | | (78) | | 204 | | — | | (185) | | (6) | | 399 | | (71) | |
| Marketable equity securities | 143 | | 9 | | — | | 10 | | — | | 174 | | — | | (244) | | — | | 92 | | (3) | |
| Asset-backed securities | 1,561 | | 67 | | — | | 257 | | (56) | | 272 | | — | | (316) | | — | | 1,785 | | 46 | |
| Other trading assets | 639 | | 27 | | — | | 153 | | (15) | | 126 | | 6 | | (134) | | (5) | | 797 | | 1 | |
| Total trading non-derivative assets | $ | 3,319 | | $ | 167 | | $ | — | | $ | 779 | | $ | (211) | | $ | 1,060 | | $ | 6 | | $ | (1,147) | | $ | (11) | | $ | 3,962 | | $ | 49 | |
Trading derivatives, net(4) | | | | | | | | | | | |
| Interest rate contracts | $ | 1,755 | | $ | 24 | | $ | — | | $ | 231 | | $ | 20 | | $ | 1 | | $ | — | | $ | — | | $ | (63) | | $ | 1,968 | | $ | 7 | |
| Foreign exchange contracts | 2 | | (37) | | — | | (8) | | 2 | | 5 | | — | | (5) | | 15 | | (26) | | (47) | |
| Equity contracts | (1,836) | | (354) | | — | | (104) | | 12 | | 21 | | — | | (5) | | 31 | | (2,235) | | (349) | |
| Commodity contracts | (542) | | 253 | | — | | (1) | | (14) | | 20 | | — | | (10) | | 16 | | (278) | | 241 | |
| Credit derivatives | 816 | | (367) | | — | | 17 | | (72) | | — | | — | | — | | 8 | | 402 | | (367) | |
Total trading derivatives, net(4) | $ | 195 | | $ | (481) | | $ | — | | $ | 135 | | $ | (52) | | $ | 47 | | $ | — | | $ | (20) | | $ | 7 | | $ | (169) | | $ | (515) | |
Table continues on the next page.
| | | | | | | | | | | | | | | | | | | | | | | | | | | | | | | | | | | |
| | | Net realized/unrealized
gains/losses incl. in | | Transfers | | | | | | | Unrealized
gains/losses
still held(3) |
| In millions of dollars | Mar. 31, 2020 | Principal
transactions | Other(1)(2) | into
Level 3 | out of
Level 3 | Purchases | Issuances | Sales | Settlements | Jun. 30, 2020 | |
| Investments | | | | | | | | | | | |
| Mortgage-backed securities | | | | | | | | | | | |
| U.S. government-sponsored agency guaranteed | $ | 47 | | $ | — | | $ | (19) | | $ | 1 | | $ | — | | $ | 1 | | $ | — | | $ | — | | $ | — | | $ | 30 | | $ | (36) | |
| Residential | — | | — | | — | | — | | — | | — | | — | | — | | — | | — | | — | |
| Commercial | — | | — | | — | | — | | — | | — | | — | | — | | — | | — | | — | |
| Total investment mortgage-backed securities | $ | 47 | | $ | — | | $ | (19) | | $ | 1 | | $ | — | | $ | 1 | | $ | — | | $ | — | | $ | — | | $ | 30 | | $ | (36) | |
| U.S. Treasury and federal agency securities | $ | — | | $ | — | | $ | — | | $ | — | | $ | — | | $ | — | | $ | — | | $ | — | | $ | — | | $ | — | | $ | — | |
| State and municipal | 687 | | — | | 24 | | 172 | | (131) | | 95 | | — | | (22) | | — | | 825 | | 21 | |
| Foreign government | 225 | | — | | 7 | | — | | (64) | | 61 | | — | | (33) | | — | | 196 | | 6 | |
| Corporate | 238 | | — | | 10 | | — | | (152) | | 10 | | — | | — | | — | | 106 | | — | |
| Marketable equity securities | — | | — | | — | | 1 | | — | | — | | — | | — | | — | | 1 | | — | |
| Asset-backed securities | 16 | | — | | (2) | | — | | — | | — | | — | | (8) | | — | | 6 | | — | |
| Other debt securities | — | | — | | — | | — | | — | | — | | — | | — | | — | | — | | — | |
| Non-marketable equity securities | 354 | | — | | 21 | | — | | — | | 2 | | — | | — | | (45) | | 332 | | 25 | |
| Total investments | $ | 1,567 | | $ | — | | $ | 41 | | $ | 174 | | $ | (347) | | $ | 169 | | $ | — | | $ | (63) | | $ | (45) | | $ | 1,496 | | $ | 16 | |
| Loans | $ | 537 | | $ | — | | $ | 447 | | $ | — | | $ | (5) | | $ | — | | $ | — | | $ | — | | $ | (1) | | $ | 978 | | $ | 355 | |
| Mortgage servicing rights | 367 | | — | | (26) | | — | | — | | — | | 24 | | — | | (20) | | 345 | | (14) | |
| Other financial assets measured on a recurring basis | — | | — | | 14 | | — | | — | | — | | (6) | | (4) | | (4) | | — | | 2 | |
| Liabilities | | | | | | | | | | | |
| Interest-bearing deposits | $ | 491 | | $ | — | | $ | (5) | | $ | — | | $ | (151) | | $ | — | | $ | 30 | | $ | — | | $ | (138) | | $ | 237 | | $ | (27) | |
| Securities loaned and sold under agreements to repurchase | 730 | | — | | — | | — | | — | | — | | — | | — | | (105) | | 625 | | — | |
| Trading account liabilities | | | | | | | | | | | |
| Securities sold, not yet purchased | 200 | | (28) | | — | | 43 | | (8) | | — | | — | | — | | (159) | | 104 | | 24 | |
| Other trading liabilities | — | | — | | — | | — | | — | | — | | — | | — | | — | | — | | — | |
| Short-term borrowings | 52 | | 9 | | — | | 75 | | (6) | | — | | 23 | | — | | (7) | | 128 | | 16 | |
| Long-term debt | 19,269 | | (2,271) | | — | | 1,438 | | (1,292) | | — | | 1,469 | | — | | (1,522) | | 21,633 | | (1,303) | |
| Other financial liabilities measured on a recurring basis | — | | — | | — | | — | | — | | — | | — | | — | | — | | — | | — | |
| | | | | | | | | | | |
(1)Changes in fair value of available-for-sale debt securities are recorded in AOCI, unless related to other-than-temporary impairment, while gains and losses from sales are recorded in Realized gains (losses) from sales of investments in the Consolidated Statement of Income.
(2)Unrealized gains (losses) on MSRs are recorded in Other revenue in the Consolidated Statement of Income.
(3)Represents the amount of total gains or losses for the period, included in earnings (and AOCI for changes in fair value of available-for-sale debt securities), attributable to the change in fair value relating to assets and liabilities classified as Level 3 that are still held at June 30, 2020.
(4)Total Level 3 trading derivative assets and liabilities have been netted in these tables for presentation purposes only.
| | | | | | | | | | | | | | | | | | | | | | | | | | | | | | | | | | | |
| | | Net realized/unrealized
gains (losses) incl. in | | Transfers | | | | | | | Unrealized
gains
(losses)
still held(3) |
| In millions of dollars | Dec. 31, 2019 | Principal
transactions | Other(1)(2) | into
Level 3 | out of
Level 3 | Purchases | Issuances | Sales | Settlements | Jun. 30, 2020 | |
| Assets | | | | | | | | | | | |
| Securities borrowed or purchased under agreements to resell | $ | 303 | | $ | 14 | | $ | — | | $ | — | | $ | — | | $ | 108 | | $ | — | | $ | — | | $ | (99) | | $ | 326 | | $ | 39 | |
| Trading non-derivative assets | | | | | | | | | | | |
| Trading mortgage-backed securities | | | | | | | | | | | |
| U.S. government-sponsored agency guaranteed | 10 | | (74) | | — | | 16 | | (9) | | 208 | | — | | (55) | | — | | 96 | | 5 | |
| Residential | 123 | | 6 | | — | | 204 | | (43) | | 274 | | — | | (131) | | — | | 433 | | — | |
| Commercial | 61 | | 4 | | — | | 143 | | (17) | | 89 | | — | | (63) | | — | | 217 | | (10) | |
| Total trading mortgage-backed securities | $ | 194 | | $ | (64) | | $ | — | | $ | 363 | | $ | (69) | | $ | 571 | | $ | — | | $ | (249) | | $ | — | | $ | 746 | | $ | (5) | |
| U.S. Treasury and federal agency securities | $ | — | | $ | — | | $ | — | | $ | — | | $ | — | | $ | — | | $ | — | | $ | — | | $ | — | | $ | — | | $ | — | |
| State and municipal | 64 | | 2 | | — | | 15 | | (3) | | 62 | | — | | (23) | | — | | 117 | | 1 | |
| Foreign government | 52 | | (28) | | — | | 2 | | (2) | | 104 | | — | | (102) | | — | | 26 | | 52 | |
| Corporate | 313 | | 290 | | — | | 86 | | (70) | | 419 | | — | | (633) | | (6) | | 399 | | (87) | |
| Equity securities | 100 | | 9 | | — | | 38 | | (3) | | 206 | | — | | (258) | | — | | 92 | | (19) | |
| Asset-backed securities | 1,177 | | (102) | | — | | 496 | | (60) | | 740 | | — | | (466) | | — | | 1,785 | | (222) | |
| Other trading assets | 555 | | 220 | | — | | 181 | | (152) | | 231 | | 14 | | (237) | | (15) | | 797 | | (23) | |
| Total trading non-derivative assets | $ | 2,455 | | $ | 327 | | $ | — | | $ | 1,181 | | $ | (359) | | $ | 2,333 | | $ | 14 | | $ | (1,968) | | $ | (21) | | $ | 3,962 | | $ | (303) | |
Trading derivatives, net(4) | | | | | | | | | | | |
| Interest rate contracts | $ | 1 | | $ | 375 | | $ | — | | $ | 1,614 | | $ | (2) | | $ | 2 | | $ | 56 | | $ | 13 | | $ | (91) | | $ | 1,968 | | $ | 387 | |
| Foreign exchange contracts | (5) | | (52) | | — | | (33) | | 11 | | 49 | | — | | (13) | | 17 | | (26) | | 104 | |
| Equity contracts | (1,596) | | (564) | | — | | (391) | | 236 | | 24 | | — | | (6) | | 62 | | (2,235) | | (663) | |
| Commodity contracts | (59) | | (206) | | — | | 37 | | (70) | | 66 | | — | | (44) | | (2) | | (278) | | (211) | |
| Credit derivatives | (56) | | 579 | | — | | 171 | | (358) | | — | | — | | — | | 66 | | 402 | | 372 | |
Total trading derivatives, net(4) | $ | (1,715) | | $ | 132 | | $ | — | | $ | 1,398 | | $ | (183) | | $ | 141 | | $ | 56 | | $ | (50) | | $ | 52 | | $ | (169) | | $ | (11) | |
| Investments | | | | | | | | | | | |
| Mortgage-backed securities | | | | | | | | | | | |
| U.S. government-sponsored agency guaranteed | $ | 32 | | $ | — | | $ | (5) | | $ | 1 | | $ | 1 | | $ | 1 | | $ | — | | $ | — | | $ | — | | $ | 30 | | $ | (23) | |
| Residential | — | | — | | — | | — | | — | | — | | — | | — | | — | | — | | — | |
| Commercial | — | | — | | — | | — | | — | | — | | — | | — | | — | | — | | — | |
| Total investment mortgage-backed securities | $ | 32 | | $ | — | | $ | (5) | | $ | 1 | | $ | 1 | | $ | 1 | | $ | — | | $ | — | | $ | — | | $ | 30 | | $ | (23) | |
| U.S. Treasury and federal agency securities | $ | — | | $ | — | | $ | — | | $ | — | | $ | — | | $ | — | | $ | — | | $ | — | | $ | — | | $ | — | | $ | — | |
| State and municipal | 623 | | — | | (7) | | 310 | | (131) | | 95 | | — | | (65) | | — | | 825 | | 25 | |
| Foreign government | 96 | | — | | 5 | | 27 | | (64) | | 208 | | — | | (76) | | — | | 196 | | (9) | |
| Corporate | 45 | | — | | 2 | | 49 | | (152) | | 162 | | — | | — | | — | | 106 | | — | |
| Equity securities | — | | — | | — | | 1 | | — | | — | | — | | — | | — | | 1 | | — | |
| Asset-backed securities | 22 | | — | | 3 | | — | | — | | — | | — | | (19) | | — | | 6 | | 34 | |
| Other debt securities | — | | — | | — | | — | | — | | — | | — | | — | | — | | — | | — | |
| Non-marketable equity securities | 441 | | — | | (53) | | — | | — | | 2 | | — | | (3) | | (55) | | 332 | | 22 | |
| Total investments | $ | 1,259 | | $ | — | | $ | (55) | | $ | 388 | | $ | (346) | | $ | 468 | | $ | — | | $ | (163) | | $ | (55) | | $ | 1,496 | | $ | 49 | |
Table continues on the next page.
| | | | | | | | | | | | | | | | | | | | | | | | | | | | | | | | | | | |
| | | Net realized/unrealized
gains (losses) incl. in | | Transfers | | | | | | | Unrealized
gains
(losses)
still held(3) |
| In millions of dollars | Dec. 31, 2019 | Principal
transactions | Other(1)(2) | into
Level 3 | out of
Level 3 | Purchases | Issuances | Sales | Settlements | Jun. 30, 2020 | |
| Loans | $ | 402 | | $ | — | | $ | 368 | | $ | 217 | | $ | (6) | | $ | — | | $ | — | | $ | — | | $ | (3) | | $ | 978 | | $ | 509 | |
| Mortgage servicing rights | 495 | | — | | (169) | | — | | — | | — | | 56 | | — | | (37) | | 345 | | (147) | |
| Other financial assets measured on a recurring basis | 1 | | — | | 14 | | — | | — | | — | | (6) | | (5) | | (4) | | — | | 16 | |
| Liabilities | | | | | | | | | | | |
| Interest-bearing deposits | $ | 215 | | $ | — | | $ | (11) | | $ | 278 | | $ | (151) | | $ | — | | $ | 30 | | $ | — | | $ | (146) | | $ | 237 | | $ | (6) | |
| Securities loaned or sold under agreements to repurchase | 757 | | 27 | | — | | — | | — | | — | | — | | — | | (105) | | 625 | | (33) | |
| Trading account liabilities | | | | | | | | | | | |
| Securities sold, not yet purchased | 48 | | (129) | | — | | 117 | | (18) | | — | | 9 | | — | | (181) | | 104 | | (7) | |
| Other trading liabilities | — | | — | | — | | — | | — | | — | | — | | — | | — | | — | | — | |
| Short-term borrowings | 13 | | 19 | | — | | 86 | | (6) | | — | | 61 | | — | | (7) | | 128 | | 21 | |
| Long-term debt | 17,169 | | (320) | | — | | 4,623 | | (2,783) | | — | | 4,809 | | — | | (2,505) | | 21,633 | | (6,945) | |
| Other financial liabilities measured on a recurring basis | — | | — | | — | | — | | — | | — | | 2 | | — | | (2) | | — | | — | |
(1)Changes in fair value of available-for-sale investments are recorded in AOCI, unless related to other-than-temporary impairment, while gains and losses from sales are recorded in Realized gains (losses) from sales of investments on the Consolidated Statement of Income.
(2)Unrealized gains (losses) on MSRs are recorded in Other revenue on the Consolidated Statement of Income.
(3)Represents the amount of total gains or losses for the period, included in earnings (and AOCI for changes in fair value of available-for-sale investments), attributable to the change in fair value relating to assets and liabilities classified as Level 3 that are still held at June 30, 2020.
(4)Total Level 3 derivative assets and liabilities have been netted in these tables for presentation purposes only.
| | | | | | | | | | | | | | | | | | | | | | | | | | | | | | | | | | | |
| | | Net realized/unrealized
gains (losses) incl. in | | Transfers | | | | | | | Unrealized
gains
(losses)
still held(3) |
| In millions of dollars | Mar. 31, 2019 | Principal
transactions | Other(1)(2) | into
Level 3 | out of
Level 3 | Purchases | Issuances | Sales | Settlements | Jun. 30, 2019 | |
| Assets | | | | | | | | | | | |
| Securities borrowed and purchased under agreements to resell | $ | 66 | | $ | 5 | | $ | — | | $ | 2 | | $ | — | | $ | 49 | | $ | — | | $ | — | | $ | — | | $ | 122 | | $ | — | |
| Trading non-derivative assets | | | | | | | | | | | |
| Trading mortgage-backed securities | | | | | | | | | | | |
| U.S. government-sponsored agency guaranteed | 154 | | 6 | | — | | 1 | | (2) | | 42 | | (1) | | (13) | | — | | 187 | | 4 | |
| Residential | 128 | | 10 | | — | | 17 | | (9) | | 61 | | — | | (76) | | — | | 131 | | 15 | |
| Commercial | 69 | | 2 | | — | | 3 | | (34) | | 38 | | — | | (25) | | — | | 53 | | (6) | |
| Total trading mortgage-backed securities | $ | 351 | | $ | 18 | | $ | — | | $ | 21 | | $ | (45) | | $ | 141 | | $ | (1) | | $ | (114) | | $ | — | | $ | 371 | | $ | 13 | |
| U.S. Treasury and federal agency securities | $ | — | | $ | — | | $ | — | | $ | — | | $ | — | | $ | — | | $ | — | | $ | — | | $ | — | | $ | — | | $ | — | |
| State and municipal | 178 | | — | | — | | — | | — | | — | | — | | (1) | | — | | 177 | | — | |
| Foreign government | 39 | | 2 | | — | | — | | — | | — | | — | | (21) | | — | | 20 | | 1 | |
| Corporate | 378 | | 255 | | — | | 41 | | (5) | | 109 | | — | | (322) | | (2) | | 454 | | 55 | |
| Marketable equity securities | 127 | | 13 | | — | | (2) | | — | | 48 | | — | | (63) | | — | | 123 | | (28) | |
| Asset-backed securities | 1,429 | | 20 | | — | | 6 | | (15) | | 242 | | — | | (271) | | — | | 1,411 | | 10 | |
| Other trading assets | 1,042 | | 45 | | — | | 2 | | (135) | | 97 | | 6 | | (312) | | (5) | | 740 | | 6 | |
| Total trading non-derivative assets | $ | 3,544 | | $ | 353 | | $ | — | | $ | 68 | | $ | (200) | | $ | 637 | | $ | 5 | | $ | (1,104) | | $ | (7) | | $ | 3,296 | | $ | 57 | |
Trading derivatives, net(4) | | | | | | | | | | | |
| Interest rate contracts | $ | (116) | | $ | (68) | | $ | — | | $ | (59) | | $ | 137 | | $ | (21) | | $ | 19 | | $ | 8 | | $ | (9) | | $ | (109) | | $ | (101) | |
| Foreign exchange contracts | 46 | | (109) | | — | | 15 | | 9 | | — | | — | | (2) | | (56) | | (97) | | (124) | |
| Equity contracts | (1,345) | | 183 | | — | | (38) | | 100 | | 2 | | (88) | | (2) | | (6) | | (1,194) | | 193 | |
| Commodity contracts | 304 | | (243) | | — | | 9 | | (4) | | 66 | | — | | (12) | | 27 | | 147 | | (135) | |
| Credit derivatives | 34 | | 59 | | — | | (1) | | (38) | | — | | — | | 14 | | 18 | | 86 | | 10 | |
Total trading derivatives, net(4) | $ | (1,077) | | $ | (178) | | $ | — | | $ | (74) | | $ | 204 | | $ | 47 | | $ | (69) | | $ | 6 | | $ | (26) | | $ | (1,167) | | $ | (157) | |
| Investments | | | | | | | | | | | |
| Mortgage-backed securities | | | | | | | | | | | |
| U.S. government-sponsored agency guaranteed | $ | 32 | | $ | — | | $ | (1) | | $ | — | | $ | — | | $ | — | | $ | — | | $ | — | | $ | — | | $ | 31 | | $ | (1) | |
| Residential | — | | — | | — | | — | | — | | — | | — | | — | | — | | — | | — | |
| Commercial | — | | — | | — | | — | | — | | — | | — | | — | | — | | — | | — | |
| Total investment mortgage-backed securities | $ | 32 | | $ | — | | $ | (1) | | $ | — | | $ | — | | $ | — | | $ | — | | $ | — | | $ | — | | $ | 31 | | $ | (1) | |
| U.S. Treasury and federal agency securities | $ | — | | $ | — | | $ | — | | $ | — | | $ | — | | $ | — | | $ | — | | $ | — | | $ | — | | $ | — | | $ | — | |
| State and municipal | 910 | | — | | 42 | | 11 | | — | | 236 | | — | | (173) | | — | | 1,026 | | 48 | |
| Foreign government | 71 | | — | | 5 | | — | | — | | 17 | | — | | (16) | | — | | 77 | | 1 | |
| Corporate | 60 | | — | | — | | — | | — | | — | | — | | (4) | | — | | 56 | | — | |
| Marketable equity securities | — | | — | | — | | — | | — | | — | | — | | — | | — | | — | | — | |
| Asset-backed securities | 806 | | — | | 10 | | 1 | | (585) | | — | | — | | (173) | | — | | 59 | | 9 | |
| Other debt securities | — | | — | | — | | — | | — | | — | | — | | — | | — | | — | | — | |
| Non-marketable equity securities | 505 | | — | | (2) | | 6 | | — | | 3 | | — | | (64) | | — | | 448 | | (12) | |
| Total investments | $ | 2,384 | | $ | — | | $ | 54 | | $ | 18 | | $ | (585) | | $ | 256 | | $ | — | | $ | (430) | | $ | — | | $ | 1,697 | | $ | 45 | |
| | | | | | | | | | | | | | | | | | | | | | | | | | | | | | | | | | | |
| | | Net realized/unrealized
gains (losses) incl. in | | Transfers | | | | | | | Unrealized
gains
(losses)
still held(3) |
| In millions of dollars | Mar. 31, 2019 | Principal
transactions | Other(1)(2) | into
Level 3 | out of
Level 3 | Purchases | Issuances | Sales | Settlements | Jun. 30, 2019 | |
| Loans | $ | 373 | | $ | — | | $ | 63 | | $ | 3 | | $ | — | | $ | 5 | | $ | — | | $ | (25) | | $ | — | | $ | 419 | | $ | 174 | |
| Mortgage servicing rights | 551 | | — | | (37) | | — | | — | | — | | 16 | | — | | (22) | | 508 | | (34) | |
| Other financial assets measured on a recurring basis | — | | — | | 9 | | — | | 4 | | — | | (3) | | (4) | | (6) | | — | | — | |
| Liabilities | | | | | | | | | | | |
| Interest-bearing deposits | $ | 1,047 | | $ | — | | $ | (39) | | $ | 2 | | $ | (18) | | $ | — | | $ | 129 | | $ | — | | $ | (17) | | $ | 1,182 | | $ | (211) | |
| Securities loaned and sold under agreements to repurchase | 1,041 | | (42) | | — | | 2 | | — | | — | | — | | — | | — | | 1,085 | | (13) | |
| Trading account liabilities | | | | | | | | | | | |
| Securities sold, not yet purchased | 15 | | (6) | | — | | 15 | | (6) | | — | | — | | — | | (2) | | 28 | | (1) | |
| Other trading liabilities | — | | — | | — | | — | | — | | — | | — | | — | | — | | — | | — | |
| Short-term borrowings | 170 | | 2 | | — | | — | | (25) | | — | | 12 | | — | | (1) | | 154 | | (2) | |
| Long-term debt | 13,734 | | (819) | | — | | 747 | | (1,360) | | 20 | | 900 | | (1) | | 79 | | 14,938 | | (1,023) | |
| Other financial liabilities measured on a recurring basis | — | | — | | 4 | | 5 | | — | | — | | — | | — | | — | | 1 | | — | |
| | | | | | | | | | | |
(1)Changes in fair value of available-for-sale debt securities are recorded in AOCI, unless related to other-than-temporary impairment, while gains and losses from sales are recorded in Realized gains (losses) from sales of investments in the Consolidated Statement of Income.
(2)Unrealized gains (losses) on MSRs are recorded in Other revenue in the Consolidated Statement of Income.
(3)Represents the amount of total gains or losses for the period, included in earnings (and AOCI for changes in fair value of available-for-sale debt securities), attributable to the change in fair value relating to assets and liabilities classified as Level 3 that are still held at June 30, 2019.
(4)Total Level 3 trading derivative assets and liabilities have been netted in these tables for presentation purposes only.
| | | | | | | | | | | | | | | | | | | | | | | | | | | | | | | | | | | |
| | | Net realized/unrealized
gains/losses incl. in | | Transfers | | | | | | | Unrealized
gains/
losses
still held(3) |
| In millions of dollars | Dec. 31, 2018 | Principal
transactions | Other(1)(2) | into
Level 3 | out of
Level 3 | Purchases | Issuances | Sales | Settlements | Jun. 30, 2019 | |
| Assets | | | | | | | | | | | |
| Securities borrowed and purchased under agreements to resell | $ | 115 | | $ | 1 | | $ | — | | $ | 5 | | $ | (4) | | $ | 94 | | $ | — | | $ | — | | $ | (89) | | $ | 122 | | $ | 3 | |
| Trading non-derivative assets | | | | | | | | | | | |
| Trading mortgage-backed securities | | | | | | | | | | | |
| U.S. government-sponsored agency guaranteed | 156 | | 6 | | — | | 1 | | (27) | | 90 | | (1) | | (38) | | — | | 187 | | 7 | |
| Residential | 268 | | 11 | | — | | 22 | | (40) | | 130 | | — | | (260) | | — | | 131 | | 15 | |
| Commercial | 77 | | 4 | | — | | 5 | | (35) | | 62 | | — | | (60) | | — | | 53 | | (5) | |
| Total trading mortgage-backed securities | $ | 501 | | $ | 21 | | $ | — | | $ | 28 | | $ | (102) | | $ | 282 | | $ | (1) | | $ | (358) | | $ | — | | $ | 371 | | $ | 17 | |
| U.S. Treasury and federal agency securities | $ | 1 | | $ | — | | $ | — | | $ | — | | $ | — | | $ | — | | $ | — | | $ | — | | $ | (1) | | $ | — | | $ | — | |
| State and municipal | 200 | | (1) | | — | | — | | (19) | | 1 | | — | | (4) | | — | | 177 | | — | |
| Foreign government | 31 | | 1 | | — | | 9 | | — | | 3 | | — | | (24) | | — | | 20 | | 1 | |
| Corporate | 360 | | 345 | | — | | 62 | | (31) | | 178 | | (33) | | (425) | | (2) | | 454 | | 34 | |
| Marketable equity securities | 153 | | 3 | | — | | (1) | | (11) | | 57 | | — | | (78) | | — | | 123 | | (25) | |
| Asset-backed securities | 1,484 | | (6) | | — | | 13 | | (47) | | 463 | | — | | (496) | | — | | 1,411 | | 57 | |
| Other trading assets | 818 | | 50 | | — | | 15 | | (167) | | 437 | | 10 | | (414) | | (9) | | 740 | | (15) | |
| Total trading non-derivative assets | $ | 3,548 | | $ | 413 | | $ | — | | $ | 126 | | $ | (377) | | $ | 1,421 | | $ | (24) | | $ | (1,799) | | $ | (12) | | $ | 3,296 | | $ | 69 | |
Trading derivatives, net(4) | | | | | | | | | | | |
| Interest rate contracts | $ | (154) | | $ | (119) | | $ | — | | $ | (74) | | $ | 164 | | $ | (15) | | $ | 31 | | $ | 8 | | $ | 50 | | $ | (109) | | $ | (85) | |
| Foreign exchange contracts | (6) | | (49) | | — | | — | | 24 | | 3 | | — | | (6) | | (63) | | (97) | | (165) | |
| Equity contracts | (784) | | (111) | | — | | (192) | | 109 | | 1 | | (147) | | — | | (70) | | (1,194) | | (338) | |
| Commodity contracts | (18) | | 37 | | — | | 6 | | 6 | | 120 | | — | | (46) | | 42 | | 147 | | 153 | |
| Credit derivatives | 61 | | (260) | | — | | (19) | | 194 | | — | | — | | 14 | | 96 | | 86 | | (335) | |
Total trading derivatives, net(4) | $ | (901) | | $ | (502) | | $ | — | | $ | (279) | | $ | 497 | | $ | 109 | | $ | (116) | | $ | (30) | | $ | 55 | | $ | (1,167) | | $ | (770) | |
| Investments | | | | | | | | | | | |
| Mortgage-backed securities | | | | | | | | | | | |
| U.S. government-sponsored agency guaranteed | $ | 32 | | $ | — | | $ | (1) | | $ | — | | $ | — | | $ | — | | $ | — | | $ | — | | $ | — | | $ | 31 | | $ | (3) | |
| Residential | — | | — | | — | | — | | — | | — | | — | | — | | — | | — | | — | |
| Commercial | — | | — | | — | | — | | — | | — | | — | | — | | — | | — | | — | |
| Total investment mortgage-backed securities | $ | 32 | | $ | — | | $ | (1) | | $ | — | | $ | — | | $ | — | | $ | — | | $ | — | | $ | — | | $ | 31 | | $ | (3) | |
| U.S. Treasury and federal agency securities | $ | — | | $ | — | | $ | — | | $ | — | | $ | — | | $ | — | | $ | — | | $ | — | | $ | — | | $ | — | | $ | — | |
| State and municipal | 708 | | — | | 94 | | 14 | | — | | 421 | | — | | (211) | | — | | 1,026 | | 84 | |
| Foreign government | 68 | | — | | 1 | | — | | — | | 56 | | — | | (48) | | — | | 77 | | 1 | |
| Corporate | 156 | | — | | — | | — | | (94) | | — | | — | | (6) | | — | | 56 | | — | |
| Marketable equity securities | — | | — | | — | | — | | — | | — | | — | | — | | — | | — | | — | |
| Asset-backed securities | 187 | | — | | 8 | | 95 | | (585) | | 550 | | — | | (196) | | — | | 59 | | 9 | |
| Other debt securities | — | | — | | — | | — | | — | | — | | — | | — | | — | | — | | — | |
| Non-marketable equity securities | 586 | | — | | 20 | | 6 | | — | | 7 | | — | | (150) | | (21) | | 448 | | (15) | |
| Total investments | $ | 1,737 | | $ | — | | $ | 122 | | $ | 115 | | $ | (679) | | $ | 1,034 | | $ | — | | $ | (611) | | $ | (21) | | $ | 1,697 | | $ | 76 | |
Table continues on the next page.
| | | | | | | | | | | | | | | | | | | | | | | | | | | | | | | | | | | |
| | | Net realized/unrealized
gains (losses) incl. in | | Transfers | | | | | | | Unrealized
gains
(losses)
still held(3) |
| In millions of dollars | Dec. 31, 2018 | Principal
transactions | Other(1)(2) | into
Level 3 | out of
Level 3 | Purchases | Issuances | Sales | Settlements | Jun. 30, 2019 | |
| Loans | $ | 277 | | $ | — | | $ | 108 | | $ | 128 | | $ | (70) | | $ | 11 | | $ | — | | $ | (35) | | $ | — | | $ | 419 | | $ | 294 | |
| Mortgage servicing rights | 584 | | — | | (64) | | — | | — | | — | | 28 | | — | | (40) | | 508 | | (60) | |
| Other financial assets measured on a recurring basis | — | | — | | 25 | | — | | 4 | | — | | (5) | | (8) | | (16) | | — | | — | |
| Liabilities | | | | | | | | | | | |
| Interest-bearing deposits | $ | 495 | | $ | — | | $ | (49) | | $ | 3 | | $ | (22) | | $ | — | | $ | 803 | | $ | — | | $ | (146) | | $ | 1,182 | | $ | (182) | |
| Securities loaned and sold under agreements to repurchase | 983 | | (38) | | — | | 1 | | 4 | | — | | — | | 1 | | 58 | | 1,085 | | (24) | |
| Trading account liabilities | | | | | | | | | | | |
| Securities sold, not yet purchased | 586 | | 118 | | — | | 16 | | (447) | | — | | — | | — | | (9) | | 28 | | — | |
| Other trading liabilities | — | | — | | — | | — | | — | | — | | — | | — | | — | | — | | — | |
| Short-term borrowings | 37 | | 25 | | — | | 9 | | (31) | | — | | 165 | | — | | (1) | | 154 | | (2) | |
| Long-term debt | 12,570 | | (1,226) | | — | | 1,624 | | (2,961) | | 20 | | 6,850 | | (4) | | (4,387) | | 14,938 | | (769) | |
| Other financial liabilities measured on a recurring basis | — | | — | | 4 | | 5 | | — | | — | | — | | — | | — | | 1 | | — | |
| | | | | | | | | | | |
(1)Changes in fair value of available-for-sale debt securities are recorded in AOCI, unless related to other-than-temporary impairment, while gains and losses from sales are recorded in Realized gains (losses) from sales of investments in the Consolidated Statement of Income.
(2)Unrealized gains (losses) on MSRs are recorded in Other revenue in the Consolidated Statement of Income.
(3)Represents the amount of total gains or losses for the period, included in earnings (and AOCI for changes in fair value of available-for-sale debt securities), attributable to the change in fair value relating to assets and liabilities classified as Level 3 that are still held at June 30, 2019.
(4)Total Level 3 trading derivative assets and liabilities have been netted in these tables for presentation purposes only.
Level 3 Fair Value Rollforward
The following were the significant Level 3 transfers for the period December 31, 2019 to June 30, 2020:
•During the six months ended June 30, 2020, transfers of Interest rate contracts of $1.6 billion from Level 2 to Level 3 were due to interest rate option volatility becoming an unobservable and/or significant input relative to the overall valuation of the related interest rate derivatives.
•During the three and six months ended June 30, 2020, $1.4 billion and $4.6 billion of Long-term debt containing embedded derivatives was transferred from Level 2 to Level 3, as a result of interest rate option volatility, equity correlation and credit derivative inputs becoming unobservable and/or significant relative to the overall valuation of certain structured long-term debt products. In other instances, market changes resulted in unobservable volatility inputs becoming insignificant to the overall valuation of the instrument (e.g., when an option becomes deep-in or deep-out of the money). This has resulted in $1.3 billion and $2.8 billion of certain structured long-term debt products being transferred from Level 3 to Level 2 during the three and six months ended June 30, 2020, respectively.
The following were the significant Level 3 transfers for the period December 31, 2018 to June 30, 2019:
•During the three and six months ended June 30, 2019, transfers of Long-term debt of $0.7 billion and $1.6 billion from Level 2 to Level 3, and of $1.4 billion and $3.0 billion from Level 3 to Level 2, mainly related to structured debt, reflecting changes in the significance of unobservable inputs as well as certain underlying market inputs becoming less or more observable.
Valuation Techniques and Inputs for Level 3 Fair Value
Measurements
The following tables present the valuation techniques covering the majority of Level 3 inventory and the most significant unobservable inputs used in Level 3 fair value measurements. Differences between this table and amounts presented in the Level 3 Fair Value Rollforward table represent individually immaterial items that have been measured using a variety of valuation techniques other than those listed.
| | | | | | | | | | | | | | | | | | | | |
| As of June 30, 2020 | Fair value(1) (in millions) | Methodology | Input | Low(2)(3) | High(2)(3) | Weighted average(4) |
| Assets | | | | | | |
| Securities borrowed and purchased under agreements to resell | $ | 326 | | Model-based | Credit spread | 15 bps | 15 bps | 15 bps |
| | | Interest rate | 0.13 | % | 1.66 | % | 0.42 | % |
| Mortgage-backed securities | $ | 473 | | Price-based | Price | $ | 25.35 | | $ | 119.20 | | $ | 87.92 | |
| 280 | | Yield analysis | Yield | 1.72 | % | 18.44 | % | 8.29 | % |
| State and municipal, foreign government, corporate and other debt securities | $ | 1,346 | | Price-based | Price | $ | — | | $ | 120.46 | | $ | 83.83 | |
| 923 | | Model-based | Credit spread | 35 bps | 349 bps | 222 bps |
Marketable equity securities(5) | $ | 60 | | Price-based | Price | $ | 0.14 | | $ | 23,250 | | $ | 1,367 | |
| 32 | | Model-based | Recovery (in millions) | $ | 5,450 | | $ | 5,450 | | $ | 5,450 | |
| | | WAL | 0.99 years | 0.99 years | 0.99 years |
| Asset-backed securities | $ | 1,273 | | Price-based | Price | $ | 1.87 | | $ | 100.00 | | $ | 59.54 | |
| 518 | | Yield analysis | Yield | 2.94 | % | 16.68 | % | 8.27 | % |
| Non-marketable equities | $ | 188 | | Comparables analysis | Price | $ | 12.36 | | $ | 1,871 | | $ | 1,039 | |
| 74 | | Price-based | Illiquidity discount | $ | 10.00 | | $ | 45.00 | | $ | 24.93 | |
| 68 | Model-based | Revenue multiple | 1.00x | 10.00x | 4.00x |
| | | PE ratio | 10.00x | 26.00x | 17.00x |
| | | Appraised value (in thousands) | $ | 865 | | $ | 27,608 | | $ | 17,324 | |
| | | Discount to price | — | % | — | % | — | % |
| | | | | | |
| | | Price to book ratio | 0.60x | 1.60x | 0.93x |
Derivatives—gross(6) | | | | | | |
| Interest rate contracts (gross) | $ | 5,408 | | Model-based | Inflation volatility | 0.25 | % | 2.83 | % | 0.78 | % |
| | | IR normal volatility | 0.16 | % | 0.84 | % | 0.57 | % |
| Foreign exchange contracts (gross) | $ | 1,115 | | Model-based | FX volatility | 0.30 | % | 15.28 | % | 6.71 | % |
| | | Credit spread | 60 bps | 699 bps | 455 bps |
| | | FX rate | $ | 4.87 | | $ | 86.03 | | $ | 43.49 | |
| | | IR normal volatility | 0.16 | % | 0.84 | % | 0.61 | % |
| | | IR-FX correlation | 40.00 | % | 60.00 | % | 50.00 | % |
| | | IR-IR correlation | (21.71) | % | 40.00 | % | 35.11 | % |
| | | Interest rate | 0.75 | % | 71.38 | % | 13.15 | % |
| | | | | | |
| | | | | | |
| | | | | | |
Equity contracts (gross)(7) | $ | 3,402 | | Model-based | Equity volatility | 3.85 | % | 72.24 | % | 33.69 | % |
| | | Forward price | 63.19 | % | 106.16 | % | 91.95 | % |
| | | | | | |
| | | | | | |
| | | | | | | | | | | | | | | | | | | | |
| As of June 30, 2020 | Fair value(1) (in millions) | Methodology | Input | Low(2)(3) | High(2)(3) | Weighted average(4) |
| Commodity and other contracts (gross) | $ | 2,250 | | Model-based | Forward price | 36.19 | % | 356.52 | % | 99.68 | % |
| | | Commodity volatility | (4.19) | % | 98.96 | % | 8.33 | % |
| | | Commodity correlation | (40.72) | % | 90.33 | % | 65.73 | % |
| Credit derivatives (gross) | $ | 2,185 | | Model-based | Credit spread | 13 bps | 608 bps | 117 bps |
| 483 | | Price-based | Credit correlation | 20.00 | % | 85.00 | % | 40.17 | % |
| | | Recovery rate | 10.00 | % | 65.00 | % | 38.87 | % |
| | | Upfront points | 2.50 | % | 100.00 | % | 53.93 | % |
| | | | | | |
| Loans and leases | $ | 917 | | Model-based | Equity volatility | 23.67 | % | 84.79 | % | 64.08 | % |
| | | Credit spread | 47 bps | 47 bps | 47 bps |
| Mortgage servicing rights | $ | 274 | | Cash flow | Yield | — | % | 14.28 | % | 2.85 | % |
| 71 | | Model-based | WAL | 2.89 years | 5.26 years | 4.00 years |
| Liabilities | | | | | | |
| Interest-bearing deposits | $ | 237 | | Model-based | IR normal volatility | 0.20 | % | 0.84 | % | 0.59 | % |
| | | Forward price | 96.40 | % | 103.26 | % | 99.76 | % |
| Securities loaned and sold under agreement to repurchase | $ | 625 | | Model-based | Interest rate | 0.13 | % | 1.66 | % | 0.78 | % |
| Trading account liabilities | | | | | | |
| Securities sold, not yet purchased | $ | 59 | | Price-based | Price | $ | 0.14 | | $ | 865.86 | | $ | 85.74 | |
| | | | | | |
| 45 | | Model-based | IR Lognormal volatility | 52.16 | % | 107.54 | % | 86.92 | % |
| | | Interest rate | 9.57 | % | 27.68 | % | 11.98 | % |
| Short-term borrowings and long-term debt | $ | 21,761 | | Model-based | IR normal volatility | 0.16 | % | 0.84 | % | 0.56 | % |
| | | Forward price | 36.19 | % | 356.52 | % | 93.95 | % |
| | | | | | | | | | | | | | | | | | | | |
| As of December 31, 2019 | Fair value(1) (in millions) | Methodology | Input | Low(2)(3) | High(2)(3) | Weighted average(4) |
| Assets | | | | | | |
| Securities borrowed and purchased under agreements to resell | $ | 303 | | Model-based | Credit spread | 15 bps | 15 bps | 15 bps |
| | | Interest rate | 1.59 | % | 3.67 | % | 2.72 | % |
| Mortgage-backed securities | $ | 196 | | Price-based | Price | $ | 36 | | $ | 505 | | $ | 97 | |
| 22 | | Model-based | | | | |
| State and municipal, foreign government, corporate and other debt securities | $ | 880 | | Model-based | Price | $ | — | | $ | 1,238 | | $ | 90 | |
| 677 | | Price-based | Credit spread | 35 bps | 295 bps | 209 bps |
Marketable equity securities(5) | $ | 70 | | Price-based | Price | $ | — | | $ | 38,500 | | $ | 2,979 | |
| 30 | | Model-based | WAL | 1.48 years | 1.48 years | 1.48 years |
| | | Recovery (in millions) | $ | 5,450 | | $ | 5,450 | | $ | 5,450 | |
| Asset-backed securities | $ | 812 | | Price-based | Price | $ | 4 | | $ | 103 | | $ | 60 | |
| 368 | | Yield analysis | Yield | 0.61 | % | 23.38 | % | 8.88 | % |
| Non-marketable equities | $ | 316 | | Comparables analysis | EBITDA multiples | 7.00x | 17.95x | 10.34x |
| 97 | | Price-based | Appraised value (in thousands) | $ | 397 | | $ | 33,246 | | $ | 8,446 | |
| | | | | | | | | | | | | | | | | | | | |
| As of December 31, 2019 | Fair value(1) (in millions) | Methodology | Input | Low(2)(3) | High(2)(3) | Weighted average(4) |
| | | Price | $ | 3 | | $ | 2,019 | | $ | 1,020 | |
| | | PE ratio | 14.70x | 28.70x | 20.54x |
| | | Price to book ratio | 1.50x | 3.00x | 1.88x |
| | | Discount to price | — | % | 10.00 | % | 2.32 | % |
Derivatives—gross(6) | | | | | | |
| Interest rate contracts (gross) | $ | 2,196 | | Model-based | Inflation volatility | 0.21 | % | 2.74 | % | 0.79 | % |
| | | Mean reversion | 1.00 | % | 20.00 | % | 10.50 | % |
| | | IR normal volatility | 0.09 | % | 0.66 | % | 0.53 | % |
| Foreign exchange contracts (gross) | $ | 1,099 | | Model-based | FX volatility | 1.27 | % | 12.16 | % | 9.17 | % |
| | | IR normal volatility | 0.27 | % | 0.66 | % | 0.58 | % |
| | | FX rate | 37.39 | % | 586.84 | % | 80.64 | % |
| | | Interest rate | 2.72 | % | 56.14 | % | 13.11 | % |
| | | IR-IR correlation | (51.00) | % | 40.00 | % | 32.00 | % |
| | | IR-FX correlation | 40.00 | % | 60.00 | % | 50.00 | % |
Equity contracts (gross)(7) | $ | 2,076 | | Model-based | Equity volatility | 3.16 | % | 52.80 | % | 28.43 | % |
| | | Forward price | 62.60 | % | 112.69 | % | 98.46 | % |
| | | WAL | 1.48 years | 1.48 years | 1.48 years |
| | | Recovery
(in millions) | $ | 5,450 | | $ | 5,450 | | $ | 5,450 | |
| Commodity and other contracts (gross) | $ | 1,487 | | Model-based | Forward price | 37.62 | % | 362.57 | % | 119.32 | % |
| | | Commodity
volatility | 5.25 | % | 93.63 | % | 23.55 | % |
| | | Commodity
correlation | (39.65) | % | 87.81 | % | 41.80 | % |
| Credit derivatives (gross) | $ | 613 | | Model-based | Credit spread | 8 bps | 283 bps | 80 bps |
| 341 | | Price-based | Upfront points | 2.59 | % | 99.94 | % | 59.41 | % |
| | | Price | $ | 12 | | $ | 100 | | $ | 87 | |
| | | Credit
correlation | 25.00 | % | 87.00 | % | 48.57 | % |
| | | Recovery rate | 20.00 | % | 65.00 | % | 48.00 | % |
| | | | | | |
| | | | | | |
| | | | | | |
| | | | | | |
| Loans and leases | $ | 378 | | Model-based | Credit spread | 9 bps | 52 bps | 48 bps |
| | | Equity volatility | 32.00 | % | 32.00 | % | 32.00 | % |
| | | | | | |
| Mortgage servicing rights | $ | 418 | | Cash flow | Yield | 1.78 | % | 12.00 | % | 9.49 | % |
| 77 | | Model-based | WAL | 4.07 years | 8.13 years | 6.61 years |
| Liabilities | | | | | | |
| Interest-bearing deposits | $ | 215 | | Model-based | Mean reversion | 1.00 | % | 20.00 | % | 10.50 | % |
| | | Forward price | 97.59 | % | 111.06 | % | 102.96 | % |
| | | | | | |
| Securities loaned and sold under agreements to repurchase | $ | 757 | | Model-based | Interest rate | 1.59 | % | 2.38 | % | 1.95 | % |
| Trading account liabilities | | | | | | |
| Securities sold, not yet purchased | $ | 46 | | Price-based | Price | $ | — | | $ | 866 | | $ | 96 | |
| | | | | | |
| | | | | | |
| | | | | | |
| | | | | | |
| | | | | | |
| | | | | | |
| Short-term borrowings and long-term debt | $ | 17,182 | | Model-based | Mean reversion | 1.00 | % | 20.00 | % | 10.50 | % |
| | | IR normal volatility | 0.09 | % | 0.66 | % | 0.46 | % |
| | | Forward price | 37.62 | % | 362.57 | % | 97.52 | % |
| | | | | | | | | | | | | | | | | | | | |
| As of December 31, 2019 | Fair value(1) (in millions) | Methodology | Input | Low(2)(3) | High(2)(3) | Weighted average(4) |
| | | Equity-IR
Correlation | 15.00 | % | 44.00 | % | 32.66 | % |
(1)The fair value amounts presented in these tables represent the primary valuation technique or techniques for each class of assets or liabilities.
(2)Some inputs are shown as zero due to rounding.
(3)When the low and high inputs are the same, there is either a constant input applied to all positions, or the methodology involving the input applies to only one large position.
(4)Weighted averages are calculated based on the fair values of the instruments.
(5)For equity securities, the price inputs are expressed on an absolute basis, not as a percentage of the notional amount.
(6)Both trading and non-trading account derivatives—assets and liabilities—are presented on a gross absolute value basis.
(7)Includes hybrid products.
Items Measured at Fair Value on a Nonrecurring Basis
Certain assets and liabilities are measured at fair value on a nonrecurring basis and, therefore, are not included in the tables above. These include assets measured at cost that have been written down to fair value during the periods as a result of an impairment. These also include non-marketable equity securities that have been measured using the measurement alternative and are either (i) written down to fair value during the periods as a result of an impairment or (ii) adjusted upward or downward to fair value as a result of a transaction observed during the periods for the identical or similar investment of the same issuer. In addition, these assets include loans held-for-sale and other real estate owned that are measured at the lower of cost or market value.
The following tables present the carrying amounts of all assets that were still held for which a nonrecurring fair value measurement was recorded:
| | | | | | | | | | | |
| In millions of dollars | Fair value | Level 2 | Level 3 |
| June 30, 2020 | | | |
Loans HFS(1) | $ | 4,680 | | $ | 493 | | $ | 4,187 | |
| Other real estate owned | 15 | | 8 | | 7 | |
Loans(2) | 990 | | 556 | | 434 | |
| | | |
| Non-marketable equity securities measured using the measurement alternative | 336 | | 336 | | — | |
| Total assets at fair value on a nonrecurring basis | $ | 6,021 | | $ | 1,393 | | $ | 4,628 | |
| | | | | | | | | | | |
| In millions of dollars | Fair value | Level 2 | Level 3 |
| December 31, 2019 | | | |
Loans HFS(1) | $ | 4,579 | | $ | 3,249 | | $ | 1,330 | |
| Other real estate owned | 20 | | 6 | | 14 | |
Loans(2) | 344 | | 93 | | 251 | |
| Non-marketable equity securities measured using the measurement alternative | 249 | | 249 | | — | |
| Total assets at fair value on a nonrecurring basis | $ | 5,192 | | $ | 3,597 | | $ | 1,595 | |
(1)Net of fair value amounts on the unfunded portion of loans HFS recognized as Other liabilities on the Consolidated Balance Sheet.
(2)Represents impaired loans held for investment whose carrying amount is based on the fair value of the underlying collateral less costs to sell, primarily real estate.
Valuation Techniques and Inputs for Level 3 Nonrecurring Fair Value Measurements
The following tables present the valuation techniques covering the majority of Level 3 nonrecurring fair value measurements and the most significant unobservable inputs used in those measurements:
| | | | | | | | | | | | | | | | | | | | |
| As of June 30, 2020 | Fair value(1) (in millions) | Methodology | Input | Low(2) | High | Weighted average(3) |
| Loans held-for-sale | $ | 4,040 | | Price-based | Price | $ | 86.83 | | $ | 100.00 | | $ | 95.43 | |
| Other real estate owned | $ | 4 | | Price-based | Appraised value(4) | $ | 186,787 | | $ | 2,339,180 | | $ | 1,540,644 | |
| 3 | | Recovery analysis | Price | 49.77 | | 49.77 | | 49.77 | |
Loans(5) | $ | 157 | | Price-based | Price | $ | 2.25 | | $ | 48.00 | | $ | 20.46 | |
| 125 | | Cash flow | Cost of capital | 52.30 | % | 100.00 | % | 85.14 | % |
| 75 | | Recovery analysis | Recovery rate | 5.80 | % | 100.00 | % | 26.68 | % |
| | | | | | | | | | | | | | | | | | | | |
| As of December 31, 2019 | Fair value(1) (in millions) | Methodology | Input | Low(2) | High | Weighted average(3) |
| Loans held-for-sale | $ | 1,320 | | Price-based | Price | $ | 86 | | $ | 100 | | $ | 99 | |
| Other real estate owned | $ | 11 | | Price-based | Appraised value(4) | $ | 2,297,358 | | $ | 8,394,102 | | $ | 5,615,884 | |
| 5 | | Recovery analysis | | | | |
| | | | | | |
| | | | | | |
Loans(6) | $ | 100 | | Recovery analysis | Recovery rate | 0.57 | % | 100.00 | % | 64.78 | % |
| 54 | | Cash flow | Price | $ | 2 | | $ | 54 | | $ | 27 | |
| 47 | | Price-based | Cost of capital | 0.10 | % | 100.00 | % | 54.84 | % |
| 29 | | Price-based | Appraised value(4) | $ | 17,521,218 | | $ | 43,646,426 | | $ | 30,583,822 | |
| | | | | | |
| | | | | | |
| | | | | | |
| | | | | | |
(1)The fair value amounts presented in this table represent the primary valuation technique or techniques for each class of assets or liabilities.
(2)Some inputs are shown as zero due to rounding.
(3)Weighted averages are calculated based on the fair values of the instruments.
(4)Appraised values are disclosed in whole dollars.
(5)Represents impaired loans held for investment whose carrying amounts are based on the fair value of the underlying collateral, primarily real estate secured loans.
(6)Includes estimated costs to sell.
Nonrecurring Fair Value Changes
The following tables present total nonrecurring fair value measurements for the period, included in earnings, attributable to the change in fair value relating to assets that were still held:
| | | | | | | | |
| Three Months Ended June 30, | |
| In millions of dollars | 2020 | 2019 |
| Loans HFS | $ | 32 | | $ | (14) | |
| Other real estate owned | (1) | | (1) | |
Loans(1) | (266) | | (44) | |
| Non-marketable equity securities measured using the measurement alternative | (52) | | 4 | |
| | |
| Total nonrecurring fair value gains (losses) | $ | (287) | | $ | (55) | |
(1)Represents loans held for investment whose carrying amount is based on the fair value of the underlying collateral, primarily real estate.
| | | | | | | | |
| Six Months Ended June 30, | |
| In millions of dollars | 2020 | 2019 |
| Loans HFS | $ | (198) | | $ | (1) | |
| Other real estate owned | (1) | | — | |
Loans(1) | (189) | | (62) | |
| Non-marketable equity securities measured using the measurement alternative | (29) | | 65 | |
| | |
| Total nonrecurring fair value gains (losses) | $ | (417) | | $ | 2 | |
| | |
(1)Represents loans held for investment whose carrying amount is based on the fair value of the underlying collateral, primarily real estate.
Estimated Fair Value of Financial Instruments Not Carried at Fair Value
The following table presents the carrying value and fair value of Citigroup’s financial instruments that are not carried at fair value. The table below therefore excludes items measured at fair value on a recurring basis presented in the tables above.
| | | | | | | | | | | | | | | | | |
| | June 30, 2020 | | Estimated fair value | | |
| | Carrying
value | Estimated
fair value | | | |
| In billions of dollars | | | Level 1 | Level 2 | Level 3 |
| Assets | | | | | |
| Investments | $ | 89.1 | | $ | 91.8 | | $ | 1.2 | | $ | 88.1 | | $ | 2.5 | |
| Securities borrowed and purchased under agreements to resell | 108.4 | | 108.4 | | — | | 107.6 | | 0.8 | |
Loans(1)(2) | 652.1 | | 677.5 | | — | | 3.0 | | 674.5 | |
Other financial assets(2)(3) | 389.7 | | 389.7 | | 294.4 | | 15.4 | | 79.9 | |
| Liabilities | | | | | |
| Deposits | $ | 1,231.2 | | $ | 1,231.5 | | $ | — | | $ | 1,028.1 | | $ | 203.4 | |
| Securities loaned and sold under agreements to repurchase | 156.3 | | 156.3 | | — | | 156.3 | | — | |
Long-term debt(4) | 217.8 | | 223.9 | | — | | 197.5 | | 26.4 | |
Other financial liabilities(5) | 113.9 | | 113.9 | | — | | 19.1 | | 94.8 | |
| | | | | | | | | | | | | | | | | |
| | December 31, 2019 | | Estimated fair value | | |
| | Carrying
value | Estimated
fair value | | | |
| In billions of dollars | | | Level 1 | Level 2 | Level 3 |
| Assets | | | | | |
| Investments | $ | 86.4 | | $ | 87.8 | | $ | 1.9 | | $ | 83.8 | | $ | 2.1 | |
| Securities borrowed and purchased under agreements to resell | 98.1 | | 98.1 | | — | | 98.1 | | — | |
Loans(1)(2) | 681.2 | | 677.7 | | — | | 4.7 | | 673.0 | |
Other financial assets(2)(3) | 262.4 | | 262.4 | | 177.6 | | 16.3 | | 68.5 | |
| Liabilities | | | | | |
| Deposits | $ | 1,068.3 | | $ | 1,066.7 | | $ | — | | $ | 875.5 | | $ | 191.2 | |
| Securities loaned and sold under agreements to repurchase | 125.7 | | 125.7 | | — | | 125.7 | | — | |
Long-term debt(4) | 193.0 | | 203.8 | | — | | 187.3 | | 16.5 | |
Other financial liabilities(5) | 110.2 | | 110.2 | | — | | 37.5 | | 72.7 | |
(1)The carrying value of loans is net of the Allowance for loan losses of $26.4 billion for June 30, 2020 and $12.8 billion for December 31, 2019. In addition, the carrying values exclude $0.9 billion and $1.4 billion of lease finance receivables at June 30, 2020 and December 31, 2019, respectively.
(2)Includes items measured at fair value on a nonrecurring basis.
(3)Includes cash and due from banks, deposits with banks, brokerage receivables, reinsurance recoverables and other financial instruments included in Other assets on the Consolidated Balance Sheet, for all of which the carrying value is a reasonable estimate of fair value.
(4)The carrying value includes long-term debt balances under qualifying fair value hedges.
(5)Includes brokerage payables, separate and variable accounts, short-term borrowings (carried at cost) and other financial instruments included in Other liabilities on the Consolidated Balance Sheet, for all of which the carrying value is a reasonable estimate of fair value.
The estimated fair values of the Company’s corporate unfunded lending commitments at June 30, 2020 and December 31, 2019 were liabilities of $14.4 billion and $5.1 billion, respectively, substantially all of which are classified as Level 3. The Company does not estimate the fair values of
consumer unfunded lending commitments, which are generally cancellable by providing notice to the borrower.
21. FAIR VALUE ELECTIONS
The Company may elect to report most financial instruments and certain other items at fair value on an instrument-by-instrument basis with changes in fair value reported in earnings, other than DVA (see below). The election is made upon the initial recognition of an eligible financial asset, financial liability or firm commitment or when certain specified reconsideration events occur. The fair value election may not otherwise be revoked once an election is made. The
changes in fair value are recorded in current earnings, other than DVA, which is reported in AOCI. Additional discussion regarding the applicable areas in which fair value elections were made is presented in Note 20 to the Consolidated Financial Statements.
The Company has elected fair value accounting for its mortgage servicing rights (MSRs). See Note 18 to the Consolidated Financial Statements for further discussions regarding the accounting and reporting of MSRs.
The following table presents the changes in fair value of those items for which the fair value option has been elected:
| | | | | | | | | | | | | | |
| Changes in fair value—gains (losses) | | | |
| | Three Months Ended June 30, | | Six Months Ended June 30, | |
| In millions of dollars | 2020 | 2019 | 2020 | 2019 |
| Assets | | | | |
| Securities borrowed and purchased under agreements to resell | $ | (48) | | $ | 6 | | $ | 44 | | $ | 35 | |
| Trading account assets | 373 | | 45 | | (461) | | 212 | |
| Investments | — | | — | | — | | — | |
| Loans | | | | |
| Certain corporate loans | (154) | | (80) | | (1,017) | | (213) | |
| Certain consumer loans | (1) | | — | | — | | — | |
| Total loans | $ | (155) | | $ | (80) | | $ | (1,017) | | $ | (213) | |
| Other assets | | | | |
| MSRs | $ | (26) | | $ | (37) | | $ | (169) | | $ | (64) | |
Certain mortgage loans HFS(1) | 72 | | 21 | | 134 | | 37 | |
| Total other assets | $ | 46 | | $ | (16) | | $ | (35) | | $ | (27) | |
| Total assets | $ | 216 | | $ | (45) | | $ | (1,469) | | $ | 7 | |
| Liabilities | | | | |
| Interest-bearing deposits | $ | (164) | | $ | (43) | | $ | (52) | | $ | (134) | |
| Securities loaned and sold under agreements to repurchase | 196 | | 51 | | (92) | | 86 | |
| Trading account liabilities | 44 | | 2 | | (17) | | 13 | |
Short-term borrowings(2) | (259) | | 94 | | 997 | | (81) | |
Long-term debt(2) | (5,402) | | (1,113) | | 1,963 | | (3,794) | |
| Total liabilities | $ | (5,585) | | $ | (1,009) | | $ | 2,799 | | $ | (3,910) | |
(1)Includes gains (losses) associated with interest rate lock commitments for those loans that have been originated and elected under the fair value option.
(2)Includes DVA that is included in AOCI. See Notes 17 and 20 to the Consolidated Financial Statements.
Own Debt Valuation Adjustments (DVA)
Own debt valuation adjustments are recognized on Citi’s liabilities for which the fair value option has been elected using Citi’s credit spreads observed in the bond market. Changes in fair value of fair value option liabilities related to changes in Citigroup’s own credit spreads (DVA) are reflected as a component of AOCI.
Among other variables, the fair value of liabilities for which the fair value option has been elected (other than non-recourse debt and similar liabilities) is impacted by the narrowing or widening of the Company’s credit spreads.
The estimated changes in the fair value of these non-derivative liabilities due to such changes in the Company’s own credit spread (or instrument-specific credit risk) were a loss of $2,935 million and a gain of $3 million for the three months ended June 30, 2020 and 2019, and a gain of $1,253 million and a loss of $722 million for the six months ended June 30, 2020 and 2019, respectively. Changes in fair value resulting from changes in instrument-specific credit risk were estimated by incorporating the Company’s current credit spreads observable in the bond market into the relevant valuation technique used to value each liability as described above.
The Fair Value Option for Financial Assets and Financial Liabilities
Selected Portfolios of Securities Purchased Under Agreements to Resell, Securities Borrowed, Securities Sold Under Agreements to Repurchase, Securities Loaned and Certain Uncollateralized Short-Term Borrowings
The Company elected the fair value option for certain portfolios of fixed income securities purchased under agreements to resell and fixed income securities sold under agreements to repurchase, securities borrowed, securities loaned and certain uncollateralized short-term borrowings held primarily by broker-dealer entities in the United States, the United Kingdom and Japan. In each case, the election was made because the related interest rate risk is managed on a portfolio basis, primarily with offsetting derivative instruments that are accounted for at fair value through earnings.
Changes in fair value for transactions in these portfolios are recorded in Principal transactions. The related interest revenue and interest expense are measured based on the contractual rates specified in the transactions and are reported as Interest revenue and Interest expense in the Consolidated Statement of Income.
Certain Loans and Other Credit Products
Citigroup has also elected the fair value option for certain other originated and purchased loans, including certain unfunded loan products, such as guarantees and letters of credit, executed by Citigroup’s lending and trading businesses. None of these credit products are highly leveraged financing commitments. Significant groups of transactions include loans and unfunded loan products that are expected to be either sold or securitized in the near term, or transactions where the economic risks are hedged with derivative instruments, such as purchased credit default swaps or total return swaps where the Company pays the total return on the underlying loans to a third party. Citigroup has elected the fair value option to mitigate accounting mismatches in cases where hedge accounting is complex and to achieve operational simplifications. Fair value was not elected for most lending transactions across the Company.
The following table provides information about certain credit products carried at fair value:
| | | | | | | | | | | | | | |
| | June 30, 2020 | | December 31, 2019 | |
| In millions of dollars | Trading assets | Loans | Trading assets | Loans |
| Carrying amount reported on the Consolidated Balance Sheet | $ | 7,851 | | $ | 5,799 | | $ | 8,320 | | $ | 4,086 | |
| Aggregate unpaid principal balance in excess of (less than) fair value | 420 | | 174 | | 410 | | 315 | |
| Balance of non-accrual loans or loans more than 90 days past due | — | | 1 | | — | | 1 | |
| Aggregate unpaid principal balance in excess of (less than) fair value for non-accrual loans or loans more than 90 days past due | — | | — | | — | | — | |
In addition to the amounts reported above, $1,068 million and $1,062 million of unfunded commitments related to certain credit products selected for fair value accounting were outstanding as of June 30, 2020 and December 31, 2019, respectively.
Changes in the fair value of funded and unfunded credit products are classified in Principal transactions in Citi’s Consolidated Statement of Income. Related interest revenue is measured based on the contractual interest rates and reported as Interest revenue on Trading account assets or loan interest depending on the balance sheet classifications of the credit products. The changes in fair value for the six months ended June 30, 2020 and 2019 due to instrument-specific credit risk totaled to a loss of $(40) million and a gain of $53 million, respectively.
Certain Investments in Unallocated Precious Metals
Citigroup invests in unallocated precious metals accounts (gold, silver, platinum and palladium) as part of its commodity and foreign currency trading activities or to economically hedge certain exposures from issuing structured liabilities. Under ASC 815, the investment is bifurcated into a debt host contract and a commodity forward derivative instrument. Citigroup elects the fair value option for the debt host contract, and reports the debt host contract within Trading account assets on the Company’s Consolidated Balance Sheet. The total carrying amount of debt host contracts across unallocated precious metals accounts was approximately $0.5 billion and $0.2 billion at June 30, 2020 and December 31, 2019, respectively. The amounts are expected to fluctuate based on trading activity in future periods.
As part of its commodity and foreign currency trading activities, Citi trades unallocated precious metals investments and executes forward purchase and forward sale derivative contracts with trading counterparties. When Citi sells an unallocated precious metals investment, Citi’s receivable from its depository bank is repaid and Citi derecognizes its investment in the unallocated precious metal. The forward purchase or sale contract with the trading counterparty indexed to unallocated precious metals is accounted for as a derivative, at fair value through earnings. As of June 30, 2020, there were approximately $10.6 billion and $8.0 billion of notional amounts of such forward purchase and forward sale derivative contracts outstanding, respectively.
Certain Investments in Private Equity and
Real Estate Ventures
Citigroup invests in private equity and real estate ventures for the purpose of earning investment returns and for capital appreciation. The Company has elected the fair value option for certain of these ventures, because such investments are considered similar to many private equity or hedge fund activities in Citi’s investment companies, which are reported at fair value. The fair value option brings consistency in the accounting and evaluation of these investments. All investments (debt and equity) in such private equity and real estate entities are accounted for at fair value. These investments are classified as Investments on Citigroup’s Consolidated Balance Sheet.
Changes in the fair values of these investments are classified in Other revenue in the Company’s Consolidated Statement of Income.
Certain Mortgage Loans Held-for-Sale (HFS)
Citigroup has elected the fair value option for certain purchased and originated prime fixed-rate and conforming adjustable-rate first mortgage loans HFS. These loans are intended for sale or securitization and are hedged with derivative instruments. The Company has elected the fair value option to mitigate accounting mismatches in cases where hedge accounting is complex and to achieve operational simplifications.
The following table provides information about certain mortgage loans HFS carried at fair value:
| | | | | | | | |
| In millions of dollars | June 30,
2020 | December 31, 2019 |
| Carrying amount reported on the Consolidated Balance Sheet | $ | 950 | | $ | 1,254 | |
| Aggregate fair value in excess of (less than) unpaid principal balance | 48 | | (31) | |
| Balance of non-accrual loans or loans more than 90 days past due | — | | 1 | |
| Aggregate unpaid principal balance in excess of fair value for non-accrual loans or loans more than 90 days past due | — | | — | |
The changes in the fair values of these mortgage loans are reported in Other revenue in the Company’s Consolidated Statement of Income. There was no net change in fair value during the six months ended June 30, 2020 and 2019 due to instrument-specific credit risk. Related interest income continues to be measured based on the contractual interest rates and reported as Interest revenue in the Consolidated Statement of Income.
Certain Structured Liabilities
The Company has elected the fair value option for certain structured liabilities whose performance is linked to structured interest rates, inflation, currency, equity, referenced credit or commodity risks. The Company elected the fair value option because these exposures are considered to be trading-related positions and, therefore, are managed on a fair value basis. These positions will continue to be classified as debt, deposits or derivatives (Trading account liabilities) on the Company’s Consolidated Balance Sheet according to their legal form.
The following table provides information about the carrying value of structured notes, disaggregated by type of embedded derivative instrument:
| | | | | | | | |
| In billions of dollars | June 30, 2020 | December 31, 2019 |
| Interest rate linked | $ | 21.9 | | $ | 22.9 | |
| Foreign exchange linked | 0.9 | | 0.9 | |
| Equity linked | 24.0 | | 21.7 | |
| Commodity linked | 1.7 | | 1.8 | |
| Credit linked | 2.4 | | 2.4 | |
| Total | $ | 50.9 | | $ | 49.7 | |
The portion of the changes in fair value attributable to changes in Citigroup’s own credit spreads (DVA) is reflected as a component of AOCI while all other changes in fair value are reported in Principal transactions. Changes in the fair value of these structured liabilities include accrued interest, which is also included in the change in fair value reported in Principal transactions.
Certain Non-Structured Liabilities
The Company has elected the fair value option for certain non-structured liabilities with fixed and floating interest rates. The Company has elected the fair value option where the interest rate risk of such liabilities may be economically hedged with derivative contracts or the proceeds are used to purchase financial assets that will also be accounted for at fair value through earnings. The elections have been made to mitigate accounting mismatches and to achieve operational simplifications. These positions are reported in Short-term borrowings and Long-term debt on the Company’s Consolidated Balance Sheet. The portion of the changes in fair value attributable to changes in Citigroup’s own credit spreads (DVA) is reflected as a component of AOCI while all other changes in fair value are reported in Principal transactions.
Interest expense on non-structured liabilities is measured based on the contractual interest rates and reported as Interest expense in the Consolidated Statement of Income.
The following table provides information about long-term debt carried at fair value:
| | | | | | | | |
| In millions of dollars | June 30, 2020 | December 31, 2019 |
| Carrying amount reported on the Consolidated Balance Sheet | $ | 61,971 | | $ | 55,783 | |
| Aggregate unpaid principal balance in excess of (less than) fair value | (980) | | (2,967) | |
The following table provides information about short-term borrowings carried at fair value:
| | | | | | | | |
| In millions of dollars | June 30, 2020 | December 31, 2019 |
| Carrying amount reported on the Consolidated Balance Sheet | $ | 6,646 | | $ | 4,946 | |
| Aggregate unpaid principal balance in excess of (less than) fair value | 119 | | 1,411 | |
22. GUARANTEES, LEASES AND COMMITMENTS
Citi provides a variety of guarantees and indemnifications to its customers to enhance their credit standing and enable them to complete a wide variety of business transactions. For
certain contracts meeting the definition of a guarantee, the guarantor must recognize, at inception, a liability for the fair value of the obligation undertaken in issuing the guarantee.
In addition, the guarantor must disclose the maximum potential amount of future payments that the guarantor could be required to make under the guarantee, if there were a total
default by the guaranteed parties. The determination of the maximum potential future payments is based on the notional
amount of the guarantees without consideration of possible recoveries under recourse provisions or from collateral held or pledged. As such, Citi believes such amounts bear no relationship to the anticipated losses, if any, on these guarantees.
For additional information regarding Citi’s guarantees and indemnifications included in the tables below, as well as its other guarantees and indemnifications excluded from the tables below, see Note 26 to the Consolidated Financial Statements in Citi’s 2019 Annual Report on Form 10-K.
The following tables present information about Citi’s guarantees at June 30, 2020 and December 31, 2019:
| | | | | | | | | | | | | | |
| | Maximum potential amount of future payments | | | |
| In billions of dollars at June 30, 2020 | Expire within
1 year | Expire after
1 year | Total amount
outstanding | Carrying value (in millions of dollars) |
| Financial standby letters of credit | $ | 23.9 | | $ | 65.7 | | $ | 89.6 | | $ | 2,009 | |
| Performance guarantees | 6.3 | | 5.8 | | 12.1 | | 142 | |
| Derivative instruments considered to be guarantees | 13.0 | | 56.0 | | 69.0 | | 1,452 | |
| Loans sold with recourse | — | | 1.2 | | 1.2 | | 6 | |
Securities lending indemnifications(1) | 99.7 | | — | | 99.7 | | — | |
Credit card merchant processing(1)(2) | 82.4 | | — | | 82.4 | | — | |
| Credit card arrangements with partners | 0.2 | | 0.4 | | 0.6 | | 7 | |
| Custody indemnifications and other | — | | 31.7 | | 31.7 | | 40 | |
| Total | $ | 225.5 | | $ | 160.8 | | $ | 386.3 | | $ | 3,656 | |
| | | | | | | | | | | | | | |
| | Maximum potential amount of future payments | | | |
| In billions of dollars at December 31, 2019 | Expire within
1 year | Expire after
1 year | Total amount
outstanding | Carrying value (in millions of dollars) |
| Financial standby letters of credit | $ | 31.9 | | $ | 62.4 | | $ | 94.3 | | $ | 581 | |
| Performance guarantees | 6.9 | | 5.5 | | 12.4 | | 36 | |
| Derivative instruments considered to be guarantees | 35.2 | | 60.8 | | 96.0 | | 474 | |
| Loans sold with recourse | — | | 1.2 | | 1.2 | | 7 | |
Securities lending indemnifications(1) | 87.8 | | — | | 87.8 | | — | |
Credit card merchant processing(1)(2) | 91.6 | | — | | 91.6 | | — | |
| Credit card arrangements with partners | 0.2 | | 0.4 | | 0.6 | | 23 | |
| Custody indemnifications and other | — | | 33.7 | | 33.7 | | 41 | |
| Total | $ | 253.6 | | $ | 164.0 | | $ | 417.6 | | $ | 1,162 | |
(1)The carrying values of securities lending indemnifications and credit card merchant processing were not material for either period presented, as the probability of potential liabilities arising from these guarantees is minimal.
(2)At June 30, 2020 and December 31, 2019, this maximum potential exposure was estimated to be $82 billion and $92 billion, respectively. However, Citi believes that the maximum exposure is not representative of the actual potential loss exposure based on its historical experience. This contingent liability is unlikely to arise, as most products and services are delivered when purchased and amounts are refunded when items are returned to merchants.
Loans Sold with Recourse
Loans sold with recourse represent Citi’s obligations to reimburse the buyers for loan losses under certain circumstances. Recourse refers to the clause in a sales agreement under which a seller/lender will fully reimburse the buyer/investor for any losses resulting from the purchased loans. This may be accomplished by the seller taking back any loans that become delinquent.
In addition to the amounts shown in the tables above, Citi has recorded a repurchase reserve for its potential repurchases or make-whole liability regarding residential mortgage representation and warranty claims related to its whole loan sales to U.S. government-sponsored agencies and, to a lesser extent, private investors. The repurchase reserve was approximately $32 million and $37 million at June 30, 2020 and December 31, 2019, respectively, and these amounts are included in Other liabilities on the Consolidated Balance Sheet.
Credit Card Arrangements with Partners
Citi, in certain of its credit card partner arrangements, provides guarantees to the partner regarding the volume of certain customer originations during the term of the agreement. To the extent that such origination targets are not met, the guarantees serve to compensate the partner for certain payments that otherwise would have been generated in connection with such originations.
Other Guarantees and Indemnifications
Credit Card Protection Programs
Citi, through its credit card businesses, provides various cardholder protection programs on several of its card products, including programs that provide insurance coverage for rental cars, coverage for certain losses associated with purchased products, price protection for certain purchases and protection for lost luggage. These guarantees are not included in the table, since the total outstanding amount of the guarantees and Citi’s maximum exposure to loss cannot be quantified. The protection is limited to certain types of purchases and losses, and it is not possible to quantify the purchases that would qualify for these benefits at any given time. Citi assesses the probability and amount of its potential liability related to these programs based on the extent and nature of its historical loss experience. At June 30, 2020 and December 31, 2019, the actual and estimated losses incurred and the carrying value of Citi’s obligations related to these programs were immaterial.
Value-Transfer Networks (Including Exchanges and Clearing Houses) (VTNs)
Citi is a member of, or shareholder in, hundreds of value-transfer networks (VTNs) (payment, clearing and settlement systems as well as exchanges) around the world. As a condition of membership, many of these VTNs require that members stand ready to pay a pro rata share of the losses incurred by the organization due to another member’s default on its obligations. Citi’s potential obligations may be limited to its membership interests in the VTNs, contributions to the VTN’s funds, or, in certain narrow cases, to the full pro rata
share. The maximum exposure is difficult to estimate as this would require an assessment of claims that have not yet occurred; however, Citi believes the risk of loss is remote given historical experience with the VTNs. Accordingly, Citi’s participation in VTNs is not reported in the guarantees tables above, and there are no amounts reflected on the Consolidated Balance Sheet as of June 30, 2020 or December 31, 2019 for potential obligations that could arise from Citi’s involvement with VTN associations.
Long-Term Care Insurance Indemnification
In 2000, Travelers Life & Annuity (Travelers), then a subsidiary of Citi, entered into a reinsurance agreement to transfer the risks and rewards of its long-term care (LTC) business to GE Life (now Genworth Financial Inc., or Genworth), then a subsidiary of the General Electric Company (GE). As part of this transaction, the reinsurance obligations were provided by two regulated insurance subsidiaries of GE Life, which funded two collateral trusts with securities. Presently, as discussed below, the trusts are referred to as the Genworth Trusts.
As part of GE’s spin-off of Genworth in 2004, GE retained the risks and rewards associated with the 2000 Travelers reinsurance agreement by providing a reinsurance contract to Genworth through GE’s Union Fidelity Life Insurance Company (UFLIC) subsidiary that covers the Travelers LTC policies. In addition, GE provided a capital maintenance agreement in favor of UFLIC that is designed to assure that UFLIC will have the funds to pay its reinsurance obligations. As a result of these reinsurance agreements and the spin-off of Genworth, Genworth has reinsurance protection from UFLIC (supported by GE) and has reinsurance obligations in connection with the Travelers LTC policies. As noted below, the Genworth reinsurance obligations now benefit Brighthouse Financial, Inc. (Brighthouse). While neither Brighthouse nor Citi are direct beneficiaries of the capital maintenance agreement between GE and UFLIC, Brighthouse and Citi benefit indirectly from the existence of the capital maintenance agreement, which helps assure that UFLIC will continue to have funds necessary to pay its reinsurance obligations to Genworth.
In connection with Citi’s 2005 sale of Travelers to MetLife Inc. (MetLife), Citi provided an indemnification to MetLife for losses (including policyholder claims) relating to the LTC business for the entire term of the Travelers LTC policies, which, as noted above, are reinsured by subsidiaries of Genworth. In 2017, MetLife spun off its retail insurance business to Brighthouse. As a result, the Travelers LTC policies now reside with Brighthouse. The original reinsurance agreement between Travelers (now Brighthouse) and Genworth remains in place and Brighthouse is the sole beneficiary of the Genworth Trusts. The Genworth Trusts are designed to provide collateral to Brighthouse in an amount equal to the statutory liabilities of Brighthouse in respect of the Travelers LTC policies. The assets in the Genworth Trusts are evaluated and adjusted periodically to ensure that the fair value of the assets continues to provide collateral in an amount equal to these estimated statutory liabilities, as the liabilities change over time.
If both (i) Genworth fails to perform under the original Travelers/GE Life reinsurance agreement for any reason, including its insolvency or the failure of UFLIC to perform under its reinsurance contract or GE to perform under the capital maintenance agreement, and (ii) the assets of the 2 Genworth Trusts are insufficient or unavailable, then Citi, through its LTC reinsurance indemnification, must reimburse Brighthouse for any losses incurred in connection with the LTC policies. Since both events would have to occur before Citi would become responsible for any payment to Brighthouse pursuant to its indemnification obligation, and the likelihood of such events occurring is currently not probable, there is 0 liability reflected on the Consolidated Balance Sheet as of June 30, 2020 and December 31, 2019 related to this indemnification. However, if both events become reasonably possible (meaning more than remote but less than probable), Citi will be required to estimate and disclose a reasonably possible loss or range of loss to the extent that such an estimate could be made. In addition, if both events become probable, Citi will be required to accrue for such liability in accordance with applicable accounting principles.
Citi continues to closely monitor its potential exposure under this indemnification obligation, given GE’s 2018 LTC and other charges and the September 2019 AM Best credit ratings downgrade for the Genworth subsidiaries.
Separately, Genworth announced that it had agreed to be purchased by China Oceanwide Holdings Co., Ltd, subject to a series of conditions and regulatory approvals. Citi is monitoring these developments.
Futures and Over-the-Counter Derivatives Clearing
Citi provides clearing services on central clearing parties (CCP) for clients that need to clear exchange-traded and over-the-counter (OTC) derivative contracts with CCPs. Based on all relevant facts and circumstances, Citi has concluded that it acts as an agent for accounting purposes in its role as clearing member for these client transactions. As such, Citi does not reflect the underlying exchange-traded or OTC derivatives contracts in its Consolidated Financial Statements. See Note 19 for a discussion of Citi’s derivatives activities that are reflected in its Consolidated Financial Statements.
As a clearing member, Citi collects and remits cash and securities collateral (margin) between its clients and the respective CCP. In certain circumstances, Citi collects a higher amount of cash (or securities) from its clients than it needs to remit to the CCPs. This excess cash is then held at depository institutions such as banks or carry brokers.
There are two types of margin: initial and variation. Where Citi obtains benefits from or controls cash initial margin (e.g., retains an interest spread), cash initial margin collected from clients and remitted to the CCP or depository institutions is reflected within Brokerage payables (payables to customers) and Brokerage receivables (receivables from brokers, dealers and clearing organizations) or Cash and due from banks, respectively.
However, for exchange-traded and OTC-cleared derivative contracts where Citi does not obtain benefits from or control the client cash balances, the client cash initial margin collected from clients and remitted to the CCP or
depository institutions is not reflected on Citi’s Consolidated Balance Sheet. These conditions are met when Citi has contractually agreed with the client that (i) Citi will pass through to the client all interest paid by the CCP or depository institutions on the cash initial margin, (ii) Citi will not utilize its right as a clearing member to transform cash margin into other assets, (iii) Citi does not guarantee and is not liable to the client for the performance of the CCP or the depository institution and (iv) the client cash balances are legally isolated from Citi’s bankruptcy estate. The total amount of cash initial margin collected and remitted in this manner was approximately $17.5 billion and $13.3 billion as of June 30, 2020 and December 31, 2019, respectively.
Variation margin due from clients to the respective CCP, or from the CCP to clients, reflects changes in the value of the client’s derivative contracts for each trading day. As a clearing member, Citi is exposed to the risk of non-performance by clients (e.g., failure of a client to post variation margin to the CCP for negative changes in the value of the client’s derivative contracts). In the event of non-performance by a client, Citi would move to close out the client’s positions. The CCP would typically utilize initial margin posted by the client and held by the CCP, with any remaining shortfalls required to be paid by Citi as clearing member. Citi generally holds incremental cash or securities margin posted by the client, which would typically be expected to be sufficient to mitigate Citi’s credit risk in the event the client fails to perform.
As required by ASC 860-30-25-5, securities collateral posted by clients is not recognized on Citi’s Consolidated Balance Sheet.
Carrying Value—Guarantees and Indemnifications
At June 30, 2020 and December 31, 2019, the total carrying amounts of the liabilities related to the guarantees and indemnifications included in the tables above amounted to approximately $3.7 billion and $1.2 billion, respectively. The carrying value of financial and performance guarantees is included in Other liabilities. For loans sold with recourse, the carrying value of the liability is included in Other liabilities.
Collateral
Cash collateral available to Citi to reimburse losses realized under these guarantees and indemnifications amounted to $50.0 billion and $46.7 billion at June 30, 2020 and December 31, 2019, respectively. Securities and other marketable assets held as collateral amounted to $67.3 billion and $58.6 billion at June 30, 2020 and December 31, 2019, respectively. The majority of collateral is held to reimburse losses realized under securities lending indemnifications. In addition, letters of credit in favor of Citi held as collateral amounted to $3.8 billion and $4.4 billion at June 30, 2020 and December 31, 2019, respectively. Other property may also be available to Citi to cover losses under certain guarantees and indemnifications; however, the value of such property has not been determined.
Performance Risk
Presented in the tables below are the maximum potential amounts of future payments that are classified based on internal and external credit ratings. The determination of the maximum potential future payments is based on the notional amount of the guarantees without consideration of possible recoveries under recourse provisions or from collateral held or pledged. As such, Citi believes such amounts bear no relationship to the anticipated losses, if any, on these guarantees.
| | | | | | | | | | | | | | |
| | Maximum potential amount of future payments | | | |
| In billions of dollars at June 30, 2020 | Investment
grade | Non-investment
grade | Not
rated | Total |
| Financial standby letters of credit | $ | 58.9 | | $ | 15.2 | | $ | 15.5 | | $ | 89.6 | |
| Performance guarantees | 8.9 | | 2.7 | | 0.5 | | 12.1 | |
| Derivative instruments deemed to be guarantees | — | | — | | 69.0 | | 69.0 | |
| Loans sold with recourse | — | | — | | 1.2 | | 1.2 | |
| Securities lending indemnifications | — | | — | | 99.7 | | 99.7 | |
| Credit card merchant processing | — | | — | | 82.4 | | 82.4 | |
| Credit card arrangements with partners | — | | — | | 0.6 | | 0.6 | |
| Custody indemnifications and other | 19.3 | | 12.4 | | — | | 31.7 | |
| Total | $ | 87.1 | | $ | 30.3 | | $ | 268.9 | | $ | 386.3 | |
| | | | | | | | | | | | | | |
| | Maximum potential amount of future payments | | | |
| In billions of dollars at December 31, 2019 | Investment
grade | Non-investment
grade | Not
rated | Total |
| Financial standby letters of credit | $ | 66.4 | | $ | 12.5 | | $ | 15.4 | | $ | 94.3 | |
| Performance guarantees | 9.7 | | 2.3 | | 0.4 | | 12.4 | |
| Derivative instruments deemed to be guarantees | — | | — | | 96.0 | | 96.0 | |
| Loans sold with recourse | — | | — | | 1.2 | | 1.2 | |
| Securities lending indemnifications | — | | — | | 87.8 | | 87.8 | |
| Credit card merchant processing | — | | — | | 91.6 | | 91.6 | |
| Credit card arrangements with partners | — | | — | | 0.6 | | 0.6 | |
| Custody indemnifications and other | 21.3 | | 12.4 | | — | | 33.7 | |
| Total | $ | 97.4 | | $ | 27.2 | | $ | 293.0 | | $ | 417.6 | |
Leases
The Company’s operating leases, where Citi is a lessee, include real estate such as office space and branches and various types of equipment. These leases have a weighted-average remaining lease term of approximately six years as of June 30, 2020. The operating lease ROU asset and lease liability were $2.9 billion and $3.2 billion, respectively, as of June 30, 2020, compared to an operating lease ROU asset of $3.1 billion and lease liability of $3.3 billion as of December 31, 2019. The Company recognizes fixed lease costs on a straight-line basis throughout the lease term in the Consolidated Statement of Income. In addition, variable lease costs are recognized in the period in which the obligation for those payments is incurred.
Credit Commitments and Lines of Credit
The table below summarizes Citigroup’s credit commitments:
| | | | | | | | | | | | | | |
| In millions of dollars | U.S. | Outside of
U.S. | June 30,
2020 | December 31,
2019 |
| Commercial and similar letters of credit | $ | 582 | | $ | 3,421 | | $ | 4,003 | | $ | 4,533 | |
| One- to four-family residential mortgages | 2,948 | | 2,322 | | 5,270 | | 3,721 | |
| Revolving open-end loans secured by one- to four-family residential properties | 9,129 | | 1,280 | | 10,409 | | 10,799 | |
| Commercial real estate, construction and land development | 10,617 | | 1,775 | | 12,392 | | 12,981 | |
| Credit card lines | 616,582 | | 97,869 | | 714,451 | | 708,023 | |
| Commercial and other consumer loan commitments | 198,358 | | 108,022 | | 306,380 | | 324,359 | |
| Other commitments and contingencies | 1,881 | | 796 | | 2,677 | | 1,948 | |
| Total | $ | 840,097 | | $ | 215,485 | | $ | 1,055,582 | | $ | 1,066,364 | |
The majority of unused commitments are contingent upon customers maintaining specific credit standards. Commercial commitments generally have floating interest rates and fixed expiration dates and may require payment of fees. Such fees (net of certain direct costs) are deferred and, upon exercise of the commitment, amortized over the life of the loan or, if exercise is deemed remote, amortized over the commitment period.
Other Commitments and Contingencies
Other commitments and contingencies include all other transactions related to commitments and contingencies not reported on the lines above.
Unsettled Reverse Repurchase and Securities Borrowing Agreements and Unsettled Repurchase and Securities Lending Agreements
In addition, in the normal course of business, Citigroup enters into reverse repurchase and securities borrowing agreements, as well as repurchase and securities lending agreements, which settle at a future date. At June 30, 2020 and December 31, 2019, Citigroup had approximately $63.0 billion and $34.0 billion of unsettled reverse repurchase and securities borrowing agreements, and approximately $72.5 billion and $38.7 billion of unsettled repurchase and securities lending agreements, respectively. For a further discussion of securities purchased under agreements to resell and securities borrowed, and securities sold under agreements to repurchase and securities loaned, including the Company’s policy for offsetting repurchase and reverse repurchase agreements, see Note 10 to the Consolidated Financial Statements.
Restricted Cash
Citigroup defines restricted cash (as cash subject to withdrawal restrictions) to include cash deposited with central banks that must be maintained to meet minimum regulatory requirements, and cash set aside for the benefit of customers or for other purposes such as compensating balance arrangements or debt retirement. Restricted cash includes minimum reserve requirements with the Federal
Reserve Bank and certain other central banks and cash segregated to satisfy rules regarding the protection of customer assets as required by Citigroup broker-dealers’ primary regulators, including the United States Securities and Exchange Commission (SEC), the Commodities Futures Trading Commission and the United Kingdom’s Prudential Regulation Authority.
Restricted cash is included on the Consolidated Balance Sheet within the following balance sheet lines:
| | | | | | | | |
| In millions of dollars | June 30,
2020 | December 31,
2019 |
| Cash and due from banks | $ | 2,789 | | $ | 3,758 | |
| Deposits with banks, net of allowance | 11,468 | | 26,493 | |
| Total | $ | 14,257 | | $ | 30,251 | |
In response to the COVID-19 pandemic, the Federal Reserve Bank and certain other central banks eased regulations related to minimum required cash deposited with central banks. This resulted in a decrease in Citigroup’s restricted cash amount at June 30, 2020.
23. CONTINGENCIES
The following information supplements and amends, as applicable, the disclosure in Note 23 to the Consolidated Financial Statements of Citigroup’s First Quarter of 2020 Form 10-Q and Note 27 to the Consolidated Financial Statements in Citi’s 2019 Annual Report on Form 10-K. For purposes of this Note, Citigroup, its affiliates and subsidiaries and current and former officers, directors, and employees, are sometimes collectively referred to as Citigroup and Related Parties.
In accordance with ASC 450, Citigroup establishes accruals for contingencies, including the litigation, regulatory, and tax matters disclosed herein or in Note 27 to the Consolidated Financial Statements in Citi’s 2019 Annual Report on Form 10-K, when Citigroup believes it is probable that a loss has been incurred and the amount of the loss can be reasonably estimated. Once established, accruals are adjusted from time to time, as appropriate, in light of additional information. The amount of loss ultimately incurred in relation to those matters may be substantially higher or lower than the amounts accrued for those matters.
If Citigroup has not accrued for a matter because the matter does not meet the criteria for accrual (as set forth above), or Citigroup believes an exposure to loss exists in excess of the amount accrued for a particular matter, in each case assuming a material loss is reasonably possible, Citigroup discloses the matter. In addition, for such matters, Citigroup discloses an estimate of the aggregate reasonably possible loss or range of loss in excess of the amounts accrued for those matters as to which an estimate can be made. At June 30, 2020, Citigroup’s estimate of the reasonably possible unaccrued loss for these matters was approximately $1.2 billion in the aggregate.
As available information changes, the matters for which Citigroup is able to estimate will change, and the estimates themselves will change. In addition, while many estimates presented in financial statements and other financial disclosures involve significant judgment and may be subject to significant uncertainty, estimates of the range of reasonably possible loss arising from litigation, regulatory, tax, or other matters are subject to particular uncertainties. For example, at the time of making an estimate, Citigroup may have only preliminary, incomplete, or inaccurate information about the facts underlying the claim; its assumptions about the future rulings of the court or other tribunal on significant issues, or the behavior and incentives of adverse parties, regulators, or tax authorities may prove to be wrong; and the outcomes it is attempting to predict are often not amenable to the use of statistical or other quantitative analytical tools. In addition, from time to time an outcome may occur that Citigroup had not accounted for in its estimates because it had deemed such an outcome to be remote. For all these reasons, the amount of loss in excess of accruals ultimately incurred for the matters as to which an estimate has been made could be substantially higher or lower than the range of loss included in the estimate.
Subject to the foregoing, it is the opinion of Citigroup’s management, based on current knowledge and after taking into account its current legal accruals, that the eventual outcome of
all matters described in this Note would not be likely to have a material adverse effect on the consolidated financial condition of Citigroup. Nonetheless, given the substantial or indeterminate amounts sought in certain of these matters and the inherent unpredictability of such matters, an adverse outcome in certain of these matters could, from time to time, have a material adverse effect on Citigroup’s consolidated results of operations or cash flows in particular quarterly or annual periods.
For further information on ASC 450 and Citigroup’s accounting and disclosure framework for contingencies, including for any litigation, regulatory, and tax matters disclosed herein, see Note 27 to the Consolidated Financial Statements in Citi’s 2019 Annual Report on Form 10-K.
Corporate Bonds Antitrust Litigation
On April 21, 2020, a complaint was filed against Citigroup, CGMI, and other defendants in the United States District Court for the Southern District of New York, asserting that defendants violated federal antitrust law by unreasonably restraining the trade of odd-lots of corporate bonds in the secondary market. The complaint seeks declaratory and injunctive relief, treble damages, pre- and post-judgment interest, and costs. The complaint is captioned LITOVICH, ET AL. v. BANK OF AMERICA CORPORATION, ET AL. Additional information concerning this action is publicly available in court filings under the docket number 1:20-cv-03154 (Liman, J.).
Foreign Exchange Matters
Antitrust and Other Litigation: On May 28, 2020, in ALLIANZ GLOBAL INVESTORS, ET AL. v. BANK OF AMERICA CORPORATION, ET AL., the court granted in part and denied in part defendants’ motion to dismiss the second amended complaint. Additional information concerning this action is publicly available in court filings under the docket number 18 Civ. 10364 (S.D.N.Y.) (Schofield, J.).
On April 30, 2020, in NYPL v. JPMORGAN CHASE & CO., ET AL., plaintiffs filed a motion for class certification. Additional information concerning this action is publicly available in court filings under the docket number 15 Civ. 9300 (S.D.N.Y.) (Schofield, J.).
On April 30, 2020, in J WISBEY & ASSOCIATES PTY LTD v. UBS AG & ORS, plaintiffs filed an application to amend their pleadings. Additional information concerning this action is publicly available in court filings under the docket number VID567/2019.
Interbank Offered Rates–Related Litigation and Other Matters
Antitrust and Other Litigation: On April 24, 2020, in IN RE ICE LIBOR ANTITRUST LITIGATION, plaintiffs filed a notice of appeal with the United States Court of Appeals for the Second Circuit from the district court’s grant of defendants’ motion to dismiss the consolidated class action complaint. Additional information concerning these actions is publicly available in court filings under the docket numbers 19 Civ. 439 (S.D.N.Y.) (Daniels, J.) and 20-1492 (2d Cir.).
Sovereign Securities Matters
Antitrust and Other Litigation: On June 16, 2020, in IN RE GSE BONDS ANTITRUST LITIGATION, the court granted final approval of a settlement with CGMI and 11 other defendants. Additional information concerning this action is publicly available in court filings under the docket number 19 Civ. 1704 (S.D.N.Y.) (Rakoff, J.).
On June 1, 2020, in IN RE SSA BONDS ANTITRUST LITIGATION, plaintiffs filed a notice of appeal with the United States Court of Appeals for the Second Circuit from the district court’s grant of defendants’ motion to dismiss the second amended consolidated class action complaint related to the supranational, subsovereign, and agency (SSA) bond market. Additional information concerning these actions is publicly available in court filings under the docket numbers 16-cv-03711 (S.D.N.Y.) (Ramos, J.) and 20-1759 (2d Cir.).
On June 25, 2020, in STACHON v. BANK OF AMERICA, N.A., ET AL., plaintiff voluntarily dismissed the action without prejudice in light of the dismissal of the IN RE SSA BONDS ANTITRUST LITIGATION. Additional information concerning this action is publicly available in court filings under the docket number 19 Civ. 1205 (S.D.N.Y.) (Swain, J.).
Settlement Payments
Payments required in settlement agreements described above have been made or are covered by existing litigation or other accruals.
24. CONDENSED CONSOLIDATING FINANCIAL STATEMENTS
Citigroup amended its Registration Statement on Form S-3 on file with the SEC (File No. 33-192302) to add its wholly owned subsidiary, Citigroup Global Markets Holdings Inc. (CGMHI), as a co-registrant. Any securities issued by CGMHI under the Form S-3 will be fully and unconditionally guaranteed by Citigroup.
The following are the Condensed Consolidating Statements of Income and Comprehensive Income for the three and six months ended June 30, 2020 and 2019, Condensed Consolidating Balance Sheet as of June 30, 2020 and December 31, 2019 and Condensed Consolidating Statement of Cash Flows for the six months ended June 30, 2020 and 2019 for Citigroup Inc., the parent holding company (Citigroup parent company), CGMHI, other Citigroup subsidiaries and eliminations and total consolidating adjustments. “Other Citigroup subsidiaries and eliminations” includes all other subsidiaries of Citigroup, intercompany eliminations and income (loss) from discontinued operations. “Consolidating adjustments” includes Citigroup parent company elimination of distributed and undistributed income of subsidiaries and investment in subsidiaries.
These Condensed Consolidating Financial Statements have been prepared and presented in accordance with SEC Regulation S-X Rule 3-10, “Financial Statements of Guarantors and Issuers of Guaranteed Securities Registered or Being Registered.”
These Condensed Consolidating Financial Statements are presented for purposes of additional analysis, but should be considered in relation to the Consolidated Financial Statements of Citigroup taken as a whole.
Condensed Consolidating Statements of Income and Comprehensive Income
| | | | | | | | | | | | | | | | | | | | | | | | | | | | | |
| Three Months Ended June 30, 2020 | | | | | | | | |
| In millions of dollars | Citigroup parent company | | CGMHI | | Other Citigroup subsidiaries and eliminations | | Consolidating adjustments | | Citigroup consolidated |
| Revenues | | | | | | | | | |
| Dividends from subsidiaries | $ | — | | | $ | — | | | $ | — | | | $ | — | | | $ | — | |
| Interest revenue | — | | | 1,309 | | | 13,280 | | | — | | | 14,589 | |
| Interest revenue—intercompany | 1,067 | | | 282 | | | (1,349) | | | — | | | — | |
| Interest expense | 1,265 | | | 380 | | | 1,864 | | | — | | | 3,509 | |
| Interest expense—intercompany | 142 | | | 621 | | | (763) | | | — | | | — | |
| Net interest revenue | $ | (340) | | | $ | 590 | | | $ | 10,830 | | | $ | — | | | $ | 11,080 | |
| Commissions and fees | $ | — | | | $ | 1,771 | | | $ | 1,162 | | | $ | — | | | $ | 2,933 | |
| Commissions and fees—intercompany | — | | | 73 | | | (73) | | | — | | | — | |
| Principal transactions | (258) | | | (2,993) | | | 7,408 | | | — | | | 4,157 | |
| Principal transactions—intercompany | 62 | | | 4,890 | | | (4,952) | | | — | | | — | |
| Other income | (14) | | | 211 | | | 1,399 | | | — | | | 1,596 | |
| Other income—intercompany | 8 | | | 13 | | | (21) | | | — | | | — | |
| Total non-interest revenues | $ | (202) | | | $ | 3,965 | | | $ | 4,923 | | | $ | — | | | $ | 8,686 | |
| Total revenues, net of interest expense | $ | (542) | | | $ | 4,555 | | | $ | 15,753 | | | $ | — | | | $ | 19,766 | |
| Provisions for credit losses and for benefits and claims | $ | — | | | $ | 1 | | | $ | 7,902 | | | $ | — | | | $ | 7,903 | |
| Operating expenses | | | | | | | | | |
| Compensation and benefits | $ | 105 | | | $ | 1,345 | | | $ | 4,174 | | | $ | — | | | $ | 5,624 | |
| Compensation and benefits—intercompany | 1 | | | — | | | (1) | | | — | | | — | |
| Other operating | 9 | | | 594 | | | 4,188 | | | — | | | 4,791 | |
| Other operating—intercompany | 4 | | | 375 | | | (379) | | | — | | | — | |
| Total operating expenses | $ | 119 | | | $ | 2,314 | | | $ | 7,982 | | | $ | — | | | $ | 10,415 | |
| Equity in undistributed income of subsidiaries | $ | 2,107 | | | $ | — | | | $ | — | | | $ | (2,107) | | | $ | — | |
| Income (loss) from continuing operations before income taxes | $ | 1,446 | | | $ | 2,240 | | | $ | (131) | | | $ | (2,107) | | | $ | 1,448 | |
| Provision (benefit) for income taxes | 130 | | | 715 | | | (714) | | | — | | | 131 | |
| Income (loss) from continuing operations | $ | 1,316 | | | $ | 1,525 | | | $ | 583 | | | $ | (2,107) | | | $ | 1,317 | |
| Income (loss) from discontinued operations, net of taxes | — | | | — | | | (1) | | | — | | | (1) | |
| Net income before attribution of noncontrolling interests | $ | 1,316 | | | $ | 1,525 | | | $ | 582 | | | $ | (2,107) | | | $ | 1,316 | |
| Noncontrolling interests | — | | | — | | | — | | | — | | | — | |
| Net income (loss) | $ | 1,316 | | | $ | 1,525 | | | $ | 582 | | | $ | (2,107) | | | $ | 1,316 | |
| Comprehensive income | | | | | | | | | |
| Add: Other comprehensive income (loss) | $ | (824) | | | $ | (1,429) | | | $ | (1,223) | | | $ | 2,652 | | | $ | (824) | |
| Total Citigroup comprehensive income (loss) | $ | 492 | | | $ | 96 | | | $ | (641) | | | $ | 545 | | | $ | 492 | |
| Add: Other comprehensive income attributable to noncontrolling interests | $ | — | | | $ | — | | | $ | 39 | | | $ | — | | | $ | 39 | |
| Add: Net income attributable to noncontrolling interests | — | | | — | | | — | | | — | | | — | |
| Total comprehensive income (loss) | $ | 492 | | | $ | 96 | | | $ | (602) | | | $ | 545 | | | $ | 531 | |
| | | | | | | | | |
| | | | | | | | | |
| | | | | | | | | |
| | | | | | | | | |
| | | | | | | | | |
| | | | | | | | | | | | | | | | | | | | | | | | | | | | | |
| Condensed Consolidating Statements of Income and Comprehensive Income | | | | | | | | | |
| Six Months Ended June 30, 2020 | | | | | | | | |
| In millions of dollars | Citigroup parent company | | CGMHI | | Other Citigroup subsidiaries and eliminations | | Consolidating adjustments | | Citigroup consolidated |
| Revenues | | | | | | | | | |
| Dividends from subsidiaries | $ | 105 | | | $ | — | | | $ | — | | | $ | (105) | | | $ | — | |
| Interest revenue | — | | | 3,212 | | | 28,516 | | | — | | | 31,728 | |
| Interest revenue—intercompany | 2,211 | | | 623 | | | (2,834) | | | — | | | — | |
| Interest expense | 2,408 | | | 1,521 | | | 5,227 | | | — | | | 9,156 | |
| Interest expense—intercompany | 390 | | | 1,403 | | | (1,793) | | | — | | | — | |
| Net interest revenue | $ | (587) | | | $ | 911 | | | $ | 22,248 | | | $ | — | | | $ | 22,572 | |
| Commissions and fees | $ | — | | | $ | 3,321 | | | $ | 2,633 | | | $ | — | | | $ | 5,954 | |
| Commissions and fees—intercompany | (19) | | | 237 | | | (218) | | | — | | | — | |
| Principal transactions | (930) | | | 3,261 | | | 7,087 | | | — | | | 9,418 | |
| Principal transactions—intercompany | 564 | | | 499 | | | (1,063) | | | — | | | — | |
| Other income | 66 | | | 260 | | | 2,227 | | | — | | | 2,553 | |
| Other income—intercompany | (62) | | | 26 | | | 36 | | | — | | | — | |
| Total non-interest revenues | $ | (381) | | | $ | 7,604 | | | $ | 10,702 | | | $ | — | | | $ | 17,925 | |
| Total revenues, net of interest expense | $ | (863) | | | $ | 8,515 | | | $ | 32,950 | | | $ | (105) | | | $ | 40,497 | |
| Provisions for credit losses and for benefits and claims | $ | — | | | $ | — | | | $ | 14,930 | | | $ | — | | | $ | 14,930 | |
| Operating expenses | | | | | | | | | |
| Compensation and benefits | $ | 133 | | | $ | 2,641 | | | $ | 8,504 | | | $ | — | | | $ | 11,278 | |
| Compensation and benefits—intercompany | 75 | | | — | | | (75) | | | — | | | — | |
| Other operating | 32 | | | 1,192 | | | 8,507 | | | — | | | 9,731 | |
| Other operating—intercompany | 8 | | | 857 | | | (865) | | | — | | | — | |
| Total operating expenses | $ | 248 | | | $ | 4,690 | | | $ | 16,071 | | | $ | — | | | $ | 21,009 | |
| Equity in undistributed income of subsidiaries | $ | 4,475 | | | $ | — | | | $ | — | | | $ | (4,475) | | | $ | — | |
| Income (loss) from continuing operations before income taxes | $ | 3,364 | | | $ | 3,825 | | | $ | 1,949 | | | $ | (4,580) | | | $ | 4,558 | |
| Provision (benefit) for income taxes | (474) | | | 1,052 | | | 129 | | | — | | | 707 | |
| Income (loss) from continuing operations | $ | 3,838 | | | $ | 2,773 | | | $ | 1,820 | | | $ | (4,580) | | | $ | 3,851 | |
| Income (loss) from discontinued operations, net of taxes | — | | | — | | | (19) | | | — | | | (19) | |
| Net income before attribution of noncontrolling interests | $ | 3,838 | | | $ | 2,773 | | | $ | 1,801 | | | $ | (4,580) | | | $ | 3,832 | |
| Noncontrolling interests | — | | | — | | | (6) | | | — | | | (6) | |
| Net income (loss) | $ | 3,838 | | | $ | 2,773 | | | $ | 1,807 | | | $ | (4,580) | | | $ | 3,838 | |
| Comprehensive income | | | | | | | | | |
| Add: Other comprehensive income (loss) | $ | 2,973 | | | $ | 328 | | | $ | 12,236 | | | $ | (12,564) | | | $ | 2,973 | |
| Total Citigroup comprehensive income (loss) | $ | 6,811 | | | $ | 3,101 | | | $ | 14,043 | | | $ | (17,144) | | | $ | 6,811 | |
| Add: Other comprehensive income attributable to noncontrolling interests | $ | — | | | $ | — | | | $ | (12) | | | $ | — | | | $ | (12) | |
| Add: Net income attributable to noncontrolling interests | — | | | — | | | (6) | | | — | | | (6) | |
| Total comprehensive income (loss) | $ | 6,811 | | | $ | 3,101 | | | $ | 14,025 | | | $ | (17,144) | | | $ | 6,793 | |
| | | | | | | | | |
| | | | | | | | | |
| | | | | | | | | |
Condensed Consolidating Statements of Income and Comprehensive Income
| | | | | | | | | | | | | | | | | | | | | | | | | | | | | |
| Three Months Ended June 30, 2019 | | | | | | | | |
| In millions of dollars | Citigroup parent company | | CGMHI | | Other Citigroup subsidiaries and eliminations | | Consolidating adjustments | | Citigroup consolidated |
| Revenues | | | | | | | | | |
| Dividends from subsidiaries | $ | 5,049 | | | $ | — | | | $ | — | | | $ | (5,049) | | | $ | — | |
| Interest revenue | — | | | 3,184 | | | 16,528 | | | — | | | 19,712 | |
| Interest revenue—intercompany | 1,327 | | | 518 | | | (1,845) | | | — | | | — | |
| Interest expense | 1,278 | | | 1,911 | | | 4,573 | | | — | | | 7,762 | |
| Interest expense—intercompany | 202 | | | 1,152 | | | (1,354) | | | — | | | — | |
| Net interest revenue | $ | (153) | | | $ | 639 | | | $ | 11,464 | | | $ | — | | | $ | 11,950 | |
| Commissions and fees | $ | — | | | $ | 1,309 | | | $ | 1,572 | | | $ | — | | | $ | 2,881 | |
| Commissions and fees—intercompany | — | | | 94 | | | (94) | | | — | | | — | |
| Principal transactions | (565) | | | 1,142 | | | 1,297 | | | — | | | 1,874 | |
| Principal transactions—intercompany | 791 | | | (675) | | | (116) | | | — | | | — | |
| Other income | (368) | | | 498 | | | 1,923 | | | — | | | 2,053 | |
| Other income—intercompany | 9 | | | 14 | | | (23) | | | — | | | — | |
| Total non-interest revenues | $ | (133) | | | $ | 2,382 | | | $ | 4,559 | | | $ | — | | | $ | 6,808 | |
| Total revenues, net of interest expense | $ | 4,763 | | | $ | 3,021 | | | $ | 16,023 | | | $ | (5,049) | | | $ | 18,758 | |
| Provisions for credit losses and for benefits and claims | $ | — | | | $ | — | | | $ | 2,093 | | | $ | — | | | $ | 2,093 | |
| Operating expenses | | | | | | | | | |
| Compensation and benefits | $ | 4 | | | $ | 1,166 | | | $ | 4,211 | | | $ | — | | | $ | 5,381 | |
| Compensation and benefits—intercompany | 17 | | | — | | | (17) | | | — | | | — | |
| Other operating | 9 | | | 540 | | | 4,570 | | | — | | | 5,119 | |
| Other operating—intercompany | 5 | | | 582 | | | (587) | | | — | | | — | |
| Total operating expenses | $ | 35 | | | $ | 2,288 | | | $ | 8,177 | | | $ | — | | | $ | 10,500 | |
| Equity in undistributed income of subsidiaries | $ | (146) | | | $ | — | | | $ | — | | | $ | 146 | | | $ | — | |
Income (loss) from continuing operations before income
taxes | $ | 4,582 | | | $ | 733 | | | $ | 5,753 | | | $ | (4,903) | | | $ | 6,165 | |
| Provision (benefit) for income taxes | (217) | | — | | 8 | | | 1,582 | | | — | | | 1,373 | |
| Income (loss) from continuing operations | $ | 4,799 | | | $ | 725 | | | $ | 4,171 | | | $ | (4,903) | | | $ | 4,792 | |
| Income (loss) from discontinued operations, net of taxes | — | | | — | | | 17 | | | — | | | 17 | |
| Net income (loss) before attribution of noncontrolling interests | $ | 4,799 | | | $ | 725 | | | $ | 4,188 | | | $ | (4,903) | | | $ | 4,809 | |
| Noncontrolling interests | — | | | — | | | 10 | | | — | | | 10 | |
| Net income (loss) | $ | 4,799 | | | $ | 725 | | | $ | 4,178 | | | $ | (4,903) | | | $ | 4,799 | |
| Comprehensive income | | | | | | | | | |
| Add: Other comprehensive income (loss) | $ | 1,105 | | | $ | (12) | | | $ | 734 | | | $ | (722) | | | $ | 1,105 | |
| Total Citigroup comprehensive income (loss) | $ | 5,904 | | | $ | 713 | | | $ | 4,912 | | | $ | (5,625) | | | $ | 5,904 | |
| Add: Other comprehensive income attributable to noncontrolling interests | $ | — | | | $ | — | | — | | $ | 20 | | | $ | — | | | $ | 20 | |
| Add: Net income attributable to noncontrolling interests | — | | | — | | | 10 | | | — | | | 10 | |
| Total comprehensive income (loss) | $ | 5,904 | | | $ | 713 | | | $ | 4,942 | | | $ | (5,625) | | | $ | 5,934 | |
| | | | | | | | | |
| | | | | | | | | |
| | | | | | | | | |
| | | | | | | | | | | | | | | | | | | | | | | | | | | | | |
| Condensed Consolidating Statements of Income and Comprehensive Income | | | | | | | | | |
| Six Months Ended June 30, 2019 | | | | | | | | |
| In millions of dollars | Citigroup parent company | | CGMHI | | Other Citigroup subsidiaries and eliminations | | Consolidating adjustments | | Citigroup consolidated |
| Revenues | | | | | | | | | |
| Dividends from subsidiaries | $ | 14,216 | | | $ | — | | | $ | — | | | $ | (14,216) | | | $ | — | |
| Interest revenue | — | | | 5,756 | | | 33,032 | | | — | | | 38,788 | |
| Interest revenue—intercompany | 2,652 | | | 1,021 | | | (3,673) | | | — | | | — | |
| Interest expense | 2,549 | | | 3,735 | | | 8,795 | | | — | | | 15,079 | |
| Interest expense—intercompany | 514 | | | 2,227 | | | (2,741) | | | — | | | — | |
| Net interest revenue | $ | (411) | | | $ | 815 | | | $ | 23,305 | | | $ | — | | | $ | 23,709 | |
| Commissions and fees | $ | — | | | $ | 2,616 | | | $ | 3,191 | | | $ | — | | | $ | 5,807 | |
| Commissions and fees—intercompany | (1) | | | 215 | | | (214) | | | — | | | — | |
| Principal transactions | (1,390) | | | 108 | | | 5,960 | | | — | | | 4,678 | |
| Principal transactions—intercompany | 1,238 | | | 1,361 | | | (2,599) | | | — | | | — | |
| Other income | (49) | | | 597 | | | 2,592 | | | — | | | 3,140 | |
| Other income—intercompany | (25) | | | 56 | | | (31) | | | — | | | — | |
| Total non-interest revenues | $ | (227) | | | $ | 4,953 | | | $ | 8,899 | | | $ | — | | | $ | 13,625 | |
| Total revenues, net of interest expense | $ | 13,578 | | | $ | 5,768 | | | $ | 32,204 | | | $ | (14,216) | | | $ | 37,334 | |
| Provisions for credit losses and for benefits and claims | $ | — | | | $ | — | | | $ | 4,073 | | | $ | — | | | $ | 4,073 | |
| Operating expenses | | | | | | | | | |
| Compensation and benefits | $ | 37 | | | $ | 2,450 | | | $ | 8,552 | | | $ | — | | | $ | 11,039 | |
| Compensation and benefits—intercompany | 43 | | | — | | | (43) | | | — | | | — | |
| Other operating | 14 | | | 1,093 | | | 8,938 | | | — | | | 10,045 | |
| Other operating—intercompany | 10 | | | 1,164 | | | (1,174) | | | — | | | — | |
| Total operating expenses | $ | 104 | | | $ | 4,707 | | | $ | 16,273 | | | $ | — | | | $ | 21,084 | |
| Equity in undistributed income of subsidiaries | $ | (4,349) | | | $ | — | | | $ | — | | | $ | 4,349 | | | $ | — | |
Income (loss) from continuing operations before income
taxes | $ | 9,125 | | | $ | 1,061 | | | $ | 11,858 | | | $ | (9,867) | | | $ | 12,177 | |
| Provision (benefit) for income taxes | (384) | | | 148 | | | 2,884 | | | — | | | 2,648 | |
| Income (loss) from continuing operations | $ | 9,509 | | | $ | 913 | | | $ | 8,974 | | | $ | (9,867) | | | $ | 9,529 | |
| Income (loss) from discontinued operations, net of taxes | — | | | — | | | 15 | | | — | | | 15 | |
| Net income (loss) before attribution of noncontrolling interests | $ | 9,509 | | | $ | 913 | | | $ | 8,989 | | | $ | (9,867) | | | $ | 9,544 | |
| Noncontrolling interests | — | | | — | | | 35 | | | — | | | 35 | |
| Net income (loss) | $ | 9,509 | | | $ | 913 | | | $ | 8,954 | | | $ | (9,867) | | | $ | 9,509 | |
| Comprehensive income | | | | | | | | | |
| Add: Other comprehensive income (loss) | $ | 1,967 | | | $ | (301) | | | $ | 1,733 | | | $ | (1,432) | | | $ | 1,967 | |
| Total Citigroup comprehensive income (loss) | $ | 11,476 | | | $ | 612 | | | $ | 10,687 | | | $ | (11,299) | | | $ | 11,476 | |
| Add: Other comprehensive income attributable to noncontrolling interests | $ | — | | | $ | — | | | $ | 7 | | | $ | — | | | $ | 7 | |
| Add: Net income attributable to noncontrolling interests | — | | | — | | | 35 | | | — | | | 35 | |
| Total comprehensive income (loss) | $ | 11,476 | | | $ | 612 | | | $ | 10,729 | | | $ | (11,299) | | | $ | 11,518 | |
Condensed Consolidating Balance Sheet
| | | | | | | | | | | | | | | | | | | | | | | | | | | | | |
| June 30, 2020 | | | | | | | | |
| In millions of dollars | Citigroup parent company | | CGMHI | | Other Citigroup subsidiaries and eliminations | | Consolidating adjustments | | Citigroup consolidated |
| Assets | | | | | | | | | |
| Cash and due from banks | $ | — | | | $ | 403 | | | $ | 22,486 | | | $ | — | | | $ | 22,889 | |
| Cash and due from banks—intercompany | 23 | | | 3,325 | | | (3,348) | | | — | | | — | |
| Deposits with banks, net of allowance | — | | | 4,784 | | | 282,100 | | | — | | | 286,884 | |
| Deposits with banks—intercompany | 3,000 | | | 8,145 | | | (11,145) | | | — | | | — | |
| Securities borrowed and purchased under resale agreements | — | | | 221,779 | | | 61,138 | | | — | | | 282,917 | |
| Securities borrowed and purchased under resale agreements—intercompany | — | | | 24,679 | | | (24,679) | | | — | | | — | |
| Trading account assets | 250 | | | 223,733 | | | 138,328 | | | — | | | 362,311 | |
| Trading account assets—intercompany | 261 | | | 3,786 | | | (4,047) | | | — | | | — | |
| Investments, net of allowance | 1 | | | 458 | | | 432,794 | | | — | | | 433,253 | |
| Loans, net of unearned income | — | | | 2,922 | | | 682,370 | | | — | | | 685,292 | |
| Loans, net of unearned income—intercompany | — | | | — | | | — | | | — | | | — | |
| Allowance for credit losses on loans (ACLL) | — | | | — | | | (26,420) | | | — | | | (26,420) | |
| Total loans, net | $ | — | | | $ | 2,922 | | | $ | 655,950 | | | $ | — | | | $ | 658,872 | |
| Advances to subsidiaries | $ | 151,652 | | | $ | — | | | $ | (151,652) | | | $ | — | | | $ | — | |
| Investments in subsidiaries | 205,625 | | | — | | | — | | | (205,625) | | | — | |
Other assets, net of allowance(1) | 13,299 | | | 64,181 | | | 108,109 | | | — | | | 185,589 | |
| Other assets—intercompany | 3,535 | | | 50,952 | | | (54,487) | | | — | | | — | |
| Total assets | $ | 377,646 | | | $ | 609,147 | | | $ | 1,451,547 | | | $ | (205,625) | | | $ | 2,232,715 | |
| Liabilities and equity | | | | | | | | | |
| Deposits | $ | — | | | $ | — | | | $ | 1,233,660 | | | $ | — | | | $ | 1,233,660 | |
| Deposits—intercompany | — | | | — | | | — | | | — | | | — | |
| Securities loaned and sold under repurchase agreements | — | | | 199,525 | | | 16,197 | | | — | | | 215,722 | |
| Securities loaned and sold under repurchase agreements—intercompany | — | | | 51,179 | | | (51,179) | | | — | | | — | |
| Trading account liabilities | 11 | | | 100,338 | | | 48,915 | | | — | | | 149,264 | |
| Trading account liabilities—intercompany | 141 | | | 2,745 | | | (2,886) | | | — | | | — | |
| Short-term borrowings | 25 | | | 12,170 | | | 27,961 | | | — | | | 40,156 | |
| Short-term borrowings—intercompany | — | | | 16,888 | | | (16,888) | | | — | | | — | |
| Long-term debt | 169,036 | | | 44,874 | | | 65,865 | | | — | | | 279,775 | |
| Long-term debt—intercompany | — | | | 76,880 | | | (76,880) | | | — | | | — | |
| Advances from subsidiaries | 13,678 | | | — | | | (13,678) | | | — | | | — | |
| Other liabilities, including allowance | 3,139 | | | 59,236 | | | 59,461 | | | — | | | 121,836 | |
| Other liabilities—intercompany | (6) | | | 9,530 | | | (9,524) | | | — | | | — | |
| Stockholders’ equity | 191,622 | | | 35,782 | | | 170,523 | | | (205,625) | | | 192,302 | |
| Total liabilities and equity | $ | 377,646 | | | $ | 609,147 | | | $ | 1,451,547 | | | $ | (205,625) | | | $ | 2,232,715 | |
(1)Other assets for Citigroup parent company at June 30, 2020 included $34.4 billion of placements to Citibank and its branches, of which $29.2 billion had a remaining term of less than 30 days.
Condensed Consolidating Balance Sheet
| | | | | | | | | | | | | | | | | | | | | | | | | | | | | |
| December 31, 2019 | | | | | | | | |
| In millions of dollars | Citigroup parent company | | CGMHI | | Other Citigroup subsidiaries and eliminations | | Consolidating adjustments | | Citigroup consolidated |
| Assets | | | | | | | | | |
| Cash and due from banks | $ | — | | | $ | 586 | | | $ | 23,381 | | | $ | — | | | $ | 23,967 | |
| Cash and due from banks—intercompany | 21 | | | 5,095 | | | (5,116) | | | — | | | — | |
| Deposits with banks | — | | | 4,050 | | | 165,902 | | | — | | | 169,952 | |
| Deposits with banks—intercompany | 3,000 | | | 6,710 | | | (9,710) | | | — | | | — | |
| Securities borrowed and purchased under resale agreements | — | | | 195,537 | | | 55,785 | | | — | | | 251,322 | |
| Securities borrowed and purchased under resale agreements—intercompany | — | | | 21,446 | | | (21,446) | | | — | | | — | |
| Trading account assets | 286 | | | 152,115 | | | 123,739 | | | — | | | 276,140 | |
| Trading account assets—intercompany | 426 | | | 5,858 | | | (6,284) | | | — | | | — | |
| Investments, net of allowance | 1 | | | 541 | | | 368,021 | | | — | | | 368,563 | |
| Loans, net of unearned income | — | | | 2,497 | | | 696,986 | | | — | | | 699,483 | |
| Loans, net of unearned income—intercompany | — | | | — | | | — | | | — | | | — | |
| Allowance for credit losses on loans (ACLL) | — | | | — | | | (12,783) | | | — | | | (12,783) | |
| Total loans, net | $ | — | | | $ | 2,497 | | | $ | 684,203 | | | $ | — | | | $ | 686,700 | |
| Advances to subsidiaries | $ | 144,587 | | | $ | — | | | $ | (144,587) | | | $ | — | | | $ | — | |
| Investments in subsidiaries | 202,116 | | | — | | | — | | | (202,116) | | | — | |
Other assets, net of allowance(1) | 12,377 | | | 54,784 | | | 107,353 | | | — | | | 174,514 | |
| Other assets—intercompany | 2,799 | | | 45,588 | | | (48,387) | | | — | | | — | |
| Total assets | $ | 365,613 | | | $ | 494,807 | | | $ | 1,292,854 | | | $ | (202,116) | | | $ | 1,951,158 | |
| Liabilities and equity | | | | | | | | | |
| Deposits | $ | — | | | $ | — | | | $ | 1,070,590 | | | $ | — | | | $ | 1,070,590 | |
| Deposits—intercompany | — | | | — | | | — | | | — | | | — | |
| Securities loaned and sold under repurchase agreements | — | | | 145,473 | | | 20,866 | | | — | | | 166,339 | |
| Securities loaned and sold under repurchase agreements—intercompany | — | | | 36,581 | | | (36,581) | | | — | | | — | |
| Trading account liabilities | 1 | | | 80,100 | | | 39,793 | | | — | | | 119,894 | |
| Trading account liabilities—intercompany | 379 | | | 5,109 | | | (5,488) | | | — | | | — | |
| Short-term borrowings | 66 | | | 11,096 | | | 33,887 | | | — | | | 45,049 | |
| Short-term borrowings—intercompany | — | | | 17,129 | | | (17,129) | | | — | | | — | |
| Long-term debt | 150,477 | | | 39,578 | | | 58,705 | | | — | | | 248,760 | |
| Long-term debt—intercompany | — | | | 66,791 | | | (66,791) | | | — | | | — | |
| Advances from subsidiaries | 20,503 | | | — | | | (20,503) | | | — | | | — | |
| Other liabilities, including allowance | 937 | | | 51,777 | | | 53,866 | | | — | | | 106,580 | |
| Other liabilities—intercompany | 8 | | | 8,414 | | | (8,422) | | | — | | | — | |
| Stockholders’ equity | 193,242 | | | 32,759 | | | 170,061 | | | (202,116) | | | 193,946 | |
| Total liabilities and equity | $ | 365,613 | | | $ | 494,807 | | | $ | 1,292,854 | | | $ | (202,116) | | | $ | 1,951,158 | |
(1)Other assets for Citigroup parent company at December 31, 2019 included $35.1 billion of placements to Citibank and its branches, of which $24.9 billion had a remaining term of less than 30 days.
Condensed Consolidating Statement of Cash Flows
| | | | | | | | | | | | | | | | | | | | | | | | | | | | | |
| Six Months Ended June 30, 2020 | | | | | | | | |
| In millions of dollars | Citigroup parent company | | CGMHI | | Other Citigroup subsidiaries and eliminations | | Consolidating adjustments | | Citigroup consolidated |
| Net cash provided by (used in) operating activities of continuing operations | $ | 2,857 | | | $ | (53,782) | | | $ | 31,717 | | | $ | — | | | $ | (19,208) | |
| Cash flows from investing activities of continuing operations | | | | | | | | | |
| Purchases of investments | $ | — | | | $ | — | | | $ | (207,701) | | | $ | — | | | $ | (207,701) | |
| Proceeds from sales of investments | — | | | — | | | 86,191 | | | — | | | 86,191 | |
| Proceeds from maturities of investments | — | | | — | | | 53,909 | | | — | | | 53,909 | |
| | | | | | | | | |
| Change in loans | — | | | — | | | 7,943 | | | — | | | 7,943 | |
| Proceeds from sales and securitizations of loans | — | | | — | | | 826 | | | — | | | 826 | |
| | | | | | | | | |
| | | | | | | | | |
| Change in securities borrowed and purchased under agreements to resell | — | | | (29,475) | | | (2,120) | | | — | | | (31,595) | |
| Changes in investments and advances—intercompany | (7,371) | | | (4,890) | | | 12,261 | | | — | | | — | |
| Other investing activities | — | | | — | | | (1,262) | | | — | | | (1,262) | |
| Net cash provided by (used in) investing activities of continuing operations | $ | (7,371) | | | $ | (34,365) | | | $ | (49,953) | | | $ | — | | | $ | (91,689) | |
| Cash flows from financing activities of continuing operations | | | | | | | | | |
| Dividends paid | $ | (2,679) | | | $ | — | | | $ | — | | | $ | — | | | $ | (2,679) | |
| Issuance of preferred stock | 1,500 | | | — | | | — | | | — | | | 1,500 | |
| Redemption of preferred stock | (1,500) | | | — | | | — | | | — | | | (1,500) | |
| Treasury stock acquired | (2,925) | | | — | | | — | | | — | | | (2,925) | |
| Proceeds (repayments) from issuance of long-term debt, net | 17,353 | | | 8,907 | | | (86) | | | — | | | 26,174 | |
| Proceeds (repayments) from issuance of long-term debt—intercompany, net | | | 6,815 | | | (6,815) | | | — | | | — | |
| Change in deposits | — | | | — | | | 163,070 | | | — | | | 163,070 | |
| Change in securities loaned and sold under agreements to repurchase | — | | | 68,650 | | | (19,267) | | | — | | | 49,383 | |
| Change in short-term borrowings | — | | | 1,074 | | | (5,967) | | | — | | | (4,893) | |
| Net change in short-term borrowings and other advances—intercompany | (6,826) | | | 3,035 | | | 3,791 | | | — | | | — | |
| Capital contributions from (to) parent | — | | — | | — | | | — | | | — | | | — | |
| Other financing activities | (407) | | | (118) | | | 118 | | | — | | | (407) | |
| Net cash provided by (used in) financing activities of continuing operations | $ | 4,516 | | | $ | 88,363 | | | $ | 134,844 | | | $ | — | | | $ | 227,723 | |
| Effect of exchange rate changes on cash and due from banks | $ | — | | | $ | — | | | $ | (972) | | | $ | — | | | $ | (972) | |
| | | | | | | | | |
| | | | | | | | | |
| Change in cash and due from banks and deposits with banks | $ | 2 | | | $ | 216 | | | $ | 115,636 | | | $ | — | | | $ | 115,854 | |
| Cash and due from banks and deposits with banks at beginning of period | 3,021 | | | 16,441 | | | 174,457 | | | — | | | 193,919 | |
| Cash and due from banks and deposits with banks at end of period | $ | 3,023�� | | | $ | 16,657 | | | $ | 290,093 | | | $ | — | | | $ | 309,773 | |
| Cash and due from banks | $ | 23 | | | $ | 3,728 | | | $ | 19,138 | | | $ | — | | | $ | 22,889 | |
| Deposits with banks, net of allowance | 3,000 | | | 12,929 | | | 270,955 | | | — | | | 286,884 | |
| Cash and due from banks and deposits with banks at end of period | $ | 3,023 | | | $ | 16,657 | | | $ | 290,093 | | | $ | — | | | $ | 309,773 | |
| Supplemental disclosure of cash flow information for continuing operations | | | | | | | | | |
| Cash paid during the period for income taxes | $ | 39 | | | $ | 174 | | | $ | 2,330 | | | $ | — | | | $ | 2,543 | |
| Cash paid during the period for interest | 1,757 | | | 3,006 | | | 3,988 | | | — | | | 8,751 | |
| Non-cash investing activities | | | | | | | | | |
| | | | | | | | | |
| | | | | | | | | |
| | | | | | | | | |
| | | | | | | | | |
| | | | | | | | | |
| Transfers to loans HFS from loans | $ | — | | | $ | — | | | $ | 1,036 | | | $ | — | | | $ | 1,036 | |
| | | | | | | | | |
| | | | | | | | | |
| | | | | | | | | |
| | | | | | | | | |
| | | | | | | | | |
| | | | | | | | | |
| | | | | | | | | |
| | | | | | | | | |
| | | | | | | | | |
| | | | | | | | | |
Condensed Consolidating Statement of Cash Flows
| | | | | | | | | | | | | | | | | | | | | | | | | | | | | |
| Six Months Ended June 30, 2019 | | | | | | | | |
| In millions of dollars | Citigroup parent company | | CGMHI | | Other Citigroup subsidiaries and eliminations | | Consolidating adjustments | | Citigroup consolidated |
| Net cash provided by (used in) operating activities of continuing operations | $ | 17,500 | | | $ | (39,793) | | | $ | (15,463) | | | $ | — | | | $ | (37,756) | |
| Cash flows from investing activities of continuing operations | | | | | | | | | |
| Purchases of investments | $ | — | | | $ | — | | | $ | (118,132) | | | $ | — | | | $ | (118,132) | |
| Proceeds from sales of investments | 4 | | | — | | | 63,591 | | | — | | | 63,595 | |
| Proceeds from maturities of investments | — | | | — | | | 57,684 | | | — | | | 57,684 | |
| Change in loans | — | | | — | | | (7,803) | | | — | | | (7,803) | |
| Proceeds from sales and securitizations of loans | — | | | — | | | 2,249 | | | — | | | 2,249 | |
| | | | | | | | | |
| | | | | | | | | |
| Change in securities borrowed and purchased under agreements to resell | — | | | 9,511 | | | 1,404 | | | — | | | 10,915 | |
| Changes in investments and advances—intercompany | (3,336) | | | (10,607) | | | 13,943 | | | — | | | — | |
| Other investing activities | — | | | (32) | | | (3,178) | | | — | | | (3,210) | |
| Net cash provided by (used in) investing activities of continuing operations | $ | (3,332) | | | $ | (1,128) | | | $ | 9,758 | | | $ | — | | | $ | 5,298 | |
| Cash flows from financing activities of continuing operations | | | | | | | | | |
| Dividends paid | $ | (2,650) | | | $ | — | | | $ | — | | | $ | — | | | $ | (2,650) | |
| | | | | | | | | |
| Redemption of preferred stock | (480) | | | — | | | — | | | — | | | (480) | |
| Treasury stock acquired | (7,518) | | | — | | | — | | | — | | | (7,518) | |
| Proceeds (repayments) from issuance of long-term debt, net | 5,418 | | | 10,817 | | | (2,814) | | | — | | | 13,421 | |
| Proceeds (repayments) from issuance of long-term debt—intercompany, net | — | | | (3,941) | | | 3,941 | | | — | | | — | |
| Change in deposits | — | | | — | | | 32,437 | | | — | | | 32,437 | |
| Change in securities loaned and sold under agreements to repurchase | — | | | 20,903 | | | (17,538) | | | — | | | 3,365 | |
| Change in short-term borrowings | — | | | 4,977 | | | 5,119 | | | — | | | 10,096 | |
| Net change in short-term borrowings and other advances—intercompany | (8,584) | | | 7,088 | | | 1,496 | | | — | | | — | |
| | | | | | | | | |
| Other financing activities | (359) | | | — | | | — | | | — | | | (359) | |
| Net cash provided by (used in) financing activities of continuing operations | $ | (14,173) | | | $ | 39,844 | | | $ | 22,641 | | | $ | — | | | $ | 48,312 | |
| Effect of exchange rate changes on cash and due from banks | $ | — | | | $ | — | | | $ | (716) | | | $ | — | | | $ | (716) | |
| | | | | | | | | |
| | | | | | | | | |
| Change in cash and due from banks and deposits with banks | $ | (5) | | | $ | (1,077) | | | $ | 16,220 | | | $ | — | | | $ | 15,138 | |
| Cash and due from banks and deposits with banks at beginning of period | 3,020 | | | 15,677 | | | 169,408 | | | — | | | 188,105 | |
| Cash and due from banks and deposits with banks at end of period | $ | 3,015 | | | $ | 14,600 | | | $ | 185,628 | | | $ | — | | | $ | 203,243 | |
| Cash and due from banks | $ | 15 | | — | | $ | 4,479 | | | $ | 20,503 | | | $ | — | | | $ | 24,997 | |
| Deposits with banks, net of allowance | 3,000 | | | 10,121 | | | 165,125 | | | — | | | 178,246 | |
| Cash and due from banks and deposits with banks at end of period | $ | 3,015 | | | $ | 14,600 | | | $ | 185,628 | | | $ | — | | | $ | 203,243 | |
| Supplemental disclosure of cash flow information for continuing operations | | | | | | | | | |
| Cash paid during the period for income taxes | $ | 154 | | | $ | 119 | | | $ | 2,541 | | | $ | — | | | $ | 2,814 | |
| Cash paid during the period for interest | 1,753 | | | 6,577 | | | 5,670 | | | — | | | 14,000 | |
| Non-cash investing activities | | | | | | | | | |
| | | | | | | | | |
| | | | | | | | | |
| | | | | | | | | |
| | | | | | | | | |
| | | | | | | | | |
| Transfers to loans HFS from loans | $ | — | | | $ | — | | | $ | 3,600 | | | $ | — | | | $ | 3,600 | |
| | | | | | | | | |
| | | | | | | | | |
| | | | | | | | | |
| | | | | | | | | |
| | | | | | | | | |
| | | | | | | | | |
UNREGISTERED SALES OF EQUITY SECURITIES, REPURCHASES OF EQUITY SECURITIES AND DIVIDENDS
Unregistered Sales of Equity Securities
None.
Equity Security Repurchases(1)
The following table summarizes Citi’s common stock repurchases:
| | | | | | | | | | | |
| In millions, except per share amounts | Total shares
purchased | Average
price paid
per share | Approximate dollar
value of shares that
may yet be purchased
under the plan or
programs |
| April 2020 | | | |
Open market repurchases(1)(2) | — | | $ | — | | $ | 3,930 | |
Employee transactions(3) | — | | — | | N/A |
| May 2020 | | | |
Open market repurchases(1)(2) | — | | — | | 3,930 | |
Employee transactions(3) | — | | — | | N/A |
| June 2020 | | | |
Open market repurchases(1)(2) | — | | — | | — | |
Employee transactions(3) | — | | — | | N/A |
| Total for 2Q20 | — | | $ | — | | $ | — | |
(1)As previously announced, on March 15, 2020, Citi joined other major U.S. banks in suspending stock repurchases in light of the COVID-19 pandemic. There was no change to Citi’s dividend policy.
(2)Citi’s $17.1 billion 2019 common stock repurchase program (2019 Repurchase Program), which was approved by Citigroup’s Board of Directors and announced on June 27, 2019, expired on June 30, 2020. The 2019 Repurchase Program was part of the planned capital actions included by Citi as part of the 2019 CCAR.
(3)Consisted of shares added to treasury stock related to (i) certain activity on employee stock option program exercises where the employee delivers existing shares to cover the option exercise, or (ii) under Citi’s employee restricted share awards where shares are withheld to satisfy tax requirements.
N/A Not applicable
Dividends
Consistent with the regulatory capital framework, Citi declared common dividends of $0.51 per share for the third quarter of 2020 on July 23, 2020, and intends to maintain its planned capital actions, which include common dividends of $0.51 per share over the four-quarter window of fourth quarter of 2020 to third quarter of 2021 (the 2020 CCAR cycle), subject to approval of Citi’s Board of Directors and the latest financial and macroeconomic conditions. For information on Citi’s interim SCB, see “Capital Resources—Stress Capital Buffer” above.
In addition to Board of Directors’ approval, Citi’s ability to pay common stock dividends substantially depends on the results of the CCAR process required by the Federal Reserve Board and the supervisory stress tests required under the Dodd-Frank Act. In June 2020, the Federal Reserve Board determined that changes in financial markets and macroeconomic outlooks related to the COVID-19 pandemic could have a material effect on the risk profile and financial condition of each firm subject to its capital plan rule, and therefore require updated capital plans. Accordingly, the Federal Reserve Board is requiring each firm, including Citi, to update and resubmit its capital plan within 45 days after the Federal Reserve Board provides updated scenarios.
Through the end of the third quarter of 2020, the Federal Reserve Board has authorized firms, including Citi, to pay common stock dividends that do not exceed an amount equal to the average of the firm’s net income for the four preceding calendar quarters, unless otherwise specified by the Federal Reserve Board, provided that the firm does not exceed the amount of common stock dividends paid in the second quarter of 2020. Citi’s common dividends of $0.51 per share during the third quarter of 2020 is not impacted by the Federal Reserve Board’s temporary limitations on capital distributions, as Citi’s average quarterly net income for the four preceding calendar quarters of $3.4 billion is more than sufficient under the four quarter average net income test. For additional information on these capital distribution limitations, see “Capital Resources—Capital Plan Resubmission and Related Limitations on Capital Distributions” above.
Any dividend on Citi’s outstanding common stock would also need to be made in compliance with Citi’s obligations on its outstanding preferred stock.
For information on the ability of Citigroup’s subsidiary depository institutions to pay dividends, see Note 18 to the Consolidated Financial Statements in Citi’s 2019 Annual Report on Form 10-K.
SIGNATURES
Pursuant to the requirements of the Securities Exchange Act of 1934, the Registrant has duly caused this report to be signed on its behalf by the undersigned, thereunto duly authorized, on the 4th day of August, 2020.
CITIGROUP INC.
(Registrant)
By /s/ Mark A. L. Mason
Mark A. L. Mason
Chief Financial Officer
(Principal Financial Officer)
By /s/ Jeffrey R. Walsh
Jeffrey R. Walsh
Interim Controller and Chief Accounting Officer
(Principal Accounting Officer)
EXHIBIT INDEX
| | | | | | | | |
| Exhibit | | |
| Number | | Description of Exhibit |
| | |
| | |
| | |
| | |
| | |
| | |
| | |
| | |
| | |
| | |
| | |
| | |
| | |
| | | |
| | |
| | |
| 104 | | See the cover page of this Quarterly Report on Form 10-Q, formatted in Inline XBRL. |
The total amount of securities authorized pursuant to any instrument defining rights of holders of long-term debt of the Company does not exceed 10% of the total assets of the Company and its consolidated subsidiaries. The Company will furnish copies of any such instrument to the SEC upon request.
* Denotes a management contract or compensatory plan or arrangement.
+ Filed herewith.