Exhibit 99.1

CITIGROUP REPORTS SECOND QUARTER NET INCOME OF $4.3 BILLION, $0.49 DILUTED EPS
$6.7 BILLION AFTER-TAX GAIN ON SALE OF SMITH BARNEY
TIER 1 CAPITAL RATIO ROSE TO APPROXIMATELY 12.7%
CITICORP NET INCOME OF $3.1 BILLION, ON STRONG INSTITUTIONAL CLIENTS GROUP RESULTS
CITI HOLDINGS NET INCOME OF $1.4 BILLION ON SMITH BARNEY GAIN
New York, NY, July 17, 2009 — Citigroup Inc. (NYSE: C) today reported net income for the second quarter of 2009 of $4.3 billion, or $0.49 per diluted share. Second quarter revenues were $30.0 billion. These results include an $11.1 billion pre-tax ($6.7 billion after-tax) gain associated with the Morgan Stanley Smith Barney joint venture transaction, which closed on June 1, 2009.
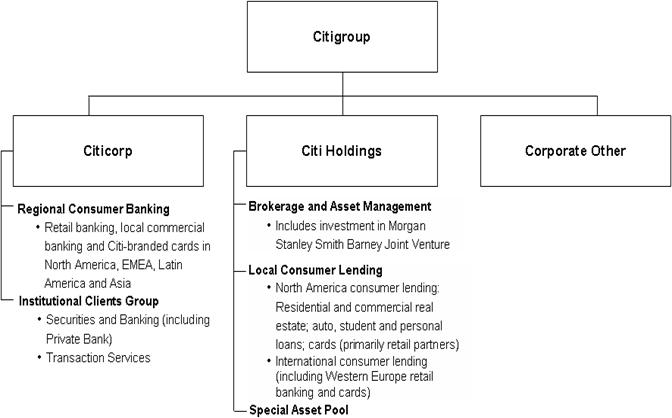
Today’s results reflect Citigroup’s previously announced realignment into two principal segments, Citicorp and Citi Holdings. A third segment, Corporate/Other, consists of various corporate level activities. An organizational chart detailing the businesses in Citicorp and Citi Holdings is attached in Appendix A.
Key Items
· Closed Morgan Stanley Smith Barney joint venture transaction on June 1, 2009, ahead of schedule.
· Total revenues were $30.0 billion, up $12.4 billion from the second quarter of 2008, due primarily to the Smith Barney gain on sale and favorable net write-ups and gains (“revenue marks”) relative to the prior year period in Citi Holdings (see Appendix B), partially offset by the impact of foreign exchange changes on non-U.S. dollar items as they are converted to U.S. dollars for reporting purposes (“the impact of foreign exchange”) and declines in Regional Consumer Banking revenues, primarily in Cards.
· Managed revenues were $33.1 billion, or $22.0 billion excluding the Smith Barney gain.
· Institutional Clients Group had net income of $2.8 billion, up 17% from prior year levels on record net income from Transaction Services, and strong results in Securities and Banking.
· Regional Consumer Banking deposits grew in each region versus the prior quarter, with particular strength in North America, where deposits grew 6%.
· Total deposits were $805 billion, up 6% sequentially, and flat with prior year levels.
· Net interest margin was 3.24%, up 7 basis points from the prior year period as the benefit of lower cost of funds was largely offset by lower asset yields and the FDIC special assessment of $333 million.
· Credit costs increased to $12.4 billion, including an addition of $3.9 billion to loan loss reserves, bringing the total allowance for loan losses to 5.6% of total loans.
· Operating expenses were $12.0 billion, down 21% from the second quarter of 2008, reflecting ongoing re-engineering efforts, expense control, and the impact of foreign exchange.
· Headcount declined by approximately 30,000 from the first quarter of 2009, to 279,000, mainly driven by the Smith Barney transaction. Headcount is now approximately 96,000 below peak levels. June was the 20th consecutive month of headcount decline.
· Capital position continued to improve during the quarter. Tier 1 capital ratio was approximately 12.7%, versus 8.7% in the second quarter of 2008 and 11.9% in the first quarter 2009. Tangible common equity grew by $9.1 billion during the quarter.
· Since the beginning of 2007, Citi has worked successfully with approximately 625,000 homeowners to avoid potential foreclosure on combined mortgages totaling more than $67 billion.
1
Management Comment
“For many quarters we have been consistently and successfully executing our plan to build financial strength and return Citi to sustained profitability and growth. We have made significant progress in recent quarters as evidenced in the significant decline in expenses, headcount, assets, including Citi’s riskiest assets, as well as our 12.7% Tier 1 capital ratio,” said Vikram Pandit, Chief Executive Officer of Citi.
“This quarter also marks a key milestone in our plan, as we are now reporting our financial results to reflect the separation of Citi into two primary operating segments: Citicorp and Citi Holdings.
“Citicorp is our core franchise and will be the source of Citi’s long term profitability and growth. Citicorp is unique with institutional and consumer businesses operating on an unmatched global footprint. We will manage our businesses and assets in Citi Holdings to optimize their value over time. We have already announced the sale of a number of businesses within Citi Holdings, and its assets have been reduced by approximately $250 billion since the first quarter of 2008.
“Our financial results today reflect the incredibly dedicated efforts of all of our people around the world and their success in implementing our plan. Our earnings of $4.3 billion reflect the benefit of the closing of the Smith Barney joint venture with Morgan Stanley, which was a key element in our Citi Holdings strategy. This quarter’s results underscore the earnings power of Citicorp, with over $3 billion of net income.
“As we look forward, we will continue the same relentless focus on executing our plan. We remain optimistic that our turnaround of Citi will gain speed. Our institutional business has a strong client franchise. Our most significant challenge now remains consumer credit. Losses in our consumer businesses have been growing for some time, but we see some positive signs of moderation in those loss trends. Sustainable profitability remains our primary goal,” said Pandit.
2
CITIGROUP RESULTS
| | Second Quarter
Revenues | | % | | Second Quarter Income
From Continuing Operations | | % | |
(In Millions of Dollars, except EPS) | | 2009 | | 2008 | | Change | | 2009 | | 2008 | | Change | |
Citicorp | | | | | | | | | | | | | |
Regional Consumer Banking | | $ | 5,605 | | $ | 6,881 | | (19 | )% | $ | 217 | | $ | 991 | | (78 | )% |
Institutional Clients Group | | 9,355 | | 9,885 | | (5 | ) | 2,841 | | 2,442 | | 16 | |
Total Citicorp | | 14,960 | | 16,766 | | (11 | ) | 3,058 | | 3,433 | | (11 | ) |
| | | | | | | | | | | | | |
Citi Holdings | | | | | | | | | | | | | |
Brokerage and Asset Management | | 12,339 | | 2,467 | | NM | | 6,814 | | 267 | | NM | |
Local Consumer Lending | | 3,930 | | 6,224 | | (37 | ) | (4,193 | ) | (1,206 | ) | NM | |
Special Asset Pool | | (519 | ) | (6,612 | ) | 92 | | (1,262 | ) | (4,286 | ) | 71 | |
Total Citi Holdings | | 15,750 | | 2,079 | | NM | | 1,359 | | (5,225 | ) | NM | |
Corporate/Other | | (741 | ) | (1,307 | ) | 43 | | (30 | ) | (537 | ) | 94 | |
Total Citigroup From Continuing Operations | | $ | 29,969 | | $ | 17,538 | | 71 | | $ | 4,387 | | $ | (2,329 | ) | NM | |
Discontinued Operations | | | | | | | | (142 | ) | (94 | ) | | |
Net income (loss) attributable to noncontrolling interest | | | | | | | | (34 | ) | 72 | | | |
Total Citigroup | | | | | | | | $ | 4,279 | | $ | (2,495 | ) | NM | |
Preferred Stock Dividends (for Diluted EPS Calculation) | | | | | | | | $ | 1,279 | | $ | 361 | | | |
Diluted Earnings (loss) per Share from Continuing Operations | | | | | | | | $ | 0.51 | | $ | (0.53 | ) | | |
Diluted Earnings (loss) per Share | | | | | | | | $ | 0.49 | | $ | (0.55 | ) | | |
NM - Not Meaningful.
SECOND QUARTER SUMMARY
Citigroup
· | Revenues were $30.0 billion, up $12.4 billion from prior year levels, primarily due to the Smith Barney gain on sale. Favorable revenue marks in Citi Holdings relative to the second quarter of 2008 (see Appendix B) also contributed to the increase, offset by the impact of foreign exchange, and declines in Regional Consumer Banking revenues, primarily in Cards. |
| |
· | Credit costs of $12.4 billion, up 81%, consisted of $8.4 billion in net credit losses, and $3.9 billion loan loss reserve build. The total allowance for loans, leases and unfunded lending commitments was $37.0 billion, up from $21.9 billion in the prior year period. |
| |
· | Operating expenses were $12.0 billion, down 21% from the prior year period, reflecting benefits from ongoing re-engineering efforts and the impact of foreign exchange. Quarterly operating expenses were down $3.7 billion from peak levels in the fourth quarter of 2007. |
| |
· | Taxes. The effective tax rate on continuing operations was 17% versus 51% in the prior-year period. The current quarter included a tax benefit of $129 million in continuing operations and $34 million in discontinued operations related to the conclusion of an IRS audit of various issues for the years 2003-2005. The effective tax rate for the prior year period was higher due to pretax losses incurred in higher tax rate jurisdictions. |
3
· | Total assets were $1.85 trillion, down 12% from the prior year level, and down 22% from peak levels in the third quarter of 2007. |
| |
· | End of period total deposits were $805 billion, generally flat from the prior year period. Deposit growth was strong in Regional Consumer Banking in North America, where deposits were up 12% from the prior year period. Deposit growth in North America was offset by the impact of foreign exchange on deposits in other regions. |
| |
· | Capital Position improved during the quarter. At the end of the second quarter, Citigroup’s Tier 1 capital ratio was approximately 12.7%, up from 8.7% in the prior year period and 11.9% at March 31, 2009. |
CITICORP
Citicorp revenues were $15.0 billion, down 11% from the year ago period driven by the impact of foreign exchange, greater credit losses flowing through the card securitization trusts in North America and lower volumes. Operating expenses were $7.8 billion, down 21% from the prior year period, primarily due to re-engineering initiatives, the impact of foreign exchange and reduced marketing.
Credit costs were $2.8 billion, up 57% from the second quarter of 2008, reflecting $1.6 billion of net credit losses and a $1.2 billion reserve build. Citicorp’s income was $3.1 billion, down 10% from the prior year period, as expense reductions offset a large portion of the decline in revenues and increase in credit costs.
Citicorp - - Regional Consumer Banking
| | Second Quarter Revenues | | % | | Second Quarter Income from Continuing Operations | | % | |
(In Millions of Dollars) | | 2009 | | 2008 | | Change | | 2009 | | 2008 | | Change | |
North America | | $ | 1,761 | | $ | 2,111 | | (17 | )% | $ | (15 | ) | $ | 169 | | NM | |
Europe, Middle East and Africa | | 394 | | 508 | | (22 | ) | (110 | ) | 37 | | NM | |
Latin America | | 1,819 | | 2,371 | | (23 | ) | 70 | | 334 | | (79 | )% |
Asia | | 1,631 | | 1,891 | | (14 | ) | 272 | | 451 | | (40 | ) |
Total Regional Consumer Banking | | $ | 5,605 | | $ | 6,881 | | (19 | )% | $ | 217 | | $ | 991 | | (78 | )% |
Regional Consumer Banking revenues were $5.6 billion, down 19% from the prior year period, driven by increasing credit losses flowing through the card securitization trusts in North America, the impact of foreign exchange, and lower loan and investment volumes. Expenses were $3.5 billion, down 17% from the prior year period, reflecting the impact of foreign exchange, re-engineering initiatives, headcount reductions and lower marketing expenditure. Credit costs of $2.0 billion were up 46% from year ago levels, and included $1.4 billion of net credit losses and $0.6 billion reserve build. Credit costs were up most significantly in North America and EMEA.
· | North America |
| | |
| · | Total revenues declined 17% from the prior year period to $1.8 billion. On a managed basis, revenues increased 1%. Retail banking revenues were flat with the prior year at $955 million, reflecting higher deposit and loan volumes, offset by lower deposit spreads and an asset sale gain recorded in the prior year period. Card GAAP revenues were down 30% from the prior year period to $806 million, reflecting higher credit losses in the securitization trusts, lower fees and a decrease in gains on sale, partially offset by pricing actions and lower funding costs. Card managed revenues of $2.5 billion were up 2% from prior year levels reflecting pricing actions and lower funding costs, partially offset by a decline in average managed card loans and lower fees. Card managed net interest margin increased to 10.51% from 8.12% in the second quarter of 2008. Total card purchase sales declined 18%. |
4
· Income declined $184 million to a loss of $15 million, as rising credit losses more than offset the benefits of higher spreads in cards, greater deposit volume and expense reductions.
· Average retail banking deposits were up 12% from the prior year period to $136 billion, driven by growth in consumer CDs and commercial deposits.
· On a managed basis, average loans and leases increased 1% to $87.6 billion.
· Total credit costs were up 66% to $435 million, as compared to prior year levels primarily due to rising net credit losses in both cards and retail banking. Loan loss reserve build was $130 million, up slightly from year ago levels. The retail banking net credit loss ratio increased 174 basis points to 4.85%, while the card managed net credit loss ratio increased 471 basis points to 10.25%.
· Expenses declined by 16% to $1.3 billion, due to re-engineering saves and reductions in marketing expenses.
· Europe, Middle East and Africa
· Revenues declined by 22% from the prior year, to $394 million. More than half of the revenue decline is attributable to the impact of foreign exchange. Other drivers included lower wealth management and lending revenues due to lower volumes and spread compression. Investment sales and assets under management declined by 38% and 32%, respectively. Average loans for retail banking were down 22% from the prior year period, as a result of tighter underwriting criteria, branch closures and the impact of foreign exchange. Average deposits were down 24% from the prior year period, primarily due to the impact of foreign exchange.
· There was a net loss of $110 million in the current period, down from income of $37 million in the prior year period, as declining revenues and increasing credit costs were partially offset by expense reductions.
· Credit costs increased $216 million to $279 million as compared to the prior year period. Net credit losses increased from $48 million to $121 million, while the loan loss reserve build increased from $15 million to $158 million. Higher credit costs reflected continued credit deterioration, particularly in UAE, Turkey, Poland and Russia. The retail banking net credit loss ratio increased from 1.7% to 5.3%.
· Expenses were down 29% as compared to the second quarter of 2008, to $282 million on expense control actions, lower marketing expenditure and the impact of foreign exchange. Cost savings were achieved by branch closures, headcount reductions and other re-engineering efforts.
· Latin America
· Revenues were $1.8 billion, down 23% from the prior year period due to the impact of foreign exchange, lower credit card receivables and spread compression, partially offset by higher volumes in retail banking.
· Income was down 79% to $70 million, as compared to the prior year period, primarily due to lower card revenues and increasing credit costs.
· Credit costs were $766 million, up 8% from the prior year period, as deteriorating credit conditions were partially offset by the impact of foreign exchange. Card net credit loss rates increased from 11.4% in the second quarter of 2008 to 16.2%. Credit deterioration was particularly apparent in the Mexico card portfolio.
· Expenses were $1.0 billion, down 16% from the prior year period, driven by the impact of foreign exchange and reengineering actions, partially offset by restructuring charges.
· Average deposits were $36.0 billion, down 14% from the prior year period, due to the impact of foreign exchange.
· Asia
· Revenues were down 14%, to $1.6 billion from the prior year period, primarily driven by the impact of foreign exchange and lower investment product volumes.
· Income was $272 million, down 40% from the prior year period, as declining revenues and increasing credit costs were partially offset by expense reductions.
· Credit costs were $504 million, up 55% from the prior year period on deteriorating credit conditions, partially offset by the impact of foreign exchange. Loan loss reserve build increased to $150 million from $84 million.
5
Card net credit loss rate increased to 6.0% from 3.4% in the prior year period. Credit deterioration was particularly apparent in the card portfolios in India and Korea.
· Expenses were $833 million, down 14% from the prior year period due primarily to re-engineering efforts, and the impact of foreign exchange.
· Average deposits were $87.6 billion, down 10% from prior year levels, primarily due to the impact of foreign exchange.
Citicorp - Institutional Clients Group
| | Second Quarter Revenues | | % | | Second Quarter Income from
Continuing Operations | | % | |
(In Millions of Dollars) | | 2009 | | 2008 | | Change | | 2009 | | 2008 | | Change | |
North America | | $ | 1,898 | | $ | 3,507 | | (46 | )% | $ | 3 | | $ | 646 | | (100 | )% |
Europe, Middle East and Africa | | 2,555 | | 1,970 | | 30 | | 746 | | 376 | | 98 | |
Latin America | | 1,046 | | 722 | | 45 | | 522 | | 325 | | 61 | |
Asia | | 1,373 | | 1,207 | | 14 | | 596 | | 306 | | 95 | |
Securities and Banking | | $ | 6,872 | | $ | 7,406 | | (7 | )% | $ | 1,867 | | $ | 1,653 | | 13 | % |
| | | | | | | | | | | | | |
North America | | $ | 656 | | $ | 511 | | 28 | % | $ | 181 | | $ | 61 | | NM | |
Europe, Middle East and Africa | | 860 | | 947 | | (9 | ) | 350 | | 299 | | 17 | |
Latin America | | 340 | | 374 | | (9 | ) | 150 | | 151 | | (1 | ) |
Asia | | 627 | | 647 | | (3 | ) | 293 | | 278 | | 5 | |
Transaction Services | | $ | 2,483 | | $ | 2,479 | | 0 | % | $ | 974 | | $ | 789 | | 23 | % |
| | | | | | | | | | | | | |
Institutional Clients Group | | $ | 9,355 | | $ | 9,885 | | (5 | )% | $ | 2,841 | | $ | 2,442 | | 16 | % |
NM - Not Meaningful.
| | Second Quarter Revenues | | % | |
(In Millions of Dollars) | | 2009 | | 2008 | | Change | |
Advisory and Other Fees | | $ | 130 | | $ | 259 | | (50 | )% |
Equity Underwriting | | 279 | | 419 | | (33 | ) |
Debt Underwriting | | 751 | | 657 | | 14 | |
Investment Banking | | 1,160 | | 1,335 | | (13 | ) |
Lending | | (928 | ) | (155 | ) | NM | |
Equity Markets | | 1,101 | | 1,526 | | (28 | ) |
Fixed Income Markets | | 5,573 | | 4,439 | | 26 | |
Private Bank | | 477 | | 593 | | (20 | ) |
Other Securities and Banking | | (511 | ) | (332 | ) | (54 | ) |
Securities and Banking | | $ | 6,872 | | $ | 7,406 | | (7 | )% |
| | | | | | | |
Treasury and Trade Solutions | | $ | 1,793 | | $ | 1,623 | | 10 | |
Securities Services | | 690 | | 856 | | (19 | ) |
Transaction Services | | $ | 2,483 | | $ | 2,479 | | 0 | % |
| | | | | | | |
Institutional Clients Group | | $ | 9,355 | | $ | 9,885 | | (5 | )% |
NM -Not Meaningful.
6
· Securities and Banking
· Securities and Banking revenues were $6.9 billion, down 7% from the prior year period, as strong trading results were offset by revenue marks of negative $776 million (see Appendix B), and lending revenues of negative $928 million.
· Investment banking revenues were $1.2 billion, down 13% from the second quarter of 2008, a quarter driven by stronger M&A and equity volumes.
· Advisory revenues were $130 million, down 50% from the prior year period, primarily as a result of continued overall lower global M&A activity partially offset by improvement in Citigroup’s completed market share.
· Equity underwriting revenues were $279 million, down 33% from a strong second quarter of 2008 which had significant Citigroup self-led issuances, but up $136 million sequentially.
· Debt underwriting revenues were $751 million, up 14% from the prior year period, driven by strong investment grade and high yield issuance.
· Lending revenues were negative $928 million, compared to negative $155 million in the second quarter of 2008, mainly due to losses on credit default swap hedges.
· Equity markets revenues were $1.1 billion, down 28% from the prior year period, primarily driven by a negative $694 million net CVA on Citigroup liabilities at fair value option and derivative positions (reflected in Appendix B). The negative net CVA was principally due to tightening in Citigroup credit spreads, partially offset by tightening counterparty spreads. The negative net CVA offset strong results in derivatives, proprietary trading and cash trading.
· Fixed income markets revenues were $5.6 billion, up 26% from the comparable period in the prior year, driven by strong results across most fixed income categories reflecting favorable positioning and sustained client activity, partially offset by a decline in commodities trading revenues from the high levels in the second quarter of 2008, and a net negative $126 million CVA (reflected in Appendix B).
· Private bank revenues were $477 million, down 20% from the prior year period, on lower assets under management, decreased investment sales and lower average lending volumes, partially offset by wider lending margins.
· Expenses decreased 25%, to $3.3 billion, driven by reductions in headcount, restructuring charges recorded in the second quarter of 2008 and reductions in other operating expenses.
· Credit costs were $819 million, up 98% from the prior year period, due to increased credit reserve builds and provisions for unfunded lending commitments, partially offset by lower net credit losses.
· Securities and Banking net income was $1.9 billion, up 13% from the second quarter of 2008, as expense reductions offset lower revenues and greater credit costs.
· Transaction Services
· Transaction Services revenues were $2.5 billion, in line with year ago levels. Growth in deposits and increasing spreads were offset by the impact of foreign exchange and declines in assets under custody. Average deposits increased by 5%, driven by growth in North America and Asia. Assets under custody declined by 13% from the prior year period, primarily due to lower equity markets.
· Treasury and Trade Solutions (“TTS”) revenues were up 10% to a record $1.8 billion as compared to the prior year period, mainly driven by growth in deposits and spreads and the growth of trade. Securities services revenues decreased by 19%, driven by declines in assets under custody.
· North America revenues were up 28% from the second quarter of 2008, driven by deposit growth, increased spreads and growth in the commercial cards business. EMEA revenues declined by 9%, primarily due to the impact of foreign exchange, and because increased deposit spreads and trade revenues were partially offset by declines in assets under custody. Latin America revenues were down 9% driven by lower balances, declines in assets under custody and the impact of foreign exchange. Asia revenues were down 3% as deposit growth was more than offset by lower assets under custody and the impact of foreign exchange.
· Expenses declined by 19% as compared to the second quarter of 2008, driven by headcount reductions, re-engineering efforts, expense management initiatives and the impact of foreign exchange.
· Record income of $974 million, up 23% from the prior year period primarily driven by growth in deposits and expense reductions, partially offset by the impact of foreign exchange.
7
CITI HOLDINGS
Citi Holdings revenues were $15.8 billion, up from $2.1 billion in the prior year period on the Smith Barney gain on sale and favorable net revenue marks relative to the prior year period, partially offset by lower volumes and greater credit losses flowing through the card securitization trusts in North America. Operating expenses were $3.8 billion, down 28% from the second quarter of 2008 on reengineering initiatives, lower headcount, and reduced marketing, partially offset by higher real estate owned and collection expenses. Credit costs were $9.9 billion, up 86% from the prior year period as net credit losses increased significantly and $2.7 billion was added to reserves. Citi Holdings assets have declined 22% to $649 billion reflecting asset run-off and management actions. Net income was $1.4 billion versus a loss of $5.3 billion in the prior year period primarily due to Smith Barney gain on sale. Positive revenue marks and expense reductions also contributed, partially offset by credit deterioration and lower volumes.
Brokerage and Asset Management
· The closing of the Smith Barney joint venture transaction on June 1, 2009, generated an $11.1 billion pre-tax, $6.7 billion after-tax gain on sale.
· Brokerage and Asset Management (BAM) revenues were $12.3 billion in the current period, up from $2.5 billion in the second quarter of 2008, mainly driven by the gain on the Smith Barney transaction, offset partially by the absence of one month of Smith Barney revenues. Net income was $6.8 billion, up from $218 million in the prior year period, due to the Smith Barney gain on sale.
· Expenses were $1.1 billion, down 45% from the prior year period due to the absence of one month of Smith Barney expenses, lower variable compensation and re-engineering efforts.
· End of period assets were $56 billion, down 14%, consistent with management efforts to reduce assets. End of period assets include approximately $19 billion of Nikko Cordial Securities assets that are recorded on the balance sheet as Assets of Discontinued Operations held for sale. The sale of Nikko Cordial Securities was announced in May, 2009.
Local Consumer Lending
· Local Consumer Lending (LCL) revenues were $3.9 billion, down 37% from the prior year period, due to lower loan volumes, higher net credit losses flowing through the securitization trusts in North America, and special FDIC assessment.
· Expenses were $2.5 billion, down 17% compared to the second quarter of 2008, primarily driven by the impact of re-engineering efforts resulting in lower headcount as well as reduced advertising and marketing.
· Credit costs were $8.0 billion, up 65% from the prior year period, driven by higher net credit losses and increased loan loss reserve build for residential mortgage loans, as well as higher losses across remaining product categories.
· End of period assets were $392 billion, down 16% from the prior year period, primarily driven by lower loans due to run-off and the impact of credit-tightening.
· Net loss was $4.2 billion, versus a loss of $1.2 billion in the second quarter of 2008, driven by lower revenues and higher credit costs.
Special Asset Pool
· Special Asset Pool (SAP) revenues were negative $519 million, compared to negative $6.5 billion in the second quarter of 2008, driven primarily by favorable net revenue marks relative to the second quarter of 2008. For the current quarter, net revenue marks were positive $1.0 billion versus negative $6.5 billion in the second quarter of 2008. The improvement in net revenue marks was primarily driven by positive marks on sub-prime related direct exposures in the second quarter of 2009, compared to net write-downs in the second quarter of 2008, as well as positive credit value adjustments on exposures to monoline insurers in the second quarter of 2009, compared with downward credit value adjustments in the second quarter of 2008 (see Appendix B).
· Expenses were $207 million, down 23% from the prior year period, reflecting lower volumes.
8
· Credit costs were $1.6 billion, up from $200 million in the prior year period, reflecting significant charge-offs of corporate loans.
· End of period assets were $201 billion, down 33% from the second quarter of 2008.
· Net loss was $1.2 billion versus a loss of $4.3 billion in the second quarter of 2008, as improvements in revenue marks more than offset increases in credit costs.
CORPORATE/OTHER
Corporate/Other revenues of negative $741 million are largely due to hedging activities. The net loss of $30 million is due to higher tax benefits held at Corporate.
DISCONTINUED OPERATIONS
Discontinued operations net loss was $142 million versus a loss of $94 million in the year-ago period. The $142 million net loss largely reflects Nikko Cordial Securities, which is now classified as discontinued operations.
NON-GAAP MEASURES
“Managed” financial metrics, including managed revenues, net interest margin, average loans and leases, net credit loss ratio and tangible common equity are non-GAAP financial measures. A reconciliation of these non-GAAP financial measures to the most directly comparable GAAP measure, as well as other information required by the SEC, is included in Appendix D.
Vikram Pandit, Chief Executive Officer, and John Gerspach, Chief Financial Officer, will host a conference call today at 11:00 AM (EDT). A live webcast of the presentation, as well as financial results and presentation materials, will be available at http://www.citigroup.com/citi/fin. A replay of the webcast will be available at http://www.citigroup.com/citi/fin/pres.htm. Dial-in numbers for the conference call are as follows: (877) 594-1392 in the U.S.; (706) 643-0278 outside of the U.S. The passcode for all numbers is 13445980.
Citigroup, the leading global financial services company, has approximately 200 million customer accounts and does business in more than 140 countries. Through its two operating units, Citicorp and Citi Holdings, Citigroup provides consumers, corporations, governments and institutions with a broad range of financial products and services, including consumer banking and credit, corporate and investment banking, securities brokerage, and wealth management. Additional information may be found at www.citigroup.com or www.citi.com.
Additional financial, statistical, and business-related information, as well as business and segment trends, is included in a Financial Supplement. Both the earnings release and the Financial Supplement are available on Citigroup’s website at www.citigroup.com or www.citi.com.
Certain statements in this document are “forward-looking statements” within the meaning of the Private Securities Litigation Reform Act. These statements are based on management’s current expectations and are subject to uncertainty and changes in circumstances. Actual results may differ materially from those included in these statements due to a variety of factors. More information about these factors is contained in Citigroup’s filings with the Securities and Exchange Commission.
Contacts: | | | | | |
Press: | Alex Samuelson | (212) 559-2791 | Equity Investors: | John Andrews | (212) 559-2718 |
| Stephen Cohen | (212) 793-0181 | Fixed Income Investors: | Ilene Fieszel-Bieler | (212) 559-5091 |
| Jon Diat | (212) 793-5462 | | | |
9
Appendix A
10
Appendix B
SUMMARY OF REVENUE MARKS
Citicorp – Securities and Banking
In Millions of Dollars | | 2Q’08 | | 1Q’09 | | 2Q’09 | |
Private Equity and equity investments | | (6 | ) | (62 | ) | 11 | |
Mark-to-market and impairments on Alt-A mortgages(1) | | (48 | ) | 13 | | 99 | |
Mark-to-market on commercial real estate positions(1) | | (65 | ) | 102 | | (32 | ) |
CVA on Citigroup Liabilities at Fair Value Option | | (228 | ) | 197 | | (1,452 | ) |
CVA on derivative positions, excluding monoline insurers(2) | | 48 | | 2,462 | | 597 | |
Total Revenue Marks | | $ | (299 | ) | $ | 2,712 | | $ | (776 | ) |
Non-Credit Accretion | | — | | — | | — | |
Net Revenue Marks | | $ | (299 | ) | $ | 2,712 | | $ | (776 | ) |
(1) Net of hedges. (2) Includes Private Bank
Citi Holdings
In Millions of Dollars | | 2Q’08 | | 1Q’09 | | 2Q’09 | |
Mark-to-market on sub-prime related direct exposures(1) | | $ | (3,395 | ) | $ | (2,296 | ) | $ | 613 | |
Private Equity and equity investments(2) | | 183 | | (1,116 | ) | (37 | ) |
CVA related to exposure to monoline insurers | | (2,428 | ) | (1,090 | ) | 157 | |
Mark-to-market and impairments on Alt-A mortgages(3),(5) | | (277 | ) | (503 | ) | (390 | ) |
Mark-to-market and impairments on highly leveraged finance commitments(4) | | (428 | ) | (247 | ) | (237 | ) |
Mark-to-market on commercial real estate positions(5),(6) | | (480 | ) | (387 | ) | (354 | ) |
Mark-to-market on ARS proprietary positions | | 197 | | (23 | ) | 0 | |
Mark-to-market on SIV assets | | 11 | | (47 | ) | 50 | |
CVA on Citigroup Liabilities at Fair Value Option | | 0 | | (18 | ) | (156 | ) |
CVA on derivative positions, excluding monoline insurers | | 52 | | 313 | | 804 | |
Total Revenue Marks | | $ | (6,565 | ) | $ | (5,414 | ) | $ | 450 | |
Non-Credit Accretion | | — | | 541 | | 501 | |
Net Revenue Marks | | $ | (6,565 | ) | $ | (4,874 | ) | $ | 952 | |
Revenue marks booked to the Special Asset Pool (SAP), unless otherwise footnoted.
(1) Net of impact from hedges against direct subprime ABS CDO super senior positions. (2) 2Q’09: $17 million booked in Brokerage and Asset Management (BAM), $(54) million in SAP. (3) Net of hedges. (4) Net of underwriting fees. (5) Excludes positions in SIVs. (6) 2Q’09: $(27) million booked in BAM, $(327) million in SAP.
11
Appendix C
SUMMARY OF PRESS RELEASE DISCLOSED ITEMS
2Q’09 (In Millions of Dollars) | | Pre-tax
Impact | | After-tax
Impact | | Income
Statement Line | | Segment/Region |
| | | | | | | | |
Smith Barney Gain on Sale | | $ | 11,078 | | $ | 6,722 | | Revenue | | Citi Holdings Brokerage and Asset Management |
| | | | | | | | |
IRS Audit Tax Benefit | | NA | | $ | 163 | | Tax | | Various(1)/Discontinued |
| | | | | | | | | | |
(1) IRS Tax Audit Benefit: $34 Discontinued Operations, $48 Local Consumer Lending, $27 Transaction Services, $27 Securities and Banking, $24 Regional Consumer Banking, $4 Corporate/Other
2Q’08 (In Millions of Dollars) | | Pre-tax
Impact | | After-tax
Impact | | Income
Statement Line | | Segment/Region |
| | | | | | | | |
Cards Portfolio Sale(1) | | $ | 170 | | $ | 107 | | Revenue | | Citicorp Regional Consumer Banking/ North America |
| | | | | | | | |
CitiCapital Sale(2) | | (517 | ) | (309 | ) | Net Income | | Discontinued Operations |
| | | | | | | | |
Repositioning Charges | | (446 | ) | (275 | ) | Expenses | | All Citigroup |
| | | | | | | | | | |
(1) | Gain on Cards portfolio sale. |
(2) | Loss on sale of CitiCapital. This item was not originally included in the 2Q’08 Press Release Disclosed Items schedule, but was disclosed in the Q2 2008 10-Q. |
12
Appendix D
Non-GAAP Financial Measures
The following measure is considered “non-GAAP financial measures” under SEC guidelines:
1) Citigroup Managed Revenues
2) Citigroup Managed Revenues, Net of Smith Barney Gain on Sale
3) Regional Consumer Banking – North America Card managed revenues
4) Regional Consumer Banking – North America Card managed net interest margin
5) Regional Consumer Banking – North America Card managed net credit loss ratio
6) Regional Consumer Banking – North America Card managed average loans and leases
7) Tangible common equity
With respect to the presentation of managed revenues and related measures, Citigroup’s management believes that these non-GAAP financial measures provide a greater understanding of ongoing operations and enhance comparability of those results in prior periods as well as demonstrating the effects of unusual gains and charges in the quarter. Management believes that a meaningful analysis of its financial performance requires an understanding of the factors underlying that performance and that investors may find it useful to see these non-GAAP financial measures to analyze financial performance without the impact of unusual items that may obscure trends in Citigroup’s underlying performance. With respect to the presentation of tangible common equity. Citigroup’s management believes that this non-GAAP financial measure is useful because it is a measure utilized by Citigroup’s regulators and market analysts in evaluating the company’s financial condition and capital strength and that, as a result, investors desire to see this information.
Reconciliation of the GAAP financial measure to the aforementioned non-GAAP measure follows:
| | 2Q | | 2Q | | 2Q’09 vs. 2Q’08 | |
($ in millions) | | 2009 | | 2008 | | % Change | |
| | | | | | | |
Total GAAP Revenues, net of Interest Expense | | $ | 29,969 | | $ | 17,538 | | | |
Excluding the impact of securitizations – Citicorp | | 1,644 | | 1,274 | | | |
Excluding the impact of securitizations – Citi Holdings | | 1,482 | | 769 | | | |
Total Citigroup Managed Revenues | | $ | 33,095 | | $ | 19,554 | | | |
Excluding Impact of Smith Barney Gain on Sale | | (11,078 | ) | | | | |
Total Citigroup Managed Revenues, Net of Smith Barney Gain on Sale | | $ | 22,017 | | | | | |
| | | | | | | |
GAAP Branded Cards Revenues – North America | | 806 | | 1,159 | | (30 | )% |
Excluding the impact of securitizations | | 1,644 | | 1,246 | | | |
Non-GAAP Branded Cards Managed Revenues – North America | | 2,450 | | 2,405 | | 2 | % |
| | | | | | | |
GAAP Branded Cards Net Interest Margin – North America | | 14.90 | % | 6.95 | % | | |
Excluding the impact of securitizations | | (4.39 | )% | 1.17 | % | | |
Non-GAAP Branded Cards Managed Net Interest Margin – North America | | 10.51 | % | 8.12 | % | | |
| | | | | | | |
GAAP Branded Cards Net Credit Loss Ratio – North America | | 7.52 | % | 3.51 | % | | |
Excluding the impact of securitizations | | 2.73 | % | 2.03 | % | | |
Non-GAAP Branded Cards Net Credit Loss Ratio – North America | | 10.25 | % | 5.54 | % | | |
| | | | | | | |
GAAP Regional Consumer Banking Average Loans and Leases | | 18.9 | | 15.9 | | 19 | % |
Excluding the impact of securitizations | | 68.7 | | 71.2 | | | |
Non-GAAP Regional Consumer Banking Managed Average Loans and Leases | | 87.6 | | 87.1 | | 1 | % |
13
Citigroup’s management believes TCE is useful because it is a measure utilized by regulators and market analysts in evaluating a company’s financial condition and capital strength. Tangible common equity (TCE), as defined by Citigroup, represents Common equity less Goodwill and Intangible assets (excluding MSRs) net of the related deferred tax liabilities.
TCE and the TCE ratio are non-GAAP financial measures. Other companies may calculate TCE in a manner different from Citigroup. A reconciliation of Citigroup’s total stockholders’ equity to TCE follows:
| | June 30, | | March 31, | | 2Q’09 vs. 1Q’09 | |
(in millions of dollars) | | 2009 | | 2009 | | Increase/(Decrease) | |
| | | | | | | |
Citigroup’s Total Stockholders’ Equity | | $ | 152,302 | | $ | 143,934 | | | |
| | | | | | | |
Less: | | | | | | | |
| | | | | | | |
Preferred Stock | | 74,301 | | 74,246 | | | |
| | | | | | | |
Common Equity | | 78,001 | | 69,688 | | | |
| | | | | | | |
Less: | | | | | | | |
| | | | | | | |
Goodwill – as reported | | 25,578 | | 26,410 | | | |
| | | | | | | |
Intangible Assets (other than MSR’s) – as reported | | 10,098 | | 13,612 | | | |
| | | | | | | |
Goodwill and Intangible Assets – recorded as Assets on Discontinued Operations Held For Sale | | 3,618 | | — | | | |
| | | | | | | |
Less: Related Net Deferred Tax Liabilities | | 1,296 | | 1,254 | | | |
| | | | | | | |
Tangible Common Equity (TCE) | | $ | 40,003 | | $ | 30,920 | | $ | 9,083 | |
| | | | | | | | | | |
14