UNITED STATES
SECURITIES AND EXCHANGE COMMISSION
Washington, D.C. 20549
FORM N-CSR
CERTIFIED SHAREHOLDER REPORT OF REGISTERED
MANAGEMENT INVESTMENT COMPANIES
Investment Company Act file number 811-5511
Variable Insurance Products Fund II
(Exact name of registrant as specified in charter)
82 Devonshire St., Boston, Massachusetts 02109
(Address of principal executive offices) (Zip code)
Scott C. Goebel, Secretary
82 Devonshire St.
Boston, Massachusetts 02109
(Name and address of agent for service)
Registrant's telephone number, including area code: 617-563-7000
Date of fiscal year end: | December 31 |
| |
Date of reporting period: | December 31, 2010 |
Item 1. Reports to Stockholders
Fidelity® Variable Insurance Products:
Contrafund Portfolio
Annual Report
December 31, 2010
(2_fidelity_logos) (Registered_Trademark)
Contents
Performance | <Click Here> | How the fund has done over time. |
Management's Discussion of Fund Performance | <Click Here> | The Portfolio Manager's review of fund performance and strategy. |
Shareholder Expense Example | <Click Here> | An example of shareholder expenses. |
Investment Changes | <Click Here> | A summary of major shifts in the fund's investments over the past six months. |
Investments | <Click Here> | A complete list of the fund's investments with their market values. |
Financial Statements | <Click Here> | Statements of assets and liabilities, operations, and changes in net assets, as well as financial highlights. |
Notes | <Click Here> | Notes to the financial statements. |
Report of Independent Registered Public Accounting Firm | <Click Here> | |
Trustees and Officers | <Click Here> | |
Distributions | <Click Here> | |
Board Approval of Investment Advisory Contracts and Management Fees | <Click Here> | |
To view a fund's proxy voting guidelines and proxy voting record for the 12-month period ended June 30, visit http://www.fidelity.com/proxyvotingresults or visit the Securities and Exchange Commission's (SEC) web site at http://www.sec.gov. You may also call 1-877-208-0098 to request a free copy of the proxy voting guidelines.
Fidelity Variable Insurance Products are separate account options which are purchased through a variable insurance contract.
Standard & Poor's, S&P and S&P 500 are registered service marks of The McGraw-Hill Companies, Inc. and have been licensed for use by Fidelity Distributors Corporation
Other third party marks appearing herein are the property of their respective owners.
All other marks appearing herein are registered or unregistered trademarks or service marks of FMR LLC or an affiliated company.
The general research services agreement with Fidelity Research & Analysis Company has been terminated and is no longer in effect for the fund.
This report and the financial statements contained herein are submitted for the general information of the shareholders of the fund. This report is not authorized for distribution to prospective investors in the fund unless preceded or accompanied by an effective prospectus.
A fund files its complete schedule of portfolio holdings with the SEC for the first and third quarters of each fiscal year on Form N-Q. Forms N-Q are available on the SEC's web site at http://www.sec.gov. A fund's Forms N-Q may be reviewed and copied at the SEC's Public Reference Room in Washington, DC. Information regarding the operation of the SEC's Public Reference Room may be obtained by calling 1-800-SEC-0330. For a complete list of a fund's portfolio holdings, view the most recent holdings listing, semiannual report, or annual report on Fidelity's web site at http://www.fidelity.com, http://www.advisor.fidelity.com, or http://www.401k.com as applicable.
NOT FDIC INSURED • MAY LOSE VALUE • NO BANK GUARANTEE
Neither the fund nor Fidelity Distributors Corporation is a bank.
Annual Report
Average annual total return reflects the change in the value of an investment, assuming reinvestment of the class' distributions from dividend income and capital gains (the profits earned upon the sale of securities that have grown in value, if any) and assuming a constant rate of performance each year. During periods of reimbursement by Fidelity, a fund's total return will be greater than it would be had the reimbursement not occurred. Performance numbers are net of all underlying fund operating expenses, but do not include any insurance charges imposed by your insurance company's separate account. If performance information included the effect of these additional charges, the total returns would have been lower. How a fund did yesterday is no guarantee of how it will do tomorrow.
Average Annual Total Returns
Periods ended December 31, 2010 | Past 1
year | Past 5
years | Past 10
years |
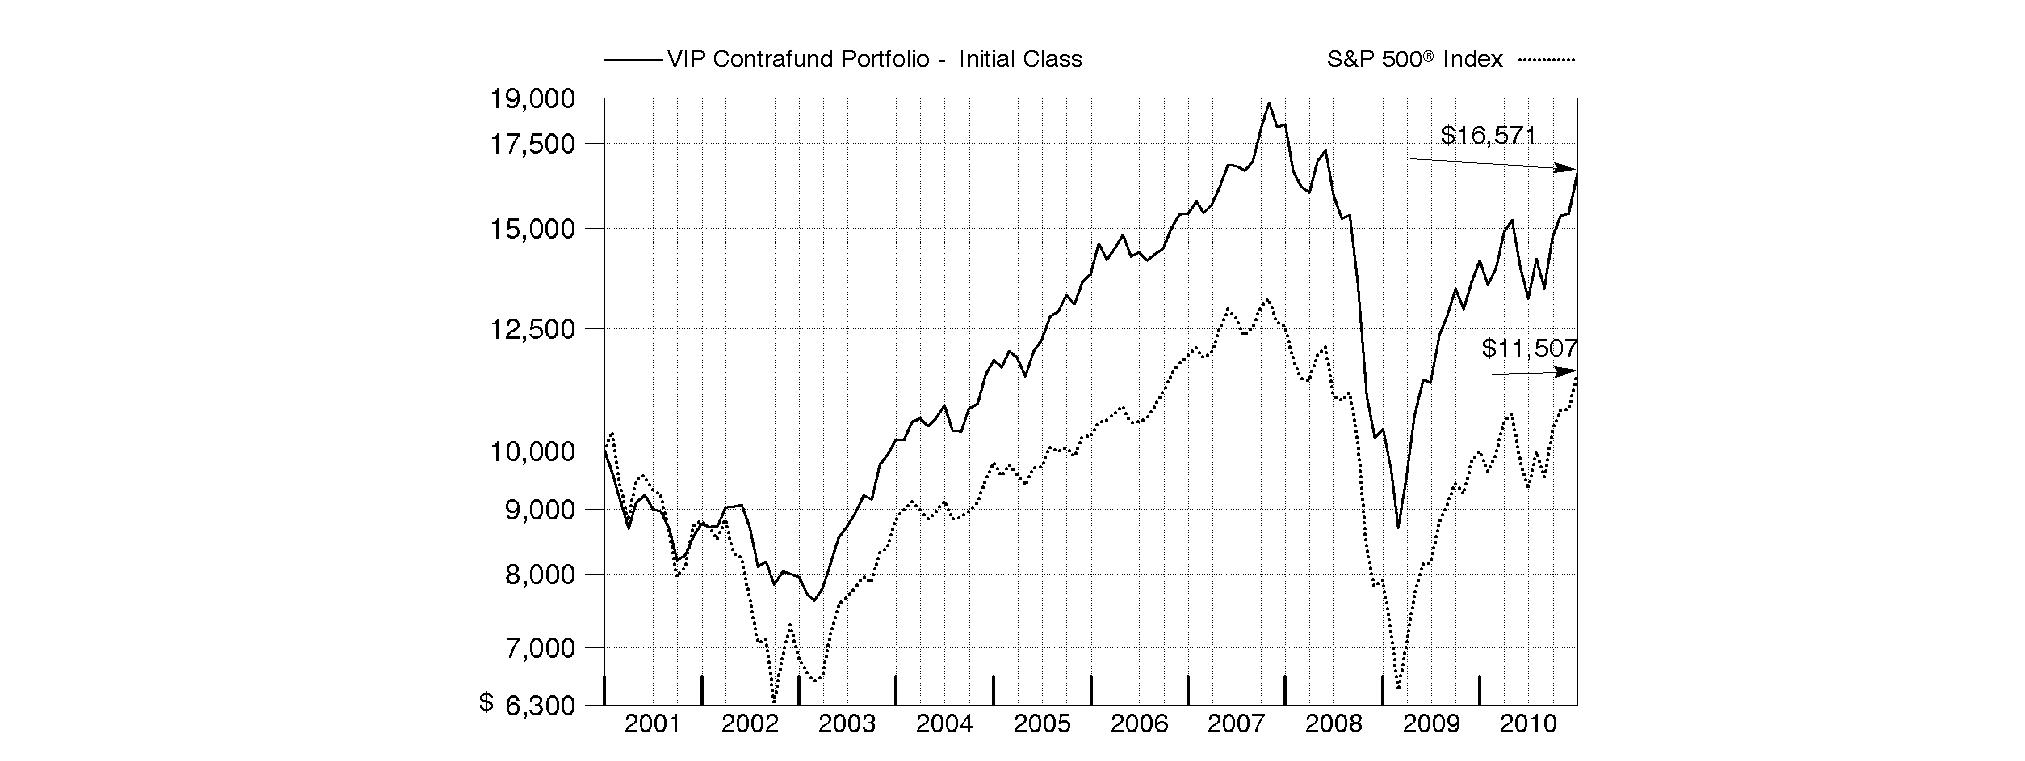
VIP Contrafund Portfolio - Initial Class | 17.22% | 3.74% | 5.18% |
VIP Contrafund Portfolio - Service Class | 17.11% | 3.64% | 5.08% |
VIP Contrafund Portfolio - Service Class 2 | 16.93% | 3.48% | 4.92% |
VIP Contrafund Portfolio - Investor Class A | 17.10% | 3.63% | 5.12% |
A The initial offering of Investor Class shares took place on July 21, 2005. Returns prior to July 21, 2005, are those of Initial Class. Had Investor Class's transfer agent fee been reflected, returns prior to July 21, 2005, would have been lower.
$10,000 Over 10 Years
Let's say hypothetically that $10,000 was invested in VIP Contrafund Portfolio - Initial Class on December 31, 2000. The chart shows how the value of your investment would have changed, and also shows how the S&P 500® Index performed over the same period.
Annual Report
Market Recap: While market improvements around the world hit a speed bump in the first half of the 12-month period ending December 31, 2010, world economies re-accelerated in August, supported by a broadening recovery and low inflation in the U.S. Domestic stock markets recorded solid gains for the year, lifted by a strong second-half rally fueled by economic optimism, encouraging earnings reports and a wave of corporate mergers. The large-cap S&P 500® Index rose 15.06%, the blue-chip-laden Dow Jones Industrial AverageSM added 14.06% and the technology-heavy Nasdaq Composite® Index climbed 18.02%. Meanwhile, international stocks, as represented by the MSCI® ACWI® (All Country World Index) ex USA Index, gained 11.29%, boosted in part by a depreciating U.S. dollar. In the fixed-income arena, U.S. taxable investment-grade bonds generated positive results during 2010, as the Barclays Capital® U.S. Aggregate Bond Index gained 6.54%. With ultra-low interest rates bolstering nearly all fixed-income securities for most of the year, sectors in the index with higher yields and more credit risk generally fared best, while most high-quality bonds generated more-moderate returns. Meanwhile, high-yield bonds, as represented by The BofA Merrill LynchSM US High Yield Constrained Index, returned 15.07%, a result of improved economic data and strengthening investor demand. Overseas, foreign bond markets showed mixed results, with a sizable disparity between the 3.97% return of the Citigroup® Non-U.S. Group of 7 Index - which measures the performance of sovereign debt of the major global economies outside the U.S. - and the 12.04% advance of the JPMorgan Emerging Markets Bond Index Global (EMBI Global), which benefited from the rising overall credit quality of emerging-markets debt issuers.
Comments from Robert Stansky, Co-Portfolio Manager and Head of Fidelity's Multi-Manager Group, which manages VIP Contrafund Portfolio: For the year, the fund's share classes outperformed the S&P 500® Index, which returned 15.06%. (For specific portfolio results, please see the performance section of this report.) Security selection among telecommunications was particularly successful, followed by health care, materials and industrials. Detractors included stock picking in energy and utilities, as well as overweighting the semiconductors/semiconductor equipment group within technology. In terms of individual securities, Qwest Communications International, by far the largest position in the telecom sleeve, was the top contributor. A strong free-cash-flow story with one of the highest dividend yields within the S&P 500, Qwest was the best-performing name within the sector. Not owning networking gear maker and index component Cisco Systems was a good call since the stock fell sharply in November after the company reduced its revenue forecast. Similarly, largely avoiding computer and peripherals maker Hewlett-Packard was beneficial, as the stock underperformed due in part to the company's printer business not growing as fast as other parts of the tech hardware marketplace. The fund did not own HP at period end. An outsized stake in flash-memory manufacturer SanDisk added value, as the stock was driven in part by the company's status as a supplier to Apple. Conversely, detractors included an outsized stake in semiconductor-related stocks, including Micron Technology and Inotera Memories, the latter of which was not in the index. Elsewhere, software giant Microsoft struggled amid a competitive environment, and the fund's overweighted stake hurt relative performance.
The views expressed above reflect those of the portfolio manager(s) only through the end of the period as stated on the cover of this report and do not necessarily represent the views of Fidelity or any other person in the Fidelity organization. Any such views are subject to change at any time based upon market or other conditions and Fidelity disclaims any responsibility to update such views. These views may not be relied on as investment advice and, because investment decisions for a Fidelity fund are based on numerous factors, may not be relied on as an indication of trading intent on behalf of any Fidelity fund.
Annual Report
As a shareholder of the Fund, you incur two types of costs: (1) transaction costs, including redemption fees, and (2) ongoing costs, including management fees, distribution and/or service (12b-1) fees and other Fund expenses. This Example is intended to help you understand your ongoing costs (in dollars) of investing in the Fund and to compare these costs with the ongoing costs of investing in other mutual funds.
The Example is based on an investment of $1,000 invested at the beginning of the period and held for the entire period (July 1, 2010 to December 31, 2010).
Actual Expenses
The first line of the accompanying table for each class of the Fund provides information about actual account values and actual expenses. You may use the information in this line, together with the amount you invested, to estimate the expenses that you paid over the period. Simply divide your account value by $1,000.00 (for example, an $8,600 account value divided by $1,000.00 = 8.6), then multiply the result by the number in the first line for a class of the Fund under the heading entitled "Expenses Paid During Period" to estimate the expenses you paid on your account during this period. The estimate of expenses does not include any fees or other expenses of any variable annuity or variable life insurance product. If they were, the estimate of expenses you paid during the period would be higher, and your ending account value would be lower. In addition, the Fund, as a shareholder in the underlying Fidelity Central Funds, will indirectly bear its pro-rata share of the fees and expenses incurred by the underlying Fidelity Central Funds. These fees and expenses are not included in the Fund's annualized expense ratio used to calculate the expense estimate in the table below.
Hypothetical Example for Comparison Purposes
The second line of the accompanying table for each class of the Fund provides information about hypothetical account values and hypothetical expenses based on a Class' actual expense ratio and an assumed rate of return of 5% per year before expenses, which is not the Class' actual return. The hypothetical account values and expenses may not be used to estimate the actual ending account balance or expenses you paid for the period. You may use this information to compare the ongoing costs of investing in the Fund and other funds. To do so, compare this 5% hypothetical example with the 5% hypothetical examples that appear in the shareholder reports of the other funds. The estimate of expenses does not include any fees or other expenses of any variable annuity or variable life insurance product. If they were, the estimate of expenses you paid during the period would be higher, and your ending account value would be lower. In addition, the Fund, as a shareholder in the underlying Fidelity Central Funds, will indirectly bear its pro-rata share of the fees and expenses incurred by the underlying Fidelity Central Funds. These fees and expenses are not included in the Fund's annualized expense ratio used to calculate the expense estimate in the table below.
Please note that the expenses shown in the table are meant to highlight your ongoing costs only and do not reflect any transaction costs. Therefore, the second line of the table is useful in comparing ongoing costs only, and will not help you determine the relative total costs of owning different funds. In addition, if these transactional costs were included, your costs would have been higher.
| Annualized
Expense Ratio | Beginning
Account Value
July 1, 2010 | Ending
Account Value
December 31, 2010 | Expenses Paid
During Period*
July 1, 2010 to
December 31, 2010 |
Initial Class | .64% | | | |
Actual | | $ 1,000.00 | $ 1,254.90 | $ 3.64 |
HypotheticalA | | $ 1,000.00 | $ 1,021.98 | $ 3.26 |
Service Class | .74% | | | |
Actual | | $ 1,000.00 | $ 1,254.70 | $ 4.21 |
HypotheticalA | | $ 1,000.00 | $ 1,021.48 | $ 3.77 |
Service Class 2 | .89% | | | |
Actual | | $ 1,000.00 | $ 1,253.90 | $ 5.06 |
HypotheticalA | | $ 1,000.00 | $ 1,020.72 | $ 4.53 |
Service Class 2R | .89% | | | |
Actual | | $ 1,000.00 | $ 1,254.30 | $ 5.06 |
HypotheticalA | | $ 1,000.00 | $ 1,020.72 | $ 4.53 |
Investor Class | .72% | | | |
Actual | | $ 1,000.00 | $ 1,254.60 | $ 4.09 |
HypotheticalA | | $ 1,000.00 | $ 1,021.58 | $ 3.67 |
A 5% return per year before expenses
* Expenses are equal to each Class' annualized expense ratio, multiplied by the average account value over the period, multiplied by 184/365 (to reflect the one-half year period).
Annual Report
Investment Changes (Unaudited)
Top Ten Stocks as of December 31, 2010 |
| % of fund's
net assets | % of fund's net assets
6 months ago |
Apple, Inc. | 4.5 | 2.8 |
JPMorgan Chase & Co. | 2.5 | 2.1 |
Procter & Gamble Co. | 2.1 | 1.6 |
Citigroup, Inc. | 1.8 | 1.5 |
The Coca-Cola Co. | 1.7 | 1.6 |
Royal Dutch Shell PLC Class B ADR | 1.6 | 0.7 |
Wells Fargo & Co. | 1.5 | 1.5 |
General Electric Co. | 1.5 | 1.5 |
Microsoft Corp. | 1.4 | 2.4 |
Qwest Communications International, Inc. | 1.3 | 1.1 |
| 19.9 | |
Market Sectors as of December 31, 2010 |
| % of fund's
net assets | % of fund's net assets
6 months ago |
Information Technology | 18.8 | 18.4 |
Financials | 16.2 | 15.6 |
Energy | 11.8 | 10.5 |
Industrials | 11.1 | 11.4 |
Health Care | 10.4 | 11.5 |
Consumer Staples | 10.3 | 10.9 |
Consumer Discretionary | 10.0 | 9.8 |
Materials | 3.4 | 3.2 |
Telecommunication Services | 3.3 | 3.3 |
Utilities | 3.2 | 3.7 |
Asset Allocation (% of fund's net assets) |
As of December 31, 2010* | As of June 30, 2010** |
 | Stocks and Equity Futures 99.2% | | | Stocks and Equity Futures 99.0% | |
 | Short-Term
Investments and
Net Other Assets 0.8% | | | Short-Term
Investments and
Net Other Assets 1.0% | |
* Foreign investments | 16.2% | | ** Foreign investments | 13.7% | |

Annual Report
Investments December 31, 2010
Showing Percentage of Net Assets
Common Stocks - 98.2% |
| Shares | | Value |
CONSUMER DISCRETIONARY - 9.7% |
Auto Components - 0.4% |
Johnson Controls, Inc. | 1,328,000 | | $ 50,729,600 |
TRW Automotive Holdings Corp. (a) | 347,875 | | 18,333,013 |
| | 69,062,613 |
Automobiles - 0.7% |
BYD Co. Ltd. (H Shares) (d) | 1,721,000 | | 9,045,076 |
Ford Motor Co. (a) | 5,746,798 | | 96,488,738 |
General Motors Co. | 492,300 | | 18,146,178 |
| | 123,679,992 |
Distributors - 0.2% |
Li & Fung Ltd. | 3,207,000 | | 18,608,646 |
Pool Corp. | 380,000 | | 8,565,200 |
| | 27,173,846 |
Hotels, Restaurants & Leisure - 1.0% |
Bravo Brio Restaurant Group, Inc. | 280,057 | | 5,368,693 |
Darden Restaurants, Inc. | 681,998 | | 31,671,987 |
Marriott International, Inc. Class A | 826,261 | | 34,322,882 |
McDonald's Corp. | 385,488 | | 29,590,059 |
Royal Caribbean Cruises Ltd. (a)(d) | 411,700 | | 19,349,900 |
Starwood Hotels & Resorts Worldwide, Inc. | 745,900 | | 45,335,802 |
| | 165,639,323 |
Household Durables - 0.6% |
D.R. Horton, Inc. | 1,479,200 | | 17,646,856 |
M.D.C. Holdings, Inc. | 483,850 | | 13,920,365 |
Stanley Black & Decker, Inc. | 530,600 | | 35,481,222 |
Whirlpool Corp. | 342,400 | | 30,415,392 |
| | 97,463,835 |
Internet & Catalog Retail - 0.6% |
Amazon.com, Inc. (a) | 346,900 | | 62,442,000 |
E-Commerce China Dangdang, Inc. ADR | 76,800 | | 2,078,976 |
Expedia, Inc. | 1,138,638 | | 28,568,427 |
Rakuten, Inc. | 11,613 | | 9,723,376 |
| | 102,812,779 |
Leisure Equipment & Products - 0.2% |
Brunswick Corp. | 687,687 | | 12,887,254 |
Eastman Kodak Co. (a)(d) | 3,136,982 | | 16,814,224 |
| | 29,701,478 |
Media - 3.3% |
Comcast Corp. Class A | 4,589,362 | | 100,828,283 |
DIRECTV (a) | 1,858,600 | | 74,213,898 |
Legend Pictures Holdings LLC unit (g) | 6,611 | | 4,958,250 |
Liberty Global, Inc. Class A (a)(d) | 659,400 | | 23,329,572 |
Naspers Ltd. Class N | 228,000 | | 13,351,336 |
The Walt Disney Co. | 3,279,242 | | 123,004,367 |
The Weinstein Co. II Holdings, LLC Class A-1 (a)(g) | 11,499 | | 4,312,125 |
Time Warner Cable, Inc. | 886,943 | | 58,564,846 |
|
| Shares | | Value |
Time Warner, Inc. | 2,476,247 | | $ 79,660,866 |
Viacom, Inc. Class B (non-vtg.) | 1,658,516 | | 65,693,819 |
| | 547,917,362 |
Multiline Retail - 0.7% |
Nordstrom, Inc. | 924,909 | | 39,197,643 |
Target Corp. | 1,463,500 | | 88,000,255 |
| | 127,197,898 |
Specialty Retail - 1.8% |
Best Buy Co., Inc. | 913,622 | | 31,328,098 |
China ZhengTong Auto Services Holdings Ltd. | 4,608,500 | | 4,346,131 |
Hengdeli Holdings Ltd. | 19,448,000 | | 11,584,978 |
Home Depot, Inc. | 3,146,100 | | 110,302,266 |
Lowe's Companies, Inc. | 3,054,000 | | 76,594,320 |
Sally Beauty Holdings, Inc. (a) | 1,270,221 | | 18,456,311 |
TJX Companies, Inc. | 870,940 | | 38,661,027 |
Urban Outfitters, Inc. (a) | 511,600 | | 18,320,396 |
| | 309,593,527 |
Textiles, Apparel & Luxury Goods - 0.2% |
LVMH Moet Hennessy - Louis Vuitton | 128,034 | | 21,072,437 |
Trinity Ltd. | 8,276,000 | | 8,720,546 |
| | 29,792,983 |
TOTAL CONSUMER DISCRETIONARY | | 1,630,035,636 |
CONSUMER STAPLES - 10.3% |
Beverages - 3.6% |
Anheuser-Busch InBev SA NV | 760,664 | | 43,527,932 |
Coca-Cola Bottling Co. Consolidated | 158,818 | | 8,827,104 |
Coca-Cola FEMSA SAB de CV sponsored ADR | 114,747 | | 9,458,595 |
Coca-Cola Icecek AS | 349,005 | | 4,617,486 |
Companhia de Bebidas das Americas (AmBev) (PN) sponsored ADR | 297,770 | | 9,239,803 |
Constellation Brands, Inc. Class A (sub. vtg.) (a) | 1,852,846 | | 41,040,539 |
Diageo PLC sponsored ADR | 843,083 | | 62,666,359 |
Embotelladora Andina SA sponsored ADR | 302,136 | | 9,145,657 |
Molson Coors Brewing Co. Class B | 1,119,411 | | 56,183,238 |
PepsiCo, Inc. | 1,013,098 | | 66,185,692 |
The Coca-Cola Co. | 4,346,622 | | 285,877,329 |
| | 596,769,734 |
Food & Staples Retailing - 1.7% |
BJ's Wholesale Club, Inc. (a) | 148,918 | | 7,133,172 |
CVS Caremark Corp. | 4,033,568 | | 140,247,159 |
Fresh Market, Inc. | 19,700 | | 811,640 |
Safeway, Inc. | 2,064,089 | | 46,421,362 |
Susser Holdings Corp. (a) | 131,355 | | 1,819,267 |
United Natural Foods, Inc. (a) | 129,581 | | 4,753,031 |
Common Stocks - continued |
| Shares | | Value |
CONSUMER STAPLES - continued |
Food & Staples Retailing - continued |
Wal-Mart Stores, Inc. | 707,002 | | $ 38,128,618 |
Walgreen Co. | 1,080,778 | | 42,107,111 |
| | 281,421,360 |
Food Products - 1.1% |
Archer Daniels Midland Co. | 469,619 | | 14,126,140 |
Bunge Ltd. | 417,901 | | 27,380,874 |
Danone | 141,400 | | 8,889,216 |
Dean Foods Co. (a) | 1,279,348 | | 11,309,436 |
Green Mountain Coffee Roasters, Inc. (a)(d) | 730,622 | | 24,008,239 |
Nestle SA | 709,799 | | 41,594,237 |
Unilever NV unit | 1,977,977 | | 62,108,478 |
Viterra, Inc. | 517,300 | | 4,813,541 |
| | 194,230,161 |
Household Products - 2.6% |
Colgate-Palmolive Co. | 983,929 | | 79,078,374 |
Procter & Gamble Co. | 5,570,244 | | 358,333,797 |
| | 437,412,171 |
Personal Products - 0.2% |
Avon Products, Inc. | 1,136,499 | | 33,026,661 |
Tobacco - 1.1% |
Altria Group, Inc. | 975,598 | | 24,019,223 |
British American Tobacco PLC sponsored ADR | 1,509,468 | | 117,285,664 |
Philip Morris International, Inc. | 717,206 | | 41,978,067 |
Souza Cruz Industria Comerico | 93,900 | | 5,114,411 |
| | 188,397,365 |
TOTAL CONSUMER STAPLES | | 1,731,257,452 |
ENERGY - 11.8% |
Energy Equipment & Services - 3.4% |
Aker Solutions ASA | 211,900 | | 3,609,927 |
Baker Hughes, Inc. | 2,612,591 | | 149,361,827 |
C&J Energy Services, Inc. (a)(e) | 482,300 | | 4,823,000 |
Cameron International Corp. (a) | 213,400 | | 10,825,782 |
Dresser-Rand Group, Inc. (a) | 88,200 | | 3,756,438 |
Ensco International Ltd. ADR | 575,401 | | 30,714,905 |
Halliburton Co. | 4,236,132 | | 172,961,270 |
National Oilwell Varco, Inc. | 267,357 | | 17,979,758 |
Noble Corp. | 1,573,200 | | 56,273,364 |
Ocean Rig UDW, Inc. (a) | 134,000 | | 2,369,076 |
Oceaneering International, Inc. (a) | 369,003 | | 27,169,691 |
Pride International, Inc. (a) | 77,827 | | 2,568,291 |
Saipem SpA | 311,652 | | 15,350,444 |
Schlumberger Ltd. | 322,279 | | 26,910,297 |
TETRA Technologies, Inc. (a) | 495,800 | | 5,885,146 |
|
| Shares | | Value |
Transocean Ltd. (a) | 596,446 | | $ 41,458,961 |
Vantage Drilling Co. (a) | 1,094,400 | | 2,221,632 |
| | 574,239,809 |
Oil, Gas & Consumable Fuels - 8.4% |
Alpha Natural Resources, Inc. (a) | 654,300 | | 39,277,629 |
Anadarko Petroleum Corp. | 642,727 | | 48,950,088 |
Apache Corp. | 884,883 | | 105,504,600 |
BP PLC | 1,010,800 | | 7,455,606 |
BP PLC sponsored ADR | 1,473,933 | | 65,103,621 |
Buckeye Partners LP (g) | 39,530 | | 2,377,611 |
Chesapeake Energy Corp. | 738,060 | | 19,123,135 |
Chevron Corp. | 288,746 | | 26,348,073 |
Cimarex Energy Co. | 257,000 | | 22,752,210 |
Concho Resources, Inc. (a) | 244,261 | | 21,414,362 |
Concho Resources, Inc. (a)(g) | 117,082 | | 10,264,579 |
CVR Energy, Inc. (a) | 194,540 | | 2,953,117 |
Denbury Resources, Inc. (a) | 2,162,187 | | 41,276,150 |
Devon Energy Corp. | 337,200 | | 26,473,572 |
EXCO Resources, Inc. | 136,700 | | 2,654,714 |
Exxon Mobil Corp. | 2,345,633 | | 171,512,685 |
Falkland Oil & Gas Ltd. (a) | 1,325,400 | | 2,140,197 |
Frontier Oil Corp. | 619,878 | | 11,164,003 |
Heritage Oil PLC | 425,712 | | 2,980,151 |
Holly Corp. | 893,186 | | 36,415,193 |
Imperial Oil Ltd. (d) | 139,500 | | 5,676,236 |
InterOil Corp. (a)(d) | 138,200 | | 9,960,074 |
Marathon Oil Corp. | 783,900 | | 29,027,817 |
Massey Energy Co. | 543,896 | | 29,180,020 |
Murphy Oil Corp. | 428,098 | | 31,914,706 |
Niko Resources Ltd. | 50,600 | | 5,235,043 |
Occidental Petroleum Corp. | 1,274,411 | | 125,019,719 |
Peabody Energy Corp. | 168,219 | | 10,762,652 |
PetroBakken Energy Ltd. Class A (d) | 409,300 | | 8,909,960 |
Petrobank Energy & Resources Ltd. (a) | 754,400 | | 19,100,171 |
Petrominerales Ltd. | 463,956 | | 15,426,432 |
Rodinia Oil Corp. | 603,000 | | 1,880,407 |
Royal Dutch Shell PLC: | | | |
Class A sponsored ADR | 6,220 | | 415,372 |
Class B ADR | 3,900,962 | | 260,077,137 |
Southwestern Energy Co. (a) | 771,043 | | 28,860,139 |
Talisman Energy, Inc. | 2,396,700 | | 53,158,532 |
Targa Resources Corp. | 254,400 | | 6,820,464 |
Tesoro Corp. | 217,000 | | 4,023,180 |
Valero Energy Corp. | 363,126 | | 8,395,473 |
Whiting Petroleum Corp. (a) | 414,650 | | 48,592,834 |
Williams Companies, Inc. | 1,338,200 | | 33,080,304 |
| | 1,401,657,968 |
TOTAL ENERGY | | 1,975,897,777 |
Common Stocks - continued |
| Shares | | Value |
FINANCIALS - 16.2% |
Capital Markets - 2.4% |
BlackRock, Inc. Class A | 401,377 | | $ 76,494,429 |
Credit Suisse Group | 933,839 | | 37,638,487 |
E*TRADE Financial Corp. (a) | 419,298 | | 6,708,768 |
Evercore Partners, Inc. Class A | 254,300 | | 8,646,200 |
Icap PLC | 549,942 | | 4,590,257 |
Invesco Ltd. | 1,631,107 | | 39,244,434 |
MF Global Holdings Ltd. (a) | 1,768,100 | | 14,781,316 |
Morgan Stanley | 3,594,753 | | 97,813,229 |
State Street Corp. | 2,396,110 | | 111,035,737 |
| | 396,952,857 |
Commercial Banks - 4.5% |
Banco do Brasil SA | 1,450,200 | | 27,456,409 |
Banco Macro SA sponsored ADR | 192,634 | | 9,670,227 |
BB&T Corp. | 1,004,544 | | 26,409,462 |
CIT Group, Inc. (a) | 157,100 | | 7,399,410 |
Comerica, Inc. | 187,555 | | 7,922,323 |
FirstMerit Corp. | 963,306 | | 19,063,826 |
Huntington Bancshares, Inc. | 8,302,724 | | 57,039,714 |
M&T Bank Corp. | 312,760 | | 27,225,758 |
PNC Financial Services Group, Inc. | 863,598 | | 52,437,671 |
PT Bank Rakyat Indonesia Tbk | 6,595,500 | | 7,686,224 |
Regions Financial Corp. | 6,941,577 | | 48,591,039 |
Sumitomo Mitsui Financial Group, Inc. | 1,577,700 | | 56,180,610 |
SunTrust Banks, Inc. | 1,688,750 | | 49,835,013 |
Synovus Financial Corp. | 4,204,900 | | 11,100,936 |
U.S. Bancorp, Delaware | 3,674,203 | | 99,093,255 |
Wells Fargo & Co. | 8,219,122 | | 254,710,591 |
| | 761,822,468 |
Consumer Finance - 0.5% |
Capital One Financial Corp. | 1,377,604 | | 58,630,826 |
Discover Financial Services | 1,472,024 | | 27,276,605 |
Promise Co. Ltd. (d) | 752,450 | | 4,326,715 |
| | 90,234,146 |
Diversified Financial Services - 5.0% |
African Bank Investments Ltd. | 4,214,241 | | 24,649,334 |
Citigroup, Inc. (a) | 64,174,388 | | 303,544,855 |
ING Groep NV (Certificaten Van Aandelen) unit (a) | 1,994,700 | | 19,469,851 |
IntercontinentalExchange, Inc. (a) | 460,104 | | 54,821,392 |
JPMorgan Chase & Co. | 9,854,597 | | 418,032,005 |
NBH Holdings Corp. Class A (a)(e) | 813,800 | | 15,869,100 |
| | 836,386,537 |
Insurance - 2.5% |
Aon Corp. | 602,596 | | 27,725,442 |
CNO Financial Group, Inc. (a) | 3,320,800 | | 22,515,024 |
Fairfax Financial Holdings Ltd. (sub. vtg.) | 91,200 | | 37,400,870 |
Genworth Financial, Inc. Class A (a) | 1,213,800 | | 15,949,332 |
Lincoln National Corp. | 1,077,312 | | 29,960,047 |
MetLife, Inc. | 3,575,685 | | 158,903,441 |
Protective Life Corp. | 662,800 | | 17,656,992 |
|
| Shares | | Value |
Prudential Financial, Inc. | 1,161,340 | | $ 68,182,271 |
Unum Group | 1,457,700 | | 35,305,494 |
| | 413,598,913 |
Real Estate Investment Trusts - 0.8% |
ProLogis Trust | 4,593,114 | | 66,324,566 |
The Macerich Co. | 643,599 | | 30,487,285 |
U-Store-It Trust | 1,241,147 | | 11,828,131 |
Weyerhaeuser Co. | 1,217,709 | | 23,051,231 |
| | 131,691,213 |
Real Estate Management & Development - 0.4% |
Ayala Land, Inc. | 21,946,000 | | 8,276,576 |
BR Malls Participacoes SA | 2,574,600 | | 26,528,673 |
Indiabulls Real Estate Ltd. (a) | 5,657,337 | | 17,618,880 |
PT Lippo Karawaci Tbk | 159,208,750 | | 12,015,777 |
| | 64,439,906 |
Thrifts & Mortgage Finance - 0.1% |
Ocwen Financial Corp. (a) | 2,593,110 | | 24,738,269 |
TOTAL FINANCIALS | | 2,719,864,309 |
HEALTH CARE - 10.4% |
Biotechnology - 1.6% |
Amgen, Inc. (a) | 728,949 | | 40,019,300 |
AVEO Pharmaceuticals, Inc. | 518,044 | | 7,573,803 |
AVEO Pharmaceuticals, Inc. (g) | 107,096 | | 1,565,744 |
Biogen Idec, Inc. (a) | 899,103 | | 60,284,856 |
BioMarin Pharmaceutical, Inc. (a) | 900,917 | | 24,261,695 |
Exelixis, Inc. (a) | 1,088,719 | | 8,938,383 |
Genzyme Corp. (a) | 654,284 | | 46,585,021 |
Gilead Sciences, Inc. (a) | 2,164,184 | | 78,430,028 |
Human Genome Sciences, Inc. (a) | 269,827 | | 6,446,167 |
| | 274,104,997 |
Health Care Equipment & Supplies - 1.8% |
American Medical Systems Holdings, Inc. (a) | 533,700 | | 10,065,582 |
Boston Scientific Corp. (a) | 4,357,239 | | 32,984,299 |
C. R. Bard, Inc. | 389,520 | | 35,746,250 |
Cooper Companies, Inc. | 83,580 | | 4,708,897 |
Covidien PLC | 1,569,508 | | 71,663,735 |
Edwards Lifesciences Corp. (a) | 777,472 | | 62,850,836 |
Mako Surgical Corp. (a) | 1,154,193 | | 17,566,817 |
Masimo Corp. | 416,279 | | 12,101,231 |
Quidel Corp. (a) | 1,322,504 | | 19,110,183 |
Shandong Weigao Group Medical Polymer Co. Ltd. (H Shares) | 3,516,000 | | 9,974,628 |
William Demant Holding AS (a) | 320,174 | | 23,659,592 |
| | 300,432,050 |
Health Care Providers & Services - 2.6% |
CIGNA Corp. | 1,056,639 | | 38,736,386 |
Diagnosticos da America SA | 1,003,000 | | 13,598,566 |
Express Scripts, Inc. (a) | 713,923 | | 38,587,538 |
Common Stocks - continued |
| Shares | | Value |
HEALTH CARE - continued |
Health Care Providers & Services - continued |
Fresenius Medical Care AG & Co. KGaA | 116,698 | | $ 6,744,970 |
Henry Schein, Inc. (a) | 940,100 | | 57,712,739 |
McKesson Corp. | 1,192,617 | | 83,936,384 |
Medco Health Solutions, Inc. (a) | 1,658,128 | | 101,593,503 |
UnitedHealth Group, Inc. | 2,417,405 | | 87,292,495 |
| | 428,202,581 |
Life Sciences Tools & Services - 1.1% |
Agilent Technologies, Inc. (a) | 1,995,561 | | 82,676,092 |
Charles River Laboratories International, Inc. (a) | 446,856 | | 15,881,262 |
Covance, Inc. (a) | 502,900 | | 25,854,089 |
Fluidigm Corp. warrants 8/25/19 (a) | 8,933 | | 826 |
Illumina, Inc. (a) | 690,454 | | 43,733,356 |
Lonza Group AG | 103,551 | | 8,306,912 |
QIAGEN NV (a) | 714,094 | | 13,960,538 |
| | 190,413,075 |
Pharmaceuticals - 3.3% |
Allergan, Inc. | 561,139 | | 38,533,415 |
Genomma Lab Internacional SA de CV (a) | 3,866,100 | | 9,260,870 |
Johnson & Johnson | 1,000,854 | | 61,902,820 |
Lupin Ltd. | 925,412 | | 9,985,239 |
Merck & Co., Inc. | 5,496,248 | | 198,084,778 |
Novo Nordisk AS Series B | 344,375 | | 38,817,288 |
Pfizer, Inc. | 6,021,955 | | 105,444,432 |
Shire PLC sponsored ADR | 573,900 | | 41,538,882 |
Valeant Pharmaceuticals International, Inc. | 1,817,773 | | 51,545,794 |
| | 555,113,518 |
TOTAL HEALTH CARE | | 1,748,266,221 |
INDUSTRIALS - 11.1% |
Aerospace & Defense - 2.3% |
Goodrich Corp. | 820,356 | | 72,248,753 |
Precision Castparts Corp. | 602,198 | | 83,831,984 |
The Boeing Co. | 1,465,477 | | 95,637,029 |
United Technologies Corp. | 1,722,109 | | 135,564,420 |
| | 387,282,186 |
Airlines - 0.1% |
Southwest Airlines Co. | 908,655 | | 11,794,342 |
Building Products - 0.4% |
Armstrong World Industries, Inc. | 342,008 | | 14,706,344 |
Lennox International, Inc. | 693,325 | | 32,787,339 |
Owens Corning (a) | 616,901 | | 19,216,466 |
| | 66,710,149 |
|
| Shares | | Value |
Commercial Services & Supplies - 0.4% |
Republic Services, Inc. | 1,095,395 | | $ 32,708,495 |
Stericycle, Inc. (a) | 455,416 | | 36,852,263 |
| | 69,560,758 |
Construction & Engineering - 0.4% |
Fluor Corp. | 633,650 | | 41,985,649 |
Foster Wheeler AG (a) | 738,700 | | 25,499,924 |
| | 67,485,573 |
Electrical Equipment - 1.4% |
Acuity Brands, Inc. | 338,037 | | 19,494,594 |
Cooper Industries PLC Class A | 819,675 | | 47,778,856 |
Emerson Electric Co. | 1,750,786 | | 100,092,436 |
GrafTech International Ltd. (a) | 540,156 | | 10,716,695 |
Regal-Beloit Corp. | 815,326 | | 54,431,164 |
| | 232,513,745 |
Industrial Conglomerates - 1.8% |
General Electric Co. | 13,592,329 | | 248,603,697 |
Textron, Inc. | 2,198,990 | | 51,984,124 |
| | 300,587,821 |
Machinery - 3.1% |
Caterpillar, Inc. | 1,570,523 | | 147,095,184 |
Charter International PLC | 726,953 | | 9,577,945 |
Cummins, Inc. | 886,986 | | 97,577,330 |
Danaher Corp. | 1,834,642 | | 86,540,063 |
Dover Corp. | 506,600 | | 29,610,770 |
Ingersoll-Rand Co. Ltd. | 968,600 | | 45,611,374 |
Komatsu Ltd. | 884,000 | | 26,743,680 |
Navistar International Corp. (a) | 830,623 | | 48,101,378 |
NSK Ltd. | 1,046,000 | | 9,453,475 |
Pall Corp. | 191,600 | | 9,499,528 |
Vallourec SA | 80,598 | | 8,469,899 |
| | 518,280,626 |
Road & Rail - 1.2% |
CSX Corp. | 1,385,330 | | 89,506,171 |
Union Pacific Corp. | 1,270,604 | | 117,734,167 |
| | 207,240,338 |
TOTAL INDUSTRIALS | | 1,861,455,538 |
INFORMATION TECHNOLOGY - 18.8% |
Communications Equipment - 1.0% |
Aruba Networks, Inc. (a)(d) | 1,483,452 | | 30,974,478 |
Ciena Corp. (a)(d) | 2,268,630 | | 47,754,662 |
Meru Networks, Inc. (a)(d) | 574,625 | | 8,860,718 |
QUALCOMM, Inc. | 1,555,407 | | 76,977,092 |
ViaSat, Inc. (a) | 231,254 | | 10,269,990 |
| | 174,836,940 |
Computers & Peripherals - 5.4% |
Apple, Inc. (a) | 2,323,883 | | 749,591,694 |
Imagination Technologies Group PLC (a) | 1,711,806 | | 9,630,451 |
Common Stocks - continued |
| Shares | | Value |
INFORMATION TECHNOLOGY - continued |
Computers & Peripherals - continued |
NetApp, Inc. (a) | 1,442,512 | | $ 79,280,460 |
SanDisk Corp. (a) | 1,140,855 | | 56,883,030 |
| | 895,385,635 |
Electronic Equipment & Components - 0.5% |
HLS Systems International Ltd. (a) | 1,050,441 | | 15,924,686 |
TPK Holdings Co. | 1,503,000 | | 34,522,111 |
Wintek Corp. (a) | 22,150,000 | | 38,043,023 |
| | 88,489,820 |
Internet Software & Services - 1.2% |
Akamai Technologies, Inc. (a) | 1,149,680 | | 54,092,444 |
eBay, Inc. (a) | 828,200 | | 23,048,806 |
Google, Inc. Class A (a) | 845 | | 501,905 |
Mail.ru Group Ltd. GDR unit (a)(e) | 37,000 | | 1,332,000 |
Monster Worldwide, Inc. (a) | 1,295,776 | | 30,619,187 |
WebMD Health Corp. (a) | 1,709,799 | | 87,302,337 |
| | 196,896,679 |
IT Services - 0.8% |
Cognizant Technology Solutions Corp. Class A (a) | 544,200 | | 39,884,418 |
Paychex, Inc. | 733,039 | | 22,658,235 |
Visa, Inc. Class A | 950,286 | | 66,881,129 |
| | 129,423,782 |
Office Electronics - 0.1% |
Xerox Corp. | 1,851,178 | | 21,325,571 |
Semiconductors & Semiconductor Equipment - 7.6% |
Amkor Technology, Inc. (a) | 1,126,474 | | 8,324,643 |
Analog Devices, Inc. | 3,201,160 | | 120,587,697 |
Applied Materials, Inc. | 11,199,293 | | 157,350,067 |
Applied Micro Circuits Corp. (a) | 1,274,195 | | 13,608,403 |
ARM Holdings PLC sponsored ADR (d) | 2,668,101 | | 55,363,096 |
ASML Holding NV | 4,791,101 | | 183,690,812 |
ATMI, Inc. (a) | 1,448,673 | | 28,886,540 |
Broadcom Corp. Class A | 2,549,814 | | 111,044,400 |
Cymer, Inc. (a) | 250,000 | | 11,267,500 |
Inotera Memories, Inc. (a) | 53,040,698 | | 25,365,709 |
Intersil Corp. Class A | 2,687,074 | | 41,031,620 |
KLA-Tencor Corp. | 458,077 | | 17,700,095 |
Lam Research Corp. (a) | 3,242,145 | | 167,878,268 |
Marvell Technology Group Ltd. (a) | 474,354 | | 8,799,267 |
Micron Technology, Inc. (a) | 22,817,702 | | 182,997,970 |
Nanya Technology Corp. (a) | 22,607,159 | | 12,593,978 |
NVIDIA Corp. (a) | 130,001 | | 2,002,015 |
Photronics, Inc. (a) | 533,948 | | 3,155,633 |
Powertech Technology, Inc. | 4,596,000 | | 15,283,236 |
Samsung Electronics Co. Ltd. | 76,588 | | 64,822,325 |
|
| Shares | | Value |
Skyworks Solutions, Inc. (a) | 129,288 | | $ 3,701,515 |
Varian Semiconductor Equipment Associates, Inc. (a) | 1,099,442 | | 40,646,371 |
| | 1,276,101,160 |
Software - 2.2% |
CA, Inc. | 290,774 | | 7,106,517 |
Check Point Software Technologies Ltd. (a) | 1,403,888 | | 64,943,859 |
Microsoft Corp. | 8,152,951 | | 227,630,392 |
Nuance Communications, Inc. (a) | 870,133 | | 15,819,018 |
Oracle Corp. | 100,290 | | 3,139,077 |
Red Hat, Inc. (a) | 774,606 | | 35,360,764 |
Taleo Corp. Class A (a) | 242,138 | | 6,695,116 |
| | 360,694,743 |
TOTAL INFORMATION TECHNOLOGY | | 3,143,154,330 |
MATERIALS - 3.4% |
Chemicals - 2.0% |
Air Products & Chemicals, Inc. | 362,069 | | 32,930,176 |
Airgas, Inc. | 23,600 | | 1,474,056 |
Albemarle Corp. | 252,467 | | 14,082,609 |
Celanese Corp. Class A | 252,758 | | 10,406,047 |
CF Industries Holdings, Inc. | 202,942 | | 27,427,611 |
Clariant AG (Reg.) (a) | 822,135 | | 16,666,207 |
Dow Chemical Co. | 1,744,299 | | 59,550,368 |
LyondellBasell Industries NV Class A (a) | 720,461 | | 24,783,858 |
Monsanto Co. | 609,238 | | 42,427,334 |
Praxair, Inc. | 471,074 | | 44,973,435 |
Solutia, Inc. (a) | 1,129,100 | | 26,059,628 |
The Mosaic Co. | 299,000 | | 22,831,640 |
Wacker Chemie AG | 60,982 | | 10,648,201 |
| | 334,261,170 |
Construction Materials - 0.0% |
HeidelbergCement AG | 117,134 | | 7,344,923 |
Containers & Packaging - 0.2% |
Ball Corp. | 360,667 | | 24,543,389 |
Metals & Mining - 1.2% |
Anglo American PLC (United Kingdom) | 347,400 | | 18,078,280 |
AngloGold Ashanti Ltd. sponsored ADR | 995,127 | | 48,990,102 |
ArcelorMittal SA Class A unit (d) | 86,700 | | 3,305,871 |
Carpenter Technology Corp. | 322,880 | | 12,992,691 |
Freeport-McMoRan Copper & Gold, Inc. | 687,400 | | 82,549,866 |
MacArthur Coal Ltd. | 206,793 | | 2,704,389 |
Pan American Silver Corp. | 92,600 | | 3,816,047 |
POSCO | 4,022 | | 1,739,078 |
Common Stocks - continued |
| Shares | | Value |
MATERIALS - continued |
Metals & Mining - continued |
Reliance Steel & Aluminum Co. | 425,700 | | $ 21,753,270 |
Walter Energy, Inc. | 86,973 | | 11,118,628 |
| | 207,048,222 |
TOTAL MATERIALS | | 573,197,704 |
TELECOMMUNICATION SERVICES - 3.3% |
Diversified Telecommunication Services - 2.2% |
Qwest Communications International, Inc. | 27,500,952 | | 209,282,245 |
Telefonica SA sponsored ADR | 94,758 | | 6,483,342 |
Verizon Communications, Inc. | 4,026,013 | | 144,050,745 |
| | 359,816,332 |
Wireless Telecommunication Services - 1.1% |
American Tower Corp. Class A (a) | 2,254,263 | | 116,410,141 |
Clearwire Corp. Class A (a)(d) | 5,717,958 | | 29,447,484 |
MetroPCS Communications, Inc. (a) | 773,352 | | 9,767,436 |
Vodafone Group PLC | 8,101,600 | | 21,282,291 |
Vodafone Group PLC sponsored ADR | 242,500 | | 6,409,275 |
| | 183,316,627 |
TOTAL TELECOMMUNICATION SERVICES | | 543,132,959 |
UTILITIES - 3.2% |
Electric Utilities - 1.6% |
Edison International | 1,422,804 | | 54,920,234 |
NextEra Energy, Inc. | 2,469,214 | | 128,374,436 |
PPL Corp. | 2,488,693 | | 65,502,400 |
Southern Co. | 399,300 | | 15,265,239 |
| | 264,062,309 |
Gas Utilities - 0.1% |
ONEOK, Inc. | 222,173 | | 12,323,936 |
Independent Power Producers & Energy Traders - 0.1% |
AES Corp. (a) | 1,213,744 | | 14,783,402 |
Multi-Utilities - 1.4% |
National Grid PLC | 1,687,900 | | 14,598,841 |
NiSource, Inc. | 1,339,400 | | 23,600,228 |
PG&E Corp. | 1,487,909 | | 71,181,567 |
Public Service Enterprise Group, Inc. | 1,499,269 | | 47,691,747 |
Sempra Energy | 1,518,315 | | 79,681,171 |
Veolia Environnement | 185,365 | | 5,428,693 |
| | 242,182,247 |
TOTAL UTILITIES | | 533,351,894 |
TOTAL COMMON STOCKS (Cost $13,749,513,259) | 16,459,613,820 |
Preferred Stocks - 0.3% |
| Shares | | Value |
Convertible Preferred Stocks - 0.0% |
HEALTH CARE - 0.0% |
Life Sciences Tools & Services - 0.0% |
Fluidigm Corp. (a) | 412,471 | | $ 2,887,297 |
Nonconvertible Preferred Stocks - 0.3% |
CONSUMER DISCRETIONARY - 0.3% |
Automobiles - 0.3% |
Porsche Automobil Holding SE | 235,768 | | 18,806,133 |
Volkswagen AG | 164,786 | | 26,746,712 |
| | 45,552,845 |
TOTAL PREFERRED STOCKS (Cost $36,855,234) | 48,440,142 |
U.S. Treasury Obligations - 0.1% |
| Principal Amount | | |
U.S. Treasury Bills, yield at date of purchase 0.12% to 0.14% 1/13/11 to 3/3/11 (f)
(Cost $12,798,085) | | $ 12,800,000 | | 12,798,593 |
Money Market Funds - 2.3% |
| Shares | | |
Fidelity Cash Central Fund, 0.19% (b) | 256,183,450 | | 256,183,450 |
Fidelity Securities Lending Cash Central Fund, 0.21% (b)(c) | 126,876,895 | | 126,876,895 |
TOTAL MONEY MARKET FUNDS (Cost $383,060,345) | 383,060,345 |
TOTAL INVESTMENT
PORTFOLIO - 100.9% (Cost $14,182,226,923) | 16,903,912,900 |
NET OTHER ASSETS
(LIABILITIES) - (0.9)% | | (154,907,483) |
NET ASSETS - 100% | $ 16,749,005,417 |
Futures Contracts |
| Expiration Date | | Underlying Face Amount at Value | | Unrealized Appreciation/(Depreciation) |
Purchased |
Equity Index Contracts |
1,870 CME E-mini S&P 500 Index Contracts | March 2011 | | $ 117,155,500 | | $ 1,594,979 |
|
The face value of futures purchased as a percentage of net assets is 0.7% |
Legend |
(a) Non-income producing |
(b) Affiliated fund that is available only to investment companies and other accounts managed by Fidelity Investments. The rate quoted is the annualized seven-day yield of the fund at period end. A complete unaudited listing of the fund's holdings as of its most recent quarter end is available upon request. In addition, each Fidelity Central Fund's financial statements, which are not covered by the Fund's Report of Independent Registered Public Accounting Firm, are available on the SEC's website or upon request. |
(c) Investment made with cash collateral received from securities on loan. |
(d) Security or a portion of the security is on loan at period end. |
(e) Security exempt from registration under Rule 144A of the Securities Act of 1933. These securities may be resold in transactions exempt from registration, normally to qualified institutional buyers. At the end of the period, the value of these securities amounted to $ 22,024,100 or 0.1% of net assets. |
(f) Security or a portion of the security was pledged to cover margin requirements for futures contracts. At the period end, the value of securities pledged amounted to $8,898,523. |
(g) Restricted securities - Investment in securities not registered under the Securities Act of 1933 (excluding 144A issues). At the end of the period, the value of restricted securities (excluding 144A issues) amounted to $23,478,308 or 0.1% of net assets. |
Additional information on each holding is as follows: |
Security | Acquisition Date | Acquisition Cost |
AVEO Pharmaceuticals, Inc. | 10/28/10 | $ 1,445,796 |
Buckeye Partners LP | 12/20/10 | $ 2,387,612 |
Concho Resources, Inc. | 7/20/10 | $ 5,303,815 |
Legend Pictures Holdings LLC unit | 9/23/10 | $ 4,958,250 |
The Weinstein Co. II Holdings, LLC Class A-1 | 10/19/05 | $ 11,499,000 |
Affiliated Central Funds |
Information regarding fiscal year to date income earned by the Fund from investments in Fidelity Central Funds is as follows: |
Fund | Income earned |
Fidelity Cash Central Fund | $ 636,061 |
Fidelity Securities Lending Cash Central Fund | 1,994,618 |
Total | $ 2,630,679 |
Other Affiliated Issuers |
An affiliated company is a company in which the Fund has ownership of at least 5% of the voting securities. Fiscal year to date transactions with companies which are or were affiliates are as follows: |
Affiliate | Value,
beginning of
period | Purchases | Sales Proceeds | Dividend Income | Value,
end of
period |
ATMI, Inc. | $ 31,994,169 | $ 4,437,195 | $ 7,670,141 | $ - | $ - |
Brooks Automation, Inc. | 29,493,235 | - | 26,169,946 | - | - |
Sycamore Networks, Inc. | 31,844,550 | - | 28,017,008 | - | - |
Total | $ 93,331,954 | $ 4,437,195 | $ 61,857,095 | $ - | $ - |
Other Information |
The following is a summary of the inputs used, as of December 31, 2010, involving the Fund's assets and liabilities carried at fair value. The inputs or methodology used for valuing securities may not be an indication of the risk associated with investing in those securities. For more information on valuation inputs, and their aggregation into the levels used in the tables below, please refer to the Security Valuation section in the accompanying Notes to Financial Statements. |
Valuation Inputs at Reporting Date: |
Description | Total | Level 1 | Level 2 | Level 3 |
Investments in Securities: | | | | |
Equities: | | | | |
Consumer Discretionary | $ 1,675,588,481 | $ 1,666,318,106 | $ - | $ 9,270,375 |
Consumer Staples | 1,731,257,452 | 1,731,257,452 | - | - |
Energy | 1,975,897,777 | 1,961,241,560 | 14,656,217 | - |
Financials | 2,719,864,309 | 2,646,886,871 | 57,108,338 | 15,869,100 |
Health Care | 1,751,153,518 | 1,709,448,107 | 38,817,288 | 2,888,123 |
Industrials | 1,861,455,538 | 1,861,455,538 | - | - |
Information Technology | 3,143,154,330 | 3,143,154,330 | - | - |
Materials | 573,197,704 | 571,458,626 | 1,739,078 | - |
Telecommunication Services | 543,132,959 | 521,850,668 | 21,282,291 | - |
Utilities | 533,351,894 | 513,324,360 | 20,027,534 | - |
U.S. Government and Government Agency Obligations | 12,798,593 | - | 12,798,593 | - |
Money Market Funds | 383,060,345 | 383,060,345 | - | - |
Total Investments in Securities: | $ 16,903,912,900 | $ 16,709,455,963 | $ 166,429,339 | $ 28,027,598 |
Derivative Instruments: | | | | |
Assets | | | | |
Futures Contracts | $ 1,594,979 | $ 1,594,979 | $ - | $ - |
The following is a reconciliation of Investments in Securities for which Level 3 inputs were used in determining value: |
Investments in Securities: | |
Beginning Balance | $ 23,678,872 |
Total Realized Gain (Loss) | - |
Total Unrealized Gain (Loss) | (609,524) |
Cost of Purchases | 4,958,250 |
Proceeds of Sales | - |
Amortization/Accretion | - |
Transfers in to Level 3 | - |
Transfers out of Level 3 | - |
Ending Balance | $ 28,027,598 |
The change in unrealized gain (loss) for the period attributable to Level 3 securities held at December 31, 2010 | $ (609,524) |
The information used in the above reconciliation represents fiscal year to date activity for any Investments in Securities identified as using Level 3 inputs at either the beginning or the end of the current fiscal period. Transfers in or out of Level 3 represent the beginning value of any Security or Instrument where a change in the pricing level occurred from the beginning to the end of the period. The cost of purchases and the proceeds of sales may include securities received or delivered through corporate actions or exchanges. Realized and unrealized gains (losses) disclosed in the reconciliation are included in Net Gain (Loss) on the Fund's Statement of Operations. |
Value of Derivative Instruments |
The following table is a summary of the Fund's value of derivative instruments by risk exposure as of December 31, 2010. For additional information on derivative instruments, please refer to the Derivative Instruments section in the accompanying Notes to Financial Statements. |
Risk Exposure /
Derivative Type | Value |
| Asset | Liability |
Equity Risk | | |
Futures Contracts (a) | $ 1,594,979 | $ - |
Total Value of Derivatives | $ 1,594,979 | $ - |
(a) Reflects cumulative appreciation/(depreciation) on futures contracts as disclosed on the Schedule of Investments. Only the period end variation margin is separately disclosed on the Statement of Assets and Liabilities. |
Distribution of investments by country of issue, as a percentage of total net assets, is as follows: (Unaudited) |
United States of America | 83.8% |
United Kingdom | 4.0% |
Netherlands | 1.8% |
Switzerland | 1.3% |
Canada | 1.1% |
Ireland | 1.0% |
Others (Individually Less Than 1%) | 7.0% |
| 100.0% |
Income Tax Information |
At December 31, 2010, the Fund had a capital loss carryforward of approximately $4,050,914,844 of which $1,715,915,916 and $2,334,998,928 will expire in fiscal 2016 and 2017, respectively. Capital loss carryforwards are only available to offset future capital gains of the Fund to the extent provided by regulations and may be limited. |
See accompanying notes which are an integral part of the financial statements.
Annual Report
Statement of Assets and Liabilities
| December 31, 2010 |
| | |
Assets | | |
Investment in securities, at value (including securities loaned of $122,984,578) - See accompanying schedule: Unaffiliated issuers (cost $13,799,166,578) | $ 16,520,852,555 | |
Fidelity Central Funds (cost $383,060,345) | 383,060,345 | |
Total Investments (cost $14,182,226,923) | | $ 16,903,912,900 |
Cash | | 90,964 |
Foreign currency held at value (cost $265,267) | | 265,571 |
Receivable for investments sold | | 52,010,259 |
Receivable for fund shares sold | | 3,728,501 |
Dividends receivable | | 15,926,606 |
Distributions receivable from Fidelity Central Funds | | 128,114 |
Prepaid expenses | | 50,044 |
Other receivables | | 961,705 |
Total assets | | 16,977,074,664 |
| | |
Liabilities | | |
Payable for investments purchased | $ 63,199,700 | |
Payable for fund shares redeemed | 26,509,840 | |
Accrued management fee | 7,909,915 | |
Distribution and service plan fees payable | 1,718,072 | |
Payable for daily variation on futures contracts | 140,250 | |
Other affiliated payables | 1,105,870 | |
Other payables and accrued expenses | 608,705 | |
Collateral on securities loaned, at value | 126,876,895 | |
Total liabilities | | 228,069,247 |
| | |
Net Assets | | $ 16,749,005,417 |
Net Assets consist of: | | |
Paid in capital | | $ 18,343,044,401 |
Distributions in excess of net investment income | | (10,971,317) |
Accumulated undistributed net realized gain (loss) on investments and foreign currency transactions | | (4,306,394,373) |
Net unrealized appreciation (depreciation) on investments and assets and liabilities in foreign currencies | | 2,723,326,706 |
Net Assets | | $ 16,749,005,417 |
Statement of Assets and Liabilities - continued
| December 31, 2010 |
| | |
Initial Class:
Net Asset Value, offering price and redemption price per share ($7,160,124,602 ÷ 299,793,788 shares) | | $ 23.88 |
| | |
Service Class:
Net Asset Value, offering price and redemption price per share ($1,379,304,556 ÷ 57,937,425 shares) | | $ 23.81 |
| | |
Service Class 2:
Net Asset Value, offering price and redemption price per share ($7,627,793,170 ÷ 324,741,004 shares) | | $ 23.49 |
| | |
Service Class 2R:
Net Asset Value, offering price and redemption price per share ($10,942,477 ÷ 466,894 shares) | | $ 23.44 |
| | |
Investor Class:
Net Asset Value, offering price and redemption price per share ($570,840,612 ÷ 23,982,076 shares) | | $ 23.80 |
See accompanying notes which are an integral part of the financial statements.
Annual Report
Statement of Operations
| Year ended December 31, 2010 |
| | |
Investment Income | | |
Dividends | | $ 279,953,565 |
Interest | | 14,369 |
Income from Fidelity Central Funds | | 2,630,679 |
Total income | | 282,598,613 |
| | |
Expenses | | |
Management fee | $ 93,327,654 | |
Transfer agent fees | 12,903,083 | |
Distribution and service plan fees | 19,986,451 | |
Accounting and security lending fees | 1,619,928 | |
Custodian fees and expenses | 1,040,715 | |
Independent trustees' compensation | 96,042 | |
Appreciation in deferred trustee compensation account | 17 | |
Audit | 115,699 | |
Legal | 85,482 | |
Miscellaneous | 226,221 | |
Total expenses before reductions | 129,401,292 | |
Expense reductions | (3,611,449) | 125,789,843 |
Net investment income (loss) | | 156,808,770 |
Realized and Unrealized Gain (Loss) Net realized gain (loss) on: | | |
Investment securities: | | |
Unaffiliated issuers | 1,240,392,304 | |
Other affiliated issuers | (25,489,001) | |
Foreign currency transactions | (1,513,030) | |
Futures contracts | (328,031) | |
Total net realized gain (loss) | | 1,213,062,242 |
Change in net unrealized appreciation (depreciation) on: Investment securities | 1,271,229,019 | |
Assets and liabilities in foreign currencies | 30,628 | |
Futures contracts | 933,702 | |
Total change in net unrealized appreciation (depreciation) | | 1,272,193,349 |
Net gain (loss) | | 2,485,255,591 |
Net increase (decrease) in net assets resulting from operations | | $ 2,642,064,361 |
See accompanying notes which are an integral part of the financial statements.
Annual Report
Financial Statements - continued
Statement of Changes in Net Assets
| Year ended
December 31,
2010 | Year ended
December 31,
2009 |
Increase (Decrease) in Net Assets | | |
Operations | | |
Net investment income (loss) | $ 156,808,770 | $ 182,048,095 |
Net realized gain (loss) | 1,213,062,242 | (1,211,829,520) |
Change in net unrealized appreciation (depreciation) | 1,272,193,349 | 5,676,838,088 |
Net increase (decrease) in net assets resulting from operations | 2,642,064,361 | 4,647,056,663 |
Distributions to shareholders from net investment income | (173,609,742) | (191,893,175) |
Distributions to shareholders from net realized gain | (7,015,810) | (4,181,790) |
Total distributions | (180,625,552) | (196,074,965) |
Share transactions - net increase (decrease) | (2,950,980,349) | (1,477,532,238) |
Redemption fees | 1,677 | 784 |
Total increase (decrease) in net assets | (489,539,863) | 2,973,450,244 |
| | |
Net Assets | | |
Beginning of period | 17,238,545,280 | 14,265,095,036 |
End of period (including distributions in excess of net investment income of $10,971,317 and undistributed net investment income of $4,097,167, respectively) | $ 16,749,005,417 | $ 17,238,545,280 |
See accompanying notes which are an integral part of the financial statements.
Annual Report
Financial Highlights - Initial Class
Years ended December 31, | 2010 | 2009 | 2008 | 2007 | 2006 |
Selected Per-Share Data | | | | | |
Net asset value, beginning of period | $ 20.62 | $ 15.39 | $ 27.90 | $ 31.47 | $ 31.03 |
Income from Investment Operations | | | | | |
Net investment income (loss) C | .23 | .23 | .24 | .34 | .27 |
Net realized and unrealized gain (loss) | 3.31 | 5.26 | (11.87) | 5.17 | 3.30 |
Total from investment operations | 3.54 | 5.49 | (11.63) | 5.51 | 3.57 |
Distributions from net investment income | (.27) | (.25) | (.23) | (.33) | (.42) |
Distributions from net realized gain | (.01) | (.01) | (.65) | (8.75) | (2.71) |
Total distributions | (.28) | (.26) H | (.88) | (9.08) | (3.13) |
Redemption fees added to paid in capital C,G | - | - | - | - | - |
Net asset value, end of period | $ 23.88 | $ 20.62 | $ 15.39 | $ 27.90 | $ 31.47 |
Total Return A,B | 17.22% | 35.71% | (42.51)% | 17.59% | 11.72% |
Ratios to Average Net Assets D,F | | | | | |
Expenses before reductions | .65% | .67% | .66% | .65% | .66% |
Expenses net of fee waivers, if any | .65% | .67% | .66% | .65% | .66% |
Expenses net of all reductions | .63% | .65% | .65% | .64% | .65% |
Net investment income (loss) | 1.06% | 1.33% | 1.07% | 1.00% | .85% |
Supplemental Data | | | | | |
Net assets, end of period (000 omitted) | $ 7,160,125 | $ 7,405,228 | $ 6,240,871 | $ 12,371,009 | $ 11,595,588 |
Portfolio turnover rate E | 117% | 145% | 172% | 134% | 75% |
A Total returns do not reflect charges attributable to your insurance company's separate account. Inclusion of these charges would reduce the total returns shown.
B Total returns would have been lower had certain expenses not been reduced during the periods shown.
C Calculated based on average shares outstanding during the period.
D Fees and expenses of the underlying Fidelity Central Funds are not included in the Fund's expense ratio. The Fund indirectly bears its proportionate share of the expenses of any underlying Fidelity Central Funds.
E Amount does not include the portfolio activity of any underlying Fidelity Central Funds.
F Expense ratios reflect operating expenses of the class. Expenses before reductions do not reflect amounts reimbursed by the investment adviser or reductions from brokerage service arrangements or reductions from other expense offset arrangements and do not represent the amount paid by the class during periods when reimbursements or reductions occur. Expenses net of fee waivers reflect expenses after reimbursement by the investment adviser but prior to reductions from brokerage service arrangements or other expense offset arrangements. Expenses net of all reductions represent the net expenses paid by the class.
G Amount represents less than $.01 per share.
H Total distributions of $.26 per share is comprised of distributions from net investment income of $.250 and distributions from net realized gain of $.005 per share.
Financial Highlights - Service Class
Years ended December 31, | 2010 | 2009 | 2008 | 2007 | 2006 |
Selected Per-Share Data | | | | | |
Net asset value, beginning of period | $ 20.55 | $ 15.33 | $ 27.80 | $ 31.38 | $ 30.93 |
Income from Investment Operations | | | | | |
Net investment income (loss) C | .20 | .21 | .21 | .30 | .24 |
Net realized and unrealized gain (loss) | 3.31 | 5.25 | (11.83) | 5.16 | 3.28 |
Total from investment operations | 3.51 | 5.46 | (11.62) | 5.46 | 3.52 |
Distributions from net investment income | (.24) | (.23) | (.20) | (.29) | (.36) |
Distributions from net realized gain | (.01) | (.01) | (.65) | (8.75) | (2.71) |
Total distributions | (.25) | (.24) H | (.85) | (9.04) | (3.07) |
Redemption fees added to paid in capital C,G | - | - | - | - | - |
Net asset value, end of period | $ 23.81 | $ 20.55 | $ 15.33 | $ 27.80 | $ 31.38 |
Total Return A,B | 17.11% | 35.66% | (42.61)% | 17.51% | 11.59% |
Ratios to Average Net Assets D,F | | | | | |
Expenses before reductions | .75% | .77% | .76% | .75% | .76% |
Expenses net of fee waivers, if any | .75% | .77% | .76% | .75% | .76% |
Expenses net of all reductions | .73% | .75% | .75% | .74% | .75% |
Net investment income (loss) | .96% | 1.23% | .97% | .90% | .75% |
Supplemental Data | | | | | |
Net assets, end of period (000 omitted) | $ 1,379,305 | $ 1,784,820 | $ 1,497,734 | $ 3,008,644 | $ 2,766,343 |
Portfolio turnover rate E | 117% | 145% | 172% | 134% | 75% |
A Total returns do not reflect charges attributable to your insurance company's separate account. Inclusion of these charges would reduce the total returns shown.
B Total returns would have been lower had certain expenses not been reduced during the periods shown.
C Calculated based on average shares outstanding during the period.
D Fees and expenses of the underlying Fidelity Central Funds are not included in the Fund's expense ratio. The Fund indirectly bears its proportionate share of the expenses of any underlying Fidelity Central Funds.
E Amount does not include the portfolio activity of any underlying Fidelity Central Funds.
F Expense ratios reflect operating expenses of the class. Expenses before reductions do not reflect amounts reimbursed by the investment adviser or reductions from brokerage service arrangements or reductions from other expense offset arrangements and do not represent the amount paid by the class during periods when reimbursements or reductions occur. Expenses net of fee waivers reflect expenses after reimbursement by the investment adviser but prior to reductions from brokerage service arrangements or other expense offset arrangements. Expenses net of all reductions represent the net expenses paid by the class.
G Amount represents less than $.01 per share.
H Total distributions of $.24 per share is comprised of distributions from net investment income of $.232 and distributions from net realized gain of $.005 per share.
See accompanying notes which are an integral part of the financial statements.
Annual Report
Financial Highlights - Service Class 2
Years ended December 31, | 2010 | 2009 | 2008 | 2007 | 2006 |
Selected Per-Share Data | | | | | |
Net asset value, beginning of period | $ 20.29 | $ 15.14 | $ 27.46 | $ 31.11 | $ 30.69 |
Income from Investment Operations | | | | | |
Net investment income (loss) C | .17 | .18 | .18 | .25 | .19 |
Net realized and unrealized gain (loss) | 3.26 | 5.18 | (11.67) | 5.11 | 3.26 |
Total from investment operations | 3.43 | 5.36 | (11.49) | 5.36 | 3.45 |
Distributions from net investment income | (.22) | (.21) | (.18) | (.26) | (.32) |
Distributions from net realized gain | (.01) | (.01) | (.65) | (8.75) | (2.71) |
Total distributions | (.23) | (.21) H | (.83) | (9.01) | (3.03) |
Redemption fees added to paid in capital C,G | - | - | - | - | - |
Net asset value, end of period | $ 23.49 | $ 20.29 | $ 15.14 | $ 27.46 | $ 31.11 |
Total Return A,B | 16.93% | 35.47% | (42.69)% | 17.30% | 11.43% |
Ratios to Average Net Assets D,F | | | | | |
Expenses before reductions | .90% | .92% | .91% | .90% | .91% |
Expenses net of fee waivers, if any | .90% | .92% | .91% | .90% | .91% |
Expenses net of all reductions | .88% | .90% | .90% | .89% | .90% |
Net investment income (loss) | .81% | 1.08% | .82% | .75% | .60% |
Supplemental Data | | | | | |
Net assets, end of period (000 omitted) | $ 7,627,793 | $ 7,577,737 | $ 6,187,985 | $ 9,339,663 | $ 6,185,595 |
Portfolio turnover rate E | 117% | 145% | 172% | 134% | 75% |
A Total returns do not reflect charges attributable to your insurance company's separate account. Inclusion of these charges would reduce the total returns shown.
B Total returns would have been lower had certain expenses not been reduced during the periods shown.
C Calculated based on average shares outstanding during the period.
D Fees and expenses of the underlying Fidelity Central Funds are not included in the Fund's expense ratio. The Fund indirectly bears its proportionate share of the expenses of any underlying Fidelity Central Funds.
E Amount does not include the portfolio activity of any underlying Fidelity Central Funds.
F Expense ratios reflect operating expenses of the class. Expenses before reductions do not reflect amounts reimbursed by the investment adviser or reductions from brokerage service arrangements or reductions from other expense offset arrangements and do not represent the amount paid by the class during periods when reimbursements or reductions occur. Expenses net of fee waivers reflect expenses after reimbursement by the investment adviser but prior to reductions from brokerage service arrangements or other expense offset arrangements. Expenses net of all reductions represent the net expenses paid by the class.
G Amount represents less than $.01 per share.
H Total distributions of $.21 per share is comprised of distributions from net investment income of $.205 and distributions from net realized gain of $.005 per share.
Financial Highlights - Service Class 2R
Years ended December 31, | 2010 | 2009 | 2008 | 2007 | 2006 |
Selected Per-Share Data | | | | | |
Net asset value, beginning of period | $ 20.24 | $ 15.10 | $ 27.35 | $ 31.02 | $ 30.61 |
Income from Investment Operations | | | | | |
Net investment income (loss) C | .17 | .18 | .18 | .25 | .19 |
Net realized and unrealized gain (loss) | 3.25 | 5.17 | (11.62) | 5.09 | 3.25 |
Total from investment operations | 3.42 | 5.35 | (11.44) | 5.34 | 3.44 |
Distributions from net investment income | (.21) | (.20) | (.16) | (.26) | (.32) |
Distributions from net realized gain | (.01) | (.01) | (.65) | (8.75) | (2.71) |
Total distributions | (.22) | (.21) H | (.81) | (9.01) | (3.03) |
Redemption fees added to paid in capital C,G | - | - | - | - | - |
Net asset value, end of period | $ 23.44 | $ 20.24 | $ 15.10 | $ 27.35 | $ 31.02 |
Total Return A,B | 16.94% | 35.46% | (42.69)% | 17.30% | 11.43% |
Ratios to Average Net Assets D,F | | | | | |
Expenses before reductions | .90% | .92% | .91% | .90% | .91% |
Expenses net of fee waivers, if any | .90% | .92% | .91% | .90% | .91% |
Expenses net of all reductions | .88% | .90% | .90% | .89% | .90% |
Net investment income (loss) | .81% | 1.08% | .82% | .75% | .60% |
Supplemental Data | | | | | |
Net assets, end of period (000 omitted) | $ 10,942 | $ 13,285 | $ 13,585 | $ 35,606 | $ 26,707 |
Portfolio turnover rate E | 117% | 145% | 172% | 134% | 75% |
A Total returns do not reflect charges attributable to your insurance company's separate account. Inclusion of these charges would reduce the total returns shown.
B Total returns would have been lower had certain expenses not been reduced during the periods shown.
C Calculated based on average shares outstanding during the period.
D Fees and expenses of the underlying Fidelity Central Funds are not included in the Fund's expense ratio. The Fund indirectly bears its proportionate share of the expenses of any underlying Fidelity Central Funds.
E Amount does not include the portfolio activity of any underlying Fidelity Central Funds.
F Expense ratios reflect operating expenses of the class. Expenses before reductions do not reflect amounts reimbursed by the investment adviser or reductions from brokerage service arrangements or reductions from other expense offset arrangements and do not represent the amount paid by the class during periods when reimbursements or reductions occur. Expenses net of fee waivers reflect expenses after reimbursement by the investment adviser but prior to reductions from brokerage service arrangements or other expense offset arrangements. Expenses net of all reductions represent the net expenses paid by the class.
G Amount represents less than $.01 per share.
H Total distributions of $.21 per share is comprised of distributions from net investment income of $.200 and distributions from net realized gain of $.005 per share.
See accompanying notes which are an integral part of the financial statements.
Annual Report
Financial Highlights - Investor Class
Years ended December 31, | 2010 | 2009 | 2008 | 2007 | 2006 |
Selected Per-Share Data | | | | | |
Net asset value, beginning of period | $ 20.56 | $ 15.34 | $ 27.82 | $ 31.41 | $ 31.00 |
Income from Investment Operations | | | | | |
Net investment income (loss) C | .21 | .21 | .21 | .30 | .23 |
Net realized and unrealized gain (loss) | 3.30 | 5.25 | (11.83) | 5.16 | 3.30 |
Total from investment operations | 3.51 | 5.46 | (11.62) | 5.46 | 3.53 |
Distributions from net investment income | (.26) | (.24) | (.21) | (.30) | (.41) |
Distributions from net realized gain | (.01) | (.01) | (.65) | (8.75) | (2.71) |
Total distributions | (.27) | (.24) H | (.86) | (9.05) | (3.12) |
Redemption fees added to paid in capital C,G | - | - | - | - | - |
Net asset value, end of period | $ 23.80 | $ 20.56 | $ 15.34 | $ 27.82 | $ 31.41 |
Total Return A,B | 17.10% | 35.66% | (42.60)% | 17.47% | 11.60% |
Ratios to Average Net Assets D,F | | | | | |
Expenses before reductions | .74% | .77% | .75% | .76% | .78% |
Expenses net of fee waivers, if any | .73% | .77% | .75% | .76% | .78% |
Expenses net of all reductions | .72% | .75% | .74% | .75% | .78% |
Net investment income (loss) | .98% | 1.23% | .98% | .89% | .73% |
Supplemental Data | | | | | |
Net assets, end of period (000 omitted) | $ 570,841 | $ 457,476 | $ 324,919 | $ 532,268 | $ 315,995 |
Portfolio turnover rate E | 117% | 145% | 172% | 134% | 75% |
A Total returns do not reflect charges attributable to your insurance company's separate account. Inclusion of these charges would reduce the total returns shown.
B Total returns would have been lower had certain expenses not been reduced during the periods shown.
C Calculated based on average shares outstanding during the period.
D Fees and expenses of the underlying Fidelity Central Funds are not included in the Fund's expense ratio. The Fund indirectly bears its proportionate share of the expenses of any underlying Fidelity Central Funds.
E Amount does not include the portfolio activity of any underlying Fidelity Central Funds.
F Expense ratios reflect operating expenses of the class. Expenses before reductions do not reflect amounts reimbursed by the investment adviser or reductions from brokerage service arrangements or reductions from other expense offset arrangements and do not represent the amount paid by the class during periods when reimbursements or reductions occur. Expenses net of fee waivers reflect expenses after reimbursement by the investment adviser but prior to reductions from brokerage service arrangements or other expense offset arrangements. Expenses net of all reductions represent the net expenses paid by the class.
G Amount represents less than $.01 per share.
H Total distributions of $.24 per share is comprised of distributions from net investment income of $.235 and distributions from net realized gain of $.005 per share.
See accompanying notes which are an integral part of the financial statements.
Annual Report
Notes to Financial Statements
For the period ended December 31, 2010
1. Organization.
VIP Contrafund Portfolio (the Fund) is a fund of Variable Insurance Products Fund II (the Trust) and is authorized to issue an unlimited number of shares. The Trust is registered under the Investment Company Act of 1940, as amended (the 1940 Act), as an open-end management investment company organized as a Massachusetts business trust. Shares of the Fund may only be purchased by insurance companies for the purpose of funding variable annuity or variable life insurance contracts. The Fund offers the following classes of shares: Initial Class shares, Service Class shares, Service Class 2 shares, Service Class 2R shares and Investor Class shares. All classes have equal rights and voting privileges, except for matters affecting a single class. Investment income, realized and unrealized capital gains and losses, the common expenses of the Fund, and certain fund-level expense reductions, if any, are allocated on a pro-rata basis to each class based on the relative net assets of each class to the total net assets of the Fund. Each class differs with respect to transfer agent and distribution and service plan fees incurred. Certain expense reductions may also differ by class.
2. Investments in Fidelity Central Funds.
The Fund may invest in Fidelity Central Funds, which are open-end investment companies available only to other investment companies and accounts managed by Fidelity Management & Research Company (FMR) and its affiliates. The Fund's Schedule of Investments lists each of the Fidelity Central Funds held as of period end, if any, as an investment of the Fund, but does not include the underlying holdings of each Fidelity Central Fund. As an Investing Fund, the Fund indirectly bears its proportionate share of the expenses of the underlying Fidelity Central Funds.
The Money Market Central Funds seek preservation of capital and current income and are managed by Fidelity Investments Money Management, Inc. (FIMM), an affiliate of FMR.
A complete unaudited list of holdings for each Fidelity Central Fund is available upon request or at the Securities and Exchange Commission (the SEC) web site at www.sec.gov. In addition, the financial statements of the Fidelity Central Funds, which are not covered by the Fund's Report of Independent Registered Public Accounting Firm, , are available on the SEC web site or upon request.
3. Significant Accounting Policies.
The financial statements have been prepared in conformity with accounting principles generally accepted in the United States of America (GAAP), which require management to make certain estimates and assumptions at the date of the financial statements. Actual results could differ from those estimates. Subsequent events, if any, through the date that the financial statements were issued have been evaluated in the preparation of the financial statements. The following summarizes the significant accounting policies of the Fund:
Security Valuation. Investments are valued as of 4:00 p.m. Eastern time on the last calendar day of the period. The Fund uses independent pricing services approved by the Board of Trustees to value its investments. When current market prices or quotations are not readily available or reliable, valuations may be determined in good faith in accordance with procedures adopted by the Board of Trustees. Factors used in determining value may include market or security specific events, changes in interest rates and credit quality. The frequency with which these procedures are used cannot be predicted and they may be utilized to a significant extent. The value used for net asset value (NAV) calculation under these procedures may differ from published prices for the same securities.
The Fund categorizes the inputs to valuation techniques used to value its investments into a disclosure hierarchy consisting of three levels as shown below.
Level 1 - quoted prices in active markets for identical investments
Level 2 - other significant observable inputs (including quoted prices for similar investments, interest rates, prepayment speeds, etc.)
Level 3 - unobservable inputs (including the Fund's own assumptions based on the best information available)
Changes in valuation techniques may result in transfers in or out of an assigned level within the disclosure hierarchy. The aggregate value of investments by input level, as of December 31, 2010, as well as a roll forward of Level 3 securities, is included at the end of the Fund's Schedule of Investments. Valuation techniques used to value the Fund's investments by major category are as follows.
Equity securities, including restricted securities, for which market quotations are readily available, are valued at the last reported sale price or official closing price as reported by an independent pricing service on the primary market or exchange on which they are traded and are categorized as Level 1 in the hierarchy. In the event there were no sales during the day or closing prices are not available, securities are valued at the last quoted bid price or may be valued using the last available price and are generally categorized as Level 2 in the hierarchy. For foreign equity securities, when significant market or security specific events arise, comparisons to the valuation of American Depositary Receipts (ADRs), futures contracts, Exchange-traded funds (ETFs) and certain indexes as well as quoted prices for similar securities are used and are categorized as Level 2 in the hierarchy in these circumstances. Utilizing these techniques may result in transfers between Level 1 and Level 2. For restricted equity securities and private placements where observable inputs are limited, assumptions about market activity and risk are used and are categorized as Level 3 in the hierarchy.
Annual Report
Notes to Financial Statements - continued
3. Significant Accounting Policies - continued
Debt securities, including restricted securities, are valued based on evaluated prices received from independent pricing services or from dealers who make markets in such securities. For preferred securities and U.S. government and government agency obligations, pricing services utilize matrix pricing which considers yield or price of bonds of comparable quality, coupon, maturity and type as well as dealer supplied prices and are generally categorized as Level 2 in the hierarchy.
Futures contracts are valued at the settlement price established each day by the board of trade or exchange on which they are traded and are categorized as Level 1 in the hierarchy. Investments in open-end mutual funds, including the Fidelity Central Funds, are valued at their closing net asset value each business day and are categorized as Level 1 in the hierarchy. Short-term securities with remaining maturities of sixty days or less for which quotations are not readily available are valued at amortized cost, which approximates fair value and are categorized as Level 2 in the hierarchy.
When independent prices are unavailable or unreliable, debt securities may be valued utilizing pricing matrices which consider similar factors that would be used by independent pricing services. These are generally categorized as Level 2 in the hierarchy but may be Level 3 depending on the circumstances.
Foreign Currency. The Fund uses foreign currency contracts to facilitate transactions in foreign-denominated securities. Gains and losses from these transactions may arise from changes in the value of the foreign currency or if the counterparties do not perform under the contracts' terms.
Foreign-denominated assets, including investment securities, and liabilities are translated into U.S. dollars at the exchange rate at period end. Purchases and sales of investment securities, income and dividends received and expenses denominated in foreign currencies are translated into U.S. dollars at the exchange rate in effect on the transaction date.
The effects of exchange rate fluctuations on investments are included with the net realized and unrealized gain (loss) on investment securities. Other foreign currency transactions resulting in realized and unrealized gain (loss) are disclosed separately.
Investment Transactions and Income. For financial reporting purposes, the Fund's investment holdings and NAV include trades executed through the end of the last business day of the period. The NAV per share for processing shareholder transactions is calculated as of the close of business of the New York Stock Exchange (NYSE), normally 4:00 p.m. Eastern time and includes trades executed through the end of the prior business day. Gains and losses on securities sold are determined on the basis of identified cost and may include proceeds received from litigation. Dividend income is recorded on the ex-dividend date, except for certain dividends from foreign securities where the ex-dividend date may have passed, which are recorded as soon as the Fund is informed of the ex-dividend date. Non-cash dividends included in dividend income, if any, are recorded at the fair market value of the securities received. Distributions received on securities that represent a return of capital or capital gain are recorded as a reduction of cost of investments and/or as a realized gain. The Fund estimates the components of distributions received that may be considered return of capital distributions or capital gain distributions. Interest income and distributions from the Fidelity Central Funds are accrued as earned. Interest income includes coupon interest and amortization of premium and accretion of discount on debt securities. Investment income is recorded net of foreign taxes withheld where recovery of such taxes is uncertain.
Expenses. Expenses directly attributable to a fund are charged to that fund. Expenses attributable to more than one fund are allocated among the respective funds on the basis of relative net assets or other appropriate methods. Expense estimates are accrued in the period to which they relate and adjustments are made when actual amounts are known.
Deferred Trustee Compensation. Under a Deferred Compensation Plan (the Plan), independent Trustees may elect to defer receipt of a portion of their annual compensation. Deferred amounts are invested in a cross-section of Fidelity funds, are marked-to-market and remain in the Fund until distributed in accordance with the Plan. The investment of deferred amounts and the offsetting payable to the Trustees are included in the accompanying Statement of Assets and Liabilities.
Income Tax Information and Distributions to Shareholders. Each year the Fund intends to qualify as a regulated investment company, including distributing substantially all of its taxable income and realized gains under Subchapter M of the Internal Revenue Code and filing its U.S. federal tax return. As a result, no provision for income taxes is required. As of December 31, 2010, the Fund did not have any unrecognized tax benefits in the accompanying financial statements. A fund's federal tax return is subject to examination by the Internal Revenue Service (IRS) for a period of three years. Foreign taxes are provided for based on the Fund's understanding of the tax rules and rates that exist in the foreign markets in which it invests.
Distributions are declared and recorded on the ex-dividend date. Income dividends and capital gain distributions are declared separately for each class. Income and capital gain distributions are determined in accordance with income tax regulations, which may differ from GAAP.
Capital accounts within the financial statements are adjusted for permanent book-tax differences. These adjustments have no impact on net assets or the results of operations. Temporary book-tax differences will reverse in a subsequent period.
Book-tax differences are primarily due to futures transactions, foreign currency transactions, passive foreign investment companies (PFIC), deferred trustees compensation, capital loss carryforwards and losses deferred due to wash sales and excise tax regulations.
Annual Report
3. Significant Accounting Policies - continued
Income Tax Information and Distributions to Shareholders - continued
The federal tax cost of investment securities and unrealized appreciation (depreciation) as of period end were as follows:
Gross unrealized appreciation | $ 3,120,736,235 |
Gross unrealized depreciation | (652,934,809) |
Net unrealized appreciation (depreciation) | $ 2,467,801,426 |
Tax Cost | $ 14,436,111,474 |
The tax-based components of distributable earnings as of period end were as follows:
Capital loss carryforward | $ (4,050,914,844) |
Net unrealized appreciation (depreciation) | $ 2,467,847,172 |
The tax character of distributions paid was as follows:
| December 31, 2010 | December 31, 2009 |
Ordinary Income | $ 180,625,552 | $ 196,074,965 |
Trading (Redemption) Fees. Service Class 2 R shares held by investors less than 60 days are subject to a redemption fee equal to 1% of the net asset value of shares redeemed. All redemption fees, which reduce the proceeds of the shareholder redemption, are retained by the Fund and accounted for as an addition to paid in capital.
4. Operating Policies.
Restricted Securities. The Fund may invest in securities that are subject to legal or contractual restrictions on resale. These securities generally may be resold in transactions exempt from registration or to the public if the securities are registered. Disposal of these securities may involve time-consuming negotiations and expense, and prompt sale at an acceptable price may be difficult. Information regarding restricted securities is included at the end of the Fund's Schedule of Investments.
5. Derivative Instruments.
Risk Exposures and the Use of Derivative Instruments. The Fund uses derivative instruments (derivatives), including futures contracts, in order to meet its investment objectives. The strategy is to use derivatives to increase returns and to manage exposure to certain risks as defined below. The success of any strategy involving derivatives depends on analysis of numerous economic factors, and if the strategies for investment do not work as intended, the Fund may not achieve its objectives.
The Fund's use of derivatives may increase or decrease its exposure to the following risk:
Equity Risk | Equity risk relates to the fluctuations in the value of financial instruments as a result of changes in market prices (other than those arising from interest rate risk or foreign exchange risk), whether caused by factors specific to an individual investment, its issuer, or all factors affecting all instruments traded in a market or market segment. |
The Fund is also exposed to additional risks from investing in derivatives, such as liquidity risk and counterparty credit risk. Liquidity risk is the risk that the Fund will be unable to sell the derivative in the open market in a timely manner. Counterparty credit risk is the risk that the counterparty will not be able to fulfill its obligation to the Fund. The Fund's maximum risk of loss from counterparty credit risk is generally the aggregate unrealized appreciation and unpaid counterparty fees in excess of any collateral pledged by the counterparty to the Fund. Counterparty risk related to exchange-traded futures contracts is minimal because of the protection provided by the exchange on which they trade. Risk of loss may exceed the amounts recognized in the Statement of Assets and Liabilities.
Annual Report
Notes to Financial Statements - continued
5. Derivative Instruments - continued
Net Realized Gain (Loss) and Change in Net Unrealized Appreciation (Depreciation) on Derivatives. The table below, which reflects the impacts of derivatives on the financial performance of the Fund, summarizes the net realized gain (loss) and change in net unrealized appreciation (depreciation) for derivatives during the period.
Risk Exposure / Derivative Type | Net Realized Gain
(Loss) | Change in
Net Unrealized
Appreciation (Depreciation) |
Equity Risk | | |
Futures Contracts | $ (328,031) | $ 933,702 |
Totals (a) | $ (328,031) | $ 933,702 |
(a) A summary of the value of derivatives by risk exposure as of period end, if any, is included at the end of the Schedule of Investments and is representative of activity for the period.
Futures Contracts. A futures contract is an agreement between two parties to buy or sell a specified underlying instrument for a fixed price at a specified future date. The Fund uses futures contracts to manage its exposure to the stock market.
Upon entering into a futures contract, a fund is required to deposit either cash or securities (initial margin) with a clearing broker in an amount equal to a certain percentage of the face value of the contract. Futures contracts are marked-to-market daily and subsequent payments (variation margin) are made or received by a fund depending on the daily fluctuations in the value of the futures contracts and are recorded as unrealized appreciation or (depreciation). Realized gain or (loss) is recorded upon the expiration or closing of a futures contract.
The underlying face amount at value of open futures contracts at period end, if any, is shown in the Schedule of Investments under the caption "Futures Contracts." This amount reflects each contract's exposure to the underlying instrument at period end and is representative of activity for the period. Securities deposited to meet initial margin requirements are identified in the Schedule of Investments. The receivable and/or payable for the variation margin are reflected in the Statement of Assets and Liabilities.
Certain risks may arise upon entering into futures contracts, including the risk that an illiquid market may limit the ability to close out a futures contract prior to settlement date.
During the period the Fund recognized net realized gain (loss) of $(328,031) and a change in net unrealized appreciation (depreciation) of $933,702 related to its investment in futures contracts. These amounts are included in the Statement of Operations.
6. Purchases and Sales of Investments.
Purchases and sales of securities, other than short-term securities, aggregated $18,911,410,312 and $21,884,933,596, respectively.
7. Fees and Other Transactions with Affiliates.
Management Fee. FMR and its affiliates provide the Fund with investment management related services for which the Fund pays a monthly management fee. The management fee is the sum of an individual fund fee rate that is based on an annual rate of .30% of the Fund's average net assets and a group fee rate that averaged .26% during the period. The group fee rate is based upon the average net assets of all the mutual funds advised by FMR. The group fee rate decreases as assets under management increase and increases as assets under management decrease. For the period, the total annual management fee rate was .56% of the Fund's average net assets.
Distribution and Service Plan Fees. In accordance with Rule 12b-1 of the 1940 Act, the Fund has adopted separate 12b-1 Plans for each Service Class of shares. Each Service Class pays Fidelity Distributors Corporation (FDC), an affiliate of FMR, a service fee. For the period, the service fee is based on an annual rate of .10% of Service Class' average net assets and .25% of Service Class 2's and Service Class 2R's average net assets.
For the period, total fees, all of which were re-allowed to insurance companies for the distribution of shares and providing shareholder support services were as follows:
Service Class | $ 1,712,276 |
Service Class 2 | 18,246,088 |
Service Class 2R | 28,087 |
| $ 19,986,451 |
Annual Report
7. Fees and Other Transactions with Affiliates - continued
Transfer Agent Fees. Fidelity Investments Institutional Operations Company, Inc. (FIIOC), an affiliate of FMR, is the Fund's transfer, dividend disbursing, and shareholder servicing agent. FIIOC receives an asset-based fee with respect to each class. Each class (with the exception of Investor Class) pays a transfer agent fee, excluding out of pocket expenses, equal to an annual rate of .07% of average net assets. Investor Class pays a monthly asset-based transfer agent fee of .15% of average net assets. In addition, FIIOC receives an asset-based fee of 0.1% of average net assets for typesetting, printing and mailing of shareholder reports, except proxy statements. FIIOC has agreed to voluntarily waive this fee until December 31, 2010. (See Note 10: Expense Reductions.) For the period, transfer agent fees for each class, including printing and out of pocket expenses, were as follows:
Initial Class | $ 5,379,310 |
Service Class | 1,282,122 |
Service Class 2 | 5,454,438 |
Service Class 2R | 8,366 |
Investor Class | 778,847 |
| $ 12,903,083 |
Accounting and Security Lending Fees. Fidelity Service Company, Inc. (FSC), an affiliate of FMR, maintains the Fund's accounting records. The accounting fee is based on the level of average net assets for the month. Under a separate contract, FSC administers the security lending program. The security lending fee is based on the number and duration of lending transactions.
Brokerage Commissions. The Fund placed a portion of its portfolio transactions with brokerage firms which are affiliates of the investment adviser. The commissions paid to these affiliated firms were $701,932 for the period.
8. Committed Line of Credit.
The Fund participates with other funds managed by FMR or an affiliate in a $3.75 billion credit facility (the "line of credit") to be utilized for temporary or emergency purposes to fund shareholder redemptions or for other short-term liquidity purposes. The Fund has agreed to pay commitment fees on its pro-rata portion of the line of credit, which amounted to $65,968 and is reflected in Miscellaneous expenses on the Statement of Operations. During the period, there were no borrowings on this line of credit.
9. Security Lending.
The Fund lends portfolio securities through a lending agent from time to time in order to earn additional income. The lending agent may loan securities to certain qualified borrowers, including Fidelity Capital Markets (FCM), a broker-dealer affiliated with the Fund. On the settlement date of the loan, the Fund receives collateral (in the form of U.S. Treasury obligations, letters of credit and/or cash) against the loaned securities and maintains collateral in an amount not less than 100% of the market value of the loaned securities during the period of the loan. The market value of the loaned securities is determined at the close of business of the Fund and any additional required collateral is delivered to the Fund on the next business day. If the borrower defaults on its obligation to return the securities loaned because of insolvency or other reasons, a fund could experience delays and costs in recovering the securities loaned or in gaining access to the collateral. Any cash collateral received is invested in the Fidelity Securities Lending Cash Central Fund. The value of loaned securities and cash collateral at period end are disclosed on the Fund's Statement of Assets and Liabilities. At period end, there were no security loans outstanding with FCM. Security lending income represents the income earned on investing cash collateral, less rebates paid to borrowers and lending agent fees associated with the loan, plus any premium payments received for lending certain types of securities. Security lending income is presented in the Statement of Operations as a component of income from Fidelity Central Funds. Total security lending income during the period amounted to $1,994,618, including $430 from securities loaned to FCM.
10. Expense Reductions.
FMR or its affiliates agreed to waive certain fees during the period as noted in the table below.
Initial Class | $ 521,337 |
Service Class | 124,035 |
Service Class 2 | 529,085 |
Service Class 2R | 813 |
Investor Class | 35,260 |
| $ 1,210,530 |
Many of the brokers with whom FMR places trades on behalf of the Fund provided services to the Fund in addition to trade execution. These services included payments of certain expenses on behalf of the Fund totaling $2,400,919 for the period.
Annual Report
Notes to Financial Statements - continued
11. Distributions to Shareholders.
Distributions to shareholders of each class were as follows:
Years ended December 31, | 2010 | 2009 |
From net investment income | | |
Initial Class | $ 82,141,064 | $ 89,825,612 |
Service Class | 14,096,830 | 20,191,848 |
Service Class 2 | 71,159,779 | 76,591,597 |
Service Class 2R | 100,197 | 133,806 |
Investor Class | 6,111,872 | 5,150,312 |
Total | $ 173,609,742 | $ 191,893,175 |
From net realized gain | | |
Initial Class | $ 2,975,123 | $ 1,784,525 |
Service Class | 575,173 | 432,148 |
Service Class 2 | 3,224,769 | 1,851,990 |
Service Class 2R | 4,617 | 3,263 |
Investor Class | 236,128 | 109,864 |
Total | $ 7,015,810 | $ 4,181,790 |
12. Share Transactions.
Transactions for each class of shares were as follows:
| Shares | Dollars |
Years ended December 31, | 2010 | 2009 | 2010 | 2009 |
Initial Class | | | | |
Shares sold | 11,081,201 | 14,081,895 | $ 237,555,506 | $ 237,639,561 |
Reinvestment of distributions | 3,639,831 | 4,636,839 | 85,116,187 | 91,610,137 |
Shares redeemed | (74,008,339) | (65,265,249) | (1,628,773,596) | (1,075,039,384) |
Net increase (decrease) | (59,287,307) | (46,546,515) | $ (1,306,101,903) | $ (745,789,686) |
Service Class | | | | |
Shares sold | 4,235,533 | 6,280,159 | $ 89,409,017 | $ 104,665,220 |
Reinvestment of distributions | 631,651 | 1,049,443 | 14,672,003 | 20,623,996 |
Shares redeemed | (33,788,989) | (18,151,640) | (763,918,858) | (296,874,025) |
Net increase (decrease) | (28,921,805) | (10,822,038) | $ (659,837,838) | $ (171,584,809) |
Service Class 2 | | | | |
Shares sold | 29,628,488 | 57,118,843 | $ 621,610,993 | $ 927,455,049 |
Reinvestment of distributions | 3,238,949 | 4,056,980 | 74,384,548 | 78,443,587 |
Shares redeemed | (81,615,457) | (96,296,164) | (1,716,672,110) | (1,585,826,463) |
Net increase (decrease) | (48,748,020) | (35,120,341) | $ (1,020,676,569) | $ (579,927,827) |
Service Class 2R | | | | |
Shares sold | 104,398 | 142,133 | $ 2,198,967 | $ 2,366,097 |
Reinvestment of distributions | 4,580 | 7,152 | 104,814 | 137,069 |
Shares redeemed | (298,461) | (392,336) | (6,070,211) | (6,296,651) |
Net increase (decrease) | (189,483) | (243,051) | $ (3,766,430) | $ (3,793,485) |
Investor Class | | | | |
Shares sold | 3,515,764 | 2,899,284 | $ 76,017,353 | $ 50,858,034 |
Reinvestment of distributions | 272,002 | 266,531 | 6,348,000 | 5,260,176 |
Shares redeemed | (2,058,150) | (2,091,088) | (42,962,962) | (32,554,641) |
Net increase (decrease) | 1,729,616 | 1,074,727 | $ 39,402,391 | $ 23,563,569 |
13. Other.
The Fund's organizational documents provide former and current trustees and officers with a limited indemnification against liabilities arising in connection with the performance of their duties to the Fund. In the normal course of business, the Fund may also enter into contracts that provide general indemnifications. The Fund's maximum exposure under these arrangements is unknown as this would be dependent on future claims that may be made against the Fund. The risk of material loss from such claims is considered remote.
At the end of the period, FMR or its affiliates were the owners of record of 10% of the total outstanding shares of the Fund and two otherwise unaffiliated shareholders were the owners of record of 29% of the total outstanding shares of the Fund.
Annual Report
Report of Independent Registered Public Accounting Firm
To the Trustees of Variable Insurance Products Fund II and Shareholders of VIP Contrafund Portfolio:
We have audited the accompanying statement of assets and liabilities of VIP Contrafund Portfolio (the Fund), a fund of Variable Insurance Products Fund II, including the schedule of investments, as of December 31, 2010, and the related statement of operations for the year then ended, the statement of changes in net assets for each of the two years in the period then ended, and the financial highlights for each of the five years in the period then ended. These financial statements and financial highlights are the responsibility of the Fund's management. Our responsibility is to express an opinion on these financial statements and financial highlights based on our audits.
We conducted our audits in accordance with the standards of the Public Company Accounting Oversight Board (United States). Those standards require that we plan and perform the audit to obtain reasonable assurance about whether the financial statements and financial highlights are free of material misstatement. The Fund is not required to have, nor were we engaged to perform, an audit of its internal control over financial reporting. Our audits included consideration of internal control over financial reporting as a basis for designing audit procedures that are appropriate in the circumstances, but not for the purpose of expressing an opinion on the effectiveness of the Fund's internal control over financial reporting. Accordingly, we express no such opinion. An audit also includes examining, on a test basis, evidence supporting the amounts and disclosures in the financial statements, assessing the accounting principles used and significant estimates made by management, as well as evaluating the overall financial statement presentation. Our procedures included confirmation of securities owned as of December 31, 2010, by correspondence with the custodians and brokers where replies were not received from brokers, we performed other auditing procedures. We believe that our audits provide a reasonable basis for our opinion.
In our opinion, the financial statements and financial highlights referred to above present fairly, in all material respects, the financial position of VIP Contrafund Portfolio as of December 31, 2010, the results of its operations for the year then ended, the changes in its net assets for each of the two years in the period then ended, and the financial highlights for each of the five years in the period then ended, in conformity with accounting principles generally accepted in the United States of America.
/s/ Deloitte & Touche LLP
DELOITTE & TOUCHE LLP
Boston, Massachusetts
February 15, 2011
Annual Report
The Trustees, Members of the Advisory Board, and executive officers of the trust and fund, as applicable, are listed below. The Board of Trustees governs the fund and is responsible for protecting the interests of shareholders. The Trustees are experienced executives who meet periodically throughout the year to oversee the fund's activities, review contractual arrangements with companies that provide services to the fund, oversee management of the risks associated with such activities and contractual arrangements, and review the fund's performance. Except for James C. Curvey, each of the Trustees oversees 219 funds advised by FMR or an affiliate. Mr. Curvey oversees 408 funds advised by FMR or an affiliate.
The Trustees hold office without limit in time except that (a) any Trustee may resign; (b) any Trustee may be removed by written instrument, signed by at least two-thirds of the number of Trustees prior to such removal; (c) any Trustee who requests to be retired or who has become incapacitated by illness or injury may be retired by written instrument signed by a majority of the other Trustees; and (d) any Trustee may be removed at any special meeting of shareholders by a two-thirds vote of the outstanding voting securities of the trust. Each Trustee who is not an interested person (as defined in the 1940 Act) (Independent Trustee), shall retire not later than the last day of the calendar year in which his or her 72nd birthday occurs. The Independent Trustees may waive this mandatory retirement age policy with respect to individual Trustees. The executive officers and Advisory Board Members hold office without limit in time, except that any officer and Advisory Board Member may resign or may be removed by a vote of a majority of the Trustees at any regular meeting or any special meeting of the Trustees. Except as indicated, each individual has held the office shown or other offices in the same company for the past five years.
Experience, Skills, Attributes, and Qualifications of the Fund's Trustees. The Governance and Nominating Committee has adopted a statement of policy that describes the experience, qualifications, attributes, and skills that are necessary and desirable for potential Independent Trustee candidates (Statement of Policy). The Board believes that each Trustee satisfied at the time he or she was initially elected or appointed a Trustee, and continues to satisfy, the standards contemplated by the Statement of Policy. The Governance and Nominating Committee also engages professional search firms to help identify potential Independent Trustee candidates who have the experience, qualifications, attributes, and skills consistent with the Statement of Policy. From time to time, additional criteria based on the composition and skills of the current Independent Trustees, as well as experience or skills that may be appropriate in light of future changes to board composition, business conditions, and regulatory or other developments, have also been considered by the professional search firms and the Governance and Nominating Committee. In addition, the Board takes into account the Trustees' commitment and participation in Board and committee meetings, as well as their leadership of standing and ad hoc committees throughout their tenure.
In determining that a particular Trustee was and continues to be qualified to serve as a Trustee, the Board has considered a variety of criteria, none of which, in isolation, was controlling. The Board believes that, collectively, the Trustees have balanced and diverse experience, qualifications, attributes, and skills, which allow the Board to operate effectively in governing the fund and protecting the interests of shareholders. Information about the specific experience, skills, attributes, and qualifications of each Trustee, which in each case led to the Board's conclusion that the Trustee should serve (or continue to serve) as a trustee of the fund, is provided below.
Board Structure and Oversight Function. James C. Curvey is an interested person (as defined in the 1940 Act) and currently serves as Acting Chairman. The Trustees have determined that an interested Chairman is appropriate and benefits shareholders because an interested Chairman has a personal and professional stake in the quality and continuity of services provided to the fund. Independent Trustees exercise their informed business judgment to appoint an individual of their choosing to serve as Chairman, regardless of whether the Trustee happens to be independent or a member of management. The Independent Trustees have determined that they can act independently and effectively without having an Independent Trustee serve as Chairman and that a key structural component for assuring that they are in a position to do so is for the Independent Trustees to constitute a substantial majority for the Board. The Independent Trustees also regularly meet in executive session. Ned C. Lautenbach serves as Chairman of the Independent Trustees and as such (i) acts as a liaison between the Independent Trustees and management with respect to matters important to the Independent Trustees and (ii) with management prepares agendas for Board meetings.
Fidelity funds are overseen by different Boards of Trustees. The fund's Board oversees Fidelity's equity and high income funds and another Board oversees Fidelity's investment-grade bond, money market, and asset allocation funds. The asset allocation funds may invest in Fidelity funds overseen by the fund's Board. The use of separate Boards, each with its own committee structure, allows the Trustees of each group of Fidelity funds to focus on the unique issues of the funds they oversee, including common research, investment, and operational issues. On occasion, the separate Boards establish joint committees to address issues of overlapping consequences for the Fidelity funds overseen by each Board.
The Trustees operate using a system of committees to facilitate the timely and efficient consideration of all matters of importance to the Trustees, the fund, and fund shareholders and to facilitate compliance with legal and regulatory requirements and oversight of the fund's activities and associated risks. The Board, acting through its committees, has charged FMR and its affiliates with (i) identifying events or circumstances the occurrence of which could have demonstrably adverse effects on the fund's business and/or reputation; (ii) implementing processes and controls to lessen the possibility that such events or circumstances occur or to mitigate the effects of such events or circumstances if they do occur; and (iii) creating and maintaining a system designed to evaluate continuously business and market conditions in order to facilitate the identification and implementation processes described in (i) and (ii) above. Because the day-to-day operations and activities of the fund are carried out by or through FMR, its affiliates and other service providers, the fund's exposure to risks is mitigated but not eliminated by the processes overseen by the Trustees. While each of the Board's committees has responsibility for overseeing different aspects of the fund's activities, oversight is exercised primarily through the Operations, Audit, and Compliance Committees. Appropriate personnel, including but not limited to the fund's Chief Compliance Officer (CCO), FMR's internal auditor, the independent accountants, the fund's Treasurer and portfolio management personnel, make periodic reports to the Board's committees, as appropriate. The responsibilities of each committee, including their oversight responsibilities, are described further under "Standing Committees of the Fund's Trustees."
Annual Report
The fund's Statement of Additional Information (SAI) includes more information about the Trustees. To request a free copy, call Fidelity at 1-877-208-0098.
Interested Trustees*:
Correspondence intended for each Trustee who is an interested person may be sent to Fidelity Investments, 82 Devonshire Street, Boston, Massachusetts 02109.
Name, Age; Principal Occupations and Other Relevant Experience+ |
James C. Curvey (75) |
| Year of Election or Appointment: 2007 Mr. Curvey is Trustee and Acting Chairman of the Board of Trustees of certain Trusts. Mr. Curvey also serves as Trustee (2007-present) of other investment companies advised by FMR. Mr. Curvey is a Director of Fidelity Investments Money Management, Inc. (2009-present), Director of Fidelity Research & Analysis Co. (2009-present) and Director of FMR and FMR Co., Inc. (2007-present). Mr. Curvey is also Vice Chairman (2007-present) and Director of FMR LLC. In addition, Mr. Curvey serves as an Overseer for the Boston Symphony Orchestra and a member of the Trustees of Villanova University. Previously, Mr. Curvey was the Vice Chairman (2006-2007) and Director (2000-2007) of FMR Corp. |
Ronald P. O'Hanley (54) |
| Year of Election or Appointment: 2011 Mr. O'Hanley is President of Fidelity Asset Management and Corporate Services and a member of Fidelity's Executive Committee (2010-present). Previously, Mr. O'Hanley served as President and Chief Executive Officer of BNY Mellon Asset Management (2007-2010). Mr. O'Hanley also served as Vice Chairman of Bank New York Mellon Corp. and a member of that firm's Executive Committee. Prior to the 2007 merger of The Bank of New York and Mellon Financial Corporation, he was Vice Chairman of Mellon Financial Corporation and President and Chief Executive Officer of Mellon Asset Management. He joined Mellon in February 1997. Mr. O'Hanley currently serves as Chairman of the Boston Public Library Foundation Board of Directors and sits on the Board of Directors of Beth Israel Deaconess Medical Center, the Board of Trustees of the Marine Biological Laboratory and the Advisory Board of the Maxwell School of Citizenship and Public Administration at Syracuse University. Mr. O'Hanley also chairs the Council on Asset Management for the Financial Services Roundtable and is a member of the Board of Directors of Institutional Investor's U.S. Institute. |
* Trustees have been determined to be "Interested Trustees" by virtue of, among other things, their affiliation with the trust or various entities under common control with FMR.
+ The information above includes each Trustee's principal occupation during the last five years and other information relating to the experience, attributes, and skills relevant to each Trustee's qualifications to serve as a Trustee, which led to the conclusion that each Trustee should serve as a Trustee for the fund.
Independent Trustees:
Correspondence intended for each Independent Trustee (that is, the Trustees other than the Interested Trustees) may be sent to Fidelity Investments, P.O. Box 55235, Boston, Massachusetts 02205-5235.
Name, Age; Principal Occupations and Other Relevant Experience+ |
Dennis J. Dirks (62) |
| Year of Election or Appointment: 2005 Prior to his retirement in May 2003, Mr. Dirks was Chief Operating Officer and a member of the Board of The Depository Trust & Clearing Corporation (DTCC). He also served as President, Chief Operating Officer, and Board member of The Depository Trust Company (DTC) and President and Board member of the National Securities Clearing Corporation (NSCC). In addition, Mr. Dirks served as Chief Executive Officer and Board member of the Government Securities Clearing Corporation, Chief Executive Officer and Board member of the Mortgage-Backed Securities Clearing Corporation, as a Trustee and a member of the Finance Committee of Manhattan College (2005-2008), and as a Trustee and a member of the Finance Committee of AHRC of Nassau County (2006-2008). Mr. Dirks is a member of the Independent Directors Council (IDC) Governing Council (2010-Present) and Board of Directors for The Brookville Center for Children's Services, Inc. (2009-present). |
Alan J. Lacy (57) |
| Year of Election or Appointment: 2008 Mr. Lacy serves as Senior Adviser (2007-present) of Oak Hill Capital Partners, L.P. (private equity). Mr. Lacy also served as Chief Executive Officer (2000-2005) and Vice Chairman (2005-2006) of Sears Holdings Corporation and Sears, Roebuck and Co. (retail). In addition, Mr. Lacy serves as a member of the Board of Directors of The Western Union Company (global money transfer, 2006-present) and Bristol-Myers Squibb Company (global pharmaceuticals, 2007-present). Mr. Lacy is Chairman (2008-present) and a member (2006-present) of the Board of Trustees of The National Parks Conservation Association. |
Ned C. Lautenbach (66) |
| Year of Election or Appointment: 2000 Mr. Lautenbach is Chairman of the Independent Trustees of the Equity and High Income Funds (2006-present). Mr. Lautenbach currently serves as the Lead Director of the Eaton Corporation Board of Directors (diversified industrial, 1997-present). Mr. Lautenbach is also a member of the Board of Directors of the Philharmonic Center for the Arts in Naples, Florida (1999-present); a member of the Board of Trustees of Fairfield University (2005-present); and a member of the Council on Foreign Relations (1994-present). Previously, Mr. Lautenbach was a Partner/Advisory Partner at Clayton, Dubilier & Rice, Inc. (private equity investment, 1998-2010), as well as a Director of Sony Corporation (2006-2007). |
Joseph Mauriello (66) |
| Year of Election or Appointment: 2008 Prior to his retirement in January 2006, Mr. Mauriello served in numerous senior management positions including Deputy Chairman and Chief Operating Officer (2004-2005), and Vice Chairman of Financial Services (2002-2004) of KPMG LLP US (professional services, 1965-2005). Mr. Mauriello currently serves as a member of the Board of Directors of XL Group plc. (global insurance and re-insurance, 2006-present) and of Arcadia Resources Inc. (health care services and products, 2007-present). Previously, Mr. Mauriello served as a Director of the Hamilton Funds of the Bank of New York (2006-2007). |
Cornelia M. Small (66) |
| Year of Election or Appointment: 2005 Ms. Small is a member of the Board of Directors of the Teagle Foundation (2009-present). Ms. Small is also a member of the Investment Committee, and Chair (2008-present) and a member of the Board of Trustees of Smith College. In addition, Ms. Small serves on the Investment Committee of the Berkshire Taconic Community Foundation (2008-present). Previously, Ms. Small served as Chairperson of the Investment Committee (2002-2008) of Smith College. In addition, Ms. Small served as Chief Investment Officer, Director of Global Equity Investments, and a member of the Board of Directors of Scudder, Stevens & Clark and Scudder Kemper Investments. |
William S. Stavropoulos (71) |
| Year of Election or Appointment: 2001 Mr. Stavropoulos is Vice Chairman of the Independent Trustees of the Equity and High Income Funds (2006-present). Mr. Stavropoulos serves as President and Founder of the Michigan Baseball Foundation, the Great Lakes Loons (2007-present). Mr. Stavropoulos is Chairman Emeritus of the Board of Directors of The Dow Chemical Company, where he previously served in numerous senior management positions, including President, CEO (1995-2000; 2002-2004), Chairman of the Executive Committee (2000-2006), and as a member of the Board of Directors (1990-2006). Currently, Mr. Stavropoulos is Chairman of Univar (global distributor of commodity and specialty chemicals, 2010-present), a Director of Teradata Corporation (data warehousing and technology solutions, 2008-present), Chemical Financial Corporation, Maersk Inc. (industrial conglomerate), Tyco International, Inc. (multinational manufacturing and services, 2007-present), and a member of the Advisory Board for Metalmark Capital (private equity investment, 2005-present). Mr. Stavropoulos is a special advisor to Clayton, Dubilier & Rice, LLC (private equity investment). In addition, Mr. Stavropoulos is a member of the University of Notre Dame Advisory Council for the College of Science. |
David M. Thomas (61) |
| Year of Election or Appointment: 2008 Previously, Mr. Thomas served as Executive Chairman (2005-2006) and Chairman and Chief Executive Officer (2000-2005) of IMS Health, Inc. (pharmaceutical and healthcare information solutions). In addition, Mr. Thomas serves as a member of the Board of Directors of Fortune Brands, Inc. (consumer products), and Interpublic Group of Companies, Inc. (marketing communication, 2004-present). |
Michael E. Wiley (60) |
| Year of Election or Appointment: 2008 Mr. Wiley also serves as a Director of Asia Pacific Exploration Consolidated (international oil and gas exploration and production, 2008-present). Mr. Wiley serves as a Director of Tesoro Corporation (independent oil refiner and marketer, 2005-present), and a Director of Bill Barrett Corporation (exploration and production, 2005-present). In addition, Mr. Wiley also serves as a Director of Post Oak Bank (privately-held bank, 2004-present). Previously, Mr. Wiley served as a member of the Board of Trustees of the University of Tulsa (2000-2006; 2007-2010), as a Senior Energy Advisor of Katzenbach Partners, LLC (consulting, 2006-2007), as an Advisory Director of Riverstone Holdings (private investment), Chairman, President, and CEO of Baker Hughes, Inc. (oilfield services, 2000-2004), and as Director of Spinnaker Exploration Company (exploration and production, 2001-2005). |
+ The information above includes each Trustee's principal occupation during the last five years and other information relating to the experience, attributes, and skills relevant to each Trustee's qualifications to serve as a Trustee, which led to the conclusion that each Trustee should serve as a Trustee for the fund.
Advisory Board Members and Executive Officers:
Correspondence intended for each executive officer, Edward C. Johnson 3d, and Peter S. Lynch may be sent to Fidelity Investments, 82 Devonshire Street, Boston, Massachusetts 02109.
Name, Age; Principal Occupation |
Edward C. Johnson 3d (80) |
| Year of Election or Appointment: 2011 Member of the Advisory Board of Fidelity's Equity and High Income Funds. Formerly Trustee and Chairman of the Board of Trustees of certain Trusts, Mr. Johnson serves as Chief Executive Officer, Chairman, and a Director of FMR LLC; Chairman and a Director of FMR; and Chairman and a Director of FMR Co., Inc. In addition, Mr. Johnson serves as Chairman and Director of FIL Limited. Previously, Mr. Johnson served as President of FMR LLC (2006-2007). |
Peter S. Lynch (66) |
| Year of Election or Appointment: 2003 Member of the Advisory Board of Fidelity's Equity and High Income Funds. Mr. Lynch is Vice Chairman and a Director of FMR and FMR Co., Inc. In addition, Mr. Lynch serves as a Trustee of Boston College and as the Chairman of the Inner-City Scholarship Fund. Previously, Mr. Lynch served on the Special Olympics International Board of Directors (1997-2006). |
Kenneth B. Robins (41) |
| Year of Election or Appointment: 2008 President and Treasurer of Fidelity's Equity and High Income Funds. Mr. Robins also serves as President and Treasurer (2010-present) and Assistant Treasurer (2009-present) of other Fidelity funds and is an employee of Fidelity Investments (2004-present). Previously, Mr. Robins served as Deputy Treasurer of the Fidelity funds (2005-2008) and Treasurer and Chief Financial Officer of The North Carolina Capital Management Trust: Cash and Term Portfolios (2006-2008). |
Bruce T. Herring (45) |
| Year of Election or Appointment: 2006 Vice President of certain Equity Funds. Mr. Herring also serves as Chief Investment Officer and Director of Fidelity Management & Research (U.K.) Inc. (2010-present) and Group Chief Investments Officer of FMR. Previously, Mr. Herring served as Vice President (2005-2006) and Senior Vice President (2006-2007) of Fidelity Management & Research Company, Vice President of FMR Co., Inc. (2001-2007) and as a portfolio manager for Fidelity U.S. Equity Funds. |
Brian B. Hogan (46) |
| Year of Election or Appointment: 2009 Vice President of certain Equity Funds and Vice President of Sector Funds. Mr. Hogan also serves as President of FMR's Equity Division (2009-present). Previously, Mr. Hogan served as Senior Vice President, Equity Research of FMR (2006-2009) and as a portfolio manager. |
Scott C. Goebel (42) |
| Year of Election or Appointment: 2008 Secretary and Chief Legal Officer (CLO) of the Fidelity funds. Mr. Goebel also serves as Secretary and CLO of The North Carolina Capital Management Trust: Cash and Term Portfolio (2008-present); General Counsel, Secretary, and Senior Vice President of FMR (2008-present) and FMR Co., Inc. (2008-present); Deputy General Counsel of FMR LLC; Chief Legal Officer of Fidelity Management & Research (Hong Kong) Limited (2008-present) and Assistant Secretary of Fidelity Management & Research (Japan) Inc. (2008-present), Fidelity Investments Money Management, Inc. (2008-present), Fidelity Management & Research (U.K.) Inc. (2008-present), and Fidelity Research and Analysis Company (2008-present). Previously, Mr. Goebel served as Assistant Secretary of the Funds (2007-2008) and as Vice President and Secretary of Fidelity Distributors Corporation (FDC) (2005-2007). |
William C. Coffey (41) |
| Year of Election or Appointment: 2009 Assistant Secretary of Fidelity's Equity and High Income Funds. Mr. Coffey also serves as Senior Vice President and Deputy General Counsel of FMR LLC (2010-present), and is an employee of Fidelity Investments. Previously, Mr. Coffey served as Vice President and Associate General Counsel of FMR LLC (2005-2009). |
Holly C. Laurent (56) |
| Year of Election or Appointment: 2008 Anti-Money Laundering (AML) Officer of the Fidelity funds. Ms. Laurent also serves as AML Officer of The North Carolina Capital Management Trust: Cash and Term Portfolio (2008-present) and is an employee of Fidelity Investments. Previously, Ms. Laurent was Senior Vice President and Head of Legal for Fidelity Business Services India Pvt. Ltd. (2006-2008), and Senior Vice President, Deputy General Counsel and Group Head for FMR LLC (2005-2006). |
Christine Reynolds (52) |
| Year of Election or Appointment: 2008 Chief Financial Officer of the Fidelity funds. Ms. Reynolds became President of Fidelity Pricing and Cash Management Services (FPCMS) in August 2008. Ms. Reynolds served as Chief Operating Officer of FPCMS (2007-2008). Previously, Ms. Reynolds served as President, Treasurer, and Anti-Money Laundering officer of the Fidelity funds (2004-2007). |
Kenneth A. Rathgeber (63) |
| Year of Election or Appointment: 2004 Chief Compliance Officer of Fidelity's Equity and High Income Funds. Mr. Rathgeber is Chief Compliance Officer of Fidelity Management & Research (Hong Kong) Limited (2008-present), Fidelity Management & Research (Japan) Inc. (2008-present), FMR (2005-present), FMR Co., Inc. (2005-present), Fidelity Management & Research (U.K.) Inc. (2005-present), Fidelity Research & Analysis Company (2005-present), Fidelity Investments Money Management, Inc. (2005-present), Pyramis Global Advisors, LLC (2005-present), and Strategic Advisers, Inc. (2005-present). |
Jeffrey S. Christian (49) |
| Year of Election or Appointment: 2009 Deputy Treasurer of the Fidelity funds. Mr. Christian is an employee of Fidelity Investments. Previously, Mr. Christian served as Chief Financial Officer (2008-2009) of certain Fidelity funds and Senior Vice President of Fidelity Pricing and Cash Management Services (FPCMS) (2004-2009). |
Bryan A. Mehrmann (49) |
| Year of Election or Appointment: 2005 Deputy Treasurer of the Fidelity funds. Mr. Mehrmann is an employee of Fidelity Investments. |
Adrien E. Deberghes (43) |
| Year of Election or Appointment: 2008 Deputy Treasurer of Fidelity's Equity and High Income Funds. Mr. Deberghes also serves as Assistant Treasurer of other Fidelity funds (2010-present) and is an employee of Fidelity Investments (2008-present). Previously, Mr. Deberghes served as Senior Vice President of Mutual Fund Administration at State Street Corporation (2007-2008), Senior Director of Mutual Fund Administration at Investors Bank & Trust (2005-2007), and Director of Finance for Dunkin' Brands (2000-2005). |
Stephanie J. Dorsey (41) |
| Year of Election or Appointment: 2010 Assistant Treasurer of Fidelity's Equity and High Income Funds. Ms. Dorsey also serves as Deputy Treasurer of other Fidelity funds (2008-present) and is an employee of Fidelity Investments (2008-present). Previously, Ms. Dorsey served as Treasurer (2004-2008) of the JPMorgan Mutual Funds and Vice President (2004-2008) of JPMorgan Chase Bank. |
John R. Hebble (52) |
| Year of Election or Appointment: 2009 Assistant Treasurer of Fidelity's Equity and High Income Funds. Mr. Hebble also serves as Treasurer and Chief Financial Officer of The North Carolina Capital Management Trust: Cash and Term Portfolio (2008-present), President and Treasurer of other Fidelity funds (2008-present) and is an employee of Fidelity Investments. |
Gary W. Ryan (52) |
| Year of Election or Appointment: 2005 Assistant Treasurer of the Fidelity funds. Mr. Ryan is an employee of Fidelity Investments. Previously, Mr. Ryan served as Vice President of Fund Reporting in Fidelity Pricing and Cash Management Services (FPCMS) (1999-2005). |
Jonathan Davis (42) |
| Year of Election or Appointment: 2010 Assistant Treasurer of the Fidelity funds. Mr. Davis is an employee of Fidelity Investments. Previously, Mr. Davis served as Vice President and Associate General Counsel of FMR LLC (2003-2010). |
Annual Report
Initial Class, Service Class, Service Class 2, and Investor Class designate 100% of the dividends distributed during the fiscal year as qualifying for the dividends received deduction for corporate shareholders.
Annual Report
Board Approval of Investment Advisory Contracts and Management Fees
VIP Contrafund Portfolio
Each year, the Board of Trustees, including the Independent Trustees (together, the Board), votes on the renewal of the management contract and sub-advisory agreements (together, the Advisory Contracts) for the fund. The Board, assisted by the advice of fund counsel and Independent Trustees' counsel, requests and considers a broad range of information relevant to the renewal of the Advisory Contracts throughout the year.
The Board meets regularly and considers at each of its meetings factors that are relevant to its annual consideration of the renewal of the fund's Advisory Contracts, including the services and support provided to the fund and its shareholders. The Board has established various standing committees, each composed of Independent Trustees with varying backgrounds, to which the Board has assigned specific subject matter responsibilities in order to enhance effective decision-making by the Board. The Board, acting directly and through its Committees, requests and receives information concerning the annual consideration of the renewal of the fund's Advisory Contracts. The Board also meets as needed to consider matters specifically related to the Board's annual consideration of the renewal of Advisory Contracts. Members of the Board may also meet with trustees of other Fidelity funds through ad hoc joint committees to discuss certain matters relevant to the Fidelity funds.
At its July 2010 meeting, the Board of Trustees, including the Independent Trustees, unanimously determined to renew the fund's Advisory Contracts. In reaching its determination, the Board considered all factors it believed relevant, including (i) the nature, extent, and quality of the services to be provided to the fund and its shareholders (including the investment performance of the fund); (ii) the competitiveness of the fund's management fee and total expenses; (iii) the total costs of the services to be provided by and the profits to be realized by Fidelity from its relationship with the fund; (iv) the extent to which economies of scale would be realized as the fund grows; and (v) whether fee levels reflect these economies of scale, if any, for the benefit of fund shareholders.
In considering whether to renew the Advisory Contracts for the fund, the Board reached a determination, with the assistance of fund counsel and Independent Trustees' counsel and through the exercise of its business judgment, that the renewal of the Advisory Contracts is in the best interests of fund shareholders and that the compensation to be received by Fidelity under the management contract is fair and reasonable. The Board's decision to renew the Advisory Contracts was not based on any single factor noted above, but rather was based on a comprehensive consideration of all the information provided to the Board at its meetings throughout the year. The Board, in reaching its determination to renew the Advisory Contracts, is aware that shareholders in the fund have a broad range of investment choices available to them, including a wide choice among mutual funds offered by Fidelity's competitors, and that the fund's shareholders, with the opportunity to review and weigh the disclosure provided by the fund in its prospectus and other public disclosures, have chosen to invest in this fund, managed by Fidelity.
Nature, Extent, and Quality of Services Provided. The Board considered the staffing within the investment adviser, FMR, and the sub-advisers (together, the Investment Advisers), including the backgrounds of the fund's investment personnel and the fund's investment objective and discipline. The Independent Trustees also had discussions with senior management of Fidelity's investment operations and investment groups. The Board considered the structure of the portfolio manager compensation program and whether this structure provides appropriate incentives to act in the best interest of the fund.
Resources Dedicated to Investment Management and Support Services. The Board and the equity research subcommittee of the Board's Fund Oversight Committee reviewed the size, education, and experience of the Investment Advisers' investment staff, their use of technology, and the Investment Advisers' approach to recruiting, training, and retaining portfolio managers and other research, advisory, and management personnel. The Board noted that Fidelity's analysts have access to a variety of technological tools and market and securities data that enable them to perform both fundamental and quantitative analysis and to specialize in various disciplines. The Board considered Fidelity's extensive global research capabilities that enable the Investment Advisers to aggregate data from various sources in an effort to produce positive investment results. The Board also considered that Fidelity's portfolio managers and analysts have access to daily portfolio attribution that allows for monitoring of a fund's portfolio, as well as an electronic communication system that provides immediate real-time access to research concerning issuers and credit enhancers. The Board noted FMR's continued focus on strengthening the organization and discipline of equity portfolio management and research.
Shareholder and Administrative Services. The Board considered (i) the nature, extent, quality, and cost of advisory, administrative, and shareholder services performed by the Investment Advisers and their affiliates under the Advisory Contracts and under separate agreements covering transfer agency, pricing and bookkeeping, and securities lending services for the fund; (ii) the nature and extent of the investment adviser's supervision of third party service providers, principally custodians and subcustodians; and (iii) the resources devoted to, and the record of compliance with, the fund's compliance policies and procedures. The Board also reviewed the allocation of fund brokerage, including allocations to brokers affiliated with the Investment Advisers, the use of brokerage commissions to pay fund expenses, and the use of "soft" commission dollars to pay for research services.
The Board noted that the growth of fund assets over time across the complex allows Fidelity to reinvest in the development of services designed to enhance the value or convenience of the Fidelity funds as investment vehicles. These services include 24-hour access to account information and market information through phone representatives and over the Internet, and investor education materials and asset allocation tools.
Investment in a Large Fund Family. The Board considered the benefits to shareholders of investing in a Fidelity fund, including the benefits of investing in a fund that is part of a large family of funds offering a variety of investment disciplines and providing a large variety of mutual fund investor services. The Board noted that Fidelity had taken, or had made recommendations that resulted in the Fidelity funds taking, a number of actions over the previous year that benefited particular funds, including (i) dedicating additional resources to investment research and restructuring and broadening the focus of the investment research teams; (ii) bolstering the senior management team that oversees asset management; (iii) launching Class F of certain funds as a lower-fee class available to Freedom K and Freedom Index Funds; (iv) lowering the initial investment minimums and ongoing balance requirements for Real Estate High Income Fund; (v) eliminating subsequent purchase minimums for all funds and adding a waiver of the investment minimum requirement for new accounts opened with the proceeds of a systematic withdrawal plan; (vi) eliminating the withdrawal minimum and maximum limits for systematic withdrawals from Advisor funds; (vii) expanding sales load waivers on Class A shares for Destiny Planholders and expanding Institutional Class eligibility for Class O Destiny Planholders; and (viii) changing certain Class A and Class T sales charge structures to further align them with industry practices.
Annual Report
Board Approval of Investment Advisory Contracts and Management Fees - continued
Investment Performance. The Board considered whether the fund has operated in accordance with its investment objective, as well as its record of compliance with its investment restrictions. It also reviewed the fund's absolute investment performance for each class, as well as the fund's relative investment performance for each class measured over multiple periods against (i) a broad-based securities market index, and (ii) a custom peer group of mutual funds deemed appropriate by Fidelity and reviewed by the Board. The following charts considered by the Board show, over the one-, three-, and five-year periods ended December 31, 2009, the cumulative total returns of Initial Class and Service Class 2 of the fund, the cumulative total returns of a broad-based securities market index ("benchmark"), and a range of cumulative total returns of a custom peer group of mutual funds defined by FMR based on categories assigned by Morningstar, Inc. The returns of Initial Class and Service Class 2 show the performance of the highest and lowest performing classes, respectively (based on five-year performance). The box within each chart shows the 25th percentile return (bottom of box) and the 75th percentile return (top of box) of the peer group. Returns shown above the box are in the first quartile and returns shown below the box are in the fourth quartile. The percentage beaten numbers noted below each chart correspond to the percentile box and represent the percentage of funds in the peer group whose performance was equal to or lower than that of the class indicated. The fund's custom peer group, defined by FMR, is a peer group that FMR believes provides a more meaningful performance comparison than the peer group assigned by Morningstar, Inc., which assigns mutual funds to categories based on their investment styles as measured by their underlying portfolio holdings.
VIP Contrafund Portfolio
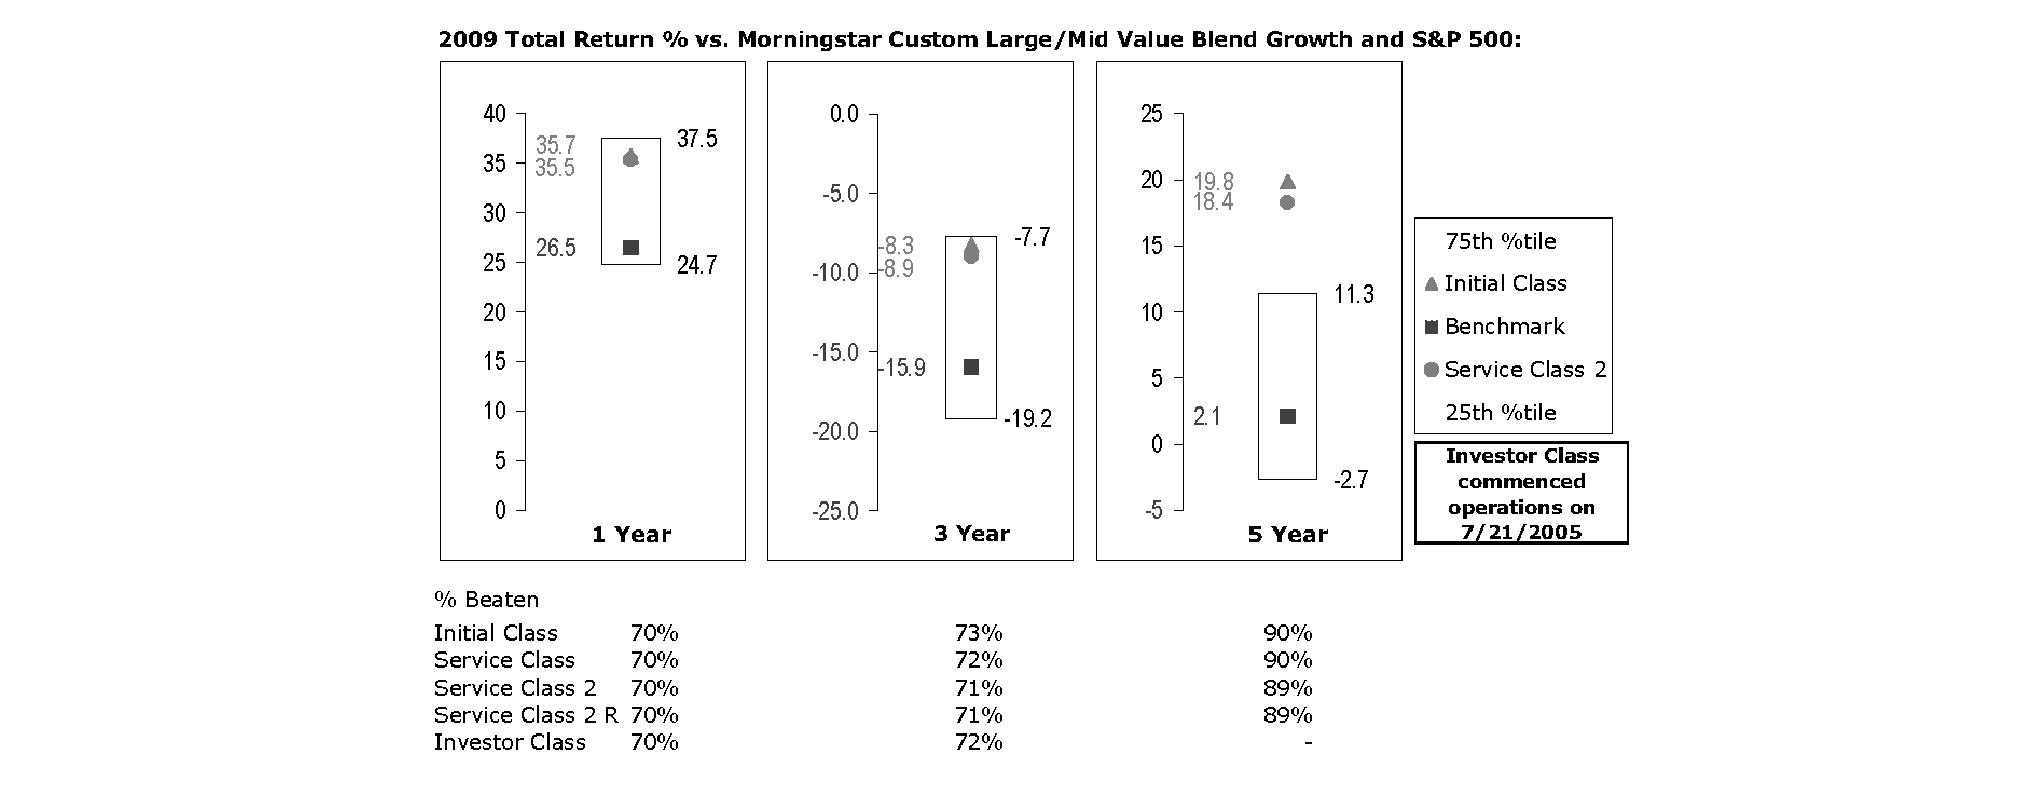
The Board reviewed the fund's relative investment performance against its peer group and noted that the performance of Initial Class of the fund was in the second quartile for the one- and three-year periods and the first quartile for the five-year period. The Board also noted that the investment performance of Initial Class of the fund compared favorably to its benchmark for all the periods shown. The Board considered that the variations in performance among the fund's classes reflect the variations in class expenses, which result in lower performance for higher expense classes. The Board also reviewed the fund's performance since inception as well as performance in the current year.
Based on its review, and giving particular weight to the nature and quality of the resources dedicated by the Investment Advisers to maintain and improve relative performance and factoring in the unprecedented market events in recent years, the Board concluded that the nature, extent, and quality of investment management and support services and of shareholder and administrative services provided to the fund will benefit the fund's shareholders, particularly in light of the Board's view that the fund's shareholders benefit from investing in a fund that is part of a large family of funds offering a variety of investment disciplines and services.
Annual Report
Competitiveness of Management Fee and Total Fund Expenses. The Board considered the fund's management fee and total expenses compared to "mapped groups" of competitive funds and classes. Fidelity creates "mapped groups" by combining similar Lipper investment objective categories that have comparable management fee characteristics. Combining Lipper investment objective categories aids the Board's management fee and total expense comparisons by broadening the competitive group used for comparison and by reducing the number of universes to which various Fidelity funds are compared.
Management Fee. The Board considered two proprietary management fee comparisons for the 12-month periods shown in the chart below. The group of Lipper funds used by the Board for management fee comparisons is referred to below as the "Total Mapped Group." The Total Mapped Group comparison focuses on a fund's standing relative to the total universe of comparable funds available to investors, in terms of gross management fees before expense reimbursements or caps. "TMG %" represents the percentage of funds in the Total Mapped Group that had management fees that were lower than the fund's. For example, a TMG % of 10% means that 90% of the funds in the Total Mapped Group had higher management fees than the fund. The "Asset-Size Peer Group" (ASPG) comparison focuses on a fund's standing relative to non-Fidelity funds similar in size to the fund within the Total Mapped Group. The ASPG represents at least 15% of the funds in the Total Mapped Group with comparable asset size and management fee characteristics, subject to a minimum of 50 funds (or all funds in the Total Mapped Group if fewer than 50). Additional information, such as the ASPG quartile in which the fund's management fee ranked, is also included in the chart and considered by the Board.
VIP Contrafund Portfolio
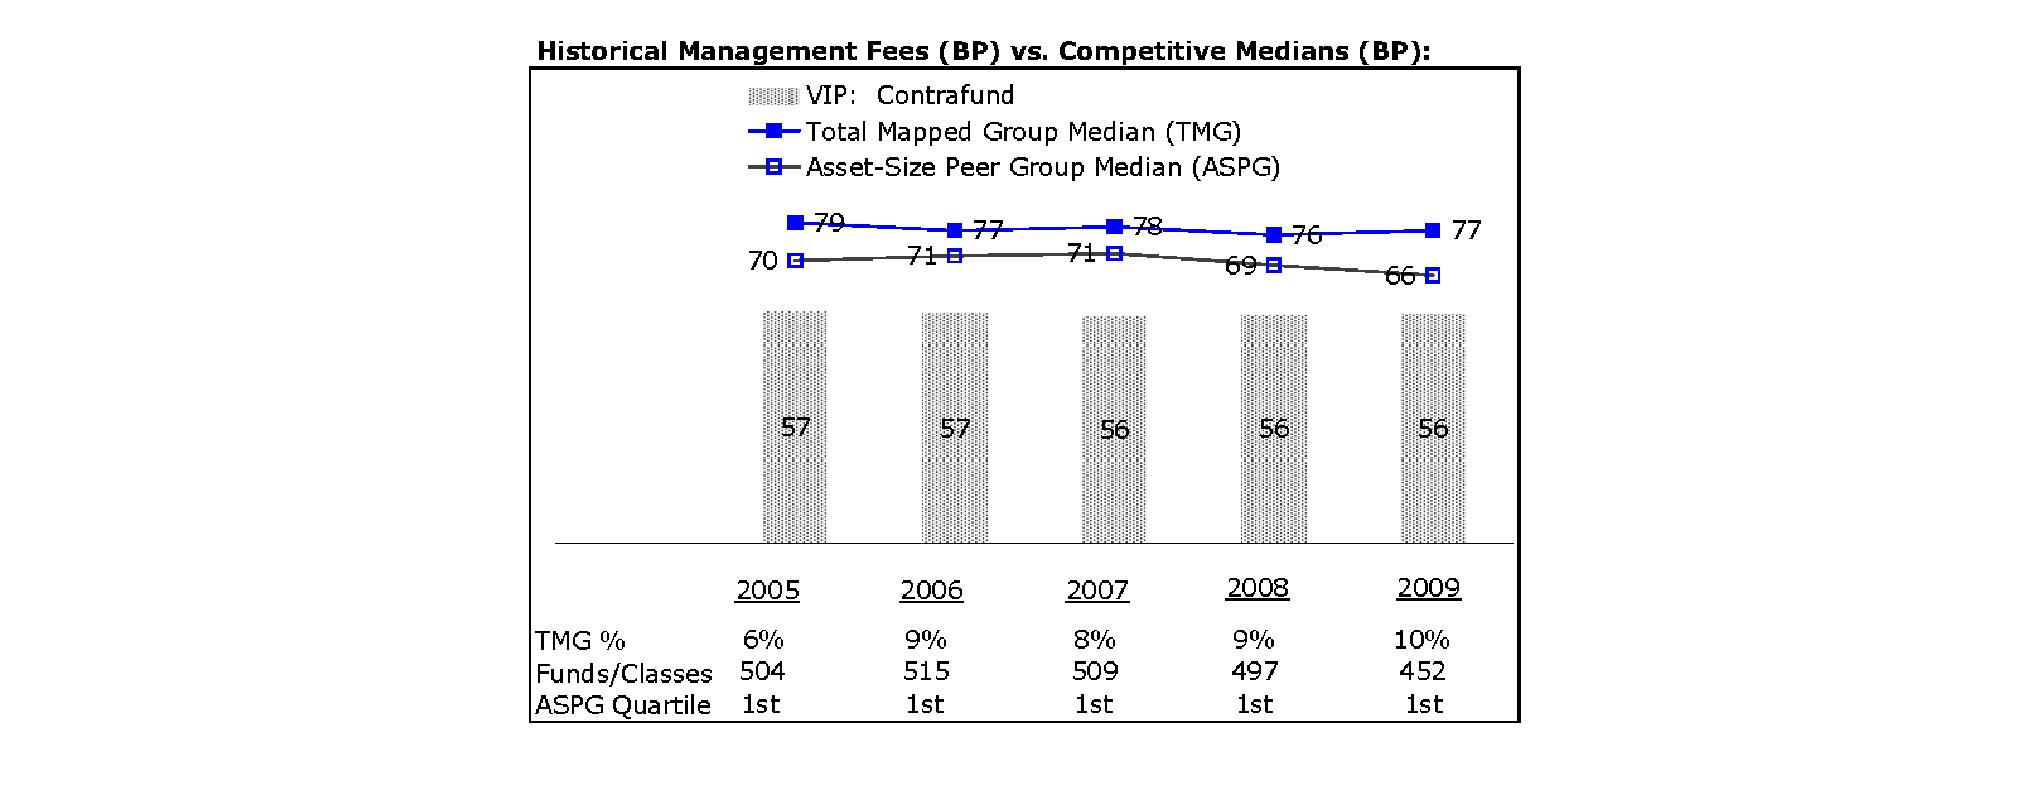
The Board noted that the fund's management fee ranked below the median of its Total Mapped Group and below the median of its ASPG for 2009.
Based on its review, the Board concluded that the fund's management fee is fair and reasonable in light of the services that the fund receives and the other factors considered.
Total Expenses. In its review of each class's total expenses, the Board considered the fund's management fee as well as other fund or class expenses, as applicable, such as transfer agent fees, pricing and bookkeeping fees, fund-paid 12b-1 fees, and custodial, legal, and audit fees. The Board also noted the effects of any waivers and reimbursements on fees and expenses. As part of its review, the Board also considered current and historical total expenses of each class of the fund compared to competitive fund median expenses. Each class of the fund is compared to those funds and classes in the Total Mapped Group (used by the Board for management fee comparisons) that have a similar sales load structure.
The Board noted that the total expenses of each class ranked below its competitive median for 2009.
Fees Charged to Other Fidelity Clients. The Board also considered Fidelity fee structures and other information with respect to clients of FMR and its affiliates, such as other mutual funds advised or subadvised by FMR or its affiliates, pension plan clients, and other institutional clients. In March 2010, the Board created an ad hoc joint committee with the board of other Fidelity funds (the Committee) to review and compare Fidelity's institutional investment advisory business with its business of providing services to the Fidelity funds, including the differences in services provided, fees charged, and costs incurred, as well as competition in their respective marketplaces.
Based on its review of total expenses and fees charged to other Fidelity clients, the Board concluded that the total expenses of each class of the fund were reasonable in light of the services that the fund and its shareholders receive and the other factors considered, including the findings of the Committee.
Annual Report
Board Approval of Investment Advisory Contracts and Management Fees - continued
Costs of the Services and Profitability. The Board considered the revenues earned and the expenses incurred by Fidelity in conducting the business of developing, marketing, distributing, managing, administering and servicing the fund and its shareholders. The Board also considered the level of Fidelity's profits in respect of all the Fidelity funds.
On an annual basis, FMR presents to the Board Fidelity's profitability for the fund. Fidelity calculates the profitability for each fund, as well as aggregate profitability for groups of Fidelity funds and all Fidelity funds, using a series of detailed revenue and cost allocation methodologies which originate with the audited books and records of Fidelity. The Audit Committee of the Board reviews any significant changes from the prior year's methodologies.
PricewaterhouseCoopers LLP (PwC), independent registered public accounting firm and auditor to Fidelity and certain Fidelity funds, has been engaged annually by the Board as part of the Board's assessment of Fidelity's profitability analysis. PwC's engagement includes the review and assessment of Fidelity's methodologies used in determining the revenues and expenses attributable to Fidelity's mutual fund business, and completion of agreed-upon procedures surrounding the mathematical accuracy of fund profitability and its conformity to allocation methodologies. After considering PwC's reports issued under the engagement and information provided by Fidelity, the Board believes that while other allocation methods may also be reasonable, Fidelity's profitability methodologies are reasonable in all material respects.
The Board has also reviewed Fidelity's non-fund businesses and fall-out benefits related to the mutual fund business as well as cases where Fidelity's affiliates may benefit from or be related to the fund's business.
The Board considered the costs of the services provided by and the profits realized by Fidelity in connection with the operation of the fund and were satisfied that the profitability was not excessive in the circumstances.
Economies of Scale. The Board considered whether there have been economies of scale in respect of the management of the Fidelity funds, whether the Fidelity funds (including the fund) have appropriately benefited from any such economies of scale, and whether there is potential for realization of any further economies of scale. The Board considered the extent to which the fund will benefit from economies of scale through increased services to the fund, through waivers or reimbursements, or through fee or expense reductions.
In February 2009, the Board and the board of other Fidelity funds created an ad hoc committee (the Economies of Scale Committee) to analyze whether FMR attains economies of scale in respect of the management and servicing of the Fidelity funds, whether the Fidelity funds have appropriately benefited from such economies of scale, and whether there is potential for realization of any further economies of scale.
The Board recognized that the fund's management contract incorporates a "group fee" structure, which provides for lower group fee rates as total fund assets under FMR's management increase, and for higher group fee rates as total fund assets under FMR's management decrease. FMR calculates the group fee rates based on a tiered asset "breakpoint" schedule that varies based on asset class. The Board considered that the group fee is designed to deliver the benefits of economies of scale to fund shareholders when total Fidelity fund assets increase, even if assets of any particular fund are unchanged or have declined, because some portion of Fidelity's costs are attributable to services provided to all Fidelity funds, and all funds benefit if those costs can be allocated among more assets. The Board concluded that, given the group fee structure, fund shareholders will benefit from lower management fees as assets under FMR's management increase at the fund complex level, regardless of whether Fidelity achieves any such economies of scale.
The Board concluded, considering the findings of the Economies of Scale Committee, that any potential economies of scale are being appropriately shared between fund shareholders and Fidelity.
Additional Information Requested by the Board. In order to develop fully the factual basis for consideration of the Fidelity funds' Advisory Contracts, the Board requested and received additional information on certain topics, including (i) fund performance trends, actions to be taken by FMR to improve certain funds' overall performance, and Fidelity's long-term strategies for certain funds; (ii) portfolio manager changes that have occurred during the past year and length of portfolio manager tenure for different categories of funds over time; (iii) Fidelity's compensation structure for portfolio managers, research analysts, and other key personnel, the rationale for the compensation structure, and how the compensation structure provides appropriate performance incentives; (iv) the amount of the investment that each portfolio manager has made in the Fidelity fund(s) that he or she manages; (v) management and other fees paid by FMR to affiliated sub-advisers on behalf of the Fidelity funds; (vi) Fidelity's fee structures and rationale for recommending different fees among different categories of funds; (vii) Fidelity's rationale for recommending which funds should have a performance adjustment component as part of their management fees; (viii) the rationale for any differences between fund fee structures and fee structures in place for other Fidelity clients; and (ix) explanations regarding the relative total expenses borne by certain funds and classes, total expense competitive trends, and actions that might be taken by FMR to reduce total expenses for certain funds and classes.
Based on its evaluation of all of the conclusions noted above, and after considering all factors it believed relevant, the Board ultimately concluded that the advisory fee structures are fair and reasonable, and that the fund's Advisory Contracts should be renewed.
Annual Report
Investment Adviser
Fidelity Management & Research Company
Boston, MA
Investment Sub-Advisers
FMR Co., Inc.
Fidelity Management & Research (U.K.) Inc.
Fidelity Management & Research (Hong Kong) Limited
Fidelity Management & Research (Japan) Inc.
General Distributor
Fidelity Distributors Corporation
Boston, MA
Transfer and Service Agents
Fidelity Investments Institutional Operations Company, Inc.
Boston, MA
Fidelity Service Company, Inc.
Boston, MA
Custodian
Brown Brothers Harriman & Co.
Boston, MA
VIPCON-ANN-0211
1.540131.113
Fidelity® Variable Insurance Products:
Contrafund Portfolio - Service Class 2R
Annual Report
December 31, 2010
(2_fidelity_logos) (Registered_Trademark)
Contents
Performance | <Click Here> | How the fund has done over time. |
Management's Discussion of Fund Performance | <Click Here> | The Portfolio Manager's review of fund performance and strategy. |
Shareholder Expense Example | <Click Here> | An example of shareholder expenses. |
Investment Changes | <Click Here> | A summary of major shifts in the fund's investments over the past six months. |
Investments | <Click Here> | A complete list of the fund's investments with their market values. |
Financial Statements | <Click Here> | Statements of assets and liabilities, operations, and changes in net assets, as well as financial highlights. |
Notes | <Click Here> | Notes to the financial statements. |
Report of Independent Registered Public Accounting Firm | <Click Here> | |
Trustees and Officers | <Click Here> | |
Distributions | <Click Here> | |
Board Approval of Investment Advisory Contracts and Management Fees | <Click Here> | |
To view a fund's proxy voting guidelines and proxy voting record for the 12-month period ended June 30, visit http://www.fidelity.com/proxyvotingresults or visit the Securities and Exchange Commission's (SEC) web site at http://www.sec.gov. You may also call 1-877-208-0098 to request a free copy of the proxy voting guidelines.
Fidelity Variable Insurance Products are separate account options which are purchased through a variable insurance contract.
Standard & Poor's, S&P and S&P 500 are registered service marks of The McGraw-Hill Companies, Inc. and have been licensed for use by Fidelity Distributors Corporation.
Other third party marks appearing herein are the property of their respective owners.
All other marks appearing herein are registered or unregistered trademarks or service marks of FMR LLC or an affiliated company.
The general research services agreement with Fidelity Research & Analysis Company has been terminated and is no longer in effect for the fund.
This report and the financial statements contained herein are submitted for the general information of the shareholders of the fund. This report is not authorized for distribution to prospective investors in the fund unless preceded or accompanied by an effective prospectus.
A fund files its complete schedule of portfolio holdings with the SEC for the first and third quarters of each fiscal year on Form N-Q. Forms N-Q are available on the SEC's web site at http://www.sec.gov. A fund's Forms N-Q may be reviewed and copied at the SEC's Public Reference Room in Washington, DC. Information regarding the operation of the SEC's Public Reference Room may be obtained by calling 1-800-SEC-0330. For a complete list of a fund's portfolio holdings, view the most recent holdings listing, semiannual report, or annual report on Fidelity's web site a http://www.fidelity.com, http://www.advisor.fidelity.com, or http://www.401k.com as applicable.
NOT FDIC INSURED • MAY LOSE VALUE • NO BANK GUARANTEE
Neither the fund nor Fidelity Distributors Corporation is a bank.
Annual Report
Average annual total return reflects the change in the value of an investment, assuming reinvestment of the class' distributions from dividend income and capital gains (the profits earned upon the sale of securities that have grown in value, if any) and assuming a constant rate of performance each year. During periods of reimbursement by Fidelity, a fund's total return will be greater than it would be had the reimbursement not occurred. Performance numbers are net of all underlying fund operating expenses, but do not include any insurance charges imposed by your insurance company's separate account. If performance information included the effect of these additional charges, the total returns would have been lower. How a fund did yesterday is no guarantee of how it will do tomorrow.
Average Annual Total Returns
Periods ended December 31, 2010 | Past 1
year | Past 5
years | Past 10
years |
VIP Contrafund Portfolio - Service Class 2RA | 16.94% | 3.48% | 4.92% |
A The initial offering of Service Class 2R shares took place on April 24, 2002. Returns prior to April 24, 2002, are those of Service Class 2.
$10,000 Over 10 Years
Let's say hypothetically that $10,000 was invested in VIP Contrafund Portfolio - Service Class 2R on December 31, 2000. The chart shows how the value of your investment would have changed, and also shows how the S&P 500® Index performed over the same period. The initial offering of Service Class 2R took place on April 24, 2002. See above for additional information regarding the performance of Service Class 2R.
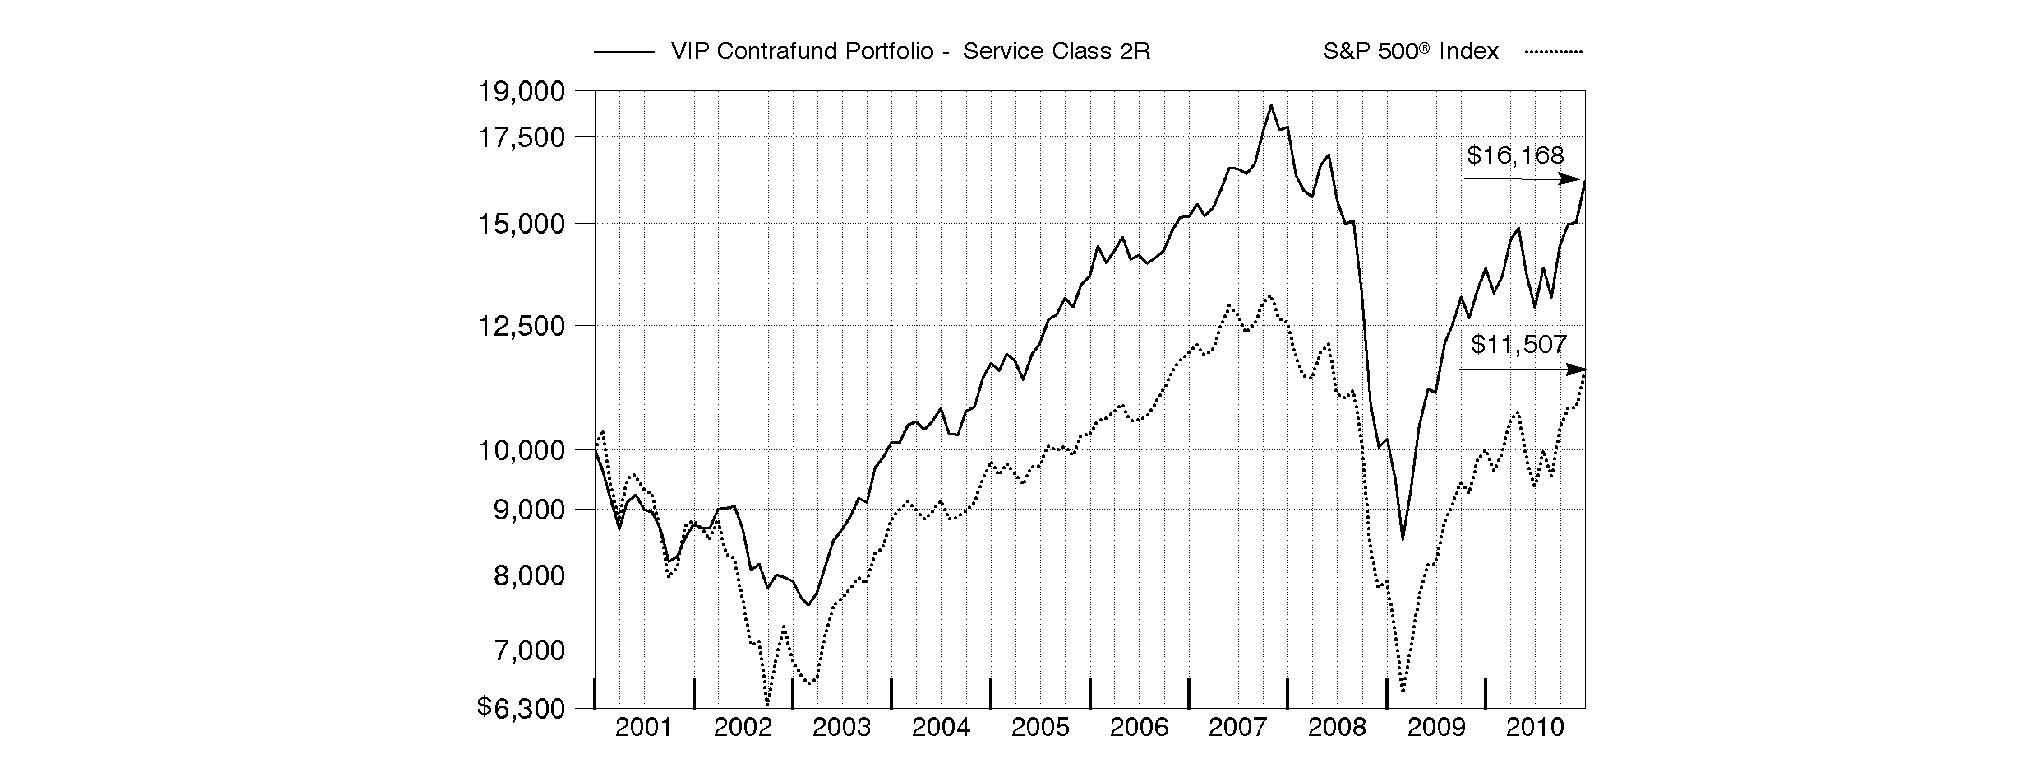
Annual Report
Market Recap: While market improvements around the world hit a speed bump in the first half of the 12-month period ending December 31, 2010, world economies re-accelerated in August, supported by a broadening recovery and low inflation in the U.S. Domestic stock markets recorded solid gains for the year, lifted by a strong second-half rally fueled by economic optimism, encouraging earnings reports and a wave of corporate mergers. The large-cap S&P 500® Index rose 15.06%, the blue-chip-laden Dow Jones Industrial AverageSM added 14.06% and the technology-heavy Nasdaq Composite® Index climbed 18.02%. Meanwhile, international stocks, as represented by the MSCI® ACWI® (All Country World Index) ex USA Index, gained 11.29%, boosted in part by a depreciating U.S. dollar. In the fixed-income arena, U.S. taxable investment-grade bonds generated positive results during 2010, as the Barclays Capital® U.S. Aggregate Bond Index gained 6.54%. With ultra-low interest rates bolstering nearly all fixed-income securities for most of the year, sectors in the index with higher yields and more credit risk generally fared best, while most high-quality bonds generated more-moderate returns. Meanwhile, high-yield bonds, as represented by The BofA Merrill LynchSM US High Yield Constrained Index, returned 15.07%, a result of improved economic data and strengthening investor demand. Overseas, foreign bond markets showed mixed results, with a sizable disparity between the 3.97% return of the Citigroup® Non-U.S. Group of 7 Index - which measures the performance of sovereign debt of the major global economies outside the U.S. - and the 12.04% advance of the JPMorgan Emerging Markets Bond Index Global (EMBI Global), which benefited from the rising overall credit quality of emerging-markets debt issuers.
Comments from Robert Stansky, Co-Portfolio Manager and Head of Fidelity's Multi-Manager Group, which manages VIP Contrafund Portfolio: For the year, the fund's share classes outperformed the S&P 500® Index, which returned 15.06%. (For specific portfolio results, please see the performance section of this report.) Security selection among telecommunications was particularly successful, followed by health care, materials and industrials. Detractors included stock picking in energy and utilities, as well as overweighting the semiconductors/semiconductor equipment group within technology. In terms of individual securities, Qwest Communications International, by far the largest position in the telecom sleeve, was the top contributor. A strong free-cash-flow story with one of the highest dividend yields within the S&P 500, Qwest was the best-performing name within the sector. Not owning networking gear maker and index component Cisco Systems was a good call since the stock fell sharply in November after the company reduced its revenue forecast. Similarly, largely avoiding computer and peripherals maker Hewlett-Packard was beneficial, as the stock underperformed due in part to the company's printer business not growing as fast as other parts of the tech hardware marketplace. The fund did not own HP at period end. An outsized stake in flash-memory manufacturer SanDisk added value, as the stock was driven in part by the company's status as a supplier to Apple. Conversely, detractors included an outsized stake in semiconductor-related stocks, including Micron Technology and Inotera Memories, the latter of which was not in the index. Elsewhere, software giant Microsoft struggled amid a competitive environment, and the fund's overweighted stake hurt relative performance.
The views expressed above reflect those of the portfolio manager(s) only through the end of the period as stated on the cover of this report and do not necessarily represent the views of Fidelity or any other person in the Fidelity organization. Any such views are subject to change at any time based upon market or other conditions and Fidelity disclaims any responsibility to update such views. These views may not be relied on as investment advice and, because investment decisions for a Fidelity fund are based on numerous factors, may not be relied on as an indication of trading intent on behalf of any Fidelity fund.
Annual Report
As a shareholder of the Fund, you incur two types of costs: (1) transaction costs, including redemption fees, and (2) ongoing costs, including management fees, distribution and/or service (12b-1) fees and other Fund expenses. This Example is intended to help you understand your ongoing costs (in dollars) of investing in the Fund and to compare these costs with the ongoing costs of investing in other mutual funds.
The Example is based on an investment of $1,000 invested at the beginning of the period and held for the entire period (July 1, 2010 to December 31, 2010).
Actual Expenses
The first line of the accompanying table for each class of the Fund provides information about actual account values and actual expenses. You may use the information in this line, together with the amount you invested, to estimate the expenses that you paid over the period. Simply divide your account value by $1,000.00 (for example, an $8,600 account value divided by $1,000.00 = 8.6), then multiply the result by the number in the first line for a class of the Fund under the heading entitled "Expenses Paid During Period" to estimate the expenses you paid on your account during this period. The estimate of expenses does not include any fees or other expenses of any variable annuity or variable life insurance product. If they were, the estimate of expenses you paid during the period would be higher, and your ending account value would be lower. In addition, the Fund, as a shareholder in the underlying Fidelity Central Funds, will indirectly bear its pro-rata share of the fees and expenses incurred by the underlying Fidelity Central Funds. These fees and expenses are not included in the Fund's annualized expense ratio used to calculate the expense estimate in the table below.
Hypothetical Example for Comparison Purposes
The second line of the accompanying table for each class of the Fund provides information about hypothetical account values and hypothetical expenses based on a Class' actual expense ratio and an assumed rate of return of 5% per year before expenses, which is not the Class' actual return. The hypothetical account values and expenses may not be used to estimate the actual ending account balance or expenses you paid for the period. You may use this information to compare the ongoing costs of investing in the Fund and other funds. To do so, compare this 5% hypothetical example with the 5% hypothetical examples that appear in the shareholder reports of the other funds. The estimate of expenses does not include any fees or other expenses of any variable annuity or variable life insurance product. If they were, the estimate of expenses you paid during the period would be higher, and your ending account value would be lower. In addition, the Fund, as a shareholder in the underlying Fidelity Central Funds, will indirectly bear its pro-rata share of the fees and expenses incurred by the underlying Fidelity Central Funds. These fees and expenses are not included in the Fund's annualized expense ratio used to calculate the expense estimate in the table below.
Please note that the expenses shown in the table are meant to highlight your ongoing costs only and do not reflect any transaction costs. Therefore, the second line of the table is useful in comparing ongoing costs only, and will not help you determine the relative total costs of owning different funds. In addition, if these transactional costs were included, your costs would have been higher.
| Annualized
Expense Ratio | Beginning
Account Value
July 1, 2010 | Ending
Account Value
December 31, 2010 | Expenses Paid
During Period*
July 1, 2010 to
December 31, 2010 |
Initial Class | .64% | | | |
Actual | | $ 1,000.00 | $ 1,254.90 | $ 3.64 |
HypotheticalA | | $ 1,000.00 | $ 1,021.98 | $ 3.26 |
Service Class | .74% | | | |
Actual | | $ 1,000.00 | $ 1,254.70 | $ 4.21 |
HypotheticalA | | $ 1,000.00 | $ 1,021.48 | $ 3.77 |
Service Class 2 | .89% | | | |
Actual | | $ 1,000.00 | $ 1,253.90 | $ 5.06 |
HypotheticalA | | $ 1,000.00 | $ 1,020.72 | $ 4.53 |
Service Class 2R | .89% | | | |
Actual | | $ 1,000.00 | $ 1,254.30 | $ 5.06 |
HypotheticalA | | $ 1,000.00 | $ 1,020.72 | $ 4.53 |
Investor Class | .72% | | | |
Actual | | $ 1,000.00 | $ 1,254.60 | $ 4.09 |
HypotheticalA | | $ 1,000.00 | $ 1,021.58 | $ 3.67 |
A 5% return per year before expenses
* Expenses are equal to each Class' annualized expense ratio, multiplied by the average account value over the period, multiplied by 184/365 (to reflect the one-half year period).
Annual Report
Investment Changes (Unaudited)
Top Ten Stocks as of December 31, 2010 |
| % of fund's
net assets | % of fund's net assets
6 months ago |
Apple, Inc. | 4.5 | 2.8 |
JPMorgan Chase & Co. | 2.5 | 2.1 |
Procter & Gamble Co. | 2.1 | 1.6 |
Citigroup, Inc. | 1.8 | 1.5 |
The Coca-Cola Co. | 1.7 | 1.6 |
Royal Dutch Shell PLC Class B ADR | 1.6 | 0.7 |
Wells Fargo & Co. | 1.5 | 1.5 |
General Electric Co. | 1.5 | 1.5 |
Microsoft Corp. | 1.4 | 2.4 |
Qwest Communications International, Inc. | 1.3 | 1.1 |
| 19.9 | |
Market Sectors as of December 31, 2010 |
| % of fund's
net assets | % of fund's net assets
6 months ago |
Information Technology | 18.8 | 18.4 |
Financials | 16.2 | 15.6 |
Energy | 11.8 | 10.5 |
Industrials | 11.1 | 11.4 |
Health Care | 10.4 | 11.5 |
Consumer Staples | 10.3 | 10.9 |
Consumer Discretionary | 10.0 | 9.8 |
Materials | 3.4 | 3.2 |
Telecommunication Services | 3.3 | 3.3 |
Utilities | 3.2 | 3.7 |
Asset Allocation (% of fund's net assets) |
As of December 31, 2010* | As of June 30, 2010** |
| Stocks and Equity Futures 99.2% | | | Stocks and Equity Futures 99.0% | |
| Short-Term
Investments and
Net Other Assets 0.8% | | | Short-Term
Investments and
Net Other Assets 1.0% | |
* Foreign investments | 16.2% | | ** Foreign investments | 13.7% | |

Annual Report
Investments December 31, 2010
Showing Percentage of Net Assets
Common Stocks - 98.2% |
| Shares | | Value |
CONSUMER DISCRETIONARY - 9.7% |
Auto Components - 0.4% |
Johnson Controls, Inc. | 1,328,000 | | $ 50,729,600 |
TRW Automotive Holdings Corp. (a) | 347,875 | | 18,333,013 |
| | 69,062,613 |
Automobiles - 0.7% |
BYD Co. Ltd. (H Shares) (d) | 1,721,000 | | 9,045,076 |
Ford Motor Co. (a) | 5,746,798 | | 96,488,738 |
General Motors Co. | 492,300 | | 18,146,178 |
| | 123,679,992 |
Distributors - 0.2% |
Li & Fung Ltd. | 3,207,000 | | 18,608,646 |
Pool Corp. | 380,000 | | 8,565,200 |
| | 27,173,846 |
Hotels, Restaurants & Leisure - 1.0% |
Bravo Brio Restaurant Group, Inc. | 280,057 | | 5,368,693 |
Darden Restaurants, Inc. | 681,998 | | 31,671,987 |
Marriott International, Inc. Class A | 826,261 | | 34,322,882 |
McDonald's Corp. | 385,488 | | 29,590,059 |
Royal Caribbean Cruises Ltd. (a)(d) | 411,700 | | 19,349,900 |
Starwood Hotels & Resorts Worldwide, Inc. | 745,900 | | 45,335,802 |
| | 165,639,323 |
Household Durables - 0.6% |
D.R. Horton, Inc. | 1,479,200 | | 17,646,856 |
M.D.C. Holdings, Inc. | 483,850 | | 13,920,365 |
Stanley Black & Decker, Inc. | 530,600 | | 35,481,222 |
Whirlpool Corp. | 342,400 | | 30,415,392 |
| | 97,463,835 |
Internet & Catalog Retail - 0.6% |
Amazon.com, Inc. (a) | 346,900 | | 62,442,000 |
E-Commerce China Dangdang, Inc. ADR | 76,800 | | 2,078,976 |
Expedia, Inc. | 1,138,638 | | 28,568,427 |
Rakuten, Inc. | 11,613 | | 9,723,376 |
| | 102,812,779 |
Leisure Equipment & Products - 0.2% |
Brunswick Corp. | 687,687 | | 12,887,254 |
Eastman Kodak Co. (a)(d) | 3,136,982 | | 16,814,224 |
| | 29,701,478 |
Media - 3.3% |
Comcast Corp. Class A | 4,589,362 | | 100,828,283 |
DIRECTV (a) | 1,858,600 | | 74,213,898 |
Legend Pictures Holdings LLC unit (g) | 6,611 | | 4,958,250 |
Liberty Global, Inc. Class A (a)(d) | 659,400 | | 23,329,572 |
Naspers Ltd. Class N | 228,000 | | 13,351,336 |
The Walt Disney Co. | 3,279,242 | | 123,004,367 |
The Weinstein Co. II Holdings, LLC Class A-1 (a)(g) | 11,499 | | 4,312,125 |
Time Warner Cable, Inc. | 886,943 | | 58,564,846 |
|
| Shares | | Value |
Time Warner, Inc. | 2,476,247 | | $ 79,660,866 |
Viacom, Inc. Class B (non-vtg.) | 1,658,516 | | 65,693,819 |
| | 547,917,362 |
Multiline Retail - 0.7% |
Nordstrom, Inc. | 924,909 | | 39,197,643 |
Target Corp. | 1,463,500 | | 88,000,255 |
| | 127,197,898 |
Specialty Retail - 1.8% |
Best Buy Co., Inc. | 913,622 | | 31,328,098 |
China ZhengTong Auto Services Holdings Ltd. | 4,608,500 | | 4,346,131 |
Hengdeli Holdings Ltd. | 19,448,000 | | 11,584,978 |
Home Depot, Inc. | 3,146,100 | | 110,302,266 |
Lowe's Companies, Inc. | 3,054,000 | | 76,594,320 |
Sally Beauty Holdings, Inc. (a) | 1,270,221 | | 18,456,311 |
TJX Companies, Inc. | 870,940 | | 38,661,027 |
Urban Outfitters, Inc. (a) | 511,600 | | 18,320,396 |
| | 309,593,527 |
Textiles, Apparel & Luxury Goods - 0.2% |
LVMH Moet Hennessy - Louis Vuitton | 128,034 | | 21,072,437 |
Trinity Ltd. | 8,276,000 | | 8,720,546 |
| | 29,792,983 |
TOTAL CONSUMER DISCRETIONARY | | 1,630,035,636 |
CONSUMER STAPLES - 10.3% |
Beverages - 3.6% |
Anheuser-Busch InBev SA NV | 760,664 | | 43,527,932 |
Coca-Cola Bottling Co. Consolidated | 158,818 | | 8,827,104 |
Coca-Cola FEMSA SAB de CV sponsored ADR | 114,747 | | 9,458,595 |
Coca-Cola Icecek AS | 349,005 | | 4,617,486 |
Companhia de Bebidas das Americas (AmBev) (PN) sponsored ADR | 297,770 | | 9,239,803 |
Constellation Brands, Inc. Class A (sub. vtg.) (a) | 1,852,846 | | 41,040,539 |
Diageo PLC sponsored ADR | 843,083 | | 62,666,359 |
Embotelladora Andina SA sponsored ADR | 302,136 | | 9,145,657 |
Molson Coors Brewing Co. Class B | 1,119,411 | | 56,183,238 |
PepsiCo, Inc. | 1,013,098 | | 66,185,692 |
The Coca-Cola Co. | 4,346,622 | | 285,877,329 |
| | 596,769,734 |
Food & Staples Retailing - 1.7% |
BJ's Wholesale Club, Inc. (a) | 148,918 | | 7,133,172 |
CVS Caremark Corp. | 4,033,568 | | 140,247,159 |
Fresh Market, Inc. | 19,700 | | 811,640 |
Safeway, Inc. | 2,064,089 | | 46,421,362 |
Susser Holdings Corp. (a) | 131,355 | | 1,819,267 |
United Natural Foods, Inc. (a) | 129,581 | | 4,753,031 |
Common Stocks - continued |
| Shares | | Value |
CONSUMER STAPLES - continued |
Food & Staples Retailing - continued |
Wal-Mart Stores, Inc. | 707,002 | | $ 38,128,618 |
Walgreen Co. | 1,080,778 | | 42,107,111 |
| | 281,421,360 |
Food Products - 1.1% |
Archer Daniels Midland Co. | 469,619 | | 14,126,140 |
Bunge Ltd. | 417,901 | | 27,380,874 |
Danone | 141,400 | | 8,889,216 |
Dean Foods Co. (a) | 1,279,348 | | 11,309,436 |
Green Mountain Coffee Roasters, Inc. (a)(d) | 730,622 | | 24,008,239 |
Nestle SA | 709,799 | | 41,594,237 |
Unilever NV unit | 1,977,977 | | 62,108,478 |
Viterra, Inc. | 517,300 | | 4,813,541 |
| | 194,230,161 |
Household Products - 2.6% |
Colgate-Palmolive Co. | 983,929 | | 79,078,374 |
Procter & Gamble Co. | 5,570,244 | | 358,333,797 |
| | 437,412,171 |
Personal Products - 0.2% |
Avon Products, Inc. | 1,136,499 | | 33,026,661 |
Tobacco - 1.1% |
Altria Group, Inc. | 975,598 | | 24,019,223 |
British American Tobacco PLC sponsored ADR | 1,509,468 | | 117,285,664 |
Philip Morris International, Inc. | 717,206 | | 41,978,067 |
Souza Cruz Industria Comerico | 93,900 | | 5,114,411 |
| | 188,397,365 |
TOTAL CONSUMER STAPLES | | 1,731,257,452 |
ENERGY - 11.8% |
Energy Equipment & Services - 3.4% |
Aker Solutions ASA | 211,900 | | 3,609,927 |
Baker Hughes, Inc. | 2,612,591 | | 149,361,827 |
C&J Energy Services, Inc. (a)(e) | 482,300 | | 4,823,000 |
Cameron International Corp. (a) | 213,400 | | 10,825,782 |
Dresser-Rand Group, Inc. (a) | 88,200 | | 3,756,438 |
Ensco International Ltd. ADR | 575,401 | | 30,714,905 |
Halliburton Co. | 4,236,132 | | 172,961,270 |
National Oilwell Varco, Inc. | 267,357 | | 17,979,758 |
Noble Corp. | 1,573,200 | | 56,273,364 |
Ocean Rig UDW, Inc. (a) | 134,000 | | 2,369,076 |
Oceaneering International, Inc. (a) | 369,003 | | 27,169,691 |
Pride International, Inc. (a) | 77,827 | | 2,568,291 |
Saipem SpA | 311,652 | | 15,350,444 |
Schlumberger Ltd. | 322,279 | | 26,910,297 |
TETRA Technologies, Inc. (a) | 495,800 | | 5,885,146 |
|
| Shares | | Value |
Transocean Ltd. (a) | 596,446 | | $ 41,458,961 |
Vantage Drilling Co. (a) | 1,094,400 | | 2,221,632 |
| | 574,239,809 |
Oil, Gas & Consumable Fuels - 8.4% |
Alpha Natural Resources, Inc. (a) | 654,300 | | 39,277,629 |
Anadarko Petroleum Corp. | 642,727 | | 48,950,088 |
Apache Corp. | 884,883 | | 105,504,600 |
BP PLC | 1,010,800 | | 7,455,606 |
BP PLC sponsored ADR | 1,473,933 | | 65,103,621 |
Buckeye Partners LP (g) | 39,530 | | 2,377,611 |
Chesapeake Energy Corp. | 738,060 | | 19,123,135 |
Chevron Corp. | 288,746 | | 26,348,073 |
Cimarex Energy Co. | 257,000 | | 22,752,210 |
Concho Resources, Inc. (a) | 244,261 | | 21,414,362 |
Concho Resources, Inc. (a)(g) | 117,082 | | 10,264,579 |
CVR Energy, Inc. (a) | 194,540 | | 2,953,117 |
Denbury Resources, Inc. (a) | 2,162,187 | | 41,276,150 |
Devon Energy Corp. | 337,200 | | 26,473,572 |
EXCO Resources, Inc. | 136,700 | | 2,654,714 |
Exxon Mobil Corp. | 2,345,633 | | 171,512,685 |
Falkland Oil & Gas Ltd. (a) | 1,325,400 | | 2,140,197 |
Frontier Oil Corp. | 619,878 | | 11,164,003 |
Heritage Oil PLC | 425,712 | | 2,980,151 |
Holly Corp. | 893,186 | | 36,415,193 |
Imperial Oil Ltd. (d) | 139,500 | | 5,676,236 |
InterOil Corp. (a)(d) | 138,200 | | 9,960,074 |
Marathon Oil Corp. | 783,900 | | 29,027,817 |
Massey Energy Co. | 543,896 | | 29,180,020 |
Murphy Oil Corp. | 428,098 | | 31,914,706 |
Niko Resources Ltd. | 50,600 | | 5,235,043 |
Occidental Petroleum Corp. | 1,274,411 | | 125,019,719 |
Peabody Energy Corp. | 168,219 | | 10,762,652 |
PetroBakken Energy Ltd. Class A (d) | 409,300 | | 8,909,960 |
Petrobank Energy & Resources Ltd. (a) | 754,400 | | 19,100,171 |
Petrominerales Ltd. | 463,956 | | 15,426,432 |
Rodinia Oil Corp. | 603,000 | | 1,880,407 |
Royal Dutch Shell PLC: | | | |
Class A sponsored ADR | 6,220 | | 415,372 |
Class B ADR | 3,900,962 | | 260,077,137 |
Southwestern Energy Co. (a) | 771,043 | | 28,860,139 |
Talisman Energy, Inc. | 2,396,700 | | 53,158,532 |
Targa Resources Corp. | 254,400 | | 6,820,464 |
Tesoro Corp. | 217,000 | | 4,023,180 |
Valero Energy Corp. | 363,126 | | 8,395,473 |
Whiting Petroleum Corp. (a) | 414,650 | | 48,592,834 |
Williams Companies, Inc. | 1,338,200 | | 33,080,304 |
| | 1,401,657,968 |
TOTAL ENERGY | | 1,975,897,777 |
Common Stocks - continued |
| Shares | | Value |
FINANCIALS - 16.2% |
Capital Markets - 2.4% |
BlackRock, Inc. Class A | 401,377 | | $ 76,494,429 |
Credit Suisse Group | 933,839 | | 37,638,487 |
E*TRADE Financial Corp. (a) | 419,298 | | 6,708,768 |
Evercore Partners, Inc. Class A | 254,300 | | 8,646,200 |
Icap PLC | 549,942 | | 4,590,257 |
Invesco Ltd. | 1,631,107 | | 39,244,434 |
MF Global Holdings Ltd. (a) | 1,768,100 | | 14,781,316 |
Morgan Stanley | 3,594,753 | | 97,813,229 |
State Street Corp. | 2,396,110 | | 111,035,737 |
| | 396,952,857 |
Commercial Banks - 4.5% |
Banco do Brasil SA | 1,450,200 | | 27,456,409 |
Banco Macro SA sponsored ADR | 192,634 | | 9,670,227 |
BB&T Corp. | 1,004,544 | | 26,409,462 |
CIT Group, Inc. (a) | 157,100 | | 7,399,410 |
Comerica, Inc. | 187,555 | | 7,922,323 |
FirstMerit Corp. | 963,306 | | 19,063,826 |
Huntington Bancshares, Inc. | 8,302,724 | | 57,039,714 |
M&T Bank Corp. | 312,760 | | 27,225,758 |
PNC Financial Services Group, Inc. | 863,598 | | 52,437,671 |
PT Bank Rakyat Indonesia Tbk | 6,595,500 | | 7,686,224 |
Regions Financial Corp. | 6,941,577 | | 48,591,039 |
Sumitomo Mitsui Financial Group, Inc. | 1,577,700 | | 56,180,610 |
SunTrust Banks, Inc. | 1,688,750 | | 49,835,013 |
Synovus Financial Corp. | 4,204,900 | | 11,100,936 |
U.S. Bancorp, Delaware | 3,674,203 | | 99,093,255 |
Wells Fargo & Co. | 8,219,122 | | 254,710,591 |
| | 761,822,468 |
Consumer Finance - 0.5% |
Capital One Financial Corp. | 1,377,604 | | 58,630,826 |
Discover Financial Services | 1,472,024 | | 27,276,605 |
Promise Co. Ltd. (d) | 752,450 | | 4,326,715 |
| | 90,234,146 |
Diversified Financial Services - 5.0% |
African Bank Investments Ltd. | 4,214,241 | | 24,649,334 |
Citigroup, Inc. (a) | 64,174,388 | | 303,544,855 |
ING Groep NV (Certificaten Van Aandelen) unit (a) | 1,994,700 | | 19,469,851 |
IntercontinentalExchange, Inc. (a) | 460,104 | | 54,821,392 |
JPMorgan Chase & Co. | 9,854,597 | | 418,032,005 |
NBH Holdings Corp. Class A (a)(e) | 813,800 | | 15,869,100 |
| | 836,386,537 |
Insurance - 2.5% |
Aon Corp. | 602,596 | | 27,725,442 |
CNO Financial Group, Inc. (a) | 3,320,800 | | 22,515,024 |
Fairfax Financial Holdings Ltd. (sub. vtg.) | 91,200 | | 37,400,870 |
Genworth Financial, Inc. Class A (a) | 1,213,800 | | 15,949,332 |
Lincoln National Corp. | 1,077,312 | | 29,960,047 |
MetLife, Inc. | 3,575,685 | | 158,903,441 |
Protective Life Corp. | 662,800 | | 17,656,992 |
|
| Shares | | Value |
Prudential Financial, Inc. | 1,161,340 | | $ 68,182,271 |
Unum Group | 1,457,700 | | 35,305,494 |
| | 413,598,913 |
Real Estate Investment Trusts - 0.8% |
ProLogis Trust | 4,593,114 | | 66,324,566 |
The Macerich Co. | 643,599 | | 30,487,285 |
U-Store-It Trust | 1,241,147 | | 11,828,131 |
Weyerhaeuser Co. | 1,217,709 | | 23,051,231 |
| | 131,691,213 |
Real Estate Management & Development - 0.4% |
Ayala Land, Inc. | 21,946,000 | | 8,276,576 |
BR Malls Participacoes SA | 2,574,600 | | 26,528,673 |
Indiabulls Real Estate Ltd. (a) | 5,657,337 | | 17,618,880 |
PT Lippo Karawaci Tbk | 159,208,750 | | 12,015,777 |
| | 64,439,906 |
Thrifts & Mortgage Finance - 0.1% |
Ocwen Financial Corp. (a) | 2,593,110 | | 24,738,269 |
TOTAL FINANCIALS | | 2,719,864,309 |
HEALTH CARE - 10.4% |
Biotechnology - 1.6% |
Amgen, Inc. (a) | 728,949 | | 40,019,300 |
AVEO Pharmaceuticals, Inc. | 518,044 | | 7,573,803 |
AVEO Pharmaceuticals, Inc. (g) | 107,096 | | 1,565,744 |
Biogen Idec, Inc. (a) | 899,103 | | 60,284,856 |
BioMarin Pharmaceutical, Inc. (a) | 900,917 | | 24,261,695 |
Exelixis, Inc. (a) | 1,088,719 | | 8,938,383 |
Genzyme Corp. (a) | 654,284 | | 46,585,021 |
Gilead Sciences, Inc. (a) | 2,164,184 | | 78,430,028 |
Human Genome Sciences, Inc. (a) | 269,827 | | 6,446,167 |
| | 274,104,997 |
Health Care Equipment & Supplies - 1.8% |
American Medical Systems Holdings, Inc. (a) | 533,700 | | 10,065,582 |
Boston Scientific Corp. (a) | 4,357,239 | | 32,984,299 |
C. R. Bard, Inc. | 389,520 | | 35,746,250 |
Cooper Companies, Inc. | 83,580 | | 4,708,897 |
Covidien PLC | 1,569,508 | | 71,663,735 |
Edwards Lifesciences Corp. (a) | 777,472 | | 62,850,836 |
Mako Surgical Corp. (a) | 1,154,193 | | 17,566,817 |
Masimo Corp. | 416,279 | | 12,101,231 |
Quidel Corp. (a) | 1,322,504 | | 19,110,183 |
Shandong Weigao Group Medical Polymer Co. Ltd. (H Shares) | 3,516,000 | | 9,974,628 |
William Demant Holding AS (a) | 320,174 | | 23,659,592 |
| | 300,432,050 |
Health Care Providers & Services - 2.6% |
CIGNA Corp. | 1,056,639 | | 38,736,386 |
Diagnosticos da America SA | 1,003,000 | | 13,598,566 |
Express Scripts, Inc. (a) | 713,923 | | 38,587,538 |
Common Stocks - continued |
| Shares | | Value |
HEALTH CARE - continued |
Health Care Providers & Services - continued |
Fresenius Medical Care AG & Co. KGaA | 116,698 | | $ 6,744,970 |
Henry Schein, Inc. (a) | 940,100 | | 57,712,739 |
McKesson Corp. | 1,192,617 | | 83,936,384 |
Medco Health Solutions, Inc. (a) | 1,658,128 | | 101,593,503 |
UnitedHealth Group, Inc. | 2,417,405 | | 87,292,495 |
| | 428,202,581 |
Life Sciences Tools & Services - 1.1% |
Agilent Technologies, Inc. (a) | 1,995,561 | | 82,676,092 |
Charles River Laboratories International, Inc. (a) | 446,856 | | 15,881,262 |
Covance, Inc. (a) | 502,900 | | 25,854,089 |
Fluidigm Corp. warrants 8/25/19 (a) | 8,933 | | 826 |
Illumina, Inc. (a) | 690,454 | | 43,733,356 |
Lonza Group AG | 103,551 | | 8,306,912 |
QIAGEN NV (a) | 714,094 | | 13,960,538 |
| | 190,413,075 |
Pharmaceuticals - 3.3% |
Allergan, Inc. | 561,139 | | 38,533,415 |
Genomma Lab Internacional SA de CV (a) | 3,866,100 | | 9,260,870 |
Johnson & Johnson | 1,000,854 | | 61,902,820 |
Lupin Ltd. | 925,412 | | 9,985,239 |
Merck & Co., Inc. | 5,496,248 | | 198,084,778 |
Novo Nordisk AS Series B | 344,375 | | 38,817,288 |
Pfizer, Inc. | 6,021,955 | | 105,444,432 |
Shire PLC sponsored ADR | 573,900 | | 41,538,882 |
Valeant Pharmaceuticals International, Inc. | 1,817,773 | | 51,545,794 |
| | 555,113,518 |
TOTAL HEALTH CARE | | 1,748,266,221 |
INDUSTRIALS - 11.1% |
Aerospace & Defense - 2.3% |
Goodrich Corp. | 820,356 | | 72,248,753 |
Precision Castparts Corp. | 602,198 | | 83,831,984 |
The Boeing Co. | 1,465,477 | | 95,637,029 |
United Technologies Corp. | 1,722,109 | | 135,564,420 |
| | 387,282,186 |
Airlines - 0.1% |
Southwest Airlines Co. | 908,655 | | 11,794,342 |
Building Products - 0.4% |
Armstrong World Industries, Inc. | 342,008 | | 14,706,344 |
Lennox International, Inc. | 693,325 | | 32,787,339 |
Owens Corning (a) | 616,901 | | 19,216,466 |
| | 66,710,149 |
|
| Shares | | Value |
Commercial Services & Supplies - 0.4% |
Republic Services, Inc. | 1,095,395 | | $ 32,708,495 |
Stericycle, Inc. (a) | 455,416 | | 36,852,263 |
| | 69,560,758 |
Construction & Engineering - 0.4% |
Fluor Corp. | 633,650 | | 41,985,649 |
Foster Wheeler AG (a) | 738,700 | | 25,499,924 |
| | 67,485,573 |
Electrical Equipment - 1.4% |
Acuity Brands, Inc. | 338,037 | | 19,494,594 |
Cooper Industries PLC Class A | 819,675 | | 47,778,856 |
Emerson Electric Co. | 1,750,786 | | 100,092,436 |
GrafTech International Ltd. (a) | 540,156 | | 10,716,695 |
Regal-Beloit Corp. | 815,326 | | 54,431,164 |
| | 232,513,745 |
Industrial Conglomerates - 1.8% |
General Electric Co. | 13,592,329 | | 248,603,697 |
Textron, Inc. | 2,198,990 | | 51,984,124 |
| | 300,587,821 |
Machinery - 3.1% |
Caterpillar, Inc. | 1,570,523 | | 147,095,184 |
Charter International PLC | 726,953 | | 9,577,945 |
Cummins, Inc. | 886,986 | | 97,577,330 |
Danaher Corp. | 1,834,642 | | 86,540,063 |
Dover Corp. | 506,600 | | 29,610,770 |
Ingersoll-Rand Co. Ltd. | 968,600 | | 45,611,374 |
Komatsu Ltd. | 884,000 | | 26,743,680 |
Navistar International Corp. (a) | 830,623 | | 48,101,378 |
NSK Ltd. | 1,046,000 | | 9,453,475 |
Pall Corp. | 191,600 | | 9,499,528 |
Vallourec SA | 80,598 | | 8,469,899 |
| | 518,280,626 |
Road & Rail - 1.2% |
CSX Corp. | 1,385,330 | | 89,506,171 |
Union Pacific Corp. | 1,270,604 | | 117,734,167 |
| | 207,240,338 |
TOTAL INDUSTRIALS | | 1,861,455,538 |
INFORMATION TECHNOLOGY - 18.8% |
Communications Equipment - 1.0% |
Aruba Networks, Inc. (a)(d) | 1,483,452 | | 30,974,478 |
Ciena Corp. (a)(d) | 2,268,630 | | 47,754,662 |
Meru Networks, Inc. (a)(d) | 574,625 | | 8,860,718 |
QUALCOMM, Inc. | 1,555,407 | | 76,977,092 |
ViaSat, Inc. (a) | 231,254 | | 10,269,990 |
| | 174,836,940 |
Computers & Peripherals - 5.4% |
Apple, Inc. (a) | 2,323,883 | | 749,591,694 |
Imagination Technologies Group PLC (a) | 1,711,806 | | 9,630,451 |
Common Stocks - continued |
| Shares | | Value |
INFORMATION TECHNOLOGY - continued |
Computers & Peripherals - continued |
NetApp, Inc. (a) | 1,442,512 | | $ 79,280,460 |
SanDisk Corp. (a) | 1,140,855 | | 56,883,030 |
| | 895,385,635 |
Electronic Equipment & Components - 0.5% |
HLS Systems International Ltd. (a) | 1,050,441 | | 15,924,686 |
TPK Holdings Co. | 1,503,000 | | 34,522,111 |
Wintek Corp. (a) | 22,150,000 | | 38,043,023 |
| | 88,489,820 |
Internet Software & Services - 1.2% |
Akamai Technologies, Inc. (a) | 1,149,680 | | 54,092,444 |
eBay, Inc. (a) | 828,200 | | 23,048,806 |
Google, Inc. Class A (a) | 845 | | 501,905 |
Mail.ru Group Ltd. GDR unit (a)(e) | 37,000 | | 1,332,000 |
Monster Worldwide, Inc. (a) | 1,295,776 | | 30,619,187 |
WebMD Health Corp. (a) | 1,709,799 | | 87,302,337 |
| | 196,896,679 |
IT Services - 0.8% |
Cognizant Technology Solutions Corp. Class A (a) | 544,200 | | 39,884,418 |
Paychex, Inc. | 733,039 | | 22,658,235 |
Visa, Inc. Class A | 950,286 | | 66,881,129 |
| | 129,423,782 |
Office Electronics - 0.1% |
Xerox Corp. | 1,851,178 | | 21,325,571 |
Semiconductors & Semiconductor Equipment - 7.6% |
Amkor Technology, Inc. (a) | 1,126,474 | | 8,324,643 |
Analog Devices, Inc. | 3,201,160 | | 120,587,697 |
Applied Materials, Inc. | 11,199,293 | | 157,350,067 |
Applied Micro Circuits Corp. (a) | 1,274,195 | | 13,608,403 |
ARM Holdings PLC sponsored ADR (d) | 2,668,101 | | 55,363,096 |
ASML Holding NV | 4,791,101 | | 183,690,812 |
ATMI, Inc. (a) | 1,448,673 | | 28,886,540 |
Broadcom Corp. Class A | 2,549,814 | | 111,044,400 |
Cymer, Inc. (a) | 250,000 | | 11,267,500 |
Inotera Memories, Inc. (a) | 53,040,698 | | 25,365,709 |
Intersil Corp. Class A | 2,687,074 | | 41,031,620 |
KLA-Tencor Corp. | 458,077 | | 17,700,095 |
Lam Research Corp. (a) | 3,242,145 | | 167,878,268 |
Marvell Technology Group Ltd. (a) | 474,354 | | 8,799,267 |
Micron Technology, Inc. (a) | 22,817,702 | | 182,997,970 |
Nanya Technology Corp. (a) | 22,607,159 | | 12,593,978 |
NVIDIA Corp. (a) | 130,001 | | 2,002,015 |
Photronics, Inc. (a) | 533,948 | | 3,155,633 |
Powertech Technology, Inc. | 4,596,000 | | 15,283,236 |
Samsung Electronics Co. Ltd. | 76,588 | | 64,822,325 |
|
| Shares | | Value |
Skyworks Solutions, Inc. (a) | 129,288 | | $ 3,701,515 |
Varian Semiconductor Equipment Associates, Inc. (a) | 1,099,442 | | 40,646,371 |
| | 1,276,101,160 |
Software - 2.2% |
CA, Inc. | 290,774 | | 7,106,517 |
Check Point Software Technologies Ltd. (a) | 1,403,888 | | 64,943,859 |
Microsoft Corp. | 8,152,951 | | 227,630,392 |
Nuance Communications, Inc. (a) | 870,133 | | 15,819,018 |
Oracle Corp. | 100,290 | | 3,139,077 |
Red Hat, Inc. (a) | 774,606 | | 35,360,764 |
Taleo Corp. Class A (a) | 242,138 | | 6,695,116 |
| | 360,694,743 |
TOTAL INFORMATION TECHNOLOGY | | 3,143,154,330 |
MATERIALS - 3.4% |
Chemicals - 2.0% |
Air Products & Chemicals, Inc. | 362,069 | | 32,930,176 |
Airgas, Inc. | 23,600 | | 1,474,056 |
Albemarle Corp. | 252,467 | | 14,082,609 |
Celanese Corp. Class A | 252,758 | | 10,406,047 |
CF Industries Holdings, Inc. | 202,942 | | 27,427,611 |
Clariant AG (Reg.) (a) | 822,135 | | 16,666,207 |
Dow Chemical Co. | 1,744,299 | | 59,550,368 |
LyondellBasell Industries NV Class A (a) | 720,461 | | 24,783,858 |
Monsanto Co. | 609,238 | | 42,427,334 |
Praxair, Inc. | 471,074 | | 44,973,435 |
Solutia, Inc. (a) | 1,129,100 | | 26,059,628 |
The Mosaic Co. | 299,000 | | 22,831,640 |
Wacker Chemie AG | 60,982 | | 10,648,201 |
| | 334,261,170 |
Construction Materials - 0.0% |
HeidelbergCement AG | 117,134 | | 7,344,923 |
Containers & Packaging - 0.2% |
Ball Corp. | 360,667 | | 24,543,389 |
Metals & Mining - 1.2% |
Anglo American PLC (United Kingdom) | 347,400 | | 18,078,280 |
AngloGold Ashanti Ltd. sponsored ADR | 995,127 | | 48,990,102 |
ArcelorMittal SA Class A unit (d) | 86,700 | | 3,305,871 |
Carpenter Technology Corp. | 322,880 | | 12,992,691 |
Freeport-McMoRan Copper & Gold, Inc. | 687,400 | | 82,549,866 |
MacArthur Coal Ltd. | 206,793 | | 2,704,389 |
Pan American Silver Corp. | 92,600 | | 3,816,047 |
POSCO | 4,022 | | 1,739,078 |
Common Stocks - continued |
| Shares | | Value |
MATERIALS - continued |
Metals & Mining - continued |
Reliance Steel & Aluminum Co. | 425,700 | | $ 21,753,270 |
Walter Energy, Inc. | 86,973 | | 11,118,628 |
| | 207,048,222 |
TOTAL MATERIALS | | 573,197,704 |
TELECOMMUNICATION SERVICES - 3.3% |
Diversified Telecommunication Services - 2.2% |
Qwest Communications International, Inc. | 27,500,952 | | 209,282,245 |
Telefonica SA sponsored ADR | 94,758 | | 6,483,342 |
Verizon Communications, Inc. | 4,026,013 | | 144,050,745 |
| | 359,816,332 |
Wireless Telecommunication Services - 1.1% |
American Tower Corp. Class A (a) | 2,254,263 | | 116,410,141 |
Clearwire Corp. Class A (a)(d) | 5,717,958 | | 29,447,484 |
MetroPCS Communications, Inc. (a) | 773,352 | | 9,767,436 |
Vodafone Group PLC | 8,101,600 | | 21,282,291 |
Vodafone Group PLC sponsored ADR | 242,500 | | 6,409,275 |
| | 183,316,627 |
TOTAL TELECOMMUNICATION SERVICES | | 543,132,959 |
UTILITIES - 3.2% |
Electric Utilities - 1.6% |
Edison International | 1,422,804 | | 54,920,234 |
NextEra Energy, Inc. | 2,469,214 | | 128,374,436 |
PPL Corp. | 2,488,693 | | 65,502,400 |
Southern Co. | 399,300 | | 15,265,239 |
| | 264,062,309 |
Gas Utilities - 0.1% |
ONEOK, Inc. | 222,173 | | 12,323,936 |
Independent Power Producers & Energy Traders - 0.1% |
AES Corp. (a) | 1,213,744 | | 14,783,402 |
Multi-Utilities - 1.4% |
National Grid PLC | 1,687,900 | | 14,598,841 |
NiSource, Inc. | 1,339,400 | | 23,600,228 |
PG&E Corp. | 1,487,909 | | 71,181,567 |
Public Service Enterprise Group, Inc. | 1,499,269 | | 47,691,747 |
Sempra Energy | 1,518,315 | | 79,681,171 |
Veolia Environnement | 185,365 | | 5,428,693 |
| | 242,182,247 |
TOTAL UTILITIES | | 533,351,894 |
TOTAL COMMON STOCKS (Cost $13,749,513,259) | 16,459,613,820 |
Preferred Stocks - 0.3% |
| Shares | | Value |
Convertible Preferred Stocks - 0.0% |
HEALTH CARE - 0.0% |
Life Sciences Tools & Services - 0.0% |
Fluidigm Corp. (a) | 412,471 | | $ 2,887,297 |
Nonconvertible Preferred Stocks - 0.3% |
CONSUMER DISCRETIONARY - 0.3% |
Automobiles - 0.3% |
Porsche Automobil Holding SE | 235,768 | | 18,806,133 |
Volkswagen AG | 164,786 | | 26,746,712 |
| | 45,552,845 |
TOTAL PREFERRED STOCKS (Cost $36,855,234) | 48,440,142 |
U.S. Treasury Obligations - 0.1% |
| Principal Amount | | |
U.S. Treasury Bills, yield at date of purchase 0.12% to 0.14% 1/13/11 to 3/3/11 (f)
(Cost $12,798,085) | | $ 12,800,000 | | 12,798,593 |
Money Market Funds - 2.3% |
| Shares | | |
Fidelity Cash Central Fund, 0.19% (b) | 256,183,450 | | 256,183,450 |
Fidelity Securities Lending Cash Central Fund, 0.21% (b)(c) | 126,876,895 | | 126,876,895 |
TOTAL MONEY MARKET FUNDS (Cost $383,060,345) | 383,060,345 |
TOTAL INVESTMENT
PORTFOLIO - 100.9% (Cost $14,182,226,923) | 16,903,912,900 |
NET OTHER ASSETS
(LIABILITIES) - (0.9)% | | (154,907,483) |
NET ASSETS - 100% | $ 16,749,005,417 |
Futures Contracts |
| Expiration Date | | Underlying Face Amount at Value | | Unrealized Appreciation/(Depreciation) |
Purchased |
Equity Index Contracts |
1,870 CME E-mini S&P 500 Index Contracts | March 2011 | | $ 117,155,500 | | $ 1,594,979 |
|
The face value of futures purchased as a percentage of net assets is 0.7% |
Legend |
(a) Non-income producing |
(b) Affiliated fund that is available only to investment companies and other accounts managed by Fidelity Investments. The rate quoted is the annualized seven-day yield of the fund at period end. A complete unaudited listing of the fund's holdings as of its most recent quarter end is available upon request. In addition, each Fidelity Central Fund's financial statements, which are not covered by the Fund's Report of Independent Registered Public Accounting Firm, are available on the SEC's website or upon request. |
(c) Investment made with cash collateral received from securities on loan. |
(d) Security or a portion of the security is on loan at period end. |
(e) Security exempt from registration under Rule 144A of the Securities Act of 1933. These securities may be resold in transactions exempt from registration, normally to qualified institutional buyers. At the end of the period, the value of these securities amounted to $ 22,024,100 or 0.1% of net assets. |
(f) Security or a portion of the security was pledged to cover margin requirements for futures contracts. At the period end, the value of securities pledged amounted to $8,898,523. |
(g) Restricted securities - Investment in securities not registered under the Securities Act of 1933 (excluding 144A issues). At the end of the period, the value of restricted securities (excluding 144A issues) amounted to $23,478,308 or 0.1% of net assets. |
Additional information on each holding is as follows: |
Security | Acquisition Date | Acquisition Cost |
AVEO Pharmaceuticals, Inc. | 10/28/10 | $ 1,445,796 |
Buckeye Partners LP | 12/20/10 | $ 2,387,612 |
Concho Resources, Inc. | 7/20/10 | $ 5,303,815 |
Legend Pictures Holdings LLC unit | 9/23/10 | $ 4,958,250 |
The Weinstein Co. II Holdings, LLC Class A-1 | 10/19/05 | $ 11,499,000 |
Affiliated Central Funds |
Information regarding fiscal year to date income earned by the Fund from investments in Fidelity Central Funds is as follows: |
Fund | Income earned |
Fidelity Cash Central Fund | $ 636,061 |
Fidelity Securities Lending Cash Central Fund | 1,994,618 |
Total | $ 2,630,679 |
Other Affiliated Issuers |
An affiliated company is a company in which the Fund has ownership of at least 5% of the voting securities. Fiscal year to date transactions with companies which are or were affiliates are as follows: |
Affiliate | Value,
beginning of
period | Purchases | Sales Proceeds | Dividend Income | Value,
end of
period |
ATMI, Inc. | $ 31,994,169 | $ 4,437,195 | $ 7,670,141 | $ - | $ - |
Brooks Automation, Inc. | 29,493,235 | - | 26,169,946 | - | - |
Sycamore Networks, Inc. | 31,844,550 | - | 28,017,008 | - | - |
Total | $ 93,331,954 | $ 4,437,195 | $ 61,857,095 | $ - | $ - |
Other Information |
The following is a summary of the inputs used, as of December 31, 2010, involving the Fund's assets and liabilities carried at fair value. The inputs or methodology used for valuing securities may not be an indication of the risk associated with investing in those securities. For more information on valuation inputs, and their aggregation into the levels used in the tables below, please refer to the Security Valuation section in the accompanying Notes to Financial Statements. |
Valuation Inputs at Reporting Date: |
Description | Total | Level 1 | Level 2 | Level 3 |
Investments in Securities: | | | | |
Equities: | | | | |
Consumer Discretionary | $ 1,675,588,481 | $ 1,666,318,106 | $ - | $ 9,270,375 |
Consumer Staples | 1,731,257,452 | 1,731,257,452 | - | - |
Energy | 1,975,897,777 | 1,961,241,560 | 14,656,217 | - |
Financials | 2,719,864,309 | 2,646,886,871 | 57,108,338 | 15,869,100 |
Health Care | 1,751,153,518 | 1,709,448,107 | 38,817,288 | 2,888,123 |
Industrials | 1,861,455,538 | 1,861,455,538 | - | - |
Information Technology | 3,143,154,330 | 3,143,154,330 | - | - |
Materials | 573,197,704 | 571,458,626 | 1,739,078 | - |
Telecommunication Services | 543,132,959 | 521,850,668 | 21,282,291 | - |
Utilities | 533,351,894 | 513,324,360 | 20,027,534 | - |
U.S. Government and Government Agency Obligations | 12,798,593 | - | 12,798,593 | - |
Money Market Funds | 383,060,345 | 383,060,345 | - | - |
Total Investments in Securities: | $ 16,903,912,900 | $ 16,709,455,963 | $ 166,429,339 | $ 28,027,598 |
Derivative Instruments: | | | | |
Assets | | | | |
Futures Contracts | $ 1,594,979 | $ 1,594,979 | $ - | $ - |
The following is a reconciliation of Investments in Securities for which Level 3 inputs were used in determining value: |
Investments in Securities: | |
Beginning Balance | $ 23,678,872 |
Total Realized Gain (Loss) | - |
Total Unrealized Gain (Loss) | (609,524) |
Cost of Purchases | 4,958,250 |
Proceeds of Sales | - |
Amortization/Accretion | - |
Transfers in to Level 3 | - |
Transfers out of Level 3 | - |
Ending Balance | $ 28,027,598 |
The change in unrealized gain (loss) for the period attributable to Level 3 securities held at December 31, 2010 | $ (609,524) |
The information used in the above reconciliation represents fiscal year to date activity for any Investments in Securities identified as using Level 3 inputs at either the beginning or the end of the current fiscal period. Transfers in or out of Level 3 represent the beginning value of any Security or Instrument where a change in the pricing level occurred from the beginning to the end of the period. The cost of purchases and the proceeds of sales may include securities received or delivered through corporate actions or exchanges. Realized and unrealized gains (losses) disclosed in the reconciliation are included in Net Gain (Loss) on the Fund's Statement of Operations. |
Value of Derivative Instruments |
The following table is a summary of the Fund's value of derivative instruments by risk exposure as of December 31, 2010. For additional information on derivative instruments, please refer to the Derivative Instruments section in the accompanying Notes to Financial Statements. |
Risk Exposure /
Derivative Type | Value |
| Asset | Liability |
Equity Risk | | |
Futures Contracts (a) | $ 1,594,979 | $ - |
Total Value of Derivatives | $ 1,594,979 | $ - |
(a) Reflects cumulative appreciation/(depreciation) on futures contracts as disclosed on the Schedule of Investments. Only the period end variation margin is separately disclosed on the Statement of Assets and Liabilities. |
Distribution of investments by country of issue, as a percentage of total net assets, is as follows: (Unaudited) |
United States of America | 83.8% |
United Kingdom | 4.0% |
Netherlands | 1.8% |
Switzerland | 1.3% |
Canada | 1.1% |
Ireland | 1.0% |
Others (Individually Less Than 1%) | 7.0% |
| 100.0% |
Income Tax Information |
At December 31, 2010, the Fund had a capital loss carryforward of approximately $4,050,914,844 of which $1,715,915,916 and $2,334,998,928 will expire in fiscal 2016 and 2017, respectively. Capital loss carryforwards are only available to offset future capital gains of the Fund to the extent provided by regulations and may be limited. |
See accompanying notes which are an integral part of the financial statements.
Annual Report
Statement of Assets and Liabilities
| December 31, 2010 |
| | |
Assets | | |
Investment in securities, at value (including securities loaned of $122,984,578) - See accompanying schedule: Unaffiliated issuers (cost $13,799,166,578) | $ 16,520,852,555 | |
Fidelity Central Funds (cost $383,060,345) | 383,060,345 | |
Total Investments (cost $14,182,226,923) | | $ 16,903,912,900 |
Cash | | 90,964 |
Foreign currency held at value (cost $265,267) | | 265,571 |
Receivable for investments sold | | 52,010,259 |
Receivable for fund shares sold | | 3,728,501 |
Dividends receivable | | 15,926,606 |
Distributions receivable from Fidelity Central Funds | | 128,114 |
Prepaid expenses | | 50,044 |
Other receivables | | 961,705 |
Total assets | | 16,977,074,664 |
| | |
Liabilities | | |
Payable for investments purchased | $ 63,199,700 | |
Payable for fund shares redeemed | 26,509,840 | |
Accrued management fee | 7,909,915 | |
Distribution and service plan fees payable | 1,718,072 | |
Payable for daily variation on futures contracts | 140,250 | |
Other affiliated payables | 1,105,870 | |
Other payables and accrued expenses | 608,705 | |
Collateral on securities loaned, at value | 126,876,895 | |
Total liabilities | | 228,069,247 |
| | |
Net Assets | | $ 16,749,005,417 |
Net Assets consist of: | | |
Paid in capital | | $ 18,343,044,401 |
Distributions in excess of net investment income | | (10,971,317) |
Accumulated undistributed net realized gain (loss) on investments and foreign currency transactions | | (4,306,394,373) |
Net unrealized appreciation (depreciation) on investments and assets and liabilities in foreign currencies | | 2,723,326,706 |
Net Assets | | $ 16,749,005,417 |
Statement of Assets and Liabilities - continued
| December 31, 2010 |
| | |
Initial Class:
Net Asset Value, offering price and redemption price per share ($7,160,124,602 ÷ 299,793,788 shares) | | $ 23.88 |
| | |
Service Class:
Net Asset Value, offering price and redemption price per share ($1,379,304,556 ÷ 57,937,425 shares) | | $ 23.81 |
| | |
Service Class 2:
Net Asset Value, offering price and redemption price per share ($7,627,793,170 ÷ 324,741,004 shares) | | $ 23.49 |
| | |
Service Class 2R:
Net Asset Value, offering price and redemption price per share ($10,942,477 ÷ 466,894 shares) | | $ 23.44 |
| | |
Investor Class:
Net Asset Value, offering price and redemption price per share ($570,840,612 ÷ 23,982,076 shares) | | $ 23.80 |
See accompanying notes which are an integral part of the financial statements.
Annual Report
Statement of Operations
| Year ended December 31, 2010 |
| | |
Investment Income | | |
Dividends | | $ 279,953,565 |
Interest | | 14,369 |
Income from Fidelity Central Funds | | 2,630,679 |
Total income | | 282,598,613 |
| | |
Expenses | | |
Management fee | $ 93,327,654 | |
Transfer agent fees | 12,903,083 | |
Distribution and service plan fees | 19,986,451 | |
Accounting and security lending fees | 1,619,928 | |
Custodian fees and expenses | 1,040,715 | |
Independent trustees' compensation | 96,042 | |
Appreciation in deferred trustee compensation account | 17 | |
Audit | 115,699 | |
Legal | 85,482 | |
Miscellaneous | 226,221 | |
Total expenses before reductions | 129,401,292 | |
Expense reductions | (3,611,449) | 125,789,843 |
Net investment income (loss) | | 156,808,770 |
Realized and Unrealized Gain (Loss) Net realized gain (loss) on: | | |
Investment securities: | | |
Unaffiliated issuers | 1,240,392,304 | |
Other affiliated issuers | (25,489,001) | |
Foreign currency transactions | (1,513,030) | |
Futures contracts | (328,031) | |
Total net realized gain (loss) | | 1,213,062,242 |
Change in net unrealized appreciation (depreciation) on: Investment securities | 1,271,229,019 | |
Assets and liabilities in foreign currencies | 30,628 | |
Futures contracts | 933,702 | |
Total change in net unrealized appreciation (depreciation) | | 1,272,193,349 |
Net gain (loss) | | 2,485,255,591 |
Net increase (decrease) in net assets resulting from operations | | $ 2,642,064,361 |
See accompanying notes which are an integral part of the financial statements.
Annual Report
Financial Statements - continued
Statement of Changes in Net Assets
| Year ended
December 31,
2010 | Year ended
December 31,
2009 |
Increase (Decrease) in Net Assets | | |
Operations | | |
Net investment income (loss) | $ 156,808,770 | $ 182,048,095 |
Net realized gain (loss) | 1,213,062,242 | (1,211,829,520) |
Change in net unrealized appreciation (depreciation) | 1,272,193,349 | 5,676,838,088 |
Net increase (decrease) in net assets resulting from operations | 2,642,064,361 | 4,647,056,663 |
Distributions to shareholders from net investment income | (173,609,742) | (191,893,175) |
Distributions to shareholders from net realized gain | (7,015,810) | (4,181,790) |
Total distributions | (180,625,552) | (196,074,965) |
Share transactions - net increase (decrease) | (2,950,980,349) | (1,477,532,238) |
Redemption fees | 1,677 | 784 |
Total increase (decrease) in net assets | (489,539,863) | 2,973,450,244 |
| | |
Net Assets | | |
Beginning of period | 17,238,545,280 | 14,265,095,036 |
End of period (including distributions in excess of net investment income of $10,971,317 and undistributed net investment income of $4,097,167, respectively) | $ 16,749,005,417 | $ 17,238,545,280 |
See accompanying notes which are an integral part of the financial statements.
Annual Report
Financial Highlights - Initial Class
Years ended December 31, | 2010 | 2009 | 2008 | 2007 | 2006 |
Selected Per-Share Data | | | | | |
Net asset value, beginning of period | $ 20.62 | $ 15.39 | $ 27.90 | $ 31.47 | $ 31.03 |
Income from Investment Operations | | | | | |
Net investment income (loss) C | .23 | .23 | .24 | .34 | .27 |
Net realized and unrealized gain (loss) | 3.31 | 5.26 | (11.87) | 5.17 | 3.30 |
Total from investment operations | 3.54 | 5.49 | (11.63) | 5.51 | 3.57 |
Distributions from net investment income | (.27) | (.25) | (.23) | (.33) | (.42) |
Distributions from net realized gain | (.01) | (.01) | (.65) | (8.75) | (2.71) |
Total distributions | (.28) | (.26) H | (.88) | (9.08) | (3.13) |
Redemption fees added to paid in capital C,G | - | - | - | - | - |
Net asset value, end of period | $ 23.88 | $ 20.62 | $ 15.39 | $ 27.90 | $ 31.47 |
Total Return A,B | 17.22% | 35.71% | (42.51)% | 17.59% | 11.72% |
Ratios to Average Net Assets D,F | | | | | |
Expenses before reductions | .65% | .67% | .66% | .65% | .66% |
Expenses net of fee waivers, if any | .65% | .67% | .66% | .65% | .66% |
Expenses net of all reductions | .63% | .65% | .65% | .64% | .65% |
Net investment income (loss) | 1.06% | 1.33% | 1.07% | 1.00% | .85% |
Supplemental Data | | | | | |
Net assets, end of period (000 omitted) | $ 7,160,125 | $ 7,405,228 | $ 6,240,871 | $ 12,371,009 | $ 11,595,588 |
Portfolio turnover rate E | 117% | 145% | 172% | 134% | 75% |
A Total returns do not reflect charges attributable to your insurance company's separate account. Inclusion of these charges would reduce the total returns shown.
B Total returns would have been lower had certain expenses not been reduced during the periods shown.
C Calculated based on average shares outstanding during the period.
D Fees and expenses of the underlying Fidelity Central Funds are not included in the Fund's expense ratio. The Fund indirectly bears its proportionate share of the expenses of any underlying Fidelity Central Funds.
E Amount does not include the portfolio activity of any underlying Fidelity Central Funds.
F Expense ratios reflect operating expenses of the class. Expenses before reductions do not reflect amounts reimbursed by the investment adviser or reductions from brokerage service arrangements or reductions from other expense offset arrangements and do not represent the amount paid by the class during periods when reimbursements or reductions occur. Expenses net of fee waivers reflect expenses after reimbursement by the investment adviser but prior to reductions from brokerage service arrangements or other expense offset arrangements. Expenses net of all reductions represent the net expenses paid by the class.
G Amount represents less than $.01 per share.
H Total distributions of $.26 per share is comprised of distributions from net investment income of $.250 and distributions from net realized gain of $.005 per share.
Financial Highlights - Service Class
Years ended December 31, | 2010 | 2009 | 2008 | 2007 | 2006 |
Selected Per-Share Data | | | | | |
Net asset value, beginning of period | $ 20.55 | $ 15.33 | $ 27.80 | $ 31.38 | $ 30.93 |
Income from Investment Operations | | | | | |
Net investment income (loss) C | .20 | .21 | .21 | .30 | .24 |
Net realized and unrealized gain (loss) | 3.31 | 5.25 | (11.83) | 5.16 | 3.28 |
Total from investment operations | 3.51 | 5.46 | (11.62) | 5.46 | 3.52 |
Distributions from net investment income | (.24) | (.23) | (.20) | (.29) | (.36) |
Distributions from net realized gain | (.01) | (.01) | (.65) | (8.75) | (2.71) |
Total distributions | (.25) | (.24) H | (.85) | (9.04) | (3.07) |
Redemption fees added to paid in capital C,G | - | - | - | - | - |
Net asset value, end of period | $ 23.81 | $ 20.55 | $ 15.33 | $ 27.80 | $ 31.38 |
Total Return A,B | 17.11% | 35.66% | (42.61)% | 17.51% | 11.59% |
Ratios to Average Net Assets D,F | | | | | |
Expenses before reductions | .75% | .77% | .76% | .75% | .76% |
Expenses net of fee waivers, if any | .75% | .77% | .76% | .75% | .76% |
Expenses net of all reductions | .73% | .75% | .75% | .74% | .75% |
Net investment income (loss) | .96% | 1.23% | .97% | .90% | .75% |
Supplemental Data | | | | | |
Net assets, end of period (000 omitted) | $ 1,379,305 | $ 1,784,820 | $ 1,497,734 | $ 3,008,644 | $ 2,766,343 |
Portfolio turnover rate E | 117% | 145% | 172% | 134% | 75% |
A Total returns do not reflect charges attributable to your insurance company's separate account. Inclusion of these charges would reduce the total returns shown.
B Total returns would have been lower had certain expenses not been reduced during the periods shown.
C Calculated based on average shares outstanding during the period.
D Fees and expenses of the underlying Fidelity Central Funds are not included in the Fund's expense ratio. The Fund indirectly bears its proportionate share of the expenses of any underlying Fidelity Central Funds.
E Amount does not include the portfolio activity of any underlying Fidelity Central Funds.
F Expense ratios reflect operating expenses of the class. Expenses before reductions do not reflect amounts reimbursed by the investment adviser or reductions from brokerage service arrangements or reductions from other expense offset arrangements and do not represent the amount paid by the class during periods when reimbursements or reductions occur. Expenses net of fee waivers reflect expenses after reimbursement by the investment adviser but prior to reductions from brokerage service arrangements or other expense offset arrangements. Expenses net of all reductions represent the net expenses paid by the class.
G Amount represents less than $.01 per share.
H Total distributions of $.24 per share is comprised of distributions from net investment income of $.232 and distributions from net realized gain of $.005 per share.
See accompanying notes which are an integral part of the financial statements.
Annual Report
Financial Highlights - Service Class 2
Years ended December 31, | 2010 | 2009 | 2008 | 2007 | 2006 |
Selected Per-Share Data | | | | | |
Net asset value, beginning of period | $ 20.29 | $ 15.14 | $ 27.46 | $ 31.11 | $ 30.69 |
Income from Investment Operations | | | | | |
Net investment income (loss) C | .17 | .18 | .18 | .25 | .19 |
Net realized and unrealized gain (loss) | 3.26 | 5.18 | (11.67) | 5.11 | 3.26 |
Total from investment operations | 3.43 | 5.36 | (11.49) | 5.36 | 3.45 |
Distributions from net investment income | (.22) | (.21) | (.18) | (.26) | (.32) |
Distributions from net realized gain | (.01) | (.01) | (.65) | (8.75) | (2.71) |
Total distributions | (.23) | (.21) H | (.83) | (9.01) | (3.03) |
Redemption fees added to paid in capital C,G | - | - | - | - | - |
Net asset value, end of period | $ 23.49 | $ 20.29 | $ 15.14 | $ 27.46 | $ 31.11 |
Total Return A,B | 16.93% | 35.47% | (42.69)% | 17.30% | 11.43% |
Ratios to Average Net Assets D,F | | | | | |
Expenses before reductions | .90% | .92% | .91% | .90% | .91% |
Expenses net of fee waivers, if any | .90% | .92% | .91% | .90% | .91% |
Expenses net of all reductions | .88% | .90% | .90% | .89% | .90% |
Net investment income (loss) | .81% | 1.08% | .82% | .75% | .60% |
Supplemental Data | | | | | |
Net assets, end of period (000 omitted) | $ 7,627,793 | $ 7,577,737 | $ 6,187,985 | $ 9,339,663 | $ 6,185,595 |
Portfolio turnover rate E | 117% | 145% | 172% | 134% | 75% |
A Total returns do not reflect charges attributable to your insurance company's separate account. Inclusion of these charges would reduce the total returns shown.
B Total returns would have been lower had certain expenses not been reduced during the periods shown.
C Calculated based on average shares outstanding during the period.
D Fees and expenses of the underlying Fidelity Central Funds are not included in the Fund's expense ratio. The Fund indirectly bears its proportionate share of the expenses of any underlying Fidelity Central Funds.
E Amount does not include the portfolio activity of any underlying Fidelity Central Funds.
F Expense ratios reflect operating expenses of the class. Expenses before reductions do not reflect amounts reimbursed by the investment adviser or reductions from brokerage service arrangements or reductions from other expense offset arrangements and do not represent the amount paid by the class during periods when reimbursements or reductions occur. Expenses net of fee waivers reflect expenses after reimbursement by the investment adviser but prior to reductions from brokerage service arrangements or other expense offset arrangements. Expenses net of all reductions represent the net expenses paid by the class.
G Amount represents less than $.01 per share.
H Total distributions of $.21 per share is comprised of distributions from net investment income of $.205 and distributions from net realized gain of $.005 per share.
Financial Highlights - Service Class 2R
Years ended December 31, | 2010 | 2009 | 2008 | 2007 | 2006 |
Selected Per-Share Data | | | | | |
Net asset value, beginning of period | $ 20.24 | $ 15.10 | $ 27.35 | $ 31.02 | $ 30.61 |
Income from Investment Operations | | | | | |
Net investment income (loss) C | .17 | .18 | .18 | .25 | .19 |
Net realized and unrealized gain (loss) | 3.25 | 5.17 | (11.62) | 5.09 | 3.25 |
Total from investment operations | 3.42 | 5.35 | (11.44) | 5.34 | 3.44 |
Distributions from net investment income | (.21) | (.20) | (.16) | (.26) | (.32) |
Distributions from net realized gain | (.01) | (.01) | (.65) | (8.75) | (2.71) |
Total distributions | (.22) | (.21) H | (.81) | (9.01) | (3.03) |
Redemption fees added to paid in capital C,G | - | - | - | - | - |
Net asset value, end of period | $ 23.44 | $ 20.24 | $ 15.10 | $ 27.35 | $ 31.02 |
Total Return A,B | 16.94% | 35.46% | (42.69)% | 17.30% | 11.43% |
Ratios to Average Net Assets D,F | | | | | |
Expenses before reductions | .90% | .92% | .91% | .90% | .91% |
Expenses net of fee waivers, if any | .90% | .92% | .91% | .90% | .91% |
Expenses net of all reductions | .88% | .90% | .90% | .89% | .90% |
Net investment income (loss) | .81% | 1.08% | .82% | .75% | .60% |
Supplemental Data | | | | | |
Net assets, end of period (000 omitted) | $ 10,942 | $ 13,285 | $ 13,585 | $ 35,606 | $ 26,707 |
Portfolio turnover rate E | 117% | 145% | 172% | 134% | 75% |
A Total returns do not reflect charges attributable to your insurance company's separate account. Inclusion of these charges would reduce the total returns shown.
B Total returns would have been lower had certain expenses not been reduced during the periods shown.
C Calculated based on average shares outstanding during the period.
D Fees and expenses of the underlying Fidelity Central Funds are not included in the Fund's expense ratio. The Fund indirectly bears its proportionate share of the expenses of any underlying Fidelity Central Funds.
E Amount does not include the portfolio activity of any underlying Fidelity Central Funds.
F Expense ratios reflect operating expenses of the class. Expenses before reductions do not reflect amounts reimbursed by the investment adviser or reductions from brokerage service arrangements or reductions from other expense offset arrangements and do not represent the amount paid by the class during periods when reimbursements or reductions occur. Expenses net of fee waivers reflect expenses after reimbursement by the investment adviser but prior to reductions from brokerage service arrangements or other expense offset arrangements. Expenses net of all reductions represent the net expenses paid by the class.
G Amount represents less than $.01 per share.
H Total distributions of $.21 per share is comprised of distributions from net investment income of $.200 and distributions from net realized gain of $.005 per share.
See accompanying notes which are an integral part of the financial statements.
Annual Report
Financial Highlights - Investor Class
Years ended December 31, | 2010 | 2009 | 2008 | 2007 | 2006 |
Selected Per-Share Data | | | | | |
Net asset value, beginning of period | $ 20.56 | $ 15.34 | $ 27.82 | $ 31.41 | $ 31.00 |
Income from Investment Operations | | | | | |
Net investment income (loss) C | .21 | .21 | .21 | .30 | .23 |
Net realized and unrealized gain (loss) | 3.30 | 5.25 | (11.83) | 5.16 | 3.30 |
Total from investment operations | 3.51 | 5.46 | (11.62) | 5.46 | 3.53 |
Distributions from net investment income | (.26) | (.24) | (.21) | (.30) | (.41) |
Distributions from net realized gain | (.01) | (.01) | (.65) | (8.75) | (2.71) |
Total distributions | (.27) | (.24) H | (.86) | (9.05) | (3.12) |
Redemption fees added to paid in capital C,G | - | - | - | - | - |
Net asset value, end of period | $ 23.80 | $ 20.56 | $ 15.34 | $ 27.82 | $ 31.41 |
Total Return A,B | 17.10% | 35.66% | (42.60)% | 17.47% | 11.60% |
Ratios to Average Net Assets D,F | | | | | |
Expenses before reductions | .74% | .77% | .75% | .76% | .78% |
Expenses net of fee waivers, if any | .73% | .77% | .75% | .76% | .78% |
Expenses net of all reductions | .72% | .75% | .74% | .75% | .78% |
Net investment income (loss) | .98% | 1.23% | .98% | .89% | .73% |
Supplemental Data | | | | | |
Net assets, end of period (000 omitted) | $ 570,841 | $ 457,476 | $ 324,919 | $ 532,268 | $ 315,995 |
Portfolio turnover rate E | 117% | 145% | 172% | 134% | 75% |
A Total returns do not reflect charges attributable to your insurance company's separate account. Inclusion of these charges would reduce the total returns shown.
B Total returns would have been lower had certain expenses not been reduced during the periods shown.
C Calculated based on average shares outstanding during the period.
D Fees and expenses of the underlying Fidelity Central Funds are not included in the Fund's expense ratio. The Fund indirectly bears its proportionate share of the expenses of any underlying Fidelity Central Funds.
E Amount does not include the portfolio activity of any underlying Fidelity Central Funds.
F Expense ratios reflect operating expenses of the class. Expenses before reductions do not reflect amounts reimbursed by the investment adviser or reductions from brokerage service arrangements or reductions from other expense offset arrangements and do not represent the amount paid by the class during periods when reimbursements or reductions occur. Expenses net of fee waivers reflect expenses after reimbursement by the investment adviser but prior to reductions from brokerage service arrangements or other expense offset arrangements. Expenses net of all reductions represent the net expenses paid by the class.
G Amount represents less than $.01 per share.
H Total distributions of $.24 per share is comprised of distributions from net investment income of $.235 and distributions from net realized gain of $.005 per share.
See accompanying notes which are an integral part of the financial statements.
Annual Report
Notes to Financial Statements
For the period ended December 31, 2010
1. Organization.
VIP Contrafund Portfolio (the Fund) is a fund of Variable Insurance Products Fund II (the Trust) and is authorized to issue an unlimited number of shares. The Trust is registered under the Investment Company Act of 1940, as amended (the 1940 Act), as an open-end management investment company organized as a Massachusetts business trust. Shares of the Fund may only be purchased by insurance companies for the purpose of funding variable annuity or variable life insurance contracts. The Fund offers the following classes of shares: Initial Class shares, Service Class shares, Service Class 2 shares, Service Class 2R shares and Investor Class shares. All classes have equal rights and voting privileges, except for matters affecting a single class. Investment income, realized and unrealized capital gains and losses, the common expenses of the Fund, and certain fund-level expense reductions, if any, are allocated on a pro-rata basis to each class based on the relative net assets of each class to the total net assets of the Fund. Each class differs with respect to transfer agent and distribution and service plan fees incurred. Certain expense reductions may also differ by class.
2. Investments in Fidelity Central Funds.
The Fund may invest in Fidelity Central Funds, which are open-end investment companies available only to other investment companies and accounts managed by Fidelity Management & Research Company (FMR) and its affiliates. The Fund's Schedule of Investments lists each of the Fidelity Central Funds held as of period end, if any, as an investment of the Fund, but does not include the underlying holdings of each Fidelity Central Fund. As an Investing Fund, the Fund indirectly bears its proportionate share of the expenses of the underlying Fidelity Central Funds.
The Money Market Central Funds seek preservation of capital and current income and are managed by Fidelity Investments Money Management, Inc. (FIMM), an affiliate of FMR.
A complete unaudited list of holdings for each Fidelity Central Fund is available upon request or at the Securities and Exchange Commission (the SEC) web site at www.sec.gov. In addition, the financial statements of the Fidelity Central Funds, which are not covered by the Fund's Report of Independent Registered Public Accounting Firm, , are available on the SEC web site or upon request.
3. Significant Accounting Policies.
The financial statements have been prepared in conformity with accounting principles generally accepted in the United States of America (GAAP), which require management to make certain estimates and assumptions at the date of the financial statements. Actual results could differ from those estimates. Subsequent events, if any, through the date that the financial statements were issued have been evaluated in the preparation of the financial statements. The following summarizes the significant accounting policies of the Fund:
Security Valuation. Investments are valued as of 4:00 p.m. Eastern time on the last calendar day of the period. The Fund uses independent pricing services approved by the Board of Trustees to value its investments. When current market prices or quotations are not readily available or reliable, valuations may be determined in good faith in accordance with procedures adopted by the Board of Trustees. Factors used in determining value may include market or security specific events, changes in interest rates and credit quality. The frequency with which these procedures are used cannot be predicted and they may be utilized to a significant extent. The value used for net asset value (NAV) calculation under these procedures may differ from published prices for the same securities.
The Fund categorizes the inputs to valuation techniques used to value its investments into a disclosure hierarchy consisting of three levels as shown below.
Level 1 - quoted prices in active markets for identical investments
Level 2 - other significant observable inputs (including quoted prices for similar investments, interest rates, prepayment speeds, etc.)
Level 3 - unobservable inputs (including the Fund's own assumptions based on the best information available)
Changes in valuation techniques may result in transfers in or out of an assigned level within the disclosure hierarchy. The aggregate value of investments by input level, as of December 31, 2010, as well as a roll forward of Level 3 securities, is included at the end of the Fund's Schedule of Investments. Valuation techniques used to value the Fund's investments by major category are as follows.
Equity securities, including restricted securities, for which market quotations are readily available, are valued at the last reported sale price or official closing price as reported by an independent pricing service on the primary market or exchange on which they are traded and are categorized as Level 1 in the hierarchy. In the event there were no sales during the day or closing prices are not available, securities are valued at the last quoted bid price or may be valued using the last available price and are generally categorized as Level 2 in the hierarchy. For foreign equity securities, when significant market or security specific events arise, comparisons to the valuation of American Depositary Receipts (ADRs), futures contracts, Exchange-traded funds (ETFs) and certain indexes as well as quoted prices for similar securities are used and are categorized as Level 2 in the hierarchy in these circumstances. Utilizing these techniques may result in transfers between Level 1 and Level 2. For restricted equity securities and private placements where observable inputs are limited, assumptions about market activity and risk are used and are categorized as Level 3 in the hierarchy.
Annual Report
Notes to Financial Statements - continued
3. Significant Accounting Policies - continued
Debt securities, including restricted securities, are valued based on evaluated prices received from independent pricing services or from dealers who make markets in such securities. For preferred securities and U.S. government and government agency obligations, pricing services utilize matrix pricing which considers yield or price of bonds of comparable quality, coupon, maturity and type as well as dealer supplied prices and are generally categorized as Level 2 in the hierarchy.
Futures contracts are valued at the settlement price established each day by the board of trade or exchange on which they are traded and are categorized as Level 1 in the hierarchy. Investments in open-end mutual funds, including the Fidelity Central Funds, are valued at their closing net asset value each business day and are categorized as Level 1 in the hierarchy. Short-term securities with remaining maturities of sixty days or less for which quotations are not readily available are valued at amortized cost, which approximates fair value and are categorized as Level 2 in the hierarchy.
When independent prices are unavailable or unreliable, debt securities may be valued utilizing pricing matrices which consider similar factors that would be used by independent pricing services. These are generally categorized as Level 2 in the hierarchy but may be Level 3 depending on the circumstances.
Foreign Currency. The Fund uses foreign currency contracts to facilitate transactions in foreign-denominated securities. Gains and losses from these transactions may arise from changes in the value of the foreign currency or if the counterparties do not perform under the contracts' terms.
Foreign-denominated assets, including investment securities, and liabilities are translated into U.S. dollars at the exchange rate at period end. Purchases and sales of investment securities, income and dividends received and expenses denominated in foreign currencies are translated into U.S. dollars at the exchange rate in effect on the transaction date.
The effects of exchange rate fluctuations on investments are included with the net realized and unrealized gain (loss) on investment securities. Other foreign currency transactions resulting in realized and unrealized gain (loss) are disclosed separately.
Investment Transactions and Income. For financial reporting purposes, the Fund's investment holdings and NAV include trades executed through the end of the last business day of the period. The NAV per share for processing shareholder transactions is calculated as of the close of business of the New York Stock Exchange (NYSE), normally 4:00 p.m. Eastern time and includes trades executed through the end of the prior business day. Gains and losses on securities sold are determined on the basis of identified cost and may include proceeds received from litigation. Dividend income is recorded on the ex-dividend date, except for certain dividends from foreign securities where the ex-dividend date may have passed, which are recorded as soon as the Fund is informed of the ex-dividend date. Non-cash dividends included in dividend income, if any, are recorded at the fair market value of the securities received. Distributions received on securities that represent a return of capital or capital gain are recorded as a reduction of cost of investments and/or as a realized gain. The Fund estimates the components of distributions received that may be considered return of capital distributions or capital gain distributions. Interest income and distributions from the Fidelity Central Funds are accrued as earned. Interest income includes coupon interest and amortization of premium and accretion of discount on debt securities. Investment income is recorded net of foreign taxes withheld where recovery of such taxes is uncertain.
Expenses. Expenses directly attributable to a fund are charged to that fund. Expenses attributable to more than one fund are allocated among the respective funds on the basis of relative net assets or other appropriate methods. Expense estimates are accrued in the period to which they relate and adjustments are made when actual amounts are known.
Deferred Trustee Compensation. Under a Deferred Compensation Plan (the Plan), independent Trustees may elect to defer receipt of a portion of their annual compensation. Deferred amounts are invested in a cross-section of Fidelity funds, are marked-to-market and remain in the Fund until distributed in accordance with the Plan. The investment of deferred amounts and the offsetting payable to the Trustees are included in the accompanying Statement of Assets and Liabilities.
Income Tax Information and Distributions to Shareholders. Each year the Fund intends to qualify as a regulated investment company, including distributing substantially all of its taxable income and realized gains under Subchapter M of the Internal Revenue Code and filing its U.S. federal tax return. As a result, no provision for income taxes is required. As of December 31, 2010, the Fund did not have any unrecognized tax benefits in the accompanying financial statements. A fund's federal tax return is subject to examination by the Internal Revenue Service (IRS) for a period of three years. Foreign taxes are provided for based on the Fund's understanding of the tax rules and rates that exist in the foreign markets in which it invests.
Distributions are declared and recorded on the ex-dividend date. Income dividends and capital gain distributions are declared separately for each class. Income and capital gain distributions are determined in accordance with income tax regulations, which may differ from GAAP.
Capital accounts within the financial statements are adjusted for permanent book-tax differences. These adjustments have no impact on net assets or the results of operations. Temporary book-tax differences will reverse in a subsequent period.
Book-tax differences are primarily due to futures transactions, foreign currency transactions, passive foreign investment companies (PFIC), deferred trustees compensation, capital loss carryforwards and losses deferred due to wash sales and excise tax regulations.
Annual Report
3. Significant Accounting Policies - continued
Income Tax Information and Distributions to Shareholders - continued
The federal tax cost of investment securities and unrealized appreciation (depreciation) as of period end were as follows:
Gross unrealized appreciation | $ 3,120,736,235 |
Gross unrealized depreciation | (652,934,809) |
Net unrealized appreciation (depreciation) | $ 2,467,801,426 |
Tax Cost | $ 14,436,111,474 |
The tax-based components of distributable earnings as of period end were as follows:
Capital loss carryforward | $ (4,050,914,844) |
Net unrealized appreciation (depreciation) | $ 2,467,847,172 |
The tax character of distributions paid was as follows:
| December 31, 2010 | December 31, 2009 |
Ordinary Income | $ 180,625,552 | $ 196,074,965 |
Trading (Redemption) Fees. Service Class 2 R shares held by investors less than 60 days are subject to a redemption fee equal to 1% of the net asset value of shares redeemed. All redemption fees, which reduce the proceeds of the shareholder redemption, are retained by the Fund and accounted for as an addition to paid in capital.
4. Operating Policies.
Restricted Securities. The Fund may invest in securities that are subject to legal or contractual restrictions on resale. These securities generally may be resold in transactions exempt from registration or to the public if the securities are registered. Disposal of these securities may involve time-consuming negotiations and expense, and prompt sale at an acceptable price may be difficult. Information regarding restricted securities is included at the end of the Fund's Schedule of Investments.
5. Derivative Instruments.
Risk Exposures and the Use of Derivative Instruments. The Fund uses derivative instruments (derivatives), including futures contracts, in order to meet its investment objectives. The strategy is to use derivatives to increase returns and to manage exposure to certain risks as defined below. The success of any strategy involving derivatives depends on analysis of numerous economic factors, and if the strategies for investment do not work as intended, the Fund may not achieve its objectives.
The Fund's use of derivatives may increase or decrease its exposure to the following risk:
Equity Risk | Equity risk relates to the fluctuations in the value of financial instruments as a result of changes in market prices (other than those arising from interest rate risk or foreign exchange risk), whether caused by factors specific to an individual investment, its issuer, or all factors affecting all instruments traded in a market or market segment. |
The Fund is also exposed to additional risks from investing in derivatives, such as liquidity risk and counterparty credit risk. Liquidity risk is the risk that the Fund will be unable to sell the derivative in the open market in a timely manner. Counterparty credit risk is the risk that the counterparty will not be able to fulfill its obligation to the Fund. The Fund's maximum risk of loss from counterparty credit risk is generally the aggregate unrealized appreciation and unpaid counterparty fees in excess of any collateral pledged by the counterparty to the Fund. Counterparty risk related to exchange-traded futures contracts is minimal because of the protection provided by the exchange on which they trade. Risk of loss may exceed the amounts recognized in the Statement of Assets and Liabilities.
Annual Report
Notes to Financial Statements - continued
5. Derivative Instruments - continued
Net Realized Gain (Loss) and Change in Net Unrealized Appreciation (Depreciation) on Derivatives. The table below, which reflects the impacts of derivatives on the financial performance of the Fund, summarizes the net realized gain (loss) and change in net unrealized appreciation (depreciation) for derivatives during the period.
Risk Exposure / Derivative Type | Net Realized Gain
(Loss) | Change in
Net Unrealized
Appreciation (Depreciation) |
Equity Risk | | |
Futures Contracts | $ (328,031) | $ 933,702 |
Totals (a) | $ (328,031) | $ 933,702 |
(a) A summary of the value of derivatives by risk exposure as of period end, if any, is included at the end of the Schedule of Investments and is representative of activity for the period.
Futures Contracts. A futures contract is an agreement between two parties to buy or sell a specified underlying instrument for a fixed price at a specified future date. The Fund uses futures contracts to manage its exposure to the stock market.
Upon entering into a futures contract, a fund is required to deposit either cash or securities (initial margin) with a clearing broker in an amount equal to a certain percentage of the face value of the contract. Futures contracts are marked-to-market daily and subsequent payments (variation margin) are made or received by a fund depending on the daily fluctuations in the value of the futures contracts and are recorded as unrealized appreciation or (depreciation). Realized gain or (loss) is recorded upon the expiration or closing of a futures contract.
The underlying face amount at value of open futures contracts at period end, if any, is shown in the Schedule of Investments under the caption "Futures Contracts." This amount reflects each contract's exposure to the underlying instrument at period end and is representative of activity for the period. Securities deposited to meet initial margin requirements are identified in the Schedule of Investments. The receivable and/or payable for the variation margin are reflected in the Statement of Assets and Liabilities.
Certain risks may arise upon entering into futures contracts, including the risk that an illiquid market may limit the ability to close out a futures contract prior to settlement date.
During the period the Fund recognized net realized gain (loss) of $(328,031) and a change in net unrealized appreciation (depreciation) of $933,702 related to its investment in futures contracts. These amounts are included in the Statement of Operations.
6. Purchases and Sales of Investments.
Purchases and sales of securities, other than short-term securities, aggregated $18,911,410,312 and $21,884,933,596, respectively.
7. Fees and Other Transactions with Affiliates.
Management Fee. FMR and its affiliates provide the Fund with investment management related services for which the Fund pays a monthly management fee. The management fee is the sum of an individual fund fee rate that is based on an annual rate of .30% of the Fund's average net assets and a group fee rate that averaged .26% during the period. The group fee rate is based upon the average net assets of all the mutual funds advised by FMR. The group fee rate decreases as assets under management increase and increases as assets under management decrease. For the period, the total annual management fee rate was .56% of the Fund's average net assets.
Distribution and Service Plan Fees. In accordance with Rule 12b-1 of the 1940 Act, the Fund has adopted separate 12b-1 Plans for each Service Class of shares. Each Service Class pays Fidelity Distributors Corporation (FDC), an affiliate of FMR, a service fee. For the period, the service fee is based on an annual rate of .10% of Service Class' average net assets and .25% of Service Class 2's and Service Class 2R's average net assets.
For the period, total fees, all of which were re-allowed to insurance companies for the distribution of shares and providing shareholder support services were as follows:
Service Class | $ 1,712,276 |
Service Class 2 | 18,246,088 |
Service Class 2R | 28,087 |
| $ 19,986,451 |
Annual Report
7. Fees and Other Transactions with Affiliates - continued
Transfer Agent Fees. Fidelity Investments Institutional Operations Company, Inc. (FIIOC), an affiliate of FMR, is the Fund's transfer, dividend disbursing, and shareholder servicing agent. FIIOC receives an asset-based fee with respect to each class. Each class (with the exception of Investor Class) pays a transfer agent fee, excluding out of pocket expenses, equal to an annual rate of .07% of average net assets. Investor Class pays a monthly asset-based transfer agent fee of .15% of average net assets. In addition, FIIOC receives an asset-based fee of 0.1% of average net assets for typesetting, printing and mailing of shareholder reports, except proxy statements. FIIOC has agreed to voluntarily waive this fee until December 31, 2010. (See Note 10: Expense Reductions.) For the period, transfer agent fees for each class, including printing and out of pocket expenses, were as follows:
Initial Class | $ 5,379,310 |
Service Class | 1,282,122 |
Service Class 2 | 5,454,438 |
Service Class 2R | 8,366 |
Investor Class | 778,847 |
| $ 12,903,083 |
Accounting and Security Lending Fees. Fidelity Service Company, Inc. (FSC), an affiliate of FMR, maintains the Fund's accounting records. The accounting fee is based on the level of average net assets for the month. Under a separate contract, FSC administers the security lending program. The security lending fee is based on the number and duration of lending transactions.
Brokerage Commissions. The Fund placed a portion of its portfolio transactions with brokerage firms which are affiliates of the investment adviser. The commissions paid to these affiliated firms were $701,932 for the period.
8. Committed Line of Credit.
The Fund participates with other funds managed by FMR or an affiliate in a $3.75 billion credit facility (the "line of credit") to be utilized for temporary or emergency purposes to fund shareholder redemptions or for other short-term liquidity purposes. The Fund has agreed to pay commitment fees on its pro-rata portion of the line of credit, which amounted to $65,968 and is reflected in Miscellaneous expenses on the Statement of Operations. During the period, there were no borrowings on this line of credit.
9. Security Lending.
The Fund lends portfolio securities through a lending agent from time to time in order to earn additional income. The lending agent may loan securities to certain qualified borrowers, including Fidelity Capital Markets (FCM), a broker-dealer affiliated with the Fund. On the settlement date of the loan, the Fund receives collateral (in the form of U.S. Treasury obligations, letters of credit and/or cash) against the loaned securities and maintains collateral in an amount not less than 100% of the market value of the loaned securities during the period of the loan. The market value of the loaned securities is determined at the close of business of the Fund and any additional required collateral is delivered to the Fund on the next business day. If the borrower defaults on its obligation to return the securities loaned because of insolvency or other reasons, a fund could experience delays and costs in recovering the securities loaned or in gaining access to the collateral. Any cash collateral received is invested in the Fidelity Securities Lending Cash Central Fund. The value of loaned securities and cash collateral at period end are disclosed on the Fund's Statement of Assets and Liabilities. At period end, there were no security loans outstanding with FCM. Security lending income represents the income earned on investing cash collateral, less rebates paid to borrowers and lending agent fees associated with the loan, plus any premium payments received for lending certain types of securities. Security lending income is presented in the Statement of Operations as a component of income from Fidelity Central Funds. Total security lending income during the period amounted to $1,994,618, including $430 from securities loaned to FCM.
10. Expense Reductions.
FMR or its affiliates agreed to waive certain fees during the period as noted in the table below.
Initial Class | $ 521,337 |
Service Class | 124,035 |
Service Class 2 | 529,085 |
Service Class 2R | 813 |
Investor Class | 35,260 |
| $ 1,210,530 |
Many of the brokers with whom FMR places trades on behalf of the Fund provided services to the Fund in addition to trade execution. These services included payments of certain expenses on behalf of the Fund totaling $2,400,919 for the period.
Annual Report
Notes to Financial Statements - continued
11. Distributions to Shareholders.
Distributions to shareholders of each class were as follows:
Years ended December 31, | 2010 | 2009 |
From net investment income | | |
Initial Class | $ 82,141,064 | $ 89,825,612 |
Service Class | 14,096,830 | 20,191,848 |
Service Class 2 | 71,159,779 | 76,591,597 |
Service Class 2R | 100,197 | 133,806 |
Investor Class | 6,111,872 | 5,150,312 |
Total | $ 173,609,742 | $ 191,893,175 |
From net realized gain | | |
Initial Class | $ 2,975,123 | $ 1,784,525 |
Service Class | 575,173 | 432,148 |
Service Class 2 | 3,224,769 | 1,851,990 |
Service Class 2R | 4,617 | 3,263 |
Investor Class | 236,128 | 109,864 |
Total | $ 7,015,810 | $ 4,181,790 |
12. Share Transactions.
Transactions for each class of shares were as follows:
| Shares | Dollars |
Years ended December 31, | 2010 | 2009 | 2010 | 2009 |
Initial Class | | | | |
Shares sold | 11,081,201 | 14,081,895 | $ 237,555,506 | $ 237,639,561 |
Reinvestment of distributions | 3,639,831 | 4,636,839 | 85,116,187 | 91,610,137 |
Shares redeemed | (74,008,339) | (65,265,249) | (1,628,773,596) | (1,075,039,384) |
Net increase (decrease) | (59,287,307) | (46,546,515) | $ (1,306,101,903) | $ (745,789,686) |
Service Class | | | | |
Shares sold | 4,235,533 | 6,280,159 | $ 89,409,017 | $ 104,665,220 |
Reinvestment of distributions | 631,651 | 1,049,443 | 14,672,003 | 20,623,996 |
Shares redeemed | (33,788,989) | (18,151,640) | (763,918,858) | (296,874,025) |
Net increase (decrease) | (28,921,805) | (10,822,038) | $ (659,837,838) | $ (171,584,809) |
Service Class 2 | | | | |
Shares sold | 29,628,488 | 57,118,843 | $ 621,610,993 | $ 927,455,049 |
Reinvestment of distributions | 3,238,949 | 4,056,980 | 74,384,548 | 78,443,587 |
Shares redeemed | (81,615,457) | (96,296,164) | (1,716,672,110) | (1,585,826,463) |
Net increase (decrease) | (48,748,020) | (35,120,341) | $ (1,020,676,569) | $ (579,927,827) |
Service Class 2R | | | | |
Shares sold | 104,398 | 142,133 | $ 2,198,967 | $ 2,366,097 |
Reinvestment of distributions | 4,580 | 7,152 | 104,814 | 137,069 |
Shares redeemed | (298,461) | (392,336) | (6,070,211) | (6,296,651) |
Net increase (decrease) | (189,483) | (243,051) | $ (3,766,430) | $ (3,793,485) |
Investor Class | | | | |
Shares sold | 3,515,764 | 2,899,284 | $ 76,017,353 | $ 50,858,034 |
Reinvestment of distributions | 272,002 | 266,531 | 6,348,000 | 5,260,176 |
Shares redeemed | (2,058,150) | (2,091,088) | (42,962,962) | (32,554,641) |
Net increase (decrease) | 1,729,616 | 1,074,727 | $ 39,402,391 | $ 23,563,569 |
13. Other.
The Fund's organizational documents provide former and current trustees and officers with a limited indemnification against liabilities arising in connection with the performance of their duties to the Fund. In the normal course of business, the Fund may also enter into contracts that provide general indemnifications. The Fund's maximum exposure under these arrangements is unknown as this would be dependent on future claims that may be made against the Fund. The risk of material loss from such claims is considered remote.
At the end of the period, FMR or its affiliates were the owners of record of 10% of the total outstanding shares of the Fund and two otherwise unaffiliated shareholders were the owners of record of 29% of the total outstanding shares of the Fund.
Annual Report
Report of Independent Registered Public Accounting Firm
To the Trustees of Variable Insurance Products Fund II and Shareholders of VIP Contrafund Portfolio:
We have audited the accompanying statement of assets and liabilities of VIP Contrafund Portfolio (the Fund), a fund of Variable Insurance Products Fund II, including the schedule of investments, as of December 31, 2010, and the related statement of operations for the year then ended, the statement of changes in net assets for each of the two years in the period then ended, and the financial highlights for each of the five years in the period then ended. These financial statements and financial highlights are the responsibility of the Fund's management. Our responsibility is to express an opinion on these financial statements and financial highlights based on our audits.
We conducted our audits in accordance with the standards of the Public Company Accounting Oversight Board (United States). Those standards require that we plan and perform the audit to obtain reasonable assurance about whether the financial statements and financial highlights are free of material misstatement. The Fund is not required to have, nor were we engaged to perform, an audit of its internal control over financial reporting. Our audits included consideration of internal control over financial reporting as a basis for designing audit procedures that are appropriate in the circumstances, but not for the purpose of expressing an opinion on the effectiveness of the Fund's internal control over financial reporting. Accordingly, we express no such opinion. An audit also includes examining, on a test basis, evidence supporting the amounts and disclosures in the financial statements, assessing the accounting principles used and significant estimates made by management, as well as evaluating the overall financial statement presentation. Our procedures included confirmation of securities owned as of December 31, 2010, by correspondence with the custodians and brokers where replies were not received from brokers, we performed other auditing procedures. We believe that our audits provide a reasonable basis for our opinion.
In our opinion, the financial statements and financial highlights referred to above present fairly, in all material respects, the financial position of VIP Contrafund Portfolio as of December 31, 2010, the results of its operations for the year then ended, the changes in its net assets for each of the two years in the period then ended, and the financial highlights for each of the five years in the period then ended, in conformity with accounting principles generally accepted in the United States of America.
/s/ Deloitte & Touche LLP
DELOITTE & TOUCHE LLP
Boston, Massachusetts
February 15, 2011
Annual Report
The Trustees, Members of the Advisory Board, and executive officers of the trust and fund, as applicable, are listed below. The Board of Trustees governs the fund and is responsible for protecting the interests of shareholders. The Trustees are experienced executives who meet periodically throughout the year to oversee the fund's activities, review contractual arrangements with companies that provide services to the fund, oversee management of the risks associated with such activities and contractual arrangements, and review the fund's performance. Except for James C. Curvey, each of the Trustees oversees 219 funds advised by FMR or an affiliate. Mr. Curvey oversees 408 funds advised by FMR or an affiliate.
The Trustees hold office without limit in time except that (a) any Trustee may resign; (b) any Trustee may be removed by written instrument, signed by at least two-thirds of the number of Trustees prior to such removal; (c) any Trustee who requests to be retired or who has become incapacitated by illness or injury may be retired by written instrument signed by a majority of the other Trustees; and (d) any Trustee may be removed at any special meeting of shareholders by a two-thirds vote of the outstanding voting securities of the trust. Each Trustee who is not an interested person (as defined in the 1940 Act) (Independent Trustee), shall retire not later than the last day of the calendar year in which his or her 72nd birthday occurs. The Independent Trustees may waive this mandatory retirement age policy with respect to individual Trustees. The executive officers and Advisory Board Members hold office without limit in time, except that any officer and Advisory Board Member may resign or may be removed by a vote of a majority of the Trustees at any regular meeting or any special meeting of the Trustees. Except as indicated, each individual has held the office shown or other offices in the same company for the past five years.
Experience, Skills, Attributes, and Qualifications of the Fund's Trustees. The Governance and Nominating Committee has adopted a statement of policy that describes the experience, qualifications, attributes, and skills that are necessary and desirable for potential Independent Trustee candidates (Statement of Policy). The Board believes that each Trustee satisfied at the time he or she was initially elected or appointed a Trustee, and continues to satisfy, the standards contemplated by the Statement of Policy. The Governance and Nominating Committee also engages professional search firms to help identify potential Independent Trustee candidates who have the experience, qualifications, attributes, and skills consistent with the Statement of Policy. From time to time, additional criteria based on the composition and skills of the current Independent Trustees, as well as experience or skills that may be appropriate in light of future changes to board composition, business conditions, and regulatory or other developments, have also been considered by the professional search firms and the Governance and Nominating Committee. In addition, the Board takes into account the Trustees' commitment and participation in Board and committee meetings, as well as their leadership of standing and ad hoc committees throughout their tenure.
In determining that a particular Trustee was and continues to be qualified to serve as a Trustee, the Board has considered a variety of criteria, none of which, in isolation, was controlling. The Board believes that, collectively, the Trustees have balanced and diverse experience, qualifications, attributes, and skills, which allow the Board to operate effectively in governing the fund and protecting the interests of shareholders. Information about the specific experience, skills, attributes, and qualifications of each Trustee, which in each case led to the Board's conclusion that the Trustee should serve (or continue to serve) as a trustee of the fund, is provided below.
Board Structure and Oversight Function. James C. Curvey is an interested person (as defined in the 1940 Act) and currently serves as Acting Chairman. The Trustees have determined that an interested Chairman is appropriate and benefits shareholders because an interested Chairman has a personal and professional stake in the quality and continuity of services provided to the fund. Independent Trustees exercise their informed business judgment to appoint an individual of their choosing to serve as Chairman, regardless of whether the Trustee happens to be independent or a member of management. The Independent Trustees have determined that they can act independently and effectively without having an Independent Trustee serve as Chairman and that a key structural component for assuring that they are in a position to do so is for the Independent Trustees to constitute a substantial majority for the Board. The Independent Trustees also regularly meet in executive session. Ned C. Lautenbach serves as Chairman of the Independent Trustees and as such (i) acts as a liaison between the Independent Trustees and management with respect to matters important to the Independent Trustees and (ii) with management prepares agendas for Board meetings.
Fidelity funds are overseen by different Boards of Trustees. The fund's Board oversees Fidelity's equity and high income funds and another Board oversees Fidelity's investment-grade bond, money market, and asset allocation funds. The asset allocation funds may invest in Fidelity funds overseen by the fund's Board. The use of separate Boards, each with its own committee structure, allows the Trustees of each group of Fidelity funds to focus on the unique issues of the funds they oversee, including common research, investment, and operational issues. On occasion, the separate Boards establish joint committees to address issues of overlapping consequences for the Fidelity funds overseen by each Board.
The Trustees operate using a system of committees to facilitate the timely and efficient consideration of all matters of importance to the Trustees, the fund, and fund shareholders and to facilitate compliance with legal and regulatory requirements and oversight of the fund's activities and associated risks. The Board, acting through its committees, has charged FMR and its affiliates with (i) identifying events or circumstances the occurrence of which could have demonstrably adverse effects on the fund's business and/or reputation; (ii) implementing processes and controls to lessen the possibility that such events or circumstances occur or to mitigate the effects of such events or circumstances if they do occur; and (iii) creating and maintaining a system designed to evaluate continuously business and market conditions in order to facilitate the identification and implementation processes described in (i) and (ii) above. Because the day-to-day operations and activities of the fund are carried out by or through FMR, its affiliates and other service providers, the fund's exposure to risks is mitigated but not eliminated by the processes overseen by the Trustees. While each of the Board's committees has responsibility for overseeing different aspects of the fund's activities, oversight is exercised primarily through the Operations, Audit, and Compliance Committees. Appropriate personnel, including but not limited to the fund's Chief Compliance Officer (CCO), FMR's internal auditor, the independent accountants, the fund's Treasurer and portfolio management personnel, make periodic reports to the Board's committees, as appropriate. The responsibilities of each committee, including their oversight responsibilities, are described further under "Standing Committees of the Fund's Trustees."
Annual Report
The fund's Statement of Additional Information (SAI) includes more information about the Trustees. To request a free copy, call Fidelity at 1-877-208-0098.
Interested Trustees*:
Correspondence intended for each Trustee who is an interested person may be sent to Fidelity Investments, 82 Devonshire Street, Boston, Massachusetts 02109.
Name, Age; Principal Occupations and Other Relevant Experience+ |
James C. Curvey (75) |
| Year of Election or Appointment: 2007 Mr. Curvey is Trustee and Acting Chairman of the Board of Trustees of certain Trusts. Mr. Curvey also serves as Trustee (2007-present) of other investment companies advised by FMR. Mr. Curvey is a Director of Fidelity Investments Money Management, Inc. (2009-present), Director of Fidelity Research & Analysis Co. (2009-present) and Director of FMR and FMR Co., Inc. (2007-present). Mr. Curvey is also Vice Chairman (2007-present) and Director of FMR LLC. In addition, Mr. Curvey serves as an Overseer for the Boston Symphony Orchestra and a member of the Trustees of Villanova University. Previously, Mr. Curvey was the Vice Chairman (2006-2007) and Director (2000-2007) of FMR Corp. |
Ronald P. O'Hanley (54) |
| Year of Election or Appointment: 2011 Mr. O'Hanley is President of Fidelity Asset Management and Corporate Services and a member of Fidelity's Executive Committee (2010-present). Previously, Mr. O'Hanley served as President and Chief Executive Officer of BNY Mellon Asset Management (2007-2010). Mr. O'Hanley also served as Vice Chairman of Bank New York Mellon Corp. and a member of that firm's Executive Committee. Prior to the 2007 merger of The Bank of New York and Mellon Financial Corporation, he was Vice Chairman of Mellon Financial Corporation and President and Chief Executive Officer of Mellon Asset Management. He joined Mellon in February 1997. Mr. O'Hanley currently serves as Chairman of the Boston Public Library Foundation Board of Directors and sits on the Board of Directors of Beth Israel Deaconess Medical Center, the Board of Trustees of the Marine Biological Laboratory and the Advisory Board of the Maxwell School of Citizenship and Public Administration at Syracuse University. Mr. O'Hanley also chairs the Council on Asset Management for the Financial Services Roundtable and is a member of the Board of Directors of Institutional Investor's U.S. Institute. |
* Trustees have been determined to be "Interested Trustees" by virtue of, among other things, their affiliation with the trust or various entities under common control with FMR.
+ The information above includes each Trustee's principal occupation during the last five years and other information relating to the experience, attributes, and skills relevant to each Trustee's qualifications to serve as a Trustee, which led to the conclusion that each Trustee should serve as a Trustee for the fund.
Independent Trustees:
Correspondence intended for each Independent Trustee (that is, the Trustees other than the Interested Trustees) may be sent to Fidelity Investments, P.O. Box 55235, Boston, Massachusetts 02205-5235.
Name, Age; Principal Occupations and Other Relevant Experience+ |
Dennis J. Dirks (62) |
| Year of Election or Appointment: 2005 Prior to his retirement in May 2003, Mr. Dirks was Chief Operating Officer and a member of the Board of The Depository Trust & Clearing Corporation (DTCC). He also served as President, Chief Operating Officer, and Board member of The Depository Trust Company (DTC) and President and Board member of the National Securities Clearing Corporation (NSCC). In addition, Mr. Dirks served as Chief Executive Officer and Board member of the Government Securities Clearing Corporation, Chief Executive Officer and Board member of the Mortgage-Backed Securities Clearing Corporation, as a Trustee and a member of the Finance Committee of Manhattan College (2005-2008), and as a Trustee and a member of the Finance Committee of AHRC of Nassau County (2006-2008). Mr. Dirks is a member of the Independent Directors Council (IDC) Governing Council (2010-Present) and Board of Directors for The Brookville Center for Children's Services, Inc. (2009-present). |
Alan J. Lacy (57) |
| Year of Election or Appointment: 2008 Mr. Lacy serves as Senior Adviser (2007-present) of Oak Hill Capital Partners, L.P. (private equity). Mr. Lacy also served as Chief Executive Officer (2000-2005) and Vice Chairman (2005-2006) of Sears Holdings Corporation and Sears, Roebuck and Co. (retail). In addition, Mr. Lacy serves as a member of the Board of Directors of The Western Union Company (global money transfer, 2006-present) and Bristol-Myers Squibb Company (global pharmaceuticals, 2007-present). Mr. Lacy is Chairman (2008-present) and a member (2006-present) of the Board of Trustees of The National Parks Conservation Association. |
Ned C. Lautenbach (66) |
| Year of Election or Appointment: 2000 Mr. Lautenbach is Chairman of the Independent Trustees of the Equity and High Income Funds (2006-present). Mr. Lautenbach currently serves as the Lead Director of the Eaton Corporation Board of Directors (diversified industrial, 1997-present). Mr. Lautenbach is also a member of the Board of Directors of the Philharmonic Center for the Arts in Naples, Florida (1999-present); a member of the Board of Trustees of Fairfield University (2005-present); and a member of the Council on Foreign Relations (1994-present). Previously, Mr. Lautenbach was a Partner/Advisory Partner at Clayton, Dubilier & Rice, Inc. (private equity investment, 1998-2010), as well as a Director of Sony Corporation (2006-2007). |
Joseph Mauriello (66) |
| Year of Election or Appointment: 2008 Prior to his retirement in January 2006, Mr. Mauriello served in numerous senior management positions including Deputy Chairman and Chief Operating Officer (2004-2005), and Vice Chairman of Financial Services (2002-2004) of KPMG LLP US (professional services, 1965-2005). Mr. Mauriello currently serves as a member of the Board of Directors of XL Group plc. (global insurance and re-insurance, 2006-present) and of Arcadia Resources Inc. (health care services and products, 2007-present). Previously, Mr. Mauriello served as a Director of the Hamilton Funds of the Bank of New York (2006-2007). |
Cornelia M. Small (66) |
| Year of Election or Appointment: 2005 Ms. Small is a member of the Board of Directors of the Teagle Foundation (2009-present). Ms. Small is also a member of the Investment Committee, and Chair (2008-present) and a member of the Board of Trustees of Smith College. In addition, Ms. Small serves on the Investment Committee of the Berkshire Taconic Community Foundation (2008-present). Previously, Ms. Small served as Chairperson of the Investment Committee (2002-2008) of Smith College. In addition, Ms. Small served as Chief Investment Officer, Director of Global Equity Investments, and a member of the Board of Directors of Scudder, Stevens & Clark and Scudder Kemper Investments. |
William S. Stavropoulos (71) |
| Year of Election or Appointment: 2001 Mr. Stavropoulos is Vice Chairman of the Independent Trustees of the Equity and High Income Funds (2006-present). Mr. Stavropoulos serves as President and Founder of the Michigan Baseball Foundation, the Great Lakes Loons (2007-present). Mr. Stavropoulos is Chairman Emeritus of the Board of Directors of The Dow Chemical Company, where he previously served in numerous senior management positions, including President, CEO (1995-2000; 2002-2004), Chairman of the Executive Committee (2000-2006), and as a member of the Board of Directors (1990-2006). Currently, Mr. Stavropoulos is Chairman of Univar (global distributor of commodity and specialty chemicals, 2010-present), a Director of Teradata Corporation (data warehousing and technology solutions, 2008-present), Chemical Financial Corporation, Maersk Inc. (industrial conglomerate), Tyco International, Inc. (multinational manufacturing and services, 2007-present), and a member of the Advisory Board for Metalmark Capital (private equity investment, 2005-present). Mr. Stavropoulos is a special advisor to Clayton, Dubilier & Rice, LLC (private equity investment). In addition, Mr. Stavropoulos is a member of the University of Notre Dame Advisory Council for the College of Science. |
David M. Thomas (61) |
| Year of Election or Appointment: 2008 Previously, Mr. Thomas served as Executive Chairman (2005-2006) and Chairman and Chief Executive Officer (2000-2005) of IMS Health, Inc. (pharmaceutical and healthcare information solutions). In addition, Mr. Thomas serves as a member of the Board of Directors of Fortune Brands, Inc. (consumer products), and Interpublic Group of Companies, Inc. (marketing communication, 2004-present). |
Michael E. Wiley (60) |
| Year of Election or Appointment: 2008 Mr. Wiley also serves as a Director of Asia Pacific Exploration Consolidated (international oil and gas exploration and production, 2008-present). Mr. Wiley serves as a Director of Tesoro Corporation (independent oil refiner and marketer, 2005-present), and a Director of Bill Barrett Corporation (exploration and production, 2005-present). In addition, Mr. Wiley also serves as a Director of Post Oak Bank (privately-held bank, 2004-present). Previously, Mr. Wiley served as a member of the Board of Trustees of the University of Tulsa (2000-2006; 2007-2010), as a Senior Energy Advisor of Katzenbach Partners, LLC (consulting, 2006-2007), as an Advisory Director of Riverstone Holdings (private investment), Chairman, President, and CEO of Baker Hughes, Inc. (oilfield services, 2000-2004), and as Director of Spinnaker Exploration Company (exploration and production, 2001-2005). |
+ The information above includes each Trustee's principal occupation during the last five years and other information relating to the experience, attributes, and skills relevant to each Trustee's qualifications to serve as a Trustee, which led to the conclusion that each Trustee should serve as a Trustee for the fund.
Advisory Board Members and Executive Officers:
Correspondence intended for each executive officer, Edward C. Johnson 3d, and Peter S. Lynch may be sent to Fidelity Investments, 82 Devonshire Street, Boston, Massachusetts 02109.
Name, Age; Principal Occupation |
Edward C. Johnson 3d (80) |
| Year of Election or Appointment: 2011 Member of the Advisory Board of Fidelity's Equity and High Income Funds. Formerly Trustee and Chairman of the Board of Trustees of certain Trusts, Mr. Johnson serves as Chief Executive Officer, Chairman, and a Director of FMR LLC; Chairman and a Director of FMR; and Chairman and a Director of FMR Co., Inc. In addition, Mr. Johnson serves as Chairman and Director of FIL Limited. Previously, Mr. Johnson served as President of FMR LLC (2006-2007). |
Peter S. Lynch (66) |
| Year of Election or Appointment: 2003 Member of the Advisory Board of Fidelity's Equity and High Income Funds. Mr. Lynch is Vice Chairman and a Director of FMR and FMR Co., Inc. In addition, Mr. Lynch serves as a Trustee of Boston College and as the Chairman of the Inner-City Scholarship Fund. Previously, Mr. Lynch served on the Special Olympics International Board of Directors (1997-2006). |
Kenneth B. Robins (41) |
| Year of Election or Appointment: 2008 President and Treasurer of Fidelity's Equity and High Income Funds. Mr. Robins also serves as President and Treasurer (2010-present) and Assistant Treasurer (2009-present) of other Fidelity funds and is an employee of Fidelity Investments (2004-present). Previously, Mr. Robins served as Deputy Treasurer of the Fidelity funds (2005-2008) and Treasurer and Chief Financial Officer of The North Carolina Capital Management Trust: Cash and Term Portfolios (2006-2008). |
Bruce T. Herring (45) |
| Year of Election or Appointment: 2006 Vice President of certain Equity Funds. Mr. Herring also serves as Chief Investment Officer and Director of Fidelity Management & Research (U.K.) Inc. (2010-present) and Group Chief Investments Officer of FMR. Previously, Mr. Herring served as Vice President (2005-2006) and Senior Vice President (2006-2007) of Fidelity Management & Research Company, Vice President of FMR Co., Inc. (2001-2007) and as a portfolio manager for Fidelity U.S. Equity Funds. |
Brian B. Hogan (46) |
| Year of Election or Appointment: 2009 Vice President of certain Equity Funds and Vice President of Sector Funds. Mr. Hogan also serves as President of FMR's Equity Division (2009-present). Previously, Mr. Hogan served as Senior Vice President, Equity Research of FMR (2006-2009) and as a portfolio manager. |
Scott C. Goebel (42) |
| Year of Election or Appointment: 2008 Secretary and Chief Legal Officer (CLO) of the Fidelity funds. Mr. Goebel also serves as Secretary and CLO of The North Carolina Capital Management Trust: Cash and Term Portfolio (2008-present); General Counsel, Secretary, and Senior Vice President of FMR (2008-present) and FMR Co., Inc. (2008-present); Deputy General Counsel of FMR LLC; Chief Legal Officer of Fidelity Management & Research (Hong Kong) Limited (2008-present) and Assistant Secretary of Fidelity Management & Research (Japan) Inc. (2008-present), Fidelity Investments Money Management, Inc. (2008-present), Fidelity Management & Research (U.K.) Inc. (2008-present), and Fidelity Research and Analysis Company (2008-present). Previously, Mr. Goebel served as Assistant Secretary of the Funds (2007-2008) and as Vice President and Secretary of Fidelity Distributors Corporation (FDC) (2005-2007). |
William C. Coffey (41) |
| Year of Election or Appointment: 2009 Assistant Secretary of Fidelity's Equity and High Income Funds. Mr. Coffey also serves as Senior Vice President and Deputy General Counsel of FMR LLC (2010-present), and is an employee of Fidelity Investments. Previously, Mr. Coffey served as Vice President and Associate General Counsel of FMR LLC (2005-2009). |
Holly C. Laurent (56) |
| Year of Election or Appointment: 2008 Anti-Money Laundering (AML) Officer of the Fidelity funds. Ms. Laurent also serves as AML Officer of The North Carolina Capital Management Trust: Cash and Term Portfolio (2008-present) and is an employee of Fidelity Investments. Previously, Ms. Laurent was Senior Vice President and Head of Legal for Fidelity Business Services India Pvt. Ltd. (2006-2008), and Senior Vice President, Deputy General Counsel and Group Head for FMR LLC (2005-2006). |
Christine Reynolds (52) |
| Year of Election or Appointment: 2008 Chief Financial Officer of the Fidelity funds. Ms. Reynolds became President of Fidelity Pricing and Cash Management Services (FPCMS) in August 2008. Ms. Reynolds served as Chief Operating Officer of FPCMS (2007-2008). Previously, Ms. Reynolds served as President, Treasurer, and Anti-Money Laundering officer of the Fidelity funds (2004-2007). |
Kenneth A. Rathgeber (63) |
| Year of Election or Appointment: 2004 Chief Compliance Officer of Fidelity's Equity and High Income Funds. Mr. Rathgeber is Chief Compliance Officer of Fidelity Management & Research (Hong Kong) Limited (2008-present), Fidelity Management & Research (Japan) Inc. (2008-present), FMR (2005-present), FMR Co., Inc. (2005-present), Fidelity Management & Research (U.K.) Inc. (2005-present), Fidelity Research & Analysis Company (2005-present), Fidelity Investments Money Management, Inc. (2005-present), Pyramis Global Advisors, LLC (2005-present), and Strategic Advisers, Inc. (2005-present). |
Jeffrey S. Christian (49) |
| Year of Election or Appointment: 2009 Deputy Treasurer of the Fidelity funds. Mr. Christian is an employee of Fidelity Investments. Previously, Mr. Christian served as Chief Financial Officer (2008-2009) of certain Fidelity funds and Senior Vice President of Fidelity Pricing and Cash Management Services (FPCMS) (2004-2009). |
Bryan A. Mehrmann (49) |
| Year of Election or Appointment: 2005 Deputy Treasurer of the Fidelity funds. Mr. Mehrmann is an employee of Fidelity Investments. |
Adrien E. Deberghes (43) |
| Year of Election or Appointment: 2008 Deputy Treasurer of Fidelity's Equity and High Income Funds. Mr. Deberghes also serves as Assistant Treasurer of other Fidelity funds (2010-present) and is an employee of Fidelity Investments (2008-present). Previously, Mr. Deberghes served as Senior Vice President of Mutual Fund Administration at State Street Corporation (2007-2008), Senior Director of Mutual Fund Administration at Investors Bank & Trust (2005-2007), and Director of Finance for Dunkin' Brands (2000-2005). |
Stephanie J. Dorsey (41) |
| Year of Election or Appointment: 2010 Assistant Treasurer of Fidelity's Equity and High Income Funds. Ms. Dorsey also serves as Deputy Treasurer of other Fidelity funds (2008-present) and is an employee of Fidelity Investments (2008-present). Previously, Ms. Dorsey served as Treasurer (2004-2008) of the JPMorgan Mutual Funds and Vice President (2004-2008) of JPMorgan Chase Bank. |
John R. Hebble (52) |
| Year of Election or Appointment: 2009 Assistant Treasurer of Fidelity's Equity and High Income Funds. Mr. Hebble also serves as Treasurer and Chief Financial Officer of The North Carolina Capital Management Trust: Cash and Term Portfolio (2008-present), President and Treasurer of other Fidelity funds (2008-present) and is an employee of Fidelity Investments. |
Gary W. Ryan (52) |
| Year of Election or Appointment: 2005 Assistant Treasurer of the Fidelity funds. Mr. Ryan is an employee of Fidelity Investments. Previously, Mr. Ryan served as Vice President of Fund Reporting in Fidelity Pricing and Cash Management Services (FPCMS) (1999-2005). |
Jonathan Davis (42) |
| Year of Election or Appointment: 2010 Assistant Treasurer of the Fidelity funds. Mr. Davis is an employee of Fidelity Investments. Previously, Mr. Davis served as Vice President and Associate General Counsel of FMR LLC (2003-2010). |
Annual Report
Service Class 2R designates 100% of the dividends distributed during the fiscal year as qualifying for the dividends received deduction for corporate shareholders.
Annual Report
Board Approval of Investment Advisory Contracts and Management Fees
VIP Contrafund Portfolio
Each year, the Board of Trustees, including the Independent Trustees (together, the Board), votes on the renewal of the management contract and sub-advisory agreements (together, the Advisory Contracts) for the fund. The Board, assisted by the advice of fund counsel and Independent Trustees' counsel, requests and considers a broad range of information relevant to the renewal of the Advisory Contracts throughout the year.
The Board meets regularly and considers at each of its meetings factors that are relevant to its annual consideration of the renewal of the fund's Advisory Contracts, including the services and support provided to the fund and its shareholders. The Board has established various standing committees, each composed of Independent Trustees with varying backgrounds, to which the Board has assigned specific subject matter responsibilities in order to enhance effective decision-making by the Board. The Board, acting directly and through its Committees, requests and receives information concerning the annual consideration of the renewal of the fund's Advisory Contracts. The Board also meets as needed to consider matters specifically related to the Board's annual consideration of the renewal of Advisory Contracts. Members of the Board may also meet with trustees of other Fidelity funds through ad hoc joint committees to discuss certain matters relevant to the Fidelity funds.
At its July 2010 meeting, the Board of Trustees, including the Independent Trustees, unanimously determined to renew the fund's Advisory Contracts. In reaching its determination, the Board considered all factors it believed relevant, including (i) the nature, extent, and quality of the services to be provided to the fund and its shareholders (including the investment performance of the fund); (ii) the competitiveness of the fund's management fee and total expenses; (iii) the total costs of the services to be provided by and the profits to be realized by Fidelity from its relationship with the fund; (iv) the extent to which economies of scale would be realized as the fund grows; and (v) whether fee levels reflect these economies of scale, if any, for the benefit of fund shareholders.
In considering whether to renew the Advisory Contracts for the fund, the Board reached a determination, with the assistance of fund counsel and Independent Trustees' counsel and through the exercise of its business judgment, that the renewal of the Advisory Contracts is in the best interests of fund shareholders and that the compensation to be received by Fidelity under the management contract is fair and reasonable. The Board's decision to renew the Advisory Contracts was not based on any single factor noted above, but rather was based on a comprehensive consideration of all the information provided to the Board at its meetings throughout the year. The Board, in reaching its determination to renew the Advisory Contracts, is aware that shareholders in the fund have a broad range of investment choices available to them, including a wide choice among mutual funds offered by Fidelity's competitors, and that the fund's shareholders, with the opportunity to review and weigh the disclosure provided by the fund in its prospectus and other public disclosures, have chosen to invest in this fund, managed by Fidelity.
Nature, Extent, and Quality of Services Provided. The Board considered the staffing within the investment adviser, FMR, and the sub-advisers (together, the Investment Advisers), including the backgrounds of the fund's investment personnel and the fund's investment objective and discipline. The Independent Trustees also had discussions with senior management of Fidelity's investment operations and investment groups. The Board considered the structure of the portfolio manager compensation program and whether this structure provides appropriate incentives to act in the best interest of the fund.
Resources Dedicated to Investment Management and Support Services. The Board and the equity research subcommittee of the Board's Fund Oversight Committee reviewed the size, education, and experience of the Investment Advisers' investment staff, their use of technology, and the Investment Advisers' approach to recruiting, training, and retaining portfolio managers and other research, advisory, and management personnel. The Board noted that Fidelity's analysts have access to a variety of technological tools and market and securities data that enable them to perform both fundamental and quantitative analysis and to specialize in various disciplines. The Board considered Fidelity's extensive global research capabilities that enable the Investment Advisers to aggregate data from various sources in an effort to produce positive investment results. The Board also considered that Fidelity's portfolio managers and analysts have access to daily portfolio attribution that allows for monitoring of a fund's portfolio, as well as an electronic communication system that provides immediate real-time access to research concerning issuers and credit enhancers. The Board noted FMR's continued focus on strengthening the organization and discipline of equity portfolio management and research.
Shareholder and Administrative Services. The Board considered (i) the nature, extent, quality, and cost of advisory, administrative, and shareholder services performed by the Investment Advisers and their affiliates under the Advisory Contracts and under separate agreements covering transfer agency, pricing and bookkeeping, and securities lending services for the fund; (ii) the nature and extent of the investment adviser's supervision of third party service providers, principally custodians and subcustodians; and (iii) the resources devoted to, and the record of compliance with, the fund's compliance policies and procedures. The Board also reviewed the allocation of fund brokerage, including allocations to brokers affiliated with the Investment Advisers, the use of brokerage commissions to pay fund expenses, and the use of "soft" commission dollars to pay for research services.
The Board noted that the growth of fund assets over time across the complex allows Fidelity to reinvest in the development of services designed to enhance the value or convenience of the Fidelity funds as investment vehicles. These services include 24-hour access to account information and market information through phone representatives and over the Internet, and investor education materials and asset allocation tools.
Investment in a Large Fund Family. The Board considered the benefits to shareholders of investing in a Fidelity fund, including the benefits of investing in a fund that is part of a large family of funds offering a variety of investment disciplines and providing a large variety of mutual fund investor services. The Board noted that Fidelity had taken, or had made recommendations that resulted in the Fidelity funds taking, a number of actions over the previous year that benefited particular funds, including (i) dedicating additional resources to investment research and restructuring and broadening the focus of the investment research teams; (ii) bolstering the senior management team that oversees asset management; (iii) launching Class F of certain funds as a lower-fee class available to Freedom K and Freedom Index Funds; (iv) lowering the initial investment minimums and ongoing balance requirements for Real Estate High Income Fund; (v) eliminating subsequent purchase minimums for all funds and adding a waiver of the investment minimum requirement for new accounts opened with the proceeds of a systematic withdrawal plan; (vi) eliminating the withdrawal minimum and maximum limits for systematic withdrawals from Advisor funds; (vii) expanding sales load waivers on Class A shares for Destiny Planholders and expanding Institutional Class eligibility for Class O Destiny Planholders; and (viii) changing certain Class A and Class T sales charge structures to further align them with industry practices.
Annual Report
Board Approval of Investment Advisory Contracts and Management Fees - continued
Investment Performance. The Board considered whether the fund has operated in accordance with its investment objective, as well as its record of compliance with its investment restrictions. It also reviewed the fund's absolute investment performance for each class, as well as the fund's relative investment performance for each class measured over multiple periods against (i) a broad-based securities market index, and (ii) a custom peer group of mutual funds deemed appropriate by Fidelity and reviewed by the Board. The following charts considered by the Board show, over the one-, three-, and five-year periods ended December 31, 2009, the cumulative total returns of Initial Class and Service Class 2 of the fund, the cumulative total returns of a broad-based securities market index ("benchmark"), and a range of cumulative total returns of a custom peer group of mutual funds defined by FMR based on categories assigned by Morningstar, Inc. The returns of Initial Class and Service Class 2 show the performance of the highest and lowest performing classes, respectively (based on five-year performance). The box within each chart shows the 25th percentile return (bottom of box) and the 75th percentile return (top of box) of the peer group. Returns shown above the box are in the first quartile and returns shown below the box are in the fourth quartile. The percentage beaten numbers noted below each chart correspond to the percentile box and represent the percentage of funds in the peer group whose performance was equal to or lower than that of the class indicated. The fund's custom peer group, defined by FMR, is a peer group that FMR believes provides a more meaningful performance comparison than the peer group assigned by Morningstar, Inc., which assigns mutual funds to categories based on their investment styles as measured by their underlying portfolio holdings.
VIP Contrafund Portfolio
The Board reviewed the fund's relative investment performance against its peer group and noted that the performance of Initial Class of the fund was in the second quartile for the one- and three-year periods and the first quartile for the five-year period. The Board also noted that the investment performance of Initial Class of the fund compared favorably to its benchmark for all the periods shown. The Board considered that the variations in performance among the fund's classes reflect the variations in class expenses, which result in lower performance for higher expense classes. The Board also reviewed the fund's performance since inception as well as performance in the current year.
Based on its review, and giving particular weight to the nature and quality of the resources dedicated by the Investment Advisers to maintain and improve relative performance and factoring in the unprecedented market events in recent years, the Board concluded that the nature, extent, and quality of investment management and support services and of shareholder and administrative services provided to the fund will benefit the fund's shareholders, particularly in light of the Board's view that the fund's shareholders benefit from investing in a fund that is part of a large family of funds offering a variety of investment disciplines and services.
Annual Report
Competitiveness of Management Fee and Total Fund Expenses. The Board considered the fund's management fee and total expenses compared to "mapped groups" of competitive funds and classes. Fidelity creates "mapped groups" by combining similar Lipper investment objective categories that have comparable management fee characteristics. Combining Lipper investment objective categories aids the Board's management fee and total expense comparisons by broadening the competitive group used for comparison and by reducing the number of universes to which various Fidelity funds are compared.
Management Fee. The Board considered two proprietary management fee comparisons for the 12-month periods shown in the chart below. The group of Lipper funds used by the Board for management fee comparisons is referred to below as the "Total Mapped Group." The Total Mapped Group comparison focuses on a fund's standing relative to the total universe of comparable funds available to investors, in terms of gross management fees before expense reimbursements or caps. "TMG %" represents the percentage of funds in the Total Mapped Group that had management fees that were lower than the fund's. For example, a TMG % of 10% means that 90% of the funds in the Total Mapped Group had higher management fees than the fund. The "Asset-Size Peer Group" (ASPG) comparison focuses on a fund's standing relative to non-Fidelity funds similar in size to the fund within the Total Mapped Group. The ASPG represents at least 15% of the funds in the Total Mapped Group with comparable asset size and management fee characteristics, subject to a minimum of 50 funds (or all funds in the Total Mapped Group if fewer than 50). Additional information, such as the ASPG quartile in which the fund's management fee ranked, is also included in the chart and considered by the Board.
VIP Contrafund Portfolio
The Board noted that the fund's management fee ranked below the median of its Total Mapped Group and below the median of its ASPG for 2009.
Based on its review, the Board concluded that the fund's management fee is fair and reasonable in light of the services that the fund receives and the other factors considered.
Total Expenses. In its review of each class's total expenses, the Board considered the fund's management fee as well as other fund or class expenses, as applicable, such as transfer agent fees, pricing and bookkeeping fees, fund-paid 12b-1 fees, and custodial, legal, and audit fees. The Board also noted the effects of any waivers and reimbursements on fees and expenses. As part of its review, the Board also considered current and historical total expenses of each class of the fund compared to competitive fund median expenses. Each class of the fund is compared to those funds and classes in the Total Mapped Group (used by the Board for management fee comparisons) that have a similar sales load structure.
The Board noted that the total expenses of each class ranked below its competitive median for 2009.
Fees Charged to Other Fidelity Clients. The Board also considered Fidelity fee structures and other information with respect to clients of FMR and its affiliates, such as other mutual funds advised or subadvised by FMR or its affiliates, pension plan clients, and other institutional clients. In March 2010, the Board created an ad hoc joint committee with the board of other Fidelity funds (the Committee) to review and compare Fidelity's institutional investment advisory business with its business of providing services to the Fidelity funds, including the differences in services provided, fees charged, and costs incurred, as well as competition in their respective marketplaces.
Based on its review of total expenses and fees charged to other Fidelity clients, the Board concluded that the total expenses of each class of the fund were reasonable in light of the services that the fund and its shareholders receive and the other factors considered, including the findings of the Committee.
Annual Report
Board Approval of Investment Advisory Contracts and Management Fees - continued
Costs of the Services and Profitability. The Board considered the revenues earned and the expenses incurred by Fidelity in conducting the business of developing, marketing, distributing, managing, administering and servicing the fund and its shareholders. The Board also considered the level of Fidelity's profits in respect of all the Fidelity funds.
On an annual basis, FMR presents to the Board Fidelity's profitability for the fund. Fidelity calculates the profitability for each fund, as well as aggregate profitability for groups of Fidelity funds and all Fidelity funds, using a series of detailed revenue and cost allocation methodologies which originate with the audited books and records of Fidelity. The Audit Committee of the Board reviews any significant changes from the prior year's methodologies.
PricewaterhouseCoopers LLP (PwC), independent registered public accounting firm and auditor to Fidelity and certain Fidelity funds, has been engaged annually by the Board as part of the Board's assessment of Fidelity's profitability analysis. PwC's engagement includes the review and assessment of Fidelity's methodologies used in determining the revenues and expenses attributable to Fidelity's mutual fund business, and completion of agreed-upon procedures surrounding the mathematical accuracy of fund profitability and its conformity to allocation methodologies. After considering PwC's reports issued under the engagement and information provided by Fidelity, the Board believes that while other allocation methods may also be reasonable, Fidelity's profitability methodologies are reasonable in all material respects.
The Board has also reviewed Fidelity's non-fund businesses and fall-out benefits related to the mutual fund business as well as cases where Fidelity's affiliates may benefit from or be related to the fund's business.
The Board considered the costs of the services provided by and the profits realized by Fidelity in connection with the operation of the fund and were satisfied that the profitability was not excessive in the circumstances.
Economies of Scale. The Board considered whether there have been economies of scale in respect of the management of the Fidelity funds, whether the Fidelity funds (including the fund) have appropriately benefited from any such economies of scale, and whether there is potential for realization of any further economies of scale. The Board considered the extent to which the fund will benefit from economies of scale through increased services to the fund, through waivers or reimbursements, or through fee or expense reductions.
In February 2009, the Board and the board of other Fidelity funds created an ad hoc committee (the Economies of Scale Committee) to analyze whether FMR attains economies of scale in respect of the management and servicing of the Fidelity funds, whether the Fidelity funds have appropriately benefited from such economies of scale, and whether there is potential for realization of any further economies of scale.
The Board recognized that the fund's management contract incorporates a "group fee" structure, which provides for lower group fee rates as total fund assets under FMR's management increase, and for higher group fee rates as total fund assets under FMR's management decrease. FMR calculates the group fee rates based on a tiered asset "breakpoint" schedule that varies based on asset class. The Board considered that the group fee is designed to deliver the benefits of economies of scale to fund shareholders when total Fidelity fund assets increase, even if assets of any particular fund are unchanged or have declined, because some portion of Fidelity's costs are attributable to services provided to all Fidelity funds, and all funds benefit if those costs can be allocated among more assets. The Board concluded that, given the group fee structure, fund shareholders will benefit from lower management fees as assets under FMR's management increase at the fund complex level, regardless of whether Fidelity achieves any such economies of scale.
The Board concluded, considering the findings of the Economies of Scale Committee, that any potential economies of scale are being appropriately shared between fund shareholders and Fidelity.
Additional Information Requested by the Board. In order to develop fully the factual basis for consideration of the Fidelity funds' Advisory Contracts, the Board requested and received additional information on certain topics, including (i) fund performance trends, actions to be taken by FMR to improve certain funds' overall performance, and Fidelity's long-term strategies for certain funds; (ii) portfolio manager changes that have occurred during the past year and length of portfolio manager tenure for different categories of funds over time; (iii) Fidelity's compensation structure for portfolio managers, research analysts, and other key personnel, the rationale for the compensation structure, and how the compensation structure provides appropriate performance incentives; (iv) the amount of the investment that each portfolio manager has made in the Fidelity fund(s) that he or she manages; (v) management and other fees paid by FMR to affiliated sub-advisers on behalf of the Fidelity funds; (vi) Fidelity's fee structures and rationale for recommending different fees among different categories of funds; (vii) Fidelity's rationale for recommending which funds should have a performance adjustment component as part of their management fees; (viii) the rationale for any differences between fund fee structures and fee structures in place for other Fidelity clients; and (ix) explanations regarding the relative total expenses borne by certain funds and classes, total expense competitive trends, and actions that might be taken by FMR to reduce total expenses for certain funds and classes.
Based on its evaluation of all of the conclusions noted above, and after considering all factors it believed relevant, the Board ultimately concluded that the advisory fee structures are fair and reasonable, and that the fund's Advisory Contracts should be renewed.
Annual Report
Investment Adviser
Fidelity Management & Research Company
Boston, MA
Investment Sub-Advisers
FMR Co., Inc.
Fidelity Management & Research (U.K.) Inc.
Fidelity Management & Research (Hong Kong) Ltd.
Fidelity Management & Research (Japan) Inc.
General Distributor
Fidelity Distributors Corporation
Boston, MA
Transfer and Servicing Agents
Fidelity Investments Institutional Operations Company, Inc.
Boston, MA
Fidelity Service Company, Inc.
Boston, MA
Custodian
Brown Brothers Harriman & Co.
Boston, MA
VIPCONR-ANN-0211
1.811844.106
Fidelity® Variable Insurance Products:
Disciplined Small Cap Portfolio
Annual Report
December 31, 2010
(2_fidelity_logos) (Registered_Trademark)
Contents
Performance | <Click Here> | How the fund has done over time. |
Management's Discussion of Fund Performance | <Click Here> | The Portfolio Manager's review of fund performance and strategy. |
Shareholder Expense Example | <Click Here> | An example of shareholder expenses. |
Investment Changes | <Click Here> | A summary of major shifts in the fund's investments over the past six months. |
Investments | <Click Here> | A complete list of the fund's investments with their market values. |
Financial Statements | <Click Here> | Statements of assets and liabilities, operations, and changes in net assets, as well as financial highlights. |
Notes | <Click Here> | Notes to the financial statements. |
Report of Independent Registered Public Accounting Firm | <Click Here> | |
Trustees and Officers | <Click Here> | |
Distributions | <Click Here> | |
Board Approval of Investment Advisory Contracts and Management Fees | <Click Here> | |
To view a fund's proxy voting guidelines and proxy voting record for the 12-month period ended June 30, visit http://www.fidelity.com/proxyvotingresults or visit the Securities and Exchange Commission's (SEC) web site at http://www.sec.gov. You may also call 1-877-208-0098 to request a free copy of the proxy voting guidelines.
Fidelity Variable Insurance Products are separate account options which are purchased through a variable insurance contract.
Geode is a registered trademark of Geode Capital Management, LLC.
Standard & Poor's, S&P and S&P 500 are registered service marks of The McGraw-Hill Companies, Inc. and have been licensed for use by Fidelity Distributors Corporation.
Other third party marks appearing herein are the property of their respective owners.
All other marks appearing herein are registered or unregistered trademarks or service marks of FMR LLC or an affiliated company.
This report and the financial statements contained herein are submitted for the general information of the shareholders of the fund. This report is not authorized for distribution to prospective investors in the fund unless preceded or accompanied by an effective prospectus.
A fund files its complete schedule of portfolio holdings with the SEC for the first and third quarters of each fiscal year on Form N-Q. Forms N-Q are available on the SEC's web site at http://www.sec.gov. A fund's Forms N-Q may be reviewed and copied at the SEC's Public Reference Room in Washington, DC. Information regarding the operation of the SEC's Public Reference Room may be obtained by calling 1-800-SEC-0330. For a complete list of a fund's portfolio holdings, view the most recent holdings listing, semiannual report, or annual report on Fidelity's web site at http://www.fidelity.com, http://www.advisor.fidelity.com, or http://www.401k.com, as applicable.
NOT FDIC INSURED • MAY LOSE VALUE • NO BANK GUARANTEE
Neither the fund nor Fidelity Distributors Corporation is a bank.
Annual Report
Average annual total return reflects the change in the value of an investment, assuming reinvestment of the class' distributions from dividend income and capital gains (the profits earned upon the sale of securities that have grown in value, if any) and assuming a constant rate of performance each year. During periods of reimbursement by Fidelity, a fund's total return will be greater than it would be had the reimbursement not occurred. Performance numbers are net of all underlying fund operating expenses, but do not include any insurance charges imposed by your insurance company's separate account. If performance information included the effect of these additional charges, the total returns would have been lower. How a fund did yesterday is no guarantee of how it will do tomorrow.
Average Annual Total Returns
Periods ended December 31, 2010 | Past 1
year | Past 5
years | Life of
fund A |
VIP Disciplined Small Cap Portfolio - Initial Class | 25.54% | 2.97% | 2.84% |
VIP Disciplined Small Cap Portfolio - Service Class | 25.35% | 2.85% | 2.72% |
VIP Disciplined Small Cap Portfolio - Service Class 2 | 25.07% | 2.68% | 2.55% |
VIP Disciplined Small Cap Portfolio - Investor Class | 25.44% | 2.86% | 2.72% |
A From December 27, 2005.
$10,000 Over Life of Fund
Let's say hypothetically that $10,000 was invested in VIP Disciplined Small Cap Portfolio - Initial Class on December 27, 2005, when the fund started. The chart shows how the value of your investment would have changed, and also shows how the Russell 2000® Index performed over the same period.
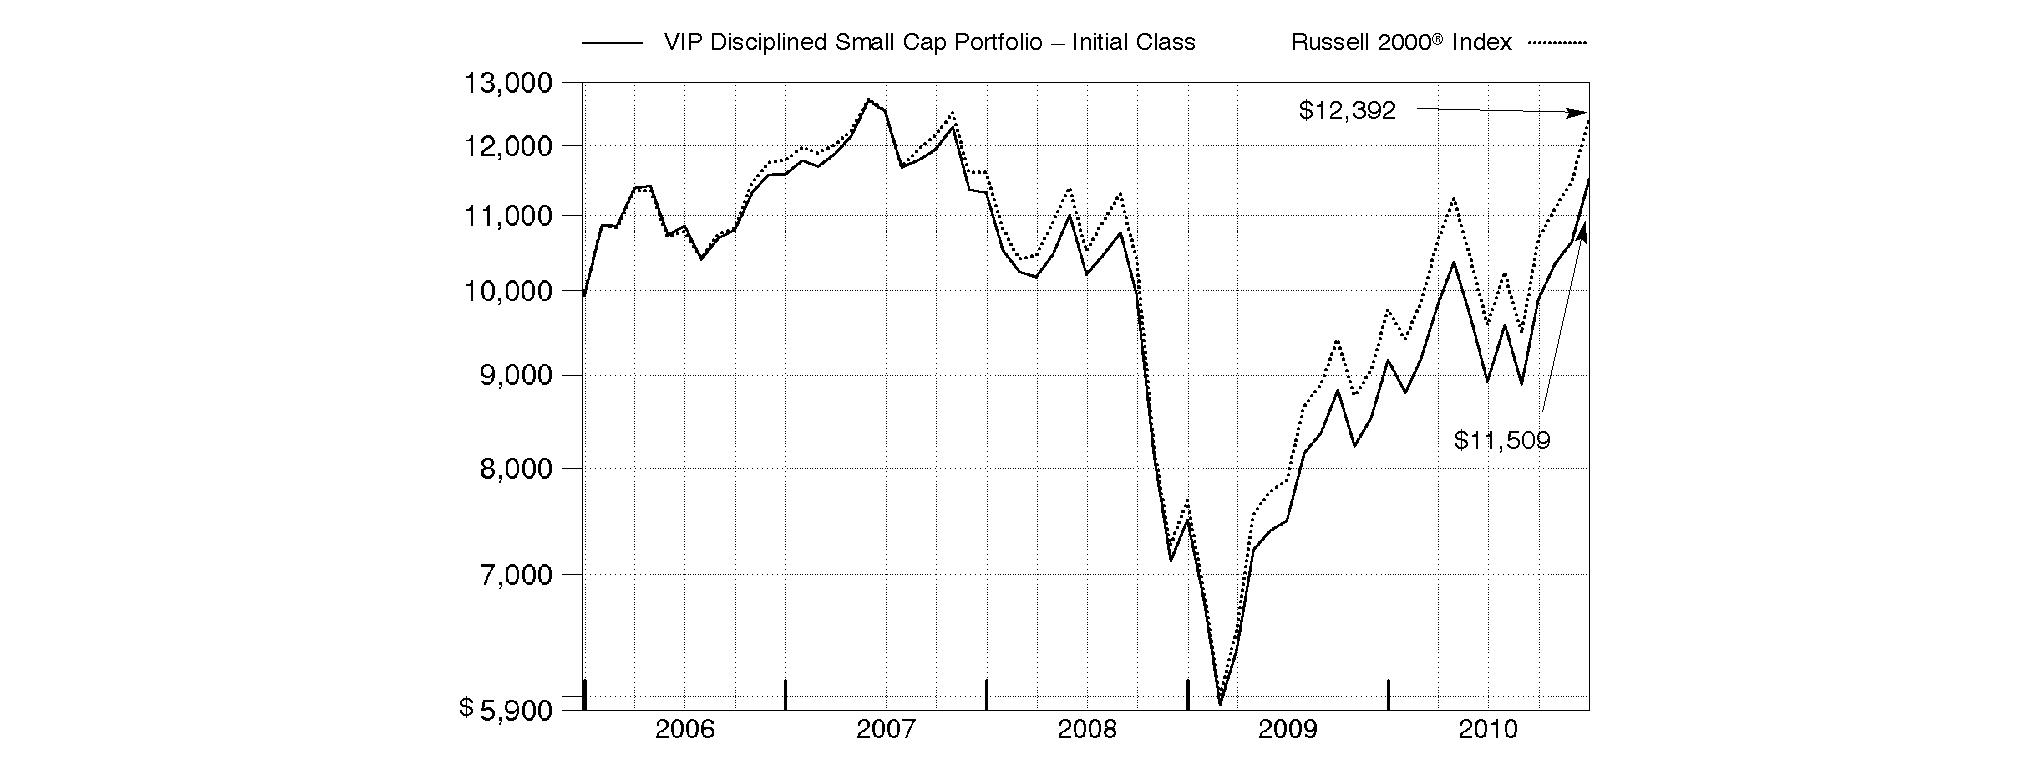
Annual Report
Market Recap: While market improvements around the world hit a speed bump in the first half of the 12-month period ending December 31, 2010, world economies re-accelerated in August, supported by a broadening recovery and low inflation in the U.S. Domestic stock markets recorded solid gains for the year, lifted by a strong second-half rally fueled by economic optimism, encouraging earnings reports and a wave of corporate mergers. The large-cap S&P 500® Index rose 15.06%, the blue-chip-laden Dow Jones Industrial AverageSM added 14.06% and the technology-heavy Nasdaq Composite® Index climbed 18.02%. Meanwhile, international stocks, as represented by the MSCI® ACWI® (All Country World Index) ex USA Index, gained 11.29%, boosted in part by a depreciating U.S. dollar. In the fixed-income arena, U.S. taxable investment-grade bonds generated positive results during 2010, as the Barclays Capital® U.S. Aggregate Bond Index gained 6.54%. With ultra-low interest rates bolstering nearly all fixed-income securities for most of the year, sectors in the index with higher yields and more credit risk generally fared best, while most high-quality bonds generated more-moderate returns. Meanwhile, high-yield bonds, as represented by The BofA Merrill LynchSM US High Yield Constrained Index, returned 15.07%, a result of improved economic data and strengthening investor demand. Overseas, foreign bond markets showed mixed results, with a sizable disparity between the 3.97% return of the Citigroup® Non-U.S. Group of 7 Index - which measures the performance of sovereign debt of the major global economies outside the U.S. - and the 12.04% advance of the JPMorgan Emerging Markets Bond Index Global (EMBI Global), which benefited from the rising overall credit quality of emerging-markets debt issuers.
Comments from Jeffrey Adams, who oversees VIP Disciplined Small Cap Portfolio's investment management team as Head of Indexing for Geode Capital Management, LLC: For the year, the fund's share classes lagged the Russell 2000® Index, which gained 26.85%. Compared with the Russell index, stock selection in industrials was disappointing. We also encountered challenges in the health care equipment/services and technology hardware/equipment industries. Good results, however, from picks in semiconductors, financials and pockets of consumer discretionary helped counter that impact. (For specific portfolio results, please refer to the performance section of this report.) Amedisys, a provider of home-nursing services, was the fund's biggest individual detractor. Its stock price dropped sharply in July after the company forecasted worse-than-expected quarterly earnings. Disappointing financial results also hurt Net 1 UEPS Technologies, a maker of "smart card" alternate payment systems for people in developing economies. Holding company M&F Worldwide and biopharmaceutical firm Medivation also weighed on performance. Underweighting Riverbed Technologies, a maker of network communications products, also hurt the fund, as its shares more than tripled during the year. On the positive side, overweighting seismic-data equipment company OYO Geospace contributed the most, as its shares rose steadily throughout 2010. Chipmaker Lattice Semiconductor also enjoyed good results. Other notable contributors included Complete Production Services, an oil and gas services company, and an out-of-benchmark position in drugmaker Valeant Pharmaceuticals International, which merged with Canadian biotechnology firm Biovail during the year. Valeant, along with several other stocks I've mentioned, were sold from the portfolio by period end.
The views expressed above reflect those of the portfolio manager(s) only through the end of the period as stated on the cover of this report and do not necessarily represent the views of Fidelity or any other person in the Fidelity organization. Any such views are subject to change at any time based upon market or other conditions and Fidelity disclaims any responsibility to update such views. These views may not be relied on as investment advice and, because investment decisions for a Fidelity fund are based on numerous factors, may not be relied on as an indication of trading intent on behalf of any Fidelity fund.
Annual Report
As a shareholder of the Fund, you incur two types of costs: (1) transaction costs, and (2) ongoing costs, including management fees, distribution and/or service (12b-1) fees and other Fund expenses. This Example is intended to help you understand your ongoing costs (in dollars) of investing in the Fund and to compare these costs with the ongoing costs of investing in other mutual funds.
The Example is based on an investment of $1,000 invested at the beginning of the period and held for the entire period (July 1, 2010 to December 31, 2010).
Actual Expenses
The first line of the accompanying table for each class of the Fund provides information about actual account values and actual expenses. You may use the information in this line, together with the amount you invested, to estimate the expenses that you paid over the period. Simply divide your account value by $1,000.00 (for example, an $8,600 account value divided by $1,000.00 = 8.6), then multiply the result by the number in the first line for a class of the Fund under the heading entitled "Expenses Paid During Period" to estimate the expenses you paid on your account during this period. The estimate of expenses does not include any fees or other expenses of any variable annuity or variable life insurance product. If they were, the estimate of expenses you paid during the period would be higher, and your ending account value would be lower. In addition, the Fund, as a shareholder in the underlying Fidelity Central Funds, will indirectly bear its pro-rata share of the fees and expenses incurred by the underlying Fidelity Central Funds. These fees and expenses are not included in the Fund's annualized expense ratio used to calculate the expense estimate in the table below.
Hypothetical Example for Comparison Purposes
The second line of the accompanying table for each class of the Fund provides information about hypothetical account values and hypothetical expenses based on a Class' actual expense ratio and an assumed rate of return of 5% per year before expenses, which is not the Class' actual return. The hypothetical account values and expenses may not be used to estimate the actual ending account balance or expenses you paid for the period. You may use this information to compare the ongoing costs of investing in the Fund and other funds. To do so, compare this 5% hypothetical example with the 5% hypothetical examples that appear in the shareholder reports of the other funds. The estimate of expenses does not include any fees or other expenses of any variable annuity or variable life insurance product. If they were, the estimate of expenses you paid during the period would be higher, and your ending account value would be lower. In addition, the Fund, as a shareholder in the underlying Fidelity Central Funds, will indirectly bear its pro-rata share of the fees and expenses incurred by the underlying Fidelity Central Funds. These fees and expenses are not included in the Fund's annualized expense ratio used to calculate the expense estimate in the table below.
Please note that the expenses shown in the table are meant to highlight your ongoing costs only and do not reflect any transaction costs. Therefore, the second line of the table is useful in comparing ongoing costs only, and will not help you determine the relative total costs of owning different funds.
| Annualized
Expense Ratio | Beginning
Account Value
July 1, 2010 | Ending
Account Value
December 31, 2010 | Expenses Paid
During Period*
July 1, 2010 to December 31, 2010 |
Initial Class | .93% | | | |
Actual | | $ 1,000.00 | $ 1,290.00 | $ 5.37 |
HypotheticalA | | $ 1,000.00 | $ 1,020.52 | $ 4.74 |
Service Class | 1.02% | | | |
Actual | | $ 1,000.00 | $ 1,288.00 | $ 5.88 |
HypotheticalA | | $ 1,000.00 | $ 1,020.06 | $ 5.19 |
Service Class 2 | 1.25% | | | |
Actual | | $ 1,000.00 | $ 1,286.60 | $ 7.20 |
HypotheticalA | | $ 1,000.00 | $ 1,018.90 | $ 6.36 |
Investor Class | 1.01% | | | |
Actual | | $ 1,000.00 | $ 1,289.00 | $ 5.83 |
HypotheticalA | | $ 1,000.00 | $ 1,020.11 | $ 5.14 |
A 5% return per year before expenses
* Expenses are equal to each Class' annualized expense ratio, multiplied by the average account value over the period, multiplied by 184/365 (to reflect the one-half year period).
Annual Report
Investment Changes (Unaudited)
Top Ten Stocks as of December 31, 2010 |
| % of fund's
net assets | % of fund's net assets
6 months ago |
Complete Production Services, Inc. | 0.7 | 0.5 |
VeriFone Systems, Inc. | 0.7 | 0.3 |
RF Micro Devices, Inc. | 0.6 | 0.3 |
OYO Geospace Corp. | 0.6 | 0.4 |
InterDigital, Inc. | 0.6 | 0.5 |
TIBCO Software, Inc. | 0.6 | 0.2 |
Jo-Ann Stores, Inc. | 0.6 | 0.6 |
MFA Financial, Inc. | 0.6 | 0.1 |
Skyworks Solutions, Inc. | 0.6 | 0.8 |
Rent-A-Center, Inc. | 0.6 | 0.5 |
| 6.2 | |
Top Five Market Sectors as of December 31, 2010 |
| % of fund's
net assets | % of fund's net assets
6 months ago |
Information Technology | 18.0 | 18.0 |
Financials | 15.3 | 17.9 |
Industrials | 13.5 | 13.7 |
Consumer Discretionary | 10.7 | 12.9 |
Health Care | 8.2 | 12.1 |
Asset Allocation (% of fund's net assets) |
As of December 31, 2010* | As of June 30, 2010** |
| Stocks and Equity Futures 99.0% | | | Stocks and Equity Futures 100.1% | |
| Short-Term
Investments and
Net Other Assets 1.0% | | | Short-Term
Investments and
Net Other Assets† (0.1)% | |
* Foreign investments | 2.9% | | ** Foreign investments | 1.6% | |

† Short-term Investments and Net Other Assets are not included in the pie chart. |
Annual Report
Investments December 31, 2010
Showing Percentage of Net Assets
Common Stocks - 85.0% |
| Shares | | Value |
CONSUMER DISCRETIONARY - 10.7% |
Auto Components - 1.5% |
American Axle & Manufacturing Holdings, Inc. (a) | 13,821 | | $ 177,738 |
Amerigon, Inc. (a) | 2,477 | | 26,950 |
Cooper Tire & Rubber Co. | 12,543 | | 295,764 |
Dana Holding Corp. (a) | 14,361 | | 247,153 |
Fuel Systems Solutions, Inc. (a) | 7,548 | | 221,760 |
Superior Industries International, Inc. | 4,133 | | 87,702 |
| | 1,057,067 |
Diversified Consumer Services - 0.4% |
Mac-Gray Corp. | 1,766 | | 26,402 |
Pre-Paid Legal Services, Inc. (a) | 3,373 | | 203,223 |
Sotheby's Class A (ltd. vtg.) | 1,335 | | 60,075 |
| | 289,700 |
Hotels, Restaurants & Leisure - 1.7% |
AFC Enterprises, Inc. (a) | 5,500 | | 76,450 |
Cracker Barrel Old Country Store, Inc. | 5,982 | | 327,634 |
DineEquity, Inc. (a) | 6,124 | | 302,403 |
Domino's Pizza, Inc. (a) | 21,000 | | 334,950 |
Ruth's Hospitality Group, Inc. (a) | 14,661 | | 67,880 |
Shuffle Master, Inc. (a) | 10,388 | | 118,943 |
| | 1,228,260 |
Household Durables - 1.8% |
American Greetings Corp. Class A | 9,562 | | 211,894 |
Blyth, Inc. | 4,748 | | 163,711 |
iRobot Corp. (a) | 10,221 | | 254,298 |
Libbey, Inc. (a) | 9,736 | | 150,616 |
Standard Pacific Corp. (a) | 43,304 | | 199,198 |
Tempur-Pedic International, Inc. (a) | 4,322 | | 173,139 |
Tupperware Brands Corp. | 2,959 | | 141,056 |
| | 1,293,912 |
Internet & Catalog Retail - 0.2% |
Shutterfly, Inc. (a) | 4,049 | | 141,836 |
Leisure Equipment & Products - 0.7% |
Arctic Cat, Inc. (a) | 11,576 | | 169,473 |
Polaris Industries, Inc. | 4,394 | | 342,820 |
| | 512,293 |
Media - 0.9% |
Cinemark Holdings, Inc. | 4,158 | | 71,684 |
Global Sources Ltd. (a)(d) | 32,706 | | 311,361 |
Journal Communications, Inc. Class A (a) | 8,663 | | 43,748 |
Valassis Communications, Inc. (a) | 7,530 | | 243,596 |
| | 670,389 |
Specialty Retail - 2.1% |
Finish Line, Inc. Class A | 15,085 | | 259,311 |
Jo-Ann Stores, Inc. (a) | 7,149 | | 430,513 |
Rent-A-Center, Inc. | 12,669 | | 408,955 |
The Cato Corp. Class A (sub. vtg.) | 8,535 | | 233,944 |
Tractor Supply Co. | 3,455 | | 167,533 |
| | 1,500,256 |
|
| Shares | | Value |
Textiles, Apparel & Luxury Goods - 1.4% |
Crocs, Inc. (a) | 8,260 | | $ 141,411 |
Fossil, Inc. (a) | 3,718 | | 262,045 |
Liz Claiborne, Inc. (a)(d) | 20,381 | | 145,928 |
Maidenform Brands, Inc. (a) | 6,990 | | 166,152 |
Movado Group, Inc. (a) | 6,271 | | 101,214 |
Warnaco Group, Inc. (a) | 2,148 | | 118,290 |
Wolverine World Wide, Inc. | 3,596 | | 114,640 |
| | 1,049,680 |
TOTAL CONSUMER DISCRETIONARY | | 7,743,393 |
CONSUMER STAPLES - 3.1% |
Beverages - 0.1% |
MGP Ingredients, Inc. | 4,707 | | 51,965 |
National Beverage Corp. | 1,683 | | 22,115 |
| | 74,080 |
Food & Staples Retailing - 1.4% |
Andersons, Inc. | 5,667 | | 205,995 |
Casey's General Stores, Inc. | 5,141 | | 218,544 |
Nash-Finch Co. | 6,689 | | 284,349 |
PriceSmart, Inc. | 9,025 | | 343,221 |
| | 1,052,109 |
Food Products - 0.4% |
TreeHouse Foods, Inc. (a)(d) | 5,644 | | 288,352 |
Personal Products - 1.0% |
Elizabeth Arden, Inc. (a) | 5,103 | | 117,420 |
Inter Parfums, Inc. | 7,589 | | 143,053 |
Nu Skin Enterprises, Inc. Class A | 12,421 | | 375,859 |
USANA Health Sciences, Inc. (a) | 1,579 | | 68,608 |
| | 704,940 |
Tobacco - 0.2% |
Universal Corp. | 2,945 | | 119,862 |
TOTAL CONSUMER STAPLES | | 2,239,343 |
ENERGY - 7.7% |
Energy Equipment & Services - 4.2% |
Cal Dive International, Inc. (a) | 20,654 | | 117,108 |
Carbo Ceramics, Inc. | 393 | | 40,691 |
Complete Production Services, Inc. (a) | 17,394 | | 513,993 |
Dril-Quip, Inc. (a) | 4,601 | | 357,590 |
Gulf Island Fabrication, Inc. | 9,670 | | 272,501 |
Hercules Offshore, Inc. (a) | 110,953 | | 383,897 |
ION Geophysical Corp. (a)(d) | 47,187 | | 400,146 |
Newpark Resources, Inc. (a) | 40,932 | | 252,141 |
OYO Geospace Corp. (a) | 4,715 | | 467,304 |
Pioneer Drilling Co. (a) | 5,531 | | 48,728 |
Tesco Corp. (a) | 10,239 | | 162,595 |
| | 3,016,694 |
Oil, Gas & Consumable Fuels - 3.5% |
Bill Barrett Corp. (a) | 6,692 | | 275,242 |
Common Stocks - continued |
| Shares | | Value |
ENERGY - continued |
Oil, Gas & Consumable Fuels - continued |
Cloud Peak Energy, Inc. (a) | 15,461 | | $ 359,159 |
Contango Oil & Gas Co. (a) | 3,719 | | 215,442 |
CVR Energy, Inc. (a) | 20,155 | | 305,953 |
DHT Holdings, Inc. | 30,321 | | 140,993 |
Petroquest Energy, Inc. (a)(d) | 39,833 | | 299,942 |
Ship Finance International Ltd. (NY Shares) | 6,455 | | 138,912 |
Stone Energy Corp. (a) | 8,143 | | 181,507 |
Teekay Tankers Ltd. | 134 | | 1,654 |
Vaalco Energy, Inc. (a) | 45,050 | | 322,558 |
W&T Offshore, Inc. | 18,317 | | 327,325 |
| | 2,568,687 |
TOTAL ENERGY | | 5,585,381 |
FINANCIALS - 15.3% |
Capital Markets - 0.6% |
PennantPark Investment Corp. | 3,548 | | 43,428 |
Prospect Capital Corp. | 5,500 | | 59,400 |
TICC Capital Corp. | 25,895 | | 290,283 |
| | 393,111 |
Commercial Banks - 4.7% |
Alliance Financial Corp. | 2,002 | | 64,765 |
Banco Latin Americano de Exporaciones SA (BLADEX) Series E | 18,058 | | 333,351 |
Bank of the Ozarks, Inc. | 7,405 | | 321,007 |
Cardinal Financial Corp. | 1,609 | | 18,713 |
Community Bank System, Inc. | 11,771 | | 326,881 |
Financial Institutions, Inc. | 4,849 | | 91,986 |
First Financial Bancorp, Ohio | 14,752 | | 272,617 |
First Financial Bankshares, Inc. | 655 | | 33,523 |
International Bancshares Corp. | 17,243 | | 345,377 |
Merchants Bancshares, Inc. | 10,306 | | 284,033 |
NBT Bancorp, Inc. | 1,400 | | 33,810 |
Prosperity Bancshares, Inc. | 8,655 | | 339,968 |
Renasant Corp. (d) | 4,604 | | 77,854 |
Republic Bancorp, Inc., Kentucky Class A | 7,994 | | 189,858 |
S&T Bancorp, Inc. | 4,680 | | 105,721 |
Signature Bank, New York (a) | 2,870 | | 143,500 |
Tompkins Financial Corp. | 12 | | 470 |
Trustmark Corp. | 2,146 | | 53,307 |
UMB Financial Corp. | 3,657 | | 151,473 |
Washington Trust Bancorp, Inc. | 4,788 | | 104,761 |
WesBanco, Inc. | 7,299 | | 138,389 |
| | 3,431,364 |
Consumer Finance - 1.4% |
Credit Acceptance Corp. (a) | 2,550 | | 160,064 |
EZCORP, Inc. (non-vtg.) Class A (a) | 3,247 | | 88,091 |
First Cash Financial Services, Inc. (a) | 3,860 | | 119,621 |
|
| Shares | | Value |
Nelnet, Inc. Class A | 14,349 | | $ 339,928 |
World Acceptance Corp. (a) | 6,142 | | 324,298 |
| | 1,032,002 |
Diversified Financial Services - 0.7% |
Encore Capital Group, Inc. (a) | 7,815 | | 183,262 |
MarketAxess Holdings, Inc. | 4,108 | | 85,487 |
NewStar Financial, Inc. (a)(d) | 23,410 | | 247,444 |
| | 516,193 |
Insurance - 1.5% |
Amtrust Financial Services, Inc. | 10,501 | | 183,768 |
Aspen Insurance Holdings Ltd. | 6,285 | | 179,877 |
FBL Financial Group, Inc. Class A | 10,404 | | 298,283 |
Flagstone Reinsurance Holdings Ltd. | 26,281 | | 331,141 |
Platinum Underwriters Holdings Ltd. | 2,501 | | 112,470 |
| | 1,105,539 |
Real Estate Investment Trusts - 5.4% |
Anworth Mortgage Asset Corp. | 5,850 | | 40,950 |
Ashford Hospitality Trust, Inc. (a)(d) | 202 | | 1,949 |
CapLease, Inc. | 6,720 | | 39,110 |
Capstead Mortgage Corp. | 11,977 | | 150,790 |
Chesapeake Lodging Trust | 13,441 | | 252,825 |
Colonial Properties Trust (SBI) | 5,291 | | 95,503 |
Colony Financial, Inc. | 5,423 | | 108,568 |
Crexus Investment Corp. | 4,995 | | 65,435 |
Dynex Capital, Inc. | 9,197 | | 100,431 |
Extra Space Storage, Inc. | 8,161 | | 142,001 |
First Industrial Realty Trust, Inc. (a)(d) | 30,763 | | 269,484 |
Highwoods Properties, Inc. (SBI) | 3,190 | | 101,602 |
Home Properties, Inc. | 653 | | 36,235 |
MFA Financial, Inc. | 51,187 | | 417,686 |
Mid-America Apartment Communities, Inc. | 3,812 | | 242,024 |
Mission West Properties, Inc. | 6,854 | | 45,853 |
National Health Investors, Inc. | 4,126 | | 185,753 |
Nationwide Health Properties, Inc. | 3,353 | | 121,982 |
Newcastle Investment Corp. (a) | 46,131 | | 309,078 |
Omega Healthcare Investors, Inc. | 14,921 | | 334,827 |
One Liberty Properties, Inc. | 7,405 | | 123,664 |
Parkway Properties, Inc. | 1,780 | | 31,186 |
Pennymac Mortgage Investment Trust | 9,379 | | 170,229 |
PS Business Parks, Inc. | 4,781 | | 266,397 |
Saul Centers, Inc. | 5,369 | | 254,222 |
| | 3,907,784 |
Thrifts & Mortgage Finance - 1.0% |
BofI Holding, Inc. (a) | 20,447 | | 317,133 |
Dime Community Bancshares, Inc. | 6,677 | | 97,417 |
Flushing Financial Corp. | 9,872 | | 138,208 |
Meridian Interstate Bancorp, Inc. (a) | 3,204 | | 37,775 |
Common Stocks - continued |
| Shares | | Value |
FINANCIALS - continued |
Thrifts & Mortgage Finance - continued |
NASB Financial, Inc. (d) | 816 | | $ 13,676 |
Provident New York Bancorp | 8,523 | | 89,406 |
| | 693,615 |
TOTAL FINANCIALS | | 11,079,608 |
HEALTH CARE - 8.2% |
Biotechnology - 2.0% |
Acorda Therapeutics, Inc. (a) | 1,016 | | 27,696 |
Alkermes, Inc. (a) | 2,440 | | 29,963 |
Alnylam Pharmaceuticals, Inc. (a) | 367 | | 3,619 |
ArQule, Inc. (a) | 7,424 | | 43,579 |
Array Biopharma, Inc. (a) | 25,114 | | 75,091 |
Celldex Therapeutics, Inc. (a)(d) | 8,511 | | 35,065 |
Cepheid, Inc. (a) | 1,358 | | 30,895 |
Cubist Pharmaceuticals, Inc. (a) | 5,811 | | 124,355 |
Exelixis, Inc. (a) | 16,462 | | 135,153 |
Incyte Corp. (a) | 2,066 | | 34,213 |
InterMune, Inc. (a) | 994 | | 36,182 |
Martek Biosciences (a) | 4,558 | | 142,665 |
Medivation, Inc. (a) | 4,086 | | 61,985 |
Nabi Biopharmaceuticals (a) | 16,819 | | 97,382 |
Neurocrine Biosciences, Inc. (a) | 12,526 | | 95,699 |
ONYX Pharmaceuticals, Inc. (a) | 272 | | 10,029 |
Osiris Therapeutics, Inc. (a)(d) | 14,905 | | 116,110 |
PDL BioPharma, Inc. | 2,142 | | 13,345 |
Regeneron Pharmaceuticals, Inc. (a) | 2,055 | | 67,466 |
SciClone Pharmaceuticals, Inc. (a) | 29,931 | | 125,112 |
Theravance, Inc. (a) | 606 | | 15,192 |
Vanda Pharmaceuticals, Inc. (a)(d) | 11,621 | | 109,935 |
| | 1,430,731 |
Health Care Equipment & Supplies - 3.0% |
American Medical Systems Holdings, Inc. (a) | 14,550 | | 274,413 |
Cantel Medical Corp. | 7,435 | | 173,979 |
Greatbatch, Inc. (a) | 2,067 | | 49,918 |
Haemonetics Corp. (a) | 1,340 | | 84,661 |
Invacare Corp. | 10,944 | | 330,071 |
Kensey Nash Corp. (a)(d) | 8,876 | | 247,019 |
Orthofix International NV (a) | 3,565 | | 103,385 |
Sirona Dental Systems, Inc. (a)(d) | 8,473 | | 354,002 |
Steris Corp. | 7,443 | | 271,372 |
Thoratec Corp. (a) | 2,618 | | 74,142 |
Young Innovations, Inc. | 5,227 | | 167,316 |
| | 2,130,278 |
Health Care Providers & Services - 2.3% |
Amedisys, Inc. (a) | 4,758 | | 159,393 |
American Dental Partners, Inc. (a) | 4,359 | | 58,890 |
AmSurg Corp. (a) | 5,763 | | 120,735 |
Chemed Corp. | 1,207 | | 76,657 |
|
| Shares | | Value |
Chindex International, Inc. (a) | 10,258 | | $ 169,154 |
Continucare Corp. (a) | 16,628 | | 77,819 |
Cross Country Healthcare, Inc. (a) | 4,301 | | 36,429 |
Emergency Medical Services Corp. Class A (a) | 1,498 | | 96,786 |
Hanger Orthopedic Group, Inc. (a) | 6,015 | | 127,458 |
Healthspring, Inc. (a) | 6,440 | | 170,853 |
Magellan Health Services, Inc. (a) | 1,718 | | 81,227 |
Owens & Minor, Inc. | 6,002 | | 176,639 |
PharMerica Corp. (a) | 8,415 | | 96,352 |
Providence Service Corp. (a) | 6,997 | | 112,442 |
Sun Healthcare Group, Inc. (a) | 10,223 | | 129,423 |
| | 1,690,257 |
Life Sciences Tools & Services - 0.1% |
Affymetrix, Inc. (a) | 5,763 | | 28,988 |
Dionex Corp. (a) | 307 | | 36,229 |
| | 65,217 |
Pharmaceuticals - 0.8% |
Medicis Pharmaceutical Corp. Class A | 6,617 | | 177,269 |
Par Pharmaceutical Companies, Inc. (a) | 2,562 | | 98,663 |
Salix Pharmaceuticals Ltd. (a) | 994 | | 46,678 |
Santarus, Inc. (a) | 7,500 | | 24,525 |
SuperGen, Inc. (a) | 39,419 | | 103,278 |
ViroPharma, Inc. (a) | 9,103 | | 157,664 |
| | 608,077 |
TOTAL HEALTH CARE | | 5,924,560 |
INDUSTRIALS - 13.5% |
Aerospace & Defense - 1.9% |
AAR Corp. (a) | 8,791 | | 241,489 |
American Science & Engineering, Inc. | 3,855 | | 328,562 |
Ceradyne, Inc. (a) | 11,796 | | 371,928 |
Cubic Corp. | 4,814 | | 226,980 |
Esterline Technologies Corp. (a) | 3,281 | | 225,044 |
| | 1,394,003 |
Air Freight & Logistics - 0.9% |
Atlas Air Worldwide Holdings, Inc. (a) | 6,653 | | 371,437 |
Hub Group, Inc. Class A (a) | 5,611 | | 197,171 |
Park-Ohio Holdings Corp. (a) | 4,355 | | 91,063 |
| | 659,671 |
Airlines - 0.1% |
Alaska Air Group, Inc. (a) | 1,632 | | 92,518 |
Building Products - 0.5% |
A.O. Smith Corp. | 5,113 | | 194,703 |
Ameron International Corp. | 495 | | 37,803 |
Gibraltar Industries, Inc. (a) | 8,699 | | 118,045 |
| | 350,551 |
Commercial Services & Supplies - 1.3% |
American Reprographics Co. (a) | 2,939 | | 22,307 |
Consolidated Graphics, Inc. (a) | 5,320 | | 257,648 |
G&K Services, Inc. Class A | 5,100 | | 157,641 |
Common Stocks - continued |
| Shares | | Value |
INDUSTRIALS - continued |
Commercial Services & Supplies - continued |
Multi-Color Corp. | 2,847 | | $ 55,403 |
Schawk, Inc. Class A | 7,991 | | 164,455 |
Tetra Tech, Inc. (a) | 7,926 | | 198,626 |
The Brink's Co. | 4,135 | | 111,149 |
| | 967,229 |
Construction & Engineering - 0.7% |
EMCOR Group, Inc. (a) | 6,596 | | 191,152 |
Great Lakes Dredge & Dock Corp. | 43,771 | | 322,592 |
| | 513,744 |
Electrical Equipment - 2.3% |
AZZ, Inc. | 5,161 | | 206,492 |
Belden, Inc. | 5,795 | | 213,372 |
Brady Corp. Class A | 11,672 | | 380,624 |
Franklin Electric Co., Inc. | 8,305 | | 323,231 |
Lihua International, Inc. (a)(d) | 5,437 | | 61,112 |
Polypore International, Inc. (a) | 3,599 | | 146,587 |
Preformed Line Products Co. | 892 | | 52,204 |
Regal-Beloit Corp. | 4,674 | | 312,036 |
| | 1,695,658 |
Industrial Conglomerates - 0.2% |
Raven Industries, Inc. | 2,876 | | 137,156 |
Machinery - 3.8% |
Actuant Corp. Class A | 4,621 | | 123,011 |
ArvinMeritor, Inc. (a) | 7,692 | | 157,840 |
Barnes Group, Inc. | 2,472 | | 51,096 |
Briggs & Stratton Corp. | 13,416 | | 264,161 |
Colfax Corp. (a) | 15,596 | | 287,122 |
Graham Corp. | 2,824 | | 56,480 |
Kadant, Inc. (a) | 13,073 | | 308,131 |
Lindsay Corp. (d) | 5,869 | | 348,795 |
NACCO Industries, Inc. Class A | 2,474 | | 268,107 |
Nordson Corp. | 3,801 | | 349,236 |
Robbins & Myers, Inc. | 7,659 | | 274,039 |
Tennant Co. | 6,087 | | 233,802 |
| | 2,721,820 |
Professional Services - 0.9% |
CBIZ, Inc. (a) | 16,254 | | 101,425 |
Huron Consulting Group, Inc. (a) | 12,794 | | 338,401 |
Kelly Services, Inc. Class A (non-vtg.) (a) | 9,843 | | 185,048 |
SFN Group, Inc. (a) | 581 | | 5,671 |
| | 630,545 |
Road & Rail - 0.4% |
AMERCO (a) | 2,810 | | 269,872 |
Trading Companies & Distributors - 0.5% |
Aircastle Ltd. | 2,296 | | 23,993 |
TAL International Group, Inc. | 11,324 | | 349,572 |
| | 373,565 |
TOTAL INDUSTRIALS | | 9,806,332 |
|
| Shares | | Value |
INFORMATION TECHNOLOGY - 18.0% |
Communications Equipment - 2.2% |
Anaren, Inc. (a) | 2,993 | | $ 62,404 |
Arris Group, Inc. (a) | 15,638 | | 175,458 |
Aviat Networks, Inc. (a) | 30,128 | | 152,749 |
Bel Fuse, Inc. Class B (non-vtg.) | 2,471 | | 59,057 |
InterDigital, Inc. | 11,017 | | 458,748 |
Plantronics, Inc. | 6,011 | | 223,729 |
Powerwave Technologies, Inc. (a)(d) | 137,741 | | 349,862 |
Riverbed Technology, Inc. (a) | 2,081 | | 73,189 |
| | 1,555,196 |
Computers & Peripherals - 0.8% |
Cray, Inc. (a) | 10,084 | | 72,101 |
Hutchinson Technology, Inc. (a)(d) | 45,599 | | 169,172 |
Synaptics, Inc. (a) | 12,061 | | 354,352 |
| | 595,625 |
Electronic Equipment & Components - 3.6% |
Anixter International, Inc. | 3,679 | | 219,747 |
CPI International, Inc. (a) | 2,827 | | 54,702 |
Insight Enterprises, Inc. (a) | 5,310 | | 69,880 |
Littelfuse, Inc. | 6,914 | | 325,373 |
Measurement Specialties, Inc. (a) | 11,092 | | 325,550 |
Multi-Fineline Electronix, Inc. (a) | 11,110 | | 294,304 |
Newport Corp. (a) | 19,331 | | 335,779 |
OSI Systems, Inc. (a) | 5,190 | | 188,708 |
Power-One, Inc. (a)(d) | 32,578 | | 332,296 |
Pulse Electronics Corp. | 61,711 | | 328,303 |
Rofin-Sinar Technologies, Inc. (a) | 836 | | 29,628 |
TTM Technologies, Inc. (a) | 4,022 | | 59,968 |
Zygo Corp. (a) | 2,384 | | 29,156 |
| | 2,593,394 |
Internet Software & Services - 1.0% |
EarthLink, Inc. | 20,399 | | 175,431 |
j2 Global Communications, Inc. (a)(d) | 6,359 | | 184,093 |
Mercadolibre, Inc. (a) | 2,044 | | 136,233 |
ValueClick, Inc. (a) | 16,311 | | 261,465 |
| | 757,222 |
IT Services - 2.4% |
Acxiom Corp. (a) | 14,967 | | 256,684 |
CACI International, Inc. Class A (a) | 3,375 | | 180,225 |
CSG Systems International, Inc. (a) | 6,513 | | 123,356 |
Jack Henry & Associates, Inc. | 7,735 | | 225,475 |
Maximus, Inc. | 1,154 | | 75,679 |
Teletech Holdings, Inc. (a) | 15,744 | | 324,169 |
Unisys Corp. (a) | 1,780 | | 46,084 |
VeriFone Systems, Inc. (a) | 12,487 | | 481,499 |
Wright Express Corp. (a) | 1,135 | | 52,210 |
| | 1,765,381 |
Semiconductors & Semiconductor Equipment - 4.8% |
Cabot Microelectronics Corp. (a) | 2,311 | | 95,791 |
Diodes, Inc. (a) | 4,921 | | 132,818 |
Common Stocks - continued |
| Shares | | Value |
INFORMATION TECHNOLOGY - continued |
Semiconductors & Semiconductor Equipment - continued |
DSP Group, Inc. (a) | 4,171 | | $ 33,952 |
Entegris, Inc. (a) | 48,317 | | 360,928 |
GT Solar International, Inc. (a)(d) | 35,770 | | 326,222 |
Lattice Semiconductor Corp. (a) | 65,103 | | 394,524 |
Omnivision Technologies, Inc. (a) | 5,130 | | 151,899 |
Photronics, Inc. (a) | 35,551 | | 210,106 |
PMC-Sierra, Inc. (a) | 28,998 | | 249,093 |
RF Micro Devices, Inc. (a) | 63,632 | | 467,695 |
Sigma Designs, Inc. (a) | 15,381 | | 217,949 |
Skyworks Solutions, Inc. (a) | 14,407 | | 412,472 |
Tessera Technologies, Inc. (a) | 1,972 | | 43,680 |
Veeco Instruments, Inc. (a) | 7,948 | | 341,446 |
| | 3,438,575 |
Software - 3.2% |
AsiaInfo Holdings, Inc. (a)(d) | 4,852 | | 80,398 |
Fair Isaac Corp. | 13,410 | | 313,392 |
Lawson Software, Inc. (a) | 13,472 | | 124,616 |
Manhattan Associates, Inc. (a) | 5,231 | | 159,755 |
Monotype Imaging Holdings, Inc. (a)(d) | 28,340 | | 314,574 |
Net 1 UEPS Technologies, Inc. (a) | 10,732 | | 131,574 |
NetScout Systems, Inc. (a) | 3,249 | | 74,759 |
Opnet Technologies, Inc. | 4,771 | | 127,720 |
QAD, Inc.: | | | |
Class A (a) | 6,868 | | 62,499 |
Class B | 2,116 | | 21,033 |
Quest Software, Inc. (a) | 13,246 | | 367,444 |
Renaissance Learning, Inc. | 4,457 | | 52,771 |
TIBCO Software, Inc. (a) | 22,931 | | 451,970 |
VirnetX Holding Corp. | 1,574 | | 23,374 |
| | 2,305,879 |
TOTAL INFORMATION TECHNOLOGY | | 13,011,272 |
MATERIALS - 6.8% |
Chemicals - 2.8% |
Arch Chemicals, Inc. | 8,040 | | 304,957 |
OM Group, Inc. (a) | 8,476 | | 326,411 |
PolyOne Corp. (a) | 4 | | 50 |
Rockwood Holdings, Inc. (a) | 5,112 | | 199,981 |
Senomyx, Inc. (a) | 20,403 | | 145,473 |
Sensient Technologies Corp. | 2,821 | | 103,615 |
ShengdaTech, Inc. (a)(d) | 18,416 | | 90,238 |
Solutia, Inc. (a) | 11,214 | | 258,819 |
TPC Group, Inc. (a) | 5,112 | | 154,996 |
W.R. Grace & Co. (a) | 8,507 | | 298,851 |
Westlake Chemical Corp. | 3,556 | | 154,579 |
| | 2,037,970 |
|
| Shares | | Value |
Containers & Packaging - 0.9% |
Boise, Inc. | 17,989 | | $ 142,653 |
Rock-Tenn Co. Class A | 5,077 | | 273,904 |
Silgan Holdings, Inc. | 7,344 | | 262,989 |
| | 679,546 |
Metals & Mining - 1.2% |
Golden Star Resources Ltd. Cda (a) | 82,687 | | 378,903 |
Hecla Mining Co. (a) | 35,929 | | 404,561 |
Noranda Aluminium Holding Corp. (a) | 4,650 | | 67,890 |
| | 851,354 |
Paper & Forest Products - 1.9% |
Buckeye Technologies, Inc. | 16,179 | | 339,921 |
Clearwater Paper Corp. (a) | 3,321 | | 260,034 |
Domtar Corp. | 4,488 | | 340,729 |
Glatfelter | 8,552 | | 104,933 |
Kapstone Paper & Packaging Corp. (a) | 20,341 | | 311,217 |
| | 1,356,834 |
TOTAL MATERIALS | | 4,925,704 |
TELECOMMUNICATION SERVICES - 0.6% |
Diversified Telecommunication Services - 0.2% |
Consolidated Communications Holdings, Inc. | 8,334 | | 160,846 |
Wireless Telecommunication Services - 0.4% |
USA Mobility, Inc. | 15,290 | | 271,703 |
TOTAL TELECOMMUNICATION SERVICES | | 432,549 |
UTILITIES - 1.1% |
Electric Utilities - 0.5% |
El Paso Electric Co. (a) | 8,924 | | 245,678 |
IDACORP, Inc. | 761 | | 28,142 |
Portland General Electric Co. | 3,271 | | 70,981 |
| | 344,801 |
Gas Utilities - 0.3% |
Chesapeake Utilities Corp. | 2,245 | | 93,212 |
New Jersey Resources Corp. | 16 | | 690 |
Nicor, Inc. | 14 | | 699 |
Southwest Gas Corp. | 3,425 | | 125,595 |
| | 220,196 |
Independent Power Producers & Energy Traders - 0.2% |
Black Hills Corp. | 4,701 | | 141,030 |
Multi-Utilities - 0.1% |
Avista Corp. | 3,670 | | 82,648 |
TOTAL UTILITIES | | 788,675 |
TOTAL COMMON STOCKS (Cost $49,511,142) | 61,536,817 |
U.S. Treasury Obligations - 0.9% |
| Principal Amount | | Value |
U.S. Treasury Bills, yield at date of purchase 0.18% to 0.2% 6/9/11 to 7/28/11 (e)
(Cost $629,345) | | $ 630,000 | | $ 629,367 |
Money Market Funds - 20.3% |
| Shares | | |
Fidelity Cash Central Fund, 0.19% (b) | 10,879,284 | | 10,879,284 |
Fidelity Securities Lending Cash Central Fund, 0.21% (b)(c) | 3,839,020 | | 3,839,020 |
TOTAL MONEY MARKET FUNDS (Cost $14,718,304) | 14,718,304 |
TOTAL INVESTMENT PORTFOLIO - 106.2% (Cost $64,858,791) | | 76,884,488 |
NET OTHER ASSETS (LIABILITIES) - (6.2)% | | (4,472,757) |
NET ASSETS - 100% | $ 72,411,731 |
Futures Contracts |
| Expiration Date | | Underlying Face Amount at Value | | Unrealized Appreciation/(Depreciation) |
Purchased |
Equity Index Contracts |
130 NYFE Russell Mini Index Contracts | March 2011 | | $ 10,169,900 | | $ 167,509 |
|
The face value of futures purchased as a percentage of net assets is 14% |
Legend |
(a) Non-income producing |
(b) Affiliated fund that is available only to investment companies and other accounts managed by Fidelity Investments. The rate quoted is the annualized seven-day yield of the fund at period end. A complete unaudited listing of the fund's holdings as of its most recent quarter end is available upon request. In addition, each Fidelity Central Fund's financial statements, which are not covered by the Fund's Report of Independent Registered Public Accounting Firm, are available on the SEC's website or upon request. |
(c) Investment made with cash collateral received from securities on loan. |
(d) Security or a portion of the security is on loan at period end. |
(e) Security or a portion of the security was pledged to cover margin requirements for futures contracts. At the period end, the value of securities pledged amounted to $619,381. |
Affiliated Central Funds |
Information regarding fiscal year to date income earned by the Fund from investments in Fidelity Central Funds is as follows: |
Fund | Income earned |
Fidelity Cash Central Fund | $ 6,304 |
Fidelity Securities Lending Cash Central Fund | 53,495 |
Total | $ 59,799 |
Other Information |
The following is a summary of the inputs used, as of December 31, 2010, involving the Fund's assets and liabilities carried at fair value. The inputs or methodology used for valuing securities may not be an indication of the risk associated with investing in those securities. For more information on valuation inputs, and their aggregation into the levels used in the table below, please refer to the Security Valuation section in the accompanying Notes to Financial Statements. |
Valuation Inputs at Reporting Date: |
Description | Total | Level 1 | Level 2 | Level 3 |
Investments in Securities: | | | | |
Equities: | | | | |
Consumer Discretionary | $ 7,743,393 | $ 7,743,393 | $ - | $ - |
Consumer Staples | 2,239,343 | 2,239,343 | - | - |
Energy | 5,585,381 | 5,585,381 | - | - |
Financials | 11,079,608 | 11,079,608 | - | - |
Health Care | 5,924,560 | 5,924,560 | - | - |
Industrials | 9,806,332 | 9,806,332 | - | - |
Information Technology | 13,011,272 | 13,011,272 | - | - |
Materials | 4,925,704 | 4,925,704 | - | - |
Telecommunication Services | 432,549 | 432,549 | - | - |
Utilities | 788,675 | 788,675 | - | - |
U.S. Government and Government Agency Obligations | 629,367 | - | 629,367 | - |
Money Market Funds | 14,718,304 | 14,718,304 | - | - |
Total Investments in Securities: | $ 76,884,488 | $ 76,255,121 | $ 629,367 | $ - |
Derivative Instruments: | | | | |
Assets | | | | |
Futures Contracts | $ 167,509 | $ 167,509 | $ - | $ - |
Value of Derivative Instruments |
The following table is a summary of the Fund's value of derivative instruments by risk exposure as of December 31, 2010. For additional information on derivative instruments, please refer to the Derivative Instruments section in the accompanying Notes to Financial Statements. |
Risk Exposure /
Derivative Type | Value |
| Asset | Liability |
Equity Risk | | |
Futures Contracts (a) | $ 167,509 | $ - |
Total Value of Derivatives | $ 167,509 | $ - |
(a) Reflects cumulative appreciation/(depreciation) on futures contracts as disclosed on the Schedule of Investments. Only the period end variation margin is separately disclosed on the Statement of Assets and Liabilities. |
Income Tax Information |
At December 31, 2010, the Fund had a capital loss carryforward of approximately $8,457,049 of which $1,202,314 and $7,254,735 will expire in fiscal 2016 and 2017, respectively. Capital loss carryforwards are only available to offset future capital gains of the Fund to the extent provided by regulations and may be limited. |
See accompanying notes which are an integral part of the financial statements.
Annual Report
Statement of Assets and Liabilities
| December 31, 2010 |
| | |
Assets | | |
Investment in securities, at value (including securities loaned of $3,680,977) - See accompanying schedule: Unaffiliated issuers (cost $50,140,487) | $ 62,166,184 | |
Fidelity Central Funds (cost $14,718,304) | 14,718,304 | |
Total Investments (cost $64,858,791) | | $ 76,884,488 |
Cash | | 2 |
Receivable for investments sold | | 1,996,467 |
Receivable for fund shares sold | | 618,255 |
Dividends receivable | | 49,444 |
Distributions receivable from Fidelity Central Funds | | 7,234 |
Prepaid expenses | | 150 |
Total assets | | 79,556,040 |
| | |
Liabilities | | |
Payable for investments purchased | $ 3,152,864 | |
Payable for fund shares redeemed | 3,514 | |
Accrued management fee | 39,405 | |
Distribution and service plan fees payable | 523 | |
Payable for daily variation on futures contracts | 66,068 | |
Other affiliated payables | 8,989 | |
Other payables and accrued expenses | 33,926 | |
Collateral on securities loaned, at value | 3,839,020 | |
Total liabilities | | 7,144,309 |
| | |
Net Assets | | $ 72,411,731 |
Net Assets consist of: | | |
Paid in capital | | $ 68,863,391 |
Accumulated undistributed net realized gain (loss) on investments and foreign currency transactions | | (8,644,866) |
Net unrealized appreciation (depreciation) on investments | | 12,193,206 |
Net Assets | | $ 72,411,731 |
Statement of Assets and Liabilities - continued
| December 31, 2010 |
| | |
Initial Class:
Net Asset Value, offering price and redemption price per share ($19,741,909 ÷ 1,771,340 shares) | | $ 11.15 |
| | |
Service Class:
Net Asset Value, offering price and redemption price per share ($326,613 ÷ 29,254 shares) | | $ 11.16 |
| | |
Service Class 2:
Net Asset Value, offering price and redemption price per share ($2,513,148 ÷ 225,307 shares) | | $ 11.15 |
| | |
Investor Class:
Net Asset Value, offering price and redemption price per share ($49,830,061 ÷ 4,480,461 shares) | | $ 11.12 |
See accompanying notes which are an integral part of the financial statements.
Annual Report
Statement of Operations
| Year ended December 31, 2010 |
| | |
Investment Income | | |
Dividends | | $ 618,124 |
Interest | | 1,117 |
Income from Fidelity Central Funds (including $53,495 from security lending) | | 59,799 |
Total income | | 679,040 |
| | |
Expenses | | |
Management fee | $ 354,579 | |
Transfer agent fees | 73,185 | |
Distribution and service plan fees | 5,468 | |
Accounting and security lending fees | 20,294 | |
Custodian fees and expenses | 5,704 | |
Independent trustees' compensation | 271 | |
Audit | 46,603 | |
Legal | 203 | |
Miscellaneous | 537 | |
Total expenses before reductions | 506,844 | |
Expense reductions | (4,126) | 502,718 |
Net investment income (loss) | | 176,322 |
Realized and Unrealized Gain (Loss) Net realized gain (loss) on: | | |
Investment securities: | | |
Unaffiliated issuers | 2,504,414 | |
Foreign currency transactions | 2,482 | |
Futures contracts | (233,666) | |
Total net realized gain (loss) | | 2,273,230 |
Change in net unrealized appreciation (depreciation) on: Investment securities | 8,771,264 | |
Futures contracts | 145,831 | |
Total change in net unrealized appreciation (depreciation) | | 8,917,095 |
Net gain (loss) | | 11,190,325 |
Net increase (decrease) in net assets resulting from operations | | $ 11,366,647 |
Statement of Changes in Net Assets
| Year ended
December 31, 2010 | Year ended
December 31, 2009 |
Increase (Decrease) in Net Assets | | |
Operations | | |
Net investment income (loss) | $ 176,322 | $ 164,872 |
Net realized gain (loss) | 2,273,230 | (6,212,796) |
Change in net unrealized appreciation (depreciation) | 8,917,095 | 13,495,798 |
Net increase (decrease) in net assets resulting from operations | 11,366,647 | 7,447,874 |
Distributions to shareholders from net investment income | (190,826) | (164,922) |
Share transactions - net increase (decrease) | 18,986,293 | 8,130,084 |
Total increase (decrease) in net assets | 30,162,114 | 15,413,036 |
| | |
Net Assets | | |
Beginning of period | 42,249,617 | 26,836,581 |
End of period (including undistributed net investment income of $0 and distributions in excess of net investment income of $2, respectively) | $ 72,411,731 | $ 42,249,617 |
See accompanying notes which are an integral part of the financial statements.
Annual Report
Financial Highlights - Initial Class
Years ended December 31, | 2010 | 2009 | 2008 | 2007 | 2006 |
Selected Per-Share Data | | | | | |
Net asset value, beginning of period | $ 8.91 | $ 7.32 | $ 11.17 | $ 11.56 | $ 9.94 |
Income from Investment Operations | | | | | |
Net investment income (loss) C | .04 | .04 | .07 | .05 | .04 |
Net realized and unrealized gain (loss) | 2.24 | 1.59 | (3.84) | (.32) | 1.60 |
Total from investment operations | 2.28 | 1.63 | (3.77) | (.27) | 1.64 |
Distributions from net investment income | (.04) | (.04) | (.08) | (.06) | (.02) |
Distributions from net realized gain | - | - | - | (.07) | - |
Total distributions | (.04) | (.04) | (.08) | (.12) G | (.02) |
Net asset value, end of period | $ 11.15 | $ 8.91 | $ 7.32 | $ 11.17 | $ 11.56 |
Total Return A, B | 25.54% | 22.28% | (33.72)% | (2.33)% | 16.51% |
Ratios to Average Net Assets D, F | | | | | |
Expenses before reductions | .95% | 1.05% | 1.04% | 1.01% | 1.30% |
Expenses net of fee waivers, if any | .94% | 1.00% | 1.00% | 1.00% | 1.00% |
Expenses net of all reductions | .94% | 1.00% | 1.00% | 1.00% | .98% |
Net investment income (loss) | .41% | .56% | .71% | .45% | .34% |
Supplemental Data | | | | | |
Net assets, end of period (000 omitted) | $ 19,742 | $ 13,864 | $ 8,381 | $ 11,668 | $ 10,119 |
Portfolio turnover rate E | 71% | 81% | 87% | 113% | 47% |
A Total returns do not reflect charges attributable to your insurance company's separate account. Inclusion of these charges would reduce the total returns shown.
B Total returns would have been lower had certain expenses not been reduced during the periods shown.
C Calculated based on average shares outstanding during the period.
D Fees and expenses of the underlying Fidelity Central Funds are not included in the Fund's expense ratio. The Fund indirectly bears its proportionate share of the expenses of any underlying Fidelity Central Funds.
E Amount does not include the portfolio activity of any underlying Fidelity Central Funds.
F Expense ratios reflect operating expenses of the class. Expenses before reductions do not reflect amounts reimbursed by the investment adviser or reductions from expense offset arrangements and do not represent the amount paid by the class during periods when reimbursements or reductions occur. Expenses net of fee waivers reflect expenses after reimbursement by the investment adviser but prior to reductions from expense offset arrangements. Expenses net of all reductions represent the net expenses paid by the class.
G Total distributions of $.12 per share is comprised of distributions from net investment income of $.059 and distributions from net realized gain of $.065 per share.
Financial Highlights - Service Class
Years ended December 31, | 2010 | 2009 | 2008 | 2007 | 2006 |
Selected Per-Share Data | | | | | |
Net asset value, beginning of period | $ 8.92 | $ 7.33 | $ 11.17 | $ 11.56 | $ 9.94 |
Income from Investment Operations | | | | | |
Net investment income (loss) C | .03 | .03 | .06 | .04 | .03 |
Net realized and unrealized gain (loss) | 2.23 | 1.58 | (3.84) | (.31) | 1.60 |
Total from investment operations | 2.26 | 1.61 | (3.78) | (.27) | 1.63 |
Distributions from net investment income | (.02) | (.02) | (.06) | (.05) | (.01) |
Distributions from net realized gain | - | - | - | (.07) | - |
Total distributions | (.02) | (.02) | (.06) | (.12) G | (.01) |
Net asset value, end of period | $ 11.16 | $ 8.92 | $ 7.33 | $ 11.17 | $ 11.56 |
Total Return A, B | 25.35% | 22.03% | (33.79)% | (2.40)% | 16.40% |
Ratios to Average Net Assets D, F | | | | | |
Expenses before reductions | 1.04% | 1.10% | 1.10% | 1.09% | 1.54% |
Expenses net of fee waivers, if any | 1.04% | 1.10% | 1.10% | 1.09% | 1.10% |
Expenses net of all reductions | 1.04% | 1.10% | 1.10% | 1.08% | 1.08% |
Net investment income (loss) | .32% | .46% | .61% | .37% | .24% |
Supplemental Data | | | | | |
Net assets, end of period (000 omitted) | $ 327 | $ 426 | $ 631 | $ 1,411 | $ 1,446 |
Portfolio turnover rate E | 71% | 81% | 87% | 113% | 47% |
A Total returns do not reflect charges attributable to your insurance company's separate account. Inclusion of these charges would reduce the total returns shown.
B Total returns would have been lower had certain expenses not been reduced during the periods shown.
C Calculated based on average shares outstanding during the period.
D Fees and expenses of the underlying Fidelity Central Funds are not included in the Fund's expense ratio. The Fund indirectly bears its proportionate share of the expenses of any underlying Fidelity Central Funds.
E Amount does not include the portfolio activity of any underlying Fidelity Central Funds.
F Expense ratios reflect operating expenses of the class. Expenses before reductions do not reflect amounts reimbursed by the investment adviser or reductions from expense offset arrangements and do not represent the amount paid by the class during periods when reimbursements or reductions occur. Expenses net of fee waivers reflect expenses after reimbursement by the investment adviser but prior to reductions from expense offset arrangements. Expenses net of all reductions represent the net expenses paid by the class.
G Total distributions of $.12 per share is comprised of distributions from net investment income of $.051 and distributions from net realized gain of $.065 per share.
See accompanying notes which are an integral part of the financial statements.
Annual Report
Financial Highlights - Service Class 2
Years ended December 31, | 2010 | 2009 | 2008 | 2007 | 2006 |
Selected Per-Share Data | | | | | |
Net asset value, beginning of period | $ 8.92 | $ 7.33 | $ 11.15 | $ 11.55 | $ 9.94 |
Income from Investment Operations | | | | | |
Net investment income (loss) C | .01 | .02 | .04 | .02 | .01 |
Net realized and unrealized gain (loss) | 2.23 | 1.59 | (3.82) | (.32) | 1.61 |
Total from investment operations | 2.24 | 1.61 | (3.78) | (.30) | 1.62 |
Distributions from net investment income | (.01) | (.02) | (.04) | (.04) | (.01) |
Distributions from net realized gain | - | - | - | (.07) | - |
Total distributions | (.01) | (.02) | (.04) | (.10) G | (.01) |
Net asset value, end of period | $ 11.15 | $ 8.92 | $ 7.33 | $ 11.15 | $ 11.55 |
Total Return A, B | 25.07% | 21.94% | (33.91)% | (2.60)% | 16.25% |
Ratios to Average Net Assets D, F | | | | | |
Expenses before reductions | 1.28% | 1.41% | 1.32% | 1.24% | 1.69% |
Expenses net of fee waivers, if any | 1.25% | 1.25% | 1.25% | 1.24% | 1.25% |
Expenses net of all reductions | 1.25% | 1.25% | 1.25% | 1.24% | 1.23% |
Net investment income (loss) | .11% | .31% | .46% | .21% | .09% |
Supplemental Data | | | | | |
Net assets, end of period (000 omitted) | $ 2,513 | $ 1,535 | $ 1,494 | $ 4,143 | $ 1,444 |
Portfolio turnover rate E | 71% | 81% | 87% | 113% | 47% |
A Total returns do not reflect charges attributable to your insurance company's separate account. Inclusion of these charges would reduce the total returns shown.
B Total returns would have been lower had certain expenses not been reduced during the periods shown.
C Calculated based on average shares outstanding during the period.
D Fees and expenses of the underlying Fidelity Central Funds are not included in the Fund's expense ratio. The Fund indirectly bears its proportionate share of the expenses of any underlying Fidelity Central Funds.
E Amount does not include the portfolio activity of any underlying Fidelity Central Funds.
F Expense ratios reflect operating expenses of the class. Expenses before reductions do not reflect amounts reimbursed by the investment adviser or reductions from expense offset arrangements and do not represent the amount paid by the class during periods when reimbursements or reductions occur. Expenses net of fee waivers reflect expenses after reimbursement by the investment adviser but prior to reductions from expense offset arrangements. Expenses net of all reductions represent the net expenses paid by the class.
G Total distributions of $.10 per share is comprised of distributions from net investment income of $.038 and distributions from net realized gain of $.065 per share.
Financial Highlights - Investor Class
Years ended December 31, | 2010 | 2009 | 2008 | 2007 | 2006 |
Selected Per-Share Data | | | | | |
Net asset value, beginning of period | $ 8.89 | $ 7.31 | $ 11.15 | $ 11.55 | $ 9.94 |
Income from Investment Operations | | | | | |
Net investment income (loss) C | .03 | .04 | .06 | .04 | .02 |
Net realized and unrealized gain (loss) | 2.23 | 1.57 | (3.83) | (.32) | 1.61 |
Total from investment operations | 2.26 | 1.61 | (3.77) | (.28) | 1.63 |
Distributions from net investment income | (.03) | (.03) | (.07) | (.05) | (.02) |
Distributions from net realized gain | - | - | - | (.07) | - |
Total distributions | (.03) | (.03) | (.07) | (.12) G | (.02) |
Net asset value, end of period | $ 11.12 | $ 8.89 | $ 7.31 | $ 11.15 | $ 11.55 |
Total Return A, B | 25.44% | 22.09% | (33.77)% | (2.50)% | 16.40% |
Ratios to Average Net Assets D, F | | | | | |
Expenses before reductions | 1.02% | 1.12% | 1.10% | 1.10% | 1.41% |
Expenses net of fee waivers, if any | 1.01% | 1.08% | 1.08% | 1.10% | 1.15% |
Expenses net of all reductions | 1.01% | 1.08% | 1.08% | 1.10% | 1.13% |
Net investment income (loss) | .34% | .48% | .63% | .35% | .19% |
Supplemental Data | | | | | |
Net assets, end of period (000 omitted) | $ 49,830 | $ 26,426 | $ 16,331 | $ 21,872 | $ 11,853 |
Portfolio turnover rate E | 71% | 81% | 87% | 113% | 47% |
A Total returns do not reflect charges attributable to your insurance company's separate account. Inclusion of these charges would reduce the total returns shown.
B Total returns would have been lower had certain expenses not been reduced during the periods shown.
C Calculated based on average shares outstanding during the period.
D Fees and expenses of the underlying Fidelity Central Funds are not included in the Fund's expense ratio. The Fund indirectly bears its proportionate share of the expenses of any underlying Fidelity Central Funds.
E Amount does not include the portfolio activity of any underlying Fidelity Central Funds.
F Expense ratios reflect operating expenses of the class. Expenses before reductions do not reflect amounts reimbursed by the investment adviser or reductions from expense offset arrangements and do not represent the amount paid by the class during periods when reimbursements or reductions occur. Expenses net of fee waivers reflect expenses after reimbursement by the investment adviser but prior to reductions from expense offset arrangements. Expenses net of all reductions represent the net expenses paid by the class.
G Total distributions of $.12 per share is comprised of distributions from net investment income of $.050 and distributions from net realized gain of $.065 per share.
See accompanying notes which are an integral part of the financial statements.
Annual Report
Notes to Financial Statements
For the period ended December 31, 2010
1. Organization.
VIP Disciplined Small Cap Portfolio (the Fund) is a fund of Variable Insurance Products Fund II (the Trust) and is authorized to issue an unlimited number of shares. The Trust is registered under the Investment Company Act of 1940, as amended (the 1940 Act), as an open-end management investment company organized as a Massachusetts business trust. Shares of the Fund may only be purchased by insurance companies for the purpose of funding variable annuity or variable life insurance contracts. The Fund offers the following classes of shares: Initial Class shares, Service Class shares, Service Class 2 shares and Investor Class shares. All classes have equal rights and voting privileges, except for matters affecting a single class. Investment income, realized and unrealized capital gains and losses, the common expenses of the Fund, and certain fund-level expense reductions, if any, are allocated on a pro-rata basis to each class based on the relative net assets of each class to the total net assets of the Fund. Each class differs with respect to transfer agent and distribution and service plan fees incurred. Certain expense reductions may also differ by class.
2. Investments in Fidelity Central Funds.
The Fund may invest in Fidelity Central Funds, which are open-end investment companies available only to other investment companies and accounts managed by Fidelity Management & Research Company (FMR) and its affiliates. The Fund's Schedule of Investments lists each of the Fidelity Central Funds held as of period end, if any, as an investment of the Fund, but does not include the underlying holdings of each Fidelity Central Fund. As an Investing Fund, the Fund indirectly bears its proportionate share of the expenses of the underlying Fidelity Central Funds.
The Money Market Central Funds seek preservation of capital and current income and are managed by Fidelity Investments Money Management, Inc. (FIMM), an affiliate of FMR.
A complete unaudited list of holdings for each Fidelity Central Fund is available upon request or at the Securities and Exchange Commission (the SEC) web site at www.sec.gov. In addition, the financial statements of the Fidelity Central Funds, which are not covered by the Fund's Report of Independent Registered Public Accounting Firm, are available on the SEC web site or upon request.
3. Significant Accounting Policies.
The financial statements have been prepared in conformity with accounting principles generally accepted in the United States of America (GAAP), which require management to make certain estimates and assumptions at the date of the financial statements. Actual results could differ from those estimates. Subsequent events, if any, through the date that the financial statements were issued have been evaluated in the preparation of the financial statements. The following summarizes the significant accounting policies of the Fund:
Security Valuation. Investments are valued as of 4:00 p.m. Eastern time on the last calendar day of the period. The Fund uses independent pricing services approved by the Board of Trustees to value its investments. When current market prices or quotations are not readily available or reliable, valuations may be determined in good faith in accordance with procedures adopted by the Board of Trustees. Factors used in determining value may include market or security specific events, changes in interest rates and credit quality. The frequency with which these procedures are used cannot be predicted and they may be utilized to a significant extent. The value used for net asset value (NAV) calculation under these procedures may differ from published prices for the same securities.
The Fund categorizes the inputs to valuation techniques used to value its investments into a disclosure hierarchy consisting of three levels as shown below.
Level 1 - quoted prices in active markets for identical investments
Level 2 - other significant observable inputs (including quoted prices for similar investments, interest rates, prepayment speeds, etc.)
Level 3 - unobservable inputs (including the Fund's own assumptions based on the best information available)
Changes in valuation techniques may result in transfers in or out of an assigned level within the disclosure hierarchy. The aggregate value of investments by input level, as of December 31, 2010, is included at the end of the Fund's Schedule of Investments. Valuation techniques used to value the Fund's investments by major category are as follows.
Equity securities, including restricted securities, for which market quotations are readily available, are valued at the last reported sale price or official closing price as reported by an independent pricing service on the primary market or exchange on which they are traded and are categorized as Level 1 in the hierarchy. In the event there were no sales during the day or closing prices are not available, securities are valued at the last quoted bid price or may be valued using the last available price and are generally categorized as Level 2 in the hierarchy. For foreign equity securities, when significant market or security specific events arise, comparisons to the valuation of American Depositary Receipts (ADRs), futures contracts, Exchange-traded funds (ETFs) and certain indexes as well as quoted prices for similar securities are used and are categorized as Level 2 in the hierarchy in these circumstances. Utilizing these techniques may result in transfers between Level 1 and Level 2. For restricted equity securities and private placements where observable inputs are limited, assumptions about market activity and risk are used and are categorized as Level 3 in the hierarchy.
Annual Report
3. Significant Accounting Policies - continued
Security Valuation - continued
Futures contracts are valued at the settlement price established each day by the board of trade or exchange on which they are traded and are categorized as Level 1 in the hierarchy. Investments in open-end mutual funds, including the Fidelity Central Funds, are valued at their closing net asset value each business day and are categorized as Level 1 in the hierarchy. Short-term securities with remaining maturities of sixty days or less for which quotations are not readily available are valued at amortized cost, which approximates fair value and are categorized as Level 2 in the hierarchy.
Foreign Currency. The Fund uses foreign currency contracts to facilitate transactions in foreign-denominated securities. Gains and losses from these transactions may arise from changes in the value of the foreign currency or if the counterparties do not perform under the contracts' terms.
Foreign-denominated assets, including investment securities, and liabilities are translated into U.S. dollars at the exchange rate at period end. Purchases and sales of investment securities, income and dividends received and expenses denominated in foreign currencies are translated into U.S. dollars at the exchange rate in effect on the transaction date.
The effects of exchange rate fluctuations on investments are included with the net realized and unrealized gain (loss) on investment securities. Other foreign currency transactions resulting in realized and unrealized gain (loss) are disclosed separately.
Investment Transactions and Income. For financial reporting purposes, the Fund's investment holdings and NAV include trades executed through the end of the last business day of the period. The NAV per share for processing shareholder transactions is calculated as of the close of business of the New York Stock Exchange (NYSE), normally 4:00 p.m. Eastern time and includes trades executed through the end of the prior business day. Gains and losses on securities sold are determined on the basis of identified cost and may include proceeds received from litigation. Dividend income is recorded on the ex-dividend date, except for certain dividends from foreign securities where the ex-dividend date may have passed, which are recorded as soon as the Fund is informed of the ex-dividend date. Non-cash dividends included in dividend income, if any, are recorded at the fair market value of the securities received. Distributions received on securities that represent a return of capital or capital gain are recorded as a reduction of cost of investments and/or as a realized gain. The Fund estimates the components of distributions received that may be considered return of capital distributions or capital gain distributions. Interest income and distributions from the Fidelity Central Funds are accrued as earned. Interest income includes coupon interest and amortization of premium and accretion of discount on debt securities. Investment income is recorded net of foreign taxes withheld where recovery of such taxes is uncertain.
Expenses. Expenses directly attributable to a fund are charged to that fund. Expenses attributable to more than one fund are allocated among the respective funds on the basis of relative net assets or other appropriate methods. Expense estimates are accrued in the period to which they relate and adjustments are made when actual amounts are known.
Income Tax Information and Distributions to Shareholders. Each year the Fund intends to qualify as a regulated investment company, including distributing substantially all of its taxable income and realized gains under Subchapter M of the Internal Revenue Code and filing its U.S. federal tax return. As a result, no provision for income taxes is required. As of December 31, 2010, the Fund did not have any unrecognized tax benefits in the accompanying financial statements. A fund's federal tax return is subject to examination by the Internal Revenue Service (IRS) for a period of three years. Foreign taxes are provided for based on the Fund's understanding of the tax rules and rates that exist in the foreign markets in which it invests.
Distributions are declared and recorded on the ex-dividend date. Income dividends and capital gain distributions are declared separately for each class. Income and capital gain distributions are determined in accordance with income tax regulations, which may differ from GAAP.
Capital accounts within the financial statements are adjusted for permanent book-tax differences. These adjustments have no impact on net assets or the results of operations. Temporary book-tax differences will reverse in a subsequent period.
Book-tax differences are primarily due to futures transactions, foreign currency transactions, market discount, capital loss carryforwards and losses deferred due to wash sales and excise tax regulations.
Annual Report
Notes to Financial Statements - continued
3. Significant Accounting Policies - continued
Income Tax Information and Distributions to Shareholders - continued
The federal tax cost of investment securities and unrealized appreciation (depreciation) as of period end were as follows:
Gross unrealized appreciation | $ 13,240,550 |
Gross unrealized depreciation | (1,235,162) |
Net unrealized appreciation (depreciation) | $ 12,005,388 |
| |
Tax Cost | $ 64,879,100 |
The tax-based components of distributable earnings as of period end were as follows:
Capital loss carryforward | $ (8,457,049) |
Net unrealized appreciation (depreciation) | $ 12,005,388 |
The tax character of distributions paid was as follows:
| December 31, 2010 | December 31, 2009 |
Ordinary Income | $ 190,826 | $ 164,922 |
4. Derivative Instruments.
Risk Exposures and the Use of Derivative Instruments. The Fund uses derivative instruments (derivatives), including futures contracts, in order to meet its investment objectives. The strategy is to use derivatives to increase returns and to manage exposure to certain risks as defined below. The success of any strategy involving derivatives depends on analysis of numerous economic factors, and if the strategies for investment do not work as intended, the Fund may not achieve its objectives.
The Fund's use of derivatives may increase or decrease its exposure to the following risk:
Equity Risk | Equity risk relates to the fluctuations in the value of financial instruments as a result of changes in market prices (other than those arising from interest rate risk or foreign exchange risk), whether caused by factors specific to an individual investment, its issuer, or all factors affecting all instruments traded in a market or market segment. |
The Fund is also exposed to additional risks from investing in derivatives, such as liquidity risk and counterparty credit risk. Liquidity risk is the risk that the Fund will be unable to sell the derivative in the open market in a timely manner. Counterparty credit risk is the risk that the counterparty will not be able to fulfill its obligation to the Fund. The Fund's maximum risk of loss from counterparty credit risk is generally the aggregate unrealized appreciation and unpaid counterparty fees in excess of any collateral pledged by the counterparty to the Fund. Counterparty risk related to exchange-traded futures contracts is minimal because of the protection provided by the exchange on which they trade. Risk of loss may exceed the amounts recognized in the Statement of Assets and Liabilities.
Futures Contracts. A futures contract is an agreement between two parties to buy or sell a specified underlying instrument for a fixed price at a specified future date. The Fund uses futures contracts to manage its exposure to the stock market.
Upon entering into a futures contract, a fund is required to deposit either cash or securities (initial margin) with a clearing broker in an amount equal to a certain percentage of the face value of the contract. Futures contracts are marked-to-market daily and subsequent payments (variation margin) are made or received by a fund depending on the daily fluctuations in the value of the futures contracts and are recorded as unrealized appreciation or (depreciation). Realized gain or (loss) is recorded upon the expiration or closing of a futures contract.
The underlying face amount at value of open futures contracts at period end is shown in the Schedule of Investments under the caption "Futures Contracts." This amount reflects each contract's exposure to the underlying instrument at period end and is representative of activity for the period. Securities deposited to meet initial margin requirements are identified in the Schedule of Investments. The receivable and/or payable for the variation margin are reflected in the Statement of Assets and Liabilities.
Certain risks may arise upon entering into futures contracts, including the risk that an illiquid market may limit the ability to close out a futures contract prior to settlement date.
During the period the Fund recognized net realized gain (loss) of $(233,666) and a change in net unrealized appreciation (depreciation) of $145,831 related to its investment in futures contracts. These amounts are included in the Statement of Operations.
Annual Report
5. Purchases and Sales of Investments.
Purchases and sales of securities, other than short-term securities, aggregated $42,500,031 and $33,345,653, respectively.
6. Fees and Other Transactions with Affiliates.
Management Fee. FMR and its affiliates provide the Fund with investment management related services for which the Fund pays a monthly management fee. The management fee is the sum of an individual fund fee rate that is based on an annual rate of .45% of the Fund's average net assets and a group fee rate that averaged .26% during the period. The group fee rate is based upon the average net assets of all the mutual funds advised by FMR. The group fee rate decreases as assets under management increase and increases as assets under management decrease. For the period, the total annual management fee rate was .71% of the Fund's average net assets.
Sub-Adviser. Geode Capital Management, LLC (Geode), serves as sub-adviser for the Fund. Geode provides discretionary investment advisory services to the Fund and is paid by FMR for providing these services.
Distribution and Service Plan Fees. In accordance with Rule 12b-1 of the 1940 Act, the Fund has adopted separate 12b-1 Plans for each Service Class of shares. Each Service Class pays Fidelity Distributors Corporation (FDC), an affiliate of FMR, a service fee. For the period, the service fee is based on an annual rate of .10% of Service Class' average net assets and .25% of Service Class 2's average net assets.
For the period, total fees, all of which were re-allowed to insurance companies for the distribution of shares and providing shareholder support services were as follows:
Service Class | $ 366 |
Service Class 2 | 5,102 |
| $ 5,468 |
Transfer Agent Fees. Fidelity Investments Institutional Operations Company, Inc. (FIIOC), an affiliate of FMR, is the Fund's transfer, dividend disbursing, and shareholder servicing agent. FIIOC receives an asset-based fee with respect to each class. Each class (with the exception of Investor Class) pays a transfer agent fee, excluding out of pocket expenses, equal to an annual rate of .07% of average net assets. Investor Class pays a monthly asset-based transfer agent fee of .15% of average net assets. In addition, FIIOC receives an asset-based fee of .01% of average net assets for typesetting, printing and mailing of shareholder reports, except proxy statements. FIIOC has agreed to voluntarily waive this fee until December 31, 2010. (See Note 9: Expense Reductions.) For the period, transfer agent fees for each class, including printing and out of pocket expenses, were as follows:
Initial Class | $ 15,088 |
Service Class | 330 |
Service Class 2 | 3,619 |
Investor Class | 54,148 |
| $ 73,185 |
Accounting and Security Lending Fees. Fidelity Service Company, Inc. (FSC), an affiliate of FMR, maintains the Fund's accounting records. The accounting fee is based on the level of average net assets for the month. Under a separate contract, FSC administers the security lending program. The security lending fee is based on the number and duration of lending transactions.
7. Committed Line of Credit.
The Fund participates with other funds managed by FMR or an affiliate in a $3.75 billion credit facility (the "line of credit") to be utilized for temporary or emergency purposes to fund shareholder redemptions or for other short-term liquidity purposes. The Fund has agreed to pay commitment fees on its pro-rata portion of the line of credit, which amounted to $181 and is reflected in Miscellaneous expenses on the Statement of Operations. During the period, there were no borrowings on this line of credit.
8. Security Lending.
The Fund lends portfolio securities through a lending agent from time to time in order to earn additional income. The lending agent may loan securities to certain qualified borrowers, including Fidelity Capital Markets (FCM), a broker-dealer affiliated with the Fund. On the settlement date of the loan, the Fund receives collateral (in the form of U.S. Treasury obligations, letters of credit and/or cash) against the loaned securities and maintains collateral in an amount not less than 100% of the market value of the loaned securities during the period of the loan. The market value of the loaned securities is determined at the close of business of the Fund and any additional required collateral is delivered to the Fund on the next business day. If the borrower defaults on its obligation to return the securities loaned because of insolvency or other reasons, a fund could experience delays and costs in recovering the securities loaned or in gaining access to the collateral. Any cash collateral received is invested in the Fidelity Securities Lending Cash
Annual Report
Notes to Financial Statements - continued
8. Security Lending - continued
Central Fund. The value of loaned securities and cash collateral at period end are disclosed on the Fund's Statement of Assets and Liabilities. Security lending income represents the income earned on investing cash collateral, less rebates paid to borrowers and lending agent fees associated with the loan, plus any premium payments received for lending certain types of securities. Security lending income is presented in the Statement of Operations as a component of income from Fidelity Central Funds. During the period, there were no securities loaned to FCM.
9. Expense Reductions.
In addition to FIIOC waiving a portion of its transfer agent fees, FMR voluntarily agreed to reimburse each class to the extent annual operating expenses exceeded certain levels of average net assets as noted in the table below. Some expenses, for example interest expense, including commitment fees, are excluded from this reimbursement.
Fees were waived and/or expenses were reimbursed for the following classes during the period:
| Expense
Limitations | Reimbursement/Waiver |
Initial Class | 1.00% | $ 1,119 |
Service Class | 1.10% | 26 |
Service Class 2 | 1.25% | 647 |
Investor Class | 1.08% | 2,334 |
| | $ 4,126 |
10. Distributions to Shareholders.
Distributions to shareholders of each class were as follows:
Years ended December 31, | 2010 | 2009 |
From net investment income | | |
Initial Class | $ 57,782 | $ 61,802 |
Service Class | 657 | 1,142 |
Service Class 2 | 1,252 | 3,081 |
Investor Class | 131,135 | 98,897 |
Total | $ 190,826 | $ 164,922 |
11. Share Transactions.
Transactions for each class of shares were as follows:
| Shares | Dollars |
Years ended December 31, | 2010 | 2009 | 2010 | 2009 |
Initial Class | | | | |
Shares sold | 872,164 | 881,945 | $ 8,757,192 | $ 6,596,533 |
Reinvestment of distributions | 5,259 | 7,120 | 57,782 | 61,801 |
Shares redeemed | (662,913) | (476,928) | (6,175,473) | (3,627,257) |
Net increase (decrease) | 214,510 | 412,137 | $ 2,639,501 | $ 3,031,077 |
Service Class | | | | |
Shares sold | - | - | $ - | $ - |
Reinvestment of distributions | 60 | 131 | 657 | 1,142 |
Shares redeemed | (18,520) | (38,457) | (177,365) | (283,451) |
Net increase (decrease) | (18,460) | (38,326) | $ (176,708) | $ (282,309) |
Service Class 2 | | | | |
Shares sold | 109,184 | 54,885 | $ 1,100,967 | $ 404,564 |
Reinvestment of distributions | 118 | 355 | 1,252 | 3,082 |
Shares redeemed | (56,115) | (86,974) | (539,602) | (623,454) |
Net increase (decrease) | 53,187 | (31,734) | $ 562,617 | $ (215,808) |
Investor Class | | | | |
Shares sold | 2,258,001 | 1,414,856 | $ 22,969,167 | $ 10,597,977 |
Reinvestment of distributions | 11,942 | 11,420 | 131,135 | 98,897 |
Shares redeemed | (762,231) | (687,162) | (7,139,419) | (5,099,750) |
Net increase (decrease) | 1,507,712 | 739,114 | $ 15,960,883 | $ 5,597,124 |
Annual Report
12. Other.
The Fund's organizational documents provide former and current trustees and officers with a limited indemnification against liabilities arising in connection with the performance of their duties to the Fund. In the normal course of business, the Fund may also enter into contracts that provide general indemnifications. The Fund's maximum exposure under these arrangements is unknown as this would be dependent on future claims that may be made against the Fund. The risk of material loss from such claims is considered remote.
At the end of the period, FMR or its affiliates were the owners of record of 96% of the total outstanding shares of the Fund.
Annual Report
Report of Independent Registered Public Accounting Firm
To the Trustees of Variable Insurance Products Fund II and Shareholders of VIP Disciplined Small Cap Portfolio:
We have audited the accompanying statement of assets and liabilities of VIP Disciplined Small Cap Portfolio (the Fund), a fund of Variable Insurance Products Fund II, including the schedule of investments, as of December 31, 2010, and the related statement of operations for the year then ended, the statement of changes in net assets for each of the two years in the period then ended, and the financial highlights for each of the five years in the period then ended. These financial statements and financial highlights are the responsibility of the Fund's management. Our responsibility is to express an opinion on these financial statements and financial highlights based on our audits.
We conducted our audits in accordance with standards of the Public Company Accounting Oversight Board (United States). Those standards require that we plan and perform the audit to obtain reasonable assurance about whether the financial statements and financial highlights are free of material misstatement. The Fund is not required to have, nor were we engaged to perform, an audit of its internal control over financial reporting. Our audits included consideration of internal control over financial reporting as a basis for designing audit procedures that are appropriate in the circumstances, but not for the purpose of expressing an opinion on the effectiveness of the Fund's internal control over financial reporting. Accordingly, we express no such opinion. An audit also includes examining, on a test basis, evidence supporting the amounts and disclosures in the financial statements, assessing the accounting principles used and significant estimates made by management, as well as evaluating the overall financial statement presentation. Our procedures included confirmation of securities owned as of December 31, 2010, by correspondence with the custodians and brokers; where replies were not received from brokers, we performed other auditing procedures. We believe that our audits provide a reasonable basis for our opinion.
In our opinion, the financial statements and financial highlights referred to above present fairly, in all material respects, the financial position of VIP Disciplined Small Cap Portfolio as of December 31, 2010, the results of its operations for the year then ended, the changes in its net assets for each of the two years in the period then ended, and the financial highlights for each of the five years in the period then ended, in conformity with accounting principles generally accepted in the United States of America.
/s/ Deloitte & Touche LLP
DELOITTE & TOUCHE LLP
Boston, Massachusetts
February 15, 2011
Annual Report
The Trustees, Members of the Advisory Board, and executive officers of the trust and fund, as applicable, are listed below. The Board of Trustees governs the fund and is responsible for protecting the interests of shareholders. The Trustees are experienced executives who meet periodically throughout the year to oversee the fund's activities, review contractual arrangements with companies that provide services to the fund, oversee management of the risks associated with such activities and contractual arrangements, and review the fund's performance. Except for James C. Curvey, each of the Trustees oversees 219 funds advised by FMR or an affiliate. Mr. Curvey oversees 408 funds advised by FMR or an affiliate.
The Trustees hold office without limit in time except that (a) any Trustee may resign; (b) any Trustee may be removed by written instrument, signed by at least two-thirds of the number of Trustees prior to such removal; (c) any Trustee who requests to be retired or who has become incapacitated by illness or injury may be retired by written instrument signed by a majority of the other Trustees; and (d) any Trustee may be removed at any special meeting of shareholders by a two-thirds vote of the outstanding voting securities of the trust. Each Trustee who is not an interested person (as defined in the 1940 Act) (Independent Trustee), shall retire not later than the last day of the calendar year in which his or her 72nd birthday occurs. The Independent Trustees may waive this mandatory retirement age policy with respect to individual Trustees. The executive officers and Advisory Board Members hold office without limit in time, except that any officer and Advisory Board Member may resign or may be removed by a vote of a majority of the Trustees at any regular meeting or any special meeting of the Trustees. Except as indicated, each individual has held the office shown or other offices in the same company for the past five years.
Experience, Skills, Attributes, and Qualifications of the Fund's Trustees. The Governance and Nominating Committee has adopted a statement of policy that describes the experience, qualifications, attributes, and skills that are necessary and desirable for potential Independent Trustee candidates (Statement of Policy). The Board believes that each Trustee satisfied at the time he or she was initially elected or appointed a Trustee, and continues to satisfy, the standards contemplated by the Statement of Policy. The Governance and Nominating Committee also engages professional search firms to help identify potential Independent Trustee candidates who have the experience, qualifications, attributes, and skills consistent with the Statement of Policy. From time to time, additional criteria based on the composition and skills of the current Independent Trustees, as well as experience or skills that may be appropriate in light of future changes to board composition, business conditions, and regulatory or other developments, have also been considered by the professional search firms and the Governance and Nominating Committee. In addition, the Board takes into account the Trustees' commitment and participation in Board and committee meetings, as well as their leadership of standing and ad hoc committees throughout their tenure.
In determining that a particular Trustee was and continues to be qualified to serve as a Trustee, the Board has considered a variety of criteria, none of which, in isolation, was controlling. The Board believes that, collectively, the Trustees have balanced and diverse experience, qualifications, attributes, and skills, which allow the Board to operate effectively in governing the fund and protecting the interests of shareholders. Information about the specific experience, skills, attributes, and qualifications of each Trustee, which in each case led to the Board's conclusion that the Trustee should serve (or continue to serve) as a trustee of the fund, is provided below.
Board Structure and Oversight Function. James C. Curvey is an interested person (as defined in the 1940 Act) and currently serves as Acting Chairman. The Trustees have determined that an interested Chairman is appropriate and benefits shareholders because an interested Chairman has a personal and professional stake in the quality and continuity of services provided to the fund. Independent Trustees exercise their informed business judgment to appoint an individual of their choosing to serve as Chairman, regardless of whether the Trustee happens to be independent or a member of management. The Independent Trustees have determined that they can act independently and effectively without having an Independent Trustee serve as Chairman and that a key structural component for assuring that they are in a position to do so is for the Independent Trustees to constitute a substantial majority for the Board. The Independent Trustees also regularly meet in executive session. Ned C. Lautenbach serves as Chairman of the Independent Trustees and as such (i) acts as a liaison between the Independent Trustees and management with respect to matters important to the Independent Trustees and (ii) with management prepares agendas for Board meetings.
Fidelity funds are overseen by different Boards of Trustees. The fund's Board oversees Fidelity's equity and high income funds and another Board oversees Fidelity's investment-grade bond, money market, and asset allocation funds. The asset allocation funds may invest in Fidelity funds overseen by the fund's Board. The use of separate Boards, each with its own committee structure, allows the Trustees of each group of Fidelity funds to focus on the unique issues of the funds they oversee, including common research, investment, and operational issues. On occasion, the separate Boards establish joint committees to address issues of overlapping consequences for the Fidelity funds overseen by each Board.
The Trustees operate using a system of committees to facilitate the timely and efficient consideration of all matters of importance to the Trustees, the fund, and fund shareholders and to facilitate compliance with legal and regulatory requirements and oversight of the fund's activities and associated risks. The Board, acting through its committees, has charged FMR and its affiliates with (i) identifying events or circumstances the occurrence of which could have demonstrably adverse effects on the fund's business and/or reputation; (ii) implementing processes and controls to lessen the possibility that such events or circumstances occur or to mitigate the effects of such events or circumstances if they do occur; and (iii) creating and maintaining a system designed to evaluate continuously business and market conditions in order to facilitate the identification and implementation processes described in (i) and (ii) above. Because the day-to-day operations and activities of the fund are carried out by or through FMR, its affiliates and other service providers, the fund's exposure to risks is mitigated but not eliminated by the processes overseen by the Trustees. While each of the Board's committees has responsibility for overseeing different aspects of the fund's activities, oversight is exercised primarily through the Operations, Audit, and Compliance Committees. Appropriate personnel, including but not limited to the fund's Chief Compliance Officer (CCO), FMR's internal auditor, the independent accountants, the fund's Treasurer and portfolio management personnel, make periodic reports to the Board's committees, as appropriate. The responsibilities of each committee, including their oversight responsibilities, are described further under "Standing Committees of the Fund's Trustees."
Annual Report
Trustees and Officers - continued
The fund's Statement of Additional Information (SAI) includes more information about the Trustees. To request a free copy, call Fidelity at 1-877-208-0098.
Interested Trustees*:
Correspondence intended for each Trustee who is an interested person may be sent to Fidelity Investments, 82 Devonshire Street, Boston, Massachusetts 02109.
Name, Age; Principal Occupations and Other Relevant Experience+ |
James C. Curvey (75) |
| Year of Election or Appointment: 2007 Mr. Curvey is Trustee and Acting Chairman of the Board of Trustees of certain Trusts. Mr. Curvey also serves as Trustee (2007-present) of other investment companies advised by FMR. Mr. Curvey is a Director of Fidelity Investments Money Management, Inc. (2009-present), Director of Fidelity Research & Analysis Co. (2009-present) and Director of FMR and FMR Co., Inc. (2007-present). Mr. Curvey is also Vice Chairman (2007-present) and Director of FMR LLC. In addition, Mr. Curvey serves as an Overseer for the Boston Symphony Orchestra and a member of the Trustees of Villanova University. Previously, Mr. Curvey was the Vice Chairman (2006-2007) and Director (2000-2007) of FMR Corp. |
Ronald P. O'Hanley (54) |
| Year of Election or Appointment: 2011 Mr. O'Hanley is President of Fidelity Asset Management and Corporate Services and a member of Fidelity's Executive Committee (2010-present). Previously, Mr. O'Hanley served as President and Chief Executive Officer of BNY Mellon Asset Management (2007-2010). Mr. O'Hanley also served as Vice Chairman of Bank New York Mellon Corp. and a member of that firm's Executive Committee. Prior to the 2007 merger of The Bank of New York and Mellon Financial Corporation, he was Vice Chairman of Mellon Financial Corporation and President and Chief Executive Officer of Mellon Asset Management. He joined Mellon in February 1997. Mr. O'Hanley currently serves as Chairman of the Boston Public Library Foundation Board of Directors and sits on the Board of Directors of Beth Israel Deaconess Medical Center, the Board of Trustees of the Marine Biological Laboratory and the Advisory Board of the Maxwell School of Citizenship and Public Administration at Syracuse University. Mr. O'Hanley also chairs the Council on Asset Management for the Financial Services Roundtable and is a member of the Board of Directors of Institutional Investor's U.S. Institute. |
* Trustees have been determined to be "Interested Trustees" by virtue of, among other things, their affiliation with the trust various entities under common control with FMR.
+ The information above includes each Trustee's principal occupation during the last five years and other information relating to the experience, attributes, and skills relevant to each Trustee's qualifications to serve as a Trustee, which led to the conclusion that each Trustee should serve as a Trustee for the fund.
Independent Trustees:
Correspondence intended for each Independent Trustee (that is, the Trustees other than the Interested Trustees) may be sent to Fidelity Investments, P.O. Box 55235, Boston, Massachusetts 02205-5235.
Name, Age; Principal Occupations and Other Relevant Experience+ |
Dennis J. Dirks (62) |
| Year of Election or Appointment: 2005 Prior to his retirement in May 2003, Mr. Dirks was Chief Operating Officer and a member of the Board of The Depository Trust & Clearing Corporation (DTCC). He also served as President, Chief Operating Officer, and Board member of The Depository Trust Company (DTC) and President and Board member of the National Securities Clearing Corporation (NSCC). In addition, Mr. Dirks served as Chief Executive Officer and Board member of the Government Securities Clearing Corporation, Chief Executive Officer and Board member of the Mortgage-Backed Securities Clearing Corporation, as a Trustee and a member of the Finance Committee of Manhattan College (2005-2008), and as a Trustee and a member of the Finance Committee of AHRC of Nassau County (2006-2008). Mr. Dirks is a member of the Independent Directors Council (IDC) Governing Council (2010-Present) and Board of Directors for The Brookville Center for Children's Services, Inc. (2009-present). |
Alan J. Lacy (57) |
| Year of Election or Appointment: 2008 Mr. Lacy serves as Senior Adviser (2007-present) of Oak Hill Capital Partners, L.P. (private equity). Mr. Lacy also served as Chief Executive Officer (2000-2005) and Vice Chairman (2005-2006) of Sears Holdings Corporation and Sears, Roebuck and Co. (retail). In addition, Mr. Lacy serves as a member of the Board of Directors of The Western Union Company (global money transfer, 2006-present) and Bristol-Myers Squibb Company (global pharmaceuticals, 2007-present). Mr. Lacy is Chairman (2008-present) and a member (2006-present) of the Board of Trustees of The National Parks Conservation Association. |
Ned C. Lautenbach (66) |
| Year of Election or Appointment: 2000 Mr. Lautenbach is Chairman of the Independent Trustees of the Equity and High Income Funds (2006-present). Mr. Lautenbach currently serves as the Lead Director of the Eaton Corporation Board of Directors (diversified industrial, 1997-present). Mr. Lautenbach is also a member of the Board of Directors of the Philharmonic Center for the Arts in Naples, Florida (1999-present); a member of the Board of Trustees of Fairfield University (2005-present); and a member of the Council on Foreign Relations (1994-present). Previously, Mr. Lautenbach was a Partner/Advisory Partner at Clayton, Dubilier & Rice, Inc. (private equity investment, 1998-2010), as well as a Director of Sony Corporation (2006-2007). |
Joseph Mauriello (66) |
| Year of Election or Appointment: 2008 Prior to his retirement in January 2006, Mr. Mauriello served in numerous senior management positions including Deputy Chairman and Chief Operating Officer (2004-2005), and Vice Chairman of Financial Services (2002-2004) of KPMG LLP US (professional services, 1965-2005). Mr. Mauriello currently serves as a member of the Board of Directors of XL Group plc. (global insurance and re-insurance, 2006-present) and of Arcadia Resources Inc. (health care services and products, 2007-present). Previously, Mr. Mauriello served as a Director of the Hamilton Funds of the Bank of New York (2006-2007). |
Cornelia M. Small (66) |
| Year of Election or Appointment: 2005 Ms. Small is a member of the Board of Directors of the Teagle Foundation (2009-present). Ms. Small is also a member of the Investment Committee, and Chair (2008-present) and a member of the Board of Trustees of Smith College. In addition, Ms. Small serves on the Investment Committee of the Berkshire Taconic Community Foundation (2008-present). Previously, Ms. Small served as Chairperson of the Investment Committee (2002-2008) of Smith College. In addition, Ms. Small served as Chief Investment Officer, Director of Global Equity Investments, and a member of the Board of Directors of Scudder, Stevens & Clark and Scudder Kemper Investments. |
William S. Stavropoulos (71) |
| Year of Election or Appointment: 2001 Mr. Stavropoulos is Vice Chairman of the Independent Trustees of the Equity and High Income Funds (2006-present). Mr. Stavropoulos serves as President and Founder of the Michigan Baseball Foundation, the Great Lakes Loons (2007-present). Mr. Stavropoulos is Chairman Emeritus of the Board of Directors of The Dow Chemical Company, where he previously served in numerous senior management positions, including President, CEO (1995-2000; 2002-2004), Chairman of the Executive Committee (2000-2006), and as a member of the Board of Directors (1990-2006). Currently, Mr. Stavropoulos is Chairman of Univar (global distributor of commodity and specialty chemicals, 2010-present), a Director of Teradata Corporation (data warehousing and technology solutions, 2008-present), Chemical Financial Corporation, Maersk Inc. (industrial conglomerate), Tyco International, Inc. (multinational manufacturing and services, 2007-present), and a member of the Advisory Board for Metalmark Capital (private equity investment, 2005-present). Mr. Stavropoulos is a special advisor to Clayton, Dubilier & Rice, LLC (private equity investment). In addition, Mr. Stavropoulos is a member of the University of Notre Dame Advisory Council for the College of Science. |
David M. Thomas (61) |
| Year of Election or Appointment: 2008 Previously, Mr. Thomas served as Executive Chairman (2005-2006) and Chairman and Chief Executive Officer (2000-2005) of IMS Health, Inc. (pharmaceutical and healthcare information solutions). In addition, Mr. Thomas serves as a member of the Board of Directors of Fortune Brands, Inc. (consumer products), and Interpublic Group of Companies, Inc. (marketing communication, 2004-present). |
Michael E. Wiley (60) |
| Year of Election or Appointment: 2008 Mr. Wiley also serves as a Director of Asia Pacific Exploration Consolidated (international oil and gas exploration and production, 2008-present). Mr. Wiley serves as a Director of Tesoro Corporation (independent oil refiner and marketer, 2005-present), and a Director of Bill Barrett Corporation (exploration and production, 2005-present). In addition, Mr. Wiley also serves as a Director of Post Oak Bank (privately-held bank, 2004-present). Previously, Mr. Wiley served as a member of the Board of Trustees of the University of Tulsa (2000-2006; 2007-2010), as a Senior Energy Advisor of Katzenbach Partners, LLC (consulting, 2006-2007), as an Advisory Director of Riverstone Holdings (private investment), Chairman, President, and CEO of Baker Hughes, Inc. (oilfield services, 2000-2004), and as Director of Spinnaker Exploration Company (exploration and production, 2001-2005). |
+ The information above includes each Trustee's principal occupation during the last five years and other information relating to the experience, attributes, and skills relevant to each Trustee's qualifications to serve as a Trustee, which led to the conclusion that each Trustee should serve as a Trustee for the fund.
Advisory Board Members and Executive Officers:
Correspondence intended for each executive officer, Edward C. Johnson 3d, and Peter S. Lynch may be sent to Fidelity Investments, 82 Devonshire Street, Boston, Massachusetts 02109.
Name, Age; Principal Occupation |
Edward C. Johnson 3d (80) |
| Year of Election or Appointment: 2011 Member of the Advisory Board of Fidelity's Equity and High Income Funds. Formerly Trustee and Chairman of the Board of Trustees of certain Trusts, Mr. Johnson serves as Chief Executive Officer, Chairman, and a Director of FMR LLC; Chairman and a Director of FMR; and Chairman and a Director of FMR Co., Inc. In addition, Mr. Johnson serves as Chairman and Director of FIL Limited. Previously, Mr. Johnson served as President of FMR LLC (2006-2007). |
Peter S. Lynch (66) |
| Year of Election or Appointment: 2003 Member of the Advisory Board of Fidelity's Equity and High Income Funds. Mr. Lynch is Vice Chairman and a Director of FMR and FMR Co., Inc. In addition, Mr. Lynch serves as a Trustee of Boston College and as the Chairman of the Inner-City Scholarship Fund. Previously, Mr. Lynch served on the Special Olympics International Board of Directors (1997-2006). |
Kenneth B. Robins (41) |
| Year of Election or Appointment: 2008 President and Treasurer of Fidelity's Equity and High Income Funds. Mr. Robins also serves as President and Treasurer (2010-present) and Assistant Treasurer (2009-present) of other Fidelity funds and is an employee of Fidelity Investments (2004-present). Previously, Mr. Robins served as Deputy Treasurer of the Fidelity funds (2005-2008) and Treasurer and Chief Financial Officer of The North Carolina Capital Management Trust: Cash and Term Portfolios (2006-2008). |
Bruce T. Herring (45) |
| Year of Election or Appointment: 2006 Vice President of certain Equity Funds. Mr. Herring also serves as Chief Investment Officer and Director of Fidelity Management & Research (U.K.) Inc. (2010-present) and Group Chief Investments Officer of FMR. Previously, Mr. Herring served as Vice President (2005-2006) and Senior Vice President (2006-2007) of Fidelity Management & Research Company, Vice President of FMR Co., Inc. (2001-2007) and as a portfolio manager for Fidelity U.S. Equity Funds. |
Brian B. Hogan (46) |
| Year of Election or Appointment: 2009 Vice President of certain Equity Funds and Vice President of Sector Funds. Mr. Hogan also serves as President of FMR's Equity Division (2009-present). Previously, Mr. Hogan served as Senior Vice President, Equity Research of FMR (2006-2009) and as a portfolio manager. |
Scott C. Goebel (42) |
| Year of Election or Appointment: 2008 Secretary and Chief Legal Officer (CLO) of the Fidelity funds. Mr. Goebel also serves as Secretary and CLO of The North Carolina Capital Management Trust: Cash and Term Portfolio (2008-present); General Counsel, Secretary, and Senior Vice President of FMR (2008-present) and FMR Co., Inc. (2008-present); Deputy General Counsel of FMR LLC; Chief Legal Officer of Fidelity Management & Research (Hong Kong) Limited (2008-present) and Assistant Secretary of Fidelity Management & Research (Japan) Inc. (2008-present), Fidelity Investments Money Management, Inc. (2008-present), Fidelity Management & Research (U.K.) Inc. (2008-present), and Fidelity Research and Analysis Company (2008-present). Previously, Mr. Goebel served as Assistant Secretary of the Funds (2007-2008) and as Vice President and Secretary of Fidelity Distributors Corporation (FDC) (2005-2007). |
William C. Coffey (41) |
| Year of Election or Appointment: 2009 Assistant Secretary of Fidelity's Equity and High Income Funds. Mr. Coffey also serves as Senior Vice President and Deputy General Counsel of FMR LLC (2010-present), and is an employee of Fidelity Investments. Previously, Mr. Coffey served as Vice President and Associate General Counsel of FMR LLC (2005-2009). |
Holly C. Laurent (56) |
| Year of Election or Appointment: 2008 Anti-Money Laundering (AML) Officer of the Fidelity funds. Ms. Laurent also serves as AML Officer of The North Carolina Capital Management Trust: Cash and Term Portfolio (2008-present) and is an employee of Fidelity Investments. Previously, Ms. Laurent was Senior Vice President and Head of Legal for Fidelity Business Services India Pvt. Ltd. (2006-2008), and Senior Vice President, Deputy General Counsel and Group Head for FMR LLC (2005-2006). |
Christine Reynolds (52) |
| Year of Election or Appointment: 2008 Chief Financial Officer of the Fidelity funds. Ms. Reynolds became President of Fidelity Pricing and Cash Management Services (FPCMS) in August 2008. Ms. Reynolds served as Chief Operating Officer of FPCMS (2007-2008). Previously, Ms. Reynolds served as President, Treasurer, and Anti-Money Laundering officer of the Fidelity funds (2004-2007). |
Kenneth A. Rathgeber (63) |
| Year of Election or Appointment: 2004 Chief Compliance Officer of Fidelity's Equity and High Income Funds. Mr. Rathgeber is Chief Compliance Officer of Fidelity Management & Research (Hong Kong) Limited (2008-present), Fidelity Management & Research (Japan) Inc. (2008-present), FMR (2005-present), FMR Co., Inc. (2005-present), Fidelity Management & Research (U.K.) Inc. (2005-present), Fidelity Research & Analysis Company (2005-present), Fidelity Investments Money Management, Inc. (2005-present), Pyramis Global Advisors, LLC (2005-present), and Strategic Advisers, Inc. (2005-present). |
Jeffrey S. Christian (49) |
| Year of Election or Appointment: 2009 Deputy Treasurer of the Fidelity funds. Mr. Christian is an employee of Fidelity Investments. Previously, Mr. Christian served as Chief Financial Officer (2008-2009) of certain Fidelity funds and Senior Vice President of Fidelity Pricing and Cash Management Services (FPCMS) (2004-2009). |
Bryan A. Mehrmann (49) |
| Year of Election or Appointment: 2005 Deputy Treasurer of the Fidelity funds. Mr. Mehrmann is an employee of Fidelity Investments. |
Adrien E. Deberghes (43) |
| Year of Election or Appointment: 2008 Deputy Treasurer of Fidelity's Equity and High Income Funds. Mr. Deberghes also serves as Assistant Treasurer of other Fidelity funds (2010-present) and is an employee of Fidelity Investments (2008-present). Previously, Mr. Deberghes served as Senior Vice President of Mutual Fund Administration at State Street Corporation (2007-2008), Senior Director of Mutual Fund Administration at Investors Bank & Trust (2005-2007), and Director of Finance for Dunkin' Brands (2000-2005). |
Stephanie J. Dorsey (41) |
| Year of Election or Appointment: 2010 Assistant Treasurer of Fidelity's Equity and High Income Funds. Ms. Dorsey also serves as Deputy Treasurer of other Fidelity funds (2008-present) and is an employee of Fidelity Investments (2008-present). Previously, Ms. Dorsey served as Treasurer (2004-2008) of the JPMorgan Mutual Funds and Vice President (2004-2008) of JPMorgan Chase Bank. |
Name, Age; Principal Occupation |
John R. Hebble (52) |
| Year of Election or Appointment: 2009 Assistant Treasurer of Fidelity's Equity and High Income Funds. Mr. Hebble also serves as Treasurer and Chief Financial Officer of The North Carolina Capital Management Trust: Cash and Term Portfolio (2008-present), President and Treasurer of other Fidelity funds (2008-present) and is an employee of Fidelity Investments. |
Gary W. Ryan (52) |
| Year of Election or Appointment: 2005 Assistant Treasurer of the Fidelity funds. Mr. Ryan is an employee of Fidelity Investments. Previously, Mr. Ryan served as Vice President of Fund Reporting in Fidelity Pricing and Cash Management Services (FPCMS) (1999-2005). |
Jonathan Davis (42) |
| Year of Election or Appointment: 2010 Assistant Treasurer of the Fidelity funds. Mr. Davis is an employee of Fidelity Investments. Previously, Mr. Davis served as Vice President and Associate General Counsel of FMR LLC (2003-2010). |
Annual Report
Initial Class, Service Class, Service Class 2, and Investor Class designates 100% of the dividends distributed in February and December 2010, respectively during the fiscal year as qualifying for the dividends-received deduction for corporate shareholders.
Annual Report
Board Approval of Investment Advisory Contracts and Management Fees
VIP Disciplined Small Cap Portfolio
Each year, the Board of Trustees, including the Independent Trustees (together, the Board), votes on the renewal of the management contract and sub-advisory agreements (together, the Advisory Contracts) for the fund. The Board, assisted by the advice of fund counsel and Independent Trustees' counsel, requests and considers a broad range of information relevant to the renewal of the Advisory Contracts throughout the year.
The Board meets regularly and considers at each of its meetings factors that are relevant to its annual consideration of the renewal of the fund's Advisory Contracts, including the services and support provided to the fund and its shareholders. The Board has established various standing committees, each composed of Independent Trustees with varying backgrounds, to which the Board has assigned specific subject matter responsibilities in order to enhance effective decision-making by the Board. The Board, acting directly and through its Committees, requests and receives information concerning the annual consideration of the renewal of the fund's Advisory Contracts. The Board also meets as needed to consider matters specifically related to the Board's annual consideration of the renewal of Advisory Contracts. Members of the Board may also meet with trustees of other Fidelity funds through ad hoc joint committees to discuss certain matters relevant to the Fidelity funds.
At its July 2010 meeting, the Board of Trustees, including the Independent Trustees, unanimously determined to renew the fund's Advisory Contracts. In reaching its determination, the Board considered all factors it believed relevant, including (i) the nature, extent, and quality of the services to be provided to the fund and its shareholders (including the investment performance of the fund); (ii) the competitiveness of the fund's management fee and total expenses; (iii) the total costs of the services to be provided by and the profits to be realized by Fidelity from its relationship with the fund; (iv) the extent to which economies of scale would be realized as the fund grows; and (v) whether fee levels reflect these economies of scale, if any, for the benefit of fund shareholders.
In considering whether to renew the Advisory Contracts for the fund, the Board reached a determination, with the assistance of fund counsel and Independent Trustees' counsel and through the exercise of its business judgment, that the renewal of the Advisory Contracts is in the best interests of fund shareholders and that the compensation to be received by Fidelity under the management contract is fair and reasonable. The Board's decision to renew the Advisory Contracts was not based on any single factor noted above, but rather was based on a comprehensive consideration of all the information provided to the Board at its meetings throughout the year. The Board, in reaching its determination to renew the Advisory Contracts, is aware that shareholders in the fund have a broad range of investment choices available to them, including a wide choice among mutual funds offered by Fidelity's competitors, and that the fund's shareholders, with the opportunity to review and weigh the disclosure provided by the fund in its prospectus and other public disclosures, have chosen to invest in this fund, managed by Fidelity.
Nature, Extent, and Quality of Services Provided. The Board considered the staffing within the investment adviser, FMR, and the sub-advisers (together, the Investment Advisers), including the backgrounds of the fund's investment personnel and the fund's investment objective and discipline. The Independent Trustees also had discussions with senior management of Fidelity's investment operations and investment groups. The Board considered the structure of the portfolio manager compensation program and whether this structure provides appropriate incentives to act in the best interest of the fund.
Resources Dedicated to Investment Management and Support Services. The Board and the equity research subcommittee of the Board's Fund Oversight Committee reviewed the size, education, and experience of the Investment Advisers' investment staff, their use of technology, and the Investment Advisers' approach to recruiting, training, and retaining portfolio managers and other research, advisory, and management personnel. The Board noted that Fidelity's analysts have access to a variety of technological tools and market and securities data that enable them to perform both fundamental and quantitative analysis and to specialize in various disciplines. The Board considered Fidelity's extensive global research capabilities that enable the Investment Advisers to aggregate data from various sources in an effort to produce positive investment results. The Board also considered that Fidelity's portfolio managers and analysts have access to daily portfolio attribution that allows for monitoring of a fund's portfolio, as well as an electronic communication system that provides immediate real-time access to research concerning issuers and credit enhancers. The Board noted FMR's continued focus on strengthening the organization and discipline of equity portfolio management and research.
Shareholder and Administrative Services. The Board considered (i) the nature, extent, quality, and cost of advisory, administrative, and shareholder services performed by the Investment Advisers and their affiliates under the Advisory Contracts and under separate agreements covering transfer agency, pricing and bookkeeping, and securities lending services for the fund; (ii) the nature and extent of the investment adviser's supervision of third party service providers, principally custodians and subcustodians; and (iii) the resources devoted to, and the record of compliance with, the fund's compliance policies and procedures. The Board also reviewed the allocation of fund brokerage, including allocations to brokers affiliated with the Investment Advisers, the use of brokerage commissions to pay fund expenses, and the use of "soft" commission dollars to pay for research services.
The Board noted that the growth of fund assets over time across the complex allows Fidelity to reinvest in the development of services designed to enhance the value or convenience of the Fidelity funds as investment vehicles. These services include 24-hour access to account information and market information through phone representatives and over the Internet, and investor education materials and asset allocation tools.
Investment in a Large Fund Family. The Board considered the benefits to shareholders of investing in a Fidelity fund, including the benefits of investing in a fund that is part of a large family of funds offering a variety of investment disciplines and providing a large variety of mutual fund investor services. The Board noted that Fidelity had taken, or had made recommendations that resulted in the Fidelity funds taking, a number of actions over the previous year that benefited particular funds, including (i) dedicating additional resources to investment research and restructuring and broadening the focus of the investment research teams; (ii) bolstering the senior management team that oversees asset management; (iii) launching Class F of certain funds as a lower-fee class available to Freedom K and Freedom Index Funds; (iv) lowering the initial investment minimums and ongoing balance requirements for Real Estate High Income Fund; (v) eliminating subsequent purchase minimums for all funds and adding a waiver of the investment minimum requirement for new accounts opened with the proceeds of a systematic withdrawal plan; (vi) eliminating the withdrawal minimum and maximum limits for systematic withdrawals from Advisor funds; (vii) expanding sales load waivers on Class A shares for Destiny Planholders and expanding Institutional Class eligibility for Class O Destiny Planholders; and (viii) changing certain Class A and Class T sales charge structures to further align them with industry practices.
Annual Report
Investment Performance. The Board considered whether the fund has operated in accordance with its investment objective, as well as its record of compliance with its investment restrictions. It also reviewed the fund's absolute investment performance for each class, as well as the fund's relative investment performance for each class measured over multiple periods against a broad-based securities market index. The Board noted that FMR does not believe that a meaningful peer group exists against which to compare the fund's performance. Because the fund had been in existence less than five calendar years, the following charts considered by the Board show, over the one- and three-year periods ended December 31, 2009, the cumulative total returns of Initial Class and Service Class 2 of the fund and the cumulative total returns of a broad-based securities market index ("benchmark"). The returns of Initial Class and Service Class 2 show the performance of the highest and lowest performing classes, respectively (based on three-year performance).
VIP Disciplined Small Cap Portfolio
The Board noted that the investment performance of the fund was lower than its benchmark for all the periods shown. The Board considered that the variations in performance among the fund's classes reflect the variations in class expenses, which result in lower performance for higher expense classes. The Board discussed with FMR actions that have been taken by FMR to improve the fund's below-benchmark performance. The Board also reviewed the fund's performance since inception as well as performance in the current year. The Board will continue to closely monitor the performance of the fund in the coming year and discuss with FMR other appropriate actions to address the performance of the fund.
Based on its review, and giving particular weight to the nature and quality of the resources dedicated by the Investment Advisers to maintain and improve relative performance and factoring in the unprecedented market events in recent years, the Board concluded that the nature, extent, and quality of investment management and support services and of shareholder and administrative services provided to the fund will benefit the fund's shareholders, particularly in light of the Board's view that the fund's shareholders benefit from investing in a fund that is part of a large family of funds offering a variety of investment disciplines and services.
Competitiveness of Management Fee and Total Fund Expenses. The Board considered the fund's management fee and total expenses compared to "mapped groups" of competitive funds and classes. Fidelity creates "mapped groups" by combining similar Lipper investment objective categories that have comparable management fee characteristics. Combining Lipper investment objective categories aids the Board's management fee and total expense comparisons by broadening the competitive group used for comparison and by reducing the number of universes to which various Fidelity funds are compared.
Annual Report
Board Approval of Investment Advisory Contracts and Management Fees - continued
Management Fee. The Board considered two proprietary management fee comparisons for the 12-month (or shorter) periods shown in the chart below. The group of Lipper funds used by the Board for management fee comparisons is referred to below as the "Total Mapped Group." The Total Mapped Group comparison focuses on a fund's standing relative to the total universe of comparable funds available to investors, in terms of gross management fees before expense reimbursements or caps. "TMG %" represents the percentage of funds in the Total Mapped Group that had management fees that were lower than the fund's. For example, a TMG % of 10% means that 90% of the funds in the Total Mapped Group had higher management fees than the fund. The "Asset-Size Peer Group" (ASPG) comparison focuses on a fund's standing relative to non-Fidelity funds similar in size to the fund within the Total Mapped Group. The ASPG represents at least 15% of the funds in the Total Mapped Group with comparable asset size and management fee characteristics, subject to a minimum of 50 funds (or all funds in the Total Mapped Group if fewer than 50). Additional information, such as the ASPG quartile in which the fund's management fee ranked, is also included in the chart and considered by the Board.
VIP Disciplined Small Cap Portfolio
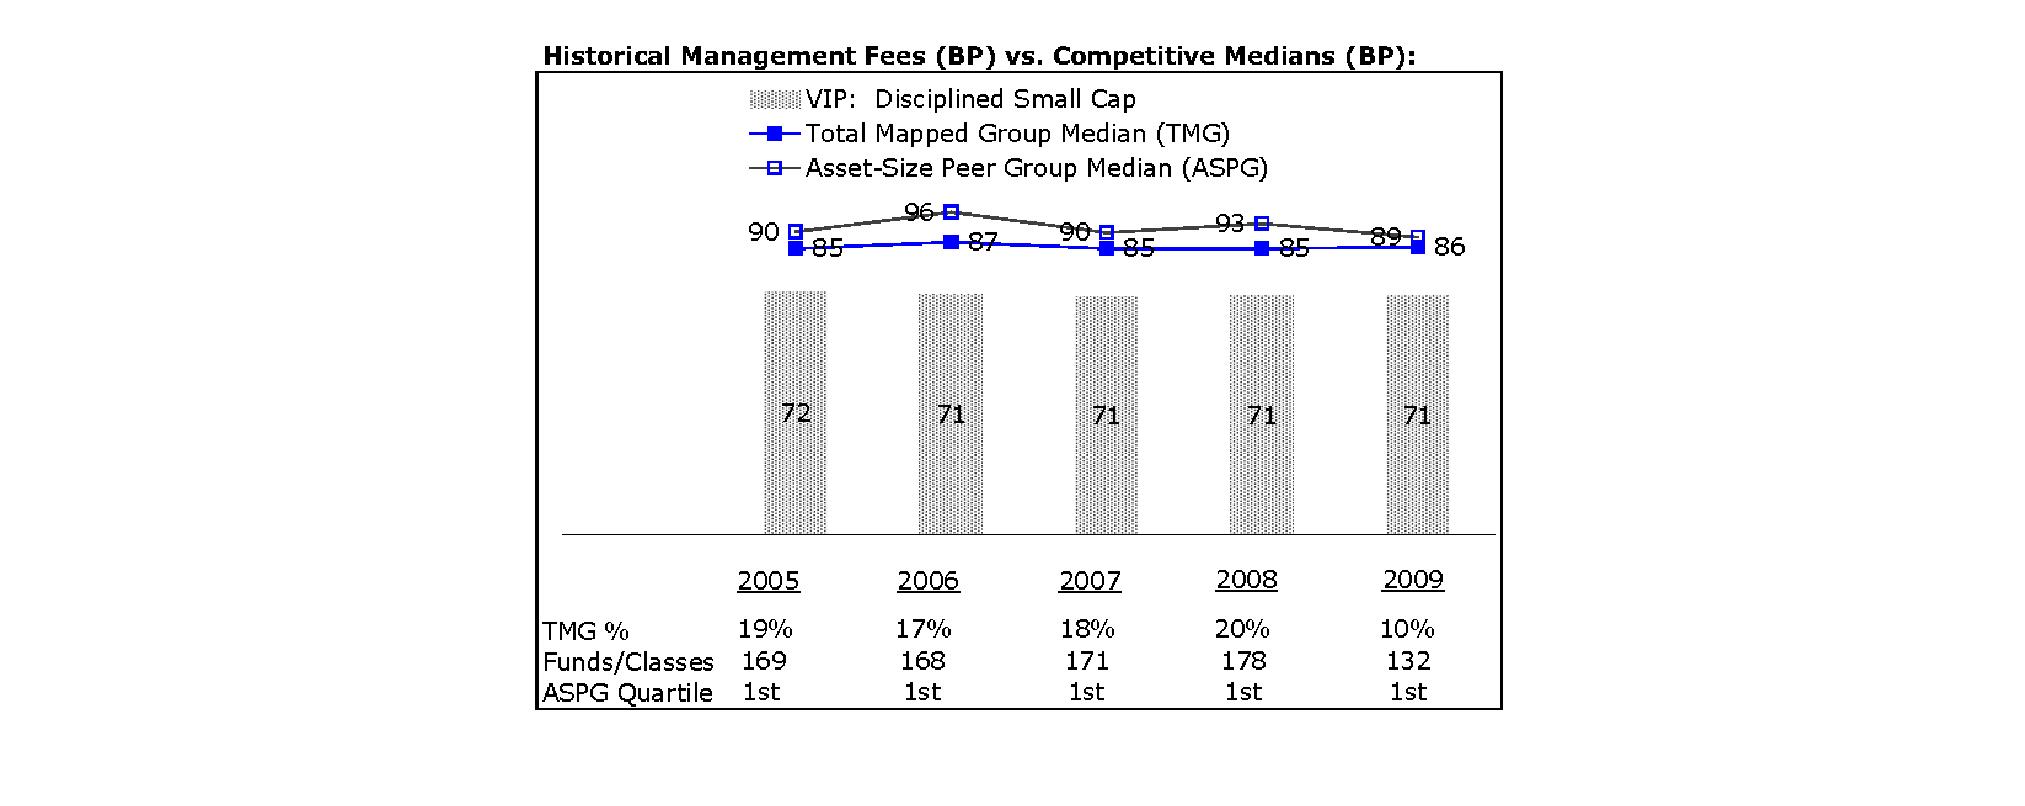
The Board noted that the fund's management fee ranked below the median of its Total Mapped Group and below the median of its ASPG for 2009.
Based on its review, the Board concluded that the fund's management fee is fair and reasonable in light of the services that the fund receives and the other factors considered.
Total Expenses. In its review of each class's total expenses, the Board considered the fund's management fee as well as other fund or class expenses, as applicable, such as transfer agent fees, pricing and bookkeeping fees, fund-paid 12b-1 fees, and custodial, legal, and audit fees. The Board also noted the effects of any waivers and reimbursements on fees and expenses. As part of its review, the Board also considered current and historical total expenses of each class of the fund compared to competitive fund median expenses. Each class of the fund is compared to those funds and classes in the Total Mapped Group (used by the Board for management fee comparisons) that have a similar sales load structure.
The Board noted that the total expenses of Initial Class ranked below its competitive median for 2009, the total expenses of Investor Class ranked equal to its competitive median for 2009, and the total expenses of each of Service Class and Service Class 2 ranked above its competitive median for 2009. The Board noted that the fund offers multiple classes, each of which has a different 12b-1 fee structure, and that the multiple structures are intended to offer a range of pricing options for the intermediary market. The Board also noted that the total expenses of the classes vary primarily by the level of their 12b-1 fees, although differences in transfer agent fees may also cause expenses to vary from class to class.
Fees Charged to Other Fidelity Clients. The Board also considered Fidelity fee structures and other information with respect to clients of FMR and its affiliates, such as other mutual funds advised or subadvised by FMR or its affiliates, pension plan clients, and other institutional clients. In March 2010, the Board created an ad hoc joint committee with the board of other Fidelity funds (the Committee) to review and compare Fidelity's institutional investment advisory business with its business of providing services to the Fidelity funds, including the differences in services provided, fees charged, and costs incurred, as well as competition in their respective marketplaces.
Based on its review of total expenses and fees charged to other Fidelity clients, the Board concluded that the total expenses of each class of the fund were reasonable, although in some cases above the median of the universe presented for comparison, in light of the services that the fund and its shareholders receive and the other factors considered, including the findings of the Committee.
Annual Report
Costs of the Services and Profitability. The Board considered the revenues earned and the expenses incurred by Fidelity in conducting the business of developing, marketing, distributing, managing, administering and servicing the fund and its shareholders. The Board also considered the level of Fidelity's profits in respect of all the Fidelity funds.
On an annual basis, FMR presents to the Board Fidelity's profitability for the fund. Fidelity calculates the profitability for each fund, as well as aggregate profitability for groups of Fidelity funds and all Fidelity funds, using a series of detailed revenue and cost allocation methodologies which originate with the audited books and records of Fidelity. The Audit Committee of the Board reviews any significant changes from the prior year's methodologies.
PricewaterhouseCoopers LLP (PwC), independent registered public accounting firm and auditor to Fidelity and certain Fidelity funds, has been engaged annually by the Board as part of the Board's assessment of Fidelity's profitability analysis. PwC's engagement includes the review and assessment of Fidelity's methodologies used in determining the revenues and expenses attributable to Fidelity's mutual fund business, and completion of agreed-upon procedures surrounding the mathematical accuracy of fund profitability and its conformity to allocation methodologies. After considering PwC's reports issued under the engagement and information provided by Fidelity, the Board believes that while other allocation methods may also be reasonable, Fidelity's profitability methodologies are reasonable in all material respects.
The Board has also reviewed Fidelity's non-fund businesses and fall-out benefits related to the mutual fund business as well as cases where Fidelity's affiliates may benefit from or be related to the fund's business.
The Board considered the costs of the services provided by and the profits realized by Fidelity in connection with the operation of the fund and were satisfied that the profitability was not excessive in the circumstances.
Economies of Scale. The Board considered whether there have been economies of scale in respect of the management of the Fidelity funds, whether the Fidelity funds (including the fund) have appropriately benefited from any such economies of scale, and whether there is potential for realization of any further economies of scale. The Board considered the extent to which the fund will benefit from economies of scale through increased services to the fund, through waivers or reimbursements, or through fee or expense reductions.
In February 2009, the Board and the board of other Fidelity funds created an ad hoc committee (the Economies of Scale Committee) to analyze whether FMR attains economies of scale in respect of the management and servicing of the Fidelity funds, whether the Fidelity funds have appropriately benefited from such economies of scale, and whether there is potential for realization of any further economies of scale.
The Board recognized that the fund's management contract incorporates a "group fee" structure, which provides for lower group fee rates as total fund assets under FMR's management increase, and for higher group fee rates as total fund assets under FMR's management decrease. FMR calculates the group fee rates based on a tiered asset "breakpoint" schedule that varies based on asset class. The Board considered that the group fee is designed to deliver the benefits of economies of scale to fund shareholders when total Fidelity fund assets increase, even if assets of any particular fund are unchanged or have declined, because some portion of Fidelity's costs are attributable to services provided to all Fidelity funds, and all funds benefit if those costs can be allocated among more assets. The Board concluded that, given the group fee structure, fund shareholders will benefit from lower management fees as assets under FMR's management increase at the fund complex level, regardless of whether Fidelity achieves any such economies of scale.
The Board concluded, considering the findings of the Economies of Scale Committee, that any potential economies of scale are being appropriately shared between fund shareholders and Fidelity.
Additional Information Requested by the Board. In order to develop fully the factual basis for consideration of the Fidelity funds' Advisory Contracts, the Board requested and received additional information on certain topics, including (i) fund performance trends, actions to be taken by FMR to improve certain funds' overall performance, and Fidelity's long-term strategies for certain funds; (ii) portfolio manager changes that have occurred during the past year and length of portfolio manager tenure for different categories of funds over time; (iii) Fidelity's compensation structure for portfolio managers, research analysts, and other key personnel, the rationale for the compensation structure, and how the compensation structure provides appropriate performance incentives; (iv) the amount of the investment that each portfolio manager has made in the Fidelity fund(s) that he or she manages; (v) management and other fees paid by FMR to affiliated sub-advisers on behalf of the Fidelity funds; (vi) Fidelity's fee structures and rationale for recommending different fees among different categories of funds; (vii) Fidelity's rationale for recommending which funds should have a performance adjustment component as part of their management fees; (viii) the rationale for any differences between fund fee structures and fee structures in place for other Fidelity clients; and (ix) explanations regarding the relative total expenses borne by certain funds and classes, total expense competitive trends, and actions that might be taken by FMR to reduce total expenses for certain funds and classes.
Based on its evaluation of all of the conclusions noted above, and after considering all factors it believed relevant, the Board ultimately concluded that the advisory fee structures are fair and reasonable, and that the fund's Advisory Contracts should be renewed.
Annual Report
Investment Adviser
Fidelity Management & Research Company
Boston, MA
Investment Sub-Advisers
Geode Capital Management, LLC
FMR Co., Inc.
General Distributor
Fidelity Distributors Corporation
Boston, MA
Transfer and Service Agents
Fidelity Investments Institutional Operations Company, Inc.
Boston, MA
Fidelity Service Company, Inc.
Boston, MA
Custodian
The Northern Trust Company
Chicago, IL
VDSC-ANN-0211
1.820582.105
Fidelity® Variable Insurance Products:
Index 500 Portfolio
Annual Report
December 31, 2010
(2_fidelity_logos) (Registered_Trademark)
Contents
Performance | <Click Here> | How the fund has done over time. |
Management's Discussion of Fund Performance | <Click Here> | The Portfolio Manager's review of fund performance and strategy. |
Shareholder Expense Example | <Click Here> | An example of shareholder expenses. |
Investment Changes | <Click Here> | A summary of major shifts in the fund's investments over the past six months. |
Investments | <Click Here> | A complete list of the fund's investments with their market values. |
Financial Statements | <Click Here> | Statements of assets and liabilities, operations, and changes in net assets, as well as financial highlights. |
Notes | <Click Here> | Notes to the financial statements. |
Report of Independent Registered Public Accounting Firm | <Click Here> | |
Trustees and Officers | <Click Here> | |
Distributions | <Click Here> | |
Board Approval of Investment Advisory Contracts and Management Fees | <Click Here> | |
To view a fund's proxy voting guidelines and proxy voting record for the 12-month period ended June 30, visit http://www.fidelity.com/proxyvotingresults or visit the Securities and Exchange Commission's (SEC) web site at http://www.sec.gov. You may also call 1-877-208-0098 to request a free copy of the proxy voting guidelines.
Fidelity Variable Insurance Products are separate account options which are purchased through a variable insurance contract.
Standard & Poor's, S&P and S&P 500 are registered service marks of The McGraw-Hill Companies, Inc. and have been licensed for use by Fidelity Distributors Corporation.
Other third party marks appearing herein are the property of their respective owners.
All other marks appearing herein are registered or unregistered trademarks or service marks of FMR LLC or an affiliated company.
This report and the financial statements contained herein are submitted for the general information of the shareholders of the fund. This report is not authorized for distribution to prospective investors in the fund unless preceded or accompanied by an effective prospectus.
A fund files its complete schedule of portfolio holdings with the SEC for the first and third quarters of each fiscal year on Form N-Q. Forms N-Q are available on the SEC's web site at http://www.sec.gov. A fund's Forms N-Q may be reviewed and copied at the SEC's Public Reference Room in Washington, DC. Information regarding the operation of the SEC's Public Reference Room may be obtained by calling 1-800-SEC-0330. For a complete list of a fund's portfolio holdings, view the most recent holdings listing, semiannual report, or annual report on Fidelity's web site at http://www.fidelity.com, http://www.advisor.fidelity.com, or http://www.401k.com, as applicable.
NOT FDIC INSURED • MAY LOSE VALUE • NO BANK GUARANTEE
Neither the fund nor Fidelity Distributors Corporation is a bank.
Annual Report
Average annual total return reflects the change in the value of an investment, assuming reinvestment of the class' distributions from dividend income and capital gains (the profits earned upon the sale of securities that have grown in value, if any) and assuming a constant rate of performance each year. During periods of reimbursement by Fidelity, a fund's total return will be greater than it would be had the reimbursement not occurred. Performance numbers are net of all underlying fund operating expenses, but do not include any insurance charges imposed by your insurance company's separate account. If performance information included the effect of these additional charges, the total returns would have been lower. How a fund did yesterday is no guarantee of how it will do tomorrow.
Average Annual Total Returns
Periods ended December 31, 2010 | Past 1
year | Past 5
years | Past 10
years |
VIP Index 500 Portfolio - Initial Class | 15.02% | 2.28% | 1.31% |
VIP Index 500 Portfolio - Service Class | 14.91% | 2.18% | 1.21% |
VIP Index 500 Portfolio - Service Class 2 | 14.73% | 2.03% | 1.06% |
$10,000 Over 10 Years
Let's say hypothetically that $10,000 was invested in VIP Index 500 Portfolio - Initial Class on December 31, 2000. The chart shows how the value of your investment would have changed, and also shows how the S&P 500 ® Index performed over the same period.
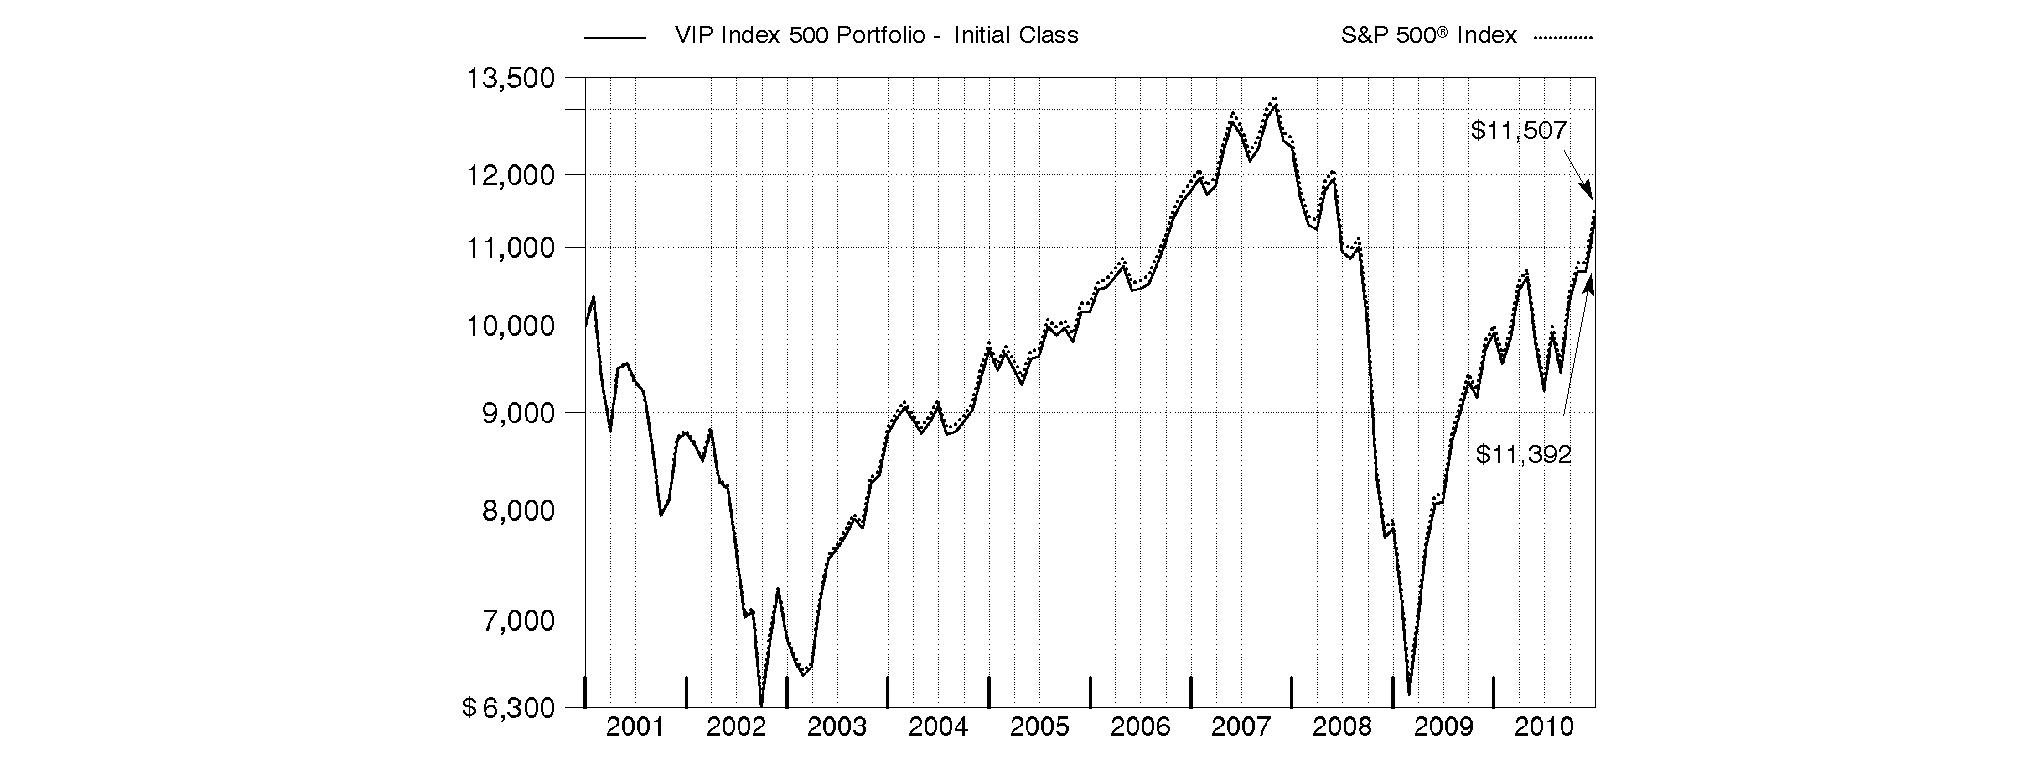
Annual Report
Market Recap: While market improvements around the world hit a speed bump in the first half of the 12-month period ending December 31, 2010, world economies re-accelerated in August, supported by a broadening recovery and low inflation in the U.S. Domestic stock markets recorded solid gains for the year, lifted by a strong second-half rally fueled by economic optimism, encouraging earnings reports and a wave of corporate mergers. The large-cap S&P 500® Index rose 15.06%, the blue-chip-laden Dow Jones Industrial AverageSM added 14.06% and the technology-heavy Nasdaq Composite® Index climbed 18.02%. Meanwhile, international stocks, as represented by the MSCI® ACWI® (All Country World Index) ex USA Index, gained 11.29%, boosted in part by a depreciating U.S. dollar. In the fixed-income arena, U.S. taxable investment-grade bonds generated positive results during 2010, as the Barclays Capital® U.S. Aggregate Bond Index gained 6.54%. With ultra-low interest rates bolstering nearly all fixed-income securities for most of the year, sectors in the index with higher yields and more credit risk generally fared best, while most high-quality bonds generated more-moderate returns. Meanwhile, high-yield bonds, as represented by The BofA Merrill LynchSM US High Yield Constrained Index, returned 15.07%, a result of improved economic data and strengthening investor demand. Overseas, foreign bond markets showed mixed results, with a sizable disparity between the 3.97% return of the Citigroup® Non-U.S. Group of 7 Index - which measures the performance of sovereign debt of the major global economies outside the U.S. - and the 12.04% advance of the JPMorgan Emerging Markets Bond Index Global (EMBI Global), which benefited from the rising overall credit quality of emerging-markets debt issuers.
Comments from Jeffrey Adams, who oversees VIP Index 500 Portfolio's investment management team as Head of Indexing for Geode Capital Management, LLC: For the year ending December 31, 2010, the fund's share classes performed in line with the S&P 500®. (For specific portfolio results, please refer to the performance section of this report.) Every sector of the index generated positive results, and only utilities and health care failed to achieve double-digit returns, gaining about 6% and 3%, respectively. The consumer discretionary sector, led by the automobiles/components industry, did the best, returning roughly 28%, followed by industrials, which rose about 27%. Other sectors to beat the index included materials, energy and telecommunication services, gaining about 23%, 20% and 19%, respectively. In contrast, consumer staples, financials and information technology returned roughly 14%, 12% and 10%, respectively, lagging the S&P 500. By a huge margin, Apple stock was the fund's top individual contributor, gaining about 53%. This personal computer and consumer-electronics manufacturer, and the second-largest position in the index, continued to impress Wall Street analysts with strong sales of its leading products - iPod® digital music players, iPhone® mobile devices, Macintosh® computers and, most recently, iPad® tablet computers. Also in technology, Oracle, a database-software maker, saw its shares rise along with good sales and profit growth, thanks to strong customer demand. A number of energy stocks performed well, including oil producers Exxon Mobil (the index's largest weighting), Chevron and ConocoPhillips, as well as oil-field service company Schlumberger. Also, industrial conglomerate General Electric had good results, as did construction equipment maker Caterpillar, diversified financial company Citigroup and beverage maker Coca-Cola. Various technology stocks detracted, especially Cisco Systems, Hewlett-Packard and Microsoft. Cisco's shares fell sharply in November after the company revised its earnings and sales forecast downward. HP lost significant ground in August following the unexpected forced resignation of the company's CEO. Software giant Microsoft struggled to manage a challenging competitive environment. In the financials sector, shares of Bank of America performed poorly, while credit card payment processor Visa declined in December following the Federal Reserve's proposal to cap debit card fees - a fast-growing part of Visa's business. In the health care sector, pharmaceutical and nutritional products company Abbott Laboratories and medical device maker Medtronic also lagged.
The views expressed above reflect those of the portfolio manager(s) only through the end of the period as stated on the cover of this report and do not necessarily represent the views of Fidelity or any other person in the Fidelity organization. Any such views are subject to change at any time based upon market or other conditions and Fidelity disclaims any responsibility to update such views. These views may not be relied on as investment advice and, because investment decisions for a Fidelity fund are based on numerous factors, may not be relied on as an indication of trading intent on behalf of any Fidelity fund.
Annual Report
As a shareholder of the Fund, you incur two types of costs: (1) transaction costs, and (2) ongoing costs, including management fees, distribution and/or service (12b-1) fees and other Fund expenses. This Example is intended to help you understand your ongoing costs (in dollars) of investing in the Fund and to compare these costs with the ongoing costs of investing in other mutual funds.
The Example is based on an investment of $1,000 invested at the beginning of the period and held for the entire period (July 1, 2010 to December 31, 2010).
Actual Expenses
The first line of the accompanying table for each class of the Fund provides information about actual account values and actual expenses. You may use the information in this line, together with the amount you invested, to estimate the expenses that you paid over the period. Simply divide your account value by $1,000.00 (for example, an $8,600 account value divided by $1,000.00 = 8.6), then multiply the result by the number in the first line for a class of the Fund under the heading entitled "Expenses Paid During Period" to estimate the expenses you paid on your account during this period. The estimate of expenses does not include any fees or other expenses of any variable annuity or variable life insurance product. If they were, the estimate of expenses you paid during the period would be higher, and your ending account value would be lower. In addition, the Fund, as a shareholder in the underlying Fidelity Central Funds, will indirectly bear its pro-rata share of the fees and expenses incurred by the underlying Fidelity Central Funds. These fees and expenses are not included in the Fund's annualized expense ratio used to calculate the expense estimate in the table below.
Hypothetical Example for Comparison Purposes
The second line of the accompanying table for each class of the Fund provides information about hypothetical account values and hypothetical expenses based on a Class' actual expense ratio and an assumed rate of return of 5% per year before expenses, which is not the Class' actual return. The hypothetical account values and expenses may not be used to estimate the actual ending account balance or expenses you paid for the period. You may use this information to compare the ongoing costs of investing in the Fund and other funds. To do so, compare this 5% hypothetical example with the 5% hypothetical examples that appear in the shareholder reports of the other funds. The estimate of expenses does not include any fees or other expenses of any variable annuity or variable life insurance product. If they were, the estimate of expenses you paid during the period would be higher, and your ending account value would be lower. In addition, the Fund, as a shareholder in the underlying Fidelity Central Funds, will indirectly bear its pro-rata share of the fees and expenses incurred by the underlying Fidelity Central Funds. These fees and expenses are not included in the Fund's annualized expense ratio used to calculate the expense estimate in the table below.
Please note that the expenses shown in the table are meant to highlight your ongoing costs only and do not reflect any transaction costs. Therefore, the second line of the table is useful in comparing ongoing costs only, and will not help you determine the relative total costs of owning different funds.
| Annualized
Expense Ratio | Beginning
Account Value
July 1, 2010 | Ending
Account Value
December 31, 2010 | Expenses Paid
During Period*
July 1, 2010 to December 31, 2010 |
Initial Class | .10% | | | |
Actual | | $ 1,000.00 | $ 1,232.30 | $ .56 |
HypotheticalA | | $ 1,000.00 | $ 1,024.70 | $ .51 |
Service Class | .20% | | | |
Actual | | $ 1,000.00 | $ 1,231.80 | $ 1.13 |
HypotheticalA | | $ 1,000.00 | $ 1,024.20 | $ 1.02 |
Service Class 2 | .35% | | | |
Actual | | $ 1,000.00 | $ 1,230.70 | $ 1.97 |
HypotheticalA | | $ 1,000.00 | $ 1,023.44 | $ 1.79 |
A 5% return per year before expenses
* Expenses are equal to each Class' annualized expense ratio, multiplied by the average account value over the period, multiplied by 184/365 (to reflect the one-half year period).
Annual Report
Investment Changes (Unaudited)
Top Ten Stocks as of December 31, 2010 |
| % of fund's
net assets | % of fund's net assets
6 months ago |
Exxon Mobil Corp. | 3.2 | 3.1 |
Apple, Inc. | 2.5 | 2.4 |
Microsoft Corp. | 1.8 | 1.9 |
General Electric Co. | 1.7 | 1.6 |
Chevron Corp. | 1.6 | 1.4 |
International Business Machines Corp. | 1.6 | 1.7 |
Procter & Gamble Co. | 1.6 | 1.8 |
AT&T, Inc. | 1.5 | 1.5 |
Johnson & Johnson | 1.5 | 1.7 |
JPMorgan Chase & Co. | 1.4 | 1.6 |
| 18.4 | |
Market Sectors as of December 31, 2010 |
| % of fund's
net assets | % of fund's net assets
6 months ago |
Information Technology | 18.3 | 18.5 |
Financials | 15.8 | 16.2 |
Energy | 11.8 | 10.6 |
Industrials | 10.8 | 10.3 |
Health Care | 10.7 | 12.0 |
Consumer Staples | 10.5 | 11.4 |
Consumer Discretionary | 10.5 | 10.0 |
Materials | 3.7 | 3.4 |
Utilities | 3.2 | 3.6 |
Telecommunication Services | 3.1 | 3.0 |
Asset Allocation |
To match the Standard & Poor's 500 Index®, the VIP Index 500 Portfolio seeks 100% investment exposure to stocks at all times. |
Annual Report
Investments December 31, 2010
Showing Percentage of Net Assets
Common Stocks - 98.4% |
| Shares | | Value |
CONSUMER DISCRETIONARY - 10.5% |
Auto Components - 0.3% |
Johnson Controls, Inc. | 128,333 | | $ 4,902,321 |
The Goodyear Tire & Rubber Co. (a) | 46,226 | | 547,778 |
| | 5,450,099 |
Automobiles - 0.6% |
Ford Motor Co. (a)(d) | 712,987 | | 11,971,052 |
Harley-Davidson, Inc. | 44,822 | | 1,553,979 |
| | 13,525,031 |
Distributors - 0.1% |
Genuine Parts Co. | 29,979 | | 1,539,122 |
Diversified Consumer Services - 0.1% |
Apollo Group, Inc. Class A (non-vtg.) (a) | 24,190 | | 955,263 |
DeVry, Inc. | 11,865 | | 569,283 |
H&R Block, Inc. (d) | 58,710 | | 699,236 |
| | 2,223,782 |
Hotels, Restaurants & Leisure - 1.7% |
Carnival Corp. unit | 81,955 | | 3,778,945 |
Darden Restaurants, Inc. | 26,340 | | 1,223,230 |
International Game Technology | 56,747 | | 1,003,854 |
Marriott International, Inc. Class A (d) | 54,759 | | 2,274,689 |
McDonald's Corp. | 201,053 | | 15,432,828 |
Starbucks Corp. | 141,031 | | 4,531,326 |
Starwood Hotels & Resorts Worldwide, Inc. | 36,281 | | 2,205,159 |
Wyndham Worldwide Corp. | 33,296 | | 997,548 |
Wynn Resorts Ltd. | 14,388 | | 1,494,050 |
Yum! Brands, Inc. | 89,171 | | 4,373,838 |
| | 37,315,467 |
Household Durables - 0.4% |
D.R. Horton, Inc. (d) | 53,401 | | 637,074 |
Fortune Brands, Inc. | 29,036 | | 1,749,419 |
Harman International Industries, Inc. (a) | 13,239 | | 612,966 |
Leggett & Platt, Inc. | 27,867 | | 634,253 |
Lennar Corp. Class A (d) | 30,268 | | 567,525 |
Newell Rubbermaid, Inc. (d) | 55,244 | | 1,004,336 |
PulteGroup, Inc. (a)(d) | 64,009 | | 481,348 |
Stanley Black & Decker, Inc. (d) | 31,575 | | 2,111,420 |
Whirlpool Corp. | 14,467 | | 1,285,104 |
| | 9,083,445 |
Internet & Catalog Retail - 0.8% |
Amazon.com, Inc. (a) | 67,477 | | 12,145,860 |
Expedia, Inc. (d) | 38,489 | | 965,689 |
Netflix, Inc. (a) | 8,254 | | 1,450,228 |
Priceline.com, Inc. (a)(d) | 9,343 | | 3,732,996 |
| | 18,294,773 |
|
| Shares | | Value |
Leisure Equipment & Products - 0.1% |
Hasbro, Inc. | 25,918 | | $ 1,222,811 |
Mattel, Inc. | 68,285 | | 1,736,488 |
| | 2,959,299 |
Media - 3.1% |
Cablevision Systems Corp. - NY Group Class A | 45,679 | | 1,545,777 |
CBS Corp. Class B | 129,574 | | 2,468,385 |
Comcast Corp. Class A | 530,957 | | 11,665,125 |
DIRECTV (a) | 158,657 | | 6,335,174 |
Discovery Communications, Inc. (a)(d) | 54,105 | | 2,256,179 |
Gannett Co., Inc. | 45,468 | | 686,112 |
Interpublic Group of Companies, Inc. (a) | 93,006 | | 987,724 |
McGraw-Hill Companies, Inc. | 58,422 | | 2,127,145 |
Meredith Corp. (d) | 6,935 | | 240,298 |
News Corp. Class A | 434,582 | | 6,327,514 |
Omnicom Group, Inc. | 57,326 | | 2,625,531 |
Scripps Networks Interactive, Inc. Class A | 17,142 | | 887,099 |
The Walt Disney Co. | 360,348 | | 13,516,653 |
Time Warner Cable, Inc. | 67,696 | | 4,469,967 |
Time Warner, Inc. | 211,099 | | 6,791,055 |
Viacom, Inc. Class B (non-vtg.) | 115,043 | | 4,556,853 |
Washington Post Co. Class B (d) | 1,045 | | 459,278 |
| | 67,945,869 |
Multiline Retail - 0.8% |
Big Lots, Inc. (a) | 14,378 | | 437,954 |
Family Dollar Stores, Inc. | 23,956 | | 1,190,853 |
JCPenney Co., Inc. | 44,995 | | 1,453,788 |
Kohl's Corp. (a)(d) | 55,641 | | 3,023,532 |
Macy's, Inc. | 80,587 | | 2,038,851 |
Nordstrom, Inc. | 32,032 | | 1,357,516 |
Sears Holdings Corp. (a)(d) | 8,374 | | 617,583 |
Target Corp. | 134,748 | | 8,102,397 |
| | 18,222,474 |
Specialty Retail - 1.9% |
Abercrombie & Fitch Co. Class A | 16,717 | | 963,401 |
AutoNation, Inc. (a)(d) | 12,110 | | 341,502 |
AutoZone, Inc. (a)(d) | 5,180 | | 1,412,016 |
Bed Bath & Beyond, Inc. (a) | 49,309 | | 2,423,537 |
Best Buy Co., Inc. | 62,838 | | 2,154,715 |
CarMax, Inc. (a)(d) | 42,790 | | 1,364,145 |
GameStop Corp. Class A (a)(d) | 28,805 | | 659,058 |
Gap, Inc. | 83,619 | | 1,851,325 |
Home Depot, Inc. | 311,867 | | 10,934,057 |
Limited Brands, Inc. | 50,333 | | 1,546,733 |
Lowe's Companies, Inc. | 262,614 | | 6,586,359 |
O'Reilly Automotive, Inc. (a) | 26,573 | | 1,605,541 |
RadioShack Corp. (d) | 21,661 | | 400,512 |
Ross Stores, Inc. | 22,923 | | 1,449,880 |
Staples, Inc. | 137,624 | | 3,133,698 |
Tiffany & Co., Inc. | 24,054 | | 1,497,843 |
Common Stocks - continued |
| Shares | | Value |
CONSUMER DISCRETIONARY - continued |
Specialty Retail - continued |
TJX Companies, Inc. | 75,321 | | $ 3,343,499 |
Urban Outfitters, Inc. (a)(d) | 24,504 | | 877,488 |
| | 42,545,309 |
Textiles, Apparel & Luxury Goods - 0.6% |
Coach, Inc. | 56,401 | | 3,119,539 |
NIKE, Inc. Class B | 72,751 | | 6,214,390 |
Polo Ralph Lauren Corp. Class A | 12,301 | | 1,364,427 |
VF Corp. (d) | 16,513 | | 1,423,090 |
| | 12,121,446 |
TOTAL CONSUMER DISCRETIONARY | | 231,226,116 |
CONSUMER STAPLES - 10.5% |
Beverages - 2.5% |
Brown-Forman Corp. Class B (non-vtg.) | 19,750 | | 1,374,995 |
Coca-Cola Enterprises, Inc. | 64,471 | | 1,613,709 |
Constellation Brands, Inc. Class A (sub. vtg.) (a)(d) | 33,927 | | 751,483 |
Dr Pepper Snapple Group, Inc. | 43,215 | | 1,519,439 |
Molson Coors Brewing Co. Class B | 30,104 | | 1,510,920 |
PepsiCo, Inc. | 301,594 | | 19,703,136 |
The Coca-Cola Co. | 441,882 | | 29,062,579 |
| | 55,536,261 |
Food & Staples Retailing - 2.3% |
Costco Wholesale Corp. (d) | 82,273 | | 5,940,933 |
CVS Caremark Corp. | 258,579 | | 8,990,792 |
Kroger Co. | 121,360 | | 2,713,610 |
Safeway, Inc. | 70,944 | | 1,595,531 |
SUPERVALU, Inc. (d) | 40,375 | | 388,811 |
Sysco Corp. | 111,341 | | 3,273,425 |
Wal-Mart Stores, Inc. | 372,815 | | 20,105,913 |
Walgreen Co. | 176,172 | | 6,863,661 |
Whole Foods Market, Inc. | 27,976 | | 1,415,306 |
| | 51,287,982 |
Food Products - 1.7% |
Archer Daniels Midland Co. | 121,581 | | 3,657,156 |
Campbell Soup Co. | 36,446 | | 1,266,499 |
ConAgra Foods, Inc. | 83,679 | | 1,889,472 |
Dean Foods Co. (a)(d) | 34,669 | | 306,474 |
General Mills, Inc. | 121,849 | | 4,336,606 |
H.J. Heinz Co. | 61,038 | | 3,018,939 |
Hershey Co. | 29,435 | | 1,387,860 |
Hormel Foods Corp. (d) | 13,179 | | 675,556 |
Kellogg Co. | 48,349 | | 2,469,667 |
Kraft Foods, Inc. Class A | 332,410 | | 10,474,239 |
McCormick & Co., Inc. (non-vtg.) | 25,299 | | 1,177,162 |
Mead Johnson Nutrition Co. Class A | 38,931 | | 2,423,455 |
Sara Lee Corp. | 121,652 | | 2,130,127 |
|
| Shares | | Value |
The J.M. Smucker Co. | 22,742 | | $ 1,493,012 |
Tyson Foods, Inc. Class A | 56,711 | | 976,563 |
| | 37,682,787 |
Household Products - 2.2% |
Clorox Co. | 26,536 | | 1,679,198 |
Colgate-Palmolive Co. | 91,855 | | 7,382,386 |
Kimberly-Clark Corp. | 77,603 | | 4,892,093 |
Procter & Gamble Co. | 532,685 | | 34,267,626 |
| | 48,221,303 |
Personal Products - 0.2% |
Avon Products, Inc. | 81,673 | | 2,373,417 |
Estee Lauder Companies, Inc. Class A | 21,609 | | 1,743,846 |
| | 4,117,263 |
Tobacco - 1.6% |
Altria Group, Inc. | 397,312 | | 9,781,821 |
Lorillard, Inc. | 28,471 | | 2,336,330 |
Philip Morris International, Inc. | 345,278 | | 20,209,121 |
Reynolds American, Inc. (d) | 64,354 | | 2,099,227 |
| | 34,426,499 |
TOTAL CONSUMER STAPLES | | 231,272,095 |
ENERGY - 11.8% |
Energy Equipment & Services - 2.1% |
Baker Hughes, Inc. | 82,071 | | 4,691,999 |
Cameron International Corp. (a) | 46,161 | | 2,341,748 |
Diamond Offshore Drilling, Inc. (d) | 13,228 | | 884,556 |
FMC Technologies, Inc. (a) | 22,781 | | 2,025,459 |
Halliburton Co. | 173,084 | | 7,067,020 |
Helmerich & Payne, Inc. | 20,169 | | 977,793 |
Nabors Industries Ltd. (a) | 54,310 | | 1,274,113 |
National Oilwell Varco, Inc. | 79,856 | | 5,370,316 |
Rowan Companies, Inc. (a)(d) | 24,019 | | 838,503 |
Schlumberger Ltd. | 259,641 | | 21,680,024 |
| | 47,151,531 |
Oil, Gas & Consumable Fuels - 9.7% |
Anadarko Petroleum Corp. | 94,311 | | 7,182,726 |
Apache Corp. | 72,727 | | 8,671,240 |
Cabot Oil & Gas Corp. (d) | 19,786 | | 748,900 |
Chesapeake Energy Corp. | 124,440 | | 3,224,240 |
Chevron Corp. | 382,964 | | 34,945,465 |
ConocoPhillips | 279,593 | | 19,040,283 |
CONSOL Energy, Inc. | 42,978 | | 2,094,748 |
Denbury Resources, Inc. (a)(d) | 76,059 | | 1,451,966 |
Devon Energy Corp. | 82,190 | | 6,452,737 |
El Paso Corp. | 133,998 | | 1,843,812 |
EOG Resources, Inc. | 48,339 | | 4,418,668 |
EQT Corp. (d) | 28,382 | | 1,272,649 |
Exxon Mobil Corp. | 959,596 | | 70,165,649 |
Hess Corp. | 57,094 | | 4,369,975 |
Marathon Oil Corp. | 135,096 | | 5,002,605 |
Massey Energy Co. | 19,434 | | 1,042,634 |
Common Stocks - continued |
| Shares | | Value |
ENERGY - continued |
Oil, Gas & Consumable Fuels - continued |
Murphy Oil Corp. | 36,607 | | $ 2,729,052 |
Newfield Exploration Co. (a) | 25,477 | | 1,837,146 |
Noble Energy, Inc. | 33,320 | | 2,868,186 |
Occidental Petroleum Corp. | 154,635 | | 15,169,694 |
Peabody Energy Corp. (d) | 51,312 | | 3,282,942 |
Pioneer Natural Resources Co. (d) | 22,093 | | 1,918,114 |
QEP Resources, Inc. | 33,421 | | 1,213,517 |
Range Resources Corp. | 30,462 | | 1,370,181 |
Southwestern Energy Co. (a) | 65,993 | | 2,470,118 |
Spectra Energy Corp. (d) | 123,356 | | 3,082,666 |
Sunoco, Inc. (d) | 22,946 | | 924,953 |
Tesoro Corp. (d) | 27,243 | | 505,085 |
Valero Energy Corp. (d) | 107,750 | | 2,491,180 |
Williams Companies, Inc. | 111,282 | | 2,750,891 |
| | 214,542,022 |
TOTAL ENERGY | | 261,693,553 |
FINANCIALS - 15.8% |
Capital Markets - 2.5% |
Ameriprise Financial, Inc. | 47,187 | | 2,715,612 |
Bank of New York Mellon Corp. | 236,058 | | 7,128,952 |
Charles Schwab Corp. | 188,721 | | 3,229,016 |
E*TRADE Financial Corp. (a) | 37,819 | | 605,104 |
Federated Investors, Inc. Class B (non-vtg.) (d) | 17,432 | | 456,195 |
Franklin Resources, Inc. | 27,707 | | 3,081,295 |
Goldman Sachs Group, Inc. | 97,289 | | 16,360,118 |
Invesco Ltd. | 87,929 | | 2,115,572 |
Janus Capital Group, Inc. (d) | 34,967 | | 453,522 |
Legg Mason, Inc. | 29,116 | | 1,056,037 |
Morgan Stanley | 287,900 | | 7,833,759 |
Northern Trust Corp. | 46,089 | | 2,553,791 |
State Street Corp. | 95,535 | | 4,427,092 |
T. Rowe Price Group, Inc. | 48,799 | | 3,149,487 |
| | 55,165,552 |
Commercial Banks - 2.9% |
BB&T Corp. | 132,017 | | 3,470,727 |
Comerica, Inc. (d) | 33,586 | | 1,418,673 |
Fifth Third Bancorp | 151,532 | | 2,224,490 |
First Horizon National Corp. (d) | 49,644 | | 584,806 |
Huntington Bancshares, Inc. | 164,260 | | 1,128,466 |
KeyCorp | 167,553 | | 1,482,844 |
M&T Bank Corp. | 22,718 | | 1,977,602 |
Marshall & Ilsley Corp. | 100,474 | | 695,280 |
PNC Financial Services Group, Inc. | 100,059 | | 6,075,582 |
Regions Financial Corp. | 239,032 | | 1,673,224 |
SunTrust Banks, Inc. | 95,142 | | 2,807,640 |
U.S. Bancorp, Delaware | 365,053 | | 9,845,479 |
|
| Shares | | Value |
Wells Fargo & Co. | 998,836 | | $ 30,953,928 |
Zions Bancorporation (d) | 33,865 | | 820,549 |
| | 65,159,290 |
Consumer Finance - 0.7% |
American Express Co. | 199,296 | | 8,553,784 |
Capital One Financial Corp. (d) | 86,953 | | 3,700,720 |
Discover Financial Services | 103,635 | | 1,920,357 |
SLM Corp. (a) | 92,408 | | 1,163,417 |
| | 15,338,278 |
Diversified Financial Services - 4.2% |
Bank of America Corp. | 1,919,199 | | 25,602,115 |
Citigroup, Inc. (a) | 5,528,233 | | 26,148,542 |
CME Group, Inc. (d) | 12,753 | | 4,103,278 |
IntercontinentalExchange, Inc. (a) | 13,921 | | 1,658,687 |
JPMorgan Chase & Co. | 743,915 | | 31,556,874 |
Leucadia National Corp. | 37,506 | | 1,094,425 |
Moody's Corp. (d) | 38,774 | | 1,029,062 |
NYSE Euronext | 49,668 | | 1,489,047 |
The NASDAQ Stock Market, Inc. (a)(d) | 28,314 | | 671,325 |
| | 93,353,355 |
Insurance - 3.8% |
ACE Ltd. | 64,586 | | 4,020,479 |
AFLAC, Inc. | 89,681 | | 5,060,699 |
Allstate Corp. | 102,416 | | 3,265,022 |
American International Group, Inc. (a)(d) | 26,647 | | 1,535,400 |
Aon Corp. | 62,783 | | 2,888,646 |
Assurant, Inc. | 20,277 | | 781,070 |
Berkshire Hathaway, Inc. Class B (a)(d) | 329,298 | | 26,380,063 |
Cincinnati Financial Corp. | 30,969 | | 981,408 |
Genworth Financial, Inc. Class A (a) | 93,170 | | 1,224,254 |
Hartford Financial Services Group, Inc. | 84,596 | | 2,240,948 |
Lincoln National Corp. | 60,279 | | 1,676,359 |
Loews Corp. | 60,196 | | 2,342,226 |
Marsh & McLennan Companies, Inc. | 103,418 | | 2,827,448 |
MetLife, Inc. (d) | 172,466 | | 7,664,389 |
Principal Financial Group, Inc. (d) | 60,963 | | 1,984,955 |
Progressive Corp. | 126,264 | | 2,508,866 |
Prudential Financial, Inc. | 92,362 | | 5,422,573 |
The Chubb Corp. | 58,029 | | 3,460,850 |
The Travelers Companies, Inc. | 87,356 | | 4,866,603 |
Torchmark Corp. | 15,234 | | 910,079 |
Unum Group | 60,352 | | 1,461,725 |
XL Capital Ltd. Class A | 61,510 | | 1,342,148 |
| | 84,846,210 |
Real Estate Investment Trusts - 1.5% |
Apartment Investment & Management Co. Class A | 22,272 | | 575,508 |
AvalonBay Communities, Inc. | 16,230 | | 1,826,687 |
Boston Properties, Inc. | 26,662 | | 2,295,598 |
Equity Residential (SBI) | 54,130 | | 2,812,054 |
HCP, Inc. | 69,332 | | 2,550,724 |
Health Care REIT, Inc. (d) | 27,618 | | 1,315,722 |
Common Stocks - continued |
| Shares | | Value |
FINANCIALS - continued |
Real Estate Investment Trusts - continued |
Host Hotels & Resorts, Inc. | 126,727 | | $ 2,264,611 |
Kimco Realty Corp. | 77,252 | | 1,393,626 |
Plum Creek Timber Co., Inc. (d) | 30,754 | | 1,151,737 |
ProLogis Trust | 108,286 | | 1,563,650 |
Public Storage | 26,578 | | 2,695,541 |
Simon Property Group, Inc. | 55,739 | | 5,545,473 |
Ventas, Inc. | 29,895 | | 1,568,890 |
Vornado Realty Trust | 30,938 | | 2,578,064 |
Weyerhaeuser Co. | 101,990 | | 1,930,671 |
| | 32,068,556 |
Real Estate Management & Development - 0.1% |
CB Richard Ellis Group, Inc. Class A (a)(d) | 55,302 | | 1,132,585 |
Thrifts & Mortgage Finance - 0.1% |
Hudson City Bancorp, Inc. (d) | 100,212 | | 1,276,701 |
People's United Financial, Inc. | 70,211 | | 983,656 |
| | 2,260,357 |
TOTAL FINANCIALS | | 349,324,183 |
HEALTH CARE - 10.7% |
Biotechnology - 1.3% |
Amgen, Inc. (a) | 179,798 | | 9,870,910 |
Biogen Idec, Inc. (a)(d) | 45,349 | | 3,040,650 |
Celgene Corp. (a) | 89,563 | | 5,296,756 |
Cephalon, Inc. (a)(d) | 14,317 | | 883,645 |
Genzyme Corp. (a) | 49,286 | | 3,509,163 |
Gilead Sciences, Inc. (a) | 154,498 | | 5,599,008 |
| | 28,200,132 |
Health Care Equipment & Supplies - 1.6% |
Baxter International, Inc. | 110,893 | | 5,613,404 |
Becton, Dickinson & Co. | 43,761 | | 3,698,680 |
Boston Scientific Corp. (a)(d) | 289,270 | | 2,189,774 |
C. R. Bard, Inc. (d) | 17,679 | | 1,622,402 |
CareFusion Corp. (a) | 42,426 | | 1,090,348 |
DENTSPLY International, Inc. | 27,041 | | 923,991 |
Intuitive Surgical, Inc. (a)(d) | 7,477 | | 1,927,197 |
Medtronic, Inc. | 205,502 | | 7,622,069 |
St. Jude Medical, Inc. (a) | 65,241 | | 2,789,053 |
Stryker Corp. | 64,992 | | 3,490,070 |
Varian Medical Systems, Inc. (a) | 22,643 | | 1,568,707 |
Zimmer Holdings, Inc. (a) | 37,573 | | 2,016,919 |
| | 34,552,614 |
Health Care Providers & Services - 1.9% |
Aetna, Inc. | 76,139 | | 2,323,001 |
AmerisourceBergen Corp. | 52,589 | | 1,794,337 |
Cardinal Health, Inc. | 66,407 | | 2,544,052 |
CIGNA Corp. | 51,556 | | 1,890,043 |
Coventry Health Care, Inc. (a) | 28,258 | | 746,011 |
DaVita, Inc. (a) | 18,497 | | 1,285,357 |
|
| Shares | | Value |
Express Scripts, Inc. (a) | 100,297 | | $ 5,421,053 |
Humana, Inc. (a) | 32,031 | | 1,753,377 |
Laboratory Corp. of America Holdings (a)(d) | 19,353 | | 1,701,516 |
McKesson Corp. | 48,158 | | 3,389,360 |
Medco Health Solutions, Inc. (a) | 80,763 | | 4,948,349 |
Patterson Companies, Inc. | 18,404 | | 563,715 |
Quest Diagnostics, Inc. | 26,915 | | 1,452,603 |
Tenet Healthcare Corp. (a) | 92,397 | | 618,136 |
UnitedHealth Group, Inc. | 209,318 | | 7,558,473 |
WellPoint, Inc. (a) | 74,904 | | 4,259,041 |
| | 42,248,424 |
Health Care Technology - 0.0% |
Cerner Corp. (a)(d) | 13,560 | | 1,284,674 |
Life Sciences Tools & Services - 0.5% |
Agilent Technologies, Inc. (a)(d) | 65,914 | | 2,730,817 |
Life Technologies Corp. (a) | 35,534 | | 1,972,137 |
PerkinElmer, Inc. | 22,464 | | 580,020 |
Thermo Fisher Scientific, Inc. (a) | 75,640 | | 4,187,430 |
Waters Corp. (a) | 17,380 | | 1,350,600 |
| | 10,821,004 |
Pharmaceuticals - 5.4% |
Abbott Laboratories | 294,168 | | 14,093,589 |
Allergan, Inc. | 58,519 | | 4,018,500 |
Bristol-Myers Squibb Co. | 325,733 | | 8,625,410 |
Eli Lilly & Co. | 193,109 | | 6,766,539 |
Forest Laboratories, Inc. (a) | 54,353 | | 1,738,209 |
Hospira, Inc. (a) | 31,795 | | 1,770,664 |
Johnson & Johnson | 522,611 | | 32,323,490 |
Merck & Co., Inc. | 586,290 | | 21,129,892 |
Mylan, Inc. (a)(d) | 82,822 | | 1,750,029 |
Pfizer, Inc. | 1,524,290 | | 26,690,318 |
Watson Pharmaceuticals, Inc. (a)(d) | 23,846 | | 1,231,646 |
| | 120,138,286 |
TOTAL HEALTH CARE | | 237,245,134 |
INDUSTRIALS - 10.8% |
Aerospace & Defense - 2.6% |
General Dynamics Corp. | 71,884 | | 5,100,889 |
Goodrich Corp. | 23,859 | | 2,101,262 |
Honeywell International, Inc. (d) | 148,467 | | 7,892,506 |
ITT Corp. (d) | 34,939 | | 1,820,671 |
L-3 Communications Holdings, Inc. | 21,539 | | 1,518,284 |
Lockheed Martin Corp. (d) | 56,196 | | 3,928,662 |
Northrop Grumman Corp. | 55,565 | | 3,599,501 |
Precision Castparts Corp. | 27,140 | | 3,778,159 |
Raytheon Co. | 69,372 | | 3,214,698 |
Rockwell Collins, Inc. | 29,848 | | 1,738,944 |
The Boeing Co. | 139,600 | | 9,110,296 |
United Technologies Corp. | 175,724 | | 13,832,993 |
| | 57,636,865 |
Common Stocks - continued |
| Shares | | Value |
INDUSTRIALS - continued |
Air Freight & Logistics - 1.1% |
C.H. Robinson Worldwide, Inc. (d) | 31,593 | | $ 2,533,443 |
Expeditors International of Washington, Inc. | 40,411 | | 2,206,441 |
FedEx Corp. | 59,876 | | 5,569,067 |
United Parcel Service, Inc. Class B | 188,194 | | 13,659,121 |
| | 23,968,072 |
Airlines - 0.1% |
Southwest Airlines Co. | 142,172 | | 1,845,393 |
Building Products - 0.0% |
Masco Corp. | 68,222 | | 863,691 |
Commercial Services & Supplies - 0.5% |
Avery Dennison Corp. | 20,546 | | 869,918 |
Cintas Corp. | 24,056 | | 672,606 |
Iron Mountain, Inc. | 38,084 | | 952,481 |
Pitney Bowes, Inc. (d) | 38,698 | | 935,718 |
R.R. Donnelley & Sons Co. | 39,259 | | 685,855 |
Republic Services, Inc. | 58,498 | | 1,746,750 |
Stericycle, Inc. (a)(d) | 16,277 | | 1,317,135 |
Waste Management, Inc. (d) | 90,545 | | 3,338,394 |
| | 10,518,857 |
Construction & Engineering - 0.2% |
Fluor Corp. | 34,024 | | 2,254,430 |
Jacobs Engineering Group, Inc. (a) | 23,997 | | 1,100,262 |
Quanta Services, Inc. (a)(d) | 41,012 | | 816,959 |
| | 4,171,651 |
Electrical Equipment - 0.5% |
Emerson Electric Co. | 143,230 | | 8,188,459 |
Rockwell Automation, Inc. | 26,983 | | 1,934,951 |
Roper Industries, Inc. | 18,016 | | 1,376,963 |
| | 11,500,373 |
Industrial Conglomerates - 2.4% |
3M Co. | 136,037 | | 11,739,993 |
General Electric Co. | 2,027,588 | | 37,084,585 |
Textron, Inc. (d) | 52,314 | | 1,236,703 |
Tyco International Ltd. | 93,141 | | 3,859,763 |
| | 53,921,044 |
Machinery - 2.3% |
Caterpillar, Inc. | 120,784 | | 11,312,629 |
Cummins, Inc. | 37,643 | | 4,141,106 |
Danaher Corp. | 102,047 | | 4,813,557 |
Deere & Co. | 80,661 | | 6,698,896 |
Dover Corp. | 35,546 | | 2,077,664 |
Eaton Corp. | 32,027 | | 3,251,061 |
Flowserve Corp. | 10,625 | | 1,266,713 |
Illinois Tool Works, Inc. | 94,375 | | 5,039,625 |
Ingersoll-Rand Co. Ltd. (d) | 61,659 | | 2,903,522 |
PACCAR, Inc. | 69,402 | | 3,985,063 |
Pall Corp. | 21,919 | | 1,086,744 |
|
| Shares | | Value |
Parker Hannifin Corp. | 30,701 | | $ 2,649,496 |
Snap-On, Inc. | 11,067 | | 626,171 |
| | 49,852,247 |
Professional Services - 0.1% |
Dun & Bradstreet Corp. | 9,479 | | 778,131 |
Equifax, Inc. | 23,483 | | 835,995 |
Robert Half International, Inc. (d) | 28,004 | | 856,922 |
| | 2,471,048 |
Road & Rail - 0.8% |
CSX Corp. | 71,207 | | 4,600,684 |
Norfolk Southern Corp. | 69,150 | | 4,344,003 |
Ryder System, Inc. | 9,846 | | 518,293 |
Union Pacific Corp. | 93,846 | | 8,695,770 |
| | 18,158,750 |
Trading Companies & Distributors - 0.2% |
Fastenal Co. (d) | 28,056 | | 1,680,835 |
W.W. Grainger, Inc. (d) | 11,040 | | 1,524,734 |
| | 3,205,569 |
TOTAL INDUSTRIALS | | 238,113,560 |
INFORMATION TECHNOLOGY - 18.3% |
Communications Equipment - 2.2% |
Cisco Systems, Inc. (a) | 1,054,785 | | 21,338,301 |
F5 Networks, Inc. (a) | 15,386 | | 2,002,642 |
Harris Corp. | 24,411 | | 1,105,818 |
JDS Uniphase Corp. (a)(d) | 42,371 | | 613,532 |
Juniper Networks, Inc. (a) | 99,565 | | 3,675,940 |
Motorola, Inc. (a) | 447,086 | | 4,055,070 |
QUALCOMM, Inc. | 307,850 | | 15,235,497 |
Tellabs, Inc. (d) | 70,207 | | 476,003 |
| | 48,502,803 |
Computers & Peripherals - 4.3% |
Apple, Inc. (a) | 174,563 | | 56,307,041 |
Dell, Inc. (a) | 319,580 | | 4,330,309 |
EMC Corp. (a) | 392,092 | | 8,978,907 |
Hewlett-Packard Co. | 431,550 | | 18,168,255 |
Lexmark International, Inc. Class A (a) | 14,951 | | 520,594 |
NetApp, Inc. (a)(d) | 68,779 | | 3,780,094 |
QLogic Corp. (a) | 20,100 | | 342,102 |
SanDisk Corp. (a) | 44,626 | | 2,225,052 |
Western Digital Corp. (a) | 43,731 | | 1,482,481 |
| | 96,134,835 |
Electronic Equipment & Components - 0.4% |
Amphenol Corp. Class A (d) | 33,229 | | 1,753,827 |
Corning, Inc. | 297,415 | | 5,746,058 |
FLIR Systems, Inc. (a) | 30,181 | | 897,885 |
Jabil Circuit, Inc. | 37,306 | | 749,478 |
Molex, Inc. | 26,291 | | 597,332 |
| | 9,744,580 |
Common Stocks - continued |
| Shares | | Value |
INFORMATION TECHNOLOGY - continued |
Internet Software & Services - 1.9% |
Akamai Technologies, Inc. (a) | 34,700 | | $ 1,632,635 |
eBay, Inc. (a)(d) | 218,329 | | 6,076,096 |
Google, Inc. Class A (a) | 47,465 | | 28,192,786 |
Monster Worldwide, Inc. (a)(d) | 24,746 | | 584,748 |
VeriSign, Inc. | 32,729 | | 1,069,256 |
Yahoo!, Inc. (a)(d) | 248,055 | | 4,125,155 |
| | 41,680,676 |
IT Services - 3.0% |
Automatic Data Processing, Inc. | 93,858 | | 4,343,748 |
Cognizant Technology Solutions Corp. Class A (a) | 57,752 | | 4,232,644 |
Computer Sciences Corp. | 29,398 | | 1,458,141 |
Fidelity National Information Services, Inc. | 50,400 | | 1,380,456 |
Fiserv, Inc. (a) | 28,301 | | 1,657,307 |
International Business Machines Corp. | 236,421 | | 34,697,146 |
MasterCard, Inc. Class A | 18,431 | | 4,130,571 |
Paychex, Inc. (d) | 61,255 | | 1,893,392 |
SAIC, Inc. (a)(d) | 55,878 | | 886,225 |
Teradata Corp. (a) | 31,875 | | 1,311,975 |
The Western Union Co. (d) | 124,811 | | 2,317,740 |
Total System Services, Inc. | 31,063 | | 477,749 |
Visa, Inc. Class A | 92,733 | | 6,526,549 |
| | 65,313,643 |
Office Electronics - 0.1% |
Xerox Corp. | 263,983 | | 3,041,084 |
Semiconductors & Semiconductor Equipment - 2.5% |
Advanced Micro Devices, Inc. (a)(d) | 108,981 | | 891,465 |
Altera Corp. | 59,481 | | 2,116,334 |
Analog Devices, Inc. | 56,834 | | 2,140,937 |
Applied Materials, Inc. | 254,253 | | 3,572,255 |
Broadcom Corp. Class A | 86,665 | | 3,774,261 |
First Solar, Inc. (a)(d) | 10,277 | | 1,337,449 |
Intel Corp. | 1,061,491 | | 22,323,156 |
KLA-Tencor Corp. | 31,792 | | 1,228,443 |
Linear Technology Corp. (d) | 42,894 | | 1,483,703 |
LSI Corp. (a) | 117,328 | | 702,795 |
MEMC Electronic Materials, Inc. (a)(d) | 43,279 | | 487,322 |
Microchip Technology, Inc. | 35,553 | | 1,216,268 |
Micron Technology, Inc. (a)(d) | 163,043 | | 1,307,605 |
National Semiconductor Corp. | 45,589 | | 627,305 |
Novellus Systems, Inc. (a) | 17,163 | | 554,708 |
NVIDIA Corp. (a)(d) | 110,564 | | 1,702,686 |
Teradyne, Inc. (a)(d) | 34,520 | | 484,661 |
Texas Instruments, Inc. | 223,442 | | 7,261,865 |
Xilinx, Inc. (d) | 49,310 | | 1,429,004 |
| | 54,642,222 |
Software - 3.9% |
Adobe Systems, Inc. (a) | 96,809 | | 2,979,781 |
|
| Shares | | Value |
Autodesk, Inc. (a)(d) | 43,273 | | $ 1,653,029 |
BMC Software, Inc. (a) | 33,811 | | 1,593,851 |
CA, Inc. | 73,021 | | 1,784,633 |
Citrix Systems, Inc. (a) | 35,733 | | 2,444,495 |
Compuware Corp. (a)(d) | 41,681 | | 486,417 |
Electronic Arts, Inc. (a) | 63,148 | | 1,034,364 |
Intuit, Inc. (a) | 53,198 | | 2,622,661 |
McAfee, Inc. (a) | 29,334 | | 1,358,458 |
Microsoft Corp. | 1,432,738 | | 40,002,045 |
Novell, Inc. (a) | 66,905 | | 396,078 |
Oracle Corp. | 736,626 | | 23,056,394 |
Red Hat, Inc. (a) | 36,267 | | 1,655,589 |
salesforce.com, Inc. (a)(d) | 22,505 | | 2,970,660 |
Symantec Corp. (a) | 147,721 | | 2,472,850 |
| | 86,511,305 |
TOTAL INFORMATION TECHNOLOGY | | 405,571,148 |
MATERIALS - 3.7% |
Chemicals - 2.1% |
Air Products & Chemicals, Inc. | 40,776 | | 3,708,577 |
Airgas, Inc. | 14,239 | | 889,368 |
CF Industries Holdings, Inc. | 13,536 | | 1,829,390 |
Dow Chemical Co. | 220,884 | | 7,540,980 |
E.I. du Pont de Nemours & Co. | 173,723 | | 8,665,303 |
Eastman Chemical Co. | 13,726 | | 1,154,082 |
Ecolab, Inc. | 44,175 | | 2,227,304 |
FMC Corp. | 13,804 | | 1,102,802 |
International Flavors & Fragrances, Inc. | 15,215 | | 845,802 |
Monsanto Co. | 102,075 | | 7,108,503 |
PPG Industries, Inc. | 31,022 | | 2,608,020 |
Praxair, Inc. | 58,304 | | 5,566,283 |
Sherwin-Williams Co. | 17,048 | | 1,427,770 |
Sigma Aldrich Corp. (d) | 23,083 | | 1,536,404 |
| | 46,210,588 |
Construction Materials - 0.1% |
Vulcan Materials Co. (d) | 24,433 | | 1,083,848 |
Containers & Packaging - 0.2% |
Ball Corp. | 16,807 | | 1,143,716 |
Bemis Co., Inc. | 20,589 | | 672,437 |
Owens-Illinois, Inc. (a) | 31,140 | | 955,998 |
Sealed Air Corp. | 30,387 | | 773,349 |
| | 3,545,500 |
Metals & Mining - 1.2% |
AK Steel Holding Corp. (d) | 20,932 | | 342,657 |
Alcoa, Inc. (d) | 194,380 | | 2,991,508 |
Allegheny Technologies, Inc. | 18,762 | | 1,035,287 |
Cliffs Natural Resources, Inc. | 25,778 | | 2,010,942 |
Freeport-McMoRan Copper & Gold, Inc. | 89,608 | | 10,761,025 |
Newmont Mining Corp. | 93,830 | | 5,763,977 |
Nucor Corp. | 60,083 | | 2,632,837 |
Common Stocks - continued |
| Shares | | Value |
MATERIALS - continued |
Metals & Mining - continued |
Titanium Metals Corp. (a)(d) | 17,144 | | $ 294,534 |
United States Steel Corp. | 27,330 | | 1,596,619 |
| | 27,429,386 |
Paper & Forest Products - 0.1% |
International Paper Co. | 83,248 | | 2,267,676 |
MeadWestvaco Corp. | 32,019 | | 837,617 |
| | 3,105,293 |
TOTAL MATERIALS | | 81,374,615 |
TELECOMMUNICATION SERVICES - 3.1% |
Diversified Telecommunication Services - 2.8% |
AT&T, Inc. | 1,124,670 | | 33,042,805 |
CenturyLink, Inc. (d) | 57,708 | | 2,664,378 |
Frontier Communications Corp. (d) | 189,134 | | 1,840,274 |
Qwest Communications International, Inc. | 331,638 | | 2,523,765 |
Verizon Communications, Inc. | 537,935 | | 19,247,314 |
Windstream Corp. | 92,048 | | 1,283,149 |
| | 60,601,685 |
Wireless Telecommunication Services - 0.3% |
American Tower Corp. Class A (a) | 75,945 | | 3,921,800 |
MetroPCS Communications, Inc. (a)(d) | 49,909 | | 630,351 |
Sprint Nextel Corp. (a)(d) | 568,433 | | 2,404,472 |
| | 6,956,623 |
TOTAL TELECOMMUNICATION SERVICES | | 67,558,308 |
UTILITIES - 3.2% |
Electric Utilities - 1.7% |
Allegheny Energy, Inc. (d) | 32,339 | | 783,897 |
American Electric Power Co., Inc. | 91,396 | | 3,288,428 |
Duke Energy Corp. (d) | 252,061 | | 4,489,206 |
Edison International | 62,002 | | 2,393,277 |
Entergy Corp. | 34,428 | | 2,438,535 |
Exelon Corp. | 125,867 | | 5,241,102 |
FirstEnergy Corp. (d) | 58,010 | | 2,147,530 |
NextEra Energy, Inc. | 79,135 | | 4,114,229 |
Northeast Utilities | 33,553 | | 1,069,670 |
Pepco Holdings, Inc. (d) | 42,722 | | 779,677 |
Pinnacle West Capital Corp. | 20,688 | | 857,518 |
PPL Corp. | 91,970 | | 2,420,650 |
Progress Energy, Inc. | 55,746 | | 2,423,836 |
Southern Co. (d) | 159,599 | | 6,101,470 |
| | 38,549,025 |
Gas Utilities - 0.1% |
Nicor, Inc. | 8,665 | | 432,557 |
ONEOK, Inc. (d) | 20,265 | | 1,124,100 |
| | 1,556,657 |
|
| Shares | | Value |
Independent Power Producers & Energy Traders - 0.1% |
AES Corp. (a) | 125,979 | | $ 1,534,424 |
Constellation Energy Group, Inc. | 38,023 | | 1,164,644 |
NRG Energy, Inc. (a)(d) | 47,041 | | 919,181 |
| | 3,618,249 |
Multi-Utilities - 1.3% |
Ameren Corp. | 45,639 | | 1,286,563 |
CenterPoint Energy, Inc. | 80,532 | | 1,265,963 |
CMS Energy Corp. (d) | 46,543 | | 865,700 |
Consolidated Edison, Inc. (d) | 55,289 | | 2,740,676 |
Dominion Resources, Inc. | 110,470 | | 4,719,278 |
DTE Energy Co. | 32,183 | | 1,458,534 |
Integrys Energy Group, Inc. (d) | 14,764 | | 716,202 |
NiSource, Inc. (d) | 52,961 | | 933,173 |
PG&E Corp. | 74,610 | | 3,569,342 |
Public Service Enterprise Group, Inc. | 96,279 | | 3,062,635 |
SCANA Corp. | 21,547 | | 874,808 |
Sempra Energy | 45,682 | | 2,397,391 |
TECO Energy, Inc. | 40,865 | | 727,397 |
Wisconsin Energy Corp. | 22,245 | | 1,309,341 |
Xcel Energy, Inc. | 87,559 | | 2,062,014 |
| | 27,989,017 |
TOTAL UTILITIES | | 71,712,948 |
TOTAL COMMON STOCKS (Cost $1,360,619,681) | 2,175,091,660 |
U.S. Treasury Obligations - 0.1% |
| Principal Amount | | |
U.S. Treasury Bills, yield at date of purchase 0.18% to 0.25% 6/30/11 to 7/28/11 (e)
(Cost $3,196,585) | | $ 3,200,000 | | 3,196,839 |
Money Market Funds - 9.9% |
| Shares | | |
Fidelity Cash Central Fund, 0.19% (b) | 31,217,294 | | 31,217,294 |
Fidelity Securities Lending Cash Central Fund, 0.21% (b)(c) | 187,591,047 | | 187,591,047 |
TOTAL MONEY MARKET FUNDS (Cost $218,808,341) | 218,808,341 |
TOTAL INVESTMENT PORTFOLIO - 108.4% (Cost $1,582,624,607) | | 2,397,096,840 |
NET OTHER ASSETS (LIABILITIES) - (8.4)% | | (185,940,190) |
NET ASSETS - 100% | $ 2,211,156,650 |
Futures Contracts |
| Expiration Date | | Underlying Face Amount at Value | | Unrealized Appreciation/(Depreciation) |
Purchased |
Equity Index Contracts |
119 CME S&P 500 Index Contracts | March 2011 | | $ 37,276,750 | | $ 706,023 |
|
The face value of futures purchased as a percentage of net assets is 1.7% |
Legend |
(a) Non-income producing |
(b) Affiliated fund that is available only to investment companies and other accounts managed by Fidelity Investments. The rate quoted is the annualized seven-day yield of the fund at period end. A complete unaudited listing of the fund's holdings as of its most recent quarter end is available upon request. In addition, each Fidelity Central Fund's financial statements, which are not covered by the Fund's Report of Independent Registered Public Accounting Firm, are available on the SEC's website or upon request. |
(c) Investment made with cash collateral received from securities on loan. |
(d) Security or a portion of the security is on loan at period end. |
(e) Security or a portion of the security was pledged to cover margin requirements for futures contracts. At the period end, the value of securities pledged amounted to $3,146,895. |
Affiliated Central Funds |
Information regarding fiscal year to date income earned by the Fund from investments in Fidelity Central Funds is as follows: |
Fund | Income earned |
Fidelity Cash Central Fund | $ 43,154 |
Fidelity Securities Lending Cash Central Fund | 373,922 |
Total | $ 417,076 |
Other Information |
The following is a summary of the inputs used, as of December 31, 2010, involving the Fund's assets and liabilities carried at fair value. The inputs or methodology used for valuing securities may not be an indication of the risk associated with investing in those securities. For more information on valuation inputs, and their aggregation into the levels used in the table below, please refer to the Security Valuation section in the accompanying Notes to Financial Statements. |
Valuation Inputs at Reporting Date: |
Description | Total | Level 1 | Level 2 | Level 3 |
Investments in Securities: | | | | |
Equities: | | | | |
Consumer Discretionary | $ 231,226,116 | $ 231,226,116 | $ - | $ - |
Consumer Staples | 231,272,095 | 231,272,095 | - | - |
Energy | 261,693,553 | 261,693,553 | - | - |
Financials | 349,324,183 | 349,324,183 | - | - |
Health Care | 237,245,134 | 237,245,134 | - | - |
Industrials | 238,113,560 | 238,113,560 | - | - |
Information Technology | 405,571,148 | 405,571,148 | - | - |
Materials | 81,374,615 | 81,374,615 | - | - |
Telecommunication Services | 67,558,308 | 67,558,308 | - | - |
Utilities | 71,712,948 | 71,712,948 | - | - |
U.S. Government and Government Agency Obligations | 3,196,839 | - | 3,196,839 | - |
Money Market Funds | 218,808,341 | 218,808,341 | - | - |
Total Investments in Securities: | $ 2,397,096,840 | $ 2,393,900,001 | $ 3,196,839 | $ - |
Derivative Instruments: | | | | |
Assets | | | | |
Futures Contracts | $ 706,023 | $ 706,023 | $ - | $ - |
Value of Derivative Instruments |
The following table is a summary of the Fund's value of derivative instruments by risk exposure as of December 31, 2010. For additional information on derivative instruments, please refer to the Derivative Instruments section in the accompanying Notes to Financial Statements. |
Risk Exposure /
Derivative Type | Value |
| Asset | Liability |
Equity Risk | | |
Futures Contracts (a) | $ 706,023 | $ - |
Total Value of Derivatives | $ 706,023 | $ - |
(a) Reflects cumulative appreciation/(depreciation) on futures contracts as disclosed on the Schedule of Investments. Only the period end variation margin is separately disclosed on the Statement of Assets and Liabilities. |
See accompanying notes which are an integral part of the financial statements.
Annual Report
Statement of Assets and Liabilities
| December 31, 2010 |
| | |
Assets | | |
Investment in securities, at value (including securities loaned of $182,886,790) - See accompanying schedule: Unaffiliated issuers (cost $1,363,816,266) | $ 2,178,288,499 | |
Fidelity Central Funds (cost $218,808,341) | 218,808,341 | |
Total Investments (cost $1,582,624,607) | | $ 2,397,096,840 |
Cash | | 6,157 |
Receivable for investments sold | | 161,194 |
Receivable for fund shares sold | | 441,082 |
Dividends receivable | | 2,550,959 |
Distributions receivable from Fidelity Central Funds | | 26,261 |
Other receivables | | 35,736 |
Total assets | | 2,400,318,229 |
| | |
Liabilities | | |
Payable for investments purchased | $ 37,945 | |
Payable for fund shares redeemed | 1,217,061 | |
Accrued management fee | 181,559 | |
Distribution and service plan fees payable | 52,848 | |
Payable for daily variation on futures contracts | 45,383 | |
Other payables and accrued expenses | 35,736 | |
Collateral on securities loaned, at value | 187,591,047 | |
Total liabilities | | 189,161,579 |
| | |
Net Assets | | $ 2,211,156,650 |
Net Assets consist of: | | |
Paid in capital | | $ 1,348,551,391 |
Distributions in excess of net investment income | | (35,740) |
Accumulated undistributed net realized gain (loss) on investments | | 47,462,743 |
Net unrealized appreciation (depreciation) on investments | | 815,178,256 |
Net Assets | | $ 2,211,156,650 |
Statement of Assets and Liabilities - continued
| December 31, 2010 |
| | |
Initial Class:
Net Asset Value, offering price and redemption price per share ($1,931,270,935 ÷ 14,587,659 shares) | | $ 132.39 |
| | |
Service Class:
Net Asset Value, offering price and redemption price per share ($37,208,552 ÷ 281,738 shares) | | $ 132.07 |
| | |
Service Class 2:
Net Asset Value, offering price and redemption price per share ($242,677,163 ÷ 1,848,091 shares) | | $ 131.31 |
See accompanying notes which are an integral part of the financial statements.
Annual Report
Financial Statements - continued
Statement of Operations
| Year ended December 31, 2010 |
| | |
Investment Income | | |
Dividends | | $ 40,815,410 |
Interest | | 11,485 |
Income from Fidelity Central Funds | | 417,076 |
Total income | | 41,243,971 |
| | |
Expenses | | |
Management fee | $ 2,020,219 | |
Distribution and service plan fees | 589,682 | |
Independent trustees' compensation | 11,811 | |
Interest | 253 | |
Miscellaneous | 11,592 | |
Total expenses before reductions | 2,633,557 | |
Expense reductions | (51) | 2,633,506 |
Net investment income (loss) | | 38,610,465 |
Realized and Unrealized Gain (Loss) Net realized gain (loss) on: | | |
Investment securities: | | |
Unaffiliated issuers | 47,282,476 | |
Futures contracts | 2,533,584 | |
Total net realized gain (loss) | | 49,816,060 |
Change in net unrealized appreciation (depreciation) on: Investment securities | 197,612,553 | |
Futures contracts | 1,040,877 | |
Total change in net unrealized appreciation (depreciation) | | 198,653,430 |
Net gain (loss) | | 248,469,490 |
Net increase (decrease) in net assets resulting from operations | | $ 287,079,955 |
Statement of Changes in Net Assets
| Year ended
December 31, 2010 | Year ended
December 31, 2009 |
Increase (Decrease) in Net Assets | | |
Operations | | |
Net investment income (loss) | $ 38,610,465 | $ 40,497,671 |
Net realized gain (loss) | 49,816,060 | 40,366,359 |
Change in net unrealized appreciation (depreciation) | 198,653,430 | 353,513,910 |
Net increase (decrease) in net assets resulting from operations | 287,079,955 | 434,377,940 |
Distributions to shareholders from net investment income | (39,528,264) | (45,093,392) |
Distributions to shareholders from net realized gain | (38,021,665) | (38,913,306) |
Total distributions | (77,549,929) | (84,006,698) |
Share transactions - net increase (decrease) | (19,052,019) | (50,449,549) |
Total increase (decrease) in net assets | 190,478,007 | 299,921,693 |
| | |
Net Assets | | |
Beginning of period | 2,020,678,643 | 1,720,756,950 |
End of period (including distributions in excess of net investment income of $35,740 and undistributed net investment income of $377,163, respectively) | $ 2,211,156,650 | $ 2,020,678,643 |
See accompanying notes which are an integral part of the financial statements.
Annual Report
Financial Highlights - Initial Class
Years ended December 31, | 2010 | 2009 | 2008 | 2007 | 2006 |
Selected Per-Share Data | | | | | |
Net asset value, beginning of period | $ 119.62 | $ 99.19 | $ 164.03 | $ 161.36 | $ 141.88 |
Income from Investment Operations | | | | | |
Net investment income (loss) C | 2.35 | 2.37 | 3.03 | 3.11 | 2.71 |
Net realized and unrealized gain (loss) | 15.13 | 23.03 | (63.32) | 5.59 | 19.26 |
Total from investment operations | 17.48 | 25.40 | (60.29) | 8.70 | 21.97 |
Distributions from net investment income | (2.44) | (2.72) | (3.07) | (6.03) | (2.49) |
Distributions from net realized gain | (2.27) | (2.25) | (1.48) | - | - |
Total distributions | (4.71) | (4.97) | (4.55) | (6.03) | (2.49) |
Net asset value, end of period | $ 132.39 | $ 119.62 | $ 99.19 | $ 164.03 | $ 161.36 |
Total Return A, B | 15.02% | 26.61% | (37.00)% | 5.45% | 15.73% |
Ratios to Average Net Assets D, F | | | | | |
Expenses before reductions | .10% | .10% | .10% | .10% | .10% |
Expenses net of fee waivers, if any | .10% | .10% | .10% | .10% | .10% |
Expenses net of all reductions | .10% | .10% | .10% | .10% | .10% |
Net investment income (loss) | 1.94% | 2.31% | 2.22% | 1.86% | 1.83% |
Supplemental Data | | | | | |
Net assets, end of period (000 omitted) | $ 1,931,271 | $ 1,767,750 | $ 1,525,779 | $ 2,626,891 | $ 2,780,085 |
Portfolio turnover rate E | 5% | 6% | 6% | 5% | 6% |
A Total returns do not reflect charges attributable to your insurance company's separate account. Inclusion of these charges would reduce the total returns shown.
B Total returns would have been lower had certain expenses not been reduced during the periods shown.
C Calculated based on average shares outstanding during the period.
D Fees and expenses of the underlying Fidelity Central Funds are not included in the Fund's expense ratio. The Fund indirectly bears its proportionate share of the expenses of any underlying Fidelity Central Funds.
E Amount does not include the portfolio activity of any underlying Fidelity Central Funds.
F Expense ratios reflect operating expenses of the class. Expenses before reductions do not reflect amounts reimbursed by the investment adviser or reductions from brokerage service arrangements or reductions from other expense offset arrangements and do not represent the amount paid by the class during periods when reimbursements or reductions occur. Expenses net of fee waivers reflect expenses after reimbursement by the investment adviser but prior to reductions from brokerage service arrangements or other expense offset arrangements. Expenses net of all reductions represent the net expenses paid by the class.
Financial Highlights - Service Class
Years ended December 31, | 2010 | 2009 | 2008 | 2007 | 2006 |
Selected Per-Share Data | | | | | |
Net asset value, beginning of period | $ 119.35 | $ 98.99 | $ 163.66 | $ 160.88 | $ 141.48 |
Income from Investment Operations | | | | | |
Net investment income (loss) C | 2.22 | 2.27 | 2.88 | 2.93 | 2.55 |
Net realized and unrealized gain (loss) | 15.09 | 22.96 | (63.14) | 5.58 | 19.22 |
Total from investment operations | 17.31 | 25.23 | (60.26) | 8.51 | 21.77 |
Distributions from net investment income | (2.32) | (2.62) | (2.93) | (5.73) | (2.37) |
Distributions from net realized gain | (2.27) | (2.25) | (1.48) | - | - |
Total distributions | (4.59) | (4.87) | (4.41) | (5.73) | (2.37) |
Net asset value, end of period | $ 132.07 | $ 119.35 | $ 98.99 | $ 163.66 | $ 160.88 |
Total Return A, B | 14.91% | 26.48% | (37.07)% | 5.34% | 15.61% |
Ratios to Average Net Assets D, F | | | | | |
Expenses before reductions | .20% | .20% | .20% | .20% | .20% |
Expenses net of fee waivers, if any | .20% | .20% | .20% | .20% | .20% |
Expenses net of all reductions | .20% | .20% | .20% | .20% | .20% |
Net investment income (loss) | 1.84% | 2.21% | 2.12% | 1.76% | 1.73% |
Supplemental Data | | | | | |
Net assets, end of period (000 omitted) | $ 37,209 | $ 32,708 | $ 24,340 | $ 38,960 | $ 35,953 |
Portfolio turnover rate E | 5% | 6% | 6% | 5% | 6% |
A Total returns do not reflect charges attributable to your insurance company's separate account. Inclusion of these charges would reduce the total returns shown.
B Total returns would have been lower had certain expenses not been reduced during the periods shown.
C Calculated based on average shares outstanding during the period.
D Fees and expenses of the underlying Fidelity Central Funds are not included in the Fund's expense ratio. The Fund indirectly bears its proportionate share of the expenses of any underlying Fidelity Central Funds.
E Amount does not include the portfolio activity of any underlying Fidelity Central Funds.
F Expense ratios reflect operating expenses of the class. Expenses before reductions do not reflect amounts reimbursed by the investment adviser or reductions from brokerage service arrangements or reductions from other expense offset arrangements and do not represent the amount paid by the class during periods when reimbursements or reductions occur. Expenses net of fee waivers reflect expenses after reimbursement by the investment adviser but prior to reductions from brokerage service arrangements or other expense offset arrangements. Expenses net of all reductions represent the net expenses paid by the class.
See accompanying notes which are an integral part of the financial statements.
Annual Report
Financial Highlights - Service Class 2
Years ended December 31, | 2010 | 2009 | 2008 | 2007 | 2006 |
Selected Per-Share Data | | | | | |
Net asset value, beginning of period | $ 118.71 | $ 98.50 | $ 162.79 | $ 159.90 | $ 140.68 |
Income from Investment Operations | | | | | |
Net investment income (loss) C | 2.03 | 2.11 | 2.66 | 2.67 | 2.32 |
Net realized and unrealized gain (loss) | 14.97 | 22.82 | (62.74) | 5.54 | 19.11 |
Total from investment operations | 17.00 | 24.93 | (60.08) | 8.21 | 21.43 |
Distributions from net investment income | (2.13) | (2.47) | (2.73) | (5.32) | (2.21) |
Distributions from net realized gain | (2.27) | (2.25) | (1.48) | - | - |
Total distributions | (4.40) | (4.72) | (4.21) | (5.32) | (2.21) |
Net asset value, end of period | $ 131.31 | $ 118.71 | $ 98.50 | $ 162.79 | $ 159.90 |
Total Return A, B | 14.73% | 26.30% | (37.16)% | 5.17% | 15.44% |
Ratios to Average Net Assets D, F | | | | | |
Expenses before reductions | .35% | .35% | .35% | .35% | .35% |
Expenses net of fee waivers, if any | .35% | .35% | .35% | .35% | .35% |
Expenses net of all reductions | .35% | .35% | .35% | .35% | .35% |
Net investment income (loss) | 1.69% | 2.06% | 1.97% | 1.61% | 1.58% |
Supplemental Data | | | | | |
Net assets, end of period (000 omitted) | $ 242,677 | $ 220,221 | $ 170,637 | $ 269,769 | $ 219,346 |
Portfolio turnover rate E | 5% | 6% | 6% | 5% | 6% |
A Total returns do not reflect charges attributable to your insurance company's separate account. Inclusion of these charges would reduce the total returns shown.
B Total returns would have been lower had certain expenses not been reduced during the periods shown.
C Calculated based on average shares outstanding during the period.
D Fees and expenses of the underlying Fidelity Central Funds are not included in the Fund's expense ratio. The Fund indirectly bears its proportionate share of the expenses of any underlying Fidelity Central Funds.
E Amount does not include the portfolio activity of any underlying Fidelity Central Funds.
F Expense ratios reflect operating expenses of the class. Expenses before reductions do not reflect amounts reimbursed by the investment adviser or reductions from brokerage service arrangements or reductions from other expense offset arrangements and do not represent the amount paid by the class during periods when reimbursements or reductions occur. Expenses net of fee waivers reflect expenses after reimbursement by the investment adviser but prior to reductions from brokerage service arrangements or other expense offset arrangements. Expenses net of all reductions represent the net expenses paid by the class.
See accompanying notes which are an integral part of the financial statements.
Annual Report
Notes to Financial Statements
For the period ended December 31, 2010
1. Organization.
VIP Index 500 Portfolio (the Fund) is a fund of Variable Insurance Products Fund II (the Trust) and is authorized to issue an unlimited number of shares. The Trust is registered under the Investment Company Act of 1940, as amended (the 1940 Act), as an open-end management investment company organized as a Massachusetts business trust. Shares of the Fund may only be purchased by insurance companies for the purpose of funding variable annuity or variable life insurance contracts. The Fund offers the following classes of shares: Initial Class shares, Service Class shares and Service Class 2 shares. All classes have equal rights and voting privileges, except for matters affecting a single class. Investment income, realized and unrealized capital gains and losses, the common expenses of the Fund, and certain fund-level expense reductions, if any, are allocated on a pro-rata basis to each class based on the relative net assets of each class to the total net assets of the Fund. Each class differs with respect to distribution and service plan fees incurred. Certain expense reductions may also differ by class.
2. Investments in Fidelity Central Funds.
The Fund may invest in Fidelity Central Funds, which are open-end investment companies available only to other investment companies and accounts managed by Fidelity Management & Research Company (FMR) and its affiliates. The Fund's Schedule of Investments lists each of the Fidelity Central Funds held as of period end, if any, as an investment of the Fund, but does not include the underlying holdings of each Fidelity Central Fund. As an Investing Fund, the Fund indirectly bears its proportionate share of the expenses of the underlying Fidelity Central Funds.
The Money Market Central Funds seek preservation of capital and current income and are managed by Fidelity Investments Money Management, Inc. (FIMM), an affiliate of FMR.
A complete unaudited list of holdings for each Fidelity Central Fund is available upon request or at the Securities and Exchange Commission (the SEC) web site at www.sec.gov. In addition, the financial statements of the Fidelity Central Funds, which are not covered by the Fund's Report of Independent Registered Public Accounting Firm, are available on the SEC web site or upon request.
3. Significant Accounting Policies.
The financial statements have been prepared in conformity with accounting principles generally accepted in the United States of America (GAAP), which require management to make certain estimates and assumptions at the date of the financial statements. Actual results could differ from those estimates. Subsequent events, if any, through the date that the financial statements were issued have been evaluated in the preparation of the financial statements. The following summarizes the significant accounting policies of the Fund:
Security Valuation. Investments are valued as of 4:00 p.m. Eastern time on the last calendar day of the period. The Fund uses independent pricing services approved by the Board of Trustees to value its investments. When current market prices or quotations are not readily available or reliable, valuations may be determined in good faith in accordance with procedures adopted by the Board of Trustees. Factors used in determining value may include market or security specific events. The frequency with which these procedures are used cannot be predicted and they may be utilized to a significant extent. The value used for net asset value (NAV) calculation under these procedures may differ from published prices for the same securities.
The Fund categorizes the inputs to valuation techniques used to value its investments into a disclosure hierarchy consisting of three levels as shown below.
Level 1 - quoted prices in active markets for identical investments
Level 2 - other significant observable inputs (including quoted prices for similar investments, interest rates, prepayment speeds, etc.)
Level 3 - unobservable inputs (including the Fund's own assumptions based on the best information available)
Changes in valuation techniques may result in transfers in or out of an assigned level within the disclosure hierarchy. The aggregate value of investments by input level, as of December 31, 2010, is included at the end of the Fund's Schedule of Investments. Valuation techniques used to value the Fund's investments by major category are as follows.
Equity securities, including restricted securities, for which market quotations are readily available, are valued at the last reported sale price or official closing price as reported by an independent pricing service on the primary market or exchange on which they are traded and are categorized as Level 1 in the hierarchy. In the event there were no sales during the day or closing prices are not available, securities are valued at the last quoted bid price or may be valued using the last available price and are generally categorized as Level 2 in the hierarchy. For foreign equity securities, when significant market or security specific events arise, comparisons to the valuation of American Depositary Receipts (ADRs), futures contracts, Exchange-traded funds (ETFs) and certain indexes as well as quoted prices for similar securities are used and are categorized as Level 2 in the hierarchy in these circumstances. Utilizing these techniques may result in transfers between Level 1 and Level 2. For restricted equity securities and private placements where observable inputs are limited, assumptions about market activity and risk are used and are categorized as Level 3 in the hierarchy.
Annual Report
Notes to Financial Statements - continued
3. Significant Accounting Policies - continued
Security Valuation - continued
Futures contracts are valued at the settlement price established each day by the board of trade or exchange on which they are traded and are categorized as Level 1 in the hierarchy. Investments in open-end mutual funds, including the Fidelity Central Funds, are valued at their closing net asset value each business day and are categorized as Level 1 in the hierarchy. Short-term securities with remaining maturities of sixty days or less for which quotations are not readily available are valued at amortized cost, which approximates fair value and are categorized as Level 2 in the hierarchy.
Investment Transactions and Income. For financial reporting purposes, the Fund's investment holdings and NAV include trades executed through the end of the last business day of the period. The NAV per share for processing shareholder transactions is calculated as of the close of business of the New York Stock Exchange (NYSE), normally 4:00 p.m. Eastern time and includes trades executed through the end of the prior business day. Gains and losses on securities sold are determined on the basis of identified cost and may include proceeds received from litigation. Dividend income is recorded on the ex-dividend date, except for certain dividends from foreign securities where the ex-dividend date may have passed, which are recorded as soon as the Fund is informed of the ex-dividend date. Non-cash dividends included in dividend income, if any, are recorded at the fair market value of the securities received. Distributions received on securities that represent a return of capital or capital gain are recorded as a reduction of cost of investments and/or as a realized gain. The Fund estimates the components of distributions received that may be considered return of capital distributions or capital gain distributions. Interest income and distributions from the Fidelity Central Funds are accrued as earned. Interest income includes coupon interest and amortization of premium and accretion of discount on debt securities.
Expenses. Expenses directly attributable to a fund are charged to that fund. Expenses attributable to more than one fund are allocated among the respective funds on the basis of relative net assets or other appropriate methods. Expense estimates are accrued in the period to which they relate and adjustments are made when actual amounts are known.
Deferred Trustee Compensation. Under a Deferred Compensation Plan (the Plan), independent Trustees may elect to defer receipt of a portion of their annual compensation. Deferred amounts are invested in a cross-section of Fidelity funds, are marked-to-market and remain in the Fund until distributed in accordance with the Plan. The investment of deferred amounts and the offsetting payable to the Trustees are included in the accompanying Statement of Assets and Liabilities.
Income Tax Information and Distributions to Shareholders. Each year the Fund intends to qualify as a regulated investment company, including distributing substantially all of its taxable income and realized gains under Subchapter M of the Internal Revenue Code and filing its U.S. federal tax return. As a result, no provision for income taxes is required. As of December 31, 2010, the Fund did not have any unrecognized tax benefits in the accompanying financial statements. A fund's federal tax return is subject to examination by the Internal Revenue Service (IRS) for a period of three years.
Distributions are declared and recorded on the ex-dividend date. Income dividends and capital gain distributions are declared separately for each class. Income and capital gain distributions are determined in accordance with income tax regulations, which may differ from GAAP.
Capital accounts within the financial statements are adjusted for permanent book-tax differences. These adjustments have no impact on net assets or the results of operations. Temporary book-tax differences will reverse in a subsequent period.
Book-tax differences are primarily due to futures transactions, market discount, deferred trustees compensation and losses deferred due to wash sales.
The federal tax cost of investment securities and unrealized appreciation (depreciation) as of period end were as follows:
Gross unrealized appreciation | $ 1,036,398,560 |
Gross unrealized depreciation | (224,171,909) |
Net unrealized appreciation (depreciation) | $ 812,226,651 |
Tax Cost | $ 1,584,870,189 |
The tax-based components of distributable earnings as of period end were as follows:
Undistributed ordinary income | $ 1,878,788 |
Undistributed long-term capital gain | $ 48,535,554 |
Net unrealized appreciation (depreciation) | $ 812,226,651 |
Annual Report
3. Significant Accounting Policies - continued
Income Tax Information and Distributions to Shareholders - continued
The tax character of distributions paid was as follows:
| December 31, 2010 | December 31, 2009 |
Ordinary Income | $ 42,375,701 | $ 45,093,392 |
Long-term Capital Gains | 35,174,228 | 38,913,306 |
Total | $ 77,549,929 | $ 84,006,698 |
4. Derivative Instruments.
Risk Exposures and the Use of Derivative Instruments. The Fund uses derivative instruments (derivatives), including futures contracts, in order to meet its investment objectives. The strategy is to use derivatives to increase returns and to manage exposure to certain risks as defined below. The success of any strategy involving derivatives depends on analysis of numerous economic factors, and if the strategies for investment do not work as intended, the Fund may not achieve its objectives.
The Fund's use of derivatives may increase or decrease its exposure to the following risk:
Equity Risk | Equity risk relates to the fluctuations in the value of financial instruments as a result of changes in market prices (other than those arising from interest rate risk or foreign exchange risk), whether caused by factors specific to an individual investment, its issuer, or all factors affecting all instruments traded in a market or market segment. |
The Fund is also exposed to additional risks from investing in derivatives, such as liquidity risk and counterparty credit risk. Liquidity risk is the risk that the Fund will be unable to sell the derivative in the open market in a timely manner. Counterparty credit risk is the risk that the counterparty will not be able to fulfill its obligation to the Fund. The Fund's maximum risk of loss from counterparty credit risk is generally the aggregate unrealized appreciation and unpaid counterparty fees in excess of any collateral pledged by the counterparty to the Fund. Counterparty risk related to exchange-traded futures contracts is minimal because of the protection provided by the exchange on which they trade. Risk of loss may exceed the amounts recognized in the Statement of Assets and Liabilities.
Futures Contracts. A futures contract is an agreement between two parties to buy or sell a specified underlying instrument for a fixed price at a specified future date. The Fund uses futures contracts to manage its exposure to the stock market.
Upon entering into a futures contract, a fund is required to deposit either cash or securities (initial margin) with a clearing broker in an amount equal to a certain percentage of the face value of the contract. Futures contracts are marked-to-market daily and subsequent payments (variation margin) are made or received by a fund depending on the daily fluctuations in the value of the futures contracts and are recorded as unrealized appreciation or (depreciation). Realized gain or (loss) is recorded upon the expiration or closing of a futures contract.
The underlying face amount at value of open futures contracts at period end is shown in the Schedule of Investments under the caption "Futures Contracts." This amount reflects each contract's exposure to the underlying instrument at period end and is representative of activity for the period. Securities deposited to meet initial margin requirements are identified in the Schedule of Investments. The receivable and/or payable for the variation margin are reflected in the Statement of Assets and Liabilities.
Certain risks may arise upon entering into futures contracts, including the risk that an illiquid market may limit the ability to close out a futures contract prior to settlement date.
During the period the Fund recognized net realized gain (loss) of $2,533,584 and a change in net unrealized appreciation (depreciation) of $1,040,877 related to its investment in futures contracts. These amounts are included in the Statement of Operations.
5. Purchases and Sales of Investments.
Purchases and sales of securities, other than short-term securities, aggregated $107,562,798 and $149,744,917, respectively.
Annual Report
Notes to Financial Statements - continued
6. Fees and Other Transactions with Affiliates.
Management Fee. FMR and its affiliates provide the Fund with investment management related services for which the Fund pays a monthly management fee that is based on an annual rate of .10% of the Fund's average net assets. Under the management contract, FMR pays all other fund-level expenses, except the compensation of the independent Trustees and certain other expenses such as interest expense, including commitment fees. In addition, under an expense contract, FMR pays all class-level expenses except distribution and service fees so that total expenses do not exceed .10% of each class' average net assets plus the distribution and service fee applicable to each class, with certain exceptions.
Sub-Adviser. Geode Capital Management, LLC (Geode), serves as sub-adviser for the Fund. Geode provides discretionary investment advisory services to the Fund and is paid by FMR for providing these services.
Distribution and Service Plan Fees. In accordance with Rule 12b-1 of the 1940 Act, the Fund has adopted separate 12b-1 Plans for each Service Class of shares. Each Service Class pays Fidelity Distributors Corporation (FDC), an affiliate of FMR, a service fee. For the period, the service fee is based on an annual rate of .10% of Service Class' average net assets and .25% of Service Class 2's average net assets.
For the period, total fees, all of which were re-allowed to insurance companies for the distribution of shares and providing shareholder support services were as follows:
Service Class | $ 33,373 |
Service Class 2 | 556,309 |
| $ 589,682 |
Transfer Agent Fees. Fidelity Investments Institutional Operations Company, Inc. (FIIOC), an affiliate of FMR, is the Fund's transfer, dividend disbursing, and shareholder servicing agent. Under the expense contract, the classes do not pay transfer agent fees.
Interfund Lending Program. Pursuant to an Exemptive Order issued by the SEC, the Fund, along with other registered investment companies having management contracts with FMR, may participate in an interfund lending program. This program provides an alternative credit facility allowing the funds to borrow from, or lend money to, other participating affiliated funds. At period end, there were no interfund loans outstanding. The Fund's activity in this program during the period for which loans were outstanding was as follows:
Borrower or Lender | Average Daily
Loan Balance | Weighted Average Interest Rate | Interest
Expense |
Borrower | $ 10,193,000 | .45% | $ 253 |
7. Committed Line of Credit.
The Fund participates with other funds managed by FMR or an affiliate in a $3.75 billion credit facility (the "line of credit") to be utilized for temporary or emergency purposes to fund shareholder redemptions or for other short-term liquidity purposes. The Fund has agreed to pay commitment fees on its pro-rata portion of the line of credit, which amounted to $7,878 and is reflected in Miscellaneous expenses on the Statement of Operations. During the period, there were no borrowings on this line of credit.
8. Security Lending.
The Fund lends portfolio securities through a lending agent from time to time in order to earn additional income. On the settlement date of the loan, the Fund receives collateral (in the form of U.S. Treasury obligations, letters of credit and/or cash) against the loaned securities and maintains collateral in an amount not less than 100% of the market value of the loaned securities during the period of the loan. The market value of the loaned securities is determined at the close of business of the Fund and any additional required collateral is delivered to the Fund on the next business day. If the borrower defaults on its obligation to return the securities loaned because of insolvency or other reasons, a fund could experience delays and costs in recovering the securities loaned or in gaining access to the collateral. Any cash collateral received is invested in the Fidelity Securities Lending Cash Central Fund. The value of loaned securities and cash collateral at period end are disclosed on the Fund's Statement of Assets and Liabilities. Security lending income represents the income earned on investing cash collateral, less rebates paid to borrowers and lending agent fees associated with the loan, plus any premium payments received for lending certain types of securities. Security lending income is presented in the Statement of Operations as a component of income from Fidelity Central Funds. Total security lending income during the period amounted to $373,922.
9. Expense Reductions.
Through arrangements with the Fund's custodian, credits realized as a result of uninvested cash balances were used to reduce the Fund's expenses. During the period, these credits reduced the Fund's custody expenses by $51.
Annual Report
10. Distributions to Shareholders.
Distributions to shareholders of each class were as follows:
Years ended December 31, | 2010 | 2009 |
From net investment income | | |
Initial Class | $ 35,017,804 | $ 39,932,619 |
Service Class | 639,120 | 698,024 |
Service Class 2 | 3,871,340 | 4,462,749 |
Total | $ 39,528,264 | $ 45,093,392 |
From net realized gain | | |
Initial Class | $ 33,213,569 | $ 34,477,306 |
Service Class | 619,294 | 558,901 |
Service Class 2 | 4,188,802 | 3,877,099 |
Total | $ 38,021,665 | $ 38,913,306 |
11. Share Transactions.
Transactions for each class of shares were as follows:
| Shares | Dollars |
Years ended December 31, | 2010 | 2009 | 2010 | 2009 |
Initial Class | | | | |
Shares sold | 1,562,668 | 1,252,280 | $ 191,691,853 | $ 123,147,859 |
Reinvestment of distributions | 564,289 | 739,759 | 68,231,373 | 74,409,925 |
Shares redeemed | (2,317,208) | (2,597,037) | (279,458,721) | (262,287,759) |
Net increase (decrease) | (190,251) | (604,998) | $ (19,535,495) | $ (64,729,975) |
Service Class | | | | |
Shares sold | 33,640 | 47,919 | $ 4,058,019 | $ 4,752,568 |
Reinvestment of distributions | 10,441 | 12,448 | 1,258,414 | 1,256,925 |
Shares redeemed | (36,392) | (32,204) | (4,366,671) | (3,225,111) |
Net increase (decrease) | 7,689 | 28,163 | $ 949,762 | $ 2,784,382 |
Service Class 2 | | | | |
Shares sold | 337,917 | 409,323 | $ 40,695,508 | $ 40,430,372 |
Reinvestment of distributions | 67,549 | 83,582 | 8,060,142 | 8,339,848 |
Shares redeemed | (412,564) | (370,073) | (49,221,936) | (37,274,176) |
Net increase (decrease) | (7,098) | 122,832 | $ (466,286) | $ 11,496,044 |
12. Other.
The Fund's organizational documents provide former and current trustees and officers with a limited indemnification against liabilities arising in connection with the performance of their duties to the Fund. In the normal course of business, the Fund may also enter into contracts that provide general indemnifications. The Fund's maximum exposure under these arrangements is unknown as this would be dependent on future claims that may be made against the Fund. The risk of material loss from such claims is considered remote.
At the end of the period, FMR or its affiliates were the owners of record of 33% of the total outstanding shares of the Fund.
Annual Report
Report of Independent Registered Public Accounting Firm
To the Trustees of Variable Insurance Products Fund II and Shareholders of VIP Index 500 Portfolio:
We have audited the accompanying statement of assets and liabilities of VIP Index 500 Portfolio (the Fund), a fund of Variable Insurance Products Fund II, including the schedule of investments, as of December 31, 2010, and the related statement of operations for the year then ended, the statement of changes in net assets for each of the two years in the period then ended, and the financial highlights for each of the five years in the period then ended. These financial statements and financial highlights are the responsibility of the Fund's management. Our responsibility is to express an opinion on these financial statements and financial highlights based on our audits.
We conducted our audits in accordance with the standards of the Public Company Accounting Oversight Board (United States). Those standards require that we plan and perform the audit to obtain reasonable assurance about whether the financial statements and financial highlights are free of material misstatement. The Fund is not required to have, nor were we engaged to perform, an audit of its internal control over financial reporting. Our audits included consideration of internal control over financial reporting as a basis for designing audit procedures that are appropriate in the circumstances, but not for the purpose of expressing an opinion on the effectiveness of the Fund's internal control over financial reporting. Accordingly, we express no such opinion. An audit also includes examining, on a test basis, evidence supporting the amounts and disclosures in the financial statements, assessing the accounting principles used and significant estimates made by management, as well as evaluating the overall financial statement presentation. Our procedures included confirmation of securities owned as of December 31, 2010, by correspondence with the custodians and brokers; where replies were not received from brokers, we performed other auditing procedures. We believe that our audits provide a reasonable basis for our opinion.
In our opinion, the financial statements and financial highlights referred to above present fairly, in all material respects, the financial position of VIP Index 500 Portfolio as of December 31, 2010, the results of its operations for the year then ended, the changes in its net assets for each of the two years in the period then ended, and the financial highlights for each of the five years in the period then ended, in conformity with accounting principles generally accepted in the United States of America.
/s/ Deloitte & Touche LLP
DELOITTE & TOUCHE LLP
Boston, Massachusetts
February 15, 2011
Annual Report
The Trustees, Members of the Advisory Board, and executive officers of the trust and fund, as applicable, are listed below. The Board of Trustees governs the fund and is responsible for protecting the interests of shareholders. The Trustees are experienced executives who meet periodically throughout the year to oversee the fund's activities, review contractual arrangements with companies that provide services to the fund, oversee management of the risks associated with such activities and contractual arrangements, and review the fund's performance. Except for James C. Curvey, each of the Trustees oversees 219 funds advised by FMR or an affiliate. Mr Curvey oversees 408 funds advised by FMR or an affiliate.
The Trustees hold office without limit in time except that (a) any Trustee may resign; (b) any Trustee may be removed by written instrument, signed by at least two-thirds of the number of Trustees prior to such removal; (c) any Trustee who requests to be retired or who has become incapacitated by illness or injury may be retired by written instrument signed by a majority of the other Trustees; and (d) any Trustee may be removed at any special meeting of shareholders by a two-thirds vote of the outstanding voting securities of the trust. Each Trustee who is not an interested person (as defined in the 1940 Act) (Independent Trustee), shall retire not later than the last day of the calendar year in which his or her 72nd birthday occurs. The Independent Trustees may waive this mandatory retirement age policy with respect to individual Trustees. The executive officers and Advisory Board Members hold office without limit in time, except that any officer and Advisory Board Member may resign or may be removed by a vote of a majority of the Trustees at any regular meeting or any special meeting of the Trustees. Except as indicated, each individual has held the office shown or other offices in the same company for the past five years.
Experience, Skills, Attributes, and Qualifications of the Fund's Trustees. The Governance and Nominating Committee has adopted a statement of policy that describes the experience, qualifications, attributes, and skills that are necessary and desirable for potential Independent Trustee candidates (Statement of Policy). The Board believes that each Trustee satisfied at the time he or she was initially elected or appointed a Trustee, and continues to satisfy, the standards contemplated by the Statement of Policy. The Governance and Nominating Committee also engages professional search firms to help identify potential Independent Trustee candidates who have the experience, qualifications, attributes, and skills consistent with the Statement of Policy. From time to time, additional criteria based on the composition and skills of the current Independent Trustees, as well as experience or skills that may be appropriate in light of future changes to board composition, business conditions, and regulatory or other developments, have also been considered by the professional search firms and the Governance and Nominating Committee. In addition, the Board takes into account the Trustees' commitment and participation in Board and committee meetings, as well as their leadership of standing and ad hoc committees throughout their tenure.
In determining that a particular Trustee was and continues to be qualified to serve as a Trustee, the Board has considered a variety of criteria, none of which, in isolation, was controlling. The Board believes that, collectively, the Trustees have balanced and diverse experience, qualifications, attributes, and skills, which allow the Board to operate effectively in governing the fund and protecting the interests of shareholders. Information about the specific experience, skills, attributes, and qualifications of each Trustee, which in each case led to the Board's conclusion that the Trustee should serve (or continue to serve) as a trustee of the fund, is provided below.
Board Structure and Oversight Function. James C. Curvey is an interested person (as defined in the 1940 Act) and currently serves as Acting Chairman. The Trustees have determined that an interested Chairman is appropriate and benefits shareholders because an interested Chairman has a personal and professional stake in the quality and continuity of services provided to the fund. Independent Trustees exercise their informed business judgment to appoint an individual of their choosing to serve as Chairman, regardless of whether the Trustee happens to be independent or a member of management. The Independent Trustees have determined that they can act independently and effectively without having an Independent Trustee serve as Chairman and that a key structural component for assuring that they are in a position to do so is for the Independent Trustees to constitute a substantial majority for the Board. The Independent Trustees also regularly meet in executive session. Ned C. Lautenbach serves as Chairman of the Independent Trustees and as such (i) acts as a liaison between the Independent Trustees and management with respect to matters important to the Independent Trustees and (ii) with management prepares agendas for Board meetings.
Fidelity funds are overseen by different Boards of Trustees. The fund's Board oversees Fidelity's equity and high income funds and another Board oversees Fidelity's investment-grade bond, money market, and asset allocation funds. The asset allocation funds may invest in Fidelity funds overseen by the fund's Board. The use of separate Boards, each with its own committee structure, allows the Trustees of each group of Fidelity funds to focus on the unique issues of the funds they oversee, including common research, investment, and operational issues. On occasion, the separate Boards establish joint committees to address issues of overlapping consequences for the Fidelity funds overseen by each Board.
The Trustees operate using a system of committees to facilitate the timely and efficient consideration of all matters of importance to the Trustees, the fund, and fund shareholders and to facilitate compliance with legal and regulatory requirements and oversight of the fund's activities and associated risks. The Board, acting through its committees, has charged FMR and its affiliates with (i) identifying events or circumstances the occurrence of which could have demonstrably adverse effects on the fund's business and/or reputation; (ii) implementing processes and controls to lessen the possibility that such events or circumstances occur or to mitigate the effects of such events or circumstances if they do occur; and (iii) creating and maintaining a system designed to evaluate continuously business and market conditions in order to facilitate the identification and implementation processes described in (i) and (ii) above. Because the day-to-day operations and activities of the fund are carried out by or through FMR, its affiliates and other service providers, the fund's exposure to risks is mitigated but not eliminated by the processes overseen by the Trustees. While each of the Board's committees has responsibility for overseeing different aspects of the fund's activities, oversight is exercised primarily through the Operations, Audit, and Compliance Committees. Appropriate personnel, including but not limited to the fund's Chief Compliance Officer (CCO), FMR's internal auditor, the independent accountants, the fund's Treasurer and portfolio management personnel, make periodic reports to the Board's committees, as appropriate. The responsibilities of each committee, including their oversight responsibilities, are described further under "Standing Committees of the Fund's Trustees."
Annual Report
The fund's Statement of Additional Information (SAI) includes more information about the Trustees. To request a free copy, call Fidelity at 1-877-208-0098.
Interested Trustees*:
Correspondence intended for each Trustee who is an interested person may be sent to Fidelity Investments, 82 Devonshire Street, Boston, Massachusetts 02109.
Name, Age; Principal Occupations and Other Relevant Experience+ |
James C. Curvey (75) |
| Year of Election or Appointment: 2007 Mr. Curvey is Trustee and Acting Chairman of the Board of Trustees of certain Trusts. Mr. Curvey also serves as Trustee (2007-present) of other investment companies advised by FMR. Mr. Curvey is a Director of Fidelity Investments Money Management, Inc. (2009-present), Director of Fidelity Research & Analysis Co. (2009-present) and Director of FMR and FMR Co., Inc. (2007-present). Mr. Curvey is also Vice Chairman (2007-present) and Director of FMR LLC. In addition, Mr. Curvey serves as an Overseer for the Boston Symphony Orchestra and a member of the Trustees of Villanova University. Previously, Mr. Curvey was the Vice Chairman (2006-2007) and Director (2000-2007) of FMR Corp. |
Ronald P. O'Hanley (54) |
| Year of Election or Appointment: 2011 Mr. O'Hanley is President of Fidelity Asset Management and Corporate Services and a member of Fidelity's Executive Committee (2010-present). Previously, Mr. O'Hanley served as President and Chief Executive Officer of BNY Mellon Asset Management (2007-2010). Mr. O'Hanley also served as Vice Chairman of Bank New York Mellon Corp. and a member of that firm's Executive Committee. Prior to the 2007 merger of The Bank of New York and Mellon Financial Corporation, he was Vice Chairman of Mellon Financial Corporation and President and Chief Executive Officer of Mellon Asset Management. He joined Mellon in February 1997. Mr. O'Hanley currently serves as Chairman of the Boston Public Library Foundation Board of Directors and sits on the Board of Directors of Beth Israel Deaconess Medical Center, the Board of Trustees of the Marine Biological Laboratory and the Advisory Board of the Maxwell School of Citizenship and Public Administration at Syracuse University. Mr. O'Hanley also chairs the Council on Asset Management for the Financial Services Roundtable and is a member of the Board of Directors of Institutional Investor's U.S. Institute. |
* Trustees have been determined to be "Interested Trustees" by virtue of, among other things, their affiliation with the trust or various entities under common control with FMR.
+ The information above includes each Trustee's principal occupation during the last five years and other information relating to the experience, attributes, and skills relevant to each Trustee's qualifications to serve as a Trustee, which led to the conclusion that each Trustee should serve as a Trustee for the fund.
Independent Trustees:
Correspondence intended for each Independent Trustee (that is, the Trustees other than the Interested Trustees) may be sent to Fidelity Investments, P.O. Box 55235, Boston, Massachusetts 02205-5235.
Name, Age; Principal Occupations and Other Relevant Experience+ |
Dennis J. Dirks (62) |
| Year of Election or Appointment: 2005 Prior to his retirement in May 2003, Mr. Dirks was Chief Operating Officer and a member of the Board of The Depository Trust & Clearing Corporation (DTCC). He also served as President, Chief Operating Officer, and Board member of The Depository Trust Company (DTC) and President and Board member of the National Securities Clearing Corporation (NSCC). In addition, Mr. Dirks served as Chief Executive Officer and Board member of the Government Securities Clearing Corporation, Chief Executive Officer and Board member of the Mortgage-Backed Securities Clearing Corporation, as a Trustee and a member of the Finance Committee of Manhattan College (2005-2008), and as a Trustee and a member of the Finance Committee of AHRC of Nassau County (2006-2008). Mr. Dirks is a member of the Independent Directors Council (IDC) Governing Council (2010-Present) and Board of Directors for The Brookville Center for Children's Services, Inc. (2009-present). |
Alan J. Lacy (57) |
| Year of Election or Appointment: 2008 Mr. Lacy serves as Senior Adviser (2007-present) of Oak Hill Capital Partners, L.P. (private equity). Mr. Lacy also served as Chief Executive Officer (2000-2005) and Vice Chairman (2005-2006) of Sears Holdings Corporation and Sears, Roebuck and Co. (retail). In addition, Mr. Lacy serves as a member of the Board of Directors of The Western Union Company (global money transfer, 2006-present) and Bristol-Myers Squibb Company (global pharmaceuticals, 2007-present). Mr. Lacy is Chairman (2008-present) and a member (2006-present) of the Board of Trustees of The National Parks Conservation Association. |
Ned C. Lautenbach (66) |
| Year of Election or Appointment: 2000 Mr. Lautenbach is Chairman of the Independent Trustees of the Equity and High Income Funds (2006-present). Mr. Lautenbach currently serves as the Lead Director of the Eaton Corporation Board of Directors (diversified industrial, 1997-present). Mr. Lautenbach is also a member of the Board of Directors of the Philharmonic Center for the Arts in Naples, Florida (1999-present); a member of the Board of Trustees of Fairfield University (2005-present); and a member of the Council on Foreign Relations (1994-present). Previously, Mr. Lautenbach was a Partner/Advisory Partner at Clayton, Dubilier & Rice, Inc. (private equity investment, 1998-2010), as well as a Director of Sony Corporation (2006-2007). |
Joseph Mauriello (66) |
| Year of Election or Appointment: 2008 Prior to his retirement in January 2006, Mr. Mauriello served in numerous senior management positions including Deputy Chairman and Chief Operating Officer (2004-2005), and Vice Chairman of Financial Services (2002-2004) of KPMG LLP US (professional services, 1965-2005). Mr. Mauriello currently serves as a member of the Board of Directors of XL Group plc. (global insurance and re-insurance, 2006-present) and of Arcadia Resources Inc. (health care services and products, 2007-present). Previously, Mr. Mauriello served as a Director of the Hamilton Funds of the Bank of New York (2006-2007). |
Cornelia M. Small (66) |
| Year of Election or Appointment: 2005 Ms. Small is a member of the Board of Directors of the Teagle Foundation (2009-present). Ms. Small is also a member of the Investment Committee, and Chair (2008-present) and a member of the Board of Trustees of Smith College. In addition, Ms. Small serves on the Investment Committee of the Berkshire Taconic Community Foundation (2008-present). Previously, Ms. Small served as Chairperson of the Investment Committee (2002-2008) of Smith College. In addition, Ms. Small served as Chief Investment Officer, Director of Global Equity Investments, and a member of the Board of Directors of Scudder, Stevens & Clark and Scudder Kemper Investments. |
William S. Stavropoulos (71) |
| Year of Election or Appointment: 2001 Mr. Stavropoulos is Vice Chairman of the Independent Trustees of the Equity and High Income Funds (2006-present). Mr. Stavropoulos serves as President and Founder of the Michigan Baseball Foundation, the Great Lakes Loons (2007-present). Mr. Stavropoulos is Chairman Emeritus of the Board of Directors of The Dow Chemical Company, where he previously served in numerous senior management positions, including President, CEO (1995-2000; 2002-2004), Chairman of the Executive Committee (2000-2006), and as a member of the Board of Directors (1990-2006). Currently, Mr. Stavropoulos is Chairman of Univar (global distributor of commodity and specialty chemicals, 2010-present), a Director of Teradata Corporation (data warehousing and technology solutions, 2008-present), Chemical Financial Corporation, Maersk Inc. (industrial conglomerate), Tyco International, Inc. (multinational manufacturing and services, 2007-present), and a member of the Advisory Board for Metalmark Capital (private equity investment, 2005-present). Mr. Stavropoulos is a special advisor to Clayton, Dubilier & Rice, LLC (private equity investment). In addition, Mr. Stavropoulos is a member of the University of Notre Dame Advisory Council for the College of Science. |
David M. Thomas (61) |
| Year of Election or Appointment: 2008 Previously, Mr. Thomas served as Executive Chairman (2005-2006) and Chairman and Chief Executive Officer (2000-2005) of IMS Health, Inc. (pharmaceutical and healthcare information solutions). In addition, Mr. Thomas serves as a member of the Board of Directors of Fortune Brands, Inc. (consumer products), and Interpublic Group of Companies, Inc. (marketing communication, 2004-present). |
Michael E. Wiley (60) |
| Year of Election or Appointment: 2008 Mr. Wiley also serves as a Director of Asia Pacific Exploration Consolidated (international oil and gas exploration and production, 2008-present). Mr. Wiley serves as a Director of Tesoro Corporation (independent oil refiner and marketer, 2005-present), and a Director of Bill Barrett Corporation (exploration and production, 2005-present). In addition, Mr. Wiley also serves as a Director of Post Oak Bank (privately-held bank, 2004-present). Previously, Mr. Wiley served as a member of the Board of Trustees of the University of Tulsa (2000-2006; 2007-2010), as a Senior Energy Advisor of Katzenbach Partners, LLC (consulting, 2006-2007), as an Advisory Director of Riverstone Holdings (private investment), Chairman, President, and CEO of Baker Hughes, Inc. (oilfield services, 2000-2004), and as Director of Spinnaker Exploration Company (exploration and production, 2001-2005). |
+ The information above includes each Trustee's principal occupation during the last five years and other information relating to the experience, attributes, and skills relevant to each Trustee's qualifications to serve as a Trustee, which led to the conclusion that each Trustee should serve as a Trustee for the fund.
Advisory Board Members and Executive Officers:
Correspondence intended for each executive officer, Edward C. Johnson 3d, and Peter S. Lynch may be sent to Fidelity Investments, 82 Devonshire Street, Boston, Massachusetts 02109.
Name, Age; Principal Occupation |
Edward C. Johnson 3d (80) |
| Year of Election or Appointment: 2011 Member of the Advisory Board of Fidelity's Equity and High Income Funds. Formerly Trustee and Chairman of the Board of Trustees of certain Trusts, Mr. Johnson serves as Chief Executive Officer, Chairman, and a Director of FMR LLC; Chairman and a Director of FMR; and Chairman and a Director of FMR Co., Inc. In addition, Mr. Johnson serves as Chairman and Director of FIL Limited. Previously, Mr. Johnson served as President of FMR LLC (2006-2007). |
Peter S. Lynch (66) |
| Year of Election or Appointment: 2003 Member of the Advisory Board of Fidelity's Equity and High Income Funds. Mr. Lynch is Vice Chairman and a Director of FMR and FMR Co., Inc. In addition, Mr. Lynch serves as a Trustee of Boston College and as the Chairman of the Inner-City Scholarship Fund. Previously, Mr. Lynch served on the Special Olympics International Board of Directors (1997-2006). |
Kenneth B. Robins (41) |
| Year of Election or Appointment: 2008 President and Treasurer of Fidelity's Equity and High Income Funds. Mr. Robins also serves as President and Treasurer (2010-present) and Assistant Treasurer (2009-present) of other Fidelity funds and is an employee of Fidelity Investments (2004-present). Previously, Mr. Robins served as Deputy Treasurer of the Fidelity funds (2005-2008) and Treasurer and Chief Financial Officer of The North Carolina Capital Management Trust: Cash and Term Portfolios (2006-2008). |
Bruce T. Herring (45) |
| Year of Election or Appointment: 2006 Vice President of certain Equity Funds. Mr. Herring also serves as Chief Investment Officer and Director of Fidelity Management & Research (U.K.) Inc. (2010-present) and Group Chief Investments Officer of FMR. Previously, Mr. Herring served as Vice President (2005-2006) and Senior Vice President (2006-2007) of Fidelity Management & Research Company, Vice President of FMR Co., Inc. (2001-2007) and as a portfolio manager for Fidelity U.S. Equity Funds. |
Brian B. Hogan (46) |
| Year of Election or Appointment: 2009 Vice President of certain Equity Funds and Vice President of Sector Funds. Mr. Hogan also serves as President of FMR's Equity Division (2009-present). Previously, Mr. Hogan served as Senior Vice President, Equity Research of FMR (2006-2009) and as a portfolio manager. |
Scott C. Goebel (42) |
| Year of Election or Appointment: 2008 Secretary and Chief Legal Officer (CLO) of the Fidelity funds. Mr. Goebel also serves as Secretary and CLO of The North Carolina Capital Management Trust: Cash and Term Portfolio (2008-present); General Counsel, Secretary, and Senior Vice President of FMR (2008-present) and FMR Co., Inc. (2008-present); Deputy General Counsel of FMR LLC; Chief Legal Officer of Fidelity Management & Research (Hong Kong) Limited (2008-present) and Assistant Secretary of Fidelity Management & Research (Japan) Inc. (2008-present), Fidelity Investments Money Management, Inc. (2008-present), Fidelity Management & Research (U.K.) Inc. (2008-present), and Fidelity Research and Analysis Company (2008-present). Previously, Mr. Goebel served as Assistant Secretary of the Funds (2007-2008) and as Vice President and Secretary of Fidelity Distributors Corporation (FDC) (2005-2007). |
William C. Coffey (41) |
| Year of Election or Appointment: 2009 Assistant Secretary of Fidelity's Equity and High Income Funds. Mr. Coffey also serves as Senior Vice President and Deputy General Counsel of FMR LLC (2010-present), and is an employee of Fidelity Investments. Previously, Mr. Coffey served as Vice President and Associate General Counsel of FMR LLC (2005-2009). |
Holly C. Laurent (56) |
| Year of Election or Appointment: 2008 Anti-Money Laundering (AML) Officer of the Fidelity funds. Ms. Laurent also serves as AML Officer of The North Carolina Capital Management Trust: Cash and Term Portfolio (2008-present) and is an employee of Fidelity Investments. Previously, Ms. Laurent was Senior Vice President and Head of Legal for Fidelity Business Services India Pvt. Ltd. (2006-2008), and Senior Vice President, Deputy General Counsel and Group Head for FMR LLC (2005-2006). |
Christine Reynolds (52) |
| Year of Election or Appointment: 2008 Chief Financial Officer of the Fidelity funds. Ms. Reynolds became President of Fidelity Pricing and Cash Management Services (FPCMS) in August 2008. Ms. Reynolds served as Chief Operating Officer of FPCMS (2007-2008). Previously, Ms. Reynolds served as President, Treasurer, and Anti-Money Laundering officer of the Fidelity funds (2004-2007). |
Kenneth A. Rathgeber (63) |
| Year of Election or Appointment: 2004 Chief Compliance Officer of Fidelity's Equity and High Income Funds. Mr. Rathgeber is Chief Compliance Officer of Fidelity Management & Research (Hong Kong) Limited (2008-present), Fidelity Management & Research (Japan) Inc. (2008-present), FMR (2005-present), FMR Co., Inc. (2005-present), Fidelity Management & Research (U.K.) Inc. (2005-present), Fidelity Research & Analysis Company (2005-present), Fidelity Investments Money Management, Inc. (2005-present), Pyramis Global Advisors, LLC (2005-present), and Strategic Advisers, Inc. (2005-present). |
Jeffrey S. Christian (49) |
| Year of Election or Appointment: 2009 Deputy Treasurer of the Fidelity funds. Mr. Christian is an employee of Fidelity Investments. Previously, Mr. Christian served as Chief Financial Officer (2008-2009) of certain Fidelity funds and Senior Vice President of Fidelity Pricing and Cash Management Services (FPCMS) (2004-2009). |
Bryan A. Mehrmann (49) |
| Year of Election or Appointment: 2005 Deputy Treasurer of the Fidelity funds. Mr. Mehrmann is an employee of Fidelity Investments. |
Adrien E. Deberghes (43) |
| Year of Election or Appointment: 2008 Deputy Treasurer of Fidelity's Equity and High Income Funds. Mr. Deberghes also serves as Assistant Treasurer of other Fidelity funds (2010-present) and is an employee of Fidelity Investments (2008-present). Previously, Mr. Deberghes served as Senior Vice President of Mutual Fund Administration at State Street Corporation (2007-2008), Senior Director of Mutual Fund Administration at Investors Bank & Trust (2005-2007), and Director of Finance for Dunkin' Brands (2000-2005). |
Stephanie J. Dorsey (41) |
| Year of Election or Appointment: 2010 Assistant Treasurer of Fidelity's Equity and High Income Funds. Ms. Dorsey also serves as Deputy Treasurer of other Fidelity funds (2008-present) and is an employee of Fidelity Investments (2008-present). Previously, Ms. Dorsey served as Treasurer (2004-2008) of the JPMorgan Mutual Funds and Vice President (2004-2008) of JPMorgan Chase Bank. |
Name, Age; Principal Occupation |
John R. Hebble (52) |
| Year of Election or Appointment: 2009 Assistant Treasurer of Fidelity's Equity and High Income Funds. Mr. Hebble also serves as Treasurer and Chief Financial Officer of The North Carolina Capital Management Trust: Cash and Term Portfolio (2008-present), President and Treasurer of other Fidelity funds (2008-present) and is an employee of Fidelity Investments. |
Gary W. Ryan (52) |
| Year of Election or Appointment: 2005 Assistant Treasurer of the Fidelity funds. Mr. Ryan is an employee of Fidelity Investments. Previously, Mr. Ryan served as Vice President of Fund Reporting in Fidelity Pricing and Cash Management Services (FPCMS) (1999-2005). |
Jonathan Davis (42) |
| Year of Election or Appointment: 2010 Assistant Treasurer of the Fidelity funds. Mr. Davis is an employee of Fidelity Investments. Previously, Mr. Davis served as Vice President and Associate General Counsel of FMR LLC (2003-2010). |
Annual Report
The Board of Trustees of VIP Index 500 Portfolio voted to pay to shareholders of record at the opening of business on record date, the following distributions per share derived from capital gains realized from sales of portfolio securities, and dividends derived from net investment income:
| Pay Date | Record Date | Dividends | Capital Gains |
Initial Class | 02/04/11 | 02/04/11 | $0.0 | $3.025 |
| | | | |
Service Class | 02/04/11 | 02/04/11 | $0.0 | $3.025 |
| | | | |
Service Class 2 | 02/04/11 | 02/04/11 | $0.0 | $3.025 |
The fund hereby designates as a capital gain dividend with respect to the taxable year ended December 31, 2010, $48,535,554, or, if subsequently determined to be different, the net capital gain of such year.
Initial Class, Service Class, and Service Class 2 designate 10% and 100% distributed in February and December, 2010, respectively as qualifying for the dividends-received deduction for corporate shareholders.
Annual Report
Board Approval of Investment Advisory Contracts and Management Fees
VIP Index 500 Portfolio
Each year, the Board of Trustees, including the Independent Trustees (together, the Board), votes on the renewal of the management contract and sub-advisory agreements (together, the Advisory Contracts) for the fund. The Board, assisted by the advice of fund counsel and Independent Trustees' counsel, requests and considers a broad range of information relevant to the renewal of the Advisory Contracts throughout the year.
The Board meets regularly and considers at each of its meetings factors that are relevant to its annual consideration of the renewal of the fund's Advisory Contracts, including the services and support provided to the fund and its shareholders. The Board has established various standing committees, each composed of Independent Trustees with varying backgrounds, to which the Board has assigned specific subject matter responsibilities in order to enhance effective decision-making by the Board. The Board, acting directly and through its Committees, requests and receives information concerning the annual consideration of the renewal of the fund's Advisory Contracts. The Board also meets as needed to consider matters specifically related to the Board's annual consideration of the renewal of Advisory Contracts. Members of the Board may also meet with trustees of other Fidelity funds through ad hoc joint committees to discuss certain matters relevant to the Fidelity funds.
At its July 2010 meeting, the Board of Trustees, including the Independent Trustees, unanimously determined to renew the fund's Advisory Contracts. In reaching its determination, the Board considered all factors it believed relevant, including (i) the nature, extent, and quality of the services to be provided to the fund and its shareholders (including the investment performance of the fund); (ii) the competitiveness of the fund's management fee and total expenses; (iii) the total costs of the services to be provided by and the profits to be realized by Fidelity from its relationship with the fund; (iv) the extent to which economies of scale would be realized as the fund grows; and (v) whether fee levels reflect these economies of scale, if any, for the benefit of fund shareholders.
In considering whether to renew the Advisory Contracts for the fund, the Board reached a determination, with the assistance of fund counsel and Independent Trustees' counsel and through the exercise of its business judgment, that the renewal of the Advisory Contracts is in the best interests of fund shareholders and that the compensation to be received by Fidelity under the management contract is fair and reasonable. The Board's decision to renew the Advisory Contracts was not based on any single factor noted above, but rather was based on a comprehensive consideration of all the information provided to the Board at its meetings throughout the year. The Board, in reaching its determination to renew the Advisory Contracts, is aware that shareholders in the fund have a broad range of investment choices available to them, including a wide choice among mutual funds offered by Fidelity's competitors, and that the fund's shareholders, with the opportunity to review and weigh the disclosure provided by the fund in its prospectus and other public disclosures, have chosen to invest in this fund, managed by Fidelity.
Nature, Extent, and Quality of Services Provided. The Board considered the staffing within the investment adviser, FMR, and the sub-advisers (together, the Investment Advisers), including the backgrounds of the fund's investment personnel and the fund's investment objective and discipline. The Independent Trustees also had discussions with senior management of Fidelity's investment operations and investment groups. The Board considered the structure of the portfolio manager compensation program and whether this structure provides appropriate incentives to act in the best interest of the fund.
Resources Dedicated to Investment Management and Support Services. The Board and the equity research subcommittee of the Board's Fund Oversight Committee reviewed the size, education, and experience of the Investment Advisers' investment staff, their use of technology, and the Investment Advisers' approach to recruiting, training, and retaining portfolio managers and other research, advisory, and management personnel. The Board noted FMR's continued focus on strengthening the organization and discipline of equity portfolio management and research.
Shareholder and Administrative Services. The Board considered (i) the nature, extent, quality, and cost of advisory, administrative, and shareholder services performed by the Investment Advisers and their affiliates under the Advisory Contracts and under separate agreements covering transfer agency, pricing and bookkeeping, and securities lending services for the fund; (ii) the nature and extent of the investment adviser's supervision of third party service providers, principally custodians and subcustodians; and (iii) the resources devoted to, and the record of compliance with, the fund's compliance policies and procedures. The Board also reviewed the allocation of fund brokerage, including allocations to brokers affiliated with the Investment Advisers.
The Board noted that the growth of fund assets over time across the complex allows Fidelity to reinvest in the development of services designed to enhance the value or convenience of the Fidelity funds as investment vehicles. These services include 24-hour access to account information and market information through phone representatives and over the Internet, and investor education materials and asset allocation tools.
Investment in a Large Fund Family. The Board considered the benefits to shareholders of investing in a Fidelity fund, including the benefits of investing in a fund that is part of a large family of funds offering a variety of investment disciplines and providing a large variety of mutual fund investor services. The Board noted that Fidelity had taken, or had made recommendations that resulted in the Fidelity funds taking, a number of actions over the previous year that benefited particular funds, including (i) dedicating additional resources to investment research and restructuring and broadening the focus of the investment research teams; (ii) bolstering the senior management team that oversees asset management; (iii) launching Class F of certain funds as a lower-fee class available to Freedom K and Freedom Index Funds; (iv) lowering the initial investment minimums and ongoing balance requirements for Real Estate High Income Fund; (v) eliminating subsequent purchase minimums for all funds and adding a waiver of the investment minimum requirement for new accounts opened with the proceeds of a systematic withdrawal plan; (vi) eliminating the withdrawal minimum and maximum limits for systematic withdrawals from Advisor funds; (vii) expanding sales load waivers on Class A shares for Destiny Planholders and expanding Institutional Class eligibility for Class O Destiny Planholders; and (viii) changing certain Class A and Class T sales charge structures to further align them with industry practices.
Annual Report
Board Approval of Investment Advisory Contracts and Management Fees - continued
Investment Performance. The Board considered whether the fund has operated in accordance with its investment objective, as well as its record of compliance with its investment restrictions. It also reviewed the fund's absolute investment performance for each class, as well as the fund's relative investment performance for each class measured over multiple periods against (i) a broad-based securities market index, and (ii) a peer group of mutual funds deemed appropriate by Fidelity and reviewed by the Board. The following charts considered by the Board show, over the one-, three-, and five-year periods ended December 31, 2009, the cumulative total returns of Initial Class and Service Class 2 of the fund, the cumulative total returns of a broad-based securities market index ("benchmark"), and a range of cumulative total returns of a peer group of mutual funds identified by Lipper Inc. as having an investment objective similar to that of the fund. The returns of Initial Class and Service Class 2 show the performance of the highest and lowest performing classes, respectively (based on five-year performance). The box within each chart shows the 25th percentile return (bottom of box) and the 75th percentile return (top of box) of the peer group. Returns shown above the box are in the first quartile and returns shown below the box are in the fourth quartile. The percentage beaten numbers noted below each chart correspond to the percentile box and represent the percentage of funds in the peer group whose performance was equal to or lower than that of the class indicated.
VIP Index 500 Portfolio
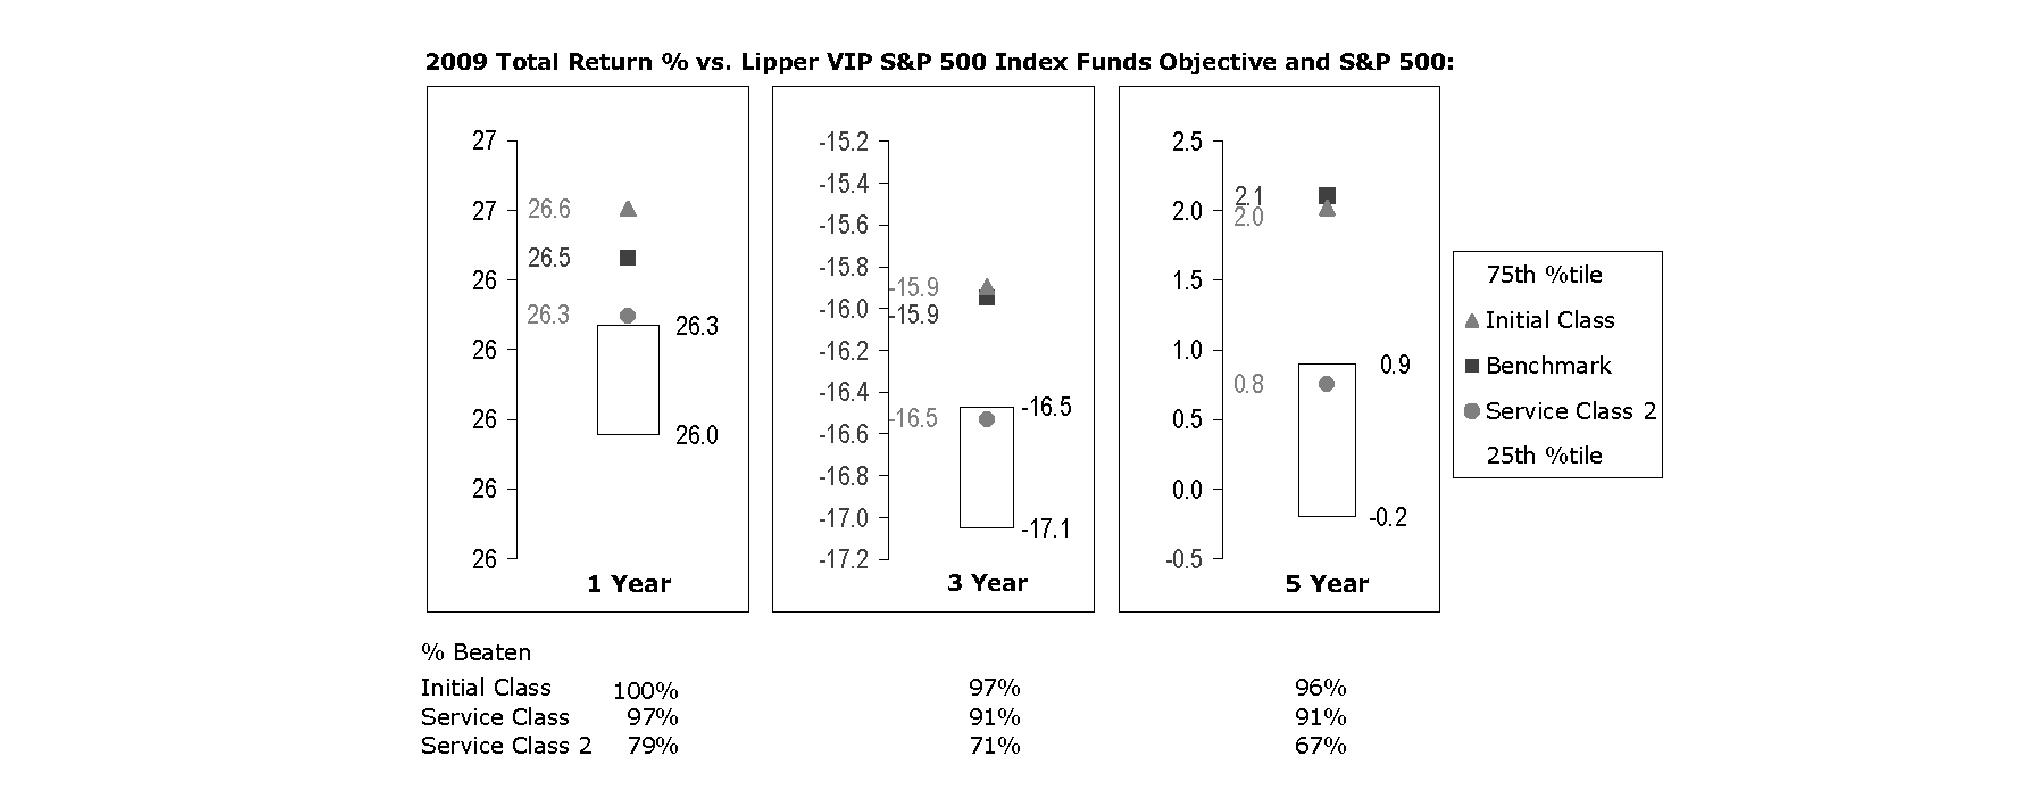
The Board reviewed the fund's relative investment performance against its peer group and noted that the performance of Initial Class of the fund was in the first quartile for all the periods shown. The Board also noted that the investment performance of Initial Class of the fund compared favorably to its benchmark for the one- and three-year periods, although the fund's five-year cumulative total return was lower than its benchmark. The Board considered that the variations in performance among the fund's classes reflect the variations in class expenses, which result in lower performance for higher expense classes. The Board also reviewed the fund's performance since inception as well as performance in the current year.
Based on its review, and giving particular weight to the nature and quality of the resources dedicated by the Investment Advisers to maintain and improve relative performance and factoring in the unprecedented market events in recent years, the Board concluded that the nature, extent, and quality of investment management and support services and of shareholder and administrative services provided to the fund will benefit the fund's shareholders, particularly in light of the Board's view that the fund's shareholders benefit from investing in a fund that is part of a large family of funds offering a variety of investment disciplines and services.
Competitiveness of Management Fee and Total Fund Expenses. The Board considered the fund's management fee and total expenses compared to "mapped groups" of competitive funds and classes. Fidelity creates "mapped groups" by combining similar Lipper investment objective categories that have comparable management fee characteristics. Combining Lipper investment objective categories aids the Board's management fee and total expense comparisons by broadening the competitive group used for comparison and by reducing the number of universes to which various Fidelity funds are compared.
Management Fee. The Board considered two proprietary management fee comparisons for the 12-month periods shown in the chart below. The group of Lipper funds used by the Board for management fee comparisons is referred to below as the "Total Mapped Group." The Total Mapped Group is broader than the Lipper peer group used by the Board for performance comparisons because the Total Mapped Group combines several Lipper investment objective categories while the Lipper peer group does not. The Total Mapped Group comparison focuses on a fund's standing relative to the total universe of comparable funds available to investors, in terms of gross management fees before expense reimbursements or caps. "TMG %" represents the percentage of funds in the Total Mapped Group that had management fees that were lower than the fund's. For example, a TMG % of 0% means that 100% of the funds in the Total Mapped Group had higher management fees than the fund. The "Asset-Size Peer Group" (ASPG) comparison focuses on a fund's standing relative to non-Fidelity funds similar in size to the fund within the Total Mapped Group. The ASPG represents at least 15% of the funds in the Total Mapped Group with comparable asset size and management fee characteristics, subject to a minimum of 50 funds (or all funds in the Total Mapped Group if fewer than 50). Additional information, such as the ASPG quartile in which the fund's management fee ranked, is also included in the chart and considered by the Board. For a more meaningful comparison of management fees, the fund is compared on the basis of a hypothetical "net management fee," which is derived by subtracting payments made by FMR for "fund-level" non-management expenses (including pricing and bookkeeping fees and non-affiliated custody fees) from the fund's management fee. In this regard, the Board realizes that net management fees can vary from year to year because of differences in "fund-level" non-management expenses. The Board noted, however, that FMR does not pay transfer agent fees or other "class-level" expenses (including 12b-1 fees, if applicable) under the fund's management contract.
Annual Report
VIP Index 500 Portfolio
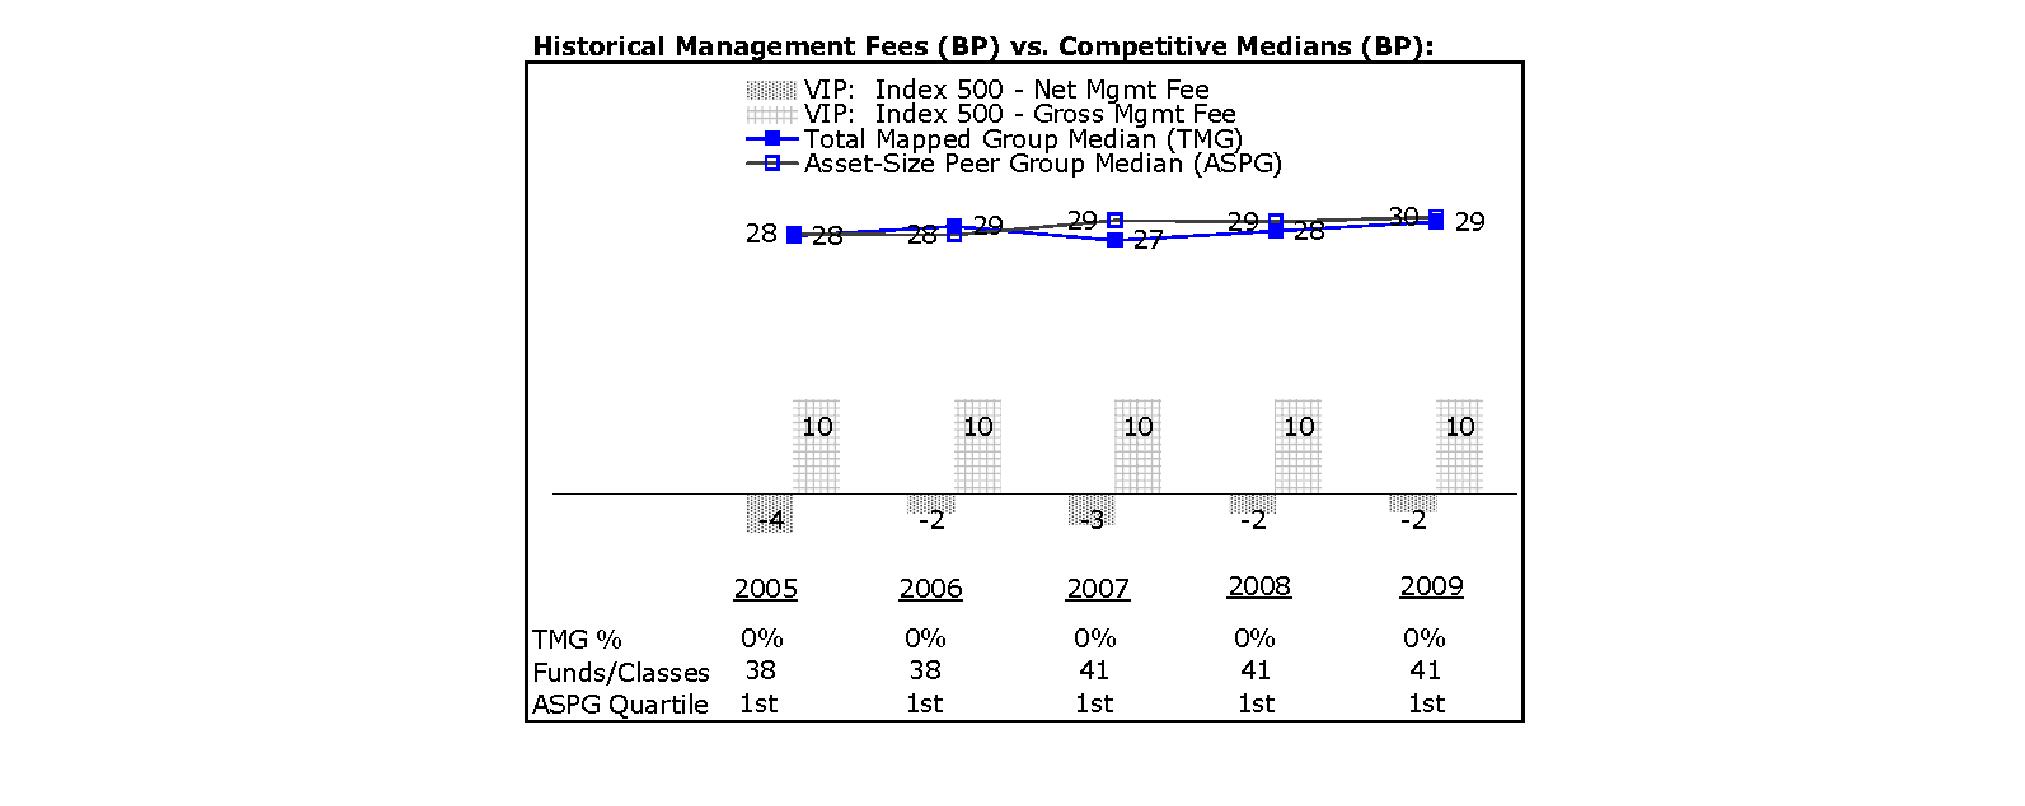
The Board noted that the fund's hypothetical net management fee ranked below the median of its Total Mapped Group and below the median of its ASPG for 2009.
Furthermore, the Board considered that it had approved an amendment (effective March 1, 2005) to the fund's management contract that lowered the fund's management fee from 24 basis points to 10 basis points. The Board considered that the chart reflects the fund's lower management fee for 2005, as if the lower fee were in effect for the entire year.
Based on its review, the Board concluded that the fund's management fee is fair and reasonable in light of the services that the fund receives and the other factors considered.
Total Expenses. In its review of each class's total expenses, the Board considered the fund's hypothetical net management fee as well as the fund's gross management fee. The Board also considered other "fund-level" expenses, such as pricing and bookkeeping fees and custodial, legal, and audit fees. The Board also considered other "class-level" expenses, such as transfer agent fees and fund-paid 12b-1 fees. The Board also noted the effects of any waivers and reimbursements on fees and expenses. As part of its review, the Board also considered current and historical total expenses of each class of the fund compared to competitive fund median expenses. Each class of the fund is compared to those funds and classes in the Total Mapped Group (used by the Board for management fee comparisons) that have a similar sales load structure.
The Board also considered that the current contractual arrangements for the fund (i) have the effect of setting the total "fund-level" expenses (including, among other expenses, the management fee) at 10 basis points, and (ii) limit the total expenses of the fund's existing classes of shareholders to 10 basis points for Initial Class, 20 basis points for Service Class, and 35 basis points for Service Class 2. These contractual expense limits may not be increased without the approval of the Board and the shareholders of the applicable class.
The Board noted that the total expenses of each class ranked below its competitive median for 2009.
Annual Report
Board Approval of Investment Advisory Contracts and Management Fees - continued
Fees Charged to Other Fidelity Clients. The Board also considered Fidelity fee structures and other information with respect to clients of FMR and its affiliates, such as other mutual funds advised or subadvised by FMR or its affiliates, pension plan clients, and other institutional clients. In March 2010, the Board created an ad hoc joint committee with the board of other Fidelity funds (the Committee) to review and compare Fidelity's institutional investment advisory business with its business of providing services to the Fidelity funds, including the differences in services provided, fees charged, and costs incurred, as well as competition in their respective marketplaces.
Based on its review of total expenses and fees charged to other Fidelity clients, the Board concluded that the total expenses of each class of the fund were reasonable in light of the services that the fund and its shareholders receive and the other factors considered, including the findings of the Committee.
Costs of the Services and Profitability. The Board considered the revenues earned and the expenses incurred by Fidelity in conducting the business of developing, marketing, distributing, managing, administering and servicing the fund and its shareholders. The Board also considered the level of Fidelity's profits in respect of all the Fidelity funds.
On an annual basis, FMR presents to the Board Fidelity's profitability for the fund. Fidelity calculates the profitability for each fund, as well as aggregate profitability for groups of Fidelity funds and all Fidelity funds, using a series of detailed revenue and cost allocation methodologies which originate with the audited books and records of Fidelity. The Audit Committee of the Board reviews any significant changes from the prior year's methodologies.
PricewaterhouseCoopers LLP (PwC), independent registered public accounting firm and auditor to Fidelity and certain Fidelity funds, has been engaged annually by the Board as part of the Board's assessment of Fidelity's profitability analysis. PwC's engagement includes the review and assessment of Fidelity's methodologies used in determining the revenues and expenses attributable to Fidelity's mutual fund business, and completion of agreed-upon procedures surrounding the mathematical accuracy of fund profitability and its conformity to allocation methodologies. After considering PwC's reports issued under the engagement and information provided by Fidelity, the Board believes that while other allocation methods may also be reasonable, Fidelity's profitability methodologies are reasonable in all material respects.
The Board has also reviewed Fidelity's non-fund businesses and fall-out benefits related to the mutual fund business as well as cases where Fidelity's affiliates may benefit from or be related to the fund's business.
The Board considered the costs of the services provided by and the profits realized by Fidelity in connection with the operation of the fund and were satisfied that the profitability was not excessive in the circumstances.
Economies of Scale. The Board considered whether there have been economies of scale in respect of the management of the Fidelity funds, whether the Fidelity funds (including the fund) have appropriately benefited from any such economies of scale, and whether there is potential for realization of any further economies of scale. The Board considered the extent to which the fund will benefit from economies of scale through increased services to the fund, through waivers or reimbursements, or through fee or expense reductions.
In February 2009, the Board and the board of other Fidelity funds created an ad hoc committee (the Economies of Scale Committee) to analyze whether FMR attains economies of scale in respect of the management and servicing of the Fidelity funds, whether the Fidelity funds have appropriately benefited from such economies of scale, and whether there is potential for realization of any further economies of scale.
The Board concluded, considering the findings of the Economies of Scale Committee, that any potential economies of scale are being appropriately shared between fund shareholders and Fidelity.
Additional Information Requested by the Board. In order to develop fully the factual basis for consideration of the Fidelity funds' Advisory Contracts, the Board requested and received additional information on certain topics, including (i) fund performance trends, actions to be taken by FMR to improve certain funds' overall performance, and Fidelity's long-term strategies for certain funds; (ii) portfolio manager changes that have occurred during the past year and length of portfolio manager tenure for different categories of funds over time; (iii) Fidelity's compensation structure for portfolio managers, research analysts, and other key personnel, the rationale for the compensation structure, and how the compensation structure provides appropriate performance incentives; (iv) the amount of the investment that each portfolio manager has made in the Fidelity fund(s) that he or she manages; (v) management and other fees paid by FMR to affiliated sub-advisers on behalf of the Fidelity funds; (vi) Fidelity's fee structures and rationale for recommending different fees among different categories of funds; (vii) Fidelity's rationale for recommending which funds should have a performance adjustment component as part of their management fees; (viii) the rationale for any differences between fund fee structures and fee structures in place for other Fidelity clients; and (ix) explanations regarding the relative total expenses borne by certain funds and classes, total expense competitive trends, and actions that might be taken by FMR to reduce total expenses for certain funds and classes.
Based on its evaluation of all of the conclusions noted above, and after considering all factors it believed relevant, the Board ultimately concluded that the advisory fee structures are fair and reasonable, and that the fund's Advisory Contracts should be renewed.
Annual Report
Investment Adviser
Fidelity Management & Research Company
Boston, MA
Investment Sub-Advisers
FMR Co., Inc.
Geode Capital Management, LLC
General Distributor
Fidelity Distributors Corporation
Boston, MA
Transfer and Service Agents
Fidelity Investments Institutional Operations Company, Inc.
Boston, MA
Fidelity Service Company, Inc.
Boston, MA
Custodian
The Bank of New York Mellon
New York, NY
VIPIDX-ANN-0211
1.540028.113
Item 2. Code of Ethics
As of the end of the period, December 31, 2010, Variable Insurance Products Fund II (the trust) has adopted a code of ethics, as defined in Item 2 of Form N-CSR, that applies to its President and Treasurer and its Chief Financial Officer. A copy of the code of ethics is filed as an exhibit to this Form N-CSR.
Item 3. Audit Committee Financial Expert
The Board of Trustees of the trust has determined that Joseph Mauriello is an audit committee financial expert, as defined in Item 3 of Form N-CSR. Mr. Mauriello is independent for purposes of Item 3 of Form N-CSR.
Item 4. Principal Accountant Fees and Services
Fees and Services
The following table presents fees billed by Deloitte & Touche LLP, the member firms of Deloitte Touche Tohmatsu, and their respective affiliates (collectively, "Deloitte Entities") in each of the last two fiscal years for services rendered to Contrafund Portfolio, Disciplined Small Cap Portfolio and Index 500 Portfolio (the "Funds"):
Services Billed by Deloitte Entities
December 31, 2010 FeesA
| Audit Fees | Audit-Related Fees | Tax Fees | All Other Fees |
Contrafund Portfolio | $55,000 | $- | $5,700 | $- |
Disciplined Small Cap Portfolio | $37,000 | $- | $5,600 | $- |
Index 500 Portfolio | $44,000 | $- | $5,600 | $- |
December 31, 2009 FeesA
| Audit Fees | Audit-Related Fees | Tax Fees | All Other Fees |
Contrafund Portfolio | $55,000 | $- | $5,700 | $- |
Disciplined Small Cap Portfolio | $38,000 | $- | $5,600 | $- |
Index 500 Portfolio | $44,000 | $- | $5,600 | $- |
A Amounts may reflect rounding.
The following table presents fees billed by Deloitte Entities that were required to be approved by the Audit Committee for services that relate directly to the operations and financial reporting of the Funds and that are rendered on behalf of Fidelity Management & Research Company ("FMR") and entities controlling, controlled by, or under common control with FMR (not including any sub-adviser whose role is primarily portfolio management and is subcontracted with or overseen by another investment adviser) that provide ongoing services to the Funds ("Fund Service Providers"):
Services Billed by Deloitte Entities
| December 31, 2010A | December 31, 2009A |
Audit-Related Fees | $645,000 | $725,000 |
Tax Fees | $- | $- |
All Other Fees | $840,000 | $515,000 |
A Amounts may reflect rounding.
"Audit-Related Fees" represent fees billed for assurance and related services that are reasonably related to the performance of the fund audit or the review of the fund's financial statements and that are not reported under Audit Fees.
"Tax Fees" represent fees billed for tax compliance, tax advice or tax planning that relate directly to the operations and financial reporting of the fund.
"All Other Fees" represent fees billed for services provided to the fund or Fund Service Provider, a significant portion of which are assurance related, that relate directly to the operations and financial reporting of the fund, excluding those services that are reported under Audit Fees, Audit-Related Fees or Tax Fees.
Assurance services must be performed by an independent public accountant.
* * *
The aggregate non-audit fees billed by Deloitte Entities for services rendered to the Funds, FMR (not including any sub-adviser whose role is primarily portfolio management and is subcontracted with or overseen by another investment adviser), and any Fund Service Provider for each of the last two fiscal years of the Funds are as follows:
Billed By | December 31, 2010 A | December 31, 2009 A |
Deloitte Entities | $1,595,000 | $1,255,000 |
A Amounts may reflect rounding.
The trust's Audit Committee has considered non-audit services that were not pre-approved that were provided by Deloitte Entities to Fund Service Providers to be compatible with maintaining the independence of Deloitte Entities in its audit of the Funds, taking into account representations from Deloitte Entities, in accordance with Public Company Accounting Oversight Board rules, regarding its independence from the Funds and their related entities and FMR's review of the appropriateness and permissibility under applicable law of such non-audit services prior to their provision to the Fund Service Providers.
Audit Committee Pre-Approval Policies and Procedures
The trust's Audit Committee must pre-approve all audit and non-audit services provided by a fund's independent registered public accounting firm relating to the operations or financial reporting of the fund. Prior to the commencement of any audit or non-audit services to a fund, the Audit Committee reviews the services to determine whether they are appropriate and permissible under applicable law.
The Audit Committee has adopted policies and procedures to, among other purposes, provide a framework for the Committee's consideration of non-audit services by the audit firms that audit the Fidelity funds. The policies and procedures require that any non-audit service provided by a fund audit firm to a Fidelity fund and any non-audit service provided by a fund auditor to a Fund Service Provider that relates directly to the operations and financial reporting of a Fidelity fund ("Covered Service") are subject to approval by the Audit Committee before such service is provided.
All Covered Services must be approved in advance of provision of the service either: (i) by formal resolution of the Audit Committee, or (ii) by oral or written approval of the service by the Chair of the Audit Committee (or if the Chair is unavailable, such other member of the Audit Committee as may be designated by the Chair to act in the Chair's absence). The approval contemplated by (ii) above is permitted where the Treasurer determines that action on such an engagement is necessary before the next meeting of the Audit Committee.
Non-audit services provided by a fund audit firm to a Fund Service Provider that do not relate directly to the operations and financial reporting of a Fidelity fund are reported to the Audit Committee on a periodic basis.
Non-Audit Services Approved Pursuant to Rule 2-01(c)(7)(i)(C) and (ii) of Regulation S-X ("De Minimis Exception")
There were no non-audit services approved or required to be approved by the Audit Committee pursuant to the De Minimis Exception during the Funds' last two fiscal years relating to services provided to (i) the Funds or (ii) any Fund Service Provider that relate directly to the operations and financial reporting of the Funds.
Item 5. Audit Committee of Listed Registrants
Not applicable.
Item 6. Investments
(a) Not applicable.
(b) Not applicable
Item 7. Disclosure of Proxy Voting Policies and Procedures for Closed-End Management Investment Companies
Not applicable.
Item 8. Portfolio Managers of Closed-End Management Investment Companies
Not applicable.
Item 9. Purchase of Equity Securities by Closed-End Management Investment Company and Affiliated Purchasers
Not applicable.
Item 10. Submission of Matters to a Vote of Security Holders
There were no material changes to the procedures by which shareholders may recommend nominees to the trust's Board of Trustees.
Item 11. Controls and Procedures
(a)(i) The President and Treasurer and the Chief Financial Officer have concluded that the trust's disclosure controls and procedures (as defined in Rule 30a-3(c) under the Investment Company Act) provide reasonable assurances that material information relating to the trust is made known to them by the appropriate persons, based on their evaluation of these controls and procedures as of a date within 90 days of the filing date of this report.
(a)(ii) There was no change in the trust's internal control over financial reporting (as defined in Rule 30a-3(d) under the Investment Company Act) that occurred during the second fiscal quarter of the period covered by this report that has materially affected, or is reasonably likely to materially affect, the trust's internal control over financial reporting.
Item 12. Exhibits
(a) | (1) | Code of Ethics pursuant to Item 2 of Form N-CSR is filed and attached hereto as EX-99.CODE ETH. |
(a) | (2) | Certification pursuant to Rule 30a-2(a) under the Investment Company Act of 1940 (17 CFR 270.30a-2(a)) is filed and attached hereto as Exhibit 99.CERT. |
(a) | (3) | Not applicable. |
(b) | | Certification pursuant to Rule 30a-2(b) under the Investment Company Act of 1940 (17 CFR 270.30a-2(b)) is furnished and attached hereto as Exhibit 99.906CERT. |
SIGNATURES
Pursuant to the requirements of the Securities Exchange Act of 1934 and the Investment Company Act of 1940, the registrant has duly caused this report to be signed on its behalf by the undersigned, thereunto duly authorized.
Variable Insurance Products Fund II
By: | /s/Kenneth B. Robins |
| Kenneth B. Robins |
| President and Treasurer |
| |
Date: | February 25, 2011 |
Pursuant to the requirements of the Securities Exchange Act of 1934 and the Investment Company Act of 1940, this report has been signed below by the following persons on behalf of the registrant and in the capacities and on the dates indicated.
By: | /s/Kenneth B. Robins |
| Kenneth B. Robins |
| President and Treasurer |
| |
Date: | February 25, 2011 |
By: | /s/Christine Reynolds |
| Christine Reynolds |
| Chief Financial Officer |
| |
Date: | February 25, 2011 |