UNITED STATES
SECURITIES AND EXCHANGE COMMISSION
Washington, D.C. 20549
FORM N-CSR
CERTIFIED SHAREHOLDER REPORT OF REGISTERED
MANAGEMENT INVESTMENT COMPANIES
Investment Company Act file number 811-5511
Variable Insurance Products Fund II
(Exact name of registrant as specified in charter)
82 Devonshire St., Boston, Massachusetts 02109
(Address of principal executive offices) (Zip code)
Scott C. Goebel, Secretary
82 Devonshire St.
Boston, Massachusetts 02109
(Name and address of agent for service)
Registrant's telephone number, including area code: 617-563-7000
Date of fiscal year end: | December 31 |
| |
Date of reporting period: | December 31, 2012 |
This report on Form N-CSR relates solely to the Registrant's Contrafund Portfolio, Disciplined Small Cap Portfolio and Index 500 Portfolio series (each, a "Fund" and collectively, the "Funds").
Item 1. Reports to Stockholders
Fidelity® Variable Insurance Products:
Contrafund® Portfolio
Annual Report
December 31, 2012
(Fidelity Cover Art)
Contents
Performance | (Click Here) | How the fund has done over time. |
Management's Discussion of Fund Performance | (Click Here) | The Portfolio Manager's review of fund performance and strategy. |
Shareholder Expense Example | (Click Here) | An example of shareholder expenses. |
Investment Changes | (Click Here) | A summary of major shifts in the fund's investments over the past six months. |
Investments | (Click Here) | A complete list of the fund's investments with their market values. |
Financial Statements | (Click Here) | Statements of assets and liabilities, operations, and changes in net assets, as well as financial highlights. |
Notes | (Click Here) | Notes to the financial statements. |
Report of Independent Registered Public Accounting Firm | (Click Here) | |
Trustees and Officers | (Click Here) | |
Distributions | (Click Here) | |
Board Approval of Investment Advisory Contracts and Management Fees | (Click Here) | |
To view a fund's proxy voting guidelines and proxy voting record for the 12-month period ended June 30, visit http://www.fidelity.com/proxyvotingresults or visit the Securities and Exchange Commission's (SEC) web site at http://www.sec.gov. You may also call 1-877-208-0098 to request a free copy of the proxy voting guidelines.
Fidelity Variable Insurance Products are separate account options which are purchased through a variable insurance contract.
Standard & Poor's, S&P and S&P 500 are registered service marks of The McGraw-Hill Companies, Inc. and have been licensed for use by Fidelity Distributors Corporation.
Other third party marks appearing herein are the property of their respective owners.
All other marks appearing herein are registered or unregistered trademarks or service marks of FMR LLC or an affiliated company. © 2013 FMR LLC. All rights reserved.
This report and the financial statements contained herein are submitted for the general information of the shareholders of the fund. This report is not authorized for distribution to prospective investors in the fund unless preceded or accompanied by an effective prospectus.
A fund files its complete schedule of portfolio holdings with the SEC for the first and third quarters of each fiscal year on Form N-Q. Forms N-Q are available on the SEC's web site at http://www.sec.gov. A fund's Forms N-Q may be reviewed and copied at the SEC's Public Reference Room in Washington, DC. Information regarding the operation of the SEC's Public Reference Room may be obtained by calling 1-800-SEC-0330. For a complete list of a fund's portfolio holdings, view the most recent holdings listing, semiannual report, or annual report on Fidelity's web site at http://www.fidelity.com, http://www.advisor.fidelity.com, or http://www.401k.com, as applicable.
NOT FDIC INSURED • MAY LOSE VALUE • NO BANK GUARANTEE
Neither the fund nor Fidelity Distributors Corporation is a bank.
Annual Report
Average annual total return reflects the change in the value of an investment, assuming reinvestment of the class' distributions from dividend income and capital gains (the profits earned upon the sale of securities that have grown in value, if any) and assuming a constant rate of performance each year. During periods of reimbursement by Fidelity, a fund's total return will be greater than it would be had the reimbursement not occurred. Performance numbers are net of all underlying fund operating expenses, but do not include any insurance charges imposed by your insurance company's separate account. If performance information included the effect of these additional charges, the total returns would have been lower. How a fund did yesterday is no guarantee of how it will do tomorrow.
Average Annual Total Returns
Periods ended December 31, 2012 | Past 1
year | Past 5
years | Past 10
years |
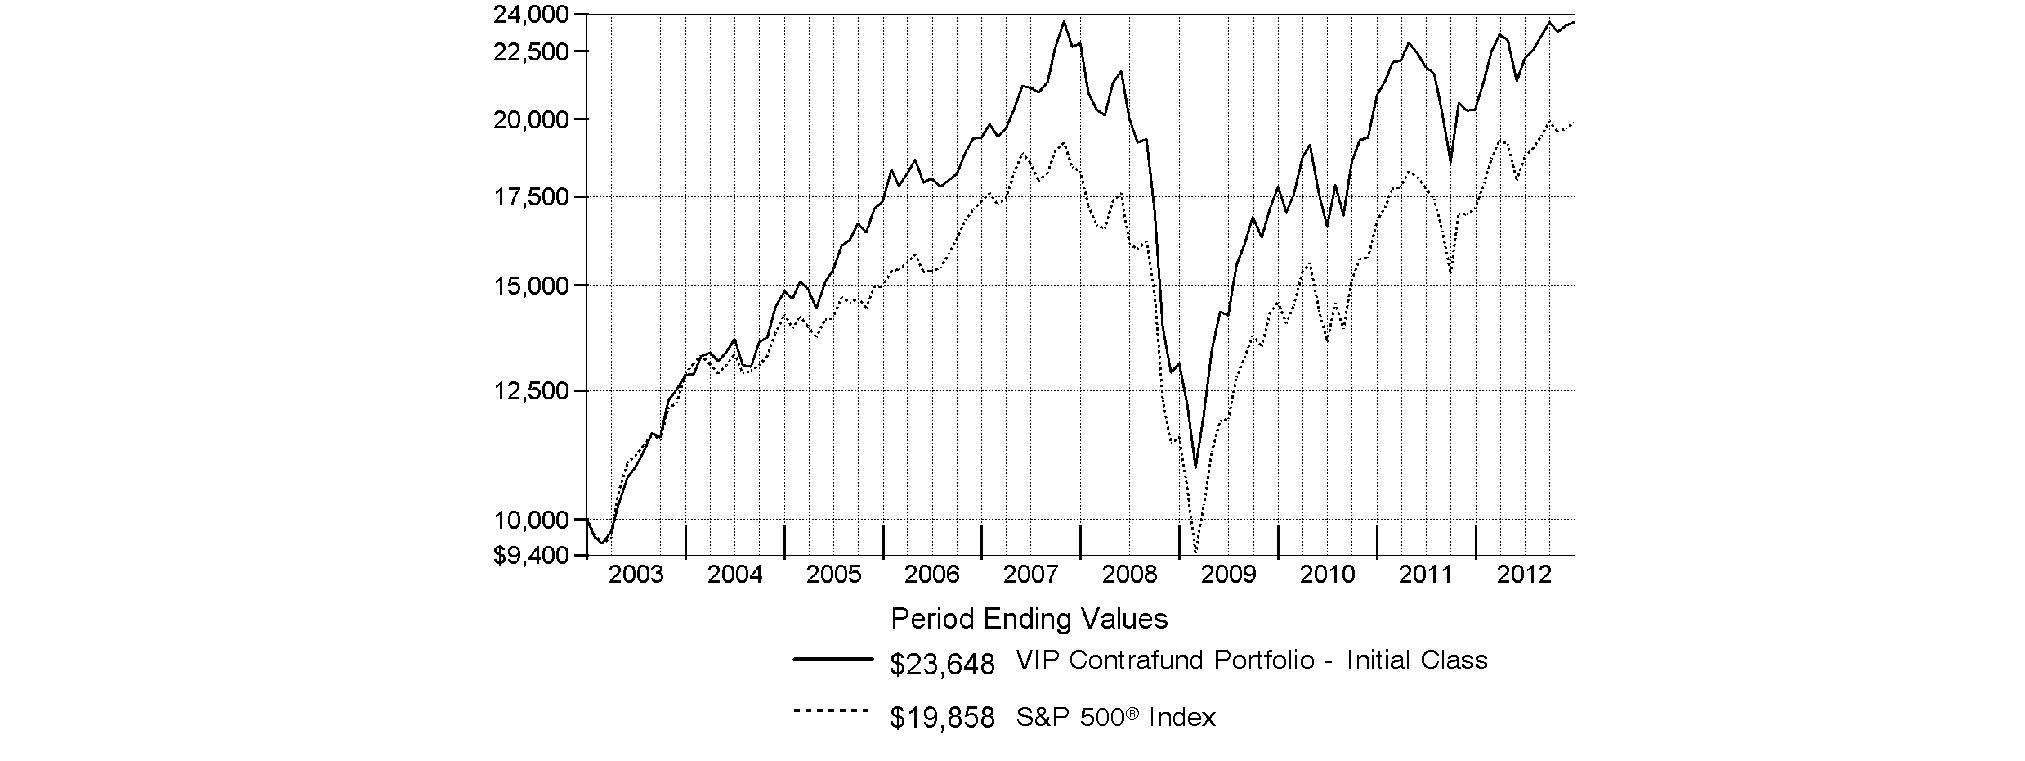
VIP ContrafundSM Portfolio - Initial Class | 16.42% | 0.74% | 8.99% |
VIP Contrafund Portfolio - Service Class | 16.31% | 0.64% | 8.88% |
VIP Contrafund Portfolio - Service Class 2 | 16.14% | 0.49% | 8.72% |
VIP Contrafund Portfolio - Investor Class A | 16.34% | 0.65% | 8.91% |
A The initial offering of Investor Class shares took place on July 21, 2005. Returns prior to July 21, 2005, are those of Initial Class. Had Investor Class's transfer agent fee been reflected, returns prior to July 21, 2005, would have been lower.
$10,000 Over 10 Years
Let's say hypothetically that $10,000 was invested in VIP ContrafundSM Portfolio - Initial Class on December 31, 2002. The chart shows how the value of your investment would have changed, and also shows how the S&P 500® Index performed over the same period.
Annual Report
Market Recap: Global markets overcame a host of macroeconomic concerns in 2012 - related to the eurozone debt crisis, the strength and pace of the U.S. economic recovery, the U.S. fiscal debate and a slowdown in China's once-blistering growth - to post broad-based gains for the year, with more-economically sensitive asset classes leading the way. Investor sentiment improved as some of the uncertainties holding back the markets began to lift and the outlook brightened in the face of stimulative global monetary policies and modest inflationary pressures. Riskier assets such as stocks saw the biggest advances, with international equities edging their U.S. counterparts, thanks to an especially strong rally in the fourth quarter. Similarly, within fixed income, credit-sensitive sectors - including high-yield/investment-grade corporate bonds and emerging-markets debt - surged ahead of more-defensive U.S. investment-grade bonds amid strong demand for higher-risk, higher-yielding securities. Emerging signs of a rebounding U.S. economy lifted domestic stocks for most of the period, extending an uptrend that began in March 2009. The broad-based S&P 500® Index rose 16.00% for the 12 months, while the technology-heavy Nasdaq Composite Index® gained 17.45% and the blue-chip-laden Dow Jones Industrial AverageSM added 10.24%. Foreign developed- and emerging-markets equities experienced periodic bouts of volatility this past year, but rode a strong second-half rally to finish ahead of their U.S. counterparts. The MSCI® ACWI® (All Country World Index) ex USA Index advanced 16.98% for the period. In an environment that favored higher-risk assets, U.S. investment-grade bonds managed only a 4.21% gain for 12 months, according to the Barclays® U.S. Aggregate Bond Index. Among sectors that comprise the index, bonds with higher yields and on the riskier end of the spectrum led the way, with investment-grade credit advancing 9.37%, while ultra-safe U.S. Treasuries managed only a 1.99% advance and finished at the back of the pack. Meanwhile, high-yield bonds, as measured by The BofA Merrill LynchSM US High Yield Constrained Index, gained a hearty 15.55%. Foreign bonds showed positive results during the year, with emerging markets easily outpacing their major developed-markets counterparts. The J.P. Morgan Emerging Markets Bond Index Global surged 18.54%, while the Citigroup® Non-USD Group-of-Seven (G7) Equal Weighted Index logged a 7.10% gain.
Comments from Robert Stansky, Head of Fidelity's Stock Selector Large Cap Group, which manages VIP ContrafundSM Portfolio: For the year, the fund's share classes modestly outperformed the S&P 500®. (For specific portfolio results, please refer to the performance section of this report.) Versus the index, the primary driver of performance was security selection by our sector-focused co-managers. The fund also benefited from some of our active positions at the industry level. Our picks were strongest in utilities and consumer staples. Positioning in telecommunication services, health care and materials also provided a lift. Conversely, results were hampered by security selection in energy and financials, as well as positioning in consumer discretionary and industrials. Looking at individual stocks, a sizable overweighting in Apple was the top contributor. The company's iPad® tablet and iPhone® smartphone continue to define their respective categories, helping the stock maintain its run of strong performance, despite slipping during the fourth quarter. Also in tech, we did not own chipmaker and index component Intel and largely avoided computer and peripherals firm Hewlett-Packard, each of which was a good call. We believed these PC-focused companies were not well-positioned to capitalize on the popularity of tablets and smartphones. Hewlett-Packard was not held at period end. The tech sector also included a notable detractor, memory-chip maker SanDisk. The stock lost significant ground during the first half of 2012 on weak sales of PCs and consumer devices. In energy, the fund was hurt by an out-of-index position in integrated oil firm Royal Dutch Shell, which we held due to what we believed was an attractive valuation, along with the company's improved growth and free cash flow profile - the result of several major projects to start production. But the stock fell during the period and hampered relative performance. Lastly, we lost ground by avoiding strong-performing home-improvement retailer and index member Home Depot, but our ownership of Lowe's Companies, its chief competitor, offset most of the negative impact.
The views expressed above reflect those of the portfolio manager(s) only through the end of the period as stated on the cover of this report and do not necessarily represent the views of Fidelity or any other person in the Fidelity organization. Any such views are subject to change at any time based upon market or other conditions and Fidelity disclaims any responsibility to update such views. These views may not be relied on as investment advice and, because investment decisions for a Fidelity fund are based on numerous factors, may not be relied on as an indication of trading intent on behalf of any Fidelity fund.
Annual Report
As a shareholder of the Fund, you incur two types of costs: (1) transaction costs, including redemption fees and (2) ongoing costs, including management fees, distribution and/or service (12b-1) fees and other Fund expenses. This Example is intended to help you understand your ongoing costs (in dollars) of investing in the Fund and to compare these costs with the ongoing costs of investing in other mutual funds.
The Example is based on an investment of $1,000 invested at the beginning of the period and held for the entire period (July 1, 2012 to December 31, 2012).
Actual Expenses
The first line of the accompanying table for each class of the Fund provides information about actual account values and actual expenses. You may use the information in this line, together with the amount you invested, to estimate the expenses that you paid over the period. Simply divide your account value by $1,000.00 (for example, an $8,600 account value divided by $1,000.00 = 8.6), then multiply the result by the number in the first line for a class of the Fund under the heading entitled "Expenses Paid During Period" to estimate the expenses you paid on your account during this period. The estimate of expenses does not include any fees or other expenses of any variable annuity or variable life insurance product. If they were, the estimate of expenses you paid during the period would be higher, and your ending account value would be lower. In addition, the Fund, as a shareholder in the underlying Fidelity Central Funds, will indirectly bear its pro-rata share of the fees and expenses incurred by the underlying Fidelity Central Funds. These fees and expenses are not included in the Fund's annualized expense ratio used to calculate the expense estimate in the table below.
Hypothetical Example for Comparison Purposes
The second line of the accompanying table for each class of the Fund provides information about hypothetical account values and hypothetical expenses based on a Class' actual expense ratio and an assumed rate of return of 5% per year before expenses, which is not the Class' actual return. The hypothetical account values and expenses may not be used to estimate the actual ending account balance or expenses you paid for the period. You may use this information to compare the ongoing costs of investing in the Fund and other funds. To do so, compare this 5% hypothetical example with the 5% hypothetical examples that appear in the shareholder reports of the other funds. The estimate of expenses does not include any fees or other expenses of any variable annuity or variable life insurance product. If they were, the estimate of expenses you paid during the period would be higher, and your ending account value would be lower. In addition, the Fund, as a shareholder in the underlying Fidelity Central Funds, will indirectly bear its pro-rata share of the fees and expenses incurred by the underlying Fidelity Central Funds. These fees and expenses are not included in the Fund's annualized expense ratio used to calculate the expense estimate in the table below.
Please note that the expenses shown in the table are meant to highlight your ongoing costs only and do not reflect any transaction costs. Therefore, the second line of the table is useful in comparing ongoing costs only, and will not help you determine the relative total costs of owning different funds. In addition, if these transactional costs were included, your costs would have been higher.
| Annualized
Expense Ratio | Beginning
Account Value
July 1, 2012 | Ending
Account Value
December 31, 2012 | Expenses Paid
During Period*
July 1, 2012
to December 31, 2012 |
Initial Class | .64% | | | |
Actual | | $ 1,000.00 | $ 1,063.90 | $ 3.32 |
HypotheticalA | | $ 1,000.00 | $ 1,021.92 | $ 3.25 |
Service Class | .74% | | | |
Actual | | $ 1,000.00 | $ 1,063.50 | $ 3.84 |
HypotheticalA | | $ 1,000.00 | $ 1,021.42 | $ 3.76 |
Service Class 2 | .89% | | | |
Actual | | $ 1,000.00 | $ 1,062.80 | $ 4.61 |
HypotheticalA | | $ 1,000.00 | $ 1,020.66 | $ 4.52 |
Service Class 2R | .89% | | | |
Actual | | $ 1,000.00 | $ 1,062.80 | $ 4.61 |
HypotheticalA | | $ 1,000.00 | $ 1,020.66 | $ 4.52 |
Investor Class | .73% | | | |
Actual | | $ 1,000.00 | $ 1,063.30 | $ 3.79 |
HypotheticalA | | $ 1,000.00 | $ 1,021.47 | $ 3.71 |
A 5% return per year before expenses
* Expenses are equal to each Class' annualized expense ratio, multiplied by the average account value over the period, multiplied by 184/366 (to reflect the one-half year period).
Annual Report
Investment Changes (Unaudited)
Top Ten Stocks as of December 31, 2012 |
| % of fund's
net assets | % of fund's net assets
6 months ago |
Apple, Inc. | 5.6 | 6.9 |
QUALCOMM, Inc. | 2.5 | 2.3 |
Exxon Mobil Corp. | 2.4 | 1.6 |
General Electric Co. | 2.2 | 1.8 |
Pfizer, Inc. | 2.2 | 1.7 |
Procter & Gamble Co. | 2.0 | 2.1 |
Capital One Financial Corp. | 1.9 | 1.7 |
The Coca-Cola Co. | 1.8 | 2.1 |
Comcast Corp. Class A | 1.8 | 1.8 |
JPMorgan Chase & Co. | 1.6 | 0.5 |
| 24.0 | |
Market Sectors as of December 31, 2012 |
| % of fund's
net assets | % of fund's net assets
6 months ago |
Information Technology | 19.5 | 20.2 |
Financials | 15.9 | 14.7 |
Health Care | 11.7 | 11.5 |
Energy | 10.8 | 10.6 |
Consumer Discretionary | 10.6 | 10.5 |
Consumer Staples | 10.5 | 11.1 |
Industrials | 10.5 | 10.2 |
Materials | 3.6 | 3.4 |
Utilities | 3.5 | 3.7 |
Telecommunication Services | 2.4 | 2.0 |
Asset Allocation (% of fund's net assets) |
As of December 31, 2012 * | As of June 30, 2012 ** |
 | Stocks and
Equity Futures 99.1% | | | Stocks and
Equity Futures 98.1% | |
 | Convertible Bonds 0.0%† | |  | Convertible Bonds 0.0% | |
 | Short-Term
Investments and
Net Other Assets
(Liabilities) 0.9% | | | Short-Term
Investments and
Net Other Assets
(Liabilities) 1.9% | |
* Foreign investments | 11.1% | | ** Foreign investments | 13.9% | |
† Amount represents less than 0.1%

Annual Report
Investments December 31, 2012
Showing Percentage of Net Assets
Common Stocks - 98.9% |
| Shares | | Value |
CONSUMER DISCRETIONARY - 10.5% |
Hotels, Restaurants & Leisure - 1.4% |
Domino's Pizza, Inc. | 967,870 | | $ 42,150,739 |
Dunkin' Brands Group, Inc. | 566,661 | | 18,801,812 |
Icahn Enterprises LP rights (a) | 363,975 | | 4 |
Starbucks Corp. | 989,322 | | 53,047,446 |
Yum! Brands, Inc. | 1,647,924 | | 109,422,154 |
| | 223,422,155 |
Internet & Catalog Retail - 1.3% |
Liberty Media Corp. Interactive Series A (a) | 4,692,540 | | 92,349,187 |
priceline.com, Inc. (a) | 180,322 | | 112,016,026 |
| | 204,365,213 |
Media - 4.5% |
Comcast Corp. Class A | 7,697,521 | | 287,733,335 |
DIRECTV (a) | 2,281,215 | | 114,425,744 |
Legend Pictures LLC (a)(h)(i) | 2,062 | | 3,821,257 |
News Corp. Class A | 6,209,595 | | 158,593,056 |
Sirius XM Radio, Inc. (d) | 13,269,786 | | 38,349,682 |
The Walt Disney Co. | 2,400,034 | | 119,497,693 |
Weinstein Co. Holdings LLC Class A-1 (a)(h)(i) | 11,499 | | 4,312,125 |
| | 726,732,892 |
Multiline Retail - 0.6% |
Dollar General Corp. (a) | 1,626,280 | | 71,702,685 |
Target Corp. | 532,276 | | 31,494,771 |
| | 103,197,456 |
Specialty Retail - 2.5% |
AutoZone, Inc. (a) | 192,169 | | 68,110,459 |
CarMax, Inc. (a) | 1,063,968 | | 39,941,359 |
Limited Brands, Inc. | 903,270 | | 42,507,886 |
Lowe's Companies, Inc. | 3,535,673 | | 125,587,105 |
Tiffany & Co., Inc. | 784,687 | | 44,993,953 |
TJX Companies, Inc. | 2,188,242 | | 92,890,873 |
| | 414,031,635 |
Textiles, Apparel & Luxury Goods - 0.2% |
Under Armour, Inc. Class A (sub. vtg.) (a)(d) | 747,260 | | 36,264,528 |
TOTAL CONSUMER DISCRETIONARY | | 1,708,013,879 |
CONSUMER STAPLES - 10.5% |
Beverages - 3.5% |
Anheuser-Busch InBev SA NV | 552,671 | | 48,129,107 |
Coca-Cola Bottling Co. CONSOLIDATED | 128,771 | | 8,563,272 |
Coca-Cola FEMSA SAB de CV sponsored ADR | 30,147 | | 4,493,109 |
Coca-Cola Icecek A/S | 439,515 | | 9,115,757 |
Companhia de Bebidas das Americas (AmBev) (PN) sponsored ADR | 200,370 | | 8,413,536 |
|
| Shares | | Value |
Constellation Brands, Inc. Class A (sub. vtg.) (a) | 1,419,209 | | $ 50,225,807 |
Diageo PLC sponsored ADR | 375,078 | | 43,726,593 |
Embotelladora Andina SA sponsored ADR | 228,456 | | 8,674,474 |
Molson Coors Brewing Co. Class B | 599,341 | | 25,645,801 |
Pernod Ricard SA | 379,779 | | 44,062,305 |
Remy Cointreau SA (d) | 212,448 | | 23,361,602 |
The Coca-Cola Co. | 7,982,545 | | 289,367,256 |
| | 563,778,619 |
Food & Staples Retailing - 1.9% |
CVS Caremark Corp. | 3,708,548 | | 179,308,296 |
Drogasil SA | 482,700 | | 5,504,039 |
Kroger Co. | 2,249,387 | | 58,529,050 |
Safeway, Inc. | 330,232 | | 5,973,897 |
Wal-Mart Stores, Inc. | 656,157 | | 44,769,592 |
Walgreen Co. | 541,501 | | 20,040,952 |
| | 314,125,826 |
Food Products - 0.6% |
Bunge Ltd. | 360,992 | | 26,240,508 |
Green Mountain Coffee Roasters, Inc. (a) | 197,119 | | 8,152,842 |
Mead Johnson Nutrition Co. Class A | 499,180 | | 32,890,970 |
Nestle SA | 402,800 | | 26,280,070 |
Unilever NV (NY Reg.) | 132,581 | | 5,077,852 |
| | 98,642,242 |
Household Products - 2.2% |
Colgate-Palmolive Co. | 411,231 | | 42,990,089 |
Procter & Gamble Co. | 4,721,058 | | 320,512,628 |
| | 363,502,717 |
Personal Products - 0.2% |
L'Oreal SA | 213,216 | | 29,667,395 |
Nu Skin Enterprises, Inc. Class A (d) | 256,858 | | 9,516,589 |
| | 39,183,984 |
Tobacco - 2.1% |
Altria Group, Inc. | 1,702,809 | | 53,502,259 |
British American Tobacco PLC sponsored ADR | 2,378,293 | | 240,802,166 |
Philip Morris International, Inc. | 386,892 | | 32,359,647 |
Souza Cruz SA | 586,300 | | 8,928,288 |
| | 335,592,360 |
TOTAL CONSUMER STAPLES | | 1,714,825,748 |
ENERGY - 10.8% |
Energy Equipment & Services - 2.4% |
Cameron International Corp. (a) | 945,980 | | 53,410,031 |
Ensco PLC Class A | 1,153,801 | | 68,397,323 |
Forum Energy Technologies, Inc. | 595,150 | | 14,729,963 |
Halliburton Co. | 757,856 | | 26,290,025 |
National Oilwell Varco, Inc. | 1,133,592 | | 77,481,013 |
Noble Corp. | 1,288,601 | | 44,869,087 |
Common Stocks - continued |
| Shares | | Value |
ENERGY - continued |
Energy Equipment & Services - continued |
Ocean Rig UDW, Inc. (United States) (a) | 792,900 | | $ 11,869,713 |
Oceaneering International, Inc. | 271,218 | | 14,588,816 |
Oil States International, Inc. (a) | 126,678 | | 9,062,544 |
Schlumberger Ltd. | 748,379 | | 51,855,181 |
Vantage Drilling Co. (a) | 7,814,300 | | 14,300,169 |
| | 386,853,865 |
Oil, Gas & Consumable Fuels - 8.4% |
Anadarko Petroleum Corp. | 1,360,903 | | 101,128,702 |
Apache Corp. | 716,928 | | 56,278,848 |
Chevron Corp. | 1,656,911 | | 179,178,356 |
Cobalt International Energy, Inc. (a) | 571,609 | | 14,038,717 |
ENI SpA sponsored ADR | 384,700 | | 18,904,158 |
EQT Corp. | 431,100 | | 25,426,278 |
Exxon Mobil Corp. | 4,503,070 | | 389,740,709 |
Falkland Oil & Gas Ltd. (a)(d) | 890,671 | | 416,729 |
Hess Corp. | 873,800 | | 46,276,448 |
InterOil Corp. (a)(d) | 403,982 | | 22,433,120 |
Marathon Oil Corp. | 2,278,558 | | 69,860,588 |
Marathon Petroleum Corp. | 1,229,405 | | 77,452,515 |
Murphy Oil Corp. | 538,295 | | 32,055,467 |
Noble Energy, Inc. | 423,250 | | 43,061,455 |
Northern Tier Energy LP Class A | 358,134 | | 9,110,929 |
Occidental Petroleum Corp. | 847,711 | | 64,943,140 |
PBF Energy, Inc. | 152,100 | | 4,418,505 |
Phillips 66 | 488,082 | | 25,917,154 |
Royal Dutch Shell PLC Class B sponsored ADR | 1,027,688 | | 72,852,802 |
Southcross Energy Partners LP | 167,700 | | 3,961,074 |
Suncor Energy, Inc. | 1,982,110 | | 65,180,274 |
The Williams Companies, Inc. | 1,318,400 | | 43,164,416 |
Western Gas Equity Partners LP | 59,300 | | 1,776,035 |
| | 1,367,576,419 |
TOTAL ENERGY | | 1,754,430,284 |
FINANCIALS - 15.9% |
Capital Markets - 1.6% |
Ameriprise Financial, Inc. | 1,117,823 | | 70,009,254 |
BlackRock, Inc. Class A | 258,134 | | 53,358,879 |
E*TRADE Financial Corp. (a) | 972,427 | | 8,703,222 |
Evercore Partners, Inc. Class A | 361,500 | | 10,913,685 |
Goldman Sachs Group, Inc. | 214,700 | | 27,387,132 |
Invesco Ltd. | 705,493 | | 18,406,312 |
Morgan Stanley | 1,432,497 | | 27,389,343 |
TD Ameritrade Holding Corp. | 860,606 | | 14,466,787 |
The Blackstone Group LP | 1,329,635 | | 20,729,010 |
UBS AG | 401,916 | | 6,289,536 |
| | 257,653,160 |
|
| Shares | | Value |
Commercial Banks - 3.0% |
CIT Group, Inc. (a) | 560,512 | | $ 21,658,184 |
First Horizon National Corp. (d) | 2,146,415 | | 21,270,973 |
Huntington Bancshares, Inc. | 2,227,851 | | 14,235,968 |
KBC Groupe SA | 308,967 | | 10,768,190 |
Lloyds Banking Group PLC (a) | 18,868,433 | | 15,036,146 |
M&T Bank Corp. | 394,200 | | 38,816,874 |
Synovus Financial Corp. | 6,342,186 | | 15,538,356 |
U.S. Bancorp | 7,904,169 | | 252,459,158 |
Wells Fargo & Co. | 3,058,196 | | 104,529,139 |
| | 494,312,988 |
Consumer Finance - 2.7% |
Capital One Financial Corp. | 5,240,510 | | 303,582,744 |
Discover Financial Services | 1,101,844 | | 42,476,086 |
SLM Corp. | 5,677,740 | | 97,259,686 |
| | 443,318,516 |
Diversified Financial Services - 4.7% |
Bank of America Corp. | 20,331,420 | | 235,844,472 |
Citigroup, Inc. | 6,303,698 | | 249,374,293 |
ING Groep NV (Certificaten Van Aandelen) (a) | 916,125 | | 8,701,339 |
JPMorgan Chase & Co. | 6,088,719 | | 267,720,974 |
| | 761,641,078 |
Insurance - 2.4% |
ACE Ltd. | 816,153 | | 65,129,009 |
AFLAC, Inc. | 516,867 | | 27,455,975 |
Berkshire Hathaway, Inc.: | | | |
Class A (a) | 288 | | 38,609,280 |
Class B (a) | 148,412 | | 13,312,556 |
Direct Line Insurance Group PLC | 4,241,500 | | 15,014,558 |
Fairfax Financial Holdings Ltd. (sub. vtg.) | 61,300 | | 22,096,225 |
Hartford Financial Services Group, Inc. | 2,314,667 | | 51,941,127 |
MetLife, Inc. | 1,909,790 | | 62,908,483 |
The Travelers Companies, Inc. | 811,581 | | 58,287,747 |
Validus Holdings Ltd. | 869,357 | | 30,062,365 |
| | 384,817,325 |
Real Estate Investment Trusts - 1.0% |
American Tower Corp. | 1,040,803 | | 80,422,848 |
Camden Property Trust (SBI) | 186,898 | | 12,748,313 |
Equity Lifestyle Properties, Inc. | 352,700 | | 23,733,183 |
Sun Communities, Inc. | 536,569 | | 21,403,737 |
The Macerich Co. | 395,980 | | 23,085,634 |
| | 161,393,715 |
Thrifts & Mortgage Finance - 0.5% |
Ocwen Financial Corp. (a) | 2,150,326 | | 74,379,776 |
TOTAL FINANCIALS | | 2,577,516,558 |
HEALTH CARE - 11.7% |
Biotechnology - 3.6% |
Amgen, Inc. | 2,242,730 | | 193,592,454 |
Common Stocks - continued |
| Shares | | Value |
HEALTH CARE - continued |
Biotechnology - continued |
Biogen Idec, Inc. (a) | 625,707 | | $ 91,772,446 |
BioMarin Pharmaceutical, Inc. (a) | 547,064 | | 26,942,902 |
CSL Ltd. | 778,516 | | 43,952,924 |
Gilead Sciences, Inc. (a) | 1,968,964 | | 144,620,406 |
Onyx Pharmaceuticals, Inc. (a) | 725,607 | | 54,805,097 |
Regeneron Pharmaceuticals, Inc. (a) | 105,175 | | 17,992,287 |
Theravance, Inc. (a) | 449,022 | | 9,999,720 |
| | 583,678,236 |
Health Care Equipment & Supplies - 1.4% |
Covidien PLC | 1,728,797 | | 99,820,739 |
Edwards Lifesciences Corp. (a) | 462,263 | | 41,682,255 |
Quidel Corp. (a)(d) | 1,571,494 | | 29,339,793 |
The Cooper Companies, Inc. | 620,565 | | 57,389,851 |
| | 228,232,638 |
Health Care Providers & Services - 1.9% |
Apollo Hospitals Enterprise Ltd. | 369,766 | | 5,332,791 |
Catamaran Corp. (a) | 678,782 | | 31,977,422 |
CIGNA Corp. | 950,939 | | 50,837,199 |
Henry Schein, Inc. (a) | 783,171 | | 63,013,939 |
McKesson Corp. | 606,550 | | 58,811,088 |
UnitedHealth Group, Inc. | 1,916,227 | | 103,936,152 |
| | 313,908,591 |
Life Sciences Tools & Services - 0.2% |
Agilent Technologies, Inc. | 262,850 | | 10,761,079 |
Fluidigm Corp. (a)(i) | 312,345 | | 4,469,657 |
Thermo Fisher Scientific, Inc. | 321,945 | | 20,533,652 |
| | 35,764,388 |
Pharmaceuticals - 4.6% |
AbbVie, Inc. (f) | 861,300 | | 29,422,008 |
Allergan, Inc. | 984,574 | | 90,314,973 |
Merck & Co., Inc. | 4,081,349 | | 167,090,428 |
Pfizer, Inc. | 14,042,238 | | 352,179,329 |
Sanofi SA sponsored ADR | 423,062 | | 20,044,678 |
Valeant Pharmaceuticals International, Inc. (Canada) (a) | 1,365,134 | | 81,438,677 |
| | 740,490,093 |
TOTAL HEALTH CARE | | 1,902,073,946 |
INDUSTRIALS - 10.5% |
Aerospace & Defense - 2.2% |
Honeywell International, Inc. | 1,954,366 | | 124,043,610 |
MTU Aero Engines Holdings AG | 238,997 | | 21,810,769 |
Raytheon Co. | 598,485 | | 34,448,797 |
Textron, Inc. | 2,802,049 | | 69,462,795 |
United Technologies Corp. | 1,354,398 | | 111,074,180 |
| | 360,840,151 |
|
| Shares | | Value |
Building Products - 0.8% |
Armstrong World Industries, Inc. | 892,006 | | $ 45,251,464 |
Owens Corning (a) | 1,390,083 | | 51,419,170 |
Quanex Building Products Corp. | 1,706,475 | | 34,829,155 |
| | 131,499,789 |
Commercial Services & Supplies - 0.8% |
ADT Corp. | 654,613 | | 30,432,958 |
KAR Auction Services, Inc. | 1,758,582 | | 35,593,700 |
Stericycle, Inc. (a) | 414,999 | | 38,706,957 |
Tyco International Ltd. | 564,726 | | 16,518,236 |
| | 121,251,851 |
Electrical Equipment - 0.8% |
Regal-Beloit Corp. | 862,575 | | 60,785,660 |
Roper Industries, Inc. | 587,612 | | 65,506,986 |
| | 126,292,646 |
Industrial Conglomerates - 2.8% |
Danaher Corp. | 1,810,555 | | 101,210,025 |
General Electric Co. | 17,141,338 | | 359,796,685 |
| | 461,006,710 |
Machinery - 1.8% |
Caterpillar, Inc. | 248,016 | | 22,217,273 |
Cummins, Inc. | 596,113 | | 64,588,844 |
Deere & Co. | 673,224 | | 58,180,018 |
Fiat Industrial SpA | 1,449,772 | | 15,883,076 |
Illinois Tool Works, Inc. | 1,432,786 | | 87,127,717 |
Parker Hannifin Corp. | 560,608 | | 47,685,316 |
| | 295,682,244 |
Professional Services - 0.1% |
Verisk Analytics, Inc. (a) | 251,800 | | 12,841,800 |
Road & Rail - 0.9% |
J.B. Hunt Transport Services, Inc. | 235,601 | | 14,067,736 |
Union Pacific Corp. | 1,014,834 | | 127,584,930 |
| | 141,652,666 |
Trading Companies & Distributors - 0.3% |
W.W. Grainger, Inc. | 256,848 | | 51,978,330 |
TOTAL INDUSTRIALS | | 1,703,046,187 |
INFORMATION TECHNOLOGY - 19.5% |
Communications Equipment - 4.6% |
Acme Packet, Inc. (a) | 906,712 | | 20,056,469 |
ADTRAN, Inc. (d) | 2,785,806 | | 54,434,649 |
Alcatel-Lucent SA sponsored ADR (a)(d) | 5,415,203 | | 7,527,132 |
Ciena Corp. (a) | 1,307,391 | | 20,526,039 |
Finisar Corp. (a) | 3,255,694 | | 53,067,812 |
JDS Uniphase Corp. (a) | 2,862,829 | | 38,762,705 |
Juniper Networks, Inc. (a) | 5,579,744 | | 109,753,564 |
NETGEAR, Inc. (a) | 840,694 | | 33,140,157 |
QUALCOMM, Inc. | 6,603,288 | | 409,535,922 |
| | 746,804,449 |
Common Stocks - continued |
| Shares | | Value |
INFORMATION TECHNOLOGY - continued |
Computers & Peripherals - 6.4% |
Apple, Inc. | 1,703,816 | | $ 908,185,037 |
EMC Corp. (a) | 1,743,195 | | 44,102,834 |
NCR Corp. (a) | 752,260 | | 19,167,585 |
SanDisk Corp. (a) | 1,494,118 | | 65,083,780 |
| | 1,036,539,236 |
Electronic Equipment & Components - 1.1% |
Corning, Inc. | 1,761,316 | | 22,227,808 |
Flextronics International Ltd. (a) | 3,032,133 | | 18,829,546 |
Jabil Circuit, Inc. | 6,014,222 | | 116,014,342 |
TPK Holding Co. Ltd. | 1,534,000 | | 27,075,246 |
| | 184,146,942 |
Internet Software & Services - 1.7% |
eBay, Inc. (a) | 2,317,063 | | 118,216,554 |
Google, Inc. Class A (a) | 154,834 | | 109,834,595 |
Mail.ru Group Ltd.: | | | |
GDR (e) | 494,266 | | 17,052,177 |
GDR (Reg. S) | 246,700 | | 8,616,788 |
Yandex NV (a) | 800,300 | | 17,262,471 |
| | 270,982,585 |
IT Services - 0.9% |
Accenture PLC Class A | 491,412 | | 32,678,898 |
Fidelity National Information Services, Inc. | 1,174,869 | | 40,897,190 |
Fiserv, Inc. (a) | 230,086 | | 18,183,697 |
Visa, Inc. Class A | 347,302 | | 52,644,037 |
| | 144,403,822 |
Semiconductors & Semiconductor Equipment - 3.2% |
Altera Corp. | 2,171,381 | | 74,782,362 |
Analog Devices, Inc. | 4,243,006 | | 178,460,832 |
ARM Holdings PLC sponsored ADR | 618,300 | | 23,390,289 |
ASML Holding NV | 233,729 | | 15,054,485 |
Avago Technologies Ltd. | 826,943 | | 26,181,015 |
Fairchild Semiconductor International, Inc. (a) | 2,185,365 | | 31,469,256 |
Integrated Device Technology, Inc. (a) | 3,031,355 | | 22,128,892 |
International Rectifier Corp. (a) | 772,566 | | 13,697,595 |
Micron Technology, Inc. (a) | 6,858,616 | | 43,552,212 |
NXP Semiconductors NV (a) | 1,838,572 | | 48,483,144 |
ON Semiconductor Corp. (a) | 4,190,219 | | 29,541,044 |
PMC-Sierra, Inc. (a) | 4,304,298 | | 22,425,393 |
| | 529,166,519 |
Software - 1.6% |
Check Point Software Technologies Ltd. (a) | 264,421 | | 12,597,016 |
Citrix Systems, Inc. (a) | 1,521,588 | | 100,044,411 |
Electronic Arts, Inc. (a) | 3,412,863 | | 49,588,899 |
Intuit, Inc. | 742,200 | | 44,160,900 |
|
| Shares | | Value |
Jive Software, Inc. | 300,826 | | $ 4,371,002 |
Oracle Corp. | 997,236 | | 33,227,904 |
VMware, Inc. Class A (a) | 154,125 | | 14,509,328 |
| | 258,499,460 |
TOTAL INFORMATION TECHNOLOGY | | 3,170,543,013 |
MATERIALS - 3.6% |
Chemicals - 2.8% |
Air Products & Chemicals, Inc. | 748,768 | | 62,911,487 |
Albemarle Corp. | 413,094 | | 25,661,399 |
Ashland, Inc. | 169,248 | | 13,609,232 |
Eastman Chemical Co. | 819,603 | | 55,773,984 |
Ecolab, Inc. | 579,682 | | 41,679,136 |
FMC Corp. | 280,854 | | 16,435,576 |
LyondellBasell Industries NV Class A | 986,136 | | 56,298,504 |
Monsanto Co. | 881,690 | | 83,451,959 |
Sherwin-Williams Co. | 324,896 | | 49,975,503 |
Sigma Aldrich Corp. | 598,515 | | 44,038,734 |
| | 449,835,514 |
Construction Materials - 0.1% |
Vulcan Materials Co. | 501,355 | | 26,095,528 |
Containers & Packaging - 0.5% |
Ball Corp. | 775,366 | | 34,697,629 |
Rock-Tenn Co. Class A | 659,686 | | 46,118,648 |
| | 80,816,277 |
Metals & Mining - 0.2% |
Goldcorp, Inc. | 895,533 | | 32,924,140 |
TOTAL MATERIALS | | 589,671,459 |
TELECOMMUNICATION SERVICES - 2.4% |
Diversified Telecommunication Services - 1.7% |
AT&T, Inc. | 320,644 | | 10,808,909 |
CenturyLink, Inc. | 1,845,501 | | 72,195,999 |
inContact, Inc. (a) | 1,155,834 | | 5,987,220 |
Verizon Communications, Inc. | 4,359,171 | | 188,621,329 |
| | 277,613,457 |
Wireless Telecommunication Services - 0.7% |
SBA Communications Corp. Class A (a) | 797,069 | | 56,607,840 |
Sprint Nextel Corp. (a) | 6,694,118 | | 37,955,649 |
Vodafone Group PLC sponsored ADR | 760,900 | | 19,167,071 |
| | 113,730,560 |
TOTAL TELECOMMUNICATION SERVICES | | 391,344,017 |
UTILITIES - 3.5% |
Electric Utilities - 2.0% |
American Electric Power Co., Inc. | 1,288,179 | | 54,979,480 |
Duke Energy Corp. | 1,712,983 | | 109,288,315 |
Edison International | 1,653,226 | | 74,709,283 |
Exelon Corp. | 102,045 | | 3,034,818 |
Common Stocks - continued |
| Shares | | Value |
UTILITIES - continued |
Electric Utilities - continued |
FirstEnergy Corp. | 679,149 | | $ 28,361,262 |
NextEra Energy, Inc. | 708,413 | | 49,015,095 |
| | 319,388,253 |
Gas Utilities - 0.1% |
ONEOK, Inc. | 285,359 | | 12,199,097 |
Independent Power Producers & Energy Traders - 0.4% |
NRG Energy, Inc. | 1,749,552 | | 40,222,200 |
The AES Corp. | 3,245,959 | | 34,731,761 |
| | 74,953,961 |
Multi-Utilities - 1.0% |
CenterPoint Energy, Inc. | 1,626,574 | | 31,311,550 |
NiSource, Inc. | 860,177 | | 21,409,806 |
PG&E Corp. | 689,134 | | 27,689,404 |
Sempra Energy | 1,090,974 | | 77,393,696 |
| | 157,804,456 |
TOTAL UTILITIES | | 564,345,767 |
TOTAL COMMON STOCKS (Cost $13,249,699,303) |
16,075,810,858
|
Convertible Preferred Stocks - 0.1% |
| | | |
CONSUMER DISCRETIONARY - 0.1% |
Media - 0.1% |
Jumptap, Inc. Series G (i) | | | | |
(Cost $8,211,980) | | 1,141,504 | | 8,211,980 |
Convertible Bonds - 0.0% |
| Principal
Amount | | |
ENERGY - 0.0% |
Oil, Gas & Consumable Fuels - 0.0% |
Cobalt International Energy, Inc. 2.625% 12/1/19 | | | | |
(Cost $4,416,625) | | $ 4,450,000 | | 4,483,375 |
U.S. Treasury Obligations - 0.0% |
|
U.S. Treasury Bills, yield at date of purchase 0.08% 2/14/13 to 2/21/13 (g)
(Cost $5,699,405) | | 5,700,000 | |
5,699,709
|
Money Market Funds - 2.0% |
| Shares | | Value |
Fidelity Cash Central Fund, 0.18% (b) | 224,491,067 | | $ 224,491,067 |
Fidelity Securities Lending Cash Central Fund, 0.18% (b)(c) | 103,069,446 | | 103,069,446 |
TOTAL MONEY MARKET FUNDS (Cost $327,560,513) |
327,560,513
|
TOTAL INVESTMENT PORTFOLIO - 101.0% (Cost $13,595,587,826) | 16,421,766,435 |
NET OTHER ASSETS (LIABILITIES) - (1.0)% | | (158,416,569) |
NET ASSETS - 100% | $ 16,263,349,866 |
Futures Contracts |
| Expiration
Date | | Underlying
Face Amount
at Value | | Unrealized
Appreciation/
(Depreciation) |
Purchased |
Equity Index Contracts |
297 CME E-mini S&P 500 Index Contracts | March 2013 | | $ 21,088,485 | | $ 156,236 |
|
The face value of futures purchased as a percentage of net assets is 0.1% |
Legend |
(a) Non-income producing |
(b) Affiliated fund that is available only to investment companies and other accounts managed by Fidelity Investments. The rate quoted is the annualized seven-day yield of the fund at period end. A complete unaudited listing of the fund's holdings as of its most recent quarter end is available upon request. In addition, each Fidelity Central Fund's financial statements, which are not covered by the Fund's Report of Independent Registered Public Accounting Firm, are available on the SEC's website or upon request. |
(c) Investment made with cash collateral received from securities on loan. |
(d) Security or a portion of the security is on loan at period end. |
(e) Security exempt from registration under Rule 144A of the Securities Act of 1933. These securities may be resold in transactions exempt from registration, normally to qualified institutional buyers. At the end of the period, the value of these securities amounted to $17,052,177 or 0.1% of net assets. |
(f) Security or a portion of the security purchased on a delayed delivery or when-issued basis. |
(g) Security or a portion of the security was pledged to cover margin requirements for futures contracts. At the period end, the value of securities pledged amounted to $3,399,830. |
(h) Investment is owned by an entity that is treated as a corporation for U.S. tax purposes which is owned by the Fund. |
(i) Restricted securities - Investment in securities not registered under the Securities Act of 1933 (excluding 144A issues). At the end of the period, the value of restricted securities (excluding 144A issues) amounted to $20,815,019 or 0.1% of net assets. |
Additional information on each restricted holding is as follows: |
Security | Acquisition Date | Acquisition Cost |
Fluidigm Corp. | 10/9/07 - 1/6/11 | $ 5,645,236 |
Jumptap, Inc. Series G | 6/29/12 | $ 8,211,980 |
Legend Pictures LLC | 9/23/10 | $ 1,546,500 |
Weinstein Co. Holdings LLC Class A-1 | 10/19/05 | $ 11,499,000 |
Affiliated Central Funds |
Information regarding fiscal year to date income earned by the Fund from investments in Fidelity Central Funds is as follows: |
Fund | Income earned |
Fidelity Cash Central Fund | $ 465,967 |
Fidelity Securities Lending Cash Central Fund | 1,950,509 |
Total | $ 2,416,476 |
Other Affiliated Issuers |
An affiliated company is a company in which the Fund has ownership of at least 5% of the voting securities. Fiscal year to date transactions with companies which are or were affiliates are as follows: |
Affiliate | Value,
beginning of
period | Purchases | Sales
Proceeds | Dividend
Income | Value,
end of
period |
Kayak Software Corp. | $ - | $ 10,143,022 | $ 14,336,521 | $ - | $ - |
Other Information |
The following is a summary of the inputs used, as of December 31, 2012, involving the Fund's assets and liabilities carried at fair value. The inputs or methodology used for valuing securities may not be an indication of the risk associated with investing in those securities. For more information on valuation inputs, and their aggregation into the levels used in the tables below, please refer to the Investment Valuation section in the accompanying Notes to Financial Statements. |
Valuation Inputs at Reporting Date: |
Description | Total | Level 1 | Level 2 | Level 3 |
Investments in Securities: | | | | |
Equities: | | | | |
Consumer Discretionary | $ 1,716,225,859 | $ 1,699,880,493 | $ - | $ 16,345,366 |
Consumer Staples | 1,714,825,748 | 1,528,892,942 | 185,932,806 | - |
Energy | 1,754,430,284 | 1,754,013,555 | 416,729 | - |
Financials | 2,577,516,558 | 2,521,706,789 | 55,809,769 | - |
Health Care | 1,902,073,946 | 1,852,788,231 | 49,285,715 | - |
Industrials | 1,703,046,187 | 1,665,352,342 | 37,693,845 | - |
Information Technology | 3,170,543,013 | 3,161,926,225 | 8,616,788 | - |
Materials | 589,671,459 | 589,671,459 | - | - |
Telecommunication Services | 391,344,017 | 391,344,017 | - | - |
Utilities | 564,345,767 | 564,345,767 | - | - |
Corporate Bonds | 4,483,375 | - | 4,483,375 | - |
U.S. Government and Government Agency Obligations | 5,699,709 | - | 5,699,709 | - |
Money Market Funds | 327,560,513 | 327,560,513 | - | - |
Total Investments in Securities: | $ 16,421,766,435 | $ 16,057,482,333 | $ 347,938,736 | $ 16,345,366 |
Derivative Instruments: | | | | |
Assets | | | | |
Futures Contracts | $ 156,236 | $ 156,236 | $ - | $ - |
The following is a summary of transfers between Level 1 and Level 2 for the period ended December 31, 2012. Transfers are assumed to have occurred at the beginning of the period, and are primarily attributable to the valuation techniques used for foreign equity securities, as discussed in the accompanying Notes to Financial Statements: |
Transfers | Total |
Level 1 to Level 2 | $ 185,071,913 |
Level 2 to Level 1 | $ 0 |
Value of Derivative Instruments |
The following table is a summary of the Fund's value of derivative instruments by primary risk exposure as of December 31, 2012. For additional information on derivative instruments, please refer to the Derivative Instruments section in the accompanying Notes to Financial Statements. |
Primary Risk Exposure /
Derivative Type | Value |
| Asset | Liability |
Equity Risk | | |
Futures Contracts (a) | $ 156,236 | $ - |
Total Value of Derivatives | $ 156,236 | $ - |
(a) Reflects cumulative appreciation/(depreciation) on futures contracts as disclosed on the Schedule of Investments. Only the period end variation margin is separately disclosed on the Statement of Assets and Liabilities. |
Distribution of investments by country or territory of incorporation, as a percentage of total net assets, is as follows. (Unaudited) |
United States of America | 88.9% |
United Kingdom | 3.0% |
Canada | 1.5% |
Switzerland | 1.0% |
Others (Individually Less Than 1%) | 5.6% |
| 100.0% |
See accompanying notes which are an integral part of the financial statements.
Annual Report
Statement of Assets and Liabilities
| December 31, 2012 |
| | |
Assets | | |
Investment in securities, at value (including securities loaned of $100,763,476) - See accompanying schedule: Unaffiliated issuers (cost $13,268,027,313) | $ 16,094,205,922 | |
Fidelity Central Funds (cost $327,560,513) | 327,560,513 | |
Total Investments (cost $13,595,587,826) | | $ 16,421,766,435 |
Cash | | 29,160,623 |
Receivable for investments sold | | 47,362,167 |
Receivable for fund shares sold | | 9,108,446 |
Dividends receivable | | 15,474,327 |
Interest receivable | | 4,543 |
Distributions receivable from Fidelity Central Funds | | 119,404 |
Receivable for daily variation margin on futures contracts | | 983,268 |
Prepaid expenses | | 45,558 |
Other receivables | | 2,469,427 |
Total assets | | 16,526,494,198 |
| | |
Liabilities | | |
Payable for investments purchased | | |
Regular delivery | $ 103,207,531 | |
Delayed delivery | 28,741,380 | |
Payable for fund shares redeemed | 14,959,516 | |
Accrued management fee | 7,543,414 | |
Distribution and service plan fees payable | 1,728,983 | |
Other affiliated payables | 3,268,793 | |
Other payables and accrued expenses | 625,269 | |
Collateral on securities loaned, at value | 103,069,446 | |
Total liabilities | | 263,144,332 |
| | |
Net Assets | | $ 16,263,349,866 |
Net Assets consist of: | | |
Paid in capital | | $ 16,195,567,898 |
Distribution in excess of net investment income | | (587,200) |
Accumulated undistributed net realized gain (loss) on investments and foreign currency transactions | | (2,757,990,758) |
Net unrealized appreciation (depreciation) on investments and assets and liabilities in foreign currencies | | 2,826,359,926 |
Net Assets | | $ 16,263,349,866 |
Statement of Assets and Liabilities - continued
| December 31, 2012 |
| | |
Initial Class:
Net Asset Value, offering price and redemption price per share ($6,440,357,464 ÷ 243,546,878 shares) | | $ 26.44 |
| | |
Service Class:
Net Asset Value, offering price and redemption price per share ($1,374,780,827 ÷ 52,157,247 shares) | | $ 26.36 |
| | |
Service Class 2:
Net Asset Value, offering price and redemption price per share ($7,740,640,006 ÷ 297,722,136 shares) | | $ 26.00 |
| | |
Service Class 2R:
Net Asset Value, offering price and redemption price per share ($8,726,568 ÷ 336,211 shares) | | $ 25.96 |
| | |
Investor Class:
Net Asset Value, offering price and redemption price per share ($698,845,001 ÷ 26,521,443 shares) | | $ 26.35 |
See accompanying notes which are an integral part of the financial statements.
Annual Report
Financial Statements - continued
Statement of Operations
| Year ended December 31, 2012 |
| | |
Investment Income | | |
Dividends | | $ 304,813,686 |
Interest | | 14,706 |
Income from Fidelity Central Funds | | 2,416,476 |
Total income | | 307,244,868 |
| | |
Expenses | | |
Management fee | $ 90,534,257 | |
Transfer agent fees | 11,970,438 | |
Distribution and service plan fees | 20,684,650 | |
Accounting and security lending fees | 1,571,978 | |
Custodian fees and expenses | 336,075 | |
Independent trustees' compensation | 107,956 | |
Appreciation in deferred trustee compensation account | 29 | |
Audit | 98,886 | |
Legal | 81,391 | |
Miscellaneous | 166,919 | |
Total expenses before reductions | 125,552,579 | |
Expense reductions | (2,620,811) | 122,931,768 |
Net investment income (loss) | | 184,313,100 |
Realized and Unrealized Gain (Loss) Net realized gain (loss) on: | | |
Investment securities: | | |
Unaffiliated issuers | 621,363,243 | |
Other affiliated issuers | 4,193,500 | |
Foreign currency transactions | (237,111) | |
Futures contracts | 10,598,796 | |
Total net realized gain (loss) | | 635,918,428 |
Change in net unrealized appreciation (depreciation) on: Investment securities | 1,584,289,235 | |
Assets and liabilities in foreign currencies | 21,036 | |
Futures contracts | 182,961 | |
Total change in net unrealized appreciation (depreciation) | | 1,584,493,232 |
Net gain (loss) | | 2,220,411,660 |
Net increase (decrease) in net assets resulting from operations | | $ 2,404,724,760 |
Statement of Changes in Net Assets
| Year ended
December 31,
2012 | Year ended
December 31,
2011 |
Increase (Decrease) in Net Assets | | |
Operations | | |
Net investment income (loss) | $ 184,313,100 | $ 145,885,373 |
Net realized gain (loss) | 635,918,428 | 923,774,773 |
Change in net unrealized appreciation (depreciation) | 1,584,493,232 | (1,481,460,012) |
Net increase (decrease) in net assets resulting from operations | 2,404,724,760 | (411,799,866) |
Distributions to shareholders from net investment income | (189,531,129) | (141,940,543) |
Distributions to shareholders from net realized gains | (8,351,979) | - |
Total distributions | (197,883,108) | (141,940,543) |
Share transactions - net increase (decrease) | (899,286,819) | (1,239,479,004) |
Redemption fees | 69 | 8,960 |
Total increase (decrease) in net assets | 1,307,554,902 | (1,793,210,453) |
| | |
Net Assets | | |
Beginning of period | 14,955,794,964 | 16,749,005,417 |
End of period (including distributions in excess of net investment income of $587,200 and distributions in excess of net investment income of $2,498,208, respectively) | $ 16,263,349,866 | $ 14,955,794,964 |
See accompanying notes which are an integral part of the financial statements.
Annual Report
Financial Highlights - Initial Class
Years ended December 31, | 2012 | 2011 | 2010 | 2009 | 2008 |
Selected Per-Share Data | | | | | |
Net asset value, beginning of period | $ 23.02 | $ 23.88 | $ 20.62 | $ 15.39 | $ 27.90 |
Income from Investment Operations | | | | | |
Net investment income (loss) C | .32 | .25 | .23 | .23 | .24 |
Net realized and unrealized gain (loss) | 3.46 | (.86) | 3.31 | 5.26 | (11.87) |
Total from investment operations | 3.78 | (.61) | 3.54 | 5.49 | (11.63) |
Distributions from net investment income | (.34) I | (.25) | (.27) | (.25) | (.23) |
Distributions from net realized gain | (.01) I | - | (.01) | (.01) | (.65) |
Total distributions | (.36) J | (.25) | (.28) | (.26) H | (.88) |
Redemption fees added to paid in capital C, G | - | - | - | - | - |
Net asset value, end of period | $ 26.44 | $ 23.02 | $ 23.88 | $ 20.62 | $ 15.39 |
Total Return A, B | 16.42% | (2.53)% | 17.22% | 35.71% | (42.51)% |
Ratios to Average Net Assets D, F | | | | | |
Expenses before reductions | .64% | .65% | .65% | .67% | .66% |
Expenses net of fee waivers, if any | .64% | .64% | .65% | .67% | .66% |
Expenses net of all reductions | .63% | .63% | .63% | .65% | .65% |
Net investment income (loss) | 1.27% | 1.03% | 1.06% | 1.33% | 1.07% |
Supplemental Data | | | | | |
Net assets, end of period (000 omitted) | $ 6,440,357 | $ 6,113,440 | $ 7,160,125 | $ 7,405,228 | $ 6,240,871 |
Portfolio turnover rate E | 87% | 135% | 117% | 145% | 172% |
A Total returns do not reflect charges attributable to your insurance company's separate account. Inclusion of these charges would reduce the total returns shown.
B Total returns would have been lower if certain expenses had not been reduced during the applicable periods shown.
C Calculated based on average shares outstanding during the period.
D Fees and expenses of any underlying Fidelity Central Funds are not included in the Fund's expense ratio. The Fund indirectly bears its proportionate share of the expenses of any underlying Fidelity Central Funds.
E Amount does not include the portfolio activity of any underlying Fidelity Central Funds.
F Expense ratios reflect operating expenses of the class. Expenses before reductions do not reflect amounts reimbursed by the investment adviser or reductions from brokerage service arrangements or reductions from other expense offset arrangements and do not represent the amount paid by the class during periods when reimbursements or reductions occur. Expenses net of fee waivers reflect expenses after reimbursement by the investment adviser but prior to reductions from brokerage service arrangements or other expense offset arrangements. Expenses net of all reductions represent the net expenses paid by the class.
G Amount represents less than $.01 per share.
H Total distributions of $.26 per share is comprised of distributions from net investment income of $.250 and distributions from net realized gain of $.005 per share.
I The amount shown reflects certain reclassifications related to book to tax differences.
J Total distributions of $.36 per share is comprised of distribution from net investment income of $.342 and distribution from net realized gain of $.013 per share.
Financial Highlights - Service Class
Years ended December 31, | 2012 | 2011 | 2010 | 2009 | 2008 |
Selected Per-Share Data | | | | | |
Net asset value, beginning of period | $ 22.95 | $ 23.81 | $ 20.55 | $ 15.33 | $ 27.80 |
Income from Investment Operations | | | | | |
Net investment income (loss) C | .30 | .22 | .20 | .21 | .21 |
Net realized and unrealized gain (loss) | 3.44 | (.85) | 3.31 | 5.25 | (11.83) |
Total from investment operations | 3.74 | (.63) | 3.51 | 5.46 | (11.62) |
Distributions from net investment income | (.32) I | (.23) | (.24) | (.23) | (.20) |
Distributions from net realized gain | (.01) I | - | (.01) | (.01) | (.65) |
Total distributions | (.33) | (.23) | (.25) | (.24) H | (.85) |
Redemption fees added to paid in capital C, G | - | - | - | - | - |
Net asset value, end of period | $ 26.36 | $ 22.95 | $ 23.81 | $ 20.55 | $ 15.33 |
Total Return A, B | 16.31% | (2.64)% | 17.11% | 35.66% | (42.61)% |
Ratios to Average Net Assets D, F | | | | | |
Expenses before reductions | .74% | .75% | .75% | .77% | .76% |
Expenses net of fee waivers, if any | .74% | .74% | .75% | .77% | .76% |
Expenses net of all reductions | .73% | .73% | .73% | .75% | .75% |
Net investment income (loss) | 1.16% | .93% | .96% | 1.23% | .97% |
Supplemental Data | | | | | |
Net assets, end of period (000 omitted) | $ 1,374,781 | $ 1,277,101 | $ 1,379,305 | $ 1,784,820 | $ 1,497,734 |
Portfolio turnover rate E | 87% | 135% | 117% | 145% | 172% |
A Total returns do not reflect charges attributable to your insurance company's separate account. Inclusion of these charges would reduce the total returns shown.
B Total returns would have been lower if certain expenses had not been reduced during the applicable periods shown.
C Calculated based on average shares outstanding during the period.
D Fees and expenses of any underlying Fidelity Central Funds are not included in the Fund's expense ratio. The Fund indirectly bears its proportionate share of the expenses of any underlying Fidelity Central Funds.
E Amount does not include the portfolio activity of any underlying Fidelity Central Funds.
F Expense ratios reflect operating expenses of the class. Expenses before reductions do not reflect amounts reimbursed by the investment adviser or reductions from brokerage service arrangements or reductions from other expense offset arrangements and do not represent the amount paid by the class during periods when reimbursements or reductions occur. Expenses net of fee waivers reflect expenses after reimbursement by the investment adviser but prior to reductions from brokerage service arrangements or other expense offset arrangements. Expenses net of all reductions represent the net expenses paid by the class.
G Amount represents less than $.01 per share.
H Total distributions of $.24 per share is comprised of distributions from net investment income of $.232 and distributions from net realized gain of $.005 per share.
I The amount shown reflects certain reclassifications related to book to tax differences.
See accompanying notes which are an integral part of the financial statements.
Annual Report
Financial Highlights - Service Class 2
Years ended December 31, | 2012 | 2011 | 2010 | 2009 | 2008 |
Selected Per-Share Data | | | | | |
Net asset value, beginning of period | $ 22.64 | $ 23.49 | $ 20.29 | $ 15.14 | $ 27.46 |
Income from Investment Operations | | | | | |
Net investment income (loss) C | .26 | .18 | .17 | .18 | .18 |
Net realized and unrealized gain (loss) | 3.39 | (.84) | 3.26 | 5.18 | (11.67) |
Total from investment operations | 3.65 | (.66) | 3.43 | 5.36 | (11.49) |
Distributions from net investment income | (.28) I | (.19) | (.22) | (.21) | (.18) |
Distributions from net realized gain | (.01) I | - | (.01) | (.01) | (.65) |
Total distributions | (.29) | (.19) | (.23) | (.21) H | (.83) |
Redemption fees added to paid in capital C, G | - | - | - | - | - |
Net asset value, end of period | $ 26.00 | $ 22.64 | $ 23.49 | $ 20.29 | $ 15.14 |
Total Return A, B | 16.14% | (2.78)% | 16.93% | 35.47% | (42.69)% |
Ratios to Average Net Assets D, F | | | | | |
Expenses before reductions | .89% | .90% | .90% | .92% | .91% |
Expenses net of fee waivers, if any | .89% | .89% | .90% | .92% | .91% |
Expenses net of all reductions | .88% | .88% | .88% | .90% | .90% |
Net investment income (loss) | 1.02% | .78% | .81% | 1.08% | .82% |
Supplemental Data | | | | | |
Net assets, end of period (000 omitted) | $ 7,740,640 | $ 6,980,191 | $ 7,627,793 | $ 7,577,737 | $ 6,187,985 |
Portfolio turnover rate E | 87% | 135% | 117% | 145% | 172% |
A Total returns do not reflect charges attributable to your insurance company's separate account. Inclusion of these charges would reduce the total returns shown.
B Total returns would have been lower if certain expenses had not been reduced during the applicable periods shown.
C Calculated based on average shares outstanding during the period.
D Fees and expenses of any underlying Fidelity Central Funds are not included in the Fund's expense ratio. The Fund indirectly bears its proportionate share of the expenses of any underlying Fidelity Central Funds.
E Amount does not include the portfolio activity of any underlying Fidelity Central Funds.
F Expense ratios reflect operating expenses of the class. Expenses before reductions do not reflect amounts reimbursed by the investment adviser or reductions from brokerage service arrangements or reductions from other expense offset arrangements and do not represent the amount paid by the class during periods when reimbursements or reductions occur. Expenses net of fee waivers reflect expenses after reimbursement by the investment adviser but prior to reductions from brokerage service arrangements or other expense offset arrangements. Expenses net of all reductions represent the net expenses paid by the class.
G Amount represents less than $.01 per share.
H Total distributions of $.21 per share is comprised of distributions from net investment income of $.205 and distributions from net realized gain of $.005 per share.
I The amount shown reflects certain reclassifications related to book to tax differences.
Financial Highlights - Service Class 2R
Years ended December 31, | 2012 | 2011 | 2010 | 2009 | 2008 |
Selected Per-Share Data | | | | | |
Net asset value, beginning of period | $ 22.60 | $ 23.44 | $ 20.24 | $ 15.10 | $ 27.35 |
Income from Investment Operations | | | | | |
Net investment income (loss) C | .26 | .18 | .17 | .18 | .18 |
Net realized and unrealized gain (loss) | 3.39 | (.84) | 3.25 | 5.17 | (11.62) |
Total from investment operations | 3.65 | (.66) | 3.42 | 5.35 | (11.44) |
Distributions from net investment income | (.27) I | (.18) | (.21) | (.20) | (.16) |
Distributions from net realized gain | (.01) I | - | (.01) | (.01) | (.65) |
Total distributions | (.29) J | (.18) | (.22) | (.21) H | (.81) |
Redemption fees added to paid in capital C, G | - | - | - | - | - |
Net asset value, end of period | $ 25.96 | $ 22.60 | $ 23.44 | $ 20.24 | $ 15.10 |
Total Return A, B | 16.15% | (2.79)% | 16.94% | 35.46% | (42.69)% |
Ratios to Average Net Assets D, F | | | | | |
Expenses before reductions | .89% | .90% | .90% | .92% | .91% |
Expenses net of fee waivers, if any | .89% | .89% | .90% | .92% | .91% |
Expenses net of all reductions | .88% | .88% | .88% | .90% | .90% |
Net investment income (loss) | 1.02% | .78% | .81% | 1.08% | .82% |
Supplemental Data | | | | | |
Net assets, end of period (000 omitted) | $ 8,727 | $ 8,042 | $ 10,942 | $ 13,285 | $ 13,585 |
Portfolio turnover rate E | 87% | 135% | 117% | 145% | 172% |
A Total returns do not reflect charges attributable to your insurance company's separate account. Inclusion of these charges would reduce the total returns shown.
B Total returns would have been lower if certain expenses had not been reduced during the applicable periods shown.
C Calculated based on average shares outstanding during the period.
D Fees and expenses of any underlying Fidelity Central Funds are not included in the Fund's expense ratio. The Fund indirectly bears its proportionate share of the expenses of any underlying Fidelity Central Funds.
E Amount does not include the portfolio activity of any underlying Fidelity Central Funds.
F Expense ratios reflect operating expenses of the class. Expenses before reductions do not reflect amounts reimbursed by the investment adviser or reductions from brokerage service arrangements or reductions from other expense offset arrangements and do not represent the amount paid by the class during periods when reimbursements or reductions occur. Expenses net of fee waivers reflect expenses after reimbursement by the investment adviser but prior to reductions from brokerage service arrangements or other expense offset arrangements. Expenses net of all reductions represent the net expenses paid by the class.
G Amount represents less than $.01 per share.
H Total distributions of $.21 per share is comprised of distributions from net investment income of $.200 and distributions from net realized gain of $.005 per share.
I The amount shown reflects certain reclassifications related to book to tax differences.
J Total distributions of $.29 per share is comprised of distribution from net investment income of $.274 and distribution from net realized gain of $.013 per share.
See accompanying notes which are an integral part of the financial statements.
Annual Report
Financial Highlights - Investor Class
Years ended December 31, | 2012 | 2011 | 2010 | 2009 | 2008 |
Selected Per-Share Data | | | | | |
Net asset value, beginning of period | $ 22.94 | $ 23.80 | $ 20.56 | $ 15.34 | $ 27.82 |
Income from Investment Operations | | | | | |
Net investment income (loss) C | .30 | .23 | .21 | .21 | .21 |
Net realized and unrealized gain (loss) | 3.45 | (.86) | 3.30 | 5.25 | (11.83) |
Total from investment operations | 3.75 | (.63) | 3.51 | 5.46 | (11.62) |
Distributions from net investment income | (.32) I | (.23) | (.26) | (.24) | (.21) |
Distributions from net realized gain | (.01) I | - | (.01) | (.01) | (.65) |
Total distributions | (.34) J | (.23) | (.27) | (.24) H | (.86) |
Redemption fees added to paid in capital C, G | - | - | - | - | - |
Net asset value, end of period | $ 26.35 | $ 22.94 | $ 23.80 | $ 20.56 | $ 15.34 |
Total Return A, B | 16.34% | (2.62)% | 17.10% | 35.66% | (42.60)% |
Ratios to Average Net Assets D, F | | | | | |
Expenses before reductions | .73% | .73% | .74% | .77% | .75% |
Expenses net of fee waivers, if any | .73% | .73% | .73% | .77% | .75% |
Expenses net of all reductions | .71% | .71% | .72% | .75% | .74% |
Net investment income (loss) | 1.18% | .94% | .98% | 1.23% | .98% |
Supplemental Data | | | | | |
Net assets, end of period (000 omitted) | $ 698,845 | $ 577,021 | $ 570,841 | $ 457,476 | $ 324,919 |
Portfolio turnover rate E | 87% | 135% | 117% | 145% | 172% |
A Total returns do not reflect charges attributable to your insurance company's separate account. Inclusion of these charges would reduce the total returns shown.
B Total returns would have been lower if certain expenses had not been reduced during the applicable periods shown.
C Calculated based on average shares outstanding during the period.
D Fees and expenses of any underlying Fidelity Central Funds are not included in the Fund's expense ratio. The Fund indirectly bears its proportionate share of the expenses of any underlying Fidelity Central Funds.
E Amount does not include the portfolio activity of any underlying Fidelity Central Funds.
F Expense ratios reflect operating expenses of the class. Expenses before reductions do not reflect amounts reimbursed by the investment adviser or reductions from brokerage service arrangements or reductions from other expense offset arrangements and do not represent the amount paid by the class during periods when reimbursements or reductions occur. Expenses net of fee waivers reflect expenses after reimbursement by the investment adviser but prior to reductions from brokerage service arrangements or other expense offset arrangements. Expenses net of all reductions represent the net expenses paid by the class.
G Amount represents less than $.01 per share.
H Total distributions of $.24 per share is comprised of distributions from net investment income of $.235 and distributions from net realized gain of $.005 per share.
I The amount shown reflects certain reclassifications related to book to tax differences.
J Total distributions of $.34 per share is comprised of distribution from net investment income of $.322 and distribution from net realized gain of $.013 per share.
See accompanying notes which are an integral part of the financial statements.
Annual Report
Notes to Financial Statements
For the period ended December 31, 2012
1. Organization.
VIP Contrafund Portfolio (the Fund) is a fund of Variable Insurance Products Fund II (the Trust) and is authorized to issue an unlimited number of shares. The Trust is registered under the Investment Company Act of 1940, as amended (the 1940 Act), as an open-end management investment company organized as a Massachusetts business trust. Shares of the Fund may only be purchased by insurance companies for the purpose of funding variable annuity or variable life insurance contracts. The Fund offers the following classes of shares: Initial Class shares, Service Class shares, Service Class 2 shares, Service Class 2R shares and Investor Class shares. All classes have equal rights and voting privileges, except for matters affecting a single class. Investment income, realized and unrealized capital gains and losses, the common expenses of the Fund, and certain fund-level expense reductions, if any, are allocated on a pro-rata basis to each class based on the relative net assets of each class to the total net assets of the Fund. Each class differs with respect to transfer agent and distribution and service plan fees incurred. Certain expense reductions may also differ by class.
2. Investments in Fidelity Central Funds.
The Fund invests in Fidelity Central Funds, which are open-end investment companies available only to other investment companies and accounts managed by Fidelity Management & Research Company (FMR) and its affiliates. The Fund's Schedule of Investments lists each of the Fidelity Central Funds held as of period end, as an investment of the Fund, but does not include the underlying holdings of each Fidelity Central Fund. As an Investing Fund, the Fund indirectly bears its proportionate share of the expenses of the underlying Fidelity Central Funds.
The Money Market Central Funds seek preservation of capital and current income and are managed by Fidelity Investments Money Management, Inc. (FIMM), an affiliate of FMR.
A complete unaudited list of holdings for each Fidelity Central Fund is available upon request or at the Securities and Exchange Commission (the SEC) website at www.sec.gov. In addition, the financial statements of the Fidelity Central Funds, which are not covered by the Fund's Report of Independent Registered Public Accounting Firm, are available on the SEC website or upon request.
3. Significant Accounting Policies.
The financial statements have been prepared in conformity with accounting principles generally accepted in the United States of America (GAAP), which require management to make certain estimates and assumptions at the date of the financial statements. Actual results could differ from those estimates. Subsequent events, if any, through the date that the financial statements were issued have been evaluated in the preparation of the financial statements. The following summarizes the significant accounting policies of the Fund:
Investment Valuation. Investments are valued as of 4:00 p.m. Eastern time on the last calendar day of the period. In accordance with valuation policies and procedures approved by the Board of Trustees (the Board), the Fund attempts to obtain prices from one or more third party pricing vendors or brokers to value its investments. When current market prices, quotations or rates are not readily available or reliable, investments will be fair valued in good faith by the FMR Fair Value Committee (the Committee), in accordance with procedures adopted by the Fund's Board. Factors used in determining fair value vary by investment type and may include market or investment specific events, changes in interest rates and credit quality. The frequency with which these procedures are used cannot be predicted and they may be utilized to a significant extent. The Committee oversees the Fund's valuation policies and procedures and is responsible for approving and reporting to the Board all fair value determinations.
The Fund categorizes the inputs to valuation techniques used to value its investments into a disclosure hierarchy consisting of three levels as shown below:
Level 1 - quoted prices in active markets for identical investments
Level 2 - other significant observable inputs (including quoted prices for similar investments, interest rates, prepayment speeds, etc.)
Level 3 - unobservable inputs (including the Fund's own assumptions based on the best information available)
Valuation techniques used to value the Fund's investments by major category are as follows:
Equity securities, including restricted securities, for which market quotations are readily available, are valued at the last reported sale price or official closing price as reported by a third party pricing vendor on the primary market or exchange on which they are traded and are categorized as Level 1 in the hierarchy. In the event there were no sales during the day or closing prices are not available, securities are valued at the last quoted bid price or may be valued using the last available price and are generally categorized as Level 2 in the hierarchy. For foreign equity securities, when significant market or security specific events arise, comparisons to the valuation of American Depositary Receipts (ADRs), futures contracts, Exchange-Traded Funds (ETFs) and certain indexes as well as quoted prices for similar securities are used and are categorized as Level 2 in the hierarchy. Utilizing these techniques may result in transfers between Level 1 and Level 2. For restricted equity securities and private placements where observable inputs are limited, assumptions about market activity and risk are used and these securities are categorized as Level 3 in the hierarchy.
Annual Report
Notes to Financial Statements - continued
3. Significant Accounting Policies - continued
Investment Valuation - continued
Debt securities, including restricted securities, are valued based on evaluated prices received from third party pricing vendors or from brokers who make markets in such securities. For corporate bonds and U.S. government and government agency obligations, pricing vendors utilize matrix pricing which considers yield or price of bonds of comparable quality, coupon, maturity and type as well as broker-supplied prices and are generally categorized as Level 2 in the hierarchy. When independent prices are unavailable or unreliable, debt securities may be valued utilizing pricing methodologies which consider similar factors that would be used by third party pricing vendors. These are generally categorized as Level 2 in the hierarchy but may be Level 3 depending on the circumstances.
Futures contracts are valued at the settlement price established each day by the board of trade or exchange on which they are traded and are categorized as Level 1 in the hierarchy. Investments in open-end mutual funds, including the Fidelity Central Funds, are valued at their closing net asset value (NAV) each business day and are categorized as Level 1 in the hierarchy.
Changes in valuation techniques may result in transfers in or out of an assigned level within the disclosure hierarchy. The aggregate value of investments by input level, as of December 31, 2012, including information on transfers between Levels 1 and 2, is included at the end of the Fund's Schedule of Investments.
Foreign Currency. The Fund may use foreign currency contracts to facilitate transactions in foreign-denominated securities. Gains and losses from these transactions may arise from changes in the value of the foreign currency or if the counterparties do not perform under the contracts' terms.
Foreign-denominated assets, including investment securities, and liabilities are translated into U.S. dollars at the exchange rates at period end. Purchases and sales of investment securities, income and dividends received and expenses denominated in foreign currencies are translated into U.S. dollars at the exchange rate in effect on the transaction date.
The effects of exchange rate fluctuations on investments are included with the net realized and unrealized gain (loss) on investment securities. Other foreign currency transactions resulting in realized and unrealized gain (loss) are disclosed separately.
Investment Transactions and Income. For financial reporting purposes, the Fund's investment holdings and NAV include trades executed through the end of the last business day of the period. The NAV per share for processing shareholder transactions is calculated as of the close of business of the New York Stock Exchange (NYSE), normally 4:00 p.m. Eastern time and includes trades executed through the end of the prior business day. Gains and losses on securities sold are determined on the basis of identified cost and may include proceeds received from litigation. Dividend income is recorded on the ex-dividend date, except for certain dividends from foreign securities where the ex-dividend date may have passed, which are recorded as soon as the Fund is informed of the ex-dividend date. Non-cash dividends included in dividend income, if any, are recorded at the fair market value of the securities received. Distributions received on securities that represent a return of capital or capital gain are recorded as a reduction of cost of investments and/or as a realized gain. The Fund estimates the components of distributions received that may be considered return of capital distributions or capital gain distributions. Interest income and distributions from the Fidelity Central Funds are accrued as earned. Interest income includes coupon interest and amortization of premium and accretion of discount on debt securities. Investment income is recorded net of foreign taxes withheld where recovery of such taxes is uncertain.
Expenses. Expenses directly attributable to a fund are charged to that fund. Expenses attributable to more than one fund are allocated among the respective funds on the basis of relative net assets or other appropriate methods. Expense estimates are accrued in the period to which they relate and adjustments are made when actual amounts are known.
Deferred Trustee Compensation. Under a Deferred Compensation Plan (the Plan), independent Trustees may elect to defer receipt of a portion of their annual compensation. Deferred amounts are invested in a cross-section of Fidelity funds, are marked-to-market and remain in the Fund until distributed in accordance with the Plan. The investment of deferred amounts and the offsetting payable to the Trustees are included in the accompanying Statement of Assets and Liabilities.
Income Tax Information and Distributions to Shareholders. Each year, the Fund intends to qualify as a regulated investment company under Subchapter M of the Internal Revenue Code, including distributing substantially all of its taxable income and realized gains. As a result, no provision for income taxes is required. As of December 31, 2012, the Fund did not have any unrecognized tax benefits in the financial statements; nor is the Fund aware of any tax positions for which it is reasonably possible that the total amounts of unrecognized tax benefits will significantly change in the next twelve months. The Fund files a U.S. federal tax return, in addition to state and local tax returns as required. A fund's federal income tax returns are subject to examination by the Internal Revenue Service (IRS) for a period of three fiscal years after they are filed. State and local tax returns may be subject to examination for an additional fiscal year depending on the jurisdiction. Foreign taxes are provided for based on the Fund's understanding of the tax rules and rates that exist in the foreign markets in which it invests.
Annual Report
3. Significant Accounting Policies - continued
Income Tax Information and Distributions to Shareholders - continued
Distributions are declared and recorded on the ex-dividend date. Income dividends and capital gain distributions are declared separately for each class. Income and capital gain distributions are determined in accordance with income tax regulations, which may differ from GAAP. These differences resulted in distribution reclassifications.
Capital accounts within the financial statements are adjusted for permanent book-tax differences. These adjustments have no impact on net assets or the results of operations. Temporary book-tax differences will reverse in a subsequent period.
Book-tax differences are primarily due to futures contracts, foreign currency transactions, passive foreign investment companies (PFIC), market discount, partnerships, deferred trustees compensation, capital loss carryforwards and losses deferred due to wash sales and excise tax regulations.
The federal tax cost of investment securities and unrealized appreciation (depreciation) as of period end were as follows:
Gross unrealized appreciation | $ 3,085,145,590 |
Gross unrealized depreciation | (344,960,912) |
Net unrealized appreciation (depreciation) on securities and other investments | $ 2,740,184,678 |
| |
Tax Cost | $ 13,681,581,757 |
The tax-based components of distributable earnings as of period end were as follows:
Capital loss carryforward | $ (2,671,840,594) |
Net unrealized appreciation (depreciation) | $ 2,740,209,758 |
Capital loss carryforwards are only available to offset future capital gains of the Fund to the extent provided by regulations and may be limited. Under the Regulated Investment Company Modernization Act of 2010 (the Act), the Fund is permitted to carry forward capital losses incurred in taxable years beginning after December 22, 2010 for an unlimited period and such capital losses are required to be used prior to any losses that expire. Capital loss carryforwards were as follows:
Fiscal year of expiration | |
2016 | $ (336,841,666) |
2017 | (2,334,998,928) |
Total capital loss carryforward | $ (2,671,840,594) |
The tax character of distributions paid was as follows:
| December 31, 2012 | December 31, 2011 |
Ordinary Income | $ 197,883,108 | $ 141,940,543 |
Trading (Redemption) Fees. Service Class 2R shares held by investors less than 60 days are subject to a redemption fee equal to 1% of the net asset value of shares redeemed. All redemption fees, which reduce the proceeds of the shareholder redemption, are retained by the Fund and accounted for as an addition to paid in capital.
Delayed Delivery Transactions and When-Issued Securities. During the period, the Fund transacted in securities on a delayed delivery or when-issued basis. Payment and delivery may take place after the customary settlement period for that security. The price of the underlying securities and the date when the securities will be delivered and paid for are fixed at the time the transaction is negotiated. The securities purchased on a delayed delivery or when-issued basis are identified as such in the Fund's Schedule of Investments. The Fund may receive compensation for interest forgone in the purchase of a delayed delivery or when-issued security. With respect to purchase commitments, the Fund identifies securities as segregated in its records with a value at least equal to the amount of the commitment. Losses may arise due to changes in the value of the underlying securities or if the counterparty does not perform under the contract's terms, or if the issuer does not issue the securities due to political, economic, or other factors.
Restricted Securities. The Fund may invest in securities that are subject to legal or contractual restrictions on resale. These securities generally may be resold in transactions exempt from registration or to the public if the securities are registered. Disposal of these securities may involve time-consuming negotiations and expense, and prompt sale at an acceptable price may be difficult. Information regarding restricted securities is included at the end of the Fund's Schedule of Investments.
Annual Report
Notes to Financial Statements - continued
3. Significant Accounting Policies - continued
New Accounting Pronouncement. In December 2011, the Financial Accounting Standards Board issued Accounting Standard Update No. 2011-11, Disclosures about Offsetting Assets and Liabilities. The update creates new disclosure requirements requiring entities to disclose both gross and net information for derivatives and other financial instruments that are either offset in the Statement of Assets and Liabilities or subject to an enforceable master netting arrangement or similar agreement. The disclosure requirements are effective for annual reporting periods beginning on or after January 1, 2013, and interim periods within those annual periods. Management is currently evaluating the impact of the update's adoption on the Fund's financial statement disclosures.
4. Derivative Instruments.
Risk Exposures and the Use of Derivative Instruments. The Fund's investment objective allows the Fund to enter into various types of derivative contracts, including futures contracts. Derivatives are investments whose value is primarily derived from underlying assets, indices or reference rates and may be transacted on an exchange or over-the-counter (OTC). Derivatives may involve a future commitment to buy or sell a specified asset based on specified terms, to exchange future cash flows at periodic intervals based on a notional principal amount, or for one party to make one or more payments upon the occurrence of specified events in exchange for periodic payments from the other party.
The Fund used derivatives to increase returns and to manage exposure to certain risks as defined below. The success of any strategy involving derivatives depends on analysis of numerous economic factors, and if the strategies for investment do not work as intended, the Fund may not achieve its objectives.
The Fund's use of derivatives increased or decreased its exposure to the following risk:
Equity Risk | Equity risk relates to the fluctuations in the value of financial instruments as a result of changes in market prices (other than those arising from interest rate risk or foreign exchange risk), whether caused by factors specific to an individual investment, its issuer, or all factors affecting all instruments traded in a market or market segment. |
The Fund is also exposed to additional risks from investing in derivatives, such as liquidity risk and counterparty credit risk. Liquidity risk is the risk that the Fund will be unable to close out the derivative in the open market in a timely manner. Counterparty credit risk is the risk that the counterparty will not be able to fulfill its obligation to the Fund. Counterparty credit risk related to exchange-traded futures contracts is mitigated by the protection provided by the exchange on which they trade.
Investing in derivatives may involve greater risks than investing in the underlying assets directly and, to varying degrees, may involve risk of loss in excess of any initial investment and collateral received and amounts recognized in the Statement of Assets and Liabilities. In addition, there may be the risk that the change in value of the derivative contract does not correspond to the change in value of the underlying instrument.
Futures Contracts. A futures contract is an agreement between two parties to buy or sell a specified underlying instrument for a fixed price at a specified future date. The Fund used futures contracts to manage its exposure to the stock market.
Upon entering into a futures contract, a fund is required to deposit either cash or securities (initial margin) with a clearing broker in an amount equal to a certain percentage of the face value of the contract. Futures contracts are marked-to-market daily and subsequent payments (variation margin) are made or received by a fund depending on the daily fluctuations in the value of the futures contracts and are recorded as unrealized appreciation or (depreciation). This receivable and/or payable, if any, is included in daily variation margin on futures contracts in the Statement of Assets and Liabilities. Realized gain or (loss) is recorded upon the expiration or closing of a futures contract.
Any open futures contracts at period end are presented in the Schedule of Investments under the caption "Futures Contracts." The underlying face amount at value reflects each contract's exposure to the underlying instrument or index at period end and is representative of activity for the period. Securities deposited to meet initial margin requirements are identified in the Schedule of Investments.
During the period the Fund recognized net realized gain (loss) of $10,598,796 and a change in net unrealized appreciation (depreciation) of $182,961 related to its investment in futures contracts. These amounts are included in the Statement of Operations.
5. Purchases and Sales of Investments.
Purchases and sales of securities, other than short-term securities, aggregated $13,768,445,499 and $14,577,513,353, respectively.
Annual Report
6. Fees and Other Transactions with Affiliates.
Management Fee. FMR and its affiliates provide the Fund with investment management related services for which the Fund pays a monthly management fee. The management fee is the sum of an individual fund fee rate that is based on an annual rate of .30% of the Fund's average net assets and an annualized group fee rate that averaged .26% during the period. The group fee rate is based upon the average net assets of all the mutual funds advised by FMR. The group fee rate decreases as assets under management increase and increases as assets under management decrease. For the period, the total annual management fee rate was .56% of the Fund's average net assets.
Distribution and Service Plan Fees. In accordance with Rule 12b-1 of the 1940 Act, the Fund has adopted separate 12b-1 Plans for each Service Class of shares. Each Service Class pays Fidelity Distributors Corporation (FDC), an affiliate of FMR, a service fee. For the period, the service fee is based on an annual rate of .10% of Service Class' average net assets and .25% of Service Class 2's and Service Class 2R's average net assets.
For the period, total fees, all of which were re-allowed to insurance companies for the distribution of shares and providing shareholder support services were as follows:
Service Class | $ 1,369,277 |
Service Class 2 | 19,292,732 |
Service Class 2R | 22,641 |
| $ 20,684,650 |
Transfer Agent Fees. Fidelity Investments Institutional Operations Company, Inc. (FIIOC), an affiliate of FMR, is the Fund's transfer, dividend disbursing, and shareholder servicing agent. FIIOC receives an asset-based fee with respect to each class. Each class (with the exception of Investor Class) pays a transfer agent fee, excluding out of pocket expenses, equal to an annual rate of .07% of average net assets. Investor Class pays a monthly asset-based transfer agent fee of .15% of average net assets. In addition, FIIOC receives an asset-based fee of .0038% of average net assets for typesetting, printing and mailing of shareholder reports, except proxy statements. For the period, transfer agent fees for each class, including printing and out of pocket expenses, were as follows:
Initial Class | $ 4,564,434 |
Service Class | 964,572 |
Service Class 2 | 5,414,509 |
Service Class 2R | 6,331 |
Investor Class | 1,020,592 |
| $ 11,970,438 |
Accounting and Security Lending Fees. Fidelity Service Company, Inc. (FSC), an affiliate of FMR, maintains the Fund's accounting records. The accounting fee is based on the level of average net assets for each month. Under a separate contract, FSC administers the security lending program. The security lending fee is based on the number and duration of lending transactions.
Brokerage Commissions. The Fund placed a portion of its portfolio transactions with brokerage firms which are affiliates of the investment adviser. The commissions paid to these affiliated firms were $462,864 for the period.
7. Committed Line of Credit.
The Fund participates with other funds managed by FMR or an affiliate in a $4.25 billion credit facility (the "line of credit") to be utilized for temporary or emergency purposes to fund shareholder redemptions or for other short-term liquidity purposes. The Fund has agreed to pay commitment fees on its pro-rata portion of the line of credit, which amounted to $43,593 and is reflected in Miscellaneous expenses on the Statement of Operations. During the period, there were no borrowings on this line of credit.
8. Security Lending.
The Fund lends portfolio securities through a lending agent from time to time in order to earn additional income. For equity securities, a lending agent is used and may loan securities to certain qualified borrowers, including Fidelity Capital Markets (FCM), a broker-dealer affiliated with the Fund. On the settlement date of the loan, the Fund receives collateral (in the form of U.S. Treasury obligations, letters of credit and/or cash) against the loaned securities and maintains collateral in an amount not less than 100% of the market value of the loaned securities during the period of the loan. The market value of the loaned securities is determined at the close of business of the Fund and any additional required collateral is delivered to the Fund on the next business day. If the borrower defaults on its obligation to return the securities loaned because of insolvency or other reasons, a fund could experience delays and costs in recovering the securities loaned or in gaining access to the collateral. Any cash collateral received is invested in the Fidelity Securities Lending Cash Central Fund. The value of loaned securities and cash collateral at period end are disclosed on the Fund's Statement
Annual Report
Notes to Financial Statements - continued
8. Security Lending - continued
of Assets and Liabilities. Security lending income represents the income earned on investing cash collateral, less rebates paid to borrowers and any lending agent fees associated with the loan, plus any premium payments received for lending certain types of securities. Security lending income is presented in the Statement of Operations as a component of income from Fidelity Central Funds. Total security lending income during the period amounted to $1,950,509, including $38,179 from securities loaned to FCM.
9. Expense Reductions.
Many of the brokers with whom FMR places trades on behalf of the Fund provided services to the Fund in addition to trade execution. These services included payments of certain expenses on behalf of the Fund totaling $2,620,811 for the period.
10. Distributions to Shareholders.
Distributions to shareholders of each class were as follows:
Years ended December 31, | 2012 | 2011 |
From net investment income | | |
Initial Class | $ 82,580,923 | $ 65,616,073 |
Service Class | 16,341,913 | 12,220,263 |
Service Class 2 | 82,113,206 | 58,305,804 |
Service Class 2R | 91,369 | 65,304 |
Investor Class | 8,403,718 | 5,733,099 |
Total | $ 189,531,129 | $ 141,940,543 |
From net realized gain | | |
Initial Class | $ 3,278,212 | $ - |
Service Class | 704,666 | - |
Service Class 2 | 4,008,661 | - |
Service Class 2R | 4,524 | - |
Investor Class | 355,916 | - |
Total | $ 8,351,979 | $ - |
11. Share Transactions.
Transactions for each class of shares were as follows:
| Shares | Dollars |
Years ended December 31, | 2012 | 2011 | 2012 | 2011 |
Initial Class | | | | |
Shares sold | 8,108,840 | 8,887,647 | $ 207,519,230 | $ 215,181,582 |
Reinvestment of distributions | 3,281,594 | 2,941,106 | 85,859,135 | 65,616,073 |
Shares redeemed | (33,386,959) | (46,079,138) | (856,012,042) | (1,098,879,687) |
Net increase (decrease) | (21,996,525) | (34,250,385) | $ (562,633,677) | $ (818,082,032) |
Service Class | | | | |
Shares sold | 4,101,561 | 5,960,533 | $ 104,241,858 | $ 142,199,635 |
Reinvestment of distributions | 653,535 | 549,472 | 17,046,579 | 12,220,263 |
Shares redeemed | (8,246,935) | (8,798,344) | (210,877,762) | (211,519,636) |
Net increase (decrease) | (3,491,839) | (2,288,339) | $ (89,589,325) | $ (57,099,738) |
Service Class 2 | | | | |
Shares sold | 32,699,560 | 28,618,316 | $ 807,565,716 | $ 674,963,970 |
Reinvestment of distributions | 3,346,604 | 2,657,512 | 86,121,867 | 58,305,804 |
Shares redeemed | (46,616,409) | (47,724,451) | (1,175,112,838) | (1,123,942,590) |
Net increase (decrease) | (10,570,245) | (16,448,623) | $ (281,425,255) | $ (390,672,816) |
Service Class 2R | | | | |
Shares sold | 68,230 | 57,708 | $ 1,645,251 | $ 1,412,478 |
Reinvestment of distributions | 3,733 | 2,982 | 95,893 | 65,304 |
Shares redeemed | (91,575) | (171,761) | (2,281,001) | (4,029,960) |
Net increase (decrease) | (19,612) | (111,071) | $ (539,857) | $ (2,552,178) |
Investor Class | | | | |
Shares sold | 2,695,333 | 3,165,850 | $ 68,539,753 | $ 76,274,096 |
Reinvestment of distributions | 335,952 | 257,783 | 8,759,634 | 5,733,099 |
Shares redeemed | (1,659,317) | (2,256,234) | (42,398,092) | (53,079,435) |
Net increase (decrease) | 1,371,968 | 1,167,399 | $ 34,901,295 | $ 28,927,760 |
Annual Report
12. Other.
The Fund's organizational documents provide former and current trustees and officers with a limited indemnification against liabilities arising in connection with the performance of their duties to the Fund. In the normal course of business, the Fund may also enter into contracts that provide general indemnifications. The Fund's maximum exposure under these arrangements is unknown as this would be dependent on future claims that may be made against the Fund. The risk of material loss from such claims is considered remote.
At the end of the period, two otherwise unaffiliated shareholders were the owners of record of 22% of the total outstanding shares of the Fund.
Annual Report
Report of Independent Registered Public Accounting Firm
To the Trustees of Variable Insurance Products Fund II and Shareholders of VIP Contrafund Portfolio:
We have audited the accompanying statement of assets and liabilities of VIP Contrafund Portfolio (the Fund), a fund of Variable Insurance Products Fund II, including the schedule of investments, as of December 31, 2012, and the related statement of operations for the year then ended, the statement of changes in net assets for each of the two years in the period then ended, and the financial highlights for each of the five years in the period then ended. These financial statements and financial highlights are the responsibility of the Fund's management. Our responsibility is to express an opinion on these financial statements and financial highlights based on our audits.
We conducted our audits in accordance with the standards of the Public Company Accounting Oversight Board (United States). Those standards require that we plan and perform the audit to obtain reasonable assurance about whether the financial statements and financial highlights are free of material misstatement. The Fund is not required to have, nor were we engaged to perform, an audit of its internal control over financial reporting. Our audits included consideration of internal control over financial reporting as a basis for designing audit procedures that are appropriate in the circumstances, but not for the purpose of expressing an opinion on the effectiveness of the Fund's internal control over financial reporting. Accordingly, we express no such opinion. An audit also includes examining, on a test basis, evidence supporting the amounts and disclosures in the financial statements, assessing the accounting principles used and significant estimates made by management, as well as evaluating the overall financial statement presentation. Our procedures included confirmation of securities owned as of December 31, 2012, by correspondence with the custodians and brokers; where replies were not received from brokers, we performed other auditing procedures. We believe that our audits provide a reasonable basis for our opinion.
In our opinion, the financial statements and financial highlights referred to above present fairly, in all material respects, the financial position of VIP Contrafund Portfolio as of December 31, 2012, the results of its operations for the year then ended, the changes in its net assets for each of the two years in the period then ended, and the financial highlights for each of the five years in the period then ended, in conformity with accounting principles generally accepted in the United States of America.
DELOITTE & TOUCHE LLP
Boston, Massachusetts
February 19, 2013
Annual Report
The Trustees, Members of the Advisory Board, and executive officers of the trust and fund, as applicable, are listed below. The Board of Trustees governs the fund and is responsible for protecting the interests of shareholders. The Trustees are experienced executives who meet periodically throughout the year to oversee the fund's activities, review contractual arrangements with companies that provide services to the fund, oversee management of the risks associated with such activities and contractual arrangements, and review the fund's performance. Except for James C. Curvey, each of the Trustees oversees 234 funds advised by FMR or an affiliate. Mr. Curvey oversees 452 funds advised by FMR or an affiliate.
The Trustees hold office without limit in time except that (a) any Trustee may resign; (b) any Trustee may be removed by written instrument, signed by at least two-thirds of the number of Trustees prior to such removal; (c) any Trustee who requests to be retired or who has become incapacitated by illness or injury may be retired by written instrument signed by a majority of the other Trustees; and (d) any Trustee may be removed at any special meeting of shareholders by a two-thirds vote of the outstanding voting securities of the trust. Each Trustee who is not an interested person (as defined in the 1940 Act) (Independent Trustee), shall retire not later than the last day of the calendar year in which his or her 75th birthday occurs. The Independent Trustees may waive this mandatory retirement age policy with respect to individual Trustees. The executive officers and Advisory Board Members hold office without limit in time, except that any officer and Advisory Board Member may resign or may be removed by a vote of a majority of the Trustees at any regular meeting or any special meeting of the Trustees. Except as indicated, each individual has held the office shown or other offices in the same company for the past five years.
Experience, Skills, Attributes, and Qualifications of the Fund's Trustees. The Governance and Nominating Committee has adopted a statement of policy that describes the experience, qualifications, attributes, and skills that are necessary and desirable for potential Independent Trustee candidates (Statement of Policy). The Board believes that each Trustee satisfied at the time he or she was initially elected or appointed a Trustee, and continues to satisfy, the standards contemplated by the Statement of Policy. The Governance and Nominating Committee also engages professional search firms to help identify potential Independent Trustee candidates who have the experience, qualifications, attributes, and skills consistent with the Statement of Policy. From time to time, additional criteria based on the composition and skills of the current Independent Trustees, as well as experience or skills that may be appropriate in light of future changes to board composition, business conditions, and regulatory or other developments, have also been considered by the professional search firms and the Governance and Nominating Committee. In addition, the Board takes into account the Trustees' commitment and participation in Board and committee meetings, as well as their leadership of standing and ad hoc committees throughout their tenure.
In determining that a particular Trustee was and continues to be qualified to serve as a Trustee, the Board has considered a variety of criteria, none of which, in isolation, was controlling. The Board believes that, collectively, the Trustees have balanced and diverse experience, qualifications, attributes, and skills, which allow the Board to operate effectively in governing the fund and protecting the interests of shareholders. Information about the specific experience, skills, attributes, and qualifications of each Trustee, which in each case led to the Board's conclusion that the Trustee should serve (or continue to serve) as a trustee of the fund, is provided below.
Board Structure and Oversight Function. James C. Curvey is an interested person (as defined in the 1940 Act) and currently serves as Chairman. The Trustees have determined that an interested Chairman is appropriate and benefits shareholders because an interested Chairman has a personal and professional stake in the quality and continuity of services provided to the fund. Independent Trustees exercise their informed business judgment to appoint an individual of their choosing to serve as Chairman, regardless of whether the Trustee happens to be independent or a member of management. The Independent Trustees have determined that they can act independently and effectively without having an Independent Trustee serve as Chairman and that a key structural component for assuring that they are in a position to do so is for the Independent Trustees to constitute a substantial majority for the Board. The Independent Trustees also regularly meet in executive session. Ned C. Lautenbach serves as Chairman of the Independent Trustees and as such (i) acts as a liaison between the Independent Trustees and management with respect to matters important to the Independent Trustees and (ii) with management prepares agendas for Board meetings.
Fidelity funds are overseen by different Boards of Trustees. The fund's Board oversees Fidelity's equity and high income funds and another Board oversees Fidelity's investment-grade bond, money market, and asset allocation funds. The asset allocation funds may invest in Fidelity funds overseen by the fund's Board. The use of separate Boards, each with its own committee structure, allows the Trustees of each group of Fidelity funds to focus on the unique issues of the funds they oversee, including common research, investment, and operational issues. On occasion, the separate Boards establish joint committees to address issues of overlapping consequences for the Fidelity funds overseen by each Board.
The Trustees operate using a system of committees to facilitate the timely and efficient consideration of all matters of importance to the Trustees, the fund, and fund shareholders and to facilitate compliance with legal and regulatory requirements and oversight of the fund's activities and associated risks. The Board, acting through its committees, has charged FMR and its affiliates with (i) identifying events or circumstances the occurrence of which could have demonstrably adverse effects on the fund's business and/or reputation; (ii) implementing processes and controls to lessen the possibility that such events or circumstances occur or to mitigate the effects of such events or circumstances if they do occur; and (iii) creating and maintaining a system designed to evaluate continuously business and market conditions in order to facilitate the identification and implementation processes described in (i) and (ii) above. Because the day-to-day operations and activities of the fund are carried out by or through FMR, its affiliates and other service providers, the fund's exposure to risks is mitigated but not eliminated by the processes overseen by the Trustees. While each of the Board's committees has responsibility for overseeing different aspects of the fund's activities, oversight is exercised primarily through the Operations, Audit, and Compliance Committees. In addition, the Independent Trustees have worked with FMR to enhance the Board's oversight of investment and financial risks, legal and regulatory risks, technology risks, and operational risks, including the development of additional risk reporting to the Board. For example, a working group comprised of Independent Trustees and FMR has worked and continues to work to review the Fidelity funds' valuation-related activities, reporting and risk management. Appropriate personnel, including but not limited to the fund's Chief Compliance Officer (CCO), FMR's internal auditor, the independent accountants, the fund's Treasurer and portfolio management personnel, make periodic reports to the Board's committees, as appropriate, including an annual review of FMR's risk management program for the Fidelity funds. The responsibilities of each standing committee, including their oversight responsibilities, are described further under "Standing Committees of the Fund's Trustees."
Annual Report
Trustees and Officers - continued
The fund's Statement of Additional Information (SAI) includes more information about the Trustees. To request a free copy, call Fidelity at 1-877-208-0098.
Interested Trustees*:
Correspondence intended for each Trustee who is an interested person may be sent to Fidelity Investments, 82 Devonshire Street, Boston, Massachusetts 02109.
Name, Age; Principal Occupations and Other Relevant Experience+ |
James C. Curvey (77) |
| Year of Election or Appointment: 2007 Mr. Curvey is Trustee and Chairman of the Board of Trustees of certain Trusts. Mr. Curvey also serves as Trustee (2007-present) of other investment companies advised by FMR. Mr. Curvey is a Director of Fidelity Investments Money Management, Inc. (2009-present), Director of Fidelity Research & Analysis Co. (2009-present) and Director of FMR and FMR Co., Inc. (2007-present). Mr. Curvey is also Vice Chairman (2007-present) and Director of FMR LLC. In addition, Mr. Curvey serves as an Overseer for the Boston Symphony Orchestra and a member of the Trustees of Villanova University. Previously, Mr. Curvey was the Vice Chairman (2006-2007) and Director (2000-2007) of FMR Corp. |
Ronald P. O'Hanley (55) |
| Year of Election or Appointment: 2011 Mr. O'Hanley is Director of FMR Co., Inc. (2010-present), Director of Fidelity Investments Money Management, Inc. (2010-present), Director of Fidelity Research & Analysis Company (2010-present), President of Fidelity Asset Management and Corporate Services and a member of Fidelity's Executive Committee (2010-present). Previously, Mr. O'Hanley served as President and Chief Executive Officer of BNY Mellon Asset Management (2007-2010). Mr. O'Hanley also served as Vice Chairman of Bank New York Mellon Corp. and a member of that firm's Executive Committee. Prior to the 2007 merger of The Bank of New York and Mellon Financial Corporation, he was Vice Chairman of Mellon Financial Corporation and President and Chief Executive Officer of Mellon Asset Management. He joined Mellon in February 1997. Mr. O'Hanley currently serves as Chairman of the Boston Public Library Foundation Board of Directors and sits on the Board of Directors of Beth Israel Deaconess Medical Center, the Board of Trustees of the Marine Biological Laboratory and the Advisory Board of the Maxwell School of Citizenship and Public Administration at Syracuse University. Mr. O'Hanley also chairs the Council on Asset Management for the Financial Services Roundtable and is a member of the Board of Directors of Institutional Investor's U.S. Institute. |
* Trustees have been determined to be "Interested Trustees" by virtue of, among other things, their affiliation with the trust or various entities under common control with FMR.
+ The information above includes each Trustee's principal occupation during the last five years and other information relating to the experience, attributes, and skills relevant to each Trustee's qualifications to serve as a Trustee, which led to the conclusion that each Trustee should serve as a Trustee for the fund.
Independent Trustees:
Correspondence intended for each Independent Trustee (that is, the Trustees other than the Interested Trustees) may be sent to Fidelity Investments, P.O. Box 55235, Boston, Massachusetts 02205-5235.
Name, Age; Principal Occupations and Other Relevant Experience+ |
Dennis J. Dirks (64) |
| Year of Election or Appointment: 2005 Prior to his retirement in May 2003, Mr. Dirks was Chief Operating Officer and a member of the Board of The Depository Trust & Clearing Corporation (DTCC). He also served as President, Chief Operating Officer, and Board member of The Depository Trust Company (DTC) and President and Board member of the National Securities Clearing Corporation (NSCC). In addition, Mr. Dirks served as Chief Executive Officer and Board member of the Government Securities Clearing Corporation, Chief Executive Officer and Board member of the Mortgage-Backed Securities Clearing Corporation, as a Trustee and a member of the Finance Committee of Manhattan College (2005-2008), and as a Trustee and a member of the Finance Committee of AHRC of Nassau County (2006-2008). Mr. Dirks is a member of the Independent Directors Council (IDC) Governing Council (2010-present) and Board of Directors for The Brookville Center for Children's Services, Inc. (2009-present). |
Alan J. Lacy (59) |
| Year of Election or Appointment: 2008 Mr. Lacy serves as Senior Adviser (2007-present) of Oak Hill Capital Partners, L.P. (private equity). Mr. Lacy also served as Chief Executive Officer (2000-2005) and Vice Chairman (2005-2006) of Sears Holdings Corporation and Sears, Roebuck and Co. (retail). In addition, Mr. Lacy serves as a member of the Board of Directors of Dave & Buster's Entertainment, Inc. (restaurant and entertainment complexes, 2010-present), Earth Fare, Inc. (retail grocery, 2012-present), The Hillman Companies, Inc. (hardware wholesalers, 2010-present), and Bristol-Myers Squibb Company (global pharmaceuticals, 2008-present). Mr. Lacy is a member of the Board of Trustees of The National Parks Conservation Association (2006-present). Previously, Mr. Lacy served as Chairman of the Board of Trustees of the National Parks Conservation Association (2008-2011) and as a member of the Board of Directors for the Western Union Company (global money transfer, 2006-2011). |
Ned C. Lautenbach (68) |
| Year of Election or Appointment: 2000 Mr. Lautenbach is Chairman of the Independent Trustees of the Equity and High Income Funds (2006-present). Mr. Lautenbach currently serves as the Lead Director of the Eaton Corporation Board of Directors (diversified industrial, 1997-present). Mr. Lautenbach is Chairman of the Board of Directors of the Philharmonic Center for the Arts in Naples, Florida (2012-present) and a member of the Council on Foreign Relations (1994-present). Previously, Mr. Lautenbach was a Partner/Advisory Partner at Clayton, Dubilier & Rice, LLC (private equity investment, 1998-2010), as well as a Director of Sony Corporation (2006-2007). |
Joseph Mauriello (68) |
| Year of Election or Appointment: 2008 Prior to his retirement in January 2006, Mr. Mauriello served in numerous senior management positions including Deputy Chairman and Chief Operating Officer (2004-2005), and Vice Chairman of Financial Services (2002-2004) of KPMG LLP US (professional services, 1965-2005). Mr. Mauriello currently serves as a member of the Board of Directors of XL Group plc. (global insurance and re-insurance, 2006-present). Previously, Mr. Mauriello served as a Director of the Hamilton Funds of the Bank of New York (2006-2007) and of Arcadia Resources Inc. (health care services and products, 2007-2012). |
Robert W. Selander (62) |
| Year of Election or Appointment: 2011 Previously, Mr. Selander served as a Member of the Advisory Board of Fidelity's Equity and High Income Funds (2011), Executive Vice Chairman (2010), Chief Executive Officer (2009-2010), and President and Chief Executive Officer (1997-2009) of Mastercard, Inc. |
Cornelia M. Small (68) |
| Year of Election or Appointment: 2005 Ms. Small is a member of the Board of Directors (2009-present) and Chair of the Investment Committee (2010-present) of the Teagle Foundation. Ms. Small also serves on the Investment Committee of the Berkshire Taconic Community Foundation (2008-present). Previously, Ms. Small served as Chairperson (2002-2008) and a member of the Investment Committee and Chairperson (2008-2012) and a member of the Board of Trustees of Smith College. In addition, Ms. Small served as Chief Investment Officer, Director of Global Equity Investments, and a member of the Board of Directors of Scudder, Stevens & Clark and Scudder Kemper Investments. |
William S. Stavropoulos (73) |
| Year of Election or Appointment: 2001 Mr. Stavropoulos is Vice Chairman of the Independent Trustees of the Equity and High Income Funds (2006-present). Mr. Stavropoulos serves as President and Founder of the Michigan Baseball Foundation, the Great Lakes Loons (2007-present). Mr. Stavropoulos is Chairman Emeritus of the Board of Directors of The Dow Chemical Company, where he previously served in numerous senior management positions, including President, CEO (1995-2000; 2002-2004), Chairman of the Executive Committee (2000-2006), and as a member of the Board of Directors (1990-2006). Currently, Mr. Stavropoulos is a Director of Univar Inc. (global distributor of commodity and specialty chemicals, Chairman from 2010-May 2012 and Lead Director from May 2012-present), Teradata Corporation (data warehousing and technology solutions, 2008-present), Maersk Inc. (industrial conglomerate), and Tyco International, Ltd. (multinational manufacturing and services, 2007-present), and a member of the Advisory Board for Metalmark Capital LLC (private equity investment, 2005-present). Mr. Stavropoulos is an operating advisor to Clayton, Dubilier & Rice, LLC (private equity investment). In addition, Mr. Stavropoulos is a member of the University of Notre Dame Advisory Council for the College of Science, a Trustee of the Rollin L. Gerstacker Foundation, and a Director of the Naples Philharmonic Center for the Arts. Previously, Mr. Stavropoulos served as a Director of Chemical Financial Corporation (bank holding company, 1993-2012). |
David M. Thomas (63) |
| Year of Election or Appointment: 2008 Previously, Mr. Thomas served as Executive Chairman (2005-2006) and Chairman and Chief Executive Officer (2000-2005) of IMS Health, Inc. (pharmaceutical and healthcare information solutions), and a Director of Fortune Brands, Inc. (consumer products, 2000-2011). In addition, Mr. Thomas serves as Non-Executive Chairman of the Board of Directors of Fortune Brands Home and Security (home and security products, 2011-present), and as a member of the Board of Directors of Interpublic Group of Companies, Inc. (marketing communication, 2004-present). |
Michael E. Wiley (62) |
| Year of Election or Appointment: 2008 Mr. Wiley also serves as a Director of Asia Pacific Exploration Consolidated (international oil and gas exploration and production, 2008-present). Mr. Wiley serves as a Director of Tesoro Corporation (independent oil refiner and marketer, 2005-present), and a Director of Bill Barrett Corporation (exploration and production, 2005-present). In addition, Mr. Wiley also serves as a Director of Post Oak Bank (privately-held bank, 2004-present). Previously, Mr. Wiley served as a member of the Board of Trustees of the University of Tulsa (2000-2006; 2007-2010), as a Senior Energy Advisor of Katzenbach Partners, LLC (consulting, 2006-2007), as an Advisory Director of Riverstone Holdings (private investment), Chairman, President, and CEO of Baker Hughes, Inc. (oilfield services, 2000-2004), and as Director of Spinnaker Exploration Company (exploration and production, 2001-2005). |
+ The information above includes each Trustee's principal occupation during the last five years and other information relating to the experience, attributes, and skills relevant to each Trustee's qualifications to serve as a Trustee, which led to the conclusion that each Trustee should serve as a Trustee for the fund.
Advisory Board Members and Executive Officers:
Correspondence intended for David A. Rosow and Garnett A. Smith may be sent to Fidelity Investments, P.O. Box 55235, Boston, Massachusetts 02205-5235. Correspondence intended for each executive officer and Peter S Lynch may be sent to Fidelity Investments, 82 Devonshire Street, Boston, Massachusetts 02109.
Name, Age; Principal Occupation |
Peter S. Lynch (68) |
| Year of Election or Appointment: 2003 Member of the Advisory Board of Fidelity's Equity and High Income Funds. Mr. Lynch is Vice Chairman and a Director of FMR and FMR Co., Inc. In addition, Mr. Lynch serves as a Trustee of Boston College and as the Chairman of the Inner-City Scholarship Fund. Previously, Mr. Lynch served on the Special Olympics International Board of Directors (1997-2006). |
David A. Rosow (70) |
| Year of Election or Appointment: 2012 Member of the Advisory Board of Fidelity's Equity and High Income Funds. Chairman and Chief Executive Officer of International Golf Group, Inc. (golf course development, 1989-present). Previously, Mr. Rosow served as Chairman and Chief Executive Officer of Rosow & Company, Inc. (private investment company, 1989-2011), a Lead Director of Hudson United Bancorp (2001-2006) and as a Director of TD Banknorth (1996-2006). In addition, Mr. Rosow is a member (2008-present) and President (2009-present) of the Town Council of Palm Beach, Florida. |
Garnett A. Smith (65) |
| Year of Election or Appointment: 2012 Member of the Advisory Board of Fidelity's Equity and High Income Funds. Prior to Mr. Smith's retirement, he served as Chairman and Chief Executive Officer of Inbrand Corp. (manufacturer of personal absorbent products, 1990-1997). He also served as President (1986-1990) of Inbrand Corp. Prior to his employment with Inbrand Corp., he was employed by a retail fabric chain and North Carolina National Bank. In addition, Mr. Smith is a board member of the Jackson Hole Land Trust (2009-present). |
Kenneth B. Robins (43) |
| Year of Election or Appointment: 2008 President and Treasurer of Fidelity's Equity and High Income Funds. Mr. Robins also serves as President and Treasurer (2010-present) and Assistant Treasurer (2009-present) of other Fidelity funds and is an employee of Fidelity Investments (2004-present). Previously, Mr. Robins served as Deputy Treasurer of the Fidelity funds (2005-2008) and Treasurer and Chief Financial Officer of The North Carolina Capital Management Trust: Cash and Term Portfolios (2006-2008). |
Bruce T. Herring (47) |
| Year of Election or Appointment: 2006 Vice President of certain Equity Funds. Mr. Herring also serves as President of Fidelity Research & Analysis Company (2010-present), Chief Investment Officer and Director of Fidelity Management & Research (U.K.) Inc. (2010-present) and Group Chief Investment Officer of FMR. Previously, Mr. Herring served as Vice President (2005-2006) and Senior Vice President (2006-2007) of Fidelity Management & Research Company, Vice President of FMR Co., Inc. (2001-2007) and as a portfolio manager for Fidelity U.S. Equity Funds. |
Brian B. Hogan (48) |
| Year of Election or Appointment: 2009 Vice President of Equity and High Income Funds. Mr. Hogan also serves as President of FMR's Equity Division (2009-present). Previously, Mr. Hogan served as Senior Vice President, Equity Research of FMR (2006-2009) and as a portfolio manager. |
Scott C. Goebel (44) |
| Year of Election or Appointment: 2008 Secretary and Chief Legal Officer (CLO) of the Fidelity funds. Mr. Goebel also serves as Secretary of Fidelity Investments Money Management, Inc. (FIMM) (2010-present) and Fidelity Research and Analysis Company (FRAC) (2010-present); Secretary and CLO of The North Carolina Capital Management Trust: Cash and Term Portfolios (2008-present); General Counsel, Secretary, and Senior Vice President of FMR (2008-present) and FMR Co., Inc. (2008-present); employed by FMR LLC or an affiliate (2001-present); Chief Legal Officer of Fidelity Management & Research (Hong Kong) Limited (2008-present) and Assistant Secretary of Fidelity Management & Research (Japan) Inc. (2008-present), and Fidelity Management & Research (U.K.) Inc. (2008-present). Previously, Mr. Goebel served as Assistant Secretary of FIMM (2008-2010), FRAC (2008-2010), and the Funds (2007-2008) and as Vice President and Secretary of Fidelity Distributors Corporation (FDC) (2005-2007). |
William C. Coffey (43) |
| Year of Election or Appointment: 2009 Assistant Secretary of Fidelity's Equity and High Income Funds. Mr. Coffey also serves as Senior Vice President and Deputy General Counsel of FMR LLC (2010-present), and is an employee of Fidelity Investments. Previously, Mr. Coffey served as Vice President and Associate General Counsel of FMR LLC (2005-2009). |
Elizabeth Paige Baumann (44) |
| Year of Election or Appointment: 2012 Anti-Money Laundering (AML) Officer of the Fidelity funds. Ms. Baumann also serves as AML Officer of The North Carolina Capital Management Trust: Cash and Term Portfolios (2012-present), Chief AML Officer of FMR LLC (2012-present), and is an employee of Fidelity Investments. Previously, Ms. Baumann served as Vice President and Deputy Anti-Money Laundering Officer (2007-2012). |
Christine Reynolds (54) |
| Year of Election or Appointment: 2008 Chief Financial Officer of the Fidelity funds. Ms. Reynolds became President of Fidelity Pricing and Cash Management Services (FPCMS) in August 2008. Ms. Reynolds served as Chief Operating Officer of FPCMS (2007-2008). Previously, Ms. Reynolds served as President, Treasurer, and Anti-Money Laundering officer of the Fidelity funds (2004-2007). |
Joseph A. Hanlon (44) |
| Year of Election or Appointment: 2012 Chief Compliance Officer of Fidelity's Equity and High Income Funds. Mr. Hanlon serves as Compliance Officer of FMR, FMR Co., Inc., Fidelity Investments Money Management, Inc. (FIMM), Fidelity Research and Analysis Company (FRAC), Fidelity Management & Research (Japan) Inc., Fidelity Management & Research (U.K.) Inc., Fidelity Management & Research (Hong Kong), and Strategic Advisers, Inc. (2009-present), as Senior Vice President of the Fidelity Asset Management Division (2009-present), and is an employee of Fidelity Investments. |
Joseph F. Zambello (55) |
| Year of Election or Appointment: 2011 Deputy Treasurer of the Fidelity funds. Mr. Zambello is an employee of Fidelity Investments. Previously, Mr. Zambello served as Vice President of FMR's Program Management Group (2009-2011) and Vice President of the Transfer Agent Oversight Group (2005-2009). |
Adrien E. Deberghes (45) |
| Year of Election or Appointment: 2008 Deputy Treasurer of Fidelity's Equity and High Income Funds. Mr. Deberghes also serves as Vice President (2011-present) and Assistant Treasurer (2010-present) of other Fidelity funds, and is an employee of Fidelity Investments (2008-present). Previously, Mr. Deberghes served as Senior Vice President of Mutual Fund Administration at State Street Corporation (2007-2008), Senior Director of Mutual Fund Administration at Investors Bank & Trust (2005-2007), and Director of Finance for Dunkin' Brands (2000-2005). |
Stephen Sadoski (41) |
| Year of Election or Appointment: 2012 Deputy Treasurer of Fidelity's Equity and High Income Funds. Mr. Sadoski also serves as Deputy Treasurer of other Fidelity funds (2013-present) and is an employee of Fidelity Investments (2012-present). Previously, Mr. Sadoski served as Assistant Treasurer of Fidelity's Fixed Income and Asset Allocation Funds (2012-2013), an assistant chief accountant in the Division of Investment Management of the Securities and Exchange Commission (SEC) (2009-2012) and as a senior manager at Deloitte & Touche (1997-2009). |
Stacie Smith (38) |
| Year of Election or Appointment: 2013 Deputy Treasurer of Fidelity's Equity and High Income Funds. Ms. Smith is an employee of Fidelity Investments (2009-present). Previously, Ms. Smith served as Senior Audit Manager of Ernst & Young LLP (1996-2009). |
Stephanie J. Dorsey (43) |
| Year of Election or Appointment: 2010 Assistant Treasurer of Fidelity's Equity and High Income Funds. Ms. Dorsey also serves as President and Treasurer (2013-present) and Assistant Treasurer (2012-present) of other Fidelity funds and is an employee of Fidelity Investments (2008-present). Previously, Ms. Dorsey served as Deputy Treasurer of Fidelity's Fixed Income and Asset Allocation Funds (2008-2013), Treasurer (2004-2008) of the JPMorgan Mutual Funds and Vice President (2004-2008) of JPMorgan Chase Bank. |
John R. Hebble (54) |
| Year of Election or Appointment: 2009 Assistant Treasurer of Fidelity's Equity and High Income Funds. Mr. Hebble also serves as President (2011-present), Treasurer, and Chief Financial Officer of The North Carolina Capital Management Trust: Cash and Term Portfolios (2008-present) and is an employee of Fidelity Investments. Previously, Mr. Hebble served as President and Treasurer of Fidelity's Fixed Income and Asset Allocation Funds (2008-2013). |
Gary W. Ryan (54) |
| Year of Election or Appointment: 2005 Assistant Treasurer of the Fidelity funds. Mr. Ryan is an employee of Fidelity Investments. Previously, Mr. Ryan served as Vice President of Fund Reporting in Fidelity Pricing and Cash Management Services (FPCMS) (1999-2005). |
Jonathan Davis (44) |
| Year of Election or Appointment: 2010 Assistant Treasurer of the Fidelity funds. Mr. Davis is also Assistant Treasurer of Fidelity Rutland Square Trust II and Fidelity Commonwealth Trust II. Mr. Davis is an employee of Fidelity Investments. Previously, Mr. Davis served as Vice President and Associate General Counsel of FMR LLC (2003-2010). |
Annual Report
Initial Class, Service Class, Service Class 2 and Investor Class designates 100% of the dividends distributed during the fiscal year as qualifying for the dividends-received deduction for corporate shareholders.
Annual Report
Board Approval of Investment Advisory Contracts and Management Fees
VIP Contrafund Portfolio
Each year, the Board of Trustees, including the Independent Trustees (together, the Board), votes on the renewal of the management contract and sub-advisory agreements (together, the Advisory Contracts) for the fund. The Board, assisted by the advice of fund counsel and Independent Trustees' counsel, requests and considers a broad range of information relevant to the renewal of the Advisory Contracts throughout the year.
The Board meets regularly and, at each of its meetings, considers factors that are relevant to its annual consideration of the renewal of the fund's Advisory Contracts, including the services and support provided to the fund and its shareholders. The Board has established various standing committees, each composed of and chaired by Independent Trustees with varying backgrounds, to which the Board has assigned specific subject matter responsibilities in order to enhance effective decision-making by the Board. The Board, acting directly and through its Committees, requests and receives information concerning the annual consideration of the renewal of the fund's Advisory Contracts. The Board also meets as needed to consider matters specifically related to the Board's annual consideration of the renewal of Advisory Contracts. Members of the Board may also meet with trustees of other Fidelity funds through ad hoc joint committees to discuss certain matters relevant to the Fidelity funds.
At its July 2012 meeting, the Board of Trustees, including the Independent Trustees, unanimously determined to renew the fund's Advisory Contracts. In reaching its determination, the Board considered all factors it believed relevant, including (i) the nature, extent, and quality of the services to be provided to the fund and its shareholders (including the investment performance of the fund); (ii) the competitiveness of the fund's management fee and total expense ratio relative to peer funds; (iii) the total costs of the services to be provided by and the profits to be realized by Fidelity from its relationship with the fund; (iv) the extent to which economies of scale exist and would be realized as the fund grows; and (v) whether fee levels reflect these economies of scale, if any, for the benefit of fund shareholders.
In considering whether to renew the Advisory Contracts for the fund, the Board reached a determination, with the assistance of fund counsel and Independent Trustees' counsel and through the exercise of its business judgment, that the renewal of the Advisory Contracts is in the best interests of the fund and its shareholders and that the compensation payable under the Advisory Contracts is fair and reasonable. The Board's decision to renew the Advisory Contracts was not based on any single factor, but rather was based on a comprehensive consideration of all the information provided to the Board at its meetings throughout the year. The Board, in reaching its determination to renew the Advisory Contracts, is aware that shareholders in the fund have a broad range of investment choices available to them, including a wide choice among mutual funds offered by Fidelity's competitors, and that the fund's shareholders, who have the opportunity to review and weigh the disclosure provided by the fund in its prospectus and other public disclosures, have chosen to invest in this fund, managed by Fidelity.
Nature, Extent, and Quality of Services Provided. The Board considered the staffing within the investment adviser, FMR, and the sub-advisers (together, the Investment Advisers), including the backgrounds of the fund's investment personnel, and also considered the fund's investment objective, strategies, and related investment philosophy. The Independent Trustees also had discussions with senior management of Fidelity's investment operations and investment groups. The Board considered the structure of the portfolio manager compensation program and whether this structure provides appropriate incentives to act in the best interests of the fund.
Resources Dedicated to Investment Management and Support Services. The Board and the Fund Oversight and Research Committees reviewed the general qualifications and capabilities of the Investment Advisers' investment staff, including its size, education, experience, and resources, as well as the Investment Advisers' approach to recruiting, training, managing, and compensating investment personnel. The Board also noted that FMR has continued to increase the resources devoted to non-U.S. offices, including expansion of Fidelity's global investment organization. The Board noted that Fidelity's analysts have extensive resources, tools and capabilities that allow them to conduct sophisticated quantitative and fundamental analysis, as well as credit analysis of issuers, counterparties and guarantors. The Board also believes that Fidelity's investment professionals have sufficient access to global information and data so as to provide competitive investment results over time, and that those professionals also have access to sophisticated tools that permit them to assess portfolio construction and risk and performance attribution characteristics continuously, as well as to transmit new information and research conclusions rapidly around the world. Additionally, in its deliberations, the Board considered the Investment Advisers' trading and risk management capabilities and resources, which are an integral part of the investment management process.
Shareholder and Administrative Services. The Board considered (i) the nature, extent, quality, and cost of advisory, administrative, and shareholder services performed by the Investment Advisers and their affiliates under the Advisory Contracts and under separate agreements covering transfer agency, pricing and bookkeeping, and securities lending services for the fund; (ii) the nature and extent of the supervision of third party service providers, principally custodians and subcustodians; and (iii) the resources devoted to, and the record of compliance with, the fund's compliance policies and procedures. The Board also reviewed the allocation of fund brokerage, including allocations to brokers affiliated with the Investment Advisers, the use of brokerage commissions to pay fund expenses, and the use of "soft" commission dollars to pay for research services.
The Board noted that the growth of fund assets over time across the complex allows Fidelity to reinvest in the development of services designed to enhance the value or convenience of the Fidelity funds as investment vehicles. These services include 24-hour access to account information and market information through telephone representatives and over the Internet, investor education materials and asset allocation tools, and the expanded availability of Fidelity Investor Centers.
Annual Report
Investment in a Large Fund Family. The Board considered the benefits to shareholders of investing in a Fidelity fund, including the benefits of investing in a fund that is part of a large family of funds offering a variety of investment disciplines and providing a large variety of mutual fund investor services. The Board noted that Fidelity had taken, or had made recommendations that resulted in the Fidelity funds taking, a number of actions over the previous year that benefited particular funds, including (i) continuing to dedicate additional resources to investment research and support of the senior management team that oversees asset management; (ii) persisting in efforts to enhance Fidelity's research capabilities, in particular, international research; (iii) launching new funds and making other enhancements to meet client needs for global and income-oriented solutions; (iv) continuing to launch dedicated lower cost underlying funds to meet investment management's portfolio construction needs related to expanding underlying fund options, specifically for the Freedom Fund product lines; (v) adopting a "Stock Selector" sector neutral investment approach and employing a team of portfolio managers who are sector specialists to manage certain funds; (vi) rationalizing product lines and gaining increased efficiencies through the mergers of several funds into other funds; (vii) strengthening the Spartan Index Fund product line by adding new funds and/or new low-cost institutional share classes, restructuring fund expenses to accommodate new classes, and reducing investment minimums for certain classes of shares; (viii) modifying the eligibility criteria for Institutional Class shares to increase their appeal to government entities and charitable investors; and (ix) reducing certain transfer agent fee rates.
Investment Performance. The Board considered whether the fund has operated in accordance with its investment objective, as well as its record of compliance with its investment restrictions. It also reviewed the fund's absolute investment performance for each class, as well as the fund's relative investment performance for each class measured over multiple periods against (i) a broad-based securities market index, and (ii) a peer group of mutual funds deemed appropriate by Fidelity and reviewed by the Board. The following charts considered by the Board show, over the one-, three-, and five-year periods ended December 31, 2011, the cumulative total returns of Initial Class and Service Class 2 of the fund, the cumulative total returns of a broad-based securities market index ("benchmark"), and a range of cumulative total returns of a peer group of mutual funds identified by Morningstar, Inc. as having an investment style similar to that of the fund based on underlying portfolio holdings. The returns of Initial Class and Service Class 2 show the performance of the highest and lowest performing classes, respectively (based on five-year performance). The box within each chart shows the 25th percentile return (top of box) and the 75th percentile return (bottom of box) of the peer group. Returns shown above the box are in the first quartile and returns shown below the box are in the fourth quartile. The percentage beaten numbers noted below each chart correspond to the percentile box and represent the percentage of funds in the peer group whose performance was equal to or lower than that of the class indicated.
VIP Contrafund Portfolio

The Board reviewed the fund's relative investment performance against its peer group and noted that the performance of Initial Class of the fund was in the third quartile for the one-year period and the first quartile for the three- and five-year periods. The Board also noted that the investment performance of Initial Class of the fund compared favorably to its benchmark for the three- and five-year periods, although the fund's one-year total return was lower than its benchmark. The Board considered that the variations in performance among the fund's classes reflect the variations in class expenses, which result in lower performance for higher expense classes. The Board also reviewed the fund's performance since inception as well as performance in the current year.
Based on its review, the Board concluded that the nature, extent, and quality of services provided to the fund under the Advisory Contracts should benefit the fund's shareholders.
Annual Report
Board Approval of Investment Advisory Contracts and Management Fees - continued
Competitiveness of Management Fee and Total Expense Ratio. The Board considered the fund's management fee and total expense ratio compared to "mapped groups" of competitive funds and classes. Fidelity creates "mapped groups" by combining similar Lipper investment objective categories that have comparable management fee characteristics. Combining Lipper investment objective categories aids the Board's management fee and total expense ratio comparisons by broadening the competitive group used for comparison and by reducing the number of universes to which various Fidelity funds are compared.
Management Fee. The Board considered two proprietary management fee comparisons for the 12-month periods shown in the chart below. The group of Lipper funds used by the Board for management fee comparisons is referred to below as the "Total Mapped Group." The Total Mapped Group comparison focuses on a fund's standing relative to the total universe of comparable funds available to investors in terms of gross management fees before expense reimbursements or caps. "TMG %" represents the percentage of funds in the Total Mapped Group that had management fees that were lower than the fund's. For example, a TMG % of 10% means that 90% of the funds in the Total Mapped Group had higher management fees than the fund. The "Asset-Size Peer Group" (ASPG) comparison focuses on a fund's standing relative to non-Fidelity funds similar in size to the fund within the Total Mapped Group. The ASPG represents at least 15% of the funds in the Total Mapped Group with comparable asset size and management fee characteristics, subject to a minimum of 50 funds (or all funds in the Total Mapped Group if fewer than 50). Additional information, such as the ASPG quartile in which the fund's management fee ranked, is also included in the chart and considered by the Board.
VIP Contrafund Portfolio

The Board noted that the fund's management fee ranked below the median of its Total Mapped Group and below the median of its ASPG for 2011.
Based on its review, the Board concluded that the fund's management fee is fair and reasonable in light of the services that the fund receives and the other factors considered.
Total Expense Ratio. In its review of each class's total expense ratio, the Board considered the fund's management fee as well as other fund or class expenses, as applicable, such as transfer agent fees, pricing and bookkeeping fees, fund-paid 12b-1 fees, and custodial, legal, and audit fees. The Board also noted the effects of any waivers and reimbursements on fees and expenses. As part of its review, the Board also considered the current and historical total expense ratios of each class of the fund compared to competitive fund median expenses. Each class of the fund is compared to those funds and classes in the Total Mapped Group (used by the Board for management fee comparisons) that have a similar sales load structure.
The Board noted that the total expense ratio of each class ranked below its competitive median for 2011.
Fees Charged to Other Fidelity Clients. The Board also considered Fidelity fee structures and other information with respect to clients of FMR and its affiliates, such as other mutual funds advised or subadvised by FMR or its affiliates, pension plan clients, and other institutional clients. The Board noted the findings of the 2010 ad hoc joint committee (created with the board of other Fidelity funds), which reviewed and compared Fidelity's institutional investment advisory business with its business of providing services to the Fidelity funds, including the differences in services provided, fees charged, and costs incurred, as well as competition in their respective marketplaces.
Based on its review of total expense ratios and fees charged to other Fidelity clients, the Board concluded that the total expense ratio of each class of the fund was reasonable in light of the services that the fund and its shareholders receive and the other factors considered.
Annual Report
Costs of the Services and Profitability. The Board considered the revenues earned and the expenses incurred by Fidelity in conducting the business of developing, marketing, distributing, managing, administering and servicing the fund and its shareholders. The Board also considered the level of Fidelity's profits in respect of all the Fidelity funds.
On an annual basis, FMR presents to the Board Fidelity's profitability for the fund. Fidelity calculates the profitability for each fund, as well as aggregate profitability for groups of Fidelity funds and all Fidelity funds, using a series of detailed revenue and cost allocation methodologies which originate with the books and records of Fidelity on which Fidelity's audited financial statements are based. The Audit Committee of the Board reviews any significant changes from the prior year's methodologies.
PricewaterhouseCoopers LLP (PwC), independent registered public accounting firm and auditor to Fidelity and certain Fidelity funds, has been engaged annually by the Board as part of the Board's assessment of Fidelity's profitability analysis. PwC's engagement includes the review and assessment of Fidelity's methodologies used in determining the revenues and expenses attributable to Fidelity's mutual fund business, and completion of agreed-upon procedures surrounding the mathematical accuracy of fund profitability and its conformity to allocation methodologies. After considering PwC's reports issued under the engagement and information provided by Fidelity, the Board concluded that while other allocation methods may also be reasonable, Fidelity's profitability methodologies are reasonable in all material respects.
The Board also reviewed Fidelity's non-fund businesses and fall-out benefits related to the mutual fund business as well as cases where Fidelity's affiliates may benefit from or be related to the fund's business.
The Board considered the costs of the services provided by and the profits realized by Fidelity in connection with the operation of the fund and was satisfied that the profitability was not excessive in the circumstances.
Economies of Scale. The Board considered whether there have been economies of scale in respect of the management of the Fidelity funds, whether the Fidelity funds (including the fund) have appropriately benefited from any such economies of scale, and whether there is potential for realization of any further economies of scale. The Board considered the extent to which the fund will benefit from economies of scale through increased services to the fund, through waivers or reimbursements, or through fee or expense reductions. The Board also noted that in 2009, it and the board of other Fidelity funds created an ad hoc committee (the Economies of Scale Committee) to analyze whether FMR attains economies of scale in respect of the management and servicing of the Fidelity funds, whether the Fidelity funds have appropriately benefited from such economies of scale, and whether there is potential for realization of any further economies of scale.
The Board recognized that the fund's management contract incorporates a "group fee" structure, which provides for lower group fee rates as total fund assets under FMR's management increase, and for higher group fee rates as total fund assets under FMR's management decrease. FMR calculates the group fee rates based on a tiered asset "breakpoint" schedule that varies based on asset class. The Board considered that the group fee is designed to deliver the benefits of economies of scale to fund shareholders when total Fidelity fund assets increase, even if assets of any particular fund are unchanged or have declined, because some portion of Fidelity's costs are attributable to services provided to all Fidelity funds, and all funds benefit if those costs can be allocated among more assets. The Board concluded that, given the group fee structure, fund shareholders will benefit from lower management fees as assets under FMR's management increase at the fund complex level, regardless of whether Fidelity achieves any such economies of scale.
The Board concluded, taking into account the analysis of the Economies of Scale Committee, that economies of scale, if any, are being appropriately shared between fund shareholders and Fidelity.
Additional Information Requested by the Board. In order to develop fully the factual basis for consideration of the Fidelity funds' Advisory Contracts, the Board requested and received additional information on certain topics, including (i) fund performance trends, actions to be taken by FMR to improve certain funds' overall performance, and Fidelity's long-term strategies for certain funds; (ii) the potential to further rationalize the Fidelity fund lineup with the possibility of achieving savings for the funds and Fidelity; (iii) Fidelity's compensation structure for portfolio managers and other key investment personnel; (iv) the amount of the investment that each portfolio manager has made in the Fidelity fund(s) that he or she manages; (v) the realization of fall-out benefits in certain Fidelity business units; (vi) Fidelity's group fee structures, the potential impact of regulatory changes on such structures, and the rationale for the individual fee rates of certain funds; (vii) fund profitability methodology, including Fidelity's cost allocation methodology, and the impact of certain factors on fund profitability results; (viii) trends regarding industry use of performance fee structures and the possibility of implementing performance fee structures for additional funds; and (ix) the impact of net redemptions from the Fidelity funds.
Based on its evaluation of all of the conclusions noted above, and after considering all factors it believed relevant, the Board ultimately concluded that the advisory fee structures are fair and reasonable, and that the fund's Advisory Contracts should be renewed.
Annual Report
Investment Adviser
Fidelity Management & Research Company
Boston, MA
Investment Sub-Advisers
FMR Co., Inc.
Fidelity Management & Research (U.K.) Inc.
Fidelity Management & Research (Hong Kong) Limited
Fidelity Management & Research (Japan) Inc.
General Distributor
Fidelity Distributors Corporation
Smithfield, RI
Transfer and Service Agents
Fidelity Investments Institutional Operations Company, Inc.
Boston, MA
Fidelity Service Company, Inc.
Boston, MA
Custodian
Brown Brothers Harriman & Co.
Boston, MA
VIPCON-ANN-0213
1.540131.115
Fidelity® Variable Insurance Products:
Contrafund® Portfolio - Service Class 2R
Annual Report
December 31, 2012
(Fidelity Cover Art)
Contents
Performance | (Click Here) | How the fund has done over time. |
Management's Discussion of Fund Performance | (Click Here) | The Portfolio Manager's review of fund performance and strategy. |
Shareholder Expense Example | (Click Here) | An example of shareholder expenses. |
Investment Changes | (Click Here) | A summary of major shifts in the fund's investments over the past six months. |
Investments | (Click Here) | A complete list of the fund's investments with their market values. |
Financial Statements | (Click Here) | Statements of assets and liabilities, operations, and changes in net assets, as well as financial highlights. |
Notes | (Click Here) | Notes to the financial statements. |
Report of Independent Registered Public Accounting Firm | (Click Here) | |
Trustees and Officers | (Click Here) | |
Distributions | (Click Here) | |
Board Approval of Investment Advisory Contracts and Management Fees | (Click Here) | |
To view a fund's proxy voting guidelines and proxy voting record for the 12-month period ended June 30, visit http://www.fidelity.com/proxyvotingresults or visit the Securities and Exchange Commission's (SEC) web site at http://www.sec.gov. You may also call 1-877-208-0098 to request a free copy of the proxy voting guidelines.
Fidelity Variable Insurance Products are separate account options which are purchased through a variable insurance contract.
Standard & Poor's, S&P and S&P 500 are registered service marks of The McGraw-Hill Companies, Inc. and have been licensed for use by Fidelity Distributors Corporation.
Other third party marks appearing herein are the property of their respective owners.
All other marks appearing herein are registered or unregistered trademarks or service marks of FMR LLC or an affiliated company. © 2013 FMR LLC. All rights reserved.
This report and the financial statements contained herein are submitted for the general information of the shareholders of the fund. This report is not authorized for distribution to prospective investors in the fund unless preceded or accompanied by an effective prospectus.
A fund files its complete schedule of portfolio holdings with the SEC for the first and third quarters of each fiscal year on Form N-Q. Forms N-Q are available on the SEC's web site at http://www.sec.gov. A fund's Forms N-Q may be reviewed and copied at the SEC's Public Reference Room in Washington, DC. Information regarding the operation of the SEC's Public Reference Room may be obtained by calling 1-800-SEC-0330. For a complete list of a fund's portfolio holdings, view the most recent holdings listing, semiannual report, or annual report on Fidelity's web site a http://www.fidelity.com, http://www.advisor.fidelity.com, or http://www.401k.com, as applicable.
NOT FDIC INSURED • MAY LOSE VALUE • NO BANK GUARANTEE
Neither the fund nor Fidelity Distributors Corporation is a bank.
Annual Report
Average annual total return reflects the change in the value of an investment, assuming reinvestment of the class' distributions from dividend income and capital gains (the profits earned upon the sale of securities that have grown in value, if any) and assuming a constant rate of performance each year. During periods of reimbursement by Fidelity, a fund's total return will be greater than it would be had the reimbursement not occurred. Performance numbers are net of all underlying fund operating expenses, but do not include any insurance charges imposed by your insurance company's separate account. If performance information included the effect of these additional charges, the total returns would have been lower. How a fund did yesterday is no guarantee of how it will do tomorrow.
Average Annual Total Returns
Periods ended December 31, 2012 | Past 1
year | Past 5
years | Past 10
years |
VIP ContrafundSM Portfolio - Service Class 2R | 16.15% | 0.50% | 8.72% |
$10,000 Over 10 Years
Let's say hypothetically that $10,000 was invested in VIP ContrafundSM Portfolio - Service Class 2R on December 31, 2002. The chart shows how the value of your investment would have changed, and also shows how the S&P 500® Index performed over the same period.
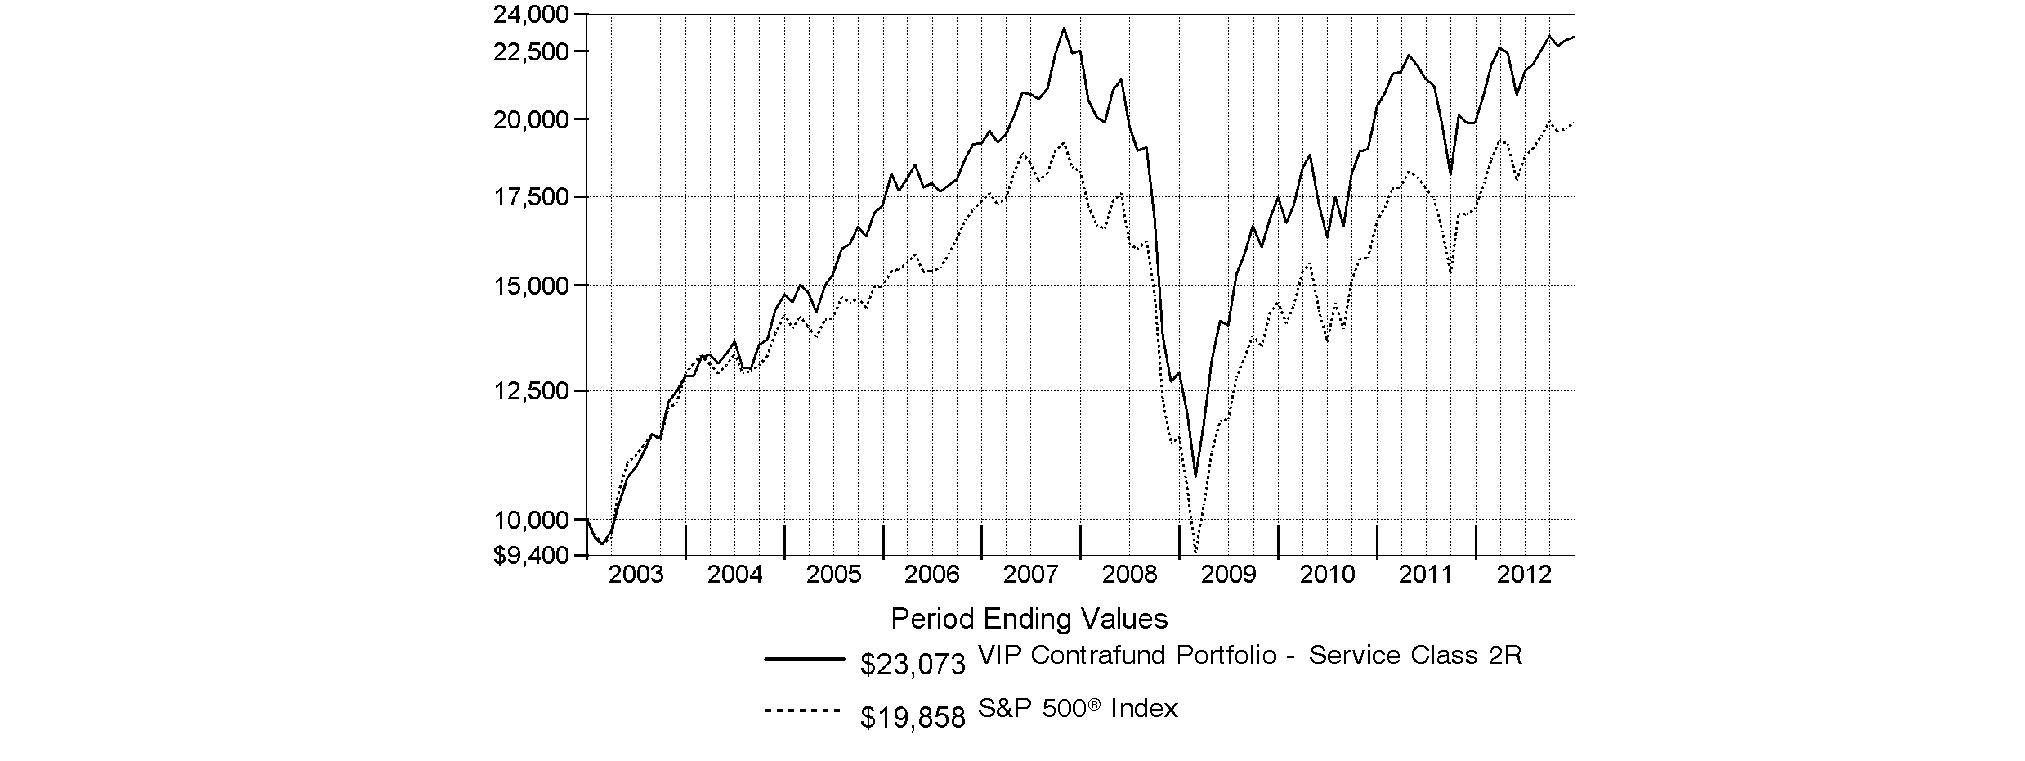
Annual Report
Market Recap: Global markets overcame a host of macroeconomic concerns in 2012 - related to the eurozone debt crisis, the strength and pace of the U.S. economic recovery, the U.S. fiscal debate and a slowdown in China's once-blistering growth - to post broad-based gains for the year, with more-economically sensitive asset classes leading the way. Investor sentiment improved as some of the uncertainties holding back the markets began to lift and the outlook brightened in the face of stimulative global monetary policies and modest inflationary pressures. Riskier assets such as stocks saw the biggest advances, with international equities edging their U.S. counterparts, thanks to an especially strong rally in the fourth quarter. Similarly, within fixed income, credit-sensitive sectors - including high-yield/investment-grade corporate bonds and emerging-markets debt - surged ahead of more-defensive U.S. investment-grade bonds amid strong demand for higher-risk, higher-yielding securities. Emerging signs of a rebounding U.S. economy lifted domestic stocks for most of the period, extending an uptrend that began in March 2009. The broad-based S&P 500® Index rose 16.00% for the 12 months, while the technology-heavy Nasdaq Composite Index® gained 17.45% and the blue-chip-laden Dow Jones Industrial AverageSM added 10.24%. Foreign developed- and emerging-markets equities experienced periodic bouts of volatility this past year, but rode a strong second-half rally to finish ahead of their U.S. counterparts. The MSCI® ACWI® (All Country World Index) ex USA Index advanced 16.98% for the period. In an environment that favored higher-risk assets, U.S. investment-grade bonds managed only a 4.21% gain for 12 months, according to the Barclays® U.S. Aggregate Bond Index. Among sectors that comprise the index, bonds with higher yields and on the riskier end of the spectrum led the way, with investment-grade credit advancing 9.37%, while ultra-safe U.S. Treasuries managed only a 1.99% advance and finished at the back of the pack. Meanwhile, high-yield bonds, as measured by The BofA Merrill LynchSM US High Yield Constrained Index, gained a hearty 15.55%. Foreign bonds showed positive results during the year, with emerging markets easily outpacing their major developed-markets counterparts. The J.P. Morgan Emerging Markets Bond Index Global surged 18.54%, while the Citigroup® Non-USD Group-of-Seven (G7) Equal Weighted Index logged a 7.10% gain.
Comments from Robert Stansky, Head of Fidelity's Stock Selector Large Cap Group, which manages VIP ContrafundSM Portfolio: For the year, the fund's share classes modestly outperformed the S&P 500®. (For specific portfolio results, please refer to the performance section of this report.) Versus the index, the primary driver of performance was security selection by our sector-focused co-managers. The fund also benefited from some of our active positions at the industry level. Our picks were strongest in utilities and consumer staples. Positioning in telecommunication services, health care and materials also provided a lift. Conversely, results were hampered by security selection in energy and financials, as well as positioning in consumer discretionary and industrials. Looking at individual stocks, a sizable overweighting in Apple was the top contributor. The company's iPad® tablet and iPhone® smartphone continue to define their respective categories, helping the stock maintain its run of strong performance, despite slipping during the fourth quarter. Also in tech, we did not own chipmaker and index component Intel and largely avoided computer and peripherals firm Hewlett-Packard, each of which was a good call. We believed these PC-focused companies were not well-positioned to capitalize on the popularity of tablets and smartphones. Hewlett-Packard was not held at period end. The tech sector also included a notable detractor, memory-chip maker SanDisk. The stock lost significant ground during the first half of 2012 on weak sales of PCs and consumer devices. In energy, the fund was hurt by an out-of-index position in integrated oil firm Royal Dutch Shell, which we held due to what we believed was an attractive valuation, along with the company's improved growth and free cash flow profile - the result of several major projects to start production. But the stock fell during the period and hampered relative performance. Lastly, we lost ground by avoiding strong-performing home-improvement retailer and index member Home Depot, but our ownership of Lowe's Companies, its chief competitor, offset most of the negative impact.
The views expressed above reflect those of the portfolio manager(s) only through the end of the period as stated on the cover of this report and do not necessarily represent the views of Fidelity or any other person in the Fidelity organization. Any such views are subject to change at any time based upon market or other conditions and Fidelity disclaims any responsibility to update such views. These views may not be relied on as investment advice and, because investment decisions for a Fidelity fund are based on numerous factors, may not be relied on as an indication of trading intent on behalf of any Fidelity fund.
Annual Report
As a shareholder of the Fund, you incur two types of costs: (1) transaction costs, including redemption fees and (2) ongoing costs, including management fees, distribution and/or service (12b-1) fees and other Fund expenses. This Example is intended to help you understand your ongoing costs (in dollars) of investing in the Fund and to compare these costs with the ongoing costs of investing in other mutual funds.
The Example is based on an investment of $1,000 invested at the beginning of the period and held for the entire period (July 1, 2012 to December 31, 2012).
Actual Expenses
The first line of the accompanying table for each class of the Fund provides information about actual account values and actual expenses. You may use the information in this line, together with the amount you invested, to estimate the expenses that you paid over the period. Simply divide your account value by $1,000.00 (for example, an $8,600 account value divided by $1,000.00 = 8.6), then multiply the result by the number in the first line for a class of the Fund under the heading entitled "Expenses Paid During Period" to estimate the expenses you paid on your account during this period. The estimate of expenses does not include any fees or other expenses of any variable annuity or variable life insurance product. If they were, the estimate of expenses you paid during the period would be higher, and your ending account value would be lower. In addition, the Fund, as a shareholder in the underlying Fidelity Central Funds, will indirectly bear its pro-rata share of the fees and expenses incurred by the underlying Fidelity Central Funds. These fees and expenses are not included in the Fund's annualized expense ratio used to calculate the expense estimate in the table below.
Hypothetical Example for Comparison Purposes
The second line of the accompanying table for each class of the Fund provides information about hypothetical account values and hypothetical expenses based on a Class' actual expense ratio and an assumed rate of return of 5% per year before expenses, which is not the Class' actual return. The hypothetical account values and expenses may not be used to estimate the actual ending account balance or expenses you paid for the period. You may use this information to compare the ongoing costs of investing in the Fund and other funds. To do so, compare this 5% hypothetical example with the 5% hypothetical examples that appear in the shareholder reports of the other funds. The estimate of expenses does not include any fees or other expenses of any variable annuity or variable life insurance product. If they were, the estimate of expenses you paid during the period would be higher, and your ending account value would be lower. In addition, the Fund, as a shareholder in the underlying Fidelity Central Funds, will indirectly bear its pro-rata share of the fees and expenses incurred by the underlying Fidelity Central Funds. These fees and expenses are not included in the Fund's annualized expense ratio used to calculate the expense estimate in the table below.
Please note that the expenses shown in the table are meant to highlight your ongoing costs only and do not reflect any transaction costs. Therefore, the second line of the table is useful in comparing ongoing costs only, and will not help you determine the relative total costs of owning different funds. In addition, if these transactional costs were included, your costs would have been higher.
| Annualized
Expense Ratio | Beginning
Account Value
July 1, 2012 | Ending
Account Value
December 31, 2012 | Expenses Paid
During Period*
July 1, 2012
to December 31, 2012 |
Initial Class | .64% | | | |
Actual | | $ 1,000.00 | $ 1,063.90 | $ 3.32 |
HypotheticalA | | $ 1,000.00 | $ 1,021.92 | $ 3.25 |
Service Class | .74% | | | |
Actual | | $ 1,000.00 | $ 1,063.50 | $ 3.84 |
HypotheticalA | | $ 1,000.00 | $ 1,021.42 | $ 3.76 |
Service Class 2 | .89% | | | |
Actual | | $ 1,000.00 | $ 1,062.80 | $ 4.61 |
HypotheticalA | | $ 1,000.00 | $ 1,020.66 | $ 4.52 |
Service Class 2R | .89% | | | |
Actual | | $ 1,000.00 | $ 1,062.80 | $ 4.61 |
HypotheticalA | | $ 1,000.00 | $ 1,020.66 | $ 4.52 |
Investor Class | .73% | | | |
Actual | | $ 1,000.00 | $ 1,063.30 | $ 3.79 |
HypotheticalA | | $ 1,000.00 | $ 1,021.47 | $ 3.71 |
A 5% return per year before expenses
* Expenses are equal to each Class' annualized expense ratio, multiplied by the average account value over the period, multiplied by 184/366 (to reflect the one-half year period).
Annual Report
Investment Changes (Unaudited)
Top Ten Stocks as of December 31, 2012 |
| % of fund's
net assets | % of fund's net assets
6 months ago |
Apple, Inc. | 5.6 | 6.9 |
QUALCOMM, Inc. | 2.5 | 2.3 |
Exxon Mobil Corp. | 2.4 | 1.6 |
General Electric Co. | 2.2 | 1.8 |
Pfizer, Inc. | 2.2 | 1.7 |
Procter & Gamble Co. | 2.0 | 2.1 |
Capital One Financial Corp. | 1.9 | 1.7 |
The Coca-Cola Co. | 1.8 | 2.1 |
Comcast Corp. Class A | 1.8 | 1.8 |
JPMorgan Chase & Co. | 1.6 | 0.5 |
| 24.0 | |
Market Sectors as of December 31, 2012 |
| % of fund's
net assets | % of fund's net assets
6 months ago |
Information Technology | 19.5 | 20.2 |
Financials | 15.9 | 14.7 |
Health Care | 11.7 | 11.5 |
Energy | 10.8 | 10.6 |
Consumer Discretionary | 10.6 | 10.5 |
Consumer Staples | 10.5 | 11.1 |
Industrials | 10.5 | 10.2 |
Materials | 3.6 | 3.4 |
Utilities | 3.5 | 3.7 |
Telecommunication Services | 2.4 | 2.0 |
Asset Allocation (% of fund's net assets) |
As of December 31, 2012 * | As of June 30, 2012 ** |
| Stocks and
Equity Futures 99.1% | | | Stocks and
Equity Futures 98.1% | |
| Convertible Bonds 0.0%† | | | Convertible Bonds 0.0% | |
| Short-Term
Investments and
Net Other Assets
(Liabilities) 0.9% | | | Short-Term
Investments and
Net Other Assets
(Liabilities) 1.9% | |
* Foreign investments | 11.1% | | ** Foreign investments | 13.9% | |
† Amount represents less than 0.1%

Annual Report
Investments December 31, 2012
Showing Percentage of Net Assets
Common Stocks - 98.9% |
| Shares | | Value |
CONSUMER DISCRETIONARY - 10.5% |
Hotels, Restaurants & Leisure - 1.4% |
Domino's Pizza, Inc. | 967,870 | | $ 42,150,739 |
Dunkin' Brands Group, Inc. | 566,661 | | 18,801,812 |
Icahn Enterprises LP rights (a) | 363,975 | | 4 |
Starbucks Corp. | 989,322 | | 53,047,446 |
Yum! Brands, Inc. | 1,647,924 | | 109,422,154 |
| | 223,422,155 |
Internet & Catalog Retail - 1.3% |
Liberty Media Corp. Interactive Series A (a) | 4,692,540 | | 92,349,187 |
priceline.com, Inc. (a) | 180,322 | | 112,016,026 |
| | 204,365,213 |
Media - 4.5% |
Comcast Corp. Class A | 7,697,521 | | 287,733,335 |
DIRECTV (a) | 2,281,215 | | 114,425,744 |
Legend Pictures LLC (a)(h)(i) | 2,062 | | 3,821,257 |
News Corp. Class A | 6,209,595 | | 158,593,056 |
Sirius XM Radio, Inc. (d) | 13,269,786 | | 38,349,682 |
The Walt Disney Co. | 2,400,034 | | 119,497,693 |
Weinstein Co. Holdings LLC Class A-1 (a)(h)(i) | 11,499 | | 4,312,125 |
| | 726,732,892 |
Multiline Retail - 0.6% |
Dollar General Corp. (a) | 1,626,280 | | 71,702,685 |
Target Corp. | 532,276 | | 31,494,771 |
| | 103,197,456 |
Specialty Retail - 2.5% |
AutoZone, Inc. (a) | 192,169 | | 68,110,459 |
CarMax, Inc. (a) | 1,063,968 | | 39,941,359 |
Limited Brands, Inc. | 903,270 | | 42,507,886 |
Lowe's Companies, Inc. | 3,535,673 | | 125,587,105 |
Tiffany & Co., Inc. | 784,687 | | 44,993,953 |
TJX Companies, Inc. | 2,188,242 | | 92,890,873 |
| | 414,031,635 |
Textiles, Apparel & Luxury Goods - 0.2% |
Under Armour, Inc. Class A (sub. vtg.) (a)(d) | 747,260 | | 36,264,528 |
TOTAL CONSUMER DISCRETIONARY | | 1,708,013,879 |
CONSUMER STAPLES - 10.5% |
Beverages - 3.5% |
Anheuser-Busch InBev SA NV | 552,671 | | 48,129,107 |
Coca-Cola Bottling Co. CONSOLIDATED | 128,771 | | 8,563,272 |
Coca-Cola FEMSA SAB de CV sponsored ADR | 30,147 | | 4,493,109 |
Coca-Cola Icecek A/S | 439,515 | | 9,115,757 |
Companhia de Bebidas das Americas (AmBev) (PN) sponsored ADR | 200,370 | | 8,413,536 |
|
| Shares | | Value |
Constellation Brands, Inc. Class A (sub. vtg.) (a) | 1,419,209 | | $ 50,225,807 |
Diageo PLC sponsored ADR | 375,078 | | 43,726,593 |
Embotelladora Andina SA sponsored ADR | 228,456 | | 8,674,474 |
Molson Coors Brewing Co. Class B | 599,341 | | 25,645,801 |
Pernod Ricard SA | 379,779 | | 44,062,305 |
Remy Cointreau SA (d) | 212,448 | | 23,361,602 |
The Coca-Cola Co. | 7,982,545 | | 289,367,256 |
| | 563,778,619 |
Food & Staples Retailing - 1.9% |
CVS Caremark Corp. | 3,708,548 | | 179,308,296 |
Drogasil SA | 482,700 | | 5,504,039 |
Kroger Co. | 2,249,387 | | 58,529,050 |
Safeway, Inc. | 330,232 | | 5,973,897 |
Wal-Mart Stores, Inc. | 656,157 | | 44,769,592 |
Walgreen Co. | 541,501 | | 20,040,952 |
| | 314,125,826 |
Food Products - 0.6% |
Bunge Ltd. | 360,992 | | 26,240,508 |
Green Mountain Coffee Roasters, Inc. (a) | 197,119 | | 8,152,842 |
Mead Johnson Nutrition Co. Class A | 499,180 | | 32,890,970 |
Nestle SA | 402,800 | | 26,280,070 |
Unilever NV (NY Reg.) | 132,581 | | 5,077,852 |
| | 98,642,242 |
Household Products - 2.2% |
Colgate-Palmolive Co. | 411,231 | | 42,990,089 |
Procter & Gamble Co. | 4,721,058 | | 320,512,628 |
| | 363,502,717 |
Personal Products - 0.2% |
L'Oreal SA | 213,216 | | 29,667,395 |
Nu Skin Enterprises, Inc. Class A (d) | 256,858 | | 9,516,589 |
| | 39,183,984 |
Tobacco - 2.1% |
Altria Group, Inc. | 1,702,809 | | 53,502,259 |
British American Tobacco PLC sponsored ADR | 2,378,293 | | 240,802,166 |
Philip Morris International, Inc. | 386,892 | | 32,359,647 |
Souza Cruz SA | 586,300 | | 8,928,288 |
| | 335,592,360 |
TOTAL CONSUMER STAPLES | | 1,714,825,748 |
ENERGY - 10.8% |
Energy Equipment & Services - 2.4% |
Cameron International Corp. (a) | 945,980 | | 53,410,031 |
Ensco PLC Class A | 1,153,801 | | 68,397,323 |
Forum Energy Technologies, Inc. | 595,150 | | 14,729,963 |
Halliburton Co. | 757,856 | | 26,290,025 |
National Oilwell Varco, Inc. | 1,133,592 | | 77,481,013 |
Noble Corp. | 1,288,601 | | 44,869,087 |
Common Stocks - continued |
| Shares | | Value |
ENERGY - continued |
Energy Equipment & Services - continued |
Ocean Rig UDW, Inc. (United States) (a) | 792,900 | | $ 11,869,713 |
Oceaneering International, Inc. | 271,218 | | 14,588,816 |
Oil States International, Inc. (a) | 126,678 | | 9,062,544 |
Schlumberger Ltd. | 748,379 | | 51,855,181 |
Vantage Drilling Co. (a) | 7,814,300 | | 14,300,169 |
| | 386,853,865 |
Oil, Gas & Consumable Fuels - 8.4% |
Anadarko Petroleum Corp. | 1,360,903 | | 101,128,702 |
Apache Corp. | 716,928 | | 56,278,848 |
Chevron Corp. | 1,656,911 | | 179,178,356 |
Cobalt International Energy, Inc. (a) | 571,609 | | 14,038,717 |
ENI SpA sponsored ADR | 384,700 | | 18,904,158 |
EQT Corp. | 431,100 | | 25,426,278 |
Exxon Mobil Corp. | 4,503,070 | | 389,740,709 |
Falkland Oil & Gas Ltd. (a)(d) | 890,671 | | 416,729 |
Hess Corp. | 873,800 | | 46,276,448 |
InterOil Corp. (a)(d) | 403,982 | | 22,433,120 |
Marathon Oil Corp. | 2,278,558 | | 69,860,588 |
Marathon Petroleum Corp. | 1,229,405 | | 77,452,515 |
Murphy Oil Corp. | 538,295 | | 32,055,467 |
Noble Energy, Inc. | 423,250 | | 43,061,455 |
Northern Tier Energy LP Class A | 358,134 | | 9,110,929 |
Occidental Petroleum Corp. | 847,711 | | 64,943,140 |
PBF Energy, Inc. | 152,100 | | 4,418,505 |
Phillips 66 | 488,082 | | 25,917,154 |
Royal Dutch Shell PLC Class B sponsored ADR | 1,027,688 | | 72,852,802 |
Southcross Energy Partners LP | 167,700 | | 3,961,074 |
Suncor Energy, Inc. | 1,982,110 | | 65,180,274 |
The Williams Companies, Inc. | 1,318,400 | | 43,164,416 |
Western Gas Equity Partners LP | 59,300 | | 1,776,035 |
| | 1,367,576,419 |
TOTAL ENERGY | | 1,754,430,284 |
FINANCIALS - 15.9% |
Capital Markets - 1.6% |
Ameriprise Financial, Inc. | 1,117,823 | | 70,009,254 |
BlackRock, Inc. Class A | 258,134 | | 53,358,879 |
E*TRADE Financial Corp. (a) | 972,427 | | 8,703,222 |
Evercore Partners, Inc. Class A | 361,500 | | 10,913,685 |
Goldman Sachs Group, Inc. | 214,700 | | 27,387,132 |
Invesco Ltd. | 705,493 | | 18,406,312 |
Morgan Stanley | 1,432,497 | | 27,389,343 |
TD Ameritrade Holding Corp. | 860,606 | | 14,466,787 |
The Blackstone Group LP | 1,329,635 | | 20,729,010 |
UBS AG | 401,916 | | 6,289,536 |
| | 257,653,160 |
|
| Shares | | Value |
Commercial Banks - 3.0% |
CIT Group, Inc. (a) | 560,512 | | $ 21,658,184 |
First Horizon National Corp. (d) | 2,146,415 | | 21,270,973 |
Huntington Bancshares, Inc. | 2,227,851 | | 14,235,968 |
KBC Groupe SA | 308,967 | | 10,768,190 |
Lloyds Banking Group PLC (a) | 18,868,433 | | 15,036,146 |
M&T Bank Corp. | 394,200 | | 38,816,874 |
Synovus Financial Corp. | 6,342,186 | | 15,538,356 |
U.S. Bancorp | 7,904,169 | | 252,459,158 |
Wells Fargo & Co. | 3,058,196 | | 104,529,139 |
| | 494,312,988 |
Consumer Finance - 2.7% |
Capital One Financial Corp. | 5,240,510 | | 303,582,744 |
Discover Financial Services | 1,101,844 | | 42,476,086 |
SLM Corp. | 5,677,740 | | 97,259,686 |
| | 443,318,516 |
Diversified Financial Services - 4.7% |
Bank of America Corp. | 20,331,420 | | 235,844,472 |
Citigroup, Inc. | 6,303,698 | | 249,374,293 |
ING Groep NV (Certificaten Van Aandelen) (a) | 916,125 | | 8,701,339 |
JPMorgan Chase & Co. | 6,088,719 | | 267,720,974 |
| | 761,641,078 |
Insurance - 2.4% |
ACE Ltd. | 816,153 | | 65,129,009 |
AFLAC, Inc. | 516,867 | | 27,455,975 |
Berkshire Hathaway, Inc.: | | | |
Class A (a) | 288 | | 38,609,280 |
Class B (a) | 148,412 | | 13,312,556 |
Direct Line Insurance Group PLC | 4,241,500 | | 15,014,558 |
Fairfax Financial Holdings Ltd. (sub. vtg.) | 61,300 | | 22,096,225 |
Hartford Financial Services Group, Inc. | 2,314,667 | | 51,941,127 |
MetLife, Inc. | 1,909,790 | | 62,908,483 |
The Travelers Companies, Inc. | 811,581 | | 58,287,747 |
Validus Holdings Ltd. | 869,357 | | 30,062,365 |
| | 384,817,325 |
Real Estate Investment Trusts - 1.0% |
American Tower Corp. | 1,040,803 | | 80,422,848 |
Camden Property Trust (SBI) | 186,898 | | 12,748,313 |
Equity Lifestyle Properties, Inc. | 352,700 | | 23,733,183 |
Sun Communities, Inc. | 536,569 | | 21,403,737 |
The Macerich Co. | 395,980 | | 23,085,634 |
| | 161,393,715 |
Thrifts & Mortgage Finance - 0.5% |
Ocwen Financial Corp. (a) | 2,150,326 | | 74,379,776 |
TOTAL FINANCIALS | | 2,577,516,558 |
HEALTH CARE - 11.7% |
Biotechnology - 3.6% |
Amgen, Inc. | 2,242,730 | | 193,592,454 |
Common Stocks - continued |
| Shares | | Value |
HEALTH CARE - continued |
Biotechnology - continued |
Biogen Idec, Inc. (a) | 625,707 | | $ 91,772,446 |
BioMarin Pharmaceutical, Inc. (a) | 547,064 | | 26,942,902 |
CSL Ltd. | 778,516 | | 43,952,924 |
Gilead Sciences, Inc. (a) | 1,968,964 | | 144,620,406 |
Onyx Pharmaceuticals, Inc. (a) | 725,607 | | 54,805,097 |
Regeneron Pharmaceuticals, Inc. (a) | 105,175 | | 17,992,287 |
Theravance, Inc. (a) | 449,022 | | 9,999,720 |
| | 583,678,236 |
Health Care Equipment & Supplies - 1.4% |
Covidien PLC | 1,728,797 | | 99,820,739 |
Edwards Lifesciences Corp. (a) | 462,263 | | 41,682,255 |
Quidel Corp. (a)(d) | 1,571,494 | | 29,339,793 |
The Cooper Companies, Inc. | 620,565 | | 57,389,851 |
| | 228,232,638 |
Health Care Providers & Services - 1.9% |
Apollo Hospitals Enterprise Ltd. | 369,766 | | 5,332,791 |
Catamaran Corp. (a) | 678,782 | | 31,977,422 |
CIGNA Corp. | 950,939 | | 50,837,199 |
Henry Schein, Inc. (a) | 783,171 | | 63,013,939 |
McKesson Corp. | 606,550 | | 58,811,088 |
UnitedHealth Group, Inc. | 1,916,227 | | 103,936,152 |
| | 313,908,591 |
Life Sciences Tools & Services - 0.2% |
Agilent Technologies, Inc. | 262,850 | | 10,761,079 |
Fluidigm Corp. (a)(i) | 312,345 | | 4,469,657 |
Thermo Fisher Scientific, Inc. | 321,945 | | 20,533,652 |
| | 35,764,388 |
Pharmaceuticals - 4.6% |
AbbVie, Inc. (f) | 861,300 | | 29,422,008 |
Allergan, Inc. | 984,574 | | 90,314,973 |
Merck & Co., Inc. | 4,081,349 | | 167,090,428 |
Pfizer, Inc. | 14,042,238 | | 352,179,329 |
Sanofi SA sponsored ADR | 423,062 | | 20,044,678 |
Valeant Pharmaceuticals International, Inc. (Canada) (a) | 1,365,134 | | 81,438,677 |
| | 740,490,093 |
TOTAL HEALTH CARE | | 1,902,073,946 |
INDUSTRIALS - 10.5% |
Aerospace & Defense - 2.2% |
Honeywell International, Inc. | 1,954,366 | | 124,043,610 |
MTU Aero Engines Holdings AG | 238,997 | | 21,810,769 |
Raytheon Co. | 598,485 | | 34,448,797 |
Textron, Inc. | 2,802,049 | | 69,462,795 |
United Technologies Corp. | 1,354,398 | | 111,074,180 |
| | 360,840,151 |
|
| Shares | | Value |
Building Products - 0.8% |
Armstrong World Industries, Inc. | 892,006 | | $ 45,251,464 |
Owens Corning (a) | 1,390,083 | | 51,419,170 |
Quanex Building Products Corp. | 1,706,475 | | 34,829,155 |
| | 131,499,789 |
Commercial Services & Supplies - 0.8% |
ADT Corp. | 654,613 | | 30,432,958 |
KAR Auction Services, Inc. | 1,758,582 | | 35,593,700 |
Stericycle, Inc. (a) | 414,999 | | 38,706,957 |
Tyco International Ltd. | 564,726 | | 16,518,236 |
| | 121,251,851 |
Electrical Equipment - 0.8% |
Regal-Beloit Corp. | 862,575 | | 60,785,660 |
Roper Industries, Inc. | 587,612 | | 65,506,986 |
| | 126,292,646 |
Industrial Conglomerates - 2.8% |
Danaher Corp. | 1,810,555 | | 101,210,025 |
General Electric Co. | 17,141,338 | | 359,796,685 |
| | 461,006,710 |
Machinery - 1.8% |
Caterpillar, Inc. | 248,016 | | 22,217,273 |
Cummins, Inc. | 596,113 | | 64,588,844 |
Deere & Co. | 673,224 | | 58,180,018 |
Fiat Industrial SpA | 1,449,772 | | 15,883,076 |
Illinois Tool Works, Inc. | 1,432,786 | | 87,127,717 |
Parker Hannifin Corp. | 560,608 | | 47,685,316 |
| | 295,682,244 |
Professional Services - 0.1% |
Verisk Analytics, Inc. (a) | 251,800 | | 12,841,800 |
Road & Rail - 0.9% |
J.B. Hunt Transport Services, Inc. | 235,601 | | 14,067,736 |
Union Pacific Corp. | 1,014,834 | | 127,584,930 |
| | 141,652,666 |
Trading Companies & Distributors - 0.3% |
W.W. Grainger, Inc. | 256,848 | | 51,978,330 |
TOTAL INDUSTRIALS | | 1,703,046,187 |
INFORMATION TECHNOLOGY - 19.5% |
Communications Equipment - 4.6% |
Acme Packet, Inc. (a) | 906,712 | | 20,056,469 |
ADTRAN, Inc. (d) | 2,785,806 | | 54,434,649 |
Alcatel-Lucent SA sponsored ADR (a)(d) | 5,415,203 | | 7,527,132 |
Ciena Corp. (a) | 1,307,391 | | 20,526,039 |
Finisar Corp. (a) | 3,255,694 | | 53,067,812 |
JDS Uniphase Corp. (a) | 2,862,829 | | 38,762,705 |
Juniper Networks, Inc. (a) | 5,579,744 | | 109,753,564 |
NETGEAR, Inc. (a) | 840,694 | | 33,140,157 |
QUALCOMM, Inc. | 6,603,288 | | 409,535,922 |
| | 746,804,449 |
Common Stocks - continued |
| Shares | | Value |
INFORMATION TECHNOLOGY - continued |
Computers & Peripherals - 6.4% |
Apple, Inc. | 1,703,816 | | $ 908,185,037 |
EMC Corp. (a) | 1,743,195 | | 44,102,834 |
NCR Corp. (a) | 752,260 | | 19,167,585 |
SanDisk Corp. (a) | 1,494,118 | | 65,083,780 |
| | 1,036,539,236 |
Electronic Equipment & Components - 1.1% |
Corning, Inc. | 1,761,316 | | 22,227,808 |
Flextronics International Ltd. (a) | 3,032,133 | | 18,829,546 |
Jabil Circuit, Inc. | 6,014,222 | | 116,014,342 |
TPK Holding Co. Ltd. | 1,534,000 | | 27,075,246 |
| | 184,146,942 |
Internet Software & Services - 1.7% |
eBay, Inc. (a) | 2,317,063 | | 118,216,554 |
Google, Inc. Class A (a) | 154,834 | | 109,834,595 |
Mail.ru Group Ltd.: | | | |
GDR (e) | 494,266 | | 17,052,177 |
GDR (Reg. S) | 246,700 | | 8,616,788 |
Yandex NV (a) | 800,300 | | 17,262,471 |
| | 270,982,585 |
IT Services - 0.9% |
Accenture PLC Class A | 491,412 | | 32,678,898 |
Fidelity National Information Services, Inc. | 1,174,869 | | 40,897,190 |
Fiserv, Inc. (a) | 230,086 | | 18,183,697 |
Visa, Inc. Class A | 347,302 | | 52,644,037 |
| | 144,403,822 |
Semiconductors & Semiconductor Equipment - 3.2% |
Altera Corp. | 2,171,381 | | 74,782,362 |
Analog Devices, Inc. | 4,243,006 | | 178,460,832 |
ARM Holdings PLC sponsored ADR | 618,300 | | 23,390,289 |
ASML Holding NV | 233,729 | | 15,054,485 |
Avago Technologies Ltd. | 826,943 | | 26,181,015 |
Fairchild Semiconductor International, Inc. (a) | 2,185,365 | | 31,469,256 |
Integrated Device Technology, Inc. (a) | 3,031,355 | | 22,128,892 |
International Rectifier Corp. (a) | 772,566 | | 13,697,595 |
Micron Technology, Inc. (a) | 6,858,616 | | 43,552,212 |
NXP Semiconductors NV (a) | 1,838,572 | | 48,483,144 |
ON Semiconductor Corp. (a) | 4,190,219 | | 29,541,044 |
PMC-Sierra, Inc. (a) | 4,304,298 | | 22,425,393 |
| | 529,166,519 |
Software - 1.6% |
Check Point Software Technologies Ltd. (a) | 264,421 | | 12,597,016 |
Citrix Systems, Inc. (a) | 1,521,588 | | 100,044,411 |
Electronic Arts, Inc. (a) | 3,412,863 | | 49,588,899 |
Intuit, Inc. | 742,200 | | 44,160,900 |
|
| Shares | | Value |
Jive Software, Inc. | 300,826 | | $ 4,371,002 |
Oracle Corp. | 997,236 | | 33,227,904 |
VMware, Inc. Class A (a) | 154,125 | | 14,509,328 |
| | 258,499,460 |
TOTAL INFORMATION TECHNOLOGY | | 3,170,543,013 |
MATERIALS - 3.6% |
Chemicals - 2.8% |
Air Products & Chemicals, Inc. | 748,768 | | 62,911,487 |
Albemarle Corp. | 413,094 | | 25,661,399 |
Ashland, Inc. | 169,248 | | 13,609,232 |
Eastman Chemical Co. | 819,603 | | 55,773,984 |
Ecolab, Inc. | 579,682 | | 41,679,136 |
FMC Corp. | 280,854 | | 16,435,576 |
LyondellBasell Industries NV Class A | 986,136 | | 56,298,504 |
Monsanto Co. | 881,690 | | 83,451,959 |
Sherwin-Williams Co. | 324,896 | | 49,975,503 |
Sigma Aldrich Corp. | 598,515 | | 44,038,734 |
| | 449,835,514 |
Construction Materials - 0.1% |
Vulcan Materials Co. | 501,355 | | 26,095,528 |
Containers & Packaging - 0.5% |
Ball Corp. | 775,366 | | 34,697,629 |
Rock-Tenn Co. Class A | 659,686 | | 46,118,648 |
| | 80,816,277 |
Metals & Mining - 0.2% |
Goldcorp, Inc. | 895,533 | | 32,924,140 |
TOTAL MATERIALS | | 589,671,459 |
TELECOMMUNICATION SERVICES - 2.4% |
Diversified Telecommunication Services - 1.7% |
AT&T, Inc. | 320,644 | | 10,808,909 |
CenturyLink, Inc. | 1,845,501 | | 72,195,999 |
inContact, Inc. (a) | 1,155,834 | | 5,987,220 |
Verizon Communications, Inc. | 4,359,171 | | 188,621,329 |
| | 277,613,457 |
Wireless Telecommunication Services - 0.7% |
SBA Communications Corp. Class A (a) | 797,069 | | 56,607,840 |
Sprint Nextel Corp. (a) | 6,694,118 | | 37,955,649 |
Vodafone Group PLC sponsored ADR | 760,900 | | 19,167,071 |
| | 113,730,560 |
TOTAL TELECOMMUNICATION SERVICES | | 391,344,017 |
UTILITIES - 3.5% |
Electric Utilities - 2.0% |
American Electric Power Co., Inc. | 1,288,179 | | 54,979,480 |
Duke Energy Corp. | 1,712,983 | | 109,288,315 |
Edison International | 1,653,226 | | 74,709,283 |
Exelon Corp. | 102,045 | | 3,034,818 |
Common Stocks - continued |
| Shares | | Value |
UTILITIES - continued |
Electric Utilities - continued |
FirstEnergy Corp. | 679,149 | | $ 28,361,262 |
NextEra Energy, Inc. | 708,413 | | 49,015,095 |
| | 319,388,253 |
Gas Utilities - 0.1% |
ONEOK, Inc. | 285,359 | | 12,199,097 |
Independent Power Producers & Energy Traders - 0.4% |
NRG Energy, Inc. | 1,749,552 | | 40,222,200 |
The AES Corp. | 3,245,959 | | 34,731,761 |
| | 74,953,961 |
Multi-Utilities - 1.0% |
CenterPoint Energy, Inc. | 1,626,574 | | 31,311,550 |
NiSource, Inc. | 860,177 | | 21,409,806 |
PG&E Corp. | 689,134 | | 27,689,404 |
Sempra Energy | 1,090,974 | | 77,393,696 |
| | 157,804,456 |
TOTAL UTILITIES | | 564,345,767 |
TOTAL COMMON STOCKS (Cost $13,249,699,303) |
16,075,810,858
|
Convertible Preferred Stocks - 0.1% |
| | | |
CONSUMER DISCRETIONARY - 0.1% |
Media - 0.1% |
Jumptap, Inc. Series G (i) | | | | |
(Cost $8,211,980) | | 1,141,504 | | 8,211,980 |
Convertible Bonds - 0.0% |
| Principal
Amount | | |
ENERGY - 0.0% |
Oil, Gas & Consumable Fuels - 0.0% |
Cobalt International Energy, Inc. 2.625% 12/1/19 | | | | |
(Cost $4,416,625) | | $ 4,450,000 | | 4,483,375 |
U.S. Treasury Obligations - 0.0% |
|
U.S. Treasury Bills, yield at date of purchase 0.08% 2/14/13 to 2/21/13 (g)
(Cost $5,699,405) | | 5,700,000 | |
5,699,709
|
Money Market Funds - 2.0% |
| Shares | | Value |
Fidelity Cash Central Fund, 0.18% (b) | 224,491,067 | | $ 224,491,067 |
Fidelity Securities Lending Cash Central Fund, 0.18% (b)(c) | 103,069,446 | | 103,069,446 |
TOTAL MONEY MARKET FUNDS (Cost $327,560,513) |
327,560,513
|
TOTAL INVESTMENT PORTFOLIO - 101.0% (Cost $13,595,587,826) | 16,421,766,435 |
NET OTHER ASSETS (LIABILITIES) - (1.0)% | | (158,416,569) |
NET ASSETS - 100% | $ 16,263,349,866 |
Futures Contracts |
| Expiration
Date | | Underlying
Face Amount
at Value | | Unrealized
Appreciation/
(Depreciation) |
Purchased |
Equity Index Contracts |
297 CME E-mini S&P 500 Index Contracts | March 2013 | | $ 21,088,485 | | $ 156,236 |
|
The face value of futures purchased as a percentage of net assets is 0.1% |
Legend |
(a) Non-income producing |
(b) Affiliated fund that is available only to investment companies and other accounts managed by Fidelity Investments. The rate quoted is the annualized seven-day yield of the fund at period end. A complete unaudited listing of the fund's holdings as of its most recent quarter end is available upon request. In addition, each Fidelity Central Fund's financial statements, which are not covered by the Fund's Report of Independent Registered Public Accounting Firm, are available on the SEC's website or upon request. |
(c) Investment made with cash collateral received from securities on loan. |
(d) Security or a portion of the security is on loan at period end. |
(e) Security exempt from registration under Rule 144A of the Securities Act of 1933. These securities may be resold in transactions exempt from registration, normally to qualified institutional buyers. At the end of the period, the value of these securities amounted to $17,052,177 or 0.1% of net assets. |
(f) Security or a portion of the security purchased on a delayed delivery or when-issued basis. |
(g) Security or a portion of the security was pledged to cover margin requirements for futures contracts. At the period end, the value of securities pledged amounted to $3,399,830. |
(h) Investment is owned by an entity that is treated as a corporation for U.S. tax purposes which is owned by the Fund. |
(i) Restricted securities - Investment in securities not registered under the Securities Act of 1933 (excluding 144A issues). At the end of the period, the value of restricted securities (excluding 144A issues) amounted to $20,815,019 or 0.1% of net assets. |
Additional information on each restricted holding is as follows: |
Security | Acquisition Date | Acquisition Cost |
Fluidigm Corp. | 10/9/07 - 1/6/11 | $ 5,645,236 |
Jumptap, Inc. Series G | 6/29/12 | $ 8,211,980 |
Legend Pictures LLC | 9/23/10 | $ 1,546,500 |
Weinstein Co. Holdings LLC Class A-1 | 10/19/05 | $ 11,499,000 |
Affiliated Central Funds |
Information regarding fiscal year to date income earned by the Fund from investments in Fidelity Central Funds is as follows: |
Fund | Income earned |
Fidelity Cash Central Fund | $ 465,967 |
Fidelity Securities Lending Cash Central Fund | 1,950,509 |
Total | $ 2,416,476 |
Other Affiliated Issuers |
An affiliated company is a company in which the Fund has ownership of at least 5% of the voting securities. Fiscal year to date transactions with companies which are or were affiliates are as follows: |
Affiliate | Value,
beginning of
period | Purchases | Sales
Proceeds | Dividend
Income | Value,
end of
period |
Kayak Software Corp. | $ - | $ 10,143,022 | $ 14,336,521 | $ - | $ - |
Other Information |
The following is a summary of the inputs used, as of December 31, 2012, involving the Fund's assets and liabilities carried at fair value. The inputs or methodology used for valuing securities may not be an indication of the risk associated with investing in those securities. For more information on valuation inputs, and their aggregation into the levels used in the tables below, please refer to the Investment Valuation section in the accompanying Notes to Financial Statements. |
Valuation Inputs at Reporting Date: |
Description | Total | Level 1 | Level 2 | Level 3 |
Investments in Securities: | | | | |
Equities: | | | | |
Consumer Discretionary | $ 1,716,225,859 | $ 1,699,880,493 | $ - | $ 16,345,366 |
Consumer Staples | 1,714,825,748 | 1,528,892,942 | 185,932,806 | - |
Energy | 1,754,430,284 | 1,754,013,555 | 416,729 | - |
Financials | 2,577,516,558 | 2,521,706,789 | 55,809,769 | - |
Health Care | 1,902,073,946 | 1,852,788,231 | 49,285,715 | - |
Industrials | 1,703,046,187 | 1,665,352,342 | 37,693,845 | - |
Information Technology | 3,170,543,013 | 3,161,926,225 | 8,616,788 | - |
Materials | 589,671,459 | 589,671,459 | - | - |
Telecommunication Services | 391,344,017 | 391,344,017 | - | - |
Utilities | 564,345,767 | 564,345,767 | - | - |
Corporate Bonds | 4,483,375 | - | 4,483,375 | - |
U.S. Government and Government Agency Obligations | 5,699,709 | - | 5,699,709 | - |
Money Market Funds | 327,560,513 | 327,560,513 | - | - |
Total Investments in Securities: | $ 16,421,766,435 | $ 16,057,482,333 | $ 347,938,736 | $ 16,345,366 |
Derivative Instruments: | | | | |
Assets | | | | |
Futures Contracts | $ 156,236 | $ 156,236 | $ - | $ - |
The following is a summary of transfers between Level 1 and Level 2 for the period ended December 31, 2012. Transfers are assumed to have occurred at the beginning of the period, and are primarily attributable to the valuation techniques used for foreign equity securities, as discussed in the accompanying Notes to Financial Statements: |
Transfers | Total |
Level 1 to Level 2 | $ 185,071,913 |
Level 2 to Level 1 | $ 0 |
Value of Derivative Instruments |
The following table is a summary of the Fund's value of derivative instruments by primary risk exposure as of December 31, 2012. For additional information on derivative instruments, please refer to the Derivative Instruments section in the accompanying Notes to Financial Statements. |
Primary Risk Exposure /
Derivative Type | Value |
| Asset | Liability |
Equity Risk | | |
Futures Contracts (a) | $ 156,236 | $ - |
Total Value of Derivatives | $ 156,236 | $ - |
(a) Reflects cumulative appreciation/(depreciation) on futures contracts as disclosed on the Schedule of Investments. Only the period end variation margin is separately disclosed on the Statement of Assets and Liabilities. |
Distribution of investments by country or territory of incorporation, as a percentage of total net assets, is as follows. (Unaudited) |
United States of America | 88.9% |
United Kingdom | 3.0% |
Canada | 1.5% |
Switzerland | 1.0% |
Others (Individually Less Than 1%) | 5.6% |
| 100.0% |
See accompanying notes which are an integral part of the financial statements.
Annual Report
Statement of Assets and Liabilities
| December 31, 2012 |
| | |
Assets | | |
Investment in securities, at value (including securities loaned of $100,763,476) - See accompanying schedule: Unaffiliated issuers (cost $13,268,027,313) | $ 16,094,205,922 | |
Fidelity Central Funds (cost $327,560,513) | 327,560,513 | |
Total Investments (cost $13,595,587,826) | | $ 16,421,766,435 |
Cash | | 29,160,623 |
Receivable for investments sold | | 47,362,167 |
Receivable for fund shares sold | | 9,108,446 |
Dividends receivable | | 15,474,327 |
Interest receivable | | 4,543 |
Distributions receivable from Fidelity Central Funds | | 119,404 |
Receivable for daily variation margin on futures contracts | | 983,268 |
Prepaid expenses | | 45,558 |
Other receivables | | 2,469,427 |
Total assets | | 16,526,494,198 |
| | |
Liabilities | | |
Payable for investments purchased | | |
Regular delivery | $ 103,207,531 | |
Delayed delivery | 28,741,380 | |
Payable for fund shares redeemed | 14,959,516 | |
Accrued management fee | 7,543,414 | |
Distribution and service plan fees payable | 1,728,983 | |
Other affiliated payables | 3,268,793 | |
Other payables and accrued expenses | 625,269 | |
Collateral on securities loaned, at value | 103,069,446 | |
Total liabilities | | 263,144,332 |
| | |
Net Assets | | $ 16,263,349,866 |
Net Assets consist of: | | |
Paid in capital | | $ 16,195,567,898 |
Distribution in excess of net investment income | | (587,200) |
Accumulated undistributed net realized gain (loss) on investments and foreign currency transactions | | (2,757,990,758) |
Net unrealized appreciation (depreciation) on investments and assets and liabilities in foreign currencies | | 2,826,359,926 |
Net Assets | | $ 16,263,349,866 |
Statement of Assets and Liabilities - continued
| December 31, 2012 |
| | |
Initial Class:
Net Asset Value, offering price and redemption price per share ($6,440,357,464 ÷ 243,546,878 shares) | | $ 26.44 |
| | |
Service Class:
Net Asset Value, offering price and redemption price per share ($1,374,780,827 ÷ 52,157,247 shares) | | $ 26.36 |
| | |
Service Class 2:
Net Asset Value, offering price and redemption price per share ($7,740,640,006 ÷ 297,722,136 shares) | | $ 26.00 |
| | |
Service Class 2R:
Net Asset Value, offering price and redemption price per share ($8,726,568 ÷ 336,211 shares) | | $ 25.96 |
| | |
Investor Class:
Net Asset Value, offering price and redemption price per share ($698,845,001 ÷ 26,521,443 shares) | | $ 26.35 |
See accompanying notes which are an integral part of the financial statements.
Annual Report
Financial Statements - continued
Statement of Operations
| Year ended December 31, 2012 |
| | |
Investment Income | | |
Dividends | | $ 304,813,686 |
Interest | | 14,706 |
Income from Fidelity Central Funds | | 2,416,476 |
Total income | | 307,244,868 |
| | |
Expenses | | |
Management fee | $ 90,534,257 | |
Transfer agent fees | 11,970,438 | |
Distribution and service plan fees | 20,684,650 | |
Accounting and security lending fees | 1,571,978 | |
Custodian fees and expenses | 336,075 | |
Independent trustees' compensation | 107,956 | |
Appreciation in deferred trustee compensation account | 29 | |
Audit | 98,886 | |
Legal | 81,391 | |
Miscellaneous | 166,919 | |
Total expenses before reductions | 125,552,579 | |
Expense reductions | (2,620,811) | 122,931,768 |
Net investment income (loss) | | 184,313,100 |
Realized and Unrealized Gain (Loss) Net realized gain (loss) on: | | |
Investment securities: | | |
Unaffiliated issuers | 621,363,243 | |
Other affiliated issuers | 4,193,500 | |
Foreign currency transactions | (237,111) | |
Futures contracts | 10,598,796 | |
Total net realized gain (loss) | | 635,918,428 |
Change in net unrealized appreciation (depreciation) on: Investment securities | 1,584,289,235 | |
Assets and liabilities in foreign currencies | 21,036 | |
Futures contracts | 182,961 | |
Total change in net unrealized appreciation (depreciation) | | 1,584,493,232 |
Net gain (loss) | | 2,220,411,660 |
Net increase (decrease) in net assets resulting from operations | | $ 2,404,724,760 |
Statement of Changes in Net Assets
| Year ended
December 31,
2012 | Year ended
December 31,
2011 |
Increase (Decrease) in Net Assets | | |
Operations | | |
Net investment income (loss) | $ 184,313,100 | $ 145,885,373 |
Net realized gain (loss) | 635,918,428 | 923,774,773 |
Change in net unrealized appreciation (depreciation) | 1,584,493,232 | (1,481,460,012) |
Net increase (decrease) in net assets resulting from operations | 2,404,724,760 | (411,799,866) |
Distributions to shareholders from net investment income | (189,531,129) | (141,940,543) |
Distributions to shareholders from net realized gains | (8,351,979) | - |
Total distributions | (197,883,108) | (141,940,543) |
Share transactions - net increase (decrease) | (899,286,819) | (1,239,479,004) |
Redemption fees | 69 | 8,960 |
Total increase (decrease) in net assets | 1,307,554,902 | (1,793,210,453) |
| | |
Net Assets | | |
Beginning of period | 14,955,794,964 | 16,749,005,417 |
End of period (including distributions in excess of net investment income of $587,200 and distributions in excess of net investment income of $2,498,208, respectively) | $ 16,263,349,866 | $ 14,955,794,964 |
See accompanying notes which are an integral part of the financial statements.
Annual Report
Financial Highlights - Initial Class
Years ended December 31, | 2012 | 2011 | 2010 | 2009 | 2008 |
Selected Per-Share Data | | | | | |
Net asset value, beginning of period | $ 23.02 | $ 23.88 | $ 20.62 | $ 15.39 | $ 27.90 |
Income from Investment Operations | | | | | |
Net investment income (loss) C | .32 | .25 | .23 | .23 | .24 |
Net realized and unrealized gain (loss) | 3.46 | (.86) | 3.31 | 5.26 | (11.87) |
Total from investment operations | 3.78 | (.61) | 3.54 | 5.49 | (11.63) |
Distributions from net investment income | (.34) I | (.25) | (.27) | (.25) | (.23) |
Distributions from net realized gain | (.01) I | - | (.01) | (.01) | (.65) |
Total distributions | (.36) J | (.25) | (.28) | (.26) H | (.88) |
Redemption fees added to paid in capital C, G | - | - | - | - | - |
Net asset value, end of period | $ 26.44 | $ 23.02 | $ 23.88 | $ 20.62 | $ 15.39 |
Total Return A, B | 16.42% | (2.53)% | 17.22% | 35.71% | (42.51)% |
Ratios to Average Net Assets D, F | | | | | |
Expenses before reductions | .64% | .65% | .65% | .67% | .66% |
Expenses net of fee waivers, if any | .64% | .64% | .65% | .67% | .66% |
Expenses net of all reductions | .63% | .63% | .63% | .65% | .65% |
Net investment income (loss) | 1.27% | 1.03% | 1.06% | 1.33% | 1.07% |
Supplemental Data | | | | | |
Net assets, end of period (000 omitted) | $ 6,440,357 | $ 6,113,440 | $ 7,160,125 | $ 7,405,228 | $ 6,240,871 |
Portfolio turnover rate E | 87% | 135% | 117% | 145% | 172% |
A Total returns do not reflect charges attributable to your insurance company's separate account. Inclusion of these charges would reduce the total returns shown.
B Total returns would have been lower if certain expenses had not been reduced during the applicable periods shown.
C Calculated based on average shares outstanding during the period.
D Fees and expenses of any underlying Fidelity Central Funds are not included in the Fund's expense ratio. The Fund indirectly bears its proportionate share of the expenses of any underlying Fidelity Central Funds.
E Amount does not include the portfolio activity of any underlying Fidelity Central Funds.
F Expense ratios reflect operating expenses of the class. Expenses before reductions do not reflect amounts reimbursed by the investment adviser or reductions from brokerage service arrangements or reductions from other expense offset arrangements and do not represent the amount paid by the class during periods when reimbursements or reductions occur. Expenses net of fee waivers reflect expenses after reimbursement by the investment adviser but prior to reductions from brokerage service arrangements or other expense offset arrangements. Expenses net of all reductions represent the net expenses paid by the class.
G Amount represents less than $.01 per share.
H Total distributions of $.26 per share is comprised of distributions from net investment income of $.250 and distributions from net realized gain of $.005 per share.
I The amount shown reflects certain reclassifications related to book to tax differences.
J Total distributions of $.36 per share is comprised of distribution from net investment income of $.342 and distribution from net realized gain of $.013 per share.
Financial Highlights - Service Class
Years ended December 31, | 2012 | 2011 | 2010 | 2009 | 2008 |
Selected Per-Share Data | | | | | |
Net asset value, beginning of period | $ 22.95 | $ 23.81 | $ 20.55 | $ 15.33 | $ 27.80 |
Income from Investment Operations | | | | | |
Net investment income (loss) C | .30 | .22 | .20 | .21 | .21 |
Net realized and unrealized gain (loss) | 3.44 | (.85) | 3.31 | 5.25 | (11.83) |
Total from investment operations | 3.74 | (.63) | 3.51 | 5.46 | (11.62) |
Distributions from net investment income | (.32) I | (.23) | (.24) | (.23) | (.20) |
Distributions from net realized gain | (.01) I | - | (.01) | (.01) | (.65) |
Total distributions | (.33) | (.23) | (.25) | (.24) H | (.85) |
Redemption fees added to paid in capital C, G | - | - | - | - | - |
Net asset value, end of period | $ 26.36 | $ 22.95 | $ 23.81 | $ 20.55 | $ 15.33 |
Total Return A, B | 16.31% | (2.64)% | 17.11% | 35.66% | (42.61)% |
Ratios to Average Net Assets D, F | | | | | |
Expenses before reductions | .74% | .75% | .75% | .77% | .76% |
Expenses net of fee waivers, if any | .74% | .74% | .75% | .77% | .76% |
Expenses net of all reductions | .73% | .73% | .73% | .75% | .75% |
Net investment income (loss) | 1.16% | .93% | .96% | 1.23% | .97% |
Supplemental Data | | | | | |
Net assets, end of period (000 omitted) | $ 1,374,781 | $ 1,277,101 | $ 1,379,305 | $ 1,784,820 | $ 1,497,734 |
Portfolio turnover rate E | 87% | 135% | 117% | 145% | 172% |
A Total returns do not reflect charges attributable to your insurance company's separate account. Inclusion of these charges would reduce the total returns shown.
B Total returns would have been lower if certain expenses had not been reduced during the applicable periods shown.
C Calculated based on average shares outstanding during the period.
D Fees and expenses of any underlying Fidelity Central Funds are not included in the Fund's expense ratio. The Fund indirectly bears its proportionate share of the expenses of any underlying Fidelity Central Funds.
E Amount does not include the portfolio activity of any underlying Fidelity Central Funds.
F Expense ratios reflect operating expenses of the class. Expenses before reductions do not reflect amounts reimbursed by the investment adviser or reductions from brokerage service arrangements or reductions from other expense offset arrangements and do not represent the amount paid by the class during periods when reimbursements or reductions occur. Expenses net of fee waivers reflect expenses after reimbursement by the investment adviser but prior to reductions from brokerage service arrangements or other expense offset arrangements. Expenses net of all reductions represent the net expenses paid by the class.
G Amount represents less than $.01 per share.
H Total distributions of $.24 per share is comprised of distributions from net investment income of $.232 and distributions from net realized gain of $.005 per share.
I The amount shown reflects certain reclassifications related to book to tax differences.
See accompanying notes which are an integral part of the financial statements.
Annual Report
Financial Highlights - Service Class 2
Years ended December 31, | 2012 | 2011 | 2010 | 2009 | 2008 |
Selected Per-Share Data | | | | | |
Net asset value, beginning of period | $ 22.64 | $ 23.49 | $ 20.29 | $ 15.14 | $ 27.46 |
Income from Investment Operations | | | | | |
Net investment income (loss) C | .26 | .18 | .17 | .18 | .18 |
Net realized and unrealized gain (loss) | 3.39 | (.84) | 3.26 | 5.18 | (11.67) |
Total from investment operations | 3.65 | (.66) | 3.43 | 5.36 | (11.49) |
Distributions from net investment income | (.28) I | (.19) | (.22) | (.21) | (.18) |
Distributions from net realized gain | (.01) I | - | (.01) | (.01) | (.65) |
Total distributions | (.29) | (.19) | (.23) | (.21) H | (.83) |
Redemption fees added to paid in capital C, G | - | - | - | - | - |
Net asset value, end of period | $ 26.00 | $ 22.64 | $ 23.49 | $ 20.29 | $ 15.14 |
Total Return A, B | 16.14% | (2.78)% | 16.93% | 35.47% | (42.69)% |
Ratios to Average Net Assets D, F | | | | | |
Expenses before reductions | .89% | .90% | .90% | .92% | .91% |
Expenses net of fee waivers, if any | .89% | .89% | .90% | .92% | .91% |
Expenses net of all reductions | .88% | .88% | .88% | .90% | .90% |
Net investment income (loss) | 1.02% | .78% | .81% | 1.08% | .82% |
Supplemental Data | | | | | |
Net assets, end of period (000 omitted) | $ 7,740,640 | $ 6,980,191 | $ 7,627,793 | $ 7,577,737 | $ 6,187,985 |
Portfolio turnover rate E | 87% | 135% | 117% | 145% | 172% |
A Total returns do not reflect charges attributable to your insurance company's separate account. Inclusion of these charges would reduce the total returns shown.
B Total returns would have been lower if certain expenses had not been reduced during the applicable periods shown.
C Calculated based on average shares outstanding during the period.
D Fees and expenses of any underlying Fidelity Central Funds are not included in the Fund's expense ratio. The Fund indirectly bears its proportionate share of the expenses of any underlying Fidelity Central Funds.
E Amount does not include the portfolio activity of any underlying Fidelity Central Funds.
F Expense ratios reflect operating expenses of the class. Expenses before reductions do not reflect amounts reimbursed by the investment adviser or reductions from brokerage service arrangements or reductions from other expense offset arrangements and do not represent the amount paid by the class during periods when reimbursements or reductions occur. Expenses net of fee waivers reflect expenses after reimbursement by the investment adviser but prior to reductions from brokerage service arrangements or other expense offset arrangements. Expenses net of all reductions represent the net expenses paid by the class.
G Amount represents less than $.01 per share.
H Total distributions of $.21 per share is comprised of distributions from net investment income of $.205 and distributions from net realized gain of $.005 per share.
I The amount shown reflects certain reclassifications related to book to tax differences.
Financial Highlights - Service Class 2R
Years ended December 31, | 2012 | 2011 | 2010 | 2009 | 2008 |
Selected Per-Share Data | | | | | |
Net asset value, beginning of period | $ 22.60 | $ 23.44 | $ 20.24 | $ 15.10 | $ 27.35 |
Income from Investment Operations | | | | | |
Net investment income (loss) C | .26 | .18 | .17 | .18 | .18 |
Net realized and unrealized gain (loss) | 3.39 | (.84) | 3.25 | 5.17 | (11.62) |
Total from investment operations | 3.65 | (.66) | 3.42 | 5.35 | (11.44) |
Distributions from net investment income | (.27) I | (.18) | (.21) | (.20) | (.16) |
Distributions from net realized gain | (.01) I | - | (.01) | (.01) | (.65) |
Total distributions | (.29) J | (.18) | (.22) | (.21) H | (.81) |
Redemption fees added to paid in capital C, G | - | - | - | - | - |
Net asset value, end of period | $ 25.96 | $ 22.60 | $ 23.44 | $ 20.24 | $ 15.10 |
Total Return A, B | 16.15% | (2.79)% | 16.94% | 35.46% | (42.69)% |
Ratios to Average Net Assets D, F | | | | | |
Expenses before reductions | .89% | .90% | .90% | .92% | .91% |
Expenses net of fee waivers, if any | .89% | .89% | .90% | .92% | .91% |
Expenses net of all reductions | .88% | .88% | .88% | .90% | .90% |
Net investment income (loss) | 1.02% | .78% | .81% | 1.08% | .82% |
Supplemental Data | | | | | |
Net assets, end of period (000 omitted) | $ 8,727 | $ 8,042 | $ 10,942 | $ 13,285 | $ 13,585 |
Portfolio turnover rate E | 87% | 135% | 117% | 145% | 172% |
A Total returns do not reflect charges attributable to your insurance company's separate account. Inclusion of these charges would reduce the total returns shown.
B Total returns would have been lower if certain expenses had not been reduced during the applicable periods shown.
C Calculated based on average shares outstanding during the period.
D Fees and expenses of any underlying Fidelity Central Funds are not included in the Fund's expense ratio. The Fund indirectly bears its proportionate share of the expenses of any underlying Fidelity Central Funds.
E Amount does not include the portfolio activity of any underlying Fidelity Central Funds.
F Expense ratios reflect operating expenses of the class. Expenses before reductions do not reflect amounts reimbursed by the investment adviser or reductions from brokerage service arrangements or reductions from other expense offset arrangements and do not represent the amount paid by the class during periods when reimbursements or reductions occur. Expenses net of fee waivers reflect expenses after reimbursement by the investment adviser but prior to reductions from brokerage service arrangements or other expense offset arrangements. Expenses net of all reductions represent the net expenses paid by the class.
G Amount represents less than $.01 per share.
H Total distributions of $.21 per share is comprised of distributions from net investment income of $.200 and distributions from net realized gain of $.005 per share.
I The amount shown reflects certain reclassifications related to book to tax differences.
J Total distributions of $.29 per share is comprised of distribution from net investment income of $.274 and distribution from net realized gain of $.013 per share.
See accompanying notes which are an integral part of the financial statements.
Annual Report
Financial Highlights - Investor Class
Years ended December 31, | 2012 | 2011 | 2010 | 2009 | 2008 |
Selected Per-Share Data | | | | | |
Net asset value, beginning of period | $ 22.94 | $ 23.80 | $ 20.56 | $ 15.34 | $ 27.82 |
Income from Investment Operations | | | | | |
Net investment income (loss) C | .30 | .23 | .21 | .21 | .21 |
Net realized and unrealized gain (loss) | 3.45 | (.86) | 3.30 | 5.25 | (11.83) |
Total from investment operations | 3.75 | (.63) | 3.51 | 5.46 | (11.62) |
Distributions from net investment income | (.32) I | (.23) | (.26) | (.24) | (.21) |
Distributions from net realized gain | (.01) I | - | (.01) | (.01) | (.65) |
Total distributions | (.34) J | (.23) | (.27) | (.24) H | (.86) |
Redemption fees added to paid in capital C, G | - | - | - | - | - |
Net asset value, end of period | $ 26.35 | $ 22.94 | $ 23.80 | $ 20.56 | $ 15.34 |
Total Return A, B | 16.34% | (2.62)% | 17.10% | 35.66% | (42.60)% |
Ratios to Average Net Assets D, F | | | | | |
Expenses before reductions | .73% | .73% | .74% | .77% | .75% |
Expenses net of fee waivers, if any | .73% | .73% | .73% | .77% | .75% |
Expenses net of all reductions | .71% | .71% | .72% | .75% | .74% |
Net investment income (loss) | 1.18% | .94% | .98% | 1.23% | .98% |
Supplemental Data | | | | | |
Net assets, end of period (000 omitted) | $ 698,845 | $ 577,021 | $ 570,841 | $ 457,476 | $ 324,919 |
Portfolio turnover rate E | 87% | 135% | 117% | 145% | 172% |
A Total returns do not reflect charges attributable to your insurance company's separate account. Inclusion of these charges would reduce the total returns shown.
B Total returns would have been lower if certain expenses had not been reduced during the applicable periods shown.
C Calculated based on average shares outstanding during the period.
D Fees and expenses of any underlying Fidelity Central Funds are not included in the Fund's expense ratio. The Fund indirectly bears its proportionate share of the expenses of any underlying Fidelity Central Funds.
E Amount does not include the portfolio activity of any underlying Fidelity Central Funds.
F Expense ratios reflect operating expenses of the class. Expenses before reductions do not reflect amounts reimbursed by the investment adviser or reductions from brokerage service arrangements or reductions from other expense offset arrangements and do not represent the amount paid by the class during periods when reimbursements or reductions occur. Expenses net of fee waivers reflect expenses after reimbursement by the investment adviser but prior to reductions from brokerage service arrangements or other expense offset arrangements. Expenses net of all reductions represent the net expenses paid by the class.
G Amount represents less than $.01 per share.
H Total distributions of $.24 per share is comprised of distributions from net investment income of $.235 and distributions from net realized gain of $.005 per share.
I The amount shown reflects certain reclassifications related to book to tax differences.
J Total distributions of $.34 per share is comprised of distribution from net investment income of $.322 and distribution from net realized gain of $.013 per share.
See accompanying notes which are an integral part of the financial statements.
Annual Report
Notes to Financial Statements
For the period ended December 31, 2012
1. Organization.
VIP Contrafund Portfolio (the Fund) is a fund of Variable Insurance Products Fund II (the Trust) and is authorized to issue an unlimited number of shares. The Trust is registered under the Investment Company Act of 1940, as amended (the 1940 Act), as an open-end management investment company organized as a Massachusetts business trust. Shares of the Fund may only be purchased by insurance companies for the purpose of funding variable annuity or variable life insurance contracts. The Fund offers the following classes of shares: Initial Class shares, Service Class shares, Service Class 2 shares, Service Class 2R shares and Investor Class shares. All classes have equal rights and voting privileges, except for matters affecting a single class. Investment income, realized and unrealized capital gains and losses, the common expenses of the Fund, and certain fund-level expense reductions, if any, are allocated on a pro-rata basis to each class based on the relative net assets of each class to the total net assets of the Fund. Each class differs with respect to transfer agent and distribution and service plan fees incurred. Certain expense reductions may also differ by class.
2. Investments in Fidelity Central Funds.
The Fund invests in Fidelity Central Funds, which are open-end investment companies available only to other investment companies and accounts managed by Fidelity Management & Research Company (FMR) and its affiliates. The Fund's Schedule of Investments lists each of the Fidelity Central Funds held as of period end, as an investment of the Fund, but does not include the underlying holdings of each Fidelity Central Fund. As an Investing Fund, the Fund indirectly bears its proportionate share of the expenses of the underlying Fidelity Central Funds.
The Money Market Central Funds seek preservation of capital and current income and are managed by Fidelity Investments Money Management, Inc. (FIMM), an affiliate of FMR.
A complete unaudited list of holdings for each Fidelity Central Fund is available upon request or at the Securities and Exchange Commission (the SEC) website at www.sec.gov. In addition, the financial statements of the Fidelity Central Funds, which are not covered by the Fund's Report of Independent Registered Public Accounting Firm, are available on the SEC website or upon request.
3. Significant Accounting Policies.
The financial statements have been prepared in conformity with accounting principles generally accepted in the United States of America (GAAP), which require management to make certain estimates and assumptions at the date of the financial statements. Actual results could differ from those estimates. Subsequent events, if any, through the date that the financial statements were issued have been evaluated in the preparation of the financial statements. The following summarizes the significant accounting policies of the Fund:
Investment Valuation. Investments are valued as of 4:00 p.m. Eastern time on the last calendar day of the period. In accordance with valuation policies and procedures approved by the Board of Trustees (the Board), the Fund attempts to obtain prices from one or more third party pricing vendors or brokers to value its investments. When current market prices, quotations or rates are not readily available or reliable, investments will be fair valued in good faith by the FMR Fair Value Committee (the Committee), in accordance with procedures adopted by the Fund's Board. Factors used in determining fair value vary by investment type and may include market or investment specific events, changes in interest rates and credit quality. The frequency with which these procedures are used cannot be predicted and they may be utilized to a significant extent. The Committee oversees the Fund's valuation policies and procedures and is responsible for approving and reporting to the Board all fair value determinations.
The Fund categorizes the inputs to valuation techniques used to value its investments into a disclosure hierarchy consisting of three levels as shown below:
Level 1 - quoted prices in active markets for identical investments
Level 2 - other significant observable inputs (including quoted prices for similar investments, interest rates, prepayment speeds, etc.)
Level 3 - unobservable inputs (including the Fund's own assumptions based on the best information available)
Valuation techniques used to value the Fund's investments by major category are as follows:
Equity securities, including restricted securities, for which market quotations are readily available, are valued at the last reported sale price or official closing price as reported by a third party pricing vendor on the primary market or exchange on which they are traded and are categorized as Level 1 in the hierarchy. In the event there were no sales during the day or closing prices are not available, securities are valued at the last quoted bid price or may be valued using the last available price and are generally categorized as Level 2 in the hierarchy. For foreign equity securities, when significant market or security specific events arise, comparisons to the valuation of American Depositary Receipts (ADRs), futures contracts, Exchange-Traded Funds (ETFs) and certain indexes as well as quoted prices for similar securities are used and are categorized as Level 2 in the hierarchy. Utilizing these techniques may result in transfers between Level 1 and Level 2. For restricted equity securities and private placements where observable inputs are limited, assumptions about market activity and risk are used and these securities are categorized as Level 3 in the hierarchy.
Annual Report
Notes to Financial Statements - continued
3. Significant Accounting Policies - continued
Investment Valuation - continued
Debt securities, including restricted securities, are valued based on evaluated prices received from third party pricing vendors or from brokers who make markets in such securities. For corporate bonds and U.S. government and government agency obligations, pricing vendors utilize matrix pricing which considers yield or price of bonds of comparable quality, coupon, maturity and type as well as broker-supplied prices and are generally categorized as Level 2 in the hierarchy. When independent prices are unavailable or unreliable, debt securities may be valued utilizing pricing methodologies which consider similar factors that would be used by third party pricing vendors. These are generally categorized as Level 2 in the hierarchy but may be Level 3 depending on the circumstances.
Futures contracts are valued at the settlement price established each day by the board of trade or exchange on which they are traded and are categorized as Level 1 in the hierarchy. Investments in open-end mutual funds, including the Fidelity Central Funds, are valued at their closing net asset value (NAV) each business day and are categorized as Level 1 in the hierarchy.
Changes in valuation techniques may result in transfers in or out of an assigned level within the disclosure hierarchy. The aggregate value of investments by input level, as of December 31, 2012, including information on transfers between Levels 1 and 2, is included at the end of the Fund's Schedule of Investments.
Foreign Currency. The Fund may use foreign currency contracts to facilitate transactions in foreign-denominated securities. Gains and losses from these transactions may arise from changes in the value of the foreign currency or if the counterparties do not perform under the contracts' terms.
Foreign-denominated assets, including investment securities, and liabilities are translated into U.S. dollars at the exchange rates at period end. Purchases and sales of investment securities, income and dividends received and expenses denominated in foreign currencies are translated into U.S. dollars at the exchange rate in effect on the transaction date.
The effects of exchange rate fluctuations on investments are included with the net realized and unrealized gain (loss) on investment securities. Other foreign currency transactions resulting in realized and unrealized gain (loss) are disclosed separately.
Investment Transactions and Income. For financial reporting purposes, the Fund's investment holdings and NAV include trades executed through the end of the last business day of the period. The NAV per share for processing shareholder transactions is calculated as of the close of business of the New York Stock Exchange (NYSE), normally 4:00 p.m. Eastern time and includes trades executed through the end of the prior business day. Gains and losses on securities sold are determined on the basis of identified cost and may include proceeds received from litigation. Dividend income is recorded on the ex-dividend date, except for certain dividends from foreign securities where the ex-dividend date may have passed, which are recorded as soon as the Fund is informed of the ex-dividend date. Non-cash dividends included in dividend income, if any, are recorded at the fair market value of the securities received. Distributions received on securities that represent a return of capital or capital gain are recorded as a reduction of cost of investments and/or as a realized gain. The Fund estimates the components of distributions received that may be considered return of capital distributions or capital gain distributions. Interest income and distributions from the Fidelity Central Funds are accrued as earned. Interest income includes coupon interest and amortization of premium and accretion of discount on debt securities. Investment income is recorded net of foreign taxes withheld where recovery of such taxes is uncertain.
Expenses. Expenses directly attributable to a fund are charged to that fund. Expenses attributable to more than one fund are allocated among the respective funds on the basis of relative net assets or other appropriate methods. Expense estimates are accrued in the period to which they relate and adjustments are made when actual amounts are known.
Deferred Trustee Compensation. Under a Deferred Compensation Plan (the Plan), independent Trustees may elect to defer receipt of a portion of their annual compensation. Deferred amounts are invested in a cross-section of Fidelity funds, are marked-to-market and remain in the Fund until distributed in accordance with the Plan. The investment of deferred amounts and the offsetting payable to the Trustees are included in the accompanying Statement of Assets and Liabilities.
Income Tax Information and Distributions to Shareholders. Each year, the Fund intends to qualify as a regulated investment company under Subchapter M of the Internal Revenue Code, including distributing substantially all of its taxable income and realized gains. As a result, no provision for income taxes is required. As of December 31, 2012, the Fund did not have any unrecognized tax benefits in the financial statements; nor is the Fund aware of any tax positions for which it is reasonably possible that the total amounts of unrecognized tax benefits will significantly change in the next twelve months. The Fund files a U.S. federal tax return, in addition to state and local tax returns as required. A fund's federal income tax returns are subject to examination by the Internal Revenue Service (IRS) for a period of three fiscal years after they are filed. State and local tax returns may be subject to examination for an additional fiscal year depending on the jurisdiction. Foreign taxes are provided for based on the Fund's understanding of the tax rules and rates that exist in the foreign markets in which it invests.
Annual Report
3. Significant Accounting Policies - continued
Income Tax Information and Distributions to Shareholders - continued
Distributions are declared and recorded on the ex-dividend date. Income dividends and capital gain distributions are declared separately for each class. Income and capital gain distributions are determined in accordance with income tax regulations, which may differ from GAAP. These differences resulted in distribution reclassifications.
Capital accounts within the financial statements are adjusted for permanent book-tax differences. These adjustments have no impact on net assets or the results of operations. Temporary book-tax differences will reverse in a subsequent period.
Book-tax differences are primarily due to futures contracts, foreign currency transactions, passive foreign investment companies (PFIC), market discount, partnerships, deferred trustees compensation, capital loss carryforwards and losses deferred due to wash sales and excise tax regulations.
The federal tax cost of investment securities and unrealized appreciation (depreciation) as of period end were as follows:
Gross unrealized appreciation | $ 3,085,145,590 |
Gross unrealized depreciation | (344,960,912) |
Net unrealized appreciation (depreciation) on securities and other investments | $ 2,740,184,678 |
| |
Tax Cost | $ 13,681,581,757 |
The tax-based components of distributable earnings as of period end were as follows:
Capital loss carryforward | $ (2,671,840,594) |
Net unrealized appreciation (depreciation) | $ 2,740,209,758 |
Capital loss carryforwards are only available to offset future capital gains of the Fund to the extent provided by regulations and may be limited. Under the Regulated Investment Company Modernization Act of 2010 (the Act), the Fund is permitted to carry forward capital losses incurred in taxable years beginning after December 22, 2010 for an unlimited period and such capital losses are required to be used prior to any losses that expire. Capital loss carryforwards were as follows:
Fiscal year of expiration | |
2016 | $ (336,841,666) |
2017 | (2,334,998,928) |
Total capital loss carryforward | $ (2,671,840,594) |
The tax character of distributions paid was as follows:
| December 31, 2012 | December 31, 2011 |
Ordinary Income | $ 197,883,108 | $ 141,940,543 |
Trading (Redemption) Fees. Service Class 2R shares held by investors less than 60 days are subject to a redemption fee equal to 1% of the net asset value of shares redeemed. All redemption fees, which reduce the proceeds of the shareholder redemption, are retained by the Fund and accounted for as an addition to paid in capital.
Delayed Delivery Transactions and When-Issued Securities. During the period, the Fund transacted in securities on a delayed delivery or when-issued basis. Payment and delivery may take place after the customary settlement period for that security. The price of the underlying securities and the date when the securities will be delivered and paid for are fixed at the time the transaction is negotiated. The securities purchased on a delayed delivery or when-issued basis are identified as such in the Fund's Schedule of Investments. The Fund may receive compensation for interest forgone in the purchase of a delayed delivery or when-issued security. With respect to purchase commitments, the Fund identifies securities as segregated in its records with a value at least equal to the amount of the commitment. Losses may arise due to changes in the value of the underlying securities or if the counterparty does not perform under the contract's terms, or if the issuer does not issue the securities due to political, economic, or other factors.
Restricted Securities. The Fund may invest in securities that are subject to legal or contractual restrictions on resale. These securities generally may be resold in transactions exempt from registration or to the public if the securities are registered. Disposal of these securities may involve time-consuming negotiations and expense, and prompt sale at an acceptable price may be difficult. Information regarding restricted securities is included at the end of the Fund's Schedule of Investments.
Annual Report
Notes to Financial Statements - continued
3. Significant Accounting Policies - continued
New Accounting Pronouncement. In December 2011, the Financial Accounting Standards Board issued Accounting Standard Update No. 2011-11, Disclosures about Offsetting Assets and Liabilities. The update creates new disclosure requirements requiring entities to disclose both gross and net information for derivatives and other financial instruments that are either offset in the Statement of Assets and Liabilities or subject to an enforceable master netting arrangement or similar agreement. The disclosure requirements are effective for annual reporting periods beginning on or after January 1, 2013, and interim periods within those annual periods. Management is currently evaluating the impact of the update's adoption on the Fund's financial statement disclosures.
4. Derivative Instruments.
Risk Exposures and the Use of Derivative Instruments. The Fund's investment objective allows the Fund to enter into various types of derivative contracts, including futures contracts. Derivatives are investments whose value is primarily derived from underlying assets, indices or reference rates and may be transacted on an exchange or over-the-counter (OTC). Derivatives may involve a future commitment to buy or sell a specified asset based on specified terms, to exchange future cash flows at periodic intervals based on a notional principal amount, or for one party to make one or more payments upon the occurrence of specified events in exchange for periodic payments from the other party.
The Fund used derivatives to increase returns and to manage exposure to certain risks as defined below. The success of any strategy involving derivatives depends on analysis of numerous economic factors, and if the strategies for investment do not work as intended, the Fund may not achieve its objectives.
The Fund's use of derivatives increased or decreased its exposure to the following risk:
Equity Risk | Equity risk relates to the fluctuations in the value of financial instruments as a result of changes in market prices (other than those arising from interest rate risk or foreign exchange risk), whether caused by factors specific to an individual investment, its issuer, or all factors affecting all instruments traded in a market or market segment. |
The Fund is also exposed to additional risks from investing in derivatives, such as liquidity risk and counterparty credit risk. Liquidity risk is the risk that the Fund will be unable to close out the derivative in the open market in a timely manner. Counterparty credit risk is the risk that the counterparty will not be able to fulfill its obligation to the Fund. Counterparty credit risk related to exchange-traded futures contracts is mitigated by the protection provided by the exchange on which they trade.
Investing in derivatives may involve greater risks than investing in the underlying assets directly and, to varying degrees, may involve risk of loss in excess of any initial investment and collateral received and amounts recognized in the Statement of Assets and Liabilities. In addition, there may be the risk that the change in value of the derivative contract does not correspond to the change in value of the underlying instrument.
Futures Contracts. A futures contract is an agreement between two parties to buy or sell a specified underlying instrument for a fixed price at a specified future date. The Fund used futures contracts to manage its exposure to the stock market.
Upon entering into a futures contract, a fund is required to deposit either cash or securities (initial margin) with a clearing broker in an amount equal to a certain percentage of the face value of the contract. Futures contracts are marked-to-market daily and subsequent payments (variation margin) are made or received by a fund depending on the daily fluctuations in the value of the futures contracts and are recorded as unrealized appreciation or (depreciation). This receivable and/or payable, if any, is included in daily variation margin on futures contracts in the Statement of Assets and Liabilities. Realized gain or (loss) is recorded upon the expiration or closing of a futures contract.
Any open futures contracts at period end are presented in the Schedule of Investments under the caption "Futures Contracts." The underlying face amount at value reflects each contract's exposure to the underlying instrument or index at period end and is representative of activity for the period. Securities deposited to meet initial margin requirements are identified in the Schedule of Investments.
During the period the Fund recognized net realized gain (loss) of $10,598,796 and a change in net unrealized appreciation (depreciation) of $182,961 related to its investment in futures contracts. These amounts are included in the Statement of Operations.
5. Purchases and Sales of Investments.
Purchases and sales of securities, other than short-term securities, aggregated $13,768,445,499 and $14,577,513,353, respectively.
Annual Report
6. Fees and Other Transactions with Affiliates.
Management Fee. FMR and its affiliates provide the Fund with investment management related services for which the Fund pays a monthly management fee. The management fee is the sum of an individual fund fee rate that is based on an annual rate of .30% of the Fund's average net assets and an annualized group fee rate that averaged .26% during the period. The group fee rate is based upon the average net assets of all the mutual funds advised by FMR. The group fee rate decreases as assets under management increase and increases as assets under management decrease. For the period, the total annual management fee rate was .56% of the Fund's average net assets.
Distribution and Service Plan Fees. In accordance with Rule 12b-1 of the 1940 Act, the Fund has adopted separate 12b-1 Plans for each Service Class of shares. Each Service Class pays Fidelity Distributors Corporation (FDC), an affiliate of FMR, a service fee. For the period, the service fee is based on an annual rate of .10% of Service Class' average net assets and .25% of Service Class 2's and Service Class 2R's average net assets.
For the period, total fees, all of which were re-allowed to insurance companies for the distribution of shares and providing shareholder support services were as follows:
Service Class | $ 1,369,277 |
Service Class 2 | 19,292,732 |
Service Class 2R | 22,641 |
| $ 20,684,650 |
Transfer Agent Fees. Fidelity Investments Institutional Operations Company, Inc. (FIIOC), an affiliate of FMR, is the Fund's transfer, dividend disbursing, and shareholder servicing agent. FIIOC receives an asset-based fee with respect to each class. Each class (with the exception of Investor Class) pays a transfer agent fee, excluding out of pocket expenses, equal to an annual rate of .07% of average net assets. Investor Class pays a monthly asset-based transfer agent fee of .15% of average net assets. In addition, FIIOC receives an asset-based fee of .0038% of average net assets for typesetting, printing and mailing of shareholder reports, except proxy statements. For the period, transfer agent fees for each class, including printing and out of pocket expenses, were as follows:
Initial Class | $ 4,564,434 |
Service Class | 964,572 |
Service Class 2 | 5,414,509 |
Service Class 2R | 6,331 |
Investor Class | 1,020,592 |
| $ 11,970,438 |
Accounting and Security Lending Fees. Fidelity Service Company, Inc. (FSC), an affiliate of FMR, maintains the Fund's accounting records. The accounting fee is based on the level of average net assets for each month. Under a separate contract, FSC administers the security lending program. The security lending fee is based on the number and duration of lending transactions.
Brokerage Commissions. The Fund placed a portion of its portfolio transactions with brokerage firms which are affiliates of the investment adviser. The commissions paid to these affiliated firms were $462,864 for the period.
7. Committed Line of Credit.
The Fund participates with other funds managed by FMR or an affiliate in a $4.25 billion credit facility (the "line of credit") to be utilized for temporary or emergency purposes to fund shareholder redemptions or for other short-term liquidity purposes. The Fund has agreed to pay commitment fees on its pro-rata portion of the line of credit, which amounted to $43,593 and is reflected in Miscellaneous expenses on the Statement of Operations. During the period, there were no borrowings on this line of credit.
8. Security Lending.
The Fund lends portfolio securities through a lending agent from time to time in order to earn additional income. For equity securities, a lending agent is used and may loan securities to certain qualified borrowers, including Fidelity Capital Markets (FCM), a broker-dealer affiliated with the Fund. On the settlement date of the loan, the Fund receives collateral (in the form of U.S. Treasury obligations, letters of credit and/or cash) against the loaned securities and maintains collateral in an amount not less than 100% of the market value of the loaned securities during the period of the loan. The market value of the loaned securities is determined at the close of business of the Fund and any additional required collateral is delivered to the Fund on the next business day. If the borrower defaults on its obligation to return the securities loaned because of insolvency or other reasons, a fund could experience delays and costs in recovering the securities loaned or in gaining access to the collateral. Any cash collateral received is invested in the Fidelity Securities Lending Cash Central Fund. The value of loaned securities and cash collateral at period end are disclosed on the Fund's Statement
Annual Report
Notes to Financial Statements - continued
8. Security Lending - continued
of Assets and Liabilities. Security lending income represents the income earned on investing cash collateral, less rebates paid to borrowers and any lending agent fees associated with the loan, plus any premium payments received for lending certain types of securities. Security lending income is presented in the Statement of Operations as a component of income from Fidelity Central Funds. Total security lending income during the period amounted to $1,950,509, including $38,179 from securities loaned to FCM.
9. Expense Reductions.
Many of the brokers with whom FMR places trades on behalf of the Fund provided services to the Fund in addition to trade execution. These services included payments of certain expenses on behalf of the Fund totaling $2,620,811 for the period.
10. Distributions to Shareholders.
Distributions to shareholders of each class were as follows:
Years ended December 31, | 2012 | 2011 |
From net investment income | | |
Initial Class | $ 82,580,923 | $ 65,616,073 |
Service Class | 16,341,913 | 12,220,263 |
Service Class 2 | 82,113,206 | 58,305,804 |
Service Class 2R | 91,369 | 65,304 |
Investor Class | 8,403,718 | 5,733,099 |
Total | $ 189,531,129 | $ 141,940,543 |
From net realized gain | | |
Initial Class | $ 3,278,212 | $ - |
Service Class | 704,666 | - |
Service Class 2 | 4,008,661 | - |
Service Class 2R | 4,524 | - |
Investor Class | 355,916 | - |
Total | $ 8,351,979 | $ - |
11. Share Transactions.
Transactions for each class of shares were as follows:
| Shares | Dollars |
Years ended December 31, | 2012 | 2011 | 2012 | 2011 |
Initial Class | | | | |
Shares sold | 8,108,840 | 8,887,647 | $ 207,519,230 | $ 215,181,582 |
Reinvestment of distributions | 3,281,594 | 2,941,106 | 85,859,135 | 65,616,073 |
Shares redeemed | (33,386,959) | (46,079,138) | (856,012,042) | (1,098,879,687) |
Net increase (decrease) | (21,996,525) | (34,250,385) | $ (562,633,677) | $ (818,082,032) |
Service Class | | | | |
Shares sold | 4,101,561 | 5,960,533 | $ 104,241,858 | $ 142,199,635 |
Reinvestment of distributions | 653,535 | 549,472 | 17,046,579 | 12,220,263 |
Shares redeemed | (8,246,935) | (8,798,344) | (210,877,762) | (211,519,636) |
Net increase (decrease) | (3,491,839) | (2,288,339) | $ (89,589,325) | $ (57,099,738) |
Service Class 2 | | | | |
Shares sold | 32,699,560 | 28,618,316 | $ 807,565,716 | $ 674,963,970 |
Reinvestment of distributions | 3,346,604 | 2,657,512 | 86,121,867 | 58,305,804 |
Shares redeemed | (46,616,409) | (47,724,451) | (1,175,112,838) | (1,123,942,590) |
Net increase (decrease) | (10,570,245) | (16,448,623) | $ (281,425,255) | $ (390,672,816) |
Service Class 2R | | | | |
Shares sold | 68,230 | 57,708 | $ 1,645,251 | $ 1,412,478 |
Reinvestment of distributions | 3,733 | 2,982 | 95,893 | 65,304 |
Shares redeemed | (91,575) | (171,761) | (2,281,001) | (4,029,960) |
Net increase (decrease) | (19,612) | (111,071) | $ (539,857) | $ (2,552,178) |
Investor Class | | | | |
Shares sold | 2,695,333 | 3,165,850 | $ 68,539,753 | $ 76,274,096 |
Reinvestment of distributions | 335,952 | 257,783 | 8,759,634 | 5,733,099 |
Shares redeemed | (1,659,317) | (2,256,234) | (42,398,092) | (53,079,435) |
Net increase (decrease) | 1,371,968 | 1,167,399 | $ 34,901,295 | $ 28,927,760 |
Annual Report
12. Other.
The Fund's organizational documents provide former and current trustees and officers with a limited indemnification against liabilities arising in connection with the performance of their duties to the Fund. In the normal course of business, the Fund may also enter into contracts that provide general indemnifications. The Fund's maximum exposure under these arrangements is unknown as this would be dependent on future claims that may be made against the Fund. The risk of material loss from such claims is considered remote.
At the end of the period, two otherwise unaffiliated shareholders were the owners of record of 22% of the total outstanding shares of the Fund.
Annual Report
Report of Independent Registered Public Accounting Firm
To the Trustees of Variable Insurance Products Fund II and Shareholders of VIP Contrafund Portfolio:
We have audited the accompanying statement of assets and liabilities of VIP Contrafund Portfolio (the Fund), a fund of Variable Insurance Products Fund II, including the schedule of investments, as of December 31, 2012, and the related statement of operations for the year then ended, the statement of changes in net assets for each of the two years in the period then ended, and the financial highlights for each of the five years in the period then ended. These financial statements and financial highlights are the responsibility of the Fund's management. Our responsibility is to express an opinion on these financial statements and financial highlights based on our audits.
We conducted our audits in accordance with the standards of the Public Company Accounting Oversight Board (United States). Those standards require that we plan and perform the audit to obtain reasonable assurance about whether the financial statements and financial highlights are free of material misstatement. The Fund is not required to have, nor were we engaged to perform, an audit of its internal control over financial reporting. Our audits included consideration of internal control over financial reporting as a basis for designing audit procedures that are appropriate in the circumstances, but not for the purpose of expressing an opinion on the effectiveness of the Fund's internal control over financial reporting. Accordingly, we express no such opinion. An audit also includes examining, on a test basis, evidence supporting the amounts and disclosures in the financial statements, assessing the accounting principles used and significant estimates made by management, as well as evaluating the overall financial statement presentation. Our procedures included confirmation of securities owned as of December 31, 2012, by correspondence with the custodians and brokers; where replies were not received from brokers, we performed other auditing procedures. We believe that our audits provide a reasonable basis for our opinion.
In our opinion, the financial statements and financial highlights referred to above present fairly, in all material respects, the financial position of VIP Contrafund Portfolio as of December 31, 2012, the results of its operations for the year then ended, the changes in its net assets for each of the two years in the period then ended, and the financial highlights for each of the five years in the period then ended, in conformity with accounting principles generally accepted in the United States of America.
DELOITTE & TOUCHE LLP
Boston, Massachusetts
February 19, 2013
Annual Report
The Trustees, Members of the Advisory Board, and executive officers of the trust and fund, as applicable, are listed below. The Board of Trustees governs the fund and is responsible for protecting the interests of shareholders. The Trustees are experienced executives who meet periodically throughout the year to oversee the fund's activities, review contractual arrangements with companies that provide services to the fund, oversee management of the risks associated with such activities and contractual arrangements, and review the fund's performance. Except for James C. Curvey, each of the Trustees oversees 234 funds advised by FMR or an affiliate. Mr. Curvey oversees 452 funds advised by FMR or an affiliate.
The Trustees hold office without limit in time except that (a) any Trustee may resign; (b) any Trustee may be removed by written instrument, signed by at least two-thirds of the number of Trustees prior to such removal; (c) any Trustee who requests to be retired or who has become incapacitated by illness or injury may be retired by written instrument signed by a majority of the other Trustees; and (d) any Trustee may be removed at any special meeting of shareholders by a two-thirds vote of the outstanding voting securities of the trust. Each Trustee who is not an interested person (as defined in the 1940 Act) (Independent Trustee), shall retire not later than the last day of the calendar year in which his or her 75th birthday occurs. The Independent Trustees may waive this mandatory retirement age policy with respect to individual Trustees. The executive officers and Advisory Board Members hold office without limit in time, except that any officer and Advisory Board Member may resign or may be removed by a vote of a majority of the Trustees at any regular meeting or any special meeting of the Trustees. Except as indicated, each individual has held the office shown or other offices in the same company for the past five years.
Experience, Skills, Attributes, and Qualifications of the Fund's Trustees. The Governance and Nominating Committee has adopted a statement of policy that describes the experience, qualifications, attributes, and skills that are necessary and desirable for potential Independent Trustee candidates (Statement of Policy). The Board believes that each Trustee satisfied at the time he or she was initially elected or appointed a Trustee, and continues to satisfy, the standards contemplated by the Statement of Policy. The Governance and Nominating Committee also engages professional search firms to help identify potential Independent Trustee candidates who have the experience, qualifications, attributes, and skills consistent with the Statement of Policy. From time to time, additional criteria based on the composition and skills of the current Independent Trustees, as well as experience or skills that may be appropriate in light of future changes to board composition, business conditions, and regulatory or other developments, have also been considered by the professional search firms and the Governance and Nominating Committee. In addition, the Board takes into account the Trustees' commitment and participation in Board and committee meetings, as well as their leadership of standing and ad hoc committees throughout their tenure.
In determining that a particular Trustee was and continues to be qualified to serve as a Trustee, the Board has considered a variety of criteria, none of which, in isolation, was controlling. The Board believes that, collectively, the Trustees have balanced and diverse experience, qualifications, attributes, and skills, which allow the Board to operate effectively in governing the fund and protecting the interests of shareholders. Information about the specific experience, skills, attributes, and qualifications of each Trustee, which in each case led to the Board's conclusion that the Trustee should serve (or continue to serve) as a trustee of the fund, is provided below.
Board Structure and Oversight Function. James C. Curvey is an interested person (as defined in the 1940 Act) and currently serves as Chairman. The Trustees have determined that an interested Chairman is appropriate and benefits shareholders because an interested Chairman has a personal and professional stake in the quality and continuity of services provided to the fund. Independent Trustees exercise their informed business judgment to appoint an individual of their choosing to serve as Chairman, regardless of whether the Trustee happens to be independent or a member of management. The Independent Trustees have determined that they can act independently and effectively without having an Independent Trustee serve as Chairman and that a key structural component for assuring that they are in a position to do so is for the Independent Trustees to constitute a substantial majority for the Board. The Independent Trustees also regularly meet in executive session. Ned C. Lautenbach serves as Chairman of the Independent Trustees and as such (i) acts as a liaison between the Independent Trustees and management with respect to matters important to the Independent Trustees and (ii) with management prepares agendas for Board meetings.
Fidelity funds are overseen by different Boards of Trustees. The fund's Board oversees Fidelity's equity and high income funds and another Board oversees Fidelity's investment-grade bond, money market, and asset allocation funds. The asset allocation funds may invest in Fidelity funds overseen by the fund's Board. The use of separate Boards, each with its own committee structure, allows the Trustees of each group of Fidelity funds to focus on the unique issues of the funds they oversee, including common research, investment, and operational issues. On occasion, the separate Boards establish joint committees to address issues of overlapping consequences for the Fidelity funds overseen by each Board.
The Trustees operate using a system of committees to facilitate the timely and efficient consideration of all matters of importance to the Trustees, the fund, and fund shareholders and to facilitate compliance with legal and regulatory requirements and oversight of the fund's activities and associated risks. The Board, acting through its committees, has charged FMR and its affiliates with (i) identifying events or circumstances the occurrence of which could have demonstrably adverse effects on the fund's business and/or reputation; (ii) implementing processes and controls to lessen the possibility that such events or circumstances occur or to mitigate the effects of such events or circumstances if they do occur; and (iii) creating and maintaining a system designed to evaluate continuously business and market conditions in order to facilitate the identification and implementation processes described in (i) and (ii) above. Because the day-to-day operations and activities of the fund are carried out by or through FMR, its affiliates and other service providers, the fund's exposure to risks is mitigated but not eliminated by the processes overseen by the Trustees. While each of the Board's committees has responsibility for overseeing different aspects of the fund's activities, oversight is exercised primarily through the Operations, Audit, and Compliance Committees. In addition, the Independent Trustees have worked with FMR to enhance the Board's oversight of investment and financial risks, legal and regulatory risks, technology risks, and operational risks, including the development of additional risk reporting to the Board. For example, a working group comprised of Independent Trustees and FMR has worked and continues to work to review the Fidelity funds' valuation-related activities, reporting and risk management. Appropriate personnel, including but not limited to the fund's Chief Compliance Officer (CCO), FMR's internal auditor, the independent accountants, the fund's Treasurer and portfolio management personnel, make periodic reports to the Board's committees, as appropriate, including an annual review of FMR's risk management program for the Fidelity funds. The responsibilities of each standing committee, including their oversight responsibilities, are described further under "Standing Committees of the Fund's Trustees."
Annual Report
Trustees and Officers - continued
The fund's Statement of Additional Information (SAI) includes more information about the Trustees. To request a free copy, call Fidelity at 1-877-208-0098.
Interested Trustees*:
Correspondence intended for each Trustee who is an interested person may be sent to Fidelity Investments, 82 Devonshire Street, Boston, Massachusetts 02109.
Name, Age; Principal Occupations and Other Relevant Experience+ |
James C. Curvey (77) |
| Year of Election or Appointment: 2007 Mr. Curvey is Trustee and Chairman of the Board of Trustees of certain Trusts. Mr. Curvey also serves as Trustee (2007-present) of other investment companies advised by FMR. Mr. Curvey is a Director of Fidelity Investments Money Management, Inc. (2009-present), Director of Fidelity Research & Analysis Co. (2009-present) and Director of FMR and FMR Co., Inc. (2007-present). Mr. Curvey is also Vice Chairman (2007-present) and Director of FMR LLC. In addition, Mr. Curvey serves as an Overseer for the Boston Symphony Orchestra and a member of the Trustees of Villanova University. Previously, Mr. Curvey was the Vice Chairman (2006-2007) and Director (2000-2007) of FMR Corp. |
Ronald P. O'Hanley (55) |
| Year of Election or Appointment: 2011 Mr. O'Hanley is Director of FMR Co., Inc. (2010-present), Director of Fidelity Investments Money Management, Inc. (2010-present), Director of Fidelity Research & Analysis Company (2010-present), President of Fidelity Asset Management and Corporate Services and a member of Fidelity's Executive Committee (2010-present). Previously, Mr. O'Hanley served as President and Chief Executive Officer of BNY Mellon Asset Management (2007-2010). Mr. O'Hanley also served as Vice Chairman of Bank New York Mellon Corp. and a member of that firm's Executive Committee. Prior to the 2007 merger of The Bank of New York and Mellon Financial Corporation, he was Vice Chairman of Mellon Financial Corporation and President and Chief Executive Officer of Mellon Asset Management. He joined Mellon in February 1997. Mr. O'Hanley currently serves as Chairman of the Boston Public Library Foundation Board of Directors and sits on the Board of Directors of Beth Israel Deaconess Medical Center, the Board of Trustees of the Marine Biological Laboratory and the Advisory Board of the Maxwell School of Citizenship and Public Administration at Syracuse University. Mr. O'Hanley also chairs the Council on Asset Management for the Financial Services Roundtable and is a member of the Board of Directors of Institutional Investor's U.S. Institute. |
* Trustees have been determined to be "Interested Trustees" by virtue of, among other things, their affiliation with the trust or various entities under common control with FMR.
+ The information above includes each Trustee's principal occupation during the last five years and other information relating to the experience, attributes, and skills relevant to each Trustee's qualifications to serve as a Trustee, which led to the conclusion that each Trustee should serve as a Trustee for the fund.
Independent Trustees:
Correspondence intended for each Independent Trustee (that is, the Trustees other than the Interested Trustees) may be sent to Fidelity Investments, P.O. Box 55235, Boston, Massachusetts 02205-5235.
Name, Age; Principal Occupations and Other Relevant Experience+ |
Dennis J. Dirks (64) |
| Year of Election or Appointment: 2005 Prior to his retirement in May 2003, Mr. Dirks was Chief Operating Officer and a member of the Board of The Depository Trust & Clearing Corporation (DTCC). He also served as President, Chief Operating Officer, and Board member of The Depository Trust Company (DTC) and President and Board member of the National Securities Clearing Corporation (NSCC). In addition, Mr. Dirks served as Chief Executive Officer and Board member of the Government Securities Clearing Corporation, Chief Executive Officer and Board member of the Mortgage-Backed Securities Clearing Corporation, as a Trustee and a member of the Finance Committee of Manhattan College (2005-2008), and as a Trustee and a member of the Finance Committee of AHRC of Nassau County (2006-2008). Mr. Dirks is a member of the Independent Directors Council (IDC) Governing Council (2010-present) and Board of Directors for The Brookville Center for Children's Services, Inc. (2009-present). |
Alan J. Lacy (59) |
| Year of Election or Appointment: 2008 Mr. Lacy serves as Senior Adviser (2007-present) of Oak Hill Capital Partners, L.P. (private equity). Mr. Lacy also served as Chief Executive Officer (2000-2005) and Vice Chairman (2005-2006) of Sears Holdings Corporation and Sears, Roebuck and Co. (retail). In addition, Mr. Lacy serves as a member of the Board of Directors of Dave & Buster's Entertainment, Inc. (restaurant and entertainment complexes, 2010-present), Earth Fare, Inc. (retail grocery, 2012-present), The Hillman Companies, Inc. (hardware wholesalers, 2010-present), and Bristol-Myers Squibb Company (global pharmaceuticals, 2008-present). Mr. Lacy is a member of the Board of Trustees of The National Parks Conservation Association (2006-present). Previously, Mr. Lacy served as Chairman of the Board of Trustees of the National Parks Conservation Association (2008-2011) and as a member of the Board of Directors for the Western Union Company (global money transfer, 2006-2011). |
Ned C. Lautenbach (68) |
| Year of Election or Appointment: 2000 Mr. Lautenbach is Chairman of the Independent Trustees of the Equity and High Income Funds (2006-present). Mr. Lautenbach currently serves as the Lead Director of the Eaton Corporation Board of Directors (diversified industrial, 1997-present). Mr. Lautenbach is Chairman of the Board of Directors of the Philharmonic Center for the Arts in Naples, Florida (2012-present) and a member of the Council on Foreign Relations (1994-present). Previously, Mr. Lautenbach was a Partner/Advisory Partner at Clayton, Dubilier & Rice, LLC (private equity investment, 1998-2010), as well as a Director of Sony Corporation (2006-2007). |
Joseph Mauriello (68) |
| Year of Election or Appointment: 2008 Prior to his retirement in January 2006, Mr. Mauriello served in numerous senior management positions including Deputy Chairman and Chief Operating Officer (2004-2005), and Vice Chairman of Financial Services (2002-2004) of KPMG LLP US (professional services, 1965-2005). Mr. Mauriello currently serves as a member of the Board of Directors of XL Group plc. (global insurance and re-insurance, 2006-present). Previously, Mr. Mauriello served as a Director of the Hamilton Funds of the Bank of New York (2006-2007) and of Arcadia Resources Inc. (health care services and products, 2007-2012). |
Robert W. Selander (62) |
| Year of Election or Appointment: 2011 Previously, Mr. Selander served as a Member of the Advisory Board of Fidelity's Equity and High Income Funds (2011), Executive Vice Chairman (2010), Chief Executive Officer (2009-2010), and President and Chief Executive Officer (1997-2009) of Mastercard, Inc. |
Cornelia M. Small (68) |
| Year of Election or Appointment: 2005 Ms. Small is a member of the Board of Directors (2009-present) and Chair of the Investment Committee (2010-present) of the Teagle Foundation. Ms. Small also serves on the Investment Committee of the Berkshire Taconic Community Foundation (2008-present). Previously, Ms. Small served as Chairperson (2002-2008) and a member of the Investment Committee and Chairperson (2008-2012) and a member of the Board of Trustees of Smith College. In addition, Ms. Small served as Chief Investment Officer, Director of Global Equity Investments, and a member of the Board of Directors of Scudder, Stevens & Clark and Scudder Kemper Investments. |
William S. Stavropoulos (73) |
| Year of Election or Appointment: 2001 Mr. Stavropoulos is Vice Chairman of the Independent Trustees of the Equity and High Income Funds (2006-present). Mr. Stavropoulos serves as President and Founder of the Michigan Baseball Foundation, the Great Lakes Loons (2007-present). Mr. Stavropoulos is Chairman Emeritus of the Board of Directors of The Dow Chemical Company, where he previously served in numerous senior management positions, including President, CEO (1995-2000; 2002-2004), Chairman of the Executive Committee (2000-2006), and as a member of the Board of Directors (1990-2006). Currently, Mr. Stavropoulos is a Director of Univar Inc. (global distributor of commodity and specialty chemicals, Chairman from 2010-May 2012 and Lead Director from May 2012-present), Teradata Corporation (data warehousing and technology solutions, 2008-present), Maersk Inc. (industrial conglomerate), and Tyco International, Ltd. (multinational manufacturing and services, 2007-present), and a member of the Advisory Board for Metalmark Capital LLC (private equity investment, 2005-present). Mr. Stavropoulos is an operating advisor to Clayton, Dubilier & Rice, LLC (private equity investment). In addition, Mr. Stavropoulos is a member of the University of Notre Dame Advisory Council for the College of Science, a Trustee of the Rollin L. Gerstacker Foundation, and a Director of the Naples Philharmonic Center for the Arts. Previously, Mr. Stavropoulos served as a Director of Chemical Financial Corporation (bank holding company, 1993-2012). |
David M. Thomas (63) |
| Year of Election or Appointment: 2008 Previously, Mr. Thomas served as Executive Chairman (2005-2006) and Chairman and Chief Executive Officer (2000-2005) of IMS Health, Inc. (pharmaceutical and healthcare information solutions), and a Director of Fortune Brands, Inc. (consumer products, 2000-2011). In addition, Mr. Thomas serves as Non-Executive Chairman of the Board of Directors of Fortune Brands Home and Security (home and security products, 2011-present), and as a member of the Board of Directors of Interpublic Group of Companies, Inc. (marketing communication, 2004-present). |
Michael E. Wiley (62) |
| Year of Election or Appointment: 2008 Mr. Wiley also serves as a Director of Asia Pacific Exploration Consolidated (international oil and gas exploration and production, 2008-present). Mr. Wiley serves as a Director of Tesoro Corporation (independent oil refiner and marketer, 2005-present), and a Director of Bill Barrett Corporation (exploration and production, 2005-present). In addition, Mr. Wiley also serves as a Director of Post Oak Bank (privately-held bank, 2004-present). Previously, Mr. Wiley served as a member of the Board of Trustees of the University of Tulsa (2000-2006; 2007-2010), as a Senior Energy Advisor of Katzenbach Partners, LLC (consulting, 2006-2007), as an Advisory Director of Riverstone Holdings (private investment), Chairman, President, and CEO of Baker Hughes, Inc. (oilfield services, 2000-2004), and as Director of Spinnaker Exploration Company (exploration and production, 2001-2005). |
+ The information above includes each Trustee's principal occupation during the last five years and other information relating to the experience, attributes, and skills relevant to each Trustee's qualifications to serve as a Trustee, which led to the conclusion that each Trustee should serve as a Trustee for the fund.
Advisory Board Members and Executive Officers:
Correspondence intended for David A. Rosow and Garnett A. Smith may be sent to Fidelity Investments, P.O. Box 55235, Boston, Massachusetts 02205-5235. Correspondence intended for each executive officer and Peter S Lynch may be sent to Fidelity Investments, 82 Devonshire Street, Boston, Massachusetts 02109.
Name, Age; Principal Occupation |
Peter S. Lynch (68) |
| Year of Election or Appointment: 2003 Member of the Advisory Board of Fidelity's Equity and High Income Funds. Mr. Lynch is Vice Chairman and a Director of FMR and FMR Co., Inc. In addition, Mr. Lynch serves as a Trustee of Boston College and as the Chairman of the Inner-City Scholarship Fund. Previously, Mr. Lynch served on the Special Olympics International Board of Directors (1997-2006). |
David A. Rosow (70) |
| Year of Election or Appointment: 2012 Member of the Advisory Board of Fidelity's Equity and High Income Funds. Chairman and Chief Executive Officer of International Golf Group, Inc. (golf course development, 1989-present). Previously, Mr. Rosow served as Chairman and Chief Executive Officer of Rosow & Company, Inc. (private investment company, 1989-2011), a Lead Director of Hudson United Bancorp (2001-2006) and as a Director of TD Banknorth (1996-2006). In addition, Mr. Rosow is a member (2008-present) and President (2009-present) of the Town Council of Palm Beach, Florida. |
Garnett A. Smith (65) |
| Year of Election or Appointment: 2012 Member of the Advisory Board of Fidelity's Equity and High Income Funds. Prior to Mr. Smith's retirement, he served as Chairman and Chief Executive Officer of Inbrand Corp. (manufacturer of personal absorbent products, 1990-1997). He also served as President (1986-1990) of Inbrand Corp. Prior to his employment with Inbrand Corp., he was employed by a retail fabric chain and North Carolina National Bank. In addition, Mr. Smith is a board member of the Jackson Hole Land Trust (2009-present). |
Kenneth B. Robins (43) |
| Year of Election or Appointment: 2008 President and Treasurer of Fidelity's Equity and High Income Funds. Mr. Robins also serves as President and Treasurer (2010-present) and Assistant Treasurer (2009-present) of other Fidelity funds and is an employee of Fidelity Investments (2004-present). Previously, Mr. Robins served as Deputy Treasurer of the Fidelity funds (2005-2008) and Treasurer and Chief Financial Officer of The North Carolina Capital Management Trust: Cash and Term Portfolios (2006-2008). |
Bruce T. Herring (47) |
| Year of Election or Appointment: 2006 Vice President of certain Equity Funds. Mr. Herring also serves as President of Fidelity Research & Analysis Company (2010-present), Chief Investment Officer and Director of Fidelity Management & Research (U.K.) Inc. (2010-present) and Group Chief Investment Officer of FMR. Previously, Mr. Herring served as Vice President (2005-2006) and Senior Vice President (2006-2007) of Fidelity Management & Research Company, Vice President of FMR Co., Inc. (2001-2007) and as a portfolio manager for Fidelity U.S. Equity Funds. |
Brian B. Hogan (48) |
| Year of Election or Appointment: 2009 Vice President of Equity and High Income Funds. Mr. Hogan also serves as President of FMR's Equity Division (2009-present). Previously, Mr. Hogan served as Senior Vice President, Equity Research of FMR (2006-2009) and as a portfolio manager. |
Scott C. Goebel (44) |
| Year of Election or Appointment: 2008 Secretary and Chief Legal Officer (CLO) of the Fidelity funds. Mr. Goebel also serves as Secretary of Fidelity Investments Money Management, Inc. (FIMM) (2010-present) and Fidelity Research and Analysis Company (FRAC) (2010-present); Secretary and CLO of The North Carolina Capital Management Trust: Cash and Term Portfolios (2008-present); General Counsel, Secretary, and Senior Vice President of FMR (2008-present) and FMR Co., Inc. (2008-present); employed by FMR LLC or an affiliate (2001-present); Chief Legal Officer of Fidelity Management & Research (Hong Kong) Limited (2008-present) and Assistant Secretary of Fidelity Management & Research (Japan) Inc. (2008-present), and Fidelity Management & Research (U.K.) Inc. (2008-present). Previously, Mr. Goebel served as Assistant Secretary of FIMM (2008-2010), FRAC (2008-2010), and the Funds (2007-2008) and as Vice President and Secretary of Fidelity Distributors Corporation (FDC) (2005-2007). |
William C. Coffey (43) |
| Year of Election or Appointment: 2009 Assistant Secretary of Fidelity's Equity and High Income Funds. Mr. Coffey also serves as Senior Vice President and Deputy General Counsel of FMR LLC (2010-present), and is an employee of Fidelity Investments. Previously, Mr. Coffey served as Vice President and Associate General Counsel of FMR LLC (2005-2009). |
Elizabeth Paige Baumann (44) |
| Year of Election or Appointment: 2012 Anti-Money Laundering (AML) Officer of the Fidelity funds. Ms. Baumann also serves as AML Officer of The North Carolina Capital Management Trust: Cash and Term Portfolios (2012-present), Chief AML Officer of FMR LLC (2012-present), and is an employee of Fidelity Investments. Previously, Ms. Baumann served as Vice President and Deputy Anti-Money Laundering Officer (2007-2012). |
Christine Reynolds (54) |
| Year of Election or Appointment: 2008 Chief Financial Officer of the Fidelity funds. Ms. Reynolds became President of Fidelity Pricing and Cash Management Services (FPCMS) in August 2008. Ms. Reynolds served as Chief Operating Officer of FPCMS (2007-2008). Previously, Ms. Reynolds served as President, Treasurer, and Anti-Money Laundering officer of the Fidelity funds (2004-2007). |
Joseph A. Hanlon (44) |
| Year of Election or Appointment: 2012 Chief Compliance Officer of Fidelity's Equity and High Income Funds. Mr. Hanlon serves as Compliance Officer of FMR, FMR Co., Inc., Fidelity Investments Money Management, Inc. (FIMM), Fidelity Research and Analysis Company (FRAC), Fidelity Management & Research (Japan) Inc., Fidelity Management & Research (U.K.) Inc., Fidelity Management & Research (Hong Kong), and Strategic Advisers, Inc. (2009-present), as Senior Vice President of the Fidelity Asset Management Division (2009-present), and is an employee of Fidelity Investments. |
Joseph F. Zambello (55) |
| Year of Election or Appointment: 2011 Deputy Treasurer of the Fidelity funds. Mr. Zambello is an employee of Fidelity Investments. Previously, Mr. Zambello served as Vice President of FMR's Program Management Group (2009-2011) and Vice President of the Transfer Agent Oversight Group (2005-2009). |
Adrien E. Deberghes (45) |
| Year of Election or Appointment: 2008 Deputy Treasurer of Fidelity's Equity and High Income Funds. Mr. Deberghes also serves as Vice President (2011-present) and Assistant Treasurer (2010-present) of other Fidelity funds, and is an employee of Fidelity Investments (2008-present). Previously, Mr. Deberghes served as Senior Vice President of Mutual Fund Administration at State Street Corporation (2007-2008), Senior Director of Mutual Fund Administration at Investors Bank & Trust (2005-2007), and Director of Finance for Dunkin' Brands (2000-2005). |
Stephen Sadoski (41) |
| Year of Election or Appointment: 2012 Deputy Treasurer of Fidelity's Equity and High Income Funds. Mr. Sadoski also serves as Deputy Treasurer of other Fidelity funds (2013-present) and is an employee of Fidelity Investments (2012-present). Previously, Mr. Sadoski served as Assistant Treasurer of Fidelity's Fixed Income and Asset Allocation Funds (2012-2013), an assistant chief accountant in the Division of Investment Management of the Securities and Exchange Commission (SEC) (2009-2012) and as a senior manager at Deloitte & Touche (1997-2009). |
Stacie Smith (38) |
| Year of Election or Appointment: 2013 Deputy Treasurer of Fidelity's Equity and High Income Funds. Ms. Smith is an employee of Fidelity Investments (2009-present). Previously, Ms. Smith served as Senior Audit Manager of Ernst & Young LLP (1996-2009). |
Stephanie J. Dorsey (43) |
| Year of Election or Appointment: 2010 Assistant Treasurer of Fidelity's Equity and High Income Funds. Ms. Dorsey also serves as President and Treasurer (2013-present) and Assistant Treasurer (2012-present) of other Fidelity funds and is an employee of Fidelity Investments (2008-present). Previously, Ms. Dorsey served as Deputy Treasurer of Fidelity's Fixed Income and Asset Allocation Funds (2008-2013), Treasurer (2004-2008) of the JPMorgan Mutual Funds and Vice President (2004-2008) of JPMorgan Chase Bank. |
John R. Hebble (54) |
| Year of Election or Appointment: 2009 Assistant Treasurer of Fidelity's Equity and High Income Funds. Mr. Hebble also serves as President (2011-present), Treasurer, and Chief Financial Officer of The North Carolina Capital Management Trust: Cash and Term Portfolios (2008-present) and is an employee of Fidelity Investments. Previously, Mr. Hebble served as President and Treasurer of Fidelity's Fixed Income and Asset Allocation Funds (2008-2013). |
Gary W. Ryan (54) |
| Year of Election or Appointment: 2005 Assistant Treasurer of the Fidelity funds. Mr. Ryan is an employee of Fidelity Investments. Previously, Mr. Ryan served as Vice President of Fund Reporting in Fidelity Pricing and Cash Management Services (FPCMS) (1999-2005). |
Jonathan Davis (44) |
| Year of Election or Appointment: 2010 Assistant Treasurer of the Fidelity funds. Mr. Davis is also Assistant Treasurer of Fidelity Rutland Square Trust II and Fidelity Commonwealth Trust II. Mr. Davis is an employee of Fidelity Investments. Previously, Mr. Davis served as Vice President and Associate General Counsel of FMR LLC (2003-2010). |
Annual Report
Service Class 2R designates 100% of the dividends distributed during the fiscal year as qualifying for the dividends-received deduction for corporate shareholders.
Annual Report
Board Approval of Investment Advisory Contracts and Management Fees
VIP Contrafund Portfolio
Each year, the Board of Trustees, including the Independent Trustees (together, the Board), votes on the renewal of the management contract and sub-advisory agreements (together, the Advisory Contracts) for the fund. The Board, assisted by the advice of fund counsel and Independent Trustees' counsel, requests and considers a broad range of information relevant to the renewal of the Advisory Contracts throughout the year.
The Board meets regularly and, at each of its meetings, considers factors that are relevant to its annual consideration of the renewal of the fund's Advisory Contracts, including the services and support provided to the fund and its shareholders. The Board has established various standing committees, each composed of and chaired by Independent Trustees with varying backgrounds, to which the Board has assigned specific subject matter responsibilities in order to enhance effective decision-making by the Board. The Board, acting directly and through its Committees, requests and receives information concerning the annual consideration of the renewal of the fund's Advisory Contracts. The Board also meets as needed to consider matters specifically related to the Board's annual consideration of the renewal of Advisory Contracts. Members of the Board may also meet with trustees of other Fidelity funds through ad hoc joint committees to discuss certain matters relevant to the Fidelity funds.
At its July 2012 meeting, the Board of Trustees, including the Independent Trustees, unanimously determined to renew the fund's Advisory Contracts. In reaching its determination, the Board considered all factors it believed relevant, including (i) the nature, extent, and quality of the services to be provided to the fund and its shareholders (including the investment performance of the fund); (ii) the competitiveness of the fund's management fee and total expense ratio relative to peer funds; (iii) the total costs of the services to be provided by and the profits to be realized by Fidelity from its relationship with the fund; (iv) the extent to which economies of scale exist and would be realized as the fund grows; and (v) whether fee levels reflect these economies of scale, if any, for the benefit of fund shareholders.
In considering whether to renew the Advisory Contracts for the fund, the Board reached a determination, with the assistance of fund counsel and Independent Trustees' counsel and through the exercise of its business judgment, that the renewal of the Advisory Contracts is in the best interests of the fund and its shareholders and that the compensation payable under the Advisory Contracts is fair and reasonable. The Board's decision to renew the Advisory Contracts was not based on any single factor, but rather was based on a comprehensive consideration of all the information provided to the Board at its meetings throughout the year. The Board, in reaching its determination to renew the Advisory Contracts, is aware that shareholders in the fund have a broad range of investment choices available to them, including a wide choice among mutual funds offered by Fidelity's competitors, and that the fund's shareholders, who have the opportunity to review and weigh the disclosure provided by the fund in its prospectus and other public disclosures, have chosen to invest in this fund, managed by Fidelity.
Nature, Extent, and Quality of Services Provided. The Board considered the staffing within the investment adviser, FMR, and the sub-advisers (together, the Investment Advisers), including the backgrounds of the fund's investment personnel, and also considered the fund's investment objective, strategies, and related investment philosophy. The Independent Trustees also had discussions with senior management of Fidelity's investment operations and investment groups. The Board considered the structure of the portfolio manager compensation program and whether this structure provides appropriate incentives to act in the best interests of the fund.
Resources Dedicated to Investment Management and Support Services. The Board and the Fund Oversight and Research Committees reviewed the general qualifications and capabilities of the Investment Advisers' investment staff, including its size, education, experience, and resources, as well as the Investment Advisers' approach to recruiting, training, managing, and compensating investment personnel. The Board also noted that FMR has continued to increase the resources devoted to non-U.S. offices, including expansion of Fidelity's global investment organization. The Board noted that Fidelity's analysts have extensive resources, tools and capabilities that allow them to conduct sophisticated quantitative and fundamental analysis, as well as credit analysis of issuers, counterparties and guarantors. The Board also believes that Fidelity's investment professionals have sufficient access to global information and data so as to provide competitive investment results over time, and that those professionals also have access to sophisticated tools that permit them to assess portfolio construction and risk and performance attribution characteristics continuously, as well as to transmit new information and research conclusions rapidly around the world. Additionally, in its deliberations, the Board considered the Investment Advisers' trading and risk management capabilities and resources, which are an integral part of the investment management process.
Shareholder and Administrative Services. The Board considered (i) the nature, extent, quality, and cost of advisory, administrative, and shareholder services performed by the Investment Advisers and their affiliates under the Advisory Contracts and under separate agreements covering transfer agency, pricing and bookkeeping, and securities lending services for the fund; (ii) the nature and extent of the supervision of third party service providers, principally custodians and subcustodians; and (iii) the resources devoted to, and the record of compliance with, the fund's compliance policies and procedures. The Board also reviewed the allocation of fund brokerage, including allocations to brokers affiliated with the Investment Advisers, the use of brokerage commissions to pay fund expenses, and the use of "soft" commission dollars to pay for research services.
The Board noted that the growth of fund assets over time across the complex allows Fidelity to reinvest in the development of services designed to enhance the value or convenience of the Fidelity funds as investment vehicles. These services include 24-hour access to account information and market information through telephone representatives and over the Internet, investor education materials and asset allocation tools, and the expanded availability of Fidelity Investor Centers.
Annual Report
Investment in a Large Fund Family. The Board considered the benefits to shareholders of investing in a Fidelity fund, including the benefits of investing in a fund that is part of a large family of funds offering a variety of investment disciplines and providing a large variety of mutual fund investor services. The Board noted that Fidelity had taken, or had made recommendations that resulted in the Fidelity funds taking, a number of actions over the previous year that benefited particular funds, including (i) continuing to dedicate additional resources to investment research and support of the senior management team that oversees asset management; (ii) persisting in efforts to enhance Fidelity's research capabilities, in particular, international research; (iii) launching new funds and making other enhancements to meet client needs for global and income-oriented solutions; (iv) continuing to launch dedicated lower cost underlying funds to meet investment management's portfolio construction needs related to expanding underlying fund options, specifically for the Freedom Fund product lines; (v) adopting a "Stock Selector" sector neutral investment approach and employing a team of portfolio managers who are sector specialists to manage certain funds; (vi) rationalizing product lines and gaining increased efficiencies through the mergers of several funds into other funds; (vii) strengthening the Spartan Index Fund product line by adding new funds and/or new low-cost institutional share classes, restructuring fund expenses to accommodate new classes, and reducing investment minimums for certain classes of shares; (viii) modifying the eligibility criteria for Institutional Class shares to increase their appeal to government entities and charitable investors; and (ix) reducing certain transfer agent fee rates.
Investment Performance. The Board considered whether the fund has operated in accordance with its investment objective, as well as its record of compliance with its investment restrictions. It also reviewed the fund's absolute investment performance for each class, as well as the fund's relative investment performance for each class measured over multiple periods against (i) a broad-based securities market index, and (ii) a peer group of mutual funds deemed appropriate by Fidelity and reviewed by the Board. The following charts considered by the Board show, over the one-, three-, and five-year periods ended December 31, 2011, the cumulative total returns of Initial Class and Service Class 2 of the fund, the cumulative total returns of a broad-based securities market index ("benchmark"), and a range of cumulative total returns of a peer group of mutual funds identified by Morningstar, Inc. as having an investment style similar to that of the fund based on underlying portfolio holdings. The returns of Initial Class and Service Class 2 show the performance of the highest and lowest performing classes, respectively (based on five-year performance). The box within each chart shows the 25th percentile return (top of box) and the 75th percentile return (bottom of box) of the peer group. Returns shown above the box are in the first quartile and returns shown below the box are in the fourth quartile. The percentage beaten numbers noted below each chart correspond to the percentile box and represent the percentage of funds in the peer group whose performance was equal to or lower than that of the class indicated.
VIP Contrafund Portfolio
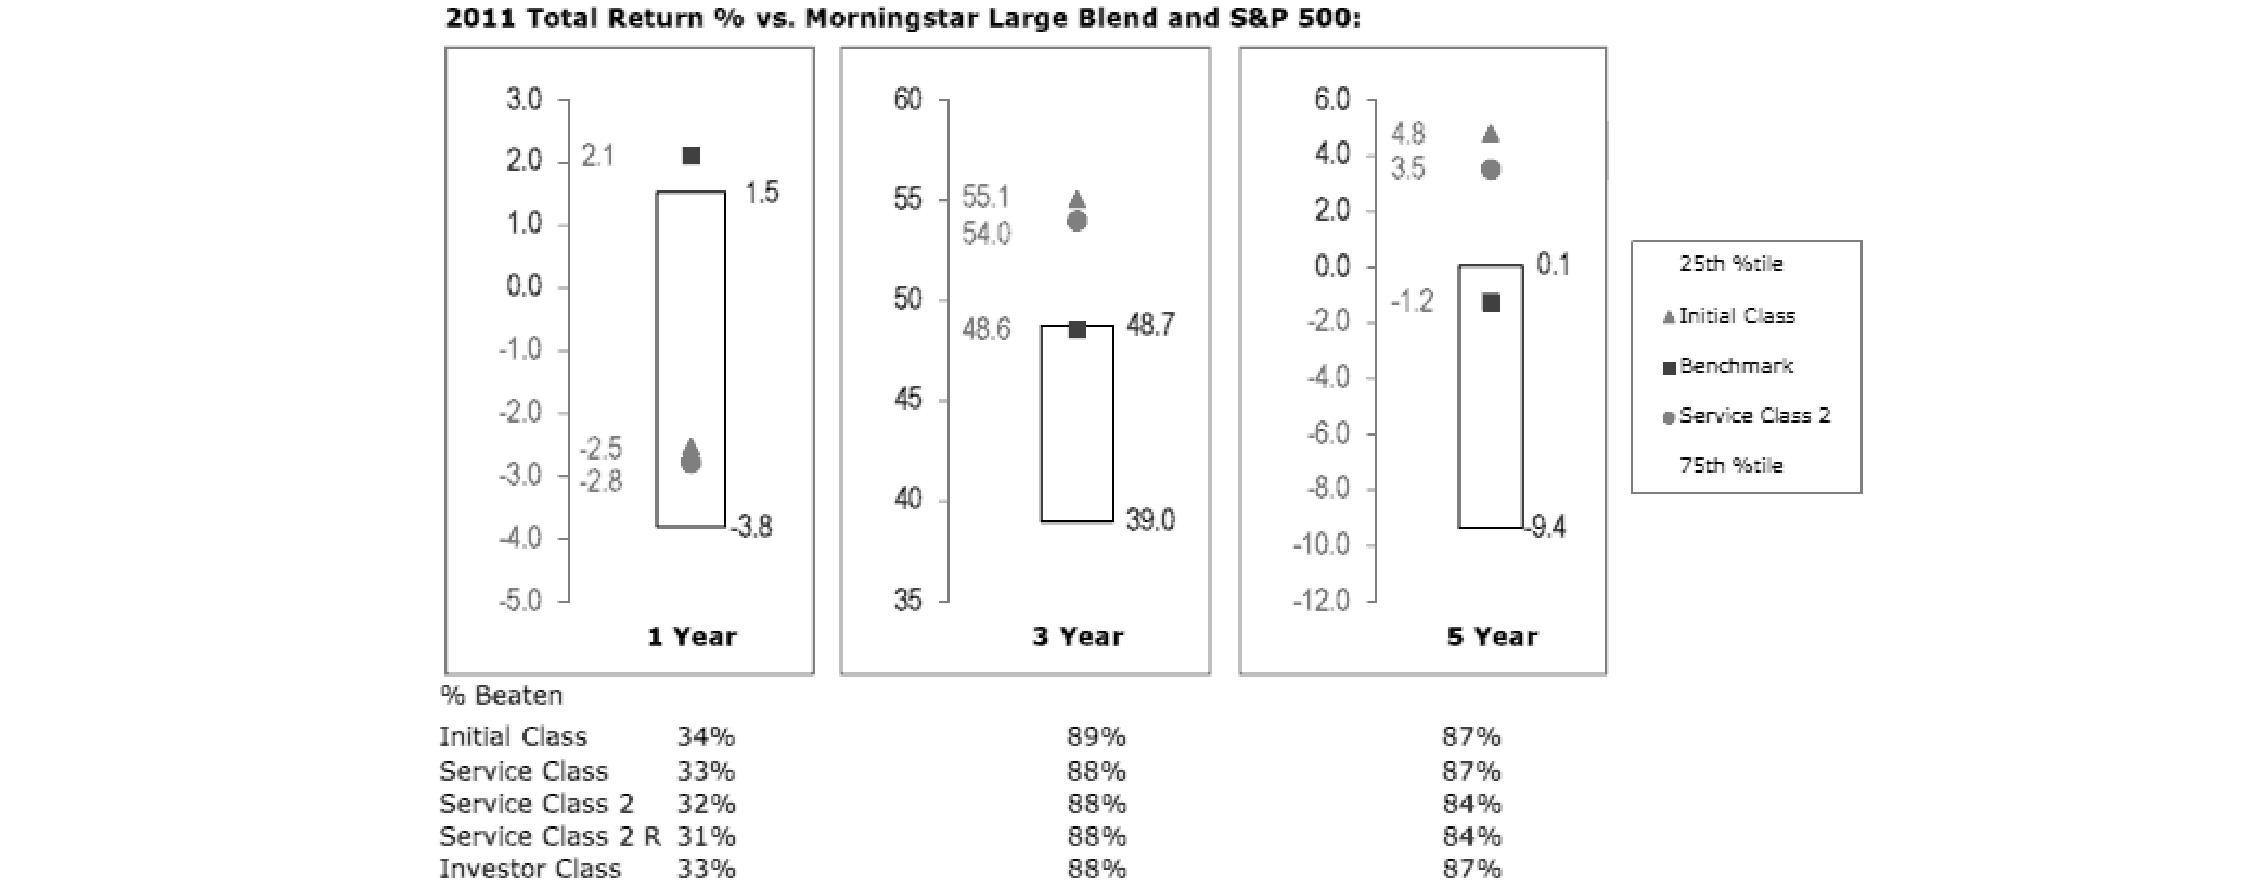
The Board reviewed the fund's relative investment performance against its peer group and noted that the performance of Initial Class of the fund was in the third quartile for the one-year period and the first quartile for the three- and five-year periods. The Board also noted that the investment performance of Initial Class of the fund compared favorably to its benchmark for the three- and five-year periods, although the fund's one-year total return was lower than its benchmark. The Board considered that the variations in performance among the fund's classes reflect the variations in class expenses, which result in lower performance for higher expense classes. The Board also reviewed the fund's performance since inception as well as performance in the current year.
Based on its review, the Board concluded that the nature, extent, and quality of services provided to the fund under the Advisory Contracts should benefit the fund's shareholders.
Annual Report
Board Approval of Investment Advisory Contracts and Management Fees - continued
Competitiveness of Management Fee and Total Expense Ratio. The Board considered the fund's management fee and total expense ratio compared to "mapped groups" of competitive funds and classes. Fidelity creates "mapped groups" by combining similar Lipper investment objective categories that have comparable management fee characteristics. Combining Lipper investment objective categories aids the Board's management fee and total expense ratio comparisons by broadening the competitive group used for comparison and by reducing the number of universes to which various Fidelity funds are compared.
Management Fee. The Board considered two proprietary management fee comparisons for the 12-month periods shown in the chart below. The group of Lipper funds used by the Board for management fee comparisons is referred to below as the "Total Mapped Group." The Total Mapped Group comparison focuses on a fund's standing relative to the total universe of comparable funds available to investors in terms of gross management fees before expense reimbursements or caps. "TMG %" represents the percentage of funds in the Total Mapped Group that had management fees that were lower than the fund's. For example, a TMG % of 10% means that 90% of the funds in the Total Mapped Group had higher management fees than the fund. The "Asset-Size Peer Group" (ASPG) comparison focuses on a fund's standing relative to non-Fidelity funds similar in size to the fund within the Total Mapped Group. The ASPG represents at least 15% of the funds in the Total Mapped Group with comparable asset size and management fee characteristics, subject to a minimum of 50 funds (or all funds in the Total Mapped Group if fewer than 50). Additional information, such as the ASPG quartile in which the fund's management fee ranked, is also included in the chart and considered by the Board.
VIP Contrafund Portfolio
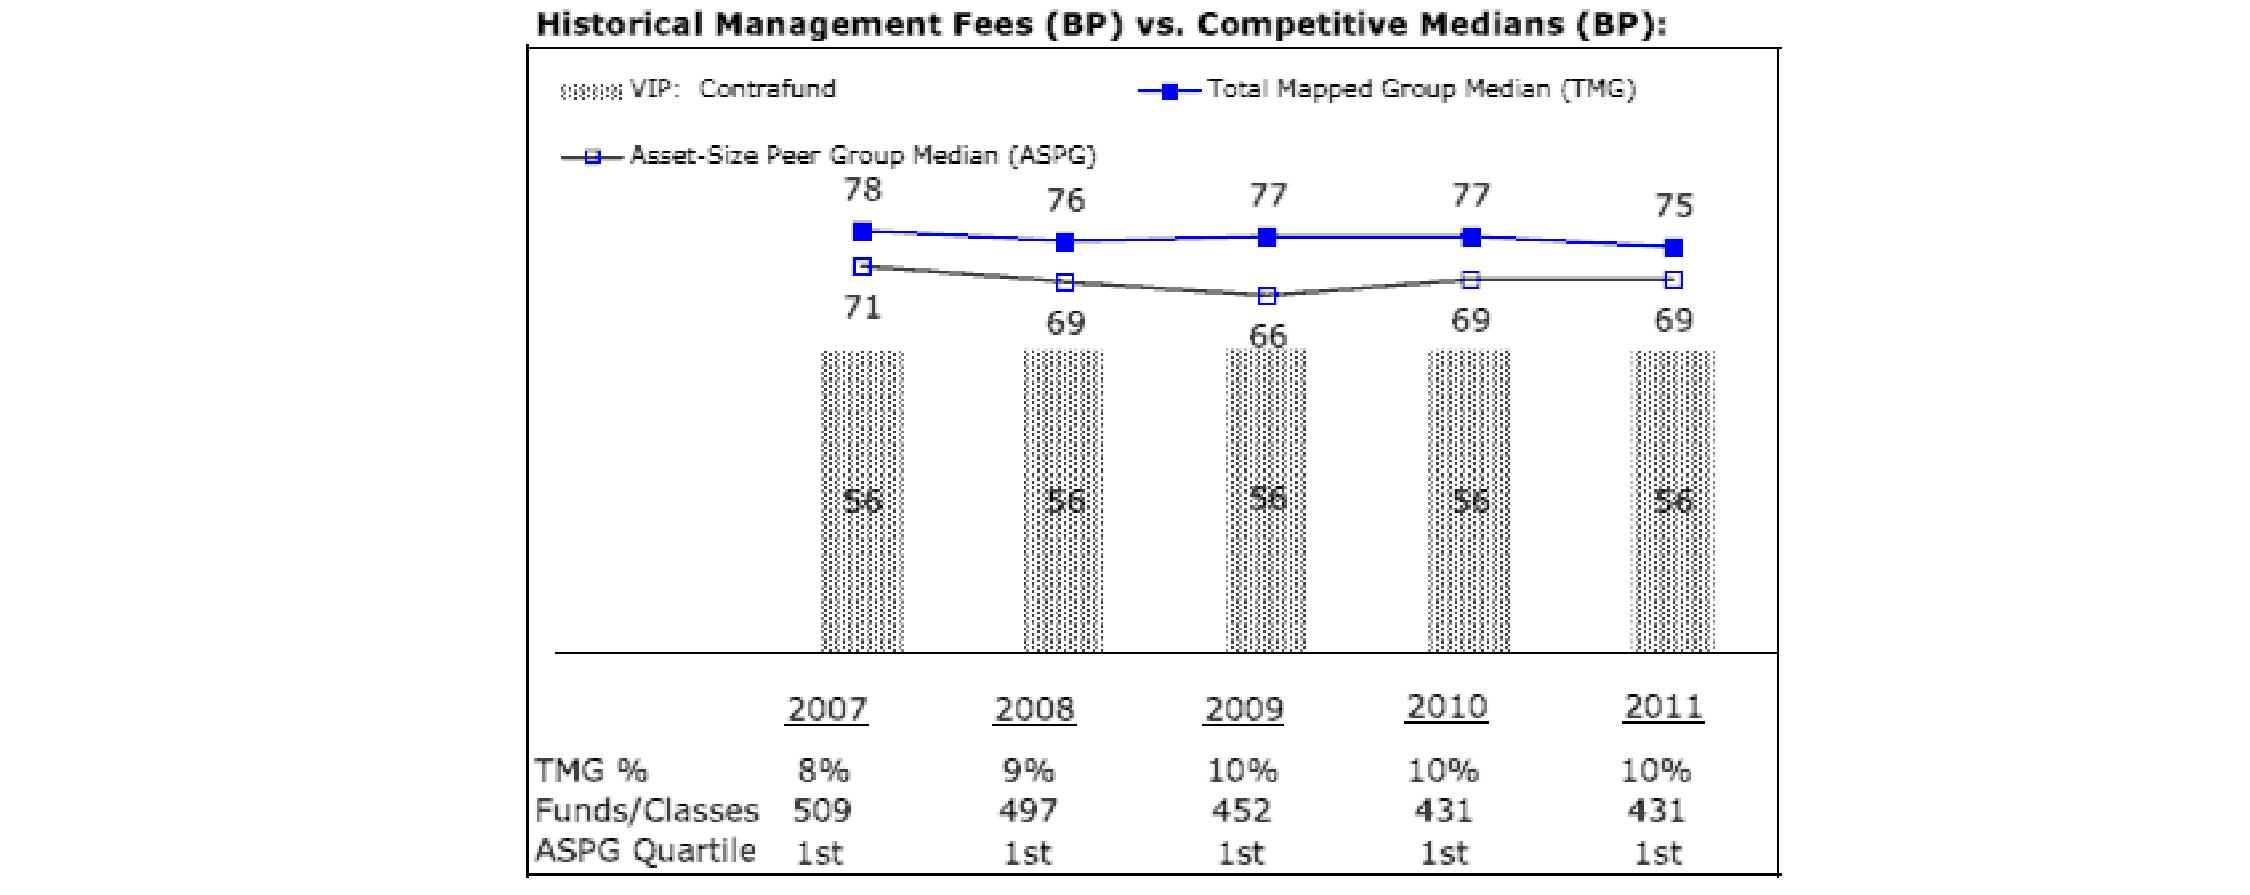
The Board noted that the fund's management fee ranked below the median of its Total Mapped Group and below the median of its ASPG for 2011.
Based on its review, the Board concluded that the fund's management fee is fair and reasonable in light of the services that the fund receives and the other factors considered.
Total Expense Ratio. In its review of each class's total expense ratio, the Board considered the fund's management fee as well as other fund or class expenses, as applicable, such as transfer agent fees, pricing and bookkeeping fees, fund-paid 12b-1 fees, and custodial, legal, and audit fees. The Board also noted the effects of any waivers and reimbursements on fees and expenses. As part of its review, the Board also considered the current and historical total expense ratios of each class of the fund compared to competitive fund median expenses. Each class of the fund is compared to those funds and classes in the Total Mapped Group (used by the Board for management fee comparisons) that have a similar sales load structure.
The Board noted that the total expense ratio of each class ranked below its competitive median for 2011.
Fees Charged to Other Fidelity Clients. The Board also considered Fidelity fee structures and other information with respect to clients of FMR and its affiliates, such as other mutual funds advised or subadvised by FMR or its affiliates, pension plan clients, and other institutional clients. The Board noted the findings of the 2010 ad hoc joint committee (created with the board of other Fidelity funds), which reviewed and compared Fidelity's institutional investment advisory business with its business of providing services to the Fidelity funds, including the differences in services provided, fees charged, and costs incurred, as well as competition in their respective marketplaces.
Based on its review of total expense ratios and fees charged to other Fidelity clients, the Board concluded that the total expense ratio of each class of the fund was reasonable in light of the services that the fund and its shareholders receive and the other factors considered.
Annual Report
Costs of the Services and Profitability. The Board considered the revenues earned and the expenses incurred by Fidelity in conducting the business of developing, marketing, distributing, managing, administering and servicing the fund and its shareholders. The Board also considered the level of Fidelity's profits in respect of all the Fidelity funds.
On an annual basis, FMR presents to the Board Fidelity's profitability for the fund. Fidelity calculates the profitability for each fund, as well as aggregate profitability for groups of Fidelity funds and all Fidelity funds, using a series of detailed revenue and cost allocation methodologies which originate with the books and records of Fidelity on which Fidelity's audited financial statements are based. The Audit Committee of the Board reviews any significant changes from the prior year's methodologies.
PricewaterhouseCoopers LLP (PwC), independent registered public accounting firm and auditor to Fidelity and certain Fidelity funds, has been engaged annually by the Board as part of the Board's assessment of Fidelity's profitability analysis. PwC's engagement includes the review and assessment of Fidelity's methodologies used in determining the revenues and expenses attributable to Fidelity's mutual fund business, and completion of agreed-upon procedures surrounding the mathematical accuracy of fund profitability and its conformity to allocation methodologies. After considering PwC's reports issued under the engagement and information provided by Fidelity, the Board concluded that while other allocation methods may also be reasonable, Fidelity's profitability methodologies are reasonable in all material respects.
The Board also reviewed Fidelity's non-fund businesses and fall-out benefits related to the mutual fund business as well as cases where Fidelity's affiliates may benefit from or be related to the fund's business.
The Board considered the costs of the services provided by and the profits realized by Fidelity in connection with the operation of the fund and was satisfied that the profitability was not excessive in the circumstances.
Economies of Scale. The Board considered whether there have been economies of scale in respect of the management of the Fidelity funds, whether the Fidelity funds (including the fund) have appropriately benefited from any such economies of scale, and whether there is potential for realization of any further economies of scale. The Board considered the extent to which the fund will benefit from economies of scale through increased services to the fund, through waivers or reimbursements, or through fee or expense reductions. The Board also noted that in 2009, it and the board of other Fidelity funds created an ad hoc committee (the Economies of Scale Committee) to analyze whether FMR attains economies of scale in respect of the management and servicing of the Fidelity funds, whether the Fidelity funds have appropriately benefited from such economies of scale, and whether there is potential for realization of any further economies of scale.
The Board recognized that the fund's management contract incorporates a "group fee" structure, which provides for lower group fee rates as total fund assets under FMR's management increase, and for higher group fee rates as total fund assets under FMR's management decrease. FMR calculates the group fee rates based on a tiered asset "breakpoint" schedule that varies based on asset class. The Board considered that the group fee is designed to deliver the benefits of economies of scale to fund shareholders when total Fidelity fund assets increase, even if assets of any particular fund are unchanged or have declined, because some portion of Fidelity's costs are attributable to services provided to all Fidelity funds, and all funds benefit if those costs can be allocated among more assets. The Board concluded that, given the group fee structure, fund shareholders will benefit from lower management fees as assets under FMR's management increase at the fund complex level, regardless of whether Fidelity achieves any such economies of scale.
The Board concluded, taking into account the analysis of the Economies of Scale Committee, that economies of scale, if any, are being appropriately shared between fund shareholders and Fidelity.
Additional Information Requested by the Board. In order to develop fully the factual basis for consideration of the Fidelity funds' Advisory Contracts, the Board requested and received additional information on certain topics, including (i) fund performance trends, actions to be taken by FMR to improve certain funds' overall performance, and Fidelity's long-term strategies for certain funds; (ii) the potential to further rationalize the Fidelity fund lineup with the possibility of achieving savings for the funds and Fidelity; (iii) Fidelity's compensation structure for portfolio managers and other key investment personnel; (iv) the amount of the investment that each portfolio manager has made in the Fidelity fund(s) that he or she manages; (v) the realization of fall-out benefits in certain Fidelity business units; (vi) Fidelity's group fee structures, the potential impact of regulatory changes on such structures, and the rationale for the individual fee rates of certain funds; (vii) fund profitability methodology, including Fidelity's cost allocation methodology, and the impact of certain factors on fund profitability results; (viii) trends regarding industry use of performance fee structures and the possibility of implementing performance fee structures for additional funds; and (ix) the impact of net redemptions from the Fidelity funds.
Based on its evaluation of all of the conclusions noted above, and after considering all factors it believed relevant, the Board ultimately concluded that the advisory fee structures are fair and reasonable, and that the fund's Advisory Contracts should be renewed.
Annual Report
Investment Adviser
Fidelity Management & Research Company
Boston, MA
Investment Sub-Advisers
FMR Co., Inc.
Fidelity Management & Research (U.K.) Inc.
Fidelity Management & Research (Hong Kong) Limited
Fidelity Management & Research (Japan) Inc.
General Distributor
Fidelity Distributors Corporation
Smithfield, RI
Transfer and Servicing Agents
Fidelity Investments Institutional Operations Company, Inc.
Boston, MA
Fidelity Service Company, Inc.
Boston, MA
Custodian
Brown Brothers Harriman & Co.
Boston, MA
VIPCONR-ANN-0213
1.811844.108
Fidelity® Variable Insurance Products:
Disciplined Small Cap Portfolio
Annual Report
December 31, 2012
(Fidelity Cover Art)
Contents
Performance | (Click Here) | How the fund has done over time. |
Management's Discussion of Fund Performance | (Click Here) | The Portfolio Manager's review of fund performance and strategy. |
Shareholder Expense Example | (Click Here) | An example of shareholder expenses. |
Investment Changes | (Click Here) | A summary of major shifts in the fund's investments over the past six months. |
Investments | (Click Here) | A complete list of the fund's investments with their market values. |
Financial Statements | (Click Here) | Statements of assets and liabilities, operations, and changes in net assets, as well as financial highlights. |
Notes | (Click Here) | Notes to the financial statements. |
Report of Independent Registered Public Accounting Firm | (Click Here) | |
Trustees and Officers | (Click Here) | |
Distributions | (Click Here) | |
Board Approval of Investment Advisory Contracts and Management Fees | (Click Here) | |
To view a fund's proxy voting guidelines and proxy voting record for the 12-month period ended June 30, visit http://www.fidelity.com/proxyvotingresults or visit the Securities and Exchange Commission's (SEC) web site at http://www.sec.gov. You may also call 1-877-208-0098 to request a free copy of the proxy voting guidelines.
Fidelity Variable Insurance Products are separate account options which are purchased through a variable insurance contract.
Standard & Poor's, S&P and S&P 500 are registered service marks of The McGraw-Hill Companies, Inc. and have been licensed for use by Fidelity Distributors Corporation.
Other third party marks appearing herein are the property of their respective owners.
All other marks appearing herein are registered or unregistered trademarks or service marks of FMR LLC or an affiliated company. © 2013 FMR LLC. All rights reserved.
This report and the financial statements contained herein are submitted for the general information of the shareholders of the fund. This report is not authorized for distribution to prospective investors in the fund unless preceded or accompanied by an effective prospectus.
A fund files its complete schedule of portfolio holdings with the SEC for the first and third quarters of each fiscal year on Form N-Q. Forms N-Q are available on the SEC's web site at http://www.sec.gov. A fund's Forms N-Q may be reviewed and copied at the SEC's Public Reference Room in Washington, DC. Information regarding the operation of the SEC's Public Reference Room may be obtained by calling 1-800-SEC-0330. For a complete list of a fund's portfolio holdings, view the most recent holdings listing, semiannual report, or annual report on Fidelity's web site at http://www.fidelity.com, http://www.advisor.fidelity.com, or http://www.401k.com, as applicable.
NOT FDIC INSURED • MAY LOSE VALUE • NO BANK GUARANTEE
Neither the fund nor Fidelity Distributors Corporation is a bank.
Annual Report
Average annual total return reflects the change in the value of an investment, assuming reinvestment of the class' distributions from dividend income and capital gains (the profits earned upon the sale of securities that have grown in value, if any) and assuming a constant rate of performance each year. During periods of reimbursement by Fidelity, a fund's total return will be greater than it would be had the reimbursement not occurred. Performance numbers are net of all underlying fund operating expenses, but do not include any insurance charges imposed by your insurance company's separate account. If performance information included the effect of these additional charges, the total returns would have been lower. How a fund did yesterday is no guarantee of how it will do tomorrow.
Average Annual Total Returns
Periods ended December 31, 2012 | Past 1
year | Past 5
years | Life of
fund A |
VIP Disciplined Small Cap Portfolio - Initial Class | 19.00% | 3.62% | 4.38% |
VIP Disciplined Small Cap Portfolio - Service Class | 18.97% | 3.51% | 4.28% |
VIP Disciplined Small Cap Portfolio - Service Class 2 | 18.58% | 3.30% | 4.08% |
VIP Disciplined Small Cap Portfolio - Investor Class | 18.96% | 3.55% | 4.29% |
A From December 27, 2005.
$10,000 Over Life of Fund
Let's say hypothetically that $10,000 was invested in VIP Disciplined Small Cap Portfolio - Initial Class on December 27, 2005, when the fund started. The chart shows how the value of your investment would have changed, and also shows how the Russell 2000® Index performed over the same period.
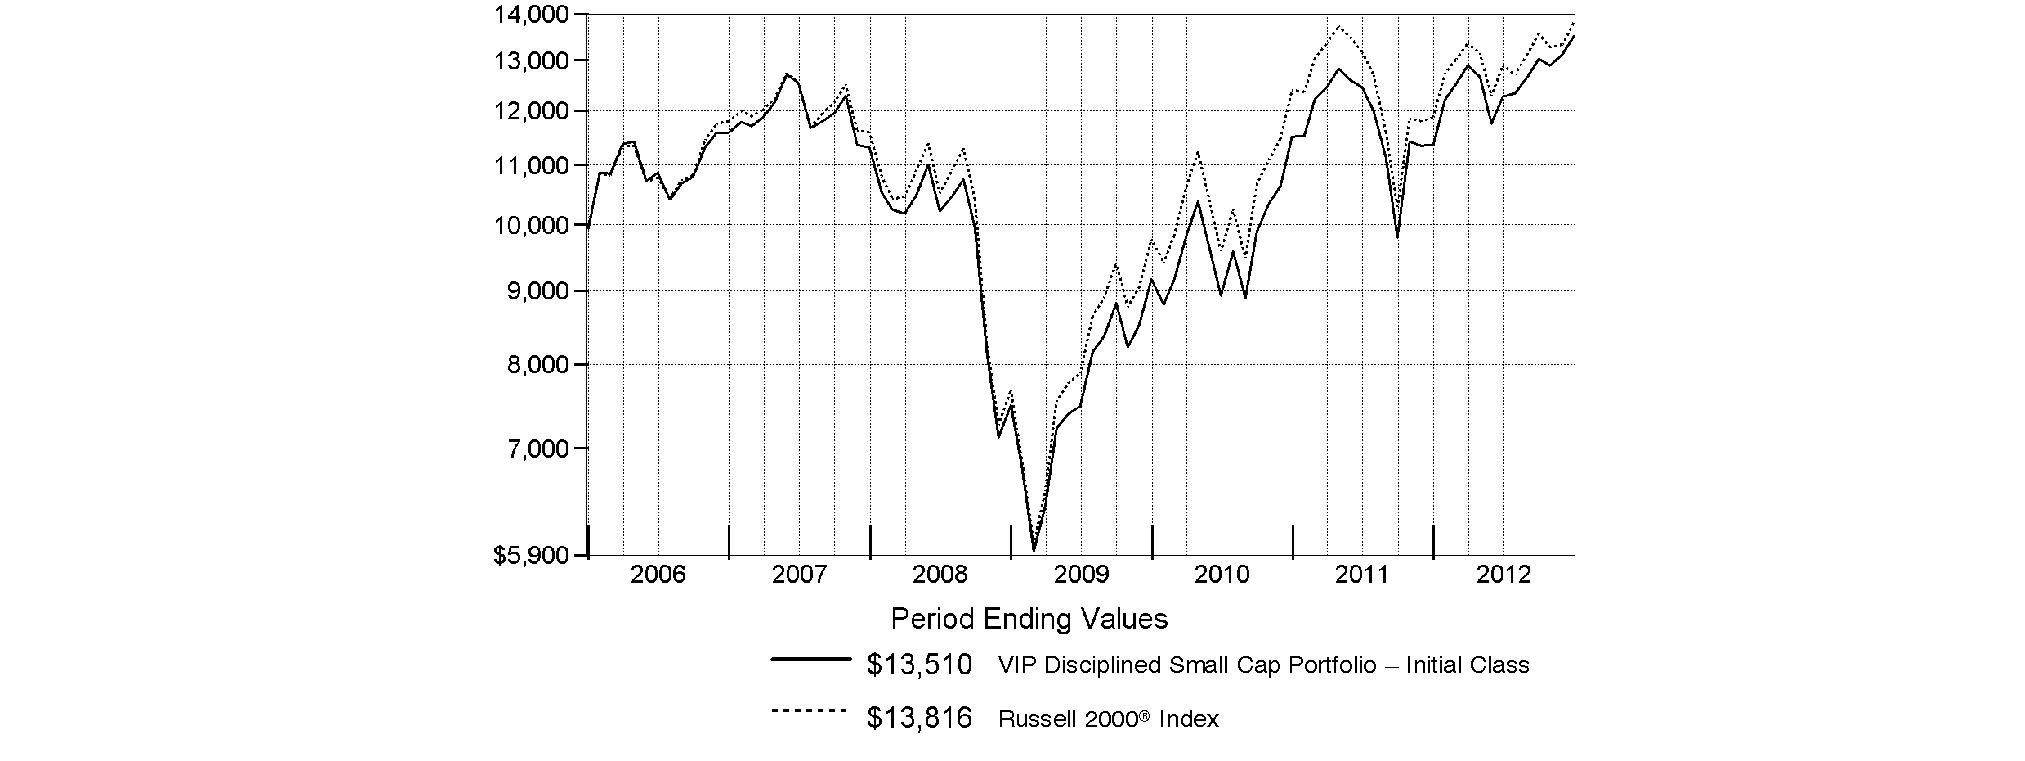
Annual Report
Market Recap: Global markets overcame a host of macroeconomic concerns in 2012 - related to the eurozone debt crisis, the strength and pace of the U.S. economic recovery, the U.S. fiscal debate and a slowdown in China's once-blistering growth - to post broad-based gains for the year, with more-economically sensitive asset classes leading the way. Investor sentiment improved as some of the uncertainties holding back the markets began to lift and the outlook brightened in the face of stimulative global monetary policies and modest inflationary pressures. Riskier assets such as stocks saw the biggest advances, with international equities edging their U.S. counterparts, thanks to an especially strong rally in the fourth quarter. Similarly, within fixed income, credit-sensitive sectors - including high-yield/investment-grade corporate bonds and emerging-markets debt - surged ahead of more-defensive U.S. investment-grade bonds amid strong demand for higher-risk, higher-yielding securities. Emerging signs of a rebounding U.S. economy lifted domestic stocks for most of the period, extending an uptrend that began in March 2009. The broad-based S&P 500® Index rose 16.00% for the 12 months, while the technology-heavy Nasdaq Composite Index® gained 17.45% and the blue-chip-laden Dow Jones Industrial AverageSM added 10.24%. Foreign developed- and emerging-markets equities experienced periodic bouts of volatility this past year, but rode a strong second-half rally to finish ahead of their U.S. counterparts. The MSCI® ACWI® (All Country World Index) ex USA Index advanced 16.98% for the period. In an environment that favored higher-risk assets, U.S. investment-grade bonds managed only a 4.21% gain for 12 months, according to the Barclays® U.S. Aggregate Bond Index. Among sectors that comprise the index, bonds with higher yields and on the riskier end of the spectrum led the way, with investment-grade credit advancing 9.37%, while ultra-safe U.S. Treasuries managed only a 1.99% advance and finished at the back of the pack. Meanwhile, high-yield bonds, as measured by The BofA Merrill LynchSM US High Yield Constrained Index, gained a hearty 15.55%. Foreign bonds showed positive results during the year, with emerging markets easily outpacing their major developed-markets counterparts. The J.P. Morgan Emerging Markets Bond Index Global surged 18.54%, while the Citigroup® Non-USD Group-of-Seven (G7) Equal Weighted Index logged a 7.10% gain.
Comments from Maximilian Kaufmann, Senior Portfolio Manager of the Geode Capital Management, LLC, investment management team for VIP Disciplined Small Cap Portfolio: For the year, the fund's share classes outpaced the benchmark Russell 2000® Index, which rose 16.35%. (For specific portfolio results, please refer to the performance section of this report.) Versus the benchmark, the fund benefited the most from strong stock selection in the energy and financials sectors. In energy, two independent crude oil refiners, Western Refining and Alon USA Energy, were standout contributors whose share price rose by triple digits during the year. In financials, meanwhile, timely ownership of Flagstar Bancorp and a holding in another bank, Banner, added value. Other helpful financials stocks included an out-of-benchmark position in American Capital, an investment firm that helps facilitate management and employee buyouts, and, in the real estate industry, PennyMac Mortgage Investment Trust, which invests in residential mortgage loans and mortgage-related assets. In the consumer discretionary sector, Movado Group, a maker of luxury watches, also contributed. On the negative side, both the consumer staples and health care sectors hampered results. On an individual basis, however, the biggest detractor came from the information technology sector - Xyratex, a provider of data-storage technology that we sold before period end. Freight transportation company Arkansas Best, which also was sold from the fund, was another laggard, as were VOXX International and Express, retailers of consumer electronics and apparel, respectively. Buckeye Technologies, a maker of fiber and woven goods, also detracted.
The views expressed above reflect those of the portfolio manager(s) only through the end of the period as stated on the cover of this report and do not necessarily represent the views of Fidelity or any other person in the Fidelity organization. Any such views are subject to change at any time based upon market or other conditions and Fidelity disclaims any responsibility to update such views. These views may not be relied on as investment advice and, because investment decisions for a Fidelity fund are based on numerous factors, may not be relied on as an indication of trading intent on behalf of any Fidelity fund.
Annual Report
As a shareholder of the Fund, you incur two types of costs: (1) transaction costs, and (2) ongoing costs, including management fees, distribution and/or service (12b-1) fees and other Fund expenses. This Example is intended to help you understand your ongoing costs (in dollars) of investing in the Fund and to compare these costs with the ongoing costs of investing in other mutual funds.
The Example is based on an investment of $1,000 invested at the beginning of the period and held for the entire period (July 1, 2012 to December 31, 2012).
Actual Expenses
The first line of the accompanying table for each class of the Fund provides information about actual account values and actual expenses. You may use the information in this line, together with the amount you invested, to estimate the expenses that you paid over the period. Simply divide your account value by $1,000.00 (for example, an $8,600 account value divided by $1,000.00 = 8.6), then multiply the result by the number in the first line for a class of the Fund under the heading entitled "Expenses Paid During Period" to estimate the expenses you paid on your account during this period. The estimate of expenses does not include any fees or other expenses of any variable annuity or variable life insurance product. If they were, the estimate of expenses you paid during the period would be higher, and your ending account value would be lower. In addition, the Fund, as a shareholder in the underlying Fidelity Central Funds, will indirectly bear its pro-rata share of the fees and expenses incurred by the underlying Fidelity Central Funds. These fees and expenses are not included in the Fund's annualized expense ratio used to calculate the expense estimate in the table below.
Hypothetical Example for Comparison Purposes
The second line of the accompanying table for each class of the Fund provides information about hypothetical account values and hypothetical expenses based on a Class' actual expense ratio and an assumed rate of return of 5% per year before expenses, which is not the Class' actual return. The hypothetical account values and expenses may not be used to estimate the actual ending account balance or expenses you paid for the period. You may use this information to compare the ongoing costs of investing in the Fund and other funds. To do so, compare this 5% hypothetical example with the 5% hypothetical examples that appear in the shareholder reports of the other funds. The estimate of expenses does not include any fees or other expenses of any variable annuity or variable life insurance product. If they were, the estimate of expenses you paid during the period would be higher, and your ending account value would be lower. In addition, the Fund, as a shareholder in the underlying Fidelity Central Funds, will indirectly bear its pro-rata share of the fees and expenses incurred by the underlying Fidelity Central Funds. These fees and expenses are not included in the Fund's annualized expense ratio used to calculate the expense estimate in the table below.
Please note that the expenses shown in the table are meant to highlight your ongoing costs only and do not reflect any transaction costs. Therefore, the second line of the table is useful in comparing ongoing costs only, and will not help you determine the relative total costs of owning different funds.
| Annualized
Expense Ratio | Beginning
Account Value
July 1, 2012 | Ending
Account Value
December 31, 2012 | Expenses Paid
During Period*
July 1, 2012
to December 31, 2012 |
Initial Class | .92% | | | |
Actual | | $ 1,000.00 | $ 1,101.00 | $ 4.86 |
HypotheticalA | | $ 1,000.00 | $ 1,020.51 | $ 4.67 |
Service Class | 1.00% | | | |
Actual | | $ 1,000.00 | $ 1,100.90 | $ 5.28 |
HypotheticalA | | $ 1,000.00 | $ 1,020.11 | $ 5.08 |
Service Class 2 | 1.27% | | | |
Actual | | $ 1,000.00 | $ 1,099.00 | $ 6.70 |
HypotheticalA | | $ 1,000.00 | $ 1,018.75 | $ 6.44 |
Investor Class | .99% | | | |
Actual | | $ 1,000.00 | $ 1,101.40 | $ 5.23 |
HypotheticalA | | $ 1,000.00 | $ 1,020.16 | $ 5.03 |
A 5% return per year before expenses
* Expenses are equal to each Class' annualized expense ratio, multiplied by the average account value over the period, multiplied by 184/366 (to reflect the one-half year period).
Annual Report
Investment Changes (Unaudited)
Top Ten Stocks as of December 31, 2012 |
| % of fund's
net assets | % of fund's net assets
6 months ago |
Ocwen Financial Corp. | 0.7 | 0.0 |
Eagle Materials, Inc. | 0.7 | 0.1 |
CommVault Systems, Inc. | 0.7 | 0.1 |
Helix Energy Solutions Group, Inc. | 0.7 | 0.6 |
Alaska Air Group, Inc. | 0.7 | 0.7 |
First American Financial Corp. | 0.7 | 0.2 |
A.O. Smith Corp. | 0.6 | 0.0 |
Hyster-Yale Materials Handling Class A | 0.6 | 0.0 |
EMCOR Group, Inc. | 0.6 | 0.0 |
Cirrus Logic, Inc. | 0.6 | 0.0 |
| 6.6 | |
Top Five Market Sectors as of December 31, 2012 |
| % of fund's
net assets | % of fund's net assets
6 months ago |
Financials | 23.0 | 22.5 |
Industrials | 16.8 | 14.4 |
Information Technology | 16.1 | 15.6 |
Consumer Discretionary | 11.3 | 14.8 |
Health Care | 9.9 | 12.4 |
Asset Allocation (% of fund's net assets) |
As of December 31, 2012 * | As of June 30, 2012 ** |
| Stocks and
Equity Futures 99.6% | | | Stocks and
Equity Futures 99.7% | |
| Short-Term
Investments and
Net Other Assets
(Liabilities) 0.4% | | | Short-Term
Investments and
Net Other Assets
(Liabilities) 0.3% | |
* Foreign investments | 3.4% | | ** Foreign investments | 3.4% | |

Annual Report
Investments December 31, 2012
Showing Percentage of Net Assets
Common Stocks - 97.3% |
| Shares | | Value |
CONSUMER DISCRETIONARY - 11.3% |
Auto Components - 0.3% |
Cooper Tire & Rubber Co. | 4,363 | | $ 110,646 |
Standard Motor Products, Inc. | 7,778 | | 172,827 |
| | 283,473 |
Distributors - 0.2% |
Pool Corp. | 1,882 | | 79,646 |
VOXX International Corp. (a) | 11,823 | | 79,569 |
| | 159,215 |
Diversified Consumer Services - 0.4% |
Coinstar, Inc. (a) | 1,910 | | 99,339 |
Hillenbrand, Inc. | 10,975 | | 248,145 |
| | 347,484 |
Hotels, Restaurants & Leisure - 3.3% |
Ameristar Casinos, Inc. | 13,868 | | 363,896 |
Bob Evans Farms, Inc. | 11,345 | | 456,069 |
Cracker Barrel Old Country Store, Inc. | 6,978 | | 448,406 |
Domino's Pizza, Inc. | 1,395 | | 60,752 |
Einstein Noah Restaurant Group, Inc. | 2,898 | | 35,385 |
Frisch's Restaurants, Inc. | 677 | | 12,525 |
Jack in the Box, Inc. (a) | 2,304 | | 65,894 |
Marriott Vacations Worldwide Corp. (a) | 10,980 | | 457,537 |
Multimedia Games Holding Co., Inc. (a) | 9,012 | | 132,567 |
Papa John's International, Inc. (a) | 8,255 | | 453,530 |
Sonic Corp. (a) | 13,554 | | 141,097 |
Texas Roadhouse, Inc. Class A | 9,676 | | 162,557 |
Town Sports International Holdings, Inc. | 2,866 | | 30,523 |
| | 2,820,738 |
Household Durables - 1.8% |
Flexsteel Industries, Inc. | 16,031 | | 343,865 |
M.D.C. Holdings, Inc. | 11,540 | | 424,210 |
NACCO Industries, Inc. Class A | 7,098 | | 430,778 |
Tupperware Brands Corp. | 5,731 | | 367,357 |
| | 1,566,210 |
Leisure Equipment & Products - 0.9% |
Arctic Cat, Inc. (a) | 7,688 | | 256,702 |
Brunswick Corp. | 17,534 | | 510,064 |
Polaris Industries, Inc. | 41 | | 3,450 |
| | 770,216 |
Media - 0.5% |
Fisher Communications, Inc. | 8,789 | | 237,215 |
Global Sources Ltd. (a) | 31,011 | | 200,951 |
Scholastic Corp. | 454 | | 13,420 |
| | 451,586 |
Specialty Retail - 3.0% |
ANN, Inc. (a) | 14,995 | | 507,431 |
Big 5 Sporting Goods Corp. | 26,831 | | 351,486 |
Brown Shoe Co., Inc. | 23,747 | | 436,232 |
Destination Maternity Corp. | 5,313 | | 114,548 |
Express, Inc. (a) | 5,693 | | 85,907 |
|
| Shares | | Value |
Finish Line, Inc. Class A | 100 | | $ 1,893 |
Haverty Furniture Companies, Inc. | 2,970 | | 48,441 |
OfficeMax, Inc. | 43,954 | | 428,991 |
Penske Automotive Group, Inc. | 4,420 | | 132,998 |
Rent-A-Center, Inc. | 2,903 | | 99,747 |
The Cato Corp. Class A (sub. vtg.) | 11,852 | | 325,100 |
The Men's Wearhouse, Inc. | 3,563 | | 111,023 |
| | 2,643,797 |
Textiles, Apparel & Luxury Goods - 0.9% |
Movado Group, Inc. | 11,392 | | 349,507 |
Perry Ellis International, Inc. | 2,361 | | 46,984 |
The Jones Group, Inc. | 9,357 | | 103,488 |
True Religion Apparel, Inc. | 6,900 | | 175,398 |
Tumi Holdings, Inc. | 5,128 | | 106,919 |
Unifi, Inc. (a) | 702 | | 9,133 |
Warnaco Group, Inc. (a) | 113 | | 8,087 |
| | 799,516 |
TOTAL CONSUMER DISCRETIONARY | | 9,842,235 |
CONSUMER STAPLES - 4.2% |
Beverages - 0.1% |
Coca-Cola Bottling Co. CONSOLIDATED | 969 | | 64,439 |
Food & Staples Retailing - 0.0% |
Ingles Markets, Inc. Class A | 329 | | 5,679 |
Village Super Market, Inc. Class A | 1 | | 33 |
| | 5,712 |
Food Products - 2.5% |
Alico, Inc. | 301 | | 11,026 |
Cal-Maine Foods, Inc. | 9,341 | | 375,695 |
Fresh Del Monte Produce, Inc. | 16,890 | | 445,052 |
J&J Snack Foods Corp. | 4,609 | | 294,699 |
Omega Protein Corp. (a) | 10,112 | | 61,885 |
Pilgrims Pride Corp. | 33,430 | | 242,368 |
Post Holdings, Inc. (a) | 5,509 | | 188,683 |
Sanderson Farms, Inc. | 9,219 | | 438,363 |
Seneca Foods Corp. Class A (a) | 3,008 | | 91,443 |
TreeHouse Foods, Inc. (a) | 940 | | 49,002 |
| | 2,198,216 |
Household Products - 0.6% |
Central Garden & Pet Co. Class A (non-vtg.) (a) | 6,276 | | 65,584 |
Orchids Paper Products Co. | 8,421 | | 170,273 |
Spectrum Brands Holdings, Inc. | 5,798 | | 260,504 |
WD-40 Co. | 1,035 | | 48,759 |
| | 545,120 |
Personal Products - 1.0% |
Inter Parfums, Inc. | 1,070 | | 20,822 |
MediFast, Inc. (a) | 12,594 | | 332,356 |
Nature's Sunshine Products, Inc. | 3,096 | | 44,830 |
Nu Skin Enterprises, Inc. Class A (d) | 8,193 | | 303,551 |
Common Stocks - continued |
| Shares | | Value |
CONSUMER STAPLES - continued |
Personal Products - continued |
Nutraceutical International Corp. | 964 | | $ 15,945 |
USANA Health Sciences, Inc. (a)(d) | 2,729 | | 89,866 |
| | 807,370 |
TOTAL CONSUMER STAPLES | | 3,620,857 |
ENERGY - 5.7% |
Energy Equipment & Services - 2.9% |
Basic Energy Services, Inc. (a) | 10,447 | | 119,200 |
Bristow Group, Inc. | 9,582 | | 514,170 |
Exterran Holdings, Inc. (a) | 3,757 | | 82,353 |
Geospace Technologies Corp. (a) | 5,615 | | 499,005 |
Gulf Island Fabrication, Inc. | 3,660 | | 87,950 |
Helix Energy Solutions Group, Inc. (a) | 28,542 | | 589,107 |
Hercules Offshore, Inc. (a) | 51,015 | | 315,273 |
Hornbeck Offshore Services, Inc. (a) | 2,870 | | 98,556 |
Matrix Service Co. (a) | 4,499 | | 51,739 |
Natural Gas Services Group, Inc. (a) | 595 | | 9,770 |
Parker Drilling Co. (a) | 14,696 | | 67,602 |
RigNet, Inc. (a) | 5,339 | | 109,076 |
| | 2,543,801 |
Oil, Gas & Consumable Fuels - 2.8% |
Adams Resources & Energy, Inc. | 570 | | 19,990 |
Alon USA Energy, Inc. | 28,328 | | 512,454 |
Cloud Peak Energy, Inc. (a) | 12,139 | | 234,647 |
CVR Energy, Inc. (a) | 7,266 | | 354,508 |
Delek US Holdings, Inc. | 15,085 | | 381,952 |
DHT Holdings, Inc. | 7,789 | | 31,935 |
Rex American Resources Corp. (a) | 7,464 | | 143,981 |
VAALCO Energy, Inc. (a) | 29,276 | | 253,237 |
Warren Resources, Inc. (a) | 5,656 | | 15,893 |
Western Refining, Inc. | 18,059 | | 509,083 |
| | 2,457,680 |
TOTAL ENERGY | | 5,001,481 |
FINANCIALS - 23.0% |
Capital Markets - 1.7% |
American Capital Ltd. (a) | 30,484 | | 365,808 |
Apollo Investment Corp. | 59,084 | | 493,942 |
Calamos Asset Management, Inc. Class A | 4,297 | | 45,419 |
FBR Capital Markets Corp. (a) | 6,418 | | 24,838 |
MCG Capital Corp. | 10,940 | | 50,324 |
Medallion Financial Corp. | 1,963 | | 23,046 |
NGP Capital Resources Co. | 613 | | 4,426 |
TCP Capital Corp. | 22,686 | | 334,392 |
TICC Capital Corp. | 13,626 | | 137,895 |
| | 1,480,090 |
|
| Shares | | Value |
Commercial Banks - 4.7% |
1st Source Corp. | 932 | | $ 20,588 |
Alliance Financial Corp. | 1,164 | | 50,646 |
American National Bankshares, Inc. | 431 | | 8,702 |
Banco Latinoamericano de Exporaciones SA (BLADEX) Series E | 16,690 | | 359,836 |
BancorpSouth, Inc. | 8,693 | | 126,396 |
Bank of Marin Bancorp | 1,363 | | 51,058 |
Banner Bank | 12,918 | | 396,970 |
BBCN Bancorp, Inc. | 694 | | 8,030 |
Central Pacific Financial Corp. (a) | 16,234 | | 253,088 |
Citizens & Northern Corp. | 2,694 | | 50,917 |
Eagle Bancorp, Inc., Maryland (a) | 4,119 | | 82,256 |
First Bancorp, Puerto Rico (a) | 41,281 | | 189,067 |
First Community Bancshares, Inc. | 3,479 | | 55,560 |
First Interstate Bancsystem, Inc. | 1,192 | | 18,393 |
First Merchants Corp. | 16,688 | | 247,650 |
Hanmi Financial Corp. (a) | 32,376 | | 439,990 |
MainSource Financial Group, Inc. | 2,101 | | 26,620 |
MB Financial, Inc. | 9,732 | | 192,207 |
Mercantile Bank Corp. | 1,066 | | 17,589 |
Merchants Bancshares, Inc. | 8,583 | | 229,767 |
Pacific Continental Corp. | 1,091 | | 10,615 |
PacWest Bancorp | 7,695 | | 190,682 |
Peoples Bancorp, Inc. | 2,413 | | 49,298 |
PrivateBancorp, Inc. | 11,949 | | 183,059 |
Republic Bancorp, Inc., Kentucky Class A | 2,456 | | 51,895 |
State Bank Financial Corp. | 2,051 | | 32,570 |
StellarOne Corp. | 1,429 | | 20,206 |
Sterling Financial Corp. | 5,776 | | 120,603 |
Susquehanna Bancshares, Inc. | 4,538 | | 47,558 |
Union/First Market Bankshares Corp. | 2,532 | | 39,930 |
Washington Trust Bancorp, Inc. | 4,402 | | 115,817 |
WesBanco, Inc. | 3,589 | | 79,748 |
Wilshire Bancorp, Inc. (a) | 57,579 | | 337,989 |
| | 4,105,300 |
Consumer Finance - 0.7% |
Cash America International, Inc. | 1,119 | | 44,391 |
Green Dot Corp. Class A (a)(d) | 6,850 | | 83,570 |
Nelnet, Inc. Class A | 17,312 | | 515,724 |
| | 643,685 |
Diversified Financial Services - 0.8% |
MarketAxess Holdings, Inc. | 8,747 | | 308,769 |
Marlin Business Services Corp. | 11,926 | | 239,236 |
MicroFinancial, Inc. | 1,402 | | 10,207 |
PHH Corp. (a) | 6,936 | | 157,794 |
Vector Capital Corp. rights (a) | 5,673 | | 0 |
| | 716,006 |
Insurance - 3.7% |
Argo Group International Holdings, Ltd. | 10,357 | | 347,892 |
eHealth, Inc. (a) | 3,776 | | 103,764 |
Enstar Group Ltd. (a) | 1,349 | | 151,061 |
FBL Financial Group, Inc. Class A | 5,442 | | 186,171 |
Common Stocks - continued |
| Shares | | Value |
FINANCIALS - continued |
Insurance - continued |
First American Financial Corp. | 23,283 | | $ 560,887 |
Horace Mann Educators Corp. | 19,224 | | 383,711 |
Maiden Holdings Ltd. | 17,281 | | 158,812 |
Montpelier Re Holdings Ltd. | 8,678 | | 198,379 |
Platinum Underwriters Holdings Ltd. | 6,529 | | 300,334 |
Primerica, Inc. | 12,506 | | 375,305 |
ProAssurance Corp. | 8,242 | | 347,730 |
Symetra Financial Corp. | 4,118 | | 53,452 |
Universal Insurance Holdings, Inc. | 670 | | 2,935 |
| | 3,170,433 |
Real Estate Investment Trusts - 7.8% |
AG Mortgage Investment Trust, Inc. | 17,493 | | 410,736 |
American Capital Mortgage Investment Corp. | 13,400 | | 315,838 |
Anworth Mortgage Asset Corp. | 70,235 | | 405,958 |
Apollo Commercial Real Estate Finance, Inc. | 16,546 | | 268,542 |
Apollo Residential Mortgage, Inc. | 16,073 | | 324,514 |
Capstead Mortgage Corp. | 37,517 | | 430,320 |
Crexus Investment Corp. | 4,838 | | 59,266 |
Extra Space Storage, Inc. | 10,498 | | 382,022 |
Gyrodyne Co. of America, Inc. | 384 | | 27,671 |
LTC Properties, Inc. | 3,443 | | 121,159 |
MFA Financial, Inc. | 14,940 | | 121,163 |
National Health Investors, Inc. | 17 | | 961 |
NorthStar Realty Finance Corp. | 47,896 | | 337,188 |
PennyMac Mortgage Investment Trust | 19,317 | | 488,527 |
Potlatch Corp. | 9,232 | | 361,802 |
PS Business Parks, Inc. | 5,350 | | 347,643 |
Resource Capital Corp. | 27,337 | | 153,087 |
RLJ Lodging Trust | 23,912 | | 463,175 |
Ryman Hospitality Properties, Inc. | 11,817 | | 454,482 |
Select Income (REIT) | 3,204 | | 79,363 |
Sovran Self Storage, Inc. | 5,127 | | 318,387 |
Stag Industrial, Inc. | 3,769 | | 67,729 |
Starwood Property Trust, Inc. | 20,321 | | 466,570 |
Western Asset Mortgage Capital Corp. | 19,453 | | 384,586 |
| | 6,790,689 |
Thrifts & Mortgage Finance - 3.6% |
Dime Community Bancshares, Inc. | 28,163 | | 391,184 |
Doral Financial Corp. (a)(d) | 138,558 | | 100,330 |
EverBank Financial Corp. | 15,828 | | 235,995 |
Farmer Mac Class C (non-vtg.) | 2,755 | | 89,538 |
First Financial Holdings, Inc. | 1,815 | | 23,740 |
Flagstar Bancorp, Inc. (a) | 20,902 | | 405,499 |
Flushing Financial Corp. | 7,546 | | 115,756 |
Fox Chase Bancorp, Inc. | 2,732 | | 45,488 |
HomeStreet, Inc. | 16,087 | | 411,023 |
NASB Financial, Inc. (a) | 130 | | 2,778 |
Ocwen Financial Corp. (a) | 18,429 | | 637,449 |
Oritani Financial Corp. | 3,491 | | 53,482 |
|
| Shares | | Value |
Provident Financial Holdings, Inc. | 1,808 | | $ 31,640 |
Rockville Financial, Inc. | 3,166 | | 40,841 |
Simplicity Bancorp, Inc. | 2,935 | | 43,878 |
ViewPoint Financial Group | 3,793 | | 79,425 |
WSFS Financial Corp. | 9,062 | | 382,870 |
| | 3,090,916 |
TOTAL FINANCIALS | | 19,997,119 |
HEALTH CARE - 9.9% |
Biotechnology - 0.9% |
Alkermes PLC (a) | 3,911 | | 72,432 |
Allos Therapeutics, Inc. rights | 5,550 | | 0 |
Arena Pharmaceuticals, Inc. (a) | 2,073 | | 18,698 |
Cepheid, Inc. (a) | 986 | | 33,337 |
Cubist Pharmaceuticals, Inc. (a) | 6,615 | | 278,227 |
Emergent BioSolutions, Inc. (a) | 8,609 | | 138,088 |
Geron Corp. (a) | 17,029 | | 24,011 |
Maxygen, Inc. | 7,858 | | 19,331 |
Pharmacyclics, Inc. (a) | 2,201 | | 127,438 |
Seattle Genetics, Inc. (a) | 1,543 | | 35,798 |
| | 747,360 |
Health Care Equipment & Supplies - 2.6% |
Analogic Corp. | 1,294 | | 96,144 |
CONMED Corp. | 3,776 | | 105,539 |
Cyberonics, Inc. (a) | 4,311 | | 226,457 |
Greatbatch, Inc. (a) | 7,797 | | 181,202 |
Integra LifeSciences Holdings Corp. (a) | 1,048 | | 40,841 |
Invacare Corp. | 11,443 | | 186,521 |
Natus Medical, Inc. (a) | 3,026 | | 33,831 |
RTI Biologics, Inc. (a) | 45,356 | | 193,670 |
Sirona Dental Systems, Inc. (a) | 5,795 | | 373,546 |
SurModics, Inc. (a) | 7,111 | | 159,002 |
Thoratec Corp. (a) | 5,998 | | 225,045 |
Vascular Solutions, Inc. (a) | 3,588 | | 56,690 |
West Pharmaceutical Services, Inc. | 3,234 | | 177,062 |
Young Innovations, Inc. | 5,665 | | 223,258 |
| | 2,278,808 |
Health Care Providers & Services - 5.6% |
Alliance Healthcare Services, Inc. (a) | 49,883 | | 318,254 |
Amedisys, Inc. (a) | 11,043 | | 124,455 |
AMN Healthcare Services, Inc. (a) | 6,178 | | 71,356 |
AmSurg Corp. (a) | 5,946 | | 178,439 |
Centene Corp. (a) | 12,449 | | 510,409 |
Corvel Corp. (a) | 980 | | 43,933 |
Five Star Quality Care, Inc. (a) | 45,405 | | 227,479 |
Gentiva Health Services, Inc. (a) | 13,122 | | 131,876 |
Hanger, Inc. (a) | 12,315 | | 336,938 |
Magellan Health Services, Inc. (a) | 9,174 | | 449,526 |
Molina Healthcare, Inc. (a) | 13,096 | | 354,378 |
National Healthcare Corp. | 4,455 | | 209,474 |
PharMerica Corp. (a) | 1,922 | | 27,369 |
Providence Service Corp. (a) | 11,460 | | 194,705 |
Common Stocks - continued |
| Shares | | Value |
HEALTH CARE - continued |
Health Care Providers & Services - continued |
Select Medical Holdings Corp. | 40,356 | | $ 380,557 |
Skilled Healthcare Group, Inc. (a) | 179 | | 1,140 |
Team Health Holdings, Inc. (a) | 15,272 | | 439,375 |
Triple-S Management Corp. (a) | 1,247 | | 23,032 |
Universal American Spin Corp. | 19,035 | | 163,511 |
Vanguard Health Systems, Inc. (a) | 30,983 | | 379,542 |
Wellcare Health Plans, Inc. (a) | 6,898 | | 335,864 |
| | 4,901,612 |
Health Care Technology - 0.6% |
Computer Programs & Systems, Inc. | 849 | | 42,739 |
Omnicell, Inc. (a) | 28,076 | | 417,490 |
Vocera Communications, Inc. | 1,288 | | 32,329 |
| | 492,558 |
Life Sciences Tools & Services - 0.1% |
PAREXEL International Corp. (a) | 3,492 | | 103,328 |
Pharmaceuticals - 0.1% |
Jazz Pharmaceuticals PLC (a) | 509 | | 27,079 |
Pozen, Inc. (a) | 18,985 | | 95,115 |
| | 122,194 |
TOTAL HEALTH CARE | | 8,645,860 |
INDUSTRIALS - 16.8% |
Aerospace & Defense - 3.4% |
AAR Corp. | 24,357 | | 454,989 |
American Science & Engineering, Inc. | 6,238 | | 406,780 |
Cubic Corp. | 8,216 | | 394,122 |
Curtiss-Wright Corp. | 14,662 | | 481,353 |
Esterline Technologies Corp. (a) | 5,291 | | 336,561 |
LMI Aerospace, Inc. (a) | 2,257 | | 43,650 |
Moog, Inc. Class A (a) | 5,812 | | 238,466 |
Taser International, Inc. (a) | 45,758 | | 409,077 |
Teledyne Technologies, Inc. (a) | 2,456 | | 159,812 |
| | 2,924,810 |
Air Freight & Logistics - 0.0% |
Park-Ohio Holdings Corp. (a) | 1,301 | | 27,724 |
Airlines - 1.2% |
Alaska Air Group, Inc. (a) | 13,581 | | 585,205 |
SkyWest, Inc. | 35,247 | | 439,178 |
Spirit Airlines, Inc. (a) | 130 | | 2,304 |
| | 1,026,687 |
Building Products - 1.3% |
A.O. Smith Corp. | 8,738 | | 551,106 |
American Woodmark Corp. (a) | 2,594 | | 72,165 |
Apogee Enterprises, Inc. | 19,919 | | 477,458 |
Gibraltar Industries, Inc. (a) | 2,745 | | 43,700 |
Nortek, Inc. (a) | 8 | | 530 |
Trex Co., Inc. (a) | 118 | | 4,393 |
| | 1,149,352 |
|
| Shares | | Value |
Commercial Services & Supplies - 2.7% |
Consolidated Graphics, Inc. (a) | 3,380 | | $ 118,030 |
Courier Corp. | 700 | | 7,700 |
G&K Services, Inc. Class A | 12,307 | | 420,284 |
Intersections, Inc. (d) | 17,011 | | 161,264 |
Kimball International, Inc. Class B | 22,364 | | 259,646 |
Performant Financial Corp. | 6,537 | | 66,024 |
Steelcase, Inc. Class A | 16,974 | | 216,249 |
Sykes Enterprises, Inc. (a) | 1,645 | | 25,037 |
The Brink's Co. | 16,312 | | 465,381 |
The Geo Group, Inc. | 4,841 | | 136,516 |
Unifirst Corp. Massachusetts | 6,146 | | 450,625 |
Viad Corp. | 1,691 | | 45,928 |
| | 2,372,684 |
Construction & Engineering - 2.1% |
Argan, Inc. | 20,832 | | 374,976 |
Dycom Industries, Inc. (a) | 9,386 | | 185,843 |
EMCOR Group, Inc. | 15,681 | | 542,719 |
Granite Construction, Inc. | 13,463 | | 452,626 |
MasTec, Inc. (a) | 5,261 | | 131,157 |
Primoris Services Corp. | 3,374 | | 50,745 |
Sterling Construction Co., Inc. (a) | 1,880 | | 18,687 |
Tutor Perini Corp. (a) | 5,673 | | 77,720 |
| | 1,834,473 |
Electrical Equipment - 0.0% |
Belden, Inc. | 850 | | 38,242 |
Brady Corp. Class A | 180 | | 6,012 |
| | 44,254 |
Industrial Conglomerates - 0.1% |
Standex International Corp. | 2,024 | | 103,811 |
Machinery - 2.7% |
Actuant Corp. Class A | 3,723 | | 103,909 |
Alamo Group, Inc. | 760 | | 24,806 |
Ampco-Pittsburgh Corp. | 375 | | 7,493 |
Cascade Corp. | 34 | | 2,186 |
CLARCOR, Inc. | 1,970 | | 94,127 |
Hurco Companies, Inc. (a) | 1,431 | | 32,913 |
Hyster-Yale Materials Handling Class A | 11,173 | | 545,242 |
Kadant, Inc. (a) | 12,021 | | 318,677 |
Kaydon Corp. | 2,872 | | 68,727 |
L.B. Foster Co. Class A | 2,213 | | 96,133 |
Lindsay Corp. | 584 | | 46,790 |
Lydall, Inc. (a) | 1,302 | | 18,671 |
Mueller Industries, Inc. | 9,412 | | 470,882 |
Nordson Corp. | 30 | | 1,894 |
RBC Bearings, Inc. (a) | 1,625 | | 81,364 |
Tennant Co. | 3,023 | | 132,861 |
Watts Water Technologies, Inc. Class A | 6,752 | | 290,268 |
| | 2,336,943 |
Professional Services - 1.1% |
Barrett Business Services, Inc. | 6,923 | | 263,697 |
CDI Corp. | 482 | | 8,257 |
Common Stocks - continued |
| Shares | | Value |
INDUSTRIALS - continued |
Professional Services - continued |
GP Strategies Corp. (a) | 870 | | $ 17,966 |
Insperity, Inc. | 9,127 | | 297,175 |
Kelly Services, Inc. Class A (non-vtg.) | 9,846 | | 154,976 |
Korn/Ferry International (a) | 3,805 | | 60,347 |
Resources Connection, Inc. | 10,058 | | 120,093 |
| | 922,511 |
Road & Rail - 0.8% |
AMERCO | 1,048 | | 132,897 |
Celadon Group, Inc. | 6,453 | | 116,606 |
Saia, Inc. (a) | 4,725 | | 109,242 |
Swift Transporation Co. (a) | 21,522 | | 196,281 |
Universal Truckload Services, Inc. | 2,766 | | 50,480 |
Werner Enterprises, Inc. | 3,760 | | 81,479 |
| | 686,985 |
Trading Companies & Distributors - 1.4% |
Aceto Corp. | 4,889 | | 49,086 |
Aircastle Ltd. | 34,956 | | 438,348 |
Applied Industrial Technologies, Inc. | 10,131 | | 425,603 |
DXP Enterprises, Inc. (a) | 2,478 | | 121,595 |
H&E Equipment Services, Inc. | 11,767 | | 177,329 |
| | 1,211,961 |
TOTAL INDUSTRIALS | | 14,642,195 |
INFORMATION TECHNOLOGY - 16.1% |
Communications Equipment - 3.2% |
Anaren, Inc. (a) | 11,892 | | 231,299 |
Arris Group, Inc. (a) | 34,463 | | 514,877 |
Black Box Corp. | 15,770 | | 383,842 |
Ciena Corp. (a) | 17,523 | | 275,111 |
Communications Systems, Inc. | 3,936 | | 40,934 |
Comtech Telecommunications Corp. | 11,333 | | 287,632 |
Emulex Corp. (a) | 25,848 | | 188,690 |
Harmonic, Inc. (a) | 11,891 | | 60,287 |
Loral Space & Communications Ltd. | 7,287 | | 398,307 |
Plantronics, Inc. | 4,796 | | 176,829 |
Tessco Technologies, Inc. (d) | 9,551 | | 211,459 |
| | 2,769,267 |
Computers & Peripherals - 0.4% |
Electronics for Imaging, Inc. (a) | 5,968 | | 113,332 |
QLogic Corp. (a) | 22,677 | | 220,647 |
| | 333,979 |
Electronic Equipment & Components - 1.7% |
Anixter International, Inc. | 7,822 | | 500,452 |
Benchmark Electronics, Inc. (a) | 15,348 | | 255,084 |
Electro Scientific Industries, Inc. | 26,811 | | 266,769 |
Newport Corp. (a) | 6,621 | | 89,052 |
OSI Systems, Inc. (a) | 53 | | 3,394 |
PC Connection, Inc. | 1,300 | | 14,950 |
Pulse Electronics Corp. (a) | 22 | | 7 |
|
| Shares | | Value |
SYNNEX Corp. (a) | 11,269 | | $ 387,428 |
Vishay Precision Group, Inc. (a) | 1,427 | | 18,865 |
| | 1,536,001 |
Internet Software & Services - 0.1% |
XO Group, Inc. (a) | 9,130 | | 84,909 |
IT Services - 3.1% |
Acxiom Corp. (a) | 25,813 | | 450,695 |
CACI International, Inc. Class A (a) | 8,367 | | 460,436 |
Convergys Corp. | 17,138 | | 281,235 |
CSG Systems International, Inc. (a) | 2,965 | | 53,904 |
Global Cash Access Holdings, Inc. (a) | 46,885 | | 367,578 |
Hackett Group, Inc. | 1,277 | | 5,466 |
Heartland Payment Systems, Inc. | 3,990 | | 117,705 |
Jack Henry & Associates, Inc. | 9,618 | | 377,603 |
Maximus, Inc. | 1,736 | | 109,750 |
NCI, Inc. Class A (a) | 5,927 | | 27,798 |
Teletech Holdings, Inc. (a) | 17,427 | | 310,201 |
TNS, Inc. (a) | 6,274 | | 130,060 |
| | 2,692,431 |
Semiconductors & Semiconductor Equipment - 3.4% |
Advanced Energy Industries, Inc. (a) | 735 | | 10,150 |
Cabot Microelectronics Corp. | 1,836 | | 65,196 |
Cirrus Logic, Inc. (a) | 18,371 | | 532,208 |
First Solar, Inc. (a)(d) | 16,694 | | 515,511 |
Hittite Microwave Corp. (a) | 962 | | 59,740 |
International Rectifier Corp. (a) | 371 | | 6,578 |
Intersil Corp. Class A | 11,513 | | 95,443 |
Kulicke & Soffa Industries, Inc. (a) | 32,719 | | 392,301 |
MEMC Electronic Materials, Inc. (a) | 11,149 | | 35,788 |
Microsemi Corp. (a) | 1,240 | | 26,090 |
MIPS Technologies, Inc. (a) | 433 | | 3,386 |
Omnivision Technologies, Inc. (a) | 20,900 | | 294,272 |
RF Micro Devices, Inc. (a) | 105,737 | | 473,702 |
Semtech Corp. (a) | 7,219 | | 208,990 |
Tessera Technologies, Inc. | 7,334 | | 120,424 |
Veeco Instruments, Inc. (a) | 3,180 | | 93,874 |
| | 2,933,653 |
Software - 4.2% |
Actuate Corp. (a) | 13,694 | | 76,686 |
Aspen Technology, Inc. (a) | 13,397 | | 370,293 |
AVG Technologies NV | 8,456 | | 133,858 |
CommVault Systems, Inc. (a) | 8,639 | | 602,225 |
Comverse, Inc. | 849 | | 24,222 |
Fair Isaac Corp. | 6,174 | | 259,493 |
Guidewire Software, Inc. | 985 | | 29,274 |
Infoblox, Inc. | 1,419 | | 25,499 |
Manhattan Associates, Inc. (a) | 7,016 | | 423,345 |
Monotype Imaging Holdings, Inc. | 22,398 | | 357,920 |
NetScout Systems, Inc. (a) | 14,934 | | 388,135 |
Progress Software Corp. (a) | 21,850 | | 458,632 |
QAD, Inc.: | | | |
Class A | 3,081 | | 44,366 |
Common Stocks - continued |
| Shares | | Value |
INFORMATION TECHNOLOGY - continued |
Software - continued |
QAD, Inc.: - continued | | | |
Class B | 2,116 | | $ 27,445 |
TeleCommunication Systems, Inc.
Class A (a) | 96,295 | | 237,849 |
TeleNav, Inc. (a) | 31,138 | | 248,481 |
TIBCO Software, Inc. (a) | 49 | | 1,078 |
| | 3,708,801 |
TOTAL INFORMATION TECHNOLOGY | | 14,059,041 |
MATERIALS - 5.7% |
Chemicals - 1.4% |
FutureFuel Corp. | 17,312 | | 204,974 |
Georgia Gulf Corp. (d) | 11,079 | | 457,341 |
Innospec, Inc. | 6,373 | | 219,805 |
LSB Industries, Inc. (a) | 3,211 | | 113,734 |
Minerals Technologies, Inc. | 5,185 | | 206,985 |
Sensient Technologies Corp. | 116 | | 4,125 |
| | 1,206,964 |
Construction Materials - 1.2% |
Eagle Materials, Inc. | 10,622 | | 621,387 |
Headwaters, Inc. (a) | 47,302 | | 404,905 |
| | 1,026,292 |
Containers & Packaging - 1.8% |
AEP Industries, Inc. (a) | 5,688 | | 336,900 |
Boise, Inc. | 46,198 | | 367,274 |
Graphic Packaging Holding Co. (a) | 68,641 | | 443,421 |
Myers Industries, Inc. | 26,597 | | 402,945 |
| | 1,550,540 |
Metals & Mining - 0.1% |
Metals USA Holdings Corp. | 6,196 | | 108,368 |
Paper & Forest Products - 1.2% |
Buckeye Technologies, Inc. | 5,979 | | 171,657 |
Domtar Corp. | 4,538 | | 379,014 |
Louisiana-Pacific Corp. (a) | 2,484 | | 47,991 |
Neenah Paper, Inc. | 4,015 | | 114,307 |
Schweitzer-Mauduit International, Inc. | 8,853 | | 345,533 |
| | 1,058,502 |
TOTAL MATERIALS | | 4,950,666 |
TELECOMMUNICATION SERVICES - 0.1% |
Diversified Telecommunication Services - 0.1% |
HickoryTech Corp. | 1,075 | | 10,460 |
inContact, Inc. (a) | 197 | | 1,020 |
Premiere Global Services, Inc. (a) | 3,930 | | 38,435 |
| | 49,915 |
|
| Shares | | Value |
Wireless Telecommunication Services - 0.0% |
NTELOS Holdings Corp. | 1,727 | | $ 22,641 |
TOTAL TELECOMMUNICATION SERVICES | | 72,556 |
UTILITIES - 4.5% |
Electric Utilities - 2.6% |
Cleco Corp. | 10,964 | | 438,670 |
El Paso Electric Co. | 14,600 | | 465,886 |
IDACORP, Inc. | 10,514 | | 455,782 |
PNM Resources, Inc. | 15,475 | | 317,392 |
Portland General Electric Co. | 19,185 | | 524,902 |
UNS Energy Corp. | 2,150 | | 91,203 |
| | 2,293,835 |
Gas Utilities - 0.1% |
Southwest Gas Corp. | 2,007 | | 85,117 |
Independent Power Producers & Energy Traders - 0.7% |
Black Hills Corp. | 13,437 | | 488,301 |
Genie Energy Ltd. Class B | 8,813 | | 62,572 |
Ormat Technologies, Inc. | 1,749 | | 33,721 |
| | 584,594 |
Multi-Utilities - 0.6% |
Avista Corp. | 4,868 | | 117,367 |
NorthWestern Energy Corp. | 11,166 | | 387,795 |
| | 505,162 |
Water Utilities - 0.5% |
American States Water Co. | 9,390 | | 450,532 |
TOTAL UTILITIES | | 3,919,240 |
TOTAL COMMON STOCKS (Cost $76,964,186) |
84,751,250
|
Money Market Funds - 4.1% |
| | | |
Fidelity Cash Central Fund, 0.18% (b) | 1,755,778 | | 1,755,778 |
Fidelity Securities Lending Cash Central Fund, 0.18% (b)(c) | 1,847,950 | | 1,847,950 |
TOTAL MONEY MARKET FUNDS (Cost $3,603,728) |
3,603,728
|
TOTAL INVESTMENT PORTFOLIO - 101.4% (Cost $80,567,914) | | 88,354,978 |
NET OTHER ASSETS (LIABILITIES) - (1.4)% | | (1,227,878) |
NET ASSETS - 100% | $ 87,127,100 |
Futures Contracts |
| Expiration
Date | | Underlying
Face Amount
at Value | | Unrealized
Appreciation/
(Depreciation) |
Purchased |
Equity Index Contracts |
24 NYFE Russell 2000 Mini Index Contracts | March 2013 | | $ 2,031,840 | | $ 39,675 |
|
The face value of futures purchased as a percentage of net assets is 2.3% |
Legend |
(a) Non-income producing |
(b) Affiliated fund that is available only to investment companies and other accounts managed by Fidelity Investments. The rate quoted is the annualized seven-day yield of the fund at period end. A complete unaudited listing of the fund's holdings as of its most recent quarter end is available upon request. In addition, each Fidelity Central Fund's financial statements, which are not covered by the Fund's Report of Independent Registered Public Accounting Firm, are available on the SEC's website or upon request. |
(c) Investment made with cash collateral received from securities on loan. |
(d) Security or a portion of the security is on loan at period end. |
Affiliated Central Funds |
Information regarding fiscal year to date income earned by the Fund from investments in Fidelity Central Funds is as follows: |
Fund | Income earned |
Fidelity Cash Central Fund | $ 2,426 |
Fidelity Securities Lending Cash Central Fund | 34,744 |
Total | $ 37,170 |
Other Information |
The following is a summary of the inputs used, as of December 31, 2012, involving the Fund's assets and liabilities carried at fair value. The inputs or methodology used for valuing securities may not be an indication of the risk associated with investing in those securities. For more information on valuation inputs, and their aggregation into the levels used in the table below, please refer to the Investment Valuation section in the accompanying Notes to Financial Statements. |
Valuation Inputs at Reporting Date: |
Description | Total | Level 1 | Level 2 | Level 3 |
Investments in Securities: | | | | |
Equities: | | | | |
Consumer Discretionary | $ 9,842,235 | $ 9,842,235 | $ - | $ - |
Consumer Staples | 3,620,857 | 3,620,857 | - | - |
Energy | 5,001,481 | 5,001,481 | - | - |
Financials | 19,997,119 | 19,997,119 | - | - |
Health Care | 8,645,860 | 8,645,860 | - | - |
Industrials | 14,642,195 | 14,642,195 | - | - |
Information Technology | 14,059,041 | 14,059,041 | - | - |
Materials | 4,950,666 | 4,950,666 | - | - |
Telecommunication Services | 72,556 | 72,556 | - | - |
Utilities | 3,919,240 | 3,919,240 | - | - |
Money Market Funds | 3,603,728 | 3,603,728 | - | - |
Total Investments in Securities: | $ 88,354,978 | $ 88,354,978 | $ - | $ - |
Derivative Instruments: | | | | |
Assets | | | | |
Futures Contracts | $ 39,675 | $ 39,675 | $ - | $ - |
Value of Derivative Instruments |
The following table is a summary of the Fund's value of derivative instruments by primary risk exposure as of December 31, 2012. For additional information on derivative instruments, please refer to the Derivative Instruments section in the accompanying Notes to Financial Statements. |
Primary Risk Exposure /
Derivative Type | Value |
| Asset | Liability |
Equity Risk | | |
Futures Contracts (a) | $ 39,675 | $ - |
Total Value of Derivatives | $ 39,675 | $ - |
(a) Reflects cumulative appreciation/(depreciation) on futures contracts as disclosed on the Schedule of Investments. Only the period end variation margin is separately disclosed on the Statement of Assets and Liabilities. |
See accompanying notes which are an integral part of the financial statements.
Annual Report
Statement of Assets and Liabilities
| December 31, 2012 |
| | |
Assets | | |
Investment in securities, at value (including securities loaned of $1,853,177) - See accompanying schedule: Unaffiliated issuers (cost $76,964,186) | $ 84,751,250 | |
Fidelity Central Funds (cost $3,603,728) | 3,603,728 | |
Total Investments (cost $80,567,914) | | $ 88,354,978 |
Segregated cash with broker for futures contracts | | 96,100 |
Cash | | 5,685 |
Receivable for investments sold | | 111,915 |
Receivable for fund shares sold | | 315,247 |
Dividends receivable | | 153,951 |
Distributions receivable from Fidelity Central Funds | | 3,615 |
Receivable for daily variation margin on futures contracts | | 52,560 |
Prepaid expenses | | 228 |
Total assets | | 89,094,279 |
| | |
Liabilities | | |
Payable for fund shares redeemed | $ 16,112 | |
Accrued management fee | 49,797 | |
Distribution and service plan fees payable | 365 | |
Other affiliated payables | 13,378 | |
Other payables and accrued expenses | 39,577 | |
Collateral on securities loaned, at value | 1,847,950 | |
Total liabilities | | 1,967,179 |
| | |
Net Assets | | $ 87,127,100 |
Net Assets consist of: | | |
Paid in capital | | $ 78,603,579 |
Distributions in excess of net investment income | | (138,807) |
Accumulated undistributed net realized gain (loss) on investments | | 835,589 |
Net unrealized appreciation (depreciation) on investments | | 7,826,739 |
Net Assets | | $ 87,127,100 |
Statement of Assets and Liabilities - continued
| December 31, 2012 |
| | |
Initial Class:
Net Asset Value, offering price and redemption price per share ($20,182,729 ÷ 1,677,284 shares) | | $ 12.03 |
| | |
Service Class:
Net Asset Value, offering price and redemption price per share ($279,006 ÷ 23,134 shares) | | $ 12.06 |
| | |
Service Class 2:
Net Asset Value, offering price and redemption price per share ($1,623,625 ÷ 134,492 shares) | | $ 12.07 |
| | |
Investor Class:
Net Asset Value, offering price and redemption price per share ($65,041,740 ÷ 5,417,734 shares) | | $ 12.01 |
See accompanying notes which are an integral part of the financial statements.
Annual Report
Statement of Operations
| Year ended December 31, 2012 |
| | |
Investment Income | | |
Dividends | | $ 2,225,762 |
Interest | | 333 |
Income from Fidelity Central Funds | | 37,170 |
Total income | | 2,263,265 |
| | |
Expenses | | |
Management fee | $ 591,192 | |
Transfer agent fees | 117,862 | |
Distribution and service plan fees | 5,977 | |
Accounting and security lending fees | 32,846 | |
Custodian fees and expenses | 12,171 | |
Independent trustees' compensation | 549 | |
Audit | 48,950 | |
Legal | 364 | |
Miscellaneous | 783 | |
Total expenses | | 810,694 |
Net investment income (loss) | | 1,452,571 |
Realized and Unrealized Gain (Loss) Net realized gain (loss) on: | | |
Investment securities: | | |
Unaffiliated issuers | 5,402,483 | |
Futures contracts | 224,780 | |
Total net realized gain (loss) | | 5,627,263 |
Change in net unrealized appreciation (depreciation) on: Investment securities | 6,737,417 | |
Futures contracts | 23,505 | |
Total change in net unrealized appreciation (depreciation) | | 6,760,922 |
Net gain (loss) | | 12,388,185 |
Net increase (decrease) in net assets resulting from operations | | $ 13,840,756 |
Statement of Changes in Net Assets
| Year ended
December 31,
2012 | Year ended
December 31,
2011 |
Increase (Decrease) in Net Assets | | |
Operations | | |
Net investment income (loss) | $ 1,452,571 | $ 328,759 |
Net realized gain (loss) | 5,627,263 | 8,584,115 |
Change in net unrealized appreciation (depreciation) | 6,760,922 | (11,127,389) |
Net increase (decrease) in net assets resulting from operations | 13,840,756 | (2,214,515) |
Distributions to shareholders from net investment income | (1,580,687) | (345,088) |
Distributions to shareholders from net realized gain | (4,740,566) | - |
Total distributions | (6,321,253) | (345,088) |
Share transactions - net increase (decrease) | 3,708,990 | 6,046,479 |
Total increase (decrease) in net assets | 11,228,493 | 3,486,876 |
| | |
Net Assets | | |
Beginning of period | 75,898,607 | 72,411,731 |
End of period (including distributions in excess of net investment income of $138,807 and distributions in excess of net investment income of $7,973, respectively) | $ 87,127,100 | $ 75,898,607 |
See accompanying notes which are an integral part of the financial statements.
Annual Report
Financial Highlights - Initial Class
Years ended December 31, | 2012 | 2011 | 2010 | 2009 | 2008 |
Selected Per-Share Data | | | | | |
Net asset value, beginning of period | $ 10.94 | $ 11.15 | $ 8.91 | $ 7.32 | $ 11.17 |
Income from Investment Operations | | | | | |
Net investment income (loss) C | .22 | .05 | .04 | .04 | .07 |
Net realized and unrealized gain (loss) | 1.83 | (.20) | 2.24 | 1.59 | (3.84) |
Total from investment operations | 2.05 | (.15) | 2.28 | 1.63 | (3.77) |
Distributions from net investment income | (.25) | (.06) | (.04) | (.04) | (.08) |
Distributions from net realized gain | (.71) | - | - | - | - |
Total distributions | (.96) | (.06) | (.04) | (.04) | (.08) |
Net asset value, end of period | $ 12.03 | $ 10.94 | $ 11.15 | $ 8.91 | $ 7.32 |
Total Return A, B | 19.00% | (1.36)% | 25.54% | 22.28% | (33.72)% |
Ratios to Average Net Assets D, F | | | | | |
Expenses before reductions | .91% | .91% | .95% | 1.05% | 1.04% |
Expenses net of fee waivers, if any | .91% | .91% | .94% | 1.00% | 1.00% |
Expenses net of all reductions | .91% | .91% | .94% | 1.00% | 1.00% |
Net investment income (loss) | 1.80% | .47% | .41% | .56% | .71% |
Supplemental Data | | | | | |
Net assets, end of period (000 omitted) | $ 20,183 | $ 19,809 | $ 19,742 | $ 13,864 | $ 8,381 |
Portfolio turnover rate E | 99% | 90% | 71% | 81% | 87% |
A Total returns do not reflect charges attributable to your insurance company's separate account. Inclusion of these charges would reduce the total returns shown.
B Total returns would have been lower if certain expenses had not been reduced during the applicable periods shown.
C Calculated based on average shares outstanding during the period.
D Fees and expenses of any underlying Fidelity Central Funds are not included in the Fund's expense ratio. The Fund indirectly bears its proportionate share of the expenses of any underlying Fidelity Central Funds.
E Amount does not include the portfolio activity of any underlying Fidelity Central Funds.
F Expense ratios reflect operating expenses of the class. Expenses before reductions do not reflect amounts reimbursed by the investment adviser or reductions from expense offset arrangements and do not represent the amount paid by the class during periods when reimbursements or reductions occur. Expenses net of fee waivers reflect expenses after reimbursement by the investment adviser but prior to reductions from expense offset arrangements. Expenses net of all reductions represent the net expenses paid by the class.
Financial Highlights - Service Class
Years ended December 31, | 2012 | 2011 | 2010 | 2009 | 2008 |
Selected Per-Share Data | | | | | |
Net asset value, beginning of period | $ 10.96 | $ 11.16 | $ 8.92 | $ 7.33 | $ 11.17 |
Income from Investment Operations | | | | | |
Net investment income (loss) C | .21 | .04 | .03 | .03 | .06 |
Net realized and unrealized gain (loss) | 1.84 | (.20) | 2.23 | 1.58 | (3.84) |
Total from investment operations | 2.05 | (.16) | 2.26 | 1.61 | (3.78) |
Distributions from net investment income | (.24) | (.04) | (.02) | (.02) | (.06) |
Distributions from net realized gain | (.71) | - | - | - | - |
Total distributions | (.95) | (.04) | (.02) | (.02) | (.06) |
Net asset value, end of period | $ 12.06 | $ 10.96 | $ 11.16 | $ 8.92 | $ 7.33 |
Total Return A, B | 18.97% | (1.41)% | 25.35% | 22.03% | (33.79)% |
Ratios to Average Net Assets D, F | | | | | |
Expenses before reductions | .99% | 1.01% | 1.04% | 1.10% | 1.10% |
Expenses net of fee waivers, if any | .99% | 1.01% | 1.04% | 1.10% | 1.10% |
Expenses net of all reductions | .99% | 1.01% | 1.04% | 1.10% | 1.10% |
Net investment income (loss) | 1.72% | .38% | .32% | .46% | .61% |
Supplemental Data | | | | | |
Net assets, end of period (000 omitted) | $ 279 | $ 235 | $ 327 | $ 426 | $ 631 |
Portfolio turnover rate E | 99% | 90% | 71% | 81% | 87% |
A Total returns do not reflect charges attributable to your insurance company's separate account. Inclusion of these charges would reduce the total returns shown.
B Total returns would have been lower if certain expenses had not been reduced during the applicable periods shown.
C Calculated based on average shares outstanding during the period.
D Fees and expenses of any underlying Fidelity Central Funds are not included in the Fund's expense ratio. The Fund indirectly bears its proportionate share of the expenses of any underlying Fidelity Central Funds.
E Amount does not include the portfolio activity of any underlying Fidelity Central Funds.
F Expense ratios reflect operating expenses of the class. Expenses before reductions do not reflect amounts reimbursed by the investment adviser or reductions from expense offset arrangements and do not represent the amount paid by the class during periods when reimbursements or reductions occur. Expenses net of fee waivers reflect expenses after reimbursement by the investment adviser but prior to reductions from expense offset arrangements. Expenses net of all reductions represent the net expenses paid by the class.
See accompanying notes which are an integral part of the financial statements.
Annual Report
Financial Highlights - Service Class 2
Years ended December 31, | 2012 | 2011 | 2010 | 2009 | 2008 |
Selected Per-Share Data | | | | | |
Net asset value, beginning of period | $ 10.96 | $ 11.15 | $ 8.92 | $ 7.33 | $ 11.15 |
Income from Investment Operations | | | | | |
Net investment income (loss) C | .18 | .02 | .01 | .02 | .04 |
Net realized and unrealized gain (loss) | 1.83 | (.20) | 2.23 | 1.59 | (3.82) |
Total from investment operations | 2.01 | (.18) | 2.24 | 1.61 | (3.78) |
Distributions from net investment income | (.19) | (.01) | (.01) | (.02) | (.04) |
Distributions from net realized gain | (.71) | - | - | - | - |
Total distributions | (.90) | (.01) | (.01) | (.02) | (.04) |
Net asset value, end of period | $ 12.07 | $ 10.96 | $ 11.15 | $ 8.92 | $ 7.33 |
Total Return A, B | 18.58% | (1.58)% | 25.07% | 21.94% | (33.91)% |
Ratios to Average Net Assets D, F | | | | | |
Expenses before reductions | 1.23% | 1.26% | 1.28% | 1.41% | 1.32% |
Expenses net of fee waivers, if any | 1.23% | 1.25% | 1.25% | 1.25% | 1.25% |
Expenses net of all reductions | 1.23% | 1.25% | 1.25% | 1.25% | 1.25% |
Net investment income (loss) | 1.48% | .14% | .11% | .31% | .46% |
Supplemental Data | | | | | |
Net assets, end of period (000 omitted) | $ 1,624 | $ 1,656 | $ 2,513 | $ 1,535 | $ 1,494 |
Portfolio turnover rate E | 99% | 90% | 71% | 81% | 87% |
A Total returns do not reflect charges attributable to your insurance company's separate account. Inclusion of these charges would reduce the total returns shown.
B Total returns would have been lower if certain expenses had not been reduced during the applicable periods shown.
C Calculated based on average shares outstanding during the period.
D Fees and expenses of any underlying Fidelity Central Funds are not included in the Fund's expense ratio. The Fund indirectly bears its proportionate share of the expenses of any underlying Fidelity Central Funds.
E Amount does not include the portfolio activity of any underlying Fidelity Central Funds.
F Expense ratios reflect operating expenses of the class. Expenses before reductions do not reflect amounts reimbursed by the investment adviser or reductions from expense offset arrangements and do not represent the amount paid by the class during periods when reimbursements or reductions occur. Expenses net of fee waivers reflect expenses after reimbursement by the investment adviser but prior to reductions from expense offset arrangements. Expenses net of all reductions represent the net expenses paid by the class.
Financial Highlights - Investor Class
Years ended December 31, | 2012 | 2011 | 2010 | 2009 | 2008 |
Selected Per-Share Data | | | | | |
Net asset value, beginning of period | $ 10.92 | $ 11.12 | $ 8.89 | $ 7.31 | $ 11.15 |
Income from Investment Operations | | | | | |
Net investment income (loss) C | .21 | .04 | .03 | .04 | .06 |
Net realized and unrealized gain (loss) | 1.83 | (.19) | 2.23 | 1.57 | (3.83) |
Total from investment operations | 2.04 | (.15) | 2.26 | 1.61 | (3.77) |
Distributions from net investment income | (.24) | (.05) | (.03) | (.03) | (.07) |
Distributions from net realized gain | (.71) | - | - | - | - |
Total distributions | (.95) | (.05) | (.03) | (.03) | (.07) |
Net asset value, end of period | $ 12.01 | $ 10.92 | $ 11.12 | $ 8.89 | $ 7.31 |
Total Return A, B | 18.96% | (1.35)% | 25.44% | 22.09% | (33.77)% |
Ratios to Average Net Assets D, F | | | | | |
Expenses before reductions | .98% | .99% | 1.02% | 1.12% | 1.10% |
Expenses net of fee waivers, if any | .98% | .98% | 1.01% | 1.08% | 1.08% |
Expenses net of all reductions | .98% | .98% | 1.01% | 1.08% | 1.08% |
Net investment income (loss) | 1.73% | .40% | .34% | .48% | .63% |
Supplemental Data | | | | | |
Net assets, end of period (000 omitted) | $ 65,042 | $ 54,198 | $ 49,830 | $ 26,426 | $ 16,331 |
Portfolio turnover rate E | 99% | 90% | 71% | 81% | 87% |
A Total returns do not reflect charges attributable to your insurance company's separate account. Inclusion of these charges would reduce the total returns shown.
B Total returns would have been lower if certain expenses had not been reduced during the applicable periods shown.
C Calculated based on average shares outstanding during the period.
D Fees and expenses of any underlying Fidelity Central Funds are not included in the Fund's expense ratio. The Fund indirectly bears its proportionate share of the expenses of any underlying Fidelity Central Funds.
E Amount does not include the portfolio activity of any underlying Fidelity Central Funds.
F Expense ratios reflect operating expenses of the class. Expenses before reductions do not reflect amounts reimbursed by the investment adviser or reductions from expense offset arrangements and do not represent the amount paid by the class during periods when reimbursements or reductions occur. Expenses net of fee waivers reflect expenses after reimbursement by the investment adviser but prior to reductions from expense offset arrangements. Expenses net of all reductions represent the net expenses paid by the class.
See accompanying notes which are an integral part of the financial statements.
Annual Report
Notes to Financial Statements
For the period ended December 31, 2012
1. Organization.
VIP Disciplined Small Cap Portfolio (the Fund) is a fund of Variable Insurance Products Fund II (the Trust) and is authorized to issue an unlimited number of shares. The Trust is registered under the Investment Company Act of 1940, as amended (the 1940 Act), as an open-end management investment company organized as a Massachusetts business trust. Shares of the Fund may only be purchased by insurance companies for the purpose of funding variable annuity or variable life insurance contracts. The Fund offers the following classes of shares: Initial Class shares, Service Class shares, Service Class 2 shares and Investor Class shares. All classes have equal rights and voting privileges, except for matters affecting a single class. Investment income, realized and unrealized capital gains and losses, the common expenses of the Fund, and certain fund-level expense reductions, if any, are allocated on a pro-rata basis to each class based on the relative net assets of each class to the total net assets of the Fund. Each class differs with respect to transfer agent and distribution and service plan fees incurred. Certain expense reductions may also differ by class.
2. Investments in Fidelity Central Funds.
The Fund invests in Fidelity Central Funds, which are open-end investment companies available only to other investment companies and accounts managed by Fidelity Management & Research Company (FMR) and its affiliates. The Fund's Schedule of Investments lists each of the Fidelity Central Funds held as of period end, as an investment of the Fund, but does not include the underlying holdings of each Fidelity Central Fund. As an Investing Fund, the Fund indirectly bears its proportionate share of the expenses of the underlying Fidelity Central Funds.
The Money Market Central Funds seek preservation of capital and current income and are managed by Fidelity Investments Money Management, Inc. (FIMM), an affiliate of FMR.
A complete unaudited list of holdings for each Fidelity Central Fund is available upon request or at the Securities and Exchange Commission (the SEC) website at www.sec.gov. In addition, the financial statements of the Fidelity Central Funds, which are not covered by the Fund's Report of Independent Registered Public Accounting Firm, are available on the SEC website or upon request.
3. Significant Accounting Policies.
The financial statements have been prepared in conformity with accounting principles generally accepted in the United States of America (GAAP), which require management to make certain estimates and assumptions at the date of the financial statements. Actual results could differ from those estimates. Subsequent events, if any, through the date that the financial statements were issued have been evaluated in the preparation of the financial statements. The following summarizes the significant accounting policies of the Fund:
Investment Valuation. Investments are valued as of 4:00 p.m. Eastern time on the last calendar day of the period. In accordance with valuation policies and procedures approved by the Board of Trustees (the Board), the Fund attempts to obtain prices from one or more third party pricing vendors or brokers to value its investments. When current market prices, quotations or rates are not readily available or reliable, investments will be fair valued in good faith by the FMR Fair Value Committee (the Committee), in accordance with procedures adopted by the Fund's Board. Factors used in determining fair value vary by investment type and may include market or investment specific events, changes in interest rates and credit quality. The frequency with which these procedures are used cannot be predicted and they may be utilized to a significant extent. The Committee oversees the Fund's valuation policies and procedures and is responsible for approving and reporting to the Board all fair value determinations.
The Fund categorizes the inputs to valuation techniques used to value its investments into a disclosure hierarchy consisting of three levels as shown below:
Level 1 - quoted prices in active markets for identical investments
Level 2 - other significant observable inputs (including quoted prices for similar investments, interest rates, prepayment speeds, etc.)
Level 3 - unobservable inputs (including the Fund's own assumptions based on the best information available)
Valuation techniques used to value the Fund's investments by major category are as follows:
Equity securities, including restricted securities, for which market quotations are readily available, are valued at the last reported sale price or official closing price as reported by a third party pricing vendor on the primary market or exchange on which they are traded and are categorized as Level 1 in the hierarchy. In the event there were no sales during the day or closing prices are not available, securities are valued at the last quoted bid price or may be valued using the last available price and are generally categorized as Level 2 in the hierarchy. For foreign equity securities, when significant market or security specific events arise, comparisons to the valuation of American Depositary Receipts (ADRs), futures contracts, Exchange-Traded Funds (ETFs) and certain indexes as well as quoted prices for similar securities are used and are categorized as Level 2 in the hierarchy. Utilizing these techniques may result in transfers between Level 1 and Level 2.
Debt securities, including restricted securities, are valued based on evaluated prices received from third party pricing vendors or from brokers who make markets in such securities. For U.S. government and government agency obligations, pricing vendors utilize matrix pricing which considers yield
Annual Report
3. Significant Accounting Policies - continued
Investment Valuation - continued
or price of bonds of comparable quality, coupon, maturity and type as well as broker-supplied prices and are generally categorized as Level 2 in the hierarchy. When independent prices are unavailable or unreliable, debt securities may be valued utilizing pricing methodologies which consider similar factors that would be used by third party pricing vendors. These are generally categorized as Level 2 in the hierarchy but may be Level 3 depending on the circumstances.
Futures contracts are valued at the settlement price established each day by the board of trade or exchange on which they are traded and are categorized as Level 1 in the hierarchy. Investments in open-end mutual funds, including the Fidelity Central Funds, are valued at their closing net asset value (NAV) each business day and are categorized as Level 1 in the hierarchy.
Changes in valuation techniques may result in transfers in or out of an assigned level within the disclosure hierarchy. The aggregate value of investments by input level, as of December 31, 2012, is included at the end of the Fund's Schedule of Investments.
Investment Transactions and Income. For financial reporting purposes, the Fund's investment holdings and NAV include trades executed through the end of the last business day of the period. The NAV per share for processing shareholder transactions is calculated as of the close of business of the New York Stock Exchange (NYSE), normally 4:00 p.m. Eastern time and includes trades executed through the end of the prior business day. Gains and losses on securities sold are determined on the basis of identified cost and may include proceeds received from litigation. Dividend income is recorded on the ex-dividend date, except for certain dividends from foreign securities where the ex-dividend date may have passed, which are recorded as soon as the Fund is informed of the ex-dividend date. Non-cash dividends included in dividend income, if any, are recorded at the fair market value of the securities received. Distributions received on securities that represent a return of capital or capital gain are recorded as a reduction of cost of investments and/or as a realized gain. The Fund estimates the components of distributions received that may be considered return of capital distributions or capital gain distributions. Interest income and distributions from the Fidelity Central Funds are accrued as earned. Interest income includes coupon interest and amortization of premium and accretion of discount on debt securities.
Expenses. Expenses directly attributable to a fund are charged to that fund. Expenses attributable to more than one fund are allocated among the respective funds on the basis of relative net assets or other appropriate methods. Expense estimates are accrued in the period to which they relate and adjustments are made when actual amounts are known.
Income Tax Information and Distributions to Shareholders. Each year, the Fund intends to qualify as a regulated investment company under Subchapter M of the Internal Revenue Code, including distributing substantially all of its taxable income and realized gains. As a result, no provision for income taxes is required. As of December 31, 2012, the Fund did not have any unrecognized tax benefits in the financial statements; nor is the Fund aware of any tax positions for which it is reasonably possible that the total amounts of unrecognized tax benefits will significantly change in the next twelve months. The Fund files a U.S. federal tax return, in addition to state and local tax returns as required. A fund's federal income tax returns are subject to examination by the Internal Revenue Service (IRS) for a period of three fiscal years after they are filed. State and local tax returns may be subject to examination for an additional fiscal year depending on the jurisdiction.
Distributions are declared and recorded on the ex-dividend date. Income dividends and capital gain distributions are declared separately for each class. Income and capital gain distributions are determined in accordance with income tax regulations, which may differ from GAAP.
Capital accounts within the financial statements are adjusted for permanent book-tax differences. These adjustments have no impact on net assets or the results of operations. Temporary book-tax differences will reverse in a subsequent period.
Book-tax differences are primarily due to futures contracts, passive foreign investment companies (PFIC), market discount, partnerships and losses deferred due to wash sales.
The federal tax cost of investment securities and unrealized appreciation (depreciation) as of period end were as follows:
Gross unrealized appreciation | $ 10,783,410 |
Gross unrealized depreciation | (3,130,803) |
Net unrealized appreciation (depreciation) on securities and other investments | $ 7,652,607 |
| |
Tax Cost | $ 80,702,371 |
The tax-based components of distributable earnings as of period end were as follows:
Undistributed long-term capital gain | $ 1,009,720 |
Net unrealized appreciation (depreciation) | $ 7,652,607 |
Annual Report
Notes to Financial Statements - continued
3. Significant Accounting Policies - continued
Income Tax Information and Distributions to Shareholders - continued
The tax character of distributions paid was as follows:
| December 31, 2012 | December 31, 2011 |
Ordinary Income | $ 1,647,059 | $ 345,088 |
Long-term Capital Gains | 4,674,194 | - |
Total | $ 6,321,253 | $ 345,088 |
New Accounting Pronouncement. In December 2011, the Financial Accounting Standards Board issued Accounting Standard Update No. 2011-11, Disclosures about Offsetting Assets and Liabilities. The update creates new disclosure requirements requiring entities to disclose both gross and net information for derivatives and other financial instruments that are either offset in the Statement of Assets and Liabilities or subject to an enforceable master netting arrangement or similar agreement. The disclosure requirements are effective for annual reporting periods beginning on or after January 1, 2013, and interim periods within those annual periods. Management is currently evaluating the impact of the update's adoption on the Fund's financial statement disclosures.
4. Derivative Instruments.
Risk Exposures and the Use of Derivative Instruments. The Fund's investment objective allows the Fund to enter into various types of derivative contracts, including futures contracts. Derivatives are investments whose value is primarily derived from underlying assets, indices or reference rates and may be transacted on an exchange or over-the-counter (OTC). Derivatives may involve a future commitment to buy or sell a specified asset based on specified terms, to exchange future cash flows at periodic intervals based on a notional principal amount, or for one party to make one or more payments upon the occurrence of specified events in exchange for periodic payments from the other party.
The Fund used derivatives to increase returns and to manage exposure to certain risks as defined below. The success of any strategy involving derivatives depends on analysis of numerous economic factors, and if the strategies for investment do not work as intended, the Fund may not achieve its objectives.
The Fund's use of derivatives increased or decreased its exposure to the following risk:
Equity Risk | Equity risk relates to the fluctuations in the value of financial instruments as a result of changes in market prices (other than those arising from interest rate risk or foreign exchange risk), whether caused by factors specific to an individual investment, its issuer, or all factors affecting all instruments traded in a market or market segment. |
The Fund is also exposed to additional risks from investing in derivatives, such as liquidity risk and counterparty credit risk. Liquidity risk is the risk that the Fund will be unable to close out the derivative in the open market in a timely manner. Counterparty credit risk is the risk that the counterparty will not be able to fulfill its obligation to the Fund. Counterparty credit risk related to exchange-traded futures contracts is mitigated by the protection provided by the exchange on which they trade.
Investing in derivatives may involve greater risks than investing in the underlying assets directly and, to varying degrees, may involve risk of loss in excess of any initial investment and collateral received and amounts recognized in the Statement of Assets and Liabilities. In addition, there may be the risk that the change in value of the derivative contract does not correspond to the change in value of the underlying instrument.
Futures Contracts. A futures contract is an agreement between two parties to buy or sell a specified underlying instrument for a fixed price at a specified future date. The Fund used futures contracts to manage its exposure to the stock market.
Upon entering into a futures contract, a fund is required to deposit either cash or securities (initial margin) with a clearing broker in an amount equal to a certain percentage of the face value of the contract. Futures contracts are marked-to-market daily and subsequent payments (variation margin) are made or received by a fund depending on the daily fluctuations in the value of the futures contracts and are recorded as unrealized appreciation or (depreciation). This receivable and/or payable, if any, is included in daily variation margin on futures contracts in the Statement of Assets and Liabilities. Realized gain or (loss) is recorded upon the expiration or closing of a futures contract.
Any open futures contracts at period end are presented in the Schedule of Investments under the caption "Futures Contracts." The underlying face amount at value reflects each contract's exposure to the underlying instrument or index at period end and is representative of activity for the period. Cash deposited to meet initial margin requirements is presented as segregated cash in the Statement of Assets and Liabilities.
During the period the Fund recognized net realized gain (loss) of $224,780 and a change in net unrealized appreciation (depreciation) of $23,505 related to its investment in futures contracts. These amounts are included in the Statement of Operations.
Annual Report
5. Purchases and Sales of Investments.
Purchases and sales of securities, other than short-term securities, aggregated $80,398,000 and $80,942,071, respectively.
6. Fees and Other Transactions with Affiliates.
Management Fee. FMR and its affiliates provide the Fund with investment management related services for which the Fund pays a monthly management fee. The management fee is the sum of an individual fund fee rate that is based on an annual rate of .45% of the Fund's average net assets and an annualized group fee rate that averaged .26% during the period. The group fee rate is based upon the average net assets of all the mutual funds advised by FMR. The group fee rate decreases as assets under management increase and increases as assets under management decrease. For the period, the total annual management fee rate was .71% of the Fund's average net assets.
Sub-Adviser. Geode Capital Management, LLC (Geode), serves as sub-adviser for the Fund. Geode provides discretionary investment advisory services to the Fund and is paid by FMR for providing these services.
Distribution and Service Plan Fees. In accordance with Rule 12b-1 of the 1940 Act, the Fund has adopted separate 12b-1 Plans for each Service Class of shares. Each Service Class pays Fidelity Distributors Corporation (FDC), an affiliate of FMR, a service fee. For the period, the service fee is based on an annual rate of .10% of Service Class' average net assets and .25% of Service Class 2's average net assets.
For the period, total fees, all of which were re-allowed to insurance companies for the distribution of shares and providing shareholder support services were as follows:
Service Class | $ 260 |
Service Class 2 | 5,717 |
| $ 5,977 |
Transfer Agent Fees. Fidelity Investments Institutional Operations Company, Inc. (FIIOC), an affiliate of FMR, is the Fund's transfer, dividend disbursing, and shareholder servicing agent. FIIOC receives an asset-based fee with respect to each class. Each class (with the exception of Investor Class) pays a transfer agent fee, excluding out of pocket expenses, equal to an annual rate of .07% of average net assets. Investor Class pays a monthly asset-based transfer agent fee of .15% of average net assets. In addition, FIIOC receives an asset-based fee of .0038% of average net assets for typesetting, printing and mailing of shareholder reports, except proxy statements. For the period, transfer agent fees for each class, including printing and out of pocket expenses, were as follows:
Initial Class | $ 17,199 |
Service Class | 182 |
Service Class 2 | 3,668 |
Investor Class | 96,813 |
| $ 117,862 |
Accounting and Security Lending Fees. Fidelity Service Company, Inc. (FSC), an affiliate of FMR, maintains the Fund's accounting records. The accounting fee is based on the level of average net assets for each month. Under a separate contract, FSC administers the security lending program. The security lending fee is based on the number and duration of lending transactions.
7. Committed Line of Credit.
The Fund participates with other funds managed by FMR or an affiliate in a $4.25 billion credit facility (the "line of credit") to be utilized for temporary or emergency purposes to fund shareholder redemptions or for other short-term liquidity purposes. The Fund has agreed to pay commitment fees on its pro-rata portion of the line of credit, which amounted to $223 and is reflected in Miscellaneous expenses on the Statement of Operations. During the period, there were no borrowings on this line of credit.
8. Security Lending.
The Fund lends portfolio securities through a lending agent from time to time in order to earn additional income. For equity securities, a lending agent is used and may loan securities to certain qualified borrowers, including Fidelity Capital Markets (FCM), a broker-dealer affiliated with the Fund. On the settlement date of the loan, the Fund receives collateral (in the form of U.S. Treasury obligations, letters of credit and/or cash) against the loaned securities and maintains collateral in an amount not less than 100% of the market value of the loaned securities during the period of the loan. The market value of the loaned securities is determined at the close of business of the Fund and any additional required collateral is delivered to the Fund on the next business day. If the borrower defaults on its obligation to return the securities loaned because of insolvency or other reasons, a fund could experience delays and costs in recovering the securities loaned or in gaining access to the collateral. Any cash collateral received is invested in the Fidelity Securities Lending Cash Central Fund. The value of loaned securities and cash collateral at period end are disclosed on the Fund's Statement
Annual Report
Notes to Financial Statements - continued
8. Security Lending - continued
of Assets and Liabilities. Security lending income represents the income earned on investing cash collateral, less rebates paid to borrowers and any lending agent fees associated with the loan, plus any premium payments received for lending certain types of securities. Security lending income is presented in the Statement of Operations as a component of income from Fidelity Central Funds. Total security lending income during the period amounted to $34,744. During the period, there were no securities loaned to FCM.
9. Distributions to Shareholders.
Distributions to shareholders of each class were as follows:
Years ended December 31, | 2012 | 2011 |
From net investment income | | |
Initial Class | $ 381,126 | $ 102,021 |
Service Class | 5,052 | 895 |
Service Class 2 | 23,651 | 1,949 |
Investor Class | 1,170,858 | 240,223 |
Total | $ 1,580,687 | $ 345,088 |
From net realized gain | | |
Initial Class | $ 1,106,489 | $ - |
Service Class | 15,283 | - |
Service Class 2 | 91,283 | - |
Investor Class | 3,527,511 | - |
Total | $ 4,740,566 | $ - |
10. Share Transactions.
Transactions for each class of shares were as follows:
| Shares | Dollars |
Years ended December 31, | 2012 | 2011 | 2012 | 2011 |
Initial Class | | | | |
Shares sold | 375,279 | 799,889 | $ 4,550,032 | $ 9,258,309 |
Reinvestment of distributions | 127,325 | 9,535 | 1,487,615 | 102,021 |
Shares redeemed | (635,915) | (770,169) | (7,619,240) | (8,596,529) |
Net increase (decrease) | (133,311) | 39,255 | $ (1,581,593) | $ 763,801 |
Service Class | | | | |
Shares sold | - | - | $ - | $ - |
Reinvestment of distributions | 1,737 | 84 | 20,335 | 895 |
Shares redeemed | - | (7,941) | - | (86,551) |
Net increase (decrease) | 1,737 | (7,857) | $ 20,335 | $ (85,656) |
Service Class 2 | | | | |
Shares sold | 182,974 | 112,730 | $ 2,230,864 | $ 1,294,995 |
Reinvestment of distributions | 9,804 | 182 | 114,934 | 1,949 |
Shares redeemed | (209,457) | (187,048) | (2,440,173) | (2,135,089) |
Net increase (decrease) | (16,679) | (74,136) | $ (94,375) | $ (838,145) |
Investor Class | | | | |
Shares sold | 1,258,406 | 2,193,939 | $ 15,122,823 | $ 25,259,132 |
Reinvestment of distributions | 403,184 | 22,493 | 4,698,369 | 240,223 |
Shares redeemed | (1,208,098) | (1,732,651) | (14,456,569) | (19,292,876) |
Net increase (decrease) | 453,492 | 483,781 | $ 5,364,623 | $ 6,206,479 |
11. Other.
The Fund's organizational documents provide former and current trustees and officers with a limited indemnification against liabilities arising in connection with the performance of their duties to the Fund. In the normal course of business, the Fund may also enter into contracts that provide general indemnifications. The Fund's maximum exposure under these arrangements is unknown as this would be dependent on future claims that may be made against the Fund. The risk of material loss from such claims is considered remote.
At the end of the period, FMR or its affiliates were the owners of record of 98% of the total outstanding shares of the Fund.
Annual Report
Report of Independent Registered Public Accounting Firm
To the Trustees of Variable Insurance Products Fund II and Shareholders of VIP Disciplined Small Cap Portfolio:
We have audited the accompanying statement of assets and liabilities of VIP Disciplined Small Cap Portfolio (the Fund), a fund of Variable Insurance Products Fund II, including the schedule of investments, as of December 31, 2012, and the related statement of operations for the year then ended, the statement of changes in net assets for each of the two years in the period then ended, and the financial highlights for each of the five years in the period then ended. These financial statements and financial highlights are the responsibility of the Fund's management. Our responsibility is to express an opinion on these financial statements and financial highlights based on our audits.
We conducted our audits in accordance with the standards of the Public Company Accounting Oversight Board (United States). Those standards require that we plan and perform the audit to obtain reasonable assurance about whether the financial statements and financial highlights are free of material misstatement. The Fund is not required to have, nor were we engaged to perform, an audit of its internal control over financial reporting. Our audits included consideration of internal control over financial reporting as a basis for designing audit procedures that are appropriate in the circumstances, but not for the purpose of expressing an opinion on the effectiveness of the Fund's internal control over financial reporting. Accordingly, we express no such opinion. An audit also includes examining, on a test basis, evidence supporting the amounts and disclosures in the financial statements, assessing the accounting principles used and significant estimates made by management, as well as evaluating the overall financial statement presentation. Our procedures included confirmation of securities owned as of December 31, 2012, by correspondence with the custodians and brokers; where replies were not received from brokers, we performed other auditing procedures. We believe that our audits provide a reasonable basis for our opinion.
In our opinion, the financial statements and financial highlights referred to above present fairly, in all material respects, the financial position of VIP Disciplined Small Cap Portfolio as of December 31, 2012, the results of its operations for the year then ended, the changes in its net assets for each of the two years in the period then ended, and the financial highlights for each of the five years in the period then ended, in conformity with accounting principles generally accepted in the United States of America.
DELOITTE & TOUCHE LLP
Boston, Massachusetts
February 11, 2013
Annual Report
The Trustees, Members of the Advisory Board, and executive officers of the trust and fund, as applicable, are listed below. The Board of Trustees governs the fund and is responsible for protecting the interests of shareholders. The Trustees are experienced executives who meet periodically throughout the year to oversee the fund's activities, review contractual arrangements with companies that provide services to the fund, oversee management of the risks associated with such activities and contractual arrangements, and review the fund's performance. Except for James C. Curvey, each of the Trustees oversees 234 funds advised by FMR or an affiliate. Mr. Curvey oversees 452 funds advised by FMR or an affiliate.
The Trustees hold office without limit in time except that (a) any Trustee may resign; (b) any Trustee may be removed by written instrument, signed by at least two-thirds of the number of Trustees prior to such removal; (c) any Trustee who requests to be retired or who has become incapacitated by illness or injury may be retired by written instrument signed by a majority of the other Trustees; and (d) any Trustee may be removed at any special meeting of shareholders by a two-thirds vote of the outstanding voting securities of the trust. Each Trustee who is not an interested person (as defined in the 1940 Act) (Independent Trustee), shall retire not later than the last day of the calendar year in which his or her 75th birthday occurs. The Independent Trustees may waive this mandatory retirement age policy with respect to individual Trustees. The executive officers and Advisory Board Members hold office without limit in time, except that any officer and Advisory Board Member may resign or may be removed by a vote of a majority of the Trustees at any regular meeting or any special meeting of the Trustees. Except as indicated, each individual has held the office shown or other offices in the same company for the past five years.
Experience, Skills, Attributes, and Qualifications of the Fund's Trustees. The Governance and Nominating Committee has adopted a statement of policy that describes the experience, qualifications, attributes, and skills that are necessary and desirable for potential Independent Trustee candidates (Statement of Policy). The Board believes that each Trustee satisfied at the time he or she was initially elected or appointed a Trustee, and continues to satisfy, the standards contemplated by the Statement of Policy. The Governance and Nominating Committee also engages professional search firms to help identify potential Independent Trustee candidates who have the experience, qualifications, attributes, and skills consistent with the Statement of Policy. From time to time, additional criteria based on the composition and skills of the current Independent Trustees, as well as experience or skills that may be appropriate in light of future changes to board composition, business conditions, and regulatory or other developments, have also been considered by the professional search firms and the Governance and Nominating Committee. In addition, the Board takes into account the Trustees' commitment and participation in Board and committee meetings, as well as their leadership of standing and ad hoc committees throughout their tenure.
In determining that a particular Trustee was and continues to be qualified to serve as a Trustee, the Board has considered a variety of criteria, none of which, in isolation, was controlling. The Board believes that, collectively, the Trustees have balanced and diverse experience, qualifications, attributes, and skills, which allow the Board to operate effectively in governing the fund and protecting the interests of shareholders. Information about the specific experience, skills, attributes, and qualifications of each Trustee, which in each case led to the Board's conclusion that the Trustee should serve (or continue to serve) as a trustee of the fund, is provided below.
Board Structure and Oversight Function. James C. Curvey is an interested person (as defined in the 1940 Act) and currently serves as Chairman. The Trustees have determined that an interested Chairman is appropriate and benefits shareholders because an interested Chairman has a personal and professional stake in the quality and continuity of services provided to the fund. Independent Trustees exercise their informed business judgment to appoint an individual of their choosing to serve as Chairman, regardless of whether the Trustee happens to be independent or a member of management. The Independent Trustees have determined that they can act independently and effectively without having an Independent Trustee serve as Chairman and that a key structural component for assuring that they are in a position to do so is for the Independent Trustees to constitute a substantial majority for the Board. The Independent Trustees also regularly meet in executive session. Ned C. Lautenbach serves as Chairman of the Independent Trustees and as such (i) acts as a liaison between the Independent Trustees and management with respect to matters important to the Independent Trustees and (ii) with management prepares agendas for Board meetings.
Fidelity funds are overseen by different Boards of Trustees. The fund's Board oversees Fidelity's equity and high income funds and another Board oversees Fidelity's investment-grade bond, money market, and asset allocation funds. The asset allocation funds may invest in Fidelity funds overseen by the fund's Board. The use of separate Boards, each with its own committee structure, allows the Trustees of each group of Fidelity funds to focus on the unique issues of the funds they oversee, including common research, investment, and operational issues. On occasion, the separate Boards establish joint committees to address issues of overlapping consequences for the Fidelity funds overseen by each Board.
The Trustees operate using a system of committees to facilitate the timely and efficient consideration of all matters of importance to the Trustees, the fund, and fund shareholders and to facilitate compliance with legal and regulatory requirements and oversight of the fund's activities and associated risks. The Board, acting through its committees, has charged FMR and its affiliates with (i) identifying events or circumstances the occurrence of which could have demonstrably adverse effects on the fund's business and/or reputation; (ii) implementing processes and controls to lessen the possibility that such events or circumstances occur or to mitigate the effects of such events or circumstances if they do occur; and (iii) creating and maintaining a system designed to evaluate continuously business and market conditions in order to facilitate the identification and implementation processes described in (i) and (ii) above. Because the day-to-day operations and activities of the fund are carried out by or through FMR, its affiliates and other service providers, the fund's exposure to risks is mitigated but not eliminated by the processes overseen by the Trustees. While each of the Board's committees has responsibility for overseeing different aspects of the fund's activities, oversight is exercised primarily through the Operations, Audit, and Compliance Committees. In addition, the Independent Trustees have worked with FMR to enhance the Board's oversight of investment and financial risks, legal and regulatory risks, technology risks, and operational risks, including the development of additional risk reporting to the Board. For example, a working group comprised of Independent Trustees and FMR has worked and continues to work to review the Fidelity funds' valuation-related activities, reporting and risk management. Appropriate personnel, including but not limited to the fund's Chief Compliance Officer (CCO), FMR's internal auditor, the independent accountants, the fund's Treasurer and portfolio management personnel, make periodic reports to the Board's committees, as appropriate, including an annual review of FMR's risk management program for the Fidelity funds. The responsibilities of each standing committee, including their oversight responsibilities, are described further under "Standing Committees of the Fund's Trustees."
Annual Report
The fund's Statement of Additional Information (SAI) includes more information about the Trustees. To request a free copy, call Fidelity at 1-877-208-0098.
Interested Trustees*:
Correspondence intended for each Trustee who is an interested person may be sent to Fidelity Investments, 82 Devonshire Street, Boston, Massachusetts 02109.
Name, Age; Principal Occupations and Other Relevant Experience+ |
James C. Curvey (77) |
| Year of Election or Appointment: 2007 Mr. Curvey is Trustee and Chairman of the Board of Trustees of certain Trusts. Mr. Curvey also serves as Trustee (2007-present) of other investment companies advised by FMR. Mr. Curvey is a Director of Fidelity Investments Money Management, Inc. (2009-present), Director of Fidelity Research & Analysis Co. (2009-present) and Director of FMR and FMR Co., Inc. (2007-present). Mr. Curvey is also Vice Chairman (2007-present) and Director of FMR LLC. In addition, Mr. Curvey serves as an Overseer for the Boston Symphony Orchestra and a member of the Trustees of Villanova University. Previously, Mr. Curvey was the Vice Chairman (2006-2007) and Director (2000-2007) of FMR Corp. |
Ronald P. O'Hanley (55) |
| Year of Election or Appointment: 2011 Mr. O'Hanley is Director of FMR Co., Inc. (2010-present), Director of Fidelity Investments Money Management, Inc. (2010-present), Director of Fidelity Research & Analysis Company (2010-present), President of Fidelity Asset Management and Corporate Services and a member of Fidelity's Executive Committee (2010-present). Previously, Mr. O'Hanley served as President and Chief Executive Officer of BNY Mellon Asset Management (2007-2010). Mr. O'Hanley also served as Vice Chairman of Bank New York Mellon Corp. and a member of that firm's Executive Committee. Prior to the 2007 merger of The Bank of New York and Mellon Financial Corporation, he was Vice Chairman of Mellon Financial Corporation and President and Chief Executive Officer of Mellon Asset Management. He joined Mellon in February 1997. Mr. O'Hanley currently serves as Chairman of the Boston Public Library Foundation Board of Directors and sits on the Board of Directors of Beth Israel Deaconess Medical Center, the Board of Trustees of the Marine Biological Laboratory and the Advisory Board of the Maxwell School of Citizenship and Public Administration at Syracuse University. Mr. O'Hanley also chairs the Council on Asset Management for the Financial Services Roundtable and is a member of the Board of Directors of Institutional Investor's U.S. Institute. |
* Trustees have been determined to be "Interested Trustees" by virtue of, among other things, their affiliation with the trust or various entities under common control with FMR.
+ The information above includes each Trustee's principal occupation during the last five years and other information relating to the experience, attributes, and skills relevant to each Trustee's qualifications to serve as a Trustee, which led to the conclusion that each Trustee should serve as a Trustee for the fund.
Independent Trustees:
Correspondence intended for each Independent Trustee (that is, the Trustees other than the Interested Trustees) may be sent to Fidelity Investments, P.O. Box 55235, Boston, Massachusetts 02205-5235.
Name, Age; Principal Occupations and Other Relevant Experience+ |
Dennis J. Dirks (64) |
| Year of Election or Appointment: 2005 Prior to his retirement in May 2003, Mr. Dirks was Chief Operating Officer and a member of the Board of The Depository Trust & Clearing Corporation (DTCC). He also served as President, Chief Operating Officer, and Board member of The Depository Trust Company (DTC) and President and Board member of the National Securities Clearing Corporation (NSCC). In addition, Mr. Dirks served as Chief Executive Officer and Board member of the Government Securities Clearing Corporation, Chief Executive Officer and Board member of the Mortgage-Backed Securities Clearing Corporation, as a Trustee and a member of the Finance Committee of Manhattan College (2005-2008), and as a Trustee and a member of the Finance Committee of AHRC of Nassau County (2006-2008). Mr. Dirks is a member of the Independent Directors Council (IDC) Governing Council (2010-present) and Board of Directors for The Brookville Center for Children's Services, Inc. (2009-present). |
Alan J. Lacy (59) |
| Year of Election or Appointment: 2008 Mr. Lacy serves as Senior Adviser (2007-present) of Oak Hill Capital Partners, L.P. (private equity). Mr. Lacy also served as Chief Executive Officer (2000-2005) and Vice Chairman (2005-2006) of Sears Holdings Corporation and Sears, Roebuck and Co. (retail). In addition, Mr. Lacy serves as a member of the Board of Directors of Dave & Buster's Entertainment, Inc. (restaurant and entertainment complexes, 2010-present), Earth Fare, Inc. (retail grocery, 2012-present), The Hillman Companies, Inc. (hardware wholesalers, 2010-present), and Bristol-Myers Squibb Company (global pharmaceuticals, 2008-present). Mr. Lacy is a member of the Board of Trustees of The National Parks Conservation Association (2006-present). Previously, Mr. Lacy served as Chairman of the Board of Trustees of the National Parks Conservation Association (2008-2011) and as a member of the Board of Directors for the Western Union Company (global money transfer, 2006-2011). |
Ned C. Lautenbach (68) |
| Year of Election or Appointment: 2000 Mr. Lautenbach is Chairman of the Independent Trustees of the Equity and High Income Funds (2006-present). Mr. Lautenbach currently serves as the Lead Director of the Eaton Corporation Board of Directors (diversified industrial, 1997-present). Mr. Lautenbach is Chairman of the Board of Directors of the Philharmonic Center for the Arts in Naples, Florida (2012-present) and a member of the Council on Foreign Relations (1994-present). Previously, Mr. Lautenbach was a Partner/Advisory Partner at Clayton, Dubilier & Rice, LLC (private equity investment, 1998-2010), as well as a Director of Sony Corporation (2006-2007). |
Joseph Mauriello (68) |
| Year of Election or Appointment: 2008 Prior to his retirement in January 2006, Mr. Mauriello served in numerous senior management positions including Deputy Chairman and Chief Operating Officer (2004-2005), and Vice Chairman of Financial Services (2002-2004) of KPMG LLP US (professional services, 1965-2005). Mr. Mauriello currently serves as a member of the Board of Directors of XL Group plc. (global insurance and re-insurance, 2006-present). Previously, Mr. Mauriello served as a Director of the Hamilton Funds of the Bank of New York (2006-2007) and of Arcadia Resources Inc. (health care services and products, 2007-2012). |
Robert W. Selander (62) |
| Year of Election or Appointment: 2011 Previously, Mr. Selander served as a Member of the Advisory Board of Fidelity's Equity and High Income Funds (2011), Executive Vice Chairman (2010), Chief Executive Officer (2009-2010), and President and Chief Executive Officer (1997-2009) of Mastercard, Inc. |
Cornelia M. Small (68) |
| Year of Election or Appointment: 2005 Ms. Small is a member of the Board of Directors (2009-present) and Chair of the Investment Committee (2010-present) of the Teagle Foundation. Ms. Small also serves on the Investment Committee of the Berkshire Taconic Community Foundation (2008-present). Previously, Ms. Small served as Chairperson (2002-2008) and a member of the Investment Committee and Chairperson (2008-2012) and a member of the Board of Trustees of Smith College. In addition, Ms. Small served as Chief Investment Officer, Director of Global Equity Investments, and a member of the Board of Directors of Scudder, Stevens & Clark and Scudder Kemper Investments. |
William S. Stavropoulos (73) |
| Year of Election or Appointment: 2001 Mr. Stavropoulos is Vice Chairman of the Independent Trustees of the Equity and High Income Funds (2006-present). Mr. Stavropoulos serves as President and Founder of the Michigan Baseball Foundation, the Great Lakes Loons (2007-present). Mr. Stavropoulos is Chairman Emeritus of the Board of Directors of The Dow Chemical Company, where he previously served in numerous senior management positions, including President, CEO (1995-2000; 2002-2004), Chairman of the Executive Committee (2000-2006), and as a member of the Board of Directors (1990-2006). Currently, Mr. Stavropoulos is a Director of Univar Inc. (global distributor of commodity and specialty chemicals, Chairman from 2010-May 2012 and Lead Director from May 2012-present), Teradata Corporation (data warehousing and technology solutions, 2008-present), Maersk Inc. (industrial conglomerate), and Tyco International, Ltd. (multinational manufacturing and services, 2007-present), and a member of the Advisory Board for Metalmark Capital LLC (private equity investment, 2005-present). Mr. Stavropoulos is an operating advisor to Clayton, Dubilier & Rice, LLC (private equity investment). In addition, Mr. Stavropoulos is a member of the University of Notre Dame Advisory Council for the College of Science, a Trustee of the Rollin L. Gerstacker Foundation, and a Director of the Naples Philharmonic Center for the Arts. Previously, Mr. Stavropoulos served as a Director of Chemical Financial Corporation (bank holding company, 1993-2012). |
David M. Thomas (63) |
| Year of Election or Appointment: 2008 Previously, Mr. Thomas served as Executive Chairman (2005-2006) and Chairman and Chief Executive Officer (2000-2005) of IMS Health, Inc. (pharmaceutical and healthcare information solutions), and a Director of Fortune Brands, Inc. (consumer products, 2000-2011). In addition, Mr. Thomas serves as Non-Executive Chairman of the Board of Directors of Fortune Brands Home and Security (home and security products, 2011-present), and as a member of the Board of Directors of Interpublic Group of Companies, Inc. (marketing communication, 2004-present). |
Michael E. Wiley (62) |
| Year of Election or Appointment: 2008 Mr. Wiley also serves as a Director of Asia Pacific Exploration Consolidated (international oil and gas exploration and production, 2008-present). Mr. Wiley serves as a Director of Tesoro Corporation (independent oil refiner and marketer, 2005-present), and a Director of Bill Barrett Corporation (exploration and production, 2005-present). In addition, Mr. Wiley also serves as a Director of Post Oak Bank (privately-held bank, 2004-present). Previously, Mr. Wiley served as a member of the Board of Trustees of the University of Tulsa (2000-2006; 2007-2010), as a Senior Energy Advisor of Katzenbach Partners, LLC (consulting, 2006-2007), as an Advisory Director of Riverstone Holdings (private investment), Chairman, President, and CEO of Baker Hughes, Inc. (oilfield services, 2000-2004), and as Director of Spinnaker Exploration Company (exploration and production, 2001-2005). |
+ The information above includes each Trustee's principal occupation during the last five years and other information relating to the experience, attributes, and skills relevant to each Trustee's qualifications to serve as a Trustee, which led to the conclusion that each Trustee should serve as a Trustee for the fund.
Advisory Board Members and Executive Officers:
Correspondence intended for David A. Rosow and Garnett A. Smith may be sent to Fidelity Investments, P.O. Box 55235, Boston, Massachusetts 02205-5235. Correspondence intended for each executive officer and Peter S. Lynch may be sent to Fidelity Investments, 82 Devonshire Street, Boston, Massachusetts 02109.
Name, Age; Principal Occupation |
Peter S. Lynch (68) |
| Year of Election or Appointment: 2003 Member of the Advisory Board of Fidelity's Equity and High Income Funds. Mr. Lynch is Vice Chairman and a Director of FMR and FMR Co., Inc. In addition, Mr. Lynch serves as a Trustee of Boston College and as the Chairman of the Inner-City Scholarship Fund. Previously, Mr. Lynch served on the Special Olympics International Board of Directors (1997-2006). |
David A. Rosow (70) |
| Year of Election or Appointment: 2012 Member of the Advisory Board of Fidelity's Equity and High Income Funds. Chairman and Chief Executive Officer of International Golf Group, Inc. (golf course development, 1989-present). Previously, Mr. Rosow served as Chairman and Chief Executive Officer of Rosow & Company, Inc. (private investment company, 1989-2011), a Lead Director of Hudson United Bancorp (2001-2006) and as a Director of TD Banknorth (1996-2006). In addition, Mr. Rosow is a member (2008-present) and President (2009-present) of the Town Council of Palm Beach, Florida. |
Garnett A. Smith (65) |
| Year of Election or Appointment: 2012 Member of the Advisory Board of Fidelity's Equity and High Income Funds. Prior to Mr. Smith's retirement, he served as Chairman and Chief Executive Officer of Inbrand Corp. (manufacturer of personal absorbent products, 1990-1997). He also served as President (1986-1990) of Inbrand Corp. Prior to his employment with Inbrand Corp., he was employed by a retail fabric chain and North Carolina National Bank. In addition, Mr. Smith is a board member of the Jackson Hole Land Trust (2009-present). |
Kenneth B. Robins (43) |
| Year of Election or Appointment: 2008 President and Treasurer of Fidelity's Equity and High Income Funds. Mr. Robins also serves as President and Treasurer (2010-present) and Assistant Treasurer (2009-present) of other Fidelity funds and is an employee of Fidelity Investments (2004-present). Previously, Mr. Robins served as Deputy Treasurer of the Fidelity funds (2005-2008) and Treasurer and Chief Financial Officer of The North Carolina Capital Management Trust: Cash and Term Portfolios (2006-2008). |
Brian B. Hogan (48) |
| Year of Election or Appointment: 2009 Vice President of Equity and High Income Funds. Mr. Hogan also serves as President of FMR's Equity Division (2009-present). Previously, Mr. Hogan served as Senior Vice President, Equity Research of FMR (2006-2009) and as a portfolio manager. |
Thomas C. Hense (48) |
| Year of Election or Appointment: 2008 or 2010 Vice President of Fidelity's High Income (2008), Small Cap (2008), and Value (2010) Funds. Previously, Mr. Hense served as a portfolio manager for Fidelity's Institutional Money Management Group (Pyramis) (2003-2008). |
Scott C. Goebel (44) |
| Year of Election or Appointment: 2008 Secretary and Chief Legal Officer (CLO) of the Fidelity funds. Mr. Goebel also serves as Secretary of Fidelity Investments Money Management, Inc. (FIMM) (2010-present) and Fidelity Research and Analysis Company (FRAC) (2010-present); Secretary and CLO of The North Carolina Capital Management Trust: Cash and Term Portfolios (2008-present); General Counsel, Secretary, and Senior Vice President of FMR (2008-present) and FMR Co., Inc. (2008-present); employed by FMR LLC or an affiliate (2001-present); Chief Legal Officer of Fidelity Management & Research (Hong Kong) Limited (2008-present) and Assistant Secretary of Fidelity Management & Research (Japan) Inc. (2008-present), and Fidelity Management & Research (U.K.) Inc. (2008-present). Previously, Mr. Goebel served as Assistant Secretary of FIMM (2008-2010), FRAC (2008-2010), and the Funds (2007-2008) and as Vice President and Secretary of Fidelity Distributors Corporation (FDC) (2005-2007). |
William C. Coffey (43) |
| Year of Election or Appointment: 2009 Assistant Secretary of Fidelity's Equity and High Income Funds. Mr. Coffey also serves as Senior Vice President and Deputy General Counsel of FMR LLC (2010-present), and is an employee of Fidelity Investments. Previously, Mr. Coffey served as Vice President and Associate General Counsel of FMR LLC (2005-2009). |
Elizabeth Paige Baumann (44) |
| Year of Election or Appointment: 2012 Anti-Money Laundering (AML) Officer of the Fidelity funds. Ms. Baumann also serves as AML Officer of The North Carolina Capital Management Trust: Cash and Term Portfolios (2012-present), Chief AML Officer of FMR LLC (2012-present), and is an employee of Fidelity Investments. Previously, Ms. Baumann served as Vice President and Deputy Anti-Money Laundering Officer (2007-2012). |
Christine Reynolds (54) |
| Year of Election or Appointment: 2008 Chief Financial Officer of the Fidelity funds. Ms. Reynolds became President of Fidelity Pricing and Cash Management Services (FPCMS) in August 2008. Ms. Reynolds served as Chief Operating Officer of FPCMS (2007-2008). Previously, Ms. Reynolds served as President, Treasurer, and Anti-Money Laundering officer of the Fidelity funds (2004-2007). |
Joseph A. Hanlon (44) |
| Year of Election or Appointment: 2012 Chief Compliance Officer of Fidelity's Equity and High Income Funds. Mr. Hanlon serves as Compliance Officer of FMR, FMR Co., Inc., Fidelity Investments Money Management, Inc. (FIMM), Fidelity Research and Analysis Company (FRAC), Fidelity Management & Research (Japan) Inc., Fidelity Management & Research (U.K.) Inc., Fidelity Management & Research (Hong Kong), and Strategic Advisers, Inc. (2009-present), as Senior Vice President of the Fidelity Asset Management Division (2009-present), and is an employee of Fidelity Investments. |
Joseph F. Zambello (55) |
| Year of Election or Appointment: 2011 Deputy Treasurer of the Fidelity funds. Mr. Zambello is an employee of Fidelity Investments. Previously, Mr. Zambello served as Vice President of FMR's Program Management Group (2009-2011) and Vice President of the Transfer Agent Oversight Group (2005-2009). |
Adrien E. Deberghes (45) |
| Year of Election or Appointment: 2008 Deputy Treasurer of Fidelity's Equity and High Income Funds. Mr. Deberghes also serves as Vice President (2011-present) and Assistant Treasurer (2010-present) of other Fidelity funds, and is an employee of Fidelity Investments (2008-present). Previously, Mr. Deberghes served as Senior Vice President of Mutual Fund Administration at State Street Corporation (2007-2008), Senior Director of Mutual Fund Administration at Investors Bank & Trust (2005-2007), and Director of Finance for Dunkin' Brands (2000-2005). |
Stephen Sadoski (41) |
| Year of Election or Appointment: 2012 Deputy Treasurer of Fidelity's Equity and High Income Funds. Mr. Sadoski also serves as Deputy Treasurer of other Fidelity funds (2013-present) and is an employee of Fidelity Investments (2012-present). Previously, Mr. Sadoski served as Assistant Treasurer of Fidelity's Fixed Income and Asset Allocation Funds (2012-2013), an assistant chief accountant in the Division of Investment Management of the Securities and Exchange Commission (SEC) (2009-2012) and as a senior manager at Deloitte & Touche (1997-2009). |
Stacie Smith (38) |
| Year of Election or Appointment: 2013 Deputy Treasurer of Fidelity's Equity and High Income Funds. Ms. Smith is an employee of Fidelity Investments (2009-present). Previously, Ms. Smith served as Senior Audit Manager of Ernst & Young LLP (1996-2009). |
Stephanie J. Dorsey (43) |
| Year of Election or Appointment: 2010 Assistant Treasurer of Fidelity's Equity and High Income Funds. Ms. Dorsey also serves as President and Treasurer (2013-present) and Assistant Treasurer (2012-present) of other Fidelity funds and is an employee of Fidelity Investments (2008-present). Previously, Ms. Dorsey served as Deputy Treasurer of Fidelity's Fixed Income and Asset Allocation Funds (2008-2013), Treasurer (2004-2008) of the JPMorgan Mutual Funds and Vice President (2004-2008) of JPMorgan Chase Bank. |
John R. Hebble (54) |
| Year of Election or Appointment: 2009 Assistant Treasurer of Fidelity's Equity and High Income Funds. Mr. Hebble also serves as President (2011-present), Treasurer, and Chief Financial Officer of The North Carolina Capital Management Trust: Cash and Term Portfolios (2008-present) and is an employee of Fidelity Investments. Previously, Mr. Hebble served as President and Treasurer of Fidelity's Fixed Income and Asset Allocation Funds (2008-2013). |
Gary W. Ryan (54) |
| Year of Election or Appointment: 2005 Assistant Treasurer of the Fidelity funds. Mr. Ryan is an employee of Fidelity Investments. Previously, Mr. Ryan served as Vice President of Fund Reporting in Fidelity Pricing and Cash Management Services (FPCMS) (1999-2005). |
Jonathan Davis (44) |
| Year of Election or Appointment: 2010 Assistant Treasurer of the Fidelity funds. Mr. Davis is also Assistant Treasurer of Fidelity Rutland Square Trust II and Fidelity Commonwealth Trust II. Mr. Davis is an employee of Fidelity Investments. Previously, Mr. Davis served as Vice President and Associate General Counsel of FMR LLC (2003-2010). |
Annual Report
The Board of Trustees of VIP Disciplined Small Cap Portfolio voted to pay to shareholders of record at the opening of business on record date, the following distributions per share derived from capital gains realized from sales of portfolio securities:
| Pay Date | Record Date | Dividends | Capital Gains |
Initial Class | 02/08/13 | 02/08/13 | $0.000 | $0.121 |
Service Class | 02/08/13 | 02/08/13 | $0.000 | $0.121 |
Service Class 2 | 02/08/13 | 02/08/13 | $0.000 | $0.121 |
Investor Class | 02/08/13 | 02/08/13 | $0.000 | $0.121 |
The fund hereby designates as a capital gain dividend with respect to the taxable year ended December 31 2012, $5,687,638, or, if subsequently determined to be different, the net capital gain of such year.
Initial Class, Service Class, Service Class 2, and Investor Class designates 100% of the dividends distributed during the fiscal year as qualifying for the dividends-received deduction for corporate shareholders.
Annual Report
Board Approval of Investment Advisory Contracts and Management Fees
VIP Disciplined Small Cap Portfolio
Each year, the Board of Trustees, including the Independent Trustees (together, the Board), votes on the renewal of the management contract and sub-advisory agreements (together, the Advisory Contracts) for the fund. The Board, assisted by the advice of fund counsel and Independent Trustees' counsel, requests and considers a broad range of information relevant to the renewal of the Advisory Contracts throughout the year.
The Board meets regularly and, at each of its meetings, considers factors that are relevant to its annual consideration of the renewal of the fund's Advisory Contracts, including the services and support provided to the fund and its shareholders. The Board has established various standing committees, each composed of and chaired by Independent Trustees with varying backgrounds, to which the Board has assigned specific subject matter responsibilities in order to enhance effective decision-making by the Board. The Board, acting directly and through its Committees, requests and receives information concerning the annual consideration of the renewal of the fund's Advisory Contracts. The Board also meets as needed to consider matters specifically related to the Board's annual consideration of the renewal of Advisory Contracts. Members of the Board may also meet with trustees of other Fidelity funds through ad hoc joint committees to discuss certain matters relevant to the Fidelity funds.
At its July 2012 meeting, the Board of Trustees, including the Independent Trustees, unanimously determined to renew the fund's Advisory Contracts. In reaching its determination, the Board considered all factors it believed relevant, including (i) the nature, extent, and quality of the services to be provided to the fund and its shareholders (including the investment performance of the fund); (ii) the competitiveness of the fund's management fee and total expense ratio relative to peer funds; (iii) the total costs of the services to be provided by and the profits to be realized by Fidelity from its relationship with the fund; (iv) the extent to which economies of scale exist and would be realized as the fund grows; and (v) whether fee levels reflect these economies of scale, if any, for the benefit of fund shareholders.
In considering whether to renew the Advisory Contracts for the fund, the Board reached a determination, with the assistance of fund counsel and Independent Trustees' counsel and through the exercise of its business judgment, that the renewal of the Advisory Contracts is in the best interests of the fund and its shareholders and that the compensation payable under the Advisory Contracts is fair and reasonable. The Board's decision to renew the Advisory Contracts was not based on any single factor, but rather was based on a comprehensive consideration of all the information provided to the Board at its meetings throughout the year. The Board, in reaching its determination to renew the Advisory Contracts, is aware that shareholders in the fund have a broad range of investment choices available to them, including a wide choice among mutual funds offered by Fidelity's competitors, and that the fund's shareholders, who have the opportunity to review and weigh the disclosure provided by the fund in its prospectus and other public disclosures, have chosen to invest in this fund, managed by Fidelity.
Nature, Extent, and Quality of Services Provided. The Board considered the staffing within the investment adviser, FMR, and the sub-advisers (together, the Investment Advisers), including the backgrounds of the fund's investment personnel, and also considered the fund's investment objective, strategies, and related investment philosophy. The Independent Trustees also had discussions with senior management of Fidelity's investment operations and investment groups. The Board considered the structure of the portfolio manager compensation program and whether this structure provides appropriate incentives to act in the best interests of the fund.
Resources Dedicated to Investment Management and Support Services. The Board and the Fund Oversight and Research Committees reviewed the general qualifications and capabilities of the Investment Advisers' investment staff, including its size, education, experience, and resources, as well as the Investment Advisers' approach to recruiting, training, managing, and compensating investment personnel. The Board also noted that FMR has continued to increase the resources devoted to non-U.S. offices, including expansion of Fidelity's global investment organization. The Board noted that Fidelity's analysts have extensive resources, tools and capabilities that allow them to conduct sophisticated quantitative and fundamental analysis, as well as credit analysis of issuers, counterparties and guarantors. The Board also believes that Fidelity's investment professionals have sufficient access to global information and data so as to provide competitive investment results over time, and that those professionals also have access to sophisticated tools that permit them to assess portfolio construction and risk and performance attribution characteristics continuously, as well as to transmit new information and research conclusions rapidly around the world. Additionally, in its deliberations, the Board considered the Investment Advisers' trading and risk management capabilities and resources, which are an integral part of the investment management process.
Shareholder and Administrative Services. The Board considered (i) the nature, extent, quality, and cost of advisory, administrative, and shareholder services performed by the Investment Advisers and their affiliates under the Advisory Contracts and under separate agreements covering transfer agency, pricing and bookkeeping, and securities lending services for the fund; (ii) the nature and extent of the supervision of third party service providers, principally custodians and subcustodians; and (iii) the resources devoted to, and the record of compliance with, the fund's compliance policies and procedures. The Board also reviewed the allocation of fund brokerage, including allocations to brokers affiliated with the Investment Advisers, the use of brokerage commissions to pay fund expenses, and the use of "soft" commission dollars to pay for research services.
The Board noted that the growth of fund assets over time across the complex allows Fidelity to reinvest in the development of services designed to enhance the value or convenience of the Fidelity funds as investment vehicles. These services include 24-hour access to account information and market information through telephone representatives and over the Internet, investor education materials and asset allocation tools, and the expanded availability of Fidelity Investor Centers.
Annual Report
Board Approval of Investment Advisory Contracts and Management Fees - continued
Investment in a Large Fund Family. The Board considered the benefits to shareholders of investing in a Fidelity fund, including the benefits of investing in a fund that is part of a large family of funds offering a variety of investment disciplines and providing a large variety of mutual fund investor services. The Board noted that Fidelity had taken, or had made recommendations that resulted in the Fidelity funds taking, a number of actions over the previous year that benefited particular funds, including (i) continuing to dedicate additional resources to investment research and support of the senior management team that oversees asset management; (ii) persisting in efforts to enhance Fidelity's research capabilities, in particular, international research; (iii) launching new funds and making other enhancements to meet client needs for global and income-oriented solutions; (iv) continuing to launch dedicated lower cost underlying funds to meet investment management's portfolio construction needs related to expanding underlying fund options, specifically for the Freedom Fund product lines; (v) adopting a "Stock Selector" sector neutral investment approach and employing a team of portfolio managers who are sector specialists to manage certain funds; (vi) rationalizing product lines and gaining increased efficiencies through the mergers of several funds into other funds; (vii) strengthening the Spartan Index Fund product line by adding new funds and/or new low-cost institutional share classes, restructuring fund expenses to accommodate new classes, and reducing investment minimums for certain classes of shares; (viii) modifying the eligibility criteria for Institutional Class shares to increase their appeal to government entities and charitable investors; and (ix) reducing certain transfer agent fee rates.
Investment Performance. The Board considered whether the fund has operated in accordance with its investment objective, as well as its record of compliance with its investment restrictions. It also reviewed the fund's absolute investment performance for each class, as well as the fund's relative investment performance for each class measured over multiple periods against a broad-based securities market index. The Board noted that FMR believes that no meaningful peer group exists for the fund principally because most other funds in the fund's third-party peer group have different and/or broader investment mandates than the fund's more specialized strategies. The following charts considered by the Board show, over the one-, three-, and five-year periods ended December 31, 2011, the cumulative total returns of Initial Class and Service Class 2 of the fund and the cumulative total returns of a broad-based securities market index ("benchmark"). The returns of Initial Class and Service Class 2 show the performance of the highest and lowest performing classes, respectively (based on five-year performance).
VIP Disciplined Small Cap Portfolio
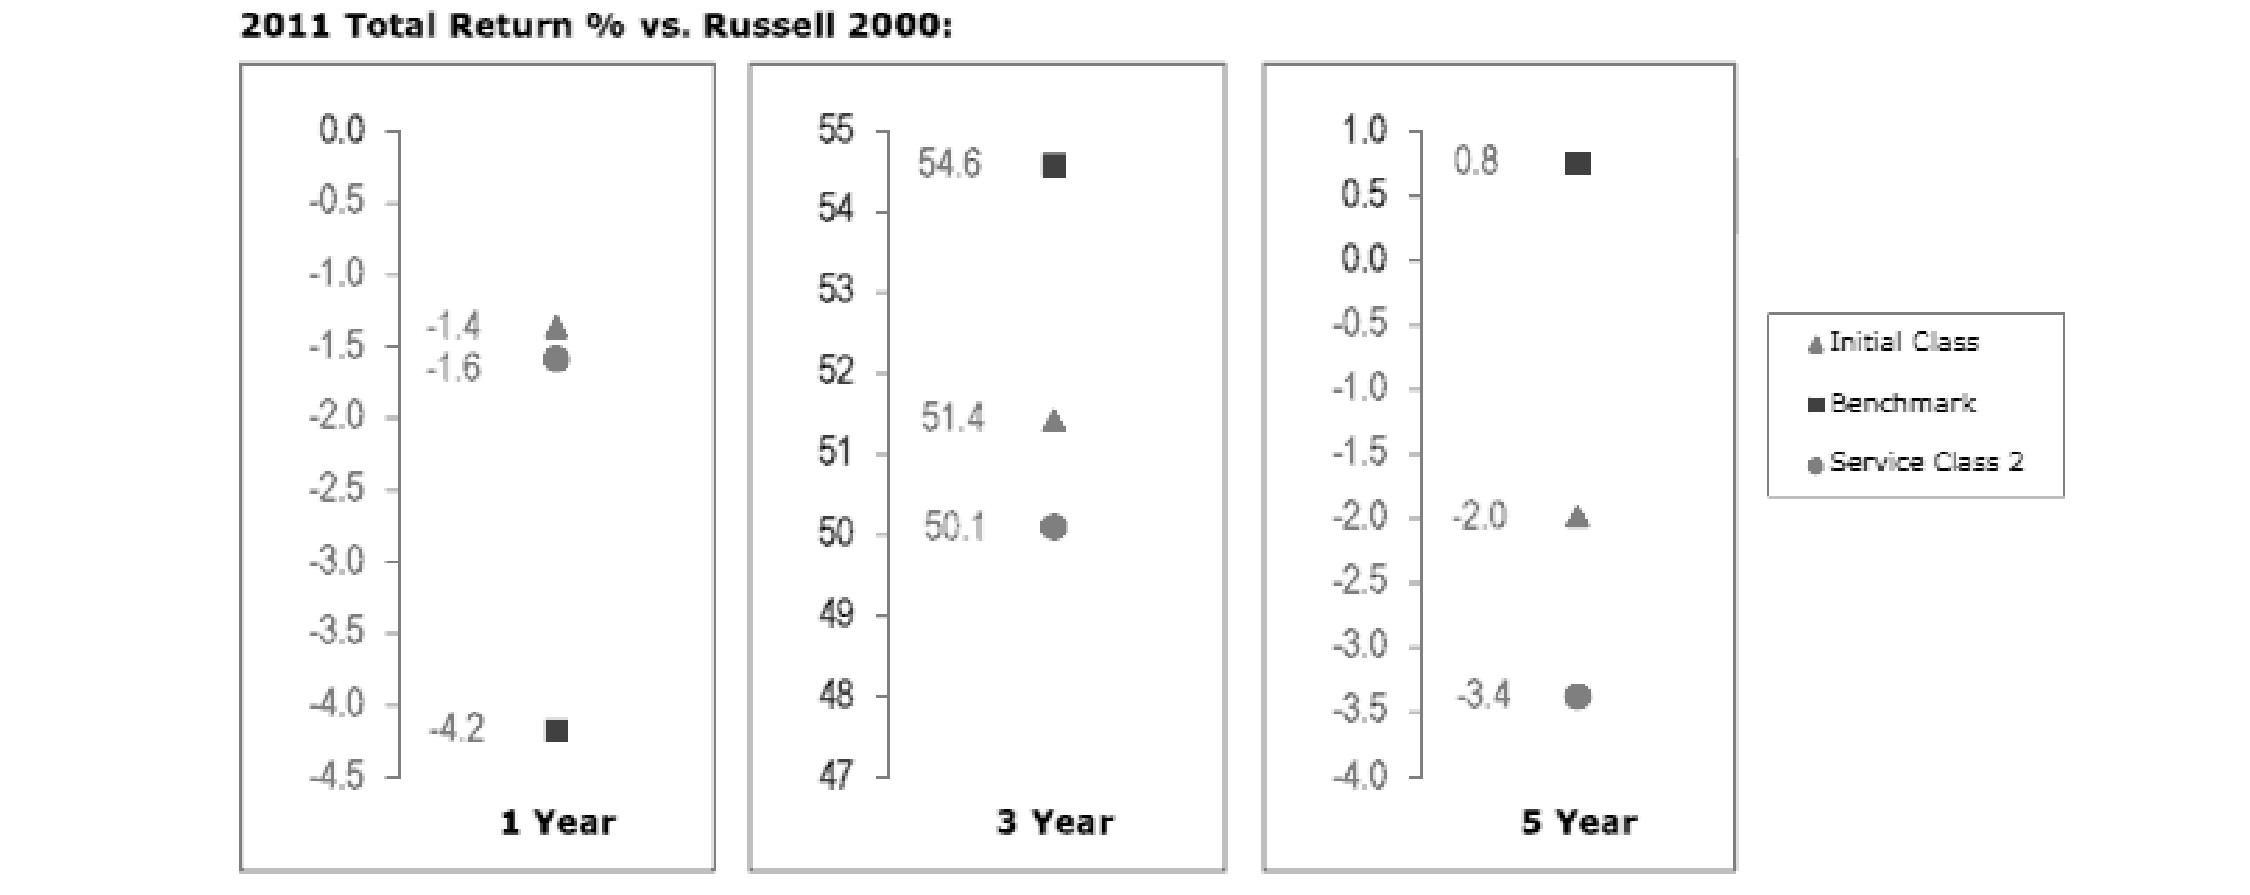
The Board noted that the investment performance of the fund was lower than its benchmark for the three- and five-year periods, although the one-year total return of Initial Class compared favorably to its benchmark. The Board considered that the variations in performance among the fund's classes reflect the variations in class expenses, which result in lower performance for higher expense classes. The Board also reviewed the fund's performance since inception as well as performance in the current year.
Based on its review, the Board concluded that the nature, extent, and quality of services provided to the fund under the Advisory Contracts should benefit the fund's shareholders.
Competitiveness of Management Fee and Total Expense Ratio. The Board considered the fund's management fee and total expense ratio compared to "mapped groups" of competitive funds and classes. Fidelity creates "mapped groups" by combining similar Lipper investment objective categories that have comparable management fee characteristics. Combining Lipper investment objective categories aids the Board's management fee and total expense ratio comparisons by broadening the competitive group used for comparison and by reducing the number of universes to which various Fidelity funds are compared.
Annual Report
Management Fee. The Board considered two proprietary management fee comparisons for the 12-month periods shown in the chart below. The group of Lipper funds used by the Board for management fee comparisons is referred to below as the "Total Mapped Group." The Total Mapped Group comparison focuses on a fund's standing relative to the total universe of comparable funds available to investors in terms of gross management fees before expense reimbursements or caps. "TMG %" represents the percentage of funds in the Total Mapped Group that had management fees that were lower than the fund's. For example, a TMG % of 11% means that 89% of the funds in the Total Mapped Group had higher management fees than the fund. The "Asset-Size Peer Group" (ASPG) comparison focuses on a fund's standing relative to non-Fidelity funds similar in size to the fund within the Total Mapped Group. The ASPG represents at least 15% of the funds in the Total Mapped Group with comparable asset size and management fee characteristics, subject to a minimum of 50 funds (or all funds in the Total Mapped Group if fewer than 50). Additional information, such as the ASPG quartile in which the fund's management fee ranked, is also included in the chart and considered by the Board.
VIP Disciplined Small Cap Portfolio
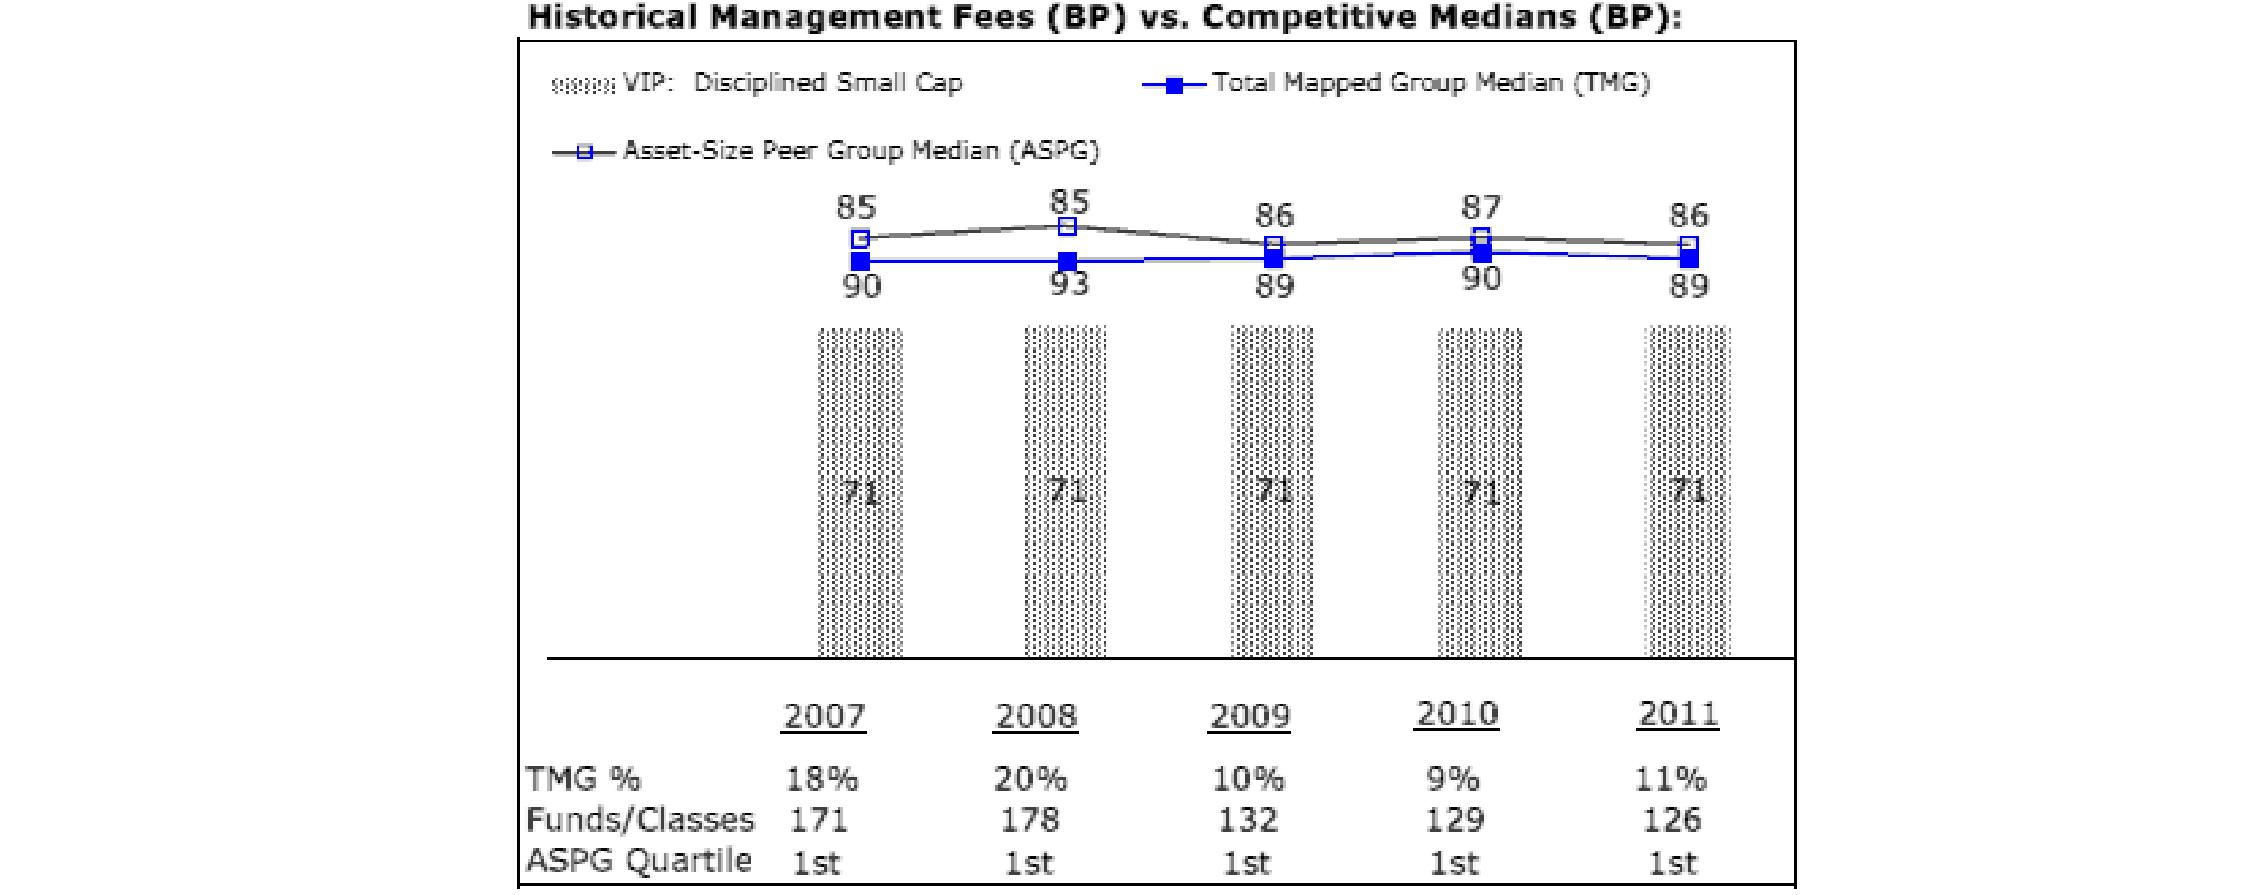
The Board noted that the fund's management fee ranked below the median of its Total Mapped Group and below the median of its ASPG for 2011.
Based on its review, the Board concluded that the fund's management fee is fair and reasonable in light of the services that the fund receives and the other factors considered.
Total Expense Ratio. In its review of each class's total expense ratio, the Board considered the fund's management fee as well as other fund or class expenses, as applicable, such as transfer agent fees, pricing and bookkeeping fees, fund-paid 12b-1 fees, and custodial, legal, and audit fees. The Board also noted the effects of any waivers and reimbursements on fees and expenses. As part of its review, the Board also considered the current and historical total expense ratios of each class of the fund compared to competitive fund median expenses. Each class of the fund is compared to those funds and classes in the Total Mapped Group (used by the Board for management fee comparisons) that have a similar sales load structure.
The Board noted that the total expense ratio of each of Initial Class, Investor Class, and Service Class ranked below its competitive median for 2011 and the total expense ratio of Service Class 2 ranked above its competitive median for 2011. The Board considered that various factors, including 12b-1 fees, positive or negative performance adjustments, and relatively higher other expenses in the case of small fund size, can affect total expense ratios. The Board noted that the fund offers multiple classes, each of which has a different 12b-1 fee structure, and that the multiple structures are intended to offer a range of pricing options for the intermediary market. The Board also noted that the total expense ratios of the classes vary primarily by the level of their 12b-1 fees, although differences in transfer agent fees may also cause expenses to vary from class to class.
Fees Charged to Other Fidelity Clients. The Board also considered Fidelity fee structures and other information with respect to clients of FMR and its affiliates, such as other mutual funds advised or subadvised by FMR or its affiliates, pension plan clients, and other institutional clients. The Board noted the findings of the 2010 ad hoc joint committee (created with the board of other Fidelity funds), which reviewed and compared Fidelity's institutional investment advisory business with its business of providing services to the Fidelity funds, including the differences in services provided, fees charged, and costs incurred, as well as competition in their respective marketplaces.
Based on its review of total expense ratios and fees charged to other Fidelity clients, the Board concluded that the total expense ratio of each class of the fund was reasonable, although Service Class 2 was above the median of the universe presented for comparison, in light of the services that the fund and its shareholders receive and the other factors considered.
Annual Report
Board Approval of Investment Advisory Contracts and Management Fees - continued
Costs of the Services and Profitability. The Board considered the revenues earned and the expenses incurred by Fidelity in conducting the business of developing, marketing, distributing, managing, administering and servicing the fund and its shareholders. The Board also considered the level of Fidelity's profits in respect of all the Fidelity funds.
On an annual basis, FMR presents to the Board Fidelity's profitability for the fund. Fidelity calculates the profitability for each fund, as well as aggregate profitability for groups of Fidelity funds and all Fidelity funds, using a series of detailed revenue and cost allocation methodologies which originate with the books and records of Fidelity on which Fidelity's audited financial statements are based. The Audit Committee of the Board reviews any significant changes from the prior year's methodologies.
PricewaterhouseCoopers LLP (PwC), independent registered public accounting firm and auditor to Fidelity and certain Fidelity funds, has been engaged annually by the Board as part of the Board's assessment of Fidelity's profitability analysis. PwC's engagement includes the review and assessment of Fidelity's methodologies used in determining the revenues and expenses attributable to Fidelity's mutual fund business, and completion of agreed-upon procedures surrounding the mathematical accuracy of fund profitability and its conformity to allocation methodologies. After considering PwC's reports issued under the engagement and information provided by Fidelity, the Board concluded that while other allocation methods may also be reasonable, Fidelity's profitability methodologies are reasonable in all material respects.
The Board also reviewed Fidelity's non-fund businesses and fall-out benefits related to the mutual fund business as well as cases where Fidelity's affiliates may benefit from or be related to the fund's business.
The Board considered the costs of the services provided by and the profits realized by Fidelity in connection with the operation of the fund and was satisfied that the profitability was not excessive in the circumstances.
Economies of Scale. The Board considered whether there have been economies of scale in respect of the management of the Fidelity funds, whether the Fidelity funds (including the fund) have appropriately benefited from any such economies of scale, and whether there is potential for realization of any further economies of scale. The Board considered the extent to which the fund will benefit from economies of scale through increased services to the fund, through waivers or reimbursements, or through fee or expense reductions. The Board also noted that in 2009, it and the board of other Fidelity funds created an ad hoc committee (the Economies of Scale Committee) to analyze whether FMR attains economies of scale in respect of the management and servicing of the Fidelity funds, whether the Fidelity funds have appropriately benefited from such economies of scale, and whether there is potential for realization of any further economies of scale.
The Board recognized that the fund's management contract incorporates a "group fee" structure, which provides for lower group fee rates as total fund assets under FMR's management increase, and for higher group fee rates as total fund assets under FMR's management decrease. FMR calculates the group fee rates based on a tiered asset "breakpoint" schedule that varies based on asset class. The Board considered that the group fee is designed to deliver the benefits of economies of scale to fund shareholders when total Fidelity fund assets increase, even if assets of any particular fund are unchanged or have declined, because some portion of Fidelity's costs are attributable to services provided to all Fidelity funds, and all funds benefit if those costs can be allocated among more assets. The Board concluded that, given the group fee structure, fund shareholders will benefit from lower management fees as assets under FMR's management increase at the fund complex level, regardless of whether Fidelity achieves any such economies of scale.
The Board concluded, taking into account the analysis of the Economies of Scale Committee, that economies of scale, if any, are being appropriately shared between fund shareholders and Fidelity.
Additional Information Requested by the Board. In order to develop fully the factual basis for consideration of the Fidelity funds' Advisory Contracts, the Board requested and received additional information on certain topics, including (i) fund performance trends, actions to be taken by FMR to improve certain funds' overall performance, and Fidelity's long-term strategies for certain funds; (ii) the potential to further rationalize the Fidelity fund lineup with the possibility of achieving savings for the funds and Fidelity; (iii) Fidelity's compensation structure for portfolio managers and other key investment personnel; (iv) the amount of the investment that each portfolio manager has made in the Fidelity fund(s) that he or she manages; (v) the realization of fall-out benefits in certain Fidelity business units; (vi) Fidelity's group fee structures, the potential impact of regulatory changes on such structures, and the rationale for the individual fee rates of certain funds; (vii) fund profitability methodology, including Fidelity's cost allocation methodology, and the impact of certain factors on fund profitability results; (viii) trends regarding industry use of performance fee structures and the possibility of implementing performance fee structures for additional funds; and (ix) the impact of net redemptions from the Fidelity funds.
Based on its evaluation of all of the conclusions noted above, and after considering all factors it believed relevant, the Board ultimately concluded that the advisory fee structures are fair and reasonable, and that the fund's Advisory Contracts should be renewed.
Annual Report
Investment Adviser
Fidelity Management & Research Company
Boston, MA
Investment Sub-Advisers
Geode Capital Management, LLC
FMR Co., Inc.
General Distributor
Fidelity Distributors Corporation
Smithfield, RI
Transfer and Service Agents
Fidelity Investments Institutional Operations Company, Inc.
Boston, MA
Fidelity Service Company, Inc.
Boston, MA
Custodian
The Northern Trust Company
Chicago, IL
VDSC-ANN-0213
1.820582.107
Fidelity® Variable Insurance Products:
Index 500 Portfolio
Annual Report
December 31, 2012
(Fidelity Cover Art)
Contents
Performance | (Click Here) | How the fund has done over time. |
Management's Discussion of Fund Performance | (Click Here) | The Portfolio Manager's review of fund performance and strategy. |
Shareholder Expense Example | (Click Here) | An example of shareholder expenses. |
Investment Changes | (Click Here) | A summary of major shifts in the fund's investments over the past six months. |
Investments | (Click Here) | A complete list of the fund's investments with their market values. |
Financial Statements | (Click Here) | Statements of assets and liabilities, operations, and changes in net assets, as well as financial highlights. |
Notes | (Click Here) | Notes to the financial statements. |
Report of Independent Registered Public Accounting Firm | (Click Here) | |
Trustees and Officers | (Click Here) | |
Distributions | (Click Here) | |
Board Approval of Investment Advisory Contracts and Management Fees | (Click Here) | |
To view a fund's proxy voting guidelines and proxy voting record for the 12-month period ended June 30, visit http://www.fidelity.com/proxyvotingresults or visit the Securities and Exchange Commission's (SEC) web site at http://www.sec.gov. You may also call 1-877-208-0098 to request a free copy of the proxy voting guidelines.
Fidelity Variable Insurance Products are separate account options which are purchased through a variable insurance contract.
Standard & Poor's, S&P and S&P 500 are registered service marks of The McGraw-Hill Companies, Inc. and have been licensed for use by Fidelity Distributors Corporation.
Other third party marks appearing herein are the property of their respective owners.
All other marks appearing herein are registered or unregistered trademarks or service marks of FMR LLC or an affiliated company. © 2013 FMR LLC. All rights reserved.
This report and the financial statements contained herein are submitted for the general information of the shareholders of the fund. This report is not authorized for distribution to prospective investors in the fund unless preceded or accompanied by an effective prospectus.
A fund files its complete schedule of portfolio holdings with the SEC for the first and third quarters of each fiscal year on Form N-Q. Forms N-Q are available on the SEC's web site at http://www.sec.gov. A fund's Forms N-Q may be reviewed and copied at the SEC's Public Reference Room in Washington, DC. Information regarding the operation of the SEC's Public Reference Room may be obtained by calling 1-800-SEC-0330. For a complete list of a fund's portfolio holdings, view the most recent holdings listing, semiannual report, or annual report on Fidelity's web site at http://www.fidelity.com, http://www.advisor.fidelity.com, or http://www.401k.com, as applicable.
NOT FDIC INSURED • MAY LOSE VALUE • NO BANK GUARANTEE
Neither the fund nor Fidelity Distributors Corporation is a bank.
Annual Report
Average annual total return reflects the change in the value of an investment, assuming reinvestment of the class' distributions from dividend income and capital gains (the profits earned upon the sale of securities that have grown in value, if any) and assuming a constant rate of performance each year. During periods of reimbursement by Fidelity, a fund's total return will be greater than it would be had the reimbursement not occurred. Performance numbers are net of all underlying fund operating expenses, but do not include any insurance charges imposed by your insurance company's separate account. If performance information included the effect of these additional charges, the total returns would have been lower. How a fund did yesterday is no guarantee of how it will do tomorrow.
Average Annual Total Returns
Periods ended December 31, 2012 | Past 1
year | Past 5
years | Past 10
years |
VIP Index 500 Portfolio - Initial Class | 15.91% | 1.65% | 7.02% |
VIP Index 500 Portfolio - Service Class | 15.80% | 1.54% | 6.92% |
VIP Index 500 Portfolio - Service Class 2 | 15.62% | 1.39% | 6.76% |
$10,000 Over 10 Years
Let's say hypothetically that $10,000 was invested in VIP Index 500 Portfolio - Initial Class on December 31, 2002. The chart shows how the value of your investment would have changed, and also shows how the S&P 500 ® Index performed over the same period.
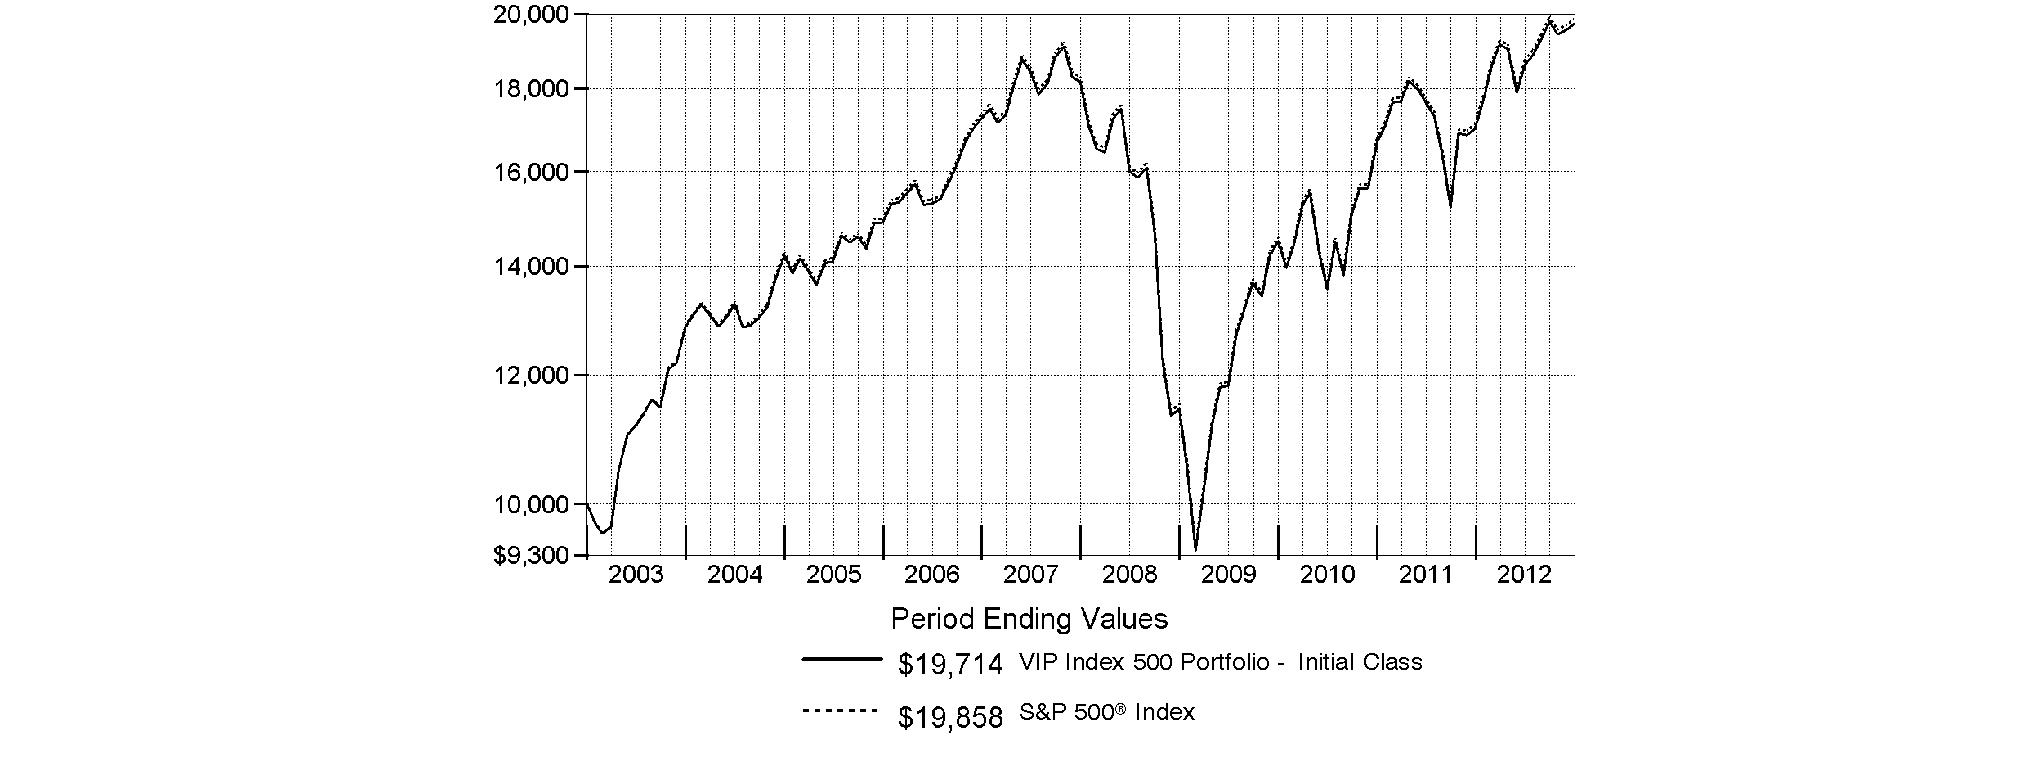
Annual Report
Market Recap: Global markets overcame a host of macroeconomic concerns in 2012 - related to the eurozone debt crisis, the strength and pace of the U.S. economic recovery, the U.S. fiscal debate and a slowdown in China's once-blistering growth - to post broad-based gains for the year, with more-economically sensitive asset classes leading the way. Investor sentiment improved as some of the uncertainties holding back the markets began to lift and the outlook brightened in the face of stimulative global monetary policies and modest inflationary pressures. Riskier assets such as stocks saw the biggest advances, with international equities edging their U.S. counterparts, thanks to an especially strong rally in the fourth quarter. Similarly, within fixed income, credit-sensitive sectors - including high-yield/investment-grade corporate bonds and emerging-markets debt - surged ahead of more-defensive U.S. investment-grade bonds amid strong demand for higher-risk, higher-yielding securities. Emerging signs of a rebounding U.S. economy lifted domestic stocks for most of the period, extending an uptrend that began in March 2009. The broad-based S&P 500® Index rose 16.00% for the 12 months, while the technology-heavy Nasdaq Composite Index® gained 17.45% and the blue-chip-laden Dow Jones Industrial AverageSM added 10.24%. Foreign developed- and emerging-markets equities experienced periodic bouts of volatility this past year, but rode a strong second-half rally to finish ahead of their U.S. counterparts. The MSCI® ACWI® (All Country World Index) ex USA Index advanced 16.98% for the period. In an environment that favored higher-risk assets, U.S. investment-grade bonds managed only a 4.21% gain for 12 months, according to the Barclays® U.S. Aggregate Bond Index. Among sectors that comprise the index, bonds with higher yields and on the riskier end of the spectrum led the way, with investment-grade credit advancing 9.37%, while ultra-safe U.S. Treasuries managed only a 1.99% advance and finished at the back of the pack. Meanwhile, high-yield bonds, as measured by The BofA Merrill LynchSM US High Yield Constrained Index, gained a hearty 15.55%. Foreign bonds showed positive results during the year, with emerging markets easily outpacing their major developed-markets counterparts. The J.P. Morgan Emerging Markets Bond Index Global surged 18.54%, while the Citigroup® Non-USD Group-of-Seven (G7) Equal Weighted Index logged a 7.10% gain.
Comments from James Francis, Senior Portfolio Manager of the Geode Capital Management, LLC, investment management team for VIP Index 500 Portfolio: For the year, the fund's share classes performed roughly in line with the S&P 500® Index, which rose 16.00%. (For specific portfolio results, please refer to the performance section of this report.) Each of the 10 sectors in the index earned a positive return, and all but two generated double-digit performance. The financials and consumer discretionary groups led the way with respective returns of 29% and 24%, while energy and utilities - the two weakest-performing sectors - gained only about 5% and 1%, respectively. On an individual stock basis, consumer products and personal computer manufacturer Apple was the leading contributor by a very wide margin. Its outsized impact was the result of a 33% share price gain and the stock's large stake in the index. Continuing a longtime trend, Apple benefited from strong sales of its iPad® tablets and iPhone® mobile devices. Cable and media company Comcast enjoyed good growth in its share price, as did financials firms Bank of America, JPMorgan Chase, Wells Fargo and Citigroup. Other contributors included pharmaceuticals manufacturer Pfizer and home products superstore Home Depot. On the negative side, computer and peripherals manufacturer Hewlett-Packard struggled amid a variety of challenges, including growing competition and difficulties with its corporate acquisitions. Also in information technology, Intel, a leading maker of microprocessors, was a notable detractor, as was Dell, whose shares dropped by approximately 30% during the period, with more than half of that coming on a single day in May, after the computer maker reported worse-than-expected fiscal second-quarter revenue. In the energy sector, Occidental Petroleum saw its shares drop by 16%, while restaurant giant McDonald's and utility Exelon were additional detractors.
The views expressed above reflect those of the portfolio manager(s) only through the end of the period as stated on the cover of this report and do not necessarily represent the views of Fidelity or any other person in the Fidelity organization. Any such views are subject to change at any time based upon market or other conditions and Fidelity disclaims any responsibility to update such views. These views may not be relied on as investment advice and, because investment decisions for a Fidelity fund are based on numerous factors, may not be relied on as an indication of trading intent on behalf of any Fidelity fund.
Annual Report
As a shareholder of the Fund, you incur two types of costs: (1) transaction costs, and (2) ongoing costs, including management fees, distribution and/or service (12b-1) fees and other Fund expenses. This Example is intended to help you understand your ongoing costs (in dollars) of investing in the Fund and to compare these costs with the ongoing costs of investing in other mutual funds.
The Example is based on an investment of $1,000 invested at the beginning of the period and held for the entire period (July 1, 2012 to December 31, 2012).
Actual Expenses
The first line of the accompanying table for each class of the Fund provides information about actual account values and actual expenses. You may use the information in this line, together with the amount you invested, to estimate the expenses that you paid over the period. Simply divide your account value by $1,000.00 (for example, an $8,600 account value divided by $1,000.00 = 8.6), then multiply the result by the number in the first line for a class of the Fund under the heading entitled "Expenses Paid During Period" to estimate the expenses you paid on your account during this period. The estimate of expenses does not include any fees or other expenses of any variable annuity or variable life insurance product. If they were, the estimate of expenses you paid during the period would be higher, and your ending account value would be lower. In addition, the Fund, as a shareholder in the underlying Fidelity Central Funds, will indirectly bear its pro-rata share of the fees and expenses incurred by the underlying Fidelity Central Funds. These fees and expenses are not included in the Fund's annualized expense ratio used to calculate the expense estimate in the table below.
Hypothetical Example for Comparison Purposes
The second line of the accompanying table for each class of the Fund provides information about hypothetical account values and hypothetical expenses based on a Class' actual expense ratio and an assumed rate of return of 5% per year before expenses, which is not the Class' actual return. The hypothetical account values and expenses may not be used to estimate the actual ending account balance or expenses you paid for the period. You may use this information to compare the ongoing costs of investing in the Fund and other funds. To do so, compare this 5% hypothetical example with the 5% hypothetical examples that appear in the shareholder reports of the other funds. The estimate of expenses does not include any fees or other expenses of any variable annuity or variable life insurance product. If they were, the estimate of expenses you paid during the period would be higher, and your ending account value would be lower. In addition, the Fund, as a shareholder in the underlying Fidelity Central Funds, will indirectly bear its pro-rata share of the fees and expenses incurred by the underlying Fidelity Central Funds. These fees and expenses are not included in the Fund's annualized expense ratio used to calculate the expense estimate in the table below.
Please note that the expenses shown in the table are meant to highlight your ongoing costs only and do not reflect any transaction costs. Therefore, the second line of the table is useful in comparing ongoing costs only, and will not help you determine the relative total costs of owning different funds.
| Annualized Expense Ratio | Beginning
Account Value
July 1, 2012 | Ending
Account Value
December 31, 2012 | Expenses Paid
During Period*
July 1, 2012 to December 31, 2012 |
Initial Class | .10% | | | |
Actual | | $ 1,000.00 | $ 1,059.00 | $ .52 |
HypotheticalA | | $ 1,000.00 | $ 1,024.63 | $ .51 |
Service Class | .20% | | | |
Actual | | $ 1,000.00 | $ 1,058.50 | $ 1.03 |
HypotheticalA | | $ 1,000.00 | $ 1,024.13 | $ 1.02 |
Service Class 2 | .35% | | | |
Actual | | $ 1,000.00 | $ 1,057.80 | $ 1.81 |
HypotheticalA | | $ 1,000.00 | $ 1,023.38 | $ 1.78 |
A 5% return per year before expenses
* Expenses are equal to each Class' annualized expense ratio, multiplied by the average account value over the period, multiplied by 184/366 (to reflect the one-half year period).
Annual Report
Investment Changes (Unaudited)
Top Ten Stocks as of December 31, 2012 |
| % of fund's
net assets | % of fund's net assets
6 months ago |
Apple, Inc. | 3.8 | 4.4 |
Exxon Mobil Corp. | 3.0 | 3.2 |
General Electric Co. | 1.7 | 1.8 |
Chevron Corp. | 1.6 | 1.7 |
IBM Corp. | 1.6 | 1.8 |
Microsoft Corp. | 1.6 | 1.8 |
Johnson & Johnson | 1.5 | 1.5 |
AT&T, Inc. | 1.5 | 1.7 |
Google, Inc. Class A | 1.4 | 1.2 |
Procter & Gamble Co. | 1.4 | 1.3 |
| 19.1 | |
Market Sectors as of December 31, 2012 |
| % of fund's
net assets | % of fund's net assets
6 months ago |
Information Technology | 18.7 | 19.7 |
Financials | 15.3 | 14.3 |
Health Care | 11.8 | 11.9 |
Consumer Discretionary | 11.3 | 10.9 |
Energy | 10.8 | 10.8 |
Consumer Staples | 10.4 | 11.2 |
Industrials | 9.9 | 10.4 |
Materials | 3.5 | 3.4 |
Utilities | 3.4 | 3.7 |
Telecommunication Services | 3.0 | 3.2 |
Asset Allocation |
To match the S&P 500® Index, the VIP Index 500 Portfolio seeks 100% investment exposure to stocks at all times. |
Annual Report
Investments December 31, 2012
Showing Percentage of Net Assets
Common Stocks - 98.1% |
| Shares | | Value |
CONSUMER DISCRETIONARY - 11.3% |
Auto Components - 0.3% |
BorgWarner, Inc. (a)(d) | 23,511 | | $ 1,683,858 |
Delphi Automotive PLC (a) | 59,326 | | 2,269,220 |
Johnson Controls, Inc. | 137,364 | | 4,217,075 |
The Goodyear Tire & Rubber Co. (a) | 49,209 | | 679,576 |
| | 8,849,729 |
Automobiles - 0.5% |
Ford Motor Co. | 765,900 | | 9,918,405 |
Harley-Davidson, Inc. | 45,451 | | 2,219,827 |
| | 12,138,232 |
Distributors - 0.1% |
Genuine Parts Co. | 31,163 | | 1,981,344 |
Diversified Consumer Services - 0.1% |
Apollo Group, Inc. Class A (non-vtg.) (a)(d) | 20,097 | | 420,429 |
H&R Block, Inc. | 54,498 | | 1,012,028 |
| | 1,432,457 |
Hotels, Restaurants & Leisure - 1.8% |
Carnival Corp. unit | 89,567 | | 3,293,379 |
Chipotle Mexican Grill, Inc. (a)(d) | 6,327 | | 1,882,029 |
Darden Restaurants, Inc. | 25,835 | | 1,164,383 |
International Game Technology | 53,455 | | 757,457 |
Marriott International, Inc. Class A | 49,442 | | 1,842,703 |
McDonald's Corp. | 201,682 | | 17,790,369 |
Starbucks Corp. | 149,377 | | 8,009,595 |
Starwood Hotels & Resorts Worldwide, Inc. | 39,369 | | 2,258,206 |
Wyndham Worldwide Corp. | 28,177 | | 1,499,298 |
Wynn Resorts Ltd. (d) | 15,962 | | 1,795,565 |
Yum! Brands, Inc. | 90,761 | | 6,026,530 |
| | 46,319,514 |
Household Durables - 0.3% |
D.R. Horton, Inc. | 56,095 | | 1,109,559 |
Garmin Ltd. (d) | 21,933 | | 895,305 |
Harman International Industries, Inc. | 13,626 | | 608,265 |
Leggett & Platt, Inc. (d) | 28,381 | | 772,531 |
Lennar Corp. Class A (d) | 32,977 | | 1,275,221 |
Newell Rubbermaid, Inc. | 57,774 | | 1,286,627 |
PulteGroup, Inc. (a)(d) | 68,292 | | 1,240,183 |
Whirlpool Corp. | 15,640 | | 1,591,370 |
| | 8,779,061 |
Internet & Catalog Retail - 1.1% |
Amazon.com, Inc. (a) | 72,794 | | 18,281,485 |
Expedia, Inc. | 18,694 | | 1,148,746 |
Netflix, Inc. (a) | 11,158 | | 1,035,239 |
Priceline.com, Inc. (a) | 10,017 | | 6,222,560 |
TripAdvisor, Inc. | 22,018 | | 923,875 |
| | 27,611,905 |
|
| Shares | | Value |
Leisure Equipment & Products - 0.1% |
Hasbro, Inc. (d) | 23,229 | | $ 833,921 |
Mattel, Inc. (d) | 68,930 | | 2,524,217 |
| | 3,358,138 |
Media - 3.5% |
Cablevision Systems Corp. - NY Group Class A | 43,347 | | 647,604 |
CBS Corp. Class B | 118,704 | | 4,516,687 |
Comcast Corp. Class A | 533,800 | | 19,953,444 |
DIRECTV (a) | 121,361 | | 6,087,468 |
Discovery Communications, Inc. (a)(d) | 47,982 | | 3,045,897 |
Gannett Co., Inc. | 46,160 | | 831,342 |
Interpublic Group of Companies, Inc. | 86,659 | | 954,982 |
McGraw-Hill Companies, Inc. | 55,785 | | 3,049,766 |
News Corp. Class A | 405,041 | | 10,344,747 |
Omnicom Group, Inc. | 53,070 | | 2,651,377 |
Scripps Networks Interactive, Inc. Class A | 17,460 | | 1,011,283 |
The Walt Disney Co. | 355,990 | | 17,724,742 |
Time Warner Cable, Inc. | 60,621 | | 5,891,755 |
Time Warner, Inc. | 190,208 | | 9,097,649 |
Viacom, Inc. Class B (non-vtg.) | 92,809 | | 4,894,747 |
Washington Post Co. Class B | 904 | | 330,150 |
| | 91,033,640 |
Multiline Retail - 0.8% |
Big Lots, Inc. (a)(d) | 11,630 | | 330,990 |
Dollar General Corp. (a) | 52,751 | | 2,325,792 |
Dollar Tree, Inc. (a) | 45,642 | | 1,851,240 |
Family Dollar Stores, Inc. | 19,242 | | 1,220,135 |
JCPenney Co., Inc. (d) | 28,628 | | 564,258 |
Kohl's Corp. | 42,509 | | 1,827,037 |
Macy's, Inc. | 79,404 | | 3,098,344 |
Nordstrom, Inc. | 30,549 | | 1,634,372 |
Target Corp. | 130,734 | | 7,735,531 |
| | 20,587,699 |
Specialty Retail - 2.1% |
Abercrombie & Fitch Co. Class A | 15,983 | | 766,705 |
AutoNation, Inc. (a) | 7,827 | | 310,732 |
AutoZone, Inc. (a) | 7,419 | | 2,629,516 |
Bed Bath & Beyond, Inc. (a) | 46,042 | | 2,574,208 |
Best Buy Co., Inc. (d) | 53,654 | | 635,800 |
CarMax, Inc. (a) | 45,965 | | 1,725,526 |
GameStop Corp. Class A (d) | 24,343 | | 610,766 |
Gap, Inc. | 59,711 | | 1,853,429 |
Home Depot, Inc. | 300,357 | | 18,577,080 |
Limited Brands, Inc. | 48,081 | | 2,262,692 |
Lowe's Companies, Inc. | 225,929 | | 8,024,998 |
O'Reilly Automotive, Inc. (a) | 23,026 | | 2,058,985 |
PetSmart, Inc. | 21,590 | | 1,475,461 |
Ross Stores, Inc. | 44,673 | | 2,419,043 |
Staples, Inc. (d) | 135,372 | | 1,543,241 |
Tiffany & Co., Inc. | 23,939 | | 1,372,662 |
Common Stocks - continued |
| Shares | | Value |
CONSUMER DISCRETIONARY - continued |
Specialty Retail - continued |
TJX Companies, Inc. | 146,495 | | $ 6,218,713 |
Urban Outfitters, Inc. (a) | 21,983 | | 865,251 |
| | 55,924,808 |
Textiles, Apparel & Luxury Goods - 0.6% |
Coach, Inc. | 56,989 | | 3,163,459 |
Fossil, Inc. (a) | 10,852 | | 1,010,321 |
NIKE, Inc. Class B | 146,624 | | 7,565,798 |
Ralph Lauren Corp. | 12,313 | | 1,845,965 |
VF Corp. | 17,703 | | 2,672,622 |
| | 16,258,165 |
TOTAL CONSUMER DISCRETIONARY | | 294,274,692 |
CONSUMER STAPLES - 10.4% |
Beverages - 2.3% |
Beam, Inc. | 31,963 | | 1,952,620 |
Brown-Forman Corp. Class B (non-vtg.) | 30,446 | | 1,925,710 |
Coca-Cola Enterprises, Inc. | 54,204 | | 1,719,893 |
Constellation Brands, Inc. Class A (sub. vtg.) (a) | 30,423 | | 1,076,670 |
Dr. Pepper Snapple Group, Inc. (d) | 41,806 | | 1,846,989 |
Molson Coors Brewing Co. Class B | 31,306 | | 1,339,584 |
Monster Beverage Corp. (a) | 29,950 | | 1,583,756 |
PepsiCo, Inc. | 310,737 | | 21,263,733 |
The Coca-Cola Co. | 774,855 | | 28,088,494 |
| | 60,797,449 |
Food & Staples Retailing - 2.3% |
Costco Wholesale Corp. | 86,867 | | 8,579,854 |
CVS Caremark Corp. | 250,440 | | 12,108,774 |
Kroger Co. | 103,214 | | 2,685,628 |
Safeway, Inc. (d) | 48,132 | | 870,708 |
Sysco Corp. | 118,080 | | 3,738,413 |
Wal-Mart Stores, Inc. | 336,001 | | 22,925,348 |
Walgreen Co. | 172,577 | | 6,387,075 |
Whole Foods Market, Inc. | 34,660 | | 3,165,498 |
| | 60,461,298 |
Food Products - 1.7% |
Archer Daniels Midland Co. | 132,295 | | 3,623,560 |
Campbell Soup Co. | 36,002 | | 1,256,110 |
ConAgra Foods, Inc. | 81,866 | | 2,415,047 |
Dean Foods Co. (a) | 37,210 | | 614,337 |
General Mills, Inc. | 129,615 | | 5,237,742 |
H.J. Heinz Co. (d) | 64,415 | | 3,715,457 |
Hormel Foods Corp. (d) | 26,932 | | 840,548 |
Kellogg Co. | 49,680 | | 2,774,628 |
Kraft Foods Group, Inc. | 119,005 | | 5,411,157 |
McCormick & Co., Inc. (non-vtg.) | 26,620 | | 1,691,169 |
Mead Johnson Nutrition Co. Class A | 40,784 | | 2,687,258 |
Mondelez International, Inc. | 356,987 | | 9,092,459 |
The Hershey Co. | 30,041 | | 2,169,561 |
|
| Shares | | Value |
The J.M. Smucker Co. | 21,789 | | $ 1,879,083 |
Tyson Foods, Inc. Class A | 57,656 | | 1,118,526 |
| | 44,526,642 |
Household Products - 2.1% |
Clorox Co. (d) | 26,209 | | 1,919,023 |
Colgate-Palmolive Co. | 89,219 | | 9,326,954 |
Kimberly-Clark Corp. | 78,603 | | 6,636,451 |
Procter & Gamble Co. | 549,262 | | 37,289,397 |
| | 55,171,825 |
Personal Products - 0.2% |
Avon Products, Inc. | 86,814 | | 1,246,649 |
Estee Lauder Companies, Inc. Class A | 48,224 | | 2,886,689 |
| | 4,133,338 |
Tobacco - 1.8% |
Altria Group, Inc. | 406,810 | | 12,781,970 |
Lorillard, Inc. | 26,003 | | 3,033,770 |
Philip Morris International, Inc. | 335,586 | | 28,068,413 |
Reynolds American, Inc. | 65,124 | | 2,698,087 |
| | 46,582,240 |
TOTAL CONSUMER STAPLES | | 271,672,792 |
ENERGY - 10.8% |
Energy Equipment & Services - 1.8% |
Baker Hughes, Inc. | 88,318 | | 3,606,907 |
Cameron International Corp. (a) | 49,561 | | 2,798,214 |
Diamond Offshore Drilling, Inc. (d) | 13,964 | | 948,993 |
Ensco PLC Class A | 46,662 | | 2,766,123 |
FMC Technologies, Inc. (a) | 47,756 | | 2,045,389 |
Halliburton Co. | 186,417 | | 6,466,806 |
Helmerich & Payne, Inc. (d) | 21,239 | | 1,189,596 |
Nabors Industries Ltd. (a) | 58,333 | | 842,912 |
National Oilwell Varco, Inc. | 85,758 | | 5,861,559 |
Noble Corp. | 50,767 | | 1,767,707 |
Rowan Companies PLC (a) | 24,949 | | 780,155 |
Schlumberger Ltd. | 266,687 | | 18,478,742 |
| | 47,553,103 |
Oil, Gas & Consumable Fuels - 9.0% |
Anadarko Petroleum Corp. | 100,393 | | 7,460,204 |
Apache Corp. | 78,602 | | 6,170,257 |
Cabot Oil & Gas Corp. | 42,153 | | 2,096,690 |
Chesapeake Energy Corp. | 104,144 | | 1,730,873 |
Chevron Corp. | 393,165 | | 42,516,863 |
ConocoPhillips | 243,851 | | 14,140,919 |
CONSOL Energy, Inc. | 45,757 | | 1,468,800 |
Denbury Resources, Inc. (a)(d) | 77,741 | | 1,259,404 |
Devon Energy Corp. | 75,663 | | 3,937,503 |
EOG Resources, Inc. | 54,415 | | 6,572,788 |
EQT Corp. | 30,055 | | 1,772,644 |
Exxon Mobil Corp. | 915,896 | | 79,270,799 |
Hess Corp. | 59,692 | | 3,161,288 |
Kinder Morgan Holding Co. LLC | 127,038 | | 4,488,253 |
Common Stocks - continued |
| Shares | | Value |
ENERGY - continued |
Oil, Gas & Consumable Fuels - continued |
Marathon Oil Corp. | 141,907 | | $ 4,350,869 |
Marathon Petroleum Corp. | 68,136 | | 4,292,568 |
Murphy Oil Corp. | 37,087 | | 2,208,531 |
Newfield Exploration Co. (a) | 27,164 | | 727,452 |
Noble Energy, Inc. | 35,735 | | 3,635,679 |
Occidental Petroleum Corp. | 162,753 | | 12,468,507 |
Peabody Energy Corp. | 53,914 | | 1,434,652 |
Phillips 66 | 125,714 | | 6,675,413 |
Pioneer Natural Resources Co. | 24,755 | | 2,638,635 |
QEP Resources, Inc. | 35,781 | | 1,083,091 |
Range Resources Corp. | 32,669 | | 2,052,593 |
Southwestern Energy Co. (a)(d) | 70,195 | | 2,345,215 |
Spectra Energy Corp. | 133,752 | | 3,662,130 |
Tesoro Corp. | 28,211 | | 1,242,695 |
The Williams Companies, Inc. | 135,361 | | 4,431,719 |
Valero Energy Corp. | 111,197 | | 3,794,042 |
WPX Energy, Inc. (d) | 40,014 | | 595,408 |
| | 233,686,484 |
TOTAL ENERGY | | 281,239,587 |
FINANCIALS - 15.3% |
Capital Markets - 1.9% |
Ameriprise Financial, Inc. | 41,345 | | 2,589,437 |
Bank of New York Mellon Corp. | 234,754 | | 6,033,178 |
BlackRock, Inc. Class A | 25,202 | | 5,209,505 |
Charles Schwab Corp. | 220,286 | | 3,163,307 |
E*TRADE Financial Corp. (a) | 51,718 | | 462,876 |
Franklin Resources, Inc. | 27,720 | | 3,484,404 |
Goldman Sachs Group, Inc. | 88,740 | | 11,319,674 |
Invesco Ltd. | 89,201 | | 2,327,254 |
Legg Mason, Inc. | 23,548 | | 605,655 |
Morgan Stanley | 277,626 | | 5,308,209 |
Northern Trust Corp. | 43,836 | | 2,198,814 |
State Street Corp. | 93,372 | | 4,389,418 |
T. Rowe Price Group, Inc. | 51,198 | | 3,334,526 |
| | 50,426,257 |
Commercial Banks - 2.7% |
BB&T Corp. | 140,546 | | 4,091,294 |
Comerica, Inc. | 38,237 | | 1,160,111 |
Fifth Third Bancorp | 180,286 | | 2,738,544 |
First Horizon National Corp. | 49,645 | | 491,982 |
Huntington Bancshares, Inc. | 171,853 | | 1,098,141 |
KeyCorp | 187,554 | | 1,579,205 |
M&T Bank Corp. (d) | 24,429 | | 2,405,524 |
PNC Financial Services Group, Inc. | 106,240 | | 6,194,854 |
Regions Financial Corp. | 283,849 | | 2,021,005 |
SunTrust Banks, Inc. | 108,242 | | 3,068,661 |
U.S. Bancorp | 377,735 | | 12,064,856 |
|
| Shares | | Value |
Wells Fargo & Co. | 983,480 | | $ 33,615,346 |
Zions Bancorporation (d) | 36,999 | | 791,779 |
| | 71,321,302 |
Consumer Finance - 0.9% |
American Express Co. | 195,577 | | 11,241,766 |
Capital One Financial Corp. | 116,851 | | 6,769,178 |
Discover Financial Services | 101,401 | | 3,909,009 |
SLM Corp. | 92,840 | | 1,590,349 |
| | 23,510,302 |
Diversified Financial Services - 3.5% |
Bank of America Corp. | 2,165,137 | | 25,115,589 |
Citigroup, Inc. | 589,095 | | 23,304,598 |
CME Group, Inc. | 61,614 | | 3,124,446 |
IntercontinentalExchange, Inc. (a) | 14,608 | | 1,808,616 |
JPMorgan Chase & Co. | 763,639 | | 33,577,207 |
Leucadia National Corp. | 39,797 | | 946,771 |
Moody's Corp. | 38,956 | | 1,960,266 |
NYSE Euronext | 48,815 | | 1,539,625 |
The NASDAQ Stock Market, Inc. | 23,525 | | 588,360 |
| | 91,965,478 |
Insurance - 3.9% |
ACE Ltd. | 68,262 | | 5,447,308 |
AFLAC, Inc. | 94,196 | | 5,003,692 |
Allstate Corp. | 96,781 | | 3,887,693 |
American International Group, Inc. (a) | 296,565 | | 10,468,745 |
Aon PLC | 64,015 | | 3,559,234 |
Assurant, Inc. | 15,811 | | 548,642 |
Berkshire Hathaway, Inc. Class B (a) | 366,422 | | 32,868,053 |
Cincinnati Financial Corp. | 29,413 | | 1,151,813 |
Genworth Financial, Inc. Class A (a) | 98,801 | | 741,996 |
Hartford Financial Services Group, Inc. | 87,647 | | 1,966,799 |
Lincoln National Corp. | 55,246 | | 1,430,871 |
Loews Corp. | 62,464 | | 2,545,408 |
Marsh & McLennan Companies, Inc. | 109,358 | | 3,769,570 |
MetLife, Inc. | 219,173 | | 7,219,559 |
Principal Financial Group, Inc. | 55,438 | | 1,581,092 |
Progressive Corp. (d) | 111,765 | | 2,358,242 |
Prudential Financial, Inc. | 93,210 | | 4,970,889 |
The Chubb Corp. | 52,620 | | 3,963,338 |
The Travelers Companies, Inc. | 76,627 | | 5,503,351 |
Torchmark Corp. | 19,070 | | 985,347 |
Unum Group | 55,268 | | 1,150,680 |
XL Group PLC Class A | 60,387 | | 1,513,298 |
| | 102,635,620 |
Real Estate Investment Trusts - 2.2% |
American Tower Corp. | 79,420 | | 6,136,783 |
Apartment Investment & Management Co. Class A | 29,238 | | 791,180 |
AvalonBay Communities, Inc. | 22,977 | | 3,115,451 |
Boston Properties, Inc. | 30,306 | | 3,206,678 |
Equity Residential (SBI) | 64,632 | | 3,662,695 |
HCP, Inc. | 90,813 | | 4,102,931 |
Common Stocks - continued |
| Shares | | Value |
FINANCIALS - continued |
Real Estate Investment Trusts - continued |
Health Care REIT, Inc. | 52,166 | | $ 3,197,254 |
Host Hotels & Resorts, Inc. | 145,590 | | 2,281,395 |
Kimco Realty Corp. | 81,885 | | 1,582,018 |
Plum Creek Timber Co., Inc. (d) | 32,458 | | 1,440,161 |
Prologis, Inc. | 92,589 | | 3,378,573 |
Public Storage | 28,964 | | 4,198,621 |
Simon Property Group, Inc. | 62,143 | | 9,824,187 |
Ventas, Inc. | 59,372 | | 3,842,556 |
Vornado Realty Trust | 34,028 | | 2,724,962 |
Weyerhaeuser Co. | 108,785 | | 3,026,399 |
| | 56,511,844 |
Real Estate Management & Development - 0.1% |
CBRE Group, Inc. (a) | 60,607 | | 1,206,079 |
Thrifts & Mortgage Finance - 0.1% |
Hudson City Bancorp, Inc. | 95,495 | | 776,374 |
People's United Financial, Inc. (d) | 69,833 | | 844,281 |
| | 1,620,655 |
TOTAL FINANCIALS | | 399,197,537 |
HEALTH CARE - 11.8% |
Biotechnology - 1.6% |
Alexion Pharmaceuticals, Inc. (a) | 39,029 | | 3,661,310 |
Amgen, Inc. | 154,149 | | 13,306,142 |
Biogen Idec, Inc. (a) | 47,528 | | 6,970,932 |
Celgene Corp. (a) | 84,971 | | 6,688,917 |
Gilead Sciences, Inc. (a) | 152,199 | | 11,179,017 |
| | 41,806,318 |
Health Care Equipment & Supplies - 1.7% |
Baxter International, Inc. | 110,361 | | 7,356,664 |
Becton, Dickinson & Co. | 39,566 | | 3,093,666 |
Boston Scientific Corp. (a) | 275,810 | | 1,580,391 |
C.R. Bard, Inc. | 15,378 | | 1,503,046 |
CareFusion Corp. (a) | 44,579 | | 1,274,068 |
Covidien PLC | 95,096 | | 5,490,843 |
DENTSPLY International, Inc. | 28,511 | | 1,129,321 |
Edwards Lifesciences Corp. (a)(d) | 23,184 | | 2,090,501 |
Intuitive Surgical, Inc. (a) | 7,988 | | 3,917,076 |
Medtronic, Inc. | 203,165 | | 8,333,828 |
St. Jude Medical, Inc. | 61,908 | | 2,237,355 |
Stryker Corp. | 58,046 | | 3,182,082 |
Varian Medical Systems, Inc. (a)(d) | 21,977 | | 1,543,664 |
Zimmer Holdings, Inc. | 34,854 | | 2,323,368 |
| | 45,055,873 |
Health Care Providers & Services - 1.9% |
Aetna, Inc. | 67,213 | | 3,111,962 |
AmerisourceBergen Corp. | 47,303 | | 2,042,544 |
Cardinal Health, Inc. | 68,256 | | 2,810,782 |
CIGNA Corp. | 57,431 | | 3,070,261 |
Coventry Health Care, Inc. | 27,019 | | 1,211,262 |
|
| Shares | | Value |
DaVita, Inc. (a) | 16,839 | | $ 1,861,215 |
Express Scripts Holding Co. (a) | 164,001 | | 8,856,054 |
Humana, Inc. | 31,785 | | 2,181,405 |
Laboratory Corp. of America Holdings (a) | 19,004 | | 1,646,126 |
McKesson Corp. | 47,417 | | 4,597,552 |
Patterson Companies, Inc. | 16,804 | | 575,201 |
Quest Diagnostics, Inc. | 31,934 | | 1,860,794 |
Tenet Healthcare Corp. (a) | 21,389 | | 694,501 |
UnitedHealth Group, Inc. | 205,201 | | 11,130,102 |
WellPoint, Inc. | 60,999 | | 3,716,059 |
| | 49,365,820 |
Health Care Technology - 0.1% |
Cerner Corp. (a)(d) | 29,295 | | 2,274,464 |
Life Sciences Tools & Services - 0.5% |
Agilent Technologies, Inc. | 69,996 | | 2,865,636 |
Life Technologies Corp. (a) | 34,563 | | 1,696,352 |
PerkinElmer, Inc. | 23,057 | | 731,829 |
Thermo Fisher Scientific, Inc. | 72,361 | | 4,615,185 |
Waters Corp. (a) | 17,468 | | 1,521,812 |
| | 11,430,814 |
Pharmaceuticals - 6.0% |
Abbott Laboratories | 317,530 | | 20,798,215 |
Allergan, Inc. | 61,779 | | 5,666,988 |
Bristol-Myers Squibb Co. | 331,596 | | 10,806,714 |
Eli Lilly & Co. | 205,142 | | 10,117,603 |
Forest Laboratories, Inc. (a) | 47,026 | | 1,660,958 |
Hospira, Inc. (a)(d) | 33,190 | | 1,036,856 |
Johnson & Johnson | 556,701 | | 39,024,740 |
Merck & Co., Inc. | 610,700 | | 25,002,058 |
Mylan, Inc. (a) | 81,866 | | 2,249,678 |
Perrigo Co. | 17,728 | | 1,844,244 |
Pfizer, Inc. | 1,479,019 | | 37,093,797 |
Watson Pharmaceuticals, Inc. (a) | 25,664 | | 2,207,104 |
| | 157,508,955 |
TOTAL HEALTH CARE | | 307,442,244 |
INDUSTRIALS - 9.9% |
Aerospace & Defense - 2.3% |
General Dynamics Corp. | 66,670 | | 4,618,231 |
Honeywell International, Inc. | 157,366 | | 9,988,020 |
L-3 Communications Holdings, Inc. | 18,895 | | 1,447,735 |
Lockheed Martin Corp. | 53,953 | | 4,979,322 |
Northrop Grumman Corp. | 49,306 | | 3,332,099 |
Precision Castparts Corp. | 29,236 | | 5,537,883 |
Raytheon Co. | 66,265 | | 3,814,213 |
Rockwell Collins, Inc. (d) | 28,166 | | 1,638,416 |
Textron, Inc. | 56,614 | | 1,403,461 |
The Boeing Co. | 136,333 | | 10,274,055 |
United Technologies Corp. | 169,389 | | 13,891,592 |
| | 60,925,027 |
Common Stocks - continued |
| Shares | | Value |
INDUSTRIALS - continued |
Air Freight & Logistics - 0.7% |
C.H. Robinson Worldwide, Inc. | 32,381 | | $ 2,047,127 |
Expeditors International of Washington, Inc. | 41,981 | | 1,660,349 |
FedEx Corp. | 58,679 | | 5,382,038 |
United Parcel Service, Inc. Class B | 143,734 | | 10,597,508 |
| | 19,687,022 |
Airlines - 0.1% |
Southwest Airlines Co. | 148,248 | | 1,518,060 |
Building Products - 0.0% |
Masco Corp. | 71,735 | | 1,195,105 |
Commercial Services & Supplies - 0.5% |
ADT Corp. | 46,699 | | 2,171,037 |
Avery Dennison Corp. | 20,007 | | 698,644 |
Cintas Corp. | 21,327 | | 872,274 |
Iron Mountain, Inc. | 33,509 | | 1,040,454 |
Pitney Bowes, Inc. (d) | 40,328 | | 429,090 |
Republic Services, Inc. | 60,075 | | 1,762,000 |
Stericycle, Inc. (a) | 17,254 | | 1,609,281 |
Tyco International Ltd. | 93,555 | | 2,736,484 |
Waste Management, Inc. | 87,598 | | 2,955,557 |
| | 14,274,821 |
Construction & Engineering - 0.2% |
Fluor Corp. | 33,449 | | 1,964,794 |
Jacobs Engineering Group, Inc. (a) | 26,130 | | 1,112,354 |
Quanta Services, Inc. (a) | 42,820 | | 1,168,558 |
| | 4,245,706 |
Electrical Equipment - 0.7% |
Eaton Corp. PLC | 92,762 | | 5,027,700 |
Emerson Electric Co. | 145,467 | | 7,703,932 |
Rockwell Automation, Inc. | 27,985 | | 2,350,460 |
Roper Industries, Inc. | 19,765 | | 2,203,402 |
| | 17,285,494 |
Industrial Conglomerates - 2.4% |
3M Co. | 127,878 | | 11,873,472 |
Danaher Corp. | 116,886 | | 6,533,927 |
General Electric Co. | 2,106,523 | | 44,215,918 |
| | 62,623,317 |
Machinery - 1.9% |
Caterpillar, Inc. | 131,364 | | 11,767,587 |
Cummins, Inc. | 35,508 | | 3,847,292 |
Deere & Co. | 78,679 | | 6,799,439 |
Dover Corp. | 35,960 | | 2,362,932 |
Flowserve Corp. | 10,041 | | 1,474,019 |
Illinois Tool Works, Inc. | 85,651 | | 5,208,437 |
Ingersoll-Rand PLC | 56,234 | | 2,696,983 |
Joy Global, Inc. | 21,269 | | 1,356,537 |
PACCAR, Inc. | 70,918 | | 3,206,203 |
Pall Corp. | 22,316 | | 1,344,762 |
Parker Hannifin Corp. | 29,968 | | 2,549,078 |
|
| Shares | | Value |
Pentair Ltd. (d) | 42,244 | | $ 2,076,293 |
Snap-On, Inc. | 11,698 | | 924,025 |
Stanley Black & Decker, Inc. | 33,906 | | 2,508,027 |
Xylem, Inc. | 37,323 | | 1,011,453 |
| | 49,133,067 |
Professional Services - 0.1% |
Dun & Bradstreet Corp. (d) | 8,952 | | 704,075 |
Equifax, Inc. | 24,025 | | 1,300,233 |
Robert Half International, Inc. | 28,272 | | 899,615 |
| | 2,903,923 |
Road & Rail - 0.8% |
CSX Corp. | 207,187 | | 4,087,800 |
Norfolk Southern Corp. | 63,488 | | 3,926,098 |
Ryder System, Inc. | 10,268 | | 512,681 |
Union Pacific Corp. | 94,495 | | 11,879,911 |
| | 20,406,490 |
Trading Companies & Distributors - 0.2% |
Fastenal Co. (d) | 54,169 | | 2,529,151 |
W.W. Grainger, Inc. | 12,006 | | 2,429,654 |
| | 4,958,805 |
TOTAL INDUSTRIALS | | 259,156,837 |
INFORMATION TECHNOLOGY - 18.7% |
Communications Equipment - 1.9% |
Cisco Systems, Inc. | 1,066,540 | | 20,957,511 |
F5 Networks, Inc. (a) | 15,880 | | 1,542,742 |
Harris Corp. | 22,813 | | 1,116,924 |
JDS Uniphase Corp. (a) | 46,997 | | 636,339 |
Juniper Networks, Inc. (a) | 103,570 | | 2,037,222 |
Motorola Solutions, Inc. | 56,348 | | 3,137,457 |
QUALCOMM, Inc. | 342,311 | | 21,230,128 |
| | 50,658,323 |
Computers & Peripherals - 4.9% |
Apple, Inc. | 188,969 | | 100,726,143 |
Dell, Inc. | 293,151 | | 2,969,620 |
EMC Corp. (a) | 423,192 | | 10,706,758 |
Hewlett-Packard Co. | 394,969 | | 5,628,308 |
NetApp, Inc. (a) | 71,973 | | 2,414,694 |
SanDisk Corp. (a) | 48,571 | | 2,115,753 |
Seagate Technology (d) | 67,491 | | 2,057,126 |
Western Digital Corp. | 44,042 | | 1,871,345 |
| | 128,489,747 |
Electronic Equipment & Components - 0.4% |
Amphenol Corp. Class A | 32,210 | | 2,083,987 |
Corning, Inc. | 296,874 | | 3,746,550 |
FLIR Systems, Inc. | 30,138 | | 672,379 |
Jabil Circuit, Inc. | 37,577 | | 724,860 |
Molex, Inc. | 27,755 | | 758,544 |
TE Connectivity Ltd. | 84,888 | | 3,151,043 |
| | 11,137,363 |
Common Stocks - continued |
| Shares | | Value |
INFORMATION TECHNOLOGY - continued |
Internet Software & Services - 2.2% |
Akamai Technologies, Inc. (a) | 35,650 | | $ 1,458,442 |
eBay, Inc. (a) | 233,946 | | 11,935,925 |
Google, Inc. Class A (a) | 53,467 | | 37,927,886 |
VeriSign, Inc. (a)(d) | 31,189 | | 1,210,757 |
Yahoo!, Inc. (a) | 209,072 | | 4,160,533 |
| | 56,693,543 |
IT Services - 3.8% |
Accenture PLC Class A | 128,269 | | 8,529,889 |
Automatic Data Processing, Inc. | 97,524 | | 5,559,843 |
Cognizant Technology Solutions Corp. Class A (a) | 60,304 | | 4,465,511 |
Computer Sciences Corp. | 31,211 | | 1,250,001 |
Fidelity National Information Services, Inc. | 50,064 | | 1,742,728 |
Fiserv, Inc. (a) | 26,813 | | 2,119,031 |
IBM Corp. | 213,365 | | 40,870,066 |
MasterCard, Inc. Class A | 21,467 | | 10,546,308 |
Paychex, Inc. (d) | 64,981 | | 2,023,508 |
SAIC, Inc. | 57,001 | | 645,251 |
Teradata Corp. (a) | 33,969 | | 2,102,341 |
The Western Union Co. | 119,843 | | 1,631,063 |
Total System Services, Inc. | 32,278 | | 691,395 |
Visa, Inc. Class A | 104,724 | | 15,874,064 |
| | 98,050,999 |
Office Electronics - 0.1% |
Xerox Corp. | 253,846 | | 1,731,230 |
Semiconductors & Semiconductor Equipment - 2.0% |
Advanced Micro Devices, Inc. (a)(d) | 121,566 | | 291,758 |
Altera Corp. | 64,398 | | 2,217,867 |
Analog Devices, Inc. | 60,538 | | 2,546,228 |
Applied Materials, Inc. | 240,590 | | 2,752,350 |
Broadcom Corp. Class A | 104,234 | | 3,461,611 |
First Solar, Inc. (a)(d) | 12,063 | | 372,505 |
Intel Corp. | 999,596 | | 20,621,665 |
KLA-Tencor Corp. | 33,450 | | 1,597,572 |
Lam Research Corp. (a) | 34,420 | | 1,243,595 |
Linear Technology Corp. | 46,483 | | 1,594,367 |
LSI Corp. (a) | 111,170 | | 787,084 |
Microchip Technology, Inc. (d) | 39,093 | | 1,274,041 |
Micron Technology, Inc. (a) | 204,411 | | 1,298,010 |
NVIDIA Corp. | 125,522 | | 1,542,665 |
Teradyne, Inc. (a)(d) | 37,736 | | 637,361 |
Texas Instruments, Inc. | 225,151 | | 6,966,172 |
Xilinx, Inc. | 52,415 | | 1,881,699 |
| | 51,086,550 |
Software - 3.4% |
Adobe Systems, Inc. (a) | 99,448 | | 3,747,201 |
Autodesk, Inc. (a) | 45,138 | | 1,595,628 |
BMC Software, Inc. (a)(d) | 28,635 | | 1,135,664 |
CA Technologies, Inc. | 67,352 | | 1,480,397 |
|
| Shares | | Value |
Citrix Systems, Inc. (a) | 37,508 | | $ 2,466,151 |
Electronic Arts, Inc. (a) | 61,297 | | 890,645 |
Intuit, Inc. | 55,904 | | 3,326,288 |
Microsoft Corp. | 1,521,655 | | 40,673,838 |
Oracle Corp. | 755,093 | | 25,159,699 |
Red Hat, Inc. (a) | 38,836 | | 2,056,755 |
salesforce.com, Inc. (a)(d) | 26,243 | | 4,411,448 |
Symantec Corp. (a) | 139,393 | | 2,621,982 |
| | 89,565,696 |
TOTAL INFORMATION TECHNOLOGY | | 487,413,451 |
MATERIALS - 3.5% |
Chemicals - 2.5% |
Air Products & Chemicals, Inc. | 42,758 | | 3,592,527 |
Airgas, Inc. | 14,120 | | 1,289,015 |
CF Industries Holdings, Inc. | 12,630 | | 2,565,911 |
E.I. du Pont de Nemours & Co. | 187,318 | | 8,423,690 |
Eastman Chemical Co. | 30,809 | | 2,096,552 |
Ecolab, Inc. | 52,956 | | 3,807,536 |
FMC Corp. | 27,600 | | 1,615,152 |
International Flavors & Fragrances, Inc. | 16,385 | | 1,090,258 |
LyondellBasell Industries NV Class A | 76,259 | | 4,353,626 |
Monsanto Co. | 107,392 | | 10,164,653 |
PPG Industries, Inc. | 30,805 | | 4,169,457 |
Praxair, Inc. | 59,688 | | 6,532,852 |
Sherwin-Williams Co. | 17,191 | | 2,644,320 |
Sigma Aldrich Corp. (d) | 24,171 | | 1,778,502 |
The Dow Chemical Co. | 240,906 | | 7,786,082 |
The Mosaic Co. | 55,579 | | 3,147,439 |
| | 65,057,572 |
Construction Materials - 0.0% |
Vulcan Materials Co. (d) | 26,034 | | 1,355,070 |
Containers & Packaging - 0.1% |
Ball Corp. | 30,906 | | 1,383,044 |
Bemis Co., Inc. | 20,749 | | 694,262 |
Owens-Illinois, Inc. (a) | 33,051 | | 702,995 |
Sealed Air Corp. | 39,075 | | 684,203 |
| | 3,464,504 |
Metals & Mining - 0.7% |
Alcoa, Inc. | 214,383 | | 1,860,844 |
Allegheny Technologies, Inc. | 21,558 | | 654,501 |
Cliffs Natural Resources, Inc. (d) | 28,625 | | 1,103,780 |
Freeport-McMoRan Copper & Gold, Inc. | 190,702 | | 6,522,008 |
Newmont Mining Corp. | 99,725 | | 4,631,229 |
Nucor Corp. | 63,808 | | 2,755,229 |
Titanium Metals Corp. | 14,732 | | 243,225 |
United States Steel Corp. (d) | 28,984 | | 691,848 |
| | 18,462,664 |
Common Stocks - continued |
| Shares | | Value |
MATERIALS - continued |
Paper & Forest Products - 0.2% |
International Paper Co. | 88,217 | | $ 3,514,565 |
MeadWestvaco Corp. | 35,115 | | 1,119,115 |
| | 4,633,680 |
TOTAL MATERIALS | | 92,973,490 |
TELECOMMUNICATION SERVICES - 3.0% |
Diversified Telecommunication Services - 2.7% |
AT&T, Inc. | 1,141,018 | | 38,463,717 |
CenturyLink, Inc. (d) | 125,404 | | 4,905,804 |
Frontier Communications Corp. (d) | 200,571 | | 858,444 |
Verizon Communications, Inc. | 573,305 | | 24,806,907 |
Windstream Corp. (d) | 118,145 | | 978,241 |
| | 70,013,113 |
Wireless Telecommunication Services - 0.3% |
Crown Castle International Corp. (a) | 58,891 | | 4,249,575 |
MetroPCS Communications, Inc. (a) | 63,634 | | 632,522 |
Sprint Nextel Corp. (a) | 603,577 | | 3,422,282 |
| | 8,304,379 |
TOTAL TELECOMMUNICATION SERVICES | | 78,317,492 |
UTILITIES - 3.4% |
Electric Utilities - 2.0% |
American Electric Power Co., Inc. | 97,478 | | 4,160,361 |
Duke Energy Corp. | 141,471 | | 9,025,850 |
Edison International | 65,450 | | 2,957,686 |
Entergy Corp. | 35,704 | | 2,276,130 |
Exelon Corp. | 171,611 | | 5,103,711 |
FirstEnergy Corp. | 84,013 | | 3,508,383 |
NextEra Energy, Inc. | 85,015 | | 5,882,188 |
Northeast Utilities | 63,066 | | 2,464,619 |
Pepco Holdings, Inc. | 46,097 | | 903,962 |
Pinnacle West Capital Corp. | 22,037 | | 1,123,446 |
PPL Corp. | 116,855 | | 3,345,559 |
Southern Co. | 175,593 | | 7,517,136 |
Xcel Energy, Inc. | 97,955 | | 2,616,378 |
| | 50,885,409 |
Gas Utilities - 0.1% |
AGL Resources, Inc. | 23,660 | | 945,690 |
ONEOK, Inc. | 41,103 | | 1,757,153 |
| | 2,702,843 |
Independent Power Producers & Energy Traders - 0.1% |
NRG Energy, Inc. (d) | 64,742 | | 1,488,419 |
The AES Corp. | 124,043 | | 1,327,260 |
| | 2,815,679 |
Multi-Utilities - 1.2% |
Ameren Corp. | 48,741 | | 1,497,324 |
CenterPoint Energy, Inc. | 85,866 | | 1,652,921 |
|
| Shares | | Value |
CMS Energy Corp. | 53,015 | | $ 1,292,506 |
Consolidated Edison, Inc. (d) | 58,833 | | 3,267,585 |
Dominion Resources, Inc. | 115,430 | | 5,979,274 |
DTE Energy Co. | 34,567 | | 2,075,748 |
Integrys Energy Group, Inc. | 15,650 | | 817,243 |
NiSource, Inc. | 62,225 | | 1,548,780 |
PG&E Corp. | 86,377 | | 3,470,628 |
Public Service Enterprise Group, Inc. | 101,630 | | 3,109,878 |
SCANA Corp. | 26,475 | | 1,208,319 |
Sempra Energy | 45,183 | | 3,205,282 |
TECO Energy, Inc. (d) | 40,898 | | 685,450 |
Wisconsin Energy Corp. | 46,217 | | 1,703,096 |
| | 31,514,034 |
TOTAL UTILITIES | | 87,917,965 |
TOTAL COMMON STOCKS (Cost $1,504,713,521) |
2,559,606,087
|
U.S. Treasury Obligations - 0.1% |
| Principal Amount | | |
U.S. Treasury Bills, yield at date of purchase 0.11% to 0.14% 4/11/13 to 4/25/13 (e)
(Cost $2,149,191) | | $ 2,150,000 | |
2,149,548
|
Money Market Funds - 4.1% |
| Shares | | |
Fidelity Cash Central Fund, 0.18% (b) | 36,551,234 | | 36,551,234 |
Fidelity Securities Lending Cash Central Fund, 0.18% (b)(c) | 70,915,562 | | 70,915,562 |
TOTAL MONEY MARKET FUNDS (Cost $107,466,796) |
107,466,796
|
TOTAL INVESTMENT PORTFOLIO - 102.3% (Cost $1,614,329,508) | 2,669,222,431 |
NET OTHER ASSETS (LIABILITIES) - (2.3)% | (59,311,782) |
NET ASSETS - 100% | $ 2,609,910,649 |
Futures Contracts |
| Expiration Date | | Underlying Face Amount at Value | | Unrealized Appreciation/(Depreciation) |
Purchased |
Equity Index Contracts |
114 CME E-mini S&P 500 Index Contracts | March 2013 | | $ 40,472,850 | | $ 186,242 |
48 CME E-mini S&P 500 Index Contracts | March 2013 | | 3,408,240 | | 8,616 |
TOTAL EQUITY INDEX CONTRACTS | | $ 43,881,090 | | $ 194,858 |
The face value of futures purchased as a percentage of net assets is 1.7% |
Legend |
(a) Non-income producing |
(b) Affiliated fund that is available only to investment companies and other accounts managed by Fidelity Investments. The rate quoted is the annualized seven-day yield of the fund at period end. A complete unaudited listing of the fund's holdings as of its most recent quarter end is available upon request. In addition, each Fidelity Central Fund's financial statements, which are not covered by the Fund's Report of Independent Registered Public Accounting Firm, are available on the SEC's website or upon request. |
(c) Investment made with cash collateral received from securities on loan. |
(d) Security or a portion of the security is on loan at period end. |
(e) Security or a portion of the security was pledged to cover margin requirements for futures contracts. At the period end, the value of securities pledged amounted to $2,149,548. |
Affiliated Central Funds |
Information regarding fiscal year to date income earned by the Fund from investments in Fidelity Central Funds is as follows: |
Fund | Income earned |
Fidelity Cash Central Fund | $ 40,110 |
Fidelity Securities Lending Cash Central Fund | 363,068 |
Total | $ 403,178 |
Other Information |
The following is a summary of the inputs used, as of December 31, 2012, involving the Fund's assets and liabilities carried at fair value. The inputs or methodology used for valuing securities may not be an indication of the risk associated with investing in those securities. For more information on valuation inputs, and their aggregation into the levels used in the table below, please refer to the Investment Valuation section in the accompanying Notes to Financial Statements. |
Valuation Inputs at Reporting Date: |
Description | Total | Level 1 | Level 2 | Level 3 |
Investments in Securities: | | | | |
Equities: | | | | |
Consumer Discretionary | $ 294,274,692 | $ 294,274,692 | $ - | $ - |
Consumer Staples | 271,672,792 | 271,672,792 | - | - |
Energy | 281,239,587 | 281,239,587 | - | - |
Financials | 399,197,537 | 399,197,537 | - | - |
Health Care | 307,442,244 | 307,442,244 | - | - |
Industrials | 259,156,837 | 259,156,837 | - | - |
Information Technology | 487,413,451 | 487,413,451 | - | - |
Materials | 92,973,490 | 92,973,490 | - | - |
Telecommunication Services | 78,317,492 | 78,317,492 | - | - |
Utilities | 87,917,965 | 87,917,965 | - | - |
U.S. Government and Government Agency Obligations | 2,149,548 | - | 2,149,548 | - |
Money Market Funds | 107,466,796 | 107,466,796 | - | - |
Total Investments in Securities: | $ 2,669,222,431 | $ 2,667,072,883 | $ 2,149,548 | $ - |
Derivative Instruments: | | | | |
Assets | | | | |
Futures Contracts | $ 194,858 | $ 194,858 | $ - | $ - |
Value of Derivative Instruments |
The following table is a summary of the Fund's value of derivative instruments by primary risk exposure as of December 31, 2012. For additional information on derivative instruments, please refer to the Derivative Instruments section in the accompanying Notes to Financial Statements. |
Primary Risk Exposure /
Derivative Type | Value |
| Asset | Liability |
Equity Risk | | |
Futures Contracts (a) | $ 194,858 | $ - |
Total Value of Derivatives | $ 194,858 | $ - |
(a) Reflects cumulative appreciation/(depreciation) on futures contracts as disclosed on the Schedule of Investments. Only the period end variation margin is separately disclosed on the Statement of Assets and Liabilities. |
See accompanying notes which are an integral part of the financial statements.
Annual Report
Statement of Assets and Liabilities
| December 31, 2012 |
| | |
Assets | | |
Investment in securities, at value (including securities loaned of $70,459,656) - See accompanying schedule: Unaffiliated issuers (cost $1,506,862,712) | $ 2,561,755,635 | |
Fidelity Central Funds (cost $107,466,796) | 107,466,796 | |
Total Investments (cost $1,614,329,508) | | $ 2,669,222,431 |
Segregated cash with broker for futures contracts | | 576,000 |
Cash | | 1,437 |
Receivable for investments sold | | 380,255 |
Receivable for fund shares sold | | 9,095,039 |
Dividends receivable | | 2,857,044 |
Distributions receivable from Fidelity Central Funds | | 33,797 |
Receivable for daily variation margin on futures contracts | | 1,173,882 |
Other receivables | | 35,309 |
Total assets | | 2,683,375,194 |
| | |
Liabilities | | |
Payable for fund shares redeemed | $ 2,237,705 | |
Accrued management fee | 96,882 | |
Distribution and service plan fees payable | 60,614 | |
Other affiliated payables | 118,470 | |
Other payables and accrued expenses | 35,312 | |
Collateral on securities loaned, at value | 70,915,562 | |
Total liabilities | | 73,464,545 |
| | |
Net Assets | | $ 2,609,910,649 |
Net Assets consist of: | | |
Paid in capital | | $ 1,534,913,332 |
Undistributed net investment income | | 152,302 |
Accumulated undistributed net realized gain (loss) on investments | | 19,757,234 |
Net unrealized appreciation (depreciation) on investments | | 1,055,087,781 |
Net Assets | | $ 2,609,910,649 |
Statement of Assets and Liabilities - continued
| December 31, 2012 |
| | |
Initial Class:
Net Asset Value, offering price and redemption price per share ($2,294,364,379 ÷ 15,832,633 shares) | | $ 144.91 |
| | |
Service Class:
Net Asset Value, offering price and redemption price per share
($41,442,608 ÷ 286,738 shares) | | $ 144.53 |
| | |
Service Class 2:
Net Asset Value, offering price and redemption price per share
($274,103,662 ÷ 1,908,290 shares) | | $ 143.64 |
See accompanying notes which are an integral part of the financial statements.
Annual Report
Statement of Operations
| Year ended December 31, 2012 |
| | |
Investment Income | | |
Dividends | | $ 56,222,015 |
Interest | | 1,674 |
Income from Fidelity Central Funds | | 403,178 |
Total income | | 56,626,867 |
| | |
Expenses | | |
Management fee | $ 1,105,856 | |
Transfer agent fees | 1,351,601 | |
Distribution and service plan fees | 697,483 | |
Independent trustees' compensation | 16,371 | |
Miscellaneous | 6,444 | |
Total expenses before reductions | 3,177,755 | |
Expense reductions | (60) | 3,177,695 |
Net investment income (loss) | | 53,449,172 |
Realized and Unrealized Gain (Loss) Net realized gain (loss) on: | | |
Investment securities: | | |
Unaffiliated issuers | 20,163,457 | |
Futures contracts | 5,858,042 | |
Total net realized gain (loss) | | 26,021,499 |
Change in net unrealized appreciation (depreciation) on: Investment securities | 268,324,952 | |
Futures contracts | (264,914) | |
Total change in net unrealized appreciation (depreciation) | | 268,060,038 |
Net gain (loss) | | 294,081,537 |
Net increase (decrease) in net assets resulting from operations | | $ 347,530,709 |
Statement of Changes in Net Assets
| Year ended
December 31,
2012 | Year ended
December 31,
2011 |
Increase (Decrease) in Net Assets | | |
Operations | | |
Net investment income (loss) | $ 53,449,172 | $ 42,729,839 |
Net realized gain (loss) | 26,021,499 | 28,415,126 |
Change in net unrealized appreciation (depreciation) | 268,060,038 | (28,150,513) |
Net increase (decrease) in net assets resulting from operations | 347,530,709 | 42,994,452 |
Distributions to shareholders from net investment income | (52,954,383) | (43,244,270) |
Distributions to shareholders from net realized gain | (30,334,618) | (51,595,129) |
Total distributions | (83,289,001) | (94,839,399) |
Share transactions - net increase (decrease) | 149,810,206 | 36,547,032 |
Total increase (decrease) in net assets | 414,051,914 | (15,297,915) |
| | |
Net Assets | | |
Beginning of period | 2,195,858,735 | 2,211,156,650 |
End of period (including undistributed net investment income of $152,302 and distributions in excess of
net investment income of $371,329, respectively) | $ 2,609,910,649 | $ 2,195,858,735 |
See accompanying notes which are an integral part of the financial statements.
Annual Report
Financial Highlights - Initial Class
Years ended December 31, | 2012 | 2011 | 2010 | 2009 | 2008 |
Selected Per-Share Data | | | | | |
Net asset value, beginning of period | $ 129.33 | $ 132.39 | $ 119.62 | $ 99.19 | $ 164.03 |
Income from Investment Operations | | | | | |
Net investment income (loss) C | 3.12 | 2.58 | 2.35 | 2.37 | 3.03 |
Net realized and unrealized gain (loss) | 17.29 | .10 | 15.13 | 23.03 | (63.32) |
Total from investment operations | 20.41 | 2.68 | 17.48 | 25.40 | (60.29) |
Distributions from net investment income | (3.06) | (2.65) | (2.44) | (2.72) | (3.07) |
Distributions from net realized gain | (1.77) | (3.09) | (2.27) | (2.25) | (1.48) |
Total distributions | (4.83) | (5.74) | (4.71) | (4.97) | (4.55) |
Net asset value, end of period | $ 144.91 | $ 129.33 | $ 132.39 | $ 119.62 | $ 99.19 |
Total Return A, B | 15.91% | 2.04% | 15.02% | 26.61% | (37.00)% |
Ratios to Average Net Assets D, F | | | | | |
Expenses before reductions | .10% | .10% | .10% | .10% | .10% |
Expenses net of fee waivers, if any | .10% | .10% | .10% | .10% | .10% |
Expenses net of all reductions | .10% | .10% | .10% | .10% | .10% |
Net investment income (loss) | 2.20% | 1.96% | 1.94% | 2.31% | 2.22% |
Supplemental Data | | | | | |
Net assets, end of period (000 omitted) | $ 2,294,364 | $ 1,918,592 | $ 1,931,271 | $ 1,767,750 | $ 1,525,779 |
Portfolio turnover rate E | 5% | 5% | 5% | 6% | 6% |
A Total returns do not reflect charges attributable to your insurance company's separate account. Inclusion of these charges would reduce the total returns shown.
B Total returns would have been lower if certain expenses had not been reduced during the applicable periods shown.
C Calculated based on average shares outstanding during the period.
D Fees and expenses of any underlying Fidelity Central Funds are not included in the Fund's expense ratio. The Fund indirectly bears its proportionate share of the expenses of any underlying Fidelity Central Funds.
E Amount does not include the portfolio activity of any underlying Fidelity Central Funds.
F Expense ratios reflect operating expenses of the class. Expenses before reductions do not reflect amounts reimbursed by the investment adviser or reductions from brokerage service arrangements or reductions from other expense offset arrangements and do not represent the amount paid by the class during periods when reimbursements or reductions occur. Expenses net of fee waivers reflect expenses after reimbursement by the investment adviser but prior to reductions from brokerage service arrangements or other expense offset arrangements. Expenses net of all reductions represent the net expenses paid by the class.
Financial Highlights - Service Class
Years ended December 31, | 2012 | 2011 | 2010 | 2009 | 2008 |
Selected Per-Share Data | | | | | |
Net asset value, beginning of period | $ 129.00 | $ 132.07 | $ 119.35 | $ 98.99 | $ 163.66 |
Income from Investment Operations | | | | | |
Net investment income (loss) C | 2.97 | 2.44 | 2.22 | 2.27 | 2.88 |
Net realized and unrealized gain (loss) | 17.25 | .10 | 15.09 | 22.96 | (63.14) |
Total from investment operations | 20.22 | 2.54 | 17.31 | 25.23 | (60.26) |
Distributions from net investment income | (2.92) | (2.52) | (2.32) | (2.62) | (2.93) |
Distributions from net realized gain | (1.77) | (3.09) | (2.27) | (2.25) | (1.48) |
Total distributions | (4.69) | (5.61) | (4.59) | (4.87) | (4.41) |
Net asset value, end of period | $ 144.53 | $ 129.00 | $ 132.07 | $ 119.35 | $ 98.99 |
Total Return A, B | 15.80% | 1.93% | 14.91% | 26.48% | (37.07)% |
Ratios to Average Net Assets D, F | | | | | |
Expenses before reductions | .20% | .20% | .20% | .20% | .20% |
Expenses net of fee waivers, if any | .20% | .20% | .20% | .20% | .20% |
Expenses net of all reductions | .20% | .20% | .20% | .20% | .20% |
Net investment income (loss) | 2.10% | 1.86% | 1.84% | 2.21% | 2.12% |
Supplemental Data | | | | | |
Net assets, end of period (000 omitted) | $ 41,443 | $ 37,095 | $ 37,209 | $ 32,708 | $ 24,340 |
Portfolio turnover rate E | 5% | 5% | 5% | 6% | 6% |
A Total returns do not reflect charges attributable to your insurance company's separate account. Inclusion of these charges would reduce the total returns shown.
B Total returns would have been lower if certain expenses had not been reduced during the applicable periods shown.
C Calculated based on average shares outstanding during the period.
D Fees and expenses of any underlying Fidelity Central Funds are not included in the Fund's expense ratio. The Fund indirectly bears its proportionate share of the expenses of any underlying Fidelity Central Funds.
E Amount does not include the portfolio activity of any underlying Fidelity Central Funds.
F Expense ratios reflect operating expenses of the class. Expenses before reductions do not reflect amounts reimbursed by the investment adviser or reductions from brokerage service arrangements or reductions from other expense offset arrangements and do not represent the amount paid by the class during periods when reimbursements or reductions occur. Expenses net of fee waivers reflect expenses after reimbursement by the investment adviser but prior to reductions from brokerage service arrangements or other expense offset arrangements. Expenses net of all reductions represent the net expenses paid by the class.
See accompanying notes which are an integral part of the financial statements.
Annual Report
Financial Highlights - Service Class 2
Years ended December 31, | 2012 | 2011 | 2010 | 2009 | 2008 |
Selected Per-Share Data | | | | | |
Net asset value, beginning of period | $ 128.24 | $ 131.31 | $ 118.71 | $ 98.50 | $ 162.79 |
Income from Investment Operations | | | | | |
Net investment income (loss) C | 2.74 | 2.23 | 2.03 | 2.11 | 2.66 |
Net realized and unrealized gain (loss) | 17.14 | .11 | 14.97 | 22.82 | (62.74) |
Total from investment operations | 19.88 | 2.34 | 17.00 | 24.93 | (60.08) |
Distributions from net investment income | (2.71) | (2.32) | (2.13) | (2.47) | (2.73) |
Distributions from net realized gain | (1.77) | (3.09) | (2.27) | (2.25) | (1.48) |
Total distributions | (4.48) | (5.41) | (4.40) | (4.72) | (4.21) |
Net asset value, end of period | $ 143.64 | $ 128.24 | $ 131.31 | $ 118.71 | $ 98.50 |
Total ReturnA, B | 15.62% | 1.78% | 14.73% | 26.30% | (37.16)% |
Ratios to Average Net AssetsD, F | | | | | |
Expenses before reductions | .35% | .35% | .35% | .35% | .35% |
Expenses net of fee waivers, if any | .35% | .35% | .35% | .35% | .35% |
Expenses net of all reductions | .35% | .35% | .35% | .35% | .35% |
Net investment income (loss) | 1.95% | 1.71% | 1.69% | 2.06% | 1.97% |
Supplemental Data | | | | | |
Net assets, end of period (000 omitted) | $ 274,104 | $ 240,172 | $ 242,677 | $ 220,221 | $ 170,637 |
Portfolio turnover rate E | 5% | 5% | 5% | 6% | 6% |
A Total returns do not reflect charges attributable to your insurance company's separate account. Inclusion of these charges would reduce the total returns shown.
B Total returns would have been lower if certain expenses had not been reduced during the applicable periods shown.
C Calculated based on average shares outstanding during the period.
D Fees and expenses of any underlying Fidelity Central Funds are not included in the Fund's expense ratio. The Fund indirectly bears its proportionate share of the expenses of any underlying Fidelity Central Funds.
E Amount does not include the portfolio activity of any underlying Fidelity Central Funds.
F Expense ratios reflect operating expenses of the class. Expenses before reductions do not reflect amounts reimbursed by the investment adviser or reductions from brokerage service arrangements or reductions from other expense offset arrangements and do not represent the amount paid by the class during periods when reimbursements or reductions occur. Expenses net of fee waivers reflect expenses after reimbursement by the investment adviser but prior to reductions from brokerage service arrangements or other expense offset arrangements. Expenses net of all reductions represent the net expenses paid by the class.
See accompanying notes which are an integral part of the financial statements.
Annual Report
Notes to Financial Statements
For the period ended December 31, 2012
1. Organization.
VIP Index 500 Portfolio (the Fund) is a fund of Variable Insurance Products Fund II (the Trust) and is authorized to issue an unlimited number of shares. The Trust is registered under the Investment Company Act of 1940, as amended (the 1940 Act), as an open-end management investment company organized as a Massachusetts business trust. Shares of the Fund may only be purchased by insurance companies for the purpose of funding variable annuity or variable life insurance contracts. The Fund offers the following classes of shares: Initial Class shares, Service Class shares and Service Class 2 shares. All classes have equal rights and voting privileges, except for matters affecting a single class. Investment income, realized and unrealized capital gains and losses, the common expenses of the Fund, and certain fund-level expense reductions, if any, are allocated on a pro-rata basis to each class based on the relative net assets of each class to the total net assets of the Fund. Each class differs with respect to distribution and service plan fees incurred. Certain expense reductions may also differ by class.
2. Investments in Fidelity Central Funds.
The Fund invests in Fidelity Central Funds, which are open-end investment companies available only to other investment companies and accounts managed by Fidelity Management & Research Company (FMR) and its affiliates. The Fund's Schedule of Investments lists each of the Fidelity Central Funds held as of period end, as an investment of the Fund, but does not include the underlying holdings of each Fidelity Central Fund. As an Investing Fund, the Fund indirectly bears its proportionate share of the expenses of the underlying Fidelity Central Funds.
The Money Market Central Funds seek preservation of capital and current income and are managed by Fidelity Investments Money Management, Inc. (FIMM), an affiliate of FMR.
A complete unaudited list of holdings for each Fidelity Central Fund is available upon request or at the Securities and Exchange Commission (the SEC) website at www.sec.gov. In addition, the financial statements of the Fidelity Central Funds, which are not covered by the Fund's Report of Independent Registered Public Accounting Firm, are available on the SEC website or upon request.
3. Significant Accounting Policies.
The financial statements have been prepared in conformity with accounting principles generally accepted in the United States of America (GAAP), which require management to make certain estimates and assumptions at the date of the financial statements. Actual results could differ from those estimates. Subsequent events, if any, through the date that the financial statements were issued have been evaluated in the preparation of the financial statements. The following summarizes the significant accounting policies of the Fund:
Investment Valuation. Investments are valued as of 4:00 p.m. Eastern time on the last calendar day of the period. In accordance with valuation policies and procedures approved by the Board of Trustees (the Board), the Fund attempts to obtain prices from one or more third party pricing vendors or brokers to value its investments. When current market prices, quotations or rates are not readily available or reliable, investments will be fair valued in good faith by the FMR Fair Value Committee (the Committee), in accordance with procedures adopted by the Fund's Board. Factors used in determining fair value vary by investment type and may include market or investment specific events, changes in interest rates and credit quality. The frequency with which these procedures are used cannot be predicted and they may be utilized to a significant extent. The Committee oversees the Fund's valuation policies and procedures and is responsible for approving and reporting to the Board all fair value determinations.
The Fund categorizes the inputs to valuation techniques used to value its investments into a disclosure hierarchy consisting of three levels as shown below:
Level 1 - quoted prices in active markets for identical investments
Level 2 - other significant observable inputs (including quoted prices for similar investments, interest rates, prepayment speeds, etc.)
Level 3 - unobservable inputs (including the Fund's own assumptions based on the best information available)
Valuation techniques used to value the Fund's investments by major category are as follows:
Equity securities, including restricted securities, for which market quotations are readily available, are valued at the last reported sale price or official closing price as reported by a third party pricing vendor on the primary market or exchange on which they are traded and are categorized as Level 1 in the hierarchy. In the event there were no sales during the day or closing prices are not available, securities are valued at the last quoted bid price or may be valued using the last available price and are generally categorized as Level 2 in the hierarchy. For foreign equity securities, when significant market or security specific events arise, comparisons to the valuation of American Depositary Receipts (ADRs), futures contracts, Exchange-Traded Funds (ETFs) and certain indexes as well as quoted prices for similar securities are used and are categorized as Level 2 in the hierarchy. Utilizing these techniques may result in transfers between Level 1 and Level 2.
Annual Report
3. Significant Accounting Policies - continued
Investment Valuation - continued
Debt securities, including restricted securities, are valued based on evaluated prices received from third party pricing vendors or from brokers who make markets in such securities. For U.S. government and government agency obligations, pricing vendors utilize matrix pricing which considers yield or price of bonds of comparable quality, coupon, maturity and type as well as broker-supplied prices and are generally categorized as Level 2 in the hierarchy. When independent prices are unavailable or unreliable, debt securities may be valued utilizing pricing methodologies which consider similar factors that would be used by third party pricing vendors. These are generally categorized as Level 2 in the hierarchy but may be Level 3 depending on the circumstances.
Futures contracts are valued at the settlement price established each day by the board of trade or exchange on which they are traded and are categorized as Level 1 in the hierarchy. Investments in open-end mutual funds, including the Fidelity Central Funds, are valued at their closing net asset value (NAV) each business day and are categorized as Level 1 in the hierarchy.
Changes in valuation techniques may result in transfers in or out of an assigned level within the disclosure hierarchy. The aggregate value of investments by input level, as of December 31, 2012, is included at the end of the Fund's Schedule of Investments.
Investment Transactions and Income. For financial reporting purposes, the Fund's investment holdings and NAV include trades executed through the end of the last business day of the period. The NAV per share for processing shareholder transactions is calculated as of the close of business of the New York Stock Exchange (NYSE), normally 4:00 p.m. Eastern time and includes trades executed through the end of the prior business day. Gains and losses on securities sold are determined on the basis of identified cost and may include proceeds received from litigation. Dividend income is recorded on the ex-dividend date, except for certain dividends from foreign securities where the ex-dividend date may have passed, which are recorded as soon as the Fund is informed of the ex-dividend date. Non-cash dividends included in dividend income, if any, are recorded at the fair market value of the securities received. Distributions received on securities that represent a return of capital or capital gain are recorded as a reduction of cost of investments and/or as a realized gain. The Fund estimates the components of distributions received that may be considered return of capital distributions or capital gain distributions. Interest income and distributions from the Fidelity Central Funds are accrued as earned. Interest income includes coupon interest and amortization of premium and accretion of discount on debt securities.
Expenses. Expenses directly attributable to a fund are charged to that fund. Expenses attributable to more than one fund are allocated among the respective funds on the basis of relative net assets or other appropriate methods. Expense estimates are accrued in the period to which they relate and adjustments are made when actual amounts are known.
Deferred Trustee Compensation. Under a Deferred Compensation Plan (the Plan), independent Trustees may elect to defer receipt of a portion of their annual compensation. Deferred amounts are invested in a cross-section of Fidelity funds, are marked-to-market and remain in the Fund until distributed in accordance with the Plan. The investment of deferred amounts and the offsetting payable to the Trustees are included in the accompanying Statement of Assets and Liabilities.
Income Tax Information and Distributions to Shareholders. Each year, the Fund intends to qualify as a regulated investment company under Subchapter M of the Internal Revenue Code, including distributing substantially all of its taxable income and realized gains. As a result, no provision for income taxes is required. As of December 31, 2012, the Fund did not have any unrecognized tax benefits in the financial statements; nor is the Fund aware of any tax positions for which it is reasonably possible that the total amounts of unrecognized tax benefits will significantly change in the next twelve months. The Fund files a U.S. federal tax return, in addition to state and local tax returns as required. A fund's federal income tax returns are subject to examination by the Internal Revenue Service (IRS) for a period of three fiscal years after they are filed. State and local tax returns may be subject to examination for an additional fiscal year depending on the jurisdiction.
Distributions are declared and recorded on the ex-dividend date. Income dividends and capital gain distributions are declared separately for each class. Income and capital gain distributions are determined in accordance with income tax regulations, which may differ from GAAP.
Capital accounts within the financial statements are adjusted for permanent book-tax differences. These adjustments have no impact on net assets or the results of operations. Temporary book-tax differences will reverse in a subsequent period.
Book-tax differences are primarily due to futures contracts, deferred trustees compensation and losses deferred due to wash sales and excise tax regulations.
The federal tax cost of investment securities and unrealized appreciation (depreciation) as of period end were as follows:
Gross unrealized appreciation | $ 1,264,638,182 |
Gross unrealized depreciation | (212,017,184) |
Net unrealized appreciation (depreciation) on securities and other investments | $ 1,052,620,998 |
| |
Tax Cost | $ 1,616,601,433 |
Annual Report
Notes to Financial Statements - continued
3. Significant Accounting Policies - continued
Income Tax Information and Distributions to Shareholders - continued
The tax-based components of distributable earnings as of period end were as follows:
Undistributed ordinary income | $ 585,312 |
Undistributed long-term capital gain | $ 21,826,375 |
Net unrealized appreciation (depreciation) | $ 1,052,620,998 |
The tax character of distributions paid was as follows:
| December 31, 2012 | December 31, 2011 |
Ordinary Income | $ 57,066,938 | $ 46,257,668 |
Long-term Capital Gains | 26,222,063 | 48,581,731 |
Total | $ 83,289,001 | $ 94,839,399 |
New Accounting Pronouncement. In December 2011, the Financial Accounting Standards Board issued Accounting Standard Update No. 2011-11, Disclosures about Offsetting Assets and Liabilities. The update creates new disclosure requirements requiring entities to disclose both gross and net information for derivatives and other financial instruments that are either offset in the Statement of Assets and Liabilities or subject to an enforceable master netting arrangement or similar agreement. The disclosure requirements are effective for annual reporting periods beginning on or after January 1, 2013, and interim periods within those annual periods. Management is currently evaluating the impact of the update's adoption on the Fund's financial statement disclosures.
4. Derivative Instruments.
Risk Exposures and the Use of Derivative Instruments. The Fund's investment objective allows the Fund to enter into various types of derivative contracts, including futures contracts. Derivatives are investments whose value is primarily derived from underlying assets, indices or reference rates and may be transacted on an exchange or over-the-counter (OTC). Derivatives may involve a future commitment to buy or sell a specified asset based on specified terms, to exchange future cash flows at periodic intervals based on a notional principal amount, or for one party to make one or more payments upon the occurrence of specified events in exchange for periodic payments from the other party.
The Fund used derivatives to increase returns and to manage exposure to certain risks as defined below. The success of any strategy involving derivatives depends on analysis of numerous economic factors, and if the strategies for investment do not work as intended, the Fund may not achieve its objectives.
The Fund's use of derivatives increased or decreased its exposure to the following risk:
Equity Risk | Equity risk relates to the fluctuations in the value of financial instruments as a result of changes in market prices (other than those arising from interest rate risk or foreign exchange risk), whether caused by factors specific to an individual investment, its issuer, or all factors affecting all instruments traded in a market or market segment. |
The Fund is also exposed to additional risks from investing in derivatives, such as liquidity risk and counterparty credit risk. Liquidity risk is the risk that the Fund will be unable to close out the derivative in the open market in a timely manner. Counterparty credit risk is the risk that the counterparty will not be able to fulfill its obligation to the Fund. Counterparty credit risk related to exchange-traded futures contracts is mitigated by the protection provided by the exchange on which they trade.
Investing in derivatives may involve greater risks than investing in the underlying assets directly and, to varying degrees, may involve risk of loss in excess of any initial investment and collateral received and amounts recognized in the Statement of Assets and Liabilities. In addition, there may be the risk that the change in value of the derivative contract does not correspond to the change in value of the underlying instrument.
Futures Contracts. A futures contract is an agreement between two parties to buy or sell a specified underlying instrument for a fixed price at a specified future date. The Fund used futures contracts to manage its exposure to the stock market.
Upon entering into a futures contract, a fund is required to deposit either cash or securities (initial margin) with a clearing broker in an amount equal to a certain percentage of the face value of the contract. Futures contracts are marked-to-market daily and subsequent payments (variation margin) are made or received by a fund depending on the daily fluctuations in the value of the futures contracts and are recorded as unrealized appreciation or (depreciation). This receivable and/or payable, if any, is included in daily variation margin on futures contracts in the Statement of Assets and Liabilities. Realized gain or (loss) is recorded upon the expiration or closing of a futures contract.
Annual Report
4. Derivative Instruments - continued
Futures Contracts - continued
Any open futures contracts at period end are presented in the Schedule of Investments under the caption "Futures Contracts." The underlying face amount at value reflects each contract's exposure to the underlying instrument or index at period end and is representative of activity for the period. Securities deposited to meet initial margin requirements are identified in the Schedule of Investments. Cash deposited to meet initial margin requirements is presented as segregated cash in the Statement of Assets and Liabilities.
During the period, the Fund recognized net realized gain (loss) of $5,858,042 and a change in net unrealized appreciation (depreciation) of $(264,914) related to its investment in futures contracts. These amounts are included in the Statement of Operations.
5. Purchases and Sales of Investments.
Purchases and sales of securities, other than short-term securities, aggregated $246,021,052 and $109,218,560, respectively.
6. Fees and Other Transactions with Affiliates.
Management Fee and Expense Contract. FMR and its affiliates provide the Fund with investment management related services for which the Fund pays a monthly management fee. The management fee is based on an annual rate of .045% of the Fund's average net assets. Under the management contract, FMR pays all other fund-level expenses, except the compensation of the independent Trustees and certain other expenses such as interest expense, including commitment fees. In addition, under an expense contract, FMR pays class-level expenses as necessary so that total expenses do not exceed an annual rate of .10% of each class' average net assets, excluding the distribution and service fee for each applicable class, with certain exceptions.
Sub-Adviser. Geode Capital Management, LLC (Geode), serves as sub-adviser for the Fund. Geode provides discretionary investment advisory services to the Fund and is paid by FMR for providing these services.
Distribution and Service Plan Fees. In accordance with Rule 12b-1 of the 1940 Act, the Fund has adopted separate 12b-1 Plans for each Service Class of shares. Each Service Class pays Fidelity Distributors Corporation (FDC), an affiliate of FMR, a service fee. For the period, the service fee is based on an annual rate of .10% of Service Class' average net assets and .25% of Service Class 2's average net assets.
For the period, total fees, all of which were re-allowed to insurance companies for the distribution of shares and providing shareholder support services were as follows:
Service Class | $ 39,142 |
Service Class 2 | 658,341 |
| $ 697,483 |
Transfer Agent Fees. Fidelity Investments Institutional Operations Company, Inc. (FIIOC), an affiliate of FMR, is the transfer, dividend disbursing, and shareholder servicing agent for each class. FIIOC receives asset-based fees of .067% of each class's average net assets. In addition, FIIOC receives an asset-based fee of .0038% of average net assets for typesetting, printing and mailing of shareholder reports, except proxy statements. Under the expense contract, each class pays a portion of the transfer agent fees at an annual rate of .055% of the class' average net assets. For the period, transfer agent fees for each class, including printing and out of pocket expenses, were as follows:
Initial Class | $ 1,185,239 |
Service Class | 21,527 |
Service Class 2 | 144,835 |
| $ 1,351,601 |
7. Committed Line of Credit.
The Fund participates with other funds managed by FMR or an affiliate in a $4.25 billion credit facility (the "line of credit") to be utilized for temporary or emergency purposes to fund shareholder redemptions or for other short-term liquidity purposes. The Fund has agreed to pay commitment fees on its pro-rata portion of the line of credit, which amounted to $6,444 and is reflected in Miscellaneous expenses on the Statement of Operations. During the period, there were no borrowings on this line of credit.
Annual Report
Notes to Financial Statements - continued
8. Security Lending.
The Fund lends portfolio securities through a lending agent from time to time in order to earn additional income. On the settlement date of the loan, the Fund receives collateral (in the form of U.S. Treasury obligations, letters of credit and/or cash) against the loaned securities and maintains collateral in an amount not less than 100% of the market value of the loaned securities during the period of the loan. The market value of the loaned securities is determined at the close of business of the Fund and any additional required collateral is delivered to the Fund on the next business day. If the borrower defaults on its obligation to return the securities loaned because of insolvency or other reasons, a fund could experience delays and costs in recovering the securities loaned or in gaining access to the collateral. Any cash collateral received is invested in the Fidelity Securities Lending Cash Central Fund. The value of loaned securities and cash collateral at period end are disclosed on the Fund's Statement of Assets and Liabilities. Security lending income represents the income earned on investing cash collateral, less rebates paid to borrowers and any lending agent fees associated with the loan, plus any premium payments received for lending certain types of securities. Security lending income is presented in the Statement of Operations as a component of income from Fidelity Central Funds. Total security lending income during the period amounted to $363,068.
9. Expense Reductions.
Through arrangements with the Fund's custodian, credits realized as a result of uninvested cash balances were used to reduce the Fund's expenses. During the period, these credits reduced the Fund's custody expenses by $60.
10. Distributions to Shareholders.
Distributions to shareholders of each class were as follows:
Years ended December 31, | 2012 | 2011 |
From net investment income | | |
Initial Class | $ 47,042,989 | $ 38,255,176 |
Service Class | 817,750 | 707,018 |
Service Class 2 | 5,093,644 | 4,282,076 |
Total | $ 52,954,383 | $ 43,244,270 |
From net realized gain | | |
Initial Class | $ 26,520,646 | $ 44,996,692 |
Service Class | 492,115 | 869,322 |
Service Class 2 | 3,321,857 | 5,729,115 |
Total | $ 30,334,618 | $ 51,595,129 |
11. Share Transactions.
Transactions for each class of shares were as follows:
| Shares | Dollars |
Years ended December 31, | 2012 | 2011 | 2012 | 2011 |
Initial Class | | | | |
Shares sold | 2,686,566 | 1,835,066 | $ 383,379,462 | $ 243,984,868 |
Reinvestment of distributions | 520,317 | 638,728 | 73,563,635 | 83,251,868 |
Shares redeemed | (2,209,387) | (2,226,316) | (312,125,251) | (294,250,679) |
Net increase (decrease) | 997,496 | 247,478 | $ 144,817,846 | $ 32,986,057 |
Service Class | | | | |
Shares sold | 32,821 | 31,831 | $ 4,627,611 | $ 4,163,777 |
Reinvestment of distributions | 9,295 | 12,115 | 1,309,865 | 1,576,340 |
Shares redeemed | (42,924) | (38,138) | (5,946,964) | (4,956,107) |
Net increase (decrease) | (808) | 5,808 | $ (9,488) | $ 784,010 |
Service Class 2 | | | | |
Shares sold | 338,381 | 359,331 | $ 47,591,017 | $ 46,317,215 |
Reinvestment of distributions | 60,133 | 77,281 | 8,415,501 | 10,011,190 |
Shares redeemed | (363,069) | (411,858) | (51,004,670) | (53,551,440) |
Net increase (decrease) | 35,445 | 24,754 | $ 5,001,848 | $ 2,776,965 |
Annual Report
12. Other.
The Fund's organizational documents provide former and current trustees and officers with a limited indemnification against liabilities arising in connection with the performance of their duties to the Fund. In the normal course of business, the Fund may also enter into contracts that provide general indemnifications. The Fund's maximum exposure under these arrangements is unknown as this would be dependent on future claims that may be made against the Fund. The risk of material loss from such claims is considered remote.
At the end of the period, FMR or its affiliates were the owners of record of 31% of the total outstanding shares of the Fund.
Annual Report
Report of Independent Registered Public Accounting Firm
To the Trustees of Variable Insurance Products Fund II and Shareholders of VIP Index 500 Portfolio:
We have audited the accompanying statement of assets and liabilities of VIP Index 500 Portfolio (the Fund), a fund of Variable Insurance Products Fund II, including the schedule of investments, as of December 31, 2012, and the related statement of operations for the year then ended, the statement of changes in net assets for each of the two years in the period then ended, and the financial highlights for each of the five years in the period then ended. These financial statements and financial highlights are the responsibility of the Fund's management. Our responsibility is to express an opinion on these financial statements and financial highlights based on our audits.
We conducted our audits in accordance with the standards of the Public Company Accounting Oversight Board (United States). Those standards require that we plan and perform the audit to obtain reasonable assurance about whether the financial statements and financial highlights are free of material misstatement. The Fund is not required to have, nor were we engaged to perform, an audit of its internal control over financial reporting. Our audits included consideration of internal control over financial reporting as a basis for designing audit procedures that are appropriate in the circumstances, but not for the purpose of expressing an opinion on the effectiveness of the Fund's internal control over financial reporting. Accordingly, we express no such opinion. An audit also includes examining, on a test basis, evidence supporting the amounts and disclosures in the financial statements, assessing the accounting principles used and significant estimates made by management, as well as evaluating the overall financial statement presentation. Our procedures included confirmation of securities owned as of December 31, 2012, by correspondence with the custodians and brokers; where replies were not received from brokers, we performed other auditing procedures. We believe that our audits provide a reasonable basis for our opinion.
In our opinion, the financial statements and financial highlights referred to above present fairly, in all material respects, the financial position of VIP Index 500 Portfolio as of December 31, 2012, the results of its operations for the year then ended, the changes in its net assets for each of the two years in the period then ended, and the financial highlights for each of the five years in the period then ended, in conformity with accounting principles generally accepted in the United States of America.
DELOITTE & TOUCHE LLP
Boston, Massachusetts
February 11, 2013
Annual Report
The Trustees, Members of the Advisory Board, and executive officers of the trust and fund, as applicable, are listed below. The Board of Trustees governs the fund and is responsible for protecting the interests of shareholders. The Trustees are experienced executives who meet periodically throughout the year to oversee the fund's activities, review contractual arrangements with companies that provide services to the fund, oversee management of the risks associated with such activities and contractual arrangements, and review the fund's performance. Except for James C. Curvey, each of the Trustees oversees 234 funds advised by FMR or an affiliate. Mr. Curvey oversees 452 funds advised by FMR or an affiliate.
The Trustees hold office without limit in time except that (a) any Trustee may resign; (b) any Trustee may be removed by written instrument, signed by at least two-thirds of the number of Trustees prior to such removal; (c) any Trustee who requests to be retired or who has become incapacitated by illness or injury may be retired by written instrument signed by a majority of the other Trustees; and (d) any Trustee may be removed at any special meeting of shareholders by a two-thirds vote of the outstanding voting securities of the trust. Each Trustee who is not an interested person (as defined in the 1940 Act) (Independent Trustee), shall retire not later than the last day of the calendar year in which his or her 75th birthday occurs. The Independent Trustees may waive this mandatory retirement age policy with respect to individual Trustees. The executive officers and Advisory Board Members hold office without limit in time, except that any officer and Advisory Board Member may resign or may be removed by a vote of a majority of the Trustees at any regular meeting or any special meeting of the Trustees. Except as indicated, each individual has held the office shown or other offices in the same company for the past five years.
Experience, Skills, Attributes, and Qualifications of the Fund's Trustees. The Governance and Nominating Committee has adopted a statement of policy that describes the experience, qualifications, attributes, and skills that are necessary and desirable for potential Independent Trustee candidates (Statement of Policy). The Board believes that each Trustee satisfied at the time he or she was initially elected or appointed a Trustee, and continues to satisfy, the standards contemplated by the Statement of Policy. The Governance and Nominating Committee also engages professional search firms to help identify potential Independent Trustee candidates who have the experience, qualifications, attributes, and skills consistent with the Statement of Policy. From time to time, additional criteria based on the composition and skills of the current Independent Trustees, as well as experience or skills that may be appropriate in light of future changes to board composition, business conditions, and regulatory or other developments, have also been considered by the professional search firms and the Governance and Nominating Committee. In addition, the Board takes into account the Trustees' commitment and participation in Board and committee meetings, as well as their leadership of standing and ad hoc committees throughout their tenure.
In determining that a particular Trustee was and continues to be qualified to serve as a Trustee, the Board has considered a variety of criteria, none of which, in isolation, was controlling. The Board believes that, collectively, the Trustees have balanced and diverse experience, qualifications, attributes, and skills, which allow the Board to operate effectively in governing the fund and protecting the interests of shareholders. Information about the specific experience, skills, attributes, and qualifications of each Trustee, which in each case led to the Board's conclusion that the Trustee should serve (or continue to serve) as a trustee of the fund, is provided below.
Board Structure and Oversight Function. James C. Curvey is an interested person (as defined in the 1940 Act) and currently serves as Chairman. The Trustees have determined that an interested Chairman is appropriate and benefits shareholders because an interested Chairman has a personal and professional stake in the quality and continuity of services provided to the fund. Independent Trustees exercise their informed business judgment to appoint an individual of their choosing to serve as Chairman, regardless of whether the Trustee happens to be independent or a member of management. The Independent Trustees have determined that they can act independently and effectively without having an Independent Trustee serve as Chairman and that a key structural component for assuring that they are in a position to do so is for the Independent Trustees to constitute a substantial majority for the Board. The Independent Trustees also regularly meet in executive session. Ned C. Lautenbach serves as Chairman of the Independent Trustees and as such (i) acts as a liaison between the Independent Trustees and management with respect to matters important to the Independent Trustees and (ii) with management prepares agendas for Board meetings.
Fidelity funds are overseen by different Boards of Trustees. The fund's Board oversees Fidelity's equity and high income funds and another Board oversees Fidelity's investment-grade bond, money market, and asset allocation funds. The asset allocation funds may invest in Fidelity funds overseen by the fund's Board. The use of separate Boards, each with its own committee structure, allows the Trustees of each group of Fidelity funds to focus on the unique issues of the funds they oversee, including common research, investment, and operational issues. On occasion, the separate Boards establish joint committees to address issues of overlapping consequences for the Fidelity funds overseen by each Board.
The Trustees operate using a system of committees to facilitate the timely and efficient consideration of all matters of importance to the Trustees, the fund, and fund shareholders and to facilitate compliance with legal and regulatory requirements and oversight of the fund's activities and associated risks. The Board, acting through its committees, has charged FMR and its affiliates with (i) identifying events or circumstances the occurrence of which could have demonstrably adverse effects on the fund's business and/or reputation; (ii) implementing processes and controls to lessen the possibility that such events or circumstances occur or to mitigate the effects of such events or circumstances if they do occur; and (iii) creating and maintaining a system designed to evaluate continuously business and market conditions in order to facilitate the identification and implementation processes described in (i) and (ii) above. Because the day-to-day operations and activities of the fund are carried out by or through FMR, its affiliates and other service providers, the fund's exposure to risks is mitigated but not eliminated by the processes overseen by the Trustees. While each of the Board's committees has responsibility for overseeing different aspects of the fund's activities, oversight is exercised primarily through the Operations, Audit, and Compliance Committees. In addition, the Independent Trustees have worked with FMR to enhance the Board's oversight of investment and financial risks, legal and regulatory risks, technology risks, and operational risks, including the development of additional risk reporting to the Board. For example, a working group comprised of Independent Trustees and FMR has worked and continues to work to review the Fidelity funds' valuation-related activities, reporting and risk management. Appropriate personnel, including but not limited to the fund's Chief Compliance Officer (CCO), FMR's internal auditor, the independent accountants, the fund's Treasurer and portfolio management personnel, make periodic reports to the Board's committees, as appropriate, including an annual review of FMR's risk management program for the Fidelity funds. The responsibilities of each standing committee, including their oversight responsibilities, are described further under "Standing Committees of the Fund's Trustees."
Annual Report
Trustees and Officers - continued
The fund's Statement of Additional Information (SAI) includes more information about the Trustees. To request a free copy, call Fidelity at 1-877-208-0098.
Interested Trustees*:
Correspondence intended for each Trustee who is an interested person may be sent to Fidelity Investments, 82 Devonshire Street, Boston, Massachusetts 02109.
Name, Age; Principal Occupations and Other Relevant Experience+ |
James C. Curvey (77) |
| Year of Election or Appointment: 2007 Mr. Curvey is Trustee and Chairman of the Board of Trustees of certain Trusts. Mr. Curvey also serves as Trustee (2007-present) of other investment companies advised by FMR. Mr. Curvey is a Director of Fidelity Investments Money Management, Inc. (2009-present), Director of Fidelity Research & Analysis Co. (2009-present) and Director of FMR and FMR Co., Inc. (2007-present). Mr. Curvey is also Vice Chairman (2007-present) and Director of FMR LLC. In addition, Mr. Curvey serves as an Overseer for the Boston Symphony Orchestra and a member of the Trustees of Villanova University. Previously, Mr. Curvey was the Vice Chairman (2006-2007) and Director (2000-2007) of FMR Corp. |
Ronald P. O'Hanley (55) |
| Year of Election or Appointment: 2011 Mr. O'Hanley is Director of FMR Co., Inc. (2010-present), Director of Fidelity Investments Money Management, Inc. (2010-present), Director of Fidelity Research & Analysis Company (2010-present), President of Fidelity Asset Management and Corporate Services and a member of Fidelity's Executive Committee (2010-present). Previously, Mr. O'Hanley served as President and Chief Executive Officer of BNY Mellon Asset Management (2007-2010). Mr. O'Hanley also served as Vice Chairman of Bank New York Mellon Corp. and a member of that firm's Executive Committee. Prior to the 2007 merger of The Bank of New York and Mellon Financial Corporation, he was Vice Chairman of Mellon Financial Corporation and President and Chief Executive Officer of Mellon Asset Management. He joined Mellon in February 1997. Mr. O'Hanley currently serves as Chairman of the Boston Public Library Foundation Board of Directors and sits on the Board of Directors of Beth Israel Deaconess Medical Center, the Board of Trustees of the Marine Biological Laboratory and the Advisory Board of the Maxwell School of Citizenship and Public Administration at Syracuse University. Mr. O'Hanley also chairs the Council on Asset Management for the Financial Services Roundtable and is a member of the Board of Directors of Institutional Investor's U.S. Institute. |
* Trustees have been determined to be "Interested Trustees" by virtue of, among other things, their affiliation with the trust or various entities under common control with FMR.
+ The information above includes each Trustee's principal occupation during the last five years and other information relating to the experience, attributes, and skills relevant to each Trustee's qualifications to serve as a Trustee, which led to the conclusion that each Trustee should serve as a Trustee for the fund.
Independent Trustees:
Correspondence intended for each Independent Trustee (that is, the Trustees other than the Interested Trustees) may be sent to Fidelity Investments, P.O. Box 55235, Boston, Massachusetts 02205-5235.
Name, Age; Principal Occupations and Other Relevant Experience+ |
Dennis J. Dirks (64) |
| Year of Election or Appointment: 2005 Prior to his retirement in May 2003, Mr. Dirks was Chief Operating Officer and a member of the Board of The Depository Trust & Clearing Corporation (DTCC). He also served as President, Chief Operating Officer, and Board member of The Depository Trust Company (DTC) and President and Board member of the National Securities Clearing Corporation (NSCC). In addition, Mr. Dirks served as Chief Executive Officer and Board member of the Government Securities Clearing Corporation, Chief Executive Officer and Board member of the Mortgage-Backed Securities Clearing Corporation, as a Trustee and a member of the Finance Committee of Manhattan College (2005-2008), and as a Trustee and a member of the Finance Committee of AHRC of Nassau County (2006-2008). Mr. Dirks is a member of the Independent Directors Council (IDC) Governing Council (2010-present) and Board of Directors for The Brookville Center for Children's Services, Inc. (2009-present). |
Alan J. Lacy (59) |
| Year of Election or Appointment: 2008 Mr. Lacy serves as Senior Adviser (2007-present) of Oak Hill Capital Partners, L.P. (private equity). Mr. Lacy also served as Chief Executive Officer (2000-2005) and Vice Chairman (2005-2006) of Sears Holdings Corporation and Sears, Roebuck and Co. (retail). In addition, Mr. Lacy serves as a member of the Board of Directors of Dave & Buster's Entertainment, Inc. (restaurant and entertainment complexes, 2010-present), Earth Fare, Inc. (retail grocery, 2012-present), The Hillman Companies, Inc. (hardware wholesalers, 2010-present), and Bristol-Myers Squibb Company (global pharmaceuticals, 2008-present). Mr. Lacy is a member of the Board of Trustees of The National Parks Conservation Association (2006-present). Previously, Mr. Lacy served as Chairman of the Board of Trustees of the National Parks Conservation Association (2008-2011) and as a member of the Board of Directors for the Western Union Company (global money transfer, 2006-2011). |
Ned C. Lautenbach (68) |
| Year of Election or Appointment: 2000 Mr. Lautenbach is Chairman of the Independent Trustees of the Equity and High Income Funds (2006-present). Mr. Lautenbach currently serves as the Lead Director of the Eaton Corporation Board of Directors (diversified industrial, 1997-present). Mr. Lautenbach is Chairman of the Board of Directors of the Philharmonic Center for the Arts in Naples, Florida (2012-present) and a member of the Council on Foreign Relations (1994-present). Previously, Mr. Lautenbach was a Partner/Advisory Partner at Clayton, Dubilier & Rice, LLC (private equity investment, 1998-2010), as well as a Director of Sony Corporation (2006-2007). |
Joseph Mauriello (68) |
| Year of Election or Appointment: 2008 Prior to his retirement in January 2006, Mr. Mauriello served in numerous senior management positions including Deputy Chairman and Chief Operating Officer (2004-2005), and Vice Chairman of Financial Services (2002-2004) of KPMG LLP US (professional services, 1965-2005). Mr. Mauriello currently serves as a member of the Board of Directors of XL Group plc. (global insurance and re-insurance, 2006-present). Previously, Mr. Mauriello served as a Director of the Hamilton Funds of the Bank of New York (2006-2007) and of Arcadia Resources Inc. (health care services and products, 2007-2012). |
Robert W. Selander (62) |
| Year of Election or Appointment: 2011 Previously, Mr. Selander served as a Member of the Advisory Board of Fidelity's Equity and High Income Funds (2011), Executive Vice Chairman (2010), Chief Executive Officer (2009-2010), and President and Chief Executive Officer (1997-2009) of Mastercard, Inc. |
Cornelia M. Small (68) |
| Year of Election or Appointment: 2005 Ms. Small is a member of the Board of Directors (2009-present) and Chair of the Investment Committee (2010-present) of the Teagle Foundation. Ms. Small also serves on the Investment Committee of the Berkshire Taconic Community Foundation (2008-present). Previously, Ms. Small served as Chairperson (2002-2008) and a member of the Investment Committee and Chairperson (2008-2012) and a member of the Board of Trustees of Smith College. In addition, Ms. Small served as Chief Investment Officer, Director of Global Equity Investments, and a member of the Board of Directors of Scudder, Stevens & Clark and Scudder Kemper Investments. |
William S. Stavropoulos (73) |
| Year of Election or Appointment: 2001 Mr. Stavropoulos is Vice Chairman of the Independent Trustees of the Equity and High Income Funds (2006-present). Mr. Stavropoulos serves as President and Founder of the Michigan Baseball Foundation, the Great Lakes Loons (2007-present). Mr. Stavropoulos is Chairman Emeritus of the Board of Directors of The Dow Chemical Company, where he previously served in numerous senior management positions, including President, CEO (1995-2000; 2002-2004), Chairman of the Executive Committee (2000-2006), and as a member of the Board of Directors (1990-2006). Currently, Mr. Stavropoulos is a Director of Univar Inc. (global distributor of commodity and specialty chemicals, Chairman from 2010-May 2012 and Lead Director from May 2012-present), Teradata Corporation (data warehousing and technology solutions, 2008-present), Maersk Inc. (industrial conglomerate), and Tyco International, Ltd. (multinational manufacturing and services, 2007-present), and a member of the Advisory Board for Metalmark Capital LLC (private equity investment, 2005-present). Mr. Stavropoulos is an operating advisor to Clayton, Dubilier & Rice, LLC (private equity investment). In addition, Mr. Stavropoulos is a member of the University of Notre Dame Advisory Council for the College of Science, a Trustee of the Rollin L. Gerstacker Foundation, and a Director of the Naples Philharmonic Center for the Arts. Previously, Mr. Stavropoulos served as a Director of Chemical Financial Corporation (bank holding company, 1993-2012). |
David M. Thomas (63) |
| Year of Election or Appointment: 2008 Previously, Mr. Thomas served as Executive Chairman (2005-2006) and Chairman and Chief Executive Officer (2000-2005) of IMS Health, Inc. (pharmaceutical and healthcare information solutions), and a Director of Fortune Brands, Inc. (consumer products, 2000-2011). In addition, Mr. Thomas serves as Non-Executive Chairman of the Board of Directors of Fortune Brands Home and Security (home and security products, 2011-present), and as a member of the Board of Directors of Interpublic Group of Companies, Inc. (marketing communication, 2004-present). |
Michael E. Wiley (62) |
| Year of Election or Appointment: 2008 Mr. Wiley also serves as a Director of Asia Pacific Exploration Consolidated (international oil and gas exploration and production, 2008-present). Mr. Wiley serves as a Director of Tesoro Corporation (independent oil refiner and marketer, 2005-present), and a Director of Bill Barrett Corporation (exploration and production, 2005-present). In addition, Mr. Wiley also serves as a Director of Post Oak Bank (privately-held bank, 2004-present). Previously, Mr. Wiley served as a member of the Board of Trustees of the University of Tulsa (2000-2006; 2007-2010), as a Senior Energy Advisor of Katzenbach Partners, LLC (consulting, 2006-2007), as an Advisory Director of Riverstone Holdings (private investment), Chairman, President, and CEO of Baker Hughes, Inc. (oilfield services, 2000-2004), and as Director of Spinnaker Exploration Company (exploration and production, 2001-2005). |
+ The information above includes each Trustee's principal occupation during the last five years and other information relating to the experience, attributes, and skills relevant to each Trustee's qualifications to serve as a Trustee, which led to the conclusion that each Trustee should serve as a Trustee for the fund.
Advisory Board Members and Executive Officers:
Correspondence intended for David A. Rosow and Garnett A. Smith may be sent to Fidelity Investments, P.O. Box 55235, Boston, Massachusetts 02205-5235. Correspondence intended for each executive officer and Peter S. Lynch may be sent to Fidelity Investments, 82 Devonshire Street, Boston, Massachusetts 02109.
Name, Age; Principal Occupation |
Peter S. Lynch (68) |
| Year of Election or Appointment: 2003 Member of the Advisory Board of Fidelity's Equity and High Income Funds. Mr. Lynch is Vice Chairman and a Director of FMR and FMR Co., Inc. In addition, Mr. Lynch serves as a Trustee of Boston College and as the Chairman of the Inner-City Scholarship Fund. Previously, Mr. Lynch served on the Special Olympics International Board of Directors (1997-2006). |
David A. Rosow (70) |
| Year of Election or Appointment: 2012 Member of the Advisory Board of Fidelity's Equity and High Income Funds. Chairman and Chief Executive Officer of International Golf Group, Inc. (golf course development, 1989-present). Previously, Mr. Rosow served as Chairman and Chief Executive Officer of Rosow & Company, Inc. (private investment company, 1989-2011), a Lead Director of Hudson United Bancorp (2001-2006) and as a Director of TD Banknorth (1996-2006). In addition, Mr. Rosow is a member (2008-present) and President (2009-present) of the Town Council of Palm Beach, Florida. |
Garnett A. Smith (65) |
| Year of Election or Appointment: 2012 Member of the Advisory Board of Fidelity's Equity and High Income Funds. Prior to Mr. Smith's retirement, he served as Chairman and Chief Executive Officer of Inbrand Corp. (manufacturer of personal absorbent products, 1990-1997). He also served as President (1986-1990) of Inbrand Corp. Prior to his employment with Inbrand Corp., he was employed by a retail fabric chain and North Carolina National Bank. In addition, Mr. Smith is a board member of the Jackson Hole Land Trust (2009-present). |
Kenneth B. Robins (43) |
| Year of Election or Appointment: 2008 President and Treasurer of Fidelity's Equity and High Income Funds. Mr. Robins also serves as President and Treasurer (2010-present) and Assistant Treasurer (2009-present) of other Fidelity funds and is an employee of Fidelity Investments (2004-present). Previously, Mr. Robins served as Deputy Treasurer of the Fidelity funds (2005-2008) and Treasurer and Chief Financial Officer of The North Carolina Capital Management Trust: Cash and Term Portfolios (2006-2008). |
Bruce T. Herring (47) |
| Year of Election or Appointment: 2006 Vice President of certain Equity Funds. Mr. Herring also serves as President of Fidelity Research & Analysis Company (2010-present), Chief Investment Officer and Director of Fidelity Management & Research (U.K.) Inc. (2010-present) and Group Chief Investment Officer of FMR. Previously, Mr. Herring served as Vice President (2005-2006) and Senior Vice President (2006-2007) of Fidelity Management & Research Company, Vice President of FMR Co., Inc. (2001-2007) and as a portfolio manager for Fidelity U.S. Equity Funds. |
Brian B. Hogan (48) |
| Year of Election or Appointment: 2009 Vice President of Equity and High Income Funds. Mr. Hogan also serves as President of FMR's Equity Division (2009-present). Previously, Mr. Hogan served as Senior Vice President, Equity Research of FMR (2006-2009) and as a portfolio manager. |
Scott C. Goebel (44) |
| Year of Election or Appointment: 2008 Secretary and Chief Legal Officer (CLO) of the Fidelity funds. Mr. Goebel also serves as Secretary of Fidelity Investments Money Management, Inc. (FIMM) (2010-present) and Fidelity Research and Analysis Company (FRAC) (2010-present); Secretary and CLO of The North Carolina Capital Management Trust: Cash and Term Portfolios (2008-present); General Counsel, Secretary, and Senior Vice President of FMR (2008-present) and FMR Co., Inc. (2008-present); employed by FMR LLC or an affiliate (2001-present); Chief Legal Officer of Fidelity Management & Research (Hong Kong) Limited (2008-present) and Assistant Secretary of Fidelity Management & Research (Japan) Inc. (2008-present), and Fidelity Management & Research (U.K.) Inc. (2008-present). Previously, Mr. Goebel served as Assistant Secretary of FIMM (2008-2010), FRAC (2008-2010), and the Funds (2007-2008) and as Vice President and Secretary of Fidelity Distributors Corporation (FDC) (2005-2007). |
William C. Coffey (43) |
| Year of Election or Appointment: 2009 Assistant Secretary of Fidelity's Equity and High Income Funds. Mr. Coffey also serves as Senior Vice President and Deputy General Counsel of FMR LLC (2010-present), and is an employee of Fidelity Investments. Previously, Mr. Coffey served as Vice President and Associate General Counsel of FMR LLC (2005-2009). |
Elizabeth Paige Baumann (44) |
| Year of Election or Appointment: 2012 Anti-Money Laundering (AML) Officer of the Fidelity funds. Ms. Baumann also serves as AML Officer of The North Carolina Capital Management Trust: Cash and Term Portfolios (2012-present), Chief AML Officer of FMR LLC (2012-present), and is an employee of Fidelity Investments. Previously, Ms. Baumann served as Vice President and Deputy Anti-Money Laundering Officer (2007-2012). |
Christine Reynolds (54) |
| Year of Election or Appointment: 2008 Chief Financial Officer of the Fidelity funds. Ms. Reynolds became President of Fidelity Pricing and Cash Management Services (FPCMS) in August 2008. Ms. Reynolds served as Chief Operating Officer of FPCMS (2007-2008). Previously, Ms. Reynolds served as President, Treasurer, and Anti-Money Laundering officer of the Fidelity funds (2004-2007). |
Joseph A. Hanlon (44) |
| Year of Election or Appointment: 2012 Chief Compliance Officer of Fidelity's Equity and High Income Funds. Mr. Hanlon serves as Compliance Officer of FMR, FMR Co., Inc., Fidelity Investments Money Management, Inc. (FIMM), Fidelity Research and Analysis Company (FRAC), Fidelity Management & Research (Japan) Inc., Fidelity Management & Research (U.K.) Inc., Fidelity Management & Research (Hong Kong), and Strategic Advisers, Inc. (2009-present), as Senior Vice President of the Fidelity Asset Management Division (2009-present), and is an employee of Fidelity Investments. |
Joseph F. Zambello (55) |
| Year of Election or Appointment: 2011 Deputy Treasurer of the Fidelity funds. Mr. Zambello is an employee of Fidelity Investments. Previously, Mr. Zambello served as Vice President of FMR's Program Management Group (2009-2011) and Vice President of the Transfer Agent Oversight Group (2005-2009). |
Adrien E. Deberghes (45) |
| Year of Election or Appointment: 2008 Deputy Treasurer of Fidelity's Equity and High Income Funds. Mr. Deberghes also serves as Vice President (2011-present) and Assistant Treasurer (2010-present) of other Fidelity funds, and is an employee of Fidelity Investments (2008-present). Previously, Mr. Deberghes served as Senior Vice President of Mutual Fund Administration at State Street Corporation (2007-2008), Senior Director of Mutual Fund Administration at Investors Bank & Trust (2005-2007), and Director of Finance for Dunkin' Brands (2000-2005). |
Stephen Sadoski (41) |
| Year of Election or Appointment: 2012 Deputy Treasurer of Fidelity's Equity and High Income Funds. Mr. Sadoski also serves as Deputy Treasurer of other Fidelity funds (2013-present) and is an employee of Fidelity Investments (2012-present). Previously, Mr. Sadoski served as Assistant Treasurer of Fidelity's Fixed Income and Asset Allocation Funds (2012-2013), an assistant chief accountant in the Division of Investment Management of the Securities and Exchange Commission (SEC) (2009-2012) and as a senior manager at Deloitte & Touche (1997-2009). |
Stacie Smith (38) |
| Year of Election or Appointment: 2013 Deputy Treasurer of Fidelity's Equity and High Income Funds. Ms. Smith is an employee of Fidelity Investments (2009-present). Previously, Ms. Smith served as Senior Audit Manager of Ernst & Young LLP (1996-2009). |
Stephanie J. Dorsey (43) |
| Year of Election or Appointment: 2010 Assistant Treasurer of Fidelity's Equity and High Income Funds. Ms. Dorsey also serves as President and Treasurer (2013-present) and Assistant Treasurer (2012-present) of other Fidelity funds and is an employee of Fidelity Investments (2008-present). Previously, Ms. Dorsey served as Deputy Treasurer of Fidelity's Fixed Income and Asset Allocation Funds (2008-2013), Treasurer (2004-2008) of the JPMorgan Mutual Funds and Vice President (2004-2008) of JPMorgan Chase Bank. |
John R. Hebble (54) |
| Year of Election or Appointment: 2009 Assistant Treasurer of Fidelity's Equity and High Income Funds. Mr. Hebble also serves as President (2011-present), Treasurer, and Chief Financial Officer of The North Carolina Capital Management Trust: Cash and Term Portfolios (2008-present) and is an employee of Fidelity Investments. Previously, Mr. Hebble served as President and Treasurer of Fidelity's Fixed Income and Asset Allocation Funds (2008-2013). |
Gary W. Ryan (54) |
| Year of Election or Appointment: 2005 Assistant Treasurer of the Fidelity funds. Mr. Ryan is an employee of Fidelity Investments. Previously, Mr. Ryan served as Vice President of Fund Reporting in Fidelity Pricing and Cash Management Services (FPCMS) (1999-2005). |
Jonathan Davis (44) |
| Year of Election or Appointment: 2010 Assistant Treasurer of the Fidelity funds. Mr. Davis is also Assistant Treasurer of Fidelity Rutland Square Trust II and Fidelity Commonwealth Trust II. Mr. Davis is an employee of Fidelity Investments. Previously, Mr. Davis served as Vice President and Associate General Counsel of FMR LLC (2003-2010). |
Annual Report
The Board of Trustees of VIP Index 500 Portfolio voted to pay to shareholders of record at the opening of business on record date, the following distributions per share derived from capital gains realized from sales of portfolio securities, and dividends derived from net investment income:
| Pay Date | Record Date | Dividends | Capital Gains |
Initial Class | 02/08/2013 | 02/08/2013 | $0.011 | $1.227 |
| | | | |
Service Class | 02/08/2013 | 02/08/2013 | $0.011 | $1.227 |
| | | | |
Service Class 2 | 02/08/2013 | 02/08/2013 | $0.011 | $1.227 |
The fund hereby designates as a capital gain dividend with respect to the taxable year ended December 31, 2012, $21,826,374, or, if subsequently determined to be different, the net capital gain of such year.
Initial Class designates 23% and 93%; Service Class designates 23% and 97%; and Service Class 2 designates 23% and 100% of the dividends distributed in February and December, 2012, respectively as qualifying for the dividends-received deduction for corporate shareholders.
Annual Report
Board Approval of Investment Advisory Contracts and Management Fees
VIP Index 500 Portfolio
Each year, the Board of Trustees, including the Independent Trustees (together, the Board), votes on the renewal of the management contract and sub-advisory agreements (together, the Advisory Contracts) for the fund. The Board, assisted by the advice of fund counsel and Independent Trustees' counsel, requests and considers a broad range of information relevant to the renewal of the Advisory Contracts throughout the year.
The Board meets regularly and, at each of its meetings, considers factors that are relevant to its annual consideration of the renewal of the fund's Advisory Contracts, including the services and support provided to the fund and its shareholders. The Board has established various standing committees, each composed of and chaired by Independent Trustees with varying backgrounds, to which the Board has assigned specific subject matter responsibilities in order to enhance effective decision-making by the Board. The Board, acting directly and through its Committees, requests and receives information concerning the annual consideration of the renewal of the fund's Advisory Contracts. The Board also meets as needed to consider matters specifically related to the Board's annual consideration of the renewal of Advisory Contracts. Members of the Board may also meet with trustees of other Fidelity funds through ad hoc joint committees to discuss certain matters relevant to the Fidelity funds.
At its July 2012 meeting, the Board of Trustees, including the Independent Trustees, unanimously determined to renew the fund's Advisory Contracts. In reaching its determination, the Board considered all factors it believed relevant, including (i) the nature, extent, and quality of the services to be provided to the fund and its shareholders (including the investment performance of the fund); (ii) the competitiveness of the fund's management fee and total expense ratio relative to peer funds; (iii) the total costs of the services to be provided by and the profits to be realized by Fidelity from its relationship with the fund; (iv) the extent to which economies of scale exist and would be realized as the fund grows; and (v) whether fee levels reflect these economies of scale, if any, for the benefit of fund shareholders.
In considering whether to renew the Advisory Contracts for the fund, the Board reached a determination, with the assistance of fund counsel and Independent Trustees' counsel and through the exercise of its business judgment, that the renewal of the Advisory Contracts is in the best interests of the fund and its shareholders and that the compensation payable under the Advisory Contracts is fair and reasonable. The Board's decision to renew the Advisory Contracts was not based on any single factor, but rather was based on a comprehensive consideration of all the information provided to the Board at its meetings throughout the year. The Board, in reaching its determination to renew the Advisory Contracts, is aware that shareholders in the fund have a broad range of investment choices available to them, including a wide choice among mutual funds offered by Fidelity's competitors, and that the fund's shareholders, who have the opportunity to review and weigh the disclosure provided by the fund in its prospectus and other public disclosures, have chosen to invest in this fund, managed by Fidelity.
Nature, Extent, and Quality of Services Provided. The Board considered the staffing within the investment adviser, FMR, and the sub-advisers (together, the Investment Advisers), including the backgrounds of the fund's investment personnel, and also considered the fund's investment objective, strategies, and related investment philosophy. The Independent Trustees also had discussions with senior management of Fidelity's investment operations and investment groups. The Board considered the structure of the portfolio manager compensation program and whether this structure provides appropriate incentives to act in the best interests of the fund.
Resources Dedicated to Investment Management and Support Services. The Board and the Fund Oversight and Research Committees reviewed the general qualifications and capabilities of the Investment Advisers' investment staff, including its size, education, experience, and resources, as well as the Investment Advisers' approach to recruiting, training, managing, and compensating investment personnel. The Board also noted that FMR has continued to increase the resources devoted to non-U.S. offices, including expansion of Fidelity's global investment organization.
Shareholder and Administrative Services. The Board considered (i) the nature, extent, quality, and cost of advisory, administrative, and shareholder services performed by the Investment Advisers and their affiliates under the Advisory Contracts and under separate agreements covering transfer agency, pricing and bookkeeping, and securities lending services for the fund; (ii) the nature and extent of the supervision of third party service providers, principally custodians and subcustodians; and (iii) the resources devoted to, and the record of compliance with, the fund's compliance policies and procedures. The Board also reviewed the allocation of fund brokerage, including allocations to brokers affiliated with the Investment Advisers.
The Board noted that the growth of fund assets over time across the complex allows Fidelity to reinvest in the development of services designed to enhance the value or convenience of the Fidelity funds as investment vehicles. These services include 24-hour access to account information and market information through telephone representatives and over the Internet, investor education materials and asset allocation tools, and the expanded availability of Fidelity Investor Centers.
Investment in a Large Fund Family. The Board considered the benefits to shareholders of investing in a Fidelity fund, including the benefits of investing in a fund that is part of a large family of funds offering a variety of investment disciplines and providing a large variety of mutual fund investor services. The Board noted that Fidelity had taken, or had made recommendations that resulted in the Fidelity funds taking, a number of actions over the previous year that benefited particular funds, including (i) continuing to dedicate additional resources to investment research and support of the senior management team that oversees asset management; (ii) persisting in efforts to enhance Fidelity's research capabilities, in particular, international research; (iii) launching new funds and making other enhancements to meet client needs for global and income-oriented solutions; (iv) continuing to launch dedicated lower cost underlying funds to meet investment management's portfolio construction needs related to expanding underlying fund options, specifically for the Freedom Fund product lines; (v) adopting a "Stock Selector" sector neutral investment approach and employing a team of portfolio managers who are sector specialists to manage certain funds; (vi) rationalizing product lines and gaining increased efficiencies through the mergers of several funds into other funds; (vii) strengthening the Spartan Index Fund product line by adding new funds and/or new low-cost institutional share classes, restructuring fund expenses to accommodate new classes, and reducing investment minimums for certain classes of shares; (viii) modifying the eligibility criteria for Institutional Class shares to increase their appeal to government entities and charitable investors; and (ix) reducing certain transfer agent fee rates.
Annual Report
Investment Performance. The Board considered whether the fund has operated in accordance with its investment objective, as well as its record of compliance with its investment restrictions. It also reviewed the fund's absolute investment performance for each class, as well as the fund's relative investment performance for each class measured over multiple periods against (i) a broad-based securities market index, and (ii) a peer group of mutual funds deemed appropriate by Fidelity and reviewed by the Board. The following charts considered by the Board show, over the one-, three-, and five-year periods ended December 31, 2011, the cumulative total returns of Initial Class and Service Class 2 of the fund, the cumulative total returns of a broad-based securities market index ("benchmark"), and a range of cumulative total returns of a peer group of mutual funds identified by Lipper Inc. as having an investment objective similar to that of the fund. The returns of Initial Class and Service Class 2 show the performance of the highest and lowest performing classes, respectively (based on five-year performance). The box within each chart shows the 25th percentile return (top of box) and the 75th percentile return (bottom of box) of the peer group. Returns shown above the box are in the first quartile and returns shown below the box are in the fourth quartile. The percentage beaten numbers noted below each chart correspond to the percentile box and represent the percentage of funds in the peer group whose performance was equal to or lower than that of the class indicated.
VIP Index 500 Portfolio
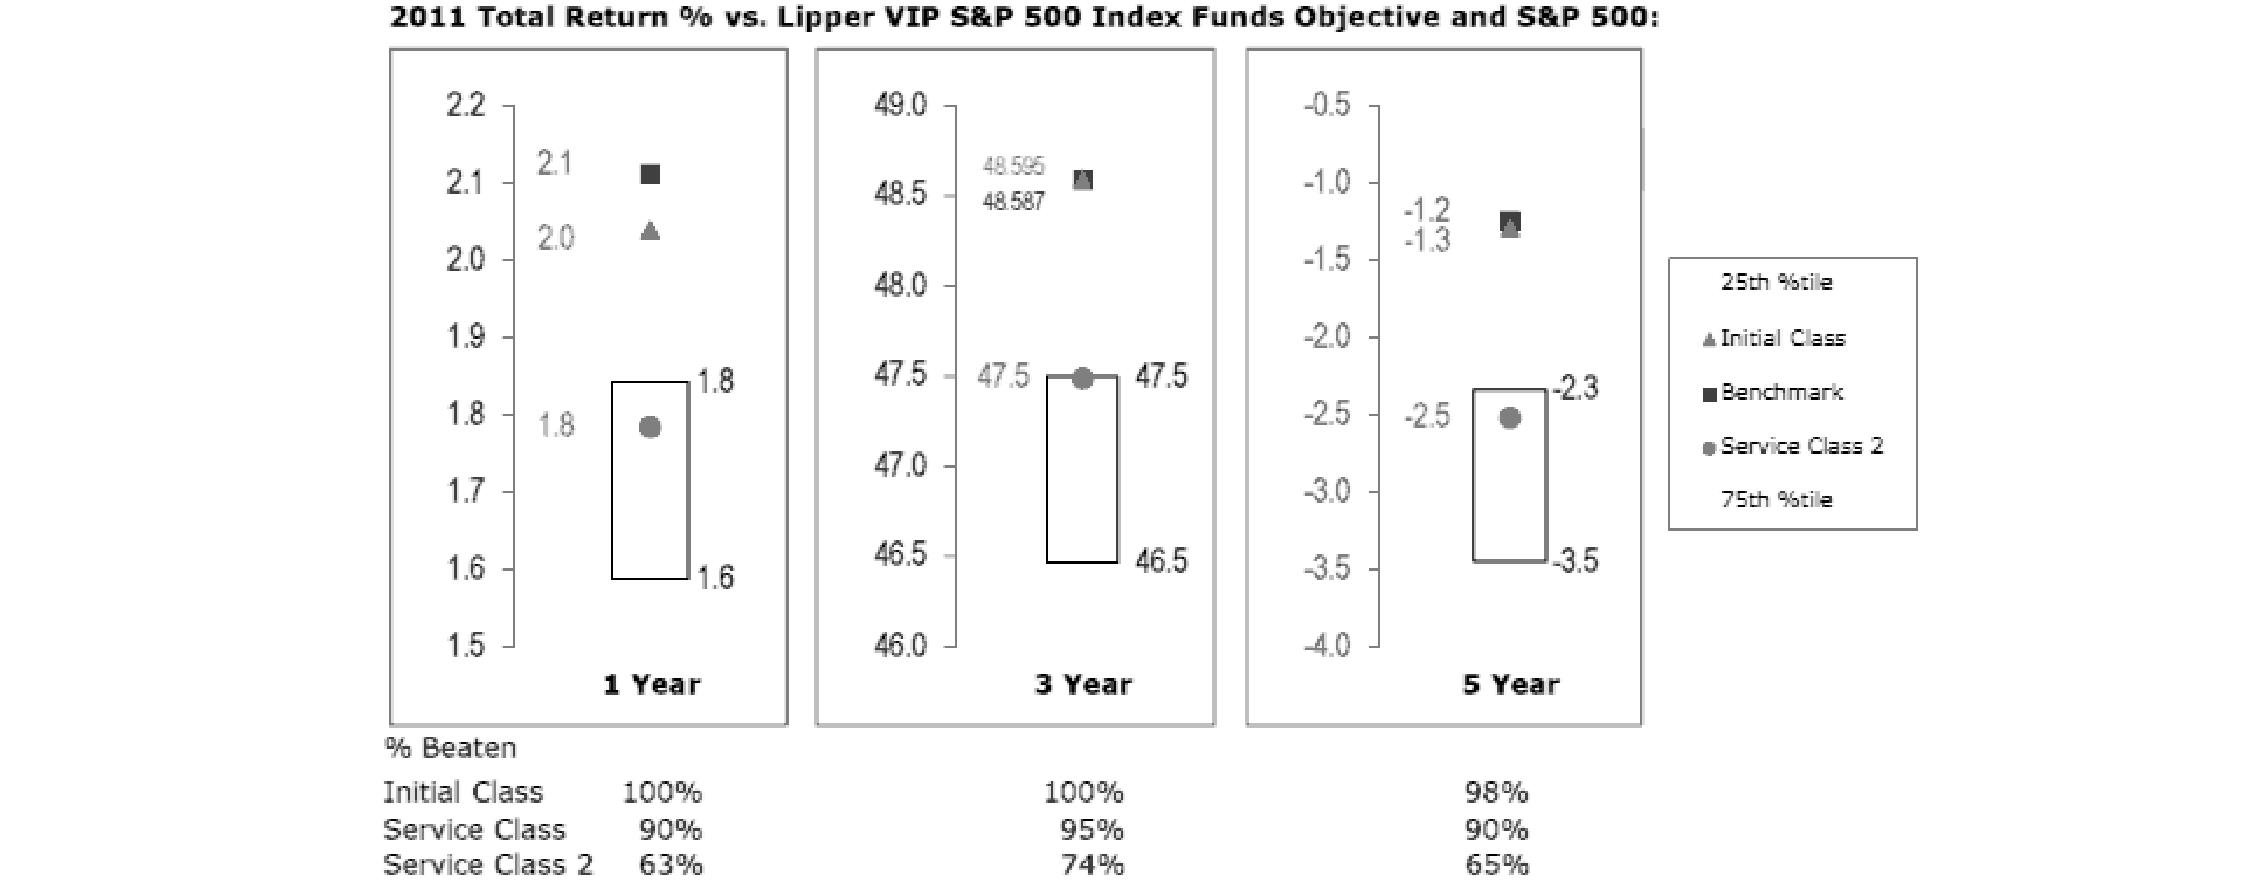
The Board reviewed the fund's relative investment performance against its peer group and noted that the performance of Initial Class of the fund was in the first quartile for all the periods shown. The Board also noted that the investment performance of the fund was lower than its benchmark for the one- and five-year periods, although the three-year cumulative total return of Initial Class was comparable to its benchmark. The Board noted that the fund bears fees, expenses, and brokerage commissions while the benchmark does not. In addition, the Board noted that the performance of the fund and benchmark may vary due to valuation differences. The Board considered that the variations in performance among the fund's classes reflect the variations in class expenses, which result in lower performance for higher expense classes. The Board also reviewed the fund's performance since inception as well as performance in the current year.
Based on its review, the Board concluded that the nature, extent, and quality of services provided to the fund under the Advisory Contracts should benefit the fund's shareholders.
Competitiveness of Management Fee and Total Expense Ratio. The Board considered the fund's management fee and total expense ratio compared to "mapped groups" of competitive funds and classes. Fidelity creates "mapped groups" by combining similar Lipper investment objective categories that have comparable management fee characteristics. Combining Lipper investment objective categories aids the Board's management fee and total expense ratio comparisons by broadening the competitive group used for comparison and by reducing the number of universes to which various Fidelity funds are compared.
Annual Report
Board Approval of Investment Advisory Contracts and Management Fees - continued
Management Fee. The Board considered two proprietary management fee comparisons for the 12-month periods shown in the chart below. The group of Lipper funds used by the Board for management fee comparisons is referred to below as the "Total Mapped Group." The Total Mapped Group is broader than the Lipper peer group used by the Board for performance comparisons because the Total Mapped Group combines several Lipper investment objective categories while the Lipper peer group does not. The Total Mapped Group comparison focuses on a fund's standing relative to the total universe of comparable funds available to investors in terms of gross management fees before expense reimbursements or caps. "TMG %" represents the percentage of funds in the Total Mapped Group that had management fees that were lower than the fund's. For example, a TMG % of 0% means that 100% of the funds in the Total Mapped Group had higher management fees than the fund. The "Asset-Size Peer Group" (ASPG) comparison focuses on a fund's standing relative to non-Fidelity funds similar in size to the fund within the Total Mapped Group. The ASPG represents at least 15% of the funds in the Total Mapped Group with comparable asset size and management fee characteristics, subject to a minimum of 50 funds (or all funds in the Total Mapped Group if fewer than 50). Additional information, such as the ASPG quartile in which the fund's management fee ranked, is also included in the chart and considered by the Board. Because the vast majority of competitor funds' management fees do not cover non-management expenses, for a more meaningful comparison of management fees, the fund is compared on the basis of a hypothetical "net management fee," which is derived by subtracting payments made by FMR for "fund-level" non-management expenses (including pricing and bookkeeping fees and fees paid to non-affiliated custodians) from the fund's management fee. In this regard, the Board considered that net management fees can vary from year to year because of differences in "fund-level" non-management expenses, and that "fund-level" non-management expenses may exceed the fund's management fee and result in a negative net management fee. The Board noted, however, that FMR does not pay transfer agent fees or other "class-level" expenses (including 12b-1 fees, if applicable) under the fund's management contract.
VIP Index 500 Portfolio
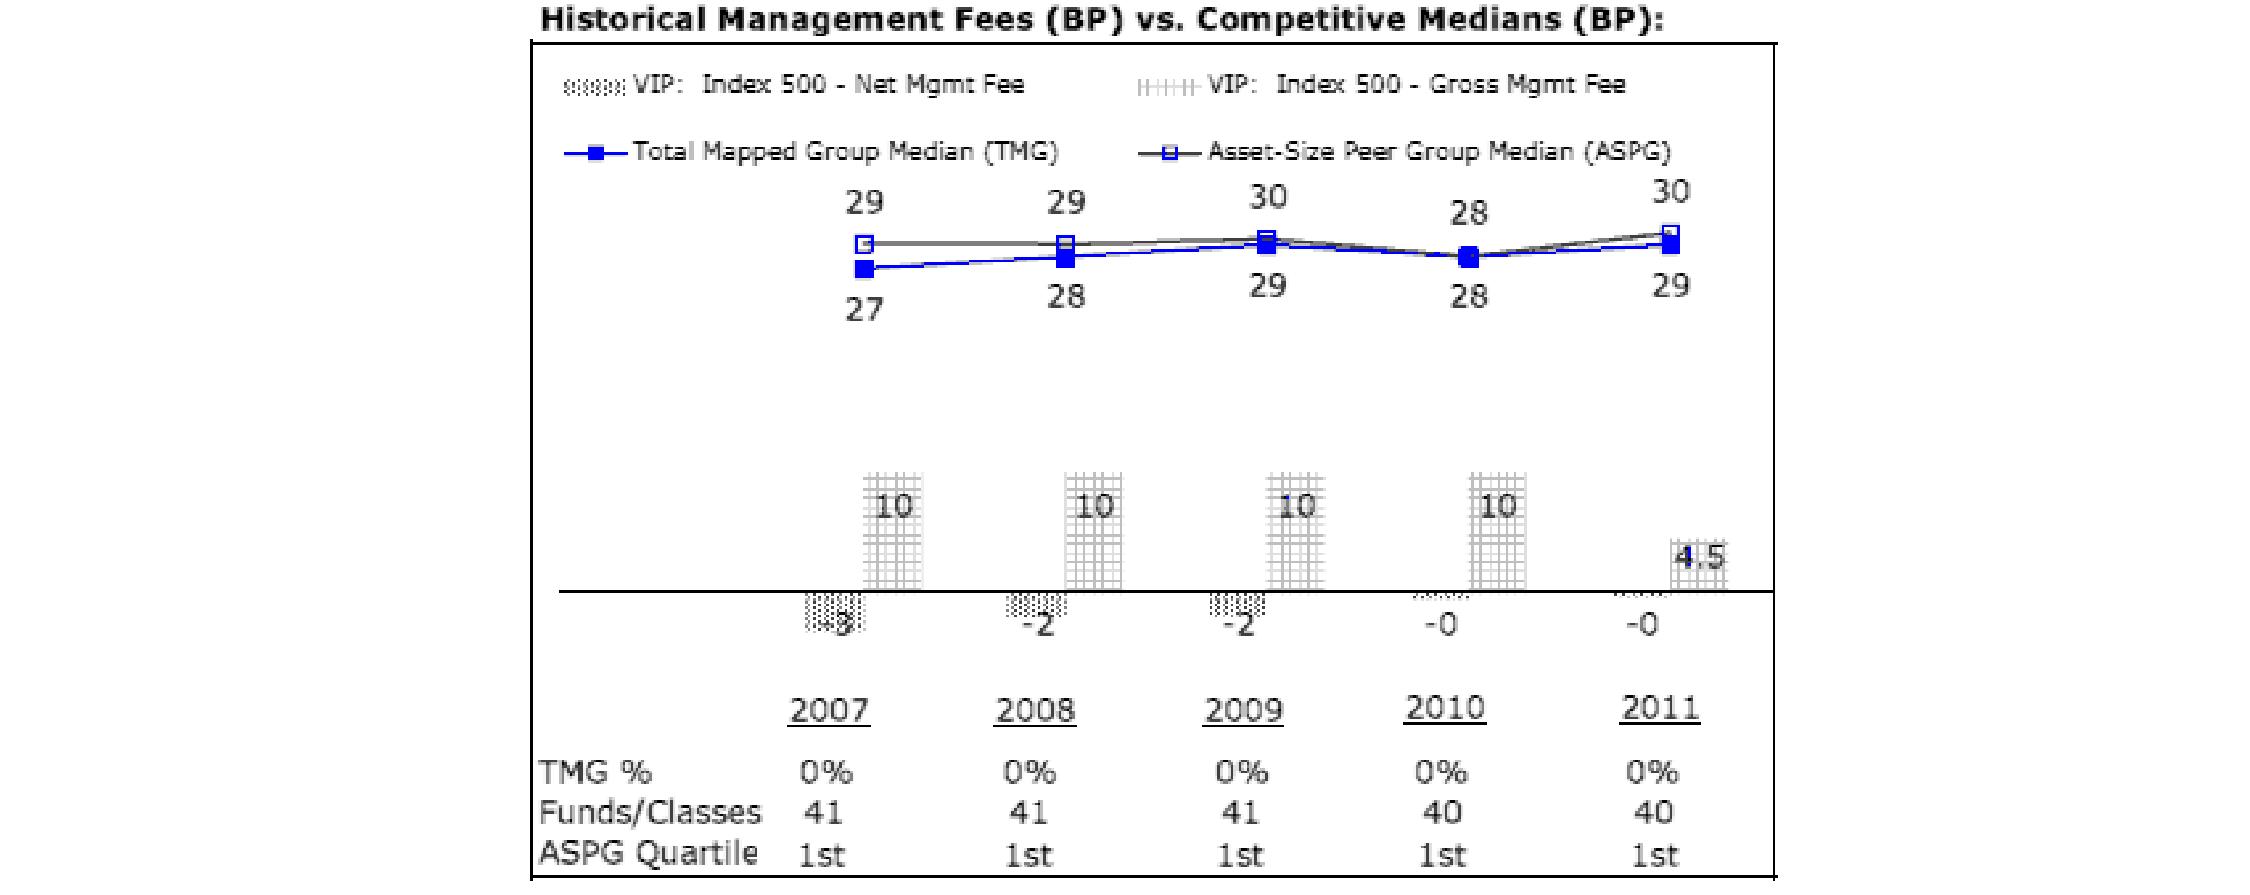
The Board noted that the fund's hypothetical net management fee ranked below the median of its Total Mapped Group and below the median of its ASPG for 2011.
Furthermore, the Board considered that it had approved an amended and restated management contract for the fund (effective September 1, 2011) that lowered the fund's management fee from 0.10% to 0.045%. The Board also considered that it had approved an amended and restated sub-advisory contract for the fund with Geode Capital Management, LLC (Geode) that lowered the sub-advisory fees that FMR pays to Geode. The Board considered that the chart reflects the fund's lower management fee for 2011, as if the lower fee were in effect for the entire year.
Based on its review, the Board concluded that the fund's management fee is fair and reasonable in light of the services that the fund receives and the other factors considered.
Total Expense Ratio. In its review of each class's total expense ratio, the Board considered the fund's hypothetical net management fee as well as the fund's gross management fee. The Board also considered other "fund-level" expenses, such as pricing and bookkeeping fees and custodial, legal, and audit fees. The Board also considered other "class-level" expenses, such as transfer agent fees and fund-paid 12b-1 fees. The Board also noted the effects of any waivers and reimbursements on fees and expenses. As part of its review, the Board also considered the current and historical total expense ratios of each class of the fund compared to competitive fund median expenses. Each class of the fund is compared to those funds and classes in the Total Mapped Group (used by the Board for management fee comparisons) that have a similar sales load structure.
The Board noted that the total expense ratio of each class ranked below its competitive median for 2011.
Annual Report
The Board also considered that current contractual arrangements for the fund in effect oblige FMR to pay all "class-level" expenses of each class of the fund to the extent necessary to limit total expenses, with certain exceptions, as follows: Initial Class: 0.10%; Service Class: 0.20%; and Service Class 2: 0.35%. These contractual arrangements may not be increased without the approval of the Board and the shareholders of the applicable class.
Fees Charged to Other Fidelity Clients. The Board also considered Fidelity fee structures and other information with respect to clients of FMR and its affiliates, such as other mutual funds advised or subadvised by FMR or its affiliates, pension plan clients, and other institutional clients. The Board noted the findings of the 2010 ad hoc joint committee (created with the board of other Fidelity funds), which reviewed and compared Fidelity's institutional investment advisory business with its business of providing services to the Fidelity funds, including the differences in services provided, fees charged, and costs incurred, as well as competition in their respective marketplaces.
Based on its review of total expense ratios and fees charged to other Fidelity clients, the Board concluded that the total expense ratio of each class of the fund was reasonable in light of the services that the fund and its shareholders receive and the other factors considered.
Costs of the Services and Profitability. The Board considered the revenues earned and the expenses incurred by Fidelity in conducting the business of developing, marketing, distributing, managing, administering and servicing the fund and its shareholders. The Board also considered the level of Fidelity's profits in respect of all the Fidelity funds.
On an annual basis, FMR presents to the Board Fidelity's profitability for the fund. Fidelity calculates the profitability for each fund, as well as aggregate profitability for groups of Fidelity funds and all Fidelity funds, using a series of detailed revenue and cost allocation methodologies which originate with the books and records of Fidelity on which Fidelity's audited financial statements are based. The Audit Committee of the Board reviews any significant changes from the prior year's methodologies.
PricewaterhouseCoopers LLP (PwC), independent registered public accounting firm and auditor to Fidelity and certain Fidelity funds, has been engaged annually by the Board as part of the Board's assessment of Fidelity's profitability analysis. PwC's engagement includes the review and assessment of Fidelity's methodologies used in determining the revenues and expenses attributable to Fidelity's mutual fund business, and completion of agreed-upon procedures surrounding the mathematical accuracy of fund profitability and its conformity to allocation methodologies. After considering PwC's reports issued under the engagement and information provided by Fidelity, the Board concluded that while other allocation methods may also be reasonable, Fidelity's profitability methodologies are reasonable in all material respects.
The Board also reviewed Fidelity's non-fund businesses and fall-out benefits related to the mutual fund business as well as cases where Fidelity's affiliates may benefit from or be related to the fund's business.
The Board considered the costs of the services provided by and the profits realized by Fidelity in connection with the operation of the fund and was satisfied that the profitability was not excessive in the circumstances.
Economies of Scale. The Board considered whether there have been economies of scale in respect of the management of the Fidelity funds, whether the Fidelity funds (including the fund) have appropriately benefited from any such economies of scale, and whether there is potential for realization of any further economies of scale. The Board considered the extent to which the fund will benefit from economies of scale through increased services to the fund, through waivers or reimbursements, or through fee or expense reductions. The Board also noted that in 2009, it and the board of other Fidelity funds created an ad hoc committee (the Economies of Scale Committee) to analyze whether FMR attains economies of scale in respect of the management and servicing of the Fidelity funds, whether the Fidelity funds have appropriately benefited from such economies of scale, and whether there is potential for realization of any further economies of scale.
The Board concluded, taking into account the analysis of the Economies of Scale Committee, that economies of scale, if any, are being appropriately shared between fund shareholders and Fidelity.
Additional Information Requested by the Board. In order to develop fully the factual basis for consideration of the Fidelity funds' Advisory Contracts, the Board requested and received additional information on certain topics, including (i) fund performance trends, actions to be taken by FMR to improve certain funds' overall performance, and Fidelity's long-term strategies for certain funds; (ii) the potential to further rationalize the Fidelity fund lineup with the possibility of achieving savings for the funds and Fidelity; (iii) Fidelity's compensation structure for portfolio managers and other key investment personnel; (iv) the amount of the investment that each portfolio manager has made in the Fidelity fund(s) that he or she manages; (v) the realization of fall-out benefits in certain Fidelity business units; (vi) Fidelity's group fee structures, the potential impact of regulatory changes on such structures, and the rationale for the individual fee rates of certain funds; (vii) fund profitability methodology, including Fidelity's cost allocation methodology, and the impact of certain factors on fund profitability results; (viii) trends regarding industry use of performance fee structures and the possibility of implementing performance fee structures for additional funds; and (ix) the impact of net redemptions from the Fidelity funds.
Based on its evaluation of all of the conclusions noted above, and after considering all factors it believed relevant, the Board ultimately concluded that the advisory fee structures are fair and reasonable, and that the fund's Advisory Contracts should be renewed.
Annual Report
Investment Adviser
Fidelity Management & Research Company
Boston, MA
Investment Sub-Advisers
FMR Co., Inc.
Geode Capital Management, LLC
General Distributor
Fidelity Distributors Corporation
Smithfield, RI
Transfer and Service Agents
Fidelity Investments Institutional Operations Company, Inc.
Boston, MA
Fidelity Service Company, Inc.
Boston, MA
Custodian
The Bank of New York Mellon
New York, NY
VIPIDX-ANN-0213
1.540028.115
Item 2. Code of Ethics
As of the end of the period, December 31, 2012, Variable Insurance Products Fund II (the trust) has adopted a code of ethics, as defined in Item 2 of Form N-CSR, that applies to its President and Treasurer and its Chief Financial Officer. A copy of the code of ethics is filed as an exhibit to this Form N-CSR.
Item 3. Audit Committee Financial Expert
The Board of Trustees of the trust has determined that Joseph Mauriello is an audit committee financial expert, as defined in Item 3 of Form N-CSR. Mr. Mauriello is independent for purposes of Item 3 of Form N-CSR.
Item 4. Principal Accountant Fees and Services
Fees and Services
The following table presents fees billed by Deloitte & Touche LLP, the member firms of Deloitte Touche Tohmatsu, and their respective affiliates (collectively, "Deloitte Entities") in each of the last two fiscal years for services rendered to Contrafund Portfolio, Disciplined Small Cap Portfolio and Index 500 Portfolio (the "Funds"):
Services Billed by Deloitte Entities
December 31, 2012 FeesA
| Audit Fees | Audit-Related Fees | Tax Fees | All Other Fees |
Contrafund Portfolio | $55,000 | $- | $5,700 | $2,700 |
Disciplined Small Cap Portfolio | $38,000 | $- | $5,700 | $400 |
Index 500 Portfolio | $44,000 | $- | $5,700 | $700 |
December 31, 2011 FeesA
| Audit Fees | Audit-Related Fees | Tax Fees | All Other Fees |
Contrafund Portfolio | $55,000 | $- | $5,700 | $2,200 |
Disciplined Small Cap Portfolio | $38,000 | $- | $5,700 | $300 |
Index 500 Portfolio | $44,000 | $- | $5,700 | $600 |
A Amounts may reflect rounding.
The following table presents fees billed by Deloitte Entities that were required to be approved by the Audit Committee for services that relate directly to the operations and financial reporting of the Funds and that are rendered on behalf of Fidelity Management & Research Company ("FMR") and entities controlling, controlled by, or under common control with FMR (not including any sub-adviser whose role is primarily portfolio management and is subcontracted with or overseen by another investment adviser) that provide ongoing services to the Funds ("Fund Service Providers"):
Services Billed by Deloitte Entities
| December 31, 2012A | December 31, 2011A |
Audit-Related Fees | $910,000 | $610,000 |
Tax Fees | $- | $- |
All Other Fees | $955,000 | $430,000 |
A Amounts may reflect rounding.
"Audit-Related Fees" represent fees billed for assurance and related services that are reasonably related to the performance of the fund audit or the review of the fund's financial statements and that are not reported under Audit Fees.
"Tax Fees" represent fees billed for tax compliance, tax advice or tax planning that relate directly to the operations and financial reporting of the fund.
"All Other Fees" represent fees billed for services provided to the fund or Fund Service Provider, a significant portion of which are assurance related, that relate directly to the operations and financial reporting of the fund, excluding those services that are reported under Audit Fees, Audit-Related Fees or Tax Fees.
Assurance services must be performed by an independent public accountant.
* * *
The aggregate non-audit fees billed by Deloitte Entities for services rendered to the Funds, FMR (not including any sub-adviser whose role is primarily portfolio management and is subcontracted with or overseen by another investment adviser), and any Fund Service Provider for each of the last two fiscal years of the Funds are as follows:
Billed By | December 31, 2012 A | December 31, 2011 A |
Deloitte Entities | $1,915,000 | $1,155,000 |
A Amounts may reflect rounding.
The trust's Audit Committee has considered non-audit services that were not pre-approved that were provided by Deloitte Entities to Fund Service Providers to be compatible with maintaining the independence of Deloitte Entities in its audit of the Funds, taking into account representations from Deloitte Entities, in accordance with Public Company Accounting Oversight Board rules, regarding its independence from the Funds and their related entities and FMR's review of the appropriateness and permissibility under applicable law of such non-audit services prior to their provision to the Fund Service Providers.
Audit Committee Pre-Approval Policies and Procedures
The trust's Audit Committee must pre-approve all audit and non-audit services provided by a fund's independent registered public accounting firm relating to the operations or financial reporting of the fund. Prior to the commencement of any audit or non-audit services to a fund, the Audit Committee reviews the services to determine whether they are appropriate and permissible under applicable law.
The Audit Committee has adopted policies and procedures to, among other purposes, provide a framework for the Committee's consideration of non-audit services by the audit firms that audit the Fidelity funds. The policies and procedures require that any non-audit service provided by a fund audit firm to a Fidelity fund and any non-audit service provided by a fund auditor to a Fund Service Provider that relates directly to the operations and financial reporting of a Fidelity fund ("Covered Service") are subject to approval by the Audit Committee before such service is provided.
All Covered Services must be approved in advance of provision of the service either: (i) by formal resolution of the Audit Committee, or (ii) by oral or written approval of the service by the Chair of the Audit Committee (or if the Chair is unavailable, such other member of the Audit Committee as may be designated by the Chair to act in the Chair's absence). The approval contemplated by (ii) above is permitted where the Treasurer determines that action on such an engagement is necessary before the next meeting of the Audit Committee.
Non-audit services provided by a fund audit firm to a Fund Service Provider that do not relate directly to the operations and financial reporting of a Fidelity fund are reported to the Audit Committee on a periodic basis.
Non-Audit Services Approved Pursuant to Rule 2-01(c)(7)(i)(C) and (ii) of Regulation S-X ("De Minimis Exception")
There were no non-audit services approved or required to be approved by the Audit Committee pursuant to the De Minimis Exception during the Funds' last two fiscal years relating to services provided to (i) the Funds or (ii) any Fund Service Provider that relate directly to the operations and financial reporting of the Funds.
Item 5. Audit Committee of Listed Registrants
Not applicable.
Item 6. Investments
(a) Not applicable.
(b) Not applicable
Item 7. Disclosure of Proxy Voting Policies and Procedures for Closed-End Management Investment Companies
Not applicable.
Item 8. Portfolio Managers of Closed-End Management Investment Companies
Not applicable.
Item 9. Purchase of Equity Securities by Closed-End Management Investment Company and Affiliated Purchasers
Not applicable.
Item 10. Submission of Matters to a Vote of Security Holders
There were no material changes to the procedures by which shareholders may recommend nominees to the trust's Board of Trustees.
Item 11. Controls and Procedures
(a)(i) The President and Treasurer and the Chief Financial Officer have concluded that the trust's disclosure controls and procedures (as defined in Rule 30a-3(c) under the Investment Company Act) provide reasonable assurances that material information relating to the trust is made known to them by the appropriate persons, based on their evaluation of these controls and procedures as of a date within 90 days of the filing date of this report.
(a)(ii) There was no change in the trust's internal control over financial reporting (as defined in Rule 30a-3(d) under the Investment Company Act) that occurred during the second fiscal quarter of the period covered by this report that has materially affected, or is reasonably likely to materially affect, the trust's internal control over financial reporting.
Item 12. Exhibits
(a) | (1) | Code of Ethics pursuant to Item 2 of Form N-CSR is filed and attached hereto as EX-99.CODE ETH. |
(a) | (2) | Certification pursuant to Rule 30a-2(a) under the Investment Company Act of 1940 (17 CFR 270.30a-2(a)) is filed and attached hereto as Exhibit 99.CERT. |
(a) | (3) | Not applicable. |
(b) | | Certification pursuant to Rule 30a-2(b) under the Investment Company Act of 1940 (17 CFR 270.30a-2(b)) is furnished and attached hereto as Exhibit 99.906CERT. |
SIGNATURES
Pursuant to the requirements of the Securities Exchange Act of 1934 and the Investment Company Act of 1940, the registrant has duly caused this report to be signed on its behalf by the undersigned, thereunto duly authorized.
Variable Insurance Products Fund II
By: | /s/Kenneth B. Robins |
| Kenneth B. Robins |
| President and Treasurer |
| |
Date: | February 20, 2013 |
Pursuant to the requirements of the Securities Exchange Act of 1934 and the Investment Company Act of 1940, this report has been signed below by the following persons on behalf of the registrant and in the capacities and on the dates indicated.
By: | /s/Kenneth B. Robins |
| Kenneth B. Robins |
| President and Treasurer |
| |
Date: | February 20, 2013 |
By: | /s/Christine Reynolds |
| Christine Reynolds |
| Chief Financial Officer |
| |
Date: | February 20, 2013 |