UNITED STATES
SECURITIES AND EXCHANGE COMMISSION
Washington, D.C. 20549
FORM N-CSR
CERTIFIED SHAREHOLDER REPORT OF REGISTERED
MANAGEMENT INVESTMENT COMPANIES
Investment Company Act file number 811-5511
Variable Insurance Products Fund II
(Exact name of registrant as specified in charter)
245 Summer St., Boston, Massachusetts 02210
(Address of principal executive offices) (Zip code)
Scott C. Goebel, Secretary
245 Summer St.
Boston, Massachusetts 02210
(Name and address of agent for service)
Registrant's telephone number, including area code: 617-563-7000
Date of fiscal year end: | December 31 |
| |
Date of reporting period: | December 31, 2013 |
Item 1. Reports to Stockholders
Fidelity® Variable Insurance Products:
Contrafund® Portfolio
Annual Report
December 31, 2013
(Fidelity Cover Art)
Contents
Performance | (Click Here) | How the fund has done over time. |
Management's Discussion of Fund Performance | (Click Here) | The Portfolio Manager's review of fund performance and strategy. |
Shareholder Expense Example | (Click Here) | An example of shareholder expenses. |
Investment Changes | (Click Here) | A summary of major shifts in the fund's investments over the past six months. |
Investments | (Click Here) | A complete list of the fund's investments with their market values. |
Financial Statements | (Click Here) | Statements of assets and liabilities, operations, and changes in net assets, as well as financial highlights. |
Notes | (Click Here) | Notes to the financial statements. |
Report of Independent Registered Public Accounting Firm | (Click Here) | |
Trustees and Officers | (Click Here) | |
Distributions | (Click Here) | |
Board Approval of Investment Advisory Contracts and Management Fees | (Click Here) | |
To view a fund's proxy voting guidelines and proxy voting record for the 12-month period ended June 30, visit http://www.fidelity.com/proxyvotingresults or visit the Securities and Exchange Commission's (SEC) web site at http://www.sec.gov. You may also call 1-877-208-0098 to request a free copy of the proxy voting guidelines.
Fidelity Variable Insurance Products are separate account options which are purchased through a variable insurance contract.
Standard & Poor's, S&P and S&P 500 are registered service marks of The McGraw-Hill Companies, Inc. and have been licensed for use by Fidelity Distributors Corporation.
Other third-party marks appearing herein are the property of their respective owners.
All other marks appearing herein are registered or unregistered trademarks or service marks of FMR LLC or an affiliated company. © 2014 FMR LLC. All rights reserved.
This report and the financial statements contained herein are submitted for the general information of the shareholders of the fund. This report is not authorized for distribution to prospective investors in the fund unless preceded or accompanied by an effective prospectus.
A fund files its complete schedule of portfolio holdings with the SEC for the first and third quarters of each fiscal year on Form N-Q. Forms N-Q are available on the SEC's web site at http://www.sec.gov. A fund's Forms N-Q may be reviewed and copied at the SEC's Public Reference Room in Washington, DC. Information regarding the operation of the SEC's Public Reference Room may be obtained by calling 1-800-SEC-0330. For a complete list of a fund's portfolio holdings, view the most recent holdings listing, semiannual report, or annual report on Fidelity's web site at http://www.fidelity.com, http://www.advisor.fidelity.com, or http://www.401k.com, as applicable.
NOT FDIC INSURED • MAY LOSE VALUE • NO BANK GUARANTEE
Neither the fund nor Fidelity Distributors Corporation is a bank.
Annual Report
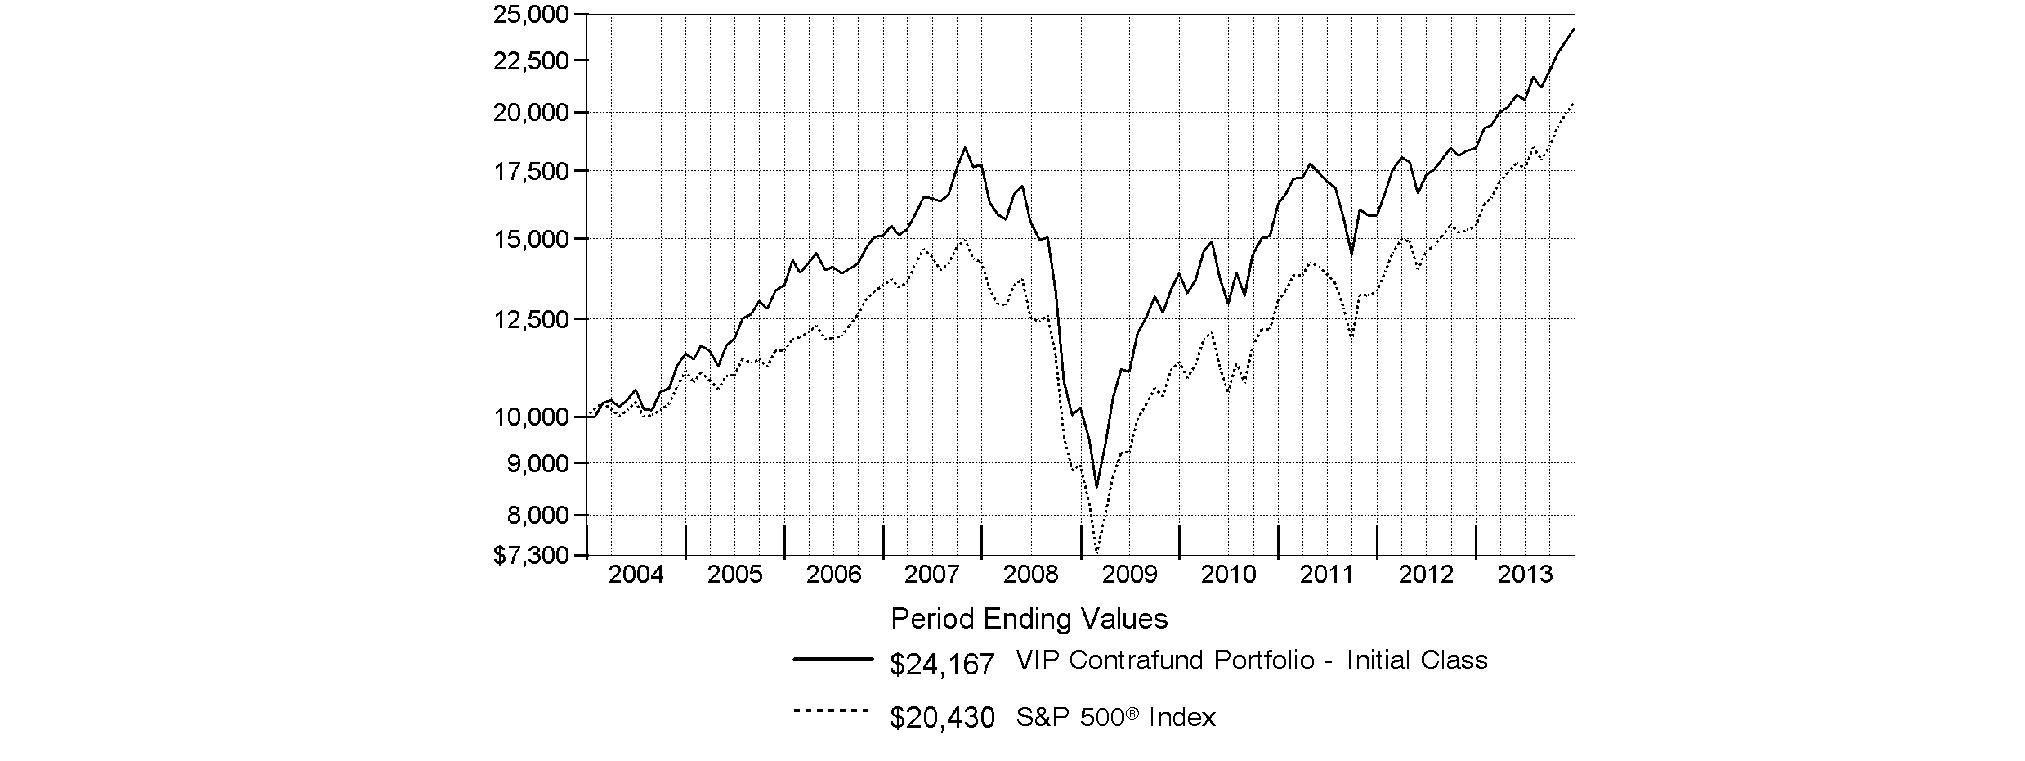
Average annual total return reflects the change in the value of an investment, assuming reinvestment of the class' distributions from dividend income and capital gains (the profits earned upon the sale of securities that have grown in value, if any) and assuming a constant rate of performance each year. During periods of reimbursement by Fidelity, a fund's total return will be greater than it would be had the reimbursement not occurred. Performance numbers are net of all underlying fund operating expenses, but do not include any insurance charges imposed by your insurance company's separate account. If performance information included the effect of these additional charges, the total returns would have been lower. How a fund did yesterday is no guarantee of how it will do tomorrow.
Average Annual Total Returns
Periods ended December 31, 2013 | Past 1
year | Past 5
years | Past 10
years |
VIP ContrafundSM Portfolio - Initial Class | 31.29% | 18.84% | 9.23% |
VIP Contrafund Portfolio - Service Class | 31.14% | 18.73% | 9.12% |
VIP Contrafund Portfolio - Service Class 2 | 30.95% | 18.55% | 8.95% |
VIP Contrafund Portfolio - Investor Class A | 31.15% | 18.74% | 9.13% |
A The initial offering of Investor Class shares took place on July 21, 2005. Returns prior to July 21, 2005, are those of Initial Class. Had Investor Class's transfer agent fee been reflected, returns prior to July 21, 2005, would have been lower.
$10,000 Over 10 Years
Let's say hypothetically that $10,000 was invested in VIP ContrafundSM Portfolio - Initial Class on December 31, 2003. The chart shows how the value of your investment would have changed, and also shows how the S&P 500® Index performed over the same period.
Annual Report
Market Recap: Global equity markets remained upbeat for the 12 months ending December 31, 2013, propelling the MSCI® ACWI® (All Country World Index) Index to a 23.24% return. Midyear turbulence gave way by autumn when policymakers in the U.S. and China had made clear their intentions to maintain accommodative monetary policies. That stance, combined with modest cyclical improvement around the globe and generally low valuations, underpinned the broad rally in equities, although the relative strength of the U.S. dollar generally tempered gains for U.S. investors holding foreign securities based in local currencies. During the period, the broad-market S&P 500® Index set a series of new highs, finishing the year up 32.39%. For the first time since 1995, the S&P® scored a "perfect 10," with all 10 economic sectors gaining at least 10% for the year. A resurgence in growth-oriented stocks lifted the Nasdaq Composite Index® to a 40.12% result for 2013, while the blue-chip Dow Jones Industrial AverageSM notched a relatively more modest 29.65% gain. International developed-markets equities rose in concert with their U.S. counterparts, with the MSCI® EAFE® Index gaining 22.92% for the period. Meanwhile, foreign exchange and commodity weakness curbed results in resource-heavy emerging markets (EM), especially in the year's waning months. More generally, concern over EM's slowing growth, its declining share of global trade and uncertainty surrounding U.S. central bank intentions were all factors hampering performance. The MSCI Emerging Markets Index returned -2.27% for the period. On the bond side, U.S. high-yield securities rallied with equities for much of the period, with The BofA Merrill LynchSM US High Yield Constrained Index returning 7.41% for 2013. The more rate-sensitive U.S. investment-grade bond category faced headwinds though, as reflected in the -2.02% return of the Barclays® U.S. Aggregate Bond Index. Within the Barclays index, investment-grade corporate credit returned -2.01%, while ultra-safe U.S. Treasuries saw a -2.75% result. Major non-U.S. developed markets performed only slightly better, with the Citigroup® Non-USD Group-of-Seven (G7) Equal Weighted Index logging a -1.59% result. After several years of strong advances, EM debt reversed course in 2013, with the J.P. Morgan Emerging Markets Bond Index Global returning -6.58%.
Comments from Co-Portfolio Manager Robert Stansky, Head of FMR's Stock Selector Large Cap Group, which manages VIP ContrafundSM Portfolio: For the year, the fund's share classes trailed the S&P 500®. (For specific portfolio results, please refer to the performance section of this report.) The fund fell short of its benchmark during this period of strong performance for equities due to disappointing picks in industrials and energy. Our stock choices were strongest within telecommunication services, health care and financials. Positioning in Apple was a major detractor, especially a sizable overweighting early in the period, when the stock lost ground. We significantly reduced our stake in the personal electronics giant - moving to an underweighting. Still, Apple remained among the fund's largest holdings, and was a modest overweighting at period end. We also missed with our timing on tech titan Microsoft. We largely avoided the stock early on, thinking its valuation reflected the software maker's near-term outlook amid a dearth of growth in personal computers. We established a position in April, however, partly in anticipation of a corporate realignment and a reshuffling of priorities to allow the company to refocus on cloud computing. The stock gained nicely through the end of the year, but it still detracted because our exposure was lower than that of the benchmark, on average. A non-index stake in British American Tobacco detracted, as the stock meaningfully underperformed, due in part to a global preference for U.S.-based stocks over European names. Conversely, we successfully avoided computer services provider and lagging index component IBM, which we believe faces increased pressure from competitors and slowing growth prospects. We fared better within telecommunication services, avoiding index goliath AT&T for much of the 12-month period. Selling it in January because its growth was slowing was a good call, as the stock lagged due to weakening fundamentals in wireless and rising interest rates, the latter of which hurt dividend-paying stocks.
The views expressed above reflect those of the portfolio manager(s) only through the end of the period as stated on the cover of this report and do not necessarily represent the views of Fidelity or any other person in the Fidelity organization. Any such views are subject to change at any time based upon market or other conditions and Fidelity disclaims any responsibility to update such views. These views may not be relied on as investment advice and, because investment decisions for a Fidelity fund are based on numerous factors, may not be relied on as an indication of trading intent on behalf of any Fidelity fund.
Annual Report
As a shareholder of the Fund, you incur two types of costs: (1) transaction costs, including redemption fees and (2) ongoing costs, including management fees, distribution and/or service (12b-1) fees and other Fund expenses. This Example is intended to help you understand your ongoing costs (in dollars) of investing in the Fund and to compare these costs with the ongoing costs of investing in other mutual funds.
The Example is based on an investment of $1,000 invested at the beginning of the period and held for the entire period (July 1, 2013 to December 31, 2013).
Actual Expenses
The first line of the accompanying table for each class of the Fund provides information about actual account values and actual expenses. You may use the information in this line, together with the amount you invested, to estimate the expenses that you paid over the period. Simply divide your account value by $1,000.00 (for example, an $8,600 account value divided by $1,000.00 = 8.6), then multiply the result by the number in the first line for a class of the Fund under the heading entitled "Expenses Paid During Period" to estimate the expenses you paid on your account during this period. The estimate of expenses does not include any fees or other expenses of any variable annuity or variable life insurance product. If they were, the estimate of expenses you paid during the period would be higher, and your ending account value would be lower. In addition, the Fund, as a shareholder in the underlying Fidelity Central Funds, will indirectly bear its pro-rata share of the fees and expenses incurred by the underlying Fidelity Central Funds. These fees and expenses are not included in the Fund's annualized expense ratio used to calculate the expense estimate in the table below.
Hypothetical Example for Comparison Purposes
The second line of the accompanying table for each class of the Fund provides information about hypothetical account values and hypothetical expenses based on a Class' actual expense ratio and an assumed rate of return of 5% per year before expenses, which is not the Class' actual return. The hypothetical account values and expenses may not be used to estimate the actual ending account balance or expenses you paid for the period. You may use this information to compare the ongoing costs of investing in the Fund and other funds. To do so, compare this 5% hypothetical example with the 5% hypothetical examples that appear in the shareholder reports of the other funds. The estimate of expenses does not include any fees or other expenses of any variable annuity or variable life insurance product. If they were, the estimate of expenses you paid during the period would be higher, and your ending account value would be lower. In addition, the Fund, as a shareholder in the underlying Fidelity Central Funds, will indirectly bear its pro-rata share of the fees and expenses incurred by the underlying Fidelity Central Funds. These fees and expenses are not included in the Fund's annualized expense ratio used to calculate the expense estimate in the table below.
Please note that the expenses shown in the table are meant to highlight your ongoing costs only and do not reflect any transaction costs. Therefore, the second line of the table is useful in comparing ongoing costs only, and will not help you determine the relative total costs of owning different funds. In addition, if these transactional costs were included, your costs would have been higher.
| Annualized
Expense Ratio B | Beginning
Account Value
July 1, 2013 | Ending
Account Value
December 31, 2013 | Expenses Paid
During Period*
July 1, 2013
to December 31, 2013 |
Initial Class | .63% | | | |
Actual | | $ 1,000.00 | $ 1,177.10 | $ 3.46 |
Hypothetical A | | $ 1,000.00 | $ 1,022.03 | $ 3.21 |
Service Class | .73% | | | |
Actual | | $ 1,000.00 | $ 1,176.60 | $ 4.00 |
Hypothetical A | | $ 1,000.00 | $ 1,021.53 | $ 3.72 |
Service Class 2 | .88% | | | |
Actual | | $ 1,000.00 | $ 1,175.70 | $ 4.83 |
Hypothetical A | | $ 1,000.00 | $ 1,020.77 | $ 4.48 |
Service Class 2R | .88% | | | |
Actual | | $ 1,000.00 | $ 1,175.40 | $ 4.83 |
Hypothetical A | | $ 1,000.00 | $ 1,020.77 | $ 4.48 |
Investor Class | .71% | | | |
Actual | | $ 1,000.00 | $ 1,176.70 | $ 3.90 |
Hypothetical A | | $ 1,000.00 | $ 1,021.63 | $ 3.62 |
A 5% return per year before expenses
B Annualized expense ratio reflects expenses net of applicable fee waivers.
* Expenses are equal to each Class' annualized expense ratio, multiplied by the average account value over the period, multiplied by 184/365 (to reflect the one-half year period).
Annual Report
Investment Changes (Unaudited)
Top Ten Stocks as of December 31, 2013 |
| % of fund's
net assets | % of fund's net assets
6 months ago |
Apple, Inc. | 3.2 | 1.8 |
JPMorgan Chase & Co. | 2.1 | 2.0 |
Procter & Gamble Co. | 2.0 | 2.1 |
Google, Inc. Class A | 1.9 | 1.9 |
Capital One Financial Corp. | 1.8 | 2.0 |
Yahoo!, Inc. | 1.8 | 0.0 |
Microsoft Corp. | 1.7 | 1.7 |
Bank of America Corp. | 1.6 | 1.6 |
The Coca-Cola Co. | 1.5 | 1.7 |
British American Tobacco PLC sponsored ADR | 1.4 | 1.5 |
| 19.0 | |
Market Sectors as of December 31, 2013 |
| % of fund's
net assets | % of fund's net assets
6 months ago |
Information Technology | 18.1 | 17.4 |
Financials | 16.5 | 16.9 |
Health Care | 13.1 | 12.4 |
Consumer Discretionary | 12.1 | 12.2 |
Industrials | 10.6 | 10.2 |
Energy | 9.8 | 9.9 |
Consumer Staples | 9.8 | 10.1 |
Materials | 3.7 | 3.3 |
Utilities | 3.1 | 3.2 |
Telecommunication Services | 1.7 | 2.1 |
Asset Allocation (% of fund's net assets) |
As of December 31, 2013* | As of June 30, 2013** |
 | Stocks and Equity
Futures 99.1% | | | Stocks and Equity
Futures 98.1% | |
 | Bonds 0.0%† | | | Bonds 0.0%† | |
 | Short-Term
Investments and
Net Other Assets (Liabilities) 0.9% | | | Short-Term
Investments and
Net Other Assets (Liabilities) 1.9% | |
* Foreign investments | 12.9% | | ** Foreign investments | 9.9% | |

† Amount represents less than 0.1%
Annual Report
Investments December 31, 2013
Showing Percentage of Net Assets
Common Stocks - 98.3% |
| Shares | | Value |
CONSUMER DISCRETIONARY - 12.1% |
Diversified Consumer Services - 0.4% |
H&R Block, Inc. | 2,656,760 | | $ 77,152,310 |
Hotels, Restaurants & Leisure - 1.9% |
ARAMARK Holdings Corp. (a) | 212,500 | | 5,571,750 |
Domino's Pizza, Inc. | 289,923 | | 20,193,137 |
Extended Stay America, Inc. unit | 1,268,238 | | 33,303,930 |
Wynn Resorts Ltd. | 586,693 | | 113,941,648 |
Yum! Brands, Inc. | 2,389,872 | | 180,698,222 |
| | 353,708,687 |
Internet & Catalog Retail - 0.7% |
Liberty Interactive Corp. Series A (a) | 4,797,679 | | 140,811,879 |
Media - 4.9% |
Comcast Corp. Class A | 762,506 | | 39,623,624 |
DIRECTV (a) | 2,215,295 | | 153,054,732 |
Legend Pictures LLC (a)(f)(g) | 2,062 | | 3,717,786 |
Liberty Global PLC Class A (a) | 542,363 | | 48,264,883 |
The Madison Square Garden Co.
Class A (a) | 337,934 | | 19,458,240 |
The Walt Disney Co. | 2,503,667 | | 191,280,159 |
Time Warner, Inc. | 2,570,067 | | 179,185,071 |
Twenty-First Century Fox, Inc. Class A | 6,333,797 | | 222,822,978 |
Viacom, Inc. Class B (non-vtg.) | 728,752 | | 63,649,200 |
Weinstein Co. Holdings LLC
Class A-1 (a)(f)(g) | 11,499 | | 4,312,125 |
| | 925,368,798 |
Multiline Retail - 1.5% |
Dollar General Corp. (a) | 2,626,220 | | 158,413,590 |
Target Corp. | 1,837,656 | | 116,268,495 |
| | 274,682,085 |
Specialty Retail - 1.6% |
Lowe's Companies, Inc. | 2,746,357 | | 136,081,989 |
TJX Companies, Inc. | 2,630,422 | | 167,636,794 |
| | 303,718,783 |
Textiles, Apparel & Luxury Goods - 1.1% |
Fossil Group, Inc. (a) | 442,606 | | 53,086,164 |
lululemon athletica, Inc. (a) | 975,262 | | 57,569,716 |
Oxford Industries, Inc. | 347,271 | | 28,014,352 |
PVH Corp. | 442,629 | | 60,206,397 |
| | 198,876,629 |
TOTAL CONSUMER DISCRETIONARY | | 2,274,319,171 |
CONSUMER STAPLES - 9.7% |
Beverages - 2.5% |
Anheuser-Busch InBev SA NV | 252,471 | | 26,846,825 |
Coca-Cola Bottling Co. Consolidated | 112,072 | | 8,202,550 |
Coca-Cola Icecek A/S | 328,515 | | 7,910,959 |
Constellation Brands, Inc. Class A
(sub. vtg.) (a) | 126,413 | | 8,896,947 |
|
| Shares | | Value |
Diageo PLC sponsored ADR | 320,642 | | $ 42,459,414 |
Embotelladora Andina SA sponsored ADR | 273,837 | | 7,733,157 |
Pernod Ricard SA | 342,679 | | 39,038,580 |
Remy Cointreau SA | 439,343 | | 36,862,610 |
The Coca-Cola Co. | 6,939,741 | | 286,680,701 |
| | 464,631,743 |
Food & Staples Retailing - 2.0% |
CVS Caremark Corp. | 2,425,815 | | 173,615,580 |
Drogasil SA | 676,600 | | 4,276,846 |
Kroger Co. | 2,951,274 | | 116,663,861 |
Sysco Corp. | 825,077 | | 29,785,280 |
Wal-Mart Stores, Inc. | 731,756 | | 57,581,880 |
| | 381,923,447 |
Food Products - 0.7% |
Bunge Ltd. | 451,712 | | 37,090,072 |
ConAgra Foods, Inc. | 512,600 | | 17,274,620 |
Green Mountain Coffee Roasters, Inc. | 249,119 | | 18,828,414 |
Mead Johnson Nutrition Co. Class A | 575,199 | | 48,178,668 |
Nestle SA | 281,488 | | 20,630,273 |
| | 142,002,047 |
Household Products - 2.0% |
Procter & Gamble Co. | 4,591,884 | | 373,825,276 |
Personal Products - 0.1% |
Nu Skin Enterprises, Inc. Class A | 89,408 | | 12,357,974 |
Tobacco - 2.4% |
Altria Group, Inc. | 3,912,630 | | 150,205,866 |
British American Tobacco PLC sponsored ADR | 2,539,979 | | 272,844,544 |
Philip Morris International, Inc. | 268,176 | | 23,366,175 |
Souza Cruz SA | 910,800 | | 9,391,553 |
| | 455,808,138 |
TOTAL CONSUMER STAPLES | | 1,830,548,625 |
ENERGY - 9.7% |
Energy Equipment & Services - 1.5% |
C&J Energy Services, Inc. (a)(d) | 1,152,539 | | 26,623,651 |
Cameron International Corp. (a) | 1,289,589 | | 76,769,233 |
Dril-Quip, Inc. (a) | 148,484 | | 16,322,846 |
FMC Technologies, Inc. (a) | 915,829 | | 47,815,432 |
Halliburton Co. | 1,577,182 | | 80,041,987 |
Ocean Rig UDW, Inc. (United States) (a) | 663,700 | | 12,776,225 |
Oceaneering International, Inc. | 234,018 | | 18,459,340 |
Pacific Drilling SA (a) | 567,835 | | 6,507,389 |
Vantage Drilling Co. (a) | 6,359,500 | | 11,701,480 |
| | 297,017,583 |
Oil, Gas & Consumable Fuels - 8.2% |
Anadarko Petroleum Corp. | 1,781,821 | | 141,334,042 |
Cabot Oil & Gas Corp. | 1,917,300 | | 74,314,548 |
Carrizo Oil & Gas, Inc. (a) | 111,000 | | 4,969,470 |
Common Stocks - continued |
| Shares | | Value |
ENERGY - continued |
Oil, Gas & Consumable Fuels - continued |
Chevron Corp. | 1,348,500 | | $ 168,441,135 |
Cobalt International Energy, Inc. (a) | 792,062 | | 13,029,420 |
Concho Resources, Inc. (a) | 397,008 | | 42,876,864 |
ConocoPhillips Co. | 2,858,975 | | 201,986,584 |
Continental Resources, Inc. (a) | 398,793 | | 44,872,188 |
EOG Resources, Inc. | 468,287 | | 78,597,290 |
Exxon Mobil Corp. | 2,693,334 | | 272,565,401 |
Forest Oil Corp. (a) | 1,403,600 | | 5,066,996 |
Kinder Morgan Holding Co. LLC | 1,185,500 | | 42,678,000 |
Marathon Oil Corp. | 2,892,518 | | 102,105,885 |
Noble Energy, Inc. | 860,300 | | 58,595,033 |
Peabody Energy Corp. | 1,705,380 | | 33,306,071 |
Phillips 66 Co. | 1,664,639 | | 128,393,606 |
Spectra Energy Corp. | 1,424,200 | | 50,730,004 |
Suncor Energy, Inc. | 1,538,460 | | 53,934,809 |
Valero Energy Partners LP | 739,400 | | 25,472,330 |
| | 1,543,269,676 |
TOTAL ENERGY | | 1,840,287,259 |
FINANCIALS - 16.5% |
Capital Markets - 3.0% |
Ameriprise Financial, Inc. | 806,107 | | 92,742,610 |
BlackRock, Inc. Class A | 310,257 | | 98,187,033 |
Credit Suisse Group AG | 667,378 | | 20,597,540 |
Deutsche Bank AG | 418,072 | | 20,084,776 |
E*TRADE Financial Corp. (a) | 2,403,227 | | 47,199,378 |
Evercore Partners, Inc. Class A | 325,400 | | 19,452,412 |
Invesco Ltd. | 2,241,982 | | 81,608,145 |
Morgan Stanley | 2,202,987 | | 69,085,672 |
Northern Trust Corp. | 456,114 | | 28,228,895 |
Oaktree Capital Group LLC Class A | 556,474 | | 32,742,930 |
The Blackstone Group LP | 1,394,238 | | 43,918,497 |
UBS AG | 355,820 | | 6,813,011 |
| | 560,660,899 |
Commercial Banks - 2.4% |
Barclays PLC | 12,566,977 | | 56,826,397 |
BNP Paribas SA | 318,300 | | 24,806,203 |
Erste Group Bank AG | 551,127 | | 19,204,836 |
Huntington Bancshares, Inc. | 4,272,374 | | 41,228,409 |
KBC Groupe SA | 161,288 | | 9,152,711 |
Mitsubishi UFJ Financial Group, Inc. | 4,030,400 | | 26,759,423 |
Sberbank (Savings Bank of the Russian Federation) sponsored ADR | 740,444 | | 9,314,786 |
Societe Generale Series A | 833,143 | | 48,390,657 |
Synovus Financial Corp. | 6,291,161 | | 22,648,180 |
U.S. Bancorp | 4,815,592 | | 194,549,917 |
| | 452,881,519 |
|
| Shares | | Value |
Consumer Finance - 2.4% |
Capital One Financial Corp. | 4,576,748 | | $ 350,624,664 |
Discover Financial Services | 378,103 | | 21,154,863 |
SLM Corp. | 3,349,176 | | 88,016,345 |
| | 459,795,872 |
Diversified Financial Services - 5.3% |
Bank of America Corp. | 19,426,114 | | 302,464,595 |
Citigroup, Inc. | 4,949,350 | | 257,910,629 |
IntercontinentalExchange Group, Inc. | 164,092 | | 36,907,573 |
JPMorgan Chase & Co. | 6,678,339 | | 390,549,265 |
KBC Ancora (a) | 411,678 | | 14,877,894 |
| | 1,002,709,956 |
Insurance - 1.8% |
ACE Ltd. | 166,551 | | 17,243,025 |
Direct Line Insurance Group PLC | 9,143,100 | | 37,790,729 |
esure Group PLC | 3,261,214 | | 13,490,217 |
Fairfax Financial Holdings Ltd.
(sub. vtg.) | 54,800 | | 21,879,245 |
Marsh & McLennan Companies, Inc. | 1,125,570 | | 54,432,565 |
MetLife, Inc. | 2,557,130 | | 137,880,450 |
The Travelers Companies, Inc. | 514,241 | | 46,559,380 |
Validus Holdings Ltd. | 318,470 | | 12,831,156 |
| | 342,106,767 |
Real Estate Investment Trusts - 0.8% |
American Tower Corp. | 1,045,333 | | 83,438,480 |
Equity Lifestyle Properties, Inc. | 821,224 | | 29,752,946 |
Sun Communities, Inc. | 701,869 | | 29,927,694 |
| | 143,119,120 |
Real Estate Management & Development - 0.7% |
Altisource Residential Corp. Class B | 1,698,082 | | 51,129,249 |
CBRE Group, Inc. (a) | 3,397,725 | | 89,360,168 |
| | 140,489,417 |
Thrifts & Mortgage Finance - 0.1% |
Ocwen Financial Corp. (a) | 238,547 | | 13,227,431 |
TOTAL FINANCIALS | | 3,114,990,981 |
HEALTH CARE - 13.1% |
Biotechnology - 3.4% |
Actelion Ltd. | 323,441 | | 27,320,531 |
Alexion Pharmaceuticals, Inc. (a) | 645,732 | | 85,921,100 |
Amgen, Inc. | 1,381,020 | | 157,657,243 |
Biogen Idec, Inc. (a) | 491,031 | | 137,365,922 |
CSL Ltd. | 296,058 | | 18,229,589 |
Gilead Sciences, Inc. (a) | 2,832,053 | | 212,828,783 |
| | 639,323,168 |
Health Care Equipment & Supplies - 1.8% |
Boston Scientific Corp. (a) | 7,767,908 | | 93,370,254 |
Covidien PLC | 1,531,290 | | 104,280,849 |
Edwards Lifesciences Corp. (a) | 150,808 | | 9,917,134 |
Common Stocks - continued |
| Shares | | Value |
HEALTH CARE - continued |
Health Care Equipment & Supplies - continued |
Quidel Corp. (a)(d) | 698,658 | | $ 21,581,546 |
Stryker Corp. | 702,754 | | 52,804,936 |
The Cooper Companies, Inc. | 475,420 | | 58,876,013 |
| | 340,830,732 |
Health Care Providers & Services - 1.7% |
Brookdale Senior Living, Inc. (a) | 1,013,632 | | 27,550,518 |
Cigna Corp. | 1,352,326 | | 118,301,478 |
HCA Holdings, Inc. | 171,124 | | 8,164,326 |
Henry Schein, Inc. (a) | 564,802 | | 64,534,277 |
McKesson Corp. | 625,600 | | 100,971,840 |
| | 319,522,439 |
Life Sciences Tools & Services - 1.0% |
Fluidigm Corp. (a)(g) | 312,345 | | 11,969,060 |
Illumina, Inc. (a) | 715,457 | | 79,143,853 |
Thermo Fisher Scientific, Inc. | 991,678 | | 110,423,345 |
| | 201,536,258 |
Pharmaceuticals - 5.2% |
AbbVie, Inc. | 2,790,821 | | 147,383,257 |
Actavis PLC (a) | 641,490 | | 107,770,320 |
Bristol-Myers Squibb Co. | 1,684,304 | | 89,520,758 |
Merck & Co., Inc. | 491,438 | | 24,596,472 |
Perrigo Co. PLC | 560,290 | | 85,982,103 |
Pfizer, Inc. | 8,742,698 | | 267,788,840 |
Roche Holding AG (participation certificate) | 90,137 | | 25,180,360 |
Salix Pharmaceuticals Ltd. (a) | 497,731 | | 44,765,926 |
Shire PLC | 1,301,374 | | 61,330,122 |
Valeant Pharmaceuticals International, Inc. (Canada) (a) | 460,981 | | 54,080,915 |
Zoetis, Inc. Class A | 2,139,353 | | 69,935,450 |
| | 978,334,523 |
TOTAL HEALTH CARE | | 2,479,547,120 |
INDUSTRIALS - 10.6% |
Aerospace & Defense - 2.2% |
Honeywell International, Inc. | 1,588,972 | | 145,184,372 |
TransDigm Group, Inc. | 625,063 | | 100,647,644 |
United Technologies Corp. | 1,489,534 | | 169,508,969 |
| | 415,340,985 |
Air Freight & Logistics - 0.6% |
FedEx Corp. | 809,892 | | 116,438,173 |
Building Products - 0.1% |
Allegion PLC (a) | 495,816 | | 21,910,109 |
Commercial Services & Supplies - 0.3% |
KAR Auction Services, Inc. | 1,570,652 | | 46,412,767 |
Electrical Equipment - 3.1% |
AMETEK, Inc. | 3,282,562 | | 172,892,541 |
Eaton Corp. PLC | 1,692,385 | | 128,824,346 |
|
| Shares | | Value |
Hubbell, Inc. Class B | 1,022,354 | | $ 111,334,351 |
Roper Industries, Inc. | 1,270,229 | | 176,155,358 |
| | 589,206,596 |
Industrial Conglomerates - 1.3% |
Danaher Corp. | 3,272,694 | | 252,651,977 |
Machinery - 1.1% |
Cummins, Inc. | 780,513 | | 110,028,918 |
Ingersoll-Rand PLC | 1,487,449 | | 91,626,858 |
| | 201,655,776 |
Professional Services - 0.6% |
Verisk Analytics, Inc. (a) | 1,697,800 | | 111,579,416 |
Road & Rail - 0.7% |
J.B. Hunt Transport Services, Inc. | 1,671,186 | | 129,182,678 |
Trading Companies & Distributors - 0.6% |
W.W. Grainger, Inc. | 437,427 | | 111,727,604 |
TOTAL INDUSTRIALS | | 1,996,106,081 |
INFORMATION TECHNOLOGY - 18.1% |
Communications Equipment - 1.8% |
Cisco Systems, Inc. | 5,451,739 | | 122,391,541 |
Juniper Networks, Inc. (a) | 3,276,585 | | 73,952,523 |
Polycom, Inc. (a) | 1,074,638 | | 12,068,185 |
QUALCOMM, Inc. | 1,752,035 | | 130,088,599 |
| | 338,500,848 |
Computers & Peripherals - 4.0% |
Apple, Inc. | 1,072,677 | | 601,889,783 |
Electronics for Imaging, Inc. (a) | 565,601 | | 21,905,727 |
EMC Corp. | 1,004,010 | | 25,250,852 |
NCR Corp. (a) | 3,182,960 | | 108,411,618 |
| | 757,457,980 |
Electronic Equipment & Components - 0.6% |
Flextronics International Ltd. (a) | 1,840,502 | | 14,300,701 |
TE Connectivity Ltd. | 1,895,849 | | 104,480,238 |
| | 118,780,939 |
Internet Software & Services - 5.3% |
Demand Media, Inc. (a) | 1,192,209 | | 6,879,046 |
Demandware, Inc. (a) | 239,622 | | 15,364,563 |
eBay, Inc. (a) | 2,570,059 | | 141,070,539 |
Endurance International Group Holdings, Inc. | 1,873,164 | | 26,561,466 |
Facebook, Inc. Class A (a) | 480,583 | | 26,268,667 |
Google, Inc. Class A (a) | 319,101 | | 357,619,682 |
Halogen Software, Inc. | 587,400 | | 7,271,650 |
IAC/InterActiveCorp | 95,224 | | 6,540,937 |
Millennial Media, Inc. | 609,164 | | 3,985,760 |
Millennial Media, Inc. | 1,218,329 | | 7,971,527 |
Millennial Media, Inc. | 222,043 | | 2 |
Naver Corp. | 37,181 | | 25,498,149 |
Tencent Holdings Ltd. | 538,700 | | 34,360,422 |
Common Stocks - continued |
| Shares | | Value |
INFORMATION TECHNOLOGY - continued |
Internet Software & Services - continued |
Wix.com Ltd. (a) | 449,803 | | $ 12,077,211 |
Yahoo!, Inc. (a) | 8,223,067 | | 332,540,829 |
| | 1,004,010,450 |
IT Services - 1.0% |
Cognizant Technology Solutions Corp. Class A (a) | 566,154 | | 57,170,231 |
Fidelity National Information Services, Inc. | 1,654,419 | | 88,809,212 |
FleetCor Technologies, Inc. (a) | 103,100 | | 12,080,227 |
Lionbridge Technologies, Inc. (a) | 722,737 | | 4,307,513 |
Luxoft Holding, Inc. | 98,853 | | 3,754,437 |
Visa, Inc. Class A | 48,634 | | 10,829,819 |
| | 176,951,439 |
Semiconductors & Semiconductor Equipment - 0.9% |
Micron Technology, Inc. (a) | 1,029,480 | | 22,401,485 |
NXP Semiconductors NV (a) | 3,125,855 | | 143,570,520 |
| | 165,972,005 |
Software - 4.5% |
Adobe Systems, Inc. (a) | 1,055,103 | | 63,179,568 |
Aspen Technology, Inc. (a) | 383,417 | | 16,026,831 |
Citrix Systems, Inc. (a) | 663,806 | | 41,985,730 |
Concur Technologies, Inc. (a) | 59,400 | | 6,128,892 |
Covisint Corp. | 393,800 | | 4,942,190 |
Electronic Arts, Inc. (a) | 3,897,169 | | 89,401,057 |
Guidewire Software, Inc. (a) | 696,047 | | 34,155,026 |
Jive Software, Inc. (a) | 661,192 | | 7,438,410 |
Microsoft Corp. | 8,641,750 | | 323,460,703 |
Oracle Corp. | 4,096,559 | | 156,734,347 |
QLIK Technologies, Inc. (a) | 187,559 | | 4,994,696 |
salesforce.com, Inc. (a) | 1,211,928 | | 66,886,306 |
Ubisoft Entertainment SA (a) | 1,218,588 | | 17,233,510 |
Xero Ltd. (a) | 45,898 | | 1,219,212 |
Xero Ltd. (g) | 496,188 | | 11,862,450 |
| | 845,648,928 |
TOTAL INFORMATION TECHNOLOGY | | 3,407,322,589 |
MATERIALS - 3.7% |
Chemicals - 3.0% |
Airgas, Inc. | 1,148,520 | | 128,461,962 |
Cabot Corp. | 396,087 | | 20,358,872 |
Eastman Chemical Co. | 744,641 | | 60,092,529 |
FMC Corp. | 801,032 | | 60,445,875 |
LyondellBasell Industries NV Class A | 915,624 | | 73,506,295 |
Monsanto Co. | 881,827 | | 102,776,937 |
Potash Corp. of Saskatchewan, Inc. | 1,119,426 | | 36,904,964 |
|
| Shares | | Value |
Sigma Aldrich Corp. | 509,538 | | $ 47,901,667 |
W.R. Grace & Co. (a) | 271,347 | | 26,828,078 |
| | 557,277,179 |
Construction Materials - 0.3% |
Vulcan Materials Co. | 869,903 | | 51,689,636 |
Containers & Packaging - 0.3% |
Graphic Packaging Holding Co. (a) | 2,518,833 | | 24,180,797 |
Rock-Tenn Co. Class A | 368,014 | | 38,645,150 |
| | 62,825,947 |
Metals & Mining - 0.1% |
Carpenter Technology Corp. | 310,787 | | 19,330,951 |
TOTAL MATERIALS | | 691,123,713 |
TELECOMMUNICATION SERVICES - 1.7% |
Diversified Telecommunication Services - 0.8% |
inContact, Inc. (a) | 1,403,117 | | 10,958,344 |
TW Telecom, Inc. (a) | 10,500 | | 319,935 |
Verizon Communications, Inc. | 2,962,371 | | 145,570,911 |
| | 156,849,190 |
Wireless Telecommunication Services - 0.9% |
SBA Communications Corp. Class A (a) | 1,074,302 | | 96,515,292 |
T-Mobile U.S., Inc. (a) | 1,020,650 | | 34,334,666 |
Vodafone Group PLC sponsored ADR | 741,300 | | 29,140,503 |
| | 159,990,461 |
TOTAL TELECOMMUNICATION SERVICES | | 316,839,651 |
UTILITIES - 3.1% |
Electric Utilities - 1.2% |
American Electric Power Co., Inc. | 1,066,629 | | 49,854,239 |
Duke Energy Corp. | 985,603 | | 68,016,463 |
Edison International | 538,226 | | 24,919,864 |
NextEra Energy, Inc. | 778,600 | | 66,663,732 |
PPL Corp. | 495,600 | | 14,912,604 |
| | 224,366,902 |
Gas Utilities - 0.4% |
National Fuel Gas Co. | 558,475 | | 39,875,115 |
ONEOK, Inc. | 650,241 | | 40,431,985 |
| | 80,307,100 |
Independent Power Producers & Energy Traders - 0.4% |
NRG Energy, Inc. | 1,738,352 | | 49,925,469 |
The AES Corp. | 1,534,604 | | 22,267,104 |
| | 72,192,573 |
Multi-Utilities - 1.1% |
Ameren Corp. | 233,177 | | 8,431,680 |
CenterPoint Energy, Inc. | 2,199,674 | | 50,988,443 |
Dominion Resources, Inc. | 427,331 | | 27,644,042 |
NiSource, Inc. | 799,577 | | 26,290,092 |
Common Stocks - continued |
| Shares | | Value |
UTILITIES - continued |
Multi-Utilities - continued |
PG&E Corp. | 713,434 | | $ 28,737,122 |
Sempra Energy | 779,950 | | 70,008,312 |
| | 212,099,691 |
TOTAL UTILITIES | | 588,966,266 |
TOTAL COMMON STOCKS (Cost $13,674,501,699) |
18,540,051,456
|
Preferred Stocks - 0.1% |
| | | |
Convertible Preferred Stocks - 0.0% |
INFORMATION TECHNOLOGY - 0.0% |
Software - 0.0% |
MongoDB, Inc. Series F, 8.00% (g) | 299,866 | | 4,512,983 |
Nonconvertible Preferred Stocks - 0.1% |
CONSUMER STAPLES - 0.1% |
Beverages - 0.1% |
Ambev SA sponsored ADR | 1,230,950 | | 9,047,483 |
TOTAL PREFERRED STOCKS (Cost $9,394,026) |
13,560,466
|
Convertible Bonds - 0.0% |
| Principal Amount | | |
ENERGY - 0.0% |
Oil, Gas & Consumable Fuels - 0.0% |
Cobalt International Energy, Inc. 2.625% 12/1/19 (Cost $2,044,550) | | $ 2,060,000 | |
1,823,100
|
U.S. Treasury Obligations - 0.1% |
|
U.S. Treasury Bills, yield at date of purchase 0.02% to 0.03% 1/2/14 to 2/27/14 (e)
(Cost $7,339,951) | | 7,340,000 | |
7,339,949
|
Money Market Funds - 1.7% |
| Shares | | Value |
Fidelity Cash Central Fund, 0.11% (b) | 306,922,194 | | $ 306,922,194 |
Fidelity Securities Lending Cash Central Fund, 0.11% (b)(c) | 20,086,025 | | 20,086,025 |
TOTAL MONEY MARKET FUNDS (Cost $327,008,219) |
327,008,219
|
TOTAL INVESTMENT
PORTFOLIO - 100.2% (Cost $14,020,288,445) | 18,889,783,190 |
NET OTHER ASSETS (LIABILITIES) - (0.2)% | | (32,299,804) |
NET ASSETS - 100% | $ 18,857,483,386 |
Futures Contracts |
| Expiration Date | | Underlying Face Amount at Value | | Unrealized Appreciation/(Depreciation) |
Purchased |
Equity Index Contracts |
1,382 CME E-mini S&P 500 Index Contracts (United States) | March 2014 | | $ 127,220,010 | | $ 4,732,983 |
|
The face value of futures purchased as a percentage of net assets is 0.7% |
Legend |
(a) Non-income producing |
(b) Affiliated fund that is generally available only to investment companies and other accounts managed by Fidelity Investments. The rate quoted is the annualized seven-day yield of the fund at period end. A complete unaudited listing of the fund's holdings as of its most recent quarter end is available upon request. In addition, each Fidelity Central Fund's financial statements, which are not covered by the Fund's Report of Independent Registered Public Accounting Firm, are available on the SEC's website or upon request. |
(c) Investment made with cash collateral received from securities on loan. |
(d) Security or a portion of the security is on loan at period end. |
(e) Security or a portion of the security was pledged to cover margin requirements for futures contracts. At period end, the value of securities pledged amounted to $7,339,949. |
(f) Investment is owned by an entity that is treated as a corporation for U.S. tax purposes and is owned by the Fund. |
(g) Restricted securities - Investment in securities not registered under the Securities Act of 1933 (excluding 144A issues). At the end of the period, the value of restricted securities (excluding 144A issues) amounted to $36,374,404 or 0.2% of net assets. |
Additional information on each restricted holding is as follows: |
Security | Acquisition Date | Acquisition Cost |
Fluidigm Corp. | 10/9/07 - 1/6/11 | $ 5,645,236 |
Legend Pictures LLC | 9/23/10 | $ 1,546,500 |
MongoDB, Inc. Series F, 8.00% | 10/2/13 | $ 5,014,998 |
Weinstein Co. Holdings LLC
Class A-1 | 10/19/05 | $ 11,499,000 |
Xero Ltd. | 10/14/13 | $ 7,545,069 |
Affiliated Central Funds |
Information regarding fiscal year to date income earned by the Fund from investments in Fidelity Central Funds is as follows: |
Fund | Income earned |
Fidelity Cash Central Fund | $ 362,779 |
Fidelity Securities Lending Cash Central Fund | 2,072,658 |
| $ 2,435,437 |
Other Affiliated Issuers |
An affiliated company is a company in which the Fund has ownership of at least 5% of the voting securities. Fiscal year to date transactions with companies which are or were affiliates are as follows: |
Affiliate | Value, beginning of period | Purchases | Sales Proceeds | Dividend Income | Value,
end of
period |
Luxoft Holding, Inc. | $ - | $ 5,783,686 | $ 7,509,251 | $ - | $ - |
Other Information |
The following is a summary of the inputs used, as of December 31, 2013, involving the Fund's assets and liabilities carried at fair value. The inputs or methodology used for valuing securities may not be an indication of the risk associated with investing in those securities. For more information on valuation inputs, and their aggregation into the levels used in the table below, please refer to the Investment Valuation section in the accompanying Notes to Financial Statements. |
Valuation Inputs at Reporting Date: |
Description | Total | Level 1 | Level 2 | Level 3 |
Investments in Securities: | | | | |
Equities: | | | | |
Consumer Discretionary | $ 2,274,319,171 | $ 2,266,289,260 | $ - | $ 8,029,911 |
Consumer Staples | 1,839,596,108 | 1,778,450,611 | 61,145,497 | - |
Energy | 1,840,287,259 | 1,840,287,259 | - | - |
Financials | 3,114,990,981 | 2,983,909,834 | 131,081,147 | - |
Health Care | 2,479,547,120 | 2,418,216,998 | 61,330,122 | - |
Industrials | 1,996,106,081 | 1,996,106,081 | - | - |
Information Technology | 3,411,835,572 | 3,383,502,850 | 23,819,737 | 4,512,985 |
Materials | 691,123,713 | 691,123,713 | - | - |
Telecommunication Services | 316,839,651 | 316,839,651 | - | - |
Utilities | 588,966,266 | 588,966,266 | - | - |
Corporate Bonds | 1,823,100 | - | 1,823,100 | - |
U.S. Government and Government Agency Obligations | 7,339,949 | - | 7,339,949 | - |
Money Market Funds | 327,008,219 | 327,008,219 | - | - |
Total Investments in Securities: | $ 18,889,783,190 | $ 18,590,700,742 | $ 286,539,552 | $ 12,542,896 |
Derivative Instruments: | | | | |
Assets | | | | |
Futures Contracts | $ 4,732,983 | $ 4,732,983 | $ - | $ - |
Value of Derivative Instruments |
The following table is a summary of the Fund's value of derivative instruments by primary risk exposure as of December 31, 2013. For additional information on derivative instruments, please refer to the Derivative Instruments section in the accompanying Notes to Financial Statements. |
Primary Risk Exposure /
Derivative Type | Value |
| Asset | Liability |
Equity Risk | | |
Futures Contracts (a) | $ 4,732,983 | $ - |
Total Value of Derivatives | $ 4,732,983 | $ - |
(a) Reflects gross cumulative appreciation (depreciation) on futures contracts as presented in the Schedule of Investments. Only the period end receivable or payable for daily variation margin and net unrealized appreciation (depreciation) are presented in the Statement of Assets and Liabilities. |
Distribution of investments by country or territory of incorporation, as a percentage of total net assets, is as follows (Unaudited): |
United States of America | 87.1% |
Ireland | 3.0% |
United Kingdom | 2.7% |
Netherlands | 1.2% |
Switzerland | 1.1% |
Others (Individually Less Than 1%) | 4.9% |
| 100.0% |
See accompanying notes which are an integral part of the financial statements.
Annual Report
Statement of Assets and Liabilities
| December 31, 2013 |
| | |
Assets | | |
Investment in securities, at value (including securities loaned of $20,025,693) - See accompanying schedule: Unaffiliated issuers (cost $13,693,280,226) | $ 18,562,774,971 | |
Fidelity Central Funds (cost $327,008,219) | 327,008,219 | |
Total Investments (cost $14,020,288,445) | | $ 18,889,783,190 |
Receivable for investments sold | | 53,228,035 |
Receivable for fund shares sold | | 7,233,669 |
Dividends receivable | | 13,094,272 |
Interest receivable | | 4,506 |
Distributions receivable from Fidelity Central Funds | | 32,527 |
Receivable for daily variation margin for derivative instruments | | 526,882 |
Prepaid expenses | | 42,495 |
Other receivables | | 860,403 |
Total assets | | 18,964,805,979 |
| | |
Liabilities | | |
Payable to custodian bank | $ 25 | |
Payable for investments purchased | 54,765,027 | |
Payable for fund shares redeemed | 20,190,433 | |
Accrued management fee | 8,463,047 | |
Distribution and service plan fees payable | 1,866,722 | |
Other affiliated payables | 1,219,447 | |
Other payables and accrued expenses | 731,867 | |
Collateral on securities loaned, at value | 20,086,025 | |
Total liabilities | | 107,322,593 |
| | |
Net Assets | | $ 18,857,483,386 |
Net Assets consist of: | | |
Paid in capital | | $ 14,225,216,432 |
Distributions in excess of net investment income | | (633,692) |
Accumulated undistributed net realized gain (loss) on investments and foreign currency transactions | | (241,327,714) |
Net unrealized appreciation (depreciation) on investments and assets and liabilities in foreign currencies | | 4,874,228,360 |
Net Assets | | $ 18,857,483,386 |
Statement of Assets and Liabilities - continued
| December 31, 2013 |
| | |
Initial Class:
Net Asset Value, offering price and redemption price per share ($7,654,304,862 ÷ 222,829,428 shares) | | $ 34.35 |
| | |
Service Class:
Net Asset Value, offering price and redemption price per share ($1,688,447,952 ÷ 49,318,066 shares) | | $ 34.24 |
| | |
Service Class 2:
Net Asset Value, offering price and redemption price per share ($8,472,779,972 ÷ 250,923,037 shares) | | $ 33.77 |
| | |
Service Class 2R:
Net Asset Value, offering price and redemption price per share ($10,592,318 ÷ 314,267 shares) | | $ 33.70 |
| | |
Investor Class:
Net Asset Value, offering price and redemption price per share ($1,031,358,282 ÷ 30,137,535 shares) | | $ 34.22 |
See accompanying notes which are an integral part of the financial statements.
Annual Report
Financial Statements - continued
Statement of Operations
| Year ended December 31, 2013 |
| | |
Investment Income | | |
Dividends | | $ 290,473,618 |
Interest | | 246,598 |
Income from Fidelity Central Funds | | 2,435,437 |
Total income | | 293,155,653 |
| | |
Expenses | | |
Management fee | $ 96,745,954 | |
Transfer agent fees | 12,737,361 | |
Distribution and service plan fees | 21,764,079 | |
Accounting and security lending fees | 1,614,111 | |
Custodian fees and expenses | 321,259 | |
Independent trustees' compensation | 92,912 | |
Appreciation in deferred trustee compensation account | 73 | |
Audit | 107,613 | |
Legal | 67,476 | |
Miscellaneous | 157,287 | |
Total expenses before reductions | 133,608,125 | |
Expense reductions | (1,895,123) | 131,713,002 |
Net investment income (loss) | | 161,442,651 |
Realized and Unrealized Gain (Loss) Net realized gain (loss) on: | | |
Investment securities: | | |
Unaffiliated issuers | 2,490,518,401 | |
Other affiliated issuers | 3,500,274 | |
Foreign currency transactions | (97,669) | |
Futures contracts | 28,199,755 | |
Total net realized gain (loss) | | 2,522,120,761 |
Change in net unrealized appreciation (depreciation) on: Investment securities | 2,043,316,136 | |
Assets and liabilities in foreign currencies | (24,449) | |
Futures contracts | 4,576,747 | |
Total change in net unrealized appreciation (depreciation) | | 2,047,868,434 |
Net gain (loss) | | 4,569,989,195 |
Net increase (decrease) in net assets resulting from operations | | $ 4,731,431,846 |
Statement of Changes in Net Assets
| Year ended
December 31,
2013 | Year ended
December 31,
2012 |
Increase (Decrease) in Net Assets | | |
Operations | | |
Net investment income (loss) | $ 161,442,651 | $ 184,313,100 |
Net realized gain (loss) | 2,522,120,761 | 635,918,428 |
Change in net unrealized appreciation (depreciation) | 2,047,868,434 | 1,584,493,232 |
Net increase (decrease) in net assets resulting from operations | 4,731,431,846 | 2,404,724,760 |
Distributions to shareholders from net investment income | (163,378,711) | (189,531,129) |
Distributions to shareholders from net realized gain | (4,947,835) | (8,351,979) |
Total distributions | (168,326,546) | (197,883,108) |
Share transactions - net increase (decrease) | (1,968,972,139) | (899,286,819) |
Redemption fees | 359 | 69 |
Total increase (decrease) in net assets | 2,594,133,520 | 1,307,554,902 |
| | |
Net Assets | | |
Beginning of period | 16,263,349,866 | 14,955,794,964 |
End of period (including distributions in excess of net investment income of $633,692 and distributions in excess of net investment income of $587,200, respectively) | $ 18,857,483,386 | $ 16,263,349,866 |
See accompanying notes which are an integral part of the financial statements.
Annual Report
Financial Highlights - Initial Class
Years ended December 31, | 2013 | 2012 | 2011 | 2010 | 2009 |
Selected Per-Share Data | | | | | |
Net asset value, beginning of period | $ 26.44 | $ 23.02 | $ 23.88 | $ 20.62 | $ 15.39 |
Income from Investment Operations | | | | | |
Net investment income (loss) C | .32 | .32 | .25 | .23 | .23 |
Net realized and unrealized gain (loss) | 7.94 | 3.46 | (.86) | 3.31 | 5.26 |
Total from investment operations | 8.26 | 3.78 | (.61) | 3.54 | 5.49 |
Distributions from net investment income | (.34) | (.34) F | (.25) | (.27) | (.25) |
Distributions from net realized gain | (.01) | (.01) F | - | (.01) | (.01) |
Total distributions | (.35) | (.36) J | (.25) | (.28) | (.26) I |
Redemption fees added to paid in capital C,H | - | - | - | - | - |
Net asset value, end of period | $ 34.35 | $ 26.44 | $ 23.02 | $ 23.88 | $ 20.62 |
Total Return A,B | 31.29% | 16.42% | (2.53)% | 17.22% | 35.71% |
Ratios to Average Net Assets D,G | | | | | |
Expenses before reductions | .64% | .64% | .65% | .65% | .67% |
Expenses net of fee waivers, if any | .63% | .64% | .64% | .65% | .67% |
Expenses net of all reductions | .62% | .63% | .63% | .63% | .65% |
Net investment income (loss) | 1.05% | 1.27% | 1.03% | 1.06% | 1.33% |
Supplemental Data | | | | | |
Net assets, end of period (000 omitted) | $ 7,654,305 | $ 6,440,357 | $ 6,113,440 | $ 7,160,125 | $ 7,405,228 |
Portfolio turnover rate E | 86% | 87% | 135% | 117% | 145% |
A Total returns do not reflect charges attributable to your insurance company's separate account. Inclusion of these charges would reduce the total returns shown.
B Total returns would have been lower if certain expenses had not been reduced during the applicable periods shown.
C Calculated based on average shares outstanding during the period.
D Fees and expenses of any underlying Fidelity Central Funds are not included in the Fund's expense ratio. The Fund indirectly bears its proportionate share of the expenses of any underlying Fidelity Central Funds.
E Amount does not include the portfolio activity of any underlying Fidelity Central Funds.
F The amounts shown reflect certain reclassifications related to book to tax differences that were made in the year shown.
G Expense ratios reflect operating expenses of the class. Expenses before reductions do not reflect amounts reimbursed by the investment adviser or reductions from brokerage service arrangements or reductions from other expense offset arrangements and do not represent the amount paid by the class during periods when reimbursements or reductions occur. Expenses net of fee waivers reflect expenses after reimbursement by the investment adviser but prior to reductions from brokerage service arrangements or other expense offset arrangements. Expenses net of all reductions represent the net expenses paid by the class.
H Amount represents less than $.01 per share.
I Total distributions of $.26 per share is comprised of distributions from net investment income of $.250 and distributions from net realized gain of $.005 per share.
J Total distributions of $.36 per share is comprised of distributions from net investment income of $.342 and distributions from net realized gain of $.013 per share.
Financial Highlights - Service Class
Years ended December 31, | 2013 | 2012 | 2011 | 2010 | 2009 |
Selected Per-Share Data | | | | | |
Net asset value, beginning of period | $ 26.36 | $ 22.95 | $ 23.81 | $ 20.55 | $ 15.33 |
Income from Investment Operations | | | | | |
Net investment income (loss) C | .29 | .30 | .22 | .20 | .21 |
Net realized and unrealized gain (loss) | 7.91 | 3.44 | (.85) | 3.31 | 5.25 |
Total from investment operations | 8.20 | 3.74 | (.63) | 3.51 | 5.46 |
Distributions from net investment income | (.31) | (.32) F | (.23) | (.24) | (.23) |
Distributions from net realized gain | (.01) | (.01) F | - | (.01) | (.01) |
Total distributions | (.32) | (.33) | (.23) | (.25) | (.24) I |
Redemption fees added to paid in capital C,H | - | - | - | - | - |
Net asset value, end of period | $ 34.24 | $ 26.36 | $ 22.95 | $ 23.81 | $ 20.55 |
Total Return A,B | 31.14% | 16.31% | (2.64)% | 17.11% | 35.66% |
Ratios to Average Net Assets D,G | | | | | |
Expenses before reductions | .74% | .74% | .75% | .75% | .77% |
Expenses net of fee waivers, if any | .73% | .74% | .74% | .75% | .77% |
Expenses net of all reductions | .72% | .73% | .73% | .73% | .75% |
Net investment income (loss) | .95% | 1.16% | .93% | .96% | 1.23% |
Supplemental Data | | | | | |
Net assets, end of period (000 omitted) | $ 1,688,448 | $ 1,374,781 | $ 1,277,101 | $ 1,379,305 | $ 1,784,820 |
Portfolio turnover rate E | 86% | 87% | 135% | 117% | 145% |
A Total returns do not reflect charges attributable to your insurance company's separate account. Inclusion of these charges would reduce the total returns shown.
B Total returns would have been lower if certain expenses had not been reduced during the applicable periods shown.
C Calculated based on average shares outstanding during the period.
D Fees and expenses of any underlying Fidelity Central Funds are not included in the Fund's expense ratio. The Fund indirectly bears its proportionate share of the expenses of any underlying Fidelity Central Funds.
E Amount does not include the portfolio activity of any underlying Fidelity Central Funds.
F The amounts shown reflect certain reclassifications related to book to tax differences that were made in the year shown.
G Expense ratios reflect operating expenses of the class. Expenses before reductions do not reflect amounts reimbursed by the investment adviser or reductions from brokerage service arrangements or reductions from other expense offset arrangements and do not represent the amount paid by the class during periods when reimbursements or reductions occur. Expenses net of fee waivers reflect expenses after reimbursement by the investment adviser but prior to reductions from brokerage service arrangements or other expense offset arrangements. Expenses net of all reductions represent the net expenses paid by the class.
H Amount represents less than $.01 per share.
I Total distributions of $.24 per share is comprised of distributions from net investment income of $.232 and distributions from net realized gain of $.005 per share.
See accompanying notes which are an integral part of the financial statements.
Annual Report
Financial Highlights - Service Class 2
Years ended December 31, | 2013 | 2012 | 2011 | 2010 | 2009 |
Selected Per-Share Data | | | | | |
Net asset value, beginning of period | $ 26.00 | $ 22.64 | $ 23.49 | $ 20.29 | $ 15.14 |
Income from Investment Operations | | | | | |
Net investment income (loss) C | .24 | .26 | .18 | .17 | .18 |
Net realized and unrealized gain (loss) | 7.80 | 3.39 | (.84) | 3.26 | 5.18 |
Total from investment operations | 8.04 | 3.65 | (.66) | 3.43 | 5.36 |
Distributions from net investment income | (.26) | (.28) F | (.19) | (.22) | (.21) |
Distributions from net realized gain | (.01) | (.01) F | - | (.01) | (.01) |
Total distributions | (.27) | (.29) | (.19) | (.23) | (.21) I |
Redemption fees added to paid in capital C,H | - | - | - | - | - |
Net asset value, end of period | $ 33.77 | $ 26.00 | $ 22.64 | $ 23.49 | $ 20.29 |
Total Return A,B | 30.95% | 16.14% | (2.78)% | 16.93% | 35.47% |
Ratios to Average Net Assets D,G | | | | | |
Expenses before reductions | .89% | .89% | .90% | .90% | .92% |
Expenses net of fee waivers, if any | .88% | .89% | .89% | .90% | .92% |
Expenses net of all reductions | .87% | .88% | .88% | .88% | .90% |
Net investment income (loss) | .80% | 1.02% | .78% | .81% | 1.08% |
Supplemental Data | | | | | |
Net assets, end of period (000 omitted) | $ 8,472,780 | $ 7,740,640 | $ 6,980,191 | $ 7,627,793 | $ 7,577,737 |
Portfolio turnover rate E | 86% | 87% | 135% | 117% | 145% |
A Total returns do not reflect charges attributable to your insurance company's separate account. Inclusion of these charges would reduce the total returns shown.
B Total returns would have been lower if certain expenses had not been reduced during the applicable periods shown.
C Calculated based on average shares outstanding during the period.
D Fees and expenses of any underlying Fidelity Central Funds are not included in the Fund's expense ratio. The Fund indirectly bears its proportionate share of the expenses of any underlying Fidelity Central Funds.
E Amount does not include the portfolio activity of any underlying Fidelity Central Funds.
F The amounts shown reflect certain reclassifications related to book to tax differences that were made in the year shown.
G Expense ratios reflect operating expenses of the class. Expenses before reductions do not reflect amounts reimbursed by the investment adviser or reductions from brokerage service arrangements or reductions from other expense offset arrangements and do not represent the amount paid by the class during periods when reimbursements or reductions occur. Expenses net of fee waivers reflect expenses after reimbursement by the investment adviser but prior to reductions from brokerage service arrangements or other expense offset arrangements. Expenses net of all reductions represent the net expenses paid by the class.
H Amount represents less than $.01 per share.
I Total distributions of $.21 per share is comprised of distributions from net investment income of $.205 and distributions from net realized gain of $.005 per share.
Financial Highlights - Service Class 2R
Years ended December 31, | 2013 | 2012 | 2011 | 2010 | 2009 |
Selected Per-Share Data | | | | | |
Net asset value, beginning of period | $ 25.96 | $ 22.60 | $ 23.44 | $ 20.24 | $ 15.10 |
Income from Investment Operations | | | | | |
Net investment income (loss) C | .24 | .26 | .18 | .17 | .18 |
Net realized and unrealized gain (loss) | 7.77 | 3.39 | (.84) | 3.25 | 5.17 |
Total from investment operations | 8.01 | 3.65 | (.66) | 3.42 | 5.35 |
Distributions from net investment income | (.26) | (.27) F | (.18) | (.21) | (.20) |
Distributions from net realized gain | (.01) | (.01) F | - | (.01) | (.01) |
Total distributions | (.27) | (.29) J | (.18) | (.22) | (.21) I |
Redemption fees added to paid in capital C,H | - | - | - | - | - |
Net asset value, end of period | $ 33.70 | $ 25.96 | $ 22.60 | $ 23.44 | $ 20.24 |
Total Return A,B | 30.90% | 16.15% | (2.79)% | 16.94% | 35.46% |
Ratios to Average Net Assets D,G | | | | | |
Expenses before reductions | .89% | .89% | .90% | .90% | .92% |
Expenses net of fee waivers, if any | .88% | .89% | .89% | .90% | .92% |
Expenses net of all reductions | .87% | .88% | .88% | .88% | .90% |
Net investment income (loss) | .80% | 1.02% | .78% | .81% | 1.08% |
Supplemental Data | | | | | |
Net assets, end of period (000 omitted) | $ 10,592 | $ 8,727 | $ 8,042 | $ 10,942 | $ 13,285 |
Portfolio turnover rate E | 86% | 87% | 135% | 117% | 145% |
A Total returns do not reflect charges attributable to your insurance company's separate account. Inclusion of these charges would reduce the total returns shown.
B Total returns would have been lower if certain expenses had not been reduced during the applicable periods shown.
C Calculated based on average shares outstanding during the period.
D Fees and expenses of any underlying Fidelity Central Funds are not included in the Fund's expense ratio. The Fund indirectly bears its proportionate share of the expenses of any underlying Fidelity Central Funds.
E Amount does not include the portfolio activity of any underlying Fidelity Central Funds.
F The amounts shown reflect certain reclassifications related to book to tax differences that were made in the year shown.
G Expense ratios reflect operating expenses of the class. Expenses before reductions do not reflect amounts reimbursed by the investment adviser or reductions from brokerage service arrangements or reductions from other expense offset arrangements and do not represent the amount paid by the class during periods when reimbursements or reductions occur. Expenses net of fee waivers reflect expenses after reimbursement by the investment adviser but prior to reductions from brokerage service arrangements or other expense offset arrangements. Expenses net of all reductions represent the net expenses paid by the class.
H Amount represents less than $.01 per share.
I Total distributions of $.21 per share is comprised of distributions from net investment income of $.200 and distributions from net realized gain of $.005 per share.
J Total distributions of $.29 per share is comprised of distributions from net investment income of $.274 and distributions from net realized gain of $.013 per share.
See accompanying notes which are an integral part of the financial statements.
Annual Report
Financial Highlights - Investor Class
Years ended December 31, | 2013 | 2012 | 2011 | 2010 | 2009 |
Selected Per-Share Data | | | | | |
Net asset value, beginning of period | $ 26.35 | $ 22.94 | $ 23.80 | $ 20.56 | $ 15.34 |
Income from Investment Operations | | | | | |
Net investment income (loss) C | .29 | .30 | .23 | .21 | .21 |
Net realized and unrealized gain (loss) | 7.91 | 3.45 | (.86) | 3.30 | 5.25 |
Total from investment operations | 8.20 | 3.75 | (.63) | 3.51 | 5.46 |
Distributions from net investment income | (.32) | (.32) F | (.23) | (.26) | (.24) |
Distributions from net realized gain | (.01) | (.01) F | - | (.01) | (.01) |
Total distributions | (.33) | (.34) J | (.23) | (.27) | (.24) I |
Redemption fees added to paid in capital C,H | - | - | - | - | - |
Net asset value, end of period | $ 34.22 | $ 26.35 | $ 22.94 | $ 23.80 | $ 20.56 |
Total Return A,B | 31.15% | 16.34% | (2.62)% | 17.10% | 35.66% |
Ratios to Average Net Assets D,G | | | | | |
Expenses before reductions | .72% | .73% | .73% | .74% | .77% |
Expenses net of fee waivers, if any | .71% | .73% | .73% | .73% | .77% |
Expenses net of all reductions | .71% | .71% | .71% | .72% | .75% |
Net investment income (loss) | .97% | 1.18% | .94% | .98% | 1.23% |
Supplemental Data | | | | | |
Net assets, end of period (000 omitted) | $ 1,031,358 | $ 698,845 | $ 577,021 | $ 570,841 | $ 457,476 |
Portfolio turnover rate E | 86% | 87% | 135% | 117% | 145% |
A Total returns do not reflect charges attributable to your insurance company's separate account. Inclusion of these charges would reduce the total returns shown.
B Total returns would have been lower if certain expenses had not been reduced during the applicable periods shown.
C Calculated based on average shares outstanding during the period.
D Fees and expenses of any underlying Fidelity Central Funds are not included in the Fund's expense ratio. The Fund indirectly bears its proportionate share of the expenses of any underlying Fidelity Central Funds.
E Amount does not include the portfolio activity of any underlying Fidelity Central Funds.
F The amounts shown reflect certain reclassifications related to book to tax differences that were made in the year shown.
G Expense ratios reflect operating expenses of the class. Expenses before reductions do not reflect amounts reimbursed by the investment adviser or reductions from brokerage service arrangements or reductions from other expense offset arrangements and do not represent the amount paid by the class during periods when reimbursements or reductions occur. Expense ratios before reductions for start-up periods may not be representative of longer-term operating periods. Expenses net of fee waivers reflect expenses after reimbursement by the investment adviser but prior to reductions from brokerage service arrangements or other expense offset arrangements. Expenses net of all reductions represent the net expenses paid by the class.
H Amount represents less than $.01 per share.
I Total distributions of $.24 per share is comprised of distributions from net investment income of $.235 and distributions from net realized gain of $.005 per share.
J Total distributions of $.34 per share is comprised of distributions from net investment income of $.322 and distributions from net realized gain of $.013 per share.
See accompanying notes which are an integral part of the financial statements.
Annual Report
Notes to Financial Statements
For the period ended December 31, 2013
1. Organization.
VIP Contrafund Portfolio (the Fund) is a fund of Variable Insurance Products Fund II (the Trust) and is authorized to issue an unlimited number of shares. The Trust is registered under the Investment Company Act of 1940, as amended (the 1940 Act), as an open-end management investment company organized as a Massachusetts business trust. Shares of the Fund may only be purchased by insurance companies for the purpose of funding variable annuity or variable life insurance contracts. The Fund offers the following classes of shares: Initial Class shares, Service Class shares, Service Class 2 shares, Service Class 2R shares and Investor Class shares. All classes have equal rights and voting privileges, except for matters affecting a single class.
2. Investments in Fidelity Central Funds.
The Fund invests in Fidelity Central Funds, which are open-end investment companies generally available only to other investment companies and accounts managed by the investment adviser and its affiliates. The Fund's Schedule of Investments lists each of the Fidelity Central Funds held as of period end, if any, as an investment of the Fund, but does not include the underlying holdings of each Fidelity Central Fund. As an Investing Fund, the Fund indirectly bears its proportionate share of the expenses of the underlying Fidelity Central Funds.
The Money Market Central Funds seek preservation of capital and current income and are managed by Fidelity Investments Money Management, Inc. (FIMM), an affiliate of the investment adviser. Annualized expenses of the Money Market Central Funds as of their most recent shareholder report date are less than .01%.
A complete unaudited list of holdings for each Fidelity Central Fund is available upon request or at the Securities and Exchange Commission (the SEC) website at www.sec.gov. In addition, the financial statements of the Fidelity Central Funds, which are not covered by the Fund's Report of Independent Registered Public Accounting Firm, are available on the SEC website or upon request.
3. Significant Accounting Policies.
The financial statements have been prepared in conformity with accounting principles generally accepted in the United States of America (GAAP), which require management to make certain estimates and assumptions at the date of the financial statements. Actual results could differ from those estimates. Subsequent events, if any, through the date that the financial statements were issued have been evaluated in the preparation of the financial statements. The following summarizes the significant accounting policies of the Fund:
Investment Valuation. Investments are valued as of 4:00 p.m. Eastern time on the last calendar day of the period. In accordance with valuation policies and procedures approved by the Board of Trustees (the Board), the Fund attempts to obtain prices from one or more third party pricing vendors or brokers to value its investments. When current market prices, quotations or currency exchange rates are not readily available or reliable, investments will be fair valued in good faith by the Fidelity Management & Research Company (FMR) Fair Value Committee (the Committee), in accordance with procedures adopted by the Board. Factors used in determining fair value vary by investment type and may include market or investment specific events, changes in interest rates and credit quality. The frequency with which these procedures are used cannot be predicted and they may be utilized to a significant extent. The Committee oversees the Fund's valuation policies and procedures and is responsible for approving and reporting to the Board all fair value determinations.
The Fund categorizes the inputs to valuation techniques used to value its investments into a disclosure hierarchy consisting of three levels as shown below:
Level 1 - quoted prices in active markets for identical investments
Level 2 - other significant observable inputs (including quoted prices for similar investments, interest rates, prepayment speeds, etc.)
Level 3 - unobservable inputs (including the Fund's own assumptions based on the best information available)
Valuation techniques used to value the Fund's investments by major category are as follows:
Equity securities, including restricted securities, for which market quotations are readily available, are valued at the last reported sale price or official closing price as reported by a third party pricing vendor on the primary market or exchange on which they are traded and are categorized as Level 1 in the hierarchy. In the event there were no sales during the day or closing prices are not available, securities are valued at the last quoted bid price or may be valued using the last available price and are generally categorized as Level 2 in the hierarchy. For foreign equity securities, when market or security specific events arise, comparisons to the valuation of American Depositary Receipts (ADRs), futures contracts, Exchange-Traded Funds (ETFs) and certain indexes as well as quoted prices for similar securities may be used and would be categorized as Level 2 in the hierarchy. Utilizing these techniques may result in transfers between Level 1 and Level 2. For equity securities, including restricted securities, where observable inputs are limited, assumptions about market activity and risk are used and these securities may be categorized as Level 3 in the hierarchy.
Annual Report
Notes to Financial Statements - continued
3. Significant Accounting Policies - continued
Investment Valuation - continued
Debt securities, including restricted securities, are valued based on evaluated prices received from third party pricing vendors or from brokers who make markets in such securities. Corporate bonds and U.S. government and government agency obligations, are valued by pricing vendors who utilize matrix pricing which considers yield or price of bonds of comparable quality, coupon, maturity and type or by broker-supplied prices. When independent prices are unavailable or unreliable, debt securities may be valued utilizing pricing methodologies which consider similar factors that would be used by third party pricing vendors. Debt securities are generally categorized as Level 2 in the hierarchy but may be Level 3 depending on the circumstances.
Futures contracts are valued at the settlement price established each day by the board of trade or exchange on which they are traded and are categorized as Level 1 in the hierarchy. Investments in open-end mutual funds, including the Fidelity Central Funds, are valued at their closing net asset value (NAV) each business day and are categorized as Level 1 in the hierarchy.
Changes in valuation techniques may result in transfers in or out of an assigned level within the disclosure hierarchy. The aggregate value of investments by input level, as of December 31, 2013, is included at the end of the Fund's Schedule of Investments.
Foreign Currency. The Fund may use foreign currency contracts to facilitate transactions in foreign-denominated securities. Gains and losses from these transactions may arise from changes in the value of the foreign currency or if the counterparties do not perform under the contracts' terms.
Foreign-denominated assets, including investment securities, and liabilities are translated into U.S. dollars at the exchange rates at period end. Purchases and sales of investment securities, income and dividends received and expenses denominated in foreign currencies are translated into U.S. dollars at the exchange rate in effect on the transaction date.
The effects of exchange rate fluctuations on investments are included with the net realized and unrealized gain (loss) on investment securities. Other foreign currency transactions resulting in realized and unrealized gain (loss) are disclosed separately.
Investment Transactions and Income. For financial reporting purposes, the Fund's investment holdings and NAV include trades executed through the end of the last business day of the period. The NAV per share for processing shareholder transactions is calculated as of the close of business of the New York Stock Exchange (NYSE), normally 4:00 p.m. Eastern time and includes trades executed through the end of the prior business day. Gains and losses on securities sold are determined on the basis of identified cost and may include proceeds received from litigation. Dividend income is recorded on the ex-dividend date, except for certain dividends from foreign securities where the ex-dividend date may have passed, which are recorded as soon as the Fund is informed of the ex-dividend date. Non-cash dividends included in dividend income, if any, are recorded at the fair market value of the securities received. Distributions received on securities that represent a return of capital or capital gain are recorded as a reduction of cost of investments and/or as a realized gain. Subsequent to ex-dividend date the Fund determines the components of these distributions, based upon receipt of tax filings or other correspondence relating to the underlying investment. Interest income and distributions from the Fidelity Central Funds are accrued as earned. Interest income includes coupon interest and amortization of premium and accretion of discount on debt securities. Investment income is recorded net of foreign taxes withheld where recovery of such taxes is uncertain.
Class Allocations and Expenses. Investment income, realized and unrealized capital gains and losses, common expenses of the Fund, and certain fund-level expense reductions, if any, are allocated daily on a pro-rata basis to each class based on the relative net assets of each class to the total net assets of the Fund. Each class differs with respect to transfer agent and distribution and service plan fees incurred. Certain expense reductions may also differ by class. For the reporting period, the allocated portion of income and expenses to each class as a percent of its average net assets may vary due to the timing of recording these transactions in relation to fluctuating net assets of the classes. Expenses directly attributable to a fund are charged to that fund. Expenses attributable to more than one fund are allocated among the respective funds on the basis of relative net assets or other appropriate methods. Expense estimates are accrued in the period to which they relate and adjustments are made when actual amounts are known.
Deferred Trustee Compensation. Under a Deferred Compensation Plan (the Plan), independent Trustees may elect to defer receipt of a portion of their annual compensation. Deferred amounts are invested in a cross-section of Fidelity funds, are marked-to-market and remain in the Fund until distributed in accordance with the Plan. The investment of deferred amounts and the offsetting payable to the Trustees are included in the accompanying Statement of Assets and Liabilities.
Income Tax Information and Distributions to Shareholders. Each year, the Fund intends to qualify as a regulated investment company under Subchapter M of the Internal Revenue Code, including distributing substantially all of its taxable income and realized gains. As a result, no provision for U.S. Federal income taxes is required. As of December 31, 2013, the Fund did not have any unrecognized tax benefits in the financial statements; nor is the Fund aware of any tax positions for which it is reasonably possible that the total amounts of unrecognized tax benefits will significantly change in the next twelve months. The Fund files a U.S. federal tax return, in addition to state and local tax returns as required. The Fund's federal income tax returns are subject to examination by the Internal Revenue Service (IRS) for a period of three fiscal years after they are filed. State and local tax
Annual Report
3. Significant Accounting Policies - continued
Income Tax Information and Distributions to Shareholders - continued
returns may be subject to examination for an additional fiscal year depending on the jurisdiction. Foreign taxes are provided for based on the Fund's understanding of the tax rules and rates that exist in the foreign markets in which it invests.
Distributions are declared and recorded on the ex-dividend date. Income dividends and capital gain distributions are declared separately for each class. Income and capital gain distributions are determined in accordance with income tax regulations, which may differ from GAAP.
Capital accounts within the financial statements are adjusted for permanent book-tax differences. These adjustments have no impact on net assets or the results of operations. Capital accounts are not adjusted for temporary book-tax differences which will reverse in a subsequent period.
Book-tax differences are primarily due to futures contracts, foreign currency transactions, partnerships, passive foreign investment companies (PFIC), deferred trustees compensation, capital loss carryforwards and losses deferred due to wash sales.
The federal tax cost of investment securities and unrealized appreciation (depreciation) as of period end were as follows:
Gross unrealized appreciation | $ 4,896,599,300 |
Gross unrealized depreciation | (81,350,387) |
Net unrealized appreciation (depreciation) on securities and other investments | $ 4,815,248,913 |
| |
Tax Cost | $ 14,074,534,277 |
The tax-based components of distributable earnings as of period end were as follows:
Capital loss carryforward | $ (182,348,903) |
Net unrealized appreciation (depreciation) | $ 4,815,249,544 |
Capital loss carryforwards are only available to offset future capital gains of the Fund to the extent provided by regulations and may be limited. Under the Regulated Investment Company Modernization Act of 2010 (the Act), the Fund is permitted to carry forward capital losses incurred in taxable years beginning after December 22, 2010 for an unlimited period and such capital losses are required to be used prior to any losses that expire. The capital loss carryforward information presented below, including any applicable limitation, is estimated as of fiscal period end and is subject to adjustment.
Fiscal year of expiration | |
2017 | $ (182,348,903) |
The tax character of distributions paid was as follows:
| December 31, 2013 | December 31, 2012 |
Ordinary Income | $ 168,326,546 | $ 197,883,108 |
Trading (Redemption) Fees. Service Class 2R shares held by investors less than 60 days may be subject to a redemption fee equal to 1% of the NAV of shares redeemed. All redemption fees, which reduce the proceeds of the shareholder redemption, are retained by the Fund and accounted for as an addition to paid in capital.
Restricted Securities. The Fund may invest in securities that are subject to legal or contractual restrictions on resale. These securities generally may be resold in transactions exempt from registration or to the public if the securities are registered. Disposal of these securities may involve time-consuming negotiations and expense, and prompt sale at an acceptable price may be difficult. Information regarding restricted securities is included at the end of the Fund's Schedule of Investments.
4. Derivative Instruments.
Risk Exposures and the Use of Derivative Instruments. The Fund's investment objective allows the Fund to enter into various types of derivative contracts, including futures contracts. Derivatives are investments whose value is primarily derived from underlying assets, indices or reference rates and may be transacted on an exchange or over-the-counter (OTC). Derivatives may involve a future commitment to buy or sell a specified asset based on specified terms, to exchange future cash flows at periodic intervals based on a notional principal amount, or for one party to make one or more payments upon the occurrence of specified events in exchange for periodic payments from the other party.
Annual Report
Notes to Financial Statements - continued
4. Derivative Instruments - continued
Risk Exposures and the Use of Derivative Instruments - continued
The Fund used derivatives to increase returns and to manage exposure to certain risks as defined below. The success of any strategy involving derivatives depends on analysis of numerous economic factors, and if the strategies for investment do not work as intended, the Fund may not achieve its objectives.
The Fund's use of derivatives increased or decreased its exposure to the following risk:
Equity Risk | Equity risk relates to the fluctuations in the value of financial instruments as a result of changes in market prices (other than those arising from interest rate risk or foreign exchange risk), whether caused by factors specific to an individual investment, its issuer, or all factors affecting all instruments traded in a market or market segment. |
The Fund is also exposed to additional risks from investing in derivatives, such as liquidity risk and counterparty credit risk. Liquidity risk is the risk that the Fund will be unable to close out the derivative in the open market in a timely manner. Counterparty credit risk is the risk that the counterparty will not be able to fulfill its obligation to the Fund. Counterparty credit risk related to exchange-traded futures contracts may be mitigated by the protection provided by the exchange on which they trade.
Investing in derivatives may involve greater risks than investing in the underlying assets directly and, to varying degrees, may involve risk of loss in excess of any initial investment and collateral received and amounts recognized in the Statement of Assets and Liabilities. In addition, there may be the risk that the change in value of the derivative contract does not correspond to the change in value of the underlying instrument.
Futures Contracts. A futures contract is an agreement between two parties to buy or sell a specified underlying instrument for a fixed price at a specified future date. The Fund used futures contracts to manage its exposure to the stock market.
Upon entering into a futures contract, a fund is required to deposit either cash or securities (initial margin) with a clearing broker in an amount equal to a certain percentage of the face value of the contract. Futures contracts are marked-to-market daily and subsequent daily payments (variation margin) are made or received by a fund depending on the daily fluctuations in the value of the futures contracts and are recorded as unrealized appreciation or (depreciation). This receivable and/or payable, if any, is included in daily variation margin for derivative instruments in the Statement of Assets and Liabilities. Realized gain or (loss) is recorded upon the expiration or closing of a futures contract.
Any open futures contracts at period end are presented in the Schedule of Investments under the caption "Futures Contracts." The underlying face amount at value reflects each contract's exposure to the underlying instrument or index at period end and is representative of volume of activity during the period. Securities deposited to meet initial margin requirements are identified in the Schedule of Investments.
During the period the Fund recognized net realized gain (loss) of $28,199,755 and a change in net unrealized appreciation (depreciation) of $4,576.747 related to its investment in futures contracts. These amounts are included in the Statement of Operations.
5. Purchases and Sales of Investments.
Purchases and sales of securities, other than short-term securities, aggregated $14,809,206,062 and $16,869,340,986, respectively.
6. Fees and Other Transactions with Affiliates.
Management Fee. Fidelity Management & Research Company (the investment adviser) and its affiliates provide the Fund with investment management related services for which the Fund pays a monthly management fee. The management fee is the sum of an individual fund fee rate that is based on an annual rate of .30% of the Fund's average net assets and an annualized group fee rate that averaged .25% during the period. The group fee rate is based upon the average net assets of all the mutual funds advised by the investment adviser, including any mutual funds previously advised by the investment adviser that are currently advised by Fidelity SelectCo, LLC, an affiliate of the investment adviser. The group fee rate decreases as assets under management increase and increases as assets under management decrease. For the reporting period, the total annual management fee rate was .55% of the Fund's average net assets.
Distribution and Service Plan Fees. In accordance with Rule 12b-1 of the 1940 Act, the Fund has adopted separate 12b-1 Plans for each Service Class of shares. Each Service Class pays Fidelity Distributors Corporation (FDC), an affiliate of the investment adviser, a service fee. For the period, the service fee is based on an annual rate of .10% of Service Class' average net assets and .25% of Service Class 2's and Service Class 2R's average net assets.
Annual Report
6. Fees and Other Transactions with Affiliates - continued
Distribution and Service Plan Fees - continued
For the period, total fees, all of which were re-allowed to insurance companies for the distribution of shares and providing shareholder support services were as follows:
Service Class | $ 1,537,731 |
Service Class 2 | 20,201,973 |
Service Class 2 R | 24,375 |
| $ 21,764,079 |
Transfer Agent Fees. Fidelity Investments Institutional Operations Company, Inc. (FIIOC), an affiliate of the investment adviser, is the Fund's transfer, dividend disbursing, and shareholder servicing agent. FIIOC receives an asset-based fee with respect to each class. Each class (with the exception of Investor Class) pays a transfer agent fee, excluding out of pocket expenses, equal to an annual rate of .07% of average net assets. Investor Class pays a monthly asset-based transfer agent fee of .15% of average net assets. In addition, FIIOC receives an asset-based fee of .0035% of average net assets for typesetting, printing and mailing of shareholder reports, except proxy statements. FIIOC voluntarily agreed to reimburse or waive this fee for the period January 1, 2013 through December 31, 2013 (see Expense Reductions note). For the period, transfer agent fees for each class, including printing and out of pocket expenses, were as follows:
Initial Class | $ 4,818,479 |
Service Class | 1,059,125 |
Service Class 2 | 5,556,611 |
Service Class 2R | 6,681 |
Investor Class | 1,296,465 |
| $ 12,737,361 |
Effective February 1, 2014, the Board of Trustees approved an amendment to the transfer agent fee agreement whereby each class (with the exception of Investor Class) pays a single fee of .07% of average net assets for transfer agent services, typesetting, printing and mailing of shareholder reports, excluding mailing of proxy statements and out of pocket expenses. Investor Class pays a single fee of .15% of average net assets.
Accounting and Security Lending Fees. Fidelity Service Company, Inc. (FSC), an affiliate of the investment adviser, maintains the Fund's accounting records. The accounting fee is based on the level of average net assets for each month. Under a separate contract, FSC administers the security lending program. The security lending fee is based on the number and duration of lending transactions.
Brokerage Commissions. The Fund placed a portion of its portfolio transactions with brokerage firms which are affiliates of the investment adviser. Brokerage commissions are included in net realized gain (loss) and change in net unrealized appreciation (depreciation) in the Statement of Operations. The commissions paid to these affiliated firms were $456,680 for the period.
7. Committed Line of Credit.
The Fund participates with other funds managed by the investment adviser or an affiliate in a $4.25 billion credit facility (the "line of credit") to be utilized for temporary or emergency purposes to fund shareholder redemptions or for other short-term liquidity purposes. The Fund has agreed to pay commitment fees on its pro-rata portion of the line of credit, which amounted to $37,049 and is reflected in Miscellaneous expenses on the Statement of Operations. During the period, there were no borrowings on this line of credit.
8. Security Lending.
The Fund lends portfolio securities through a lending agent from time to time in order to earn additional income. For equity securities, a lending agent is used and may loan securities to certain qualified borrowers, including Fidelity Capital Markets (FCM), a broker-dealer affiliated with the Fund. On the settlement date of the loan, the Fund receives collateral (in the form of U.S. Treasury obligations, letters of credit and/or cash) against the loaned securities and maintains collateral in an amount not less than 100% of the market value of the loaned securities during the period of the loan. The market value of the loaned securities is determined at the close of business of the Fund and any additional required collateral is delivered to the Fund on the next business day. If the borrower defaults on its obligation to return the securities loaned because of insolvency or other reasons, the Fund may apply collateral received from the borrower against the obligation. The Fund may experience delays and costs in recovering the securities loaned. Any cash collateral received is invested in the Fidelity Securities Lending Cash Central Fund. The value of loaned securities and cash collateral at period end are disclosed on the Fund's Statement of Assets and Liabilities. At period end, there were no security loans outstanding with FCM. Security lending income represents the income earned on investing cash collateral, less rebates paid to borrowers and any lending agent fees associated with the loan, plus any premium payments received for lending certain types of securities. Security lending income is presented in the Statement of Operations as a component of income from Fidelity Central Funds. Total security lending income during the period amounted to $2,072,658, including $18,334 from securities loaned to FCM.
Annual Report
Notes to Financial Statements - continued
9. Expense Reductions.
The investment adviser or its affiliates agreed to reimburse or waive certain fees during the period as noted in the table below.
Initial Class | $ 274,674 |
Service Class | 60,362 |
Service Class 2 | 316,959 |
Service Class 2R | 383 |
Investor Class | 33,622 |
| $ 686,000 |
Commissions paid to certain brokers with whom the investment adviser, or its affiliates, places trades on behalf of the Fund include an amount in addition to trade execution, which may be rebated back to the Fund to offset certain expenses. This amount totaled $1,209,092 for the period. In addition, through arrangements with the Fund's custodian, credits realized as a result of uninvested cash balances were used to reduce the Fund's expenses. During the period, these credits reduced the Fund's custody expenses by $31.
10. Distributions to Shareholders.
Distributions to shareholders of each class were as follows:
Years ended December 31, | 2013 | 2012 |
From net investment income | | |
Initial Class | $ 74,639,848 | $ 82,580,923 |
Service Class | 15,078,586 | 16,341,913 |
Service Class 2 | 64,224,245 | 82,113,206 |
Service Class 2R | 82,385 | 91,369 |
Investor Class | 9,353,647 | 8,403,718 |
Total | $ 163,378,711 | $ 189,531,129 |
From net realized gain | | |
Initial Class | $ 1,987,452 | $ 3,278,212 |
Service Class | 442,043 | 704,666 |
Service Class 2 | 2,249,098 | 4,008,661 |
Service Class 2R | 2,841 | 4,524 |
Investor Class | 266,401 | 355,916 |
Total | $ 4,947,835 | $ 8,351,979 |
11. Share Transactions.
Transactions for each class of shares were as follows:
| Shares | Dollars |
Years ended December 31, | 2013 | 2012 | 2013 | 2012 |
Initial Class | | | | |
Shares sold | 8,443,448 | 8,108,840 | $ 260,463,356 | $ 207,519,230 |
Reinvestment of distributions | 2,327,682 | 3,281,594 | 76,627,300 | 85,859,135 |
Shares redeemed | (31,488,580) | (33,386,959) | (952,835,862) | (856,012,042) |
Net increase (decrease) | (20,717,450) | (21,996,525) | $ (615,745,206) | $ (562,633,677) |
Service Class | | | | |
Shares sold | 3,357,075 | 4,101,561 | $ 99,734,652 | $ 104,241,858 |
Reinvestment of distributions | 473,046 | 653,535 | 15,520,629 | 17,046,579 |
Shares redeemed | (6,669,302) | (8,246,935) | (202,333,378) | (210,877,762) |
Net increase (decrease) | (2,839,181) | (3,491,839) | $ (87,078,097) | $ (89,589,325) |
Service Class 2 | | | | |
Shares sold | 20,920,336 | 32,699,560 | $ 626,652,763 | $ 807,565,716 |
Reinvestment of distributions | 2,054,182 | 3,346,604 | 66,473,343 | 86,121,867 |
Shares redeemed | (69,773,617) | (46,616,409) | (2,068,437,076) | (1,175,112,838) |
Net increase (decrease) | (46,799,099) | (10,570,245) | $ (1,375,310,970) | $ (281,425,255) |
Service Class 2R | | | | |
Shares sold | 46,981 | 68,230 | $ 1,393,336 | $ 1,645,251 |
Reinvestment of distributions | 2,639 | 3,733 | 85,226 | 95,893 |
Shares redeemed | (71,564) | (91,575) | (2,147,878) | (2,281,001) |
Net increase (decrease) | (21,944) | (19,612) | $ (669,316) | $ (539,857) |
Annual Report
11. Share Transactions - continued
| Shares | Dollars |
Years ended December 31, | 2013 | 2012 | 2013 | 2012 |
Investor Class | | | | |
Shares sold | 4,323,390 | 2,695,333 | $ 130,507,518 | $ 68,539,753 |
Reinvestment of distributions | 293,384 | 335,952 | 9,620,048 | 8,759,634 |
Shares redeemed | (1,000,682) | (1,659,317) | (30,296,116) | (42,398,092) |
Net increase (decrease) | 3,616,092 | 1,371,968 | $ 109,831,450 | $ 34,901,295 |
12. Other.
The Fund's organizational documents provide former and current trustees and officers with a limited indemnification against liabilities arising in connection with the performance of their duties to the Fund. In the normal course of business, the Fund may also enter into contracts that provide general indemnifications. The Fund's maximum exposure under these arrangements is unknown as this would be dependent on future claims that may be made against the Fund. The risk of material loss from such claims is considered remote.
At the end of the period, the investment adviser or its affiliates were the owners of record of 11% of the total outstanding shares of the Fund and two otherwise unaffiliated shareholders were the owners of record of 22% of the total outstanding shares of the Fund.
Annual Report
Report of Independent Registered Public Accounting Firm
To the Trustees of Variable Insurance Products Fund II and Shareholders of VIP Contrafund Portfolio:
We have audited the accompanying statement of assets and liabilities of VIP Contrafund Portfolio (the Fund), a fund of Variable Insurance Products Fund II, including the schedule of investments, as of December 31, 2013, and the related statement of operations for the year then ended, the statement of changes in net assets for each of the two years in the period then ended, and the financial highlights for each of the five years in the period then ended. These financial statements and financial highlights are the responsibility of the Fund's management. Our responsibility is to express an opinion on these financial statements and financial highlights based on our audits.
We conducted our audits in accordance with the standards of the Public Company Accounting Oversight Board (United States). Those standards require that we plan and perform the audit to obtain reasonable assurance about whether the financial statements and financial highlights are free of material misstatement. The Fund is not required to have, nor were we engaged to perform, an audit of its internal control over financial reporting. Our audits included consideration of internal control over financial reporting as a basis for designing audit procedures that are appropriate in the circumstances, but not for the purpose of expressing an opinion on the effectiveness of the Fund's internal control over financial reporting. Accordingly, we express no such opinion. An audit also includes examining, on a test basis, evidence supporting the amounts and disclosures in the financial statements, assessing the accounting principles used and significant estimates made by management, as well as evaluating the overall financial statement presentation. Our procedures included confirmation of securities owned as of December 31, 2013, by correspondence with the custodians and brokers; where replies were not received from brokers, we performed other auditing procedures. We believe that our audits provide a reasonable basis for our opinion.
In our opinion, the financial statements and financial highlights referred to above present fairly, in all material respects, the financial position of VIP Contrafund Portfolio as of December 31, 2013, the results of its operations for the year then ended, the changes in its net assets for each of the two years in the period then ended, and the financial highlights for each of the five years in the period then ended, in conformity with accounting principles generally accepted in the United States of America.
DELOITTE & TOUCHE LLP
Boston, Massachusetts
February 11, 2014
Annual Report
The Trustees, Member of the Advisory Board, and officers of the trust and fund, as applicable, are listed below. The Board of Trustees governs the fund and is responsible for protecting the interests of shareholders. The Trustees are experienced executives who meet periodically throughout the year to oversee the fund's activities, review contractual arrangements with companies that provide services to the fund, oversee management of the risks associated with such activities and contractual arrangements, and review the fund's performance. Except for James C. Curvey, Ned C. Lautenbach, Ronald P. O'Hanley, and William S. Stavropoulos, each of the Trustees oversees 173 funds. Mr. Curvey oversees 396 funds. Mr. Lautenbach, Mr. O'Hanley, and Mr. Stavropoulos each oversees 247 funds.
The Trustees hold office without limit in time except that (a) any Trustee may resign; (b) any Trustee may be removed by written instrument, signed by at least two-thirds of the number of Trustees prior to such removal; (c) any Trustee who requests to be retired or who has become incapacitated by illness or injury may be retired by written instrument signed by a majority of the other Trustees; and (d) any Trustee may be removed at any special meeting of shareholders by a two-thirds vote of the outstanding voting securities of the trust. Each Trustee who is not an interested person (as defined in the 1940 Act) of the trust and the fund (Independent Trustee), shall retire not later than the last day of the calendar year in which his or her 75th birthday occurs. The Independent Trustees may waive this mandatory retirement age policy with respect to individual Trustees. The officers and Advisory Board Member hold office without limit in time, except that any officer and Advisory Board Member may resign or may be removed by a vote of a majority of the Trustees at any regular meeting or any special meeting of the Trustees. Except as indicated, each individual has held the office shown or other offices in the same company for the past five years.
Experience, Skills, Attributes, and Qualifications of the Fund's Trustees. The Governance and Nominating Committee has adopted a statement of policy that describes the experience, qualifications, attributes, and skills that are necessary and desirable for potential Independent Trustee candidates (Statement of Policy). The Board believes that each Trustee satisfied at the time he or she was initially elected or appointed a Trustee, and continues to satisfy, the standards contemplated by the Statement of Policy. The Governance and Nominating Committee also engages professional search firms to help identify potential Independent Trustee candidates who have the experience, qualifications, attributes, and skills consistent with the Statement of Policy. From time to time, additional criteria based on the composition and skills of the current Independent Trustees, as well as experience or skills that may be appropriate in light of future changes to board composition, business conditions, and regulatory or other developments, have also been considered by the professional search firms and the Governance and Nominating Committee. In addition, the Board takes into account the Trustees' commitment and participation in Board and committee meetings, as well as their leadership of standing and ad hoc committees throughout their tenure.
In determining that a particular Trustee was and continues to be qualified to serve as a Trustee, the Board has considered a variety of criteria, none of which, in isolation, was controlling. The Board believes that, collectively, the Trustees have balanced and diverse experience, qualifications, attributes, and skills, which allow the Board to operate effectively in governing the fund and protecting the interests of shareholders. Information about the specific experience, skills, attributes, and qualifications of each Trustee, which in each case led to the Board's conclusion that the Trustee should serve (or continue to serve) as a trustee of the fund, is provided below.
Board Structure and Oversight Function. James C. Curvey is an interested person (as defined in the 1940 Act) and currently serves as Chairman. The Trustees have determined that an interested Chairman is appropriate and benefits shareholders because an interested Chairman has a personal and professional stake in the quality and continuity of services provided to the fund. Independent Trustees exercise their informed business judgment to appoint an individual of their choosing to serve as Chairman, regardless of whether the Trustee happens to be independent or a member of management. The Independent Trustees have determined that they can act independently and effectively without having an Independent Trustee serve as Chairman and that a key structural component for assuring that they are in a position to do so is for the Independent Trustees to constitute a substantial majority for the Board. The Independent Trustees also regularly meet in executive session. Ned C. Lautenbach serves as Chairman of the Independent Trustees and as such (i) acts as a liaison between the Independent Trustees and management with respect to matters important to the Independent Trustees and (ii) with management prepares agendas for Board meetings.
Fidelity funds are overseen by different Boards of Trustees. The fund's Board oversees Fidelity's equity and high income funds and another Board oversees Fidelity's investment-grade bond, money market, and asset allocation funds. The asset allocation funds may invest in Fidelity funds overseen by the fund's Board. The use of separate Boards, each with its own committee structure, allows the Trustees of each group of Fidelity funds to focus on the unique issues of the funds they oversee, including common research, investment, and operational issues. On occasion, the separate Boards establish joint committees to address issues of overlapping consequences for the Fidelity funds overseen by each Board.
The Trustees operate using a system of committees to facilitate the timely and efficient consideration of all matters of importance to the Trustees, the fund, and fund shareholders and to facilitate compliance with legal and regulatory requirements and oversight of the fund's activities and associated risks. The Board, acting through its committees, has charged FMR and its affiliates with (i) identifying events or circumstances the occurrence of which could have demonstrably adverse effects on the fund's business and/or reputation; (ii) implementing processes and controls to lessen the possibility that such events or circumstances occur or to mitigate the effects of such events or circumstances if they do occur; and (iii) creating and maintaining a system designed to evaluate continuously business and market conditions in order to facilitate the identification and implementation processes described in (i) and (ii) above. Because the day-to-day operations and activities of the fund are carried out by or through FMR, its affiliates and other service providers, the fund's exposure to risks is mitigated but not eliminated by the processes overseen by the Trustees. While each of the Board's committees has responsibility for overseeing different aspects of the fund's activities, oversight is exercised primarily through the Operations, Audit, and Compliance Committees. In addition, the Independent Trustees have worked with FMR to enhance the Board's oversight of investment and financial risks, legal and regulatory risks, technology risks, and operational risks, including the development of additional risk reporting to the Board. For example, a working group comprised of Independent Trustees and FMR has worked and continues to work to review the Fidelity funds' valuation-related activities, reporting and risk management. Appropriate personnel, including but not limited to the fund's Chief Compliance Officer (CCO), FMR's internal auditor, the independent accountants, the fund's Treasurer and portfolio management personnel, make periodic reports to the Board's committees, as appropriate, including an annual review of FMR's risk management program for the Fidelity funds. The responsibilities of each standing committee, including their oversight responsibilities, are described further under "Standing Committees of the Fund's Trustees."
Annual Report
The fund's Statement of Additional Information (SAI) includes more information about the Trustees. To request a free copy, call Fidelity at 1-877-208-0098.
Interested Trustees*:
Correspondence intended for each Trustee who is an interested person may be sent to Fidelity Investments, 245 Summer Street, Boston, Massachusetts 02210.
Name, Year of Birth; Principal Occupations and Other Relevant Experience+ |
James C. Curvey (1935) |
Year of Election or Appointment: 2007 Trustee Chairman of the Board of Trustees |
| Mr. Curvey also serves as Trustee of other Fidelity funds. Mr. Curvey is a Director of Fidelity Investments Money Management, Inc. (2009-present), Director of Fidelity Research & Analysis Co. (2009-present) and Director of FMR and FMR Co., Inc. (2007-present). Mr. Curvey is also Vice Chairman (2007-present) and Director of FMR LLC. In addition, Mr. Curvey serves as an Overseer for the Boston Symphony Orchestra and a member of the Trustees of Villanova University. Previously, Mr. Curvey was the Vice Chairman (2006-2007) and Director (2000-2007) of FMR Corp. |
Ronald P. O'Hanley (1957) |
Year of Election or Appointment: 2011 Trustee |
| Mr. O'Hanley also serves as Trustee of other Fidelity funds. He is Director of Fidelity SelectCo, LLC (2013-present), FMR Co., Inc. (2010-present), Director of Fidelity Investments Money Management, Inc. (2010-present), Director of Fidelity Research & Analysis Company (2010-present), President of Fidelity Asset Management and Corporate Services and a Member of Fidelity's Executive Committee (2010-present). Previously, Mr. O'Hanley served as President and Chief Executive Officer of BNY Mellon Asset Management (2007-2010). Mr. O'Hanley also served as Vice Chairman of Bank New York Mellon Corp. and a member of that firm's Executive Committee. Prior to the 2007 merger of The Bank of New York and Mellon Financial Corporation, he was Vice Chairman of Mellon Financial Corporation and President and Chief Executive Officer of Mellon Asset Management. He joined Mellon in February 1997. Mr. O'Hanley currently serves as Chairman of the Boston Public Library Foundation Board of Directors and sits on the Board of Directors of Beth Israel Deaconess Medical Center, the Board of Trustees of the Marine Biological Laboratory and the Advisory Board of the Maxwell School of Citizenship and Public Administration at Syracuse University. Mr. O'Hanley also chairs the Council on Asset Management for the Financial Services Roundtable and is a member of the Board of Directors of Institutional Investor's U.S. Institute. |
* Trustees have been determined to be "Interested Trustees" by virtue of, among other things, their affiliation with the trust or various entities under common control with FMR.
+ The information above includes each Trustee's principal occupation during the last five years and other information relating to the experience, attributes, and skills relevant to each Trustee's qualifications to serve as a Trustee, which led to the conclusion that each Trustee should serve as a Trustee for the fund.
Annual Report
Trustees and Officers - continued
Independent Trustees:
Correspondence intended for each Independent Trustee (that is, the Trustees other than the Interested Trustees) may be sent to Fidelity Investments, P.O. Box 55235, Boston, Massachusetts 02205-5235.
Name, Year of Birth; Principal Occupations and Other Relevant Experience+ |
Dennis J. Dirks (1948) |
Year of Election or Appointment: 2005 Trustee |
| Mr. Dirks also serves as Trustee of other Fidelity funds. Prior to his retirement in May 2003, Mr. Dirks was Chief Operating Officer and a member of the Board of The Depository Trust & Clearing Corporation (DTCC). He also served as President, Chief Operating Officer, and Board member of The Depository Trust Company (DTC) and President and Board member of the National Securities Clearing Corporation (NSCC). In addition, Mr. Dirks served as Chief Executive Officer and Board member of the Government Securities Clearing Corporation, Chief Executive Officer and Board member of the Mortgage-Backed Securities Clearing Corporation, as a Trustee and a member of the Finance Committee of Manhattan College (2005-2008), and as a Trustee and a member of the Finance Committee of AHRC of Nassau County (2006-2008). Mr. Dirks is a member of the Independent Directors Council (IDC) Governing Council (2010-present) and Board of Directors for The Brookville Center for Children's Services, Inc. (2009-present). |
Alan J. Lacy (1953) |
Year of Election or Appointment: 2008 Trustee |
| Mr. Lacy also serves as Trustee of other Fidelity funds. Mr. Lacy serves as Senior Adviser (2007-present) of Oak Hill Capital Partners, L.P. (private equity). Mr. Lacy also served as Chief Executive Officer (2000-2005) and Vice Chairman (2005-2006) of Sears Holdings Corporation and Sears, Roebuck and Co. (retail). In addition, Mr. Lacy serves as a member of the Board of Directors of Dave & Buster's Entertainment, Inc. (restaurant and entertainment complexes, 2010-present), Earth Fare, Inc. (retail grocery, 2012-present), The Hillman Companies, Inc. (hardware wholesalers, 2010-present), and Bristol-Myers Squibb Company (global pharmaceuticals, 2008-present). Mr. Lacy is a member of the Board of Trustees of The National Parks Conservation Association (2006-present). Previously, Mr. Lacy served as Chairman of the Board of Trustees of the National Parks Conservation Association (2008-2011) and as a member of the Board of Directors for the Western Union Company (global money transfer, 2006-2011). |
Ned C. Lautenbach (1944) |
Year of Election or Appointment: 2000 Trustee Chairman of the Independent Trustees |
| Mr. Lautenbach also serves as Trustee of other Fidelity funds. Mr. Lautenbach currently serves as the Lead Director of the Eaton Corporation Board of Directors (diversified industrial, 1997-present). Mr. Lautenbach is Chairman of the Board of Directors of the Philharmonic Center for the Arts in Naples, Florida (2012-present) and a member of the Council on Foreign Relations (1994-present). Previously, Mr. Lautenbach was a Partner/Advisory Partner at Clayton, Dubilier & Rice, LLC (private equity investment, 1998-2010), as well as a Director of Sony Corporation (2006-2007). |
Joseph Mauriello (1944) |
Year of Election or Appointment: 2008 Trustee |
| Mr. Mauriello also serves as Trustee of other Fidelity funds. Prior to his retirement in January 2006, Mr. Mauriello served in numerous senior management positions including Deputy Chairman and Chief Operating Officer (2004-2005), and Vice Chairman of Financial Services (2002-2004) of KPMG LLP US (professional services, 1965-2005). Mr. Mauriello currently serves as a member of the Board of Directors of XL Group plc. (global insurance and re-insurance, 2006-present). Previously, Mr. Mauriello served as a Director of the Hamilton Funds of the Bank of New York (2006-2007) and of Arcadia Resources Inc. (health care services and products, 2007-2012). |
Robert W. Selander (1950) |
Year of Election or Appointment: 2011 Trustee |
| Mr. Selander also serves as Trustee of other Fidelity funds. Previously, Mr. Selander served as a Member of the Advisory Board of other Fidelity funds (2011), and Executive Vice Chairman (2010), Chief Executive Officer (2009-2010), and President and Chief Executive Officer (1997-2009) of Mastercard, Inc. |
Cornelia M. Small (1944) |
Year of Election or Appointment: 2005 Trustee |
| Ms. Small also serves as Trustee of other Fidelity funds. Ms. Small is a member of the Board of Directors (2009-present) and Chair of the Investment Committee (2010-present) of the Teagle Foundation. Ms. Small also serves on the Investment Committee of the Berkshire Taconic Community Foundation (2008-present). Previously, Ms. Small served as Chairperson (2002-2008) and a member of the Investment Committee and Chairperson (2008-2012) and a member of the Board of Trustees of Smith College. In addition, Ms. Small served as Chief Investment Officer, Director of Global Equity Investments, and a member of the Board of Directors of Scudder, Stevens & Clark and Scudder Kemper Investments. |
William S. Stavropoulos (1939) |
Year of Election or Appointment: 2001 Trustee Vice Chairman of the Independent Trustees |
| Mr. Stavropoulos also serves as Trustee of other Fidelity funds. Mr. Stavropoulos serves as President and Founder of the Michigan Baseball Foundation, the Great Lakes Loons (2007-present). Mr. Stavropoulos is Chairman Emeritus of the Board of Directors of The Dow Chemical Company, where he previously served in numerous senior management positions, including President, CEO (1995-2000; 2002-2004), Chairman of the Executive Committee (2000-2006), and as a member of the Board of Directors (1990-2006). Currently, Mr. Stavropoulos is Chairman of the Board of Directors of Univar Inc. (global distributor of commodity and specialty chemicals), a Director of Teradata Corporation (data warehousing and technology solutions), and Maersk Inc. (industrial conglomerate), and a member of the Advisory Board for Metalmark Capital LLC (private equity investment, 2005-present). Mr. Stavropoulos is an operating advisor to Clayton, Dubilier & Rice, LLC (private equity investment). In addition, Mr. Stavropoulos is a member of the University of Notre Dame Advisory Council for the College of Science, a Trustee of the Rollin L. Gerstacker Foundation, and a Director of the Naples Philharmonic Center for the Arts. Previously, Mr. Stavropoulos served as a Director of Chemical Financial Corporation (bank holding company, 1993-2012) and Tyco International, Ltd. (multinational manufacturing and services, 2007-2012). |
David M. Thomas (1949) |
Year of Election or Appointment: 2008 Trustee |
| Mr. Thomas also serves as Trustee of other Fidelity funds. Mr. Thomas serves as Non-Executive Chairman of the Board of Directors of Fortune Brands Home and Security (home and security products, 2011-present), and as a member of the Board of Directors of Interpublic Group of Companies, Inc. (marketing communication, 2004-present). Previously, Mr. Thomas served as Executive Chairman (2005-2006) and Chairman and Chief Executive Officer (2000-2005) of IMS Health, Inc. (pharmaceutical and healthcare information solutions), and a Director of Fortune Brands, Inc. (consumer products, 2000-2011). |
+ The information above includes each Trustee's principal occupation during the last five years and other information relating to the experience, attributes, and skills relevant to each Trustee's qualifications to serve as a Trustee, which led to the conclusion that each Trustee should serve as a Trustee for the fund.
Advisory Board Member and Officers:
Correspondence intended for each officer and Peter S. Lynch may be sent to Fidelity Investments, 245 Summer Street, Boston, Massachusetts 02210. Officers appear below in alphabetical order.
Name, Year of Birth; Principal Occupation |
Peter S. Lynch (1944) |
Year of Election or Appointment: 2003 Member of the Advisory Board |
| Mr. Lynch also serves as Member of the Advisory Board of other Fidelity funds. Mr. Lynch is Vice Chairman and a Director of FMR and FMR Co., Inc. In addition, Mr. Lynch serves as a Trustee of Boston College and as the Chairman of the Inner-City Scholarship Fund. Previously, Mr. Lynch served on the Special Olympics International Board of Directors (1997-2006). |
Elizabeth Paige Baumann (1968) |
Year of Election or Appointment: 2012 Anti-Money Laundering (AML) Officer |
| Ms. Baumann also serves as AML Officer of other funds. She is Chief AML Officer of FMR LLC (2012-present) and is an employee of Fidelity Investments. Previously, Ms. Baumann served as Vice President and Deputy Anti-Money Laundering Officer (2007-2012). |
William C. Coffey (1969) |
Year of Election or Appointment: 2009 Assistant Secretary |
| Mr. Coffey also serves as Assistant Secretary of other funds. He is Senior Vice President and Deputy General Counsel of FMR LLC (2010-present), and is an employee of Fidelity Investments. Previously, Mr. Coffey served as Vice President and Associate General Counsel of FMR LLC (2005-2009). |
Jonathan Davis (1968) |
Year of Election or Appointment: 2010 Assistant Treasurer |
| Mr. Davis also serves as Assistant Treasurer of other funds. Mr. Davis is an employee of Fidelity Investments. Previously, Mr. Davis served as Vice President and Associate General Counsel of FMR LLC (2003-2010). |
Adrien E. Deberghes (1967) |
Year of Election or Appointment: 2008 Deputy Treasurer |
| Mr. Deberghes also serves as an officer of other funds. He is an employee of Fidelity Investments (2008-present). Prior to joining Fidelity Investments, Mr. Deberghes was Senior Vice President of Mutual Fund Administration at State Street Corporation (2007-2008), Senior Director of Mutual Fund Administration at Investors Bank & Trust (2005-2007), and Director of Finance for Dunkin' Brands (2000-2005). |
Stephanie J. Dorsey (1969) |
Year of Election or Appointment: 2010 Assistant Treasurer |
| Ms. Dorsey also serves as an officer of other funds. She is an employee of Fidelity Investments (2008-present) and has served in other fund officer roles. Prior to joining Fidelity Investments, Ms. Dorsey served as Treasurer (2004-2008) of the JPMorgan Mutual Funds and Vice President (2004-2008) of JPMorgan Chase Bank. |
Scott C. Goebel (1968) |
Year of Election or Appointment: 2008 Secretary and Chief Legal Officer (CLO) |
| Mr. Goebel serves as Secretary and CLO of other funds. Mr. Goebel also serves as Secretary of Fidelity Investments Money Management, Inc. (FIMM) (2010-present) and Fidelity Research and Analysis Company (FRAC) (2010-present); General Counsel, Secretary, and Senior Vice President of FMR (2008-present) and FMR Co., Inc. (2008-present); Chief Legal Officer of Fidelity Management & Research (Hong Kong) Limited (2008-present) and Assistant Secretary of Fidelity Management & Research (Japan) Inc. (2008-present), and Fidelity Management & Research (U.K.) Inc. (2008-present). Previously, Mr. Goebel served as Secretary and CLO of other Fidelity funds (2008-2013), Assistant Secretary of FIMM (2008-2010), FRAC (2008-2010), and certain funds (2007-2008); and as Vice President and Secretary of Fidelity Distributors Corporation (FDC) (2005-2007). Mr. Goebel has been employed by FMR LLC or an affiliate since 2001. |
Joseph A. Hanlon (1968) |
Year of Election or Appointment: 2012 Chief Compliance Officer |
| Mr. Hanlon also serves as Chief Compliance Officer of other funds. Mr. Hanlon serves as Compliance Officer of FMR, FMR Co., Inc., Fidelity Investments Money Management, Inc. (FIMM), Fidelity Research and Analysis Company (FRAC), and Fidelity Management & Research (Hong Kong) (2009-present), as Senior Vice President of the Fidelity Asset Management Division (2009-present), and is an employee of Fidelity Investments. Previously, Mr. Hanlon served as Compliance Officer of Fidelity Management & Research (Japan) Inc. (2009-2013), Strategic Advisers, Inc. (2009-2013), and Fidelity Management & Research (U.K.) Inc. (2009-2013). |
Bruce T. Herring (1965) |
Year of Election or Appointment: 2006 Vice President of certain Equity Funds |
| Mr. Herring also serves as Vice President of other funds. He serves as Chief Investment Officer of Fidelity Global Asset Allocation (GAA) (2013-present), Group Chief Investment Officer of FMR, and President of Fidelity Research & Analysis Company (2010-present). Previously, Mr. Herring served as Chief Investment Officer and Director of Fidelity Management & Research (U.K.) Inc. (2010-2013), Vice President (2005-2006) and Senior Vice President (2006-2007) of Fidelity Management & Research Company, Vice President of FMR Co., Inc. (2001-2007), and as a portfolio manager for Fidelity U.S. Equity Funds. |
Brian B. Hogan (1964) |
Year of Election or Appointment: 2009 Vice President |
| Mr. Hogan also serves as Vice President of other funds. Mr. Hogan serves as President of FMR's Equity Division (2009-present). Previously, Mr. Hogan served as Senior Vice President, Equity Research of FMR (2006-2009) and as a portfolio manager. |
Chris Maher (1972) |
Year of Election or Appointment: 2013 Assistant Treasurer |
| Mr. Maher serves as Assistant Treasurer of other funds. Mr. Maher is Vice President of Valuation Oversight and is an employee of Fidelity Investments. Previously, Mr. Maher served as Vice President of Asset Management Compliance (2013), Vice President of FMR's Program Management Group (2010-2013), and Vice President of Valuation Oversight (2008-2010). |
Christine Reynolds (1958) |
Year of Election or Appointment: 2008 Chief Financial Officer |
| Ms. Reynolds also serves as Chief Financial Officer of other funds. Ms. Reynolds became President of Fidelity Pricing and Cash Management Services (FPCMS) in August 2008. Ms. Reynolds served as Chief Operating Officer of FPCMS (2007-2008). Previously, Ms. Reynolds served as President, Treasurer, and Anti-Money Laundering officer of the Fidelity funds (2004-2007). |
Kenneth B. Robins (1969) |
Year of Election or Appointment: 2008 President and Treasurer |
| Mr. Robins also serves as an officer of other funds. Mr. Robins serves as Executive Vice President of Fidelity Investments Money Management, Inc. (FIMM) (2013-present) and is an employee of Fidelity Investments (2004-present). Previously, Mr. Robins served in other fund officer roles. |
Gary W. Ryan (1958) |
Year of Election or Appointment: 2005 Assistant Treasurer |
| Mr. Ryan also serves as Assistant Treasurer of other funds. Mr. Ryan is an employee of Fidelity Investments and has served in other fund officer roles. Previously, Mr. Ryan served as Vice President of Fund Reporting in Fidelity Pricing and Cash Management Services (FPCMS) (1999-2005). |
Stephen Sadoski (1971) |
Year of Election or Appointment: 2012 Deputy Treasurer |
| Mr. Sadoski also serves as Deputy Treasurer of other funds. He is an employee of Fidelity Investments (2012-present) and has served in another fund officer role. Prior to joining Fidelity Investments, Mr. Sadoski served as an assistant chief accountant in the Division of Investment Management of the Securities and Exchange Commission (SEC) (2009-2012) and as a senior manager at Deloitte & Touche LLP (1997-2009). |
Stacie M. Smith (1974) |
Year of Election or Appointment: 2013 Deputy Treasurer |
| Ms. Smith also serves as an officer of other funds. She is an employee of Fidelity Investments (2009-present) and has served in other fund officer roles. Prior to joining Fidelity Investments, Ms. Smith served as Senior Audit Manager of Ernst & Young LLP (1996-2009). |
Renee Stagnone (1975) |
Year of Election or Appointment: 2013 Deputy Treasurer |
| Ms. Stagnone also serves as Deputy Treasurer of other funds. Ms. Stagnone is an employee of Fidelity Investments. |
Joseph F. Zambello (1957) |
Year of Election or Appointment: 2011 Deputy Treasurer |
| Mr. Zambello also serves as Deputy Treasurer of other funds. Mr. Zambello is an employee of Fidelity Investments. Previously, Mr. Zambello served as Vice President of FMR's Program Management Group (2009-2011) and Vice President of the Transfer Agent Oversight Group (2005-2009). |
Annual Report
Initial Class, Service Class, Service Class 2 and Investor Class designates 100% of the dividends distributed during the fiscal year as qualifying for the dividends-received deduction for corporate shareholders.
Annual Report
Board Approval of Investment Advisory Contracts and Management Fees
VIP Contrafund Portfolio
Each year, the Board of Trustees, including the Independent Trustees (together, the Board), votes on the renewal of the management contract and sub-advisory agreements (together, the Advisory Contracts) for the fund. The Board, assisted by the advice of fund counsel and Independent Trustees' counsel, requests and considers a broad range of information relevant to the renewal of the Advisory Contracts throughout the year.
The Board meets regularly and, at each of its meetings, covers an extensive agenda of topics and materials and considers factors that are relevant to its annual consideration of the renewal of the fund's Advisory Contracts, including the services and support provided to the fund and its shareholders. The Board has established various standing committees, each composed of and chaired by Independent Trustees with varying backgrounds, to which the Board has assigned specific subject matter responsibilities in order to enhance effective decision-making by the Board. The Board, acting directly and through its Committees, requests and receives information concerning the annual consideration of the renewal of the fund's Advisory Contracts. The Board also meets as needed to consider matters specifically related to the Board's annual consideration of the renewal of Advisory Contracts. Members of the Board may also meet with trustees of other Fidelity funds through ad hoc joint committees to discuss certain matters relevant to the Fidelity funds.
At its July 2013 meeting, the Board, including the Independent Trustees, unanimously determined to renew the fund's Advisory Contracts. In reaching its determination, the Board considered all factors it believed relevant, including (i) the nature, extent, and quality of the services to be provided to the fund and its shareholders (including the investment performance of the fund); (ii) the competitiveness of the fund's management fee and total expense ratio relative to peer funds; (iii) the total costs of the services to be provided by and the profits to be realized by Fidelity from its relationship with the fund; (iv) the extent to which economies of scale exist and would be realized as the fund grows; and (v) whether fee levels reflect these economies of scale, if any, for the benefit of fund shareholders.
In considering whether to renew the Advisory Contracts for the fund, the Board reached a determination, with the assistance of fund counsel and Independent Trustees' counsel and through the exercise of its business judgment, that the renewal of the Advisory Contracts was in the best interests of the fund and its shareholders and that the compensation payable under the Advisory Contracts was fair and reasonable. The Board's decision to renew the Advisory Contracts was not based on any single factor, but rather was based on a comprehensive consideration of all the information provided to the Board at its meetings throughout the year. The Board, in reaching its determination to renew the Advisory Contracts, was aware that shareholders in the fund have a broad range of investment choices available to them, including a wide choice among mutual funds offered by Fidelity's competitors, and that the fund's shareholders, who have the opportunity to review and weigh the disclosure provided by the fund in its prospectus and other public disclosures, have chosen to invest in this fund, which is a part of the Fidelity family of funds.
Nature, Extent, and Quality of Services Provided. The Board considered the staffing within the investment adviser, Fidelity Management & Research Company (FMR), and the sub-advisers (together, the Investment Advisers) as it relates to the fund, including the backgrounds of the fund's investment personnel, and also considered the fund's investment objective, strategies, and related investment philosophy. The Independent Trustees also had discussions with senior management of Fidelity's investment operations and investment groups. The Board considered the structure of the portfolio manager compensation program and whether this structure provides appropriate incentives to act in the best interests of the fund.
Resources Dedicated to Investment Management and Support Services. The Board and the Fund Oversight and Research Committees reviewed the general qualifications and capabilities of the Investment Advisers' investment staff, including its size, education, experience, and resources, as well as the Investment Advisers' approach to recruiting, training, managing, and compensating investment personnel. The Board noted that FMR has continued to increase the resources devoted to non-U.S. offices, including expansion of Fidelity's global investment organization. The Board also noted that Fidelity's analysts have extensive resources, tools and capabilities that allow them to conduct sophisticated quantitative and fundamental analysis, as well as credit analysis of issuers, counterparties and guarantors. Further, the Board believes that Fidelity's investment professionals have sufficient access to global information and data so as to provide competitive investment results over time, and that those professionals also have access to sophisticated tools that permit them to assess portfolio construction and risk and performance attribution characteristics continuously, as well as to transmit new information and research conclusions rapidly around the world. Additionally, in its deliberations, the Board considered the Investment Advisers' trading and risk management capabilities and resources, which are an integral part of the investment management process.
Shareholder and Administrative Services. The Board considered (i) the nature, extent, quality, and cost of advisory, administrative, and shareholder services performed by the Investment Advisers and their affiliates under the Advisory Contracts and under separate agreements covering transfer agency, pricing and bookkeeping, and securities lending services for the fund; (ii) the nature and extent of the supervision of third party service providers, principally custodians and subcustodians; and (iii) the resources devoted to, and the record of compliance with, the fund's compliance policies and procedures. The Board also reviewed the allocation of fund brokerage, including allocations to brokers affiliated with the Investment Advisers, the use of brokerage commissions to pay fund expenses, and the use of "soft" commission dollars to pay for research services.
The Board noted that the growth of fund assets over time across the complex allows Fidelity to reinvest in the development of services designed to enhance the value or convenience of the Fidelity funds as investment vehicles. These services include 24-hour access to account information and market information through telephone representatives and over the Internet, investor education materials and asset allocation tools, and the expanded availability of Fidelity Investor Centers.
Annual Report
Investment in a Large Fund Family. The Board considered the benefits to shareholders of investing in a Fidelity fund, including the benefits of investing in a fund that is part of a large family of funds offering a variety of investment disciplines and providing a large variety of mutual fund investor services. The Board noted that Fidelity had taken, or had made recommendations that resulted in the Fidelity funds taking, a number of actions over the previous year that benefited particular funds, including (i) continuing to dedicate additional resources to investment research and to the support of the senior management team that oversees asset management; (ii) persisting in efforts to enhance Fidelity's global research capabilities; (iii) launching new funds and making other enhancements to meet client needs for global and income-oriented solutions; (iv) continuing to launch dedicated lower cost underlying funds to meet portfolio construction needs related to expanding underlying fund options for Fidelity funds of funds, specifically for the Freedom Fund product lines; (v) rationalizing product lines and gaining increased efficiencies through the mergers of several funds into other funds; (vi) strengthening Fidelity's index fund offerings by reducing investment minimums and adopting or lowering existing expense caps for certain funds and classes; (vii) enhancing Global Asset Allocation product offerings by launching new funds and strategies, including "open architecture" target date funds that utilize affiliated and unaffiliated sub-advisers; (viii) modifying the eligibility criteria for Institutional Class shares of Advisor funds to increase their marketability to a portion of the defined contribution plan market; (ix) creating a new low-cost retirement share class for certain Advisor funds to appeal to large retirement plans; (x) transitioning the management of certain Fidelity commodity funds to Geode Capital Management LLC, a registered commodity pool operator, while retaining administrative responsibilities for the funds; (xi) reorganizing a number of funds; and (xii) taking steps toward establishing a new Fidelity adviser to manage sector-based funds and products.
Investment Performance. The Board considered whether the fund has operated in accordance with its investment objective, as well as its record of compliance with its investment restrictions and its performance history. The Board noted that there was a portfolio management change for a sleeve of the fund in March 2011, April 2013, and June 2013.
The Board took into account discussions with the Investment Advisers about fund investment performance that occur at Board meetings throughout the year. In this regard the Board noted that as part of regularly scheduled fund reviews and other reports to the Board on fund performance, the Board periodically considers annualized return information for the fund, for different time periods, measured against a securities market index ("benchmark index") and a peer group of mutual funds with similar objectives ("peer group"). In its evaluation of fund investment performance, the Board gave particular attention to information indicating changes in performance of certain Fidelity funds for specific time periods and the Investment Advisers' explanations for any overperformance or, in the case of the fund, underperformance.
In addition to reviewing absolute and relative fund performance, the Independent Trustees periodically consider the appropriateness of fund performance metrics in evaluating the results achieved. In general, the Independent Trustees believe that fund performance should be evaluated based on net performance (after fees and expenses) of both the highest performing and lowest performing classes, where applicable, compared to appropriate benchmark indices, over appropriate time periods which may include full market cycles, and compared to peer groups, as applicable, over the same periods, taking into account relevant factors including the following: general market conditions; issuer-specific information; tactical opportunities for investment; and fund cash flows and other factors.
The Independent Trustees recognize that shareholders evaluate performance on a net basis over their own holding periods, for which one-, three-, and five-year periods are used as a proxy. For this reason, the performance information reviewed by the Board also included net cumulative calendar year total return information for the fund and an appropriate benchmark index and peer group for the most recent one-, three-, and five-year periods, as shown below. Returns are shown compared to the 25th percentile (top of box) and 75th percentile (bottom of box) of the peer universe.
Annual Report
Board Approval of Investment Advisory Contracts and Management Fees - continued
VIP Contrafund Portfolio
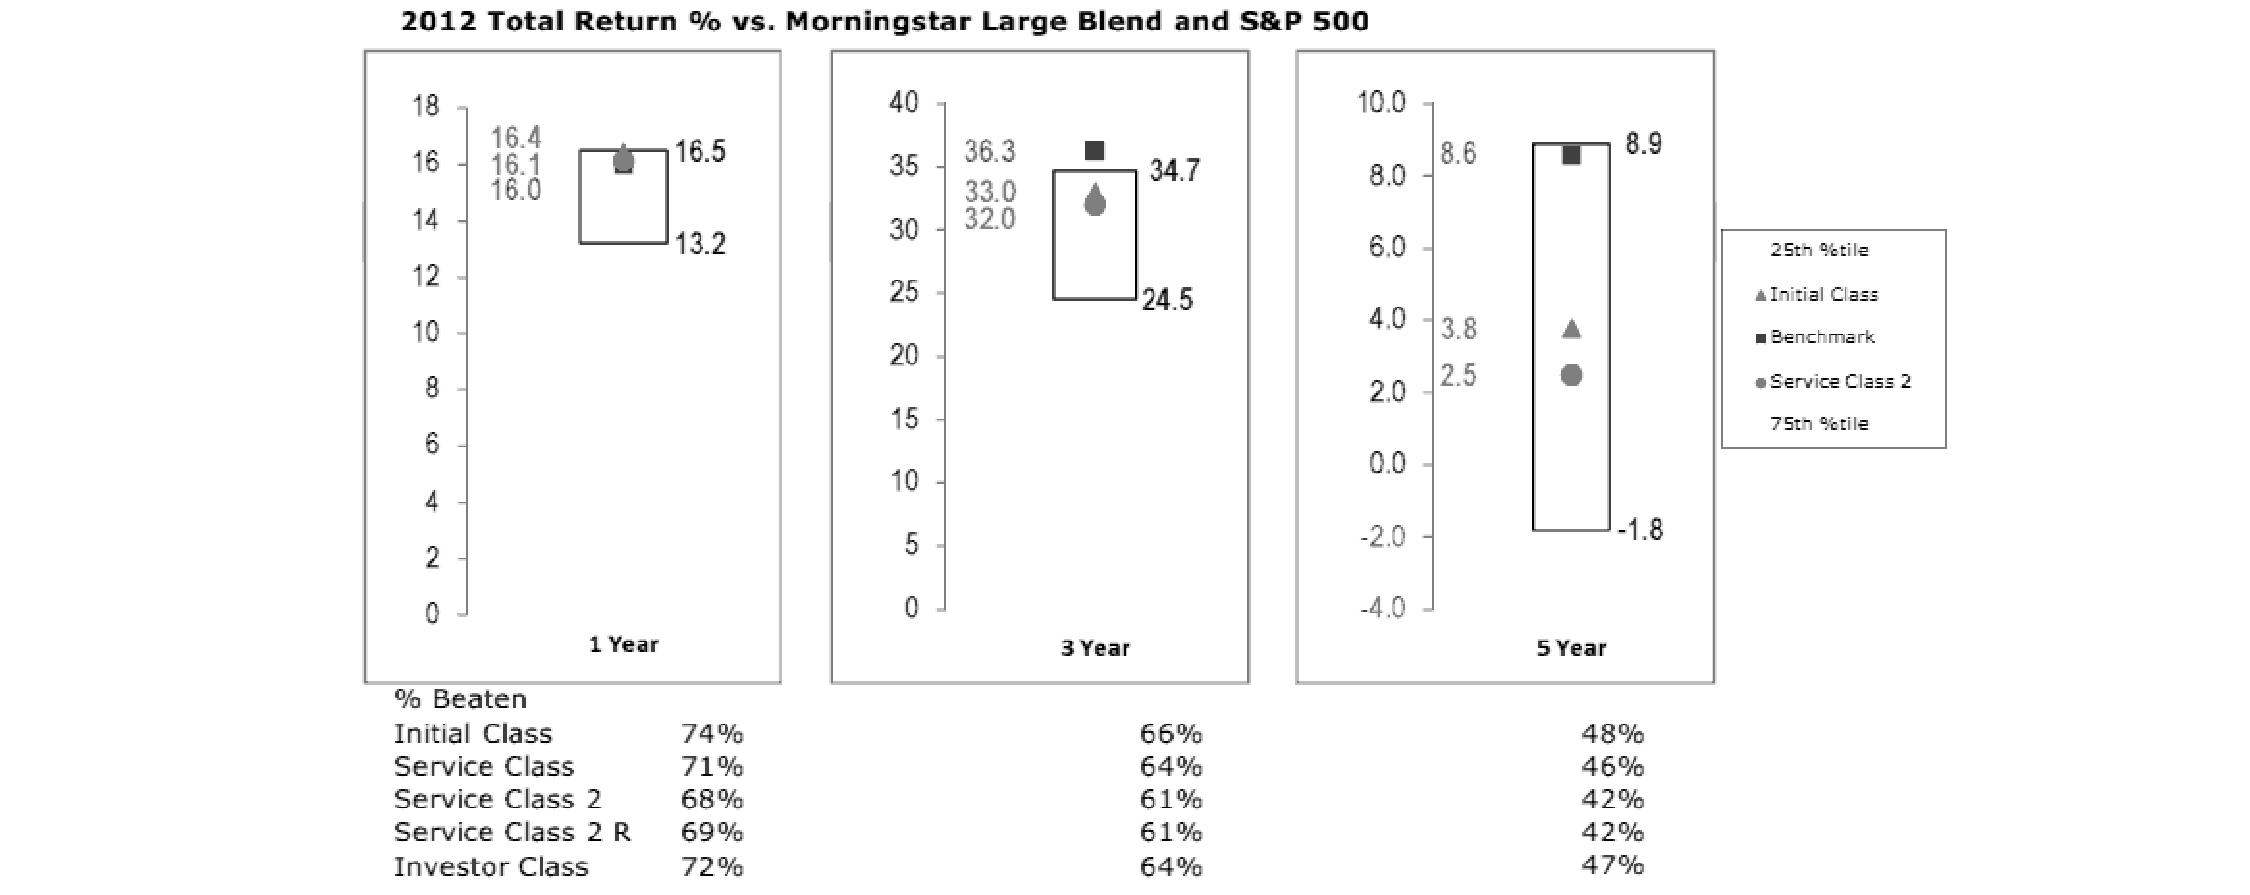
The Board has discussed the fund's performance with FMR, including the fund's underperformance based on more recent periods ended after 2012 (which periods are not shown in the chart above) but prior to the date of the Board's approval of the renewal of the Advisory Contracts, and has engaged with FMR to consider what steps might be taken to remediate the fund's more recent underperformance.
Based on its review, the Board concluded that the nature, extent, and quality of services provided to the fund under the Advisory Contracts should benefit the fund's shareholders.
Competitiveness of Management Fee and Total Expense Ratio. The Board considered the fund's management fee and total expense ratio compared to "mapped groups" of competitive funds and classes. Fidelity creates "mapped groups" by combining similar Lipper investment objective categories that have comparable management fee characteristics. Combining Lipper investment objective categories aids the Board's management fee and total expense ratio comparisons by broadening the competitive group used for comparison and by reducing the number of universes to which various Fidelity funds are compared.
Management Fee. The Board considered two proprietary management fee comparisons for the 12-month periods shown in the chart below. The group of Lipper funds used by the Board for management fee comparisons is referred to below as the "Total Mapped Group." The Total Mapped Group comparison focuses on a fund's standing in terms of gross management fees before expense reimbursements or caps relative to the total universe of funds with comparable investment mandates, regardless of whether their management fee structures also are comparable. Funds with comparable investment mandates offer exposure to similar types of securities. Funds with comparable management fee structures have similar management fee contractual arrangements (e.g., flat rate charged for advisory services, all-inclusive fee rate, etc.). "TMG %" represents the percentage of funds in the Total Mapped Group that had management fees that were lower than the fund's. For example, a TMG % of 10% means that 90% of the funds in the Total Mapped Group had higher management fees than the fund. The "Asset-Size Peer Group" (ASPG) comparison focuses on a fund's standing relative to a subset of non-Fidelity funds within the Total Mapped Group that are similar in size and management fee structure. The ASPG represents at least 15% of the funds in the Total Mapped Group with comparable asset size and management fee structures, subject to a minimum of 50 funds (or all funds in the Total Mapped Group if fewer than 50). Additional information, such as the ASPG quartile in which the fund's management fee ranked, is also included in the chart and considered by the Board.
Annual Report
VIP Contrafund Portfolio

The Board noted that the fund's management fee ranked below the median of its Total Mapped Group and below the median of its ASPG for 2012.
Based on its review, the Board concluded that the fund's management fee is fair and reasonable in light of the services that the fund receives and the other factors considered.
Total Expense Ratio. In its review of each class's total expense ratio, the Board considered the fund's management fee as well as other fund or class expenses, as applicable, such as transfer agent fees, pricing and bookkeeping fees, fund-paid 12b-1 fees, and custodial, legal, and audit fees. The Board also noted the effects of any waivers and reimbursements on fees and expenses. As part of its review, the Board also considered the current and historical total expense ratios of each class of the fund compared to competitive fund median expenses. Each class of the fund is compared to those funds and classes in the Total Mapped Group (used by the Board for management fee comparisons) that have a similar sales load structure.
The Board noted that the total expense ratio of each class ranked below its competitive median for 2012.
Fees Charged to Other Fidelity Clients. The Board also considered Fidelity fee structures and other information with respect to clients of FMR and its affiliates, such as other mutual funds advised or subadvised by FMR or its affiliates, pension plan clients, and other institutional clients. The Board noted the findings of the 2013 ad hoc joint committee (created with the board of other Fidelity funds), which reviewed and compared Fidelity's institutional investment advisory business with its business of providing services to the Fidelity funds, including the differences in services provided, fees charged, and costs incurred, as well as competition in their respective marketplaces.
Based on its review of total expense ratios and fees charged to other Fidelity clients, the Board concluded that the total expense ratio of each class of the fund was reasonable in light of the services that the fund and its shareholders receive and the other factors considered.
Costs of the Services and Profitability. The Board considered the revenues earned and the expenses incurred by Fidelity in conducting the business of developing, marketing, distributing, managing, administering and servicing the fund and servicing the fund's shareholders. The Board also considered the level of Fidelity's profits in respect of all the Fidelity funds.
On an annual basis, FMR presents to the Board Fidelity's profitability for the fund. Fidelity calculates the profitability for each fund, as well as aggregate profitability for groups of Fidelity funds and all Fidelity funds, using a series of detailed revenue and cost allocation methodologies which originate with the books and records of Fidelity on which Fidelity's audited financial statements are based. The Audit Committee of the Board reviews any significant changes from the prior year's methodologies.
PricewaterhouseCoopers LLP (PwC), independent registered public accounting firm and auditor to Fidelity and certain Fidelity funds, has been engaged annually by the Board as part of the Board's assessment of Fidelity's profitability analysis. PwC's engagement includes the review and assessment of the methodologies used by Fidelity in determining the revenues and expenses attributable to Fidelity's mutual fund business, and completion of agreed-upon procedures surrounding the mathematical accuracy of fund profitability and its conformity to allocation methodologies. After considering PwC's reports issued under the engagement and information provided by Fidelity, the Board concluded that while other allocation methods may also be reasonable, Fidelity's profitability methodologies are reasonable in all material respects.
Annual Report
Board Approval of Investment Advisory Contracts and Management Fees - continued
The Board also reviewed Fidelity's non-fund businesses and fall-out benefits related to the mutual fund business as well as cases where Fidelity's affiliates may benefit from or be related to the fund's business.
The Board considered the costs of the services provided by and the profits realized by Fidelity in connection with the operation of the fund and was satisfied that the profitability was not excessive in the circumstances.
Economies of Scale. The Board considered whether there have been economies of scale in respect of the management of the Fidelity funds, whether the Fidelity funds (including the fund) have appropriately benefited from any such economies of scale, and whether there is potential for realization of any further economies of scale. The Board considered the extent to which the fund will benefit from economies of scale through increased services to the fund, through waivers or reimbursements, or through fee or expense reductions. The Board also noted that in 2009, it and the board of other Fidelity funds created an ad hoc committee (the Economies of Scale Committee) to analyze whether FMR attains economies of scale in respect of the management and servicing of the Fidelity funds, whether the Fidelity funds have appropriately benefited from such economies of scale, and whether there is potential for realization of any further economies of scale.
The Board recognized that the fund's management contract incorporates a "group fee" structure, which provides for lower group fee rates as total fund assets under FMR's management increase, and for higher group fee rates as total fund assets under FMR's management decrease. FMR calculates the group fee rates based on a tiered asset "breakpoint" schedule that varies based on asset class. The Board considered that the group fee is designed to deliver the benefits of economies of scale to fund shareholders when total Fidelity fund assets increase, even if assets of any particular fund are unchanged or have declined, because some portion of Fidelity's costs are attributable to services provided to all Fidelity funds, and all funds benefit if those costs can be allocated among more assets. The Board concluded that, given the group fee structure, fund shareholders will benefit from lower management fees as assets under FMR's management increase at the fund complex level, regardless of whether Fidelity achieves any such economies of scale.
The Board concluded, taking into account the analysis of the Economies of Scale Committee, that economies of scale, if any, are being appropriately shared between fund shareholders and Fidelity.
Amendment to Description of Group Fee Rate. At its July 2013 meeting, the Board voted to approve an amendment to the fund's management contract to modify the description of the "group fee rate" effective August 1, 2013. The Board noted that under the prior description in the contract, the group fee rate was based on the average net assets of all registered investment companies with which FMR has management contracts. Under the contract's tiered asset breakpoint schedule, the group fee rate is lower as total fund assets under FMR's management increase, and higher as total fund assets under FMR's management decrease. The Board considered that the prior description would have excluded the assets of 64 Fidelity sector funds from the group fee rate calculation once Fidelity SelectCo, LLC, an affiliate of FMR, assumed management responsibilities for those funds. The Board noted that modifying the description of the group fee rate to continue to include the assets of those 64 funds for purposes of determining group fee rate breakpoints would avoid an immediate adverse impact on the group fee rate for any fund.
Additional Information Requested by the Board. In order to develop fully the factual basis for consideration of the Fidelity funds' Advisory Contracts, the Board requested and received additional information on certain topics, including: (i) fund performance trends and Fidelity's long-term strategies for certain funds; (ii) the potential to further rationalize the Fidelity fund lineup with the possibility of achieving savings for the funds and Fidelity; (iii) the methodology with respect to competitive fund data and peer group classifications; (iv) the arrangements with, and performance of, certain sub-advisers on behalf of the Fidelity funds, as well as certain proposed participating affiliate arrangements; (v) the realization of fall-out benefits in certain Fidelity business units; (vi) Fidelity's group fee structures, including the rationale for the individual fee rates of certain categories of funds and the definition of group assets; (vii) trends regarding industry use of performance fee structures and the performance adjustment methodologies applicable to the Fidelity funds; (viii) additional competitive analysis regarding the total expenses for certain classes; and (ix) fund profitability methodology, including Fidelity's cost allocation methodology, and the impact of certain factors on fund profitability results.
Based on its evaluation of all of the conclusions noted above, and after considering all factors it believed relevant, the Board ultimately concluded that the advisory fee structures are fair and reasonable, and that the fund's Advisory Contracts should be renewed.
Annual Report
Investment Adviser
Fidelity Management & Research Company
Boston, MA
Investment Sub-Advisers
FMR Co., Inc.
Fidelity Management & Research (U.K.) Inc.
Fidelity Management & Research (Hong Kong) Limited
Fidelity Management & Research (Japan) Inc.
General Distributor
Fidelity Distributors Corporation
Smithfield, RI
Transfer and Service Agents
Fidelity Investments Institutional Operations Company, Inc.
Boston, MA
Fidelity Service Company, Inc.
Boston, MA
Custodian
Brown Brothers Harriman & Co.
Boston, MA
VIPCON-ANN-0214
1.540131.116
Fidelity® Variable Insurance Products:
Contrafund® Portfolio - Service Class 2R
Annual Report
December 31, 2013
(Fidelity Cover Art)
Contents
Performance | (Click Here) | How the fund has done over time. |
Management's Discussion of Fund Performance | (Click Here) | The Portfolio Manager's review of fund performance and strategy. |
Shareholder Expense Example | (Click Here) | An example of shareholder expenses. |
Investment Changes | (Click Here) | A summary of major shifts in the fund's investments over the past six months. |
Investments | (Click Here) | A complete list of the fund's investments with their market values. |
Financial Statements | (Click Here) | Statements of assets and liabilities, operations, and changes in net assets, as well as financial highlights. |
Notes | (Click Here) | Notes to the financial statements. |
Report of Independent Registered Public Accounting Firm | (Click Here) | |
Trustees and Officers | (Click Here) | |
Distributions | (Click Here) | |
Board Approval of Investment Advisory Contracts and Management Fees | (Click Here) | |
To view a fund's proxy voting guidelines and proxy voting record for the 12-month period ended June 30, visit http://www.fidelity.com/proxyvotingresults or visit the Securities and Exchange Commission's (SEC) web site at http://www.sec.gov. You may also call 1-877-208-0098 to request a free copy of the proxy voting guidelines.
Fidelity Variable Insurance Products are separate account options which are purchased through a variable insurance contract.
Standard & Poor's, S&P and S&P 500 are registered service marks of The McGraw-Hill Companies, Inc. and have been licensed for use by Fidelity Distributors Corporation.
Other third-party marks appearing herein are the property of their respective owners.
All other marks appearing herein are registered or unregistered trademarks or service marks of FMR LLC or an affiliated company. © 2014 FMR LLC. All rights reserved.
This report and the financial statements contained herein are submitted for the general information of the shareholders of the fund. This report is not authorized for distribution to prospective investors in the fund unless preceded or accompanied by an effective prospectus.
A fund files its complete schedule of portfolio holdings with the SEC for the first and third quarters of each fiscal year on Form N-Q. Forms N-Q are available on the SEC's web site at http://www.sec.gov. A fund's Forms N-Q may be reviewed and copied at the SEC's Public Reference Room in Washington, DC. Information regarding the operation of the SEC's Public Reference Room may be obtained by calling 1-800-SEC-0330. For a complete list of a fund's portfolio holdings, view the most recent holdings listing, semiannual report, or annual report on Fidelity's web site at http://www.fidelity.com, http://www.advisor.fidelity.com, or http://www.401k.com, as applicable.
NOT FDIC INSURED • MAY LOSE VALUE • NO BANK GUARANTEE
Neither the fund nor Fidelity Distributors Corporation is a bank.
Annual Report
Average annual total return reflects the change in the value of an investment, assuming reinvestment of the class' distributions from dividend income and capital gains (the profits earned upon the sale of securities that have grown in value, if any) and assuming a constant rate of performance each year. During periods of reimbursement by Fidelity, a fund's total return will be greater than it would be had the reimbursement not occurred. Performance numbers are net of all underlying fund operating expenses, but do not include any insurance charges imposed by your insurance company's separate account. If performance information included the effect of these additional charges, the total returns would have been lower. How a fund did yesterday is no guarantee of how it will do tomorrow.
Average Annual Total Returns
Periods ended December 31, 2013 | Past 1
year | Past 5
years | Past 10
years |
VIP ContrafundSM Portfolio - Service Class 2R | 30.90% | 18.55% | 8.95% |
$10,000 Over 10 Years
Let's say hypothetically that $10,000 was invested in VIP ContrafundSM Portfolio - Service Class 2R on December 31, 2003. The chart shows how the value of your investment would have changed, and also shows how the S&P 500® Index performed over the same period.
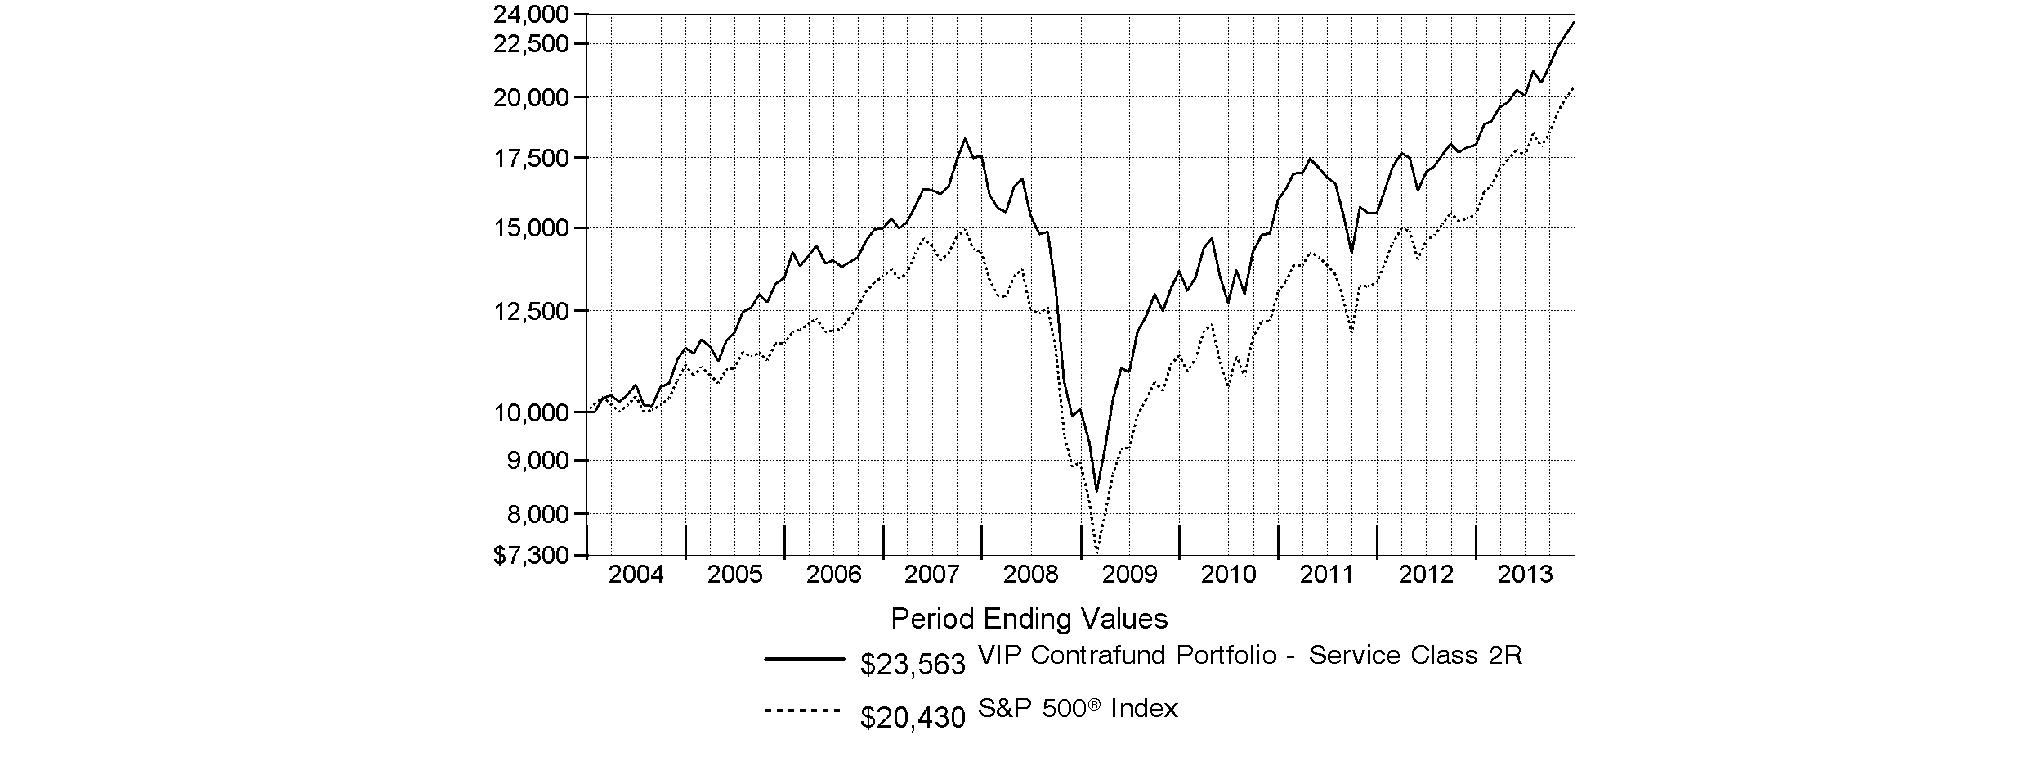
Annual Report
Market Recap: Global equity markets remained upbeat for the 12 months ending December 31, 2013, propelling the MSCI® ACWI® (All Country World Index) Index to a 23.24% return. Midyear turbulence gave way by autumn when policymakers in the U.S. and China had made clear their intentions to maintain accommodative monetary policies. That stance, combined with modest cyclical improvement around the globe and generally low valuations, underpinned the broad rally in equities, although the relative strength of the U.S. dollar generally tempered gains for U.S. investors holding foreign securities based in local currencies. During the period, the broad-market S&P 500® Index set a series of new highs, finishing the year up 32.39%. For the first time since 1995, the S&P® scored a "perfect 10," with all 10 economic sectors gaining at least 10% for the year. A resurgence in growth-oriented stocks lifted the Nasdaq Composite Index® to a 40.12% result for 2013, while the blue-chip Dow Jones Industrial AverageSM notched a relatively more modest 29.65% gain. International developed-markets equities rose in concert with their U.S. counterparts, with the MSCI® EAFE® Index gaining 22.92% for the period. Meanwhile, foreign exchange and commodity weakness curbed results in resource-heavy emerging markets (EM), especially in the year's waning months. More generally, concern over EM's slowing growth, its declining share of global trade and uncertainty surrounding U.S. central bank intentions were all factors hampering performance. The MSCI Emerging Markets Index returned -2.27% for the period. On the bond side, U.S. high-yield securities rallied with equities for much of the period, with The BofA Merrill LynchSM US High Yield Constrained Index returning 7.41% for 2013. The more rate-sensitive U.S. investment-grade bond category faced headwinds though, as reflected in the -2.02% return of the Barclays® U.S. Aggregate Bond Index. Within the Barclays index, investment-grade corporate credit returned -2.01%, while ultra-safe U.S. Treasuries saw a -2.75% result. Major non-U.S. developed markets performed only slightly better, with the Citigroup® Non-USD Group-of-Seven (G7) Equal Weighted Index logging a -1.59% result. After several years of strong advances, EM debt reversed course in 2013, with the J.P. Morgan Emerging Markets Bond Index Global returning -6.58%.
Comments from Co-Portfolio Manager Robert Stansky, Head of FMR's Stock Selector Large Cap Group, which manages VIP ContrafundSM Portfolio: For the year, the fund's share classes trailed the S&P 500®. (For specific portfolio results, please refer to the performance section of this report.) The fund fell short of its benchmark during this period of strong performance for equities due to disappointing picks in industrials and energy. Our stock choices were strongest within telecommunication services, health care and financials. Positioning in Apple was a major detractor, especially a sizable overweighting early in the period, when the stock lost ground. We significantly reduced our stake in the personal electronics giant - moving to an underweighting. Still, Apple remained among the fund's largest holdings, and was a modest overweighting at period end. We also missed with our timing on tech titan Microsoft. We largely avoided the stock early on, thinking its valuation reflected the software maker's near-term outlook amid a dearth of growth in personal computers. We established a position in April, however, partly in anticipation of a corporate realignment and a reshuffling of priorities to allow the company to refocus on cloud computing. The stock gained nicely through the end of the year, but it still detracted because our exposure was lower than that of the benchmark, on average. A non-index stake in British American Tobacco detracted, as the stock meaningfully underperformed, due in part to a global preference for U.S.-based stocks over European names. Conversely, we successfully avoided computer services provider and lagging index component IBM, which we believe faces increased pressure from competitors and slowing growth prospects. We fared better within telecommunication services, avoiding index goliath AT&T for much of the 12-month period. Selling it in January because its growth was slowing was a good call, as the stock lagged due to weakening fundamentals in wireless and rising interest rates, the latter of which hurt dividend-paying stocks.
The views expressed above reflect those of the portfolio manager(s) only through the end of the period as stated on the cover of this report and do not necessarily represent the views of Fidelity or any other person in the Fidelity organization. Any such views are subject to change at any time based upon market or other conditions and Fidelity disclaims any responsibility to update such views. These views may not be relied on as investment advice and, because investment decisions for a Fidelity fund are based on numerous factors, may not be relied on as an indication of trading intent on behalf of any Fidelity fund.
Annual Report
As a shareholder of the Fund, you incur two types of costs: (1) transaction costs, including redemption fees and (2) ongoing costs, including management fees, distribution and/or service (12b-1) fees and other Fund expenses. This Example is intended to help you understand your ongoing costs (in dollars) of investing in the Fund and to compare these costs with the ongoing costs of investing in other mutual funds.
The Example is based on an investment of $1,000 invested at the beginning of the period and held for the entire period (July 1, 2013 to December 31, 2013).
Actual Expenses
The first line of the accompanying table for each class of the Fund provides information about actual account values and actual expenses. You may use the information in this line, together with the amount you invested, to estimate the expenses that you paid over the period. Simply divide your account value by $1,000.00 (for example, an $8,600 account value divided by $1,000.00 = 8.6), then multiply the result by the number in the first line for a class of the Fund under the heading entitled "Expenses Paid During Period" to estimate the expenses you paid on your account during this period. The estimate of expenses does not include any fees or other expenses of any variable annuity or variable life insurance product. If they were, the estimate of expenses you paid during the period would be higher, and your ending account value would be lower. In addition, the Fund, as a shareholder in the underlying Fidelity Central Funds, will indirectly bear its pro-rata share of the fees and expenses incurred by the underlying Fidelity Central Funds. These fees and expenses are not included in the Fund's annualized expense ratio used to calculate the expense estimate in the table below.
Hypothetical Example for Comparison Purposes
The second line of the accompanying table for each class of the Fund provides information about hypothetical account values and hypothetical expenses based on a Class' actual expense ratio and an assumed rate of return of 5% per year before expenses, which is not the Class' actual return. The hypothetical account values and expenses may not be used to estimate the actual ending account balance or expenses you paid for the period. You may use this information to compare the ongoing costs of investing in the Fund and other funds. To do so, compare this 5% hypothetical example with the 5% hypothetical examples that appear in the shareholder reports of the other funds. The estimate of expenses does not include any fees or other expenses of any variable annuity or variable life insurance product. If they were, the estimate of expenses you paid during the period would be higher, and your ending account value would be lower. In addition, the Fund, as a shareholder in the underlying Fidelity Central Funds, will indirectly bear its pro-rata share of the fees and expenses incurred by the underlying Fidelity Central Funds. These fees and expenses are not included in the Fund's annualized expense ratio used to calculate the expense estimate in the table below.
Please note that the expenses shown in the table are meant to highlight your ongoing costs only and do not reflect any transaction costs. Therefore, the second line of the table is useful in comparing ongoing costs only, and will not help you determine the relative total costs of owning different funds. In addition, if these transactional costs were included, your costs would have been higher.
| Annualized
Expense Ratio B | Beginning
Account Value
July 1, 2013 | Ending
Account Value
December 31, 2013 | Expenses Paid
During Period*
July 1, 2013
to December 31, 2013 |
Initial Class | .63% | | | |
Actual | | $ 1,000.00 | $ 1,177.10 | $ 3.46 |
Hypothetical A | | $ 1,000.00 | $ 1,022.03 | $ 3.21 |
Service Class | .73% | | | |
Actual | | $ 1,000.00 | $ 1,176.60 | $ 4.00 |
Hypothetical A | | $ 1,000.00 | $ 1,021.53 | $ 3.72 |
Service Class 2 | .88% | | | |
Actual | | $ 1,000.00 | $ 1,175.70 | $ 4.83 |
Hypothetical A | | $ 1,000.00 | $ 1,020.77 | $ 4.48 |
Service Class 2R | .88% | | | |
Actual | | $ 1,000.00 | $ 1,175.40 | $ 4.83 |
Hypothetical A | | $ 1,000.00 | $ 1,020.77 | $ 4.48 |
Investor Class | .71% | | | |
Actual | | $ 1,000.00 | $ 1,176.70 | $ 3.90 |
Hypothetical A | | $ 1,000.00 | $ 1,021.63 | $ 3.62 |
A 5% return per year before expenses
B Annualized expense ratio reflects expenses net of applicable fee waivers.
* Expenses are equal to each Class' annualized expense ratio, multiplied by the average account value over the period, multiplied by 184/365 (to reflect the one-half year period).
Annual Report
Investment Changes (Unaudited)
Top Ten Stocks as of December 31, 2013 |
| % of fund's
net assets | % of fund's net assets
6 months ago |
Apple, Inc. | 3.2 | 1.8 |
JPMorgan Chase & Co. | 2.1 | 2.0 |
Procter & Gamble Co. | 2.0 | 2.1 |
Google, Inc. Class A | 1.9 | 1.9 |
Capital One Financial Corp. | 1.8 | 2.0 |
Yahoo!, Inc. | 1.8 | 0.0 |
Microsoft Corp. | 1.7 | 1.7 |
Bank of America Corp. | 1.6 | 1.6 |
The Coca-Cola Co. | 1.5 | 1.7 |
British American Tobacco PLC sponsored ADR | 1.4 | 1.5 |
| 19.0 | |
Market Sectors as of December 31, 2013 |
| % of fund's
net assets | % of fund's net assets
6 months ago |
Information Technology | 18.1 | 17.4 |
Financials | 16.5 | 16.9 |
Health Care | 13.1 | 12.4 |
Consumer Discretionary | 12.1 | 12.2 |
Industrials | 10.6 | 10.2 |
Energy | 9.8 | 9.9 |
Consumer Staples | 9.8 | 10.1 |
Materials | 3.7 | 3.3 |
Utilities | 3.1 | 3.2 |
Telecommunication Services | 1.7 | 2.1 |
Asset Allocation (% of fund's net assets) |
As of December 31, 2013* | As of June 30, 2013** |
 | Stocks and Equity
Futures 99.1% | | | Stocks and Equity
Futures 98.1% | |
 | Bonds 0.0%† | | | Bonds 0.0%† | |
 | Short-Term
Investments and
Net Other Assets (Liabilities) 0.9% | | | Short-Term
Investments and
Net Other Assets (Liabilities) 1.9% | |
* Foreign investments | 12.9% | | ** Foreign investments | 9.9% | |

† Amount represents less than 0.1%
Annual Report
Investments December 31, 2013
Showing Percentage of Net Assets
Common Stocks - 98.3% |
| Shares | | Value |
CONSUMER DISCRETIONARY - 12.1% |
Diversified Consumer Services - 0.4% |
H&R Block, Inc. | 2,656,760 | | $ 77,152,310 |
Hotels, Restaurants & Leisure - 1.9% |
ARAMARK Holdings Corp. (a) | 212,500 | | 5,571,750 |
Domino's Pizza, Inc. | 289,923 | | 20,193,137 |
Extended Stay America, Inc. unit | 1,268,238 | | 33,303,930 |
Wynn Resorts Ltd. | 586,693 | | 113,941,648 |
Yum! Brands, Inc. | 2,389,872 | | 180,698,222 |
| | 353,708,687 |
Internet & Catalog Retail - 0.7% |
Liberty Interactive Corp. Series A (a) | 4,797,679 | | 140,811,879 |
Media - 4.9% |
Comcast Corp. Class A | 762,506 | | 39,623,624 |
DIRECTV (a) | 2,215,295 | | 153,054,732 |
Legend Pictures LLC (a)(f)(g) | 2,062 | | 3,717,786 |
Liberty Global PLC Class A (a) | 542,363 | | 48,264,883 |
The Madison Square Garden Co.
Class A (a) | 337,934 | | 19,458,240 |
The Walt Disney Co. | 2,503,667 | | 191,280,159 |
Time Warner, Inc. | 2,570,067 | | 179,185,071 |
Twenty-First Century Fox, Inc. Class A | 6,333,797 | | 222,822,978 |
Viacom, Inc. Class B (non-vtg.) | 728,752 | | 63,649,200 |
Weinstein Co. Holdings LLC
Class A-1 (a)(f)(g) | 11,499 | | 4,312,125 |
| | 925,368,798 |
Multiline Retail - 1.5% |
Dollar General Corp. (a) | 2,626,220 | | 158,413,590 |
Target Corp. | 1,837,656 | | 116,268,495 |
| | 274,682,085 |
Specialty Retail - 1.6% |
Lowe's Companies, Inc. | 2,746,357 | | 136,081,989 |
TJX Companies, Inc. | 2,630,422 | | 167,636,794 |
| | 303,718,783 |
Textiles, Apparel & Luxury Goods - 1.1% |
Fossil Group, Inc. (a) | 442,606 | | 53,086,164 |
lululemon athletica, Inc. (a) | 975,262 | | 57,569,716 |
Oxford Industries, Inc. | 347,271 | | 28,014,352 |
PVH Corp. | 442,629 | | 60,206,397 |
| | 198,876,629 |
TOTAL CONSUMER DISCRETIONARY | | 2,274,319,171 |
CONSUMER STAPLES - 9.7% |
Beverages - 2.5% |
Anheuser-Busch InBev SA NV | 252,471 | | 26,846,825 |
Coca-Cola Bottling Co. Consolidated | 112,072 | | 8,202,550 |
Coca-Cola Icecek A/S | 328,515 | | 7,910,959 |
Constellation Brands, Inc. Class A
(sub. vtg.) (a) | 126,413 | | 8,896,947 |
|
| Shares | | Value |
Diageo PLC sponsored ADR | 320,642 | | $ 42,459,414 |
Embotelladora Andina SA sponsored ADR | 273,837 | | 7,733,157 |
Pernod Ricard SA | 342,679 | | 39,038,580 |
Remy Cointreau SA | 439,343 | | 36,862,610 |
The Coca-Cola Co. | 6,939,741 | | 286,680,701 |
| | 464,631,743 |
Food & Staples Retailing - 2.0% |
CVS Caremark Corp. | 2,425,815 | | 173,615,580 |
Drogasil SA | 676,600 | | 4,276,846 |
Kroger Co. | 2,951,274 | | 116,663,861 |
Sysco Corp. | 825,077 | | 29,785,280 |
Wal-Mart Stores, Inc. | 731,756 | | 57,581,880 |
| | 381,923,447 |
Food Products - 0.7% |
Bunge Ltd. | 451,712 | | 37,090,072 |
ConAgra Foods, Inc. | 512,600 | | 17,274,620 |
Green Mountain Coffee Roasters, Inc. | 249,119 | | 18,828,414 |
Mead Johnson Nutrition Co. Class A | 575,199 | | 48,178,668 |
Nestle SA | 281,488 | | 20,630,273 |
| | 142,002,047 |
Household Products - 2.0% |
Procter & Gamble Co. | 4,591,884 | | 373,825,276 |
Personal Products - 0.1% |
Nu Skin Enterprises, Inc. Class A | 89,408 | | 12,357,974 |
Tobacco - 2.4% |
Altria Group, Inc. | 3,912,630 | | 150,205,866 |
British American Tobacco PLC sponsored ADR | 2,539,979 | | 272,844,544 |
Philip Morris International, Inc. | 268,176 | | 23,366,175 |
Souza Cruz SA | 910,800 | | 9,391,553 |
| | 455,808,138 |
TOTAL CONSUMER STAPLES | | 1,830,548,625 |
ENERGY - 9.7% |
Energy Equipment & Services - 1.5% |
C&J Energy Services, Inc. (a)(d) | 1,152,539 | | 26,623,651 |
Cameron International Corp. (a) | 1,289,589 | | 76,769,233 |
Dril-Quip, Inc. (a) | 148,484 | | 16,322,846 |
FMC Technologies, Inc. (a) | 915,829 | | 47,815,432 |
Halliburton Co. | 1,577,182 | | 80,041,987 |
Ocean Rig UDW, Inc. (United States) (a) | 663,700 | | 12,776,225 |
Oceaneering International, Inc. | 234,018 | | 18,459,340 |
Pacific Drilling SA (a) | 567,835 | | 6,507,389 |
Vantage Drilling Co. (a) | 6,359,500 | | 11,701,480 |
| | 297,017,583 |
Oil, Gas & Consumable Fuels - 8.2% |
Anadarko Petroleum Corp. | 1,781,821 | | 141,334,042 |
Cabot Oil & Gas Corp. | 1,917,300 | | 74,314,548 |
Carrizo Oil & Gas, Inc. (a) | 111,000 | | 4,969,470 |
Common Stocks - continued |
| Shares | | Value |
ENERGY - continued |
Oil, Gas & Consumable Fuels - continued |
Chevron Corp. | 1,348,500 | | $ 168,441,135 |
Cobalt International Energy, Inc. (a) | 792,062 | | 13,029,420 |
Concho Resources, Inc. (a) | 397,008 | | 42,876,864 |
ConocoPhillips Co. | 2,858,975 | | 201,986,584 |
Continental Resources, Inc. (a) | 398,793 | | 44,872,188 |
EOG Resources, Inc. | 468,287 | | 78,597,290 |
Exxon Mobil Corp. | 2,693,334 | | 272,565,401 |
Forest Oil Corp. (a) | 1,403,600 | | 5,066,996 |
Kinder Morgan Holding Co. LLC | 1,185,500 | | 42,678,000 |
Marathon Oil Corp. | 2,892,518 | | 102,105,885 |
Noble Energy, Inc. | 860,300 | | 58,595,033 |
Peabody Energy Corp. | 1,705,380 | | 33,306,071 |
Phillips 66 Co. | 1,664,639 | | 128,393,606 |
Spectra Energy Corp. | 1,424,200 | | 50,730,004 |
Suncor Energy, Inc. | 1,538,460 | | 53,934,809 |
Valero Energy Partners LP | 739,400 | | 25,472,330 |
| | 1,543,269,676 |
TOTAL ENERGY | | 1,840,287,259 |
FINANCIALS - 16.5% |
Capital Markets - 3.0% |
Ameriprise Financial, Inc. | 806,107 | | 92,742,610 |
BlackRock, Inc. Class A | 310,257 | | 98,187,033 |
Credit Suisse Group AG | 667,378 | | 20,597,540 |
Deutsche Bank AG | 418,072 | | 20,084,776 |
E*TRADE Financial Corp. (a) | 2,403,227 | | 47,199,378 |
Evercore Partners, Inc. Class A | 325,400 | | 19,452,412 |
Invesco Ltd. | 2,241,982 | | 81,608,145 |
Morgan Stanley | 2,202,987 | | 69,085,672 |
Northern Trust Corp. | 456,114 | | 28,228,895 |
Oaktree Capital Group LLC Class A | 556,474 | | 32,742,930 |
The Blackstone Group LP | 1,394,238 | | 43,918,497 |
UBS AG | 355,820 | | 6,813,011 |
| | 560,660,899 |
Commercial Banks - 2.4% |
Barclays PLC | 12,566,977 | | 56,826,397 |
BNP Paribas SA | 318,300 | | 24,806,203 |
Erste Group Bank AG | 551,127 | | 19,204,836 |
Huntington Bancshares, Inc. | 4,272,374 | | 41,228,409 |
KBC Groupe SA | 161,288 | | 9,152,711 |
Mitsubishi UFJ Financial Group, Inc. | 4,030,400 | | 26,759,423 |
Sberbank (Savings Bank of the Russian Federation) sponsored ADR | 740,444 | | 9,314,786 |
Societe Generale Series A | 833,143 | | 48,390,657 |
Synovus Financial Corp. | 6,291,161 | | 22,648,180 |
U.S. Bancorp | 4,815,592 | | 194,549,917 |
| | 452,881,519 |
|
| Shares | | Value |
Consumer Finance - 2.4% |
Capital One Financial Corp. | 4,576,748 | | $ 350,624,664 |
Discover Financial Services | 378,103 | | 21,154,863 |
SLM Corp. | 3,349,176 | | 88,016,345 |
| | 459,795,872 |
Diversified Financial Services - 5.3% |
Bank of America Corp. | 19,426,114 | | 302,464,595 |
Citigroup, Inc. | 4,949,350 | | 257,910,629 |
IntercontinentalExchange Group, Inc. | 164,092 | | 36,907,573 |
JPMorgan Chase & Co. | 6,678,339 | | 390,549,265 |
KBC Ancora (a) | 411,678 | | 14,877,894 |
| | 1,002,709,956 |
Insurance - 1.8% |
ACE Ltd. | 166,551 | | 17,243,025 |
Direct Line Insurance Group PLC | 9,143,100 | | 37,790,729 |
esure Group PLC | 3,261,214 | | 13,490,217 |
Fairfax Financial Holdings Ltd.
(sub. vtg.) | 54,800 | | 21,879,245 |
Marsh & McLennan Companies, Inc. | 1,125,570 | | 54,432,565 |
MetLife, Inc. | 2,557,130 | | 137,880,450 |
The Travelers Companies, Inc. | 514,241 | | 46,559,380 |
Validus Holdings Ltd. | 318,470 | | 12,831,156 |
| | 342,106,767 |
Real Estate Investment Trusts - 0.8% |
American Tower Corp. | 1,045,333 | | 83,438,480 |
Equity Lifestyle Properties, Inc. | 821,224 | | 29,752,946 |
Sun Communities, Inc. | 701,869 | | 29,927,694 |
| | 143,119,120 |
Real Estate Management & Development - 0.7% |
Altisource Residential Corp. Class B | 1,698,082 | | 51,129,249 |
CBRE Group, Inc. (a) | 3,397,725 | | 89,360,168 |
| | 140,489,417 |
Thrifts & Mortgage Finance - 0.1% |
Ocwen Financial Corp. (a) | 238,547 | | 13,227,431 |
TOTAL FINANCIALS | | 3,114,990,981 |
HEALTH CARE - 13.1% |
Biotechnology - 3.4% |
Actelion Ltd. | 323,441 | | 27,320,531 |
Alexion Pharmaceuticals, Inc. (a) | 645,732 | | 85,921,100 |
Amgen, Inc. | 1,381,020 | | 157,657,243 |
Biogen Idec, Inc. (a) | 491,031 | | 137,365,922 |
CSL Ltd. | 296,058 | | 18,229,589 |
Gilead Sciences, Inc. (a) | 2,832,053 | | 212,828,783 |
| | 639,323,168 |
Health Care Equipment & Supplies - 1.8% |
Boston Scientific Corp. (a) | 7,767,908 | | 93,370,254 |
Covidien PLC | 1,531,290 | | 104,280,849 |
Edwards Lifesciences Corp. (a) | 150,808 | | 9,917,134 |
Common Stocks - continued |
| Shares | | Value |
HEALTH CARE - continued |
Health Care Equipment & Supplies - continued |
Quidel Corp. (a)(d) | 698,658 | | $ 21,581,546 |
Stryker Corp. | 702,754 | | 52,804,936 |
The Cooper Companies, Inc. | 475,420 | | 58,876,013 |
| | 340,830,732 |
Health Care Providers & Services - 1.7% |
Brookdale Senior Living, Inc. (a) | 1,013,632 | | 27,550,518 |
Cigna Corp. | 1,352,326 | | 118,301,478 |
HCA Holdings, Inc. | 171,124 | | 8,164,326 |
Henry Schein, Inc. (a) | 564,802 | | 64,534,277 |
McKesson Corp. | 625,600 | | 100,971,840 |
| | 319,522,439 |
Life Sciences Tools & Services - 1.0% |
Fluidigm Corp. (a)(g) | 312,345 | | 11,969,060 |
Illumina, Inc. (a) | 715,457 | | 79,143,853 |
Thermo Fisher Scientific, Inc. | 991,678 | | 110,423,345 |
| | 201,536,258 |
Pharmaceuticals - 5.2% |
AbbVie, Inc. | 2,790,821 | | 147,383,257 |
Actavis PLC (a) | 641,490 | | 107,770,320 |
Bristol-Myers Squibb Co. | 1,684,304 | | 89,520,758 |
Merck & Co., Inc. | 491,438 | | 24,596,472 |
Perrigo Co. PLC | 560,290 | | 85,982,103 |
Pfizer, Inc. | 8,742,698 | | 267,788,840 |
Roche Holding AG (participation certificate) | 90,137 | | 25,180,360 |
Salix Pharmaceuticals Ltd. (a) | 497,731 | | 44,765,926 |
Shire PLC | 1,301,374 | | 61,330,122 |
Valeant Pharmaceuticals International, Inc. (Canada) (a) | 460,981 | | 54,080,915 |
Zoetis, Inc. Class A | 2,139,353 | | 69,935,450 |
| | 978,334,523 |
TOTAL HEALTH CARE | | 2,479,547,120 |
INDUSTRIALS - 10.6% |
Aerospace & Defense - 2.2% |
Honeywell International, Inc. | 1,588,972 | | 145,184,372 |
TransDigm Group, Inc. | 625,063 | | 100,647,644 |
United Technologies Corp. | 1,489,534 | | 169,508,969 |
| | 415,340,985 |
Air Freight & Logistics - 0.6% |
FedEx Corp. | 809,892 | | 116,438,173 |
Building Products - 0.1% |
Allegion PLC (a) | 495,816 | | 21,910,109 |
Commercial Services & Supplies - 0.3% |
KAR Auction Services, Inc. | 1,570,652 | | 46,412,767 |
Electrical Equipment - 3.1% |
AMETEK, Inc. | 3,282,562 | | 172,892,541 |
Eaton Corp. PLC | 1,692,385 | | 128,824,346 |
|
| Shares | | Value |
Hubbell, Inc. Class B | 1,022,354 | | $ 111,334,351 |
Roper Industries, Inc. | 1,270,229 | | 176,155,358 |
| | 589,206,596 |
Industrial Conglomerates - 1.3% |
Danaher Corp. | 3,272,694 | | 252,651,977 |
Machinery - 1.1% |
Cummins, Inc. | 780,513 | | 110,028,918 |
Ingersoll-Rand PLC | 1,487,449 | | 91,626,858 |
| | 201,655,776 |
Professional Services - 0.6% |
Verisk Analytics, Inc. (a) | 1,697,800 | | 111,579,416 |
Road & Rail - 0.7% |
J.B. Hunt Transport Services, Inc. | 1,671,186 | | 129,182,678 |
Trading Companies & Distributors - 0.6% |
W.W. Grainger, Inc. | 437,427 | | 111,727,604 |
TOTAL INDUSTRIALS | | 1,996,106,081 |
INFORMATION TECHNOLOGY - 18.1% |
Communications Equipment - 1.8% |
Cisco Systems, Inc. | 5,451,739 | | 122,391,541 |
Juniper Networks, Inc. (a) | 3,276,585 | | 73,952,523 |
Polycom, Inc. (a) | 1,074,638 | | 12,068,185 |
QUALCOMM, Inc. | 1,752,035 | | 130,088,599 |
| | 338,500,848 |
Computers & Peripherals - 4.0% |
Apple, Inc. | 1,072,677 | | 601,889,783 |
Electronics for Imaging, Inc. (a) | 565,601 | | 21,905,727 |
EMC Corp. | 1,004,010 | | 25,250,852 |
NCR Corp. (a) | 3,182,960 | | 108,411,618 |
| | 757,457,980 |
Electronic Equipment & Components - 0.6% |
Flextronics International Ltd. (a) | 1,840,502 | | 14,300,701 |
TE Connectivity Ltd. | 1,895,849 | | 104,480,238 |
| | 118,780,939 |
Internet Software & Services - 5.3% |
Demand Media, Inc. (a) | 1,192,209 | | 6,879,046 |
Demandware, Inc. (a) | 239,622 | | 15,364,563 |
eBay, Inc. (a) | 2,570,059 | | 141,070,539 |
Endurance International Group Holdings, Inc. | 1,873,164 | | 26,561,466 |
Facebook, Inc. Class A (a) | 480,583 | | 26,268,667 |
Google, Inc. Class A (a) | 319,101 | | 357,619,682 |
Halogen Software, Inc. | 587,400 | | 7,271,650 |
IAC/InterActiveCorp | 95,224 | | 6,540,937 |
Millennial Media, Inc. | 609,164 | | 3,985,760 |
Millennial Media, Inc. | 1,218,329 | | 7,971,527 |
Millennial Media, Inc. | 222,043 | | 2 |
Naver Corp. | 37,181 | | 25,498,149 |
Tencent Holdings Ltd. | 538,700 | | 34,360,422 |
Common Stocks - continued |
| Shares | | Value |
INFORMATION TECHNOLOGY - continued |
Internet Software & Services - continued |
Wix.com Ltd. (a) | 449,803 | | $ 12,077,211 |
Yahoo!, Inc. (a) | 8,223,067 | | 332,540,829 |
| | 1,004,010,450 |
IT Services - 1.0% |
Cognizant Technology Solutions Corp. Class A (a) | 566,154 | | 57,170,231 |
Fidelity National Information Services, Inc. | 1,654,419 | | 88,809,212 |
FleetCor Technologies, Inc. (a) | 103,100 | | 12,080,227 |
Lionbridge Technologies, Inc. (a) | 722,737 | | 4,307,513 |
Luxoft Holding, Inc. | 98,853 | | 3,754,437 |
Visa, Inc. Class A | 48,634 | | 10,829,819 |
| | 176,951,439 |
Semiconductors & Semiconductor Equipment - 0.9% |
Micron Technology, Inc. (a) | 1,029,480 | | 22,401,485 |
NXP Semiconductors NV (a) | 3,125,855 | | 143,570,520 |
| | 165,972,005 |
Software - 4.5% |
Adobe Systems, Inc. (a) | 1,055,103 | | 63,179,568 |
Aspen Technology, Inc. (a) | 383,417 | | 16,026,831 |
Citrix Systems, Inc. (a) | 663,806 | | 41,985,730 |
Concur Technologies, Inc. (a) | 59,400 | | 6,128,892 |
Covisint Corp. | 393,800 | | 4,942,190 |
Electronic Arts, Inc. (a) | 3,897,169 | | 89,401,057 |
Guidewire Software, Inc. (a) | 696,047 | | 34,155,026 |
Jive Software, Inc. (a) | 661,192 | | 7,438,410 |
Microsoft Corp. | 8,641,750 | | 323,460,703 |
Oracle Corp. | 4,096,559 | | 156,734,347 |
QLIK Technologies, Inc. (a) | 187,559 | | 4,994,696 |
salesforce.com, Inc. (a) | 1,211,928 | | 66,886,306 |
Ubisoft Entertainment SA (a) | 1,218,588 | | 17,233,510 |
Xero Ltd. (a) | 45,898 | | 1,219,212 |
Xero Ltd. (g) | 496,188 | | 11,862,450 |
| | 845,648,928 |
TOTAL INFORMATION TECHNOLOGY | | 3,407,322,589 |
MATERIALS - 3.7% |
Chemicals - 3.0% |
Airgas, Inc. | 1,148,520 | | 128,461,962 |
Cabot Corp. | 396,087 | | 20,358,872 |
Eastman Chemical Co. | 744,641 | | 60,092,529 |
FMC Corp. | 801,032 | | 60,445,875 |
LyondellBasell Industries NV Class A | 915,624 | | 73,506,295 |
Monsanto Co. | 881,827 | | 102,776,937 |
Potash Corp. of Saskatchewan, Inc. | 1,119,426 | | 36,904,964 |
|
| Shares | | Value |
Sigma Aldrich Corp. | 509,538 | | $ 47,901,667 |
W.R. Grace & Co. (a) | 271,347 | | 26,828,078 |
| | 557,277,179 |
Construction Materials - 0.3% |
Vulcan Materials Co. | 869,903 | | 51,689,636 |
Containers & Packaging - 0.3% |
Graphic Packaging Holding Co. (a) | 2,518,833 | | 24,180,797 |
Rock-Tenn Co. Class A | 368,014 | | 38,645,150 |
| | 62,825,947 |
Metals & Mining - 0.1% |
Carpenter Technology Corp. | 310,787 | | 19,330,951 |
TOTAL MATERIALS | | 691,123,713 |
TELECOMMUNICATION SERVICES - 1.7% |
Diversified Telecommunication Services - 0.8% |
inContact, Inc. (a) | 1,403,117 | | 10,958,344 |
TW Telecom, Inc. (a) | 10,500 | | 319,935 |
Verizon Communications, Inc. | 2,962,371 | | 145,570,911 |
| | 156,849,190 |
Wireless Telecommunication Services - 0.9% |
SBA Communications Corp. Class A (a) | 1,074,302 | | 96,515,292 |
T-Mobile U.S., Inc. (a) | 1,020,650 | | 34,334,666 |
Vodafone Group PLC sponsored ADR | 741,300 | | 29,140,503 |
| | 159,990,461 |
TOTAL TELECOMMUNICATION SERVICES | | 316,839,651 |
UTILITIES - 3.1% |
Electric Utilities - 1.2% |
American Electric Power Co., Inc. | 1,066,629 | | 49,854,239 |
Duke Energy Corp. | 985,603 | | 68,016,463 |
Edison International | 538,226 | | 24,919,864 |
NextEra Energy, Inc. | 778,600 | | 66,663,732 |
PPL Corp. | 495,600 | | 14,912,604 |
| | 224,366,902 |
Gas Utilities - 0.4% |
National Fuel Gas Co. | 558,475 | | 39,875,115 |
ONEOK, Inc. | 650,241 | | 40,431,985 |
| | 80,307,100 |
Independent Power Producers & Energy Traders - 0.4% |
NRG Energy, Inc. | 1,738,352 | | 49,925,469 |
The AES Corp. | 1,534,604 | | 22,267,104 |
| | 72,192,573 |
Multi-Utilities - 1.1% |
Ameren Corp. | 233,177 | | 8,431,680 |
CenterPoint Energy, Inc. | 2,199,674 | | 50,988,443 |
Dominion Resources, Inc. | 427,331 | | 27,644,042 |
NiSource, Inc. | 799,577 | | 26,290,092 |
Common Stocks - continued |
| Shares | | Value |
UTILITIES - continued |
Multi-Utilities - continued |
PG&E Corp. | 713,434 | | $ 28,737,122 |
Sempra Energy | 779,950 | | 70,008,312 |
| | 212,099,691 |
TOTAL UTILITIES | | 588,966,266 |
TOTAL COMMON STOCKS (Cost $13,674,501,699) |
18,540,051,456
|
Preferred Stocks - 0.1% |
| | | |
Convertible Preferred Stocks - 0.0% |
INFORMATION TECHNOLOGY - 0.0% |
Software - 0.0% |
MongoDB, Inc. Series F, 8.00% (g) | 299,866 | | 4,512,983 |
Nonconvertible Preferred Stocks - 0.1% |
CONSUMER STAPLES - 0.1% |
Beverages - 0.1% |
Ambev SA sponsored ADR | 1,230,950 | | 9,047,483 |
TOTAL PREFERRED STOCKS (Cost $9,394,026) |
13,560,466
|
Convertible Bonds - 0.0% |
| Principal Amount | | |
ENERGY - 0.0% |
Oil, Gas & Consumable Fuels - 0.0% |
Cobalt International Energy, Inc. 2.625% 12/1/19 (Cost $2,044,550) | | $ 2,060,000 | |
1,823,100
|
U.S. Treasury Obligations - 0.1% |
|
U.S. Treasury Bills, yield at date of purchase 0.02% to 0.03% 1/2/14 to 2/27/14 (e)
(Cost $7,339,951) | | 7,340,000 | |
7,339,949
|
Money Market Funds - 1.7% |
| Shares | | Value |
Fidelity Cash Central Fund, 0.11% (b) | 306,922,194 | | $ 306,922,194 |
Fidelity Securities Lending Cash Central Fund, 0.11% (b)(c) | 20,086,025 | | 20,086,025 |
TOTAL MONEY MARKET FUNDS (Cost $327,008,219) |
327,008,219
|
TOTAL INVESTMENT
PORTFOLIO - 100.2% (Cost $14,020,288,445) | 18,889,783,190 |
NET OTHER ASSETS (LIABILITIES) - (0.2)% | | (32,299,804) |
NET ASSETS - 100% | $ 18,857,483,386 |
Futures Contracts |
| Expiration Date | | Underlying Face Amount at Value | | Unrealized Appreciation/(Depreciation) |
Purchased |
Equity Index Contracts |
1,382 CME E-mini S&P 500 Index Contracts (United States) | March 2014 | | $ 127,220,010 | | $ 4,732,983 |
|
The face value of futures purchased as a percentage of net assets is 0.7% |
Legend |
(a) Non-income producing |
(b) Affiliated fund that is generally available only to investment companies and other accounts managed by Fidelity Investments. The rate quoted is the annualized seven-day yield of the fund at period end. A complete unaudited listing of the fund's holdings as of its most recent quarter end is available upon request. In addition, each Fidelity Central Fund's financial statements, which are not covered by the Fund's Report of Independent Registered Public Accounting Firm, are available on the SEC's website or upon request. |
(c) Investment made with cash collateral received from securities on loan. |
(d) Security or a portion of the security is on loan at period end. |
(e) Security or a portion of the security was pledged to cover margin requirements for futures contracts. At period end, the value of securities pledged amounted to $7,339,949. |
(f) Investment is owned by an entity that is treated as a corporation for U.S. tax purposes and is owned by the Fund. |
(g) Restricted securities - Investment in securities not registered under the Securities Act of 1933 (excluding 144A issues). At the end of the period, the value of restricted securities (excluding 144A issues) amounted to $36,374,404 or 0.2% of net assets. |
Additional information on each restricted holding is as follows: |
Security | Acquisition Date | Acquisition Cost |
Fluidigm Corp. | 10/9/07 - 1/6/11 | $ 5,645,236 |
Legend Pictures LLC | 9/23/10 | $ 1,546,500 |
MongoDB, Inc. Series F, 8.00% | 10/2/13 | $ 5,014,998 |
Weinstein Co. Holdings LLC
Class A-1 | 10/19/05 | $ 11,499,000 |
Xero Ltd. | 10/14/13 | $ 7,545,069 |
Affiliated Central Funds |
Information regarding fiscal year to date income earned by the Fund from investments in Fidelity Central Funds is as follows: |
Fund | Income earned |
Fidelity Cash Central Fund | $ 362,779 |
Fidelity Securities Lending Cash Central Fund | 2,072,658 |
| $ 2,435,437 |
Other Affiliated Issuers |
An affiliated company is a company in which the Fund has ownership of at least 5% of the voting securities. Fiscal year to date transactions with companies which are or were affiliates are as follows: |
Affiliate | Value, beginning of period | Purchases | Sales Proceeds | Dividend Income | Value,
end of
period |
Luxoft Holding, Inc. | $ - | $ 5,783,686 | $ 7,509,251 | $ - | $ - |
Other Information |
The following is a summary of the inputs used, as of December 31, 2013, involving the Fund's assets and liabilities carried at fair value. The inputs or methodology used for valuing securities may not be an indication of the risk associated with investing in those securities. For more information on valuation inputs, and their aggregation into the levels used in the table below, please refer to the Investment Valuation section in the accompanying Notes to Financial Statements. |
Valuation Inputs at Reporting Date: |
Description | Total | Level 1 | Level 2 | Level 3 |
Investments in Securities: | | | | |
Equities: | | | | |
Consumer Discretionary | $ 2,274,319,171 | $ 2,266,289,260 | $ - | $ 8,029,911 |
Consumer Staples | 1,839,596,108 | 1,778,450,611 | 61,145,497 | - |
Energy | 1,840,287,259 | 1,840,287,259 | - | - |
Financials | 3,114,990,981 | 2,983,909,834 | 131,081,147 | - |
Health Care | 2,479,547,120 | 2,418,216,998 | 61,330,122 | - |
Industrials | 1,996,106,081 | 1,996,106,081 | - | - |
Information Technology | 3,411,835,572 | 3,383,502,850 | 23,819,737 | 4,512,985 |
Materials | 691,123,713 | 691,123,713 | - | - |
Telecommunication Services | 316,839,651 | 316,839,651 | - | - |
Utilities | 588,966,266 | 588,966,266 | - | - |
Corporate Bonds | 1,823,100 | - | 1,823,100 | - |
U.S. Government and Government Agency Obligations | 7,339,949 | - | 7,339,949 | - |
Money Market Funds | 327,008,219 | 327,008,219 | - | - |
Total Investments in Securities: | $ 18,889,783,190 | $ 18,590,700,742 | $ 286,539,552 | $ 12,542,896 |
Derivative Instruments: | | | | |
Assets | | | | |
Futures Contracts | $ 4,732,983 | $ 4,732,983 | $ - | $ - |
Value of Derivative Instruments |
The following table is a summary of the Fund's value of derivative instruments by primary risk exposure as of December 31, 2013. For additional information on derivative instruments, please refer to the Derivative Instruments section in the accompanying Notes to Financial Statements. |
Primary Risk Exposure /
Derivative Type | Value |
| Asset | Liability |
Equity Risk | | |
Futures Contracts (a) | $ 4,732,983 | $ - |
Total Value of Derivatives | $ 4,732,983 | $ - |
(a) Reflects gross cumulative appreciation (depreciation) on futures contracts as presented in the Schedule of Investments. Only the period end receivable or payable for daily variation margin and net unrealized appreciation (depreciation) are presented in the Statement of Assets and Liabilities. |
Distribution of investments by country or territory of incorporation, as a percentage of total net assets, is as follows (Unaudited): |
United States of America | 87.1% |
Ireland | 3.0% |
United Kingdom | 2.7% |
Netherlands | 1.2% |
Switzerland | 1.1% |
Others (Individually Less Than 1%) | 4.9% |
| 100.0% |
See accompanying notes which are an integral part of the financial statements.
Annual Report
Statement of Assets and Liabilities
| December 31, 2013 |
| | |
Assets | | |
Investment in securities, at value (including securities loaned of $20,025,693) - See accompanying schedule: Unaffiliated issuers (cost $13,693,280,226) | $ 18,562,774,971 | |
Fidelity Central Funds (cost $327,008,219) | 327,008,219 | |
Total Investments (cost $14,020,288,445) | | $ 18,889,783,190 |
Receivable for investments sold | | 53,228,035 |
Receivable for fund shares sold | | 7,233,669 |
Dividends receivable | | 13,094,272 |
Interest receivable | | 4,506 |
Distributions receivable from Fidelity Central Funds | | 32,527 |
Receivable for daily variation margin for derivative instruments | | 526,882 |
Prepaid expenses | | 42,495 |
Other receivables | | 860,403 |
Total assets | | 18,964,805,979 |
| | |
Liabilities | | |
Payable to custodian bank | $ 25 | |
Payable for investments purchased | 54,765,027 | |
Payable for fund shares redeemed | 20,190,433 | |
Accrued management fee | 8,463,047 | |
Distribution and service plan fees payable | 1,866,722 | |
Other affiliated payables | 1,219,447 | |
Other payables and accrued expenses | 731,867 | |
Collateral on securities loaned, at value | 20,086,025 | |
Total liabilities | | 107,322,593 |
| | |
Net Assets | | $ 18,857,483,386 |
Net Assets consist of: | | |
Paid in capital | | $ 14,225,216,432 |
Distributions in excess of net investment income | | (633,692) |
Accumulated undistributed net realized gain (loss) on investments and foreign currency transactions | | (241,327,714) |
Net unrealized appreciation (depreciation) on investments and assets and liabilities in foreign currencies | | 4,874,228,360 |
Net Assets | | $ 18,857,483,386 |
Statement of Assets and Liabilities - continued
| December 31, 2013 |
| | |
Initial Class:
Net Asset Value, offering price and redemption price per share ($7,654,304,862 ÷ 222,829,428 shares) | | $ 34.35 |
| | |
Service Class:
Net Asset Value, offering price and redemption price per share ($1,688,447,952 ÷ 49,318,066 shares) | | $ 34.24 |
| | |
Service Class 2:
Net Asset Value, offering price and redemption price per share ($8,472,779,972 ÷ 250,923,037 shares) | | $ 33.77 |
| | |
Service Class 2R:
Net Asset Value, offering price and redemption price per share ($10,592,318 ÷ 314,267 shares) | | $ 33.70 |
| | |
Investor Class:
Net Asset Value, offering price and redemption price per share ($1,031,358,282 ÷ 30,137,535 shares) | | $ 34.22 |
See accompanying notes which are an integral part of the financial statements.
Annual Report
Financial Statements - continued
Statement of Operations
| Year ended December 31, 2013 |
| | |
Investment Income | | |
Dividends | | $ 290,473,618 |
Interest | | 246,598 |
Income from Fidelity Central Funds | | 2,435,437 |
Total income | | 293,155,653 |
| | |
Expenses | | |
Management fee | $ 96,745,954 | |
Transfer agent fees | 12,737,361 | |
Distribution and service plan fees | 21,764,079 | |
Accounting and security lending fees | 1,614,111 | |
Custodian fees and expenses | 321,259 | |
Independent trustees' compensation | 92,912 | |
Appreciation in deferred trustee compensation account | 73 | |
Audit | 107,613 | |
Legal | 67,476 | |
Miscellaneous | 157,287 | |
Total expenses before reductions | 133,608,125 | |
Expense reductions | (1,895,123) | 131,713,002 |
Net investment income (loss) | | 161,442,651 |
Realized and Unrealized Gain (Loss) Net realized gain (loss) on: | | |
Investment securities: | | |
Unaffiliated issuers | 2,490,518,401 | |
Other affiliated issuers | 3,500,274 | |
Foreign currency transactions | (97,669) | |
Futures contracts | 28,199,755 | |
Total net realized gain (loss) | | 2,522,120,761 |
Change in net unrealized appreciation (depreciation) on: Investment securities | 2,043,316,136 | |
Assets and liabilities in foreign currencies | (24,449) | |
Futures contracts | 4,576,747 | |
Total change in net unrealized appreciation (depreciation) | | 2,047,868,434 |
Net gain (loss) | | 4,569,989,195 |
Net increase (decrease) in net assets resulting from operations | | $ 4,731,431,846 |
Statement of Changes in Net Assets
| Year ended
December 31,
2013 | Year ended
December 31,
2012 |
Increase (Decrease) in Net Assets | | |
Operations | | |
Net investment income (loss) | $ 161,442,651 | $ 184,313,100 |
Net realized gain (loss) | 2,522,120,761 | 635,918,428 |
Change in net unrealized appreciation (depreciation) | 2,047,868,434 | 1,584,493,232 |
Net increase (decrease) in net assets resulting from operations | 4,731,431,846 | 2,404,724,760 |
Distributions to shareholders from net investment income | (163,378,711) | (189,531,129) |
Distributions to shareholders from net realized gain | (4,947,835) | (8,351,979) |
Total distributions | (168,326,546) | (197,883,108) |
Share transactions - net increase (decrease) | (1,968,972,139) | (899,286,819) |
Redemption fees | 359 | 69 |
Total increase (decrease) in net assets | 2,594,133,520 | 1,307,554,902 |
| | |
Net Assets | | |
Beginning of period | 16,263,349,866 | 14,955,794,964 |
End of period (including distributions in excess of net investment income of $633,692 and distributions in excess of net investment income of $587,200, respectively) | $ 18,857,483,386 | $ 16,263,349,866 |
See accompanying notes which are an integral part of the financial statements.
Annual Report
Financial Highlights - Initial Class
Years ended December 31, | 2013 | 2012 | 2011 | 2010 | 2009 |
Selected Per-Share Data | | | | | |
Net asset value, beginning of period | $ 26.44 | $ 23.02 | $ 23.88 | $ 20.62 | $ 15.39 |
Income from Investment Operations | | | | | |
Net investment income (loss) C | .32 | .32 | .25 | .23 | .23 |
Net realized and unrealized gain (loss) | 7.94 | 3.46 | (.86) | 3.31 | 5.26 |
Total from investment operations | 8.26 | 3.78 | (.61) | 3.54 | 5.49 |
Distributions from net investment income | (.34) | (.34) F | (.25) | (.27) | (.25) |
Distributions from net realized gain | (.01) | (.01) F | - | (.01) | (.01) |
Total distributions | (.35) | (.36) J | (.25) | (.28) | (.26) I |
Redemption fees added to paid in capital C,H | - | - | - | - | - |
Net asset value, end of period | $ 34.35 | $ 26.44 | $ 23.02 | $ 23.88 | $ 20.62 |
Total Return A,B | 31.29% | 16.42% | (2.53)% | 17.22% | 35.71% |
Ratios to Average Net Assets D,G | | | | | |
Expenses before reductions | .64% | .64% | .65% | .65% | .67% |
Expenses net of fee waivers, if any | .63% | .64% | .64% | .65% | .67% |
Expenses net of all reductions | .62% | .63% | .63% | .63% | .65% |
Net investment income (loss) | 1.05% | 1.27% | 1.03% | 1.06% | 1.33% |
Supplemental Data | | | | | |
Net assets, end of period (000 omitted) | $ 7,654,305 | $ 6,440,357 | $ 6,113,440 | $ 7,160,125 | $ 7,405,228 |
Portfolio turnover rate E | 86% | 87% | 135% | 117% | 145% |
A Total returns do not reflect charges attributable to your insurance company's separate account. Inclusion of these charges would reduce the total returns shown.
B Total returns would have been lower if certain expenses had not been reduced during the applicable periods shown.
C Calculated based on average shares outstanding during the period.
D Fees and expenses of any underlying Fidelity Central Funds are not included in the Fund's expense ratio. The Fund indirectly bears its proportionate share of the expenses of any underlying Fidelity Central Funds.
E Amount does not include the portfolio activity of any underlying Fidelity Central Funds.
F The amounts shown reflect certain reclassifications related to book to tax differences that were made in the year shown.
G Expense ratios reflect operating expenses of the class. Expenses before reductions do not reflect amounts reimbursed by the investment adviser or reductions from brokerage service arrangements or reductions from other expense offset arrangements and do not represent the amount paid by the class during periods when reimbursements or reductions occur. Expenses net of fee waivers reflect expenses after reimbursement by the investment adviser but prior to reductions from brokerage service arrangements or other expense offset arrangements. Expenses net of all reductions represent the net expenses paid by the class.
H Amount represents less than $.01 per share.
I Total distributions of $.26 per share is comprised of distributions from net investment income of $.250 and distributions from net realized gain of $.005 per share.
J Total distributions of $.36 per share is comprised of distributions from net investment income of $.342 and distributions from net realized gain of $.013 per share.
Financial Highlights - Service Class
Years ended December 31, | 2013 | 2012 | 2011 | 2010 | 2009 |
Selected Per-Share Data | | | | | |
Net asset value, beginning of period | $ 26.36 | $ 22.95 | $ 23.81 | $ 20.55 | $ 15.33 |
Income from Investment Operations | | | | | |
Net investment income (loss) C | .29 | .30 | .22 | .20 | .21 |
Net realized and unrealized gain (loss) | 7.91 | 3.44 | (.85) | 3.31 | 5.25 |
Total from investment operations | 8.20 | 3.74 | (.63) | 3.51 | 5.46 |
Distributions from net investment income | (.31) | (.32) F | (.23) | (.24) | (.23) |
Distributions from net realized gain | (.01) | (.01) F | - | (.01) | (.01) |
Total distributions | (.32) | (.33) | (.23) | (.25) | (.24) I |
Redemption fees added to paid in capital C,H | - | - | - | - | - |
Net asset value, end of period | $ 34.24 | $ 26.36 | $ 22.95 | $ 23.81 | $ 20.55 |
Total Return A,B | 31.14% | 16.31% | (2.64)% | 17.11% | 35.66% |
Ratios to Average Net Assets D,G | | | | | |
Expenses before reductions | .74% | .74% | .75% | .75% | .77% |
Expenses net of fee waivers, if any | .73% | .74% | .74% | .75% | .77% |
Expenses net of all reductions | .72% | .73% | .73% | .73% | .75% |
Net investment income (loss) | .95% | 1.16% | .93% | .96% | 1.23% |
Supplemental Data | | | | | |
Net assets, end of period (000 omitted) | $ 1,688,448 | $ 1,374,781 | $ 1,277,101 | $ 1,379,305 | $ 1,784,820 |
Portfolio turnover rate E | 86% | 87% | 135% | 117% | 145% |
A Total returns do not reflect charges attributable to your insurance company's separate account. Inclusion of these charges would reduce the total returns shown.
B Total returns would have been lower if certain expenses had not been reduced during the applicable periods shown.
C Calculated based on average shares outstanding during the period.
D Fees and expenses of any underlying Fidelity Central Funds are not included in the Fund's expense ratio. The Fund indirectly bears its proportionate share of the expenses of any underlying Fidelity Central Funds.
E Amount does not include the portfolio activity of any underlying Fidelity Central Funds.
F The amounts shown reflect certain reclassifications related to book to tax differences that were made in the year shown.
G Expense ratios reflect operating expenses of the class. Expenses before reductions do not reflect amounts reimbursed by the investment adviser or reductions from brokerage service arrangements or reductions from other expense offset arrangements and do not represent the amount paid by the class during periods when reimbursements or reductions occur. Expenses net of fee waivers reflect expenses after reimbursement by the investment adviser but prior to reductions from brokerage service arrangements or other expense offset arrangements. Expenses net of all reductions represent the net expenses paid by the class.
H Amount represents less than $.01 per share.
I Total distributions of $.24 per share is comprised of distributions from net investment income of $.232 and distributions from net realized gain of $.005 per share.
See accompanying notes which are an integral part of the financial statements.
Annual Report
Financial Highlights - Service Class 2
Years ended December 31, | 2013 | 2012 | 2011 | 2010 | 2009 |
Selected Per-Share Data | | | | | |
Net asset value, beginning of period | $ 26.00 | $ 22.64 | $ 23.49 | $ 20.29 | $ 15.14 |
Income from Investment Operations | | | | | |
Net investment income (loss) C | .24 | .26 | .18 | .17 | .18 |
Net realized and unrealized gain (loss) | 7.80 | 3.39 | (.84) | 3.26 | 5.18 |
Total from investment operations | 8.04 | 3.65 | (.66) | 3.43 | 5.36 |
Distributions from net investment income | (.26) | (.28) F | (.19) | (.22) | (.21) |
Distributions from net realized gain | (.01) | (.01) F | - | (.01) | (.01) |
Total distributions | (.27) | (.29) | (.19) | (.23) | (.21) I |
Redemption fees added to paid in capital C,H | - | - | - | - | - |
Net asset value, end of period | $ 33.77 | $ 26.00 | $ 22.64 | $ 23.49 | $ 20.29 |
Total Return A,B | 30.95% | 16.14% | (2.78)% | 16.93% | 35.47% |
Ratios to Average Net Assets D,G | | | | | |
Expenses before reductions | .89% | .89% | .90% | .90% | .92% |
Expenses net of fee waivers, if any | .88% | .89% | .89% | .90% | .92% |
Expenses net of all reductions | .87% | .88% | .88% | .88% | .90% |
Net investment income (loss) | .80% | 1.02% | .78% | .81% | 1.08% |
Supplemental Data | | | | | |
Net assets, end of period (000 omitted) | $ 8,472,780 | $ 7,740,640 | $ 6,980,191 | $ 7,627,793 | $ 7,577,737 |
Portfolio turnover rate E | 86% | 87% | 135% | 117% | 145% |
A Total returns do not reflect charges attributable to your insurance company's separate account. Inclusion of these charges would reduce the total returns shown.
B Total returns would have been lower if certain expenses had not been reduced during the applicable periods shown.
C Calculated based on average shares outstanding during the period.
D Fees and expenses of any underlying Fidelity Central Funds are not included in the Fund's expense ratio. The Fund indirectly bears its proportionate share of the expenses of any underlying Fidelity Central Funds.
E Amount does not include the portfolio activity of any underlying Fidelity Central Funds.
F The amounts shown reflect certain reclassifications related to book to tax differences that were made in the year shown.
G Expense ratios reflect operating expenses of the class. Expenses before reductions do not reflect amounts reimbursed by the investment adviser or reductions from brokerage service arrangements or reductions from other expense offset arrangements and do not represent the amount paid by the class during periods when reimbursements or reductions occur. Expenses net of fee waivers reflect expenses after reimbursement by the investment adviser but prior to reductions from brokerage service arrangements or other expense offset arrangements. Expenses net of all reductions represent the net expenses paid by the class.
H Amount represents less than $.01 per share.
I Total distributions of $.21 per share is comprised of distributions from net investment income of $.205 and distributions from net realized gain of $.005 per share.
Financial Highlights - Service Class 2R
Years ended December 31, | 2013 | 2012 | 2011 | 2010 | 2009 |
Selected Per-Share Data | | | | | |
Net asset value, beginning of period | $ 25.96 | $ 22.60 | $ 23.44 | $ 20.24 | $ 15.10 |
Income from Investment Operations | | | | | |
Net investment income (loss) C | .24 | .26 | .18 | .17 | .18 |
Net realized and unrealized gain (loss) | 7.77 | 3.39 | (.84) | 3.25 | 5.17 |
Total from investment operations | 8.01 | 3.65 | (.66) | 3.42 | 5.35 |
Distributions from net investment income | (.26) | (.27) F | (.18) | (.21) | (.20) |
Distributions from net realized gain | (.01) | (.01) F | - | (.01) | (.01) |
Total distributions | (.27) | (.29) J | (.18) | (.22) | (.21) I |
Redemption fees added to paid in capital C,H | - | - | - | - | - |
Net asset value, end of period | $ 33.70 | $ 25.96 | $ 22.60 | $ 23.44 | $ 20.24 |
Total Return A,B | 30.90% | 16.15% | (2.79)% | 16.94% | 35.46% |
Ratios to Average Net Assets D,G | | | | | |
Expenses before reductions | .89% | .89% | .90% | .90% | .92% |
Expenses net of fee waivers, if any | .88% | .89% | .89% | .90% | .92% |
Expenses net of all reductions | .87% | .88% | .88% | .88% | .90% |
Net investment income (loss) | .80% | 1.02% | .78% | .81% | 1.08% |
Supplemental Data | | | | | |
Net assets, end of period (000 omitted) | $ 10,592 | $ 8,727 | $ 8,042 | $ 10,942 | $ 13,285 |
Portfolio turnover rate E | 86% | 87% | 135% | 117% | 145% |
A Total returns do not reflect charges attributable to your insurance company's separate account. Inclusion of these charges would reduce the total returns shown.
B Total returns would have been lower if certain expenses had not been reduced during the applicable periods shown.
C Calculated based on average shares outstanding during the period.
D Fees and expenses of any underlying Fidelity Central Funds are not included in the Fund's expense ratio. The Fund indirectly bears its proportionate share of the expenses of any underlying Fidelity Central Funds.
E Amount does not include the portfolio activity of any underlying Fidelity Central Funds.
F The amounts shown reflect certain reclassifications related to book to tax differences that were made in the year shown.
G Expense ratios reflect operating expenses of the class. Expenses before reductions do not reflect amounts reimbursed by the investment adviser or reductions from brokerage service arrangements or reductions from other expense offset arrangements and do not represent the amount paid by the class during periods when reimbursements or reductions occur. Expenses net of fee waivers reflect expenses after reimbursement by the investment adviser but prior to reductions from brokerage service arrangements or other expense offset arrangements. Expenses net of all reductions represent the net expenses paid by the class.
H Amount represents less than $.01 per share.
I Total distributions of $.21 per share is comprised of distributions from net investment income of $.200 and distributions from net realized gain of $.005 per share.
J Total distributions of $.29 per share is comprised of distributions from net investment income of $.274 and distributions from net realized gain of $.013 per share.
See accompanying notes which are an integral part of the financial statements.
Annual Report
Financial Highlights - Investor Class
Years ended December 31, | 2013 | 2012 | 2011 | 2010 | 2009 |
Selected Per-Share Data | | | | | |
Net asset value, beginning of period | $ 26.35 | $ 22.94 | $ 23.80 | $ 20.56 | $ 15.34 |
Income from Investment Operations | | | | | |
Net investment income (loss) C | .29 | .30 | .23 | .21 | .21 |
Net realized and unrealized gain (loss) | 7.91 | 3.45 | (.86) | 3.30 | 5.25 |
Total from investment operations | 8.20 | 3.75 | (.63) | 3.51 | 5.46 |
Distributions from net investment income | (.32) | (.32) F | (.23) | (.26) | (.24) |
Distributions from net realized gain | (.01) | (.01) F | - | (.01) | (.01) |
Total distributions | (.33) | (.34) J | (.23) | (.27) | (.24) I |
Redemption fees added to paid in capital C,H | - | - | - | - | - |
Net asset value, end of period | $ 34.22 | $ 26.35 | $ 22.94 | $ 23.80 | $ 20.56 |
Total Return A,B | 31.15% | 16.34% | (2.62)% | 17.10% | 35.66% |
Ratios to Average Net Assets D,G | | | | | |
Expenses before reductions | .72% | .73% | .73% | .74% | .77% |
Expenses net of fee waivers, if any | .71% | .73% | .73% | .73% | .77% |
Expenses net of all reductions | .71% | .71% | .71% | .72% | .75% |
Net investment income (loss) | .97% | 1.18% | .94% | .98% | 1.23% |
Supplemental Data | | | | | |
Net assets, end of period (000 omitted) | $ 1,031,358 | $ 698,845 | $ 577,021 | $ 570,841 | $ 457,476 |
Portfolio turnover rate E | 86% | 87% | 135% | 117% | 145% |
A Total returns do not reflect charges attributable to your insurance company's separate account. Inclusion of these charges would reduce the total returns shown.
B Total returns would have been lower if certain expenses had not been reduced during the applicable periods shown.
C Calculated based on average shares outstanding during the period.
D Fees and expenses of any underlying Fidelity Central Funds are not included in the Fund's expense ratio. The Fund indirectly bears its proportionate share of the expenses of any underlying Fidelity Central Funds.
E Amount does not include the portfolio activity of any underlying Fidelity Central Funds.
F The amounts shown reflect certain reclassifications related to book to tax differences that were made in the year shown.
G Expense ratios reflect operating expenses of the class. Expenses before reductions do not reflect amounts reimbursed by the investment adviser or reductions from brokerage service arrangements or reductions from other expense offset arrangements and do not represent the amount paid by the class during periods when reimbursements or reductions occur. Expense ratios before reductions for start-up periods may not be representative of longer-term operating periods. Expenses net of fee waivers reflect expenses after reimbursement by the investment adviser but prior to reductions from brokerage service arrangements or other expense offset arrangements. Expenses net of all reductions represent the net expenses paid by the class.
H Amount represents less than $.01 per share.
I Total distributions of $.24 per share is comprised of distributions from net investment income of $.235 and distributions from net realized gain of $.005 per share.
J Total distributions of $.34 per share is comprised of distributions from net investment income of $.322 and distributions from net realized gain of $.013 per share.
See accompanying notes which are an integral part of the financial statements.
Annual Report
Notes to Financial Statements
For the period ended December 31, 2013
1. Organization.
VIP Contrafund Portfolio (the Fund) is a fund of Variable Insurance Products Fund II (the Trust) and is authorized to issue an unlimited number of shares. The Trust is registered under the Investment Company Act of 1940, as amended (the 1940 Act), as an open-end management investment company organized as a Massachusetts business trust. Shares of the Fund may only be purchased by insurance companies for the purpose of funding variable annuity or variable life insurance contracts. The Fund offers the following classes of shares: Initial Class shares, Service Class shares, Service Class 2 shares, Service Class 2R shares and Investor Class shares. All classes have equal rights and voting privileges, except for matters affecting a single class.
2. Investments in Fidelity Central Funds.
The Fund invests in Fidelity Central Funds, which are open-end investment companies generally available only to other investment companies and accounts managed by the investment adviser and its affiliates. The Fund's Schedule of Investments lists each of the Fidelity Central Funds held as of period end, if any, as an investment of the Fund, but does not include the underlying holdings of each Fidelity Central Fund. As an Investing Fund, the Fund indirectly bears its proportionate share of the expenses of the underlying Fidelity Central Funds.
The Money Market Central Funds seek preservation of capital and current income and are managed by Fidelity Investments Money Management, Inc. (FIMM), an affiliate of the investment adviser. Annualized expenses of the Money Market Central Funds as of their most recent shareholder report date are less than .01%.
A complete unaudited list of holdings for each Fidelity Central Fund is available upon request or at the Securities and Exchange Commission (the SEC) website at www.sec.gov. In addition, the financial statements of the Fidelity Central Funds, which are not covered by the Fund's Report of Independent Registered Public Accounting Firm, are available on the SEC website or upon request.
3. Significant Accounting Policies.
The financial statements have been prepared in conformity with accounting principles generally accepted in the United States of America (GAAP), which require management to make certain estimates and assumptions at the date of the financial statements. Actual results could differ from those estimates. Subsequent events, if any, through the date that the financial statements were issued have been evaluated in the preparation of the financial statements. The following summarizes the significant accounting policies of the Fund:
Investment Valuation. Investments are valued as of 4:00 p.m. Eastern time on the last calendar day of the period. In accordance with valuation policies and procedures approved by the Board of Trustees (the Board), the Fund attempts to obtain prices from one or more third party pricing vendors or brokers to value its investments. When current market prices, quotations or currency exchange rates are not readily available or reliable, investments will be fair valued in good faith by the Fidelity Management & Research Company (FMR) Fair Value Committee (the Committee), in accordance with procedures adopted by the Board. Factors used in determining fair value vary by investment type and may include market or investment specific events, changes in interest rates and credit quality. The frequency with which these procedures are used cannot be predicted and they may be utilized to a significant extent. The Committee oversees the Fund's valuation policies and procedures and is responsible for approving and reporting to the Board all fair value determinations.
The Fund categorizes the inputs to valuation techniques used to value its investments into a disclosure hierarchy consisting of three levels as shown below:
Level 1 - quoted prices in active markets for identical investments
Level 2 - other significant observable inputs (including quoted prices for similar investments, interest rates, prepayment speeds, etc.)
Level 3 - unobservable inputs (including the Fund's own assumptions based on the best information available)
Valuation techniques used to value the Fund's investments by major category are as follows:
Equity securities, including restricted securities, for which market quotations are readily available, are valued at the last reported sale price or official closing price as reported by a third party pricing vendor on the primary market or exchange on which they are traded and are categorized as Level 1 in the hierarchy. In the event there were no sales during the day or closing prices are not available, securities are valued at the last quoted bid price or may be valued using the last available price and are generally categorized as Level 2 in the hierarchy. For foreign equity securities, when market or security specific events arise, comparisons to the valuation of American Depositary Receipts (ADRs), futures contracts, Exchange-Traded Funds (ETFs) and certain indexes as well as quoted prices for similar securities may be used and would be categorized as Level 2 in the hierarchy. Utilizing these techniques may result in transfers between Level 1 and Level 2. For equity securities, including restricted securities, where observable inputs are limited, assumptions about market activity and risk are used and these securities may be categorized as Level 3 in the hierarchy.
Annual Report
Notes to Financial Statements - continued
3. Significant Accounting Policies - continued
Investment Valuation - continued
Debt securities, including restricted securities, are valued based on evaluated prices received from third party pricing vendors or from brokers who make markets in such securities. Corporate bonds and U.S. government and government agency obligations, are valued by pricing vendors who utilize matrix pricing which considers yield or price of bonds of comparable quality, coupon, maturity and type or by broker-supplied prices. When independent prices are unavailable or unreliable, debt securities may be valued utilizing pricing methodologies which consider similar factors that would be used by third party pricing vendors. Debt securities are generally categorized as Level 2 in the hierarchy but may be Level 3 depending on the circumstances.
Futures contracts are valued at the settlement price established each day by the board of trade or exchange on which they are traded and are categorized as Level 1 in the hierarchy. Investments in open-end mutual funds, including the Fidelity Central Funds, are valued at their closing net asset value (NAV) each business day and are categorized as Level 1 in the hierarchy.
Changes in valuation techniques may result in transfers in or out of an assigned level within the disclosure hierarchy. The aggregate value of investments by input level, as of December 31, 2013, is included at the end of the Fund's Schedule of Investments.
Foreign Currency. The Fund may use foreign currency contracts to facilitate transactions in foreign-denominated securities. Gains and losses from these transactions may arise from changes in the value of the foreign currency or if the counterparties do not perform under the contracts' terms.
Foreign-denominated assets, including investment securities, and liabilities are translated into U.S. dollars at the exchange rates at period end. Purchases and sales of investment securities, income and dividends received and expenses denominated in foreign currencies are translated into U.S. dollars at the exchange rate in effect on the transaction date.
The effects of exchange rate fluctuations on investments are included with the net realized and unrealized gain (loss) on investment securities. Other foreign currency transactions resulting in realized and unrealized gain (loss) are disclosed separately.
Investment Transactions and Income. For financial reporting purposes, the Fund's investment holdings and NAV include trades executed through the end of the last business day of the period. The NAV per share for processing shareholder transactions is calculated as of the close of business of the New York Stock Exchange (NYSE), normally 4:00 p.m. Eastern time and includes trades executed through the end of the prior business day. Gains and losses on securities sold are determined on the basis of identified cost and may include proceeds received from litigation. Dividend income is recorded on the ex-dividend date, except for certain dividends from foreign securities where the ex-dividend date may have passed, which are recorded as soon as the Fund is informed of the ex-dividend date. Non-cash dividends included in dividend income, if any, are recorded at the fair market value of the securities received. Distributions received on securities that represent a return of capital or capital gain are recorded as a reduction of cost of investments and/or as a realized gain. Subsequent to ex-dividend date the Fund determines the components of these distributions, based upon receipt of tax filings or other correspondence relating to the underlying investment. Interest income and distributions from the Fidelity Central Funds are accrued as earned. Interest income includes coupon interest and amortization of premium and accretion of discount on debt securities. Investment income is recorded net of foreign taxes withheld where recovery of such taxes is uncertain.
Class Allocations and Expenses. Investment income, realized and unrealized capital gains and losses, common expenses of the Fund, and certain fund-level expense reductions, if any, are allocated daily on a pro-rata basis to each class based on the relative net assets of each class to the total net assets of the Fund. Each class differs with respect to transfer agent and distribution and service plan fees incurred. Certain expense reductions may also differ by class. For the reporting period, the allocated portion of income and expenses to each class as a percent of its average net assets may vary due to the timing of recording these transactions in relation to fluctuating net assets of the classes. Expenses directly attributable to a fund are charged to that fund. Expenses attributable to more than one fund are allocated among the respective funds on the basis of relative net assets or other appropriate methods. Expense estimates are accrued in the period to which they relate and adjustments are made when actual amounts are known.
Deferred Trustee Compensation. Under a Deferred Compensation Plan (the Plan), independent Trustees may elect to defer receipt of a portion of their annual compensation. Deferred amounts are invested in a cross-section of Fidelity funds, are marked-to-market and remain in the Fund until distributed in accordance with the Plan. The investment of deferred amounts and the offsetting payable to the Trustees are included in the accompanying Statement of Assets and Liabilities.
Income Tax Information and Distributions to Shareholders. Each year, the Fund intends to qualify as a regulated investment company under Subchapter M of the Internal Revenue Code, including distributing substantially all of its taxable income and realized gains. As a result, no provision for U.S. Federal income taxes is required. As of December 31, 2013, the Fund did not have any unrecognized tax benefits in the financial statements; nor is the Fund aware of any tax positions for which it is reasonably possible that the total amounts of unrecognized tax benefits will significantly change in the next twelve months. The Fund files a U.S. federal tax return, in addition to state and local tax returns as required. The Fund's federal income tax returns are subject to examination by the Internal Revenue Service (IRS) for a period of three fiscal years after they are filed. State and local tax
Annual Report
3. Significant Accounting Policies - continued
Income Tax Information and Distributions to Shareholders - continued
returns may be subject to examination for an additional fiscal year depending on the jurisdiction. Foreign taxes are provided for based on the Fund's understanding of the tax rules and rates that exist in the foreign markets in which it invests.
Distributions are declared and recorded on the ex-dividend date. Income dividends and capital gain distributions are declared separately for each class. Income and capital gain distributions are determined in accordance with income tax regulations, which may differ from GAAP.
Capital accounts within the financial statements are adjusted for permanent book-tax differences. These adjustments have no impact on net assets or the results of operations. Capital accounts are not adjusted for temporary book-tax differences which will reverse in a subsequent period.
Book-tax differences are primarily due to futures contracts, foreign currency transactions, partnerships, passive foreign investment companies (PFIC), deferred trustees compensation, capital loss carryforwards and losses deferred due to wash sales.
The federal tax cost of investment securities and unrealized appreciation (depreciation) as of period end were as follows:
Gross unrealized appreciation | $ 4,896,599,300 |
Gross unrealized depreciation | (81,350,387) |
Net unrealized appreciation (depreciation) on securities and other investments | $ 4,815,248,913 |
| |
Tax Cost | $ 14,074,534,277 |
The tax-based components of distributable earnings as of period end were as follows:
Capital loss carryforward | $ (182,348,903) |
Net unrealized appreciation (depreciation) | $ 4,815,249,544 |
Capital loss carryforwards are only available to offset future capital gains of the Fund to the extent provided by regulations and may be limited. Under the Regulated Investment Company Modernization Act of 2010 (the Act), the Fund is permitted to carry forward capital losses incurred in taxable years beginning after December 22, 2010 for an unlimited period and such capital losses are required to be used prior to any losses that expire. The capital loss carryforward information presented below, including any applicable limitation, is estimated as of fiscal period end and is subject to adjustment.
Fiscal year of expiration | |
2017 | $ (182,348,903) |
The tax character of distributions paid was as follows:
| December 31, 2013 | December 31, 2012 |
Ordinary Income | $ 168,326,546 | $ 197,883,108 |
Trading (Redemption) Fees. Service Class 2R shares held by investors less than 60 days may be subject to a redemption fee equal to 1% of the NAV of shares redeemed. All redemption fees, which reduce the proceeds of the shareholder redemption, are retained by the Fund and accounted for as an addition to paid in capital.
Restricted Securities. The Fund may invest in securities that are subject to legal or contractual restrictions on resale. These securities generally may be resold in transactions exempt from registration or to the public if the securities are registered. Disposal of these securities may involve time-consuming negotiations and expense, and prompt sale at an acceptable price may be difficult. Information regarding restricted securities is included at the end of the Fund's Schedule of Investments.
4. Derivative Instruments.
Risk Exposures and the Use of Derivative Instruments. The Fund's investment objective allows the Fund to enter into various types of derivative contracts, including futures contracts. Derivatives are investments whose value is primarily derived from underlying assets, indices or reference rates and may be transacted on an exchange or over-the-counter (OTC). Derivatives may involve a future commitment to buy or sell a specified asset based on specified terms, to exchange future cash flows at periodic intervals based on a notional principal amount, or for one party to make one or more payments upon the occurrence of specified events in exchange for periodic payments from the other party.
Annual Report
Notes to Financial Statements - continued
4. Derivative Instruments - continued
Risk Exposures and the Use of Derivative Instruments - continued
The Fund used derivatives to increase returns and to manage exposure to certain risks as defined below. The success of any strategy involving derivatives depends on analysis of numerous economic factors, and if the strategies for investment do not work as intended, the Fund may not achieve its objectives.
The Fund's use of derivatives increased or decreased its exposure to the following risk:
Equity Risk | Equity risk relates to the fluctuations in the value of financial instruments as a result of changes in market prices (other than those arising from interest rate risk or foreign exchange risk), whether caused by factors specific to an individual investment, its issuer, or all factors affecting all instruments traded in a market or market segment. |
The Fund is also exposed to additional risks from investing in derivatives, such as liquidity risk and counterparty credit risk. Liquidity risk is the risk that the Fund will be unable to close out the derivative in the open market in a timely manner. Counterparty credit risk is the risk that the counterparty will not be able to fulfill its obligation to the Fund. Counterparty credit risk related to exchange-traded futures contracts may be mitigated by the protection provided by the exchange on which they trade.
Investing in derivatives may involve greater risks than investing in the underlying assets directly and, to varying degrees, may involve risk of loss in excess of any initial investment and collateral received and amounts recognized in the Statement of Assets and Liabilities. In addition, there may be the risk that the change in value of the derivative contract does not correspond to the change in value of the underlying instrument.
Futures Contracts. A futures contract is an agreement between two parties to buy or sell a specified underlying instrument for a fixed price at a specified future date. The Fund used futures contracts to manage its exposure to the stock market.
Upon entering into a futures contract, a fund is required to deposit either cash or securities (initial margin) with a clearing broker in an amount equal to a certain percentage of the face value of the contract. Futures contracts are marked-to-market daily and subsequent daily payments (variation margin) are made or received by a fund depending on the daily fluctuations in the value of the futures contracts and are recorded as unrealized appreciation or (depreciation). This receivable and/or payable, if any, is included in daily variation margin for derivative instruments in the Statement of Assets and Liabilities. Realized gain or (loss) is recorded upon the expiration or closing of a futures contract.
Any open futures contracts at period end are presented in the Schedule of Investments under the caption "Futures Contracts." The underlying face amount at value reflects each contract's exposure to the underlying instrument or index at period end and is representative of volume of activity during the period. Securities deposited to meet initial margin requirements are identified in the Schedule of Investments.
During the period the Fund recognized net realized gain (loss) of $28,199,755 and a change in net unrealized appreciation (depreciation) of $4,576.747 related to its investment in futures contracts. These amounts are included in the Statement of Operations.
5. Purchases and Sales of Investments.
Purchases and sales of securities, other than short-term securities, aggregated $14,809,206,062 and $16,869,340,986, respectively.
6. Fees and Other Transactions with Affiliates.
Management Fee. Fidelity Management & Research Company (the investment adviser) and its affiliates provide the Fund with investment management related services for which the Fund pays a monthly management fee. The management fee is the sum of an individual fund fee rate that is based on an annual rate of .30% of the Fund's average net assets and an annualized group fee rate that averaged .25% during the period. The group fee rate is based upon the average net assets of all the mutual funds advised by the investment adviser, including any mutual funds previously advised by the investment adviser that are currently advised by Fidelity SelectCo, LLC, an affiliate of the investment adviser. The group fee rate decreases as assets under management increase and increases as assets under management decrease. For the reporting period, the total annual management fee rate was .55% of the Fund's average net assets.
Distribution and Service Plan Fees. In accordance with Rule 12b-1 of the 1940 Act, the Fund has adopted separate 12b-1 Plans for each Service Class of shares. Each Service Class pays Fidelity Distributors Corporation (FDC), an affiliate of the investment adviser, a service fee. For the period, the service fee is based on an annual rate of .10% of Service Class' average net assets and .25% of Service Class 2's and Service Class 2R's average net assets.
Annual Report
6. Fees and Other Transactions with Affiliates - continued
Distribution and Service Plan Fees - continued
For the period, total fees, all of which were re-allowed to insurance companies for the distribution of shares and providing shareholder support services were as follows:
Service Class | $ 1,537,731 |
Service Class 2 | 20,201,973 |
Service Class 2 R | 24,375 |
| $ 21,764,079 |
Transfer Agent Fees. Fidelity Investments Institutional Operations Company, Inc. (FIIOC), an affiliate of the investment adviser, is the Fund's transfer, dividend disbursing, and shareholder servicing agent. FIIOC receives an asset-based fee with respect to each class. Each class (with the exception of Investor Class) pays a transfer agent fee, excluding out of pocket expenses, equal to an annual rate of .07% of average net assets. Investor Class pays a monthly asset-based transfer agent fee of .15% of average net assets. In addition, FIIOC receives an asset-based fee of .0035% of average net assets for typesetting, printing and mailing of shareholder reports, except proxy statements. FIIOC voluntarily agreed to reimburse or waive this fee for the period January 1, 2013 through December 31, 2013 (see Expense Reductions note). For the period, transfer agent fees for each class, including printing and out of pocket expenses, were as follows:
Initial Class | $ 4,818,479 |
Service Class | 1,059,125 |
Service Class 2 | 5,556,611 |
Service Class 2R | 6,681 |
Investor Class | 1,296,465 |
| $ 12,737,361 |
Effective February 1, 2014, the Board of Trustees approved an amendment to the transfer agent fee agreement whereby each class (with the exception of Investor Class) pays a single fee of .07% of average net assets for transfer agent services, typesetting, printing and mailing of shareholder reports, excluding mailing of proxy statements and out of pocket expenses. Investor Class pays a single fee of .15% of average net assets.
Accounting and Security Lending Fees. Fidelity Service Company, Inc. (FSC), an affiliate of the investment adviser, maintains the Fund's accounting records. The accounting fee is based on the level of average net assets for each month. Under a separate contract, FSC administers the security lending program. The security lending fee is based on the number and duration of lending transactions.
Brokerage Commissions. The Fund placed a portion of its portfolio transactions with brokerage firms which are affiliates of the investment adviser. Brokerage commissions are included in net realized gain (loss) and change in net unrealized appreciation (depreciation) in the Statement of Operations. The commissions paid to these affiliated firms were $456,680 for the period.
7. Committed Line of Credit.
The Fund participates with other funds managed by the investment adviser or an affiliate in a $4.25 billion credit facility (the "line of credit") to be utilized for temporary or emergency purposes to fund shareholder redemptions or for other short-term liquidity purposes. The Fund has agreed to pay commitment fees on its pro-rata portion of the line of credit, which amounted to $37,049 and is reflected in Miscellaneous expenses on the Statement of Operations. During the period, there were no borrowings on this line of credit.
8. Security Lending.
The Fund lends portfolio securities through a lending agent from time to time in order to earn additional income. For equity securities, a lending agent is used and may loan securities to certain qualified borrowers, including Fidelity Capital Markets (FCM), a broker-dealer affiliated with the Fund. On the settlement date of the loan, the Fund receives collateral (in the form of U.S. Treasury obligations, letters of credit and/or cash) against the loaned securities and maintains collateral in an amount not less than 100% of the market value of the loaned securities during the period of the loan. The market value of the loaned securities is determined at the close of business of the Fund and any additional required collateral is delivered to the Fund on the next business day. If the borrower defaults on its obligation to return the securities loaned because of insolvency or other reasons, the Fund may apply collateral received from the borrower against the obligation. The Fund may experience delays and costs in recovering the securities loaned. Any cash collateral received is invested in the Fidelity Securities Lending Cash Central Fund. The value of loaned securities and cash collateral at period end are disclosed on the Fund's Statement of Assets and Liabilities. At period end, there were no security loans outstanding with FCM. Security lending income represents the income earned on investing cash collateral, less rebates paid to borrowers and any lending agent fees associated with the loan, plus any premium payments received for lending certain types of securities. Security lending income is presented in the Statement of Operations as a component of income from Fidelity Central Funds. Total security lending income during the period amounted to $2,072,658, including $18,334 from securities loaned to FCM.
Annual Report
Notes to Financial Statements - continued
9. Expense Reductions.
The investment adviser or its affiliates agreed to reimburse or waive certain fees during the period as noted in the table below.
Initial Class | $ 274,674 |
Service Class | 60,362 |
Service Class 2 | 316,959 |
Service Class 2R | 383 |
Investor Class | 33,622 |
| $ 686,000 |
Commissions paid to certain brokers with whom the investment adviser, or its affiliates, places trades on behalf of the Fund include an amount in addition to trade execution, which may be rebated back to the Fund to offset certain expenses. This amount totaled $1,209,092 for the period. In addition, through arrangements with the Fund's custodian, credits realized as a result of uninvested cash balances were used to reduce the Fund's expenses. During the period, these credits reduced the Fund's custody expenses by $31.
10. Distributions to Shareholders.
Distributions to shareholders of each class were as follows:
Years ended December 31, | 2013 | 2012 |
From net investment income | | |
Initial Class | $ 74,639,848 | $ 82,580,923 |
Service Class | 15,078,586 | 16,341,913 |
Service Class 2 | 64,224,245 | 82,113,206 |
Service Class 2R | 82,385 | 91,369 |
Investor Class | 9,353,647 | 8,403,718 |
Total | $ 163,378,711 | $ 189,531,129 |
From net realized gain | | |
Initial Class | $ 1,987,452 | $ 3,278,212 |
Service Class | 442,043 | 704,666 |
Service Class 2 | 2,249,098 | 4,008,661 |
Service Class 2R | 2,841 | 4,524 |
Investor Class | 266,401 | 355,916 |
Total | $ 4,947,835 | $ 8,351,979 |
11. Share Transactions.
Transactions for each class of shares were as follows:
| Shares | Dollars |
Years ended December 31, | 2013 | 2012 | 2013 | 2012 |
Initial Class | | | | |
Shares sold | 8,443,448 | 8,108,840 | $ 260,463,356 | $ 207,519,230 |
Reinvestment of distributions | 2,327,682 | 3,281,594 | 76,627,300 | 85,859,135 |
Shares redeemed | (31,488,580) | (33,386,959) | (952,835,862) | (856,012,042) |
Net increase (decrease) | (20,717,450) | (21,996,525) | $ (615,745,206) | $ (562,633,677) |
Service Class | | | | |
Shares sold | 3,357,075 | 4,101,561 | $ 99,734,652 | $ 104,241,858 |
Reinvestment of distributions | 473,046 | 653,535 | 15,520,629 | 17,046,579 |
Shares redeemed | (6,669,302) | (8,246,935) | (202,333,378) | (210,877,762) |
Net increase (decrease) | (2,839,181) | (3,491,839) | $ (87,078,097) | $ (89,589,325) |
Service Class 2 | | | | |
Shares sold | 20,920,336 | 32,699,560 | $ 626,652,763 | $ 807,565,716 |
Reinvestment of distributions | 2,054,182 | 3,346,604 | 66,473,343 | 86,121,867 |
Shares redeemed | (69,773,617) | (46,616,409) | (2,068,437,076) | (1,175,112,838) |
Net increase (decrease) | (46,799,099) | (10,570,245) | $ (1,375,310,970) | $ (281,425,255) |
Service Class 2R | | | | |
Shares sold | 46,981 | 68,230 | $ 1,393,336 | $ 1,645,251 |
Reinvestment of distributions | 2,639 | 3,733 | 85,226 | 95,893 |
Shares redeemed | (71,564) | (91,575) | (2,147,878) | (2,281,001) |
Net increase (decrease) | (21,944) | (19,612) | $ (669,316) | $ (539,857) |
Annual Report
11. Share Transactions - continued
| Shares | Dollars |
Years ended December 31, | 2013 | 2012 | 2013 | 2012 |
Investor Class | | | | |
Shares sold | 4,323,390 | 2,695,333 | $ 130,507,518 | $ 68,539,753 |
Reinvestment of distributions | 293,384 | 335,952 | 9,620,048 | 8,759,634 |
Shares redeemed | (1,000,682) | (1,659,317) | (30,296,116) | (42,398,092) |
Net increase (decrease) | 3,616,092 | 1,371,968 | $ 109,831,450 | $ 34,901,295 |
12. Other.
The Fund's organizational documents provide former and current trustees and officers with a limited indemnification against liabilities arising in connection with the performance of their duties to the Fund. In the normal course of business, the Fund may also enter into contracts that provide general indemnifications. The Fund's maximum exposure under these arrangements is unknown as this would be dependent on future claims that may be made against the Fund. The risk of material loss from such claims is considered remote.
At the end of the period, the investment adviser or its affiliates were the owners of record of 11% of the total outstanding shares of the Fund and two otherwise unaffiliated shareholders were the owners of record of 22% of the total outstanding shares of the Fund.
Annual Report
Report of Independent Registered Public Accounting Firm
To the Trustees of Variable Insurance Products Fund II and Shareholders of VIP Contrafund Portfolio:
We have audited the accompanying statement of assets and liabilities of VIP Contrafund Portfolio (the Fund), a fund of Variable Insurance Products Fund II, including the schedule of investments, as of December 31, 2013, and the related statement of operations for the year then ended, the statement of changes in net assets for each of the two years in the period then ended, and the financial highlights for each of the five years in the period then ended. These financial statements and financial highlights are the responsibility of the Fund's management. Our responsibility is to express an opinion on these financial statements and financial highlights based on our audits.
We conducted our audits in accordance with the standards of the Public Company Accounting Oversight Board (United States). Those standards require that we plan and perform the audit to obtain reasonable assurance about whether the financial statements and financial highlights are free of material misstatement. The Fund is not required to have, nor were we engaged to perform, an audit of its internal control over financial reporting. Our audits included consideration of internal control over financial reporting as a basis for designing audit procedures that are appropriate in the circumstances, but not for the purpose of expressing an opinion on the effectiveness of the Fund's internal control over financial reporting. Accordingly, we express no such opinion. An audit also includes examining, on a test basis, evidence supporting the amounts and disclosures in the financial statements, assessing the accounting principles used and significant estimates made by management, as well as evaluating the overall financial statement presentation. Our procedures included confirmation of securities owned as of December 31, 2013, by correspondence with the custodians and brokers; where replies were not received from brokers, we performed other auditing procedures. We believe that our audits provide a reasonable basis for our opinion.
In our opinion, the financial statements and financial highlights referred to above present fairly, in all material respects, the financial position of VIP Contrafund Portfolio as of December 31, 2013, the results of its operations for the year then ended, the changes in its net assets for each of the two years in the period then ended, and the financial highlights for each of the five years in the period then ended, in conformity with accounting principles generally accepted in the United States of America.
DELOITTE & TOUCHE LLP
Boston, Massachusetts
February 11, 2014
Annual Report
The Trustees, Member of the Advisory Board, and officers of the trust and fund, as applicable, are listed below. The Board of Trustees governs the fund and is responsible for protecting the interests of shareholders. The Trustees are experienced executives who meet periodically throughout the year to oversee the fund's activities, review contractual arrangements with companies that provide services to the fund, oversee management of the risks associated with such activities and contractual arrangements, and review the fund's performance. Except for James C. Curvey, Ned C. Lautenbach, Ronald P. O'Hanley, and William S. Stavropoulos, each of the Trustees oversees 173 funds. Mr. Curvey oversees 396 funds. Mr. Lautenbach, Mr. O'Hanley, and Mr. Stavropoulos each oversees 247 funds.
The Trustees hold office without limit in time except that (a) any Trustee may resign; (b) any Trustee may be removed by written instrument, signed by at least two-thirds of the number of Trustees prior to such removal; (c) any Trustee who requests to be retired or who has become incapacitated by illness or injury may be retired by written instrument signed by a majority of the other Trustees; and (d) any Trustee may be removed at any special meeting of shareholders by a two-thirds vote of the outstanding voting securities of the trust. Each Trustee who is not an interested person (as defined in the 1940 Act) of the trust and the fund (Independent Trustee), shall retire not later than the last day of the calendar year in which his or her 75th birthday occurs. The Independent Trustees may waive this mandatory retirement age policy with respect to individual Trustees. The officers and Advisory Board Member hold office without limit in time, except that any officer and Advisory Board Member may resign or may be removed by a vote of a majority of the Trustees at any regular meeting or any special meeting of the Trustees. Except as indicated, each individual has held the office shown or other offices in the same company for the past five years.
Experience, Skills, Attributes, and Qualifications of the Fund's Trustees. The Governance and Nominating Committee has adopted a statement of policy that describes the experience, qualifications, attributes, and skills that are necessary and desirable for potential Independent Trustee candidates (Statement of Policy). The Board believes that each Trustee satisfied at the time he or she was initially elected or appointed a Trustee, and continues to satisfy, the standards contemplated by the Statement of Policy. The Governance and Nominating Committee also engages professional search firms to help identify potential Independent Trustee candidates who have the experience, qualifications, attributes, and skills consistent with the Statement of Policy. From time to time, additional criteria based on the composition and skills of the current Independent Trustees, as well as experience or skills that may be appropriate in light of future changes to board composition, business conditions, and regulatory or other developments, have also been considered by the professional search firms and the Governance and Nominating Committee. In addition, the Board takes into account the Trustees' commitment and participation in Board and committee meetings, as well as their leadership of standing and ad hoc committees throughout their tenure.
In determining that a particular Trustee was and continues to be qualified to serve as a Trustee, the Board has considered a variety of criteria, none of which, in isolation, was controlling. The Board believes that, collectively, the Trustees have balanced and diverse experience, qualifications, attributes, and skills, which allow the Board to operate effectively in governing the fund and protecting the interests of shareholders. Information about the specific experience, skills, attributes, and qualifications of each Trustee, which in each case led to the Board's conclusion that the Trustee should serve (or continue to serve) as a trustee of the fund, is provided below.
Board Structure and Oversight Function. James C. Curvey is an interested person (as defined in the 1940 Act) and currently serves as Chairman. The Trustees have determined that an interested Chairman is appropriate and benefits shareholders because an interested Chairman has a personal and professional stake in the quality and continuity of services provided to the fund. Independent Trustees exercise their informed business judgment to appoint an individual of their choosing to serve as Chairman, regardless of whether the Trustee happens to be independent or a member of management. The Independent Trustees have determined that they can act independently and effectively without having an Independent Trustee serve as Chairman and that a key structural component for assuring that they are in a position to do so is for the Independent Trustees to constitute a substantial majority for the Board. The Independent Trustees also regularly meet in executive session. Ned C. Lautenbach serves as Chairman of the Independent Trustees and as such (i) acts as a liaison between the Independent Trustees and management with respect to matters important to the Independent Trustees and (ii) with management prepares agendas for Board meetings.
Fidelity funds are overseen by different Boards of Trustees. The fund's Board oversees Fidelity's equity and high income funds and another Board oversees Fidelity's investment-grade bond, money market, and asset allocation funds. The asset allocation funds may invest in Fidelity funds overseen by the fund's Board. The use of separate Boards, each with its own committee structure, allows the Trustees of each group of Fidelity funds to focus on the unique issues of the funds they oversee, including common research, investment, and operational issues. On occasion, the separate Boards establish joint committees to address issues of overlapping consequences for the Fidelity funds overseen by each Board.
The Trustees operate using a system of committees to facilitate the timely and efficient consideration of all matters of importance to the Trustees, the fund, and fund shareholders and to facilitate compliance with legal and regulatory requirements and oversight of the fund's activities and associated risks. The Board, acting through its committees, has charged FMR and its affiliates with (i) identifying events or circumstances the occurrence of which could have demonstrably adverse effects on the fund's business and/or reputation; (ii) implementing processes and controls to lessen the possibility that such events or circumstances occur or to mitigate the effects of such events or circumstances if they do occur; and (iii) creating and maintaining a system designed to evaluate continuously business and market conditions in order to facilitate the identification and implementation processes described in (i) and (ii) above. Because the day-to-day operations and activities of the fund are carried out by or through FMR, its affiliates and other service providers, the fund's exposure to risks is mitigated but not eliminated by the processes overseen by the Trustees. While each of the Board's committees has responsibility for overseeing different aspects of the fund's activities, oversight is exercised primarily through the Operations, Audit, and Compliance Committees. In addition, the Independent Trustees have worked with FMR to enhance the Board's oversight of investment and financial risks, legal and regulatory risks, technology risks, and operational risks, including the development of additional risk reporting to the Board. For example, a working group comprised of Independent Trustees and FMR has worked and continues to work to review the Fidelity funds' valuation-related activities, reporting and risk management. Appropriate personnel, including but not limited to the fund's Chief Compliance Officer (CCO), FMR's internal auditor, the independent accountants, the fund's Treasurer and portfolio management personnel, make periodic reports to the Board's committees, as appropriate, including an annual review of FMR's risk management program for the Fidelity funds. The responsibilities of each standing committee, including their oversight responsibilities, are described further under "Standing Committees of the Fund's Trustees."
Annual Report
The fund's Statement of Additional Information (SAI) includes more information about the Trustees. To request a free copy, call Fidelity at 1-877-208-0098.
Interested Trustees*:
Correspondence intended for each Trustee who is an interested person may be sent to Fidelity Investments, 245 Summer Street, Boston, Massachusetts 02210.
Name, Year of Birth; Principal Occupations and Other Relevant Experience+ |
James C. Curvey (1935) |
Year of Election or Appointment: 2007 Trustee Chairman of the Board of Trustees |
| Mr. Curvey also serves as Trustee of other Fidelity funds. Mr. Curvey is a Director of Fidelity Investments Money Management, Inc. (2009-present), Director of Fidelity Research & Analysis Co. (2009-present) and Director of FMR and FMR Co., Inc. (2007-present). Mr. Curvey is also Vice Chairman (2007-present) and Director of FMR LLC. In addition, Mr. Curvey serves as an Overseer for the Boston Symphony Orchestra and a member of the Trustees of Villanova University. Previously, Mr. Curvey was the Vice Chairman (2006-2007) and Director (2000-2007) of FMR Corp. |
Ronald P. O'Hanley (1957) |
Year of Election or Appointment: 2011 Trustee |
| Mr. O'Hanley also serves as Trustee of other Fidelity funds. He is Director of Fidelity SelectCo, LLC (2013-present), FMR Co., Inc. (2010-present), Director of Fidelity Investments Money Management, Inc. (2010-present), Director of Fidelity Research & Analysis Company (2010-present), President of Fidelity Asset Management and Corporate Services and a Member of Fidelity's Executive Committee (2010-present). Previously, Mr. O'Hanley served as President and Chief Executive Officer of BNY Mellon Asset Management (2007-2010). Mr. O'Hanley also served as Vice Chairman of Bank New York Mellon Corp. and a member of that firm's Executive Committee. Prior to the 2007 merger of The Bank of New York and Mellon Financial Corporation, he was Vice Chairman of Mellon Financial Corporation and President and Chief Executive Officer of Mellon Asset Management. He joined Mellon in February 1997. Mr. O'Hanley currently serves as Chairman of the Boston Public Library Foundation Board of Directors and sits on the Board of Directors of Beth Israel Deaconess Medical Center, the Board of Trustees of the Marine Biological Laboratory and the Advisory Board of the Maxwell School of Citizenship and Public Administration at Syracuse University. Mr. O'Hanley also chairs the Council on Asset Management for the Financial Services Roundtable and is a member of the Board of Directors of Institutional Investor's U.S. Institute. |
* Trustees have been determined to be "Interested Trustees" by virtue of, among other things, their affiliation with the trust or various entities under common control with FMR.
+ The information above includes each Trustee's principal occupation during the last five years and other information relating to the experience, attributes, and skills relevant to each Trustee's qualifications to serve as a Trustee, which led to the conclusion that each Trustee should serve as a Trustee for the fund.
Annual Report
Trustees and Officers - continued
Independent Trustees:
Correspondence intended for each Independent Trustee (that is, the Trustees other than the Interested Trustees) may be sent to Fidelity Investments, P.O. Box 55235, Boston, Massachusetts 02205-5235.
Name, Year of Birth; Principal Occupations and Other Relevant Experience+ |
Dennis J. Dirks (1948) |
Year of Election or Appointment: 2005 Trustee |
| Mr. Dirks also serves as Trustee of other Fidelity funds. Prior to his retirement in May 2003, Mr. Dirks was Chief Operating Officer and a member of the Board of The Depository Trust & Clearing Corporation (DTCC). He also served as President, Chief Operating Officer, and Board member of The Depository Trust Company (DTC) and President and Board member of the National Securities Clearing Corporation (NSCC). In addition, Mr. Dirks served as Chief Executive Officer and Board member of the Government Securities Clearing Corporation, Chief Executive Officer and Board member of the Mortgage-Backed Securities Clearing Corporation, as a Trustee and a member of the Finance Committee of Manhattan College (2005-2008), and as a Trustee and a member of the Finance Committee of AHRC of Nassau County (2006-2008). Mr. Dirks is a member of the Independent Directors Council (IDC) Governing Council (2010-present) and Board of Directors for The Brookville Center for Children's Services, Inc. (2009-present). |
Alan J. Lacy (1953) |
Year of Election or Appointment: 2008 Trustee |
| Mr. Lacy also serves as Trustee of other Fidelity funds. Mr. Lacy serves as Senior Adviser (2007-present) of Oak Hill Capital Partners, L.P. (private equity). Mr. Lacy also served as Chief Executive Officer (2000-2005) and Vice Chairman (2005-2006) of Sears Holdings Corporation and Sears, Roebuck and Co. (retail). In addition, Mr. Lacy serves as a member of the Board of Directors of Dave & Buster's Entertainment, Inc. (restaurant and entertainment complexes, 2010-present), Earth Fare, Inc. (retail grocery, 2012-present), The Hillman Companies, Inc. (hardware wholesalers, 2010-present), and Bristol-Myers Squibb Company (global pharmaceuticals, 2008-present). Mr. Lacy is a member of the Board of Trustees of The National Parks Conservation Association (2006-present). Previously, Mr. Lacy served as Chairman of the Board of Trustees of the National Parks Conservation Association (2008-2011) and as a member of the Board of Directors for the Western Union Company (global money transfer, 2006-2011). |
Ned C. Lautenbach (1944) |
Year of Election or Appointment: 2000 Trustee Chairman of the Independent Trustees |
| Mr. Lautenbach also serves as Trustee of other Fidelity funds. Mr. Lautenbach currently serves as the Lead Director of the Eaton Corporation Board of Directors (diversified industrial, 1997-present). Mr. Lautenbach is Chairman of the Board of Directors of the Philharmonic Center for the Arts in Naples, Florida (2012-present) and a member of the Council on Foreign Relations (1994-present). Previously, Mr. Lautenbach was a Partner/Advisory Partner at Clayton, Dubilier & Rice, LLC (private equity investment, 1998-2010), as well as a Director of Sony Corporation (2006-2007). |
Joseph Mauriello (1944) |
Year of Election or Appointment: 2008 Trustee |
| Mr. Mauriello also serves as Trustee of other Fidelity funds. Prior to his retirement in January 2006, Mr. Mauriello served in numerous senior management positions including Deputy Chairman and Chief Operating Officer (2004-2005), and Vice Chairman of Financial Services (2002-2004) of KPMG LLP US (professional services, 1965-2005). Mr. Mauriello currently serves as a member of the Board of Directors of XL Group plc. (global insurance and re-insurance, 2006-present). Previously, Mr. Mauriello served as a Director of the Hamilton Funds of the Bank of New York (2006-2007) and of Arcadia Resources Inc. (health care services and products, 2007-2012). |
Robert W. Selander (1950) |
Year of Election or Appointment: 2011 Trustee |
| Mr. Selander also serves as Trustee of other Fidelity funds. Previously, Mr. Selander served as a Member of the Advisory Board of other Fidelity funds (2011), and Executive Vice Chairman (2010), Chief Executive Officer (2009-2010), and President and Chief Executive Officer (1997-2009) of Mastercard, Inc. |
Cornelia M. Small (1944) |
Year of Election or Appointment: 2005 Trustee |
| Ms. Small also serves as Trustee of other Fidelity funds. Ms. Small is a member of the Board of Directors (2009-present) and Chair of the Investment Committee (2010-present) of the Teagle Foundation. Ms. Small also serves on the Investment Committee of the Berkshire Taconic Community Foundation (2008-present). Previously, Ms. Small served as Chairperson (2002-2008) and a member of the Investment Committee and Chairperson (2008-2012) and a member of the Board of Trustees of Smith College. In addition, Ms. Small served as Chief Investment Officer, Director of Global Equity Investments, and a member of the Board of Directors of Scudder, Stevens & Clark and Scudder Kemper Investments. |
William S. Stavropoulos (1939) |
Year of Election or Appointment: 2001 Trustee Vice Chairman of the Independent Trustees |
| Mr. Stavropoulos also serves as Trustee of other Fidelity funds. Mr. Stavropoulos serves as President and Founder of the Michigan Baseball Foundation, the Great Lakes Loons (2007-present). Mr. Stavropoulos is Chairman Emeritus of the Board of Directors of The Dow Chemical Company, where he previously served in numerous senior management positions, including President, CEO (1995-2000; 2002-2004), Chairman of the Executive Committee (2000-2006), and as a member of the Board of Directors (1990-2006). Currently, Mr. Stavropoulos is Chairman of the Board of Directors of Univar Inc. (global distributor of commodity and specialty chemicals), a Director of Teradata Corporation (data warehousing and technology solutions), and Maersk Inc. (industrial conglomerate), and a member of the Advisory Board for Metalmark Capital LLC (private equity investment, 2005-present). Mr. Stavropoulos is an operating advisor to Clayton, Dubilier & Rice, LLC (private equity investment). In addition, Mr. Stavropoulos is a member of the University of Notre Dame Advisory Council for the College of Science, a Trustee of the Rollin L. Gerstacker Foundation, and a Director of the Naples Philharmonic Center for the Arts. Previously, Mr. Stavropoulos served as a Director of Chemical Financial Corporation (bank holding company, 1993-2012) and Tyco International, Ltd. (multinational manufacturing and services, 2007-2012). |
David M. Thomas (1949) |
Year of Election or Appointment: 2008 Trustee |
| Mr. Thomas also serves as Trustee of other Fidelity funds. Mr. Thomas serves as Non-Executive Chairman of the Board of Directors of Fortune Brands Home and Security (home and security products, 2011-present), and as a member of the Board of Directors of Interpublic Group of Companies, Inc. (marketing communication, 2004-present). Previously, Mr. Thomas served as Executive Chairman (2005-2006) and Chairman and Chief Executive Officer (2000-2005) of IMS Health, Inc. (pharmaceutical and healthcare information solutions), and a Director of Fortune Brands, Inc. (consumer products, 2000-2011). |
+ The information above includes each Trustee's principal occupation during the last five years and other information relating to the experience, attributes, and skills relevant to each Trustee's qualifications to serve as a Trustee, which led to the conclusion that each Trustee should serve as a Trustee for the fund.
Advisory Board Member and Officers:
Correspondence intended for each officer and Peter S. Lynch may be sent to Fidelity Investments, 245 Summer Street, Boston, Massachusetts 02210. Officers appear below in alphabetical order.
Name, Year of Birth; Principal Occupation |
Peter S. Lynch (1944) |
Year of Election or Appointment: 2003 Member of the Advisory Board |
| Mr. Lynch also serves as Member of the Advisory Board of other Fidelity funds. Mr. Lynch is Vice Chairman and a Director of FMR and FMR Co., Inc. In addition, Mr. Lynch serves as a Trustee of Boston College and as the Chairman of the Inner-City Scholarship Fund. Previously, Mr. Lynch served on the Special Olympics International Board of Directors (1997-2006). |
Elizabeth Paige Baumann (1968) |
Year of Election or Appointment: 2012 Anti-Money Laundering (AML) Officer |
| Ms. Baumann also serves as AML Officer of other funds. She is Chief AML Officer of FMR LLC (2012-present) and is an employee of Fidelity Investments. Previously, Ms. Baumann served as Vice President and Deputy Anti-Money Laundering Officer (2007-2012). |
William C. Coffey (1969) |
Year of Election or Appointment: 2009 Assistant Secretary |
| Mr. Coffey also serves as Assistant Secretary of other funds. He is Senior Vice President and Deputy General Counsel of FMR LLC (2010-present), and is an employee of Fidelity Investments. Previously, Mr. Coffey served as Vice President and Associate General Counsel of FMR LLC (2005-2009). |
Jonathan Davis (1968) |
Year of Election or Appointment: 2010 Assistant Treasurer |
| Mr. Davis also serves as Assistant Treasurer of other funds. Mr. Davis is an employee of Fidelity Investments. Previously, Mr. Davis served as Vice President and Associate General Counsel of FMR LLC (2003-2010). |
Adrien E. Deberghes (1967) |
Year of Election or Appointment: 2008 Deputy Treasurer |
| Mr. Deberghes also serves as an officer of other funds. He is an employee of Fidelity Investments (2008-present). Prior to joining Fidelity Investments, Mr. Deberghes was Senior Vice President of Mutual Fund Administration at State Street Corporation (2007-2008), Senior Director of Mutual Fund Administration at Investors Bank & Trust (2005-2007), and Director of Finance for Dunkin' Brands (2000-2005). |
Stephanie J. Dorsey (1969) |
Year of Election or Appointment: 2010 Assistant Treasurer |
| Ms. Dorsey also serves as an officer of other funds. She is an employee of Fidelity Investments (2008-present) and has served in other fund officer roles. Prior to joining Fidelity Investments, Ms. Dorsey served as Treasurer (2004-2008) of the JPMorgan Mutual Funds and Vice President (2004-2008) of JPMorgan Chase Bank. |
Scott C. Goebel (1968) |
Year of Election or Appointment: 2008 Secretary and Chief Legal Officer (CLO) |
| Mr. Goebel serves as Secretary and CLO of other funds. Mr. Goebel also serves as Secretary of Fidelity Investments Money Management, Inc. (FIMM) (2010-present) and Fidelity Research and Analysis Company (FRAC) (2010-present); General Counsel, Secretary, and Senior Vice President of FMR (2008-present) and FMR Co., Inc. (2008-present); Chief Legal Officer of Fidelity Management & Research (Hong Kong) Limited (2008-present) and Assistant Secretary of Fidelity Management & Research (Japan) Inc. (2008-present), and Fidelity Management & Research (U.K.) Inc. (2008-present). Previously, Mr. Goebel served as Secretary and CLO of other Fidelity funds (2008-2013), Assistant Secretary of FIMM (2008-2010), FRAC (2008-2010), and certain funds (2007-2008); and as Vice President and Secretary of Fidelity Distributors Corporation (FDC) (2005-2007). Mr. Goebel has been employed by FMR LLC or an affiliate since 2001. |
Joseph A. Hanlon (1968) |
Year of Election or Appointment: 2012 Chief Compliance Officer |
| Mr. Hanlon also serves as Chief Compliance Officer of other funds. Mr. Hanlon serves as Compliance Officer of FMR, FMR Co., Inc., Fidelity Investments Money Management, Inc. (FIMM), Fidelity Research and Analysis Company (FRAC), and Fidelity Management & Research (Hong Kong) (2009-present), as Senior Vice President of the Fidelity Asset Management Division (2009-present), and is an employee of Fidelity Investments. Previously, Mr. Hanlon served as Compliance Officer of Fidelity Management & Research (Japan) Inc. (2009-2013), Strategic Advisers, Inc. (2009-2013), and Fidelity Management & Research (U.K.) Inc. (2009-2013). |
Bruce T. Herring (1965) |
Year of Election or Appointment: 2006 Vice President of certain Equity Funds |
| Mr. Herring also serves as Vice President of other funds. He serves as Chief Investment Officer of Fidelity Global Asset Allocation (GAA) (2013-present), Group Chief Investment Officer of FMR, and President of Fidelity Research & Analysis Company (2010-present). Previously, Mr. Herring served as Chief Investment Officer and Director of Fidelity Management & Research (U.K.) Inc. (2010-2013), Vice President (2005-2006) and Senior Vice President (2006-2007) of Fidelity Management & Research Company, Vice President of FMR Co., Inc. (2001-2007), and as a portfolio manager for Fidelity U.S. Equity Funds. |
Brian B. Hogan (1964) |
Year of Election or Appointment: 2009 Vice President |
| Mr. Hogan also serves as Vice President of other funds. Mr. Hogan serves as President of FMR's Equity Division (2009-present). Previously, Mr. Hogan served as Senior Vice President, Equity Research of FMR (2006-2009) and as a portfolio manager. |
Chris Maher (1972) |
Year of Election or Appointment: 2013 Assistant Treasurer |
| Mr. Maher serves as Assistant Treasurer of other funds. Mr. Maher is Vice President of Valuation Oversight and is an employee of Fidelity Investments. Previously, Mr. Maher served as Vice President of Asset Management Compliance (2013), Vice President of FMR's Program Management Group (2010-2013), and Vice President of Valuation Oversight (2008-2010). |
Christine Reynolds (1958) |
Year of Election or Appointment: 2008 Chief Financial Officer |
| Ms. Reynolds also serves as Chief Financial Officer of other funds. Ms. Reynolds became President of Fidelity Pricing and Cash Management Services (FPCMS) in August 2008. Ms. Reynolds served as Chief Operating Officer of FPCMS (2007-2008). Previously, Ms. Reynolds served as President, Treasurer, and Anti-Money Laundering officer of the Fidelity funds (2004-2007). |
Kenneth B. Robins (1969) |
Year of Election or Appointment: 2008 President and Treasurer |
| Mr. Robins also serves as an officer of other funds. Mr. Robins serves as Executive Vice President of Fidelity Investments Money Management, Inc. (FIMM) (2013-present) and is an employee of Fidelity Investments (2004-present). Previously, Mr. Robins served in other fund officer roles. |
Gary W. Ryan (1958) |
Year of Election or Appointment: 2005 Assistant Treasurer |
| Mr. Ryan also serves as Assistant Treasurer of other funds. Mr. Ryan is an employee of Fidelity Investments and has served in other fund officer roles. Previously, Mr. Ryan served as Vice President of Fund Reporting in Fidelity Pricing and Cash Management Services (FPCMS) (1999-2005). |
Stephen Sadoski (1971) |
Year of Election or Appointment: 2012 Deputy Treasurer |
| Mr. Sadoski also serves as Deputy Treasurer of other funds. He is an employee of Fidelity Investments (2012-present) and has served in another fund officer role. Prior to joining Fidelity Investments, Mr. Sadoski served as an assistant chief accountant in the Division of Investment Management of the Securities and Exchange Commission (SEC) (2009-2012) and as a senior manager at Deloitte & Touche LLP (1997-2009). |
Stacie M. Smith (1974) |
Year of Election or Appointment: 2013 Deputy Treasurer |
| Ms. Smith also serves as an officer of other funds. She is an employee of Fidelity Investments (2009-present) and has served in other fund officer roles. Prior to joining Fidelity Investments, Ms. Smith served as Senior Audit Manager of Ernst & Young LLP (1996-2009). |
Renee Stagnone (1975) |
Year of Election or Appointment: 2013 Deputy Treasurer |
| Ms. Stagnone also serves as Deputy Treasurer of other funds. Ms. Stagnone is an employee of Fidelity Investments. |
Joseph F. Zambello (1957) |
Year of Election or Appointment: 2011 Deputy Treasurer |
| Mr. Zambello also serves as Deputy Treasurer of other funds. Mr. Zambello is an employee of Fidelity Investments. Previously, Mr. Zambello served as Vice President of FMR's Program Management Group (2009-2011) and Vice President of the Transfer Agent Oversight Group (2005-2009). |
Annual Report
Service Class 2R designates 100% of the dividends distributed during the fiscal year as qualifying for the dividends-received deduction for corporate shareholders.
Annual Report
Board Approval of Investment Advisory Contracts and Management Fees
VIP Contrafund Portfolio
Each year, the Board of Trustees, including the Independent Trustees (together, the Board), votes on the renewal of the management contract and sub-advisory agreements (together, the Advisory Contracts) for the fund. The Board, assisted by the advice of fund counsel and Independent Trustees' counsel, requests and considers a broad range of information relevant to the renewal of the Advisory Contracts throughout the year.
The Board meets regularly and, at each of its meetings, covers an extensive agenda of topics and materials and considers factors that are relevant to its annual consideration of the renewal of the fund's Advisory Contracts, including the services and support provided to the fund and its shareholders. The Board has established various standing committees, each composed of and chaired by Independent Trustees with varying backgrounds, to which the Board has assigned specific subject matter responsibilities in order to enhance effective decision-making by the Board. The Board, acting directly and through its Committees, requests and receives information concerning the annual consideration of the renewal of the fund's Advisory Contracts. The Board also meets as needed to consider matters specifically related to the Board's annual consideration of the renewal of Advisory Contracts. Members of the Board may also meet with trustees of other Fidelity funds through ad hoc joint committees to discuss certain matters relevant to the Fidelity funds.
At its July 2013 meeting, the Board, including the Independent Trustees, unanimously determined to renew the fund's Advisory Contracts. In reaching its determination, the Board considered all factors it believed relevant, including (i) the nature, extent, and quality of the services to be provided to the fund and its shareholders (including the investment performance of the fund); (ii) the competitiveness of the fund's management fee and total expense ratio relative to peer funds; (iii) the total costs of the services to be provided by and the profits to be realized by Fidelity from its relationship with the fund; (iv) the extent to which economies of scale exist and would be realized as the fund grows; and (v) whether fee levels reflect these economies of scale, if any, for the benefit of fund shareholders.
In considering whether to renew the Advisory Contracts for the fund, the Board reached a determination, with the assistance of fund counsel and Independent Trustees' counsel and through the exercise of its business judgment, that the renewal of the Advisory Contracts was in the best interests of the fund and its shareholders and that the compensation payable under the Advisory Contracts was fair and reasonable. The Board's decision to renew the Advisory Contracts was not based on any single factor, but rather was based on a comprehensive consideration of all the information provided to the Board at its meetings throughout the year. The Board, in reaching its determination to renew the Advisory Contracts, was aware that shareholders in the fund have a broad range of investment choices available to them, including a wide choice among mutual funds offered by Fidelity's competitors, and that the fund's shareholders, who have the opportunity to review and weigh the disclosure provided by the fund in its prospectus and other public disclosures, have chosen to invest in this fund, which is a part of the Fidelity family of funds.
Nature, Extent, and Quality of Services Provided. The Board considered the staffing within the investment adviser, Fidelity Management & Research Company (FMR), and the sub-advisers (together, the Investment Advisers) as it relates to the fund, including the backgrounds of the fund's investment personnel, and also considered the fund's investment objective, strategies, and related investment philosophy. The Independent Trustees also had discussions with senior management of Fidelity's investment operations and investment groups. The Board considered the structure of the portfolio manager compensation program and whether this structure provides appropriate incentives to act in the best interests of the fund.
Resources Dedicated to Investment Management and Support Services. The Board and the Fund Oversight and Research Committees reviewed the general qualifications and capabilities of the Investment Advisers' investment staff, including its size, education, experience, and resources, as well as the Investment Advisers' approach to recruiting, training, managing, and compensating investment personnel. The Board noted that FMR has continued to increase the resources devoted to non-U.S. offices, including expansion of Fidelity's global investment organization. The Board also noted that Fidelity's analysts have extensive resources, tools and capabilities that allow them to conduct sophisticated quantitative and fundamental analysis, as well as credit analysis of issuers, counterparties and guarantors. Further, the Board believes that Fidelity's investment professionals have sufficient access to global information and data so as to provide competitive investment results over time, and that those professionals also have access to sophisticated tools that permit them to assess portfolio construction and risk and performance attribution characteristics continuously, as well as to transmit new information and research conclusions rapidly around the world. Additionally, in its deliberations, the Board considered the Investment Advisers' trading and risk management capabilities and resources, which are an integral part of the investment management process.
Shareholder and Administrative Services. The Board considered (i) the nature, extent, quality, and cost of advisory, administrative, and shareholder services performed by the Investment Advisers and their affiliates under the Advisory Contracts and under separate agreements covering transfer agency, pricing and bookkeeping, and securities lending services for the fund; (ii) the nature and extent of the supervision of third party service providers, principally custodians and subcustodians; and (iii) the resources devoted to, and the record of compliance with, the fund's compliance policies and procedures. The Board also reviewed the allocation of fund brokerage, including allocations to brokers affiliated with the Investment Advisers, the use of brokerage commissions to pay fund expenses, and the use of "soft" commission dollars to pay for research services.
The Board noted that the growth of fund assets over time across the complex allows Fidelity to reinvest in the development of services designed to enhance the value or convenience of the Fidelity funds as investment vehicles. These services include 24-hour access to account information and market information through telephone representatives and over the Internet, investor education materials and asset allocation tools, and the expanded availability of Fidelity Investor Centers.
Annual Report
Investment in a Large Fund Family. The Board considered the benefits to shareholders of investing in a Fidelity fund, including the benefits of investing in a fund that is part of a large family of funds offering a variety of investment disciplines and providing a large variety of mutual fund investor services. The Board noted that Fidelity had taken, or had made recommendations that resulted in the Fidelity funds taking, a number of actions over the previous year that benefited particular funds, including (i) continuing to dedicate additional resources to investment research and to the support of the senior management team that oversees asset management; (ii) persisting in efforts to enhance Fidelity's global research capabilities; (iii) launching new funds and making other enhancements to meet client needs for global and income-oriented solutions; (iv) continuing to launch dedicated lower cost underlying funds to meet portfolio construction needs related to expanding underlying fund options for Fidelity funds of funds, specifically for the Freedom Fund product lines; (v) rationalizing product lines and gaining increased efficiencies through the mergers of several funds into other funds; (vi) strengthening Fidelity's index fund offerings by reducing investment minimums and adopting or lowering existing expense caps for certain funds and classes; (vii) enhancing Global Asset Allocation product offerings by launching new funds and strategies, including "open architecture" target date funds that utilize affiliated and unaffiliated sub-advisers; (viii) modifying the eligibility criteria for Institutional Class shares of Advisor funds to increase their marketability to a portion of the defined contribution plan market; (ix) creating a new low-cost retirement share class for certain Advisor funds to appeal to large retirement plans; (x) transitioning the management of certain Fidelity commodity funds to Geode Capital Management LLC, a registered commodity pool operator, while retaining administrative responsibilities for the funds; (xi) reorganizing a number of funds; and (xii) taking steps toward establishing a new Fidelity adviser to manage sector-based funds and products.
Investment Performance. The Board considered whether the fund has operated in accordance with its investment objective, as well as its record of compliance with its investment restrictions and its performance history. The Board noted that there was a portfolio management change for a sleeve of the fund in March 2011, April 2013, and June 2013.
The Board took into account discussions with the Investment Advisers about fund investment performance that occur at Board meetings throughout the year. In this regard the Board noted that as part of regularly scheduled fund reviews and other reports to the Board on fund performance, the Board periodically considers annualized return information for the fund, for different time periods, measured against a securities market index ("benchmark index") and a peer group of mutual funds with similar objectives ("peer group"). In its evaluation of fund investment performance, the Board gave particular attention to information indicating changes in performance of certain Fidelity funds for specific time periods and the Investment Advisers' explanations for any overperformance or, in the case of the fund, underperformance.
In addition to reviewing absolute and relative fund performance, the Independent Trustees periodically consider the appropriateness of fund performance metrics in evaluating the results achieved. In general, the Independent Trustees believe that fund performance should be evaluated based on net performance (after fees and expenses) of both the highest performing and lowest performing classes, where applicable, compared to appropriate benchmark indices, over appropriate time periods which may include full market cycles, and compared to peer groups, as applicable, over the same periods, taking into account relevant factors including the following: general market conditions; issuer-specific information; tactical opportunities for investment; and fund cash flows and other factors.
The Independent Trustees recognize that shareholders evaluate performance on a net basis over their own holding periods, for which one-, three-, and five-year periods are used as a proxy. For this reason, the performance information reviewed by the Board also included net cumulative calendar year total return information for the fund and an appropriate benchmark index and peer group for the most recent one-, three-, and five-year periods, as shown below. Returns are shown compared to the 25th percentile (top of box) and 75th percentile (bottom of box) of the peer universe.
Annual Report
Board Approval of Investment Advisory Contracts and Management Fees - continued
VIP Contrafund Portfolio

The Board has discussed the fund's performance with FMR, including the fund's underperformance based on more recent periods ended after 2012 (which periods are not shown in the chart above) but prior to the date of the Board's approval of the renewal of the Advisory Contracts, and has engaged with FMR to consider what steps might be taken to remediate the fund's more recent underperformance.
Based on its review, the Board concluded that the nature, extent, and quality of services provided to the fund under the Advisory Contracts should benefit the fund's shareholders.
Competitiveness of Management Fee and Total Expense Ratio. The Board considered the fund's management fee and total expense ratio compared to "mapped groups" of competitive funds and classes. Fidelity creates "mapped groups" by combining similar Lipper investment objective categories that have comparable management fee characteristics. Combining Lipper investment objective categories aids the Board's management fee and total expense ratio comparisons by broadening the competitive group used for comparison and by reducing the number of universes to which various Fidelity funds are compared.
Management Fee. The Board considered two proprietary management fee comparisons for the 12-month periods shown in the chart below. The group of Lipper funds used by the Board for management fee comparisons is referred to below as the "Total Mapped Group." The Total Mapped Group comparison focuses on a fund's standing in terms of gross management fees before expense reimbursements or caps relative to the total universe of funds with comparable investment mandates, regardless of whether their management fee structures also are comparable. Funds with comparable investment mandates offer exposure to similar types of securities. Funds with comparable management fee structures have similar management fee contractual arrangements (e.g., flat rate charged for advisory services, all-inclusive fee rate, etc.). "TMG %" represents the percentage of funds in the Total Mapped Group that had management fees that were lower than the fund's. For example, a TMG % of 10% means that 90% of the funds in the Total Mapped Group had higher management fees than the fund. The "Asset-Size Peer Group" (ASPG) comparison focuses on a fund's standing relative to a subset of non-Fidelity funds within the Total Mapped Group that are similar in size and management fee structure. The ASPG represents at least 15% of the funds in the Total Mapped Group with comparable asset size and management fee structures, subject to a minimum of 50 funds (or all funds in the Total Mapped Group if fewer than 50). Additional information, such as the ASPG quartile in which the fund's management fee ranked, is also included in the chart and considered by the Board.
Annual Report
VIP Contrafund Portfolio

The Board noted that the fund's management fee ranked below the median of its Total Mapped Group and below the median of its ASPG for 2012.
Based on its review, the Board concluded that the fund's management fee is fair and reasonable in light of the services that the fund receives and the other factors considered.
Total Expense Ratio. In its review of each class's total expense ratio, the Board considered the fund's management fee as well as other fund or class expenses, as applicable, such as transfer agent fees, pricing and bookkeeping fees, fund-paid 12b-1 fees, and custodial, legal, and audit fees. The Board also noted the effects of any waivers and reimbursements on fees and expenses. As part of its review, the Board also considered the current and historical total expense ratios of each class of the fund compared to competitive fund median expenses. Each class of the fund is compared to those funds and classes in the Total Mapped Group (used by the Board for management fee comparisons) that have a similar sales load structure.
The Board noted that the total expense ratio of each class ranked below its competitive median for 2012.
Fees Charged to Other Fidelity Clients. The Board also considered Fidelity fee structures and other information with respect to clients of FMR and its affiliates, such as other mutual funds advised or subadvised by FMR or its affiliates, pension plan clients, and other institutional clients. The Board noted the findings of the 2013 ad hoc joint committee (created with the board of other Fidelity funds), which reviewed and compared Fidelity's institutional investment advisory business with its business of providing services to the Fidelity funds, including the differences in services provided, fees charged, and costs incurred, as well as competition in their respective marketplaces.
Based on its review of total expense ratios and fees charged to other Fidelity clients, the Board concluded that the total expense ratio of each class of the fund was reasonable in light of the services that the fund and its shareholders receive and the other factors considered.
Costs of the Services and Profitability. The Board considered the revenues earned and the expenses incurred by Fidelity in conducting the business of developing, marketing, distributing, managing, administering and servicing the fund and servicing the fund's shareholders. The Board also considered the level of Fidelity's profits in respect of all the Fidelity funds.
On an annual basis, FMR presents to the Board Fidelity's profitability for the fund. Fidelity calculates the profitability for each fund, as well as aggregate profitability for groups of Fidelity funds and all Fidelity funds, using a series of detailed revenue and cost allocation methodologies which originate with the books and records of Fidelity on which Fidelity's audited financial statements are based. The Audit Committee of the Board reviews any significant changes from the prior year's methodologies.
PricewaterhouseCoopers LLP (PwC), independent registered public accounting firm and auditor to Fidelity and certain Fidelity funds, has been engaged annually by the Board as part of the Board's assessment of Fidelity's profitability analysis. PwC's engagement includes the review and assessment of the methodologies used by Fidelity in determining the revenues and expenses attributable to Fidelity's mutual fund business, and completion of agreed-upon procedures surrounding the mathematical accuracy of fund profitability and its conformity to allocation methodologies. After considering PwC's reports issued under the engagement and information provided by Fidelity, the Board concluded that while other allocation methods may also be reasonable, Fidelity's profitability methodologies are reasonable in all material respects.
Annual Report
Board Approval of Investment Advisory Contracts and Management Fees - continued
The Board also reviewed Fidelity's non-fund businesses and fall-out benefits related to the mutual fund business as well as cases where Fidelity's affiliates may benefit from or be related to the fund's business.
The Board considered the costs of the services provided by and the profits realized by Fidelity in connection with the operation of the fund and was satisfied that the profitability was not excessive in the circumstances.
Economies of Scale. The Board considered whether there have been economies of scale in respect of the management of the Fidelity funds, whether the Fidelity funds (including the fund) have appropriately benefited from any such economies of scale, and whether there is potential for realization of any further economies of scale. The Board considered the extent to which the fund will benefit from economies of scale through increased services to the fund, through waivers or reimbursements, or through fee or expense reductions. The Board also noted that in 2009, it and the board of other Fidelity funds created an ad hoc committee (the Economies of Scale Committee) to analyze whether FMR attains economies of scale in respect of the management and servicing of the Fidelity funds, whether the Fidelity funds have appropriately benefited from such economies of scale, and whether there is potential for realization of any further economies of scale.
The Board recognized that the fund's management contract incorporates a "group fee" structure, which provides for lower group fee rates as total fund assets under FMR's management increase, and for higher group fee rates as total fund assets under FMR's management decrease. FMR calculates the group fee rates based on a tiered asset "breakpoint" schedule that varies based on asset class. The Board considered that the group fee is designed to deliver the benefits of economies of scale to fund shareholders when total Fidelity fund assets increase, even if assets of any particular fund are unchanged or have declined, because some portion of Fidelity's costs are attributable to services provided to all Fidelity funds, and all funds benefit if those costs can be allocated among more assets. The Board concluded that, given the group fee structure, fund shareholders will benefit from lower management fees as assets under FMR's management increase at the fund complex level, regardless of whether Fidelity achieves any such economies of scale.
The Board concluded, taking into account the analysis of the Economies of Scale Committee, that economies of scale, if any, are being appropriately shared between fund shareholders and Fidelity.
Amendment to Description of Group Fee Rate. At its July 2013 meeting, the Board voted to approve an amendment to the fund's management contract to modify the description of the "group fee rate" effective August 1, 2013. The Board noted that under the prior description in the contract, the group fee rate was based on the average net assets of all registered investment companies with which FMR has management contracts. Under the contract's tiered asset breakpoint schedule, the group fee rate is lower as total fund assets under FMR's management increase, and higher as total fund assets under FMR's management decrease. The Board considered that the prior description would have excluded the assets of 64 Fidelity sector funds from the group fee rate calculation once Fidelity SelectCo, LLC, an affiliate of FMR, assumed management responsibilities for those funds. The Board noted that modifying the description of the group fee rate to continue to include the assets of those 64 funds for purposes of determining group fee rate breakpoints would avoid an immediate adverse impact on the group fee rate for any fund.
Additional Information Requested by the Board. In order to develop fully the factual basis for consideration of the Fidelity funds' Advisory Contracts, the Board requested and received additional information on certain topics, including: (i) fund performance trends and Fidelity's long-term strategies for certain funds; (ii) the potential to further rationalize the Fidelity fund lineup with the possibility of achieving savings for the funds and Fidelity; (iii) the methodology with respect to competitive fund data and peer group classifications; (iv) the arrangements with, and performance of, certain sub-advisers on behalf of the Fidelity funds, as well as certain proposed participating affiliate arrangements; (v) the realization of fall-out benefits in certain Fidelity business units; (vi) Fidelity's group fee structures, including the rationale for the individual fee rates of certain categories of funds and the definition of group assets; (vii) trends regarding industry use of performance fee structures and the performance adjustment methodologies applicable to the Fidelity funds; (viii) additional competitive analysis regarding the total expenses for certain classes; and (ix) fund profitability methodology, including Fidelity's cost allocation methodology, and the impact of certain factors on fund profitability results.
Based on its evaluation of all of the conclusions noted above, and after considering all factors it believed relevant, the Board ultimately concluded that the advisory fee structures are fair and reasonable, and that the fund's Advisory Contracts should be renewed.
Annual Report
Investment Adviser
Fidelity Management & Research Company
Boston, MA
Investment Sub-Advisers
FMR Co., Inc.
Fidelity Management & Research (U.K.) Inc.
Fidelity Management & Research (Hong Kong) Limited
Fidelity Management & Research (Japan) Inc.
General Distributor
Fidelity Distributors Corporation
Smithfield, RI
Transfer and Servicing Agents
Fidelity Investments Institutional Operations Company, Inc.
Boston, MA
Fidelity Service Company, Inc.
Boston, MA
Custodian
Brown Brothers Harriman & Co.
Boston, MA
VIPCONR-ANN-0214
1.811844.109
Fidelity® Variable Insurance Products:
Disciplined Small Cap Portfolio
Annual Report
December 31, 2013
(Fidelity Cover Art)
Contents
Performance | (Click Here) | How the fund has done over time. |
Management's Discussion of Fund Performance | (Click Here) | The Portfolio Manager's review of fund performance and strategy. |
Shareholder Expense Example | (Click Here) | An example of shareholder expenses. |
Investment Changes | (Click Here) | A summary of major shifts in the fund's investments over the past six months. |
Investments | (Click Here) | A complete list of the fund's investments with their market values. |
Financial Statements | (Click Here) | Statements of assets and liabilities, operations, and changes in net assets, as well as financial highlights. |
Notes | (Click Here) | Notes to the financial statements. |
Report of Independent Registered Public Accounting Firm | (Click Here) | |
Trustees and Officers | (Click Here) | |
Distributions | (Click Here) | |
Board Approval of Investment Advisory Contracts and Management Fees | (Click Here) | |
To view a fund's proxy voting guidelines and proxy voting record for the 12-month period ended June 30, visit http://www.fidelity.com/proxyvotingresults or visit the Securities and Exchange Commission's (SEC) web site at http://www.sec.gov. You may also call 1-877-208-0098 to request a free copy of the proxy voting guidelines.
Fidelity Variable Insurance Products are separate account options which are purchased through a variable insurance contract.
Standard & Poor's, S&P and S&P 500 are registered service marks of The McGraw-Hill Companies, Inc. and have been licensed for use by Fidelity Distributors Corporation.
Other third-party marks appearing herein are the property of their respective owners.
All other marks appearing herein are registered or unregistered trademarks or service marks of FMR LLC or an affiliated company. © 2014 FMR LLC. All rights reserved.
This report and the financial statements contained herein are submitted for the general information of the shareholders of the fund. This report is not authorized for distribution to prospective investors in the fund unless preceded or accompanied by an effective prospectus.
A fund files its complete schedule of portfolio holdings with the SEC for the first and third quarters of each fiscal year on Form N-Q. Forms N-Q are available on the SEC's web site at http://www.sec.gov. A fund's Forms N-Q may be reviewed and copied at the SEC's Public Reference Room in Washington, DC. Information regarding the operation of the SEC's Public Reference Room may be obtained by calling 1-800-SEC-0330. For a complete list of a fund's portfolio holdings, view the most recent holdings listing, semiannual report, or annual report on Fidelity's web site at http://www.fidelity.com, http://www.advisor.fidelity.com, or http://www.401k.com, as applicable.
NOT FDIC INSURED • MAY LOSE VALUE • NO BANK GUARANTEE
Neither the fund nor Fidelity Distributors Corporation is a bank.
Annual Report
Average annual total return reflects the change in the value of an investment, assuming reinvestment of the class' distributions from dividend income and capital gains (the profits earned upon the sale of securities that have grown in value, if any) and assuming a constant rate of performance each year. During periods of reimbursement by Fidelity, a fund's total return will be greater than it would be had the reimbursement not occurred. Performance numbers are net of all underlying fund operating expenses, but do not include any insurance charges imposed by your insurance company's separate account. If performance information included the effect of these additional charges, the total returns would have been lower. How a fund did yesterday is no guarantee of how it will do tomorrow.
Average Annual Total Returns
Periods ended December 31, 2013 | Past 1
year | Past 5
years | Life of
fund A |
VIP Disciplined Small Cap Portfolio - Initial Class | 38.35% | 20.05% | 8.12% |
VIP Disciplined Small Cap Portfolio - Service Class | 38.19% | 19.91% | 8.01% |
VIP Disciplined Small Cap Portfolio - Service Class 2 | 37.96% | 19.68% | 7.80% |
VIP Disciplined Small Cap Portfolio - Investor Class | 38.18% | 19.95% | 8.02% |
A From December 27, 2005.
$10,000 Over Life of Fund
Let's say hypothetically that $10,000 was invested in VIP Disciplined Small Cap Portfolio - Initial Class on December 27, 2005, when the fund started. The chart shows how the value of your investment would have changed, and also shows how the Russell 2000® Index performed over the same period.
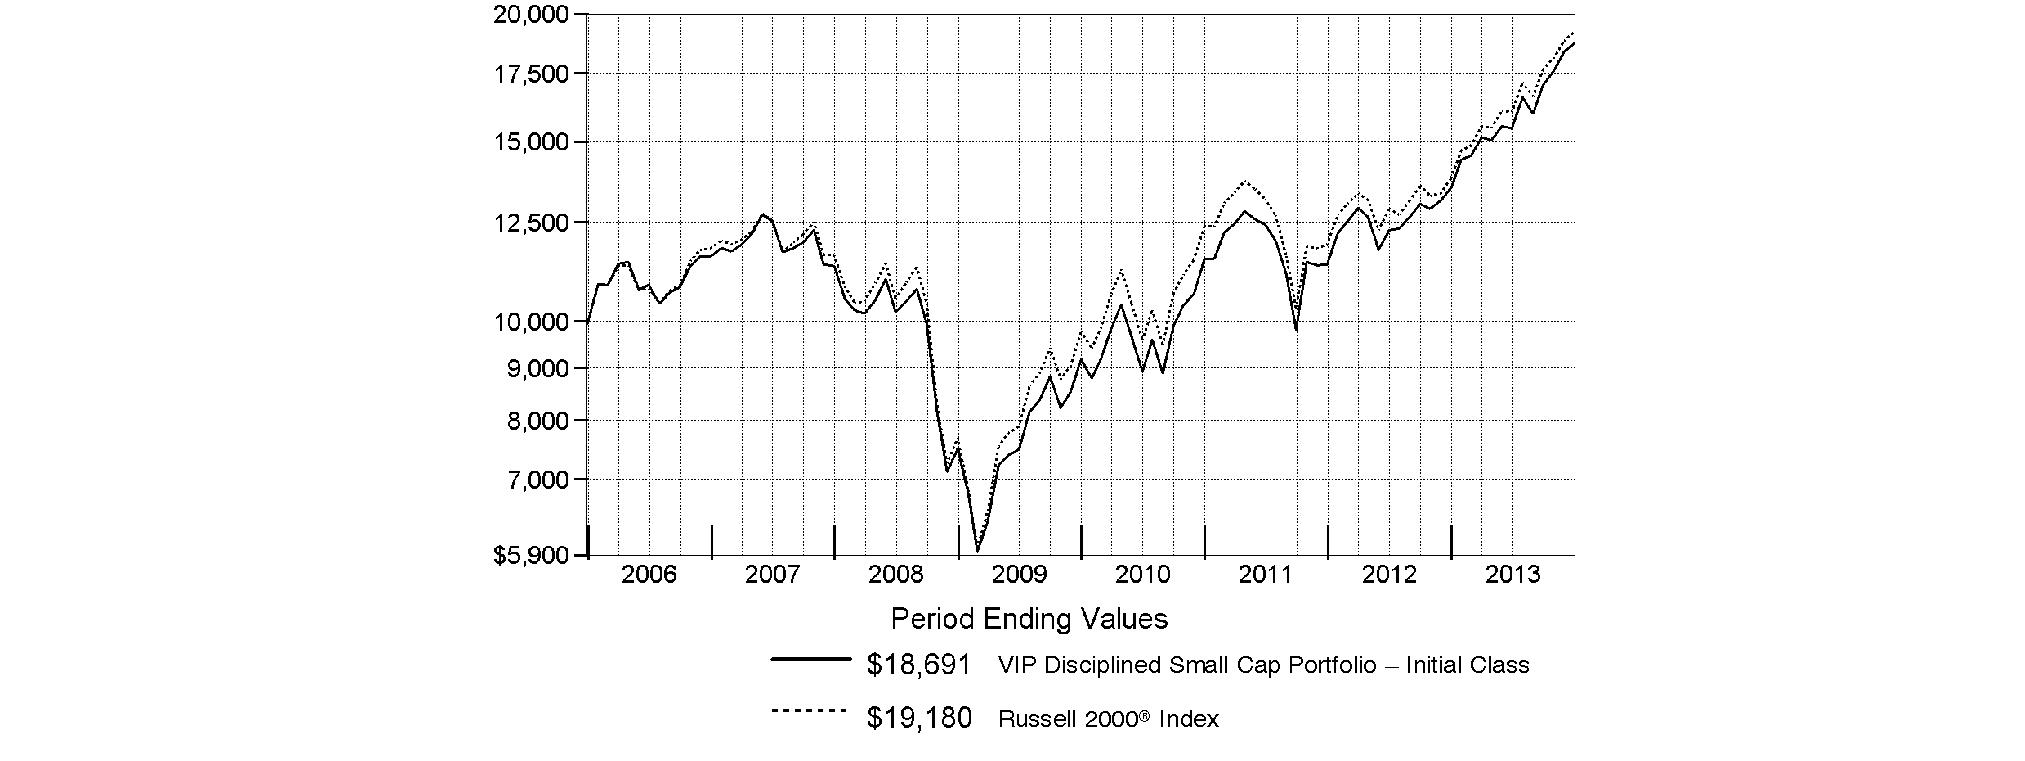
Annual Report
Market Recap: Global equity markets remained upbeat for the 12 months ending December 31, 2013, propelling the MSCI® ACWI® (All Country World Index) Index to a 23.24% return. Midyear turbulence gave way by autumn when policymakers in the U.S. and China had made clear their intentions to maintain accommodative monetary policies. That stance, combined with modest cyclical improvement around the globe and generally low valuations, underpinned the broad rally in equities, although the relative strength of the U.S. dollar generally tempered gains for U.S. investors holding foreign securities based in local currencies. During the period, the broad-market S&P 500® Index set a series of new highs, finishing the year up 32.39%. For the first time since 1995, the S&P® scored a "perfect 10," with all 10 economic sectors gaining at least 10% for the year. A resurgence in growth-oriented stocks lifted the Nasdaq Composite Index® to a 40.12% result for 2013, while the blue-chip Dow Jones Industrial AverageSM notched a relatively more modest 29.65% gain. International developed-markets equities rose in concert with their U.S. counterparts, with the MSCI® EAFE® Index gaining 22.92% for the period. Meanwhile, foreign exchange and commodity weakness curbed results in resource-heavy emerging markets (EM), especially in the year's waning months. More generally, concern over EM's slowing growth, its declining share of global trade and uncertainty surrounding U.S. central bank intentions were all factors hampering performance. The MSCI Emerging Markets Index returned -2.27% for the period. On the bond side, U.S. high-yield securities rallied with equities for much of the period, with The BofA Merrill LynchSM US High Yield Constrained Index returning 7.41% for 2013. The more rate-sensitive U.S. investment-grade bond category faced headwinds though, as reflected in the -2.02% return of the Barclays® U.S. Aggregate Bond Index. Within the Barclays index, investment-grade corporate credit returned -2.01%, while ultra-safe U.S. Treasuries saw a -2.75% result. Major non-U.S. developed markets performed only slightly better, with the Citigroup® Non-USD Group-of-Seven (G7) Equal Weighted Index logging a -1.59% result. After several years of strong advances, EM debt reversed course in 2013, with the J.P. Morgan Emerging Markets Bond Index Global returning -6.58%.
Comments from Maximilian Kaufmann, Senior Portfolio Manager of the Geode Capital Management, LLC, investment management team for VIP Disciplined Small Cap Portfolio: For the year, the fund's share classes were in line with the benchmark Russell 2000® Index, which rose 38.82%. (For specific portfolio results, please refer to the performance section of this report.) Applying our quantitative security selection strategy, stock picking in the financials sector hurt relative to the benchmark, although underweighting the lagging real estate industry cushioned the negative impact. Within financials, the biggest challenges came from Redwood Trust, a mortgage-related real estate investment trust (REIT) we sold in November, and savings & loan Flagstar Bancorp. Our investments in the energy and information technology sectors also detracted. In energy, refinery Alon USA Energy lost value throughout most of the period, while biodiesel company Renewable Energy Group also hurt. In this latter case, Renewable was a strong performer that, in retrospect, we owned at suboptimal times. At our quantitative models' recommendation, we gradually added to the fund's position. Meanwhile, in technology, Dutch software & services company AVG Technologies struggled in November, after the company reduced its earnings forecast for the 2013 fiscal year. Untimely ownership of solar energy equipment manufacturer First Solar also hurt, and we sold this stock in September. Conversely, good stock selection in consumer staples and industrials was particularly helpful. In the former group, the fund benefited from timely ownership of Alliance HealthCare Services, a provider of diagnostic imaging and radiation therapy services. We owned more of this stock when it was rising during the first half of the year, and began scaling back our exposure in the second half. These moves were beneficial, as Alliance's shares lost momentum toward year end. In industrials, various stocks - including Cooper Tire & Rubber, Barrett Business Services and Swift Transportation - combined to add value. Neither Cooper nor Swift was in the portfolio at year end, at the recommendation of our models. Other notable contributors were drug store chain Rite Aid and an out-of-benchmark allocation to personal care and nutritional products manufacturer Nu Skin Enterprises. Both companies achieved share price gains exceeding 200% during the year.
The views expressed above reflect those of the portfolio manager(s) only through the end of the period as stated on the cover of this report and do not necessarily represent the views of Fidelity or any other person in the Fidelity organization. Any such views are subject to change at any time based upon market or other conditions and Fidelity disclaims any responsibility to update such views. These views may not be relied on as investment advice and, because investment decisions for a Fidelity fund are based on numerous factors, may not be relied on as an indication of trading intent on behalf of any Fidelity fund.
Annual Report
As a shareholder of the Fund, you incur two types of costs: (1) transaction costs, and (2) ongoing costs, including management fees, distribution and/or service (12b-1) fees and other Fund expenses. This Example is intended to help you understand your ongoing costs (in dollars) of investing in the Fund and to compare these costs with the ongoing costs of investing in other mutual funds.
The Example is based on an investment of $1,000 invested at the beginning of the period and held for the entire period (July 1, 2013 to December 31, 2013).
Actual Expenses
The first line of the accompanying table for each class of the Fund provides information about actual account values and actual expenses. You may use the information in this line, together with the amount you invested, to estimate the expenses that you paid over the period. Simply divide your account value by $1,000.00 (for example, an $8,600 account value divided by $1,000.00 = 8.6), then multiply the result by the number in the first line for a class of the Fund under the heading entitled "Expenses Paid During Period" to estimate the expenses you paid on your account during this period. The estimate of expenses does not include any fees or other expenses of any variable annuity or variable life insurance product. If they were, the estimate of expenses you paid during the period would be higher, and your ending account value would be lower. In addition, the Fund, as a shareholder in the underlying Fidelity Central Funds, will indirectly bear its pro-rata share of the fees and expenses incurred by the underlying Fidelity Central Funds. These fees and expenses are not included in the Fund's annualized expense ratio used to calculate the expense estimate in the table below.
Hypothetical Example for Comparison Purposes
The second line of the accompanying table for each class of the Fund provides information about hypothetical account values and hypothetical expenses based on a Class' actual expense ratio and an assumed rate of return of 5% per year before expenses, which is not the Class' actual return. The hypothetical account values and expenses may not be used to estimate the actual ending account balance or expenses you paid for the period. You may use this information to compare the ongoing costs of investing in the Fund and other funds. To do so, compare this 5% hypothetical example with the 5% hypothetical examples that appear in the shareholder reports of the other funds. The estimate of expenses does not include any fees or other expenses of any variable annuity or variable life insurance product. If they were, the estimate of expenses you paid during the period would be higher, and your ending account value would be lower. In addition, the Fund, as a shareholder in the underlying Fidelity Central Funds, will indirectly bear its pro-rata share of the fees and expenses incurred by the underlying Fidelity Central Funds. These fees and expenses are not included in the Fund's annualized expense ratio used to calculate the expense estimate in the table below.
Please note that the expenses shown in the table are meant to highlight your ongoing costs only and do not reflect any transaction costs. Therefore, the second line of the table is useful in comparing ongoing costs only, and will not help you determine the relative total costs of owning different funds.
| Annualized
Expense RatioB | Beginning
Account Value
July 1, 2013 | Ending
Account Value
December 31, 2013 | Expenses Paid
During Period*
July 1, 2013
to December 31, 2013 |
Initial Class | .85% | | | |
Actual | | $ 1,000.00 | $ 1,211.50 | $ 4.74 |
HypotheticalA | | $ 1,000.00 | $ 1,020.92 | $ 4.33 |
Service Class | .93% | | | |
Actual | | $ 1,000.00 | $ 1,210.50 | $ 5.18 |
HypotheticalA | | $ 1,000.00 | $ 1,020.52 | $ 4.74 |
Service Class 2 | 1.13% | | | |
Actual | | $ 1,000.00 | $ 1,209.40 | $ 6.29 |
HypotheticalA | | $ 1,000.00 | $ 1,019.51 | $ 5.75 |
Investor Class | .93% | | | |
Actual | | $ 1,000.00 | $ 1,210.60 | $ 5.18 |
HypotheticalA | | $ 1,000.00 | $ 1,020.52 | $ 4.74 |
A 5% return per year before expenses
B Annualized expense ratio reflects expenses net of applicable fee waivers.
* Expenses are equal to each Class' annualized expense ratio, multiplied by the average account value over the period, multiplied by 184/365 (to reflect the one-half year period).
Annual Report
Investment Changes (Unaudited)
Top Ten Stocks as of December 31, 2013 |
| % of fund's
net assets | % of fund's net assets
6 months ago |
Aspen Technology, Inc. | 0.8 | 0.6 |
Align Technology, Inc. | 0.8 | 0.0 |
Generac Holdings, Inc. | 0.7 | 0.6 |
First American Financial Corp. | 0.7 | 0.6 |
West Pharmaceutical Services, Inc. | 0.7 | 0.3 |
Verint Systems, Inc. | 0.7 | 0.0 |
SS&C Technologies Holdings, Inc. | 0.7 | 0.0 |
Spirit Airlines, Inc. | 0.7 | 0.3 |
Rite Aid Corp. | 0.7 | 0.6 |
Western Refining, Inc. | 0.7 | 0.5 |
| 7.2 | |
Top Five Market Sectors as of December 31, 2013 |
| % of fund's
net assets | % of fund's net assets
6 months ago |
Financials | 20.8 | 20.5 |
Information Technology | 19.5 | 14.6 |
Industrials | 16.1 | 15.1 |
Health Care | 14.9 | 10.9 |
Consumer Discretionary | 11.9 | 15.6 |
Asset Allocation (% of fund's net assets) |
As of December 31, 2013* | As of June 30, 2013** |
 | Stocks and
Equity Futures 99.7% | | | Stocks and
Equity Futures 99.3% | |
 | Short-Term
Investments and Net
Other Assets
(Liabilities) 0.3% | | | Short-Term
Investments and
Net Other Assets
(Liabilities) 0.7% | |
* Foreign investments | 4.8% | | ** Foreign investments | 3.8% | |

Annual Report
Investments December 31, 2013
Showing Percentage of Net Assets
Common Stocks - 99.3% |
| Shares | | Value |
CONSUMER DISCRETIONARY - 11.9% |
Auto Components - 1.5% |
Dana Holding Corp. | 58,952 | | $ 1,156,638 |
Dorman Products, Inc. | 2,535 | | 142,137 |
Drew Industries, Inc. | 3,954 | | 202,445 |
Gentherm, Inc. (a) | 4,893 | | 131,181 |
Modine Manufacturing Co. (a) | 2,859 | | 36,652 |
Remy International, Inc. | 10,551 | | 246,049 |
Standard Motor Products, Inc. | 12,648 | | 465,446 |
Stoneridge, Inc. (a) | 16,733 | | 213,346 |
Superior Industries International, Inc. | 5,085 | | 104,904 |
Tower International, Inc. (a) | 38,549 | | 824,949 |
| | 3,523,747 |
Automobiles - 0.3% |
Winnebago Industries, Inc. (a) | 26,150 | | 717,818 |
Distributors - 0.2% |
Core-Mark Holding Co., Inc. | 3,736 | | 283,674 |
VOXX International Corp. (a) | 12,901 | | 215,447 |
| | 499,121 |
Diversified Consumer Services - 1.0% |
Bridgepoint Education, Inc. (a) | 22,151 | | 392,294 |
Capella Education Co. | 7,588 | | 504,147 |
Hillenbrand, Inc. | 4,848 | | 142,628 |
K12, Inc. (a) | 10,168 | | 221,154 |
LifeLock, Inc. (a) | 71,826 | | 1,178,665 |
| | 2,438,888 |
Hotels, Restaurants & Leisure - 4.2% |
Bloomin' Brands, Inc. (a) | 34,917 | | 838,357 |
CEC Entertainment, Inc. | 1,453 | | 64,339 |
Cracker Barrel Old Country Store, Inc. | 11,275 | | 1,241,039 |
Einstein Noah Restaurant Group, Inc. | 8,138 | | 118,001 |
Fiesta Restaurant Group, Inc. (a) | 5,989 | | 312,865 |
Interval Leisure Group, Inc. | 2,591 | | 80,062 |
Jack in the Box, Inc. (a) | 30,329 | | 1,517,057 |
Krispy Kreme Doughnuts, Inc. (a) | 51,820 | | 999,608 |
Marcus Corp. | 3,855 | | 51,811 |
Marriott Vacations Worldwide Corp. (a) | 25,541 | | 1,347,543 |
Monarch Casino & Resort, Inc. (a) | 3,657 | | 73,433 |
Multimedia Games Holding Co., Inc. (a) | 33,668 | | 1,055,828 |
Papa John's International, Inc. | 22,177 | | 1,006,836 |
Scientific Games Corp. Class A (a) | 6,483 | | 109,757 |
Sonic Corp. (a) | 714 | | 14,416 |
Texas Roadhouse, Inc. Class A | 36,623 | | 1,018,119 |
Town Sports International Holdings, Inc. | 1,542 | | 22,760 |
| | 9,871,831 |
Household Durables - 0.7% |
Flexsteel Industries, Inc. | 19,051 | | 585,437 |
|
| Shares | | Value |
La-Z-Boy, Inc. | 14,794 | | $ 458,614 |
NACCO Industries, Inc. Class A | 8,573 | | 533,155 |
| | 1,577,206 |
Internet & Catalog Retail - 0.1% |
FTD Companies, Inc. (a) | 10,036 | | 326,973 |
Media - 1.5% |
Carmike Cinemas, Inc. (a) | 1,476 | | 41,092 |
E.W. Scripps Co. Class A (a) | 38,858 | | 843,996 |
Entravision Communication Corp. Class A | 181,577 | | 1,105,804 |
Global Sources Ltd. (a) | 33,734 | | 274,257 |
Gray Television, Inc. (a) | 37,757 | | 561,824 |
Harte-Hanks, Inc. | 6,466 | | 50,564 |
Loral Space & Communications Ltd. | 2,183 | | 176,779 |
MDC Partners, Inc. Class A | 12,638 | | 322,395 |
Nexstar Broadcasting Group, Inc. Class A | 927 | | 51,662 |
| | 3,428,373 |
Specialty Retail - 2.4% |
Big 5 Sporting Goods Corp. | 59,260 | | 1,174,533 |
Christopher & Banks Corp. (a) | 4,706 | | 40,189 |
Destination Maternity Corp. | 5,872 | | 175,455 |
Express, Inc. (a) | 53,083 | | 991,060 |
Haverty Furniture Companies, Inc. | 5,247 | | 164,231 |
Kirkland's, Inc. (a) | 4,100 | | 97,047 |
Office Depot, Inc. (a) | 280,188 | | 1,482,195 |
Sears Hometown & Outlet Stores, Inc. (a) | 10,497 | | 267,674 |
Stein Mart, Inc. | 3,075 | | 41,359 |
The Cato Corp. Class A (sub. vtg.) | 13,275 | | 422,145 |
The Children's Place Retail Stores, Inc. (a) | 12,829 | | 730,868 |
| | 5,586,756 |
Textiles, Apparel & Luxury Goods - 0.0% |
Costa, Inc. Class A (a) | 1,646 | | 35,768 |
Unifi, Inc. (a) | 894 | | 24,353 |
| | 60,121 |
TOTAL CONSUMER DISCRETIONARY | | 28,030,834 |
CONSUMER STAPLES - 4.9% |
Beverages - 0.0% |
Coca-Cola Bottling Co. Consolidated | 964 | | 70,555 |
Food & Staples Retailing - 1.4% |
Andersons, Inc. | 16,319 | | 1,455,165 |
Harris Teeter Supermarkets, Inc. | 5,613 | | 277,002 |
Rite Aid Corp. (a) | 305,790 | | 1,547,297 |
| | 3,279,464 |
Food Products - 2.6% |
Cal-Maine Foods, Inc. | 7,653 | | 460,940 |
Chiquita Brands International, Inc. (a) | 20,200 | | 236,340 |
Fresh Del Monte Produce, Inc. | 23,928 | | 677,162 |
J&J Snack Foods Corp. | 5,761 | | 510,367 |
Omega Protein Corp. (a) | 30,851 | | 379,159 |
Common Stocks - continued |
| Shares | | Value |
CONSUMER STAPLES - continued |
Food Products - continued |
Pilgrims Pride Corp. (a) | 70,878 | | $ 1,151,768 |
Sanderson Farms, Inc. | 17,341 | | 1,254,275 |
Seneca Foods Corp. Class A (a) | 3,566 | | 113,720 |
TreeHouse Foods, Inc. (a) | 18,149 | | 1,250,829 |
| | 6,034,560 |
Household Products - 0.3% |
Orchids Paper Products Co. | 10,898 | | 357,890 |
WD-40 Co. | 5,890 | | 439,865 |
| | 797,755 |
Personal Products - 0.6% |
Inter Parfums, Inc. | 549 | | 19,660 |
Nature's Sunshine Products, Inc. | 3,478 | | 60,239 |
Nu Skin Enterprises, Inc. Class A | 9,305 | | 1,286,137 |
Nutraceutical International Corp. | 964 | | 25,816 |
| | 1,391,852 |
TOTAL CONSUMER STAPLES | | 11,574,186 |
ENERGY - 4.4% |
Energy Equipment & Services - 2.0% |
Dril-Quip, Inc. (a) | 10,408 | | 1,144,151 |
Exterran Holdings, Inc. (a) | 13,382 | | 457,664 |
Gulf Island Fabrication, Inc. | 4,203 | | 97,594 |
Hercules Offshore, Inc. (a) | 143,844 | | 939,301 |
Matrix Service Co. (a) | 27,682 | | 677,379 |
Newpark Resources, Inc. (a) | 5,636 | | 69,266 |
Parker Drilling Co. (a) | 53,858 | | 437,866 |
RigNet, Inc. (a) | 6,063 | | 290,600 |
Tesco Corp. (a) | 29,198 | | 577,536 |
| | 4,691,357 |
Oil, Gas & Consumable Fuels - 2.4% |
Abraxas Petroleum Corp. (a) | 990 | | 3,247 |
Adams Resources & Energy, Inc. | 445 | | 30,483 |
Alon U.S.A. Energy, Inc. | 27,961 | | 462,475 |
Crosstex Energy, Inc. | 280 | | 10,125 |
CVR Energy, Inc. | 29,210 | | 1,268,590 |
Delek U.S. Holdings, Inc. | 10,165 | | 349,778 |
Evolution Petroleum Corp. | 5,919 | | 73,040 |
Renewable Energy Group, Inc. (a) | 107,787 | | 1,235,239 |
Rex American Resources Corp. (a) | 9,998 | | 447,011 |
Warren Resources, Inc. (a) | 29,241 | | 91,817 |
Western Refining, Inc. (d) | 36,432 | | 1,545,081 |
| | 5,516,886 |
TOTAL ENERGY | | 10,208,243 |
FINANCIALS - 20.8% |
Capital Markets - 2.0% |
American Capital Ltd. (a) | 75,379 | | 1,178,928 |
|
| Shares | | Value |
Calamos Asset Management, Inc. Class A | 11,374 | | $ 134,668 |
Evercore Partners, Inc. Class A | 22,361 | | 1,336,741 |
FBR & Co. (a) | 6,165 | | 162,633 |
GAMCO Investors, Inc. Class A | 648 | | 56,357 |
HFF, Inc. | 3,707 | | 99,533 |
Investment Technology Group, Inc. (a) | 17,489 | | 359,574 |
MCG Capital Corp. | 19,837 | | 87,283 |
New Mountain Finance Corp. | 1,669 | | 25,102 |
Piper Jaffray Companies (a) | 1,548 | | 61,223 |
Silvercrest Asset Management Group Class A | 679 | | 11,577 |
TCP Capital Corp. | 23,147 | | 388,407 |
Virtus Investment Partners, Inc. (a) | 2,491 | | 498,325 |
WisdomTree Investments, Inc. (a) | 13,355 | | 236,517 |
| | 4,636,868 |
Commercial Banks - 5.9% |
1st Source Corp. | 174 | | 5,558 |
Ameris Bancorp (a) | 5,211 | | 110,004 |
BancFirst Corp. | 417 | | 23,377 |
Banco Latinoamericano de Comercio Exterior SA Series E | 3,930 | | 110,119 |
Bank of Kentucky Financial Corp. | 1,060 | | 39,114 |
Bank of Marin Bancorp | 1,493 | | 64,781 |
Banner Bank | 16,777 | | 751,945 |
BBCN Bancorp, Inc. | 8,262 | | 137,067 |
BNC Bancorp | 5,074 | | 86,968 |
Central Pacific Financial Corp. | 18,215 | | 365,757 |
Chemical Financial Corp. | 5,611 | | 177,700 |
Citizens & Northern Corp. | 3,074 | | 63,417 |
Customers Bancorp, Inc. (a) | 15,918 | | 325,682 |
Eagle Bancorp, Inc., Maryland | 4,040 | | 123,745 |
First Bancorp, Puerto Rico (a) | 112,072 | | 693,726 |
First Community Bancshares, Inc. | 3,908 | | 65,264 |
First Financial Holdings, Inc. | 151 | | 10,043 |
First Interstate Bancsystem, Inc. | 6,851 | | 194,363 |
First Merchants Corp. | 21,525 | | 489,909 |
Flushing Financial Corp. | 8,114 | | 167,960 |
Hanmi Financial Corp. | 36,267 | | 793,885 |
Home Bancshares, Inc. | 4,982 | | 186,078 |
HomeTrust Bancshares, Inc. (a) | 1,269 | | 20,291 |
International Bancshares Corp. | 7,083 | | 186,920 |
Lakeland Financial Corp. | 685 | | 26,715 |
MainSource Financial Group, Inc. | 2,037 | | 36,727 |
MB Financial, Inc. | 31,617 | | 1,014,590 |
Mercantile Bank Corp. | 582 | | 12,560 |
Merchants Bancshares, Inc. | 8,936 | | 299,356 |
OmniAmerican Bancorp, Inc. (a) | 1,442 | | 30,830 |
Peoples Bancorp, Inc. | 2,729 | | 61,430 |
PrivateBancorp, Inc. | 50,948 | | 1,473,926 |
Republic Bancorp, Inc., Kentucky Class A | 2,520 | | 61,841 |
Simmons First National Corp. Class A | 1,284 | | 47,701 |
Southwest Bancorp, Inc., Oklahoma (a) | 3,660 | | 58,267 |
Susquehanna Bancshares, Inc. | 51,012 | | 654,994 |
Common Stocks - continued |
| Shares | | Value |
FINANCIALS - continued |
Commercial Banks - continued |
Umpqua Holdings Corp. (d) | 77,689 | | $ 1,486,967 |
United Community Banks, Inc., Georgia (a) | 47,799 | | 848,432 |
ViewPoint Financial Group | 1,287 | | 35,328 |
Washington Trust Bancorp, Inc. | 5,055 | | 188,147 |
WesBanco, Inc. | 6,043 | | 193,376 |
Wilshire Bancorp, Inc. | 64,738 | | 707,586 |
Wintrust Financial Corp. | 29,522 | | 1,361,555 |
Yadkin Financial Corp. (a) | 5,493 | | 93,601 |
| | 13,887,602 |
Consumer Finance - 1.3% |
Cash America International, Inc. | 7,573 | | 290,046 |
Credit Acceptance Corp. (a) | 3,667 | | 476,673 |
Green Dot Corp. Class A (a) | 30,644 | | 770,697 |
Nelnet, Inc. Class A | 30,225 | | 1,273,682 |
Regional Management Corp. (a) | 8,792 | | 298,313 |
| | 3,109,411 |
Diversified Financial Services - 0.9% |
Gain Capital Holdings, Inc. | 25,422 | | 190,919 |
MarketAxess Holdings, Inc. | 22,522 | | 1,506,046 |
Marlin Business Services Corp. | 13,095 | | 329,994 |
Vector Capital Corp. rights (a) | 5,673 | | 0 |
| | 2,026,959 |
Insurance - 4.2% |
Amerisafe, Inc. | 946 | | 39,959 |
Argo Group International Holdings, Ltd. | 19,366 | | 900,325 |
eHealth, Inc. (a) | 17,051 | | 792,701 |
Employers Holdings, Inc. | 1,172 | | 37,094 |
FBL Financial Group, Inc. Class A | 7,686 | | 344,256 |
First American Financial Corp. | 56,376 | | 1,589,803 |
HCI Group, Inc. (d) | 5,589 | | 299,012 |
Hilltop Holdings, Inc. (a) | 41,510 | | 960,126 |
Horace Mann Educators Corp. | 41,445 | | 1,307,175 |
Navigators Group, Inc. (a) | 2,794 | | 176,469 |
Platinum Underwriters Holdings Ltd. | 21,263 | | 1,302,997 |
ProAssurance Corp. | 20,635 | | 1,000,385 |
Selective Insurance Group, Inc. | 17,419 | | 471,358 |
Symetra Financial Corp. | 6,120 | | 116,035 |
United Fire Group, Inc. | 845 | | 24,218 |
Universal Insurance Holdings, Inc. | 43,537 | | 630,416 |
| | 9,992,329 |
Real Estate Investment Trusts - 4.0% |
Agree Realty Corp. | 5,439 | | 157,840 |
Apollo Commercial Real Estate Finance, Inc. | 26,508 | | 430,755 |
Ashford Hospitality Prime, Inc. | 5,642 | | 102,684 |
Ashford Hospitality Trust, Inc. | 31,305 | | 259,205 |
Capstead Mortgage Corp. | 24,720 | | 298,618 |
CubeSmart | 22,363 | | 356,466 |
Extra Space Storage, Inc. | 26,742 | | 1,126,640 |
|
| Shares | | Value |
MFA Financial, Inc. | 50,864 | | $ 359,100 |
National Health Investors, Inc. | 18,888 | | 1,059,617 |
New Residential Investment Corp. | 175,127 | | 1,169,848 |
Potlatch Corp. | 2,754 | | 114,952 |
Resource Capital Corp. | 22,932 | | 135,987 |
RLJ Lodging Trust | 53,263 | | 1,295,356 |
Sovran Self Storage, Inc. | 11,891 | | 774,936 |
Sunstone Hotel Investors, Inc. | 29,631 | | 397,055 |
The Geo Group, Inc. | 39,167 | | 1,261,961 |
| | 9,301,020 |
Real Estate Management & Development - 0.6% |
Altisource Residential Corp. Class B | 46,436 | | 1,398,188 |
Thrifts & Mortgage Finance - 1.9% |
Dime Community Bancshares, Inc. | 21,777 | | 368,467 |
Doral Financial Corp. (a) | 7,783 | | 121,882 |
EverBank Financial Corp. | 14,892 | | 273,119 |
Farmer Mac Class C (non-vtg.) | 3,220 | | 110,285 |
Flagstar Bancorp, Inc. (a) | 32,096 | | 629,724 |
Fox Chase Bancorp, Inc. | 1,973 | | 34,291 |
Home Loan Servicing Solutions Ltd. | 48,964 | | 1,124,703 |
HomeStreet, Inc. | 16,854 | | 337,080 |
Northwest Bancshares, Inc. | 21,912 | | 323,859 |
Provident Financial Holdings, Inc. | 3,598 | | 53,970 |
Simplicity Bancorp, Inc. | 3,267 | | 52,795 |
WSFS Financial Corp. | 13,142 | | 1,018,899 |
| | 4,449,074 |
TOTAL FINANCIALS | | 48,801,451 |
HEALTH CARE - 14.9% |
Biotechnology - 1.0% |
Alnylam Pharmaceuticals, Inc. (a) | 2,627 | | 168,995 |
Cepheid, Inc. (a) | 2,380 | | 111,194 |
Dyax Corp. (a) | 34,809 | | 262,112 |
Emergent BioSolutions, Inc. (a) | 7,093 | | 163,068 |
Insys Therapeutics, Inc. (a) | 9,099 | | 352,222 |
Intercept Pharmaceuticals, Inc. (a) | 3,399 | | 232,084 |
Isis Pharmaceuticals, Inc. (a) | 22,035 | | 877,874 |
NPS Pharmaceuticals, Inc. (a) | 847 | | 25,715 |
Pharmacyclics, Inc. (a) | 1,062 | | 112,338 |
| | 2,305,602 |
Health Care Equipment & Supplies - 5.6% |
Align Technology, Inc. (a) | 31,016 | | 1,772,564 |
Analogic Corp. | 1,446 | | 128,058 |
Angiodynamics, Inc. (a) | 3,743 | | 64,342 |
Anika Therapeutics, Inc. (a) | 20,010 | | 763,582 |
ArthroCare Corp. (a) | 7,719 | | 310,613 |
Cantel Medical Corp. | 15,952 | | 540,932 |
Cardiovascular Systems, Inc. (a) | 7,563 | | 259,335 |
CONMED Corp. | 3,099 | | 131,708 |
Cryolife, Inc. | 5,796 | | 64,278 |
Cyberonics, Inc. (a) | 19,899 | | 1,303,583 |
Globus Medical, Inc. (a) | 18,528 | | 373,895 |
Common Stocks - continued |
| Shares | | Value |
HEALTH CARE - continued |
Health Care Equipment & Supplies - continued |
Greatbatch, Inc. (a) | 8,090 | | $ 357,902 |
ICU Medical, Inc. (a) | 1,518 | | 96,712 |
Invacare Corp. | 2,029 | | 47,093 |
Masimo Corp. | 3,240 | | 94,705 |
Natus Medical, Inc. (a) | 26,649 | | 599,603 |
NuVasive, Inc. (a) | 24,356 | | 787,429 |
Orthofix International NV (a) | 18,325 | | 418,177 |
RTI Biologics, Inc. (a) | 45,541 | | 161,215 |
Sirona Dental Systems, Inc. (a) | 16,337 | | 1,146,857 |
Steris Corp. | 1,685 | | 80,964 |
SurModics, Inc. (a) | 9,684 | | 236,193 |
Thoratec Corp. (a) | 38,940 | | 1,425,204 |
Vascular Solutions, Inc. (a) | 5,361 | | 124,107 |
West Pharmaceutical Services, Inc. | 32,287 | | 1,584,000 |
Zeltiq Aesthetics, Inc. (a) | 17,371 | | 328,486 |
| | 13,201,537 |
Health Care Providers & Services - 5.5% |
Addus HomeCare Corp. (a) | 10,385 | | 233,143 |
Alliance Healthcare Services, Inc. (a) | 37,741 | | 933,712 |
AMN Healthcare Services, Inc. (a) | 35,585 | | 523,100 |
AmSurg Corp. (a) | 10,593 | | 486,431 |
Corvel Corp. (a) | 5,828 | | 272,168 |
Cross Country Healthcare, Inc. (a) | 11,554 | | 115,309 |
Five Star Quality Care, Inc. (a) | 49,939 | | 274,165 |
Hanger, Inc. (a) | 30,684 | | 1,207,109 |
HealthSouth Corp. | 17,836 | | 594,296 |
Kindred Healthcare, Inc. | 6,323 | | 124,816 |
Magellan Health Services, Inc. (a) | 22,229 | | 1,331,739 |
Molina Healthcare, Inc. (a) | 2,650 | | 92,088 |
National Healthcare Corp. | 4,886 | | 263,404 |
Owens & Minor, Inc. | 39,348 | | 1,438,563 |
PharMerica Corp. (a) | 23,155 | | 497,833 |
Providence Service Corp. (a) | 24,318 | | 625,459 |
Select Medical Holdings Corp. | 120,803 | | 1,402,523 |
Team Health Holdings, Inc. (a) | 33,256 | | 1,514,811 |
Triple-S Management Corp. (a) | 6,228 | | 121,072 |
Universal American Spin Corp. | 3,539 | | 25,835 |
Wellcare Health Plans, Inc. (a) | 13,541 | | 953,557 |
| | 13,031,133 |
Health Care Technology - 0.8% |
Medidata Solutions, Inc. (a) | 6,794 | | 411,513 |
Omnicell, Inc. (a) | 51,204 | | 1,307,238 |
Quality Systems, Inc. | 8,851 | | 186,402 |
| | 1,905,153 |
Life Sciences Tools & Services - 0.5% |
Albany Molecular Research, Inc. (a) | 36,176 | | 364,654 |
Cambrex Corp. (a) | 13,400 | | 238,922 |
|
| Shares | | Value |
Luminex Corp. (a) | 5,157 | | $ 100,046 |
PAREXEL International Corp. (a) | 10,622 | | 479,902 |
| | 1,183,524 |
Pharmaceuticals - 1.5% |
Impax Laboratories, Inc. (a) | 2,755 | | 69,261 |
Jazz Pharmaceuticals PLC (a) | 3,854 | | 487,762 |
Lannett Co., Inc. (a) | 18,242 | | 603,810 |
Pozen, Inc. | 23,272 | | 187,107 |
Prestige Brands Holdings, Inc. (a) | 5,951 | | 213,046 |
Questcor Pharmaceuticals, Inc. (d) | 12,367 | | 673,383 |
Sagent Pharmaceuticals, Inc. (a) | 10,650 | | 270,297 |
Santarus, Inc. (a) | 7,491 | | 239,412 |
The Medicines Company (a) | 17,890 | | 690,912 |
| | 3,434,990 |
TOTAL HEALTH CARE | | 35,061,939 |
INDUSTRIALS - 16.1% |
Aerospace & Defense - 2.4% |
AAR Corp. | 16,922 | | 473,985 |
American Science & Engineering, Inc. | 9,117 | | 655,603 |
Astronics Corp. (a) | 2,806 | | 143,106 |
Curtiss-Wright Corp. | 16,564 | | 1,030,778 |
Ducommun, Inc. (a) | 1,036 | | 30,883 |
Engility Holdings, Inc. (a) | 5,041 | | 168,369 |
Esterline Technologies Corp. (a) | 9,032 | | 920,903 |
Moog, Inc. Class A (a) | 14,827 | | 1,007,346 |
Taser International, Inc. (a) | 74,629 | | 1,185,109 |
Teledyne Technologies, Inc. (a) | 1,602 | | 147,160 |
| | 5,763,242 |
Air Freight & Logistics - 0.0% |
Park-Ohio Holdings Corp. (a) | 201 | | 10,532 |
Airlines - 1.2% |
Republic Airways Holdings, Inc. (a) | 56,968 | | 608,988 |
SkyWest, Inc. | 42,063 | | 623,794 |
Spirit Airlines, Inc. (a) | 34,191 | | 1,552,613 |
| | 2,785,395 |
Building Products - 0.6% |
AAON, Inc. | 4,775 | | 152,561 |
American Woodmark Corp. (a) | 6,186 | | 244,533 |
Apogee Enterprises, Inc. | 10,735 | | 385,494 |
Gibraltar Industries, Inc. (a) | 4,130 | | 76,777 |
PGT, Inc. (a) | 52,881 | | 535,156 |
| | 1,394,521 |
Commercial Services & Supplies - 1.9% |
ABM Industries, Inc. | 7,502 | | 214,482 |
ARC Document Solutions, Inc. (a) | 19,711 | | 162,024 |
Consolidated Graphics, Inc. (a) | 1,003 | | 67,642 |
Deluxe Corp. | 13,805 | | 720,483 |
G&K Services, Inc. Class A | 14,744 | | 917,519 |
Intersections, Inc. | 19,256 | | 150,004 |
Kimball International, Inc. Class B | 32,372 | | 486,551 |
Common Stocks - continued |
| Shares | | Value |
INDUSTRIALS - continued |
Commercial Services & Supplies - continued |
Knoll, Inc. | 3,546 | | $ 64,927 |
Mine Safety Appliances Co. | 165 | | 8,450 |
Multi-Color Corp. | 2,136 | | 80,613 |
Performant Financial Corp. (a) | 2,035 | | 20,961 |
Steelcase, Inc. Class A | 13,445 | | 213,238 |
UniFirst Corp. | 10,376 | | 1,110,232 |
Viad Corp. | 6,488 | | 180,237 |
| | 4,397,363 |
Construction & Engineering - 0.8% |
Argan, Inc. (a) | 25,304 | | 697,378 |
Comfort Systems U.S.A., Inc. | 18,676 | | 362,128 |
EMCOR Group, Inc. | 2,773 | | 117,686 |
Furmanite Corp. (a) | 17,986 | | 191,011 |
MYR Group, Inc. (a) | 2,890 | | 72,481 |
Primoris Services Corp. | 10,674 | | 332,282 |
| | 1,772,966 |
Electrical Equipment - 1.1% |
EnerSys | 13,437 | | 941,799 |
Generac Holdings, Inc. | 28,716 | | 1,626,474 |
Powell Industries, Inc. | 453 | | 30,346 |
| | 2,598,619 |
Industrial Conglomerates - 0.0% |
Raven Industries, Inc. | 1,312 | | 53,976 |
Machinery - 2.5% |
Alamo Group, Inc. | 1,502 | | 91,156 |
Altra Industrial Motion Corp. | 831 | | 28,437 |
CIRCOR International, Inc. | 5,440 | | 439,443 |
Federal Signal Corp. (a) | 6,306 | | 92,383 |
Global Brass & Copper Holdings, Inc. | 6,944 | | 114,923 |
Hurco Companies, Inc. | 1,660 | | 41,517 |
Hyster-Yale Materials Handling Class A | 14,795 | | 1,378,302 |
John Bean Technologies Corp. | 6,614 | | 193,989 |
Kadant, Inc. | 14,211 | | 575,830 |
L.B. Foster Co. Class A | 2,490 | | 117,752 |
Lydall, Inc. (a) | 1,430 | | 25,197 |
Mueller Industries, Inc. | 18,574 | | 1,170,348 |
Mueller Water Products, Inc. Class A | 135,238 | | 1,267,180 |
NN, Inc. | 2,215 | | 44,721 |
Standex International Corp. | 3,345 | | 210,334 |
Sun Hydraulics Corp. | 802 | | 32,746 |
Tennant Co. | 565 | | 38,313 |
Xerium Technologies, Inc. (a) | 3,576 | | 58,968 |
| | 5,921,539 |
Marine - 0.4% |
Matson, Inc. | 34,977 | | 913,249 |
Professional Services - 3.0% |
Barrett Business Services, Inc. | 13,246 | | 1,228,434 |
Exponent, Inc. | 3,175 | | 245,872 |
Huron Consulting Group, Inc. (a) | 4,878 | | 305,948 |
|
| Shares | | Value |
ICF International, Inc. (a) | 647 | | $ 22,457 |
Insperity, Inc. | 17,392 | | 628,373 |
Kelly Services, Inc. Class A (non-vtg.) | 8,644 | | 215,581 |
Korn/Ferry International (a) | 53,416 | | 1,395,226 |
Navigant Consulting, Inc. (a) | 8,125 | | 156,000 |
On Assignment, Inc. (a) | 10,657 | | 372,142 |
Resources Connection, Inc. | 19,901 | | 285,181 |
RPX Corp. (a) | 75,414 | | 1,274,497 |
TrueBlue, Inc. (a) | 4,960 | | 127,869 |
WageWorks, Inc. (a) | 11,812 | | 702,105 |
| | 6,959,685 |
Road & Rail - 1.4% |
AMERCO | 5,262 | | 1,251,514 |
Arkansas Best Corp. | 7,183 | | 241,923 |
Heartland Express, Inc. | 26,890 | | 527,582 |
Marten Transport Ltd. | 4,670 | | 94,287 |
Old Dominion Freight Lines, Inc. (a) | 22,237 | | 1,179,006 |
Universal Truckload Services, Inc. | 3,260 | | 99,463 |
| | 3,393,775 |
Trading Companies & Distributors - 0.6% |
Aceto Corp. | 33,526 | | 838,485 |
Aircastle Ltd. | 21,594 | | 413,741 |
DXP Enterprises, Inc. (a) | 2,162 | | 249,062 |
| | 1,501,288 |
Transportation Infrastructure - 0.2% |
Wesco Aircraft Holdings, Inc. (a) | 19,072 | | 418,058 |
TOTAL INDUSTRIALS | | 37,884,208 |
INFORMATION TECHNOLOGY - 19.5% |
Communications Equipment - 4.2% |
Anaren, Inc. (a) | 6,440 | | 180,256 |
Arris Group, Inc. (a) | 30,727 | | 748,663 |
Aruba Networks, Inc. (a) | 79,830 | | 1,428,957 |
Black Box Corp. | 17,244 | | 513,871 |
Communications Systems, Inc. | 4,445 | | 49,517 |
Comtech Telecommunications Corp. | 23,098 | | 728,049 |
Emulex Corp. (a) | 67,429 | | 482,792 |
Extreme Networks, Inc. (a) | 179,768 | | 1,258,376 |
Finisar Corp. (a) | 63,370 | | 1,515,810 |
Harmonic, Inc. (a) | 3,393 | | 25,040 |
Ixia (a) | 16,764 | | 223,129 |
Oplink Communications, Inc. (a) | 4,732 | | 88,015 |
Plantronics, Inc. | 16,759 | | 778,456 |
Tessco Technologies, Inc. | 10,481 | | 422,594 |
Ubiquiti Networks, Inc. (d) | 31,225 | | 1,435,101 |
| | 9,878,626 |
Computers & Peripherals - 0.4% |
QLogic Corp. (a) | 68,072 | | 805,292 |
Super Micro Computer, Inc. (a) | 12,304 | | 211,137 |
| | 1,016,429 |
Common Stocks - continued |
| Shares | | Value |
INFORMATION TECHNOLOGY - continued |
Electronic Equipment & Components - 2.4% |
Benchmark Electronics, Inc. (a) | 58,606 | | $ 1,352,626 |
Daktronics, Inc. | 25,092 | | 393,443 |
Electro Scientific Industries, Inc. | 27,442 | | 287,043 |
Insight Enterprises, Inc. (a) | 13,110 | | 297,728 |
Methode Electronics, Inc. Class A | 20,864 | | 713,340 |
Newport Corp. (a) | 6,697 | | 121,015 |
PC Connection, Inc. | 1,143 | | 28,404 |
Plexus Corp. (a) | 1,907 | | 82,554 |
Sanmina Corp. (a) | 20,334 | | 339,578 |
ScanSource, Inc. (a) | 19,305 | | 819,111 |
SYNNEX Corp. (a) | 19,225 | | 1,295,765 |
| | 5,730,607 |
Internet Software & Services - 1.2% |
comScore, Inc. (a) | 12,188 | | 348,699 |
Constant Contact, Inc. (a) | 7,131 | | 221,560 |
eGain Communications Corp. (a) | 12,592 | | 128,942 |
Perficient, Inc. (a) | 6,339 | | 148,459 |
Shutterstock, Inc. (a) | 1,291 | | 107,966 |
Stamps.com, Inc. (a) | 10,012 | | 421,505 |
United Online, Inc. | 51,969 | | 715,093 |
ValueClick, Inc. (a) | 6,377 | | 149,030 |
WebMD Health Corp. (a) | 8,940 | | 353,130 |
XO Group, Inc. (a) | 12,643 | | 187,875 |
| | 2,782,259 |
IT Services - 3.7% |
Acxiom Corp. (a) | 39,510 | | 1,461,080 |
Cardtronics, Inc. (a) | 16,011 | | 695,678 |
CSG Systems International, Inc. | 15,359 | | 451,555 |
ExlService Holdings, Inc. (a) | 12,655 | | 349,531 |
Forrester Research, Inc. | 2,448 | | 93,660 |
Global Cash Access Holdings, Inc. (a) | 69,903 | | 698,331 |
Hackett Group, Inc. | 5,098 | | 31,659 |
iGATE Corp. (a) | 14,510 | | 582,722 |
Jack Henry & Associates, Inc. | 19,651 | | 1,163,536 |
Maximus, Inc. | 13,025 | | 572,970 |
MoneyGram International, Inc. (a) | 3,611 | | 75,037 |
NCI, Inc. Class A (a) | 5,191 | | 34,364 |
Sapient Corp. (a) | 84,358 | | 1,464,455 |
Syntel, Inc. | 7,293 | | 663,298 |
Teletech Holdings, Inc. (a) | 14,425 | | 345,335 |
| | 8,683,211 |
Semiconductors & Semiconductor Equipment - 2.0% |
Advanced Energy Industries, Inc. (a) | 9,039 | | 206,632 |
Ambarella, Inc. (a) | 38,631 | | 1,310,750 |
ATMI, Inc. (a) | 1,909 | | 57,671 |
Cabot Microelectronics Corp. (a) | 18,329 | | 837,635 |
Intersil Corp. Class A | 12,541 | | 143,845 |
|
| Shares | | Value |
Kulicke & Soffa Industries, Inc. (a) | 62,409 | | $ 830,040 |
Rambus, Inc. (a) | 107,214 | | 1,015,317 |
Spansion, Inc. Class A (a) | 18,580 | | 258,076 |
Supertex, Inc. | 408 | | 10,220 |
Ultra Clean Holdings, Inc. (a) | 2,207 | | 22,136 |
| | 4,692,322 |
Software - 5.6% |
Actuate Corp. (a) | 8,129 | | 62,675 |
Advent Software, Inc. | 36,783 | | 1,287,037 |
Aspen Technology, Inc. (a) | 42,482 | | 1,775,736 |
AVG Technologies NV (a) | 49,047 | | 844,099 |
Comverse, Inc. | 12,685 | | 492,178 |
ePlus, Inc. | 2,006 | | 114,021 |
Gigamon, Inc. (a) | 2,924 | | 82,106 |
Manhattan Associates, Inc. (a) | 12,356 | | 1,451,583 |
Monotype Imaging Holdings, Inc. | 25,881 | | 824,569 |
NetScout Systems, Inc. (a) | 21,099 | | 624,319 |
Pegasystems, Inc. | 9,732 | | 478,620 |
QAD, Inc.: | | | |
Class A | 3,608 | | 63,717 |
Class B | 2,068 | | 33,129 |
SS&C Technologies Holdings, Inc. (a) | 35,231 | | 1,559,324 |
TeleCommunication Systems, Inc. Class A (a) | 105,661 | | 245,134 |
TeleNav, Inc. (a) | 36,989 | | 243,758 |
TiVo, Inc. (a) | 105,341 | | 1,382,074 |
Verint Systems, Inc. (a) | 36,799 | | 1,580,149 |
| | 13,144,228 |
TOTAL INFORMATION TECHNOLOGY | | 45,927,682 |
MATERIALS - 4.6% |
Chemicals - 2.6% |
A. Schulman, Inc. | 3,883 | | 136,915 |
American Pacific Corp. (a) | 11,088 | | 413,139 |
Ferro Corp. (a) | 21,159 | | 271,470 |
FutureFuel Corp. | 53,973 | | 852,773 |
H.B. Fuller Co. | 22,389 | | 1,165,124 |
Innospec, Inc. | 7,743 | | 357,881 |
Landec Corp. (a) | 14,922 | | 180,855 |
Minerals Technologies, Inc. | 20,999 | | 1,261,410 |
Quaker Chemical Corp. | 2,937 | | 226,355 |
Sensient Technologies Corp. | 16,857 | | 817,902 |
Stepan Co. | 3,595 | | 235,940 |
Zep, Inc. | 5,516 | | 100,171 |
| | 6,019,935 |
Containers & Packaging - 1.1% |
AEP Industries, Inc. (a) | 1,050 | | 55,472 |
Berry Plastics Group, Inc. (a) | 10,848 | | 258,074 |
Graphic Packaging Holding Co. (a) | 158,185 | | 1,518,576 |
Myers Industries, Inc. | 34,022 | | 718,545 |
| | 2,550,667 |
Common Stocks - continued |
| Shares | | Value |
MATERIALS - continued |
Metals & Mining - 0.3% |
Worthington Industries, Inc. | 18,136 | | $ 763,163 |
Paper & Forest Products - 0.6% |
P.H. Glatfelter Co. | 3,536 | | 97,735 |
Schweitzer-Mauduit International, Inc. | 27,473 | | 1,414,035 |
| | 1,511,770 |
TOTAL MATERIALS | | 10,845,535 |
TELECOMMUNICATION SERVICES - 0.7% |
Diversified Telecommunication Services - 0.7% |
IDT Corp. Class B | 9,995 | | 178,611 |
Inteliquent, Inc. | 101,351 | | 1,157,428 |
Premiere Global Services, Inc. (a) | 9,742 | | 112,910 |
Vonage Holdings Corp. (a) | 48,193 | | 160,483 |
| | 1,609,432 |
Wireless Telecommunication Services - 0.0% |
Shenandoah Telecommunications Co. | 1,961 | | 50,339 |
TOTAL TELECOMMUNICATION SERVICES | | 1,659,771 |
UTILITIES - 1.5% |
Electric Utilities - 0.5% |
El Paso Electric Co. | 20,748 | | 728,462 |
UNS Energy Corp. | 7,621 | | 456,117 |
| | 1,184,579 |
Gas Utilities - 0.1% |
Southwest Gas Corp. | 4,553 | | 254,558 |
Independent Power Producers & Energy Traders - 0.0% |
Genie Energy Ltd. Class B (a) | 4,004 | | 40,881 |
Multi-Utilities - 0.4% |
Avista Corp. | 4,551 | | 128,293 |
NorthWestern Energy Corp. | 17,413 | | 754,331 |
| | 882,624 |
Water Utilities - 0.5% |
American States Water Co. | 37,382 | | 1,073,985 |
Consolidated Water Co., Inc. | 8,037 | | 113,322 |
| | 1,187,307 |
TOTAL UTILITIES | | 3,549,949 |
TOTAL COMMON STOCKS (Cost $194,111,541) |
233,543,798
|
U.S. Treasury Obligations - 0.1% |
| Principal Amount | | Value |
U.S. Treasury Bills, yield at date of purchase 0.08% 5/29/14 (e)
(Cost $249,913) | | $ 250,000 | | $ 249,939 |
Money Market Funds - 8.4% |
| Shares | | |
Fidelity Cash Central Fund, 0.11% (b) | 14,555,623 | | 14,555,623 |
Fidelity Securities Lending Cash Central Fund, 0.11% (b)(c) | 5,147,975 | | 5,147,975 |
TOTAL MONEY MARKET FUNDS (Cost $19,703,598) |
19,703,598
|
TOTAL INVESTMENT PORTFOLIO - 107.8% (Cost $214,065,052) | | 253,497,335 |
NET OTHER ASSETS (LIABILITIES) - (7.8)% | | (18,397,719) |
NET ASSETS - 100% | $ 235,099,616 |
Futures Contracts |
| Expiration Date | | Underlying Face Amount at Value | | Unrealized Appreciation/(Depreciation) |
Purchased |
Equity Index Contracts |
9 ICE Russell 2000 Index Contracts (United States) | March 2014 | | $ 1,045,260 | | $ 57,158 |
|
The face value of futures purchased as a percentage of net assets is 0.4% |
Legend |
(a) Non-income producing |
(b) Affiliated fund that is generally available only to investment companies and other accounts managed by Fidelity Investments. The rate quoted is the annualized seven-day yield of the fund at period end. A complete unaudited listing of the fund's holdings as of its most recent quarter end is available upon request. In addition, each Fidelity Central Fund's financial statements, which are not covered by the Fund's Report of Independent Registered Public Accounting Firm, are available on the SEC's website or upon request. |
(c) Investment made with cash collateral received from securities on loan. |
(d) Security or a portion of the security is on loan at period end. |
(e) Security or a portion of the security was pledged to cover margin requirements for futures contracts. At period end, the value of securities pledged amounted to $249,939. |
Affiliated Central Funds |
Information regarding fiscal year to date income earned by the Fund from investments in Fidelity Central Funds is as follows: |
Fund | Income earned |
Fidelity Cash Central Fund | $ 5,067 |
Fidelity Securities Lending Cash Central Fund | 25,190 |
Total | $ 30,257 |
Other Information |
The following is a summary of the inputs used, as of December 31, 2013, involving the Fund's assets and liabilities carried at fair value. The inputs or methodology used for valuing securities may not be an indication of the risk associated with investing in those securities. For more information on valuation inputs, and their aggregation into the levels used in the table below, please refer to the Investment Valuation section in the accompanying Notes to Financial Statements. |
Valuation Inputs at Reporting Date: |
Description | Total | Level 1 | Level 2 | Level 3 |
Investments in Securities: | | | | |
Equities: | | | | |
Consumer Discretionary | $ 28,030,834 | $ 28,030,834 | $ - | $ - |
Consumer Staples | 11,574,186 | 11,574,186 | - | - |
Energy | 10,208,243 | 10,208,243 | - | - |
Financials | 48,801,451 | 48,801,451 | - | - |
Health Care | 35,061,939 | 35,061,939 | - | - |
Industrials | 37,884,208 | 37,884,208 | - | - |
Information Technology | 45,927,682 | 45,927,682 | - | - |
Materials | 10,845,535 | 10,845,535 | - | - |
Telecommunication Services | 1,659,771 | 1,659,771 | - | - |
Utilities | 3,549,949 | 3,549,949 | - | - |
U.S. Government and Government Agency Obligations | 249,939 | - | 249,939 | - |
Money Market Funds | 19,703,598 | 19,703,598 | - | - |
Total Investments in Securities: | $ 253,497,335 | $ 253,247,396 | $ 249,939 | $ - |
Derivative Instruments: | | | | |
Assets | | | | |
Futures Contracts | $ 57,158 | $ 57,158 | $ - | $ - |
Value of Derivative Instruments |
The following table is a summary of the Fund's value of derivative instruments by primary risk exposure as of December 31, 2013. For additional information on derivative instruments, please refer to the Derivative Instruments section in the accompanying Notes to Financial Statements. |
Primary Risk Exposure /
Derivative Type | Value |
| Asset | Liability |
Equity Risk | | |
Futures Contracts (a) | $ 57,158 | $ - |
Total Value of Derivatives | $ 57,158 | $ - |
(a) Reflects gross cumulative appreciation (depreciation) on futures contracts as presented in the Schedule of Investments. Only the period end receivable or payable for daily variation margin and net unrealized appreciation (depreciation) are presented in the Statement of Assets and Liabilities. |
See accompanying notes which are an integral part of the financial statements.
Annual Report
Statement of Assets and Liabilities
| December 31, 2013 |
| | |
Assets | | |
Investment in securities, at value (including securities loaned of $5,098,740) - See accompanying schedule: Unaffiliated issuers (cost $194,361,454) | $ 233,793,737 | |
Fidelity Central Funds (cost $19,703,598) | 19,703,598 | |
Total Investments (cost $214,065,052) | | $ 253,497,335 |
Segregated cash with brokers for derivative instruments | | 86,000 |
Cash | | 2,687 |
Receivable for investments sold | | 102,372 |
Receivable for fund shares sold | | 581,166 |
Dividends receivable | | 178,497 |
Distributions receivable from Fidelity Central Funds | | 2,214 |
Receivable for daily variation margin for derivative instruments | | 61,239 |
Prepaid expenses | | 488 |
Total assets | | 254,511,998 |
| | |
Liabilities | | |
Payable for investments purchased | $ 13,997,563 | |
Payable for fund shares redeemed | 65,634 | |
Accrued management fee | 127,358 | |
Distribution and service plan fees payable | 860 | |
Other affiliated payables | 31,043 | |
Other payables and accrued expenses | 41,949 | |
Collateral on securities loaned, at value | 5,147,975 | |
Total liabilities | | 19,412,382 |
| | |
Net Assets | | $ 235,099,616 |
Net Assets consist of: | | |
Paid in capital | | $ 192,525,713 |
Accumulated undistributed net realized gain (loss) on investments | | 3,084,462 |
Net unrealized appreciation (depreciation) on investments | | 39,489,441 |
Net Assets | | $ 235,099,616 |
Statement of Assets and Liabilities - continued
| December 31, 2013 |
| | |
Initial Class:
Net Asset Value, offering price and redemption price per share ($45,698,762 ÷ 2,967,479 shares) | | $ 15.40 |
| | |
Service Class:
Net Asset Value, offering price and redemption price per share ($329,082 ÷ 21,313 shares) | | $ 15.44 |
| | |
Service Class 2:
Net Asset Value, offering price and redemption price per share ($4,115,288 ÷ 266,398 shares) | | $ 15.45 |
| | |
Investor Class:
Net Asset Value, offering price and redemption price per share ($184,956,484 ÷ 12,043,466 shares) | | $ 15.36 |
See accompanying notes which are an integral part of the financial statements.
Annual Report
Statement of Operations
| Year ended December 31, 2013 |
| | |
Investment Income | | |
Dividends | | $ 2,335,120 |
Interest | | 280 |
Income from Fidelity Central Funds | | 30,257 |
Total income | | 2,365,657 |
| | |
Expenses | | |
Management fee | $ 1,093,406 | |
Transfer agent fees | 211,291 | |
Distribution and service plan fees | 8,728 | |
Accounting and security lending fees | 60,894 | |
Custodian fees and expenses | 19,546 | |
Independent trustees' compensation | 738 | |
Audit | 48,574 | |
Legal | 443 | |
Miscellaneous | 858 | |
Total expenses before reductions | 1,444,478 | |
Expense reductions | (5,962) | 1,438,516 |
Net investment income (loss) | | 927,141 |
Realized and Unrealized Gain (Loss) Net realized gain (loss) on: | | |
Investment securities: | | |
Unaffiliated issuers | 15,379,489 | |
Futures contracts | 1,119,192 | |
Total net realized gain (loss) | | 16,498,681 |
Change in net unrealized appreciation (depreciation) on: Investment securities | 31,645,219 | |
Futures contracts | 17,483 | |
Total change in net unrealized appreciation (depreciation) | | 31,662,702 |
Net gain (loss) | | 48,161,383 |
Net increase (decrease) in net assets resulting from operations | | $ 49,088,524 |
Statement of Changes in Net Assets
| Year ended
December 31,
2013 | Year ended
December 31,
2012 |
Increase (Decrease) in Net Assets | | |
Operations | | |
Net investment income (loss) | $ 927,141 | $ 1,452,571 |
Net realized gain (loss) | 16,498,681 | 5,627,263 |
Change in net unrealized appreciation (depreciation) | 31,662,702 | 6,760,922 |
Net increase (decrease) in net assets resulting from operations | 49,088,524 | 13,840,756 |
Distributions to shareholders from net investment income | (856,753) | (1,580,687) |
Distributions to shareholders from net realized gain | (14,181,388) | (4,740,566) |
Total distributions | (15,038,141) | (6,321,253) |
Share transactions - net increase (decrease) | 113,922,133 | 3,708,990 |
Total increase (decrease) in net assets | 147,972,516 | 11,228,493 |
| | |
Net Assets | | |
Beginning of period | 87,127,100 | 75,898,607 |
End of period (including undistributed net investment income of $0 and distributions in excess of net investment income of $138,807, respectively) | $ 235,099,616 | $ 87,127,100 |
See accompanying notes which are an integral part of the financial statements.
Annual Report
Financial Highlights - Initial Class
Years ended December 31, | 2013 | 2012 | 2011 | 2010 | 2009 |
Selected Per-Share Data | | | | | |
Net asset value, beginning of period | $ 12.03 | $ 10.94 | $ 11.15 | $ 8.91 | $ 7.32 |
Income from Investment Operations | | | | | |
Net investment income (loss) C | .09 | .22 | .05 | .04 | .04 |
Net realized and unrealized gain (loss) | 4.44 | 1.83 | (.20) | 2.24 | 1.59 |
Total from investment operations | 4.53 | 2.05 | (.15) | 2.28 | 1.63 |
Distributions from net investment income | (.07) | (.25) | (.06) | (.04) | (.04) |
Distributions from net realized gain | (1.09) | (.71) | - | - | - |
Total distributions | (1.16) | (.96) | (.06) | (.04) | (.04) |
Net asset value, end of period | $ 15.40 | $ 12.03 | $ 10.94 | $ 11.15 | $ 8.91 |
Total Return A, B | 38.35% | 19.00% | (1.36)% | 25.54% | 22.28% |
Ratios to Average Net Assets D, F | | | | | |
Expenses before reductions | .86% | .91% | .91% | .95% | 1.05% |
Expenses net of fee waivers, if any | .86% | .91% | .91% | .94% | 1.00% |
Expenses net of all reductions | .86% | .91% | .91% | .94% | 1.00% |
Net investment income (loss) | .66% | 1.80% | .47% | .41% | .56% |
Supplemental Data | | | | | |
Net assets, end of period (000 omitted) | $ 45,699 | $ 20,183 | $ 19,809 | $ 19,742 | $ 13,864 |
Portfolio turnover rate E | 108% | 99% | 90% | 71% | 81% |
A Total returns do not reflect charges attributable to your insurance company's separate account. Inclusion of these charges would reduce the total returns shown.
B Total returns would have been lower if certain expenses had not been reduced during the applicable periods shown.
C Calculated based on average shares outstanding during the period.
D Fees and expenses of any underlying Fidelity Central Funds are not included in the Fund's expense ratio. The Fund indirectly bears its proportionate share of the expenses of any underlying Fidelity Central Funds.
E Amount does not include the portfolio activity of any underlying Fidelity Central Funds.
F Expense ratios reflect operating expenses of the class. Expenses before reductions do not reflect amounts reimbursed by the investment adviser or reductions from expense offset arrangements and do not represent the amount paid by the class during periods when reimbursements or reductions occur. Expenses net of fee waivers reflect expenses after reimbursement by the investment adviser but prior to reductions from expense offset arrangements. Expenses net of all reductions represent the net expenses paid by the class.
Financial Highlights - Service Class
Years ended December 31, | 2013 | 2012 | 2011 | 2010 | 2009 |
Selected Per-Share Data | | | | | |
Net asset value, beginning of period | $ 12.06 | $ 10.96 | $ 11.16 | $ 8.92 | $ 7.33 |
Income from Investment Operations | | | | | |
Net investment income (loss) C | .08 | .21 | .04 | .03 | .03 |
Net realized and unrealized gain (loss) | 4.44 | 1.84 | (.20) | 2.23 | 1.58 |
Total from investment operations | 4.52 | 2.05 | (.16) | 2.26 | 1.61 |
Distributions from net investment income | (.05) | (.24) | (.04) | (.02) | (.02) |
Distributions from net realized gain | (1.09) | (.71) | - | - | - |
Total distributions | (1.14) | (.95) | (.04) | (.02) | (.02) |
Net asset value, end of period | $ 15.44 | $ 12.06 | $ 10.96 | $ 11.16 | $ 8.92 |
Total Return A, B | 38.19% | 18.97% | (1.41)% | 25.35% | 22.03% |
Ratios to Average Net Assets D, F | | | | | |
Expenses before reductions | .95% | .99% | 1.01% | 1.04% | 1.10% |
Expenses net of fee waivers, if any | .95% | .99% | 1.01% | 1.04% | 1.10% |
Expenses net of all reductions | .95% | .99% | 1.01% | 1.04% | 1.10% |
Net investment income (loss) | .57% | 1.72% | .38% | .32% | .46% |
Supplemental Data | | | | | |
Net assets, end of period (000 omitted) | $ 329 | $ 279 | $ 235 | $ 327 | $ 426 |
Portfolio turnover rate E | 108% | 99% | 90% | 71% | 81% |
A Total returns do not reflect charges attributable to your insurance company's separate account. Inclusion of these charges would reduce the total returns shown.
B Total returns would have been lower if certain expenses had not been reduced during the applicable periods shown.
C Calculated based on average shares outstanding during the period.
D Fees and expenses of any underlying Fidelity Central Funds are not included in the Fund's expense ratio. The Fund indirectly bears its proportionate share of the expenses of any underlying Fidelity Central Funds.
E Amount does not include the portfolio activity of any underlying Fidelity Central Funds.
F Expense ratios reflect operating expenses of the class. Expenses before reductions do not reflect amounts reimbursed by the investment adviser or reductions from expense offset arrangements and do not represent the amount paid by the class during periods when reimbursements or reductions occur. Expenses net of fee waivers reflect expenses after reimbursement by the investment adviser but prior to reductions from expense offset arrangements. Expenses net of all reductions represent the net expenses paid by the class.
See accompanying notes which are an integral part of the financial statements.
Annual Report
Financial Highlights - Service Class 2
Years ended December 31, | 2013 | 2012 | 2011 | 2010 | 2009 |
Selected Per-Share Data | | | | | |
Net asset value, beginning of period | $ 12.07 | $ 10.96 | $ 11.15 | $ 8.92 | $ 7.33 |
Income from Investment Operations | | | | | |
Net investment income (loss) C | .05 | .18 | .02 | .01 | .02 |
Net realized and unrealized gain (loss) | 4.45 | 1.83 | (.20) | 2.23 | 1.59 |
Total from investment operations | 4.50 | 2.01 | (.18) | 2.24 | 1.61 |
Distributions from net investment income | (.03) | (.19) | (.01) | (.01) | (.02) |
Distributions from net realized gain | (1.09) | (.71) | - | - | - |
Total distributions | (1.12) | (.90) | (.01) | (.01) | (.02) |
Net asset value, end of period | $ 15.45 | $ 12.07 | $ 10.96 | $ 11.15 | $ 8.92 |
Total Return A, B | 37.96% | 18.58% | (1.58)% | 25.07% | 21.94% |
Ratios to Average Net Assets D, F | | | | | |
Expenses before reductions | 1.15% | 1.23% | 1.26% | 1.28% | 1.41% |
Expenses net of fee waivers, if any | 1.15% | 1.23% | 1.25% | 1.25% | 1.25% |
Expenses net of all reductions | 1.15% | 1.23% | 1.25% | 1.25% | 1.25% |
Net investment income (loss) | .37% | 1.48% | .14% | .11% | .31% |
Supplemental Data | | | | | |
Net assets, end of period (000 omitted) | $ 4,115 | $ 1,624 | $ 1,656 | $ 2,513 | $ 1,535 |
Portfolio turnover rate E | 108% | 99% | 90% | 71% | 81% |
A Total returns do not reflect charges attributable to your insurance company's separate account. Inclusion of these charges would reduce the total returns shown.
B Total returns would have been lower if certain expenses had not been reduced during the applicable periods shown.
C Calculated based on average shares outstanding during the period.
D Fees and expenses of any underlying Fidelity Central Funds are not included in the Fund's expense ratio. The Fund indirectly bears its proportionate share of the expenses of any underlying Fidelity Central Funds.
E Amount does not include the portfolio activity of any underlying Fidelity Central Funds.
F Expense ratios reflect operating expenses of the class. Expenses before reductions do not reflect amounts reimbursed by the investment adviser or reductions from expense offset arrangements and do not represent the amount paid by the class during periods when reimbursements or reductions occur. Expenses net of fee waivers reflect expenses after reimbursement by the investment adviser but prior to reductions from expense offset arrangements. Expenses net of all reductions represent the net expenses paid by the class.
Financial Highlights - Investor Class
Years ended December 31, | 2013 | 2012 | 2011 | 2010 | 2009 |
Selected Per-Share Data | | | | | |
Net asset value, beginning of period | $ 12.01 | $ 10.92 | $ 11.12 | $ 8.89 | $ 7.31 |
Income from Investment Operations | | | | | |
Net investment income (loss) C | .08 | .21 | .04 | .03 | .04 |
Net realized and unrealized gain (loss) | 4.42 | 1.83 | (.19) | 2.23 | 1.57 |
Total from investment operations | 4.50 | 2.04 | (.15) | 2.26 | 1.61 |
Distributions from net investment income | (.06) | (.24) | (.05) | (.03) | (.03) |
Distributions from net realized gain | (1.09) | (.71) | - | - | - |
Total distributions | (1.15) | (.95) | (.05) | (.03) | (.03) |
Net asset value, end of period | $ 15.36 | $ 12.01 | $ 10.92 | $ 11.12 | $ 8.89 |
Total Return A, B | 38.18% | 18.96% | (1.35)% | 25.44% | 22.09% |
Ratios to Average Net Assets D, F | | | | | |
Expenses before reductions | .94% | .98% | .99% | 1.02% | 1.12% |
Expenses net of fee waivers, if any | .93% | .98% | .98% | 1.01% | 1.08% |
Expenses net of all reductions | .93% | .98% | .98% | 1.01% | 1.08% |
Net investment income (loss) | .58% | 1.73% | .40% | .34% | .48% |
Supplemental Data | | | | | |
Net assets, end of period (000 omitted) | $ 184,956 | $ 65,042 | $ 54,198 | $ 49,830 | $ 26,426 |
Portfolio turnover rate E | 108% | 99% | 90% | 71% | 81% |
A Total returns do not reflect charges attributable to your insurance company's separate account. Inclusion of these charges would reduce the total returns shown.
B Total returns would have been lower if certain expenses had not been reduced during the applicable periods shown.
C Calculated based on average shares outstanding during the period.
D Fees and expenses of any underlying Fidelity Central Funds are not included in the Fund's expense ratio. The Fund indirectly bears its proportionate share of the expenses of any underlying Fidelity Central Funds.
E Amount does not include the portfolio activity of any underlying Fidelity Central Funds.
F Expense ratios reflect operating expenses of the class. Expenses before reductions do not reflect amounts reimbursed by the investment adviser or reductions from expense offset arrangements and do not represent the amount paid by the class during periods when reimbursements or reductions occur. Expenses net of fee waivers reflect expenses after reimbursement by the investment adviser but prior to reductions from expense offset arrangements. Expenses net of all reductions represent the net expenses paid by the class.
See accompanying notes which are an integral part of the financial statements.
Annual Report
Notes to Financial Statements
For the period ended December 31, 2013
1. Organization.
VIP Disciplined Small Cap Portfolio (the Fund) is a fund of Variable Insurance Products Fund II (the Trust) and is authorized to issue an unlimited number of shares. The Trust is registered under the Investment Company Act of 1940, as amended (the 1940 Act), as an open-end management investment company organized as a Massachusetts business trust. Shares of the Fund may only be purchased by insurance companies for the purpose of funding variable annuity or variable life insurance contracts. The Fund offers the following classes of shares: Initial Class shares, Service Class shares, Service Class 2 shares and Investor Class shares. All classes have equal rights and voting privileges, except for matters affecting a single class.
2. Investments in Fidelity Central Funds.
The Fund invests in Fidelity Central Funds, which are open-end investment companies generally available only to other investment companies and accounts managed by the investment adviser and its affiliates. The Fund's Schedule of Investments lists each of the Fidelity Central Funds held as of period end, if any, as an investment of the Fund, but does not include the underlying holdings of each Fidelity Central Fund. As an Investing Fund, the Fund indirectly bears its proportionate share of the expenses of the underlying Fidelity Central Funds.
The Money Market Central Funds seek preservation of capital and current income and are managed by Fidelity Investments Money Management, Inc. (FIMM), an affiliate of the investment adviser. Annualized expenses of the Money Market Central Funds as of their most recent shareholder report date are less than .01%.
A complete unaudited list of holdings for each Fidelity Central Fund is available upon request or at the Securities and Exchange Commission (the SEC) website at www.sec.gov. In addition, the financial statements of the Fidelity Central Funds, which are not covered by the Fund's Report of Independent Registered Public Accounting Firm, are available on the SEC website or upon request.
3. Significant Accounting Policies.
The financial statements have been prepared in conformity with accounting principles generally accepted in the United States of America (GAAP), which require management to make certain estimates and assumptions at the date of the financial statements. Actual results could differ from those estimates. Subsequent events, if any, through the date that the financial statements were issued have been evaluated in the preparation of the financial statements. The following summarizes the significant accounting policies of the Fund:
Investment Valuation. Investments are valued as of 4:00 p.m. Eastern time on the last calendar day of the period. In accordance with valuation policies and procedures approved by the Board of Trustees (the Board), the Fund attempts to obtain prices from one or more third party pricing vendors or brokers to value its investments. When current market prices, quotations or currency exchange rates are not readily available or reliable, investments will be fair valued in good faith by the Fidelity Management & Research Company (FMR) Fair Value Committee (the Committee), in accordance with procedures adopted by the Board. Factors used in determining fair value vary by investment type and may include market or investment specific events, changes in interest rates and credit quality. The frequency with which these procedures are used cannot be predicted and they may be utilized to a significant extent. The Committee oversees the Fund's valuation policies and procedures and is responsible for approving and reporting to the Board all fair value determinations.
The Fund categorizes the inputs to valuation techniques used to value its investments into a disclosure hierarchy consisting of three levels as shown below:
Level 1 - quoted prices in active markets for identical investments
Level 2 - other significant observable inputs (including quoted prices for similar investments, interest rates, prepayment speeds, etc.)
Level 3 - unobservable inputs (including the Fund's own assumptions based on the best information available)
Valuation techniques used to value the Fund's investments by major category are as follows:
Equity securities, including restricted securities, for which market quotations are readily available, are valued at the last reported sale price or official closing price as reported by a third party pricing vendor on the primary market or exchange on which they are traded and are categorized as Level 1 in the hierarchy. In the event there were no sales during the day or closing prices are not available, securities are valued at the last quoted bid price or may be valued using the last available price and are generally categorized as Level 2 in the hierarchy. For foreign equity securities, when market or security specific events arise, comparisons to the valuation of American Depositary Receipts (ADRs), futures contracts, Exchange-Traded Funds (ETFs) and certain indexes as well as quoted prices for similar securities may be used and would be categorized as Level 2 in the hierarchy. Utilizing these techniques may result in transfers between Level 1 and Level 2. For equity securities, including restricted securities, where observable inputs are limited, assumptions about market activity and risk are used and these securities may be categorized as Level 3 in the hierarchy.
Annual Report
3. Significant Accounting Policies - continued
Investment Valuation - continued
Debt securities, including restricted securities, are valued based on evaluated prices received from third party pricing vendors or from brokers who make markets in such securities. U.S. government and government agency obligations, are valued by pricing vendors who utilize matrix pricing which considers yield or price of bonds of comparable quality, coupon, maturity and type or by broker-supplied prices. When independent prices are unavailable or unreliable, debt securities may be valued utilizing pricing methodologies which consider similar factors that would be used by third party pricing vendors. Debt securities are generally categorized as Level 2 in the hierarchy but may be Level 3 depending on the circumstances.
Futures contracts are valued at the settlement price established each day by the board of trade or exchange on which they are traded and are categorized as Level 1 in the hierarchy. Investments in open-end mutual funds, including the Fidelity Central Funds, are valued at their closing net asset value (NAV) each business day and are categorized as Level 1 in the hierarchy.
Changes in valuation techniques may result in transfers in or out of an assigned level within the disclosure hierarchy. The aggregate value of investments by input level, as of December 31, 2013, is included at the end of the Fund's Schedule of Investments.
Investment Transactions and Income. For financial reporting purposes, the Fund's investment holdings and NAV include trades executed through the end of the last business day of the period. The NAV per share for processing shareholder transactions is calculated as of the close of business of the New York Stock Exchange (NYSE), normally 4:00 p.m. Eastern time and includes trades executed through the end of the prior business day. Gains and losses on securities sold are determined on the basis of identified cost and may include proceeds received from litigation. Dividend income is recorded on the ex-dividend date, except for certain dividends from foreign securities where the ex-dividend date may have passed, which are recorded as soon as the Fund is informed of the ex-dividend date. Non-cash dividends included in dividend income, if any, are recorded at the fair market value of the securities received. Distributions received on securities that represent a return of capital or capital gain are recorded as a reduction of cost of investments and/or as a realized gain. Subsequent to ex-dividend date the Fund determines the components of these distributions, based upon receipt of tax filings or other correspondence relating to the underlying investment. Interest income and distributions from the Fidelity Central Funds are accrued as earned. Interest income includes coupon interest and amortization of premium and accretion of discount on debt securities.
Class Allocations and Expenses. Investment income, realized and unrealized capital gains and losses, common expenses of the Fund, and certain fund-level expense reductions, if any, are allocated daily on a pro-rata basis to each class based on the relative net assets of each class to the total net assets of the Fund. Each class differs with respect to transfer agent and distribution and service plan fees incurred. Certain expense reductions may also differ by class. For the reporting period, the allocated portion of income and expenses to each class as a percent of its average net assets may vary due to the timing of recording these transactions in relation to fluctuating net assets of the classes. Expenses directly attributable to a fund are charged to that fund. Expenses attributable to more than one fund are allocated among the respective funds on the basis of relative net assets or other appropriate methods. Expense estimates are accrued in the period to which they relate and adjustments are made when actual amounts are known.
Income Tax Information and Distributions to Shareholders. Each year, the Fund intends to qualify as a regulated investment company under Subchapter M of the Internal Revenue Code, including distributing substantially all of its taxable income and realized gains. As a result, no provision for U.S. Federal income taxes is required. As of December 31, 2013, the Fund did not have any unrecognized tax benefits in the financial statements; nor is the Fund aware of any tax positions for which it is reasonably possible that the total amounts of unrecognized tax benefits will significantly change in the next twelve months. The Fund files a U.S. federal tax return, in addition to state and local tax returns as required. The Fund's federal income tax returns are subject to examination by the Internal Revenue Service (IRS) for a period of three fiscal years after they are filed. State and local tax returns may be subject to examination for an additional fiscal year depending on the jurisdiction.
Distributions are declared and recorded on the ex-dividend date. Income dividends and capital gain distributions are declared separately for each class. Income and capital gain distributions are determined in accordance with income tax regulations, which may differ from GAAP.
Capital accounts within the financial statements are adjusted for permanent book-tax differences. These adjustments have no impact on net assets or the results of operations. Capital accounts are not adjusted for temporary book-tax differences which will reverse in a subsequent period.
Book-tax differences are primarily due to futures transactions, passive foreign investment companies (PFIC) and losses deferred due to wash sales.
The federal tax cost of investment securities and unrealized appreciation (depreciation) as of period end were as follows:
Gross unrealized appreciation | $ 42,840,867 |
Gross unrealized depreciation | (3,708,217) |
Net unrealized appreciation (depreciation) on securities and other investments | $ 39,132,650 |
| |
Tax Cost | $ 214,364,685 |
Annual Report
Notes to Financial Statements - continued
3. Significant Accounting Policies - continued
Income Tax Information and Distributions to Shareholders - continued
The tax-based components of distributable earnings as of period end were as follows:
Undistributed ordinary income | $ 1,922,725 |
Undistributed long-term capital gain | $ 1,518,529 |
Net unrealized appreciation (depreciation) | $ 39,132,650 |
The tax character of distributions paid was as follows:
| December 31, 2013 | December 31, 2012 |
Ordinary Income | $ 8,301,540 | $ 1,647,059 |
Long-term Capital Gains | 6,736,601 | 4,674,194 |
Total | $ 15,038,141 | $ 6,321,253 |
4. Derivative Instruments.
Risk Exposures and the Use of Derivative Instruments. The Fund's investment objective allows the Fund to enter into various types of derivative contracts, including futures contracts. Derivatives are investments whose value is primarily derived from underlying assets, indices or reference rates and may be transacted on an exchange or over-the-counter (OTC). Derivatives may involve a future commitment to buy or sell a specified asset based on specified terms, to exchange future cash flows at periodic intervals based on a notional principal amount, or for one party to make one or more payments upon the occurrence of specified events in exchange for periodic payments from the other party.
The Fund used derivatives to increase returns and to manage exposure to certain risks as defined below. The success of any strategy involving derivatives depends on analysis of numerous economic factors, and if the strategies for investment do not work as intended, the Fund may not achieve its objectives.
The Fund's use of derivatives increased or decreased its exposure to the following risk:
Equity Risk | Equity risk relates to the fluctuations in the value of financial instruments as a result of changes in market prices (other than those arising from interest rate risk or foreign exchange risk), whether caused by factors specific to an individual investment, its issuer, or all factors affecting all instruments traded in a market or market segment. |
The Fund is also exposed to additional risks from investing in derivatives, such as liquidity risk and counterparty credit risk. Liquidity risk is the risk that the Fund will be unable to close out the derivative in the open market in a timely manner. Counterparty credit risk is the risk that the counterparty will not be able to fulfill its obligation to the Fund. Counterparty credit risk related to exchange-traded futures contracts may be mitigated by the protection provided by the exchange on which they trade.
Investing in derivatives may involve greater risks than investing in the underlying assets directly and, to varying degrees, may involve risk of loss in excess of any initial investment and collateral received and amounts recognized in the Statement of Assets and Liabilities. In addition, there may be the risk that the change in value of the derivative contract does not correspond to the change in value of the underlying instrument.
Futures Contracts. A futures contract is an agreement between two parties to buy or sell a specified underlying instrument for a fixed price at a specified future date. The Fund used futures contracts to manage its exposure to the stock market.
Upon entering into a futures contract, a fund is required to deposit either cash or securities (initial margin) with a clearing broker in an amount equal to a certain percentage of the face value of the contract. Futures contracts are marked-to-market daily and subsequent daily payments (variation margin) are made or received by a fund depending on the daily fluctuations in the value of the futures contracts and are recorded as unrealized appreciation or (depreciation). This receivable and/or payable, if any, is included in daily variation margin for derivative instruments in the Statement of Assets and Liabilities. Realized gain or (loss) is recorded upon the expiration or closing of a futures contract.
Any open futures contracts at period end are presented in the Schedule of Investments under the caption "Futures Contracts." The underlying face amount at value reflects each contract's exposure to the underlying instrument or index at period end and is representative of volume of activity during the period. Cash deposited to meet initial margin requirements is presented as segregated cash with brokers for derivative instruments in the Statement of Assets and Liabilities.
During the period the Fund recognized net realized gain (loss) of $1,119,192 and a change in net unrealized appreciation (depreciation) of $17,483 related to its investment in futures contracts. These amounts are included in the Statement of Operations.
5. Purchases and Sales of Investments.
Purchases and sales of securities, other than short-term securities, aggregated $266,330,627 and $164,238,137, respectively.
Annual Report
6. Fees and Other Transactions with Affiliates.
Management Fee. Fidelity Management & Research Company (the investment adviser) and its affiliates provide the Fund with investment management related services for which the Fund pays a monthly management fee. The management fee is the sum of an individual fund fee rate that is based on an annual rate of .45% of the Fund's average net assets and an annualized group fee rate that averaged .25% during the period. The group fee rate is based upon the average net assets of all the mutual funds advised by the investment adviser, including any mutual funds previously advised by the investment adviser that are currently advised by Fidelity SelectCo, LLC, an affiliate of the investment adviser. The group fee rate decreases as assets under management increase and increases as assets under management decrease. For the reporting period, the total annual management fee rate was .70% of the Fund's average net assets.
Sub-Adviser. Geode Capital Management, LLC (Geode), serves as sub-adviser for the Fund. Geode provides discretionary investment advisory services to the Fund and is paid by the investment adviser for providing these services.
Distribution and Service Plan Fees. In accordance with Rule 12b-1 of the 1940 Act, the Fund has adopted separate 12b-1 Plans for each Service Class of shares. Each Service Class pays Fidelity Distributors Corporation (FDC), an affiliate of the investment adviser, a service fee. For the period, the service fee is based on an annual rate of .10% of Service Class' average net assets and .25% of Service Class 2's average net assets.
For the period, total fees, all of which were re-allowed to insurance companies for the distribution of shares and providing shareholder support services were as follows:
Service Class | $ 326 |
Service Class 2 | 8,402 |
| $ 8,728 |
Transfer Agent Fees. Fidelity Investments Institutional Operations Company, Inc. (FIIOC), an affiliate of the investment adviser, is the Fund's transfer, dividend disbursing, and shareholder servicing agent. FIIOC receives an asset-based fee with respect to each class. Each class (with the exception of Investor Class) pays a transfer agent fee, excluding out of pocket expenses, equal to an annual rate of .07% of average net assets. Investor Class pays a monthly asset-based transfer agent fee of .15% of average net assets. In addition, FIIOC receives an asset-based fee of .0035% of average net assets for typesetting, printing and mailing of shareholder reports, except proxy statements. FIIOC voluntarily agreed to reimburse or waive this fee for the period January 1, 2013 through December 31, 2013 (see Expense Reductions note). For the period, transfer agent fees for each class, including printing and out of pocket expenses, were as follows:
Initial Class | $ 24,799 |
Service Class | 224 |
Service Class 2 | 3,943 |
Investor Class | 182,325 |
| $ 211,291 |
Effective February 1, 2014, the Board of Trustees approved an amendment to the transfer agent fee agreement whereby each class (with the exception of Investor Class) pays a single fee of .07% of average net assets for transfer agent services, typesetting, printing and mailing of shareholder reports, excluding mailing of proxy statements and out of pocket expenses. Investor Class pays a single fee of .15% of average net assets.
Accounting and Security Lending Fees. Fidelity Service Company, Inc. (FSC), an affiliate of the investment adviser, maintains the Fund's accounting records. The accounting fee is based on the level of average net assets for each month. Under a separate contract, FSC administers the security lending program. The security lending fee is based on the number and duration of lending transactions.
7. Committed Line of Credit.
The Fund participates with other funds managed by the investment adviser or an affiliate in a $4.25 billion credit facility (the "line of credit") to be utilized for temporary or emergency purposes to fund shareholder redemptions or for other short-term liquidity purposes. The Fund has agreed to pay commitment fees on its pro-rata portion of the line of credit, which amounted to $259 and is reflected in Miscellaneous expenses on the Statement of Operations. During the period, there were no borrowings on this line of credit.
8. Security Lending.
The Fund lends portfolio securities through a lending agent from time to time in order to earn additional income. On the settlement date of the loan, the Fund receives collateral (in the form of U.S. Treasury obligations, letters of credit and/or cash) against the loaned securities and maintains collateral in an amount not less than 100% of the market value of the loaned securities during the period of the loan. The market value of the loaned securities is determined at the close of business of the Fund and any additional required collateral is delivered to the Fund on the next business day. If the borrower defaults on its obligation to return the securities loaned because of insolvency or other reasons, the Fund may apply collateral received from
Annual Report
Notes to Financial Statements - continued
8. Security Lending - continued
the borrower against the obligation. The Fund may experience delays and costs in recovering the securities loaned. Any cash collateral received is invested in the Fidelity Securities Lending Cash Central Fund. The value of loaned securities and cash collateral at period end are disclosed on the Fund's Statement of Assets and Liabilities. Security lending income represents the income earned on investing cash collateral, less rebates paid to borrowers and any lending agent fees associated with the loan, plus any premium payments received for lending certain types of securities. Security lending income is presented in the Statement of Operations as a component of income from Fidelity Central Funds. Total security lending income during the period amounted to $25,190.
9. Expense Reductions.
The investment adviser or its affiliates agreed to reimburse or waive certain fees during the period as noted in the table below.
Initial Class | $ 1,247 |
Service Class | 12 |
Service Class 2 | 129 |
Investor Class | 4,574 |
| $ 5,962 |
10. Distributions to Shareholders.
Distributions to shareholders of each class were as follows:
Years ended December 31, | 2013 | 2012 |
From net investment income | | |
Initial Class | $ 184,787 | $ 381,126 |
Service Class | 1,130 | 5,052 |
Service Class 2 | 7,506 | 23,651 |
Investor Class | 663,330 | 1,170,858 |
Total | $ 856,753 | $ 1,580,687 |
From net realized gain | | |
Initial Class | $ 2,792,903 | $ 1,106,489 |
Service Class | 23,408 | 15,283 |
Service Class 2 | 268,065 | 91,283 |
Investor Class | 11,097,012 | 3,527,511 |
Total | $ 14,181,388 | $ 4,740,566 |
11. Share Transactions.
Transactions for each class of shares were as follows:
| Shares | Dollars |
Years ended December 31, | 2013 | 2012 | 2013 | 2012 |
Initial Class | | | | |
Shares sold | 1,566,816 | 375,279 | $ 22,056,440 | $ 4,550,032 |
Reinvestment of distributions | 205,297 | 127,325 | 2,977,690 | 1,487,615 |
Shares redeemed | (481,918) | (635,915) | (6,764,258) | (7,619,240) |
Net increase (decrease) | 1,290,195 | (133,311) | $ 18,269,872 | $ (1,581,593) |
Service Class | | | | |
Reinvestment of distributions | 1,695 | 1,737 | $ 24,538 | $ 20,335 |
Shares redeemed | (3,516) | - | (54,536) | - |
Net increase (decrease) | (1,821) | 1,737 | $ (29,998) | $ 20,335 |
Service Class 2 | | | | |
Shares sold | 217,738 | 182,974 | $ 2,920,795 | $ 2,230,864 |
Reinvestment of distributions | 18,973 | 9,804 | 275,571 | 114,934 |
Shares redeemed | (104,805) | (209,457) | (1,448,600) | (2,440,173) |
Net increase (decrease) | 131,906 | (16,679) | $ 1,747,766 | $ (94,375) |
Investor Class | | | | |
Shares sold | 6,636,999 | 1,258,406 | $ 93,464,777 | $ 15,122,823 |
Reinvestment of distributions | 811,101 | 403,184 | 11,760,342 | 4,698,369 |
Shares redeemed | (822,368) | (1,208,098) | (11,290,626) | (14,456,569) |
Net increase (decrease) | 6,625,732 | 453,492 | $ 93,934,493 | $ 5,364,623 |
Annual Report
12. Other.
The Fund's organizational documents provide former and current trustees and officers with a limited indemnification against liabilities arising in connection with the performance of their duties to the Fund. In the normal course of business, the Fund may also enter into contracts that provide general indemnifications. The Fund's maximum exposure under these arrangements is unknown as this would be dependent on future claims that may be made against the Fund. The risk of material loss from such claims is considered remote.
At the end of the period, the investment adviser or its affiliates were the owners of record of 98% of the total outstanding shares of the Fund.
Annual Report
Report of Independent Registered Public Accounting Firm
To the Trustees of Variable Insurance Products Fund II and Shareholders of VIP Disciplined Small Cap Portfolio:
We have audited the accompanying statement of assets and liabilities of VIP Disciplined Small Cap Portfolio (the Fund), a fund of Variable Insurance Products Fund II, including the schedule of investments, as of December 31, 2013, and the related statement of operations for the year then ended, the statement of changes in net assets for each of the two years in the period then ended, and the financial highlights for each of the five years in the period then ended. These financial statements and financial highlights are the responsibility of the Fund's management. Our responsibility is to express an opinion on these financial statements and financial highlights based on our audits.
We conducted our audits in accordance with the standards of the Public Company Accounting Oversight Board (United States). Those standards require that we plan and perform the audit to obtain reasonable assurance about whether the financial statements and financial highlights are free of material misstatement. The Fund is not required to have, nor were we engaged to perform, an audit of its internal control over financial reporting. Our audits included consideration of internal control over financial reporting as a basis for designing audit procedures that are appropriate in the circumstances, but not for the purpose of expressing an opinion on the effectiveness of the Fund's internal control over financial reporting. Accordingly, we express no such opinion. An audit also includes examining, on a test basis, evidence supporting the amounts and disclosures in the financial statements, assessing the accounting principles used and significant estimates made by management, as well as evaluating the overall financial statement presentation. Our procedures included confirmation of securities owned as of December 31, 2013, by correspondence with the custodians and brokers; where replies were not received from brokers, we performed other auditing procedures. We believe that our audits provide a reasonable basis for our opinion.
In our opinion, the financial statements and financial highlights referred to above present fairly, in all material respects, the financial position of VIP Disciplined Small Cap Portfolio as of December 31, 2013, the results of its operations for the year then ended, the changes in its net assets for each of the two years in the period then ended, and the financial highlights for each of the five years in the period then ended, in conformity with accounting principles generally accepted in the United States of America.
DELOITTE & TOUCHE LLP
Boston, Massachusetts
February 11, 2014
Annual Report
The Trustees, Member of the Advisory Board, and officers of the trust and fund, as applicable, are listed below. The Board of Trustees governs the fund and is responsible for protecting the interests of shareholders. The Trustees are experienced executives who meet periodically throughout the year to oversee the fund's activities, review contractual arrangements with companies that provide services to the fund, oversee management of the risks associated with such activities and contractual arrangements, and review the fund's performance. Except for James C. Curvey, Ned C. Lautenbach, Ronald P. O'Hanley, and William S. Stavropoulos, each of the Trustees oversees 173 funds. Mr. Curvey oversees 396 funds. Mr. Lautenbach, Mr. O'Hanley, and Mr. Stavropoulos each oversees 247 funds.
The Trustees hold office without limit in time except that (a) any Trustee may resign; (b) any Trustee may be removed by written instrument, signed by at least two-thirds of the number of Trustees prior to such removal; (c) any Trustee who requests to be retired or who has become incapacitated by illness or injury may be retired by written instrument signed by a majority of the other Trustees; and (d) any Trustee may be removed at any special meeting of shareholders by a two-thirds vote of the outstanding voting securities of the trust. Each Trustee who is not an interested person (as defined in the 1940 Act) of the trust and the fund (Independent Trustee), shall retire not later than the last day of the calendar year in which his or her 75th birthday occurs. The Independent Trustees may waive this mandatory retirement age policy with respect to individual Trustees. The officers and Advisory Board Member hold office without limit in time, except that any officer and Advisory Board Member may resign or may be removed by a vote of a majority of the Trustees at any regular meeting or any special meeting of the Trustees. Except as indicated, each individual has held the office shown or other offices in the same company for the past five years.
Experience, Skills, Attributes, and Qualifications of the Fund's Trustees. The Governance and Nominating Committee has adopted a statement of policy that describes the experience, qualifications, attributes, and skills that are necessary and desirable for potential Independent Trustee candidates (Statement of Policy). The Board believes that each Trustee satisfied at the time he or she was initially elected or appointed a Trustee, and continues to satisfy, the standards contemplated by the Statement of Policy. The Governance and Nominating Committee also engages professional search firms to help identify potential Independent Trustee candidates who have the experience, qualifications, attributes, and skills consistent with the Statement of Policy. From time to time, additional criteria based on the composition and skills of the current Independent Trustees, as well as experience or skills that may be appropriate in light of future changes to board composition, business conditions, and regulatory or other developments, have also been considered by the professional search firms and the Governance and Nominating Committee. In addition, the Board takes into account the Trustees' commitment and participation in Board and committee meetings, as well as their leadership of standing and ad hoc committees throughout their tenure.
In determining that a particular Trustee was and continues to be qualified to serve as a Trustee, the Board has considered a variety of criteria, none of which, in isolation, was controlling. The Board believes that, collectively, the Trustees have balanced and diverse experience, qualifications, attributes, and skills, which allow the Board to operate effectively in governing the fund and protecting the interests of shareholders. Information about the specific experience, skills, attributes, and qualifications of each Trustee, which in each case led to the Board's conclusion that the Trustee should serve (or continue to serve) as a trustee of the fund, is provided below.
Board Structure and Oversight Function. James C. Curvey is an interested person (as defined in the 1940 Act) and currently serves as Chairman. The Trustees have determined that an interested Chairman is appropriate and benefits shareholders because an interested Chairman has a personal and professional stake in the quality and continuity of services provided to the fund. Independent Trustees exercise their informed business judgment to appoint an individual of their choosing to serve as Chairman, regardless of whether the Trustee happens to be independent or a member of management. The Independent Trustees have determined that they can act independently and effectively without having an Independent Trustee serve as Chairman and that a key structural component for assuring that they are in a position to do so is for the Independent Trustees to constitute a substantial majority for the Board. The Independent Trustees also regularly meet in executive session. Ned C. Lautenbach serves as Chairman of the Independent Trustees and as such (i) acts as a liaison between the Independent Trustees and management with respect to matters important to the Independent Trustees and (ii) with management prepares agendas for Board meetings.
Fidelity funds are overseen by different Boards of Trustees. The fund's Board oversees Fidelity's equity and high income funds and another Board oversees Fidelity's investment-grade bond, money market, and asset allocation funds. The asset allocation funds may invest in Fidelity funds overseen by the fund's Board. The use of separate Boards, each with its own committee structure, allows the Trustees of each group of Fidelity funds to focus on the unique issues of the funds they oversee, including common research, investment, and operational issues. On occasion, the separate Boards establish joint committees to address issues of overlapping consequences for the Fidelity funds overseen by each Board.
The Trustees operate using a system of committees to facilitate the timely and efficient consideration of all matters of importance to the Trustees, the fund, and fund shareholders and to facilitate compliance with legal and regulatory requirements and oversight of the fund's activities and associated risks. The Board, acting through its committees, has charged FMR and its affiliates with (i) identifying events or circumstances the occurrence of which could have demonstrably adverse effects on the fund's business and/or reputation; (ii) implementing processes and controls to lessen the possibility that such events or circumstances occur or to mitigate the effects of such events or circumstances if they do occur; and (iii) creating and maintaining a system designed to evaluate continuously business and market conditions in order to facilitate the identification and implementation processes described in (i) and (ii) above. Because the day-to-day operations and activities of the fund are carried out by or through FMR, its affiliates and other service providers, the fund's exposure to risks is mitigated but not eliminated by the processes overseen by the Trustees. While each of the Board's committees has responsibility for overseeing different aspects of the fund's activities, oversight is exercised primarily through the Operations, Audit, and Compliance Committees. In addition, the Independent Trustees have worked with FMR to enhance the Board's oversight of investment and financial risks, legal and regulatory risks, technology risks, and operational risks, including the development of additional risk reporting to the Board. For example, a working group comprised of Independent Trustees and FMR has worked and continues to work to review the Fidelity funds' valuation-related activities, reporting and risk management. Appropriate personnel, including but not limited to the fund's Chief Compliance Officer (CCO), FMR's internal auditor, the independent accountants, the fund's Treasurer and portfolio management personnel, make periodic reports to the Board's committees, as appropriate, including an annual review of FMR's risk management program for the Fidelity funds. The responsibilities of each standing committee, including their oversight responsibilities, are described further under "Standing Committees of the Fund's Trustees."
Annual Report
Trustees and Officers - continued
The fund's Statement of Additional Information (SAI) includes more information about the Trustees. To request a free copy, call Fidelity at 1-877-208-0098.
Interested Trustees*:
Correspondence intended for each Trustee who is an interested person may be sent to Fidelity Investments, 245 Summer Street, Boston, Massachusetts 02210.
Name, Year of Birth; Principal Occupations and Other Relevant Experience+ |
James C. Curvey (1935) |
Year of Election or Appointment: 2007 Trustee Chairman of the Board of Trustees |
| Mr. Curvey also serves as Trustee of other Fidelity funds. Mr. Curvey is a Director of Fidelity Investments Money Management, Inc. (2009-present), Director of Fidelity Research & Analysis Co. (2009-present) and Director of FMR and FMR Co., Inc. (2007-present). Mr. Curvey is also Vice Chairman (2007-present) and Director of FMR LLC. In addition, Mr. Curvey serves as an Overseer for the Boston Symphony Orchestra and a member of the Trustees of Villanova University. Previously, Mr. Curvey was the Vice Chairman (2006-2007) and Director (2000-2007) of FMR Corp. |
Ronald P. O'Hanley (1957) |
Year of Election or Appointment: 2011 Trustee |
| Mr. O'Hanley also serves as Trustee of other Fidelity funds. He is Director of Fidelity SelectCo, LLC (2013-present), FMR Co., Inc. (2010-present), Director of Fidelity Investments Money Management, Inc. (2010-present), Director of Fidelity Research & Analysis Company (2010-present), President of Fidelity Asset Management and Corporate Services and a Member of Fidelity's Executive Committee (2010-present). Previously, Mr. O'Hanley served as President and Chief Executive Officer of BNY Mellon Asset Management (2007-2010). Mr. O'Hanley also served as Vice Chairman of Bank New York Mellon Corp. and a member of that firm's Executive Committee. Prior to the 2007 merger of The Bank of New York and Mellon Financial Corporation, he was Vice Chairman of Mellon Financial Corporation and President and Chief Executive Officer of Mellon Asset Management. He joined Mellon in February 1997. Mr. O'Hanley currently serves as Chairman of the Boston Public Library Foundation Board of Directors and sits on the Board of Directors of Beth Israel Deaconess Medical Center, the Board of Trustees of the Marine Biological Laboratory and the Advisory Board of the Maxwell School of Citizenship and Public Administration at Syracuse University. Mr. O'Hanley also chairs the Council on Asset Management for the Financial Services Roundtable and is a member of the Board of Directors of Institutional Investor's U.S. Institute. |
* Trustees have been determined to be "Interested Trustees" by virtue of, among other things, their affiliation with the trust or various entities under common control with FMR.
+ The information above includes each Trustee's principal occupation during the last five years and other information relating to the experience, attributes, and skills relevant to each Trustee's qualifications to serve as a Trustee, which led to the conclusion that each Trustee should serve as a Trustee for the fund.
Annual Report
Independent Trustees:
Correspondence intended for each Independent Trustee (that is, the Trustees other than the Interested Trustees) may be sent to Fidelity Investments, P.O. Box 55235, Boston, Massachusetts 02205-5235.
Name, Year of Birth; Principal Occupations and Other Relevant Experience+ |
Dennis J. Dirks (1948) |
Year of Election or Appointment: 2005 Trustee |
| Mr. Dirks also serves as Trustee of other Fidelity funds. Prior to his retirement in May 2003, Mr. Dirks was Chief Operating Officer and a member of the Board of The Depository Trust & Clearing Corporation (DTCC). He also served as President, Chief Operating Officer, and Board member of The Depository Trust Company (DTC) and President and Board member of the National Securities Clearing Corporation (NSCC). In addition, Mr. Dirks served as Chief Executive Officer and Board member of the Government Securities Clearing Corporation, Chief Executive Officer and Board member of the Mortgage-Backed Securities Clearing Corporation, as a Trustee and a member of the Finance Committee of Manhattan College (2005-2008), and as a Trustee and a member of the Finance Committee of AHRC of Nassau County (2006-2008). Mr. Dirks is a member of the Independent Directors Council (IDC) Governing Council (2010-present) and Board of Directors for The Brookville Center for Children's Services, Inc. (2009-present). |
Alan J. Lacy (1953) |
Year of Election or Appointment: 2008 Trustee |
| Mr. Lacy also serves as Trustee of other Fidelity funds. Mr. Lacy serves as Senior Adviser (2007-present) of Oak Hill Capital Partners, L.P. (private equity). Mr. Lacy also served as Chief Executive Officer (2000-2005) and Vice Chairman (2005-2006) of Sears Holdings Corporation and Sears, Roebuck and Co. (retail). In addition, Mr. Lacy serves as a member of the Board of Directors of Dave & Buster's Entertainment, Inc. (restaurant and entertainment complexes, 2010-present), Earth Fare, Inc. (retail grocery, 2012-present), The Hillman Companies, Inc. (hardware wholesalers, 2010-present), and Bristol-Myers Squibb Company (global pharmaceuticals, 2008-present). Mr. Lacy is a member of the Board of Trustees of The National Parks Conservation Association (2006-present). Previously, Mr. Lacy served as Chairman of the Board of Trustees of the National Parks Conservation Association (2008-2011) and as a member of the Board of Directors for the Western Union Company (global money transfer, 2006-2011). |
Ned C. Lautenbach (1944) |
Year of Election or Appointment: 2000 Trustee Chairman of the Independent Trustees |
| Mr. Lautenbach also serves as Trustee of other Fidelity funds. Mr. Lautenbach currently serves as the Lead Director of the Eaton Corporation Board of Directors (diversified industrial, 1997-present). Mr. Lautenbach is Chairman of the Board of Directors of the Philharmonic Center for the Arts in Naples, Florida (2012-present) and a member of the Council on Foreign Relations (1994-present). Previously, Mr. Lautenbach was a Partner/Advisory Partner at Clayton, Dubilier & Rice, LLC (private equity investment, 1998-2010), as well as a Director of Sony Corporation (2006-2007). |
Joseph Mauriello (1944) |
Year of Election or Appointment: 2008 Trustee |
| Mr. Mauriello also serves as Trustee of other Fidelity funds. Prior to his retirement in January 2006, Mr. Mauriello served in numerous senior management positions including Deputy Chairman and Chief Operating Officer (2004-2005), and Vice Chairman of Financial Services (2002-2004) of KPMG LLP US (professional services, 1965-2005). Mr. Mauriello currently serves as a member of the Board of Directors of XL Group plc. (global insurance and re-insurance, 2006-present). Previously, Mr. Mauriello served as a Director of the Hamilton Funds of the Bank of New York (2006-2007) and of Arcadia Resources Inc. (health care services and products, 2007-2012). |
Robert W. Selander (1950) |
Year of Election or Appointment: 2011 Trustee |
| Mr. Selander also serves as Trustee of other Fidelity funds. Previously, Mr. Selander served as a Member of the Advisory Board of other Fidelity funds (2011), and Executive Vice Chairman (2010), Chief Executive Officer (2009-2010), and President and Chief Executive Officer (1997-2009) of Mastercard, Inc. |
Cornelia M. Small (1944) |
Year of Election or Appointment: 2005 Trustee |
| Ms. Small also serves as Trustee of other Fidelity funds. Ms. Small is a member of the Board of Directors (2009-present) and Chair of the Investment Committee (2010-present) of the Teagle Foundation. Ms. Small also serves on the Investment Committee of the Berkshire Taconic Community Foundation (2008-present). Previously, Ms. Small served as Chairperson (2002-2008) and a member of the Investment Committee and Chairperson (2008-2012) and a member of the Board of Trustees of Smith College. In addition, Ms. Small served as Chief Investment Officer, Director of Global Equity Investments, and a member of the Board of Directors of Scudder, Stevens & Clark and Scudder Kemper Investments. |
William S. Stavropoulos (1939) |
Year of Election or Appointment: 2001 Trustee Vice Chairman of the Independent Trustees |
| Mr. Stavropoulos also serves as Trustee of other Fidelity funds. Mr. Stavropoulos serves as President and Founder of the Michigan Baseball Foundation, the Great Lakes Loons (2007-present). Mr. Stavropoulos is Chairman Emeritus of the Board of Directors of The Dow Chemical Company, where he previously served in numerous senior management positions, including President, CEO (1995-2000; 2002-2004), Chairman of the Executive Committee (2000-2006), and as a member of the Board of Directors (1990-2006). Currently, Mr. Stavropoulos is Chairman of the Board of Directors of Univar Inc. (global distributor of commodity and specialty chemicals), a Director of Teradata Corporation (data warehousing and technology solutions), and Maersk Inc. (industrial conglomerate), and a member of the Advisory Board for Metalmark Capital LLC (private equity investment, 2005-present). Mr. Stavropoulos is an operating advisor to Clayton, Dubilier & Rice, LLC (private equity investment). In addition, Mr. Stavropoulos is a member of the University of Notre Dame Advisory Council for the College of Science, a Trustee of the Rollin L. Gerstacker Foundation, and a Director of the Naples Philharmonic Center for the Arts. Previously, Mr. Stavropoulos served as a Director of Chemical Financial Corporation (bank holding company, 1993-2012) and Tyco International, Ltd. (multinational manufacturing and services, 2007-2012). |
David M. Thomas (1949) |
Year of Election or Appointment: 2008 Trustee |
| Mr. Thomas also serves as Trustee of other Fidelity funds. Mr. Thomas serves as Non-Executive Chairman of the Board of Directors of Fortune Brands Home and Security (home and security products, 2011-present), and as a member of the Board of Directors of Interpublic Group of Companies, Inc. (marketing communication, 2004-present). Previously, Mr. Thomas served as Executive Chairman (2005-2006) and Chairman and Chief Executive Officer (2000-2005) of IMS Health, Inc. (pharmaceutical and healthcare information solutions), and a Director of Fortune Brands, Inc. (consumer products, 2000-2011). |
+ The information above includes each Trustee's principal occupation during the last five years and other information relating to the experience, attributes, and skills relevant to each Trustee's qualifications to serve as a Trustee, which led to the conclusion that each Trustee should serve as a Trustee for the fund.
Advisory Board Member and Officers:
Correspondence intended for each officer and Peter S. Lynch may be sent to Fidelity Investments, 245 Summer Street, Boston, Massachusetts 02210. Officers appear below in alphabetical order.
Name, Year of Birth; Principal Occupation |
Peter S. Lynch (1944) |
Year of Election or Appointment: 2003 Member of the Advisory Board |
| Mr. Lynch also serves as Member of the Advisory Board of other Fidelity funds. Mr. Lynch is Vice Chairman and a Director of FMR and FMR Co., Inc. In addition, Mr. Lynch serves as a Trustee of Boston College and as the Chairman of the Inner-City Scholarship Fund. Previously, Mr. Lynch served on the Special Olympics International Board of Directors (1997-2006). |
Elizabeth Paige Baumann (1968) |
Year of Election or Appointment: 2012 Anti-Money Laundering (AML) Officer |
| Ms. Baumann also serves as AML Officer of other funds. She is Chief AML Officer of FMR LLC (2012-present) and is an employee of Fidelity Investments. Previously, Ms. Baumann served as Vice President and Deputy Anti-Money Laundering Officer (2007-2012). |
William C. Coffey (1969) |
Year of Election or Appointment: 2009 Assistant Secretary |
| Mr. Coffey also serves as Assistant Secretary of other funds. He is Senior Vice President and Deputy General Counsel of FMR LLC (2010-present), and is an employee of Fidelity Investments. Previously, Mr. Coffey served as Vice President and Associate General Counsel of FMR LLC (2005-2009). |
Jonathan Davis (1968) |
Year of Election or Appointment: 2010 Assistant Treasurer |
| Mr. Davis also serves as Assistant Treasurer of other funds. Mr. Davis is an employee of Fidelity Investments. Previously, Mr. Davis served as Vice President and Associate General Counsel of FMR LLC (2003-2010). |
Adrien E. Deberghes (1967) |
Year of Election or Appointment: 2008 Deputy Treasurer |
| Mr. Deberghes also serves as an officer of other funds. He is an employee of Fidelity Investments (2008-present). Prior to joining Fidelity Investments, Mr. Deberghes was Senior Vice President of Mutual Fund Administration at State Street Corporation (2007-2008), Senior Director of Mutual Fund Administration at Investors Bank & Trust (2005-2007), and Director of Finance for Dunkin' Brands (2000-2005). |
Stephanie J. Dorsey (1969) |
Year of Election or Appointment: 2010 Assistant Treasurer |
| Ms. Dorsey also serves as an officer of other funds. She is an employee of Fidelity Investments (2008-present) and has served in other fund officer roles. Prior to joining Fidelity Investments, Ms. Dorsey served as Treasurer (2004-2008) of the JPMorgan Mutual Funds and Vice President (2004-2008) of JPMorgan Chase Bank. |
Scott C. Goebel (1968) |
Year of Election or Appointment: 2008 Secretary and Chief Legal Officer (CLO) |
| Mr. Goebel serves as Secretary and CLO of other funds. Mr. Goebel also serves as Secretary of Fidelity Investments Money Management, Inc. (FIMM) (2010-present) and Fidelity Research and Analysis Company (FRAC) (2010-present); General Counsel, Secretary, and Senior Vice President of FMR (2008-present) and FMR Co., Inc. (2008-present); Chief Legal Officer of Fidelity Management & Research (Hong Kong) Limited (2008-present) and Assistant Secretary of Fidelity Management & Research (Japan) Inc. (2008-present), and Fidelity Management & Research (U.K.) Inc. (2008-present). Previously, Mr. Goebel served as Secretary and CLO of other Fidelity funds (2008-2013), Assistant Secretary of FIMM (2008-2010), FRAC (2008-2010), and certain funds (2007-2008); and as Vice President and Secretary of Fidelity Distributors Corporation (FDC) (2005-2007). Mr. Goebel has been employed by FMR LLC or an affiliate since 2001. |
Joseph A. Hanlon (1968) |
Year of Election or Appointment: 2012 Chief Compliance Officer |
| Mr. Hanlon also serves as Chief Compliance Officer of other funds. Mr. Hanlon serves as Compliance Officer of FMR, FMR Co., Inc., Fidelity Investments Money Management, Inc. (FIMM), Fidelity Research and Analysis Company (FRAC), and Fidelity Management & Research (Hong Kong) (2009-present), as Senior Vice President of the Fidelity Asset Management Division (2009-present), and is an employee of Fidelity Investments. Previously, Mr. Hanlon served as Compliance Officer of Fidelity Management & Research (Japan) Inc. (2009-2013), Strategic Advisers, Inc. (2009-2013), and Fidelity Management & Research (U.K.) Inc. (2009-2013). |
Thomas C. Hense (1964) |
Year of Election or Appointment: 2008/2010 Vice President |
| Mr. Hense also serves as Vice President of other funds (High Income (2008), Small Cap (2008), and Value (2010) funds). Previously, Mr. Hense served as a portfolio manager for Fidelity's Institutional Money Management Group (Pyramis) (2003-2008). |
Brian B. Hogan (1964) |
Year of Election or Appointment: 2009 Vice President |
| Mr. Hogan also serves as Vice President of other funds. Mr. Hogan serves as President of FMR's Equity Division (2009-present). Previously, Mr. Hogan served as Senior Vice President, Equity Research of FMR (2006-2009) and as a portfolio manager. |
Chris Maher (1972) |
Year of Election or Appointment: 2013 Assistant Treasurer |
| Mr. Maher serves as Assistant Treasurer of other funds. Mr. Maher is Vice President of Valuation Oversight and is an employee of Fidelity Investments. Previously, Mr. Maher served as Vice President of Asset Management Compliance (2013), Vice President of FMR's Program Management Group (2010-2013), and Vice President of Valuation Oversight (2008-2010). |
Christine Reynolds (1958) |
Year of Election or Appointment: 2008 Chief Financial Officer |
| Ms. Reynolds also serves as Chief Financial Officer of other funds. Ms. Reynolds became President of Fidelity Pricing and Cash Management Services (FPCMS) in August 2008. Ms. Reynolds served as Chief Operating Officer of FPCMS (2007-2008). Previously, Ms. Reynolds served as President, Treasurer, and Anti-Money Laundering officer of the Fidelity funds (2004-2007). |
Kenneth B. Robins (1969) |
Year of Election or Appointment: 2008 President and Treasurer |
| Mr. Robins also serves as an officer of other funds. Mr. Robins serves as Executive Vice President of Fidelity Investments Money Management, Inc. (FIMM) (2013-present) and is an employee of Fidelity Investments (2004-present). Previously, Mr. Robins served in other fund officer roles. |
Gary W. Ryan (1958) |
Year of Election or Appointment: 2005 Assistant Treasurer |
| Mr. Ryan also serves as Assistant Treasurer of other funds. Mr. Ryan is an employee of Fidelity Investments and has served in other fund officer roles. Previously, Mr. Ryan served as Vice President of Fund Reporting in Fidelity Pricing and Cash Management Services (FPCMS) (1999-2005). |
Stephen Sadoski (1971) |
Year of Election or Appointment: 2012 Deputy Treasurer |
| Mr. Sadoski also serves as Deputy Treasurer of other funds. He is an employee of Fidelity Investments (2012-present) and has served in another fund officer role. Prior to joining Fidelity Investments, Mr. Sadoski served as an assistant chief accountant in the Division of Investment Management of the Securities and Exchange Commission (SEC) (2009-2012) and as a senior manager at Deloitte & Touche LLP (1997-2009). |
Stacie M. Smith (1974) |
Year of Election or Appointment: 2013 Deputy Treasurer |
| Ms. Smith also serves as an officer of other funds. She is an employee of Fidelity Investments (2009-present) and has served in other fund officer roles. Prior to joining Fidelity Investments, Ms. Smith served as Senior Audit Manager of Ernst & Young LLP (1996-2009). |
Renee Stagnone (1975) |
Year of Election or Appointment: 2013 Deputy Treasurer |
| Ms. Stagnone also serves as Deputy Treasurer of other funds. Ms. Stagnone is an employee of Fidelity Investments. |
Joseph F. Zambello (1957) |
Year of Election or Appointment: 2011 Deputy Treasurer |
| Mr. Zambello also serves as Deputy Treasurer of other funds. Mr. Zambello is an employee of Fidelity Investments. Previously, Mr. Zambello served as Vice President of FMR's Program Management Group (2009-2011) and Vice President of the Transfer Agent Oversight Group (2005-2009). |
Annual Report
The Board of Trustees of VIP Disciplined Small Cap Portfolio voted to pay to shareholders of record at the opening of business on record date, the following distributions per share derived from capital gains realized from sales of portfolio securities.
| Pay Date | Record Date | Capital Gains |
Initial Class | 02/07/14 | 02/07/14 | $0.223 |
Service Class | 02/07/14 | 02/07/14 | $0.223 |
Service Class 2 | 02/07/14 | 02/07/14 | $0.223 |
Investor Class | 02/07/14 | 02/07/14 | $0.223 |
Initial Class designates 19%; Service Class designates 20%; Service Class 2 designates 21 %; and Investor Class designates 19% of the dividends distributed in December 2013 during the fiscal year as qualifying for the dividends-received deduction for corporate shareholders.
The fund hereby designates as a capital gain dividend with respect to the taxable year ended December 31 2013, $7,234,830, or, if subsequently determined to be different, the net capital gain of such year.
Annual Report
Board Approval of Investment Advisory Contracts and Management Fees
VIP Disciplined Small Cap Portfolio
Each year, the Board of Trustees, including the Independent Trustees (together, the Board), votes on the renewal of the management contract and sub-advisory agreements (together, the Advisory Contracts) for the fund. The Board, assisted by the advice of fund counsel and Independent Trustees' counsel, requests and considers a broad range of information relevant to the renewal of the Advisory Contracts throughout the year.
The Board meets regularly and, at each of its meetings, covers an extensive agenda of topics and materials and considers factors that are relevant to its annual consideration of the renewal of the fund's Advisory Contracts, including the services and support provided to the fund and its shareholders. The Board has established various standing committees, each composed of and chaired by Independent Trustees with varying backgrounds, to which the Board has assigned specific subject matter responsibilities in order to enhance effective decision-making by the Board. The Board, acting directly and through its Committees, requests and receives information concerning the annual consideration of the renewal of the fund's Advisory Contracts. The Board also meets as needed to consider matters specifically related to the Board's annual consideration of the renewal of Advisory Contracts. Members of the Board may also meet with trustees of other Fidelity funds through ad hoc joint committees to discuss certain matters relevant to the Fidelity funds.
At its July 2013 meeting, the Board, including the Independent Trustees, unanimously determined to renew the fund's Advisory Contracts. In reaching its determination, the Board considered all factors it believed relevant, including (i) the nature, extent, and quality of the services to be provided to the fund and its shareholders (including the investment performance of the fund); (ii) the competitiveness of the fund's management fee and total expense ratio relative to peer funds; (iii) the total costs of the services to be provided by and the profits to be realized by Fidelity from its relationship with the fund; (iv) the extent to which economies of scale exist and would be realized as the fund grows; and (v) whether fee levels reflect these economies of scale, if any, for the benefit of fund shareholders.
In considering whether to renew the Advisory Contracts for the fund, the Board reached a determination, with the assistance of fund counsel and Independent Trustees' counsel and through the exercise of its business judgment, that the renewal of the Advisory Contracts was in the best interests of the fund and its shareholders and that the compensation payable under the Advisory Contracts was fair and reasonable. The Board's decision to renew the Advisory Contracts was not based on any single factor, but rather was based on a comprehensive consideration of all the information provided to the Board at its meetings throughout the year. The Board, in reaching its determination to renew the Advisory Contracts, was aware that shareholders in the fund have a broad range of investment choices available to them, including a wide choice among mutual funds offered by Fidelity's competitors, and that the fund's shareholders, who have the opportunity to review and weigh the disclosure provided by the fund in its prospectus and other public disclosures, have chosen to invest in this fund, which is a part of the Fidelity family of funds.
Nature, Extent, and Quality of Services Provided. The Board considered the staffing within the investment adviser, Fidelity Management & Research Company (FMR), and the sub-advisers (together, the Investment Advisers) as it relates to the fund, including the backgrounds of the fund's investment personnel, and also considered the fund's investment objective, strategies, and related investment philosophy. The Independent Trustees also had discussions with senior management of Fidelity's investment operations and investment groups. The Board considered the structure of the portfolio manager compensation program and whether this structure provides appropriate incentives to act in the best interests of the fund.
Resources Dedicated to Investment Management and Support Services. The Board and the Fund Oversight and Research Committees reviewed the general qualifications and capabilities of the Investment Advisers' investment staff, including its size, education, experience, and resources, as well as the Investment Advisers' approach to recruiting, training, managing, and compensating investment personnel. The Board noted that FMR has continued to increase the resources devoted to non-U.S. offices, including expansion of Fidelity's global investment organization. The Board also noted that Fidelity's analysts have extensive resources, tools and capabilities that allow them to conduct sophisticated quantitative and fundamental analysis, as well as credit analysis of issuers, counterparties and guarantors. Further, the Board believes that Fidelity's investment professionals have sufficient access to global information and data so as to provide competitive investment results over time, and that those professionals also have access to sophisticated tools that permit them to assess portfolio construction and risk and performance attribution characteristics continuously, as well as to transmit new information and research conclusions rapidly around the world. Additionally, in its deliberations, the Board considered the Investment Advisers' trading and risk management capabilities and resources, which are an integral part of the investment management process.
Shareholder and Administrative Services. The Board considered (i) the nature, extent, quality, and cost of advisory, administrative, and shareholder services performed by the Investment Advisers and their affiliates under the Advisory Contracts and under separate agreements covering transfer agency, pricing and bookkeeping, and securities lending services for the fund; (ii) the nature and extent of the supervision of third party service providers, principally custodians and subcustodians; and (iii) the resources devoted to, and the record of compliance with, the fund's compliance policies and procedures. The Board also reviewed the allocation of fund brokerage, including allocations to brokers affiliated with the Investment Advisers, the use of brokerage commissions to pay fund expenses, and the use of "soft" commission dollars to pay for research services.
The Board noted that the growth of fund assets over time across the complex allows Fidelity to reinvest in the development of services designed to enhance the value or convenience of the Fidelity funds as investment vehicles. These services include 24-hour access to account information and market information through telephone representatives and over the Internet, investor education materials and asset allocation tools, and the expanded availability of Fidelity Investor Centers.
Annual Report
Board Approval of Investment Advisory Contracts and Management Fees - continued
Investment in a Large Fund Family. The Board considered the benefits to shareholders of investing in a Fidelity fund, including the benefits of investing in a fund that is part of a large family of funds offering a variety of investment disciplines and providing a large variety of mutual fund investor services. The Board noted that Fidelity had taken, or had made recommendations that resulted in the Fidelity funds taking, a number of actions over the previous year that benefited particular funds, including (i) continuing to dedicate additional resources to investment research and to the support of the senior management team that oversees asset management; (ii) persisting in efforts to enhance Fidelity's global research capabilities; (iii) launching new funds and making other enhancements to meet client needs for global and income-oriented solutions; (iv) continuing to launch dedicated lower cost underlying funds to meet portfolio construction needs related to expanding underlying fund options for Fidelity funds of funds, specifically for the Freedom Fund product lines; (v) rationalizing product lines and gaining increased efficiencies through the mergers of several funds into other funds; (vi) strengthening Fidelity's index fund offerings by reducing investment minimums and adopting or lowering existing expense caps for certain funds and classes; (vii) enhancing Global Asset Allocation product offerings by launching new funds and strategies, including "open architecture" target date funds that utilize affiliated and unaffiliated sub-advisers; (viii) modifying the eligibility criteria for Institutional Class shares of Advisor funds to increase their marketability to a portion of the defined contribution plan market; (ix) creating a new low-cost retirement share class for certain Advisor funds to appeal to large retirement plans; (x) transitioning the management of certain Fidelity commodity funds to Geode Capital Management LLC, a registered commodity pool operator, while retaining administrative responsibilities for the funds; (xi) reorganizing a number of funds; and (xii) taking steps toward establishing a new Fidelity adviser to manage sector-based funds and products.
Investment Performance. The Board considered whether the fund has operated in accordance with its investment objective, as well as its record of compliance with its investment restrictions and its performance history.
The Board took into account discussions with the Investment Advisers about fund investment performance that occur at Board meetings throughout the year. In this regard the Board noted that as part of regularly scheduled fund reviews and other reports to the Board on fund performance, the Board periodically considers annualized return information for the fund, for different time periods, measured against a securities market index ("benchmark index") and a peer group of mutual funds with similar objectives ("peer group"). In its evaluation of fund investment performance, the Board gave particular attention to information indicating changes in performance of certain Fidelity funds for specific time periods and the Investment Advisers' explanations for any overperformance or underperformance.
In addition to reviewing absolute and relative fund performance, the Independent Trustees periodically consider the appropriateness of fund performance metrics in evaluating the results achieved. In general, the Independent Trustees believe that fund performance should be evaluated based on net performance (after fees and expenses) of both the highest performing and lowest performing classes, where applicable, compared to appropriate benchmark indices, over appropriate time periods which may include full market cycles, and compared to peer groups, as applicable, over the same periods, taking into account relevant factors including the following: general market conditions; issuer-specific information; tactical opportunities for investment; and fund cash flows and other factors.
The Independent Trustees recognize that shareholders evaluate performance on a net basis over their own holding periods, for which one-, three-, and five-year periods are used as a proxy. For this reason, the performance information reviewed by the Board also included net cumulative calendar year total return information for the fund and an appropriate benchmark index for the most recent one-, three-, and five-year periods, as shown below. A peer group comparison is not shown below.
Annual Report
VIP Disciplined Small Cap Portfolio
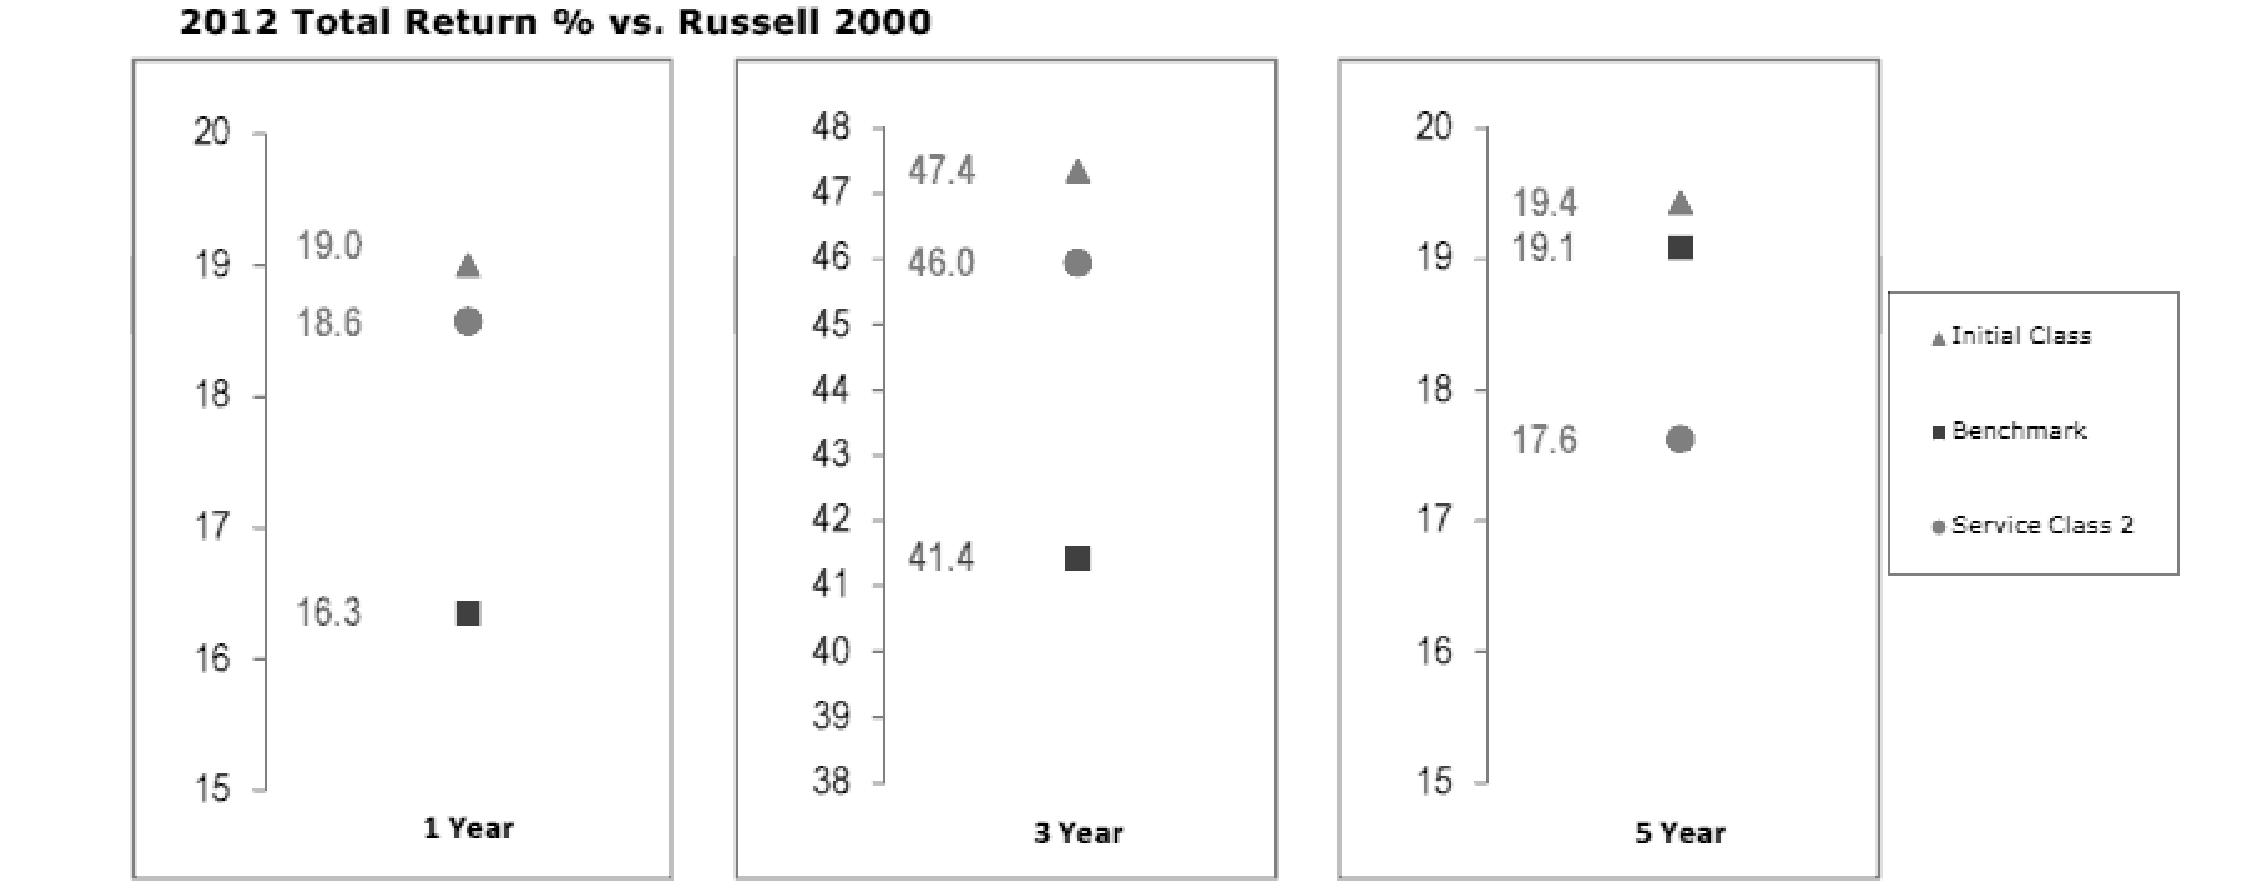
Based on its review, the Board concluded that the nature, extent, and quality of services provided to the fund under the Advisory Contracts should benefit the fund's shareholders.
Competitiveness of Management Fee and Total Expense Ratio. The Board considered the fund's management fee and total expense ratio compared to "mapped groups" of competitive funds and classes. Fidelity creates "mapped groups" by combining similar Lipper investment objective categories that have comparable management fee characteristics. Combining Lipper investment objective categories aids the Board's management fee and total expense ratio comparisons by broadening the competitive group used for comparison and by reducing the number of universes to which various Fidelity funds are compared.
Management Fee. The Board considered two proprietary management fee comparisons for the 12-month periods shown in the chart below. The group of Lipper funds used by the Board for management fee comparisons is referred to below as the "Total Mapped Group." The Total Mapped Group comparison focuses on a fund's standing in terms of gross management fees before expense reimbursements or caps relative to the total universe of funds with comparable investment mandates, regardless of whether their management fee structures also are comparable. Funds with comparable investment mandates offer exposure to similar types of securities. Funds with comparable management fee structures have similar management fee contractual arrangements (e.g., flat rate charged for advisory services, all-inclusive fee rate, etc.). "TMG %" represents the percentage of funds in the Total Mapped Group that had management fees that were lower than the fund's. For example, a TMG % of 10% means that 90% of the funds in the Total Mapped Group had higher management fees than the fund. The "Asset-Size Peer Group" (ASPG) comparison focuses on a fund's standing relative to a subset of non-Fidelity funds within the Total Mapped Group that are similar in size and management fee structure. The ASPG represents at least 15% of the funds in the Total Mapped Group with comparable asset size and management fee structures, subject to a minimum of 50 funds (or all funds in the Total Mapped Group if fewer than 50). Additional information, such as the ASPG quartile in which the fund's management fee ranked, is also included in the chart and considered by the Board.
Annual Report
Board Approval of Investment Advisory Contracts and Management Fees - continued
VIP Disciplined Small Cap Portfolio
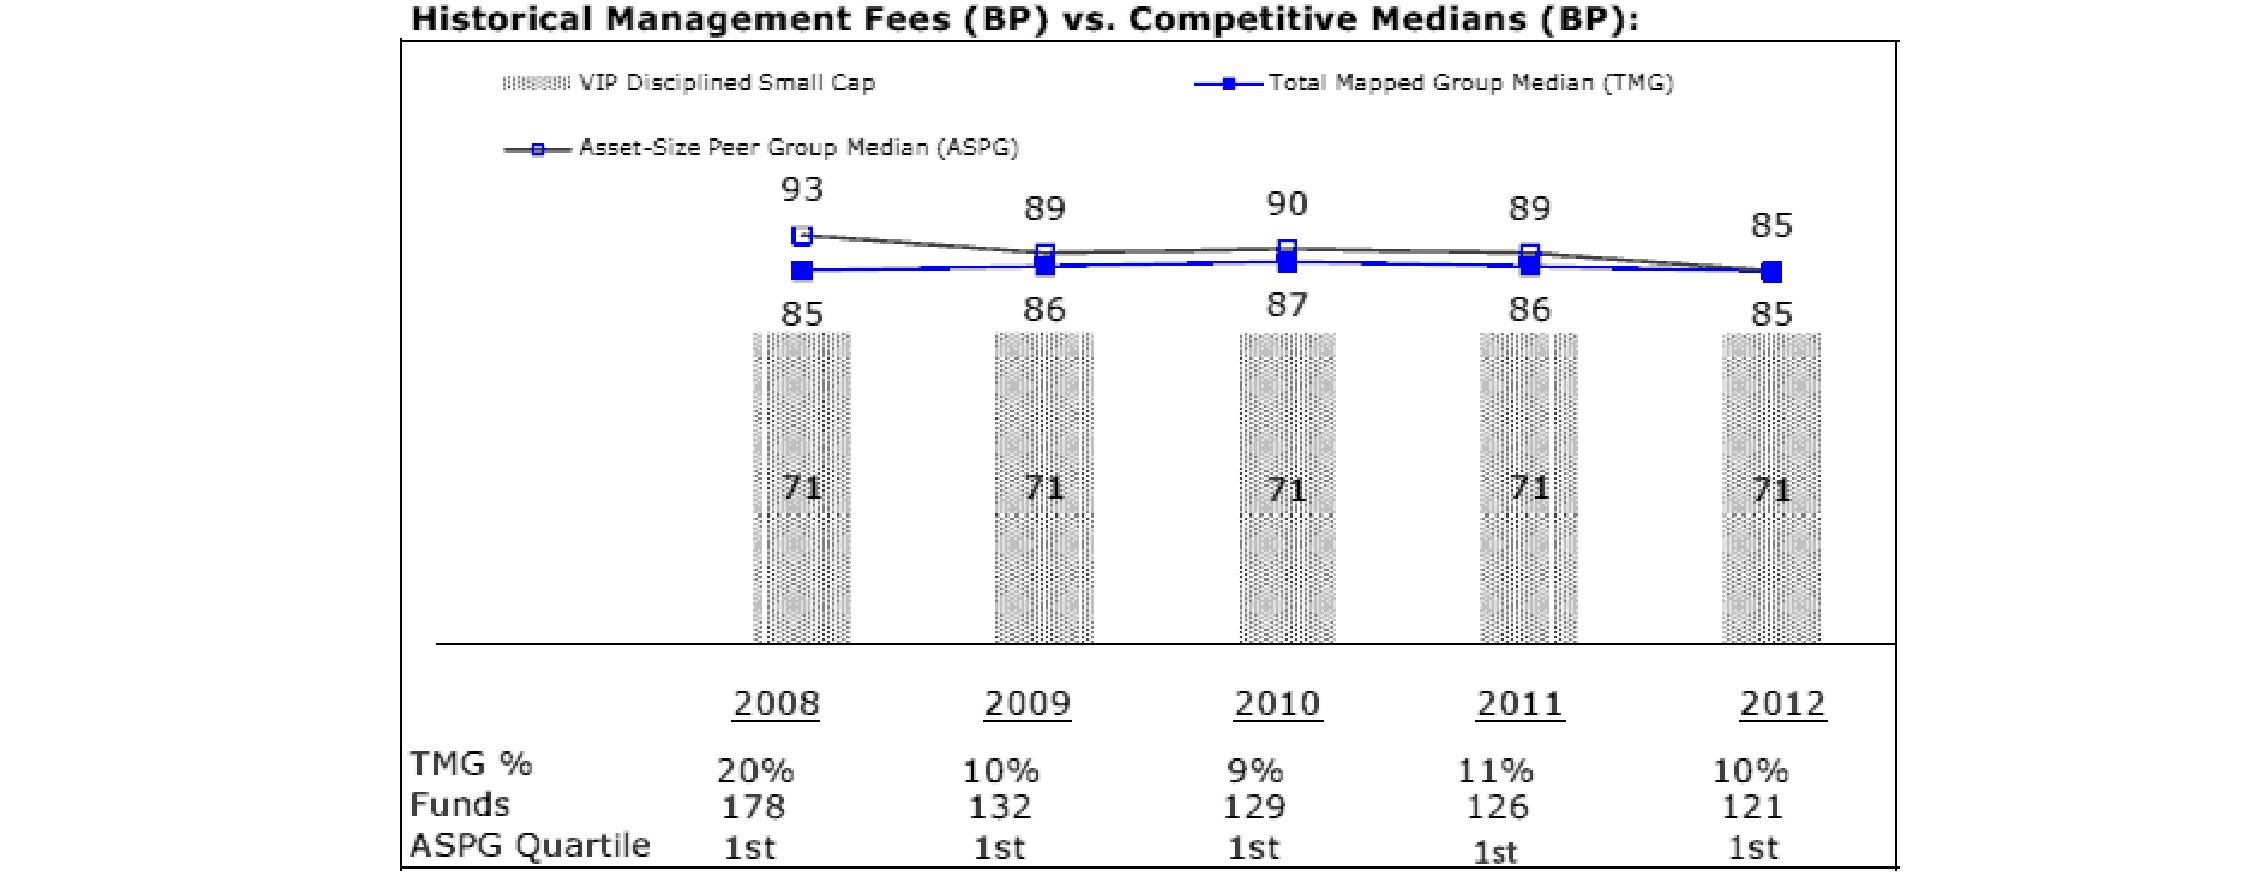
The Board noted that the fund's management fee ranked below the median of its Total Mapped Group and below the median of its ASPG for 2012.
Based on its review, the Board concluded that the fund's management fee is fair and reasonable in light of the services that the fund receives and the other factors considered.
Total Expense Ratio. In its review of each class's total expense ratio, the Board considered the fund's management fee as well as other fund or class expenses, as applicable, such as transfer agent fees, pricing and bookkeeping fees, fund-paid 12b-1 fees, and custodial, legal, and audit fees. The Board also noted the effects of any waivers and reimbursements on fees and expenses. As part of its review, the Board also considered the current and historical total expense ratios of each class of the fund compared to competitive fund median expenses. Each class of the fund is compared to those funds and classes in the Total Mapped Group (used by the Board for management fee comparisons) that have a similar sales load structure.
The Board noted that the total expense ratio of each of Initial Class, Investor Class, and Service Class ranked below its competitive median for 2012 and the total expense ratio of Service Class 2 ranked above its competitive median for 2012. The Board considered that, in general, various factors can affect total expense ratios. The Board noted that the fund offers multiple classes, each of which has a different 12b-1 fee structure, and that the multiple structures are intended to offer a range of pricing options for the intermediary market. The Board also noted that the total expense ratios of the classes vary primarily by the level of their 12b-1 fees, although differences in transfer agent fees may also cause expenses to vary from class to class.
Fees Charged to Other Fidelity Clients. The Board also considered Fidelity fee structures and other information with respect to clients of FMR and its affiliates, such as other mutual funds advised or subadvised by FMR or its affiliates, pension plan clients, and other institutional clients. The Board noted the findings of the 2013 ad hoc joint committee (created with the board of other Fidelity funds), which reviewed and compared Fidelity's institutional investment advisory business with its business of providing services to the Fidelity funds, including the differences in services provided, fees charged, and costs incurred, as well as competition in their respective marketplaces.
Based on its review of total expense ratios and fees charged to other Fidelity clients, the Board concluded that the total expense ratio of each class of the fund was reasonable, although Service Class 2 was above the median of the universe presented for comparison, in light of the services that the fund and its shareholders receive and the other factors considered.
Costs of the Services and Profitability. The Board considered the revenues earned and the expenses incurred by Fidelity in conducting the business of developing, marketing, distributing, managing, administering and servicing the fund and servicing the fund's shareholders. The Board also considered the level of Fidelity's profits in respect of all the Fidelity funds.
On an annual basis, FMR presents to the Board Fidelity's profitability for the fund. Fidelity calculates the profitability for each fund, as well as aggregate profitability for groups of Fidelity funds and all Fidelity funds, using a series of detailed revenue and cost allocation methodologies which originate with the books and records of Fidelity on which Fidelity's audited financial statements are based. The Audit Committee of the Board reviews any significant changes from the prior year's methodologies.
PricewaterhouseCoopers LLP (PwC), independent registered public accounting firm and auditor to Fidelity and certain Fidelity funds, has been engaged annually by the Board as part of the Board's assessment of Fidelity's profitability analysis. PwC's engagement includes the review and assessment of the methodologies used by Fidelity in determining the revenues and expenses attributable to Fidelity's mutual fund business, and completion of agreed-upon procedures surrounding the mathematical accuracy of fund profitability and its conformity to allocation methodologies. After considering PwC's reports issued under the engagement and information provided by Fidelity, the Board concluded that while other allocation methods may also be reasonable, Fidelity's profitability methodologies are reasonable in all material respects.
Annual Report
The Board also reviewed Fidelity's non-fund businesses and fall-out benefits related to the mutual fund business as well as cases where Fidelity's affiliates may benefit from or be related to the fund's business.
The Board considered the costs of the services provided by and the profits realized by Fidelity in connection with the operation of the fund and was satisfied that the profitability was not excessive in the circumstances.
Economies of Scale. The Board considered whether there have been economies of scale in respect of the management of the Fidelity funds, whether the Fidelity funds (including the fund) have appropriately benefited from any such economies of scale, and whether there is potential for realization of any further economies of scale. The Board considered the extent to which the fund will benefit from economies of scale through increased services to the fund, through waivers or reimbursements, or through fee or expense reductions. The Board also noted that in 2009, it and the board of other Fidelity funds created an ad hoc committee (the Economies of Scale Committee) to analyze whether FMR attains economies of scale in respect of the management and servicing of the Fidelity funds, whether the Fidelity funds have appropriately benefited from such economies of scale, and whether there is potential for realization of any further economies of scale.
The Board recognized that the fund's management contract incorporates a "group fee" structure, which provides for lower group fee rates as total fund assets under FMR's management increase, and for higher group fee rates as total fund assets under FMR's management decrease. FMR calculates the group fee rates based on a tiered asset "breakpoint" schedule that varies based on asset class. The Board considered that the group fee is designed to deliver the benefits of economies of scale to fund shareholders when total Fidelity fund assets increase, even if assets of any particular fund are unchanged or have declined, because some portion of Fidelity's costs are attributable to services provided to all Fidelity funds, and all funds benefit if those costs can be allocated among more assets. The Board concluded that, given the group fee structure, fund shareholders will benefit from lower management fees as assets under FMR's management increase at the fund complex level, regardless of whether Fidelity achieves any such economies of scale.
The Board concluded, taking into account the analysis of the Economies of Scale Committee, that economies of scale, if any, are being appropriately shared between fund shareholders and Fidelity.
Amendment to Description of Group Fee Rate. At its July 2013 meeting, the Board voted to approve an amendment to the fund's management contract to modify the description of the "group fee rate" effective August 1, 2013. The Board noted that under the prior description in the contract, the group fee rate was based on the average net assets of all registered investment companies with which FMR has management contracts. Under the contract's tiered asset breakpoint schedule, the group fee rate is lower as total fund assets under FMR's management increase, and higher as total fund assets under FMR's management decrease. The Board considered that the prior description would have excluded the assets of 64 Fidelity sector funds from the group fee rate calculation once Fidelity SelectCo, LLC, an affiliate of FMR, assumed management responsibilities for those funds. The Board noted that modifying the description of the group fee rate to continue to include the assets of those 64 funds for purposes of determining group fee rate breakpoints would avoid an immediate adverse impact on the group fee rate for any fund.
Additional Information Requested by the Board. In order to develop fully the factual basis for consideration of the Fidelity funds' Advisory Contracts, the Board requested and received additional information on certain topics, including: (i) fund performance trends and Fidelity's long-term strategies for certain funds; (ii) the potential to further rationalize the Fidelity fund lineup with the possibility of achieving savings for the funds and Fidelity; (iii) the methodology with respect to competitive fund data and peer group classifications; (iv) the arrangements with, and performance of, certain sub-advisers on behalf of the Fidelity funds, as well as certain proposed participating affiliate arrangements; (v) the realization of fall-out benefits in certain Fidelity business units; (vi) Fidelity's group fee structures, including the rationale for the individual fee rates of certain categories of funds and the definition of group assets; (vii) trends regarding industry use of performance fee structures and the performance adjustment methodologies applicable to the Fidelity funds; (viii) additional competitive analysis regarding the total expenses for certain classes; and (ix) fund profitability methodology, including Fidelity's cost allocation methodology, and the impact of certain factors on fund profitability results.
Based on its evaluation of all of the conclusions noted above, and after considering all factors it believed relevant, the Board ultimately concluded that the advisory fee structures are fair and reasonable, and that the fund's Advisory Contracts should be renewed.
Annual Report
Investment Adviser
Fidelity Management & Research Company
Boston, MA
Investment Sub-Advisers
Geode Capital Management, LLC
FMR Co., Inc.
General Distributor
Fidelity Distributors Corporation
Smithfield, RI
Transfer and Service Agents
Fidelity Investments Institutional Operations Company, Inc.
Boston, MA
Fidelity Service Company, Inc.
Boston, MA
Custodian
The Northern Trust Company
Chicago, IL
VDSC-ANN-0214
1.820582.108
Fidelity® Variable Insurance Products:
Value Leaders Portfolio
Annual Report
December 31, 2013
(Fidelity Cover Art)
Contents
Performance | (Click Here) | How the fund has done over time. |
Management's Discussion of Fund Performance | (Click Here) | The Portfolio Manager's review of fund performance and strategy. |
Shareholder Expense Example | (Click Here) | An example of shareholder expenses. |
Investment Changes | (Click Here) | A summary of major shifts in the fund's investments over the past six months. |
Investments | (Click Here) | A complete list of the fund's investments with their market values. |
Financial Statements | (Click Here) | Statements of assets and liabilities, operations, and changes in net assets, as well as financial highlights. |
Notes | (Click Here) | Notes to the financial statements. |
Report of Independent Registered Public Accounting Firm | (Click Here) | |
Trustees and Officers | (Click Here) | |
Distributions | (Click Here) | |
Board Approval of Investment Advisory Contracts and Management Fees | (Click Here) | |
To view a fund's proxy voting guidelines and proxy voting record for the 12-month period ended June 30, visit http://www.fidelity.com/proxyvotingresults or visit the Securities and Exchange Commission's (SEC) web site at http://www.sec.gov. You may also call 1-877-208-0098 to request a free copy of the proxy voting guidelines.
Fidelity Variable Insurance Products are separate account options which are purchased through a variable insurance contract.
Standard & Poor's, S&P and S&P 500 are registered service marks of The McGraw-Hill Companies, Inc. and have been licensed for use by Fidelity Distributors Corporation.
Other third-party marks appearing herein are the property of their respective owners.
All other marks appearing herein are registered or unregistered trademarks or service marks of FMR LLC or an affiliated company. © 2014 FMR LLC. All rights reserved.
This report and the financial statements contained herein are submitted for the general information of the shareholders of the fund. This report is not authorized for distribution to prospective investors in the fund unless preceded or accompanied by an effective prospectus.
A fund files its complete schedule of portfolio holdings with the SEC for the first and third quarters of each fiscal year on Form N-Q. Forms N-Q are available on the SEC's web site at http://www.sec.gov. A fund's Forms N-Q may be reviewed and copied at the SEC's Public Reference Room in Washington, DC. Information regarding the operation of the SEC's Public Reference Room may be obtained by calling 1-800-SEC-0330. For a complete list of a fund's portfolio holdings, view the most recent holdings listing, semiannual report, or annual report on Fidelity's web site at http://www.fidelity.com, http://www.advisor.fidelity.com, or http://www.401k.com, as applicable.
NOT FDIC INSURED • MAY LOSE VALUE • NO BANK GUARANTEE
Neither the fund nor Fidelity Distributors Corporation is a bank.
Annual Report
Average annual total return reflects the change in the value of an investment, assuming reinvestment of the class' distributions from dividend income and capital gains (the profits earned upon the sale of securities that have grown in value, if any) and assuming a constant rate of performance each year. During periods of reimbursement by Fidelity, a fund's total return will be greater than it would be had the reimbursement not occurred. Performance numbers are net of all underlying fund operating expenses, but do not include any insurance charges imposed by your insurance company's separate account. If performance information included the effect of these additional charges, the total returns would have been lower. How a fund did yesterday is no guarantee of how it will do tomorrow.
Average Annual Total Returns
Periods ended December 31, 2013 | Past 1
year | Past 5
years | Past 10 years |
VIP Value Leaders Portfolio - Initial Class | 35.17% | 14.82% | 5.38% |
VIP Value Leaders Portfolio - Service Class | 35.06% | 14.72% | 5.29% |
VIP Value Leaders Portfolio - Service Class 2 | 34.88% | 14.55% | 5.12% |
VIP Value Leaders Portfolio - Investor Class A | 34.99% | 14.72% | 5.30% |
A The initial offering of Investor Class shares took place on July 21, 2005. Returns prior to July 21, 2005 are those of Initial Class. Had Investor Class's transfer agent fee been reflected, returns prior to July 21, 2005, would have been lower.
$10,000 Over 10 Years
Let's say hypothetically that $10,000 was invested in VIP Value Leaders Portfolio - Initial Class on December 31, 2003. The chart shows how the value of your investment would have changed, and also shows how the Russell 1000® Value Index performed over the same period.
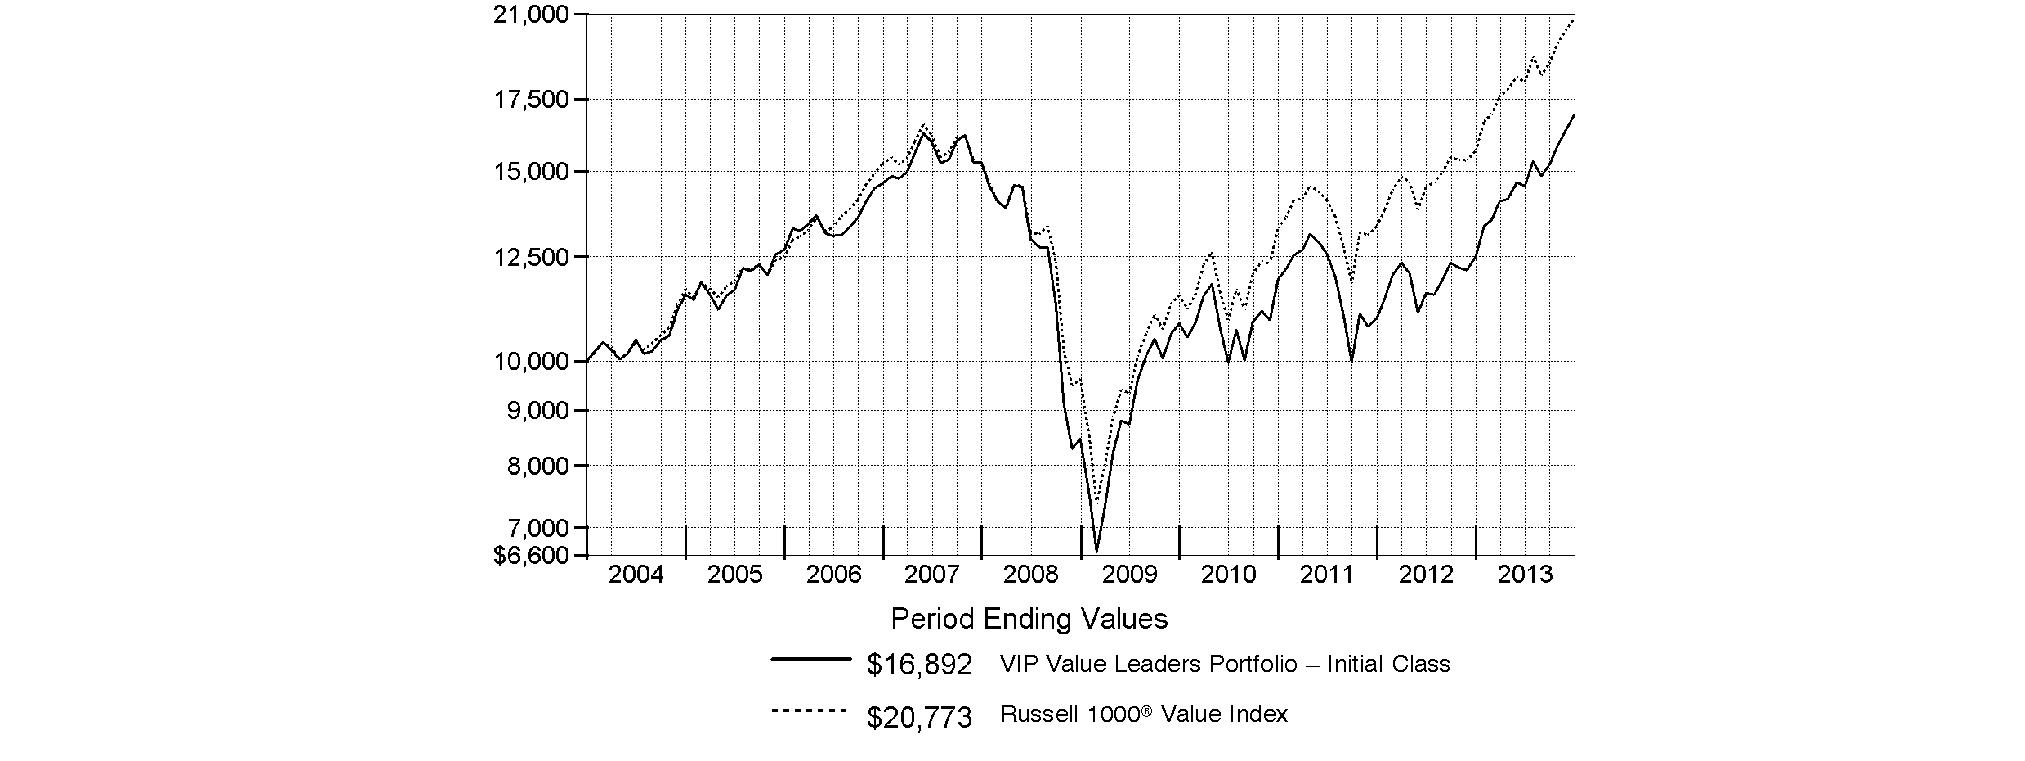
Annual Report
Market Recap: Global equity markets remained upbeat for the 12 months ending December 31, 2013, propelling the MSCI® ACWI® (All Country World Index) Index to a 23.24% return. Midyear turbulence gave way by autumn when policymakers in the U.S. and China had made clear their intentions to maintain accommodative monetary policies. That stance, combined with modest cyclical improvement around the globe and generally low valuations, underpinned the broad rally in equities, although the relative strength of the U.S. dollar generally tempered gains for U.S. investors holding foreign securities based in local currencies. During the period, the broad-market S&P 500® Index set a series of new highs, finishing the year up 32.39%. For the first time since 1995, the S&P® scored a "perfect 10," with all 10 economic sectors gaining at least 10% for the year. A resurgence in growth-oriented stocks lifted the Nasdaq Composite Index® to a 40.12% result for 2013, while the blue-chip Dow Jones Industrial AverageSM notched a relatively more modest 29.65% gain. International developed-markets equities rose in concert with their U.S. counterparts, with the MSCI® EAFE® Index gaining 22.92% for the period. Meanwhile, foreign exchange and commodity weakness curbed results in resource-heavy emerging markets (EM), especially in the year's waning months. More generally, concern over EM's slowing growth, its declining share of global trade and uncertainty surrounding U.S. central bank intentions were all factors hampering performance. The MSCI Emerging Markets Index returned -2.27% for the period. On the bond side, U.S. high-yield securities rallied with equities for much of the period, with The BofA Merrill LynchSM US High Yield Constrained Index returning 7.41% for 2013. The more rate-sensitive U.S. investment-grade bond category faced headwinds though, as reflected in the -2.02% return of the Barclays® U.S. Aggregate Bond Index. Within the Barclays index, investment-grade corporate credit returned -2.01%, while ultra-safe U.S. Treasuries saw a -2.75% result. Major non-U.S. developed markets performed only slightly better, with the Citigroup® Non-USD Group-of-Seven (G7) Equal Weighted Index logging a -1.59% result. After several years of strong advances, EM debt reversed course in 2013, with the J.P. Morgan Emerging Markets Bond Index Global returning -6.58%.
Comments from Michael Chren, Portfolio Manager of VIP Value Leaders Portfolio: For the year ending December 31, 2013, the fund's share classes easily outpaced the benchmark Russell 1000® Value Index, which gained 32.53%. (For specific portfolio results, please refer to the performance section of this report.) Relative to the Russell index, the fund benefited from favorable positioning in the financials and information technology sectors, strong stock selection in telecommunication services, and a timely underweighting in the utilities sector, which lagged during the year following an extended rally. In contrast, stock picking in materials was subpar, as was positioning in health care. The fund also had an above-average cash weighting - a reflection of fewer buying opportunities as the period progressed - which detracted in a rising market. On an individual basis, Yahoo!, a global technology company, was a leading contributor for the fund. After conducting a thorough analysis, I concluded the stock met both my valuation and quality criteria. Accordingly, I began building a position in Yahoo! in the second half of 2012. During 2013, the stock outperformed my high expectations, and I significantly reduced the fund's stake toward year end. Meanwhile, online brokerage company E*TRADE also helped, benefiting from its attractive valuation and multiple pathways for accelerating growth and improving profitability. The story played out as I'd hoped, and I trimmed the fund's position as E*TRADE's shares rose. In contrast, the biggest individual detractor was gold producer Newmont Mining. Among other reasons, I bought this stock as a hedge against the potential downside risk that would be triggered by further turmoil in Europe, as well as potential runaway inflation in the U.S. resulting from the Federal Reserve's quantitative easing program. As gold prices fell during the period, so did Newmont's stock. On its way down, I added to the fund's stake to maintain its position size as a percentage of the overall portfolio.
The views expressed above reflect those of the portfolio manager(s) only through the end of the period as stated on the cover of this report and do not necessarily represent the views of Fidelity or any other person in the Fidelity organization. Any such views are subject to change at any time based upon market or other conditions and Fidelity disclaims any responsibility to update such views. These views may not be relied on as investment advice and, because investment decisions for a Fidelity fund are based on numerous factors, may not be relied on as an indication of trading intent on behalf of any Fidelity fund.
Annual Report
As a shareholder of the Fund, you incur two types of costs: (1) transaction costs, and (2) ongoing costs, including management fees, distribution and/or service (12b-1) fees and other Fund expenses. This Example is intended to help you understand your ongoing costs (in dollars) of investing in the Fund and to compare these costs with the ongoing costs of investing in other mutual funds.
The Example is based on an investment of $1,000 invested at the beginning of the period and held for the entire period (July 1, 2013 to December 31, 2013).
Actual Expenses
The first line of the accompanying table for each class of the Fund provides information about actual account values and actual expenses. You may use the information in this line, together with the amount you invested, to estimate the expenses that you paid over the period. Simply divide your account value by $1,000.00 (for example, an $8,600 account value divided by $1,000.00 = 8.6), then multiply the result by the number in the first line for a class of the Fund under the heading entitled "Expenses Paid During Period" to estimate the expenses you paid on your account during this period. The estimate of expenses does not include any fees or other expenses of any variable annuity or variable life insurance product. If they were, the estimate of expenses you paid during the period would be higher, and your ending account value would be lower. In addition, the Fund, as a shareholder in the underlying Fidelity Central Funds, will indirectly bear its pro-rata share of the fees and expenses incurred by the underlying Fidelity Central Funds. These fees and expenses are not included in the Fund's annualized expense ratio used to calculate the expense estimate in the table below.
Hypothetical Example for Comparison Purposes
The second line of the accompanying table for each class of the Fund provides information about hypothetical account values and hypothetical expenses based on a Class' actual expense ratio and an assumed rate of return of 5% per year before expenses, which is not the Class' actual return. The hypothetical account values and expenses may not be used to estimate the actual ending account balance or expenses you paid for the period. You may use this information to compare the ongoing costs of investing in the Fund and other funds. To do so, compare this 5% hypothetical example with the 5% hypothetical examples that appear in the shareholder reports of the other funds. The estimate of expenses does not include any fees or other expenses of any variable annuity or variable life insurance product. If they were, the estimate of expenses you paid during the period would be higher, and your ending account value would be lower. In addition, the Fund, as a shareholder in the underlying Fidelity Central Funds, will indirectly bear its pro-rata share of the fees and expenses incurred by the underlying Fidelity Central Funds. These fees and expenses are not included in the Fund's annualized expense ratio used to calculate the expense estimate in the table below.
Please note that the expenses shown in the table are meant to highlight your ongoing costs only and do not reflect any transaction costs. Therefore, the second line of the table is useful in comparing ongoing costs only, and will not help you determine the relative total costs of owning different funds.
| Annualized Expense Ratio B | Beginning
Account Value
July 1, 2013 | Ending
Account Value
December 31, 2013 | Expenses Paid
During Period*
July 1, 2013
to December 31, 2013 |
Initial Class | .85% | | | |
Actual | | $ 1,000.00 | $ 1,161.90 | $ 4.63 |
HypotheticalA | | $ 1,000.00 | $ 1,020.92 | $ 4.33 |
Service Class | .95% | | | |
Actual | | $ 1,000.00 | $ 1,160.90 | $ 5.17 |
HypotheticalA | | $ 1,000.00 | $ 1,020.42 | $ 4.84 |
Service Class 2 | 1.10% | | | |
Actual | | $ 1,000.00 | $ 1,160.80 | $ 5.99 |
HypotheticalA | | $ 1,000.00 | $ 1,019.66 | $ 5.60 |
Investor Class | .93% | | | |
Actual | | $ 1,000.00 | $ 1,160.80 | $ 5.07 |
HypotheticalA | | $ 1,000.00 | $ 1,020.52 | $ 4.74 |
A 5% return per year before expenses
B Annualized expense ratio reflects expenses net of applicable fee waivers.
* Expenses are equal to each Class' annualized expense ratio, multiplied by the average account value over the period, multiplied by 184/365 (to reflect the one-half year period).
Annual Report
Investment Changes (Unaudited)
Top Ten Stocks as of December 31, 2013 |
| % of fund's
net assets | % of fund's net assets
6 months ago |
General Electric Co. | 4.9 | 4.0 |
Exxon Mobil Corp. | 4.7 | 3.9 |
Pfizer, Inc. | 4.3 | 4.4 |
Merck & Co., Inc. | 3.7 | 3.7 |
JPMorgan Chase & Co. | 3.0 | 2.3 |
Occidental Petroleum Corp. | 2.9 | 2.5 |
Citigroup, Inc. | 2.9 | 3.0 |
AT&T, Inc. | 2.8 | 0.0 |
Zoetis, Inc. Class A | 2.4 | 2.2 |
Apache Corp. | 2.4 | 1.1 |
| 34.0 | |
Top Five Market Sectors as of December 31, 2013 |
| % of fund's
net assets | % of fund's net assets
6 months ago |
Financials | 28.1 | 23.3 |
Information Technology | 15.4 | 12.5 |
Health Care | 12.9 | 12.1 |
Energy | 11.9 | 14.3 |
Consumer Staples | 6.4 | 6.2 |
Asset Allocation (% of fund's net assets) |
As of December 31, 2013 * | As of June 30, 2013 ** |
 | Stocks 97.3% | | | Stocks and
Equity Futures 98.5% | |
 | Short-Term
Investments and
Net Other Assets (Liabilities) 2.7% | | | Short-Term
Investments and
Net Other Assets (Liabilities) 1.5% | |
* Foreign investments 1.9% | | ** Foreign investments 0.9% | |

Annual Report
Investments December 31, 2013
Showing Percentage of Net Assets
Common Stocks - 97.3% |
| Shares | | Value |
CONSUMER DISCRETIONARY - 4.6% |
Auto Components - 0.9% |
Johnson Controls, Inc. | 5,535 | | $ 283,946 |
Automobiles - 1.2% |
Ford Motor Co. | 7,911 | | 122,067 |
General Motors Co. (a) | 6,300 | | 257,481 |
| | 379,548 |
Diversified Consumer Services - 0.8% |
Apollo Ed Group, Inc. Class A (non-vtg.) (a) | 3,277 | | 89,528 |
DeVry, Inc. (d) | 4,466 | | 158,543 |
| | 248,071 |
Hotels, Restaurants & Leisure - 0.6% |
International Game Technology | 9,900 | | 179,784 |
Media - 0.6% |
DISH Network Corp. Class A | 3,031 | | 175,556 |
Specialty Retail - 0.5% |
Foot Locker, Inc. | 4,008 | | 166,092 |
TOTAL CONSUMER DISCRETIONARY | | 1,432,997 |
CONSUMER STAPLES - 6.4% |
Beverages - 0.5% |
PepsiCo, Inc. | 1,800 | | 149,292 |
Food & Staples Retailing - 1.7% |
CVS Caremark Corp. | 2,180 | | 156,023 |
Wal-Mart Stores, Inc. | 4,973 | | 391,325 |
| | 547,348 |
Food Products - 2.3% |
Kraft Foods Group, Inc. | 6,968 | | 375,715 |
Mondelez International, Inc. | 9,880 | | 348,764 |
| | 724,479 |
Household Products - 1.9% |
Procter & Gamble Co. | 7,120 | | 579,639 |
TOTAL CONSUMER STAPLES | | 2,000,758 |
ENERGY - 11.9% |
Oil, Gas & Consumable Fuels - 11.9% |
Anadarko Petroleum Corp. | 1,652 | | 131,037 |
Apache Corp. | 8,801 | | 756,358 |
Chevron Corp. | 3,592 | | 448,677 |
Exxon Mobil Corp. | 14,471 | | 1,464,465 |
Occidental Petroleum Corp. | 9,520 | | 905,352 |
| | 3,705,889 |
FINANCIALS - 28.1% |
Capital Markets - 6.6% |
Ares Capital Corp. | 13,796 | | 245,155 |
Bank of New York Mellon Corp. | 6,800 | | 237,592 |
Carlyle Group LP | 5,500 | | 195,910 |
E*TRADE Financial Corp. (a) | 23,050 | | 452,702 |
|
| Shares | | Value |
Goldman Sachs Group, Inc. | 1,661 | | $ 294,429 |
Raymond James Financial, Inc. | 5,292 | | 276,189 |
State Street Corp. | 4,947 | | 363,060 |
| | 2,065,037 |
Commercial Banks - 7.1% |
Fifth Third Bancorp | 20,353 | | 428,024 |
KeyCorp | 43,464 | | 583,287 |
U.S. Bancorp | 7,613 | | 307,565 |
Wells Fargo & Co. | 14,155 | | 642,637 |
Zions Bancorporation | 8,413 | | 252,053 |
| | 2,213,566 |
Consumer Finance - 2.1% |
Capital One Financial Corp. | 7,200 | | 551,592 |
Springleaf Holdings, Inc. | 4,400 | | 111,232 |
| | 662,824 |
Diversified Financial Services - 7.5% |
Bank of America Corp. | 31,612 | | 492,199 |
Citigroup, Inc. | 17,331 | | 903,118 |
JPMorgan Chase & Co. | 16,097 | | 941,353 |
| | 2,336,670 |
Insurance - 4.8% |
Allstate Corp. | 3,900 | | 212,706 |
American International Group, Inc. | 5,300 | | 270,565 |
Fidelity National Financial, Inc. Class A | 8,360 | | 271,282 |
MetLife, Inc. | 3,200 | | 172,544 |
Reinsurance Group of America, Inc. | 2,518 | | 194,918 |
The Chubb Corp. | 1,338 | | 129,291 |
XL Group PLC Class A | 7,358 | | 234,279 |
| | 1,485,585 |
TOTAL FINANCIALS | | 8,763,682 |
HEALTH CARE - 12.9% |
Health Care Providers & Services - 2.0% |
HCA Holdings, Inc. | 8,149 | | 388,789 |
Humana, Inc. | 2,100 | | 216,762 |
WellPoint, Inc. | 200 | | 18,478 |
| | 624,029 |
Pharmaceuticals - 10.9% |
Merck & Co., Inc. | 22,842 | | 1,143,242 |
Pfizer, Inc. | 43,733 | | 1,339,542 |
Teva Pharmaceutical Industries Ltd. sponsored ADR | 4,000 | | 160,320 |
Zoetis, Inc. Class A | 23,437 | | 766,156 |
| | 3,409,260 |
TOTAL HEALTH CARE | | 4,033,289 |
INDUSTRIALS - 5.8% |
Aerospace & Defense - 0.9% |
Textron, Inc. | 8,156 | | 299,815 |
Common Stocks - continued |
| Shares | | Value |
INDUSTRIALS - continued |
Industrial Conglomerates - 4.9% |
General Electric Co. | 54,358 | | $ 1,523,652 |
TOTAL INDUSTRIALS | | 1,823,467 |
INFORMATION TECHNOLOGY - 15.4% |
Communications Equipment - 2.1% |
Brocade Communications Systems, Inc. (a) | 22,050 | | 195,584 |
Cisco Systems, Inc. | 20,011 | | 449,247 |
| | 644,831 |
Computers & Peripherals - 2.2% |
Apple, Inc. | 880 | | 493,777 |
Hewlett-Packard Co. | 7,093 | | 198,462 |
| | 692,239 |
Internet Software & Services - 0.3% |
Yahoo!, Inc. (a) | 1,974 | | 79,829 |
IT Services - 1.1% |
EVERTEC, Inc. | 8,500 | | 209,610 |
Global Payments, Inc. | 2,191 | | 142,393 |
| | 352,003 |
Office Electronics - 1.0% |
Xerox Corp. | 24,581 | | 299,151 |
Semiconductors & Semiconductor Equipment - 3.3% |
Broadcom Corp. Class A | 17,900 | | 530,735 |
Intel Corp. | 19,823 | | 514,605 |
| | 1,045,340 |
Software - 5.4% |
Activision Blizzard, Inc. | 35,615 | | 635,015 |
Comverse, Inc. | 12,138 | | 470,954 |
Symantec Corp. | 10,560 | | 249,005 |
Verint Systems, Inc. (a) | 7,804 | | 335,104 |
| | 1,690,078 |
TOTAL INFORMATION TECHNOLOGY | | 4,803,471 |
MATERIALS - 5.9% |
Chemicals - 1.3% |
The Dow Chemical Co. | 6,940 | | 308,136 |
The Mosaic Co. | 1,885 | | 89,104 |
| | 397,240 |
Containers & Packaging - 0.7% |
Crown Holdings, Inc. (a) | 5,225 | | 232,878 |
Metals & Mining - 3.9% |
Freeport-McMoRan Copper & Gold, Inc. | 12,036 | | 454,239 |
|
| Shares | | Value |
Newmont Mining Corp. | 21,806 | | $ 502,192 |
United States Steel Corp. | 8,850 | | 261,075 |
| | 1,217,506 |
TOTAL MATERIALS | | 1,847,624 |
TELECOMMUNICATION SERVICES - 5.3% |
Diversified Telecommunication Services - 4.2% |
AT&T, Inc. | 24,577 | | 864,127 |
Level 3 Communications, Inc. (a) | 13,388 | | 444,080 |
| | 1,308,207 |
Wireless Telecommunication Services - 1.1% |
T-Mobile U.S., Inc. (a) | 10,763 | | 362,067 |
TOTAL TELECOMMUNICATION SERVICES | | 1,670,274 |
UTILITIES - 1.0% |
Multi-Utilities - 1.0% |
CenterPoint Energy, Inc. | 10,478 | | 242,880 |
Sempra Energy | 811 | | 72,795 |
| | 315,675 |
TOTAL COMMON STOCKS (Cost $26,103,416) |
30,397,126
|
U.S. Treasury Obligations - 0.1% |
| Principal Amount | | |
U.S. Treasury Bills, yield at date of purchase 0.02% to 0.03% 1/2/14 to 2/27/14
(Cost $20,000) | | $ 20,000 | |
20,000
|
Money Market Funds - 9.3% |
| Shares | | |
Fidelity Cash Central Fund, 0.11% (b) | 2,780,983 | | 2,780,983 |
Fidelity Securities Lending Cash Central Fund, 0.11% (b)(c) | 140,400 | | 140,400 |
TOTAL MONEY MARKET FUNDS (Cost $2,921,383) |
2,921,383
|
TOTAL INVESTMENT PORTFOLIO - 106.7% (Cost $29,044,799) | | 33,338,509 |
NET OTHER ASSETS (LIABILITIES) - (6.7)% | | (2,102,811) |
NET ASSETS - 100% | $ 31,235,698 |
Legend |
(a) Non-income producing |
(b) Affiliated fund that is generally available only to investment companies and other accounts managed by Fidelity Investments. The rate quoted is the annualized seven-day yield of the fund at period end. A complete unaudited listing of the fund's holdings as of its most recent quarter end is available upon request. In addition, each Fidelity Central Fund's financial statements, which are not covered by the Fund's Report of Independent Registered Public Accounting Firm, are available on the SEC's website or upon request. |
(c) Investment made with cash collateral received from securities on loan. |
(d) Security or a portion of the security is on loan at period end. |
Affiliated Central Funds |
Information regarding fiscal year to date income earned by the Fund from investments in Fidelity Central Funds is as follows: |
Fund | Income earned |
Fidelity Cash Central Fund | $ 2,101 |
Fidelity Securities Lending Cash Central Fund | 7,001 |
Total | $ 9,102 |
Other Information |
The following is a summary of the inputs used, as of December 31, 2013, involving the Fund's assets and liabilities carried at fair value. The inputs or methodology used for valuing securities may not be an indication of the risk associated with investing in those securities. For more information on valuation inputs, and their aggregation into the levels used in the table below, please refer to the Investment Valuation section in the accompanying Notes to Financial Statements. |
Valuation Inputs at Reporting Date: |
Description | Total | Level 1 | Level 2 | Level 3 |
Investments in Securities: | | | | |
Equities: | | | | |
Consumer Discretionary | $ 1,432,997 | $ 1,432,997 | $ - | $ - |
Consumer Staples | 2,000,758 | 2,000,758 | - | - |
Energy | 3,705,889 | 3,705,889 | - | - |
Financials | 8,763,682 | 8,763,682 | - | - |
Health Care | 4,033,289 | 4,033,289 | - | - |
Industrials | 1,823,467 | 1,823,467 | - | - |
Information Technology | 4,803,471 | 4,803,471 | - | - |
Materials | 1,847,624 | 1,847,624 | - | - |
Telecommunication Services | 1,670,274 | 1,670,274 | - | - |
Utilities | 315,675 | 315,675 | - | - |
U.S. Government and Government Agency Obligations | 20,000 | - | 20,000 | - |
Money Market Funds | 2,921,383 | 2,921,383 | - | - |
Total Investments in Securities: | $ 33,338,509 | $ 33,318,509 | $ 20,000 | $ - |
See accompanying notes which are an integral part of the financial statements.
Annual Report
Statement of Assets and Liabilities
| December 31, 2013 |
| | |
Assets | | |
Investment in securities, at value (including securities loaned of $138,450) - See accompanying schedule: Unaffiliated issuers (cost $26,123,416) | $ 30,417,126 | |
Fidelity Central Funds (cost $2,921,383) | 2,921,383 | |
Total Investments (cost $29,044,799) | | $ 33,338,509 |
Receivable for investments sold | | 82,416 |
Receivable for fund shares sold | | 75,767 |
Dividends receivable | | 54,842 |
Distributions receivable from Fidelity Central Funds | | 223 |
Receivable for daily variation margin for derivative instruments | | 2,281 |
Prepaid expenses | | 94 |
Other receivables | | 239 |
Total assets | | 33,554,371 |
| | |
Liabilities | | |
Payable for investments purchased | $ 2,117,296 | |
Payable for fund shares redeemed | 1,405 | |
Accrued management fee | 14,025 | |
Distribution and service plan fees payable | 518 | |
Other affiliated payables | 3,925 | |
Other payables and accrued expenses | 41,104 | |
Collateral on securities loaned, at value | 140,400 | |
Total liabilities | | 2,318,673 |
| | |
Net Assets | | $ 31,235,698 |
Net Assets consist of: | | |
Paid in capital | | $ 48,301,700 |
Accumulated undistributed net realized gain (loss) on investments and foreign currency transactions | | (21,359,712) |
Net unrealized appreciation (depreciation) on investments | | 4,293,710 |
Net Assets | | $ 31,235,698 |
Statement of Assets and Liabilities - continued
| December 31, 2013 |
| | |
Initial Class:
Net Asset Value, offering price and redemption price per share ($8,451,164 ÷ 610,766 shares) | | $ 13.84 |
| | |
Service Class:
Net Asset Value, offering price and redemption price per share ($396,532 ÷ 28,656 shares) | | $ 13.84 |
| | |
Service Class 2:
Net Asset Value, offering price and redemption price per share ($2,380,760 ÷ 172,560 shares) | | $ 13.80 |
| | |
Investor Class:
Net Asset Value, offering price and redemption price per share ($20,007,242 ÷ 1,450,381 shares) | | $ 13.79 |
See accompanying notes which are an integral part of the financial statements.
Annual Report
Financial Statements - continued
Statement of Operations
| Year ended December 31, 2013 |
| | |
Investment Income | | |
Dividends | | $ 387,707 |
Interest | | 11 |
Income from Fidelity Central Funds | | 9,102 |
Total income | | 396,820 |
| | |
Expenses | | |
Management fee | $ 148,433 | |
Transfer agent fees | 35,720 | |
Distribution and service plan fees | 5,595 | |
Accounting and security lending fees | 10,514 | |
Custodian fees and expenses | 14,126 | |
Independent trustees' compensation | 134 | |
Audit | 44,492 | |
Legal | 425 | |
Miscellaneous | 385 | |
Total expenses before reductions | 259,824 | |
Expense reductions | (14,082) | 245,742 |
Net investment income (loss) | | 151,078 |
Realized and Unrealized Gain (Loss) Net realized gain (loss) on: | | |
Investment securities: | | |
Unaffiliated issuers | 3,014,866 | |
Foreign currency transactions | (999) | |
Futures contracts | 48,497 | |
Total net realized gain (loss) | | 3,062,364 |
Change in net unrealized appreciation (depreciation) on: Investment securities | 4,388,383 | |
Assets and liabilities in foreign currencies | (155) | |
Total change in net unrealized appreciation (depreciation) | | 4,388,228 |
Net gain (loss) | | 7,450,592 |
Net increase (decrease) in net assets resulting from operations | | $ 7,601,670 |
Statement of Changes in Net Assets
| Year ended
December 31, 2013 | Year ended
December 31, 2012 |
Increase (Decrease) in Net Assets | | |
Operations | | |
Net investment income (loss) | $ 151,078 | $ 422,442 |
Net realized gain (loss) | 3,062,364 | 4,102 |
Change in net unrealized appreciation (depreciation) | 4,388,228 | 2,090,342 |
Net increase (decrease) in net assets resulting from operations | 7,601,670 | 2,516,886 |
Distributions to shareholders from net investment income | (154,375) | (414,362) |
Share transactions - net increase (decrease) | 6,511,950 | (5,749,897) |
Total increase (decrease) in net assets | 13,959,245 | (3,647,373) |
| | |
Net Assets | | |
Beginning of period | 17,276,453 | 20,923,826 |
End of period (including undistributed net investment income of $0 and undistributed net investment income of $2,471, respectively) | $ 31,235,698 | $ 17,276,453 |
See accompanying notes which are an integral part of the financial statements.
Annual Report
Financial Highlights - Initial Class
Years ended December 31, | 2013 | 2012 | 2011 | 2010 | 2009 |
Selected Per-Share Data | | | | | |
Net asset value, beginning of period | $ 10.30 | $ 9.26 | $ 10.23 | $ 9.42 | $ 7.49 |
Income from Investment Operations | | | | | |
Net investment income (loss) C | .08 | .23 | .15 | .10 | .12 |
Net realized and unrealized gain (loss) | 3.54 | 1.06 | (.97) | .84 | 1.97 |
Total from investment operations | 3.62 | 1.29 | (.82) | .94 | 2.09 |
Distributions from net investment income | (.08) | (.25) | (.15) | (.13) | (.16) |
Net asset value, end of period | $ 13.84 | $ 10.30 | $ 9.26 | $ 10.23 | $ 9.42 |
Total Return A, B | 35.17% | 14.00% | (8.00)% | 10.04% | 27.91% |
Ratios to Average Net Assets D, F | | | | | |
Expenses before reductions | .91% | 1.10% | 1.04% | .90% | .89% |
Expenses net of fee waivers, if any | .85% | .85% | .85% | .85% | .85% |
Expenses net of all reductions | .84% | .82% | .84% | .85% | .85% |
Net investment income (loss) | .63% | 2.27% | 1.45% | 1.05% | 1.48% |
Supplemental Data | | | | | |
Net assets, end of period (000 omitted) | $ 8,451 | $ 5,464 | $ 6,275 | $ 9,855 | $ 12,826 |
Portfolio turnover rate E | 104% | 96% | 95% | 109% | 58% |
A Total returns do not reflect charges attributable to your insurance company's separate account. Inclusion of these charges would reduce the total returns shown.
B Total returns would have been lower if certain expenses had not been reduced during the applicable periods shown.
C Calculated based on average shares outstanding during the period.
D Fees and expenses of any underlying Fidelity Central Funds are not included in the Fund's expense ratio. The Fund indirectly bears its proportionate share of the expenses of any underlying Fidelity Central Funds.
E Amount does not include the portfolio activity of any underlying Fidelity Central Funds.
F Expense ratios reflect operating expenses of the class. Expenses before reductions do not reflect amounts reimbursed by the investment adviser or reductions from brokerage service arrangements or reductions from other expense offset arrangements and do not represent the amount paid by the class during periods when reimbursements or reductions occur. Expenses net of fee waivers reflect expenses after reimbursement by the investment adviser but prior to reductions from brokerage service arrangements or other expense offset arrangements. Expenses net of all reductions represent the net expenses paid by the class.
Financial Highlights - Service Class
Years ended December 31, | 2013 | 2012 | 2011 | 2010 | 2009 |
Selected Per-Share Data | | | | | |
Net asset value, beginning of period | $ 10.30 | $ 9.27 | $ 10.23 | $ 9.41 | $ 7.48 |
Income from Investment Operations | | | | | |
Net investment income (loss) C | .06 | .22 | .14 | .09 | .11 |
Net realized and unrealized gain (loss) | 3.55 | 1.05 | (.97) | .85 | 1.96 |
Total from investment operations | 3.61 | 1.27 | (.83) | .94 | 2.07 |
Distributions from net investment income | (.07) | (.24) | (.13) | (.12) | (.14) |
Net asset value, end of period | $ 13.84 | $ 10.30 | $ 9.27 | $ 10.23 | $ 9.41 |
Total Return A, B | 35.06% | 13.77% | (8.03)% | 10.01% | 27.80% |
Ratios to Average Net Assets D, F | | | | | |
Expenses before reductions | .99% | 1.14% | 1.11% | .98% | .97% |
Expenses net of fee waivers, if any | .95% | .95% | .95% | .95% | .95% |
Expenses net of all reductions | .95% | .92% | .93% | .95% | .95% |
Net investment income (loss) | .53% | 2.18% | 1.35% | .95% | 1.38% |
Supplemental Data | | | | | |
Net assets, end of period (000 omitted) | $ 397 | $ 307 | $ 270 | $ 430 | $ 677 |
Portfolio turnover rate E | 104% | 96% | 95% | 109% | 58% |
A Total returns do not reflect charges attributable to your insurance company's separate account. Inclusion of these charges would reduce the total returns shown.
B Total returns would have been lower if certain expenses had not been reduced during the applicable periods shown.
C Calculated based on average shares outstanding during the period.
D Fees and expenses of any underlying Fidelity Central Funds are not included in the Fund's expense ratio. The Fund indirectly bears its proportionate share of the expenses of any underlying Fidelity Central Funds.
E Amount does not include the portfolio activity of any underlying Fidelity Central Funds.
F Expense ratios reflect operating expenses of the class. Expenses before reductions do not reflect amounts reimbursed by the investment adviser or reductions from brokerage service arrangements or reductions from other expense offset arrangements and do not represent the amount paid by the class during periods when reimbursements or reductions occur. Expenses net of fee waivers reflect expenses after reimbursement by the investment adviser but prior to reductions from brokerage service arrangements or other expense offset arrangements. Expenses net of all reductions represent the net expenses paid by the class.
See accompanying notes which are an integral part of the financial statements.
Annual Report
Financial Highlights - Service Class 2
Years ended December 31, | 2013 | 2012 | 2011 | 2010 | 2009 |
Selected Per-Share Data | | | | | |
Net asset value, beginning of period | $ 10.27 | $ 9.24 | $ 10.20 | $ 9.39 | $ 7.46 |
Income from Investment Operations | | | | | |
Net investment income (loss) C | .05 | .20 | .12 | .08 | .10 |
Net realized and unrealized gain (loss) | 3.53 | 1.06 | (.96) | .84 | 1.96 |
Total from investment operations | 3.58 | 1.26 | (.84) | .92 | 2.06 |
Distributions from net investment income | (.05) | (.23) | (.12) | (.11) | (.13) |
Net asset value, end of period | $ 13.80 | $ 10.27 | $ 9.24 | $ 10.20 | $ 9.39 |
Total Return A, B | 34.88% | 13.62% | (8.20)% | 9.81% | 27.70% |
Ratios to Average Net Assets D, F | | | | | |
Expenses before reductions | 1.13% | 1.29% | 1.25% | 1.12% | 1.12% |
Expenses net of fee waivers, if any | 1.10% | 1.10% | 1.10% | 1.10% | 1.10% |
Expenses net of all reductions | 1.09% | 1.07% | 1.09% | 1.10% | 1.10% |
Net investment income (loss) | .38% | 2.03% | 1.20% | .80% | 1.23% |
Supplemental Data | | | | | |
Net assets, end of period (000 omitted) | $ 2,381 | $ 1,379 | $ 1,339 | $ 1,779 | $ 1,756 |
Portfolio turnover rate E | 104% | 96% | 95% | 109% | 58% |
A Total returns do not reflect charges attributable to your insurance company's separate account. Inclusion of these charges would reduce the total returns shown.
B Total returns would have been lower if certain expenses had not been reduced during the applicable periods shown.
C Calculated based on average shares outstanding during the period.
D Fees and expenses of any underlying Fidelity Central Funds are not included in the Fund's expense ratio. The Fund indirectly bears its proportionate share of the expenses of any underlying Fidelity Central Funds.
E Amount does not include the portfolio activity of any underlying Fidelity Central Funds.
F Expense ratios reflect operating expenses of the class. Expenses before reductions do not reflect amounts reimbursed by the investment adviser or reductions from brokerage service arrangements or reductions from other expense offset arrangements and do not represent the amount paid by the class during periods when reimbursements or reductions occur. Expenses net of fee waivers reflect expenses after reimbursement by the investment adviser but prior to reductions from brokerage service arrangements or other expense offset arrangements. Expenses net of all reductions represent the net expenses paid by the class.
Financial Highlights - Investor Class
Years ended December 31, | 2013 | 2012 | 2011 | 2010 | 2009 |
Selected Per-Share Data | | | | | |
Net asset value, beginning of period | $ 10.27 | $ 9.25 | $ 10.22 | $ 9.40 | $ 7.48 |
Income from Investment Operations | | | | | |
Net investment income (loss) C | .07 | .22 | .14 | .09 | .11 |
Net realized and unrealized gain (loss) | 3.52 | 1.05 | (.96) | .85 | 1.96 |
Total from investment operations | 3.59 | 1.27 | (.82) | .94 | 2.07 |
Distributions from net investment income | (.07) | (.25) | (.15) | (.12) | (.15) |
Net asset value, end of period | $ 13.79 | $ 10.27 | $ 9.25 | $ 10.22 | $ 9.40 |
Total Return A, B | 34.99% | 13.80% | (8.00)% | 10.08% | 27.72% |
Ratios to Average Net Assets D, F | | | | | |
Expenses before reductions | .97% | 1.14% | 1.10% | .96% | .97% |
Expenses net of fee waivers, if any | .93% | .93% | .93% | .93% | .93% |
Expenses net of all reductions | .92% | .90% | .92% | .93% | .93% |
Net investment income (loss) | .55% | 2.19% | 1.37% | .97% | 1.40% |
Supplemental Data | | | | | |
Net assets, end of period (000 omitted) | $ 20,007 | $ 10,127 | $ 13,040 | $ 16,858 | $ 19,249 |
Portfolio turnover rate E | 104% | 96% | 95% | 109% | 58% |
A Total returns do not reflect charges attributable to your insurance company's separate account. Inclusion of these charges would reduce the total returns shown.
B Total returns would have been lower if certain expenses had not been reduced during the applicable periods shown.
C Calculated based on average shares outstanding during the period.
D Fees and expenses of any underlying Fidelity Central Funds are not included in the Fund's expense ratio. The Fund indirectly bears its proportionate share of the expenses of any underlying Fidelity Central Funds.
E Amount does not include the portfolio activity of any underlying Fidelity Central Funds.
F Expense ratios reflect operating expenses of the class. Expenses before reductions do not reflect amounts reimbursed by the investment adviser or reductions from brokerage service arrangements or reductions from other expense offset arrangements and do not represent the amount paid by the class during periods when reimbursements or reductions occur. Expenses net of fee waivers reflect expenses after reimbursement by the investment adviser but prior to reductions from brokerage service arrangements or other expense offset arrangements. Expenses net of all reductions represent the net expenses paid by the class.
See accompanying notes which are an integral part of the financial statements.
Annual Report
Notes to Financial Statements
For the period ended December 31, 2013
1. Organization.
VIP Value Leaders Portfolio (the Fund) is a fund of Variable Insurance Products Fund II (the Trust) and is authorized to issue an unlimited number of shares. The Trust is registered under the Investment Company Act of 1940, as amended (the 1940 Act), as an open-end management investment company organized as a Massachusetts business trust. Shares of the Fund may only be purchased by insurance companies for the purpose of funding variable annuity or variable life insurance contracts. The Fund offers the following classes of shares: Initial Class shares, Service Class shares, Service Class 2 shares and Investor Class shares. All classes have equal rights and voting privileges, except for matters affecting a single class.
2. Investments in Fidelity Central Funds.
The Fund invests in Fidelity Central Funds, which are open-end investment companies generally available only to other investment companies and accounts managed by the investment adviser and its affiliates. The Fund's Schedule of Investments lists each of the Fidelity Central Funds held as of period end, if any, as an investment of the Fund, but does not include the underlying holdings of each Fidelity Central Fund. As an Investing Fund, the Fund indirectly bears its proportionate share of the expenses of the underlying Fidelity Central Funds.
The Money Market Central Funds seek preservation of capital and current income and are managed by Fidelity Investments Money Management, Inc. (FIMM), an affiliate of the investment adviser. Annualized expenses of the Money Market Central Funds as of their most recent shareholder report date are less than .01%.
A complete unaudited list of holdings for each Fidelity Central Fund is available upon request or at the Securities and Exchange Commission (the SEC) website at www.sec.gov. In addition, the financial statements of the Fidelity Central Funds, which are not covered by the Fund's Report of Independent Registered Public Accounting Firm, are available on the SEC website or upon request.
3. Significant Accounting Policies.
The financial statements have been prepared in conformity with accounting principles generally accepted in the United States of America (GAAP), which require management to make certain estimates and assumptions at the date of the financial statements. Actual results could differ from those estimates. Subsequent events, if any, through the date that the financial statements were issued have been evaluated in the preparation of the financial statements. The following summarizes the significant accounting policies of the Fund:
Investment Valuation. Investments are valued as of 4:00 p.m. Eastern time on the last calendar day of the period. In accordance with valuation policies and procedures approved by the Board of Trustees (the Board), the Fund attempts to obtain prices from one or more third party pricing vendors or brokers to value its investments. When current market prices, quotations or currency exchange rates are not readily available or reliable, investments will be fair valued in good faith by the Fidelity Management & Research Company (FMR) Fair Value Committee (the Committee), in accordance with procedures adopted by the Board. Factors used in determining fair value vary by investment type and may include market or investment specific events, changes in interest rates and credit quality. The frequency with which these procedures are used cannot be predicted and they may be utilized to a significant extent. The Committee oversees the Fund's valuation policies and procedures and is responsible for approving and reporting to the Board all fair value determinations.
The Fund categorizes the inputs to valuation techniques used to value its investments into a disclosure hierarchy consisting of three levels as shown below:
Level 1 - quoted prices in active markets for identical investments
Level 2 - other significant observable inputs (including quoted prices for similar investments, interest rates, prepayment speeds, etc.)
Level 3 - unobservable inputs (including the Fund's own assumptions based on the best information available)
Valuation techniques used to value the Fund's investments by major category are as follows:
Equity securities, including restricted securities, for which market quotations are readily available, are valued at the last reported sale price or official closing price as reported by a third party pricing vendor on the primary market or exchange on which they are traded and are categorized as Level 1 in the hierarchy. In the event there were no sales during the day or closing prices are not available, securities are valued at the last quoted bid price or may be valued using the last available price and are generally categorized as Level 2 in the hierarchy. For foreign equity securities, when market or security specific events arise, comparisons to the valuation of American Depositary Receipts (ADRs), futures contracts, Exchange-Traded Funds (ETFs) and certain indexes as well as quoted prices for similar securities may be used and would be categorized as Level 2 in the hierarchy. Utilizing these techniques may result in transfers between Level 1 and Level 2. For equity securities, including restricted securities, where observable inputs are limited, assumptions about market activity and risk are used and these securities may be categorized as Level 3 in the hierarchy.
Annual Report
Notes to Financial Statements - continued
3. Significant Accounting Policies - continued
Investment Valuation - continued
Debt securities, including restricted securities, are valued based on evaluated prices received from third party pricing vendors or from brokers who make markets in such securities. U.S. government and government agency obligations are valued by pricing vendors who utilize matrix pricing which considers yield or price of bonds of comparable quality, coupon, maturity and type or by broker-supplied prices. When independent prices are unavailable or unreliable, debt securities may be valued utilizing pricing methodologies which consider similar factors that would be used by third party pricing vendors. Debt securities are generally categorized as Level 2 in the hierarchy but may be Level 3 depending on the circumstances.
Investments in open-end mutual funds, including the Fidelity Central Funds, are valued at their closing net asset value (NAV) each business day and are categorized as Level 1 in the hierarchy.
Changes in valuation techniques may result in transfers in or out of an assigned level within the disclosure hierarchy. The aggregate value of investments by input level, as of December 31, 2013 is included at the end of the Fund's Schedule of Investments.
Foreign Currency. The Fund may use foreign currency contracts to facilitate transactions in foreign-denominated securities. Gains and losses from these transactions may arise from changes in the value of the foreign currency or if the counterparties do not perform under the contracts' terms.
Foreign-denominated assets, including investment securities, and liabilities are translated into U.S. dollars at the exchange rates at period end. Purchases and sales of investment securities, income and dividends received and expenses denominated in foreign currencies are translated into U.S. dollars at the exchange rate in effect on the transaction date.
The effects of exchange rate fluctuations on investments are included with the net realized and unrealized gain (loss) on investment securities. Other foreign currency transactions resulting in realized and unrealized gain (loss) are disclosed separately.
Investment Transactions and Income. For financial reporting purposes, the Fund's investment holdings and NAV include trades executed through the end of the last business day of the period. The NAV per share for processing shareholder transactions is calculated as of the close of business of the New York Stock Exchange (NYSE), normally 4:00 p.m. Eastern time and includes trades executed through the end of the prior business day. Gains and losses on securities sold are determined on the basis of identified cost and may include proceeds received from litigation. Dividend income is recorded on the ex-dividend date, except for certain dividends from foreign securities where the ex-dividend date may have passed, which are recorded as soon as the Fund is informed of the ex-dividend date. Non-cash dividends included in dividend income, if any, are recorded at the fair market value of the securities received. Distributions received on securities that represent a return of capital or capital gain are recorded as a reduction of cost of investments and/or as a realized gain. Subsequent to ex-dividend date the Fund determines the components of these distributions, based upon receipt of tax filings or other correspondence relating to the underlying investment. During the period, dividend income has been reduced $94,797 with a corresponding increase to net unrealized appreciation (depreciation) as a result of a change in the prior period estimate, which had no impact on the total net assets or total return of the Fund. Interest income and distributions from the Fidelity Central Funds are accrued as earned. Interest income includes coupon interest and amortization of premium and accretion of discount on debt securities. Investment income is recorded net of foreign taxes withheld where recovery of such taxes is uncertain.
Class Allocations and Expenses. Investment income, realized and unrealized capital gains and losses, common expenses of the Fund, and certain fund-level expense reductions, if any, are allocated daily on a pro-rata basis to each class based on the relative net assets of each class to the total net assets of the Fund. Each class differs with respect to transfer agent and distribution and service plan fees incurred. Certain expense reductions may also differ by class. For the reporting period, the allocated portion of income and expenses to each class as a percent of its average net assets may vary due to the timing of recording these transactions in relation to fluctuating net assets of the classes. Expenses directly attributable to a fund are charged to that fund. Expenses attributable to more than one fund are allocated among the respective funds on the basis of relative net assets or other appropriate methods. Expense estimates are accrued in the period to which they relate and adjustments are made when actual amounts are known.
Income Tax Information and Distributions to Shareholders. Each year, the Fund intends to qualify as a regulated investment company under Subchapter M of the Internal Revenue Code, including distributing substantially all of its taxable income and realized gains. As a result, no provision for U.S. Federal income taxes is required. As of December 31, 2013, the Fund did not have any unrecognized tax benefits in the financial statements; nor is the Fund aware of any tax positions for which it is reasonably possible that the total amounts of unrecognized tax benefits will significantly change in the next twelve months. The Fund files a U.S. federal tax return, in addition to state and local tax returns as required. The Fund's federal income tax returns are subject to examination by the Internal Revenue Service (IRS) for a period of three fiscal years after they are filed. State and local tax returns may be subject to examination for an additional fiscal year depending on the jurisdiction. Foreign taxes are provided for based on the Fund's understanding of the tax rules and rates that exist in the foreign markets in which it invests.
Distributions are declared and recorded on the ex-dividend date. Income dividends and capital gain distributions are declared separately for each class. Income and capital gain distributions are determined in accordance with income tax regulations, which may differ from GAAP.
Annual Report
3. Significant Accounting Policies - continued
Income Tax Information and Distributions to Shareholders - continued
Capital accounts within the financial statements are adjusted for permanent book-tax differences. These adjustments have no impact on net assets or the results of operations. Capital accounts are not adjusted for temporary book-tax differences which will reverse in a subsequent period.
Book-tax differences are primarily due to future contracts, foreign currency transactions, capital loss carryforwards, partnerships and losses deferred due to wash sales.
The federal tax cost of investment securities and unrealized appreciation (depreciation) as of period end were as follows:
Gross unrealized appreciation | $ 5,287,909 |
Gross unrealized depreciation | (1,431,569) |
Net unrealized appreciation (depreciation) on securities and other investments | $ 3,856,340 |
| |
Tax Cost | $ 29,482,169 |
The tax-based components of distributable earnings as of period end were as follows:
Capital loss carryforward | $ (20,922,344) |
Net unrealized appreciation (depreciation) | $ 3,856,340 |
Capital loss carryforwards are only available to offset future capital gains of the Fund to the extent provided by regulations and may be limited. Under the Regulated Investment Company Modernization Act of 2010 (the Act), the Fund is permitted to carry forward capital losses incurred in taxable years beginning after December 22, 2010 for an unlimited period and such capital losses are required to be used prior to any losses that expire. The capital loss carryforward information presented below, including any applicable limitation, is estimated as of fiscal period end and is subject to adjustment.
Fiscal year of expiration | |
2016 | $ (9,477,122) |
2017 | (11,445,222) |
Total capital loss carryforward | $ (20,922,344) |
The tax character of distributions paid was as follows:
| December 31, 2013 | December 31, 2012 |
Ordinary Income | $ 154,375 | $ 414,362 |
4. Derivative Instruments.
Risk Exposures and the Use of Derivative Instruments. The Fund's investment objective allows the Fund to enter into various types of derivative contracts, including futures contracts. Derivatives are investments whose value is primarily derived from underlying assets, indices or reference rates and may be transacted on an exchange or over-the-counter (OTC). Derivatives may involve a future commitment to buy or sell a specified asset based on specified terms, to exchange future cash flows at periodic intervals based on a notional principal amount, or for one party to make one or more payments upon the occurrence of specified events in exchange for periodic payments from the other party.
The Fund used derivatives to increase returns and to manage exposure to certain risks as defined below. The success of any strategy involving derivatives depends on analysis of numerous economic factors, and if the strategies for investment do not work as intended, the Fund may not achieve its objectives.
The Fund's use of derivatives increased or decreased its exposure to the following risk:
Equity Risk | Equity risk relates to the fluctuations in the value of financial instruments as a result of changes in market prices (other than those arising from interest rate risk or foreign exchange risk), whether caused by factors specific to an individual investment, its issuer, or all factors affecting all instruments traded in a market or market segment. |
The Fund is also exposed to additional risks from investing in derivatives, such as liquidity risk and counterparty credit risk. Liquidity risk is the risk that the Fund will be unable to close out the derivative in the open market in a timely manner. Counterparty credit risk is the risk that the counterparty will not be able to fulfill its obligation to the Fund. Counterparty credit risk related to exchange-traded futures contracts may be mitigated by the protection provided by the exchange on which they trade.
Investing in derivatives may involve greater risks than investing in the underlying assets directly and, to varying degrees, may involve risk of loss in excess of any initial investment and collateral received and amounts recognized in the Statement of Assets and Liabilities. In addition, there may be the risk that the change in value of the derivative contract does not correspond to the change in value of the underlying instrument.
Annual Report
Notes to Financial Statements - continued
4. Derivative Instruments - continued
Futures Contracts. A futures contract is an agreement between two parties to buy or sell a specified underlying instrument for a fixed price at a specified future date. The Fund used futures contracts to manage its exposure to the stock market.
Upon entering into a futures contract, a fund is required to deposit either cash or securities (initial margin) with a clearing broker in an amount equal to a certain percentage of the face value of the contract. Futures contracts are marked-to-market daily and subsequent daily payments (variation margin) are made or received by a fund depending on the daily fluctuations in the value of the futures contracts and are recorded as unrealized appreciation or (depreciation). This receivable and/or payable, if any, is included in daily variation margin for derivative instruments in the Statement of Assets and Liabilities. Realized gain or (loss) is recorded upon the expiration or closing of a futures contract.
Any open futures contracts at period end are presented in the Schedule of Investments under the caption "Futures Contracts." The underlying face amount at value reflects each contract's exposure to the underlying instrument or index at period end.
During the period the Fund recognized net realized gain (loss) of $48,497 related to its investment in futures contracts. This amount is included in the Statement of Operations.
5. Purchases and Sales of Investments.
Purchases and sales of securities, other than short-term securities, aggregated $32,078,851 and $25,983,760, respectively.
6. Fees and Other Transactions with Affiliates.
Management Fee. Fidelity Management & Research Company (the investment adviser) and its affiliates provide the Fund with investment management related services for which the Fund pays a monthly management fee. The management fee is the sum of an individual fund fee rate that is based on an annual rate of .30% of the Fund's average net assets and an annualized group fee rate that averaged .25% during the period. The group fee rate is based upon the average net assets of all the mutual funds advised by the investment adviser, including any mutual funds previously advised by the investment adviser that are currently advised by Fidelity SelectCo, LLC, an affiliate of the investment adviser. The group fee rate decreases as assets under management increase and increases as assets under management decrease. For the reporting period, the total annual management fee rate was .55% of the Fund's average net assets.
Distribution and Service Plan Fees. In accordance with Rule 12b-1 of the 1940 Act, the Fund has adopted separate 12b-1 Plans for each Service Class of shares. Each Service Class pays Fidelity Distributors Corporation (FDC), an affiliate of the investment adviser, a service fee. For the period, the service fee is based on an annual rate of .10% of Service Class' average net assets and .25% of Service Class 2's average net assets.
For the period, total fees, all of which were re-allowed to insurance companies for the distribution of shares and providing shareholder support services were as follows:
Service Class | $ 361 |
Service Class 2 | 5,234 |
| $ 5,595 |
Transfer Agent Fees. Fidelity Investments Institutional Operations Company, Inc. (FIIOC), an affiliate of the investment adviser, is the Fund's transfer, dividend disbursing, and shareholder servicing agent. FIIOC receives an asset-based fee with respect to each class. Each class (with the exception of Investor Class) pays a transfer agent fee, excluding out of pocket expenses, equal to an annual rate of .07% of average net assets. Investor Class pays a monthly asset-based transfer agent fee of .15% of average net assets. In addition, FIIOC receives an asset-based fee of .0035% of average net assets for typesetting, printing and mailing of shareholder reports, except proxy statements. FIIOC voluntarily agreed to reimburse or waive this fee for the period January 1, 2013 through December 31, 2013 (see Expense Reductions note).For the period, transfer agent fees for each class, including printing and out of pocket expenses, were as follows:
Initial Class | $ 8,169 |
Service Class | 251 |
Service Class 2 | 1,451 |
Investor Class | 25,849 |
| $ 35,720 |
Effective February 1, 2014, the Board of Trustees approved an amendment to the transfer agent fee agreement whereby each class (with the exception of Investor Class) pays a single fee of .07% of average net assets for transfer agent services, typesetting, printing and mailing of shareholder reports, excluding mailing of proxy statements and out of pocket expenses. Investor Class pays a single fee of .15% of average net assets.
Annual Report
6. Fees and Other Transactions with Affiliates - continued
Accounting and Security Lending Fees. Fidelity Service Company, Inc. (FSC), an affiliate of the investment adviser, maintains the Fund's accounting records. The accounting fee is based on the level of average net assets for each month. Under a separate contract, FSC administers the security lending program. The security lending fee is based on the number and duration of lending transactions.
Brokerage Commissions. The Fund placed a portion of its portfolio transactions with brokerage firms which are affiliates of the investment adviser. Brokerage commissions are included in net realized gain (loss) and change in net unrealized appreciation (depreciation) in the Statement of Operations. The commissions paid to these affiliated firms were $1,840 for the period.
7. Committed Line of Credit.
The Fund participates with other funds managed by the investment adviser or an affiliate in a $4.25 billion credit facility (the "line of credit") to be utilized for temporary or emergency purposes to fund shareholder redemptions or for other short-term liquidity purposes. The Fund has agreed to pay commitment fees on its pro-rata portion of the line of credit, which amounted to $50 and is reflected in Miscellaneous expenses on the Statement of Operations. During the period, there were no borrowings on this line of credit.
8. Security Lending.
The Fund lends portfolio securities through a lending agent from time to time in order to earn additional income. For equity securities, a lending agent is used and may loan securities to certain qualified borrowers, including Fidelity Capital Markets (FCM), a broker-dealer affiliated with the Fund. On the settlement date of the loan, the Fund receives collateral (in the form of U.S. Treasury obligations, letters of credit and/or cash) against the loaned securities and maintains collateral in an amount not less than 100% of the market value of the loaned securities during the period of the loan. The market value of the loaned securities is determined at the close of business of the Fund and any additional required collateral is delivered to the Fund on the next business day. If the borrower defaults on its obligation to return the securities loaned because of insolvency or other reasons, the Fund may apply collateral received from the borrower against the obligation. The Fund may experience delays and costs in recovering the securities loaned. Any cash collateral received is invested in the Fidelity Securities Lending Cash Central Fund. The value of loaned securities and cash collateral at period end are disclosed on the Fund's Statement of Assets and Liabilities. At period end, there were no security loans outstanding with FCM. Security lending income represents the income earned on investing cash collateral, less rebates paid to borrowers and any lending agent fees associated with the loan, plus any premium payments received for lending certain types of securities. Security lending income is presented in the Statement of Operations as a component of income from Fidelity Central Funds. Total security lending income during the period amounted to $7,001, including $2,667 from securities loaned to FCM.
9. Expense Reductions.
In addition to FIIOC reimbursing or waiving a portion of its transfer agent fees, the investment adviser voluntarily agreed to reimburse each class to the extent annual operating expenses exceeded certain levels of average net assets as noted in the table below. Some expenses, for example interest expense, including commitment fees, are excluded from this reimbursement.
Expenses were reimbursed and/or waived for the following classes during the period:
| Expense
Limitations | Reimbursement/Waiver |
Initial Class | .85% | $ 5,269 |
Service Class | .95% | 138 |
Service Class 2 | 1.10% | 569 |
Investor Class | .93% | 6,557 |
| | $ 12,533 |
Commissions paid to certain brokers with whom the investment adviser, or its affiliates, places trades on behalf of the Fund include an amount in addition to trade execution, which may be rebated back to the Fund to offset certain expenses. This amount totaled $1,549 for the period.
Annual Report
Notes to Financial Statements - continued
10. Distributions to Shareholders.
Distributions to shareholders of each class were as follows:
Years ended December 31, | 2013 | 2012 |
From net investment income | | |
Initial Class | $ 47,370 | $ 132,429 |
Service Class | 1,952 | 7,068 |
Service Class 2 | 8,315 | 29,641 |
Investor Class | 96,738 | 245,224 |
Total | $ 154,375 | $ 414,362 |
11. Share Transactions.
Transactions for each class of shares were as follows:
| Shares | Dollars |
Years ended December 31, | 2013 | 2012 | 2013 | 2012 |
Initial Class | | | | |
Shares sold | 476,170 | 87,813 | $ 5,608,305 | $ 877,739 |
Reinvestment of distributions | 3,592 | 13,022 | 47,370 | 132,429 |
Shares redeemed | (399,458) | (247,718) | (4,955,139) | (2,475,155) |
Net increase (decrease) | 80,304 | (146,883) | $ 700,536 | $ (1,464,987) |
Service Class | | | | |
Shares sold | - | - | $ - | $ - |
Reinvestment of distributions | 148 | 695 | 1,952 | 7,068 |
Shares redeemed | (1,272) | - | (17,099) | - |
Net increase (decrease) | (1,124) | 695 | $ (15,147) | $ 7,068 |
Service Class 2 | | | | |
Shares sold | 125,205 | 35,889 | $ 1,502,557 | $ 351,968 |
Reinvestment of distributions | 634 | 2,920 | 8,315 | 29,641 |
Shares redeemed | (87,494) | (49,489) | (1,090,366) | (492,162) |
Net increase (decrease) | 38,345 | (10,680) | $ 420,506 | $ (110,553) |
Investor Class | | | | |
Shares sold | 1,149,949 | 115,700 | $ 13,787,042 | $ 1,165,614 |
Reinvestment of distributions | 7,359 | 24,184 | 96,738 | 245,224 |
Shares redeemed | (693,047) | (564,194) | (8,477,725) | (5,592,263) |
Net increase (decrease) | 464,261 | (424,310) | $ 5,406,055 | $ (4,181,425) |
12. Other.
The Fund's organizational documents provide former and current trustees and officers with a limited indemnification against liabilities arising in connection with the performance of their duties to the Fund. In the normal course of business, the Fund may also enter into contracts that provide general indemnifications. The Fund's maximum exposure under these arrangements is unknown as this would be dependent on future claims that may be made against the Fund. The risk of material loss from such claims is considered remote.
At the end of the period, the investment adviser or its affiliates were the owners of record of 92% of the total outstanding shares of the Fund.
Annual Report
Report of Independent Registered Public Accounting Firm
To the Trustees of Variable Insurance Products Fund II and the Shareholders of VIP Value Leaders Portfolio:
In our opinion, the accompanying statement of assets and liabilities, including the schedule of investments, and the related statements of operations and of changes in net assets and the financial highlights present fairly, in all material respects, the financial position of VIP Value Leaders Portfolio (a fund of Variable Insurance Products Fund II) at December 31, 2013, the results of its operations for the year then ended, the changes in its net assets for each of the two years in the period then ended and the financial highlights for each of the five years in the period then ended, in conformity with accounting principles generally accepted in the United States of America. These financial statements and financial highlights (hereafter referred to as "financial statements") are the responsibility of the VIP Value Leaders Portfolio's management. Our responsibility is to express an opinion on these financial statements based on our audits. We conducted our audits of these financial statements in accordance with the standards of the Public Company Accounting Oversight Board (United States). Those standards require that we plan and perform the audit to obtain reasonable assurance about whether the financial statements are free of material misstatement. An audit includes examining, on a test basis, evidence supporting the amounts and disclosures in the financial statements, assessing the accounting principles used and significant estimates made by management, and evaluating the overall financial statement presentation. We believe that our audits, which included confirmation of securities at December 31, 2013 by correspondence with the custodian and brokers, provide a reasonable basis for our opinion.
PricewaterhouseCoopers LLP
Boston, Massachusetts
February 13, 2014
Annual Report
The Trustees, Member of the Advisory Board, and officers of the trust and fund, as applicable, are listed below. The Board of Trustees governs the fund and is responsible for protecting the interests of shareholders. The Trustees are experienced executives who meet periodically throughout the year to oversee the fund's activities, review contractual arrangements with companies that provide services to the fund, oversee management of the risks associated with such activities and contractual arrangements, and review the fund's performance. Except for James C. Curvey, Ned C. Lautenbach, Ronald P. O'Hanley, and William S. Stavropoulos, each of the Trustees oversees 173 funds. Mr. Curvey oversees 396 funds. Mr. Lautenbach, Mr. O'Hanley, and Mr. Stavropoulos each oversees 247 funds.
The Trustees hold office without limit in time except that (a) any Trustee may resign; (b) any Trustee may be removed by written instrument, signed by at least two-thirds of the number of Trustees prior to such removal; (c) any Trustee who requests to be retired or who has become incapacitated by illness or injury may be retired by written instrument signed by a majority of the other Trustees; and (d) any Trustee may be removed at any special meeting of shareholders by a two-thirds vote of the outstanding voting securities of the trust. Each Trustee who is not an interested person (as defined in the 1940 Act) of the trust and the fund (Independent Trustee), shall retire not later than the last day of the calendar year in which his or her 75th birthday occurs. The Independent Trustees may waive this mandatory retirement age policy with respect to individual Trustees. The officers and Advisory Board Member hold office without limit in time, except that any officer and Advisory Board Member may resign or may be removed by a vote of a majority of the Trustees at any regular meeting or any special meeting of the Trustees. Except as indicated, each individual has held the office shown or other offices in the same company for the past five years.
Experience, Skills, Attributes, and Qualifications of the Fund's Trustees. The Governance and Nominating Committee has adopted a statement of policy that describes the experience, qualifications, attributes, and skills that are necessary and desirable for potential Independent Trustee candidates (Statement of Policy). The Board believes that each Trustee satisfied at the time he or she was initially elected or appointed a Trustee, and continues to satisfy, the standards contemplated by the Statement of Policy. The Governance and Nominating Committee also engages professional search firms to help identify potential Independent Trustee candidates who have the experience, qualifications, attributes, and skills consistent with the Statement of Policy. From time to time, additional criteria based on the composition and skills of the current Independent Trustees, as well as experience or skills that may be appropriate in light of future changes to board composition, business conditions, and regulatory or other developments, have also been considered by the professional search firms and the Governance and Nominating Committee. In addition, the Board takes into account the Trustees' commitment and participation in Board and committee meetings, as well as their leadership of standing and ad hoc committees throughout their tenure.
In determining that a particular Trustee was and continues to be qualified to serve as a Trustee, the Board has considered a variety of criteria, none of which, in isolation, was controlling. The Board believes that, collectively, the Trustees have balanced and diverse experience, qualifications, attributes, and skills, which allow the Board to operate effectively in governing the fund and protecting the interests of shareholders. Information about the specific experience, skills, attributes, and qualifications of each Trustee, which in each case led to the Board's conclusion that the Trustee should serve (or continue to serve) as a trustee of the fund, is provided below.
Board Structure and Oversight Function. James C. Curvey is an interested person (as defined in the 1940 Act) and currently serves as Chairman. The Trustees have determined that an interested Chairman is appropriate and benefits shareholders because an interested Chairman has a personal and professional stake in the quality and continuity of services provided to the fund. Independent Trustees exercise their informed business judgment to appoint an individual of their choosing to serve as Chairman, regardless of whether the Trustee happens to be independent or a member of management. The Independent Trustees have determined that they can act independently and effectively without having an Independent Trustee serve as Chairman and that a key structural component for assuring that they are in a position to do so is for the Independent Trustees to constitute a substantial majority for the Board. The Independent Trustees also regularly meet in executive session. Ned C. Lautenbach serves as Chairman of the Independent Trustees and as such (i) acts as a liaison between the Independent Trustees and management with respect to matters important to the Independent Trustees and (ii) with management prepares agendas for Board meetings.
Fidelity funds are overseen by different Boards of Trustees. The funds' Board oversees Fidelity's equity and high income funds and another Board oversees Fidelity's investment-grade bond, money market, and asset allocation funds. The asset allocation funds may invest in Fidelity funds overseen by the funds' Board. The use of separate Boards, each with its own committee structure, allows the Trustees of each group of Fidelity funds to focus on the unique issues of the funds they oversee, including common research, investment, and operational issues. On occasion, the separate Boards establish joint committees to address issues of overlapping consequences for the Fidelity funds overseen by each Board.
The Trustees operate using a system of committees to facilitate the timely and efficient consideration of all matters of importance to the Trustees, the fund, and fund shareholders and to facilitate compliance with legal and regulatory requirements and oversight of the fund's activities and associated risks. The Board, acting through its committees, has charged FMR and its affiliates with (i) identifying events or circumstances the occurrence of which could have demonstrably adverse effects on the fund's business and/or reputation; (ii) implementing processes and controls to lessen the possibility that such events or circumstances occur or to mitigate the effects of such events or circumstances if they do occur; and (iii) creating and maintaining a system designed to evaluate continuously business and market conditions in order to facilitate the identification and implementation processes described in (i) and (ii) above. Because the day-to-day operations and activities of the fund are carried out by or through FMR, its affiliates and other service providers, the fund's exposure to risks is mitigated but not eliminated by the processes overseen by the Trustees. While each of the Board's committees has responsibility for overseeing different aspects of the fund's activities, oversight is exercised primarily through the Operations, Audit, and Compliance Committees. In addition, the Independent Trustees have worked with FMR to enhance the Board's oversight of investment and financial risks, legal and regulatory risks, technology risks, and operational risks, including the development of additional risk reporting to the Board. For example, a working group comprised of Independent Trustees and FMR has worked and continues to work to review the Fidelity fund's valuation-related activities, reporting and risk management. Appropriate personnel, including but not limited to the fund's Chief Compliance Officer (CCO), FMR's internal auditor, the independent accountants, the fund's Treasurer and portfolio management personnel, make periodic reports to the Board's committees, as appropriate, including an annual review of FMR's risk management program for the Fidelity fund. The responsibilities of each standing committee, including their oversight responsibilities, are described further under "Standing Committees of the Fund's Trustees."
Annual Report
The fund's Statement of Additional Information (SAI) includes more information about the Trustees. To request a free copy, call Fidelity at 1-877-208-0098.
Interested Trustees*:
Correspondence intended for each Trustee who is an interested person may be sent to Fidelity Investments, 245 Summer Street, Boston, Massachusetts 02210.
Name, Year of Birth; Principal Occupations and Other Relevant Experience+ |
James C. Curvey (1935) |
Year of Election or Appointment: 2007 Trustee Chairman of the Board of Trustees |
| Mr. Curvey also serves as Trustee of other Fidelity funds. Mr. Curvey is a Director of Fidelity Investments Money Management, Inc. (2009-present), Director of Fidelity Research & Analysis Co. (2009-present) and Director of FMR and FMR Co., Inc. (2007-present). Mr. Curvey is also Vice Chairman (2007-present) and Director of FMR LLC. In addition, Mr. Curvey serves as an Overseer for the Boston Symphony Orchestra and a member of the Trustees of Villanova University. Previously, Mr. Curvey was the Vice Chairman (2006-2007) and Director (2000-2007) of FMR Corp. |
Ronald P. O'Hanley (1957) |
Year of Election or Appointment: 2011 Trustee |
| Mr. O'Hanley also serves as Trustee of other Fidelity funds. He is Director of Fidelity SelectCo, LLC (2013-present), FMR Co., Inc. (2010-present), Director of Fidelity Investments Money Management, Inc. (2010-present), Director of Fidelity Research & Analysis Company (2010-present), President of Fidelity Asset Management and Corporate Services and a Member of Fidelity's Executive Committee (2010-present). Previously, Mr. O'Hanley served as President and Chief Executive Officer of BNY Mellon Asset Management (2007-2010). Mr. O'Hanley also served as Vice Chairman of Bank New York Mellon Corp. and a member of that firm's Executive Committee. Prior to the 2007 merger of The Bank of New York and Mellon Financial Corporation, he was Vice Chairman of Mellon Financial Corporation and President and Chief Executive Officer of Mellon Asset Management. He joined Mellon in February 1997. Mr. O'Hanley currently serves as Chairman of the Boston Public Library Foundation Board of Directors and sits on the Board of Directors of Beth Israel Deaconess Medical Center, the Board of Trustees of the Marine Biological Laboratory and the Advisory Board of the Maxwell School of Citizenship and Public Administration at Syracuse University. Mr. O'Hanley also chairs the Council on Asset Management for the Financial Services Roundtable and is a member of the Board of Directors of Institutional Investor's U.S. Institute. |
* Trustees have been determined to be "Interested Trustees" by virtue of, among other things, their affiliation with the trust or various entities under common control with FMR.
+ The information above includes each Trustee's principal occupation during the last five years and other information relating to the experience, attributes, and skills relevant to each Trustee's qualifications to serve as a Trustee, which led to the conclusion that each Trustee should serve as a Trustee for the fund.
Annual Report
Trustees and Officers - continued
Independent Trustees:
Correspondence intended for each Independent Trustee (that is, the Trustees other than the Interested Trustee) may be sent to Fidelity Investments, P.O. Box 55235, Boston, Massachusetts 02205-5235.
Name, Year of Birth; Principal Occupations and Other Relevant Experience+ |
Dennis J. Dirks (1948) |
Year of Election or Appointment: 2005 Trustee |
| Mr. Dirks also serves as Trustee of other Fidelity funds. Prior to his retirement in May 2003, Mr. Dirks was Chief Operating Officer and a member of the Board of The Depository Trust & Clearing Corporation (DTCC). He also served as President, Chief Operating Officer, and Board member of The Depository Trust Company (DTC) and President and Board member of the National Securities Clearing Corporation (NSCC). In addition, Mr. Dirks served as Chief Executive Officer and Board member of the Government Securities Clearing Corporation, Chief Executive Officer and Board member of the Mortgage-Backed Securities Clearing Corporation, as a Trustee and a member of the Finance Committee of Manhattan College (2005-2008), and as a Trustee and a member of the Finance Committee of AHRC of Nassau County (2006-2008). Mr. Dirks is a member of the Independent Directors Council (IDC) Governing Council (2010-present) and Board of Directors for The Brookville Center for Children's Services, Inc. (2009-present). |
Alan J. Lacy (1953) |
Year of Election or Appointment: 2008 Trustee |
| Mr. Lacy also serves as Trustee of other Fidelity funds. Mr. Lacy serves as Senior Adviser (2007-present) of Oak Hill Capital Partners, L.P. (private equity). Mr. Lacy also served as Chief Executive Officer (2000-2005) and Vice Chairman (2005-2006) of Sears Holdings Corporation and Sears, Roebuck and Co. (retail). In addition, Mr. Lacy serves as a member of the Board of Directors of Dave & Buster's Entertainment, Inc. (restaurant and entertainment complexes, 2010-present), Earth Fare, Inc. (retail grocery, 2012-present), The Hillman Companies, Inc. (hardware wholesalers, 2010-present), and Bristol-Myers Squibb Company (global pharmaceuticals, 2008-present). Mr. Lacy is a member of the Board of Trustees of The National Parks Conservation Association (2006-present). Previously, Mr. Lacy served as Chairman of the Board of Trustees of the National Parks Conservation Association (2008-2011) and as a member of the Board of Directors for the Western Union Company (global money transfer, 2006-2011). |
Ned C. Lautenbach (1944) |
Year of Election or Appointment: 2000 Trustee Chairman of the Independent Trustees |
| Mr. Lautenbach also serves as Trustee of other Fidelity funds. Mr. Lautenbach currently serves as the Lead Director of the Eaton Corporation Board of Directors (diversified industrial, 1997-present). Mr. Lautenbach is Chairman of the Board of Directors of the Philharmonic Center for the Arts in Naples, Florida (2012-present) and a member of the Council on Foreign Relations (1994-present). Previously, Mr. Lautenbach was a Partner/Advisory Partner at Clayton, Dubilier & Rice, LLC (private equity investment, 1998-2010), as well as a Director of Sony Corporation (2006-2007). |
Joseph Mauriello (1944) |
Year of Election or Appointment: 2008 Trustee |
| Mr. Mauriello also serves as Trustee of other Fidelity funds. Prior to his retirement in January 2006, Mr. Mauriello served in numerous senior management positions including Deputy Chairman and Chief Operating Officer (2004-2005), and Vice Chairman of Financial Services (2002-2004) of KPMG LLP US (professional services, 1965-2005). Mr. Mauriello currently serves as a member of the Board of Directors of XL Group plc. (global insurance and re-insurance, 2006-present). Previously, Mr. Mauriello served as a Director of the Hamilton Funds of the Bank of New York (2006-2007) and of Arcadia Resources Inc. (health care services and products, 2007-2012). |
Robert W. Selander (1950) |
Year of Election or Appointment: 2011 Trustee |
| Mr. Selander also serves as Trustee of other Fidelity funds. Previously, Mr. Selander served as a Member of the Advisory Board of other Fidelity funds (2011), and Executive Vice Chairman (2010), Chief Executive Officer (2009-2010), and President and Chief Executive Officer (1997-2009) of Mastercard, Inc. |
Cornelia M. Small (1944) |
Year of Election or Appointment: 2005 Trustee |
| Ms. Small also serves as Trustee of other Fidelity funds. Ms. Small is a member of the Board of Directors (2009-present) and Chair of the Investment Committee (2010-present) of the Teagle Foundation. Ms. Small also serves on the Investment Committee of the Berkshire Taconic Community Foundation (2008-present). Previously, Ms. Small served as Chairperson (2002-2008) and a member of the Investment Committee and Chairperson (2008-2012) and a member of the Board of Trustees of Smith College. In addition, Ms. Small served as Chief Investment Officer, Director of Global Equity Investments, and a member of the Board of Directors of Scudder, Stevens & Clark and Scudder Kemper Investments. |
William S. Stavropoulos (1939) |
Year of Election or Appointment: 2001 Trustee Vice Chairman of the Independent Trustees |
| Mr. Stavropoulos also serves as Trustee of other Fidelity funds. Mr. Stavropoulos serves as President and Founder of the Michigan Baseball Foundation, the Great Lakes Loons (2007-present). Mr. Stavropoulos is Chairman Emeritus of the Board of Directors of The Dow Chemical Company, where he previously served in numerous senior management positions, including President, CEO (1995-2000; 2002-2004), Chairman of the Executive Committee (2000-2006), and as a member of the Board of Directors (1990-2006). Currently, Mr. Stavropoulos is Chairman of the Board of Directors of Univar Inc. (global distributor of commodity and specialty chemicals), a Director of Teradata Corporation (data warehousing and technology solutions), and Maersk Inc. (industrial conglomerate), and a member of the Advisory Board for Metalmark Capital LLC (private equity investment, 2005-present). Mr. Stavropoulos is an operating advisor to Clayton, Dubilier & Rice, LLC (private equity investment). In addition, Mr. Stavropoulos is a member of the University of Notre Dame Advisory Council for the College of Science, a Trustee of the Rollin L. Gerstacker Foundation, and a Director of the Naples Philharmonic Center for the Arts. Previously, Mr. Stavropoulos served as a Director of Chemical Financial Corporation (bank holding company, 1993-2012) and Tyco International, Ltd. (multinational manufacturing and services, 2007-2012). |
David M. Thomas (1949) |
Year of Election or Appointment: 2008 Trustee |
| Mr. Thomas also serves as Trustee of other Fidelity funds. Mr. Thomas serves as Non-Executive Chairman of the Board of Directors of Fortune Brands Home and Security (home and security products, 2011-present), and as a member of the Board of Directors of Interpublic Group of Companies, Inc. (marketing communication, 2004-present). Previously, Mr. Thomas served as Executive Chairman (2005-2006) and Chairman and Chief Executive Officer (2000-2005) of IMS Health, Inc. (pharmaceutical and healthcare information solutions), and a Director of Fortune Brands, Inc. (consumer products, 2000-2011). |
+ The information above includes each Trustee's principal occupation during the last five years and other information relating to the experience, attributes, and skills relevant to each Trustee's qualifications to serve as a Trustee, which led to the conclusion that each Trustee should serve as a Trustee for the fund.
Advisory Board Members and Officers:
Correspondence intended for each officer and Peter S. Lynch may be sent to Fidelity Investments, 245 Summer Street, Boston, Massachusetts 02210. Officers appear below in alphabetical order.
Name, Year of Birth; Principal Occupation |
Peter S. Lynch (1944) |
Year of Election or Appointment: 2003 Member of the Advisory Board |
| Mr. Lynch also serves as Member of the Advisory Board of other Fidelity funds. Mr. Lynch is Vice Chairman and a Director of FMR and FMR Co., Inc. In addition, Mr. Lynch serves as a Trustee of Boston College and as the Chairman of the Inner-City Scholarship Fund. Previously, Mr. Lynch served on the Special Olympics International Board of Directors (1997-2006). |
Elizabeth Paige Baumann (1968) |
Year of Election or Appointment: 2012 Anti-Money Laundering (AML) Officer |
| Ms. Baumann also serves as AML Officer of other funds. She is Chief AML Officer of FMR LLC (2012-present) and is an employee of Fidelity Investments. Previously, Ms. Baumann served as Vice President and Deputy Anti-Money Laundering Officer (2007-2012). |
William C. Coffey (1969) |
Year of Election or Appointment: 2009 Assistant Secretary |
| Mr. Coffey also serves as Assistant Secretary of other funds. He is Senior Vice President and Deputy General Counsel of FMR LLC (2010-present), and is an employee of Fidelity Investments. Previously, Mr. Coffey served as Vice President and Associate General Counsel of FMR LLC (2005-2009). |
Jonathan Davis (1968) |
Year of Election or Appointment: 2010 Assistant Treasurer |
| Mr. Davis also serves as Assistant Treasurer of other funds. Mr. Davis is an employee of Fidelity Investments. Previously, Mr. Davis served as Vice President and Associate General Counsel of FMR LLC (2003-2010). |
Adrien E. Deberghes (1967) |
Year of Election or Appointment: 2008 Deputy Treasurer |
| Mr. Deberghes also serves as an officer of other funds. He is an employee of Fidelity Investments (2008-present). Prior to joining Fidelity Investments, Mr. Deberghes was Senior Vice President of Mutual Fund Administration at State Street Corporation (2007-2008), Senior Director of Mutual Fund Administration at Investors Bank & Trust (2005-2007), and Director of Finance for Dunkin' Brands (2000-2005). |
Stephanie J. Dorsey (1969) |
Year of Election or Appointment: 2010 Assistant Treasurer |
| Ms. Dorsey also serves as an officer of other funds. She is an employee of Fidelity Investments (2008-present) and has served in other fund officer roles. Prior to joining Fidelity Investments, Ms. Dorsey served as Treasurer (2004-2008) of the JPMorgan Mutual Funds and Vice President (2004-2008) of JPMorgan Chase Bank. |
Scott C. Goebel (1968) |
Year of Election or Appointment: 2008 Secretary and Chief Legal Officer (CLO) |
| Mr. Goebel serves as Secretary and CLO of other funds. Mr. Goebel also serves as Secretary of Fidelity Investments Money Management, Inc. (FIMM) (2010-present) and Fidelity Research and Analysis Company (FRAC) (2010-present); General Counsel, Secretary, and Senior Vice President of FMR (2008-present) and FMR Co., Inc. (2008-present); Chief Legal Officer of Fidelity Management & Research (Hong Kong) Limited (2008-present) and Assistant Secretary of Fidelity Management & Research (Japan) Inc. (2008-present), and Fidelity Management & Research (U.K.) Inc. (2008-present). Previously, Mr. Goebel served as Secretary and CLO of other Fidelity funds (2008-2013), Assistant Secretary of FIMM (2008-2010), FRAC (2008-2010), and certain funds (2007-2008); and as Vice President and Secretary of Fidelity Distributors Corporation (FDC) (2005-2007). Mr. Goebel has been employed by FMR LLC or an affiliate since 2001. |
Joseph A. Hanlon (1968) |
Year of Election or Appointment: 2012 Chief Compliance Officer |
| Mr. Hanlon also serves as Chief Compliance Officer of other funds. Mr. Hanlon serves as Compliance Officer of FMR, FMR Co., Inc., Fidelity Investments Money Management, Inc. (FIMM), Fidelity Research and Analysis Company (FRAC), and Fidelity Management & Research (Hong Kong) (2009-present), as Senior Vice President of the Fidelity Asset Management Division (2009-present), and is an employee of Fidelity Investments. Previously, Mr. Hanlon served as Compliance Officer of Fidelity Management & Research (Japan) Inc. (2009-2013), Strategic Advisers, Inc. (2009-2013), and Fidelity Management & Research (U.K.) Inc. (2009-2013). |
Thomas C. Hense (1964) |
Year of Election or Appointment: 2008/2010 Vice President |
| Mr. Hense also serves as Vice President of other funds (High Income (2008), Small Cap (2008), and Value (2010) funds). Previously, Mr. Hense served as a portfolio manager for Fidelity's Institutional Money Management Group (Pyramis) (2003-2008). |
Brian B. Hogan (1964) |
Year of Election or Appointment: 2009 Vice President |
| Mr. Hogan also serves as Vice President of other funds. Mr. Hogan serves as President of FMR's Equity Division (2009-present). Previously, Mr. Hogan served as Senior Vice President, Equity Research of FMR (2006-2009) and as a portfolio manager. |
Chris Maher (1972) |
Year of Election or Appointment: 2013 Assistant Treasurer |
| Mr. Maher serves as Assistant Treasurer of other funds. Mr. Maher is Vice President of Valuation Oversight and is an employee of Fidelity Investments. Previously, Mr. Maher served as Vice President of Asset Management Compliance (2013), Vice President of FMR's Program Management Group (2010-2013), and Vice President of Valuation Oversight (2008-2010). |
Christine Reynolds (1958) |
Year of Election or Appointment: 2008 Chief Financial Officer |
| Ms. Reynolds also serves as Chief Financial Officer of other funds. Ms. Reynolds became President of Fidelity Pricing and Cash Management Services (FPCMS) in August 2008. Ms. Reynolds served as Chief Operating Officer of FPCMS (2007-2008). Previously, Ms. Reynolds served as President, Treasurer, and Anti-Money Laundering officer of the Fidelity funds (2004-2007). |
Kenneth B. Robins (1969) |
Year of Election or Appointment: 2008 President and Treasurer |
| Mr. Robins also serves as an officer of other funds. Mr. Robins serves as Executive Vice President of Fidelity Investments Money Management, Inc. (FIMM) (2013-present) and is an employee of Fidelity Investments (2004-present). Previously, Mr. Robins served in other fund officer roles. |
Gary W. Ryan (1958) |
Year of Election or Appointment: 2005 Assistant Treasurer |
| Mr. Ryan also serves as Assistant Treasurer of other funds. Mr. Ryan is an employee of Fidelity Investments and has served in other fund officer roles. Previously, Mr. Ryan served as Vice President of Fund Reporting in Fidelity Pricing and Cash Management Services (FPCMS) (1999-2005). |
Stephen Sadoski (1971) |
Year of Election or Appointment: 2012 Deputy Treasurer |
| Mr. Sadoski also serves as Deputy Treasurer of other funds. He is an employee of Fidelity Investments (2012-present) and has served in another fund officer role. Prior to joining Fidelity Investments, Mr. Sadoski served as an assistant chief accountant in the Division of Investment Management of the Securities and Exchange Commission (SEC) (2009-2012) and as a senior manager at Deloitte & Touche LLP (1997-2009). |
Stacie M. Smith (1974) |
Year of Election or Appointment: 2013 Deputy Treasurer |
| Ms. Smith also serves as an officer of other funds. She is an employee of Fidelity Investments (2009-present) and has served in other fund officer roles. Prior to joining Fidelity Investments, Ms. Smith served as Senior Audit Manager of Ernst & Young LLP (1996-2009). |
Renee Stagnone (1975) |
Year of Election or Appointment: 2013 Deputy Treasurer |
| Ms. Stagnone also serves as Deputy Treasurer of other funds. Ms. Stagnone is an employee of Fidelity Investments. |
Joseph F. Zambello (1957) |
Year of Election or Appointment: 2011 Deputy Treasurer |
| Mr. Zambello also serves as Deputy Treasurer of other funds. Mr. Zambello is an employee of Fidelity Investments. Previously, Mr. Zambello served as Vice President of FMR's Program Management Group (2009-2011) and Vice President of the Transfer Agent Oversight Group (2005-2009). |
Annual Report
Initial Class, Service Class, Service Class 2, and Investor Class designates 100% of the dividends distributed during the fiscal year as qualifying for the dividends-received deduction for corporate shareholders.
Annual Report
Board Approval of Investment Advisory Contracts and Management Fees
VIP Value Leaders Portfolio
Each year, the Board of Trustees, including the Independent Trustees (together, the Board), votes on the renewal of the management contract and sub-advisory agreements (together, the Advisory Contracts) for the fund. The Board, assisted by the advice of fund counsel and Independent Trustees' counsel, requests and considers a broad range of information relevant to the renewal of the Advisory Contracts throughout the year.
The Board meets regularly and, at each of its meetings, covers an extensive agenda of topics and materials and considers factors that are relevant to its annual consideration of the renewal of the fund's Advisory Contracts, including the services and support provided to the fund and its shareholders. The Board has established various standing committees, each composed of and chaired by Independent Trustees with varying backgrounds, to which the Board has assigned specific subject matter responsibilities in order to enhance effective decision-making by the Board. The Board, acting directly and through its Committees, requests and receives information concerning the annual consideration of the renewal of the fund's Advisory Contracts. The Board also meets as needed to consider matters specifically related to the Board's annual consideration of the renewal of Advisory Contracts. Members of the Board may also meet with trustees of other Fidelity funds through ad hoc joint committees to discuss certain matters relevant to the Fidelity funds.
At its July 2013 meeting, the Board, including the Independent Trustees, unanimously determined to renew the fund's Advisory Contracts. In reaching its determination, the Board considered all factors it believed relevant, including (i) the nature, extent, and quality of the services to be provided to the fund and its shareholders (including the investment performance of the fund); (ii) the competitiveness of the fund's management fee and total expense ratio relative to peer funds; (iii) the total costs of the services to be provided by and the profits to be realized by Fidelity from its relationship with the fund; (iv) the extent to which economies of scale exist and would be realized as the fund grows; and (v) whether fee levels reflect these economies of scale, if any, for the benefit of fund shareholders.
In considering whether to renew the Advisory Contracts for the fund, the Board reached a determination, with the assistance of fund counsel and Independent Trustees' counsel and through the exercise of its business judgment, that the renewal of the Advisory Contracts was in the best interests of the fund and its shareholders and that the compensation payable under the Advisory Contracts was fair and reasonable. The Board's decision to renew the Advisory Contracts was not based on any single factor, but rather was based on a comprehensive consideration of all the information provided to the Board at its meetings throughout the year. The Board, in reaching its determination to renew the Advisory Contracts, was aware that shareholders in the fund have a broad range of investment choices available to them, including a wide choice among mutual funds offered by Fidelity's competitors, and that the fund's shareholders, who have the opportunity to review and weigh the disclosure provided by the fund in its prospectus and other public disclosures, have chosen to invest in this fund, which is a part of the Fidelity family of funds.
Nature, Extent, and Quality of Services Provided. The Board considered the staffing within the investment adviser, Fidelity Management & Research Company (FMR), and the sub-advisers (together, the Investment Advisers) as it relates to the fund, including the backgrounds of the fund's investment personnel, and also considered the fund's investment objective, strategies, and related investment philosophy. The Independent Trustees also had discussions with senior management of Fidelity's investment operations and investment groups. The Board considered the structure of the portfolio manager compensation program and whether this structure provides appropriate incentives to act in the best interests of the fund.
Resources Dedicated to Investment Management and Support Services. The Board and the Fund Oversight and Research Committees reviewed the general qualifications and capabilities of the Investment Advisers' investment staff, including its size, education, experience, and resources, as well as the Investment Advisers' approach to recruiting, training, managing, and compensating investment personnel. The Board noted that FMR has continued to increase the resources devoted to non-U.S. offices, including expansion of Fidelity's global investment organization. The Board also noted that Fidelity's analysts have extensive resources, tools and capabilities that allow them to conduct sophisticated quantitative and fundamental analysis, as well as credit analysis of issuers, counterparties and guarantors. Further, the Board believes that Fidelity's investment professionals have sufficient access to global information and data so as to provide competitive investment results over time, and that those professionals also have access to sophisticated tools that permit them to assess portfolio construction and risk and performance attribution characteristics continuously, as well as to transmit new information and research conclusions rapidly around the world. Additionally, in its deliberations, the Board considered the Investment Advisers' trading and risk management capabilities and resources, which are an integral part of the investment management process.
Shareholder and Administrative Services. The Board considered (i) the nature, extent, quality, and cost of advisory, administrative, and shareholder services performed by the Investment Advisers and their affiliates under the Advisory Contracts and under separate agreements covering transfer agency, pricing and bookkeeping, and securities lending services for the fund; (ii) the nature and extent of the supervision of third party service providers, principally custodians and subcustodians; and (iii) the resources devoted to, and the record of compliance with, the fund's compliance policies and procedures. The Board also reviewed the allocation of fund brokerage, including allocations to brokers affiliated with the Investment Advisers, the use of brokerage commissions to pay fund expenses, and the use of "soft" commission dollars to pay for research services.
The Board noted that the growth of fund assets over time across the complex allows Fidelity to reinvest in the development of services designed to enhance the value or convenience of the Fidelity funds as investment vehicles. These services include 24-hour access to account information and market information through telephone representatives and over the Internet, investor education materials and asset allocation tools, and the expanded availability of Fidelity Investor Centers.
Annual Report
Investment in a Large Fund Family. The Board considered the benefits to shareholders of investing in a Fidelity fund, including the benefits of investing in a fund that is part of a large family of funds offering a variety of investment disciplines and providing a large variety of mutual fund investor services. The Board noted that Fidelity had taken, or had made recommendations that resulted in the Fidelity funds taking, a number of actions over the previous year that benefited particular funds, including (i) continuing to dedicate additional resources to investment research and to the support of the senior management team that oversees asset management; (ii) persisting in efforts to enhance Fidelity's global research capabilities; (iii) launching new funds and making other enhancements to meet client needs for global and income-oriented solutions; (iv) continuing to launch dedicated lower cost underlying funds to meet portfolio construction needs related to expanding underlying fund options for Fidelity funds of funds, specifically for the Freedom Fund product lines; (v) rationalizing product lines and gaining increased efficiencies through the mergers of several funds into other funds; (vi) strengthening Fidelity's index fund offerings by reducing investment minimums and adopting or lowering existing expense caps for certain funds and classes; (vii) enhancing Global Asset Allocation product offerings by launching new funds and strategies, including "open architecture" target date funds that utilize affiliated and unaffiliated sub-advisers; (viii) modifying the eligibility criteria for Institutional Class shares of Advisor funds to increase their marketability to a portion of the defined contribution plan market; (ix) creating a new low-cost retirement share class for certain Advisor funds to appeal to large retirement plans; (x) transitioning the management of certain Fidelity commodity funds to Geode Capital Management LLC, a registered commodity pool operator, while retaining administrative responsibilities for the funds; (xi) reorganizing a number of funds; and (xii) taking steps toward establishing a new Fidelity adviser to manage sector-based funds and products.
Investment Performance. The Board considered whether the fund has operated in accordance with its investment objective, as well as its record of compliance with its investment restrictions and its performance history. The Board noted that there was a portfolio management change for the fund in November 2010.
The Board took into account discussions with the Investment Advisers about fund investment performance that occur at Board meetings throughout the year. In this regard the Board noted that as part of regularly scheduled fund reviews and other reports to the Board on fund performance, the Board periodically considers annualized return information for the fund, for different time periods, measured against a securities market index ("benchmark index") and a peer group of mutual funds with similar objectives ("peer group"). In its evaluation of fund investment performance, the Board gave particular attention to information indicating changes in performance of certain Fidelity funds for specific time periods and the Investment Advisers' explanations for any overperformance or, in the case of the fund, underperformance.
In addition to reviewing absolute and relative fund performance, the Independent Trustees periodically consider the appropriateness of fund performance metrics in evaluating the results achieved. In general, the Independent Trustees believe that fund performance should be evaluated based on net performance (after fees and expenses) of both the highest performing and lowest performing classes, where applicable, compared to appropriate benchmark indices, over appropriate time periods which may include full market cycles, and compared to peer groups, as applicable, over the same periods, taking into account relevant factors including the following: general market conditions; issuer-specific information; tactical opportunities for investment; and fund cash flows and other factors.
The Independent Trustees recognize that shareholders evaluate performance on a net basis over their own holding periods, for which one-, three-, and five-year periods are used as a proxy. For this reason, the performance information reviewed by the Board also included net cumulative calendar year total return information for the fund and an appropriate benchmark index and peer group for the most recent one-, three-, and five-year periods, as shown below. Returns are shown compared to the 25th percentile (top of box) and 75th percentile (bottom of box) of the peer universe.
Annual Report
Board Approval of Investment Advisory Contracts and Management Fees - continued
VIP Value Leaders Portfolio
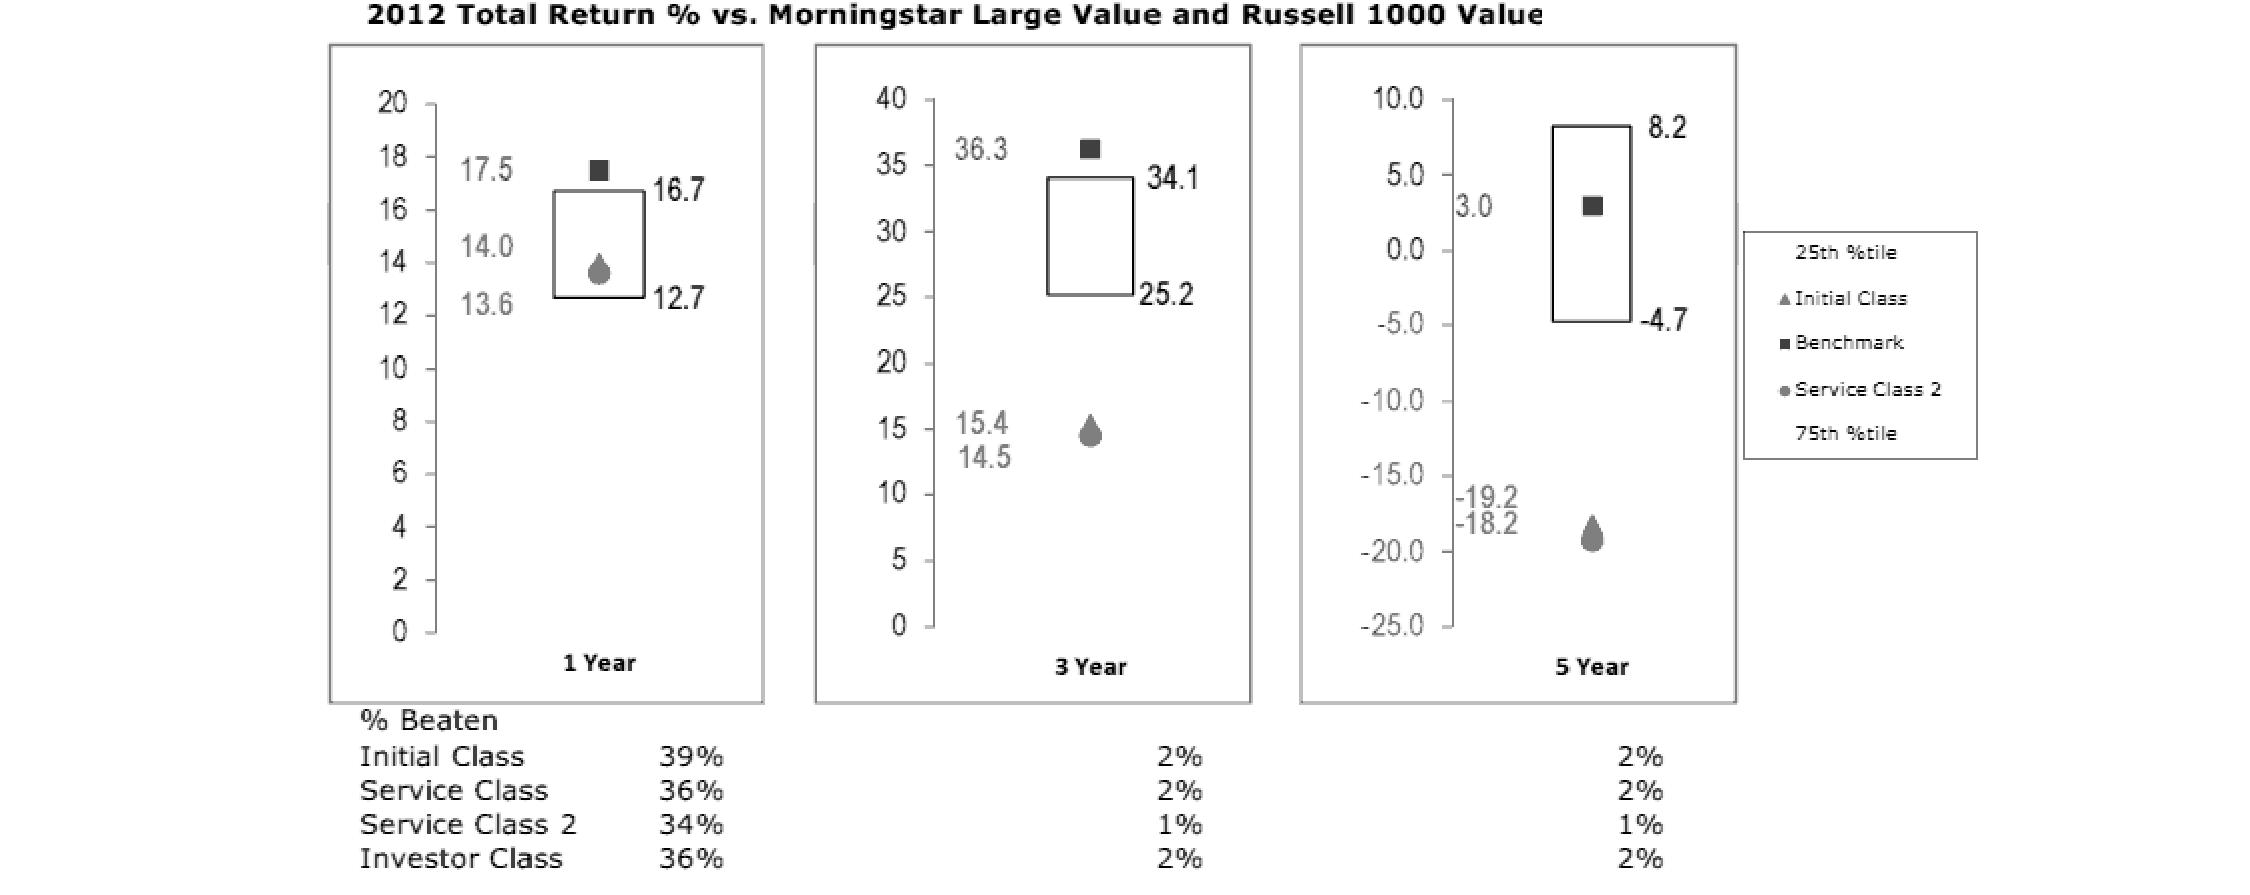
The Board has discussed the fund's underperformance with FMR and has engaged with FMR to consider what steps might be taken to remediate the fund's underperformance.
Based on its review, the Board concluded that the nature, extent, and quality of services provided to the fund under the Advisory Contracts should benefit the fund's shareholders.
Competitiveness of Management Fee and Total Expense Ratio. The Board considered the fund's management fee and total expense ratio compared to "mapped groups" of competitive funds and classes. Fidelity creates "mapped groups" by combining similar Lipper investment objective categories that have comparable management fee characteristics. Combining Lipper investment objective categories aids the Board's management fee and total expense ratio comparisons by broadening the competitive group used for comparison and by reducing the number of universes to which various Fidelity funds are compared.
Management Fee. The Board considered two proprietary management fee comparisons for the 12-month periods shown in the chart below. The group of Lipper funds used by the Board for management fee comparisons is referred to below as the "Total Mapped Group." The Total Mapped Group comparison focuses on a fund's standing in terms of gross management fees before expense reimbursements or caps relative to the total universe of funds with comparable investment mandates, regardless of whether their management fee structures also are comparable. Funds with comparable investment mandates offer exposure to similar types of securities. Funds with comparable management fee structures have similar management fee contractual arrangements (e.g., flat rate charged for advisory services, all-inclusive fee rate, etc.). "TMG %" represents the percentage of funds in the Total Mapped Group that had management fees that were lower than the fund's. For example, a TMG % of 10% means that 90% of the funds in the Total Mapped Group had higher management fees than the fund. The "Asset-Size Peer Group" (ASPG) comparison focuses on a fund's standing relative to a subset of non-Fidelity funds within the Total Mapped Group that are similar in size and management fee structure. The ASPG represents at least 15% of the funds in the Total Mapped Group with comparable asset size and management fee structures, subject to a minimum of 50 funds (or all funds in the Total Mapped Group if fewer than 50). Additional information, such as the ASPG quartile in which the fund's management fee ranked, is also included in the chart and considered by the Board.
Annual Report
VIP Value Leaders Portfolio

The Board noted that the fund's management fee ranked below the median of its Total Mapped Group and below the median of its ASPG for 2012.
Based on its review, the Board concluded that the fund's management fee is fair and reasonable in light of the services that the fund receives and the other factors considered.
Total Expense Ratio. In its review of each class's total expense ratio, the Board considered the fund's management fee as well as other fund or class expenses, as applicable, such as transfer agent fees, pricing and bookkeeping fees, fund-paid 12b-1 fees, and custodial, legal, and audit fees. The Board also noted the effects of any waivers and reimbursements on fees and expenses. As part of its review, the Board also considered the current and historical total expense ratios of each class of the fund compared to competitive fund median expenses. Each class of the fund is compared to those funds and classes in the Total Mapped Group (used by the Board for management fee comparisons) that have a similar sales load structure.
The Board noted that the total expense ratio of Initial Class ranked below its competitive median for 2012, the total expense ratio of Investor Class ranked equal to its competitive median for 2012, and the total expense ratio of each of Service Class and Service Class 2 ranked above its competitive median for 2012. The Board considered that, in general, various factors can affect total expense ratios. The Board noted that the fund offers multiple classes, each of which has a different 12b-1 fee structure, and that the multiple structures are intended to offer a range of pricing options for the intermediary market. The Board also noted that the total expense ratios of the classes vary primarily by the level of their 12b-1 fees, although differences in transfer agent fees may also cause expenses to vary from class to class.
Fees Charged to Other Fidelity Clients. The Board also considered Fidelity fee structures and other information with respect to clients of FMR and its affiliates, such as other mutual funds advised or subadvised by FMR or its affiliates, pension plan clients, and other institutional clients. The Board noted the findings of the 2013 ad hoc joint committee (created with the board of other Fidelity funds), which reviewed and compared Fidelity's institutional investment advisory business with its business of providing services to the Fidelity funds, including the differences in services provided, fees charged, and costs incurred, as well as competition in their respective marketplaces.
Based on its review of total expense ratios and fees charged to other Fidelity clients, the Board concluded that the total expense ratio of each class of the fund was reasonable, although in some cases above the median of the universe presented for comparison, in light of the services that the fund and its shareholders receive and the other factors considered.
Costs of the Services and Profitability. The Board considered the revenues earned and the expenses incurred by Fidelity in conducting the business of developing, marketing, distributing, managing, administering and servicing the fund and servicing the fund's shareholders. The Board also considered the level of Fidelity's profits in respect of all the Fidelity funds.
On an annual basis, FMR presents to the Board Fidelity's profitability for the fund. Fidelity calculates the profitability for each fund, as well as aggregate profitability for groups of Fidelity funds and all Fidelity funds, using a series of detailed revenue and cost allocation methodologies which originate with the books and records of Fidelity on which Fidelity's audited financial statements are based. The Audit Committee of the Board reviews any significant changes from the prior year's methodologies.
PricewaterhouseCoopers LLP (PwC), independent registered public accounting firm and auditor to Fidelity and certain Fidelity funds, has been engaged annually by the Board as part of the Board's assessment of Fidelity's profitability analysis. PwC's engagement includes the review and assessment of the methodologies used by Fidelity in determining the revenues and expenses attributable to Fidelity's mutual fund business, and completion of agreed-upon procedures surrounding the mathematical accuracy of fund profitability and its conformity to allocation methodologies. After considering PwC's reports issued under the engagement and information provided by Fidelity, the Board concluded that while other allocation methods may also be reasonable, Fidelity's profitability methodologies are reasonable in all material respects.
Annual Report
Board Approval of Investment Advisory Contracts and Management Fees - continued
The Board also reviewed Fidelity's non-fund businesses and fall-out benefits related to the mutual fund business as well as cases where Fidelity's affiliates may benefit from or be related to the fund's business.
The Board considered the costs of the services provided by and the profits realized by Fidelity in connection with the operation of the fund and was satisfied that the profitability was not excessive in the circumstances.
Economies of Scale. The Board considered whether there have been economies of scale in respect of the management of the Fidelity funds, whether the Fidelity funds (including the fund) have appropriately benefited from any such economies of scale, and whether there is potential for realization of any further economies of scale. The Board considered the extent to which the fund will benefit from economies of scale through increased services to the fund, through waivers or reimbursements, or through fee or expense reductions. The Board also noted that in 2009, it and the board of other Fidelity funds created an ad hoc committee (the Economies of Scale Committee) to analyze whether FMR attains economies of scale in respect of the management and servicing of the Fidelity funds, whether the Fidelity funds have appropriately benefited from such economies of scale, and whether there is potential for realization of any further economies of scale.
The Board recognized that the fund's management contract incorporates a "group fee" structure, which provides for lower group fee rates as total fund assets under FMR's management increase, and for higher group fee rates as total fund assets under FMR's management decrease. FMR calculates the group fee rates based on a tiered asset "breakpoint" schedule that varies based on asset class. The Board considered that the group fee is designed to deliver the benefits of economies of scale to fund shareholders when total Fidelity fund assets increase, even if assets of any particular fund are unchanged or have declined, because some portion of Fidelity's costs are attributable to services provided to all Fidelity funds, and all funds benefit if those costs can be allocated among more assets. The Board concluded that, given the group fee structure, fund shareholders will benefit from lower management fees as assets under FMR's management increase at the fund complex level, regardless of whether Fidelity achieves any such economies of scale.
The Board concluded, taking into account the analysis of the Economies of Scale Committee, that economies of scale, if any, are being appropriately shared between fund shareholders and Fidelity.
Amendment to Description of Group Fee Rate. At its July 2013 meeting, the Board voted to approve an amendment to the fund's management contract to modify the description of the "group fee rate" effective August 1, 2013. The Board noted that under the prior description in the contract, the group fee rate was based on the average net assets of all registered investment companies with which FMR has management contracts. Under the contract's tiered asset breakpoint schedule, the group fee rate is lower as total fund assets under FMR's management increase, and higher as total fund assets under FMR's management decrease. The Board considered that the prior description would have excluded the assets of 64 Fidelity sector funds from the group fee rate calculation once Fidelity SelectCo, LLC, an affiliate of FMR, assumed management responsibilities for those funds. The Board noted that modifying the description of the group fee rate to continue to include the assets of those 64 funds for purposes of determining group fee rate breakpoints would avoid an immediate adverse impact on the group fee rate for any fund.
Additional Information Requested by the Board. In order to develop fully the factual basis for consideration of the Fidelity funds' Advisory Contracts, the Board requested and received additional information on certain topics, including: (i) fund performance trends and Fidelity's long-term strategies for certain funds; (ii) the potential to further rationalize the Fidelity fund lineup with the possibility of achieving savings for the funds and Fidelity; (iii) the methodology with respect to competitive fund data and peer group classifications; (iv) the arrangements with, and performance of, certain sub-advisers on behalf of the Fidelity funds, as well as certain proposed participating affiliate arrangements; (v) the realization of fall-out benefits in certain Fidelity business units; (vi) Fidelity's group fee structures, including the rationale for the individual fee rates of certain categories of funds and the definition of group assets; (vii) trends regarding industry use of performance fee structures and the performance adjustment methodologies applicable to the Fidelity funds; (viii) additional competitive analysis regarding the total expenses for certain classes; and (ix) fund profitability methodology, including Fidelity's cost allocation methodology, and the impact of certain factors on fund profitability results.
Based on its evaluation of all of the conclusions noted above, and after considering all factors it believed relevant, the Board ultimately concluded that the advisory fee structures are fair and reasonable, and that the fund's Advisory Contracts should be renewed.
Annual Report
Investment Adviser
Fidelity Management & Research Company
Boston, MA
Investment Sub-Advisers
FMR Co., Inc.
Fidelity Management & Research (U.K.) Inc.
Fidelity Management & Research (Hong Kong) Limited
Fidelity Management & Research (Japan) Inc.
General Distributor
Fidelity Distributors Corporation
Smithfield, RI
Transfer and Service Agents
Fidelity Investments Institutional Operations Company, Inc.
Boston, MA
Fidelity Service Company, Inc.
Boston, MA
Custodian
Brown Brothers Harriman & Co.
Boston, MA
VVL-ANN-0214
1.796594.110
Fidelity® Variable Insurance Products:
Emerging Markets Portfolio
Annual Report
December 31, 2013
(Fidelity Cover Art)
Contents
Performance | (Click Here) | How the fund has done over time. |
Management's Discussion of Fund Performance | (Click Here) | The Portfolio Manager's review of fund performance and strategy. |
Shareholder Expense Example | (Click Here) | An example of shareholder expenses. |
Investment Changes | (Click Here) | A summary of major shifts in the fund's investments over the past six months. |
Investments | (Click Here) | A complete list of the fund's investments with their market values. |
Financial Statements | (Click Here) | Statements of assets and liabilities, operations, and changes in net assets, as well as financial highlights. |
Notes | (Click Here) | Notes to the financial statements. |
Report of Independent Registered Public Accounting Firm | (Click Here) | |
Trustees and Officers | (Click Here) | |
Distributions | (Click Here) | |
Board Approval of Investment Advisory Contracts and Management Fees | (Click Here) | |
To view a fund's proxy voting guidelines and proxy voting record for the 12-month period ended June 30, visit http://www.fidelity.com/proxyvotingresults or visit the Securities and Exchange Commission's (SEC) web site at http://www.sec.gov. You may also call 1-877-208-0098 to request a free copy of the proxy voting guidelines.
Fidelity Variable Insurance Products are separate account options which are purchased through a variable insurance contract.
Standard & Poor's, S&P and S&P 500 are registered service marks of The McGraw-Hill Companies, Inc. and have been licensed for use by Fidelity Distributors Corporation.
Other third-party marks appearing herein are the property of their respective owners.
All other marks appearing herein are registered or unregistered trademarks or service marks of FMR LLC or an affiliated company. © 2014 FMR LLC. All rights reserved.
This report and the financial statements contained herein are submitted for the general information of the shareholders of the fund. This report is not authorized for distribution to prospective investors in the fund unless preceded or accompanied by an effective prospectus.
A fund files its complete schedule of portfolio holdings with the SEC for the first and third quarters of each fiscal year on Form N-Q. Forms N-Q are available on the SEC's web site at http://www.sec.gov. A fund's Forms N-Q may be reviewed and copied at the SEC's Public Reference Room in Washington, DC. Information regarding the operation of the SEC's Public Reference Room may be obtained by calling 1-800-SEC-0330. For a complete list of a fund's portfolio holdings, view the most recent holdings listing, semiannual report, or annual report on Fidelity's web site at http://www.fidelity.com, http://www.advisor.fidelity.com, or http://www.401k.com, as applicable.
NOT FDIC INSURED • MAY LOSE VALUE • NO BANK GUARANTEE
Neither the fund nor Fidelity Distributors Corporation is a bank.
Annual Report
Average annual total return reflects the change in the value of an investment, assuming reinvestment of the class' distributions from dividend income and capital gains (the profits earned upon the sale of securities that have grown in value, if any) and assuming a constant rate of performance each year. During periods of reimbursement by Fidelity, a fund's total return will be greater than it would be had the reimbursement not occurred. Performance numbers are net of all underlying fund operating expenses, but do not include any insurance charges imposed by your insurance company's separate account. If performance information included the effect of these additional charges, the total returns would have been lower. How a fund did yesterday is no guarantee of how it will do tomorrow.
Average Annual Total Returns
Periods ended December 31, 2013 | Past 1
year | Past 5
years | Life of
fund A |
VIP Emerging Markets Portfolio - Initial Class | 3.85% | 14.17% | -0.66% |
VIP Emerging Markets Portfolio - Service Class | 3.84% | 14.08% | -0.76% |
VIP Emerging Markets Portfolio - Service Class 2 | 3.70% | 13.94% | -0.90% |
A From January 23, 2008.
$10,000 Over Life of Fund
Let's say hypothetically that $10,000 was invested in VIP Emerging Markets Portfolio - Initial Class on January 23, 2008, when the fund started. The chart shows how the value of your investment would have changed, and also shows how the MSCI® Emerging Markets Index performed over the same period.
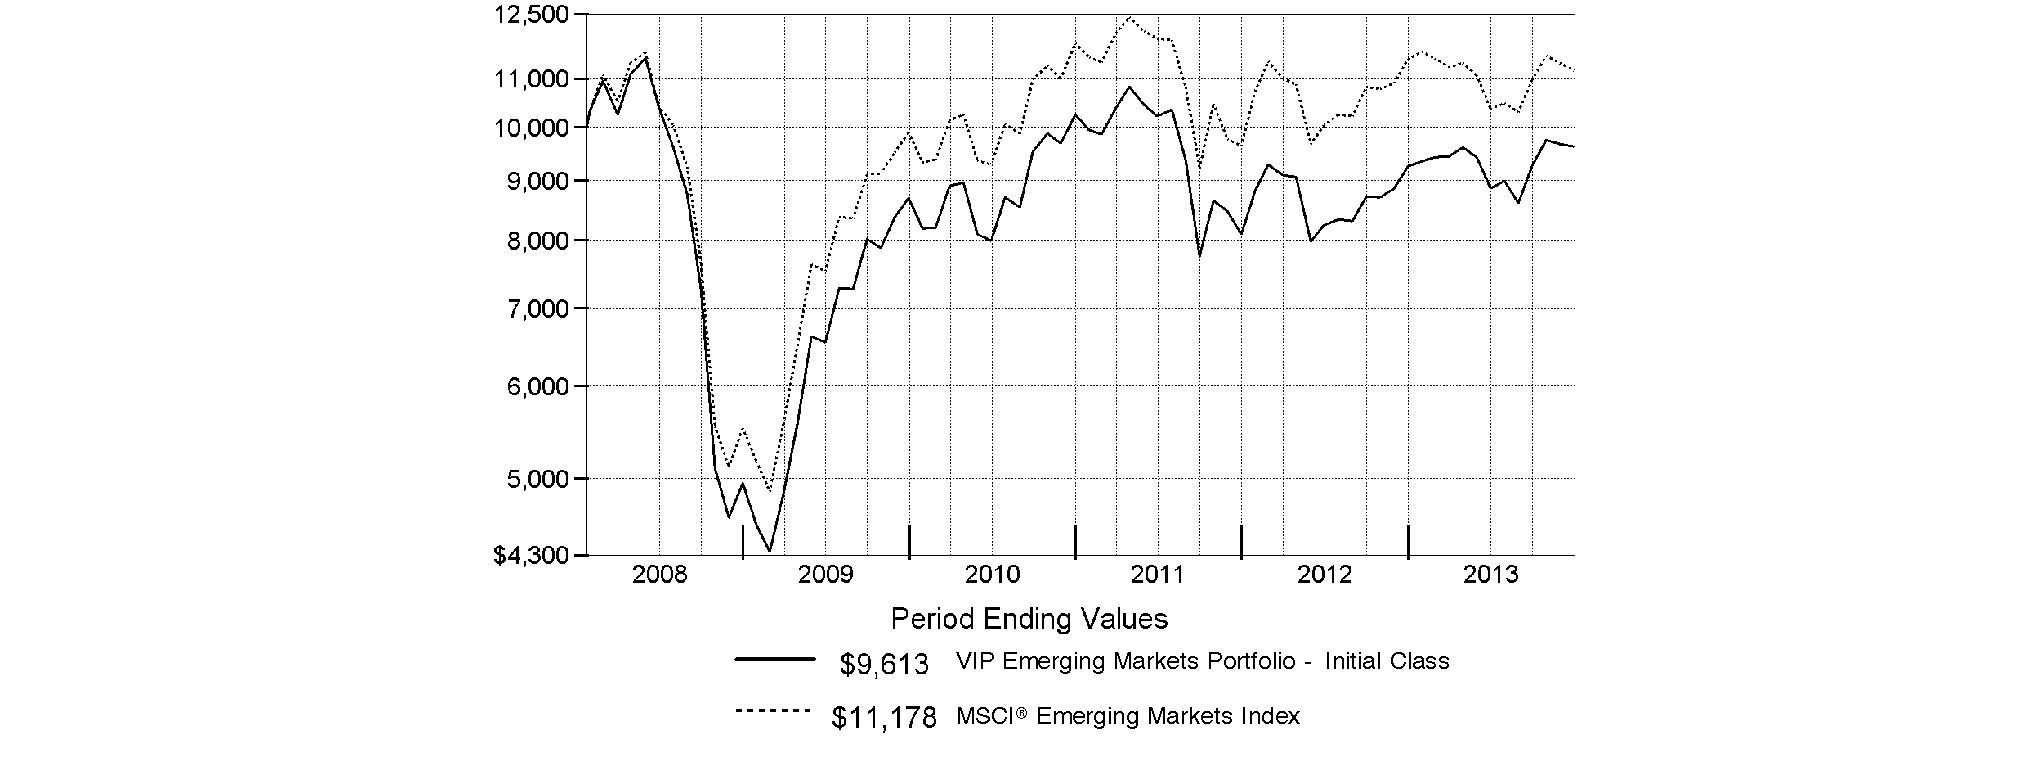
Annual Report
Market Recap: Global equity markets remained upbeat for the 12 months ending December 31, 2013, propelling the MSCI® ACWI® (All Country World Index) Index to a 23.24% return. Midyear turbulence gave way by autumn when policymakers in the U.S. and China had made clear their intentions to maintain accommodative monetary policies. That stance, combined with modest cyclical improvement around the globe and generally low valuations, underpinned the broad rally in equities, although the relative strength of the U.S. dollar generally tempered gains for U.S. investors holding foreign securities based in local currencies. During the period, the broad-market S&P 500® Index set a series of new highs, finishing the year up 32.39%. For the first time since 1995, the S&P® scored a "perfect 10," with all 10 economic sectors gaining at least 10% for the year. A resurgence in growth-oriented stocks lifted the Nasdaq Composite Index® to a 40.12% result for 2013, while the blue-chip Dow Jones Industrial AverageSM notched a relatively more modest 29.65% gain. International developed-markets equities rose in concert with their U.S. counterparts, with the MSCI® EAFE® Index gaining 22.92% for the period. Meanwhile, foreign exchange and commodity weakness curbed results in resource-heavy emerging markets (EM), especially in the year's waning months. More generally, concern over EM's slowing growth, its declining share of global trade and uncertainty surrounding U.S. central bank intentions were all factors hampering performance. The MSCI Emerging Markets Index returned -2.27% for the period. On the bond side, U.S. high-yield securities rallied with equities for much of the period, with The BofA Merrill LynchSM US High Yield Constrained Index returning 7.41% for 2013. The more rate-sensitive U.S. investment-grade bond category faced headwinds though, as reflected in the -2.02% return of the Barclays® U.S. Aggregate Bond Index. Within the Barclays index, investment-grade corporate credit returned -2.01%, while ultra-safe U.S. Treasuries saw a -2.75% result. Major non-U.S. developed markets performed only slightly better, with the Citigroup Non-USD Group-of-Seven (G7) Equal Weighted Index logging a -1.59% result. After several years of strong advances, EM debt reversed course in 2013, with the J.P. Morgan Emerging Markets Bond Index Global returning -6.58%.
Comments from Sammy Simnegar, Portfolio Manager of VIP Emerging Markets Portfolio: For the year, the fund's share classes delivered positive returns and came out significantly ahead of the -2.27% return of the MSCI® Emerging Markets Index. (For specific portfolio results, please refer to the performance section of this report.) A large overweighting in software & services - a group where I considerably boosted the fund's weighting - meaningfully aided performance relative to the fund's MSCI benchmark. Here, a new position in real estate Internet portal SouFun Holdings benefited from the revaluation of Internet businesses in China, and similar factors fueled the strong gain of Russian Internet search engine Yandex. Neither stock was in the index. Within consumer services - another group that materially contributed to relative performance - one standout was a non-index position in Hong Kong-listed casino operator Galaxy Entertainment Group, a beneficiary of the dynamic growth of tourism in Macau, China's coastal gaming hotspot. I reduced this position to lock in profits. Elsewhere, large underweightings in materials and energy had a positive impact on the fund's relative results. In energy, the fund was helped by not owning Petroleo Brasileiro - commonly known as Petrobras - Brazil's largest integrated oil and gas company and a weak performer in the index. Conversely, stock selection had a meaningfully negative impact in several groups, including media, automobiles & components, and commercial & professional services. At the stock level, the biggest detractor was BR Malls Participacoes, a Brazilian shopping mall manager. Disappointing economic growth and consumer spending in that nation hampered the stock. However, I thought we'd seen the worst and added to this position. Golden Eagle Retail Group, a China-based chain of department stores, also disappointed me, and I sold this stock. Overweighting South Korean electronics giant Samsung Electronics, the fund's largest holding, detracted as well.
The views expressed above reflect those of the portfolio manager(s) only through the end of the period as stated on the cover of this report and do not necessarily represent the views of Fidelity or any other person in the Fidelity organization. Any such views are subject to change at any time based upon market or other conditions and Fidelity disclaims any responsibility to update such views. These views may not be relied on as investment advice and, because investment decisions for a Fidelity fund are based on numerous factors, may not be relied on as an indication of trading intent on behalf of any Fidelity fund.
Annual Report
As a shareholder of the Fund, you incur two types of costs: (1) transaction costs, including redemption fees and (2) ongoing costs, including management fees, distribution and/or service (12b-1) fees and other Fund expenses. This Example is intended to help you understand your ongoing costs (in dollars) of investing in the Fund and to compare these costs with the ongoing costs of investing in other mutual funds.
The Example is based on an investment of $1,000 invested at the beginning of the period and held for the entire period (July 1, 2013 to December 31, 2013).
Actual Expenses
The first line of the accompanying table for each class of the Fund provides information about actual account values and actual expenses. You may use the information in this line, together with the amount you invested, to estimate the expenses that you paid over the period. Simply divide your account value by $1,000.00 (for example, an $8,600 account value divided by $1,000.00 = 8.6), then multiply the result by the number in the first line for a class of the Fund under the heading entitled "Expenses Paid During Period" to estimate the expenses you paid on your account during this period. The estimate of expenses does not include any fees or other expenses of any variable annuity or variable life insurance product. If they were, the estimate of expenses you paid during the period would be higher, and your ending account value would be lower. In addition, the Fund, as a shareholder in the underlying Fidelity Central Funds, will indirectly bear its pro-rata share of the fees and expenses incurred by the underlying Fidelity Central Funds. These fees and expenses are not included in the Fund's annualized expense ratio used to calculate the expense estimate in the table below.
Hypothetical Example for Comparison Purposes
The second line of the accompanying table for each class of the Fund provides information about hypothetical account values and hypothetical expenses based on a Class' actual expense ratio and an assumed rate of return of 5% per year before expenses, which is not the Class' actual return. The hypothetical account values and expenses may not be used to estimate the actual ending account balance or expenses you paid for the period. You may use this information to compare the ongoing costs of investing in the Fund and other funds. To do so, compare this 5% hypothetical example with the 5% hypothetical examples that appear in the shareholder reports of the other funds. The estimate of expenses does not include any fees or other expenses of any variable annuity or variable life insurance product. If they were, the estimate of expenses you paid during the period would be higher, and your ending account value would be lower. In addition, the Fund, as a shareholder in the underlying Fidelity Central Funds, will indirectly bear its pro-rata share of the fees and expenses incurred by the underlying Fidelity Central Funds. These fees and expenses are not included in the Fund's annualized expense ratio used to calculate the expense estimate in the table below.
Please note that the expenses shown in the table are meant to highlight your ongoing costs only and do not reflect any transaction costs. Therefore, the second line of the table is useful in comparing ongoing costs only, and will not help you determine the relative total costs of owning different funds. In addition, if these transactional costs were included, your costs would have been higher.
| Annualized
Expense Ratio B | Beginning
Account Value
July 1, 2013 | Ending
Account Value
December 31, 2013 | Expenses Paid
During Period*
July 1, 2013
to December 31, 2013 |
Initial Class | 1.10% | | | |
Actual | | $ 1,000.00 | $ 1,084.30 | $ 5.78 |
HypotheticalA | | $ 1,000.00 | $ 1,019.66 | $ 5.60 |
Service Class | 1.20% | | | |
Actual | | $ 1,000.00 | $ 1,084.10 | $ 6.30 |
HypotheticalA | | $ 1,000.00 | $ 1,019.16 | $ 6.11 |
Service Class 2 | 1.35% | | | |
Actual | | $ 1,000.00 | $ 1,084.00 | $ 7.09 |
HypotheticalA | | $ 1,000.00 | $ 1,018.40 | $ 6.87 |
Initial Class R | 1.10% | | | |
Actual | | $ 1,000.00 | $ 1,085.40 | $ 5.78 |
HypotheticalA | | $ 1,000.00 | $ 1,019.66 | $ 5.60 |
Service Class 2R | 1.35% | | | |
Actual | | $ 1,000.00 | $ 1,083.50 | $ 7.09 |
HypotheticalA | | $ 1,000.00 | $ 1,018.40 | $ 6.87 |
Investor Class R | 1.18% | | | |
Actual | | $ 1,000.00 | $ 1,083.80 | $ 6.20 |
HypotheticalA | | $ 1,000.00 | $ 1,019.26 | $ 6.01 |
A 5% return per year before expenses
B Annualized expense ratio reflects expenses net of applicable fee waivers.
* Expenses are equal to each Class' annualized expense ratio, multiplied by the average account value over the period, multiplied by 184/365 (to reflect the one-half year period).
Annual Report
Investment Changes (Unaudited)
Geographic Diversification (% of fund's net assets) |
As of December 31, 2013 |
 | Brazil | 11.6% | |
 | India | 10.1% | |
 | Korea (South) | 8.9% | |
 | Cayman Islands | 8.0% | |
 | South Africa | 7.8% | |
 | Mexico | 5.4% | |
 | United Kingdom | 5.0% | |
 | Indonesia | 4.6% | |
 | China | 4.1% | |
 | Other* | 34.5% | |

* Includes Short-Term Investments and Net Other Assets (Liabilities) |
Percentages are based on country or territory of incorporation and are adjusted for the effect of futures contracts, if applicable. |
As of June 30, 2013 |
| Brazil | 12.4% | |
| India | 9.1% | |
| Cayman Islands | 8.5% | |
| Korea (South) | 8.4% | |
| South Africa | 6.9% | |
| Mexico | 6.5% | |
| Indonesia | 6.5% | |
| United States of America* | 6.5% | |
| Philippines | 3.2% | |
| Other | 32.0% | |

* Includes Short-Term Investments and Net Other Assets (Liabilities) |
Percentages are based on country or territory of incorporation and are adjusted for the effect of futures contracts, if applicable. |
Asset Allocation as of December 31, 2013 |
| % of fund's
net assets | % of fund's net assets
6 months ago |
Stocks | 100.3 | 97.8 |
Short-Term Investments and Net Other Assets (Liabilities) | (0.3) | 2.2 |
Top Ten Stocks as of December 31, 2013 |
| % of fund's
net assets | % of fund's net assets
6 months ago |
Samsung Electronics Co. Ltd. (Korea (South), Semiconductors & Semiconductor Equipment) | 4.6 | 4.5 |
Taiwan Semiconductor Manufacturing Co. Ltd. (Taiwan, Semiconductors & Semiconductor Equipment) | 2.7 | 2.9 |
Tencent Holdings Ltd. (Cayman Islands, Internet Software & Services) | 2.0 | 1.5 |
Naspers Ltd. Class N (South Africa, Media) | 1.5 | 1.2 |
Hyundai Motor Co. (Korea (South), Automobiles) | 1.4 | 1.5 |
Sberbank (Savings Bank of the Russian Federation) (Russia, Commercial Banks) | 1.4 | 1.3 |
Ambev SA sponsored ADR (Brazil, Beverages) | 1.3 | 1.3 |
Itau Unibanco Holding SA sponsored ADR (Brazil, Commercial Banks) | 1.3 | 1.4 |
MTN Group Ltd. (South Africa, Wireless Telecommunication Services) | 1.2 | 0.0 |
Banco Bradesco SA (PN) sponsored ADR (Brazil, Commercial Banks) | 1.2 | 0.0 |
| 18.6 | |
Market Sectors as of December 31, 2013 |
| % of fund's
net assets | % of fund's net assets
6 months ago |
Financials | 24.9 | 22.4 |
Consumer Discretionary | 21.0 | 19.3 |
Information Technology | 16.6 | 16.0 |
Industrials | 12.0 | 13.4 |
Consumer Staples | 11.5 | 13.4 |
Materials | 5.4 | 5.0 |
Health Care | 3.6 | 3.9 |
Energy | 2.5 | 3.5 |
Telecommunication Services | 2.1 | 0.4 |
Utilities | 0.7 | 0.5 |
Annual Report
Investments December 31, 2013
Showing Percentage of Net Assets
Common Stocks - 95.2% |
| Shares | | Value |
Australia - 0.4% |
Fortescue Metals Group Ltd. | 100,046 | | $ 519,907 |
Bailiwick of Jersey - 0.4% |
WPP PLC | 23,500 | | 537,025 |
Bermuda - 1.3% |
Brilliance China Automotive Holdings
Ltd. | 413,000 | | 673,216 |
Cosan Ltd. Class A | 13,258 | | 181,900 |
Credicorp Ltd. | 6,336 | | 840,977 |
TOTAL BERMUDA | | 1,696,093 |
Brazil - 7.2% |
Anhanguera Educacional Participacoes SA | 94,400 | | 601,555 |
BB Seguridade Participacoes SA | 71,900 | | 753,377 |
BR Malls Participacoes SA | 84,300 | | 614,708 |
BTG Pactual Participations Ltd. unit | 41,700 | | 487,587 |
CCR SA | 99,900 | | 759,224 |
Cetip SA - Mercados Organizado | 43,000 | | 445,042 |
Cielo SA | 32,980 | | 925,982 |
Iguatemi Empresa de Shopping Centers SA | 59,200 | | 564,604 |
Localiza Rent A Car SA | 39,510 | | 562,351 |
Multiplan Empreendimentos Imobiliarios SA | 27,000 | | 576,211 |
Odontoprev SA | 131,900 | | 554,518 |
Qualicorp SA (a) | 60,900 | | 586,026 |
Souza Cruz SA | 70,200 | | 723,855 |
Ultrapar Participacoes SA | 33,400 | | 799,215 |
Weg SA | 40,900 | | 545,052 |
TOTAL BRAZIL | | 9,499,307 |
British Virgin Islands - 0.5% |
Mail.Ru Group Ltd. GDR (e) | 14,800 | | 660,080 |
Cayman Islands - 8.0% |
51job, Inc. sponsored ADR (a) | 7,024 | | 547,170 |
Baidu.com, Inc. sponsored ADR (a) | 3,657 | | 650,507 |
Baoxin Auto Group Ltd. | 521,000 | | 505,930 |
Bitauto Holdings Ltd. ADR (a) | 14,310 | | 457,348 |
Cimc Enric Holdings Ltd. | 322,000 | | 519,067 |
ENN Energy Holdings Ltd. | 116,000 | | 857,924 |
Eurasia Drilling Co. Ltd. GDR (Reg. S) | 12,053 | | 542,385 |
Geely Automobile Holdings Ltd. | 1,060,000 | | 512,619 |
Greatview Aseptic Pack Co. Ltd. | 859,000 | | 507,360 |
Haitian International Holdings Ltd. | 217,000 | | 490,288 |
Lifestyle International Holdings Ltd. | 18,000 | | 33,334 |
New Oriental Education & Technology Group, Inc. sponsored ADR | 16,900 | | 532,350 |
Sands China Ltd. | 65,600 | | 535,930 |
Shenzhou International Group Holdings Ltd. | 154,000 | | 577,925 |
|
| Shares | | Value |
SouFun Holdings Ltd. ADR | 7,170 | | $ 590,880 |
Tencent Holdings Ltd. | 41,800 | | 2,666,170 |
TOTAL CAYMAN ISLANDS | | 10,527,187 |
China - 4.1% |
China Merchants Bank Co. Ltd.
(H Shares) | 447,610 | | 953,602 |
China Minsheng Banking Corp. Ltd.
(H Shares) | 574,000 | | 637,342 |
China Pacific Insurance Group Co. Ltd. (H Shares) | 244,800 | | 959,715 |
Great Wall Motor Co. Ltd. (H Shares) | 106,000 | | 585,069 |
PICC Property & Casualty Co. Ltd.
(H Shares) (a) | 395,300 | | 586,249 |
Ping An Insurance (Group) Co. of China Ltd. (H Shares) | 133,500 | | 1,195,669 |
Travelsky Technology Ltd. (H Shares) | 532,000 | | 524,844 |
TOTAL CHINA | | 5,442,490 |
Colombia - 0.9% |
Cemex Latam Holdings SA (a) | 70,088 | | 537,463 |
Grupo de Inversiones Suramerica SA | 36,115 | | 630,609 |
TOTAL COLOMBIA | | 1,168,072 |
Denmark - 0.4% |
Novo Nordisk A/S Series B sponsored ADR | 2,600 | | 480,376 |
Finland - 0.3% |
Kone Oyj (B Shares) (d) | 10,400 | | 469,279 |
France - 1.1% |
Bureau Veritas SA | 15,800 | | 461,783 |
LVMH Moet Hennessy - Louis Vuitton SA | 2,947 | | 537,585 |
Pernod Ricard SA | 4,584 | | 522,217 |
TOTAL FRANCE | | 1,521,585 |
Greece - 1.2% |
Folli Follie SA (a) | 16,848 | | 542,360 |
Greek Organization of Football Prognostics SA | 39,100 | | 520,148 |
Jumbo SA (a) | 30,500 | | 486,723 |
TOTAL GREECE | | 1,549,231 |
Hong Kong - 1.2% |
AIA Group Ltd. | 110,800 | | 555,836 |
Far East Horizon Ltd. | 581,000 | | 496,761 |
Galaxy Entertainment Group Ltd. (a) | 60,000 | | 538,153 |
TOTAL HONG KONG | | 1,590,750 |
India - 10.1% |
Axis Bank Ltd. | 28,824 | | 605,728 |
Bajaj Auto Ltd. | 19,236 | | 594,391 |
Exide Industries Ltd. | 192,513 | | 383,220 |
Grasim Industries Ltd. sponsored GDR | 8,736 | | 383,336 |
HCL Technologies Ltd. | 29,584 | | 603,999 |
HDFC Bank Ltd. | 109,435 | | 1,201,886 |
Common Stocks - continued |
| Shares | | Value |
India - continued |
Housing Development Finance Corp. Ltd. | 94,780 | | $ 1,217,932 |
ITC Ltd. | 183,409 | | 954,563 |
Larsen & Toubro Ltd. | 42,226 | | 730,795 |
Lupin Ltd. | 31,836 | | 493,241 |
Mahindra & Mahindra Ltd. | 43,864 | | 669,735 |
Maruti Suzuki India Ltd. | 16,504 | | 470,754 |
Mundra Port and SEZ Ltd. | 195,572 | | 491,460 |
Sun Pharmaceutical Industries Ltd. | 76,894 | | 705,587 |
Sun TV Ltd. | 89,341 | | 549,424 |
Tata Consultancy Services Ltd. | 32,027 | | 1,124,907 |
Tata Motors Ltd. | 110,604 | | 676,635 |
Titan Co. Ltd. | 148,755 | | 553,852 |
Yes Bank Ltd. | 83,429 | | 499,441 |
Zee Entertainment Enterprises Ltd. | 111,910 | | 500,555 |
TOTAL INDIA | | 13,411,441 |
Indonesia - 4.6% |
PT ACE Hardware Indonesia Tbk | 9,578,000 | | 464,989 |
PT Bank Central Asia Tbk | 960,000 | | 759,413 |
PT Bank Rakyat Indonesia Tbk | 1,258,140 | | 752,014 |
PT Global Mediacom Tbk | 3,430,500 | | 536,134 |
PT Gudang Garam Tbk | 176,500 | | 610,461 |
PT Indocement Tunggal Prakarsa Tbk | 343,000 | | 565,009 |
PT Jasa Marga Tbk | 1,211,000 | | 470,896 |
PT Kalbe Farma Tbk | 4,774,000 | | 491,728 |
PT Media Nusantara Citra Tbk | 1,822,500 | | 394,800 |
PT Semen Gresik (Persero) Tbk | 532,000 | | 620,366 |
PT Surya Citra Media Tbk | 2,087,500 | | 450,422 |
TOTAL INDONESIA | | 6,116,232 |
Italy - 0.8% |
Pirelli & C SpA | 28,612 | | 495,168 |
Prada SpA | 57,500 | | 511,652 |
TOTAL ITALY | | 1,006,820 |
Japan - 0.3% |
Japan Tobacco, Inc. (f) | 12,300 | | 400,227 |
Kenya - 0.4% |
Safaricom Ltd. | 4,350,700 | | 546,988 |
Korea (South) - 8.9% |
Grand Korea Leisure Co. Ltd. | 10,610 | | 406,018 |
Hyundai Mobis | 4,070 | | 1,131,492 |
Hyundai Motor Co. | 8,411 | | 1,884,203 |
Hyundai Wia Corp. | 2,732 | | 491,681 |
LG Household & Health Care Ltd. | 1,266 | | 657,148 |
Naver Corp. | 1,487 | | 1,019,761 |
Samsung Electronics Co. Ltd. | 4,698 | | 6,105,422 |
TOTAL KOREA (SOUTH) | | 11,695,725 |
Luxembourg - 0.3% |
Brait SA | 93,900 | | 469,410 |
|
| Shares | | Value |
Malaysia - 0.5% |
Public Bank Bhd | 114,900 | | $ 679,902 |
Mexico - 5.4% |
Banregio Grupo Financiero S.A.B. de CV | 83,877 | | 502,503 |
Fomento Economico Mexicano S.A.B. de CV unit | 120,800 | | 1,178,821 |
Gruma S.A.B. de CV Series B (a) | 73,373 | | 559,550 |
Grupo Aeroportuario del Pacifico SA de CV Series B | 99,300 | | 535,104 |
Grupo Aeroportuario del Sureste SA de CV Series B | 48,400 | | 609,966 |
Grupo Financiero Banorte S.A.B. de CV Series O | 157,700 | | 1,112,299 |
Grupo Financiero Interacciones SA de CV | 6,537 | | 30,856 |
Grupo Televisa SA de CV | 182,600 | | 1,109,454 |
Kimberly-Clark de Mexico SA de CV Series A | 218,500 | | 625,497 |
Megacable Holdings S.A.B. de CV unit | 45,169 | | 153,994 |
Mexichem S.A.B. de CV (d) | 158,480 | | 657,760 |
TOTAL MEXICO | | 7,075,804 |
Netherlands - 0.5% |
Yandex NV (a) | 14,604 | | 630,163 |
Nigeria - 0.8% |
Dangote Cement PLC | 326,946 | | 447,627 |
Guaranty Trust Bank PLC GDR (Reg. S) | 76,133 | | 624,291 |
TOTAL NIGERIA | | 1,071,918 |
Panama - 0.4% |
Copa Holdings SA Class A | 3,500 | | 560,385 |
Philippines - 3.3% |
Alliance Global Group, Inc. | 971,100 | | 564,288 |
DMCI Holdings, Inc. | 407,520 | | 513,989 |
GT Capital Holdings, Inc. (a) | 23,520 | | 408,951 |
LT Group, Inc. | 1,711,300 | | 595,101 |
Metropolitan Bank & Trust Co. | 318,875 | | 542,590 |
Security Bank Corp. | 233,672 | | 608,389 |
SM Investments Corp. | 35,875 | | 574,485 |
SM Prime Holdings, Inc. | 1,722,300 | | 569,445 |
TOTAL PHILIPPINES | | 4,377,238 |
Poland - 0.1% |
Eurocash SA | 5,950 | | 93,926 |
Russia - 4.1% |
Alrosa Co. Ltd. (a) | 397,000 | | 422,456 |
Magnit OJSC GDR (Reg. S) | 16,900 | | 1,118,780 |
Moscow Exchange MICEX-RTS OAO | 206,300 | | 406,127 |
NOVATEK OAO GDR (Reg. S) | 7,214 | | 987,597 |
Sberbank (Savings Bank of the Russian Federation) | 582,500 | | 1,789,597 |
Sistema JSFC | 489,700 | | 665,817 |
TOTAL RUSSIA | | 5,390,374 |
Common Stocks - continued |
| Shares | | Value |
South Africa - 7.8% |
Aspen Pharmacare Holdings Ltd. | 30,784 | | $ 788,587 |
Bidvest Group Ltd. | 30,000 | | 767,445 |
Capitec Bank Holdings Ltd. | 22,436 | | 445,448 |
Clicks Group Ltd. | 88,664 | | 530,716 |
Discovery Holdings Ltd. | 80,437 | | 647,943 |
Imperial Holdings Ltd. | 33,038 | | 638,115 |
Life Healthcare Group Holdings Ltd. | 165,972 | | 662,306 |
Mr Price Group Ltd. | 43,613 | | 680,762 |
MTN Group Ltd. | 79,900 | | 1,652,993 |
Nampak Ltd. | 171,557 | | 670,528 |
Naspers Ltd. Class N | 18,568 | | 1,940,011 |
Shoprite Holdings Ltd. | 48,027 | | 750,851 |
Wilson Bayly Holmes-Ovcon Ltd. | 6,531 | | 90,899 |
TOTAL SOUTH AFRICA | | 10,266,604 |
Sweden - 0.7% |
Atlas Copco AB (A Shares) | 16,400 | | 454,631 |
Investment AB Kinnevik (B Shares) | 10,136 | | 469,463 |
TOTAL SWEDEN | | 924,094 |
Switzerland - 1.9% |
Compagnie Financiere Richemont SA Series A | 5,456 | | 543,123 |
Schindler Holding AG (Reg.) | 3,470 | | 511,913 |
SGS SA (Reg.) | 200 | | 460,064 |
Swatch Group AG (Bearer) | 820 | | 541,887 |
Syngenta AG (Switzerland) | 1,261 | | 502,757 |
TOTAL SWITZERLAND | | 2,559,744 |
Taiwan - 3.0% |
Merida Industry Co. Ltd. | 64,000 | | 464,475 |
Taiwan Semiconductor Manufacturing Co. Ltd. | 1,006,000 | | 3,548,812 |
TOTAL TAIWAN | | 4,013,287 |
Thailand - 1.7% |
Airports of Thailand PCL (For. Reg.) | 93,800 | | 454,036 |
BEC World PCL (For. Reg.) | 348,700 | | 537,540 |
Kasikornbank PCL (For. Reg.) | 160,400 | | 779,005 |
Minor International PCL (For. Reg.) | 755,700 | | 477,917 |
TOTAL THAILAND | | 2,248,498 |
Togo - 0.4% |
Ecobank Transnational, Inc. | 5,091,904 | | 515,716 |
Turkey - 3.5% |
Anadolu Hayat Sigorta AS | 137,930 | | 337,604 |
Coca-Cola Icecek A/S | 24,115 | | 580,713 |
Enka Insaat ve Sanayi A/S | 203,475 | | 569,995 |
Koc Holding A/S | 160,000 | | 655,188 |
TAV Havalimanlari Holding A/S | 78,000 | | 560,772 |
Tofas Turk Otomobil Fabrikasi A/S | 83,830 | | 522,718 |
|
| Shares | | Value |
Tupras Turkiye Petrol Rafinelleri A/S | 31,000 | | $ 618,846 |
Turkiye Garanti Bankasi A/S | 233,000 | | 754,621 |
TOTAL TURKEY | | 4,600,457 |
United Kingdom - 5.0% |
Aberdeen Asset Management PLC | 66,372 | | 549,544 |
British American Tobacco PLC (United Kingdom) | 9,800 | | 526,006 |
Burberry Group PLC | 22,300 | | 559,824 |
Diageo PLC | 16,942 | | 561,434 |
InterContinental Hotel Group PLC | 15,738 | | 524,963 |
Intertek Group PLC | 9,842 | | 513,057 |
Johnson Matthey PLC | 7,884 | | 428,221 |
Meggitt PLC | 49,200 | | 429,769 |
Mondi PLC | 21,900 | | 379,335 |
Prudential PLC | 25,548 | | 570,845 |
Rolls-Royce Group PLC | 25,700 | | 542,613 |
Standard Chartered PLC (United Kingdom) | 24,340 | | 548,159 |
The Weir Group PLC | 11,800 | | 416,597 |
TOTAL UNITED KINGDOM | | 6,550,367 |
United States of America - 3.7% |
Colgate-Palmolive Co. | 8,000 | | 521,680 |
Cummins, Inc. | 3,000 | | 422,910 |
FMC Corp. | 7,400 | | 558,404 |
Google, Inc. Class A (a) | 550 | | 616,391 |
MasterCard, Inc. Class A | 780 | | 651,659 |
Mead Johnson Nutrition Co. Class A | 6,042 | | 506,078 |
Philip Morris International, Inc. | 5,800 | | 505,354 |
Visa, Inc. Class A | 2,700 | | 601,236 |
Yahoo!, Inc. (a) | 12,700 | | 513,588 |
TOTAL UNITED STATES OF AMERICA | | 4,897,300 |
TOTAL COMMON STOCKS (Cost $109,529,329) |
125,764,002
|
Nonconvertible Preferred Stocks - 5.1% |
| | | |
Brazil - 4.4% |
Ambev SA sponsored ADR | 236,290 | | 1,736,732 |
Banco Bradesco SA (PN) sponsored ADR | 130,368 | | 1,633,511 |
Companhia Brasileira de Distribuicao Grupo Pao de Acucar sponsored ADR (d) | 16,400 | | 732,588 |
Itau Unibanco Holding SA sponsored ADR | 122,508 | | 1,662,434 |
TOTAL BRAZIL | | 5,765,265 |
Colombia - 0.4% |
Grupo Aval Acciones y Valores SA | 716,982 | | 473,654 |
Germany - 0.3% |
Porsche Automobil Holding SE (Germany) | 4,300 | | 447,567 |
Nonconvertible Preferred Stocks - continued |
| Shares | | Value |
United Kingdom - 0.0% |
Rolls-Royce Group PLC Series C | 2,003,800 | | $ 3,318 |
TOTAL NONCONVERTIBLE PREFERRED STOCKS (Cost $7,049,948) |
6,689,804
|
Money Market Funds - 2.2% |
| | | |
Fidelity Cash Central Fund, 0.11% (b) | 1,503,718 | | 1,503,718 |
Fidelity Securities Lending Cash Central Fund, 0.11% (b)(c) | 1,417,114 | | 1,417,114 |
TOTAL MONEY MARKET FUNDS (Cost $2,920,832) |
2,920,832
|
TOTAL INVESTMENT PORTFOLIO - 102.5% (Cost $119,500,109) | | 135,374,638 |
NET OTHER ASSETS (LIABILITIES) - (2.5)% | | (3,332,872) |
NET ASSETS - 100% | $ 132,041,766 |
Legend |
(a) Non-income producing |
(b) Affiliated fund that is generally available only to investment companies and other accounts managed by Fidelity Investments. The rate quoted is the annualized seven-day yield of the fund at period end. A complete unaudited listing of the fund's holdings as of its most recent quarter end is available upon request. In addition, each Fidelity Central Fund's financial statements, which are not covered by the Fund's Report of Independent Registered Public Accounting Firm, are available on the SEC's website or upon request. |
(c) Investment made with cash collateral received from securities on loan. |
(d) Security or a portion of the security is on loan at period end. |
(e) Security exempt from registration under Rule 144A of the Securities Act of 1933. These securities may be resold in transactions exempt from registration, normally to qualified institutional buyers. At the end of the period, the value of these securities amounted to $660,080 or 0.5% of net assets. |
(f) Security or a portion of the security purchased on a delayed delivery or when-issued basis. |
Affiliated Central Funds |
Information regarding fiscal year to date income earned by the Fund from investments in Fidelity Central Funds is as follows: |
Fund | Income earned |
Fidelity Cash Central Fund | $ 1,647 |
Fidelity Securities Lending Cash Central Fund | 11,992 |
Total | $ 13,639 |
Other Information |
Categorizations in the Schedule of Investments are based on country or territory of incorporation. |
The following is a summary of the inputs used, as of December 31, 2013, involving the Fund's assets and liabilities carried at fair value. The inputs or methodology used for valuing securities may not be an indication of the risk associated with investing in those securities. For more information on valuation inputs, and their aggregation into the levels used in the tables below, please refer to the Investment Valuation section in the accompanying Notes to Financial Statements. |
Valuation Inputs at Reporting Date: |
Description | Total | Level 1 | Level 2 | Level 3 |
Investments in Securities: | | | | |
Equities: | | | | |
Consumer Discretionary | $ 28,027,397 | $ 21,545,142 | $ 6,482,255 | $ - |
Consumer Staples | 14,992,298 | 9,806,447 | 5,185,851 | - |
Energy | 3,129,943 | 2,330,728 | 799,215 | - |
Financials | 32,467,010 | 23,316,660 | 9,150,350 | - |
Health Care | 4,762,369 | 2,636,856 | 2,125,513 | - |
Industrials | 16,258,789 | 12,322,160 | 3,936,629 | - |
Information Technology | 21,891,749 | 17,416,955 | 4,474,794 | - |
Materials | 7,200,529 | 4,854,637 | 2,345,892 | - |
Telecommunication Services | 2,865,798 | 2,865,798 | - | - |
Utilities | 857,924 | 857,924 | - | - |
Money Market Funds | 2,920,832 | 2,920,832 | - | - |
Total Investments in Securities: | $ 135,374,638 | $ 100,874,139 | $ 34,500,499 | $ - |
The following is a summary of transfers between Level 1 and Level 2 for the period ended December 31, 2013. Transfers are assumed to have occurred at the beginning of the period, and are primarily attributable to the valuation techniques used for foreign equity securities, as discussed in the accompanying Notes to Financial Statements: |
Transfers | Total |
Level 1 to Level 2 | $ 2,696,464 |
Level 2 to Level 1 | $ 25,358,999 |
See accompanying notes which are an integral part of the financial statements.
Annual Report
Statement of Assets and Liabilities
| December 31, 2013 |
| | |
Assets | | |
Investment in securities, at value (including securities loaned of $1,354,731) - See accompanying schedule: Unaffiliated issuers (cost $116,579,277) | $ 132,453,806 | |
Fidelity Central Funds (cost $2,920,832) | 2,920,832 | |
Total Investments (cost $119,500,109) | | $ 135,374,638 |
Cash | | 26,068 |
Foreign currency held at value (cost $204,391) | | 204,574 |
Receivable for investments sold | | 1,759,740 |
Receivable for fund shares sold | | 57,117 |
Dividends receivable | | 207,261 |
Distributions receivable from Fidelity Central Funds | | 1,093 |
Prepaid expenses | | 262 |
Other receivables | | 539 |
Total assets | | 137,631,292 |
| | |
Liabilities | | |
Payable for investments purchased | | |
Regular delivery | $ 901,529 | |
Delayed delivery | 399,473 | |
Payable for fund shares redeemed | 2,555,105 | |
Accrued management fee | 86,302 | |
Distribution and service plan fees payable | 1,663 | |
Other affiliated payables | 16,188 | |
Other payables and accrued expenses | 212,152 | |
Collateral on securities loaned, at value | 1,417,114 | |
Total liabilities | | 5,589,526 |
| | |
Net Assets | | $ 132,041,766 |
Net Assets consist of: | | |
Paid in capital | | $ 120,872,834 |
Distributions in excess of net investment income | | (47,249) |
Accumulated undistributed net realized gain (loss) on investments and foreign currency transactions | | (4,513,851) |
Net unrealized appreciation (depreciation) on investments and assets and liabilities in foreign currencies | | 15,730,032 |
Net Assets | | $ 132,041,766 |
Statement of Assets and Liabilities - continued
| December 31, 2013 |
| | |
Initial Class:
Net Asset Value, offering price and redemption price per share ($60,923,869 ÷ 6,759,613 shares) | | $ 9.01 |
| | |
Service Class:
Net Asset Value, offering price and redemption price per share ($83,548 ÷ 9,240 shares) | | $ 9.04 |
| | |
Service Class 2:
Net Asset Value, offering price and redemption price per share ($6,517,373 ÷ 721,993 shares) | | $ 9.03 |
| | |
Initial Class R:
Net Asset Value, offering price and redemption price per share ($9,672,168 ÷ 1,072,785 shares) | | $ 9.02 |
| | |
Service Class 2R:
Net Asset Value, offering price and redemption price per share ($83,374 ÷ 9,195 shares) | | $ 9.07 |
| | |
Investor Class R:
Net Asset Value, offering price and redemption price per share ($54,761,434 ÷ 6,099,755 shares) | | $ 8.98 |
See accompanying notes which are an integral part of the financial statements.
Annual Report
Statement of Operations
| Year ended December 31, 2013 |
| | |
Investment Income | | |
Dividends | | $ 2,320,980 |
Income from Fidelity Central Funds | | 13,639 |
Income before foreign taxes withheld | | 2,334,619 |
Less foreign taxes withheld | | (186,555) |
Total income | | 2,148,064 |
| | |
Expenses | | |
Management fee | $ 901,982 | |
Transfer agent fees | 124,921 | |
Distribution and service plan fees | 13,330 | |
Accounting and security lending fees | 58,342 | |
Custodian fees and expenses | 133,290 | |
Independent trustees' compensation | 588 | |
Audit | 99,990 | |
Legal | 675 | |
Interest | 255 | |
Miscellaneous | 840 | |
Total expenses before reductions | 1,334,213 | |
Expense reductions | (75,698) | 1,258,515 |
Net investment income (loss) | | 889,549 |
Realized and Unrealized Gain (Loss) Net realized gain (loss) on: | | |
Investment securities: | | |
Unaffiliated issuers | 3,104,976 | |
Foreign currency transactions | (70,212) | |
Total net realized gain (loss) | | 3,034,764 |
Change in net unrealized appreciation (depreciation) on: Investment securities (net of increase in deferred foreign taxes of $139,215) | 492,207 | |
Assets and liabilities in foreign currencies | (4,808) | |
Total change in net unrealized appreciation (depreciation) | | 487,399 |
Net gain (loss) | | 3,522,163 |
Net increase (decrease) in net assets resulting from operations | | $ 4,411,712 |
Statement of Changes in Net Assets
| Year ended
December 31,
2013 | Year ended
December 31,
2012 |
Increase (Decrease) in Net Assets | | |
Operations | | |
Net investment income (loss) | $ 889,549 | $ 1,294,334 |
Net realized gain (loss) | 3,034,764 | (56,334) |
Change in net unrealized appreciation (depreciation) | 487,399 | 11,501,487 |
Net increase (decrease) in net assets resulting from operations | 4,411,712 | 12,739,487 |
Distributions to shareholders from net investment income | (882,874) | (1,007,988) |
Distributions to shareholders from net realized gain | (111,840) | (91,285) |
Distributions to shareholders from tax return of capital | - | (106,326) |
Total distributions | (994,714) | (1,205,599) |
Share transactions - net increase (decrease) | 21,113,394 | 7,291,850 |
Redemption fees | 13,883 | 6,318 |
Total increase (decrease) in net assets | 24,544,275 | 18,832,056 |
| | |
Net Assets | | |
Beginning of period | 107,497,491 | 88,665,435 |
End of period (including distributions in excess of net investment income of $47,249 and distributions in excess of net investment income of $2,861, respectively) | $ 132,041,766 | $ 107,497,491 |
See accompanying notes which are an integral part of the financial statements.
Annual Report
Financial Highlights - Initial Class
Years ended December 31, | 2013 | 2012 | 2011 | 2010 | 2009 |
Selected Per-Share Data | | | | | |
Net asset value, beginning of period | $ 8.75 | $ 7.74 | $ 9.91 | $ 8.51 | $ 4.88 |
Income from Investment Operations | | | | | |
Net investment income (loss) C | .07 | .11 | .13 | .09 | .04 |
Net realized and unrealized gain (loss) | .27 | 1.00 | (2.22) | 1.43 | 3.64 |
Total from investment operations | .34 | 1.11 | (2.09) | 1.52 | 3.68 |
Distributions from net investment income | (.07) | (.08) | (.09) | (.08) | (.02) |
Distributions from net realized gain | (.01) | (.01) | - | (.04) | (.03) |
Tax return of capital | - | (.01) | - | - | - |
Total distributions | (.08) | (.10) | (.09) | (.12) | (.05) |
Redemption fees added to paid in capital C | - G | - G | .01 | - G | - G |
Net asset value, end of period | $ 9.01 | $ 8.75 | $ 7.74 | $ 9.91 | $ 8.51 |
Total Return A,B | 3.85% | 14.37% | (21.01)% | 17.89% | 75.40% |
Ratios to Average Net Assets D,F | | | | | |
Expenses before reductions | 1.14% | 1.38% | 1.31% | 1.33% | 2.85% |
Expenses net of fee waivers, if any | 1.10% | 1.10% | 1.10% | 1.10% | 1.10% |
Expenses net of all reductions | 1.07% | 1.05% | 1.02% | 1.04% | 1.02% |
Net investment income (loss) | .84% | 1.36% | 1.46% | 1.05% | .60% |
Supplemental Data | | | | | |
Net assets, end of period (000 omitted) | $ 60,924 | $ 44,979 | $ 29,478 | $ 18,478 | $ 250 |
Portfolio turnover rate E | 110% | 198% | 151% | 100% | 70% |
A Total returns do not reflect charges attributable to your insurance company's separate account. Inclusion of these charges would reduce the total returns shown.
B Total returns would have been lower if certain expenses had not been reduced during the applicable periods shown.
C Calculated based on average shares outstanding during the period.
D Fees and expenses of any underlying Fidelity Central Funds are not included in the Fund's expense ratio. The Fund indirectly bears its proportionate share of the expenses of any underlying Fidelity Central Funds.
E Amount does not include the portfolio activity of any underlying Fidelity Central Funds.
F Expense ratios reflect operating expenses of the class. Expenses before reductions do not reflect amounts reimbursed by the investment adviser or reductions from brokerage service arrangements or reductions from other expense offset arrangements and do not represent the amount paid by the class during periods when reimbursements or reductions occur. Expenses net of fee waivers reflect expenses after reimbursement by the investment adviser but prior to reductions from brokerage service arrangements or other expense offset arrangements. Expenses net of all reductions represent the net expenses paid by the class.
G Amount represents less than $.01 per share.
Financial Highlights - Service Class
Years ended December 31, | 2013 | 2012 | 2011 | 2010 | 2009 |
Selected Per-Share Data | | | | | |
Net asset value, beginning of period | $ 8.77 | $ 7.76 | $ 9.94 | $ 8.54 | $ 4.88 |
Income from Investment Operations | | | | | |
Net investment income (loss) C | .07 | .10 | .12 | .08 | .03 |
Net realized and unrealized gain (loss) | .27 | 1.00 | (2.23) | 1.43 | 3.65 |
Total from investment operations | .34 | 1.10 | (2.11) | 1.51 | 3.68 |
Distributions from net investment income | (.06) | (.07) | (.08) | (.07) | - G |
Distributions from net realized gain | (.01) | (.01) | - | (.04) | (.02) |
Tax return of capital | - | (.01) | - | - | - |
Total distributions | (.07) | (.09) | (.08) | (.11) | (.02) |
Redemption fees added to paid in capital C | - G | - G | .01 | - G | - G |
Net asset value, end of period | $ 9.04 | $ 8.77 | $ 7.76 | $ 9.94 | $ 8.54 |
Total Return A,B | 3.84% | 14.22% | (21.15)% | 17.70% | 75.49% |
Ratios to Average Net Assets D,F | | | | | |
Expenses before reductions | 1.23% | 1.47% | 1.40% | 1.48% | 3.02% |
Expenses net of fee waivers, if any | 1.20% | 1.20% | 1.20% | 1.20% | 1.20% |
Expenses net of all reductions | 1.18% | 1.15% | 1.12% | 1.14% | 1.12% |
Net investment income (loss) | .74% | 1.26% | 1.35% | .95% | .50% |
Supplemental Data | | | | | |
Net assets, end of period (000 omitted) | $ 84 | $ 83 | $ 72 | $ 102 | $ 118 |
Portfolio turnover rate E | 110% | 198% | 151% | 100% | 70% |
A Total returns do not reflect charges attributable to your insurance company's separate account. Inclusion of these charges would reduce the total returns shown.
B Total returns would have been lower if certain expenses had not been reduced during the applicable periods shown.
C Calculated based on average shares outstanding during the period.
D Fees and expenses of any underlying Fidelity Central Funds are not included in the Fund's expense ratio. The Fund indirectly bears its proportionate share of the expenses of any underlying Fidelity Central Funds.
E Amount does not include the portfolio activity of any underlying Fidelity Central Funds.
F Expense ratios reflect operating expenses of the class. Expenses before reductions do not reflect amounts reimbursed by the investment adviser or reductions from brokerage service arrangements or reductions from other expense offset arrangements and do not represent the amount paid by the class during periods when reimbursements or reductions occur. Expenses net of fee waivers reflect expenses after reimbursement by the investment adviser but prior to reductions from brokerage service arrangements or other expense offset arrangements. Expenses net of all reductions represent the net expenses paid by the class.
G Amount represents less than $.01 per share.
See accompanying notes which are an integral part of the financial statements.
Annual Report
Financial Highlights - Service Class 2
Years ended December 31, | 2013 | 2012 | 2011 | 2010 | 2009 |
Selected Per-Share Data | | | | | |
Net asset value, beginning of period | $ 8.77 | $ 7.76 | $ 9.95 | $ 8.56 | $ 4.88 |
Income from Investment Operations | | | | | |
Net investment income (loss) C | .05 | .09 | .11 | .07 | .02 |
Net realized and unrealized gain (loss) | .27 | 1.00 | (2.24) | 1.43 | 3.66 |
Total from investment operations | .32 | 1.09 | (2.13) | 1.50 | 3.68 |
Distributions from net investment income | (.06) | (.06) | (.07) | (.07) | - |
Distributions from net realized gain | (.01) | (.01) | - | (.04) | - |
Tax return of capital | - | (.01) | - | - | - |
Total distributions | (.06) H | (.08) | (.07) | (.11) | - |
Redemption fees added to paid in capital C | - G | - G | .01 | - G | - G |
Net asset value, end of period | $ 9.03 | $ 8.77 | $ 7.76 | $ 9.95 | $ 8.56 |
Total Return A,B | 3.70% | 14.10% | (21.30)% | 17.57% | 75.41% |
Ratios to Average Net Assets D,F | | | | | |
Expenses before reductions | 1.38% | 1.63% | 1.54% | 1.59% | 3.17% |
Expenses net of fee waivers, if any | 1.35% | 1.35% | 1.35% | 1.35% | 1.35% |
Expenses net of all reductions | 1.32% | 1.30% | 1.27% | 1.30% | 1.27% |
Net investment income (loss) | .59% | 1.11% | 1.21% | .80% | .35% |
Supplemental Data | | | | | |
Net assets, end of period (000 omitted) | $ 6,517 | $ 4,042 | $ 2,249 | $ 1,348 | $ 117 |
Portfolio turnover rate E | 110% | 198% | 151% | 100% | 70% |
A Total returns do not reflect charges attributable to your insurance company's separate account. Inclusion of these charges would reduce the total returns shown.
B Total returns would have been lower if certain expenses had not been reduced during the applicable periods shown.
C Calculated based on average shares outstanding during the period.
D Fees and expenses of any underlying Fidelity Central Funds are not included in the Fund's expense ratio. The Fund indirectly bears its proportionate share of the expenses of any underlying Fidelity Central Funds.
E Amount does not include the portfolio activity of any underlying Fidelity Central Funds.
F Expense ratios reflect operating expenses of the class. Expenses before reductions do not reflect amounts reimbursed by the investment adviser or reductions from brokerage service arrangements or reductions from other expense offset arrangements and do not represent the amount paid by the class during periods when reimbursements or reductions occur. Expenses net of fee waivers reflect expenses after reimbursement by the investment adviser but prior to reductions from brokerage service arrangements or other expense offset arrangements. Expenses net of all reductions represent the net expenses paid by the class.
G Amount represents less than $.01 per share.
H Total distributions of $.06 per share is comprised of distributions from net investment income of $.055 and distributions from net realized gain of $.008 per share.
Financial Highlights - Initial Class R
Years ended December 31, | 2013 | 2012 | 2011 | 2010 | 2009 |
Selected Per-Share Data | | | | | |
Net asset value, beginning of period | $ 8.75 | $ 7.74 | $ 9.92 | $ 8.51 | $ 4.88 |
Income from Investment Operations | | | | | |
Net investment income (loss) C | .07 | .11 | .14 | .09 | .04 |
Net realized and unrealized gain (loss) | .27 | 1.00 | (2.24) | 1.44 | 3.63 |
Total from investment operations | .34 | 1.11 | (2.10) | 1.53 | 3.67 |
Distributions from net investment income | (.07) | (.08) | (.09) | (.08) | (.02) |
Distributions from net realized gain | (.01) | (.01) | - | (.04) | (.03) |
Tax return of capital | - | (.01) | - | - | - |
Total distributions | (.07) H | (.10) | (.09) | (.12) | (.05) |
Redemption fees added to paid in capital C | - G | - G | .01 | - G | .01 |
Net asset value, end of period | $ 9.02 | $ 8.75 | $ 7.74 | $ 9.92 | $ 8.51 |
Total Return A,B | 3.95% | 14.37% | (21.09)% | 18.01% | 75.40% |
Ratios to Average Net Assets D,F | | | | | |
Expenses before reductions | 1.15% | 1.37% | 1.30% | 1.35% | 2.03% |
Expenses net of fee waivers, if any | 1.10% | 1.10% | 1.10% | 1.10% | 1.10% |
Expenses net of all reductions | 1.08% | 1.05% | 1.02% | 1.04% | 1.02% |
Net investment income (loss) | .84% | 1.36% | 1.46% | 1.05% | .60% |
Supplemental Data | | | | | |
Net assets, end of period (000 omitted) | $ 9,672 | $ 11,344 | $ 14,870 | $ 30,649 | $ 31,314 |
Portfolio turnover rate E | 110% | 198% | 151% | 100% | 70% |
A Total returns do not reflect charges attributable to your insurance company's separate account. Inclusion of these charges would reduce the total returns shown.
B Total returns would have been lower if certain expenses had not been reduced during the applicable periods shown.
C Calculated based on average shares outstanding during the period.
D Fees and expenses of any underlying Fidelity Central Funds are not included in the Fund's expense ratio. The Fund indirectly bears its proportionate share of the expenses of any underlying Fidelity Central Funds.
E Amount does not include the portfolio activity of any underlying Fidelity Central Funds.
F Expense ratios reflect operating expenses of the class. Expenses before reductions do not reflect amounts reimbursed by the investment adviser or reductions from brokerage service arrangements or reductions from other expense offset arrangements and do not represent the amount paid by the class during periods when reimbursements or reductions occur. Expenses net of fee waivers reflect expenses after reimbursement by the investment adviser but prior to reductions from brokerage service arrangements or other expense offset arrangements. Expenses net of all reductions represent the net expenses paid by the class.
G Amount represents less than $.01 per share.
H Total distributions of $.07 per share is comprised of distributions from net investment income of $.066 and distributions from net realized gain of $.008 per share.
See accompanying notes which are an integral part of the financial statements.
Annual Report
Financial Highlights - Service Class 2R
Years ended December 31, | 2013 | 2012 | 2011 | 2010 | 2009 |
Selected Per-Share Data | | | | | |
Net asset value, beginning of period | $ 8.80 | $ 7.79 | $ 9.97 | $ 8.56 | $ 4.88 |
Income from Investment Operations | | | | | |
Net investment income (loss) C | .05 | .09 | .11 | .07 | .02 |
Net realized and unrealized gain (loss) | .27 | 1.00 | (2.24) | 1.43 | 3.66 |
Total from investment operations | .32 | 1.09 | (2.13) | 1.50 | 3.68 |
Distributions from net investment income | (.04) | (.06) | (.06) | (.06) | - |
Distributions from net realized gain | (.01) | (.01) | - | (.04) | - |
Tax return of capital | - | (.01) | - | - | - |
Total distributions | (.05) | (.08) | (.06) | (.09) H | - |
Redemption fees added to paid in capital C | - G | - G | .01 | - G | - G |
Net asset value, end of period | $ 9.07 | $ 8.80 | $ 7.79 | $ 9.97 | $ 8.56 |
Total Return A,B | 3.67% | 14.00% | (21.24)% | 17.60% | 75.41% |
Ratios to Average Net Assets D,F | | | | | |
Expenses before reductions | 1.38% | 1.62% | 1.56% | 1.63% | 3.17% |
Expenses net of fee waivers, if any | 1.35% | 1.35% | 1.35% | 1.35% | 1.35% |
Expenses net of all reductions | 1.33% | 1.30% | 1.27% | 1.29% | 1.27% |
Net investment income (loss) | .59% | 1.10% | 1.20% | .80% | .35% |
Supplemental Data | | | | | |
Net assets, end of period (000 omitted) | $ 83 | $ 82 | $ 72 | $ 102 | $ 117 |
Portfolio turnover rate E | 110% | 198% | 151% | 100% | 70% |
A Total returns do not reflect charges attributable to your insurance company's separate account. Inclusion of these charges would reduce the total returns shown.
B Total returns would have been lower if certain expenses had not been reduced during the applicable periods shown.
C Calculated based on average shares outstanding during the period.
D Fees and expenses of any underlying Fidelity Central Funds are not included in the Fund's expense ratio. The Fund indirectly bears its proportionate share of the expenses of any underlying Fidelity Central Funds.
E Amount does not include the portfolio activity of any underlying Fidelity Central Funds.
F Expense ratios reflect operating expenses of the class. Expenses before reductions do not reflect amounts reimbursed by the investment adviser or reductions from brokerage service arrangements or reductions from other expense offset arrangements and do not represent the amount paid by the class during periods when reimbursements or reductions occur. Expenses net of fee waivers reflect expenses after reimbursement by the investment adviser but prior to reductions from brokerage service arrangements or other expense offset arrangements. Expenses net of all reductions represent the net expenses paid by the class.
G Amount represents less than $.01 per share.
H Total distributions of $.09 per share is comprised of distributions from net investment income of $.056 and distributions from net realized gain of $.037 per share.
Financial Highlights - Investor Class R
Years ended December 31, | 2013 | 2012 | 2011 | 2010 | 2009 |
Selected Per-Share Data | | | | | |
Net asset value, beginning of period | $ 8.71 | $ 7.72 | $ 9.89 | $ 8.50 | $ 4.87 |
Income from Investment Operations | | | | | |
Net investment income (loss) C | .07 | .11 | .13 | .08 | .04 |
Net realized and unrealized gain (loss) | .27 | .98 | (2.22) | 1.43 | 3.63 |
Total from investment operations | .34 | 1.09 | (2.09) | 1.51 | 3.67 |
Distributions from net investment income | (.06) | (.08) | (.09) | (.08) | (.02) |
Distributions from net realized gain | (.01) | (.01) | - | (.04) | (.03) |
Tax return of capital | - | (.01) | - | - | - |
Total distributions | (.07) | (.10) | (.09) | (.12) | (.05) |
Redemption fees added to paid in capital C | - G | - G | .01 | - G | .01 |
Net asset value, end of period | $ 8.98 | $ 8.71 | $ 7.72 | $ 9.89 | $ 8.50 |
Total Return A,B | 3.90% | 14.14% | (21.05)% | 17.79% | 75.56% |
Ratios to Average Net Assets D,F | | | | | |
Expenses before reductions | 1.22% | 1.46% | 1.38% | 1.42% | 2.07% |
Expenses net of fee waivers, if any | 1.18% | 1.18% | 1.18% | 1.18% | 1.18% |
Expenses net of all reductions | 1.15% | 1.13% | 1.10% | 1.12% | 1.10% |
Net investment income (loss) | .76% | 1.28% | 1.37% | .97% | .52% |
Supplemental Data | | | | | |
Net assets, end of period (000 omitted) | $ 54,761 | $ 46,967 | $ 41,924 | $ 53,089 | $ 40,070 |
Portfolio turnover rate E | 110% | 198% | 151% | 100% | 70% |
A Total returns do not reflect charges attributable to your insurance company's separate account. Inclusion of these charges would reduce the total returns shown.
B Total returns would have been lower if certain expenses had not been reduced during the applicable periods shown.
C Calculated based on average shares outstanding during the period.
D Fees and expenses of any underlying Fidelity Central Funds are not included in the Fund's expense ratio. The Fund indirectly bears its proportionate share of the expenses of any underlying Fidelity Central Funds.
E Amount does not include the portfolio activity of any underlying Fidelity Central Funds.
F Expense ratios reflect operating expenses of the class. Expenses before reductions do not reflect amounts reimbursed by the investment adviser or reductions from brokerage service arrangements or reductions from other expense offset arrangements and do not represent the amount paid by the class during periods when reimbursements or reductions occur. Expenses net of fee waivers reflect expenses after reimbursement by the investment adviser but prior to reductions from brokerage service arrangements or other expense offset arrangements. Expenses net of all reductions represent the net expenses paid by the class.
G Amount represents less than $.01 per share.
See accompanying notes which are an integral part of the financial statements.
Annual Report
Notes to Financial Statements
For the period ended December 31, 2013
1. Organization.
VIP Emerging Markets Portfolio (the Fund) is a fund of Variable Insurance Products Fund II (the Trust) and is authorized to issue an unlimited number of shares. The Trust is registered under the Investment Company Act of 1940, as amended (the 1940 Act), as an open-end management investment company organized as a Massachusetts business trust. Shares of the Fund may only be purchased by insurance companies for the purpose of funding variable annuity or variable life insurance contracts. The Fund offers the following classes of shares: Initial Class shares, Service Class shares, Service Class 2 shares, Initial Class R shares, Service Class 2R shares, and Investor Class R shares. All classes have equal rights and voting privileges, except for matters affecting a single class. The Fund's investments in emerging markets can be subject to social, economic, regulatory, and political uncertainties and can be extremely volatile.
2. Investments in Fidelity Central Funds.
The Fund invests in Fidelity Central Funds, which are open-end investment companies generally available only to other investment companies and accounts managed by the investment adviser and its affiliates. The Fund's Schedule of Investments lists each of the Fidelity Central Funds held as of period end, if any, as an investment of the Fund, but does not include the underlying holdings of each Fidelity Central Fund. As an Investing Fund, the Fund indirectly bears its proportionate share of the expenses of the underlying Fidelity Central Funds.
The Money Market Central Funds seek preservation of capital and current income and are managed by Fidelity Investments Money Management, Inc. (FIMM), an affiliate of the investment adviser. Annualized expenses of the Money Market Central Funds as of their most recent shareholder report date are less than .01%.
A complete unaudited list of holdings for each Fidelity Central Fund is available upon request or at the Securities and Exchange Commission (the SEC) website at www.sec.gov. In addition, the financial statements of the Fidelity Central Funds, which are not covered by the Fund's Report of Independent Registered Public Accounting Firm, are available on the SEC website or upon request.
3. Significant Accounting Policies.
The financial statements have been prepared in conformity with accounting principles generally accepted in the United States of America (GAAP), which require management to make certain estimates and assumptions at the date of the financial statements. Actual results could differ from those estimates. Subsequent events, if any, through the date that the financial statements were issued have been evaluated in the preparation of the financial statements. The following summarizes the significant accounting policies of the Fund:
Investment Valuation. Investments are valued as of 4:00 p.m. Eastern time on the last calendar day of the period. In accordance with valuation policies and procedures approved by the Board of Trustees (the Board), the Fund attempts to obtain prices from one or more third party pricing vendors or brokers to value its investments. When current market prices, quotations or currency exchange rates are not readily available or reliable, investments will be fair valued in good faith by the Fidelity Management & Research Company (FMR) Fair Value Committee (the Committee), in accordance with procedures adopted by the Board. Factors used in determining fair value vary by investment type and may include market or investment specific events. The frequency with which these procedures are used cannot be predicted and they may be utilized to a significant extent. The Committee oversees the Fund's valuation policies and procedures and is responsible for approving and reporting to the Board all fair value determinations.
The Fund categorizes the inputs to valuation techniques used to value its investments into a disclosure hierarchy consisting of three levels as shown below:
Level 1 - quoted prices in active markets for identical investments
Level 2 - other significant observable inputs (including quoted prices for similar investments, interest rates, prepayment speeds, etc.)
Level 3 - unobservable inputs (including the Fund's own assumptions based on the best information available)
Valuation techniques used to value the Fund's investments by major category are as follows:
Equity securities, including restricted securities, for which market quotations are readily available, are valued at the last reported sale price or official closing price as reported by a third party pricing vendor on the primary market or exchange on which they are traded and are categorized as Level 1 in the hierarchy. In the event there were no sales during the day or closing prices are not available, securities are valued at the last quoted bid price or may be valued using the last available price and are generally categorized as Level 2 in the hierarchy. For foreign equity securities, when market or security specific events arise, comparisons to the valuation of American Depositary Receipts (ADRs), futures contracts, Exchange-Traded Funds (ETFs) and certain indexes as well as quoted prices for similar securities may be used and would be categorized as Level 2 in the hierarchy. Utilizing these techniques may result in transfers between Level 1 and Level 2. For equity securities, including restricted securities, where observable inputs are limited, assumptions about market activity and risk are used and these securities may be categorized as Level 3 in the hierarchy.
Annual Report
3. Significant Accounting Policies - continued
Investment Valuation - continued
Investments in open-end mutual funds , including the Fidelity Central Funds, are valued at their closing net asset value (NAV) each business day and are categorized as Level 1 in the hierarchy.
Changes in valuation techniques may result in transfers in or out of an assigned level within the disclosure hierarchy. The aggregate value of investments by input level, as of December 31, 2013, including information on transfers between Levels 1 and 2, is included at the end of the Fund's Schedule of Investments.
Foreign Currency. The Fund may use foreign currency contracts to facilitate transactions in foreign-denominated securities. Gains and losses from these transactions may arise from changes in the value of the foreign currency or if the counterparties do not perform under the contracts' terms.
Foreign-denominated assets, including investment securities, and liabilities are translated into U.S. dollars at the exchange rates at period end. Purchases and sales of investment securities, income and dividends received and expenses denominated in foreign currencies are translated into U.S. dollars at the exchange rate in effect on the transaction date.
The effects of exchange rate fluctuations on investments are included with the net realized and unrealized gain (loss) on investment securities. Other foreign currency transactions resulting in realized and unrealized gain (loss) are disclosed separately.
Investment Transactions and Income. For financial reporting purposes, the Fund's investment holdings and NAV include trades executed through the end of the last business day of the period. The NAV per share for processing shareholder transactions is calculated as of the close of business of the New York Stock Exchange (NYSE), normally 4:00 p.m. Eastern time and includes trades executed through the end of the prior business day. Gains and losses on securities sold are determined on the basis of identified cost. Dividend income is recorded on the ex-dividend date, except for certain dividends from foreign securities where the ex-dividend date may have passed, which are recorded as soon as the Fund is informed of the ex-dividend date. Non-cash dividends included in dividend income, if any, are recorded at the fair market value of the securities received. Interest income and distributions from the Fidelity Central Funds are accrued as earned. Investment income is recorded net of foreign taxes withheld where recovery of such taxes is uncertain.
Class Allocations and Expenses. Investment income, realized and unrealized capital gains and losses, common expenses of the Fund, and certain fund-level expense reductions, if any, are allocated daily on a pro-rata basis to each class based on the relative net assets of each class to the total net assets of the Fund. Each class differs with respect to transfer agent and distribution and service plan fees incurred. Certain expense reductions may also differ by class. For the reporting period, the allocated portion of income and expenses to each class as a percent of its average net assets may vary due to the timing of recording these transactions in relation to fluctuating net assets of the classes. Expenses directly attributable to a fund are charged to that fund. Expenses attributable to more than one fund are allocated among the respective funds on the basis of relative net assets or other appropriate methods. Expense estimates are accrued in the period to which they relate and adjustments are made when actual amounts are known.
Income Tax Information and Distributions to Shareholders. Each year, the Fund intends to qualify as a regulated investment company under Subchapter M of the Internal Revenue Code, including distributing substantially all of its taxable income and realized gains. As a result, no provision for U.S. Federal income taxes is required. As of December 31, 2013, the Fund did not have any unrecognized tax benefits in the financial statements; nor is the Fund aware of any tax positions for which it is reasonably possible that the total amounts of unrecognized tax benefits will significantly change in the next twelve months. The Fund files a U.S. federal tax return, in addition to state and local tax returns as required. The Fund's federal income tax returns are subject to examination by the Internal Revenue Service (IRS) for a period of three fiscal years after they are filed. State and local tax returns may be subject to examination for an additional fiscal year depending on the jurisdiction. Foreign taxes are provided for based on the Fund's understanding of the tax rules and rates that exist in the foreign markets in which it invests. The Fund is subject to a tax imposed on capital gains by certain countries in which it invests. An estimated deferred tax liability for net unrealized appreciation on the applicable securities is included in Other payables and accrued expenses on the Statement of Assets & Liabilities.
Distributions are declared and recorded on the ex-dividend date. Income dividends and capital gain distributions are declared separately for each class. Income and capital gain distributions are determined in accordance with income tax regulations, which may differ from GAAP.
Capital accounts within the financial statements are adjusted for permanent book-tax differences. These adjustments have no impact on net assets or the results of operations. Capital accounts are not adjusted for temporary book-tax differences which will reverse in a subsequent period.
Book-tax differences are primarily due to foreign currency transactions, certain foreign taxes, passive foreign investment companies (PFIC), capital loss carryforwards and losses deferred due to wash sales and excise tax regulations.
Annual Report
Notes to Financial Statements - continued
3. Significant Accounting Policies - continued
Income Tax Information and Distributions to Shareholders - continued
The federal tax cost of investment securities and unrealized appreciation (depreciation) as of period end were as follows:
Gross unrealized appreciation | $ 19,726,488 |
Gross unrealized depreciation | (4,666,734) |
Net unrealized appreciation (depreciation) on securities and other investments | $ 15,059,754 |
| |
Tax Cost | $ 120,314,884 |
The tax-based components of distributable earnings as of period end were as follows:
Capital loss carryforward | $ (3,143,603) |
Net unrealized appreciation (depreciation) | $ 15,054,472 |
Capital loss carryforwards are only available to offset future capital gains of the Fund to the extent provided by regulations and may be limited. Under the Regulated Investment Company Modernization Act of 2010 (the Act), the Fund is permitted to carry forward capital losses incurred in taxable years beginning after December 22, 2010 for an unlimited period and such capital losses are required to be used prior to any losses that expire. The capital loss carryforward information presented below, including any applicable limitation, is estimated as of fiscal period end and is subject to adjustment.
Fiscal year of expiration | |
2016 | $ (319,346) |
2017 | (2,824,257) |
Total capital loss carryforward | $ (3,143,603) |
The tax character of distributions paid was as follows:
| December 31, 2013 | December 31, 2012 |
Ordinary Income | $ 994,714 | $ 1,099,273 |
Tax Return of Capital | - | 106,326 |
Total | $ 994,714 | $ 1,205,599 |
Trading (Redemption) Fees. Initial Class R shares, Service Class 2R shares and Investor Class R shares held by investors less than 60 days may be subject to a redemption fee equal to 1% of the NAV of shares redeemed. All redemption fees, which reduce the proceeds of the shareholder redemption, are retained by the Fund and accounted for as an addition to paid in capital.
Delayed Delivery Transactions and When-Issued Securities. During the period, the Fund transacted in securities on a delayed delivery or when-issued basis. Payment and delivery may take place after the customary settlement period for that security. The price of the underlying securities and the date when the securities will be delivered and paid for are fixed at the time the transaction is negotiated. The securities purchased on a delayed delivery or when-issued basis are identified as such in the Fund's Schedule of Investments. With respect to purchase commitments, the Fund identifies securities as segregated in its records with a value at least equal to the amount of the commitment. Losses may arise due to changes in the value of the underlying securities or if the counterparty does not perform under the contract's terms, or if the issuer does not issue the securities due to political, economic, or other factors.
Restricted Securities. The Fund may invest in securities that are subject to legal or contractual restrictions on resale. These securities generally may be resold in transactions exempt from registration or to the public if the securities are registered. Disposal of these securities may involve time-consuming negotiations and expense, and prompt sale at an acceptable price may be difficult. Information regarding restricted securities is included at the end of the Fund's Schedule of Investments.
4. Purchases and Sales of Investments.
Purchases and sales of securities, other than short-term securities, aggregated $145,093,363 and $122,713,326, respectively.
5. Fees and Other Transactions with Affiliates.
Management Fee. Fidelity Management & Research Company (the investment adviser) and its affiliates provide the Fund with investment management related services for which the Fund pays a monthly management fee. The management fee is the sum of an individual fund fee rate that is based on an annual rate of .55% of the Fund's average net assets and an annualized group fee rate that averaged .25% during the period. The group fee rate is
Annual Report
5. Fees and Other Transactions with Affiliates - continued
Management Fee - continued
based upon the average net assets of all the mutual funds advised by the investment adviser, including any mutual funds previously advised by the investment adviser that are currently advised by Fidelity SelectCo, LLC, an affiliate of the investment adviser. The group fee rate decreases as assets under management increase and increases as assets under management decrease. For the reporting period, the total annual management fee rate was .80% of the Fund's average net assets.
Distribution and Service Plan Fees. In accordance with Rule 12b-1 of the 1940 Act, the Fund has adopted separate 12b-1 Plans for each Service Class of shares. Each Service Class pays Fidelity Distributors Corporation (FDC), an affiliate of the investment adviser, a service fee. For the period, the service fee is based on an annual rate of .10% of Service Class' average net assets and .25% of Service Class 2's and Service Class 2R's average net assets.
For the period, total fees, all of which were re-allowed to insurance companies for the distribution of shares and providing shareholder support services were as follows:
Service Class | $ 83 |
Service Class 2 | 13,040 |
Service Class 2 R | 207 |
| $ 13,330 |
Transfer Agent Fees. Fidelity Investments Institutional Operations Company, Inc. (FIIOC), an affiliate of the investment adviser, is the Fund's transfer, dividend disbursing, and shareholder servicing agent. FIIOC receives an asset-based fee with respect to each class. Each class (with the exception of Investor Class R) pays a transfer agent fee, excluding out of pocket expenses, equal to an annual rate of .07% of average net assets. Investor Class R pays a monthly asset-based transfer agent fee of .15% of average net assets. In addition, FIIOC receives an asset-based fee of ..0035% of average net assets for typesetting, printing and mailing of shareholder reports, except proxy statements. FIIOC voluntarily agreed to reimburse or waive this fee for the period January 1, 2013 through December 31, 2013 (see Expense Reductions note). For the period, transfer agent fees for each class, including printing and out of pocket expenses, were as follows:
Initial Class | $ 36,579 |
Service Class | 58 |
Service Class 2 | 3,623 |
Initial Class R | 8,888 |
Service Class 2R | 58 |
Investor Class R | 75,715 |
| $ 124,921 |
Effective February 1, 2014, the Board of Trustees approved an amendment to the transfer agent fee agreement whereby each class (with the exception of Investor Class R) pays a single fee of .07% of average net assets for transfer agent services, typesetting, printing and mailing of shareholder reports, excluding mailing of proxy statements and out of pocket expenses. Investor Class R pays a single fee of .15% of average net assets.
Accounting and Security Lending Fees. Fidelity Service Company, Inc. (FSC), an affiliate of the investment adviser, maintains the Fund's accounting records. The accounting fee is based on the level of average net assets for each month. Under a separate contract, FSC administers the security lending program. The security lending fee is based on the number and duration of lending transactions.
Brokerage Commissions. The Fund placed a portion of its portfolio transactions with brokerage firms which are affiliates of the investment adviser. Brokerage commissions are included in net realized gain (loss) and change in net unrealized appreciation (depreciation) in the Statement of Operations. The commissions paid to these affiliated firms were $479 for the period.
Interfund Lending Program. Pursuant to an Exemptive Order issued by the SEC, the Fund, along with other registered investment companies having management contracts with Fidelity Management & Research Company (FMR) or other affiliated entities of FMR, may participate in an interfund lending program. This program provides an alternative credit facility allowing the funds to borrow from, or lend money to, other participating affiliated funds. At period end, there were no interfund loans outstanding. The Fund's activity in this program during the period for which loans were outstanding was as follows:
Borrower or Lender | Average Loan
Balance | Weighted Average Interest Rate | Interest Expense |
Borrower | $ 5,783,000 | .32% | $ 255 |
6. Committed Line of Credit.
The Fund participates with other funds managed by the investment adviser or an affiliate in a $4.25 billion credit facility (the "line of credit") to be utilized for temporary or emergency purposes to fund shareholder redemptions or for other short-term liquidity purposes. The Fund has agreed to pay
Annual Report
Notes to Financial Statements - continued
6. Committed Line of Credit - continued
commitment fees on its pro-rata portion of the line of credit, which amounted to $234 and is reflected in Miscellaneous expenses on the Statement of Operations. During the period, there were no borrowings on this line of credit.
7. Security Lending.
The Fund lends portfolio securities through a lending agent from time to time in order to earn additional income. For equity securities, a lending agent is used and may loan securities to certain qualified borrowers, including Fidelity Capital Markets (FCM), a broker-dealer affiliated with the Fund. On the settlement date of the loan, the Fund receives collateral (in the form of U.S. Treasury obligations, letters of credit and/or cash) against the loaned securities and maintains collateral in an amount not less than 100% of the market value of the loaned securities during the period of the loan. The market value of the loaned securities is determined at the close of business of the Fund and any additional required collateral is delivered to the Fund on the next business day. If the borrower defaults on its obligation to return the securities loaned because of insolvency or other reasons, the Fund may apply collateral received from the borrower against the obligation. The Fund may experience delays and costs in recovering the securities loaned. Any cash collateral received is invested in the Fidelity Securities Lending Cash Central Fund. The value of loaned securities and cash collateral at period end are disclosed on the Fund's Statement of Assets and Liabilities. Security lending income represents the income earned on investing cash collateral, less rebates paid to borrowers and any lending agent fees associated with the loan, plus any premium payments received for lending certain types of securities. Security lending income is presented in the Statement of Operations as a component of income from Fidelity Central Funds. Total security lending income during the period amounted to $11,992. During the period, there were no securities loaned to FCM.
8. Expense Reductions.
In addition to FIIOC reimbursing or waiving a portion of its transfer agent fees , the investment adviser voluntarily agreed to reimburse each class to the extent annual operating expenses exceeded certain levels of average net assets as noted in the table below. Some expenses, for example interest expense, including commitment fees, are excluded from this reimbursement.
Expenses were reimbursed and/or waived for the following classes during the period:
| Expense
Limitations | Reimbursement/Waiver |
Initial Class | 1.10% | $ 20,476 |
Service Class | 1.20% | 28 |
Service Class 2 | 1.35% | 1,911 |
Initial Class R | 1.10% | 4,961 |
Service Class 2R | 1.35% | 28 |
Investor Class R | 1.18% | 19,968 |
| | $ 47,372 |
Commissions paid to certain brokers with whom the investment adviser, or its affiliates, places trades on behalf of the Fund include an amount in addition to trade execution, which may be rebated back to the Fund to offset certain expenses. This amount totaled $28,326 for the period.
9. Distributions to Shareholders.
Distributions to shareholders of each class were as follows:
Years ended December 31, | 2013 | 2012 |
From net investment income | | |
Initial Class | $ 407,624 | $ 423,228 |
Service Class | 527 | 707 |
Service Class 2 | 53,414 | 29,964 |
Initial Class R | 71,589 | 107,482 |
Service Class 2R | 404 | 581 |
Investor Class R | 349,316 | 446,026 |
Total | $ 882,874 | $ 1,007,988 |
From net realized gain | | |
Initial Class | $ 48,671 | $ 38,030 |
Service Class | 74 | 70 |
Service Class 2 | 7,769 | 3,378 |
Initial Class R | 8,677 | 9,658 |
Service Class 2R | 74 | 70 |
Investor Class R | 46,575 | 40,079 |
Total | $ 111,840 | $ 91,285 |
Annual Report
9. Distributions to Shareholders - continued
Years ended December 31, | 2013 | 2012 |
Tax Return of Capital | | |
Initial Class | $ - | $ 44,296 |
Service Class | - | 82 |
Service Class 2 | - | 3,935 |
Initial Class R | - | 11,249 |
Service Class 2R | - | 82 |
Investor Class R | - | 46,682 |
Total | $ - | $ 106,326 |
10. Share Transactions.
Transactions for each class of shares were as follows:
| Shares | Dollars |
Years ended December 31, | 2013 | 2012 | 2013 | 2012 |
Initial Class | | | | |
Shares sold | 2,314,809 | 1,795,123 | $ 20,504,643 | $ 14,860,844 |
Reinvestment of distributions | 51,734 | 58,922 | 456,295 | 505,554 |
Shares redeemed | (749,757) | (520,087) | (6,626,736) | (4,326,747) |
Net increase (decrease) | 1,616,786 | 1,333,958 | $ 14,334,202 | $ 11,039,651 |
Service Class | | | | |
Reinvestment of distributions | 68 | 100 | $ 601 | $ 858 |
Shares redeemed | (260) | - | (2,351) | - |
Net increase (decrease) | (192) | 100 | $ (1,750) | $ 858 |
Service Class 2 | | | | |
Shares sold | 595,640 | 205,197 | $ 5,335,046 | $ 1,709,550 |
Reinvestment of distributions | 6,921 | 4,330 | 61,183 | 37,277 |
Shares redeemed | (341,472) | (38,252) | (3,074,549) | (320,023) |
Net increase (decrease) | 261,089 | 171,275 | $ 2,321,680 | $ 1,426,804 |
Initial Class R | | | | |
Shares sold | 369,430 | 305,108 | $ 3,295,234 | $ 2,561,953 |
Reinvestment of distributions | 9,100 | 14,964 | 80,266 | 128,390 |
Shares redeemed | (602,524) | (944,184) | (5,333,441) | (7,798,843) |
Net increase (decrease) | (223,994) | (624,112) | $ (1,957,941) | $ (5,108,500) |
Service Class 2R | | | | |
Reinvestment of distributions | 54 | 85 | $ 478 | $ 733 |
Shares redeemed | (213) | - | (1,924) | - |
Net increase (decrease) | (159) | 85 | $ (1,446) | $ 733 |
Investor Class R | | | | |
Shares sold | 2,065,057 | 1,502,832 | $ 18,235,757 | $ 12,517,464 |
Reinvestment of distributions | 45,039 | 62,314 | 395,891 | 532,787 |
Shares redeemed | (1,401,329) | (1,607,620) | (12,212,999) | (13,117,947) |
Net increase (decrease) | 708,767 | (42,474) | $ 6,418,649 | $ (67,696) |
11. Other.
The Fund's organizational documents provide former and current trustees and officers with a limited indemnification against liabilities arising in connection with the performance of their duties to the Fund. In the normal course of business, the Fund may also enter into contracts that provide general indemnifications. The Fund's maximum exposure under these arrangements is unknown as this would be dependent on future claims that may be made against the Fund. The risk of material loss from such claims is considered remote.
At the end of the period, VIP Freedom 2020 Portfolio was the owner of record of approximately 21% of the total outstanding shares of the fund. The VIP Freedom Funds and VIP Investor Freedom Funds were the owners of record, in the aggregate, of approximately 64% of the total outstanding shares of the Fund. In addition, the investment adviser or its affiliates were the owners of record of 30% of the total outstanding shares of the Fund.
Annual Report
Report of Independent Registered Public Accounting Firm
To the Trustees of Variable Insurance Products Fund II and Shareholders of VIP Emerging Markets Portfolio:
We have audited the accompanying statement of assets and liabilities of VIP Emerging Markets Portfolio (the Fund), a fund of Variable Insurance Products Fund II, including the schedule of investments, as of December 31, 2013, and the related statement of operations for the year then ended, the statement of changes in net assets for each of the two years in the period then ended, and the financial highlights for each of the five years in the period then ended. These financial statements and financial highlights are the responsibility of the Fund's management. Our responsibility is to express an opinion on these financial statements and financial highlights based on our audits.
We conducted our audits in accordance with the standards of the Public Company Accounting Oversight Board (United States). Those standards require that we plan and perform the audit to obtain reasonable assurance about whether the financial statements and financial highlights are free of material misstatement. The Fund is not required to have, nor were we engaged to perform, an audit of its internal control over financial reporting. Our audits included consideration of internal control over financial reporting as a basis for designing audit procedures that are appropriate in the circumstances, but not for the purpose of expressing an opinion on the effectiveness of the Fund's internal control over financial reporting. Accordingly, we express no such opinion. An audit also includes examining, on a test basis, evidence supporting the amounts and disclosures in the financial statements, assessing the accounting principles used and significant estimates made by management, as well as evaluating the overall financial statement presentation. Our procedures included confirmation of securities owned as of December 31, 2013, by correspondence with the custodians and brokers; where replies were not received from brokers, we performed other auditing procedures. We believe that our audits provide a reasonable basis for our opinion.
In our opinion, the financial statements and financial highlights referred to above present fairly, in all material respects, the financial position of VIP Emerging Markets Portfolio as of December 31, 2013, the results of its operations for the year then ended, the changes in its net assets for each of the two years in the period then ended, and the financial highlights for each of the five years in the period then ended, in conformity with accounting principles generally accepted in the United States of America.
DELOITTE & TOUCHE LLP
Boston, Massachusetts
February 14, 2014
Annual Report
The Trustees, Member of the Advisory Board, and officers of the trust and fund, as applicable, are listed below. The Board of Trustees governs the fund and is responsible for protecting the interests of shareholders. The Trustees are experienced executives who meet periodically throughout the year to oversee the fund's activities, review contractual arrangements with companies that provide services to the fund, oversee management of the risks associated with such activities and contractual arrangements, and review the fund's performance. Except for James C. Curvey, Ned C. Lautenbach, Ronald P. O'Hanley, and William S. Stavropoulos, each of the Trustees oversees 173 funds. Mr. Curvey oversees 396 funds. Mr. Lautenbach, Mr. O'Hanley, and Mr. Stavropoulos each oversees 247 funds.
The Trustees hold office without limit in time except that (a) any Trustee may resign; (b) any Trustee may be removed by written instrument, signed by at least two-thirds of the number of Trustees prior to such removal; (c) any Trustee who requests to be retired or who has become incapacitated by illness or injury may be retired by written instrument signed by a majority of the other Trustees; and (d) any Trustee may be removed at any special meeting of shareholders by a two-thirds vote of the outstanding voting securities of the trust. Each Trustee who is not an interested person (as defined in the 1940 Act) of the trust and the fund (Independent Trustee), shall retire not later than the last day of the calendar year in which his or her 75th birthday occurs. The Independent Trustees may waive this mandatory retirement age policy with respect to individual Trustees. The officers and Advisory Board Member hold office without limit in time, except that any officer and Advisory Board Member may resign or may be removed by a vote of a majority of the Trustees at any regular meeting or any special meeting of the Trustees. Except as indicated, each individual has held the office shown or other offices in the same company for the past five years.
Experience, Skills, Attributes, and Qualifications of the Fund's Trustees. The Governance and Nominating Committee has adopted a statement of policy that describes the experience, qualifications, attributes, and skills that are necessary and desirable for potential Independent Trustee candidates (Statement of Policy). The Board believes that each Trustee satisfied at the time he or she was initially elected or appointed a Trustee, and continues to satisfy, the standards contemplated by the Statement of Policy. The Governance and Nominating Committee also engages professional search firms to help identify potential Independent Trustee candidates who have the experience, qualifications, attributes, and skills consistent with the Statement of Policy. From time to time, additional criteria based on the composition and skills of the current Independent Trustees, as well as experience or skills that may be appropriate in light of future changes to board composition, business conditions, and regulatory or other developments, have also been considered by the professional search firms and the Governance and Nominating Committee. In addition, the Board takes into account the Trustees' commitment and participation in Board and committee meetings, as well as their leadership of standing and ad hoc committees throughout their tenure.
In determining that a particular Trustee was and continues to be qualified to serve as a Trustee, the Board has considered a variety of criteria, none of which, in isolation, was controlling. The Board believes that, collectively, the Trustees have balanced and diverse experience, qualifications, attributes, and skills, which allow the Board to operate effectively in governing the fund and protecting the interests of shareholders. Information about the specific experience, skills, attributes, and qualifications of each Trustee, which in each case led to the Board's conclusion that the Trustee should serve (or continue to serve) as a trustee of the fund, is provided below.
Board Structure and Oversight Function. James C. Curvey is an interested person (as defined in the 1940 Act) and currently serves as Chairman. The Trustees have determined that an interested Chairman is appropriate and benefits shareholders because an interested Chairman has a personal and professional stake in the quality and continuity of services provided to the fund. Independent Trustees exercise their informed business judgment to appoint an individual of their choosing to serve as Chairman, regardless of whether the Trustee happens to be independent or a member of management. The Independent Trustees have determined that they can act independently and effectively without having an Independent Trustee serve as Chairman and that a key structural component for assuring that they are in a position to do so is for the Independent Trustees to constitute a substantial majority for the Board. The Independent Trustees also regularly meet in executive session. Ned C. Lautenbach serves as Chairman of the Independent Trustees and as such (i) acts as a liaison between the Independent Trustees and management with respect to matters important to the Independent Trustees and (ii) with management prepares agendas for Board meetings.
Fidelity funds are overseen by different Boards of Trustees. The fund's Board oversees Fidelity's equity and high income funds and another Board oversees Fidelity's investment-grade bond, money market, and asset allocation funds. The asset allocation funds may invest in Fidelity funds overseen by the fund's Board. The use of separate Boards, each with its own committee structure, allows the Trustees of each group of Fidelity funds to focus on the unique issues of the funds they oversee, including common research, investment, and operational issues. On occasion, the separate Boards establish joint committees to address issues of overlapping consequences for the Fidelity funds overseen by each Board.
The Trustees operate using a system of committees to facilitate the timely and efficient consideration of all matters of importance to the Trustees, the fund, and fund shareholders and to facilitate compliance with legal and regulatory requirements and oversight of the fund's activities and associated risks. The Board, acting through its committees, has charged FMR and its affiliates with (i) identifying events or circumstances the occurrence of which could have demonstrably adverse effects on the fund's business and/or reputation; (ii) implementing processes and controls to lessen the possibility that such events or circumstances occur or to mitigate the effects of such events or circumstances if they do occur; and (iii) creating and maintaining a system designed to evaluate continuously business and market conditions in order to facilitate the identification and implementation processes described in (i) and (ii) above. Because the day-to-day operations and activities of the fund are carried out by or through FMR, its affiliates and other service providers, the fund's exposure to risks is mitigated but not eliminated by the processes overseen by the Trustees. While each of the Board's committees has responsibility for overseeing different aspects of the fund's activities, oversight is exercised primarily through the Operations, Audit, and Compliance Committees. In addition, the Independent Trustees have worked with FMR to enhance the Board's oversight of investment and financial risks, legal and regulatory risks, technology risks, and operational risks, including the development of additional risk reporting to the Board. For example, a working group comprised of Independent Trustees and FMR has worked and continues to work to review the Fidelity fund's valuation-related activities, reporting and risk management. Appropriate personnel, including but not limited to the fund's Chief Compliance Officer (CCO), FMR's internal auditor, the independent accountants, the fund's Treasurer and portfolio management personnel, make periodic reports to the Board's committees, as appropriate, including an annual review of FMR's risk management program for the Fidelity funds. The responsibilities of each standing committee, including their oversight responsibilities, are described further under "Standing Committees of the Fund's Trustees."
Annual Report
The fund's Statement of Additional Information (SAI) includes more information about the Trustees. To request a free copy, call Fidelity at 1-877-208-0098.
Interested Trustees*:
Correspondence intended for each Trustee who is an interested person may be sent to Fidelity Investments, 245 Summer Street, Boston, Massachusetts 02210.
Name, Year of Birth; Principal Occupations and Other Relevant Experience+ |
James C. Curvey (1935) |
Year of Election or Appointment: 2007 Trustee Chairman of the Board of Trustees |
| Mr. Curvey also serves as Trustee of other Fidelity funds. Mr. Curvey is a Director of Fidelity Investments Money Management, Inc. (2009-present), Director of Fidelity Research & Analysis Co. (2009-present) and Director of FMR and FMR Co., Inc. (2007-present). Mr. Curvey is also Vice Chairman (2007-present) and Director of FMR LLC. In addition, Mr. Curvey serves as an Overseer for the Boston Symphony Orchestra and a member of the Trustees of Villanova University. Previously, Mr. Curvey was the Vice Chairman (2006-2007) and Director (2000-2007) of FMR Corp. |
Ronald P. O'Hanley (1957) |
Year of Election or Appointment: 2011 Trustee |
| Mr. O'Hanley also serves as Trustee of other Fidelity funds. He is Director of Fidelity SelectCo, LLC (2013-present), FMR Co., Inc. (2010-present), Director of Fidelity Investments Money Management, Inc. (2010-present), Director of Fidelity Research & Analysis Company (2010-present), President of Fidelity Asset Management and Corporate Services and a Member of Fidelity's Executive Committee (2010-present). Previously, Mr. O'Hanley served as President and Chief Executive Officer of BNY Mellon Asset Management (2007-2010). Mr. O'Hanley also served as Vice Chairman of Bank New York Mellon Corp. and a member of that firm's Executive Committee. Prior to the 2007 merger of The Bank of New York and Mellon Financial Corporation, he was Vice Chairman of Mellon Financial Corporation and President and Chief Executive Officer of Mellon Asset Management. He joined Mellon in February 1997. Mr. O'Hanley currently serves as Chairman of the Boston Public Library Foundation Board of Directors and sits on the Board of Directors of Beth Israel Deaconess Medical Center, the Board of Trustees of the Marine Biological Laboratory and the Advisory Board of the Maxwell School of Citizenship and Public Administration at Syracuse University. Mr. O'Hanley also chairs the Council on Asset Management for the Financial Services Roundtable and is a member of the Board of Directors of Institutional Investor's U.S. Institute. |
* Trustees have been determined to be "Interested Trustees" by virtue of, among other things, their affiliation with the trust or various entities under common control with FMR.
+ The information above includes each Trustee's principal occupation during the last five years and other information relating to the experience, attributes, and skills relevant to each Trustee's qualifications to serve as a Trustee, which led to the conclusion that each Trustee should serve as a Trustee for the fund.
Annual Report
Trustees and Officers - continued
Independent Trustees:
Correspondence intended for each Independent Trustee (that is, the Trustees other than the Interested Trustees) may be sent to Fidelity Investments, P.O. Box 55235, Boston, Massachusetts 02205-5235.
Name, Year of Birth; Principal Occupations and Other Relevant Experience+ |
Dennis J. Dirks (1948) |
Year of Election or Appointment: 2005 Trustee |
| Mr. Dirks also serves as Trustee of other Fidelity funds. Prior to his retirement in May 2003, Mr. Dirks was Chief Operating Officer and a member of the Board of The Depository Trust & Clearing Corporation (DTCC). He also served as President, Chief Operating Officer, and Board member of The Depository Trust Company (DTC) and President and Board member of the National Securities Clearing Corporation (NSCC). In addition, Mr. Dirks served as Chief Executive Officer and Board member of the Government Securities Clearing Corporation, Chief Executive Officer and Board member of the Mortgage-Backed Securities Clearing Corporation, as a Trustee and a member of the Finance Committee of Manhattan College (2005-2008), and as a Trustee and a member of the Finance Committee of AHRC of Nassau County (2006-2008). Mr. Dirks is a member of the Independent Directors Council (IDC) Governing Council (2010-present) and Board of Directors for The Brookville Center for Children's Services, Inc. (2009-present). |
Alan J. Lacy (1953) |
Year of Election or Appointment: 2008 Trustee |
| Mr. Lacy also serves as Trustee of other Fidelity funds. Mr. Lacy serves as Senior Adviser (2007-present) of Oak Hill Capital Partners, L.P. (private equity). Mr. Lacy also served as Chief Executive Officer (2000-2005) and Vice Chairman (2005-2006) of Sears Holdings Corporation and Sears, Roebuck and Co. (retail). In addition, Mr. Lacy serves as a member of the Board of Directors of Dave & Buster's Entertainment, Inc. (restaurant and entertainment complexes, 2010-present), Earth Fare, Inc. (retail grocery, 2012-present), The Hillman Companies, Inc. (hardware wholesalers, 2010-present), and Bristol-Myers Squibb Company (global pharmaceuticals, 2008-present). Mr. Lacy is a member of the Board of Trustees of The National Parks Conservation Association (2006-present). Previously, Mr. Lacy served as Chairman of the Board of Trustees of the National Parks Conservation Association (2008-2011) and as a member of the Board of Directors for the Western Union Company (global money transfer, 2006-2011). |
Ned C. Lautenbach (1944) |
Year of Election or Appointment: 2000 Trustee Chairman of the Independent Trustees |
| Mr. Lautenbach also serves as Trustee of other Fidelity funds. Mr. Lautenbach currently serves as the Lead Director of the Eaton Corporation Board of Directors (diversified industrial, 1997-present). Mr. Lautenbach is Chairman of the Board of Directors of the Philharmonic Center for the Arts in Naples, Florida (2012-present) and a member of the Council on Foreign Relations (1994-present). Previously, Mr. Lautenbach was a Partner/Advisory Partner at Clayton, Dubilier & Rice, LLC (private equity investment, 1998-2010), as well as a Director of Sony Corporation (2006-2007). |
Joseph Mauriello (1944) |
Year of Election or Appointment: 2008 Trustee |
| Mr. Mauriello also serves as Trustee of other Fidelity funds. Prior to his retirement in January 2006, Mr. Mauriello served in numerous senior management positions including Deputy Chairman and Chief Operating Officer (2004-2005), and Vice Chairman of Financial Services (2002-2004) of KPMG LLP US (professional services, 1965-2005). Mr. Mauriello currently serves as a member of the Board of Directors of XL Group plc. (global insurance and re-insurance, 2006-present). Previously, Mr. Mauriello served as a Director of the Hamilton Funds of the Bank of New York (2006-2007) and of Arcadia Resources Inc. (health care services and products, 2007-2012). |
Robert W. Selander (1950) |
Year of Election or Appointment: 2011 Trustee |
| Mr. Selander also serves as Trustee of other Fidelity funds. Previously, Mr. Selander served as a Member of the Advisory Board of other Fidelity funds (2011), and Executive Vice Chairman (2010), Chief Executive Officer (2009-2010), and President and Chief Executive Officer (1997-2009) of Mastercard, Inc. |
Cornelia M. Small (1944) |
Year of Election or Appointment: 2005 Trustee |
| Ms. Small also serves as Trustee of other Fidelity funds. Ms. Small is a member of the Board of Directors (2009-present) and Chair of the Investment Committee (2010-present) of the Teagle Foundation. Ms. Small also serves on the Investment Committee of the Berkshire Taconic Community Foundation (2008-present). Previously, Ms. Small served as Chairperson (2002-2008) and a member of the Investment Committee and Chairperson (2008-2012) and a member of the Board of Trustees of Smith College. In addition, Ms. Small served as Chief Investment Officer, Director of Global Equity Investments, and a member of the Board of Directors of Scudder, Stevens & Clark and Scudder Kemper Investments. |
William S. Stavropoulos (1939) |
Year of Election or Appointment: 2001 Trustee Vice Chairman of the Independent Trustees |
| Mr. Stavropoulos also serves as Trustee of other Fidelity funds. Mr. Stavropoulos serves as President and Founder of the Michigan Baseball Foundation, the Great Lakes Loons (2007-present). Mr. Stavropoulos is Chairman Emeritus of the Board of Directors of The Dow Chemical Company, where he previously served in numerous senior management positions, including President, CEO (1995-2000; 2002-2004), Chairman of the Executive Committee (2000-2006), and as a member of the Board of Directors (1990-2006). Currently, Mr. Stavropoulos is Chairman of the Board of Directors of Univar Inc. (global distributor of commodity and specialty chemicals), a Director of Teradata Corporation (data warehousing and technology solutions), and Maersk Inc. (industrial conglomerate), and a member of the Advisory Board for Metalmark Capital LLC (private equity investment, 2005-present). Mr. Stavropoulos is an operating advisor to Clayton, Dubilier & Rice, LLC (private equity investment). In addition, Mr. Stavropoulos is a member of the University of Notre Dame Advisory Council for the College of Science, a Trustee of the Rollin L. Gerstacker Foundation, and a Director of the Naples Philharmonic Center for the Arts. Previously, Mr. Stavropoulos served as a Director of Chemical Financial Corporation (bank holding company, 1993-2012) and Tyco International, Ltd. (multinational manufacturing and services, 2007-2012). |
David M. Thomas (1949) |
Year of Election or Appointment: 2008 Trustee |
| Mr. Thomas also serves as Trustee of other Fidelity funds. Mr. Thomas serves as Non-Executive Chairman of the Board of Directors of Fortune Brands Home and Security (home and security products, 2011-present), and as a member of the Board of Directors of Interpublic Group of Companies, Inc. (marketing communication, 2004-present). Previously, Mr. Thomas served as Executive Chairman (2005-2006) and Chairman and Chief Executive Officer (2000-2005) of IMS Health, Inc. (pharmaceutical and healthcare information solutions), and a Director of Fortune Brands, Inc. (consumer products, 2000-2011). |
+ The information above includes each Trustee's principal occupation during the last five years and other information relating to the experience, attributes, and skills relevant to each Trustee's qualifications to serve as a Trustee, which led to the conclusion that each Trustee should serve as a Trustee for the fund.
Advisory Board Member and Officers:
Correspondence intended for each officer and Peter S. Lynch may be sent to Fidelity Investments, 245 Summer Street, Boston, Massachusetts 02210. Officers appear below in alphabetical order.
Name, Year of Birth; Principal Occupation |
Peter S. Lynch (1944) |
Year of Election or Appointment: 2003 Member of the Advisory Board |
| Mr. Lynch also serves as Member of the Advisory Board of other Fidelity funds. Mr. Lynch is Vice Chairman and a Director of FMR and FMR Co., Inc. In addition, Mr. Lynch serves as a Trustee of Boston College and as the Chairman of the Inner-City Scholarship Fund. Previously, Mr. Lynch served on the Special Olympics International Board of Directors (1997-2006). |
Elizabeth Paige Baumann (1968) |
Year of Election or Appointment: 2012 Anti-Money Laundering (AML) Officer |
| Ms. Baumann also serves as AML Officer of other funds. She is Chief AML Officer of FMR LLC (2012-present) and is an employee of Fidelity Investments. Previously, Ms. Baumann served as Vice President and Deputy Anti-Money Laundering Officer (2007-2012). |
William C. Coffey (1969) |
Year of Election or Appointment: 2009 Assistant Secretary |
| Mr. Coffey also serves as Assistant Secretary of other funds. He is Senior Vice President and Deputy General Counsel of FMR LLC (2010-present), and is an employee of Fidelity Investments. Previously, Mr. Coffey served as Vice President and Associate General Counsel of FMR LLC (2005-2009). |
Jonathan Davis (1968) |
Year of Election or Appointment: 2010 Assistant Treasurer |
| Mr. Davis also serves as Assistant Treasurer of other funds. Mr. Davis is an employee of Fidelity Investments. Previously, Mr. Davis served as Vice President and Associate General Counsel of FMR LLC (2003-2010). |
Adrien E. Deberghes (1967) |
Year of Election or Appointment: 2008 Deputy Treasurer |
| Mr. Deberghes also serves as an officer of other funds. He is an employee of Fidelity Investments (2008-present). Prior to joining Fidelity Investments, Mr. Deberghes was Senior Vice President of Mutual Fund Administration at State Street Corporation (2007-2008), Senior Director of Mutual Fund Administration at Investors Bank & Trust (2005-2007), and Director of Finance for Dunkin' Brands (2000-2005). |
Stephanie J. Dorsey (1969) |
Year of Election or Appointment: 2010 Assistant Treasurer |
| Ms. Dorsey also serves as an officer of other funds. She is an employee of Fidelity Investments (2008-present) and has served in other fund officer roles. Prior to joining Fidelity Investments, Ms. Dorsey served as Treasurer (2004-2008) of the JPMorgan Mutual Funds and Vice President (2004-2008) of JPMorgan Chase Bank. |
Scott C. Goebel (1968) |
Year of Election or Appointment: 2008 Secretary and Chief Legal Officer (CLO) |
| Mr. Goebel serves as Secretary and CLO of other funds. Mr. Goebel also serves as Secretary of Fidelity Investments Money Management, Inc. (FIMM) (2010-present) and Fidelity Research and Analysis Company (FRAC) (2010-present); General Counsel, Secretary, and Senior Vice President of FMR (2008-present) and FMR Co., Inc. (2008-present); Chief Legal Officer of Fidelity Management & Research (Hong Kong) Limited (2008-present) and Assistant Secretary of Fidelity Management & Research (Japan) Inc. (2008-present), and Fidelity Management & Research (U.K.) Inc. (2008-present). Previously, Mr. Goebel served as Secretary and CLO of other Fidelity funds (2008-2013), Assistant Secretary of FIMM (2008-2010), FRAC (2008-2010), and certain funds (2007-2008); and as Vice President and Secretary of Fidelity Distributors Corporation (FDC) (2005-2007). Mr. Goebel has been employed by FMR LLC or an affiliate since 2001. |
Joseph A. Hanlon (1968) |
Year of Election or Appointment: 2012 Chief Compliance Officer |
| Mr. Hanlon also serves as Chief Compliance Officer of other funds. Mr. Hanlon serves as Compliance Officer of FMR, FMR Co., Inc., Fidelity Investments Money Management, Inc. (FIMM), Fidelity Research and Analysis Company (FRAC), and Fidelity Management & Research (Hong Kong) (2009-present), as Senior Vice President of the Fidelity Asset Management Division (2009-present), and is an employee of Fidelity Investments. Previously, Mr. Hanlon served as Compliance Officer of Fidelity Management & Research (Japan) Inc. (2009-2013), Strategic Advisers, Inc. (2009-2013), and Fidelity Management & Research (U.K.) Inc. (2009-2013). |
Bruce T. Herring (1965) |
Year of Election or Appointment: 2006 Vice President of certain Equity Funds |
| Mr. Herring also serves as Vice President of other funds. He serves as Chief Investment Officer of Fidelity Global Asset Allocation (GAA) (2013-present), Group Chief Investment Officer of FMR, and President of Fidelity Research & Analysis Company (2010-present). Previously, Mr. Herring served as Chief Investment Officer and Director of Fidelity Management & Research (U.K.) Inc. (2010-2013), Vice President (2005-2006) and Senior Vice President (2006-2007) of Fidelity Management & Research Company, Vice President of FMR Co., Inc. (2001-2007), and as a portfolio manager for Fidelity U.S. Equity Funds. |
Brian B. Hogan (1964) |
Year of Election or Appointment: 2009 Vice President |
| Mr. Hogan also serves as Vice President of other funds. Mr. Hogan serves as President of FMR's Equity Division (2009-present). Previously, Mr. Hogan served as Senior Vice President, Equity Research of FMR (2006-2009) and as a portfolio manager. |
Chris Maher (1972) |
Year of Election or Appointment: 2013 Assistant Treasurer |
| Mr. Maher serves as Assistant Treasurer of other funds. Mr. Maher is Vice President of Valuation Oversight and is an employee of Fidelity Investments. Previously, Mr. Maher served as Vice President of Asset Management Compliance (2013), Vice President of FMR's Program Management Group (2010-2013), and Vice President of Valuation Oversight (2008-2010). |
Christine Reynolds (1958) |
Year of Election or Appointment: 2008 Chief Financial Officer |
| Ms. Reynolds also serves as Chief Financial Officer of other funds. Ms. Reynolds became President of Fidelity Pricing and Cash Management Services (FPCMS) in August 2008. Ms. Reynolds served as Chief Operating Officer of FPCMS (2007-2008). Previously, Ms. Reynolds served as President, Treasurer, and Anti-Money Laundering officer of the Fidelity funds (2004-2007). |
Kenneth B. Robins (1969) |
Year of Election or Appointment: 2008 President and Treasurer |
| Mr. Robins also serves as an officer of other funds. Mr. Robins serves as Executive Vice President of Fidelity Investments Money Management, Inc. (FIMM) (2013-present) and is an employee of Fidelity Investments (2004-present). Previously, Mr. Robins served in other fund officer roles. |
Gary W. Ryan (1958) |
Year of Election or Appointment: 2005 Assistant Treasurer |
| Mr. Ryan also serves as Assistant Treasurer of other funds. Mr. Ryan is an employee of Fidelity Investments and has served in other fund officer roles. Previously, Mr. Ryan served as Vice President of Fund Reporting in Fidelity Pricing and Cash Management Services (FPCMS) (1999-2005). |
Stephen Sadoski (1971) |
Year of Election or Appointment: 2012 Deputy Treasurer |
| Mr. Sadoski also serves as Deputy Treasurer of other funds. He is an employee of Fidelity Investments (2012-present) and has served in another fund officer role. Prior to joining Fidelity Investments, Mr. Sadoski served as an assistant chief accountant in the Division of Investment Management of the Securities and Exchange Commission (SEC) (2009-2012) and as a senior manager at Deloitte & Touche LLP (1997-2009). |
Stacie M. Smith (1974) |
Year of Election or Appointment: 2013 Deputy Treasurer |
| Ms. Smith also serves as an officer of other funds. She is an employee of Fidelity Investments (2009-present) and has served in other fund officer roles. Prior to joining Fidelity Investments, Ms. Smith served as Senior Audit Manager of Ernst & Young LLP (1996-2009). |
Renee Stagnone (1975) |
Year of Election or Appointment: 2013 Deputy Treasurer |
| Ms. Stagnone also serves as Deputy Treasurer of other funds. Ms. Stagnone is an employee of Fidelity Investments. |
Joseph F. Zambello (1957) |
Year of Election or Appointment: 2011 Deputy Treasurer |
| Mr. Zambello also serves as Deputy Treasurer of other funds. Mr. Zambello is an employee of Fidelity Investments. Previously, Mr. Zambello served as Vice President of FMR's Program Management Group (2009-2011) and Vice President of the Transfer Agent Oversight Group (2005-2009). |
Annual Report
Initial Class designates 6%; Service Class designates 7%; and Service Class 2 designates 7%; of the dividends distributed during the fiscal year as qualifying for the dividends-received deduction for corporate shareholders.
The amounts per share which represent income derived from sources within, and taxes paid to, foreign countries or possessions of the United States are as follows:
| Pay Date | Income | Taxes |
Initial Class | 12/13/2013 | $0.087 | $0.012 |
Service Class | 12/13/2013 | $0.077 | $0.012 |
Service Class 2 | 12/13/2013 | $0.075 | $0.012 |
Annual Report
Board Approval of Investment Advisory Contracts and Management Fees
VIP Emerging Markets Portfolio
Each year, the Board of Trustees, including the Independent Trustees (together, the Board), votes on the renewal of the management contract and sub-advisory agreements (together, the Advisory Contracts) for the fund. The Board, assisted by the advice of fund counsel and Independent Trustees' counsel, requests and considers a broad range of information relevant to the renewal of the Advisory Contracts throughout the year.
The Board meets regularly and, at each of its meetings, covers an extensive agenda of topics and materials and considers factors that are relevant to its annual consideration of the renewal of the fund's Advisory Contracts, including the services and support provided to the fund and its shareholders. The Board has established various standing committees, each composed of and chaired by Independent Trustees with varying backgrounds, to which the Board has assigned specific subject matter responsibilities in order to enhance effective decision-making by the Board. The Board, acting directly and through its Committees, requests and receives information concerning the annual consideration of the renewal of the fund's Advisory Contracts. The Board also meets as needed to consider matters specifically related to the Board's annual consideration of the renewal of Advisory Contracts. Members of the Board may also meet with trustees of other Fidelity funds through ad hoc joint committees to discuss certain matters relevant to the Fidelity funds.
At its July 2013 meeting, the Board, including the Independent Trustees, unanimously determined to renew the fund's Advisory Contracts. In reaching its determination, the Board considered all factors it believed relevant, including (i) the nature, extent, and quality of the services to be provided to the fund and its shareholders (including the investment performance of the fund); (ii) the competitiveness of the fund's management fee and total expense ratio relative to peer funds; (iii) the total costs of the services to be provided by and the profits to be realized by Fidelity from its relationship with the fund; (iv) the extent to which economies of scale exist and would be realized as the fund grows; and (v) whether fee levels reflect these economies of scale, if any, for the benefit of fund shareholders.
In considering whether to renew the Advisory Contracts for the fund, the Board reached a determination, with the assistance of fund counsel and Independent Trustees' counsel and through the exercise of its business judgment, that the renewal of the Advisory Contracts was in the best interests of the fund and its shareholders and that the compensation payable under the Advisory Contracts was fair and reasonable. The Board's decision to renew the Advisory Contracts was not based on any single factor, but rather was based on a comprehensive consideration of all the information provided to the Board at its meetings throughout the year. The Board, in reaching its determination to renew the Advisory Contracts, was aware that shareholders in the fund have a broad range of investment choices available to them, including a wide choice among mutual funds offered by Fidelity's competitors, and that the fund's shareholders, who have the opportunity to review and weigh the disclosure provided by the fund in its prospectus and other public disclosures, have chosen to invest in this fund, which is a part of the Fidelity family of funds.
Nature, Extent, and Quality of Services Provided. The Board considered the staffing within the investment adviser, Fidelity Management & Research Company (FMR), and the sub-advisers (together, the Investment Advisers) as it relates to the fund, including the backgrounds of the fund's investment personnel, and also considered the fund's investment objective, strategies, and related investment philosophy. The Independent Trustees also had discussions with senior management of Fidelity's investment operations and investment groups. The Board considered the structure of the portfolio manager compensation program and whether this structure provides appropriate incentives to act in the best interests of the fund.
Resources Dedicated to Investment Management and Support Services. The Board and the Fund Oversight and Research Committees reviewed the general qualifications and capabilities of the Investment Advisers' investment staff, including its size, education, experience, and resources, as well as the Investment Advisers' approach to recruiting, training, managing, and compensating investment personnel. The Board noted that FMR has continued to increase the resources devoted to non-U.S. offices, including expansion of Fidelity's global investment organization. The Board also noted that Fidelity's analysts have extensive resources, tools and capabilities that allow them to conduct sophisticated quantitative and fundamental analysis, as well as credit analysis of issuers, counterparties and guarantors. Further, the Board believes that Fidelity's investment professionals have sufficient access to global information and data so as to provide competitive investment results over time, and that those professionals also have access to sophisticated tools that permit them to assess portfolio construction and risk and performance attribution characteristics continuously, as well as to transmit new information and research conclusions rapidly around the world. Additionally, in its deliberations, the Board considered the Investment Advisers' trading and risk management capabilities and resources, which are an integral part of the investment management process.
Shareholder and Administrative Services. The Board considered (i) the nature, extent, quality, and cost of advisory, administrative, and shareholder services performed by the Investment Advisers and their affiliates under the Advisory Contracts and under separate agreements covering transfer agency, pricing and bookkeeping, and securities lending services for the fund; (ii) the nature and extent of the supervision of third party service providers, principally custodians and subcustodians; and (iii) the resources devoted to, and the record of compliance with, the fund's compliance policies and procedures. The Board also reviewed the allocation of fund brokerage, including allocations to brokers affiliated with the Investment Advisers, the use of brokerage commissions to pay fund expenses, and the use of "soft" commission dollars to pay for research services.
The Board noted that the growth of fund assets over time across the complex allows Fidelity to reinvest in the development of services designed to enhance the value or convenience of the Fidelity funds as investment vehicles. These services include 24-hour access to account information and market information through telephone representatives and over the Internet, investor education materials and asset allocation tools, and the expanded availability of Fidelity Investor Centers.
Annual Report
Investment in a Large Fund Family. The Board considered the benefits to shareholders of investing in a Fidelity fund, including the benefits of investing in a fund that is part of a large family of funds offering a variety of investment disciplines and providing a large variety of mutual fund investor services. The Board noted that Fidelity had taken, or had made recommendations that resulted in the Fidelity funds taking, a number of actions over the previous year that benefited particular funds, including (i) continuing to dedicate additional resources to investment research and to the support of the senior management team that oversees asset management; (ii) persisting in efforts to enhance Fidelity's global research capabilities; (iii) launching new funds and making other enhancements to meet client needs for global and income-oriented solutions; (iv) continuing to launch dedicated lower cost underlying funds to meet portfolio construction needs related to expanding underlying fund options for Fidelity funds of funds, specifically for the Freedom Fund product lines; (v) rationalizing product lines and gaining increased efficiencies through the mergers of several funds into other funds; (vi) strengthening Fidelity's index fund offerings by reducing investment minimums and adopting or lowering existing expense caps for certain funds and classes; (vii) enhancing Global Asset Allocation product offerings by launching new funds and strategies, including "open architecture" target date funds that utilize affiliated and unaffiliated sub-advisers; (viii) modifying the eligibility criteria for Institutional Class shares of Advisor funds to increase their marketability to a portion of the defined contribution plan market; (ix) creating a new low-cost retirement share class for certain Advisor funds to appeal to large retirement plans; (x) transitioning the management of certain Fidelity commodity funds to Geode Capital Management LLC, a registered commodity pool operator, while retaining administrative responsibilities for the funds; (xi) reorganizing a number of funds; and (xii) taking steps toward establishing a new Fidelity adviser to manage sector-based funds and products.
Investment Performance. The Board considered whether the fund has operated in accordance with its investment objective, as well as its record of compliance with its investment restrictions and its performance history. The Board noted that there was a portfolio management change for the fund in October 2012.
The Board took into account discussions with the Investment Advisers about fund investment performance that occur at Board meetings throughout the year. In this regard the Board noted that as part of regularly scheduled fund reviews and other reports to the Board on fund performance, the Board periodically considers annualized return information for the fund, for different time periods, measured against a securities market index ("benchmark index") and a peer group of mutual funds with similar objectives ("peer group"). In its evaluation of fund investment performance, the Board gave particular attention to information indicating changes in performance of certain Fidelity funds for specific time periods and the Investment Advisers' explanations for any overperformance or underperformance.
In addition to reviewing absolute and relative fund performance, the Independent Trustees periodically consider the appropriateness of fund performance metrics in evaluating the results achieved. In general, the Independent Trustees believe that fund performance should be evaluated based on net performance (after fees and expenses) of both the highest performing and lowest performing classes, where applicable, compared to appropriate benchmark indices, over appropriate time periods which may include full market cycles, and compared to peer groups, as applicable, over the same periods, taking into account relevant factors including the following: general market conditions; issuer-specific information; tactical opportunities for investment; and fund cash flows and other factors.
The Independent Trustees recognize that shareholders evaluate performance on a net basis over their own holding periods, for which one-, three-, and five-year periods are used as a proxy. For this reason, the performance information reviewed by the Board also included net cumulative calendar year total return information for the fund and an appropriate benchmark index and peer group for the most recent one- and three-year periods, as shown below. Returns are shown compared to the 25th percentile (top of box) and 75th percentile (bottom of box) of the peer universe.
Annual Report
Board Approval of Investment Advisory Contracts and Management Fees - continued
VIP Emerging Markets Portfolio
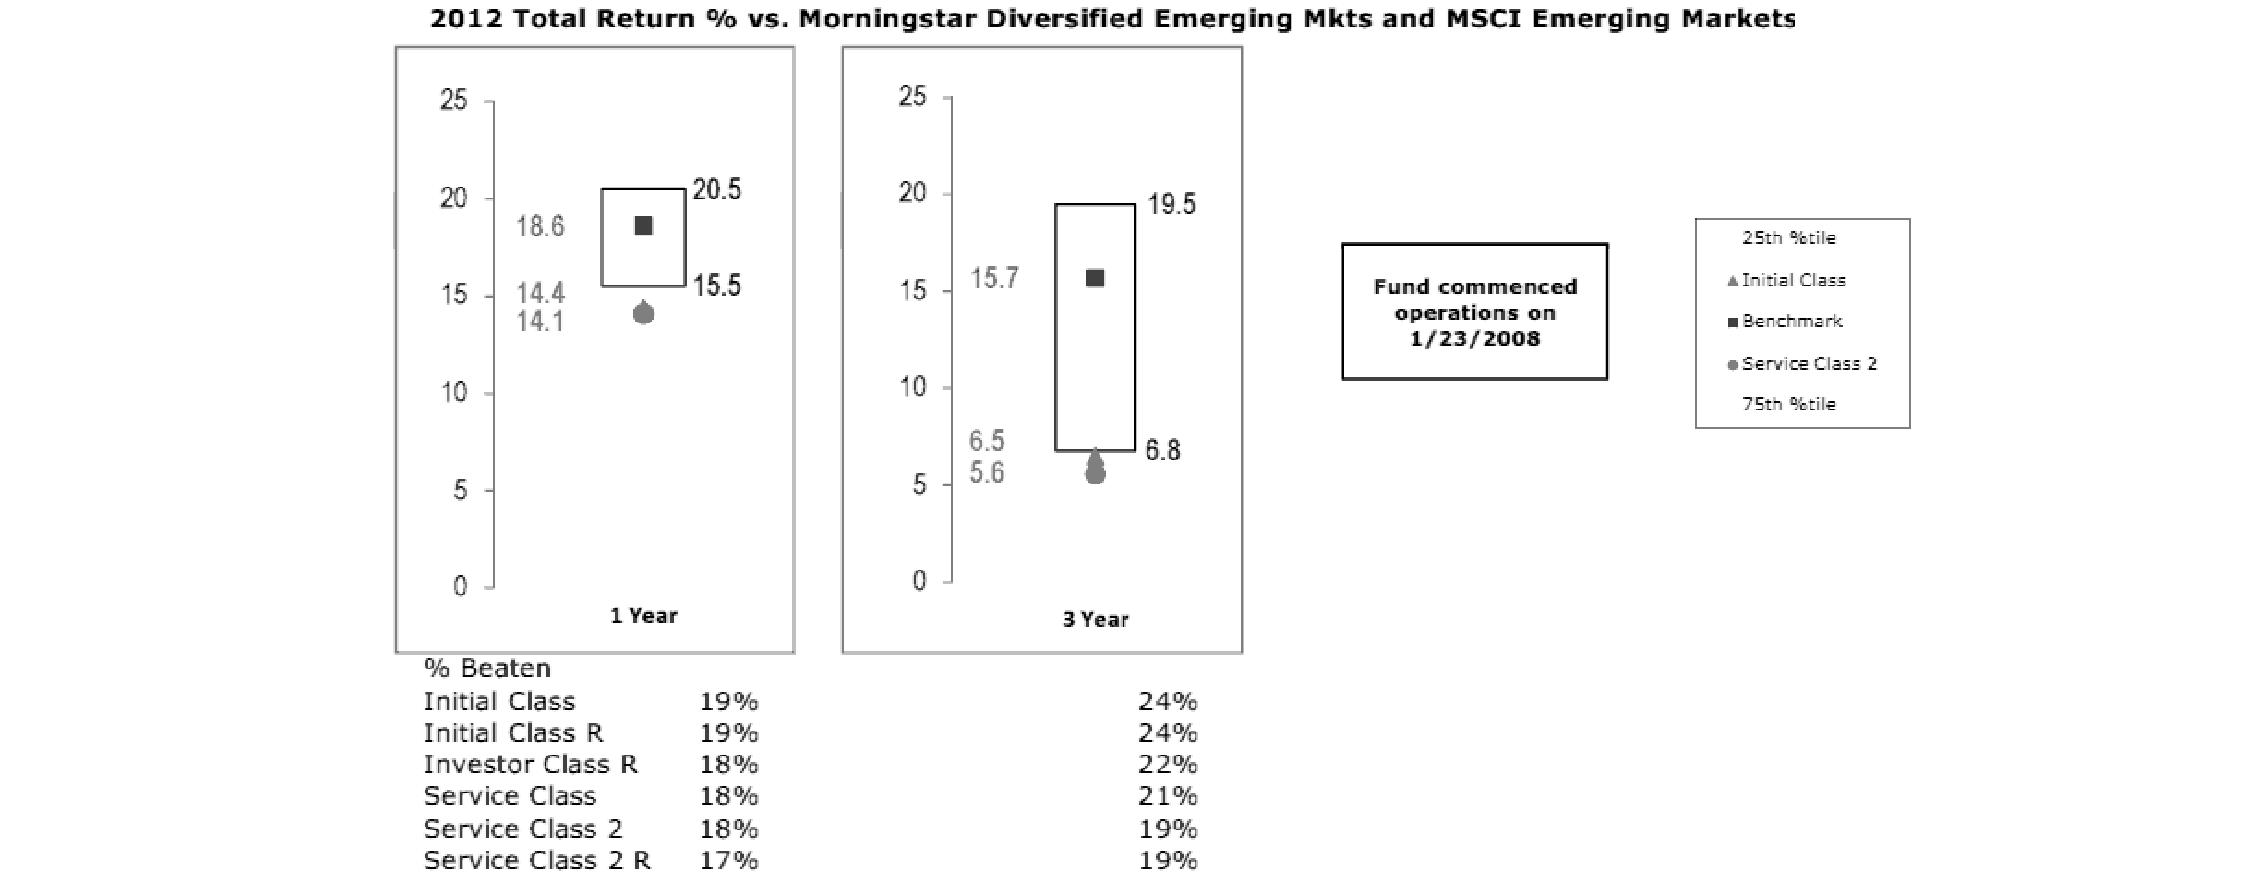
The Board has discussed with FMR the fund's underperformance (based on the December 31, 2012 data presented herein) and has engaged with FMR to consider what steps might be taken to remediate the fund's underperformance. The Board noted that the fund's performance has improved for more recent periods.
Based on its review, the Board concluded that the nature, extent, and quality of services provided to the fund under the Advisory Contracts should benefit the fund's shareholders.
Competitiveness of Management Fee and Total Expense Ratio. The Board considered the fund's management fee and total expense ratio compared to "mapped groups" of competitive funds and classes. Fidelity creates "mapped groups" by combining similar Lipper investment objective categories that have comparable management fee characteristics. Combining Lipper investment objective categories aids the Board's management fee and total expense ratio comparisons by broadening the competitive group used for comparison and by reducing the number of universes to which various Fidelity funds are compared.
Management Fee. The Board considered two proprietary management fee comparisons for the 12-month (or shorter) periods shown in the chart below. The group of Lipper funds used by the Board for management fee comparisons is referred to below as the "Total Mapped Group." The Total Mapped Group comparison focuses on a fund's standing in terms of gross management fees before expense reimbursements or caps relative to the total universe of funds with comparable investment mandates, regardless of whether their management fee structures also are comparable. Funds with comparable investment mandates offer exposure to similar types of securities. Funds with comparable management fee structures have similar management fee contractual arrangements (e.g., flat rate charged for advisory services, all-inclusive fee rate, etc.). "TMG %" represents the percentage of funds in the Total Mapped Group that had management fees that were lower than the fund's. For example, a TMG % of 39% means that 61% of the funds in the Total Mapped Group had higher management fees than the fund. The "Asset-Size Peer Group" (ASPG) comparison focuses on a fund's standing relative to a subset of non-Fidelity funds within the Total Mapped Group that are similar in size and management fee structure. The ASPG represents at least 15% of the funds in the Total Mapped Group with comparable asset size and management fee structures, subject to a minimum of 50 funds (or all funds in the Total Mapped Group if fewer than 50). Additional information, such as the ASPG quartile in which the fund's management fee ranked, is also included in the chart and considered by the Board.
Annual Report
VIP Emerging Markets Portfolio

The Board noted that the fund's management fee ranked below the median of its Total Mapped Group and below the median of its ASPG for 2012.
Based on its review, the Board concluded that the fund's management fee is fair and reasonable in light of the services that the fund receives and the other factors considered.
Total Expense Ratio. In its review of each class's total expense ratio, the Board considered the fund's management fee as well as other fund or class expenses, as applicable, such as transfer agent fees, pricing and bookkeeping fees, fund-paid 12b-1 fees, and custodial, legal, and audit fees. The Board also noted the effects of any waivers and reimbursements on fees and expenses. As part of its review, the Board also considered the current and historical total expense ratios of each class of the fund compared to competitive fund median expenses. Each class of the fund is compared to those funds and classes in the Total Mapped Group (used by the Board for management fee comparisons) that have a similar sales load structure.
The Board noted that the total expense ratio of each class ranked above its competitive median for 2012. The Board considered that, in general, various factors can affect total expense ratios. The Board also noted that Investor Class R has higher transfer agent fees than traditional variable annuity classes because it is designed for lower cost annuity products, where the majority of servicing costs are incorporated into the funds' total expense ratios rather than being paid at the annuity level. The Board noted that the fund offers multiple classes, each of which has a different 12b-1 fee structure, and that the multiple structures are intended to offer a range of pricing options for the intermediary market. The Board also noted that the total expense ratios of the classes vary primarily by the level of their 12b-1 fees, although differences in transfer agent fees may also cause expenses to vary from class to class.
Fees Charged to Other Fidelity Clients. The Board also considered Fidelity fee structures and other information with respect to clients of FMR and its affiliates, such as other mutual funds advised or subadvised by FMR or its affiliates, pension plan clients, and other institutional clients. The Board noted the findings of the 2013 ad hoc joint committee (created with the board of other Fidelity funds), which reviewed and compared Fidelity's institutional investment advisory business with its business of providing services to the Fidelity funds, including the differences in services provided, fees charged, and costs incurred, as well as competition in their respective marketplaces.
Based on its review of total expense ratios and fees charged to other Fidelity clients, the Board concluded that the total expense ratio of each class of the fund was reasonable, although in all cases above the median of the universe presented for comparison, in light of the services that the fund and its shareholders receive and the other factors considered.
Costs of the Services and Profitability. The Board considered the revenues earned and the expenses incurred by Fidelity in conducting the business of developing, marketing, distributing, managing, administering and servicing the fund and servicing the fund's shareholders. The Board also considered the level of Fidelity's profits in respect of all the Fidelity funds.
On an annual basis, FMR presents to the Board Fidelity's profitability for the fund. Fidelity calculates the profitability for each fund, as well as aggregate profitability for groups of Fidelity funds and all Fidelity funds, using a series of detailed revenue and cost allocation methodologies which originate with the books and records of Fidelity on which Fidelity's audited financial statements are based. The Audit Committee of the Board reviews any significant changes from the prior year's methodologies.
Annual Report
Board Approval of Investment Advisory Contracts and Management Fees - continued
PricewaterhouseCoopers LLP (PwC), independent registered public accounting firm and auditor to Fidelity and certain Fidelity funds, has been engaged annually by the Board as part of the Board's assessment of Fidelity's profitability analysis. PwC's engagement includes the review and assessment of the methodologies used by Fidelity in determining the revenues and expenses attributable to Fidelity's mutual fund business, and completion of agreed-upon procedures surrounding the mathematical accuracy of fund profitability and its conformity to allocation methodologies. After considering PwC's reports issued under the engagement and information provided by Fidelity, the Board concluded that while other allocation methods may also be reasonable, Fidelity's profitability methodologies are reasonable in all material respects.
The Board also reviewed Fidelity's non-fund businesses and fall-out benefits related to the mutual fund business as well as cases where Fidelity's affiliates may benefit from or be related to the fund's business.
The Board considered the costs of the services provided by and the profits realized by Fidelity in connection with the operation of the fund and was satisfied that the profitability was not excessive in the circumstances.
Economies of Scale. The Board considered whether there have been economies of scale in respect of the management of the Fidelity funds, whether the Fidelity funds (including the fund) have appropriately benefited from any such economies of scale, and whether there is potential for realization of any further economies of scale. The Board considered the extent to which the fund will benefit from economies of scale through increased services to the fund, through waivers or reimbursements, or through fee or expense reductions. The Board also noted that in 2009, it and the board of other Fidelity funds created an ad hoc committee (the Economies of Scale Committee) to analyze whether FMR attains economies of scale in respect of the management and servicing of the Fidelity funds, whether the Fidelity funds have appropriately benefited from such economies of scale, and whether there is potential for realization of any further economies of scale.
The Board recognized that the fund's management contract incorporates a "group fee" structure, which provides for lower group fee rates as total fund assets under FMR's management increase, and for higher group fee rates as total fund assets under FMR's management decrease. FMR calculates the group fee rates based on a tiered asset "breakpoint" schedule that varies based on asset class. The Board considered that the group fee is designed to deliver the benefits of economies of scale to fund shareholders when total Fidelity fund assets increase, even if assets of any particular fund are unchanged or have declined, because some portion of Fidelity's costs are attributable to services provided to all Fidelity funds, and all funds benefit if those costs can be allocated among more assets. The Board concluded that, given the group fee structure, fund shareholders will benefit from lower management fees as assets under FMR's management increase at the fund complex level, regardless of whether Fidelity achieves any such economies of scale.
The Board concluded, taking into account the analysis of the Economies of Scale Committee, that economies of scale, if any, are being appropriately shared between fund shareholders and Fidelity.
Amendment to Description of Group Fee Rate. At its July 2013 meeting, the Board voted to approve an amendment to the fund's management contract to modify the description of the "group fee rate" effective August 1, 2013. The Board noted that under the prior description in the contract, the group fee rate was based on the average net assets of all registered investment companies with which FMR has management contracts. Under the contract's tiered asset breakpoint schedule, the group fee rate is lower as total fund assets under FMR's management increase, and higher as total fund assets under FMR's management decrease. The Board considered that the prior description would have excluded the assets of 64 Fidelity sector funds from the group fee rate calculation once Fidelity SelectCo, LLC, an affiliate of FMR, assumed management responsibilities for those funds. The Board noted that modifying the description of the group fee rate to continue to include the assets of those 64 funds for purposes of determining group fee rate breakpoints would avoid an immediate adverse impact on the group fee rate for any fund.
Additional Information Requested by the Board. In order to develop fully the factual basis for consideration of the Fidelity funds' Advisory Contracts, the Board requested and received additional information on certain topics, including: (i) fund performance trends and Fidelity's long-term strategies for certain funds; (ii) the potential to further rationalize the Fidelity fund lineup with the possibility of achieving savings for the funds and Fidelity; (iii) the methodology with respect to competitive fund data and peer group classifications; (iv) the arrangements with, and performance of, certain sub-advisers on behalf of the Fidelity funds, as well as certain proposed participating affiliate arrangements; (v) the realization of fall-out benefits in certain Fidelity business units; (vi) Fidelity's group fee structures, including the rationale for the individual fee rates of certain categories of funds and the definition of group assets; (vii) trends regarding industry use of performance fee structures and the performance adjustment methodologies applicable to the Fidelity funds; (viii) additional competitive analysis regarding the total expenses for certain classes; and (ix) fund profitability methodology, including Fidelity's cost allocation methodology, and the impact of certain factors on fund profitability results.
Based on its evaluation of all of the conclusions noted above, and after considering all factors it believed relevant, the Board ultimately concluded that the advisory fee structures are fair and reasonable, and that the fund's Advisory Contracts should be renewed.
Annual Report
Investment Adviser
Fidelity Management & Research Company
Boston, MA
Investment Sub-Advisers
FMR Co., Inc.
Fidelity Management & Research (U.K.) Inc.
Fidelity Management & Research (Hong Kong) Limited
Fidelity Management & Research (Japan) Inc.
FIL Investment Advisors
FIL Investment Advisors (UK) Limited
FIL Investments (Japan) Limited
General Distributor
Fidelity Distributors Corporation
Smithfield, RI
Transfer and Service Agents
Fidelity Investments Institutional Operations Company, Inc.
Boston, MA
Fidelity Service Company, Inc.
Boston, MA
Custodian
State Street Bank and Trust Company
Quincy, MA
VIPEM-ANN-0214
1.858135.105
Fidelity® Variable Insurance Products:
Emerging Markets Portfolio - Class R
Annual Report
December 31, 2013
(Fidelity Cover Art)
Contents
Performance | (Click Here) | How the fund has done over time. |
Management's Discussion of Fund Performance | (Click Here) | The Portfolio Manager's review of fund performance and strategy. |
Shareholder Expense Example | (Click Here) | An example of shareholder expenses. |
Investment Changes | (Click Here) | A summary of major shifts in the fund's investments over the past six months. |
Investments | (Click Here) | A complete list of the fund's investments with their market values. |
Financial Statements | (Click Here) | Statements of assets and liabilities, operations, and changes in net assets, as well as financial highlights. |
Notes | (Click Here) | Notes to the financial statements. |
Report of Independent Registered Public Accounting Firm | (Click Here) | |
Trustees and Officers | (Click Here) | |
Distributions | (Click Here) | |
Board Approval of Investment Advisory Contracts and Management Fees | (Click Here) | |
To view a fund's proxy voting guidelines and proxy voting record for the 12-month period ended June 30, visit http://www.fidelity.com/proxyvotingresults or visit the Securities and Exchange Commission's (SEC) web site at http://www.sec.gov. You may also call 1-877-208-0098 to request a free copy of the proxy voting guidelines.
Fidelity Variable Insurance Products are separate account options which are purchased through a variable insurance contract.
Standard & Poor's, S&P and S&P 500 are registered service marks of The McGraw-Hill Companies, Inc. and have been licensed for use by Fidelity Distributors Corporation.
Other third-party marks appearing herein are the property of their respective owners.
All other marks appearing herein are registered or unregistered trademarks or service marks of FMR LLC or an affiliated company. © 2014 FMR LLC. All rights reserved.
This report and the financial statements contained herein are submitted for the general information of the shareholders of the fund. This report is not authorized for distribution to prospective investors in the fund unless preceded or accompanied by an effective prospectus.
A fund files its complete schedule of portfolio holdings with the SEC for the first and third quarters of each fiscal year on Form N-Q. Forms N-Q are available on the SEC's web site at http://www.sec.gov. A fund's Forms N-Q may be reviewed and copied at the SEC's Public Reference Room in Washington, DC. Information regarding the operation of the SEC's Public Reference Room may be obtained by calling 1-800-SEC-0330. For a complete list of a fund's portfolio holdings, view the most recent holdings listing, semiannual report, or annual report on Fidelity's web site at http://www.fidelity.com, http://www.advisor.fidelity.com, or http://www.401k.com, as applicable.
NOT FDIC INSURED • MAY LOSE VALUE • NO BANK GUARANTEE
Neither the fund nor Fidelity Distributors Corporation is a bank.
Annual Report
Average annual total return reflects the change in the value of an investment, assuming reinvestment of the class' distributions from dividend income and capital gains (the profits earned upon the sale of securities that have grown in value, if any) and assuming a constant rate of performance each year. During periods of reimbursement by Fidelity, a fund's total return will be greater than it would be had the reimbursement not occurred. Performance numbers are net of all underlying fund operating expenses, but do not include any insurance charges imposed by your insurance company's separate account. If performance information included the effect of these additional charges, the total returns would have been lower. How a fund did yesterday is no guarantee of how it will do tomorrow.
Average Annual Total Returns
Periods ended December 31, 2013 | Past 1
year | Past 5
years | Life of
fund A |
VIP Emerging Markets Portfolio - Initial Class R | 3.95% | 14.19% | -0.65% |
VIP Emerging Markets Portfolio - Service Class 2R | 3.67% | 13.94% | -0.90% |
VIP Emerging Markets Portfolio - Investor Class R | 3.90% | 14.13% | -0.73% |
A From January 23, 2008.
$10,000 Over Life of Fund
Let's say hypothetically that $10,000 was invested in VIP Emerging Markets Portfolio - Initial Class R on January 23, 2008, when the fund started. The chart shows how the value of your investment would have changed, and also shows how the MSCI® Emerging Markets Index performed over the same period.

Annual Report
Market Recap: Global equity markets remained upbeat for the 12 months ending December 31, 2013, propelling the MSCI® ACWI® (All Country World Index) Index to a 23.24% return. Midyear turbulence gave way by autumn when policymakers in the U.S. and China had made clear their intentions to maintain accommodative monetary policies. That stance, combined with modest cyclical improvement around the globe and generally low valuations, underpinned the broad rally in equities, although the relative strength of the U.S. dollar generally tempered gains for U.S. investors holding foreign securities based in local currencies. During the period, the broad-market S&P 500® Index set a series of new highs, finishing the year up 32.39%. For the first time since 1995, the S&P® scored a "perfect 10," with all 10 economic sectors gaining at least 10% for the year. A resurgence in growth-oriented stocks lifted the Nasdaq Composite Index® to a 40.12% result for 2013, while the blue-chip Dow Jones Industrial AverageSM notched a relatively more modest 29.65% gain. International developed-markets equities rose in concert with their U.S. counterparts, with the MSCI® EAFE® Index gaining 22.92% for the period. Meanwhile, foreign exchange and commodity weakness curbed results in resource-heavy emerging markets (EM), especially in the year's waning months. More generally, concern over EM's slowing growth, its declining share of global trade and uncertainty surrounding U.S. central bank intentions were all factors hampering performance. The MSCI Emerging Markets Index returned -2.27% for the period. On the bond side, U.S. high-yield securities rallied with equities for much of the period, with The BofA Merrill LynchSM US High Yield Constrained Index returning 7.41% for 2013. The more rate-sensitive U.S. investment-grade bond category faced headwinds though, as reflected in the -2.02% return of the Barclays® U.S. Aggregate Bond Index. Within the Barclays index, investment-grade corporate credit returned -2.01%, while ultra-safe U.S. Treasuries saw a -2.75% result. Major non-U.S. developed markets performed only slightly better, with the Citigroup Non-USD Group-of-Seven (G7) Equal Weighted Index logging a -1.59% result. After several years of strong advances, EM debt reversed course in 2013, with the J.P. Morgan Emerging Markets Bond Index Global returning -6.58%.
Comments from Sammy Simnegar, Portfolio Manager of VIP Emerging Markets Portfolio: For the year, the fund's share classes delivered positive returns and came out significantly ahead of the -2.27% return of the MSCI® Emerging Markets Index. (For specific portfolio results, please refer to the performance section of this report.) A large overweighting in software & services - a group where I considerably boosted the fund's weighting - meaningfully aided performance relative to the fund's MSCI benchmark. Here, a new position in real estate Internet portal SouFun Holdings benefited from the revaluation of Internet businesses in China, and similar factors fueled the strong gain of Russian Internet search engine Yandex. Neither stock was in the index. Within consumer services - another group that materially contributed to relative performance - one standout was a non-index position in Hong Kong-listed casino operator Galaxy Entertainment Group, a beneficiary of the dynamic growth of tourism in Macau, China's coastal gaming hotspot. I reduced this position to lock in profits. Elsewhere, large underweightings in materials and energy had a positive impact on the fund's relative results. In energy, the fund was helped by not owning Petroleo Brasileiro - commonly known as Petrobras - Brazil's largest integrated oil and gas company and a weak performer in the index. Conversely, stock selection had a meaningfully negative impact in several groups, including media, automobiles & components, and commercial & professional services. At the stock level, the biggest detractor was BR Malls Participacoes, a Brazilian shopping mall manager. Disappointing economic growth and consumer spending in that nation hampered the stock. However, I thought we'd seen the worst and added to this position. Golden Eagle Retail Group, a China-based chain of department stores, also disappointed me, and I sold this stock. Overweighting South Korean electronics giant Samsung Electronics, the fund's largest holding, detracted as well.
The views expressed above reflect those of the portfolio manager(s) only through the end of the period as stated on the cover of this report and do not necessarily represent the views of Fidelity or any other person in the Fidelity organization. Any such views are subject to change at any time based upon market or other conditions and Fidelity disclaims any responsibility to update such views. These views may not be relied on as investment advice and, because investment decisions for a Fidelity fund are based on numerous factors, may not be relied on as an indication of trading intent on behalf of any Fidelity fund.
Annual Report
As a shareholder of the Fund, you incur two types of costs: (1) transaction costs, including redemption fees and (2) ongoing costs, including management fees, distribution and/or service (12b-1) fees and other Fund expenses. This Example is intended to help you understand your ongoing costs (in dollars) of investing in the Fund and to compare these costs with the ongoing costs of investing in other mutual funds.
The Example is based on an investment of $1,000 invested at the beginning of the period and held for the entire period (July 1, 2013 to December 31, 2013).
Actual Expenses
The first line of the accompanying table for each class of the Fund provides information about actual account values and actual expenses. You may use the information in this line, together with the amount you invested, to estimate the expenses that you paid over the period. Simply divide your account value by $1,000.00 (for example, an $8,600 account value divided by $1,000.00 = 8.6), then multiply the result by the number in the first line for a class of the Fund under the heading entitled "Expenses Paid During Period" to estimate the expenses you paid on your account during this period. The estimate of expenses does not include any fees or other expenses of any variable annuity or variable life insurance product. If they were, the estimate of expenses you paid during the period would be higher, and your ending account value would be lower. In addition, the Fund, as a shareholder in the underlying Fidelity Central Funds, will indirectly bear its pro-rata share of the fees and expenses incurred by the underlying Fidelity Central Funds. These fees and expenses are not included in the Fund's annualized expense ratio used to calculate the expense estimate in the table below.
Hypothetical Example for Comparison Purposes
The second line of the accompanying table for each class of the Fund provides information about hypothetical account values and hypothetical expenses based on a Class' actual expense ratio and an assumed rate of return of 5% per year before expenses, which is not the Class' actual return. The hypothetical account values and expenses may not be used to estimate the actual ending account balance or expenses you paid for the period. You may use this information to compare the ongoing costs of investing in the Fund and other funds. To do so, compare this 5% hypothetical example with the 5% hypothetical examples that appear in the shareholder reports of the other funds. The estimate of expenses does not include any fees or other expenses of any variable annuity or variable life insurance product. If they were, the estimate of expenses you paid during the period would be higher, and your ending account value would be lower. In addition, the Fund, as a shareholder in the underlying Fidelity Central Funds, will indirectly bear its pro-rata share of the fees and expenses incurred by the underlying Fidelity Central Funds. These fees and expenses are not included in the Fund's annualized expense ratio used to calculate the expense estimate in the table below.
Please note that the expenses shown in the table are meant to highlight your ongoing costs only and do not reflect any transaction costs. Therefore, the second line of the table is useful in comparing ongoing costs only, and will not help you determine the relative total costs of owning different funds. In addition, if these transactional costs were included, your costs would have been higher.
| Annualized
Expense Ratio B | Beginning
Account Value
July 1, 2013 | Ending
Account Value
December 31, 2013 | Expenses Paid
During Period*
July 1, 2013
to December 31, 2013 |
Initial Class | 1.10% | | | |
Actual | | $ 1,000.00 | $ 1,084.30 | $ 5.78 |
HypotheticalA | | $ 1,000.00 | $ 1,019.66 | $ 5.60 |
Service Class | 1.20% | | | |
Actual | | $ 1,000.00 | $ 1,084.10 | $ 6.30 |
HypotheticalA | | $ 1,000.00 | $ 1,019.16 | $ 6.11 |
Service Class 2 | 1.35% | | | |
Actual | | $ 1,000.00 | $ 1,084.00 | $ 7.09 |
HypotheticalA | | $ 1,000.00 | $ 1,018.40 | $ 6.87 |
Initial Class R | 1.10% | | | |
Actual | | $ 1,000.00 | $ 1,085.40 | $ 5.78 |
HypotheticalA | | $ 1,000.00 | $ 1,019.66 | $ 5.60 |
Service Class 2R | 1.35% | | | |
Actual | | $ 1,000.00 | $ 1,083.50 | $ 7.09 |
HypotheticalA | | $ 1,000.00 | $ 1,018.40 | $ 6.87 |
Investor Class R | 1.18% | | | |
Actual | | $ 1,000.00 | $ 1,083.80 | $ 6.20 |
HypotheticalA | | $ 1,000.00 | $ 1,019.26 | $ 6.01 |
A 5% return per year before expenses
B Annualized expense ratio reflects expenses net of applicable fee waivers.
* Expenses are equal to each Class' annualized expense ratio, multiplied by the average account value over the period, multiplied by 184/365 (to reflect the one-half year period).
Annual Report
Investment Changes (Unaudited)
Geographic Diversification (% of fund's net assets) |
As of December 31, 2013 |
 | Brazil | 11.6% | |
 | India | 10.1% | |
 | Korea (South) | 8.9% | |
 | Cayman Islands | 8.0% | |
 | South Africa | 7.8% | |
 | Mexico | 5.4% | |
 | United Kingdom | 5.0% | |
 | Indonesia | 4.6% | |
 | China | 4.1% | |
 | Other* | 34.5% | |

* Includes Short-Term Investments and Net Other Assets (Liabilities) |
Percentages are based on country or territory of incorporation and are adjusted for the effect of futures contracts, if applicable. |
As of June 30, 2013 |
| Brazil | 12.4% | |
| India | 9.1% | |
| Cayman Islands | 8.5% | |
| Korea (South) | 8.4% | |
| South Africa | 6.9% | |
| Mexico | 6.5% | |
| Indonesia | 6.5% | |
| United States of America* | 6.5% | |
| Philippines | 3.2% | |
| Other | 32.0% | |

* Includes Short-Term Investments and Net Other Assets (Liabilities) |
Percentages are based on country or territory of incorporation and are adjusted for the effect of futures contracts, if applicable. |
Asset Allocation as of December 31, 2013 |
| % of fund's
net assets | % of fund's net assets
6 months ago |
Stocks | 100.3 | 97.8 |
Short-Term Investments and Net Other Assets (Liabilities) | (0.3) | 2.2 |
Top Ten Stocks as of December 31, 2013 |
| % of fund's
net assets | % of fund's net assets
6 months ago |
Samsung Electronics Co. Ltd. (Korea (South), Semiconductors & Semiconductor Equipment) | 4.6 | 4.5 |
Taiwan Semiconductor Manufacturing Co. Ltd. (Taiwan, Semiconductors & Semiconductor Equipment) | 2.7 | 2.9 |
Tencent Holdings Ltd. (Cayman Islands, Internet Software & Services) | 2.0 | 1.5 |
Naspers Ltd. Class N (South Africa, Media) | 1.5 | 1.2 |
Hyundai Motor Co. (Korea (South), Automobiles) | 1.4 | 1.5 |
Sberbank (Savings Bank of the Russian Federation) (Russia, Commercial Banks) | 1.4 | 1.3 |
Ambev SA sponsored ADR (Brazil, Beverages) | 1.3 | 1.3 |
Itau Unibanco Holding SA sponsored ADR (Brazil, Commercial Banks) | 1.3 | 1.4 |
MTN Group Ltd. (South Africa, Wireless Telecommunication Services) | 1.2 | 0.0 |
Banco Bradesco SA (PN) sponsored ADR (Brazil, Commercial Banks) | 1.2 | 0.0 |
| 18.6 | |
Market Sectors as of December 31, 2013 |
| % of fund's
net assets | % of fund's net assets
6 months ago |
Financials | 24.9 | 22.4 |
Consumer Discretionary | 21.0 | 19.3 |
Information Technology | 16.6 | 16.0 |
Industrials | 12.0 | 13.4 |
Consumer Staples | 11.5 | 13.4 |
Materials | 5.4 | 5.0 |
Health Care | 3.6 | 3.9 |
Energy | 2.5 | 3.5 |
Telecommunication Services | 2.1 | 0.4 |
Utilities | 0.7 | 0.5 |
Annual Report
Investments December 31, 2013
Showing Percentage of Net Assets
Common Stocks - 95.2% |
| Shares | | Value |
Australia - 0.4% |
Fortescue Metals Group Ltd. | 100,046 | | $ 519,907 |
Bailiwick of Jersey - 0.4% |
WPP PLC | 23,500 | | 537,025 |
Bermuda - 1.3% |
Brilliance China Automotive Holdings
Ltd. | 413,000 | | 673,216 |
Cosan Ltd. Class A | 13,258 | | 181,900 |
Credicorp Ltd. | 6,336 | | 840,977 |
TOTAL BERMUDA | | 1,696,093 |
Brazil - 7.2% |
Anhanguera Educacional Participacoes SA | 94,400 | | 601,555 |
BB Seguridade Participacoes SA | 71,900 | | 753,377 |
BR Malls Participacoes SA | 84,300 | | 614,708 |
BTG Pactual Participations Ltd. unit | 41,700 | | 487,587 |
CCR SA | 99,900 | | 759,224 |
Cetip SA - Mercados Organizado | 43,000 | | 445,042 |
Cielo SA | 32,980 | | 925,982 |
Iguatemi Empresa de Shopping Centers SA | 59,200 | | 564,604 |
Localiza Rent A Car SA | 39,510 | | 562,351 |
Multiplan Empreendimentos Imobiliarios SA | 27,000 | | 576,211 |
Odontoprev SA | 131,900 | | 554,518 |
Qualicorp SA (a) | 60,900 | | 586,026 |
Souza Cruz SA | 70,200 | | 723,855 |
Ultrapar Participacoes SA | 33,400 | | 799,215 |
Weg SA | 40,900 | | 545,052 |
TOTAL BRAZIL | | 9,499,307 |
British Virgin Islands - 0.5% |
Mail.Ru Group Ltd. GDR (e) | 14,800 | | 660,080 |
Cayman Islands - 8.0% |
51job, Inc. sponsored ADR (a) | 7,024 | | 547,170 |
Baidu.com, Inc. sponsored ADR (a) | 3,657 | | 650,507 |
Baoxin Auto Group Ltd. | 521,000 | | 505,930 |
Bitauto Holdings Ltd. ADR (a) | 14,310 | | 457,348 |
Cimc Enric Holdings Ltd. | 322,000 | | 519,067 |
ENN Energy Holdings Ltd. | 116,000 | | 857,924 |
Eurasia Drilling Co. Ltd. GDR (Reg. S) | 12,053 | | 542,385 |
Geely Automobile Holdings Ltd. | 1,060,000 | | 512,619 |
Greatview Aseptic Pack Co. Ltd. | 859,000 | | 507,360 |
Haitian International Holdings Ltd. | 217,000 | | 490,288 |
Lifestyle International Holdings Ltd. | 18,000 | | 33,334 |
New Oriental Education & Technology Group, Inc. sponsored ADR | 16,900 | | 532,350 |
Sands China Ltd. | 65,600 | | 535,930 |
Shenzhou International Group Holdings Ltd. | 154,000 | | 577,925 |
|
| Shares | | Value |
SouFun Holdings Ltd. ADR | 7,170 | | $ 590,880 |
Tencent Holdings Ltd. | 41,800 | | 2,666,170 |
TOTAL CAYMAN ISLANDS | | 10,527,187 |
China - 4.1% |
China Merchants Bank Co. Ltd.
(H Shares) | 447,610 | | 953,602 |
China Minsheng Banking Corp. Ltd.
(H Shares) | 574,000 | | 637,342 |
China Pacific Insurance Group Co. Ltd. (H Shares) | 244,800 | | 959,715 |
Great Wall Motor Co. Ltd. (H Shares) | 106,000 | | 585,069 |
PICC Property & Casualty Co. Ltd.
(H Shares) (a) | 395,300 | | 586,249 |
Ping An Insurance (Group) Co. of China Ltd. (H Shares) | 133,500 | | 1,195,669 |
Travelsky Technology Ltd. (H Shares) | 532,000 | | 524,844 |
TOTAL CHINA | | 5,442,490 |
Colombia - 0.9% |
Cemex Latam Holdings SA (a) | 70,088 | | 537,463 |
Grupo de Inversiones Suramerica SA | 36,115 | | 630,609 |
TOTAL COLOMBIA | | 1,168,072 |
Denmark - 0.4% |
Novo Nordisk A/S Series B sponsored ADR | 2,600 | | 480,376 |
Finland - 0.3% |
Kone Oyj (B Shares) (d) | 10,400 | | 469,279 |
France - 1.1% |
Bureau Veritas SA | 15,800 | | 461,783 |
LVMH Moet Hennessy - Louis Vuitton SA | 2,947 | | 537,585 |
Pernod Ricard SA | 4,584 | | 522,217 |
TOTAL FRANCE | | 1,521,585 |
Greece - 1.2% |
Folli Follie SA (a) | 16,848 | | 542,360 |
Greek Organization of Football Prognostics SA | 39,100 | | 520,148 |
Jumbo SA (a) | 30,500 | | 486,723 |
TOTAL GREECE | | 1,549,231 |
Hong Kong - 1.2% |
AIA Group Ltd. | 110,800 | | 555,836 |
Far East Horizon Ltd. | 581,000 | | 496,761 |
Galaxy Entertainment Group Ltd. (a) | 60,000 | | 538,153 |
TOTAL HONG KONG | | 1,590,750 |
India - 10.1% |
Axis Bank Ltd. | 28,824 | | 605,728 |
Bajaj Auto Ltd. | 19,236 | | 594,391 |
Exide Industries Ltd. | 192,513 | | 383,220 |
Grasim Industries Ltd. sponsored GDR | 8,736 | | 383,336 |
HCL Technologies Ltd. | 29,584 | | 603,999 |
HDFC Bank Ltd. | 109,435 | | 1,201,886 |
Common Stocks - continued |
| Shares | | Value |
India - continued |
Housing Development Finance Corp. Ltd. | 94,780 | | $ 1,217,932 |
ITC Ltd. | 183,409 | | 954,563 |
Larsen & Toubro Ltd. | 42,226 | | 730,795 |
Lupin Ltd. | 31,836 | | 493,241 |
Mahindra & Mahindra Ltd. | 43,864 | | 669,735 |
Maruti Suzuki India Ltd. | 16,504 | | 470,754 |
Mundra Port and SEZ Ltd. | 195,572 | | 491,460 |
Sun Pharmaceutical Industries Ltd. | 76,894 | | 705,587 |
Sun TV Ltd. | 89,341 | | 549,424 |
Tata Consultancy Services Ltd. | 32,027 | | 1,124,907 |
Tata Motors Ltd. | 110,604 | | 676,635 |
Titan Co. Ltd. | 148,755 | | 553,852 |
Yes Bank Ltd. | 83,429 | | 499,441 |
Zee Entertainment Enterprises Ltd. | 111,910 | | 500,555 |
TOTAL INDIA | | 13,411,441 |
Indonesia - 4.6% |
PT ACE Hardware Indonesia Tbk | 9,578,000 | | 464,989 |
PT Bank Central Asia Tbk | 960,000 | | 759,413 |
PT Bank Rakyat Indonesia Tbk | 1,258,140 | | 752,014 |
PT Global Mediacom Tbk | 3,430,500 | | 536,134 |
PT Gudang Garam Tbk | 176,500 | | 610,461 |
PT Indocement Tunggal Prakarsa Tbk | 343,000 | | 565,009 |
PT Jasa Marga Tbk | 1,211,000 | | 470,896 |
PT Kalbe Farma Tbk | 4,774,000 | | 491,728 |
PT Media Nusantara Citra Tbk | 1,822,500 | | 394,800 |
PT Semen Gresik (Persero) Tbk | 532,000 | | 620,366 |
PT Surya Citra Media Tbk | 2,087,500 | | 450,422 |
TOTAL INDONESIA | | 6,116,232 |
Italy - 0.8% |
Pirelli & C SpA | 28,612 | | 495,168 |
Prada SpA | 57,500 | | 511,652 |
TOTAL ITALY | | 1,006,820 |
Japan - 0.3% |
Japan Tobacco, Inc. (f) | 12,300 | | 400,227 |
Kenya - 0.4% |
Safaricom Ltd. | 4,350,700 | | 546,988 |
Korea (South) - 8.9% |
Grand Korea Leisure Co. Ltd. | 10,610 | | 406,018 |
Hyundai Mobis | 4,070 | | 1,131,492 |
Hyundai Motor Co. | 8,411 | | 1,884,203 |
Hyundai Wia Corp. | 2,732 | | 491,681 |
LG Household & Health Care Ltd. | 1,266 | | 657,148 |
Naver Corp. | 1,487 | | 1,019,761 |
Samsung Electronics Co. Ltd. | 4,698 | | 6,105,422 |
TOTAL KOREA (SOUTH) | | 11,695,725 |
Luxembourg - 0.3% |
Brait SA | 93,900 | | 469,410 |
|
| Shares | | Value |
Malaysia - 0.5% |
Public Bank Bhd | 114,900 | | $ 679,902 |
Mexico - 5.4% |
Banregio Grupo Financiero S.A.B. de CV | 83,877 | | 502,503 |
Fomento Economico Mexicano S.A.B. de CV unit | 120,800 | | 1,178,821 |
Gruma S.A.B. de CV Series B (a) | 73,373 | | 559,550 |
Grupo Aeroportuario del Pacifico SA de CV Series B | 99,300 | | 535,104 |
Grupo Aeroportuario del Sureste SA de CV Series B | 48,400 | | 609,966 |
Grupo Financiero Banorte S.A.B. de CV Series O | 157,700 | | 1,112,299 |
Grupo Financiero Interacciones SA de CV | 6,537 | | 30,856 |
Grupo Televisa SA de CV | 182,600 | | 1,109,454 |
Kimberly-Clark de Mexico SA de CV Series A | 218,500 | | 625,497 |
Megacable Holdings S.A.B. de CV unit | 45,169 | | 153,994 |
Mexichem S.A.B. de CV (d) | 158,480 | | 657,760 |
TOTAL MEXICO | | 7,075,804 |
Netherlands - 0.5% |
Yandex NV (a) | 14,604 | | 630,163 |
Nigeria - 0.8% |
Dangote Cement PLC | 326,946 | | 447,627 |
Guaranty Trust Bank PLC GDR (Reg. S) | 76,133 | | 624,291 |
TOTAL NIGERIA | | 1,071,918 |
Panama - 0.4% |
Copa Holdings SA Class A | 3,500 | | 560,385 |
Philippines - 3.3% |
Alliance Global Group, Inc. | 971,100 | | 564,288 |
DMCI Holdings, Inc. | 407,520 | | 513,989 |
GT Capital Holdings, Inc. (a) | 23,520 | | 408,951 |
LT Group, Inc. | 1,711,300 | | 595,101 |
Metropolitan Bank & Trust Co. | 318,875 | | 542,590 |
Security Bank Corp. | 233,672 | | 608,389 |
SM Investments Corp. | 35,875 | | 574,485 |
SM Prime Holdings, Inc. | 1,722,300 | | 569,445 |
TOTAL PHILIPPINES | | 4,377,238 |
Poland - 0.1% |
Eurocash SA | 5,950 | | 93,926 |
Russia - 4.1% |
Alrosa Co. Ltd. (a) | 397,000 | | 422,456 |
Magnit OJSC GDR (Reg. S) | 16,900 | | 1,118,780 |
Moscow Exchange MICEX-RTS OAO | 206,300 | | 406,127 |
NOVATEK OAO GDR (Reg. S) | 7,214 | | 987,597 |
Sberbank (Savings Bank of the Russian Federation) | 582,500 | | 1,789,597 |
Sistema JSFC | 489,700 | | 665,817 |
TOTAL RUSSIA | | 5,390,374 |
Common Stocks - continued |
| Shares | | Value |
South Africa - 7.8% |
Aspen Pharmacare Holdings Ltd. | 30,784 | | $ 788,587 |
Bidvest Group Ltd. | 30,000 | | 767,445 |
Capitec Bank Holdings Ltd. | 22,436 | | 445,448 |
Clicks Group Ltd. | 88,664 | | 530,716 |
Discovery Holdings Ltd. | 80,437 | | 647,943 |
Imperial Holdings Ltd. | 33,038 | | 638,115 |
Life Healthcare Group Holdings Ltd. | 165,972 | | 662,306 |
Mr Price Group Ltd. | 43,613 | | 680,762 |
MTN Group Ltd. | 79,900 | | 1,652,993 |
Nampak Ltd. | 171,557 | | 670,528 |
Naspers Ltd. Class N | 18,568 | | 1,940,011 |
Shoprite Holdings Ltd. | 48,027 | | 750,851 |
Wilson Bayly Holmes-Ovcon Ltd. | 6,531 | | 90,899 |
TOTAL SOUTH AFRICA | | 10,266,604 |
Sweden - 0.7% |
Atlas Copco AB (A Shares) | 16,400 | | 454,631 |
Investment AB Kinnevik (B Shares) | 10,136 | | 469,463 |
TOTAL SWEDEN | | 924,094 |
Switzerland - 1.9% |
Compagnie Financiere Richemont SA Series A | 5,456 | | 543,123 |
Schindler Holding AG (Reg.) | 3,470 | | 511,913 |
SGS SA (Reg.) | 200 | | 460,064 |
Swatch Group AG (Bearer) | 820 | | 541,887 |
Syngenta AG (Switzerland) | 1,261 | | 502,757 |
TOTAL SWITZERLAND | | 2,559,744 |
Taiwan - 3.0% |
Merida Industry Co. Ltd. | 64,000 | | 464,475 |
Taiwan Semiconductor Manufacturing Co. Ltd. | 1,006,000 | | 3,548,812 |
TOTAL TAIWAN | | 4,013,287 |
Thailand - 1.7% |
Airports of Thailand PCL (For. Reg.) | 93,800 | | 454,036 |
BEC World PCL (For. Reg.) | 348,700 | | 537,540 |
Kasikornbank PCL (For. Reg.) | 160,400 | | 779,005 |
Minor International PCL (For. Reg.) | 755,700 | | 477,917 |
TOTAL THAILAND | | 2,248,498 |
Togo - 0.4% |
Ecobank Transnational, Inc. | 5,091,904 | | 515,716 |
Turkey - 3.5% |
Anadolu Hayat Sigorta AS | 137,930 | | 337,604 |
Coca-Cola Icecek A/S | 24,115 | | 580,713 |
Enka Insaat ve Sanayi A/S | 203,475 | | 569,995 |
Koc Holding A/S | 160,000 | | 655,188 |
TAV Havalimanlari Holding A/S | 78,000 | | 560,772 |
Tofas Turk Otomobil Fabrikasi A/S | 83,830 | | 522,718 |
|
| Shares | | Value |
Tupras Turkiye Petrol Rafinelleri A/S | 31,000 | | $ 618,846 |
Turkiye Garanti Bankasi A/S | 233,000 | | 754,621 |
TOTAL TURKEY | | 4,600,457 |
United Kingdom - 5.0% |
Aberdeen Asset Management PLC | 66,372 | | 549,544 |
British American Tobacco PLC (United Kingdom) | 9,800 | | 526,006 |
Burberry Group PLC | 22,300 | | 559,824 |
Diageo PLC | 16,942 | | 561,434 |
InterContinental Hotel Group PLC | 15,738 | | 524,963 |
Intertek Group PLC | 9,842 | | 513,057 |
Johnson Matthey PLC | 7,884 | | 428,221 |
Meggitt PLC | 49,200 | | 429,769 |
Mondi PLC | 21,900 | | 379,335 |
Prudential PLC | 25,548 | | 570,845 |
Rolls-Royce Group PLC | 25,700 | | 542,613 |
Standard Chartered PLC (United Kingdom) | 24,340 | | 548,159 |
The Weir Group PLC | 11,800 | | 416,597 |
TOTAL UNITED KINGDOM | | 6,550,367 |
United States of America - 3.7% |
Colgate-Palmolive Co. | 8,000 | | 521,680 |
Cummins, Inc. | 3,000 | | 422,910 |
FMC Corp. | 7,400 | | 558,404 |
Google, Inc. Class A (a) | 550 | | 616,391 |
MasterCard, Inc. Class A | 780 | | 651,659 |
Mead Johnson Nutrition Co. Class A | 6,042 | | 506,078 |
Philip Morris International, Inc. | 5,800 | | 505,354 |
Visa, Inc. Class A | 2,700 | | 601,236 |
Yahoo!, Inc. (a) | 12,700 | | 513,588 |
TOTAL UNITED STATES OF AMERICA | | 4,897,300 |
TOTAL COMMON STOCKS (Cost $109,529,329) |
125,764,002
|
Nonconvertible Preferred Stocks - 5.1% |
| | | |
Brazil - 4.4% |
Ambev SA sponsored ADR | 236,290 | | 1,736,732 |
Banco Bradesco SA (PN) sponsored ADR | 130,368 | | 1,633,511 |
Companhia Brasileira de Distribuicao Grupo Pao de Acucar sponsored ADR (d) | 16,400 | | 732,588 |
Itau Unibanco Holding SA sponsored ADR | 122,508 | | 1,662,434 |
TOTAL BRAZIL | | 5,765,265 |
Colombia - 0.4% |
Grupo Aval Acciones y Valores SA | 716,982 | | 473,654 |
Germany - 0.3% |
Porsche Automobil Holding SE (Germany) | 4,300 | | 447,567 |
Nonconvertible Preferred Stocks - continued |
| Shares | | Value |
United Kingdom - 0.0% |
Rolls-Royce Group PLC Series C | 2,003,800 | | $ 3,318 |
TOTAL NONCONVERTIBLE PREFERRED STOCKS (Cost $7,049,948) |
6,689,804
|
Money Market Funds - 2.2% |
| | | |
Fidelity Cash Central Fund, 0.11% (b) | 1,503,718 | | 1,503,718 |
Fidelity Securities Lending Cash Central Fund, 0.11% (b)(c) | 1,417,114 | | 1,417,114 |
TOTAL MONEY MARKET FUNDS (Cost $2,920,832) |
2,920,832
|
TOTAL INVESTMENT PORTFOLIO - 102.5% (Cost $119,500,109) | | 135,374,638 |
NET OTHER ASSETS (LIABILITIES) - (2.5)% | | (3,332,872) |
NET ASSETS - 100% | $ 132,041,766 |
Legend |
(a) Non-income producing |
(b) Affiliated fund that is generally available only to investment companies and other accounts managed by Fidelity Investments. The rate quoted is the annualized seven-day yield of the fund at period end. A complete unaudited listing of the fund's holdings as of its most recent quarter end is available upon request. In addition, each Fidelity Central Fund's financial statements, which are not covered by the Fund's Report of Independent Registered Public Accounting Firm, are available on the SEC's website or upon request. |
(c) Investment made with cash collateral received from securities on loan. |
(d) Security or a portion of the security is on loan at period end. |
(e) Security exempt from registration under Rule 144A of the Securities Act of 1933. These securities may be resold in transactions exempt from registration, normally to qualified institutional buyers. At the end of the period, the value of these securities amounted to $660,080 or 0.5% of net assets. |
(f) Security or a portion of the security purchased on a delayed delivery or when-issued basis. |
Affiliated Central Funds |
Information regarding fiscal year to date income earned by the Fund from investments in Fidelity Central Funds is as follows: |
Fund | Income earned |
Fidelity Cash Central Fund | $ 1,647 |
Fidelity Securities Lending Cash Central Fund | 11,992 |
Total | $ 13,639 |
Other Information |
Categorizations in the Schedule of Investments are based on country or territory of incorporation. |
The following is a summary of the inputs used, as of December 31, 2013, involving the Fund's assets and liabilities carried at fair value. The inputs or methodology used for valuing securities may not be an indication of the risk associated with investing in those securities. For more information on valuation inputs, and their aggregation into the levels used in the tables below, please refer to the Investment Valuation section in the accompanying Notes to Financial Statements. |
Valuation Inputs at Reporting Date: |
Description | Total | Level 1 | Level 2 | Level 3 |
Investments in Securities: | | | | |
Equities: | | | | |
Consumer Discretionary | $ 28,027,397 | $ 21,545,142 | $ 6,482,255 | $ - |
Consumer Staples | 14,992,298 | 9,806,447 | 5,185,851 | - |
Energy | 3,129,943 | 2,330,728 | 799,215 | - |
Financials | 32,467,010 | 23,316,660 | 9,150,350 | - |
Health Care | 4,762,369 | 2,636,856 | 2,125,513 | - |
Industrials | 16,258,789 | 12,322,160 | 3,936,629 | - |
Information Technology | 21,891,749 | 17,416,955 | 4,474,794 | - |
Materials | 7,200,529 | 4,854,637 | 2,345,892 | - |
Telecommunication Services | 2,865,798 | 2,865,798 | - | - |
Utilities | 857,924 | 857,924 | - | - |
Money Market Funds | 2,920,832 | 2,920,832 | - | - |
Total Investments in Securities: | $ 135,374,638 | $ 100,874,139 | $ 34,500,499 | $ - |
The following is a summary of transfers between Level 1 and Level 2 for the period ended December 31, 2013. Transfers are assumed to have occurred at the beginning of the period, and are primarily attributable to the valuation techniques used for foreign equity securities, as discussed in the accompanying Notes to Financial Statements: |
Transfers | Total |
Level 1 to Level 2 | $ 2,696,464 |
Level 2 to Level 1 | $ 25,358,999 |
See accompanying notes which are an integral part of the financial statements.
Annual Report
Statement of Assets and Liabilities
| December 31, 2013 |
| | |
Assets | | |
Investment in securities, at value (including securities loaned of $1,354,731) - See accompanying schedule: Unaffiliated issuers (cost $116,579,277) | $ 132,453,806 | |
Fidelity Central Funds (cost $2,920,832) | 2,920,832 | |
Total Investments (cost $119,500,109) | | $ 135,374,638 |
Cash | | 26,068 |
Foreign currency held at value (cost $204,391) | | 204,574 |
Receivable for investments sold | | 1,759,740 |
Receivable for fund shares sold | | 57,117 |
Dividends receivable | | 207,261 |
Distributions receivable from Fidelity Central Funds | | 1,093 |
Prepaid expenses | | 262 |
Other receivables | | 539 |
Total assets | | 137,631,292 |
| | |
Liabilities | | |
Payable for investments purchased | | |
Regular delivery | $ 901,529 | |
Delayed delivery | 399,473 | |
Payable for fund shares redeemed | 2,555,105 | |
Accrued management fee | 86,302 | |
Distribution and service plan fees payable | 1,663 | |
Other affiliated payables | 16,188 | |
Other payables and accrued expenses | 212,152 | |
Collateral on securities loaned, at value | 1,417,114 | |
Total liabilities | | 5,589,526 |
| | |
Net Assets | | $ 132,041,766 |
Net Assets consist of: | | |
Paid in capital | | $ 120,872,834 |
Distributions in excess of net investment income | | (47,249) |
Accumulated undistributed net realized gain (loss) on investments and foreign currency transactions | | (4,513,851) |
Net unrealized appreciation (depreciation) on investments and assets and liabilities in foreign currencies | | 15,730,032 |
Net Assets | | $ 132,041,766 |
Statement of Assets and Liabilities - continued
| December 31, 2013 |
| | |
Initial Class:
Net Asset Value, offering price and redemption price per share ($60,923,869 ÷ 6,759,613 shares) | | $ 9.01 |
| | |
Service Class:
Net Asset Value, offering price and redemption price per share ($83,548 ÷ 9,240 shares) | | $ 9.04 |
| | |
Service Class 2:
Net Asset Value, offering price and redemption price per share ($6,517,373 ÷ 721,993 shares) | | $ 9.03 |
| | |
Initial Class R:
Net Asset Value, offering price and redemption price per share ($9,672,168 ÷ 1,072,785 shares) | | $ 9.02 |
| | |
Service Class 2R:
Net Asset Value, offering price and redemption price per share ($83,374 ÷ 9,195 shares) | | $ 9.07 |
| | |
Investor Class R:
Net Asset Value, offering price and redemption price per share ($54,761,434 ÷ 6,099,755 shares) | | $ 8.98 |
See accompanying notes which are an integral part of the financial statements.
Annual Report
Statement of Operations
| Year ended December 31, 2013 |
| | |
Investment Income | | |
Dividends | | $ 2,320,980 |
Income from Fidelity Central Funds | | 13,639 |
Income before foreign taxes withheld | | 2,334,619 |
Less foreign taxes withheld | | (186,555) |
Total income | | 2,148,064 |
| | |
Expenses | | |
Management fee | $ 901,982 | |
Transfer agent fees | 124,921 | |
Distribution and service plan fees | 13,330 | |
Accounting and security lending fees | 58,342 | |
Custodian fees and expenses | 133,290 | |
Independent trustees' compensation | 588 | |
Audit | 99,990 | |
Legal | 675 | |
Interest | 255 | |
Miscellaneous | 840 | |
Total expenses before reductions | 1,334,213 | |
Expense reductions | (75,698) | 1,258,515 |
Net investment income (loss) | | 889,549 |
Realized and Unrealized Gain (Loss) Net realized gain (loss) on: | | |
Investment securities: | | |
Unaffiliated issuers | 3,104,976 | |
Foreign currency transactions | (70,212) | |
Total net realized gain (loss) | | 3,034,764 |
Change in net unrealized appreciation (depreciation) on: Investment securities (net of increase in deferred foreign taxes of $139,215) | 492,207 | |
Assets and liabilities in foreign currencies | (4,808) | |
Total change in net unrealized appreciation (depreciation) | | 487,399 |
Net gain (loss) | | 3,522,163 |
Net increase (decrease) in net assets resulting from operations | | $ 4,411,712 |
Statement of Changes in Net Assets
| Year ended
December 31,
2013 | Year ended
December 31,
2012 |
Increase (Decrease) in Net Assets | | |
Operations | | |
Net investment income (loss) | $ 889,549 | $ 1,294,334 |
Net realized gain (loss) | 3,034,764 | (56,334) |
Change in net unrealized appreciation (depreciation) | 487,399 | 11,501,487 |
Net increase (decrease) in net assets resulting from operations | 4,411,712 | 12,739,487 |
Distributions to shareholders from net investment income | (882,874) | (1,007,988) |
Distributions to shareholders from net realized gain | (111,840) | (91,285) |
Distributions to shareholders from tax return of capital | - | (106,326) |
Total distributions | (994,714) | (1,205,599) |
Share transactions - net increase (decrease) | 21,113,394 | 7,291,850 |
Redemption fees | 13,883 | 6,318 |
Total increase (decrease) in net assets | 24,544,275 | 18,832,056 |
| | |
Net Assets | | |
Beginning of period | 107,497,491 | 88,665,435 |
End of period (including distributions in excess of net investment income of $47,249 and distributions in excess of net investment income of $2,861, respectively) | $ 132,041,766 | $ 107,497,491 |
See accompanying notes which are an integral part of the financial statements.
Annual Report
Financial Highlights - Initial Class
Years ended December 31, | 2013 | 2012 | 2011 | 2010 | 2009 |
Selected Per-Share Data | | | | | |
Net asset value, beginning of period | $ 8.75 | $ 7.74 | $ 9.91 | $ 8.51 | $ 4.88 |
Income from Investment Operations | | | | | |
Net investment income (loss) C | .07 | .11 | .13 | .09 | .04 |
Net realized and unrealized gain (loss) | .27 | 1.00 | (2.22) | 1.43 | 3.64 |
Total from investment operations | .34 | 1.11 | (2.09) | 1.52 | 3.68 |
Distributions from net investment income | (.07) | (.08) | (.09) | (.08) | (.02) |
Distributions from net realized gain | (.01) | (.01) | - | (.04) | (.03) |
Tax return of capital | - | (.01) | - | - | - |
Total distributions | (.08) | (.10) | (.09) | (.12) | (.05) |
Redemption fees added to paid in capital C | - G | - G | .01 | - G | - G |
Net asset value, end of period | $ 9.01 | $ 8.75 | $ 7.74 | $ 9.91 | $ 8.51 |
Total Return A,B | 3.85% | 14.37% | (21.01)% | 17.89% | 75.40% |
Ratios to Average Net Assets D,F | | | | | |
Expenses before reductions | 1.14% | 1.38% | 1.31% | 1.33% | 2.85% |
Expenses net of fee waivers, if any | 1.10% | 1.10% | 1.10% | 1.10% | 1.10% |
Expenses net of all reductions | 1.07% | 1.05% | 1.02% | 1.04% | 1.02% |
Net investment income (loss) | .84% | 1.36% | 1.46% | 1.05% | .60% |
Supplemental Data | | | | | |
Net assets, end of period (000 omitted) | $ 60,924 | $ 44,979 | $ 29,478 | $ 18,478 | $ 250 |
Portfolio turnover rate E | 110% | 198% | 151% | 100% | 70% |
A Total returns do not reflect charges attributable to your insurance company's separate account. Inclusion of these charges would reduce the total returns shown.
B Total returns would have been lower if certain expenses had not been reduced during the applicable periods shown.
C Calculated based on average shares outstanding during the period.
D Fees and expenses of any underlying Fidelity Central Funds are not included in the Fund's expense ratio. The Fund indirectly bears its proportionate share of the expenses of any underlying Fidelity Central Funds.
E Amount does not include the portfolio activity of any underlying Fidelity Central Funds.
F Expense ratios reflect operating expenses of the class. Expenses before reductions do not reflect amounts reimbursed by the investment adviser or reductions from brokerage service arrangements or reductions from other expense offset arrangements and do not represent the amount paid by the class during periods when reimbursements or reductions occur. Expenses net of fee waivers reflect expenses after reimbursement by the investment adviser but prior to reductions from brokerage service arrangements or other expense offset arrangements. Expenses net of all reductions represent the net expenses paid by the class.
G Amount represents less than $.01 per share.
Financial Highlights - Service Class
Years ended December 31, | 2013 | 2012 | 2011 | 2010 | 2009 |
Selected Per-Share Data | | | | | |
Net asset value, beginning of period | $ 8.77 | $ 7.76 | $ 9.94 | $ 8.54 | $ 4.88 |
Income from Investment Operations | | | | | |
Net investment income (loss) C | .07 | .10 | .12 | .08 | .03 |
Net realized and unrealized gain (loss) | .27 | 1.00 | (2.23) | 1.43 | 3.65 |
Total from investment operations | .34 | 1.10 | (2.11) | 1.51 | 3.68 |
Distributions from net investment income | (.06) | (.07) | (.08) | (.07) | - G |
Distributions from net realized gain | (.01) | (.01) | - | (.04) | (.02) |
Tax return of capital | - | (.01) | - | - | - |
Total distributions | (.07) | (.09) | (.08) | (.11) | (.02) |
Redemption fees added to paid in capital C | - G | - G | .01 | - G | - G |
Net asset value, end of period | $ 9.04 | $ 8.77 | $ 7.76 | $ 9.94 | $ 8.54 |
Total Return A,B | 3.84% | 14.22% | (21.15)% | 17.70% | 75.49% |
Ratios to Average Net Assets D,F | | | | | |
Expenses before reductions | 1.23% | 1.47% | 1.40% | 1.48% | 3.02% |
Expenses net of fee waivers, if any | 1.20% | 1.20% | 1.20% | 1.20% | 1.20% |
Expenses net of all reductions | 1.18% | 1.15% | 1.12% | 1.14% | 1.12% |
Net investment income (loss) | .74% | 1.26% | 1.35% | .95% | .50% |
Supplemental Data | | | | | |
Net assets, end of period (000 omitted) | $ 84 | $ 83 | $ 72 | $ 102 | $ 118 |
Portfolio turnover rate E | 110% | 198% | 151% | 100% | 70% |
A Total returns do not reflect charges attributable to your insurance company's separate account. Inclusion of these charges would reduce the total returns shown.
B Total returns would have been lower if certain expenses had not been reduced during the applicable periods shown.
C Calculated based on average shares outstanding during the period.
D Fees and expenses of any underlying Fidelity Central Funds are not included in the Fund's expense ratio. The Fund indirectly bears its proportionate share of the expenses of any underlying Fidelity Central Funds.
E Amount does not include the portfolio activity of any underlying Fidelity Central Funds.
F Expense ratios reflect operating expenses of the class. Expenses before reductions do not reflect amounts reimbursed by the investment adviser or reductions from brokerage service arrangements or reductions from other expense offset arrangements and do not represent the amount paid by the class during periods when reimbursements or reductions occur. Expenses net of fee waivers reflect expenses after reimbursement by the investment adviser but prior to reductions from brokerage service arrangements or other expense offset arrangements. Expenses net of all reductions represent the net expenses paid by the class.
G Amount represents less than $.01 per share.
See accompanying notes which are an integral part of the financial statements.
Annual Report
Financial Highlights - Service Class 2
Years ended December 31, | 2013 | 2012 | 2011 | 2010 | 2009 |
Selected Per-Share Data | | | | | |
Net asset value, beginning of period | $ 8.77 | $ 7.76 | $ 9.95 | $ 8.56 | $ 4.88 |
Income from Investment Operations | | | | | |
Net investment income (loss) C | .05 | .09 | .11 | .07 | .02 |
Net realized and unrealized gain (loss) | .27 | 1.00 | (2.24) | 1.43 | 3.66 |
Total from investment operations | .32 | 1.09 | (2.13) | 1.50 | 3.68 |
Distributions from net investment income | (.06) | (.06) | (.07) | (.07) | - |
Distributions from net realized gain | (.01) | (.01) | - | (.04) | - |
Tax return of capital | - | (.01) | - | - | - |
Total distributions | (.06) H | (.08) | (.07) | (.11) | - |
Redemption fees added to paid in capital C | - G | - G | .01 | - G | - G |
Net asset value, end of period | $ 9.03 | $ 8.77 | $ 7.76 | $ 9.95 | $ 8.56 |
Total Return A,B | 3.70% | 14.10% | (21.30)% | 17.57% | 75.41% |
Ratios to Average Net Assets D,F | | | | | |
Expenses before reductions | 1.38% | 1.63% | 1.54% | 1.59% | 3.17% |
Expenses net of fee waivers, if any | 1.35% | 1.35% | 1.35% | 1.35% | 1.35% |
Expenses net of all reductions | 1.32% | 1.30% | 1.27% | 1.30% | 1.27% |
Net investment income (loss) | .59% | 1.11% | 1.21% | .80% | .35% |
Supplemental Data | | | | | |
Net assets, end of period (000 omitted) | $ 6,517 | $ 4,042 | $ 2,249 | $ 1,348 | $ 117 |
Portfolio turnover rate E | 110% | 198% | 151% | 100% | 70% |
A Total returns do not reflect charges attributable to your insurance company's separate account. Inclusion of these charges would reduce the total returns shown.
B Total returns would have been lower if certain expenses had not been reduced during the applicable periods shown.
C Calculated based on average shares outstanding during the period.
D Fees and expenses of any underlying Fidelity Central Funds are not included in the Fund's expense ratio. The Fund indirectly bears its proportionate share of the expenses of any underlying Fidelity Central Funds.
E Amount does not include the portfolio activity of any underlying Fidelity Central Funds.
F Expense ratios reflect operating expenses of the class. Expenses before reductions do not reflect amounts reimbursed by the investment adviser or reductions from brokerage service arrangements or reductions from other expense offset arrangements and do not represent the amount paid by the class during periods when reimbursements or reductions occur. Expenses net of fee waivers reflect expenses after reimbursement by the investment adviser but prior to reductions from brokerage service arrangements or other expense offset arrangements. Expenses net of all reductions represent the net expenses paid by the class.
G Amount represents less than $.01 per share.
H Total distributions of $.06 per share is comprised of distributions from net investment income of $.055 and distributions from net realized gain of $.008 per share.
Financial Highlights - Initial Class R
Years ended December 31, | 2013 | 2012 | 2011 | 2010 | 2009 |
Selected Per-Share Data | | | | | |
Net asset value, beginning of period | $ 8.75 | $ 7.74 | $ 9.92 | $ 8.51 | $ 4.88 |
Income from Investment Operations | | | | | |
Net investment income (loss) C | .07 | .11 | .14 | .09 | .04 |
Net realized and unrealized gain (loss) | .27 | 1.00 | (2.24) | 1.44 | 3.63 |
Total from investment operations | .34 | 1.11 | (2.10) | 1.53 | 3.67 |
Distributions from net investment income | (.07) | (.08) | (.09) | (.08) | (.02) |
Distributions from net realized gain | (.01) | (.01) | - | (.04) | (.03) |
Tax return of capital | - | (.01) | - | - | - |
Total distributions | (.07) H | (.10) | (.09) | (.12) | (.05) |
Redemption fees added to paid in capital C | - G | - G | .01 | - G | .01 |
Net asset value, end of period | $ 9.02 | $ 8.75 | $ 7.74 | $ 9.92 | $ 8.51 |
Total Return A,B | 3.95% | 14.37% | (21.09)% | 18.01% | 75.40% |
Ratios to Average Net Assets D,F | | | | | |
Expenses before reductions | 1.15% | 1.37% | 1.30% | 1.35% | 2.03% |
Expenses net of fee waivers, if any | 1.10% | 1.10% | 1.10% | 1.10% | 1.10% |
Expenses net of all reductions | 1.08% | 1.05% | 1.02% | 1.04% | 1.02% |
Net investment income (loss) | .84% | 1.36% | 1.46% | 1.05% | .60% |
Supplemental Data | | | | | |
Net assets, end of period (000 omitted) | $ 9,672 | $ 11,344 | $ 14,870 | $ 30,649 | $ 31,314 |
Portfolio turnover rate E | 110% | 198% | 151% | 100% | 70% |
A Total returns do not reflect charges attributable to your insurance company's separate account. Inclusion of these charges would reduce the total returns shown.
B Total returns would have been lower if certain expenses had not been reduced during the applicable periods shown.
C Calculated based on average shares outstanding during the period.
D Fees and expenses of any underlying Fidelity Central Funds are not included in the Fund's expense ratio. The Fund indirectly bears its proportionate share of the expenses of any underlying Fidelity Central Funds.
E Amount does not include the portfolio activity of any underlying Fidelity Central Funds.
F Expense ratios reflect operating expenses of the class. Expenses before reductions do not reflect amounts reimbursed by the investment adviser or reductions from brokerage service arrangements or reductions from other expense offset arrangements and do not represent the amount paid by the class during periods when reimbursements or reductions occur. Expenses net of fee waivers reflect expenses after reimbursement by the investment adviser but prior to reductions from brokerage service arrangements or other expense offset arrangements. Expenses net of all reductions represent the net expenses paid by the class.
G Amount represents less than $.01 per share.
H Total distributions of $.07 per share is comprised of distributions from net investment income of $.066 and distributions from net realized gain of $.008 per share.
See accompanying notes which are an integral part of the financial statements.
Annual Report
Financial Highlights - Service Class 2R
Years ended December 31, | 2013 | 2012 | 2011 | 2010 | 2009 |
Selected Per-Share Data | | | | | |
Net asset value, beginning of period | $ 8.80 | $ 7.79 | $ 9.97 | $ 8.56 | $ 4.88 |
Income from Investment Operations | | | | | |
Net investment income (loss) C | .05 | .09 | .11 | .07 | .02 |
Net realized and unrealized gain (loss) | .27 | 1.00 | (2.24) | 1.43 | 3.66 |
Total from investment operations | .32 | 1.09 | (2.13) | 1.50 | 3.68 |
Distributions from net investment income | (.04) | (.06) | (.06) | (.06) | - |
Distributions from net realized gain | (.01) | (.01) | - | (.04) | - |
Tax return of capital | - | (.01) | - | - | - |
Total distributions | (.05) | (.08) | (.06) | (.09) H | - |
Redemption fees added to paid in capital C | - G | - G | .01 | - G | - G |
Net asset value, end of period | $ 9.07 | $ 8.80 | $ 7.79 | $ 9.97 | $ 8.56 |
Total Return A,B | 3.67% | 14.00% | (21.24)% | 17.60% | 75.41% |
Ratios to Average Net Assets D,F | | | | | |
Expenses before reductions | 1.38% | 1.62% | 1.56% | 1.63% | 3.17% |
Expenses net of fee waivers, if any | 1.35% | 1.35% | 1.35% | 1.35% | 1.35% |
Expenses net of all reductions | 1.33% | 1.30% | 1.27% | 1.29% | 1.27% |
Net investment income (loss) | .59% | 1.10% | 1.20% | .80% | .35% |
Supplemental Data | | | | | |
Net assets, end of period (000 omitted) | $ 83 | $ 82 | $ 72 | $ 102 | $ 117 |
Portfolio turnover rate E | 110% | 198% | 151% | 100% | 70% |
A Total returns do not reflect charges attributable to your insurance company's separate account. Inclusion of these charges would reduce the total returns shown.
B Total returns would have been lower if certain expenses had not been reduced during the applicable periods shown.
C Calculated based on average shares outstanding during the period.
D Fees and expenses of any underlying Fidelity Central Funds are not included in the Fund's expense ratio. The Fund indirectly bears its proportionate share of the expenses of any underlying Fidelity Central Funds.
E Amount does not include the portfolio activity of any underlying Fidelity Central Funds.
F Expense ratios reflect operating expenses of the class. Expenses before reductions do not reflect amounts reimbursed by the investment adviser or reductions from brokerage service arrangements or reductions from other expense offset arrangements and do not represent the amount paid by the class during periods when reimbursements or reductions occur. Expenses net of fee waivers reflect expenses after reimbursement by the investment adviser but prior to reductions from brokerage service arrangements or other expense offset arrangements. Expenses net of all reductions represent the net expenses paid by the class.
G Amount represents less than $.01 per share.
H Total distributions of $.09 per share is comprised of distributions from net investment income of $.056 and distributions from net realized gain of $.037 per share.
Financial Highlights - Investor Class R
Years ended December 31, | 2013 | 2012 | 2011 | 2010 | 2009 |
Selected Per-Share Data | | | | | |
Net asset value, beginning of period | $ 8.71 | $ 7.72 | $ 9.89 | $ 8.50 | $ 4.87 |
Income from Investment Operations | | | | | |
Net investment income (loss) C | .07 | .11 | .13 | .08 | .04 |
Net realized and unrealized gain (loss) | .27 | .98 | (2.22) | 1.43 | 3.63 |
Total from investment operations | .34 | 1.09 | (2.09) | 1.51 | 3.67 |
Distributions from net investment income | (.06) | (.08) | (.09) | (.08) | (.02) |
Distributions from net realized gain | (.01) | (.01) | - | (.04) | (.03) |
Tax return of capital | - | (.01) | - | - | - |
Total distributions | (.07) | (.10) | (.09) | (.12) | (.05) |
Redemption fees added to paid in capital C | - G | - G | .01 | - G | .01 |
Net asset value, end of period | $ 8.98 | $ 8.71 | $ 7.72 | $ 9.89 | $ 8.50 |
Total Return A,B | 3.90% | 14.14% | (21.05)% | 17.79% | 75.56% |
Ratios to Average Net Assets D,F | | | | | |
Expenses before reductions | 1.22% | 1.46% | 1.38% | 1.42% | 2.07% |
Expenses net of fee waivers, if any | 1.18% | 1.18% | 1.18% | 1.18% | 1.18% |
Expenses net of all reductions | 1.15% | 1.13% | 1.10% | 1.12% | 1.10% |
Net investment income (loss) | .76% | 1.28% | 1.37% | .97% | .52% |
Supplemental Data | | | | | |
Net assets, end of period (000 omitted) | $ 54,761 | $ 46,967 | $ 41,924 | $ 53,089 | $ 40,070 |
Portfolio turnover rate E | 110% | 198% | 151% | 100% | 70% |
A Total returns do not reflect charges attributable to your insurance company's separate account. Inclusion of these charges would reduce the total returns shown.
B Total returns would have been lower if certain expenses had not been reduced during the applicable periods shown.
C Calculated based on average shares outstanding during the period.
D Fees and expenses of any underlying Fidelity Central Funds are not included in the Fund's expense ratio. The Fund indirectly bears its proportionate share of the expenses of any underlying Fidelity Central Funds.
E Amount does not include the portfolio activity of any underlying Fidelity Central Funds.
F Expense ratios reflect operating expenses of the class. Expenses before reductions do not reflect amounts reimbursed by the investment adviser or reductions from brokerage service arrangements or reductions from other expense offset arrangements and do not represent the amount paid by the class during periods when reimbursements or reductions occur. Expenses net of fee waivers reflect expenses after reimbursement by the investment adviser but prior to reductions from brokerage service arrangements or other expense offset arrangements. Expenses net of all reductions represent the net expenses paid by the class.
G Amount represents less than $.01 per share.
See accompanying notes which are an integral part of the financial statements.
Annual Report
Notes to Financial Statements
For the period ended December 31, 2013
1. Organization.
VIP Emerging Markets Portfolio (the Fund) is a fund of Variable Insurance Products Fund II (the Trust) and is authorized to issue an unlimited number of shares. The Trust is registered under the Investment Company Act of 1940, as amended (the 1940 Act), as an open-end management investment company organized as a Massachusetts business trust. Shares of the Fund may only be purchased by insurance companies for the purpose of funding variable annuity or variable life insurance contracts. The Fund offers the following classes of shares: Initial Class shares, Service Class shares, Service Class 2 shares, Initial Class R shares, Service Class 2R shares, and Investor Class R shares. All classes have equal rights and voting privileges, except for matters affecting a single class. The Fund's investments in emerging markets can be subject to social, economic, regulatory, and political uncertainties and can be extremely volatile.
2. Investments in Fidelity Central Funds.
The Fund invests in Fidelity Central Funds, which are open-end investment companies generally available only to other investment companies and accounts managed by the investment adviser and its affiliates. The Fund's Schedule of Investments lists each of the Fidelity Central Funds held as of period end, if any, as an investment of the Fund, but does not include the underlying holdings of each Fidelity Central Fund. As an Investing Fund, the Fund indirectly bears its proportionate share of the expenses of the underlying Fidelity Central Funds.
The Money Market Central Funds seek preservation of capital and current income and are managed by Fidelity Investments Money Management, Inc. (FIMM), an affiliate of the investment adviser. Annualized expenses of the Money Market Central Funds as of their most recent shareholder report date are less than .01%.
A complete unaudited list of holdings for each Fidelity Central Fund is available upon request or at the Securities and Exchange Commission (the SEC) website at www.sec.gov. In addition, the financial statements of the Fidelity Central Funds, which are not covered by the Fund's Report of Independent Registered Public Accounting Firm, are available on the SEC website or upon request.
3. Significant Accounting Policies.
The financial statements have been prepared in conformity with accounting principles generally accepted in the United States of America (GAAP), which require management to make certain estimates and assumptions at the date of the financial statements. Actual results could differ from those estimates. Subsequent events, if any, through the date that the financial statements were issued have been evaluated in the preparation of the financial statements. The following summarizes the significant accounting policies of the Fund:
Investment Valuation. Investments are valued as of 4:00 p.m. Eastern time on the last calendar day of the period. In accordance with valuation policies and procedures approved by the Board of Trustees (the Board), the Fund attempts to obtain prices from one or more third party pricing vendors or brokers to value its investments. When current market prices, quotations or currency exchange rates are not readily available or reliable, investments will be fair valued in good faith by the Fidelity Management & Research Company (FMR) Fair Value Committee (the Committee), in accordance with procedures adopted by the Board. Factors used in determining fair value vary by investment type and may include market or investment specific events. The frequency with which these procedures are used cannot be predicted and they may be utilized to a significant extent. The Committee oversees the Fund's valuation policies and procedures and is responsible for approving and reporting to the Board all fair value determinations.
The Fund categorizes the inputs to valuation techniques used to value its investments into a disclosure hierarchy consisting of three levels as shown below:
Level 1 - quoted prices in active markets for identical investments
Level 2 - other significant observable inputs (including quoted prices for similar investments, interest rates, prepayment speeds, etc.)
Level 3 - unobservable inputs (including the Fund's own assumptions based on the best information available)
Valuation techniques used to value the Fund's investments by major category are as follows:
Equity securities, including restricted securities, for which market quotations are readily available, are valued at the last reported sale price or official closing price as reported by a third party pricing vendor on the primary market or exchange on which they are traded and are categorized as Level 1 in the hierarchy. In the event there were no sales during the day or closing prices are not available, securities are valued at the last quoted bid price or may be valued using the last available price and are generally categorized as Level 2 in the hierarchy. For foreign equity securities, when market or security specific events arise, comparisons to the valuation of American Depositary Receipts (ADRs), futures contracts, Exchange-Traded Funds (ETFs) and certain indexes as well as quoted prices for similar securities may be used and would be categorized as Level 2 in the hierarchy. Utilizing these techniques may result in transfers between Level 1 and Level 2. For equity securities, including restricted securities, where observable inputs are limited, assumptions about market activity and risk are used and these securities may be categorized as Level 3 in the hierarchy.
Annual Report
3. Significant Accounting Policies - continued
Investment Valuation - continued
Investments in open-end mutual funds , including the Fidelity Central Funds, are valued at their closing net asset value (NAV) each business day and are categorized as Level 1 in the hierarchy.
Changes in valuation techniques may result in transfers in or out of an assigned level within the disclosure hierarchy. The aggregate value of investments by input level, as of December 31, 2013, including information on transfers between Levels 1 and 2, is included at the end of the Fund's Schedule of Investments.
Foreign Currency. The Fund may use foreign currency contracts to facilitate transactions in foreign-denominated securities. Gains and losses from these transactions may arise from changes in the value of the foreign currency or if the counterparties do not perform under the contracts' terms.
Foreign-denominated assets, including investment securities, and liabilities are translated into U.S. dollars at the exchange rates at period end. Purchases and sales of investment securities, income and dividends received and expenses denominated in foreign currencies are translated into U.S. dollars at the exchange rate in effect on the transaction date.
The effects of exchange rate fluctuations on investments are included with the net realized and unrealized gain (loss) on investment securities. Other foreign currency transactions resulting in realized and unrealized gain (loss) are disclosed separately.
Investment Transactions and Income. For financial reporting purposes, the Fund's investment holdings and NAV include trades executed through the end of the last business day of the period. The NAV per share for processing shareholder transactions is calculated as of the close of business of the New York Stock Exchange (NYSE), normally 4:00 p.m. Eastern time and includes trades executed through the end of the prior business day. Gains and losses on securities sold are determined on the basis of identified cost. Dividend income is recorded on the ex-dividend date, except for certain dividends from foreign securities where the ex-dividend date may have passed, which are recorded as soon as the Fund is informed of the ex-dividend date. Non-cash dividends included in dividend income, if any, are recorded at the fair market value of the securities received. Interest income and distributions from the Fidelity Central Funds are accrued as earned. Investment income is recorded net of foreign taxes withheld where recovery of such taxes is uncertain.
Class Allocations and Expenses. Investment income, realized and unrealized capital gains and losses, common expenses of the Fund, and certain fund-level expense reductions, if any, are allocated daily on a pro-rata basis to each class based on the relative net assets of each class to the total net assets of the Fund. Each class differs with respect to transfer agent and distribution and service plan fees incurred. Certain expense reductions may also differ by class. For the reporting period, the allocated portion of income and expenses to each class as a percent of its average net assets may vary due to the timing of recording these transactions in relation to fluctuating net assets of the classes. Expenses directly attributable to a fund are charged to that fund. Expenses attributable to more than one fund are allocated among the respective funds on the basis of relative net assets or other appropriate methods. Expense estimates are accrued in the period to which they relate and adjustments are made when actual amounts are known.
Income Tax Information and Distributions to Shareholders. Each year, the Fund intends to qualify as a regulated investment company under Subchapter M of the Internal Revenue Code, including distributing substantially all of its taxable income and realized gains. As a result, no provision for U.S. Federal income taxes is required. As of December 31, 2013, the Fund did not have any unrecognized tax benefits in the financial statements; nor is the Fund aware of any tax positions for which it is reasonably possible that the total amounts of unrecognized tax benefits will significantly change in the next twelve months. The Fund files a U.S. federal tax return, in addition to state and local tax returns as required. The Fund's federal income tax returns are subject to examination by the Internal Revenue Service (IRS) for a period of three fiscal years after they are filed. State and local tax returns may be subject to examination for an additional fiscal year depending on the jurisdiction. Foreign taxes are provided for based on the Fund's understanding of the tax rules and rates that exist in the foreign markets in which it invests. The Fund is subject to a tax imposed on capital gains by certain countries in which it invests. An estimated deferred tax liability for net unrealized appreciation on the applicable securities is included in Other payables and accrued expenses on the Statement of Assets & Liabilities.
Distributions are declared and recorded on the ex-dividend date. Income dividends and capital gain distributions are declared separately for each class. Income and capital gain distributions are determined in accordance with income tax regulations, which may differ from GAAP.
Capital accounts within the financial statements are adjusted for permanent book-tax differences. These adjustments have no impact on net assets or the results of operations. Capital accounts are not adjusted for temporary book-tax differences which will reverse in a subsequent period.
Book-tax differences are primarily due to foreign currency transactions, certain foreign taxes, passive foreign investment companies (PFIC), capital loss carryforwards and losses deferred due to wash sales and excise tax regulations.
Annual Report
Notes to Financial Statements - continued
3. Significant Accounting Policies - continued
Income Tax Information and Distributions to Shareholders - continued
The federal tax cost of investment securities and unrealized appreciation (depreciation) as of period end were as follows:
Gross unrealized appreciation | $ 19,726,488 |
Gross unrealized depreciation | (4,666,734) |
Net unrealized appreciation (depreciation) on securities and other investments | $ 15,059,754 |
| |
Tax Cost | $ 120,314,884 |
The tax-based components of distributable earnings as of period end were as follows:
Capital loss carryforward | $ (3,143,603) |
Net unrealized appreciation (depreciation) | $ 15,054,472 |
Capital loss carryforwards are only available to offset future capital gains of the Fund to the extent provided by regulations and may be limited. Under the Regulated Investment Company Modernization Act of 2010 (the Act), the Fund is permitted to carry forward capital losses incurred in taxable years beginning after December 22, 2010 for an unlimited period and such capital losses are required to be used prior to any losses that expire. The capital loss carryforward information presented below, including any applicable limitation, is estimated as of fiscal period end and is subject to adjustment.
Fiscal year of expiration | |
2016 | $ (319,346) |
2017 | (2,824,257) |
Total capital loss carryforward | $ (3,143,603) |
The tax character of distributions paid was as follows:
| December 31, 2013 | December 31, 2012 |
Ordinary Income | $ 994,714 | $ 1,099,273 |
Tax Return of Capital | - | 106,326 |
Total | $ 994,714 | $ 1,205,599 |
Trading (Redemption) Fees. Initial Class R shares, Service Class 2R shares and Investor Class R shares held by investors less than 60 days may be subject to a redemption fee equal to 1% of the NAV of shares redeemed. All redemption fees, which reduce the proceeds of the shareholder redemption, are retained by the Fund and accounted for as an addition to paid in capital.
Delayed Delivery Transactions and When-Issued Securities. During the period, the Fund transacted in securities on a delayed delivery or when-issued basis. Payment and delivery may take place after the customary settlement period for that security. The price of the underlying securities and the date when the securities will be delivered and paid for are fixed at the time the transaction is negotiated. The securities purchased on a delayed delivery or when-issued basis are identified as such in the Fund's Schedule of Investments. With respect to purchase commitments, the Fund identifies securities as segregated in its records with a value at least equal to the amount of the commitment. Losses may arise due to changes in the value of the underlying securities or if the counterparty does not perform under the contract's terms, or if the issuer does not issue the securities due to political, economic, or other factors.
Restricted Securities. The Fund may invest in securities that are subject to legal or contractual restrictions on resale. These securities generally may be resold in transactions exempt from registration or to the public if the securities are registered. Disposal of these securities may involve time-consuming negotiations and expense, and prompt sale at an acceptable price may be difficult. Information regarding restricted securities is included at the end of the Fund's Schedule of Investments.
4. Purchases and Sales of Investments.
Purchases and sales of securities, other than short-term securities, aggregated $145,093,363 and $122,713,326, respectively.
5. Fees and Other Transactions with Affiliates.
Management Fee. Fidelity Management & Research Company (the investment adviser) and its affiliates provide the Fund with investment management related services for which the Fund pays a monthly management fee. The management fee is the sum of an individual fund fee rate that is based on an annual rate of .55% of the Fund's average net assets and an annualized group fee rate that averaged .25% during the period. The group fee rate is
Annual Report
5. Fees and Other Transactions with Affiliates - continued
Management Fee - continued
based upon the average net assets of all the mutual funds advised by the investment adviser, including any mutual funds previously advised by the investment adviser that are currently advised by Fidelity SelectCo, LLC, an affiliate of the investment adviser. The group fee rate decreases as assets under management increase and increases as assets under management decrease. For the reporting period, the total annual management fee rate was .80% of the Fund's average net assets.
Distribution and Service Plan Fees. In accordance with Rule 12b-1 of the 1940 Act, the Fund has adopted separate 12b-1 Plans for each Service Class of shares. Each Service Class pays Fidelity Distributors Corporation (FDC), an affiliate of the investment adviser, a service fee. For the period, the service fee is based on an annual rate of .10% of Service Class' average net assets and .25% of Service Class 2's and Service Class 2R's average net assets.
For the period, total fees, all of which were re-allowed to insurance companies for the distribution of shares and providing shareholder support services were as follows:
Service Class | $ 83 |
Service Class 2 | 13,040 |
Service Class 2 R | 207 |
| $ 13,330 |
Transfer Agent Fees. Fidelity Investments Institutional Operations Company, Inc. (FIIOC), an affiliate of the investment adviser, is the Fund's transfer, dividend disbursing, and shareholder servicing agent. FIIOC receives an asset-based fee with respect to each class. Each class (with the exception of Investor Class R) pays a transfer agent fee, excluding out of pocket expenses, equal to an annual rate of .07% of average net assets. Investor Class R pays a monthly asset-based transfer agent fee of .15% of average net assets. In addition, FIIOC receives an asset-based fee of ..0035% of average net assets for typesetting, printing and mailing of shareholder reports, except proxy statements. FIIOC voluntarily agreed to reimburse or waive this fee for the period January 1, 2013 through December 31, 2013 (see Expense Reductions note). For the period, transfer agent fees for each class, including printing and out of pocket expenses, were as follows:
Initial Class | $ 36,579 |
Service Class | 58 |
Service Class 2 | 3,623 |
Initial Class R | 8,888 |
Service Class 2R | 58 |
Investor Class R | 75,715 |
| $ 124,921 |
Effective February 1, 2014, the Board of Trustees approved an amendment to the transfer agent fee agreement whereby each class (with the exception of Investor Class R) pays a single fee of .07% of average net assets for transfer agent services, typesetting, printing and mailing of shareholder reports, excluding mailing of proxy statements and out of pocket expenses. Investor Class R pays a single fee of .15% of average net assets.
Accounting and Security Lending Fees. Fidelity Service Company, Inc. (FSC), an affiliate of the investment adviser, maintains the Fund's accounting records. The accounting fee is based on the level of average net assets for each month. Under a separate contract, FSC administers the security lending program. The security lending fee is based on the number and duration of lending transactions.
Brokerage Commissions. The Fund placed a portion of its portfolio transactions with brokerage firms which are affiliates of the investment adviser. Brokerage commissions are included in net realized gain (loss) and change in net unrealized appreciation (depreciation) in the Statement of Operations. The commissions paid to these affiliated firms were $479 for the period.
Interfund Lending Program. Pursuant to an Exemptive Order issued by the SEC, the Fund, along with other registered investment companies having management contracts with Fidelity Management & Research Company (FMR) or other affiliated entities of FMR, may participate in an interfund lending program. This program provides an alternative credit facility allowing the funds to borrow from, or lend money to, other participating affiliated funds. At period end, there were no interfund loans outstanding. The Fund's activity in this program during the period for which loans were outstanding was as follows:
Borrower or Lender | Average Loan
Balance | Weighted Average Interest Rate | Interest Expense |
Borrower | $ 5,783,000 | .32% | $ 255 |
6. Committed Line of Credit.
The Fund participates with other funds managed by the investment adviser or an affiliate in a $4.25 billion credit facility (the "line of credit") to be utilized for temporary or emergency purposes to fund shareholder redemptions or for other short-term liquidity purposes. The Fund has agreed to pay
Annual Report
Notes to Financial Statements - continued
6. Committed Line of Credit - continued
commitment fees on its pro-rata portion of the line of credit, which amounted to $234 and is reflected in Miscellaneous expenses on the Statement of Operations. During the period, there were no borrowings on this line of credit.
7. Security Lending.
The Fund lends portfolio securities through a lending agent from time to time in order to earn additional income. For equity securities, a lending agent is used and may loan securities to certain qualified borrowers, including Fidelity Capital Markets (FCM), a broker-dealer affiliated with the Fund. On the settlement date of the loan, the Fund receives collateral (in the form of U.S. Treasury obligations, letters of credit and/or cash) against the loaned securities and maintains collateral in an amount not less than 100% of the market value of the loaned securities during the period of the loan. The market value of the loaned securities is determined at the close of business of the Fund and any additional required collateral is delivered to the Fund on the next business day. If the borrower defaults on its obligation to return the securities loaned because of insolvency or other reasons, the Fund may apply collateral received from the borrower against the obligation. The Fund may experience delays and costs in recovering the securities loaned. Any cash collateral received is invested in the Fidelity Securities Lending Cash Central Fund. The value of loaned securities and cash collateral at period end are disclosed on the Fund's Statement of Assets and Liabilities. Security lending income represents the income earned on investing cash collateral, less rebates paid to borrowers and any lending agent fees associated with the loan, plus any premium payments received for lending certain types of securities. Security lending income is presented in the Statement of Operations as a component of income from Fidelity Central Funds. Total security lending income during the period amounted to $11,992. During the period, there were no securities loaned to FCM.
8. Expense Reductions.
In addition to FIIOC reimbursing or waiving a portion of its transfer agent fees , the investment adviser voluntarily agreed to reimburse each class to the extent annual operating expenses exceeded certain levels of average net assets as noted in the table below. Some expenses, for example interest expense, including commitment fees, are excluded from this reimbursement.
Expenses were reimbursed and/or waived for the following classes during the period:
| Expense
Limitations | Reimbursement/Waiver |
Initial Class | 1.10% | $ 20,476 |
Service Class | 1.20% | 28 |
Service Class 2 | 1.35% | 1,911 |
Initial Class R | 1.10% | 4,961 |
Service Class 2R | 1.35% | 28 |
Investor Class R | 1.18% | 19,968 |
| | $ 47,372 |
Commissions paid to certain brokers with whom the investment adviser, or its affiliates, places trades on behalf of the Fund include an amount in addition to trade execution, which may be rebated back to the Fund to offset certain expenses. This amount totaled $28,326 for the period.
9. Distributions to Shareholders.
Distributions to shareholders of each class were as follows:
Years ended December 31, | 2013 | 2012 |
From net investment income | | |
Initial Class | $ 407,624 | $ 423,228 |
Service Class | 527 | 707 |
Service Class 2 | 53,414 | 29,964 |
Initial Class R | 71,589 | 107,482 |
Service Class 2R | 404 | 581 |
Investor Class R | 349,316 | 446,026 |
Total | $ 882,874 | $ 1,007,988 |
From net realized gain | | |
Initial Class | $ 48,671 | $ 38,030 |
Service Class | 74 | 70 |
Service Class 2 | 7,769 | 3,378 |
Initial Class R | 8,677 | 9,658 |
Service Class 2R | 74 | 70 |
Investor Class R | 46,575 | 40,079 |
Total | $ 111,840 | $ 91,285 |
Annual Report
9. Distributions to Shareholders - continued
Years ended December 31, | 2013 | 2012 |
Tax Return of Capital | | |
Initial Class | $ - | $ 44,296 |
Service Class | - | 82 |
Service Class 2 | - | 3,935 |
Initial Class R | - | 11,249 |
Service Class 2R | - | 82 |
Investor Class R | - | 46,682 |
Total | $ - | $ 106,326 |
10. Share Transactions.
Transactions for each class of shares were as follows:
| Shares | Dollars |
Years ended December 31, | 2013 | 2012 | 2013 | 2012 |
Initial Class | | | | |
Shares sold | 2,314,809 | 1,795,123 | $ 20,504,643 | $ 14,860,844 |
Reinvestment of distributions | 51,734 | 58,922 | 456,295 | 505,554 |
Shares redeemed | (749,757) | (520,087) | (6,626,736) | (4,326,747) |
Net increase (decrease) | 1,616,786 | 1,333,958 | $ 14,334,202 | $ 11,039,651 |
Service Class | | | | |
Reinvestment of distributions | 68 | 100 | $ 601 | $ 858 |
Shares redeemed | (260) | - | (2,351) | - |
Net increase (decrease) | (192) | 100 | $ (1,750) | $ 858 |
Service Class 2 | | | | |
Shares sold | 595,640 | 205,197 | $ 5,335,046 | $ 1,709,550 |
Reinvestment of distributions | 6,921 | 4,330 | 61,183 | 37,277 |
Shares redeemed | (341,472) | (38,252) | (3,074,549) | (320,023) |
Net increase (decrease) | 261,089 | 171,275 | $ 2,321,680 | $ 1,426,804 |
Initial Class R | | | | |
Shares sold | 369,430 | 305,108 | $ 3,295,234 | $ 2,561,953 |
Reinvestment of distributions | 9,100 | 14,964 | 80,266 | 128,390 |
Shares redeemed | (602,524) | (944,184) | (5,333,441) | (7,798,843) |
Net increase (decrease) | (223,994) | (624,112) | $ (1,957,941) | $ (5,108,500) |
Service Class 2R | | | | |
Reinvestment of distributions | 54 | 85 | $ 478 | $ 733 |
Shares redeemed | (213) | - | (1,924) | - |
Net increase (decrease) | (159) | 85 | $ (1,446) | $ 733 |
Investor Class R | | | | |
Shares sold | 2,065,057 | 1,502,832 | $ 18,235,757 | $ 12,517,464 |
Reinvestment of distributions | 45,039 | 62,314 | 395,891 | 532,787 |
Shares redeemed | (1,401,329) | (1,607,620) | (12,212,999) | (13,117,947) |
Net increase (decrease) | 708,767 | (42,474) | $ 6,418,649 | $ (67,696) |
11. Other.
The Fund's organizational documents provide former and current trustees and officers with a limited indemnification against liabilities arising in connection with the performance of their duties to the Fund. In the normal course of business, the Fund may also enter into contracts that provide general indemnifications. The Fund's maximum exposure under these arrangements is unknown as this would be dependent on future claims that may be made against the Fund. The risk of material loss from such claims is considered remote.
At the end of the period, VIP Freedom 2020 Portfolio was the owner of record of approximately 21% of the total outstanding shares of the fund. The VIP Freedom Funds and VIP Investor Freedom Funds were the owners of record, in the aggregate, of approximately 64% of the total outstanding shares of the Fund. In addition, the investment adviser or its affiliates were the owners of record of 30% of the total outstanding shares of the Fund.
Annual Report
Report of Independent Registered Public Accounting Firm
To the Trustees of Variable Insurance Products Fund II and Shareholders of VIP Emerging Markets Portfolio:
We have audited the accompanying statement of assets and liabilities of VIP Emerging Markets Portfolio (the Fund), a fund of Variable Insurance Products Fund II, including the schedule of investments, as of December 31, 2013, and the related statement of operations for the year then ended, the statement of changes in net assets for each of the two years in the period then ended, and the financial highlights for each of the five years in the period then ended. These financial statements and financial highlights are the responsibility of the Fund's management. Our responsibility is to express an opinion on these financial statements and financial highlights based on our audits.
We conducted our audits in accordance with the standards of the Public Company Accounting Oversight Board (United States). Those standards require that we plan and perform the audit to obtain reasonable assurance about whether the financial statements and financial highlights are free of material misstatement. The Fund is not required to have, nor were we engaged to perform, an audit of its internal control over financial reporting. Our audits included consideration of internal control over financial reporting as a basis for designing audit procedures that are appropriate in the circumstances, but not for the purpose of expressing an opinion on the effectiveness of the Fund's internal control over financial reporting. Accordingly, we express no such opinion. An audit also includes examining, on a test basis, evidence supporting the amounts and disclosures in the financial statements, assessing the accounting principles used and significant estimates made by management, as well as evaluating the overall financial statement presentation. Our procedures included confirmation of securities owned as of December 31, 2013, by correspondence with the custodians and brokers; where replies were not received from brokers, we performed other auditing procedures. We believe that our audits provide a reasonable basis for our opinion.
In our opinion, the financial statements and financial highlights referred to above present fairly, in all material respects, the financial position of VIP Emerging Markets Portfolio as of December 31, 2013, the results of its operations for the year then ended, the changes in its net assets for each of the two years in the period then ended, and the financial highlights for each of the five years in the period then ended, in conformity with accounting principles generally accepted in the United States of America.
DELOITTE & TOUCHE LLP
Boston, Massachusetts
February 14, 2014
Annual Report
The Trustees, Member of the Advisory Board, and officers of the trust and fund, as applicable, are listed below. The Board of Trustees governs the fund and is responsible for protecting the interests of shareholders. The Trustees are experienced executives who meet periodically throughout the year to oversee the fund's activities, review contractual arrangements with companies that provide services to the fund, oversee management of the risks associated with such activities and contractual arrangements, and review the fund's performance. Except for James C. Curvey, Ned C. Lautenbach, Ronald P. O'Hanley, and William S. Stavropoulos, each of the Trustees oversees 173 funds. Mr. Curvey oversees 396 funds. Mr. Lautenbach, Mr. O'Hanley, and Mr. Stavropoulos each oversees 247 funds.
The Trustees hold office without limit in time except that (a) any Trustee may resign; (b) any Trustee may be removed by written instrument, signed by at least two-thirds of the number of Trustees prior to such removal; (c) any Trustee who requests to be retired or who has become incapacitated by illness or injury may be retired by written instrument signed by a majority of the other Trustees; and (d) any Trustee may be removed at any special meeting of shareholders by a two-thirds vote of the outstanding voting securities of the trust. Each Trustee who is not an interested person (as defined in the 1940 Act) of the trust and the fund (Independent Trustee), shall retire not later than the last day of the calendar year in which his or her 75th birthday occurs. The Independent Trustees may waive this mandatory retirement age policy with respect to individual Trustees. The officers and Advisory Board Member hold office without limit in time, except that any officer and Advisory Board Member may resign or may be removed by a vote of a majority of the Trustees at any regular meeting or any special meeting of the Trustees. Except as indicated, each individual has held the office shown or other offices in the same company for the past five years.
Experience, Skills, Attributes, and Qualifications of the Fund's Trustees. The Governance and Nominating Committee has adopted a statement of policy that describes the experience, qualifications, attributes, and skills that are necessary and desirable for potential Independent Trustee candidates (Statement of Policy). The Board believes that each Trustee satisfied at the time he or she was initially elected or appointed a Trustee, and continues to satisfy, the standards contemplated by the Statement of Policy. The Governance and Nominating Committee also engages professional search firms to help identify potential Independent Trustee candidates who have the experience, qualifications, attributes, and skills consistent with the Statement of Policy. From time to time, additional criteria based on the composition and skills of the current Independent Trustees, as well as experience or skills that may be appropriate in light of future changes to board composition, business conditions, and regulatory or other developments, have also been considered by the professional search firms and the Governance and Nominating Committee. In addition, the Board takes into account the Trustees' commitment and participation in Board and committee meetings, as well as their leadership of standing and ad hoc committees throughout their tenure.
In determining that a particular Trustee was and continues to be qualified to serve as a Trustee, the Board has considered a variety of criteria, none of which, in isolation, was controlling. The Board believes that, collectively, the Trustees have balanced and diverse experience, qualifications, attributes, and skills, which allow the Board to operate effectively in governing the fund and protecting the interests of shareholders. Information about the specific experience, skills, attributes, and qualifications of each Trustee, which in each case led to the Board's conclusion that the Trustee should serve (or continue to serve) as a trustee of the fund, is provided below.
Board Structure and Oversight Function. James C. Curvey is an interested person (as defined in the 1940 Act) and currently serves as Chairman. The Trustees have determined that an interested Chairman is appropriate and benefits shareholders because an interested Chairman has a personal and professional stake in the quality and continuity of services provided to the fund. Independent Trustees exercise their informed business judgment to appoint an individual of their choosing to serve as Chairman, regardless of whether the Trustee happens to be independent or a member of management. The Independent Trustees have determined that they can act independently and effectively without having an Independent Trustee serve as Chairman and that a key structural component for assuring that they are in a position to do so is for the Independent Trustees to constitute a substantial majority for the Board. The Independent Trustees also regularly meet in executive session. Ned C. Lautenbach serves as Chairman of the Independent Trustees and as such (i) acts as a liaison between the Independent Trustees and management with respect to matters important to the Independent Trustees and (ii) with management prepares agendas for Board meetings.
Fidelity funds are overseen by different Boards of Trustees. The fund's Board oversees Fidelity's equity and high income funds and another Board oversees Fidelity's investment-grade bond, money market, and asset allocation funds. The asset allocation funds may invest in Fidelity funds overseen by the fund's Board. The use of separate Boards, each with its own committee structure, allows the Trustees of each group of Fidelity funds to focus on the unique issues of the funds they oversee, including common research, investment, and operational issues. On occasion, the separate Boards establish joint committees to address issues of overlapping consequences for the Fidelity funds overseen by each Board.
The Trustees operate using a system of committees to facilitate the timely and efficient consideration of all matters of importance to the Trustees, the fund, and fund shareholders and to facilitate compliance with legal and regulatory requirements and oversight of the fund's activities and associated risks. The Board, acting through its committees, has charged FMR and its affiliates with (i) identifying events or circumstances the occurrence of which could have demonstrably adverse effects on the fund's business and/or reputation; (ii) implementing processes and controls to lessen the possibility that such events or circumstances occur or to mitigate the effects of such events or circumstances if they do occur; and (iii) creating and maintaining a system designed to evaluate continuously business and market conditions in order to facilitate the identification and implementation processes described in (i) and (ii) above. Because the day-to-day operations and activities of the fund are carried out by or through FMR, its affiliates and other service providers, the fund's exposure to risks is mitigated but not eliminated by the processes overseen by the Trustees. While each of the Board's committees has responsibility for overseeing different aspects of the fund's activities, oversight is exercised primarily through the Operations, Audit, and Compliance Committees. In addition, the Independent Trustees have worked with FMR to enhance the Board's oversight of investment and financial risks, legal and regulatory risks, technology risks, and operational risks, including the development of additional risk reporting to the Board. For example, a working group comprised of Independent Trustees and FMR has worked and continues to work to review the Fidelity fund's valuation-related activities, reporting and risk management. Appropriate personnel, including but not limited to the fund's Chief Compliance Officer (CCO), FMR's internal auditor, the independent accountants, the fund's Treasurer and portfolio management personnel, make periodic reports to the Board's committees, as appropriate, including an annual review of FMR's risk management program for the Fidelity funds. The responsibilities of each standing committee, including their oversight responsibilities, are described further under "Standing Committees of the Fund's Trustees."
Annual Report
The fund's Statement of Additional Information (SAI) includes more information about the Trustees. To request a free copy, call Fidelity at 1-877-208-0098.
Interested Trustees*:
Correspondence intended for each Trustee who is an interested person may be sent to Fidelity Investments, 245 Summer Street, Boston, Massachusetts 02210.
Name, Year of Birth; Principal Occupations and Other Relevant Experience+ |
James C. Curvey (1935) |
Year of Election or Appointment: 2007 Trustee Chairman of the Board of Trustees |
| Mr. Curvey also serves as Trustee of other Fidelity funds. Mr. Curvey is a Director of Fidelity Investments Money Management, Inc. (2009-present), Director of Fidelity Research & Analysis Co. (2009-present) and Director of FMR and FMR Co., Inc. (2007-present). Mr. Curvey is also Vice Chairman (2007-present) and Director of FMR LLC. In addition, Mr. Curvey serves as an Overseer for the Boston Symphony Orchestra and a member of the Trustees of Villanova University. Previously, Mr. Curvey was the Vice Chairman (2006-2007) and Director (2000-2007) of FMR Corp. |
Ronald P. O'Hanley (1957) |
Year of Election or Appointment: 2011 Trustee |
| Mr. O'Hanley also serves as Trustee of other Fidelity funds. He is Director of Fidelity SelectCo, LLC (2013-present), FMR Co., Inc. (2010-present), Director of Fidelity Investments Money Management, Inc. (2010-present), Director of Fidelity Research & Analysis Company (2010-present), President of Fidelity Asset Management and Corporate Services and a Member of Fidelity's Executive Committee (2010-present). Previously, Mr. O'Hanley served as President and Chief Executive Officer of BNY Mellon Asset Management (2007-2010). Mr. O'Hanley also served as Vice Chairman of Bank New York Mellon Corp. and a member of that firm's Executive Committee. Prior to the 2007 merger of The Bank of New York and Mellon Financial Corporation, he was Vice Chairman of Mellon Financial Corporation and President and Chief Executive Officer of Mellon Asset Management. He joined Mellon in February 1997. Mr. O'Hanley currently serves as Chairman of the Boston Public Library Foundation Board of Directors and sits on the Board of Directors of Beth Israel Deaconess Medical Center, the Board of Trustees of the Marine Biological Laboratory and the Advisory Board of the Maxwell School of Citizenship and Public Administration at Syracuse University. Mr. O'Hanley also chairs the Council on Asset Management for the Financial Services Roundtable and is a member of the Board of Directors of Institutional Investor's U.S. Institute. |
* Trustees have been determined to be "Interested Trustees" by virtue of, among other things, their affiliation with the trust or various entities under common control with FMR.
+ The information above includes each Trustee's principal occupation during the last five years and other information relating to the experience, attributes, and skills relevant to each Trustee's qualifications to serve as a Trustee, which led to the conclusion that each Trustee should serve as a Trustee for the fund.
Annual Report
Trustees and Officers - continued
Independent Trustees:
Correspondence intended for each Independent Trustee (that is, the Trustees other than the Interested Trustees) may be sent to Fidelity Investments, P.O. Box 55235, Boston, Massachusetts 02205-5235.
Name, Year of Birth; Principal Occupations and Other Relevant Experience+ |
Dennis J. Dirks (1948) |
Year of Election or Appointment: 2005 Trustee |
| Mr. Dirks also serves as Trustee of other Fidelity funds. Prior to his retirement in May 2003, Mr. Dirks was Chief Operating Officer and a member of the Board of The Depository Trust & Clearing Corporation (DTCC). He also served as President, Chief Operating Officer, and Board member of The Depository Trust Company (DTC) and President and Board member of the National Securities Clearing Corporation (NSCC). In addition, Mr. Dirks served as Chief Executive Officer and Board member of the Government Securities Clearing Corporation, Chief Executive Officer and Board member of the Mortgage-Backed Securities Clearing Corporation, as a Trustee and a member of the Finance Committee of Manhattan College (2005-2008), and as a Trustee and a member of the Finance Committee of AHRC of Nassau County (2006-2008). Mr. Dirks is a member of the Independent Directors Council (IDC) Governing Council (2010-present) and Board of Directors for The Brookville Center for Children's Services, Inc. (2009-present). |
Alan J. Lacy (1953) |
Year of Election or Appointment: 2008 Trustee |
| Mr. Lacy also serves as Trustee of other Fidelity funds. Mr. Lacy serves as Senior Adviser (2007-present) of Oak Hill Capital Partners, L.P. (private equity). Mr. Lacy also served as Chief Executive Officer (2000-2005) and Vice Chairman (2005-2006) of Sears Holdings Corporation and Sears, Roebuck and Co. (retail). In addition, Mr. Lacy serves as a member of the Board of Directors of Dave & Buster's Entertainment, Inc. (restaurant and entertainment complexes, 2010-present), Earth Fare, Inc. (retail grocery, 2012-present), The Hillman Companies, Inc. (hardware wholesalers, 2010-present), and Bristol-Myers Squibb Company (global pharmaceuticals, 2008-present). Mr. Lacy is a member of the Board of Trustees of The National Parks Conservation Association (2006-present). Previously, Mr. Lacy served as Chairman of the Board of Trustees of the National Parks Conservation Association (2008-2011) and as a member of the Board of Directors for the Western Union Company (global money transfer, 2006-2011). |
Ned C. Lautenbach (1944) |
Year of Election or Appointment: 2000 Trustee Chairman of the Independent Trustees |
| Mr. Lautenbach also serves as Trustee of other Fidelity funds. Mr. Lautenbach currently serves as the Lead Director of the Eaton Corporation Board of Directors (diversified industrial, 1997-present). Mr. Lautenbach is Chairman of the Board of Directors of the Philharmonic Center for the Arts in Naples, Florida (2012-present) and a member of the Council on Foreign Relations (1994-present). Previously, Mr. Lautenbach was a Partner/Advisory Partner at Clayton, Dubilier & Rice, LLC (private equity investment, 1998-2010), as well as a Director of Sony Corporation (2006-2007). |
Joseph Mauriello (1944) |
Year of Election or Appointment: 2008 Trustee |
| Mr. Mauriello also serves as Trustee of other Fidelity funds. Prior to his retirement in January 2006, Mr. Mauriello served in numerous senior management positions including Deputy Chairman and Chief Operating Officer (2004-2005), and Vice Chairman of Financial Services (2002-2004) of KPMG LLP US (professional services, 1965-2005). Mr. Mauriello currently serves as a member of the Board of Directors of XL Group plc. (global insurance and re-insurance, 2006-present). Previously, Mr. Mauriello served as a Director of the Hamilton Funds of the Bank of New York (2006-2007) and of Arcadia Resources Inc. (health care services and products, 2007-2012). |
Robert W. Selander (1950) |
Year of Election or Appointment: 2011 Trustee |
| Mr. Selander also serves as Trustee of other Fidelity funds. Previously, Mr. Selander served as a Member of the Advisory Board of other Fidelity funds (2011), and Executive Vice Chairman (2010), Chief Executive Officer (2009-2010), and President and Chief Executive Officer (1997-2009) of Mastercard, Inc. |
Cornelia M. Small (1944) |
Year of Election or Appointment: 2005 Trustee |
| Ms. Small also serves as Trustee of other Fidelity funds. Ms. Small is a member of the Board of Directors (2009-present) and Chair of the Investment Committee (2010-present) of the Teagle Foundation. Ms. Small also serves on the Investment Committee of the Berkshire Taconic Community Foundation (2008-present). Previously, Ms. Small served as Chairperson (2002-2008) and a member of the Investment Committee and Chairperson (2008-2012) and a member of the Board of Trustees of Smith College. In addition, Ms. Small served as Chief Investment Officer, Director of Global Equity Investments, and a member of the Board of Directors of Scudder, Stevens & Clark and Scudder Kemper Investments. |
William S. Stavropoulos (1939) |
Year of Election or Appointment: 2001 Trustee Vice Chairman of the Independent Trustees |
| Mr. Stavropoulos also serves as Trustee of other Fidelity funds. Mr. Stavropoulos serves as President and Founder of the Michigan Baseball Foundation, the Great Lakes Loons (2007-present). Mr. Stavropoulos is Chairman Emeritus of the Board of Directors of The Dow Chemical Company, where he previously served in numerous senior management positions, including President, CEO (1995-2000; 2002-2004), Chairman of the Executive Committee (2000-2006), and as a member of the Board of Directors (1990-2006). Currently, Mr. Stavropoulos is Chairman of the Board of Directors of Univar Inc. (global distributor of commodity and specialty chemicals), a Director of Teradata Corporation (data warehousing and technology solutions), and Maersk Inc. (industrial conglomerate), and a member of the Advisory Board for Metalmark Capital LLC (private equity investment, 2005-present). Mr. Stavropoulos is an operating advisor to Clayton, Dubilier & Rice, LLC (private equity investment). In addition, Mr. Stavropoulos is a member of the University of Notre Dame Advisory Council for the College of Science, a Trustee of the Rollin L. Gerstacker Foundation, and a Director of the Naples Philharmonic Center for the Arts. Previously, Mr. Stavropoulos served as a Director of Chemical Financial Corporation (bank holding company, 1993-2012) and Tyco International, Ltd. (multinational manufacturing and services, 2007-2012). |
David M. Thomas (1949) |
Year of Election or Appointment: 2008 Trustee |
| Mr. Thomas also serves as Trustee of other Fidelity funds. Mr. Thomas serves as Non-Executive Chairman of the Board of Directors of Fortune Brands Home and Security (home and security products, 2011-present), and as a member of the Board of Directors of Interpublic Group of Companies, Inc. (marketing communication, 2004-present). Previously, Mr. Thomas served as Executive Chairman (2005-2006) and Chairman and Chief Executive Officer (2000-2005) of IMS Health, Inc. (pharmaceutical and healthcare information solutions), and a Director of Fortune Brands, Inc. (consumer products, 2000-2011). |
+ The information above includes each Trustee's principal occupation during the last five years and other information relating to the experience, attributes, and skills relevant to each Trustee's qualifications to serve as a Trustee, which led to the conclusion that each Trustee should serve as a Trustee for the fund.
Advisory Board Member and Officers:
Correspondence intended for each officer and Peter S. Lynch may be sent to Fidelity Investments, 245 Summer Street, Boston, Massachusetts 02210. Officers appear below in alphabetical order.
Name, Year of Birth; Principal Occupation |
Peter S. Lynch (1944) |
Year of Election or Appointment: 2003 Member of the Advisory Board |
| Mr. Lynch also serves as Member of the Advisory Board of other Fidelity funds. Mr. Lynch is Vice Chairman and a Director of FMR and FMR Co., Inc. In addition, Mr. Lynch serves as a Trustee of Boston College and as the Chairman of the Inner-City Scholarship Fund. Previously, Mr. Lynch served on the Special Olympics International Board of Directors (1997-2006). |
Elizabeth Paige Baumann (1968) |
Year of Election or Appointment: 2012 Anti-Money Laundering (AML) Officer |
| Ms. Baumann also serves as AML Officer of other funds. She is Chief AML Officer of FMR LLC (2012-present) and is an employee of Fidelity Investments. Previously, Ms. Baumann served as Vice President and Deputy Anti-Money Laundering Officer (2007-2012). |
William C. Coffey (1969) |
Year of Election or Appointment: 2009 Assistant Secretary |
| Mr. Coffey also serves as Assistant Secretary of other funds. He is Senior Vice President and Deputy General Counsel of FMR LLC (2010-present), and is an employee of Fidelity Investments. Previously, Mr. Coffey served as Vice President and Associate General Counsel of FMR LLC (2005-2009). |
Jonathan Davis (1968) |
Year of Election or Appointment: 2010 Assistant Treasurer |
| Mr. Davis also serves as Assistant Treasurer of other funds. Mr. Davis is an employee of Fidelity Investments. Previously, Mr. Davis served as Vice President and Associate General Counsel of FMR LLC (2003-2010). |
Adrien E. Deberghes (1967) |
Year of Election or Appointment: 2008 Deputy Treasurer |
| Mr. Deberghes also serves as an officer of other funds. He is an employee of Fidelity Investments (2008-present). Prior to joining Fidelity Investments, Mr. Deberghes was Senior Vice President of Mutual Fund Administration at State Street Corporation (2007-2008), Senior Director of Mutual Fund Administration at Investors Bank & Trust (2005-2007), and Director of Finance for Dunkin' Brands (2000-2005). |
Stephanie J. Dorsey (1969) |
Year of Election or Appointment: 2010 Assistant Treasurer |
| Ms. Dorsey also serves as an officer of other funds. She is an employee of Fidelity Investments (2008-present) and has served in other fund officer roles. Prior to joining Fidelity Investments, Ms. Dorsey served as Treasurer (2004-2008) of the JPMorgan Mutual Funds and Vice President (2004-2008) of JPMorgan Chase Bank. |
Scott C. Goebel (1968) |
Year of Election or Appointment: 2008 Secretary and Chief Legal Officer (CLO) |
| Mr. Goebel serves as Secretary and CLO of other funds. Mr. Goebel also serves as Secretary of Fidelity Investments Money Management, Inc. (FIMM) (2010-present) and Fidelity Research and Analysis Company (FRAC) (2010-present); General Counsel, Secretary, and Senior Vice President of FMR (2008-present) and FMR Co., Inc. (2008-present); Chief Legal Officer of Fidelity Management & Research (Hong Kong) Limited (2008-present) and Assistant Secretary of Fidelity Management & Research (Japan) Inc. (2008-present), and Fidelity Management & Research (U.K.) Inc. (2008-present). Previously, Mr. Goebel served as Secretary and CLO of other Fidelity funds (2008-2013), Assistant Secretary of FIMM (2008-2010), FRAC (2008-2010), and certain funds (2007-2008); and as Vice President and Secretary of Fidelity Distributors Corporation (FDC) (2005-2007). Mr. Goebel has been employed by FMR LLC or an affiliate since 2001. |
Joseph A. Hanlon (1968) |
Year of Election or Appointment: 2012 Chief Compliance Officer |
| Mr. Hanlon also serves as Chief Compliance Officer of other funds. Mr. Hanlon serves as Compliance Officer of FMR, FMR Co., Inc., Fidelity Investments Money Management, Inc. (FIMM), Fidelity Research and Analysis Company (FRAC), and Fidelity Management & Research (Hong Kong) (2009-present), as Senior Vice President of the Fidelity Asset Management Division (2009-present), and is an employee of Fidelity Investments. Previously, Mr. Hanlon served as Compliance Officer of Fidelity Management & Research (Japan) Inc. (2009-2013), Strategic Advisers, Inc. (2009-2013), and Fidelity Management & Research (U.K.) Inc. (2009-2013). |
Bruce T. Herring (1965) |
Year of Election or Appointment: 2006 Vice President of certain Equity Funds |
| Mr. Herring also serves as Vice President of other funds. He serves as Chief Investment Officer of Fidelity Global Asset Allocation (GAA) (2013-present), Group Chief Investment Officer of FMR, and President of Fidelity Research & Analysis Company (2010-present). Previously, Mr. Herring served as Chief Investment Officer and Director of Fidelity Management & Research (U.K.) Inc. (2010-2013), Vice President (2005-2006) and Senior Vice President (2006-2007) of Fidelity Management & Research Company, Vice President of FMR Co., Inc. (2001-2007), and as a portfolio manager for Fidelity U.S. Equity Funds. |
Brian B. Hogan (1964) |
Year of Election or Appointment: 2009 Vice President |
| Mr. Hogan also serves as Vice President of other funds. Mr. Hogan serves as President of FMR's Equity Division (2009-present). Previously, Mr. Hogan served as Senior Vice President, Equity Research of FMR (2006-2009) and as a portfolio manager. |
Chris Maher (1972) |
Year of Election or Appointment: 2013 Assistant Treasurer |
| Mr. Maher serves as Assistant Treasurer of other funds. Mr. Maher is Vice President of Valuation Oversight and is an employee of Fidelity Investments. Previously, Mr. Maher served as Vice President of Asset Management Compliance (2013), Vice President of FMR's Program Management Group (2010-2013), and Vice President of Valuation Oversight (2008-2010). |
Christine Reynolds (1958) |
Year of Election or Appointment: 2008 Chief Financial Officer |
| Ms. Reynolds also serves as Chief Financial Officer of other funds. Ms. Reynolds became President of Fidelity Pricing and Cash Management Services (FPCMS) in August 2008. Ms. Reynolds served as Chief Operating Officer of FPCMS (2007-2008). Previously, Ms. Reynolds served as President, Treasurer, and Anti-Money Laundering officer of the Fidelity funds (2004-2007). |
Kenneth B. Robins (1969) |
Year of Election or Appointment: 2008 President and Treasurer |
| Mr. Robins also serves as an officer of other funds. Mr. Robins serves as Executive Vice President of Fidelity Investments Money Management, Inc. (FIMM) (2013-present) and is an employee of Fidelity Investments (2004-present). Previously, Mr. Robins served in other fund officer roles. |
Gary W. Ryan (1958) |
Year of Election or Appointment: 2005 Assistant Treasurer |
| Mr. Ryan also serves as Assistant Treasurer of other funds. Mr. Ryan is an employee of Fidelity Investments and has served in other fund officer roles. Previously, Mr. Ryan served as Vice President of Fund Reporting in Fidelity Pricing and Cash Management Services (FPCMS) (1999-2005). |
Stephen Sadoski (1971) |
Year of Election or Appointment: 2012 Deputy Treasurer |
| Mr. Sadoski also serves as Deputy Treasurer of other funds. He is an employee of Fidelity Investments (2012-present) and has served in another fund officer role. Prior to joining Fidelity Investments, Mr. Sadoski served as an assistant chief accountant in the Division of Investment Management of the Securities and Exchange Commission (SEC) (2009-2012) and as a senior manager at Deloitte & Touche LLP (1997-2009). |
Stacie M. Smith (1974) |
Year of Election or Appointment: 2013 Deputy Treasurer |
| Ms. Smith also serves as an officer of other funds. She is an employee of Fidelity Investments (2009-present) and has served in other fund officer roles. Prior to joining Fidelity Investments, Ms. Smith served as Senior Audit Manager of Ernst & Young LLP (1996-2009). |
Renee Stagnone (1975) |
Year of Election or Appointment: 2013 Deputy Treasurer |
| Ms. Stagnone also serves as Deputy Treasurer of other funds. Ms. Stagnone is an employee of Fidelity Investments. |
Joseph F. Zambello (1957) |
Year of Election or Appointment: 2011 Deputy Treasurer |
| Mr. Zambello also serves as Deputy Treasurer of other funds. Mr. Zambello is an employee of Fidelity Investments. Previously, Mr. Zambello served as Vice President of FMR's Program Management Group (2009-2011) and Vice President of the Transfer Agent Oversight Group (2005-2009). |
Annual Report
Initial Class R designates 6%; Service Class 2R designates 9%; and Investor Class R designates 7% of the dividends distributed during the fiscal year as qualifying for the dividends-received deduction for corporate shareholders.
The amounts per share which represent income derived from sources within, and taxes paid to, foreign countries or possessions of the United States are as follows:
| Pay Date | Income | Taxes |
Initial Class R | 12/13/2013 | $0.086 | $0.012 |
Service Class 2R | 12/13/2013 | $0.064 | $0.012 |
Investor Class R | 12/13/2013 | $0.080 | $0.012 |
Annual Report
Board Approval of Investment Advisory Contracts and Management Fees
VIP Emerging Markets Portfolio
Each year, the Board of Trustees, including the Independent Trustees (together, the Board), votes on the renewal of the management contract and sub-advisory agreements (together, the Advisory Contracts) for the fund. The Board, assisted by the advice of fund counsel and Independent Trustees' counsel, requests and considers a broad range of information relevant to the renewal of the Advisory Contracts throughout the year.
The Board meets regularly and, at each of its meetings, covers an extensive agenda of topics and materials and considers factors that are relevant to its annual consideration of the renewal of the fund's Advisory Contracts, including the services and support provided to the fund and its shareholders. The Board has established various standing committees, each composed of and chaired by Independent Trustees with varying backgrounds, to which the Board has assigned specific subject matter responsibilities in order to enhance effective decision-making by the Board. The Board, acting directly and through its Committees, requests and receives information concerning the annual consideration of the renewal of the fund's Advisory Contracts. The Board also meets as needed to consider matters specifically related to the Board's annual consideration of the renewal of Advisory Contracts. Members of the Board may also meet with trustees of other Fidelity funds through ad hoc joint committees to discuss certain matters relevant to the Fidelity funds.
At its July 2013 meeting, the Board, including the Independent Trustees, unanimously determined to renew the fund's Advisory Contracts. In reaching its determination, the Board considered all factors it believed relevant, including (i) the nature, extent, and quality of the services to be provided to the fund and its shareholders (including the investment performance of the fund); (ii) the competitiveness of the fund's management fee and total expense ratio relative to peer funds; (iii) the total costs of the services to be provided by and the profits to be realized by Fidelity from its relationship with the fund; (iv) the extent to which economies of scale exist and would be realized as the fund grows; and (v) whether fee levels reflect these economies of scale, if any, for the benefit of fund shareholders.
In considering whether to renew the Advisory Contracts for the fund, the Board reached a determination, with the assistance of fund counsel and Independent Trustees' counsel and through the exercise of its business judgment, that the renewal of the Advisory Contracts was in the best interests of the fund and its shareholders and that the compensation payable under the Advisory Contracts was fair and reasonable. The Board's decision to renew the Advisory Contracts was not based on any single factor, but rather was based on a comprehensive consideration of all the information provided to the Board at its meetings throughout the year. The Board, in reaching its determination to renew the Advisory Contracts, was aware that shareholders in the fund have a broad range of investment choices available to them, including a wide choice among mutual funds offered by Fidelity's competitors, and that the fund's shareholders, who have the opportunity to review and weigh the disclosure provided by the fund in its prospectus and other public disclosures, have chosen to invest in this fund, which is a part of the Fidelity family of funds.
Nature, Extent, and Quality of Services Provided. The Board considered the staffing within the investment adviser, Fidelity Management & Research Company (FMR), and the sub-advisers (together, the Investment Advisers) as it relates to the fund, including the backgrounds of the fund's investment personnel, and also considered the fund's investment objective, strategies, and related investment philosophy. The Independent Trustees also had discussions with senior management of Fidelity's investment operations and investment groups. The Board considered the structure of the portfolio manager compensation program and whether this structure provides appropriate incentives to act in the best interests of the fund.
Resources Dedicated to Investment Management and Support Services. The Board and the Fund Oversight and Research Committees reviewed the general qualifications and capabilities of the Investment Advisers' investment staff, including its size, education, experience, and resources, as well as the Investment Advisers' approach to recruiting, training, managing, and compensating investment personnel. The Board noted that FMR has continued to increase the resources devoted to non-U.S. offices, including expansion of Fidelity's global investment organization. The Board also noted that Fidelity's analysts have extensive resources, tools and capabilities that allow them to conduct sophisticated quantitative and fundamental analysis, as well as credit analysis of issuers, counterparties and guarantors. Further, the Board believes that Fidelity's investment professionals have sufficient access to global information and data so as to provide competitive investment results over time, and that those professionals also have access to sophisticated tools that permit them to assess portfolio construction and risk and performance attribution characteristics continuously, as well as to transmit new information and research conclusions rapidly around the world. Additionally, in its deliberations, the Board considered the Investment Advisers' trading and risk management capabilities and resources, which are an integral part of the investment management process.
Shareholder and Administrative Services. The Board considered (i) the nature, extent, quality, and cost of advisory, administrative, and shareholder services performed by the Investment Advisers and their affiliates under the Advisory Contracts and under separate agreements covering transfer agency, pricing and bookkeeping, and securities lending services for the fund; (ii) the nature and extent of the supervision of third party service providers, principally custodians and subcustodians; and (iii) the resources devoted to, and the record of compliance with, the fund's compliance policies and procedures. The Board also reviewed the allocation of fund brokerage, including allocations to brokers affiliated with the Investment Advisers, the use of brokerage commissions to pay fund expenses, and the use of "soft" commission dollars to pay for research services.
The Board noted that the growth of fund assets over time across the complex allows Fidelity to reinvest in the development of services designed to enhance the value or convenience of the Fidelity funds as investment vehicles. These services include 24-hour access to account information and market information through telephone representatives and over the Internet, investor education materials and asset allocation tools, and the expanded availability of Fidelity Investor Centers.
Annual Report
Investment in a Large Fund Family. The Board considered the benefits to shareholders of investing in a Fidelity fund, including the benefits of investing in a fund that is part of a large family of funds offering a variety of investment disciplines and providing a large variety of mutual fund investor services. The Board noted that Fidelity had taken, or had made recommendations that resulted in the Fidelity funds taking, a number of actions over the previous year that benefited particular funds, including (i) continuing to dedicate additional resources to investment research and to the support of the senior management team that oversees asset management; (ii) persisting in efforts to enhance Fidelity's global research capabilities; (iii) launching new funds and making other enhancements to meet client needs for global and income-oriented solutions; (iv) continuing to launch dedicated lower cost underlying funds to meet portfolio construction needs related to expanding underlying fund options for Fidelity funds of funds, specifically for the Freedom Fund product lines; (v) rationalizing product lines and gaining increased efficiencies through the mergers of several funds into other funds; (vi) strengthening Fidelity's index fund offerings by reducing investment minimums and adopting or lowering existing expense caps for certain funds and classes; (vii) enhancing Global Asset Allocation product offerings by launching new funds and strategies, including "open architecture" target date funds that utilize affiliated and unaffiliated sub-advisers; (viii) modifying the eligibility criteria for Institutional Class shares of Advisor funds to increase their marketability to a portion of the defined contribution plan market; (ix) creating a new low-cost retirement share class for certain Advisor funds to appeal to large retirement plans; (x) transitioning the management of certain Fidelity commodity funds to Geode Capital Management LLC, a registered commodity pool operator, while retaining administrative responsibilities for the funds; (xi) reorganizing a number of funds; and (xii) taking steps toward establishing a new Fidelity adviser to manage sector-based funds and products.
Investment Performance. The Board considered whether the fund has operated in accordance with its investment objective, as well as its record of compliance with its investment restrictions and its performance history. The Board noted that there was a portfolio management change for the fund in October 2012.
The Board took into account discussions with the Investment Advisers about fund investment performance that occur at Board meetings throughout the year. In this regard the Board noted that as part of regularly scheduled fund reviews and other reports to the Board on fund performance, the Board periodically considers annualized return information for the fund, for different time periods, measured against a securities market index ("benchmark index") and a peer group of mutual funds with similar objectives ("peer group"). In its evaluation of fund investment performance, the Board gave particular attention to information indicating changes in performance of certain Fidelity funds for specific time periods and the Investment Advisers' explanations for any overperformance or underperformance.
In addition to reviewing absolute and relative fund performance, the Independent Trustees periodically consider the appropriateness of fund performance metrics in evaluating the results achieved. In general, the Independent Trustees believe that fund performance should be evaluated based on net performance (after fees and expenses) of both the highest performing and lowest performing classes, where applicable, compared to appropriate benchmark indices, over appropriate time periods which may include full market cycles, and compared to peer groups, as applicable, over the same periods, taking into account relevant factors including the following: general market conditions; issuer-specific information; tactical opportunities for investment; and fund cash flows and other factors.
The Independent Trustees recognize that shareholders evaluate performance on a net basis over their own holding periods, for which one-, three-, and five-year periods are used as a proxy. For this reason, the performance information reviewed by the Board also included net cumulative calendar year total return information for the fund and an appropriate benchmark index and peer group for the most recent one- and three-year periods, as shown below. Returns are shown compared to the 25th percentile (top of box) and 75th percentile (bottom of box) of the peer universe.
Annual Report
Board Approval of Investment Advisory Contracts and Management Fees - continued
VIP Emerging Markets Portfolio

The Board has discussed with FMR the fund's underperformance (based on the December 31, 2012 data presented herein) and has engaged with FMR to consider what steps might be taken to remediate the fund's underperformance. The Board noted that the fund's performance has improved for more recent periods.
Based on its review, the Board concluded that the nature, extent, and quality of services provided to the fund under the Advisory Contracts should benefit the fund's shareholders.
Competitiveness of Management Fee and Total Expense Ratio. The Board considered the fund's management fee and total expense ratio compared to "mapped groups" of competitive funds and classes. Fidelity creates "mapped groups" by combining similar Lipper investment objective categories that have comparable management fee characteristics. Combining Lipper investment objective categories aids the Board's management fee and total expense ratio comparisons by broadening the competitive group used for comparison and by reducing the number of universes to which various Fidelity funds are compared.
Management Fee. The Board considered two proprietary management fee comparisons for the 12-month (or shorter) periods shown in the chart below. The group of Lipper funds used by the Board for management fee comparisons is referred to below as the "Total Mapped Group." The Total Mapped Group comparison focuses on a fund's standing in terms of gross management fees before expense reimbursements or caps relative to the total universe of funds with comparable investment mandates, regardless of whether their management fee structures also are comparable. Funds with comparable investment mandates offer exposure to similar types of securities. Funds with comparable management fee structures have similar management fee contractual arrangements (e.g., flat rate charged for advisory services, all-inclusive fee rate, etc.). "TMG %" represents the percentage of funds in the Total Mapped Group that had management fees that were lower than the fund's. For example, a TMG % of 39% means that 61% of the funds in the Total Mapped Group had higher management fees than the fund. The "Asset-Size Peer Group" (ASPG) comparison focuses on a fund's standing relative to a subset of non-Fidelity funds within the Total Mapped Group that are similar in size and management fee structure. The ASPG represents at least 15% of the funds in the Total Mapped Group with comparable asset size and management fee structures, subject to a minimum of 50 funds (or all funds in the Total Mapped Group if fewer than 50). Additional information, such as the ASPG quartile in which the fund's management fee ranked, is also included in the chart and considered by the Board.
Annual Report
VIP Emerging Markets Portfolio
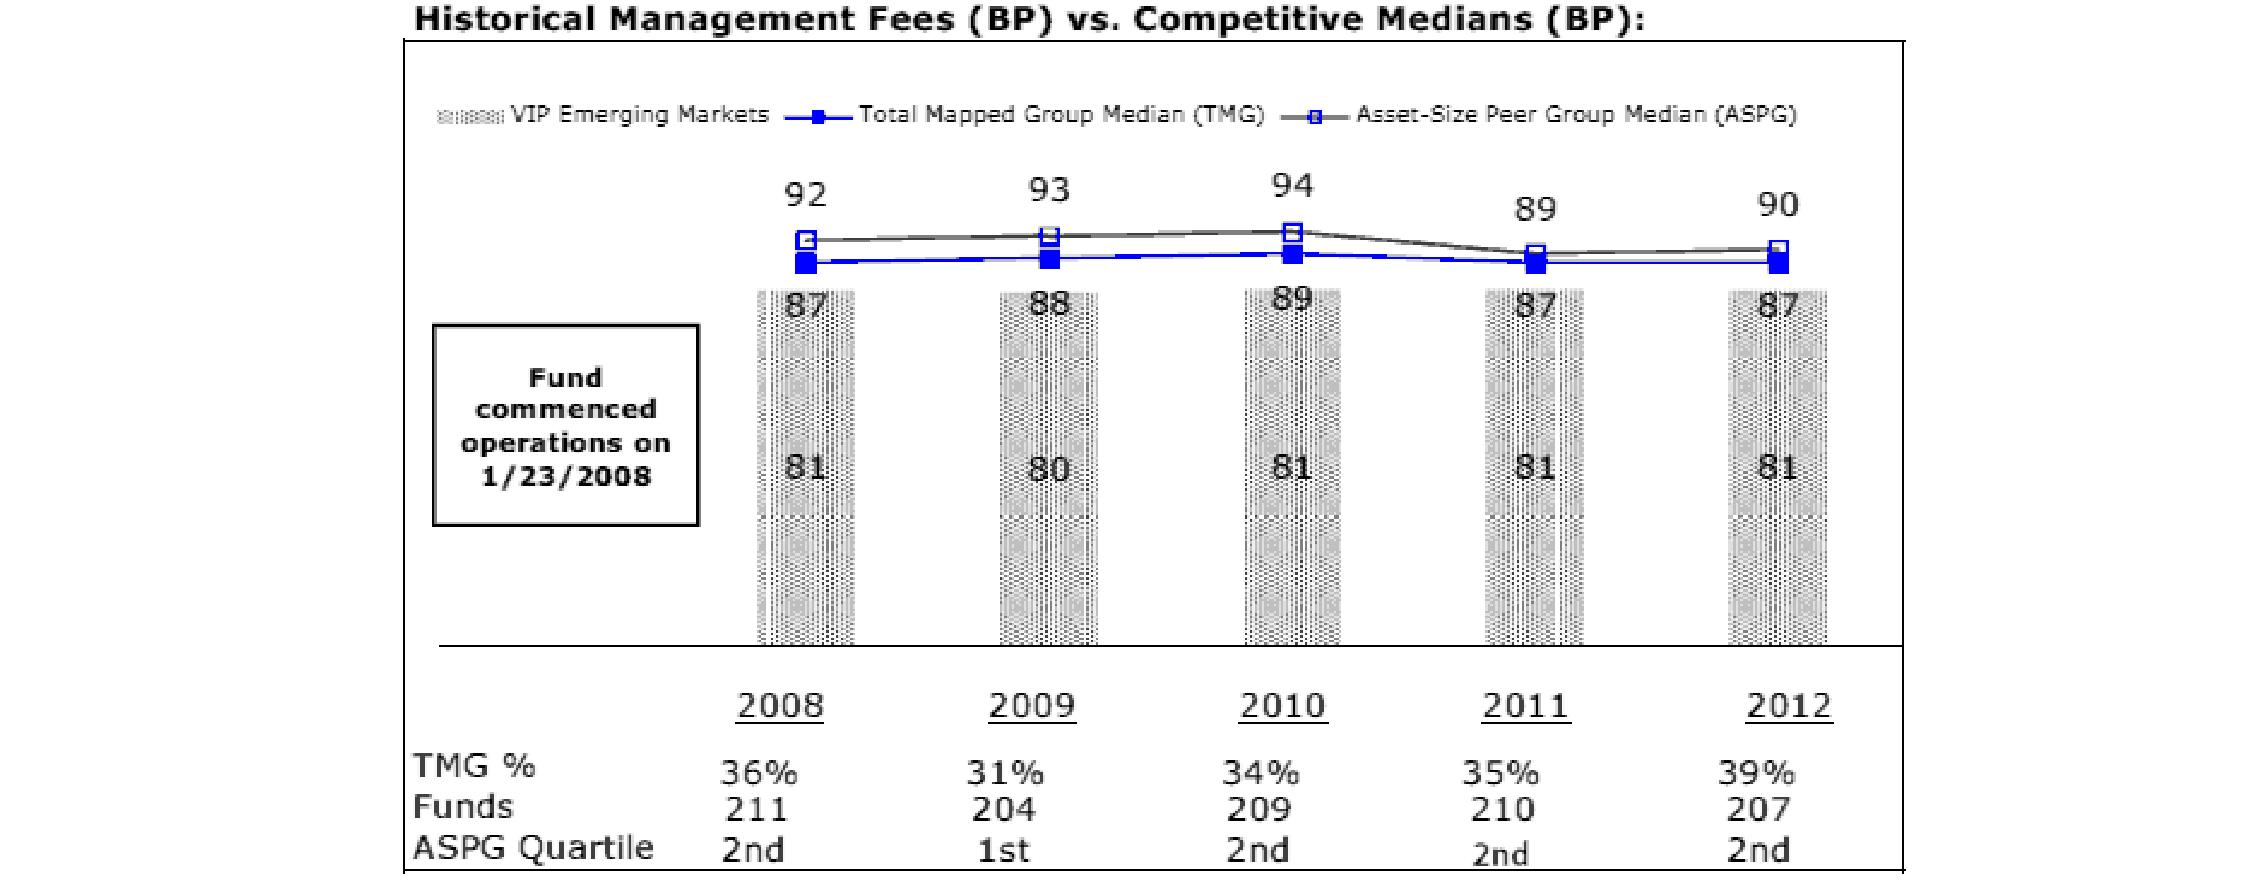
The Board noted that the fund's management fee ranked below the median of its Total Mapped Group and below the median of its ASPG for 2012.
Based on its review, the Board concluded that the fund's management fee is fair and reasonable in light of the services that the fund receives and the other factors considered.
Total Expense Ratio. In its review of each class's total expense ratio, the Board considered the fund's management fee as well as other fund or class expenses, as applicable, such as transfer agent fees, pricing and bookkeeping fees, fund-paid 12b-1 fees, and custodial, legal, and audit fees. The Board also noted the effects of any waivers and reimbursements on fees and expenses. As part of its review, the Board also considered the current and historical total expense ratios of each class of the fund compared to competitive fund median expenses. Each class of the fund is compared to those funds and classes in the Total Mapped Group (used by the Board for management fee comparisons) that have a similar sales load structure.
The Board noted that the total expense ratio of each class ranked above its competitive median for 2012. The Board considered that, in general, various factors can affect total expense ratios. The Board also noted that Investor Class R has higher transfer agent fees than traditional variable annuity classes because it is designed for lower cost annuity products, where the majority of servicing costs are incorporated into the funds' total expense ratios rather than being paid at the annuity level. The Board noted that the fund offers multiple classes, each of which has a different 12b-1 fee structure, and that the multiple structures are intended to offer a range of pricing options for the intermediary market. The Board also noted that the total expense ratios of the classes vary primarily by the level of their 12b-1 fees, although differences in transfer agent fees may also cause expenses to vary from class to class.
Fees Charged to Other Fidelity Clients. The Board also considered Fidelity fee structures and other information with respect to clients of FMR and its affiliates, such as other mutual funds advised or subadvised by FMR or its affiliates, pension plan clients, and other institutional clients. The Board noted the findings of the 2013 ad hoc joint committee (created with the board of other Fidelity funds), which reviewed and compared Fidelity's institutional investment advisory business with its business of providing services to the Fidelity funds, including the differences in services provided, fees charged, and costs incurred, as well as competition in their respective marketplaces.
Based on its review of total expense ratios and fees charged to other Fidelity clients, the Board concluded that the total expense ratio of each class of the fund was reasonable, although in all cases above the median of the universe presented for comparison, in light of the services that the fund and its shareholders receive and the other factors considered.
Costs of the Services and Profitability. The Board considered the revenues earned and the expenses incurred by Fidelity in conducting the business of developing, marketing, distributing, managing, administering and servicing the fund and servicing the fund's shareholders. The Board also considered the level of Fidelity's profits in respect of all the Fidelity funds.
On an annual basis, FMR presents to the Board Fidelity's profitability for the fund. Fidelity calculates the profitability for each fund, as well as aggregate profitability for groups of Fidelity funds and all Fidelity funds, using a series of detailed revenue and cost allocation methodologies which originate with the books and records of Fidelity on which Fidelity's audited financial statements are based. The Audit Committee of the Board reviews any significant changes from the prior year's methodologies.
Annual Report
Board Approval of Investment Advisory Contracts and Management Fees - continued
PricewaterhouseCoopers LLP (PwC), independent registered public accounting firm and auditor to Fidelity and certain Fidelity funds, has been engaged annually by the Board as part of the Board's assessment of Fidelity's profitability analysis. PwC's engagement includes the review and assessment of the methodologies used by Fidelity in determining the revenues and expenses attributable to Fidelity's mutual fund business, and completion of agreed-upon procedures surrounding the mathematical accuracy of fund profitability and its conformity to allocation methodologies. After considering PwC's reports issued under the engagement and information provided by Fidelity, the Board concluded that while other allocation methods may also be reasonable, Fidelity's profitability methodologies are reasonable in all material respects.
The Board also reviewed Fidelity's non-fund businesses and fall-out benefits related to the mutual fund business as well as cases where Fidelity's affiliates may benefit from or be related to the fund's business.
The Board considered the costs of the services provided by and the profits realized by Fidelity in connection with the operation of the fund and was satisfied that the profitability was not excessive in the circumstances.
Economies of Scale. The Board considered whether there have been economies of scale in respect of the management of the Fidelity funds, whether the Fidelity funds (including the fund) have appropriately benefited from any such economies of scale, and whether there is potential for realization of any further economies of scale. The Board considered the extent to which the fund will benefit from economies of scale through increased services to the fund, through waivers or reimbursements, or through fee or expense reductions. The Board also noted that in 2009, it and the board of other Fidelity funds created an ad hoc committee (the Economies of Scale Committee) to analyze whether FMR attains economies of scale in respect of the management and servicing of the Fidelity funds, whether the Fidelity funds have appropriately benefited from such economies of scale, and whether there is potential for realization of any further economies of scale.
The Board recognized that the fund's management contract incorporates a "group fee" structure, which provides for lower group fee rates as total fund assets under FMR's management increase, and for higher group fee rates as total fund assets under FMR's management decrease. FMR calculates the group fee rates based on a tiered asset "breakpoint" schedule that varies based on asset class. The Board considered that the group fee is designed to deliver the benefits of economies of scale to fund shareholders when total Fidelity fund assets increase, even if assets of any particular fund are unchanged or have declined, because some portion of Fidelity's costs are attributable to services provided to all Fidelity funds, and all funds benefit if those costs can be allocated among more assets. The Board concluded that, given the group fee structure, fund shareholders will benefit from lower management fees as assets under FMR's management increase at the fund complex level, regardless of whether Fidelity achieves any such economies of scale.
The Board concluded, taking into account the analysis of the Economies of Scale Committee, that economies of scale, if any, are being appropriately shared between fund shareholders and Fidelity.
Amendment to Description of Group Fee Rate. At its July 2013 meeting, the Board voted to approve an amendment to the fund's management contract to modify the description of the "group fee rate" effective August 1, 2013. The Board noted that under the prior description in the contract, the group fee rate was based on the average net assets of all registered investment companies with which FMR has management contracts. Under the contract's tiered asset breakpoint schedule, the group fee rate is lower as total fund assets under FMR's management increase, and higher as total fund assets under FMR's management decrease. The Board considered that the prior description would have excluded the assets of 64 Fidelity sector funds from the group fee rate calculation once Fidelity SelectCo, LLC, an affiliate of FMR, assumed management responsibilities for those funds. The Board noted that modifying the description of the group fee rate to continue to include the assets of those 64 funds for purposes of determining group fee rate breakpoints would avoid an immediate adverse impact on the group fee rate for any fund.
Additional Information Requested by the Board. In order to develop fully the factual basis for consideration of the Fidelity funds' Advisory Contracts, the Board requested and received additional information on certain topics, including: (i) fund performance trends and Fidelity's long-term strategies for certain funds; (ii) the potential to further rationalize the Fidelity fund lineup with the possibility of achieving savings for the funds and Fidelity; (iii) the methodology with respect to competitive fund data and peer group classifications; (iv) the arrangements with, and performance of, certain sub-advisers on behalf of the Fidelity funds, as well as certain proposed participating affiliate arrangements; (v) the realization of fall-out benefits in certain Fidelity business units; (vi) Fidelity's group fee structures, including the rationale for the individual fee rates of certain categories of funds and the definition of group assets; (vii) trends regarding industry use of performance fee structures and the performance adjustment methodologies applicable to the Fidelity funds; (viii) additional competitive analysis regarding the total expenses for certain classes; and (ix) fund profitability methodology, including Fidelity's cost allocation methodology, and the impact of certain factors on fund profitability results.
Based on its evaluation of all of the conclusions noted above, and after considering all factors it believed relevant, the Board ultimately concluded that the advisory fee structures are fair and reasonable, and that the fund's Advisory Contracts should be renewed.
Annual Report
Investment Adviser
Fidelity Management & Research Company
Boston, MA
Investment Sub-Advisers
FMR Co., Inc.
Fidelity Management & Research (U.K.) Inc.
Fidelity Management & Research (Hong Kong) Limited
Fidelity Management & Research (Japan) Inc.
FIL Investment Advisors
FIL Investment Advisors (UK) Limited
FIL Investments (Japan) Limited
General Distributor
Fidelity Distributors Corporation
Smithfield, RI
Transfer and Service Agents
Fidelity Investments Institutional Operations Company, Inc.
Boston, MA
Fidelity Service Company, Inc.
Boston, MA
Custodian
State Street Bank and Trust Company
Quincy, MA
VIPEMR-ANN-0214
1.888698.105
Fidelity® Variable Insurance Products:
Growth Stock Portfolio
Annual Report
December 31, 2013
(Fidelity Cover Art)
Contents
Performance | (Click Here) | How the fund has done over time. |
Management's Discussion of Fund Performance | (Click Here) | The Portfolio Manager's review of fund performance and strategy. |
Shareholder Expense Example | (Click Here) | An example of shareholder expenses. |
Investment Changes | (Click Here) | A summary of major shifts in the fund's investments over the past six months. |
Investments | (Click Here) | A complete list of the fund's investments with their market values. |
Financial Statements | (Click Here) | Statements of assets and liabilities, operations, and changes in net assets, as well as financial highlights. |
Notes | (Click Here) | Notes to the financial statements. |
Report of Independent Registered Public Accounting Firm | (Click Here) | |
Trustees and Officers | (Click Here) | |
Distributions | (Click Here) | |
Board Approval of Investment Advisory Contracts and Management Fees | (Click Here) | |
To view a fund's proxy voting guidelines and proxy voting record for the 12-month period ended June 30, visit http://www.fidelity.com/proxyvotingresults or visit the Securities and Exchange Commission's (SEC) web site at http://www.sec.gov. You may also call 1-877-208-0098 to request a free copy of the proxy voting guidelines.
Fidelity Variable Insurance Products are separate account options which are purchased through a variable insurance contract.
Standard & Poor's, S&P and S&P 500 are registered service marks of The McGraw-Hill Companies, Inc. and have been licensed for use by Fidelity Distributors Corporation.
Other third-party marks appearing herein are the property of their respective owners.
All other marks appearing herein are registered or unregistered trademarks or service marks of FMR LLC or an affiliated company. © 2014 FMR LLC. All rights reserved.
This report and the financial statements contained herein are submitted for the general information of the shareholders of the fund. This report is not authorized for distribution to prospective investors in the fund unless preceded or accompanied by an effective prospectus.
A fund files its complete schedule of portfolio holdings with the SEC for the first and third quarters of each fiscal year on Form N-Q. Forms N-Q are available on the SEC's web site at http://www.sec.gov. A fund's Forms N-Q may be reviewed and copied at the SEC's Public Reference Room in Washington, DC. Information regarding the operation of the SEC's Public Reference Room may be obtained by calling 1-800-SEC-0330. For a complete list of a fund's portfolio holdings, view the most recent holdings listing, semiannual report, or annual report on Fidelity's web site at http://www.fidelity.com, http://www.advisor.fidelity.com, or http://www.401k.com, as applicable.
NOT FDIC INSURED • MAY LOSE VALUE • NO BANK GUARANTEE
Neither the fund nor Fidelity Distributors Corporation is a bank.
Annual Report
Average annual total return reflects the change in the value of an investment, assuming reinvestment of the class' distributions from dividend income and capital gains (the profits earned upon the sale of securities that have grown in value, if any) and assuming a constant rate of performance each year. During periods of reimbursement by Fidelity, a fund's total return will be greater than it would be had the reimbursement not occurred. Performance numbers are net of all underlying fund operating expenses, but do not include any insurance charges imposed by your insurance company's separate account. If performance information included the effect of these additional charges, the total returns would have been lower. How a fund did yesterday is no guarantee of how it will do tomorrow.
Average Annual Total Returns
Periods ended December 31, 2013 | Past 1
year | Past 5
years | Past 10
years |
VIP Growth Stock Portfolio - Initial Class | 34.87% | 22.86% | 7.78% |
VIP Growth Stock Portfolio - Service Class | 34.73% | 22.73% | 7.68% |
VIP Growth Stock Portfolio - Service Class 2 | 34.61% | 22.55% | 7.52% |
VIP Growth Stock Portfolio - Investor Class A | 34.73% | 22.75% | 7.69% |
A The initial offering of Investor Class shares took place on July 21, 2005. Returns prior to July 21, 2005 are those of Initial Class. Had Investor Class's transfer agent fee been reflected, returns prior to July 21, 2005, would have been lower.
$10,000 Over 10 Years
Let's say hypothetically that $10,000 was invested in VIP Growth Stock Portfolio - Initial Class on December 31, 2003. The chart shows how the value of your investment would have changed, and also shows how the Russell 1000® Growth Index performed over the same period.
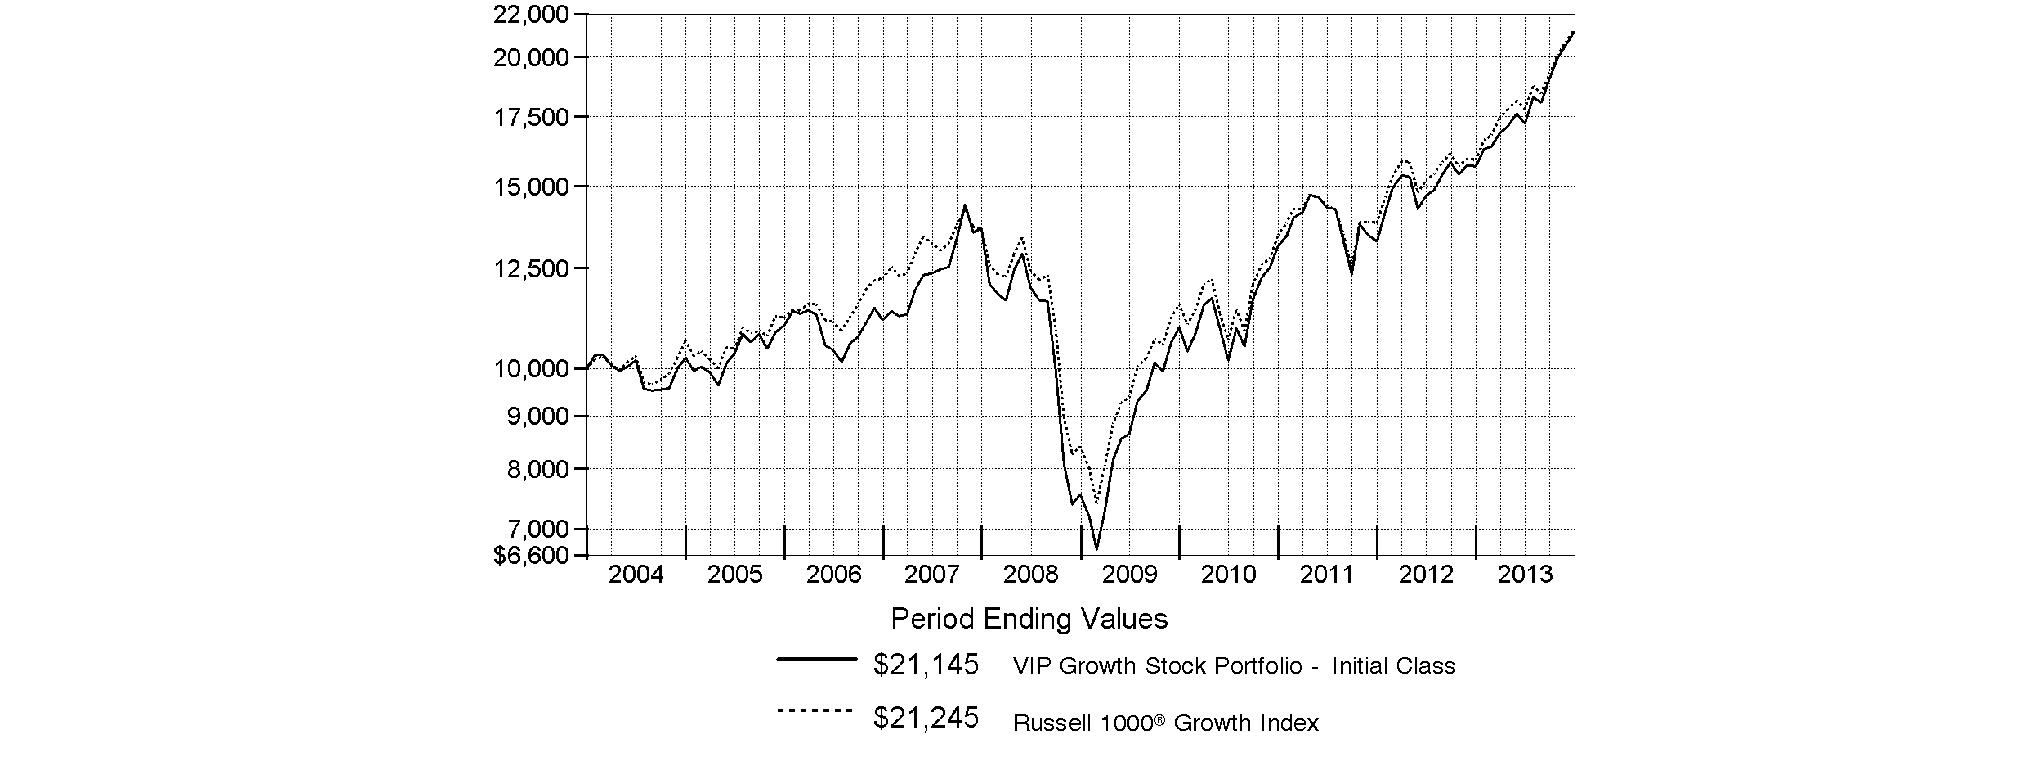
Annual Report
Market Recap: Global equity markets remained upbeat for the 12 months ending December 31, 2013, propelling the MSCI® ACWI® (All Country World Index) Index to a 23.24% return. Midyear turbulence gave way by autumn when policymakers in the U.S. and China had made clear their intentions to maintain accommodative monetary policies. That stance, combined with modest cyclical improvement around the globe and generally low valuations, underpinned the broad rally in equities, although the relative strength of the U.S. dollar generally tempered gains for U.S. investors holding foreign securities based in local currencies. During the period, the broad-market S&P 500® Index set a series of new highs, finishing the year up 32.39%. For the first time since 1995, the S&P® scored a "perfect 10," with all 10 economic sectors gaining at least 10% for the year. A resurgence in growth-oriented stocks lifted the Nasdaq Composite Index® to a 40.12% result for 2013, while the blue-chip Dow Jones Industrial AverageSM notched a relatively more modest 29.65% gain. International developed-markets equities rose in concert with their U.S. counterparts, with the MSCI® EAFE® Index gaining 22.92% for the period. Meanwhile, foreign exchange and commodity weakness curbed results in resource-heavy emerging markets (EM), especially in the year's waning months. More generally, concern over EM's slowing growth, its declining share of global trade and uncertainty surrounding U.S. central bank intentions were all factors hampering performance. The MSCI Emerging Markets Index returned -2.27% for the period. On the bond side, U.S. high-yield securities rallied with equities for much of the period, with The BofA Merrill LynchSM US High Yield Constrained Index returning 7.41% for 2013. The more rate-sensitive U.S. investment-grade bond category faced headwinds though, as reflected in the -2.02% return of the Barclays® U.S. Aggregate Bond Index. Within the Barclays index, investment-grade corporate credit returned -2.01%, while ultra-safe U.S. Treasuries saw a -2.75% result. Major non-U.S. developed markets performed only slightly better, with the Citigroup Non-USD Group-of-Seven (G7) Equal Weighted Index logging a -1.59% result. After several years of strong advances, EM debt reversed course in 2013, with the J.P. Morgan Emerging Markets Bond Index Global returning -6.58%.
Comments from Daniel Kelley, Portfolio Manager of VIP Growth Stock Portfolio: For the year, the fund's share classes beat the 33.48% advance of its benchmark, the Russell 1000® Growth Index. (For specific portfolio results, please refer to the performance section of this report.) The fund's focus on stocks with mispriced earnings growth led to outperformance in the health care and information technology sectors. Top individual contributors included biotechnology leader Gilead Sciences, whose share price benefited from better-than-expected trial data for a new hepatitis C treatment and then its approval by the U.S. Food and Drug Administration. Winners in technology included social media company Facebook, which saw increased advertising revenues fuel a return of over 100% for the year. Underweighting more-defensive, dividend-paying stocks, such as IBM, also helped, as bond-proxy-type investments lagged the market. IBM was not in the portfolio at period end. By contrast, security selection in consumer discretionary detracted, due in part to a stake in teen retailer American Eagle Outfitters. The stock appeared to have strong earnings growth prospects under a new CEO, but declined as slowing mall traffic led to product markdowns across the industry. The position was no longer held at period end. Elsewhere, semiconductor stock Broadcom slid, due to weakness in its mobile business and a recent acquisition that unsettled investors.
The views expressed above reflect those of the portfolio manager(s) only through the end of the period as stated on the cover of this report and do not necessarily represent the views of Fidelity or any other person in the Fidelity organization. Any such views are subject to change at any time based upon market or other conditions and Fidelity disclaims any responsibility to update such views. These views may not be relied on as investment advice and, because investment decisions for a Fidelity fund are based on numerous factors, may not be relied on as an indication of trading intent on behalf of any Fidelity fund.
Annual Report
As a shareholder of the Fund, you incur two types of costs: (1) transaction costs, and (2) ongoing costs, including management fees, distribution and/or service (12b-1) fees and other Fund expenses. This Example is intended to help you understand your ongoing costs (in dollars) of investing in the Fund and to compare these costs with the ongoing costs of investing in other mutual funds.
The Example is based on an investment of $1,000 invested at the beginning of the period and held for the entire period (July 1, 2013 to December 31, 2013).
Actual Expenses
The first line of the accompanying table for each class of the Fund provides information about actual account values and actual expenses. You may use the information in this line, together with the amount you invested, to estimate the expenses that you paid over the period. Simply divide your account value by $1,000.00 (for example, an $8,600 account value divided by $1,000.00 = 8.6), then multiply the result by the number in the first line for a class of the Fund under the heading entitled "Expenses Paid During Period" to estimate the expenses you paid on your account during this period. The estimate of expenses does not include any fees or other expenses of any variable annuity or variable life insurance product. If they were, the estimate of expenses you paid during the period would be higher, and your ending account value would be lower. In addition, the Fund, as a shareholder in the underlying Fidelity Central Funds, will indirectly bear its pro-rata share of the fees and expenses incurred by the underlying Fidelity Central Funds. These fees and expenses are not included in the Fund's annualized expense ratio used to calculate the expense estimate in the table below.
Hypothetical Example for Comparison Purposes
The second line of the accompanying table for each class of the Fund provides information about hypothetical account values and hypothetical expenses based on a Class' actual expense ratio and an assumed rate of return of 5% per year before expenses, which is not the Class' actual return. The hypothetical account values and expenses may not be used to estimate the actual ending account balance or expenses you paid for the period. You may use this information to compare the ongoing costs of investing in the Fund and other funds. To do so, compare this 5% hypothetical example with the 5% hypothetical examples that appear in the shareholder reports of the other funds. The estimate of expenses does not include any fees or other expenses of any variable annuity or variable life insurance product. If they were, the estimate of expenses you paid during the period would be higher, and your ending account value would be lower. In addition, the Fund, as a shareholder in the underlying Fidelity Central Funds, will indirectly bear its pro-rata share of the fees and expenses incurred by the underlying Fidelity Central Funds. These fees and expenses are not included in the Fund's annualized expense ratio used to calculate the expense estimate in the table below.
Please note that the expenses shown in the table are meant to highlight your ongoing costs only and do not reflect any transaction costs. Therefore, the second line of the table is useful in comparing ongoing costs only, and will not help you determine the relative total costs of owning different funds.
| Annualized
Expense RatioB | Beginning
Account Value
July 1, 2013 | Ending
Account Value
December 31, 2013 | Expenses Paid
During Period*
July 1, 2013
to December 31, 2013 |
Initial Class | .75% | | | |
Actual | | $ 1,000.00 | $ 1,226.90 | $ 4.21 |
HypotheticalA | | $ 1,000.00 | $ 1,021.42 | $ 3.82 |
Service Class | .84% | | | |
Actual | | $ 1,000.00 | $ 1,226.30 | $ 4.71 |
HypotheticalA | | $ 1,000.00 | $ 1,020.97 | $ 4.28 |
Service Class 2 | .99% | | | |
Actual | | $ 1,000.00 | $ 1,226.00 | $ 5.55 |
HypotheticalA | | $ 1,000.00 | $ 1,020.21 | $ 5.04 |
Investor Class | .83% | | | |
Actual | | $ 1,000.00 | $ 1,226.20 | $ 4.66 |
HypotheticalA | | $ 1,000.00 | $ 1,021.02 | $ 4.23 |
A 5% return per year before expenses
B Annualized expense ratio reflects expenses net of applicable fee waivers.
* Expenses are equal to each Class' annualized expense ratio, multiplied by the average account value over the period, multiplied by 184/365 (to reflect the one-half year period).
Annual Report
Investment Changes (Unaudited)
Top Ten Stocks as of December 31, 2013 |
| % of fund's
net assets | % of fund's net assets
6 months ago |
Google, Inc. Class A | 5.4 | 4.8 |
Apple, Inc. | 4.4 | 3.9 |
Microsoft Corp. | 3.3 | 1.7 |
Facebook, Inc. Class A | 3.0 | 0.3 |
The Coca-Cola Co. | 2.6 | 2.8 |
Home Depot, Inc. | 2.2 | 2.5 |
Gilead Sciences, Inc. | 2.2 | 2.3 |
Amazon.com, Inc. | 2.1 | 1.5 |
Twenty-First Century Fox, Inc. Class A | 1.9 | 0.7 |
Visa, Inc. Class A | 1.8 | 1.7 |
| 28.9 | |
Top Five Market Sectors as of December 31, 2013 |
| % of fund's
net assets | % of fund's net assets
6 months ago |
Information Technology | 28.6 | 25.9 |
Consumer Discretionary | 20.2 | 20.8 |
Health Care | 15.0 | 16.1 |
Industrials | 11.3 | 10.9 |
Consumer Staples | 9.3 | 10.9 |
Asset Allocation (% of fund's net assets) |
As of December 31, 2013 * | As of June 30, 2013 ** |
 | Stocks 99.2% | | | Stocks 99.2% | |
 | Short-Term
Investments and
Net Other Assets (Liabilities) 0.8% | | | Short-Term
Investments and
Net Other Assets (Liabilities) 0.8% | |
* Foreign investments | 9.3% | | ** Foreign investments | 8.3% | |

Annual Report
Investments December 31, 2013
Showing Percentage of Net Assets
Common Stocks - 99.2% |
| Shares | | Value |
CONSUMER DISCRETIONARY - 20.2% |
Auto Components - 0.8% |
Johnson Controls, Inc. | 22,718 | | $ 1,165,433 |
Automobiles - 0.4% |
Tesla Motors, Inc. (a) | 3,900 | | 586,482 |
Diversified Consumer Services - 1.1% |
H&R Block, Inc. | 56,367 | | 1,636,898 |
Hotels, Restaurants & Leisure - 3.0% |
Las Vegas Sands Corp. | 15,440 | | 1,217,753 |
McDonald's Corp. | 6,023 | | 584,412 |
Starbucks Corp. | 17,732 | | 1,390,011 |
Wyndham Worldwide Corp. | 8,191 | | 603,595 |
Yum! Brands, Inc. | 12,275 | | 928,113 |
| | 4,723,884 |
Internet & Catalog Retail - 3.4% |
Amazon.com, Inc. (a) | 8,303 | | 3,311,153 |
Netflix, Inc. (a) | 1,400 | | 515,438 |
priceline.com, Inc. (a) | 1,100 | | 1,278,640 |
Qunar Cayman Islands Ltd. sponsored ADR | 9,237 | | 245,058 |
| | 5,350,289 |
Media - 3.3% |
Comcast Corp. Class A | 41,559 | | 2,159,613 |
Twenty-First Century Fox, Inc. Class A | 85,872 | | 3,020,977 |
| | 5,180,590 |
Multiline Retail - 0.6% |
Dollar General Corp. (a) | 16,372 | | 987,559 |
Specialty Retail - 5.0% |
Best Buy Co., Inc. | 18,477 | | 736,863 |
Home Depot, Inc. | 42,310 | | 3,483,805 |
Restoration Hardware Holdings, Inc. (a)(d) | 9,369 | | 630,534 |
TJX Companies, Inc. | 24,700 | | 1,574,131 |
Tractor Supply Co. | 7,300 | | 566,334 |
Urban Outfitters, Inc. (a) | 20,200 | | 749,420 |
| | 7,741,087 |
Textiles, Apparel & Luxury Goods - 2.6% |
adidas AG | 7,800 | | 994,070 |
Michael Kors Holdings Ltd. (a) | 3,673 | | 298,211 |
NIKE, Inc. Class B | 14,734 | | 1,158,682 |
Under Armour, Inc. Class A (sub. vtg.) (a) | 3,400 | | 296,820 |
VF Corp. | 19,668 | | 1,226,103 |
| | 3,973,886 |
TOTAL CONSUMER DISCRETIONARY | | 31,346,108 |
CONSUMER STAPLES - 9.3% |
Beverages - 3.3% |
Beam, Inc. | 4,200 | | 285,852 |
|
| Shares | | Value |
Monster Beverage Corp. (a) | 10,865 | | $ 736,321 |
The Coca-Cola Co. | 98,369 | | 4,063,623 |
| | 5,085,796 |
Food & Staples Retailing - 1.4% |
CVS Caremark Corp. | 10,746 | | 769,091 |
Kroger Co. | 11,650 | | 460,525 |
Whole Foods Market, Inc. | 15,700 | | 907,931 |
| | 2,137,547 |
Food Products - 2.6% |
Bunge Ltd. | 21,698 | | 1,781,623 |
Green Mountain Coffee Roasters, Inc. | 6,802 | | 514,095 |
Mead Johnson Nutrition Co. Class A | 7,776 | | 651,318 |
WhiteWave Foods Co. (a) | 49,706 | | 1,140,256 |
| | 4,087,292 |
Tobacco - 2.0% |
Altria Group, Inc. | 26,392 | | 1,013,189 |
Japan Tobacco, Inc. | 17,400 | | 566,174 |
Lorillard, Inc. | 31,521 | | 1,597,484 |
| | 3,176,847 |
TOTAL CONSUMER STAPLES | | 14,487,482 |
ENERGY - 4.0% |
Energy Equipment & Services - 2.0% |
Ensco PLC Class A | 21,100 | | 1,206,498 |
National Oilwell Varco, Inc. | 6,208 | | 493,722 |
Schlumberger Ltd. | 15,856 | | 1,428,784 |
| | 3,129,004 |
Oil, Gas & Consumable Fuels - 2.0% |
Cabot Oil & Gas Corp. | 27,382 | | 1,061,326 |
Concho Resources, Inc. (a) | 4,293 | | 463,644 |
Noble Energy, Inc. | 8,104 | | 551,963 |
Pioneer Natural Resources Co. | 800 | | 147,256 |
Suncor Energy, Inc. | 24,600 | | 862,418 |
| | 3,086,607 |
TOTAL ENERGY | | 6,215,611 |
FINANCIALS - 5.7% |
Capital Markets - 0.9% |
Morgan Stanley | 19,139 | | 600,199 |
The Blackstone Group LP | 24,468 | | 770,742 |
| | 1,370,941 |
Commercial Banks - 0.5% |
Wells Fargo & Co. | 17,030 | | 773,162 |
Consumer Finance - 2.2% |
American Express Co. | 11,600 | | 1,052,468 |
Capital One Financial Corp. | 21,000 | | 1,608,810 |
SLM Corp. | 28,104 | | 738,573 |
| | 3,399,851 |
Common Stocks - continued |
| Shares | | Value |
FINANCIALS - continued |
Diversified Financial Services - 2.1% |
Bank of America Corp. | 78,356 | | $ 1,220,003 |
Citigroup, Inc. | 16,689 | | 869,664 |
JPMorgan Chase & Co. | 20,200 | | 1,181,296 |
| | 3,270,963 |
TOTAL FINANCIALS | | 8,814,917 |
HEALTH CARE - 15.0% |
Biotechnology - 7.8% |
Alexion Pharmaceuticals, Inc. (a) | 6,260 | | 832,956 |
Amgen, Inc. | 22,069 | | 2,519,397 |
Biogen Idec, Inc. (a) | 5,800 | | 1,622,550 |
BioMarin Pharmaceutical, Inc. (a) | 3,205 | | 225,215 |
Cubist Pharmaceuticals, Inc. | 22,857 | | 1,574,162 |
Gilead Sciences, Inc. (a) | 44,986 | | 3,380,698 |
Pharmacyclics, Inc. (a) | 4,234 | | 447,873 |
Theravance, Inc. (a) | 42,639 | | 1,520,080 |
| | 12,122,931 |
Health Care Equipment & Supplies - 1.4% |
Boston Scientific Corp. (a) | 153,829 | | 1,849,025 |
Intuitive Surgical, Inc. (a) | 700 | | 268,856 |
| | 2,117,881 |
Health Care Providers & Services - 1.1% |
Catamaran Corp. (a) | 3,188 | | 151,409 |
DaVita Healthcare Partners, Inc. (a) | 18,684 | | 1,184,005 |
McKesson Corp. | 2,460 | | 397,044 |
| | 1,732,458 |
Health Care Technology - 0.4% |
Cerner Corp. (a) | 11,582 | | 645,581 |
Life Sciences Tools & Services - 0.8% |
Illumina, Inc. (a) | 10,896 | | 1,205,316 |
Pharmaceuticals - 3.5% |
AbbVie, Inc. | 9,865 | | 520,971 |
Actavis PLC (a) | 13,961 | | 2,345,448 |
Bristol-Myers Squibb Co. | 26,941 | | 1,431,914 |
Perrigo Co. PLC | 5,800 | | 890,068 |
Salix Pharmaceuticals Ltd. (a) | 3,000 | | 269,820 |
| | 5,458,221 |
TOTAL HEALTH CARE | | 23,282,388 |
INDUSTRIALS - 11.3% |
Aerospace & Defense - 4.1% |
Meggitt PLC | 32,000 | | 279,524 |
Textron, Inc. | 11,883 | | 436,819 |
The Boeing Co. | 17,198 | | 2,347,355 |
TransDigm Group, Inc. | 6,800 | | 1,094,936 |
United Technologies Corp. | 19,163 | | 2,180,749 |
| | 6,339,383 |
|
| Shares | | Value |
Air Freight & Logistics - 1.3% |
United Parcel Service, Inc. Class B | 18,952 | | $ 1,991,476 |
Airlines - 0.6% |
American Airlines Group, Inc. (a)(d) | 19,100 | | 482,275 |
Delta Air Lines, Inc. | 15,382 | | 422,544 |
| | 904,819 |
Building Products - 1.1% |
A.O. Smith Corp. | 31,260 | | 1,686,164 |
Construction & Engineering - 0.3% |
URS Corp. | 9,548 | | 505,949 |
Electrical Equipment - 1.8% |
Emerson Electric Co. | 16,265 | | 1,141,478 |
Generac Holdings, Inc. | 29,893 | | 1,693,140 |
| | 2,834,618 |
Industrial Conglomerates - 0.4% |
3M Co. | 3,823 | | 536,176 |
Machinery - 1.0% |
Cummins, Inc. | 7,127 | | 1,004,693 |
Manitowoc Co., Inc. | 23,836 | | 555,856 |
| | 1,560,549 |
Road & Rail - 0.7% |
CSX Corp. | 30,445 | | 875,903 |
Union Pacific Corp. | 1,553 | | 260,904 |
| | 1,136,807 |
TOTAL INDUSTRIALS | | 17,495,941 |
INFORMATION TECHNOLOGY - 28.6% |
Communications Equipment - 1.6% |
QUALCOMM, Inc. | 32,513 | | 2,414,090 |
Computers & Peripherals - 4.7% |
Apple, Inc. | 12,017 | | 6,742,859 |
EMC Corp. | 18,036 | | 453,605 |
| | 7,196,464 |
Electronic Equipment & Components - 0.3% |
InvenSense, Inc. (a) | 24,576 | | 510,689 |
Internet Software & Services - 10.9% |
eBay, Inc. (a) | 8,296 | | 455,367 |
Facebook, Inc. Class A (a) | 86,314 | | 4,717,923 |
Google, Inc. Class A (a) | 7,538 | | 8,447,912 |
LinkedIn Corp. (a) | 2,055 | | 445,586 |
Naver Corp. | 1,508 | | 1,034,163 |
Tencent Holdings Ltd. | 8,800 | | 561,299 |
Yahoo!, Inc. (a) | 31,810 | | 1,286,396 |
| | 16,948,646 |
IT Services - 4.1% |
Amdocs Ltd. | 9,305 | | 383,738 |
Cognizant Technology Solutions Corp. Class A (a) | 8,900 | | 898,722 |
Common Stocks - continued |
| Shares | | Value |
INFORMATION TECHNOLOGY - continued |
IT Services - continued |
MasterCard, Inc. Class A | 2,700 | | $ 2,255,742 |
Visa, Inc. Class A | 12,500 | | 2,783,500 |
| | 6,321,702 |
Semiconductors & Semiconductor Equipment - 0.4% |
Broadcom Corp. Class A | 20,933 | | 620,663 |
Software - 6.6% |
Adobe Systems, Inc. (a) | 9,500 | | 568,860 |
Citrix Systems, Inc. (a) | 7,301 | | 461,788 |
Electronic Arts, Inc. (a) | 37,126 | | 851,670 |
Microsoft Corp. | 137,049 | | 5,129,744 |
Oracle Corp. | 12,370 | | 473,276 |
salesforce.com, Inc. (a) | 30,870 | | 1,703,715 |
ServiceNow, Inc. (a) | 3,600 | | 201,636 |
Splunk, Inc. (a) | 1,922 | | 131,984 |
Workday, Inc. Class A (a) | 9,257 | | 769,812 |
| | 10,292,485 |
TOTAL INFORMATION TECHNOLOGY | | 44,304,739 |
MATERIALS - 3.2% |
Chemicals - 2.0% |
Eastman Chemical Co. | 15,671 | | 1,264,650 |
Monsanto Co. | 15,212 | | 1,772,959 |
| | 3,037,609 |
Construction Materials - 0.2% |
Vulcan Materials Co. | 6,391 | | 379,753 |
Paper & Forest Products - 1.0% |
Boise Cascade Co. | 51,654 | | 1,522,760 |
TOTAL MATERIALS | | 4,940,122 |
TELECOMMUNICATION SERVICES - 1.9% |
Diversified Telecommunication Services - 1.0% |
Verizon Communications, Inc. | 30,361 | | 1,491,940 |
|
| Shares | | Value |
Wireless Telecommunication Services - 0.9% |
Vodafone Group PLC sponsored ADR | 34,974 | | $ 1,374,828 |
TOTAL TELECOMMUNICATION SERVICES | | 2,866,768 |
TOTAL COMMON STOCKS (Cost $119,407,081) |
153,754,076
|
Money Market Funds - 2.1% |
| | | |
Fidelity Cash Central Fund, 0.11% (b) | 2,862,978 | | 2,862,978 |
Fidelity Securities Lending Cash Central Fund, 0.11% (b)(c) | 431,150 | | 431,150 |
TOTAL MONEY MARKET FUNDS (Cost $3,294,128) |
3,294,128
|
TOTAL INVESTMENT PORTFOLIO - 101.3% (Cost $122,701,209) | | 157,048,204 |
NET OTHER ASSETS (LIABILITIES) - (1.3)% | | (2,011,807) |
NET ASSETS - 100% | $ 155,036,397 |
Legend |
(a) Non-income producing |
(b) Affiliated fund that is generally available only to investment companies and other accounts managed by Fidelity Investments. The rate quoted is the annualized seven-day yield of the fund at period end. A complete unaudited listing of the fund's holdings as of its most recent quarter end is available upon request. In addition, each Fidelity Central Fund's financial statements, which are not covered by the Fund's Report of Independent Registered Public Accounting Firm, are available on the SEC's website or upon request. |
(c) Investment made with cash collateral received from securities on loan. |
(d) Security or a portion of the security is on loan at period end. |
Affiliated Central Funds |
Information regarding fiscal year to date income earned by the Fund from investments in Fidelity Central Funds is as follows: |
Fund | Income earned |
Fidelity Cash Central Fund | $ 1,744 |
Fidelity Securities Lending Cash Central Fund | 3,838 |
Total | $ 5,582 |
Other Information |
The following is a summary of the inputs used, as of December 31, 2013, involving the Fund's assets and liabilities carried at fair value. The inputs or methodology used for valuing securities may not be an indication of the risk associated with investing in those securities. For more information on valuation inputs, and their aggregation into the levels used in the table below, please refer to the Investment Valuation section in the accompanying Notes to Financial Statements. |
Valuation Inputs at Reporting Date: |
Description | Total | Level 1 | Level 2 | Level 3 |
Investments in Securities: | | | | |
Equities: | | | | |
Consumer Discretionary | $ 31,346,108 | $ 31,346,108 | $ - | $ - |
Consumer Staples | 14,487,482 | 13,921,308 | 566,174 | - |
Energy | 6,215,611 | 6,215,611 | - | - |
Financials | 8,814,917 | 8,814,917 | - | - |
Health Care | 23,282,388 | 23,282,388 | - | - |
Industrials | 17,495,941 | 17,495,941 | - | - |
Information Technology | 44,304,739 | 44,304,739 | - | - |
Materials | 4,940,122 | 4,940,122 | - | - |
Telecommunication Services | 2,866,768 | 2,866,768 | - | - |
Money Market Funds | 3,294,128 | 3,294,128 | - | - |
Total Investments in Securities: | $ 157,048,204 | $ 156,482,030 | $ 566,174 | $ - |
See accompanying notes which are an integral part of the financial statements.
Annual Report
Statement of Assets and Liabilities
| December 31, 2013 |
| | |
Assets | | |
Investment in securities, at value (including securities loaned of $428,375) - See accompanying schedule: Unaffiliated issuers (cost $119,407,081) | $ 153,754,076 | |
Fidelity Central Funds (cost $3,294,128) | 3,294,128 | |
Total Investments (cost $122,701,209) | | $ 157,048,204 |
Foreign currency held at value (cost $47,814) | | 47,917 |
Receivable for investments sold | | 2,009,521 |
Receivable for fund shares sold | | 105,441 |
Dividends receivable | | 90,133 |
Distributions receivable from Fidelity Central Funds | | 1,306 |
Prepaid expenses | | 334 |
Other receivables | | 1,012 |
Total assets | | 159,303,868 |
| | |
Liabilities | | |
Payable for investments purchased | $ 3,667,353 | |
Payable for fund shares redeemed | 19,043 | |
Accrued management fee | 68,251 | |
Distribution and service plan fees payable | 11,232 | |
Other affiliated payables | 18,375 | |
Other payables and accrued expenses | 52,067 | |
Collateral on securities loaned, at value | 431,150 | |
Total liabilities | | 4,267,471 |
| | |
Net Assets | | $ 155,036,397 |
Net Assets consist of: | | |
Paid in capital | | $ 117,828,319 |
Distributions in excess of net investment income | | (50,865) |
Accumulated undistributed net realized gain (loss) on investments and foreign currency transactions | | 2,912,411 |
Net unrealized appreciation (depreciation) on investments and assets and liabilities in foreign currencies | | 34,346,532 |
Net Assets | | $ 155,036,397 |
Statement of Assets and Liabilities - continued
| December 31, 2013 |
| | |
Initial Class:
Net Asset Value, offering price and redemption price per share ($18,411,877 ÷ 935,912 shares) | | $ 19.67 |
| | |
Service Class:
Net Asset Value, offering price and redemption price per share ($579,918 ÷ 29,693 shares) | | $ 19.53 |
| | |
Service Class 2:
Net Asset Value, offering price and redemption price per share ($54,480,995 ÷ 2,824,692 shares) | | $ 19.29 |
| | |
Investor Class:
Net Asset Value, offering price and redemption price per share ($81,563,607 ÷ 4,179,785 shares) | | $ 19.51 |
See accompanying notes which are an integral part of the financial statements.
Annual Report
Financial Statements - continued
Statement of Operations
| Year ended December 31, 2013 |
| | |
Investment Income | | |
Dividends | | $ 1,748,490 |
Income from Fidelity Central Funds | | 5,582 |
Total income | | 1,754,072 |
| | |
Expenses | | |
Management fee | $ 713,542 | |
Transfer agent fees | 143,724 | |
Distribution and service plan fees | 132,424 | |
Accounting and security lending fees | 50,259 | |
Custodian fees and expenses | 72,943 | |
Independent trustees' compensation | 662 | |
Audit | 53,050 | |
Legal | 730 | |
Miscellaneous | 1,286 | |
Total expenses before reductions | 1,168,620 | |
Expense reductions | (12,413) | 1,156,207 |
Net investment income (loss) | | 597,865 |
Realized and Unrealized Gain (Loss) Net realized gain (loss) on: | | |
Investment securities: | | |
Unaffiliated issuers | 16,676,920 | |
Foreign currency transactions | 1,943 | |
Total net realized gain (loss) | | 16,678,863 |
Change in net unrealized appreciation (depreciation) on: Investment securities | 21,701,315 | |
Assets and liabilities in foreign currencies | (393) | |
Total change in net unrealized appreciation (depreciation) | | 21,700,922 |
Net gain (loss) | | 38,379,785 |
Net increase (decrease) in net assets resulting from operations | | $ 38,977,650 |
Statement of Changes in Net Assets
| Year ended
December 31,
2013 | Year ended
December 31,
2012 |
Increase (Decrease) in Net Assets | | |
Operations | | |
Net investment income (loss) | $ 597,865 | $ 670,531 |
Net realized gain (loss) | 16,678,863 | 1,864,140 |
Change in net unrealized appreciation (depreciation) | 21,700,922 | 9,938,842 |
Net increase (decrease) in net assets resulting from operations | 38,977,650 | 12,473,513 |
Distributions to shareholders from net investment income | (591,489) | (808,310) |
Distributions to shareholders from net realized gain | (12,481,900) | - |
Total distributions | (13,073,389) | (808,310) |
Share transactions - net increase (decrease) | 18,953,174 | 64,011,977 |
Total increase (decrease) in net assets | 44,857,435 | 75,677,180 |
| | |
Net Assets | | |
Beginning of period | 110,178,962 | 34,501,782 |
End of period (including distributions in excess of net investment income of $50,865 and distributions in excess of net investment income of $840, respectively) | $ 155,036,397 | $ 110,178,962 |
See accompanying notes which are an integral part of the financial statements.
Annual Report
Financial Highlights - Initial Class
Years ended December 31, | 2013 | 2012 | 2011 | 2010 | 2009 |
Selected Per-Share Data | | | | | |
Net asset value, beginning of period | $ 16.01 | $ 13.64 | $ 13.53 | $ 11.27 | $ 7.81 |
Income from Investment Operations | | | | | |
Net investment income (loss) C | .11 | .12 | .01 | - G | .04 |
Net realized and unrealized gain (loss) | 5.40 | 2.39 | .10 | 2.26 | 3.46 |
Total from investment operations | 5.51 | 2.51 | .11 | 2.26 | 3.50 |
Distributions from net investment income | (.11) | (.14) | - | - | (.04) |
Distributions from net realized gain | (1.74) | - | - | - | - |
Total distributions | (1.85) | (.14) | - | - | (.04) |
Net asset value, end of period | $ 19.67 | $ 16.01 | $ 13.64 | $ 13.53 | $ 11.27 |
Total Return A, B | 34.87% | 18.39% | .81% | 20.05% | 44.86% |
Ratios to Average Net Assets D, F | | | | | |
Expenses before reductions | .77% | .79% | .96% | 1.09% | 1.35% |
Expenses net of fee waivers, if any | .77% | .79% | .85% | .85% | .85% |
Expenses net of all reductions | .76% | .78% | .84% | .84% | .84% |
Net investment income (loss) | .60% | .80% | .07% | .01% | .39% |
Supplemental Data | | | | | |
Net assets, end of period (000 omitted) | $ 18,412 | $ 12,634 | $ 9,012 | $ 7,008 | $ 5,374 |
Portfolio turnover rate E | 158% | 166% | 84% | 114% | 173% |
A Total returns do not reflect charges attributable to your insurance company's separate account. Inclusion of these charges would reduce the total returns shown.
B Total returns would have been lower if certain expenses had not been reduced during the applicable periods shown.
C Calculated based on average shares outstanding during the period.
D Fees and expenses of any underlying Fidelity Central Funds are not included in the Fund's expense ratio. The Fund indirectly bears its proportionate share of the expenses of any underlying Fidelity Central Funds.
E Amount does not include the portfolio activity of any underlying Fidelity Central Funds.
F Expense ratios reflect operating expenses of the class. Expenses before reductions do not reflect amounts reimbursed by the investment adviser or reductions from brokerage service arrangements or reductions from other expense offset arrangements and do not represent the amount paid by the class during periods when reimbursements or reductions occur. Expenses net of fee waivers reflect expenses after reimbursement by the investment adviser but prior to reductions from brokerage service arrangements or other expense offset arrangements. Expenses net of all reductions represent the net expenses paid by the class.
G Amount represents less than $.01 per share.
Financial Highlights - Service Class
Years ended December 31, | 2013 | 2012 | 2011 | 2010 | 2009 |
Selected Per-Share Data | | | | | |
Net asset value, beginning of period | $ 15.91 | $ 13.55 | $ 13.46 | $ 11.22 | $ 7.78 |
Income from Investment Operations | | | | | |
Net investment income (loss) C | .09 | .11 | - G | (.01) | .03 |
Net realized and unrealized gain (loss) | 5.36 | 2.37 | .09 | 2.25 | 3.44 |
Total from investment operations | 5.45 | 2.48 | .09 | 2.24 | 3.47 |
Distributions from net investment income | (.09) | (.12) | - | - | (.03) |
Distributions from net realized gain | (1.74) | - | - | - | - |
Total distributions | (1.83) | (.12) | - | - | (.03) |
Net asset value, end of period | $ 19.53 | $ 15.91 | $ 13.55 | $ 13.46 | $ 11.22 |
Total Return A, B | 34.73% | 18.35% | .67% | 19.96% | 44.61% |
Ratios to Average Net Assets D, F | | | | | |
Expenses before reductions | .86% | .87% | 1.04% | 1.17% | 1.42% |
Expenses net of fee waivers, if any | .86% | .87% | .95% | .95% | .95% |
Expenses net of all reductions | .85% | .86% | .94% | .94% | .94% |
Net investment income (loss) | .51% | .72% | (.03)% | (.10)% | .30% |
Supplemental Data | | | | | |
Net assets, end of period (000 omitted) | $ 580 | $ 476 | $ 402 | $ 573 | $ 823 |
Portfolio turnover rate E | 158% | 166% | 84% | 114% | 173% |
A Total returns do not reflect charges attributable to your insurance company's separate account. Inclusion of these charges would reduce the total returns shown.
B Total returns would have been lower if certain expenses had not been reduced during the applicable periods shown.
C Calculated based on average shares outstanding during the period.
D Fees and expenses of any underlying Fidelity Central Funds are not included in the Fund's expense ratio. The Fund indirectly bears its proportionate share of the expenses of any underlying Fidelity Central Funds.
E Amount does not include the portfolio activity of any underlying Fidelity Central Funds.
F Expense ratios reflect operating expenses of the class. Expenses before reductions do not reflect amounts reimbursed by the investment adviser or reductions from brokerage service arrangements or reductions from other expense offset arrangements and do not represent the amount paid by the class during periods when reimbursements or reductions occur. Expenses net of fee waivers reflect expenses after reimbursement by the investment adviser but prior to reductions from brokerage service arrangements or other expense offset arrangements. Expenses net of all reductions represent the net expenses paid by the class.
G Amount represents less than $.01 per share.
See accompanying notes which are an integral part of the financial statements.
Annual Report
Financial Highlights - Service Class 2
Years ended December 31, | 2013 | 2012 | 2011 | 2010 | 2009 |
Selected Per-Share Data | | | | | |
Net asset value, beginning of period | $ 15.72 | $ 13.39 | $ 13.33 | $ 11.13 | $ 7.71 |
Income from Investment Operations | | | | | |
Net investment income (loss) C | .06 | .09 | (.03) | (.03) | .01 |
Net realized and unrealized gain (loss) | 5.31 | 2.34 | .09 | 2.23 | 3.42 |
Total from investment operations | 5.37 | 2.43 | .06 | 2.20 | 3.43 |
Distributions from net investment income | (.06) | (.10) | - | - | (.01) |
Distributions from net realized gain | (1.74) | - | - | - | - |
Total distributions | (1.80) | (.10) | - | - | (.01) |
Net asset value, end of period | $ 19.29 | $ 15.72 | $ 13.39 | $ 13.33 | $ 11.13 |
Total Return A, B | 34.61% | 18.17% | .45% | 19.77% | 44.42% |
Ratios to Average Net Assets D, F | | | | | |
Expenses before reductions | 1.01% | 1.03% | 1.26% | 1.42% | 1.67% |
Expenses net of fee waivers, if any | 1.01% | 1.03% | 1.10% | 1.10% | 1.10% |
Expenses net of all reductions | 1.00% | 1.02% | 1.10% | 1.10% | 1.09% |
Net investment income (loss) | .36% | .57% | (.19)% | (.25)% | .15% |
Supplemental Data | | | | | |
Net assets, end of period (000 omitted) | $ 54,481 | $ 50,967 | $ 1,415 | $ 2,592 | $ 1,684 |
Portfolio turnover rate E | 158% | 166% | 84% | 114% | 173% |
A Total returns do not reflect charges attributable to your insurance company's separate account. Inclusion of these charges would reduce the total returns shown.
B Total returns would have been lower if certain expenses had not been reduced during the applicable periods shown.
C Calculated based on average shares outstanding during the period.
D Fees and expenses of any underlying Fidelity Central Funds are not included in the Fund's expense ratio. The Fund indirectly bears its proportionate share of the expenses of any underlying Fidelity Central Funds.
E Amount does not include the portfolio activity of any underlying Fidelity Central Funds.
F Expense ratios reflect operating expenses of the class. Expenses before reductions do not reflect amounts reimbursed by the investment adviser or reductions from brokerage service arrangements or reductions from other expense offset arrangements and do not represent the amount paid by the class during periods when reimbursements or reductions occur. Expenses net of fee waivers reflect expenses after reimbursement by the investment adviser but prior to reductions from brokerage service arrangements or other expense offset arrangements. Expenses net of all reductions represent the net expenses paid by the class.
Financial Highlights - Investor Class
Years ended December 31, | 2013 | 2012 | 2011 | 2010 | 2009 |
Selected Per-Share Data | | | | | |
Net asset value, beginning of period | $ 15.90 | $ 13.54 | $ 13.45 | $ 11.21 | $ 7.78 |
Income from Investment Operations | | | | | |
Net investment income (loss) C | .10 | .11 | - G | (.01) | .03 |
Net realized and unrealized gain (loss) | 5.35 | 2.38 | .09 | 2.25 | 3.44 |
Total from investment operations | 5.45 | 2.49 | .09 | 2.24 | 3.47 |
Distributions from net investment income | (.10) | (.13) | - | - | (.04) |
Distributions from net realized gain | (1.74) | - | - | - | - |
Total distributions | (1.84) | (.13) | - | - | (.04) |
Net asset value, end of period | $ 19.51 | $ 15.90 | $ 13.54 | $ 13.45 | $ 11.21 |
Total Return A, B | 34.73% | 18.39% | .67% | 19.98% | 44.64% |
Ratios to Average Net Assets D, F | | | | | |
Expenses before reductions | .84% | .86% | 1.02% | 1.16% | 1.43% |
Expenses net of fee waivers, if any | .84% | .86% | .93% | .93% | .93% |
Expenses net of all reductions | .83% | .85% | .93% | .92% | .93% |
Net investment income (loss) | .52% | .73% | (.02)% | (.08)% | .31% |
Supplemental Data | | | | | |
Net assets, end of period (000 omitted) | $ 81,564 | $ 46,103 | $ 23,672 | $ 14,427 | $ 7,044 |
Portfolio turnover rate E | 158% | 166% | 84% | 114% | 173% |
A Total returns do not reflect charges attributable to your insurance company's separate account. Inclusion of these charges would reduce the total returns shown.
B Total returns would have been lower if certain expenses had not been reduced during the applicable periods shown.
C Calculated based on average shares outstanding during the period.
D Fees and expenses of any underlying Fidelity Central Funds are not included in the Fund's expense ratio. The Fund indirectly bears its proportionate share of the expenses of any underlying Fidelity Central Funds.
E Amount does not include the portfolio activity of any underlying Fidelity Central Funds.
F Expense ratios reflect operating expenses of the class. Expenses before reductions do not reflect amounts reimbursed by the investment adviser or reductions from brokerage service arrangements or reductions from other expense offset arrangements and do not represent the amount paid by the class during periods when reimbursements or reductions occur. Expenses net of fee waivers reflect expenses after reimbursement by the investment adviser but prior to reductions from brokerage service arrangements or other expense offset arrangements. Expenses net of all reductions represent the net expenses paid by the class.
G Amount represents less than $.01 per share.
See accompanying notes which are an integral part of the financial statements.
Annual Report
Notes to Financial Statements
For the period ended December 31, 2013
1. Organization.
VIP Growth Stock Portfolio (the Fund) is a fund of Variable Insurance Products Fund II (the Trust) and is authorized to issue an unlimited number of shares. The Trust is registered under the Investment Company Act of 1940, as amended (the 1940 Act), as an open-end management investment company organized as a Massachusetts business trust. Shares of the Fund may only be purchased by insurance companies for the purpose of funding variable annuity or variable life insurance contracts. The Fund offers the following classes of shares: Initial Class shares, Service Class shares, Service Class 2 shares, and Investor Class shares. All classes have equal rights and voting privileges, except for matters affecting a single class.
2. Investments in Fidelity Central Funds.
The Fund invests in Fidelity Central Funds, which are open-end investment companies generally available only to other investment companies and accounts managed by the investment adviser and its affiliates. The Fund's Schedule of Investments lists each of the Fidelity Central Funds held as of period end, if any, as an investment of the Fund, but does not include the underlying holdings of each Fidelity Central Fund. As an Investing Fund, the Fund indirectly bears its proportionate share of the expenses of the underlying Fidelity Central Funds.
The Money Market Central Funds seek preservation of capital and current income and are managed by Fidelity Investments Money Management, Inc. (FIMM), an affiliate of the investment adviser. Annualized expenses of the Money Market Central Funds as of their most recent shareholder report date are less than .01%.
A complete unaudited list of holdings for each Fidelity Central Fund is available upon request or at the Securities and Exchange Commission (the SEC) website at www.sec.gov. In addition, the financial statements of the Fidelity Central Funds, which are not covered by the Fund's Report of Independent Registered Public Accounting Firm, are available on the SEC website or upon request.
3. Significant Accounting Policies.
The financial statements have been prepared in conformity with accounting principles generally accepted in the United States of America (GAAP), which require management to make certain estimates and assumptions at the date of the financial statements. Actual results could differ from those estimates. Subsequent events, if any, through the date that the financial statements were issued have been evaluated in the preparation of the financial statements. The following summarizes the significant accounting policies of the Fund:
Investment Valuation. Investments are valued as of 4:00 p.m. Eastern time on the last calendar day of the period. In accordance with valuation policies and procedures approved by the Board of Trustees (the Board), the Fund attempts to obtain prices from one or more third party pricing vendors or brokers to value its investments. When current market prices, quotations or currency exchange rates are not readily available or reliable, investments will be fair valued in good faith by the Fidelity Management & Research Company (FMR) Fair Value Committee (the Committee), in accordance with procedures adopted by the Board. Factors used in determining fair value vary by investment type and may include market or investment specific events. The frequency with which these procedures are used cannot be predicted and they may be utilized to a significant extent. The Committee oversees the Fund's valuation policies and procedures and is responsible for approving and reporting to the Board all fair value determinations.
The Fund categorizes the inputs to valuation techniques used to value its investments into a disclosure hierarchy consisting of three levels as shown below:
Level 1 - quoted prices in active markets for identical investments
Level 2 - other significant observable inputs (including quoted prices for similar investments, interest rates, prepayment speeds, etc.)
Level 3 - unobservable inputs (including the Fund's own assumptions based on the best information available)
Valuation techniques used to value the Fund's investments by major category are as follows:
Equity securities, including restricted securities, for which market quotations are readily available, are valued at the last reported sale price or official closing price as reported by a third party pricing vendor on the primary market or exchange on which they are traded and are categorized as Level 1 in the hierarchy. In the event there were no sales during the day or closing prices are not available, securities are valued at the last quoted bid price or may be valued using the last available price and are generally categorized as Level 2 in the hierarchy. For foreign equity securities, when market or security specific events arise, comparisons to the valuation of American Depositary Receipts (ADRs), futures contracts, Exchange-Traded Funds (ETFs) and certain indexes as well as quoted prices for similar securities may be used and would be categorized as Level 2 in the hierarchy. Utilizing these techniques may result in transfers between Level 1 and Level 2. For equity securities, including restricted securities, where observable inputs are limited, assumptions about market activity and risk are used and these securities may be categorized as Level 3 in the hierarchy.
Investments in open-end mutual funds, including the Fidelity Central Funds, are valued at their closing net asset value (NAV) each business day and are categorized as Level 1 in the hierarchy.
Annual Report
Notes to Financial Statements - continued
3. Significant Accounting Policies - continued
Investment Valuation - continued
Changes in valuation techniques may result in transfers in or out of an assigned level within the disclosure hierarchy. The aggregate value of investments by input level, as of December 31, 2013, is included at the end of the Fund's Schedule of Investments.
Foreign Currency. The Fund may use foreign currency contracts to facilitate transactions in foreign-denominated securities. Gains and losses from these transactions may arise from changes in the value of the foreign currency or if the counterparties do not perform under the contracts' terms.
Foreign-denominated assets, including investment securities, and liabilities are translated into U.S. dollars at the exchange rates at period end. Purchases and sales of investment securities, income and dividends received and expenses denominated in foreign currencies are translated into U.S. dollars at the exchange rate in effect on the transaction date.
The effects of exchange rate fluctuations on investments are included with the net realized and unrealized gain (loss) on investment securities. Other foreign currency transactions resulting in realized and unrealized gain (loss) are disclosed separately.
Investment Transactions and Income. For financial reporting purposes, the Fund's investment holdings and NAV include trades executed through the end of the last business day of the period. The NAV per share for processing shareholder transactions is calculated as of the close of business of the New York Stock Exchange (NYSE), normally 4:00 p.m. Eastern time and includes trades executed through the end of the prior business day. Gains and losses on securities sold are determined on the basis of identified cost and may include proceeds received from litigation. Dividend income is recorded on the ex-dividend date, except for certain dividends from foreign securities where the ex-dividend date may have passed, which are recorded as soon as the Fund is informed of the ex-dividend date. Non-cash dividends included in dividend income, if any, are recorded at the fair market value of the securities received. Distributions received on securities that represent a return of capital or capital gain are recorded as a reduction of cost of investments and/or as a realized gain. Subsequent to ex-dividend date the Fund determines the components of these distributions, based upon receipt of tax filings or other correspondence relating to the underlying investment. Interest income and distributions from the Fidelity Central Funds are accrued as earned. Investment income is recorded net of foreign taxes withheld where recovery of such taxes is uncertain.
Class Allocations and Expenses. Investment income, realized and unrealized capital gains and losses, common expenses of the Fund, and certain fund-level expense reductions, if any, are allocated daily on a pro-rata basis to each class based on the relative net assets of each class to the total net assets of the Fund. Each class differs with respect to transfer agent and distribution and service plan fees incurred. Certain expense reductions may also differ by class. For the reporting period, the allocated portion of income and expenses to each class as a percent of its average net assets may vary due to the timing of recording these transactions in relation to fluctuating net assets of the classes. Expenses directly attributable to a fund are charged to that fund. Expenses attributable to more than one fund are allocated among the respective funds on the basis of relative net assets or other appropriate methods. Expense estimates are accrued in the period to which they relate and adjustments are made when actual amounts are known.
Income Tax Information and Distributions to Shareholders. Each year, the Fund intends to qualify as a regulated investment company under Subchapter M of the Internal Revenue Code, including distributing substantially all of its taxable income and realized gains. As a result, no provision for U.S. Federal income taxes is required. As of December 31, 2013, the Fund did not have any unrecognized tax benefits in the financial statements; nor is the Fund aware of any tax positions for which it is reasonably possible that the total amounts of unrecognized tax benefits will significantly change in the next twelve months. The Fund files a U.S. federal tax return, in addition to state and local tax returns as required. The Fund's federal income tax returns are subject to examination by the Internal Revenue Service (IRS) for a period of three fiscal years after they are filed. State and local tax returns may be subject to examination for an additional fiscal year depending on the jurisdiction. Foreign taxes are provided for based on the Fund's understanding of the tax rules and rates that exist in the foreign markets in which it invests.
Distributions are declared and recorded on the ex-dividend date. Income dividends and capital gain distributions are declared separately for each class. Income and capital gain distributions are determined in accordance with income tax regulations, which may differ from GAAP.
Capital accounts within the financial statements are adjusted for permanent book-tax differences. These adjustments have no impact on net assets or the results of operations. Capital accounts are not adjusted for temporary book-tax differences which will reverse in a subsequent period.
Book-tax differences are primarily due to foreign currency transactions, partnerships, passive foreign investment companies (PFIC), capital loss carryforwards and losses deferred due to wash sales and excise tax regulations.
The federal tax cost of investment securities and unrealized appreciation (depreciation) as of period end were as follows:
Gross unrealized appreciation | $ 34,626,281 |
Gross unrealized depreciation | (604,984) |
Net unrealized appreciation (depreciation) on securities and other investments | $ 34,021,297 |
| |
Tax Cost | $ 123,026,907 |
Annual Report
3. Significant Accounting Policies - continued
Income Tax Information and Distributions to Shareholders - continued
The tax-based components of distributable earnings as of period end were as follows:
Undistributed ordinary income | $ 2,310,024 |
Undistributed long-term capital gain | $ 928,084 |
Net unrealized appreciation (depreciation) | $ 34,020,834 |
The tax character of distributions paid was as follows:
| December 31, 2013 | December 31, 2012 |
Ordinary Income | $ 8,084,923 | $ 808,310 |
Long-term Capital Gains | 4,988,466 | - |
Total | $ 13,073,389 | $ 808,310 |
4. Purchases and Sales of Investments.
Purchases and sales of securities, other than short-term securities, aggregated $210,648,241 and $202,337,603, respectively.
5. Fees and Other Transactions with Affiliates.
Management Fee. Fidelity Management & Research Company (the investment adviser) and its affiliates provide the Fund with investment management related services for which the Fund pays a monthly management fee. The management fee is the sum of an individual fund fee rate that is based on an annual rate of .30% of the Fund's average net assets and an annualized group fee rate that averaged .25% during the period. The group fee rate is based upon the average net assets of all the mutual funds advised by the investment adviser, including any mutual funds previously advised by the investment adviser that are currently advised by Fidelity SelectCo, LLC, an affiliate of the investment adviser. The group fee rate decreases as assets under management increase and increases as assets under management decrease. For the reporting period, the total annual management fee rate was .55% of the Fund's average net assets.
Distribution and Service Plan Fees. In accordance with Rule 12b-1 of the 1940 Act, the Fund has adopted separate 12b-1 Plans for each Service Class of shares. Each Service Class pays Fidelity Distributors Corporation (FDC), an affiliate of the investment adviser, a service fee. For the period, the service fee is based on an annual rate of .10% of Service Class' average net assets and .25% of Service Class 2's average net assets.
For the period, total fees, all of which were re-allowed to insurance companies for the distribution of shares and providing shareholder support services were as follows:
Service Class | $ 544 |
Service Class 2 | 131,880 |
| $ 132,424 |
Transfer Agent Fees. Fidelity Investments Institutional Operations Company, Inc. (FIIOC), an affiliate of the investment adviser, is the Fund's transfer, dividend disbursing, and shareholder servicing agent. FIIOC receives an asset-based fee with respect to each class. Each class (with the exception of Investor Class) pays a transfer agent fee, excluding out of pocket expenses, equal to an annual rate of .07% of average net assets. Investor Class pays a monthly asset-based transfer agent fee of .15% of average net assets. In addition, FIIOC receives an asset-based fee of .0035% of average net assets for typesetting, printing and mailing of shareholder reports, except proxy statements. FIIOC voluntarily agreed to reimburse or waive this fee for the period January 1, 2013 through December 31, 2013 (see Expense Reductions note). For the period, transfer agent fees for each class, including printing and out of pocket expenses, were as follows:
Initial Class | $ 12,145 |
Service Class | 375 |
Service Class 2 | 37,890 |
Investor Class | 93,314 |
| $ 143,724 |
Effective February 1, 2014, the Board of Trustees approved an amendment to the transfer agent fee agreement whereby each class (with the exception of Investor Class) pays a single fee of .07% of average net assets for transfer agent services, typesetting, printing and mailing of shareholder reports, excluding mailing of proxy statements and out of pocket expenses. Investor Class pays a single fee of .15% of average net assets.
Annual Report
Notes to Financial Statements - continued
5. Fees and Other Transactions with Affiliates - continued
Accounting and Security Lending Fees. Fidelity Service Company, Inc. (FSC), an affiliate of the investment adviser, maintains the Fund's accounting records. The accounting fee is based on the level of average net assets for each month. Under a separate contract, FSC administers the security lending program. The security lending fee is based on the number and duration of lending transactions.
Brokerage Commissions. The Fund placed a portion of its portfolio transactions with brokerage firms which are affiliates of the investment adviser. Brokerage commissions are included in net realized gain (loss) and change in net unrealized appreciation (depreciation) in the Statement of Operations. The commissions paid to these affiliated firms were $7,466 for the period.
6. Committed Line of Credit.
The Fund participates with other funds managed by the investment adviser or an affiliate in a $4.25 billion credit facility (the "line of credit") to be utilized for temporary or emergency purposes to fund shareholder redemptions or for other short-term liquidity purposes. The Fund has agreed to pay commitment fees on its pro-rata portion of the line of credit, which amounted to $260 and is reflected in Miscellaneous expenses on the Statement of Operations. During the period, there were no borrowings on this line of credit.
7. Security Lending.
The Fund lends portfolio securities through a lending agent from time to time in order to earn additional income. For equity securities, a lending agent is used and may loan securities to certain qualified borrowers, including Fidelity Capital Markets (FCM), a broker-dealer affiliated with the Fund. On the settlement date of the loan, the Fund receives collateral (in the form of U.S. Treasury obligations, letters of credit and/or cash) against the loaned securities and maintains collateral in an amount not less than 100% of the market value of the loaned securities during the period of the loan. The market value of the loaned securities is determined at the close of business of the Fund and any additional required collateral is delivered to the Fund on the next business day. If the borrower defaults on its obligation to return the securities loaned because of insolvency or other reasons, the Fund may apply collateral received from the borrower against the obligation. The Fund may experience delays and costs in recovering the securities loaned. Any cash collateral received is invested in the Fidelity Securities Lending Cash Central Fund. The value of loaned securities and cash collateral at period end are disclosed on the Fund's Statement of Assets and Liabilities. Security lending income represents the income earned on investing cash collateral, less rebates paid to borrowers and any lending agent fees associated with the loan, plus any premium payments received for lending certain types of securities. Security lending income is presented in the Statement of Operations as a component of income from Fidelity Central Funds. Total security lending income during the period amounted to $3,838. During the period, there were no securities loaned to FCM.
8. Expense Reductions.
The investment adviser or its affiliates agreed to reimburse or waive certain fees during the period as noted in the table below.
Initial Class | $ 578 |
Service Class | 21 |
Service Class 2 | 2,055 |
Investor Class | 2,375 |
| $ 5,029 |
Commissions paid to certain brokers with whom the investment adviser, or its affiliates, places trades on behalf of the Fund include an amount in addition to trade execution, which may be rebated back to the Fund to offset certain expenses. This amount totaled $7,379 for the period. In addition, through arrangements with the Fund's custodian, credits realized as a result of uninvested cash balances were used to reduce the Fund's expenses. During the period, these credits reduced the Fund's custody expenses by $5.
9. Distributions to Shareholders.
Distributions to shareholders of each class were as follows:
Years ended December 31, | 2013 | 2012 |
From net investment income | | |
Initial Class | $ 87,885 | $ 109,221 |
Service Class | 2,673 | 3,682 |
Service Class 2 | 146,223 | 329,727 |
Investor Class | 354,708 | 365,680 |
Total | $ 591,489 | $ 808,310 |
Annual Report
9. Distributions to Shareholders - continued
Years ended December 31, | 2013 | 2012 |
From net realized gain | | |
Initial Class | $ 1,432,436 | $ - |
Service Class | 51,785 | - |
Service Class 2 | 4,553,813 | - |
Investor Class | 6,443,866 | - |
Total | $ 12,481,900 | $ - |
10. Share Transactions.
Transactions for each class of shares were as follows:
| Shares | Dollars |
Years ended December 31, | 2013 | 2012 | 2013 | 2012 |
Initial Class | | | | |
Shares sold | 302,170 | 408,448 | $ 5,576,525 | $ 6,352,331 |
Reinvestment of distributions | 80,313 | 6,917 | 1,520,321 | 109,221 |
Shares redeemed | (235,607) | (287,269) | (4,282,056) | (4,425,864) |
Net increase (decrease) | 146,876 | 128,096 | $ 2,814,790 | $ 2,035,688 |
Service Class | | | | |
Shares sold | - | - | $ - | $ - |
Reinvestment of distributions | 2,898 | 235 | 54,458 | 3,682 |
Shares redeemed | (3,133) | - | (59,314) | - |
Net increase (decrease) | (235) | 235 | $ (4,856) | $ 3,682 |
Service Class 2 | | | | |
Shares sold | 60,017 | 3,714,844 | $ 1,070,908 | $ 53,358,057 |
Reinvestment of distributions | 253,235 | 21,273 | 4,700,036 | 329,727 |
Shares redeemed | (729,835) | (600,496) | (13,291,068) | (9,237,828) |
Net increase (decrease) | (416,583) | 3,135,621 | $ (7,520,124) | $ 44,449,956 |
Investor Class | | | | |
Shares sold | 1,512,697 | 1,612,961 | $ 27,699,454 | $ 24,573,908 |
Reinvestment of distributions | 362,204 | 23,336 | 6,798,574 | 365,680 |
Shares redeemed | (595,236) | (484,401) | (10,834,664) | (7,416,937) |
Net increase (decrease) | 1,279,665 | 1,151,896 | $ 23,663,364 | $ 17,522,651 |
11. Other.
The Fund's organizational documents provide former and current trustees and officers with a limited indemnification against liabilities arising in connection with the performance of their duties to the Fund. In the normal course of business, the Fund may also enter into contracts that provide general indemnifications. The Fund's maximum exposure under these arrangements is unknown as this would be dependent on future claims that may be made against the Fund. The risk of material loss from such claims is considered remote.
At the end of the period, the investment adviser or its affiliates were the owners of record of 64% of the total outstanding shares of the Fund and one otherwise unaffiliated shareholder was the owner of record of 30% of the total outstanding shares of the Fund.
Annual Report
Report of Independent Registered Public Accounting Firm
To the Trustees of Variable Insurance Products Fund II and the Shareholders of VIP Growth Stock Portfolio:
In our opinion, the accompanying statement of assets and liabilities, including the schedule of investments, and the related statements of operations and of changes in net assets and the financial highlights present fairly, in all material respects, the financial position of VIP Growth Stock Portfolio (a fund of Variable Insurance Products Fund II) at December 31, 2013, the results of its operations for the year then ended, the changes in its net assets for each of the two years in the period then ended and the financial highlights for each of the five years in the period then ended, in conformity with accounting principles generally accepted in the United States of America. These financial statements and financial highlights (hereafter referred to as "financial statements") are the responsibility of the VIP Growth Stock Portfolio's management. Our responsibility is to express an opinion on these financial statements based on our audits. We conducted our audits of these financial statements in accordance with the standards of the Public Company Accounting Oversight Board (United States). Those standards require that we plan and perform the audit to obtain reasonable assurance about whether the financial statements are free of material misstatement. An audit includes examining, on a test basis, evidence supporting the amounts and disclosures in the financial statements, assessing the accounting principles used and significant estimates made by management, and evaluating the overall financial statement presentation. We believe that our audits, which included confirmation of securities at December 31, 2013 by correspondence with the custodian and brokers, provide a reasonable basis for our opinion.
PricewaterhouseCoopers LLP
Boston, Massachusetts
February 14, 2014
Annual Report
The Trustees, Member of the Advisory Board, and officers of the trust and fund, as applicable, are listed below. The Board of Trustees governs the fund and is responsible for protecting the interests of shareholders. The Trustees are experienced executives who meet periodically throughout the year to oversee the fund's activities, review contractual arrangements with companies that provide services to the fund, oversee management of the risks associated with such activities and contractual arrangements, and review the fund's performance. Except for James C. Curvey, Ned C. Lautenbach, Ronald P. O'Hanley, and William S. Stavropoulos, each of the Trustees oversees 173 funds. Mr. Curvey oversees 396 funds. Mr. Lautenbach, Mr. O'Hanley, and Mr. Stavropoulos each oversees 247 funds.
The Trustees hold office without limit in time except that (a) any Trustee may resign; (b) any Trustee may be removed by written instrument, signed by at least two-thirds of the number of Trustees prior to such removal; (c) any Trustee who requests to be retired or who has become incapacitated by illness or injury may be retired by written instrument signed by a majority of the other Trustees; and (d) any Trustee may be removed at any special meeting of shareholders by a two-thirds vote of the outstanding voting securities of the trust. Each Trustee who is not an interested person (as defined in the 1940 Act) of the trust and the fund (Independent Trustee), shall retire not later than the last day of the calendar year in which his or her 75th birthday occurs. The Independent Trustees may waive this mandatory retirement age policy with respect to individual Trustees. The officers and Advisory Board Member hold office without limit in time, except that any officer and Advisory Board Member may resign or may be removed by a vote of a majority of the Trustees at any regular meeting or any special meeting of the Trustees. Except as indicated, each individual has held the office shown or other offices in the same company for the past five years.
Experience, Skills, Attributes, and Qualifications of the Fund's Trustees. The Governance and Nominating Committee has adopted a statement of policy that describes the experience, qualifications, attributes, and skills that are necessary and desirable for potential Independent Trustee candidates (Statement of Policy). The Board believes that each Trustee satisfied at the time he or she was initially elected or appointed a Trustee, and continues to satisfy, the standards contemplated by the Statement of Policy. The Governance and Nominating Committee also engages professional search firms to help identify potential Independent Trustee candidates who have the experience, qualifications, attributes, and skills consistent with the Statement of Policy. From time to time, additional criteria based on the composition and skills of the current Independent Trustees, as well as experience or skills that may be appropriate in light of future changes to board composition, business conditions, and regulatory or other developments, have also been considered by the professional search firms and the Governance and Nominating Committee. In addition, the Board takes into account the Trustees' commitment and participation in Board and committee meetings, as well as their leadership of standing and ad hoc committees throughout their tenure.
In determining that a particular Trustee was and continues to be qualified to serve as a Trustee, the Board has considered a variety of criteria, none of which, in isolation, was controlling. The Board believes that, collectively, the Trustees have balanced and diverse experience, qualifications, attributes, and skills, which allow the Board to operate effectively in governing the fund and protecting the interests of shareholders. Information about the specific experience, skills, attributes, and qualifications of each Trustee, which in each case led to the Board's conclusion that the Trustee should serve (or continue to serve) as a trustee of the fund, is provided below.
Board Structure and Oversight Function. James C. Curvey is an interested person (as defined in the 1940 Act) and currently serves as Chairman. The Trustees have determined that an interested Chairman is appropriate and benefits shareholders because an interested Chairman has a personal and professional stake in the quality and continuity of services provided to the fund. Independent Trustees exercise their informed business judgment to appoint an individual of their choosing to serve as Chairman, regardless of whether the Trustee happens to be independent or a member of management. The Independent Trustees have determined that they can act independently and effectively without having an Independent Trustee serve as Chairman and that a key structural component for assuring that they are in a position to do so is for the Independent Trustees to constitute a substantial majority for the Board. The Independent Trustees also regularly meet in executive session. Ned C. Lautenbach serves as Chairman of the Independent Trustees and as such (i) acts as a liaison between the Independent Trustees and management with respect to matters important to the Independent Trustees and (ii) with management prepares agendas for Board meetings.
Fidelity funds are overseen by different Boards of Trustees. The fund's Board oversees Fidelity's equity and high income funds and another Board oversees Fidelity's investment-grade bond, money market, and asset allocation funds. The asset allocation funds may invest in Fidelity funds overseen by the fund's Board. The use of separate Boards, each with its own committee structure, allows the Trustees of each group of Fidelity funds to focus on the unique issues of the funds they oversee, including common research, investment, and operational issues. On occasion, the separate Boards establish joint committees to address issues of overlapping consequences for the Fidelity funds overseen by each Board.
The Trustees operate using a system of committees to facilitate the timely and efficient consideration of all matters of importance to the Trustees, the fund, and fund shareholders and to facilitate compliance with legal and regulatory requirements and oversight of the fund's activities and associated risks. The Board, acting through its committees, has charged FMR and its affiliates with (i) identifying events or circumstances the occurrence of which could have demonstrably adverse effects on the fund's business and/or reputation; (ii) implementing processes and controls to lessen the possibility that such events or circumstances occur or to mitigate the effects of such events or circumstances if they do occur; and (iii) creating and maintaining a system designed to evaluate continuously business and market conditions in order to facilitate the identification and implementation processes described in (i) and (ii) above. Because the day-to-day operations and activities of the fund are carried out by or through FMR, its affiliates and other service providers, the fund's exposure to risks is mitigated but not eliminated by the processes overseen by the Trustees. While each of the Board's committees has responsibility for overseeing different aspects of the fund's activities, oversight is exercised primarily through the Operations, Audit, and Compliance Committees. In addition, the Independent Trustees have worked with FMR to enhance the Board's oversight of investment and financial risks, legal and regulatory risks, technology risks, and operational risks, including the development of additional risk reporting to the Board. For example, a working group comprised of Independent Trustees and FMR has worked and continues to work to review the Fidelity funds' valuation-related activities, reporting and risk management. Appropriate personnel, including but not limited to the fund's Chief Compliance Officer (CCO), FMR's internal auditor, the independent accountants, the fund's Treasurer and portfolio management personnel, make periodic reports to the Board's committees, as appropriate, including an annual review of FMR's risk management program for the Fidelity funds. The responsibilities of each standing committee, including their oversight responsibilities, are described further under "Standing Committees of the Fund's Trustees."
Annual Report
The fund's Statement of Additional Information (SAI) includes more information about the Trustees. To request a free copy, call Fidelity at 1-877-208-0098.
Interested Trustees*:
Correspondence intended for each Trustee who is an interested person may be sent to Fidelity Investments, 245 Summer Street, Boston, Massachusetts 02210.
Name, Year of Birth; Principal Occupations and Other Relevant Experience+ |
James C. Curvey (1935) |
Year of Election or Appointment: 2007 Trustee Chairman of the Board of Trustees |
| Mr. Curvey also serves as Trustee of other Fidelity funds. Mr. Curvey is a Director of Fidelity Investments Money Management, Inc. (2009-present), Director of Fidelity Research & Analysis Co. (2009-present) and Director of FMR and FMR Co., Inc. (2007-present). Mr. Curvey is also Vice Chairman (2007-present) and Director of FMR LLC. In addition, Mr. Curvey serves as an Overseer for the Boston Symphony Orchestra and a member of the Trustees of Villanova University. Previously, Mr. Curvey was the Vice Chairman (2006-2007) and Director (2000-2007) of FMR Corp. |
Ronald P. O'Hanley (1957) |
Year of Election or Appointment: 2011 Trustee |
| Mr. O'Hanley also serves as Trustee of other Fidelity funds. He is Director of Fidelity SelectCo, LLC (2013-present), FMR Co., Inc. (2010-present), Director of Fidelity Investments Money Management, Inc. (2010-present), Director of Fidelity Research & Analysis Company (2010-present), President of Fidelity Asset Management and Corporate Services and a Member of Fidelity's Executive Committee (2010-present). Previously, Mr. O'Hanley served as President and Chief Executive Officer of BNY Mellon Asset Management (2007-2010). Mr. O'Hanley also served as Vice Chairman of Bank New York Mellon Corp. and a member of that firm's Executive Committee. Prior to the 2007 merger of The Bank of New York and Mellon Financial Corporation, he was Vice Chairman of Mellon Financial Corporation and President and Chief Executive Officer of Mellon Asset Management. He joined Mellon in February 1997. Mr. O'Hanley currently serves as Chairman of the Boston Public Library Foundation Board of Directors and sits on the Board of Directors of Beth Israel Deaconess Medical Center, the Board of Trustees of the Marine Biological Laboratory and the Advisory Board of the Maxwell School of Citizenship and Public Administration at Syracuse University. Mr. O'Hanley also chairs the Council on Asset Management for the Financial Services Roundtable and is a member of the Board of Directors of Institutional Investor's U.S. Institute. |
* Trustees have been determined to be "Interested Trustees" by virtue of, among other things, their affiliation with the trust or various entities under common control with FMR.
+ The information above includes each Trustee's principal occupation during the last five years and other information relating to the experience, attributes, and skills relevant to each Trustee's qualifications to serve as a Trustee, which led to the conclusion that each Trustee should serve as a Trustee for the fund.
Annual Report
Trustees and Officers - continued
Independent Trustees:
Correspondence intended for each Independent Trustee (that is, the Trustees other than the Interested Trustees) may be sent to Fidelity Investments, P.O. Box 55235, Boston, Massachusetts 02205-5235.
Name, Year of Birth; Principal Occupations and Other Relevant Experience+ |
Dennis J. Dirks (1948) |
Year of Election or Appointment: 2005 Trustee |
| Mr. Dirks also serves as Trustee of other Fidelity funds. Prior to his retirement in May 2003, Mr. Dirks was Chief Operating Officer and a member of the Board of The Depository Trust & Clearing Corporation (DTCC). He also served as President, Chief Operating Officer, and Board member of The Depository Trust Company (DTC) and President and Board member of the National Securities Clearing Corporation (NSCC). In addition, Mr. Dirks served as Chief Executive Officer and Board member of the Government Securities Clearing Corporation, Chief Executive Officer and Board member of the Mortgage-Backed Securities Clearing Corporation, as a Trustee and a member of the Finance Committee of Manhattan College (2005-2008), and as a Trustee and a member of the Finance Committee of AHRC of Nassau County (2006-2008). Mr. Dirks is a member of the Independent Directors Council (IDC) Governing Council (2010-present) and Board of Directors for The Brookville Center for Children's Services, Inc. (2009-present). |
Alan J. Lacy (1953) |
Year of Election or Appointment: 2008 Trustee |
| Mr. Lacy also serves as Trustee of other Fidelity funds. Mr. Lacy serves as Senior Adviser (2007-present) of Oak Hill Capital Partners, L.P. (private equity). Mr. Lacy also served as Chief Executive Officer (2000-2005) and Vice Chairman (2005-2006) of Sears Holdings Corporation and Sears, Roebuck and Co. (retail). In addition, Mr. Lacy serves as a member of the Board of Directors of Dave & Buster's Entertainment, Inc. (restaurant and entertainment complexes, 2010-present), Earth Fare, Inc. (retail grocery, 2012-present), The Hillman Companies, Inc. (hardware wholesalers, 2010-present), and Bristol-Myers Squibb Company (global pharmaceuticals, 2008-present). Mr. Lacy is a member of the Board of Trustees of The National Parks Conservation Association (2006-present). Previously, Mr. Lacy served as Chairman of the Board of Trustees of the National Parks Conservation Association (2008-2011) and as a member of the Board of Directors for the Western Union Company (global money transfer, 2006-2011). |
Ned C. Lautenbach (1944) |
Year of Election or Appointment: 2000 Trustee Chairman of the Independent Trustees |
| Mr. Lautenbach also serves as Trustee of other Fidelity funds. Mr. Lautenbach currently serves as the Lead Director of the Eaton Corporation Board of Directors (diversified industrial, 1997-present). Mr. Lautenbach is Chairman of the Board of Directors of the Philharmonic Center for the Arts in Naples, Florida (2012-present) and a member of the Council on Foreign Relations (1994-present). Previously, Mr. Lautenbach was a Partner/Advisory Partner at Clayton, Dubilier & Rice, LLC (private equity investment, 1998-2010), as well as a Director of Sony Corporation (2006-2007). |
Joseph Mauriello (1944) |
Year of Election or Appointment: 2008 Trustee |
| Mr. Mauriello also serves as Trustee of other Fidelity funds. Prior to his retirement in January 2006, Mr. Mauriello served in numerous senior management positions including Deputy Chairman and Chief Operating Officer (2004-2005), and Vice Chairman of Financial Services (2002-2004) of KPMG LLP US (professional services, 1965-2005). Mr. Mauriello currently serves as a member of the Board of Directors of XL Group plc. (global insurance and re-insurance, 2006-present). Previously, Mr. Mauriello served as a Director of the Hamilton Funds of the Bank of New York (2006-2007) and of Arcadia Resources Inc. (health care services and products, 2007-2012). |
Robert W. Selander (1950) |
Year of Election or Appointment: 2011 Trustee |
| Mr. Selander also serves as Trustee of other Fidelity funds. Previously, Mr. Selander served as a Member of the Advisory Board of other Fidelity funds (2011), and Executive Vice Chairman (2010), Chief Executive Officer (2009-2010), and President and Chief Executive Officer (1997-2009) of Mastercard, Inc. |
Cornelia M. Small (1944) |
Year of Election or Appointment: 2005 Trustee |
| Ms. Small also serves as Trustee of other Fidelity funds. Ms. Small is a member of the Board of Directors (2009-present) and Chair of the Investment Committee (2010-present) of the Teagle Foundation. Ms. Small also serves on the Investment Committee of the Berkshire Taconic Community Foundation (2008-present). Previously, Ms. Small served as Chairperson (2002-2008) and a member of the Investment Committee and Chairperson (2008-2012) and a member of the Board of Trustees of Smith College. In addition, Ms. Small served as Chief Investment Officer, Director of Global Equity Investments, and a member of the Board of Directors of Scudder, Stevens & Clark and Scudder Kemper Investments. |
William S. Stavropoulos (1939) |
Year of Election or Appointment: 2001 Trustee Vice Chairman of the Independent Trustees |
| Mr. Stavropoulos also serves as Trustee of other Fidelity funds. Mr. Stavropoulos serves as President and Founder of the Michigan Baseball Foundation, the Great Lakes Loons (2007-present). Mr. Stavropoulos is Chairman Emeritus of the Board of Directors of The Dow Chemical Company, where he previously served in numerous senior management positions, including President, CEO (1995-2000; 2002-2004), Chairman of the Executive Committee (2000-2006), and as a member of the Board of Directors (1990-2006). Currently, Mr. Stavropoulos is Chairman of the Board of Directors of Univar Inc. (global distributor of commodity and specialty chemicals), a Director of Teradata Corporation (data warehousing and technology solutions), and Maersk Inc. (industrial conglomerate), and a member of the Advisory Board for Metalmark Capital LLC (private equity investment, 2005-present). Mr. Stavropoulos is an operating advisor to Clayton, Dubilier & Rice, LLC (private equity investment). In addition, Mr. Stavropoulos is a member of the University of Notre Dame Advisory Council for the College of Science, a Trustee of the Rollin L. Gerstacker Foundation, and a Director of the Naples Philharmonic Center for the Arts. Previously, Mr. Stavropoulos served as a Director of Chemical Financial Corporation (bank holding company, 1993-2012) and Tyco International, Ltd. (multinational manufacturing and services, 2007-2012). |
David M. Thomas (1949) |
Year of Election or Appointment: 2008 Trustee |
| Mr. Thomas also serves as Trustee of other Fidelity funds. Mr. Thomas serves as Non-Executive Chairman of the Board of Directors of Fortune Brands Home and Security (home and security products, 2011-present), and as a member of the Board of Directors of Interpublic Group of Companies, Inc. (marketing communication, 2004-present). Previously, Mr. Thomas served as Executive Chairman (2005-2006) and Chairman and Chief Executive Officer (2000-2005) of IMS Health, Inc. (pharmaceutical and healthcare information solutions), and a Director of Fortune Brands, Inc. (consumer products, 2000-2011). |
+ The information above includes each Trustee's principal occupation during the last five years and other information relating to the experience, attributes, and skills relevant to each Trustee's qualifications to serve as a Trustee, which led to the conclusion that each Trustee should serve as a Trustee for the fund.
Advisory Board Member and Officers:
Correspondence intended for each officer and Peter S. Lynch may be sent to Fidelity Investments, 245 Summer Street, Boston, Massachusetts 02210. Officers appear below in alphabetical order.
Name, Year of Birth; Principal Occupation |
Peter S. Lynch (1944) |
Year of Election or Appointment: 2003 Member of the Advisory Board |
| Mr. Lynch also serves as Member of the Advisory Board of other Fidelity funds. Mr. Lynch is Vice Chairman and a Director of FMR and FMR Co., Inc. In addition, Mr. Lynch serves as a Trustee of Boston College and as the Chairman of the Inner-City Scholarship Fund. Previously, Mr. Lynch served on the Special Olympics International Board of Directors (1997-2006). |
Elizabeth Paige Baumann (1968) |
Year of Election or Appointment: 2012 Anti-Money Laundering (AML) Officer |
| Ms. Baumann also serves as AML Officer of other funds. She is Chief AML Officer of FMR LLC (2012-present) and is an employee of Fidelity Investments. Previously, Ms. Baumann served as Vice President and Deputy Anti-Money Laundering Officer (2007-2012). |
William C. Coffey (1969) |
Year of Election or Appointment: 2009 Assistant Secretary |
| Mr. Coffey also serves as Assistant Secretary of other funds. He is Senior Vice President and Deputy General Counsel of FMR LLC (2010-present), and is an employee of Fidelity Investments. Previously, Mr. Coffey served as Vice President and Associate General Counsel of FMR LLC (2005-2009). |
Jonathan Davis (1968) |
Year of Election or Appointment: 2010 Assistant Treasurer |
| Mr. Davis also serves as Assistant Treasurer of other funds. Mr. Davis is an employee of Fidelity Investments. Previously, Mr. Davis served as Vice President and Associate General Counsel of FMR LLC (2003-2010). |
Adrien E. Deberghes (1967) |
Year of Election or Appointment: 2008 Deputy Treasurer |
| Mr. Deberghes also serves as an officer of other funds. He is an employee of Fidelity Investments (2008-present). Prior to joining Fidelity Investments, Mr. Deberghes was Senior Vice President of Mutual Fund Administration at State Street Corporation (2007-2008), Senior Director of Mutual Fund Administration at Investors Bank & Trust (2005-2007), and Director of Finance for Dunkin' Brands (2000-2005). |
Stephanie J. Dorsey (1969) |
Year of Election or Appointment: 2010 Assistant Treasurer |
| Ms. Dorsey also serves as an officer of other funds. She is an employee of Fidelity Investments (2008-present) and has served in other fund officer roles. Prior to joining Fidelity Investments, Ms. Dorsey served as Treasurer (2004-2008) of the JPMorgan Mutual Funds and Vice President (2004-2008) of JPMorgan Chase Bank. |
Scott C. Goebel (1968) |
Year of Election or Appointment: 2008 Secretary and Chief Legal Officer (CLO) |
| Mr. Goebel serves as Secretary and CLO of other funds. Mr. Goebel also serves as Secretary of Fidelity Investments Money Management, Inc. (FIMM) (2010-present) and Fidelity Research and Analysis Company (FRAC) (2010-present); General Counsel, Secretary, and Senior Vice President of FMR (2008-present) and FMR Co., Inc. (2008-present); Chief Legal Officer of Fidelity Management & Research (Hong Kong) Limited (2008-present) and Assistant Secretary of Fidelity Management & Research (Japan) Inc. (2008-present), and Fidelity Management & Research (U.K.) Inc. (2008-present). Previously, Mr. Goebel served as Secretary and CLO of other Fidelity funds (2008-2013), Assistant Secretary of FIMM (2008-2010), FRAC (2008-2010), and certain funds (2007-2008); and as Vice President and Secretary of Fidelity Distributors Corporation (FDC) (2005-2007). Mr. Goebel has been employed by FMR LLC or an affiliate since 2001. |
Joseph A. Hanlon (1968) |
Year of Election or Appointment: 2012 Chief Compliance Officer |
| Mr. Hanlon also serves as Chief Compliance Officer of other funds. Mr. Hanlon serves as Compliance Officer of FMR, FMR Co., Inc., Fidelity Investments Money Management, Inc. (FIMM), Fidelity Research and Analysis Company (FRAC), and Fidelity Management & Research (Hong Kong) (2009-present), as Senior Vice President of the Fidelity Asset Management Division (2009-present), and is an employee of Fidelity Investments. Previously, Mr. Hanlon served as Compliance Officer of Fidelity Management & Research (Japan) Inc. (2009-2013), Strategic Advisers, Inc. (2009-2013), and Fidelity Management & Research (U.K.) Inc. (2009-2013). |
Bruce T. Herring (1965) |
Year of Election or Appointment: 2006 Vice President of certain Equity Funds |
| Mr. Herring also serves as Vice President of other funds. He serves as Chief Investment Officer of Fidelity Global Asset Allocation (GAA) (2013-present), Group Chief Investment Officer of FMR, and President of Fidelity Research & Analysis Company (2010-present). Previously, Mr. Herring served as Chief Investment Officer and Director of Fidelity Management & Research (U.K.) Inc. (2010-2013), Vice President (2005-2006) and Senior Vice President (2006-2007) of Fidelity Management & Research Company, Vice President of FMR Co., Inc. (2001-2007), and as a portfolio manager for Fidelity U.S. Equity Funds. |
Brian B. Hogan (1964) |
Year of Election or Appointment: 2009 Vice President |
| Mr. Hogan also serves as Vice President of other funds. Mr. Hogan serves as President of FMR's Equity Division (2009-present). Previously, Mr. Hogan served as Senior Vice President, Equity Research of FMR (2006-2009) and as a portfolio manager. |
Chris Maher (1972) |
Year of Election or Appointment: 2013 Assistant Treasurer |
| Mr. Maher serves as Assistant Treasurer of other funds. Mr. Maher is Vice President of Valuation Oversight and is an employee of Fidelity Investments. Previously, Mr. Maher served as Vice President of Asset Management Compliance (2013), Vice President of FMR's Program Management Group (2010-2013), and Vice President of Valuation Oversight (2008-2010). |
Christine Reynolds (1958) |
Year of Election or Appointment: 2008 Chief Financial Officer |
| Ms. Reynolds also serves as Chief Financial Officer of other funds. Ms. Reynolds became President of Fidelity Pricing and Cash Management Services (FPCMS) in August 2008. Ms. Reynolds served as Chief Operating Officer of FPCMS (2007-2008). Previously, Ms. Reynolds served as President, Treasurer, and Anti-Money Laundering officer of the Fidelity funds (2004-2007). |
Kenneth B. Robins (1969) |
Year of Election or Appointment: 2008 President and Treasurer |
| Mr. Robins also serves as an officer of other funds. Mr. Robins serves as Executive Vice President of Fidelity Investments Money Management, Inc. (FIMM) (2013-present) and is an employee of Fidelity Investments (2004-present). Previously, Mr. Robins served in other fund officer roles. |
Gary W. Ryan (1958) |
Year of Election or Appointment: 2005 Assistant Treasurer |
| Mr. Ryan also serves as Assistant Treasurer of other funds. Mr. Ryan is an employee of Fidelity Investments and has served in other fund officer roles. Previously, Mr. Ryan served as Vice President of Fund Reporting in Fidelity Pricing and Cash Management Services (FPCMS) (1999-2005). |
Stephen Sadoski (1971) |
Year of Election or Appointment: 2012 Deputy Treasurer |
| Mr. Sadoski also serves as Deputy Treasurer of other funds. He is an employee of Fidelity Investments (2012-present) and has served in another fund officer role. Prior to joining Fidelity Investments, Mr. Sadoski served as an assistant chief accountant in the Division of Investment Management of the Securities and Exchange Commission (SEC) (2009-2012) and as a senior manager at Deloitte & Touche LLP (1997-2009). |
Stacie M. Smith (1974) |
Year of Election or Appointment: 2013 Deputy Treasurer |
| Ms. Smith also serves as an officer of other funds. She is an employee of Fidelity Investments (2009-present) and has served in other fund officer roles. Prior to joining Fidelity Investments, Ms. Smith served as Senior Audit Manager of Ernst & Young LLP (1996-2009). |
Renee Stagnone (1975) |
Year of Election or Appointment: 2013 Deputy Treasurer |
| Ms. Stagnone also serves as Deputy Treasurer of other funds. Ms. Stagnone is an employee of Fidelity Investments. |
Joseph F. Zambello (1957) |
Year of Election or Appointment: 2011 Deputy Treasurer |
| Mr. Zambello also serves as Deputy Treasurer of other funds. Mr. Zambello is an employee of Fidelity Investments. Previously, Mr. Zambello served as Vice President of FMR's Program Management Group (2009-2011) and Vice President of the Transfer Agent Oversight Group (2005-2009). |
Annual Report
The Board of Trustees of VIP Growth Stock Portfolio voted to pay to shareholders of record at the opening of business on record date, the following distributions per share derived from capital gains realized from sales of portfolio securities.
| Pay Date | Record Date | Capital Gains |
Initial Class | 02/14/14 | 02/14/14 | $0.401 |
Service Class | 02/14/14 | 02/14/14 | $0.401 |
Service Class 2 | 02/14/14 | 02/14/14 | $0.401 |
Investor Class | 02/14/14 | 02/14/14 | $0.401 |
The fund hereby designates as a capital gain dividend with respect to the taxable year ended December 31, 2013 $5,916,549, or, if subsequently determined to be different, the net capital gain of such year.
Initial Class, Service Class, and Investor Class designate 18% and Service Class 2 designates 19%, of the dividends distributed in December 2013, as qualifying for the dividends-received deduction for corporate shareholders.
Annual Report
Board Approval of Investment Advisory Contracts and Management Fees
VIP Growth Stock Portfolio
Each year, the Board of Trustees, including the Independent Trustees (together, the Board), votes on the renewal of the management contract and sub-advisory agreements (together, the Advisory Contracts) for the fund. The Board, assisted by the advice of fund counsel and Independent Trustees' counsel, requests and considers a broad range of information relevant to the renewal of the Advisory Contracts throughout the year.
The Board meets regularly and, at each of its meetings, covers an extensive agenda of topics and materials and considers factors that are relevant to its annual consideration of the renewal of the fund's Advisory Contracts, including the services and support provided to the fund and its shareholders. The Board has established various standing committees, each composed of and chaired by Independent Trustees with varying backgrounds, to which the Board has assigned specific subject matter responsibilities in order to enhance effective decision-making by the Board. The Board, acting directly and through its Committees, requests and receives information concerning the annual consideration of the renewal of the fund's Advisory Contracts. The Board also meets as needed to consider matters specifically related to the Board's annual consideration of the renewal of Advisory Contracts. Members of the Board may also meet with trustees of other Fidelity funds through ad hoc joint committees to discuss certain matters relevant to the Fidelity funds.
At its July 2013 meeting, the Board, including the Independent Trustees, unanimously determined to renew the fund's Advisory Contracts. In reaching its determination, the Board considered all factors it believed relevant, including (i) the nature, extent, and quality of the services to be provided to the fund and its shareholders (including the investment performance of the fund); (ii) the competitiveness of the fund's management fee and total expense ratio relative to peer funds; (iii) the total costs of the services to be provided by and the profits to be realized by Fidelity from its relationship with the fund; (iv) the extent to which economies of scale exist and would be realized as the fund grows; and (v) whether fee levels reflect these economies of scale, if any, for the benefit of fund shareholders.
In considering whether to renew the Advisory Contracts for the fund, the Board reached a determination, with the assistance of fund counsel and Independent Trustees' counsel and through the exercise of its business judgment, that the renewal of the Advisory Contracts was in the best interests of the fund and its shareholders and that the compensation payable under the Advisory Contracts was fair and reasonable. The Board's decision to renew the Advisory Contracts was not based on any single factor, but rather was based on a comprehensive consideration of all the information provided to the Board at its meetings throughout the year. The Board, in reaching its determination to renew the Advisory Contracts, was aware that shareholders in the fund have a broad range of investment choices available to them, including a wide choice among mutual funds offered by Fidelity's competitors, and that the fund's shareholders, who have the opportunity to review and weigh the disclosure provided by the fund in its prospectus and other public disclosures, have chosen to invest in this fund, which is a part of the Fidelity family of funds.
Nature, Extent, and Quality of Services Provided. The Board considered the staffing within the investment adviser, Fidelity Management & Research Company (FMR), and the sub-advisers (together, the Investment Advisers) as it relates to the fund, including the backgrounds of the fund's investment personnel, and also considered the fund's investment objective, strategies, and related investment philosophy. The Independent Trustees also had discussions with senior management of Fidelity's investment operations and investment groups. The Board considered the structure of the portfolio manager compensation program and whether this structure provides appropriate incentives to act in the best interests of the fund.
Resources Dedicated to Investment Management and Support Services. The Board and the Fund Oversight and Research Committees reviewed the general qualifications and capabilities of the Investment Advisers' investment staff, including its size, education, experience, and resources, as well as the Investment Advisers' approach to recruiting, training, managing, and compensating investment personnel. The Board noted that FMR has continued to increase the resources devoted to non-U.S. offices, including expansion of Fidelity's global investment organization. The Board also noted that Fidelity's analysts have extensive resources, tools and capabilities that allow them to conduct sophisticated quantitative and fundamental analysis, as well as credit analysis of issuers, counterparties and guarantors. Further, the Board believes that Fidelity's investment professionals have sufficient access to global information and data so as to provide competitive investment results over time, and that those professionals also have access to sophisticated tools that permit them to assess portfolio construction and risk and performance attribution characteristics continuously, as well as to transmit new information and research conclusions rapidly around the world. Additionally, in its deliberations, the Board considered the Investment Advisers' trading and risk management capabilities and resources, which are an integral part of the investment management process.
Shareholder and Administrative Services. The Board considered (i) the nature, extent, quality, and cost of advisory, administrative, and shareholder services performed by the Investment Advisers and their affiliates under the Advisory Contracts and under separate agreements covering transfer agency, pricing and bookkeeping, and securities lending services for the fund; (ii) the nature and extent of the supervision of third party service providers, principally custodians and subcustodians; and (iii) the resources devoted to, and the record of compliance with, the fund's compliance policies and procedures. The Board also reviewed the allocation of fund brokerage, including allocations to brokers affiliated with the Investment Advisers, the use of brokerage commissions to pay fund expenses, and the use of "soft" commission dollars to pay for research services.
The Board noted that the growth of fund assets over time across the complex allows Fidelity to reinvest in the development of services designed to enhance the value or convenience of the Fidelity funds as investment vehicles. These services include 24-hour access to account information and market information through telephone representatives and over the Internet, investor education materials and asset allocation tools, and the expanded availability of Fidelity Investor Centers.
Annual Report
Investment in a Large Fund Family. The Board considered the benefits to shareholders of investing in a Fidelity fund, including the benefits of investing in a fund that is part of a large family of funds offering a variety of investment disciplines and providing a large variety of mutual fund investor services. The Board noted that Fidelity had taken, or had made recommendations that resulted in the Fidelity funds taking, a number of actions over the previous year that benefited particular funds, including (i) continuing to dedicate additional resources to investment research and to the support of the senior management team that oversees asset management; (ii) persisting in efforts to enhance Fidelity's global research capabilities; (iii) launching new funds and making other enhancements to meet client needs for global and income-oriented solutions; (iv) continuing to launch dedicated lower cost underlying funds to meet portfolio construction needs related to expanding underlying fund options for Fidelity funds of funds, specifically for the Freedom Fund product lines; (v) rationalizing product lines and gaining increased efficiencies through the mergers of several funds into other funds; (vi) strengthening Fidelity's index fund offerings by reducing investment minimums and adopting or lowering existing expense caps for certain funds and classes; (vii) enhancing Global Asset Allocation product offerings by launching new funds and strategies, including "open architecture" target date funds that utilize affiliated and unaffiliated sub-advisers; (viii) modifying the eligibility criteria for Institutional Class shares of Advisor funds to increase their marketability to a portion of the defined contribution plan market; (ix) creating a new low-cost retirement share class for certain Advisor funds to appeal to large retirement plans; (x) transitioning the management of certain Fidelity commodity funds to Geode Capital Management LLC, a registered commodity pool operator, while retaining administrative responsibilities for the funds; (xi) reorganizing a number of funds; and (xii) taking steps toward establishing a new Fidelity adviser to manage sector-based funds and products.
Investment Performance. The Board considered whether the fund has operated in accordance with its investment objective, as well as its record of compliance with its investment restrictions and its performance history. The Board noted that there was a portfolio management change for the fund in January 2012.
The Board took into account discussions with the Investment Advisers about fund investment performance that occur at Board meetings throughout the year. In this regard the Board noted that as part of regularly scheduled fund reviews and other reports to the Board on fund performance, the Board periodically considers annualized return information for the fund, for different time periods, measured against a securities market index ("benchmark index") and a peer group of mutual funds with similar objectives ("peer group"). In its evaluation of fund investment performance, the Board gave particular attention to information indicating changes in performance of certain Fidelity funds for specific time periods and the Investment Advisers' explanations for any overperformance or underperformance.
In addition to reviewing absolute and relative fund performance, the Independent Trustees periodically consider the appropriateness of fund performance metrics in evaluating the results achieved. In general, the Independent Trustees believe that fund performance should be evaluated based on net performance (after fees and expenses) of both the highest performing and lowest performing classes, where applicable, compared to appropriate benchmark indices, over appropriate time periods which may include full market cycles, and compared to peer groups, as applicable, over the same periods, taking into account relevant factors including the following: general market conditions; issuer-specific information; tactical opportunities for investment; and fund cash flows and other factors.
The Independent Trustees recognize that shareholders evaluate performance on a net basis over their own holding periods, for which one-, three-, and five-year periods are used as a proxy. For this reason, the performance information reviewed by the Board also included net cumulative calendar year total return information for the fund and an appropriate benchmark index and peer group for the most recent one-, three-, and five-year periods, as shown below. Returns are shown compared to the 25th percentile (top of box) and 75th percentile (bottom of box) of the peer universe.
Annual Report
Board Approval of Investment Advisory Contracts and Management Fees - continued
VIP Growth Stock Portfolio
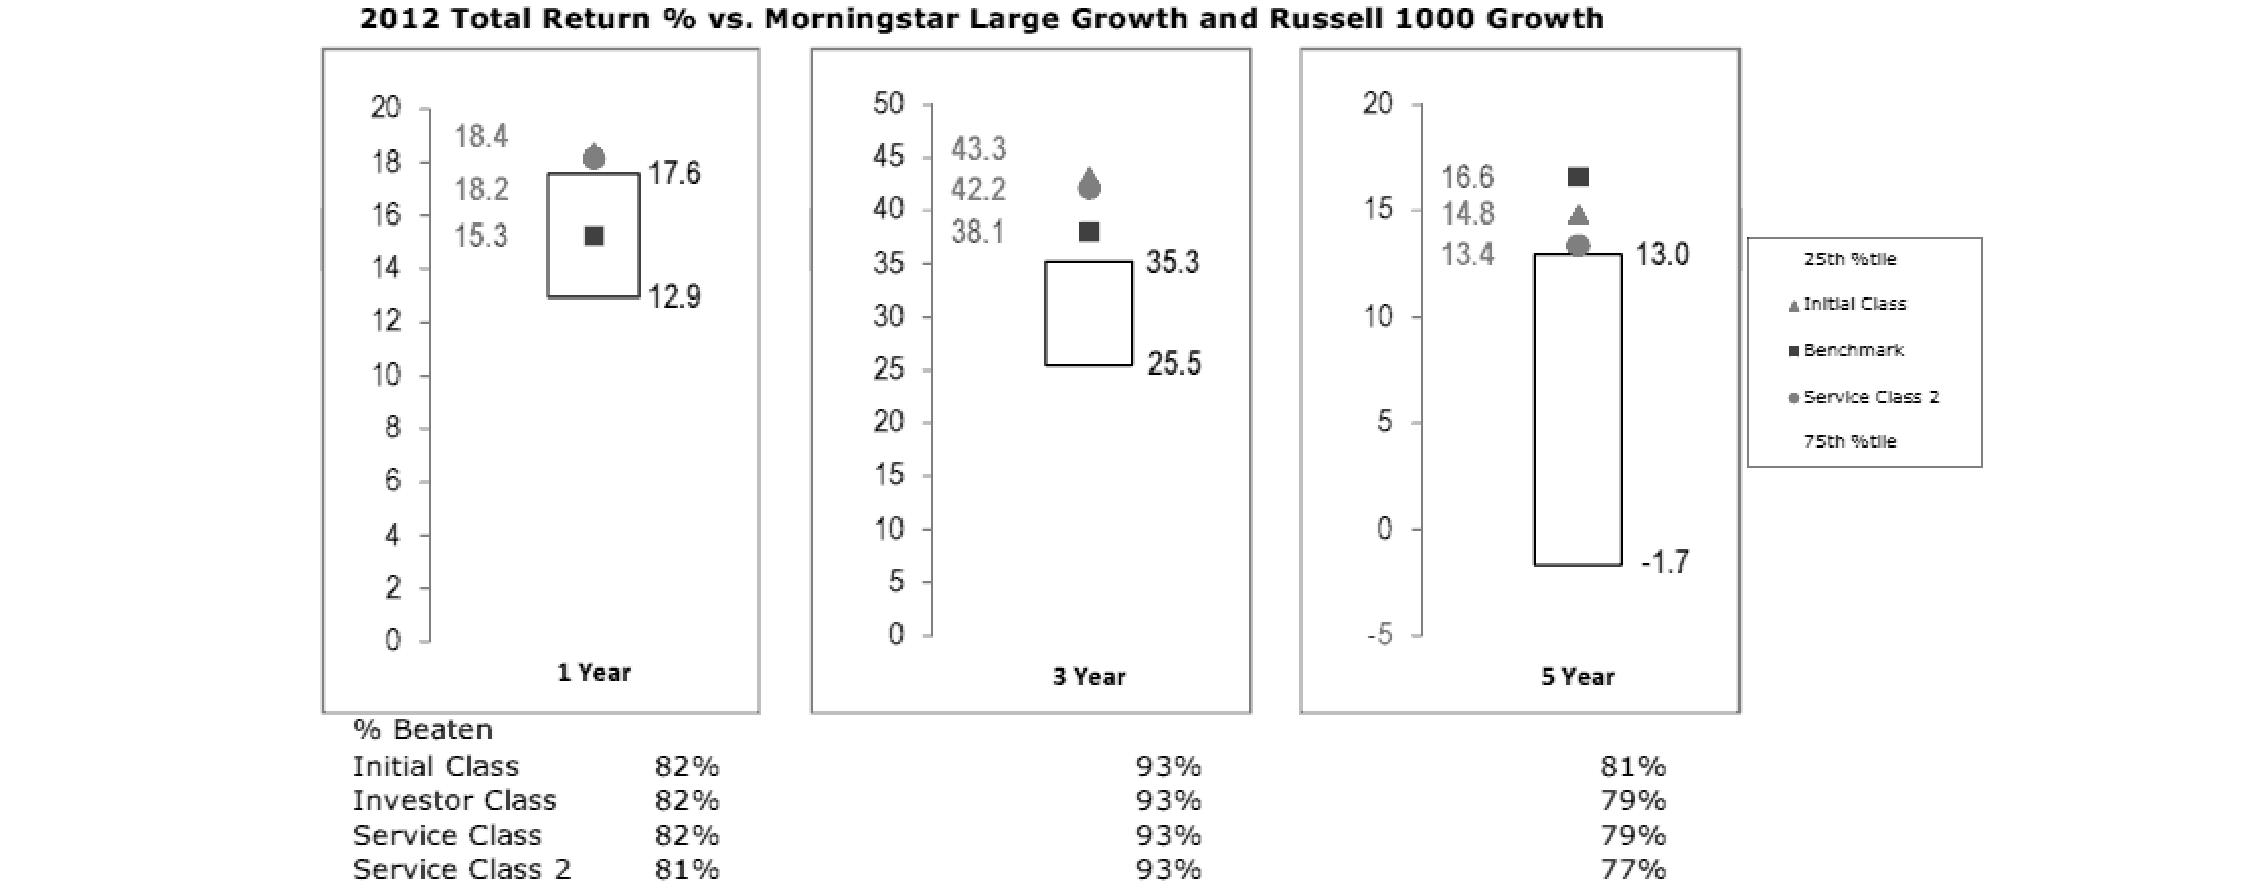
Based on its review, the Board concluded that the nature, extent, and quality of services provided to the fund under the Advisory Contracts should benefit the fund's shareholders.
Competitiveness of Management Fee and Total Expense Ratio. The Board considered the fund's management fee and total expense ratio compared to "mapped groups" of competitive funds and classes. Fidelity creates "mapped groups" by combining similar Lipper investment objective categories that have comparable management fee characteristics. Combining Lipper investment objective categories aids the Board's management fee and total expense ratio comparisons by broadening the competitive group used for comparison and by reducing the number of universes to which various Fidelity funds are compared.
Management Fee. The Board considered two proprietary management fee comparisons for the 12-month periods shown in the chart below. The group of Lipper funds used by the Board for management fee comparisons is referred to below as the "Total Mapped Group." The Total Mapped Group comparison focuses on a fund's standing in terms of gross management fees before expense reimbursements or caps relative to the total universe of funds with comparable investment mandates, regardless of whether their management fee structures also are comparable. Funds with comparable investment mandates offer exposure to similar types of securities. Funds with comparable management fee structures have similar management fee contractual arrangements (e.g., flat rate charged for advisory services, all-inclusive fee rate, etc.). "TMG %" represents the percentage of funds in the Total Mapped Group that had management fees that were lower than the fund's. For example, a TMG % of 10% means that 90% of the funds in the Total Mapped Group had higher management fees than the fund. The "Asset-Size Peer Group" (ASPG) comparison focuses on a fund's standing relative to a subset of non-Fidelity funds within the Total Mapped Group that are similar in size and management fee structure. The ASPG represents at least 15% of the funds in the Total Mapped Group with comparable asset size and management fee structures, subject to a minimum of 50 funds (or all funds in the Total Mapped Group if fewer than 50). Additional information, such as the ASPG quartile in which the fund's management fee ranked, is also included in the chart and considered by the Board.
Annual Report
VIP Growth Stock Portfolio
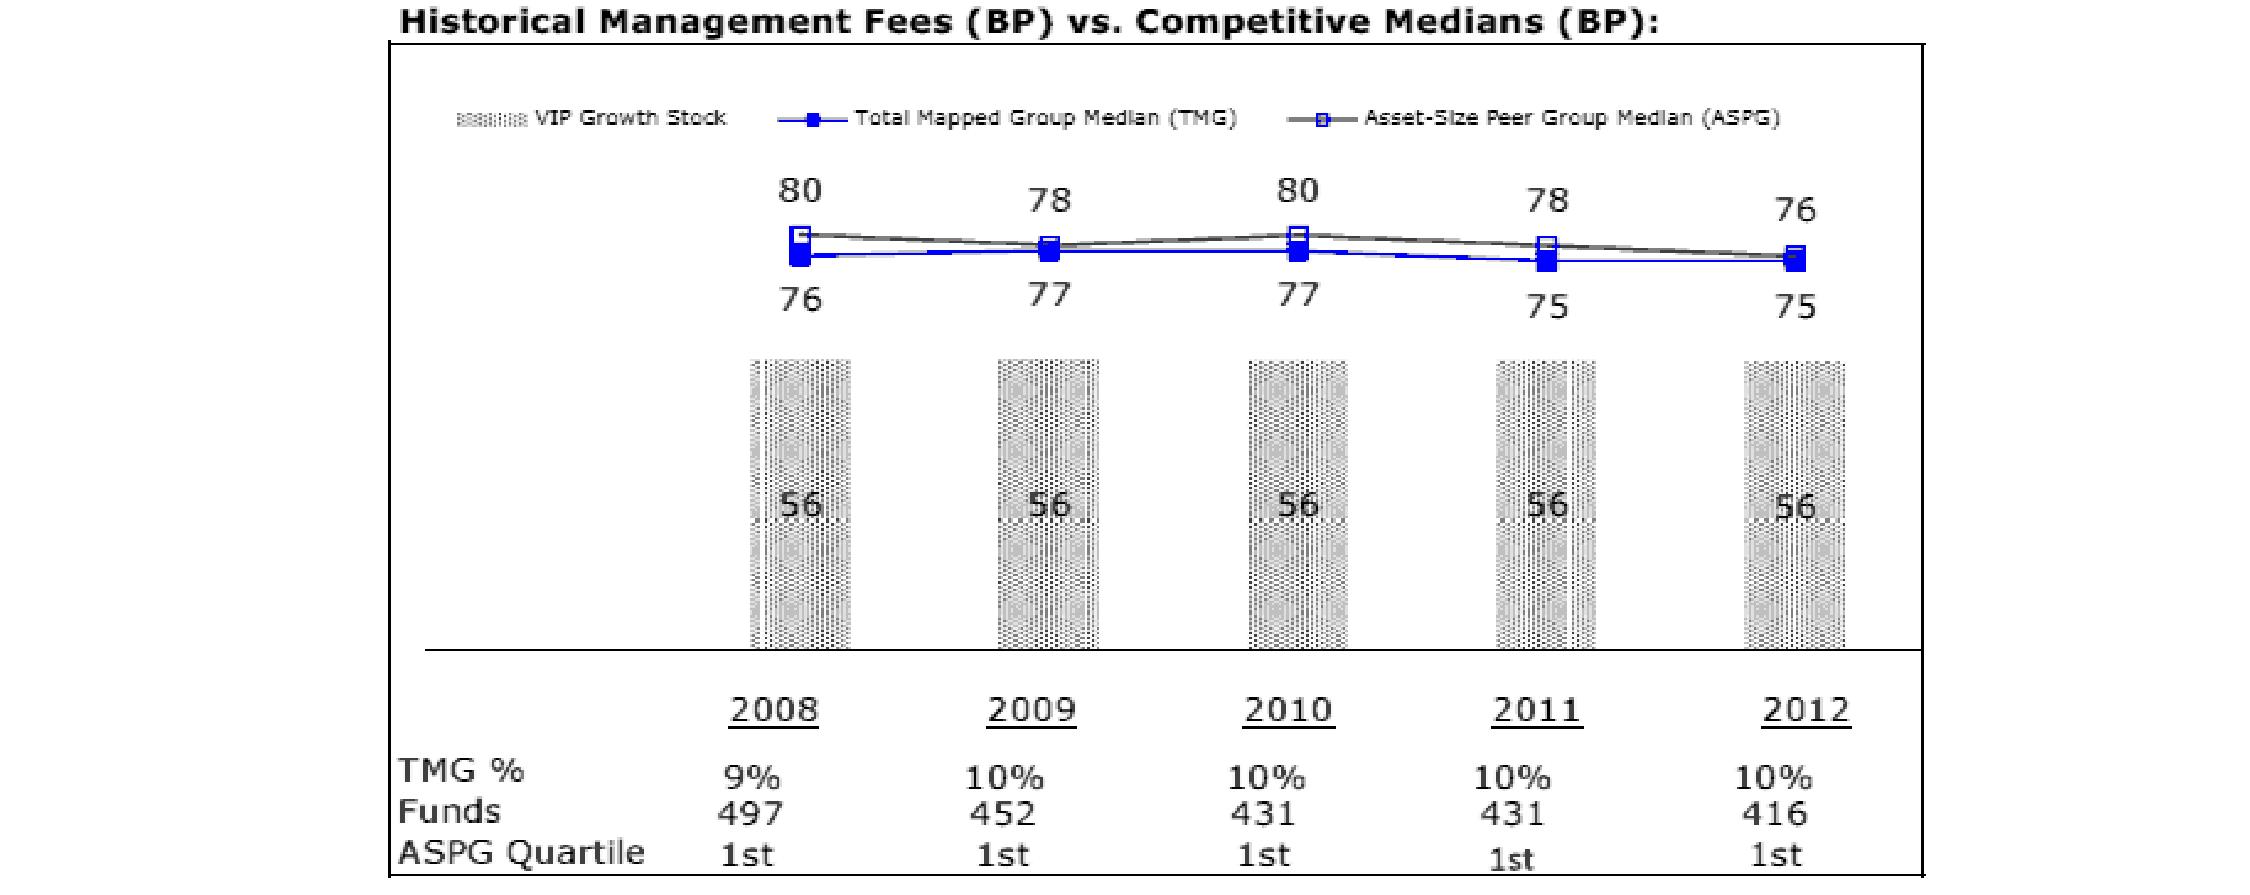
The Board noted that the fund's management fee ranked below the median of its Total Mapped Group and below the median of its ASPG for 2012.
Based on its review, the Board concluded that the fund's management fee is fair and reasonable in light of the services that the fund receives and the other factors considered.
Total Expense Ratio. In its review of each class's total expense ratio, the Board considered the fund's management fee as well as other fund or class expenses, as applicable, such as transfer agent fees, pricing and bookkeeping fees, fund-paid 12b-1 fees, and custodial, legal, and audit fees. The Board also noted the effects of any waivers and reimbursements on fees and expenses. As part of its review, the Board also considered the current and historical total expense ratios of each class of the fund compared to competitive fund median expenses. Each class of the fund is compared to those funds and classes in the Total Mapped Group (used by the Board for management fee comparisons) that have a similar sales load structure.
The Board noted that the total expense ratio of each of Initial Class, Investor Class, and Service Class ranked below its competitive median for 2012 and the total expense ratio of Service Class 2 ranked above its competitive median for 2012. The Board considered that, in general, various factors can affect total expense ratios. The Board noted that the fund offers multiple classes, each of which has a different 12b-1 fee structure, and that the multiple structures are intended to offer a range of pricing options for the intermediary market. The Board also noted that the total expense ratios of the classes vary primarily by the level of their 12b-1 fees, although differences in transfer agent fees may also cause expenses to vary from class to class.
Fees Charged to Other Fidelity Clients. The Board also considered Fidelity fee structures and other information with respect to clients of FMR and its affiliates, such as other mutual funds advised or subadvised by FMR or its affiliates, pension plan clients, and other institutional clients. The Board noted the findings of the 2013 ad hoc joint committee (created with the board of other Fidelity funds), which reviewed and compared Fidelity's institutional investment advisory business with its business of providing services to the Fidelity funds, including the differences in services provided, fees charged, and costs incurred, as well as competition in their respective marketplaces.
Based on its review of total expense ratios and fees charged to other Fidelity clients, the Board concluded that the total expense ratio of each class of the fund was reasonable, although Service Class 2 was above the median of the universe presented for comparison, in light of the services that the fund and its shareholders receive and the other factors considered.
Costs of the Services and Profitability. The Board considered the revenues earned and the expenses incurred by Fidelity in conducting the business of developing, marketing, distributing, managing, administering and servicing the fund and servicing the fund's shareholders. The Board also considered the level of Fidelity's profits in respect of all the Fidelity funds.
On an annual basis, FMR presents to the Board Fidelity's profitability for the fund. Fidelity calculates the profitability for each fund, as well as aggregate profitability for groups of Fidelity funds and all Fidelity funds, using a series of detailed revenue and cost allocation methodologies which originate with the books and records of Fidelity on which Fidelity's audited financial statements are based. The Audit Committee of the Board reviews any significant changes from the prior year's methodologies.
PricewaterhouseCoopers LLP (PwC), independent registered public accounting firm and auditor to Fidelity and certain Fidelity funds, has been engaged annually by the Board as part of the Board's assessment of Fidelity's profitability analysis. PwC's engagement includes the review and assessment of the methodologies used by Fidelity in determining the revenues and expenses attributable to Fidelity's mutual fund business, and completion of agreed-upon procedures surrounding the mathematical accuracy of fund profitability and its conformity to allocation methodologies. After considering PwC's reports issued under the engagement and information provided by Fidelity, the Board concluded that while other allocation methods may also be reasonable, Fidelity's profitability methodologies are reasonable in all material respects.
Annual Report
Board Approval of Investment Advisory Contracts and Management Fees - continued
The Board also reviewed Fidelity's non-fund businesses and fall-out benefits related to the mutual fund business as well as cases where Fidelity's affiliates may benefit from or be related to the fund's business.
The Board considered the costs of the services provided by and the profits realized by Fidelity in connection with the operation of the fund and was satisfied that the profitability was not excessive in the circumstances.
Economies of Scale. The Board considered whether there have been economies of scale in respect of the management of the Fidelity funds, whether the Fidelity funds (including the fund) have appropriately benefited from any such economies of scale, and whether there is potential for realization of any further economies of scale. The Board considered the extent to which the fund will benefit from economies of scale through increased services to the fund, through waivers or reimbursements, or through fee or expense reductions. The Board also noted that in 2009, it and the board of other Fidelity funds created an ad hoc committee (the Economies of Scale Committee) to analyze whether FMR attains economies of scale in respect of the management and servicing of the Fidelity funds, whether the Fidelity funds have appropriately benefited from such economies of scale, and whether there is potential for realization of any further economies of scale.
The Board recognized that the fund's management contract incorporates a "group fee" structure, which provides for lower group fee rates as total fund assets under FMR's management increase, and for higher group fee rates as total fund assets under FMR's management decrease. FMR calculates the group fee rates based on a tiered asset "breakpoint" schedule that varies based on asset class. The Board considered that the group fee is designed to deliver the benefits of economies of scale to fund shareholders when total Fidelity fund assets increase, even if assets of any particular fund are unchanged or have declined, because some portion of Fidelity's costs are attributable to services provided to all Fidelity funds, and all funds benefit if those costs can be allocated among more assets. The Board concluded that, given the group fee structure, fund shareholders will benefit from lower management fees as assets under FMR's management increase at the fund complex level, regardless of whether Fidelity achieves any such economies of scale.
The Board concluded, taking into account the analysis of the Economies of Scale Committee, that economies of scale, if any, are being appropriately shared between fund shareholders and Fidelity.
Amendment to Description of Group Fee Rate. At its July 2013 meeting, the Board voted to approve an amendment to the fund's management contract to modify the description of the "group fee rate" effective August 1, 2013. The Board noted that under the prior description in the contract, the group fee rate was based on the average net assets of all registered investment companies with which FMR has management contracts. Under the contract's tiered asset breakpoint schedule, the group fee rate is lower as total fund assets under FMR's management increase, and higher as total fund assets under FMR's management decrease. The Board considered that the prior description would have excluded the assets of 64 Fidelity sector funds from the group fee rate calculation once Fidelity SelectCo, LLC, an affiliate of FMR, assumed management responsibilities for those funds. The Board noted that modifying the description of the group fee rate to continue to include the assets of those 64 funds for purposes of determining group fee rate breakpoints would avoid an immediate adverse impact on the group fee rate for any fund.
Additional Information Requested by the Board. In order to develop fully the factual basis for consideration of the Fidelity funds' Advisory Contracts, the Board requested and received additional information on certain topics, including: (i) fund performance trends and Fidelity's long-term strategies for certain funds; (ii) the potential to further rationalize the Fidelity fund lineup with the possibility of achieving savings for the funds and Fidelity; (iii) the methodology with respect to competitive fund data and peer group classifications; (iv) the arrangements with, and performance of, certain sub-advisers on behalf of the Fidelity funds, as well as certain proposed participating affiliate arrangements; (v) the realization of fall-out benefits in certain Fidelity business units; (vi) Fidelity's group fee structures, including the rationale for the individual fee rates of certain categories of funds and the definition of group assets; (vii) trends regarding industry use of performance fee structures and the performance adjustment methodologies applicable to the Fidelity funds; (viii) additional competitive analysis regarding the total expenses for certain classes; and (ix) fund profitability methodology, including Fidelity's cost allocation methodology, and the impact of certain factors on fund profitability results.
Based on its evaluation of all of the conclusions noted above, and after considering all factors it believed relevant, the Board ultimately concluded that the advisory fee structures are fair and reasonable, and that the fund's Advisory Contracts should be renewed.
Annual Report
Investment Adviser
Fidelity Management & Research Company
Boston, MA
Investment Sub-Advisers
FMR Co., Inc.
Fidelity Management & Research (U.K.) Inc.
Fidelity Management & Research (Hong Kong) Limited
Fidelity Management & Research (Japan) Inc.
General Distributor
Fidelity Distributors Corporation
Smithfield, RI
Transfer and Service Agents
Fidelity Investments Institutional Operations Company, Inc.
Boston, MA
Fidelity Service Company, Inc.
Boston, MA
Custodian
The Bank of New York Mellon
New York, NY
VIPGR-ANN-0214
1.781993.111
Fidelity® Variable Insurance Products:
International Capital Appreciation Portfolio - Class R
Annual Report
December 31, 2013
(Fidelity Cover Art)
Contents
Performance | (Click Here) | How the fund has done over time. |
Management's Discussion of Fund Performance | (Click Here) | The Portfolio Manager's review of fund performance and strategy. |
Shareholder Expense Example | (Click Here) | An example of shareholder expenses. |
Investment Changes | (Click Here) | A summary of major shifts in the fund's investments over the past six months. |
Investments | (Click Here) | A complete list of the fund's investments with their market values. |
Financial Statements | (Click Here) | Statements of assets and liabilities, operations, and changes in net assets, as well as financial highlights. |
Notes | (Click Here) | Notes to the financial statements. |
Report of Independent Registered Public Accounting Firm | (Click Here) | |
Trustees and Officers | (Click Here) | |
Distributions | (Click Here) | |
Board Approval of Investment Advisory Contracts and Management Fees | (Click Here) | |
To view a fund's proxy voting guidelines and proxy voting record for the 12-month period ended June 30, visit http://www.fidelity.com/proxyvotingresults or visit the Securities and Exchange Commission's (SEC) web site at http://www.sec.gov. You may also call 1-877-208-0098 to request a free copy of the proxy voting guidelines.
Fidelity Variable Insurance Products are separate account options which are purchased through a variable insurance contract.
Standard & Poor's, S&P and S&P 500 are registered service marks of The McGraw-Hill Companies, Inc. and have been licensed for use by Fidelity Distributors Corporation.
Other third-party marks appearing herein are the property of their respective owners.
All other marks appearing herein are registered or unregistered trademarks or service marks of FMR LLC or an affiliated company. © 2014 FMR LLC. All rights reserved.
This report and the financial statements contained herein are submitted for the general information of the shareholders of the fund. This report is not authorized for distribution to prospective investors in the fund unless preceded or accompanied by an effective prospectus.
A fund files its complete schedule of portfolio holdings with the SEC for the first and third quarters of each fiscal year on Form N-Q. Forms N-Q are available on the SEC's web site at http://www.sec.gov. A fund's Forms N-Q may be reviewed and copied at the SEC's Public Reference Room in Washington, DC. Information regarding the operation of the SEC's Public Reference Room may be obtained by calling 1-800-SEC-0330. For a complete list of a fund's portfolio holdings, view the most recent holdings listing, semiannual report, or annual report on Fidelity's web site at http://www.fidelity.com, http://www.advisor.fidelity.com, or http://www.401k.com, as applicable.
NOT FDIC INSURED • MAY LOSE VALUE • NO BANK GUARANTEE
Neither the fund nor Fidelity Distributors Corporation is a bank.
Annual Report
Average annual total return reflects the change in the value of an investment, assuming reinvestment of the class' distributions from dividend income and capital gains (the profits earned upon the sale of securities that have grown in value, if any) and assuming a constant rate of performance each year. During periods of reimbursement by Fidelity, a fund's total return will be greater than it would be had the reimbursement not occurred. Performance numbers are net of all underlying fund operating expenses, but do not include any insurance charges imposed by your insurance company's separate account. If performance information included the effect of these additional charges, the total returns would have been lower. How a fund did yesterday is no guarantee of how it will do tomorrow.
Average Annual Total Returns
Periods ended December 31, 2013 | Past 1
year | Past 5
years | Life of
fundA |
VIP International Capital Appreciation Portfolio - Initial Class R | 21.65% | 19.27% | 5.72% |
VIP International Capital Appreciation Portfolio - Service Class R | 21.44% | 19.16% | 5.61% |
VIP International Capital Appreciation Portfolio - Service Class 2R | 21.40% | 18.99% | 5.45% |
VIP International Capital Appreciation Portfolio - Investor Class R B | 21.50% | 19.18% | 5.62% |
A From December 22, 2004.
B The initial offering of Investor Class R shares took place on July 21, 2005. Returns prior to July 21, 2005 are those of Initial Class R. Had Investor Class R's transfer agent fee been reflected, returns prior to July 21, 2005, would have been lower.
$10,000 Over Life of Fund
Let's say hypothetically that $10,000 was invested in VIP International Capital Appreciation Portfolio - Initial Class R on December 22, 2004, when the fund started. The chart shows how the value of your investment would have changed, and also shows how the MSCI® ACWI® (All Country World Index) ex USA Index performed over the same period.
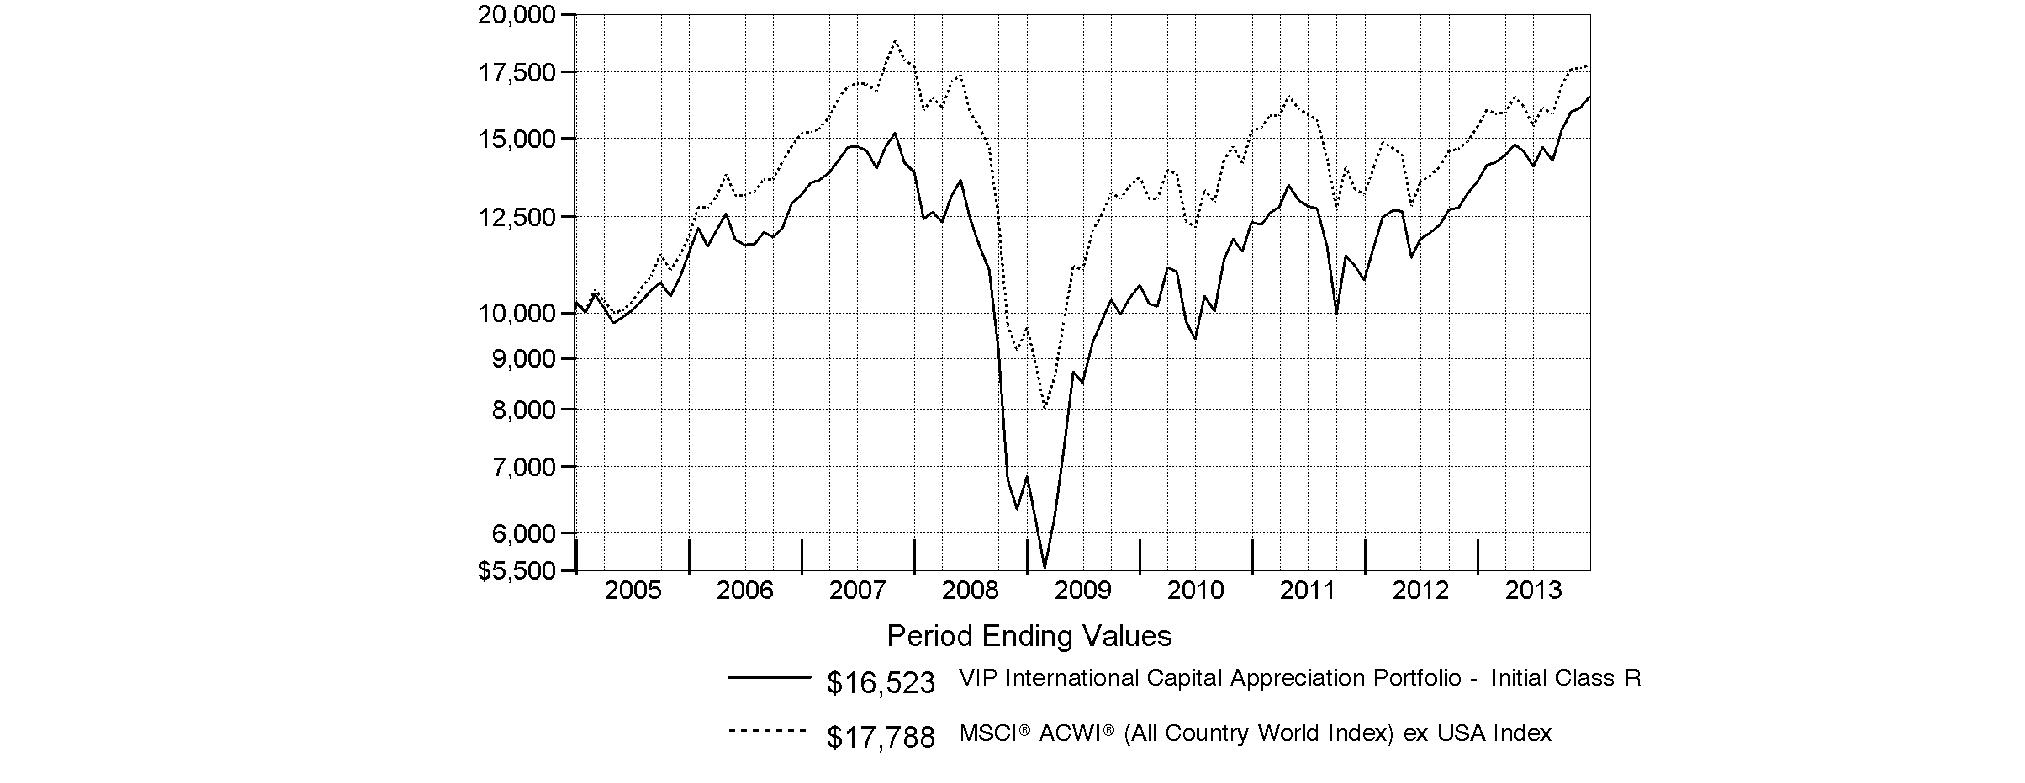
Annual Report
Market Recap: Global equity markets remained upbeat for the 12 months ending December 31, 2013, propelling the MSCI® ACWI® (All Country World Index) Index to a 23.24% return. Midyear turbulence gave way by autumn when policymakers in the U.S. and China had made clear their intentions to maintain accommodative monetary policies. That stance, combined with modest cyclical improvement around the globe and generally low valuations, underpinned the broad rally in equities, although the relative strength of the U.S. dollar generally tempered gains for U.S. investors holding foreign securities based in local currencies. During the period, the broad-market S&P 500® Index set a series of new highs, finishing the year up 32.39%. For the first time since 1995, the S&P® scored a "perfect 10," with all 10 economic sectors gaining at least 10% for the year. A resurgence in growth-oriented stocks lifted the Nasdaq Composite Index® to a 40.12% result for 2013, while the blue-chip Dow Jones Industrial AverageSM notched a relatively more modest 29.65% gain. International developed-markets equities rose in concert with their U.S. counterparts, with the MSCI® EAFE® Index gaining 22.92% for the period. Meanwhile, foreign exchange and commodity weakness curbed results in resource-heavy emerging markets (EM), especially in the year's waning months. More generally, concern over EM's slowing growth, its declining share of global trade and uncertainty surrounding U.S. central bank intentions were all factors hampering performance. The MSCI Emerging Markets Index returned -2.27% for the period. On the bond side, U.S. high-yield securities rallied with equities for much of the period, with The BofA Merrill LynchSM US High Yield Constrained Index returning 7.41% for 2013. The more rate-sensitive U.S. investment-grade bond category faced headwinds though, as reflected in the -2.02% return of the Barclays® U.S. Aggregate Bond Index. Within the Barclays index, investment-grade corporate credit returned -2.01%, while ultra-safe U.S. Treasuries saw a -2.75% result. Major non-U.S. developed markets performed only slightly better, with the Citigroup Non-USD Group-of-Seven (G7) Equal Weighted Index logging a -1.59% result. After several years of strong advances, EM debt reversed course in 2013, with the J.P. Morgan Emerging Markets Bond Index Global returning -6.58%.
Comments from Sammy Simnegar, Portfolio Manager of VIP International Capital Appreciation Portfolio: For the year, the fund's share classes posted strong gains that handily topped the 15.42% advance of the MSCI® ACWI® (All Country World Index) ex USA Index. (For specific portfolio results, please refer to the performance section of this report.) Versus its MSCI benchmark, an overweighting in media - where I substantially raised the fund's overweighted exposure - proved rewarding, and was one factor that made consumer discretionary the sector that bolstered the fund's relative performance the most. One standout from consumer discretionary was Hong Kong-listed casino operator Galaxy Entertainment Group, a beneficiary of the dynamic growth of tourism in Macau, China's coastal gaming mecca. Another contributor from this sector was Japan's Fuji Heavy Industries, manufacturer of Subaru vehicles, whose outstanding share-price performance reflected the positive impact of Japan's efforts to drive the value of the yen lower and make its exports more competitive. Elsewhere, the fund's positioning in software & services meaningfully aided relative performance. Here, real estate Internet portal SouFun Holdings benefited from the revaluation of Internet businesses in China, as did Bitauto Holdings, a provider of Internet content and marketing services for the automobile industry - primarily in China. I bought both of these non-index stocks during the period. Underweighting or avoiding the shares of some resource-intensive companies in the materials and energy sectors also worked out well. On the other hand, one factor curbing the fund's results was a large underweighting in Japan, although a lot of the damage here was mitigated by lessened exposure to a much weaker yen. At the stock level, the biggest relative detractor was U.K.-based wireless carrier and index Vodafone Group, which hurt because it did well, and the fund didn't own this index constituent. Although I believed there were better growth opportunities elsewhere, the stock got a boost in late summer, as the market began to anticipate Vodafone's September announcement of plans to sell its large stake in Verizon Wireless. Lastly, relative performance suffered from not owning Swiss drug company Roche Holding, a strong-performing benchmark constituent that seemed expensive to me.
The views expressed above reflect those of the portfolio manager(s) only through the end of the period as stated on the cover of this report and do not necessarily represent the views of Fidelity or any other person in the Fidelity organization. Any such views are subject to change at any time based upon market or other conditions and Fidelity disclaims any responsibility to update such views. These views may not be relied on as investment advice and, because investment decisions for a Fidelity fund are based on numerous factors, may not be relied on as an indication of trading intent on behalf of any Fidelity fund.
Annual Report
As a shareholder of the Fund, you incur two types of costs: (1) transaction costs, including redemption fees and (2) ongoing costs, including management fees, distribution and/or service (12b-1) fees and other Fund expenses. This Example is intended to help you understand your ongoing costs (in dollars) of investing in the Fund and to compare these costs with the ongoing costs of investing in other mutual funds.
The Example is based on an investment of $1,000 invested at the beginning of the period and held for the entire period (July 1, 2013 to December 31, 2013).
Actual Expenses
The first line of the accompanying table for each class of the Fund provides information about actual account values and actual expenses. You may use the information in this line, together with the amount you invested, to estimate the expenses that you paid over the period. Simply divide your account value by $1,000.00 (for example, an $8,600 account value divided by $1,000.00 = 8.6), then multiply the result by the number in the first line for a class of the Fund under the heading entitled "Expenses Paid During Period" to estimate the expenses you paid on your account during this period. The estimate of expenses does not include any fees or other expenses of any variable annuity or variable life insurance product. If they were, the estimate of expenses you paid during the period would be higher, and your ending account value would be lower. In addition, the Fund, as a shareholder in the underlying Fidelity Central Funds, will indirectly bear its pro-rata share of the fees and expenses incurred by the underlying Fidelity Central Funds. These fees and expenses are not included in the Fund's annualized expense ratio used to calculate the expense estimate in the table below.
Hypothetical Example for Comparison Purposes
The second line of the accompanying table for each class of the Fund provides information about hypothetical account values and hypothetical expenses based on a Class' actual expense ratio and an assumed rate of return of 5% per year before expenses, which is not the Class' actual return. The hypothetical account values and expenses may not be used to estimate the actual ending account balance or expenses you paid for the period. You may use this information to compare the ongoing costs of investing in the Fund and other funds. To do so, compare this 5% hypothetical example with the 5% hypothetical examples that appear in the shareholder reports of the other funds. The estimate of expenses does not include any fees or other expenses of any variable annuity or variable life insurance product. If they were, the estimate of expenses you paid during the period would be higher, and your ending account value would be lower. In addition, the Fund, as a shareholder in the underlying Fidelity Central Funds, will indirectly bear its pro-rata share of the fees and expenses incurred by the underlying Fidelity Central Funds. These fees and expenses are not included in the Fund's annualized expense ratio used to calculate the expense estimate in the table below.
Please note that the expenses shown in the table are meant to highlight your ongoing costs only and do not reflect any transaction costs. Therefore, the second line of the table is useful in comparing ongoing costs only, and will not help you determine the relative total costs of owning different funds. In addition, if these transactional costs were included, your costs would have been higher.
| Annualized
Expense Ratio B | Beginning
Account Value
July 1, 2013 | Ending
Account Value
December 31, 2013 | Expenses Paid
During Period*
July 1, 2013
to December 31, 2013 |
Initial Class | 1.10% | | | |
Actual | | $ 1,000.00 | $ 1,175.90 | $ 6.03 |
HypotheticalA | | $ 1,000.00 | $ 1,019.66 | $ 5.60 |
Service Class | 1.20% | | | |
Actual | | $ 1,000.00 | $ 1,175.20 | $ 6.58 |
HypotheticalA | | $ 1,000.00 | $ 1,019.16 | $ 6.11 |
Service Class 2 | 1.35% | | | |
Actual | | $ 1,000.00 | $ 1,175.20 | $ 7.40 |
HypotheticalA | | $ 1,000.00 | $ 1,018.40 | $ 6.87 |
Initial Class R | 1.10% | | | |
Actual | | $ 1,000.00 | $ 1,176.20 | $ 6.03 |
HypotheticalA | | $ 1,000.00 | $ 1,019.66 | $ 5.60 |
Service Class R | 1.20% | | | |
Actual | | $ 1,000.00 | $ 1,175.20 | $ 6.58 |
HypotheticalA | | $ 1,000.00 | $ 1,019.16 | $ 6.11 |
Service Class 2R | 1.35% | | | |
Actual | | $ 1,000.00 | $ 1,174.70 | $ 7.40 |
HypotheticalA | | $ 1,000.00 | $ 1,018.40 | $ 6.87 |
Investor Class R | 1.18% | | | |
Actual | | $ 1,000.00 | $ 1,175.60 | $ 6.47 |
HypotheticalA | | $ 1,000.00 | $ 1,019.26 | $ 6.01 |
A 5% return per year before expenses
B Annualized expense ratio reflects expenses net of applicable fee waivers.
* Expenses are equal to each Class' annualized expense ratio, multiplied by the average account value over the period, multiplied by 184/365 (to reflect the one-half year period).
Annual Report
Investment Changes (Unaudited)
Geographic Diversification (% of fund's net assets) |
As of December 31, 2013 |
 | United Kingdom | 17.2% | |
 | United States of America* | 15.8% | |
 | Japan | 14.4% | |
 | Germany | 5.9% | |
 | France | 5.8% | |
 | India | 3.5% | |
 | Switzerland | 2.8% | |
 | Australia | 2.8% | |
 | Canada | 2.8% | |
 | Other | 29.0% | |

Percentages are based on country or territory of incorporation and are adjusted for the effect of futures contracts, if applicable. |
* Includes Short-Term Investments and Net Other Assets.
As of June 30, 2013 |
| United States of America* | 16.4% | |
| United Kingdom | 15.1% | |
| Japan | 11.5% | |
| France | 7.4% | |
| Germany | 6.0% | |
| Switzerland | 5.0% | |
| India | 3.2% | |
| Brazil | 3.1% | |
| Indonesia | 3.0% | |
| Other | 29.3% | |

Percentages are based on country or territory of incorporation and are adjusted for the effect of futures contracts, if applicable. |
* Includes Short-Term Investments and Net Other Assets.
Asset Allocation as of December 31, 2013 |
| % of fund's
net assets | % of fund's net assets
6 months ago |
Stocks | 98.6 | 99.0 |
Short-Term Investments and Net Other Assets (Liabilities) | 1.4 | 1.0 |
Top Ten Stocks as of December 31, 2013 |
| % of fund's
net assets | % of fund's net assets
6 months ago |
Bayer AG (Germany, Pharmaceuticals) | 0.9 | 0.7 |
British American Tobacco PLC (United Kingdom) (United Kingdom, Tobacco) | 0.9 | 0.9 |
Diageo PLC sponsored ADR (United Kingdom, Beverages) | 0.7 | 0.7 |
Anheuser-Busch InBev SA NV (Belgium, Beverages) | 0.7 | 0.6 |
SoftBank Corp. (Japan, Wireless Telecommunication Services) | 0.6 | 0.6 |
Novo Nordisk A/S Series B sponsored ADR (Denmark, Pharmaceuticals) | 0.6 | 0.6 |
Sumitomo Mitsui Financial Group, Inc. ADR (Japan, Commercial Banks) | 0.6 | 0.7 |
Standard Chartered PLC (United Kingdom) (United Kingdom, Commercial Banks) | 0.6 | 0.6 |
Compagnie Financiere Richemont SA Series A (Switzerland, Textiles, Apparel & Luxury Goods) | 0.6 | 0.6 |
AIA Group Ltd. (Hong Kong, Insurance) | 0.5 | 0.6 |
| 6.7 | |
Market Sectors as of December 31, 2013 |
| % of fund's
net assets | % of fund's net assets
6 months ago |
Consumer Discretionary | 24.5 | 23.8 |
Industrials | 19.8 | 17.0 |
Financials | 14.2 | 15.4 |
Consumer Staples | 10.9 | 14.6 |
Information Technology | 10.3 | 10.7 |
Materials | 8.9 | 7.9 |
Health Care | 7.9 | 7.4 |
Telecommunication Services | 1.8 | 1.7 |
Energy | 0.3 | 0.5 |
Annual Report
Investments December 31, 2013
Showing Percentage of Net Assets
Common Stocks - 97.3% |
| Shares | | Value |
Australia - 2.8% |
ALS Ltd. | 34,526 | | $ 271,597 |
Amcor Ltd. | 32,475 | | 305,918 |
Ansell Ltd. | 13,882 | | 256,210 |
Carsales.com Ltd. | 26,745 | | 243,343 |
CSL Ltd. | 7,042 | | 433,607 |
DuluxGroup Ltd. | 48,192 | | 230,644 |
Flight Centre Trvl Group Ltd. | 6,858 | | 291,173 |
Fortescue Metals Group Ltd. | 54,657 | | 284,035 |
Orora Ltd. (a) | 32,475 | | 33,636 |
realestate.com.au Ltd. | 7,544 | | 254,353 |
SEEK Ltd. | 21,400 | | 256,239 |
Sydney Airport unit | 79,722 | | 270,498 |
TOTAL AUSTRALIA | | 3,131,253 |
Austria - 0.3% |
Andritz AG | 4,702 | | 294,901 |
Bailiwick of Jersey - 1.7% |
Delphi Automotive PLC | 4,671 | | 280,867 |
Experian PLC | 23,501 | | 433,530 |
Shire PLC | 8,300 | | 391,156 |
Wolseley PLC | 6,168 | | 349,826 |
WPP PLC | 19,700 | | 450,187 |
TOTAL BAILIWICK OF JERSEY | | 1,905,566 |
Belgium - 0.7% |
Anheuser-Busch InBev SA NV | 7,368 | | 783,486 |
Bermuda - 0.8% |
Credicorp Ltd. | 2,500 | | 331,825 |
Invesco Ltd. | 7,877 | | 286,723 |
Signet Jewelers Ltd. | 3,771 | | 296,778 |
TOTAL BERMUDA | | 915,326 |
Brazil - 2.1% |
BB Seguridade Participacoes SA | 24,700 | | 258,810 |
CCR SA | 37,900 | | 288,034 |
Cielo SA | 11,140 | | 312,779 |
Iguatemi Empresa de Shopping Centers SA | 29,100 | | 277,533 |
Multiplan Empreendimentos Imobiliarios SA | 11,600 | | 247,557 |
Qualicorp SA (a) | 27,100 | | 260,777 |
Souza Cruz SA | 30,300 | | 312,433 |
Ultrapar Participacoes SA | 12,800 | | 306,286 |
TOTAL BRAZIL | | 2,264,209 |
Canada - 2.8% |
Alimentation Couche-Tard, Inc. Class B (sub. vtg.) | 4,700 | | 353,435 |
AutoCanada, Inc. | 5,900 | | 254,884 |
Canadian National Railway Co. | 9,000 | | 513,100 |
Canadian Pacific Railway Ltd. | 3,000 | | 453,707 |
CGI Group, Inc. Class A (sub. vtg.) (a) | 8,800 | | 294,424 |
Cineplex, Inc. | 6,800 | | 282,050 |
|
| Shares | | Value |
Constellation Software, Inc. | 1,250 | | $ 264,756 |
Jean Coutu Group, Inc. Class A (sub. vtg.) | 13,900 | | 240,903 |
Valeant Pharmaceuticals International, Inc. (Canada) (a) | 3,800 | | 445,805 |
TOTAL CANADA | | 3,103,064 |
Cayman Islands - 1.6% |
Baidu.com, Inc. sponsored ADR (a) | 1,600 | | 284,608 |
Baoxin Auto Group Ltd. | 268,000 | | 260,248 |
Bitauto Holdings Ltd. ADR (a) | 8,185 | | 261,593 |
Lifestyle International Holdings Ltd. | 7,500 | | 13,889 |
New Oriental Education & Technology Group, Inc. sponsored ADR | 8,600 | | 270,900 |
Sands China Ltd. | 47,000 | | 383,974 |
SouFun Holdings Ltd. ADR | 3,600 | | 296,676 |
TOTAL CAYMAN ISLANDS | | 1,771,888 |
China - 0.3% |
Travelsky Technology Ltd. (H Shares) | 306,000 | | 301,884 |
Colombia - 0.3% |
Cemex Latam Holdings SA (a) | 36,522 | | 280,065 |
Denmark - 0.9% |
Coloplast A/S Series B | 4,200 | | 278,051 |
Novo Nordisk A/S Series B sponsored ADR | 3,700 | | 683,612 |
TOTAL DENMARK | | 961,663 |
Finland - 0.7% |
Kone Oyj (B Shares) | 8,000 | | 360,984 |
Nokian Tyres PLC | 5,728 | | 274,776 |
Tikkurila Oyj | 6,927 | | 189,637 |
TOTAL FINLAND | | 825,397 |
France - 5.8% |
Air Liquide SA | 3,680 | | 520,433 |
Atos Origin SA | 3,112 | | 281,659 |
AXA SA | 21,000 | | 583,861 |
Bureau Veritas SA | 9,700 | | 283,499 |
Christian Dior SA | 1,881 | | 355,419 |
Dassault Systemes SA | 2,200 | | 273,085 |
Edenred SA | 7,854 | | 262,880 |
Essilor International SA | 3,357 | | 356,896 |
Ingenico SA (d) | 3,285 | | 263,377 |
L'Oreal SA | 2,900 | | 509,463 |
Pernod Ricard SA | 4,100 | | 467,079 |
Publicis Groupe SA | 4,400 | | 402,590 |
Safran SA | 5,700 | | 396,074 |
Schneider Electric SA | 6,329 | | 552,011 |
Sodexo SA | 3,400 | | 344,442 |
Tarkett SA (a) | 6,056 | | 237,607 |
Zodiac Aerospace | 1,800 | | 318,818 |
TOTAL FRANCE | | 6,409,193 |
Common Stocks - continued |
| Shares | | Value |
Germany - 5.3% |
adidas AG | 3,400 | | $ 433,312 |
Bayer AG | 6,900 | | 967,742 |
Bayerische Motoren Werke AG (BMW) | 4,460 | | 522,878 |
Brenntag AG | 1,800 | | 333,676 |
Continental AG | 2,100 | | 460,502 |
CTS Eventim AG | 5,253 | | 266,009 |
Deutsche Post AG | 13,605 | | 495,985 |
Fresenius SE & Co. KGaA | 2,600 | | 399,173 |
GEA Group AG | 6,256 | | 297,781 |
Gerry Weber International AG (Bearer) | 6,024 | | 255,785 |
Henkel AG & Co. KGaA | 4,908 | | 510,716 |
Linde AG | 2,600 | | 543,856 |
ProSiebenSat.1 Media AG | 6,500 | | 321,914 |
TOTAL GERMANY | | 5,809,329 |
Greece - 0.2% |
Folli Follie SA (a) | 7,574 | | 243,818 |
Hong Kong - 1.2% |
AIA Group Ltd. | 125,400 | | 629,078 |
Galaxy Entertainment Group Ltd. (a) | 46,000 | | 412,584 |
Techtronic Industries Co. Ltd. | 111,000 | | 314,922 |
TOTAL HONG KONG | | 1,356,584 |
India - 3.5% |
Amara Raja Batteries Ltd. | 46,753 | | 254,027 |
Axis Bank Ltd. | 15,106 | | 317,448 |
Bajaj Auto Ltd. | 8,987 | | 277,697 |
Grasim Industries Ltd. | 5,789 | | 267,525 |
HCL Technologies Ltd. | 16,234 | | 331,440 |
HDFC Bank Ltd. | 32,973 | | 362,131 |
Housing Development Finance Corp. Ltd. | 29,677 | | 381,352 |
ITC Ltd. | 74,012 | | 385,200 |
Sun Pharmaceutical Industries Ltd. | 31,396 | | 288,093 |
Sun TV Ltd. | 49,658 | | 305,384 |
Tata Consultancy Services Ltd. | 10,711 | | 376,210 |
Yes Bank Ltd. | 46,091 | | 275,920 |
TOTAL INDIA | | 3,822,427 |
Indonesia - 1.8% |
PT Bank Central Asia Tbk | 357,500 | | 282,802 |
PT Bank Rakyat Indonesia Tbk | 548,000 | | 327,550 |
PT Global Mediacom Tbk | 1,769,500 | | 276,546 |
PT Indocement Tunggal Prakarsa Tbk | 199,500 | | 328,627 |
PT Jasa Marga Tbk | 421,500 | | 163,900 |
PT Semen Gresik (Persero) Tbk | 274,500 | | 320,095 |
PT Surya Citra Media Tbk | 1,128,500 | | 243,498 |
TOTAL INDONESIA | | 1,943,018 |
Ireland - 1.3% |
Accenture PLC Class A | 3,892 | | 320,000 |
Actavis PLC (a) | 1,633 | | 274,344 |
James Hardie Industries PLC CDI | 24,858 | | 287,212 |
|
| Shares | | Value |
Kerry Group PLC Class A | 5,100 | | $ 354,312 |
Perrigo Co. PLC | 1,622 | | 248,912 |
TOTAL IRELAND | | 1,484,780 |
Italy - 1.6% |
Azimut Holding SpA | 11,800 | | 321,906 |
Lottomatica SpA | 9,014 | | 274,796 |
Luxottica Group SpA | 5,600 | | 300,112 |
Pirelli & C SpA | 17,200 | | 297,668 |
Prada SpA | 30,400 | | 270,508 |
World Duty Free SpA (a) | 22,775 | | 286,371 |
TOTAL ITALY | | 1,751,361 |
Japan - 14.4% |
Ain Pharmaciez, Inc. | 6,100 | | 299,579 |
Bridgestone Corp. | 11,600 | | 439,488 |
Chiyoda Corp. | 23,000 | | 333,880 |
Daikin Industries Ltd. | 5,700 | | 355,696 |
Daito Trust Construction Co. Ltd. | 3,200 | | 299,161 |
DENSO Corp. | 8,700 | | 459,610 |
Dentsu, Inc. | 7,900 | | 323,099 |
East Japan Railway Co. | 5,900 | | 469,981 |
Fuji Heavy Industries Ltd. | 14,300 | | 410,967 |
Fuji Media Holdings, Inc. | 13,400 | | 274,418 |
Hitachi Ltd. | 67,000 | | 508,004 |
Hoya Corp. | 12,900 | | 358,773 |
Japan Tobacco, Inc. | 16,200 | | 527,128 |
JGC Corp. | 9,000 | | 353,194 |
Kansai Paint Co. Ltd. | 23,000 | | 340,122 |
KDDI Corp. ADR | 30,370 | | 468,913 |
Keyence Corp. | 967 | | 414,055 |
LIXIL Group Corp. | 11,000 | | 301,976 |
Makita Corp. | 6,400 | | 336,593 |
Miraca Holdings, Inc. | 6,600 | | 311,364 |
Misumi Group, Inc. | 8,300 | | 260,956 |
MS&AD Insurance Group Holdings, Inc. | 14,300 | | 384,369 |
Nippon Paint Co. Ltd. | 18,000 | | 299,486 |
Nippon Television Network Corp. | 16,700 | | 301,522 |
Nomura Research Institute Ltd. | 9,500 | | 300,227 |
Obic Co. Ltd. | 10,700 | | 316,160 |
Omron Corp. | 8,500 | | 375,643 |
ORIX Corp. | 24,700 | | 434,025 |
Park24 Co. Ltd. | 13,000 | | 245,166 |
Rakuten, Inc. | 25,700 | | 383,532 |
Ryohin Keikaku Co. Ltd. | 2,500 | | 270,406 |
Ship Healthcare Holdings, Inc. | 7,100 | | 275,702 |
SMC Corp. | 1,500 | | 378,583 |
SoftBank Corp. | 8,100 | | 710,781 |
Sumitomo Mitsui Financial Group, Inc. ADR (d) | 63,458 | | 665,674 |
Sumitomo Mitsui Trust Holdings, Inc. | 74,000 | | 391,550 |
Sumitomo Osaka Cement Co. Ltd. | 83,000 | | 319,079 |
Taiheiyo Cement Corp. | 88,000 | | 338,426 |
Tokio Marine Holdings, Inc. | 12,300 | | 411,677 |
Common Stocks - continued |
| Shares | | Value |
Japan - continued |
Tsuruha Holdings, Inc. | 3,100 | | $ 284,638 |
TV Asahi Corp. | 13,200 | | 292,790 |
USS Co. Ltd. | 21,100 | | 289,418 |
Yahoo! Japan Corp. | 61,400 | | 342,391 |
TOTAL JAPAN | | 15,858,202 |
Kenya - 0.3% |
Equity Bank Ltd. | 197,100 | | 70,230 |
Safaricom Ltd. | 2,358,500 | | 296,521 |
TOTAL KENYA | | 366,751 |
Luxembourg - 0.3% |
RTL Group SA | 2,300 | | 294,104 |
Mexico - 1.3% |
Fomento Economico Mexicano S.A.B. de CV sponsored ADR | 4,200 | | 411,054 |
Grupo Aeroportuario del Pacifico SA de CV Series B | 46,700 | | 251,655 |
Grupo Financiero Banorte S.A.B. de CV Series O | 54,600 | | 385,108 |
Grupo Televisa SA de CV (CPO) sponsored ADR | 12,300 | | 372,198 |
TOTAL MEXICO | | 1,420,015 |
Netherlands - 0.8% |
AEGON NV | 36,846 | | 349,300 |
European Aeronautic Defence and Space Co. (EADS) NV | 7,000 | | 537,445 |
TOTAL NETHERLANDS | | 886,745 |
New Zealand - 0.1% |
EBOS Group Ltd. | 11,611 | | 92,624 |
Nigeria - 0.5% |
Dangote Cement PLC | 211,518 | | 289,593 |
Guaranty Trust Bank PLC | 1,600,693 | | 270,402 |
TOTAL NIGERIA | | 559,995 |
Panama - 0.3% |
Copa Holdings SA Class A | 1,800 | | 288,198 |
Philippines - 1.0% |
Alliance Global Group, Inc. | 475,300 | | 276,188 |
Security Bank Corp. | 111,448 | | 290,166 |
SM Investments Corp. | 16,572 | | 265,376 |
SM Prime Holdings, Inc. | 725,100 | | 239,740 |
TOTAL PHILIPPINES | | 1,071,470 |
Russia - 0.8% |
Magnit OJSC GDR (Reg. S) | 5,800 | | 383,960 |
Sberbank (Savings Bank of the Russian Federation) sponsored ADR | 37,600 | | 473,008 |
TOTAL RUSSIA | | 856,968 |
South Africa - 2.0% |
Aspen Pharmacare Holdings Ltd. | 10,600 | | 271,538 |
|
| Shares | | Value |
Discovery Holdings Ltd. | 33,551 | | $ 270,263 |
Life Healthcare Group Holdings Ltd. | 68,400 | | 272,948 |
Mr Price Group Ltd. | 19,000 | | 296,574 |
Nampak Ltd. | 77,000 | | 300,953 |
Naspers Ltd. Class N | 4,700 | | 491,063 |
Shoprite Holdings Ltd. | 18,480 | | 288,915 |
TOTAL SOUTH AFRICA | | 2,192,254 |
Spain - 1.0% |
Amadeus IT Holding SA Class A | 9,100 | | 389,399 |
Grifols SA ADR | 7,900 | | 285,348 |
Inditex SA | 2,760 | | 454,872 |
TOTAL SPAIN | | 1,129,619 |
Sweden - 2.3% |
ASSA ABLOY AB (B Shares) | 8,000 | | 422,647 |
Atlas Copco AB (A Shares) | 15,700 | | 435,226 |
Elekta AB (B Shares) | 18,800 | | 287,473 |
Eniro AB (a) | 43,610 | | 336,236 |
Hexagon AB (B Shares) | 9,500 | | 300,279 |
Investment AB Kinnevik (B Shares) | 7,700 | | 356,636 |
Svenska Cellulosa AB (SCA) (B Shares) | 13,200 | | 406,353 |
TOTAL SWEDEN | | 2,544,850 |
Switzerland - 2.8% |
Compagnie Financiere Richemont SA Series A | 6,542 | | 651,230 |
DKSH Holding AG | 3,158 | | 245,333 |
Schindler Holding AG (Reg.) | 2,470 | | 364,388 |
SGS SA (Reg.) | 150 | | 345,048 |
Sika AG (Bearer) | 77 | | 273,714 |
Swatch Group AG (Bearer) | 650 | | 429,544 |
Syngenta AG (Switzerland) | 1,297 | | 517,110 |
TE Connectivity Ltd. | 5,600 | | 308,616 |
TOTAL SWITZERLAND | | 3,134,983 |
Thailand - 0.9% |
Airports of Thailand PCL (For. Reg.) | 49,600 | | 240,087 |
BEC World PCL (For. Reg.) | 163,000 | | 251,273 |
Kasikornbank PCL (For. Reg.) | 60,700 | | 294,798 |
Major Cineplex Group PCL (For. Reg.) | 290,100 | | 155,023 |
TOTAL THAILAND | | 941,181 |
Turkey - 1.2% |
Coca-Cola Icecek A/S | 10,000 | | 240,810 |
Enka Insaat ve Sanayi A/S | 98,000 | | 274,528 |
Koc Holding A/S | 65,000 | | 266,170 |
TAV Havalimanlari Holding A/S | 42,000 | | 301,954 |
Tofas Turk Otomobil Fabrikasi A/S | 43,872 | | 273,562 |
TOTAL TURKEY | | 1,357,024 |
United Kingdom - 17.2% |
Aberdeen Asset Management PLC | 43,800 | | 362,653 |
Ashtead Group PLC | 23,000 | | 289,460 |
Associated British Foods PLC | 9,300 | | 376,538 |
Common Stocks - continued |
| Shares | | Value |
United Kingdom - continued |
Aveva Group PLC | 7,300 | | $ 261,594 |
Babcock International Group PLC | 12,700 | | 284,964 |
Berkeley Group Holdings PLC | 6,741 | | 296,483 |
British American Tobacco PLC (United Kingdom) | 17,700 | | 950,032 |
British Sky Broadcasting Group PLC | 22,900 | | 320,055 |
BT Group PLC | 83,200 | | 524,654 |
Bunzl PLC | 12,558 | | 301,534 |
Burberry Group PLC | 12,800 | | 321,334 |
Capita Group PLC | 22,000 | | 378,153 |
Compass Group PLC | 29,400 | | 471,270 |
Croda International PLC | 8,500 | | 345,837 |
Daily Mail & General Trust PLC Class A | 18,195 | | 289,399 |
Diageo PLC sponsored ADR | 6,100 | | 807,762 |
Diploma PLC | 21,548 | | 240,856 |
Domino's Pizza UK & IRL PLC | 33,500 | | 284,583 |
easyJet PLC | 12,300 | | 312,855 |
Elementis PLC | 63,036 | | 280,690 |
Filtrona PLC | 21,200 | | 301,562 |
Galiform PLC | 50,052 | | 285,783 |
Halma PLC | 29,700 | | 296,812 |
IMI PLC | 12,500 | | 315,665 |
InterContinental Hotel Group PLC ADR | 9,893 | | 330,723 |
Intertek Group PLC | 6,600 | | 344,053 |
ITV PLC | 111,354 | | 357,730 |
Johnson Matthey PLC | 6,616 | | 359,349 |
Legal & General Group PLC | 106,864 | | 394,093 |
Meggitt PLC | 40,300 | | 352,026 |
Mondi PLC | 18,200 | | 315,247 |
Next PLC | 4,200 | | 379,047 |
Oxford Instruments PLC | 9,800 | | 286,754 |
Prudential PLC | 26,548 | | 593,189 |
Reckitt Benckiser Group PLC | 7,200 | | 571,462 |
Rexam PLC | 40,380 | | 354,731 |
Rightmove PLC | 6,716 | | 304,725 |
Rolls-Royce Group PLC | 24,800 | | 523,611 |
Rotork PLC | 5,800 | | 275,649 |
Royal Mail PLC | 30,000 | | 283,167 |
SABMiller PLC | 10,700 | | 549,456 |
Schroders PLC | 7,300 | | 314,058 |
Senior Engineering Group PLC | 54,000 | | 274,702 |
Spectris PLC | 6,800 | | 288,380 |
Sports Direct International PLC (a) | 21,200 | | 251,009 |
St. James's Place Capital PLC | 25,771 | | 310,678 |
Standard Chartered PLC (United Kingdom) | 29,309 | | 660,066 |
The Restaurant Group PLC | 27,673 | | 271,285 |
The Weir Group PLC | 9,330 | | 329,394 |
Travis Perkins PLC | 10,889 | | 337,552 |
Whitbread PLC | 5,893 | | 366,042 |
TOTAL UNITED KINGDOM | | 18,878,706 |
|
| Shares | | Value |
United States of America - 14.4% |
Affiliated Managers Group, Inc. (a) | 1,300 | | $ 281,944 |
AMETEK, Inc. | 5,700 | | 300,219 |
Amphenol Corp. Class A | 3,330 | | 296,969 |
AutoZone, Inc. (a) | 600 | | 286,764 |
BlackRock, Inc. Class A | 900 | | 284,823 |
BorgWarner, Inc. | 5,200 | | 290,732 |
Carlyle Group LP | 7,900 | | 281,398 |
CBS Corp. Class B | 5,015 | | 319,656 |
Colgate-Palmolive Co. | 4,440 | | 289,532 |
Comcast Corp. Class A | 4,800 | | 249,432 |
Computer Sciences Corp. | 4,900 | | 273,812 |
Cummins, Inc. | 2,144 | | 302,240 |
Danaher Corp. | 3,800 | | 293,360 |
Estee Lauder Companies, Inc. Class A | 3,396 | | 255,787 |
Fidelity National Information Services, Inc. | 4,597 | | 246,767 |
Fiserv, Inc. (a) | 4,236 | | 250,136 |
FMC Corp. | 4,000 | | 301,840 |
Google, Inc. Class A (a) | 300 | | 336,213 |
Home Depot, Inc. | 3,659 | | 301,282 |
Honeywell International, Inc. | 2,998 | | 273,927 |
KKR & Co. LP | 10,800 | | 262,872 |
Las Vegas Sands Corp. | 3,458 | | 272,732 |
Live Nation Entertainment, Inc. (a) | 15,900 | | 314,184 |
Lorillard, Inc. | 4,900 | | 248,332 |
Lowe's Companies, Inc. | 5,700 | | 282,435 |
MasterCard, Inc. Class A | 400 | | 334,184 |
McGraw-Hill Companies, Inc. | 4,011 | | 313,660 |
Mead Johnson Nutrition Co. Class A | 3,183 | | 266,608 |
Mettler-Toledo International, Inc. (a) | 1,000 | | 242,590 |
Monsanto Co. | 2,300 | | 268,065 |
Moody's Corp. | 3,820 | | 299,755 |
Mylan, Inc. (a) | 5,914 | | 256,668 |
NIKE, Inc. Class B | 3,300 | | 259,512 |
PetSmart, Inc. | 3,400 | | 247,350 |
Philip Morris International, Inc. | 3,400 | | 296,242 |
PPG Industries, Inc. | 1,645 | | 311,991 |
Precision Castparts Corp. | 1,087 | | 292,729 |
priceline.com, Inc. (a) | 240 | | 278,976 |
ResMed, Inc. (d) | 5,400 | | 254,232 |
Rockwell Automation, Inc. | 2,346 | | 277,203 |
Roper Industries, Inc. | 2,000 | | 277,360 |
Sherwin-Williams Co. | 1,500 | | 275,250 |
Sirona Dental Systems, Inc. (a) | 3,800 | | 266,760 |
The Blackstone Group LP | 9,300 | | 292,950 |
The Walt Disney Co. | 4,140 | | 316,296 |
Thermo Fisher Scientific, Inc. | 2,500 | | 278,375 |
Tiffany & Co., Inc. | 2,675 | | 248,187 |
Time Warner, Inc. | 3,900 | | 271,908 |
Twenty-First Century Fox, Inc. Class A | 8,200 | | 288,476 |
Union Pacific Corp. | 1,700 | | 285,600 |
United Technologies Corp. | 2,611 | | 297,132 |
Common Stocks - continued |
| Shares | | Value |
United States of America - continued |
Viacom, Inc. Class B (non-vtg.) | 3,551 | | $ 310,144 |
Visa, Inc. Class A | 1,500 | | 334,020 |
W.R. Grace & Co. (a) | 2,551 | | 252,217 |
Waddell & Reed Financial, Inc. Class A | 3,900 | | 253,968 |
Yahoo!, Inc. (a) | 6,300 | | 254,772 |
TOTAL UNITED STATES OF AMERICA | | 15,800,568 |
TOTAL COMMON STOCKS (Cost $89,860,158) |
107,033,469
|
Nonconvertible Preferred Stocks - 1.3% |
| | | |
Brazil - 0.7% |
Ambev SA sponsored ADR | 59,500 | | 437,325 |
Itausa-Investimentos Itau SA (PN) | 83,000 | | 315,926 |
TOTAL BRAZIL | | 753,251 |
Germany - 0.6% |
Porsche Automobil Holding SE (Germany) | 3,528 | | 367,214 |
Sartorius AG (non-vtg.) | 2,555 | | 304,110 |
TOTAL GERMANY | | 671,324 |
United Kingdom - 0.0% |
Rolls-Royce Group PLC Series C | 1,995,200 | | 3,304 |
TOTAL NONCONVERTIBLE PREFERRED STOCKS (Cost $1,290,014) |
1,427,879
|
Money Market Funds - 2.8% |
| Shares | | Value |
Fidelity Cash Central Fund, 0.11% (b) | 2,100,902 | | $ 2,100,902 |
Fidelity Securities Lending Cash Central Fund, 0.11% (b)(c) | 967,200 | | 967,200 |
TOTAL MONEY MARKET FUNDS (Cost $3,068,102) |
3,068,102
|
TOTAL INVESTMENT PORTFOLIO - 101.4% (Cost $94,218,274) | | 111,529,450 |
NET OTHER ASSETS (LIABILITIES) - (1.4)% | | (1,587,115) |
NET ASSETS - 100% | $ 109,942,335 |
Legend |
(a) Non-income producing |
(b) Affiliated fund that is generally available only to investment companies and other accounts managed by Fidelity Investments. The rate quoted is the annualized seven-day yield of the fund at period end. A complete unaudited listing of the fund's holdings as of its most recent quarter end is available upon request. In addition, each Fidelity Central Fund's financial statements, which are not covered by the Fund's Report of Independent Registered Public Accounting Firm, are available on the SEC's website or upon request. |
(c) Investment made with cash collateral received from securities on loan. |
(d) Security or a portion of the security is on loan at period end. |
Affiliated Central Funds |
Information regarding fiscal year to date income earned by the Fund from investments in Fidelity Central Funds is as follows: |
Fund | Income earned |
Fidelity Cash Central Fund | $ 1,357 |
Fidelity Securities Lending Cash Central Fund | 21,011 |
Total | $ 22,368 |
Other Information |
Categorizations in the Schedule of Investments are based on country or territory of incorporation. |
The following is a summary of the inputs used, as of December 31, 2013, involving the Fund's assets and liabilities carried at fair value. The inputs or methodology used for valuing securities may not be an indication of the risk associated with investing in those securities. For more information on valuation inputs, and their aggregation into the levels used in the table below, please refer to the Investment Valuation section in the accompanying Notes to Financial Statements. |
Valuation Inputs at Reporting Date: |
Description | Total | Level 1 | Level 2 | Level 3 |
Investments in Securities: | | | | |
Equities: | | | | |
Consumer Discretionary | $ 27,066,511 | $ 22,394,809 | $ 4,671,702 | $ - |
Consumer Staples | 11,808,540 | 8,651,244 | 3,157,296 | - |
Energy | 306,286 | - | 306,286 | - |
Financials | 15,692,636 | 10,426,450 | 5,266,186 | - |
Health Care | 8,684,110 | 7,445,111 | 1,238,999 | - |
Industrials | 21,844,801 | 17,865,100 | 3,979,701 | - |
Information Technology | 11,420,650 | 8,492,618 | 2,928,032 | - |
Materials | 9,636,945 | 6,906,475 | 2,730,470 | - |
Telecommunication Services | 2,000,869 | 765,434 | 1,235,435 | - |
Money Market Funds | 3,068,102 | 3,068,102 | - | - |
Total Investments in Securities: | $ 111,529,450 | $ 86,015,343 | $ 25,514,107 | $ - |
The following is a summary of transfers between Level 1 and Level 2 for the period ended December 31, 2013. Transfers are assumed to have occurred at the beginning of the period, and are primarily attributable to the valuation techniques used for foreign equity securities, as discussed in the accompanying Notes to Financial Statements: |
Transfers | Total |
Level 1 to Level 2 | $ 249,841 |
Level 2 to Level 1 | $ 13,541,891 |
See accompanying notes which are an integral part of the financial statements.
Annual Report
Statement of Assets and Liabilities
| December 31, 2013 |
| | |
Assets | | |
Investment in securities, at value (including securities loaned of $940,338) - See accompanying schedule: Unaffiliated issuers (cost $91,150,172) | $ 108,461,348 | |
Fidelity Central Funds (cost $3,068,102) | 3,068,102 | |
Total Investments (cost $94,218,274) | | $ 111,529,450 |
Foreign currency held at value (cost $112,885) | | 112,885 |
Receivable for investments sold | | 1,168,746 |
Receivable for fund shares sold | | 396,111 |
Dividends receivable | | 128,901 |
Distributions receivable from Fidelity Central Funds | | 859 |
Prepaid expenses | | 222 |
Receivable from investment adviser for expense reductions | | 19,366 |
Other receivables | | 50,057 |
Total assets | | 113,406,597 |
| | |
Liabilities | | |
Payable for investments purchased | $ 2,269,175 | |
Payable for fund shares redeemed | 271 | |
Accrued management fee | 60,681 | |
Distribution and service plan fees payable | 513 | |
Other affiliated payables | 15,925 | |
Other payables and accrued expenses | 150,497 | |
Collateral on securities loaned, at value | 967,200 | |
Total liabilities | | 3,464,262 |
| | |
Net Assets | | $ 109,942,335 |
Net Assets consist of: | | |
Paid in capital | | $ 107,826,836 |
Undistributed net investment income | | 1,347 |
Accumulated undistributed net realized gain (loss) on investments and foreign currency transactions | | (15,109,749) |
Net unrealized appreciation (depreciation) on investments and assets and liabilities in foreign currencies | | 17,223,901 |
Net Assets | | $ 109,942,335 |
Statement of Assets and Liabilities - continued
| December 31, 2013 |
| | |
Initial Class:
Net Asset Value, offering price and redemption price per share ($2,404,145 ÷ 189,543 shares) | | $ 12.68 |
| | |
Service Class:
Net Asset Value, offering price and redemption price per share ($111,230 ÷ 8,785 shares) | | $ 12.66 |
| | |
Service Class 2:
Net Asset Value, offering price and redemption price per share ($2,373,868 ÷ 188,296 shares) | | $ 12.61 |
| | |
Initial Class R:
Net Asset Value, offering price and redemption price per share ($17,791,167 ÷ 1,402,702 shares) | | $ 12.68 |
| | |
Service Class R:
Net Asset Value, offering price and redemption price per share ($111,230 ÷ 8,785 shares) | | $ 12.66 |
| | |
Service Class 2R:
Net Asset Value, offering price and redemption price per share ($121,478 ÷ 9,605 shares) | | $ 12.65 |
| | |
Investor Class R:
Net Asset Value, offering price and redemption price per share ($87,029,217 ÷ 6,909,921 shares) | | $ 12.59 |
See accompanying notes which are an integral part of the financial statements.
Annual Report
Statement of Operations
| Year ended December 31, 2013 |
| | |
Investment Income | | |
Dividends | | $ 1,614,457 |
Income from Fidelity Central Funds | | 22,368 |
Income before foreign taxes withheld | | 1,636,825 |
Less foreign taxes withheld | | (113,053) |
Total income | | 1,523,772 |
| | |
Expenses | | |
Management fee | $ 563,333 | |
Transfer agent fees | 109,847 | |
Distribution and service plan fees | 2,459 | |
Accounting and security lending fees | 41,706 | |
Custodian fees and expenses | 185,984 | |
Independent trustees' compensation | 397 | |
Audit | 94,440 | |
Legal | 550 | |
Interest | 188 | |
Miscellaneous | 656 | |
Total expenses before reductions | 999,560 | |
Expense reductions | (91,152) | 908,408 |
Net investment income (loss) | | 615,364 |
Realized and Unrealized Gain (Loss) Net realized gain (loss) on: | | |
Investment securities: | | |
Unaffiliated issuers (net of foreign taxes of $19,506) | 7,115,802 | |
Foreign currency transactions | (11,229) | |
Total net realized gain (loss) | | 7,104,573 |
Change in net unrealized appreciation (depreciation) on: Investment securities (net of increase in deferred foreign taxes of $48,411) | 8,281,413 | |
Assets and liabilities in foreign currencies | (3,647) | |
Total change in net unrealized appreciation (depreciation) | | 8,277,766 |
Net gain (loss) | | 15,382,339 |
Net increase (decrease) in net assets resulting from operations | | $ 15,997,703 |
Statement of Changes in Net Assets
| Year ended
December 31,
2013 | Year ended
December 31,
2012 |
Increase (Decrease) in Net Assets | | |
Operations | | |
Net investment income (loss) | $ 615,364 | $ 438,350 |
Net realized gain (loss) | 7,104,573 | 780,847 |
Change in net unrealized appreciation (depreciation) | 8,277,766 | 8,306,305 |
Net increase (decrease) in net assets resulting from operations | 15,997,703 | 9,525,502 |
Distributions to shareholders from net investment income | (596,439) | (486,943) |
Distributions to shareholders from net realized gain | (84,330) | - |
Total distributions | (680,769) | (486,943) |
Share transactions - net increase (decrease) | 33,588,933 | 15,248,354 |
Redemption fees | 16,383 | 6,117 |
Total increase (decrease) in net assets | 48,922,250 | 24,293,030 |
| | |
Net Assets | | |
Beginning of period | 61,020,085 | 36,727,055 |
End of period (including undistributed net investment income of $1,347 and distributions in excess of net investment income of $2,227, respectively) | $ 109,942,335 | $ 61,020,085 |
See accompanying notes which are an integral part of the financial statements.
Annual Report
Financial Highlights - Initial Class
Years ended December 31, | 2013 | 2012 | 2011 | 2010 | 2009 |
Selected Per-Share Data | | | | | |
Net asset value, beginning of period | $ 10.50 | $ 8.42 | $ 9.74 | $ 8.60 | $ 5.61 |
Income from Investment Operations | | | | | |
Net investment income (loss) C | .10 | .10 | .08 | .10 | .07 |
Net realized and unrealized gain (loss) | 2.17 | 2.08 | (1.30) | 1.24 | 3.07 |
Total from investment operations | 2.27 | 2.18 | (1.22) | 1.34 | 3.14 |
Distributions from net investment income | (.08) | (.10) | (.09) | (.11) | (.06) |
Distributions from net realized gain | (.01) | - | (.01) | (.10) | (.09) |
Total distributions | (.09) | (.10) | (.10) | (.20) H | (.15) |
Redemption fees added to paid in capital C, G | - | - | - | - | - |
Net asset value, end of period | $ 12.68 | $ 10.50 | $ 8.42 | $ 9.74 | $ 8.60 |
Total Return A, B | 21.62% | 25.91% | (12.57)% | 15.73% | 56.04% |
Ratios to Average Net Assets D, F | | | | | |
Expenses before reductions | 1.17% | 1.25% | 1.30% | 1.60% | 1.81% |
Expenses net of fee waivers, if any | 1.10% | 1.10% | 1.10% | 1.10% | 1.10% |
Expenses net of all reductions | 1.07% | 1.05% | 1.03% | .96% | .93% |
Net investment income (loss) | .84% | 1.07% | .88% | 1.19% | 1.03% |
Supplemental Data | | | | | |
Net assets, end of period (000 omitted) | $ 2,404 | $ 573 | $ 511 | $ 732 | $ 645 |
Portfolio turnover rate E | 153% | 137% | 236% | 463% | 416% |
A Total returns do not reflect charges attributable to your insurance company's separate account. Inclusion of these charges would reduce the total returns shown.
B Total returns would have been lower if certain expenses had not been reduced during the applicable periods shown.
C Calculated based on average shares outstanding during the period.
D Fees and expenses of any underlying Fidelity Central Funds are not included in the Fund's expense ratio. The Fund indirectly bears its proportionate share of the expenses of any underlying Fidelity Central Funds.
E Amount does not include the portfolio activity of any underlying Fidelity Central Funds.
F Expense ratios reflect operating expenses of the class. Expenses before reductions do not reflect amounts reimbursed by the investment adviser or reductions from brokerage service arrangements or reductions from other expense offset arrangements and do not represent the amount paid by the class during periods when reimbursements or reductions occur. Expenses net of fee waivers reflect expenses after reimbursement by the investment adviser but prior to reductions from brokerage service arrangements or other expense offset arrangements. Expenses net of all reductions represent the net expenses paid by the class.
G Amount represents less than $.01 per share.
H Total distributions of $.20 per share is comprised of distributions from net investment income of $.105 and distributions from net realized gain of $.097 per share.
Financial Highlights - Service Class
Years ended December 31, | 2013 | 2012 | 2011 | 2010 | 2009 |
Selected Per-Share Data | | | | | |
Net asset value, beginning of period | $ 10.49 | $ 8.41 | $ 9.72 | $ 8.58 | $ 5.61 |
Income from Investment Operations | | | | | |
Net investment income (loss) C | .08 | .09 | .07 | .10 | .06 |
Net realized and unrealized gain (loss) | 2.17 | 2.08 | (1.29) | 1.23 | 3.05 |
Total from investment operations | 2.25 | 2.17 | (1.22) | 1.33 | 3.11 |
Distributions from net investment income | (.07) | (.09) | (.08) | (.10) | (.05) |
Distributions from net realized gain | (.01) | - | (.01) | (.10) | (.09) |
Total distributions | (.08) | (.09) | (.09) | (.19) H | (.14) |
Redemption fees added to paid in capital C, G | - | - | - | - | - |
Net asset value, end of period | $ 12.66 | $ 10.49 | $ 8.41 | $ 9.72 | $ 8.58 |
Total Return A, B | 21.44% | 25.83% | (12.60)% | 15.65% | 55.52% |
Ratios to Average Net Assets D, F | | | | | |
Expenses before reductions | 1.28% | 1.35% | 1.42% | 1.67% | 1.73% |
Expenses net of fee waivers, if any | 1.20% | 1.20% | 1.20% | 1.20% | 1.20% |
Expenses net of all reductions | 1.17% | 1.15% | 1.14% | 1.05% | 1.04% |
Net investment income (loss) | .73% | .96% | .78% | 1.09% | .92% |
Supplemental Data | | | | | |
Net assets, end of period (000 omitted) | $ 111 | $ 94 | $ 75 | $ 100 | $ 117 |
Portfolio turnover rate E | 153% | 137% | 236% | 463% | 416% |
A Total returns do not reflect charges attributable to your insurance company's separate account. Inclusion of these charges would reduce the total returns shown.
B Total returns would have been lower if certain expenses had not been reduced during the applicable periods shown.
C Calculated based on average shares outstanding during the period.
D Fees and expenses of any underlying Fidelity Central Funds are not included in the Fund's expense ratio. The Fund indirectly bears its proportionate share of the expenses of any underlying Fidelity Central Funds.
E Amount does not include the portfolio activity of any underlying Fidelity Central Funds.
F Expense ratios reflect operating expenses of the class. Expenses before reductions do not reflect amounts reimbursed by the investment adviser or reductions from brokerage service arrangements or reductions from other expense offset arrangements and do not represent the amount paid by the class during periods when reimbursements or reductions occur. Expenses net of fee waivers reflect expenses after reimbursement by the investment adviser but prior to reductions from brokerage service arrangements or other expense offset arrangements. Expenses net of all reductions represent the net expenses paid by the class.
G Amount represents less than $.01 per share.
H Total distributions of $.19 per share is comprised of distributions from net investment income of $.095 and distributions from net realized gain of $.097 per share.
See accompanying notes which are an integral part of the financial statements.
Annual Report
Financial Highlights - Service Class 2
Years ended December 31, | 2013 | 2012 | 2011 | 2010 | 2009 |
Selected Per-Share Data | | | | | |
Net asset value, beginning of period | $ 10.46 | $ 8.40 | $ 9.72 | $ 8.57 | $ 5.60 |
Income from Investment Operations | | | | | |
Net investment income (loss) C | .07 | .08 | .06 | .08 | .05 |
Net realized and unrealized gain (loss) | 2.16 | 2.07 | (1.30) | 1.24 | 3.05 |
Total from investment operations | 2.23 | 2.15 | (1.24) | 1.32 | 3.10 |
Distributions from net investment income | (.07) | (.09) | (.07) | (.07) | (.04) |
Distributions from net realized gain | (.01) | - | (.01) | (.10) | (.09) |
Total distributions | (.08) | (.09) | (.08) | (.17) | (.13) |
Redemption fees added to paid in capital C, G | - | - | - | - | - |
Net asset value, end of period | $ 12.61 | $ 10.46 | $ 8.40 | $ 9.72 | $ 8.57 |
Total Return A, B | 21.33% | 25.61% | (12.74)% | 15.53% | 55.44% |
Ratios to Average Net Assets D, F | | | | | |
Expenses before reductions | 1.46% | 1.49% | 1.58% | 1.88% | 2.02% |
Expenses net of fee waivers, if any | 1.35% | 1.35% | 1.35% | 1.35% | 1.35% |
Expenses net of all reductions | 1.32% | 1.29% | 1.28% | 1.21% | 1.19% |
Net investment income (loss) | .59% | .82% | .63% | .94% | .77% |
Supplemental Data | | | | | |
Net assets, end of period (000 omitted) | $ 2,374 | $ 1,476 | $ 166 | $ 115 | $ 424 |
Portfolio turnover rate E | 153% | 137% | 236% | 463% | 416% |
A Total returns do not reflect charges attributable to your insurance company's separate account. Inclusion of these charges would reduce the total returns shown.
B Total returns would have been lower if certain expenses had not been reduced during the applicable periods shown.
C Calculated based on average shares outstanding during the period.
D Fees and expenses of any underlying Fidelity Central Funds are not included in the Fund's expense ratio. The Fund indirectly bears its proportionate share of the expenses of any underlying Fidelity Central Funds.
E Amount does not include the portfolio activity of any underlying Fidelity Central Funds.
F Expense ratios reflect operating expenses of the class. Expenses before reductions do not reflect amounts reimbursed by the investment adviser or reductions from brokerage service arrangements or reductions from other expense offset arrangements and do not represent the amount paid by the class during periods when reimbursements or reductions occur. Expenses net of fee waivers reflect expenses after reimbursement by the investment adviser but prior to reductions from brokerage service arrangements or other expense offset arrangements. Expenses net of all reductions represent the net expenses paid by the class.
G Amount represents less than $.01 per share.
Financial Highlights - Initial Class R
Years ended December 31, | 2013 | 2012 | 2011 | 2010 | 2009 |
Selected Per-Share Data | | | | | |
Net asset value, beginning of period | $ 10.50 | $ 8.42 | $ 9.74 | $ 8.60 | $ 5.62 |
Income from Investment Operations | | | | | |
Net investment income (loss) C | .10 | .10 | .08 | .10 | .07 |
Net realized and unrealized gain (loss) | 2.17 | 2.08 | (1.30) | 1.24 | 3.06 |
Total from investment operations | 2.27 | 2.18 | (1.22) | 1.34 | 3.13 |
Distributions from net investment income | (.08) | (.10) | (.09) | (.11) | (.06) |
Distributions from net realized gain | (.01) | - | (.01) | (.10) | (.09) |
Total distributions | (.09) | (.10) | (.10) | (.20) H | (.15) |
Redemption fees added to paid in capital C, G | - | - | - | - | - |
Net asset value, end of period | $ 12.68 | $ 10.50 | $ 8.42 | $ 9.74 | $ 8.60 |
Total Return A, B | 21.65% | 25.91% | (12.57)% | 15.73% | 55.76% |
Ratios to Average Net Assets D, F | | | | | |
Expenses before reductions | 1.21% | 1.28% | 1.33% | 1.55% | 1.60% |
Expenses net of fee waivers, if any | 1.10% | 1.10% | 1.10% | 1.10% | 1.10% |
Expenses net of all reductions | 1.07% | 1.05% | 1.03% | .95% | .93% |
Net investment income (loss) | .83% | 1.07% | .88% | 1.19% | 1.02% |
Supplemental Data | | | | | |
Net assets, end of period (000 omitted) | $ 17,791 | $ 18,575 | $ 10,557 | $ 15,305 | $ 17,150 |
Portfolio turnover rate E | 153% | 137% | 236% | 463% | 416% |
A Total returns do not reflect charges attributable to your insurance company's separate account. Inclusion of these charges would reduce the total returns shown.
B Total returns would have been lower if certain expenses had not been reduced during the applicable periods shown.
C Calculated based on average shares outstanding during the period.
D Fees and expenses of any underlying Fidelity Central Funds are not included in the Fund's expense ratio. The Fund indirectly bears its proportionate share of the expenses of any underlying Fidelity Central Funds.
E Amount does not include the portfolio activity of any underlying Fidelity Central Funds.
F Expense ratios reflect operating expenses of the class. Expenses before reductions do not reflect amounts reimbursed by the investment adviser or reductions from brokerage service arrangements or reductions from other expense offset arrangements and do not represent the amount paid by the class during periods when reimbursements or reductions occur. Expenses net of fee waivers reflect expenses after reimbursement by the investment adviser but prior to reductions from brokerage service arrangements or other expense offset arrangements. Expenses net of all reductions represent the net expenses paid by the class.
G Amount represents less than $.01 per share.
H Total distributions of $.20 per share is comprised of distributions from net investment income of $.105 and distributions from net realized gain of $.097 per share.
See accompanying notes which are an integral part of the financial statements.
Annual Report
Financial Highlights - Service Class R
Years ended December 31, | 2013 | 2012 | 2011 | 2010 | 2009 |
Selected Per-Share Data | | | | | |
Net asset value, beginning of period | $ 10.49 | $ 8.41 | $ 9.72 | $ 8.58 | $ 5.61 |
Income from Investment Operations | | | | | |
Net investment income (loss) C | .08 | .09 | .07 | .10 | .06 |
Net realized and unrealized gain (loss) | 2.17 | 2.08 | (1.29) | 1.23 | 3.05 |
Total from investment operations | 2.25 | 2.17 | (1.22) | 1.33 | 3.11 |
Distributions from net investment income | (.07) | (.09) | (.08) | (.10) | (.05) |
Distributions from net realized gain | (.01) | - | (.01) | (.10) | (.09) |
Total distributions | (.08) | (.09) | (.09) | (.19) H | (.14) |
Redemption fees added to paid in capital C, G | - | - | - | - | - |
Net asset value, end of period | $ 12.66 | $ 10.49 | $ 8.41 | $ 9.72 | $ 8.58 |
Total Return A, B | 21.44% | 25.83% | (12.60)% | 15.65% | 55.52% |
Ratios to Average Net Assets D, F | | | | | |
Expenses before reductions | 1.28% | 1.35% | 1.42% | 1.67% | 1.73% |
Expenses net of fee waivers, if any | 1.20% | 1.20% | 1.20% | 1.20% | 1.20% |
Expenses net of all reductions | 1.17% | 1.15% | 1.14% | 1.05% | 1.04% |
Net investment income (loss) | .73% | .96% | .78% | 1.09% | .92% |
Supplemental Data | | | | | |
Net assets, end of period (000 omitted) | $ 111 | $ 94 | $ 75 | $ 100 | $ 117 |
Portfolio turnover rate E | 153% | 137% | 236% | 463% | 416% |
A Total returns do not reflect charges attributable to your insurance company's separate account. Inclusion of these charges would reduce the total returns shown.
B Total returns would have been lower if certain expenses had not been reduced during the applicable periods shown.
C Calculated based on average shares outstanding during the period.
D Fees and expenses of any underlying Fidelity Central Funds are not included in the Fund's expense ratio. The Fund indirectly bears its proportionate share of the expenses of any underlying Fidelity Central Funds.
E Amount does not include the portfolio activity of any underlying Fidelity Central Funds.
F Expense ratios reflect operating expenses of the class. Expenses before reductions do not reflect amounts reimbursed by the investment adviser or reductions from brokerage service arrangements or reductions from other expense offset arrangements and do not represent the amount paid by the class during periods when reimbursements or reductions occur. Expenses net of fee waivers reflect expenses after reimbursement by the investment adviser but prior to reductions from brokerage service arrangements or other expense offset arrangements. Expenses net of all reductions represent the net expenses paid by the class.
G Amount represents less than $.01 per share.
H Total distributions of $.19 per share is comprised of distributions from net investment income of $.095 and distributions from net realized gain of $.097 per share.
Financial Highlights - Service Class 2R
Years ended December 31, | 2013 | 2012 | 2011 | 2010 | 2009 |
Selected Per-Share Data | | | | | |
Net asset value, beginning of period | $ 10.47 | $ 8.40 | $ 9.71 | $ 8.57 | $ 5.60 |
Income from Investment Operations | | | | | |
Net investment income (loss) C | .07 | .08 | .06 | .08 | .05 |
Net realized and unrealized gain (loss) | 2.17 | 2.07 | (1.30) | 1.23 | 3.05 |
Total from investment operations | 2.24 | 2.15 | (1.24) | 1.31 | 3.10 |
Distributions from net investment income | (.05) | (.08) | (.06) | (.08) | (.04) |
Distributions from net realized gain | (.01) | - | (.01) | (.10) | (.09) |
Total distributions | (.06) | (.08) | (.07) | (.17) H | (.13) |
Redemption fees added to paid in capital C, G | - | - | - | - | - |
Net asset value, end of period | $ 12.65 | $ 10.47 | $ 8.40 | $ 9.71 | $ 8.57 |
Total Return A, B | 21.40% | 25.56% | (12.77)% | 15.45% | 55.36% |
Ratios to Average Net Assets D, F | | | | | |
Expenses before reductions | 1.43% | 1.50% | 1.57% | 1.83% | 1.87% |
Expenses net of fee waivers, if any | 1.35% | 1.35% | 1.35% | 1.35% | 1.35% |
Expenses net of all reductions | 1.32% | 1.30% | 1.28% | 1.21% | 1.19% |
Net investment income (loss) | .58% | .82% | .63% | .94% | .77% |
Supplemental Data | | | | | |
Net assets, end of period (000 omitted) | $ 121 | $ 102 | $ 81 | $ 109 | $ 155 |
Portfolio turnover rate E | 153% | 137% | 236% | 463% | 416% |
A Total returns do not reflect charges attributable to your insurance company's separate account. Inclusion of these charges would reduce the total returns shown.
B Total returns would have been lower if certain expenses had not been reduced during the applicable periods shown.
C Calculated based on average shares outstanding during the period.
D Fees and expenses of any underlying Fidelity Central Funds are not included in the Fund's expense ratio. The Fund indirectly bears its proportionate share of the expenses of any underlying Fidelity Central Funds.
E Amount does not include the portfolio activity of any underlying Fidelity Central Funds.
F Expense ratios reflect operating expenses of the class. Expenses before reductions do not reflect amounts reimbursed by the investment adviser or reductions from brokerage service arrangements or reductions from other expense offset arrangements and do not represent the amount paid by the class during periods when reimbursements or reductions occur. Expenses net of fee waivers reflect expenses after reimbursement by the investment adviser but prior to reductions from brokerage service arrangements or other expense offset arrangements. Expenses net of all reductions represent the net expenses paid by the class.
G Amount represents less than $.01 per share.
H Total distributions of $.17 per share is comprised of distributions from net investment income of $.077 and distributions from net realized gain of $.097 per share.
See accompanying notes which are an integral part of the financial statements.
Annual Report
Financial Highlights - Investor Class R
Years ended December 31, | 2013 | 2012 | 2011 | 2010 | 2009 |
Selected Per-Share Data | | | | | |
Net asset value, beginning of period | $ 10.43 | $ 8.37 | $ 9.69 | $ 8.56 | $ 5.60 |
Income from Investment Operations | | | | | |
Net investment income (loss) C | .09 | .09 | .07 | .10 | .07 |
Net realized and unrealized gain (loss) | 2.15 | 2.07 | (1.29) | 1.23 | 3.04 |
Total from investment operations | 2.24 | 2.16 | (1.22) | 1.33 | 3.11 |
Distributions from net investment income | (.07) | (.10) | (.09) | (.11) | (.06) |
Distributions from net realized gain | (.01) | - | (.01) | (.10) | (.09) |
Total distributions | (.08) | (.10) | (.10) | (.20) H | (.15) |
Redemption fees added to paid in capital C, G | - | - | - | - | - |
Net asset value, end of period | $ 12.59 | $ 10.43 | $ 8.37 | $ 9.69 | $ 8.56 |
Total Return A, B | 21.50% | 25.81% | (12.63)% | 15.69% | 55.61% |
Ratios to Average Net Assets D, F | | | | | |
Expenses before reductions | 1.26% | 1.34% | 1.39% | 1.63% | 1.68% |
Expenses net of fee waivers, if any | 1.18% | 1.18% | 1.18% | 1.18% | 1.18% |
Expenses net of all reductions | 1.15% | 1.13% | 1.12% | 1.04% | 1.01% |
Net investment income (loss) | .75% | .99% | .80% | 1.11% | .94% |
Supplemental Data | | | | | |
Net assets, end of period (000 omitted) | $ 87,029 | $ 40,107 | $ 25,262 | $ 29,249 | $ 27,695 |
Portfolio turnover rate E | 153% | 137% | 236% | 463% | 416% |
A Total returns do not reflect charges attributable to your insurance company's separate account. Inclusion of these charges would reduce the total returns shown.
B Total returns would have been lower if certain expenses had not been reduced during the applicable periods shown.
C Calculated based on average shares outstanding during the period.
D Fees and expenses of any underlying Fidelity Central Funds are not included in the Fund's expense ratio. The Fund indirectly bears its proportionate share of the expenses of any underlying Fidelity Central Funds.
E Amount does not include the portfolio activity of any underlying Fidelity Central Funds.
F Expense ratios reflect operating expenses of the class. Expenses before reductions do not reflect amounts reimbursed by the investment adviser or reductions from brokerage service arrangements or reductions from other expense offset arrangements and do not represent the amount paid by the class during periods when reimbursements or reductions occur. Expenses net of fee waivers reflect expenses after reimbursement by the investment adviser but prior to reductions from brokerage service arrangements or other expense offset arrangements. Expenses net of all reductions represent the net expenses paid by the class.
G Amount represents less than $.01 per share.
H Total distributions of $.20 per share is comprised of distributions from net investment income of $.105 and distributions from net realized gain of $.097 per share.
See accompanying notes which are an integral part of the financial statements.
Annual Report
Notes to Financial Statements
For the period ended December 31, 2013
1. Organization.
VIP International Capital Appreciation Portfolio (the Fund) is a fund of Variable Insurance Products Fund II (the Trust) and is authorized to issue an unlimited number of shares. The Trust is registered under the Investment Company Act of 1940, as amended (the 1940 Act), as an open-end management investment company organized as a Massachusetts business trust. Shares of the Fund may only be purchased by insurance companies for the purpose of funding variable annuity or variable life insurance contracts. The Fund offers the following classes of shares: Initial Class shares, Service Class shares, Service Class 2 shares, Initial Class R shares, Service Class R shares, Service Class 2R shares and Investor Class R shares. All classes have equal rights and voting privileges, except for matters affecting a single class. The Fund's investments in emerging markets can be subject to social, economic, regulatory, and political uncertainties and can be extremely volatile.
2. Investments in Fidelity Central Funds.
The Fund invests in Fidelity Central Funds, which are open-end investment companies generally available only to other investment companies and accounts managed by the investment adviser and its affiliates. The Fund's Schedule of Investments lists each of the Fidelity Central Funds held as of period end, if any, as an investment of the Fund, but does not include the underlying holdings of each Fidelity Central Fund. As an Investing Fund, the Fund indirectly bears its proportionate share of the expenses of the underlying Fidelity Central Funds.
The Money Market Central Funds seek preservation of capital and current income and are managed by Fidelity Investments Money Management, Inc. (FIMM), an affiliate of the investment adviser. Annualized expenses of the Money Market Central Funds as of their most recent shareholder report date are less than .01%.
A complete unaudited list of holdings for each Fidelity Central Fund is available upon request or at the Securities and Exchange Commission (the SEC) website at www.sec.gov. In addition, the financial statements of the Fidelity Central Funds, which are not covered by the Fund's Report of Independent Registered Public Accounting Firm, are available on the SEC website or upon request.
3. Significant Accounting Policies.
The financial statements have been prepared in conformity with accounting principles generally accepted in the United States of America (GAAP), which require management to make certain estimates and assumptions at the date of the financial statements. Actual results could differ from those estimates. Subsequent events, if any, through the date that the financial statements were issued have been evaluated in the preparation of the financial statements. The following summarizes the significant accounting policies of the Fund:
Investment Valuation. Investments are valued as of 4:00 p.m. Eastern time on the last calendar day of the period. In accordance with valuation policies and procedures approved by the Board of Trustees (the Board), the Fund attempts to obtain prices from one or more third party pricing vendors or brokers to value its investments. When current market prices, quotations or currency exchange rates are not readily available or reliable, investments will be fair valued in good faith by the Fidelity Management & Research Company (FMR) Fair Value Committee (the Committee), in accordance with procedures adopted by the Board. Factors used in determining fair value vary by investment type and may include market or investment specific events. The frequency with which these procedures are used cannot be predicted and they may be utilized to a significant extent. The Committee oversees the Fund's valuation policies and procedures and is responsible for approving and reporting to the Board all fair value determinations.
The Fund categorizes the inputs to valuation techniques used to value its investments into a disclosure hierarchy consisting of three levels as shown below:
Level 1 - quoted prices in active markets for identical investments
Level 2 - other significant observable inputs (including quoted prices for similar investments, interest rates, prepayment speeds, etc.)
Level 3 - unobservable inputs (including the Fund's own assumptions based on the best information available)
Valuation techniques used to value the Fund's investments by major category are as follows:
Equity securities, including restricted securities, for which market quotations are readily available, are valued at the last reported sale price or official closing price as reported by a third party pricing vendor on the primary market or exchange on which they are traded and are categorized as Level 1 in the hierarchy. In the event there were no sales during the day or closing prices are not available, securities are valued at the last quoted bid price or may be valued using the last available price and are generally categorized as Level 2 in the hierarchy. For foreign equity securities, when market or security specific events arise, comparisons to the valuation of American Depositary Receipts (ADRs), futures contracts, Exchange-Traded Funds (ETFs) and certain indexes as well as quoted prices for similar securities may be used and would be categorized as Level 2 in the hierarchy. Utilizing these techniques may result in transfers between Level 1 and Level 2. For equity securities, including restricted securities, where observable inputs are limited, assumptions about market activity and risk are used and these securities may be categorized as Level 3 in the hierarchy.
Annual Report
3. Significant Accounting Policies - continued
Investment Valuation - continued
Investments in open-end mutual funds, including the Fidelity Central Funds, are valued at their closing net asset value (NAV) each business day and are categorized as Level 1 in the hierarchy.
Changes in valuation techniques may result in transfers in or out of an assigned level within the disclosure hierarchy. The aggregate value of investments by input level, as of December 31, 2013, including information on transfers between Levels 1 and 2 is included at the end of the Fund's Schedule of Investments.
Foreign Currency. The Fund may use foreign currency contracts to facilitate transactions in foreign-denominated securities. Gains and losses from these transactions may arise from changes in the value of the foreign currency or if the counterparties do not perform under the contracts' terms.
Foreign-denominated assets, including investment securities, and liabilities are translated into U.S. dollars at the exchange rates at period end. Purchases and sales of investment securities, income and dividends received and expenses denominated in foreign currencies are translated into U.S. dollars at the exchange rate in effect on the transaction date.
The effects of exchange rate fluctuations on investments are included with the net realized and unrealized gain (loss) on investment securities. Other foreign currency transactions resulting in realized and unrealized gain (loss) are disclosed separately.
Investment Transactions and Income. For financial reporting purposes, the Fund's investment holdings and NAV include trades executed through the end of the last business day of the period. The NAV per share for processing shareholder transactions is calculated as of the close of business of the New York Stock Exchange (NYSE), normally 4:00 p.m. Eastern time and includes trades executed through the end of the prior business day. Gains and losses on securities sold are determined on the basis of identified cost. Dividend income is recorded on the ex-dividend date, except for certain dividends from foreign securities where the ex-dividend date may have passed, which are recorded as soon as the Fund is informed of the ex-dividend date. Non-cash dividends included in dividend income, if any, are recorded at the fair market value of the securities received. Distributions received on securities that represent a return of capital or capital gain are recorded as a reduction of cost of investments and/or as a realized gain. Subsequent to ex-dividend date the Fund determines the components of these distributions, based upon receipt of tax filings or other correspondence relating to the underlying investment. Interest income and distributions from the Fidelity Central Funds are accrued as earned. Investment income is recorded net of foreign taxes withheld where recovery of such taxes is uncertain.
Class Allocations and Expenses. Investment income, realized and unrealized capital gains and losses, common expenses of the Fund, and certain fund-level expense reductions, if any, are allocated daily on a pro-rata basis to each class based on the relative net assets of each class to the total net assets of the Fund. Each class differs with respect to transfer agent and distribution and service plan fees incurred. Certain expense reductions may also differ by class. For the reporting period, the allocated portion of income and expenses to each class as a percent of its average net assets may vary due to the timing of recording these transactions in relation to fluctuating net assets of the classes. Expenses directly attributable to a fund are charged to that fund. Expenses attributable to more than one fund are allocated among the respective funds on the basis of relative net assets or other appropriate methods. Expense estimates are accrued in the period to which they relate and adjustments are made when actual amounts are known.
Income Tax Information and Distributions to Shareholders. Each year, the Fund intends to qualify as a regulated investment company under Subchapter M of the Internal Revenue Code, including distributing substantially all of its taxable income and realized gains. As a result, no provision for U.S. Federal income taxes is required. As of December 31, 2013, the Fund did not have any unrecognized tax benefits in the financial statements; nor is the Fund aware of any tax positions for which it is reasonably possible that the total amounts of unrecognized tax benefits will significantly change in the next twelve months. The Fund files a U.S. federal tax return, in addition to state and local tax returns as required. The Fund's federal income tax returns are subject to examination by the Internal Revenue Service (IRS) for a period of three fiscal years after they are filed. State and local tax returns may be subject to examination for an additional fiscal year depending on the jurisdiction. Foreign taxes are provided for based on the Fund's understanding of the tax rules and rates that exist in the foreign markets in which it invests. The Fund is subject to a tax imposed on capital gains by certain countries in which it invests. An estimated deferred tax liability for net unrealized appreciation on the applicable securities is included in Other payables and accrued expenses on the Statement of Assets & Liabilities.
Distributions are declared and recorded on the ex-dividend date. Income dividends and capital gain distributions are declared separately for each class. Income and capital gain distributions are determined in accordance with income tax regulations, which may differ from GAAP.
Capital accounts within the financial statements are adjusted for permanent book-tax differences. These adjustments have no impact on net assets or the results of operations. Capital accounts are not adjusted for temporary book-tax differences which will reverse in a subsequent period.
Book-tax differences are primarily due to foreign currency transactions, certain foreign taxes, passive foreign investment companies (PFIC), partnerships, capital loss carryforwards and losses deferred due to wash sales and excise tax regulations.
Annual Report
Notes to Financial Statements - continued
3. Significant Accounting Policies - continued
Income Tax Information and Distributions to Shareholders - continued
The federal tax cost of investment securities and unrealized appreciation (depreciation) as of period end were as follows:
Gross unrealized appreciation | $ 18,080,619 |
Gross unrealized depreciation | (1,225,838) |
Net unrealized appreciation (depreciation) on securities and other investments | $ 16,854,781 |
| |
Tax Cost | $ 94,674,669 |
The tax-based components of distributable earnings as of period end were as follows:
Undistributed ordinary income | $ 1,347 |
Capital loss carryforward | $ (14,653,354) |
Net unrealized appreciation (depreciation) | $ 16,836,799 |
Capital loss carryforwards are only available to offset future capital gains of the Fund to the extent provided by regulations and may be limited. Under the Regulated Investment Company Modernization Act of 2010 (the Act), the Fund is permitted to carry forward capital losses incurred in taxable years beginning after December 22, 2010 for an unlimited period and such capital losses are required to be used prior to any losses that expire. The capital loss carryforward information presented below, including any applicable limitation, is estimated as of fiscal period end and is subject to adjustment.
Fiscal year of expiration | |
2016 | $ (10,224,172) |
2017 | (4,429,182) |
Total capital loss carryforward | $ (14,653,354) |
The tax character of distributions paid was as follows:
| December 31, 2013 | December 31, 2012 |
Ordinary Income | $ 680,769 | $ 486,943 |
Trading (Redemption) Fees. Initial Class R shares, Service Class R shares, Service Class 2R shares and Investor Class R shares held by investors less than 60 days may be subject to a redemption fee equal to 1% of the NAV of shares redeemed. All redemption fees, which reduce the proceeds of the shareholder redemption, are retained by the Fund and accounted for as an addition to paid in capital.
4. Purchases and Sales of Investments.
Purchases and sales of securities, other than short-term securities, aggregated $159,044,042 and $121,905,189, respectively.
5. Fees and Other Transactions with Affiliates.
Management Fee. Fidelity Management & Research Company (the investment adviser) and its affiliates provide the Fund with investment management related services for which the Fund pays a monthly management fee. The management fee is the sum of an individual fund fee rate that is based on an annual rate of .45% of the Fund's average net assets and an annualized group fee rate that averaged .25% during the period. The group fee rate is based upon the average net assets of all the mutual funds advised by the investment adviser, including any mutual funds previously advised by the investment adviser that are currently advised by Fidelity SelectCo, LLC, an affiliate of the investment adviser. The group fee rate decreases as assets under management increase and increases as assets under management decrease. For the reporting period, the total annual management fee rate was .70% of the Fund's average net assets.
Distribution and Service Plan Fees. In accordance with Rule 12b-1 of the 1940 Act, the Fund has adopted separate 12b-1 Plans for each Service Class of shares. Each Service Class pays Fidelity Distributors Corporation (FDC), an affiliate of the investment adviser, a service fee. For the period, the service fee is based on an annual rate of .10% of Service Class' and Service Class R's average net assets and .25% of Service Class 2's and Service Class 2R's average net assets.
Annual Report
5. Fees and Other Transactions with Affiliates - continued
Distribution and Service Plan Fees - continued
For the period, total fees, all of which were re-allowed to insurance companies for the distribution of shares and providing shareholder support services were as follows:
Service Class | $ 102 |
Service Class 2 | 1,977 |
Service Class R | 102 |
Service Class 2R | 278 |
| $ 2,459 |
Transfer Agent Fees. Fidelity Investments Institutional Operations Company, Inc. (FIIOC), an affiliate of the investment adviser, is the Fund's transfer, dividend disbursing, and shareholder servicing agent. FIIOC receives an asset-based fee with respect to each class. Each class (with the exception of Investor Class R) pays a transfer agent fee, excluding out of pocket expenses, equal to an annual rate of .07% of average net assets. Investor Class R pays a monthly asset-based transfer agent fee of .15% of average net assets. In addition, FIIOC receives an asset-based fee of ..0035% of average net assets for typesetting, printing and mailing of shareholder reports, except proxy statements. FIIOC voluntarily agreed to reimburse or waive this fee for the period January 1, 2013 through December 31, 2013 (see Expense Reductions note). For the period, transfer agent fees for each class, including printing and out of pocket expenses, were as follows:
Initial Class | $ 689 |
Service Class | 70 |
Service Class 2 | 543 |
Initial Class R | 13,314 |
Service Class R | 70 |
Service Class 2R | 76 |
Investor Class R | 95,085 |
| $ 109,847 |
Effective February 1, 2014, the Board of Trustees approved an amendment to the transfer agent fee agreement whereby each class (with the exception of Investor Class R) pays a single fee of .07% of average net assets for transfer agent services, typesetting, printing and mailing of shareholder reports, excluding mailing of proxy statements and out of pocket expenses. Investor Class R pays a single fee of .15% of average net assets.
Accounting and Security Lending Fees. Fidelity Service Company, Inc. (FSC), an affiliate of the investment adviser, maintains the Fund's accounting records. The accounting fee is based on the level of average net assets for each month. Under a separate contract, FSC administers the security lending program. The security lending fee is based on the number and duration of lending transactions.
Brokerage Commissions. The Fund placed a portion of its portfolio transactions with brokerage firms which are affiliates of the investment adviser. Brokerage commissions are included in net realized gain (loss) and change in net unrealized appreciation (depreciation) in the Statement of Operations. The commissions paid to these affiliated firms were $1,077 for the period.
Interfund Lending Program. Pursuant to an Exemptive Order issued by the SEC, the Fund, along with other registered investment companies having management contracts with FMR or other affiliated entities of FMR, may participate in an interfund lending program. This program provides an alternative credit facility allowing the funds to borrow from, or lend money to, other participating affiliated funds. At period end, there were no interfund loans outstanding. The Fund's activity in this program during the period for which loans were outstanding was as follows:
Borrower or Lender | Average Loan
Balance | Weighted Average
Interest Rate | Interest
Expense |
Borrower | $ 4,278,500 | .40% | $ 188 |
6. Committed Line of Credit.
The Fund participates with other funds managed by the investment adviser or an affiliate in a $4.25 billion credit facility (the "line of credit") to be utilized for temporary or emergency purposes to fund shareholder redemptions or for other short-term liquidity purposes. The Fund has agreed to pay commitment fees on its pro-rata portion of the line of credit, which amounted to $144 and is reflected in Miscellaneous expenses on the Statement of Operations. During the period, there were no borrowings on this line of credit.
Annual Report
Notes to Financial Statements - continued
7. Security Lending.
The Fund lends portfolio securities through a lending agent from time to time in order to earn additional income. For equity securities, a lending agent is used and may loan securities to certain qualified borrowers, including Fidelity Capital Markets (FCM), a broker-dealer affiliated with the Fund. On the settlement date of the loan, the Fund receives collateral (in the form of U.S. Treasury obligations, letters of credit and/or cash) against the loaned securities and maintains collateral in an amount not less than 100% of the market value of the loaned securities during the period of the loan. The market value of the loaned securities is determined at the close of business of the Fund and any additional required collateral is delivered to the Fund on the next business day. If the borrower defaults on its obligation to return the securities loaned because of insolvency or other reasons, the Fund may apply collateral received from the borrower against the obligation. The Fund may experience delays and costs in recovering the securities loaned. Any cash collateral received is invested in the Fidelity Securities Lending Cash Central Fund. The value of loaned securities and cash collateral at period end are disclosed on the Fund's Statement of Assets and Liabilities. Security lending income represents the income earned on investing cash collateral, less rebates paid to borrowers and any lending agent fees associated with the loan, plus any premium payments received for lending certain types of securities. Security lending income is presented in the Statement of Operations as a component of income from Fidelity Central Funds. Total security lending income during the period amounted to $21,011. During the period, there were no securities loaned to FCM.
8. Expense Reductions.
In addition to FIIOC reimbursing or waiving a portion of its transfer agent fees, the investment adviser voluntarily agreed to reimburse each class to the extent annual operating expenses exceeded certain levels of average net assets as noted in the table below. Some expenses, for example interest expense, including commitment fees, are excluded from this reimbursement.
Expenses were reimbursed and/or waived for the following classes during the period:
| Expense
Limitations | Reimbursement/
Waiver |
Initial Class | 1.10% | $ 709 |
Service Class | 1.20% | 79 |
Service Class 2 | 1.35% | 927 |
Initial Class R | 1.10% | 17,587 |
Service Class R | 1.20% | 80 |
Service Class 2R | 1.35% | 87 |
Investor Class R | 1.18% | 47,964 |
| | $ 67,433 |
Commissions paid to certain brokers with whom the investment adviser, or its affiliates, places trades on behalf of the Fund include an amount in addition to trade execution, which may be rebated back to the Fund to offset certain expenses. This amount totaled $23,719 for the period.
9. Distributions to Shareholders.
Distributions to shareholders of each class were as follows:
Years ended December 31, | 2013 | 2012 |
From net investment income | | |
Initial Class | $ 13,323 | $ 5,389 |
Service Class | 580 | 807 |
Service Class 2 | 12,602 | 12,868 |
Initial Class R | 108,813 | 109,490 |
Service Class R | 580 | 807 |
Service Class 2R | 461 | 735 |
Investor Class R | 460,080 | 356,847 |
Total | $ 596,439 | $ 486,943 |
From net realized gain | | |
Initial Class | $ 1,753 | $ - |
Service Class | 88 | - |
Service Class 2 | 1,853 | - |
Initial Class R | 13,774 | - |
Service Class R | 88 | - |
Service Class 2R | 96 | - |
Investor Class R | 66,678 | - |
Total | $ 84,330 | $ - |
Annual Report
10. Share Transactions.
Transactions for each class of shares were as follows:
| Shares | Dollars |
Years ended December 31, | 2013 | 2012 | 2013 | 2012 |
Initial Class | | | | |
Shares sold | 225,575 | 8,980 | $ 2,755,189 | $ 86,362 |
Reinvestment of distributions | 1,244 | 520 | 15,076 | 5,389 |
Shares redeemed | (91,808) | (15,676) | (1,113,813) | (145,102) |
Net increase (decrease) | 135,011 | (6,176) | $ 1,656,452 | $ (53,351) |
Service Class | | | | |
Reinvestment of distributions | 55 | 78 | 668 | 807 |
Shares redeemed | (213) | - | (2,620) | - |
Net increase (decrease) | (158) | 78 | $ (1,952) | $ 807 |
Service Class 2 | | | | |
Shares sold | 205,988 | 181,170 | $ 2,464,727 | $ 1,780,864 |
Reinvestment of distributions | 1,200 | 1,247 | 14,455 | 12,868 |
Shares redeemed | (160,020) | (61,074) | (1,773,723) | (559,878) |
Net increase (decrease) | 47,168 | 121,343 | $ 705,459 | $ 1,233,854 |
Initial Class R | | | | |
Shares sold | 671,810 | 976,500 | $ 7,638,454 | $ 9,996,676 |
Reinvestment of distributions | 10,114 | 10,557 | 122,587 | 109,490 |
Shares redeemed | (1,047,613) | (472,161) | (11,628,951) | (4,456,994) |
Net increase (decrease) | (365,689) | 514,896 | $ (3,867,910) | $ 5,649,172 |
Service Class R | | | | |
Reinvestment of distributions | 55 | 78 | 668 | 807 |
Shares redeemed | (213) | - | (2,620) | - |
Net increase (decrease) | (158) | 78 | $ (1,952) | $ 807 |
Service Class 2R | | | | |
Reinvestment of distributions | 46 | 71 | 557 | 735 |
Shares redeemed | (187) | - | (2,298) | - |
Net increase (decrease) | (141) | 71 | $ (1,741) | $ 735 |
Investor Class R | | | | |
Shares sold | 3,811,446 | 1,363,457 | $ 43,371,608 | $ 13,420,273 |
Reinvestment of distributions | 43,751 | 34,641 | 526,758 | 356,847 |
Shares redeemed | (790,106) | (571,301) | (8,797,789) | (5,360,790) |
Net increase (decrease) | 3,065,091 | 826,797 | $ 35,100,577 | $ 8,416,330 |
11. Other.
The Fund's organizational documents provide former and current trustees and officers with a limited indemnification against liabilities arising in connection with the performance of their duties to the Fund. In the normal course of business, the Fund may also enter into contracts that provide general indemnifications. The Fund's maximum exposure under these arrangements is unknown as this would be dependent on future claims that may be made against the Fund. The risk of material loss from such claims is considered remote.
At the end of the period, the investment adviser or its affiliates were the owners of record of 96% of the total outstanding shares of the Fund.
Annual Report
Report of Independent Registered Public Accounting Firm
To the Trustees of Variable Insurance Products Fund II and the Shareholders of VIP International Capital Appreciation Portfolio:
In our opinion, the accompanying statement of assets and liabilities, including the schedule of investments, and the related statements of operations and of changes in net assets and the financial highlights present fairly, in all material respects, the financial position of VIP International Capital Appreciation Portfolio (a fund of Variable Insurance Products Fund II) at December 31, 2013, the results of its operations for the year then ended, the changes in its net assets for each of the two years in the period then ended and the financial highlights for each of the five years in the period then ended, in conformity with accounting principles generally accepted in the United States of America. These financial statements and financial highlights (hereafter referred to as "financial statements") are the responsibility of the VIP International Capital Appreciation Portfolio's management. Our responsibility is to express an opinion on these financial statements based on our audits. We conducted our audits of these financial statements in accordance with the standards of the Public Company Accounting Oversight Board (United States). Those standards require that we plan and perform the audit to obtain reasonable assurance about whether the financial statements are free of material misstatement. An audit includes examining, on a test basis, evidence supporting the amounts and disclosures in the financial statements, assessing the accounting principles used and significant estimates made by management, and evaluating the overall financial statement presentation. We believe that our audits, which included confirmation of securities at December 31, 2013 by correspondence with the custodian and brokers, provide a reasonable basis for our opinion.
PricewaterhouseCoopers LLP
Boston, Massachusetts
February 14, 2014
Annual Report
The Trustees, Member of the Advisory Board, and officers of the trust and fund, as applicable, are listed below. The Board of Trustees governs the fund and is responsible for protecting the interests of shareholders. The Trustees are experienced executives who meet periodically throughout the year to oversee the fund's activities, review contractual arrangements with companies that provide services to the fund, oversee management of the risks associated with such activities and contractual arrangements, and review the fund's performance. Except for James C. Curvey, Ned C. Lautenbach, Ronald P. O'Hanley, and William S. Stavropoulos, each of the Trustees oversees 173 funds. Mr. Curvey oversees 396 funds. Mr. Lautenbach, Mr. O'Hanley, and Mr. Stavropoulos each oversees 247 funds.
The Trustees hold office without limit in time except that (a) any Trustee may resign; (b) any Trustee may be removed by written instrument, signed by at least two-thirds of the number of Trustees prior to such removal; (c) any Trustee who requests to be retired or who has become incapacitated by illness or injury may be retired by written instrument signed by a majority of the other Trustees; and (d) any Trustee may be removed at any special meeting of shareholders by a two-thirds vote of the outstanding voting securities of the trust. Each Trustee who is not an interested person (as defined in the 1940 Act) of the trust and the fund (Independent Trustee), shall retire not later than the last day of the calendar year in which his or her 75th birthday occurs. The Independent Trustees may waive this mandatory retirement age policy with respect to individual Trustees. The officers and Advisory Board Member hold office without limit in time, except that any officer and Advisory Board Member may resign or may be removed by a vote of a majority of the Trustees at any regular meeting or any special meeting of the Trustees. Except as indicated, each individual has held the office shown or other offices in the same company for the past five years.
Experience, Skills, Attributes, and Qualifications of the Fund's Trustees. The Governance and Nominating Committee has adopted a statement of policy that describes the experience, qualifications, attributes, and skills that are necessary and desirable for potential Independent Trustee candidates (Statement of Policy). The Board believes that each Trustee satisfied at the time he or she was initially elected or appointed a Trustee, and continues to satisfy, the standards contemplated by the Statement of Policy. The Governance and Nominating Committee also engages professional search firms to help identify potential Independent Trustee candidates who have the experience, qualifications, attributes, and skills consistent with the Statement of Policy. From time to time, additional criteria based on the composition and skills of the current Independent Trustees, as well as experience or skills that may be appropriate in light of future changes to board composition, business conditions, and regulatory or other developments, have also been considered by the professional search firms and the Governance and Nominating Committee. In addition, the Board takes into account the Trustees' commitment and participation in Board and committee meetings, as well as their leadership of standing and ad hoc committees throughout their tenure.
In determining that a particular Trustee was and continues to be qualified to serve as a Trustee, the Board has considered a variety of criteria, none of which, in isolation, was controlling. The Board believes that, collectively, the Trustees have balanced and diverse experience, qualifications, attributes, and skills, which allow the Board to operate effectively in governing the fund and protecting the interests of shareholders. Information about the specific experience, skills, attributes, and qualifications of each Trustee, which in each case led to the Board's conclusion that the Trustee should serve (or continue to serve) as a trustee of the fund, is provided below.
Board Structure and Oversight Function. James C. Curvey is an interested person (as defined in the 1940 Act) and currently serves as Chairman. The Trustees have determined that an interested Chairman is appropriate and benefits shareholders because an interested Chairman has a personal and professional stake in the quality and continuity of services provided to the fund. Independent Trustees exercise their informed business judgment to appoint an individual of their choosing to serve as Chairman, regardless of whether the Trustee happens to be independent or a member of management. The Independent Trustees have determined that they can act independently and effectively without having an Independent Trustee serve as Chairman and that a key structural component for assuring that they are in a position to do so is for the Independent Trustees to constitute a substantial majority for the Board. The Independent Trustees also regularly meet in executive session. Ned C. Lautenbach serves as Chairman of the Independent Trustees and as such (i) acts as a liaison between the Independent Trustees and management with respect to matters important to the Independent Trustees and (ii) with management prepares agendas for Board meetings.
Fidelity funds are overseen by different Boards of Trustees. The fund's Board oversees Fidelity's equity and high income funds and another Board oversees Fidelity's investment-grade bond, money market, and asset allocation funds. The asset allocation funds may invest in Fidelity funds overseen by the fund's Board. The use of separate Boards, each with its own committee structure, allows the Trustees of each group of Fidelity funds to focus on the unique issues of the funds they oversee, including common research, investment, and operational issues. On occasion, the separate Boards establish joint committees to address issues of overlapping consequences for the Fidelity funds overseen by each Board.
The Trustees operate using a system of committees to facilitate the timely and efficient consideration of all matters of importance to the Trustees, the fund, and fund shareholders and to facilitate compliance with legal and regulatory requirements and oversight of the fund's activities and associated risks. The Board, acting through its committees, has charged FMR and its affiliates with (i) identifying events or circumstances the occurrence of which could have demonstrably adverse effects on the fund's business and/or reputation; (ii) implementing processes and controls to lessen the possibility that such events or circumstances occur or to mitigate the effects of such events or circumstances if they do occur; and (iii) creating and maintaining a system designed to evaluate continuously business and market conditions in order to facilitate the identification and implementation processes described in (i) and (ii) above. Because the day-to-day operations and activities of the fund are carried out by or through FMR, its affiliates and other service providers, the fund's exposure to risks is mitigated but not eliminated by the processes overseen by the Trustees. While each of the Board's committees has responsibility for overseeing different aspects of the fund's activities, oversight is exercised primarily through the Operations, Audit, and Compliance Committees. In addition, the Independent Trustees have worked with FMR to enhance the Board's oversight of investment and financial risks, legal and regulatory risks, technology risks, and operational risks, including the development of additional risk reporting to the Board. For example, a working group comprised of Independent Trustees and FMR has worked and continues to work to review the Fidelity fund's valuation-related activities, reporting and risk management. Appropriate personnel, including but not limited to the fund's Chief Compliance Officer (CCO), FMR's internal auditor, the independent accountants, the fund's Treasurer and portfolio management personnel, make periodic reports to the Board's committees, as appropriate, including an annual review of FMR's risk management program for the Fidelity funds. The responsibilities of each standing committee, including their oversight responsibilities, are described further under "Standing Committees of the Fund's Trustees."
Annual Report
The fund's Statement of Additional Information (SAI) includes more information about the Trustees. To request a free copy, call Fidelity at 1-877-208-0098.
Interested Trustees*:
Correspondence intended for each Trustee who is an interested person may be sent to Fidelity Investments, 245 Summer Street, Boston, Massachusetts 02210.
Name, Year of Birth; Principal Occupations and Other Relevant Experience+ |
James C. Curvey (1935) |
Year of Election or Appointment: 2007 Trustee Chairman of the Board of Trustees |
| Mr. Curvey also serves as Trustee of other Fidelity funds. Mr. Curvey is a Director of Fidelity Investments Money Management, Inc. (2009-present), Director of Fidelity Research & Analysis Co. (2009-present) and Director of FMR and FMR Co., Inc. (2007-present). Mr. Curvey is also Vice Chairman (2007-present) and Director of FMR LLC. In addition, Mr. Curvey serves as an Overseer for the Boston Symphony Orchestra and a member of the Trustees of Villanova University. Previously, Mr. Curvey was the Vice Chairman (2006-2007) and Director (2000-2007) of FMR Corp. |
Ronald P. O'Hanley (1957) |
Year of Election or Appointment: 2011 Trustee |
| Mr. O'Hanley also serves as Trustee of other Fidelity funds. He is Director of Fidelity SelectCo, LLC (2013-present), FMR Co., Inc. (2010-present), Director of Fidelity Investments Money Management, Inc. (2010-present), Director of Fidelity Research & Analysis Company (2010-present), President of Fidelity Asset Management and Corporate Services and a Member of Fidelity's Executive Committee (2010-present). Previously, Mr. O'Hanley served as President and Chief Executive Officer of BNY Mellon Asset Management (2007-2010). Mr. O'Hanley also served as Vice Chairman of Bank New York Mellon Corp. and a member of that firm's Executive Committee. Prior to the 2007 merger of The Bank of New York and Mellon Financial Corporation, he was Vice Chairman of Mellon Financial Corporation and President and Chief Executive Officer of Mellon Asset Management. He joined Mellon in February 1997. Mr. O'Hanley currently serves as Chairman of the Boston Public Library Foundation Board of Directors and sits on the Board of Directors of Beth Israel Deaconess Medical Center, the Board of Trustees of the Marine Biological Laboratory and the Advisory Board of the Maxwell School of Citizenship and Public Administration at Syracuse University. Mr. O'Hanley also chairs the Council on Asset Management for the Financial Services Roundtable and is a member of the Board of Directors of Institutional Investor's U.S. Institute. |
* Trustees have been determined to be "Interested Trustees" by virtue of, among other things, their affiliation with the trust or various entities under common control with FMR.
+ The information above includes each Trustee's principal occupation during the last five years and other information relating to the experience, attributes, and skills relevant to each Trustee's qualifications to serve as a Trustee, which led to the conclusion that each Trustee should serve as a Trustee for the fund.
Annual Report
Trustees and Officers - continued
Independent Trustees:
Correspondence intended for each Independent Trustee (that is, the Trustees other than the Interested Trustees) may be sent to Fidelity Investments, P.O. Box 55235, Boston, Massachusetts 02205-5235.
Name, Year of Birth; Principal Occupations and Other Relevant Experience+ |
Dennis J. Dirks (1948) |
Year of Election or Appointment: 2005 Trustee |
| Mr. Dirks also serves as Trustee of other Fidelity funds. Prior to his retirement in May 2003, Mr. Dirks was Chief Operating Officer and a member of the Board of The Depository Trust & Clearing Corporation (DTCC). He also served as President, Chief Operating Officer, and Board member of The Depository Trust Company (DTC) and President and Board member of the National Securities Clearing Corporation (NSCC). In addition, Mr. Dirks served as Chief Executive Officer and Board member of the Government Securities Clearing Corporation, Chief Executive Officer and Board member of the Mortgage-Backed Securities Clearing Corporation, as a Trustee and a member of the Finance Committee of Manhattan College (2005-2008), and as a Trustee and a member of the Finance Committee of AHRC of Nassau County (2006-2008). Mr. Dirks is a member of the Independent Directors Council (IDC) Governing Council (2010-present) and Board of Directors for The Brookville Center for Children's Services, Inc. (2009-present). |
Alan J. Lacy (1953) |
Year of Election or Appointment: 2008 Trustee |
| Mr. Lacy also serves as Trustee of other Fidelity funds. Mr. Lacy serves as Senior Adviser (2007-present) of Oak Hill Capital Partners, L.P. (private equity). Mr. Lacy also served as Chief Executive Officer (2000-2005) and Vice Chairman (2005-2006) of Sears Holdings Corporation and Sears, Roebuck and Co. (retail). In addition, Mr. Lacy serves as a member of the Board of Directors of Dave & Buster's Entertainment, Inc. (restaurant and entertainment complexes, 2010-present), Earth Fare, Inc. (retail grocery, 2012-present), The Hillman Companies, Inc. (hardware wholesalers, 2010-present), and Bristol-Myers Squibb Company (global pharmaceuticals, 2008-present). Mr. Lacy is a member of the Board of Trustees of The National Parks Conservation Association (2006-present). Previously, Mr. Lacy served as Chairman of the Board of Trustees of the National Parks Conservation Association (2008-2011) and as a member of the Board of Directors for the Western Union Company (global money transfer, 2006-2011). |
Ned C. Lautenbach (1944) |
Year of Election or Appointment: 2000 Trustee Chairman of the Independent Trustees |
| Mr. Lautenbach also serves as Trustee of other Fidelity funds. Mr. Lautenbach currently serves as the Lead Director of the Eaton Corporation Board of Directors (diversified industrial, 1997-present). Mr. Lautenbach is Chairman of the Board of Directors of the Philharmonic Center for the Arts in Naples, Florida (2012-present) and a member of the Council on Foreign Relations (1994-present). Previously, Mr. Lautenbach was a Partner/Advisory Partner at Clayton, Dubilier & Rice, LLC (private equity investment, 1998-2010), as well as a Director of Sony Corporation (2006-2007). |
Joseph Mauriello (1944) |
Year of Election or Appointment: 2008 Trustee |
| Mr. Mauriello also serves as Trustee of other Fidelity funds. Prior to his retirement in January 2006, Mr. Mauriello served in numerous senior management positions including Deputy Chairman and Chief Operating Officer (2004-2005), and Vice Chairman of Financial Services (2002-2004) of KPMG LLP US (professional services, 1965-2005). Mr. Mauriello currently serves as a member of the Board of Directors of XL Group plc. (global insurance and re-insurance, 2006-present). Previously, Mr. Mauriello served as a Director of the Hamilton Funds of the Bank of New York (2006-2007) and of Arcadia Resources Inc. (health care services and products, 2007-2012). |
Robert W. Selander (1950) |
Year of Election or Appointment: 2011 Trustee |
| Mr. Selander also serves as Trustee of other Fidelity funds. Previously, Mr. Selander served as a Member of the Advisory Board of other Fidelity funds (2011), and Executive Vice Chairman (2010), Chief Executive Officer (2009-2010), and President and Chief Executive Officer (1997-2009) of Mastercard, Inc. |
Cornelia M. Small (1944) |
Year of Election or Appointment: 2005 Trustee |
| Ms. Small also serves as Trustee of other Fidelity funds. Ms. Small is a member of the Board of Directors (2009-present) and Chair of the Investment Committee (2010-present) of the Teagle Foundation. Ms. Small also serves on the Investment Committee of the Berkshire Taconic Community Foundation (2008-present). Previously, Ms. Small served as Chairperson (2002-2008) and a member of the Investment Committee and Chairperson (2008-2012) and a member of the Board of Trustees of Smith College. In addition, Ms. Small served as Chief Investment Officer, Director of Global Equity Investments, and a member of the Board of Directors of Scudder, Stevens & Clark and Scudder Kemper Investments. |
William S. Stavropoulos (1939) |
Year of Election or Appointment: 2001 Trustee Vice Chairman of the Independent Trustees |
| Mr. Stavropoulos also serves as Trustee of other Fidelity funds. Mr. Stavropoulos serves as President and Founder of the Michigan Baseball Foundation, the Great Lakes Loons (2007-present). Mr. Stavropoulos is Chairman Emeritus of the Board of Directors of The Dow Chemical Company, where he previously served in numerous senior management positions, including President, CEO (1995-2000; 2002-2004), Chairman of the Executive Committee (2000-2006), and as a member of the Board of Directors (1990-2006). Currently, Mr. Stavropoulos is Chairman of the Board of Directors of Univar Inc. (global distributor of commodity and specialty chemicals), a Director of Teradata Corporation (data warehousing and technology solutions), and Maersk Inc. (industrial conglomerate), and a member of the Advisory Board for Metalmark Capital LLC (private equity investment, 2005-present). Mr. Stavropoulos is an operating advisor to Clayton, Dubilier & Rice, LLC (private equity investment). In addition, Mr. Stavropoulos is a member of the University of Notre Dame Advisory Council for the College of Science, a Trustee of the Rollin L. Gerstacker Foundation, and a Director of the Naples Philharmonic Center for the Arts. Previously, Mr. Stavropoulos served as a Director of Chemical Financial Corporation (bank holding company, 1993-2012) and Tyco International, Ltd. (multinational manufacturing and services, 2007-2012). |
David M. Thomas (1949) |
Year of Election or Appointment: 2008 Trustee |
| Mr. Thomas also serves as Trustee of other Fidelity funds. Mr. Thomas serves as Non-Executive Chairman of the Board of Directors of Fortune Brands Home and Security (home and security products, 2011-present), and as a member of the Board of Directors of Interpublic Group of Companies, Inc. (marketing communication, 2004-present). Previously, Mr. Thomas served as Executive Chairman (2005-2006) and Chairman and Chief Executive Officer (2000-2005) of IMS Health, Inc. (pharmaceutical and healthcare information solutions), and a Director of Fortune Brands, Inc. (consumer products, 2000-2011). |
+ The information above includes each Trustee's principal occupation during the last five years and other information relating to the experience, attributes, and skills relevant to each Trustee's qualifications to serve as a Trustee, which led to the conclusion that each Trustee should serve as a Trustee for the fund.
Advisory Board Member and Officers:
Correspondence intended for each officer and Peter S. Lynch may be sent to Fidelity Investments, 245 Summer Street, Boston, Massachusetts 02210. Officers appear below in alphabetical order.
Name, Year of Birth; Principal Occupation |
Peter S. Lynch (1944) |
Year of Election or Appointment: 2003 Member of the Advisory Board |
| Mr. Lynch also serves as Member of the Advisory Board of other Fidelity funds. Mr. Lynch is Vice Chairman and a Director of FMR and FMR Co., Inc. In addition, Mr. Lynch serves as a Trustee of Boston College and as the Chairman of the Inner-City Scholarship Fund. Previously, Mr. Lynch served on the Special Olympics International Board of Directors (1997-2006). |
Elizabeth Paige Baumann (1968) |
Year of Election or Appointment: 2012 Anti-Money Laundering (AML) Officer |
| Ms. Baumann also serves as AML Officer of other funds. She is Chief AML Officer of FMR LLC (2012-present) and is an employee of Fidelity Investments. Previously, Ms. Baumann served as Vice President and Deputy Anti-Money Laundering Officer (2007-2012). |
William C. Coffey (1969) |
Year of Election or Appointment: 2009 Assistant Secretary |
| Mr. Coffey also serves as Assistant Secretary of other funds. He is Senior Vice President and Deputy General Counsel of FMR LLC (2010-present), and is an employee of Fidelity Investments. Previously, Mr. Coffey served as Vice President and Associate General Counsel of FMR LLC (2005-2009). |
Jonathan Davis (1968) |
Year of Election or Appointment: 2010 Assistant Treasurer |
| Mr. Davis also serves as Assistant Treasurer of other funds. Mr. Davis is an employee of Fidelity Investments. Previously, Mr. Davis served as Vice President and Associate General Counsel of FMR LLC (2003-2010). |
Adrien E. Deberghes (1967) |
Year of Election or Appointment: 2008 Deputy Treasurer |
| Mr. Deberghes also serves as an officer of other funds. He is an employee of Fidelity Investments (2008-present). Prior to joining Fidelity Investments, Mr. Deberghes was Senior Vice President of Mutual Fund Administration at State Street Corporation (2007-2008), Senior Director of Mutual Fund Administration at Investors Bank & Trust (2005-2007), and Director of Finance for Dunkin' Brands (2000-2005). |
Stephanie J. Dorsey (1969) |
Year of Election or Appointment: 2010 Assistant Treasurer |
| Ms. Dorsey also serves as an officer of other funds. She is an employee of Fidelity Investments (2008-present) and has served in other fund officer roles. Prior to joining Fidelity Investments, Ms. Dorsey served as Treasurer (2004-2008) of the JPMorgan Mutual Funds and Vice President (2004-2008) of JPMorgan Chase Bank. |
Scott C. Goebel (1968) |
Year of Election or Appointment: 2008 Secretary and Chief Legal Officer (CLO) |
| Mr. Goebel serves as Secretary and CLO of other funds. Mr. Goebel also serves as Secretary of Fidelity Investments Money Management, Inc. (FIMM) (2010-present) and Fidelity Research and Analysis Company (FRAC) (2010-present); General Counsel, Secretary, and Senior Vice President of FMR (2008-present) and FMR Co., Inc. (2008-present); Chief Legal Officer of Fidelity Management & Research (Hong Kong) Limited (2008-present) and Assistant Secretary of Fidelity Management & Research (Japan) Inc. (2008-present), and Fidelity Management & Research (U.K.) Inc. (2008-present). Previously, Mr. Goebel served as Secretary and CLO of other Fidelity funds (2008-2013), Assistant Secretary of FIMM (2008-2010), FRAC (2008-2010), and certain funds (2007-2008); and as Vice President and Secretary of Fidelity Distributors Corporation (FDC) (2005-2007). Mr. Goebel has been employed by FMR LLC or an affiliate since 2001. |
Joseph A. Hanlon (1968) |
Year of Election or Appointment: 2012 Chief Compliance Officer |
| Mr. Hanlon also serves as Chief Compliance Officer of other funds. Mr. Hanlon serves as Compliance Officer of FMR, FMR Co., Inc., Fidelity Investments Money Management, Inc. (FIMM), Fidelity Research and Analysis Company (FRAC), and Fidelity Management & Research (Hong Kong) (2009-present), as Senior Vice President of the Fidelity Asset Management Division (2009-present), and is an employee of Fidelity Investments. Previously, Mr. Hanlon served as Compliance Officer of Fidelity Management & Research (Japan) Inc. (2009-2013), Strategic Advisers, Inc. (2009-2013), and Fidelity Management & Research (U.K.) Inc. (2009-2013). |
Bruce T. Herring (1965) |
Year of Election or Appointment: 2006 Vice President of certain Equity Funds |
| Mr. Herring also serves as Vice President of other funds. He serves as Chief Investment Officer of Fidelity Global Asset Allocation (GAA) (2013-present), Group Chief Investment Officer of FMR, and President of Fidelity Research & Analysis Company (2010-present). Previously, Mr. Herring served as Chief Investment Officer and Director of Fidelity Management & Research (U.K.) Inc. (2010-2013), Vice President (2005-2006) and Senior Vice President (2006-2007) of Fidelity Management & Research Company, Vice President of FMR Co., Inc. (2001-2007), and as a portfolio manager for Fidelity U.S. Equity Funds. |
Brian B. Hogan (1964) |
Year of Election or Appointment: 2009 Vice President |
| Mr. Hogan also serves as Vice President of other funds. Mr. Hogan serves as President of FMR's Equity Division (2009-present). Previously, Mr. Hogan served as Senior Vice President, Equity Research of FMR (2006-2009) and as a portfolio manager. |
Chris Maher (1972) |
Year of Election or Appointment: 2013 Assistant Treasurer |
| Mr. Maher serves as Assistant Treasurer of other funds. Mr. Maher is Vice President of Valuation Oversight and is an employee of Fidelity Investments. Previously, Mr. Maher served as Vice President of Asset Management Compliance (2013), Vice President of FMR's Program Management Group (2010-2013), and Vice President of Valuation Oversight (2008-2010). |
Christine Reynolds (1958) |
Year of Election or Appointment: 2008 Chief Financial Officer |
| Ms. Reynolds also serves as Chief Financial Officer of other funds. Ms. Reynolds became President of Fidelity Pricing and Cash Management Services (FPCMS) in August 2008. Ms. Reynolds served as Chief Operating Officer of FPCMS (2007-2008). Previously, Ms. Reynolds served as President, Treasurer, and Anti-Money Laundering officer of the Fidelity funds (2004-2007). |
Kenneth B. Robins (1969) |
Year of Election or Appointment: 2008 President and Treasurer |
| Mr. Robins also serves as an officer of other funds. Mr. Robins serves as Executive Vice President of Fidelity Investments Money Management, Inc. (FIMM) (2013-present) and is an employee of Fidelity Investments (2004-present). Previously, Mr. Robins served in other fund officer roles. |
Gary W. Ryan (1958) |
Year of Election or Appointment: 2005 Assistant Treasurer |
| Mr. Ryan also serves as Assistant Treasurer of other funds. Mr. Ryan is an employee of Fidelity Investments and has served in other fund officer roles. Previously, Mr. Ryan served as Vice President of Fund Reporting in Fidelity Pricing and Cash Management Services (FPCMS) (1999-2005). |
Stephen Sadoski (1971) |
Year of Election or Appointment: 2012 Deputy Treasurer |
| Mr. Sadoski also serves as Deputy Treasurer of other funds. He is an employee of Fidelity Investments (2012-present) and has served in another fund officer role. Prior to joining Fidelity Investments, Mr. Sadoski served as an assistant chief accountant in the Division of Investment Management of the Securities and Exchange Commission (SEC) (2009-2012) and as a senior manager at Deloitte & Touche LLP (1997-2009). |
Stacie M. Smith (1974) |
Year of Election or Appointment: 2013 Deputy Treasurer |
| Ms. Smith also serves as an officer of other funds. She is an employee of Fidelity Investments (2009-present) and has served in other fund officer roles. Prior to joining Fidelity Investments, Ms. Smith served as Senior Audit Manager of Ernst & Young LLP (1996-2009). |
Renee Stagnone (1975) |
Year of Election or Appointment: 2013 Deputy Treasurer |
| Ms. Stagnone also serves as Deputy Treasurer of other funds. Ms. Stagnone is an employee of Fidelity Investments. |
Joseph F. Zambello (1957) |
Year of Election or Appointment: 2011 Deputy Treasurer |
| Mr. Zambello also serves as Deputy Treasurer of other funds. Mr. Zambello is an employee of Fidelity Investments. Previously, Mr. Zambello served as Vice President of FMR's Program Management Group (2009-2011) and Vice President of the Transfer Agent Oversight Group (2005-2009). |
Annual Report
The percentage of dividends distributed during the fiscal year representing income derived from sources within, and taxes paid to, foreign countries or possessions of the United States are as follows:
| Pay Date | Income | Taxes |
Initial Class R | 12 /13 /2013 | $0.101 | $0.0119 |
Service Class R | 12 /13 /2013 | $0.088 | $0.0119 |
Service Class 2R | 12 /13 /2013 | $0.070 | $0.0119 |
Investor Class R | 12 /13 /2013 | $0.091 | $0.0119 |
Initial Class R designates 15%, Service Class R designates 17%, Service Class 2R designates 22%, and Investor Class R designates 17% of the dividends distributed during the fiscal year as qualifying for the dividends-received deduction for corporate shareholders.
Annual Report
Board Approval of Investment Advisory Contracts and Management Fees
VIP International Capital Appreciation Portfolio
Each year, the Board of Trustees, including the Independent Trustees (together, the Board), votes on the renewal of the management contract and sub-advisory agreements (together, the Advisory Contracts) for the fund. The Board, assisted by the advice of fund counsel and Independent Trustees' counsel, requests and considers a broad range of information relevant to the renewal of the Advisory Contracts throughout the year.
The Board meets regularly and, at each of its meetings, covers an extensive agenda of topics and materials and considers factors that are relevant to its annual consideration of the renewal of the fund's Advisory Contracts, including the services and support provided to the fund and its shareholders. The Board has established various standing committees, each composed of and chaired by Independent Trustees with varying backgrounds, to which the Board has assigned specific subject matter responsibilities in order to enhance effective decision-making by the Board. The Board, acting directly and through its Committees, requests and receives information concerning the annual consideration of the renewal of the fund's Advisory Contracts. The Board also meets as needed to consider matters specifically related to the Board's annual consideration of the renewal of Advisory Contracts. Members of the Board may also meet with trustees of other Fidelity funds through ad hoc joint committees to discuss certain matters relevant to the Fidelity funds.
At its July 2013 meeting, the Board, including the Independent Trustees, unanimously determined to renew the fund's Advisory Contracts. In reaching its determination, the Board considered all factors it believed relevant, including (i) the nature, extent, and quality of the services to be provided to the fund and its shareholders (including the investment performance of the fund); (ii) the competitiveness of the fund's management fee and total expense ratio relative to peer funds; (iii) the total costs of the services to be provided by and the profits to be realized by Fidelity from its relationship with the fund; (iv) the extent to which economies of scale exist and would be realized as the fund grows; and (v) whether fee levels reflect these economies of scale, if any, for the benefit of fund shareholders.
In considering whether to renew the Advisory Contracts for the fund, the Board reached a determination, with the assistance of fund counsel and Independent Trustees' counsel and through the exercise of its business judgment, that the renewal of the Advisory Contracts was in the best interests of the fund and its shareholders and that the compensation payable under the Advisory Contracts was fair and reasonable. The Board's decision to renew the Advisory Contracts was not based on any single factor, but rather was based on a comprehensive consideration of all the information provided to the Board at its meetings throughout the year. The Board, in reaching its determination to renew the Advisory Contracts, was aware that shareholders in the fund have a broad range of investment choices available to them, including a wide choice among mutual funds offered by Fidelity's competitors, and that the fund's shareholders, who have the opportunity to review and weigh the disclosure provided by the fund in its prospectus and other public disclosures, have chosen to invest in this fund, which is a part of the Fidelity family of funds.
Nature, Extent, and Quality of Services Provided. The Board considered the staffing within the investment adviser, Fidelity Management & Research Company (FMR), and the sub-advisers (together, the Investment Advisers) as it relates to the fund, including the backgrounds of the fund's investment personnel, and also considered the fund's investment objective, strategies, and related investment philosophy. The Independent Trustees also had discussions with senior management of Fidelity's investment operations and investment groups. The Board considered the structure of the portfolio manager compensation program and whether this structure provides appropriate incentives to act in the best interests of the fund.
Resources Dedicated to Investment Management and Support Services. The Board and the Fund Oversight and Research Committees reviewed the general qualifications and capabilities of the Investment Advisers' investment staff, including its size, education, experience, and resources, as well as the Investment Advisers' approach to recruiting, training, managing, and compensating investment personnel. The Board noted that FMR has continued to increase the resources devoted to non-U.S. offices, including expansion of Fidelity's global investment organization. The Board also noted that Fidelity's analysts have extensive resources, tools and capabilities that allow them to conduct sophisticated quantitative and fundamental analysis, as well as credit analysis of issuers, counterparties and guarantors. Further, the Board believes that Fidelity's investment professionals have sufficient access to global information and data so as to provide competitive investment results over time, and that those professionals also have access to sophisticated tools that permit them to assess portfolio construction and risk and performance attribution characteristics continuously, as well as to transmit new information and research conclusions rapidly around the world. Additionally, in its deliberations, the Board considered the Investment Advisers' trading and risk management capabilities and resources, which are an integral part of the investment management process.
Shareholder and Administrative Services. The Board considered (i) the nature, extent, quality, and cost of advisory, administrative, and shareholder services performed by the Investment Advisers and their affiliates under the Advisory Contracts and under separate agreements covering transfer agency, pricing and bookkeeping, and securities lending services for the fund; (ii) the nature and extent of the supervision of third party service providers, principally custodians and subcustodians; and (iii) the resources devoted to, and the record of compliance with, the fund's compliance policies and procedures. The Board also reviewed the allocation of fund brokerage, including allocations to brokers affiliated with the Investment Advisers, the use of brokerage commissions to pay fund expenses, and the use of "soft" commission dollars to pay for research services.
The Board noted that the growth of fund assets over time across the complex allows Fidelity to reinvest in the development of services designed to enhance the value or convenience of the Fidelity funds as investment vehicles. These services include 24-hour access to account information and market information through telephone representatives and over the Internet, investor education materials and asset allocation tools, and the expanded availability of Fidelity Investor Centers.
Annual Report
Investment in a Large Fund Family. The Board considered the benefits to shareholders of investing in a Fidelity fund, including the benefits of investing in a fund that is part of a large family of funds offering a variety of investment disciplines and providing a large variety of mutual fund investor services. The Board noted that Fidelity had taken, or had made recommendations that resulted in the Fidelity funds taking, a number of actions over the previous year that benefited particular funds, including (i) continuing to dedicate additional resources to investment research and to the support of the senior management team that oversees asset management; (ii) persisting in efforts to enhance Fidelity's global research capabilities; (iii) launching new funds and making other enhancements to meet client needs for global and income-oriented solutions; (iv) continuing to launch dedicated lower cost underlying funds to meet portfolio construction needs related to expanding underlying fund options for Fidelity funds of funds, specifically for the Freedom Fund product lines; (v) rationalizing product lines and gaining increased efficiencies through the mergers of several funds into other funds; (vi) strengthening Fidelity's index fund offerings by reducing investment minimums and adopting or lowering existing expense caps for certain funds and classes; (vii) enhancing Global Asset Allocation product offerings by launching new funds and strategies, including "open architecture" target date funds that utilize affiliated and unaffiliated sub-advisers; (viii) modifying the eligibility criteria for Institutional Class shares of Advisor funds to increase their marketability to a portion of the defined contribution plan market; (ix) creating a new low-cost retirement share class for certain Advisor funds to appeal to large retirement plans; (x) transitioning the management of certain Fidelity commodity funds to Geode Capital Management LLC, a registered commodity pool operator, while retaining administrative responsibilities for the funds; (xi) reorganizing a number of funds; and (xii) taking steps toward establishing a new Fidelity adviser to manage sector-based funds and products.
Investment Performance. The Board considered whether the fund has operated in accordance with its investment objective, as well as its record of compliance with its investment restrictions and its performance history.
The Board took into account discussions with the Investment Advisers about fund investment performance that occur at Board meetings throughout the year. In this regard the Board noted that as part of regularly scheduled fund reviews and other reports to the Board on fund performance, the Board periodically considers annualized return information for the fund, for different time periods, measured against a securities market index ("benchmark index") and a peer group of mutual funds with similar objectives ("peer group"). In its evaluation of fund investment performance, the Board gave particular attention to information indicating changes in performance of certain Fidelity funds for specific time periods and the Investment Advisers' explanations for any overperformance or underperformance.
In addition to reviewing absolute and relative fund performance, the Independent Trustees periodically consider the appropriateness of fund performance metrics in evaluating the results achieved. In general, the Independent Trustees believe that fund performance should be evaluated based on net performance (after fees and expenses) of both the highest performing and lowest performing classes, where applicable, compared to appropriate benchmark indices, over appropriate time periods which may include full market cycles, and compared to peer groups, as applicable, over the same periods, taking into account relevant factors including the following: general market conditions; issuer-specific information; tactical opportunities for investment; and fund cash flows and other factors.
The Independent Trustees recognize that shareholders evaluate performance on a net basis over their own holding periods, for which one-, three-, and five-year periods are used as a proxy. For this reason, the performance information reviewed by the Board also included net cumulative calendar year total return information for the fund and an appropriate benchmark index and peer group for the most recent one-, three-, and five-year periods, as shown below. Returns are shown compared to the 25th percentile (top of box) and 75th percentile (bottom of box) of the peer universe. Returns of the benchmark index are "net MA," i.e., adjusted for tax withholding rates applicable to U.S.-based mutual funds organized as Massachusetts business trusts.
Annual Report
Board Approval of Investment Advisory Contracts and Management Fees - continued
VIP International Capital Appreciation Portfolio
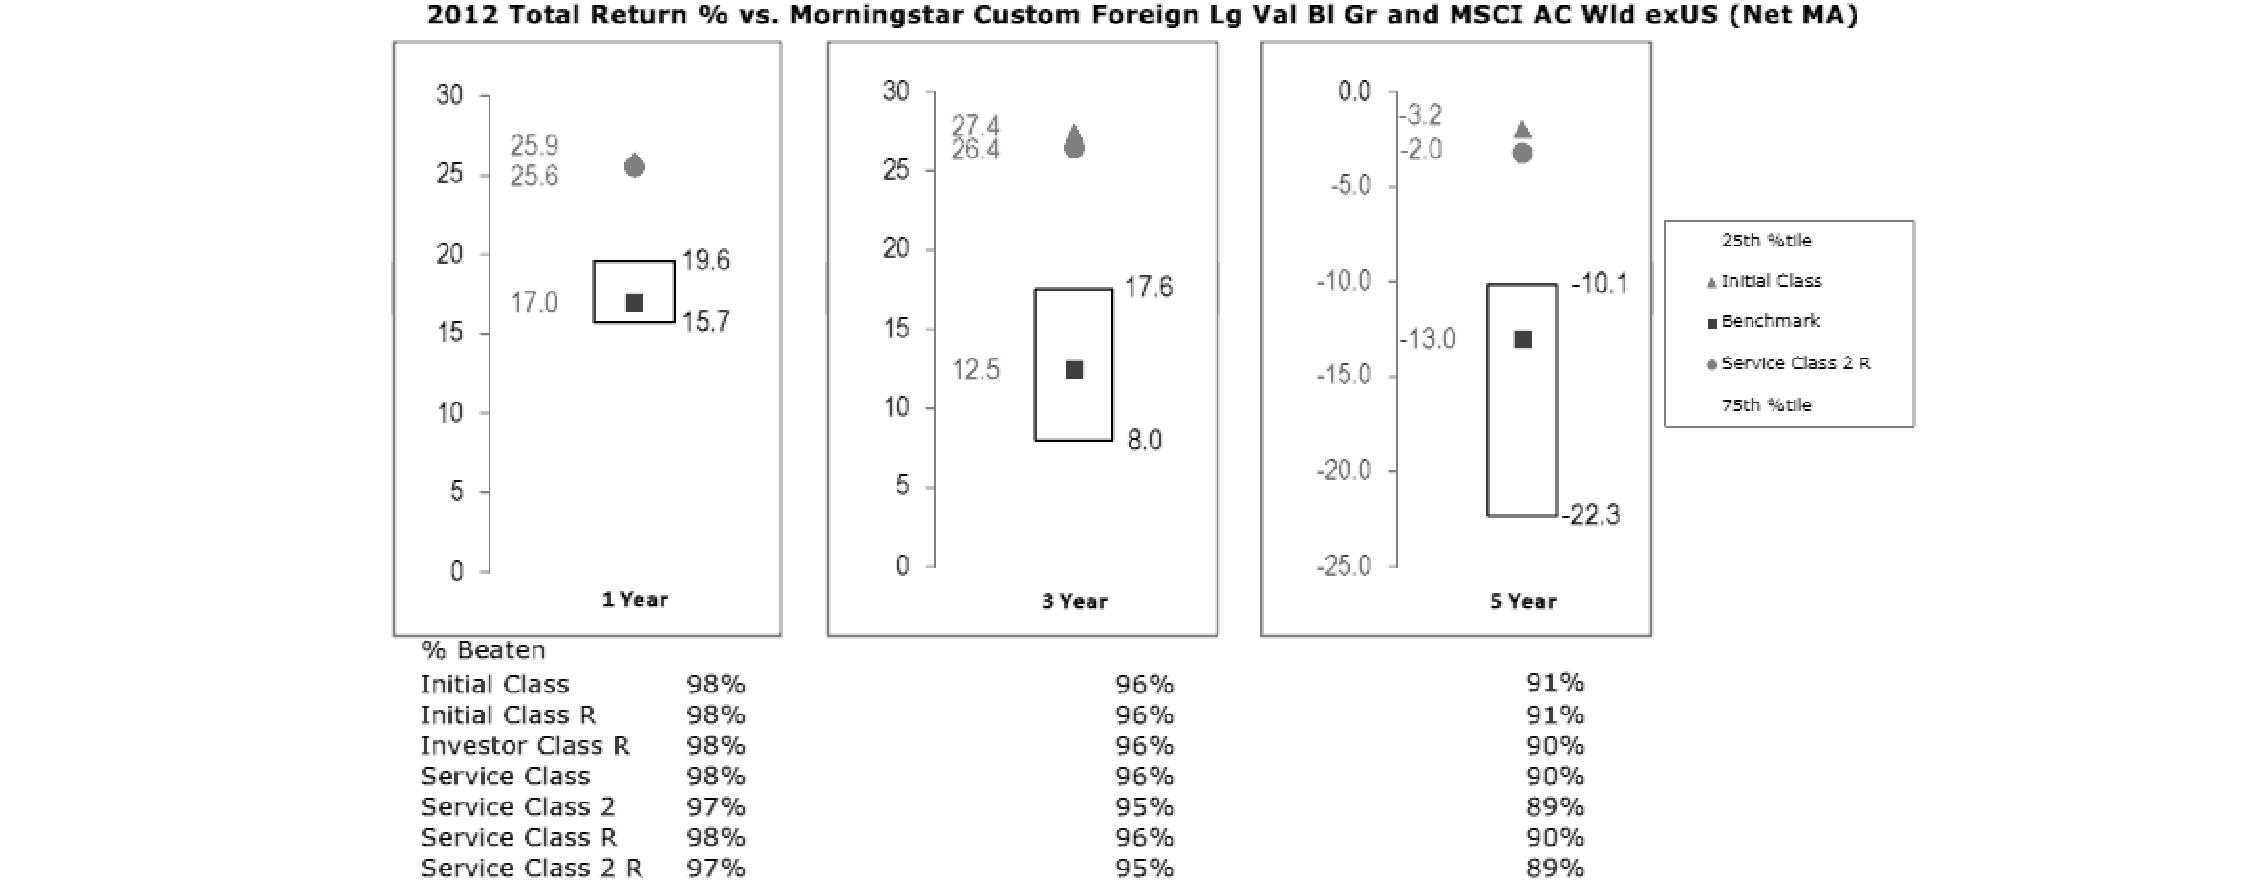
Based on its review, the Board concluded that the nature, extent, and quality of services provided to the fund under the Advisory Contracts should benefit the fund's shareholders.
Competitiveness of Management Fee and Total Expense Ratio. The Board considered the fund's management fee and total expense ratio compared to "mapped groups" of competitive funds and classes. Fidelity creates "mapped groups" by combining similar Lipper investment objective categories that have comparable management fee characteristics. Combining Lipper investment objective categories aids the Board's management fee and total expense ratio comparisons by broadening the competitive group used for comparison and by reducing the number of universes to which various Fidelity funds are compared.
Management Fee. The Board considered two proprietary management fee comparisons for the 12-month periods shown in the chart below. The group of Lipper funds used by the Board for management fee comparisons is referred to below as the "Total Mapped Group." The Total Mapped Group comparison focuses on a fund's standing in terms of gross management fees before expense reimbursements or caps relative to the total universe of funds with comparable investment mandates, regardless of whether their management fee structures also are comparable. Funds with comparable investment mandates offer exposure to similar types of securities. Funds with comparable management fee structures have similar management fee contractual arrangements (e.g., flat rate charged for advisory services, all-inclusive fee rate, etc.). "TMG %" represents the percentage of funds in the Total Mapped Group that had management fees that were lower than the fund's. For example, a TMG % of 19% means that 81% of the funds in the Total Mapped Group had higher management fees than the fund. The "Asset-Size Peer Group" (ASPG) comparison focuses on a fund's standing relative to a subset of non-Fidelity funds within the Total Mapped Group that are similar in size and management fee structure. The ASPG represents at least 15% of the funds in the Total Mapped Group with comparable asset size and management fee structures, subject to a minimum of 50 funds (or all funds in the Total Mapped Group if fewer than 50). Additional information, such as the ASPG quartile in which the fund's management fee ranked, is also included in the chart and considered by the Board.
Annual Report
VIP International Capital Appreciation Portfolio
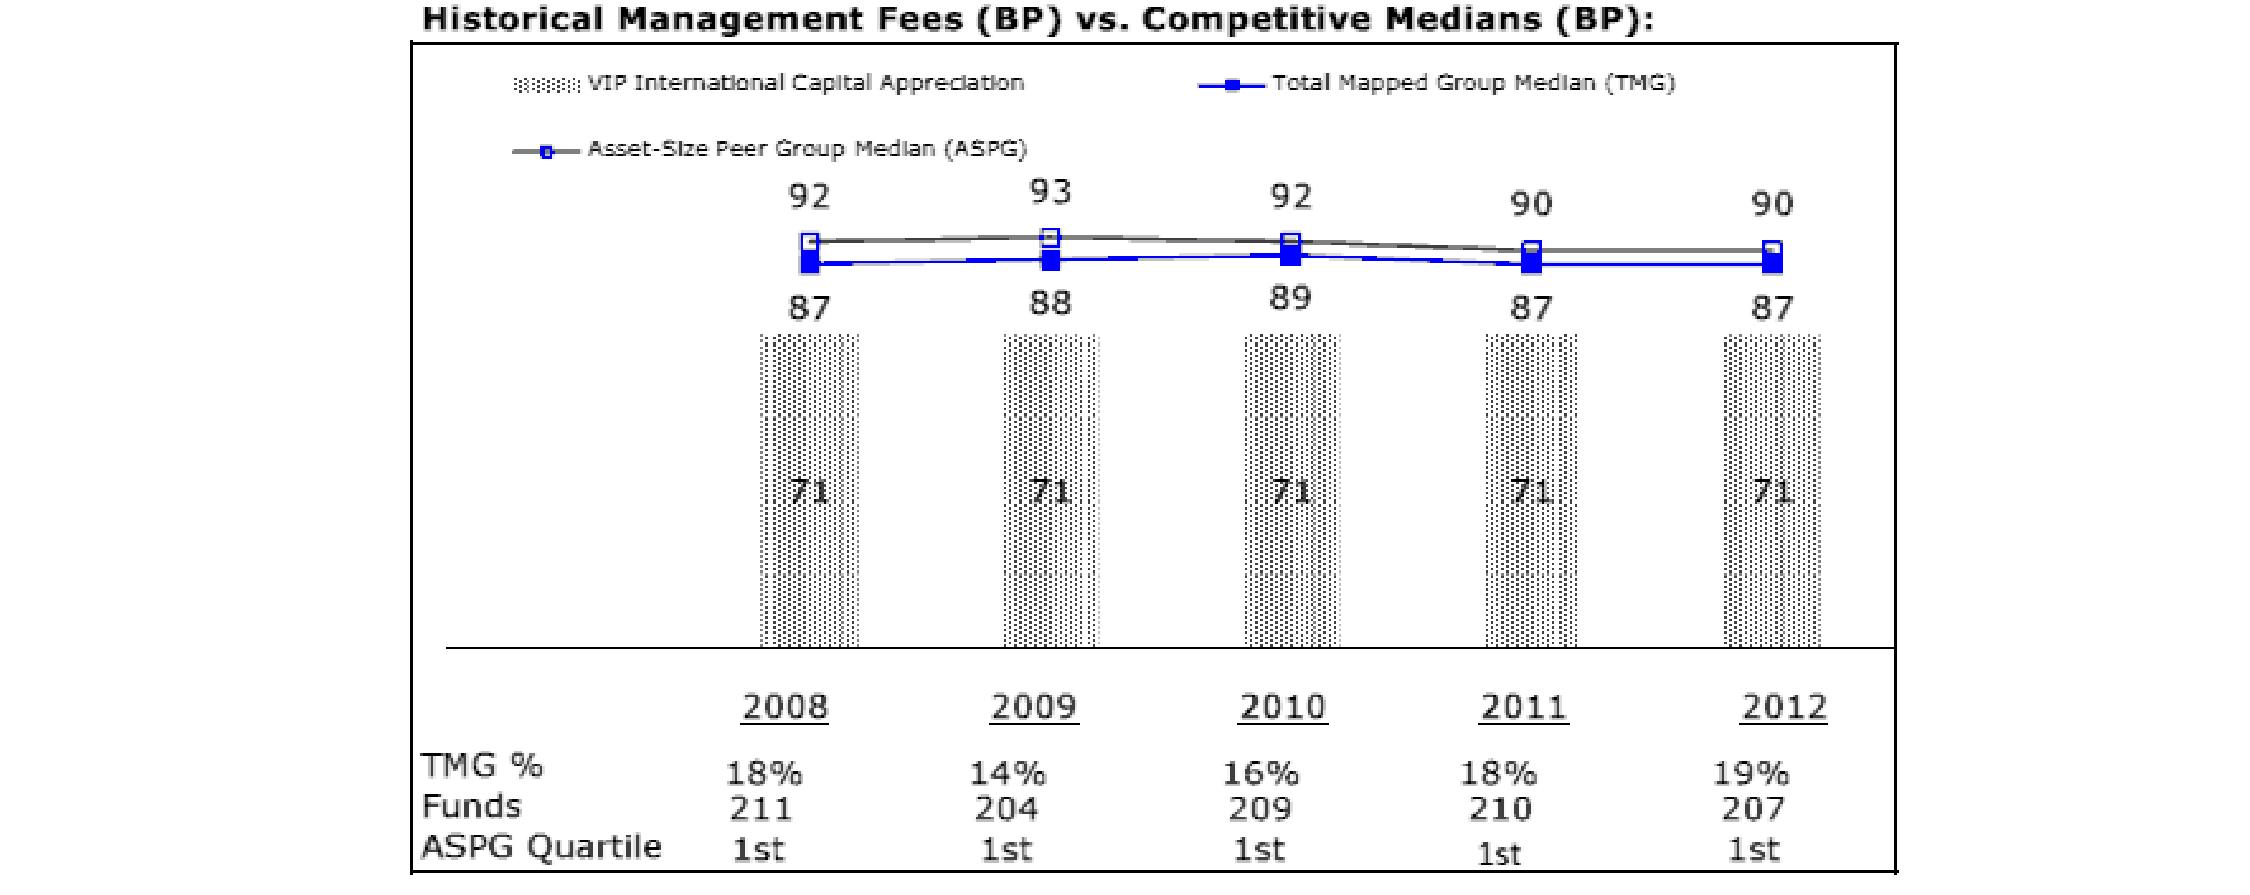
The Board noted that the fund's management fee ranked below the median of its Total Mapped Group and below the median of its ASPG for 2012.
Based on its review, the Board concluded that the fund's management fee is fair and reasonable in light of the services that the fund receives and the other factors considered.
Total Expense Ratio. In its review of each class's total expense ratio, the Board considered the fund's management fee as well as other fund or class expenses, as applicable, such as transfer agent fees, pricing and bookkeeping fees, fund-paid 12b-1 fees, and custodial, legal, and audit fees. The Board also noted the effects of any waivers and reimbursements on fees and expenses. As part of its review, the Board also considered the current and historical total expense ratios of each class of the fund compared to competitive fund median expenses. Each class of the fund is compared to those funds and classes in the Total Mapped Group (used by the Board for management fee comparisons) that have a similar sales load structure.
The Board noted that the total expense ratio of each class ranked above its competitive median for 2012. The Board considered that, in general, various factors can affect total expense ratios. The Board also noted that Investor Class R has higher transfer agent fees than traditional variable annuity classes because it is designed for lower cost annuity products, where the majority of servicing costs are incorporated into the funds' total expense ratios rather than being paid at the annuity level. The Board noted that the fund offers multiple classes, each of which has a different 12b-1 fee structure, and that the multiple structures are intended to offer a range of pricing options for the intermediary market. The Board also noted that the total expense ratios of the classes vary primarily by the level of their 12b-1 fees, although differences in transfer agent fees may also cause expenses to vary from class to class.
Fees Charged to Other Fidelity Clients. The Board also considered Fidelity fee structures and other information with respect to clients of FMR and its affiliates, such as other mutual funds advised or subadvised by FMR or its affiliates, pension plan clients, and other institutional clients. The Board noted the findings of the 2013 ad hoc joint committee (created with the board of other Fidelity funds), which reviewed and compared Fidelity's institutional investment advisory business with its business of providing services to the Fidelity funds, including the differences in services provided, fees charged, and costs incurred, as well as competition in their respective marketplaces.
Based on its review of total expense ratios and fees charged to other Fidelity clients, the Board concluded that the total expense ratio of each class of the fund was reasonable, although in all cases above the median of the universe presented for comparison, in light of the services that the fund and its shareholders receive and the other factors considered.
Costs of the Services and Profitability. The Board considered the revenues earned and the expenses incurred by Fidelity in conducting the business of developing, marketing, distributing, managing, administering and servicing the fund and servicing the fund's shareholders. The Board also considered the level of Fidelity's profits in respect of all the Fidelity funds.
On an annual basis, FMR presents to the Board Fidelity's profitability for the fund. Fidelity calculates the profitability for each fund, as well as aggregate profitability for groups of Fidelity funds and all Fidelity funds, using a series of detailed revenue and cost allocation methodologies which originate with the books and records of Fidelity on which Fidelity's audited financial statements are based. The Audit Committee of the Board reviews any significant changes from the prior year's methodologies.
Annual Report
Board Approval of Investment Advisory Contracts and Management Fees - continued
PricewaterhouseCoopers LLP (PwC), independent registered public accounting firm and auditor to Fidelity and certain Fidelity funds, has been engaged annually by the Board as part of the Board's assessment of Fidelity's profitability analysis. PwC's engagement includes the review and assessment of the methodologies used by Fidelity in determining the revenues and expenses attributable to Fidelity's mutual fund business, and completion of agreed-upon procedures surrounding the mathematical accuracy of fund profitability and its conformity to allocation methodologies. After considering PwC's reports issued under the engagement and information provided by Fidelity, the Board concluded that while other allocation methods may also be reasonable, Fidelity's profitability methodologies are reasonable in all material respects.
The Board also reviewed Fidelity's non-fund businesses and fall-out benefits related to the mutual fund business as well as cases where Fidelity's affiliates may benefit from or be related to the fund's business.
The Board considered the costs of the services provided by and the profits realized by Fidelity in connection with the operation of the fund and was satisfied that the profitability was not excessive in the circumstances.
Economies of Scale. The Board considered whether there have been economies of scale in respect of the management of the Fidelity funds, whether the Fidelity funds (including the fund) have appropriately benefited from any such economies of scale, and whether there is potential for realization of any further economies of scale. The Board considered the extent to which the fund will benefit from economies of scale through increased services to the fund, through waivers or reimbursements, or through fee or expense reductions. The Board also noted that in 2009, it and the board of other Fidelity funds created an ad hoc committee (the Economies of Scale Committee) to analyze whether FMR attains economies of scale in respect of the management and servicing of the Fidelity funds, whether the Fidelity funds have appropriately benefited from such economies of scale, and whether there is potential for realization of any further economies of scale.
The Board recognized that the fund's management contract incorporates a "group fee" structure, which provides for lower group fee rates as total fund assets under FMR's management increase, and for higher group fee rates as total fund assets under FMR's management decrease. FMR calculates the group fee rates based on a tiered asset "breakpoint" schedule that varies based on asset class. The Board considered that the group fee is designed to deliver the benefits of economies of scale to fund shareholders when total Fidelity fund assets increase, even if assets of any particular fund are unchanged or have declined, because some portion of Fidelity's costs are attributable to services provided to all Fidelity funds, and all funds benefit if those costs can be allocated among more assets. The Board concluded that, given the group fee structure, fund shareholders will benefit from lower management fees as assets under FMR's management increase at the fund complex level, regardless of whether Fidelity achieves any such economies of scale.
The Board concluded, taking into account the analysis of the Economies of Scale Committee, that economies of scale, if any, are being appropriately shared between fund shareholders and Fidelity.
Amendment to Description of Group Fee Rate. At its July 2013 meeting, the Board voted to approve an amendment to the fund's management contract to modify the description of the "group fee rate" effective August 1, 2013. The Board noted that under the prior description in the contract, the group fee rate was based on the average net assets of all registered investment companies with which FMR has management contracts. Under the contract's tiered asset breakpoint schedule, the group fee rate is lower as total fund assets under FMR's management increase, and higher as total fund assets under FMR's management decrease. The Board considered that the prior description would have excluded the assets of 64 Fidelity sector funds from the group fee rate calculation once Fidelity SelectCo, LLC, an affiliate of FMR, assumed management responsibilities for those funds. The Board noted that modifying the description of the group fee rate to continue to include the assets of those 64 funds for purposes of determining group fee rate breakpoints would avoid an immediate adverse impact on the group fee rate for any fund.
Additional Information Requested by the Board. In order to develop fully the factual basis for consideration of the Fidelity funds' Advisory Contracts, the Board requested and received additional information on certain topics, including: (i) fund performance trends and Fidelity's long-term strategies for certain funds; (ii) the potential to further rationalize the Fidelity fund lineup with the possibility of achieving savings for the funds and Fidelity; (iii) the methodology with respect to competitive fund data and peer group classifications; (iv) the arrangements with, and performance of, certain sub-advisers on behalf of the Fidelity funds, as well as certain proposed participating affiliate arrangements; (v) the realization of fall-out benefits in certain Fidelity business units; (vi) Fidelity's group fee structures, including the rationale for the individual fee rates of certain categories of funds and the definition of group assets; (vii) trends regarding industry use of performance fee structures and the performance adjustment methodologies applicable to the Fidelity funds; (viii) additional competitive analysis regarding the total expenses for certain classes; and (ix) fund profitability methodology, including Fidelity's cost allocation methodology, and the impact of certain factors on fund profitability results.
Based on its evaluation of all of the conclusions noted above, and after considering all factors it believed relevant, the Board ultimately concluded that the advisory fee structures are fair and reasonable, and that the fund's Advisory Contracts should be renewed.
Annual Report
Investment Adviser
Fidelity Management & Research Company
Boston, MA
Investment Sub-Advisers
FMR Co., Inc.
Fidelity Management & Research (U.K.) Inc.
FIL Investment Advisors
FIL Investment Advisors (UK) Limited
Fidelity Management & Research (Hong Kong) Limited
Fidelity Management & Research (Japan) Inc.
General Distributor
Fidelity Distributors Corporation
Smithfield, RI
Transfer and Service Agents
Fidelity Investments Institutional Operations Company, Inc.
Boston, MA
Fidelity Service Company, Inc.
Boston, MA
Custodian
Brown Brothers Harriman & Co.
Boston, MA
VIPCAR-ANN-0214
1.805787.109
Fidelity® Variable Insurance Products:
International Capital Appreciation Portfolio
Annual Report
December 31, 2013
(Fidelity Cover Art)
Contents
Performance | (Click Here) | How the fund has done over time. |
Management's Discussion of Fund Performance | (Click Here) | The Portfolio Manager's review of fund performance and strategy. |
Shareholder Expense Example | (Click Here) | An example of shareholder expenses. |
Investment Changes | (Click Here) | A summary of major shifts in the fund's investments over the past six months. |
Investments | (Click Here) | A complete list of the fund's investments with their market values. |
Financial Statements | (Click Here) | Statements of assets and liabilities, operations, and changes in net assets, as well as financial highlights. |
Notes | (Click Here) | Notes to the financial statements. |
Report of Independent Registered Public Accounting Firm | (Click Here) | |
Trustees and Officers | (Click Here) | |
Distributions | (Click Here) | |
Board Approval of Investment Advisory Contracts and Management Fees | (Click Here) | |
To view a fund's proxy voting guidelines and proxy voting record for the 12-month period ended June 30, visit http://www.fidelity.com/proxyvotingresults or visit the Securities and Exchange Commission's (SEC) web site at http://www.sec.gov. You may also call 1-877-208-0098 to request a free copy of the proxy voting guidelines.
Fidelity Variable Insurance Products are separate account options which are purchased through a variable insurance contract.
Standard & Poor's, S&P and S&P 500 are registered service marks of The McGraw-Hill Companies, Inc. and have been licensed for use by Fidelity Distributors Corporation.
Other third-party marks appearing herein are the property of their respective owners.
All other marks appearing herein are registered or unregistered trademarks or service marks of FMR LLC or an affiliated company. © 2014 FMR LLC. All rights reserved.
This report and the financial statements contained herein are submitted for the general information of the shareholders of the fund. This report is not authorized for distribution to prospective investors in the fund unless preceded or accompanied by an effective prospectus.
A fund files its complete schedule of portfolio holdings with the SEC for the first and third quarters of each fiscal year on Form N-Q. Forms N-Q are available on the SEC's web site at http://www.sec.gov. A fund's Forms N-Q may be reviewed and copied at the SEC's Public Reference Room in Washington, DC. Information regarding the operation of the SEC's Public Reference Room may be obtained by calling 1-800-SEC-0330. For a complete list of a fund's portfolio holdings, view the most recent holdings listing, semiannual report, or annual report on Fidelity's web site at http://www.fidelity.com, http://www.advisor.fidelity.com, or http://www.401k.com, as applicable.
NOT FDIC INSURED • MAY LOSE VALUE • NO BANK GUARANTEE
Neither the fund nor Fidelity Distributors Corporation is a bank.
Annual Report
Average annual total return reflects the change in the value of an investment, assuming reinvestment of the class' distributions from dividend income and capital gains (the profits earned upon the sale of securities that have grown in value, if any) and assuming a constant rate of performance each year. During periods of reimbursement by Fidelity, a fund's total return will be greater than it would be had the reimbursement not occurred. Performance numbers are net of all underlying fund operating expenses, but do not include any insurance charges imposed by your insurance company's separate account. If performance information included the effect of these additional charges, the total returns would have been lower. How a fund did yesterday is no guarantee of how it will do tomorrow.
Average Annual Total Returns
Periods ended December 31, 2013 | Past 1
Year | Past 5
Years | Life of
fundA |
VIP International Capital Appreciation Portfolio - Initial Class | 21.62% | 19.31% | 5.71% |
VIP International Capital Appreciation Portfolio - Service Class | 21.44% | 19.16% | 5.61% |
VIP International Capital Appreciation Portfolio - Service Class 2 | 21.33% | 19.02% | 5.47% |
A From December 22, 2004.
$10,000 Over Life of Fund
Let's say hypothetically that $10,000 was invested in VIP International Capital Appreciation Portfolio - Initial Class on December 22, 2004, when the fund started. The chart shows how the value of your investment would have changed, and also shows how the MSCI® ACWI® (All Country World Index) ex USA Index performed over the same period.
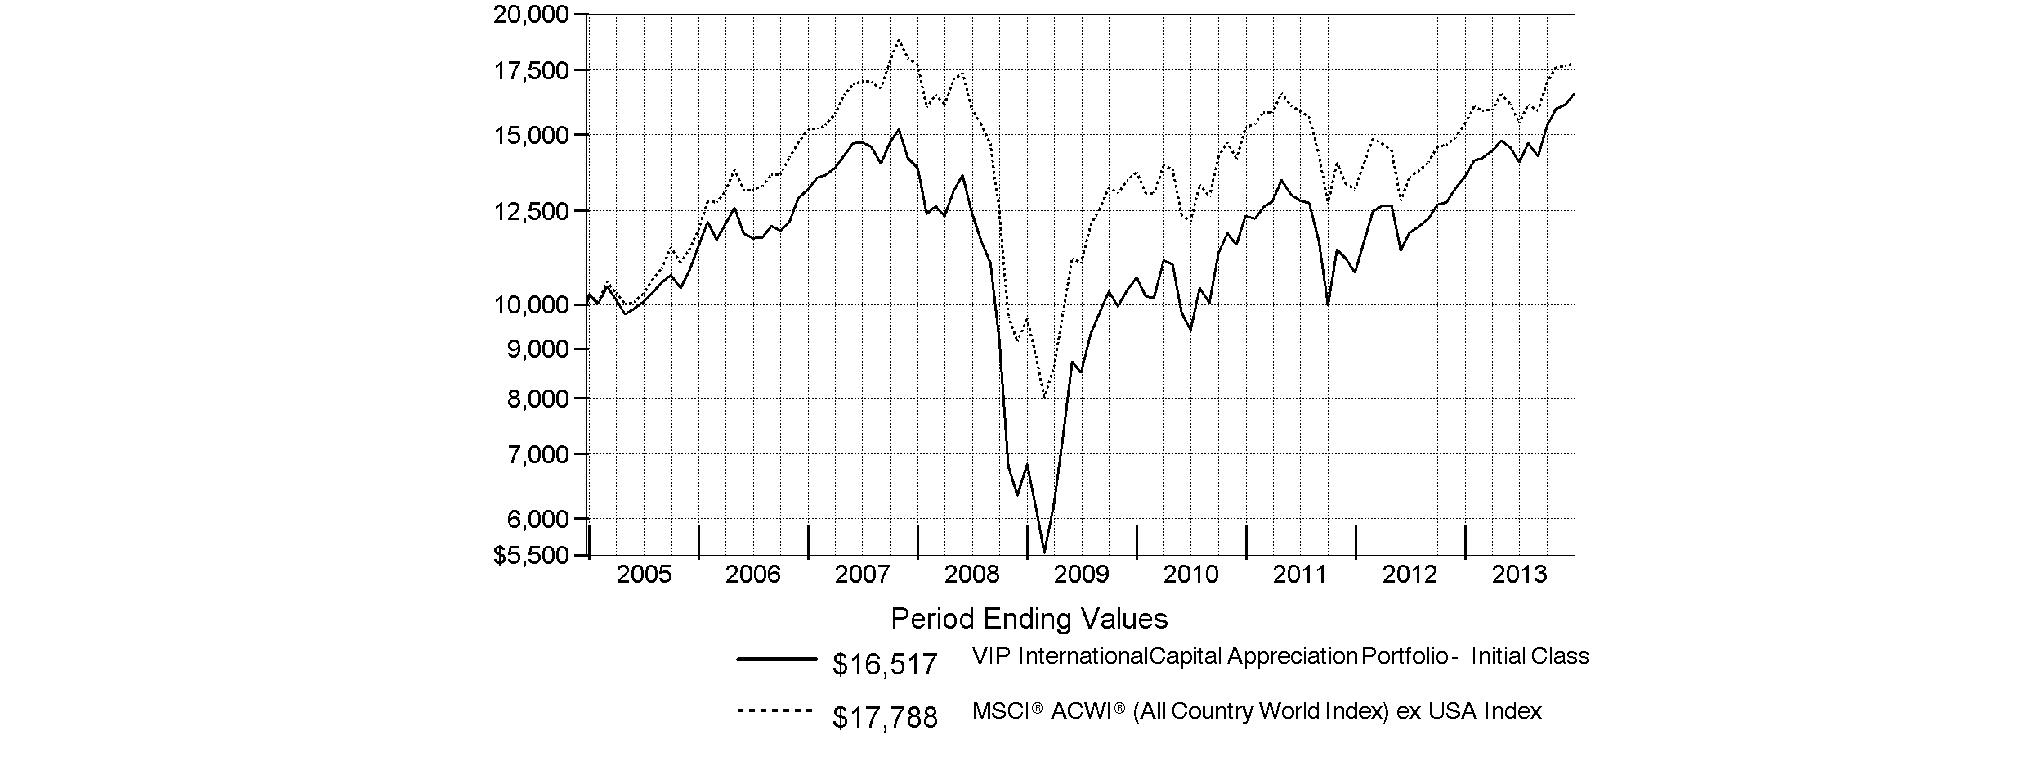
Annual Report
Market Recap: Global equity markets remained upbeat for the 12 months ending December 31, 2013, propelling the MSCI® ACWI® (All Country World Index) Index to a 23.24% return. Midyear turbulence gave way by autumn when policymakers in the U.S. and China had made clear their intentions to maintain accommodative monetary policies. That stance, combined with modest cyclical improvement around the globe and generally low valuations, underpinned the broad rally in equities, although the relative strength of the U.S. dollar generally tempered gains for U.S. investors holding foreign securities based in local currencies. During the period, the broad-market S&P 500® Index set a series of new highs, finishing the year up 32.39%. For the first time since 1995, the S&P® scored a "perfect 10," with all 10 economic sectors gaining at least 10% for the year. A resurgence in growth-oriented stocks lifted the Nasdaq Composite Index® to a 40.12% result for 2013, while the blue-chip Dow Jones Industrial AverageSM notched a relatively more modest 29.65% gain. International developed-markets equities rose in concert with their U.S. counterparts, with the MSCI® EAFE® Index gaining 22.92% for the period. Meanwhile, foreign exchange and commodity weakness curbed results in resource-heavy emerging markets (EM), especially in the year's waning months. More generally, concern over EM's slowing growth, its declining share of global trade and uncertainty surrounding U.S. central bank intentions were all factors hampering performance. The MSCI Emerging Markets Index returned -2.27% for the period. On the bond side, U.S. high-yield securities rallied with equities for much of the period, with The BofA Merrill LynchSM US High Yield Constrained Index returning 7.41% for 2013. The more rate-sensitive U.S. investment-grade bond category faced headwinds though, as reflected in the -2.02% return of the Barclays® U.S. Aggregate Bond Index. Within the Barclays index, investment-grade corporate credit returned -2.01%, while ultra-safe U.S. Treasuries saw a -2.75% result. Major non-U.S. developed markets performed only slightly better, with the Citigroup Non-USD Group-of-Seven (G7) Equal Weighted Index logging a -1.59% result. After several years of strong advances, EM debt reversed course in 2013, with the J.P. Morgan Emerging Markets Bond Index Global returning -6.58%.
Comments from Sammy Simnegar, Portfolio Manager of VIP International Capital Appreciation Portfolio: For the year, the fund's share classes posted strong gains that handily topped the 15.42% advance of the MSCI® ACWI® (All Country World Index) ex USA Index. (For specific portfolio results, please refer to the performance section of this report.) Versus its MSCI benchmark, an overweighting in media - where I substantially raised the fund's overweighted exposure - proved rewarding, and was one factor that made consumer discretionary the sector that bolstered the fund's relative performance the most. One standout from consumer discretionary was Hong Kong-listed casino operator Galaxy Entertainment Group, a beneficiary of the dynamic growth of tourism in Macau, China's coastal gaming mecca. Another contributor from this sector was Japan's Fuji Heavy Industries, manufacturer of Subaru vehicles, whose outstanding share-price performance reflected the positive impact of Japan's efforts to drive the value of the yen lower and make its exports more competitive. Elsewhere, the fund's positioning in software & services meaningfully aided relative performance. Here, real estate Internet portal SouFun Holdings benefited from the revaluation of Internet businesses in China, as did Bitauto Holdings, a provider of Internet content and marketing services for the automobile industry - primarily in China. I bought both of these non-index stocks during the period. Underweighting or avoiding the shares of some resource-intensive companies in the materials and energy sectors also worked out well. On the other hand, one factor curbing the fund's results was a large underweighting in Japan, although a lot of the damage here was mitigated by lessened exposure to a much weaker yen. At the stock level, the biggest relative detractor was U.K.-based wireless carrier and index Vodafone Group, which hurt because it did well, and the fund didn't own this index constituent. Although I believed there were better growth opportunities elsewhere, the stock got a boost in late summer, as the market began to anticipate Vodafone's September announcement of plans to sell its large stake in Verizon Wireless. Lastly, relative performance suffered from not owning Swiss drug company Roche Holding, a strong-performing benchmark constituent that seemed expensive to me.
The views expressed above reflect those of the portfolio manager(s) only through the end of the period as stated on the cover of this report and do not necessarily represent the views of Fidelity or any other person in the Fidelity organization. Any such views are subject to change at any time based upon market or other conditions and Fidelity disclaims any responsibility to update such views. These views may not be relied on as investment advice and, because investment decisions for a Fidelity fund are based on numerous factors, may not be relied on as an indication of trading intent on behalf of any Fidelity fund.
Annual Report
As a shareholder of the Fund, you incur two types of costs: (1) transaction costs, including redemption fees and (2) ongoing costs, including management fees, distribution and/or service (12b-1) fees and other Fund expenses. This Example is intended to help you understand your ongoing costs (in dollars) of investing in the Fund and to compare these costs with the ongoing costs of investing in other mutual funds.
The Example is based on an investment of $1,000 invested at the beginning of the period and held for the entire period (July 1, 2013 to December 31, 2013).
Actual Expenses
The first line of the accompanying table for each class of the Fund provides information about actual account values and actual expenses. You may use the information in this line, together with the amount you invested, to estimate the expenses that you paid over the period. Simply divide your account value by $1,000.00 (for example, an $8,600 account value divided by $1,000.00 = 8.6), then multiply the result by the number in the first line for a class of the Fund under the heading entitled "Expenses Paid During Period" to estimate the expenses you paid on your account during this period. The estimate of expenses does not include any fees or other expenses of any variable annuity or variable life insurance product. If they were, the estimate of expenses you paid during the period would be higher, and your ending account value would be lower. In addition, the Fund, as a shareholder in the underlying Fidelity Central Funds, will indirectly bear its pro-rata share of the fees and expenses incurred by the underlying Fidelity Central Funds. These fees and expenses are not included in the Fund's annualized expense ratio used to calculate the expense estimate in the table below.
Hypothetical Example for Comparison Purposes
The second line of the accompanying table for each class of the Fund provides information about hypothetical account values and hypothetical expenses based on a Class' actual expense ratio and an assumed rate of return of 5% per year before expenses, which is not the Class' actual return. The hypothetical account values and expenses may not be used to estimate the actual ending account balance or expenses you paid for the period. You may use this information to compare the ongoing costs of investing in the Fund and other funds. To do so, compare this 5% hypothetical example with the 5% hypothetical examples that appear in the shareholder reports of the other funds. The estimate of expenses does not include any fees or other expenses of any variable annuity or variable life insurance product. If they were, the estimate of expenses you paid during the period would be higher, and your ending account value would be lower. In addition, the Fund, as a shareholder in the underlying Fidelity Central Funds, will indirectly bear its pro-rata share of the fees and expenses incurred by the underlying Fidelity Central Funds. These fees and expenses are not included in the Fund's annualized expense ratio used to calculate the expense estimate in the table below.
Please note that the expenses shown in the table are meant to highlight your ongoing costs only and do not reflect any transaction costs. Therefore, the second line of the table is useful in comparing ongoing costs only, and will not help you determine the relative total costs of owning different funds. In addition, if these transactional costs were included, your costs would have been higher.
| Annualized
Expense Ratio B | Beginning
Account Value
July 1, 2013 | Ending
Account Value
December 31, 2013 | Expenses Paid
During Period*
July 1, 2013
to December 31, 2013 |
Initial Class | 1.10% | | | |
Actual | | $ 1,000.00 | $ 1,175.90 | $ 6.03 |
HypotheticalA | | $ 1,000.00 | $ 1,019.66 | $ 5.60 |
Service Class | 1.20% | | | |
Actual | | $ 1,000.00 | $ 1,175.20 | $ 6.58 |
HypotheticalA | | $ 1,000.00 | $ 1,019.16 | $ 6.11 |
Service Class 2 | 1.35% | | | |
Actual | | $ 1,000.00 | $ 1,175.20 | $ 7.40 |
HypotheticalA | | $ 1,000.00 | $ 1,018.40 | $ 6.87 |
Initial Class R | 1.10% | | | |
Actual | | $ 1,000.00 | $ 1,176.20 | $ 6.03 |
HypotheticalA | | $ 1,000.00 | $ 1,019.66 | $ 5.60 |
Service Class R | 1.20% | | | |
Actual | | $ 1,000.00 | $ 1,175.20 | $ 6.58 |
HypotheticalA | | $ 1,000.00 | $ 1,019.16 | $ 6.11 |
Service Class 2R | 1.35% | | | |
Actual | | $ 1,000.00 | $ 1,174.70 | $ 7.40 |
HypotheticalA | | $ 1,000.00 | $ 1,018.40 | $ 6.87 |
Investor Class R | 1.18% | | | |
Actual | | $ 1,000.00 | $ 1,175.60 | $ 6.47 |
HypotheticalA | | $ 1,000.00 | $ 1,019.26 | $ 6.01 |
A 5% return per year before expenses
B Annualized expense ratio reflects expenses net of applicable fee waivers.
* Expenses are equal to each Class' annualized expense ratio, multiplied by the average account value over the period, multiplied by 184/365 (to reflect the one-half year period).
Annual Report
Investment Changes (Unaudited)
Geographic Diversification (% of fund's net assets) |
As of December 31, 2013 |
 | United Kingdom | 17.2% | |
 | United States of America* | 15.8% | |
 | Japan | 14.4% | |
 | Germany | 5.9% | |
 | France | 5.8% | |
 | India | 3.5% | |
 | Switzerland | 2.8% | |
 | Australia | 2.8% | |
 | Canada | 2.8% | |
 | Other | 29.0% | |

Percentages are based on country or territory of incorporation and are adjusted for the effect of futures contracts, if applicable. |
* Includes Short-Term Investments and Net Other Assets.
As of June 30, 2013 |
| United States of America* | 16.4% | |
| United Kingdom | 15.1% | |
| Japan | 11.5% | |
| France | 7.4% | |
| Germany | 6.0% | |
| Switzerland | 5.0% | |
| India | 3.2% | |
| Brazil | 3.1% | |
| Indonesia | 3.0% | |
| Other | 29.3% | |

Percentages are based on country or territory of incorporation and are adjusted for the effect of futures contracts, if applicable. |
* Includes Short-Term Investments and Net Other Assets.
Asset Allocation as of December 31, 2013 |
| % of fund's
net assets | % of fund's net assets
6 months ago |
Stocks | 98.6 | 99.0 |
Short-Term Investments and Net Other Assets (Liabilities) | 1.4 | 1.0 |
Top Ten Stocks as of December 31, 2013 |
| % of fund's
net assets | % of fund's net assets
6 months ago |
Bayer AG (Germany, Pharmaceuticals) | 0.9 | 0.7 |
British American Tobacco PLC (United Kingdom) (United Kingdom, Tobacco) | 0.9 | 0.9 |
Diageo PLC sponsored ADR (United Kingdom, Beverages) | 0.7 | 0.7 |
Anheuser-Busch InBev SA NV (Belgium, Beverages) | 0.7 | 0.6 |
SoftBank Corp. (Japan, Wireless Telecommunication Services) | 0.6 | 0.6 |
Novo Nordisk A/S Series B sponsored ADR (Denmark, Pharmaceuticals) | 0.6 | 0.6 |
Sumitomo Mitsui Financial Group, Inc. ADR (Japan, Commercial Banks) | 0.6 | 0.7 |
Standard Chartered PLC (United Kingdom) (United Kingdom, Commercial Banks) | 0.6 | 0.6 |
Compagnie Financiere Richemont SA Series A (Switzerland, Textiles, Apparel & Luxury Goods) | 0.6 | 0.6 |
AIA Group Ltd. (Hong Kong, Insurance) | 0.5 | 0.6 |
| 6.7 | |
Market Sectors as of December 31, 2013 |
| % of fund's
net assets | % of fund's net assets
6 months ago |
Consumer Discretionary | 24.5 | 23.8 |
Industrials | 19.8 | 17.0 |
Financials | 14.2 | 15.4 |
Consumer Staples | 10.9 | 14.6 |
Information Technology | 10.3 | 10.7 |
Materials | 8.9 | 7.9 |
Health Care | 7.9 | 7.4 |
Telecommunication Services | 1.8 | 1.7 |
Energy | 0.3 | 0.5 |
Annual Report
Investments December 31, 2013
Showing Percentage of Net Assets
Common Stocks - 97.3% |
| Shares | | Value |
Australia - 2.8% |
ALS Ltd. | 34,526 | | $ 271,597 |
Amcor Ltd. | 32,475 | | 305,918 |
Ansell Ltd. | 13,882 | | 256,210 |
Carsales.com Ltd. | 26,745 | | 243,343 |
CSL Ltd. | 7,042 | | 433,607 |
DuluxGroup Ltd. | 48,192 | | 230,644 |
Flight Centre Trvl Group Ltd. | 6,858 | | 291,173 |
Fortescue Metals Group Ltd. | 54,657 | | 284,035 |
Orora Ltd. (a) | 32,475 | | 33,636 |
realestate.com.au Ltd. | 7,544 | | 254,353 |
SEEK Ltd. | 21,400 | | 256,239 |
Sydney Airport unit | 79,722 | | 270,498 |
TOTAL AUSTRALIA | | 3,131,253 |
Austria - 0.3% |
Andritz AG | 4,702 | | 294,901 |
Bailiwick of Jersey - 1.7% |
Delphi Automotive PLC | 4,671 | | 280,867 |
Experian PLC | 23,501 | | 433,530 |
Shire PLC | 8,300 | | 391,156 |
Wolseley PLC | 6,168 | | 349,826 |
WPP PLC | 19,700 | | 450,187 |
TOTAL BAILIWICK OF JERSEY | | 1,905,566 |
Belgium - 0.7% |
Anheuser-Busch InBev SA NV | 7,368 | | 783,486 |
Bermuda - 0.8% |
Credicorp Ltd. | 2,500 | | 331,825 |
Invesco Ltd. | 7,877 | | 286,723 |
Signet Jewelers Ltd. | 3,771 | | 296,778 |
TOTAL BERMUDA | | 915,326 |
Brazil - 2.1% |
BB Seguridade Participacoes SA | 24,700 | | 258,810 |
CCR SA | 37,900 | | 288,034 |
Cielo SA | 11,140 | | 312,779 |
Iguatemi Empresa de Shopping Centers SA | 29,100 | | 277,533 |
Multiplan Empreendimentos Imobiliarios SA | 11,600 | | 247,557 |
Qualicorp SA (a) | 27,100 | | 260,777 |
Souza Cruz SA | 30,300 | | 312,433 |
Ultrapar Participacoes SA | 12,800 | | 306,286 |
TOTAL BRAZIL | | 2,264,209 |
Canada - 2.8% |
Alimentation Couche-Tard, Inc. Class B (sub. vtg.) | 4,700 | | 353,435 |
AutoCanada, Inc. | 5,900 | | 254,884 |
Canadian National Railway Co. | 9,000 | | 513,100 |
Canadian Pacific Railway Ltd. | 3,000 | | 453,707 |
CGI Group, Inc. Class A (sub. vtg.) (a) | 8,800 | | 294,424 |
Cineplex, Inc. | 6,800 | | 282,050 |
|
| Shares | | Value |
Constellation Software, Inc. | 1,250 | | $ 264,756 |
Jean Coutu Group, Inc. Class A (sub. vtg.) | 13,900 | | 240,903 |
Valeant Pharmaceuticals International, Inc. (Canada) (a) | 3,800 | | 445,805 |
TOTAL CANADA | | 3,103,064 |
Cayman Islands - 1.6% |
Baidu.com, Inc. sponsored ADR (a) | 1,600 | | 284,608 |
Baoxin Auto Group Ltd. | 268,000 | | 260,248 |
Bitauto Holdings Ltd. ADR (a) | 8,185 | | 261,593 |
Lifestyle International Holdings Ltd. | 7,500 | | 13,889 |
New Oriental Education & Technology Group, Inc. sponsored ADR | 8,600 | | 270,900 |
Sands China Ltd. | 47,000 | | 383,974 |
SouFun Holdings Ltd. ADR | 3,600 | | 296,676 |
TOTAL CAYMAN ISLANDS | | 1,771,888 |
China - 0.3% |
Travelsky Technology Ltd. (H Shares) | 306,000 | | 301,884 |
Colombia - 0.3% |
Cemex Latam Holdings SA (a) | 36,522 | | 280,065 |
Denmark - 0.9% |
Coloplast A/S Series B | 4,200 | | 278,051 |
Novo Nordisk A/S Series B sponsored ADR | 3,700 | | 683,612 |
TOTAL DENMARK | | 961,663 |
Finland - 0.7% |
Kone Oyj (B Shares) | 8,000 | | 360,984 |
Nokian Tyres PLC | 5,728 | | 274,776 |
Tikkurila Oyj | 6,927 | | 189,637 |
TOTAL FINLAND | | 825,397 |
France - 5.8% |
Air Liquide SA | 3,680 | | 520,433 |
Atos Origin SA | 3,112 | | 281,659 |
AXA SA | 21,000 | | 583,861 |
Bureau Veritas SA | 9,700 | | 283,499 |
Christian Dior SA | 1,881 | | 355,419 |
Dassault Systemes SA | 2,200 | | 273,085 |
Edenred SA | 7,854 | | 262,880 |
Essilor International SA | 3,357 | | 356,896 |
Ingenico SA (d) | 3,285 | | 263,377 |
L'Oreal SA | 2,900 | | 509,463 |
Pernod Ricard SA | 4,100 | | 467,079 |
Publicis Groupe SA | 4,400 | | 402,590 |
Safran SA | 5,700 | | 396,074 |
Schneider Electric SA | 6,329 | | 552,011 |
Sodexo SA | 3,400 | | 344,442 |
Tarkett SA (a) | 6,056 | | 237,607 |
Zodiac Aerospace | 1,800 | | 318,818 |
TOTAL FRANCE | | 6,409,193 |
Common Stocks - continued |
| Shares | | Value |
Germany - 5.3% |
adidas AG | 3,400 | | $ 433,312 |
Bayer AG | 6,900 | | 967,742 |
Bayerische Motoren Werke AG (BMW) | 4,460 | | 522,878 |
Brenntag AG | 1,800 | | 333,676 |
Continental AG | 2,100 | | 460,502 |
CTS Eventim AG | 5,253 | | 266,009 |
Deutsche Post AG | 13,605 | | 495,985 |
Fresenius SE & Co. KGaA | 2,600 | | 399,173 |
GEA Group AG | 6,256 | | 297,781 |
Gerry Weber International AG (Bearer) | 6,024 | | 255,785 |
Henkel AG & Co. KGaA | 4,908 | | 510,716 |
Linde AG | 2,600 | | 543,856 |
ProSiebenSat.1 Media AG | 6,500 | | 321,914 |
TOTAL GERMANY | | 5,809,329 |
Greece - 0.2% |
Folli Follie SA (a) | 7,574 | | 243,818 |
Hong Kong - 1.2% |
AIA Group Ltd. | 125,400 | | 629,078 |
Galaxy Entertainment Group Ltd. (a) | 46,000 | | 412,584 |
Techtronic Industries Co. Ltd. | 111,000 | | 314,922 |
TOTAL HONG KONG | | 1,356,584 |
India - 3.5% |
Amara Raja Batteries Ltd. | 46,753 | | 254,027 |
Axis Bank Ltd. | 15,106 | | 317,448 |
Bajaj Auto Ltd. | 8,987 | | 277,697 |
Grasim Industries Ltd. | 5,789 | | 267,525 |
HCL Technologies Ltd. | 16,234 | | 331,440 |
HDFC Bank Ltd. | 32,973 | | 362,131 |
Housing Development Finance Corp. Ltd. | 29,677 | | 381,352 |
ITC Ltd. | 74,012 | | 385,200 |
Sun Pharmaceutical Industries Ltd. | 31,396 | | 288,093 |
Sun TV Ltd. | 49,658 | | 305,384 |
Tata Consultancy Services Ltd. | 10,711 | | 376,210 |
Yes Bank Ltd. | 46,091 | | 275,920 |
TOTAL INDIA | | 3,822,427 |
Indonesia - 1.8% |
PT Bank Central Asia Tbk | 357,500 | | 282,802 |
PT Bank Rakyat Indonesia Tbk | 548,000 | | 327,550 |
PT Global Mediacom Tbk | 1,769,500 | | 276,546 |
PT Indocement Tunggal Prakarsa Tbk | 199,500 | | 328,627 |
PT Jasa Marga Tbk | 421,500 | | 163,900 |
PT Semen Gresik (Persero) Tbk | 274,500 | | 320,095 |
PT Surya Citra Media Tbk | 1,128,500 | | 243,498 |
TOTAL INDONESIA | | 1,943,018 |
Ireland - 1.3% |
Accenture PLC Class A | 3,892 | | 320,000 |
Actavis PLC (a) | 1,633 | | 274,344 |
James Hardie Industries PLC CDI | 24,858 | | 287,212 |
|
| Shares | | Value |
Kerry Group PLC Class A | 5,100 | | $ 354,312 |
Perrigo Co. PLC | 1,622 | | 248,912 |
TOTAL IRELAND | | 1,484,780 |
Italy - 1.6% |
Azimut Holding SpA | 11,800 | | 321,906 |
Lottomatica SpA | 9,014 | | 274,796 |
Luxottica Group SpA | 5,600 | | 300,112 |
Pirelli & C SpA | 17,200 | | 297,668 |
Prada SpA | 30,400 | | 270,508 |
World Duty Free SpA (a) | 22,775 | | 286,371 |
TOTAL ITALY | | 1,751,361 |
Japan - 14.4% |
Ain Pharmaciez, Inc. | 6,100 | | 299,579 |
Bridgestone Corp. | 11,600 | | 439,488 |
Chiyoda Corp. | 23,000 | | 333,880 |
Daikin Industries Ltd. | 5,700 | | 355,696 |
Daito Trust Construction Co. Ltd. | 3,200 | | 299,161 |
DENSO Corp. | 8,700 | | 459,610 |
Dentsu, Inc. | 7,900 | | 323,099 |
East Japan Railway Co. | 5,900 | | 469,981 |
Fuji Heavy Industries Ltd. | 14,300 | | 410,967 |
Fuji Media Holdings, Inc. | 13,400 | | 274,418 |
Hitachi Ltd. | 67,000 | | 508,004 |
Hoya Corp. | 12,900 | | 358,773 |
Japan Tobacco, Inc. | 16,200 | | 527,128 |
JGC Corp. | 9,000 | | 353,194 |
Kansai Paint Co. Ltd. | 23,000 | | 340,122 |
KDDI Corp. ADR | 30,370 | | 468,913 |
Keyence Corp. | 967 | | 414,055 |
LIXIL Group Corp. | 11,000 | | 301,976 |
Makita Corp. | 6,400 | | 336,593 |
Miraca Holdings, Inc. | 6,600 | | 311,364 |
Misumi Group, Inc. | 8,300 | | 260,956 |
MS&AD Insurance Group Holdings, Inc. | 14,300 | | 384,369 |
Nippon Paint Co. Ltd. | 18,000 | | 299,486 |
Nippon Television Network Corp. | 16,700 | | 301,522 |
Nomura Research Institute Ltd. | 9,500 | | 300,227 |
Obic Co. Ltd. | 10,700 | | 316,160 |
Omron Corp. | 8,500 | | 375,643 |
ORIX Corp. | 24,700 | | 434,025 |
Park24 Co. Ltd. | 13,000 | | 245,166 |
Rakuten, Inc. | 25,700 | | 383,532 |
Ryohin Keikaku Co. Ltd. | 2,500 | | 270,406 |
Ship Healthcare Holdings, Inc. | 7,100 | | 275,702 |
SMC Corp. | 1,500 | | 378,583 |
SoftBank Corp. | 8,100 | | 710,781 |
Sumitomo Mitsui Financial Group, Inc. ADR (d) | 63,458 | | 665,674 |
Sumitomo Mitsui Trust Holdings, Inc. | 74,000 | | 391,550 |
Sumitomo Osaka Cement Co. Ltd. | 83,000 | | 319,079 |
Taiheiyo Cement Corp. | 88,000 | | 338,426 |
Tokio Marine Holdings, Inc. | 12,300 | | 411,677 |
Common Stocks - continued |
| Shares | | Value |
Japan - continued |
Tsuruha Holdings, Inc. | 3,100 | | $ 284,638 |
TV Asahi Corp. | 13,200 | | 292,790 |
USS Co. Ltd. | 21,100 | | 289,418 |
Yahoo! Japan Corp. | 61,400 | | 342,391 |
TOTAL JAPAN | | 15,858,202 |
Kenya - 0.3% |
Equity Bank Ltd. | 197,100 | | 70,230 |
Safaricom Ltd. | 2,358,500 | | 296,521 |
TOTAL KENYA | | 366,751 |
Luxembourg - 0.3% |
RTL Group SA | 2,300 | | 294,104 |
Mexico - 1.3% |
Fomento Economico Mexicano S.A.B. de CV sponsored ADR | 4,200 | | 411,054 |
Grupo Aeroportuario del Pacifico SA de CV Series B | 46,700 | | 251,655 |
Grupo Financiero Banorte S.A.B. de CV Series O | 54,600 | | 385,108 |
Grupo Televisa SA de CV (CPO) sponsored ADR | 12,300 | | 372,198 |
TOTAL MEXICO | | 1,420,015 |
Netherlands - 0.8% |
AEGON NV | 36,846 | | 349,300 |
European Aeronautic Defence and Space Co. (EADS) NV | 7,000 | | 537,445 |
TOTAL NETHERLANDS | | 886,745 |
New Zealand - 0.1% |
EBOS Group Ltd. | 11,611 | | 92,624 |
Nigeria - 0.5% |
Dangote Cement PLC | 211,518 | | 289,593 |
Guaranty Trust Bank PLC | 1,600,693 | | 270,402 |
TOTAL NIGERIA | | 559,995 |
Panama - 0.3% |
Copa Holdings SA Class A | 1,800 | | 288,198 |
Philippines - 1.0% |
Alliance Global Group, Inc. | 475,300 | | 276,188 |
Security Bank Corp. | 111,448 | | 290,166 |
SM Investments Corp. | 16,572 | | 265,376 |
SM Prime Holdings, Inc. | 725,100 | | 239,740 |
TOTAL PHILIPPINES | | 1,071,470 |
Russia - 0.8% |
Magnit OJSC GDR (Reg. S) | 5,800 | | 383,960 |
Sberbank (Savings Bank of the Russian Federation) sponsored ADR | 37,600 | | 473,008 |
TOTAL RUSSIA | | 856,968 |
South Africa - 2.0% |
Aspen Pharmacare Holdings Ltd. | 10,600 | | 271,538 |
|
| Shares | | Value |
Discovery Holdings Ltd. | 33,551 | | $ 270,263 |
Life Healthcare Group Holdings Ltd. | 68,400 | | 272,948 |
Mr Price Group Ltd. | 19,000 | | 296,574 |
Nampak Ltd. | 77,000 | | 300,953 |
Naspers Ltd. Class N | 4,700 | | 491,063 |
Shoprite Holdings Ltd. | 18,480 | | 288,915 |
TOTAL SOUTH AFRICA | | 2,192,254 |
Spain - 1.0% |
Amadeus IT Holding SA Class A | 9,100 | | 389,399 |
Grifols SA ADR | 7,900 | | 285,348 |
Inditex SA | 2,760 | | 454,872 |
TOTAL SPAIN | | 1,129,619 |
Sweden - 2.3% |
ASSA ABLOY AB (B Shares) | 8,000 | | 422,647 |
Atlas Copco AB (A Shares) | 15,700 | | 435,226 |
Elekta AB (B Shares) | 18,800 | | 287,473 |
Eniro AB (a) | 43,610 | | 336,236 |
Hexagon AB (B Shares) | 9,500 | | 300,279 |
Investment AB Kinnevik (B Shares) | 7,700 | | 356,636 |
Svenska Cellulosa AB (SCA) (B Shares) | 13,200 | | 406,353 |
TOTAL SWEDEN | | 2,544,850 |
Switzerland - 2.8% |
Compagnie Financiere Richemont SA Series A | 6,542 | | 651,230 |
DKSH Holding AG | 3,158 | | 245,333 |
Schindler Holding AG (Reg.) | 2,470 | | 364,388 |
SGS SA (Reg.) | 150 | | 345,048 |
Sika AG (Bearer) | 77 | | 273,714 |
Swatch Group AG (Bearer) | 650 | | 429,544 |
Syngenta AG (Switzerland) | 1,297 | | 517,110 |
TE Connectivity Ltd. | 5,600 | | 308,616 |
TOTAL SWITZERLAND | | 3,134,983 |
Thailand - 0.9% |
Airports of Thailand PCL (For. Reg.) | 49,600 | | 240,087 |
BEC World PCL (For. Reg.) | 163,000 | | 251,273 |
Kasikornbank PCL (For. Reg.) | 60,700 | | 294,798 |
Major Cineplex Group PCL (For. Reg.) | 290,100 | | 155,023 |
TOTAL THAILAND | | 941,181 |
Turkey - 1.2% |
Coca-Cola Icecek A/S | 10,000 | | 240,810 |
Enka Insaat ve Sanayi A/S | 98,000 | | 274,528 |
Koc Holding A/S | 65,000 | | 266,170 |
TAV Havalimanlari Holding A/S | 42,000 | | 301,954 |
Tofas Turk Otomobil Fabrikasi A/S | 43,872 | | 273,562 |
TOTAL TURKEY | | 1,357,024 |
United Kingdom - 17.2% |
Aberdeen Asset Management PLC | 43,800 | | 362,653 |
Ashtead Group PLC | 23,000 | | 289,460 |
Associated British Foods PLC | 9,300 | | 376,538 |
Common Stocks - continued |
| Shares | | Value |
United Kingdom - continued |
Aveva Group PLC | 7,300 | | $ 261,594 |
Babcock International Group PLC | 12,700 | | 284,964 |
Berkeley Group Holdings PLC | 6,741 | | 296,483 |
British American Tobacco PLC (United Kingdom) | 17,700 | | 950,032 |
British Sky Broadcasting Group PLC | 22,900 | | 320,055 |
BT Group PLC | 83,200 | | 524,654 |
Bunzl PLC | 12,558 | | 301,534 |
Burberry Group PLC | 12,800 | | 321,334 |
Capita Group PLC | 22,000 | | 378,153 |
Compass Group PLC | 29,400 | | 471,270 |
Croda International PLC | 8,500 | | 345,837 |
Daily Mail & General Trust PLC Class A | 18,195 | | 289,399 |
Diageo PLC sponsored ADR | 6,100 | | 807,762 |
Diploma PLC | 21,548 | | 240,856 |
Domino's Pizza UK & IRL PLC | 33,500 | | 284,583 |
easyJet PLC | 12,300 | | 312,855 |
Elementis PLC | 63,036 | | 280,690 |
Filtrona PLC | 21,200 | | 301,562 |
Galiform PLC | 50,052 | | 285,783 |
Halma PLC | 29,700 | | 296,812 |
IMI PLC | 12,500 | | 315,665 |
InterContinental Hotel Group PLC ADR | 9,893 | | 330,723 |
Intertek Group PLC | 6,600 | | 344,053 |
ITV PLC | 111,354 | | 357,730 |
Johnson Matthey PLC | 6,616 | | 359,349 |
Legal & General Group PLC | 106,864 | | 394,093 |
Meggitt PLC | 40,300 | | 352,026 |
Mondi PLC | 18,200 | | 315,247 |
Next PLC | 4,200 | | 379,047 |
Oxford Instruments PLC | 9,800 | | 286,754 |
Prudential PLC | 26,548 | | 593,189 |
Reckitt Benckiser Group PLC | 7,200 | | 571,462 |
Rexam PLC | 40,380 | | 354,731 |
Rightmove PLC | 6,716 | | 304,725 |
Rolls-Royce Group PLC | 24,800 | | 523,611 |
Rotork PLC | 5,800 | | 275,649 |
Royal Mail PLC | 30,000 | | 283,167 |
SABMiller PLC | 10,700 | | 549,456 |
Schroders PLC | 7,300 | | 314,058 |
Senior Engineering Group PLC | 54,000 | | 274,702 |
Spectris PLC | 6,800 | | 288,380 |
Sports Direct International PLC (a) | 21,200 | | 251,009 |
St. James's Place Capital PLC | 25,771 | | 310,678 |
Standard Chartered PLC (United Kingdom) | 29,309 | | 660,066 |
The Restaurant Group PLC | 27,673 | | 271,285 |
The Weir Group PLC | 9,330 | | 329,394 |
Travis Perkins PLC | 10,889 | | 337,552 |
Whitbread PLC | 5,893 | | 366,042 |
TOTAL UNITED KINGDOM | | 18,878,706 |
|
| Shares | | Value |
United States of America - 14.4% |
Affiliated Managers Group, Inc. (a) | 1,300 | | $ 281,944 |
AMETEK, Inc. | 5,700 | | 300,219 |
Amphenol Corp. Class A | 3,330 | | 296,969 |
AutoZone, Inc. (a) | 600 | | 286,764 |
BlackRock, Inc. Class A | 900 | | 284,823 |
BorgWarner, Inc. | 5,200 | | 290,732 |
Carlyle Group LP | 7,900 | | 281,398 |
CBS Corp. Class B | 5,015 | | 319,656 |
Colgate-Palmolive Co. | 4,440 | | 289,532 |
Comcast Corp. Class A | 4,800 | | 249,432 |
Computer Sciences Corp. | 4,900 | | 273,812 |
Cummins, Inc. | 2,144 | | 302,240 |
Danaher Corp. | 3,800 | | 293,360 |
Estee Lauder Companies, Inc. Class A | 3,396 | | 255,787 |
Fidelity National Information Services, Inc. | 4,597 | | 246,767 |
Fiserv, Inc. (a) | 4,236 | | 250,136 |
FMC Corp. | 4,000 | | 301,840 |
Google, Inc. Class A (a) | 300 | | 336,213 |
Home Depot, Inc. | 3,659 | | 301,282 |
Honeywell International, Inc. | 2,998 | | 273,927 |
KKR & Co. LP | 10,800 | | 262,872 |
Las Vegas Sands Corp. | 3,458 | | 272,732 |
Live Nation Entertainment, Inc. (a) | 15,900 | | 314,184 |
Lorillard, Inc. | 4,900 | | 248,332 |
Lowe's Companies, Inc. | 5,700 | | 282,435 |
MasterCard, Inc. Class A | 400 | | 334,184 |
McGraw-Hill Companies, Inc. | 4,011 | | 313,660 |
Mead Johnson Nutrition Co. Class A | 3,183 | | 266,608 |
Mettler-Toledo International, Inc. (a) | 1,000 | | 242,590 |
Monsanto Co. | 2,300 | | 268,065 |
Moody's Corp. | 3,820 | | 299,755 |
Mylan, Inc. (a) | 5,914 | | 256,668 |
NIKE, Inc. Class B | 3,300 | | 259,512 |
PetSmart, Inc. | 3,400 | | 247,350 |
Philip Morris International, Inc. | 3,400 | | 296,242 |
PPG Industries, Inc. | 1,645 | | 311,991 |
Precision Castparts Corp. | 1,087 | | 292,729 |
priceline.com, Inc. (a) | 240 | | 278,976 |
ResMed, Inc. (d) | 5,400 | | 254,232 |
Rockwell Automation, Inc. | 2,346 | | 277,203 |
Roper Industries, Inc. | 2,000 | | 277,360 |
Sherwin-Williams Co. | 1,500 | | 275,250 |
Sirona Dental Systems, Inc. (a) | 3,800 | | 266,760 |
The Blackstone Group LP | 9,300 | | 292,950 |
The Walt Disney Co. | 4,140 | | 316,296 |
Thermo Fisher Scientific, Inc. | 2,500 | | 278,375 |
Tiffany & Co., Inc. | 2,675 | | 248,187 |
Time Warner, Inc. | 3,900 | | 271,908 |
Twenty-First Century Fox, Inc. Class A | 8,200 | | 288,476 |
Union Pacific Corp. | 1,700 | | 285,600 |
United Technologies Corp. | 2,611 | | 297,132 |
Common Stocks - continued |
| Shares | | Value |
United States of America - continued |
Viacom, Inc. Class B (non-vtg.) | 3,551 | | $ 310,144 |
Visa, Inc. Class A | 1,500 | | 334,020 |
W.R. Grace & Co. (a) | 2,551 | | 252,217 |
Waddell & Reed Financial, Inc. Class A | 3,900 | | 253,968 |
Yahoo!, Inc. (a) | 6,300 | | 254,772 |
TOTAL UNITED STATES OF AMERICA | | 15,800,568 |
TOTAL COMMON STOCKS (Cost $89,860,158) |
107,033,469
|
Nonconvertible Preferred Stocks - 1.3% |
| | | |
Brazil - 0.7% |
Ambev SA sponsored ADR | 59,500 | | 437,325 |
Itausa-Investimentos Itau SA (PN) | 83,000 | | 315,926 |
TOTAL BRAZIL | | 753,251 |
Germany - 0.6% |
Porsche Automobil Holding SE (Germany) | 3,528 | | 367,214 |
Sartorius AG (non-vtg.) | 2,555 | | 304,110 |
TOTAL GERMANY | | 671,324 |
United Kingdom - 0.0% |
Rolls-Royce Group PLC Series C | 1,995,200 | | 3,304 |
TOTAL NONCONVERTIBLE PREFERRED STOCKS (Cost $1,290,014) |
1,427,879
|
Money Market Funds - 2.8% |
| Shares | | Value |
Fidelity Cash Central Fund, 0.11% (b) | 2,100,902 | | $ 2,100,902 |
Fidelity Securities Lending Cash Central Fund, 0.11% (b)(c) | 967,200 | | 967,200 |
TOTAL MONEY MARKET FUNDS (Cost $3,068,102) |
3,068,102
|
TOTAL INVESTMENT PORTFOLIO - 101.4% (Cost $94,218,274) | | 111,529,450 |
NET OTHER ASSETS (LIABILITIES) - (1.4)% | | (1,587,115) |
NET ASSETS - 100% | $ 109,942,335 |
Legend |
(a) Non-income producing |
(b) Affiliated fund that is generally available only to investment companies and other accounts managed by Fidelity Investments. The rate quoted is the annualized seven-day yield of the fund at period end. A complete unaudited listing of the fund's holdings as of its most recent quarter end is available upon request. In addition, each Fidelity Central Fund's financial statements, which are not covered by the Fund's Report of Independent Registered Public Accounting Firm, are available on the SEC's website or upon request. |
(c) Investment made with cash collateral received from securities on loan. |
(d) Security or a portion of the security is on loan at period end. |
Affiliated Central Funds |
Information regarding fiscal year to date income earned by the Fund from investments in Fidelity Central Funds is as follows: |
Fund | Income earned |
Fidelity Cash Central Fund | $ 1,357 |
Fidelity Securities Lending Cash Central Fund | 21,011 |
Total | $ 22,368 |
Other Information |
Categorizations in the Schedule of Investments are based on country or territory of incorporation. |
The following is a summary of the inputs used, as of December 31, 2013, involving the Fund's assets and liabilities carried at fair value. The inputs or methodology used for valuing securities may not be an indication of the risk associated with investing in those securities. For more information on valuation inputs, and their aggregation into the levels used in the table below, please refer to the Investment Valuation section in the accompanying Notes to Financial Statements. |
Valuation Inputs at Reporting Date: |
Description | Total | Level 1 | Level 2 | Level 3 |
Investments in Securities: | | | | |
Equities: | | | | |
Consumer Discretionary | $ 27,066,511 | $ 22,394,809 | $ 4,671,702 | $ - |
Consumer Staples | 11,808,540 | 8,651,244 | 3,157,296 | - |
Energy | 306,286 | - | 306,286 | - |
Financials | 15,692,636 | 10,426,450 | 5,266,186 | - |
Health Care | 8,684,110 | 7,445,111 | 1,238,999 | - |
Industrials | 21,844,801 | 17,865,100 | 3,979,701 | - |
Information Technology | 11,420,650 | 8,492,618 | 2,928,032 | - |
Materials | 9,636,945 | 6,906,475 | 2,730,470 | - |
Telecommunication Services | 2,000,869 | 765,434 | 1,235,435 | - |
Money Market Funds | 3,068,102 | 3,068,102 | - | - |
Total Investments in Securities: | $ 111,529,450 | $ 86,015,343 | $ 25,514,107 | $ - |
The following is a summary of transfers between Level 1 and Level 2 for the period ended December 31, 2013. Transfers are assumed to have occurred at the beginning of the period, and are primarily attributable to the valuation techniques used for foreign equity securities, as discussed in the accompanying Notes to Financial Statements: |
Transfers | Total |
Level 1 to Level 2 | $ 249,841 |
Level 2 to Level 1 | $ 13,541,891 |
See accompanying notes which are an integral part of the financial statements.
Annual Report
Statement of Assets and Liabilities
| December 31, 2013 |
| | |
Assets | | |
Investment in securities, at value (including securities loaned of $940,338) - See accompanying schedule: Unaffiliated issuers (cost $91,150,172) | $ 108,461,348 | |
Fidelity Central Funds (cost $3,068,102) | 3,068,102 | |
Total Investments (cost $94,218,274) | | $ 111,529,450 |
Foreign currency held at value (cost $112,885) | | 112,885 |
Receivable for investments sold | | 1,168,746 |
Receivable for fund shares sold | | 396,111 |
Dividends receivable | | 128,901 |
Distributions receivable from Fidelity Central Funds | | 859 |
Prepaid expenses | | 222 |
Receivable from investment adviser for expense reductions | | 19,366 |
Other receivables | | 50,057 |
Total assets | | 113,406,597 |
| | |
Liabilities | | |
Payable for investments purchased | $ 2,269,175 | |
Payable for fund shares redeemed | 271 | |
Accrued management fee | 60,681 | |
Distribution and service plan fees payable | 513 | |
Other affiliated payables | 15,925 | |
Other payables and accrued expenses | 150,497 | |
Collateral on securities loaned, at value | 967,200 | |
Total liabilities | | 3,464,262 |
| | |
Net Assets | | $ 109,942,335 |
Net Assets consist of: | | |
Paid in capital | | $ 107,826,836 |
Undistributed net investment income | | 1,347 |
Accumulated undistributed net realized gain (loss) on investments and foreign currency transactions | | (15,109,749) |
Net unrealized appreciation (depreciation) on investments and assets and liabilities in foreign currencies | | 17,223,901 |
Net Assets | | $ 109,942,335 |
Statement of Assets and Liabilities - continued
| December 31, 2013 |
| | |
Initial Class:
Net Asset Value, offering price and redemption price per share ($2,404,145 ÷ 189,543 shares) | | $ 12.68 |
| | |
Service Class:
Net Asset Value, offering price and redemption price per share ($111,230 ÷ 8,785 shares) | | $ 12.66 |
| | |
Service Class 2:
Net Asset Value, offering price and redemption price per share ($2,373,868 ÷ 188,296 shares) | | $ 12.61 |
| | |
Initial Class R:
Net Asset Value, offering price and redemption price per share ($17,791,167 ÷ 1,402,702 shares) | | $ 12.68 |
| | |
Service Class R:
Net Asset Value, offering price and redemption price per share ($111,230 ÷ 8,785 shares) | | $ 12.66 |
| | |
Service Class 2R:
Net Asset Value, offering price and redemption price per share ($121,478 ÷ 9,605 shares) | | $ 12.65 |
| | |
Investor Class R:
Net Asset Value, offering price and redemption price per share ($87,029,217 ÷ 6,909,921 shares) | | $ 12.59 |
See accompanying notes which are an integral part of the financial statements.
Annual Report
Statement of Operations
| Year ended December 31, 2013 |
| | |
Investment Income | | |
Dividends | | $ 1,614,457 |
Income from Fidelity Central Funds | | 22,368 |
Income before foreign taxes withheld | | 1,636,825 |
Less foreign taxes withheld | | (113,053) |
Total income | | 1,523,772 |
| | |
Expenses | | |
Management fee | $ 563,333 | |
Transfer agent fees | 109,847 | |
Distribution and service plan fees | 2,459 | |
Accounting and security lending fees | 41,706 | |
Custodian fees and expenses | 185,984 | |
Independent trustees' compensation | 397 | |
Audit | 94,440 | |
Legal | 550 | |
Interest | 188 | |
Miscellaneous | 656 | |
Total expenses before reductions | 999,560 | |
Expense reductions | (91,152) | 908,408 |
Net investment income (loss) | | 615,364 |
Realized and Unrealized Gain (Loss) Net realized gain (loss) on: | | |
Investment securities: | | |
Unaffiliated issuers (net of foreign taxes of $19,506) | 7,115,802 | |
Foreign currency transactions | (11,229) | |
Total net realized gain (loss) | | 7,104,573 |
Change in net unrealized appreciation (depreciation) on: Investment securities (net of increase in deferred foreign taxes of $48,411) | 8,281,413 | |
Assets and liabilities in foreign currencies | (3,647) | |
Total change in net unrealized appreciation (depreciation) | | 8,277,766 |
Net gain (loss) | | 15,382,339 |
Net increase (decrease) in net assets resulting from operations | | $ 15,997,703 |
Statement of Changes in Net Assets
| Year ended
December 31,
2013 | Year ended
December 31,
2012 |
Increase (Decrease) in Net Assets | | |
Operations | | |
Net investment income (loss) | $ 615,364 | $ 438,350 |
Net realized gain (loss) | 7,104,573 | 780,847 |
Change in net unrealized appreciation (depreciation) | 8,277,766 | 8,306,305 |
Net increase (decrease) in net assets resulting from operations | 15,997,703 | 9,525,502 |
Distributions to shareholders from net investment income | (596,439) | (486,943) |
Distributions to shareholders from net realized gain | (84,330) | - |
Total distributions | (680,769) | (486,943) |
Share transactions - net increase (decrease) | 33,588,933 | 15,248,354 |
Redemption fees | 16,383 | 6,117 |
Total increase (decrease) in net assets | 48,922,250 | 24,293,030 |
| | |
Net Assets | | |
Beginning of period | 61,020,085 | 36,727,055 |
End of period (including undistributed net investment income of $1,347 and distributions in excess of net investment income of $2,227, respectively) | $ 109,942,335 | $ 61,020,085 |
See accompanying notes which are an integral part of the financial statements.
Annual Report
Financial Highlights - Initial Class
Years ended December 31, | 2013 | 2012 | 2011 | 2010 | 2009 |
Selected Per-Share Data | | | | | |
Net asset value, beginning of period | $ 10.50 | $ 8.42 | $ 9.74 | $ 8.60 | $ 5.61 |
Income from Investment Operations | | | | | |
Net investment income (loss) C | .10 | .10 | .08 | .10 | .07 |
Net realized and unrealized gain (loss) | 2.17 | 2.08 | (1.30) | 1.24 | 3.07 |
Total from investment operations | 2.27 | 2.18 | (1.22) | 1.34 | 3.14 |
Distributions from net investment income | (.08) | (.10) | (.09) | (.11) | (.06) |
Distributions from net realized gain | (.01) | - | (.01) | (.10) | (.09) |
Total distributions | (.09) | (.10) | (.10) | (.20) H | (.15) |
Redemption fees added to paid in capital C, G | - | - | - | - | - |
Net asset value, end of period | $ 12.68 | $ 10.50 | $ 8.42 | $ 9.74 | $ 8.60 |
Total Return A, B | 21.62% | 25.91% | (12.57)% | 15.73% | 56.04% |
Ratios to Average Net Assets D, F | | | | | |
Expenses before reductions | 1.17% | 1.25% | 1.30% | 1.60% | 1.81% |
Expenses net of fee waivers, if any | 1.10% | 1.10% | 1.10% | 1.10% | 1.10% |
Expenses net of all reductions | 1.07% | 1.05% | 1.03% | .96% | .93% |
Net investment income (loss) | .84% | 1.07% | .88% | 1.19% | 1.03% |
Supplemental Data | | | | | |
Net assets, end of period (000 omitted) | $ 2,404 | $ 573 | $ 511 | $ 732 | $ 645 |
Portfolio turnover rate E | 153% | 137% | 236% | 463% | 416% |
A Total returns do not reflect charges attributable to your insurance company's separate account. Inclusion of these charges would reduce the total returns shown.
B Total returns would have been lower if certain expenses had not been reduced during the applicable periods shown.
C Calculated based on average shares outstanding during the period.
D Fees and expenses of any underlying Fidelity Central Funds are not included in the Fund's expense ratio. The Fund indirectly bears its proportionate share of the expenses of any underlying Fidelity Central Funds.
E Amount does not include the portfolio activity of any underlying Fidelity Central Funds.
F Expense ratios reflect operating expenses of the class. Expenses before reductions do not reflect amounts reimbursed by the investment adviser or reductions from brokerage service arrangements or reductions from other expense offset arrangements and do not represent the amount paid by the class during periods when reimbursements or reductions occur. Expenses net of fee waivers reflect expenses after reimbursement by the investment adviser but prior to reductions from brokerage service arrangements or other expense offset arrangements. Expenses net of all reductions represent the net expenses paid by the class.
G Amount represents less than $.01 per share.
H Total distributions of $.20 per share is comprised of distributions from net investment income of $.105 and distributions from net realized gain of $.097 per share.
Financial Highlights - Service Class
Years ended December 31, | 2013 | 2012 | 2011 | 2010 | 2009 |
Selected Per-Share Data | | | | | |
Net asset value, beginning of period | $ 10.49 | $ 8.41 | $ 9.72 | $ 8.58 | $ 5.61 |
Income from Investment Operations | | | | | |
Net investment income (loss) C | .08 | .09 | .07 | .10 | .06 |
Net realized and unrealized gain (loss) | 2.17 | 2.08 | (1.29) | 1.23 | 3.05 |
Total from investment operations | 2.25 | 2.17 | (1.22) | 1.33 | 3.11 |
Distributions from net investment income | (.07) | (.09) | (.08) | (.10) | (.05) |
Distributions from net realized gain | (.01) | - | (.01) | (.10) | (.09) |
Total distributions | (.08) | (.09) | (.09) | (.19) H | (.14) |
Redemption fees added to paid in capital C, G | - | - | - | - | - |
Net asset value, end of period | $ 12.66 | $ 10.49 | $ 8.41 | $ 9.72 | $ 8.58 |
Total Return A, B | 21.44% | 25.83% | (12.60)% | 15.65% | 55.52% |
Ratios to Average Net Assets D, F | | | | | |
Expenses before reductions | 1.28% | 1.35% | 1.42% | 1.67% | 1.73% |
Expenses net of fee waivers, if any | 1.20% | 1.20% | 1.20% | 1.20% | 1.20% |
Expenses net of all reductions | 1.17% | 1.15% | 1.14% | 1.05% | 1.04% |
Net investment income (loss) | .73% | .96% | .78% | 1.09% | .92% |
Supplemental Data | | | | | |
Net assets, end of period (000 omitted) | $ 111 | $ 94 | $ 75 | $ 100 | $ 117 |
Portfolio turnover rate E | 153% | 137% | 236% | 463% | 416% |
A Total returns do not reflect charges attributable to your insurance company's separate account. Inclusion of these charges would reduce the total returns shown.
B Total returns would have been lower if certain expenses had not been reduced during the applicable periods shown.
C Calculated based on average shares outstanding during the period.
D Fees and expenses of any underlying Fidelity Central Funds are not included in the Fund's expense ratio. The Fund indirectly bears its proportionate share of the expenses of any underlying Fidelity Central Funds.
E Amount does not include the portfolio activity of any underlying Fidelity Central Funds.
F Expense ratios reflect operating expenses of the class. Expenses before reductions do not reflect amounts reimbursed by the investment adviser or reductions from brokerage service arrangements or reductions from other expense offset arrangements and do not represent the amount paid by the class during periods when reimbursements or reductions occur. Expenses net of fee waivers reflect expenses after reimbursement by the investment adviser but prior to reductions from brokerage service arrangements or other expense offset arrangements. Expenses net of all reductions represent the net expenses paid by the class.
G Amount represents less than $.01 per share.
H Total distributions of $.19 per share is comprised of distributions from net investment income of $.095 and distributions from net realized gain of $.097 per share.
See accompanying notes which are an integral part of the financial statements.
Annual Report
Financial Highlights - Service Class 2
Years ended December 31, | 2013 | 2012 | 2011 | 2010 | 2009 |
Selected Per-Share Data | | | | | |
Net asset value, beginning of period | $ 10.46 | $ 8.40 | $ 9.72 | $ 8.57 | $ 5.60 |
Income from Investment Operations | | | | | |
Net investment income (loss) C | .07 | .08 | .06 | .08 | .05 |
Net realized and unrealized gain (loss) | 2.16 | 2.07 | (1.30) | 1.24 | 3.05 |
Total from investment operations | 2.23 | 2.15 | (1.24) | 1.32 | 3.10 |
Distributions from net investment income | (.07) | (.09) | (.07) | (.07) | (.04) |
Distributions from net realized gain | (.01) | - | (.01) | (.10) | (.09) |
Total distributions | (.08) | (.09) | (.08) | (.17) | (.13) |
Redemption fees added to paid in capital C, G | - | - | - | - | - |
Net asset value, end of period | $ 12.61 | $ 10.46 | $ 8.40 | $ 9.72 | $ 8.57 |
Total Return A, B | 21.33% | 25.61% | (12.74)% | 15.53% | 55.44% |
Ratios to Average Net Assets D, F | | | | | |
Expenses before reductions | 1.46% | 1.49% | 1.58% | 1.88% | 2.02% |
Expenses net of fee waivers, if any | 1.35% | 1.35% | 1.35% | 1.35% | 1.35% |
Expenses net of all reductions | 1.32% | 1.29% | 1.28% | 1.21% | 1.19% |
Net investment income (loss) | .59% | .82% | .63% | .94% | .77% |
Supplemental Data | | | | | |
Net assets, end of period (000 omitted) | $ 2,374 | $ 1,476 | $ 166 | $ 115 | $ 424 |
Portfolio turnover rate E | 153% | 137% | 236% | 463% | 416% |
A Total returns do not reflect charges attributable to your insurance company's separate account. Inclusion of these charges would reduce the total returns shown.
B Total returns would have been lower if certain expenses had not been reduced during the applicable periods shown.
C Calculated based on average shares outstanding during the period.
D Fees and expenses of any underlying Fidelity Central Funds are not included in the Fund's expense ratio. The Fund indirectly bears its proportionate share of the expenses of any underlying Fidelity Central Funds.
E Amount does not include the portfolio activity of any underlying Fidelity Central Funds.
F Expense ratios reflect operating expenses of the class. Expenses before reductions do not reflect amounts reimbursed by the investment adviser or reductions from brokerage service arrangements or reductions from other expense offset arrangements and do not represent the amount paid by the class during periods when reimbursements or reductions occur. Expenses net of fee waivers reflect expenses after reimbursement by the investment adviser but prior to reductions from brokerage service arrangements or other expense offset arrangements. Expenses net of all reductions represent the net expenses paid by the class.
G Amount represents less than $.01 per share.
Financial Highlights - Initial Class R
Years ended December 31, | 2013 | 2012 | 2011 | 2010 | 2009 |
Selected Per-Share Data | | | | | |
Net asset value, beginning of period | $ 10.50 | $ 8.42 | $ 9.74 | $ 8.60 | $ 5.62 |
Income from Investment Operations | | | | | |
Net investment income (loss) C | .10 | .10 | .08 | .10 | .07 |
Net realized and unrealized gain (loss) | 2.17 | 2.08 | (1.30) | 1.24 | 3.06 |
Total from investment operations | 2.27 | 2.18 | (1.22) | 1.34 | 3.13 |
Distributions from net investment income | (.08) | (.10) | (.09) | (.11) | (.06) |
Distributions from net realized gain | (.01) | - | (.01) | (.10) | (.09) |
Total distributions | (.09) | (.10) | (.10) | (.20) H | (.15) |
Redemption fees added to paid in capital C, G | - | - | - | - | - |
Net asset value, end of period | $ 12.68 | $ 10.50 | $ 8.42 | $ 9.74 | $ 8.60 |
Total Return A, B | 21.65% | 25.91% | (12.57)% | 15.73% | 55.76% |
Ratios to Average Net Assets D, F | | | | | |
Expenses before reductions | 1.21% | 1.28% | 1.33% | 1.55% | 1.60% |
Expenses net of fee waivers, if any | 1.10% | 1.10% | 1.10% | 1.10% | 1.10% |
Expenses net of all reductions | 1.07% | 1.05% | 1.03% | .95% | .93% |
Net investment income (loss) | .83% | 1.07% | .88% | 1.19% | 1.02% |
Supplemental Data | | | | | |
Net assets, end of period (000 omitted) | $ 17,791 | $ 18,575 | $ 10,557 | $ 15,305 | $ 17,150 |
Portfolio turnover rate E | 153% | 137% | 236% | 463% | 416% |
A Total returns do not reflect charges attributable to your insurance company's separate account. Inclusion of these charges would reduce the total returns shown.
B Total returns would have been lower if certain expenses had not been reduced during the applicable periods shown.
C Calculated based on average shares outstanding during the period.
D Fees and expenses of any underlying Fidelity Central Funds are not included in the Fund's expense ratio. The Fund indirectly bears its proportionate share of the expenses of any underlying Fidelity Central Funds.
E Amount does not include the portfolio activity of any underlying Fidelity Central Funds.
F Expense ratios reflect operating expenses of the class. Expenses before reductions do not reflect amounts reimbursed by the investment adviser or reductions from brokerage service arrangements or reductions from other expense offset arrangements and do not represent the amount paid by the class during periods when reimbursements or reductions occur. Expenses net of fee waivers reflect expenses after reimbursement by the investment adviser but prior to reductions from brokerage service arrangements or other expense offset arrangements. Expenses net of all reductions represent the net expenses paid by the class.
G Amount represents less than $.01 per share.
H Total distributions of $.20 per share is comprised of distributions from net investment income of $.105 and distributions from net realized gain of $.097 per share.
See accompanying notes which are an integral part of the financial statements.
Annual Report
Financial Highlights - Service Class R
Years ended December 31, | 2013 | 2012 | 2011 | 2010 | 2009 |
Selected Per-Share Data | | | | | |
Net asset value, beginning of period | $ 10.49 | $ 8.41 | $ 9.72 | $ 8.58 | $ 5.61 |
Income from Investment Operations | | | | | |
Net investment income (loss) C | .08 | .09 | .07 | .10 | .06 |
Net realized and unrealized gain (loss) | 2.17 | 2.08 | (1.29) | 1.23 | 3.05 |
Total from investment operations | 2.25 | 2.17 | (1.22) | 1.33 | 3.11 |
Distributions from net investment income | (.07) | (.09) | (.08) | (.10) | (.05) |
Distributions from net realized gain | (.01) | - | (.01) | (.10) | (.09) |
Total distributions | (.08) | (.09) | (.09) | (.19) H | (.14) |
Redemption fees added to paid in capital C, G | - | - | - | - | - |
Net asset value, end of period | $ 12.66 | $ 10.49 | $ 8.41 | $ 9.72 | $ 8.58 |
Total Return A, B | 21.44% | 25.83% | (12.60)% | 15.65% | 55.52% |
Ratios to Average Net Assets D, F | | | | | |
Expenses before reductions | 1.28% | 1.35% | 1.42% | 1.67% | 1.73% |
Expenses net of fee waivers, if any | 1.20% | 1.20% | 1.20% | 1.20% | 1.20% |
Expenses net of all reductions | 1.17% | 1.15% | 1.14% | 1.05% | 1.04% |
Net investment income (loss) | .73% | .96% | .78% | 1.09% | .92% |
Supplemental Data | | | | | |
Net assets, end of period (000 omitted) | $ 111 | $ 94 | $ 75 | $ 100 | $ 117 |
Portfolio turnover rate E | 153% | 137% | 236% | 463% | 416% |
A Total returns do not reflect charges attributable to your insurance company's separate account. Inclusion of these charges would reduce the total returns shown.
B Total returns would have been lower if certain expenses had not been reduced during the applicable periods shown.
C Calculated based on average shares outstanding during the period.
D Fees and expenses of any underlying Fidelity Central Funds are not included in the Fund's expense ratio. The Fund indirectly bears its proportionate share of the expenses of any underlying Fidelity Central Funds.
E Amount does not include the portfolio activity of any underlying Fidelity Central Funds.
F Expense ratios reflect operating expenses of the class. Expenses before reductions do not reflect amounts reimbursed by the investment adviser or reductions from brokerage service arrangements or reductions from other expense offset arrangements and do not represent the amount paid by the class during periods when reimbursements or reductions occur. Expenses net of fee waivers reflect expenses after reimbursement by the investment adviser but prior to reductions from brokerage service arrangements or other expense offset arrangements. Expenses net of all reductions represent the net expenses paid by the class.
G Amount represents less than $.01 per share.
H Total distributions of $.19 per share is comprised of distributions from net investment income of $.095 and distributions from net realized gain of $.097 per share.
Financial Highlights - Service Class 2R
Years ended December 31, | 2013 | 2012 | 2011 | 2010 | 2009 |
Selected Per-Share Data | | | | | |
Net asset value, beginning of period | $ 10.47 | $ 8.40 | $ 9.71 | $ 8.57 | $ 5.60 |
Income from Investment Operations | | | | | |
Net investment income (loss) C | .07 | .08 | .06 | .08 | .05 |
Net realized and unrealized gain (loss) | 2.17 | 2.07 | (1.30) | 1.23 | 3.05 |
Total from investment operations | 2.24 | 2.15 | (1.24) | 1.31 | 3.10 |
Distributions from net investment income | (.05) | (.08) | (.06) | (.08) | (.04) |
Distributions from net realized gain | (.01) | - | (.01) | (.10) | (.09) |
Total distributions | (.06) | (.08) | (.07) | (.17) H | (.13) |
Redemption fees added to paid in capital C, G | - | - | - | - | - |
Net asset value, end of period | $ 12.65 | $ 10.47 | $ 8.40 | $ 9.71 | $ 8.57 |
Total Return A, B | 21.40% | 25.56% | (12.77)% | 15.45% | 55.36% |
Ratios to Average Net Assets D, F | | | | | |
Expenses before reductions | 1.43% | 1.50% | 1.57% | 1.83% | 1.87% |
Expenses net of fee waivers, if any | 1.35% | 1.35% | 1.35% | 1.35% | 1.35% |
Expenses net of all reductions | 1.32% | 1.30% | 1.28% | 1.21% | 1.19% |
Net investment income (loss) | .58% | .82% | .63% | .94% | .77% |
Supplemental Data | | | | | |
Net assets, end of period (000 omitted) | $ 121 | $ 102 | $ 81 | $ 109 | $ 155 |
Portfolio turnover rate E | 153% | 137% | 236% | 463% | 416% |
A Total returns do not reflect charges attributable to your insurance company's separate account. Inclusion of these charges would reduce the total returns shown.
B Total returns would have been lower if certain expenses had not been reduced during the applicable periods shown.
C Calculated based on average shares outstanding during the period.
D Fees and expenses of any underlying Fidelity Central Funds are not included in the Fund's expense ratio. The Fund indirectly bears its proportionate share of the expenses of any underlying Fidelity Central Funds.
E Amount does not include the portfolio activity of any underlying Fidelity Central Funds.
F Expense ratios reflect operating expenses of the class. Expenses before reductions do not reflect amounts reimbursed by the investment adviser or reductions from brokerage service arrangements or reductions from other expense offset arrangements and do not represent the amount paid by the class during periods when reimbursements or reductions occur. Expenses net of fee waivers reflect expenses after reimbursement by the investment adviser but prior to reductions from brokerage service arrangements or other expense offset arrangements. Expenses net of all reductions represent the net expenses paid by the class.
G Amount represents less than $.01 per share.
H Total distributions of $.17 per share is comprised of distributions from net investment income of $.077 and distributions from net realized gain of $.097 per share.
See accompanying notes which are an integral part of the financial statements.
Annual Report
Financial Highlights - Investor Class R
Years ended December 31, | 2013 | 2012 | 2011 | 2010 | 2009 |
Selected Per-Share Data | | | | | |
Net asset value, beginning of period | $ 10.43 | $ 8.37 | $ 9.69 | $ 8.56 | $ 5.60 |
Income from Investment Operations | | | | | |
Net investment income (loss) C | .09 | .09 | .07 | .10 | .07 |
Net realized and unrealized gain (loss) | 2.15 | 2.07 | (1.29) | 1.23 | 3.04 |
Total from investment operations | 2.24 | 2.16 | (1.22) | 1.33 | 3.11 |
Distributions from net investment income | (.07) | (.10) | (.09) | (.11) | (.06) |
Distributions from net realized gain | (.01) | - | (.01) | (.10) | (.09) |
Total distributions | (.08) | (.10) | (.10) | (.20) H | (.15) |
Redemption fees added to paid in capital C, G | - | - | - | - | - |
Net asset value, end of period | $ 12.59 | $ 10.43 | $ 8.37 | $ 9.69 | $ 8.56 |
Total Return A, B | 21.50% | 25.81% | (12.63)% | 15.69% | 55.61% |
Ratios to Average Net Assets D, F | | | | | |
Expenses before reductions | 1.26% | 1.34% | 1.39% | 1.63% | 1.68% |
Expenses net of fee waivers, if any | 1.18% | 1.18% | 1.18% | 1.18% | 1.18% |
Expenses net of all reductions | 1.15% | 1.13% | 1.12% | 1.04% | 1.01% |
Net investment income (loss) | .75% | .99% | .80% | 1.11% | .94% |
Supplemental Data | | | | | |
Net assets, end of period (000 omitted) | $ 87,029 | $ 40,107 | $ 25,262 | $ 29,249 | $ 27,695 |
Portfolio turnover rate E | 153% | 137% | 236% | 463% | 416% |
A Total returns do not reflect charges attributable to your insurance company's separate account. Inclusion of these charges would reduce the total returns shown.
B Total returns would have been lower if certain expenses had not been reduced during the applicable periods shown.
C Calculated based on average shares outstanding during the period.
D Fees and expenses of any underlying Fidelity Central Funds are not included in the Fund's expense ratio. The Fund indirectly bears its proportionate share of the expenses of any underlying Fidelity Central Funds.
E Amount does not include the portfolio activity of any underlying Fidelity Central Funds.
F Expense ratios reflect operating expenses of the class. Expenses before reductions do not reflect amounts reimbursed by the investment adviser or reductions from brokerage service arrangements or reductions from other expense offset arrangements and do not represent the amount paid by the class during periods when reimbursements or reductions occur. Expenses net of fee waivers reflect expenses after reimbursement by the investment adviser but prior to reductions from brokerage service arrangements or other expense offset arrangements. Expenses net of all reductions represent the net expenses paid by the class.
G Amount represents less than $.01 per share.
H Total distributions of $.20 per share is comprised of distributions from net investment income of $.105 and distributions from net realized gain of $.097 per share.
See accompanying notes which are an integral part of the financial statements.
Annual Report
Notes to Financial Statements
For the period ended December 31, 2013
1. Organization.
VIP International Capital Appreciation Portfolio (the Fund) is a fund of Variable Insurance Products Fund II (the Trust) and is authorized to issue an unlimited number of shares. The Trust is registered under the Investment Company Act of 1940, as amended (the 1940 Act), as an open-end management investment company organized as a Massachusetts business trust. Shares of the Fund may only be purchased by insurance companies for the purpose of funding variable annuity or variable life insurance contracts. The Fund offers the following classes of shares: Initial Class shares, Service Class shares, Service Class 2 shares, Initial Class R shares, Service Class R shares, Service Class 2R shares and Investor Class R shares. All classes have equal rights and voting privileges, except for matters affecting a single class. The Fund's investments in emerging markets can be subject to social, economic, regulatory, and political uncertainties and can be extremely volatile.
2. Investments in Fidelity Central Funds.
The Fund invests in Fidelity Central Funds, which are open-end investment companies generally available only to other investment companies and accounts managed by the investment adviser and its affiliates. The Fund's Schedule of Investments lists each of the Fidelity Central Funds held as of period end, if any, as an investment of the Fund, but does not include the underlying holdings of each Fidelity Central Fund. As an Investing Fund, the Fund indirectly bears its proportionate share of the expenses of the underlying Fidelity Central Funds.
The Money Market Central Funds seek preservation of capital and current income and are managed by Fidelity Investments Money Management, Inc. (FIMM), an affiliate of the investment adviser. Annualized expenses of the Money Market Central Funds as of their most recent shareholder report date are less than .01%.
A complete unaudited list of holdings for each Fidelity Central Fund is available upon request or at the Securities and Exchange Commission (the SEC) website at www.sec.gov. In addition, the financial statements of the Fidelity Central Funds, which are not covered by the Fund's Report of Independent Registered Public Accounting Firm, are available on the SEC website or upon request.
3. Significant Accounting Policies.
The financial statements have been prepared in conformity with accounting principles generally accepted in the United States of America (GAAP), which require management to make certain estimates and assumptions at the date of the financial statements. Actual results could differ from those estimates. Subsequent events, if any, through the date that the financial statements were issued have been evaluated in the preparation of the financial statements. The following summarizes the significant accounting policies of the Fund:
Investment Valuation. Investments are valued as of 4:00 p.m. Eastern time on the last calendar day of the period. In accordance with valuation policies and procedures approved by the Board of Trustees (the Board), the Fund attempts to obtain prices from one or more third party pricing vendors or brokers to value its investments. When current market prices, quotations or currency exchange rates are not readily available or reliable, investments will be fair valued in good faith by the Fidelity Management & Research Company (FMR) Fair Value Committee (the Committee), in accordance with procedures adopted by the Board. Factors used in determining fair value vary by investment type and may include market or investment specific events. The frequency with which these procedures are used cannot be predicted and they may be utilized to a significant extent. The Committee oversees the Fund's valuation policies and procedures and is responsible for approving and reporting to the Board all fair value determinations.
The Fund categorizes the inputs to valuation techniques used to value its investments into a disclosure hierarchy consisting of three levels as shown below:
Level 1 - quoted prices in active markets for identical investments
Level 2 - other significant observable inputs (including quoted prices for similar investments, interest rates, prepayment speeds, etc.)
Level 3 - unobservable inputs (including the Fund's own assumptions based on the best information available)
Valuation techniques used to value the Fund's investments by major category are as follows:
Equity securities, including restricted securities, for which market quotations are readily available, are valued at the last reported sale price or official closing price as reported by a third party pricing vendor on the primary market or exchange on which they are traded and are categorized as Level 1 in the hierarchy. In the event there were no sales during the day or closing prices are not available, securities are valued at the last quoted bid price or may be valued using the last available price and are generally categorized as Level 2 in the hierarchy. For foreign equity securities, when market or security specific events arise, comparisons to the valuation of American Depositary Receipts (ADRs), futures contracts, Exchange-Traded Funds (ETFs) and certain indexes as well as quoted prices for similar securities may be used and would be categorized as Level 2 in the hierarchy. Utilizing these techniques may result in transfers between Level 1 and Level 2. For equity securities, including restricted securities, where observable inputs are limited, assumptions about market activity and risk are used and these securities may be categorized as Level 3 in the hierarchy.
Annual Report
3. Significant Accounting Policies - continued
Investment Valuation - continued
Investments in open-end mutual funds, including the Fidelity Central Funds, are valued at their closing net asset value (NAV) each business day and are categorized as Level 1 in the hierarchy.
Changes in valuation techniques may result in transfers in or out of an assigned level within the disclosure hierarchy. The aggregate value of investments by input level, as of December 31, 2013, including information on transfers between Levels 1 and 2 is included at the end of the Fund's Schedule of Investments.
Foreign Currency. The Fund may use foreign currency contracts to facilitate transactions in foreign-denominated securities. Gains and losses from these transactions may arise from changes in the value of the foreign currency or if the counterparties do not perform under the contracts' terms.
Foreign-denominated assets, including investment securities, and liabilities are translated into U.S. dollars at the exchange rates at period end. Purchases and sales of investment securities, income and dividends received and expenses denominated in foreign currencies are translated into U.S. dollars at the exchange rate in effect on the transaction date.
The effects of exchange rate fluctuations on investments are included with the net realized and unrealized gain (loss) on investment securities. Other foreign currency transactions resulting in realized and unrealized gain (loss) are disclosed separately.
Investment Transactions and Income. For financial reporting purposes, the Fund's investment holdings and NAV include trades executed through the end of the last business day of the period. The NAV per share for processing shareholder transactions is calculated as of the close of business of the New York Stock Exchange (NYSE), normally 4:00 p.m. Eastern time and includes trades executed through the end of the prior business day. Gains and losses on securities sold are determined on the basis of identified cost. Dividend income is recorded on the ex-dividend date, except for certain dividends from foreign securities where the ex-dividend date may have passed, which are recorded as soon as the Fund is informed of the ex-dividend date. Non-cash dividends included in dividend income, if any, are recorded at the fair market value of the securities received. Distributions received on securities that represent a return of capital or capital gain are recorded as a reduction of cost of investments and/or as a realized gain. Subsequent to ex-dividend date the Fund determines the components of these distributions, based upon receipt of tax filings or other correspondence relating to the underlying investment. Interest income and distributions from the Fidelity Central Funds are accrued as earned. Investment income is recorded net of foreign taxes withheld where recovery of such taxes is uncertain.
Class Allocations and Expenses. Investment income, realized and unrealized capital gains and losses, common expenses of the Fund, and certain fund-level expense reductions, if any, are allocated daily on a pro-rata basis to each class based on the relative net assets of each class to the total net assets of the Fund. Each class differs with respect to transfer agent and distribution and service plan fees incurred. Certain expense reductions may also differ by class. For the reporting period, the allocated portion of income and expenses to each class as a percent of its average net assets may vary due to the timing of recording these transactions in relation to fluctuating net assets of the classes. Expenses directly attributable to a fund are charged to that fund. Expenses attributable to more than one fund are allocated among the respective funds on the basis of relative net assets or other appropriate methods. Expense estimates are accrued in the period to which they relate and adjustments are made when actual amounts are known.
Income Tax Information and Distributions to Shareholders. Each year, the Fund intends to qualify as a regulated investment company under Subchapter M of the Internal Revenue Code, including distributing substantially all of its taxable income and realized gains. As a result, no provision for U.S. Federal income taxes is required. As of December 31, 2013, the Fund did not have any unrecognized tax benefits in the financial statements; nor is the Fund aware of any tax positions for which it is reasonably possible that the total amounts of unrecognized tax benefits will significantly change in the next twelve months. The Fund files a U.S. federal tax return, in addition to state and local tax returns as required. The Fund's federal income tax returns are subject to examination by the Internal Revenue Service (IRS) for a period of three fiscal years after they are filed. State and local tax returns may be subject to examination for an additional fiscal year depending on the jurisdiction. Foreign taxes are provided for based on the Fund's understanding of the tax rules and rates that exist in the foreign markets in which it invests. The Fund is subject to a tax imposed on capital gains by certain countries in which it invests. An estimated deferred tax liability for net unrealized appreciation on the applicable securities is included in Other payables and accrued expenses on the Statement of Assets & Liabilities.
Distributions are declared and recorded on the ex-dividend date. Income dividends and capital gain distributions are declared separately for each class. Income and capital gain distributions are determined in accordance with income tax regulations, which may differ from GAAP.
Capital accounts within the financial statements are adjusted for permanent book-tax differences. These adjustments have no impact on net assets or the results of operations. Capital accounts are not adjusted for temporary book-tax differences which will reverse in a subsequent period.
Book-tax differences are primarily due to foreign currency transactions, certain foreign taxes, passive foreign investment companies (PFIC), partnerships, capital loss carryforwards and losses deferred due to wash sales and excise tax regulations.
Annual Report
Notes to Financial Statements - continued
3. Significant Accounting Policies - continued
Income Tax Information and Distributions to Shareholders - continued
The federal tax cost of investment securities and unrealized appreciation (depreciation) as of period end were as follows:
Gross unrealized appreciation | $ 18,080,619 |
Gross unrealized depreciation | (1,225,838) |
Net unrealized appreciation (depreciation) on securities and other investments | $ 16,854,781 |
| |
Tax Cost | $ 94,674,669 |
The tax-based components of distributable earnings as of period end were as follows:
Undistributed ordinary income | $ 1,347 |
Capital loss carryforward | $ (14,653,354) |
Net unrealized appreciation (depreciation) | $ 16,836,799 |
Capital loss carryforwards are only available to offset future capital gains of the Fund to the extent provided by regulations and may be limited. Under the Regulated Investment Company Modernization Act of 2010 (the Act), the Fund is permitted to carry forward capital losses incurred in taxable years beginning after December 22, 2010 for an unlimited period and such capital losses are required to be used prior to any losses that expire. The capital loss carryforward information presented below, including any applicable limitation, is estimated as of fiscal period end and is subject to adjustment.
Fiscal year of expiration | |
2016 | $ (10,224,172) |
2017 | (4,429,182) |
Total capital loss carryforward | $ (14,653,354) |
The tax character of distributions paid was as follows:
| December 31, 2013 | December 31, 2012 |
Ordinary Income | $ 680,769 | $ 486,943 |
Trading (Redemption) Fees. Initial Class R shares, Service Class R shares, Service Class 2R shares and Investor Class R shares held by investors less than 60 days may be subject to a redemption fee equal to 1% of the NAV of shares redeemed. All redemption fees, which reduce the proceeds of the shareholder redemption, are retained by the Fund and accounted for as an addition to paid in capital.
4. Purchases and Sales of Investments.
Purchases and sales of securities, other than short-term securities, aggregated $159,044,042 and $121,905,189, respectively.
5. Fees and Other Transactions with Affiliates.
Management Fee. Fidelity Management & Research Company (the investment adviser) and its affiliates provide the Fund with investment management related services for which the Fund pays a monthly management fee. The management fee is the sum of an individual fund fee rate that is based on an annual rate of .45% of the Fund's average net assets and an annualized group fee rate that averaged .25% during the period. The group fee rate is based upon the average net assets of all the mutual funds advised by the investment adviser, including any mutual funds previously advised by the investment adviser that are currently advised by Fidelity SelectCo, LLC, an affiliate of the investment adviser. The group fee rate decreases as assets under management increase and increases as assets under management decrease. For the reporting period, the total annual management fee rate was .70% of the Fund's average net assets.
Distribution and Service Plan Fees. In accordance with Rule 12b-1 of the 1940 Act, the Fund has adopted separate 12b-1 Plans for each Service Class of shares. Each Service Class pays Fidelity Distributors Corporation (FDC), an affiliate of the investment adviser, a service fee. For the period, the service fee is based on an annual rate of .10% of Service Class' and Service Class R's average net assets and .25% of Service Class 2's and Service Class 2R's average net assets.
Annual Report
5. Fees and Other Transactions with Affiliates - continued
Distribution and Service Plan Fees - continued
For the period, total fees, all of which were re-allowed to insurance companies for the distribution of shares and providing shareholder support services were as follows:
Service Class | $ 102 |
Service Class 2 | 1,977 |
Service Class R | 102 |
Service Class 2R | 278 |
| $ 2,459 |
Transfer Agent Fees. Fidelity Investments Institutional Operations Company, Inc. (FIIOC), an affiliate of the investment adviser, is the Fund's transfer, dividend disbursing, and shareholder servicing agent. FIIOC receives an asset-based fee with respect to each class. Each class (with the exception of Investor Class R) pays a transfer agent fee, excluding out of pocket expenses, equal to an annual rate of .07% of average net assets. Investor Class R pays a monthly asset-based transfer agent fee of .15% of average net assets. In addition, FIIOC receives an asset-based fee of ..0035% of average net assets for typesetting, printing and mailing of shareholder reports, except proxy statements. FIIOC voluntarily agreed to reimburse or waive this fee for the period January 1, 2013 through December 31, 2013 (see Expense Reductions note). For the period, transfer agent fees for each class, including printing and out of pocket expenses, were as follows:
Initial Class | $ 689 |
Service Class | 70 |
Service Class 2 | 543 |
Initial Class R | 13,314 |
Service Class R | 70 |
Service Class 2R | 76 |
Investor Class R | 95,085 |
| $ 109,847 |
Effective February 1, 2014, the Board of Trustees approved an amendment to the transfer agent fee agreement whereby each class (with the exception of Investor Class R) pays a single fee of .07% of average net assets for transfer agent services, typesetting, printing and mailing of shareholder reports, excluding mailing of proxy statements and out of pocket expenses. Investor Class R pays a single fee of .15% of average net assets.
Accounting and Security Lending Fees. Fidelity Service Company, Inc. (FSC), an affiliate of the investment adviser, maintains the Fund's accounting records. The accounting fee is based on the level of average net assets for each month. Under a separate contract, FSC administers the security lending program. The security lending fee is based on the number and duration of lending transactions.
Brokerage Commissions. The Fund placed a portion of its portfolio transactions with brokerage firms which are affiliates of the investment adviser. Brokerage commissions are included in net realized gain (loss) and change in net unrealized appreciation (depreciation) in the Statement of Operations. The commissions paid to these affiliated firms were $1,077 for the period.
Interfund Lending Program. Pursuant to an Exemptive Order issued by the SEC, the Fund, along with other registered investment companies having management contracts with FMR or other affiliated entities of FMR, may participate in an interfund lending program. This program provides an alternative credit facility allowing the funds to borrow from, or lend money to, other participating affiliated funds. At period end, there were no interfund loans outstanding. The Fund's activity in this program during the period for which loans were outstanding was as follows:
Borrower or Lender | Average Loan
Balance | Weighted Average
Interest Rate | Interest
Expense |
Borrower | $ 4,278,500 | .40% | $ 188 |
6. Committed Line of Credit.
The Fund participates with other funds managed by the investment adviser or an affiliate in a $4.25 billion credit facility (the "line of credit") to be utilized for temporary or emergency purposes to fund shareholder redemptions or for other short-term liquidity purposes. The Fund has agreed to pay commitment fees on its pro-rata portion of the line of credit, which amounted to $144 and is reflected in Miscellaneous expenses on the Statement of Operations. During the period, there were no borrowings on this line of credit.
Annual Report
Notes to Financial Statements - continued
7. Security Lending.
The Fund lends portfolio securities through a lending agent from time to time in order to earn additional income. For equity securities, a lending agent is used and may loan securities to certain qualified borrowers, including Fidelity Capital Markets (FCM), a broker-dealer affiliated with the Fund. On the settlement date of the loan, the Fund receives collateral (in the form of U.S. Treasury obligations, letters of credit and/or cash) against the loaned securities and maintains collateral in an amount not less than 100% of the market value of the loaned securities during the period of the loan. The market value of the loaned securities is determined at the close of business of the Fund and any additional required collateral is delivered to the Fund on the next business day. If the borrower defaults on its obligation to return the securities loaned because of insolvency or other reasons, the Fund may apply collateral received from the borrower against the obligation. The Fund may experience delays and costs in recovering the securities loaned. Any cash collateral received is invested in the Fidelity Securities Lending Cash Central Fund. The value of loaned securities and cash collateral at period end are disclosed on the Fund's Statement of Assets and Liabilities. Security lending income represents the income earned on investing cash collateral, less rebates paid to borrowers and any lending agent fees associated with the loan, plus any premium payments received for lending certain types of securities. Security lending income is presented in the Statement of Operations as a component of income from Fidelity Central Funds. Total security lending income during the period amounted to $21,011. During the period, there were no securities loaned to FCM.
8. Expense Reductions.
In addition to FIIOC reimbursing or waiving a portion of its transfer agent fees, the investment adviser voluntarily agreed to reimburse each class to the extent annual operating expenses exceeded certain levels of average net assets as noted in the table below. Some expenses, for example interest expense, including commitment fees, are excluded from this reimbursement.
Expenses were reimbursed and/or waived for the following classes during the period:
| Expense
Limitations | Reimbursement/
Waiver |
Initial Class | 1.10% | $ 709 |
Service Class | 1.20% | 79 |
Service Class 2 | 1.35% | 927 |
Initial Class R | 1.10% | 17,587 |
Service Class R | 1.20% | 80 |
Service Class 2R | 1.35% | 87 |
Investor Class R | 1.18% | 47,964 |
| | $ 67,433 |
Commissions paid to certain brokers with whom the investment adviser, or its affiliates, places trades on behalf of the Fund include an amount in addition to trade execution, which may be rebated back to the Fund to offset certain expenses. This amount totaled $23,719 for the period.
9. Distributions to Shareholders.
Distributions to shareholders of each class were as follows:
Years ended December 31, | 2013 | 2012 |
From net investment income | | |
Initial Class | $ 13,323 | $ 5,389 |
Service Class | 580 | 807 |
Service Class 2 | 12,602 | 12,868 |
Initial Class R | 108,813 | 109,490 |
Service Class R | 580 | 807 |
Service Class 2R | 461 | 735 |
Investor Class R | 460,080 | 356,847 |
Total | $ 596,439 | $ 486,943 |
From net realized gain | | |
Initial Class | $ 1,753 | $ - |
Service Class | 88 | - |
Service Class 2 | 1,853 | - |
Initial Class R | 13,774 | - |
Service Class R | 88 | - |
Service Class 2R | 96 | - |
Investor Class R | 66,678 | - |
Total | $ 84,330 | $ - |
Annual Report
10. Share Transactions.
Transactions for each class of shares were as follows:
| Shares | Dollars |
Years ended December 31, | 2013 | 2012 | 2013 | 2012 |
Initial Class | | | | |
Shares sold | 225,575 | 8,980 | $ 2,755,189 | $ 86,362 |
Reinvestment of distributions | 1,244 | 520 | 15,076 | 5,389 |
Shares redeemed | (91,808) | (15,676) | (1,113,813) | (145,102) |
Net increase (decrease) | 135,011 | (6,176) | $ 1,656,452 | $ (53,351) |
Service Class | | | | |
Reinvestment of distributions | 55 | 78 | 668 | 807 |
Shares redeemed | (213) | - | (2,620) | - |
Net increase (decrease) | (158) | 78 | $ (1,952) | $ 807 |
Service Class 2 | | | | |
Shares sold | 205,988 | 181,170 | $ 2,464,727 | $ 1,780,864 |
Reinvestment of distributions | 1,200 | 1,247 | 14,455 | 12,868 |
Shares redeemed | (160,020) | (61,074) | (1,773,723) | (559,878) |
Net increase (decrease) | 47,168 | 121,343 | $ 705,459 | $ 1,233,854 |
Initial Class R | | | | |
Shares sold | 671,810 | 976,500 | $ 7,638,454 | $ 9,996,676 |
Reinvestment of distributions | 10,114 | 10,557 | 122,587 | 109,490 |
Shares redeemed | (1,047,613) | (472,161) | (11,628,951) | (4,456,994) |
Net increase (decrease) | (365,689) | 514,896 | $ (3,867,910) | $ 5,649,172 |
Service Class R | | | | |
Reinvestment of distributions | 55 | 78 | 668 | 807 |
Shares redeemed | (213) | - | (2,620) | - |
Net increase (decrease) | (158) | 78 | $ (1,952) | $ 807 |
Service Class 2R | | | | |
Reinvestment of distributions | 46 | 71 | 557 | 735 |
Shares redeemed | (187) | - | (2,298) | - |
Net increase (decrease) | (141) | 71 | $ (1,741) | $ 735 |
Investor Class R | | | | |
Shares sold | 3,811,446 | 1,363,457 | $ 43,371,608 | $ 13,420,273 |
Reinvestment of distributions | 43,751 | 34,641 | 526,758 | 356,847 |
Shares redeemed | (790,106) | (571,301) | (8,797,789) | (5,360,790) |
Net increase (decrease) | 3,065,091 | 826,797 | $ 35,100,577 | $ 8,416,330 |
11. Other.
The Fund's organizational documents provide former and current trustees and officers with a limited indemnification against liabilities arising in connection with the performance of their duties to the Fund. In the normal course of business, the Fund may also enter into contracts that provide general indemnifications. The Fund's maximum exposure under these arrangements is unknown as this would be dependent on future claims that may be made against the Fund. The risk of material loss from such claims is considered remote.
At the end of the period, the investment adviser or its affiliates were the owners of record of 96% of the total outstanding shares of the Fund.
Annual Report
Report of Independent Registered Public Accounting Firm
To the Trustees of Variable Insurance Products Fund II and the Shareholders of VIP International Capital Appreciation Portfolio:
In our opinion, the accompanying statement of assets and liabilities, including the schedule of investments, and the related statements of operations and of changes in net assets and the financial highlights present fairly, in all material respects, the financial position of VIP International Capital Appreciation Portfolio (a fund of Variable Insurance Products Fund II) at December 31, 2013, the results of its operations for the year then ended, the changes in its net assets for each of the two years in the period then ended and the financial highlights for each of the five years in the period then ended, in conformity with accounting principles generally accepted in the United States of America. These financial statements and financial highlights (hereafter referred to as "financial statements") are the responsibility of the VIP International Capital Appreciation Portfolio's management. Our responsibility is to express an opinion on these financial statements based on our audits. We conducted our audits of these financial statements in accordance with the standards of the Public Company Accounting Oversight Board (United States). Those standards require that we plan and perform the audit to obtain reasonable assurance about whether the financial statements are free of material misstatement. An audit includes examining, on a test basis, evidence supporting the amounts and disclosures in the financial statements, assessing the accounting principles used and significant estimates made by management, and evaluating the overall financial statement presentation. We believe that our audits, which included confirmation of securities at December 31, 2013 by correspondence with the custodian and brokers, provide a reasonable basis for our opinion.
PricewaterhouseCoopers LLP
Boston, Massachusetts
February 14, 2014
Annual Report
The Trustees, Member of the Advisory Board, and officers of the trust and fund, as applicable, are listed below. The Board of Trustees governs the fund and is responsible for protecting the interests of shareholders. The Trustees are experienced executives who meet periodically throughout the year to oversee the fund's activities, review contractual arrangements with companies that provide services to the fund, oversee management of the risks associated with such activities and contractual arrangements, and review the fund's performance. Except for James C. Curvey, Ned C. Lautenbach, Ronald P. O'Hanley, and William S. Stavropoulos, each of the Trustees oversees 173 funds. Mr. Curvey oversees 396 funds. Mr. Lautenbach, Mr. O'Hanley, and Mr. Stavropoulos each oversees 247 funds.
The Trustees hold office without limit in time except that (a) any Trustee may resign; (b) any Trustee may be removed by written instrument, signed by at least two-thirds of the number of Trustees prior to such removal; (c) any Trustee who requests to be retired or who has become incapacitated by illness or injury may be retired by written instrument signed by a majority of the other Trustees; and (d) any Trustee may be removed at any special meeting of shareholders by a two-thirds vote of the outstanding voting securities of the trust. Each Trustee who is not an interested person (as defined in the 1940 Act) of the trust and the fund (Independent Trustee), shall retire not later than the last day of the calendar year in which his or her 75th birthday occurs. The Independent Trustees may waive this mandatory retirement age policy with respect to individual Trustees. The officers and Advisory Board Member hold office without limit in time, except that any officer and Advisory Board Member may resign or may be removed by a vote of a majority of the Trustees at any regular meeting or any special meeting of the Trustees. Except as indicated, each individual has held the office shown or other offices in the same company for the past five years.
Experience, Skills, Attributes, and Qualifications of the Fund's Trustees. The Governance and Nominating Committee has adopted a statement of policy that describes the experience, qualifications, attributes, and skills that are necessary and desirable for potential Independent Trustee candidates (Statement of Policy). The Board believes that each Trustee satisfied at the time he or she was initially elected or appointed a Trustee, and continues to satisfy, the standards contemplated by the Statement of Policy. The Governance and Nominating Committee also engages professional search firms to help identify potential Independent Trustee candidates who have the experience, qualifications, attributes, and skills consistent with the Statement of Policy. From time to time, additional criteria based on the composition and skills of the current Independent Trustees, as well as experience or skills that may be appropriate in light of future changes to board composition, business conditions, and regulatory or other developments, have also been considered by the professional search firms and the Governance and Nominating Committee. In addition, the Board takes into account the Trustees' commitment and participation in Board and committee meetings, as well as their leadership of standing and ad hoc committees throughout their tenure.
In determining that a particular Trustee was and continues to be qualified to serve as a Trustee, the Board has considered a variety of criteria, none of which, in isolation, was controlling. The Board believes that, collectively, the Trustees have balanced and diverse experience, qualifications, attributes, and skills, which allow the Board to operate effectively in governing the fund and protecting the interests of shareholders. Information about the specific experience, skills, attributes, and qualifications of each Trustee, which in each case led to the Board's conclusion that the Trustee should serve (or continue to serve) as a trustee of the fund, is provided below.
Board Structure and Oversight Function. James C. Curvey is an interested person (as defined in the 1940 Act) and currently serves as Chairman. The Trustees have determined that an interested Chairman is appropriate and benefits shareholders because an interested Chairman has a personal and professional stake in the quality and continuity of services provided to the fund. Independent Trustees exercise their informed business judgment to appoint an individual of their choosing to serve as Chairman, regardless of whether the Trustee happens to be independent or a member of management. The Independent Trustees have determined that they can act independently and effectively without having an Independent Trustee serve as Chairman and that a key structural component for assuring that they are in a position to do so is for the Independent Trustees to constitute a substantial majority for the Board. The Independent Trustees also regularly meet in executive session. Ned C. Lautenbach serves as Chairman of the Independent Trustees and as such (i) acts as a liaison between the Independent Trustees and management with respect to matters important to the Independent Trustees and (ii) with management prepares agendas for Board meetings.
Fidelity funds are overseen by different Boards of Trustees. The fund's Board oversees Fidelity's equity and high income funds and another Board oversees Fidelity's investment-grade bond, money market, and asset allocation funds. The asset allocation funds may invest in Fidelity funds overseen by the fund's Board. The use of separate Boards, each with its own committee structure, allows the Trustees of each group of Fidelity funds to focus on the unique issues of the funds they oversee, including common research, investment, and operational issues. On occasion, the separate Boards establish joint committees to address issues of overlapping consequences for the Fidelity funds overseen by each Board.
The Trustees operate using a system of committees to facilitate the timely and efficient consideration of all matters of importance to the Trustees, the fund, and fund shareholders and to facilitate compliance with legal and regulatory requirements and oversight of the fund's activities and associated risks. The Board, acting through its committees, has charged FMR and its affiliates with (i) identifying events or circumstances the occurrence of which could have demonstrably adverse effects on the fund's business and/or reputation; (ii) implementing processes and controls to lessen the possibility that such events or circumstances occur or to mitigate the effects of such events or circumstances if they do occur; and (iii) creating and maintaining a system designed to evaluate continuously business and market conditions in order to facilitate the identification and implementation processes described in (i) and (ii) above. Because the day-to-day operations and activities of the fund are carried out by or through FMR, its affiliates and other service providers, the fund's exposure to risks is mitigated but not eliminated by the processes overseen by the Trustees. While each of the Board's committees has responsibility for overseeing different aspects of the fund's activities, oversight is exercised primarily through the Operations, Audit, and Compliance Committees. In addition, the Independent Trustees have worked with FMR to enhance the Board's oversight of investment and financial risks, legal and regulatory risks, technology risks, and operational risks, including the development of additional risk reporting to the Board. For example, a working group comprised of Independent Trustees and FMR has worked and continues to work to review the Fidelity fund's valuation-related activities, reporting and risk management. Appropriate personnel, including but not limited to the fund's Chief Compliance Officer (CCO), FMR's internal auditor, the independent accountants, the fund's Treasurer and portfolio management personnel, make periodic reports to the Board's committees, as appropriate, including an annual review of FMR's risk management program for the Fidelity funds. The responsibilities of each standing committee, including their oversight responsibilities, are described further under "Standing Committees of the Fund's Trustees."
Annual Report
The fund's Statement of Additional Information (SAI) includes more information about the Trustees. To request a free copy, call Fidelity at 1-877-208-0098.
Interested Trustees*:
Correspondence intended for each Trustee who is an interested person may be sent to Fidelity Investments, 245 Summer Street, Boston, Massachusetts 02210.
Name, Year of Birth; Principal Occupations and Other Relevant Experience+ |
James C. Curvey (1935) |
Year of Election or Appointment: 2007 Trustee Chairman of the Board of Trustees |
| Mr. Curvey also serves as Trustee of other Fidelity funds. Mr. Curvey is a Director of Fidelity Investments Money Management, Inc. (2009-present), Director of Fidelity Research & Analysis Co. (2009-present) and Director of FMR and FMR Co., Inc. (2007-present). Mr. Curvey is also Vice Chairman (2007-present) and Director of FMR LLC. In addition, Mr. Curvey serves as an Overseer for the Boston Symphony Orchestra and a member of the Trustees of Villanova University. Previously, Mr. Curvey was the Vice Chairman (2006-2007) and Director (2000-2007) of FMR Corp. |
Ronald P. O'Hanley (1957) |
Year of Election or Appointment: 2011 Trustee |
| Mr. O'Hanley also serves as Trustee of other Fidelity funds. He is Director of Fidelity SelectCo, LLC (2013-present), FMR Co., Inc. (2010-present), Director of Fidelity Investments Money Management, Inc. (2010-present), Director of Fidelity Research & Analysis Company (2010-present), President of Fidelity Asset Management and Corporate Services and a Member of Fidelity's Executive Committee (2010-present). Previously, Mr. O'Hanley served as President and Chief Executive Officer of BNY Mellon Asset Management (2007-2010). Mr. O'Hanley also served as Vice Chairman of Bank New York Mellon Corp. and a member of that firm's Executive Committee. Prior to the 2007 merger of The Bank of New York and Mellon Financial Corporation, he was Vice Chairman of Mellon Financial Corporation and President and Chief Executive Officer of Mellon Asset Management. He joined Mellon in February 1997. Mr. O'Hanley currently serves as Chairman of the Boston Public Library Foundation Board of Directors and sits on the Board of Directors of Beth Israel Deaconess Medical Center, the Board of Trustees of the Marine Biological Laboratory and the Advisory Board of the Maxwell School of Citizenship and Public Administration at Syracuse University. Mr. O'Hanley also chairs the Council on Asset Management for the Financial Services Roundtable and is a member of the Board of Directors of Institutional Investor's U.S. Institute. |
* Trustees have been determined to be "Interested Trustees" by virtue of, among other things, their affiliation with the trust or various entities under common control with FMR.
+ The information above includes each Trustee's principal occupation during the last five years and other information relating to the experience, attributes, and skills relevant to each Trustee's qualifications to serve as a Trustee, which led to the conclusion that each Trustee should serve as a Trustee for the fund.
Annual Report
Trustees and Officers - continued
Independent Trustees:
Correspondence intended for each Independent Trustee (that is, the Trustees other than the Interested Trustees) may be sent to Fidelity Investments, P.O. Box 55235, Boston, Massachusetts 02205-5235.
Name, Year of Birth; Principal Occupations and Other Relevant Experience+ |
Dennis J. Dirks (1948) |
Year of Election or Appointment: 2005 Trustee |
| Mr. Dirks also serves as Trustee of other Fidelity funds. Prior to his retirement in May 2003, Mr. Dirks was Chief Operating Officer and a member of the Board of The Depository Trust & Clearing Corporation (DTCC). He also served as President, Chief Operating Officer, and Board member of The Depository Trust Company (DTC) and President and Board member of the National Securities Clearing Corporation (NSCC). In addition, Mr. Dirks served as Chief Executive Officer and Board member of the Government Securities Clearing Corporation, Chief Executive Officer and Board member of the Mortgage-Backed Securities Clearing Corporation, as a Trustee and a member of the Finance Committee of Manhattan College (2005-2008), and as a Trustee and a member of the Finance Committee of AHRC of Nassau County (2006-2008). Mr. Dirks is a member of the Independent Directors Council (IDC) Governing Council (2010-present) and Board of Directors for The Brookville Center for Children's Services, Inc. (2009-present). |
Alan J. Lacy (1953) |
Year of Election or Appointment: 2008 Trustee |
| Mr. Lacy also serves as Trustee of other Fidelity funds. Mr. Lacy serves as Senior Adviser (2007-present) of Oak Hill Capital Partners, L.P. (private equity). Mr. Lacy also served as Chief Executive Officer (2000-2005) and Vice Chairman (2005-2006) of Sears Holdings Corporation and Sears, Roebuck and Co. (retail). In addition, Mr. Lacy serves as a member of the Board of Directors of Dave & Buster's Entertainment, Inc. (restaurant and entertainment complexes, 2010-present), Earth Fare, Inc. (retail grocery, 2012-present), The Hillman Companies, Inc. (hardware wholesalers, 2010-present), and Bristol-Myers Squibb Company (global pharmaceuticals, 2008-present). Mr. Lacy is a member of the Board of Trustees of The National Parks Conservation Association (2006-present). Previously, Mr. Lacy served as Chairman of the Board of Trustees of the National Parks Conservation Association (2008-2011) and as a member of the Board of Directors for the Western Union Company (global money transfer, 2006-2011). |
Ned C. Lautenbach (1944) |
Year of Election or Appointment: 2000 Trustee Chairman of the Independent Trustees |
| Mr. Lautenbach also serves as Trustee of other Fidelity funds. Mr. Lautenbach currently serves as the Lead Director of the Eaton Corporation Board of Directors (diversified industrial, 1997-present). Mr. Lautenbach is Chairman of the Board of Directors of the Philharmonic Center for the Arts in Naples, Florida (2012-present) and a member of the Council on Foreign Relations (1994-present). Previously, Mr. Lautenbach was a Partner/Advisory Partner at Clayton, Dubilier & Rice, LLC (private equity investment, 1998-2010), as well as a Director of Sony Corporation (2006-2007). |
Joseph Mauriello (1944) |
Year of Election or Appointment: 2008 Trustee |
| Mr. Mauriello also serves as Trustee of other Fidelity funds. Prior to his retirement in January 2006, Mr. Mauriello served in numerous senior management positions including Deputy Chairman and Chief Operating Officer (2004-2005), and Vice Chairman of Financial Services (2002-2004) of KPMG LLP US (professional services, 1965-2005). Mr. Mauriello currently serves as a member of the Board of Directors of XL Group plc. (global insurance and re-insurance, 2006-present). Previously, Mr. Mauriello served as a Director of the Hamilton Funds of the Bank of New York (2006-2007) and of Arcadia Resources Inc. (health care services and products, 2007-2012). |
Robert W. Selander (1950) |
Year of Election or Appointment: 2011 Trustee |
| Mr. Selander also serves as Trustee of other Fidelity funds. Previously, Mr. Selander served as a Member of the Advisory Board of other Fidelity funds (2011), and Executive Vice Chairman (2010), Chief Executive Officer (2009-2010), and President and Chief Executive Officer (1997-2009) of Mastercard, Inc. |
Cornelia M. Small (1944) |
Year of Election or Appointment: 2005 Trustee |
| Ms. Small also serves as Trustee of other Fidelity funds. Ms. Small is a member of the Board of Directors (2009-present) and Chair of the Investment Committee (2010-present) of the Teagle Foundation. Ms. Small also serves on the Investment Committee of the Berkshire Taconic Community Foundation (2008-present). Previously, Ms. Small served as Chairperson (2002-2008) and a member of the Investment Committee and Chairperson (2008-2012) and a member of the Board of Trustees of Smith College. In addition, Ms. Small served as Chief Investment Officer, Director of Global Equity Investments, and a member of the Board of Directors of Scudder, Stevens & Clark and Scudder Kemper Investments. |
William S. Stavropoulos (1939) |
Year of Election or Appointment: 2001 Trustee Vice Chairman of the Independent Trustees |
| Mr. Stavropoulos also serves as Trustee of other Fidelity funds. Mr. Stavropoulos serves as President and Founder of the Michigan Baseball Foundation, the Great Lakes Loons (2007-present). Mr. Stavropoulos is Chairman Emeritus of the Board of Directors of The Dow Chemical Company, where he previously served in numerous senior management positions, including President, CEO (1995-2000; 2002-2004), Chairman of the Executive Committee (2000-2006), and as a member of the Board of Directors (1990-2006). Currently, Mr. Stavropoulos is Chairman of the Board of Directors of Univar Inc. (global distributor of commodity and specialty chemicals), a Director of Teradata Corporation (data warehousing and technology solutions), and Maersk Inc. (industrial conglomerate), and a member of the Advisory Board for Metalmark Capital LLC (private equity investment, 2005-present). Mr. Stavropoulos is an operating advisor to Clayton, Dubilier & Rice, LLC (private equity investment). In addition, Mr. Stavropoulos is a member of the University of Notre Dame Advisory Council for the College of Science, a Trustee of the Rollin L. Gerstacker Foundation, and a Director of the Naples Philharmonic Center for the Arts. Previously, Mr. Stavropoulos served as a Director of Chemical Financial Corporation (bank holding company, 1993-2012) and Tyco International, Ltd. (multinational manufacturing and services, 2007-2012). |
David M. Thomas (1949) |
Year of Election or Appointment: 2008 Trustee |
| Mr. Thomas also serves as Trustee of other Fidelity funds. Mr. Thomas serves as Non-Executive Chairman of the Board of Directors of Fortune Brands Home and Security (home and security products, 2011-present), and as a member of the Board of Directors of Interpublic Group of Companies, Inc. (marketing communication, 2004-present). Previously, Mr. Thomas served as Executive Chairman (2005-2006) and Chairman and Chief Executive Officer (2000-2005) of IMS Health, Inc. (pharmaceutical and healthcare information solutions), and a Director of Fortune Brands, Inc. (consumer products, 2000-2011). |
+ The information above includes each Trustee's principal occupation during the last five years and other information relating to the experience, attributes, and skills relevant to each Trustee's qualifications to serve as a Trustee, which led to the conclusion that each Trustee should serve as a Trustee for the fund.
Advisory Board Member and Officers:
Correspondence intended for each officer and Peter S. Lynch may be sent to Fidelity Investments, 245 Summer Street, Boston, Massachusetts 02210. Officers appear below in alphabetical order.
Name, Year of Birth; Principal Occupation |
Peter S. Lynch (1944) |
Year of Election or Appointment: 2003 Member of the Advisory Board |
| Mr. Lynch also serves as Member of the Advisory Board of other Fidelity funds. Mr. Lynch is Vice Chairman and a Director of FMR and FMR Co., Inc. In addition, Mr. Lynch serves as a Trustee of Boston College and as the Chairman of the Inner-City Scholarship Fund. Previously, Mr. Lynch served on the Special Olympics International Board of Directors (1997-2006). |
Elizabeth Paige Baumann (1968) |
Year of Election or Appointment: 2012 Anti-Money Laundering (AML) Officer |
| Ms. Baumann also serves as AML Officer of other funds. She is Chief AML Officer of FMR LLC (2012-present) and is an employee of Fidelity Investments. Previously, Ms. Baumann served as Vice President and Deputy Anti-Money Laundering Officer (2007-2012). |
William C. Coffey (1969) |
Year of Election or Appointment: 2009 Assistant Secretary |
| Mr. Coffey also serves as Assistant Secretary of other funds. He is Senior Vice President and Deputy General Counsel of FMR LLC (2010-present), and is an employee of Fidelity Investments. Previously, Mr. Coffey served as Vice President and Associate General Counsel of FMR LLC (2005-2009). |
Jonathan Davis (1968) |
Year of Election or Appointment: 2010 Assistant Treasurer |
| Mr. Davis also serves as Assistant Treasurer of other funds. Mr. Davis is an employee of Fidelity Investments. Previously, Mr. Davis served as Vice President and Associate General Counsel of FMR LLC (2003-2010). |
Adrien E. Deberghes (1967) |
Year of Election or Appointment: 2008 Deputy Treasurer |
| Mr. Deberghes also serves as an officer of other funds. He is an employee of Fidelity Investments (2008-present). Prior to joining Fidelity Investments, Mr. Deberghes was Senior Vice President of Mutual Fund Administration at State Street Corporation (2007-2008), Senior Director of Mutual Fund Administration at Investors Bank & Trust (2005-2007), and Director of Finance for Dunkin' Brands (2000-2005). |
Stephanie J. Dorsey (1969) |
Year of Election or Appointment: 2010 Assistant Treasurer |
| Ms. Dorsey also serves as an officer of other funds. She is an employee of Fidelity Investments (2008-present) and has served in other fund officer roles. Prior to joining Fidelity Investments, Ms. Dorsey served as Treasurer (2004-2008) of the JPMorgan Mutual Funds and Vice President (2004-2008) of JPMorgan Chase Bank. |
Scott C. Goebel (1968) |
Year of Election or Appointment: 2008 Secretary and Chief Legal Officer (CLO) |
| Mr. Goebel serves as Secretary and CLO of other funds. Mr. Goebel also serves as Secretary of Fidelity Investments Money Management, Inc. (FIMM) (2010-present) and Fidelity Research and Analysis Company (FRAC) (2010-present); General Counsel, Secretary, and Senior Vice President of FMR (2008-present) and FMR Co., Inc. (2008-present); Chief Legal Officer of Fidelity Management & Research (Hong Kong) Limited (2008-present) and Assistant Secretary of Fidelity Management & Research (Japan) Inc. (2008-present), and Fidelity Management & Research (U.K.) Inc. (2008-present). Previously, Mr. Goebel served as Secretary and CLO of other Fidelity funds (2008-2013), Assistant Secretary of FIMM (2008-2010), FRAC (2008-2010), and certain funds (2007-2008); and as Vice President and Secretary of Fidelity Distributors Corporation (FDC) (2005-2007). Mr. Goebel has been employed by FMR LLC or an affiliate since 2001. |
Joseph A. Hanlon (1968) |
Year of Election or Appointment: 2012 Chief Compliance Officer |
| Mr. Hanlon also serves as Chief Compliance Officer of other funds. Mr. Hanlon serves as Compliance Officer of FMR, FMR Co., Inc., Fidelity Investments Money Management, Inc. (FIMM), Fidelity Research and Analysis Company (FRAC), and Fidelity Management & Research (Hong Kong) (2009-present), as Senior Vice President of the Fidelity Asset Management Division (2009-present), and is an employee of Fidelity Investments. Previously, Mr. Hanlon served as Compliance Officer of Fidelity Management & Research (Japan) Inc. (2009-2013), Strategic Advisers, Inc. (2009-2013), and Fidelity Management & Research (U.K.) Inc. (2009-2013). |
Bruce T. Herring (1965) |
Year of Election or Appointment: 2006 Vice President of certain Equity Funds |
| Mr. Herring also serves as Vice President of other funds. He serves as Chief Investment Officer of Fidelity Global Asset Allocation (GAA) (2013-present), Group Chief Investment Officer of FMR, and President of Fidelity Research & Analysis Company (2010-present). Previously, Mr. Herring served as Chief Investment Officer and Director of Fidelity Management & Research (U.K.) Inc. (2010-2013), Vice President (2005-2006) and Senior Vice President (2006-2007) of Fidelity Management & Research Company, Vice President of FMR Co., Inc. (2001-2007), and as a portfolio manager for Fidelity U.S. Equity Funds. |
Brian B. Hogan (1964) |
Year of Election or Appointment: 2009 Vice President |
| Mr. Hogan also serves as Vice President of other funds. Mr. Hogan serves as President of FMR's Equity Division (2009-present). Previously, Mr. Hogan served as Senior Vice President, Equity Research of FMR (2006-2009) and as a portfolio manager. |
Chris Maher (1972) |
Year of Election or Appointment: 2013 Assistant Treasurer |
| Mr. Maher serves as Assistant Treasurer of other funds. Mr. Maher is Vice President of Valuation Oversight and is an employee of Fidelity Investments. Previously, Mr. Maher served as Vice President of Asset Management Compliance (2013), Vice President of FMR's Program Management Group (2010-2013), and Vice President of Valuation Oversight (2008-2010). |
Christine Reynolds (1958) |
Year of Election or Appointment: 2008 Chief Financial Officer |
| Ms. Reynolds also serves as Chief Financial Officer of other funds. Ms. Reynolds became President of Fidelity Pricing and Cash Management Services (FPCMS) in August 2008. Ms. Reynolds served as Chief Operating Officer of FPCMS (2007-2008). Previously, Ms. Reynolds served as President, Treasurer, and Anti-Money Laundering officer of the Fidelity funds (2004-2007). |
Kenneth B. Robins (1969) |
Year of Election or Appointment: 2008 President and Treasurer |
| Mr. Robins also serves as an officer of other funds. Mr. Robins serves as Executive Vice President of Fidelity Investments Money Management, Inc. (FIMM) (2013-present) and is an employee of Fidelity Investments (2004-present). Previously, Mr. Robins served in other fund officer roles. |
Gary W. Ryan (1958) |
Year of Election or Appointment: 2005 Assistant Treasurer |
| Mr. Ryan also serves as Assistant Treasurer of other funds. Mr. Ryan is an employee of Fidelity Investments and has served in other fund officer roles. Previously, Mr. Ryan served as Vice President of Fund Reporting in Fidelity Pricing and Cash Management Services (FPCMS) (1999-2005). |
Stephen Sadoski (1971) |
Year of Election or Appointment: 2012 Deputy Treasurer |
| Mr. Sadoski also serves as Deputy Treasurer of other funds. He is an employee of Fidelity Investments (2012-present) and has served in another fund officer role. Prior to joining Fidelity Investments, Mr. Sadoski served as an assistant chief accountant in the Division of Investment Management of the Securities and Exchange Commission (SEC) (2009-2012) and as a senior manager at Deloitte & Touche LLP (1997-2009). |
Stacie M. Smith (1974) |
Year of Election or Appointment: 2013 Deputy Treasurer |
| Ms. Smith also serves as an officer of other funds. She is an employee of Fidelity Investments (2009-present) and has served in other fund officer roles. Prior to joining Fidelity Investments, Ms. Smith served as Senior Audit Manager of Ernst & Young LLP (1996-2009). |
Renee Stagnone (1975) |
Year of Election or Appointment: 2013 Deputy Treasurer |
| Ms. Stagnone also serves as Deputy Treasurer of other funds. Ms. Stagnone is an employee of Fidelity Investments. |
Joseph F. Zambello (1957) |
Year of Election or Appointment: 2011 Deputy Treasurer |
| Mr. Zambello also serves as Deputy Treasurer of other funds. Mr. Zambello is an employee of Fidelity Investments. Previously, Mr. Zambello served as Vice President of FMR's Program Management Group (2009-2011) and Vice President of the Transfer Agent Oversight Group (2005-2009). |
Annual Report
The percentage of dividends distributed during the fiscal year representing income derived from sources within, and taxes paid to, foreign countries or possessions of the United States are as follows:
| Pay Date | Income | Taxes |
Initial Class | 12/13/2013 | $0.098 | $0.0119 |
Service Class | 12/13/2013 | $0.088 | $0.0119 |
Service Class 2 | 12/13/2013 | $0.090 | $0.0119 |
Initial Class designates 16%, Service Class designates 17%, and Service Class 2 designates 17% of the dividends distributed during the fiscal year as qualifying for the dividends-received deduction for corporate shareholders.
Annual Report
Board Approval of Investment Advisory Contracts and Management Fees
VIP International Capital Appreciation Portfolio
Each year, the Board of Trustees, including the Independent Trustees (together, the Board), votes on the renewal of the management contract and sub-advisory agreements (together, the Advisory Contracts) for the fund. The Board, assisted by the advice of fund counsel and Independent Trustees' counsel, requests and considers a broad range of information relevant to the renewal of the Advisory Contracts throughout the year.
The Board meets regularly and, at each of its meetings, covers an extensive agenda of topics and materials and considers factors that are relevant to its annual consideration of the renewal of the fund's Advisory Contracts, including the services and support provided to the fund and its shareholders. The Board has established various standing committees, each composed of and chaired by Independent Trustees with varying backgrounds, to which the Board has assigned specific subject matter responsibilities in order to enhance effective decision-making by the Board. The Board, acting directly and through its Committees, requests and receives information concerning the annual consideration of the renewal of the fund's Advisory Contracts. The Board also meets as needed to consider matters specifically related to the Board's annual consideration of the renewal of Advisory Contracts. Members of the Board may also meet with trustees of other Fidelity funds through ad hoc joint committees to discuss certain matters relevant to the Fidelity funds.
At its July 2013 meeting, the Board, including the Independent Trustees, unanimously determined to renew the fund's Advisory Contracts. In reaching its determination, the Board considered all factors it believed relevant, including (i) the nature, extent, and quality of the services to be provided to the fund and its shareholders (including the investment performance of the fund); (ii) the competitiveness of the fund's management fee and total expense ratio relative to peer funds; (iii) the total costs of the services to be provided by and the profits to be realized by Fidelity from its relationship with the fund; (iv) the extent to which economies of scale exist and would be realized as the fund grows; and (v) whether fee levels reflect these economies of scale, if any, for the benefit of fund shareholders.
In considering whether to renew the Advisory Contracts for the fund, the Board reached a determination, with the assistance of fund counsel and Independent Trustees' counsel and through the exercise of its business judgment, that the renewal of the Advisory Contracts was in the best interests of the fund and its shareholders and that the compensation payable under the Advisory Contracts was fair and reasonable. The Board's decision to renew the Advisory Contracts was not based on any single factor, but rather was based on a comprehensive consideration of all the information provided to the Board at its meetings throughout the year. The Board, in reaching its determination to renew the Advisory Contracts, was aware that shareholders in the fund have a broad range of investment choices available to them, including a wide choice among mutual funds offered by Fidelity's competitors, and that the fund's shareholders, who have the opportunity to review and weigh the disclosure provided by the fund in its prospectus and other public disclosures, have chosen to invest in this fund, which is a part of the Fidelity family of funds.
Nature, Extent, and Quality of Services Provided. The Board considered the staffing within the investment adviser, Fidelity Management & Research Company (FMR), and the sub-advisers (together, the Investment Advisers) as it relates to the fund, including the backgrounds of the fund's investment personnel, and also considered the fund's investment objective, strategies, and related investment philosophy. The Independent Trustees also had discussions with senior management of Fidelity's investment operations and investment groups. The Board considered the structure of the portfolio manager compensation program and whether this structure provides appropriate incentives to act in the best interests of the fund.
Resources Dedicated to Investment Management and Support Services. The Board and the Fund Oversight and Research Committees reviewed the general qualifications and capabilities of the Investment Advisers' investment staff, including its size, education, experience, and resources, as well as the Investment Advisers' approach to recruiting, training, managing, and compensating investment personnel. The Board noted that FMR has continued to increase the resources devoted to non-U.S. offices, including expansion of Fidelity's global investment organization. The Board also noted that Fidelity's analysts have extensive resources, tools and capabilities that allow them to conduct sophisticated quantitative and fundamental analysis, as well as credit analysis of issuers, counterparties and guarantors. Further, the Board believes that Fidelity's investment professionals have sufficient access to global information and data so as to provide competitive investment results over time, and that those professionals also have access to sophisticated tools that permit them to assess portfolio construction and risk and performance attribution characteristics continuously, as well as to transmit new information and research conclusions rapidly around the world. Additionally, in its deliberations, the Board considered the Investment Advisers' trading and risk management capabilities and resources, which are an integral part of the investment management process.
Shareholder and Administrative Services. The Board considered (i) the nature, extent, quality, and cost of advisory, administrative, and shareholder services performed by the Investment Advisers and their affiliates under the Advisory Contracts and under separate agreements covering transfer agency, pricing and bookkeeping, and securities lending services for the fund; (ii) the nature and extent of the supervision of third party service providers, principally custodians and subcustodians; and (iii) the resources devoted to, and the record of compliance with, the fund's compliance policies and procedures. The Board also reviewed the allocation of fund brokerage, including allocations to brokers affiliated with the Investment Advisers, the use of brokerage commissions to pay fund expenses, and the use of "soft" commission dollars to pay for research services.
The Board noted that the growth of fund assets over time across the complex allows Fidelity to reinvest in the development of services designed to enhance the value or convenience of the Fidelity funds as investment vehicles. These services include 24-hour access to account information and market information through telephone representatives and over the Internet, investor education materials and asset allocation tools, and the expanded availability of Fidelity Investor Centers.
Annual Report
Investment in a Large Fund Family. The Board considered the benefits to shareholders of investing in a Fidelity fund, including the benefits of investing in a fund that is part of a large family of funds offering a variety of investment disciplines and providing a large variety of mutual fund investor services. The Board noted that Fidelity had taken, or had made recommendations that resulted in the Fidelity funds taking, a number of actions over the previous year that benefited particular funds, including (i) continuing to dedicate additional resources to investment research and to the support of the senior management team that oversees asset management; (ii) persisting in efforts to enhance Fidelity's global research capabilities; (iii) launching new funds and making other enhancements to meet client needs for global and income-oriented solutions; (iv) continuing to launch dedicated lower cost underlying funds to meet portfolio construction needs related to expanding underlying fund options for Fidelity funds of funds, specifically for the Freedom Fund product lines; (v) rationalizing product lines and gaining increased efficiencies through the mergers of several funds into other funds; (vi) strengthening Fidelity's index fund offerings by reducing investment minimums and adopting or lowering existing expense caps for certain funds and classes; (vii) enhancing Global Asset Allocation product offerings by launching new funds and strategies, including "open architecture" target date funds that utilize affiliated and unaffiliated sub-advisers; (viii) modifying the eligibility criteria for Institutional Class shares of Advisor funds to increase their marketability to a portion of the defined contribution plan market; (ix) creating a new low-cost retirement share class for certain Advisor funds to appeal to large retirement plans; (x) transitioning the management of certain Fidelity commodity funds to Geode Capital Management LLC, a registered commodity pool operator, while retaining administrative responsibilities for the funds; (xi) reorganizing a number of funds; and (xii) taking steps toward establishing a new Fidelity adviser to manage sector-based funds and products.
Investment Performance. The Board considered whether the fund has operated in accordance with its investment objective, as well as its record of compliance with its investment restrictions and its performance history.
The Board took into account discussions with the Investment Advisers about fund investment performance that occur at Board meetings throughout the year. In this regard the Board noted that as part of regularly scheduled fund reviews and other reports to the Board on fund performance, the Board periodically considers annualized return information for the fund, for different time periods, measured against a securities market index ("benchmark index") and a peer group of mutual funds with similar objectives ("peer group"). In its evaluation of fund investment performance, the Board gave particular attention to information indicating changes in performance of certain Fidelity funds for specific time periods and the Investment Advisers' explanations for any overperformance or underperformance.
In addition to reviewing absolute and relative fund performance, the Independent Trustees periodically consider the appropriateness of fund performance metrics in evaluating the results achieved. In general, the Independent Trustees believe that fund performance should be evaluated based on net performance (after fees and expenses) of both the highest performing and lowest performing classes, where applicable, compared to appropriate benchmark indices, over appropriate time periods which may include full market cycles, and compared to peer groups, as applicable, over the same periods, taking into account relevant factors including the following: general market conditions; issuer-specific information; tactical opportunities for investment; and fund cash flows and other factors.
The Independent Trustees recognize that shareholders evaluate performance on a net basis over their own holding periods, for which one-, three-, and five-year periods are used as a proxy. For this reason, the performance information reviewed by the Board also included net cumulative calendar year total return information for the fund and an appropriate benchmark index and peer group for the most recent one-, three-, and five-year periods, as shown below. Returns are shown compared to the 25th percentile (top of box) and 75th percentile (bottom of box) of the peer universe. Returns of the benchmark index are "net MA," i.e., adjusted for tax withholding rates applicable to U.S.-based mutual funds organized as Massachusetts business trusts.
Annual Report
Board Approval of Investment Advisory Contracts and Management Fees - continued
VIP International Capital Appreciation Portfolio

Based on its review, the Board concluded that the nature, extent, and quality of services provided to the fund under the Advisory Contracts should benefit the fund's shareholders.
Competitiveness of Management Fee and Total Expense Ratio. The Board considered the fund's management fee and total expense ratio compared to "mapped groups" of competitive funds and classes. Fidelity creates "mapped groups" by combining similar Lipper investment objective categories that have comparable management fee characteristics. Combining Lipper investment objective categories aids the Board's management fee and total expense ratio comparisons by broadening the competitive group used for comparison and by reducing the number of universes to which various Fidelity funds are compared.
Management Fee. The Board considered two proprietary management fee comparisons for the 12-month periods shown in the chart below. The group of Lipper funds used by the Board for management fee comparisons is referred to below as the "Total Mapped Group." The Total Mapped Group comparison focuses on a fund's standing in terms of gross management fees before expense reimbursements or caps relative to the total universe of funds with comparable investment mandates, regardless of whether their management fee structures also are comparable. Funds with comparable investment mandates offer exposure to similar types of securities. Funds with comparable management fee structures have similar management fee contractual arrangements (e.g., flat rate charged for advisory services, all-inclusive fee rate, etc.). "TMG %" represents the percentage of funds in the Total Mapped Group that had management fees that were lower than the fund's. For example, a TMG % of 19% means that 81% of the funds in the Total Mapped Group had higher management fees than the fund. The "Asset-Size Peer Group" (ASPG) comparison focuses on a fund's standing relative to a subset of non-Fidelity funds within the Total Mapped Group that are similar in size and management fee structure. The ASPG represents at least 15% of the funds in the Total Mapped Group with comparable asset size and management fee structures, subject to a minimum of 50 funds (or all funds in the Total Mapped Group if fewer than 50). Additional information, such as the ASPG quartile in which the fund's management fee ranked, is also included in the chart and considered by the Board.
Annual Report
VIP International Capital Appreciation Portfolio

The Board noted that the fund's management fee ranked below the median of its Total Mapped Group and below the median of its ASPG for 2012.
Based on its review, the Board concluded that the fund's management fee is fair and reasonable in light of the services that the fund receives and the other factors considered.
Total Expense Ratio. In its review of each class's total expense ratio, the Board considered the fund's management fee as well as other fund or class expenses, as applicable, such as transfer agent fees, pricing and bookkeeping fees, fund-paid 12b-1 fees, and custodial, legal, and audit fees. The Board also noted the effects of any waivers and reimbursements on fees and expenses. As part of its review, the Board also considered the current and historical total expense ratios of each class of the fund compared to competitive fund median expenses. Each class of the fund is compared to those funds and classes in the Total Mapped Group (used by the Board for management fee comparisons) that have a similar sales load structure.
The Board noted that the total expense ratio of each class ranked above its competitive median for 2012. The Board considered that, in general, various factors can affect total expense ratios. The Board also noted that Investor Class R has higher transfer agent fees than traditional variable annuity classes because it is designed for lower cost annuity products, where the majority of servicing costs are incorporated into the funds' total expense ratios rather than being paid at the annuity level. The Board noted that the fund offers multiple classes, each of which has a different 12b-1 fee structure, and that the multiple structures are intended to offer a range of pricing options for the intermediary market. The Board also noted that the total expense ratios of the classes vary primarily by the level of their 12b-1 fees, although differences in transfer agent fees may also cause expenses to vary from class to class.
Fees Charged to Other Fidelity Clients. The Board also considered Fidelity fee structures and other information with respect to clients of FMR and its affiliates, such as other mutual funds advised or subadvised by FMR or its affiliates, pension plan clients, and other institutional clients. The Board noted the findings of the 2013 ad hoc joint committee (created with the board of other Fidelity funds), which reviewed and compared Fidelity's institutional investment advisory business with its business of providing services to the Fidelity funds, including the differences in services provided, fees charged, and costs incurred, as well as competition in their respective marketplaces.
Based on its review of total expense ratios and fees charged to other Fidelity clients, the Board concluded that the total expense ratio of each class of the fund was reasonable, although in all cases above the median of the universe presented for comparison, in light of the services that the fund and its shareholders receive and the other factors considered.
Costs of the Services and Profitability. The Board considered the revenues earned and the expenses incurred by Fidelity in conducting the business of developing, marketing, distributing, managing, administering and servicing the fund and servicing the fund's shareholders. The Board also considered the level of Fidelity's profits in respect of all the Fidelity funds.
On an annual basis, FMR presents to the Board Fidelity's profitability for the fund. Fidelity calculates the profitability for each fund, as well as aggregate profitability for groups of Fidelity funds and all Fidelity funds, using a series of detailed revenue and cost allocation methodologies which originate with the books and records of Fidelity on which Fidelity's audited financial statements are based. The Audit Committee of the Board reviews any significant changes from the prior year's methodologies.
Annual Report
Board Approval of Investment Advisory Contracts and Management Fees - continued
PricewaterhouseCoopers LLP (PwC), independent registered public accounting firm and auditor to Fidelity and certain Fidelity funds, has been engaged annually by the Board as part of the Board's assessment of Fidelity's profitability analysis. PwC's engagement includes the review and assessment of the methodologies used by Fidelity in determining the revenues and expenses attributable to Fidelity's mutual fund business, and completion of agreed-upon procedures surrounding the mathematical accuracy of fund profitability and its conformity to allocation methodologies. After considering PwC's reports issued under the engagement and information provided by Fidelity, the Board concluded that while other allocation methods may also be reasonable, Fidelity's profitability methodologies are reasonable in all material respects.
The Board also reviewed Fidelity's non-fund businesses and fall-out benefits related to the mutual fund business as well as cases where Fidelity's affiliates may benefit from or be related to the fund's business.
The Board considered the costs of the services provided by and the profits realized by Fidelity in connection with the operation of the fund and was satisfied that the profitability was not excessive in the circumstances.
Economies of Scale. The Board considered whether there have been economies of scale in respect of the management of the Fidelity funds, whether the Fidelity funds (including the fund) have appropriately benefited from any such economies of scale, and whether there is potential for realization of any further economies of scale. The Board considered the extent to which the fund will benefit from economies of scale through increased services to the fund, through waivers or reimbursements, or through fee or expense reductions. The Board also noted that in 2009, it and the board of other Fidelity funds created an ad hoc committee (the Economies of Scale Committee) to analyze whether FMR attains economies of scale in respect of the management and servicing of the Fidelity funds, whether the Fidelity funds have appropriately benefited from such economies of scale, and whether there is potential for realization of any further economies of scale.
The Board recognized that the fund's management contract incorporates a "group fee" structure, which provides for lower group fee rates as total fund assets under FMR's management increase, and for higher group fee rates as total fund assets under FMR's management decrease. FMR calculates the group fee rates based on a tiered asset "breakpoint" schedule that varies based on asset class. The Board considered that the group fee is designed to deliver the benefits of economies of scale to fund shareholders when total Fidelity fund assets increase, even if assets of any particular fund are unchanged or have declined, because some portion of Fidelity's costs are attributable to services provided to all Fidelity funds, and all funds benefit if those costs can be allocated among more assets. The Board concluded that, given the group fee structure, fund shareholders will benefit from lower management fees as assets under FMR's management increase at the fund complex level, regardless of whether Fidelity achieves any such economies of scale.
The Board concluded, taking into account the analysis of the Economies of Scale Committee, that economies of scale, if any, are being appropriately shared between fund shareholders and Fidelity.
Amendment to Description of Group Fee Rate. At its July 2013 meeting, the Board voted to approve an amendment to the fund's management contract to modify the description of the "group fee rate" effective August 1, 2013. The Board noted that under the prior description in the contract, the group fee rate was based on the average net assets of all registered investment companies with which FMR has management contracts. Under the contract's tiered asset breakpoint schedule, the group fee rate is lower as total fund assets under FMR's management increase, and higher as total fund assets under FMR's management decrease. The Board considered that the prior description would have excluded the assets of 64 Fidelity sector funds from the group fee rate calculation once Fidelity SelectCo, LLC, an affiliate of FMR, assumed management responsibilities for those funds. The Board noted that modifying the description of the group fee rate to continue to include the assets of those 64 funds for purposes of determining group fee rate breakpoints would avoid an immediate adverse impact on the group fee rate for any fund.
Additional Information Requested by the Board. In order to develop fully the factual basis for consideration of the Fidelity funds' Advisory Contracts, the Board requested and received additional information on certain topics, including: (i) fund performance trends and Fidelity's long-term strategies for certain funds; (ii) the potential to further rationalize the Fidelity fund lineup with the possibility of achieving savings for the funds and Fidelity; (iii) the methodology with respect to competitive fund data and peer group classifications; (iv) the arrangements with, and performance of, certain sub-advisers on behalf of the Fidelity funds, as well as certain proposed participating affiliate arrangements; (v) the realization of fall-out benefits in certain Fidelity business units; (vi) Fidelity's group fee structures, including the rationale for the individual fee rates of certain categories of funds and the definition of group assets; (vii) trends regarding industry use of performance fee structures and the performance adjustment methodologies applicable to the Fidelity funds; (viii) additional competitive analysis regarding the total expenses for certain classes; and (ix) fund profitability methodology, including Fidelity's cost allocation methodology, and the impact of certain factors on fund profitability results.
Based on its evaluation of all of the conclusions noted above, and after considering all factors it believed relevant, the Board ultimately concluded that the advisory fee structures are fair and reasonable, and that the fund's Advisory Contracts should be renewed.
Annual Report
Investment Adviser
Fidelity Management & Research Company
Boston, MA
Investment Sub-Advisers
FMR Co., Inc.
Fidelity Management & Research (U.K.) Inc.
FIL Investment Advisors
FIL Investment Advisors (UK) Limited
Fidelity Management & Research (Hong Kong) Limited
Fidelity Management & Research (Japan) Inc.
General Distributor
Fidelity Distributors Corporation
Smithfield, RI
Transfer and Service Agents
Fidelity Investments Institutional Operations Company, Inc.
Boston, MA
Fidelity Service Company, Inc.
Boston, MA
Custodian
Brown Brothers Harriman & Co.
Boston, MA
VIPCAP-ANN-0214
1.811843.109
Fidelity® Variable Insurance Products:
Index 500 Portfolio
Annual Report
December 31, 2013
(Fidelity Cover Art)
Contents
Performance | (Click Here) | How the fund has done over time. |
Management's Discussion of Fund Performance | (Click Here) | The Portfolio Manager's review of fund performance and strategy. |
Shareholder Expense Example | (Click Here) | An example of shareholder expenses. |
Investment Changes | (Click Here) | A summary of major shifts in the fund's investments over the past six months. |
Investments | (Click Here) | A complete list of the fund's investments with their market values. |
Financial Statements | (Click Here) | Statements of assets and liabilities, operations, and changes in net assets, as well as financial highlights. |
Notes | (Click Here) | Notes to the financial statements. |
Report of Independent Registered Public Accounting Firm | (Click Here) | |
Trustees and Officers | (Click Here) | |
Distributions | (Click Here) | |
Board Approval of Investment Advisory Contracts and Management Fees | (Click Here) | |
To view a fund's proxy voting guidelines and proxy voting record for the 12-month period ended June 30, visit http://www.fidelity.com/proxyvotingresults or visit the Securities and Exchange Commission's (SEC) web site at http://www.sec.gov. You may also call 1-877-208-0098 to request a free copy of the proxy voting guidelines.
Fidelity Variable Insurance Products are separate account options which are purchased through a variable insurance contract.
Standard & Poor's, S&P and S&P 500 are registered service marks of The McGraw-Hill Companies, Inc. and have been licensed for use by Fidelity Distributors Corporation.
Other third-party marks appearing herein are the property of their respective owners.
All other marks appearing herein are registered or unregistered trademarks or service marks of FMR LLC or an affiliated company. © 2014 FMR LLC. All rights reserved.
This report and the financial statements contained herein are submitted for the general information of the shareholders of the fund. This report is not authorized for distribution to prospective investors in the fund unless preceded or accompanied by an effective prospectus.
A fund files its complete schedule of portfolio holdings with the SEC for the first and third quarters of each fiscal year on Form N-Q. Forms N-Q are available on the SEC's web site at http://www.sec.gov. A fund's Forms N-Q may be reviewed and copied at the SEC's Public Reference Room in Washington, DC. Information regarding the operation of the SEC's Public Reference Room may be obtained by calling 1-800-SEC-0330. For a complete list of a fund's portfolio holdings, view the most recent holdings listing, semiannual report, or annual report on Fidelity's web site at http://www.fidelity.com, http://www.advisor.fidelity.com, or http://www.401k.com, as applicable.
NOT FDIC INSURED • MAY LOSE VALUE • NO BANK GUARANTEE
Neither the fund nor Fidelity Distributors Corporation is a bank.
Annual Report
Average annual total return reflects the change in the value of an investment, assuming reinvestment of the class' distributions from dividend income and capital gains (the profits earned upon the sale of securities that have grown in value, if any) and assuming a constant rate of performance each year. During periods of reimbursement by Fidelity, a fund's total return will be greater than it would be had the reimbursement not occurred. Performance numbers are net of all underlying fund operating expenses, but do not include any insurance charges imposed by your insurance company's separate account. If performance information included the effect of these additional charges, the total returns would have been lower. How a fund did yesterday is no guarantee of how it will do tomorrow.
Average Annual Total Returns
Periods ended December 31, 2013 | Past 1
year | Past 5
years | Past 10
years |
VIP Index 500 Portfolio - Initial Class | 32.25% | 17.90% | 7.34% |
VIP Index 500 Portfolio - Service Class | 32.12% | 17.78% | 7.23% |
VIP Index 500 Portfolio - Service Class 2 | 31.92% | 17.60% | 7.07% |
$10,000 Over 10 Years
Let's say hypothetically that $10,000 was invested in VIP Index 500 Portfolio - Initial Class on December 31, 2003. The chart shows how the value of your investment would have changed, and also shows how the S&P 500 ® Index performed over the same period.
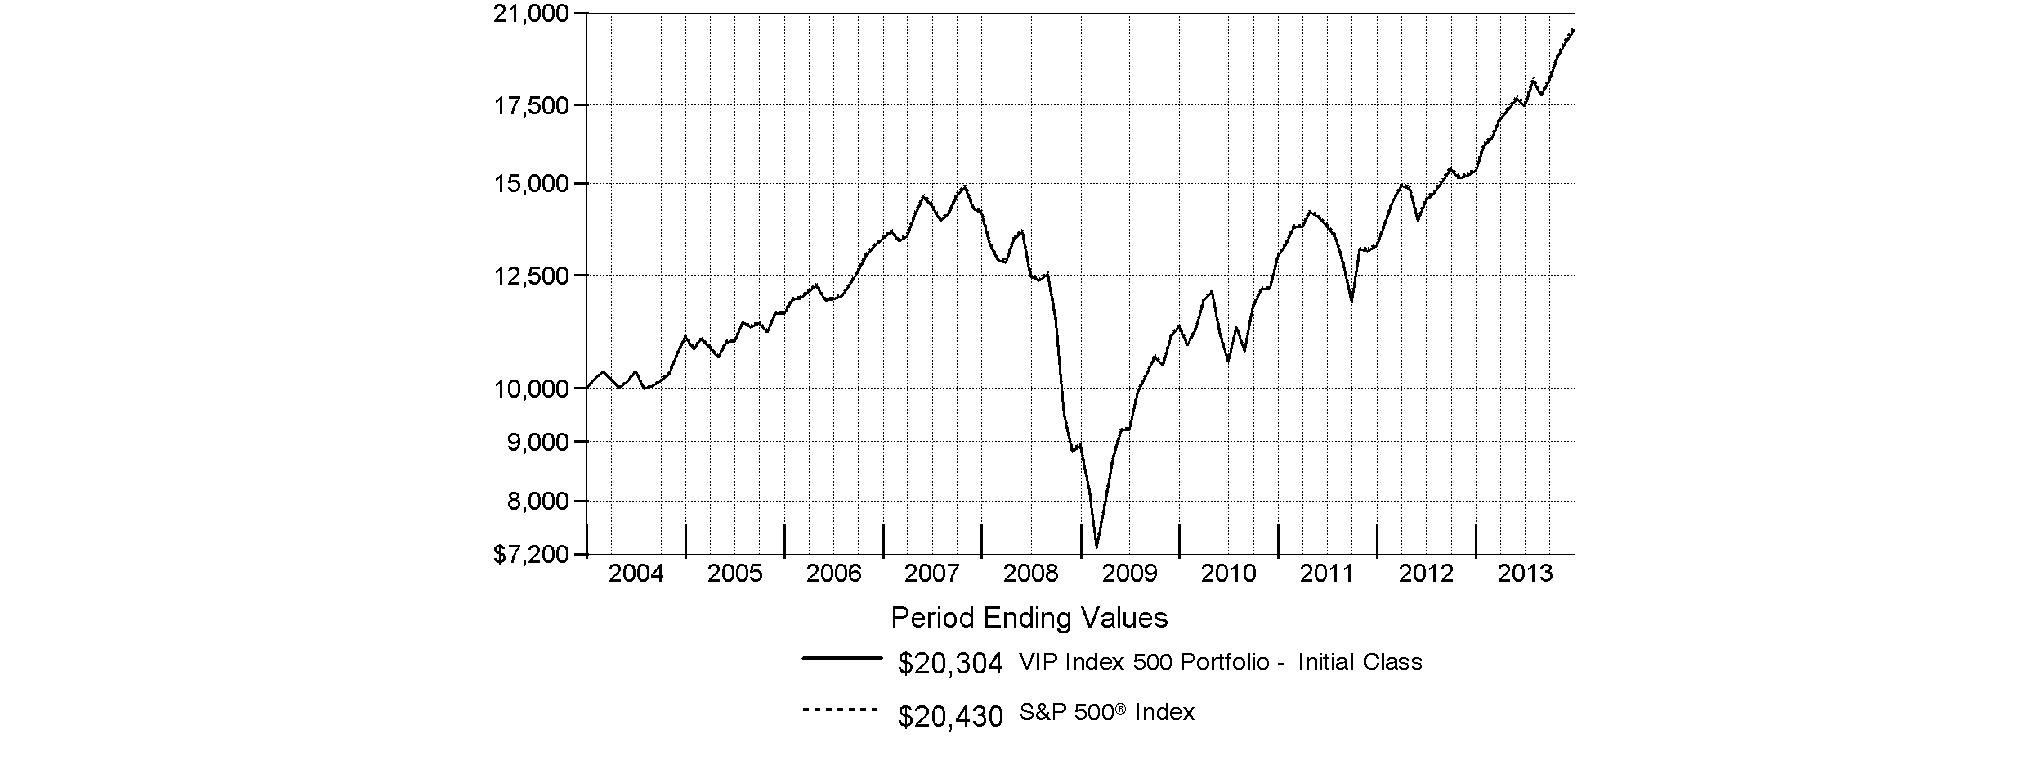
Annual Report
Market Recap: Global equity markets remained upbeat for the 12 months ending December 31, 2013, propelling the MSCI® ACWI® (All Country World Index) Index to a 23.24% return. Midyear turbulence gave way by autumn when policymakers in the U.S. and China had made clear their intentions to maintain accommodative monetary policies. That stance, combined with modest cyclical improvement around the globe and generally low valuations, underpinned the broad rally in equities, although the relative strength of the U.S. dollar generally tempered gains for U.S. investors holding foreign securities based in local currencies. During the period, the broad-market S&P 500® Index set a series of new highs, finishing the year up 32.39%. For the first time since 1995, the S&P® scored a "perfect 10," with all 10 economic sectors gaining at least 10% for the year. A resurgence in growth-oriented stocks lifted the Nasdaq Composite Index® to a 40.12% result for 2013, while the blue-chip Dow Jones Industrial AverageSM notched a relatively more modest 29.65% gain. International developed-markets equities rose in concert with their U.S. counterparts, with the MSCI® EAFE® Index gaining 22.92% for the period. Meanwhile, foreign exchange and commodity weakness curbed results in resource-heavy emerging markets (EM), especially in the year's waning months. More generally, concern over EM's slowing growth, its declining share of global trade and uncertainty surrounding U.S. central bank intentions were all factors hampering performance. The MSCI Emerging Markets Index returned -2.27% for the period. On the bond side, U.S. high-yield securities rallied with equities for much of the period, with The BofA Merrill LynchSM US High Yield Constrained Index returning 7.41% for 2013. The more rate-sensitive U.S. investment-grade bond category faced headwinds though, as reflected in the -2.02% return of the Barclays® U.S. Aggregate Bond Index. Within the Barclays index, investment-grade corporate credit returned -2.01%, while ultra-safe U.S. Treasuries saw a -2.75% result. Major non-U.S. developed markets performed only slightly better, with the Citigroup® Non-USD Group-of-Seven (G7) Equal Weighted Index logging a -1.59% result. After several years of strong advances, EM debt reversed course in 2013, with the J.P. Morgan Emerging Markets Bond Index Global returning -6.58%.
Comments from James Francis, Senior Portfolio Manager of the Geode Capital Management, LLC, investment management team for VIP Index 500 Portfolio: For the 12 months ending December 31, 2013, the fund's share classes performed roughly in line with the broadly based S&P 500® Index, which returned 32.39%. (For specific portfolio results, please refer to the performance section of this report.) In a very strong stock market environment, there were many more contributors than detractors. During the year, all 10 S&P® index sectors turned in double-digit performance, while three groups - consumer discretionary, health care and industrials - returned more than 40%. Within consumer discretionary, major online retailer Amazon.com did very well, especially in late October, after the company posted better-than-anticipated third-quarter sales and earnings. In the health care sector, pharmaceuticals and medical products company Johnson & Johnson contributed, as did biotechnology firm Gilead Sciences, whose shares more than doubled during the year. Meanwhile, the fund's top-performing industrials stock was conglomerate General Electric, which benefited from strong customer demand and favorable profit margin growth. In contrast, the worst-performing sectors of the year - telecommunication services and utilities - still managed gains of about 11% and 13%, respectively. In telecom, the biggest source of difficulty was CenturyLink, whose shares dropped sharply early in the year after the provider of communication services to rural areas cut its dividend. In utilities, FirstEnergy was the biggest detractor, with its stock shedding roughly 17%. The biggest overall detractor was Newmont Mining, a gold producer that struggled as the price of the commodity lost substantial value.
The views expressed above reflect those of the portfolio manager(s) only through the end of the period as stated on the cover of this report and do not necessarily represent the views of Fidelity or any other person in the Fidelity organization. Any such views are subject to change at any time based upon market or other conditions and Fidelity disclaims any responsibility to update such views. These views may not be relied on as investment advice and, because investment decisions for a Fidelity fund are based on numerous factors, may not be relied on as an indication of trading intent on behalf of any Fidelity fund.
Annual Report
As a shareholder of the Fund, you incur two types of costs: (1) transaction costs, and (2) ongoing costs, including management fees, distribution and/or service (12b-1) fees and other Fund expenses. This Example is intended to help you understand your ongoing costs (in dollars) of investing in the Fund and to compare these costs with the ongoing costs of investing in other mutual funds.
The Example is based on an investment of $1,000 invested at the beginning of the period and held for the entire period (July 1, 2013 to December 31, 2013).
Actual Expenses
The first line of the accompanying table for each class of the Fund provides information about actual account values and actual expenses. You may use the information in this line, together with the amount you invested, to estimate the expenses that you paid over the period. Simply divide your account value by $1,000.00 (for example, an $8,600 account value divided by $1,000.00 = 8.6), then multiply the result by the number in the first line for a class of the Fund under the heading entitled "Expenses Paid During Period" to estimate the expenses you paid on your account during this period. The estimate of expenses does not include any fees or other expenses of any variable annuity or variable life insurance product. If they were, the estimate of expenses you paid during the period would be higher, and your ending account value would be lower. In addition, the Fund, as a shareholder in the underlying Fidelity Central Funds, will indirectly bear its pro-rata share of the fees and expenses incurred by the underlying Fidelity Central Funds. These fees and expenses are not included in the Fund's annualized expense ratio used to calculate the expense estimate in the table below.
Hypothetical Example for Comparison Purposes
The second line of the accompanying table for each class of the Fund provides information about hypothetical account values and hypothetical expenses based on a Class' actual expense ratio and an assumed rate of return of 5% per year before expenses, which is not the Class' actual return. The hypothetical account values and expenses may not be used to estimate the actual ending account balance or expenses you paid for the period. You may use this information to compare the ongoing costs of investing in the Fund and other funds. To do so, compare this 5% hypothetical example with the 5% hypothetical examples that appear in the shareholder reports of the other funds. The estimate of expenses does not include any fees or other expenses of any variable annuity or variable life insurance product. If they were, the estimate of expenses you paid during the period would be higher, and your ending account value would be lower. In addition, the Fund, as a shareholder in the underlying Fidelity Central Funds, will indirectly bear its pro-rata share of the fees and expenses incurred by the underlying Fidelity Central Funds. These fees and expenses are not included in the Fund's annualized expense ratio used to calculate the expense estimate in the table below.
Please note that the expenses shown in the table are meant to highlight your ongoing costs only and do not reflect any transaction costs. Therefore, the second line of the table is useful in comparing ongoing costs only, and will not help you determine the relative total costs of owning different funds.
| Annualized
Expense RatioB | Beginning
Account Value
July 1, 2013 | Ending
Account Value
December 31, 2013 | Expenses Paid
During Period*
July 1, 2013 to
December 31, 2013 |
Initial Class | .10% | | | |
Actual | | $ 1,000.00 | $ 1,162.50 | $ .55 |
HypotheticalA | | $ 1,000.00 | $ 1,024.70 | $ .51 |
Service Class | .20% | | | |
Actual | | $ 1,000.00 | $ 1,161.90 | $ 1.09 |
HypotheticalA | | $ 1,000.00 | $ 1,024.20 | $ 1.02 |
Service Class 2 | .35% | | | |
Actual | | $ 1,000.00 | $ 1,161.00 | $ 1.91 |
HypotheticalA | | $ 1,000.00 | $ 1,023.44 | $ 1.79 |
A 5% return per year before expenses
B Annualized expense ratio reflects expenses net of applicable fee waivers.
* Expenses are equal to each Class' annualized expense ratio, multiplied by the average account value over the period, multiplied by 184/365 (to reflect the one-half year period).
Annual Report
Investment Changes (Unaudited)
Top Ten Stocks as of December 31, 2013 |
| % of fund's
net assets | % of fund's net assets
6 months ago |
Apple, Inc. | 3.0 | 2.6 |
Exxon Mobil Corp. | 2.6 | 2.8 |
Google, Inc. Class A | 1.9 | 1.6 |
Microsoft Corp. | 1.7 | 1.8 |
General Electric Co. | 1.7 | 1.6 |
Johnson & Johnson | 1.6 | 1.6 |
Chevron Corp. | 1.4 | 1.6 |
Procter & Gamble Co. | 1.3 | 1.4 |
JPMorgan Chase & Co. | 1.3 | 1.4 |
Wells Fargo & Co. | 1.3 | 1.4 |
| 17.8 | |
Market Sectors as of December 31, 2013 |
| % of fund's
net assets | % of fund's net assets
6 months ago |
Information Technology | 18.4 | 17.5 |
Financials | 15.9 | 16.4 |
Health Care | 12.8 | 12.5 |
Consumer Discretionary | 12.3 | 12.0 |
Industrials | 10.8 | 10.0 |
Energy | 10.1 | 10.4 |
Consumer Staples | 9.6 | 10.3 |
Materials | 3.4 | 3.2 |
Utilities | 2.9 | 3.2 |
Telecommunication Services | 2.3 | 2.8 |
Asset Allocation |
To match the S&P 500® Index, the VIP Index 500 Portfolio seeks 100% investment exposure to stocks at all times. |
Annual Report
Investments December 31, 2013
Showing Percentage of Net Assets
Common Stocks - 98.5% |
| Shares | | Value |
CONSUMER DISCRETIONARY - 12.3% |
Auto Components - 0.4% |
BorgWarner, Inc. | 48,735 | | $ 2,724,774 |
Delphi Automotive PLC | 59,972 | | 3,606,116 |
Johnson Controls, Inc. | 146,704 | | 7,525,915 |
The Goodyear Tire & Rubber Co. | 52,877 | | 1,261,116 |
| | 15,117,921 |
Automobiles - 0.7% |
Ford Motor Co. | 844,769 | | 13,034,786 |
General Motors Co. (a) | 243,928 | | 9,969,337 |
Harley-Davidson, Inc. | 47,354 | | 3,278,791 |
| | 26,282,914 |
Distributors - 0.1% |
Genuine Parts Co. | 33,058 | | 2,750,095 |
Diversified Consumer Services - 0.0% |
H&R Block, Inc. | 58,524 | | 1,699,537 |
Hotels, Restaurants & Leisure - 1.7% |
Carnival Corp. unit | 93,810 | | 3,768,348 |
Chipotle Mexican Grill, Inc. (a)(d) | 6,627 | | 3,530,733 |
Darden Restaurants, Inc. | 27,963 | | 1,520,348 |
International Game Technology | 53,306 | | 968,037 |
Marriott International, Inc. Class A | 48,113 | | 2,374,858 |
McDonald's Corp. | 213,103 | | 20,677,384 |
Starbucks Corp. | 161,396 | | 12,651,832 |
Starwood Hotels & Resorts Worldwide, Inc. | 41,016 | | 3,258,721 |
Wyndham Worldwide Corp. | 27,907 | | 2,056,467 |
Wynn Resorts Ltd. | 17,299 | | 3,359,639 |
Yum! Brands, Inc. | 95,375 | | 7,211,304 |
| | 61,377,671 |
Household Durables - 0.4% |
D.R. Horton, Inc. (d) | 60,864 | | 1,358,484 |
Garmin Ltd. | 26,340 | | 1,217,435 |
Harman International Industries, Inc. | 14,467 | | 1,184,124 |
Leggett & Platt, Inc. (d) | 30,243 | | 935,718 |
Lennar Corp. Class A (d) | 35,808 | | 1,416,564 |
Mohawk Industries, Inc. (a) | 13,065 | | 1,945,379 |
Newell Rubbermaid, Inc. | 61,509 | | 1,993,507 |
PulteGroup, Inc. | 73,834 | | 1,503,999 |
Whirlpool Corp. | 16,811 | | 2,636,973 |
| | 14,192,183 |
Internet & Catalog Retail - 1.5% |
Amazon.com, Inc. (a) | 79,406 | | 31,666,319 |
Expedia, Inc. | 22,055 | | 1,536,351 |
Netflix, Inc. (a) | 12,691 | | 4,672,445 |
priceline.com, Inc. (a) | 11,014 | | 12,802,674 |
TripAdvisor, Inc. (a)(d) | 23,732 | | 1,965,722 |
| | 52,643,511 |
|
| Shares | | Value |
Leisure Equipment & Products - 0.1% |
Hasbro, Inc. | 24,732 | | $ 1,360,507 |
Mattel, Inc. | 72,481 | | 3,448,646 |
| | 4,809,153 |
Media - 3.7% |
Cablevision Systems Corp. - NY Group Class A (d) | 45,849 | | 822,073 |
CBS Corp. Class B | 119,522 | | 7,618,332 |
Comcast Corp. Class A | 558,116 | | 29,002,498 |
DIRECTV (a) | 104,655 | | 7,230,614 |
Discovery Communications, Inc. Class A (a)(d) | 48,332 | | 4,370,179 |
Gannett Co., Inc. | 48,807 | | 1,443,711 |
Graham Holdings Co. | 933 | | 618,878 |
Interpublic Group of Companies, Inc. | 89,145 | | 1,577,867 |
News Corp. Class A (a) | 106,615 | | 1,921,202 |
Omnicom Group, Inc. | 55,118 | | 4,099,126 |
Scripps Networks Interactive, Inc. Class A | 23,463 | | 2,027,438 |
The Walt Disney Co. | 350,007 | | 26,740,535 |
Time Warner Cable, Inc. | 60,372 | | 8,180,406 |
Time Warner, Inc. | 193,762 | | 13,509,087 |
Twenty-First Century Fox, Inc. Class A | 420,272 | | 14,785,169 |
Viacom, Inc. Class B (non-vtg.) | 86,918 | | 7,591,418 |
| | 131,538,533 |
Multiline Retail - 0.7% |
Dollar General Corp. (a) | 63,101 | | 3,806,252 |
Dollar Tree, Inc. (a) | 44,567 | | 2,514,470 |
Family Dollar Stores, Inc. | 20,707 | | 1,345,334 |
Kohl's Corp. | 43,110 | | 2,446,493 |
Macy's, Inc. | 78,917 | | 4,214,168 |
Nordstrom, Inc. | 30,644 | | 1,893,799 |
Target Corp. | 135,372 | | 8,564,986 |
| | 24,785,502 |
Specialty Retail - 2.2% |
AutoNation, Inc. (a) | 13,827 | | 687,064 |
AutoZone, Inc. (a)(d) | 7,289 | | 3,483,705 |
Bed Bath & Beyond, Inc. (a) | 45,991 | | 3,693,077 |
Best Buy Co., Inc. | 58,542 | | 2,334,655 |
CarMax, Inc. (a) | 47,833 | | 2,249,108 |
GameStop Corp. Class A (d) | 25,035 | | 1,233,224 |
Gap, Inc. | 56,732 | | 2,217,087 |
Home Depot, Inc. | 301,596 | | 24,833,415 |
L Brands, Inc. | 52,222 | | 3,229,931 |
Lowe's Companies, Inc. | 223,982 | | 11,098,308 |
O'Reilly Automotive, Inc. (a) | 22,985 | | 2,958,399 |
PetSmart, Inc. (d) | 22,216 | | 1,616,214 |
Ross Stores, Inc. | 46,406 | | 3,477,202 |
Staples, Inc. | 141,456 | | 2,247,736 |
Tiffany & Co., Inc. | 23,584 | | 2,188,124 |
TJX Companies, Inc. | 152,315 | | 9,707,035 |
Urban Outfitters, Inc. (a) | 23,356 | | 866,508 |
| | 78,120,792 |
Common Stocks - continued |
| Shares | | Value |
CONSUMER DISCRETIONARY - continued |
Textiles, Apparel & Luxury Goods - 0.8% |
Coach, Inc. | 60,066 | | $ 3,371,505 |
Fossil Group, Inc. (a) | 10,523 | | 1,262,129 |
Michael Kors Holdings Ltd. (a) | 38,419 | | 3,119,239 |
NIKE, Inc. Class B | 160,031 | | 12,584,838 |
PVH Corp. | 17,470 | | 2,376,269 |
Ralph Lauren Corp. | 12,770 | | 2,254,799 |
VF Corp. | 75,440 | | 4,702,930 |
| | 29,671,709 |
TOTAL CONSUMER DISCRETIONARY | | 442,989,521 |
CONSUMER STAPLES - 9.6% |
Beverages - 2.1% |
Beam, Inc. | 34,924 | | 2,376,927 |
Brown-Forman Corp. Class B (non-vtg.) | 34,702 | | 2,622,430 |
Coca-Cola Enterprises, Inc. | 51,715 | | 2,282,183 |
Constellation Brands, Inc. Class A (sub. vtg.) (a) | 35,684 | | 2,511,440 |
Dr. Pepper Snapple Group, Inc. | 42,971 | | 2,093,547 |
Molson Coors Brewing Co. Class B | 33,863 | | 1,901,407 |
Monster Beverage Corp. (a) | 29,087 | | 1,971,226 |
PepsiCo, Inc. | 328,447 | | 27,241,394 |
The Coca-Cola Co. | 813,341 | | 33,599,117 |
| | 76,599,671 |
Food & Staples Retailing - 2.3% |
Costco Wholesale Corp. | 93,574 | | 11,136,242 |
CVS Caremark Corp. | 254,913 | | 18,244,123 |
Kroger Co. | 111,456 | | 4,405,856 |
Safeway, Inc. | 52,856 | | 1,721,520 |
Sysco Corp. | 124,555 | | 4,496,436 |
Wal-Mart Stores, Inc. | 346,498 | | 27,265,928 |
Walgreen Co. | 186,511 | | 10,713,192 |
Whole Foods Market, Inc. | 79,700 | | 4,609,051 |
| | 82,592,348 |
Food Products - 1.5% |
Archer Daniels Midland Co. | 140,916 | | 6,115,754 |
Campbell Soup Co. | 38,455 | | 1,664,332 |
ConAgra Foods, Inc. | 90,353 | | 3,044,896 |
General Mills, Inc. | 135,838 | | 6,779,675 |
Hormel Foods Corp. | 28,828 | | 1,302,161 |
Kellogg Co. | 55,075 | | 3,363,430 |
Kraft Foods Group, Inc. | 127,616 | | 6,881,055 |
McCormick & Co., Inc. (non-vtg.) | 28,281 | | 1,949,127 |
Mead Johnson Nutrition Co. Class A | 43,259 | | 3,623,374 |
Mondelez International, Inc. | 375,604 | | 13,258,821 |
The Hershey Co. | 32,084 | | 3,119,527 |
The J.M. Smucker Co. | 22,517 | | 2,333,212 |
Tyson Foods, Inc. Class A | 58,171 | | 1,946,402 |
| | 55,381,766 |
|
| Shares | | Value |
Household Products - 2.0% |
Clorox Co. (d) | 27,637 | | $ 2,563,608 |
Colgate-Palmolive Co. | 188,242 | | 12,275,261 |
Kimberly-Clark Corp. | 81,735 | | 8,538,038 |
Procter & Gamble Co. | 582,156 | | 47,393,320 |
| | 70,770,227 |
Personal Products - 0.2% |
Avon Products, Inc. | 92,899 | | 1,599,721 |
Estee Lauder Companies, Inc. Class A | 54,837 | | 4,130,323 |
| | 5,730,044 |
Tobacco - 1.5% |
Altria Group, Inc. | 428,337 | | 16,443,857 |
Lorillard, Inc. | 78,891 | | 3,998,196 |
Philip Morris International, Inc. | 343,131 | | 29,897,004 |
Reynolds American, Inc. | 67,134 | | 3,356,029 |
| | 53,695,086 |
TOTAL CONSUMER STAPLES | | 344,769,142 |
ENERGY - 10.1% |
Energy Equipment & Services - 1.8% |
Baker Hughes, Inc. | 94,924 | | 5,245,500 |
Cameron International Corp. (a) | 50,944 | | 3,032,696 |
Diamond Offshore Drilling, Inc. | 14,888 | | 847,425 |
Ensco PLC Class A | 50,027 | | 2,860,544 |
FMC Technologies, Inc. (a) | 50,670 | | 2,645,481 |
Halliburton Co. | 181,662 | | 9,219,347 |
Helmerich & Payne, Inc. | 22,947 | | 1,929,384 |
Nabors Industries Ltd. | 55,629 | | 945,137 |
National Oilwell Varco, Inc. | 91,685 | | 7,291,708 |
Noble Corp. | 54,271 | | 2,033,534 |
Rowan Companies PLC (a) | 26,607 | | 940,824 |
Schlumberger Ltd. | 282,048 | | 25,415,345 |
Transocean Ltd. (United States) | 72,593 | | 3,587,546 |
| | 65,994,471 |
Oil, Gas & Consumable Fuels - 8.3% |
Anadarko Petroleum Corp. | 107,783 | | 8,549,348 |
Apache Corp. | 85,503 | | 7,348,128 |
Cabot Oil & Gas Corp. | 90,197 | | 3,496,036 |
Chesapeake Energy Corp. | 108,256 | | 2,938,068 |
Chevron Corp. | 411,880 | | 51,447,931 |
ConocoPhillips Co. | 262,376 | | 18,536,864 |
CONSOL Energy, Inc. | 49,032 | | 1,865,177 |
Denbury Resources, Inc. (a) | 78,533 | | 1,290,297 |
Devon Energy Corp. | 81,735 | | 5,056,944 |
EOG Resources, Inc. | 58,462 | | 9,812,262 |
EQT Corp. | 32,278 | | 2,897,919 |
Exxon Mobil Corp. | 935,592 | | 94,681,910 |
Hess Corp. | 60,919 | | 5,056,277 |
Kinder Morgan Holding Co. LLC | 144,199 | | 5,191,164 |
Marathon Oil Corp. | 149,196 | | 5,266,619 |
Marathon Petroleum Corp. | 64,470 | | 5,913,833 |
Common Stocks - continued |
| Shares | | Value |
ENERGY - continued |
Oil, Gas & Consumable Fuels - continued |
Murphy Oil Corp. | 37,643 | | $ 2,442,278 |
Newfield Exploration Co. (a) | 29,153 | | 718,038 |
Noble Energy, Inc. | 76,945 | | 5,240,724 |
Occidental Petroleum Corp. | 172,632 | | 16,417,303 |
Peabody Energy Corp. | 57,789 | | 1,128,619 |
Phillips 66 Co. | 128,401 | | 9,903,569 |
Pioneer Natural Resources Co. | 30,544 | | 5,622,234 |
QEP Resources, Inc. | 38,396 | | 1,176,837 |
Range Resources Corp. | 35,000 | | 2,950,850 |
Southwestern Energy Co. (a) | 75,107 | | 2,953,958 |
Spectra Energy Corp. | 143,500 | | 5,111,470 |
Tesoro Corp. | 28,448 | | 1,664,208 |
The Williams Companies, Inc. | 146,368 | | 5,645,414 |
Valero Energy Corp. | 115,556 | | 5,824,022 |
WPX Energy, Inc. (a)(d) | 43,007 | | 876,483 |
| | 297,024,784 |
TOTAL ENERGY | | 363,019,255 |
FINANCIALS - 15.9% |
Capital Markets - 2.2% |
Ameriprise Financial, Inc. | 41,664 | | 4,793,443 |
Bank of New York Mellon Corp. | 245,976 | | 8,594,401 |
BlackRock, Inc. Class A | 27,212 | | 8,611,782 |
Charles Schwab Corp. | 248,497 | | 6,460,922 |
E*TRADE Financial Corp. (a) | 61,508 | | 1,208,017 |
Franklin Resources, Inc. | 86,467 | | 4,991,740 |
Goldman Sachs Group, Inc. | 90,272 | | 16,001,615 |
Invesco Ltd. | 94,936 | | 3,455,670 |
Legg Mason, Inc. | 22,735 | | 988,518 |
Morgan Stanley | 296,718 | | 9,305,076 |
Northern Trust Corp. | 48,112 | | 2,977,652 |
State Street Corp. | 94,020 | | 6,900,128 |
T. Rowe Price Group, Inc. | 55,878 | | 4,680,900 |
| | 78,969,864 |
Commercial Banks - 2.7% |
BB&T Corp. | 150,972 | | 5,634,275 |
Comerica, Inc. | 39,174 | | 1,862,332 |
Fifth Third Bancorp | 189,074 | | 3,976,226 |
Huntington Bancshares, Inc. | 177,870 | | 1,716,446 |
KeyCorp | 192,038 | | 2,577,150 |
M&T Bank Corp. (d) | 27,891 | | 3,247,070 |
PNC Financial Services Group, Inc. | 113,960 | | 8,841,017 |
Regions Financial Corp. | 295,027 | | 2,917,817 |
SunTrust Banks, Inc. | 114,638 | | 4,219,825 |
U.S. Bancorp | 391,135 | | 15,801,854 |
Wells Fargo & Co. | 1,026,613 | | 46,608,230 |
Zions Bancorporation | 39,538 | | 1,184,558 |
| | 98,586,800 |
|
| Shares | | Value |
Consumer Finance - 1.0% |
American Express Co. | 197,311 | | $ 17,902,027 |
Capital One Financial Corp. | 123,479 | | 9,459,726 |
Discover Financial Services | 102,586 | | 5,739,687 |
SLM Corp. | 93,433 | | 2,455,419 |
| | 35,556,859 |
Diversified Financial Services - 5.1% |
Bank of America Corp. | 2,284,335 | | 35,567,096 |
Berkshire Hathaway, Inc. Class B (a) | 385,507 | | 45,705,710 |
Citigroup, Inc. | 649,569 | | 33,849,041 |
CME Group, Inc. | 67,513 | | 5,297,070 |
IntercontinentalExchange Group, Inc. | 24,637 | | 5,541,354 |
JPMorgan Chase & Co. | 805,095 | | 47,081,956 |
Leucadia National Corp. | 67,142 | | 1,902,804 |
McGraw-Hill Companies, Inc. | 57,996 | | 4,535,287 |
Moody's Corp. | 40,539 | | 3,181,095 |
The NASDAQ Stock Market, Inc. | 24,764 | | 985,607 |
| | 183,647,020 |
Insurance - 3.0% |
ACE Ltd. | 72,831 | | 7,540,193 |
AFLAC, Inc. | 99,821 | | 6,668,043 |
Allstate Corp. | 97,413 | | 5,312,905 |
American International Group, Inc. | 315,328 | | 16,097,494 |
Aon PLC | 64,475 | | 5,408,808 |
Assurant, Inc. | 15,574 | | 1,033,646 |
Cincinnati Financial Corp. | 31,578 | | 1,653,740 |
Genworth Financial, Inc. Class A (a) | 105,854 | | 1,643,913 |
Hartford Financial Services Group, Inc. | 95,750 | | 3,469,023 |
Lincoln National Corp. | 56,186 | | 2,900,321 |
Loews Corp. | 65,505 | | 3,159,961 |
Marsh & McLennan Companies, Inc. | 117,530 | | 5,683,751 |
MetLife, Inc. | 240,094 | | 12,945,868 |
Principal Financial Group, Inc. | 58,631 | | 2,891,095 |
Progressive Corp. | 118,219 | | 3,223,832 |
Prudential Financial, Inc. | 99,159 | | 9,144,443 |
The Chubb Corp. | 53,919 | | 5,210,193 |
The Travelers Companies, Inc. | 77,971 | | 7,059,494 |
Torchmark Corp. | 19,365 | | 1,513,375 |
Unum Group | 55,932 | | 1,962,095 |
XL Group PLC Class A | 60,569 | | 1,928,517 |
| | 106,450,710 |
Real Estate Investment Trusts - 1.8% |
American Tower Corp. | 84,519 | | 6,746,307 |
Apartment Investment & Management Co. Class A | 31,250 | | 809,688 |
AvalonBay Communities, Inc. | 26,053 | | 3,080,246 |
Boston Properties, Inc. | 32,742 | | 3,286,315 |
Equity Residential (SBI) | 71,785 | | 3,723,488 |
General Growth Properties, Inc. | 115,135 | | 2,310,759 |
HCP, Inc. | 97,718 | | 3,549,118 |
Health Care REIT, Inc. | 61,824 | | 3,311,912 |
Host Hotels & Resorts, Inc. | 161,971 | | 3,148,716 |
Kimco Realty Corp. | 87,742 | | 1,732,905 |
Common Stocks - continued |
| Shares | | Value |
FINANCIALS - continued |
Real Estate Investment Trusts - continued |
Plum Creek Timber Co., Inc. | 37,888 | | $ 1,762,171 |
Prologis, Inc. | 106,810 | | 3,946,630 |
Public Storage | 30,955 | | 4,659,347 |
Simon Property Group, Inc. | 66,461 | | 10,112,706 |
The Macerich Co. | 30,099 | | 1,772,530 |
Ventas, Inc. | 62,982 | | 3,607,609 |
Vornado Realty Trust | 37,255 | | 3,307,871 |
Weyerhaeuser Co. | 124,807 | | 3,940,157 |
| | 64,808,475 |
Real Estate Management & Development - 0.0% |
CBRE Group, Inc. (a) | 59,618 | | 1,567,953 |
Thrifts & Mortgage Finance - 0.1% |
Hudson City Bancorp, Inc. | 101,853 | | 960,474 |
People's United Financial, Inc. (d) | 68,063 | | 1,029,113 |
| | 1,989,587 |
TOTAL FINANCIALS | | 571,577,268 |
HEALTH CARE - 12.8% |
Biotechnology - 2.4% |
Alexion Pharmaceuticals, Inc. (a) | 41,993 | | 5,587,589 |
Amgen, Inc. | 161,509 | | 18,437,867 |
Biogen Idec, Inc. (a) | 50,589 | | 14,152,273 |
Celgene Corp. (a) | 88,252 | | 14,911,058 |
Gilead Sciences, Inc. (a) | 328,393 | | 24,678,734 |
Regeneron Pharmaceuticals, Inc. (a) | 16,821 | | 4,629,812 |
Vertex Pharmaceuticals, Inc. (a) | 50,063 | | 3,719,681 |
| | 86,117,014 |
Health Care Equipment & Supplies - 2.0% |
Abbott Laboratories | 331,142 | | 12,692,673 |
Baxter International, Inc. | 116,228 | | 8,083,657 |
Becton, Dickinson & Co. | 41,569 | | 4,592,959 |
Boston Scientific Corp. (a) | 285,960 | | 3,437,239 |
C.R. Bard, Inc. | 16,681 | | 2,234,253 |
CareFusion Corp. (a) | 45,262 | | 1,802,333 |
Covidien PLC | 98,516 | | 6,708,940 |
DENTSPLY International, Inc. | 30,551 | | 1,481,112 |
Edwards Lifesciences Corp. (a) | 23,431 | | 1,540,823 |
Intuitive Surgical, Inc. (a) | 8,152 | | 3,131,020 |
Medtronic, Inc. | 213,814 | | 12,270,785 |
St. Jude Medical, Inc. | 62,497 | | 3,871,689 |
Stryker Corp. | 63,215 | | 4,749,975 |
Varian Medical Systems, Inc. (a) | 22,642 | | 1,759,057 |
Zimmer Holdings, Inc. | 36,619 | | 3,412,525 |
| | 71,769,040 |
Health Care Providers & Services - 2.0% |
Aetna, Inc. | 78,706 | | 5,398,445 |
AmerisourceBergen Corp. | 49,265 | | 3,463,822 |
Cardinal Health, Inc. | 73,133 | | 4,886,016 |
|
| Shares | | Value |
Cigna Corp. | 59,198 | | $ 5,178,641 |
DaVita HealthCare Partners, Inc. (a) | 37,809 | | 2,395,956 |
Express Scripts Holding Co. (a) | 172,576 | | 12,121,738 |
Humana, Inc. | 33,391 | | 3,446,619 |
Laboratory Corp. of America Holdings (a)(d) | 18,718 | | 1,710,264 |
McKesson Corp. | 49,197 | | 7,940,396 |
Patterson Companies, Inc. | 17,855 | | 735,626 |
Quest Diagnostics, Inc. | 31,146 | | 1,667,557 |
Tenet Healthcare Corp. (a)(d) | 21,251 | | 895,092 |
UnitedHealth Group, Inc. | 215,614 | | 16,235,734 |
WellPoint, Inc. | 63,269 | | 5,845,423 |
| | 71,921,329 |
Health Care Technology - 0.1% |
Cerner Corp. (a)(d) | 63,223 | | 3,524,050 |
Life Sciences Tools & Services - 0.5% |
Agilent Technologies, Inc. | 70,845 | | 4,051,626 |
Life Technologies Corp. (a) | 36,979 | | 2,803,008 |
PerkinElmer, Inc. | 24,071 | | 992,447 |
Thermo Fisher Scientific, Inc. | 77,393 | | 8,617,711 |
Waters Corp. (a) | 18,232 | | 1,823,200 |
| | 18,287,992 |
Pharmaceuticals - 5.8% |
AbbVie, Inc. | 340,710 | | 17,992,895 |
Actavis PLC (a) | 37,275 | | 6,262,200 |
Allergan, Inc. | 63,642 | | 7,069,353 |
Bristol-Myers Squibb Co. | 352,635 | | 18,742,550 |
Eli Lilly & Co. | 212,336 | | 10,829,136 |
Forest Laboratories, Inc. (a) | 50,775 | | 3,048,023 |
Hospira, Inc. (a) | 35,525 | | 1,466,472 |
Johnson & Johnson | 604,259 | | 55,344,082 |
Merck & Co., Inc. | 625,781 | | 31,320,339 |
Mylan, Inc. (a) | 81,995 | | 3,558,583 |
Perrigo Co. PLC (d) | 28,495 | | 4,372,843 |
Pfizer, Inc. | 1,388,032 | | 42,515,420 |
Zoetis, Inc. Class A | 107,085 | | 3,500,609 |
| | 206,022,505 |
TOTAL HEALTH CARE | | 457,641,930 |
INDUSTRIALS - 10.8% |
Aerospace & Defense - 2.7% |
General Dynamics Corp. | 71,658 | | 6,846,922 |
Honeywell International, Inc. | 168,051 | | 15,354,820 |
L-3 Communications Holdings, Inc. | 18,981 | | 2,028,310 |
Lockheed Martin Corp. | 57,623 | | 8,566,235 |
Northrop Grumman Corp. | 47,543 | | 5,448,903 |
Precision Castparts Corp. | 31,109 | | 8,377,654 |
Raytheon Co. | 68,420 | | 6,205,694 |
Rockwell Collins, Inc. | 28,938 | | 2,139,097 |
Textron, Inc. | 60,213 | | 2,213,430 |
Common Stocks - continued |
| Shares | | Value |
INDUSTRIALS - continued |
Aerospace & Defense - continued |
The Boeing Co. | 148,062 | | $ 20,208,982 |
United Technologies Corp. | 180,795 | | 20,574,471 |
| | 97,964,518 |
Air Freight & Logistics - 0.8% |
C.H. Robinson Worldwide, Inc. | 32,475 | | 1,894,592 |
Expeditors International of Washington, Inc. | 44,028 | | 1,948,239 |
FedEx Corp. | 63,745 | | 9,164,619 |
United Parcel Service, Inc. Class B | 153,093 | | 16,087,012 |
| | 29,094,462 |
Airlines - 0.2% |
Delta Air Lines, Inc. | 183,230 | | 5,033,328 |
Southwest Airlines Co. | 149,215 | | 2,811,211 |
| | 7,844,539 |
Building Products - 0.1% |
Allegion PLC (a) | 19,127 | | 845,222 |
Masco Corp. | 76,455 | | 1,740,880 |
| | 2,586,102 |
Commercial Services & Supplies - 0.5% |
ADT Corp. (d) | 42,832 | | 1,733,411 |
Cintas Corp. | 21,568 | | 1,285,237 |
Iron Mountain, Inc. | 36,448 | | 1,106,197 |
Pitney Bowes, Inc. (d) | 43,260 | | 1,007,958 |
Republic Services, Inc. | 57,840 | | 1,920,288 |
Stericycle, Inc. (a) | 18,356 | | 2,132,417 |
Tyco International Ltd. | 99,653 | | 4,089,759 |
Waste Management, Inc. | 93,450 | | 4,193,102 |
| | 17,468,369 |
Construction & Engineering - 0.2% |
Fluor Corp. | 34,985 | | 2,808,946 |
Jacobs Engineering Group, Inc. (a) | 28,209 | | 1,776,885 |
Quanta Services, Inc. (a) | 46,230 | | 1,459,019 |
| | 6,044,850 |
Electrical Equipment - 0.8% |
AMETEK, Inc. | 52,418 | | 2,760,856 |
Eaton Corp. PLC | 101,622 | | 7,735,467 |
Emerson Electric Co. | 150,766 | | 10,580,758 |
Rockwell Automation, Inc. | 29,698 | | 3,509,116 |
Roper Industries, Inc. | 21,269 | | 2,949,585 |
| | 27,535,782 |
Industrial Conglomerates - 2.5% |
3M Co. | 136,983 | | 19,211,866 |
Danaher Corp. | 128,413 | | 9,913,484 |
General Electric Co. | 2,166,808 | | 60,735,628 |
| | 89,860,978 |
Machinery - 1.7% |
Caterpillar, Inc. | 136,287 | | 12,376,222 |
Cummins, Inc. | 37,318 | | 5,260,718 |
|
| Shares | | Value |
Deere & Co. | 81,993 | | $ 7,488,421 |
Dover Corp. | 36,487 | | 3,522,455 |
Flowserve Corp. | 29,870 | | 2,354,652 |
Illinois Tool Works, Inc. | 87,451 | | 7,352,880 |
Ingersoll-Rand PLC | 57,380 | | 3,534,608 |
Joy Global, Inc. (d) | 22,761 | | 1,331,291 |
PACCAR, Inc. | 75,835 | | 4,487,157 |
Pall Corp. | 23,728 | | 2,025,185 |
Parker Hannifin Corp. | 31,961 | | 4,111,463 |
Pentair Ltd. | 42,691 | | 3,315,810 |
Snap-On, Inc. | 12,454 | | 1,363,962 |
Stanley Black & Decker, Inc. | 33,242 | | 2,682,297 |
Xylem, Inc. | 39,511 | | 1,367,081 |
| | 62,574,202 |
Professional Services - 0.2% |
Dun & Bradstreet Corp. | 8,173 | | 1,003,236 |
Equifax, Inc. | 26,061 | | 1,800,554 |
Nielsen Holdings B.V. | 54,195 | | 2,487,009 |
Robert Half International, Inc. | 29,683 | | 1,246,389 |
| | 6,537,188 |
Road & Rail - 0.9% |
CSX Corp. | 217,096 | | 6,245,852 |
Kansas City Southern | 23,603 | | 2,922,759 |
Norfolk Southern Corp. | 66,158 | | 6,141,447 |
Ryder System, Inc. | 11,264 | | 831,058 |
Union Pacific Corp. | 98,639 | | 16,571,352 |
| | 32,712,468 |
Trading Companies & Distributors - 0.2% |
Fastenal Co. (d) | 58,468 | | 2,777,815 |
W.W. Grainger, Inc. | 13,231 | | 3,379,462 |
| | 6,157,277 |
TOTAL INDUSTRIALS | | 386,380,735 |
INFORMATION TECHNOLOGY - 18.4% |
Communications Equipment - 1.7% |
Cisco Systems, Inc. | 1,145,070 | | 25,706,822 |
F5 Networks, Inc. (a) | 16,621 | | 1,510,184 |
Harris Corp. | 22,889 | | 1,597,881 |
Juniper Networks, Inc. (a) | 108,155 | | 2,441,058 |
Motorola Solutions, Inc. | 49,313 | | 3,328,628 |
QUALCOMM, Inc. | 361,822 | | 26,865,284 |
| | 61,449,857 |
Computers & Peripherals - 4.1% |
Apple, Inc. | 192,694 | | 108,122,518 |
EMC Corp. | 440,723 | | 11,084,183 |
Hewlett-Packard Co. | 411,592 | | 11,516,344 |
NetApp, Inc. | 72,992 | | 3,002,891 |
SanDisk Corp. | 48,378 | | 3,412,584 |
Seagate Technology | 69,849 | | 3,922,720 |
Western Digital Corp. | 45,084 | | 3,782,548 |
| | 144,843,788 |
Common Stocks - continued |
| Shares | | Value |
INFORMATION TECHNOLOGY - continued |
Electronic Equipment & Components - 0.4% |
Amphenol Corp. Class A | 33,899 | | $ 3,023,113 |
Corning, Inc. | 309,943 | | 5,523,184 |
FLIR Systems, Inc. | 30,338 | | 913,174 |
Jabil Circuit, Inc. | 39,595 | | 690,537 |
TE Connectivity Ltd. | 87,889 | | 4,843,563 |
| | 14,993,571 |
Internet Software & Services - 3.1% |
Akamai Technologies, Inc. (a) | 38,331 | | 1,808,457 |
eBay, Inc. (a) | 249,534 | | 13,696,921 |
Facebook, Inc. Class A (a) | 352,248 | | 19,253,876 |
Google, Inc. Class A (a) | 60,102 | | 67,356,912 |
VeriSign, Inc. (a)(d) | 27,591 | | 1,649,390 |
Yahoo!, Inc. (a) | 202,052 | | 8,170,983 |
| | 111,936,539 |
IT Services - 3.6% |
Accenture PLC Class A | 136,153 | | 11,194,500 |
Alliance Data Systems Corp. (a) | 10,433 | | 2,743,149 |
Automatic Data Processing, Inc. | 103,105 | | 8,331,915 |
Cognizant Technology Solutions Corp. Class A (a) | 64,785 | | 6,541,989 |
Computer Sciences Corp. | 31,528 | | 1,761,785 |
Fidelity National Information Services, Inc. | 62,351 | | 3,347,002 |
Fiserv, Inc. (a) | 55,242 | | 3,262,040 |
IBM Corp. | 218,601 | | 41,002,990 |
MasterCard, Inc. Class A | 22,172 | | 18,523,819 |
Paychex, Inc. | 69,610 | | 3,169,343 |
Teradata Corp. (a)(d) | 34,995 | | 1,591,923 |
The Western Union Co. | 118,274 | | 2,040,227 |
Total System Services, Inc. | 35,767 | | 1,190,326 |
Visa, Inc. Class A | 109,062 | | 24,285,926 |
| | 128,986,934 |
Office Electronics - 0.1% |
Xerox Corp. | 247,844 | | 3,016,261 |
Semiconductors & Semiconductor Equipment - 2.0% |
Altera Corp. | 68,775 | | 2,237,251 |
Analog Devices, Inc. | 66,616 | | 3,392,753 |
Applied Materials, Inc. | 257,896 | | 4,562,180 |
Broadcom Corp. Class A | 115,565 | | 3,426,502 |
First Solar, Inc. (a)(d) | 15,121 | | 826,211 |
Intel Corp. | 1,064,625 | | 27,637,665 |
KLA-Tencor Corp. | 35,691 | | 2,300,642 |
Lam Research Corp. (a) | 34,779 | | 1,893,717 |
Linear Technology Corp. (d) | 50,150 | | 2,284,333 |
LSI Corp. | 116,707 | | 1,286,111 |
Microchip Technology, Inc. (d) | 42,484 | | 1,901,159 |
Micron Technology, Inc. (a) | 225,273 | | 4,901,940 |
NVIDIA Corp. | 123,917 | | 1,985,150 |
|
| Shares | | Value |
Texas Instruments, Inc. | 234,419 | | $ 10,293,338 |
Xilinx, Inc. | 57,464 | | 2,638,747 |
| | 71,567,699 |
Software - 3.4% |
Adobe Systems, Inc. (a) | 99,565 | | 5,961,952 |
Autodesk, Inc. (a) | 48,316 | | 2,431,744 |
CA Technologies, Inc. | 69,587 | | 2,341,603 |
Citrix Systems, Inc. (a) | 39,920 | | 2,524,940 |
Electronic Arts, Inc. (a) | 66,204 | | 1,518,720 |
Intuit, Inc. | 61,006 | | 4,655,978 |
Microsoft Corp. | 1,626,953 | | 60,896,851 |
Oracle Corp. | 751,565 | | 28,754,877 |
Red Hat, Inc. (a) | 40,584 | | 2,274,327 |
salesforce.com, Inc. (a)(d) | 118,811 | | 6,557,179 |
Symantec Corp. | 149,067 | | 3,515,000 |
| | 121,433,171 |
TOTAL INFORMATION TECHNOLOGY | | 658,227,820 |
MATERIALS - 3.4% |
Chemicals - 2.5% |
Air Products & Chemicals, Inc. | 45,248 | | 5,057,821 |
Airgas, Inc. | 14,215 | | 1,589,948 |
CF Industries Holdings, Inc. | 12,275 | | 2,860,566 |
E.I. du Pont de Nemours & Co. | 198,341 | | 12,886,215 |
Eastman Chemical Co. | 32,965 | | 2,660,276 |
Ecolab, Inc. | 58,076 | | 6,055,585 |
FMC Corp. | 28,543 | | 2,153,855 |
International Flavors & Fragrances, Inc. | 17,457 | | 1,500,953 |
LyondellBasell Industries NV Class A | 93,558 | | 7,510,836 |
Monsanto Co. | 112,617 | | 13,125,511 |
PPG Industries, Inc. | 30,417 | | 5,768,888 |
Praxair, Inc. | 63,043 | | 8,197,481 |
Sherwin-Williams Co. | 18,447 | | 3,385,025 |
Sigma Aldrich Corp. | 25,629 | | 2,409,382 |
The Dow Chemical Co. | 259,756 | | 11,533,166 |
The Mosaic Co. | 72,985 | | 3,450,001 |
| | 90,145,509 |
Construction Materials - 0.1% |
Vulcan Materials Co. | 27,839 | | 1,654,193 |
Containers & Packaging - 0.2% |
Avery Dennison Corp. | 20,692 | | 1,038,531 |
Ball Corp. | 30,976 | | 1,600,220 |
Bemis Co., Inc. | 22,047 | | 903,045 |
MeadWestvaco Corp. | 38,096 | | 1,406,885 |
Owens-Illinois, Inc. (a) | 35,336 | | 1,264,322 |
Sealed Air Corp. | 42,013 | | 1,430,543 |
| | 7,643,546 |
Metals & Mining - 0.5% |
Alcoa, Inc. (d) | 229,074 | | 2,435,057 |
Allegheny Technologies, Inc. | 23,126 | | 823,979 |
Cliffs Natural Resources, Inc. (d) | 32,794 | | 859,531 |
Common Stocks - continued |
| Shares | | Value |
MATERIALS - continued |
Metals & Mining - continued |
Freeport-McMoRan Copper & Gold, Inc. | 222,339 | | $ 8,391,074 |
Newmont Mining Corp. | 106,628 | | 2,455,643 |
Nucor Corp. | 68,150 | | 3,637,847 |
United States Steel Corp. (d) | 30,983 | | 913,999 |
| | 19,517,130 |
Paper & Forest Products - 0.1% |
International Paper Co. | 95,009 | | 4,658,291 |
TOTAL MATERIALS | | 123,618,669 |
TELECOMMUNICATION SERVICES - 2.3% |
Diversified Telecommunication Services - 2.1% |
AT&T, Inc. | 1,128,232 | | 39,668,637 |
CenturyLink, Inc. | 126,588 | | 4,031,828 |
Frontier Communications Corp. (d) | 214,070 | | 995,426 |
Verizon Communications, Inc. | 612,893 | | 30,117,562 |
Windstream Holdings, Inc. (d) | 127,659 | | 1,018,719 |
| | 75,832,172 |
Wireless Telecommunication Services - 0.2% |
Crown Castle International Corp. (a) | 71,547 | | 5,253,696 |
TOTAL TELECOMMUNICATION SERVICES | | 81,085,868 |
UTILITIES - 2.9% |
Electric Utilities - 1.6% |
American Electric Power Co., Inc. | 104,362 | | 4,877,880 |
Duke Energy Corp. | 151,201 | | 10,434,381 |
Edison International | 69,778 | | 3,230,721 |
Entergy Corp. | 38,190 | | 2,416,281 |
Exelon Corp. | 183,521 | | 5,026,640 |
FirstEnergy Corp. | 89,571 | | 2,954,052 |
NextEra Energy, Inc. | 92,238 | | 7,897,418 |
Northeast Utilities | 67,483 | | 2,860,604 |
Pepco Holdings, Inc. | 53,490 | | 1,023,264 |
Pinnacle West Capital Corp. | 23,568 | | 1,247,219 |
PPL Corp. | 134,979 | | 4,061,518 |
Southern Co. | 188,840 | | 7,763,212 |
Xcel Energy, Inc. | 106,578 | | 2,977,789 |
| | 56,770,979 |
Gas Utilities - 0.1% |
AGL Resources, Inc. | 25,441 | | 1,201,578 |
ONEOK, Inc. | 44,180 | | 2,747,112 |
| | 3,948,690 |
Independent Power Producers & Energy Traders - 0.1% |
NRG Energy, Inc. | 69,265 | | 1,989,291 |
The AES Corp. | 140,630 | | 2,040,541 |
| | 4,029,832 |
|
| Shares | | Value |
Multi-Utilities - 1.1% |
Ameren Corp. | 51,964 | | $ 1,879,018 |
CenterPoint Energy, Inc. | 91,801 | | 2,127,947 |
CMS Energy Corp. | 56,968 | | 1,525,033 |
Consolidated Edison, Inc. | 62,727 | | 3,467,549 |
Dominion Resources, Inc. | 124,310 | | 8,041,614 |
DTE Energy Co. | 37,864 | | 2,513,791 |
Integrys Energy Group, Inc. | 17,092 | | 929,976 |
NiSource, Inc. | 67,097 | | 2,206,149 |
PG&E Corp. | 96,224 | | 3,875,903 |
Public Service Enterprise Group, Inc. (d) | 108,339 | | 3,471,182 |
SCANA Corp. | 30,101 | | 1,412,640 |
Sempra Energy | 48,678 | | 4,369,337 |
TECO Energy, Inc. (d) | 43,747 | | 754,198 |
Wisconsin Energy Corp. (d) | 48,513 | | 2,005,527 |
| | 38,579,864 |
TOTAL UTILITIES | | 103,329,365 |
TOTAL COMMON STOCKS (Cost $1,681,346,000) |
3,532,639,573
|
U.S. Treasury Obligations - 0.1% |
| Principal Amount | | |
U.S. Treasury Bills, yield at date of purchase 0.07% to 0.08% 4/3/14 to 7/24/14 (e)
(Cost $2,499,104) | | $ 2,500,000 | |
2,499,074
|
Money Market Funds - 3.0% |
| Shares | | |
Fidelity Cash Central Fund, 0.11% (b) | 42,705,315 | | 42,705,315 |
Fidelity Securities Lending Cash Central Fund, 0.11% (b)(c) | 66,683,235 | | 66,683,235 |
TOTAL MONEY MARKET FUNDS (Cost $109,388,550) |
109,388,550
|
TOTAL INVESTMENT PORTFOLIO - 101.6% (Cost $1,793,233,654) | | 3,644,527,197 |
NET OTHER ASSETS (LIABILITIES) - (1.6)% | | (58,666,781) |
NET ASSETS - 100% | $ 3,585,860,416 |
Futures Contracts |
| Expiration Date | | Underlying Face Amount at Value | | Unrealized Appreciation/(Depreciation) |
Purchased |
Equity Index Contracts |
262 CME E-mini S&P 500 Index Contracts (United States) | March 2014 | | $ 24,118,410 | | $ 839,250 |
56 CME S&P 500 Index Contracts | March 2014 | | 25,775,400 | | 840,130 |
TOTAL EQUITY INDEX CONTRACTS | | $ 49,893,810 | | $ 1,679,380 |
|
The face value of futures purchased as a percentage of net assets is 1.4% |
Legend |
(a) Non-income producing |
(b) Affiliated fund that is generally available only to investment companies and other accounts managed by Fidelity Investments. The rate quoted is the annualized seven-day yield of the fund at period end. A complete unaudited listing of the fund's holdings as of its most recent quarter end is available upon request. In addition, each Fidelity Central Fund's financial statements, which are not covered by the Fund's Report of Independent Registered Public Accounting Firm, are available on the SEC's website or upon request. |
(c) Investment made with cash collateral received from securities on loan. |
(d) Security or a portion of the security is on loan at period end. |
(e) Security or a portion of the security was pledged to cover margin requirements for futures contracts. At period end, the value of securities pledged amounted to $2,454,093. |
Affiliated Central Funds |
Information regarding fiscal year to date income earned by the Fund from investments in Fidelity Central Funds is as follows: |
Fund | Income earned |
Fidelity Cash Central Fund | $ 50,108 |
Fidelity Securities Lending Cash Central Fund | 196,757 |
Total | $ 246,865 |
Other Information |
The following is a summary of the inputs used, as of December 31, 2013, involving the Fund's assets and liabilities carried at fair value. The inputs or methodology used for valuing securities may not be an indication of the risk associated with investing in those securities. For more information on valuation inputs, and their aggregation into the levels used in the table below, please refer to the Investment Valuation section in the accompanying Notes to Financial Statements. |
Valuation Inputs at Reporting Date: |
Description | Total | Level 1 | Level 2 | Level 3 |
Investments in Securities: | | | | |
Equities: | | | | |
Consumer Discretionary | $ 442,989,521 | $ 442,989,521 | $ - | $ - |
Consumer Staples | 344,769,142 | 344,769,142 | - | - |
Energy | 363,019,255 | 363,019,255 | - | - |
Financials | 571,577,268 | 571,577,268 | - | - |
Health Care | 457,641,930 | 457,641,930 | - | - |
Industrials | 386,380,735 | 386,380,735 | - | - |
Information Technology | 658,227,820 | 658,227,820 | - | - |
Materials | 123,618,669 | 123,618,669 | - | - |
Telecommunication Services | 81,085,868 | 81,085,868 | - | - |
Utilities | 103,329,365 | 103,329,365 | - | - |
U.S. Government and Government Agency Obligations | 2,499,074 | - | 2,499,074 | - |
Money Market Funds | 109,388,550 | 109,388,550 | - | - |
Total Investments in Securities: | $ 3,644,527,197 | $ 3,642,028,123 | $ 2,499,074 | $ - |
Derivative Instruments: | | | | |
Assets | | | | |
Futures Contracts | $ 1,679,380 | $ 1,679,380 | $ - | $ - |
Value of Derivative Instruments |
The following table is a summary of the Fund's value of derivative instruments by primary risk exposure as of December 31, 2013. For additional information on derivative instruments, please refer to the Derivative Instruments section in the accompanying Notes to Financial Statements. |
Primary Risk Exposure /
Derivative Type | Value |
| Asset | Liability |
Equity Risk | | |
Futures Contracts (a) | $ 1,679,380 | $ - |
Total Value of Derivatives | $ 1,679,380 | $ - |
(a) Reflects gross cumulative appreciation (depreciation) on futures contracts as presented in the Schedule of Investments. Only the period end receivable or payable for daily variation margin and net unrealized appreciation (depreciation) are presented in the Statement of Assets and Liabilities. |
See accompanying notes which are an integral part of the financial statements.
Annual Report
Statement of Assets and Liabilities
| December 31, 2013 |
| | |
Assets | | |
Investment in securities, at value (including securities loaned of $65,256,158) - See accompanying schedule: Unaffiliated issuers (cost $1,683,845,104) | $ 3,535,138,647 | |
Fidelity Central Funds (cost $109,388,550) | 109,388,550 | |
Total Investments (cost $1,793,233,654) | | $ 3,644,527,197 |
Cash | | 1,323,220 |
Receivable for fund shares sold | | 5,367,220 |
Dividends receivable | | 4,758,281 |
Distributions receivable from Fidelity Central Funds | | 14,821 |
Receivable for daily variation margin for derivative instruments | | 167,576 |
Other receivables | | 45,635 |
Total assets | | 3,656,203,950 |
| | |
Liabilities | | |
Payable for investments purchased | $ 1,300,505 | |
Payable for fund shares redeemed | 1,947,421 | |
Accrued management fee | 130,893 | |
Distribution and service plan fees payable | 79,298 | |
Other affiliated payables | 160,039 | |
Other payables and accrued expenses | 42,143 | |
Collateral on securities loaned, at value | 66,683,235 | |
Total liabilities | | 70,343,534 |
| | |
Net Assets | | $ 3,585,860,416 |
Net Assets consist of: | | |
Paid in capital | | $1,745,676,377 |
Distributions in excess of net investment income | | (288,900) |
Accumulated undistributed net realized gain (loss) on investments | | (12,499,984) |
Net unrealized appreciation (depreciation) on investments | | 1,852,972,923 |
Net Assets | | $ 3,585,860,416 |
Statement of Assets and Liabilities - continued
| December 31, 2013 |
| | |
Initial Class:
Net Asset Value, offering price and redemption price per share ($3,163,672,781 ÷ 16,982,270 shares) | | $ 186.29 |
| | |
Service Class:
Net Asset Value, offering price and redemption price per share ($55,065,581 ÷ 296,416 shares) | | $ 185.77 |
| | |
Service Class 2:
Net Asset Value, offering price and redemption price per share ($367,122,054 ÷ 1,989,154 shares) | | $ 184.56 |
See accompanying notes which are an integral part of the financial statements.
Annual Report
Financial Statements - continued
Statement of Operations
| Year ended December 31, 2013 |
| | |
Investment Income | | |
Dividends | | $ 63,975,795 |
Interest | | 2,662 |
Income from Fidelity Central Funds | | 246,865 |
Total income | | 64,225,322 |
| | |
Expenses | | |
Management fee | $ 1,390,818 | |
Transfer agent fees | 1,699,889 | |
Distribution and service plan fees | 850,679 | |
Independent trustees' compensation | 16,160 | |
Miscellaneous | 6,201 | |
Total expenses before reductions | 3,963,747 | |
Expense reductions | (113) | 3,963,634 |
Net investment income (loss) | | 60,261,688 |
Realized and Unrealized Gain (Loss) Net realized gain (loss) on: | | |
Investment securities: | | |
Unaffiliated issuers | (14,213,470) | |
Futures contracts | 11,913,798 | |
Total net realized gain (loss) | | (2,299,672) |
Change in net unrealized appreciation (depreciation) on: Investment securities | 796,400,620 | |
Futures contracts | 1,484,522 | |
Total change in net unrealized appreciation (depreciation) | | 797,885,142 |
Net gain (loss) | | 795,585,470 |
Net increase (decrease) in net assets resulting from operations | | $ 855,847,158 |
Statement of Changes in Net Assets
| Year ended
December 31, 2013 | Year ended
December 31, 2012 |
Increase (Decrease) in Net Assets | | |
Operations | | |
Net investment income (loss) | $ 60,261,688 | $ 53,449,172 |
Net realized gain (loss) | (2,299,672) | 26,021,499 |
Change in net unrealized appreciation (depreciation) | 797,885,142 | 268,060,038 |
Net increase (decrease) in net assets resulting from operations | 855,847,158 | 347,530,709 |
Distributions to shareholders from net investment income | (60,739,824) | (52,954,383) |
Distributions to shareholders from net realized gain | (29,920,613) | (30,334,618) |
Total distributions | (90,660,437) | (83,289,001) |
Share transactions - net increase (decrease) | 210,763,046 | 149,810,206 |
Total increase (decrease) in net assets | 975,949,767 | 414,051,914 |
| | |
Net Assets | | |
Beginning of period | 2,609,910,649 | 2,195,858,735 |
End of period (including distributions in excess of net investment income of $288,900 and undistributed net investment income of $152,302, respectively) | $ 3,585,860,416 | $ 2,609,910,649 |
See accompanying notes which are an integral part of the financial statements.
Annual Report
Financial Highlights - Initial Class
Years ended December 31, | 2013 | 2012 | 2011 | 2010 | 2009 |
Selected Per-Share Data | | | | | |
Net asset value, beginning of period | $ 144.91 | $ 129.33 | $ 132.39 | $ 119.62 | $ 99.19 |
Income from Investment Operations | | | | | |
Net investment income (loss) C | 3.31 | 3.12 | 2.58 | 2.35 | 2.37 |
Net realized and unrealized gain (loss) | 42.98 | 17.29 | .10 | 15.13 | 23.03 |
Total from investment operations | 46.29 | 20.41 | 2.68 | 17.48 | 25.40 |
Distributions from net investment income | (3.27) | (3.06) | (2.65) | (2.44) | (2.72) |
Distributions from net realized gain | (1.64) | (1.77) | (3.09) | (2.27) | (2.25) |
Total distributions | (4.91) | (4.83) | (5.74) | (4.71) | (4.97) |
Net asset value, end of period | $ 186.29 | $ 144.91 | $ 129.33 | $ 132.39 | $ 119.62 |
Total Return A, B | 32.25% | 15.91% | 2.04% | 15.02% | 26.61% |
Ratios to Average Net Assets D, F | | | | | |
Expenses before reductions | .10% | .10% | .10% | .10% | .10% |
Expenses net of fee waivers, if any | .10% | .10% | .10% | .10% | .10% |
Expenses net of all reductions | .10% | .10% | .10% | .10% | .10% |
Net investment income (loss) | 1.98% | 2.20% | 1.96% | 1.94% | 2.31% |
Supplemental Data | | | | | |
Net assets, end of period (000 omitted) | $ 3,163,673 | $ 2,294,364 | $ 1,918,592 | $ 1,931,271 | $ 1,767,750 |
Portfolio turnover rate E | 5% | 5% | 5% | 5% | 6% |
A Total returns do not reflect charges attributable to your insurance company's separate account. Inclusion of these charges would reduce the total returns shown.
B Total returns would have been lower if certain expenses had not been reduced during the applicable periods shown.
C Calculated based on average shares outstanding during the period.
D Fees and expenses of any underlying Fidelity Central Funds are not included in the Fund's expense ratio. The Fund indirectly bears its proportionate share of the expenses of any underlying Fidelity Central Funds.
E Amount does not include the portfolio activity of any underlying Fidelity Central Funds.
F Expense ratios reflect operating expenses of the class. Expenses before reductions do not reflect amounts reimbursed by the investment adviser or reductions from expense offset arrangements and do not represent the amount paid by the class during periods when reimbursements or reductions occur. Expenses net of fee waivers reflect expenses after reimbursement by the investment adviser but prior to reductions from expense offset arrangements. Expenses net of all reductions represent the net expenses paid by the class.
Financial Highlights - Service Class
Years ended December 31, | 2013 | 2012 | 2011 | 2010 | 2009 |
Selected Per-Share Data | | | | | |
Net asset value, beginning of period | $ 144.53 | $ 129.00 | $ 132.07 | $ 119.35 | $ 98.99 |
Income from Investment Operations | | | | | |
Net investment income (loss) C | 3.13 | 2.97 | 2.44 | 2.22 | 2.27 |
Net realized and unrealized gain (loss) | 42.85 | 17.25 | .10 | 15.09 | 22.96 |
Total from investment operations | 45.98 | 20.22 | 2.54 | 17.31 | 25.23 |
Distributions from net investment income | (3.10) | (2.92) | (2.52) | (2.32) | (2.62) |
Distributions from net realized gain | (1.64) | (1.77) | (3.09) | (2.27) | (2.25) |
Total distributions | (4.74) | (4.69) | (5.61) | (4.59) | (4.87) |
Net asset value, end of period | $ 185.77 | $ 144.53 | $ 129.00 | $ 132.07 | $ 119.35 |
Total Return A, B | 32.12% | 15.80% | 1.93% | 14.91% | 26.48% |
Ratios to Average Net Assets D, F | | | | | |
Expenses before reductions | .20% | .20% | .20% | .20% | .20% |
Expenses net of fee waivers, if any | .20% | .20% | .20% | .20% | .20% |
Expenses net of all reductions | .20% | .20% | .20% | .20% | .20% |
Net investment income (loss) | 1.88% | 2.10% | 1.86% | 1.84% | 2.21% |
Supplemental Data | | | | | |
Net assets, end of period (000 omitted) | $ 55,066 | $ 41,443 | $ 37,095 | $ 37,209 | $ 32,708 |
Portfolio turnover rate E | 5% | 5% | 5% | 5% | 6% |
A Total returns do not reflect charges attributable to your insurance company's separate account. Inclusion of these charges would reduce the total returns shown.
B Total returns would have been lower if certain expenses had not been reduced during the applicable periods shown.
C Calculated based on average shares outstanding during the period.
D Fees and expenses of any underlying Fidelity Central Funds are not included in the Fund's expense ratio. The Fund indirectly bears its proportionate share of the expenses of any underlying Fidelity Central Funds.
E Amount does not include the portfolio activity of any underlying Fidelity Central Funds.
F Expense ratios reflect operating expenses of the class. Expenses before reductions do not reflect amounts reimbursed by the investment adviser or reductions from expense offset arrangements and do not represent the amount paid by the class during periods when reimbursements or reductions occur. Expenses net of fee waivers reflect expenses after reimbursement by the investment adviser but prior to reductions from expense offset arrangements. Expenses net of all reductions represent the net expenses paid by the class.
See accompanying notes which are an integral part of the financial statements.
Annual Report
Financial Highlights - Service Class 2
Years ended December 31, | 2013 | 2012 | 2011 | 2010 | 2009 |
Selected Per-Share Data | | | | | |
Net asset value, beginning of period | $ 143.64 | $ 128.24 | $ 131.31 | $ 118.71 | $ 98.50 |
Income from Investment Operations | | | | | |
Net investment income (loss) C | 2.86 | 2.74 | 2.23 | 2.03 | 2.11 |
Net realized and unrealized gain (loss) | 42.56 | 17.14 | .11 | 14.97 | 22.82 |
Total from investment operations | 45.42 | 19.88 | 2.34 | 17.00 | 24.93 |
Distributions from net investment income | (2.86) | (2.71) | (2.32) | (2.13) | (2.47) |
Distributions from net realized gain | (1.64) | (1.77) | (3.09) | (2.27) | (2.25) |
Total distributions | (4.50) | (4.48) | (5.41) | (4.40) | (4.72) |
Net asset value, end of period | $ 184.56 | $ 143.64 | $ 128.24 | $ 131.31 | $ 118.71 |
Total Return A, B | 31.92% | 15.62% | 1.78% | 14.73% | 26.30% |
Ratios to Average Net Assets D, F | | | | | |
Expenses before reductions | .35% | .35% | .35% | .35% | .35% |
Expenses net of fee waivers, if any | .35% | .35% | .35% | .35% | .35% |
Expenses net of all reductions | .35% | .35% | .35% | .35% | .35% |
Net investment income (loss) | 1.73% | 1.95% | 1.71% | 1.69% | 2.06% |
Supplemental Data | | | | | |
Net assets, end of period (000 omitted) | $ 367,122 | $ 274,104 | $ 240,172 | $ 242,677 | $ 220,221 |
Portfolio turnover rate E | 5% | 5% | 5% | 5% | 6% |
A Total returns do not reflect charges attributable to your insurance company's separate account. Inclusion of these charges would reduce the total returns shown.
B Total returns would have been lower if certain expenses had not been reduced during the applicable periods shown.
C Calculated based on average shares outstanding during the period.
D Fees and expenses of any underlying Fidelity Central Funds are not included in the Fund's expense ratio. The Fund indirectly bears its proportionate share of the expenses of any underlying Fidelity Central Funds.
E Amount does not include the portfolio activity of any underlying Fidelity Central Funds.
F Expense ratios reflect operating expenses of the class. Expenses before reductions do not reflect amounts reimbursed by the investment adviser or reductions from expense offset arrangements and do not represent the amount paid by the class during periods when reimbursements or reductions occur. Expenses net of fee waivers reflect expenses after reimbursement by the investment adviser but prior to reductions from expense offset arrangements. Expenses net of all reductions represent the net expenses paid by the class.
See accompanying notes which are an integral part of the financial statements.
Annual Report
Notes to Financial Statements
For the period ended December 31, 2013
1. Organization.
VIP Index 500 Portfolio (the Fund) is a fund of Variable Insurance Products Fund II (the Trust) and is authorized to issue an unlimited number of shares. The Trust is registered under the Investment Company Act of 1940, as amended (the 1940 Act), as an open-end management investment company organized as a Massachusetts business trust. Shares of the Fund may only be purchased by insurance companies for the purpose of funding variable annuity or variable life insurance contracts. The Fund offers the following classes of shares: Initial Class shares, Service Class shares and Service Class 2 shares. All classes have equal rights and voting privileges, except for matters affecting a single class.
2. Investments in Fidelity Central Funds.
The Fund invests in Fidelity Central Funds, which are open-end investment companies generally available only to other investment companies and accounts managed by the investment adviser and its affiliates. The Fund's Schedule of Investments lists each of the Fidelity Central Funds held as of period end, if any, as an investment of the Fund, but does not include the underlying holdings of each Fidelity Central Fund. As an Investing Fund, the Fund indirectly bears its proportionate share of the expenses of the underlying Fidelity Central Funds.
The Money Market Central Funds seek preservation of capital and current income and are managed by Fidelity Investments Money Management, Inc. (FIMM), an affiliate of the investment adviser. Annualized expenses of the Money Market Central Funds as of their most recent shareholder report date are less than .01%.
A complete unaudited list of holdings for each Fidelity Central Fund is available upon request or at the Securities and Exchange Commission (the SEC) website at www.sec.gov. In addition, the financial statements of the Fidelity Central Funds, which are not covered by the Fund's Report of Independent Registered Public Accounting Firm, are available on the SEC website or upon request.
3. Significant Accounting Policies.
The financial statements have been prepared in conformity with accounting principles generally accepted in the United States of America (GAAP), which require management to make certain estimates and assumptions at the date of the financial statements. Actual results could differ from those estimates. Subsequent events, if any, through the date that the financial statements were issued have been evaluated in the preparation of the financial statements. The following summarizes the significant accounting policies of the Fund:
Investment Valuation. Investments are valued as of 4:00 p.m. Eastern time on the last calendar day of the period. In accordance with valuation policies and procedures approved by the Board of Trustees (the Board), the Fund attempts to obtain prices from one or more third party pricing vendors or brokers to value its investments. When current market prices, quotations or currency exchange rates are not readily available or reliable, investments will be fair valued in good faith by the Fidelity Management & Research Company (FMR) Fair Value Committee (the Committee), in accordance with procedures adopted by the Board. Factors used in determining fair value vary by investment type and may include market or investment specific events, changes in interest rates and credit quality. The frequency with which these procedures are used cannot be predicted and they may be utilized to a significant extent. The Committee oversees the Fund's valuation policies and procedures and is responsible for approving and reporting to the Board all fair value determinations.
The Fund categorizes the inputs to valuation techniques used to value its investments into a disclosure hierarchy consisting of three levels as shown below:
Level 1 - quoted prices in active markets for identical investments
Level 2 - other significant observable inputs (including quoted prices for similar investments, interest rates, prepayment speeds, etc.)
Level 3 - unobservable inputs (including the Fund's own assumptions based on the best information available)
Valuation techniques used to value the Fund's investments by major category are as follows:
Equity securities, including restricted securities, for which market quotations are readily available, are valued at the last reported sale price or official closing price as reported by a third party pricing vendor on the primary market or exchange on which they are traded and are categorized as Level 1 in the hierarchy. In the event there were no sales during the day or closing prices are not available, securities are valued at the last quoted bid price or may be valued using the last available price and are generally categorized as Level 2 in the hierarchy. For foreign equity securities, when market or security specific events arise, comparisons to the valuation of American Depositary Receipts (ADRs), futures contracts, Exchange-Traded Funds (ETFs) and certain indexes as well as quoted prices for similar securities may be used and would be categorized as Level 2 in the hierarchy. Utilizing these techniques may result in transfers between Level 1 and Level 2. For equity securities, including restricted securities, where observable inputs are limited, assumptions about market activity and risk are used and these securities may be categorized as Level 3 in the hierarchy.
Annual Report
Notes to Financial Statements - continued
3. Significant Accounting Policies - continued
Investment Valuation - continued
Debt securities, including restricted securities, are valued based on evaluated prices received from third party pricing vendors or from brokers who make markets in such securities. U.S. government and government agency obligations, are valued by pricing vendors who utilize matrix pricing which considers yield or price of bonds of comparable quality, coupon, maturity and type or by broker-supplied prices. When independent prices are unavailable or unreliable, debt securities may be valued utilizing pricing methodologies which consider similar factors that would be used by third party pricing vendors. Debt securities are generally categorized as Level 2 in the hierarchy but may be Level 3 depending on the circumstances.
Futures contracts are valued at the settlement price established each day by the board of trade or exchange on which they are traded and are categorized as Level 1 in the hierarchy. Investments in open-end mutual funds, including the Fidelity Central Funds, are valued at their closing net asset value (NAV) each business day and are categorized as Level 1 in the hierarchy.
Changes in valuation techniques may result in transfers in or out of an assigned level within the disclosure hierarchy. The aggregate value of investments by input level, as of December 31, 2013, is included at the end of the Fund's Schedule of Investments.
Investment Transactions and Income. For financial reporting purposes, the Fund's investment holdings and NAV include trades executed through the end of the last business day of the period. The NAV per share for processing shareholder transactions is calculated as of the close of business of the New York Stock Exchange (NYSE), normally 4:00 p.m. Eastern time and includes trades executed through the end of the prior business day. Gains and losses on securities sold are determined on the basis of identified cost and may include proceeds received from litigation. Dividend income is recorded on the ex-dividend date, except for certain dividends from foreign securities where the ex-dividend date may have passed, which are recorded as soon as the Fund is informed of the ex-dividend date. Non-cash dividends included in dividend income, if any, are recorded at the fair market value of the securities received. Distributions received on securities that represent a return of capital or capital gain are recorded as a reduction of cost of investments and/or as a realized gain. Subsequent to ex-dividend date the Fund determines the components of these distributions, based upon receipt of tax filings or other correspondence relating to the underlying investment. Interest income and distributions from the Fidelity Central Funds are accrued as earned. Interest income includes coupon interest and amortization of premium and accretion of discount on debt securities.
Class Allocations and Expenses. Investment income, realized and unrealized capital gains and losses, common expenses of the Fund, and certain fund-level expense reductions, if any, are allocated daily on a pro-rata basis to each class based on the relative net assets of each class to the total net assets of the Fund. Each class differs with respect to distribution and service plan fees incurred. Certain expense reductions may also differ by class. For the reporting period, the allocated portion of income and expenses to each class as a percent of its average net assets may vary due to the timing of recording these transactions in relation to fluctuating net assets of the classes. Expenses directly attributable to a fund are charged to that fund. Expenses attributable to more than one fund are allocated among the respective funds on the basis of relative net assets or other appropriate methods. Expense estimates are accrued in the period to which they relate and adjustments are made when actual amounts are known.
Deferred Trustee Compensation. Under a Deferred Compensation Plan (the Plan), independent Trustees may elect to defer receipt of a portion of their annual compensation. Deferred amounts are invested in a cross-section of Fidelity funds, are marked-to-market and remain in the Fund until distributed in accordance with the Plan. The investment of deferred amounts and the offsetting payable to the Trustees are included in the accompanying Statement of Assets and Liabilities.
Income Tax Information and Distributions to Shareholders. Each year, the Fund intends to qualify as a regulated investment company under Subchapter M of the Internal Revenue Code, including distributing substantially all of its taxable income and realized gains. As a result, no provision for U.S. Federal income taxes is required. As of December 31, 2013, the Fund did not have any unrecognized tax benefits in the financial statements; nor is the Fund aware of any tax positions for which it is reasonably possible that the total amounts of unrecognized tax benefits will significantly change in the next twelve months. The Fund files a U.S. federal tax return, in addition to state and local tax returns as required. The Fund's federal income tax returns are subject to examination by the Internal Revenue Service (IRS) for a period of three fiscal years after they are filed. State and local tax returns may be subject to examination for an additional fiscal year depending on the jurisdiction.
Distributions are declared and recorded on the ex-dividend date. Income dividends and capital gain distributions are declared separately for each class. Income and capital gain distributions are determined in accordance with income tax regulations, which may differ from GAAP.
Capital accounts within the financial statements are adjusted for permanent book-tax differences. These adjustments have no impact on net assets or the results of operations. Capital accounts are not adjusted for temporary book-tax differences which will reverse in a subsequent period.
Book-tax differences are primarily due to futures contracts, deferred trustees compensation and losses deferred due to wash sales and excise tax regulations.
Annual Report
3. Significant Accounting Policies - continued
Income Tax Information and Distributions to Shareholders - continued
The federal tax cost of investment securities and unrealized appreciation (depreciation) as of period end were as follows:
Gross unrealized appreciation | $ 1,968,388,263 |
Gross unrealized depreciation | (117,521,704) |
Net unrealized appreciation (depreciation) on securities and other investments | $ 1,850,866,559 |
| |
Tax Cost | $ 1,793,660,638 |
The tax-based components of distributable earnings as of period end were as follows:
Undistributed ordinary income | $ 90,161 |
Net unrealized appreciation (depreciation) | $ 1,850,866,559 |
The tax character of distributions paid was as follows:
| December 31, 2013 | December 31, 2012 |
Ordinary Income | $ 68,824,135 | $ 57,066,938 |
Long-term Capital Gains | 21,836,302 | 26,222,063 |
Total | $ 90,660,437 | $ 83,289,001 |
4. Derivative Instruments.
Risk Exposures and the Use of Derivative Instruments. The Fund's investment objective allows the Fund to enter into various types of derivative contracts, including futures contracts. Derivatives are investments whose value is primarily derived from underlying assets, indices or reference rates and may be transacted on an exchange or over-the-counter (OTC). Derivatives may involve a future commitment to buy or sell a specified asset based on specified terms, to exchange future cash flows at periodic intervals based on a notional principal amount, or for one party to make one or more payments upon the occurrence of specified events in exchange for periodic payments from the other party.
The Fund used derivatives to increase returns and to manage exposure to certain risks as defined below. The success of any strategy involving derivatives depends on analysis of numerous economic factors, and if the strategies for investment do not work as intended, the Fund may not achieve its objectives.
The Fund's use of derivatives increased or decreased its exposure to the following risk:
Equity Risk | Equity risk relates to the fluctuations in the value of financial instruments as a result of changes in market prices (other than those arising from interest rate risk or foreign exchange risk), whether caused by factors specific to an individual investment, its issuer, or all factors affecting all instruments traded in a market or market segment. |
The Fund is also exposed to additional risks from investing in derivatives, such as liquidity risk and counterparty credit risk. Liquidity risk is the risk that the Fund will be unable to close out the derivative in the open market in a timely manner. Counterparty credit risk is the risk that the counterparty will not be able to fulfill its obligation to the Fund. Counterparty credit risk related to exchange-traded futures contracts may be mitigated by the protection provided by the exchange on which they trade.
Investing in derivatives may involve greater risks than investing in the underlying assets directly and, to varying degrees, may involve risk of loss in excess of any initial investment and collateral received and amounts recognized in the Statement of Assets and Liabilities. In addition, there may be the risk that the change in value of the derivative contract does not correspond to the change in value of the underlying instrument.
Futures Contracts. A futures contract is an agreement between two parties to buy or sell a specified underlying instrument for a fixed price at a specified future date. The Fund used futures contracts to manage its exposure to the stock market.
Annual Report
Notes to Financial Statements - continued
4. Derivative Instruments - continued
Futures Contracts - continued
Upon entering into a futures contract, a fund is required to deposit either cash or securities (initial margin) with a clearing broker in an amount equal to a certain percentage of the face value of the contract. Futures contracts are marked-to-market daily and subsequent daily payments (variation margin) are made or received by a fund depending on the daily fluctuations in the value of the futures contracts and are recorded as unrealized appreciation or (depreciation). This receivable and/or payable, if any, is included in daily variation margin for derivative instruments in the Statement of Assets and Liabilities. Realized gain or (loss) is recorded upon the expiration or closing of a futures contract.
Any open futures contracts at period end are presented in the Schedule of Investments under the caption "Futures Contracts." The underlying face amount at value reflects each contract's exposure to the underlying instrument or index at period end and is representative of volume of activity during the period. Securities deposited to meet initial margin requirements are identified in the Schedule of Investments.
During the period the Fund recognized net realized gain (loss) of $11,913,798 and a change in net unrealized appreciation (depreciation) of $1,484,522 related to its investment in futures contracts. These amounts are included in the Statement of Operations.
5. Purchases and Sales of Investments.
Purchases and sales of securities, other than short-term securities, aggregated $334,762,840 and $142,456,824, respectively.
6. Fees and Other Transactions with Affiliates.
Management Fee and Expense Contract. Fidelity Management & Research Company (the investment adviser) and its affiliates provide the Fund with investment management related services for which the Fund pays a monthly management fee. The management fee is based on an annual rate of .045% of the Fund's average net assets. Under the management contract, the investment adviser pays all other fund-level expenses, except the compensation of the independent Trustees and certain other expenses such as interest expense, including commitment fees. In addition, under an expense contract, the investment adviser pays class-level expenses as necessary so that total expenses do not exceed an annual rate of .10% of each class' average net assets, excluding the distribution and service fee for each applicable class, with certain exceptions.
Sub-Adviser. Geode Capital Management, LLC (Geode), serves as sub-adviser for the Fund. Geode provides discretionary investment advisory services to the Fund and is paid by the investment adviser for providing these services.
Distribution and Service Plan Fees. In accordance with Rule 12b-1 of the 1940 Act, the Fund has adopted separate 12b-1 Plans for each Service Class of shares. Each Service Class pays Fidelity Distributors Corporation (FDC), an affiliate of the investment adviser, a service fee. For the period, the service fee is based on an annual rate of .10% of Service Class' average net assets and .25% of Service Class 2's average net assets.
For the period, total fees, all of which were re-allowed to insurance companies for the distribution of shares and providing shareholder support services were as follows:
Service Class | $ 48,513 |
Service Class 2 | 802,166 |
| $ 850,679 |
Transfer Agent Fees. Fidelity Investments Institutional Operations Company, Inc. (FIIOC), an affiliate of the investment adviser, is the transfer, dividend disbursing, and shareholder servicing agent for each class. FIIOC receives asset-based fees of .066% of each class's average net assets. In addition, FIIOC receives an asset-based fee of .0035% of average net assets for typesetting, printing and mailing of shareholder reports, except proxy statements. Under the expense contract, each class pays a portion of the transfer agent fees at an annual rate of .055% of the class' average net assets. For the period, transfer agent fees for each class, including printing and out of pocket expenses, were as follows:
Initial Class | $ 1,496,730 |
Service Class | 26,682 |
Service Class 2 | 176,477 |
| $ 1,699,889 |
Effective February 1, 2014, the Board of Trustees approved an amendment to the transfer agent fee agreement whereby FIIOC receives a single fee of .07% of average net assets for transfer agent services, typesetting, printing and mailing of shareholder reports, excluding mailing of proxy statements and out of pocket expenses.
7. Committed Line of Credit.
The Fund participates with other funds managed by the investment adviser or an affiliate in a $4.25 billion credit facility (the "line of credit") to be utilized for temporary or emergency purposes to fund shareholder redemptions or for other short-term liquidity purposes. The Fund has agreed to pay commitment fees on its pro-rata portion of the line of credit, which amounted to $6,201 and is reflected in Miscellaneous expenses on the Statement of Operations. During the period, there were no borrowings on this line of credit.
Annual Report
8. Security Lending.
The Fund lends portfolio securities through a lending agent from time to time in order to earn additional income. On the settlement date of the loan, the Fund receives collateral (in the form of U.S. Treasury obligations, letters of credit and/or cash) against the loaned securities and maintains collateral in an amount not less than 100% of the market value of the loaned securities during the period of the loan. The market value of the loaned securities is determined at the close of business of the Fund and any additional required collateral is delivered to the Fund on the next business day. If the borrower defaults on its obligation to return the securities loaned because of insolvency or other reasons, the Fund may apply collateral received from the borrower against the obligation. The Fund may experience delays and costs in recovering the securities loaned. Any cash collateral received is invested in the Fidelity Securities Lending Cash Central Fund. The value of loaned securities and cash collateral at period end are disclosed on the Fund's Statement of Assets and Liabilities. Security lending income represents the income earned on investing cash collateral, less rebates paid to borrowers and any lending agent fees associated with the loan, plus any premium payments received for lending certain types of securities. Security lending income is presented in the Statement of Operations as a component of income from Fidelity Central Funds. Total security lending income during the period amounted to $196,757.
9. Expense Reductions.
Through arrangements with the Fund's custodian, credits realized as a result of uninvested cash balances were used to reduce the Fund's expenses. During the period, these credits reduced the Fund's expenses by $113.
10. Distributions to Shareholders.
Distributions to shareholders of each class were as follows:
Years ended December 31, | 2013 | 2012 |
From net investment income | | |
Initial Class | $ 54,227,431 | $ 47,042,989 |
Service Class | 904,731 | 817,750 |
Service Class 2 | 5,607,662 | 5,093,644 |
Total | $ 60,739,824 | $ 52,954,383 |
From net realized gain | | |
Initial Class | $ 26,317,948 | $ 26,520,646 |
Service Class | 475,053 | 492,115 |
Service Class 2 | 3,127,612 | 3,321,857 |
Total | $ 29,920,613 | $ 30,334,618 |
11. Share Transactions.
Transactions for each class of shares were as follows:
| Shares | Dollars |
Years ended December 31, | 2013 | 2012 | 2013 | 2012 |
Initial Class | | | | |
Shares sold | 2,704,992 | 2,686,566 | $ 452,321,126 | $ 383,379,462 |
Reinvestment of distributions | 468,846 | 520,317 | 80,545,379 | 73,563,635 |
Shares redeemed | (2,024,201) | (2,209,387) | (337,548,716) | (312,125,251) |
Net increase (decrease) | 1,149,637 | 997,496 | $ 195,317,789 | $ 144,817,846 |
Service Class | | | | |
Shares sold | 32,810 | 32,821 | $ 5,462,769 | $ 4,627,611 |
Reinvestment of distributions | 8,074 | 9,295 | 1,379,784 | 1,309,865 |
Shares redeemed | (31,206) | (42,924) | (5,198,852) | (5,946,964) |
Net increase (decrease) | 9,678 | (808) | $ 1,643,701 | $ (9,488) |
Service Class 2 | | | | |
Shares sold | 373,889 | 338,381 | $ 61,633,716 | $ 47,591,017 |
Reinvestment of distributions | 51,514 | 60,133 | 8,735,274 | 8,415,501 |
Shares redeemed | (344,539) | (363,069) | (56,567,434) | (51,004,670) |
Net increase (decrease) | 80,864 | 35,445 | $ 13,801,556 | $ 5,001,848 |
Annual Report
Notes to Financial Statements - continued
12. Other.
The Fund's organizational documents provide former and current trustees and officers with a limited indemnification against liabilities arising in connection with the performance of their duties to the Fund. In the normal course of business, the Fund may also enter into contracts that provide general indemnifications. The Fund's maximum exposure under these arrangements is unknown as this would be dependent on future claims that may be made against the Fund. The risk of material loss from such claims is considered remote.
At the end of the period, the investment adviser or its affiliates were the owners of record of 36% of the total outstanding shares of the Fund.
Annual Report
Report of Independent Registered Public Accounting Firm
To the Trustees of Variable Insurance Products Fund II and Shareholders of VIP Index 500 Portfolio:
We have audited the accompanying statement of assets and liabilities of VIP Index 500 Portfolio (the Fund), a fund of Variable Insurance Products Fund II, including the schedule of investments, as of December 31, 2013, and the related statement of operations for the year then ended, the statement of changes in net assets for each of the two years in the period then ended, and the financial highlights for each of the five years in the period then ended. These financial statements and financial highlights are the responsibility of the Fund's management. Our responsibility is to express an opinion on these financial statements and financial highlights based on our audits.
We conducted our audits in accordance with the standards of the Public Company Accounting Oversight Board (United States). Those standards require that we plan and perform the audit to obtain reasonable assurance about whether the financial statements and financial highlights are free of material misstatement. The Fund is not required to have, nor were we engaged to perform, an audit of its internal control over financial reporting. Our audits included consideration of internal control over financial reporting as a basis for designing audit procedures that are appropriate in the circumstances, but not for the purpose of expressing an opinion on the effectiveness of the Fund's internal control over financial reporting. Accordingly, we express no such opinion. An audit also includes examining, on a test basis, evidence supporting the amounts and disclosures in the financial statements, assessing the accounting principles used and significant estimates made by management, as well as evaluating the overall financial statement presentation. Our procedures included confirmation of securities owned as of December 31, 2013, by correspondence with the custodians and brokers; where replies were not received from brokers, we performed other auditing procedures. We believe that our audits provide a reasonable basis for our opinion.
In our opinion, the financial statements and financial highlights referred to above present fairly, in all material respects, the financial position of VIP Index 500 Portfolio as of December 31, 2013, the results of its operations for the year then ended, the changes in its net assets for each of the two years in the period then ended, and the financial highlights for each of the five years in the period then ended, in conformity with accounting principles generally accepted in the United States of America.
DELOITTE & TOUCHE LLP
Boston, Massachusetts
February 11, 2014
Annual Report
The Trustees, Member of the Advisory Board, and officers of the trust and fund, as applicable, are listed below. The Board of Trustees governs the fund and is responsible for protecting the interests of shareholders. The Trustees are experienced executives who meet periodically throughout the year to oversee the fund's activities, review contractual arrangements with companies that provide services to the fund, oversee management of the risks associated with such activities and contractual arrangements, and review the fund's performance. Except for James C. Curvey, Ned C. Lautenbach, Ronald P. O'Hanley, and William S. Stavropoulos, each of the Trustees oversees 173 funds. Mr. Curvey oversees 396 funds. Mr. Lautenbach, Mr. O'Hanley, and Mr. Stavropoulos each oversees 247 funds.
The Trustees hold office without limit in time except that (a) any Trustee may resign; (b) any Trustee may be removed by written instrument, signed by at least two-thirds of the number of Trustees prior to such removal; (c) any Trustee who requests to be retired or who has become incapacitated by illness or injury may be retired by written instrument signed by a majority of the other Trustees; and (d) any Trustee may be removed at any special meeting of shareholders by a two-thirds vote of the outstanding voting securities of the trust. Each Trustee who is not an interested person (as defined in the 1940 Act) of the trust and the fund (Independent Trustee), shall retire not later than the last day of the calendar year in which his or her 75th birthday occurs. The Independent Trustees may waive this mandatory retirement age policy with respect to individual Trustees. The officers and Advisory Board Member hold office without limit in time, except that any officer and Advisory Board Member may resign or may be removed by a vote of a majority of the Trustees at any regular meeting or any special meeting of the Trustees. Except as indicated, each individual has held the office shown or other offices in the same company for the past five years.
Experience, Skills, Attributes, and Qualifications of the Fund's Trustees. The Governance and Nominating Committee has adopted a statement of policy that describes the experience, qualifications, attributes, and skills that are necessary and desirable for potential Independent Trustee candidates (Statement of Policy). The Board believes that each Trustee satisfied at the time he or she was initially elected or appointed a Trustee, and continues to satisfy, the standards contemplated by the Statement of Policy. The Governance and Nominating Committee also engages professional search firms to help identify potential Independent Trustee candidates who have the experience, qualifications, attributes, and skills consistent with the Statement of Policy. From time to time, additional criteria based on the composition and skills of the current Independent Trustees, as well as experience or skills that may be appropriate in light of future changes to board composition, business conditions, and regulatory or other developments, have also been considered by the professional search firms and the Governance and Nominating Committee. In addition, the Board takes into account the Trustees' commitment and participation in Board and committee meetings, as well as their leadership of standing and ad hoc committees throughout their tenure.
In determining that a particular Trustee was and continues to be qualified to serve as a Trustee, the Board has considered a variety of criteria, none of which, in isolation, was controlling. The Board believes that, collectively, the Trustees have balanced and diverse experience, qualifications, attributes, and skills, which allow the Board to operate effectively in governing the fund and protecting the interests of shareholders. Information about the specific experience, skills, attributes, and qualifications of each Trustee, which in each case led to the Board's conclusion that the Trustee should serve (or continue to serve) as a trustee of the fund, is provided below.
Board Structure and Oversight Function. James C. Curvey is an interested person (as defined in the 1940 Act) and currently serves as Chairman. The Trustees have determined that an interested Chairman is appropriate and benefits shareholders because an interested Chairman has a personal and professional stake in the quality and continuity of services provided to the fund Independent Trustees exercise their informed business judgment to appoint an individual of their choosing to serve as Chairman, regardless of whether the Trustee happens to be independent or a member of management. The Independent Trustees have determined that they can act independently and effectively without having an Independent Trustee serve as Chairman and that a key structural component for assuring that they are in a position to do so is for the Independent Trustees to constitute a substantial majority for the Board. The Independent Trustees also regularly meet in executive session. Ned C. Lautenbach serves as Chairman of the Independent Trustees and as such (i) acts as a liaison between the Independent Trustees and management with respect to matters important to the Independent Trustees and (ii) with management prepares agendas for Board meetings.
Fidelity funds are overseen by different Boards of Trustees. The fund's Board oversees Fidelity's equity and high income funds and another Board oversees Fidelity's investment-grade bond, money market, and asset allocation funds. The asset allocation funds may invest in Fidelity funds overseen by the fund's Board. The use of separate Boards, each with its own committee structure, allows the Trustees of each group of Fidelity funds to focus on the unique issues of the funds they oversee, including common research, investment, and operational issues. On occasion, the separate Boards establish joint committees to address issues of overlapping consequences for the Fidelity funds overseen by each Board.
The Trustees operate using a system of committees to facilitate the timely and efficient consideration of all matters of importance to the Trustees, the fund, and fund shareholders and to facilitate compliance with legal and regulatory requirements and oversight of the fund's activities and associated risks. The Board, acting through its committees, has charged FMR and its affiliates with (i) identifying events or circumstances the occurrence of which could have demonstrably adverse effects on the fund's business and/or reputation; (ii) implementing processes and controls to lessen the possibility that such events or circumstances occur or to mitigate the effects of such events or circumstances if they do occur; and (iii) creating and maintaining a system designed to evaluate continuously business and market conditions in order to facilitate the identification and implementation processes described in (i) and (ii) above. Because the day-to-day operations and activities of the fund are carried out by or through FMR, its affiliates and other service providers, the fund's exposure to risks is mitigated but not eliminated by the processes overseen by the Trustees. While each of the Board's committees has responsibility for overseeing different aspects of the fund's activities, oversight is exercised primarily through the Operations, Audit, and Compliance Committees. In addition, the Independent Trustees have worked with FMR to enhance the Board's oversight of investment and financial risks, legal and regulatory risks, technology risks, and operational risks, including the development of additional risk reporting to the Board. For example, a working group comprised of Independent Trustees and FMR has worked and continues to work to review the Fidelity funds' valuation-related activities, reporting and risk management. Appropriate personnel, including but not limited to the fund's Chief Compliance Officer (CCO), FMR's internal auditor, the independent accountants, the fund's Treasurer and portfolio management personnel, make periodic reports to the Board's committees, as appropriate, including an annual review of FMR's risk management program for the Fidelity funds. The responsibilities of each standing committee, including their oversight responsibilities, are described further under "Standing Committees of the Fund's Trustees."
Annual Report
The fund's Statement of Additional Information (SAI) includes more information about the Trustees. To request a free copy, call Fidelity at 1-877-208-0098.
Interested Trustees*:
Correspondence intended for each Trustee who is an interested person may be sent to Fidelity Investments, 245 Summer Street, Boston, Massachusetts 02210.
Name, Year of Birth; Principal Occupations and Other Relevant Experience+ |
James C. Curvey (1935) |
Year of Election or Appointment: 2007 Trustee Chairman of the Board of Trustees |
| Mr. Curvey also serves as Trustee of other Fidelity funds. Mr. Curvey is a Director of Fidelity Investments Money Management, Inc. (2009-present), Director of Fidelity Research & Analysis Co. (2009-present) and Director of FMR and FMR Co., Inc. (2007-present). Mr. Curvey is also Vice Chairman (2007-present) and Director of FMR LLC. In addition, Mr. Curvey serves as an Overseer for the Boston Symphony Orchestra and a member of the Trustees of Villanova University. Previously, Mr. Curvey was the Vice Chairman (2006-2007) and Director (2000-2007) of FMR Corp. |
Ronald P. O'Hanley (1957) |
Year of Election or Appointment: 2011 Trustee |
| Mr. O'Hanley also serves as Trustee of other Fidelity funds. He is Director of Fidelity SelectCo, LLC (2013-present), FMR Co., Inc. (2010-present), Director of Fidelity Investments Money Management, Inc. (2010-present), Director of Fidelity Research & Analysis Company (2010-present), President of Fidelity Asset Management and Corporate Services and a Member of Fidelity's Executive Committee (2010-present). Previously, Mr. O'Hanley served as President and Chief Executive Officer of BNY Mellon Asset Management (2007-2010). Mr. O'Hanley also served as Vice Chairman of Bank New York Mellon Corp. and a member of that firm's Executive Committee. Prior to the 2007 merger of The Bank of New York and Mellon Financial Corporation, he was Vice Chairman of Mellon Financial Corporation and President and Chief Executive Officer of Mellon Asset Management. He joined Mellon in February 1997. Mr. O'Hanley currently serves as Chairman of the Boston Public Library Foundation Board of Directors and sits on the Board of Directors of Beth Israel Deaconess Medical Center, the Board of Trustees of the Marine Biological Laboratory and the Advisory Board of the Maxwell School of Citizenship and Public Administration at Syracuse University. Mr. O'Hanley also chairs the Council on Asset Management for the Financial Services Roundtable and is a member of the Board of Directors of Institutional Investor's U.S. Institute. |
* Trustees has been determined to be "Interested Trustees" by virtue of, among other things, their affiliation with the trust or various entities under common control with FMR.
+ The information above includes each Trustee's principal occupation during the last five years and other information relating to the experience, attributes, and skills relevant to each Trustee's qualifications to serve as a Trustee, which led to the conclusion that each Trustee should serve as a Trustee for the fund.
Annual Report
Trustees and Officers - continued
Independent Trustees:
Correspondence intended for each Independent Trustee (that is, the Trustees other than the Interested Trustees) may be sent to Fidelity Investments, P.O. Box 55235, Boston, Massachusetts 02205-5235.
Name, Year of Birth; Principal Occupations and Other Relevant Experience+ |
Dennis J. Dirks (1948) |
Year of Election or Appointment: 2005 Trustee |
| Mr. Dirks also serves as Trustee of other Fidelity funds. Prior to his retirement in May 2003, Mr. Dirks was Chief Operating Officer and a member of the Board of The Depository Trust & Clearing Corporation (DTCC). He also served as President, Chief Operating Officer, and Board member of The Depository Trust Company (DTC) and President and Board member of the National Securities Clearing Corporation (NSCC). In addition, Mr. Dirks served as Chief Executive Officer and Board member of the Government Securities Clearing Corporation, Chief Executive Officer and Board member of the Mortgage-Backed Securities Clearing Corporation, as a Trustee and a member of the Finance Committee of Manhattan College (2005-2008), and as a Trustee and a member of the Finance Committee of AHRC of Nassau County (2006-2008). Mr. Dirks is a member of the Independent Directors Council (IDC) Governing Council (2010-present) and Board of Directors for The Brookville Center for Children's Services, Inc. (2009-present). |
Alan J. Lacy (1953) |
Year of Election or Appointment: 2008 Trustee |
| Mr. Lacy also serves as Trustee of other Fidelity funds. Mr. Lacy serves as Senior Adviser (2007-present) of Oak Hill Capital Partners, L.P. (private equity). Mr. Lacy also served as Chief Executive Officer (2000-2005) and Vice Chairman (2005-2006) of Sears Holdings Corporation and Sears, Roebuck and Co. (retail). In addition, Mr. Lacy serves as a member of the Board of Directors of Dave & Buster's Entertainment, Inc. (restaurant and entertainment complexes, 2010-present), Earth Fare, Inc. (retail grocery, 2012-present), The Hillman Companies, Inc. (hardware wholesalers, 2010-present), and Bristol-Myers Squibb Company (global pharmaceuticals, 2008-present). Mr. Lacy is a member of the Board of Trustees of The National Parks Conservation Association (2006-present). Previously, Mr. Lacy served as Chairman of the Board of Trustees of the National Parks Conservation Association (2008-2011) and as a member of the Board of Directors for the Western Union Company (global money transfer, 2006-2011). |
Ned C. Lautenbach (1944) |
Year of Election or Appointment: 2000 Trustee Chairman of the Independent Trustees |
| Mr. Lautenbach also serves as Trustee of other Fidelity funds. Mr. Lautenbach currently serves as the Lead Director of the Eaton Corporation Board of Directors (diversified industrial, 1997-present). Mr. Lautenbach is Chairman of the Board of Directors of the Philharmonic Center for the Arts in Naples, Florida (2012-present) and a member of the Council on Foreign Relations (1994-present). Previously, Mr. Lautenbach was a Partner/Advisory Partner at Clayton, Dubilier & Rice, LLC (private equity investment, 1998-2010), as well as a Director of Sony Corporation (2006-2007). |
Joseph Mauriello (1944) |
Year of Election or Appointment: 2008 Trustee |
| Mr. Mauriello also serves as Trustee of other Fidelity funds. Prior to his retirement in January 2006, Mr. Mauriello served in numerous senior management positions including Deputy Chairman and Chief Operating Officer (2004-2005), and Vice Chairman of Financial Services (2002-2004) of KPMG LLP US (professional services, 1965-2005). Mr. Mauriello currently serves as a member of the Board of Directors of XL Group plc. (global insurance and re-insurance, 2006-present). Previously, Mr. Mauriello served as a Director of the Hamilton Funds of the Bank of New York (2006-2007) and of Arcadia Resources Inc. (health care services and products, 2007-2012). |
Robert W. Selander (1950) |
Year of Election or Appointment: 2011 |
| Mr. Selander also serves as Trustee of other Fidelity funds. Previously, Mr. Selander served as a Member of the Advisory Board of other Fidelity funds (2011), and Executive Vice Chairman (2010), Chief Executive Officer (2009-2010), and President and Chief Executive Officer (1997-2009) of Mastercard, Inc. |
Cornelia M. Small (1944) |
Year of Election or Appointment: 2005 Trustee |
| Ms. Small also serves as Trustee of other Fidelity funds. Ms. Small is a member of the Board of Directors (2009-present) and Chair of the Investment Committee (2010-present) of the Teagle Foundation. Ms. Small also serves on the Investment Committee of the Berkshire Taconic Community Foundation (2008-present). Previously, Ms. Small served as Chairperson (2002-2008) and a member of the Investment Committee and Chairperson (2008-2012) and a member of the Board of Trustees of Smith College. In addition, Ms. Small served as Chief Investment Officer, Director of Global Equity Investments, and a member of the Board of Directors of Scudder, Stevens & Clark and Scudder Kemper Investments. |
William S. Stavropoulos (1939) |
Year of Election or Appointment: 2001 Trustee Vice Chairman of the Independent Trustees |
| Mr. Stavropoulos also serves as Trustee of other Fidelity funds. Mr. Stavropoulos serves as President and Founder of the Michigan Baseball Foundation, the Great Lakes Loons (2007-present). Mr. Stavropoulos is Chairman Emeritus of the Board of Directors of The Dow Chemical Company, where he previously served in numerous senior management positions, including President, CEO (1995-2000; 2002-2004), Chairman of the Executive Committee (2000-2006), and as a member of the Board of Directors (1990-2006). Currently, Mr. Stavropoulos is Chairman of the Board of Directors of Univar Inc. (global distributor of commodity and specialty chemicals), a Director of Teradata Corporation (data warehousing and technology solutions), and Maersk Inc. (industrial conglomerate), and a member of the Advisory Board for Metalmark Capital LLC (private equity investment, 2005-present). Mr. Stavropoulos is an operating advisor to Clayton, Dubilier & Rice, LLC (private equity investment). In addition, Mr. Stavropoulos is a member of the University of Notre Dame Advisory Council for the College of Science, a Trustee of the Rollin L. Gerstacker Foundation, and a Director of the Naples Philharmonic Center for the Arts. Previously, Mr. Stavropoulos served as a Director of Chemical Financial Corporation (bank holding company, 1993-2012) and Tyco International, Ltd. (multinational manufacturing and services, 2007-2012). |
David M. Thomas (1949) |
Year of Election or Appointment: 2008 Trustee |
| Mr. Thomas also serves as Trustee of other Fidelity funds. Mr. Thomas serves as Non-Executive Chairman of the Board of Directors of Fortune Brands Home and Security (home and security products, 2011-present), and as a member of the Board of Directors of Interpublic Group of Companies, Inc. (marketing communication, 2004-present). Previously, Mr. Thomas served as Executive Chairman (2005-2006) and Chairman and Chief Executive Officer (2000-2005) of IMS Health, Inc. (pharmaceutical and healthcare information solutions), and a Director of Fortune Brands, Inc. (consumer products, 2000-2011). |
+ The information above includes each Trustee's principal occupation during the last five years and other information relating to the experience, attributes, and skills relevant to each Trustee's qualifications to serve as a Trustee, which led to the conclusion that each Trustee should serve as a Trustee for the fund.
Advisory Board Member and Officers:
Correspondence intended for each officer and Peter S. Lynch may be sent to Fidelity Investments, 245 Summer Street, Boston, Massachusetts 02210. Officers appear below in alphabetical order.
Name, Year of Birth; Principal Occupation |
Peter S. Lynch (1944) |
Year of Election or Appointment: 2003 Member of the Advisory Board |
| Mr. Lynch also serves as Member of the Advisory Board of other Fidelity funds. Mr. Lynch is Vice Chairman and a Director of FMR and FMR Co., Inc. In addition, Mr. Lynch serves as a Trustee of Boston College and as the Chairman of the Inner-City Scholarship Fund. Previously, Mr. Lynch served on the Special Olympics International Board of Directors (1997-2006). |
Elizabeth Paige Baumann (1968) |
Year of Election or Appointment: 2012 Anti-Money Laundering (AML) Officer |
| Ms. Baumann also serves as AML Officer of other funds. She is Chief AML Officer of FMR LLC (2012-present) and is an employee of Fidelity Investments. Previously, Ms. Baumann served as Vice President and Deputy Anti-Money Laundering Officer (2007-2012). |
William C. Coffey (1969) |
Year of Election or Appointment: 2009 Assistant Secretary |
| Mr. Coffey also serves as Assistant Secretary of other funds. He is Senior Vice President and Deputy General Counsel of FMR LLC (2010-present), and is an employee of Fidelity Investments. Previously, Mr. Coffey served as Vice President and Associate General Counsel of FMR LLC (2005-2009). |
Jonathan Davis (1968) |
Year of Election or Appointment: 2010 Assistant Treasurer |
| Mr. Davis also serves as Assistant Treasurer of other funds. Mr. Davis is an employee of Fidelity Investments. Previously, Mr. Davis served as Vice President and Associate General Counsel of FMR LLC (2003-2010). |
Adrien E. Deberghes (1967) |
Year of Election or Appointment: 2008 Deputy Treasurer |
| Mr. Deberghes also serves as an officer of other funds. He is an employee of Fidelity Investments (2008-present). Prior to joining Fidelity Investments, Mr. Deberghes was Senior Vice President of Mutual Fund Administration at State Street Corporation (2007-2008), Senior Director of Mutual Fund Administration at Investors Bank & Trust (2005-2007), and Director of Finance for Dunkin' Brands (2000-2005). |
Stephanie J. Dorsey (1969) |
Year of Election or Appointment: 2010 Assistant Treasurer |
| Ms. Dorsey also serves as an officer of other funds. She is an employee of Fidelity Investments (2008-present) and has served in other fund officer roles. Prior to joining Fidelity Investments, Ms. Dorsey served as Treasurer (2004-2008) of the JPMorgan Mutual Funds and Vice President (2004-2008) of JPMorgan Chase Bank. |
Scott C. Goebel (1968) |
Year of Election or Appointment: 2008 Secretary and Chief Legal Officer (CLO) |
| Mr. Goebel serves as Secretary and CLO of other funds. Mr. Goebel also serves as Secretary of Fidelity Investments Money Management, Inc. (FIMM) (2010-present) and Fidelity Research and Analysis Company (FRAC) (2010-present); General Counsel, Secretary, and Senior Vice President of FMR (2008-present) and FMR Co., Inc. (2008-present); Chief Legal Officer of Fidelity Management & Research (Hong Kong) Limited (2008-present) and Assistant Secretary of Fidelity Management & Research (Japan) Inc. (2008-present), and Fidelity Management & Research (U.K.) Inc. (2008-present). Previously, Mr. Goebel served as Secretary and CLO of other Fidelity funds (2008-2013), Assistant Secretary of FIMM (2008-2010), FRAC (2008-2010), and certain funds (2007-2008); and as Vice President and Secretary of Fidelity Distributors Corporation (FDC) (2005-2007). Mr. Goebel has been employed by FMR LLC or an affiliate since 2001. |
Joseph A. Hanlon (1968) |
Year of Election or Appointment: 2012 Chief Compliance Officer |
| Mr. Hanlon also serves as Chief Compliance Officer of other funds. Mr. Hanlon serves as Compliance Officer of FMR, FMR Co., Inc., Fidelity Investments Money Management, Inc. (FIMM), Fidelity Research and Analysis Company (FRAC), and Fidelity Management & Research (Hong Kong) (2009-present), as Senior Vice President of the Fidelity Asset Management Division (2009-present), and is an employee of Fidelity Investments. Previously, Mr. Hanlon served as Compliance Officer of Fidelity Management & Research (Japan) Inc. (2009-2013), Strategic Advisers, Inc. (2009-2013), and Fidelity Management & Research (U.K.) Inc. (2009-2013). |
Bruce T. Herring (1965) |
Year of Election or Appointment: 2006 Vice President of certain Equity Funds |
| Mr. Herring also serves as Vice President of other funds. He serves as Chief Investment Officer of Fidelity Global Asset Allocation (GAA) (2013-present), Group Chief Investment Officer of FMR, and President of Fidelity Research & Analysis Company (2010-present). Previously, Mr. Herring served as Chief Investment Officer and Director of Fidelity Management & Research (U.K.) Inc. (2010-2013), Vice President (2005-2006) and Senior Vice President (2006-2007) of Fidelity Management & Research Company, Vice President of FMR Co., Inc. (2001-2007), and as a portfolio manager for Fidelity U.S. Equity Funds. |
Brian B. Hogan (1964) |
Year of Election or Appointment: 2009 Vice President |
| Mr. Hogan also serves as Vice President of other funds. Mr. Hogan serves as President of FMR's Equity Division (2009-present). Previously, Mr. Hogan served as Senior Vice President, Equity Research of FMR (2006-2009) and as a portfolio manager. |
Chris Maher (1972) |
Year of Election or Appointment: 2013 Assistant Treasurer |
| Mr. Maher serves as Assistant Treasurer of other funds. Mr. Maher is Vice President of Valuation Oversight and is an employee of Fidelity Investments. Previously, Mr. Maher served as Vice President of Asset Management Compliance (2013), Vice President of FMR's Program Management Group (2010-2013), and Vice President of Valuation Oversight (2008-2010). |
Christine Reynolds (1958) |
Year of Election or Appointment: 2008 Chief Financial Officer |
| Ms. Reynolds also serves as Chief Financial Officer of other funds. Ms. Reynolds became President of Fidelity Pricing and Cash Management Services (FPCMS) in August 2008. Ms. Reynolds served as Chief Operating Officer of FPCMS (2007-2008). Previously, Ms. Reynolds served as President, Treasurer, and Anti-Money Laundering officer of the Fidelity funds (2004-2007). |
Kenneth B. Robins (1969) |
Year of Election or Appointment: 2008 President and Treasurer |
| Mr. Robins also serves as an officer of other funds. Mr. Robins serves as Executive Vice President of Fidelity Investments Money Management, Inc. (FIMM) (2013-present) and is an employee of Fidelity Investments (2004-present). Previously, Mr. Robins served in other fund officer roles. |
Gary W. Ryan (1958) |
Year of Election or Appointment: 2005 Assistant Treasurer |
| Mr. Ryan also serves as Assistant Treasurer of other funds. Mr. Ryan is an employee of Fidelity Investments and has served in other fund officer roles. Previously, Mr. Ryan served as Vice President of Fund Reporting in Fidelity Pricing and Cash Management Services (FPCMS) (1999-2005). |
Stephen Sadoski (1971) |
Year of Election or Appointment: 2012 Deputy Treasurer |
| Mr. Sadoski also serves as Deputy Treasurer of other funds. He is an employee of Fidelity Investments (2012-present) and has served in another fund officer role. Prior to joining Fidelity Investments, Mr. Sadoski served as an assistant chief accountant in the Division of Investment Management of the Securities and Exchange Commission (SEC) (2009-2012) and as a senior manager at Deloitte & Touche LLP (1997-2009). |
Stacie M. Smith (1974) |
Year of Election or Appointment: 2013 Deputy Treasurer |
| Ms. Smith also serves as an officer of other funds. She is an employee of Fidelity Investments (2009-present) and has served in other fund officer roles. Prior to joining Fidelity Investments, Ms. Smith served as Senior Audit Manager of Ernst & Young LLP (1996-2009). |
Renee Stagnone (1975) |
Year of Election or Appointment: 2013 Deputy Treasurer |
| Ms. Stagnone also serves as Deputy Treasurer of other funds. Ms. Stagnone is an employee of Fidelity Investments. |
Joseph F. Zambello (1957) |
Year of Election or Appointment: 2011 Deputy Treasurer |
| Mr. Zambello also serves as Deputy Treasurer of other funds. Mr. Zambello is an employee of Fidelity Investments. Previously, Mr. Zambello served as Vice President of FMR's Program Management Group (2009-2011) and Vice President of the Transfer Agent Oversight Group (2005-2009). |
Annual Report
Initial Class designates 5% and 88%; Service Class designates 5% and 92%; Service Class 2 designates 5% and 99%; of the dividends distributed in February and December, during the fiscal year as qualifying for the dividends-received deduction for corporate shareholders.
Annual Report
Board Approval of Investment Advisory Contracts and Management Fees
VIP Index 500 Portfolio
Each year, the Board of Trustees, including the Independent Trustees (together, the Board), votes on the renewal of the management contract and sub-advisory agreements (together, the Advisory Contracts) for the fund. The Board, assisted by the advice of fund counsel and Independent Trustees' counsel, requests and considers a broad range of information relevant to the renewal of the Advisory Contracts throughout the year.
The Board meets regularly and, at each of its meetings, covers an extensive agenda of topics and materials and considers factors that are relevant to its annual consideration of the renewal of the fund's Advisory Contracts, including the services and support provided to the fund and its shareholders. The Board has established various standing committees, each composed of and chaired by Independent Trustees with varying backgrounds, to which the Board has assigned specific subject matter responsibilities in order to enhance effective decision-making by the Board. The Board, acting directly and through its Committees, requests and receives information concerning the annual consideration of the renewal of the fund's Advisory Contracts. The Board also meets as needed to consider matters specifically related to the Board's annual consideration of the renewal of Advisory Contracts. Members of the Board may also meet with trustees of other Fidelity funds through ad hoc joint committees to discuss certain matters relevant to the Fidelity funds.
At its July 2013 meeting, the Board, including the Independent Trustees, unanimously determined to renew the fund's Advisory Contracts. In reaching its determination, the Board considered all factors it believed relevant, including (i) the nature, extent, and quality of the services to be provided to the fund and its shareholders (including the investment performance of the fund); (ii) the competitiveness of the fund's management fee and total expense ratio relative to peer funds; (iii) the total costs of the services to be provided by and the profits to be realized by Fidelity from its relationship with the fund; (iv) the extent to which economies of scale exist and would be realized as the fund grows; and (v) whether fee levels reflect these economies of scale, if any, for the benefit of fund shareholders.
In considering whether to renew the Advisory Contracts for the fund, the Board reached a determination, with the assistance of fund counsel and Independent Trustees' counsel and through the exercise of its business judgment, that the renewal of the Advisory Contracts was in the best interests of the fund and its shareholders and that the compensation payable under the Advisory Contracts was fair and reasonable. The Board's decision to renew the Advisory Contracts was not based on any single factor, but rather was based on a comprehensive consideration of all the information provided to the Board at its meetings throughout the year. The Board, in reaching its determination to renew the Advisory Contracts, was aware that shareholders in the fund have a broad range of investment choices available to them, including a wide choice among mutual funds offered by Fidelity's competitors, and that the fund's shareholders, who have the opportunity to review and weigh the disclosure provided by the fund in its prospectus and other public disclosures, have chosen to invest in this fund, which is a part of the Fidelity family of funds.
Nature, Extent, and Quality of Services Provided. The Board considered the staffing within the investment adviser, Fidelity Management & Research Company (FMR), and the sub-advisers (together, the Investment Advisers) as it relates to the fund, including the backgrounds of the fund's investment personnel, and also considered the fund's investment objective, strategies, and related investment philosophy. The Independent Trustees also had discussions with senior management of Fidelity's investment operations and investment groups. The Board considered the structure of the portfolio manager compensation program and whether this structure provides appropriate incentives to act in the best interests of the fund.
Resources Dedicated to Investment Management and Support Services. The Board and the Fund Oversight and Research Committees reviewed the general qualifications and capabilities of the Investment Advisers' investment staff, including its size, education, experience, and resources, as well as the Investment Advisers' approach to recruiting, training, managing, and compensating investment personnel. The Board noted that FMR has continued to increase the resources devoted to non-U.S. offices, including expansion of Fidelity's global investment organization.
Shareholder and Administrative Services. The Board considered (i) the nature, extent, quality, and cost of advisory, administrative, and shareholder services performed by the Investment Advisers and their affiliates under the Advisory Contracts and under separate agreements covering transfer agency, pricing and bookkeeping, and securities lending services for the fund; (ii) the nature and extent of the supervision of third party service providers, principally custodians and subcustodians; and (iii) the resources devoted to, and the record of compliance with, the fund's compliance policies and procedures. The Board also reviewed the allocation of fund brokerage, including allocations to brokers affiliated with the Investment Advisers.
The Board noted that the growth of fund assets over time across the complex allows Fidelity to reinvest in the development of services designed to enhance the value or convenience of the Fidelity funds as investment vehicles. These services include 24-hour access to account information and market information through telephone representatives and over the Internet, investor education materials and asset allocation tools, and the expanded availability of Fidelity Investor Centers.
Investment in a Large Fund Family. The Board considered the benefits to shareholders of investing in a Fidelity fund, including the benefits of investing in a fund that is part of a large family of funds offering a variety of investment disciplines and providing a large variety of mutual fund investor services. The Board noted that Fidelity had taken, or had made recommendations that resulted in the Fidelity funds taking, a number of actions over the previous year that benefited particular funds, including (i) continuing to dedicate additional resources to investment research and to the support of the senior management team that oversees asset management; (ii) persisting in efforts to enhance Fidelity's global research capabilities; (iii) launching new funds and making other enhancements to meet client needs for global and income-oriented solutions; (iv) continuing to launch dedicated lower cost underlying funds to meet portfolio construction needs related to expanding underlying fund options for Fidelity funds of funds, specifically for the Freedom Fund product lines; (v) rationalizing product lines and gaining increased efficiencies through the mergers of several funds into other funds; (vi) strengthening Fidelity's index fund offerings by reducing investment minimums and adopting or lowering existing expense caps for certain funds and classes; (vii) enhancing Global Asset Allocation product offerings by launching new funds and strategies, including "open architecture" target date funds that utilize affiliated and unaffiliated sub-advisers; (viii) modifying the eligibility criteria for Institutional Class shares of Advisor funds to increase their marketability to a portion of the defined contribution plan market; (ix) creating a new low-cost retirement share class for certain Advisor funds to appeal to large retirement plans; (x) transitioning the management of certain Fidelity commodity funds to Geode Capital Management LLC, a registered commodity pool operator, while retaining administrative responsibilities for the funds; (xi) reorganizing a number of funds; and (xii) taking steps toward establishing a new Fidelity adviser to manage sector-based funds and products.
Annual Report
Investment Performance. The Board considered whether the fund has operated in accordance with its investment objective, as well as its record of compliance with its investment restrictions and its performance history.
The Board took into account discussions with the Investment Advisers about fund investment performance that occur at Board meetings throughout the year. In this regard the Board noted that as part of regularly scheduled fund reviews and other reports to the Board on fund performance, the Board periodically considers annualized return information for the fund, for different time periods, measured against the securities market index the fund seeks to track and a peer group of mutual funds with similar objectives ("peer group"). The Board also periodically considers the fund's tracking error versus its benchmark index. In its evaluation of fund investment performance, the Board gave particular attention to information indicating changes in performance of certain Fidelity funds for specific time periods and the Investment Advisers' explanations for any overperformance or underperformance.
In addition to reviewing absolute and relative fund performance, the Independent Trustees periodically consider the appropriateness of fund performance metrics in evaluating the results achieved. In general, the Independent Trustees believe that fund performance should be evaluated based on net performance (after fees and expenses) of both the highest performing and lowest performing classes, where applicable, compared to a fund's benchmark index, over appropriate time periods taking into account relevant factors including the following: general market conditions; the characteristics of the fund's benchmark index; the extent to which statistical sampling is employed; securities lending revenues; and fund cash flows and other factors.
The Independent Trustees recognize that shareholders evaluate performance on a net basis over their own holding periods, for which one-, three-, and five-year periods are used as a proxy. For this reason, the performance information reviewed by the Board also included net cumulative calendar year total return information for the fund and its benchmark index and peer group for the most recent one-, three-, and five-year periods, as shown below. Returns are shown compared to the 25th percentile (top of box) and 75th percentile (bottom of box) of the peer universe.
VIP Index 500 Portfolio
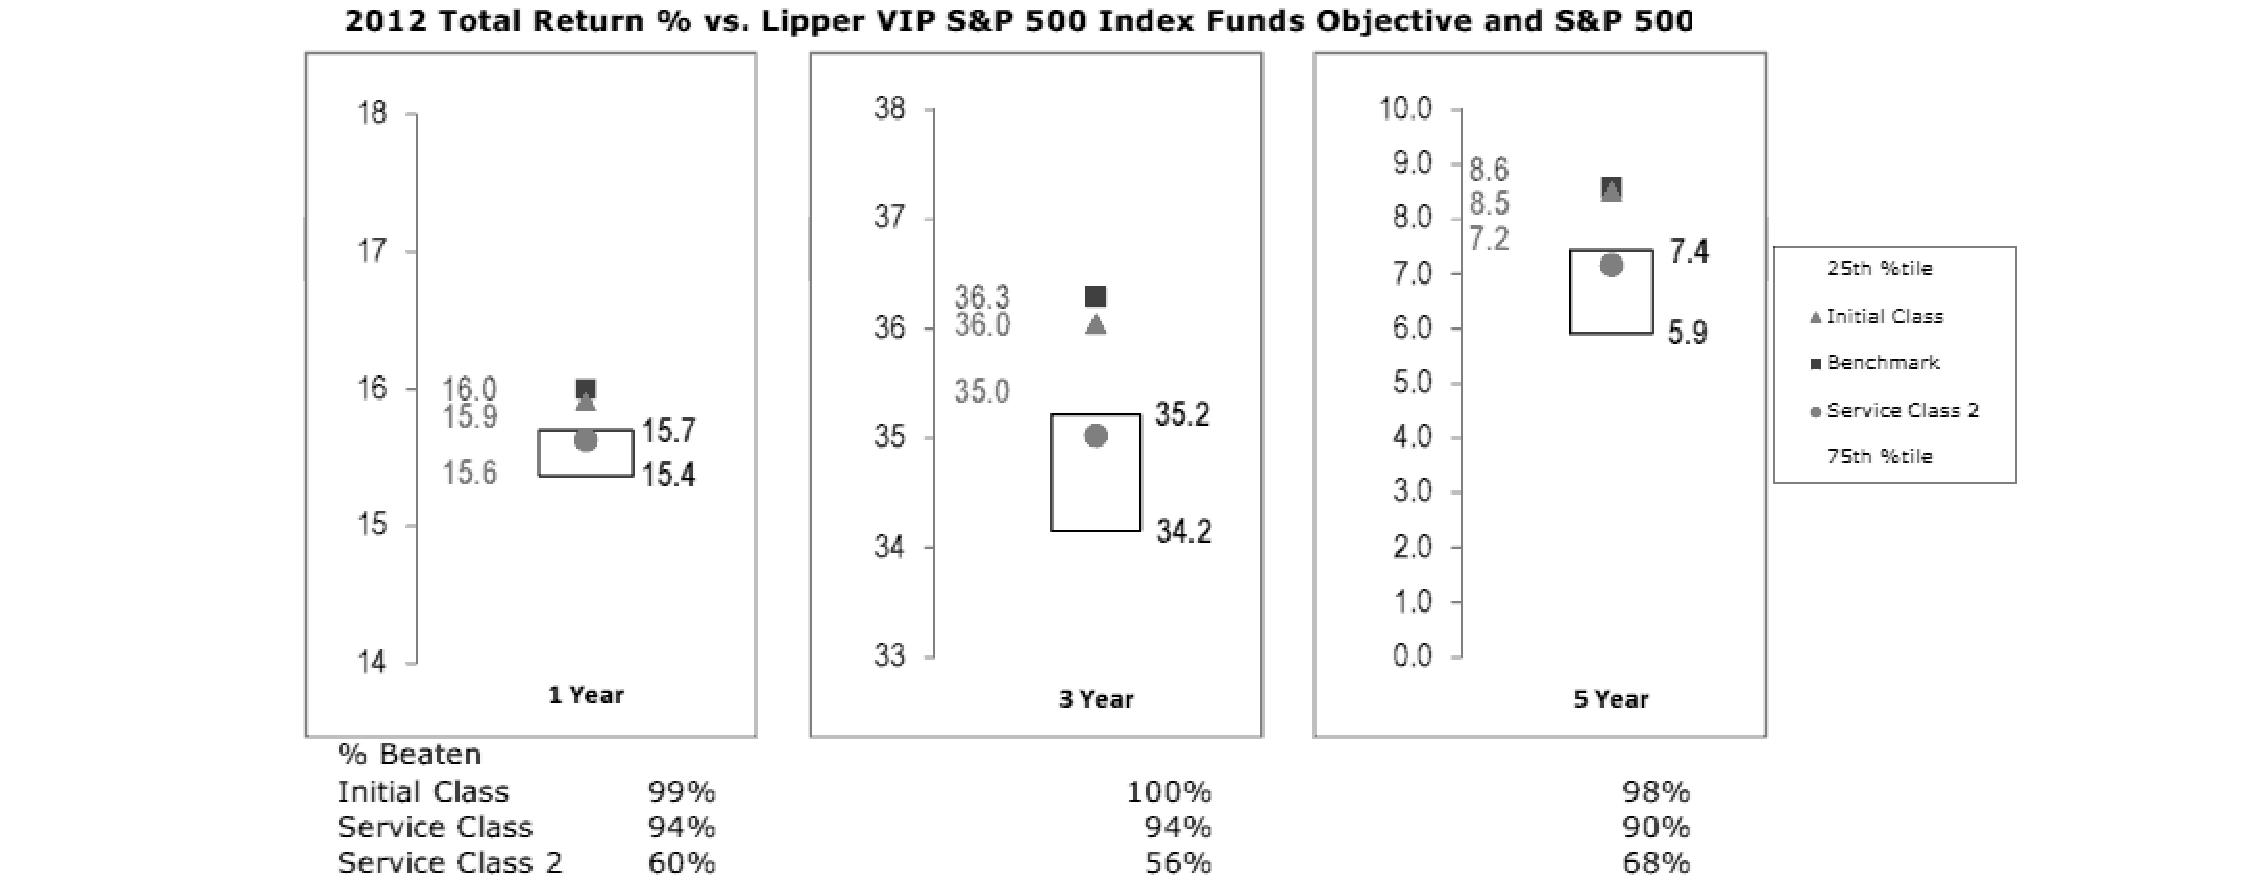
Based on its review, the Board concluded that the nature, extent, and quality of services provided to the fund under the Advisory Contracts should benefit the fund's shareholders.
Annual Report
Board Approval of Investment Advisory Contracts and Management Fees - continued
Competitiveness of Management Fee and Total Expense Ratio. The Board considered the fund's management fee and total expense ratio compared to "mapped groups" of competitive funds and classes. Fidelity creates "mapped groups" by combining similar Lipper investment objective categories that have comparable management fee characteristics. Combining Lipper investment objective categories aids the Board's management fee and total expense ratio comparisons by broadening the competitive group used for comparison and by reducing the number of universes to which various Fidelity funds are compared.
Management Fee. The Board considered two proprietary management fee comparisons for the 12-month periods shown in the chart below. The group of Lipper funds used by the Board for management fee comparisons is referred to below as the "Total Mapped Group." The Total Mapped Group is broader than the Lipper peer group used by the Board for performance comparisons because the Total Mapped Group combines several Lipper investment objective categories while the Lipper peer group does not. The Total Mapped Group comparison focuses on a fund's standing in terms of gross management fees before expense reimbursements or caps relative to the total universe of funds with comparable investment mandates, regardless of whether their management fee structures also are comparable. Funds with comparable investment mandates offer exposure to similar types of securities. Funds with comparable management fee structures have similar management fee contractual arrangements (e.g., flat rate charged for advisory services, all-inclusive fee rate, etc.). "TMG %" represents the percentage of funds in the Total Mapped Group that had management fees that were lower than the fund's. For example, a TMG % of 0% means that 100% of the funds in the Total Mapped Group had higher management fees than the fund. The "Asset-Size Peer Group" (ASPG) comparison focuses on a fund's standing relative to a subset of non-Fidelity funds within the Total Mapped Group that are similar in size and management fee structure. The ASPG represents at least 15% of the funds in the Total Mapped Group with comparable asset size and management fee structures, subject to a minimum of 50 funds (or all funds in the Total Mapped Group if fewer than 50). Additional information, such as the ASPG quartile in which the fund's management fee ranked, is also included in the chart and considered by the Board. Because the vast majority of competitor funds' management fees do not cover non-management expenses, for a more meaningful comparison of management fees, the fund is compared on the basis of a hypothetical "net management fee," which is derived by subtracting payments made by FMR for "fund-level" non-management expenses (including pricing and bookkeeping fees and fees paid to non-affiliated custodians) from the fund's management fee. In this regard, the Board considered that net management fees can vary from year to year because of differences in "fund-level" non-management expenses, and that "fund-level" non-management expenses may exceed the fund's management fee and result in a negative net management fee. The Board noted, however, that FMR does not pay transfer agent fees or other "class-level" expenses (including 12b-1 fees, if applicable) under the fund's management contract.
VIP Index 500 Portfolio
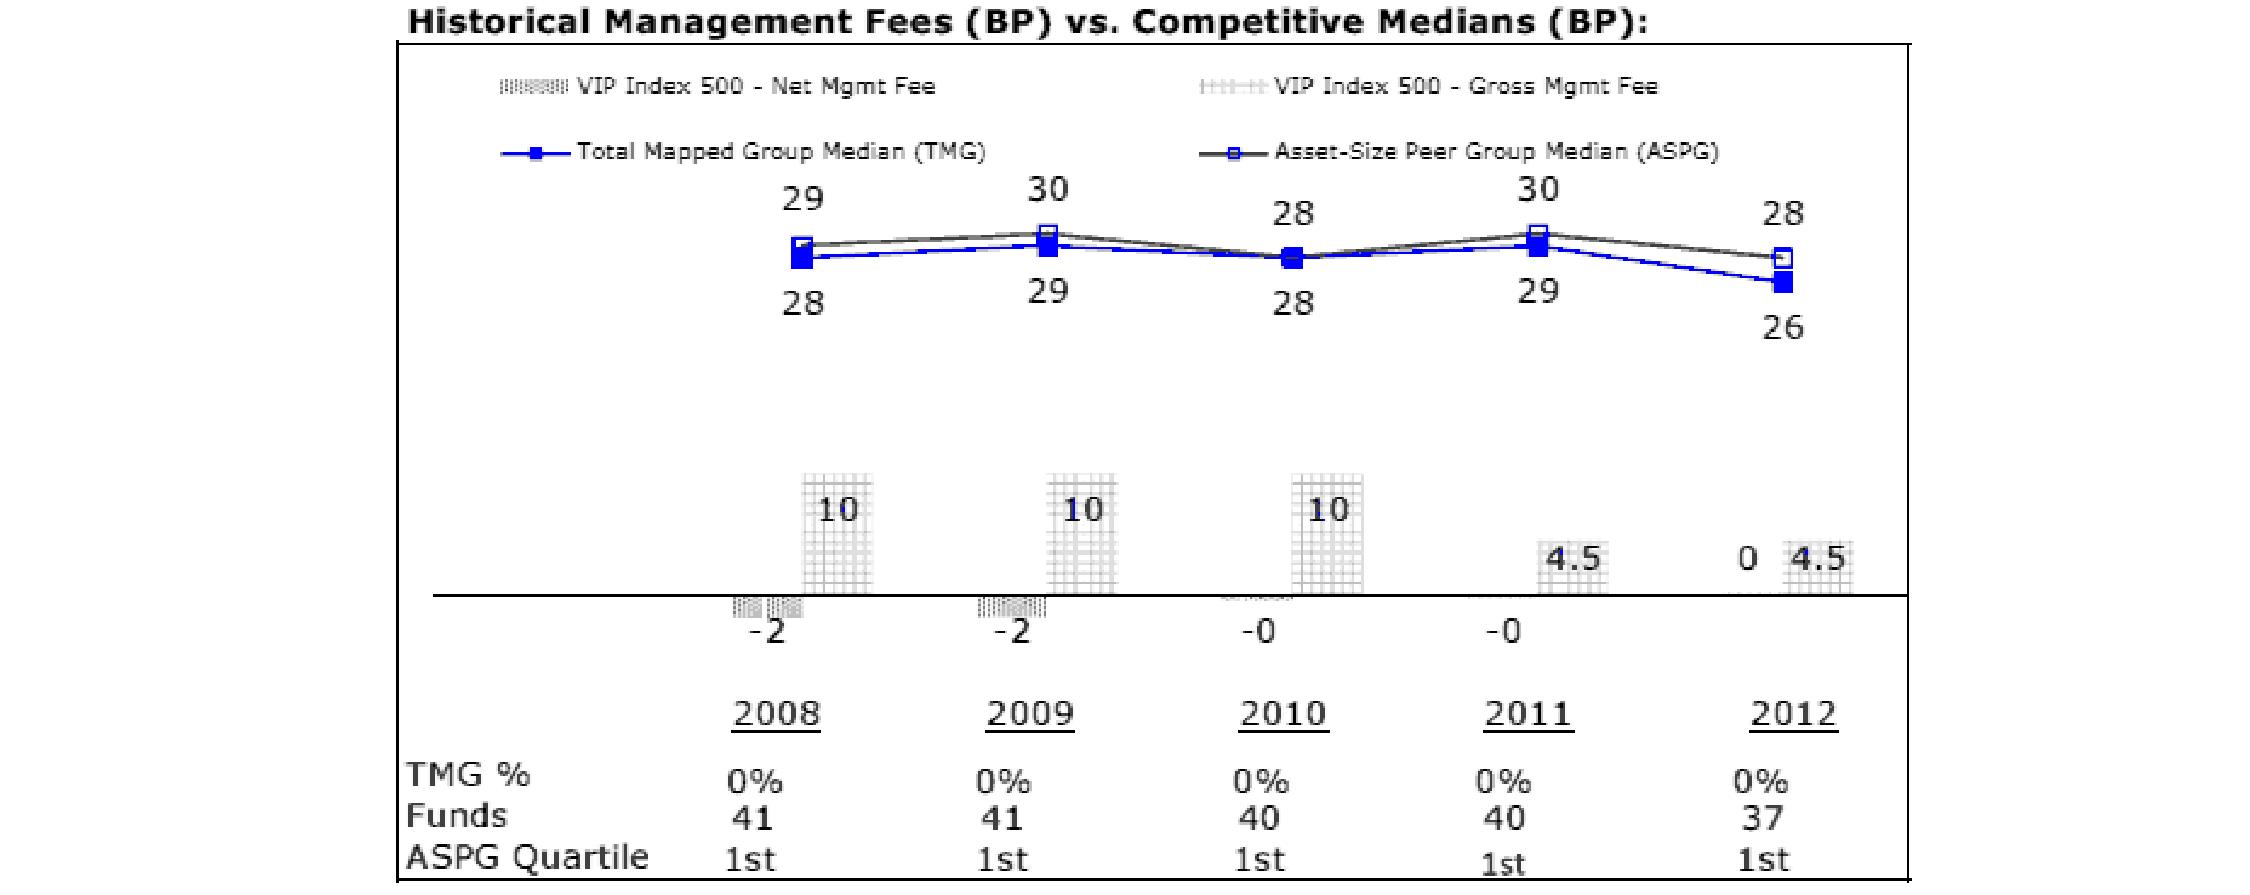
The Board noted that the fund's hypothetical net management fee ranked below the median of its Total Mapped Group and below the median of its ASPG for 2012.
Furthermore, the Board considered that it had approved an amended and restated management contract for the fund (effective September 1, 2011) that lowered the fund's management fee from 0.10% to 0.045%. The Board considered that the chart reflects the fund's lower management fee for 2011, as if the lower fee were in effect for the entire year.
Based on its review, the Board concluded that the fund's management fee is fair and reasonable in light of the services that the fund receives and the other factors considered.
Annual Report
Total Expense Ratio. In its review of each class's total expense ratio, the Board considered the fund's hypothetical net management fee as well as the fund's gross management fee. The Board also considered other "fund-level" expenses, such as pricing and bookkeeping fees and custodial, legal, and audit fees. The Board also considered other "class-level" expenses, such as transfer agent fees and fund-paid 12b-1 fees. The Board also noted the effects of any waivers and reimbursements on fees and expenses. As part of its review, the Board also considered the current and historical total expense ratios of each class of the fund compared to competitive fund median expenses. Each class of the fund is compared to those funds and classes in the Total Mapped Group (used by the Board for management fee comparisons) that have a similar sales load structure.
The Board noted that the total expense ratio of each class ranked below its competitive median for 2012.
The Board also considered that current contractual arrangements for the fund in effect oblige FMR to pay all "class-level" expenses of each class of the fund to the extent necessary to limit total expenses, with certain exceptions, as follows: Initial Class: 0.10%; Service Class: 0.20%; and Service Class 2: 0.35%. These contractual arrangements may not be increased without the approval of the Board and the shareholders of the applicable class.
Fees Charged to Other Fidelity Clients. The Board also considered Fidelity fee structures and other information with respect to clients of FMR and its affiliates, such as other mutual funds advised or subadvised by FMR or its affiliates, pension plan clients, and other institutional clients. The Board noted the findings of the 2013 ad hoc joint committee (created with the board of other Fidelity funds), which reviewed and compared Fidelity's institutional investment advisory business with its business of providing services to the Fidelity funds, including the differences in services provided, fees charged, and costs incurred, as well as competition in their respective marketplaces.
Based on its review of total expense ratios and fees charged to other Fidelity clients, the Board concluded that the total expense ratio of each class of the fund was reasonable in light of the services that the fund and its shareholders receive and the other factors considered.
Costs of the Services and Profitability. The Board considered the revenues earned and the expenses incurred by Fidelity in conducting the business of developing, marketing, distributing, managing, administering and servicing the fund and servicing the fund's shareholders. The Board also considered the level of Fidelity's profits in respect of all the Fidelity funds.
On an annual basis, FMR presents to the Board Fidelity's profitability for the fund. Fidelity calculates the profitability for each fund, as well as aggregate profitability for groups of Fidelity funds and all Fidelity funds, using a series of detailed revenue and cost allocation methodologies which originate with the books and records of Fidelity on which Fidelity's audited financial statements are based. The Audit Committee of the Board reviews any significant changes from the prior year's methodologies.
PricewaterhouseCoopers LLP (PwC), independent registered public accounting firm and auditor to Fidelity and certain Fidelity funds, has been engaged annually by the Board as part of the Board's assessment of Fidelity's profitability analysis. PwC's engagement includes the review and assessment of the methodologies used by Fidelity in determining the revenues and expenses attributable to Fidelity's mutual fund business, and completion of agreed-upon procedures surrounding the mathematical accuracy of fund profitability and its conformity to allocation methodologies. After considering PwC's reports issued under the engagement and information provided by Fidelity, the Board concluded that while other allocation methods may also be reasonable, Fidelity's profitability methodologies are reasonable in all material respects.
The Board also reviewed Fidelity's non-fund businesses and fall-out benefits related to the mutual fund business as well as cases where Fidelity's affiliates may benefit from or be related to the fund's business.
The Board considered the costs of the services provided by and the profits realized by Fidelity in connection with the operation of the fund and was satisfied that the profitability was not excessive in the circumstances.
Economies of Scale. The Board considered whether there have been economies of scale in respect of the management of the Fidelity funds, whether the Fidelity funds (including the fund) have appropriately benefited from any such economies of scale, and whether there is potential for realization of any further economies of scale. The Board considered the extent to which the fund will benefit from economies of scale through increased services to the fund, through waivers or reimbursements, or through fee or expense reductions. The Board also noted that in 2009, it and the board of other Fidelity funds created an ad hoc committee (the Economies of Scale Committee) to analyze whether FMR attains economies of scale in respect of the management and servicing of the Fidelity funds, whether the Fidelity funds have appropriately benefited from such economies of scale, and whether there is potential for realization of any further economies of scale.
The Board concluded, taking into account the analysis of the Economies of Scale Committee, that economies of scale, if any, are being appropriately shared between fund shareholders and Fidelity.
Additional Information Requested by the Board. In order to develop fully the factual basis for consideration of the Fidelity funds' Advisory Contracts, the Board requested and received additional information on certain topics, including: (i) fund performance trends and Fidelity's long-term strategies for certain funds; (ii) the potential to further rationalize the Fidelity fund lineup with the possibility of achieving savings for the funds and Fidelity; (iii) the methodology with respect to competitive fund data and peer group classifications; (iv) the arrangements with, and performance of, certain sub-advisers on behalf of the Fidelity funds, as well as certain proposed participating affiliate arrangements; (v) the realization of fall-out benefits in certain Fidelity business units; (vi) Fidelity's group fee structures, including the rationale for the individual fee rates of certain categories of funds and the definition of group assets; (vii) trends regarding industry use of performance fee structures and the performance adjustment methodologies applicable to the Fidelity funds; (viii) additional competitive analysis regarding the total expenses for certain classes; and (ix) fund profitability methodology, including Fidelity's cost allocation methodology, and the impact of certain factors on fund profitability results.
Annual Report
Board Approval of Investment Advisory Contracts and Management Fees - continued
Based on its evaluation of all of the conclusions noted above, and after considering all factors it believed relevant, the Board ultimately concluded that the advisory fee structures are fair and reasonable, and that the fund's Advisory Contracts should be renewed.
Annual Report
Investment Adviser
Fidelity Management & Research Company
Boston, MA
Investment Sub-Advisers
FMR Co., Inc.
Geode Capital Management, LLC
General Distributor
Fidelity Distributors Corporation
Smithfield, RI
Transfer and Service Agents
Fidelity Investments Institutional Operations Company, Inc.
Boston, MA
Fidelity Service Company, Inc.
Boston, MA
Custodian
The Bank of New York Mellon
New York, NY
VIPIDX-ANN-0214
1.540028.116
Item 2. Code of Ethics
As of the end of the period, December 31, 2013, Variable Insurance Products Fund II (the trust) has adopted a code of ethics, as defined in Item 2 of Form N-CSR, that applies to its President and Treasurer and its Chief Financial Officer. A copy of the code of ethics is filed as an exhibit to this Form N-CSR.
Item 3. Audit Committee Financial Expert
The Board of Trustees of the trust has determined that Joseph Mauriello is an audit committee financial expert, as defined in Item 3 of Form N-CSR. Mr. Mauriello is independent for purposes of Item 3 of Form N-CSR.
Item 4. Principal Accountant Fees and Services
Fees and Services
The following table presents fees billed by Deloitte & Touche LLP, the member firms of Deloitte Touche Tohmatsu, and their respective affiliates (collectively, "Deloitte Entities") in each of the last two fiscal years for services rendered to Contrafund Portfolio, Disciplined Small Cap Portfolio, Emerging Markets Portfolio and Index 500 Portfolio (the "Funds"):
Services Billed by Deloitte Entities
December 31, 2013 FeesA
| Audit Fees | Audit-Related Fees | Tax Fees | All Other Fees |
Contrafund Portfolio | $54,000 | $- | $6,100 | $3,800 |
Disciplined Small Cap Portfolio $40,000 $- $6,000 $500
Emerging Markets Portfolio $49,000 $- $6,000 $500
Index 500 Portfolio $45,000 $- $6,000 $1,100
December 31, 2012 FeesA
| Audit Fees | Audit-Related Fees | Tax Fees | All Other Fees |
Contrafund Portfolio | $55,000 | $- | $5,700 | $2,700 |
Disciplined Small Cap Portfolio $38,000 $- $5,700 $400
Emerging Markets Portfolio $48,000 $- $5,700 $400
Index 500 Portfolio $44,000 $- $5,700 $700
A Amounts may reflect rounding.
The following table presents fees billed by PricewaterhouseCoopers LLP ("PwC") in each of the last two fiscal years for services rendered to Growth Stock Portfolio, International Capital Appreciation Portfolio and Value Leaders Portfolio (the "Funds"):
Services Billed by PwC
December 31, 2013 FeesA
| Audit Fees | Audit-Related Fees | Tax Fees | All Other Fees |
| | | | |
Growth Stock Portfolio | $47,000 | $- | $3,100 | $1,500 |
International Capital Appreciation Portfolio | $56,000 | $- | $5,200 | $1,500 |
Value Leaders Portfolio | $44,000 | $- | $3,100 | $1,500 |
December 31, 2012 FeesA
| Audit Fees | Audit-Related Fees | Tax Fees | All Other Fees |
| | | | |
Growth Stock Portfolio | $43,000 | $- | $3,300 | $1,500 |
International Capital Appreciation Portfolio | $48,000 | $- | $5,100 | $1,500 |
Value Leaders Portfolio | $43,000 | $- | $3,100 | $1,500 |
A Amounts may reflect rounding.
The following table presents fees billed by PwC and Deloitte Entities that were required to be approved by the Audit Committee for services that relate directly to the operations and financial reporting of the Funds and that are rendered on behalf of Fidelity Management & Research Company ("FMR") and entities controlling, controlled by, or under common control with FMR (not including any sub-adviser whose role is primarily portfolio management and is subcontracted with or overseen by another investment adviser) that provide ongoing services to the Funds ("Fund Service Providers"):
Services Billed by Deloitte Entities
| December 31, 2013A | December 31, 2012A |
Audit-Related Fees | $765,000 | $910,000 |
Tax Fees | $- | $- |
All Other Fees | $795,000 | $955,000 |
A Amounts may reflect rounding.
Services Billed by PwC
| December 31, 2013A | December 31, 2012A |
Audit-Related Fees | $4,920,000 | $4,805,000 |
Tax Fees | $- | $- |
All Other Fees | $50,000 | $- |
A Amounts may reflect rounding.
"Audit-Related Fees" represent fees billed for assurance and related services that are reasonably related to the performance of the fund audit or the review of the fund's financial statements and that are not reported under Audit Fees.
"Tax Fees" represent fees billed for tax compliance, tax advice or tax planning that relate directly to the operations and financial reporting of the fund.
"All Other Fees" represent fees billed for services provided to the fund or Fund Service Provider, a significant portion of which are assurance related, that relate directly to the operations and financial reporting of the fund, excluding those services that are reported under Audit Fees, Audit-Related Fees or Tax Fees.
Assurance services must be performed by an independent public accountant.
* * *
The aggregate non-audit fees billed by PwC and Deloitte Entities for services rendered to the Funds, FMR (not including any sub-adviser whose role is primarily portfolio management and is subcontracted with or overseen by another investment adviser), and any Fund Service Provider for each of the last two fiscal years of the Funds are as follows:
Billed By | December 31, 2013 A | December 31, 2012 A,B |
PwC | $5,535,000 | $5,625,000 |
Deloitte Entities | $1,710,000 | $1,920,000 |
A Amounts may reflect rounding.
B Reflects current period presentation.
The trust's Audit Committee has considered non-audit services that were not pre-approved that were provided by PwC and Deloitte Entities to Fund Service Providers to be compatible with maintaining the independence of PwC and Deloitte Entities in their audits of the Funds, taking into account representations from PwC and Deloitte Entities, in accordance with Public Company Accounting Oversight Board rules, regarding their independence from the Funds and their related entities and FMR's review of the appropriateness and permissibility under applicable law of such non-audit services prior to their provision to the Fund Service Providers.
Audit Committee Pre-Approval Policies and Procedures
The trust's Audit Committee must pre-approve all audit and non-audit services provided by a fund's independent registered public accounting firm relating to the operations or financial reporting of the fund. Prior to the commencement of any audit or non-audit services to a fund, the Audit Committee reviews the services to determine whether they are appropriate and permissible under applicable law.
The Audit Committee has adopted policies and procedures to, among other purposes, provide a framework for the Committee's consideration of non-audit services by the audit firms that audit the Fidelity funds. The policies and procedures require that any non-audit service provided by a fund audit firm to a Fidelity fund and any non-audit service provided by a fund auditor to a Fund Service Provider that relates directly to the operations and financial reporting of a Fidelity fund ("Covered Service") are subject to approval by the Audit Committee before such service is provided.
All Covered Services must be approved in advance of provision of the service either: (i) by formal resolution of the Audit Committee, or (ii) by oral or written approval of the service by the Chair of the Audit Committee (or if the Chair is unavailable, such other member of the Audit Committee as may be designated by the Chair to act in the Chair's absence). The approval contemplated by (ii) above is permitted where the Treasurer determines that action on such an engagement is necessary before the next meeting of the Audit Committee.
Non-audit services provided by a fund audit firm to a Fund Service Provider that do not relate directly to the operations and financial reporting of a Fidelity fund are reported to the Audit Committee on a periodic basis.
Non-Audit Services Approved Pursuant to Rule 2-01(c)(7)(i)(C) and (ii) of Regulation S-X ("De Minimis Exception")
There were no non-audit services approved or required to be approved by the Audit Committee pursuant to the De Minimis Exception during the Funds' last two fiscal years relating to services provided to (i) the Funds or (ii) any Fund Service Provider that relate directly to the operations and financial reporting of the Funds.
Item 5. Audit Committee of Listed Registrants
Not applicable.
Item 6. Investments
(a) Not applicable.
(b) Not applicable
Item 7. Disclosure of Proxy Voting Policies and Procedures for Closed-End Management Investment Companies
Not applicable.
Item 8. Portfolio Managers of Closed-End Management Investment Companies
Not applicable.
Item 9. Purchase of Equity Securities by Closed-End Management Investment Company and Affiliated Purchasers
Not applicable.
Item 10. Submission of Matters to a Vote of Security Holders
There were no material changes to the procedures by which shareholders may recommend nominees to the trust's Board of Trustees.
Item 11. Controls and Procedures
(a)(i) The President and Treasurer and the Chief Financial Officer have concluded that the trust's disclosure controls and procedures (as defined in Rule 30a-3(c) under the Investment Company Act) provide reasonable assurances that material information relating to the trust is made known to them by the appropriate persons, based on their evaluation of these controls and procedures as of a date within 90 days of the filing date of this report.
(a)(ii) There was no change in the trust's internal control over financial reporting (as defined in Rule 30a-3(d) under the Investment Company Act) that occurred during the second fiscal quarter of the period covered by this report that has materially affected, or is reasonably likely to materially affect, the trust's internal control over financial reporting.
Item 12. Exhibits
(a) | (1) | Code of Ethics pursuant to Item 2 of Form N-CSR is filed and attached hereto as EX-99.CODE ETH. |
(a) | (2) | Certification pursuant to Rule 30a-2(a) under the Investment Company Act of 1940 (17 CFR 270.30a-2(a)) is filed and attached hereto as Exhibit 99.CERT. |
(a) | (3) | Not applicable. |
(b) | | Certification pursuant to Rule 30a-2(b) under the Investment Company Act of 1940 (17 CFR 270.30a-2(b)) is furnished and attached hereto as Exhibit 99.906CERT. |
SIGNATURES
Pursuant to the requirements of the Securities Exchange Act of 1934 and the Investment Company Act of 1940, the registrant has duly caused this report to be signed on its behalf by the undersigned, thereunto duly authorized.
Variable Insurance Products Fund II
By: | /s/Kenneth B. Robins |
| Kenneth B. Robins |
| President and Treasurer |
| |
Date: | February 21, 2014 |
Pursuant to the requirements of the Securities Exchange Act of 1934 and the Investment Company Act of 1940, this report has been signed below by the following persons on behalf of the registrant and in the capacities and on the dates indicated.
By: | /s/Kenneth B. Robins |
| Kenneth B. Robins |
| President and Treasurer |
| |
Date: | February 21, 2014 |
By: | /s/Christine Reynolds |
| Christine Reynolds |
| Chief Financial Officer |
| |
Date: | February 21, 2014 |