UNITED STATES
SECURITIES AND EXCHANGE COMMISSION
Washington, D.C. 20549
FORM N-CSR
CERTIFIED SHAREHOLDER REPORT OF REGISTERED
MANAGEMENT INVESTMENT COMPANIES
Investment Company Act file number 811-5511
Variable Insurance Products Fund II
(Exact name of registrant as specified in charter)
245 Summer St., Boston, Massachusetts 02210
(Address of principal executive offices) (Zip code)
Marc Bryant, Secretary
245 Summer St.
Boston, Massachusetts 02210
(Name and address of agent for service)
Registrant's telephone number, including area code:
617-563-7000
| |
Date of fiscal year end: | December 31 |
| |
Date of reporting period: | December 31, 2017 |
Item 1.
Reports to Stockholders
Fidelity® Variable Insurance Products: Index 500 Portfolio
Annual Report December 31, 2017 |
 |
Contents
To view a fund's proxy voting guidelines and proxy voting record for the 12-month period ended June 30, visit http://www.fidelity.com/proxyvotingresults or visit the Securities and Exchange Commission's (SEC) web site at http://www.sec.gov.
You may also call 1-877-208-0098 to request a free copy of the proxy voting guidelines.
Fidelity® Variable Insurance Products are separate account options which are purchased through a variable insurance contract.
Standard & Poor's, S&P and S&P 500 are registered service marks of The McGraw-Hill Companies, Inc. and have been licensed for use by Fidelity Distributors Corporation.
Other third-party marks appearing herein are the property of their respective owners.
All other marks appearing herein are registered or unregistered trademarks or service marks of FMR LLC or an affiliated company. © 2018 FMR LLC. All rights reserved.
This report and the financial statements contained herein are submitted for the general information of the shareholders of the Fund. This report is not authorized for distribution to prospective investors in the Fund unless preceded or accompanied by an effective prospectus.
A fund files its complete schedule of portfolio holdings with the SEC for the first and third quarters of each fiscal year on Form N-Q. Forms N-Q are available on the SEC’s web site at http://www.sec.gov. A fund's Forms N-Q may be reviewed and copied at the SEC’s Public Reference Room in Washington, DC. Information regarding the operation of the SEC's Public Reference Room may be obtained by calling 1-800-SEC-0330.
For a complete list of a fund's portfolio holdings, view the most recent holdings listing, semiannual report, or annual report on Fidelity's web site at http://www.fidelity.com, http://www.institutional.fidelity.com, or http://www.401k.com, as applicable.
NOT FDIC INSURED •MAY LOSE VALUE •NO BANK GUARANTEE
Neither the Fund nor Fidelity Distributors Corporation is a bank.
Performance: The Bottom Line
Average annual total return reflects the change in the value of an investment, assuming reinvestment of distributions from dividend income and capital gains (the profits earned upon the sale of securities that have grown in value, if any) and assuming a constant rate of performance each year. During periods of reimbursement by Fidelity, a fund’s total return will be greater than it would be had the reimbursement not occurred. Performance numbers are net of all underlying fund operating expenses, but do not include any insurance charges imposed by your insurance company’s separate account. If performance information included the effect of these additional charges, the total returns would have been lower. How a fund did yesterday is no guarantee of how it will do tomorrow.
Average Annual Total Returns
| For the periods ended December 31, 2017 | Past 1 year | Past 5 years | Past 10 years |
| Initial Class | 21.71% | 15.69% | 8.44% |
| Service Class | 21.59% | 15.57% | 8.33% |
| Service Class 2 | 21.41% | 15.40% | 8.17% |
$10,000 Over 10 Years
Let's say hypothetically that $10,000 was invested in VIP Index 500 Portfolio - Initial Class on December 31, 2007.
The chart shows how the value of your investment would have changed, and also shows how the S&P 500® Index performed over the same period.
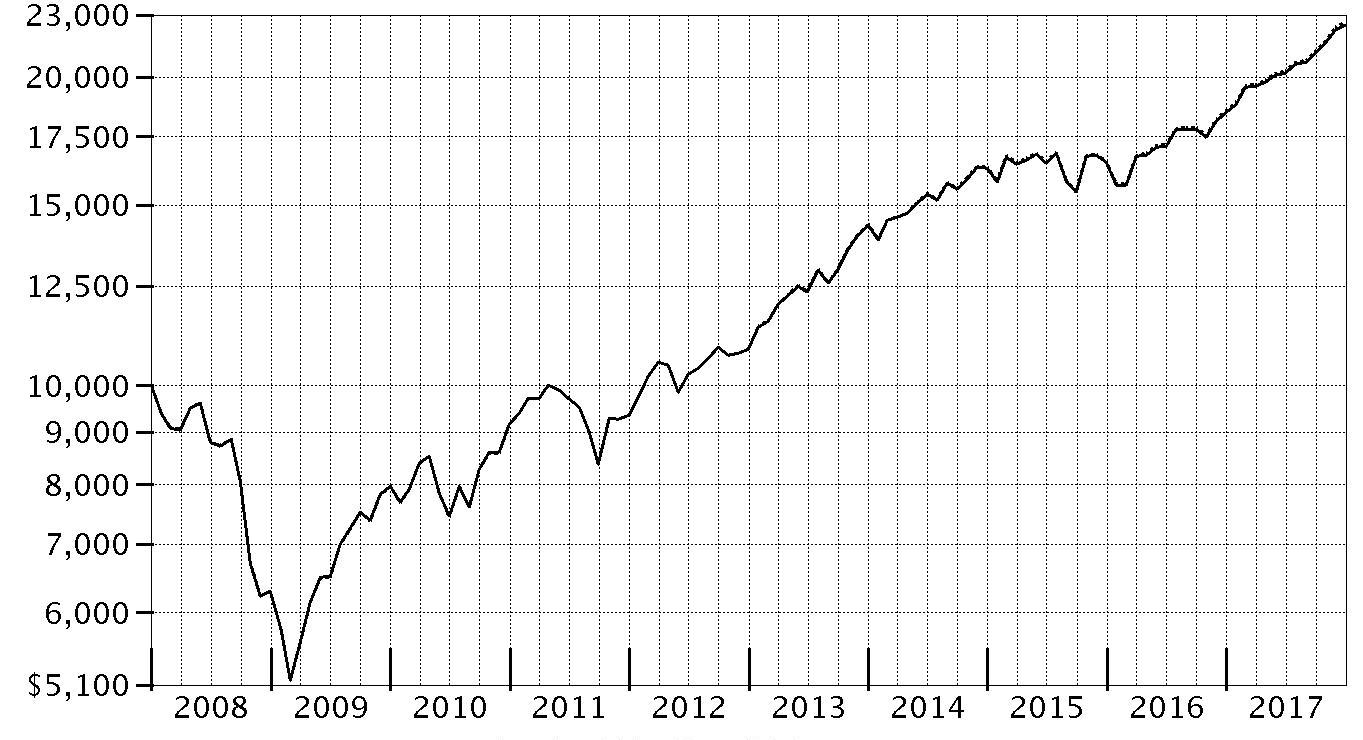
| Period Ending Values |
| $22,484 | VIP Index 500 Portfolio - Initial Class |
| $22,603 | S&P 500® Index |
Management's Discussion of Fund Performance
Market Recap: U.S. equities gained 21.83% in 2017, as the S&P 500
® index rose steadily and closed the year just shy of an all-time high after a particularly strong three-month finish. Early on, equities rallied on optimism for President Trump’s pro-business agenda but leveled off in March amid fading optimism and stalled efforts by Congress to repeal and replace the Affordable Care Act. Upward momentum soon returned and continued through year-end with consumer sentiment and other market indicators staying positive. The lone exception was a brief cooldown in August, when geopolitical tension escalated and uncertainty grew regarding the future of health care, tax reform and the debt ceiling. Sector-wise, information technology fared best by a wide margin, rising 39% amid strong earnings growth from several major index constituents. A 24% gain in materials was spurred by increased demand, especially from China. Consumer discretionary gained 23%, despite many brick-and-mortar retailers suffering from online competition, and financials edged the broader market on an uptick in bond yields. Conversely, the defensive energy and telecom services sectors returned about -1% each. Rising interest rates held back real estate (+11%), while consumer staples (+13%) and utilities (+12%) struggled due to investors’ general preference for risk assets.
Comments from Patrick Waddell, Senior Portfolio Manager of the Geode Capital Management, LLC, investment management team: For the year, the fund’s share classes returned roughly in line with the benchmark S&P 500
® index. In a strong market environment, an increasingly narrow slice of growth companies led the way, with many residing in the information technology sector, by far the top-performing group. Of the 11 sectors in the index, only energy and telecommunication services lost ground, each returning about -1% in 2017. In terms of individual stocks, consumer electronics giant Apple saw its shares gain about 48%, as the firm continued to benefit from growing demand for its iPhone
® mobile devices and other products. Software manufacturer Microsoft (+41%) reported financial progress from its shift in business strategy toward cloud computing and subscription-based software. The stock of Facebook rose roughly 53%, as the social-media juggernaut continued to generate substantial cash, especially from mobile video advertising, while Alphabet also added significant value, as the parent company of internet search giant Google continued to report stronger-than-expected quarterly earnings. In the consumer discretionary sector, shares of internet retailer Amazon.com advanced 56%. In contrast, the stock of industrial conglomerate General Electric returned -43% amid a variety of business challenges and, late in the period, a reduction in its dividend. Oil-field services company Schlumberger struggled amid muted oil prices, as did energy giant Exxon Mobil.
The views expressed above reflect those of the portfolio manager(s) only through the end of the period as stated on the cover of this report and do not necessarily represent the views of Fidelity or any other person in the Fidelity organization. Any such views are subject to change at any time based upon market or other conditions and Fidelity disclaims any responsibility to update such views. These views may not be relied on as investment advice and, because investment decisions for a Fidelity fund are based on numerous factors, may not be relied on as an indication of trading intent on behalf of any Fidelity fund.
Investment Summary (Unaudited)
Top Ten Stocks as of December 31, 2017
| | % of fund's net assets |
| Apple, Inc. | 3.8 |
| Microsoft Corp. | 2.9 |
| Amazon.com, Inc. | 2.0 |
| Facebook, Inc. Class A | 1.8 |
| Berkshire Hathaway, Inc. Class B | 1.7 |
| Johnson & Johnson | 1.6 |
| JPMorgan Chase & Co. | 1.6 |
| Exxon Mobil Corp. | 1.5 |
| Alphabet, Inc. Class C | 1.4 |
| Alphabet, Inc. Class A | 1.4 |
| | 19.7 |
Top Market Sectors as of December 31, 2017
| | % of fund's net assets |
| Information Technology | 23.6 |
| Financials | 14.7 |
| Health Care | 13.6 |
| Consumer Discretionary | 12.1 |
| Industrials | 10.1 |
| Consumer Staples | 8.1 |
| Energy | 6.0 |
| Materials | 3.0 |
| Utilities | 2.9 |
| Real Estate | 2.9 |
Asset Allocation (% of fund's net assets)
| As of December 31, 2017 * |
| | Stocks and Equity Futures | 100.0% |

* Foreign investments - 4.3%
Investments December 31, 2017
Showing Percentage of Net Assets
| Common Stocks - 99.1% | | | |
| | | Shares | Value |
| CONSUMER DISCRETIONARY - 12.1% | | | |
| Auto Components - 0.2% | | | |
| Aptiv PLC | | 89,314 | $7,576,507 |
| BorgWarner, Inc. | | 66,585 | 3,401,828 |
| The Goodyear Tire & Rubber Co. | | 82,758 | 2,673,911 |
| | | | 13,652,246 |
| Automobiles - 0.5% | | | |
| Ford Motor Co. | | 1,310,763 | 16,371,430 |
| General Motors Co. | | 429,491 | 17,604,836 |
| Harley-Davidson, Inc. (a) | | 56,542 | 2,876,857 |
| | | | 36,853,123 |
| Distributors - 0.1% | | | |
| Genuine Parts Co. | | 49,257 | 4,679,908 |
| LKQ Corp. (b) | | 103,829 | 4,222,725 |
| | | | 8,902,633 |
| Diversified Consumer Services - 0.0% | | | |
| H&R Block, Inc. (a) | | 70,236 | 1,841,588 |
| Hotels, Restaurants & Leisure - 1.8% | | | |
| Carnival Corp. | | 137,017 | 9,093,818 |
| Chipotle Mexican Grill, Inc. (a)(b) | | 8,347 | 2,412,533 |
| Darden Restaurants, Inc. | | 41,550 | 3,989,631 |
| Hilton Worldwide Holdings, Inc. | | 67,938 | 5,425,529 |
| Marriott International, Inc. Class A | | 102,890 | 13,965,260 |
| McDonald's Corp. | | 267,829 | 46,098,727 |
| MGM Mirage, Inc. | | 171,184 | 5,715,834 |
| Norwegian Cruise Line Holdings Ltd. (b) | | 59,870 | 3,188,078 |
| Royal Caribbean Cruises Ltd. | | 57,542 | 6,863,610 |
| Starbucks Corp. | | 478,016 | 27,452,459 |
| Wyndham Worldwide Corp. | | 34,042 | 3,944,447 |
| Wynn Resorts Ltd. | | 26,935 | 4,540,972 |
| Yum! Brands, Inc. | | 113,219 | 9,239,803 |
| | | | 141,930,701 |
| Household Durables - 0.4% | | | |
| D.R. Horton, Inc. | | 114,661 | 5,855,737 |
| Garmin Ltd. (a) | | 37,281 | 2,220,829 |
| Leggett & Platt, Inc. (a) | | 44,286 | 2,113,771 |
| Lennar Corp. Class A | | 68,706 | 4,344,967 |
| Mohawk Industries, Inc. (b) | | 21,229 | 5,857,081 |
| Newell Brands, Inc. | | 164,658 | 5,087,932 |
| PulteGroup, Inc. | | 90,863 | 3,021,195 |
| Whirlpool Corp. | | 24,144 | 4,071,644 |
| | | | 32,573,156 |
| Internet & Direct Marketing Retail - 2.8% | | | |
| Amazon.com, Inc. (b) | | 134,372 | 157,144,023 |
| Expedia, Inc. | | 41,301 | 4,946,621 |
| Netflix, Inc. (b) | | 145,384 | 27,907,913 |
| Priceline Group, Inc. (b) | | 16,385 | 28,472,870 |
| TripAdvisor, Inc. (a)(b) | | 36,428 | 1,255,309 |
| | | | 219,726,736 |
| Leisure Products - 0.1% | | | |
| Hasbro, Inc. | | 38,081 | 3,461,182 |
| Mattel, Inc. (a) | | 115,482 | 1,776,113 |
| | | | 5,237,295 |
| Media - 2.7% | | | |
| CBS Corp. Class B | | 121,815 | 7,187,085 |
| Charter Communications, Inc. Class A (b) | | 65,150 | 21,887,794 |
| Comcast Corp. Class A | | 1,567,066 | 62,760,993 |
| Discovery Communications, Inc.: | | | |
| Class A (a)(b) | | 51,740 | 1,157,941 |
| Class C (non-vtg.) (b) | | 68,277 | 1,445,424 |
| DISH Network Corp. Class A (b) | | 76,575 | 3,656,456 |
| Interpublic Group of Companies, Inc. | | 130,560 | 2,632,090 |
| News Corp.: | | | |
| Class A | | 128,673 | 2,085,789 |
| Class B | | 40,912 | 679,139 |
| Omnicom Group, Inc. (a) | | 77,452 | 5,640,829 |
| Scripps Networks Interactive, Inc. Class A | | 32,275 | 2,755,640 |
| The Walt Disney Co. | | 507,417 | 54,552,402 |
| Time Warner, Inc. | | 261,583 | 23,926,997 |
| Twenty-First Century Fox, Inc.: | | | |
| Class A | | 354,114 | 12,227,556 |
| Class B | | 147,553 | 5,034,508 |
| Viacom, Inc. Class B (non-vtg.) | | 118,539 | 3,652,187 |
| | | | 211,282,830 |
| Multiline Retail - 0.5% | | | |
| Dollar General Corp. | | 87,524 | 8,140,607 |
| Dollar Tree, Inc. (b) | | 79,657 | 8,547,993 |
| Kohl's Corp. | | 56,638 | 3,071,479 |
| Macy's, Inc. (a) | | 102,336 | 2,577,844 |
| Nordstrom, Inc. (a) | | 39,181 | 1,856,396 |
| Target Corp. | | 182,623 | 11,916,151 |
| | | | 36,110,470 |
| Specialty Retail - 2.3% | | | |
| Advance Auto Parts, Inc. | | 24,827 | 2,475,004 |
| AutoZone, Inc. (b) | | 9,237 | 6,570,925 |
| Best Buy Co., Inc. | | 85,445 | 5,850,419 |
| CarMax, Inc. (b) | | 61,257 | 3,928,411 |
| Foot Locker, Inc. | | 41,659 | 1,952,974 |
| Gap, Inc. (a) | | 73,160 | 2,491,830 |
| Home Depot, Inc. | | 392,327 | 74,357,736 |
| L Brands, Inc. (a) | | 82,966 | 4,996,213 |
| Lowe's Companies, Inc. | | 279,798 | 26,004,426 |
| O'Reilly Automotive, Inc. (b) | | 28,567 | 6,871,506 |
| Ross Stores, Inc. | | 129,547 | 10,396,147 |
| Signet Jewelers Ltd. (a) | | 20,313 | 1,148,700 |
| Tiffany & Co., Inc. | | 34,302 | 3,565,693 |
| TJX Companies, Inc. | | 213,768 | 16,344,701 |
| Tractor Supply Co. (a) | | 42,186 | 3,153,404 |
| Ulta Beauty, Inc. | | 19,607 | 4,385,302 |
| | | | 174,493,391 |
| Textiles, Apparel & Luxury Goods - 0.7% | | | |
| Hanesbrands, Inc. (a) | | 122,489 | 2,561,245 |
| Michael Kors Holdings Ltd. (b) | | 51,094 | 3,216,367 |
| NIKE, Inc. Class B | | 441,445 | 27,612,385 |
| PVH Corp. | | 26,012 | 3,569,107 |
| Ralph Lauren Corp. | | 18,611 | 1,929,775 |
| Tapestry, Inc. | | 95,541 | 4,225,778 |
| Under Armour, Inc.: | | | |
| Class A (sub. vtg.) (a)(b) | | 62,198 | 897,517 |
| Class C (non-vtg.) (a)(b) | | 61,933 | 824,948 |
| VF Corp. | | 110,189 | 8,153,986 |
| | | | 52,991,108 |
|
| TOTAL CONSUMER DISCRETIONARY | | | 935,595,277 |
|
| CONSUMER STAPLES - 8.1% | | | |
| Beverages - 2.0% | | | |
| Brown-Forman Corp. Class B (non-vtg.) (a) | | 65,790 | 4,517,799 |
| Constellation Brands, Inc. Class A (sub. vtg.) | | 57,878 | 13,229,174 |
| Dr. Pepper Snapple Group, Inc. | | 60,656 | 5,887,271 |
| Molson Coors Brewing Co. Class B | | 62,076 | 5,094,577 |
| Monster Beverage Corp. (b) | | 138,316 | 8,754,020 |
| PepsiCo, Inc. | | 477,795 | 57,297,176 |
| The Coca-Cola Co. | | 1,288,304 | 59,107,388 |
| | | | 153,887,405 |
| Food & Staples Retailing - 1.8% | | | |
| Costco Wholesale Corp. | | 146,815 | 27,325,208 |
| CVS Health Corp. | | 340,333 | 24,674,143 |
| Kroger Co. | | 298,851 | 8,203,460 |
| Sysco Corp. | | 161,054 | 9,780,809 |
| Wal-Mart Stores, Inc. | | 491,766 | 48,561,893 |
| Walgreens Boots Alliance, Inc. | | 291,692 | 21,182,673 |
| | | | 139,728,186 |
| Food Products - 1.2% | | | |
| Archer Daniels Midland Co. | | 187,890 | 7,530,631 |
| Campbell Soup Co. (a) | | 64,620 | 3,108,868 |
| ConAgra Foods, Inc. | | 137,242 | 5,169,906 |
| General Mills, Inc. (a) | | 190,944 | 11,321,070 |
| Hormel Foods Corp. (a) | | 90,440 | 3,291,112 |
| Kellogg Co. (a) | | 83,569 | 5,681,021 |
| McCormick & Co., Inc. (non-vtg.) (a) | | 40,230 | 4,099,839 |
| Mondelez International, Inc. | | 502,067 | 21,488,468 |
| The Hershey Co. | | 47,396 | 5,379,920 |
| The J.M. Smucker Co. | | 38,161 | 4,741,123 |
| The Kraft Heinz Co. | | 200,590 | 15,597,878 |
| Tyson Foods, Inc. Class A | | 99,983 | 8,105,622 |
| | | | 95,515,458 |
| Household Products - 1.6% | | | |
| Church & Dwight Co., Inc. | | 83,967 | 4,212,624 |
| Clorox Co. | | 43,319 | 6,443,268 |
| Colgate-Palmolive Co. | | 295,015 | 22,258,882 |
| Kimberly-Clark Corp. | | 118,179 | 14,259,478 |
| Procter & Gamble Co. | | 856,084 | 78,656,998 |
| | | | 125,831,250 |
| Personal Products - 0.2% | | | |
| Coty, Inc. Class A (a) | | 158,637 | 3,155,290 |
| Estee Lauder Companies, Inc. Class A | | 75,214 | 9,570,229 |
| | | | 12,725,519 |
| Tobacco - 1.3% | | | |
| Altria Group, Inc. | | 641,091 | 45,780,308 |
| Philip Morris International, Inc. | | 521,807 | 55,128,910 |
| | | | 100,909,218 |
|
| TOTAL CONSUMER STAPLES | | | 628,597,036 |
|
| ENERGY - 6.0% | | | |
| Energy Equipment & Services - 0.8% | | | |
| Baker Hughes, a GE Co. Class A | | 143,854 | 4,551,541 |
| Halliburton Co. | | 293,146 | 14,326,045 |
| Helmerich & Payne, Inc. (a) | | 36,488 | 2,358,584 |
| National Oilwell Varco, Inc. (a) | | 127,682 | 4,599,106 |
| Schlumberger Ltd. | | 465,404 | 31,363,576 |
| TechnipFMC PLC | | 147,303 | 4,612,057 |
| | | | 61,810,909 |
| Oil, Gas & Consumable Fuels - 5.2% | | | |
| Anadarko Petroleum Corp. | | 183,828 | 9,860,534 |
| Andeavor | | 48,217 | 5,513,132 |
| Apache Corp. (a) | | 127,982 | 5,403,400 |
| Cabot Oil & Gas Corp. | | 155,383 | 4,443,954 |
| Chesapeake Energy Corp. (a)(b) | | 305,290 | 1,208,948 |
| Chevron Corp. | | 638,129 | 79,887,370 |
| Cimarex Energy Co. | | 32,005 | 3,904,930 |
| Concho Resources, Inc. (b) | | 49,963 | 7,505,442 |
| ConocoPhillips Co. | | 401,655 | 22,046,843 |
| Devon Energy Corp. | | 176,556 | 7,309,418 |
| EOG Resources, Inc. | | 194,263 | 20,962,920 |
| EQT Corp. | | 82,255 | 4,681,955 |
| Exxon Mobil Corp. | | 1,423,587 | 119,068,817 |
| Hess Corp. | | 90,742 | 4,307,523 |
| Kinder Morgan, Inc. | | 645,256 | 11,659,776 |
| Marathon Oil Corp. | | 285,460 | 4,832,838 |
| Marathon Petroleum Corp. | | 164,091 | 10,826,724 |
| Newfield Exploration Co. (b) | | 66,923 | 2,110,082 |
| Noble Energy, Inc. | | 163,485 | 4,763,953 |
| Occidental Petroleum Corp. | | 257,098 | 18,937,839 |
| ONEOK, Inc. | | 128,823 | 6,885,589 |
| Phillips 66 Co. | | 144,355 | 14,601,508 |
| Pioneer Natural Resources Co. | | 57,170 | 9,881,835 |
| Range Resources Corp. (a) | | 75,862 | 1,294,206 |
| The Williams Companies, Inc. | | 277,761 | 8,468,933 |
| Valero Energy Corp. | | 147,013 | 13,511,965 |
| | | | 403,880,434 |
|
| TOTAL ENERGY | | | 465,691,343 |
|
| FINANCIALS - 14.7% | | | |
| Banks - 6.5% | | | |
| Bank of America Corp. | | 3,259,049 | 96,207,126 |
| BB&T Corp. | | 265,052 | 13,178,385 |
| Citigroup, Inc. | | 888,301 | 66,098,477 |
| Citizens Financial Group, Inc. | | 165,293 | 6,939,000 |
| Comerica, Inc. | | 58,430 | 5,072,308 |
| Fifth Third Bancorp | | 237,053 | 7,192,188 |
| Huntington Bancshares, Inc. | | 363,164 | 5,287,668 |
| JPMorgan Chase & Co. | | 1,165,718 | 124,661,883 |
| KeyCorp | | 361,300 | 7,287,421 |
| M&T Bank Corp. | | 50,568 | 8,646,622 |
| Peoples United Financial, Inc. (a) | | 116,330 | 2,175,371 |
| PNC Financial Services Group, Inc. | | 159,854 | 23,065,334 |
| Regions Financial Corp. | | 389,713 | 6,734,241 |
| SunTrust Banks, Inc. | | 159,932 | 10,330,008 |
| U.S. Bancorp | | 529,659 | 28,379,129 |
| Wells Fargo & Co. | | 1,488,956 | 90,334,961 |
| Zions Bancorporation | | 67,108 | 3,411,100 |
| | | | 505,001,222 |
| Capital Markets - 3.1% | | | |
| Affiliated Managers Group, Inc. | | 18,674 | 3,832,839 |
| Ameriprise Financial, Inc. | | 49,700 | 8,422,659 |
| Bank of New York Mellon Corp. | | 344,039 | 18,529,941 |
| BlackRock, Inc. Class A | | 41,477 | 21,307,150 |
| Brighthouse Financial, Inc. | | 32,192 | 1,887,739 |
| CBOE Holdings, Inc. | | 38,118 | 4,749,122 |
| Charles Schwab Corp. | | 400,848 | 20,591,562 |
| CME Group, Inc. | | 114,327 | 16,697,458 |
| E*TRADE Financial Corp. (b) | | 90,943 | 4,508,045 |
| Franklin Resources, Inc. | | 109,796 | 4,757,461 |
| Goldman Sachs Group, Inc. | | 117,857 | 30,025,249 |
| IntercontinentalExchange, Inc. | | 196,550 | 13,868,568 |
| Invesco Ltd. | | 136,766 | 4,997,430 |
| Moody's Corp. | | 55,857 | 8,245,052 |
| Morgan Stanley | | 467,695 | 24,539,957 |
| Northern Trust Corp. | | 72,158 | 7,207,863 |
| Raymond James Financial, Inc. | | 43,178 | 3,855,795 |
| S&P Global, Inc. | | 85,672 | 14,512,837 |
| State Street Corp. | | 124,589 | 12,161,132 |
| T. Rowe Price Group, Inc. | | 81,408 | 8,542,141 |
| The NASDAQ OMX Group, Inc. | | 39,093 | 3,003,515 |
| | | | 236,243,515 |
| Consumer Finance - 0.8% | | | |
| American Express Co. | | 242,044 | 24,037,390 |
| Capital One Financial Corp. | | 162,859 | 16,217,499 |
| Discover Financial Services | | 122,084 | 9,390,701 |
| Navient Corp. | | 88,364 | 1,177,008 |
| Synchrony Financial | | 247,151 | 9,542,500 |
| | | | 60,365,098 |
| Diversified Financial Services - 1.7% | | | |
| Berkshire Hathaway, Inc. Class B (b) | | 646,539 | 128,156,961 |
| Leucadia National Corp. | | 105,333 | 2,790,271 |
| | | | 130,947,232 |
| Insurance - 2.6% | | | |
| AFLAC, Inc. | | 132,086 | 11,594,509 |
| Allstate Corp. | | 120,554 | 12,623,209 |
| American International Group, Inc. | | 302,022 | 17,994,471 |
| Aon PLC | | 83,958 | 11,250,372 |
| Arthur J. Gallagher & Co. | | 60,743 | 3,843,817 |
| Assurant, Inc. | | 18,079 | 1,823,086 |
| Chubb Ltd. | | 155,964 | 22,791,019 |
| Cincinnati Financial Corp. | | 50,162 | 3,760,645 |
| Everest Re Group Ltd. | | 13,798 | 3,052,945 |
| Hartford Financial Services Group, Inc. | | 119,846 | 6,744,933 |
| Lincoln National Corp. | | 73,520 | 5,651,482 |
| Loews Corp. | | 92,732 | 4,639,382 |
| Marsh & McLennan Companies, Inc. | | 171,464 | 13,955,455 |
| MetLife, Inc. | | 353,539 | 17,874,932 |
| Principal Financial Group, Inc. | | 90,222 | 6,366,064 |
| Progressive Corp. | | 195,399 | 11,004,872 |
| Prudential Financial, Inc. | | 142,451 | 16,379,016 |
| The Travelers Companies, Inc. | | 91,953 | 12,472,505 |
| Torchmark Corp. | | 36,071 | 3,272,000 |
| Unum Group | | 75,388 | 4,138,047 |
| Willis Group Holdings PLC | | 44,361 | 6,684,759 |
| XL Group Ltd. | | 86,013 | 3,024,217 |
| | | | 200,941,737 |
|
| TOTAL FINANCIALS | | | 1,133,498,804 |
|
| HEALTH CARE - 13.6% | | | |
| Biotechnology - 2.7% | | | |
| AbbVie, Inc. | | 535,565 | 51,794,491 |
| Alexion Pharmaceuticals, Inc. (b) | | 75,059 | 8,976,306 |
| Amgen, Inc. | | 243,883 | 42,411,254 |
| Biogen, Inc. (b) | | 71,034 | 22,629,301 |
| Celgene Corp. (b) | | 264,514 | 27,604,681 |
| Gilead Sciences, Inc. | | 438,865 | 31,440,289 |
| Incyte Corp. (b) | | 58,848 | 5,573,494 |
| Regeneron Pharmaceuticals, Inc. (b) | | 25,881 | 9,730,221 |
| Vertex Pharmaceuticals, Inc. (b) | | 84,967 | 12,733,155 |
| | | | 212,893,192 |
| Health Care Equipment & Supplies - 2.7% | | | |
| Abbott Laboratories | | 584,787 | 33,373,794 |
| Align Technology, Inc. (b) | | 24,244 | 5,386,774 |
| Baxter International, Inc. | | 168,415 | 10,886,346 |
| Becton, Dickinson & Co. | | 89,026 | 19,056,906 |
| Boston Scientific Corp. (b) | | 461,350 | 11,436,867 |
| Danaher Corp. | | 205,657 | 19,089,083 |
| Dentsply Sirona, Inc. | | 77,166 | 5,079,838 |
| Edwards Lifesciences Corp. (b) | | 71,098 | 8,013,456 |
| Hologic, Inc. (b) | | 92,621 | 3,959,548 |
| IDEXX Laboratories, Inc. (b) | | 29,303 | 4,582,403 |
| Intuitive Surgical, Inc. (b) | | 37,645 | 13,738,166 |
| Medtronic PLC | | 454,764 | 36,722,193 |
| ResMed, Inc. (a) | | 47,675 | 4,037,596 |
| Stryker Corp. | | 108,130 | 16,742,849 |
| The Cooper Companies, Inc. | | 16,445 | 3,583,037 |
| Varian Medical Systems, Inc. (b) | | 30,780 | 3,421,197 |
| Zimmer Biomet Holdings, Inc. | | 68,025 | 8,208,577 |
| | | | 207,318,630 |
| Health Care Providers & Services - 2.7% | | | |
| Aetna, Inc. | | 109,559 | 19,763,348 |
| AmerisourceBergen Corp. | | 54,219 | 4,978,389 |
| Anthem, Inc. | | 86,264 | 19,410,263 |
| Cardinal Health, Inc. | | 105,697 | 6,476,055 |
| Centene Corp. (b) | | 57,946 | 5,845,592 |
| Cigna Corp. | | 82,833 | 16,822,554 |
| DaVita HealthCare Partners, Inc. (b) | | 50,861 | 3,674,707 |
| Envision Healthcare Corp. (a) | | 40,647 | 1,404,760 |
| Express Scripts Holding Co. (b) | | 190,283 | 14,202,723 |
| HCA Holdings, Inc. (b) | | 95,160 | 8,358,854 |
| Henry Schein, Inc. (a)(b) | | 52,732 | 3,684,912 |
| Humana, Inc. | | 47,996 | 11,906,368 |
| Laboratory Corp. of America Holdings (b) | | 34,202 | 5,455,561 |
| McKesson Corp. | | 70,041 | 10,922,894 |
| Patterson Companies, Inc. (a) | | 27,673 | 999,825 |
| Quest Diagnostics, Inc. | | 45,792 | 4,510,054 |
| UnitedHealth Group, Inc. | | 325,576 | 71,776,485 |
| Universal Health Services, Inc. Class B | | 29,442 | 3,337,251 |
| | | | 213,530,595 |
| Health Care Technology - 0.1% | | | |
| Cerner Corp. (b) | | 106,097 | 7,149,877 |
| Life Sciences Tools & Services - 0.8% | | | |
| Agilent Technologies, Inc. | | 108,124 | 7,241,064 |
| Illumina, Inc. (b) | | 49,051 | 10,717,153 |
| Mettler-Toledo International, Inc. (b) | | 8,594 | 5,324,155 |
| PerkinElmer, Inc. | | 37,029 | 2,707,560 |
| Quintiles Transnational Holdings, Inc. (b) | | 48,914 | 4,788,681 |
| Thermo Fisher Scientific, Inc. | | 134,722 | 25,581,013 |
| Waters Corp. (b) | | 26,721 | 5,162,230 |
| | | | 61,521,856 |
| Pharmaceuticals - 4.6% | | | |
| Allergan PLC | | 111,737 | 18,277,938 |
| Bristol-Myers Squibb Co. | | 549,879 | 33,696,585 |
| Eli Lilly & Co. | | 325,510 | 27,492,575 |
| Johnson & Johnson | | 902,585 | 126,109,176 |
| Merck & Co., Inc. | | 918,929 | 51,708,135 |
| Mylan NV (b) | | 180,173 | 7,623,120 |
| Perrigo Co. PLC | | 44,006 | 3,835,563 |
| Pfizer, Inc. | | 2,002,608 | 72,534,462 |
| Zoetis, Inc. Class A | | 163,713 | 11,793,885 |
| | | | 353,071,439 |
|
| TOTAL HEALTH CARE | | | 1,055,485,589 |
|
| INDUSTRIALS - 10.1% | | | |
| Aerospace & Defense - 2.5% | | | |
| Arconic, Inc. | | 142,304 | 3,877,784 |
| General Dynamics Corp. | | 93,292 | 18,980,257 |
| L3 Technologies, Inc. | | 26,253 | 5,194,156 |
| Lockheed Martin Corp. | | 83,810 | 26,907,201 |
| Northrop Grumman Corp. | | 58,485 | 17,949,631 |
| Raytheon Co. | | 97,124 | 18,244,743 |
| Rockwell Collins, Inc. | | 54,695 | 7,417,736 |
| Textron, Inc. | | 88,501 | 5,008,272 |
| The Boeing Co. | | 188,090 | 55,469,622 |
| TransDigm Group, Inc. (a) | | 16,235 | 4,458,456 |
| United Technologies Corp. | | 249,514 | 31,830,501 |
| | | | 195,338,359 |
| Air Freight & Logistics - 0.7% | | | |
| C.H. Robinson Worldwide, Inc. (a) | | 46,836 | 4,172,619 |
| Expeditors International of Washington, Inc. | | 59,703 | 3,862,187 |
| FedEx Corp. | | 82,882 | 20,682,374 |
| United Parcel Service, Inc. Class B | | 230,829 | 27,503,275 |
| | | | 56,220,455 |
| Airlines - 0.5% | | | |
| Alaska Air Group, Inc. | | 41,339 | 3,038,830 |
| American Airlines Group, Inc. | | 143,077 | 7,444,296 |
| Delta Air Lines, Inc. | | 220,373 | 12,340,888 |
| Southwest Airlines Co. | | 183,411 | 12,004,250 |
| United Continental Holdings, Inc. (b) | | 84,602 | 5,702,175 |
| | | | 40,530,439 |
| Building Products - 0.3% | | | |
| A.O. Smith Corp. | | 48,990 | 3,002,107 |
| Allegion PLC | | 31,912 | 2,538,919 |
| Fortune Brands Home & Security, Inc. | | 51,743 | 3,541,291 |
| Johnson Controls International PLC | | 310,917 | 11,849,047 |
| Masco Corp. | | 105,684 | 4,643,755 |
| | | | 25,575,119 |
| Commercial Services & Supplies - 0.3% | | | |
| Cintas Corp. | | 28,929 | 4,508,006 |
| Republic Services, Inc. | | 76,357 | 5,162,497 |
| Stericycle, Inc. (b) | | 28,683 | 1,950,157 |
| Waste Management, Inc. | | 134,212 | 11,582,496 |
| | | | 23,203,156 |
| Construction & Engineering - 0.1% | | | |
| Fluor Corp. | | 46,994 | 2,427,240 |
| Jacobs Engineering Group, Inc. | | 40,473 | 2,669,599 |
| Quanta Services, Inc. (b) | | 51,981 | 2,032,977 |
| | | | 7,129,816 |
| Electrical Equipment - 0.7% | | | |
| Acuity Brands, Inc. (a) | | 14,162 | 2,492,512 |
| AMETEK, Inc. | | 77,648 | 5,627,151 |
| Eaton Corp. PLC | | 148,028 | 11,695,692 |
| Emerson Electric Co. | | 215,631 | 15,027,324 |
| Fortive Corp. | | 102,757 | 7,434,469 |
| Rockwell Automation, Inc. | | 43,173 | 8,477,019 |
| | | | 50,754,167 |
| Industrial Conglomerates - 1.9% | | | |
| 3M Co. | | 200,495 | 47,190,508 |
| General Electric Co. | | 2,913,545 | 50,841,360 |
| Honeywell International, Inc. | | 255,948 | 39,252,185 |
| Roper Technologies, Inc. | | 34,390 | 8,907,010 |
| | | | 146,191,063 |
| Machinery - 1.6% | | | |
| Caterpillar, Inc. | | 199,879 | 31,496,933 |
| Cummins, Inc. | | 52,414 | 9,258,409 |
| Deere & Co. | | 107,463 | 16,819,034 |
| Dover Corp. | | 52,341 | 5,285,918 |
| Flowserve Corp. (a) | | 43,890 | 1,849,086 |
| Illinois Tool Works, Inc. | | 103,592 | 17,284,325 |
| Ingersoll-Rand PLC | | 83,948 | 7,487,322 |
| PACCAR, Inc. | | 118,130 | 8,396,680 |
| Parker Hannifin Corp. | | 44,760 | 8,933,201 |
| Pentair PLC | | 55,484 | 3,918,280 |
| Snap-On, Inc. (a) | | 19,153 | 3,338,368 |
| Stanley Black & Decker, Inc. | | 51,521 | 8,742,598 |
| Xylem, Inc. | | 60,340 | 4,115,188 |
| | | | 126,925,342 |
| Professional Services - 0.3% | | | |
| Equifax, Inc. | | 40,343 | 4,757,247 |
| IHS Markit Ltd. (b) | | 122,047 | 5,510,422 |
| Nielsen Holdings PLC (a) | | 112,481 | 4,094,308 |
| Robert Half International, Inc. | | 42,114 | 2,339,012 |
| Verisk Analytics, Inc. (b) | | 52,216 | 5,012,736 |
| | | | 21,713,725 |
| Road & Rail - 1.0% | | | |
| CSX Corp. | | 300,263 | 16,517,468 |
| J.B. Hunt Transport Services, Inc. | | 28,761 | 3,306,940 |
| Kansas City Southern | | 34,787 | 3,660,288 |
| Norfolk Southern Corp. | | 96,137 | 13,930,251 |
| Union Pacific Corp. | | 264,464 | 35,464,622 |
| | | | 72,879,569 |
| Trading Companies & Distributors - 0.2% | | | |
| Fastenal Co. (a) | | 96,554 | 5,280,538 |
| United Rentals, Inc. (b) | | 28,394 | 4,881,213 |
| W.W. Grainger, Inc. (a) | | 17,421 | 4,115,711 |
| | | | 14,277,462 |
|
| TOTAL INDUSTRIALS | | | 780,738,672 |
|
| INFORMATION TECHNOLOGY - 23.6% | | | |
| Communications Equipment - 1.0% | | | |
| Cisco Systems, Inc. | | 1,660,900 | 63,612,470 |
| F5 Networks, Inc. (b) | | 21,030 | 2,759,557 |
| Harris Corp. | | 40,048 | 5,672,799 |
| Juniper Networks, Inc. | | 125,964 | 3,589,974 |
| Motorola Solutions, Inc. | | 54,427 | 4,916,935 |
| | | | 80,551,735 |
| Electronic Equipment & Components - 0.4% | | | |
| Amphenol Corp. Class A | | 102,584 | 9,006,875 |
| Corning, Inc. | | 291,976 | 9,340,312 |
| FLIR Systems, Inc. | | 46,556 | 2,170,441 |
| TE Connectivity Ltd. | | 118,139 | 11,227,931 |
| | | | 31,745,559 |
| Internet Software & Services - 4.8% | | | |
| Akamai Technologies, Inc. (b) | | 56,830 | 3,696,223 |
| Alphabet, Inc.: | | | |
| Class A (b) | | 100,134 | 105,481,156 |
| Class C (b) | | 101,416 | 106,121,702 |
| eBay, Inc. (b) | | 326,377 | 12,317,468 |
| Facebook, Inc. Class A (b) | | 801,216 | 141,382,575 |
| VeriSign, Inc. (a)(b) | | 28,480 | 3,259,251 |
| | | | 372,258,375 |
| IT Services - 4.0% | | | |
| Accenture PLC Class A | | 207,624 | 31,785,158 |
| Alliance Data Systems Corp. | | 16,149 | 4,093,449 |
| Automatic Data Processing, Inc. | | 148,999 | 17,461,193 |
| Cognizant Technology Solutions Corp. Class A | | 198,102 | 14,069,204 |
| CSRA, Inc. | | 55,025 | 1,646,348 |
| DXC Technology Co. | | 95,841 | 9,095,311 |
| Fidelity National Information Services, Inc. | | 112,169 | 10,553,981 |
| Fiserv, Inc. (b) | | 70,015 | 9,181,067 |
| Gartner, Inc. (b) | | 30,456 | 3,750,656 |
| Global Payments, Inc. | | 53,467 | 5,359,532 |
| IBM Corp. | | 289,264 | 44,378,883 |
| MasterCard, Inc. Class A | | 312,050 | 47,231,888 |
| Paychex, Inc. | | 107,444 | 7,314,788 |
| PayPal Holdings, Inc. (b) | | 379,575 | 27,944,312 |
| The Western Union Co. | | 154,308 | 2,933,395 |
| Total System Services, Inc. | | 56,207 | 4,445,412 |
| Visa, Inc. Class A (a) | | 609,266 | 69,468,509 |
| | | | 310,713,086 |
| Semiconductors & Semiconductor Equipment - 3.9% | | | |
| Advanced Micro Devices, Inc. (a)(b) | | 275,521 | 2,832,356 |
| Analog Devices, Inc. | | 123,850 | 11,026,366 |
| Applied Materials, Inc. | | 358,306 | 18,316,603 |
| Broadcom Ltd. | | 136,602 | 35,093,054 |
| Intel Corp. | | 1,572,331 | 72,578,799 |
| KLA-Tencor Corp. | | 52,649 | 5,531,830 |
| Lam Research Corp. | | 54,409 | 10,015,065 |
| Microchip Technology, Inc. (a) | | 78,585 | 6,906,050 |
| Micron Technology, Inc. (b) | | 387,457 | 15,932,232 |
| NVIDIA Corp. | | 203,597 | 39,396,020 |
| Qorvo, Inc. (b) | | 42,758 | 2,847,683 |
| Qualcomm, Inc. | | 495,273 | 31,707,377 |
| Skyworks Solutions, Inc. | | 61,731 | 5,861,358 |
| Texas Instruments, Inc. | | 331,117 | 34,581,859 |
| Xilinx, Inc. | | 84,312 | 5,684,315 |
| | | | 298,310,967 |
| Software - 5.2% | | | |
| Activision Blizzard, Inc. | | 254,025 | 16,084,863 |
| Adobe Systems, Inc. (b) | | 165,613 | 29,022,022 |
| ANSYS, Inc. (b) | | 28,510 | 4,207,791 |
| Autodesk, Inc. (b) | | 73,642 | 7,719,891 |
| CA Technologies, Inc. | | 105,463 | 3,509,809 |
| Cadence Design Systems, Inc. (b) | | 94,864 | 3,967,212 |
| Citrix Systems, Inc. (b) | | 48,091 | 4,232,008 |
| Electronic Arts, Inc. (b) | | 103,453 | 10,868,772 |
| Intuit, Inc. | | 81,596 | 12,874,217 |
| Microsoft Corp. | | 2,591,857 | 221,707,448 |
| Oracle Corp. | | 1,023,576 | 48,394,673 |
| Red Hat, Inc. (b) | | 59,449 | 7,139,825 |
| Salesforce.com, Inc. (b) | | 230,536 | 23,567,695 |
| Symantec Corp. | | 208,294 | 5,844,730 |
| Synopsys, Inc. (b) | | 50,475 | 4,302,489 |
| | | | 403,443,445 |
| Technology Hardware, Storage & Peripherals - 4.3% | | | |
| Apple, Inc. | | 1,724,966 | 291,915,980 |
| Hewlett Packard Enterprise Co. | | 535,869 | 7,695,079 |
| HP, Inc. | | 561,152 | 11,789,804 |
| NetApp, Inc. | | 90,630 | 5,013,652 |
| Seagate Technology LLC (a) | | 97,202 | 4,066,932 |
| Western Digital Corp. | | 99,375 | 7,903,294 |
| Xerox Corp. | | 71,723 | 2,090,725 |
| | | | 330,475,466 |
|
| TOTAL INFORMATION TECHNOLOGY | | | 1,827,498,633 |
|
| MATERIALS - 3.0% | | | |
| Chemicals - 2.2% | | | |
| Air Products & Chemicals, Inc. | | 73,227 | 12,015,086 |
| Albemarle Corp. U.S. | | 37,123 | 4,747,660 |
| CF Industries Holdings, Inc. | | 78,364 | 3,333,605 |
| DowDuPont, Inc. | | 786,162 | 55,990,458 |
| Eastman Chemical Co. | | 48,290 | 4,473,586 |
| Ecolab, Inc. | | 87,359 | 11,721,831 |
| FMC Corp. | | 45,108 | 4,269,923 |
| International Flavors & Fragrances, Inc. | | 26,532 | 4,049,049 |
| LyondellBasell Industries NV Class A | | 108,671 | 11,988,585 |
| Monsanto Co. | | 147,599 | 17,236,611 |
| PPG Industries, Inc. | | 85,496 | 9,987,643 |
| Praxair, Inc. | | 96,189 | 14,878,515 |
| Sherwin-Williams Co. | | 27,648 | 11,336,786 |
| The Mosaic Co. | | 117,931 | 3,026,109 |
| | | | 169,055,447 |
| Construction Materials - 0.1% | | | |
| Martin Marietta Materials, Inc. | | 21,119 | 4,668,144 |
| Vulcan Materials Co. | | 44,440 | 5,704,763 |
| | | | 10,372,907 |
| Containers & Packaging - 0.4% | | | |
| Avery Dennison Corp. | | 29,696 | 3,410,883 |
| Ball Corp. | | 117,608 | 4,451,463 |
| International Paper Co. | | 138,720 | 8,037,437 |
| Packaging Corp. of America | | 31,699 | 3,821,314 |
| Sealed Air Corp. | | 60,605 | 2,987,827 |
| WestRock Co. | | 85,542 | 5,407,110 |
| | | | 28,116,034 |
| Metals & Mining - 0.3% | | | |
| Freeport-McMoRan, Inc. (b) | | 452,301 | 8,575,627 |
| Newmont Mining Corp. | | 179,184 | 6,722,984 |
| Nucor Corp. | | 106,810 | 6,790,980 |
| | | | 22,089,591 |
|
| TOTAL MATERIALS | | | 229,633,979 |
|
| REAL ESTATE - 2.9% | | | |
| Equity Real Estate Investment Trusts (REITs) - 2.8% | | | |
| Alexandria Real Estate Equities, Inc. | | 32,158 | 4,199,513 |
| American Tower Corp. | | 144,082 | 20,556,179 |
| Apartment Investment & Management Co. Class A | | 52,754 | 2,305,877 |
| AvalonBay Communities, Inc. | | 46,392 | 8,276,797 |
| Boston Properties, Inc. | | 51,846 | 6,741,535 |
| Crown Castle International Corp. | | 136,493 | 15,152,088 |
| Digital Realty Trust, Inc. | | 69,022 | 7,861,606 |
| Duke Realty Corp. | | 119,652 | 3,255,731 |
| Equinix, Inc. | | 26,284 | 11,912,434 |
| Equity Residential (SBI) | | 123,463 | 7,873,236 |
| Essex Property Trust, Inc. | | 22,186 | 5,355,035 |
| Extra Space Storage, Inc. (a) | | 42,302 | 3,699,310 |
| Federal Realty Investment Trust (SBI) | | 24,373 | 3,236,978 |
| General Growth Properties, Inc. | | 209,760 | 4,906,286 |
| HCP, Inc. | | 157,605 | 4,110,338 |
| Host Hotels & Resorts, Inc. | | 248,634 | 4,935,385 |
| Iron Mountain, Inc. | | 94,556 | 3,567,598 |
| Kimco Realty Corp. | | 143,007 | 2,595,577 |
| Mid-America Apartment Communities, Inc. | | 38,175 | 3,838,878 |
| Prologis, Inc. | | 178,763 | 11,532,001 |
| Public Storage | | 50,286 | 10,509,774 |
| Realty Income Corp. (a) | | 94,671 | 5,398,140 |
| Regency Centers Corp. | | 49,713 | 3,439,145 |
| SBA Communications Corp. Class A (b) | | 39,491 | 6,451,250 |
| Simon Property Group, Inc. | | 104,431 | 17,934,980 |
| SL Green Realty Corp. | | 33,014 | 3,332,103 |
| The Macerich Co. (a) | | 36,417 | 2,391,869 |
| UDR, Inc. | | 89,896 | 3,462,794 |
| Ventas, Inc. | | 119,655 | 7,180,497 |
| Vornado Realty Trust | | 57,925 | 4,528,577 |
| Welltower, Inc. | | 124,428 | 7,934,774 |
| Weyerhaeuser Co. | | 253,599 | 8,941,901 |
| | | | 217,418,186 |
| Real Estate Management & Development - 0.1% | | | |
| CBRE Group, Inc. (b) | | 101,502 | 4,396,052 |
|
| TOTAL REAL ESTATE | | | 221,814,238 |
|
| TELECOMMUNICATION SERVICES - 2.1% | | | |
| Diversified Telecommunication Services - 2.1% | | | |
| AT&T, Inc. | | 2,062,845 | 80,203,414 |
| CenturyLink, Inc. (a) | | 326,827 | 5,451,474 |
| Verizon Communications, Inc. | | 1,370,539 | 72,542,629 |
| | | | 158,197,517 |
| UTILITIES - 2.9% | | | |
| Electric Utilities - 1.8% | | | |
| Alliant Energy Corp. | | 77,677 | 3,309,817 |
| American Electric Power Co., Inc. | | 165,243 | 12,156,928 |
| Duke Energy Corp. | | 235,139 | 19,777,541 |
| Edison International | | 109,462 | 6,922,377 |
| Entergy Corp. | | 60,559 | 4,928,897 |
| Eversource Energy | | 106,464 | 6,726,396 |
| Exelon Corp. | | 322,559 | 12,712,050 |
| FirstEnergy Corp. | | 149,458 | 4,576,404 |
| NextEra Energy, Inc. | | 158,039 | 24,684,111 |
| PG&E Corp. | | 172,292 | 7,723,850 |
| Pinnacle West Capital Corp. | | 37,538 | 3,197,487 |
| PPL Corp. | | 229,525 | 7,103,799 |
| Southern Co. | | 337,187 | 16,215,323 |
| Xcel Energy, Inc. | | 170,592 | 8,207,181 |
| | | | 138,242,161 |
| Independent Power and Renewable Electricity Producers - 0.0% | | | |
| NRG Energy, Inc. | | 101,063 | 2,878,274 |
| The AES Corp. | | 221,869 | 2,402,841 |
| | | | 5,281,115 |
| Multi-Utilities - 1.0% | | | |
| Ameren Corp. | | 81,518 | 4,808,747 |
| CenterPoint Energy, Inc. | | 144,810 | 4,106,812 |
| CMS Energy Corp. | | 94,747 | 4,481,533 |
| Consolidated Edison, Inc. | | 104,173 | 8,849,496 |
| Dominion Resources, Inc. | | 216,206 | 17,525,658 |
| DTE Energy Co. | | 60,268 | 6,596,935 |
| NiSource, Inc. | | 113,152 | 2,904,612 |
| Public Service Enterprise Group, Inc. | | 170,013 | 8,755,670 |
| SCANA Corp. | | 47,914 | 1,906,019 |
| Sempra Energy | | 84,354 | 9,019,130 |
| WEC Energy Group, Inc. | | 106,025 | 7,043,241 |
| | | | 75,997,853 |
| Water Utilities - 0.1% | | | |
| American Water Works Co., Inc. | | 59,928 | 5,482,813 |
|
| TOTAL UTILITIES | | | 225,003,942 |
|
| TOTAL COMMON STOCKS | | | |
| (Cost $3,755,260,133) | | | 7,661,755,030 |
| | | Principal Amount | Value |
|
| U.S. Treasury Obligations - 0.0% | | | |
| U.S. Treasury Bills, yield at date of purchase 1.04% to 1.31% 1/11/18 to 5/10/18 (c) | | | |
| (Cost $2,296,266) | | 2,300,000 | 2,295,982 |
| | | Shares | Value |
|
| Money Market Funds - 3.4% | | | |
| Fidelity Cash Central Fund, 1.36% (d) | | 60,919,014 | $60,931,198 |
| Fidelity Securities Lending Cash Central Fund 1.36% (d)(e) | | 200,886,535 | 200,926,712 |
| TOTAL MONEY MARKET FUNDS | | | |
| (Cost $261,828,289) | | | 261,857,910 |
| TOTAL INVESTMENT IN SECURITIES - 102.5% | | | |
| (Cost $4,019,384,688) | | | 7,925,908,922 |
| NET OTHER ASSETS (LIABILITIES) - (2.5)% | | | (190,443,127) |
| NET ASSETS - 100% | | | $7,735,465,795 |
| Futures Contracts | | | | | |
| | Number of contracts | Expiration Date | Notional Amount | Value | Unrealized Appreciation/(Depreciation) |
| Purchased | | | | | |
| Equity Index Contracts | | | | | |
| CME E-mini S&P 500 Index Contracts (United States) | 524 | March 2018 | $70,111,200 | $452,029 | $452,029 |
The notional amount of futures purchased as a percentage of Net Assets is 0.9%
Legend
(a) Security or a portion of the security is on loan at period end.
(b) Non-income producing
(c) Security or a portion of the security was pledged to cover margin requirements for futures contracts. At period end, the value of securities pledged amounted to $2,295,982.
(d) Affiliated fund that is generally available only to investment companies and other accounts managed by Fidelity Investments. The rate quoted is the annualized seven-day yield of the fund at period end. A complete unaudited listing of the fund's holdings as of its most recent quarter end is available upon request. In addition, each Fidelity Central Fund's financial statements, which are not covered by the Fund's Report of Independent Registered Public Accounting Firm, are available on the SEC's website or upon request.
(e) Investment made with cash collateral received from securities on loan.
Affiliated Central Funds
Information regarding fiscal year to date income earned by the Fund from investments in Fidelity Central Funds is as follows:
| Fund | Income earned |
| Fidelity Cash Central Fund | $371,740 |
| Fidelity Securities Lending Cash Central Fund | 213,839 |
| Total | $585,579 |
Amounts in the income column in the above table include any capital gain distributions from underlying funds, which are presented in the corresponding line-item in the Statement of Operations if applicable.
Investment Valuation
The following is a summary of the inputs used, as of December 31, 2017, involving the Fund's assets and liabilities carried at fair value. The inputs or methodology used for valuing securities may not be an indication of the risk associated with investing in those securities. For more information on valuation inputs, and their aggregation into the levels used below, please refer to the Investment Valuation section in the accompanying Notes to Financial Statements.
| | Valuation Inputs at Reporting Date: |
| Description | Total | Level 1 | Level 2 | Level 3 |
| Investments in Securities: | | | | |
| Equities: | | | | |
| Consumer Discretionary | $935,595,277 | $935,595,277 | $-- | $-- |
| Consumer Staples | 628,597,036 | 628,597,036 | -- | -- |
| Energy | 465,691,343 | 465,691,343 | -- | -- |
| Financials | 1,133,498,804 | 1,133,498,804 | -- | -- |
| Health Care | 1,055,485,589 | 1,055,485,589 | -- | -- |
| Industrials | 780,738,672 | 780,738,672 | -- | -- |
| Information Technology | 1,827,498,633 | 1,827,498,633 | -- | -- |
| Materials | 229,633,979 | 229,633,979 | -- | -- |
| Real Estate | 221,814,238 | 221,814,238 | -- | -- |
| Telecommunication Services | 158,197,517 | 158,197,517 | -- | -- |
| Utilities | 225,003,942 | 225,003,942 | -- | -- |
| U.S. Government and Government Agency Obligations | 2,295,982 | -- | 2,295,982 | -- |
| Money Market Funds | 261,857,910 | 261,857,910 | -- | -- |
| Total Investments in Securities: | $7,925,908,922 | $7,923,612,940 | $2,295,982 | $-- |
| Derivative Instruments: | | | | |
| Assets | | | | |
| Futures Contracts | $452,029 | $452,029 | $-- | $-- |
| Total Assets | $452,029 | $452,029 | $-- | $-- |
| Total Derivative Instruments: | $452,029 | $452,029 | $-- | $-- |
Value of Derivative Instruments
The following table is a summary of the Fund's value of derivative instruments by primary risk exposure as of December 31, 2017. For additional information on derivative instruments, please refer to the Derivative Instruments section in the accompanying Notes to Financial Statements.
| Primary Risk Exposure / Derivative Type | Value |
| | Asset | Liability |
| Equity Risk | | |
| Futures Contracts(a) | $452,029 | $0 |
| Total Equity Risk | 452,029 | 0 |
| Total Value of Derivatives | $452,029 | $0 |
(a) Reflects gross cumulative appreciation (depreciation) on futures contracts as presented in the Schedule of Investments. In the Statement of Assets and Liabilities, the period end daily variation margin is included in receivable or payable for daily variation margin on futures contracts, and the net cumulative appreciation (depreciation) is included in net unrealized appreciation (depreciation).
See accompanying notes which are an integral part of the financial statements.
Financial Statements
Statement of Assets and Liabilities
| | | December 31, 2017 |
| Assets | | |
Investment in securities, at value (including securities loaned of $195,392,980) — See accompanying schedule:
Unaffiliated issuers (cost $3,757,556,399) | $7,664,051,012 | |
| Fidelity Central Funds (cost $261,828,289) | 261,857,910 | |
| Total Investment in Securities (cost $4,019,384,688) | | $7,925,908,922 |
| Segregated cash with brokers for derivative instruments | | 233,738 |
| Cash | | 1,259 |
| Receivable for investments sold | | 5,459,333 |
| Receivable for fund shares sold | | 1,848,681 |
| Dividends receivable | | 7,750,971 |
| Distributions receivable from Fidelity Central Funds | | 72,786 |
| Other receivables | | 45,330 |
| Total assets | | 7,941,321,020 |
| Liabilities | | |
| Payable for fund shares redeemed | $3,710,195 | |
| Accrued management fee | 288,068 | |
| Distribution and service plan fees payable | 319,392 | |
| Payable for daily variation margin on futures contracts | 253,188 | |
| Other affiliated payables | 352,143 | |
| Other payables and accrued expenses | 45,332 | |
| Collateral on securities loaned | 200,886,907 | |
| Total liabilities | | 205,855,225 |
| Net Assets | | $7,735,465,795 |
| Net Assets consist of: | | |
| Paid in capital | | $3,781,563,994 |
| Undistributed net investment income | | 25,327,631 |
| Accumulated undistributed net realized gain (loss) on investments | | 21,597,907 |
| Net unrealized appreciation (depreciation) on investments | | 3,906,976,263 |
| Net Assets | | $7,735,465,795 |
| Initial Class: | | |
| Net Asset Value, offering price and redemption price per share ($6,139,812,951 ÷ 22,640,954 shares) | | $271.18 |
| Service Class: | | |
| Net Asset Value, offering price and redemption price per share ($92,965,093 ÷ 344,021 shares) | | $270.23 |
| Service Class 2: | | |
| Net Asset Value, offering price and redemption price per share ($1,502,687,751 ÷ 5,611,709 shares) | | $267.78 |
See accompanying notes which are an integral part of the financial statements.
Statement of Operations
| | | Year ended December 31, 2017 |
| Investment Income | | |
| Dividends | | $139,685,894 |
| Interest | | 26,272 |
| Income from Fidelity Central Funds | | 585,579 |
| Total income | | 140,297,745 |
| Expenses | | |
| Management fee | $3,173,641 | |
| Transfer agent fees | 3,878,894 | |
| Distribution and service plan fees | 3,485,451 | |
| Independent trustees' fees and expenses | 27,540 | |
| Legal | 5,832 | |
| Miscellaneous | 21,310 | |
| Total expenses before reductions | 10,592,668 | |
| Expense reductions | (1,078) | 10,591,590 |
| Net investment income (loss) | | 129,706,155 |
| Realized and Unrealized Gain (Loss) | | |
| Net realized gain (loss) on: | | |
| Investment securities: | | |
| Unaffiliated issuers | 29,715,314 | |
| Fidelity Central Funds | 26,464 | |
| Futures contracts | 7,345,652 | |
| Total net realized gain (loss) | | 37,087,430 |
| Change in net unrealized appreciation (depreciation) on: | | |
| Investment securities: | | |
| Unaffiliated issuers | 1,212,957,451 | |
| Fidelity Central Funds | 2,746 | |
| Futures contracts | 569,806 | |
| Total change in net unrealized appreciation (depreciation) | | 1,213,530,003 |
| Net gain (loss) | | 1,250,617,433 |
| Net increase (decrease) in net assets resulting from operations | | $1,380,323,588 |
See accompanying notes which are an integral part of the financial statements.
Statement of Changes in Net Assets
| | Year ended December 31, 2017 | Year ended December 31, 2016 |
| Increase (Decrease) in Net Assets | | |
| Operations | | |
| Net investment income (loss) | $129,706,155 | $107,503,577 |
| Net realized gain (loss) | 37,087,430 | 17,682,543 |
| Change in net unrealized appreciation (depreciation) | 1,213,530,003 | 474,343,317 |
| Net increase (decrease) in net assets resulting from operations | 1,380,323,588 | 599,529,437 |
| Distributions to shareholders from net investment income | (125,118,539) | (86,820,037) |
| Distributions to shareholders from net realized gain | (21,811,874) | (4,792,061) |
| Total distributions | (146,930,413) | (91,612,098) |
| Share transactions - net increase (decrease) | 207,772,017 | 1,042,741,643 |
| Total increase (decrease) in net assets | 1,441,165,192 | 1,550,658,982 |
| Net Assets | | |
| Beginning of period | 6,294,300,603 | 4,743,641,621 |
| End of period | $7,735,465,795 | $6,294,300,603 |
| Other Information | | |
| Undistributed net investment income end of period | $25,327,631 | $20,741,251 |
See accompanying notes which are an integral part of the financial statements.
Financial Highlights
VIP Index 500 Portfolio Initial Class
| Years ended December 31, | 2017 | 2016 | 2015 | 2014 | 2013 |
| Selected Per–Share Data | | | | | |
| Net asset value, beginning of period | $227.46 | $206.43 | $208.12 | $186.29 | $144.91 |
| Income from Investment Operations | | | | | |
| Net investment income (loss)A | 4.71 | 4.42 | 4.15 | 3.75 | 3.31 |
| Net realized and unrealized gain (loss) | 44.36 | 20.06 | (1.44) | 21.58 | 42.98 |
| Total from investment operations | 49.07 | 24.48 | 2.71 | 25.33 | 46.29 |
| Distributions from net investment income | (4.57) | (3.23) | (4.26) | (3.31) | (3.27) |
| Distributions from net realized gain | (.78) | (.22) | (.13) | (.18) | (1.64) |
| Total distributions | (5.35) | (3.45) | (4.40)B | (3.50)C | (4.91) |
| Net asset value, end of period | $271.18 | $227.46 | $206.43 | $208.12 | $186.29 |
| Total ReturnD,E | 21.71% | 11.86% | 1.33% | 13.57% | 32.25% |
| Ratios to Average Net AssetsF,G | | | | | |
| Expenses before reductions | .10% | .10% | .10% | .10% | .10% |
| Expenses net of fee waivers, if any | .10% | .10% | .10% | .10% | .10% |
| Expenses net of all reductions | .10% | .10% | .10% | .10% | .10% |
| Net investment income (loss) | 1.89% | 2.07% | 1.98% | 1.91% | 1.98% |
| Supplemental Data | | | | | |
| Net assets, end of period (000 omitted) | $6,139,813 | $5,001,375 | $4,103,865 | $3,823,973 | $3,163,673 |
| Portfolio turnover rateH | 5% | 6% | 9% | 3% | 5% |
A Calculated based on average shares outstanding during the period.
B Total distributions of $4.40 per share is comprised of distributions from net investment income of $4.262 and distributions from net realized gain of $.133 per share.
C Total distributions of $3.50 per share is comprised of distributions from net investment income of $3.314 and distributions from net realized gain of $.184 per share.
D Total returns do not reflect charges attributable to your insurance company's separate account. Inclusion of these charges would reduce the total returns shown.
E Total returns would have been lower if certain expenses had not been reduced during the applicable periods shown.
F Fees and expenses of any underlying Fidelity Central Funds are not included in the Fund's expense ratio. The Fund indirectly bears its proportionate share of the expenses of any underlying Fidelity Central Funds.
G Expense ratios reflect operating expenses of the class. Expenses before reductions do not reflect amounts reimbursed by the investment adviser or reductions from expense offset arrangements and do not represent the amount paid by the class during periods when reimbursements or reductions occur. Expenses net of fee waivers reflect expenses after reimbursement by the investment adviser but prior to reductions from expense offset arrangements. Expenses net of all reductions represent the net expenses paid by the class.
H Amount does not include the portfolio activity of any underlying Fidelity Central Funds.
See accompanying notes which are an integral part of the financial statements.
VIP Index 500 Portfolio Service Class
| Years ended December 31, | 2017 | 2016 | 2015 | 2014 | 2013 |
| Selected Per–Share Data | | | | | |
| Net asset value, beginning of period | $226.70 | $205.82 | $207.49 | $185.77 | $144.53 |
| Income from Investment Operations | | | | | |
| Net investment income (loss)A | 4.44 | 4.19 | 3.93 | 3.54 | 3.13 |
| Net realized and unrealized gain (loss) | 44.21 | 19.97 | (1.43) | 21.50 | 42.85 |
| Total from investment operations | 48.65 | 24.16 | 2.50 | 25.04 | 45.98 |
| Distributions from net investment income | (4.34) | (3.07) | (4.03) | (3.14) | (3.10) |
| Distributions from net realized gain | (.78) | (.22) | (.13) | (.18) | (1.64) |
| Total distributions | (5.12) | (3.28)B | (4.17)C | (3.32) | (4.74) |
| Net asset value, end of period | $270.23 | $226.70 | $205.82 | $207.49 | $185.77 |
| Total ReturnD,E | 21.59% | 11.75% | 1.24% | 13.46% | 32.12% |
| Ratios to Average Net AssetsF,G | | | | | |
| Expenses before reductions | .20% | .20% | .20% | .20% | .20% |
| Expenses net of fee waivers, if any | .20% | .20% | .20% | .20% | .20% |
| Expenses net of all reductions | .20% | .20% | .20% | .20% | .20% |
| Net investment income (loss) | 1.79% | 1.97% | 1.88% | 1.81% | 1.88% |
| Supplemental Data | | | | | |
| Net assets, end of period (000 omitted) | $92,965 | $77,697 | $64,618 | $64,442 | $55,066 |
| Portfolio turnover rateH | 5% | 6% | 9% | 3% | 5% |
A Calculated based on average shares outstanding during the period.
B Total distributions of $3.28 per share is comprised of distributions from net investment income of $3.068 and distributions from net realized gain of $.216 per share.
C Total distributions of $4.17 per share is comprised of distributions from net investment income of $4.033 and distributions from net realized gain of $.133 per share.
D Total returns do not reflect charges attributable to your insurance company's separate account. Inclusion of these charges would reduce the total returns shown.
E Total returns would have been lower if certain expenses had not been reduced during the applicable periods shown.
F Fees and expenses of any underlying Fidelity Central Funds are not included in the Fund's expense ratio. The Fund indirectly bears its proportionate share of the expenses of any underlying Fidelity Central Funds.
G Expense ratios reflect operating expenses of the class. Expenses before reductions do not reflect amounts reimbursed by the investment adviser or reductions from expense offset arrangements and do not represent the amount paid by the class during periods when reimbursements or reductions occur. Expenses net of fee waivers reflect expenses after reimbursement by the investment adviser but prior to reductions from expense offset arrangements. Expenses net of all reductions represent the net expenses paid by the class.
H Amount does not include the portfolio activity of any underlying Fidelity Central Funds.
See accompanying notes which are an integral part of the financial statements.
VIP Index 500 Portfolio Service Class 2
| Years ended December 31, | 2017 | 2016 | 2015 | 2014 | 2013 |
| Selected Per–Share Data | | | | | |
| Net asset value, beginning of period | $224.72 | $204.25 | $206.02 | $184.56 | $143.64 |
| Income from Investment Operations | | | | | |
| Net investment income (loss)A | 4.04 | 3.88 | 3.59 | 3.23 | 2.86 |
| Net realized and unrealized gain (loss) | 43.79 | 19.76 | (1.42) | 21.34 | 42.56 |
| Total from investment operations | 47.83 | 23.64 | 2.17 | 24.57 | 45.42 |
| Distributions from net investment income | (3.99) | (2.95) | (3.80) | (2.92) | (2.86) |
| Distributions from net realized gain | (.78) | (.22) | (.13) | (.18) | (1.64) |
| Total distributions | (4.77) | (3.17) | (3.94)B | (3.11)C | (4.50) |
| Net asset value, end of period | $267.78 | $224.72 | $204.25 | $206.02 | $184.56 |
| Total ReturnD,E | 21.41% | 11.58% | 1.08% | 13.29% | 31.92% |
| Ratios to Average Net AssetsF,G | | | | | |
| Expenses before reductions | .35% | .35% | .35% | .35% | .35% |
| Expenses net of fee waivers, if any | .35% | .35% | .35% | .35% | .35% |
| Expenses net of all reductions | .35% | .35% | .35% | .35% | .35% |
| Net investment income (loss) | 1.64% | 1.82% | 1.73% | 1.66% | 1.73% |
| Supplemental Data | | | | | |
| Net assets, end of period (000 omitted) | $1,502,688 | $1,215,228 | $575,158 | $466,026 | $367,122 |
| Portfolio turnover rateH | 5% | 6% | 9% | 3% | 5% |
A Calculated based on average shares outstanding during the period.
B Total distributions of $3.94 per share is comprised of distributions from net investment income of $3.804 and distributions from net realized gain of $.133 per share.
C Total distributions of $3.11 per share is comprised of distributions from net investment income of $2.923 and distributions from net realized gain of $.184 per share.
D Total returns do not reflect charges attributable to your insurance company's separate account. Inclusion of these charges would reduce the total returns shown.
E Total returns would have been lower if certain expenses had not been reduced during the applicable periods shown.
F Fees and expenses of any underlying Fidelity Central Funds are not included in the Fund's expense ratio. The Fund indirectly bears its proportionate share of the expenses of any underlying Fidelity Central Funds.
G Expense ratios reflect operating expenses of the class. Expenses before reductions do not reflect amounts reimbursed by the investment adviser or reductions from expense offset arrangements and do not represent the amount paid by the class during periods when reimbursements or reductions occur. Expenses net of fee waivers reflect expenses after reimbursement by the investment adviser but prior to reductions from expense offset arrangements. Expenses net of all reductions represent the net expenses paid by the class.
H Amount does not include the portfolio activity of any underlying Fidelity Central Funds.
See accompanying notes which are an integral part of the financial statements.
Notes to Financial Statements
For the period ended December 31, 2017
1. Organization.
VIP Index 500 Portfolio (the Fund) is a fund of Variable Insurance Products Fund II (the Trust) and is authorized to issue an unlimited number of shares. The Trust is registered under the Investment Company Act of 1940, as amended (the 1940 Act), as an open-end management investment company organized as a Massachusetts business trust. Shares of the Fund may only be purchased by insurance companies for the purpose of funding variable annuity or variable life insurance contracts. The Fund offers the following classes of shares: Initial Class shares, Service Class shares and Service Class 2 shares. All classes have equal rights and voting privileges, except for matters affecting a single class.
2. Investments in Fidelity Central Funds.
The Fund invests in Fidelity Central Funds, which are open-end investment companies generally available only to other investment companies and accounts managed by the investment adviser and its affiliates. The Fund's Schedule of Investments lists each of the Fidelity Central Funds held as of period end, if any, as an investment of the Fund, but does not include the underlying holdings of each Fidelity Central Fund. As an Investing Fund, the Fund indirectly bears its proportionate share of the expenses of the underlying Fidelity Central Funds.
The Money Market Central Funds seek preservation of capital and current income and are managed by Fidelity Investments Money Management, Inc. (FIMM), an affiliate of the investment adviser. Annualized expenses of the Money Market Central Funds as of their most recent shareholder report date are less than .005%.
A complete unaudited list of holdings for each Fidelity Central Fund is available upon request or at the Securities and Exchange Commission (the SEC) website at www.sec.gov. In addition, the financial statements of the Fidelity Central Funds, which are not covered by the Fund's Report of Independent Registered Public Accounting Firm, are available on the SEC website or upon request.
3. Significant Accounting Policies.
The Fund is an investment company and applies the accounting and reporting guidance of the Financial Accounting Standards Board (FASB) Accounting Standards Codification Topic 946 Financial Services – Investments Companies. The financial statements have been prepared in conformity with accounting principles generally accepted in the United States of America (GAAP), which require management to make certain estimates and assumptions at the date of the financial statements. Actual results could differ from those estimates. Subsequent events, if any, through the date that the financial statements were issued have been evaluated in the preparation of the financial statements. The following summarizes the significant accounting policies of the Fund:
Investment Valuation. Investments are valued as of 4:00 p.m. Eastern time on the last calendar day of the period. The Board of Trustees (the Board) has delegated the day to day responsibility for the valuation of the Fund's investments to the Fair Value Committee (the Committee) established by the Fund's investment adviser. In accordance with valuation policies and procedures approved by the Board, the Fund attempts to obtain prices from one or more third party pricing vendors or brokers to value its investments. When current market prices, quotations or currency exchange rates are not readily available or reliable, investments will be fair valued in good faith by the Committee, in accordance with procedures adopted by the Board. Factors used in determining fair value vary by investment type and may include market or investment specific events, changes in interest rates and credit quality. The frequency with which these procedures are used cannot be predicted and they may be utilized to a significant extent. The Committee oversees the Fund's valuation policies and procedures and reports to the Board on the Committee's activities and fair value determinations. The Board monitors the appropriateness of the procedures used in valuing the Fund's investments and ratifies the fair value determinations of the Committee.
The Fund categorizes the inputs to valuation techniques used to value its investments into a disclosure hierarchy consisting of three levels as shown below:
- Level 1 – quoted prices in active markets for identical investments
- Level 2 – other significant observable inputs (including quoted prices for similar investments, interest rates, prepayment speeds, etc.)
- Level 3 – unobservable inputs (including the Fund's own assumptions based on the best information available)
Valuation techniques used to value the Fund's investments by major category are as follows:
Equity securities, including restricted securities, for which market quotations are readily available, are valued at the last reported sale price or official closing price as reported by a third party pricing vendor on the primary market or exchange on which they are traded and are categorized as Level 1 in the hierarchy. In the event there were no sales during the day or closing prices are not available, securities are valued at the last quoted bid price or may be valued using the last available price and are generally categorized as Level 2 in the hierarchy. For foreign equity securities, when market or security specific events arise, comparisons to the valuation of American Depositary Receipts (ADRs), futures contracts, Exchange-Traded Funds (ETFs) and certain indexes as well as quoted prices for similar securities may be used and would be categorized as Level 2 in the hierarchy. Utilizing these techniques may result in transfers between Level 1 and Level 2. For equity securities, including restricted securities, where observable inputs are limited, assumptions about market activity and risk are used and these securities may be categorized as Level 3 in the hierarchy.
Debt securities, including restricted securities, are valued based on evaluated prices received from third party pricing vendors or from brokers who make markets in such securities. U.S. government and government agency obligations are valued by pricing vendors who utilize matrix pricing which considers yield or price of bonds of comparable quality, coupon, maturity and type or by broker-supplied prices. When independent prices are unavailable or unreliable, debt securities may be valued utilizing pricing methodologies which consider similar factors that would be used by third party pricing vendors. Debt securities are generally categorized as Level 2 in the hierarchy but may be Level 3 depending on the circumstances.
Futures contracts are valued at the settlement price established each day by the board of trade or exchange on which they are traded and are categorized as Level 1 in the hierarchy. Investments in open-end mutual funds, including the Fidelity Central Funds, are valued at their closing net asset value (NAV) each business day and are categorized as Level 1 in the hierarchy.
Changes in valuation techniques may result in transfers in or out of an assigned level within the disclosure hierarchy. The aggregate value of investments by input level as of December 31, 2017 is included at the end of the Fund's Schedule of Investments.
Investment Transactions and Income. For financial reporting purposes, the Fund's investment holdings and NAV include trades executed through the end of the last business day of the period. The NAV per share for processing shareholder transactions is calculated as of the close of business of the New York Stock Exchange (NYSE), normally 4:00 p.m. Eastern time and includes trades executed through the end of the prior business day. Gains and losses on securities sold are determined on the basis of identified cost and includes proceeds received from litigation. Dividend income is recorded on the ex-dividend date, except for certain dividends from foreign securities where the ex-dividend date may have passed, which are recorded as soon as the Fund is informed of the ex-dividend date. Non-cash dividends included in dividend income, if any, are recorded at the fair market value of the securities received. Income and capital gain distributions from Fidelity Central Funds, if any, are recorded on the ex-dividend date. Certain distributions received by the Fund represent a return of capital or capital gain. The Fund determines the components of these distributions subsequent to the ex-dividend date, based upon receipt of tax filings or other correspondence relating to the underlying investment. These distributions are recorded as a reduction of cost of investments and/or as a realized gain. Interest income is accrued as earned and includes coupon interest and amortization of premium and accretion of discount on debt securities as applicable.
Class Allocations and Expenses. Investment income, realized and unrealized capital gains and losses, common expenses of the Fund, and certain fund-level expense reductions, if any, are allocated daily on a pro-rata basis to each class based on the relative net assets of each class to the total net assets of the Fund. Each class differs with respect to transfer agent and distribution and service plan fees incurred. Certain expense reductions may also differ by class. For the reporting period, the allocated portion of income and expenses to each class as a percent of its average net assets may vary due to the timing of recording these transactions in relation to fluctuating net assets of the classes. Expenses directly attributable to a fund are charged to that fund. Expenses attributable to more than one fund are allocated among the respective funds on the basis of relative net assets or other appropriate methods. Expense estimates are accrued in the period to which they relate and adjustments are made when actual amounts are known.
Deferred Trustee Compensation. Under a Deferred Compensation Plan (the Plan), independent Trustees may elect to defer receipt of a portion of their annual compensation. Deferred amounts are invested in a cross-section of Fidelity funds, are marked-to-market and remain in the Fund until distributed in accordance with the Plan. The investment of deferred amounts and the offsetting payable to the Trustees are included in the accompanying Statement of Assets and Liabilities.
Income Tax Information and Distributions to Shareholders. Each year, the Fund intends to qualify as a regulated investment company under Subchapter M of the Internal Revenue Code, including distributing substantially all of its taxable income and realized gains. As a result, no provision for U.S. Federal income taxes is required. As of December 31, 2017, the Fund did not have any unrecognized tax benefits in the financial statements; nor is the Fund aware of any tax positions for which it is reasonably possible that the total amounts of unrecognized tax benefits will significantly change in the next twelve months. The Fund files a U.S. federal tax return, in addition to state and local tax returns as required. The Fund's federal income tax returns are subject to examination by the Internal Revenue Service (IRS) for a period of three fiscal years after they are filed. State and local tax returns may be subject to examination for an additional fiscal year depending on the jurisdiction.
Distributions are declared and recorded on the ex-dividend date. Income dividends and capital gain distributions are declared separately for each class. Income and capital gain distributions are determined in accordance with income tax regulations, which may differ from GAAP.
Capital accounts within the financial statements are adjusted for permanent book-tax differences. These adjustments have no impact on net assets or the results of operations. Capital accounts are not adjusted for temporary book-tax differences which will reverse in a subsequent period.
Book-tax differences are primarily due to futures contracts, market discount, deferred trustees compensation and losses deferred due to wash sales.
As of period end, the cost and unrealized appreciation (depreciation) in securities, and derivatives if applicable, for federal income tax purposes were as follows:
| Gross unrealized appreciation | $4,022,633,249 |
| Gross unrealized depreciation | (124,789,144) |
| Net unrealized appreciation (depreciation) | $3,897,844,105 |
| Tax Cost | $4,028,064,817 |
The tax-based components of distributable earnings as of period end were as follows:
| Undistributed ordinary income | $26,343,256 |
| Undistributed long-term capital gain | $26,769,434 |
| Net unrealized appreciation (depreciation) on securities and other investments | $3,897,844,105 |
The tax character of distributions paid was as follows:
| | December 31, 2017 | December 31, 2016 |
| Ordinary Income | $127,563,087 | $ 86,820,037 |
| Long-term Capital Gains | 19,367,326 | 4,792,061 |
| Total | $146,930,413 | $ 91,612,098 |
4. Derivative Instruments.
Risk Exposures and the Use of Derivative Instruments. The Fund's investment objective allows the Fund to enter into various types of derivative contracts, including futures contracts. Derivatives are investments whose value is primarily derived from underlying assets, indices or reference rates and may be transacted on an exchange or over-the-counter (OTC). Derivatives may involve a future commitment to buy or sell a specified asset based on specified terms, to exchange future cash flows at periodic intervals based on a notional principal amount, or for one party to make one or more payments upon the occurrence of specified events in exchange for periodic payments from the other party.
The Fund used derivatives to increase returns and to manage exposure to certain risks as defined below. The success of any strategy involving derivatives depends on analysis of numerous economic factors, and if the strategies for investment do not work as intended, the Fund may not achieve its objectives.
The Fund's use of derivatives increased or decreased its exposure to the following risk:
| Equity Risk | Equity risk relates to the fluctuations in the value of financial instruments as a result of changes in market prices (other than those arising from interest rate risk or foreign exchange risk), whether caused by factors specific to an individual investment, its issuer, or all factors affecting all instruments traded in a market or market segment.
|
The Fund is also exposed to additional risks from investing in derivatives, such as liquidity risk and counterparty credit risk. Liquidity risk is the risk that the Fund will be unable to close out the derivative in the open market in a timely manner. Counterparty credit risk is the risk that the counterparty will not be able to fulfill its obligation to the Fund. Counterparty credit risk related to exchange-traded futures contracts may be mitigated by the protection provided by the exchange on which they trade.
Investing in derivatives may involve greater risks than investing in the underlying assets directly and, to varying degrees, may involve risk of loss in excess of any initial investment and collateral received and amounts recognized in the Statement of Assets and Liabilities. In addition, there may be the risk that the change in value of the derivative contract does not correspond to the change in value of the underlying instrument.
Futures Contracts. A futures contract is an agreement between two parties to buy or sell a specified underlying instrument for a fixed price at a specified future date. The Fund used futures contracts to manage its exposure to the stock market.
Upon entering into a futures contract, a fund is required to deposit either cash or securities (initial margin) with a clearing broker in an amount equal to a certain percentage of the face value of the contract. Futures contracts are marked-to-market daily and subsequent daily payments (variation margin) are made or received by a fund depending on the daily fluctuations in the value of the futures contracts and are recorded as unrealized appreciation or (depreciation). This receivable and/or payable, if any, is included in daily variation margin on futures contracts in the Statement of Assets and Liabilities. Realized gain or (loss) is recorded upon the expiration or closing of a futures contract. The net realized gain (loss) and change in net unrealized appreciation (depreciation) on futures contracts during the period is presented in the Statement of Operations.
Any open futures contracts at period end are presented in the Schedule of Investments under the caption "Futures Contracts". The notional amount at value reflects each contract's exposure to the underlying instrument or index at period end and is representative of volume of activity during the period. Securities deposited to meet initial margin requirements are identified in the Schedule of Investments. Cash deposited to meet initial margin requirements is presented as segregated cash with brokers for derivative instruments in the Statement of Assets and Liabilities.
5. Purchases and Sales of Investments.
Purchases and sales of securities, other than short-term securities, aggregated $540,291,369 and $339,591,060, respectively.
6. Fees and Other Transactions with Affiliates.
Management Fee and Expense Contract. Fidelity Management & Research Company (the investment adviser) and its affiliates provide the Fund with investment management related services for which the Fund pays a monthly management fee. The management fee is based on an annual rate of .045% of the Fund's average net assets. Under the management contract, the investment adviser pays all other fund-level expenses, except the compensation of the independent Trustees and certain miscellaneous expenses such as proxy and shareholder meeting expenses. In addition, under an expense contract, the investment adviser pays class-level expenses as necessary so that total expenses do not exceed an annual rate of .10% of each class' average net assets, excluding the distribution and service fee for each applicable class, with certain exceptions.
Sub-Adviser. Geode Capital Management, LLC (Geode), serves as sub-adviser for the Fund. Geode provides discretionary investment advisory services to the Fund and is paid by the investment adviser for providing these services.
Distribution and Service Plan Fees. In accordance with Rule 12b-1 of the 1940 Act, the Fund has adopted separate 12b-1 Plans for each Service Class of shares. Each Service Class pays Fidelity Distributors Corporation (FDC), an affiliate of the investment adviser, a service fee. For the period, the service fee is based on an annual rate of .10% of Service Class' average net assets and .25% of Service Class 2's average net assets.
For the period, total fees, all of which were re-allowed to insurance companies for the distribution of shares and providing shareholder support services, were as follows:
| Service Class | $83,877 |
| Service Class 2 | 3,401,574 |
| | $3,485,451 |
Transfer Agent Fees. Fidelity Investments Institutional Operations Company, Inc. (FIIOC), an affiliate of the investment adviser, is the transfer, dividend disbursing, and shareholder servicing agent for each class. FIIOC receives asset-based fees of .07% of each class's average net assets for transfer agent services, typesetting, and printing and mailing of shareholder reports, excluding mailing of proxy statements. Under the expense contract, each class pays a portion of the transfer agent fees equal to an annual rate of .055% of class-level average net assets. For the period, transfer agent fees for each class were as follows:
| Initial Class | $3,084,416 |
| Service Class | 46,132 |
| Service Class 2 | 748,346 |
| | $3,878,894 |
Interfund Trades. The Funds may purchase from or sell securities to other Fidelity Funds under procedures adopted by the Board. The procedures have been designed to ensure these interfund trades are executed in accordance with Rule 17a-7 of the 1940 Act. Interfund trades are included within the respective purchases and sales amounts shown in the Purchases and Sales of Investments note.
7. Committed Line of Credit.
The Fund participates with other funds managed by the investment adviser or an affiliate in a $4.25 billion credit facility (the "line of credit") to be utilized for temporary or emergency purposes to fund shareholder redemptions or for other short-term liquidity purposes. The Fund has agreed to pay commitment fees on its pro-rata portion of the line of credit, which amounted to $21,310 and is reflected in Miscellaneous expenses on the Statement of Operations. During the period, the Fund did not borrow on this line of credit.
8. Security Lending.
The Fund lends portfolio securities through a lending agent from time to time in order to earn additional income. On the settlement date of the loan, the Fund receives collateral (in the form of U.S. Treasury obligations, letters of credit and/or cash) against the loaned securities and maintains collateral in an amount not less than 100% of the market value of the loaned securities during the period of the loan. The market value of the loaned securities is determined at the close of business of the Fund and any additional required collateral is delivered to the Fund on the next business day. The Fund or borrower may terminate the loan at any time, and if the borrower defaults on its obligation to return the securities loaned because of insolvency or other reasons, the Fund may apply collateral received from the borrower against the obligation. The Fund may experience delays and costs in recovering the securities loaned. Any cash collateral received is invested in the Fidelity Securities Lending Cash Central Fund. The value of loaned securities and cash collateral at period end are disclosed on the Fund's Statement of Assets and Liabilities. Security lending income represents the income earned on investing cash collateral, less rebates paid to borrowers and any lending agent fees associated with the loan, plus any premium payments received for lending certain types of securities. Security lending income is presented in the Statement of Operations as a component of income from Fidelity Central Funds. Total security lending income during the period amounted to $213,839.
9. Expense Reductions.
Through arrangements with the Fund's custodian, credits realized as a result of certain uninvested cash balances were used to reduce the Fund's expenses. During the period, these credits reduced the Fund's expenses by $1,078.
10. Distributions to Shareholders.
Distributions to shareholders of each class were as follows:
| | Year ended
December 31, 2017 | Year ended December 31, 2016 |
| From net investment income | | |
| Initial Class | $101,596,891 | $70,054,010 |
| Service Class | 1,476,833 | 1,039,558 |
| Service Class 2 | 22,044,815 | 15,726,469 |
| Total | $125,118,539 | $86,820,037 |
| From net realized gain | | |
| Initial Class | $17,306,529 | $4,273,944 |
| Service Class | 265,442 | 67,680 |
| Service Class 2 | 4,239,903 | 450,437 |
| Total | $21,811,874 | $4,792,061 |
11. Share Transactions.
Transactions for each class of shares were as follows:
| | Shares | Shares | Dollars | Dollars |
| | Year ended
December 31, 2017 | Year ended December 31, 2016 | Year ended
December 31, 2017 | Year ended December 31, 2016 |
| Initial Class | | | | |
| Shares sold | 2,523,522 | 3,632,858 | $627,402,721 | $784,242,215 |
| Reinvestment of distributions | 461,364 | 327,219 | 118,903,420 | 74,327,954 |
| Shares redeemed | (2,332,221) | (1,851,642) | (589,015,454) | (392,431,867) |
| Net increase (decrease) | 652,665 | 2,108,435 | $157,290,687 | $466,138,302 |
| Service Class | | | | |
| Shares sold | 51,053 | 52,986 | $12,677,416 | $11,566,212 |
| Reinvestment of distributions | 6,789 | 4,894 | 1,742,275 | 1,107,238 |
| Shares redeemed | (56,550) | (29,110) | (13,888,179) | (6,156,452) |
| Net increase (decrease) | 1,292 | 28,770 | $531,512 | $6,516,998 |
| Service Class 2 | | | | |
| Shares sold | 495,272 | 3,813,500 | $121,131,652 | $812,723,011 |
| Reinvestment of distributions | 103,412 | 71,615 | 26,284,718 | 16,176,906 |
| Shares redeemed | (394,781) | (1,293,305) | (97,466,552) | (258,813,574) |
| Net increase (decrease) | 203,903 | 2,591,810 | $49,949,818 | $570,086,343 |
12. Other.
The Fund's organizational documents provide former and current trustees and officers with a limited indemnification against liabilities arising in connection with the performance of their duties to the Fund. In the normal course of business, the Fund may also enter into contracts that provide general indemnifications. The Fund's maximum exposure under these arrangements is unknown as this would be dependent on future claims that may be made against the Fund. The risk of material loss from such claims is considered remote.
At the end of the period, the investment adviser or its affiliates were the owners of record of 38% of the total outstanding shares of the Fund.
Report of Independent Registered Public Accounting Firm
To the Trustees of Variable Insurance Products Fund II and Shareholders of VIP Index 500 Portfolio:
Opinion on the Financial Statements and Financial Highlights
We have audited the accompanying statement of assets and liabilities of VIP Index 500 Portfolio (the "Fund"), a fund of Variable Insurance Products Fund II, including the schedule of investments, as of December 31, 2017, and the related statement of operations for the year then ended, the statement of changes in net assets for each of the two years in the period then ended, the financial highlights for each of the five years in the period then ended, and the related notes. In our opinion, the financial statements and financial highlights present fairly, in all material respects, the financial position of the Fund as of December 31, 2017, and the results of its operations for the year then ended, the changes in its net assets for each of the two years in the period then ended, and the financial highlights for each of the five years in the period then ended, in conformity with accounting principles generally accepted in the United States of America.
Basis for Opinion
These financial statements and financial highlights are the responsibility of the Fund's management. Our responsibility is to express an opinion on the Fund's financial statements and financial highlights based on our audits. We are a public accounting firm registered with the Public Company Accounting Oversight Board (United States) (PCAOB) and are required to be independent with respect to the Fund in accordance with the U.S. federal securities laws and the applicable rules and regulations of the Securities and Exchange Commission and the PCAOB.
We conducted our audits in accordance with the standards of the PCAOB. Those standards require that we plan and perform the audit to obtain reasonable assurance about whether the financial statements and financial highlights are free of material misstatement, whether due to error or fraud. The Fund is not required to have, nor were we engaged to perform, an audit of its internal control over financial reporting. As part of our audits we are required to obtain an understanding of internal control over financial reporting but not for the purpose of expressing an opinion on the effectiveness of the Fund’s internal control over financial reporting. Accordingly, we express no such opinion.
Our audits included performing procedures to assess the risks of material misstatement of the financial statements and financial highlights, whether due to error or fraud, and performing procedures that respond to those risks. Such procedures included examining, on a test basis, evidence regarding the amounts and disclosures in the financial statements and financial highlights. Our audits also included evaluating the accounting principles used and significant estimates made by management, as well as evaluating the overall presentation of the financial statements and financial highlights. Our procedures included confirmation of securities owned as of December 31, 2017, by correspondence with the custodians and brokers; when replies were not received from brokers, we performed other auditing procedures. We believe that our audits provide a reasonable basis for our opinion.
DELOITTE & TOUCHE LLP
Boston, Massachusetts
February 12, 2018
We have served as the auditor of one or more of the Fidelity investment companies since 1999.
Trustees and Officers
The Trustees, Members of the Advisory Board (if any), and officers of the trust and fund, as applicable, are listed below. The Board of Trustees governs the fund and is responsible for protecting the interests of shareholders. The Trustees are experienced executives who meet periodically throughout the year to oversee the fund's activities, review contractual arrangements with companies that provide services to the fund, oversee management of the risks associated with such activities and contractual arrangements, and review the fund's performance. Each of the Trustees oversees 190 funds.
The Trustees hold office without limit in time except that (a) any Trustee may resign; (b) any Trustee may be removed by written instrument, signed by at least two-thirds of the number of Trustees prior to such removal; (c) any Trustee who requests to be retired or who has become incapacitated by illness or injury may be retired by written instrument signed by a majority of the other Trustees; and (d) any Trustee may be removed at any special meeting of shareholders by a two-thirds vote of the outstanding voting securities of the trust. Each Trustee who is not an interested person (as defined in the 1940 Act) of the trust and the fund is referred to herein as an Independent Trustee. Each Independent Trustee shall retire not later than the last day of the calendar year in which his or her 75th birthday occurs. The Independent Trustees may waive this mandatory retirement age policy with respect to individual Trustees. Officers and Advisory Board Members hold office without limit in time, except that any officer or Advisory Board Member may resign or may be removed by a vote of a majority of the Trustees at any regular meeting or any special meeting of the Trustees. Except as indicated, each individual has held the office shown or other offices in the same company for the past five years.
The fund’s Statement of Additional Information (SAI) includes more information about the Trustees. To request a free copy, call Fidelity at 1-877-208-0098.
Experience, Skills, Attributes, and Qualifications of the Trustees. The Governance and Nominating Committee has adopted a statement of policy that describes the experience, qualifications, attributes, and skills that are necessary and desirable for potential Independent Trustee candidates (Statement of Policy). The Board believes that each Trustee satisfied at the time he or she was initially elected or appointed a Trustee, and continues to satisfy, the standards contemplated by the Statement of Policy. The Governance and Nominating Committee also engages professional search firms to help identify potential Independent Trustee candidates who have the experience, qualifications, attributes, and skills consistent with the Statement of Policy. From time to time, additional criteria based on the composition and skills of the current Independent Trustees, as well as experience or skills that may be appropriate in light of future changes to board composition, business conditions, and regulatory or other developments, have also been considered by the professional search firms and the Governance and Nominating Committee. In addition, the Board takes into account the Trustees' commitment and participation in Board and committee meetings, as well as their leadership of standing and ad hoc committees throughout their tenure.
In determining that a particular Trustee was and continues to be qualified to serve as a Trustee, the Board has considered a variety of criteria, none of which, in isolation, was controlling. The Board believes that, collectively, the Trustees have balanced and diverse experience, qualifications, attributes, and skills, which allow the Board to operate effectively in governing the fund and protecting the interests of shareholders. Information about the specific experience, skills, attributes, and qualifications of each Trustee, which in each case led to the Board's conclusion that the Trustee should serve (or continue to serve) as a trustee of the fund, is provided below.
Board Structure and Oversight Function. James C. Curvey is an interested person and currently serves as Chairman. The Trustees have determined that an interested Chairman is appropriate and benefits shareholders because an interested Chairman has a personal and professional stake in the quality and continuity of services provided to the fund. Independent Trustees exercise their informed business judgment to appoint an individual of their choosing to serve as Chairman, regardless of whether the Trustee happens to be independent or a member of management. The Independent Trustees have determined that they can act independently and effectively without having an Independent Trustee serve as Chairman and that a key structural component for assuring that they are in a position to do so is for the Independent Trustees to constitute a substantial majority for the Board. The Independent Trustees also regularly meet in executive session. Ned C. Lautenbach serves as Chairman of the Independent Trustees and as such (i) acts as a liaison between the Independent Trustees and management with respect to matters important to the Independent Trustees and (ii) with management prepares agendas for Board meetings.
Fidelity® funds are overseen by different Boards of Trustees. The fund's Board oversees Fidelity's high income and certain equity funds, and other Boards oversee Fidelity's investment-grade bond, money market, asset allocation, and sector funds. The asset allocation funds may invest in Fidelity® funds overseen by the fund's Board. The use of separate Boards, each with its own committee structure, allows the Trustees of each group of Fidelity® funds to focus on the unique issues of the funds they oversee, including common research, investment, and operational issues. On occasion, the separate Boards establish joint committees to address issues of overlapping consequences for the Fidelity® funds overseen by each Board.
The Trustees operate using a system of committees to facilitate the timely and efficient consideration of all matters of importance to the Trustees, the fund, and fund shareholders and to facilitate compliance with legal and regulatory requirements and oversight of the fund's activities and associated risks. The Board, acting through its committees, has charged FMR and its affiliates with (i) identifying events or circumstances the occurrence of which could have demonstrably adverse effects on the fund's business and/or reputation; (ii) implementing processes and controls to lessen the possibility that such events or circumstances occur or to mitigate the effects of such events or circumstances if they do occur; and (iii) creating and maintaining a system designed to evaluate continuously business and market conditions in order to facilitate the identification and implementation processes described in (i) and (ii) above. Because the day-to-day operations and activities of the fund are carried out by or through FMR, its affiliates, and other service providers, the fund's exposure to risks is mitigated but not eliminated by the processes overseen by the Trustees. While each of the Board's committees has responsibility for overseeing different aspects of the fund's activities, oversight is exercised primarily through the Operations, Audit, and Compliance Committees. In addition, the Independent Trustees have worked with FMR to enhance the Board's oversight of investment and financial risks, legal and regulatory risks, technology risks, and operational risks, including the development of additional risk reporting to the Board. For example, a working group comprised of Independent Trustees and FMR has worked and continues to work to review the Fidelity® funds' valuation-related activities, reporting and risk management. Appropriate personnel, including but not limited to the fund's Chief Compliance Officer (CCO), FMR's internal auditor, the independent accountants, the fund's Treasurer and portfolio management personnel, make periodic reports to the Board's committees, as appropriate, including an annual review of Fidelity's risk management program for the Fidelity® funds. The responsibilities of each standing committee, including their oversight responsibilities, are described further under "Standing Committees of the Trustees."
Interested Trustees*:
Correspondence intended for a Trustee who is an interested person may be sent to Fidelity Investments, 245 Summer Street, Boston, Massachusetts 02210.
Name, Year of Birth; Principal Occupations and Other Relevant Experience+
James C. Curvey (1935)
Year of Election or Appointment: 2007
Trustee
Chairman of the Board of Trustees
Mr. Curvey also serves as Trustee of other Fidelity® funds. Mr. Curvey is a Director of Fidelity Research & Analysis Co. (investment adviser firm, 2009-present), and Vice Chairman (2007-present) and Director of FMR LLC (diversified financial services company). In addition, Mr. Curvey serves as an Overseer for the Boston Symphony Orchestra and a member of the board of Artis-Naples, Naples, Florida, and as a Trustee for Brewster Academy, Wolfeboro, New Hampshire. Previously, Mr. Curvey served as a Director of Fidelity Investments Money Management, Inc. (investment adviser firm, 2009-2014) and a Director of FMR and FMR Co., Inc. (investment adviser firms, 2007-2014).
Charles S. Morrison (1960)
Year of Election or Appointment: 2014
Trustee
Mr. Morrison also serves as Trustee of other funds. He serves as President of Fidelity SelectCo, LLC (investment adviser firm, 2017-present) and Fidelity Management & Research Company (FMR) (investment adviser firm, 2016-present), a Director of Fidelity Investments Money Management, Inc. (FIMM) (investment adviser firm, 2014-present), Director of Fidelity SelectCo, LLC (investment adviser firm, 2014-present), President, Asset Management (2014-present), and is an employee of Fidelity Investments. Previously, Mr. Morrison served as Vice President of Fidelity's Fixed Income and Asset Allocation Funds (2012-2014), President, Fixed Income (2011-2014), Vice President of Fidelity's Money Market Funds (2005-2009), President, Money Market Group Leader of FMR (investment adviser firm, 2009), and Senior Vice President, Money Market Group of FMR (2004-2009). Mr. Morrison also served as Vice President of Fidelity's Bond Funds (2002-2005), certain Balanced Funds (2002-2005), and certain Asset Allocation Funds (2002-2007), and as Senior Vice President (2002-2005) of Fidelity's Bond Division.
* Determined to be an “Interested Trustee” by virtue of, among other things, his or her affiliation with the trust or various entities under common control with FMR.
+ The information includes the Trustee's principal occupation during the last five years and other information relating to the experience, attributes, and skills relevant to the Trustee's qualifications to serve as a Trustee, which led to the conclusion that the Trustee should serve as a Trustee for the fund.
Independent Trustees:
Correspondence intended for an Independent Trustee may be sent to Fidelity Investments, P.O. Box 55235, Boston, Massachusetts 02205-5235.
Name, Year of Birth; Principal Occupations and Other Relevant Experience+
Dennis J. Dirks (1948)
Year of Election or Appointment: 2005
Trustee
Mr. Dirks also serves as Trustee of other Fidelity® funds. Prior to his retirement in May 2003, Mr. Dirks was Chief Operating Officer and a member of the Board of The Depository Trust & Clearing Corporation (DTCC). He also served as President, Chief Operating Officer, and Board member of The Depository Trust Company (DTC) and President and Board member of the National Securities Clearing Corporation (NSCC). In addition, Mr. Dirks served as Chief Executive Officer and Board member of the Government Securities Clearing Corporation, Chief Executive Officer and Board member of the Mortgage-Backed Securities Clearing Corporation, as a Trustee and a member of the Finance Committee of Manhattan College (2005-2008), as a Trustee and a member of the Finance Committee of AHRC of Nassau County (2006-2008), as a member of the Independent Directors Council (IDC) Governing Council (2010-2015), and as a member of the Board of Directors for The Brookville Center for Children’s Services, Inc. (2009-2017). Mr. Dirks is a member of the Finance Committee (2016-present) and Board of Directors (2017-present) of the Asolo Repertory Theatre.
Alan J. Lacy (1953)
Year of Election or Appointment: 2008
Trustee
Mr. Lacy also serves as Trustee of other Fidelity® funds. Mr. Lacy serves as a Director of Bristol-Myers Squibb Company (global pharmaceuticals, 2008-present). He is a Trustee of the California Chapter of The Nature Conservancy (2015-present) and a Director of the Center for Advanced Study in the Behavioral Sciences at Stanford University (2015-present). In addition, Mr. Lacy served as Senior Adviser (2007-2014) of Oak Hill Capital Partners, L.P. (private equity) and also served as Chief Executive Officer (2005) and Vice Chairman (2005-2006) of Sears Holdings Corporation (retail) and Chief Executive Officer and Chairman of the Board of Sears, Roebuck and Co. (retail, 2000-2005). Previously, Mr. Lacy served as Chairman (2014-2017) and a member (2010-2017) of the Board of Directors of Dave & Buster’s Entertainment, Inc. (restaurant and entertainment complexes), as Chairman (2008-2011) and a member (2006-2015) of the Board of Trustees of the National Parks Conservation Association, and as a member of the Board of Directors for The Hillman Companies, Inc. (hardware wholesalers, 2010-2014), Earth Fare, Inc. (retail grocery, 2010-2014), and The Western Union Company (global money transfer, 2006-2011).
Ned C. Lautenbach (1944)
Year of Election or Appointment: 2000
Trustee
Chairman of the Independent Trustees
Mr. Lautenbach also serves as Trustee of other Fidelity® funds. Mr. Lautenbach currently serves as Vice Chair of the Board of Governors, State University System of Florida (2013-present) and is a member of the Council on Foreign Relations (1994-present). He is also a member and has most recently served as Chairman of the Board of Directors of Artis-Naples (2012-present). Previously, Mr. Lautenbach served as a member and then Lead Director of the Board of Directors of Eaton Corporation (diversified industrial, 1997-2016). He was also a Partner and Advisory Partner at Clayton, Dubilier & Rice, LLC (private equity investment, 1998-2010), as well as a Director of Sony Corporation (2006-2007). In addition, Mr. Lautenbach also had a 30-year career with IBM (technology company) during which time he served as Senior Vice President and a member of the Corporate Executive Committee (1968-1998).
Joseph Mauriello (1944)
Year of Election or Appointment: 2008
Trustee
Mr. Mauriello also serves as Trustee of other Fidelity® funds. Prior to his retirement in January 2006, Mr. Mauriello served in numerous senior management positions including Deputy Chairman and Chief Operating Officer (2004-2005), and Vice Chairman of Financial Services (2002-2004) of KPMG LLP US (professional services, 1965-2005). Mr. Mauriello currently serves as a member of the Board of Directors of XL Group plc. (global insurance and re-insurance, 2006-present) and the Independent Directors Council (IDC) Governing Council (2015-present). Previously, Mr. Mauriello served as a Director of the Hamilton Funds of the Bank of New York (2006-2007) and of Arcadia Resources Inc. (health care services and products, 2007-2012).
Cornelia M. Small (1944)
Year of Election or Appointment: 2005
Trustee
Ms. Small also serves as Trustee of other Fidelity® funds. Ms. Small is a member of the Board of Directors (2009-present) and Chair of the Investment Committee (2010-present) of the Teagle Foundation. Ms. Small also serves on the Investment Committee of the Berkshire Taconic Community Foundation (2008-present). Previously, Ms. Small served as Chairperson (2002-2008) and a member of the Investment Committee and Chairperson (2008-2012) and a member of the Board of Trustees of Smith College. In addition, Ms. Small served as Chief Investment Officer, Director of Global Equity Investments, and a member of the Board of Directors of Scudder, Stevens & Clark and Scudder Kemper Investments.
William S. Stavropoulos (1939)
Year of Election or Appointment: 2001
Trustee
Vice Chairman of the Independent Trustees
Mr. Stavropoulos also serves as Trustee of other Fidelity® funds. Mr. Stavropoulos serves as President and Founder of the Michigan Baseball Foundation, the Great Lakes Loons (2007-present). Mr. Stavropoulos is Chairman Emeritus of the Board of Directors of The Dow Chemical Company, where he previously served in numerous senior management positions, including President, CEO (1995-2000; 2002-2004), Chairman of the Executive Committee (2000-2006), and as a member of the Board of Directors (1990-2006). Currently, Mr. Stavropoulos is Chairman of the Board of Directors of Univar Inc. (global distributor of commodity and specialty chemicals), a Director of Teradata Corporation (data warehousing and technology solutions), and a member of the Advisory Board for Metalmark Capital LLC (private equity investment, 2005-present). Mr. Stavropoulos is an operating advisor to Clayton, Dubilier & Rice, LLC (private equity investment). In addition, Mr. Stavropoulos is a member of the University of Notre Dame Advisory Council for the College of Science, a Trustee of the Rollin L. Gerstacker Foundation, and a Director of Artis-Naples in Naples, Florida. Previously, Mr. Stavropoulos served as a Director of Chemical Financial Corporation (bank holding company, 1993-2012) and Tyco International, Ltd. (multinational manufacturing and services, 2007-2012).
David M. Thomas (1949)
Year of Election or Appointment: 2008
Trustee
Mr. Thomas also serves as Trustee of other Fidelity® funds. Mr. Thomas serves as Non-Executive Chairman of the Board of Directors of Fortune Brands Home and Security (home and security products, 2011-present), as a member of the Board of Directors (2004-present) and Presiding Director (2013-present) of Interpublic Group of Companies, Inc. (marketing communication), and as a member of the Board of Trustees of the University of Florida (2013-present). Previously, Mr. Thomas served as Executive Chairman (2005-2006) and Chairman and Chief Executive Officer (2000-2005) of IMS Health, Inc. (pharmaceutical and healthcare information solutions), and a Director of Fortune Brands, Inc. (consumer products, 2000-2011).
+ The information includes the Trustee's principal occupation during the last five years and other information relating to the experience, attributes, and skills relevant to the Trustee's qualifications to serve as a Trustee, which led to the conclusion that the Trustee should serve as a Trustee for the fund.
Advisory Board Members and Officers:
Correspondence intended for an officer or Peter S. Lynch may be sent to Fidelity Investments, 245 Summer Street, Boston, Massachusetts 02210. Officers appear below in alphabetical order.
Name, Year of Birth; Principal Occupation
Peter S. Lynch (1944)
Year of Election or Appointment: 2003
Member of the Advisory Board
Mr. Lynch also serves as Member of the Advisory Board of other Fidelity® funds. Mr. Lynch is Vice Chairman and a Director of FMR (investment adviser firm) and FMR Co., Inc. (investment adviser firm). In addition, Mr. Lynch serves as a Trustee of Boston College and as the Chairman of the Inner-City Scholarship Fund. Previously, Mr. Lynch served on the Special Olympics International Board of Directors (1997-2006).
Elizabeth Paige Baumann (1968)
Year of Election or Appointment: 2017
Anti-Money Laundering (AML) Officer
Ms. Baumann also serves as AML Officer of other funds. She is Chief AML Officer (2012-present) and Senior Vice President (2014-present) of FMR LLC (diversified financial services company) and is an employee of Fidelity Investments. Previously, Ms. Baumann served as AML Officer of the funds (2012-2016), and Vice President (2007-2014) and Deputy Anti-Money Laundering Officer (2007-2012) of FMR LLC.
Marc R. Bryant (1966)
Year of Election or Appointment: 2015
Secretary and Chief Legal Officer (CLO)
Mr. Bryant also serves as Secretary and CLO of other funds. Mr. Bryant serves as CLO, Secretary, and Senior Vice President of Fidelity Management & Research Company (investment adviser firm, 2015-present) and FMR Co., Inc. (investment adviser firm, 2015-present); Secretary of Fidelity SelectCo, LLC (investment adviser firm, 2015-present) and Fidelity Investments Money Management, Inc. (investment adviser firm, 2015-present); and CLO of Fidelity Management & Research (Hong Kong) Limited and FMR Investment Management (UK) Limited (investment adviser firms, 2015-present) and Fidelity Management & Research (Japan) Limited (investment adviser firm, 2016-present). He is Senior Vice President and Deputy General Counsel of FMR LLC (diversified financial services company). Previously, Mr. Bryant served as Secretary and CLO of Fidelity Rutland Square Trust II (2010-2014) and Assistant Secretary of Fidelity's Fixed Income and Asset Allocation Funds (2013-2015). Prior to joining Fidelity Investments, Mr. Bryant served as a Senior Vice President and the Head of Global Retail Legal for AllianceBernstein L.P. (2006-2010), and as the General Counsel for ProFund Advisors LLC (2001-2006).
William C. Coffey (1969)
Year of Election or Appointment: 2009
Assistant Secretary
Mr. Coffey also serves as Assistant Secretary of other funds. He is Senior Vice President and Deputy General Counsel of FMR LLC (diversified financial services company, 2010-present), and is an employee of Fidelity Investments. Previously, Mr. Coffey served as Vice President and Associate General Counsel of FMR LLC (2005-2009).
Jonathan Davis (1968)
Year of Election or Appointment: 2010
Assistant Treasurer
Mr. Davis also serves as Assistant Treasurer of other funds. Mr. Davis serves as Assistant Treasurer of FMR Capital, Inc. (2017-present) and is an employee of Fidelity Investments. Previously, Mr. Davis served as Vice President and Associate General Counsel of FMR LLC (diversified financial services company, 2003-2010).
Adrien E. Deberghes (1967)
Year of Election or Appointment: 2016
Assistant Treasurer
Mr. Deberghes also serves as an officer of other funds. He serves as Assistant Treasurer of FMR Capital, Inc. (2017-present), Executive Vice President of Fidelity Investments Money Management, Inc. (FIMM) (investment adviser firm, 2016-present), and is an employee of Fidelity Investments (2008-present). Prior to joining Fidelity Investments, Mr. Deberghes was Senior Vice President of Mutual Fund Administration at State Street Corporation (2007-2008), Senior Director of Mutual Fund Administration at Investors Bank & Trust (2005-2007), and Director of Finance for Dunkin' Brands (2000-2005). Previously, Mr. Deberghes served in other fund officer roles.
Stephanie J. Dorsey (1969)
Year of Election or Appointment: 2010
Assistant Treasurer
Ms. Dorsey also serves as an officer of other funds. Ms. Dorsey serves as Assistant Treasurer of FMR Capital, Inc. (2017-present), is an employee of Fidelity Investments (2008-present), and has served in other fund officer roles. Prior to joining Fidelity Investments, Ms. Dorsey served as Treasurer (2004-2008) of the JPMorgan Mutual Funds and Vice President (2004-2008) of JPMorgan Chase Bank.
Howard J. Galligan III (1966)
Year of Election or Appointment: 2014
Chief Financial Officer
Mr. Galligan also serves as Chief Financial Officer of other funds. Mr. Galligan serves as President of Fidelity Pricing and Cash Management Services (FPCMS) (2014-present) and as a Director of Strategic Advisers, Inc. (investment adviser firm, 2008-present). Previously, Mr. Galligan served as Chief Administrative Officer of Asset Management (2011-2014) and Chief Operating Officer and Senior Vice President of Investment Support for Strategic Advisers, Inc. (2003-2011).
Brian B. Hogan (1964)
Year of Election or Appointment: 2009
Vice President
Mr. Hogan also serves as Trustee or Vice President of other funds. Mr. Hogan serves as a Director of FMR Investment Management (UK) Limited (investment adviser firm, 2015-present) and Fidelity SelectCo, LLC (investment adviser firm, 2014-present) and President of the Equity Division of FMR (investment adviser firm, 2009-present). Previously, Mr. Hogan served as Senior Vice President, Equity Research of FMR (2006-2009) and as a portfolio manager. Mr. Brian B. Hogan is not related to Mr. Colm A. Hogan.
Colm A. Hogan (1973)
Year of Election or Appointment: 2016
Deputy Treasurer
Mr. Hogan also serves as an officer of other funds. Mr. Hogan serves as Assistant Treasurer of FMR Capital, Inc. (2017-present) and is an employee of Fidelity Investments (2005-present). Mr. Colm A. Hogan is not related to Mr. Brian B. Hogan.
Chris Maher (1972)
Year of Election or Appointment: 2013
Assistant Treasurer
Mr. Maher serves as Assistant Treasurer of other funds. Mr. Maher is Vice President of Valuation Oversight, serves as Assistant Treasurer of FMR Capital, Inc. (2017-present), and is an employee of Fidelity Investments. Previously, Mr. Maher served as Vice President of Asset Management Compliance (2013), Vice President of the Program Management Group of FMR (investment adviser firm, 2010-2013), and Vice President of Valuation Oversight (2008-2010).
Rieco E. Mello (1969)
Year of Election or Appointment: 2017
Assistant Treasurer
Mr. Mello also serves as Assistant Treasurer of other funds. Mr. Mello serves as Assistant Treasurer of FMR Capital, Inc. (2017-present) and is an employee of Fidelity Investments (1995-present).
Kenneth B. Robins (1969)
Year of Election or Appointment: 2016
Chief Compliance Officer
Mr. Robins also serves as an officer of other funds. Mr. Robins serves as Compliance Officer of Fidelity Management & Research Company and FMR Co., Inc. (investment adviser firms, 2016-present) and is an employee of Fidelity Investments (2004-present). Previously, Mr. Robins served as Executive Vice President of Fidelity Investments Money Management, Inc. (investment adviser firm, 2013-2016) and served in other fund officer roles.
Stacie M. Smith (1974)
Year of Election or Appointment: 2016
President and Treasurer
Ms. Smith also serves as an officer of other funds. Ms. Smith serves as Assistant Treasurer of FMR Capital, Inc. (2017-present), is an employee of Fidelity Investments (2009-present), and has served in other fund officer roles. Prior to joining Fidelity Investments, Ms. Smith served as Senior Audit Manager of Ernst & Young LLP (accounting firm, 1996-2009). Previously, Ms. Smith served as Deputy Treasurer of certain Fidelity® funds (2013-2016).
Marc L. Spector (1972)
Year of Election or Appointment: 2016
Assistant Treasurer
Mr. Spector also serves as an officer of other funds. Mr. Spector serves as Assistant Treasurer of FMR Capital, Inc. (2017-present) and is an employee of Fidelity Investments (2016-present). Prior to joining Fidelity Investments, Mr. Spector served as Director at the Siegfried Group (accounting firm, 2013-2016), and prior to Siegfried Group as audit senior manager at Deloitte & Touche (accounting firm, 2005-2013).
Renee Stagnone (1975)
Year of Election or Appointment: 2016
Assistant Treasurer
Ms. Stagnone also serves as an officer of other funds. Ms. Stagnone serves as Assistant Treasurer of FMR Capital, Inc. (2017-present) and is an employee of Fidelity Investments (1997-present). Previously, Ms. Stagnone served as Deputy Treasurer of certain Fidelity® funds (2013-2016).
Shareholder Expense Example
As a shareholder of a Fund, you incur two types of costs: (1) transaction costs and (2) ongoing costs, including management fees, distribution and/or service (12b-1) fees and other Fund expenses. This Example is intended to help you understand your ongoing costs (in dollars) of investing in the Funds and to compare these costs with the ongoing costs of investing in other mutual funds.
The Example is based on an investment of $1,000 invested at the beginning of the period and held for the entire period (July 1, 2017 to December 31, 2017).
Actual Expenses
The first line of the accompanying table for each class of the Fund provides information about actual account values and actual expenses. You may use the information in this line, together with the amount you invested, to estimate the expenses that you paid over the period. Simply divide your account value by $1,000.00 (for example, an $8,600 account value divided by $1,000.00 = 8.6), then multiply the result by the number in the first line for a class of the Fund under the heading entitled "Expenses Paid During Period" to estimate the expenses you paid on your account during this period. The estimate of expenses does not include any fees or other expenses of any variable annuity or variable life insurance product. If they were, the estimate of expenses you paid during the period would be higher, and your ending account value would be lower. In addition, the Fund, as a shareholder in the underlying Fidelity Central Funds, will indirectly bear its pro-rata share of the fees and expenses incurred by the underlying Fidelity Central Funds. These fees and expenses are not included in the Fund's annualized expense ratio used to calculate the expense estimate in the table below.
Hypothetical Example for Comparison Purposes
The second line of the accompanying table for each class of the Fund provides information about hypothetical account values and hypothetical expenses based on a Class' actual expense ratio and an assumed rate of return of 5% per year before expenses, which is not the Class' actual return. The hypothetical account values and expenses may not be used to estimate the actual ending account balance or expenses you paid for the period. You may use this information to compare the ongoing costs of investing in the Fund and other funds. To do so, compare this 5% hypothetical example with the 5% hypothetical examples that appear in the shareholder reports of the other funds. The estimate of expenses does not include any fees or other expenses of any variable annuity or variable life insurance product. If they were, the estimate of expenses you paid during the period would be higher, and your ending account value would be lower. In addition, the Fund, as a shareholder in the underlying Fidelity Central Funds, will indirectly bear its pro-rata share of the fees and expenses incurred by the underlying Fidelity Central Funds. These fees and expenses are not included in the Fund's annualized expense ratio used to calculate the expense estimate in the table below.
Please note that the expenses shown in the table are meant to highlight your ongoing costs only and do not reflect any transaction costs. Therefore, the second line of the table is useful in comparing ongoing costs only, and will not help you determine the relative total costs of owning different funds.
| | Annualized Expense Ratio-A | Beginning
Account Value
July 1, 2017 | Ending
Account Value
December 31, 2017 | Expenses Paid
During Period-B
July 1, 2017
to December 31, 2017 |
| Initial Class | .10% | | | |
| Actual | | $1,000.00 | $1,113.70 | $.53 |
| Hypothetical-C | | $1,000.00 | $1,024.70 | $.51 |
| Service Class | .20% | | | |
| Actual | | $1,000.00 | $1,113.10 | $1.07 |
| Hypothetical-C | | $1,000.00 | $1,024.20 | $1.02 |
| Service Class 2 | .35% | | | |
| Actual | | $1,000.00 | $1,112.30 | $1.86 |
| Hypothetical-C | | $1,000.00 | $1,023.44 | $1.79 |
A Annualized expense ratio reflects expenses net of applicable fee waivers.
B Expenses are equal to each Class' annualized expense ratio, multiplied by the average account value over the period, multiplied by 184/365 (to reflect the one-half year period).
C 5% return per year before expenses
Distributions (Unaudited)
The Board of Trustees of VIP Index 500 Portfolio voted to pay to shareholders of record at the opening of business on record date, the following distributions per share derived from capital gains realized from sales of portfolio securities, and dividends derived from net investment income:
| | Pay Date | Record Date | Dividends | Capital Gains |
| VIP Index 500 Portfolio | | | | |
| Initial Class | 02/09/2018 | 02/09/2018 | $0.917 | $0.980 |
| Service Class | 02/09/2018 | 02/09/2018 | $0.874 | $0.980 |
| Service Class 2 | 02/09/2018 | 02/09/2018 | $0.809 | $0.980 |
|
The fund hereby designates as a capital gain dividend with respect to the taxable year ended December 31, 2017, $26,769,433, or, if subsequently determined to be different, the net capital gain of such year.
Initial Class designates 80% and 100%; Service Class designates 84% and 100%; and Service Class 2 designates 91% and 100%; of the dividends distributed in February and December, respectively, during the fiscal year as qualifying for the dividends–received deduction for corporate shareholders.
Board Approval of Investment Advisory Contracts and Management Fees
VIP Index 500 Portfolio
Each year, the Board of Trustees, including the Independent Trustees (together, the Board), votes on the renewal of the management contract with Fidelity Management & Research Company (FMR) and the sub-advisory agreements (together, the Advisory Contracts) for the fund, including the fund's sub-advisory agreement with Geode Capital Management, LLC (Geode). FMR and the sub-advisers are referred to herein as the Investment Advisers. The Board, assisted by the advice of fund counsel and Independent Trustees' counsel, requests and considers a broad range of information relevant to the renewal of the Advisory Contracts throughout the year.
The Board meets regularly and, at each of its meetings, covers an extensive agenda of topics and materials and considers factors that are relevant to its annual consideration of the renewal of the fund's Advisory Contracts, including the services and support provided to the fund and its shareholders. The Board has established various standing committees (Committees), each composed of and chaired by Independent Trustees with varying backgrounds, to which the Board has assigned specific subject matter responsibilities in order to enhance effective decision-making by the Board. The Board, acting directly and through its Committees, requests and receives information concerning the annual consideration of the renewal of the fund's Advisory Contracts. The Board also meets as needed to review matters specifically related to the Board's annual consideration of the renewal of the Advisory Contracts. Members of the Board may also meet with trustees of other Fidelity funds through ad hoc joint committees to discuss certain matters relevant to all of the Fidelity funds.
At its July 2017 meeting, the Board unanimously determined to renew the fund's Advisory Contracts. In reaching its determination, the Board considered all factors it believed relevant, including (i) the nature, extent, and quality of the services to be provided to the fund and its shareholders (including the investment performance of the fund); (ii) the competitiveness of the fund's management fee and total expense ratio relative to peer funds; (iii) the total costs of the services to be provided by and the profits to be realized by Fidelity from its relationships with the fund; and (iv) the extent to which, if any, economies of scale exist and would be realized as the fund grows, and whether any economies of scale are appropriately shared with fund shareholders.
In considering whether to renew the Advisory Contracts for the fund, the Board reached a determination, with the assistance of fund counsel and Independent Trustees' counsel and through the exercise of its business judgment, that the renewal of the Advisory Contracts was in the best interests of the fund and its shareholders and that the compensation payable under the Advisory Contracts was fair and reasonable. The Board's decision to renew the Advisory Contracts was not based on any single factor, but rather was based on a comprehensive consideration of all the information provided to the Board at its meetings throughout the year. The Board, in reaching its determination to renew the Advisory Contracts, was aware that shareholders of the fund have a broad range of investment choices available to them, including a wide choice among funds offered by Fidelity's competitors, and that the fund's shareholders, who have the opportunity to review and weigh the disclosure provided by the fund in its prospectus and other public disclosures, have chosen to invest in this fund, which is part of the Fidelity family of funds.
Nature, Extent, and Quality of Services Provided. The Board considered staffing as it relates to the fund, including the backgrounds of investment personnel of Fidelity and Geode, and also considered the fund's investment objective, strategies, and related investment philosophy. The Independent Trustees also had discussions with senior management of Fidelity's investment operations and investment groups and with representatives of Geode. The Board considered the structure of the investment personnel compensation programs and whether the structures provide appropriate incentives to act in the best interests of the fund. Additionally, the Board considered the portfolio managers' investments, if any, in the funds that they manage.
Resources Dedicated to Investment Management and Support Services. The Board and the Fund Oversight and Research Committees reviewed the general qualifications and capabilities of Fidelity's and Geode's investment staffs, including their size, education, experience, and resources, as well as Fidelity's approach to recruiting, training, managing, and compensating investment personnel. The Board noted that Fidelity has continued to increase the resources devoted to non-U.S. offices, including expansion of Fidelity's global investment organization. Additionally, in its deliberations, the Board considered Fidelity's and Geode's trading, risk management, compliance, and technology and operations capabilities and resources, which are integral parts of the investment management process.
Shareholder and Administrative Services. The Board considered (i) the nature, extent, quality, and cost of advisory, administrative, and shareholder services performed by the Investment Advisers and their affiliates under the Advisory Contracts and under separate agreements covering transfer agency, pricing and bookkeeping, and securities lending services for the fund; (ii) the nature and extent of the supervision of third party service providers, principally custodians, subcustodians, and pricing vendors; and (iii) the resources devoted to, and the record of compliance with, the fund's compliance policies and procedures. The Board also reviewed the allocation of fund brokerage, including allocations to brokers affiliated with the Investment Advisers.
The Board noted that the growth of fund assets over time across the complex allows Fidelity to reinvest in the development of services designed to enhance the value or convenience of the Fidelity funds as investment vehicles. These services include 24-hour access to account information and market information through telephone representatives and over the Internet, investor education materials and asset allocation tools, and the expanded availability of Fidelity Investor Centers.
In 2014, the Board formed an ad hoc Committee on Transfer Agency Fees to review the variety of transfer agency fee structures throughout the industry and Fidelity's competitive positioning with respect to industry participants.
Investment in a Large Fund Family. The Board considered the benefits to shareholders of investing in a Fidelity fund, including the benefits of investing in a fund that is part of a large family of funds offering a variety of investment disciplines and providing a large variety of mutual fund investor services. The Board noted that Fidelity had taken, or had made recommendations that resulted in the Fidelity funds taking, a number of actions over the previous year that benefited particular funds, including: (i) continuing to dedicate additional resources to Fidelity's investment research process, and to the support of the senior management team that oversees asset management; (ii) continuing efforts to enhance Fidelity's global research capabilities; (iii) launching new funds and making other enhancements to meet client needs; (iv) launching new share classes of existing funds; (v) eliminating purchase minimums and broadening eligibility requirements for certain lower-priced share classes; (vi) reducing management fees and total expenses for certain growth equity funds and index funds; (vii) lowering expense caps for certain existing funds and classes to reduce expenses borne by shareholders; (viii) eliminating short-term redemption fees for certain funds; (ix) introducing a new pricing structure for certain funds of funds that is expected to reduce overall expenses paid by shareholders; (x) rationalizing product lines and gaining increased efficiencies through proposals for fund mergers and share class consolidations; (xi) continuing to develop, acquire and implement systems and technology to improve services to the funds and shareholders, strengthen information security, and increase efficiency; and (xii) implementing enhancements to further strengthen Fidelity's product line to increase investors' probability of success in achieving their investment goals, including retirement income goals.
Investment Performance. The Board considered whether the fund has operated in accordance with its investment objective, as well as its record of compliance with its investment restrictions and its performance history.
The Board took into account discussions with representatives of the Investment Advisers about fund investment performance that occur at Board meetings throughout the year. In this regard the Board noted that as part of regularly scheduled fund reviews and other reports to the Board on fund performance, the Board considers annualized return information for the fund for different time periods, measured against the securities market index the fund seeks to track and a peer group of funds with similar objectives ("peer group"), if any. The Board also periodically considers the fund's tracking error versus its benchmark index. In its evaluation of fund investment performance, the Board gave particular attention to information indicating changes in performance of certain Fidelity funds for specific time periods and discussed with the Investment Advisers the reasons for any overperformance or underperformance.
In addition to reviewing absolute and relative fund performance, the Independent Trustees periodically consider the appropriateness of fund performance metrics in evaluating the results achieved. In general, the Independent Trustees believe that an index fund's performance should be evaluated based on net performance (after fees and expenses) of both the highest performing and lowest performing fund share classes, where applicable, compared to a fund's benchmark index, over appropriate time periods taking into account relevant factors including the following: general market conditions; the characteristics of the fund's benchmark index; the extent to which statistical sampling is employed; any securities lending revenues; and fund cash flows and other factors.
The Independent Trustees recognize that shareholders evaluate performance on a net basis over their own holding periods, for which one-, three-, and five-year periods are often used as a proxy. For this reason, the performance information reviewed by the Board also included net cumulative calendar year total return information for the fund and an appropriate benchmark index and peer group for the most recent one-, three-, and five-year periods, as shown below. Returns are shown compared to the 25th percentile (top of box, 75% beaten) and 75th percentile (bottom of box, 25% beaten) of the peer universe.
VIP Index 500 Portfolio

Based on its review, the Board concluded that the nature, extent, and quality of services provided to the fund under the Advisory Contracts should continue to benefit the shareholders of the fund.
Competitiveness of Management Fee and Total Expense Ratio. The Board considered the fund's management fee and total expense ratio compared to "mapped groups" of competitive funds and classes created for the purpose of facilitating the Trustees' competitive analysis of management fees and total expenses. Fidelity creates "mapped groups" by combining similar Lipper investment objective categories that have comparable investment mandates. Combining Lipper investment objective categories aids the Board's management fee and total expense ratio comparisons by broadening the competitive group used for comparison.
Management Fee. The Board considered two proprietary management fee comparisons for the 12-month periods shown in basis points (BP) in the chart below. The group of Lipper funds used by the Board for management fee comparisons is referred to below as the "Total Mapped Group." The Total Mapped Group is broader than the Lipper peer group used by the Board for performance comparisons because the Total Mapped Group combines several Lipper investment objective categories while the Lipper peer group does not. The Total Mapped Group comparison focuses on a fund's standing in terms of gross management fees before expense reimbursements or caps relative to the total universe of funds with comparable investment mandates, regardless of whether their management fee structures also are comparable. Funds with comparable investment mandates offer exposure to similar types of securities. Funds with comparable management fee structures have similar management fee contractual arrangements (
e.g., flat rate charged for advisory services, all-inclusive fee rate,
etc.). "TMG %" represents the percentage of funds in the Total Mapped Group that had management fees that were lower than the fund's. For example, a hypothetical TMG % of 20% would mean that 80% of the funds in the Total Mapped Group had higher, and 20% had lower, management fees than the fund. The fund's actual TMG %s and the number of funds in the Total Mapped Group are in the chart below. The "Asset-Size Peer Group" (ASPG) comparison focuses on a fund's standing relative to a subset of non-Fidelity funds within the Total Mapped Group that are similar in size and management fee structure. For example, if a fund is in the first quartile of the ASPG, the fund's management fee ranks in the least expensive or lowest 25% of funds in the ASPG. The ASPG represents at least 15% of the funds in the Total Mapped Group with comparable asset size and management fee structures, subject to a minimum of 50 funds (or all funds in the Total Mapped Group if fewer than 50). Additional information, such as the ASPG quartile in which the fund's management fee rate ranked, is also included in the chart and considered by the Board. Because the vast majority of competitor funds' management fees do not cover non-management expenses, in prior years, the fund was compared on the basis of a hypothetical "net management fee," which was derived by subtracting payments made by FMR for "fund-level" non-management expenses (including pricing and bookkeeping fees and fees paid to non-affiliated custodians) from the fund's management fee. Due to the fund's low contractual management fee rate compared to its Total Mapped Group median, Fidelity no longer calculates a hypothetical net management fee for the fund. As a result, the chart does not include a hypothetical net management fee for 2016.
VIP Index 500 Portfolio
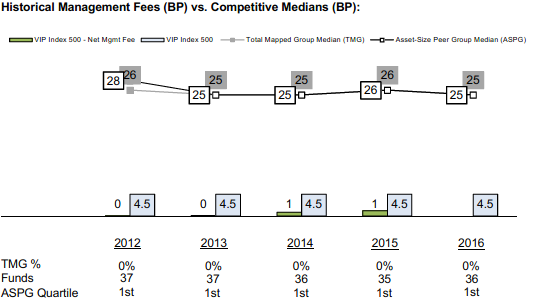
The Board noted that the fund's management fee rate ranked below the median of its Total Mapped Group and below the median of its ASPG for 2016.
At the July 2017 meeting, in connection with the renewal of the Advisory Contracts, the Board approved an amended and restated sub-advisory agreement for the fund with Geode (effective August 1, 2017) that lowered the sub-advisory fee rate that FMR pays to Geode.
The Board noted that, in 2014, the Board and the boards of other Fidelity funds formed the ad hoc Committee on Group Fee to conduct an in-depth review of the "group fee" component of the management fee of funds with such management fee structures. The Committee's focus included the mechanics of the group fee, the competitive landscape of group fee structures, Fidelity funds with no group fee component (such as the fund) and investment products not included in group fee assets. The Board also considered that, for funds subject to the group fee, FMR agreed to voluntarily waive fees over a specified period of time in amounts designed to account for assets converted from certain funds to certain collective investment trusts.
Based on its review, the Board concluded that the fund's management fee is fair and reasonable in light of the services that the fund receives and the other factors considered.
Total Expense Ratio. In its review of each class's total expense ratio, the Board considered the fund's management fee rate as well as other "fund-level" expenses, such as pricing and bookkeeping fees and custodial, legal, and audit fees, paid by FMR under the fund's management contract. The Board also considered other "class-level" expenses, such as transfer agent fees and fund-paid 12b-1 fees. The Board also noted that Fidelity may agree to waive fees and expenses from time to time, and the extent to which, if any, it has done so for the fund. As part of its review, the Board also considered the current and historical total expense ratios of each class of the fund compared to competitive fund median expenses. Each class of the fund is compared to those funds and classes in the Total Mapped Group (used by the Board for management fee comparisons) that have a similar sales load structure.
The Board noted that the total expense ratio of each class ranked below the competitive median for 2016.
The Board considered that current contractual arrangements for the fund oblige FMR to pay all "class-level" expenses of each class of the fund to the extent necessary to limit total operating expenses, with certain exceptions, as follows: Initial Class: 0.10%; Service Class: 0.20%; and Service Class 2: 0.35%. These contractual arrangements may not be amended to increase the fees or expenses payable except by a vote of a majority of the Board and by a vote of a majority of the outstanding voting securities of the applicable class.
Fees Charged to Other Fidelity Clients. The Board also considered Fidelity fee structures and other information with respect to clients of Fidelity, such as other funds advised or subadvised by Fidelity, pension plan clients, and other institutional clients with similar mandates. The Board noted that an ad hoc joint committee created by it and the boards of other Fidelity funds periodically (most recently in 2013) reviews and compares Fidelity's institutional investment advisory business with its business of providing services to the Fidelity funds, including the differences in services provided, fees charged, and costs incurred, as well as competition in their respective marketplaces.
Based on its review of total expense ratios and fees charged to other Fidelity clients, the Board concluded that the total expense ratio of each class of the fund was reasonable in light of the services that the fund and its shareholders receive and the other factors considered.
Costs of the Services and Profitability. The Board considered the revenues earned and the expenses incurred by Fidelity in conducting the business of developing, marketing, distributing, managing, administering and servicing the fund and servicing the fund's shareholders. The Board also considered the level of Fidelity's profits in respect of all the Fidelity funds.
On an annual basis, Fidelity presents to the Board information about the profitability of its relationships with the fund. Fidelity calculates profitability information for each fund, as well as aggregate profitability information for groups of Fidelity funds and all Fidelity funds, using a series of detailed revenue and cost allocation methodologies which originate with the books and records of Fidelity on which Fidelity's audited financial statements are based. The Audit Committee of the Board reviews any significant changes from the prior year's methodologies.
PricewaterhouseCoopers LLP (PwC), independent registered public accounting firm and auditor to Fidelity and certain Fidelity funds, has been engaged annually by the Board as part of the Board's assessment of Fidelity's profitability analysis. PwC's engagement includes the review and assessment of the methodologies used by Fidelity in determining the revenues and expenses attributable to Fidelity's mutual fund business, and completion of agreed-upon procedures in respect of the mathematical accuracy of the fund profitability information and its conformity to established allocation methodologies. After considering PwC's reports issued under the engagement and information provided by Fidelity, the Board concluded that while other allocation methods may also be reasonable, Fidelity's profitability methodologies are reasonable in all material respects.
The Board also reviewed Fidelity's non-fund businesses and potential fall-out benefits related to the mutual fund business as well as cases where Fidelity's affiliates may benefit from or be related to the fund's business.
The Board considered the costs of the services provided by and the profits realized by Fidelity in connection with the operation of the fund and was satisfied that the profitability was not excessive.
Economies of Scale. The Board considered whether there have been economies of scale in respect of the management of the Fidelity funds, whether the Fidelity funds (including the fund) have appropriately benefited from any such economies of scale, and whether there is potential for realization of any further economies of scale. The Board considered the extent to which the fund will benefit from economies of scale as assets grow through increased services to the fund, through waivers or reimbursements, or through fee or expense ratio reductions. The Board recognized that due to the fund's current contractual arrangements the expense ratio of each class will not decline if the class's operating costs decrease as assets grow, or rise as assets decrease. The Board also noted that a committee (the Economies of Scale Committee) created by it and the boards of other Fidelity funds periodically (most recently in 2013) analyzes whether Fidelity attains economies of scale in respect of the management and servicing of the Fidelity funds, whether the Fidelity funds have appropriately benefited from such economies of scale, and whether there is potential for realization of any further economies of scale.
The Board concluded, taking into account the analysis of the Economies of Scale Committee, that economies of scale, if any, are being appropriately shared between fund shareholders and Fidelity.
Additional Information Requested by the Board. In order to develop fully the factual basis for consideration of the Fidelity funds' advisory contracts, the Board requested and received additional information on certain topics, including: (i) fund performance trends, in particular the underperformance of certain funds, and Fidelity's long-term strategies for certain funds; (ii) Fidelity's fund profitability methodology, profitability trends for certain funds, and the impact of certain factors on fund profitability results, including the impact of market trends on actively managed funds; (iii) the use of performance fees and the calculation of performance adjustments, including the impact of underperformance and fund outflows on performance adjustments; (iv) metrics for evaluating index fund performance; (v) Fidelity's group fee structure, including the group fee breakpoint schedules; (vi) the terms of Fidelity's contractual and voluntary expense cap arrangements with the funds; (vii) the methodology with respect to evaluating competitive fund data and peer group classifications and fee comparisons; (viii) the expense structures for different funds and classes; (ix) Fidelity's arrangements with affiliated sub-advisers on behalf of the funds; (x) information regarding other accounts managed by Fidelity, including institutional accounts and collective investment trusts; (xi) recent changes to the fee structure for certain funds of funds; and (xii) the impact of the Department of Labor's new fiduciary rule on the funds' comparative expense information.
Based on its evaluation of all of the conclusions noted above, and after considering all factors it believed relevant, the Board concluded that the advisory and sub-advisory fee structures are fair and reasonable, and that the fund's Advisory Contracts should be renewed.

VIPIDX-ANN-0218
1.540028.120
Fidelity® Variable Insurance Products: Contrafund® Portfolio
Annual Report December 31, 2017 |
|
Contents
To view a fund's proxy voting guidelines and proxy voting record for the 12-month period ended June 30, visit http://www.fidelity.com/proxyvotingresults or visit the Securities and Exchange Commission's (SEC) web site at http://www.sec.gov.
You may also call 1-877-208-0098 to request a free copy of the proxy voting guidelines.
Fidelity® Variable Insurance Products are separate account options which are purchased through a variable insurance contract.
Standard & Poor's, S&P and S&P 500 are registered service marks of The McGraw-Hill Companies, Inc. and have been licensed for use by Fidelity Distributors Corporation.
Other third-party marks appearing herein are the property of their respective owners.
All other marks appearing herein are registered or unregistered trademarks or service marks of FMR LLC or an affiliated company. © 2018 FMR LLC. All rights reserved.
This report and the financial statements contained herein are submitted for the general information of the shareholders of the Fund. This report is not authorized for distribution to prospective investors in the Fund unless preceded or accompanied by an effective prospectus.
A fund files its complete schedule of portfolio holdings with the SEC for the first and third quarters of each fiscal year on Form N-Q. Forms N-Q are available on the SEC’s web site at http://www.sec.gov. A fund's Forms N-Q may be reviewed and copied at the SEC’s Public Reference Room in Washington, DC. Information regarding the operation of the SEC's Public Reference Room may be obtained by calling 1-800-SEC-0330.
For a complete list of a fund's portfolio holdings, view the most recent holdings listing, semiannual report, or annual report on Fidelity's web site at http://www.fidelity.com, http://www.institutional.fidelity.com, or http://www.401k.com, as applicable.
NOT FDIC INSURED •MAY LOSE VALUE •NO BANK GUARANTEE
Neither the Fund nor Fidelity Distributors Corporation is a bank.
Performance: The Bottom Line
Average annual total return reflects the change in the value of an investment, assuming reinvestment of distributions from dividend income and capital gains (the profits earned upon the sale of securities that have grown in value, if any) and assuming a constant rate of performance each year. During periods of reimbursement by Fidelity, a fund’s total return will be greater than it would be had the reimbursement not occurred. Performance numbers are net of all underlying fund operating expenses, but do not include any insurance charges imposed by your insurance company’s separate account. If performance information included the effect of these additional charges, the total returns would have been lower. How a fund did yesterday is no guarantee of how it will do tomorrow.
Average Annual Total Returns
| For the periods ended December 31, 2017 | Past 1 year | Past 5 years | Past 10 years |
| Initial Class | 21.88% | 14.26% | 7.29% |
| Service Class | 21.76% | 14.14% | 7.18% |
| Service Class 2 | 21.59% | 13.97% | 7.02% |
| Investor Class | 21.81% | 14.17% | 7.20% |
$10,000 Over 10 Years
Let's say hypothetically that $10,000 was invested in VIP Contrafund℠ Portfolio - Initial Class on December 31, 2007.
The chart shows how the value of your investment would have changed, and also shows how the S&P 500® Index performed over the same period.

| Period Ending Values |
| $20,209 | VIP Contrafund℠ Portfolio - Initial Class |
| $22,603 | S&P 500® Index |
Management's Discussion of Fund Performance
Market Recap: U.S. equities gained 21.83% in 2017, as the S&P 500
® index rose steadily and closed the year just shy of an all-time high after a particularly strong three-month finish. Early on, equities rallied on optimism for President Trump’s pro-business agenda but leveled off in March amid fading optimism and stalled efforts by Congress to repeal and replace the Affordable Care Act. Upward momentum soon returned and continued through year-end with consumer sentiment and other market indicators staying positive. The lone exception was a brief cooldown in August, when geopolitical tension escalated and uncertainty grew regarding the future of health care, tax reform and the debt ceiling. Sector-wise, information technology fared best by a wide margin, rising 39% amid strong earnings growth from several major index constituents. A 24% gain in materials was spurred by increased demand, especially from China. Consumer discretionary gained 23%, despite many brick-and-mortar retailers suffering from online competition, and financials edged the broader market on an uptick in bond yields. Conversely, the defensive energy and telecom services sectors returned about -1% each. Rising interest rates held back real estate (+11%), while consumer staples (+13%) and utilities (+12%) struggled due to investors’ general preference for risk assets.
Comments from Co-Portfolio Manager Robert Stansky: For the year, the fund’s share classes gained roughly 22%, about in line with the benchmark S&P 500
® index. Versus the benchmark, stock selection in the information technology sector was by far the biggest positive, especially in software & services. Picks in financials and real estate also helped. The fund’s two largest relative contributors were software & services holdings: Autodesk, a maker of design software for engineering and architectural firms, and China-based online advertising provider 58.com, a non-benchmark position. Autodesk has been transitioning its business to a subscription, cloud-based model, and it made solid progress toward that goal in 2017. It was among our largest holdings at year-end. 58.com has been on an acquisition tear of late, and has been one beneficiary of the rapid expansion in China’s middle class. Electric automaker Tesla further bolstered our relative performance. Conversely, stock selection in consumer discretionary and health care weighed on relative performance, as did a small cash position in a strongly advancing market. Within consumer discretionary, shares of consumer products company Newell Brands – which we bought in August – fell sharply in early November after the company reported weaker-than-expected sales and lowered its earnings guidance for 2017. Also detracting was retailer L Brands, which was sold from the fund.
The views expressed above reflect those of the portfolio manager(s) only through the end of the period as stated on the cover of this report and do not necessarily represent the views of Fidelity or any other person in the Fidelity organization. Any such views are subject to change at any time based upon market or other conditions and Fidelity disclaims any responsibility to update such views. These views may not be relied on as investment advice and, because investment decisions for a Fidelity fund are based on numerous factors, may not be relied on as an indication of trading intent on behalf of any Fidelity fund.
Notes to shareholders: On August 3, 2017, Chip Perrone became Co-Manager of the fund, succeeding Peter Dixon in overseeing the consumer discretionary sleeve. On November 17, 2017, Richard Malnight assumed Co-Manager responsibilities for the fund’s materials sleeve, succeeding Tobias Welo.
Investment Summary (Unaudited)
Top Ten Stocks as of December 31, 2017
| | % of fund's net assets |
| Alphabet, Inc. Class C | 2.9 |
| Bank of America Corp. | 2.4 |
| Amazon.com, Inc. | 2.3 |
| Autodesk, Inc. | 2.0 |
| UnitedHealth Group, Inc. | 2.0 |
| Microsoft Corp. | 1.8 |
| Capital One Financial Corp. | 1.6 |
| The Walt Disney Co. | 1.6 |
| Facebook, Inc. Class A | 1.5 |
| Citrix Systems, Inc. | 1.5 |
| | 19.6 |
Top Market Sectors as of December 31, 2017
| | % of fund's net assets |
| Information Technology | 21.8 |
| Financials | 14.9 |
| Consumer Discretionary | 13.8 |
| Health Care | 13.5 |
| Industrials | 9.8 |
| Consumer Staples | 8.1 |
| Energy | 6.0 |
| Materials | 3.0 |
| Utilities | 2.9 |
| Real Estate | 2.8 |
Asset Allocation (% of fund's net assets)
| As of December 31, 2017 * |
| | Stocks and Equity Futures | 99.1% |
| | Short-Term Investments and Net Other Assets (Liabilities) | 0.9% |

* Foreign investments - 8.4%
Investments December 31, 2017
Showing Percentage of Net Assets
| Common Stocks - 98.5% | | | |
| | | Shares | Value |
| CONSUMER DISCRETIONARY - 13.8% | | | |
| Auto Components - 0.6% | | | |
| Aptiv PLC | | 1,142,600 | $96,926,758 |
| Delphi Technologies PLC (a) | | 558,166 | 29,286,970 |
| | | | 126,213,728 |
| Automobiles - 0.4% | | | |
| Tesla, Inc. (a) | | 249,450 | 77,666,258 |
| Diversified Consumer Services - 0.6% | | | |
| ServiceMaster Global Holdings, Inc. (a) | | 2,410,096 | 123,565,622 |
| Hotels, Restaurants & Leisure - 1.8% | | | |
| Marriott International, Inc. Class A | | 834,401 | 113,253,248 |
| Starbucks Corp. | | 3,950,600 | 226,882,958 |
| U.S. Foods Holding Corp. (a) | | 330,200 | 10,543,286 |
| | | | 350,679,492 |
| Household Durables - 1.2% | | | |
| Mohawk Industries, Inc. (a) | | 460,854 | 127,149,619 |
| Newell Brands, Inc. | | 3,263,900 | 100,854,510 |
| | | | 228,004,129 |
| Internet & Direct Marketing Retail - 2.5% | | | |
| Amazon.com, Inc. (a) | | 388,500 | 454,339,095 |
| JD.com, Inc. sponsored ADR (a) | | 1,272,400 | 52,702,808 |
| | | | 507,041,903 |
| Media - 3.5% | | | |
| Comcast Corp. Class A | | 7,318,500 | 293,105,925 |
| DISH Network Corp. Class A (a) | | 70,400 | 3,361,600 |
| MDC Partners, Inc. Class A (a) | | 2,160,073 | 21,060,712 |
| The Walt Disney Co. | | 2,895,800 | 311,327,458 |
| Time Warner, Inc.�� | | 724,726 | 66,290,687 |
| Weinstein Co. Holdings LLC Class A-1 (a)(b)(c)(d) | | 11,499 | 0 |
| | | | 695,146,382 |
| Specialty Retail - 2.1% | | | |
| Home Depot, Inc. | | 1,185,689 | 224,723,636 |
| TJX Companies, Inc. | | 2,575,321 | 196,909,044 |
| | | | 421,632,680 |
| Textiles, Apparel & Luxury Goods - 1.1% | | | |
| NIKE, Inc. Class B | | 2,667,652 | 166,861,633 |
| Tapestry, Inc. | | 1,156,200 | 51,138,726 |
| | | | 218,000,359 |
|
| TOTAL CONSUMER DISCRETIONARY | | | 2,747,950,553 |
|
| CONSUMER STAPLES - 8.1% | | | |
| Beverages - 1.8% | | | |
| Anheuser-Busch InBev SA NV | | 321,700 | 35,915,051 |
| Constellation Brands, Inc. Class A (sub. vtg.) | | 330,400 | 75,519,528 |
| Molson Coors Brewing Co. Class B | | 121,100 | 9,938,677 |
| Monster Beverage Corp. (a) | | 919,988 | 58,226,041 |
| The Coca-Cola Co. | | 4,159,506 | 190,838,135 |
| | | | 370,437,432 |
| Food & Staples Retailing - 1.3% | | | |
| CVS Health Corp. | | 1,965,464 | 142,496,140 |
| Kroger Co. | | 2,831,464 | 77,723,687 |
| Rite Aid Corp. (a)(e) | | 2,899,727 | 5,712,462 |
| Walgreens Boots Alliance, Inc. | | 536,500 | 38,960,630 |
| | | | 264,892,919 |
| Food Products - 1.0% | | | |
| Blue Buffalo Pet Products, Inc. (a)(e) | | 268,200 | 8,794,278 |
| Bunge Ltd. | | 663,481 | 44,506,305 |
| Mondelez International, Inc. | | 2,243,600 | 96,026,080 |
| The Hain Celestial Group, Inc. (a) | | 54,092 | 2,292,960 |
| The Kraft Heinz Co. | | 53,900 | 4,191,264 |
| The Simply Good Foods Co. | | 963,900 | 13,745,214 |
| TreeHouse Foods, Inc. (a) | | 486,798 | 24,077,029 |
| | | | 193,633,130 |
| Household Products - 0.8% | | | |
| Colgate-Palmolive Co. | | 1,609,687 | 121,450,884 |
| Kimberly-Clark Corp. | | 126,167 | 15,223,310 |
| Spectrum Brands Holdings, Inc. | | 168,117 | 18,896,351 |
| | | | 155,570,545 |
| Personal Products - 0.7% | | | |
| Avon Products, Inc. (a) | | 8,797,544 | 18,914,720 |
| Coty, Inc. Class A | | 2,069,336 | 41,159,093 |
| Edgewell Personal Care Co. (a) | | 267,500 | 15,886,825 |
| Estee Lauder Companies, Inc. Class A | | 486,374 | 61,886,228 |
| Unilever NV (Certificaten Van Aandelen) (Bearer) | | 188,400 | 10,607,485 |
| | | | 148,454,351 |
| Tobacco - 2.5% | | | |
| Altria Group, Inc. | | 716,556 | 51,169,264 |
| British American Tobacco PLC sponsored ADR | | 3,247,981 | 217,582,247 |
| Philip Morris International, Inc. | | 2,144,078 | 226,521,841 |
| | | | 495,273,352 |
|
| TOTAL CONSUMER STAPLES | | | 1,628,261,729 |
|
| ENERGY - 6.0% | | | |
| Energy Equipment & Services - 0.5% | | | |
| Baker Hughes, a GE Co. Class A | | 1,109,200 | 35,095,088 |
| Hess Midstream Partners LP | | 396,700 | 7,858,627 |
| NCS Multistage Holdings, Inc. | | 925,400 | 13,640,396 |
| Oceaneering International, Inc. | | 479,162 | 10,129,485 |
| Schlumberger Ltd. | | 339,700 | 22,892,383 |
| | | | 89,615,979 |
| Oil, Gas & Consumable Fuels - 5.5% | | | |
| Anadarko Petroleum Corp. | | 1,328,721 | 71,272,594 |
| Black Stone Minerals LP | | 736,600 | 13,214,604 |
| Boardwalk Pipeline Partners, LP | | 1,552,000 | 20,036,320 |
| Cabot Oil & Gas Corp. | | 1,248,035 | 35,693,801 |
| Centennial Resource Development, Inc.: | | | |
| Class A (a) | | 393,700 | 7,795,260 |
| Class A (c) | | 400,000 | 7,920,000 |
| Chevron Corp. | | 738,400 | 92,440,296 |
| Cimarex Energy Co. | | 357,900 | 43,667,379 |
| ConocoPhillips Co. | | 2,086,400 | 114,522,496 |
| Devon Energy Corp. | | 1,722,600 | 71,315,640 |
| EOG Resources, Inc. | | 618,900 | 66,785,499 |
| Extraction Oil & Gas, Inc. (a) | | 425,209 | 6,084,741 |
| Extraction Oil & Gas, Inc. (c) | | 541,782 | 7,752,900 |
| Exxon Mobil Corp. | | 1,594,902 | 133,397,603 |
| Newfield Exploration Co. (a) | | 1,408,600 | 44,413,158 |
| Parsley Energy, Inc. Class A (a) | | 1,659,457 | 48,854,414 |
| PDC Energy, Inc. (a) | | 447,050 | 23,040,957 |
| Phillips 66 Co. | | 771,039 | 77,990,595 |
| Pioneer Natural Resources Co. | | 332,900 | 57,541,765 |
| PrairieSky Royalty Ltd. | | 811,912 | 20,707,954 |
| Reliance Industries Ltd. | | 1,227,178 | 17,705,080 |
| Suncor Energy, Inc. | | 1,571,395 | 57,692,824 |
| Suncor Energy, Inc. | | 66,000 | 2,423,520 |
| Valero Energy Corp. | | 702,700 | 64,585,157 |
| | | | 1,106,854,557 |
|
| TOTAL ENERGY | | | 1,196,470,536 |
|
| FINANCIALS - 14.9% | | | |
| Banks - 7.2% | | | |
| Bank of America Corp. | | 15,805,614 | 466,581,725 |
| Citigroup, Inc. | | 3,303,450 | 245,809,715 |
| Huntington Bancshares, Inc. | | 13,648,196 | 198,717,734 |
| JPMorgan Chase & Co. | | 734,206 | 78,515,990 |
| KeyCorp | | 2,231,600 | 45,011,372 |
| PNC Financial Services Group, Inc. | | 946,200 | 136,527,198 |
| Societe Generale Series A | | 389,000 | 20,055,103 |
| SunTrust Banks, Inc. | | 1,006,400 | 65,003,376 |
| Synovus Financial Corp. | | 396,323 | 18,999,725 |
| Wells Fargo & Co. | | 2,597,100 | 157,566,057 |
| | | | 1,432,787,995 |
| Capital Markets - 2.7% | | | |
| Affiliated Managers Group, Inc. | | 87,800 | 18,020,950 |
| BlackRock, Inc. Class A | | 223,213 | 114,666,750 |
| CBOE Holdings, Inc. | | 236,691 | 29,489,332 |
| Credit Suisse Group AG | | 915,852 | 16,334,884 |
| E*TRADE Financial Corp. (a) | | 2,060,078 | 102,118,066 |
| Goldman Sachs Group, Inc. | | 131,200 | 33,424,512 |
| IntercontinentalExchange, Inc. | | 822,600 | 58,042,656 |
| Northern Trust Corp. | | 723,200 | 72,240,448 |
| State Street Corp. | | 1,004,300 | 98,029,723 |
| | | | 542,367,321 |
| Consumer Finance - 2.3% | | | |
| Capital One Financial Corp. | | 3,256,048 | 324,237,260 |
| OneMain Holdings, Inc. (a) | | 1,592,097 | 41,378,601 |
| SLM Corp. (a) | | 2,140,176 | 24,183,989 |
| Synchrony Financial | | 1,858,600 | 71,760,546 |
| | | | 461,560,396 |
| Diversified Financial Services - 0.5% | | | |
| Berkshire Hathaway, Inc.: | | | |
| Class A (a) | | 47 | 13,987,200 |
| Class B (a) | | 178,300 | 35,342,626 |
| KBC Ancora | | 450,178 | 28,352,267 |
| Kimbell Royalty Partners LP | | 433,900 | 7,050,875 |
| On Deck Capital, Inc. (a) | | 595,900 | 3,420,466 |
| | | | 88,153,434 |
| Insurance - 2.2% | | | |
| American International Group, Inc. | | 351,500 | 20,942,370 |
| Chubb Ltd. | | 659,948 | 96,438,201 |
| Hartford Financial Services Group, Inc. | | 1,140,100 | 64,164,828 |
| Marsh & McLennan Companies, Inc. | | 796,470 | 64,824,693 |
| MetLife, Inc. | | 1,456,600 | 73,645,696 |
| The Travelers Companies, Inc. | | 927,700 | 125,833,228 |
| | | | 445,849,016 |
|
| TOTAL FINANCIALS | | | 2,970,718,162 |
|
| HEALTH CARE - 13.5% | | | |
| Biotechnology - 3.6% | | | |
| Alexion Pharmaceuticals, Inc. (a) | | 625,832 | 74,843,249 |
| Amgen, Inc. | | 1,403,733 | 244,109,169 |
| Biogen, Inc. (a) | | 458,431 | 146,042,364 |
| BioMarin Pharmaceutical, Inc. (a) | | 204,600 | 18,244,182 |
| Celgene Corp. (a) | | 278,500 | 29,064,260 |
| Regeneron Pharmaceuticals, Inc. (a) | | 135,600 | 50,980,176 |
| Shire PLC sponsored ADR | | 231,800 | 35,956,816 |
| TESARO, Inc. (a) | | 295,000 | 24,446,650 |
| Vertex Pharmaceuticals, Inc. (a) | | 679,630 | 101,849,352 |
| | | | 725,536,218 |
| Health Care Equipment & Supplies - 3.5% | | | |
| Abbott Laboratories | | 3,181,330 | 181,558,503 |
| Becton, Dickinson & Co. | | 709,300 | 151,832,758 |
| Boston Scientific Corp. (a) | | 5,558,549 | 137,796,430 |
| Intuitive Surgical, Inc. (a) | | 238,800 | 87,147,672 |
| Medtronic PLC | | 489,690 | 39,542,468 |
| ResMed, Inc. | | 737,300 | 62,441,937 |
| Wright Medical Group NV (a) | | 1,168,600 | 25,942,920 |
| | | | 686,262,688 |
| Health Care Providers & Services - 3.2% | | | |
| DaVita HealthCare Partners, Inc. (a) | | 563,900 | 40,741,775 |
| Henry Schein, Inc. (a) | | 385,582 | 26,944,470 |
| Humana, Inc. | | 379,100 | 94,043,337 |
| McKesson Corp. | | 539,000 | 84,057,050 |
| UnitedHealth Group, Inc. | | 1,810,800 | 399,208,968 |
| | | | 644,995,600 |
| Health Care Technology - 0.3% | | | |
| Cerner Corp. (a) | | 880,700 | 59,350,373 |
| Life Sciences Tools & Services - 1.0% | | | |
| Agilent Technologies, Inc. | | 1,241,300 | 83,129,861 |
| Thermo Fisher Scientific, Inc. | | 647,913 | 123,025,720 |
| | | | 206,155,581 |
| Pharmaceuticals - 1.9% | | | |
| Allergan PLC | | 502,752 | 82,240,172 |
| AstraZeneca PLC sponsored ADR | | 1,019,300 | 35,369,710 |
| Bristol-Myers Squibb Co. | | 1,910,405 | 117,069,618 |
| Jazz Pharmaceuticals PLC (a) | | 276,900 | 37,284,585 |
| Merck & Co., Inc. | | 363,900 | 20,476,653 |
| Mylan NV (a) | | 670,800 | 28,381,548 |
| Roche Holding AG (participation certificate) | | 149,535 | 37,810,728 |
| Sanofi SA sponsored ADR | | 612,500 | 26,337,500 |
| | | | 384,970,514 |
|
| TOTAL HEALTH CARE | | | 2,707,270,974 |
|
| INDUSTRIALS - 9.8% | | | |
| Aerospace & Defense - 1.7% | | | |
| Axon Enterprise, Inc. (a) | | 1,861,075 | 49,318,488 |
| Lockheed Martin Corp. | | 126,100 | 40,484,405 |
| Northrop Grumman Corp. | | 310,475 | 95,287,882 |
| Orbital ATK, Inc. | | 30,450 | 4,004,175 |
| Raytheon Co. | | 512,220 | 96,220,527 |
| Rockwell Collins, Inc. | | 75,130 | 10,189,131 |
| The Boeing Co. | | 16,210 | 4,780,491 |
| United Technologies Corp. | | 306,548 | 39,106,328 |
| | | | 339,391,427 |
| Air Freight & Logistics - 0.2% | | | |
| United Parcel Service, Inc. Class B | | 347,925 | 41,455,264 |
| Airlines - 1.8% | | | |
| American Airlines Group, Inc. | | 4,005,001 | 208,380,202 |
| JetBlue Airways Corp. (a) | | 2,803,460 | 62,629,296 |
| United Continental Holdings, Inc. (a) | | 1,206,140 | 81,293,836 |
| | | | 352,303,334 |
| Building Products - 0.5% | | | |
| Allegion PLC | | 1,145,070 | 91,101,769 |
| Johnson Controls International PLC | | 381,720 | 14,547,349 |
| | | | 105,649,118 |
| Commercial Services & Supplies - 0.1% | | | |
| Waste Management, Inc. | | 225,570 | 19,466,691 |
| Construction & Engineering - 0.4% | | | |
| AECOM (a) | | 2,282,601 | 84,798,627 |
| Electrical Equipment - 1.8% | | | |
| AMETEK, Inc. | | 1,184,854 | 85,866,369 |
| Fortive Corp. | | 1,242,710 | 89,910,069 |
| Sensata Technologies Holding BV (a) | | 2,659,571 | 135,930,674 |
| Sunrun, Inc. (a)(e)(f) | | 6,185,222 | 36,492,810 |
| Vivint Solar, Inc. (a)(e) | | 4,358,120 | 17,650,386 |
| | | | 365,850,308 |
| Industrial Conglomerates - 1.0% | | | |
| 3M Co. | | 92,770 | 21,835,275 |
| General Electric Co. | | 6,075,181 | 106,011,908 |
| Honeywell International, Inc. | | 474,890 | 72,829,130 |
| | | | 200,676,313 |
| Machinery - 0.1% | | | |
| Caterpillar, Inc. | | 119,846 | 18,885,333 |
| Marine - 0.0% | | | |
| A.P. Moller - Maersk A/S Series B | | 1,006 | 1,757,545 |
| Professional Services - 0.0% | | | |
| Nielsen Holdings PLC | | 55,140 | 2,007,096 |
| Road & Rail - 1.7% | | | |
| Avis Budget Group, Inc. (a) | | 1,124,864 | 49,359,032 |
| CSX Corp. | | 2,547,297 | 140,126,808 |
| eHi Car Service Co. Ltd. sponsored ADR (a) | | 40 | 463 |
| Norfolk Southern Corp. | | 962,410 | 139,453,209 |
| | | | 328,939,512 |
| Trading Companies & Distributors - 0.5% | | | |
| HD Supply Holdings, Inc. (a) | | 2,304,752 | 92,259,223 |
|
| TOTAL INDUSTRIALS | | | 1,953,439,791 |
|
| INFORMATION TECHNOLOGY - 21.8% | | | |
| Communications Equipment - 0.0% | | | |
| CommScope Holding Co., Inc. (a) | | 275,600 | 10,425,948 |
| Electronic Equipment & Components - 0.7% | | | |
| Dell Technologies, Inc. (a) | | 50,400 | 4,096,512 |
| Jabil, Inc. | | 4,664,652 | 122,447,115 |
| Samsung SDI Co. Ltd. | | 72,555 | 13,900,923 |
| | | | 140,444,550 |
| Internet Software & Services - 7.2% | | | |
| 58.com, Inc. ADR (a) | | 1,692,189 | 121,109,967 |
| Alibaba Group Holding Ltd. sponsored ADR (a) | | 753,900 | 129,994,977 |
| Alphabet, Inc.: | | | |
| Class A (a) | | 200 | 210,680 |
| Class C (a) | | 554,136 | 579,847,907 |
| Box, Inc. Class A (a) | | 2,440,067 | 51,534,215 |
| Facebook, Inc. Class A (a) | | 1,715,376 | 302,695,249 |
| GoDaddy, Inc. (a) | | 163,700 | 8,230,836 |
| MINDBODY, Inc. (a) | | 2,306,283 | 70,226,317 |
| MongoDB, Inc. Class B | | 149,933 | 4,005,010 |
| NetEase, Inc. ADR | | 82,700 | 28,537,289 |
| New Relic, Inc. (a) | | 634,364 | 36,647,208 |
| Okta, Inc. | | 167,100 | 4,279,431 |
| Shopify, Inc. (a) | | 112,400 | 11,352,400 |
| Twilio, Inc. Class A (a) | | 1,390,900 | 32,825,240 |
| Yext, Inc. (e) | | 4,142,290 | 49,831,749 |
| | | | 1,431,328,475 |
| IT Services - 1.4% | | | |
| Cognizant Technology Solutions Corp. Class A | | 1,279,780 | 90,889,976 |
| FleetCor Technologies, Inc. (a) | | 363,000 | 69,852,090 |
| Leidos Holdings, Inc. | | 398,900 | 25,756,973 |
| PayPal Holdings, Inc. (a) | | 1,083,800 | 79,789,356 |
| Vantiv, Inc. (a) | | 63,500 | 4,670,425 |
| | | | 270,958,820 |
| Semiconductors & Semiconductor Equipment - 3.0% | | | |
| Advanced Micro Devices, Inc. (a) | | 229,000 | 2,354,120 |
| Analog Devices, Inc. | | 413,200 | 36,787,196 |
| Broadcom Ltd. | | 251,800 | 64,687,420 |
| Himax Technologies, Inc. sponsored ADR | | 521,515 | 5,434,186 |
| Micron Technology, Inc. (a) | | 1,524,300 | 62,679,216 |
| Nanya Technology Corp. | | 4,516,000 | 11,599,393 |
| NVIDIA Corp. | | 538,602 | 104,219,487 |
| ON Semiconductor Corp. (a) | | 3,708,436 | 77,654,650 |
| Qorvo, Inc. (a) | | 1,747,761 | 116,400,883 |
| Qualcomm, Inc. | | 1,403,805 | 89,871,596 |
| Semtech Corp. (a) | | 1,139,984 | 38,987,453 |
| | | | 610,675,600 |
| Software - 8.4% | | | |
| Activision Blizzard, Inc. | | 600,332 | 38,013,022 |
| Adobe Systems, Inc. (a) | | 332,629 | 58,289,906 |
| Autodesk, Inc. (a) | | 3,905,045 | 409,365,867 |
| Citrix Systems, Inc. (a) | | 3,374,017 | 296,913,496 |
| Electronic Arts, Inc. (a) | | 272,300 | 28,607,838 |
| Fortinet, Inc. (a) | | 53,800 | 2,350,522 |
| HubSpot, Inc. (a) | | 395,711 | 34,980,852 |
| Microsoft Corp. | | 4,331,013 | 370,474,852 |
| Oracle Corp. | | 886,500 | 41,913,720 |
| Parametric Technology Corp. (a) | | 1,576,435 | 95,799,955 |
| Red Hat, Inc. (a) | | 104,100 | 12,502,410 |
| Salesforce.com, Inc. (a) | | 1,419,857 | 145,151,981 |
| ServiceNow, Inc. (a) | | 111,200 | 14,499,368 |
| Symantec Corp. | | 1,254,787 | 35,209,323 |
| Totvs SA | | 1,528,400 | 13,772,234 |
| Workday, Inc. Class A (a) | | 136,800 | 13,918,032 |
| Zendesk, Inc. (a) | | 1,860,706 | 62,966,291 |
| | | | 1,674,729,669 |
| Technology Hardware, Storage & Peripherals - 1.1% | | | |
| Apple, Inc. | | 1,279,162 | 216,472,585 |
|
| TOTAL INFORMATION TECHNOLOGY | | | 4,355,035,647 |
|
| MATERIALS - 3.0% | | | |
| Chemicals - 2.6% | | | |
| CF Industries Holdings, Inc. | | 210,400 | 8,950,416 |
| DowDuPont, Inc. | | 2,792,306 | 198,868,033 |
| FMC Corp. | | 120,400 | 11,397,064 |
| International Flavors & Fragrances, Inc. | | 70,900 | 10,820,049 |
| LyondellBasell Industries NV Class A | | 1,090,000 | 120,248,800 |
| Monsanto Co. | | 45,700 | 5,336,846 |
| Olin Corp. | | 151,527 | 5,391,331 |
| Platform Specialty Products Corp. (a) | | 2,146,800 | 21,296,256 |
| Praxair, Inc. | | 256,400 | 39,659,952 |
| Sherwin-Williams Co. | | 73,500 | 30,137,940 |
| The Chemours Co. LLC | | 1,146,400 | 57,388,784 |
| Tronox Ltd. Class A | | 45,700 | 937,307 |
| Westlake Chemical Corp. | | 162,937 | 17,357,679 |
| | | | 527,790,457 |
| Construction Materials - 0.2% | | | |
| Eagle Materials, Inc. | | 211,059 | 23,912,985 |
| Summit Materials, Inc. | | 498,400 | 15,669,696 |
| | | | 39,582,681 |
| Containers & Packaging - 0.1% | | | |
| Ball Corp. | | 317,742 | 12,026,535 |
| Metals & Mining - 0.1% | | | |
| Freeport-McMoRan, Inc. (a) | | 1,207,400 | 22,892,304 |
|
| TOTAL MATERIALS | | | 602,291,977 |
|
| REAL ESTATE - 2.8% | | | |
| Equity Real Estate Investment Trusts (REITs) - 2.7% | | | |
| Altisource Residential Corp. Class B | | 2,006,182 | 23,793,319 |
| American Homes 4 Rent Class A | | 1,272,400 | 27,789,216 |
| American Tower Corp. | | 799,305 | 114,036,844 |
| Boston Properties, Inc. | | 370,400 | 48,163,112 |
| Colony NorthStar, Inc. | | 2,044,781 | 23,330,951 |
| Corporate Office Properties Trust (SBI) | | 579,900 | 16,933,080 |
| Corrections Corp. of America | | 206,800 | 4,653,000 |
| DDR Corp. | | 696,100 | 6,237,056 |
| Equinix, Inc. | | 118,100 | 53,525,282 |
| Equity Lifestyle Properties, Inc. | | 97,800 | 8,706,156 |
| Extra Space Storage, Inc. | | 229,783 | 20,094,523 |
| Gaming & Leisure Properties | | 123,600 | 4,573,200 |
| General Growth Properties, Inc. | | 788,300 | 18,438,337 |
| Healthcare Trust of America, Inc. | | 849,900 | 25,530,996 |
| Omega Healthcare Investors, Inc. (e) | | 96,100 | 2,646,594 |
| Outfront Media, Inc. | | 549,173 | 12,740,814 |
| Pennsylvania Real Estate Investment Trust (SBI) (e) | | 555,700 | 6,607,273 |
| Prologis, Inc. | | 844,700 | 54,491,597 |
| Spirit Realty Capital, Inc. | | 1,694,300 | 14,537,094 |
| Store Capital Corp. | | 1,117,100 | 29,089,284 |
| Sun Communities, Inc. | | 160,469 | 14,888,314 |
| VEREIT, Inc. | | 998,600 | 7,779,094 |
| | | | 538,585,136 |
| Real Estate Management & Development - 0.1% | | | |
| CBRE Group, Inc. (a) | | 684,389 | 29,640,888 |
|
| TOTAL REAL ESTATE | | | 568,226,024 |
|
| TELECOMMUNICATION SERVICES - 1.9% | | | |
| Diversified Telecommunication Services - 1.7% | | | |
| AT&T, Inc. | | 4,615,368 | 179,445,508 |
| Verizon Communications, Inc. | | 2,724,308 | 144,197,622 |
| Zayo Group Holdings, Inc. (a) | | 509,200 | 18,738,560 |
| | | | 342,381,690 |
| Wireless Telecommunication Services - 0.2% | | | |
| T-Mobile U.S., Inc. (a) | | 437,824 | 27,806,202 |
|
| TOTAL TELECOMMUNICATION SERVICES | | | 370,187,892 |
|
| UTILITIES - 2.9% | | | |
| Electric Utilities - 1.6% | | | |
| Exelon Corp. | | 2,258,892 | 89,022,934 |
| FirstEnergy Corp. | | 754,490 | 23,102,484 |
| Great Plains Energy, Inc. | | 381,699 | 12,305,976 |
| NextEra Energy, Inc. | | 947,150 | 147,935,359 |
| PG&E Corp. | | 1,010,234 | 45,288,790 |
| | | | 317,655,543 |
| Independent Power and Renewable Electricity Producers - 0.4% | | | |
| NRG Energy, Inc. | | 1,367,500 | 38,946,400 |
| NRG Yield, Inc. Class C | | 481,627 | 9,102,750 |
| The AES Corp. | | 2,498,200 | 27,055,506 |
| | | | 75,104,656 |
| Multi-Utilities - 0.9% | | | |
| Dominion Resources, Inc. | | 924,235 | 74,918,489 |
| Public Service Enterprise Group, Inc. | | 500,071 | 25,753,657 |
| SCANA Corp. | | 110,000 | 4,375,800 |
| Sempra Energy | | 814,750 | 87,113,070 |
| | | | 192,161,016 |
|
| TOTAL UTILITIES | | | 584,921,215 |
|
| TOTAL COMMON STOCKS | | | |
| (Cost $14,656,488,684) | | | 19,684,774,500 |
| | | Principal Amount | Value |
|
| U.S. Treasury Obligations - 0.0% | | | |
| U.S. Treasury Bills, yield at date of purchase 1.06% to 1.3% 1/11/18 to 3/15/18 (g) | | | |
| (Cost $7,212,077) | | 7,220,000 | 7,211,929 |
| | | Shares | Value |
|
| Money Market Funds - 1.7% | | | |
| Fidelity Cash Central Fund, 1.36% (h) | | 311,908,822 | $311,971,204 |
| Fidelity Securities Lending Cash Central Fund 1.36% (h)(i) | | 30,909,614 | 30,915,796 |
| TOTAL MONEY MARKET FUNDS | | | |
| (Cost $342,857,212) | | | 342,887,000 |
| TOTAL INVESTMENT IN SECURITIES - 100.2% | | | |
| (Cost $15,006,557,973) | | | 20,034,873,429 |
| NET OTHER ASSETS (LIABILITIES) - (0.2)% | | | (46,356,994) |
| NET ASSETS - 100% | | | $19,988,516,435 |
| Futures Contracts | | | | | |
| | Number of contracts | Expiration Date | Notional Amount | Value | Unrealized Appreciation/(Depreciation) |
| Purchased | | | | | |
| Equity Index Contracts | | | | | |
| CME E-mini S&P 500 Index Contracts (United States) | 858 | March 2018 | $114,800,400 | $1,594,818 | $1,594,818 |
The notional amount of futures purchased as a percentage of Net Assets is 0.6%
Legend
(a) Non-income producing
(b) Investment is owned by a wholly-owned subsidiary (Subsidiary) that is treated as a corporation for U.S. tax purposes.
(c) Restricted securities - Investment in securities not registered under the Securities Act of 1933 (excluding 144A issues). At the end of the period, the value of restricted securities (excluding 144A issues) amounted to $15,672,900 or 0.1% of net assets.
(d) Level 3 security
(e) Security or a portion of the security is on loan at period end.
(f) Affiliated company
(g) Security or a portion of the security was pledged to cover margin requirements for futures contracts. At period end, the value of securities pledged amounted to $4,074,657.
(h) Affiliated fund that is generally available only to investment companies and other accounts managed by Fidelity Investments. The rate quoted is the annualized seven-day yield of the fund at period end. A complete unaudited listing of the fund's holdings as of its most recent quarter end is available upon request. In addition, each Fidelity Central Fund's financial statements, which are not covered by the Fund's Report of Independent Registered Public Accounting Firm, are available on the SEC's website or upon request.
(i) Investment made with cash collateral received from securities on loan.
Additional information on each restricted holding is as follows:
| Security | Acquisition Date | Acquisition Cost |
| Centennial Resource Development, Inc. Class A | 12/28/16 | $5,816,000 |
| Extraction Oil & Gas, Inc. | 12/12/16 | $9,887,522 |
| Weinstein Co. Holdings LLC Class A-1 | 10/19/05 | $11,499,000 |
Affiliated Central Funds
Information regarding fiscal year to date income earned by the Fund from investments in Fidelity Central Funds is as follows:
| Fund | Income earned |
| Fidelity Cash Central Fund | $3,617,053 |
| Fidelity Securities Lending Cash Central Fund | 5,679,879 |
| Total | $9,296,932 |
Amounts in the income column in the above table include any capital gain distributions from underlying funds, which are presented in the corresponding line-item in the Statement of Operations if applicable.
Other Affiliated Issuers
An affiliated company is a company in which the Fund has ownership of at least 5% of the voting securities. Fiscal year to date transactions with companies which are or were affiliates are as follows:
| Affiliate | Value, beginning of period | Purchases | Sales Proceeds | Dividend Income | Realized Gain (loss) | Change in Unrealized appreciation (depreciation) | Value, end of period |
| MDC Partners, Inc. Class A | $21,263,743 | $-- | $11,119,572 | $-- | $(11,962,663) | $22,879,204 | $-- |
| Sunrun, Inc. | 32,490,945 | 411,419 | -- | -- | -- | 3,590,446 | 36,492,810 |
| Total | $53,754,688 | $411,419 | $11,119,572 | $-- | $(11,962,663) | $26,469,650 | $36,492,810 |
Investment Valuation
The following is a summary of the inputs used, as of December 31, 2017, involving the Fund's assets and liabilities carried at fair value. The inputs or methodology used for valuing securities may not be an indication of the risk associated with investing in those securities. For more information on valuation inputs, and their aggregation into the levels used below, please refer to the Investment Valuation section in the accompanying Notes to Financial Statements.
| | Valuation Inputs at Reporting Date: |
| Description | Total | Level 1 | Level 2 | Level 3 |
| Investments in Securities: | | | | |
| Equities: | | | | |
| Consumer Discretionary | $2,747,950,553 | $2,747,950,553 | $-- | $-- |
| Consumer Staples | 1,628,261,729 | 1,581,739,193 | 46,522,536 | -- |
| Energy | 1,196,470,536 | 1,196,470,536 | -- | -- |
| Financials | 2,970,718,162 | 2,934,328,175 | 36,389,987 | -- |
| Health Care | 2,707,270,974 | 2,669,460,246 | 37,810,728 | -- |
| Industrials | 1,953,439,791 | 1,953,439,791 | -- | -- |
| Information Technology | 4,355,035,647 | 4,351,030,637 | 4,005,010 | -- |
| Materials | 602,291,977 | 602,291,977 | -- | -- |
| Real Estate | 568,226,024 | 568,226,024 | -- | -- |
| Telecommunication Services | 370,187,892 | 370,187,892 | -- | -- |
| Utilities | 584,921,215 | 584,921,215 | -- | -- |
| U.S. Government and Government Agency Obligations | 7,211,929 | -- | 7,211,929 | -- |
| Money Market Funds | 342,887,000 | 342,887,000 | -- | -- |
| Total Investments in Securities: | $20,034,873,429 | $19,902,933,239 | $131,940,190 | $-- |
| Derivative Instruments: | | | | |
| Assets | | | | |
| Futures Contracts | $1,594,818 | $1,594,818 | $-- | $-- |
| Total Assets | $1,594,818 | $1,594,818 | $-- | $-- |
| Total Derivative Instruments: | $1,594,818 | $1,594,818 | $-- | $-- |
Value of Derivative Instruments
The following table is a summary of the Fund's value of derivative instruments by primary risk exposure as of December 31, 2017. For additional information on derivative instruments, please refer to the Derivative Instruments section in the accompanying Notes to Financial Statements.
| Primary Risk Exposure / Derivative Type | Value |
| | Asset | Liability |
| Equity Risk | | |
| Futures Contracts(a) | $1,594,818 | $0 |
| Total Equity Risk | 1,594,818 | 0 |
| Total Value of Derivatives | $1,594,818 | $0 |
(a) Reflects gross cumulative appreciation (depreciation) on futures contracts as presented in the Schedule of Investments. In the Statement of Assets and Liabilities, the period end daily variation margin is included in receivable or payable for daily variation margin on futures contracts, and the net cumulative appreciation (depreciation) is included in net unrealized appreciation (depreciation).
See accompanying notes which are an integral part of the financial statements.
Financial Statements
Statement of Assets and Liabilities
| | | December 31, 2017 |
| Assets | | |
Investment in securities, at value (including securities loaned of $29,307,626) — See accompanying schedule:
Unaffiliated issuers (cost $14,623,960,650) | $19,655,493,619 | |
| Fidelity Central Funds (cost $342,857,212) | 342,887,000 | |
| Other affiliated issuers (cost $39,740,111) | 36,492,810 | |
| Total Investment in Securities (cost $15,006,557,973) | | $20,034,873,429 |
| Cash | | 792,110 |
| Foreign currency held at value (cost $9,756,587) | | 9,756,587 |
| Receivable for investments sold | | 4,630,539 |
| Receivable for fund shares sold | | 1,868,369 |
| Dividends receivable | | 19,340,907 |
| Distributions receivable from Fidelity Central Funds | | 683,111 |
| Prepaid expenses | | 32,946 |
| Other receivables | | 1,369,021 |
| Total assets | | 20,073,347,019 |
| Liabilities | | |
| Payable for investments purchased | $29,576,393 | |
| Payable for fund shares redeemed | 10,366,992 | |
| Accrued management fee | 9,021,816 | |
| Distribution and service plan fees payable | 2,053,869 | |
| Payable for daily variation margin on futures contracts | 416,130 | |
| Other affiliated payables | 1,347,129 | |
| Other payables and accrued expenses | 1,137,701 | |
| Collateral on securities loaned | 30,910,554 | |
| Total liabilities | | 84,830,584 |
| Net Assets | | $19,988,516,435 |
| Net Assets consist of: | | |
| Paid in capital | | $13,288,820,360 |
| Undistributed net investment income | | 29,159,381 |
| Accumulated undistributed net realized gain (loss) on investments and foreign currency transactions | | 1,640,649,727 |
| Net unrealized appreciation (depreciation) on investments and assets and liabilities in foreign currencies | | 5,029,886,967 |
| Net Assets | | $19,988,516,435 |
| Initial Class: | | |
| Net Asset Value, offering price and redemption price per share ($7,609,925,175 ÷ 200,552,436 shares) | | $37.94 |
| Service Class: | | |
| Net Asset Value, offering price and redemption price per share ($1,569,797,720 ÷ 41,560,747 shares) | | $37.77 |
| Service Class 2: | | |
| Net Asset Value, offering price and redemption price per share ($9,255,124,005 ÷ 249,793,203 shares) | | $37.05 |
| Investor Class: | | |
| Net Asset Value, offering price and redemption price per share ($1,553,669,535 ÷ 41,172,158 shares) | | $37.74 |
See accompanying notes which are an integral part of the financial statements.
Statement of Operations
| | | Year ended December 31, 2017 |
| Investment Income | | |
| Dividends | | $295,636,892 |
| Interest | | 48,380 |
| Income from Fidelity Central Funds | | 9,296,932 |
| Total income | | 304,982,204 |
| Expenses | | |
| Management fee | $104,190,200 | |
| Transfer agent fees | 13,807,888 | |
| Distribution and service plan fees | 23,511,100 | |
| Accounting and security lending fees | 1,687,786 | |
| Custodian fees and expenses | 278,898 | |
| Independent trustees' fees and expenses | 75,405 | |
| Appreciation in deferred trustee compensation account | 89 | |
| Audit | 77,424 | |
| Legal | 57,273 | |
| Miscellaneous | 154,592 | |
| Total expenses before reductions | 143,840,655 | |
| Expense reductions | (1,231,206) | 142,609,449 |
| Net investment income (loss) | | 162,372,755 |
| Realized and Unrealized Gain (Loss) | | |
| Net realized gain (loss) on: | | |
| Investment securities: | | |
| Unaffiliated issuers | 2,018,681,086 | |
| Fidelity Central Funds | 11,234 | |
| Other affiliated issuers | (11,962,663) | |
| Foreign currency transactions | (96,363) | |
| Futures contracts | 15,219,792 | |
| Total net realized gain (loss) | | 2,021,853,086 |
| Change in net unrealized appreciation (depreciation) on: | | |
| Investment securities: | | |
| Unaffiliated issuers | 1,521,585,137 | |
| Fidelity Central Funds | (12,507) | |
| Other affiliated issuers | 26,469,650 | |
| Assets and liabilities in foreign currencies | 99,344 | |
| Futures contracts | 2,336,491 | |
| Total change in net unrealized appreciation (depreciation) | | 1,550,478,115 |
| Net gain (loss) | | 3,572,331,201 |
| Net increase (decrease) in net assets resulting from operations | | $3,734,703,956 |
See accompanying notes which are an integral part of the financial statements.
Statement of Changes in Net Assets
| | Year ended December 31, 2017 | Year ended December 31, 2016 |
| Increase (Decrease) in Net Assets | | |
| Operations | | |
| Net investment income (loss) | $162,372,755 | $161,252,799 |
| Net realized gain (loss) | 2,021,853,086 | 751,550,819 |
| Change in net unrealized appreciation (depreciation) | 1,550,478,115 | 414,451,844 |
| Net increase (decrease) in net assets resulting from operations | 3,734,703,956 | 1,327,255,462 |
| Distributions to shareholders from net investment income | (167,795,221) | (123,732,924) |
| Distributions to shareholders from net realized gain | (1,017,638,614) | (1,451,984,960) |
| Total distributions | (1,185,433,835) | (1,575,717,884) |
| Share transactions - net increase (decrease) | (417,890,496) | (517,277,577) |
| Total increase (decrease) in net assets | 2,131,379,625 | (765,739,999) |
| Net Assets | | |
| Beginning of period | 17,857,136,810 | 18,622,876,809 |
| End of period | $19,988,516,435 | $17,857,136,810 |
| Other Information | | |
| Undistributed net investment income end of period | $29,159,381 | $34,198,739 |
See accompanying notes which are an integral part of the financial statements.
Financial Highlights
VIP Contrafund Portfolio Initial Class
| Years ended December 31, | 2017 | 2016 | 2015 | 2014 | 2013 |
| Selected Per–Share Data | | | | | |
| Net asset value, beginning of period | $33.18 | $33.91 | $37.36 | $34.35 | $26.44 |
| Income from Investment Operations | | | | | |
| Net investment income (loss)A | .35 | .33 | .35 | .36 | .32 |
| Net realized and unrealized gain (loss) | 6.69 | 1.85 | (.14) | 3.76 | 7.94 |
| Total from investment operations | 7.04 | 2.18 | .21 | 4.12 | 8.26 |
| Distributions from net investment income | (.36) | (.26) | (.37) | (.36) | (.34) |
| Distributions from net realized gain | (1.91) | (2.65) | (3.30) | (.75) | (.01) |
| Total distributions | (2.28)B | (2.91) | (3.66)C | (1.11) | (.35) |
| Redemption fees added to paid in capitalA | – | – | – | –D | –D |
| Net asset value, end of period | $37.94 | $33.18 | $33.91 | $37.36 | $34.35 |
| Total ReturnE,F | 21.88% | 8.04% | .64% | 11.94% | 31.29% |
| Ratios to Average Net AssetsG,H | | | | | |
| Expenses before reductions | .62% | .63% | .63% | .63% | .64% |
| Expenses net of fee waivers, if any | .62% | .63% | .63% | .63% | .63% |
| Expenses net of all reductions | .62% | .62% | .62% | .63% | .62% |
| Net investment income (loss) | .98% | 1.04% | 1.01% | 1.01% | 1.05% |
| Supplemental Data | | | | | |
| Net assets, end of period (000 omitted) | $7,609,925 | $6,962,430 | $7,436,130 | $8,005,930 | $7,654,305 |
| Portfolio turnover rateI | 70% | 62% | 80% | 74% | 86% |
A Calculated based on average shares outstanding during the period.
B Total distributions of $2.28 per share is comprised of distributions from net investment income of $.364 and distributions from net realized gain of $1.911 per share.
C Total distributions of $3.66 per share is comprised of distributions from net investment income of $.369 and distributions from net realized gain of $3.295 per share.
D Amount represents less than $.005 per share.
E Total returns do not reflect charges attributable to your insurance company's separate account. Inclusion of these charges would reduce the total returns shown.
F Total returns would have been lower if certain expenses had not been reduced during the applicable periods shown.
G Fees and expenses of any underlying Fidelity Central Funds are not included in the Fund's expense ratio. The Fund indirectly bears its proportionate share of the expenses of any underlying Fidelity Central Funds.
H Expense ratios reflect operating expenses of the class. Expenses before reductions do not reflect amounts reimbursed by the investment adviser or reductions from brokerage service arrangements or reductions from other expense offset arrangements and do not represent the amount paid by the class during periods when reimbursements or reductions occur. Expenses net of fee waivers reflect expenses after reimbursement by the investment adviser but prior to reductions from brokerage service arrangements or other expense offset arrangements. Expenses net of all reductions represent the net expenses paid by the class.
I Amount does not include the portfolio activity of any underlying Fidelity Central Funds.
See accompanying notes which are an integral part of the financial statements.
VIP Contrafund Portfolio Service Class
| Years ended December 31, | 2017 | 2016 | 2015 | 2014 | 2013 |
| Selected Per–Share Data | | | | | |
| Net asset value, beginning of period | $33.04 | $33.79 | $37.23 | $34.24 | $26.36 |
| Income from Investment Operations | | | | | |
| Net investment income (loss)A | .31 | .29 | .32 | .33 | .29 |
| Net realized and unrealized gain (loss) | 6.66 | 1.84 | (.13) | 3.73 | 7.91 |
| Total from investment operations | 6.97 | 2.13 | .19 | 4.06 | 8.20 |
| Distributions from net investment income | (.33) | (.23) | (.33) | (.32) | (.31) |
| Distributions from net realized gain | (1.91) | (2.65) | (3.30) | (.75) | (.01) |
| Total distributions | (2.24) | (2.88) | (3.63) | (1.07) | (.32) |
| Redemption fees added to paid in capitalA | – | – | – | –B | –B |
| Net asset value, end of period | $37.77 | $33.04 | $33.79 | $37.23 | $34.24 |
| Total ReturnC,D | 21.76% | 7.91% | .56% | 11.82% | 31.14% |
| Ratios to Average Net AssetsE,F | | | | | |
| Expenses before reductions | .72% | .73% | .73% | .73% | .74% |
| Expenses net of fee waivers, if any | .72% | .73% | .73% | .73% | .73% |
| Expenses net of all reductions | .72% | .72% | .72% | .73% | .72% |
| Net investment income (loss) | .88% | .94% | .91% | .91% | .95% |
| Supplemental Data | | | | | |
| Net assets, end of period (000 omitted) | $1,569,798 | $1,428,793 | $1,546,864 | $1,714,615 | $1,688,448 |
| Portfolio turnover rateG | 70% | 62% | 80% | 74% | 86% |
A Calculated based on average shares outstanding during the period.
B Amount represents less than $.005 per share.
C Total returns do not reflect charges attributable to your insurance company's separate account. Inclusion of these charges would reduce the total returns shown.
D Total returns would have been lower if certain expenses had not been reduced during the applicable periods shown.
E Fees and expenses of any underlying Fidelity Central Funds are not included in the Fund's expense ratio. The Fund indirectly bears its proportionate share of the expenses of any underlying Fidelity Central Funds.
F Expense ratios reflect operating expenses of the class. Expenses before reductions do not reflect amounts reimbursed by the investment adviser or reductions from brokerage service arrangements or reductions from other expense offset arrangements and do not represent the amount paid by the class during periods when reimbursements or reductions occur. Expenses net of fee waivers reflect expenses after reimbursement by the investment adviser but prior to reductions from brokerage service arrangements or other expense offset arrangements. Expenses net of all reductions represent the net expenses paid by the class.
G Amount does not include the portfolio activity of any underlying Fidelity Central Funds.
See accompanying notes which are an integral part of the financial statements.
VIP Contrafund Portfolio Service Class 2
| Years ended December 31, | 2017 | 2016 | 2015 | 2014 | 2013 |
| Selected Per–Share Data | | | | | |
| Net asset value, beginning of period | $32.45 | $33.25 | $36.70 | $33.77 | $26.00 |
| Income from Investment Operations | | | | | |
| Net investment income (loss)A | .25 | .24 | .26 | .27 | .24 |
| Net realized and unrealized gain (loss) | 6.54 | 1.80 | (.14) | 3.68 | 7.80 |
| Total from investment operations | 6.79 | 2.04 | .12 | 3.95 | 8.04 |
| Distributions from net investment income | (.28) | (.20) | (.28) | (.27) | (.26) |
| Distributions from net realized gain | (1.91) | (2.65) | (3.30) | (.75) | (.01) |
| Total distributions | (2.19) | (2.84)B | (3.57)C | (1.02) | (.27) |
| Redemption fees added to paid in capitalA | – | – | – | –D | –D |
| Net asset value, end of period | $37.05 | $32.45 | $33.25 | $36.70 | $33.77 |
| Total ReturnE,F | 21.59% | 7.76% | .39% | 11.65% | 30.95% |
| Ratios to Average Net AssetsG,H | | | | | |
| Expenses before reductions | .87% | .88% | .88% | .88% | .89% |
| Expenses net of fee waivers, if any | .87% | .88% | .88% | .88% | .88% |
| Expenses net of all reductions | .87% | .87% | .87% | .88% | .87% |
| Net investment income (loss) | .73% | .79% | .76% | .76% | .80% |
| Supplemental Data | | | | | |
| Net assets, end of period (000 omitted) | $9,255,124 | $8,138,206 | $8,363,076 | $8,764,266 | $8,472,780 |
| Portfolio turnover rateI | 70% | 62% | 80% | 74% | 86% |
A Calculated based on average shares outstanding during the period.
B Total distributions of $2.84 per share is comprised of distributions from net investment income of $.196 and distributions from net realized gain of $2.648 per share.
C Total distributions of $3.57 per share is comprised of distributions from net investment income of $.279 and distributions from net realized gain of $3.295 per share.
D Amount represents less than $.005 per share.
E Total returns do not reflect charges attributable to your insurance company's separate account. Inclusion of these charges would reduce the total returns shown.
F Total returns would have been lower if certain expenses had not been reduced during the applicable periods shown.
G Fees and expenses of any underlying Fidelity Central Funds are not included in the Fund's expense ratio. The Fund indirectly bears its proportionate share of the expenses of any underlying Fidelity Central Funds.
H Expense ratios reflect operating expenses of the class. Expenses before reductions do not reflect amounts reimbursed by the investment adviser or reductions from brokerage service arrangements or reductions from other expense offset arrangements and do not represent the amount paid by the class during periods when reimbursements or reductions occur. Expenses net of fee waivers reflect expenses after reimbursement by the investment adviser but prior to reductions from brokerage service arrangements or other expense offset arrangements. Expenses net of all reductions represent the net expenses paid by the class.
I Amount does not include the portfolio activity of any underlying Fidelity Central Funds.
See accompanying notes which are an integral part of the financial statements.
VIP Contrafund Portfolio Investor Class
| Years ended December 31, | 2017 | 2016 | 2015 | 2014 | 2013 |
| Selected Per–Share Data | | | | | |
| Net asset value, beginning of period | $33.01 | $33.76 | $37.21 | $34.22 | $26.35 |
| Income from Investment Operations | | | | | |
| Net investment income (loss)A | .32 | .30 | .32 | .33 | .29 |
| Net realized and unrealized gain (loss) | 6.66 | 1.84 | (.13) | 3.74 | 7.91 |
| Total from investment operations | 6.98 | 2.14 | .19 | 4.07 | 8.20 |
| Distributions from net investment income | (.34) | (.24) | (.34) | (.33) | (.32) |
| Distributions from net realized gain | (1.91) | (2.65) | (3.30) | (.75) | (.01) |
| Total distributions | (2.25) | (2.89) | (3.64) | (1.08) | (.33) |
| Redemption fees added to paid in capitalA | – | – | – | –B | –B |
| Net asset value, end of period | $37.74 | $33.01 | $33.76 | $37.21 | $34.22 |
| Total ReturnC,D | 21.81% | 7.95% | .56% | 11.85% | 31.15% |
| Ratios to Average Net AssetsE,F | | | | | |
| Expenses before reductions | .70% | .71% | .71% | .71% | .72% |
| Expenses net of fee waivers, if any | .70% | .71% | .71% | .71% | .71% |
| Expenses net of all reductions | .70% | .70% | .70% | .71% | .71% |
| Net investment income (loss) | .90% | .95% | .93% | .93% | .97% |
| Supplemental Data | | | | | |
| Net assets, end of period (000 omitted) | $1,553,670 | $1,327,708 | $1,276,807 | $1,210,592 | $1,031,358 |
| Portfolio turnover rateG | 70% | 62% | 80% | 74% | 86% |
A Calculated based on average shares outstanding during the period.
B Amount represents less than $.005 per share.
C Total returns do not reflect charges attributable to your insurance company's separate account. Inclusion of these charges would reduce the total returns shown.
D Total returns would have been lower if certain expenses had not been reduced during the applicable periods shown.
E Fees and expenses of any underlying Fidelity Central Funds are not included in the Fund's expense ratio. The Fund indirectly bears its proportionate share of the expenses of any underlying Fidelity Central Funds.
F Expense ratios reflect operating expenses of the class. Expenses before reductions do not reflect amounts reimbursed by the investment adviser or reductions from brokerage service arrangements or reductions from other expense offset arrangements and do not represent the amount paid by the class during periods when reimbursements or reductions occur. Expenses net of fee waivers reflect expenses after reimbursement by the investment adviser but prior to reductions from brokerage service arrangements or other expense offset arrangements. Expenses net of all reductions represent the net expenses paid by the class.
G Amount does not include the portfolio activity of any underlying Fidelity Central Funds.
See accompanying notes which are an integral part of the financial statements.
Notes to Financial Statements
For the period ended December 31, 2017
1. Organization.
VIP Contrafund Portfolio (the Fund) is a fund of Variable Insurance Products Fund II (the Trust) and is authorized to issue an unlimited number of shares. The Trust is registered under the Investment Company Act of 1940, as amended (the 1940 Act), as an open-end management investment company organized as a Massachusetts business trust. Shares of the Fund may only be purchased by insurance companies for the purpose of funding variable annuity or variable life insurance contracts. The Fund offers the following classes of shares: Initial Class shares, Service Class shares, Service Class 2 shares and Investor Class shares. All classes have equal rights and voting privileges, except for matters affecting a single class.
2. Investments in Fidelity Central Funds.
The Fund invests in Fidelity Central Funds, which are open-end investment companies generally available only to other investment companies and accounts managed by the investment adviser and its affiliates. The Fund's Schedule of Investments lists each of the Fidelity Central Funds held as of period end, if any, as an investment of the Fund, but does not include the underlying holdings of each Fidelity Central Fund. As an Investing Fund, the Fund indirectly bears its proportionate share of the expenses of the underlying Fidelity Central Funds.
The Money Market Central Funds seek preservation of capital and current income and are managed by Fidelity Investments Money Management, Inc. (FIMM), an affiliate of the investment adviser. Annualized expenses of the Money Market Central Funds as of their most recent shareholder report date are less than .005%.
A complete unaudited list of holdings for each Fidelity Central Fund is available upon request or at the Securities and Exchange Commission (the SEC) website at www.sec.gov. In addition, the financial statements of the Fidelity Central Funds, which are not covered by the Fund's Report of Independent Registered Public Accounting Firm, are available on the SEC website or upon request.
3. Significant Accounting Policies.
The Fund is an investment company and applies the accounting and reporting guidance of the Financial Accounting Standards Board (FASB) Accounting Standards Codification Topic 946 Financial Services – Investments Companies. The financial statements have been prepared in conformity with accounting principles generally accepted in the United States of America (GAAP), which require management to make certain estimates and assumptions at the date of the financial statements. Actual results could differ from those estimates. Subsequent events, if any, through the date that the financial statements were issued have been evaluated in the preparation of the financial statements. The following summarizes the significant accounting policies of the Fund:
Investment Valuation. Investments are valued as of 4:00 p.m. Eastern time on the last calendar day of the period. The Board of Trustees (the Board) has delegated the day to day responsibility for the valuation of the Fund's investments to the Fair Value Committee (the Committee) established by the Fund's investment adviser. In accordance with valuation policies and procedures approved by the Board, the Fund attempts to obtain prices from one or more third party pricing vendors or brokers to value its investments. When current market prices, quotations or currency exchange rates are not readily available or reliable, investments will be fair valued in good faith by the Committee, in accordance with procedures adopted by the Board. Factors used in determining fair value vary by investment type and may include market or investment specific events, changes in interest rates and credit quality. The frequency with which these procedures are used cannot be predicted and they may be utilized to a significant extent. The Committee oversees the Fund's valuation policies and procedures and reports to the Board on the Committee's activities and fair value determinations. The Board monitors the appropriateness of the procedures used in valuing the Fund's investments and ratifies the fair value determinations of the Committee.
The Fund categorizes the inputs to valuation techniques used to value its investments into a disclosure hierarchy consisting of three levels as shown below:
- Level 1 – quoted prices in active markets for identical investments
- Level 2 – other significant observable inputs (including quoted prices for similar investments, interest rates, prepayment speeds, etc.)
- Level 3 – unobservable inputs (including the Fund's own assumptions based on the best information available)
Valuation techniques used to value the Fund's investments by major category are as follows:
Equity securities, including restricted securities, for which market quotations are readily available, are valued at the last reported sale price or official closing price as reported by a third party pricing vendor on the primary market or exchange on which they are traded and are categorized as Level 1 in the hierarchy. In the event there were no sales during the day or closing prices are not available, securities are valued at the last quoted bid price or may be valued using the last available price and are generally categorized as Level 2 in the hierarchy. For foreign equity securities, when market or security specific events arise, comparisons to the valuation of American Depositary Receipts (ADRs), futures contracts, Exchange-Traded Funds (ETFs) and certain indexes as well as quoted prices for similar securities may be used and would be categorized as Level 2 in the hierarchy. Utilizing these techniques may result in transfers between Level 1 and Level 2. For equity securities, including restricted securities, where observable inputs are limited, assumptions about market activity and risk are used and these securities may be categorized as Level 3 in the hierarchy.
Debt securities, including restricted securities, are valued based on evaluated prices received from third party pricing vendors or from brokers who make markets in such securities. U.S. government and government agency obligations are valued by pricing vendors who utilize matrix pricing which considers yield or price of bonds of comparable quality, coupon, maturity and type or by broker-supplied prices. When independent prices are unavailable or unreliable, debt securities may be valued utilizing pricing methodologies which consider similar factors that would be used by third party pricing vendors. Debt securities are generally categorized as Level 2 in the hierarchy but may be Level 3 depending on the circumstances.
Futures contracts are valued at the settlement price established each day by the board of trade or exchange on which they are traded and are categorized as Level 1 in the hierarchy. Investments in open-end mutual funds, including the Fidelity Central Funds, are valued at their closing net asset value (NAV) each business day and are categorized as Level 1 in the hierarchy.
Changes in valuation techniques may result in transfers in or out of an assigned level within the disclosure hierarchy. The aggregate value of investments by input level as of December 31, 2017 is included at the end of the Fund's Schedule of Investments.
Foreign Currency. The Fund may use foreign currency contracts to facilitate transactions in foreign-denominated securities. Gains and losses from these transactions may arise from changes in the value of the foreign currency or if the counterparties do not perform under the contracts' terms.
Foreign-denominated assets, including investment securities, and liabilities are translated into U.S. dollars at the exchange rates at period end. Purchases and sales of investment securities, income and dividends received and expenses denominated in foreign currencies are translated into U.S. dollars at the exchange rate in effect on the transaction date.
The effects of exchange rate fluctuations on investments are included with the net realized and unrealized gain (loss) on investment securities. Other foreign currency transactions resulting in realized and unrealized gain (loss) are disclosed separately.
Investment Transactions and Income. For financial reporting purposes, the Fund's investment holdings and NAV include trades executed through the end of the last business day of the period. The NAV per share for processing shareholder transactions is calculated as of the close of business of the New York Stock Exchange (NYSE), normally 4:00 p.m. Eastern time and includes trades executed through the end of the prior business day. Gains and losses on securities sold are determined on the basis of identified cost and includes proceeds received from litigation. Dividend income is recorded on the ex-dividend date, except for certain dividends from foreign securities where the ex-dividend date may have passed, which are recorded as soon as the Fund is informed of the ex-dividend date. Non-cash dividends included in dividend income, if any, are recorded at the fair market value of the securities received. Income and capital gain distributions from Fidelity Central Funds, if any, are recorded on the ex-dividend date. Certain distributions received by the Fund represent a return of capital or capital gain. The Fund determines the components of these distributions subsequent to the ex-dividend date, based upon receipt of tax filings or other correspondence relating to the underlying investment. These distributions are recorded as a reduction of cost of investments and/or as a realized gain. Interest income is accrued as earned and includes coupon interest and amortization of premium and accretion of discount on debt securities as applicable. Investment income is recorded net of foreign taxes withheld where recovery of such taxes is uncertain.
Class Allocations and Expenses. Investment income, realized and unrealized capital gains and losses, common expenses of the Fund, and certain fund-level expense reductions, if any, are allocated daily on a pro-rata basis to each class based on the relative net assets of each class to the total net assets of the Fund. Each class differs with respect to transfer agent and distribution and service plan fees incurred. Certain expense reductions may also differ by class. For the reporting period, the allocated portion of income and expenses to each class as a percent of its average net assets may vary due to the timing of recording these transactions in relation to fluctuating net assets of the classes. Expenses directly attributable to a fund are charged to that fund. Expenses attributable to more than one fund are allocated among the respective funds on the basis of relative net assets or other appropriate methods. Expense estimates are accrued in the period to which they relate and adjustments are made when actual amounts are known.
Deferred Trustee Compensation. Under a Deferred Compensation Plan (the Plan), independent Trustees may elect to defer receipt of a portion of their annual compensation. Deferred amounts are invested in a cross-section of Fidelity funds, are marked-to-market and remain in the Fund until distributed in accordance with the Plan. The investment of deferred amounts and the offsetting payable to the Trustees are included in the accompanying Statement of Assets and Liabilities.
Income Tax Information and Distributions to Shareholders. Each year, the Fund intends to qualify as a regulated investment company under Subchapter M of the Internal Revenue Code, including distributing substantially all of its taxable income and realized gains. As a result, no provision for U.S. Federal income taxes is required. As of December 31, 2017, the Fund did not have any unrecognized tax benefits in the financial statements; nor is the Fund aware of any tax positions for which it is reasonably possible that the total amounts of unrecognized tax benefits will significantly change in the next twelve months. The Fund files a U.S. federal tax return, in addition to state and local tax returns as required. The Fund's federal income tax returns are subject to examination by the Internal Revenue Service (IRS) for a period of three fiscal years after they are filed. State and local tax returns may be subject to examination for an additional fiscal year depending on the jurisdiction. Foreign taxes are provided for based on the Fund's understanding of the tax rules and rates that exist in the foreign markets in which it invests.
Distributions are declared and recorded on the ex-dividend date. Income dividends and capital gain distributions are declared separately for each class. Income and capital gain distributions are determined in accordance with income tax regulations, which may differ from GAAP.
Capital accounts within the financial statements are adjusted for permanent book-tax differences. These adjustments have no impact on net assets or the results of operations. Capital accounts are not adjusted for temporary book-tax differences which will reverse in a subsequent period.
Book-tax differences are primarily due to futures contracts, foreign currency transactions, passive foreign investment companies (PFIC), market discount, partnerships, deferred trustees compensation and losses deferred due to wash sales.
As of period end, the cost and unrealized appreciation (depreciation) in securities, and derivatives if applicable, for federal income tax purposes were as follows:
| Gross unrealized appreciation | $5,360,078,312 |
| Gross unrealized depreciation | (409,214,429) |
| Net unrealized appreciation (depreciation) | $4,950,863,883 |
| Tax Cost | $15,084,009,546 |
The tax-based components of distributable earnings as of period end were as follows:
| Undistributed ordinary income | $91,935,225 |
| Undistributed long-term capital gain | $1,657,988,027 |
| Net unrealized appreciation (depreciation) on securities and other investments | $4,950,840,575 |
The tax character of distributions paid was as follows:
| | December 31, 2017 | December 31, 2016 |
| Ordinary Income | $505,184,577 | $ 123,732,925 |
| Long-term Capital Gains | 680,249,258 | 1,451,984,959 |
| Total | $1,185,433,835 | $ 1,575,717,884 |
Restricted Securities. The Fund may invest in securities that are subject to legal or contractual restrictions on resale. These securities generally may be resold in transactions exempt from registration or to the public if the securities are registered. Disposal of these securities may involve time-consuming negotiations and expense, and prompt sale at an acceptable price may be difficult. Information regarding restricted securities is included at the end of the Fund's Schedule of Investments.
Consolidated Subsidiary. The Fund invests in certain investments through a wholly-owned subsidiary ("Subsidiary"), which may be subject to federal and state taxes upon disposition.
As of period end, the Fund held an investment of $0 in this Subsidiary representing .00% of the Fund's net assets. The financial statements have been consolidated and include accounts of the Fund and the Subsidiary. Accordingly, all inter-company transactions and balances have been eliminated.
4. Derivative Instruments.
Risk Exposures and the Use of Derivative Instruments. The Fund's investment objective allows the Fund to enter into various types of derivative contracts, including futures contracts. Derivatives are investments whose value is primarily derived from underlying assets, indices or reference rates and may be transacted on an exchange or over-the-counter (OTC). Derivatives may involve a future commitment to buy or sell a specified asset based on specified terms, to exchange future cash flows at periodic intervals based on a notional principal amount, or for one party to make one or more payments upon the occurrence of specified events in exchange for periodic payments from the other party.
The Fund used derivatives to increase returns and to manage exposure to certain risks as defined below. The success of any strategy involving derivatives depends on analysis of numerous economic factors, and if the strategies for investment do not work as intended, the Fund may not achieve its objectives.
The Fund's use of derivatives increased or decreased its exposure to the following risk:
| Equity Risk | Equity risk relates to the fluctuations in the value of financial instruments as a result of changes in market prices (other than those arising from interest rate risk or foreign exchange risk), whether caused by factors specific to an individual investment, its issuer, or all factors affecting all instruments traded in a market or market segment.
|
The Fund is also exposed to additional risks from investing in derivatives, such as liquidity risk and counterparty credit risk. Liquidity risk is the risk that the Fund will be unable to close out the derivative in the open market in a timely manner. Counterparty credit risk is the risk that the counterparty will not be able to fulfill its obligation to the Fund. Counterparty credit risk related to exchange-traded futures contracts may be mitigated by the protection provided by the exchange on which they trade.
Investing in derivatives may involve greater risks than investing in the underlying assets directly and, to varying degrees, may involve risk of loss in excess of any initial investment and collateral received and amounts recognized in the Statement of Assets and Liabilities. In addition, there may be the risk that the change in value of the derivative contract does not correspond to the change in value of the underlying instrument.
Futures Contracts. A futures contract is an agreement between two parties to buy or sell a specified underlying instrument for a fixed price at a specified future date. The Fund used futures contracts to manage its exposure to the stock market.
Upon entering into a futures contract, a fund is required to deposit either cash or securities (initial margin) with a clearing broker in an amount equal to a certain percentage of the face value of the contract. Futures contracts are marked-to-market daily and subsequent daily payments (variation margin) are made or received by a fund depending on the daily fluctuations in the value of the futures contracts and are recorded as unrealized appreciation or (depreciation). This receivable and/or payable, if any, is included in daily variation margin on futures contracts in the Statement of Assets and Liabilities. Realized gain or (loss) is recorded upon the expiration or closing of a futures contract. The net realized gain (loss) and change in net unrealized appreciation (depreciation) on futures contracts during the period is presented in the Statement of Operations.
Any open futures contracts at period end are presented in the Schedule of Investments under the caption "Futures Contracts". The notional amount at value reflects each contract's exposure to the underlying instrument or index at period end and is representative of volume of activity during the period. Securities deposited to meet initial margin requirements are identified in the Schedule of Investments.
5. Purchases and Sales of Investments.
Purchases and sales of securities, other than short-term securities, aggregated $13,134,044,800 and $14,411,349,120, respectively.
6. Fees and Other Transactions with Affiliates.
Management Fee. Fidelity Management & Research Company (the investment adviser) and its affiliates provide the Fund with investment management related services for which the Fund pays a monthly management fee. The management fee is the sum of an individual fund fee rate that is based on an annual rate of .30% of the Fund's average net assets and an annualized group fee rate that averaged .24% during the period. The group fee rate is based upon the average net assets of all the mutual funds advised by the investment adviser, including any mutual funds previously advised by the investment adviser that are currently advised by Fidelity SelectCo, LLC, an affiliate of the investment adviser. The group fee rate decreases as assets under management increase and increases as assets under management decrease. For the reporting period, the total annual management fee rate was .54% of the Fund's average net assets.
Distribution and Service Plan Fees. In accordance with Rule 12b-1 of the 1940 Act, the Fund has adopted separate 12b-1 Plans for each Service Class of shares. Each Service Class pays Fidelity Distributors Corporation (FDC), an affiliate of the investment adviser, a service fee. For the period, the service fee is based on an annual rate of .10% of Service Class' average net assets and .25% of Service Class 2's average net assets.
For the period, total fees, all of which were re-allowed to insurance companies for the distribution of shares and providing shareholder support services, were as follows:
| Service Class | $1,507,930 |
| Service Class 2 | 22,003,170 |
| | $23,511,100 |
Transfer Agent Fees. Fidelity Investments Institutional Operations Company, Inc. (FIIOC), an affiliate of the investment adviser, is the Fund's transfer, dividend disbursing, and shareholder servicing agent. FIIOC receives an asset-based fee with respect to each class. Each class pays a fee for transfer agent services, typesetting and printing and mailing of shareholder reports, excluding mailing of proxy statements, equal to an annual rate of of class-level average net assets. The annual rate for Investor Class is .15% and the annual rate for all other classes is .07%. For the period, transfer agent fees for each class were as follows:
| Initial Class | $4,857,011 |
| Service Class | 994,046 |
| Service Class 2 | 5,801,813 |
| Investor Class | 2,155,018 |
| | $13,807,888 |
Accounting and Security Lending Fees. Fidelity Service Company, Inc. (FSC), an affiliate of the investment adviser, maintains the Fund's accounting records. The accounting fee is based on the level of average net assets for each month. Under a separate contract, FSC administers the security lending program. The security lending fee is based on the number and duration of lending transactions.
Brokerage Commissions. The Fund placed a portion of its portfolio transactions with brokerage firms which are affiliates of the investment adviser. Brokerage commissions are included in net realized gain (loss) and change in net unrealized appreciation (depreciation) in the Statement of Operations. The commissions paid to these affiliated firms were $396,010 for the period.
Interfund Trades. The Fund may purchase from or sell securities to other Fidelity Funds under procedures adopted by the Board. The procedures have been designed to ensure these interfund trades are executed in accordance with Rule 17a-7 of the 1940 Act. Interfund trades are included within the respective purchases and sales amounts shown in the Purchases and Sales of Investments note.
Other. During the period, the investment adviser reimbursed the Fund for certain losses in the amount of $31,494.
7. Committed Line of Credit.
The Fund participates with other funds managed by the investment adviser or an affiliate in a $4.25 billion credit facility (the "line of credit") to be utilized for temporary or emergency purposes to fund shareholder redemptions or for other short-term liquidity purposes. The Fund has agreed to pay commitment fees on its pro-rata portion of the line of credit, which amounted to $59,557 and is reflected in Miscellaneous expenses on the Statement of Operations. During the period, the Fund did not borrow on this line of credit.
8. Security Lending.
The Fund lends portfolio securities through a lending agent from time to time in order to earn additional income. For equity securities, a lending agent is used and may loan securities to certain qualified borrowers, including Fidelity Capital Markets (FCM), a broker-dealer affiliated with the Fund. On the settlement date of the loan, the Fund receives collateral (in the form of U.S. Treasury obligations, letters of credit and/or cash) against the loaned securities and maintains collateral in an amount not less than 100% of the market value of the loaned securities during the period of the loan. The market value of the loaned securities is determined at the close of business of the Fund and any additional required collateral is delivered to the Fund on the next business day. The Fund or borrower may terminate the loan at any time, and if the borrower defaults on its obligation to return the securities loaned because of insolvency or other reasons, the Fund may apply collateral received from the borrower against the obligation. The Fund may experience delays and costs in recovering the securities loaned. Any cash collateral received is invested in the Fidelity Securities Lending Cash Central Fund. The value of loaned securities and cash collateral at period end are disclosed on the Fund's Statement of Assets and Liabilities. At period end, there were no security loans outstanding with FCM. Security lending income represents the income earned on investing cash collateral, less rebates paid to borrowers and any lending agent fees associated with the loan, plus any premium payments received for lending certain types of securities. Security lending income is presented in the Statement of Operations as a component of income from Fidelity Central Funds. Total security lending income during the period amounted to $5,679,879, including $448,176 from securities loaned to FCM.
9. Expense Reductions.
Commissions paid to certain brokers with whom the investment adviser, or its affiliates, places trades on behalf of the Fund include an amount in addition to trade execution, which may be rebated back to the Fund to offset certain expenses. This amount totaled $1,066,249 for the period. In addition, through arrangements with the Fund's custodian, credits realized as a result of certain uninvested cash balances were used to reduce the Fund's expenses. During the period, these credits reduced the Fund's custody expenses by $2,879.
In addition, during the period the investment adviser reimbursed and/or waived a portion of fund-level operating expenses in the amount of $162,078.
10. Distributions to Shareholders.
Distributions to shareholders of each class were as follows:
| | Year ended
December 31, 2017 | Year ended
December 31, 2016 |
| From net investment income | | |
| Initial Class | $72,522,215 | $54,940,478 |
| Service Class | 13,446,755 | 10,073,381 |
| Service Class 2 | 68,183,160 | 48,997,544 |
| Investor Class | 13,643,091 | 9,721,521 |
| Total | $167,795,221 | $123,732,924 |
| From net realized gain | | |
| Initial Class | $387,865,841 | $575,054,471 |
| Service Class | 79,829,047 | 119,636,942 |
| Service Class 2 | 472,898,767 | 657,251,824 |
| Investor Class | 77,044,959 | 100,041,723 |
| Total | $1,017,638,614 | $1,451,984,960 |
11. Share Transactions.
Transactions for each class of shares were as follows:
| | Shares | Shares | Dollars | Dollars |
| | Year ended
December 31, 2017 | Year ended December 31, 2016 | Year ended
December 31, 2017 | Year ended December 31, 2016 |
| Initial Class | | | | |
| Shares sold | 4,614,129 | 4,917,198 | $164,590,229 | $154,447,968 |
| Reinvestment of distributions | 13,138,586 | 22,388,704 | 460,388,056 | 629,994,949 |
| Shares redeemed | (27,023,436) | (36,744,966) | (965,808,041) | (1,144,427,127) |
| Net increase (decrease) | (9,270,721) | (9,439,064) | $(340,829,756) | $(359,984,210) |
| Service Class | | | | |
| Shares sold | 1,491,143 | 1,377,610 | $53,076,113 | $43,113,058 |
| Reinvestment of distributions | 2,676,168 | 4,635,999 | 93,275,802 | 129,710,323 |
| Shares redeemed | (5,849,185) | (8,552,024) | (207,172,250) | (269,744,462) |
| Net increase (decrease) | (1,681,874) | (2,538,415) | $(60,820,335) | $(96,921,081) |
| Service Class 2 | | | | |
| Shares sold | 15,028,601 | 22,094,254 | $522,007,548 | $675,363,352 |
| Reinvestment of distributions | 15,821,660 | 25,726,957 | 541,081,927 | 706,249,368 |
| Shares redeemed | (31,821,656) | (48,541,399) | (1,110,004,186) | (1,504,027,418) |
| Net increase (decrease) | (971,395) | (720,188) | $(46,914,711) | $(122,414,698) |
| Investor Class | | | | |
| Shares sold | 1,548,363 | 1,712,207 | $54,849,925 | $53,815,278 |
| Reinvestment of distributions | 2,599,769 | 3,918,305 | 90,688,050 | 109,763,244 |
| Shares redeemed | (3,193,633) | (3,227,939) | (114,863,669) | (101,536,110) |
| Net increase (decrease) | 954,499 | 2,402,573 | $30,674,306 | $62,042,412 |
12. Other.
The Fund's organizational documents provide former and current trustees and officers with a limited indemnification against liabilities arising in connection with the performance of their duties to the Fund. In the normal course of business, the Fund may also enter into contracts that provide general indemnifications. The Fund's maximum exposure under these arrangements is unknown as this would be dependent on future claims that may be made against the Fund. The risk of material loss from such claims is considered remote.
At the end of the period, the investment adviser or its affiliates were the owners of record of 13% of the total outstanding shares of the Fund and one otherwise unaffiliated shareholder was the owner of record of 10% of the total outstanding shares of the Fund.
Report of Independent Registered Public Accounting Firm
To the Trustees of Variable Insurance Products Fund II and Shareholders of VIP Contrafund℠ Portfolio:
Opinion on the Financial Statements and Financial Highlights
We have audited the accompanying statement of assets and liabilities of VIP Contrafund Portfolio (the "Fund"), a fund of Variable Insurance Products Fund II, including the schedule of investments, as of December 31, 2017, and the related statement of operations for the year then ended, the statement of changes in net assets for each of the two years in the period then ended, the financial highlights for each of the five years in the period then ended, and the related notes. In our opinion, the financial statements and financial highlights present fairly, in all material respects, the financial position of the Fund as of December 31, 2017, and the results of its operations for the year then ended, the changes in its net assets for each of the two years in the period then ended, and the financial highlights for each of the five years in the period then ended, in conformity with accounting principles generally accepted in the United States of America.
Basis for Opinion
These financial statements and financial highlights are the responsibility of the Fund's management. Our responsibility is to express an opinion on the Fund's financial statements and financial highlights based on our audits. We are a public accounting firm registered with the Public Company Accounting Oversight Board (United States) (PCAOB) and are required to be independent with respect to the Fund in accordance with the U.S. federal securities laws and the applicable rules and regulations of the Securities and Exchange Commission and the PCAOB.
We conducted our audits in accordance with the standards of the PCAOB. Those standards require that we plan and perform the audit to obtain reasonable assurance about whether the financial statements and financial highlights are free of material misstatement, whether due to error or fraud. The Fund is not required to have, nor were we engaged to perform, an audit of its internal control over financial reporting. As part of our audits we are required to obtain an understanding of internal control over financial reporting but not for the purpose of expressing an opinion on the effectiveness of the Fund’s internal control over financial reporting. Accordingly, we express no such opinion.
Our audits included performing procedures to assess the risks of material misstatement of the financial statements and financial highlights, whether due to error or fraud, and performing procedures that respond to those risks. Such procedures included examining, on a test basis, evidence regarding the amounts and disclosures in the financial statements and financial highlights. Our audits also included evaluating the accounting principles used and significant estimates made by management, as well as evaluating the overall presentation of the financial statements and financial highlights. Our procedures included confirmation of securities owned as of December 31, 2017, by correspondence with the custodians and brokers; when replies were not received from brokers, we performed other auditing procedures. We believe that our audits provide a reasonable basis for our opinion.
DELOITTE & TOUCHE LLP
Boston, Massachusetts
February 12, 2018
We have served as the auditor of one or more of the Fidelity investment companies since 1999.
Trustees and Officers
The Trustees, Members of the Advisory Board (if any), and officers of the trust and fund, as applicable, are listed below. The Board of Trustees governs the fund and is responsible for protecting the interests of shareholders. The Trustees are experienced executives who meet periodically throughout the year to oversee the fund's activities, review contractual arrangements with companies that provide services to the fund, oversee management of the risks associated with such activities and contractual arrangements, and review the fund's performance. Each of the Trustees oversees 190 funds.
The Trustees hold office without limit in time except that (a) any Trustee may resign; (b) any Trustee may be removed by written instrument, signed by at least two-thirds of the number of Trustees prior to such removal; (c) any Trustee who requests to be retired or who has become incapacitated by illness or injury may be retired by written instrument signed by a majority of the other Trustees; and (d) any Trustee may be removed at any special meeting of shareholders by a two-thirds vote of the outstanding voting securities of the trust. Each Trustee who is not an interested person (as defined in the 1940 Act) of the trust and the fund is referred to herein as an Independent Trustee. Each Independent Trustee shall retire not later than the last day of the calendar year in which his or her 75th birthday occurs. The Independent Trustees may waive this mandatory retirement age policy with respect to individual Trustees. Officers and Advisory Board Members hold office without limit in time, except that any officer or Advisory Board Member may resign or may be removed by a vote of a majority of the Trustees at any regular meeting or any special meeting of the Trustees. Except as indicated, each individual has held the office shown or other offices in the same company for the past five years.
The fund’s Statement of Additional Information (SAI) includes more information about the Trustees. To request a free copy, call Fidelity at 1-877-208-0098.
Experience, Skills, Attributes, and Qualifications of the Trustees. The Governance and Nominating Committee has adopted a statement of policy that describes the experience, qualifications, attributes, and skills that are necessary and desirable for potential Independent Trustee candidates (Statement of Policy). The Board believes that each Trustee satisfied at the time he or she was initially elected or appointed a Trustee, and continues to satisfy, the standards contemplated by the Statement of Policy. The Governance and Nominating Committee also engages professional search firms to help identify potential Independent Trustee candidates who have the experience, qualifications, attributes, and skills consistent with the Statement of Policy. From time to time, additional criteria based on the composition and skills of the current Independent Trustees, as well as experience or skills that may be appropriate in light of future changes to board composition, business conditions, and regulatory or other developments, have also been considered by the professional search firms and the Governance and Nominating Committee. In addition, the Board takes into account the Trustees' commitment and participation in Board and committee meetings, as well as their leadership of standing and ad hoc committees throughout their tenure.
In determining that a particular Trustee was and continues to be qualified to serve as a Trustee, the Board has considered a variety of criteria, none of which, in isolation, was controlling. The Board believes that, collectively, the Trustees have balanced and diverse experience, qualifications, attributes, and skills, which allow the Board to operate effectively in governing the fund and protecting the interests of shareholders. Information about the specific experience, skills, attributes, and qualifications of each Trustee, which in each case led to the Board's conclusion that the Trustee should serve (or continue to serve) as a trustee of the fund, is provided below.
Board Structure and Oversight Function. James C. Curvey is an interested person and currently serves as Chairman. The Trustees have determined that an interested Chairman is appropriate and benefits shareholders because an interested Chairman has a personal and professional stake in the quality and continuity of services provided to the fund. Independent Trustees exercise their informed business judgment to appoint an individual of their choosing to serve as Chairman, regardless of whether the Trustee happens to be independent or a member of management. The Independent Trustees have determined that they can act independently and effectively without having an Independent Trustee serve as Chairman and that a key structural component for assuring that they are in a position to do so is for the Independent Trustees to constitute a substantial majority for the Board. The Independent Trustees also regularly meet in executive session. Ned C. Lautenbach serves as Chairman of the Independent Trustees and as such (i) acts as a liaison between the Independent Trustees and management with respect to matters important to the Independent Trustees and (ii) with management prepares agendas for Board meetings.
Fidelity® funds are overseen by different Boards of Trustees. The fund's Board oversees Fidelity's high income and certain equity funds, and other Boards oversee Fidelity's investment-grade bond, money market, asset allocation, and sector funds. The asset allocation funds may invest in Fidelity® funds overseen by the fund's Board. The use of separate Boards, each with its own committee structure, allows the Trustees of each group of Fidelity® funds to focus on the unique issues of the funds they oversee, including common research, investment, and operational issues. On occasion, the separate Boards establish joint committees to address issues of overlapping consequences for the Fidelity® funds overseen by each Board.
The Trustees operate using a system of committees to facilitate the timely and efficient consideration of all matters of importance to the Trustees, the fund, and fund shareholders and to facilitate compliance with legal and regulatory requirements and oversight of the fund's activities and associated risks. The Board, acting through its committees, has charged FMR and its affiliates with (i) identifying events or circumstances the occurrence of which could have demonstrably adverse effects on the fund's business and/or reputation; (ii) implementing processes and controls to lessen the possibility that such events or circumstances occur or to mitigate the effects of such events or circumstances if they do occur; and (iii) creating and maintaining a system designed to evaluate continuously business and market conditions in order to facilitate the identification and implementation processes described in (i) and (ii) above. Because the day-to-day operations and activities of the fund are carried out by or through FMR, its affiliates, and other service providers, the fund's exposure to risks is mitigated but not eliminated by the processes overseen by the Trustees. While each of the Board's committees has responsibility for overseeing different aspects of the fund's activities, oversight is exercised primarily through the Operations, Audit, and Compliance Committees. In addition, the Independent Trustees have worked with FMR to enhance the Board's oversight of investment and financial risks, legal and regulatory risks, technology risks, and operational risks, including the development of additional risk reporting to the Board. For example, a working group comprised of Independent Trustees and FMR has worked and continues to work to review the Fidelity® funds' valuation-related activities, reporting and risk management. Appropriate personnel, including but not limited to the fund's Chief Compliance Officer (CCO), FMR's internal auditor, the independent accountants, the fund's Treasurer and portfolio management personnel, make periodic reports to the Board's committees, as appropriate, including an annual review of Fidelity's risk management program for the Fidelity® funds. The responsibilities of each standing committee, including their oversight responsibilities, are described further under "Standing Committees of the Trustees."
Interested Trustees*:
Correspondence intended for a Trustee who is an interested person may be sent to Fidelity Investments, 245 Summer Street, Boston, Massachusetts 02210.
Name, Year of Birth; Principal Occupations and Other Relevant Experience+
James C. Curvey (1935)
Year of Election or Appointment: 2007
Trustee
Chairman of the Board of Trustees
Mr. Curvey also serves as Trustee of other Fidelity® funds. Mr. Curvey is a Director of Fidelity Research & Analysis Co. (investment adviser firm, 2009-present), and Vice Chairman (2007-present) and Director of FMR LLC (diversified financial services company). In addition, Mr. Curvey serves as an Overseer for the Boston Symphony Orchestra and a member of the board of Artis-Naples, Naples, Florida, and as a Trustee for Brewster Academy, Wolfeboro, New Hampshire. Previously, Mr. Curvey served as a Director of Fidelity Investments Money Management, Inc. (investment adviser firm, 2009-2014) and a Director of FMR and FMR Co., Inc. (investment adviser firms, 2007-2014).
Charles S. Morrison (1960)
Year of Election or Appointment: 2014
Trustee
Mr. Morrison also serves as Trustee of other funds. He serves as President of Fidelity SelectCo, LLC (investment adviser firm, 2017-present) and Fidelity Management & Research Company (FMR) (investment adviser firm, 2016-present), a Director of Fidelity Investments Money Management, Inc. (FIMM) (investment adviser firm, 2014-present), Director of Fidelity SelectCo, LLC (investment adviser firm, 2014-present), President, Asset Management (2014-present), and is an employee of Fidelity Investments. Previously, Mr. Morrison served as Vice President of Fidelity's Fixed Income and Asset Allocation Funds (2012-2014), President, Fixed Income (2011-2014), Vice President of Fidelity's Money Market Funds (2005-2009), President, Money Market Group Leader of FMR (investment adviser firm, 2009), and Senior Vice President, Money Market Group of FMR (2004-2009). Mr. Morrison also served as Vice President of Fidelity's Bond Funds (2002-2005), certain Balanced Funds (2002-2005), and certain Asset Allocation Funds (2002-2007), and as Senior Vice President (2002-2005) of Fidelity's Bond Division.
* Determined to be an “Interested Trustee” by virtue of, among other things, his or her affiliation with the trust or various entities under common control with FMR.
+ The information includes the Trustee's principal occupation during the last five years and other information relating to the experience, attributes, and skills relevant to the Trustee's qualifications to serve as a Trustee, which led to the conclusion that the Trustee should serve as a Trustee for the fund.
Independent Trustees:
Correspondence intended for an Independent Trustee may be sent to Fidelity Investments, P.O. Box 55235, Boston, Massachusetts 02205-5235.
Name, Year of Birth; Principal Occupations and Other Relevant Experience+
Dennis J. Dirks (1948)
Year of Election or Appointment: 2005
Trustee
Mr. Dirks also serves as Trustee of other Fidelity® funds. Prior to his retirement in May 2003, Mr. Dirks was Chief Operating Officer and a member of the Board of The Depository Trust & Clearing Corporation (DTCC). He also served as President, Chief Operating Officer, and Board member of The Depository Trust Company (DTC) and President and Board member of the National Securities Clearing Corporation (NSCC). In addition, Mr. Dirks served as Chief Executive Officer and Board member of the Government Securities Clearing Corporation, Chief Executive Officer and Board member of the Mortgage-Backed Securities Clearing Corporation, as a Trustee and a member of the Finance Committee of Manhattan College (2005-2008), as a Trustee and a member of the Finance Committee of AHRC of Nassau County (2006-2008), as a member of the Independent Directors Council (IDC) Governing Council (2010-2015), and as a member of the Board of Directors for The Brookville Center for Children’s Services, Inc. (2009-2017). Mr. Dirks is a member of the Finance Committee (2016-present) and Board of Directors (2017-present) of the Asolo Repertory Theatre.
Alan J. Lacy (1953)
Year of Election or Appointment: 2008
Trustee
Mr. Lacy also serves as Trustee of other Fidelity® funds. Mr. Lacy serves as a Director of Bristol-Myers Squibb Company (global pharmaceuticals, 2008-present). He is a Trustee of the California Chapter of The Nature Conservancy (2015-present) and a Director of the Center for Advanced Study in the Behavioral Sciences at Stanford University (2015-present). In addition, Mr. Lacy served as Senior Adviser (2007-2014) of Oak Hill Capital Partners, L.P. (private equity) and also served as Chief Executive Officer (2005) and Vice Chairman (2005-2006) of Sears Holdings Corporation (retail) and Chief Executive Officer and Chairman of the Board of Sears, Roebuck and Co. (retail, 2000-2005). Previously, Mr. Lacy served as Chairman (2014-2017) and a member (2010-2017) of the Board of Directors of Dave & Buster’s Entertainment, Inc. (restaurant and entertainment complexes), as Chairman (2008-2011) and a member (2006-2015) of the Board of Trustees of the National Parks Conservation Association, and as a member of the Board of Directors for The Hillman Companies, Inc. (hardware wholesalers, 2010-2014), Earth Fare, Inc. (retail grocery, 2010-2014), and The Western Union Company (global money transfer, 2006-2011).
Ned C. Lautenbach (1944)
Year of Election or Appointment: 2000
Trustee
Chairman of the Independent Trustees
Mr. Lautenbach also serves as Trustee of other Fidelity® funds. Mr. Lautenbach currently serves as Vice Chair of the Board of Governors, State University System of Florida (2013-present) and is a member of the Council on Foreign Relations (1994-present). He is also a member and has most recently served as Chairman of the Board of Directors of Artis-Naples (2012-present). Previously, Mr. Lautenbach served as a member and then Lead Director of the Board of Directors of Eaton Corporation (diversified industrial, 1997-2016). He was also a Partner and Advisory Partner at Clayton, Dubilier & Rice, LLC (private equity investment, 1998-2010), as well as a Director of Sony Corporation (2006-2007). In addition, Mr. Lautenbach also had a 30-year career with IBM (technology company) during which time he served as Senior Vice President and a member of the Corporate Executive Committee (1968-1998).
Joseph Mauriello (1944)
Year of Election or Appointment: 2008
Trustee
Mr. Mauriello also serves as Trustee of other Fidelity® funds. Prior to his retirement in January 2006, Mr. Mauriello served in numerous senior management positions including Deputy Chairman and Chief Operating Officer (2004-2005), and Vice Chairman of Financial Services (2002-2004) of KPMG LLP US (professional services, 1965-2005). Mr. Mauriello currently serves as a member of the Board of Directors of XL Group plc. (global insurance and re-insurance, 2006-present) and the Independent Directors Council (IDC) Governing Council (2015-present). Previously, Mr. Mauriello served as a Director of the Hamilton Funds of the Bank of New York (2006-2007) and of Arcadia Resources Inc. (health care services and products, 2007-2012).
Cornelia M. Small (1944)
Year of Election or Appointment: 2005
Trustee
Ms. Small also serves as Trustee of other Fidelity® funds. Ms. Small is a member of the Board of Directors (2009-present) and Chair of the Investment Committee (2010-present) of the Teagle Foundation. Ms. Small also serves on the Investment Committee of the Berkshire Taconic Community Foundation (2008-present). Previously, Ms. Small served as Chairperson (2002-2008) and a member of the Investment Committee and Chairperson (2008-2012) and a member of the Board of Trustees of Smith College. In addition, Ms. Small served as Chief Investment Officer, Director of Global Equity Investments, and a member of the Board of Directors of Scudder, Stevens & Clark and Scudder Kemper Investments.
William S. Stavropoulos (1939)
Year of Election or Appointment: 2001
Trustee
Vice Chairman of the Independent Trustees
Mr. Stavropoulos also serves as Trustee of other Fidelity® funds. Mr. Stavropoulos serves as President and Founder of the Michigan Baseball Foundation, the Great Lakes Loons (2007-present). Mr. Stavropoulos is Chairman Emeritus of the Board of Directors of The Dow Chemical Company, where he previously served in numerous senior management positions, including President, CEO (1995-2000; 2002-2004), Chairman of the Executive Committee (2000-2006), and as a member of the Board of Directors (1990-2006). Currently, Mr. Stavropoulos is Chairman of the Board of Directors of Univar Inc. (global distributor of commodity and specialty chemicals), a Director of Teradata Corporation (data warehousing and technology solutions), and a member of the Advisory Board for Metalmark Capital LLC (private equity investment, 2005-present). Mr. Stavropoulos is an operating advisor to Clayton, Dubilier & Rice, LLC (private equity investment). In addition, Mr. Stavropoulos is a member of the University of Notre Dame Advisory Council for the College of Science, a Trustee of the Rollin L. Gerstacker Foundation, and a Director of Artis-Naples in Naples, Florida. Previously, Mr. Stavropoulos served as a Director of Chemical Financial Corporation (bank holding company, 1993-2012) and Tyco International, Ltd. (multinational manufacturing and services, 2007-2012).
David M. Thomas (1949)
Year of Election or Appointment: 2008
Trustee
Mr. Thomas also serves as Trustee of other Fidelity® funds. Mr. Thomas serves as Non-Executive Chairman of the Board of Directors of Fortune Brands Home and Security (home and security products, 2011-present), as a member of the Board of Directors (2004-present) and Presiding Director (2013-present) of Interpublic Group of Companies, Inc. (marketing communication), and as a member of the Board of Trustees of the University of Florida (2013-present). Previously, Mr. Thomas served as Executive Chairman (2005-2006) and Chairman and Chief Executive Officer (2000-2005) of IMS Health, Inc. (pharmaceutical and healthcare information solutions), and a Director of Fortune Brands, Inc. (consumer products, 2000-2011).
+ The information includes the Trustee's principal occupation during the last five years and other information relating to the experience, attributes, and skills relevant to the Trustee's qualifications to serve as a Trustee, which led to the conclusion that the Trustee should serve as a Trustee for the fund.
Advisory Board Members and Officers:
Correspondence intended for an officer or Peter S. Lynch may be sent to Fidelity Investments, 245 Summer Street, Boston, Massachusetts 02210. Officers appear below in alphabetical order.
Name, Year of Birth; Principal Occupation
Peter S. Lynch (1944)
Year of Election or Appointment: 2003
Member of the Advisory Board
Mr. Lynch also serves as Member of the Advisory Board of other Fidelity® funds. Mr. Lynch is Vice Chairman and a Director of FMR (investment adviser firm) and FMR Co., Inc. (investment adviser firm). In addition, Mr. Lynch serves as a Trustee of Boston College and as the Chairman of the Inner-City Scholarship Fund. Previously, Mr. Lynch served on the Special Olympics International Board of Directors (1997-2006).
Elizabeth Paige Baumann (1968)
Year of Election or Appointment: 2017
Anti-Money Laundering (AML) Officer
Ms. Baumann also serves as AML Officer of other funds. She is Chief AML Officer (2012-present) and Senior Vice President (2014-present) of FMR LLC (diversified financial services company) and is an employee of Fidelity Investments. Previously, Ms. Baumann served as AML Officer of the funds (2012-2016), and Vice President (2007-2014) and Deputy Anti-Money Laundering Officer (2007-2012) of FMR LLC.
Marc R. Bryant (1966)
Year of Election or Appointment: 2015
Secretary and Chief Legal Officer (CLO)
Mr. Bryant also serves as Secretary and CLO of other funds. Mr. Bryant serves as CLO, Secretary, and Senior Vice President of Fidelity Management & Research Company (investment adviser firm, 2015-present) and FMR Co., Inc. (investment adviser firm, 2015-present); Secretary of Fidelity SelectCo, LLC (investment adviser firm, 2015-present) and Fidelity Investments Money Management, Inc. (investment adviser firm, 2015-present); and CLO of Fidelity Management & Research (Hong Kong) Limited and FMR Investment Management (UK) Limited (investment adviser firms, 2015-present) and Fidelity Management & Research (Japan) Limited (investment adviser firm, 2016-present). He is Senior Vice President and Deputy General Counsel of FMR LLC (diversified financial services company). Previously, Mr. Bryant served as Secretary and CLO of Fidelity Rutland Square Trust II (2010-2014) and Assistant Secretary of Fidelity's Fixed Income and Asset Allocation Funds (2013-2015). Prior to joining Fidelity Investments, Mr. Bryant served as a Senior Vice President and the Head of Global Retail Legal for AllianceBernstein L.P. (2006-2010), and as the General Counsel for ProFund Advisors LLC (2001-2006).
William C. Coffey (1969)
Year of Election or Appointment: 2009
Assistant Secretary
Mr. Coffey also serves as Assistant Secretary of other funds. He is Senior Vice President and Deputy General Counsel of FMR LLC (diversified financial services company, 2010-present), and is an employee of Fidelity Investments. Previously, Mr. Coffey served as Vice President and Associate General Counsel of FMR LLC (2005-2009).
Jonathan Davis (1968)
Year of Election or Appointment: 2010
Assistant Treasurer
Mr. Davis also serves as Assistant Treasurer of other funds. Mr. Davis serves as Assistant Treasurer of FMR Capital, Inc. (2017-present) and is an employee of Fidelity Investments. Previously, Mr. Davis served as Vice President and Associate General Counsel of FMR LLC (diversified financial services company, 2003-2010).
Adrien E. Deberghes (1967)
Year of Election or Appointment: 2016
Assistant Treasurer
Mr. Deberghes also serves as an officer of other funds. He serves as Assistant Treasurer of FMR Capital, Inc. (2017-present), Executive Vice President of Fidelity Investments Money Management, Inc. (FIMM) (investment adviser firm, 2016-present), and is an employee of Fidelity Investments (2008-present). Prior to joining Fidelity Investments, Mr. Deberghes was Senior Vice President of Mutual Fund Administration at State Street Corporation (2007-2008), Senior Director of Mutual Fund Administration at Investors Bank & Trust (2005-2007), and Director of Finance for Dunkin' Brands (2000-2005). Previously, Mr. Deberghes served in other fund officer roles.
Stephanie J. Dorsey (1969)
Year of Election or Appointment: 2010
Assistant Treasurer
Ms. Dorsey also serves as an officer of other funds. Ms. Dorsey serves as Assistant Treasurer of FMR Capital, Inc. (2017-present), is an employee of Fidelity Investments (2008-present), and has served in other fund officer roles. Prior to joining Fidelity Investments, Ms. Dorsey served as Treasurer (2004-2008) of the JPMorgan Mutual Funds and Vice President (2004-2008) of JPMorgan Chase Bank.
Howard J. Galligan III (1966)
Year of Election or Appointment: 2014
Chief Financial Officer
Mr. Galligan also serves as Chief Financial Officer of other funds. Mr. Galligan serves as President of Fidelity Pricing and Cash Management Services (FPCMS) (2014-present) and as a Director of Strategic Advisers, Inc. (investment adviser firm, 2008-present). Previously, Mr. Galligan served as Chief Administrative Officer of Asset Management (2011-2014) and Chief Operating Officer and Senior Vice President of Investment Support for Strategic Advisers, Inc. (2003-2011).
Brian B. Hogan (1964)
Year of Election or Appointment: 2009
Vice President
Mr. Hogan also serves as Trustee or Vice President of other funds. Mr. Hogan serves as a Director of FMR Investment Management (UK) Limited (investment adviser firm, 2015-present) and Fidelity SelectCo, LLC (investment adviser firm, 2014-present) and President of the Equity Division of FMR (investment adviser firm, 2009-present). Previously, Mr. Hogan served as Senior Vice President, Equity Research of FMR (2006-2009) and as a portfolio manager. Mr. Brian B. Hogan is not related to Mr. Colm A. Hogan.
Colm A. Hogan (1973)
Year of Election or Appointment: 2016
Deputy Treasurer
Mr. Hogan also serves as an officer of other funds. Mr. Hogan serves as Assistant Treasurer of FMR Capital, Inc. (2017-present) and is an employee of Fidelity Investments (2005-present). Mr. Colm A. Hogan is not related to Mr. Brian B. Hogan.
Chris Maher (1972)
Year of Election or Appointment: 2013
Assistant Treasurer
Mr. Maher serves as Assistant Treasurer of other funds. Mr. Maher is Vice President of Valuation Oversight, serves as Assistant Treasurer of FMR Capital, Inc. (2017-present), and is an employee of Fidelity Investments. Previously, Mr. Maher served as Vice President of Asset Management Compliance (2013), Vice President of the Program Management Group of FMR (investment adviser firm, 2010-2013), and Vice President of Valuation Oversight (2008-2010).
Rieco E. Mello (1969)
Year of Election or Appointment: 2017
Assistant Treasurer
Mr. Mello also serves as Assistant Treasurer of other funds. Mr. Mello serves as Assistant Treasurer of FMR Capital, Inc. (2017-present) and is an employee of Fidelity Investments (1995-present).
Melissa M. Reilly (1971)
Year of Election or Appointment: 2014
Vice President of certain Equity Funds
Ms. Reilly also serves as Vice President of other funds. Ms. Reilly is an employee of Fidelity Investments (2004-present).
Kenneth B. Robins (1969)
Year of Election or Appointment: 2016
Chief Compliance Officer
Mr. Robins also serves as an officer of other funds. Mr. Robins serves as Compliance Officer of Fidelity Management & Research Company and FMR Co., Inc. (investment adviser firms, 2016-present) and is an employee of Fidelity Investments (2004-present). Previously, Mr. Robins served as Executive Vice President of Fidelity Investments Money Management, Inc. (investment adviser firm, 2013-2016) and served in other fund officer roles.
Stacie M. Smith (1974)
Year of Election or Appointment: 2016
President and Treasurer
Ms. Smith also serves as an officer of other funds. Ms. Smith serves as Assistant Treasurer of FMR Capital, Inc. (2017-present), is an employee of Fidelity Investments (2009-present), and has served in other fund officer roles. Prior to joining Fidelity Investments, Ms. Smith served as Senior Audit Manager of Ernst & Young LLP (accounting firm, 1996-2009). Previously, Ms. Smith served as Deputy Treasurer of certain Fidelity® funds (2013-2016).
Marc L. Spector (1972)
Year of Election or Appointment: 2016
Assistant Treasurer
Mr. Spector also serves as an officer of other funds. Mr. Spector serves as Assistant Treasurer of FMR Capital, Inc. (2017-present) and is an employee of Fidelity Investments (2016-present). Prior to joining Fidelity Investments, Mr. Spector served as Director at the Siegfried Group (accounting firm, 2013-2016), and prior to Siegfried Group as audit senior manager at Deloitte & Touche (accounting firm, 2005-2013).
Renee Stagnone (1975)
Year of Election or Appointment: 2016
Assistant Treasurer
Ms. Stagnone also serves as an officer of other funds. Ms. Stagnone serves as Assistant Treasurer of FMR Capital, Inc. (2017-present) and is an employee of Fidelity Investments (1997-present). Previously, Ms. Stagnone served as Deputy Treasurer of certain Fidelity® funds (2013-2016).
Shareholder Expense Example
As a shareholder of the Fund, you incur two types of costs: (1) transaction costs and (2) ongoing costs, including management fees, distribution and/or service (12b-1) fees and other Fund expenses. This Example is intended to help you understand your ongoing costs (in dollars) of investing in the Fund and to compare these costs with the ongoing costs of investing in other mutual funds.
The Example is based on an investment of $1,000 invested at the beginning of the period and held for the entire period (July 1, 2017 to December 31, 2017).
Actual Expenses
The first line of the accompanying table for each class of the Fund provides information about actual account values and actual expenses. You may use the information in this line, together with the amount you invested, to estimate the expenses that you paid over the period. Simply divide your account value by $1,000.00 (for example, an $8,600 account value divided by $1,000.00 = 8.6), then multiply the result by the number in the first line for a class of the Fund under the heading entitled "Expenses Paid During Period" to estimate the expenses you paid on your account during this period. The estimate of expenses does not include any fees or other expenses of any variable annuity or variable life insurance product. If they were, the estimate of expenses you paid during the period would be higher, and your ending account value would be lower. In addition, the Fund, as a shareholder in the underlying Fidelity Central Funds, will indirectly bear its pro-rata share of the fees and expenses incurred by the underlying Fidelity Central Funds. These fees and expenses are not included in the Fund's annualized expense ratio used to calculate the expense estimate in the table below.
Hypothetical Example for Comparison Purposes
The second line of the accompanying table for each class of the Fund provides information about hypothetical account values and hypothetical expenses based on a Class' actual expense ratio and an assumed rate of return of 5% per year before expenses, which is not the Class' actual return. The hypothetical account values and expenses may not be used to estimate the actual ending account balance or expenses you paid for the period. You may use this information to compare the ongoing costs of investing in the Fund and other funds. To do so, compare this 5% hypothetical example with the 5% hypothetical examples that appear in the shareholder reports of the other funds. The estimate of expenses does not include any fees or other expenses of any variable annuity or variable life insurance product. If they were, the estimate of expenses you paid during the period would be higher, and your ending account value would be lower. In addition, the Fund, as a shareholder in the underlying Fidelity Central Funds, will indirectly bear its pro-rata share of the fees and expenses incurred by the underlying Fidelity Central Funds. These fees and expenses are not included in the Fund's annualized expense ratio used to calculate the expense estimate in the table below.
Please note that the expenses shown in the table are meant to highlight your ongoing costs only and do not reflect any transaction costs. Therefore, the second line of the table is useful in comparing ongoing costs only, and will not help you determine the relative total costs of owning different funds.
| | Annualized Expense Ratio-A | Beginning
Account Value
July 1, 2017 | Ending
Account Value
December 31, 2017 | Expenses Paid
During Period-B
July 1, 2017
to December 31, 2017 |
| Initial Class | .62% | | | |
| Actual | | $1,000.00 | $1,092.70 | $3.27 |
| Hypothetical-C | | $1,000.00 | $1,022.08 | $3.16 |
| Service Class | .72% | | | |
| Actual | | $1,000.00 | $1,092.20 | $3.80 |
| Hypothetical-C | | $1,000.00 | $1,021.58 | $3.67 |
| Service Class 2 | .87% | | | |
| Actual | | $1,000.00 | $1,091.30 | $4.59 |
| Hypothetical-C | | $1,000.00 | $1,020.82 | $4.43 |
| Investor Class | .70% | | | |
| Actual | | $1,000.00 | $1,092.50 | $3.69 |
| Hypothetical-C | | $1,000.00 | $1,021.68 | $3.57 |
A Annualized expense ratio reflects expenses net of applicable fee waivers.
B Expenses are equal to each Class' annualized expense ratio, multiplied by the average account value over the period, multiplied by 184/365 (to reflect the one-half year period).
C 5% return per year before expenses
Distributions (Unaudited)
The Board of Trustees of VIP Contrafund Portfolio voted to pay to shareholders of record at the opening of business on record date, the following distributions per share derived from capital gains realized from sales of portfolio securities, and dividends derived from net investment income:
| | Pay Date | Record Date | Dividends | Capital Gains |
| VIP Contrafund Portfolio | | | | |
| Initial Class | 02/09/18 | 02/09/18 | $0.065 | $3.276 |
| Service Class | 02/09/18 | 02/09/18 | $0.059 | $3.276 |
| Service Class 2 | 02/09/18 | 02/09/18 | $0.050 | $3.276 |
| Investor Class | 02/09/18 | 02/09/18 | $0.060 | $3.276 |
|
The fund hereby designates as a capital gain dividend with respect to the taxable year ended December 31, 2017, $1,658,225,053, or, if subsequently determined to be different, the net capital gain of such year.
Initial Class designates 93% and 51%; Service Class designates 99% and 53%; Service Class 2 designates 100% and 55% and Investor Class designates 98% and 52% of the dividends distributed in February and December 2017, respectively, during the fiscal year as qualifying for the dividends–received deduction for corporate shareholders.
Board Approval of Investment Advisory Contracts and Management Fees
VIP Contrafund Portfolio
Each year, the Board of Trustees, including the Independent Trustees (together, the Board), votes on the renewal of the management contract with Fidelity Management & Research Company (FMR) and the sub-advisory agreements (together, the Advisory Contracts) for the fund. FMR and the sub-advisers are referred to herein as the Investment Advisers. The Board, assisted by the advice of fund counsel and Independent Trustees' counsel, requests and considers a broad range of information relevant to the renewal of the Advisory Contracts throughout the year.
The Board meets regularly and, at each of its meetings, covers an extensive agenda of topics and materials and considers factors that are relevant to its annual consideration of the renewal of the fund's Advisory Contracts, including the services and support provided to the fund and its shareholders. The Board has established various standing committees (Committees), each composed of and chaired by Independent Trustees with varying backgrounds, to which the Board has assigned specific subject matter responsibilities in order to enhance effective decision-making by the Board. The Board, acting directly and through its Committees, requests and receives information concerning the annual consideration of the renewal of the fund's Advisory Contracts. The Board also meets as needed to review matters specifically related to the Board's annual consideration of the renewal of the Advisory Contracts. Members of the Board may also meet with trustees of other Fidelity funds through ad hoc joint committees to discuss certain matters relevant to all of the Fidelity funds.
At its July 2017 meeting, the Board unanimously determined to renew the fund's Advisory Contracts. In reaching its determination, the Board considered all factors it believed relevant, including (i) the nature, extent, and quality of the services to be provided to the fund and its shareholders (including the investment performance of the fund); (ii) the competitiveness of the fund's management fee and total expense ratio relative to peer funds; (iii) the total costs of the services to be provided by and the profits to be realized by Fidelity from its relationships with the fund; and (iv) the extent to which, if any, economies of scale exist and would be realized as the fund grows, and whether any economies of scale are appropriately shared with fund shareholders.
In considering whether to renew the Advisory Contracts for the fund, the Board reached a determination, with the assistance of fund counsel and Independent Trustees' counsel and through the exercise of its business judgment, that the renewal of the Advisory Contracts was in the best interests of the fund and its shareholders and that the compensation payable under the Advisory Contracts was fair and reasonable. The Board's decision to renew the Advisory Contracts was not based on any single factor, but rather was based on a comprehensive consideration of all the information provided to the Board at its meetings throughout the year. The Board, in reaching its determination to renew the Advisory Contracts, was aware that shareholders of the fund have a broad range of investment choices available to them, including a wide choice among funds offered by Fidelity's competitors, and that the fund's shareholders, who have the opportunity to review and weigh the disclosure provided by the fund in its prospectus and other public disclosures, have chosen to invest in this fund, which is part of the Fidelity family of funds.
Amendment to Group Fee Rate. The Board also approved an amendment to the management contract for the fund to add an additional breakpoint to the group fee schedule, effective October 1, 2017. The Board noted that the additional breakpoint would result in lower management fee rates as Fidelity's assets under management increase.
Nature, Extent, and Quality of Services Provided. The Board considered Fidelity's staffing as it relates to the fund, including the backgrounds of investment personnel of Fidelity, and also considered the fund's investment objective, strategies, and related investment philosophy. The Independent Trustees also had discussions with senior management of Fidelity's investment operations and investment groups. The Board considered the structure of the investment personnel compensation program and whether this structure provides appropriate incentives to act in the best interests of the fund. Additionally, the Board considered the portfolio managers' investments, if any, in the funds that they manage.
Resources Dedicated to Investment Management and Support Services. The Board and the Fund Oversight and Research Committees reviewed the general qualifications and capabilities of Fidelity's investment staff, including its size, education, experience, and resources, as well as Fidelity's approach to recruiting, training, managing, and compensating investment personnel. The Board noted that Fidelity has continued to increase the resources devoted to non-U.S. offices, including expansion of Fidelity's global investment organization. The Board also noted that Fidelity's analysts have extensive resources, tools and capabilities that allow them to conduct sophisticated quantitative and fundamental analysis, as well as credit analysis of issuers, counterparties and guarantors. Further, the Board considered that Fidelity's investment professionals have sufficient access to global information and data so as to provide competitive investment results over time, and that those professionals also have access to sophisticated tools that permit them to assess portfolio construction and risk and performance attribution characteristics continuously, as well as to transmit new information and research conclusions rapidly around the world. Additionally, in its deliberations, the Board considered Fidelity's trading, risk management, compliance, and technology and operations capabilities and resources, which are integral parts of the investment management process.
Shareholder and Administrative Services. The Board considered (i) the nature, extent, quality, and cost of advisory, administrative, and shareholder services performed by the Investment Advisers and their affiliates under the Advisory Contracts and under separate agreements covering transfer agency, pricing and bookkeeping, and securities lending services for the fund; (ii) the nature and extent of the supervision of third party service providers, principally custodians, subcustodians, and pricing vendors; and (iii) the resources devoted to, and the record of compliance with, the fund's compliance policies and procedures. The Board also reviewed the allocation of fund brokerage, including allocations to brokers affiliated with the Investment Advisers, the use of brokerage commissions to pay fund expenses, and the use of "soft" commission dollars to pay for research services.
The Board noted that the growth of fund assets over time across the complex allows Fidelity to reinvest in the development of services designed to enhance the value or convenience of the Fidelity funds as investment vehicles. These services include 24-hour access to account information and market information through telephone representatives and over the Internet, investor education materials and asset allocation tools, and the expanded availability of Fidelity Investor Centers.
In 2014, the Board formed an ad hoc Committee on Transfer Agency Fees to review the variety of transfer agency fee structures throughout the industry and Fidelity's competitive positioning with respect to industry participants.
Investment in a Large Fund Family. The Board considered the benefits to shareholders of investing in a Fidelity fund, including the benefits of investing in a fund that is part of a large family of funds offering a variety of investment disciplines and providing a large variety of mutual fund investor services. The Board noted that Fidelity had taken, or had made recommendations that resulted in the Fidelity funds taking, a number of actions over the previous year that benefited particular funds, including: (i) continuing to dedicate additional resources to Fidelity's investment research process, and to the support of the senior management team that oversees asset management; (ii) continuing efforts to enhance Fidelity's global research capabilities; (iii) launching new funds and making other enhancements to meet client needs; (iv) launching new share classes of existing funds; (v) eliminating purchase minimums and broadening eligibility requirements for certain lower-priced share classes; (vi) reducing management fees and total expenses for certain growth equity funds and index funds; (vii) lowering expense caps for certain existing funds and classes to reduce expenses borne by shareholders; (viii) eliminating short-term redemption fees for certain funds; (ix) introducing a new pricing structure for certain funds of funds that is expected to reduce overall expenses paid by shareholders; (x) rationalizing product lines and gaining increased efficiencies through proposals for fund mergers and share class consolidations; (xi) continuing to develop, acquire and implement systems and technology to improve services to the funds and shareholders, strengthen information security, and increase efficiency; and (xii) implementing enhancements to further strengthen Fidelity's product line to increase investors' probability of success in achieving their investment goals, including retirement income goals.
Investment Performance. The Board considered whether the fund has operated in accordance with its investment objective, as well as its record of compliance with its investment restrictions and its performance history.
The Board took into account discussions with representatives of the Investment Advisers about fund investment performance that occur at Board meetings throughout the year. In this regard the Board noted that as part of regularly scheduled fund reviews and other reports to the Board on fund performance, the Board considers annualized return information for the fund for different time periods, measured against a securities market index ("benchmark index") and a peer group of funds with similar objectives ("peer group"), if any. In its evaluation of fund investment performance, the Board gave particular attention to information indicating changes in performance of certain Fidelity funds for specific time periods and discussed with the Investment Advisers the reasons for any overperformance or underperformance.
In addition to reviewing absolute and relative fund performance, the Independent Trustees periodically consider the appropriateness of fund performance metrics in evaluating the results achieved. In general, the Independent Trustees believe that fund performance should be evaluated based on net performance (after fees and expenses) of both the highest performing and lowest performing fund share classes, where applicable, compared to appropriate benchmark indices, over appropriate time periods that may include full market cycles, and compared to peer groups, as applicable, over the same periods, taking into account relevant factors including the following: general market conditions; issuer-specific information; and fund cash flows and other factors.
The Independent Trustees recognize that shareholders evaluate performance on a net basis over their own holding periods, for which one-, three-, and five-year periods are often used as a proxy. For this reason, the performance information reviewed by the Board also included net cumulative calendar year total return information for the fund and an appropriate benchmark index and peer group for the most recent one-, three-, and five-year periods, as shown below. Returns are shown compared to the 25th percentile (top of box, 75% beaten) and 75th percentile (bottom of box, 25% beaten) of the peer universe.
VIP Contrafund Portfolio

The Board has discussed the fund's underperformance (based on the December 31, 2016 data presented herein) with FMR, including the fund's investment strategy, the portfolio management team, and broader trends in the market that may have impacted the fund's performance, and has engaged with FMR to consider what steps might be taken to remediate the fund's underperformance. The Board noted that the fund's performance has improved since the period shown. The Board noted that there were portfolio management changes for the fund in October 2015 and October 2016.
Based on its review, the Board concluded that the nature, extent, and quality of services provided to the fund under the Advisory Contracts should continue to benefit the shareholders of the fund.
Competitiveness of Management Fee and Total Expense Ratio. The Board considered the fund's management fee and total expense ratio compared to "mapped groups" of competitive funds and classes created for the purpose of facilitating the Trustees' competitive analysis of management fees and total expenses. Fidelity creates "mapped groups" by combining similar Lipper investment objective categories that have comparable investment mandates. Combining Lipper investment objective categories aids the Board's management fee and total expense ratio comparisons by broadening the competitive group used for comparison.
Management Fee. The Board considered two proprietary management fee comparisons for the 12-month periods shown in basis points (BP) in the chart below. The group of Lipper funds used by the Board for management fee comparisons is referred to below as the "Total Mapped Group." The Total Mapped Group comparison focuses on a fund's standing in terms of gross management fees before expense reimbursements or caps relative to the total universe of funds with comparable investment mandates, regardless of whether their management fee structures also are comparable. Funds with comparable investment mandates offer exposure to similar types of securities. Funds with comparable management fee structures have similar management fee contractual arrangements (
e.g., flat rate charged for advisory services, all-inclusive fee rate,
etc.). "TMG %" represents the percentage of funds in the Total Mapped Group that had management fees that were lower than the fund's. For example, a hypothetical TMG % of 20% would mean that 80% of the funds in the Total Mapped Group had higher, and 20% had lower, management fees than the fund. The fund's actual TMG %s and the number of funds in the Total Mapped Group are in the chart below. The "Asset-Size Peer Group" (ASPG) comparison focuses on a fund's standing relative to a subset of non-Fidelity funds within the Total Mapped Group that are similar in size and management fee structure. For example, if a fund is in the first quartile of the ASPG, the fund's management fee ranks in the least expensive or lowest 25% of funds in the ASPG. The ASPG represents at least 15% of the funds in the Total Mapped Group with comparable asset size and management fee structures, subject to a minimum of 50 funds (or all funds in the Total Mapped Group if fewer than 50). Additional information, such as the ASPG quartile in which the fund's management fee rate ranked, is also included in the chart and considered by the Board.
VIP Contrafund Portfolio

The Board noted that the fund's management fee rate ranked below the median of its Total Mapped Group and below the median of its ASPG for 2016.
The Board noted that, in 2014, the Board and the boards of other Fidelity funds formed the ad hoc Committee on Group Fee to conduct an in-depth review of the "group fee" component of the management fee of funds with such management fee structures. The Committee's focus included the mechanics of the group fee, the competitive landscape of group fee structures, Fidelity funds with no group fee component and investment products not included in group fee assets. The Board also considered that, for funds subject to the group fee, FMR agreed to voluntarily waive fees over a specified period of time in amounts designed to account for assets converted from certain funds to certain collective investment trusts.
The Board also noted that, in 2013, the ad hoc Committee on Management Fees was formed to conduct an in-depth review of the management fee rates of Fidelity's active equity mutual funds. The Committee focused on the following areas: (i) standard fee structures; (ii) research consumption and trading evolution; (iii) management fee competitiveness/profitability by category; and (iv) factors that drive institutional pricing.
Based on its review, the Board concluded that the fund's management fee is fair and reasonable in light of the services that the fund receives and the other factors considered.
Total Expense Ratio. In its review of each class's total expense ratio, the Board considered the fund's management fee rate as well as other fund or class expenses, as applicable, such as transfer agent fees, pricing and bookkeeping fees, fund-paid 12b-1 fees, and custodial, legal, and audit fees. The Board also noted that Fidelity may agree to waive fees and expenses from time to time, and the extent to which, if any, it has done so for the fund. As part of its review, the Board also considered the current and historical total expense ratios of each class of the fund compared to competitive fund median expenses. Each class of the fund is compared to those funds and classes in the Total Mapped Group (used by the Board for management fee comparisons) that have a similar sales load structure.
The Board noted that the total expense ratio of each class ranked below the competitive median for 2016.
Fees Charged to Other Fidelity Clients. The Board also considered Fidelity fee structures and other information with respect to clients of Fidelity, such as other funds advised or subadvised by Fidelity, pension plan clients, and other institutional clients with similar mandates. The Board noted that an ad hoc joint committee created by it and the boards of other Fidelity funds periodically (most recently in 2013) reviews and compares Fidelity's institutional investment advisory business with its business of providing services to the Fidelity funds, including the differences in services provided, fees charged, and costs incurred, as well as competition in their respective marketplaces.
Based on its review of total expense ratios and fees charged to other Fidelity clients, the Board concluded that the total expense ratio of each class of the fund was reasonable in light of the services that the fund and its shareholders receive and the other factors considered.
Costs of the Services and Profitability. The Board considered the revenues earned and the expenses incurred by Fidelity in conducting the business of developing, marketing, distributing, managing, administering and servicing the fund and servicing the fund's shareholders. The Board also considered the level of Fidelity's profits in respect of all the Fidelity funds.
On an annual basis, Fidelity presents to the Board information about the profitability of its relationships with the fund. Fidelity calculates profitability information for each fund, as well as aggregate profitability information for groups of Fidelity funds and all Fidelity funds, using a series of detailed revenue and cost allocation methodologies which originate with the books and records of Fidelity on which Fidelity's audited financial statements are based. The Audit Committee of the Board reviews any significant changes from the prior year's methodologies.
PricewaterhouseCoopers LLP (PwC), independent registered public accounting firm and auditor to Fidelity and certain Fidelity funds, has been engaged annually by the Board as part of the Board's assessment of Fidelity's profitability analysis. PwC's engagement includes the review and assessment of the methodologies used by Fidelity in determining the revenues and expenses attributable to Fidelity's mutual fund business, and completion of agreed-upon procedures in respect of the mathematical accuracy of the fund profitability information and its conformity to established allocation methodologies. After considering PwC's reports issued under the engagement and information provided by Fidelity, the Board concluded that while other allocation methods may also be reasonable, Fidelity's profitability methodologies are reasonable in all material respects.
The Board also reviewed Fidelity's non-fund businesses and potential fall-out benefits related to the mutual fund business as well as cases where Fidelity's affiliates may benefit from or be related to the fund's business.
The Board considered the costs of the services provided by and the profits realized by Fidelity in connection with the operation of the fund and was satisfied that the profitability was not excessive.
Economies of Scale. The Board considered whether there have been economies of scale in respect of the management of the Fidelity funds, whether the Fidelity funds (including the fund) have appropriately benefited from any such economies of scale, and whether there is potential for realization of any further economies of scale. The Board considered the extent to which the fund will benefit from economies of scale as assets grow through increased services to the fund, through waivers or reimbursements, or through fee or expense ratio reductions. The Board also noted that a committee (the Economies of Scale Committee) created by it and the boards of other Fidelity funds periodically (most recently in 2013) analyzes whether Fidelity attains economies of scale in respect of the management and servicing of the Fidelity funds, whether the Fidelity funds have appropriately benefited from such economies of scale, and whether there is potential for realization of any further economies of scale.
The Board recognized that the fund's management contract incorporates a "group fee" structure, which provides for lower group fee rates as total group assets increase, and for higher group fee rates as total group assets decrease (with "group assets" defined to include fund assets under FMR's management plus the assets of sector funds previously under FMR's management). FMR calculates the group fee rates based on a tiered asset "breakpoint" schedule that varies based on asset class. The Board considered that the group fee is designed to deliver the benefits of economies of scale to fund shareholders when total Fidelity fund assets increase, even if assets of any particular fund are unchanged or have declined, because some portion of Fidelity's costs are attributable to services provided to all Fidelity funds, and all funds benefit if those costs can be allocated among more assets. The Board concluded that, given the group fee structure, fund shareholders will benefit from lower management fees as group assets increase at the fund complex level, regardless of whether Fidelity achieves any such economies of scale.
The Board concluded, taking into account the analysis of the Economies of Scale Committee, that economies of scale, if any, are being appropriately shared between fund shareholders and Fidelity.
Additional Information Requested by the Board. In order to develop fully the factual basis for consideration of the Fidelity funds' advisory contracts, the Board requested and received additional information on certain topics, including: (i) fund performance trends, in particular the underperformance of certain funds, and Fidelity's long-term strategies for certain funds; (ii) Fidelity's fund profitability methodology, profitability trends for certain funds, and the impact of certain factors on fund profitability results, including the impact of market trends on actively managed funds; (iii) the use of performance fees and the calculation of performance adjustments, including the impact of underperformance and fund outflows on performance adjustments; (iv) metrics for evaluating index fund performance; (v) Fidelity's group fee structure, including the group fee breakpoint schedules; (vi) the terms of Fidelity's contractual and voluntary expense cap arrangements with the funds; (vii) the methodology with respect to evaluating competitive fund data and peer group classifications and fee comparisons; (viii) the expense structures for different funds and classes; (ix) Fidelity's arrangements with affiliated sub-advisers on behalf of the funds; (x) information regarding other accounts managed by Fidelity, including institutional accounts and collective investment trusts; (xi) recent changes to the fee structure for certain funds of funds; and (xii) the impact of the Department of Labor's new fiduciary rule on the funds' comparative expense information.
Based on its evaluation of all of the conclusions noted above, and after considering all factors it believed relevant, the Board concluded that the advisory fee structures are fair and reasonable, and that the fund's Advisory Contracts should be renewed.
VIPCON-ANN-0218
1.540131.120
Fidelity® Variable Insurance Products: International Capital Appreciation Portfolio
Annual Report December 31, 2017 |
|
Contents
To view a fund's proxy voting guidelines and proxy voting record for the 12-month period ended June 30, visit http://www.fidelity.com/proxyvotingresults or visit the Securities and Exchange Commission's (SEC) web site at http://www.sec.gov.
You may also call 1-877-208-0098 to request a free copy of the proxy voting guidelines.
Fidelity® Variable Insurance Products are separate account options which are purchased through a variable insurance contract.
Standard & Poor's, S&P and S&P 500 are registered service marks of The McGraw-Hill Companies, Inc. and have been licensed for use by Fidelity Distributors Corporation.
Other third-party marks appearing herein are the property of their respective owners.
All other marks appearing herein are registered or unregistered trademarks or service marks of FMR LLC or an affiliated company. © 2018 FMR LLC. All rights reserved.
This report and the financial statements contained herein are submitted for the general information of the shareholders of the Fund. This report is not authorized for distribution to prospective investors in the Fund unless preceded or accompanied by an effective prospectus.
A fund files its complete schedule of portfolio holdings with the SEC for the first and third quarters of each fiscal year on Form N-Q. Forms N-Q are available on the SEC’s web site at http://www.sec.gov. A fund's Forms N-Q may be reviewed and copied at the SEC’s Public Reference Room in Washington, DC. Information regarding the operation of the SEC's Public Reference Room may be obtained by calling 1-800-SEC-0330.
For a complete list of a fund's portfolio holdings, view the most recent holdings listing, semiannual report, or annual report on Fidelity's web site at http://www.fidelity.com, http://www.institutional.fidelity.com, or http://www.401k.com, as applicable.
NOT FDIC INSURED •MAY LOSE VALUE •NO BANK GUARANTEE
Neither the Fund nor Fidelity Distributors Corporation is a bank.
Performance: The Bottom Line
Average annual total return reflects the change in the value of an investment, assuming reinvestment of distributions from dividend income and capital gains (the profits earned upon the sale of securities that have grown in value, if any) and assuming a constant rate of performance each year. During periods of reimbursement by Fidelity, a fund’s total return will be greater than it would be had the reimbursement not occurred. Performance numbers are net of all underlying fund operating expenses, but do not include any insurance charges imposed by your insurance company’s separate account. If performance information included the effect of these additional charges, the total returns would have been lower. How a fund did yesterday is no guarantee of how it will do tomorrow.
Average Annual Total Returns
| For the periods ended December 31, 2017 | Past 1 year | Past 5 years | Past 10 years |
| Initial Class | 36.45% | 11.35% | 5.31% |
| Service Class | 36.35% | 11.24% | 5.22% |
| Service Class 2 | 36.09% | 11.07% | 5.07% |
| Investor Class | 36.33% | 11.27% | 5.23% |
$10,000 Over 10 Years
Let's say hypothetically that $10,000 was invested in VIP International Capital Appreciation Portfolio - Initial Class on December 31, 2007.
The chart shows how the value of your investment would have changed, and also shows how the MSCI ACWI (All Country World Index) ex USA Index performed over the same period.
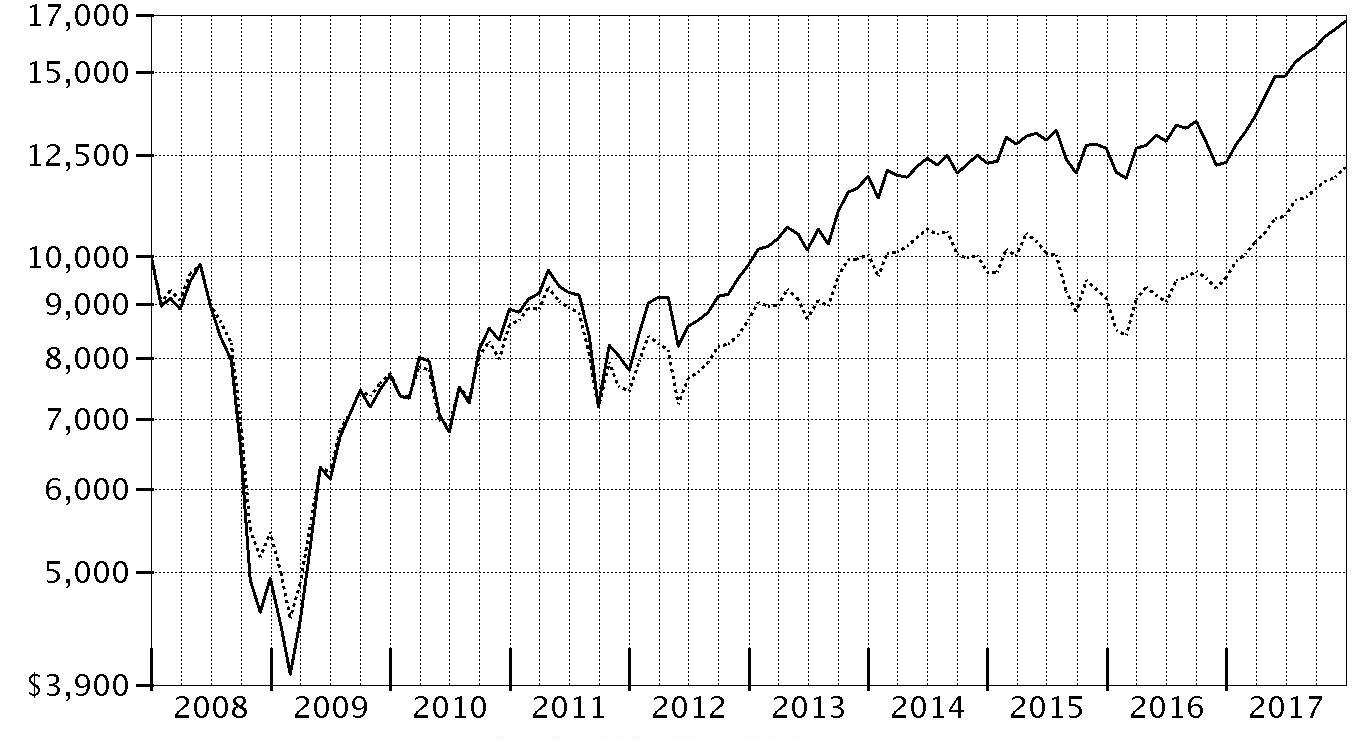
| Period Ending Values |
| $16,782 | VIP International Capital Appreciation Portfolio - Initial Class |
| $12,175 | MSCI ACWI (All Country World Index) ex USA Index |
Management's Discussion of Fund Performance
Market Recap: The MSCI ACWI (All Country World Index) ex USA Index gained 27.40% in 2017, helped partly by a generally weak U.S. dollar. Certain election results in continental Europe (+28%) suggested ebbing political uncertainty and near-term risk there, whereas the U.K. (+21%) faced more-mixed conditions ahead of its expected exit from the European Union. Japan (+24%), despite central-bank easing and recent pressure from regional yen strength, lagged the rest of the Asia-Pacific group (+26%). Commodity-price volatility slowed Canada (+17%), but emerging markets (+36%) sped ahead. Sector-wise, information technology (+52%) was driven by a surge among software, semiconductor and internet-related names. Financials (+27%) rode rising interest rates that, at the same time, held back consumer staples (+24%), utilities (+19%) and telecommunication services (+15%) – so-called “bond proxy” sectors. Real estate (+27%) bucked the trend, largely due to demand in China. Similarly, materials (+33%) and industrials (+30%) responded to Chinese demand, as well as to price gains for certain commodities. In the energy sector (+17%), oil prices lost ground in the first half of 2017 before rebounding through December 31 to end well above where they started 12 months ago. Lastly, health care (+19%) dealt with early-year turmoil around drug pricing and health care legislation.
Comments from Portfolio Manager Sammy Simnegar: For the year, the fund’s share classes gained about 36%, well ahead of the 27.40% advance of the benchmark MSCI ACWI (All Country World Index) ex USA Index. Versus the benchmark, active management added value in 10 of 11 market sectors. Stock picking in the financials and consumer discretionary sectors, along with positioning information technology and industrials, contributed most. All major geographical regions were relative contributors, led by Europe ex U.K. and Japan. At the stock level, our top relative contributor was an out-of-benchmark position in Wirecard, a Germany-based online-payments business benefiting from the secular shift toward e-commerce. Wirecard's organic growth, profit margins and, most importantly, free cash flow all improved dramatically during the period. Overweighting China-based internet companies Tencent Holdings and Alibaba Group Holding also proved rewarding to the fund, as did an out-of-index stake in Maruti Suzuki India, by far the dominant automaker in India. On the downside, stock picking in materials proved the only notable sector-level detractor. Regionally, South Korea and Brazil, part of the emerging-markets group, weighed on relative performance. The negative impact from Korea primarily was due to largely avoiding benchmark component Samsung Electronics, which gained 62%. Position management was partly responsible for the negative impact of FirstRand Limited, a South Africa-based provider of banking, investment and insurance products and services. Most notably, the fund did not own this benchmark stock in December, thereby missing its year-end rally. Our overweighted position in James Hardie Industries also detracted. Here, too, I sold our position at what proved to be an inopportune time.
The views expressed above reflect those of the portfolio manager(s) only through the end of the period as stated on the cover of this report and do not necessarily represent the views of Fidelity or any other person in the Fidelity organization. Any such views are subject to change at any time based upon market or other conditions and Fidelity disclaims any responsibility to update such views. These views may not be relied on as investment advice and, because investment decisions for a Fidelity fund are based on numerous factors, may not be relied on as an indication of trading intent on behalf of any Fidelity fund.
Investment Summary (Unaudited)
Geographic Diversification (% of fund's net assets)
| As of December 31, 2017 |
| | United Kingdom | 14.1% |
| | United States of America* | 13.6% |
| | France | 9.5% |
| | Japan | 9.0% |
| | Germany | 7.4% |
| | India | 6.0% |
| | Netherlands | 4.1% |
| | Canada | 4.0% |
| | Cayman Islands | 3.7% |
| | Other | 28.6% |

* Includes Short-Term investments and Net Other Assets (Liabilities).
Percentages are based on country or territory of incorporation and are adjusted for the effect of futures contracts, if applicable.
Asset Allocation as of December 31, 2017
| | % of fund's net assets |
| Stocks | 98.9 |
| Short-Term Investments and Net Other Assets (Liabilities) | 1.1 |
Top Ten Stocks as of December 31, 2017
| | % of fund's net assets |
| Tencent Holdings Ltd. (Cayman Islands, Internet Software & Services) | 1.7 |
| Alibaba Group Holding Ltd. sponsored ADR (Cayman Islands, Internet Software & Services) | 1.4 |
| Taiwan Semiconductor Manufacturing Co. Ltd. sponsored ADR (Taiwan, Semiconductors & Semiconductor Equipment) | 1.3 |
| British American Tobacco PLC (United Kingdom) (United Kingdom, Tobacco) | 1.2 |
| Unilever PLC (United Kingdom, Personal Products) | 1.2 |
| Naspers Ltd. Class N (South Africa, Media) | 1.1 |
| AIA Group Ltd. (Hong Kong, Insurance) | 1.0 |
| SAP SE (Germany, Software) | 0.9 |
| Diageo PLC (United Kingdom, Beverages) | 0.9 |
| LVMH Moet Hennessy - Louis Vuitton SA (France, Textiles, Apparel & Luxury Goods) | 0.8 |
| | 11.5 |
Top Market Sectors as of December 31, 2017
| | % of fund's net assets |
| Industrials | 23.5 |
| Information Technology | 19.0 |
| Financials | 13.1 |
| Consumer Discretionary | 11.6 |
| Consumer Staples | 10.4 |
| Health Care | 7.5 |
| Materials | 7.0 |
| Real Estate | 4.2 |
| Utilities | 1.0 |
| Telecommunication Services | 1.0 |
Investments December 31, 2017
Showing Percentage of Net Assets
| Common Stocks - 98.2% | | | |
| | | Shares | Value |
| Argentina - 0.5% | | | |
| Banco Macro SA sponsored ADR | | 13,300 | $1,541,204 |
| Australia - 1.7% | | | |
| Amcor Ltd. | | 148,540 | 1,787,152 |
| CSL Ltd. | | 20,599 | 2,271,026 |
| realestate.com.au Ltd. | | 26,633 | 1,592,818 |
|
| TOTAL AUSTRALIA | | | 5,650,996 |
|
| Bailiwick of Jersey - 1.3% | | | |
| Glencore Xstrata PLC | | 473,590 | 2,493,728 |
| Wolseley PLC | | 24,823 | 1,786,337 |
|
| TOTAL BAILIWICK OF JERSEY | | | 4,280,065 |
|
| Belgium - 0.5% | | | |
| Umicore SA | | 35,830 | 1,696,195 |
| Bermuda - 0.5% | | | |
| Hiscox Ltd. | | 78,200 | 1,545,717 |
| Brazil - 1.6% | | | |
| BM&F BOVESPA SA | | 269,400 | 1,850,090 |
| BTG Pactual Participations Ltd. unit | | 72,100 | 412,764 |
| CVC Brasil Operadora e Agencia de Viagens SA | | 96,700 | 1,413,871 |
| Equatorial Energia SA | | 86,700 | 1,715,913 |
|
| TOTAL BRAZIL | | | 5,392,638 |
|
| Canada - 4.0% | | | |
| Alimentation Couche-Tard, Inc. Class B (sub. vtg.) | | 37,000 | 1,930,652 |
| Canadian National Railway Co. | | 30,300 | 2,498,484 |
| Canadian Pacific Railway Ltd. | | 10,900 | 1,991,483 |
| CCL Industries, Inc. Class B | | 34,000 | 1,570,979 |
| Constellation Software, Inc. | | 2,950 | 1,788,352 |
| Descartes Systems Group, Inc. (a) | | 55,000 | 1,563,803 |
| Waste Connection, Inc. (Canada) | | 22,550 | 1,599,489 |
|
| TOTAL CANADA | | | 12,943,242 |
|
| Cayman Islands - 3.7% | | | |
| Alibaba Group Holding Ltd. sponsored ADR (a) | | 26,230 | 4,522,839 |
| New Oriental Education & Technology Group, Inc. sponsored ADR | | 20,000 | 1,880,000 |
| Tencent Holdings Ltd. | | 111,650 | 5,778,776 |
|
| TOTAL CAYMAN ISLANDS | | | 12,181,615 |
|
| Denmark - 0.7% | | | |
| DSV de Sammensluttede Vognmaend A/S | | 22,200 | 1,748,178 |
| SimCorp A/S | | 12,346 | 702,990 |
|
| TOTAL DENMARK | | | 2,451,168 |
|
| France - 9.5% | | | |
| ALTEN | | 18,263 | 1,525,354 |
| Dassault Systemes SA | | 14,800 | 1,573,162 |
| Eiffage SA | | 15,800 | 1,731,590 |
| Elis SA | | 58,100 | 1,604,405 |
| Hermes International SCA | | 3,300 | 1,766,929 |
| Kering SA | | 4,260 | 2,008,765 |
| Legrand SA | | 23,400 | 1,802,230 |
| LVMH Moet Hennessy - Louis Vuitton SA | | 9,164 | 2,689,683 |
| Orpea | | 13,700 | 1,615,850 |
| Pernod Ricard SA | | 12,900 | 2,042,331 |
| Rubis | | 22,300 | 1,578,108 |
| Sartorius Stedim Biotech | | 23,600 | 1,707,199 |
| Sodexo SA | | 13,200 | 1,774,650 |
| SR Teleperformance SA | | 11,600 | 1,662,536 |
| Thales SA | | 16,800 | 1,811,754 |
| VINCI SA | | 22,460 | 2,294,676 |
| Vivendi SA | | 71,200 | 1,915,325 |
|
| TOTAL FRANCE | | | 31,104,547 |
|
| Germany - 7.4% | | | |
| adidas AG | | 10,378 | 2,081,359 |
| Deutsche Post AG | | 44,915 | 2,142,178 |
| Deutsche Wohnen AG (Bearer) | | 41,000 | 1,793,608 |
| Fresenius Medical Care AG & Co. KGaA | | 17,400 | 1,827,170 |
| Fresenius SE & Co. KGaA | | 26,400 | 2,061,160 |
| Henkel AG & Co. KGaA | | 17,848 | 2,141,492 |
| Infineon Technologies AG | | 70,900 | 1,930,906 |
| SAP SE | | 27,314 | 3,055,764 |
| Symrise AG | | 20,900 | 1,796,005 |
| United Internet AG | | 23,148 | 1,592,568 |
| Vonovia SE | | 40,200 | 1,996,404 |
| Wirecard AG | | 15,100 | 1,686,218 |
|
| TOTAL GERMANY | | | 24,104,832 |
|
| Hong Kong - 1.5% | | | |
| AIA Group Ltd. | | 370,400 | 3,159,815 |
| Techtronic Industries Co. Ltd. | | 276,000 | 1,799,881 |
|
| TOTAL HONG KONG | | | 4,959,696 |
|
| India - 6.0% | | | |
| Adani Ports & Special Economic Zone Ltd. | | 252,029 | 1,601,434 |
| Asian Paints Ltd. | | 89,322 | 1,620,920 |
| Eicher Motors Ltd. | | 3,529 | 1,677,206 |
| HDFC Bank Ltd. | | 54,060 | 1,598,986 |
| Housing Development Finance Corp. Ltd. | | 76,714 | 2,055,320 |
| IndusInd Bank Ltd. | | 58,700 | 1,516,141 |
| Kotak Mahindra Bank Ltd. | | 95,801 | 1,515,949 |
| LIC Housing Finance Ltd. | | 182,300 | 1,609,117 |
| Maruti Suzuki India Ltd. | | 11,712 | 1,784,970 |
| PC Jeweller Ltd. | | 217,785 | 1,558,166 |
| Reliance Industries Ltd. | | 146,087 | 2,107,667 |
| Vakrangee Ltd. | | 140,882 | 927,407 |
|
| TOTAL INDIA | | | 19,573,283 |
|
| Indonesia - 1.1% | | | |
| PT Bank Central Asia Tbk | | 1,094,800 | 1,767,173 |
| PT Bank Rakyat Indonesia Tbk | | 7,099,100 | 1,904,605 |
|
| TOTAL INDONESIA | | | 3,671,778 |
|
| Ireland - 2.7% | | | |
| CRH PLC | | 56,200 | 2,017,018 |
| DCC PLC (United Kingdom) | | 17,860 | 1,800,086 |
| Kerry Group PLC Class A | | 16,330 | 1,831,997 |
| Kingspan Group PLC (Ireland) | | 39,000 | 1,703,541 |
| United Drug PLC (United Kingdom) | | 134,956 | 1,539,682 |
|
| TOTAL IRELAND | | | 8,892,324 |
|
| Israel - 1.0% | | | |
| Frutarom Industries Ltd. | | 18,700 | 1,754,645 |
| NICE Systems Ltd. sponsored ADR | | 18,100 | 1,663,571 |
|
| TOTAL ISRAEL | | | 3,418,216 |
|
| Italy - 0.9% | | | |
| DiaSorin S.p.A. | | 16,700 | 1,482,775 |
| Recordati SpA | | 35,058 | 1,558,904 |
|
| TOTAL ITALY | | | 3,041,679 |
|
| Japan - 9.0% | | | |
| Benefit One, Inc. (b)(c) | | 81,900 | 1,714,685 |
| Daikin Industries Ltd. | | 17,500 | 2,071,112 |
| Daito Trust Construction Co. Ltd. | | 9,040 | 1,843,302 |
| Hoya Corp. | | 37,900 | 1,893,066 |
| Kansai Paint Co. Ltd. | | 64,100 | 1,665,718 |
| Kao Corp. | | 32,000 | 2,163,816 |
| Keyence Corp. | | 4,248 | 2,379,709 |
| Misumi Group, Inc. | | 57,900 | 1,685,485 |
| Nabtesco Corp. | | 42,700 | 1,637,133 |
| Nidec Corp. | | 14,000 | 1,964,411 |
| Nitori Holdings Co. Ltd. | | 12,300 | 1,753,712 |
| Recruit Holdings Co. Ltd. | | 74,400 | 1,848,857 |
| Relo Holdings Corp. | | 60,900 | 1,659,312 |
| SMC Corp. | | 4,780 | 1,967,574 |
| Sundrug Co. Ltd. | | 35,500 | 1,650,943 |
| Tsuruha Holdings, Inc. | | 12,300 | 1,672,385 |
|
| TOTAL JAPAN | | | 29,571,220 |
|
| Kenya - 0.5% | | | |
| Safaricom Ltd. | | 6,052,400 | 1,569,575 |
| Korea (South) - 0.1% | | | |
| Samsung Electronics Co. Ltd. | | 129 | 307,944 |
| Luxembourg - 0.5% | | | |
| Eurofins Scientific SA | | 2,760 | 1,680,961 |
| Mexico - 0.5% | | | |
| Grupo Aeroportuario del Sureste S.A.B. de CV Series B | | 89,140 | 1,623,311 |
| Netherlands - 4.1% | | | |
| ASML Holding NV (Netherlands) | | 13,900 | 2,416,633 |
| Ferrari NV | | 17,000 | 1,783,757 |
| Heineken NV (Bearer) | | 20,500 | 2,138,211 |
| IMCD Group BV | | 24,200 | 1,522,377 |
| Interxion Holding N.V. (a) | | 26,938 | 1,587,456 |
| RELX NV | | 95,024 | 2,185,089 |
| Wolters Kluwer NV | | 34,800 | 1,815,498 |
|
| TOTAL NETHERLANDS | | | 13,449,021 |
|
| Philippines - 1.5% | | | |
| Ayala Land, Inc. | | 1,878,500 | 1,675,136 |
| SM Investments Corp. | | 78,993 | 1,563,608 |
| SM Prime Holdings, Inc. | | 2,173,700 | 1,629,802 |
|
| TOTAL PHILIPPINES | | | 4,868,546 |
|
| Russia - 0.7% | | | |
| Sberbank of Russia | | 558,340 | 2,180,945 |
| South Africa - 1.6% | | | |
| Capitec Bank Holdings Ltd. | | 19,409 | 1,722,393 |
| Naspers Ltd. Class N | | 12,510 | 3,489,352 |
|
| TOTAL SOUTH AFRICA | | | 5,211,745 |
|
| Spain - 1.6% | | | |
| Amadeus IT Holding SA Class A | | 27,330 | 1,971,121 |
| Cellnex Telecom Sau (d) | | 60,600 | 1,552,378 |
| Grifols SA | | 55,200 | 1,617,710 |
|
| TOTAL SPAIN | | | 5,141,209 |
|
| Sweden - 2.3% | | | |
| ASSA ABLOY AB (B Shares) | | 89,000 | 1,845,100 |
| Atlas Copco AB (A Shares) | | 51,700 | 2,232,344 |
| Hexagon AB (B Shares) | | 34,800 | 1,743,161 |
| Indutrade AB | | 57,100 | 1,556,431 |
|
| TOTAL SWEDEN | | | 7,377,036 |
|
| Switzerland - 3.3% | | | |
| Compagnie Financiere Richemont SA Series A | | 24,787 | 2,244,906 |
| Kaba Holding AG (B Shares) (Reg.) | | 1,740 | 1,620,453 |
| Lonza Group AG | | 6,819 | 1,842,519 |
| Partners Group Holding AG (b) | | 2,470 | 1,693,222 |
| Schindler Holding AG (participation certificate) | | 7,466 | 1,718,532 |
| Sika AG | | 224 | 1,779,219 |
|
| TOTAL SWITZERLAND | | | 10,898,851 |
|
| Taiwan - 1.3% | | | |
| Taiwan Semiconductor Manufacturing Co. Ltd. sponsored ADR | | 107,700 | 4,270,305 |
| United Kingdom - 14.1% | | | |
| Ashtead Group PLC | | 26,243 | 705,805 |
| British American Tobacco PLC (United Kingdom) | | 58,300 | 3,949,856 |
| Bunzl PLC | | 60,758 | 1,699,712 |
| Compass Group PLC | | 101,801 | 2,199,146 |
| Cranswick PLC | | 38,119 | 1,717,433 |
| Croda International PLC | | 28,800 | 1,720,242 |
| Diageo PLC | | 80,919 | 2,966,034 |
| Diploma PLC | | 98,000 | 1,649,964 |
| DS Smith PLC | | 222,800 | 1,556,709 |
| Halma PLC | | 93,100 | 1,583,807 |
| Hargreaves Lansdown PLC | | 75,300 | 1,832,027 |
| HomeServe PLC | | 147,100 | 1,607,724 |
| InterContinental Hotel Group PLC | | 27,959 | 1,781,368 |
| Intertek Group PLC | | 23,900 | 1,674,740 |
| London Stock Exchange Group PLC | | 36,300 | 1,858,966 |
| Micro Focus International PLC | | 53,100 | 1,808,814 |
| Prudential PLC | | 99,915 | 2,558,855 |
| Reckitt Benckiser Group PLC | | 27,730 | 2,587,028 |
| Rentokil Initial PLC | | 342,500 | 1,470,516 |
| Rightmove PLC | | 27,036 | 1,642,619 |
| Sage Group PLC | | 161,600 | 1,741,110 |
| St. James's Place Capital PLC | | 106,100 | 1,756,256 |
| Unilever PLC | | 71,200 | 3,949,188 |
|
| TOTAL UNITED KINGDOM | | | 46,017,919 |
|
| United States of America - 12.5% | | | |
| A.O. Smith Corp. | | 25,026 | 1,533,593 |
| Adobe Systems, Inc. (a) | | 9,300 | 1,629,732 |
| Alphabet, Inc. Class C (a) | | 1,485 | 1,553,904 |
| Altria Group, Inc. | | 22,100 | 1,578,161 |
| Amazon.com, Inc. (a) | | 1,372 | 1,604,513 |
| American Tower Corp. | | 11,200 | 1,597,904 |
| Amphenol Corp. Class A | | 17,588 | 1,544,226 |
| BlackRock, Inc. Class A | | 2,980 | 1,530,856 |
| Cintas Corp. | | 10,200 | 1,589,466 |
| Comcast Corp. Class A | | 40,200 | 1,610,010 |
| Constellation Brands, Inc. Class A (sub. vtg.) | | 7,000 | 1,599,990 |
| Equinix, Inc. | | 3,600 | 1,631,592 |
| Facebook, Inc. Class A (a) | | 8,570 | 1,512,262 |
| Fiserv, Inc. (a) | | 11,916 | 1,562,545 |
| HEICO Corp. Class A | | 19,400 | 1,533,570 |
| Home Depot, Inc. | | 8,700 | 1,648,911 |
| MasterCard, Inc. Class A | | 10,290 | 1,557,494 |
| Moody's Corp. | | 10,100 | 1,490,861 |
| MSCI, Inc. | | 12,200 | 1,543,788 |
| Northrop Grumman Corp. | | 5,100 | 1,565,241 |
| S&P Global, Inc. | | 9,211 | 1,560,343 |
| Sherwin-Williams Co. | | 3,990 | 1,636,060 |
| Thermo Fisher Scientific, Inc. | | 8,800 | 1,670,944 |
| TransDigm Group, Inc. | | 5,700 | 1,565,334 |
| UnitedHealth Group, Inc. | | 7,000 | 1,543,220 |
| Visa, Inc. Class A | | 14,380 | 1,639,608 |
|
| TOTAL UNITED STATES OF AMERICA | | | 41,034,128 |
|
| TOTAL COMMON STOCKS | | | |
| (Cost $250,457,994) | | | 321,651,911 |
|
| Nonconvertible Preferred Stocks - 0.7% | | | |
| Brazil - 0.7% | | | |
| Itau Unibanco Holding SA sponsored ADR | | | |
| (Cost $1,863,147) | | 171,200 | 2,225,600 |
|
| Money Market Funds - 1.8% | | | |
| Fidelity Cash Central Fund, 1.36% (e) | | 3,615,283 | 3,616,006 |
| Fidelity Securities Lending Cash Central Fund 1.36% (e)(f) | | 2,211,764 | 2,212,206 |
| TOTAL MONEY MARKET FUNDS | | | |
| (Cost $5,827,995) | | | 5,828,212 |
| TOTAL INVESTMENT IN SECURITIES - 100.7% | | | |
| (Cost $258,149,136) | | | 329,705,723 |
| NET OTHER ASSETS (LIABILITIES) - (0.7)% | | | (2,174,922) |
| NET ASSETS - 100% | | | $327,530,801 |
Categorizations in the Schedule of Investments are based on country or territory of incorporation.
Legend
(a) Non-income producing
(b) Security or a portion of the security is on loan at period end.
(c) A portion of the security sold on a delayed delivery basis.
(d) Security exempt from registration under Rule 144A of the Securities Act of 1933. These securities may be resold in transactions exempt from registration, normally to qualified institutional buyers. At the end of the period, the value of these securities amounted to $1,552,378 or 0.5% of net assets.
(e) Affiliated fund that is generally available only to investment companies and other accounts managed by Fidelity Investments. The rate quoted is the annualized seven-day yield of the fund at period end. A complete unaudited listing of the fund's holdings as of its most recent quarter end is available upon request. In addition, each Fidelity Central Fund's financial statements, which are not covered by the Fund's Report of Independent Registered Public Accounting Firm, are available on the SEC's website or upon request.
(f) Investment made with cash collateral received from securities on loan.
Affiliated Central Funds
Information regarding fiscal year to date income earned by the Fund from investments in Fidelity Central Funds is as follows:
| Fund | Income earned |
| Fidelity Cash Central Fund | $35,275 |
| Fidelity Securities Lending Cash Central Fund | 29,341 |
| Total | $64,616 |
Amounts in the income column in the above table include any capital gain distributions from underlying funds, which are presented in the corresponding line-item in the Statement of Operations if applicable.
Investment Valuation
The following is a summary of the inputs used, as of December 31, 2017, involving the Fund's assets and liabilities carried at fair value. The inputs or methodology used for valuing securities may not be an indication of the risk associated with investing in those securities. For more information on valuation inputs, and their aggregation into the levels used below, please refer to the Investment Valuation section in the accompanying Notes to Financial Statements.
| | Valuation Inputs at Reporting Date: |
| Description | Total | Level 1 | Level 2 | Level 3 |
| Investments in Securities: | | | | |
| Equities: | | | | |
| Consumer Discretionary | $38,789,274 | $33,854,685 | $4,934,589 | $-- |
| Consumer Staples | 33,919,517 | 24,417,267 | 9,502,250 | -- |
| Energy | 2,107,667 | 2,107,667 | -- | -- |
| Financials | 42,430,993 | 36,092,207 | 6,338,786 | -- |
| Health Care | 24,312,186 | 22,485,016 | 1,827,170 | -- |
| Industrials | 76,623,272 | 74,778,172 | 1,845,100 | -- |
| Information Technology | 62,356,978 | 49,174,899 | 13,182,079 | -- |
| Materials | 23,094,590 | 21,077,572 | 2,017,018 | -- |
| Real Estate | 13,827,060 | 13,827,060 | -- | -- |
| Telecommunication Services | 3,121,953 | 3,121,953 | -- | -- |
| Utilities | 3,294,021 | 3,294,021 | -- | -- |
| Money Market Funds | 5,828,212 | 5,828,212 | -- | -- |
| Total Investments in Securities: | $329,705,723 | $290,058,731 | $39,646,992 | $-- |
The following is a summary of transfers between Level 1 and Level 2 for the period ended December 31, 2017. Transfers are assumed to have occurred at the beginning of the period, and are primarily attributable to the valuation techniques used for foreign equity securities, as discussed in the accompanying Notes to Financial Statements:
| Transfers | Total |
| Level 1 to Level 2 | $0 |
| Level 2 to Level 1 | $10,674,006 |
See accompanying notes which are an integral part of the financial statements.
Financial Statements
Statement of Assets and Liabilities
| | | December 31, 2017 |
| Assets | | |
Investment in securities, at value (including securities loaned of $2,107,486) — See accompanying schedule:
Unaffiliated issuers (cost $252,321,141) | $323,877,511 | |
| Fidelity Central Funds (cost $5,827,995) | 5,828,212 | |
| Total Investment in Securities (cost $258,149,136) | | $329,705,723 |
| Cash | | 12 |
| Receivable for investments sold | | |
| Regular delivery | | 2,897,561 |
| Delayed delivery | | 16,812 |
| Receivable for fund shares sold | | 305,860 |
| Dividends receivable | | 370,010 |
| Distributions receivable from Fidelity Central Funds | | 5,742 |
| Prepaid expenses | | 436 |
| Other receivables | | 102,818 |
| Total assets | | 333,404,974 |
| Liabilities | | |
| Payable for investments purchased | $3,022,943 | |
| Payable for fund shares redeemed | 66,696 | |
| Accrued management fee | 183,852 | |
| Distribution and service plan fees payable | 2,570 | |
| Other affiliated payables | 50,320 | |
| Other payables and accrued expenses | 336,283 | |
| Collateral on securities loaned | 2,211,509 | |
| Total liabilities | | 5,874,173 |
| Net Assets | | $327,530,801 |
| Net Assets consist of: | | |
| Paid in capital | | $251,579,319 |
| Distributions in excess of net investment income | | (874) |
| Accumulated undistributed net realized gain (loss) on investments and foreign currency transactions | | 4,644,036 |
| Net unrealized appreciation (depreciation) on investments and assets and liabilities in foreign currencies | | 71,308,320 |
| Net Assets | | $327,530,801 |
| Initial Class: | | |
| Net Asset Value, offering price and redemption price per share ($28,571,825 ÷ 1,642,655 shares) | | $17.39 |
| Service Class: | | |
| Net Asset Value, offering price and redemption price per share ($235,601 ÷ 13,575 shares) | | $17.36 |
| Service Class 2: | | |
| Net Asset Value, offering price and redemption price per share ($12,532,528 ÷ 726,244 shares) | | $17.26 |
| Investor Class: | | |
| Net Asset Value, offering price and redemption price per share ($286,190,847 ÷ 16,582,107 shares) | | $17.26 |
See accompanying notes which are an integral part of the financial statements.
Statement of Operations
| | | Year ended December 31, 2017 |
| Investment Income | | |
| Dividends | | $3,871,123 |
| Income from Fidelity Central Funds | | 64,616 |
| Income before foreign taxes withheld | | 3,935,739 |
| Less foreign taxes withheld | | (304,137) |
| Total income | | 3,631,602 |
| Expenses | | |
| Management fee | $1,718,467 | |
| Transfer agent fees | 337,603 | |
| Distribution and service plan fees | 22,831 | |
| Accounting and security lending fees | 128,645 | |
| Custodian fees and expenses | 179,169 | |
| Independent trustees' fees and expenses | 934 | |
| Audit | 92,583 | |
| Legal | 2,591 | |
| Miscellaneous | 1,601 | |
| Total expenses before reductions | 2,484,424 | |
| Expense reductions | (77,469) | 2,406,955 |
| Net investment income (loss) | | 1,224,647 |
| Realized and Unrealized Gain (Loss) | | |
| Net realized gain (loss) on: | | |
| Investment securities: | | |
| Unaffiliated issuers | 16,017,959 | |
| Fidelity Central Funds | 166 | |
| Foreign currency transactions | 4,369 | |
| Total net realized gain (loss) | | 16,022,494 |
| Change in net unrealized appreciation (depreciation) on: | | |
| Unaffiliated issuers (net of increase in deferred foreign taxes of $232,579) | 55,088,329 | |
| Fidelity Central Funds | 217 | |
| Assets and liabilities in foreign currencies | 17,547 | |
| Total change in net unrealized appreciation (depreciation) | | 55,106,093 |
| Net gain (loss) | | 71,128,587 |
| Net increase (decrease) in net assets resulting from operations | | $72,353,234 |
See accompanying notes which are an integral part of the financial statements.
Statement of Changes in Net Assets
| | Year ended December 31, 2017 | Year ended December 31, 2016 |
| Increase (Decrease) in Net Assets | | |
| Operations | | |
| Net investment income (loss) | $1,224,647 | $1,518,230 |
| Net realized gain (loss) | 16,022,494 | (4,443,690) |
| Change in net unrealized appreciation (depreciation) | 55,106,093 | (3,117,089) |
| Net increase (decrease) in net assets resulting from operations | 72,353,234 | (6,042,549) |
| Distributions to shareholders from net investment income | (1,225,134) | (1,446,618) |
| Distributions to shareholders from tax return of capital | – | (106,313) |
| Total distributions | (1,225,134) | (1,552,931) |
| Share transactions - net increase (decrease) | 77,954,388 | (3,219,510) |
| Total increase (decrease) in net assets | 149,082,488 | (10,814,990) |
| Net Assets | | |
| Beginning of period | 178,448,313 | 189,263,303 |
| End of period | $327,530,801 | $178,448,313 |
| Other Information | | |
| Distributions in excess of net investment income end of period | $(874) | $(5,512) |
See accompanying notes which are an integral part of the financial statements.
Financial Highlights
VIP International Capital Appreciation Portfolio Initial Class
| Years ended December 31, | 2017 | 2016 | 2015 | 2014 | 2013 |
| Selected Per–Share Data | | | | | |
| Net asset value, beginning of period | $12.80 | $13.32 | $13.01 | $12.68 | $10.50 |
| Income from Investment Operations | | | | | |
| Net investment income (loss)A | .09 | .12 | .09 | .10 | .10 |
| Net realized and unrealized gain (loss) | 4.57 | (.52) | .33 | .28 | 2.17 |
| Total from investment operations | 4.66 | (.40) | .42 | .38 | 2.27 |
| Distributions from net investment income | (.07) | (.11)B | (.10) | (.05) | (.08) |
| Distributions from net realized gain | – | – | – | – | (.01) |
| Tax return of capital | – | (.01)B | (.01) | – | – |
| Total distributions | (.07) | (.12) | (.11) | (.05) | (.09) |
| Redemption fees added to paid in capitalA | – | – | –C | –C | –C |
| Net asset value, end of period | $17.39 | $12.80 | $13.32 | $13.01 | $12.68 |
| Total ReturnD,E | 36.45% | (2.98)% | 3.22% | 3.01% | 21.62% |
| Ratios to Average Net AssetsF,G | | | | | |
| Expenses before reductions | .92% | .99% | .98% | 1.10% | 1.17% |
| Expenses net of fee waivers, if any | .92% | .99% | .98% | 1.10% | 1.10% |
| Expenses net of all reductions | .89% | .97% | .96% | 1.09% | 1.07% |
| Net investment income (loss) | .57% | .89% | .68% | .78% | .84% |
| Supplemental Data | | | | | |
| Net assets, end of period (000 omitted) | $28,572 | $16,644 | $20,154 | $1,464 | $2,404 |
| Portfolio turnover rateH | 153% | 188% | 189% | 183% | 153% |
A Calculated based on average shares outstanding during the period.
B The amounts shown reflect certain reclassifications related to book to tax differences that were made in the year shown.
C Amount represents less than $.005 per share.
D Total returns do not reflect charges attributable to your insurance company's separate account. Inclusion of these charges would reduce the total returns shown.
E Total returns would have been lower if certain expenses had not been reduced during the applicable periods shown.
F Fees and expenses of any underlying Fidelity Central Funds are not included in the Fund's expense ratio. The Fund indirectly bears its proportionate share of the expenses of any underlying Fidelity Central Funds.
G Expense ratios reflect operating expenses of the class. Expenses before reductions do not reflect amounts reimbursed by the investment adviser or reductions from brokerage service arrangements or reductions from other expense offset arrangements and do not represent the amount paid by the class during periods when reimbursements or reductions occur. Expenses net of fee waivers reflect expenses after reimbursement by the investment adviser but prior to reductions from brokerage service arrangements or other expense offset arrangements. Expenses net of all reductions represent the net expenses paid by the class.
H Amount does not include the portfolio activity of any underlying Fidelity Central Funds.
See accompanying notes which are an integral part of the financial statements.
VIP International Capital Appreciation Portfolio Service Class
| Years ended December 31, | 2017 | 2016 | 2015 | 2014 | 2013 |
| Selected Per–Share Data | | | | | |
| Net asset value, beginning of period | $12.78 | $13.30 | $12.99 | $12.66 | $10.49 |
| Income from Investment Operations | | | | | |
| Net investment income (loss)A | .07 | .10 | .08 | .09 | .08 |
| Net realized and unrealized gain (loss) | 4.57 | (.51) | .32 | .28 | 2.17 |
| Total from investment operations | 4.64 | (.41) | .40 | .37 | 2.25 |
| Distributions from net investment income | (.06) | (.10)B | (.09) | (.04) | (.07) |
| Distributions from net realized gain | – | – | – | – | (.01) |
| Tax return of capital | – | (.01)B | (.01) | – | – |
| Total distributions | (.06) | (.11) | (.09)C | (.04) | (.08) |
| Redemption fees added to paid in capitalA | – | – | –D | –D | –D |
| Net asset value, end of period | $17.36 | $12.78 | $13.30 | $12.99 | $12.66 |
| Total ReturnE,F | 36.35% | (3.11)% | 3.12% | 2.93% | 21.44% |
| Ratios to Average Net AssetsG,H | | | | | |
| Expenses before reductions | 1.02% | 1.09% | 1.09% | 1.21% | 1.28% |
| Expenses net of fee waivers, if any | 1.02% | 1.09% | 1.09% | 1.20% | 1.20% |
| Expenses net of all reductions | .99% | 1.07% | 1.07% | 1.19% | 1.17% |
| Net investment income (loss) | .47% | .79% | .58% | .68% | .73% |
| Supplemental Data | | | | | |
| Net assets, end of period (000 omitted) | $236 | $142 | $222 | $114 | $111 |
| Portfolio turnover rateI | 153% | 188% | 189% | 183% | 153% |
A Calculated based on average shares outstanding during the period.
B The amounts shown reflect certain reclassifications related to book to tax differences that were made in the year shown.
C Total distributions of $.09 per share is comprised of distributions from net investment income of $.088 and distributions from net realized gain of $.006 per share.
D Amount represents less than $.005 per share.
E Total returns do not reflect charges attributable to your insurance company's separate account. Inclusion of these charges would reduce the total returns shown.
F Total returns would have been lower if certain expenses had not been reduced during the applicable periods shown.
G Fees and expenses of any underlying Fidelity Central Funds are not included in the Fund's expense ratio. The Fund indirectly bears its proportionate share of the expenses of any underlying Fidelity Central Funds.
H Expense ratios reflect operating expenses of the class. Expenses before reductions do not reflect amounts reimbursed by the investment adviser or reductions from brokerage service arrangements or reductions from other expense offset arrangements and do not represent the amount paid by the class during periods when reimbursements or reductions occur. Expenses net of fee waivers reflect expenses after reimbursement by the investment adviser but prior to reductions from brokerage service arrangements or other expense offset arrangements. Expenses net of all reductions represent the net expenses paid by the class.
I Amount does not include the portfolio activity of any underlying Fidelity Central Funds.
See accompanying notes which are an integral part of the financial statements.
VIP International Capital Appreciation Portfolio Service Class 2
| Years ended December 31, | 2017 | 2016 | 2015 | 2014 | 2013 |
| Selected Per–Share Data | | | | | |
| Net asset value, beginning of period | $12.72 | $13.24 | $12.92 | $12.61 | $10.46 |
| Income from Investment Operations | | | | | |
| Net investment income (loss)A | .05 | .08 | .06 | .07 | .07 |
| Net realized and unrealized gain (loss) | 4.54 | (.50) | .32 | .27 | 2.16 |
| Total from investment operations | 4.59 | (.42) | .38 | .34 | 2.23 |
| Distributions from net investment income | (.05) | (.09)B | (.06) | (.03) | (.07) |
| Distributions from net realized gain | – | – | – | – | (.01) |
| Tax return of capital | – | (.01)B | –C | – | – |
| Total distributions | (.05) | (.10) | (.06) | (.03) | (.08) |
| Redemption fees added to paid in capitalA | – | – | –C | –C | –C |
| Net asset value, end of period | $17.26 | $12.72 | $13.24 | $12.92 | $12.61 |
| Total ReturnD,E | 36.09% | (3.18)% | 2.96% | 2.71% | 21.33% |
| Ratios to Average Net AssetsF,G | | | | | |
| Expenses before reductions | 1.17% | 1.24% | 1.23% | 1.35% | 1.46% |
| Expenses net of fee waivers, if any | 1.17% | 1.24% | 1.23% | 1.35% | 1.35% |
| Expenses net of all reductions | 1.14% | 1.22% | 1.21% | 1.34% | 1.32% |
| Net investment income (loss) | .32% | .64% | .43% | .54% | .59% |
| Supplemental Data | | | | | |
| Net assets, end of period (000 omitted) | $12,533 | $6,144 | $3,629 | $2,360 | $2,374 |
| Portfolio turnover rateH | 153% | 188% | 189% | 183% | 153% |
A Calculated based on average shares outstanding during the period.
B The amounts shown reflect certain reclassifications related to book to tax differences that were made in the year shown.
C Amount represents less than $.005 per share.
D Total returns do not reflect charges attributable to your insurance company's separate account. Inclusion of these charges would reduce the total returns shown.
E Total returns would have been lower if certain expenses had not been reduced during the applicable periods shown.
F Fees and expenses of any underlying Fidelity Central Funds are not included in the Fund's expense ratio. The Fund indirectly bears its proportionate share of the expenses of any underlying Fidelity Central Funds.
G Expense ratios reflect operating expenses of the class. Expenses before reductions do not reflect amounts reimbursed by the investment adviser or reductions from brokerage service arrangements or reductions from other expense offset arrangements and do not represent the amount paid by the class during periods when reimbursements or reductions occur. Expenses net of fee waivers reflect expenses after reimbursement by the investment adviser but prior to reductions from brokerage service arrangements or other expense offset arrangements. Expenses net of all reductions represent the net expenses paid by the class.
H Amount does not include the portfolio activity of any underlying Fidelity Central Funds.
See accompanying notes which are an integral part of the financial statements.
VIP International Capital Appreciation Portfolio Investor Class
| Years ended December 31, | 2017 | 2016 | 2015 | 2014 | 2013 |
| Selected Per–Share Data | | | | | |
| Net asset value, beginning of period | $12.71 | $13.22 | $12.92 | $12.59 | $10.43 |
| Income from Investment Operations | | | | | |
| Net investment income (loss)A | .08 | .11 | .08 | .09 | .09 |
| Net realized and unrealized gain (loss) | 4.54 | (.51) | .32 | .29 | 2.15 |
| Total from investment operations | 4.62 | (.40) | .40 | .38 | 2.24 |
| Distributions from net investment income | (.07) | (.10)B | (.09) | (.05) | (.07) |
| Distributions from net realized gain | – | – | – | – | (.01) |
| Tax return of capital | – | (.01)B | (.01) | – | – |
| Total distributions | (.07) | (.11) | (.10) | (.05) | (.08) |
| Redemption fees added to paid in capitalA | – | – | –C | –C | –C |
| Net asset value, end of period | $17.26 | $12.71 | $13.22 | $12.92 | $12.59 |
| Total ReturnD,E | 36.33% | (3.01)% | 3.08% | 2.99% | 21.50% |
| Ratios to Average Net AssetsF,G | | | | | |
| Expenses before reductions | 1.00% | 1.07% | 1.07% | 1.19% | 1.26% |
| Expenses net of fee waivers, if any | 1.00% | 1.07% | 1.06% | 1.18% | 1.18% |
| Expenses net of all reductions | .97% | 1.05% | 1.04% | 1.17% | 1.15% |
| Net investment income (loss) | .49% | .80% | .60% | .71% | .75% |
| Supplemental Data | | | | | |
| Net assets, end of period (000 omitted) | $286,191 | $155,518 | $165,258 | $112,479 | $87,029 |
| Portfolio turnover rateH | 153% | 188% | 189% | 183% | 153% |
A Calculated based on average shares outstanding during the period.
B The amounts shown reflect certain reclassifications related to book to tax differences that were made in the year shown.
C Amount represents less than $.005 per share.
D Total returns do not reflect charges attributable to your insurance company's separate account. Inclusion of these charges would reduce the total returns shown.
E Total returns would have been lower if certain expenses had not been reduced during the applicable periods shown.
F Fees and expenses of any underlying Fidelity Central Funds are not included in the Fund's expense ratio. The Fund indirectly bears its proportionate share of the expenses of any underlying Fidelity Central Funds.
G Expense ratios reflect operating expenses of the class. Expenses before reductions do not reflect amounts reimbursed by the investment adviser or reductions from brokerage service arrangements or reductions from other expense offset arrangements and do not represent the amount paid by the class during periods when reimbursements or reductions occur. Expenses net of fee waivers reflect expenses after reimbursement by the investment adviser but prior to reductions from brokerage service arrangements or other expense offset arrangements. Expenses net of all reductions represent the net expenses paid by the class.
H Amount does not include the portfolio activity of any underlying Fidelity Central Funds.
See accompanying notes which are an integral part of the financial statements.
Notes to Financial Statements
For the period ended December 31, 2017
1. Organization.
VIP International Capital Appreciation Portfolio (the Fund) is a fund of Variable Insurance Products Fund II (the Trust) and is authorized to issue an unlimited number of shares. The Trust is registered under the Investment Company Act of 1940, as amended (the 1940 Act), as an open-end management investment company organized as a Massachusetts business trust. Shares of the Fund may only be purchased by insurance companies for the purpose of funding variable annuity or variable life insurance contracts. The Fund offers the following classes of shares: Initial Class shares, Service Class shares, Service Class 2 shares and Investor Class shares. All classes have equal rights and voting privileges, except for matters affecting a single class. The Fund's investments in emerging markets can be subject to social, economic, regulatory, and political uncertainties and can be extremely volatile.
2. Investments in Fidelity Central Funds.
The Fund invests in Fidelity Central Funds, which are open-end investment companies generally available only to other investment companies and accounts managed by the investment adviser and its affiliates. The Fund's Schedule of Investments lists each of the Fidelity Central Funds held as of period end, if any, as an investment of the Fund, but does not include the underlying holdings of each Fidelity Central Fund. As an Investing Fund, the Fund indirectly bears its proportionate share of the expenses of the underlying Fidelity Central Funds.
The Money Market Central Funds seek preservation of capital and current income and are managed by Fidelity Investments Money Management, Inc. (FIMM), an affiliate of the investment adviser. Annualized expenses of the Money Market Central Funds as of their most recent shareholder report date are less than .005%.
A complete unaudited list of holdings for each Fidelity Central Fund is available upon request or at the Securities and Exchange Commission (the SEC) website at www.sec.gov. In addition, the financial statements of the Fidelity Central Funds, which are not covered by the Fund's Report of Independent Registered Public Accounting Firm, are available on the SEC website or upon request.
3. Significant Accounting Policies.
The Fund is an investment company and applies the accounting and reporting guidance of the Financial Accounting Standards Board (FASB) Accounting Standards Codification Topic 946 Financial Services – Investments Companies. The financial statements have been prepared in conformity with accounting principles generally accepted in the United States of America (GAAP), which require management to make certain estimates and assumptions at the date of the financial statements. Actual results could differ from those estimates. Subsequent events, if any, through the date that the financial statements were issued have been evaluated in the preparation of the financial statements. The following summarizes the significant accounting policies of the Fund:
Investment Valuation. Investments are valued as of 4:00 p.m. Eastern time on the last calendar day of the period. The Board of Trustees (the Board) has delegated the day to day responsibility for the valuation of the Fund's investments to the Fair Value Committee (the Committee) established by the Fund's investment adviser. In accordance with valuation policies and procedures approved by the Board, the Fund attempts to obtain prices from one or more third party pricing vendors or brokers to value its investments. When current market prices, quotations or currency exchange rates are not readily available or reliable, investments will be fair valued in good faith by the Committee, in accordance with procedures adopted by the Board. Factors used in determining fair value vary by investment type and may include market or investment specific events. The frequency with which these procedures are used cannot be predicted and they may be utilized to a significant extent. The Committee oversees the Fund's valuation policies and procedures and reports to the Board on the Committee's activities and fair value determinations. The Board monitors the appropriateness of the procedures used in valuing the Fund's investments and ratifies the fair value determinations of the Committee.
The Fund categorizes the inputs to valuation techniques used to value its investments into a disclosure hierarchy consisting of three levels as shown below:
- Level 1 – quoted prices in active markets for identical investments
- Level 2 – other significant observable inputs (including quoted prices for similar investments, interest rates, prepayment speeds, etc.)
- Level 3 – unobservable inputs (including the Fund's own assumptions based on the best information available)
Valuation techniques used to value the Fund's investments by major category are as follows:
Equity securities, including restricted securities, for which market quotations are readily available, are valued at the last reported sale price or official closing price as reported by a third party pricing vendor on the primary market or exchange on which they are traded and are categorized as Level 1 in the hierarchy. In the event there were no sales during the day or closing prices are not available, securities are valued at the last quoted bid price or may be valued using the last available price and are generally categorized as Level 2 in the hierarchy. For foreign equity securities, when market or security specific events arise, comparisons to the valuation of American Depositary Receipts (ADRs), futures contracts and certain indexes as well as quoted prices for similar securities may be used and would be categorized as Level 2 in the hierarchy. Utilizing these techniques may result in transfers between Level 1 and Level 2. For equity securities, including restricted securities, where observable inputs are limited, assumptions about market activity and risk are used and these securities may be categorized as Level 3 in the hierarchy.
Investments in open-end mutual funds, including the Fidelity Central Funds, are valued at their closing net asset value (NAV) each business day and are categorized as Level 1 in the hierarchy.
Changes in valuation techniques may result in transfers in or out of an assigned level within the disclosure hierarchy. The aggregate value of investments by input level as of December 31, 2017, including information on transfers between Levels 1 and 2, is included at the end of the Fund's Schedule of Investments.
Foreign Currency. The Fund may use foreign currency contracts to facilitate transactions in foreign-denominated securities. Gains and losses from these transactions may arise from changes in the value of the foreign currency or if the counterparties do not perform under the contracts' terms.
Foreign-denominated assets, including investment securities, and liabilities are translated into U.S. dollars at the exchange rates at period end. Purchases and sales of investment securities, income and dividends received and expenses denominated in foreign currencies are translated into U.S. dollars at the exchange rate in effect on the transaction date.
The effects of exchange rate fluctuations on investments are included with the net realized and unrealized gain (loss) on investment securities. Other foreign currency transactions resulting in realized and unrealized gain (loss) are disclosed separately.
Investment Transactions and Income. For financial reporting purposes, the Fund's investment holdings and NAV include trades executed through the end of the last business day of the period. The NAV per share for processing shareholder transactions is calculated as of the close of business of the New York Stock Exchange (NYSE), normally 4:00 p.m. Eastern time and includes trades executed through the end of the prior business day. Gains and losses on securities sold are determined on the basis of identified cost and includes proceeds received from litigation. Dividend income is recorded on the ex-dividend date, except for certain dividends from foreign securities where the ex-dividend date may have passed, which are recorded as soon as the Fund is informed of the ex-dividend date. Non-cash dividends included in dividend income, if any, are recorded at the fair market value of the securities received. Income and capital gain distributions from Fidelity Central Funds, if any, are recorded on the ex-dividend date. Certain distributions received by the Fund represent a return of capital or capital gain. The Fund determines the components of these distributions subsequent to the ex-dividend date, based upon receipt of tax filings or other correspondence relating to the underlying investment. These distributions are recorded as a reduction of cost of investments and/or as a realized gain. Investment income is recorded net of foreign taxes withheld where recovery of such taxes is uncertain.
Class Allocations and Expenses. Investment income, realized and unrealized capital gains and losses, common expenses of the Fund, and certain fund-level expense reductions, if any, are allocated daily on a pro-rata basis to each class based on the relative net assets of each class to the total net assets of the Fund. Each class differs with respect to transfer agent and distribution and service plan fees incurred. Certain expense reductions may also differ by class. For the reporting period, the allocated portion of income and expenses to each class as a percent of its average net assets may vary due to the timing of recording these transactions in relation to fluctuating net assets of the classes. Expenses directly attributable to a fund are charged to that fund. Expenses attributable to more than one fund are allocated among the respective funds on the basis of relative net assets or other appropriate methods. Expense estimates are accrued in the period to which they relate and adjustments are made when actual amounts are known.
Income Tax Information and Distributions to Shareholders. Each year, the Fund intends to qualify as a regulated investment company under Subchapter M of the Internal Revenue Code, including distributing substantially all of its taxable income and realized gains. As a result, no provision for U.S. Federal income taxes is required. As of December 31, 2017, the Fund did not have any unrecognized tax benefits in the financial statements; nor is the Fund aware of any tax positions for which it is reasonably possible that the total amounts of unrecognized tax benefits will significantly change in the next twelve months. The Fund files a U.S. federal tax return, in addition to state and local tax returns as required. The Fund's federal income tax returns are subject to examination by the Internal Revenue Service (IRS) for a period of three fiscal years after they are filed. State and local tax returns may be subject to examination for an additional fiscal year depending on the jurisdiction. Foreign taxes are provided for based on the Fund's understanding of the tax rules and rates that exist in the foreign markets in which it invests. The Fund is subject to a tax imposed on capital gains by certain countries in which it invests. An estimated deferred tax liability for net unrealized appreciation on the applicable securities is included in Other payables and accrued expenses on the Statement of Assets & Liabilities.
Distributions are declared and recorded on the ex-dividend date. Income dividends and capital gain distributions are declared separately for each class. Income and capital gain distributions are determined in accordance with income tax regulations, which may differ from GAAP.
Capital accounts within the financial statements are adjusted for permanent book-tax differences. These adjustments have no impact on net assets or the results of operations. Capital accounts are not adjusted for temporary book-tax differences which will reverse in a subsequent period.
Book-tax differences are primarily due to foreign currency transactions, passive foreign investments companies (PFIC), capital loss carryforwards and losses deferred due to wash sales and excise tax regulations.
As of period end, the cost and unrealized appreciation (depreciation) in securities, and derivatives if applicable, for federal income tax purposes were as follows:
| Gross unrealized appreciation | $71,963,607 |
| Gross unrealized depreciation | (965,873) |
| Net unrealized appreciation (depreciation) | $70,997,734 |
| Tax Cost | $258,707,989 |
The tax-based components of distributable earnings as of period end were as follows:
| Undistributed long-term capital gain | $5,202,889 |
| Net unrealized appreciation (depreciation) on securities and other investments | $70,981,644 |
The Fund intends to elect to defer to its next fiscal year $473 of ordinary losses recognized during the period November 1, 2017 to December 31, 2017.
The tax character of distributions paid was as follows:
| | December 31, 2017 | December 31, 2016 |
| Ordinary Income | $1,225,134 | $ 1,446,618 |
| Tax Return of Capital | – | 106,313 |
| Total | $1,225,134 | $ 1,552,931 |
Delayed Delivery Transactions and When-Issued Securities. During the period, the Fund transacted in securities on a delayed delivery or when-issued basis. Payment and delivery may take place after the customary settlement period for that security. The price of the underlying securities and the date when the securities will be delivered and paid for are fixed at the time the transaction is negotiated. With respect to purchase commitments, the Fund identifies securities as segregated in its records with a value at least equal to the amount of the commitment. Losses may arise due to changes in the value of the underlying securities or if the counterparty does not perform under the contract's terms, or if the issuer does not issue the securities due to political, economic, or other factors.
Restricted Securities. The Fund may invest in securities that are subject to legal or contractual restrictions on resale. These securities generally may be resold in transactions exempt from registration or to the public if the securities are registered. Disposal of these securities may involve time-consuming negotiations and expense, and prompt sale at an acceptable price may be difficult. Information regarding restricted securities is included at the end of the Fund's Schedule of Investments.
4. Purchases and Sales of Investments.
Purchases and sales of securities, other than short-term securities, aggregated $449,427,995 and $372,938,814, respectively.
5. Fees and Other Transactions with Affiliates.
Management Fee. Fidelity Management & Research Company (the investment adviser) and its affiliates provide the Fund with investment management related services for which the Fund pays a monthly management fee. The management fee is the sum of an individual fund fee rate that is based on an annual rate of .45% of the Fund's average net assets and an annualized group fee rate that averaged .24% during the period. The group fee rate is based upon the average net assets of all the mutual funds advised by the investment adviser, including any mutual funds previously advised by the investment adviser that are currently advised by Fidelity SelectCo, LLC, an affiliate of the investment adviser. The group fee rate decreases as assets under management increase and increases as assets under management decrease. For the reporting period, the total annual management fee rate was .69% of the Fund's average net assets.
Distribution and Service Plan Fees. In accordance with Rule 12b-1 of the 1940 Act, the Fund has adopted separate 12b-1 Plans for each Service Class of shares. Each Service Class pays Fidelity Distributors Corporation (FDC), an affiliate of the investment adviser, a service fee. For the period, the service fee is based on an annual rate of .10% of Service Class' average net assets and .25% of Service Class 2's average net assets.
For the period, total fees, all of which were re-allowed to insurance companies for the distribution of shares and providing shareholder support services, were as follows:
| Service Class | $181 |
| Service Class 2 | 22,650 |
| | $22,831 |
Transfer Agent Fees. Fidelity Investments Institutional Operations Company, Inc. (FIIOC), an affiliate of the investment adviser, is the Fund's transfer, dividend disbursing, and shareholder servicing agent. FIIOC receives an asset-based fee with respect to each class. Each class pays a fee for transfer agent services, typesetting and printing and mailing of shareholder reports, excluding mailing of proxy statements, equal to an annual rate of class-level average net assets.. The annual rate for Investor Class is .15% and the annual rate for all other classes is .07%. For the period, transfer agent fees for each class were as follows:
| Initial Class | $15,076 |
| Service Class | 119 |
| Service Class 2 | 5,970 |
| Investor Class | 316,438 |
| | $337,603 |
Accounting and Security Lending Fees. Fidelity Service Company, Inc. (FSC), an affiliate of the investment adviser, maintains the Fund's accounting records. The accounting fee is based on the level of average net assets for each month. Under a separate contract, FSC administers the security lending program. The security lending fee is based on the number and duration of lending transactions.
Brokerage Commissions. The Fund placed a portion of its portfolio transactions with brokerage firms which are affiliates of the investment adviser. Brokerage commissions are included in net realized gain (loss) and change in net unrealized appreciation (depreciation) in the Statement of Operations. The commissions paid to these affiliated firms were $2,248 for the period.
Interfund Trades. The Fund may purchase from or sell securities to other Fidelity Funds under procedures adopted by the Board. The procedures have been designed to ensure these interfund trades are executed in accordance with Rule 17a-7 of the 1940 Act. Interfund trades are included within the respective purchases and sales amounts shown in the Purchases and Sales of Investments note.
6. Committed Line of Credit.
The Fund participates with other funds managed by the investment adviser or an affiliate in a $4.25 billion credit facility (the "line of credit") to be utilized for temporary or emergency purposes to fund shareholder redemptions or for other short-term liquidity purposes. The Fund has agreed to pay commitment fees on its pro-rata portion of the line of credit, which amounted to $683 and is reflected in Miscellaneous expenses on the Statement of Operations. During the period, the Fund did not borrow on this line of credit.
7. Security Lending.
The Fund lends portfolio securities through a lending agent from time to time in order to earn additional income. For equity securities, a lending agent is used and may loan securities to certain qualified borrowers, including Fidelity Capital Markets (FCM), a broker-dealer affiliated with the Fund. On the settlement date of the loan, the Fund receives collateral (in the form of U.S. Treasury obligations, letters of credit and/or cash) against the loaned securities and maintains collateral in an amount not less than 100% of the market value of the loaned securities during the period of the loan. The market value of the loaned securities is determined at the close of business of the Fund and any additional required collateral is delivered to the Fund on the next business day. The Fund or borrower may terminate the loan at any time, and if the borrower defaults on its obligation to return the securities loaned because of insolvency or other reasons, the Fund may apply collateral received from the borrower against the obligation. The Fund may experience delays and costs in recovering the securities loaned. Any cash collateral received is invested in the Fidelity Securities Lending Cash Central Fund. The value of loaned securities and cash collateral at period end are disclosed on the Fund's Statement of Assets and Liabilities. Security lending income represents the income earned on investing cash collateral, less rebates paid to borrowers and any lending agent fees associated with the loan, plus any premium payments received for lending certain types of securities. Security lending income is presented in the Statement of Operations as a component of income from Fidelity Central Funds. Total security lending income during the period amounted to $29,341 During the period, there were no securities loaned to FCM.
8. Expense Reductions.
Commissions paid to certain brokers with whom the investment adviser, or its affiliates, places trades on behalf of the Fund include an amount in addition to trade execution, which may be rebated back to the Fund to offset certain expenses. This amount totaled $75,865 for the period.
In addition, during the period the investment adviser reimbursed and/or waived a portion of fund-level operating expenses in the amount of $1,604.
9. Distributions to Shareholders.
Distributions to shareholders of each class were as follows:
| | Year ended
December 31, 2017 | Year ended December 31, 2016 |
| From net investment income | | |
| Initial Class | $119,468 | $146,515 |
| Service Class | 870 | 1,097 |
| Service Class 2 | 35,414 | 43,797 |
| Investor Class | 1,069,382 | 1,255,209 |
| Total | $1,225,134 | $1,446,618 |
| Tax Return of Capital | | |
| Initial Class | $– | $10,767 |
| Service Class | – | 80 |
| Service Class 2 | – | 3,219 |
| Investor Class | – | 92,247 |
| Total | $– | $106,313 |
10. Share Transactions.
Transactions for each class of shares were as follows:
| | Shares | Shares | Dollars | Dollars |
| | Year ended
December 31, 2017 | Year ended December 31, 2016 | Year ended
December 31, 2017 | Year ended December 31, 2016 |
| Initial Class | | | | |
| Shares sold | 607,788 | 140,726 | $9,449,414 | $1,871,117 |
| Reinvestment of distributions | 7,036 | 12,404 | 119,468 | 157,282 |
| Shares redeemed | (272,027) | (366,088) | (4,202,521) | (4,866,479) |
| Net increase (decrease) | 342,797 | (212,958) | $5,366,361 | $(2,838,080) |
| Service Class | | | | |
| Shares sold | 4,850 | – | $78,703 | $– |
| Reinvestment of distributions | 51 | 93 | 870 | 1,177 |
| Shares redeemed | (2,432) | (5,693) | (38,727) | (75,207) |
| Net increase (decrease) | 2,469 | (5,600) | $40,846 | $(74,030) |
| Service Class 2 | | | | |
| Shares sold | 427,031 | 357,681 | $6,621,187 | $4,764,967 |
| Reinvestment of distributions | 2,102 | 3,734 | 35,414 | 47,016 |
| Shares redeemed | (185,956) | (152,446) | (2,848,091) | (2,017,714) |
| Net increase (decrease) | 243,177 | 208,969 | $3,808,510 | $2,794,269 |
| Investor Class | | | | |
| Shares sold | 4,977,507 | 1,417,731 | $78,059,466 | $18,814,334 |
| Reinvestment of distributions | 63,465 | 107,111 | 1,069,382 | 1,347,456 |
| Shares redeemed | (694,422) | (1,785,856) | (10,390,177) | (23,263,459) |
| Net increase (decrease) | 4,346,550 | (261,014) | $68,738,671 | $(3,101,669) |
11. Other.
The Fund's organizational documents provide former and current trustees and officers with a limited indemnification against liabilities arising in connection with the performance of their duties to the Fund. In the normal course of business, the Fund may also enter into contracts that provide general indemnifications. The Fund's maximum exposure under these arrangements is unknown as this would be dependent on future claims that may be made against the Fund. The risk of material loss from such claims is considered remote.
At the end of the period, the investment adviser or its affiliates were the owners of record of 96% of the total outstanding shares of the Fund.
Report of Independent Registered Public Accounting Firm
To the Board of Trustees of Variable Insurance Products Fund II and Shareholders of VIP International Capital Appreciation Portfolio:
Opinion on the Financial Statements
We have audited the accompanying statement of assets and liabilities, including the schedule of investments, of VIP International Capital Appreciation Portfolio (one of the funds constituting Variable Insurance Products Fund II, referred to hereafter as the “Fund”) as of December 31, 2017, the related statement of operations for the year ended December 31, 2017, the statement of changes in net assets for each of the two years in the period ended December 31, 2017, including the related notes, and the financial highlights for each of the five years in the period ended December 31, 2017 (collectively referred to as the “financial statements”). In our opinion, the financial statements present fairly, in all material respects, the financial position of the Fund as of December 31, 2017, the results of its operations for the year then ended, the changes in its net assets for each of the two years in the period ended December 31, 2017 and the financial highlights for each of the five years in the period ended December 31, 2017 in conformity with accounting principles generally accepted in the United States of America.
Basis for Opinion
These financial statements are the responsibility of the Fund’s management. Our responsibility is to express an opinion on the Fund’s financial statements based on our audits. We are a public accounting firm registered with the Public Company Accounting Oversight Board (United States) (“PCAOB”) and are required to be independent with respect to the Fund in accordance with the U.S. federal securities laws and the applicable rules and regulations of the Securities and Exchange Commission and the PCAOB.
We conducted our audits of these financial statements in accordance with the standards of the PCAOB. Those standards require that we plan and perform the audit to obtain reasonable assurance about whether the financial statements are free of material misstatement, whether due to error or fraud.
Our audits included performing procedures to assess the risks of material misstatement of the financial statements, whether due to error or fraud, and performing procedures that respond to those risks. Such procedures included examining, on a test basis, evidence regarding the amounts and disclosures in the financial statements. Our audits also included evaluating the accounting principles used and significant estimates made by management, as well as evaluating the overall presentation of the financial statements. Our procedures included confirmation of securities owned as of December 31, 2017 by correspondence with the custodian and brokers; when replies were not received from brokers, we performed other auditing procedures. We believe that our audits provide a reasonable basis for our opinion.
PricewaterhouseCoopers LLP
Boston, Massachusetts
February 14, 2018
We have served as the auditor of one or more investment companies in the Fidelity group of funds since 1932.
Trustees and Officers
The Trustees, Members of the Advisory Board (if any), and officers of the trust and fund, as applicable, are listed below. The Board of Trustees governs the fund and is responsible for protecting the interests of shareholders. The Trustees are experienced executives who meet periodically throughout the year to oversee the fund's activities, review contractual arrangements with companies that provide services to the fund, oversee management of the risks associated with such activities and contractual arrangements, and review the fund's performance. Each of the Trustees oversees 190 funds.
The Trustees hold office without limit in time except that (a) any Trustee may resign; (b) any Trustee may be removed by written instrument, signed by at least two-thirds of the number of Trustees prior to such removal; (c) any Trustee who requests to be retired or who has become incapacitated by illness or injury may be retired by written instrument signed by a majority of the other Trustees; and (d) any Trustee may be removed at any special meeting of shareholders by a two-thirds vote of the outstanding voting securities of the trust. Each Trustee who is not an interested person (as defined in the 1940 Act) of the trust and the fund is referred to herein as an Independent Trustee. Each Independent Trustee shall retire not later than the last day of the calendar year in which his or her 75th birthday occurs. The Independent Trustees may waive this mandatory retirement age policy with respect to individual Trustees. Officers and Advisory Board Members hold office without limit in time, except that any officer or Advisory Board Member may resign or may be removed by a vote of a majority of the Trustees at any regular meeting or any special meeting of the Trustees. Except as indicated, each individual has held the office shown or other offices in the same company for the past five years.
The fund’s Statement of Additional Information (SAI) includes more information about the Trustees. To request a free copy, call Fidelity at 1-877-208-0098.
Experience, Skills, Attributes, and Qualifications of the Trustees. The Governance and Nominating Committee has adopted a statement of policy that describes the experience, qualifications, attributes, and skills that are necessary and desirable for potential Independent Trustee candidates (Statement of Policy). The Board believes that each Trustee satisfied at the time he or she was initially elected or appointed a Trustee, and continues to satisfy, the standards contemplated by the Statement of Policy. The Governance and Nominating Committee also engages professional search firms to help identify potential Independent Trustee candidates who have the experience, qualifications, attributes, and skills consistent with the Statement of Policy. From time to time, additional criteria based on the composition and skills of the current Independent Trustees, as well as experience or skills that may be appropriate in light of future changes to board composition, business conditions, and regulatory or other developments, have also been considered by the professional search firms and the Governance and Nominating Committee. In addition, the Board takes into account the Trustees' commitment and participation in Board and committee meetings, as well as their leadership of standing and ad hoc committees throughout their tenure.
In determining that a particular Trustee was and continues to be qualified to serve as a Trustee, the Board has considered a variety of criteria, none of which, in isolation, was controlling. The Board believes that, collectively, the Trustees have balanced and diverse experience, qualifications, attributes, and skills, which allow the Board to operate effectively in governing the fund and protecting the interests of shareholders. Information about the specific experience, skills, attributes, and qualifications of each Trustee, which in each case led to the Board's conclusion that the Trustee should serve (or continue to serve) as a trustee of the fund, is provided below.
Board Structure and Oversight Function. James C. Curvey is an interested person and currently serves as Chairman. The Trustees have determined that an interested Chairman is appropriate and benefits shareholders because an interested Chairman has a personal and professional stake in the quality and continuity of services provided to the fund. Independent Trustees exercise their informed business judgment to appoint an individual of their choosing to serve as Chairman, regardless of whether the Trustee happens to be independent or a member of management. The Independent Trustees have determined that they can act independently and effectively without having an Independent Trustee serve as Chairman and that a key structural component for assuring that they are in a position to do so is for the Independent Trustees to constitute a substantial majority for the Board. The Independent Trustees also regularly meet in executive session. Ned C. Lautenbach serves as Chairman of the Independent Trustees and as such (i) acts as a liaison between the Independent Trustees and management with respect to matters important to the Independent Trustees and (ii) with management prepares agendas for Board meetings.
Fidelity® funds are overseen by different Boards of Trustees. The fund's Board oversees Fidelity's high income and certain equity funds, and other Boards oversee Fidelity's investment-grade bond, money market, asset allocation, and sector funds. The asset allocation funds may invest in Fidelity® funds overseen by the fund's Board. The use of separate Boards, each with its own committee structure, allows the Trustees of each group of Fidelity® funds to focus on the unique issues of the funds they oversee, including common research, investment, and operational issues. On occasion, the separate Boards establish joint committees to address issues of overlapping consequences for the Fidelity® funds overseen by each Board.
The Trustees operate using a system of committees to facilitate the timely and efficient consideration of all matters of importance to the Trustees, the fund, and fund shareholders and to facilitate compliance with legal and regulatory requirements and oversight of the fund's activities and associated risks. The Board, acting through its committees, has charged FMR and its affiliates with (i) identifying events or circumstances the occurrence of which could have demonstrably adverse effects on the fund's business and/or reputation; (ii) implementing processes and controls to lessen the possibility that such events or circumstances occur or to mitigate the effects of such events or circumstances if they do occur; and (iii) creating and maintaining a system designed to evaluate continuously business and market conditions in order to facilitate the identification and implementation processes described in (i) and (ii) above. Because the day-to-day operations and activities of the fund are carried out by or through FMR, its affiliates, and other service providers, the fund's exposure to risks is mitigated but not eliminated by the processes overseen by the Trustees. While each of the Board's committees has responsibility for overseeing different aspects of the fund's activities, oversight is exercised primarily through the Operations, Audit, and Compliance Committees. In addition, the Independent Trustees have worked with FMR to enhance the Board's oversight of investment and financial risks, legal and regulatory risks, technology risks, and operational risks, including the development of additional risk reporting to the Board. For example, a working group comprised of Independent Trustees and FMR has worked and continues to work to review the Fidelity® funds' valuation-related activities, reporting and risk management. Appropriate personnel, including but not limited to the fund's Chief Compliance Officer (CCO), FMR's internal auditor, the independent accountants, the fund's Treasurer and portfolio management personnel, make periodic reports to the Board's committees, as appropriate, including an annual review of Fidelity's risk management program for the Fidelity® funds. The responsibilities of each standing committee, including their oversight responsibilities, are described further under "Standing Committees of the Trustees."
Interested Trustees*:
Correspondence intended for a Trustee who is an interested person may be sent to Fidelity Investments, 245 Summer Street, Boston, Massachusetts 02210.
Name, Year of Birth; Principal Occupations and Other Relevant Experience+
James C. Curvey (1935)
Year of Election or Appointment: 2007
Trustee
Chairman of the Board of Trustees
Mr. Curvey also serves as Trustee of other Fidelity® funds. Mr. Curvey is a Director of Fidelity Research & Analysis Co. (investment adviser firm, 2009-present), and Vice Chairman (2007-present) and Director of FMR LLC (diversified financial services company). In addition, Mr. Curvey serves as an Overseer for the Boston Symphony Orchestra and a member of the board of Artis-Naples, Naples, Florida, and as a Trustee for Brewster Academy, Wolfeboro, New Hampshire. Previously, Mr. Curvey served as a Director of Fidelity Investments Money Management, Inc. (investment adviser firm, 2009-2014) and a Director of FMR and FMR Co., Inc. (investment adviser firms, 2007-2014).
Charles S. Morrison (1960)
Year of Election or Appointment: 2014
Trustee
Mr. Morrison also serves as Trustee of other funds. He serves as President of Fidelity SelectCo, LLC (investment adviser firm, 2017-present) and Fidelity Management & Research Company (FMR) (investment adviser firm, 2016-present), a Director of Fidelity Investments Money Management, Inc. (FIMM) (investment adviser firm, 2014-present), Director of Fidelity SelectCo, LLC (investment adviser firm, 2014-present), President, Asset Management (2014-present), and is an employee of Fidelity Investments. Previously, Mr. Morrison served as Vice President of Fidelity's Fixed Income and Asset Allocation Funds (2012-2014), President, Fixed Income (2011-2014), Vice President of Fidelity's Money Market Funds (2005-2009), President, Money Market Group Leader of FMR (investment adviser firm, 2009), and Senior Vice President, Money Market Group of FMR (2004-2009). Mr. Morrison also served as Vice President of Fidelity's Bond Funds (2002-2005), certain Balanced Funds (2002-2005), and certain Asset Allocation Funds (2002-2007), and as Senior Vice President (2002-2005) of Fidelity's Bond Division.
* Determined to be an “Interested Trustee” by virtue of, among other things, his or her affiliation with the trust or various entities under common control with FMR.
+ The information includes the Trustee's principal occupation during the last five years and other information relating to the experience, attributes, and skills relevant to the Trustee's qualifications to serve as a Trustee, which led to the conclusion that the Trustee should serve as a Trustee for the fund.
Independent Trustees:
Correspondence intended for an Independent Trustee may be sent to Fidelity Investments, P.O. Box 55235, Boston, Massachusetts 02205-5235.
Name, Year of Birth; Principal Occupations and Other Relevant Experience+
Dennis J. Dirks (1948)
Year of Election or Appointment: 2005
Trustee
Mr. Dirks also serves as Trustee of other Fidelity® funds. Prior to his retirement in May 2003, Mr. Dirks was Chief Operating Officer and a member of the Board of The Depository Trust & Clearing Corporation (DTCC). He also served as President, Chief Operating Officer, and Board member of The Depository Trust Company (DTC) and President and Board member of the National Securities Clearing Corporation (NSCC). In addition, Mr. Dirks served as Chief Executive Officer and Board member of the Government Securities Clearing Corporation, Chief Executive Officer and Board member of the Mortgage-Backed Securities Clearing Corporation, as a Trustee and a member of the Finance Committee of Manhattan College (2005-2008), as a Trustee and a member of the Finance Committee of AHRC of Nassau County (2006-2008), as a member of the Independent Directors Council (IDC) Governing Council (2010-2015), and as a member of the Board of Directors for The Brookville Center for Children’s Services, Inc. (2009-2017). Mr. Dirks is a member of the Finance Committee (2016-present) and Board of Directors (2017-present) of the Asolo Repertory Theatre.
Alan J. Lacy (1953)
Year of Election or Appointment: 2008
Trustee
Mr. Lacy also serves as Trustee of other Fidelity® funds. Mr. Lacy serves as a Director of Bristol-Myers Squibb Company (global pharmaceuticals, 2008-present). He is a Trustee of the California Chapter of The Nature Conservancy (2015-present) and a Director of the Center for Advanced Study in the Behavioral Sciences at Stanford University (2015-present). In addition, Mr. Lacy served as Senior Adviser (2007-2014) of Oak Hill Capital Partners, L.P. (private equity) and also served as Chief Executive Officer (2005) and Vice Chairman (2005-2006) of Sears Holdings Corporation (retail) and Chief Executive Officer and Chairman of the Board of Sears, Roebuck and Co. (retail, 2000-2005). Previously, Mr. Lacy served as Chairman (2014-2017) and a member (2010-2017) of the Board of Directors of Dave & Buster’s Entertainment, Inc. (restaurant and entertainment complexes), as Chairman (2008-2011) and a member (2006-2015) of the Board of Trustees of the National Parks Conservation Association, and as a member of the Board of Directors for The Hillman Companies, Inc. (hardware wholesalers, 2010-2014), Earth Fare, Inc. (retail grocery, 2010-2014), and The Western Union Company (global money transfer, 2006-2011).
Ned C. Lautenbach (1944)
Year of Election or Appointment: 2000
Trustee
Chairman of the Independent Trustees
Mr. Lautenbach also serves as Trustee of other Fidelity® funds. Mr. Lautenbach currently serves as Vice Chair of the Board of Governors, State University System of Florida (2013-present) and is a member of the Council on Foreign Relations (1994-present). He is also a member and has most recently served as Chairman of the Board of Directors of Artis-Naples (2012-present). Previously, Mr. Lautenbach served as a member and then Lead Director of the Board of Directors of Eaton Corporation (diversified industrial, 1997-2016). He was also a Partner and Advisory Partner at Clayton, Dubilier & Rice, LLC (private equity investment, 1998-2010), as well as a Director of Sony Corporation (2006-2007). In addition, Mr. Lautenbach also had a 30-year career with IBM (technology company) during which time he served as Senior Vice President and a member of the Corporate Executive Committee (1968-1998).
Joseph Mauriello (1944)
Year of Election or Appointment: 2008
Trustee
Mr. Mauriello also serves as Trustee of other Fidelity® funds. Prior to his retirement in January 2006, Mr. Mauriello served in numerous senior management positions including Deputy Chairman and Chief Operating Officer (2004-2005), and Vice Chairman of Financial Services (2002-2004) of KPMG LLP US (professional services, 1965-2005). Mr. Mauriello currently serves as a member of the Board of Directors of XL Group plc. (global insurance and re-insurance, 2006-present) and the Independent Directors Council (IDC) Governing Council (2015-present). Previously, Mr. Mauriello served as a Director of the Hamilton Funds of the Bank of New York (2006-2007) and of Arcadia Resources Inc. (health care services and products, 2007-2012).
Cornelia M. Small (1944)
Year of Election or Appointment: 2005
Trustee
Ms. Small also serves as Trustee of other Fidelity® funds. Ms. Small is a member of the Board of Directors (2009-present) and Chair of the Investment Committee (2010-present) of the Teagle Foundation. Ms. Small also serves on the Investment Committee of the Berkshire Taconic Community Foundation (2008-present). Previously, Ms. Small served as Chairperson (2002-2008) and a member of the Investment Committee and Chairperson (2008-2012) and a member of the Board of Trustees of Smith College. In addition, Ms. Small served as Chief Investment Officer, Director of Global Equity Investments, and a member of the Board of Directors of Scudder, Stevens & Clark and Scudder Kemper Investments.
William S. Stavropoulos (1939)
Year of Election or Appointment: 2001
Trustee
Vice Chairman of the Independent Trustees
Mr. Stavropoulos also serves as Trustee of other Fidelity® funds. Mr. Stavropoulos serves as President and Founder of the Michigan Baseball Foundation, the Great Lakes Loons (2007-present). Mr. Stavropoulos is Chairman Emeritus of the Board of Directors of The Dow Chemical Company, where he previously served in numerous senior management positions, including President, CEO (1995-2000; 2002-2004), Chairman of the Executive Committee (2000-2006), and as a member of the Board of Directors (1990-2006). Currently, Mr. Stavropoulos is Chairman of the Board of Directors of Univar Inc. (global distributor of commodity and specialty chemicals), a Director of Teradata Corporation (data warehousing and technology solutions), and a member of the Advisory Board for Metalmark Capital LLC (private equity investment, 2005-present). Mr. Stavropoulos is an operating advisor to Clayton, Dubilier & Rice, LLC (private equity investment). In addition, Mr. Stavropoulos is a member of the University of Notre Dame Advisory Council for the College of Science, a Trustee of the Rollin L. Gerstacker Foundation, and a Director of Artis-Naples in Naples, Florida. Previously, Mr. Stavropoulos served as a Director of Chemical Financial Corporation (bank holding company, 1993-2012) and Tyco International, Ltd. (multinational manufacturing and services, 2007-2012).
David M. Thomas (1949)
Year of Election or Appointment: 2008
Trustee
Mr. Thomas also serves as Trustee of other Fidelity® funds. Mr. Thomas serves as Non-Executive Chairman of the Board of Directors of Fortune Brands Home and Security (home and security products, 2011-present), as a member of the Board of Directors (2004-present) and Presiding Director (2013-present) of Interpublic Group of Companies, Inc. (marketing communication), and as a member of the Board of Trustees of the University of Florida (2013-present). Previously, Mr. Thomas served as Executive Chairman (2005-2006) and Chairman and Chief Executive Officer (2000-2005) of IMS Health, Inc. (pharmaceutical and healthcare information solutions), and a Director of Fortune Brands, Inc. (consumer products, 2000-2011).
+ The information includes the Trustee's principal occupation during the last five years and other information relating to the experience, attributes, and skills relevant to the Trustee's qualifications to serve as a Trustee, which led to the conclusion that the Trustee should serve as a Trustee for the fund.
Advisory Board Members and Officers:
Correspondence intended for an officer or Peter S. Lynch may be sent to Fidelity Investments, 245 Summer Street, Boston, Massachusetts 02210. Officers appear below in alphabetical order.
Name, Year of Birth; Principal Occupation
Peter S. Lynch (1944)
Year of Election or Appointment: 2003
Member of the Advisory Board
Mr. Lynch also serves as Member of the Advisory Board of other Fidelity® funds. Mr. Lynch is Vice Chairman and a Director of FMR (investment adviser firm) and FMR Co., Inc. (investment adviser firm). In addition, Mr. Lynch serves as a Trustee of Boston College and as the Chairman of the Inner-City Scholarship Fund. Previously, Mr. Lynch served on the Special Olympics International Board of Directors (1997-2006).
Elizabeth Paige Baumann (1968)
Year of Election or Appointment: 2017
Anti-Money Laundering (AML) Officer
Ms. Baumann also serves as AML Officer of other funds. She is Chief AML Officer (2012-present) and Senior Vice President (2014-present) of FMR LLC (diversified financial services company) and is an employee of Fidelity Investments. Previously, Ms. Baumann served as AML Officer of the funds (2012-2016), and Vice President (2007-2014) and Deputy Anti-Money Laundering Officer (2007-2012) of FMR LLC.
Marc R. Bryant (1966)
Year of Election or Appointment: 2015
Secretary and Chief Legal Officer (CLO)
Mr. Bryant also serves as Secretary and CLO of other funds. Mr. Bryant serves as CLO, Secretary, and Senior Vice President of Fidelity Management & Research Company (investment adviser firm, 2015-present) and FMR Co., Inc. (investment adviser firm, 2015-present); Secretary of Fidelity SelectCo, LLC (investment adviser firm, 2015-present) and Fidelity Investments Money Management, Inc. (investment adviser firm, 2015-present); and CLO of Fidelity Management & Research (Hong Kong) Limited and FMR Investment Management (UK) Limited (investment adviser firms, 2015-present) and Fidelity Management & Research (Japan) Limited (investment adviser firm, 2016-present). He is Senior Vice President and Deputy General Counsel of FMR LLC (diversified financial services company). Previously, Mr. Bryant served as Secretary and CLO of Fidelity Rutland Square Trust II (2010-2014) and Assistant Secretary of Fidelity's Fixed Income and Asset Allocation Funds (2013-2015). Prior to joining Fidelity Investments, Mr. Bryant served as a Senior Vice President and the Head of Global Retail Legal for AllianceBernstein L.P. (2006-2010), and as the General Counsel for ProFund Advisors LLC (2001-2006).
William C. Coffey (1969)
Year of Election or Appointment: 2009
Assistant Secretary
Mr. Coffey also serves as Assistant Secretary of other funds. He is Senior Vice President and Deputy General Counsel of FMR LLC (diversified financial services company, 2010-present), and is an employee of Fidelity Investments. Previously, Mr. Coffey served as Vice President and Associate General Counsel of FMR LLC (2005-2009).
Jonathan Davis (1968)
Year of Election or Appointment: 2010
Assistant Treasurer
Mr. Davis also serves as Assistant Treasurer of other funds. Mr. Davis serves as Assistant Treasurer of FMR Capital, Inc. (2017-present) and is an employee of Fidelity Investments. Previously, Mr. Davis served as Vice President and Associate General Counsel of FMR LLC (diversified financial services company, 2003-2010).
Adrien E. Deberghes (1967)
Year of Election or Appointment: 2016
Assistant Treasurer
Mr. Deberghes also serves as an officer of other funds. He serves as Assistant Treasurer of FMR Capital, Inc. (2017-present), Executive Vice President of Fidelity Investments Money Management, Inc. (FIMM) (investment adviser firm, 2016-present), and is an employee of Fidelity Investments (2008-present). Prior to joining Fidelity Investments, Mr. Deberghes was Senior Vice President of Mutual Fund Administration at State Street Corporation (2007-2008), Senior Director of Mutual Fund Administration at Investors Bank & Trust (2005-2007), and Director of Finance for Dunkin' Brands (2000-2005). Previously, Mr. Deberghes served in other fund officer roles.
Joseph DeSantis (1959)
Year of Election or Appointment: 2017
Vice President
Mr. DeSantis also serves as Vice President of other funds. Mr. DeSantis serves as a Director of Fidelity Management & Research (Japan) Limited (investment adviser firm, 2016-present), Chief Investment Officer, Equities (2010-present) and is an employee of Fidelity Investments.
Stephanie J. Dorsey (1969)
Year of Election or Appointment: 2010
Assistant Treasurer
Ms. Dorsey also serves as an officer of other funds. Ms. Dorsey serves as Assistant Treasurer of FMR Capital, Inc. (2017-present), is an employee of Fidelity Investments (2008-present), and has served in other fund officer roles. Prior to joining Fidelity Investments, Ms. Dorsey served as Treasurer (2004-2008) of the JPMorgan Mutual Funds and Vice President (2004-2008) of JPMorgan Chase Bank.
Howard J. Galligan III (1966)
Year of Election or Appointment: 2014
Chief Financial Officer
Mr. Galligan also serves as Chief Financial Officer of other funds. Mr. Galligan serves as President of Fidelity Pricing and Cash Management Services (FPCMS) (2014-present) and as a Director of Strategic Advisers, Inc. (investment adviser firm, 2008-present). Previously, Mr. Galligan served as Chief Administrative Officer of Asset Management (2011-2014) and Chief Operating Officer and Senior Vice President of Investment Support for Strategic Advisers, Inc. (2003-2011).
Brian B. Hogan (1964)
Year of Election or Appointment: 2009
Vice President
Mr. Hogan also serves as Trustee or Vice President of other funds. Mr. Hogan serves as a Director of FMR Investment Management (UK) Limited (investment adviser firm, 2015-present) and Fidelity SelectCo, LLC (investment adviser firm, 2014-present) and President of the Equity Division of FMR (investment adviser firm, 2009-present). Previously, Mr. Hogan served as Senior Vice President, Equity Research of FMR (2006-2009) and as a portfolio manager. Mr. Brian B. Hogan is not related to Mr. Colm A. Hogan.
Colm A. Hogan (1973)
Year of Election or Appointment: 2016
Deputy Treasurer
Mr. Hogan also serves as an officer of other funds. Mr. Hogan serves as Assistant Treasurer of FMR Capital, Inc. (2017-present) and is an employee of Fidelity Investments (2005-present). Mr. Colm A. Hogan is not related to Mr. Brian B. Hogan.
Chris Maher (1972)
Year of Election or Appointment: 2013
Assistant Treasurer
Mr. Maher serves as Assistant Treasurer of other funds. Mr. Maher is Vice President of Valuation Oversight, serves as Assistant Treasurer of FMR Capital, Inc. (2017-present), and is an employee of Fidelity Investments. Previously, Mr. Maher served as Vice President of Asset Management Compliance (2013), Vice President of the Program Management Group of FMR (investment adviser firm, 2010-2013), and Vice President of Valuation Oversight (2008-2010).
Rieco E. Mello (1969)
Year of Election or Appointment: 2017
Assistant Treasurer
Mr. Mello also serves as Assistant Treasurer of other funds. Mr. Mello serves as Assistant Treasurer of FMR Capital, Inc. (2017-present) and is an employee of Fidelity Investments (1995-present).
Kenneth B. Robins (1969)
Year of Election or Appointment: 2016
Chief Compliance Officer
Mr. Robins also serves as an officer of other funds. Mr. Robins serves as Compliance Officer of Fidelity Management & Research Company and FMR Co., Inc. (investment adviser firms, 2016-present) and is an employee of Fidelity Investments (2004-present). Previously, Mr. Robins served as Executive Vice President of Fidelity Investments Money Management, Inc. (investment adviser firm, 2013-2016) and served in other fund officer roles.
Stacie M. Smith (1974)
Year of Election or Appointment: 2016
President and Treasurer
Ms. Smith also serves as an officer of other funds. Ms. Smith serves as Assistant Treasurer of FMR Capital, Inc. (2017-present), is an employee of Fidelity Investments (2009-present), and has served in other fund officer roles. Prior to joining Fidelity Investments, Ms. Smith served as Senior Audit Manager of Ernst & Young LLP (accounting firm, 1996-2009). Previously, Ms. Smith served as Deputy Treasurer of certain Fidelity® funds (2013-2016).
Marc L. Spector (1972)
Year of Election or Appointment: 2016
Assistant Treasurer
Mr. Spector also serves as an officer of other funds. Mr. Spector serves as Assistant Treasurer of FMR Capital, Inc. (2017-present) and is an employee of Fidelity Investments (2016-present). Prior to joining Fidelity Investments, Mr. Spector served as Director at the Siegfried Group (accounting firm, 2013-2016), and prior to Siegfried Group as audit senior manager at Deloitte & Touche (accounting firm, 2005-2013).
Renee Stagnone (1975)
Year of Election or Appointment: 2016
Assistant Treasurer
Ms. Stagnone also serves as an officer of other funds. Ms. Stagnone serves as Assistant Treasurer of FMR Capital, Inc. (2017-present) and is an employee of Fidelity Investments (1997-present). Previously, Ms. Stagnone served as Deputy Treasurer of certain Fidelity® funds (2013-2016).
Shareholder Expense Example
As a shareholder of the Fund, you incur two types of costs: (1) transaction costs, and (2) ongoing costs, including management fees, distribution and/or service (12b-1) fees and other Fund expenses. This Example is intended to help you understand your ongoing costs (in dollars) of investing in the Fund and to compare these costs with the ongoing costs of investing in other mutual funds.
The Example is based on an investment of $1,000 invested at the beginning of the period and held for the entire period (July 1, 2017 to December 31, 2017).
Actual Expenses
The first line of the accompanying table for each class of the Fund provides information about actual account values and actual expenses. You may use the information in this line, together with the amount you invested, to estimate the expenses that you paid over the period. Simply divide your account value by $1,000.00 (for example, an $8,600 account value divided by $1,000.00 = 8.6), then multiply the result by the number in the first line for a class of the Fund under the heading entitled "Expenses Paid During Period" to estimate the expenses you paid on your account during this period. The estimate of expenses does not include any fees or other expenses of any variable annuity or variable life insurance product. If they were, the estimate of expenses you paid during the period would be higher, and your ending account value would be lower. In addition, the Fund, as a shareholder in the underlying Fidelity Central Funds, will indirectly bear its pro-rata share of the fees and expenses incurred by the underlying Fidelity Central Funds. These fees and expenses are not included in the Fund's annualized expense ratio used to calculate the expense estimate in the table below.
Hypothetical Example for Comparison Purposes
The second line of the accompanying table for each class of the Fund provides information about hypothetical account values and hypothetical expenses based on a Class' actual expense ratio and an assumed rate of return of 5% per year before expenses, which is not the Class' actual return. The hypothetical account values and expenses may not be used to estimate the actual ending account balance or expenses you paid for the period. You may use this information to compare the ongoing costs of investing in the Fund and other funds. To do so, compare this 5% hypothetical example with the 5% hypothetical examples that appear in the shareholder reports of the other funds. The estimate of expenses does not include any fees or other expenses of any variable annuity or variable life insurance product. If they were, the estimate of expenses you paid during the period would be higher, and your ending account value would be lower. In addition, the Fund, as a shareholder in the underlying Fidelity Central Funds, will indirectly bear its pro-rata share of the fees and expenses incurred by the underlying Fidelity Central Funds. These fees and expenses are not included in the Fund's annualized expense ratio used to calculate the expense estimate in the table below.
Please note that the expenses shown in the table are meant to highlight your ongoing costs only and do not reflect any transaction costs. Therefore, the second line of the table is useful in comparing ongoing costs only, and will not help you determine the relative total costs of owning different funds.
| | Annualized Expense Ratio-A | Beginning
Account Value
July 1, 2017 | Ending
Account Value
December 31, 2017 | Expenses Paid
During Period-B
July 1, 2017
to December 31, 2017 |
| Initial Class | .91% | | | |
| Actual | | $1,000.00 | $1,128.30 | $4.88 |
| Hypothetical-C | | $1,000.00 | $1,020.62 | $4.63 |
| Service Class | 1.01% | | | |
| Actual | | $1,000.00 | $1,127.90 | $5.42 |
| Hypothetical-C | | $1,000.00 | $1,020.11 | $5.14 |
| Service Class 2 | 1.16% | | | |
| Actual | | $1,000.00 | $1,127.00 | $6.22 |
| Hypothetical-C | | $1,000.00 | $1,019.36 | $5.90 |
| Investor Class | .99% | | | |
| Actual | | $1,000.00 | $1,128.10 | $5.31 |
| Hypothetical-C | | $1,000.00 | $1,020.21 | $5.04 |
A Annualized expense ratio reflects expenses net of applicable fee waivers.
B Expenses are equal to each Class' annualized expense ratio, multiplied by the average account value over the period, multiplied by 184/365 (to reflect the one-half year period).
C 5% return per year before expenses
Distributions (Unaudited)
The Board of Trustees of VIP International Capital Appreciation Portfolio voted to pay to shareholders of record at the opening of business on record date, the following distributions per share derived from capital gains realized from sales of portfolio securities:
| | Pay Date | Record Date | Capital Gains |
| VIP International Capital Appreciation Portfolio | | | |
| Initial Class | 02/09/18 | 02/09/18 | $0.260 |
| Service Class | 02/09/18 | 02/09/18 | $0.260 |
| Service Class 2 | 02/09/18 | 02/09/18 | $0.260 |
| Investor Class | 02/09/18 | 02/09/18 | $0.260 |
|
The fund hereby designates as a capital gain dividend with respect to the taxable year ended December 31, 2017 $5,202,889, or, if subsequently determined to be different, the net capital gain of such year.
Initial Class designates 16%, Service Class designates 18%, Service Class 2 designates 22%, and Investor Class designates 17% of the dividends distributed during the fiscal year as qualifying for the dividends–received deduction for corporate shareholders
The amounts per share which represent income derived from sources within, and taxes paid to, foreign countries or possessions of the United States are as follows:
| | Pay Date | Income | Taxes |
| VIP International Capital Appreciation Portfolio | | | |
| Initial Class | 12/01/2017 | $0.0869 | $0.0129 |
| Service Class | 12/01/2017 | $0.0769 | $0.0129 |
| Service Class 2 | 12/01/2017 | $0.0629 | $0.0129 |
| Investor Class | 12/01/2017 | $0.0789 | $0.0129 |
|
Board Approval of Investment Advisory Contracts and Management Fees
VIP International Capital Appreciation Portfolio
Each year, the Board of Trustees, including the Independent Trustees (together, the Board), votes on the renewal of the management contract with Fidelity Management & Research Company (FMR) and the sub-advisory agreements (together, the Advisory Contracts) for the fund. FMR and the sub-advisers are referred to herein as the Investment Advisers. The Board, assisted by the advice of fund counsel and Independent Trustees' counsel, requests and considers a broad range of information relevant to the renewal of the Advisory Contracts throughout the year.
The Board meets regularly and, at each of its meetings, covers an extensive agenda of topics and materials and considers factors that are relevant to its annual consideration of the renewal of the fund's Advisory Contracts, including the services and support provided to the fund and its shareholders. The Board has established various standing committees (Committees), each composed of and chaired by Independent Trustees with varying backgrounds, to which the Board has assigned specific subject matter responsibilities in order to enhance effective decision-making by the Board. The Board, acting directly and through its Committees, requests and receives information concerning the annual consideration of the renewal of the fund's Advisory Contracts. The Board also meets as needed to review matters specifically related to the Board's annual consideration of the renewal of the Advisory Contracts. Members of the Board may also meet with trustees of other Fidelity funds through ad hoc joint committees to discuss certain matters relevant to all of the Fidelity funds.
At its July 2017 meeting, the Board unanimously determined to renew the fund's Advisory Contracts. In reaching its determination, the Board considered all factors it believed relevant, including (i) the nature, extent, and quality of the services to be provided to the fund and its shareholders (including the investment performance of the fund); (ii) the competitiveness of the fund's management fee and total expense ratio relative to peer funds; (iii) the total costs of the services to be provided by and the profits to be realized by Fidelity from its relationships with the fund; and (iv) the extent to which, if any, economies of scale exist and would be realized as the fund grows, and whether any economies of scale are appropriately shared with fund shareholders.
In considering whether to renew the Advisory Contracts for the fund, the Board reached a determination, with the assistance of fund counsel and Independent Trustees' counsel and through the exercise of its business judgment, that the renewal of the Advisory Contracts was in the best interests of the fund and its shareholders and that the compensation payable under the Advisory Contracts was fair and reasonable. The Board's decision to renew the Advisory Contracts was not based on any single factor, but rather was based on a comprehensive consideration of all the information provided to the Board at its meetings throughout the year. The Board, in reaching its determination to renew the Advisory Contracts, was aware that shareholders of the fund have a broad range of investment choices available to them, including a wide choice among funds offered by Fidelity's competitors, and that the fund's shareholders, who have the opportunity to review and weigh the disclosure provided by the fund in its prospectus and other public disclosures, have chosen to invest in this fund, which is part of the Fidelity family of funds.
Amendment to Group Fee Rate. The Board also approved an amendment to the management contract for the fund to add an additional breakpoint to the group fee schedule, effective October 1, 2017. The Board noted that the additional breakpoint would result in lower management fee rates as Fidelity's assets under management increase.
Nature, Extent, and Quality of Services Provided. The Board considered Fidelity's staffing as it relates to the fund, including the backgrounds of investment personnel of Fidelity, and also considered the fund's investment objective, strategies, and related investment philosophy. The Independent Trustees also had discussions with senior management of Fidelity's investment operations and investment groups. The Board considered the structure of the investment personnel compensation program and whether this structure provides appropriate incentives to act in the best interests of the fund. Additionally, the Board considered the portfolio managers' investments, if any, in the funds that they manage.
Resources Dedicated to Investment Management and Support Services. The Board and the Fund Oversight and Research Committees reviewed the general qualifications and capabilities of Fidelity's investment staff, including its size, education, experience, and resources, as well as Fidelity's approach to recruiting, training, managing, and compensating investment personnel. The Board noted that Fidelity has continued to increase the resources devoted to non-U.S. offices, including expansion of Fidelity's global investment organization. The Board also noted that Fidelity's analysts have extensive resources, tools and capabilities that allow them to conduct sophisticated quantitative and fundamental analysis, as well as credit analysis of issuers, counterparties and guarantors. Further, the Board considered that Fidelity's investment professionals have sufficient access to global information and data so as to provide competitive investment results over time, and that those professionals also have access to sophisticated tools that permit them to assess portfolio construction and risk and performance attribution characteristics continuously, as well as to transmit new information and research conclusions rapidly around the world. Additionally, in its deliberations, the Board considered Fidelity's trading, risk management, compliance, and technology and operations capabilities and resources, which are integral parts of the investment management process.
Shareholder and Administrative Services. The Board considered (i) the nature, extent, quality, and cost of advisory, administrative, and shareholder services performed by the Investment Advisers and their affiliates under the Advisory Contracts and under separate agreements covering transfer agency, pricing and bookkeeping, and securities lending services for the fund; (ii) the nature and extent of the supervision of third party service providers, principally custodians, subcustodians, and pricing vendors; and (iii) the resources devoted to, and the record of compliance with, the fund's compliance policies and procedures. The Board also reviewed the allocation of fund brokerage, including allocations to brokers affiliated with the Investment Advisers, the use of brokerage commissions to pay fund expenses, and the use of "soft" commission dollars to pay for research services.
The Board noted that the growth of fund assets over time across the complex allows Fidelity to reinvest in the development of services designed to enhance the value or convenience of the Fidelity funds as investment vehicles. These services include 24-hour access to account information and market information through telephone representatives and over the Internet, investor education materials and asset allocation tools, and the expanded availability of Fidelity Investor Centers.
In 2014, the Board formed an ad hoc Committee on Transfer Agency Fees to review the variety of transfer agency fee structures throughout the industry and Fidelity's competitive positioning with respect to industry participants.
Investment in a Large Fund Family. The Board considered the benefits to shareholders of investing in a Fidelity fund, including the benefits of investing in a fund that is part of a large family of funds offering a variety of investment disciplines and providing a large variety of mutual fund investor services. The Board noted that Fidelity had taken, or had made recommendations that resulted in the Fidelity funds taking, a number of actions over the previous year that benefited particular funds, including: (i) continuing to dedicate additional resources to Fidelity's investment research process, and to the support of the senior management team that oversees asset management; (ii) continuing efforts to enhance Fidelity's global research capabilities; (iii) launching new funds and making other enhancements to meet client needs; (iv) launching new share classes of existing funds; (v) eliminating purchase minimums and broadening eligibility requirements for certain lower-priced share classes; (vi) reducing management fees and total expenses for certain growth equity funds and index funds; (vii) lowering expense caps for certain existing funds and classes to reduce expenses borne by shareholders; (viii) eliminating short-term redemption fees for certain funds; (ix) introducing a new pricing structure for certain funds of funds that is expected to reduce overall expenses paid by shareholders; (x) rationalizing product lines and gaining increased efficiencies through proposals for fund mergers and share class consolidations; (xi) continuing to develop, acquire and implement systems and technology to improve services to the funds and shareholders, strengthen information security, and increase efficiency; and (xii) implementing enhancements to further strengthen Fidelity's product line to increase investors' probability of success in achieving their investment goals, including retirement income goals.
Investment Performance. The Board considered whether the fund has operated in accordance with its investment objective, as well as its record of compliance with its investment restrictions and its performance history.
The Board took into account discussions with representatives of the Investment Advisers about fund investment performance that occur at Board meetings throughout the year. In this regard the Board noted that as part of regularly scheduled fund reviews and other reports to the Board on fund performance, the Board considers annualized return information for the fund for different time periods, measured against a securities market index ("benchmark index") and a peer group of funds with similar objectives ("peer group"), if any. In its evaluation of fund investment performance, the Board gave particular attention to information indicating changes in performance of certain Fidelity funds for specific time periods and discussed with the Investment Advisers the reasons for any overperformance or underperformance.
In addition to reviewing absolute and relative fund performance, the Independent Trustees periodically consider the appropriateness of fund performance metrics in evaluating the results achieved. In general, the Independent Trustees believe that fund performance should be evaluated based on net performance (after fees and expenses) of both the highest performing and lowest performing fund share classes, where applicable, compared to appropriate benchmark indices, over appropriate time periods that may include full market cycles, and compared to peer groups, as applicable, over the same periods, taking into account relevant factors including the following: general market conditions; issuer-specific information; and fund cash flows and other factors.
The Independent Trustees recognize that shareholders evaluate performance on a net basis over their own holding periods, for which one-, three-, and five-year periods are often used as a proxy. For this reason, the performance information reviewed by the Board also included net cumulative calendar year total return information for the fund and an appropriate benchmark index and peer group for the most recent one-, three-, and five-year periods, as shown below. Returns are shown compared to the 25th percentile (top of box, 75% beaten) and 75th percentile (bottom of box, 25% beaten) of the peer universe. Returns of the benchmark index are "net MA," i.e., adjusted for tax withholding rates applicable to U.S.-based funds organized as Massachusetts business trusts.
VIP International Capital Appreciation Portfolio

Based on its review, the Board concluded that the nature, extent, and quality of services provided to the fund under the Advisory Contracts should continue to benefit the shareholders of the fund.
Competitiveness of Management Fee and Total Expense Ratio. The Board considered the fund's management fee and total expense ratio compared to "mapped groups" of competitive funds and classes created for the purpose of facilitating the Trustees' competitive analysis of management fees and total expenses. Fidelity creates "mapped groups" by combining similar Lipper investment objective categories that have comparable investment mandates. Combining Lipper investment objective categories aids the Board's management fee and total expense ratio comparisons by broadening the competitive group used for comparison.
Management Fee. The Board considered two proprietary management fee comparisons for the 12-month periods shown in basis points (BP) in the chart below. The group of Lipper funds used by the Board for management fee comparisons is referred to below as the "Total Mapped Group." The Total Mapped Group comparison focuses on a fund's standing in terms of gross management fees before expense reimbursements or caps relative to the total universe of funds with comparable investment mandates, regardless of whether their management fee structures also are comparable. Funds with comparable investment mandates offer exposure to similar types of securities. Funds with comparable management fee structures have similar management fee contractual arrangements (
e.g., flat rate charged for advisory services, all-inclusive fee rate,
etc.). "TMG %" represents the percentage of funds in the Total Mapped Group that had management fees that were lower than the fund's. For example, a hypothetical TMG % of 20% would mean that 80% of the funds in the Total Mapped Group had higher, and 20% had lower, management fees than the fund. The fund's actual TMG %s and the number of funds in the Total Mapped Group are in the chart below. The "Asset-Size Peer Group" (ASPG) comparison focuses on a fund's standing relative to a subset of non-Fidelity funds within the Total Mapped Group that are similar in size and management fee structure. For example, if a fund is in the first quartile of the ASPG, the fund's management fee ranks in the least expensive or lowest 25% of funds in the ASPG. The ASPG represents at least 15% of the funds in the Total Mapped Group with comparable asset size and management fee structures, subject to a minimum of 50 funds (or all funds in the Total Mapped Group if fewer than 50). Additional information, such as the ASPG quartile in which the fund's management fee rate ranked, is also included in the chart and considered by the Board.
VIP International Capital Appreciation Portfolio

The Board noted that the fund's management fee rate ranked below the median of its Total Mapped Group and below the median of its ASPG for 2016.
The Board noted that, in 2014, the Board and the boards of other Fidelity funds formed the ad hoc Committee on Group Fee to conduct an in-depth review of the "group fee" component of the management fee of funds with such management fee structures. The Committee's focus included the mechanics of the group fee, the competitive landscape of group fee structures, Fidelity funds with no group fee component and investment products not included in group fee assets. The Board also considered that, for funds subject to the group fee, FMR agreed to voluntarily waive fees over a specified period of time in amounts designed to account for assets converted from certain funds to certain collective investment trusts.
The Board also noted that, in 2013, the ad hoc Committee on Management Fees was formed to conduct an in-depth review of the management fee rates of Fidelity's active equity mutual funds. The Committee focused on the following areas: (i) standard fee structures; (ii) research consumption and trading evolution; (iii) management fee competitiveness/profitability by category; and (iv) factors that drive institutional pricing.
Based on its review, the Board concluded that the fund's management fee is fair and reasonable in light of the services that the fund receives and the other factors considered.
Total Expense Ratio. In its review of each class's total expense ratio, the Board considered the fund's management fee rate as well as other fund or class expenses, as applicable, such as transfer agent fees, pricing and bookkeeping fees, fund-paid 12b-1 fees, and custodial, legal, and audit fees. The Board also noted that Fidelity may agree to waive fees and expenses from time to time, and the extent to which, if any, it has done so for the fund. As part of its review, the Board also considered the current and historical total expense ratios of each class of the fund compared to competitive fund median expenses. Each class of the fund is compared to those funds and classes in the Total Mapped Group (used by the Board for management fee comparisons) that have a similar sales load structure.
The Board noted that the total expense ratio of Initial Class ranked below the competitive median for 2016 and the total expense ratio of each of Investor Class, Service Class, and Service Class 2 ranked above the competitive median for 2016. The Board considered that, in general, various factors can affect total expense ratios. The Board noted that Investor Class was above the competitive median primarily because of relatively higher other expenses due to low asset levels. The Board also noted that Investor Class has higher transfer agent fees than most of its competitors because it is designed for lower cost annuity products, where the majority of servicing costs are incorporated into the funds' total expense ratios rather than being paid at the annuity level. The Board noted that the total expense ratio of each of Service Class and Service Class 2 was above the competitive median because of its 12b-1 fees. The Board noted that the fund offers multiple classes, each of which has a different 12b-1 fee structure, and that the multiple structures are intended to offer a range of pricing options for the intermediary market. The Board also noted that the total expense ratios of the classes vary primarily by the level of their 12b-1 fees, although differences in transfer agent fees may also cause expenses to vary from class to class.
Fees Charged to Other Fidelity Clients. The Board also considered Fidelity fee structures and other information with respect to clients of Fidelity, such as other funds advised or subadvised by Fidelity, pension plan clients, and other institutional clients with similar mandates. The Board noted that an ad hoc joint committee created by it and the boards of other Fidelity funds periodically (most recently in 2013) reviews and compares Fidelity's institutional investment advisory business with its business of providing services to the Fidelity funds, including the differences in services provided, fees charged, and costs incurred, as well as competition in their respective marketplaces.
Based on its review of total expense ratios and fees charged to other Fidelity clients, the Board concluded that, although some classes were above the median of the universe presented for comparison, the total expense ratio of each class of the fund was reasonable in light of the services that the fund and its shareholders receive and the other factors considered.
Costs of the Services and Profitability. The Board considered the revenues earned and the expenses incurred by Fidelity in conducting the business of developing, marketing, distributing, managing, administering and servicing the fund and servicing the fund's shareholders. The Board also considered the level of Fidelity's profits in respect of all the Fidelity funds.
On an annual basis, Fidelity presents to the Board information about the profitability of its relationships with the fund. Fidelity calculates profitability information for each fund, as well as aggregate profitability information for groups of Fidelity funds and all Fidelity funds, using a series of detailed revenue and cost allocation methodologies which originate with the books and records of Fidelity on which Fidelity's audited financial statements are based. The Audit Committee of the Board reviews any significant changes from the prior year's methodologies.
PricewaterhouseCoopers LLP (PwC), independent registered public accounting firm and auditor to Fidelity and certain Fidelity funds, has been engaged annually by the Board as part of the Board's assessment of Fidelity's profitability analysis. PwC's engagement includes the review and assessment of the methodologies used by Fidelity in determining the revenues and expenses attributable to Fidelity's mutual fund business, and completion of agreed-upon procedures in respect of the mathematical accuracy of the fund profitability information and its conformity to established allocation methodologies. After considering PwC's reports issued under the engagement and information provided by Fidelity, the Board concluded that while other allocation methods may also be reasonable, Fidelity's profitability methodologies are reasonable in all material respects.
The Board also reviewed Fidelity's non-fund businesses and potential fall-out benefits related to the mutual fund business as well as cases where Fidelity's affiliates may benefit from or be related to the fund's business.
The Board considered the costs of the services provided by and the profits realized by Fidelity in connection with the operation of the fund and was satisfied that the profitability was not excessive.
Economies of Scale. The Board considered whether there have been economies of scale in respect of the management of the Fidelity funds, whether the Fidelity funds (including the fund) have appropriately benefited from any such economies of scale, and whether there is potential for realization of any further economies of scale. The Board considered the extent to which the fund will benefit from economies of scale as assets grow through increased services to the fund, through waivers or reimbursements, or through fee or expense ratio reductions. The Board also noted that a committee (the Economies of Scale Committee) created by it and the boards of other Fidelity funds periodically (most recently in 2013) analyzes whether Fidelity attains economies of scale in respect of the management and servicing of the Fidelity funds, whether the Fidelity funds have appropriately benefited from such economies of scale, and whether there is potential for realization of any further economies of scale.
The Board recognized that the fund's management contract incorporates a "group fee" structure, which provides for lower group fee rates as total group assets increase, and for higher group fee rates as total group assets decrease (with "group assets" defined to include fund assets under FMR's management plus the assets of sector funds previously under FMR's management). FMR calculates the group fee rates based on a tiered asset "breakpoint" schedule that varies based on asset class. The Board considered that the group fee is designed to deliver the benefits of economies of scale to fund shareholders when total Fidelity fund assets increase, even if assets of any particular fund are unchanged or have declined, because some portion of Fidelity's costs are attributable to services provided to all Fidelity funds, and all funds benefit if those costs can be allocated among more assets. The Board concluded that, given the group fee structure, fund shareholders will benefit from lower management fees as group assets increase at the fund complex level, regardless of whether Fidelity achieves any such economies of scale.
The Board concluded, taking into account the analysis of the Economies of Scale Committee, that economies of scale, if any, are being appropriately shared between fund shareholders and Fidelity.
Additional Information Requested by the Board. In order to develop fully the factual basis for consideration of the Fidelity funds' advisory contracts, the Board requested and received additional information on certain topics, including: (i) fund performance trends, in particular the underperformance of certain funds, and Fidelity's long-term strategies for certain funds; (ii) Fidelity's fund profitability methodology, profitability trends for certain funds, and the impact of certain factors on fund profitability results, including the impact of market trends on actively managed funds; (iii) the use of performance fees and the calculation of performance adjustments, including the impact of underperformance and fund outflows on performance adjustments; (iv) metrics for evaluating index fund performance; (v) Fidelity's group fee structure, including the group fee breakpoint schedules; (vi) the terms of Fidelity's contractual and voluntary expense cap arrangements with the funds; (vii) the methodology with respect to evaluating competitive fund data and peer group classifications and fee comparisons; (viii) the expense structures for different funds and classes; (ix) Fidelity's arrangements with affiliated sub-advisers on behalf of the funds; (x) information regarding other accounts managed by Fidelity, including institutional accounts and collective investment trusts; (xi) recent changes to the fee structure for certain funds of funds; and (xii) the impact of the Department of Labor's new fiduciary rule on the funds' comparative expense information.
Based on its evaluation of all of the conclusions noted above, and after considering all factors it believed relevant, the Board concluded that the advisory fee structures are fair and reasonable, and that the fund's Advisory Contracts should be renewed.
VIPCAP-ANN-0218
1.811843.113
Fidelity® Variable Insurance Products: Disciplined Small Cap Portfolio
Annual Report December 31, 2017 |
|
Contents
To view a fund's proxy voting guidelines and proxy voting record for the 12-month period ended June 30, visit http://www.fidelity.com/proxyvotingresults or visit the Securities and Exchange Commission's (SEC) web site at http://www.sec.gov.
You may also call 1-877-208-0098 to request a free copy of the proxy voting guidelines.
Fidelity® Variable Insurance Products are separate account options which are purchased through a variable insurance contract.
Standard & Poor's, S&P and S&P 500 are registered service marks of The McGraw-Hill Companies, Inc. and have been licensed for use by Fidelity Distributors Corporation.
Other third-party marks appearing herein are the property of their respective owners.
All other marks appearing herein are registered or unregistered trademarks or service marks of FMR LLC or an affiliated company. © 2018 FMR LLC. All rights reserved.
This report and the financial statements contained herein are submitted for the general information of the shareholders of the Fund. This report is not authorized for distribution to prospective investors in the Fund unless preceded or accompanied by an effective prospectus.
A fund files its complete schedule of portfolio holdings with the SEC for the first and third quarters of each fiscal year on Form N-Q. Forms N-Q are available on the SEC’s web site at http://www.sec.gov. A fund's Forms N-Q may be reviewed and copied at the SEC’s Public Reference Room in Washington, DC. Information regarding the operation of the SEC's Public Reference Room may be obtained by calling 1-800-SEC-0330.
For a complete list of a fund's portfolio holdings, view the most recent holdings listing, semiannual report, or annual report on Fidelity's web site at http://www.fidelity.com, http://www.institutional.fidelity.com, or http://www.401k.com, as applicable.
NOT FDIC INSURED •MAY LOSE VALUE •NO BANK GUARANTEE
Neither the Fund nor Fidelity Distributors Corporation is a bank.
Performance: The Bottom Line
Average annual total return reflects the change in the value of an investment, assuming reinvestment of distributions from dividend income and capital gains (the profits earned upon the sale of securities that have grown in value, if any) and assuming a constant rate of performance each year. During periods of reimbursement by Fidelity, a fund’s total return will be greater than it would be had the reimbursement not occurred. Performance numbers are net of all underlying fund operating expenses, but do not include any insurance charges imposed by your insurance company’s separate account. If performance information included the effect of these additional charges, the total returns would have been lower. How a fund did yesterday is no guarantee of how it will do tomorrow.
Average Annual Total Returns
| For the periods ended December 31, 2017 | Past 1 year | Past 5 years | Past 10 years |
| Initial Class | 7.02% | 13.39% | 8.39% |
| Service Class | 6.97% | 13.27% | 8.28% |
| Service Class 2 | 6.79% | 13.09% | 8.08% |
| Investor Class | 6.91% | 13.28% | 8.30% |
$10,000 Over 10 Years
Let's say hypothetically that $10,000 was invested in VIP Disciplined Small Cap Portfolio - Initial Class on December 31, 2007.
The chart shows how the value of your investment would have changed, and also shows how the Russell 2000® Index performed over the same period.

| Period Ending Values |
| $22,387 | VIP Disciplined Small Cap Portfolio - Initial Class |
| $23,054 | Russell 2000® Index |
Management's Discussion of Fund Performance
Market Recap: U.S. equities gained 21.83% in 2017, as the S&P 500
® index rose steadily and closed the year just shy of an all-time high after a particularly strong three-month finish. Early on, equities rallied on optimism for President Trump’s pro-business agenda but leveled off in March amid fading optimism and stalled efforts by Congress to repeal and replace the Affordable Care Act. Upward momentum soon returned and continued through year-end with consumer sentiment and other market indicators staying positive. The lone exception was a brief cooldown in August, when geopolitical tension escalated and uncertainty grew regarding the future of health care, tax reform and the debt ceiling. Sector-wise, information technology fared best by a wide margin, rising 39% amid strong earnings growth from several major index constituents. A 24% gain in materials was spurred by increased demand, especially from China. Consumer discretionary gained 23%, despite many brick-and-mortar retailers suffering from online competition, and financials edged the broader market on an uptick in bond yields. Conversely, the defensive energy and telecom services sectors returned about -1% each. Rising interest rates held back real estate (+11%), while consumer staples (+13%) and utilities (+12%) struggled due to investors’ general preference for risk assets.
Comments from Maximilan Kaufmann, Senior Portfolio Manager of the Geode Capital Management, LLC, investment management team: For the year, the fund’s share classes rose about 7%, trailing the 14.65% gain of the benchmark Russell 2000
® Index. Security selection in the consumer discretionary, information technology and industrials sectors significantly hurt relative results, while picks in financials modestly helped. For the vast majority of the year, investors preferred growth stocks to their value-oriented counterparts – an unfavorable backdrop for the fund, given that our investment models favored equities with value characteristics and tended to steer clear of growth stocks. On an individual basis, the fund’s biggest detractor was Big 5 Sporting Goods, which reported weaker-than-expected quarterly results. Dean Foods also detracted on disappointing financial results and increased competitive pressure. Health care logistics company Owens & Minor, as well as Argan, a service provider to power-generation and renewable-energy companies, further weighed on results. In contrast, shares of chemical manufacturer Chemours gained 78% for the fund in 2017, as some of the company’s legal liabilities were resolved. We ultimately sold the name in pursuit of other opportunities our models concluded offered better upside. Another contributor was Tivity Health, a provider of fitness solutions for seniors whose shares gained on strong quarterly earnings reported in April.
The views expressed above reflect those of the portfolio manager(s) only through the end of the period as stated on the cover of this report and do not necessarily represent the views of Fidelity or any other person in the Fidelity organization. Any such views are subject to change at any time based upon market or other conditions and Fidelity disclaims any responsibility to update such views. These views may not be relied on as investment advice and, because investment decisions for a Fidelity fund are based on numerous factors, may not be relied on as an indication of trading intent on behalf of any Fidelity fund.
Investment Summary (Unaudited)
Top Ten Stocks as of December 31, 2017
| | % of fund's net assets |
| MKS Instruments, Inc. | 0.7 |
| EMCOR Group, Inc. | 0.7 |
| Chemed Corp. | 0.7 |
| Wintrust Financial Corp. | 0.7 |
| Curtiss-Wright Corp. | 0.7 |
| Umpqua Holdings Corp. | 0.7 |
| Evercore, Inc. Class A | 0.7 |
| HealthSouth Corp. | 0.7 |
| Tech Data Corp. | 0.7 |
| Molina Healthcare, Inc. | 0.7 |
| | 7.0 |
Top Five Market Sectors as of December 31, 2017
| | % of fund's net assets |
| Information Technology | 17.9 |
| Financials | 16.3 |
| Industrials | 16.0 |
| Health Care | 15.4 |
| Consumer Discretionary | 11.5 |
Asset Allocation (% of fund's net assets)
| As of December 31, 2017* |
| | Stocks and Equity Futures | 100.0% |

* Foreign investments – 5.6%
Investments December 31, 2017
Showing Percentage of Net Assets
| Common Stocks - 96.5% | | | |
| | | Shares | Value |
| CONSUMER DISCRETIONARY - 11.5% | | | |
| Auto Components - 1.8% | | | |
| American Axle & Manufacturing Holdings, Inc. (a) | | 96,485 | $1,643,140 |
| Cooper-Standard Holding, Inc. (a) | | 14,125 | 1,730,313 |
| Tenneco, Inc. | | 32,031 | 1,875,095 |
| | | | 5,248,548 |
| Automobiles - 0.1% | | | |
| Winnebago Industries, Inc. | | 7,844 | 436,126 |
| Distributors - 0.0% | | | |
| Weyco Group, Inc. | | 134 | 3,982 |
| Diversified Consumer Services - 0.4% | | | |
| Cambium Learning Group, Inc. (a) | | 637 | 3,618 |
| K12, Inc. (a) | | 66,831 | 1,062,613 |
| Liberty Tax, Inc. | | 1,510 | 16,610 |
| | | | 1,082,841 |
| Hotels, Restaurants & Leisure - 0.6% | | | |
| Buffalo Wild Wings, Inc. (a) | | 112 | 17,511 |
| Penn National Gaming, Inc. (a) | | 57,796 | 1,810,749 |
| | | | 1,828,260 |
| Household Durables - 2.8% | | | |
| Bassett Furniture Industries, Inc. | | 3,068 | 115,357 |
| Beazer Homes U.S.A., Inc. (a) | | 11,608 | 222,990 |
| Flexsteel Industries, Inc. | | 19,186 | 897,521 |
| KB Home | | 50,882 | 1,625,680 |
| La-Z-Boy, Inc. | | 54,830 | 1,710,696 |
| M.D.C. Holdings, Inc. | | 52,085 | 1,660,470 |
| New Home Co. LLC (a) | | 292 | 3,659 |
| Taylor Morrison Home Corp. (a) | | 73,623 | 1,801,555 |
| William Lyon Homes, Inc. (a) | | 1,836 | 53,391 |
| | | | 8,091,319 |
| Internet & Direct Marketing Retail - 0.4% | | | |
| Shutterfly, Inc. (a) | | 21,749 | 1,082,013 |
| Leisure Products - 0.4% | | | |
| Callaway Golf Co. | | 10,696 | 148,995 |
| Johnson Outdoors, Inc. Class A | | 7,732 | 480,080 |
| MCBC Holdings, Inc. (a) | | 26,846 | 596,518 |
| Nautilus, Inc. (a) | | 1,882 | 25,125 |
| | | | 1,250,718 |
| Media - 0.4% | | | |
| A.H. Belo Corp. Class A | | 4,519 | 21,691 |
| Entravision Communication Corp. Class A | | 49,346 | 352,824 |
| New Media Investment Group, Inc. | | 2,833 | 47,538 |
| Saga Communications, Inc. Class A | | 335 | 13,551 |
| Sinclair Broadcast Group, Inc. Class A (b) | | 20,401 | 772,178 |
| The McClatchy Co. Class A (a) | | 1,899 | 16,958 |
| | | | 1,224,740 |
| Multiline Retail - 0.5% | | | |
| Big Lots, Inc. (b) | | 23,476 | 1,318,177 |
| Specialty Retail - 3.6% | | | |
| Aaron's, Inc. Class A | | 40,237 | 1,603,444 |
| American Eagle Outfitters, Inc. | | 4,630 | 87,044 |
| Ascena Retail Group, Inc. (a) | | 100 | 235 |
| Big 5 Sporting Goods Corp. (b) | | 82,098 | 623,945 |
| Chico's FAS, Inc. | | 156,842 | 1,383,346 |
| Conn's, Inc. (a) | | 4,975 | 176,861 |
| DSW, Inc. Class A (b) | | 61,598 | 1,318,813 |
| Finish Line, Inc. Class A | | 12,448 | 180,869 |
| Hibbett Sports, Inc. (a) | | 4,218 | 86,047 |
| Office Depot, Inc. | | 325,470 | 1,152,164 |
| Party City Holdco, Inc. (a) | | 5,638 | 78,650 |
| Pier 1 Imports, Inc. (b) | | 184,021 | 761,847 |
| Shoe Carnival, Inc. | | 1,164 | 31,137 |
| Sleep Number Corp. (a)(b) | | 20,561 | 772,888 |
| Tailored Brands, Inc. (b) | | 60,867 | 1,328,727 |
| The Children's Place Retail Stores, Inc. | | 6,155 | 894,629 |
| Tilly's, Inc. | | 1,938 | 28,605 |
| | | | 10,509,251 |
| Textiles, Apparel & Luxury Goods - 0.5% | | | |
| Cadence Bancorp | | 2,072 | 56,193 |
| Columbia Sportswear Co. | | 417 | 29,974 |
| Crocs, Inc. (a) | | 21,873 | 276,475 |
| Movado Group, Inc. (b) | | 24,552 | 790,574 |
| Oxford Industries, Inc. | | 2,181 | 163,989 |
| | | | 1,317,205 |
|
| TOTAL CONSUMER DISCRETIONARY | | | 33,393,180 |
|
| CONSUMER STAPLES - 4.3% | | | |
| Beverages - 1.1% | | | |
| Boston Beer Co., Inc. Class A (a)(b) | | 8,365 | 1,598,552 |
| National Beverage Corp. (b) | | 15,281 | 1,488,981 |
| | | | 3,087,533 |
| Food & Staples Retailing - 1.2% | | | |
| Ingles Markets, Inc. Class A | | 20,769 | 718,607 |
| Performance Food Group Co. (a) | | 1,127 | 37,304 |
| SpartanNash Co. | | 63,698 | 1,699,463 |
| United Natural Foods, Inc. (a)(b) | | 20,683 | 1,019,051 |
| Village Super Market, Inc. Class A (b) | | 1,693 | 38,820 |
| Weis Markets, Inc. | | 338 | 13,990 |
| | | | 3,527,235 |
| Food Products - 1.2% | | | |
| Dean Foods Co. | | 48,031 | 555,238 |
| Fresh Del Monte Produce, Inc. | | 15,921 | 758,954 |
| Sanderson Farms, Inc. (b) | | 12,733 | 1,767,086 |
| Seneca Foods Corp. Class A (a) | | 4,115 | 126,536 |
| Snyders-Lance, Inc. | | 5,831 | 292,016 |
| | | | 3,499,830 |
| Household Products - 0.2% | | | |
| Central Garden & Pet Co. Class A (non-vtg.) (a) | | 19,701 | 742,925 |
| Personal Products - 0.4% | | | |
| MediFast, Inc. | | 15,699 | 1,095,947 |
| USANA Health Sciences, Inc. (a) | | 83 | 6,146 |
| | | | 1,102,093 |
| Tobacco - 0.2% | | | |
| Universal Corp. | | 10,085 | 529,463 |
| Vector Group Ltd. | | 2,280 | 51,026 |
| | | | 580,489 |
|
| TOTAL CONSUMER STAPLES | | | 12,540,105 |
|
| ENERGY - 2.1% | | | |
| Energy Equipment & Services - 0.7% | | | |
| Archrock, Inc. | | 29,642 | 311,241 |
| Geospace Technologies Corp. (a) | | 26 | 337 |
| McDermott International, Inc. (a) | | 251,366 | 1,653,988 |
| Natural Gas Services Group, Inc. (a) | | 350 | 9,170 |
| PHI, Inc. (non-vtg.) (a) | | 3,802 | 43,989 |
| | | | 2,018,725 |
| Oil, Gas & Consumable Fuels - 1.4% | | | |
| Adams Resources & Energy, Inc. | | 224 | 9,744 |
| Arch Coal, Inc. | | 652 | 60,740 |
| Bill Barrett Corp. (a) | | 60,690 | 311,340 |
| Cloud Peak Energy, Inc. (a) | | 4,563 | 20,305 |
| CVR Energy, Inc. (b) | | 42,007 | 1,564,341 |
| Delek U.S. Holdings, Inc. | | 4,513 | 157,684 |
| Denbury Resources, Inc. (a) | | 47,833 | 105,711 |
| Eclipse Resources Corp. (a) | | 4,073 | 9,775 |
| Evolution Petroleum Corp. | | 4,702 | 32,209 |
| Hallador Energy Co. | | 78 | 475 |
| NACCO Industries, Inc. Class A | | 937 | 35,278 |
| Navios Maritime Acquisition Corp. | | 14,834 | 16,466 |
| Oasis Petroleum, Inc. (a) | | 1,383 | 11,631 |
| Overseas Shipholding Group, Inc. (a) | | 92,846 | 254,398 |
| Par Pacific Holdings, Inc. (a) | | 1,238 | 23,869 |
| Penn Virginia Corp. (a) | | 362 | 14,158 |
| Teekay Tankers Ltd. | | 21,037 | 29,452 |
| W&T Offshore, Inc. (a) | | 398,132 | 1,317,817 |
| | | | 3,975,393 |
|
| TOTAL ENERGY | | | 5,994,118 |
|
| FINANCIALS - 16.3% | | | |
| Banks - 7.1% | | | |
| Arrow Financial Corp. | | 350 | 11,883 |
| BancFirst Corp. | | 21,136 | 1,081,106 |
| Banco Latinoamericano de Comercio Exterior SA Series E | | 34,474 | 927,351 |
| C & F Financial Corp. | | 59 | 3,422 |
| Capital City Bank Group, Inc. | | 342 | 7,845 |
| Cathay General Bancorp | | 45,837 | 1,932,946 |
| Community Trust Bancorp, Inc. | | 2,629 | 123,826 |
| Customers Bancorp, Inc. (a) | | 10,214 | 265,462 |
| Eagle Bancorp, Inc. (a) | | 1,726 | 99,935 |
| Fidelity Southern Corp. | | 17,682 | 385,468 |
| First Bancorp, Puerto Rico (a) | | 196,306 | 1,001,161 |
| First Busey Corp. | | 4,974 | 148,922 |
| First Citizen Bancshares, Inc. | | 120 | 48,360 |
| First Financial Bancorp, Ohio | | 15,293 | 402,971 |
| First Interstate Bancsystem, Inc. | | 9,514 | 381,036 |
| Fulton Financial Corp. | | 102,273 | 1,830,687 |
| Great Southern Bancorp, Inc. | | 7,414 | 382,933 |
| Hancock Holding Co. | | 23,015 | 1,139,243 |
| Heartland Financial U.S.A., Inc. | | 3,424 | 183,698 |
| Heritage Commerce Corp. | | 1,271 | 19,472 |
| Hilltop Holdings, Inc. | | 12,425 | 314,725 |
| Hope Bancorp, Inc. | | 6,285 | 114,701 |
| IBERIABANK Corp. | | 13,840 | 1,072,600 |
| Independent Bank Corp. | | 4,018 | 89,802 |
| International Bancshares Corp. | | 38,309 | 1,520,867 |
| Investors Bancorp, Inc. | | 46,826 | 649,945 |
| LegacyTexas Financial Group, Inc. | | 8,803 | 371,575 |
| Midland States Bancorp, Inc. | | 6 | 195 |
| Northeast Bancorp | | 1,732 | 40,096 |
| Peapack-Gladstone Financial Corp. | | 2,185 | 76,519 |
| Peoples Bancorp, Inc. | | 253 | 8,253 |
| Republic Bancorp, Inc., Kentucky Class A | | 1,454 | 55,281 |
| Sandy Spring Bancorp, Inc. | | 15,497 | 604,693 |
| Sierra Bancorp | | 928 | 24,648 |
| The Bank of NT Butterfield & Son Ltd. | | 1,748 | 63,435 |
| TowneBank | | 813 | 25,000 |
| UMB Financial Corp. | | 2,475 | 178,002 |
| Umpqua Holdings Corp. | | 96,020 | 1,997,216 |
| Valley National Bancorp | | 88,522 | 993,217 |
| Wintrust Financial Corp. | | 24,922 | 2,052,825 |
| | | | 20,631,322 |
| Capital Markets - 4.0% | | | |
| Artisan Partners Asset Management, Inc. | | 44,031 | 1,739,225 |
| Diamond Hill Investment Group, Inc. | | 658 | 135,982 |
| Evercore, Inc. Class A | | 22,045 | 1,984,050 |
| Financial Engines, Inc. | | 59,684 | 1,808,425 |
| Gain Capital Holdings, Inc. (b) | | 7,825 | 78,250 |
| GAMCO Investors, Inc. Class A | | 745 | 22,089 |
| Houlihan Lokey | | 6,024 | 273,670 |
| INTL FCStone, Inc. (a) | | 24,055 | 1,023,059 |
| Investment Technology Group, Inc. | | 17,572 | 338,261 |
| Manning & Napier, Inc. Class A | | 10,643 | 38,315 |
| Moelis & Co. Class A | | 19,828 | 961,658 |
| OM Asset Management Ltd. | | 7,427 | 124,402 |
| Piper Jaffray Companies | | 15,202 | 1,311,173 |
| Vector Capital Corp. rights (a)(c) | | 5,673 | 0 |
| Waddell & Reed Financial, Inc. Class A (b) | | 75,746 | 1,692,166 |
| | | | 11,530,725 |
| Consumer Finance - 0.7% | | | |
| Enova International, Inc. (a) | | 36,191 | 550,103 |
| Nelnet, Inc. Class A | | 27,280 | 1,494,398 |
| Regional Management Corp. (a) | | 881 | 23,179 |
| | | | 2,067,680 |
| Diversified Financial Services - 0.6% | | | |
| Cotiviti Holdings, Inc. (a) | | 49,879 | 1,606,603 |
| Marlin Business Services Corp. | | 13,668 | 306,163 |
| | | | 1,912,766 |
| Insurance - 1.0% | | | |
| EMC Insurance Group | | 735 | 21,087 |
| Federated National Holding Co. | | 21,187 | 351,069 |
| Health Insurance Innovations, Inc. (a)(b) | | 45,616 | 1,138,119 |
| Kemper Corp. | | 1,351 | 93,084 |
| National General Holdings Corp. | | 9,845 | 193,356 |
| Selective Insurance Group, Inc. | | 2,551 | 149,744 |
| Stewart Information Services Corp. | | 1,242 | 52,537 |
| Universal Insurance Holdings, Inc. (b) | | 35,782 | 978,638 |
| | | | 2,977,634 |
| Mortgage Real Estate Investment Trusts - 0.7% | | | |
| Apollo Commercial Real Estate Finance, Inc. (b) | | 89,743 | 1,655,758 |
| Cherry Hill Mortgage Investment Corp. | | 16,537 | 297,501 |
| | | | 1,953,259 |
| Real Estate Management & Development - 0.3% | | | |
| The RMR Group, Inc. | | 14,562 | 863,527 |
| Thrifts & Mortgage Finance - 1.9% | | | |
| Essent Group Ltd. (a) | | 36,832 | 1,599,245 |
| Farmer Mac Class C (non-vtg.) | | 3,824 | 299,190 |
| Meridian Bancorp, Inc. Maryland | | 1,032 | 21,259 |
| Nationstar Mortgage Holdings, Inc. (a) | | 15,123 | 279,776 |
| NMI Holdings, Inc. (a) | | 30,367 | 516,239 |
| Northwest Bancshares, Inc. | | 76,979 | 1,287,859 |
| PennyMac Financial Services, Inc. (a) | | 4,377 | 97,826 |
| Trustco Bank Corp., New York | | 2,552 | 23,478 |
| United Financial Bancorp, Inc. New | | 330 | 5,821 |
| Walker & Dunlop, Inc. (a) | | 22,315 | 1,059,963 |
| Waterstone Financial, Inc. | | 13,422 | 228,845 |
| | | | 5,419,501 |
|
| TOTAL FINANCIALS | | | 47,356,414 |
|
| HEALTH CARE - 15.4% | | | |
| Biotechnology - 4.3% | | | |
| Acceleron Pharma, Inc. (a) | | 1,741 | 73,888 |
| Aimmune Therapeutics, Inc. (a) | | 4,731 | 178,926 |
| Akebia Therapeutics, Inc. (a) | | 15,651 | 232,730 |
| Altimmune, Inc. (b) | | 17,631 | 35,086 |
| AMAG Pharmaceuticals, Inc. (a)(b) | | 14,879 | 197,147 |
| Amicus Therapeutics, Inc. (a)(b) | | 30,356 | 436,823 |
| AnaptysBio, Inc. | | 982 | 98,907 |
| Applied Genetic Technologies Corp. (a) | | 11,338 | 40,817 |
| Arena Pharmaceuticals, Inc. (a) | | 1,178 | 40,017 |
| Array BioPharma, Inc. (a)(b) | | 36,539 | 467,699 |
| Biohaven Pharmaceutical Holding Co. Ltd. | | 6,639 | 179,120 |
| Biospecifics Technologies Corp. (a) | | 724 | 31,371 |
| bluebird bio, Inc. (a) | | 5,750 | 1,024,075 |
| Blueprint Medicines Corp. (a) | | 7,618 | 574,473 |
| Calithera Biosciences, Inc. (a) | | 8,970 | 74,900 |
| ChemoCentryx, Inc. (a) | | 7,135 | 42,453 |
| Clovis Oncology, Inc. (a) | | 3,730 | 253,640 |
| Conatus Pharmaceuticals, Inc. (a) | | 37,304 | 172,344 |
| Concert Pharmaceuticals, Inc. (a) | | 7,919 | 204,865 |
| CytomX Therapeutics, Inc. (a) | | 11,580 | 244,454 |
| Dyax Corp. rights 12/31/19 (a)(c) | | 11,419 | 38,710 |
| Dynavax Technologies Corp. (a) | | 866 | 16,194 |
| Editas Medicine, Inc. (a)(b) | | 10,268 | 315,536 |
| Emergent BioSolutions, Inc. (a) | | 10,382 | 482,452 |
| Esperion Therapeutics, Inc. (a) | | 72 | 4,740 |
| Exact Sciences Corp. (a) | | 13,000 | 683,020 |
| FibroGen, Inc. (a) | | 12,581 | 596,339 |
| Foundation Medicine, Inc. (a)(b) | | 4,272 | 291,350 |
| Genomic Health, Inc. (a) | | 215 | 7,353 |
| Global Blood Therapeutics, Inc. (a) | | 1,311 | 51,588 |
| Halozyme Therapeutics, Inc. (a) | | 24,208 | 490,454 |
| ImmunoGen, Inc. (a) | | 6,422 | 41,165 |
| Immunomedics, Inc. (a) | | 4,515 | 72,962 |
| Insmed, Inc. (a) | | 5,716 | 178,225 |
| Ironwood Pharmaceuticals, Inc. Class A (a)(b) | | 8,940 | 134,011 |
| Ligand Pharmaceuticals, Inc. Class B (a) | | 1,704 | 233,329 |
| Loxo Oncology, Inc. (a)(b) | | 1,433 | 120,630 |
| Madrigal Pharmaceuticals, Inc. (a) | | 2,308 | 211,851 |
| MiMedx Group, Inc. (a)(b) | | 3,035 | 38,271 |
| Momenta Pharmaceuticals, Inc. (a) | | 15,351 | 214,146 |
| Myriad Genetics, Inc. (a)(b) | | 4,585 | 157,472 |
| PDL BioPharma, Inc. (a) | | 97,483 | 267,103 |
| Pfenex, Inc. (a) | | 1,391 | 3,700 |
| Pieris Pharmaceuticals, Inc. (a) | | 24,045 | 181,540 |
| Portola Pharmaceuticals, Inc. (a) | | 10,522 | 512,211 |
| Prothena Corp. PLC (a)(b) | | 1,335 | 50,049 |
| Puma Biotechnology, Inc. (a) | | 5,314 | 525,289 |
| Radius Health, Inc. (a)(b) | | 552 | 17,537 |
| Repligen Corp. (a) | | 1,035 | 37,550 |
| Sage Therapeutics, Inc. (a) | | 5,910 | 973,436 |
| Sangamo Therapeutics, Inc. (a) | | 22,893 | 375,445 |
| Sarepta Therapeutics, Inc. (a) | | 5,670 | 315,479 |
| Spark Therapeutics, Inc. (a)(b) | | 2,355 | 121,094 |
| Spectrum Pharmaceuticals, Inc. (a) | | 4,428 | 83,911 |
| Strongbridge Biopharma PLC (a) | | 1,175 | 8,519 |
| Ultragenyx Pharmaceutical, Inc. (a) | | 2,355 | 109,225 |
| | | | 12,565,621 |
| Health Care Equipment & Supplies - 3.6% | | | |
| Analogic Corp. | | 6,938 | 581,058 |
| Angiodynamics, Inc. (a) | | 23,551 | 391,653 |
| Cutera, Inc. (a) | | 7,750 | 351,463 |
| Haemonetics Corp. (a) | | 11,312 | 657,001 |
| Halyard Health, Inc. (a) | | 28,822 | 1,331,000 |
| Lantheus Holdings, Inc. (a) | | 39,102 | 799,636 |
| Masimo Corp. (a) | | 22,803 | 1,933,694 |
| Meridian Bioscience, Inc. | | 61,321 | 858,494 |
| Merit Medical Systems, Inc. (a) | | 15,944 | 688,781 |
| OraSure Technologies, Inc. (a) | | 13,577 | 256,062 |
| Orthofix International NV (a) | | 16,295 | 891,337 |
| Quidel Corp. (a) | | 37,139 | 1,609,976 |
| SurModics, Inc. (a) | | 5,129 | 143,612 |
| | | | 10,493,767 |
| Health Care Providers & Services - 4.8% | | | |
| Amedisys, Inc. (a) | | 3,893 | 205,200 |
| Chemed Corp. (b) | | 8,473 | 2,059,108 |
| Civitas Solutions, Inc. (a) | | 2,174 | 37,175 |
| Corvel Corp. (a) | | 14,181 | 750,175 |
| Diplomat Pharmacy, Inc. (a) | | 15,341 | 307,894 |
| HealthEquity, Inc. (a) | | 1,929 | 90,007 |
| HealthSouth Corp. | | 39,888 | 1,970,866 |
| LHC Group, Inc. (a) | | 338 | 20,703 |
| Magellan Health Services, Inc. (a) | | 18,872 | 1,822,092 |
| Molina Healthcare, Inc. (a)(b) | | 25,314 | 1,941,078 |
| National Healthcare Corp. | | 11,920 | 726,405 |
| National Research Corp. Class A | | 190 | 7,087 |
| Owens & Minor, Inc. (b) | | 83,030 | 1,567,606 |
| Providence Service Corp. (a) | | 3,559 | 211,191 |
| RadNet, Inc. (a) | | 46,117 | 465,782 |
| Tivity Health, Inc. (a) | | 16,258 | 594,230 |
| Triple-S Management Corp. (a) | | 44,684 | 1,110,397 |
| | | | 13,886,996 |
| Health Care Technology - 1.0% | | | |
| Allscripts Healthcare Solutions, Inc. (a) | | 74,492 | 1,083,859 |
| HMS Holdings Corp. (a) | | 27,521 | 466,481 |
| Quality Systems, Inc. (a) | | 91,180 | 1,238,224 |
| | | | 2,788,564 |
| Life Sciences Tools & Services - 0.5% | | | |
| Cambrex Corp. (a) | | 1,379 | 66,192 |
| INC Research Holdings, Inc. Class A (a) | | 4,027 | 175,577 |
| Luminex Corp. | | 12,616 | 248,535 |
| Medpace Holdings, Inc. (a) | | 5,311 | 192,577 |
| PRA Health Sciences, Inc. (a) | | 7,348 | 669,182 |
| | | | 1,352,063 |
| Pharmaceuticals - 1.2% | | | |
| Aerie Pharmaceuticals, Inc. (a) | | 2,102 | 125,595 |
| Assembly Biosciences, Inc. (a) | | 5,328 | 241,092 |
| Athenex, Inc. | | 1,033 | 16,425 |
| Avexis, Inc. (a) | | 2,018 | 223,332 |
| Catalent, Inc. (a) | | 14,456 | 593,852 |
| Corcept Therapeutics, Inc. (a)(b) | | 21,103 | 381,120 |
| Horizon Pharma PLC (a) | | 12,287 | 179,390 |
| Innoviva, Inc. (a) | | 8,590 | 121,892 |
| Mersana Therapeutics, Inc. | | 2,144 | 35,226 |
| Nektar Therapeutics (a) | | 17,435 | 1,041,218 |
| Pacira Pharmaceuticals, Inc. (a) | | 2,138 | 97,600 |
| Phibro Animal Health Corp. Class A | | 3,414 | 114,369 |
| Prestige Brands Holdings, Inc. (a) | | 3,968 | 176,219 |
| Supernus Pharmaceuticals, Inc. (a) | | 2,814 | 112,138 |
| The Medicines Company (a)(b) | | 4,176 | 114,172 |
| Theravance Biopharma, Inc. (a)(b) | | 439 | 12,244 |
| Zogenix, Inc. (a) | | 1,049 | 42,012 |
| | | | 3,627,896 |
|
| TOTAL HEALTH CARE | | | 44,714,907 |
|
| INDUSTRIALS - 16.0% | | | |
| Aerospace & Defense - 2.7% | | | |
| Astronics Corp. (a) | | 30,491 | 1,264,462 |
| Astronics Corp. Class B (a) | | 7,789 | 324,412 |
| Curtiss-Wright Corp. | | 16,690 | 2,033,677 |
| Esterline Technologies Corp. (a) | | 3,188 | 238,144 |
| KLX, Inc. (a) | | 23,365 | 1,594,661 |
| Moog, Inc. Class A (a) | | 21,614 | 1,877,176 |
| Triumph Group, Inc. | | 19,374 | 526,973 |
| Vectrus, Inc. (a) | | 1,603 | 49,453 |
| | | | 7,908,958 |
| Airlines - 0.6% | | | |
| Hawaiian Holdings, Inc. | | 41,642 | 1,659,434 |
| Building Products - 0.6% | | | |
| Builders FirstSource, Inc. (a) | | 844 | 18,391 |
| Caesarstone Sdot-Yam Ltd. (a) | | 6,937 | 152,614 |
| Jeld-Wen Holding, Inc. | | 12,899 | 507,834 |
| NCI Building Systems, Inc. (a) | | 22,306 | 430,506 |
| Universal Forest Products, Inc. | | 12,845 | 483,229 |
| | | | 1,592,574 |
| Commercial Services & Supplies - 4.7% | | | |
| ARC Document Solutions, Inc. (a) | | 2,776 | 7,079 |
| Brady Corp. Class A | | 43,356 | 1,643,192 |
| Casella Waste Systems, Inc. Class A (a) | | 1,215 | 27,969 |
| Deluxe Corp. | | 12,024 | 923,924 |
| Ennis, Inc. | | 11,514 | 238,916 |
| Essendant, Inc. | | 85,066 | 788,562 |
| Herman Miller, Inc. | | 47,714 | 1,910,946 |
| HNI Corp. | | 3,276 | 126,355 |
| Kimball International, Inc. Class B | | 82,989 | 1,549,405 |
| Knoll, Inc. | | 30,744 | 708,342 |
| LSC Communications, Inc. | | 57,562 | 872,064 |
| Msa Safety, Inc. | | 19,968 | 1,547,919 |
| Quad/Graphics, Inc. | | 70,506 | 1,593,436 |
| SP Plus Corp. (a) | | 862 | 31,980 |
| Steelcase, Inc. Class A | | 105,151 | 1,598,295 |
| VSE Corp. | | 3,067 | 148,535 |
| | | | 13,716,919 |
| Construction & Engineering - 2.0% | | | |
| Argan, Inc. | | 24,941 | 1,122,345 |
| EMCOR Group, Inc. | | 25,973 | 2,123,293 |
| KBR, Inc. | | 85,791 | 1,701,236 |
| MasTec, Inc. (a) | | 9,061 | 443,536 |
| Primoris Services Corp. | | 19,067 | 518,432 |
| | | | 5,908,842 |
| Electrical Equipment - 0.4% | | | |
| Allied Motion Technologies, Inc. | | 1,216 | 40,237 |
| EnerSys | | 13,761 | 958,178 |
| Hamilton Beach Brands Holding Co. Class A | | 1,129 | 29,004 |
| Preformed Line Products Co. | | 937 | 66,574 |
| | | | 1,093,993 |
| Machinery - 1.7% | | | |
| Alamo Group, Inc. | | 6,478 | 731,172 |
| Global Brass & Copper Holdings, Inc. | | 25,449 | 842,362 |
| Graham Corp. | | 169 | 3,537 |
| Greenbrier Companies, Inc. (b) | | 32,611 | 1,738,166 |
| Hillenbrand, Inc. | | 652 | 29,144 |
| Hurco Companies, Inc. | | 7,483 | 315,783 |
| Meritor, Inc. (a) | | 15,369 | 360,557 |
| Wabash National Corp. (b) | | 39,540 | 858,018 |
| | | | 4,878,739 |
| Marine - 0.1% | | | |
| Costamare, Inc. (b) | | 69,958 | 403,658 |
| Professional Services - 2.1% | | | |
| Barrett Business Services, Inc. | | 1,269 | 81,838 |
| Heidrick & Struggles International, Inc. | | 9,545 | 234,330 |
| Insperity, Inc. | | 30,387 | 1,742,694 |
| Kelly Services, Inc. Class A (non-vtg.) | | 21,902 | 597,268 |
| Kforce, Inc. | | 10,635 | 268,534 |
| Korn/Ferry International | | 1,055 | 43,656 |
| Resources Connection, Inc. | | 61,563 | 951,148 |
| RPX Corp. | | 110,340 | 1,482,970 |
| TriNet Group, Inc. (a) | | 12,888 | 571,454 |
| TrueBlue, Inc. (a) | | 6,993 | 192,308 |
| | | | 6,166,200 |
| Road & Rail - 0.0% | | | |
| Roadrunner Transportation Systems, Inc. (a) | | 7,987 | 61,580 |
| Trading Companies & Distributors - 1.1% | | | |
| Applied Industrial Technologies, Inc. | | 668 | 45,491 |
| Beacon Roofing Supply, Inc. (a) | | 13,215 | 842,588 |
| Rush Enterprises, Inc. Class A (a) | | 33,149 | 1,684,301 |
| Titan Machinery, Inc. (a) | | 5,889 | 124,670 |
| Triton International Ltd. | | 13,579 | 508,534 |
| | | | 3,205,584 |
|
| TOTAL INDUSTRIALS | | | 46,596,481 |
|
| INFORMATION TECHNOLOGY - 17.9% | | | |
| Communications Equipment - 1.8% | | | |
| ADTRAN, Inc. | | 29,675 | 574,211 |
| Communications Systems, Inc. | | 2,778 | 10,112 |
| Comtech Telecommunications Corp. | | 2,294 | 50,743 |
| Extreme Networks, Inc. (a) | | 81,369 | 1,018,740 |
| InterDigital, Inc. | | 9,523 | 725,176 |
| NetScout Systems, Inc. (a) | | 40,769 | 1,241,416 |
| Plantronics, Inc. | | 34,193 | 1,722,643 |
| | | | 5,343,041 |
| Electronic Equipment & Components - 4.8% | | | |
| Anixter International, Inc. (a) | | 13,224 | 1,005,024 |
| Belden, Inc. | | 2,464 | 190,147 |
| Benchmark Electronics, Inc. (a) | | 28,408 | 826,673 |
| Daktronics, Inc. | | 4,955 | 45,239 |
| Electro Scientific Industries, Inc. (a) | | 73,487 | 1,574,826 |
| Itron, Inc. (a) | | 4,583 | 312,561 |
| Kimball Electronics, Inc. (a) | | 36,099 | 658,807 |
| Methode Electronics, Inc. Class A | | 11,433 | 458,463 |
| PC Connection, Inc. | | 581 | 15,228 |
| Plexus Corp. (a) | | 10,660 | 647,275 |
| ScanSource, Inc. (a) | | 30,235 | 1,082,413 |
| SYNNEX Corp. | | 13,107 | 1,781,897 |
| Tech Data Corp. (a) | | 20,100 | 1,969,197 |
| TTM Technologies, Inc. (a)(b) | | 102,561 | 1,607,131 |
| VeriFone Systems, Inc. (a) | | 4,713 | 83,467 |
| Vishay Intertechnology, Inc. (b) | | 86,652 | 1,798,029 |
| | | | 14,056,377 |
| Internet Software & Services - 1.1% | | | |
| AppFolio, Inc. (a) | | 5,510 | 228,665 |
| Box, Inc. Class A (a) | | 68,809 | 1,453,246 |
| Care.com, Inc. (a) | | 2,833 | 51,107 |
| DHI Group, Inc. (a) | | 37,391 | 71,043 |
| Etsy, Inc. (a) | | 6,158 | 125,931 |
| Hortonworks, Inc. (a) | | 46,175 | 928,579 |
| MeetMe, Inc. (a)(b) | | 89,253 | 251,693 |
| | | | 3,110,264 |
| IT Services - 3.0% | | | |
| CACI International, Inc. Class A (a) | | 146 | 19,323 |
| Computer Task Group, Inc. (a) | | 3,424 | 17,462 |
| Convergys Corp. (b) | | 44,331 | 1,041,779 |
| CSG Systems International, Inc. | | 37,734 | 1,653,504 |
| EVERTEC, Inc. | | 77,763 | 1,061,465 |
| Hackett Group, Inc. | | 13,173 | 206,948 |
| ManTech International Corp. Class A | | 4,461 | 223,898 |
| Maximus, Inc. | | 18,159 | 1,299,821 |
| Science Applications International Corp. | | 7,527 | 576,342 |
| Sykes Enterprises, Inc. (a) | | 30,372 | 955,199 |
| Syntel, Inc. (a) | | 2,899 | 66,648 |
| Travelport Worldwide Ltd. | | 109,283 | 1,428,329 |
| | | | 8,550,718 |
| Semiconductors & Semiconductor Equipment - 5.6% | | | |
| Advanced Energy Industries, Inc. (a) | | 5,304 | 357,914 |
| Alpha & Omega Semiconductor Ltd. (a) | | 19,251 | 314,946 |
| Amkor Technology, Inc. (a) | | 133,335 | 1,340,017 |
| Brooks Automation, Inc. | | 68,023 | 1,622,349 |
| Cabot Microelectronics Corp. | | 13,476 | 1,267,822 |
| Cirrus Logic, Inc. (a) | | 36,975 | 1,917,524 |
| Cohu, Inc. | | 18,519 | 406,492 |
| Entegris, Inc. | | 35,521 | 1,081,614 |
| FormFactor, Inc. (a) | | 55,042 | 861,407 |
| Lattice Semiconductor Corp. (a) | | 50,678 | 292,919 |
| MKS Instruments, Inc. | | 22,591 | 2,134,838 |
| Nanometrics, Inc. (a) | | 22,510 | 560,949 |
| Photronics, Inc. (a) | | 68,670 | 585,412 |
| Pixelworks, Inc. (a) | | 22,046 | 139,551 |
| Rambus, Inc. (a) | | 23,218 | 330,160 |
| Rudolph Technologies, Inc. (a) | | 51,623 | 1,233,790 |
| Synaptics, Inc. (a)(b) | | 39,951 | 1,595,643 |
| Ultra Clean Holdings, Inc. (a) | | 10,062 | 232,332 |
| | | | 16,275,679 |
| Software - 1.2% | | | |
| Aspen Technology, Inc. (a) | | 16,221 | 1,073,830 |
| Progress Software Corp. | | 41,367 | 1,760,993 |
| QAD, Inc.: | | | |
| Class A | | 4,681 | 181,857 |
| Class B | | 1,619 | 49,363 |
| TiVo Corp. | | 18,375 | 286,650 |
| Verint Systems, Inc. (a) | | 5,018 | 210,003 |
| Workiva, Inc. (a) | | 1,084 | 23,198 |
| Zedge, Inc. (a) | | 8,170 | 22,462 |
| | | | 3,608,356 |
| Technology Hardware, Storage & Peripherals - 0.4% | | | |
| Pure Storage, Inc. Class A (a) | | 62,861 | 996,975 |
|
| TOTAL INFORMATION TECHNOLOGY | | | 51,941,410 |
|
| MATERIALS - 5.8% | | | |
| Chemicals - 3.2% | | | |
| Chase Corp. | | 3,506 | 422,473 |
| FutureFuel Corp. | | 60,693 | 855,164 |
| Ingevity Corp. (a) | | 3,417 | 240,796 |
| Innophos Holdings, Inc. | | 6,996 | 326,923 |
| Kronos Worldwide, Inc. (b) | | 57,187 | 1,473,709 |
| Minerals Technologies, Inc. | | 7,740 | 532,899 |
| PolyOne Corp. | | 24,001 | 1,044,044 |
| Rayonier Advanced Materials, Inc. | | 4,248 | 86,872 |
| Sensient Technologies Corp. | | 7,723 | 564,937 |
| Stepan Co. | | 3,640 | 287,451 |
| Tredegar Corp. | | 10 | 192 |
| Trinseo SA | | 24,012 | 1,743,271 |
| Tronox Ltd. Class A | | 83,185 | 1,706,124 |
| Valhi, Inc. | | 22,529 | 139,004 |
| | | | 9,423,859 |
| Containers & Packaging - 0.1% | | | |
| Greif, Inc. Class A | | 1,315 | 79,663 |
| Myers Industries, Inc. | | 11,244 | 219,258 |
| UFP Technologies, Inc. (a) | | 425 | 11,815 |
| | | | 310,736 |
| Metals & Mining - 1.2% | | | |
| Atkore International Group, Inc. (a) | | 57,926 | 1,242,513 |
| Century Aluminum Co. (a)(b) | | 37,884 | 744,042 |
| Cliffs Natural Resources, Inc. (a) | | 88,343 | 636,953 |
| Schnitzer Steel Industries, Inc. Class A | | 22,111 | 740,719 |
| Worthington Industries, Inc. | | 1,109 | 48,863 |
| | | | 3,413,090 |
| Paper & Forest Products - 1.3% | | | |
| Boise Cascade Co. | | 3,539 | 141,206 |
| Louisiana-Pacific Corp. (a) | | 73,636 | 1,933,681 |
| Schweitzer-Mauduit International, Inc. | | 35,653 | 1,617,220 |
| Verso Corp. (a) | | 2,472 | 43,433 |
| | | | 3,735,540 |
|
| TOTAL MATERIALS | | | 16,883,225 |
|
| REAL ESTATE - 5.0% | | | |
| Equity Real Estate Investment Trusts (REITs) - 4.9% | | | |
| Ashford Hospitality Trust, Inc. | | 29,164 | 196,274 |
| Chesapeake Lodging Trust | | 19,334 | 523,758 |
| DiamondRock Hospitality Co. | | 25,128 | 283,695 |
| Four Corners Property Trust, Inc. | | 19,246 | 494,622 |
| InfraReit, Inc. | | 28,478 | 529,121 |
| iStar Financial, Inc. (a) | | 24,252 | 274,048 |
| LaSalle Hotel Properties (SBI) (b) | | 49,897 | 1,400,609 |
| Potlatch Corp. (b) | | 34,408 | 1,716,959 |
| PS Business Parks, Inc. | | 8,701 | 1,088,408 |
| RAIT Financial Trust | | 24,486 | 9,182 |
| RLJ Lodging Trust | | 56,066 | 1,231,770 |
| Ryman Hospitality Properties, Inc. (b) | | 20,369 | 1,405,868 |
| Summit Hotel Properties, Inc. | | 46,420 | 706,977 |
| Sunstone Hotel Investors, Inc. | | 82,620 | 1,365,709 |
| WP Glimcher, Inc. | | 157,470 | 1,121,186 |
| Xenia Hotels & Resorts, Inc. | | 83,105 | 1,794,237 |
| | | | 14,142,423 |
| Real Estate Management & Development - 0.1% | | | |
| Forestar Group, Inc. (a)(b) | | 9,597 | 211,134 |
| Gyrodyne LLC | | 126 | 2,534 |
| HFF, Inc. | | 2,730 | 132,787 |
| Maui Land & Pineapple, Inc. (a) | | 7,732 | 133,764 |
| | | | 480,219 |
|
| TOTAL REAL ESTATE | | | 14,622,642 |
|
| TELECOMMUNICATION SERVICES - 0.1% | | | |
| Diversified Telecommunication Services - 0.0% | | | |
| IDT Corp. Class B | | 1,442 | 15,285 |
| Wireless Telecommunication Services - 0.1% | | | |
| Spok Holdings, Inc. | | 10,188 | 159,442 |
|
| TOTAL TELECOMMUNICATION SERVICES | | | 174,727 |
|
| UTILITIES - 2.1% | | | |
| Electric Utilities - 0.9% | | | |
| Allete, Inc. | | 24,065 | 1,789,473 |
| PNM Resources, Inc. | | 1,480 | 59,866 |
| Portland General Electric Co. | | 17,354 | 790,995 |
| | | | 2,640,334 |
| Gas Utilities - 0.5% | | | |
| Northwest Natural Gas Co. | | 1,404 | 83,749 |
| ONE Gas, Inc. | | 4,164 | 305,055 |
| Southwest Gas Holdings, Inc. | | 10,079 | 811,158 |
| WGL Holdings, Inc. | | 2,729 | 234,257 |
| | | | 1,434,219 |
| Independent Power and Renewable Electricity Producers - 0.6% | | | |
| Atlantic Power Corp. (a) | | 5,534 | 13,164 |
| NRG Yield, Inc. Class A | | 65,194 | 1,228,907 |
| Ormat Technologies, Inc. | | 6,180 | 395,273 |
| Pattern Energy Group, Inc. (b) | | 11,231 | 241,354 |
| | | | 1,878,698 |
| Multi-Utilities - 0.1% | | | |
| Avista Corp. | | 3,093 | 159,259 |
| Black Hills Corp. | | 1,594 | 95,815 |
| NorthWestern Energy Corp. | | 423 | 25,253 |
| | | | 280,327 |
| Water Utilities - 0.0% | | | |
| Consolidated Water Co., Inc. | | 863 | 10,874 |
| SJW Corp. | | 231 | 14,745 |
| | | | 25,619 |
|
| TOTAL UTILITIES | | | 6,259,197 |
|
| TOTAL COMMON STOCKS | | | |
| (Cost $233,792,229) | | | 280,476,406 |
| | | Principal Amount | Value |
|
| U.S. Treasury Obligations - 0.3% | | | |
| U.S. Treasury Bills, yield at date of purchase 1.18% 6/21/18 (d) | | | |
| (Cost $994,443) | | 1,000,000 | 992,917 |
| | | Shares | Value |
|
| Money Market Funds - 15.5% | | | |
| Fidelity Cash Central Fund, 1.36% (e) | | 9,677,617 | $9,679,553 |
| Fidelity Securities Lending Cash Central Fund 1.36% (e)(f) | | 35,390,987 | 35,398,065 |
| TOTAL MONEY MARKET FUNDS | | | |
| (Cost $45,073,633) | | | 45,077,618 |
| TOTAL INVESTMENT IN SECURITIES - 112.3% | | | |
| (Cost $279,860,305) | | | 326,546,941 |
| NET OTHER ASSETS (LIABILITIES) - (12.3)% | | | (35,867,665) |
| NET ASSETS - 100% | | | $290,679,276 |
| Futures Contracts | | | | | |
| | Number of contracts | Expiration Date | Notional Amount | Value | Unrealized Appreciation/(Depreciation) |
| Purchased | | | | | |
| Equity Index Contracts | | | | | |
| CME E-mini Russell 2000 Index Contracts (United States) | 133 | March 2018 | $10,217,725 | $59,982 | $59,982 |
The notional amount of futures purchased as a percentage of Net Assets is 3.5%
Legend
(a) Non-income producing
(b) Security or a portion of the security is on loan at period end.
(c) Level 3 security
(d) Security or a portion of the security was pledged to cover margin requirements for futures contracts. At period end, the value of securities pledged amounted to $425,961.
(e) Affiliated fund that is generally available only to investment companies and other accounts managed by Fidelity Investments. The rate quoted is the annualized seven-day yield of the fund at period end. A complete unaudited listing of the fund's holdings as of its most recent quarter end is available upon request. In addition, each Fidelity Central Fund's financial statements, which are not covered by the Fund's Report of Independent Registered Public Accounting Firm, are available on the SEC's website or upon request.
(f) Includes investment made with cash collateral received from securities on loan.
Affiliated Central Funds
Information regarding fiscal year to date income earned by the Fund from investments in Fidelity Central Funds is as follows:
| Fund | Income earned |
| Fidelity Cash Central Fund | $50,619 |
| Fidelity Securities Lending Cash Central Fund | 180,369 |
| Total | $230,988 |
Amounts in the income column in the above table include any capital gain distributions from underlying funds, which are presented in the corresponding line-item in the Statement of Operations if applicable.
Investment Valuation
The following is a summary of the inputs used, as of December 31, 2017, involving the Fund's assets and liabilities carried at fair value. The inputs or methodology used for valuing securities may not be an indication of the risk associated with investing in those securities. For more information on valuation inputs, and their aggregation into the levels used below, please refer to the Investment Valuation section in the accompanying Notes to Financial Statements.
| | Valuation Inputs at Reporting Date: |
| Description | Total | Level 1 | Level 2 | Level 3 |
| Investments in Securities: | | | | |
| Equities: | | | | |
| Consumer Discretionary | $33,393,180 | $33,393,180 | $-- | $-- |
| Consumer Staples | 12,540,105 | 12,540,105 | -- | -- |
| Energy | 5,994,118 | 5,994,118 | -- | -- |
| Financials | 47,356,414 | 47,356,414 | -- | -- |
| Health Care | 44,714,907 | 44,676,197 | -- | 38,710 |
| Industrials | 46,596,481 | 46,596,481 | -- | -- |
| Information Technology | 51,941,410 | 51,941,410 | -- | -- |
| Materials | 16,883,225 | 16,883,225 | -- | -- |
| Real Estate | 14,622,642 | 14,622,642 | -- | -- |
| Telecommunication Services | 174,727 | 174,727 | -- | -- |
| Utilities | 6,259,197 | 6,259,197 | -- | -- |
| U.S. Government and Government Agency Obligations | 992,917 | -- | 992,917 | -- |
| Money Market Funds | 45,077,618 | 45,077,618 | -- | -- |
| Total Investments in Securities: | $326,546,941 | $325,515,314 | $992,917 | $38,710 |
| Derivative Instruments: | | | | |
| Assets | | | | |
| Futures Contracts | $59,982 | $59,982 | $-- | $-- |
| Total Assets | $59,982 | $59,982 | $-- | $-- |
| Total Derivative Instruments: | $59,982 | $59,982 | $-- | $-- |
Value of Derivative Instruments
The following table is a summary of the Fund's value of derivative instruments by primary risk exposure as of December 31, 2017. For additional information on derivative instruments, please refer to the Derivative Instruments section in the accompanying Notes to Financial Statements.
| Primary Risk Exposure / Derivative Type | Value |
| | Asset | Liability |
| Equity Risk | | |
| Futures Contracts(a) | $59,982 | $0 |
| Total Value of Derivatives | $59,982 | $0 |
(a) Reflects gross cumulative appreciation (depreciation) on futures contracts as presented in the Schedule of Investments. In the Statement of Assets and Liabilities, the period end daily variation margin is included in receivable or payable for daily variation margin on futures contracts, and the net cumulative appreciation (depreciation) is included in net unrealized appreciation (depreciation).
See accompanying notes which are an integral part of the financial statements.
Financial Statements
Statement of Assets and Liabilities
| | | December 31, 2017 |
| Assets | | |
Investment in securities, at value (including securities loaned of $34,285,876) — See accompanying schedule:
Unaffiliated issuers (cost $234,786,672) | $281,469,323 | |
| Fidelity Central Funds (cost $45,073,633) | 45,077,618 | |
| Total Investment in Securities (cost $279,860,305) | | $326,546,941 |
| Receivable for investments sold | | 4,199,447 |
| Receivable for fund shares sold | | 87,586 |
| Dividends receivable | | 370,789 |
| Distributions receivable from Fidelity Central Funds | | 17,770 |
| Prepaid expenses | | 510 |
| Total assets | | 331,223,043 |
| Liabilities | | |
| Payable to custodian bank | $79,829 | |
| Payable for investments purchased | 4,205,105 | |
| Payable for fund shares redeemed | 603,264 | |
| Accrued management fee | 108,968 | |
| Distribution and service plan fees payable | 1,728 | |
| Payable for daily variation margin on futures contracts | 91,334 | |
| Other affiliated payables | 42,501 | |
| Other payables and accrued expenses | 18,780 | |
| Collateral on securities loaned | 35,392,258 | |
| Total liabilities | | 40,543,767 |
| Net Assets | | $290,679,276 |
| Net Assets consist of: | | |
| Paid in capital | | $221,980,812 |
| Undistributed net investment income | | 377,410 |
| Accumulated undistributed net realized gain (loss) on investments and foreign currency transactions | | 21,574,436 |
| Net unrealized appreciation (depreciation) on investments | | 46,746,618 |
| Net Assets | | $290,679,276 |
| Initial Class: | | |
| Net Asset Value, offering price and redemption price per share ($31,332,375 ÷ 1,858,397 shares) | | $16.86 |
| Service Class: | | |
| Net Asset Value, offering price and redemption price per share ($249,041 ÷ 14,729 shares) | | $16.91 |
| Service Class 2: | | |
| Net Asset Value, offering price and redemption price per share ($7,880,866 ÷ 466,402 shares) | | $16.90 |
| Investor Class: | | |
| Net Asset Value, offering price and redemption price per share ($251,216,994 ÷ 14,958,651 shares) | | $16.79 |
See accompanying notes which are an integral part of the financial statements.
Statement of Operations
| | | Year ended December 31, 2017 |
| Investment Income | | |
| Dividends | | $4,256,463 |
| Interest | | 7,772 |
| Income from Fidelity Central Funds | | 230,988 |
| Total income | | 4,495,223 |
| Expenses | | |
| Management fee | $2,026,721 | |
| Transfer agent fees | 406,045 | |
| Distribution and service plan fees | 18,548 | |
| Accounting and security lending fees | 121,549 | |
| Custodian fees and expenses | 87,443 | |
| Independent trustees' fees and expenses | 1,198 | |
| Audit | 54,585 | |
| Legal | 6,954 | |
| Miscellaneous | 2,158 | |
| Total expenses before reductions | 2,725,201 | |
| Expense reductions | (2,782) | 2,722,419 |
| Net investment income (loss) | | 1,772,804 |
| Realized and Unrealized Gain (Loss) | | |
| Net realized gain (loss) on: | | |
| Investment securities: | | |
| Unaffiliated issuers | 24,778,181 | |
| Fidelity Central Funds | 2,479 | |
| Foreign currency transactions | 110 | |
| Futures contracts | (16,546) | |
| Total net realized gain (loss) | | 24,764,224 |
| Change in net unrealized appreciation (depreciation) on: | | |
| Investment securities: | | |
| Unaffiliated issuers | (8,124,549) | |
| Fidelity Central Funds | 1,981 | |
| Futures contracts | 66,006 | |
| Total change in net unrealized appreciation (depreciation) | | (8,056,562) |
| Net gain (loss) | | 16,707,662 |
| Net increase (decrease) in net assets resulting from operations | | $18,480,466 |
See accompanying notes which are an integral part of the financial statements.
Statement of Changes in Net Assets
| | Year ended December 31, 2017 | Year ended December 31, 2016 |
| Increase (Decrease) in Net Assets | | |
| Operations | | |
| Net investment income (loss) | $1,772,804 | $1,926,337 |
| Net realized gain (loss) | 24,764,224 | 6,721,795 |
| Change in net unrealized appreciation (depreciation) | (8,056,562) | 41,767,033 |
| Net increase (decrease) in net assets resulting from operations | 18,480,466 | 50,415,165 |
| Distributions to shareholders from net investment income | (1,887,602) | (1,477,372) |
| Distributions to shareholders from net realized gain | (7,801,890) | (16,439,954) |
| Total distributions | (9,689,492) | (17,917,326) |
| Share transactions - net increase (decrease) | (29,728,112) | 54,712,795 |
| Total increase (decrease) in net assets | (20,937,138) | 87,210,634 |
| Net Assets | | |
| Beginning of period | 311,616,414 | 224,405,780 |
| End of period | $290,679,276 | $311,616,414 |
| Other Information | | |
| Undistributed net investment income end of period | $377,410 | $523,375 |
See accompanying notes which are an integral part of the financial statements.
Financial Highlights
VIP Disciplined Small Cap Portfolio Initial Class
| Years ended December 31, | 2017 | 2016 | 2015 | 2014 | 2013 |
| Selected Per–Share Data | | | | | |
| Net asset value, beginning of period | $16.25 | $14.52 | $14.94 | $15.40 | $12.03 |
| Income from Investment Operations | | | | | |
| Net investment income (loss)A | .11 | .13 | .10 | .06 | .09 |
| Net realized and unrealized gain (loss) | 1.01 | 2.75 | (.40) | .69 | 4.44 |
| Total from investment operations | 1.12 | 2.88 | (.30) | .75 | 4.53 |
| Distributions from net investment income | (.12) | (.09) | (.09) | (.07) | (.07) |
| Distributions from net realized gain | (.40) | (1.06) | (.03) | (1.14) | (1.09) |
| Total distributions | (.51)B | (1.15) | (.12) | (1.21) | (1.16) |
| Net asset value, end of period | $16.86 | $16.25 | $14.52 | $14.94 | $15.40 |
| Total ReturnC,D | 7.02% | 22.68% | (1.99)% | 5.28% | 38.35% |
| Ratios to Average Net AssetsE,F | | | | | |
| Expenses before reductions | .83% | .86% | .85% | .85% | .86% |
| Expenses net of fee waivers, if any | .83% | .86% | .84% | .85% | .86% |
| Expenses net of all reductions | .83% | .86% | .84% | .85% | .86% |
| Net investment income (loss) | .67% | .90% | .68% | .41% | .66% |
| Supplemental Data | | | | | |
| Net assets, end of period (000 omitted) | $31,332 | $41,185 | $30,227 | $33,658 | $45,699 |
| Portfolio turnover rateG | 103% | 83% | 96% | 100% | 108% |
A Calculated based on average shares outstanding during the period.
B Total distributions of $.51 per share is comprised of distributions from net investment income of $.116 and distributions from net realized gain of $.395 per share.
C Total returns do not reflect charges attributable to your insurance company's separate account. Inclusion of these charges would reduce the total returns shown.
D Total returns would have been lower if certain expenses had not been reduced during the applicable periods shown.
E Fees and expenses of any underlying Fidelity Central Funds are not included in the Fund's expense ratio. The Fund indirectly bears its proportionate share of the expenses of any underlying Fidelity Central Funds.
F Expense ratios reflect operating expenses of the class. Expenses before reductions do not reflect amounts reimbursed by the investment adviser or reductions from expense offset arrangements and do not represent the amount paid by the class during periods when reimbursements or reductions occur. Expenses net of fee waivers reflect expenses after reimbursement by the investment adviser but prior to reductions from expense offset arrangements. Expenses net of all reductions represent the net expenses paid by the class.
G Amount does not include the portfolio activity of any underlying Fidelity Central Funds.
See accompanying notes which are an integral part of the financial statements.
VIP Disciplined Small Cap Portfolio Service Class
| Years ended December 31, | 2017 | 2016 | 2015 | 2014 | 2013 |
| Selected Per–Share Data | | | | | |
| Net asset value, beginning of period | $16.29 | $14.56 | $14.98 | $15.44 | $12.06 |
| Income from Investment Operations | | | | | |
| Net investment income (loss)A | .09 | .11 | .09 | .05 | .08 |
| Net realized and unrealized gain (loss) | 1.03 | 2.75 | (.40) | .68 | 4.44 |
| Total from investment operations | 1.12 | 2.86 | (.31) | .73 | 4.52 |
| Distributions from net investment income | (.10) | (.07) | (.08) | (.05) | (.05) |
| Distributions from net realized gain | (.40) | (1.06) | (.03) | (1.14) | (1.09) |
| Total distributions | (.50) | (1.13) | (.11) | (1.19) | (1.14) |
| Net asset value, end of period | $16.91 | $16.29 | $14.56 | $14.98 | $15.44 |
| Total ReturnB,C | 6.97% | 22.49% | (2.09)% | 5.19% | 38.19% |
| Ratios to Average Net AssetsD,E | | | | | |
| Expenses before reductions | .93% | .96% | .95% | .95% | .95% |
| Expenses net of fee waivers, if any | .93% | .96% | .94% | .95% | .95% |
| Expenses net of all reductions | .93% | .96% | .94% | .95% | .95% |
| Net investment income (loss) | .57% | .80% | .58% | .32% | .57% |
| Supplemental Data | | | | | |
| Net assets, end of period (000 omitted) | $249 | $266 | $311 | $320 | $329 |
| Portfolio turnover rateF | 103% | 83% | 96% | 100% | 108% |
A Calculated based on average shares outstanding during the period.
B Total returns do not reflect charges attributable to your insurance company's separate account. Inclusion of these charges would reduce the total returns shown.
C Total returns would have been lower if certain expenses had not been reduced during the applicable periods shown.
D Fees and expenses of any underlying Fidelity Central Funds are not included in the Fund's expense ratio. The Fund indirectly bears its proportionate share of the expenses of any underlying Fidelity Central Funds.
E Expense ratios reflect operating expenses of the class. Expenses before reductions do not reflect amounts reimbursed by the investment adviser or reductions from expense offset arrangements and do not represent the amount paid by the class during periods when reimbursements or reductions occur. Expenses net of fee waivers reflect expenses after reimbursement by the investment adviser but prior to reductions from expense offset arrangements. Expenses net of all reductions represent the net expenses paid by the class.
F Amount does not include the portfolio activity of any underlying Fidelity Central Funds.
See accompanying notes which are an integral part of the financial statements.
VIP Disciplined Small Cap Portfolio Service Class 2
| Years ended December 31, | 2017 | 2016 | 2015 | 2014 | 2013 |
| Selected Per–Share Data | | | | | |
| Net asset value, beginning of period | $16.29 | $14.58 | $14.99 | $15.45 | $12.07 |
| Income from Investment Operations | | | | | |
| Net investment income (loss)A | .07 | .09 | .07 | .02 | .05 |
| Net realized and unrealized gain (loss) | 1.02 | 2.75 | (.40) | .68 | 4.45 |
| Total from investment operations | 1.09 | 2.84 | (.33) | .70 | 4.50 |
| Distributions from net investment income | (.08) | (.07) | (.05) | (.02) | (.03) |
| Distributions from net realized gain | (.40) | (1.06) | (.03) | (1.14) | (1.09) |
| Total distributions | (.48) | (1.13) | (.08) | (1.16) | (1.12) |
| Net asset value, end of period | $16.90 | $16.29 | $14.58 | $14.99 | $15.45 |
| Total ReturnB,C | 6.79% | 22.31% | (2.18)% | 4.93% | 37.96% |
| Ratios to Average Net AssetsD,E | | | | | |
| Expenses before reductions | 1.08% | 1.11% | 1.10% | 1.14% | 1.15% |
| Expenses net of fee waivers, if any | 1.08% | 1.11% | 1.10% | 1.14% | 1.15% |
| Expenses net of all reductions | 1.08% | 1.11% | 1.10% | 1.14% | 1.15% |
| Net investment income (loss) | .42% | .65% | .43% | .12% | .37% |
| Supplemental Data | | | | | |
| Net assets, end of period (000 omitted) | $7,881 | $6,403 | $3,198 | $3,097 | $4,115 |
| Portfolio turnover rateF | 103% | 83% | 96% | 100% | 108% |
A Calculated based on average shares outstanding during the period.
B Total returns do not reflect charges attributable to your insurance company's separate account. Inclusion of these charges would reduce the total returns shown.
C Total returns would have been lower if certain expenses had not been reduced during the applicable periods shown.
D Fees and expenses of any underlying Fidelity Central Funds are not included in the Fund's expense ratio. The Fund indirectly bears its proportionate share of the expenses of any underlying Fidelity Central Funds.
E Expense ratios reflect operating expenses of the class. Expenses before reductions do not reflect amounts reimbursed by the investment adviser or reductions from expense offset arrangements and do not represent the amount paid by the class during periods when reimbursements or reductions occur. Expenses net of fee waivers reflect expenses after reimbursement by the investment adviser but prior to reductions from expense offset arrangements. Expenses net of all reductions represent the net expenses paid by the class.
F Amount does not include the portfolio activity of any underlying Fidelity Central Funds.
See accompanying notes which are an integral part of the financial statements.
VIP Disciplined Small Cap Portfolio Investor Class
| Years ended December 31, | 2017 | 2016 | 2015 | 2014 | 2013 |
| Selected Per–Share Data | | | | | |
| Net asset value, beginning of period | $16.19 | $14.48 | $14.89 | $15.36 | $12.01 |
| Income from Investment Operations | | | | | |
| Net investment income (loss)A | .09 | .11 | .09 | .05 | .08 |
| Net realized and unrealized gain (loss) | 1.01 | 2.74 | (.39) | .68 | 4.42 |
| Total from investment operations | 1.10 | 2.85 | (.30) | .73 | 4.50 |
| Distributions from net investment income | (.10) | (.08) | (.08) | (.05) | (.06) |
| Distributions from net realized gain | (.40) | (1.06) | (.03) | (1.14) | (1.09) |
| Total distributions | (.50) | (1.14) | (.11) | (1.20)B | (1.15) |
| Net asset value, end of period | $16.79 | $16.19 | $14.48 | $14.89 | $15.36 |
| Total ReturnC,D | 6.91% | 22.54% | (2.00)% | 5.15% | 38.18% |
| Ratios to Average Net AssetsE,F | | | | | |
| Expenses before reductions | .91% | .94% | .93% | .93% | .94% |
| Expenses net of fee waivers, if any | .91% | .94% | .92% | .93% | .93% |
| Expenses net of all reductions | .91% | .94% | .92% | .93% | .93% |
| Net investment income (loss) | .59% | .82% | .60% | .34% | .58% |
| Supplemental Data | | | | | |
| Net assets, end of period (000 omitted) | $251,217 | $263,763 | $190,669 | $173,570 | $184,956 |
| Portfolio turnover rateG | 103% | 83% | 96% | 100% | 108% |
A Calculated based on average shares outstanding during the period.
B Total distributions of $1.20 per share is comprised of distributions from net investment income of $.054 and distributions from net realized gain of $1.141 per share.
C Total returns do not reflect charges attributable to your insurance company's separate account. Inclusion of these charges would reduce the total returns shown.
D Total returns would have been lower if certain expenses had not been reduced during the applicable periods shown.
E Fees and expenses of any underlying Fidelity Central Funds are not included in the Fund's expense ratio. The Fund indirectly bears its proportionate share of the expenses of any underlying Fidelity Central Funds.
F Expense ratios reflect operating expenses of the class. Expenses before reductions do not reflect amounts reimbursed by the investment adviser or reductions from expense offset arrangements and do not represent the amount paid by the class during periods when reimbursements or reductions occur. Expenses net of fee waivers reflect expenses after reimbursement by the investment adviser but prior to reductions from expense offset arrangements. Expenses net of all reductions represent the net expenses paid by the class.
G Amount does not include the portfolio activity of any underlying Fidelity Central Funds.
See accompanying notes which are an integral part of the financial statements.
Notes to Financial Statements
For the period ended December 31, 2017
1. Organization.
VIP Disciplined Small Cap Portfolio (the Fund) is a fund of Variable Insurance Products Fund II (the Trust) and is authorized to issue an unlimited number of shares. The Trust is registered under the Investment Company Act of 1940, as amended (the 1940 Act), as an open-end management investment company organized as a Massachusetts business trust. Shares of the Fund may only be purchased by insurance companies for the purpose of funding variable annuity or variable life insurance contracts. The Fund offers the following classes of shares: Initial Class shares, Service Class shares, Service Class 2 shares and Investor Class shares. All classes have equal rights and voting privileges, except for matters affecting a single class.
2. Investments in Fidelity Central Funds.
The Fund invests in Fidelity Central Funds, which are open-end investment companies generally available only to other investment companies and accounts managed by the investment adviser and its affiliates. The Fund's Schedule of Investments lists each of the Fidelity Central Funds held as of period end, if any, as an investment of the Fund, but does not include the underlying holdings of each Fidelity Central Fund. As an Investing Fund, the Fund indirectly bears its proportionate share of the expenses of the underlying Fidelity Central Funds.
The Money Market Central Funds seek preservation of capital and current income and are managed by Fidelity Investments Money Management, Inc. (FIMM), an affiliate of the investment adviser. Annualized expenses of the Money Market Central Funds as of their most recent shareholder report date are less than .005%.
A complete unaudited list of holdings for each Fidelity Central Fund is available upon request or at the Securities and Exchange Commission (the SEC) website at www.sec.gov. In addition, the financial statements of the Fidelity Central Funds, which are not covered by the Fund's Report of Independent Registered Public Accounting Firm, are available on the SEC website or upon request.
3. Significant Accounting Policies.
The Fund is an investment company and applies the accounting and reporting guidance of the Financial Accounting Standards Board (FASB) Accounting Standards Codification Topic 946 Financial Services – Investments Companies. The financial statements have been prepared in conformity with accounting principles generally accepted in the United States of America (GAAP), which require management to make certain estimates and assumptions at the date of the financial statements. Actual results could differ from those estimates. Subsequent events, if any, through the date that the financial statements were issued have been evaluated in the preparation of the financial statements. The following summarizes the significant accounting policies of the Fund:
Investment Valuation. Investments are valued as of 4:00 p.m. Eastern time on the last calendar day of the period. The Board of Trustees (the Board) has delegated the day to day responsibility for the valuation of the Fund's investments to the Fair Value Committee (the Committee) established by the Fund's investment adviser. In accordance with valuation policies and procedures approved by the Board, the Fund attempts to obtain prices from one or more third party pricing vendors or brokers to value its investments. When current market prices, quotations or currency exchange rates are not readily available or reliable, investments will be fair valued in good faith by the Committee, in accordance with procedures adopted by the Board. Factors used in determining fair value vary by investment type and may include market or investment specific events, changes in interest rates and credit quality. The frequency with which these procedures are used cannot be predicted and they may be utilized to a significant extent. The Committee oversees the Fund's valuation policies and procedures and reports to the Board on the Committee's activities and fair value determinations. The Board monitors the appropriateness of the procedures used in valuing the Fund's investments and ratifies the fair value determinations of the Committee.
The Fund categorizes the inputs to valuation techniques used to value its investments into a disclosure hierarchy consisting of three levels as shown below:
- Level 1 – quoted prices in active markets for identical investments
- Level 2 – other significant observable inputs (including quoted prices for similar investments, interest rates, prepayment speeds, etc.)
- Level 3 – unobservable inputs (including the Fund's own assumptions based on the best information available)
Valuation techniques used to value the Fund's investments by major category are as follows:
Equity securities, including restricted securities, for which market quotations are readily available, are valued at the last reported sale price or official closing price as reported by a third party pricing vendor on the primary market or exchange on which they are traded and are categorized as Level 1 in the hierarchy. In the event there were no sales during the day or closing prices are not available, securities are valued at the last quoted bid price or may be valued using the last available price and are generally categorized as Level 2 in the hierarchy. For foreign equity securities, when market or security specific events arise, comparisons to the valuation of American Depositary Receipts (ADRs), futures contracts, Exchange-Traded Funds (ETFs) and certain indexes as well as quoted prices for similar securities may be used and would be categorized as Level 2 in the hierarchy. Utilizing these techniques may result in transfers between Level 1 and Level 2. For equity securities, including restricted securities, where observable inputs are limited, assumptions about market activity and risk are used and these securities may be categorized as Level 3 in the hierarchy.
Debt securities, including restricted securities, are valued based on evaluated prices received from third party pricing vendors or from brokers who make markets in such securities. U.S. government and government agency obligations are valued by pricing vendors who utilize matrix pricing which considers prepayment speed assumptions, attributes of the collateral, yield or price of bonds of comparable quality, coupon, maturity and type or by broker-supplied prices. When independent prices are unavailable or unreliable, debt securities may be valued utilizing pricing methodologies which consider similar factors that would be used by third party pricing vendors. Debt securities are generally categorized as Level 2 in the hierarchy but may be Level 3 depending on the circumstances.
Futures contracts are valued at the settlement price established each day by the board of trade or exchange on which they are traded and are categorized as Level 1 in the hierarchy. Investments in open-end mutual funds, including the Fidelity Central Funds, are valued at their closing net asset value (NAV) each business day and are categorized as Level 1 in the hierarchy.
Changes in valuation techniques may result in transfers in or out of an assigned level within the disclosure hierarchy. The aggregate value of investments by input level as of December 31, 2017 is included at the end of the Fund's Schedule of Investments.
Foreign Currency. The Fund may use foreign currency contracts to facilitate transactions in foreign-denominated securities. Gains and losses from these transactions may arise from changes in the value of the foreign currency or if the counterparties do not perform under the contracts' terms.
Foreign-denominated assets, including investment securities, and liabilities are translated into U.S. dollars at the exchange rates at period end. Purchases and sales of investment securities, income and dividends received and expenses denominated in foreign currencies are translated into U.S. dollars at the exchange rate in effect on the transaction date.
The effects of exchange rate fluctuations on investments are included with the net realized and unrealized gain (loss) on investment securities. Other foreign currency transactions resulting in realized and unrealized gain (loss) are disclosed separately.
Investment Transactions and Income. For financial reporting purposes, the Fund's investment holdings and NAV include trades executed through the end of the last business day of the period. The NAV per share for processing shareholder transactions is calculated as of the close of business of the New York Stock Exchange (NYSE), normally 4:00 p.m. Eastern time and includes trades executed through the end of the prior business day. Gains and losses on securities sold are determined on the basis of identified cost and includes proceeds received from litigation. Dividend income is recorded on the ex-dividend date, except for certain dividends from foreign securities where the ex-dividend date may have passed, which are recorded as soon as the Fund is informed of the ex-dividend date. Non-cash dividends included in dividend income, if any, are recorded at the fair market value of the securities received. Income and capital gain distributions from Fidelity Central Funds, if any, are recorded on the ex-dividend date. Certain distributions received by the Fund represent a return of capital or capital gain. The Fund determines the components of these distributions subsequent to the ex-dividend date, based upon receipt of tax filings or other correspondence relating to the underlying investment. These distributions are recorded as a reduction of cost of investments and/or as a realized gain. Interest income is accrued as earned and includes coupon interest and amortization of premium and accretion of discount on debt securities as applicable. Investment income is recorded net of foreign taxes withheld where recovery of such taxes is uncertain.
Class Allocations and Expenses. Investment income, realized and unrealized capital gains and losses, common expenses of the Fund, and certain fund-level expense reductions, if any, are allocated daily on a pro-rata basis to each class based on the relative net assets of each class to the total net assets of the Fund. Each class differs with respect to transfer agent and distribution and service plan fees incurred. Certain expense reductions may also differ by class. For the reporting period, the allocated portion of income and expenses to each class as a percent of its average net assets may vary due to the timing of recording these transactions in relation to fluctuating net assets of the classes. Expenses directly attributable to a fund are charged to that fund. Expenses attributable to more than one fund are allocated among the respective funds on the basis of relative net assets or other appropriate methods. Expense estimates are accrued in the period to which they relate and adjustments are made when actual amounts are known.
Income Tax Information and Distributions to Shareholders. Each year, the Fund intends to qualify as a regulated investment company under Subchapter M of the Internal Revenue Code, including distributing substantially all of its taxable income and realized gains. As a result, no provision for U.S. Federal income taxes is required. As of December 31, 2017, the Fund did not have any unrecognized tax benefits in the financial statements; nor is the Fund aware of any tax positions for which it is reasonably possible that the total amounts of unrecognized tax benefits will significantly change in the next twelve months. The Fund files a U.S. federal tax return, in addition to state and local tax returns as required. The Fund's federal income tax returns are subject to examination by the Internal Revenue Service (IRS) for a period of three fiscal years after they are filed. State and local tax returns may be subject to examination for an additional fiscal year depending on the jurisdiction. Foreign taxes are provided for based on the Fund's understanding of the tax rules and rates that exist in the foreign markets in which it invests.
Distributions are declared and recorded on the ex-dividend date. Income dividends and capital gain distributions are declared separately for each class. Income and capital gain distributions are determined in accordance with income tax regulations, which may differ from GAAP.
Capital accounts within the financial statements are adjusted for permanent book-tax differences. These adjustments have no impact on net assets or the results of operations. Capital accounts are not adjusted for temporary book-tax differences which will reverse in a subsequent period.
Book-tax differences are primarily due to futures contracts, foreign currency transactions, partnerships, and passive foreign investment companies (PFIC), market discount, and losses deferred due to wash sales and excise tax regulations.
As of period end, the cost and unrealized appreciation (depreciation) in securities, and derivatives if applicable, for federal income tax purposes were as follows:
| Gross unrealized appreciation | $54,430,822 |
| Gross unrealized depreciation | (9,499,193) |
| Net unrealized appreciation (depreciation) | $44,931,629 |
| Tax Cost | $281,615,312 |
The tax-based components of distributable earnings as of period end were as follows:
| Undistributed ordinary income | $372,959 |
| Undistributed long-term capital gain | $23,854,511 |
| Net unrealized appreciation (depreciation) on securities and other investments | $44,931,629 |
The Fund intends to elect to defer to its next fiscal year $460,632 of capital losses recognized during the period November 1, 2017 to December 31, 2017.
The tax character of distributions paid was as follows:
| | December 31, 2017 | December 31, 2016 |
| Ordinary Income | $2,973,631 | $ 1,477,372 |
| Long-term Capital Gains | 6,715,861 | 16,439,954 |
| Total | $9,689,492 | $ 17,917,326 |
4. Derivative Instruments.
Risk Exposures and the Use of Derivative Instruments. The Fund's investment objective allows the Fund to enter into various types of derivative contracts, including futures contracts. Derivatives are investments whose value is primarily derived from underlying assets, indices or reference rates and may be transacted on an exchange or over-the-counter (OTC). Derivatives may involve a future commitment to buy or sell a specified asset based on specified terms, to exchange future cash flows at periodic intervals based on a notional principal amount, or for one party to make one or more payments upon the occurrence of specified events in exchange for periodic payments from the other party.
The Fund used derivatives to increase returns and to manage exposure to certain risks as defined below. The success of any strategy involving derivatives depends on analysis of numerous economic factors, and if the strategies for investment do not work as intended, the Fund may not achieve its objectives.
The Fund's use of derivatives increased or decreased its exposure to the following risk:
| Equity Risk | Equity risk relates to the fluctuations in the value of financial instruments as a result of changes in market prices (other than those arising from interest rate risk or foreign exchange risk), whether caused by factors specific to an individual investment, its issuer, or all factors affecting all instruments traded in a market or market segment.
|
The Fund is also exposed to additional risks from investing in derivatives, such as liquidity risk and counterparty credit risk. Liquidity risk is the risk that the Fund will be unable to close out the derivative in the open market in a timely manner. Counterparty credit risk is the risk that the counterparty will not be able to fulfill its obligation to the Fund. Counterparty credit risk related to exchange-traded futures contracts may be mitigated by the protection provided by the exchange on which they trade.
Investing in derivatives may involve greater risks than investing in the underlying assets directly and, to varying degrees, may involve risk of loss in excess of any initial investment and collateral received and amounts recognized in the Statement of Assets and Liabilities. In addition, there may be the risk that the change in value of the derivative contract does not correspond to the change in value of the underlying instrument.
Futures Contracts. A futures contract is an agreement between two parties to buy or sell a specified underlying instrument for a fixed price at a specified future date. The Fund used futures contracts to manage its exposure to the stock market.
Upon entering into a futures contract, a fund is required to deposit either cash or securities (initial margin) with a clearing broker in an amount equal to a certain percentage of the face value of the contract. Futures contracts are marked-to-market daily and subsequent daily payments (variation margin) are made or received by a fund depending on the daily fluctuations in the value of the futures contracts and are recorded as unrealized appreciation or (depreciation). This receivable and/or payable, if any, is included in daily variation margin on futures contracts in the Statement of Assets and Liabilities. Realized gain or (loss) is recorded upon the expiration or closing of a futures contract. The net realized gain (loss) and change in net unrealized appreciation (depreciation) on futures contracts during the period is presented in the Statement of Operations.
Any open futures contracts at period end are presented in the Schedule of Investments under the caption "Futures Contracts". The notional amount at value reflects each contract's exposure to the underlying instrument or index at period end. Securities deposited to meet initial margin requirements are identified in the Schedule of Investments.
5. Purchases and Sales of Investments.
Purchases and sales of securities, other than short-term securities, aggregated $304,584,684 and $343,756,691, respectively.
6. Fees and Other Transactions with Affiliates.
Management Fee. Fidelity Management & Research Company (the investment adviser) and its affiliates provide the Fund with investment management related services for which the Fund pays a monthly management fee. Effective December 1, 2017, the Board approved an amendment to the management contract whereby the Fund pays a monthly management fee that is based on an annual rate of .45% of the Fund's average net assets. Prior to December 1, 2017, the management fee was the sum of an individual fund fee rate that was based on an annual rate of .45% of the Fund's average net assets and an annualized group fee rate that averaged .24% during the period. The group fee rate was based upon the average net assets of all the mutual funds advised by the investment adviser, including any mutual funds previously advised by the investment adviser that are currently advised by Fidelity SelectCo, LLC, an affiliate of the investment adviser. The group fee rate decreased as assets under management increased and increased as assets under management decreased. For the reporting period, the total annual management fee rate was .68% of the Fund's average net assets.
Sub-Adviser. Geode Capital Management, LLC (Geode), serves as sub-adviser for the Fund. Geode provides discretionary investment advisory services to the Fund and is paid by the investment adviser for providing these services.
Distribution and Service Plan Fees. In accordance with Rule 12b-1 of the 1940 Act, the Fund has adopted separate 12b-1 Plans for each Service Class of shares. Each Service Class pays Fidelity Distributors Corporation (FDC), an affiliate of the investment adviser, a service fee. For the period, the service fee is based on an annual rate of .10% of Service Class' average net assets and .25% of Service Class 2's average net assets.
For the period, total fees, all of which were re-allowed to insurance companies for the distribution of shares and providing shareholder support services, were as follows:
| Service Class | $248 |
| Service Class 2 | 18,300 |
| | $18,548 |
Transfer Agent Fees. Fidelity Investments Institutional Operations Company, Inc. (FIIOC), an affiliate of the investment adviser, is the Fund's transfer, dividend disbursing, and shareholder servicing agent. FIIOC receives an asset-based fee with respect to each class. Each class pays a fee for transfer agent services, typesetting and printing and mailing of shareholder reports, excluding mailing of proxy statements, equal to an annual rate of class-level average net assets. The annual rate for Investor Class is .15% and the annual rate for all other classes is .07%. For the period, transfer agent fees for each class were as follows:
| Initial Class | $23,495 |
| Service Class | 164 |
| Service Class 2 | 4,825 |
| Investor Class | 377,561 |
| | $406,045 |
Accounting and Security Lending Fees. Fidelity Service Company, Inc. (FSC), an affiliate of the investment adviser, maintains the Fund's accounting records. The accounting fee is based on the level of average net assets for each month. Under a separate contract, FSC administers the security lending program. The security lending fee is based on the number and duration of lending transactions.
Interfund Trades. The Fund may purchase from or sell securities to other Fidelity Funds under procedures adopted by the Board. The procedures have been designed to ensure these interfund trades are executed in accordance with Rule 17a-7 of the 1940 Act. Interfund trades are included within the respective purchases and sales amounts shown in the Purchases and Sales of Investments note.
7. Committed Line of Credit.
The Fund participates with other funds managed by the investment adviser or an affiliate in a $4.25 billion credit facility (the "line of credit") to be utilized for temporary or emergency purposes to fund shareholder redemptions or for other short-term liquidity purposes. The Fund has agreed to pay commitment fees on its pro-rata portion of the line of credit, which amounted to $949 and is reflected in Miscellaneous expenses on the Statement of Operations. During the period, the Fund did not borrow on this line of credit.
8. Security Lending.
The Fund lends portfolio securities through a lending agent from time to time in order to earn additional income. On the settlement date of the loan, the Fund receives collateral (in the form of U.S. Treasury obligations, letters of credit and/or cash) against the loaned securities and maintains collateral in an amount not less than 100% of the market value of the loaned securities during the period of the loan. The market value of the loaned securities is determined at the close of business of the Fund and any additional required collateral is delivered to the Fund on the next business day. The Fund or borrower may terminate the loan at any time, and if the borrower defaults on its obligation to return the securities loaned because of insolvency or other reasons, the Fund may apply collateral received from the borrower against the obligation. The Fund may experience delays and costs in recovering the securities loaned. Any cash collateral received is invested in the Fidelity Securities Lending Cash Central Fund. The value of loaned securities and cash collateral at period end are disclosed on the Fund's Statement of Assets and Liabilities. Security lending income represents the income earned on investing cash collateral, less rebates paid to borrowers and any lending agent fees associated with the loan, plus any premium payments received for lending certain types of securities. Security lending income is presented in the Statement of Operations as a component of income from Fidelity Central Funds. Total security lending income during the period amounted to $180,369
9. Expense Reductions.
Through arrangements with the Fund's custodian, credits realized as a result of certain uninvested cash balances were used to reduce the Fund's expenses. During the period, these credits reduced the Fund's custody expenses by $62.
In addition, during the period the investment adviser reimbursed and/or waived a portion of fund-level operating expenses in the amount of $2,720.
10. Distributions to Shareholders.
Distributions to shareholders of each class were as follows:
| | Year ended
December 31, 2017 | Year ended December 31, 2016 |
| From net investment income | | |
| Initial Class | $243,380 | $211,720 |
| Service Class | 1,545 | 1,157 |
| Service Class 2 | 36,671 | 26,481 |
| Investor Class | 1,606,006 | 1,238,014 |
| Total | $1,887,602 | $1,477,372 |
| From net realized gain | | |
| Initial Class | $1,006,342 | $2,180,117 |
| Service Class | 6,341 | 21,487 |
| Service Class 2 | 155,568 | 242,534 |
| Investor Class | 6,633,639 | 13,995,816 |
| Total | $7,801,890 | $16,439,954 |
11. Share Transactions.
Transactions for each class of shares were as follows:
| | Shares | Shares | Dollars | Dollars |
| | Year ended
December 31, 2017 | Year ended December 31, 2016 | Year ended
December 31, 2017 | Year ended December 31, 2016 |
| Initial Class | | | | |
| Shares sold | 359,158 | 836,381 | $5,847,426 | $12,593,980 |
| Reinvestment of distributions | 76,652 | 198,718 | 1,249,722 | 2,391,837 |
| Shares redeemed | (1,112,602) | (581,693) | (17,806,943) | (7,883,903) |
| Net increase (decrease) | (676,792) | 453,406 | $(10,709,795) | $7,101,914 |
| Service Class | | | | |
| Reinvestment of distributions | 482 | 1,896 | 7,886 | 22,644 |
| Shares redeemed | (2,058) | (6,979) | (33,107) | (93,765) |
| Net increase (decrease) | (1,576) | (5,083) | $(25,221) | $(71,121) |
| Service Class 2 | | | | |
| Shares sold | 371,124 | 239,344 | $5,997,819 | $3,482,612 |
| Reinvestment of distributions | 11,728 | 22,192 | 192,239 | 269,015 |
| Shares redeemed | (309,508) | (87,894) | (5,064,390) | (1,200,378) |
| Net increase (decrease) | 73,344 | 173,642 | $1,125,668 | $2,551,249 |
| Investor Class | | | | |
| Shares sold | 1,955,751 | 3,546,667 | $31,681,480 | $52,700,249 |
| Reinvestment of distributions | 506,846 | 1,272,740 | 8,239,645 | 15,233,830 |
| Shares redeemed | (3,800,361) | (1,695,095) | (60,039,889) | (22,803,326) |
| Net increase (decrease) | (1,337,764) | 3,124,312 | $(20,118,764) | $45,130,753 |
12. Other.
The Fund's organizational documents provide former and current trustees and officers with a limited indemnification against liabilities arising in connection with the performance of their duties to the Fund. In the normal course of business, the Fund may also enter into contracts that provide general indemnifications. The Fund's maximum exposure under these arrangements is unknown as this would be dependent on future claims that may be made against the Fund. The risk of material loss from such claims is considered remote.
At the end of the period, the investment adviser or its affiliates were the owners of record of 97% of the total outstanding shares of the Fund.
Report of Independent Registered Public Accounting Firm
To the Trustees of Variable Insurance Products Fund II and Shareholders of VIP Disciplined Small Cap Portfolio:
Opinion on the Financial Statements and Financial Highlights
We have audited the accompanying statement of assets and liabilities of VIP Disciplined Small Cap Portfolio (the "Fund"), a fund of Variable Insurance Products Fund II, including the schedule of investments, as of December 31, 2017, and the related statement of operations for the year then ended, the statement of changes in net assets for each of the two years in the period then ended, the financial highlights for each of the five years in the period then ended, and the related notes. In our opinion, the financial statements and financial highlights present fairly, in all material respects, the financial position of the Fund as of December 31, 2017, and the results of its operations for the year then ended, the changes in its net assets for each of the two years in the period then ended, and the financial highlights for each of the five years in the period then ended, in conformity with accounting principles generally accepted in the United States of America.
Basis for Opinion
These financial statements and financial highlights are the responsibility of the Fund's management. Our responsibility is to express an opinion on the Fund's financial statements and financial highlights based on our audits. We are a public accounting firm registered with the Public Company Accounting Oversight Board (United States) (PCAOB) and are required to be independent with respect to the Fund in accordance with the U.S. federal securities laws and the applicable rules and regulations of the Securities and Exchange Commission and the PCAOB.
We conducted our audits in accordance with the standards of the PCAOB. Those standards require that we plan and perform the audit to obtain reasonable assurance about whether the financial statements and financial highlights are free of material misstatement, whether due to error or fraud. The Fund is not required to have, nor were we engaged to perform, an audit of its internal control over financial reporting. As part of our audits we are required to obtain an understanding of internal control over financial reporting but not for the purpose of expressing an opinion on the effectiveness of the Fund’s internal control over financial reporting. Accordingly, we express no such opinion.
Our audits included performing procedures to assess the risks of material misstatement of the financial statements and financial highlights, whether due to error or fraud, and performing procedures that respond to those risks. Such procedures included examining, on a test basis, evidence regarding the amounts and disclosures in the financial statements and financial highlights. Our audits also included evaluating the accounting principles used and significant estimates made by management, as well as evaluating the overall presentation of the financial statements and financial highlights. Our procedures included confirmation of securities owned as of December 31, 2017, by correspondence with the custodians and brokers; when replies were not received from brokers, we performed other auditing procedures. We believe that our audits provide a reasonable basis for our opinion.
DELOITTE & TOUCHE LLP
Boston, Massachusetts
February 14, 2018
We have served as the auditor of one or more of the Fidelity investment companies since 1999.
Trustees and Officers
The Trustees, Members of the Advisory Board (if any), and officers of the trust and fund, as applicable, are listed below. The Board of Trustees governs the fund and is responsible for protecting the interests of shareholders. The Trustees are experienced executives who meet periodically throughout the year to oversee the fund's activities, review contractual arrangements with companies that provide services to the fund, oversee management of the risks associated with such activities and contractual arrangements, and review the fund's performance. Each of the Trustees oversees 190 funds.
The Trustees hold office without limit in time except that (a) any Trustee may resign; (b) any Trustee may be removed by written instrument, signed by at least two-thirds of the number of Trustees prior to such removal; (c) any Trustee who requests to be retired or who has become incapacitated by illness or injury may be retired by written instrument signed by a majority of the other Trustees; and (d) any Trustee may be removed at any special meeting of shareholders by a two-thirds vote of the outstanding voting securities of the trust. Each Trustee who is not an interested person (as defined in the 1940 Act) of the trust and the fund is referred to herein as an Independent Trustee. Each Independent Trustee shall retire not later than the last day of the calendar year in which his or her 75th birthday occurs. The Independent Trustees may waive this mandatory retirement age policy with respect to individual Trustees. Officers and Advisory Board Members hold office without limit in time, except that any officer or Advisory Board Member may resign or may be removed by a vote of a majority of the Trustees at any regular meeting or any special meeting of the Trustees. Except as indicated, each individual has held the office shown or other offices in the same company for the past five years.
The fund’s Statement of Additional Information (SAI) includes more information about the Trustees. To request a free copy, call Fidelity at 1-877-208-0098.
Experience, Skills, Attributes, and Qualifications of the Trustees. The Governance and Nominating Committee has adopted a statement of policy that describes the experience, qualifications, attributes, and skills that are necessary and desirable for potential Independent Trustee candidates (Statement of Policy). The Board believes that each Trustee satisfied at the time he or she was initially elected or appointed a Trustee, and continues to satisfy, the standards contemplated by the Statement of Policy. The Governance and Nominating Committee also engages professional search firms to help identify potential Independent Trustee candidates who have the experience, qualifications, attributes, and skills consistent with the Statement of Policy. From time to time, additional criteria based on the composition and skills of the current Independent Trustees, as well as experience or skills that may be appropriate in light of future changes to board composition, business conditions, and regulatory or other developments, have also been considered by the professional search firms and the Governance and Nominating Committee. In addition, the Board takes into account the Trustees' commitment and participation in Board and committee meetings, as well as their leadership of standing and ad hoc committees throughout their tenure.
In determining that a particular Trustee was and continues to be qualified to serve as a Trustee, the Board has considered a variety of criteria, none of which, in isolation, was controlling. The Board believes that, collectively, the Trustees have balanced and diverse experience, qualifications, attributes, and skills, which allow the Board to operate effectively in governing the fund and protecting the interests of shareholders. Information about the specific experience, skills, attributes, and qualifications of each Trustee, which in each case led to the Board's conclusion that the Trustee should serve (or continue to serve) as a trustee of the fund, is provided below.
Board Structure and Oversight Function. James C. Curvey is an interested person and currently serves as Chairman. The Trustees have determined that an interested Chairman is appropriate and benefits shareholders because an interested Chairman has a personal and professional stake in the quality and continuity of services provided to the fund. Independent Trustees exercise their informed business judgment to appoint an individual of their choosing to serve as Chairman, regardless of whether the Trustee happens to be independent or a member of management. The Independent Trustees have determined that they can act independently and effectively without having an Independent Trustee serve as Chairman and that a key structural component for assuring that they are in a position to do so is for the Independent Trustees to constitute a substantial majority for the Board. The Independent Trustees also regularly meet in executive session. Ned C. Lautenbach serves as Chairman of the Independent Trustees and as such (i) acts as a liaison between the Independent Trustees and management with respect to matters important to the Independent Trustees and (ii) with management prepares agendas for Board meetings.
Fidelity® funds are overseen by different Boards of Trustees. The fund's Board oversees Fidelity's high income and certain equity funds, and other Boards oversee Fidelity's investment-grade bond, money market, asset allocation, and sector funds. The asset allocation funds may invest in Fidelity® funds overseen by the fund's Board. The use of separate Boards, each with its own committee structure, allows the Trustees of each group of Fidelity® funds to focus on the unique issues of the funds they oversee, including common research, investment, and operational issues. On occasion, the separate Boards establish joint committees to address issues of overlapping consequences for the Fidelity® funds overseen by each Board.
The Trustees operate using a system of committees to facilitate the timely and efficient consideration of all matters of importance to the Trustees, the fund, and fund shareholders and to facilitate compliance with legal and regulatory requirements and oversight of the fund's activities and associated risks. The Board, acting through its committees, has charged FMR and its affiliates with (i) identifying events or circumstances the occurrence of which could have demonstrably adverse effects on the fund's business and/or reputation; (ii) implementing processes and controls to lessen the possibility that such events or circumstances occur or to mitigate the effects of such events or circumstances if they do occur; and (iii) creating and maintaining a system designed to evaluate continuously business and market conditions in order to facilitate the identification and implementation processes described in (i) and (ii) above. Because the day-to-day operations and activities of the fund are carried out by or through FMR, its affiliates, and other service providers, the fund's exposure to risks is mitigated but not eliminated by the processes overseen by the Trustees. While each of the Board's committees has responsibility for overseeing different aspects of the fund's activities, oversight is exercised primarily through the Operations, Audit, and Compliance Committees. In addition, the Independent Trustees have worked with FMR to enhance the Board's oversight of investment and financial risks, legal and regulatory risks, technology risks, and operational risks, including the development of additional risk reporting to the Board. For example, a working group comprised of Independent Trustees and FMR has worked and continues to work to review the Fidelity® funds' valuation-related activities, reporting and risk management. Appropriate personnel, including but not limited to the fund's Chief Compliance Officer (CCO), FMR's internal auditor, the independent accountants, the fund's Treasurer and portfolio management personnel, make periodic reports to the Board's committees, as appropriate, including an annual review of Fidelity's risk management program for the Fidelity® funds. The responsibilities of each standing committee, including their oversight responsibilities, are described further under "Standing Committees of the Trustees."
Interested Trustees*:
Correspondence intended for a Trustee who is an interested person may be sent to Fidelity Investments, 245 Summer Street, Boston, Massachusetts 02210.
Name, Year of Birth; Principal Occupations and Other Relevant Experience+
James C. Curvey (1935)
Year of Election or Appointment: 2007
Trustee
Chairman of the Board of Trustees
Mr. Curvey also serves as Trustee of other Fidelity® funds. Mr. Curvey is a Director of Fidelity Research & Analysis Co. (investment adviser firm, 2009-present), and Vice Chairman (2007-present) and Director of FMR LLC (diversified financial services company). In addition, Mr. Curvey serves as an Overseer for the Boston Symphony Orchestra and a member of the board of Artis-Naples, Naples, Florida, and as a Trustee for Brewster Academy, Wolfeboro, New Hampshire. Previously, Mr. Curvey served as a Director of Fidelity Investments Money Management, Inc. (investment adviser firm, 2009-2014) and a Director of FMR and FMR Co., Inc. (investment adviser firms, 2007-2014).
Charles S. Morrison (1960)
Year of Election or Appointment: 2014
Trustee
Mr. Morrison also serves as Trustee of other funds. He serves as President of Fidelity SelectCo, LLC (investment adviser firm, 2017-present) and Fidelity Management & Research Company (FMR) (investment adviser firm, 2016-present), a Director of Fidelity Investments Money Management, Inc. (FIMM) (investment adviser firm, 2014-present), Director of Fidelity SelectCo, LLC (investment adviser firm, 2014-present), President, Asset Management (2014-present), and is an employee of Fidelity Investments. Previously, Mr. Morrison served as Vice President of Fidelity's Fixed Income and Asset Allocation Funds (2012-2014), President, Fixed Income (2011-2014), Vice President of Fidelity's Money Market Funds (2005-2009), President, Money Market Group Leader of FMR (investment adviser firm, 2009), and Senior Vice President, Money Market Group of FMR (2004-2009). Mr. Morrison also served as Vice President of Fidelity's Bond Funds (2002-2005), certain Balanced Funds (2002-2005), and certain Asset Allocation Funds (2002-2007), and as Senior Vice President (2002-2005) of Fidelity's Bond Division.
* Determined to be an “Interested Trustee” by virtue of, among other things, his or her affiliation with the trusts or various entities under common control with FMR.
+ The information includes the Trustee's principal occupation during the last five years and other information relating to the experience, attributes, and skills relevant to the Trustee's qualifications to serve as a Trustee, which led to the conclusion that the Trustee should serve as a Trustee for the fund.
Independent Trustees:
Correspondence intended for an Independent Trustee may be sent to Fidelity Investments, P.O. Box 55235, Boston, Massachusetts 02205-5235.
Name, Year of Birth; Principal Occupations and Other Relevant Experience+
Dennis J. Dirks (1948)
Year of Election or Appointment: 2005
Trustee
Mr. Dirks also serves as Trustee of other Fidelity® funds. Prior to his retirement in May 2003, Mr. Dirks was Chief Operating Officer and a member of the Board of The Depository Trust & Clearing Corporation (DTCC). He also served as President, Chief Operating Officer, and Board member of The Depository Trust Company (DTC) and President and Board member of the National Securities Clearing Corporation (NSCC). In addition, Mr. Dirks served as Chief Executive Officer and Board member of the Government Securities Clearing Corporation, Chief Executive Officer and Board member of the Mortgage-Backed Securities Clearing Corporation, as a Trustee and a member of the Finance Committee of Manhattan College (2005-2008), as a Trustee and a member of the Finance Committee of AHRC of Nassau County (2006-2008), as a member of the Independent Directors Council (IDC) Governing Council (2010-2015), and as a member of the Board of Directors for The Brookville Center for Children’s Services, Inc. (2009-2017). Mr. Dirks is a member of the Finance Committee (2016-present) and Board of Directors (2017-present) of the Asolo Repertory Theatre.
Alan J. Lacy (1953)
Year of Election or Appointment: 2008
Trustee
Mr. Lacy also serves as Trustee of other Fidelity® funds. Mr. Lacy serves as a Director of Bristol-Myers Squibb Company (global pharmaceuticals, 2008-present). He is a Trustee of the California Chapter of The Nature Conservancy (2015-present) and a Director of the Center for Advanced Study in the Behavioral Sciences at Stanford University (2015-present). In addition, Mr. Lacy served as Senior Adviser (2007-2014) of Oak Hill Capital Partners, L.P. (private equity) and also served as Chief Executive Officer (2005) and Vice Chairman (2005-2006) of Sears Holdings Corporation (retail) and Chief Executive Officer and Chairman of the Board of Sears, Roebuck and Co. (retail, 2000-2005). Previously, Mr. Lacy served as Chairman (2014-2017) and a member (2010-2017) of the Board of Directors of Dave & Buster’s Entertainment, Inc. (restaurant and entertainment complexes), as Chairman (2008-2011) and a member (2006-2015) of the Board of Trustees of the National Parks Conservation Association, and as a member of the Board of Directors for The Hillman Companies, Inc. (hardware wholesalers, 2010-2014), Earth Fare, Inc. (retail grocery, 2010-2014), and The Western Union Company (global money transfer, 2006-2011).
Ned C. Lautenbach (1944)
Year of Election or Appointment: 2000
Trustee
Chairman of the Independent Trustees
Mr. Lautenbach also serves as Trustee of other Fidelity® funds. Mr. Lautenbach currently serves as Vice Chair of the Board of Governors, State University System of Florida (2013-present) and is a member of the Council on Foreign Relations (1994-present). He is also a member and has most recently served as Chairman of the Board of Directors of Artis-Naples (2012-present). Previously, Mr. Lautenbach served as a member and then Lead Director of the Board of Directors of Eaton Corporation (diversified industrial, 1997-2016). He was also a Partner and Advisory Partner at Clayton, Dubilier & Rice, LLC (private equity investment, 1998-2010), as well as a Director of Sony Corporation (2006-2007). In addition, Mr. Lautenbach also had a 30-year career with IBM (technology company) during which time he served as Senior Vice President and a member of the Corporate Executive Committee (1968-1998).
Joseph Mauriello (1944)
Year of Election or Appointment: 2008
Trustee
Mr. Mauriello also serves as Trustee of other Fidelity® funds. Prior to his retirement in January 2006, Mr. Mauriello served in numerous senior management positions including Deputy Chairman and Chief Operating Officer (2004-2005), and Vice Chairman of Financial Services (2002-2004) of KPMG LLP US (professional services, 1965-2005). Mr. Mauriello currently serves as a member of the Board of Directors of XL Group plc. (global insurance and re-insurance, 2006-present) and the Independent Directors Council (IDC) Governing Council (2015-present). Previously, Mr. Mauriello served as a Director of the Hamilton Funds of the Bank of New York (2006-2007) and of Arcadia Resources Inc. (health care services and products, 2007-2012).
Cornelia M. Small (1944)
Year of Election or Appointment: 2005
Trustee
Ms. Small also serves as Trustee of other Fidelity® funds. Ms. Small is a member of the Board of Directors (2009-present) and Chair of the Investment Committee (2010-present) of the Teagle Foundation. Ms. Small also serves on the Investment Committee of the Berkshire Taconic Community Foundation (2008-present). Previously, Ms. Small served as Chairperson (2002-2008) and a member of the Investment Committee and Chairperson (2008-2012) and a member of the Board of Trustees of Smith College. In addition, Ms. Small served as Chief Investment Officer, Director of Global Equity Investments, and a member of the Board of Directors of Scudder, Stevens & Clark and Scudder Kemper Investments.
William S. Stavropoulos (1939)
Year of Election or Appointment: 2001
Trustee
Vice Chairman of the Independent Trustees
Mr. Stavropoulos also serves as Trustee of other Fidelity® funds. Mr. Stavropoulos serves as President and Founder of the Michigan Baseball Foundation, the Great Lakes Loons (2007-present). Mr. Stavropoulos is Chairman Emeritus of the Board of Directors of The Dow Chemical Company, where he previously served in numerous senior management positions, including President, CEO (1995-2000; 2002-2004), Chairman of the Executive Committee (2000-2006), and as a member of the Board of Directors (1990-2006). Currently, Mr. Stavropoulos is Chairman of the Board of Directors of Univar Inc. (global distributor of commodity and specialty chemicals), a Director of Teradata Corporation (data warehousing and technology solutions), and a member of the Advisory Board for Metalmark Capital LLC (private equity investment, 2005-present). Mr. Stavropoulos is an operating advisor to Clayton, Dubilier & Rice, LLC (private equity investment). In addition, Mr. Stavropoulos is a member of the University of Notre Dame Advisory Council for the College of Science, a Trustee of the Rollin L. Gerstacker Foundation, and a Director of Artis-Naples in Naples, Florida. Previously, Mr. Stavropoulos served as a Director of Chemical Financial Corporation (bank holding company, 1993-2012) and Tyco International, Ltd. (multinational manufacturing and services, 2007-2012).
David M. Thomas (1949)
Year of Election or Appointment: 2008
Trustee
Mr. Thomas also serves as Trustee of other Fidelity® funds. Mr. Thomas serves as Non-Executive Chairman of the Board of Directors of Fortune Brands Home and Security (home and security products, 2011-present), as a member of the Board of Directors (2004-present) and Presiding Director (2013-present) of Interpublic Group of Companies, Inc. (marketing communication), and as a member of the Board of Trustees of the University of Florida (2013-present). Previously, Mr. Thomas served as Executive Chairman (2005-2006) and Chairman and Chief Executive Officer (2000-2005) of IMS Health, Inc. (pharmaceutical and healthcare information solutions), and a Director of Fortune Brands, Inc. (consumer products, 2000-2011).
+ The information includes the Trustee's principal occupation during the last five years and other information relating to the experience, attributes, and skills relevant to the Trustee's qualifications to serve as a Trustee, which led to the conclusion that the Trustee should serve as a Trustee for the fund.
Advisory Board Members and Officers:
Correspondence intended for an officer or Peter S. Lynch may be sent to Fidelity Investments, 245 Summer Street, Boston, Massachusetts 02210. Officers appear below in alphabetical order.
Name, Year of Birth; Principal Occupation
Peter S. Lynch (1944)
Year of Election or Appointment: 2003
Member of the Advisory Board
Mr. Lynch also serves as Member of the Advisory Board of other Fidelity® funds. Mr. Lynch is Vice Chairman and a Director of FMR (investment adviser firm) and FMR Co., Inc. (investment adviser firm). In addition, Mr. Lynch serves as a Trustee of Boston College and as the Chairman of the Inner-City Scholarship Fund. Previously, Mr. Lynch served on the Special Olympics International Board of Directors (1997-2006).
Elizabeth Paige Baumann (1968)
Year of Election or Appointment: 2017
Anti-Money Laundering (AML) Officer
Ms. Baumann also serves as AML Officer of other funds. She is Chief AML Officer (2012-present) and Senior Vice President (2014-present) of FMR LLC (diversified financial services company) and is an employee of Fidelity Investments. Previously, Ms. Baumann served as AML Officer of the funds (2012-2016), and Vice President (2007-2014) and Deputy Anti-Money Laundering Officer (2007-2012) of FMR LLC.
Marc R. Bryant (1966)
Year of Election or Appointment: 2015
Secretary and Chief Legal Officer (CLO)
Mr. Bryant also serves as Secretary and CLO of other funds. Mr. Bryant serves as CLO, Secretary, and Senior Vice President of Fidelity Management & Research Company (investment adviser firm, 2015-present) and FMR Co., Inc. (investment adviser firm, 2015-present); Secretary of Fidelity SelectCo, LLC (investment adviser firm, 2015-present) and Fidelity Investments Money Management, Inc. (investment adviser firm, 2015-present); and CLO of Fidelity Management & Research (Hong Kong) Limited and FMR Investment Management (UK) Limited (investment adviser firms, 2015-present) and Fidelity Management & Research (Japan) Limited (investment adviser firm, 2016-present). He is Senior Vice President and Deputy General Counsel of FMR LLC (diversified financial services company). Previously, Mr. Bryant served as Secretary and CLO of Fidelity Rutland Square Trust II (2010-2014) and Assistant Secretary of Fidelity's Fixed Income and Asset Allocation Funds (2013-2015). Prior to joining Fidelity Investments, Mr. Bryant served as a Senior Vice President and the Head of Global Retail Legal for AllianceBernstein L.P. (2006-2010), and as the General Counsel for ProFund Advisors LLC (2001-2006).
William C. Coffey (1969)
Year of Election or Appointment: 2009
Assistant Secretary
Mr. Coffey also serves as Assistant Secretary of other funds. He is Senior Vice President and Deputy General Counsel of FMR LLC (diversified financial services company, 2010-present), and is an employee of Fidelity Investments. Previously, Mr. Coffey served as Vice President and Associate General Counsel of FMR LLC (2005-2009).
Jonathan Davis (1968)
Year of Election or Appointment: 2010
Assistant Treasurer
Mr. Davis also serves as Assistant Treasurer of other funds. Mr. Davis serves as Assistant Treasurer of FMR Capital, Inc. (2017-present) and is an employee of Fidelity Investments. Previously, Mr. Davis served as Vice President and Associate General Counsel of FMR LLC (diversified financial services company, 2003-2010).
Adrien E. Deberghes (1967)
Year of Election or Appointment: 2016
Assistant Treasurer
Mr. Deberghes also serves as an officer of other funds. He serves as Assistant Treasurer of FMR Capital, Inc. (2017-present), Executive Vice President of Fidelity Investments Money Management, Inc. (FIMM) (investment adviser firm, 2016-present), and is an employee of Fidelity Investments (2008-present). Prior to joining Fidelity Investments, Mr. Deberghes was Senior Vice President of Mutual Fund Administration at State Street Corporation (2007-2008), Senior Director of Mutual Fund Administration at Investors Bank & Trust (2005-2007), and Director of Finance for Dunkin' Brands (2000-2005). Previously, Mr. Deberghes served in other fund officer roles.
Stephanie J. Dorsey (1969)
Year of Election or Appointment: 2010
Assistant Treasurer
Ms. Dorsey also serves as an officer of other funds. Ms. Dorsey serves as Assistant Treasurer of FMR Capital, Inc. (2017-present), is an employee of Fidelity Investments (2008-present), and has served in other fund officer roles. Prior to joining Fidelity Investments, Ms. Dorsey served as Treasurer (2004-2008) of the JPMorgan Mutual Funds and Vice President (2004-2008) of JPMorgan Chase Bank.
Howard J. Galligan III (1966)
Year of Election or Appointment: 2014
Chief Financial Officer
Mr. Galligan also serves as Chief Financial Officer of other funds. Mr. Galligan serves as President of Fidelity Pricing and Cash Management Services (FPCMS) (2014-present) and as a Director of Strategic Advisers, Inc. (investment adviser firm, 2008-present). Previously, Mr. Galligan served as Chief Administrative Officer of Asset Management (2011-2014) and Chief Operating Officer and Senior Vice President of Investment Support for Strategic Advisers, Inc. (2003-2011).
Brian B. Hogan (1964)
Year of Election or Appointment: 2009
Vice President
Mr. Hogan also serves as Trustee or Vice President of other funds. Mr. Hogan serves as a Director of FMR Investment Management (UK) Limited (investment adviser firm, 2015-present) and Fidelity SelectCo, LLC (investment adviser firm, 2014-present) and President of the Equity Division of FMR (investment adviser firm, 2009-present). Previously, Mr. Hogan served as Senior Vice President, Equity Research of FMR (2006-2009) and as a portfolio manager. Mr. Brian B. Hogan is not related to Mr. Colm A. Hogan.
Colm A. Hogan (1973)
Year of Election or Appointment: 2016
Deputy Treasurer
Mr. Hogan also serves as an officer of other funds. Mr. Hogan serves as Assistant Treasurer of FMR Capital, Inc. (2017-present) and is an employee of Fidelity Investments (2005-present). Mr. Colm A. Hogan is not related to Mr. Brian B. Hogan.
Chris Maher (1972)
Year of Election or Appointment: 2013
Assistant Treasurer
Mr. Maher serves as Assistant Treasurer of other funds. Mr. Maher is Vice President of Valuation Oversight, serves as Assistant Treasurer of FMR Capital, Inc. (2017-present), and is an employee of Fidelity Investments. Previously, Mr. Maher served as Vice President of Asset Management Compliance (2013), Vice President of the Program Management Group of FMR (investment adviser firm, 2010-2013), and Vice President of Valuation Oversight (2008-2010).
Rieco E. Mello (1969)
Year of Election or Appointment: 2017
Assistant Treasurer
Mr. Mello also serves as Assistant Treasurer of other funds. Mr. Mello serves as Assistant Treasurer of FMR Capital, Inc. (2017-present) and is an employee of Fidelity Investments (1995-present).
Kenneth B. Robins (1969)
Year of Election or Appointment: 2016
Chief Compliance Officer
Mr. Robins also serves as an officer of other funds. Mr. Robins serves as Compliance Officer of Fidelity Management & Research Company and FMR Co., Inc. (investment adviser firms, 2016-present) and is an employee of Fidelity Investments (2004-present). Previously, Mr. Robins served as Executive Vice President of Fidelity Investments Money Management, Inc. (investment adviser firm, 2013-2016) and served in other fund officer roles.
Stacie M. Smith (1974)
Year of Election or Appointment: 2016
President and Treasurer
Ms. Smith also serves as an officer of other funds. Ms. Smith serves as Assistant Treasurer of FMR Capital, Inc. (2017-present), is an employee of Fidelity Investments (2009-present), and has served in other fund officer roles. Prior to joining Fidelity Investments, Ms. Smith served as Senior Audit Manager of Ernst & Young LLP (accounting firm, 1996-2009). Previously, Ms. Smith served as Deputy Treasurer of certain Fidelity® funds (2013-2016).
Marc L. Spector (1972)
Year of Election or Appointment: 2016
Assistant Treasurer
Mr. Spector also serves as an officer of other funds. Mr. Spector serves as Assistant Treasurer of FMR Capital, Inc. (2017-present) and is an employee of Fidelity Investments (2016-present). Prior to joining Fidelity Investments, Mr. Spector served as Director at the Siegfried Group (accounting firm, 2013-2016), and prior to Siegfried Group as audit senior manager at Deloitte & Touche (accounting firm, 2005-2013).
Renee Stagnone (1975)
Year of Election or Appointment: 2016
Assistant Treasurer
Ms. Stagnone also serves as an officer of other funds. Ms. Stagnone serves as Assistant Treasurer of FMR Capital, Inc. (2017-present) and is an employee of Fidelity Investments (1997-present). Previously, Ms. Stagnone served as Deputy Treasurer of certain Fidelity® funds (2013-2016).
Shareholder Expense Example
As a shareholder of the Fund, you incur two types of costs: (1) transaction costs, and (2) ongoing costs, including management fees, distribution and/or service (12b-1) fees and other Fund expenses. This Example is intended to help you understand your ongoing costs (in dollars) of investing in the Fund and to compare these costs with the ongoing costs of investing in other mutual funds.
The Example is based on an investment of $1,000 invested at the beginning of the period and held for the entire period (July 1, 2017 to December 31, 2017).
Actual Expenses
The first line of the accompanying table for each class of the Fund provides information about actual account values and actual expenses. You may use the information in this line, together with the amount you invested, to estimate the expenses that you paid over the period. Simply divide your account value by $1,000.00 (for example, an $8,600 account value divided by $1,000.00 = 8.6), then multiply the result by the number in the first line for a class of the Fund under the heading entitled "Expenses Paid During Period" to estimate the expenses you paid on your account during this period. The estimate of expenses does not include any fees or other expenses of any variable annuity or variable life insurance product. If they were, the estimate of expenses you paid during the period would be higher, and your ending account value would be lower. In addition, the Fund, as a shareholder in the underlying Fidelity Central Funds, will indirectly bear its pro-rata share of the fees and expenses incurred by the underlying Fidelity Central Funds. These fees and expenses are not included in the Fund's annualized expense ratio used to calculate the expense estimate in the table below.
Hypothetical Example for Comparison Purposes
The second line of the accompanying table for each class of the Fund provides information about hypothetical account values and hypothetical expenses based on a Class' actual expense ratio and an assumed rate of return of 5% per year before expenses, which is not the Class' actual return. The hypothetical account values and expenses may not be used to estimate the actual ending account balance or expenses you paid for the period. You may use this information to compare the ongoing costs of investing in the Fund and other funds. To do so, compare this 5% hypothetical example with the 5% hypothetical examples that appear in the shareholder reports of the other funds. The estimate of expenses does not include any fees or other expenses of any variable annuity or variable life insurance product. If they were, the estimate of expenses you paid during the period would be higher, and your ending account value would be lower. In addition, the Fund, as a shareholder in the underlying Fidelity Central Funds, will indirectly bear its pro-rata share of the fees and expenses incurred by the underlying Fidelity Central Funds. These fees and expenses are not included in the Fund's annualized expense ratio used to calculate the expense estimate in the table below.
Please note that the expenses shown in the table are meant to highlight your ongoing costs only and do not reflect any transaction costs. Therefore, the second line of the table is useful in comparing ongoing costs only, and will not help you determine the relative total costs of owning different funds.
| | Annualized Expense Ratio-A | Beginning
Account Value
July 1, 2017 | Ending
Account Value
December 31, 2017 | Expenses Paid
During Period-B
July 1, 2017
to December 31, 2017 |
| Initial Class | .81% | | | |
| Actual | | $1,000.00 | $1,066.60 | $4.22** |
| Hypothetical-C | | $1,000.00 | $1,021.12 | $4.13** |
| Service Class | .91% | | | |
| Actual | | $1,000.00 | $1,066.20 | $4.74** |
| Hypothetical-C | | $1,000.00 | $1,020.62 | $4.63** |
| Service Class 2 | 1.07% | | | |
| Actual | | $1,000.00 | $1,065.20 | $5.57** |
| Hypothetical-C | | $1,000.00 | $1,019.81 | $5.45** |
| Investor Class | .89% | | | |
| Actual | | $1,000.00 | $1,065.50 | $4.63** |
| Hypothetical-C | | $1,000.00 | $1,020.72 | $4.53** |
A Annualized expense ratio reflects expenses net of applicable fee waivers.
B Expenses are equal to each Class' annualized expense ratio, multiplied by the average account value over the period, multiplied by 184/365 (to reflect the one-half year period).
C 5% return per year before expenses
** If fees and changes to the class level expense contract and/ or expense cap, effective December 1, 2017, had been in effect during the entire period, the annualized expense ratio and the expenses paid in the actual and hypothetical examples above would have been as shown in table below.
| | Annualized Expense Ratio-(a)
| Expenses Paid
|
| Initial Class | .61% | |
| Actual | | $3.18 |
| Hypothetical-(b) | | $3.11 |
| Service Class | .71% | |
| Actual | | $3.70 |
| Hypothetical-(b) | | $3.62 |
| Service Class 2 | .87% | |
| Actual | | $4.53 |
| Hypothetical-(b) | | $4.43 |
| Investor Class | .69% | |
| Actual | | $3.59 |
| Hypothetical-(b) | | $3.52 |
(a) Annualized expense ratio reflects expenses net of applicable fee waivers.
(b) 5% return per year before expenses
Distributions (Unaudited)
The Board of Trustees of VIP Disciplined Small Cap Portfolio voted to pay to shareholders of record at the opening of business on record date, the following distributions per share derived from capital gains realized from sales of portfolio securities, and dividends derived from net investment income:
| | Pay Date | Record Date | Dividends | Capital Gains |
| VIP Disciplined Small Cap Portfolio | | | | |
| Initial Class | 02/09/18 | 02/09/18 | $0.026 | $1.429 |
| Service Class | 02/09/18 | 02/09/18 | $0.024 | $1.429 |
| Service Class 2 | 02/09/18 | 02/09/18 | $0.018 | $1.429 |
| Investor Class | 02/09/18 | 02/09/18 | $0.024 | $1.429 |
|
The fund hereby designates as a capital gain dividend with respect to the taxable year ended December 31, 2017, $23,854,510, or, if subsequently determined to be different, the net capital gain of such year.
Initial Class designates 96%, and 82%; Service Class designates 99%, and 90%; Service Class 2 designates 100%, and 100%; and Investor Class designates 99%, and 89%; of the dividends distributed in February and December 2017, respectively during the fiscal year as qualifying for the dividends–received deduction for corporate shareholders.
Board Approval of Investment Advisory Contracts and Management Fees
VIP Disciplined Small Cap Portfolio
Each year, the Board of Trustees, including the Independent Trustees (together, the Board), votes on the renewal of the management contract with Fidelity Management & Research Company (FMR) and the sub-advisory agreements (together, the Advisory Contracts) for the fund, including the fund's sub-advisory agreement with Geode Capital Management, LLC (Geode). FMR and the sub-advisers are referred to herein as the Investment Advisers. The Board, assisted by the advice of fund counsel and Independent Trustees' counsel, requests and considers a broad range of information relevant to the renewal of the Advisory Contracts throughout the year.
The Board meets regularly and, at each of its meetings, covers an extensive agenda of topics and materials and considers factors that are relevant to its annual consideration of the renewal of the fund's Advisory Contracts, including the services and support provided to the fund and its shareholders. The Board has established various standing committees (Committees), each composed of and chaired by Independent Trustees with varying backgrounds, to which the Board has assigned specific subject matter responsibilities in order to enhance effective decision-making by the Board. The Board, acting directly and through its Committees, requests and receives information concerning the annual consideration of the renewal of the fund's Advisory Contracts. The Board also meets as needed to review matters specifically related to the Board's annual consideration of the renewal of the Advisory Contracts. Members of the Board may also meet with trustees of other Fidelity funds through ad hoc joint committees to discuss certain matters relevant to all of the Fidelity funds.
At its July 2017 meeting, the Board unanimously determined to renew the fund's Advisory Contracts. In reaching its determination, the Board considered all factors it believed relevant, including (i) the nature, extent, and quality of the services to be provided to the fund and its shareholders (including the investment performance of the fund); (ii) the competitiveness of the fund's management fee and total expense ratio relative to peer funds; (iii) the total costs of the services to be provided by and the profits to be realized by Fidelity from its relationships with the fund; and (iv) the extent to which, if any, economies of scale exist and would be realized as the fund grows, and whether any economies of scale are appropriately shared with fund shareholders.
In considering whether to renew the Advisory Contracts for the fund, the Board reached a determination, with the assistance of fund counsel and Independent Trustees' counsel and through the exercise of its business judgment, that the renewal of the Advisory Contracts was in the best interests of the fund and its shareholders and that the compensation payable under the Advisory Contracts was fair and reasonable. The Board's decision to renew the Advisory Contracts was not based on any single factor, but rather was based on a comprehensive consideration of all the information provided to the Board at its meetings throughout the year. The Board, in reaching its determination to renew the Advisory Contracts, was aware that shareholders of the fund have a broad range of investment choices available to them, including a wide choice among funds offered by Fidelity's competitors, and that the fund's shareholders, who have the opportunity to review and weigh the disclosure provided by the fund in its prospectus and other public disclosures, have chosen to invest in this fund, which is part of the Fidelity family of funds.
Amendment to Group Fee Rate. The Board also approved an amendment to the management contract for the fund to add an additional breakpoint to the group fee schedule, effective October 1, 2017. The Board noted that the additional breakpoint would result in lower management fee rates as Fidelity's assets under management increase.
Nature, Extent, and Quality of Services Provided. The Board considered staffing as it relates to the fund, including the backgrounds of investment personnel of Fidelity and Geode, and also considered the fund's investment objective, strategies, and related investment philosophy. The Independent Trustees also had discussions with senior management of Fidelity's investment operations and investment groups and with representatives of Geode. The Board considered the structure of the investment personnel compensation programs and whether the structures provide appropriate incentives to act in the best interests of the fund. Additionally, the Board considered the portfolio managers' investments, if any, in the funds that they manage.
Resources Dedicated to Investment Management and Support Services. The Board and the Fund Oversight and Research Committees reviewed the general qualifications and capabilities of Fidelity's and Geode's investment staffs, including their size, education, experience, and resources, as well as Fidelity's approach to recruiting, training, managing, and compensating investment personnel. The Board noted that Fidelity has continued to increase the resources devoted to non-U.S. offices, including expansion of Fidelity's global investment organization. The Board also noted that Fidelity's and Geode's analysts have extensive resources, tools and capabilities that allow them to conduct sophisticated quantitative and fundamental analysis, as well as credit analysis of issuers, counterparties and guarantors. Further, the Board considered that Fidelity's and Geode's investment professionals have sufficient access to information and data so as to provide competitive investment results over time, and that those professionals also have access to sophisticated tools that permit them to assess portfolio construction and risk and performance attribution characteristics continuously. Additionally, in its deliberations, the Board considered Fidelity's and Geode's trading, risk management, compliance, and technology and operations capabilities and resources, which are integral parts of the investment management process.
Shareholder and Administrative Services. The Board considered (i) the nature, extent, quality, and cost of advisory, administrative, and shareholder services performed by the Investment Advisers and their affiliates under the Advisory Contracts and under separate agreements covering transfer agency, pricing and bookkeeping, and securities lending services for the fund; (ii) the nature and extent of the supervision of third party service providers, principally custodians, subcustodians, and pricing vendors; and (iii) the resources devoted to, and the record of compliance with, the fund's compliance policies and procedures. The Board also reviewed the allocation of fund brokerage, including allocations to brokers affiliated with the Investment Advisers, the use of brokerage commissions to pay fund expenses, and the use of "soft" commission dollars to pay for research services.
The Board noted that the growth of fund assets over time across the complex allows Fidelity to reinvest in the development of services designed to enhance the value or convenience of the Fidelity funds as investment vehicles. These services include 24-hour access to account information and market information through telephone representatives and over the Internet, investor education materials and asset allocation tools, and the expanded availability of Fidelity Investor Centers.
In 2014, the Board formed an ad hoc Committee on Transfer Agency Fees to review the variety of transfer agency fee structures throughout the industry and Fidelity's competitive positioning with respect to industry participants.
Investment in a Large Fund Family. The Board considered the benefits to shareholders of investing in a Fidelity fund, including the benefits of investing in a fund that is part of a large family of funds offering a variety of investment disciplines and providing a large variety of mutual fund investor services. The Board noted that Fidelity had taken, or had made recommendations that resulted in the Fidelity funds taking, a number of actions over the previous year that benefited particular funds, including: (i) continuing to dedicate additional resources to Fidelity's investment research process, and to the support of the senior management team that oversees asset management; (ii) continuing efforts to enhance Fidelity's global research capabilities; (iii) launching new funds and making other enhancements to meet client needs; (iv) launching new share classes of existing funds; (v) eliminating purchase minimums and broadening eligibility requirements for certain lower-priced share classes; (vi) reducing management fees and total expenses for certain growth equity funds and index funds; (vii) lowering expense caps for certain existing funds and classes to reduce expenses borne by shareholders; (viii) eliminating short-term redemption fees for certain funds; (ix) introducing a new pricing structure for certain funds of funds that is expected to reduce overall expenses paid by shareholders; (x) rationalizing product lines and gaining increased efficiencies through proposals for fund mergers and share class consolidations; (xi) continuing to develop, acquire and implement systems and technology to improve services to the funds and shareholders, strengthen information security, and increase efficiency; and (xii) implementing enhancements to further strengthen Fidelity's product line to increase investors' probability of success in achieving their investment goals, including retirement income goals.
Investment Performance. The Board considered whether the fund has operated in accordance with its investment objective, as well as its record of compliance with its investment restrictions and its performance history.
The Board took into account discussions with representatives of the Investment Advisers about fund investment performance that occur at Board meetings throughout the year. In this regard the Board noted that as part of regularly scheduled fund reviews and other reports to the Board on fund performance, the Board considers annualized return information for the fund for different time periods, measured against a securities market index ("benchmark index") and a peer group of funds with similar objectives ("peer group"), if any. In its evaluation of fund investment performance, the Board gave particular attention to information indicating changes in performance of certain Fidelity funds for specific time periods and discussed with the Investment Advisers the reasons for any overperformance or underperformance.
In addition to reviewing absolute and relative fund performance, the Independent Trustees periodically consider the appropriateness of fund performance metrics in evaluating the results achieved. In general, the Independent Trustees believe that fund performance should be evaluated based on net performance (after fees and expenses) of both the highest performing and lowest performing fund share classes, where applicable, compared to appropriate benchmark indices, over appropriate time periods that may include full market cycles, and compared to peer groups, as applicable, over the same periods, taking into account relevant factors including the following: general market conditions; issuer-specific information; and fund cash flows and other factors.
The Independent Trustees recognize that shareholders evaluate performance on a net basis over their own holding periods, for which one-, three-, and five-year periods are often used as a proxy. For this reason, the performance information reviewed by the Board also included net cumulative calendar year total return information for the fund and an appropriate benchmark index for the most recent one-, three-, and five-year periods, as shown below. A peer group is not shown below because the fund does not generally utilize a peer group for performance comparison purposes.
VIP Disciplined Small Cap Portfolio

Based on its review, the Board concluded that the nature, extent, and quality of services provided to the fund under the Advisory Contracts should continue to benefit the shareholders of the fund.
Competitiveness of Management Fee and Total Expense Ratio. The Board considered the fund's management fee and total expense ratio compared to "mapped groups" of competitive funds and classes created for the purpose of facilitating the Trustees' competitive analysis of management fees and total expenses. Fidelity creates "mapped groups" by combining similar Lipper investment objective categories that have comparable investment mandates. Combining Lipper investment objective categories aids the Board's management fee and total expense ratio comparisons by broadening the competitive group used for comparison.
Management Fee. The Board considered two proprietary management fee comparisons for the 12-month periods shown in basis points (BP) in the chart below. The group of Lipper funds used by the Board for management fee comparisons is referred to below as the "Total Mapped Group." The Total Mapped Group comparison focuses on a fund's standing in terms of gross management fees before expense reimbursements or caps relative to the total universe of funds with comparable investment mandates, regardless of whether their management fee structures also are comparable. Funds with comparable investment mandates offer exposure to similar types of securities. Funds with comparable management fee structures have similar management fee contractual arrangements (
e.g., flat rate charged for advisory services, all-inclusive fee rate,
etc.). "TMG %" represents the percentage of funds in the Total Mapped Group that had management fees that were lower than the fund's. For example, a hypothetical TMG % of 20% would mean that 80% of the funds in the Total Mapped Group had higher, and 20% had lower, management fees than the fund. The fund's actual TMG %s and the number of funds in the Total Mapped Group are in the chart below. The "Asset-Size Peer Group" (ASPG) comparison focuses on a fund's standing relative to a subset of non-Fidelity funds within the Total Mapped Group that are similar in size and management fee structure. For example, if a fund is in the first quartile of the ASPG, the fund's management fee ranks in the least expensive or lowest 25% of funds in the ASPG. The ASPG represents at least 15% of the funds in the Total Mapped Group with comparable asset size and management fee structures, subject to a minimum of 50 funds (or all funds in the Total Mapped Group if fewer than 50). Additional information, such as the ASPG quartile in which the fund's management fee rate ranked, is also included in the chart and considered by the Board.
VIP Disciplined Small Cap Portfolio
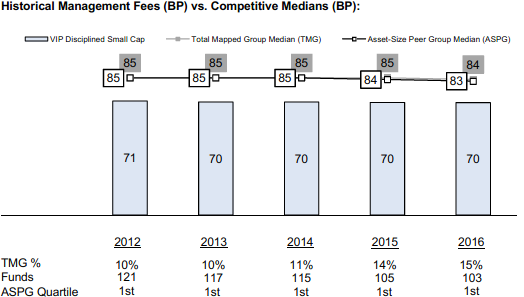
The Board noted that the fund's management fee rate ranked below the median of its Total Mapped Group and below the median of its ASPG for 2016.
The Board noted that, in 2014, the Board and the boards of other Fidelity funds formed the ad hoc Committee on Group Fee to conduct an in-depth review of the "group fee" component of the management fee of funds with such management fee structures. The Committee's focus included the mechanics of the group fee, the competitive landscape of group fee structures, Fidelity funds with no group fee component and investment products not included in group fee assets. The Board also considered that, for funds subject to the group fee, FMR agreed to voluntarily waive fees over a specified period of time in amounts designed to account for assets converted from certain funds to certain collective investment trusts.
The Board also noted that, in 2013, the ad hoc Committee on Management Fees was formed to conduct an in-depth review of the management fee rates of Fidelity's active equity mutual funds. The Committee focused on the following areas: (i) standard fee structures; (ii) research consumption and trading evolution; (iii) management fee competitiveness/profitability by category; and (iv) factors that drive institutional pricing.
Based on its review, the Board concluded that the fund's management fee is fair and reasonable in light of the services that the fund receives and the other factors considered.
Total Expense Ratio. In its review of each class's total expense ratio, the Board considered the fund's management fee rate as well as other fund or class expenses, as applicable, such as transfer agent fees, pricing and bookkeeping fees, fund-paid 12b-1 fees, and custodial, legal, and audit fees. The Board also noted that Fidelity may agree to waive fees and expenses from time to time, and the extent to which, if any, it has done so for the fund. As part of its review, the Board also considered the current and historical total expense ratios of each class of the fund compared to competitive fund median expenses. Each class of the fund is compared to those funds and classes in the Total Mapped Group (used by the Board for management fee comparisons) that have a similar sales load structure.
The Board noted that the total expense ratio of each of Initial Class, Investor Class, and Service Class ranked below the competitive median for 2016 and the total expense ratio of Service Class 2 ranked above the competitive median for 2016. The Board considered that, in general, various factors can affect total expense ratios. The Board noted that the total expense ratio of Service Class 2 was above the competitive median because of its 12b-1 fees. The Board noted that the fund offers multiple classes, each of which has a different 12b-1 fee structure, and that the multiple structures are intended to offer a range of pricing options for the intermediary market. The Board also noted that the total expense ratios of the classes vary primarily by the level of their 12b-1 fees, although differences in transfer agent fees may also cause expenses to vary from class to class.
Fees Charged to Other Fidelity Clients. The Board also considered Fidelity fee structures and other information with respect to clients of Fidelity, such as other funds advised or subadvised by Fidelity, pension plan clients, and other institutional clients with similar mandates. The Board noted that an ad hoc joint committee created by it and the boards of other Fidelity funds periodically (most recently in 2013) reviews and compares Fidelity's institutional investment advisory business with its business of providing services to the Fidelity funds, including the differences in services provided, fees charged, and costs incurred, as well as competition in their respective marketplaces.
Based on its review of total expense ratios and fees charged to other Fidelity clients, the Board concluded that, although Service Class 2 was above the median of the universe presented for comparison, the total expense ratio of each class of the fund was reasonable in light of the services that the fund and its shareholders receive and the other factors considered.
Costs of the Services and Profitability. The Board considered the revenues earned and the expenses incurred by Fidelity in conducting the business of developing, marketing, distributing, managing, administering and servicing the fund and servicing the fund's shareholders. The Board also considered the level of Fidelity's profits in respect of all the Fidelity funds.
On an annual basis, Fidelity presents to the Board information about the profitability of its relationships with the fund. Fidelity calculates profitability information for each fund, as well as aggregate profitability information for groups of Fidelity funds and all Fidelity funds, using a series of detailed revenue and cost allocation methodologies which originate with the books and records of Fidelity on which Fidelity's audited financial statements are based. The Audit Committee of the Board reviews any significant changes from the prior year's methodologies.
PricewaterhouseCoopers LLP (PwC), independent registered public accounting firm and auditor to Fidelity and certain Fidelity funds, has been engaged annually by the Board as part of the Board's assessment of Fidelity's profitability analysis. PwC's engagement includes the review and assessment of the methodologies used by Fidelity in determining the revenues and expenses attributable to Fidelity's mutual fund business, and completion of agreed-upon procedures in respect of the mathematical accuracy of the fund profitability information and its conformity to established allocation methodologies. After considering PwC's reports issued under the engagement and information provided by Fidelity, the Board concluded that while other allocation methods may also be reasonable, Fidelity's profitability methodologies are reasonable in all material respects.
The Board also reviewed Fidelity's non-fund businesses and potential fall-out benefits related to the mutual fund business as well as cases where Fidelity's affiliates may benefit from or be related to the fund's business.
The Board considered the costs of the services provided by and the profits realized by Fidelity in connection with the operation of the fund and was satisfied that the profitability was not excessive.
Economies of Scale. The Board considered whether there have been economies of scale in respect of the management of the Fidelity funds, whether the Fidelity funds (including the fund) have appropriately benefited from any such economies of scale, and whether there is potential for realization of any further economies of scale. The Board considered the extent to which the fund will benefit from economies of scale as assets grow through increased services to the fund, through waivers or reimbursements, or through fee or expense ratio reductions. The Board also noted that a committee (the Economies of Scale Committee) created by it and the boards of other Fidelity funds periodically (most recently in 2013) analyzes whether Fidelity attains economies of scale in respect of the management and servicing of the Fidelity funds, whether the Fidelity funds have appropriately benefited from such economies of scale, and whether there is potential for realization of any further economies of scale.
The Board recognized that the fund's management contract incorporates a "group fee" structure, which provides for lower group fee rates as total group assets increase, and for higher group fee rates as total group assets decrease (with "group assets" defined to include fund assets under FMR's management plus the assets of sector funds previously under FMR's management). FMR calculates the group fee rates based on a tiered asset "breakpoint" schedule that varies based on asset class. The Board considered that the group fee is designed to deliver the benefits of economies of scale to fund shareholders when total Fidelity fund assets increase, even if assets of any particular fund are unchanged or have declined, because some portion of Fidelity's costs are attributable to services provided to all Fidelity funds, and all funds benefit if those costs can be allocated among more assets. The Board concluded that, given the group fee structure, fund shareholders will benefit from lower management fees as group assets increase at the fund complex level, regardless of whether Fidelity achieves any such economies of scale.
The Board concluded, taking into account the analysis of the Economies of Scale Committee, that economies of scale, if any, are being appropriately shared between fund shareholders and Fidelity.
Additional Information Requested by the Board. In order to develop fully the factual basis for consideration of the Fidelity funds' advisory contracts, the Board requested and received additional information on certain topics, including: (i) fund performance trends, in particular the underperformance of certain funds, and Fidelity's long-term strategies for certain funds; (ii) Fidelity's fund profitability methodology, profitability trends for certain funds, and the impact of certain factors on fund profitability results, including the impact of market trends on actively managed funds; (iii) the use of performance fees and the calculation of performance adjustments, including the impact of underperformance and fund outflows on performance adjustments; (iv) metrics for evaluating index fund performance; (v) Fidelity's group fee structure, including the group fee breakpoint schedules; (vi) the terms of Fidelity's contractual and voluntary expense cap arrangements with the funds; (vii) the methodology with respect to evaluating competitive fund data and peer group classifications and fee comparisons; (viii) the expense structures for different funds and classes; (ix) Fidelity's arrangements with affiliated sub-advisers on behalf of the funds; (x) information regarding other accounts managed by Fidelity, including institutional accounts and collective investment trusts; (xi) recent changes to the fee structure for certain funds of funds; and (xii) the impact of the Department of Labor's new fiduciary rule on the funds' comparative expense information.
Based on its evaluation of all of the conclusions noted above, and after considering all factors it believed relevant, the Board concluded that the advisory and sub-advisory fee structures are fair and reasonable, and that the fund's Advisory Contracts should be renewed.
Board Approval of Investment Advisory Contracts and Management Fees.
Fidelity VIP Disciplined Small Cap Portfolio. On November 15, 2017, the Board of Trustees, including the Independent Trustees (together, the Board), voted to approve an amended and restated management contract with Fidelity Management & Research Company (FMR) for the fund (Amended Contract) that will charge a flat management fee of 45 basis points. As a result, the Amended Contract will decrease the management fee paid by the fund by approximately 24 basis points, effective December 1, 2017. The Board, assisted by the advice of fund counsel and Independent Trustees' counsel, considered a broad range of information relevant to the approval of the Amended Contract.
Nature, Extent, and Quality of Services Provided. The Board noted that it previously received and considered materials relating to the nature, extent and quality of services provided by FMR to the fund, including the resources dedicated to investment management and support services, shareholder and administrative services, the benefits to shareholders of investment in a large fund family and the investment performance of the fund in connection with the annual renewal of the fund's current management contract with FMR (Current Management Contract). At its July 2017 meeting, the Board concluded that the nature, extent and quality of the services provided to the fund under the Current Management Contract should benefit the shareholders of the fund. The Board noted FMR's representation that approval of the Amended Contract would not change the funds' portfolio managers, the investment processes, the level or nature of services provided, the resources and personnel allocated or trading and compliance operations. The Board concluded that the nature, extent, and quality of services to be provided to the fund under the Amended Contract will continue to benefit the shareholders of the fund.
Competitiveness of Management Fee and Total Expense Ratio. The Board considered that it received and reviewed information regarding the fund's management fee rate and total expense ratio compared to "mapped groups" of competitive funds and classes at the current management fee and expense levels in connection with the annual renewal of the Current Management Contract. Based on its review, the Board concluded at its July 2017 meeting that the fund's current management fee and total expense ratio are fair and reasonable in light of the services that the fund receives and the other factors considered. In its review of the proposed management fee rate under the Amended Contract, the Board considered that the proposed fee rate is lower by approximately 24 basis points than the current management fee rate. The Board also considered that the fund's management fee rate and total expense ratio for all classes would rank below the median of its competitor funds based on the competitive mapped group data provided to the Board in connection with the annual renewal of the Current Management Contract.
Based on its review, the Board concluded that the fund's management fee and total expense ratio continue to be fair and reasonable in light of the services that the fund and its shareholders receive and the other factors considered.
Costs of the Services and Profitability. The Board considered that it previously reviewed information regarding the revenues earned, the expenses incurred by Fidelity in providing services to the fund and the level of Fidelity's profitability. At its July 2017 meeting, the Board concluded that it was satisfied that the profitability of Fidelity in connection with the operation of the fund was not excessive. Because the Board was approving an arrangement under which the management fees were being reduced, the Board did not consider Fidelity's costs of services, revenues, or profitability to be significant factors in its decision to approve the Amended Contract.
Economies of Scale. The Board considered that it previously received and reviewed information regarding whether there have been economies of scale in respect of the management of the Fidelity funds, whether the Fidelity funds (including the fund) have appropriately benefited from any such economies of scale, and whether there is a potential realization of any further economies of scale and that it concluded, at its July 2017 meeting, that economies of scale, if any, are being appropriately shared between fund shareholders and Fidelity. The Board will continue to review economies of scale in connection with future renewals of the Amended Contract.
Based on its evaluation of all of the conclusions noted above, and after considering all factors it believed relevant, the Board concluded that the fund's advisory fee structures continue to be fair and reasonable, and that the fund's Amended Contract should be approved.
VDSC-ANN-0218
1.820582.112
Fidelity® Variable Insurance Products: Emerging Markets Portfolio
Annual Report December 31, 2017 |
|
Contents
To view a fund's proxy voting guidelines and proxy voting record for the 12-month period ended June 30, visit http://www.fidelity.com/proxyvotingresults or visit the Securities and Exchange Commission's (SEC) web site at http://www.sec.gov.
You may also call 1-877-208-0098 to request a free copy of the proxy voting guidelines.
Fidelity® Variable Insurance Products are separate account options which are purchased through a variable insurance contract.
Standard & Poor's, S&P and S&P 500 are registered service marks of The McGraw-Hill Companies, Inc. and have been licensed for use by Fidelity Distributors Corporation.
Other third-party marks appearing herein are the property of their respective owners.
All other marks appearing herein are registered or unregistered trademarks or service marks of FMR LLC or an affiliated company. © 2018 FMR LLC. All rights reserved.
This report and the financial statements contained herein are submitted for the general information of the shareholders of the Fund. This report is not authorized for distribution to prospective investors in the Fund unless preceded or accompanied by an effective prospectus.
A fund files its complete schedule of portfolio holdings with the SEC for the first and third quarters of each fiscal year on Form N-Q. Forms N-Q are available on the SEC’s web site at http://www.sec.gov. A fund's Forms N-Q may be reviewed and copied at the SEC’s Public Reference Room in Washington, DC. Information regarding the operation of the SEC's Public Reference Room may be obtained by calling 1-800-SEC-0330.
For a complete list of a fund's portfolio holdings, view the most recent holdings listing, semiannual report, or annual report on Fidelity's web site at http://www.fidelity.com, http://www.institutional.fidelity.com, or http://www.401k.com, as applicable.
NOT FDIC INSURED •MAY LOSE VALUE •NO BANK GUARANTEE
Neither the Fund nor Fidelity Distributors Corporation is a bank.
Performance: The Bottom Line
Average annual total return reflects the change in the value of an investment, assuming reinvestment of distributions from dividend income and capital gains (the profits earned upon the sale of securities that have grown in value, if any) and assuming a constant rate of performance each year. During periods of reimbursement by Fidelity, a fund’s total return will be greater than it would be had the reimbursement not occurred. Performance numbers are net of all underlying fund operating expenses, but do not include any insurance charges imposed by your insurance company’s separate account. If performance information included the effect of these additional charges, the total returns would have been lower. How a fund did yesterday is no guarantee of how it will do tomorrow.
Average Annual Total Returns
| For the periods ended December 31, 2017 | Past 1 year | Past 5 years | Life of fundA |
| Initial Class | 47.40% | 7.60% | 2.95% |
| Service Class | 47.19% | 7.50% | 2.84% |
| Service Class 2 | 47.05% | 7.32% | 2.68% |
| Investor Class | 47.32% | 7.52% | 2.86% |
A From January 23, 2008
$10,000 Over Life of Fund
Let's say hypothetically that $10,000 was invested in VIP Emerging Markets Portfolio - Initial Class on January 23, 2008, when the fund started.
The chart shows how the value of your investment would have changed, and also shows how the MSCI Emerging Markets Index performed over the same period.
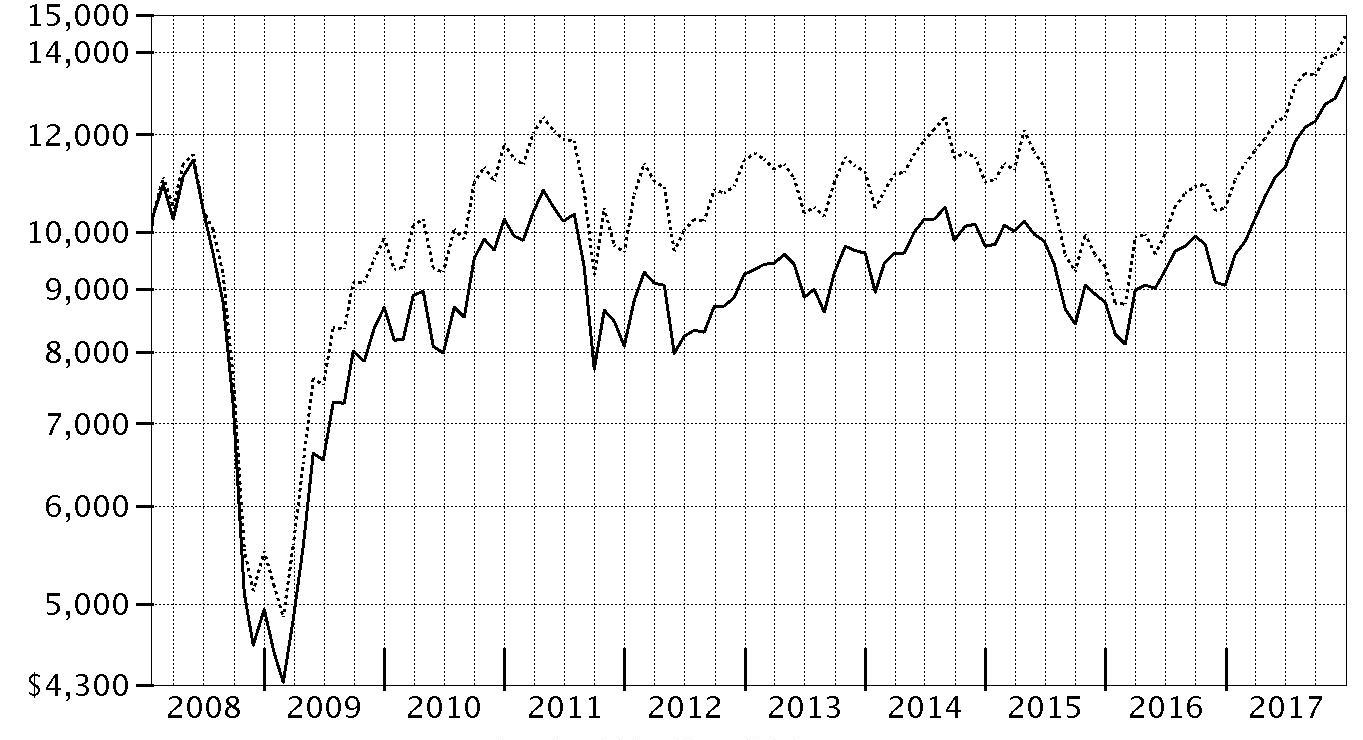
| Period Ending Values |
| $13,351 | VIP Emerging Markets Portfolio - Initial Class |
| $14,410 | MSCI Emerging Markets Index |
Management's Discussion of Fund Performance
Market Recap: The MSCI ACWI (All Country World Index) ex USA Index gained 27.40% in 2017, helped partly by a generally weak U.S. dollar. Certain election results in continental Europe (+28%) suggested ebbing political uncertainty and near-term risk there, whereas the U.K. (+21%) faced more-mixed conditions ahead of its expected exit from the European Union. Japan (+24%), despite central-bank easing and recent pressure from regional yen strength, lagged the rest of the Asia-Pacific group (+26%). Commodity-price volatility slowed Canada (+17%), but emerging markets (+36%) sped ahead. Sector-wise, information technology (+52%) was driven by a surge among software, semiconductor and internet-related names. Financials (+27%) rode rising interest rates that, at the same time, held back consumer staples (+24%), utilities (+19%) and telecommunication services (+15%) – so-called “bond proxy” sectors. Real estate (+27%) bucked the trend, largely due to demand in China. Similarly, materials (+33%) and industrials (+30%) responded to Chinese demand, as well as to price gains for certain commodities. In the energy sector (+17%), oil prices lost ground in the first half of 2017 before rebounding through December 31 to end well above where they started 12 months ago. Lastly, health care (+19%) dealt with early-year turmoil around drug pricing and health care legislation.
Comments from Portfolio Manager Sammy Simnegar: For the year, the fund’s share classes gained about 47%, considerably ahead of the 37.75% advance of the benchmark MSCI Emerging Markets Index. Versus the benchmark, active management added value in nine of 11 market sectors. Positioning in consumer discretionary, financials and information technology contributed most, mainly due to stock selection. All major geographical regions were relative contributors, led by emerging Asia. Avoiding China Mobile made this benchmark component the fund’s largest relative contributor. China Mobile shares returned about 3% in 2017. In the energy sector, sidestepping Russia-based Gazprom and Brazil’s Petroleo Brasileiro (Petrobras) worked well, as both significantly underperformed our benchmark. Out-of-benchmark positions in Brazil-based for-profit educator Estacio Participacoes and China’s Hangzhou Hikvision Digital Technology, the world’s largest manufacturer of security cameras, further lifted our relative result. Conversely, the materials and real estate sectors detracted, and a small cash allocation hurt in such a strong market. Among individual countries, South Korea and Mexico were noteworthy negatives. Untimely ownership of strong-performing index name JD.com, a China-based e-tailer akin to Amazon.com in the United States, made this stock our largest relative detractor. Avoiding shares of index constituent SK Hynix, South Korea’s No. 2 memory-chip maker after Samsung, also hurt.
The views expressed above reflect those of the portfolio manager(s) only through the end of the period as stated on the cover of this report and do not necessarily represent the views of Fidelity or any other person in the Fidelity organization. Any such views are subject to change at any time based upon market or other conditions and Fidelity disclaims any responsibility to update such views. These views may not be relied on as investment advice and, because investment decisions for a Fidelity fund are based on numerous factors, may not be relied on as an indication of trading intent on behalf of any Fidelity fund.
Investment Summary (Unaudited)
Geographic Diversification (% of fund's net assets)
| As of December 31, 2017 |
| | Cayman Islands | 14.9% |
| | India | 12.8% |
| | China | 8.4% |
| | United States of America* | 7.9% |
| | Brazil | 7.5% |
| | South Africa | 7.1% |
| | Korea (South) | 6.8% |
| | Taiwan | 4.6% |
| | Mexico | 3.9% |
| | Other | 26.1% |

* Includes Short-Term investments and Net Other Assets (Liabilities).
Percentages are based on country or territory of incorporation and are adjusted for the effect of futures contracts, if applicable.
Asset Allocation as of December 31, 2017
| | % of fund's net assets |
| Stocks | 97.6 |
| Short-Term Investments and Net Other Assets (Liabilities) | 2.4 |
Top Ten Stocks as of December 31, 2017
| | % of fund's net assets |
| Tencent Holdings Ltd. (Cayman Islands, Internet Software & Services) | 5.8 |
| Samsung Electronics Co. Ltd. (Korea (South), Technology Hardware, Storage & Peripherals) | 5.3 |
| Alibaba Group Holding Ltd. sponsored ADR (Cayman Islands, Internet Software & Services) | 4.1 |
| Taiwan Semiconductor Manufacturing Co. Ltd. (Taiwan, Semiconductors & Semiconductor Equipment) | 3.9 |
| Naspers Ltd. Class N (South Africa, Media) | 2.8 |
| Baidu.com, Inc. sponsored ADR (Cayman Islands, Internet Software & Services) | 1.6 |
| Ping An Insurance (Group) Co. of China Ltd. (H Shares) (China, Insurance) | 1.4 |
| Sberbank of Russia (Russia, Banks) | 1.3 |
| Itau Unibanco Holding SA (Brazil, Banks) | 1.3 |
| Housing Development Finance Corp. Ltd. (India, Thrifts & Mortgage Finance) | 1.2 |
| | 28.7 |
Top Market Sectors as of December 31, 2017
| | % of fund's net assets |
| Information Technology | 28.4 |
| Financials | 19.9 |
| Consumer Discretionary | 15.9 |
| Industrials | 8.0 |
| Consumer Staples | 7.3 |
| Materials | 6.4 |
| Health Care | 3.7 |
| Energy | 2.4 |
| Real Estate | 2.1 |
| Utilities | 2.0 |
Investments December 31, 2017
Showing Percentage of Net Assets
| Common Stocks - 95.6% | | | |
| | | Shares | Value |
| Argentina - 1.8% | | | |
| Banco Macro SA sponsored ADR | | 15,100 | $1,749,788 |
| IRSA Propiedades Comerciales SA sponsored ADR | | 30,300 | 1,711,950 |
| Loma Negra Compania Industrial Argentina SA ADR (a) | | 78,100 | 1,799,424 |
| Telecom Argentina SA Class B sponsored ADR (b) | | 47,793 | 1,750,658 |
|
| TOTAL ARGENTINA | | | 7,011,820 |
|
| Australia - 0.5% | | | |
| Amcor Ltd. | | 150,725 | 1,813,441 |
| Bailiwick of Jersey - 0.5% | | | |
| Glencore Xstrata PLC | | 393,473 | 2,071,866 |
| Bermuda - 0.7% | | | |
| Credicorp Ltd. (United States) | | 13,176 | 2,733,098 |
| Brazil - 5.5% | | | |
| BM&F BOVESPA SA | | 421,200 | 2,892,568 |
| BTG Pactual Participations Ltd. unit | | 359,100 | 2,055,804 |
| CVC Brasil Operadora e Agencia de Viagens SA | | 131,900 | 1,928,537 |
| Equatorial Energia SA | | 105,000 | 2,078,095 |
| Estacio Participacoes SA | | 190,700 | 1,886,821 |
| Fleury SA | | 205,300 | 1,832,605 |
| IRB Brasil Resseguros SA | | 177,600 | 1,820,385 |
| Kroton Educacional SA | | 442,100 | 2,452,335 |
| Qualicorp SA | | 218,600 | 2,042,929 |
| Smiles Fidelidade SA | | 82,500 | 1,887,718 |
|
| TOTAL BRAZIL | | | 20,877,797 |
|
| British Virgin Islands - 0.3% | | | |
| Despegar.com Corp. (b) | | 48,200 | 1,324,536 |
| Cayman Islands - 14.9% | | | |
| 58.com, Inc. ADR (a) | | 31,500 | 2,254,455 |
| Alibaba Group Holding Ltd. sponsored ADR (a) | | 90,500 | 15,604,915 |
| Baidu.com, Inc. sponsored ADR (a) | | 26,569 | 6,222,725 |
| NetEase, Inc. ADR | | 10,700 | 3,692,249 |
| New Oriental Education & Technology Group, Inc. sponsored ADR | | 29,100 | 2,735,400 |
| Sands China Ltd. | | 360,400 | 1,861,311 |
| Shenzhou International Group Holdings Ltd. | | 234,000 | 2,228,329 |
| Tencent Holdings Ltd. | | 422,300 | 21,857,384 |
|
| TOTAL CAYMAN ISLANDS | | | 56,456,768 |
|
| Chile - 0.6% | | | |
| Banco Santander Chile sponsored ADR | | 70,300 | 2,198,281 |
| China - 8.4% | | | |
| Dong E-E-Jiao Co. Ltd. Class A | | 195,400 | 1,809,957 |
| Gree Electric Appliances, Inc. of Zhuhai Class A | | 277,000 | 1,860,389 |
| Hangzhou Hikvision Digital Technology Co. Ltd. Class A | | 287,645 | 1,724,106 |
| Hangzhou Robam Appliances Co. Ltd. Class A | | 272,538 | 2,014,720 |
| Inner Mongoli Yili Industries Co. Ltd. (A Shares) | | 372,290 | 1,841,810 |
| Jiangsu Yanghe Brewery Joint-Stock Co. Ltd. Class A | | 106,201 | 1,877,020 |
| Kweichow Moutai Co. Ltd. (A Shares) | | 17,648 | 1,891,804 |
| Midea Group Co. Ltd. Class A | | 213,300 | 1,817,098 |
| Ping An Insurance (Group) Co. of China Ltd. (H Shares) | | 522,000 | 5,435,238 |
| Shanghai International Airport Co. Ltd. (A Shares) | | 292,124 | 2,020,779 |
| Shenzhen Inovance Technology Co. Ltd. Class A | | 436,995 | 1,949,021 |
| Tonghua Dongbao Pharmaceutical Co. Ltd. Class A | | 515,998 | 1,815,250 |
| TravelSky Technology Ltd. (H Shares) | | 628,000 | 1,884,920 |
| Wuliangye Yibin Co. Ltd. Class A | | 161,587 | 1,983,750 |
| Yunnan Baiyao Group Co. Ltd. | | 125,133 | 1,957,580 |
|
| TOTAL CHINA | | | 31,883,442 |
|
| France - 2.2% | | | |
| Hermes International SCA | | 3,600 | 1,927,559 |
| Kering SA | | 3,872 | 1,825,807 |
| LVMH Moet Hennessy - Louis Vuitton SA | | 5,907 | 1,733,736 |
| Rubis | | 26,100 | 1,847,023 |
| Thales SA | | 10,738 | 1,158,013 |
|
| TOTAL FRANCE | | | 8,492,138 |
|
| Germany - 0.5% | | | |
| adidas AG | | 8,524 | 1,709,530 |
| Hong Kong - 2.2% | | | |
| AIA Group Ltd. | | 225,600 | 1,924,553 |
| CSPC Pharmaceutical Group Ltd. | | 1,234,000 | 2,492,371 |
| Galaxy Entertainment Group Ltd. | | 222,000 | 1,781,603 |
| Techtronic Industries Co. Ltd. | | 302,500 | 1,972,696 |
|
| TOTAL HONG KONG | | | 8,171,223 |
|
| Hungary - 0.7% | | | |
| OTP Bank PLC | | 61,400 | 2,541,762 |
| India - 12.8% | | | |
| Adani Ports & Special Economic Zone Ltd. | | 339,372 | 2,156,426 |
| Asian Paints Ltd. | | 116,117 | 2,107,167 |
| Bharat Petroleum Corp. Ltd. | | 262,299 | 2,127,071 |
| Eicher Motors Ltd. | | 4,882 | 2,320,239 |
| Godrej Consumer Products Ltd. | | 136,513 | 2,137,185 |
| HDFC Bank Ltd. | | 65,301 | 1,931,472 |
| Hero Motocorp Ltd. | | 34,510 | 2,046,139 |
| Housing Development Finance Corp. Ltd. | | 173,660 | 4,652,695 |
| Indraprastha Gas Ltd. | | 349,130 | 1,836,433 |
| IndusInd Bank Ltd. | | 71,460 | 1,845,714 |
| Kotak Mahindra Bank Ltd. (a) | | 115,237 | 1,823,503 |
| LIC Housing Finance Ltd. | | 212,896 | 1,879,181 |
| Maruti Suzuki India Ltd. | | 21,105 | 3,216,512 |
| Motherson Sumi Systems Ltd. | | 350,231 | 2,080,594 |
| PC Jeweller Ltd. | | 286,978 | 2,053,214 |
| Pidilite Industries Ltd. (a) | | 136,241 | 1,925,386 |
| Power Grid Corp. of India Ltd. | | 533,707 | 1,674,940 |
| Reliance Industries Ltd. | | 309,953 | 4,471,839 |
| Shree Cement Ltd. | | 6,501 | 1,840,575 |
| Ultratech Cemco Ltd. | | 32,713 | 2,213,969 |
| Vakrangee Ltd. | | 339,992 | 2,238,121 |
|
| TOTAL INDIA | | | 48,578,375 |
|
| Indonesia - 1.6% | | | |
| PT Bank Central Asia Tbk | | 1,867,600 | 3,014,589 |
| PT Bank Rakyat Indonesia Tbk | | 11,190,600 | 3,002,306 |
|
| TOTAL INDONESIA | | | 6,016,895 |
|
| Israel - 1.0% | | | |
| Elbit Systems Ltd. (Israel) | | 13,100 | 1,750,607 |
| Frutarom Industries Ltd. | | 21,225 | 1,991,569 |
|
| TOTAL ISRAEL | | | 3,742,176 |
|
| Kenya - 0.5% | | | |
| Safaricom Ltd. | | 7,205,800 | 1,868,688 |
| Korea (South) - 6.8% | | | |
| LG Chemical Ltd. | | 8,160 | 3,096,194 |
| LG Household & Health Care Ltd. | | 2,254 | 2,510,838 |
| Samsung Electronics Co. Ltd. | | 8,438 | 20,142,896 |
|
| TOTAL KOREA (SOUTH) | | | 25,749,928 |
|
| Mexico - 3.9% | | | |
| Embotelladoras Arca S.A.B. de CV | | 314,500 | 2,174,189 |
| Fomento Economico Mexicano S.A.B. de CV unit | | 325,300 | 3,059,847 |
| Gruma S.A.B. de CV Series B | | 154,645 | 1,960,737 |
| Grupo Aeroportuario del Pacifico S.A.B. de CV Series B | | 201,800 | 2,074,088 |
| Grupo Aeroportuario del Sureste S.A.B. de CV Series B | | 115,330 | 2,100,252 |
| Grupo Aeroportuario Norte S.A.B. de CV | | 344,900 | 1,783,394 |
| Grupo Cementos de Chihuahua S.A.B. de CV | | 329,800 | 1,534,230 |
|
| TOTAL MEXICO | | | 14,686,737 |
|
| Netherlands - 1.4% | | | |
| ASML Holding NV (Netherlands) | | 10,300 | 1,790,742 |
| X5 Retail Group NV GDR (Reg. S) (a) | | 45,700 | 1,726,089 |
| Yandex NV Series A (a) | | 54,000 | 1,768,500 |
|
| TOTAL NETHERLANDS | | | 5,285,331 |
|
| Panama - 0.5% | | | |
| Copa Holdings SA Class A | | 13,700 | 1,836,622 |
| Philippines - 2.4% | | | |
| Ayala Corp. | | 105,320 | 2,137,376 |
| Ayala Land, Inc. | | 2,644,100 | 2,357,853 |
| SM Investments Corp. | | 108,952 | 2,156,624 |
| SM Prime Holdings, Inc. | | 3,150,400 | 2,362,115 |
|
| TOTAL PHILIPPINES | | | 9,013,968 |
|
| Russia - 1.3% | | | |
| Sberbank of Russia | | 1,221,270 | 4,770,432 |
| South Africa - 7.1% | | | |
| Bidcorp Ltd. | | 107,025 | 2,603,633 |
| Capitec Bank Holdings Ltd. | | 28,200 | 2,502,524 |
| Discovery Ltd. | | 179,764 | 2,702,453 |
| FirstRand Ltd. | | 664,800 | 3,613,482 |
| Imperial Holdings Ltd. | | 44 | 932 |
| Mondi Ltd. | | 79,063 | 2,040,206 |
| Naspers Ltd. Class N | | 38,368 | 10,701,796 |
| Sanlam Ltd. | | 416,900 | 2,931,526 |
|
| TOTAL SOUTH AFRICA | | | 27,096,552 |
|
| Spain - 0.5% | | | |
| Amadeus IT Holding SA Class A | | 25,100 | 1,810,287 |
| Switzerland - 1.0% | | | |
| Compagnie Financiere Richemont SA Series A | | 20,214 | 1,830,739 |
| Sika AG | | 230 | 1,826,877 |
|
| TOTAL SWITZERLAND | | | 3,657,616 |
|
| Taiwan - 4.6% | | | |
| Advantech Co. Ltd. | | 263,292 | 1,868,169 |
| Taiwan Semiconductor Manufacturing Co. Ltd. | | 1,945,000 | 14,938,945 |
| United Microelectronics Corp. | | 1,324,000 | 630,634 |
|
| TOTAL TAIWAN | | | 17,437,748 |
|
| Thailand - 0.7% | | | |
| Airports of Thailand PCL (For. Reg.) | | 1,243,800 | 2,595,226 |
| Turkey - 2.2% | | | |
| Koc Holding A/S | | 468,000 | 2,281,662 |
| Tofas Turk Otomobil Fabrikasi A/S | | 218,567 | 1,903,992 |
| Tupras Turkiye Petrol Rafinerileri A/S | | 67,000 | 2,147,606 |
| Turkcell Iletisim Hizmet A/S | | 524,000 | 2,139,960 |
|
| TOTAL TURKEY | | | 8,473,220 |
|
| United Arab Emirates - 0.5% | | | |
| DP World Ltd. | | 83,477 | 2,086,925 |
| United Kingdom - 2.5% | | | |
| British American Tobacco PLC (United Kingdom) | | 26,600 | 1,802,164 |
| Diageo PLC | | 52,643 | 1,929,596 |
| InterContinental Hotel Group PLC | | 32,700 | 2,083,434 |
| NMC Health PLC | | 47,200 | 1,838,526 |
| Prudential PLC | | 71,633 | 1,834,544 |
|
| TOTAL UNITED KINGDOM | | | 9,488,264 |
|
| United States of America - 5.5% | | | |
| A.O. Smith Corp. | | 29,300 | 1,795,504 |
| Alphabet, Inc. Class C (a) | | 1,793 | 1,876,195 |
| American Tower Corp. | | 13,100 | 1,868,977 |
| Amphenol Corp. Class A | | 20,100 | 1,764,780 |
| Facebook, Inc. Class A (a) | | 9,700 | 1,711,662 |
| MasterCard, Inc. Class A | | 11,900 | 1,801,184 |
| Moody's Corp. | | 12,900 | 1,904,169 |
| MSCI, Inc. | | 14,300 | 1,809,522 |
| S&P Global, Inc. | | 11,000 | 1,863,400 |
| Visa, Inc. Class A | | 15,100 | 1,721,702 |
| Yum China Holdings, Inc. | | 69,300 | 2,773,386 |
|
| TOTAL UNITED STATES OF AMERICA | | | 20,890,481 |
|
| TOTAL COMMON STOCKS | | | |
| (Cost $245,834,590) | | | 362,371,173 |
|
| Nonconvertible Preferred Stocks - 2.0% | | | |
| Brazil - 2.0% | | | |
| Itau Unibanco Holding SA (a) | | 365,220 | 4,688,152 |
| Itausa-Investimentos Itau SA (PN) | | 838,600 | 2,735,417 |
| TOTAL NONCONVERTIBLE PREFERRED STOCKS | | | |
| (Cost $5,774,577) | | | 7,423,569 |
|
| Money Market Funds - 1.5% | | | |
| Fidelity Cash Central Fund, 1.36% (c) | | 5,088,583 | 5,089,601 |
| Fidelity Securities Lending Cash Central Fund 1.36% (c)(d) | | 627,826 | 627,951 |
| TOTAL MONEY MARKET FUNDS | | | |
| (Cost $5,717,489) | | | 5,717,552 |
| TOTAL INVESTMENT IN SECURITIES - 99.1% | | | |
| (Cost $257,326,656) | | | 375,512,294 |
| NET OTHER ASSETS (LIABILITIES) - 0.9% | | | 3,434,727 |
| NET ASSETS - 100% | | | $378,947,021 |
Categorizations in the Schedule of Investments are based on country or territory of incorporation.
Legend
(a) Non-income producing
(b) Security or a portion of the security is on loan at period end.
(c) Affiliated fund that is generally available only to investment companies and other accounts managed by Fidelity Investments. The rate quoted is the annualized seven-day yield of the fund at period end. A complete unaudited listing of the fund's holdings as of its most recent quarter end is available upon request. In addition, each Fidelity Central Fund's financial statements, which are not covered by the Fund's Report of Independent Registered Public Accounting Firm, are available on the SEC's website or upon request.
(d) Investment made with cash collateral received from securities on loan.
Affiliated Central Funds
Information regarding fiscal year to date income earned by the Fund from investments in Fidelity Central Funds is as follows:
| Fund | Income earned |
| Fidelity Cash Central Fund | $45,788 |
| Fidelity Securities Lending Cash Central Fund | 8,858 |
| Total | $54,646 |
Amounts in the income column in the above table include any capital gain distributions from underlying funds, which are presented in the corresponding line-item in the Statement of Operations if applicable.
Investment Valuation
The following is a summary of the inputs used, as of December 31, 2017, involving the Fund's assets and liabilities carried at fair value. The inputs or methodology used for valuing securities may not be an indication of the risk associated with investing in those securities. For more information on valuation inputs, and their aggregation into the levels used below, please refer to the Investment Valuation section in the accompanying Notes to Financial Statements.
| | Valuation Inputs at Reporting Date: |
| Description | Total | Level 1 | Level 2 | Level 3 |
| Investments in Securities: | | | | |
| Equities: | | | | |
| Consumer Discretionary | $61,638,863 | $58,074,388 | $3,564,475 | $-- |
| Consumer Staples | 27,498,662 | 25,569,066 | 1,929,596 | -- |
| Energy | 8,746,516 | 8,746,516 | -- | -- |
| Financials | 74,993,934 | 66,457,486 | 8,536,448 | -- |
| Health Care | 13,789,218 | 13,789,218 | -- | -- |
| Industrials | 30,065,382 | 30,065,382 | -- | -- |
| Information Technology | 107,304,571 | 68,086,866 | 39,217,705 | -- |
| Materials | 24,260,904 | 24,260,904 | -- | -- |
| Real Estate | 8,300,895 | 8,300,895 | -- | -- |
| Telecommunication Services | 5,759,306 | 5,759,306 | -- | -- |
| Utilities | 7,436,491 | 7,436,491 | -- | -- |
| Money Market Funds | 5,717,552 | 5,717,552 | -- | -- |
| Total Investments in Securities: | $375,512,294 | $322,264,070 | $53,248,224 | $-- |
The following is a summary of transfers between Level 1 and Level 2 for the period ended December 31, 2017. Transfers are assumed to have occurred at the beginning of the period, and are primarily attributable to the valuation techniques used for foreign equity securities, as discussed in the accompanying Notes to Financial Statements:
| Transfers | Total |
| Level 1 to Level 2 | $0 |
| Level 2 to Level 1 | $19,045,721 |
See accompanying notes which are an integral part of the financial statements.
Financial Statements
Statement of Assets and Liabilities
| | | December 31, 2017 |
| Assets | | |
Investment in securities, at value (including securities loaned of $619,167) — See accompanying schedule:
Unaffiliated issuers (cost $251,609,167) | $369,794,742 | |
| Fidelity Central Funds (cost $5,717,489) | 5,717,552 | |
| Total Investment in Securities (cost $257,326,656) | | $375,512,294 |
| Foreign currency held at value (cost $132,492) | | 133,209 |
| Receivable for investments sold | | 2,196,127 |
| Receivable for fund shares sold | | 3,681,944 |
| Dividends receivable | | 380,145 |
| Distributions receivable from Fidelity Central Funds | | 4,941 |
| Prepaid expenses | | 550 |
| Other receivables | | 34,442 |
| Total assets | | 381,943,652 |
| Liabilities | | |
| Payable for investments purchased | $1,162,965 | |
| Payable for fund shares redeemed | 447,925 | |
| Accrued management fee | 240,150 | |
| Distribution and service plan fees payable | 1,555 | |
| Other affiliated payables | 49,174 | |
| Other payables and accrued expenses | 467,112 | |
| Collateral on securities loaned | 627,750 | |
| Total liabilities | | 2,996,631 |
| Net Assets | | $378,947,021 |
| Net Assets consist of: | | |
| Paid in capital | | $271,098,933 |
| Undistributed net investment income | | 71,956 |
| Accumulated undistributed net realized gain (loss) on investments and foreign currency transactions | | (10,000,895) |
| Net unrealized appreciation (depreciation) on investments and assets and liabilities in foreign currencies | | 117,777,027 |
| Net Assets | | $378,947,021 |
| Initial Class: | | |
| Net Asset Value, offering price and redemption price per share ($165,395,542 ÷ 13,528,121 shares) | | $12.23 |
| Service Class: | | |
| Net Asset Value, offering price and redemption price per share ($1,088,838 ÷ 88,790 shares) | | $12.26 |
| Service Class 2: | | |
| Net Asset Value, offering price and redemption price per share ($7,245,584 ÷ 591,308 shares) | | $12.25 |
| Investor Class: | | |
| Net Asset Value, offering price and redemption price per share ($205,217,057 ÷ 16,861,500 shares) | | $12.17 |
See accompanying notes which are an integral part of the financial statements.
Statement of Operations
| | | Year ended December 31, 2017 |
| Investment Income | | |
| Dividends | | $5,396,143 |
| Income from Fidelity Central Funds | | 54,646 |
| Income before foreign taxes withheld | | 5,450,789 |
| Less foreign taxes withheld | | (465,442) |
| Total income | | 4,985,347 |
| Expenses | | |
| Management fee | $2,420,247 | |
| Transfer agent fees | 318,555 | |
| Distribution and service plan fees | 13,233 | |
| Accounting and security lending fees | 158,056 | |
| Custodian fees and expenses | 213,143 | |
| Independent trustees' fees and expenses | 1,163 | |
| Audit | 91,864 | |
| Legal | 784 | |
| Miscellaneous | 1,985 | |
| Total expenses before reductions | 3,219,030 | |
| Expense reductions | (65,079) | 3,153,951 |
| Net investment income (loss) | | 1,831,396 |
| Realized and Unrealized Gain (Loss) | | |
| Net realized gain (loss) on: | | |
| Investment securities: | | |
| Unaffiliated issuers | 19,445,893 | |
| Fidelity Central Funds | 528 | |
| Foreign currency transactions | (56,391) | |
| Total net realized gain (loss) | | 19,390,030 |
| Change in net unrealized appreciation (depreciation) on: | | |
| Unaffiliated issuers (net of increase in deferred foreign taxes of $419,264) | 92,796,521 | |
| Fidelity Central Funds | 5 | |
| Assets and liabilities in foreign currencies | 12,953 | |
| Total change in net unrealized appreciation (depreciation) | | 92,809,479 |
| Net gain (loss) | | 112,199,509 |
| Net increase (decrease) in net assets resulting from operations | | $114,030,905 |
See accompanying notes which are an integral part of the financial statements.
Statement of Changes in Net Assets
| | Year ended December 31, 2017 | Year ended December 31, 2016 |
| Increase (Decrease) in Net Assets | | |
| Operations | | |
| Net investment income (loss) | $1,831,396 | $1,479,027 |
| Net realized gain (loss) | 19,390,030 | (12,728,655) |
| Change in net unrealized appreciation (depreciation) | 92,809,479 | 18,862,755 |
| Net increase (decrease) in net assets resulting from operations | 114,030,905 | 7,613,127 |
| Distributions to shareholders from net investment income | (2,105,874) | (1,110,495) |
| Distributions to shareholders from net realized gain | (336,794) | – |
| Total distributions | (2,442,668) | (1,110,495) |
| Share transactions - net increase (decrease) | 37,991,802 | 25,997,383 |
| Total increase (decrease) in net assets | 149,580,039 | 32,500,015 |
| Net Assets | | |
| Beginning of period | 229,366,982 | 196,866,967 |
| End of period | $378,947,021 | $229,366,982 |
| Other Information | | |
| Undistributed net investment income end of period | $71,956 | $341,624 |
See accompanying notes which are an integral part of the financial statements.
Financial Highlights
VIP Emerging Markets Portfolio Initial Class
| Years ended December 31, | 2017 | 2016 | 2015 | 2014 | 2013 |
| Selected Per–Share Data | | | | | |
| Net asset value, beginning of period | $8.36 | $8.14 | $9.10 | $9.01 | $8.75 |
| Income from Investment Operations | | | | | |
| Net investment income (loss)A | .07 | .06 | .06 | .06 | .07 |
| Net realized and unrealized gain (loss) | 3.88 | .20 | (.97) | .06 | .27 |
| Total from investment operations | 3.95 | .26 | (.91) | .12 | .34 |
| Distributions from net investment income | (.07) | (.04) | (.05) | (.03) | (.07) |
| Distributions from net realized gain | (.01) | – | – | – | (.01) |
| Total distributions | (.08) | (.04) | (.05) | (.03) | (.08) |
| Redemption fees added to paid in capitalA | – | – | –B | –B | –B |
| Net asset value, end of period | $12.23 | $8.36 | $8.14 | $9.10 | $9.01 |
| Total ReturnC,D | 47.40% | 3.24% | (9.97)% | 1.38% | 3.85% |
| Ratios to Average Net AssetsE,F | | | | | |
| Expenses before reductions | 1.01% | 1.05% | 1.07% | 1.10% | 1.14% |
| Expenses net of fee waivers, if any | 1.01% | 1.05% | 1.07% | 1.10% | 1.10% |
| Expenses net of all reductions | .99% | 1.05% | 1.05% | 1.10% | 1.07% |
| Net investment income (loss) | .64% | .71% | .69% | .62% | .84% |
| Supplemental Data | | | | | |
| Net assets, end of period (000 omitted) | $165,396 | $132,435 | $112,675 | $91,224 | $60,924 |
| Portfolio turnover rateG | 82% | 86% | 106% | 96% | 110% |
A Calculated based on average shares outstanding during the period.
B Amount represents less than $.005 per share.
C Total returns do not reflect charges attributable to your insurance company's separate account. Inclusion of these charges would reduce the total returns shown.
D Total returns would have been lower if certain expenses had not been reduced during the applicable periods shown.
E Fees and expenses of any underlying Fidelity Central Funds are not included in the Fund's expense ratio. The Fund indirectly bears its proportionate share of the expenses of any underlying Fidelity Central Funds.
F Expense ratios reflect operating expenses of the class. Expenses before reductions do not reflect amounts reimbursed by the investment adviser or reductions from brokerage service arrangements or reductions from other expense offset arrangements and do not represent the amount paid by the class during periods when reimbursements or reductions occur. Expenses net of fee waivers reflect expenses after reimbursement by the investment adviser but prior to reductions from brokerage service arrangements or other expense offset arrangements. Expenses net of all reductions represent the net expenses paid by the class.
G Amount does not include the portfolio activity of any underlying Fidelity Central Funds.
See accompanying notes which are an integral part of the financial statements.
VIP Emerging Markets Portfolio Service Class
| Years ended December 31, | 2017 | 2016 | 2015 | 2014 | 2013 |
| Selected Per–Share Data | | | | | |
| Net asset value, beginning of period | $8.39 | $8.17 | $9.14 | $9.04 | $8.77 |
| Income from Investment Operations | | | | | |
| Net investment income (loss)A | .06 | .05 | .05 | .05 | .07 |
| Net realized and unrealized gain (loss) | 3.89 | .21 | (.98) | .07 | .27 |
| Total from investment operations | 3.95 | .26 | (.93) | .12 | .34 |
| Distributions from net investment income | (.07) | (.04) | (.04) | (.02) | (.06) |
| Distributions from net realized gain | (.01) | – | – | – | (.01) |
| Total distributions | (.08) | (.04) | (.04) | (.02) | (.07) |
| Redemption fees added to paid in capitalA | – | – | –B | –B | –B |
| Net asset value, end of period | $12.26 | $8.39 | $8.17 | $9.14 | $9.04 |
| Total ReturnC,D | 47.19% | 3.13% | (10.15)% | 1.36% | 3.84% |
| Ratios to Average Net AssetsE,F | | | | | |
| Expenses before reductions | 1.11% | 1.16% | 1.17% | 1.20% | 1.23% |
| Expenses net of fee waivers, if any | 1.11% | 1.16% | 1.17% | 1.20% | 1.20% |
| Expenses net of all reductions | 1.09% | 1.15% | 1.16% | 1.19% | 1.18% |
| Net investment income (loss) | .54% | .61% | .58% | .52% | .74% |
| Supplemental Data | | | | | |
| Net assets, end of period (000 omitted) | $1,089 | $81 | $72 | $84 | $84 |
| Portfolio turnover rateG | 82% | 86% | 106% | 96% | 110% |
A Calculated based on average shares outstanding during the period.
B Amount represents less than $.005 per share.
C Total returns do not reflect charges attributable to your insurance company's separate account. Inclusion of these charges would reduce the total returns shown.
D Total returns would have been lower if certain expenses had not been reduced during the applicable periods shown.
E Fees and expenses of any underlying Fidelity Central Funds are not included in the Fund's expense ratio. The Fund indirectly bears its proportionate share of the expenses of any underlying Fidelity Central Funds.
F Expense ratios reflect operating expenses of the class. Expenses before reductions do not reflect amounts reimbursed by the investment adviser or reductions from brokerage service arrangements or reductions from other expense offset arrangements and do not represent the amount paid by the class during periods when reimbursements or reductions occur. Expenses net of fee waivers reflect expenses after reimbursement by the investment adviser but prior to reductions from brokerage service arrangements or other expense offset arrangements. Expenses net of all reductions represent the net expenses paid by the class.
G Amount does not include the portfolio activity of any underlying Fidelity Central Funds.
See accompanying notes which are an integral part of the financial statements.
VIP Emerging Markets Portfolio Service Class 2
| Years ended December 31, | 2017 | 2016 | 2015 | 2014 | 2013 |
| Selected Per–Share Data | | | | | |
| Net asset value, beginning of period | $8.38 | $8.15 | $9.12 | $9.03 | $8.77 |
| Income from Investment Operations | | | | | |
| Net investment income (loss)A | .04 | .04 | .04 | .03 | .05 |
| Net realized and unrealized gain (loss) | 3.90 | .20 | (.98) | .07 | .27 |
| Total from investment operations | 3.94 | .24 | (.94) | .10 | .32 |
| Distributions from net investment income | (.06) | (.01) | (.03) | (.01) | (.06) |
| Distributions from net realized gain | (.01) | – | – | – | (.01) |
| Total distributions | (.07) | (.01) | (.03) | (.01) | (.06)B |
| Redemption fees added to paid in capitalA | – | – | –C | –C | –C |
| Net asset value, end of period | $12.25 | $8.38 | $8.15 | $9.12 | $9.03 |
| Total ReturnD,E | 47.05% | 2.95% | (10.31)% | 1.13% | 3.70% |
| Ratios to Average Net AssetsF,G | | | | | |
| Expenses before reductions | 1.26% | 1.31% | 1.32% | 1.35% | 1.38% |
| Expenses net of fee waivers, if any | 1.26% | 1.31% | 1.32% | 1.35% | 1.35% |
| Expenses net of all reductions | 1.24% | 1.30% | 1.30% | 1.34% | 1.32% |
| Net investment income (loss) | .39% | .45% | .44% | .37% | .59% |
| Supplemental Data | | | | | |
| Net assets, end of period (000 omitted) | $7,246 | $2,868 | $8,076 | $7,681 | $6,517 |
| Portfolio turnover rateH | 82% | 86% | 106% | 96% | 110% |
A Calculated based on average shares outstanding during the period.
B Total distributions of $.06 per share is comprised of distributions from net investment income of $.055 and distributions from net realized gain of $.008 per share.
C Amount represents less than $.005 per share.
D Total returns do not reflect charges attributable to your insurance company's separate account. Inclusion of these charges would reduce the total returns shown.
E Total returns would have been lower if certain expenses had not been reduced during the applicable periods shown.
F Fees and expenses of any underlying Fidelity Central Funds are not included in the Fund's expense ratio. The Fund indirectly bears its proportionate share of the expenses of any underlying Fidelity Central Funds.
G Expense ratios reflect operating expenses of the class. Expenses before reductions do not reflect amounts reimbursed by the investment adviser or reductions from brokerage service arrangements or reductions from other expense offset arrangements and do not represent the amount paid by the class during periods when reimbursements or reductions occur. Expenses net of fee waivers reflect expenses after reimbursement by the investment adviser but prior to reductions from brokerage service arrangements or other expense offset arrangements. Expenses net of all reductions represent the net expenses paid by the class.
H Amount does not include the portfolio activity of any underlying Fidelity Central Funds.
See accompanying notes which are an integral part of the financial statements.
VIP Emerging Markets Portfolio Investor Class
| Years ended December 31, | 2017 | 2016 | 2015 | 2014 | 2013 |
| Selected Per–Share Data | | | | | |
| Net asset value, beginning of period | $8.32 | $8.11 | $9.07 | $8.98 | $8.71 |
| Income from Investment Operations | | | | | |
| Net investment income (loss)A | .06 | .05 | .05 | .05 | .07 |
| Net realized and unrealized gain (loss) | 3.87 | .20 | (.96) | .07 | .27 |
| Total from investment operations | 3.93 | .25 | (.91) | .12 | .34 |
| Distributions from net investment income | (.07) | (.04) | (.05) | (.03) | (.06) |
| Distributions from net realized gain | (.01) | – | – | – | (.01) |
| Total distributions | (.08) | (.04) | (.05) | (.03) | (.07) |
| Redemption fees added to paid in capitalA | – | – | –B | –B | –B |
| Net asset value, end of period | $12.17 | $8.32 | $8.11 | $9.07 | $8.98 |
| Total ReturnC,D | 47.32% | 3.06% | (10.08)% | 1.30% | 3.90% |
| Ratios to Average Net AssetsE,F | | | | | |
| Expenses before reductions | 1.09% | 1.14% | 1.15% | 1.18% | 1.22% |
| Expenses net of fee waivers, if any | 1.09% | 1.14% | 1.15% | 1.18% | 1.18% |
| Expenses net of all reductions | 1.07% | 1.13% | 1.13% | 1.18% | 1.15% |
| Net investment income (loss) | .56% | .63% | .61% | .54% | .76% |
| Supplemental Data | | | | | |
| Net assets, end of period (000 omitted) | $205,217 | $93,982 | $76,045 | $69,854 | $54,761 |
| Portfolio turnover rateG | 82% | 86% | 106% | 96% | 110% |
A Calculated based on average shares outstanding during the period.
B Amount represents less than $.005 per share.
C Total returns do not reflect charges attributable to your insurance company's separate account. Inclusion of these charges would reduce the total returns shown.
D Total returns would have been lower if certain expenses had not been reduced during the applicable periods shown.
E Fees and expenses of any underlying Fidelity Central Funds are not included in the Fund's expense ratio. The Fund indirectly bears its proportionate share of the expenses of any underlying Fidelity Central Funds.
F Expense ratios reflect operating expenses of the class. Expenses before reductions do not reflect amounts reimbursed by the investment adviser or reductions from brokerage service arrangements or reductions from other expense offset arrangements and do not represent the amount paid by the class during periods when reimbursements or reductions occur. Expenses net of fee waivers reflect expenses after reimbursement by the investment adviser but prior to reductions from brokerage service arrangements or other expense offset arrangements. Expenses net of all reductions represent the net expenses paid by the class.
G Amount does not include the portfolio activity of any underlying Fidelity Central Funds.
See accompanying notes which are an integral part of the financial statements.
Notes to Financial Statements
For the period ended December 31, 2017
1. Organization.
VIP Emerging Markets Portfolio (the Fund) is a fund of Variable Insurance Products Fund II (the Trust) and is authorized to issue an unlimited number of shares. The Trust is registered under the Investment Company Act of 1940, as amended (the 1940 Act), as an open-end management investment company organized as a Massachusetts business trust. Shares of the Fund may only be purchased by insurance companies for the purpose of funding variable annuity or variable life insurance contracts. The Fund offers the following classes of shares: Initial Class shares, Service Class shares, Service Class 2 shares and Investor Class shares. All classes have equal rights and voting privileges, except for matters affecting a single class. The Fund's investments in emerging markets can be subject to social, economic, regulatory, and political uncertainties and can be extremely volatile.
2. Investments in Fidelity Central Funds.
The Fund invests in Fidelity Central Funds, which are open-end investment companies generally available only to other investment companies and accounts managed by the investment adviser and its affiliates. The Fund's Schedule of Investments lists each of the Fidelity Central Funds held as of period end, if any, as an investment of the Fund, but does not include the underlying holdings of each Fidelity Central Fund. As an Investing Fund, the Fund indirectly bears its proportionate share of the expenses of the underlying Fidelity Central Funds.
The Money Market Central Funds seek preservation of capital and current income and are managed by Fidelity Investments Money Management, Inc. (FIMM), an affiliate of the investment adviser. Annualized expenses of the Money Market Central Funds as of their most recent shareholder report date are less than .005%.
A complete unaudited list of holdings for each Fidelity Central Fund is available upon request or at the Securities and Exchange Commission (the SEC) website at www.sec.gov. In addition, the financial statements of the Fidelity Central Funds, which are not covered by the Fund's Report of Independent Registered Public Accounting Firm, are available on the SEC website or upon request.
3. Significant Accounting Policies.
The Fund is an investment company and applies the accounting and reporting guidance of the Financial Accounting Standards Board (FASB) Accounting Standards Codification Topic 946 Financial Services – Investments Companies. The financial statements have been prepared in conformity with accounting principles generally accepted in the United States of America (GAAP), which require management to make certain estimates and assumptions at the date of the financial statements. Actual results could differ from those estimates. Subsequent events, if any, through the date that the financial statements were issued have been evaluated in the preparation of the financial statements. The following summarizes the significant accounting policies of the Fund:
Investment Valuation. Investments are valued as of 4:00 p.m. Eastern time on the last calendar day of the period. The Board of Trustees (the Board) has delegated the day to day responsibility for the valuation of the Fund's investments to the Fair Value Committee (the Committee) established by the Fund's investment adviser. In accordance with valuation policies and procedures approved by the Board, the Fund attempts to obtain prices from one or more third party pricing vendors or brokers to value its investments. When current market prices, quotations or currency exchange rates are not readily available or reliable, investments will be fair valued in good faith by the Committee, in accordance with procedures adopted by the Board. Factors used in determining fair value vary by investment type and may include market or investment specific events. The frequency with which these procedures are used cannot be predicted and they may be utilized to a significant extent. The Committee oversees the Fund's valuation policies and procedures and reports to the Board on the Committee's activities and fair value determinations. The Board monitors the appropriateness of the procedures used in valuing the Fund's investments and ratifies the fair value determinations of the Committee.
The Fund categorizes the inputs to valuation techniques used to value its investments into a disclosure hierarchy consisting of three levels as shown below:
- Level 1 – quoted prices in active markets for identical investments
- Level 2 – other significant observable inputs (including quoted prices for similar investments, interest rates, prepayment speeds, etc.)
- Level 3 – unobservable inputs (including the Fund's own assumptions based on the best information available)
Valuation techniques used to value the Fund's investments by major category are as follows:
Equity securities, including restricted securities, for which market quotations are readily available, are valued at the last reported sale price or official closing price as reported by a third party pricing vendor on the primary market or exchange on which they are traded and are categorized as Level 1 in the hierarchy. In the event there were no sales during the day or closing prices are not available, securities are valued at the last quoted bid price or may be valued using the last available price and are generally categorized as Level 2 in the hierarchy. For foreign equity securities, when market or security specific events arise, comparisons to the valuation of American Depositary Receipts (ADRs), futures contracts, Exchange-Traded Funds (ETFs) and certain indexes as well as quoted prices for similar securities may be used and would be categorized as Level 2 in the hierarchy. Utilizing these techniques may result in transfers between Level 1 and Level 2. For equity securities, including restricted securities, where observable inputs are limited, assumptions about market activity and risk are used and these securities may be categorized as Level 3 in the hierarchy.
Investments in open-end mutual funds, including the Fidelity Central Funds, are valued at their closing net asset value (NAV) each business day and are categorized as Level 1 in the hierarchy.
Changes in valuation techniques may result in transfers in or out of an assigned level within the disclosure hierarchy. The aggregate value of investments by input level as of December 31, 2017, including information on transfers between Levels 1 and 2, is included at the end of the Fund's Schedule of Investments.
Foreign Currency. The Fund may use foreign currency contracts to facilitate transactions in foreign-denominated securities. Gains and losses from these transactions may arise from changes in the value of the foreign currency or if the counterparties do not perform under the contracts' terms.
Foreign-denominated assets, including investment securities, and liabilities are translated into U.S. dollars at the exchange rates at period end. Purchases and sales of investment securities, income and dividends received and expenses denominated in foreign currencies are translated into U.S. dollars at the exchange rate in effect on the transaction date.
The effects of exchange rate fluctuations on investments are included with the net realized and unrealized gain (loss) on investment securities. Other foreign currency transactions resulting in realized and unrealized gain (loss) are disclosed separately.
Investment Transactions and Income. For financial reporting purposes, the Fund's investment holdings and NAV include trades executed through the end of the last business day of the period. The NAV per share for processing shareholder transactions is calculated as of the close of business of the New York Stock Exchange (NYSE), normally 4:00 p.m. Eastern time and includes trades executed through the end of the prior business day. Gains and losses on securities sold are determined on the basis of identified cost. Dividend income is recorded on the ex-dividend date, except for certain dividends from foreign securities where the ex-dividend date may have passed, which are recorded as soon as the Fund is informed of the ex-dividend date. Non-cash dividends included in dividend income, if any, are recorded at the fair market value of the securities received. Income and capital gain distributions from Fidelity Central Funds, if any, are recorded on the ex-dividend date. Certain distributions received by the Fund represent a return of capital or capital gain. The Fund determines the components of these distributions subsequent to the ex-dividend date, based upon receipt of tax filings or other correspondence relating to the underlying investment. These distributions are recorded as a reduction of cost of investments and/or as a realized gain. Investment income is recorded net of foreign taxes withheld where recovery of such taxes is uncertain.
Class Allocations and Expenses. Investment income, realized and unrealized capital gains and losses, common expenses of the Fund, and certain fund-level expense reductions, if any, are allocated daily on a pro-rata basis to each class based on the relative net assets of each class to the total net assets of the Fund. Each class differs with respect to transfer agent and distribution and service plan fees incurred. Certain expense reductions may also differ by class. For the reporting period, the allocated portion of income and expenses to each class as a percent of its average net assets may vary due to the timing of recording these transactions in relation to fluctuating net assets of the classes. Expenses directly attributable to a fund are charged to that fund. Expenses attributable to more than one fund are allocated among the respective funds on the basis of relative net assets or other appropriate methods. Expense estimates are accrued in the period to which they relate and adjustments are made when actual amounts are known.
Income Tax Information and Distributions to Shareholders. Each year, the Fund intends to qualify as a regulated investment company under Subchapter M of the Internal Revenue Code, including distributing substantially all of its taxable income and realized gains. As a result, no provision for U.S. Federal income taxes is required. As of December 31, 2017, the Fund did not have any unrecognized tax benefits in the financial statements; nor is the Fund aware of any tax positions for which it is reasonably possible that the total amounts of unrecognized tax benefits will significantly change in the next twelve months. The Fund files a U.S. federal tax return, in addition to state and local tax returns as required. The Fund's federal income tax returns are subject to examination by the Internal Revenue Service (IRS) for a period of three fiscal years after they are filed. State and local tax returns may be subject to examination for an additional fiscal year depending on the jurisdiction. Foreign taxes are provided for based on the Fund's understanding of the tax rules and rates that exist in the foreign markets in which it invests. The Fund is subject to a tax imposed on capital gains by certain countries in which it invests. An estimated deferred tax liability for net unrealized appreciation on the applicable securities is included in Other payables and accrued expenses on the Statement of Assets & Liabilities.
Distributions are declared and recorded on the ex-dividend date. Income dividends and capital gain distributions are declared separately for each class. Income and capital gain distributions are determined in accordance with income tax regulations, which may differ from GAAP.
Capital accounts within the financial statements are adjusted for permanent book-tax differences. These adjustments have no impact on net assets or the results of operations. Capital accounts are not adjusted for temporary book-tax differences which will reverse in a subsequent period.
Book-tax differences are primarily due to foreign currency transactions, passive foreign investment companies (PFIC), capital loss carryforwards, expiring capital loss carryforwards and losses deferred due to wash sales.
As of period end, the cost and unrealized appreciation (depreciation) in securities, and derivatives if applicable, for federal income tax purposes were as follows:
| Gross unrealized appreciation | $118,761,746 |
| Gross unrealized depreciation | (1,278,720) |
| Net unrealized appreciation (depreciation) | $117,483,026 |
| Tax Cost | $258,029,268 |
The tax-based components of distributable earnings as of period end were as follows:
| Undistributed ordinary income | $119,850 |
| Capital loss carryforward | $(9,350,593) |
| Net unrealized appreciation (depreciation) on securities and other investments | $117,498,094 |
Capital loss carryforwards are only available to offset future capital gains of the Fund to the extent provided by regulations and may be limited. Under the Regulated Investment Company Modernization Act of 2010 (the Act), the Fund is permitted to carry forward capital losses incurred in taxable years beginning after December 22, 2010 for an unlimited period and such capital losses are required to be used prior to any losses that expire. The capital loss carryforward information presented below, including any applicable limitation, is estimated as of fiscal period end and is subject to adjustment.
| No expiration | |
| Short-term | $(9,350,593) |
The tax character of distributions paid was as follows:
| | December 31, 2017 | December 31, 2016 |
| Ordinary Income | $2,442,668 | $1,110,495 |
| Total | $2,442,668 | $ 1,110,495 |
4. Purchases and Sales of Investments.
Purchases and sales of securities, other than short-term securities, aggregated $276,647,135 and $245,949,675, respectively.
5. Fees and Other Transactions with Affiliates.
Management Fee. Fidelity Management & Research Company (the investment adviser) and its affiliates provide the Fund with investment management related services for which the Fund pays a monthly management fee. The management fee is the sum of an individual fund fee rate that is based on an annual rate of .55% of the Fund's average net assets and an annualized group fee rate that averaged .24% during the period. The group fee rate is based upon the average net assets of all the mutual funds advised by the investment adviser, including any mutual funds previously advised by the investment adviser that are currently advised by Fidelity SelectCo, LLC, an affiliate of the investment adviser. The group fee rate decreases as assets under management increase and increases as assets under management decrease. For the reporting period, the total annual management fee rate was .79% of the Fund's average net assets.
Distribution and Service Plan Fees. In accordance with Rule 12b-1 of the 1940 Act, the Fund has adopted separate 12b-1 Plans for each Service Class of shares. Each Service Class pays Fidelity Distributors Corporation (FDC), an affiliate of the investment adviser, a service fee. For the period, the service fee is based on an annual rate of .10% of Service Class' average net assets and .25% of Service Class 2's average net assets.
For the period, total fees, all of which were re-allowed to insurance companies for the distribution of shares and providing shareholder support services, were as follows:
| Service Class | $603 |
| Service Class 2 | 12,630 |
| | $13,233 |
Transfer Agent Fees. Fidelity Investments Institutional Operations Company, Inc. (FIIOC), an affiliate of the investment adviser, is the Fund's transfer, dividend disbursing, and shareholder servicing agent. FIIOC receives an asset-based fee with respect to each class. Each class pays a fee for transfer agent services, typesetting and printing and mailing of shareholder reports, excluding mailing of proxy statements, equal to an annual rate of class-level average net assets. The annual rate for Investor Class is .15% and the annual rate for all other classes is .07%. For the period, transfer agent fees for each class were as follows:
| Initial Class | $101,358 |
| Service Class | 397 |
| Service Class 2 | 3,329 |
| Investor Class | 213,471 |
| | $318,555 |
Accounting and Security Lending Fees. Fidelity Service Company, Inc. (FSC), an affiliate of the investment adviser, maintains the Fund's accounting records. The accounting fee is based on the level of average net assets for each month. Under a separate contract, FSC administers the security lending program. The security lending fee is based on the number and duration of lending transactions.
Brokerage Commissions. The Fund placed a portion of its portfolio transactions with brokerage firms which are affiliates of the investment adviser. Brokerage commissions are included in net realized gain (loss) and change in net unrealized appreciation (depreciation) in the Statement of Operations. The commissions paid to these affiliated firms were $1,656 for the period.
Interfund Trades. The Fund may purchase from or sell securities to other Fidelity Funds under procedures adopted by the Board. The procedures have been designed to ensure these interfund trades are executed in accordance with Rule 17a-7 of the 1940 Act. Interfund trades are included within the respective purchases and sales amounts shown in the Purchases and Sales of Investments note.
6. Committed Line of Credit.
The Fund participates with other funds managed by the investment adviser or an affiliate in a $4.25 billion credit facility (the "line of credit") to be utilized for temporary or emergency purposes to fund shareholder redemptions or for other short-term liquidity purposes. The Fund has agreed to pay commitment fees on its pro-rata portion of the line of credit, which amounted to $868 and is reflected in Miscellaneous expenses on the Statement of Operations. During the period, the Fund did not borrow on this line of credit.
7. Security Lending.
The Fund lends portfolio securities through a lending agent from time to time in order to earn additional income. For equity securities, a lending agent is used and may loan securities to certain qualified borrowers, including Fidelity Capital Markets (FCM), a broker-dealer affiliated with the Fund. On the settlement date of the loan, the Fund receives collateral (in the form of U.S. Treasury obligations, letters of credit and/or cash) against the loaned securities and maintains collateral in an amount not less than 100% of the market value of the loaned securities during the period of the loan. The market value of the loaned securities is determined at the close of business of the Fund and any additional required collateral is delivered to the Fund on the next business day. The Fund or borrower may terminate the loan at any time, and if the borrower defaults on its obligation to return the securities loaned because of insolvency or other reasons, the Fund may apply collateral received from the borrower against the obligation. The Fund may experience delays and costs in recovering the securities loaned. Any cash collateral received is invested in the Fidelity Securities Lending Cash Central Fund. The value of loaned securities and cash collateral at period end are disclosed on the Fund's Statement of Assets and Liabilities. At period end, there were no security loans outstanding with FCM. Security lending income represents the income earned on investing cash collateral, less rebates paid to borrowers and any lending agent fees associated with the loan, plus any premium payments received for lending certain types of securities. Security lending income is presented in the Statement of Operations as a component of income from Fidelity Central Funds. Total security lending income during the period amounted to $8,858, including $3,415 from securities loaned to FCM.
8. Expense Reductions.
Commissions paid to certain brokers with whom the investment adviser, or its affiliates, places trades on behalf of the Fund include an amount in addition to trade execution, which may be rebated back to the Fund to offset certain expenses. This amount totaled $63,023 for the period.
In addition, during the period the investment adviser reimbursed and/or waived a portion of fund-level operating expenses in the amount of $2,056.
9. Distributions to Shareholders.
Distributions to shareholders of each class were as follows:
| | Year ended
December 31, 2017 | Year ended
December 31, 2016 |
| From net investment income | | |
| Initial Class | $1,017,988 | $679,873 |
| Service Class | 5,076 | 291 |
| Service Class 2 | 29,491 | 3,358 |
| Investor Class | 1,053,319 | 426,973 |
| Total | $2,105,874 | $1,110,495 |
| From net realized gain | | |
| Initial Class | $147,812 | $– |
| Service Class | 968 | – |
| Service Class 2 | 6,466 | – |
| Investor Class | 181,548 | – |
| Total | $336,794 | $– |
10. Share Transactions.
Transactions for each class of shares were as follows:
| | Shares | Shares | Dollars | Dollars |
| | Year ended December 31, 2017 | Year ended December 31, 2016 | Year ended December 31, 2017 | Year ended December 31, 2016 |
| Initial Class | | | | |
| Shares sold | 3,787,927 | 4,689,958 | $40,080,203 | $38,480,671 |
| Reinvestment of distributions | 105,633 | 82,309 | 1,165,800 | 679,873 |
| Shares redeemed | (6,215,200) | (2,767,616) | (66,225,214) | (23,746,125) |
| Net increase (decrease) | (2,321,640) | 2,004,651 | $(24,979,211) | $15,414,419 |
| Service Class | | | | |
| Shares sold | 90,604 | 1,379 | $942,041 | $11,573 |
| Reinvestment of distributions | 518 | 35 | 6,044 | 291 |
| Shares redeemed | (12,018) | (508) | (134,324) | (3,718) |
| Net increase (decrease) | 79,104 | 906 | $813,761 | $8,146 |
| Service Class 2 | | | | |
| Shares sold | 354,795 | 162,060 | $3,726,150 | $1,326,312 |
| Reinvestment of distributions | 3,169 | 405 | 35,957 | 3,358 |
| Shares redeemed | (108,883) | (810,748) | (1,168,231) | (6,802,720) |
| Net increase (decrease) | 249,081 | (648,283) | $2,593,876 | $(5,473,050) |
| Investor Class | | | | |
| Shares sold | 9,122,232 | 3,757,797 | $97,121,074 | $31,598,034 |
| Reinvestment of distributions | 110,035 | 51,880 | 1,234,867 | 426,973 |
| Shares redeemed | (3,665,255) | (1,895,883) | (38,792,565) | (15,977,139) |
| Net increase (decrease) | 5,567,012 | 1,913,794 | $59,563,376 | $16,047,868 |
11. Other.
The Fund's organizational documents provide former and current trustees and officers with a limited indemnification against liabilities arising in connection with the performance of their duties to the Fund. In the normal course of business, the Fund may also enter into contracts that provide general indemnifications. The Fund's maximum exposure under these arrangements is unknown as this would be dependent on future claims that may be made against the Fund. The risk of material loss from such claims is considered remote.
At the end of the period, the investment adviser or its affiliates were the owners of record of 43% of the total outstanding shares of the Fund. In addition, at the end of the period, VIP Freedom 2020 Portfolio was the owner of record of approximately 14% of the total outstanding shares of the Fund. Mutual funds managed by the investment adviser or its affiliates were the owners of record, in the aggregate, of approximately 54% of the total outstanding shares of the Fund.
Report of Independent Registered Public Accounting Firm
To the Trustees of Variable Insurance Products Fund II and Shareholders of VIP Emerging Markets Portfolio:
Opinion on the Financial Statements and Financial Highlights
We have audited the accompanying statement of assets and liabilities of VIP Emerging Markets Portfolio (the "Fund"), a fund of Variable Insurance Products Fund II, including the schedule of investments, as of December 31, 2017, and the related statement of operations for the year then ended, the statement of changes in net assets for each of the two years in the period then ended, the financial highlights for each of the five years in the period then ended, and the related notes. In our opinion, the financial statements and financial highlights present fairly, in all material respects, the financial position of the Fund as of December 31, 2017, and the results of its operations for the year then ended, the changes in its net assets for each of the two years in the period then ended, and the financial highlights for each of the five years in the period then ended, in conformity with accounting principles generally accepted in the United States of America.
Basis for Opinion
These financial statements and financial highlights are the responsibility of the Fund's management. Our responsibility is to express an opinion on the Fund's financial statements and financial highlights based on our audits. We are a public accounting firm registered with the Public Company Accounting Oversight Board (United States) (PCAOB) and are required to be independent with respect to the Fund in accordance with the U.S. federal securities laws and the applicable rules and regulations of the Securities and Exchange Commission and the PCAOB.
We conducted our audits in accordance with the standards of the PCAOB. Those standards require that we plan and perform the audit to obtain reasonable assurance about whether the financial statements and financial highlights are free of material misstatement, whether due to error or fraud. The Fund is not required to have, nor were we engaged to perform, an audit of its internal control over financial reporting. As part of our audits we are required to obtain an understanding of internal control over financial reporting but not for the purpose of expressing an opinion on the effectiveness of the Fund’s internal control over financial reporting. Accordingly, we express no such opinion.
Our audits included performing procedures to assess the risks of material misstatement of the financial statements and financial highlights, whether due to error or fraud, and performing procedures that respond to those risks. Such procedures included examining, on a test basis, evidence regarding the amounts and disclosures in the financial statements and financial highlights. Our audits also included evaluating the accounting principles used and significant estimates made by management, as well as evaluating the overall presentation of the financial statements and financial highlights. Our procedures included confirmation of securities owned as of December 31, 2017, by correspondence with the custodians and brokers; when replies were not received from brokers, we performed other auditing procedures. We believe that our audits provide a reasonable basis for our opinion.
DELOITTE & TOUCHE LLP
Boston, Massachusetts
February 15, 2018
We have served as the auditor of one or more of the Fidelity investment companies since 1999.
Trustees and Officers
The Trustees, Members of the Advisory Board (if any), and officers of the trust and fund, as applicable, are listed below. The Board of Trustees governs the fund and is responsible for protecting the interests of shareholders. The Trustees are experienced executives who meet periodically throughout the year to oversee the fund's activities, review contractual arrangements with companies that provide services to the fund, oversee management of the risks associated with such activities and contractual arrangements, and review the fund's performance. Each of the Trustees oversees 190 funds.
The Trustees hold office without limit in time except that (a) any Trustee may resign; (b) any Trustee may be removed by written instrument, signed by at least two-thirds of the number of Trustees prior to such removal; (c) any Trustee who requests to be retired or who has become incapacitated by illness or injury may be retired by written instrument signed by a majority of the other Trustees; and (d) any Trustee may be removed at any special meeting of shareholders by a two-thirds vote of the outstanding voting securities of the trust. Each Trustee who is not an interested person (as defined in the 1940 Act) of the trust and the fund is referred to herein as an Independent Trustee. Each Independent Trustee shall retire not later than the last day of the calendar year in which his or her 75th birthday occurs. The Independent Trustees may waive this mandatory retirement age policy with respect to individual Trustees. Officers and Advisory Board Members hold office without limit in time, except that any officer or Advisory Board Member may resign or may be removed by a vote of a majority of the Trustees at any regular meeting or any special meeting of the Trustees. Except as indicated, each individual has held the office shown or other offices in the same company for the past five years.
The fund’s Statement of Additional Information (SAI) includes more information about the Trustees. To request a free copy, call Fidelity at 1-877-208-0098.
Experience, Skills, Attributes, and Qualifications of the Trustees. The Governance and Nominating Committee has adopted a statement of policy that describes the experience, qualifications, attributes, and skills that are necessary and desirable for potential Independent Trustee candidates (Statement of Policy). The Board believes that each Trustee satisfied at the time he or she was initially elected or appointed a Trustee, and continues to satisfy, the standards contemplated by the Statement of Policy. The Governance and Nominating Committee also engages professional search firms to help identify potential Independent Trustee candidates who have the experience, qualifications, attributes, and skills consistent with the Statement of Policy. From time to time, additional criteria based on the composition and skills of the current Independent Trustees, as well as experience or skills that may be appropriate in light of future changes to board composition, business conditions, and regulatory or other developments, have also been considered by the professional search firms and the Governance and Nominating Committee. In addition, the Board takes into account the Trustees' commitment and participation in Board and committee meetings, as well as their leadership of standing and ad hoc committees throughout their tenure.
In determining that a particular Trustee was and continues to be qualified to serve as a Trustee, the Board has considered a variety of criteria, none of which, in isolation, was controlling. The Board believes that, collectively, the Trustees have balanced and diverse experience, qualifications, attributes, and skills, which allow the Board to operate effectively in governing the fund and protecting the interests of shareholders. Information about the specific experience, skills, attributes, and qualifications of each Trustee, which in each case led to the Board's conclusion that the Trustee should serve (or continue to serve) as a trustee of the fund, is provided below.
Board Structure and Oversight Function. James C. Curvey is an interested person and currently serves as Chairman. The Trustees have determined that an interested Chairman is appropriate and benefits shareholders because an interested Chairman has a personal and professional stake in the quality and continuity of services provided to the fund. Independent Trustees exercise their informed business judgment to appoint an individual of their choosing to serve as Chairman, regardless of whether the Trustee happens to be independent or a member of management. The Independent Trustees have determined that they can act independently and effectively without having an Independent Trustee serve as Chairman and that a key structural component for assuring that they are in a position to do so is for the Independent Trustees to constitute a substantial majority for the Board. The Independent Trustees also regularly meet in executive session. Ned C. Lautenbach serves as Chairman of the Independent Trustees and as such (i) acts as a liaison between the Independent Trustees and management with respect to matters important to the Independent Trustees and (ii) with management prepares agendas for Board meetings.
Fidelity® funds are overseen by different Boards of Trustees. The fund's Board oversees Fidelity's high income and certain equity funds, and other Boards oversee Fidelity's investment-grade bond, money market, asset allocation, and sector funds. The asset allocation funds may invest in Fidelity® funds overseen by the fund's Board. The use of separate Boards, each with its own committee structure, allows the Trustees of each group of Fidelity® funds to focus on the unique issues of the funds they oversee, including common research, investment, and operational issues. On occasion, the separate Boards establish joint committees to address issues of overlapping consequences for the Fidelity® funds overseen by each Board.
The Trustees operate using a system of committees to facilitate the timely and efficient consideration of all matters of importance to the Trustees, the fund, and fund shareholders and to facilitate compliance with legal and regulatory requirements and oversight of the fund's activities and associated risks. The Board, acting through its committees, has charged FMR and its affiliates with (i) identifying events or circumstances the occurrence of which could have demonstrably adverse effects on the fund's business and/or reputation; (ii) implementing processes and controls to lessen the possibility that such events or circumstances occur or to mitigate the effects of such events or circumstances if they do occur; and (iii) creating and maintaining a system designed to evaluate continuously business and market conditions in order to facilitate the identification and implementation processes described in (i) and (ii) above. Because the day-to-day operations and activities of the fund are carried out by or through FMR, its affiliates, and other service providers, the fund's exposure to risks is mitigated but not eliminated by the processes overseen by the Trustees. While each of the Board's committees has responsibility for overseeing different aspects of the fund's activities, oversight is exercised primarily through the Operations, Audit, and Compliance Committees. In addition, the Independent Trustees have worked with FMR to enhance the Board's oversight of investment and financial risks, legal and regulatory risks, technology risks, and operational risks, including the development of additional risk reporting to the Board. For example, a working group comprised of Independent Trustees and FMR has worked and continues to work to review the Fidelity® funds' valuation-related activities, reporting and risk management. Appropriate personnel, including but not limited to the fund's Chief Compliance Officer (CCO), FMR's internal auditor, the independent accountants, the fund's Treasurer and portfolio management personnel, make periodic reports to the Board's committees, as appropriate, including an annual review of Fidelity's risk management program for the Fidelity® funds. The responsibilities of each standing committee, including their oversight responsibilities, are described further under "Standing Committees of the Trustees."
Interested Trustees*:
Correspondence intended for a Trustee who is an interested person may be sent to Fidelity Investments, 245 Summer Street, Boston, Massachusetts 02210.
Name, Year of Birth; Principal Occupations and Other Relevant Experience+
James C. Curvey (1935)
Year of Election or Appointment: 2007
Trustee
Chairman of the Board of Trustees
Mr. Curvey also serves as Trustee of other Fidelity® funds. Mr. Curvey is a Director of Fidelity Research & Analysis Co. (investment adviser firm, 2009-present), and Vice Chairman (2007-present) and Director of FMR LLC (diversified financial services company). In addition, Mr. Curvey serves as an Overseer for the Boston Symphony Orchestra and a member of the board of Artis-Naples, Naples, Florida, and as a Trustee for Brewster Academy, Wolfeboro, New Hampshire. Previously, Mr. Curvey served as a Director of Fidelity Investments Money Management, Inc. (investment adviser firm, 2009-2014) and a Director of FMR and FMR Co., Inc. (investment adviser firms, 2007-2014).
Charles S. Morrison (1960)
Year of Election or Appointment: 2014
Trustee
Mr. Morrison also serves as Trustee of other funds. He serves as President of Fidelity SelectCo, LLC (investment adviser firm, 2017-present) and Fidelity Management & Research Company (FMR) (investment adviser firm, 2016-present), a Director of Fidelity Investments Money Management, Inc. (FIMM) (investment adviser firm, 2014-present), Director of Fidelity SelectCo, LLC (investment adviser firm, 2014-present), President, Asset Management (2014-present), and is an employee of Fidelity Investments. Previously, Mr. Morrison served as Vice President of Fidelity's Fixed Income and Asset Allocation Funds (2012-2014), President, Fixed Income (2011-2014), Vice President of Fidelity's Money Market Funds (2005-2009), President, Money Market Group Leader of FMR (investment adviser firm, 2009), and Senior Vice President, Money Market Group of FMR (2004-2009). Mr. Morrison also served as Vice President of Fidelity's Bond Funds (2002-2005), certain Balanced Funds (2002-2005), and certain Asset Allocation Funds (2002-2007), and as Senior Vice President (2002-2005) of Fidelity's Bond Division.
* Determined to be an “Interested Trustee” by virtue of, among other things, his or her affiliation with the trust or various entities under common control with FMR.
+ The information includes the Trustee's principal occupation during the last five years and other information relating to the experience, attributes, and skills relevant to the Trustee's qualifications to serve as a Trustee, which led to the conclusion that the Trustee should serve as a Trustee for the fund.
Independent Trustees:
Correspondence intended for an Independent Trustee may be sent to Fidelity Investments, P.O. Box 55235, Boston, Massachusetts 02205-5235.
Name, Year of Birth; Principal Occupations and Other Relevant Experience+
Dennis J. Dirks (1948)
Year of Election or Appointment: 2005
Trustee
Mr. Dirks also serves as Trustee of other Fidelity® funds. Prior to his retirement in May 2003, Mr. Dirks was Chief Operating Officer and a member of the Board of The Depository Trust & Clearing Corporation (DTCC). He also served as President, Chief Operating Officer, and Board member of The Depository Trust Company (DTC) and President and Board member of the National Securities Clearing Corporation (NSCC). In addition, Mr. Dirks served as Chief Executive Officer and Board member of the Government Securities Clearing Corporation, Chief Executive Officer and Board member of the Mortgage-Backed Securities Clearing Corporation, as a Trustee and a member of the Finance Committee of Manhattan College (2005-2008), as a Trustee and a member of the Finance Committee of AHRC of Nassau County (2006-2008), as a member of the Independent Directors Council (IDC) Governing Council (2010-2015), and as a member of the Board of Directors for The Brookville Center for Children’s Services, Inc. (2009-2017). Mr. Dirks is a member of the Finance Committee (2016-present) and Board of Directors (2017-present) of the Asolo Repertory Theatre.
Alan J. Lacy (1953)
Year of Election or Appointment: 2008
Trustee
Mr. Lacy also serves as Trustee of other Fidelity® funds. Mr. Lacy serves as a Director of Bristol-Myers Squibb Company (global pharmaceuticals, 2008-present). He is a Trustee of the California Chapter of The Nature Conservancy (2015-present) and a Director of the Center for Advanced Study in the Behavioral Sciences at Stanford University (2015-present). In addition, Mr. Lacy served as Senior Adviser (2007-2014) of Oak Hill Capital Partners, L.P. (private equity) and also served as Chief Executive Officer (2005) and Vice Chairman (2005-2006) of Sears Holdings Corporation (retail) and Chief Executive Officer and Chairman of the Board of Sears, Roebuck and Co. (retail, 2000-2005). Previously, Mr. Lacy served as Chairman (2014-2017) and a member (2010-2017) of the Board of Directors of Dave & Buster’s Entertainment, Inc. (restaurant and entertainment complexes), as Chairman (2008-2011) and a member (2006-2015) of the Board of Trustees of the National Parks Conservation Association, and as a member of the Board of Directors for The Hillman Companies, Inc. (hardware wholesalers, 2010-2014), Earth Fare, Inc. (retail grocery, 2010-2014), and The Western Union Company (global money transfer, 2006-2011).
Ned C. Lautenbach (1944)
Year of Election or Appointment: 2000
Trustee
Chairman of the Independent Trustees
Mr. Lautenbach also serves as Trustee of other Fidelity® funds. Mr. Lautenbach currently serves as Vice Chair of the Board of Governors, State University System of Florida (2013-present) and is a member of the Council on Foreign Relations (1994-present). He is also a member and has most recently served as Chairman of the Board of Directors of Artis-Naples (2012-present). Previously, Mr. Lautenbach served as a member and then Lead Director of the Board of Directors of Eaton Corporation (diversified industrial, 1997-2016). He was also a Partner and Advisory Partner at Clayton, Dubilier & Rice, LLC (private equity investment, 1998-2010), as well as a Director of Sony Corporation (2006-2007). In addition, Mr. Lautenbach also had a 30-year career with IBM (technology company) during which time he served as Senior Vice President and a member of the Corporate Executive Committee (1968-1998).
Joseph Mauriello (1944)
Year of Election or Appointment: 2008
Trustee
Mr. Mauriello also serves as Trustee of other Fidelity® funds. Prior to his retirement in January 2006, Mr. Mauriello served in numerous senior management positions including Deputy Chairman and Chief Operating Officer (2004-2005), and Vice Chairman of Financial Services (2002-2004) of KPMG LLP US (professional services, 1965-2005). Mr. Mauriello currently serves as a member of the Board of Directors of XL Group plc. (global insurance and re-insurance, 2006-present) and the Independent Directors Council (IDC) Governing Council (2015-present). Previously, Mr. Mauriello served as a Director of the Hamilton Funds of the Bank of New York (2006-2007) and of Arcadia Resources Inc. (health care services and products, 2007-2012).
Cornelia M. Small (1944)
Year of Election or Appointment: 2005
Trustee
Ms. Small also serves as Trustee of other Fidelity® funds. Ms. Small is a member of the Board of Directors (2009-present) and Chair of the Investment Committee (2010-present) of the Teagle Foundation. Ms. Small also serves on the Investment Committee of the Berkshire Taconic Community Foundation (2008-present). Previously, Ms. Small served as Chairperson (2002-2008) and a member of the Investment Committee and Chairperson (2008-2012) and a member of the Board of Trustees of Smith College. In addition, Ms. Small served as Chief Investment Officer, Director of Global Equity Investments, and a member of the Board of Directors of Scudder, Stevens & Clark and Scudder Kemper Investments.
William S. Stavropoulos (1939)
Year of Election or Appointment: 2001
Trustee
Vice Chairman of the Independent Trustees
Mr. Stavropoulos also serves as Trustee of other Fidelity® funds. Mr. Stavropoulos serves as President and Founder of the Michigan Baseball Foundation, the Great Lakes Loons (2007-present). Mr. Stavropoulos is Chairman Emeritus of the Board of Directors of The Dow Chemical Company, where he previously served in numerous senior management positions, including President, CEO (1995-2000; 2002-2004), Chairman of the Executive Committee (2000-2006), and as a member of the Board of Directors (1990-2006). Currently, Mr. Stavropoulos is Chairman of the Board of Directors of Univar Inc. (global distributor of commodity and specialty chemicals), a Director of Teradata Corporation (data warehousing and technology solutions), and a member of the Advisory Board for Metalmark Capital LLC (private equity investment, 2005-present). Mr. Stavropoulos is an operating advisor to Clayton, Dubilier & Rice, LLC (private equity investment). In addition, Mr. Stavropoulos is a member of the University of Notre Dame Advisory Council for the College of Science, a Trustee of the Rollin L. Gerstacker Foundation, and a Director of Artis-Naples in Naples, Florida. Previously, Mr. Stavropoulos served as a Director of Chemical Financial Corporation (bank holding company, 1993-2012) and Tyco International, Ltd. (multinational manufacturing and services, 2007-2012).
David M. Thomas (1949)
Year of Election or Appointment: 2008
Trustee
Mr. Thomas also serves as Trustee of other Fidelity® funds. Mr. Thomas serves as Non-Executive Chairman of the Board of Directors of Fortune Brands Home and Security (home and security products, 2011-present), as a member of the Board of Directors (2004-present) and Presiding Director (2013-present) of Interpublic Group of Companies, Inc. (marketing communication), and as a member of the Board of Trustees of the University of Florida (2013-present). Previously, Mr. Thomas served as Executive Chairman (2005-2006) and Chairman and Chief Executive Officer (2000-2005) of IMS Health, Inc. (pharmaceutical and healthcare information solutions), and a Director of Fortune Brands, Inc. (consumer products, 2000-2011).
+ The information includes the Trustee's principal occupation during the last five years and other information relating to the experience, attributes, and skills relevant to the Trustee's qualifications to serve as a Trustee, which led to the conclusion that the Trustee should serve as a Trustee for the fund.
Advisory Board Members and Officers:
Correspondence intended for an officer or Peter S. Lynch may be sent to Fidelity Investments, 245 Summer Street, Boston, Massachusetts 02210. Officers appear below in alphabetical order.
Name, Year of Birth; Principal Occupation
Peter S. Lynch (1944)
Year of Election or Appointment: 2003
Member of the Advisory Board
Mr. Lynch also serves as Member of the Advisory Board of other Fidelity® funds. Mr. Lynch is Vice Chairman and a Director of FMR (investment adviser firm) and FMR Co., Inc. (investment adviser firm). In addition, Mr. Lynch serves as a Trustee of Boston College and as the Chairman of the Inner-City Scholarship Fund. Previously, Mr. Lynch served on the Special Olympics International Board of Directors (1997-2006).
Elizabeth Paige Baumann (1968)
Year of Election or Appointment: 2017
Anti-Money Laundering (AML) Officer
Ms. Baumann also serves as AML Officer of other funds. She is Chief AML Officer (2012-present) and Senior Vice President (2014-present) of FMR LLC (diversified financial services company) and is an employee of Fidelity Investments. Previously, Ms. Baumann served as AML Officer of the funds (2012-2016), and Vice President (2007-2014) and Deputy Anti-Money Laundering Officer (2007-2012) of FMR LLC.
Marc R. Bryant (1966)
Year of Election or Appointment: 2015
Secretary and Chief Legal Officer (CLO)
Mr. Bryant also serves as Secretary and CLO of other funds. Mr. Bryant serves as CLO, Secretary, and Senior Vice President of Fidelity Management & Research Company (investment adviser firm, 2015-present) and FMR Co., Inc. (investment adviser firm, 2015-present); Secretary of Fidelity SelectCo, LLC (investment adviser firm, 2015-present) and Fidelity Investments Money Management, Inc. (investment adviser firm, 2015-present); and CLO of Fidelity Management & Research (Hong Kong) Limited and FMR Investment Management (UK) Limited (investment adviser firms, 2015-present) and Fidelity Management & Research (Japan) Limited (investment adviser firm, 2016-present). He is Senior Vice President and Deputy General Counsel of FMR LLC (diversified financial services company). Previously, Mr. Bryant served as Secretary and CLO of Fidelity Rutland Square Trust II (2010-2014) and Assistant Secretary of Fidelity's Fixed Income and Asset Allocation Funds (2013-2015). Prior to joining Fidelity Investments, Mr. Bryant served as a Senior Vice President and the Head of Global Retail Legal for AllianceBernstein L.P. (2006-2010), and as the General Counsel for ProFund Advisors LLC (2001-2006).
William C. Coffey (1969)
Year of Election or Appointment: 2009
Assistant Secretary
Mr. Coffey also serves as Assistant Secretary of other funds. He is Senior Vice President and Deputy General Counsel of FMR LLC (diversified financial services company, 2010-present), and is an employee of Fidelity Investments. Previously, Mr. Coffey served as Vice President and Associate General Counsel of FMR LLC (2005-2009).
Jonathan Davis (1968)
Year of Election or Appointment: 2010
Assistant Treasurer
Mr. Davis also serves as Assistant Treasurer of other funds. Mr. Davis serves as Assistant Treasurer of FMR Capital, Inc. (2017-present) and is an employee of Fidelity Investments. Previously, Mr. Davis served as Vice President and Associate General Counsel of FMR LLC (diversified financial services company, 2003-2010).
Adrien E. Deberghes (1967)
Year of Election or Appointment: 2016
Assistant Treasurer
Mr. Deberghes also serves as an officer of other funds. He serves as Assistant Treasurer of FMR Capital, Inc. (2017-present), Executive Vice President of Fidelity Investments Money Management, Inc. (FIMM) (investment adviser firm, 2016-present), and is an employee of Fidelity Investments (2008-present). Prior to joining Fidelity Investments, Mr. Deberghes was Senior Vice President of Mutual Fund Administration at State Street Corporation (2007-2008), Senior Director of Mutual Fund Administration at Investors Bank & Trust (2005-2007), and Director of Finance for Dunkin' Brands (2000-2005). Previously, Mr. Deberghes served in other fund officer roles.
Joseph DeSantis (1959)
Year of Election or Appointment: 2017
Vice President
Mr. DeSantis also serves as Vice President of other funds. Mr. DeSantis serves as a Director of Fidelity Management & Research (Japan) Limited (investment adviser firm, 2016-present), Chief Investment Officer, Equities (2010-present) and is an employee of Fidelity Investments.
Stephanie J. Dorsey (1969)
Year of Election or Appointment: 2010
Assistant Treasurer
Ms. Dorsey also serves as an officer of other funds. Ms. Dorsey serves as Assistant Treasurer of FMR Capital, Inc. (2017-present), is an employee of Fidelity Investments (2008-present), and has served in other fund officer roles. Prior to joining Fidelity Investments, Ms. Dorsey served as Treasurer (2004-2008) of the JPMorgan Mutual Funds and Vice President (2004-2008) of JPMorgan Chase Bank.
Howard J. Galligan III (1966)
Year of Election or Appointment: 2014
Chief Financial Officer
Mr. Galligan also serves as Chief Financial Officer of other funds. Mr. Galligan serves as President of Fidelity Pricing and Cash Management Services (FPCMS) (2014-present) and as a Director of Strategic Advisers, Inc. (investment adviser firm, 2008-present). Previously, Mr. Galligan served as Chief Administrative Officer of Asset Management (2011-2014) and Chief Operating Officer and Senior Vice President of Investment Support for Strategic Advisers, Inc. (2003-2011).
Brian B. Hogan (1964)
Year of Election or Appointment: 2009
Vice President
Mr. Hogan also serves as Trustee or Vice President of other funds. Mr. Hogan serves as a Director of FMR Investment Management (UK) Limited (investment adviser firm, 2015-present) and Fidelity SelectCo, LLC (investment adviser firm, 2014-present) and President of the Equity Division of FMR (investment adviser firm, 2009-present). Previously, Mr. Hogan served as Senior Vice President, Equity Research of FMR (2006-2009) and as a portfolio manager. Mr. Brian B. Hogan is not related to Mr. Colm A. Hogan.
Colm A. Hogan (1973)
Year of Election or Appointment: 2016
Deputy Treasurer
Mr. Hogan also serves as an officer of other funds. Mr. Hogan serves as Assistant Treasurer of FMR Capital, Inc. (2017-present) and is an employee of Fidelity Investments (2005-present). Mr. Colm A. Hogan is not related to Mr. Brian B. Hogan.
Chris Maher (1972)
Year of Election or Appointment: 2013
Assistant Treasurer
Mr. Maher serves as Assistant Treasurer of other funds. Mr. Maher is Vice President of Valuation Oversight, serves as Assistant Treasurer of FMR Capital, Inc. (2017-present), and is an employee of Fidelity Investments. Previously, Mr. Maher served as Vice President of Asset Management Compliance (2013), Vice President of the Program Management Group of FMR (investment adviser firm, 2010-2013), and Vice President of Valuation Oversight (2008-2010).
Rieco E. Mello (1969)
Year of Election or Appointment: 2017
Assistant Treasurer
Mr. Mello also serves as Assistant Treasurer of other funds. Mr. Mello serves as Assistant Treasurer of FMR Capital, Inc. (2017-present) and is an employee of Fidelity Investments (1995-present).
Kenneth B. Robins (1969)
Year of Election or Appointment: 2016
Chief Compliance Officer
Mr. Robins also serves as an officer of other funds. Mr. Robins serves as Compliance Officer of Fidelity Management & Research Company and FMR Co., Inc. (investment adviser firms, 2016-present) and is an employee of Fidelity Investments (2004-present). Previously, Mr. Robins served as Executive Vice President of Fidelity Investments Money Management, Inc. (investment adviser firm, 2013-2016) and served in other fund officer roles.
Stacie M. Smith (1974)
Year of Election or Appointment: 2016
President and Treasurer
Ms. Smith also serves as an officer of other funds. Ms. Smith serves as Assistant Treasurer of FMR Capital, Inc. (2017-present), is an employee of Fidelity Investments (2009-present), and has served in other fund officer roles. Prior to joining Fidelity Investments, Ms. Smith served as Senior Audit Manager of Ernst & Young LLP (accounting firm, 1996-2009). Previously, Ms. Smith served as Deputy Treasurer of certain Fidelity® funds (2013-2016).
Marc L. Spector (1972)
Year of Election or Appointment: 2016
Assistant Treasurer
Mr. Spector also serves as an officer of other funds. Mr. Spector serves as Assistant Treasurer of FMR Capital, Inc. (2017-present) and is an employee of Fidelity Investments (2016-present). Prior to joining Fidelity Investments, Mr. Spector served as Director at the Siegfried Group (accounting firm, 2013-2016), and prior to Siegfried Group as audit senior manager at Deloitte & Touche (accounting firm, 2005-2013).
Renee Stagnone (1975)
Year of Election or Appointment: 2016
Assistant Treasurer
Ms. Stagnone also serves as an officer of other funds. Ms. Stagnone serves as Assistant Treasurer of FMR Capital, Inc. (2017-present) and is an employee of Fidelity Investments (1997-present). Previously, Ms. Stagnone served as Deputy Treasurer of certain Fidelity® funds (2013-2016).
Shareholder Expense Example
As a shareholder of the Fund, you incur two types of costs: (1) transaction costs, and (2) ongoing costs, including management fees, distribution and/or service (12b-1) fees and other Fund expenses. This Example is intended to help you understand your ongoing costs (in dollars) of investing in the Fund and to compare these costs with the ongoing costs of investing in other mutual funds.
The Example is based on an investment of $1,000 invested at the beginning of the period and held for the entire period (July 1, 2017 to December 31, 2017).
Actual Expenses
The first line of the accompanying table for each class of the Fund provides information about actual account values and actual expenses. You may use the information in this line, together with the amount you invested, to estimate the expenses that you paid over the period. Simply divide your account value by $1,000.00 (for example, an $8,600 account value divided by $1,000.00 = 8.6), then multiply the result by the number in the first line for a class of the Fund under the heading entitled "Expenses Paid During Period" to estimate the expenses you paid on your account during this period. The estimate of expenses does not include any fees or other expenses of any variable annuity or variable life insurance product. If they were, the estimate of expenses you paid during the period would be higher, and your ending account value would be lower. In addition, the Fund, as a shareholder in the underlying Fidelity Central Funds, will indirectly bear its pro-rata share of the fees and expenses incurred by the underlying Fidelity Central Funds. These fees and expenses are not included in the Fund's annualized expense ratio used to calculate the expense estimate in the table below.
Hypothetical Example for Comparison Purposes
The second line of the accompanying table for each class of the Fund provides information about hypothetical account values and hypothetical expenses based on a Class' actual expense ratio and an assumed rate of return of 5% per year before expenses, which is not the Class' actual return. The hypothetical account values and expenses may not be used to estimate the actual ending account balance or expenses you paid for the period. You may use this information to compare the ongoing costs of investing in the Fund and other funds. To do so, compare this 5% hypothetical example with the 5% hypothetical examples that appear in the shareholder reports of the other funds. The estimate of expenses does not include any fees or other expenses of any variable annuity or variable life insurance product. If they were, the estimate of expenses you paid during the period would be higher, and your ending account value would be lower. In addition, the Fund, as a shareholder in the underlying Fidelity Central Funds, will indirectly bear its pro-rata share of the fees and expenses incurred by the underlying Fidelity Central Funds. These fees and expenses are not included in the Fund's annualized expense ratio used to calculate the expense estimate in the table below.
Please note that the expenses shown in the table are meant to highlight your ongoing costs only and do not reflect any transaction costs. Therefore, the second line of the table is useful in comparing ongoing costs only, and will not help you determine the relative total costs of owning different funds.
| | Annualized Expense Ratio-A | Beginning
Account Value
July 1, 2017 | Ending
Account Value
December 31, 2017 | Expenses Paid
During Period-B
July 1, 2017
to December 31, 2017 |
| Initial Class | 1.01% | | | |
| Actual | | $1,000.00 | $1,182.90 | $5.56 |
| Hypothetical-C | | $1,000.00 | $1,020.11 | $5.14 |
| Service Class | 1.11% | | | |
| Actual | | $1,000.00 | $1,182.20 | $6.11 |
| Hypothetical-C | | $1,000.00 | $1,019.61 | $5.65 |
| Service Class 2 | 1.26% | | | |
| Actual | | $1,000.00 | $1,181.00 | $6.93 |
| Hypothetical-C | | $1,000.00 | $1,018.85 | $6.41 |
| Investor Class | 1.09% | | | |
| Actual | | $1,000.00 | $1,182.40 | $6.00 |
| Hypothetical-C | | $1,000.00 | $1,019.71 | $5.55 |
A Annualized expense ratio reflects expenses net of applicable fee waivers.
B Expenses are equal to each Class' annualized expense ratio, multiplied by the average account value over the period, multiplied by 184/365 (to reflect the one-half year period).
C 5% return per year before expenses
Distributions (Unaudited)
The Board of Trustees of VIP Emerging Markets Portfolio voted to pay to shareholders of record at the opening of business on record date, the following distributions per share derived from capital gains realized from sales of portfolio securities, and dividends derived from net investment income:
| | Pay Date | Record Date | Dividends | Capital Gains |
| Emerging Markets Portfolio | | | | |
| Initial Class | 02/09/18 | 02/09/18 | $0.003 | $0.004 |
| Service Class | 02/09/18 | 02/09/18 | $0.002 | $0.004 |
| Service Class 2 | 02/09/18 | 02/09/18 | $0.000 | $0.003 |
| Investor Class | 02/09/18 | 02/09/18 | $0.002 | $0.004 |
|
Initial Class designates 1%, and 7%; Service Class designates 1%, and 7%; Service Class 2 designates 1%, and 8%; and Investor Class designates 1%, and 7%; of the dividends distributed in February and December, 2017, respectively during the fiscal year as qualifying for the dividends–received deduction for corporate shareholders.
The amounts per share which represent income derived from sources within, and taxes paid to, foreign countries or possessions of the United States are as follows:
| | Pay Date | Income | Taxes |
| Emerging Markets Portfolio | | | |
| Initial Class | 12/01/17 | $0.0835 | $0.0145 |
| Service Class | 12/01/17 | $0.0815 | $0.0145 |
| Service Class 2 | 12/01/17 | $0.0685 | $0.0145 |
| Investor Class | 12/01/17 | $0.0795 | $0.0145 |
|
Board Approval of Investment Advisory Contracts and Management Fees
VIP Emerging Markets Portfolio
Each year, the Board of Trustees, including the Independent Trustees (together, the Board), votes on the renewal of the management contract with Fidelity Management & Research Company (FMR) and the sub-advisory agreements (together, the Advisory Contracts) for the fund. FMR and the sub-advisers are referred to herein as the Investment Advisers. The Board, assisted by the advice of fund counsel and Independent Trustees' counsel, requests and considers a broad range of information relevant to the renewal of the Advisory Contracts throughout the year.
The Board meets regularly and, at each of its meetings, covers an extensive agenda of topics and materials and considers factors that are relevant to its annual consideration of the renewal of the fund's Advisory Contracts, including the services and support provided to the fund and its shareholders. The Board has established various standing committees (Committees), each composed of and chaired by Independent Trustees with varying backgrounds, to which the Board has assigned specific subject matter responsibilities in order to enhance effective decision-making by the Board. The Board, acting directly and through its Committees, requests and receives information concerning the annual consideration of the renewal of the fund's Advisory Contracts. The Board also meets as needed to review matters specifically related to the Board's annual consideration of the renewal of the Advisory Contracts. Members of the Board may also meet with trustees of other Fidelity funds through ad hoc joint committees to discuss certain matters relevant to all of the Fidelity funds.
At its July 2017 meeting, the Board unanimously determined to renew the fund's Advisory Contracts. In reaching its determination, the Board considered all factors it believed relevant, including (i) the nature, extent, and quality of the services to be provided to the fund and its shareholders (including the investment performance of the fund); (ii) the competitiveness of the fund's management fee and total expense ratio relative to peer funds; (iii) the total costs of the services to be provided by and the profits to be realized by Fidelity from its relationships with the fund; and (iv) the extent to which, if any, economies of scale exist and would be realized as the fund grows, and whether any economies of scale are appropriately shared with fund shareholders.
In considering whether to renew the Advisory Contracts for the fund, the Board reached a determination, with the assistance of fund counsel and Independent Trustees' counsel and through the exercise of its business judgment, that the renewal of the Advisory Contracts was in the best interests of the fund and its shareholders and that the compensation payable under the Advisory Contracts was fair and reasonable. The Board's decision to renew the Advisory Contracts was not based on any single factor, but rather was based on a comprehensive consideration of all the information provided to the Board at its meetings throughout the year. The Board, in reaching its determination to renew the Advisory Contracts, was aware that shareholders of the fund have a broad range of investment choices available to them, including a wide choice among funds offered by Fidelity's competitors, and that the fund's shareholders, who have the opportunity to review and weigh the disclosure provided by the fund in its prospectus and other public disclosures, have chosen to invest in this fund, which is part of the Fidelity family of funds.
Amendment to Group Fee Rate. The Board also approved an amendment to the management contract for the fund to add an additional breakpoint to the group fee schedule, effective October 1, 2017. The Board noted that the additional breakpoint would result in lower management fee rates as Fidelity's assets under management increase.
Nature, Extent, and Quality of Services Provided. The Board considered Fidelity's staffing as it relates to the fund, including the backgrounds of investment personnel of Fidelity, and also considered the fund's investment objective, strategies, and related investment philosophy. The Independent Trustees also had discussions with senior management of Fidelity's investment operations and investment groups. The Board considered the structure of the investment personnel compensation program and whether this structure provides appropriate incentives to act in the best interests of the fund. Additionally, the Board considered the portfolio managers' investments, if any, in the funds that they manage.
Resources Dedicated to Investment Management and Support Services. The Board and the Fund Oversight and Research Committees reviewed the general qualifications and capabilities of Fidelity's investment staff, including its size, education, experience, and resources, as well as Fidelity's approach to recruiting, training, managing, and compensating investment personnel. The Board noted that Fidelity has continued to increase the resources devoted to non-U.S. offices, including expansion of Fidelity's global investment organization. The Board also noted that Fidelity's analysts have extensive resources, tools and capabilities that allow them to conduct sophisticated quantitative and fundamental analysis, as well as credit analysis of issuers, counterparties and guarantors. Further, the Board considered that Fidelity's investment professionals have sufficient access to global information and data so as to provide competitive investment results over time, and that those professionals also have access to sophisticated tools that permit them to assess portfolio construction and risk and performance attribution characteristics continuously, as well as to transmit new information and research conclusions rapidly around the world. Additionally, in its deliberations, the Board considered Fidelity's trading, risk management, compliance, and technology and operations capabilities and resources, which are integral parts of the investment management process.
Shareholder and Administrative Services. The Board considered (i) the nature, extent, quality, and cost of advisory, administrative, and shareholder services performed by the Investment Advisers and their affiliates under the Advisory Contracts and under separate agreements covering transfer agency, pricing and bookkeeping, and securities lending services for the fund; (ii) the nature and extent of the supervision of third party service providers, principally custodians, subcustodians, and pricing vendors; and (iii) the resources devoted to, and the record of compliance with, the fund's compliance policies and procedures. The Board also reviewed the allocation of fund brokerage, including allocations to brokers affiliated with the Investment Advisers, the use of brokerage commissions to pay fund expenses, and the use of "soft" commission dollars to pay for research services.
The Board noted that the growth of fund assets over time across the complex allows Fidelity to reinvest in the development of services designed to enhance the value or convenience of the Fidelity funds as investment vehicles. These services include 24-hour access to account information and market information through telephone representatives and over the Internet, investor education materials and asset allocation tools, and the expanded availability of Fidelity Investor Centers.
In 2014, the Board formed an ad hoc Committee on Transfer Agency Fees to review the variety of transfer agency fee structures throughout the industry and Fidelity's competitive positioning with respect to industry participants.
Investment in a Large Fund Family. The Board considered the benefits to shareholders of investing in a Fidelity fund, including the benefits of investing in a fund that is part of a large family of funds offering a variety of investment disciplines and providing a large variety of mutual fund investor services. The Board noted that Fidelity had taken, or had made recommendations that resulted in the Fidelity funds taking, a number of actions over the previous year that benefited particular funds, including: (i) continuing to dedicate additional resources to Fidelity's investment research process, and to the support of the senior management team that oversees asset management; (ii) continuing efforts to enhance Fidelity's global research capabilities; (iii) launching new funds and making other enhancements to meet client needs; (iv) launching new share classes of existing funds; (v) eliminating purchase minimums and broadening eligibility requirements for certain lower-priced share classes; (vi) reducing management fees and total expenses for certain growth equity funds and index funds; (vii) lowering expense caps for certain existing funds and classes to reduce expenses borne by shareholders; (viii) eliminating short-term redemption fees for certain funds; (ix) introducing a new pricing structure for certain funds of funds that is expected to reduce overall expenses paid by shareholders; (x) rationalizing product lines and gaining increased efficiencies through proposals for fund mergers and share class consolidations; (xi) continuing to develop, acquire and implement systems and technology to improve services to the funds and shareholders, strengthen information security, and increase efficiency; and (xii) implementing enhancements to further strengthen Fidelity's product line to increase investors' probability of success in achieving their investment goals, including retirement income goals.
Investment Performance. The Board considered whether the fund has operated in accordance with its investment objective, as well as its record of compliance with its investment restrictions and its performance history.
The Board took into account discussions with representatives of the Investment Advisers about fund investment performance that occur at Board meetings throughout the year. In this regard the Board noted that as part of regularly scheduled fund reviews and other reports to the Board on fund performance, the Board considers annualized return information for the fund for different time periods, measured against a securities market index ("benchmark index") and a peer group of funds with similar objectives ("peer group"), if any. In its evaluation of fund investment performance, the Board gave particular attention to information indicating changes in performance of certain Fidelity funds for specific time periods and discussed with the Investment Advisers the reasons for any overperformance or underperformance.
In addition to reviewing absolute and relative fund performance, the Independent Trustees periodically consider the appropriateness of fund performance metrics in evaluating the results achieved. In general, the Independent Trustees believe that fund performance should be evaluated based on net performance (after fees and expenses) of both the highest performing and lowest performing fund share classes, where applicable, compared to appropriate benchmark indices, over appropriate time periods that may include full market cycles, and compared to peer groups, as applicable, over the same periods, taking into account relevant factors including the following: general market conditions; issuer-specific information; and fund cash flows and other factors.
The Independent Trustees recognize that shareholders evaluate performance on a net basis over their own holding periods, for which one-, three-, and five-year periods are often used as a proxy. For this reason, the performance information reviewed by the Board also included net cumulative calendar year total return information for the fund and an appropriate benchmark index and peer group for the most recent one-, three-, and five-year periods, as shown below. Returns are shown compared to the 25th percentile (top of box, 75% beaten) and 75th percentile (bottom of box, 25% beaten) of the peer universe.
VIP Emerging Markets Portfolio

Based on its review, the Board concluded that the nature, extent, and quality of services provided to the fund under the Advisory Contracts should continue to benefit the shareholders of the fund.
Competitiveness of Management Fee and Total Expense Ratio. The Board considered the fund's management fee and total expense ratio compared to "mapped groups" of competitive funds and classes created for the purpose of facilitating the Trustees' competitive analysis of management fees and total expenses. Fidelity creates "mapped groups" by combining similar Lipper investment objective categories that have comparable investment mandates. Combining Lipper investment objective categories aids the Board's management fee and total expense ratio comparisons by broadening the competitive group used for comparison.
Management Fee. The Board considered two proprietary management fee comparisons for the 12-month periods shown in basis points (BP) in the chart below. The group of Lipper funds used by the Board for management fee comparisons is referred to below as the "Total Mapped Group." The Total Mapped Group comparison focuses on a fund's standing in terms of gross management fees before expense reimbursements or caps relative to the total universe of funds with comparable investment mandates, regardless of whether their management fee structures also are comparable. Funds with comparable investment mandates offer exposure to similar types of securities. Funds with comparable management fee structures have similar management fee contractual arrangements (
e.g., flat rate charged for advisory services, all-inclusive fee rate,
etc.). "TMG %" represents the percentage of funds in the Total Mapped Group that had management fees that were lower than the fund's. For example, a hypothetical TMG % of 20% would mean that 80% of the funds in the Total Mapped Group had higher, and 20% had lower, management fees than the fund. The fund's actual TMG %s and the number of funds in the Total Mapped Group are in the chart below. The "Asset-Size Peer Group" (ASPG) comparison focuses on a fund's standing relative to a subset of non-Fidelity funds within the Total Mapped Group that are similar in size and management fee structure. For example, if a fund is in the first quartile of the ASPG, the fund's management fee ranks in the least expensive or lowest 25% of funds in the ASPG. The ASPG represents at least 15% of the funds in the Total Mapped Group with comparable asset size and management fee structures, subject to a minimum of 50 funds (or all funds in the Total Mapped Group if fewer than 50). Additional information, such as the ASPG quartile in which the fund's management fee rate ranked, is also included in the chart and considered by the Board.
VIP Emerging Markets Portfolio

The Board noted that the fund's management fee rate ranked below the median of its Total Mapped Group and below the median of its ASPG for 2016.
The Board noted that, in 2014, the Board and the boards of other Fidelity funds formed the ad hoc Committee on Group Fee to conduct an in-depth review of the "group fee" component of the management fee of funds with such management fee structures. The Committee's focus included the mechanics of the group fee, the competitive landscape of group fee structures, Fidelity funds with no group fee component and investment products not included in group fee assets. The Board also considered that, for funds subject to the group fee, FMR agreed to voluntarily waive fees over a specified period of time in amounts designed to account for assets converted from certain funds to certain collective investment trusts.
The Board also noted that, in 2013, the ad hoc Committee on Management Fees was formed to conduct an in-depth review of the management fee rates of Fidelity's active equity mutual funds. The Committee focused on the following areas: (i) standard fee structures; (ii) research consumption and trading evolution; (iii) management fee competitiveness/profitability by category; and (iv) factors that drive institutional pricing.
Based on its review, the Board concluded that the fund's management fee is fair and reasonable in light of the services that the fund receives and the other factors considered.
Total Expense Ratio. In its review of each class's total expense ratio, the Board considered the fund's management fee rate as well as other fund or class expenses, as applicable, such as transfer agent fees, pricing and bookkeeping fees, fund-paid 12b-1 fees, and custodial, legal, and audit fees. The Board also noted that Fidelity may agree to waive fees and expenses from time to time, and the extent to which, if any, it has done so for the fund. As part of its review, the Board also considered the current and historical total expense ratios of each class of the fund compared to competitive fund median expenses. Each class of the fund is compared to those funds and classes in the Total Mapped Group (used by the Board for management fee comparisons) that have a similar sales load structure.
The Board noted that the total expense ratio of Initial Class ranked equal to the competitive median for 2016 and the total expense ratio of each of Investor Class, Service Class, and Service Class 2 ranked above the competitive median for 2016. The Board considered that, in general, various factors can affect total expense ratios. The Board noted that the total expense ratio of each of Investor Class, Service Class, and Service Class 2 was above the competitive median because of relatively higher other expenses due to low asset levels. The Board also noted that Investor Class has higher transfer agent fees than most of its competitors because it is designed for lower cost annuity products, where the majority of servicing costs are incorporated into the funds' total expense ratios rather than being paid at the annuity level. The Board noted that the total expense ratio of each of Service Class and Service Class 2 was also above the competitive median because of its 12b-1 fees. The Board noted that the fund offers multiple classes, each of which has a different 12b-1 fee structure, and that the multiple structures are intended to offer a range of pricing options for the intermediary market. The Board also noted that the total expense ratios of the classes vary primarily by the level of their 12b-1 fees, although differences in transfer agent fees may also cause expenses to vary from class to class.
Fees Charged to Other Fidelity Clients. The Board also considered Fidelity fee structures and other information with respect to clients of Fidelity, such as other funds advised or subadvised by Fidelity, pension plan clients, and other institutional clients with similar mandates. The Board noted that an ad hoc joint committee created by it and the boards of other Fidelity funds periodically (most recently in 2013) reviews and compares Fidelity's institutional investment advisory business with its business of providing services to the Fidelity funds, including the differences in services provided, fees charged, and costs incurred, as well as competition in their respective marketplaces.
Based on its review of total expense ratios and fees charged to other Fidelity clients, the Board concluded that, although some classes were above the median of the universe presented for comparison, the total expense ratio of each class of the fund was reasonable in light of the services that the fund and its shareholders receive and the other factors considered.
Costs of the Services and Profitability. The Board considered the revenues earned and the expenses incurred by Fidelity in conducting the business of developing, marketing, distributing, managing, administering and servicing the fund and servicing the fund's shareholders. The Board also considered the level of Fidelity's profits in respect of all the Fidelity funds.
On an annual basis, Fidelity presents to the Board information about the profitability of its relationships with the fund. Fidelity calculates profitability information for each fund, as well as aggregate profitability information for groups of Fidelity funds and all Fidelity funds, using a series of detailed revenue and cost allocation methodologies which originate with the books and records of Fidelity on which Fidelity's audited financial statements are based. The Audit Committee of the Board reviews any significant changes from the prior year's methodologies.
PricewaterhouseCoopers LLP (PwC), independent registered public accounting firm and auditor to Fidelity and certain Fidelity funds, has been engaged annually by the Board as part of the Board's assessment of Fidelity's profitability analysis. PwC's engagement includes the review and assessment of the methodologies used by Fidelity in determining the revenues and expenses attributable to Fidelity's mutual fund business, and completion of agreed-upon procedures in respect of the mathematical accuracy of the fund profitability information and its conformity to established allocation methodologies. After considering PwC's reports issued under the engagement and information provided by Fidelity, the Board concluded that while other allocation methods may also be reasonable, Fidelity's profitability methodologies are reasonable in all material respects.
The Board also reviewed Fidelity's non-fund businesses and potential fall-out benefits related to the mutual fund business as well as cases where Fidelity's affiliates may benefit from or be related to the fund's business.
The Board considered the costs of the services provided by and the profits realized by Fidelity in connection with the operation of the fund and was satisfied that the profitability was not excessive.
Economies of Scale. The Board considered whether there have been economies of scale in respect of the management of the Fidelity funds, whether the Fidelity funds (including the fund) have appropriately benefited from any such economies of scale, and whether there is potential for realization of any further economies of scale. The Board considered the extent to which the fund will benefit from economies of scale as assets grow through increased services to the fund, through waivers or reimbursements, or through fee or expense ratio reductions. The Board also noted that a committee (the Economies of Scale Committee) created by it and the boards of other Fidelity funds periodically (most recently in 2013) analyzes whether Fidelity attains economies of scale in respect of the management and servicing of the Fidelity funds, whether the Fidelity funds have appropriately benefited from such economies of scale, and whether there is potential for realization of any further economies of scale.
The Board recognized that the fund's management contract incorporates a "group fee" structure, which provides for lower group fee rates as total group assets increase, and for higher group fee rates as total group assets decrease (with "group assets" defined to include fund assets under FMR's management plus the assets of sector funds previously under FMR's management). FMR calculates the group fee rates based on a tiered asset "breakpoint" schedule that varies based on asset class. The Board considered that the group fee is designed to deliver the benefits of economies of scale to fund shareholders when total Fidelity fund assets increase, even if assets of any particular fund are unchanged or have declined, because some portion of Fidelity's costs are attributable to services provided to all Fidelity funds, and all funds benefit if those costs can be allocated among more assets. The Board concluded that, given the group fee structure, fund shareholders will benefit from lower management fees as group assets increase at the fund complex level, regardless of whether Fidelity achieves any such economies of scale.
The Board concluded, taking into account the analysis of the Economies of Scale Committee, that economies of scale, if any, are being appropriately shared between fund shareholders and Fidelity.
Additional Information Requested by the Board. In order to develop fully the factual basis for consideration of the Fidelity funds' advisory contracts, the Board requested and received additional information on certain topics, including: (i) fund performance trends, in particular the underperformance of certain funds, and Fidelity's long-term strategies for certain funds; (ii) Fidelity's fund profitability methodology, profitability trends for certain funds, and the impact of certain factors on fund profitability results, including the impact of market trends on actively managed funds; (iii) the use of performance fees and the calculation of performance adjustments, including the impact of underperformance and fund outflows on performance adjustments; (iv) metrics for evaluating index fund performance; (v) Fidelity's group fee structure, including the group fee breakpoint schedules; (vi) the terms of Fidelity's contractual and voluntary expense cap arrangements with the funds; (vii) the methodology with respect to evaluating competitive fund data and peer group classifications and fee comparisons; (viii) the expense structures for different funds and classes; (ix) Fidelity's arrangements with affiliated sub-advisers on behalf of the funds; (x) information regarding other accounts managed by Fidelity, including institutional accounts and collective investment trusts; (xi) recent changes to the fee structure for certain funds of funds; and (xii) the impact of the Department of Labor's new fiduciary rule on the funds' comparative expense information.
Based on its evaluation of all of the conclusions noted above, and after considering all factors it believed relevant, the Board concluded that the advisory fee structures are fair and reasonable, and that the fund's Advisory Contracts should be renewed.
VIPEM-ANN-0218
1.858135.109
Item 2.
Code of Ethics
As of the end of the period, December 31, 2017, Variable Insurance Products Fund II (the trust) has adopted a code of ethics, as defined in Item 2 of Form N-CSR, that applies to its President and Treasurer and its Chief Financial Officer. A copy of the code of ethics is filed as an exhibit to this Form N-CSR.
Item 3.
Audit Committee Financial Expert
The Board of Trustees of the trust has determined that Joseph Mauriello is an audit committee financial expert, as defined in Item 3 of Form N-CSR. Mr. Mauriello is independent for purposes of Item 3 of Form N-CSR.
Item 4.
Principal Accountant Fees and Services
Fees and Services
The following table presents fees billed by Deloitte & Touche LLP, the member firms of Deloitte Touche Tohmatsu, and their respective affiliates (collectively, “Deloitte Entities”) in each of the last two fiscal years for services rendered to VIP Contrafund Portfolio, VIP Disciplined Small Cap Portfolio, VIP Emerging Markets Portfolio and VIP Index 500 Portfolio (the “Funds”):
Services Billed by Deloitte Entities
December 31, 2017 FeesA
| | | | |
| Audit Fees | Audit-Related Fees | Tax Fees | All Other Fees |
VIP Contrafund Portfolio | $56,000 | $100 | $6,200 | $1,600 |
VIP Disciplined Small Cap
Portfolio
$43,000 $100
$6,500
$1,200
VIP Emerging Markets
Portfolio
$48,000 $100
$6,300 $1,400
VIP Index 500 Portfolio $49,000 $100
$6,600
$1,400
December 31, 2016 FeesA,B
| | | | |
| Audit Fees | Audit-Related Fees | Tax Fees | All Other Fees |
VIP Contrafund Portfolio | $56,000 | $100 | $6,400 | $1,600 |
VIP Disciplined Small Cap
Portfolio
$43,000 $100
$6,500
$1,300
VIP Emerging Markets
Portfolio
$48,000 $100
$6,300
$1,400
VIP Index 500 Portfolio $49,000 $100
$6,600
$1,500
A Amounts may reflect rounding.
B Certain amounts have been reclassified to align with current period presentation.
The following table presents fees billed by PricewaterhouseCoopers LLP (“PwC”) in each of the last two fiscal years for services rendered to VIP International Capital Appreciation Portfolio (the “Fund”):
Services Billed by PwC
December 31, 2017 FeesA
| | | | |
| Audit Fees | Audit-Related Fees | Tax Fees | All Other Fees |
VIP International Capital Appreciation Portfolio | $57,000 | $5,400 | $7,000 | $2,600 |
December 31, 2016 FeesA,B
| | | | |
| Audit Fees | Audit-Related Fees | Tax Fees | All Other Fees |
VIP International Capital Appreciation Portfolio | $57,000 | $6,200 | $5,500 | $2,900 |
A Amounts may reflect rounding.
B Certain amounts have been reclassified to align with current period presentation.
The following table presents fees billed by PwC and Deloitte Entities that were required to be approved by the Audit Committee for services that relate directly to the operations and financial reporting of the Funds and that are rendered on behalf of Fidelity Management & Research Company (“FMR”) and entities controlling, controlled by, or under common control with FMR (not including any sub-adviser whose role is primarily portfolio management and is subcontracted with or overseen by another investment adviser) that provide ongoing services to the Funds (“Fund Service Providers”):
Services Billed by Deloitte Entities
| | |
| December 31, 2017A | December 31, 2016A |
Audit-Related Fees | $- | $35,000 |
Tax Fees | $25,000 | $- |
All Other Fees | $- | $- |
A Amounts may reflect rounding.
Services Billed by PwC
| | |
| December 31, 2017A | December 31, 2016A |
Audit-Related Fees | $8,470,000 | $6,240,000 |
Tax Fees | $160,000 | $10,000 |
All Other Fees | $- | $- |
A Amounts may reflect rounding.
“Audit-Related Fees” represent fees billed for assurance and related services that are reasonably related to the performance of the fund audit or the review of the fund's financial statements and that are not reported under Audit Fees.
“Tax Fees” represent fees billed for tax compliance, tax advice or tax planning that relate directly to the operations and financial reporting of the fund.
“All Other Fees” represent fees billed for services provided to the fund or Fund Service Provider, a significant portion of which are assurance related, that relate directly to the operations and financial reporting of the fund, excluding those services that are reported under Audit Fees, Audit-Related Fees or Tax Fees.
Assurance services must be performed by an independent public accountant.
* * *
The aggregate non-audit fees billed by PwC and Deloitte Entities for services rendered to the Funds, FMR (not including any sub-adviser whose role is primarily portfolio management and is subcontracted with or overseen by another investment adviser), and any Fund Service Provider for each of the last two fiscal years of the Funds are as follows:
| | |
Billed By | December 31, 2017A | December 31, 2016A,B |
Deloitte Entities | $335,000 | $295,000 |
PwC | $10,730,000 | $7,650,000 |
A Amounts may reflect rounding.
B Certain amounts have been reclassified to align with current period presentation.
The trust's Audit Committee has considered non-audit services that were not pre-approved that were provided by PwC and Deloitte Entities to Fund Service Providers to be compatible with maintaining the independence of PwC and Deloitte Entities in their
audits of the Funds, taking into account representations from PwC and Deloitte Entities, in accordance with Public Company Accounting Oversight Board rules, regarding their independence from the Funds and their related entities and FMR’s review of the appropriateness and permissibility under applicable law of such non-audit services prior to their provision to the Fund Service Providers.
Audit Committee Pre-Approval Policies and Procedures
The trust’s Audit Committee must pre-approve all audit and non-audit services provided by a fund’s independent registered public accounting firm relating to the operations or financial reporting of the fund. Prior to the commencement of any audit or non-audit services to a fund, the Audit Committee reviews the services to determine whether they are appropriate and permissible under applicable law.
The Audit Committee has adopted policies and procedures to, among other purposes, provide a framework for the Committee’s consideration of non-audit services by the audit firms that audit the Fidelity funds. The policies and procedures require that any non-audit service provided by a fund audit firm to a Fidelity fund and any non-audit service provided by a fund auditor to a Fund Service Provider that relates directly to the operations and financial reporting of a Fidelity fund (“Covered Service”) are subject to approval by the Audit Committee before such service is provided.
All Covered Services must be approved in advance of provision of the service either: (i) by formal resolution of the Audit Committee, or (ii) by oral or written approval of the service by the Chair of the Audit Committee (or if the Chair is unavailable, such other member of the Audit Committee as may be designated by the Chair to act in the Chair’s absence). The approval contemplated by (ii) above is permitted where the Treasurer determines that action on such an engagement is necessary before the next meeting of the Audit Committee.
Non-audit services provided by a fund audit firm to a Fund Service Provider that do not relate directly to the operations and financial reporting of a Fidelity fund are reported to the Audit Committee on a periodic basis.
Non-Audit Services Approved Pursuant to Rule 2-01(c)(7)(i)(C) and (ii) of Regulation S-X (“De Minimis Exception”)
There were no non-audit services approved or required to be approved by the Audit Committee pursuant to the De Minimis Exception during the Funds’ last two fiscal years relating to services provided to (i) the Funds or (ii) any Fund Service Provider that relate directly to the operations and financial reporting of the Funds.
Item 5.
Audit Committee of Listed Registrants
Not applicable.
Item 6.
Investments
(a)
Not applicable.
(b)
Not applicable
Item 7.
Disclosure of Proxy Voting Policies and Procedures for Closed-End Management Investment Companies
Not applicable.
Item 8.
Portfolio Managers of Closed-End Management Investment Companies
Not applicable.
Item 9.
Purchase of Equity Securities by Closed-End Management Investment Company and Affiliated Purchasers
Not applicable.
Item 10.
Submission of Matters to a Vote of Security Holders
There were no material changes to the procedures by which shareholders may recommend nominees to the trust’s Board of Trustees.
Item 11.
Controls and Procedures
(a)(i) The President and Treasurer and the Chief Financial Officer have concluded that the trust’s disclosure controls and procedures (as defined in Rule 30a-3(c) under the Investment Company Act) provide reasonable assurances that material information relating to the trust is made known to them by the appropriate persons, based on their evaluation of these controls and procedures as of a date within 90 days of the filing date of this report.
(a)(ii) There was no change in the trust’s internal control over financial reporting (as defined in Rule 30a-3(d) under the Investment Company Act) that occurred during the second fiscal quarter of the period covered by this report that has materially affected, or is reasonably likely to materially affect, the trust’s internal control over financial reporting.
Item 12.
Exhibits
| | |
(a) | (1) | Code of Ethics pursuant to Item 2 of Form N-CSR is filed and attached hereto as EX-99.CODE ETH. |
(a) | (2) | Certification pursuant to Rule 30a-2(a) under the Investment Company Act of 1940 (17 CFR 270.30a-2(a)) is filed and attached hereto as Exhibit 99.CERT. |
(a) | (3) | Not applicable. |
(b) | | Certification pursuant to Rule 30a-2(b) under the Investment Company Act of 1940 (17 CFR 270.30a-2(b)) is furnished and attached hereto as Exhibit 99.906CERT. |
SIGNATURES
Pursuant to the requirements of the Securities Exchange Act of 1934 and the Investment Company Act of 1940, the registrant has duly caused this report to be signed on its behalf by the undersigned, thereunto duly authorized.
Variable Insurance Products Fund II
| |
By: | /s/ Stacie M. Smith |
| Stacie M. Smith |
| President and Treasurer |
| |
Date: | February 22, 2018 |
Pursuant to the requirements of the Securities Exchange Act of 1934 and the Investment Company Act of 1940, this report has been signed below by the following persons on behalf of the registrant and in the capacities and on the dates indicated.
| |
By: | /s/Stacie M. Smith |
| Stacie M. Smith |
| President and Treasurer |
| |
Date: | February 22, 2018 |
| |
By: | /s/Howard J. Galligan III |
| Howard J. Galligan III |
| Chief Financial Officer |
| |
Date: | February 22, 2018 |