As filed with the Securities and Exchange Commission on [date]
UNITED STATES
SECURITIES AND EXCHANGE COMMISSION
Washington, D.C. 20549
FORM N-CSR
CERTIFIED SHAREHOLDER REPORT OF REGISTERED
MANAGEMENT INVESTMENT COMPANIES
811-05518
Investment Company Act file number
The RBB FUND, INC.
(Exact name of registrant as specified in charter)
615 East Michigan Street
Milwaukee, WI 53202
(Address of principal executive offices) (Zip code)
Salvatore Faia, President
c/o U.S. Bancorp Fund Services, LLC
615 East Michigan Street
Milwaukee, WI 53202
(Name and address of agent for service)
(414) 765-5366
Registrant's telephone number, including area code
Date of fiscal year end: August 31
Date of reporting period: February 28, 2018
Item 1. Reports to Stockholders.

Abbey Capital Futures Strategy Fund
of
THE RBB FUND, INC.
Semi-Annual Report
February 28, 2018
(Unaudited)
This report is submitted for the general information of the shareholders of the Fund. It is not authorized for distribution unless preceded or accompanied by a current prospectus for the Fund.
Abbey Capital Futures Strategy Fund
Semi-Annual Investment Adviser’s Report
February 28, 2018 (Unaudited)
Dear Shareholder,
The Abbey Capital Futures Strategy Fund (the “Fund”) Class I Shares returned +1.43% net of fees for the six-month period ended February 28, 2018. The positive performance was driven by strong trends in equities, energy and interest rates over the period, with some partially offsetting losses from trading in bonds and major currencies. The presence of strong trends in some markets supported the Fund’s core allocation to trendfollowing systems, through its investment in Abbey Capital Offshore Fund Limited (the “ACOF”), a wholly-owned subsidiary of the Fund. The Fund invests up to 25% of its assets into the ACOF and its remaining assets in a fixed income strategy consisting primarily of U.S. Treasury obligations.
| 2018
YTD | MAR. 1, 2017 TO
FEB. 28, 2018 | SEPT. 1, 2017 TO
FEB. 28, 2018 | ANNUALIZED
SINCE INCEPTION
ON JULY 1, 2014 TO
FEB. 28, 2018 |
Class I Shares | -2.07% | -2.57% | 1.43% | 4.20% |
Class A Shares* | -2.16% | -2.84% | 1.25% | 3.94% |
Class A Shares (max load)* | -7.76% | -8.43% | -4.56% | 2.27% |
Class C Shares** | -2.28% | -3.56% | 0.91% | 3.18% |
BofA Merrill Lynch 3-Month T-Bill Index | 0.21% | 0.99% | 0.58% | 0.40% |
S&P 500® Total Return Index | 1.83% | 17.10% | 10.84% | 11.58% |
Barclay CTA Index | -1.02% | 0.09% | 0.34% | 1.03% |
Source: Abbey Capital and Bloomberg
Performance quoted is past performance and does not guarantee future results. Investment return and principal value will fluctuate so that shares, when redeemed, may be worth more or less than their original cost. Current performance may be lower or higher than the returns quoted. Visit www.abbeycapital.com for returns updated daily. Call (US Toll Free) 1-844-261-6484 or (international callers) + 1-508-871-3276 for returns current to the most recent month-end.
Please note the above is shown for illustrative purposes only; the Fund is not benchmarked against any of the indices referenced.
* | Class A Shares performance prior to its inception on August 29, 2014 is the performance of Class I Shares, adjusted for the Class A Shares expense ratio. There is a maximum sales charge (load) imposed on purchases (as a percentage of offering price) of 5.75% in Class A Shares. |
** | Class C Shares performance prior to its inception on October 6, 2015 is the performance of Class I Shares, adjusted for the Class C Shares expense ratio. |
The Barclay CTA Index is derived from data which is self-reported by investment managers based on the performance of privately managed funds. In contrast, the S&P 500® Total Return Index and the Bank of America Merrill Lynch 3-Month T-Bill Index are comprised of publicly traded securities. As a result of these differences, these indices may not be directly comparable and the above is shown for illustrative purposes only.
Abbey Capital Limited (the “Adviser”) has contractually agreed to waive its advisory fee and/or reimburse expenses in order to limit total annual Fund operating expenses (excluding acquired fund fees and expenses, brokerage commissions, extraordinary items, interest or taxes) to 1.79%, 2.04% and 2.79% of the Fund’s average daily net assets attributable to Class I Shares, Class A Shares, and Class C Shares, respectively. This contractual limitation is in effect until December 31, 2018, and may not be terminated without the approval of the Board of Directors of The RBB Fund, Inc. In addition, the Adviser may recoup any waived or reimbursed amounts from the Fund within three years from the date on which such waiver or reimbursement was made by the Adviser, provided such reimbursement does not cause the Fund to exceed expense limitations that were in effect at the time of the waiver or reimbursement. In determining the Adviser’s obligation to waive its investment advisory fees and/or reimburse expenses, the following expenses are not taken into account: acquired fund fees and expenses, brokerage commissions, extraordinary items, interest or taxes. Without the
1
Abbey Capital Futures Strategy Fund
Semi-Annual Investment Adviser’s Report (Continued)
February 28, 2018 (Unaudited)
limitation agreement, the expense ratios are 1.93%. 2.18% and 2.93% of the Fund’s average daily net assets attributable to Class I Shares, Class A Shares, and Class C Shares, respectively, as stated in the current prospectus dated December 31, 2017, as supplemented (and which may differ from the actual expense ratios for the period covered by this report). The quoted performance would have been lower without the expense limitation.
Please refer to the prospectus for further information on expenses and fees.
Market Commentary
In general, investor sentiment was positive over the six-month period ended February 28, 2018 and this supported risk assets amid signs of an uptick in global growth; however this positive sentiment did appear to unwind somewhat in late January and February on signs of building inflationary pressures.
Global equities rallied over the period, supported by solid earnings growth, signs of improving economic conditions and the passing of U.S. tax reform. While most developed market equity indices were positive for the period, gains were pared from late January onwards as worries that mounting inflationary pressures could lead to a more aggressive pace of central bank tightening weighed on risk appetite.
Signs of higher inflation also impacted U.S. Treasuries. The Federal Reserve (“Fed”) began its balance sheet normalisation program in September 2017 and hiked interest rates in December 2017, and this, along with some hawkish Fed signals and higher inflation expectations, resulted in a decline in U.S. Treasury prices as the market priced a steeper path of monetary tightening. In Europe, the European Central Bank began tapering its asset purchase program in January 2018, and this helped to push bond yields in the region higher. The re-appointment of Kuroda as Bank of Japan Governor together with the re-affirmation of the central bank’s commitment to accommodative monetary policy and its yield targeting program meant that Japanese bond yields were largely range-bound over the period.
Despite the improving yield differential of U.S. Treasuries versus other developed market bonds and forecasts of more aggressive Fed rate hikes, the USD weakened over the period. Worries that tax reform could lead to a larger budget deficit weighed on demand for the greenback, as did uncertainty about the U.S. government’s views on currency strength. The EUR was supported by signs of stronger growth in the eurozone, while GBP benefited from reports of progress in Brexit negotiations and forecasts of rate hikes by the Bank of England in 2018.
Signs of stronger global growth were generally supportive of commodity markets, as was the overall weakness in the USD. Crude oil rallied over the period, boosted by the extension of OPEC supply cuts and projections of stronger global demand, however gains were pared somewhat in February as U.S. production reached a 47-year high. Stronger global growth was generally supportive of base metals prices, while in precious metals, the benefits from a weaker USD were offset by signs of a reduction in safe-haven demand. In agricultural commodities, both wheat and soybeans benefited late in the period from concerns about growing conditions in the U.S. and Argentina, respectively, while sugar dropped on concerns of a global supply glut.
Performance Attribution
Returns for the ACOF were driven by gains in equities, interest rates and energy. Within equities, strong upward trends in prices generated profits from long positions, however these gains unwound somewhat later in the period amid sharp corrections in equity markets. Within equities, the S&P 500®, Nikkei 225 and NASDAQ 100 were the top-performing positions, with ACOF’s Diversified Trendfollowing (“Trendfollowing”) sub-advisors (sub-advisors are also known as “Trading Advisors”) generating the largest gains. Profits from energy were generated mostly by Trendfollowing sub-advisors via long positions in crude oil and distillates. In interest rates, the ACOF’s Global Macro and Trendfollowing sub-advisors performed positively, with mostly short positions in 3-month Eurodollar contracts the primary driver. In major currencies, a short position in USD/NOK was the worst performer, with Value sub-advisors seeing the largest
2
Abbey Capital Futures Strategy Fund
Semi-Annual Investment Adviser’s Report (Concluded)
February 28, 2018 (Unaudited)
losses in this currency pair. Trendfollowing sub-advisors saw the largest losses in bonds, with primarily long positions in UK and eurozone contracts the largest detractors, while Value sub-advisors saw some partially offsetting profits through short positions in U.S. Treasury contracts as U.S. rate hike expectations increased.
An investment in the Abbey Capital Futures Strategy Fund is speculative and involves substantial risk and conflicts of interest. It is possible that an investor may lose some or all of their investment. Except for fund returns, the portfolio statistics shown in this presentation are based only on the open forward, future and option contracts held by Abbey Capital Offshore Fund Limited (a wholly-owned and controlled subsidiary of the Fund) and does not take into account any other assets held by the Fund (primarily cash and cash-equivalents). The Fund may invest up to 25% of its total assets in the Abbey Capital Offshore Fund Limited which is a multi-advisor fund that invests in managed futures and foreign exchange. All investments in securities involve risk of the loss of capital. An investment in the Fund includes the risks inherent in an investment in securities, as well as specific risks associated with this open-ended investment product. Among the risks associated with investing in this Fund are Commodity Sector Risk, Counter-Party Risk, Credit Risk, Currency Risk, Derivatives Risk, Manager and Management Risks, Advisory Risk, Subsidiary Risks, Tax Risks, Emerging Markets Risk, Leveraging Risks, Foreign Investment Risks, Fixed Income Securities Risks, Short Sale Risk and Portfolio Turnover Risks. The Fund may invest in or utilize derivative investments, futures contracts, and hedging strategies. A portfolio of hedge funds may increase the potential for losses or gains. One or more underlying managers, from time to time, may invest a substantial portion of the assets managed in a specific industry sector. As a result, the underlying manager’s investment portfolio (as well as the Fund’s) may be subject to greater risk and volatility than if investments had been made in the securities of a broader range of issuers. Trading in futures is not suitable for all investors given its speculative nature and the high level of risk involved. There can be no assurance that the Fund’s or an underlying manager’s strategy (hedging or otherwise) will be successful or that it will employ such strategies with respect to all or any portion of its portfolio. The value of the Fund’s portfolio investments should be expected to fluctuate. Investing in managed futures is not suitable for all investors given its speculative nature and the high level of risk involved. The Fund is appropriate only for investors who can bear the risks associated with the product. Investors may lose some or all of their investment. This brief statement cannot disclose all of the risks and other factors necessary to evaluate a participation in the Fund. Investors are urged to take appropriate investment advice and to carefully consider their investment objectives, personal situation, and factors such as net worth, income, age, risk tolerance and liquidity needs before investing in the Fund. Before investing, investors should carefully consider the Fund’s investment objectives, risks, conflicts, tax considerations, charges and expenses. It is not possible to invest directly in an index.
Fund holdings and sector allocations are subject to change and should not be considered recommendations to buy or sell any security. Please refer to the Schedule of Investments in this report for a complete list of fund holdings.
Earnings growth is not representative of the Fund’s future performance.
3
Abbey Capital Futures Strategy Fund
Performance Data
February 28, 2018 (Unaudited)
Average Annual Total Returns for the Periods Ended February 28, 2018 |
| | Six
Months† | One
Year | Three
Years | Since
Inception†† |
Class A Shares (without sales charge) (Pro forma July 1, 2014 to August 29, 2014) | 1.25% | -2.84% | -3.03% | 3.94%* |
Class A Shares (with sales charge) (Pro forma July 1, 2014 to August 29, 2014) | -4.56% | -8.43% | -4.93% | 2.27%* |
BofA Merrill Lynch 3-Month U.S. Treasury Bill Index | 0.58% | 0.99% | 0.48% | 0.40%** |
S&P 500® Total Return Index | 10.84% | 17.10% | 11.14% | 11.58%** |
Barclay CTA Index | 0.34% | 0.09% | -1.92% | 1.03%** |
†† | Inception date of Class A Shares of the Fund was August 29, 2014. |
* | Class A Shares performance prior to its inception on August 29, 2014 is the performance of Class I Shares, adjusted for the Class A Shares expense ratio. |
** | Performance is from the inception date of the Fund and is not the inception date of the index itself. The above is shown for illustrative purposes only the Fund is not benchmarked against any of the indices referenced. |
The Fund charges a 5.75% maximum sales charge on purchases (as a percentage of offering price) of Class A Shares. The performance data quoted reflects fee waivers in effect and would have been less in their absence. The Adviser has contractually agreed to waive its advisory fee and/or reimburse expenses in order to limit total annual Fund operating expenses (excluding acquired fund fees and expenses, brokerage commissions, extraordinary items, interest or taxes) to 2.04% of the Fund’s average daily net assets attributable to Class A Shares. Without the limitation arrangement, the gross expense ratios are 2.18% for Class A Shares as stated in the current prospectus (and which may differ from the actual expense ratios for the period covered by this report). This contractual limitation is in effect until December 31, 2018 and may not be terminated without the approval of the Board of Directors of The RBB Fund, Inc. Please see the Consolidated Financial Highlights for current figures.
4
Abbey Capital Futures Strategy Fund
Performance Data (Continued)
February 28, 2018 (Unaudited)
Average Annual Total Returns for the Periods Ended February 28, 2018 |
| | Six
Months† | One
Year | Three
Years | Since
Inception†† |
Class I Shares | 1.43% | -2.57% | -2.80% | 4.20% |
BofA Merrill Lynch 3-Month U.S. Treasury Bill Index | 0.58% | 0.99% | 0.48% | 0.40%* |
S&P 500® Total Return Index | 10.84% | 17.10% | 11.14% | 11.58%* |
Barclay CTA Index | 0.34% | 0.09% | -1.92% | 1.03%* |
†† | Inception date of Class I Shares of the Fund was July 1, 2014. |
* | Performance is from the inception date of the Fund and is not the inception date of the index itself. The above is shown for illustrative purposes only, the Fund is not benchmarked against any of the indices referenced. |
The performance data quoted reflects fee waivers in effect and would have been less in their absence. The Adviser has contractually agreed to waive its advisory fee and/or reimburse expenses in order to limit total annual Fund operating expenses (excluding acquired fund fees and expenses, brokerage commissions, extraordinary items, interest or taxes) to 1.79% of the Fund’s average daily net assets attributable to Class I Shares. Without the limitation arrangement, the gross expense ratio is 1.93% for Class I Shares, as stated in the current prospectus (and which may differ from the actual expense ratios for the period covered by this report). This contractual limitation is in effect until December 31, 2018 and may not be terminated without the approval of the Board of Directors of The RBB Fund, Inc. Please see the Consolidated Financial Highlights for current figures.
5
Abbey Capital Futures Strategy Fund
Performance Data (Continued)
February 28, 2018 (Unaudited)
Average Annual Total Returns for the Periods Ended February 28, 2018 |
| | Six
Months† | One
Year | Three
Years | Since
Inception†† |
Class C Shares (Pro forma July 1, 2014 to October 6, 2015) | 0.91% | -3.56% | N/A | 3.18%* |
BofA Merrill Lynch 3-Month U.S. Treasury Bill Index | 0.58% | 0.99% | 0.48% | 0.40%** |
S&P 500® Total Return Index | 10.84% | 17.10% | 11.14% | 11.58%** |
Barclay CTA Index | 0.34% | 0.09% | -1.92% | 1.03%** |
†† | Inception date of Class C Shares of the Fund was October 6, 2015. |
* | Class C Shares performance prior to its inception on October 6, 2015 is the performance of Class I Shares, adjusted for the Class C Shares expense ratio. |
** | Performance is from the inception date of the Fund and is not the inception date of the index itself. The above is shown for illustrative purposes only the Fund is not benchmarked against any of the indices referenced. |
The performance data quoted reflects fee waivers in effect and would have been less in their absence. The Adviser has contractually agreed to waive its advisory fee and/or reimburse expenses in order to limit total annual Fund operating expenses (excluding acquired fund fees and expenses, brokerage commissions, extraordinary items, interest or taxes) to 2.79% of the Fund’s average daily net assets attributable to Class C Shares. Without the limitation arrangement, the gross expense ratio is 2.93% for Class C Shares, as stated in the current prospectus (and which may differ from the actual expense ratios for the period covered by this report). This contractual limitation is in effect until December 31, 2018 and may not be terminated without the approval of the Board of Directors of The RBB Fund, Inc. Please see the Consolidated Financial Highlights for current figures.
Performance quoted is past performance and does not guarantee future results. Investment return and principal value of an investment will fluctuate so that shares, when redeemed, may be worth more or less than their original cost. Current performance may be lower or higher than the returns quoted. Visit www.abbeycapital.com for returns updated daily. Call (US Toll Free) 1-844-261-6484 or (international callers) + 1-508-871-3276 for returns current to the most recent month-end.
The Barclay CTA Index is derived from data which is self-reported by investment managers based on the performance of privately managed funds. In contrast, the S&P 500® Total Return Index and the BofA Merrill Lynch 3-Month U.S. Treasury Bill Index are comprised of publicly traded securities. As a result of these differences, these indices may not be directly comparable, are not available for direct investment and the above is shown for illustrative purposes only.
6
Abbey Capital Futures Strategy Fund
Performance Data (Concluded)
February 28, 2018 (Unaudited)
The S&P 500® Total Return Index
The S&P 500® Total Return Index is the total return version of the S&P 500® Index. Dividends are reinvested on a daily basis and all regular cash dividends are assumed reinvested in the index on the ex-dividend date.
S&P 500® Index
The S&P 500® Index is a market-capitalization-weighted index of 500 US stocks chosen for market size, liquidity and industry grouping, among other factors. The S&P 500® Index is designed to be a leading indicator of U.S. equities and is meant to reflect the risk/return characteristics of the large cap universe. The S&P 500® Index was first introduced on the 1st of January, 1923, though expanded to 500 stocks on March 4, 1957.
Nasdaq 100 Index
Launched in January 1985, the Nasdaq-100 Index includes 100 of the largest US domestic and international non-financial companies listed on the Nasdaq stock market. The Nasdaq-100 Index is calculated under a modified capitalization-weighted methodology. The index reflects companies across major industry groups including computer hardware and software, telecommunications, retail/wholesale trade and biotechnology. It does not contain securities of financial companies including investment companies.
Barclay CTA Index
The Barclay CTA Index is a leading industry benchmark of representative performance of commodity trading advisors. There are currently 541 programs included in the calculation of the Barclay CTA Index for 2018. The Barclay CTA Index is equally weighted and rebalanced at the beginning of each year.
BofA Merrill Lynch 3-Month U.S. Treasury Bill Index
The BofA Merrill Lynch 3-Month U.S. Treasury Bill Index is an unmanaged market index of U.S. Treasury securities maturing in 90 days that assumes reinvestment of all income.
Hang Seng Index
The Hang Seng Index is a market capitalization-weighted index of 40 of the largest companies that trade on the Hong Kong Exchange. The Hang Seng Index is maintained by a subsidiary of Hang Seng Bank, and has been published since 1969.
Nikkei 225 Index
The Nikkei 225 Index is a price-weighted index comprised of Japan’s top 225 blue-chip companies traded on the Tokyo Stock Exchange.
Portfolio composition is subject to change. It is not possible to invest directly in an index.
7
Abbey Capital Futures Strategy Fund
Fund Expense Examples
February 28, 2018 (Unaudited)
As a shareholder of the Fund, you incur two types of costs: (1) transaction costs, including sales charges (loads) on purchase payments, (if any) and (2) ongoing costs, including management fees, distribution and/or service (12b-1) fees and other Fund expenses. These examples are intended to help you understand your ongoing costs (in dollars) of investing in the Fund and to compare these costs with the ongoing costs of investing in other mutual funds.
These examples are based on an investment of $1,000 invested at the beginning of the six-month period from September 1, 2017 through February 28, 2018, and held for the entire period.
ACTUAL EXPENSES
The first line of the accompanying table provides information about actual account values and actual expenses. You may use the information in this line, together with the amount you invested, to estimate the expenses that you paid over the period. Simply divide your account value by $1,000 (for example, an $8,600 account value divided by $1,000 = 8.6), then multiply the result by the number in the first line under the heading entitled “Expenses Paid During Period” to estimate the expenses you paid on your account during this period.
HYPOTHETICAL EXAMPLE FOR COMPARISON PURPOSES
The second line of the accompanying table provides information about hypothetical account values and hypothetical expenses based on the Fund’s actual expense ratio and an assumed rate of return of 5% per year before expenses, which is not the Fund’s actual return. The hypothetical account values and expenses may not be used to estimate the actual ending account balance or expenses you paid for the period. You may use this information to compare the ongoing costs of investing in the Fund and other funds. To do so, compare these 5% hypothetical examples with the 5% hypothetical examples that appear in the shareholder reports of other funds.
Please note that the expenses shown in the accompanying table are meant to highlight your ongoing costs only and do not reflect any transactional costs, such as sales charges (loads) on purchase payments (if any). Therefore, the second line of the accompanying table is useful in comparing ongoing costs only and will not help you determine the relative total costs of owning different funds. In addition, if these transactional costs were included, your costs would have been higher.
| | Class A Shares |
| | Beginning
Account Value
September 1, 2017 | Ending
Account Value
February 28, 2018 | Expenses Paid
During Period* |
Actual | $ 1,000.00 | $ 1,012.50 | $ 10.18 |
Hypothetical (5% return before expenses) | 1,000.00 | 1,014.68 | 10.19 |
| | Class I Shares |
| | Beginning
Account Value
September 1, 2017 | Ending
Account Value
February 28, 2018 | Expenses Paid
During Period** |
Actual | $ 1,000.00 | $ 1,014.30 | $ 8.94 |
Hypothetical (5% return before expenses) | 1,000.00 | 1,015.92 | 8.95 |
8
Abbey Capital Futures Strategy Fund
Fund Expense Examples (Concluded)
(Unaudited)
| | Class C Shares |
| | Beginning
Account Value
September 1, 2017 | Ending
Account Value
February 28, 2018 | Expenses Paid
During Period*** |
Actual | $ 1,000.00 | $ 1,009.10 | $ 13.90 |
Hypothetical (5% return before expenses) | 1,000.00 | 1,010.96 | 13.91 |
* | Expenses are equal to an annualized expense ratio for the period September 1, 2017 to February 28, 2018 of 2.04% for the Class A Shares of the Fund, which includes waived fees or reimbursed expenses (including interest expense), multiplied by the average account value over the period, multiplied by the number of days (181) in the most recent fiscal half-year then divided by 365 to reflect the one-half year period. The Fund’s ending account value on the first line in the table is based on the actual six-month total investment return for the Class A Shares of the Fund of 1.25%. |
** | Expenses are equal to an annualized expense ratio for the period September 1, 2017 to February 28, 2018 of 1.79% for the Class I Shares of the Fund, which includes waived fees or reimbursed expenses (including interest expense), multiplied by the average account value over the period, multiplied by the number of days (181) in the most recent fiscal half-year then divided by 365 to reflect the one-half year period. The Fund’s ending account value on the first line in the table is based on the actual six-month total investment return for the Class I Shares of the Fund of 1.43%. |
*** | Expenses are equal to an annualized expense ratio for the period September 1, 2017 to February 28, 2018 of 2.79% for the Class C Shares of the Fund, which includes waived fees or reimbursed expenses (including interest expense), multiplied by the average account value over the period, multiplied by the number of days (181) in the most recent fiscal half-year then divided by 365 to reflect the one-half year period. The Fund’s ending account value on the first line in the table is based on the actual six-month total investment return for the Class C Shares of the Fund of 0.91%. |
9
Abbey Capital Futures Strategy Fund
Consolidated Portfolio Holdings Summary Table
February 28, 2018 (Unaudited)
The following table presents a consolidated summary of the portfolio holdings of the Fund at February 28, 2018.
| | | % of Net
Assets | | | Value | |
| SHORT-TERM INVESTMENTS: | | | | | | |
| U.S. Treasury Obligations | | | 94.8 | % | | $ | 894,516,988 | |
| PURCHASED OPTIONS | | | 0.9 | | | | 8,638,070 | |
| OTHER ASSETS IN EXCESS OF LIABILITIES | | | | | | | | |
| (including futures, forward foreign currency contracts and written options) | | | 4.3 | | | | 40,926,049 | |
| NET ASSETS | | | 100.0 | % | | $ | 944,081,107 | |
Portfolio holdings are subject to change at any time.
Refer to the Consolidated Portfolio of Investments for a detailed listing of the Fund’s holdings.
The accompanying notes are an integral part of the consolidated financial statements.
10
Abbey Capital Futures Strategy Fund
Consolidated Portfolio of Investments
February 28, 2018 (Unaudited)
| | | Coupon* | | | Maturity
Date | | Par
(000’s) | | | Value | |
| Short-Term Investments — 94.8% | | | | | | | | | | | |
| U.S. Treasury Obligations — 94.8% | | | | | | | | | | | |
| U.S. Treasury Bills | | | 1.086 | % | | 03/01/18 | | $ | 51,370 | | | $ | 51,370,000 | |
| U.S. Treasury Bills | | | 1.133 | % | | 03/08/18 | | | 4,825 | | | | 4,823,898 | |
| U.S. Treasury Bills | | | 1.167 | % | | 03/22/18 | | | 24,525 | | | | 24,505,776 | |
| U.S. Treasury Bills | | | 1.192 | % | | 03/29/18 | | | 2,990 | | | | 2,986,576 | |
| U.S. Treasury Bills | | | 1.226 | % | | 04/05/18 | | | 20,784 | | | | 20,754,498 | |
| U.S. Treasury Bills | | | 1.226 | % | | 04/12/18 | | | 4,690 | | | | 4,681,707 | |
| U.S. Treasury Bills | | | 1.252 | % | | 04/19/18 | | | 7,874 | | | | 7,857,524 | |
| U.S. Treasury Bills | | | 1.242 | % | | 04/26/18 | | | 23,948 | | | | 23,891,329 | |
| U.S. Treasury Bills | | | 1.374 | % | | 05/10/18 | | | 57,543 | | | | 57,369,292 | |
| U.S. Treasury Bills | | | 1.382 | % | | 05/17/18 | | | 63,050 | | | | 62,838,781 | |
| U.S. Treasury Bills | | | 1.412 | % | | 05/24/18 | | | 61,218 | | | | 60,990,524 | |
| U.S. Treasury Bills | | | 1.421 | % | | 05/31/18 | | | 10,731 | | | | 10,687,124 | |
| U.S. Treasury Bills | | | 1.438 | % | | 06/07/18 | | | 40,754 | | | | 40,576,216 | |
| U.S. Treasury Bills | | | 1.477 | % | | 06/14/18 | | | 70,880 | | | | 70,544,059 | |
| U.S. Treasury Bills | | | 1.509 | % | | 06/21/18 | | | 18,150 | | | | 18,057,677 | |
| U.S. Treasury Bills | | | 1.549 | % | | 06/28/18 | | | 25,087 | | | | 24,950,172 | |
| U.S. Treasury Bills | | | 1.563 | % | | 07/05/18 | | | 9,518 | | | | 9,461,576 | |
| U.S. Treasury Bills | | | 1.601 | % | | 07/12/18 | | | 77,940 | | | | 77,443,328 | |
| U.S. Treasury Bills | | | 1.610 | % | | 07/19/18 | | | 97,200 | | | | 96,535,912 | |
| U.S. Treasury Bills | | | 1.613 | % | | 07/26/18 | | | 42,912 | | | | 42,604,106 | |
| U.S. Treasury Bills | | | 1.635 | % | | 08/02/18 | | | 52,611 | | | | 52,219,399 | |
| U.S. Treasury Bills | | | 1.746 | % | | 08/09/18 | | | 27,306 | | | | 27,091,071 | |
| U.S. Treasury Bills | | | 1.826 | % | | 08/16/18 | | | 12,858 | | | | 12,750,068 | |
| U.S. Treasury Bills | | | 1.831 | % | | 08/23/18 | | | 90,319 | | | | 89,526,375 | |
| | | | | | | | | | | | | | 894,516,988 | |
| TOTAL SHORT-TERM INVESTMENTS | | | | | | | | | | | | | | |
| (Cost $894,901,865) | | | | | | | | | | | | | 894,516,988 | |
| Total Purchased Options — 0.9%** | | | | | | | | | | | | | | |
| (Cost $4,027,045) | | | | | | | | | | | | | 8,638,070 | |
| Total Investments — 95.7% | | | | | | | | | | | | | | |
| (Cost $898,928,910) | | | | | | | | | | | | | 903,155,058 | |
| | | | | | | | | | | | | | | |
| Other Assets in Excess of Liabilities — 4.3% | | | | | | | | | | | | | 40,926,049 | |
| Net Assets — 100.0% | | | | | | | | | | | | $ | 944,081,107 | |
* | Short-term investments reflect the annualized effective yield on the date of purchase for discounted investments. |
** | See page 19 for detailed information regarding the Purchased Options. |
The accompanying notes are an integral part of the consolidated financial statements.
11
Abbey Capital Futures Strategy Fund
Consolidated Portfolio of Investments (Continued)
February 28, 2018 (Unaudited)
Futures contracts outstanding as of February 28, 2018 were as follows:
| Long Contracts | | Expiration
Date | | Number of
Contracts | | | Notional
Amount | | | Value and
Unrealized Appreciation/ (Depreciation) | |
| 10-Year Mini Japanese Government Bond Futures | | Mar-18 | | | 46 | | | $ | 4,311,355 | | | $ | 4,836 | |
| 2-Year Euro Swapnote Futures | | Mar-18 | | | 47 | | | | 5,734,015 | | | | (4,301 | ) |
| 3-Month Euro Euribor | | Jun-18 | | | 10 | | | | 3,050,008 | | | | 1,525 | |
| 3-Month Euro Euribor | | Sep-18 | | | 8 | | | | 2,440,006 | | | | 732 | |
| 3-Month Euro Euribor | | Dec-18 | | | 247 | | | | 75,335,196 | | | | 4,789 | |
| 3-Month Euro Euribor | | Mar-19 | | | 25 | | | | 7,625,020 | | | | 137 | |
| 3-Month Euro Euribor | | Jun-19 | | | 340 | | | | 103,700,270 | | | | (28,182 | ) |
| 3-Month Euro Euribor | | Sep-19 | | | 11 | | | | 3,355,009 | | | | (1,189 | ) |
| 5-Year Euro Swapnote Futures | | Mar-18 | | | 12 | | | | 1,464,004 | | | | (16,372 | ) |
| 90-DAY Bank Bill | | Jun-18 | | | 48 | | | | 37,281,553 | | | | (588 | ) |
| 90-DAY Bank Bill | | Sep-18 | | | 516 | | | | 400,776,699 | | | | 22,880 | |
| 90-DAY Bank Bill | | Dec-18 | | | 112 | | | | 86,990,291 | | | | (1,708 | ) |
| 90-DAY Bank Bill | | Mar-19 | | | 22 | | | | 17,087,379 | | | | 341 | |
| 90-DAY Eurodollar Futures | | Dec-18 | | | 694 | | | | 173,500,000 | | | | (1,063,613 | ) |
| 90-DAY Eurodollar Futures | | Jun-21 | | | 1 | | | | 250,000 | | | | (63 | ) |
| 90-DAY Eurodollar Futures | | Sep-21 | | | 2 | | | | 500,000 | | | | (163 | ) |
| 90-DAY Sterling Futures | | Jun-18 | | | 10 | | | | 1,720,886 | | | | (2,925 | ) |
| 90-DAY Sterling Futures | | Sep-18 | | | 7 | | | | 1,204,620 | | | | (2,409 | ) |
| Amsterdam Index Futures | | Mar-18 | | | 61 | | | | 7,968,170 | | | | 179,572 | |
| AUD/USD Currency Futures | | Mar-18 | | | 215 | | | | 16,684,774 | | | | (435,738 | ) |
| BP Currency Futures | | Mar-18 | | | 366 | | | | 31,464,492 | | | | (471,590 | ) |
| Brent Crude Futures | | May-18 | | | 160 | | | | 10,356,800 | | | | (41,850 | ) |
| Brent Crude Futures | | Jun-18 | | | 18 | | | | 1,160,280 | | | | 3,030 | |
| Brent Crude Futures | | Jul-18 | | | 14 | | | | 897,820 | | | | 4,430 | |
| Brent Crude Futures | | Aug-18 | | | 12 | | | | 765,360 | | | | (1,020 | ) |
| Brent Crude Futures | | Sep-18 | | | 3 | | | | 190,320 | | | | (5,040 | ) |
| Brent Crude Futures | | Oct-18 | | | 3 | | | | 189,210 | | | | (5,720 | ) |
| CAC40 10 Euro Futures | | Mar-18 | | | 117 | | | | 7,592,360 | | | | 187,228 | |
| CAD Currency Futures | | Mar-18 | | | 49 | | | | 3,817,835 | | | | (49,481 | ) |
| Cattle Feeder Futures | | Mar-18 | | | 9 | | | | 651,375 | | | | (12,000 | ) |
| Cattle Feeder Futures | | Apr-18 | | | 15 | | | | 1,102,500 | | | | (14,275 | ) |
| Cattle Feeder Futures | | May-18 | | | 19 | | | | 1,411,225 | | | | (1,425 | ) |
| CHF Currency Futures | | Mar-18 | | | 87 | | | | 11,515,248 | | | | (186,084 | ) |
| Cocoa Futures | | May-18 | | | 73 | | | | 1,619,140 | | | | 85,310 | |
| Cocoa Futures | | Jul-18 | | | 8 | | | | 179,280 | | | | 6,850 | |
| Cocoa Futures | | Sep-18 | | | 3 | | | | 67,710 | | | | 2,000 | |
| COP/USD Futures | | Mar-18 | | | 107 | | | | 3,733,061 | | | | 97,877 | |
| Copper Futures | | May-18 | | | 101 | | | | 7,909,563 | | | | (178,075 | ) |
| Copper Futures | | Jul-18 | | | 10 | | | | 788,000 | | | | (30,388 | ) |
| Copper Futures | | Sep-18 | | | 1 | | | | 79,238 | | | | (1,575 | ) |
| Corn Futures | | May-18 | | | 61 | | | | 1,165,100 | | | | (64,163 | ) |
| Cotton No.2 Futures | | May-18 | | | 146 | | | | 6,053,890 | | | | (36,780 | ) |
| DAX Index Futures | | Mar-18 | | | 7 | | | | 2,654,346 | | | | (267,104 | ) |
| EUR Foreign Exchange Currency Futures | | Mar-18 | | | 86 | | | | 13,110,236 | | | | (2,063,836 | ) |
| Euro E-Mini Futures | | Mar-18 | | | 29 | | | | 2,210,447 | | | | (40,600 | ) |
| Euro STOXX 50 | | Mar-18 | | | 18 | | | | 754,987 | | | | (188,478 | ) |
| Euro/CHF 3-Month Futures ICE | | Jun-18 | | | 1 | | | | 264,718 | | | | (26 | ) |
| Euro/CHF 3-Month Futures ICE | | Sep-18 | | | 4 | | | | 1,058,873 | | | | (26 | ) |
The accompanying notes are an integral part of the consolidated financial statements.
12
Abbey Capital Futures Strategy Fund
Consolidated Portfolio of Investments (Continued)
February 28, 2018 (Unaudited)
| Long Contracts | | Expiration
Date | | Number of
Contracts | | | Notional
Amount | | | Value and
Unrealized Appreciation/ (Depreciation) | |
| Euro/CHF 3-Month Futures ICE | | Dec-18 | | | 4 | | | $ | 1,058,873 | | | $ | 26 | |
| Euro/CHF 3-Month Futures ICE | | Mar-19 | | | 2 | | | | 529,437 | | | | 79 | |
| Euro/JPY Futures | | Mar-18 | | | 7 | | | | 1,067,112 | | | | (48,315 | ) |
| Euro-BTP Futures | | Mar-18 | | | 114 | | | | 13,908,036 | | | | (99,833 | ) |
| Euro-BTP Futures | | Jun-18 | | | 19 | | | | 2,318,006 | | | | (695 | ) |
| Euro-Bund Futures | | Jun-18 | | | 3 | | | | 366,001 | | | | 11,773 | |
| Euro-Oat Futures | | Mar-18 | | | 26 | | | | 3,172,008 | | | | 11,053 | |
| Euro-Schatz Futures | | Mar-18 | | | 134 | | | | 16,348,043 | | | | (1,659 | ) |
| FTSE 100 Index Futures | | Mar-18 | | | 51 | | | | 5,073,530 | | | | (286,941 | ) |
| FTSE 250 Index Futures | | Mar-18 | | | 46 | | | | 2,493,437 | | | | (50,576 | ) |
| FTSE/JSE TOP 40 | | Mar-18 | | | 60 | | | | 2,610,722 | | | | (68,009 | ) |
| FTSE/MIB Index Futures | | Mar-18 | | | 33 | | | | 4,549,794 | | | | (145,388 | ) |
| Gasoline RBOB Futures | | Apr-18 | | | 196 | | | | 15,843,307 | | | | (363,661 | ) |
| Gasoline RBOB Futures | | May-18 | | | 21 | | | | 1,710,463 | | | | (60,203 | ) |
| Gasoline RBOB Futures | | Jul-18 | | | 2 | | | | 161,557 | | | | (4,339 | ) |
| Gold 100 Oz Futures | | Apr-18 | | | 507 | | | | 66,817,530 | | | | (1,109,860 | ) |
| Gold 100 Oz Futures | | Jun-18 | | | 16 | | | | 2,117,920 | | | | (15,410 | ) |
| Hang Seng China Enterprises Index Futures | | Mar-18 | | | 115 | | | | 9,072,567 | | | | (210,538 | ) |
| Hang Seng Index Futures | | Mar-18 | | | 93 | | | | 18,260,366 | | | | (276,760 | ) |
| IBEX 35 Index Futures | | Mar-18 | | | 25 | | | | 2,999,500 | | | | 32,550 | |
| ILS/USD Futures | | Mar-18 | | | 16 | | | | 4,604,250 | | | | (31,460 | ) |
| INR/USD Futures | | Mar-18 | | | 295 | | | | 9,049,177 | | | | (12,492 | ) |
| JPN 10-Year Bond (Osaka Securities Exchange) | | Mar-18 | | | 139 | | | | 130,277,895 | | | | 342,284 | |
| JPY Currency Futures | | Mar-18 | | | 313 | | | | 36,692,476 | | | | 444,218 | |
| Lean Hogs Futures | | Jun-18 | | | 7 | | | | 225,892 | | | | (13,550 | ) |
| Live Cattle Futures | | Apr-18 | | | 107 | | | | 5,276,176 | | | | (69,010 | ) |
| Live Cattle Futures | | Jun-18 | | | 49 | | | | 2,265,760 | | | | (13,180 | ) |
| Live Cattle Futures | | Aug-18 | | | 22 | | | | 994,180 | | | | (12,280 | ) |
| LME Aluminum Forward | | Mar-18 | | | 1,471 | | | | 78,312,363 | | | | (469,874 | ) |
| LME Aluminum Forward | | Apr-18 | | | 34 | | | | 1,810,500 | | | | (123,133 | ) |
| LME Aluminum Forward | | May-18 | | | 6 | | | | 319,725 | | | | (54,916 | ) |
| LME Aluminum Forward | | Jun-18 | | | 292 | | | | 15,581,850 | | | | (371,282 | ) |
| LME Copper Forward | | Mar-18 | | | 1 | | | | 172,588 | | | | 183,525 | |
| LME Copper Forward | | Apr-18 | | | 34 | | | | 5,878,388 | | | | (270,456 | ) |
| LME Copper Forward | | May-18 | | | 1 | | | | 173,194 | | | | (2,981 | ) |
| LME Copper Forward | | Jun-18 | | | 156 | | | | 27,077,700 | | | | (646,276 | ) |
| LME Lead Forward | | Mar-18 | | | 8 | | | | 500,000 | | | | 20,873 | |
| LME Lead Forward | | Apr-18 | | | 11 | | | | 687,775 | | | | (30,001 | ) |
| LME Lead Forward | | May-18 | | | 4 | | | | 250,000 | | | | (5,800 | ) |
| LME Nickel Forward | | Mar-18 | | | 5 | | | | 412,575 | | | | 815,626 | |
| LME Nickel Forward | | Apr-18 | | | 19 | | | | 1,569,438 | | | | 84,478 | |
| LME Nickel Forward | | May-18 | | | 7 | | | | 578,970 | | | | 3,921 | |
| LME Nickel Forward | | Jun-18 | | | 80 | | | | 6,626,400 | | | | (459 | ) |
| LME Zinc Forward | | Mar-18 | | | 10 | | | | 865,000 | | | | 646,862 | |
| LME Zinc Forward | | Apr-18 | | | 23 | | | | 1,986,625 | | | | 17,555 | |
| LME Zinc Forward | | May-18 | | | 9 | | | | 776,588 | | | | (9,756 | ) |
| LME Zinc Forward | | Jun-18 | | | 60 | | | | 5,169,750 | | | | (45,831 | ) |
| Low Sulphur Gasoil G Futures | | Apr-18 | | | 185 | | | | 10,706,875 | | | | (155,725 | ) |
| Low Sulphur Gasoil G Futures | | May-18 | | | 38 | | | | 2,197,350 | | | | (29,625 | ) |
| Low Sulphur Gasoil G Futures | | Jun-18 | | | 5 | | | | 288,000 | | | | (5,550 | ) |
The accompanying notes are an integral part of the consolidated financial statements.
13
Abbey Capital Futures Strategy Fund
Consolidated Portfolio of Investments (Continued)
February 28, 2018 (Unaudited)
| Long Contracts | | Expiration
Date | | Number of Contracts | | | Notional
Amount | | | Value and
Unrealized Appreciation/ (Depreciation) | |
| Mini HSI Index Futures | | Mar-18 | | | 24 | | | $ | 942,471 | | | $ | (16,157 | ) |
| MSCI EAFE Index Futures | | Mar-18 | | | 29 | | | | 2,952,925 | | | | (98,445 | ) |
| MSCI Emerging Markets Index Futures | | Mar-18 | | | 62 | | | | 3,667,300 | | | | (13,460 | ) |
| MSCI Singapore Exchange ETS | | Mar-18 | | | 180 | | | | 5,443,820 | | | | (14,335 | ) |
| MSCI Taiwan Index Futures | | Mar-18 | | | 118 | | | | 4,697,580 | | | | (6,080 | ) |
| MXN Currency Futures | | Mar-18 | | | 386 | | | | 10,247,751 | | | | (33,425 | ) |
| Nasdaq 100 E-Mini | | Mar-18 | | | 280 | | | | 38,444,000 | | | | (6,050 | ) |
| Natural Gas Futures | | Nov-18 | | | 1 | | | | 28,400 | | | | (570 | ) |
| Nikkei 225 (Chicago Mercantile Exchange) | | Mar-18 | | | 10 | | | | 1,096,000 | | | | (35,750 | ) |
| Nikkei 225 (Singapore Exchange) | | Mar-18 | | | 67 | | | | 6,940,508 | | | | (424,575 | ) |
| Nikkei 225 Mini | | Mar-18 | | | 191 | | | | 3,956,230 | | | | (217,709 | ) |
| NY Harbor Ultra-Low Sulfur Diesel Futures | | Apr-18 | | | 174 | | | | 13,910,778 | | | | (616,224 | ) |
| NY Harbor Ultra-Low Sulfur Diesel Futures | | May-18 | | | 13 | | | | 1,040,130 | | | | (48,476 | ) |
| NY Harbor Ultra-Low Sulfur Diesel Futures | | Jun-18 | | | 23 | | | | 1,838,588 | | | | (57,288 | ) |
| NZD Currency Futures | | Mar-18 | | | 367 | | | | 26,442,256 | | | | (437,435 | ) |
| OMX Stockholm 30 Index Futures | | Mar-18 | | | 30 | | | | 569,154 | | | | 10,783 | |
| Palladium Futures | | Jun-18 | | | 19 | | | | 1,971,440 | | | | 20,850 | |
| Platinum Futures | | Apr-18 | | | 76 | | | | 3,754,780 | | | | (85,120 | ) |
| PLN/USD Futures | | Mar-18 | | | 46 | | | | 6,716,544 | | | | 92,270 | |
| RUB Currency Futures | | Mar-18 | | | 62 | | | | 2,754,162 | | | | 116,125 | |
| Russell 2000 E-Mini | | Mar-18 | | | 112 | | | | 8,462,720 | | | | (231,340 | ) |
| S&P 500 E-Mini Futures | | Mar-18 | | | 122 | | | | 16,557,840 | | | | (553,868 | ) |
| S&P Mid 400 E-Mini Futures | | Mar-18 | | | 28 | | | | 5,220,600 | | | | (173,410 | ) |
| S&P/TSX 60 IX Futures | | Mar-18 | | | 70 | | | | 9,957,762 | | | | (308,180 | ) |
| SGX Nifty 50 | | Mar-18 | | | 294 | | | | 6,185,172 | | | | 5,628 | |
| Soybean Futures | | May-18 | | | 257 | | | | 13,563,175 | | | | 246,075 | |
| Soybean Futures | | Jul-18 | | | 2 | | | | 106,425 | | | | 725 | |
| Soybean Futures | | Sep-18 | | | 1 | | | | 52,275 | | | | (88 | ) |
| Soybean Meal Futures | | May-18 | | | 214 | | | | 8,446,580 | | | | 461,270 | |
| Soybean Meal Futures | | Jul-18 | | | 46 | | | | 1,803,660 | | | | 56,950 | |
| Soybean Meal Futures | | Aug-18 | | | 5 | | | | 193,050 | | | | 5,190 | |
| SPI 200 Futures | | Mar-18 | | | 194 | | | | 22,605,709 | | | | 30,369 | |
| Swiss Federal Bond Futures | | Mar-18 | | | 20 | | | | 2,117,747 | | | | (39,814 | ) |
| Topix Index Futures | | Mar-18 | | | 59 | | | | 9,776,653 | | | | (230,048 | ) |
| TRY/USD Futures | | Mar-18 | | | 29 | | | | 3,812,579 | | | | 10,265 | |
| WTI Crude Futures | | Apr-18 | | | 312 | | | | 19,231,680 | | | | 109,250 | |
| WTI Crude Futures | | May-18 | | | 183 | | | | 11,249,010 | | | | (277,520 | ) |
| WTI Crude Futures | | Jun-18 | | | 10 | | | | 611,400 | | | | (15,230 | ) |
| WTI Crude Futures | | Jul-18 | | | 2 | | | | 121,340 | | | | (3,180 | ) |
| WTI Crude Futures | | Aug-18 | | | 6 | | | | 360,840 | | | | 21,390 | |
| WTI Crude Futures | | Sep-18 | | | 6 | | | | 357,480 | | | | (4,050 | ) |
| WTI Crude Futures | | Oct-18 | | | 1 | | | | 59,040 | | | | (1,680 | ) |
| WTI Crude Futures | | Nov-18 | | | 1 | | | | 58,560 | | | | (1,770 | ) |
| | | | | | | | | | | | | $ | (9,880,388 | ) |
The accompanying notes are an integral part of the consolidated financial statements.
14
Abbey Capital Futures Strategy Fund
Consolidated Portfolio of Investments (Continued)
February 28, 2018 (Unaudited)
| Short Contracts | | Expiration
Date | | Number of
Contracts | | | Notional
Amount | | | Value and
Unrealized Appreciation/ (Depreciation) | |
| 3-Month Euro Euribor | | Dec-19 | | | 1,083 | | | $ | (330,315,859 | ) | | $ | 227,238 | |
| 3-Month Euro Euribor | | Mar-20 | | | 4 | | | | (1,220,003 | ) | | | (717 | ) |
| 3-Month Euro Euribor | | Jun-20 | | | 19 | | | | (5,795,015 | ) | | | (3,248 | ) |
| 3-Month Euro Euribor | | Sep-20 | | | 1 | | | | (305,001 | ) | | | (31 | ) |
| 3-Month Euro Euribor | | Dec-20 | | | 1 | | | | (305,001 | ) | | | (76 | ) |
| 90-DAY Eurodollar Futures | | Mar-18 | | | 72 | | | | (18,000,000 | ) | | | 94,838 | |
| 90-DAY Eurodollar Futures | | Jun-18 | | | 224 | | | | (56,000,000 | ) | | | 220,300 | |
| 90-DAY Eurodollar Futures | | Sep-18 | | | 295 | | | | (73,750,000 | ) | | | 251,900 | |
| 90-DAY Eurodollar Futures | | Mar-19 | | | 298 | | | | (74,500,000 | ) | | | 268,725 | |
| 90-DAY Eurodollar Futures | | Jun-19 | | | 1,827 | | | | (456,750,000 | ) | | | 2,445,483 | |
| 90-DAY Eurodollar Futures | | Sep-19 | | | 209 | | | | (52,250,000 | ) | | | 252,038 | |
| 90-DAY Eurodollar Futures | | Dec-19 | | | 2,549 | | | | (637,250,000 | ) | | | 2,649,125 | |
| 90-DAY Eurodollar Futures | | Mar-20 | | | 77 | | | | (19,250,000 | ) | | | 66,963 | |
| 90-DAY Eurodollar Futures | | Jun-20 | | | 71 | | | | (17,750,000 | ) | | | 62,537 | |
| 90-DAY Eurodollar Futures | | Sep-20 | | | 1 | | | | (250,000 | ) | | | (125 | ) |
| 90-DAY Eurodollar Futures | | Dec-20 | | | 132 | | | | (33,000,000 | ) | | | 143,325 | |
| 90-DAY Eurodollar Futures | | Mar-21 | | | 2 | | | | (500,000 | ) | | | (75 | ) |
| 90-DAY Sterling Futures | | Dec-18 | | | 1,512 | | | | (260,197,971 | ) | | | 62,933 | |
| 90-DAY Sterling Futures | | Mar-19 | | | 145 | | | | (24,952,848 | ) | | | (688 | ) |
| 90-DAY Sterling Futures | | Jun-19 | | | 223 | | | | (38,375,759 | ) | | | (12,291 | ) |
| 90-DAY Sterling Futures | | Sep-19 | | | 271 | | | | (46,636,012 | ) | | | 20,302 | |
| 90-DAY Sterling Futures | | Dec-19 | | | 416 | | | | (71,588,860 | ) | | | 109,338 | |
| 90-DAY Sterling Futures | | Mar-20 | | | 252 | | | | (43,366,328 | ) | | | 14,920 | |
| 90-DAY Sterling Futures | | Jun-20 | | | 273 | | | | (46,980,189 | ) | | | 40,763 | |
| 90-DAY Sterling Futures | | Sep-20 | | | 8 | | | | (1,376,709 | ) | | | 120 | |
| 90-DAY Sterling Futures | | Dec-20 | | | 220 | | | | (37,859,493 | ) | | | 104,819 | |
| Australian 10-Year Bond Futures | | Mar-18 | | | 88 | | | | (6,834,951 | ) | | | (50,167 | ) |
| Australian 3-Year Bond Futures | | Mar-18 | | | 19 | | | | (1,475,728 | ) | | | (12,751 | ) |
| Bank Acceptance Futures | | Jun-18 | | | 13 | | | | (2,532,731 | ) | | | (3,419 | ) |
| Bank Acceptance Futures | | Sep-18 | | | 59 | | | | (11,494,701 | ) | | | 2,445 | |
| Bank Acceptance Futures | | Dec-18 | | | 85 | | | | (16,560,162 | ) | | | 18,937 | |
| Canadian 10-Year Bond Futures | | Jun-18 | | | 358 | | | | (27,899,002 | ) | | | (215,578 | ) |
| Canola Futures (Winnipeg Commodity Exchange) | | May-18 | | | 1 | | | | (8,167 | ) | | | (401 | ) |
| Canola Futures (Winnipeg Commodity Exchange) | | Jul-18 | | | 5 | | | | (41,225 | ) | | | (1,897 | ) |
| Cocoa Futures | | May-18 | | | 69 | | | | (1,502,788 | ) | | | (113,207 | ) |
| Cocoa Futures | | Jul-18 | | | 22 | | | | (484,299 | ) | | | (53,471 | ) |
| Coffee 'C' Futures | | May-18 | | | 325 | | | | (14,868,750 | ) | | | 253,144 | |
| Coffee 'C' Futures | | Jul-18 | | | 45 | | | | (2,094,188 | ) | | | 67,781 | |
| Coffee 'C' Futures | | Sep-18 | | | 10 | | | | (473,250 | ) | | | 3,769 | |
| Coffee Robusta Futures | | May-18 | | | 72 | | | | (1,241,280 | ) | | | 77,340 | |
| Coffee Robusta Futures | | Jul-18 | | | 30 | | | | (526,200 | ) | | | 120 | |
| Corn Futures | | Sep-18 | | | 25 | | | | (493,750 | ) | | | (28,525 | ) |
| DJIA Mini E-CBOT | | Mar-18 | | | 60 | | | | (7,511,400 | ) | | | (431,385 | ) |
| Dollar Index | | Mar-18 | | | 3 | | | | (300,000 | ) | | | (4,448 | ) |
| E-Mini Natural Gas | | Apr-18 | | | 16 | | | | (106,675 | ) | | | (1,780 | ) |
| Euro BUXL 30-Year Bond Futures | | Mar-18 | | | 17 | | | | (2,074,005 | ) | | | (53,241 | ) |
| Euro/CHF 3-Month Futures ICE | | Mar-18 | | | 1 | | | | (264,718 | ) | | | (132 | ) |
| Euro-Bobl Futures | | Mar-18 | | | 444 | | | | (54,168,141 | ) | | | (96,917 | ) |
| Euro-Bobl Futures | | Jun-18 | | | 186 | | | | (22,692,059 | ) | | | (20,740 | ) |
| Euro-Bund Futures | | Mar-18 | | | 193 | | | | (23,546,061 | ) | | | (388,546 | ) |
The accompanying notes are an integral part of the consolidated financial statements.
15
Abbey Capital Futures Strategy Fund
Consolidated Portfolio of Investments (Continued)
February 28, 2018 (Unaudited)
| Short Contracts | | Expiration
Date | | Number of
Contracts | | | Notional
Amount | | | Value and
Unrealized Appreciation/ (Depreciation) | |
| Euro-Oat Futures | | Jun-18 | | | 37 | | | $ | (4,514,012 | ) | | $ | (451 | ) |
| Kansas City Hard Red Winter Wheat Futures | | May-18 | | | 22 | | | | (574,475 | ) | | | (46,025 | ) |
| Kansas City Hard Red Winter Wheat Futures | | Jul-18 | | | 58 | | | | (1,563,100 | ) | | | (131,925 | ) |
| Lean Hogs Futures | | Apr-18 | | | 92 | | | | (2,473,880 | ) | | | 67,880 | |
| Lean Hogs Futures | | Jul-18 | | | 1 | | | | (32,880 | ) | | | (850 | ) |
| LME Aluminum Forward | | Mar-18 | | | 1,471 | | | | (78,312,363 | ) | | | 447,614 | |
| Long Gilt Futures | | Jun-18 | | | 306 | | | | (42,127,290 | ) | | | (131,710 | ) |
| Mill Wheat Euro | | Mar-18 | | | 1 | | | | (10,172 | ) | | | (427 | ) |
| Mill Wheat Euro | | May-18 | | | 180 | | | | (1,847,390 | ) | | | 10,217 | |
| Mill Wheat Euro | | Sep-18 | | | 118 | | | | (1,239,859 | ) | | | (30,454 | ) |
| Natural Gas Futures | | Apr-18 | | | 533 | | | | (14,215,200 | ) | | | (54,980 | ) |
| Natural Gas Futures | | May-18 | | | 207 | | | | (5,580,700 | ) | | | (28,220 | ) |
| Natural Gas Futures | | Jun-18 | | | 20 | | | | (547,000 | ) | | | (9,070 | ) |
| Natural Gas Futures | | Jul-18 | | | 14 | | | | (389,100 | ) | | | (7,290 | ) |
| Natural Gas Futures | | Aug-18 | | | 6 | | | | (167,500 | ) | | | (3,740 | ) |
| Natural Gas Futures | | Sep-18 | | | 1 | | | | (27,700 | ) | | | (700 | ) |
| Nikkie 225 (Osaka Securities Exchange) | | Mar-18 | | | 5 | | | | (1,035,662 | ) | | | (6,467 | ) |
| Rapeseed Euro | | May-18 | | | 94 | | | | (2,067,112 | ) | | | (55,998 | ) |
| Rapeseed Euro | | Aug-18 | | | 62 | | | | (1,345,450 | ) | | | (4,514 | ) |
| Rapeseed Euro | | Nov-18 | | | 6 | | | | (131,211 | ) | | | (4,133 | ) |
| Silver Futures | | May-18 | | | 97 | | | | (7,957,400 | ) | | | 84,795 | |
| Silver Futures | | Jul-18 | | | 5 | | | | (412,450 | ) | | | 3,125 | |
| Soybean Futures | | Aug-18 | | | 3 | | | | (159,488 | ) | | | (11,975 | ) |
| Soybean Oil Futures | | May-18 | | | 98 | | | | (1,895,124 | ) | | | 74,262 | |
| Soybean Oil Futures | | Jul-18 | | | 88 | | | | (1,712,304 | ) | | | 36,042 | |
| Sugar No. 11 (World) | | May-18 | | | 355 | | | | (5,319,888 | ) | | | 78,299 | |
| Sugar No. 11 (World) | | Jul-18 | | | 314 | | | | (4,744,163 | ) | | | 37,094 | |
| Sugar No. 11 (World) | | Oct-18 | | | 22 | | | | (340,278 | ) | | | 1,042 | |
| U.S. Treasury 10-Year Notes (Chicago Board of Trade) | | Jun-18 | | | 1,559 | | | | (152,323,900 | ) | | | 54,609 | |
| U.S. Treasury 2-Year Notes (Chicago Board of Trade) | | Jun-18 | | | 694 | | | | (136,276,340 | ) | | | 63,813 | |
| U.S. Treasury 5-Year Notes (Chicago Board of Trade) | | Jun-18 | | | 2,012 | | | | (192,733,675 | ) | | | 242,054 | |
| U.S. Treasury Long Bond (Chicago Board of Trade) | | Jun-18 | | | 246 | | | | (29,597,586 | ) | | | (106,570 | ) |
| U.S. Treasury Ultra Long Bond (Chicago Board of Trade) | | Jun-18 | | | 22 | | | | (2,432,024 | ) | | | (26,164 | ) |
| USD/CZK Futures | | Mar-18 | | | 30 | | | | (3,000,000 | ) | | | 60,939 | |
| USD/HUF Futures | | Mar-18 | | | 29 | | | | (2,900,000 | ) | | | (26,120 | ) |
| USD/NOK Futures | | Mar-18 | | | 1 | | | | (100,000 | ) | | | (49,036 | ) |
| USD/SEK Futures | | Mar-18 | | | 3 | | | | (300,000 | ) | | | (6,266 | ) |
| Wheat (Chicago Board of Trade) | | May-18 | | | 53 | | | | (1,311,750 | ) | | | (200,038 | ) |
| Wheat (Chicago Board of Trade) | | Jul-18 | | | 10 | | | | (253,625 | ) | | | (21,400 | ) |
| White Sugar ICE | | May-18 | | | 111 | | | | (2,005,215 | ) | | | 4,280 | |
| White Sugar ICE | | Aug-18 | | | 51 | | | | (914,175 | ) | | | 43,860 | |
| White Sugar ICE | | Oct-18 | | | 3 | | | | (54,210 | ) | | | (30 | ) |
| | | | | | | | | | | | | $ | 6,310,719 | |
| Total Futures Contracts | | | | | | | | | | | | $ | (3,569,669 | ) |
The accompanying notes are an integral part of the consolidated financial statements.
16
Abbey Capital Futures Strategy Fund
Consolidated Portfolio of Investments (Continued)
February 28, 2018 (Unaudited)
Forward foreign currency contracts outstanding as of February 28, 2018 were as follows:
| Currency Purchased | | Currency Sold | | Expiration
Date | Counterparty | | Unrealized Appreciation/ (Depreciation) | |
| AUD | | | 28,207,023 | | USD | | | 21,925,673 | | Mar 21 2018 | BOA | | $ | (16,788 | ) |
| AUD | | | 62,391,000 | | USD | | | 49,588,180 | | Mar 23 2018 | BOA | | | (1,127,841 | ) |
| AUD | | | 66,000 | | USD | | | 51,293 | | Mar 28 2018 | BOA | | | (29 | ) |
| BRL | | | 35,100,283 | | USD | | | 10,635,697 | | Mar 21 2018 | BOA | | | 150,069 | |
| BRL | | | 4,083,438 | | USD | | | 1,250,000 | | Jun 20 2018 | BOA | | | (6,969 | ) |
| CAD | | | 411,008 | | USD | | | 320,712 | | Mar 01 2018 | BOA | | | (408 | ) |
| CAD | | | 43,572,010 | | USD | | | 34,524,849 | | Mar 21 2018 | BOA | | | (554,833 | ) |
| CAD | | | 35,824,000 | | USD | | | 28,619,060 | | Mar 23 2018 | BOA | | | (688,285 | ) |
| CAD | | | 83,000 | | USD | | | 64,710 | | Mar 28 2018 | BOA | | | 10 | |
| CHF | | | 18,249,000 | | USD | | | 19,460,315 | | Mar 23 2018 | BOA | | | (95,082 | ) |
| CHF | | | 2,108,000 | | USD | | | 2,257,788 | | Mar 28 2018 | BOA | | | (19,671 | ) |
| CLP | | | 9,543,488,344 | | USD | | | 15,089,803 | | Mar 21 2018 | BOA | | | 945,930 | |
| CLP | | | 5,739,651,730 | | USD | | | 9,700,000 | | Jun 20 2018 | BOA | | | (67,079 | ) |
| CNH | | | 35,398,277 | | USD | | | 5,450,000 | | Mar 21 2018 | BOA | | | 136,056 | |
| EUR | | | 1,211,918 | | USD | | | 1,492,251 | | Mar 01 2018 | BOA | | | (13,617 | ) |
| EUR | | | 351,108 | | USD | | | 428,352 | | Mar 02 2018 | BOA | | | 53 | |
| EUR | | | 7,000,000 | | HUF | | | 2,193,803,866 | | Mar 21 2018 | BOA | | | 15,246 | |
| EUR | | | 20,200,000 | | NOK | | | 198,381,048 | | Mar 21 2018 | BOA | | | (452,959 | ) |
| EUR | | | 4,200,000 | | PLN | | | 17,540,487 | | Mar 21 2018 | BOA | | | 6,001 | |
| EUR | | | 32,900,000 | | SEK | | | 326,224,377 | | Mar 21 2018 | BOA | | | 773,199 | |
| EUR | | | 57,430,978 | | USD | | | 68,993,607 | | Mar 21 2018 | BOA | | | 1,190,419 | |
| EUR | | | 40,911,000 | | USD | | | 49,034,498 | | Mar 23 2018 | BOA | | | 970,126 | |
| EUR | | | 51,000 | | JPY | | | 6,636,865 | | Mar 28 2018 | BOA | | | 28 | |
| EUR | | | 1,598,000 | | USD | | | 1,967,381 | | Mar 28 2018 | BOA | | | (13,303 | ) |
| GBP | | | 187,872 | | USD | | | 262,411 | | Mar 01 2018 | BOA | | | (3,758 | ) |
| GBP | | | 629,759 | | USD | | | 868,438 | | Mar 02 2018 | BOA | | | (1,393 | ) |
| GBP | | | 40,902,068 | | USD | | | 55,339,182 | | Mar 21 2018 | BOA | | | 1,027,891 | |
| GBP | | | 28,572,000 | | USD | | | 38,718,816 | | Mar 23 2018 | BOA | | | 660,764 | |
| HUF | | | 1,209,335,168 | | EUR | | | 3,900,000 | | Mar 21 2018 | BOA | | | (58,811 | ) |
| HUF | | | 871,004,193 | | USD | | | 3,331,682 | | Mar 21 2018 | BOA | | | 58,616 | |
| ILS | | | 60,457,605 | | USD | | | 17,400,000 | | Mar 21 2018 | BOA | | | 2,551 | |
| INR | | | 1,592,111,220 | | USD | | | 24,581,464 | | Mar 21 2018 | BOA | | | (204,581 | ) |
| INR | | | 464,187,362 | | USD | | | 7,050,000 | | Jun 20 2018 | BOA | | | (12,507 | ) |
| JPY | | | 132,243,069 | | USD | | | 1,235,398 | | Mar 01 2018 | BOA | | | 4,116 | |
| JPY | | | 33,394,981 | | USD | | | 313,074 | | Mar 02 2018 | BOA | | | (47 | ) |
| JPY | | | 13,734,831,293 | | USD | | | 123,792,616 | | Mar 22 2018 | BOA | | | 5,146,085 | |
| JPY | | | 7,665,381,000 | | USD | | | 70,211,719 | | Mar 23 2018 | BOA | | | 1,754,740 | |
| JPY | | | 754,889,850 | | EUR | | | 5,756,000 | | Mar 28 2018 | BOA | | | 51,666 | |
| JPY | | | 269,445,000 | | USD | | | 2,529,742 | | Mar 28 2018 | BOA | | | 1,005 | |
| KRW | | | 15,558,251,318 | | USD | | | 14,321,492 | | Mar 21 2018 | BOA | | | 50,069 | |
| KRW | | | 6,203,926,766 | | USD | | | 5,800,000 | | Jun 20 2018 | BOA | | | (54,855 | ) |
| MXN | | | 247,139,302 | | USD | | | 12,925,820 | | Mar 21 2018 | BOA | | | 138,374 | |
| MXN | | | 42,318,000 | | USD | | | 2,234,541 | | Mar 23 2018 | BOA | | | 1,700 | |
| NOK | | | 1,995,841 | | USD | | | 253,054 | | Mar 02 2018 | BOA | | | (316 | ) |
| NOK | | | 182,185,533 | | EUR | | | 18,850,000 | | Mar 21 2018 | BOA | | | 50,467 | |
| NOK | | | 76,291,950 | | USD | | | 9,469,998 | | Mar 21 2018 | BOA | | | 197,602 | |
| NZD | | | 567,875 | | USD | | | 411,550 | | Mar 01 2018 | BOA | | | (2,005 | ) |
| NZD | | | 646,453 | | USD | | | 466,752 | | Mar 02 2018 | BOA | | | (543 | ) |
| NZD | | | 29,127,323 | | USD | | | 20,780,991 | | Mar 21 2018 | BOA | | | 221,313 | |
The accompanying notes are an integral part of the consolidated financial statements.
17
Abbey Capital Futures Strategy Fund
Consolidated Portfolio of Investments (Continued)
February 28, 2018 (Unaudited)
| Currency Purchased | | Currency Sold | | Expiration
Date | Counterparty | | Unrealized Appreciation/ (Depreciation) | |
| NZD | | | 26,641,000 | | USD | | | 19,503,897 | | Mar 23 2018 | BOA | | $ | (294,674 | ) |
| PHP | | | 152,928,179 | | USD | | | 3,000,000 | | Mar 21 2018 | BOA | | | (67,139 | ) |
| PHP | | | 52,708,000 | | USD | | | 1,000,000 | | Jun 20 2018 | BOA | | | 5,739 | |
| PLN | | | 59,357,624 | | EUR | | | 14,100,000 | | Mar 21 2018 | BOA | | | 117,720 | |
| PLN | | | 41,783,161 | | USD | | | 11,878,179 | | Mar 21 2018 | BOA | | | 333,993 | |
| RUB | | | 697,612,030 | | USD | | | 11,850,000 | | Mar 21 2018 | BOA | | | 491,484 | |
| RUB | | | 582,127,294 | | USD | | | 10,300,000 | | Jun 20 2018 | BOA | | | (95,873 | ) |
| SEK | | | 102,050,745 | | EUR | | | 10,300,000 | | Mar 21 2018 | BOA | | | (251,770 | ) |
| SEK | | | 55,748,129 | | USD | | | 6,835,933 | | Mar 21 2018 | BOA | | | (97,350 | ) |
| SGD | | | 18,595,366 | | USD | | | 13,921,309 | | Mar 21 2018 | BOA | | | 119,601 | |
| THB | | | 281,887,053 | | USD | | | 8,750,000 | | Mar 21 2018 | BOA | | | 235,164 | |
| TRY | | | 92,811,563 | | USD | | | 23,922,279 | | Mar 21 2018 | BOA | | | 332,803 | |
| TWD | | | 141,365,177 | | USD | | | 4,837,566 | | Mar 21 2018 | BOA | | | 9,586 | |
| TWD | | | 13,005,450 | | USD | | | 450,000 | | Jun 20 2018 | BOA | | | (1,327 | ) |
| USD | | | 19,565,650 | | AUD | | | 25,093,248 | | Mar 21 2018 | BOA | | | 75,288 | |
| USD | | | 44,176,625 | | AUD | | | 56,848,000 | | Mar 23 2018 | BOA | | | 21,646 | |
| USD | | | 3,725,832 | | AUD | | | 4,784,000 | | Mar 28 2018 | BOA | | | 9,972 | |
| USD | | | 8,847,371 | | BRL | | | 28,935,944 | | Mar 21 2018 | BOA | | | (44,190 | ) |
| USD | | | 321,789 | | CAD | | | 411,008 | | Mar 01 2018 | BOA | | | 1,486 | |
| USD | | | 31,434,971 | | CAD | | | 39,648,157 | | Mar 21 2018 | BOA | | | 524,105 | |
| USD | | | 44,962,240 | | CAD | | | 56,987,000 | | Mar 23 2018 | BOA | | | 531,381 | |
| USD | | | 4,766,897 | | CAD | | | 6,079,000 | | Mar 28 2018 | BOA | | | 26,738 | |
| USD | | | 17,011,798 | | CHF | | | 16,644,000 | | Mar 23 2018 | BOA | | | (650,263 | ) |
| USD | | | 10,953,013 | | CHF | | | 10,287,000 | | Mar 28 2018 | BOA | | | 31,046 | |
| USD | | | 14,800,000 | | CLP | | | 8,868,988,180 | | Mar 21 2018 | BOA | | | (102,383 | ) |
| USD | | | 1,150,000 | | CNH | | | 7,330,709 | | Mar 21 2018 | BOA | | | (6,829 | ) |
| USD | | | 1,483,788 | | EUR | | | 1,211,918 | | Mar 01 2018 | BOA | | | 5,154 | |
| USD | | | 428,615 | | EUR | | | 351,108 | | Mar 02 2018 | BOA | | | 210 | |
| USD | | | 59,106,325 | | EUR | | | 48,486,598 | | Mar 21 2018 | BOA | | | (147,144 | ) |
| USD | | | 28,729,544 | | EUR | | | 23,458,000 | | Mar 23 2018 | BOA | | | 57,342 | |
| USD | | | 11,520,132 | | EUR | | | 9,383,000 | | Mar 28 2018 | BOA | | | 46,343 | |
| USD | | | 260,932 | | GBP | | | 187,872 | | Mar 01 2018 | BOA | | | 2,279 | |
| USD | | | 872,316 | | GBP | | | 629,759 | | Mar 02 2018 | BOA | | | 5,272 | |
| USD | | | 46,249,538 | | GBP | | | 33,729,682 | | Mar 21 2018 | BOA | | | (233,282 | ) |
| USD | | | 27,658,457 | | GBP | | | 19,905,000 | | Mar 23 2018 | BOA | | | 224,236 | |
| USD | | | 2,314,604 | | HUF | | | 599,008,928 | | Mar 21 2018 | BOA | | | (16,979 | ) |
| USD | | | 11,600,000 | | ILS | | | 40,282,107 | | Mar 21 2018 | BOA | | | 4,909 | |
| USD | | | 20,649,868 | | INR | | | 1,336,353,258 | | Mar 21 2018 | BOA | | | 188,906 | |
| USD | | | 50,000 | | INR | | | 3,307,516 | | Jun 20 2018 | BOA | | | (145 | ) |
| USD | | | 1,230,443 | | JPY | | | 132,243,069 | | Mar 01 2018 | BOA | | | (9,071 | ) |
| USD | | | 311,734 | | JPY | | | 33,394,981 | | Mar 02 2018 | BOA | | | (1,294 | ) |
| USD | | | 98,816,578 | | JPY | | | 10,953,406,181 | | Mar 22 2018 | BOA | | | (4,010,893 | ) |
| USD | | | 51,519,027 | | JPY | | | 5,703,270,000 | | Mar 23 2018 | BOA | | | (2,026,145 | ) |
| USD | | | 13,401,378 | | KRW | | | 14,391,319,609 | | Mar 21 2018 | BOA | | | 107,742 | |
| USD | | | 9,136,033 | | MXN | | | 175,545,983 | | Mar 21 2018 | BOA | | | (143,619 | ) |
| USD | | | 7,904,221 | | MXN | | | 154,908,000 | | Mar 23 2018 | BOA | | | (281,694 | ) |
| USD | | | 253,470 | | NOK | | | 1,995,841 | | Mar 02 2018 | BOA | | | 731 | |
| USD | | | 8,291,714 | | NOK | | | 67,238,070 | | Mar 21 2018 | BOA | | | (228,592 | ) |
| USD | | | 412,815 | | NZD | | | 567,875 | | Mar 01 2018 | BOA | | | 3,269 | |
| USD | | | 467,453 | | NZD | | | 646,453 | | Mar 02 2018 | BOA | | | 1,244 | |
| USD | | | 17,986,186 | | NZD | | | 25,480,884 | | Mar 21 2018 | BOA | | | (386,847 | ) |
The accompanying notes are an integral part of the consolidated financial statements.
18
Abbey Capital Futures Strategy Fund
Consolidated Portfolio of Investments (Continued)
February 28, 2018 (Unaudited)
| Currency Purchased | | Currency Sold | | Expiration
Date | Counterparty | | Unrealized Appreciation/ (Depreciation) | |
| USD | | | 10,865,269 | | NZD | 15,391,000 | | Mar 23 2018 | BOA | | $ | (232,256 | ) |
| USD | | | 3,000,000 | | PHP | 154,804,442 | | Mar 21 2018 | BOA | | | 31,156 | |
| USD | | | 9,195,286 | | PLN | 31,764,012 | | Mar 21 2018 | BOA | | | (88,539 | ) |
| USD | | | 12,437,693 | | RUB | 697,612,030 | | Mar 21 2018 | BOA | | | 96,209 | |
| USD | | | 5,149,397 | | SEK | 41,633,135 | | Mar 21 2018 | BOA | | | 116,972 | |
| USD | | | 4,417,203 | | SGD | 5,862,398 | | Mar 21 2018 | BOA | | | (9,352 | ) |
| USD | | | 3,200,000 | | THB | 101,847,261 | | Mar 21 2018 | BOA | | | (46,387 | ) |
| USD | | | 13,415,657 | | TRY | 52,288,666 | | Mar 21 2018 | BOA | | | (249,298 | ) |
| USD | | | 5,140,721 | | TWD | 152,408,122 | | Mar 21 2018 | BOA | | | (85,073 | ) |
| USD | | | 5,986,475 | | ZAR | 74,065,828 | | Mar 22 2018 | BOA | | | (271,782 | ) |
| ZAR | | | 177,193,588 | | USD | 14,000,133 | | Mar 22 2018 | BOA | | | 971,996 | |
| ZAR | | | 19,636,000 | | USD | 1,688,550 | | Mar 28 2018 | BOA | | | (30,988 | ) |
| Total Forward Foreign Currency Contracts | | | | | | $ | 4,778,960 | |
| | | Put/Call | | | Counterparty | | | Number
Of Contracts | | | Notional
Amount | | Value | |
| Purchased Options — 0.9% | | | | | | | | | | | | | | |
| 3-Month Euro Euribor, Expires 12/16/19, Strike Price $99.50 | | | Put | | | | BAML | | | | 4,356 | | | EUR 173,996,064 | | $ | 963,223 | |
| EURO Currency Futures, Expires 4/06/18, Strike Price $1.20 | | | Put | | | | BAML | | | | 561 | | | EUR 70,125,000 | | | 203,363 | |
| IMM Eurodollar Futures, Expires 12/17/18, Strike Price $97.625 | | | Put | | | | BAML | | | | 2,420 | | | EUR 94,350,960 | | | 1,376,375 | |
| IMM Eurodollar Futures, Expires 12/17/18, Strike Price $97.875 | | | Put | | | | BAML | | | | 4,699 | | | EUR 183,204,612 | | | 5,022,056 | |
| IMM Eurodollar Futures, Expires 3/19/18, Strike Price $98 | | | Put | | | | BAML | | | | 1,753 | | | EUR 68,636,962 | | | 514,944 | |
| U.S. 10-Year Treasury Bond, Expires 3/23/18, Strike Price $119 | | | Put | | | | BAML | | | | 1,508 | | | USD 181,035 | | | 282,750 | |
| USD JPY Currency Futures, Expires 4/06/18, Strike Price $103 | | | Put | | | | BAML | | | | 111,032,000 | | | JPY 111,032,000 | | | 275,359 | |
| TOTAL PURCHASED OPTIONS (COST $4,027,045) | | | | | | | | | $ | 8,638,070 | |
The accompanying notes are an integral part of the consolidated financial statements.
19
Abbey Capital Futures Strategy Fund
Consolidated Portfolio of Investments (Concluded)
February 28, 2018 (Unaudited)
| | | Put/Call | | | Counterparty | | | Number Of
Contracts | | | Notional
Amount | | Value | |
| Written Options — (0.6)% | | | | | | | | | | | | | | | | | | |
| 3-Month Euro Euribor, Expires 12/16/19, Strike Price $99.375 | | | Put | | | | BAML | | | | 4,356 | | | EUR 173,996,064 | | $ | (697,506 | ) |
| IMM Eurodollar Futures, Expires 12/17/18, Strike Price $97.5 | | | Put | | | | BAML | | | | 2,420 | | | EUR 94,350,960 | | | (892,375 | ) |
| IMM Eurodollar Futures, Expires 12/17/18, Strike Price $97.75 | | | Put | | | | BAML | | | | 4,699 | | | EUR 183,204,612 | | | (3,788,569 | ) |
| U.S. 10-Year Treasury Bond, Expires 3/23/18, Strike Price $118 | | | Put | | | | BAML | | | | 1,508 | | | USD 181,035 | | | (70,687 | ) |
| USD JPY Currency Futures, Expires 4/06/18, Strike Price $100 | | | Put | | | | BAML | | | | 111,032,000 | | | JPY 111,032,000 | | | (79,499 | ) |
| TOTAL WRITTEN OPTIONS (PREMIUMS RECEIVED $2,164,490) | | | | | | | | | $ | (5,528,636 | ) |
AUD | Australian Dollar |
BAML | Bank of America Merrill Lynch |
BOA | Bank of America |
BRL | Brazilian Real |
CAD | Canadian Dollar |
CBOT | Chicago Board of Trade |
CHF | Swiss Franc |
CLP | Chilean Peso |
CNH | Chinese Yuan Renminbi |
COP | Colombian Peso |
CZK | Czech Koruna |
DAX | Deutscher Aktienindex |
DJIA | Dow Jones Industrial Average |
EUR | Euro |
FTSE | Financial Times Stock Exchange |
GBP | British Pound |
HUF | Hungarian Forint |
IBEX | Index of the Bolsa de Madrid |
ICE | Intercontinental Exchange |
ILS | Israeli New Shekel |
IMM | International Monetary Market |
INR | Indian Rupee |
JPY | Japanese Yen |
KRW | Korean Won |
LME | London Mercantile Exchange |
MXN | Mexican Peso |
NOK | Norwegian Krone |
NZD | New Zealand Dollar |
PHP | Philippine Peso |
PLN | Polish Zloty |
RBOB | Reformulated Blendstock for Oxygenate Blending |
RUB | Russian Ruble |
SEK | Swedish Krona |
SGD | Singapore Dollar |
SGX | Singapore Exchange |
THB | Thai Baht |
TRY | Turkish Lira |
TSX | Toronto Stock Exchange |
TWD | Taiwan Dollar |
USD | United States Dollar |
WTI | West Texas Intermediate |
ZAR | South African Rand |
The accompanying notes are an integral part of the consolidated financial statements.
20
Abbey Capital Futures Strategy Fund
Consolidated Statement of Assets And Liabilities
February 28, 2018 (Unaudited)
| ASSETS | | | |
| Investments, at value (cost $898,928,910) | | $ | 903,155,058 | |
| Cash | | | 17,881,937 | |
| Deposits with broker for forward foreign currency contracts | | | 10,935,448 | |
| Deposits with brokers for futures contracts | | | 66,187,979 | |
| Receivables for: | | | | |
| Capital shares sold | | | 9,860,916 | |
| Unrealized appreciation on forward foreign currency contracts | | | 18,285,818 | |
| Unrealized appreciation on futures contracts | | | 13,172,628 | |
| Prepaid expenses and other assets | | | 65,644 | |
| Total assets | | | 1,039,545,428 | |
| LIABILITIES | | | | |
| Options written, at value (premiums received $2,164,490) | | | 5,528,636 | |
| Due to broker | | | 2,395,078 | |
| Payables for: | | | | |
| Investments purchased | | | 55,379,630 | |
| Advisory fees | | | 1,211,443 | |
| Capital shares redeemed | | | 432,956 | |
| Administration and accounting services fees | | | 72,108 | |
| Unrealized depreciation on forward foreign currency contracts | | | 13,506,858 | |
| Unrealized depreciation on futures contracts | | | 16,742,297 | |
| Other accrued expenses and liabilities | | | 195,315 | |
| Total liabilities | | | 95,464,321 | |
| Net assets | | $ | 944,081,107 | |
| | | | | |
| NET ASSETS CONSIST OF: | | | | |
| Par value | | $ | 83,096 | |
| Paid-in capital | | | 921,161,000 | |
| Accumulated net investment income/(loss) | | | (13,674,585 | ) |
| Accumulated net realized gain/(loss) from investments, futures contracts, foreign currency transactions, forward foreign currency contracts and written options | | | 34,401,388 | |
| Net unrealized appreciation/(depreciation) on investments, futures contracts, foreign currency translation, forward foreign currency contracts and written options | | | 2,110,208 | |
| Net assets | | $ | 944,081,107 | |
| | | | | |
| CLASS A SHARES: | | | | |
| Net assets | | $ | 13,107,496 | |
| Shares outstanding ($0.001 par value, 100,000,000 shares authorized) | | | 1,160,554 | |
| Net asset value and redemption price per share | | $ | 11.29 | |
| Maximum offering price per share (100/94.25 of $11.29) | | $ | 11.98 | |
| | | | | |
| CLASS I SHARES: | | | | |
| Net assets | | $ | 921,700,371 | |
| Shares outstanding ($0.001 par value, 300,000,000 shares authorized) | | | 81,101,363 | |
| Net asset value, offering and redemption price per share | | $ | 11.36 | |
| | | | | |
| CLASS C SHARES: | | | | |
| Net assets | | $ | 9,273,240 | |
| Shares outstanding ($0.001 par value, 100,000,000 shares authorized) | | | 834,273 | |
| Net asset value, offering and redemption price per share | | $ | 11.12 | |
The accompanying notes are an integral part of the consolidated financial statements.
21
Abbey Capital Futures Strategy Fund
Consolidated Statement of Operations
For the Six Months Ended
February 28, 2018 (Unaudited)
| INVESTMENT INCOME | | | |
| Interest | | $ | 4,773,127 | |
| Total investment income | | | 4,773,127 | |
| EXPENSES | | | | |
| Advisory fees (Note 2) | | | 7,678,675 | |
| Administration and accounting services fees (Note 2) | | | 194,293 | |
| Legal fees | | | 93,565 | |
| Registration and filing fees | | | 53,329 | |
| Transfer agent fees (Note 2) | | | 47,853 | |
| Printing and shareholder reporting fees | | | 46,579 | |
| Distribution fees (Class C Shares) (Note 2) | | | 35,797 | |
| Distribution fees (Class A Shares) (Note 2) | | | 17,217 | |
| Audit and tax service fees | | | 31,245 | |
| Directors fees | | | 26,945 | |
| Officers fees | | | 16,127 | |
| Custodian fees (Note 2) | | | 8,765 | |
| Other expenses | | | 32,113 | |
| Total expenses before waivers and reimbursements | | | 8,282,503 | |
| Less: waivers and reimbursements (Note 2) | | | (447,424 | ) |
| Net expenses after waivers and reimbursements | | | 7,835,079 | |
| Net investment income/(loss) | | | (3,061,952 | ) |
| NET REALIZED AND UNREALIZED GAIN/(LOSS) FROM INVESTMENTS | | | | |
| Net realized gain/(loss) from: | | | | |
| Investments | | | 2,242,234 | |
| Futures contracts | | | 37,972,930 | |
| Foreign currency transactions | | | 71,372 | |
| Forward foreign currency contracts | | | (4,566,810 | ) |
| Written options | | | (1,313,894 | ) |
| Net change in unrealized appreciation/(depreciation) on: | | | | |
| Investments | | | 4,447,722 | |
| Futures contracts | | | (26,263,709 | ) |
| Foreign currency translation | | | 38,915 | |
| Forward foreign currency contracts | | | 2,465,906 | |
| Written options | | | (3,416,396 | ) |
| Net realized and unrealized gain/(loss) from investments | | | 11,678,270 | |
| NET INCREASE/(DECREASE) IN NET ASSETS RESULTING FROM OPERATIONS | | $ | 8,616,318 | |
The accompanying notes are an integral part of the consolidated financial statements.
22
Abbey Capital Futures Strategy Fund
Consolidated Statements of Changes in Net Assets
| | | For the
Six Months Ended
February 28, 2018
(Unaudited) | | | For the
Year Ended
August 31, 2017 | |
| INCREASE/(DECREASE) IN NET ASSET FROM OPERATIONS: | | | | | | |
| Net investment income/(loss) | | $ | (3,061,952 | ) | | $ | (10,879,903 | ) |
| Net realized gain/(loss) from investments, futures contracts, foreign currency transactions, forward foreign currency contracts and written options | | | 34,405,832 | | | | (50,609,874 | ) |
| Net change in unrealized appreciation/(depreciation) on investments, futures contracts, foreign currency translation, forward foreign currency contracts and written options | | | (22,727,562 | ) | | | 20,193,769 | |
| Net increase/(decrease) in net assets resulting from operations | | | 8,616,318 | | | | (41,296,008 | ) |
| capital SHARE TRANSACTIONS: | | | | | | | | |
| Class A Shares | | | | | | | | |
| Proceeds from shares sold | | | 1,754,722 | | | | 9,247,071 | |
| Shares redeemed | | | (4,206,562 | ) | | | (10,029,596 | ) |
| Total from Class A Shares | | | (2,451,840 | ) | | | (782,525 | ) |
| Class I Shares | | | | | | | | |
| Proceeds from shares sold | | | 340,278,315 | | | | 561,507,438 | |
| Shares redeemed | | | (199,363,200 | ) | | | (489,198,240 | ) |
| Total from Class I Shares | | | 140,915,115 | | | | 72,309,198 | |
| Class C Shares | | | | | | | | |
| Proceeds from shares sold | | | 1,068,532 | | | | 6,146,653 | |
| Shares redeemed | | | (1,342,971 | ) | | | (4,447,796 | ) |
| Total from Class C Shares | | | (274,439 | ) | | | 1,698,857 | |
| Net increase/(decrease) in net assets from capital share transactions | | | 138,188,836 | | | | 73,225,530 | |
| Total increase/(decrease) in net assets | | | 146,805,154 | | | | 31,929,522 | |
| NET ASSETS: | | | | | | | | |
| Beginning of period | | | 797,275,953 | | | | 765,346,431 | |
| End of period | | $ | 944,081,107 | | | $ | 797,275,953 | |
| Accumulated net investment income/(loss), end of period | | $ | (13,674,585 | ) | | $ | (10,612,633 | ) |
The accompanying notes are an integral part of the consolidated financial statements.
23
Abbey Capital Futures Strategy Fund
Consolidated Statements of Changes in Net Assets (Concluded)
| | | For the
Six Months Ended
February 28, 2018
(Unaudited) | | | For the
Year Ended
August 31, 2017 | |
| SHARE TRANSACTIONS: | | | | | | |
| Class A Shares | | | | | | | | |
| Shares sold | | | 153,265 | | | | 807,849 | |
| Shares redeemed | | | (374,285 | ) | | | (881,702 | ) |
| Total Class A Shares | | | (221,020 | ) | | | (73,853 | ) |
| Class I Shares | | | | | | | | |
| Shares sold | | | 29,381,645 | | | | 49,037,837 | |
| Shares redeemed | | | (17,226,439 | ) | | | (42,813,179 | ) |
| Total Class I Shares | | | 12,155,206 | | | | 6,224,658 | |
| Class C Shares | | | | | | | | |
| Shares sold | | | 93,830 | | | | 539,738 | |
| Shares redeemed | | | (118,786 | ) | | | (395,929 | ) |
| Total Class C Shares | | | (24,956 | ) | | | 143,809 | |
| Net increase/(decrease) in shares outstanding | | | 11,909,230 | | | | 6,294,614 | |
The accompanying notes are an integral part of the consolidated financial statements.
24
Abbey Capital Futures Strategy Fund
Consolidated Financial Highlights
Contained below is per share operating performance data for Class A Shares outstanding, total investment return, ratios to average net assets and other supplemental data for the respective periods. This information has been derived from information provided in the consolidated financial statements. |
| | | Class A Shares | |
| | | For the
Six Months Ended
February 28, 2018
(Unaudited) | | | For the
Year
Ended
August 31,
2017 | | | For the
Year
Ended
August 31,
2016 | | | For the
Year
Ended
August 31,
2015(1) | |
| Per Share Operating Performance |
| Net asset value, beginning of period | | $ | 11.15 | | | $ | 11.77 | | | $ | 12.01 | | | $ | 10.36 | |
Net investment income/(loss)(2) | | | (0.05 | ) | | | (0.18 | ) | | | (0.24 | ) | | | (0.27 | ) |
Net realized and unrealized gain/(loss)
from investments | | | 0.19 | | | | (0.44 | ) | | | 0.01 | | | | 2.14 | |
Net increase/(decrease) in net assets resulting
from operations | | | 0.14 | | | | (0.62 | ) | | | (0.23 | ) | | | 1.87 | |
| Dividends and distributions to shareholders from: | | | | | | | | | | | | | | | | |
| Net investment income | | | — | | | | — | | | | (0.01 | ) | | | (0.21 | ) |
| Net realized capital gains | | | — | | | | — | | | | — | | | | (0.01 | ) |
| Total dividends and distributions to shareholders | | | — | | | | — | | | | (0.01 | ) | | | (0.22 | ) |
| Net asset value, end of period | | $ | 11.29 | | | $ | 11.15 | | | $ | 11.77 | | | $ | 12.01 | |
Total investment return(3) | | | 1.25 | %(4) | | | (5.18 | )% | | | (1.94 | )% | | | 18.17 | % |
| Ratios/Supplemental Data | | | | | | | | | | | | | | | | |
| Net assets, end of period (000's omitted) | | $ | 13,107 | | | $ | 15,401 | | | $ | 17,125 | | | $ | 11,013 | |
Ratio of expenses to average net assets with
waivers and reimbursements (including
interest expense)(6) | | | 2.04 | %(5) | | | 2.14 | % | | | 2.26 | % | | | 2.28 | % |
Ratio of expenses to average net assets with
waivers and reimbursements (excluding
interest expense)(6) | | | 2.04 | %(5) | | | 2.14 | % | | | 2.24 | % | | | 2.24 | % |
Ratio of expenses to average net assets without
waivers and reimbursements (including
interest expense)(6) | | | 2.14 | %(5) | | | 2.28 | % | | | 2.42 | % | | | 2.71 | % |
Ratio of net investment income/(loss) to
average net assets | | | (0.94 | )%(5) | | | (1.60 | )% | | | (2.01 | )% | | | (2.23 | )% |
Portfolio turnover rate(7) | | | 0.00 | %(4) | | | 0.00 | % | | | 0.00 | % | | | 0.00 | % |
(1) | Inception date of Class A Shares of the Fund was August 29, 2014. |
(2) | Calculated based on average shares outstanding for the period. |
(3) | Total investment return is calculated assuming a purchase of shares on the first day and a sale of shares on the last day of each year reported and includes reinvestments of dividends and distributions, if any. Total return does not reflect any applicable sales charge. |
(6) | Effective February 28, 2017, the Adviser has contractually agreed to waive its advisory fee and/or reimburse expenses in order to limit total annual Fund operating expenses (excluding acquired Fund fees and expenses, brokerage commissions, extraordinary items, interest or taxes) to 2.04% of the Fund’s average daily net assets attributable to Class A Shares. Prior to February 28, 2017, the contractual fee waiver limited total annual Fund operating expenses (excluding acquired fund fees and expenses, brokerage commissions, extraordinary items, interest or taxes) to 2.24% of the Fund’s average daily net assets attributable to Class A Shares. |
(7) | Portfolio turnover rate is calculated for the Fund, as a whole, for the entire period. |
The accompanying notes are an integral part of the consolidated financial statements.
25
Abbey Capital Futures Strategy Fund
Consolidated Financial Highlights (Continued)
Contained below is per share operating performance data for Class I Shares outstanding, total investment return, ratios to average net assets and other supplemental data for the respective periods. This information has been derived from information provided in the consolidated financial statements. |
| | | Class I Shares | |
| | | For the
Six Months Ended
February 28, 2018
(Unaudited) | | | For the
Year
Ended
August 31,
2017 | | | For the
Year
Ended
August 31,
2016 | | | For the
Year
Ended
August 31,
2015 | | | For the
Period
Ended
August 31,
2014(1) | |
| Per Share Operating Performance |
| Net asset value, beginning of period | | $ | 11.20 | | | $ | 11.80 | | | $ | 12.03 | | | $ | 10.36 | | | $ | 10.00 | |
Net investment income/(loss)(2) | | | (0.04 | ) | | | (0.15 | ) | | | (0.21 | ) | | | (0.24 | ) | | | (0.03 | ) |
| Net realized and unrealized gain/(loss) from investments | | | 0.20 | | | | (0.45 | ) | | | 0.01 | | | | 2.14 | | | | 0.39 | |
| Net increase/(decrease) in net assets resulting from operations | | | 0.16 | | | | (0.60 | ) | | | (0.20 | ) | | | 1.90 | | | | 0.36 | |
| Dividends and distributions to shareholders from: | | | | | | | | | | | | | | | | | | | | |
| Net investment income | | | — | | | | — | | | | (0.03 | ) | | | (0.22 | ) | | | — | |
| Net realized gains | | | — | | | | — | | | | — | | | | (0.01 | ) | | | — | |
| Total dividends and distributions to shareholders | | | — | | | | — | | | | (0.03 | ) | | | (0.23 | ) | | | — | |
| Net asset value, end of period | | $ | 11.36 | | | $ | 11.20 | | | $ | 11.80 | | | $ | 12.03 | | | $ | 10.36 | |
Total investment return(3) | | | 1.43 | %(4) | | | (5.00 | )% | | | (1.68 | )% | | | 18.46 | % | | | 3.60 | %(4) |
| Ratios/Supplemental Data | | | | | | | | | | | | | | | | | | | | |
| Net assets, end of period (000's omitted) | | $ | 921,700 | | | $ | 772,413 | | | $ | 739,842 | | | $ | 220,441 | | | $ | 24,349 | |
Ratio of expenses to average net assets
with waivers and reimbursements
(including interest expense)(6) | | | 1.79 | %(5) | | | 1.89 | % | | | 2.01 | % | | | 2.03 | % | | | 2.01 | %(5) |
Ratio of expenses to average net assets
with waivers and reimbursements
(excluding interest expense)(6) | | | 1.79 | %(5) | | | 1.89 | % | | | 1.99 | % | | | 1.99 | % | | | 1.99 | %(5) |
Ratio of expenses to average net assets
without waivers and reimbursements
(including interest expense)(6) | | | 1.89 | %(5) | | | 2.03 | % | | | 2.17 | % | | | 2.46 | % | | | 4.71 | %(5) |
| Ratio of net investment income/(loss) to average net assets | | | (0.69 | )%(5) | | | (1.35 | )% | | | (1.76 | )% | | | (1.98 | )% | | | (1.99 | )%(5) |
Portfolio turnover rate(7) | | | 0.00 | %(4) | | | 0.00 | % | | | 0.00 | % | | | 0.00 | % | | | 0.00 | %(4) |
(1) | Inception date of Class I Shares of the Fund was July 1, 2014. |
(2) | Calculated based on average shares outstanding for the period. |
(3) | Total investment return is calculated assuming a purchase of shares on the first day and a sale of shares on the last day of each period reported and includes reinvestments of dividends and distributions, if any. |
(6) | Effective February 28, 2017, the Adviser has contractually agreed to waive its advisory fee and/or reimburse expenses in order to limit total annual Fund operating expenses (excluding acquired Fund fees and expenses, brokerage commissions, extraordinary items, interest or taxes) to 1.79% of the Fund’s average daily net assets attributable to Class I Shares. Prior to February 28, 2017, the contractual fee waiver limited total annual Fund operating expenses (excluding acquired fund fees and expenses, brokerage commissions, extraordinary items, interest or taxes) to 1.99% of the Fund’s average daily net assets attributable to Class I Shares. |
(7) | Portfolio turnover rate is calculated for the Fund, as a whole, for the entire period. |
The accompanying notes are an integral part of the consolidated financial statements.
26
Abbey Capital Futures Strategy Fund
Consolidated Financial Highlights (Concluded)
Contained below is per share operating performance data for Class C Shares outstanding, total investment return, ratios to average net assets and other supplemental data for the respective periods. This information has been derived from information provided in the consolidated financial statements. |
| | | Class C Shares | |
| | | For the
Six Months Ended
February 28, 2018
(Unaudited) | | | For the
Year
Ended
August 31,
2017 | | | For the
Period
Ended
August 31,
2016(1) | |
| Per Share Operating Performance | | | | | | | | | |
| Net asset value, beginning of period | | $ | 11.01 | | | $ | 11.71 | | | $ | 11.99 | |
Net investment income/(loss)(2) | | | (0.09 | ) | | | (0.26 | ) | | | (0.30 | ) |
| Net realized and unrealized gain/(loss) from investments | | | 0.20 | | | | (0.44 | ) | | | 0.03 | |
| Net increase/(decrease) in net assets resulting from operations | | | 0.11 | | | | (0.70 | ) | | | (0.27 | ) |
| Dividends and distributions to shareholders from: | | | | | | | | | | | | |
| Net investment income | | | — | | | | — | | | | (0.01 | ) |
| Total dividends and distributions to shareholders | | | — | | | | — | | | | (0.01 | ) |
| Net asset value, end of period | | $ | 11.12 | | | $ | 11.01 | | | $ | 11.71 | |
Total investment return(3) | | | 0.91 | %(4) | | | (5.89 | )% | | | (2.22 | )%(4) |
| Ratios/Supplemental Data | | | | | | | | | | | | |
| Net assets, end of period (000's omitted) | | $ | 9,273 | | | $ | 9,462 | | | $ | 8,380 | |
Ratio of expenses to average net assets with waivers and reimbursements (including interest expense)(6) | | | 2.79 | %(5) | | | 2.89 | % | | | 3.01 | %(5) |
Ratio of expenses to average net assets with waivers and reimbursements (excluding interest expense)(6) | | | 2.79 | %(5) | | | 2.89 | % | | | 2.99 | %(5) |
Ratio of expenses to average net assets without waivers and reimbursements (including interest expense)(6) | | | 2.89 | %(5) | | | 3.03 | % | | | 3.17 | %(5) |
| Ratio of net investment income/(loss) to average net assets | | | (1.69 | )%(5) | | | (2.35 | )% | | | (2.76 | )%(5) |
Portfolio turnover rate(7) | | | 0.00 | %(4) | | | 0.00 | % | | | 0.00 | %(4) |
(1) | Inception date of Class C Shares of the Fund was October 6, 2015. |
(2) | Calculated based on average shares outstanding for the period. |
(3) | Total investment return is calculated assuming a purchase of shares on the first day and a sale of shares on the last day of the period reported and includes reinvestments of dividends and distributions, if any. |
(6) | Effective February 28, 2017, the Adviser has contractually agreed to waive its advisory fee and/or reimburse expenses in order to limit total annual Fund operating expenses (excluding acquired Fund fees and expenses, brokerage commissions, extraordinary items, interest or taxes) to 2.79% of the Fund’s average daily net assets attributable to Class C Shares. Prior to February 28, 2017, the contractual fee waiver limited total annual Fund operating expenses (excluding acquired fund fees and expenses, brokerage commissions, extraordinary items, interest or taxes) to 2.99% of the Fund’s average daily net assets attributable to Class C Shares. |
(7) | Portfolio turnover rate is calculated for the Fund, as a whole, for the entire period. |
The accompanying notes are an integral part of the consolidated financial statements.
27
Abbey Capital Futures Strategy Fund
Notes To Consolidated Financial Statements
February 28, 2018 (Unaudited)
1. Organization and Significant Accounting Policies
The RBB Fund, Inc. (“RBB” or the “Company”) was incorporated under the laws of the State of Maryland on February 29, 1988 and is registered under the Investment Company Act of 1940, as amended (the “1940 Act”), as an open-end management investment company. RBB is a “series fund,” which is a mutual fund divided into separate portfolios. Each portfolio is treated as a separate entity for certain matters under the 1940 Act, and for other purposes, and a shareholder of one portfolio is not deemed to be a shareholder of any other portfolio. Currently, RBB has twenty-nine active investment portfolios, including the Abbey Capital Futures Strategy Fund (the “Fund”), which commenced investment operations on July 1, 2014. The Fund is authorized to offer four classes of shares, Class A Shares, Class I Shares, Class C Shares and Class T Shares. Class A Shares are sold subject to a front-end maximum sales charge of 5.75%. Front-end sales charges may be reduced or waived under certain circumstances. Class T Shares are not currently available for sale.
RBB has authorized capital of one hundred billion shares of common stock of which 87.023 billion shares are currently classified into one hundred and eighty-one classes of common stock. Each class represents an interest in an active or inactive RBB investment portfolio.
The Fund seeks to achieve its investment objective by allocating its assets between a “Managed Futures” strategy and a “Fixed Income” strategy.
The Fund is an investment company and follows accounting and reporting guidance in the Financial Accounting Standards Board (“FASB”) Accounting Standards Codification Topic 946 – “Financial Services – Investment Companies.”
The end of the reporting period for the Fund is February 28, 2018, and the period covered by these Notes to Consolidated Financial Statements is the six months ended February 28, 2018 (the “current fiscal period”).
Consolidation of Subsidiary — The Managed Futures strategy will be achieved by the Fund investing up to 25% of its total assets in Abbey Capital Offshore Fund Limited (the “Subsidiary”), a wholly-owned and controlled subsidiary of the Fund organized under the laws of the Cayman Islands. The consolidated financial statements of the Fund include the financial statements of the Subsidiary. The Fund consolidates the results of subsidiaries in which the Fund holds a controlling financial interest (greater than 50%). All inter-company accounts and transactions have been eliminated. As of the end of the reporting period, the net assets of the Subsidiary were $188,789,159, which represented 20.00% of the Fund’s net assets.
Portfolio Valuation — The Fund’s net asset value (“NAV”) is calculated once daily at the close of regular trading hours on the New York Stock Exchange (“NYSE”) (generally 4:00 p.m. Eastern time) on each day the NYSE is open. Securities held by the Fund are valued using the closing price or the last sale price on a national securities exchange or the National Association of Securities Dealers Automatic Quotation System (“NASDAQ”) market system where they are primarily traded. Fixed income securities are valued using an independent pricing service, which considers such factors as security prices, yields, maturities and ratings, and are deemed representative of market values at the close of the market. Forward exchange contracts are valued by interpolating between spot and forward currency rates as quoted by an independent pricing service. Futures contracts are generally valued using the settlement price determined by the relevant exchange. Options for which the primary market is a national securities exchange are valued at the last sale price on the exchange on which they are traded, or, in the absence of any sale, will be valued at the mean of the last bid and ask prices prior to the market close. Options not traded on a national securities exchange are valued at the last quoted bid price for long option positions and the closing ask price for short option positions. If market quotations are unavailable or deemed unreliable, securities will be valued in accordance with procedures adopted by the Company’s Board of Directors (the “Board”). Relying on prices supplied by pricing services or dealers or using fair valuation may result in values that are higher or lower than the values used by other investment companies and investors to price the same investments.
Fair Value Measurements — The inputs and valuation techniques used to measure the fair value of the Fund’s investments are summarized into three levels as described in the hierarchy below:
| | ● Level 1 | – Prices are determined using quoted prices in active markets for identical securities. |
28
Abbey Capital Futures Strategy Fund
Notes To Consolidated Financial Statements (Continued)
February 28, 2018 (Unaudited)
| | ● Level 2 – | Prices are determined using other significant observable inputs (including quoted prices for similar securities, interest rates, prepayment speeds, credit risk, etc.). |
| | ● Level 3 – | Prices are determined using significant unobservable inputs (including the Fund’s own assumptions in determining the fair value of investments). |
The inputs or methodologies used for valuing securities are not necessarily an indication of the risk associated with investing in those securities.
The following is a summary of the inputs used, as of the end of the reporting period, in valuing the Fund’s investments carried at fair value:
| | | Total | | | Level 1 | | | Level 2 | | | Level 3 | |
| Short-Term Investments | | $ | 894,516,988 | | | $ | 894,516,988 | | | $ | — | | | $ | — | |
| Commodity Contracts | | | | | | | | | | | | | | | | |
| Futures Contracts | | | 4,086,824 | | | | 4,086,824 | | | | — | | | | — | |
| Equity Contracts | | | | | | | | | | | | | | | | |
| Futures Contracts | | | 446,130 | | | | 446,130 | | | | — | | | | — | |
| Foreign Currency Contracts | | | | | | | | | | | | | | | | |
| Forward Foreign Currency Contracts | | | 18,285,818 | | | | — | | | | 18,285,818 | | | | — | |
| Futures Contracts | | | 821,694 | | | | 821,694 | | | | — | | | | — | |
| Purchased Options | | | 478,722 | | | | 478,722 | | | | — | | | | — | |
| Interest Rate Contracts | | | | | | | | | | | | | | | | |
| Futures Contracts | | | 7,817,980 | | | | 7,817,980 | | | | — | | | | — | |
| Purchased Options | | | 8,159,348 | | | | 8,159,348 | | | | — | | | | — | |
| Total Assets | | $ | 934,613,504 | | | $ | 916,327,686 | | | $ | 18,285,818 | | | $ | — | |
| | | Total | | | Level 1 | | | Level 2 | | | Level 3 | |
| Commodity Contracts | | | | | | | | | | | | | | | | |
| Futures Contracts | | $ | (6,197,715 | ) | | $ | (6,197,715 | ) | | $ | — | | | $ | — | |
| Equity Contracts | | | | | | | | | | | | | | | | |
| Futures Contracts | | | (4,261,053 | ) | | | (4,261,053 | ) | | | — | | | | — | |
| Foreign Currency Contracts | | | | | | | | | | | | | | | | |
| Forward Foreign Currency Contracts | | | (13,506,858 | ) | | | — | | | | (13,506,858 | ) | | | — | |
| Futures Contracts | | | (3,896,326 | ) | | | (3,896,326 | ) | | | — | | | | — | |
| Written Options | | | (79,499 | ) | | | (79,499 | ) | | | — | | | | — | |
| Interest Rate Contracts | | | | | | | | | | | | | | | | |
| Futures Contracts | | | (2,387,203 | ) | | | (2,387,203 | ) | | | — | | | | — | |
| Written Options | | | (5,449,137 | ) | | | (5,449,137 | ) | | | — | | | | — | |
| Total Liabilities | | $ | (35,777,791 | ) | | $ | (22,270,933 | ) | | $ | (13,506,858 | ) | | $ | — | |
At the end of each quarter, management evaluates the classification of Levels 1, 2 and 3 assets and liabilities. Various factors are considered, such as changes in liquidity from the prior reporting period; whether or not a broker is willing to execute at the quoted price; the depth and consistency of prices from third party pricing services; and the existence of contemporaneous, observable trades in the market. Additionally, management evaluates the classification of Level 1 and Level 2 assets and liabilities on a quarterly basis for changes in listings or delistings on national exchanges.
29
Abbey Capital Futures Strategy Fund
Notes To Consolidated Financial Statements (Continued)
February 28, 2018 (Unaudited)
Due to the inherent uncertainty of determining the fair value of investments that do not have a readily available market value, the fair value of the Fund’s investments may fluctuate from period to period. Additionally, the fair value of investments may differ significantly from the values that would have been used had a ready market existed for such investments and may differ materially from the values the Fund may ultimately realize. Further, such investments may be subject to legal and other restrictions on resale or otherwise less liquid than publicly traded securities.
For fair valuations using significant unobservable inputs, U.S. generally accepted accounting principles (“U.S. GAAP”) requires the Fund to present a reconciliation of the beginning to ending balances for reported market values that presents changes attributable to total realized and unrealized gains or losses, purchase and sales, and transfers in and out of Level 3 during the period. Transfers in and out between levels are based on values at the end of the period. U.S. GAAP also requires the Fund to disclose amounts and reasons for all transfers in and out of Level 1 and Level 2 fair value measurements. A reconciliation of Level 3 investments is presented only when the Fund had an amount of Level 3 investments at the end of the reporting period that was meaningful in relation to its net assets. The amounts and reasons for all transfers in and out of each level within the three-tier hierarchy are disclosed when the Fund had an amount of total transfers during the reporting period that was meaningful in relation to its net assets as of the end of the reporting period.
During the current fiscal period, the Fund had no transfers between Levels 1, 2 and 3.
Disclosures about Derivative instruments and Hedging Activities — Derivative instruments are defined as financial instruments whose value and performance are based on the value and performance of another security or financial instrument. Derivative instruments that the Fund used during the period include options, forward foreign currency contracts and futures contracts.
During the current fiscal period, the Fund used long and short contracts on U.S. and foreign equity market indices, U.S. and foreign government bonds, foreign currencies, interest rates, and commodities (through investment in the Subsidiary), to gain investment exposure in accordance with its investment objective.
The following tables provide quantitative disclosures about fair value amounts of, and gains and losses on, the Fund’s derivative instruments as of and for the current fiscal period.
The following tables list the fair values of the Fund’s derivative holdings as of the end of the reporting period, grouped by contract type and risk exposure category.
| Derivative Type | | Consolidated
Statement
of Assets and
Liabilities
Location | | Equity
Contracts | | | Interest
Rate
Contracts | | | Foreign
Currency
Contracts | | | Commodity
Contracts | | | Total | |
| Asset Derivatives |
| Purchased Options | | Investments, at
value | | $ | — | | | $ | 8,159,348 | | | $ | 478,722 | | | $ | — | | | $ | 8,638,070 | |
Forward Contracts (a) | | Unrealized
appreciation on
forward foreign currency contracts | | | — | | | | — | | | | 18,285,818 | | | | — | | | | 18,285,818 | |
Futures Contracts (a) | | Unrealized appreciation on futures contracts | | | 446,130 | | | | 7,817,980 | | | | 821,694 | | | | 4,086,824 | | | | 13,172,628 | |
Total Value-
Assets | | | | $ | 446,130 | | | $ | 15,977,328 | | | $ | 19,586,234 | | | $ | 4,086,824 | | | $ | 40,096,516 | |
(a) | This amount represents the cumulative appreciation/(depreciation) of forwards and futures contracts as reported on the Consolidated Portfolio of Investments. |
30
Abbey Capital Futures Strategy Fund
Notes To Consolidated Financial Statements (Continued)
February 28, 2018 (Unaudited)
| Derivative Type | | Consolidated
Statement
of Assets and
Liabilities
Location | | Equity
Contracts | | | Interest
Rate
Contracts | | | Foreign
Currency
Contracts | | | Commodity
Contracts | | | Total | |
| Liability Derivatives |
| Written Options | | Options written, at
value | | $ | — | | | $ | (5,449,137 | ) | | $ | (79,499 | ) | | $ | — | | | $ | (5,528,636 | ) |
Forward Contracts (a) | | Unrealized
depreciation on
forward foreign currency contracts | | | — | | | | — | | | | (13,506,858 | ) | | | — | | | | (13,506,858 | ) |
Futures Contracts (a) | | Unrealized depreciation on futures contracts | | | (4,261,053 | ) | | | (2,387,203 | ) | | | (3,896,326 | ) | | | (6,197,715 | ) | | | (16,742,297 | ) |
| Total Value- Liabilities | | | | $ | (4,261,053 | ) | | $ | (7,836,340 | ) | | $ | (17,482,683 | ) | | $ | (6,197,715 | ) | | $ | (35,777,791 | ) |
(a) | This amount represents the cumulative appreciation/(depreciation) of forwards and futures contracts as reported on the Consolidated Portfolio of Investments. |
The following table lists the amounts of realized gains/(losses) included in net increase/(decrease) in net assets resulting from operations during the current fiscal period, grouped by contract type and risk exposure.
| Derivative Type | | Consolidated
Statement of
Operations
Location | | Equity
Contracts | | | Interest
Rate
Contracts | | | Foreign
Currency
Contracts | | | Commodity
Contracts | | | Total | |
| Realized Gain/(Loss) |
| Purchased Options | | Net realized
gain/(loss) from
Investments | | $ | (542,047 | ) | | $ | 3,193,359 | | | $ | (114,245 | ) | | $ | (304,107 | ) | | $ | 2,232,960 | |
| Futures Contracts | | Net realized
gain/(loss) from
Futures Contracts | | | 33,538,268 | | | | 2,478,501 | | | | (3,627,079 | ) | | | 5,583,240 | | | | 37,972,930 | |
| Forward Contracts | | Net realized
gain/(loss) from
Forward Foreign
Currency Contracts | | | — | | | | — | | | | (4,566,810 | ) | | | — | | | | (4,566,810 | ) |
| Written Options | | Net realized
gain/(loss) from
Written Options | | | 199,544 | | | | (1,513,438 | ) | | | — | | | | — | | | | (1,313,894 | ) |
| Total Realized Gain/(Loss) | | | | $ | 33,195,765 | | | $ | 4,158,422 | | | $ | (8,308,134 | ) | | $ | 5,279,133 | | | $ | 34,325,186 | |
31
Abbey Capital Futures Strategy Fund
Notes To Consolidated Financial Statements (Continued)
February 28, 2018 (Unaudited)
The following table lists the amounts of change in unrealized appreciation/(depreciation) included in net increase/(decrease) in net assets resulting from operations during the current fiscal period, grouped by contract type and risk exposure.
| Derivative Type | | Consolidated
Statement of
Operations
Location | | Equity
Contracts | | | Interest
Rate
Contracts | | | Foreign
Currency
Contracts | | | Commodity
Contracts | | | Total | |
| Change in Unrealized Appreciation/(Depreciation) |
| Purchased Options | | Net change in
unrealized
appreciation/
(depreciation) on
investments | | $ | 26,260 | | | $ | 5,111,428 | | | $ | (170,676 | ) | | $ | — | | | $ | 4,967,012 | |
| Futures Contracts | | Net change in
unrealized
appreciation/
(depreciation) on
futures contracts | | | (6,369,006 | ) | | | (2,002,820 | ) | | | (4,669,129 | ) | | | (13,222,754 | ) | | | (26,263,709 | ) |
| Forward Contracts | | Net change in
unrealized
appreciation/
(depreciation) on
forward foreign
currency contracts | | | — | | | | — | | | | 2,465,906 | | | | — | | | | 2,465,906 | |
| Written Options | | Net change in
unrealized
appreciation/
(depreciation) on
written options | | | — | | | | (3,591,383 | ) | | | 174,987 | | | | — | | | | (3,416,396 | ) |
| Total Change in Unrealized Appreciation/(Depreciation) | | | | $ | (6,342,746 | ) | | $ | (482,775 | ) | | $ | (2,198,912 | ) | | $ | (13,222,754 | ) | | $ | (22,247,187 | ) |
During the current fiscal period, the Fund’s quarterly average volume of derivatives was as follows:
Purchased
Options
(Cost) | | | Written
Options
(Proceeds) | | | Long Futures
Notional
Amount | | | Short Futures
Notional
Amount | | | Forward Foreign Currency
Contracts — Payable
(Value at Trade Date) | | | Forward Foreign Currency
Contracts — Receivable
(Value at Trade Date) | |
| $ | 2,299,981 | | | $ | (1,049,330 | ) | | $ | 3,102,129,942 | | | $ | (2,492,687,344 | ) | | $ | (1,801,185,795 | ) | | $ | 1,801,539,324 | |
For financial reporting purposes, the Fund does not offset fair value amounts recognized for derivative instruments and fair value amounts recognized for the right to reclaim cash collateral (receivables) or the obligation to return cash collateral (payables) arising from derivative instruments recognized at fair value executed with the same counterparty under a master netting arrangement.
32
Abbey Capital Futures Strategy Fund
Notes To Consolidated Financial Statements (Continued)
February 28, 2018 (Unaudited)
The following is a summary of financial and derivative instruments that are subject to enforceable master netting agreements (or similar arrangements) and collateral received and pledged in connection with the master netting agreements (or similar arrangements).
| | | | | | Gross Amount Not
Offset in Consolidated
Statement of
Assets and Liabilities | | | | | | | | Gross Amount Not
Offset in Consolidated
Statement of
Assets and Liabilities | | | |
| Description | | Gross Amount
Presented
in the
Consolidated Statement of Assets and Liabilities | | | Financial
Instruments | | Collateral
Received | | | Net
Amount(1) | | | Gross Amount
Presented
in the
Consolidated Statement of Assets and Liabilities | | | Financial
Instruments | | Collateral
Pledged(2) | | | Net
Amount(3) | |
| | | Assets | | | Liabilities | |
| Forward Foreign Currency Contracts | | $ | 18,285,818 | | | $(13,506,858) | | $ | — | | | $ | 4,778,960 | | | $ | 13,506,858 | | $ | (13,506,858) | | $ | — | | | $ | — | |
(1) | Net amount represents the net amount receivable from the counterparty in the event of default. |
(2) | Actual collateral pledged may be more than the amount shown. |
(3) | Net amount represents the net amount payable to the counterparty in the event of default. |
Use of Estimates — The preparation of consolidated financial statements in conformity with U.S. GAAP requires management to make estimates and assumptions that affect the reported amounts of assets and liabilities and disclosure of contingent assets and liabilities at the date of the consolidated financial statements and the reported amounts of revenues and expenses during the reporting period. Actual results could differ from those estimates and those differences could be significant.
Investment Transactions, Investment Income and Expenses — The Fund records security transactions based on trade date for financial reporting purposes. The cost of investments sold is determined by use of the specific identification method for both financial reporting and income tax purposes in determining realized gains and losses on investments. Interest income is accrued when earned. Dividend income is recorded on the ex-dividend date. Distributions received on securities that represent a return of capital or capital gain are recorded as a reduction of cost of investments and/or as a realized gain. The Fund’s investment income, expenses (other than class specific expenses) and unrealized and realized gains and losses are allocated daily to each class of shares based upon the relative proportion of net assets of each class at the beginning of the day. Expenses incurred on behalf of a specific class, fund or fund family of the Company are charged directly to the class, fund or fund family (in proportion to net assets). Expenses incurred for all of the RBB funds (such as director or professional fees) are charged to all funds in proportion to their average net assets of RBB, or in such other manner as the Board deems fair or equitable. Expenses and fees, including investment advisory and administration fees, are accrued daily and taken into account for the purpose of determining the NAV of the Fund.
Dividends and Distributions to Shareholders — Dividends from net investment income and distributions from net realized capital gains, if any, are declared and paid at least annually to shareholders and recorded on the ex-dividend date. Income dividends and capital gain distributions are determined in accordance with U.S. federal income tax regulations, which may differ from U.S. GAAP.
U.S. Tax Status — No provision is made for U.S. income taxes as it is the Fund’s intention to continue to qualify for and elect the tax treatment applicable to regulated investment companies under Subchapter M of the Internal Revenue Code of 1986, as amended, and make the requisite distributions to its shareholders which will be sufficient to relieve it from U.S. income and excise taxes.
33
Abbey Capital Futures Strategy Fund
Notes To Consolidated Financial Statements (Continued)
February 28, 2018 (Unaudited)
For tax purposes, the Subsidiary is an exempted Cayman Islands investment company. The Subsidiary has received an undertaking from the Government of the Cayman Islands exempting it from all local income, profits and capital gains taxes. No such taxes are levied in the Cayman Islands at the present time. For U.S. income tax purposes, the Subsidiary is a Controlled Foreign Corporation and as such is not subject to U.S. income tax.
Foreign Currency Translation — Assets and liabilities initially expressed in non-U.S. currencies are translated into U.S. dollars based on the applicable exchange rates at the date of the last business day of the financial statement period. Purchases and sales of securities, interest income, dividends, variation margin received and expenses denominated in foreign currencies are translated into U.S. dollars at the exchange rates in effect on the transaction date.
The Fund does not separately report the effect of changes in foreign exchange rates from changes in market prices of securities held. Such changes are included with the net realized gain or loss and change in unrealized appreciation or depreciation on investments in the Consolidated Statement of Operations. Other foreign currency transactions resulting in realized and unrealized gain or loss are reported separately as net realized gain or loss and change in unrealized appreciation or depreciation on foreign currencies in the Consolidated Statement of Operations.
Currency Risk —Investment in foreign securities involves currency risk associated with securities that trade or are denominated in currencies other than the U.S. dollar and which may be affected by fluctuations in currency exchange rates. An increase in the strength of the U.S. dollar relative to a foreign currency may cause the U.S. dollar value of an investment in that country to decline. Foreign currencies also are subject to risks caused by inflation, interest rates, budget deficits and low savings rates, political factors and government controls. Forward foreign currency exchange contracts may limit potential gains from a favorable change in value between the U.S. dollar and foreign currencies. Unanticipated changes in currency pricing may result in poorer overall performance for the Fund than if it had not engaged in these contracts.
Commodity Sector Risk — Exposure to the commodities markets may subject the Fund to greater volatility than investments in traditional securities. The value of commodity-linked derivative instruments may be affected by changes in overall market movements, commodity index volatility, changes in interest rates, or factors affecting a particular industry or commodity, such as drought, floods, weather, livestock disease, embargoes, tariffs and international economic, political and regulatory developments. The prices of energy, industrial metals, precious metals, agriculture and livestock sector commodities may fluctuate widely due to factors such as changes in value, supply and demand and governmental regulatory policies. The commodity-linked securities in which the Fund invests may be issued by companies in the financial services sector, and events affecting the financial services sector may cause the Fund’s share value to fluctuate.
Foreign Securities Market Risk — A substantial portion of the trades of the Fund are expected to take place on markets or exchanges outside the United States. There is no limit to the amount of assets of the Fund that may be committed to trading on foreign markets. The risk of loss in trading foreign futures and options on futures contracts can be substantial. Participation in foreign futures and options on futures contracts involves the execution and clearing of trades on, or subject to the rules of, a foreign board of trade or exchange. Some of these foreign markets, in contrast to U.S. exchanges, are so-called principals’ markets in which performance is the responsibility only of the individual counterparty with whom the trader has entered into a commodity interest transaction and not of the exchange or clearing corporation. In these kinds of markets, there is risk of bankruptcy or other failure or refusal to perform by the counterparty.
Counterparty Risk — The derivative contracts entered into by the Fund or its Subsidiary may be privately negotiated in the over-the-counter market. These contracts also involve exposure to credit risk, since contract performance depends in part on the financial condition of the counterparty. Relying on a counterparty exposes the Fund to the risk that a counterparty will not settle a transaction in accordance with its terms and conditions because of a dispute over the terms of the contract (whether or not bona fide) or because of a credit or liquidity problem, thus causing the Fund to suffer a loss. If a counterparty defaults on its payment obligations to the Fund, this default will cause the value of an investment in the Fund to decrease.
34
Abbey Capital Futures Strategy Fund
Notes To Consolidated Financial Statements (Continued)
February 28, 2018 (Unaudited)
Credit Risk — Credit risk refers to the possibility that the issuer of the security or a counterparty in respect of a derivative instrument will not be able to satisfy its payment obligations to the Fund when due. Changes in an issuer’s credit rating or the market’s perception of an issuer’s creditworthiness may also affect the value of the Fund’s investment in that issuer. Securities rated in the four highest categories by the rating agencies are considered investment grade but they may also have some speculative characteristics. Investment grade ratings do not guarantee that bonds will not lose value or default. In addition, the credit quality of securities may be lowered if an issuer’s financial condition changes.
Options — An option on a futures contract gives the purchaser the right, in exchange for a premium, to assume a position in a futures contract at a specified exercise price during the term of the option. The Fund may use futures contracts and related options for: bona fide hedging; attempting to offset changes in the value of securities held or expected to be acquired or be disposed of; attempting to minimize fluctuations in foreign currencies; attempting to gain exposure to a particular market, index or instrument; or other risk management purposes. The risk associated with purchasing an option is that the Fund pays a premium whether or not the option is exercised. Additionally, the Fund bears the risk of loss of premium and change in market value should the counterparty not perform under the contract. Put and call options are accounted for in the same manner as other securities owned. The cost of securities acquired through the exercise of call options is increased by the premiums paid. The proceeds from securities sold through the exercise of put options are decreased by the premiums paid.
Options Written — The Fund may enter into options written for: bona fide hedging; attempting to offset changes in the value of securities held or expected to be acquired or be disposed of; attempting to minimize fluctuations in foreign currencies; attempting to gain exposure to a particular market, index or instrument; or other risk management purposes. Such options may relate to particular securities or domestic stock indices, and may or may not be listed on exchanges regulated by the Commodity Futures Trading Commission or on other non-U.S. exchanges. An option on a futures contract gives the purchaser the right, in return for the premium paid, to assume a position in the contract (a long position if the option is a call and a short position if the option is a put) at a specified exercise price at any time during the option exercise period. The writer of the option is required upon exercise to assume a short futures position (if the option is a call) or a long futures position (if the option is a put). Upon exercise of the option, the accumulated cash balance in the writer’s futures margin account is delivered to the holder of the option. That balance represents the amount by which the market price of the futures contract at exercise exceeds, in the case of a call, or is less than, in the case of a put, the exercise price of the option. The maximum risk of loss associated with writing put options is limited to the exercised fair value of the option contract. The maximum risk of loss associated with writing call options is potentially unlimited. The Fund also has the additional risk of being unable to enter into a closing transaction at an acceptable price if a liquid secondary market does not exist. The Fund also may write over-the-counter options where completing the obligation depends upon the credit standing of the other party. Option contracts also involve the risk that they may result in loss due to unanticipated developments in market conditions or other causes. Written options are initially recorded as liabilities to the extent of premiums received and subsequently marked to market to reflect the current value of the option written. Gains or losses are realized when the option transaction expires or closes. When an option is exercised, the proceeds on sales for a written call option or the purchase cost for a written put option is adjusted by the amount of the premium received. Listed option contracts present minimal counterparty credit risk since they are exchange traded and the exchange’s clearinghouse, as counterparty to all exchange-traded options, guarantees the options against default. As of the end of the reporting period, all of the Fund’s written options are exchange-traded options.
Futures Contracts — The Fund may use futures contracts in the normal course of pursuing its investment objective. Upon entering into a futures contract, the Fund must deposit initial margin in addition to segregating cash or liquid assets sufficient to meet its obligation to purchase or provide securities, or to pay the amount owed at the expiration of an index-based futures contract. Such liquid assets may consist of cash, cash equivalents, liquid debt or equity securities or other acceptable assets. Pursuant to the futures contract, the Fund agrees to receive from, or pay to the broker, an amount of cash equal to the daily fluctuation in value of the contract. Such a receipt of payment is known as “variation margin” and is recorded by the Fund as an unrealized gain or loss. When the contract is closed, the Fund records a realized gain or loss equal to the difference between the proceeds from (or cost of) the closing transactions and the Fund’s basis in the contract. Futures contracts have market risks, including the risk that the change in the value
35
Abbey Capital Futures Strategy Fund
Notes To Consolidated Financial Statements (Continued)
February 28, 2018 (Unaudited)
of the contract may not correlate with changes in the value of the underlying securities. Use of long futures contracts subjects the Fund to risk of loss in excess of the amount shown on the Consolidated Statement of Assets and Liabilities, up to the notional value of the futures contract. Use of short futures contracts subjects the Fund to unlimited risk of loss.
Forward Foreign Currency Contracts — In the normal course of pursuing its investment objectives, the Fund is subject to foreign investment and currency risk. The Fund uses forward foreign currency contracts (“forward contracts”) for purposes of hedging, duration management, as a substitute for securities, to increase returns, for currency hedging or risk management, or to otherwise help achieve the Fund’s investment goal. These contracts are marked-to-market daily at the applicable translation rates. The Fund records realized gains or losses at the time the forward contract is closed. A forward contract is extinguished through a closing transaction or upon delivery of the currency or entering an offsetting contract. Risks may arise upon entering these contracts from the potential inability of a counterparty to meet the terms of their contracts and from unanticipated movements in the value of a foreign currency relative to the U.S. dollar or other currencies. The Fund’s maximum risk of loss from counterparty credit risk related to forward foreign currency contracts is the fair value of the contract. The risk may be mitigated to some extent if a master netting arrangement between the Fund and the counterparty is in place and to the extent the Fund obtains collateral to cover the Fund’s exposure to the counterparty.
Cash and Cash Equivalents — Cash and cash equivalents are valued at cost plus accrued interest, which approximates market value.
Other — In the normal course of business, the Fund may enter into contracts that provide general indemnifications. The Fund’s maximum exposure under these arrangements is dependent on claims that may be made against the Fund in the future, and, therefore, cannot be estimated; however, based on experience, the risk of material loss from such claims is considered remote.
2. Investment Adviser and Other Services
Abbey Capital Limited (“Abbey Capital” or the “Adviser”) serves as the investment adviser to the Fund and its Subsidiary. The Adviser allocates the assets of the Subsidiary to one or more Trading Advisers unaffiliated with the Adviser to manage. The Adviser also has the ultimate responsibility to oversee the Trading Advisers, and to recommend their hiring, termination and replacement, subject to approval by the Board. The Fund compensates the Adviser for its services at an annual rate based on the Fund’s average daily net assets (the “Advisory Fee”), payable on a monthly basis in arrears, as shown in the following table.
The Adviser has contractually agreed to waive its advisory fee and/or reimburse expenses in order to limit total annual Fund operating expenses (excluding certain items discussed below) to the rates (“Expense Caps”) shown in the following table of the Fund’s average daily net assets. In determining the Adviser’s obligation to waive advisory fees and/or reimburse expenses, the following expenses are not taken into account and could cause net total annual Fund operating expenses to exceed the Expense Caps as applicable: acquired fund fees and expenses, brokerage commissions, extraordinary expenses, interest and taxes. This contractual limitation is in effect until December 31, 2018 and may not be terminated without the approval of the Board. The Adviser may discontinue these arrangements at any time after December 31, 2018.
| Advisory Fee | Expense Caps |
| Class A | Class I | Class C | Class T |
1.77% | 2.04% | 1.79% | 2.79% | 2.04% |
36
Abbey Capital Futures Strategy Fund
Notes To Consolidated Financial Statements (Continued)
February 28, 2018 (Unaudited)
During the current fiscal period, investment advisory fees accrued, waived and reimbursed were as follows:
Gross
Advisory
Fees | | | Waivers | | | Net
Advisory
Fees | |
| $7,678,675 | | | | $(447,424) | | | | $7,231,251 | |
If at any time the Fund's total annual fund operating expenses (not including acquired fund fees and expenses, brokerage commissions, extraordinary items, interest or taxes) for a year are less than the relevant share class’s Expense Cap, the Adviser may recoup any waived or reimbursed amounts from the Fund within three years from the date on which such waiver or reimbursement was made, provided such reimbursement does not cause the Fund to exceed expense limitations that were in effect at the time of the waiver or reimbursement.
As of the end of the reporting period, the Fund had amounts available for recoupment as follows:
| Expiration | |
August 31,
2019 | | | August 31,
2020 | | | August 31,
2021 | | | Total | |
| $801,204 | | | | $1,087,123 | | | | $447,424 | | | | $2,335,751 | |
Altis Partners (Jersey) Limited, Aspect Capital Limited, Cantab Capital Partners LLP, Conquest Capital, LLC, Eclipse Capital Management, Inc., Graham Capital Management, LP, Harmonic Capital Partners LLP, P/E Global, LLC, Revolution Capital Management, LLC, Trigon Investment Advisors, LLC and Welton Investment Partners, LLC each served as a Trading Adviser to the Fund during the period.
Effective October 4, 2017, Conquest Capital LLC no longer serves as a Trading Adviser to the Fund. Effective February 8, 2018, Harmonic Capital Partners LLP no longer serves as a Trading Adviser to the Fund.
U.S. Bancorp Fund Services, LLC (“USBFS”) serves as administrator for the Fund. For providing administrative and accounting services, USBFS is entitled to receive a monthly fee, subject to certain minimum and out of pocket expenses.
USBFS serves as the Fund’s transfer and dividend disbursing agent. For providing transfer agent services, USBFS is entitled to receive a monthly fee, subject to certain minimum and out of pocket expenses.
U.S. Bank, N.A. (the “Custodian”) provides certain custodial services to the Fund. The Custodian is entitled to receive a monthly fee, subject to certain minimum and out of pocket expenses.
Quasar Distributors, LLC serves as the principal underwriter and distributor of the Fund’s shares pursuant to a Distribution Agreement with RBB.
For compensation amounts payable to USBFS, please refer to the Consolidated Statement of Operations.
The Board has adopted a Plan of Distribution for the Class A Shares, Class C Shares and Class T Shares (the “Plan”) pursuant to Rule 12b-1 under the 1940 Act. Under the Plan, the Fund’s distributor is entitled to receive from the Fund a distribution fee with respect to the Shares, which is accrued daily and paid monthly, of up to 0.25% on an annualized basis of the average daily net assets of the Class A Shares and Class T Shares and up to 1.00% of the Class C Shares. The actual amount of such compensation under the Plan is agreed upon by the Board and by the Distributor. Because these fees are paid out of the Fund’s assets on an ongoing basis, over time these fees will increase the cost of your investment and may cost you more than paying other types of sales charges. Amounts paid to the Distributor under the Plan may be used by the Distributor to cover expenses that are related to (i) the sale of the Shares, (ii) ongoing servicing and/or maintenance of the accounts of shareholders, and (iii) sub-transfer agency services, subaccounting services or administrative services related to the sale of the Shares, all as set forth in the Fund’s 12b-1 Plan.
37
Abbey Capital Futures Strategy Fund
Notes To Consolidated Financial Statements (Continued)
February 28, 2018 (Unaudited)
3. Director’s And Officer’s Compensation
The Directors of the Company receive an annual retainer and meeting fees for meetings attended. Employees of Vigilant Compliance, LLC serve as President, Chief Compliance Officer and Assistant Treasurer of the Company. Vigilant Compliance, LLC is compensated for the services provided to the Company. An employee of RBB serves as Treasurer and Secretary and is compensated for services provided. Certain employees of USBFS serve as officers of the Company. They are not compensated by the Fund or the Company. For Director’s and Officer’s compensation amounts, please refer to the Consolidated Statement of Operations.
4. Purchases and Sales of Investment Securities
During the current fiscal period, aggregate purchases and sales of investment securities (excluding short-term investments and derivative transactions) of the Fund were as follows:
| | | | Purchases | | | | Sales | |
| Investments in Non U.S. Government Securities | | | $ — | | | | $ — | |
| Investments in U.S. Government Securities | | | $ — | | | | $ — | |
5. Federal Income Tax Information
The Fund has followed the authoritative guidance on accounting for and disclosure of uncertainty in tax positions, which requires the Fund to determine whether a tax position is more likely than not to be sustained upon examination, including resolution of any related appeals or litigation processes, based on the technical merits of the position. The Fund has determined that there was no effect on the consolidated financial statements from following this authoritative guidance. In the normal course of business, the Fund is subject to examination by federal, state and local jurisdictions, where applicable, for tax years for which applicable statutes of limitations have not expired. The Fund is not aware of any tax positions for which it is reasonably possible that the total amounts of unrecognized tax benefits will significantly change in the next twelve months.
As of August 31, 2017, the federal tax cost and aggregate gross unrealized appreciation and depreciation of investments held by the Fund were as follows:
Federal Tax
Cost | | | Unrealized
Appreciation | | | Unrealized
(Depreciation) | | | Net
Unrealized
Appreciation/ (Depreciation) | |
| $ 742,804,483 | | | | $ 29,545,769 | | | | $ — | | | | $ 29,545,769 | |
Distributions to shareholders, if any, from net investment income and realized gains are determined in accordance with federal income tax regulations, which may differ from net investment income and realized gains recognized for financial reporting purposes. Accordingly, the character of distributions and composition of net assets for tax purposes may differ from those reflected in the accompanying consolidated financial statements. To the extent these differences are permanent, such amounts are reclassified within the capital accounts based on the tax treatment; temporary differences do not require such reclassification.
38
Abbey Capital Futures Strategy Fund
Notes To Consolidated Financial Statements (Concluded)
February 28, 2018 (Unaudited)
The following permanent differences as of August 31, 2017, primarily attributable to disallowed losses from the Subsidiary, and net investment loss, were reclassified to the following accounts:
Undistributed
Net Investment
Income/(Loss) | | | Accumulated
Net Realized
Gain/(Loss) | | | Paid-In
Capital | |
| $ 10,874,916 | | | | $ 50,606,729 | | | | $(61,481,645) | |
As of August 31, 2017, the components of distributable earnings on a tax basis were as follows:
Undistributed
Ordinary
Income | | | Undistributed Long-Term
Capital Gains | | | Net Unrealized
Appreciation/
(Depreciation) | | | Capital Loss Carryforwards | | | Qualified
Late-Year
Losses | | | Other
Temporary Differences | |
| $ — | | | | $ — | | | | $ 21,334,532 | | | | $ (4,444) | | | | $ (7,109,395) | | | | $ — | |
The differences between the book and tax basis components of distributable earnings relate principally to the timing of recognition of income and gains of the Subsidiary for federal income tax purposes. Short-term and foreign currency gains are reported as ordinary income for federal income tax purposes.
The tax character of dividends and distributions paid during the fiscal year ended August 31, 2017, were as follows:
| | Ordinary
Income | | | | Long-Term
Gains | | | | Total | |
| $ — | | | | $ — | | | | $ — | |
Pursuant to federal income tax rules applicable to regulated investment companies, the Fund may elect to treat certain capital losses between November 1 and August 31 and late year ordinary losses ((i) ordinary losses between January 1 and August 31, and (ii) specified ordinary and currency losses between November 1 and August 31) as occurring on the first day of the following tax year. For the fiscal year ended August 31, 2017, any amount of losses elected within the tax return will not be recognized for federal income tax purposes until September 1, 2017.
For the fiscal year ended August 31, 2017, the Fund deferred to September 1, 2017, the following losses:
Late-Year
Ordinary
Loss Deferral | | | Short-Term
Capital
Loss Deferral | | | Long-Term
Capital
Loss Deferral | |
| $ 7,109,395 | | | | $ — | | | | $ — | |
Accumulated capital losses represent net capital loss carry forwards as of August 31, 2017 that may be available to offset future realized capital gains and thereby reduce future capital gains distributions. Under the Regulated Investment Company Modernization Act of 2010, the Fund is permitted to carry forward capital losses incurred in taxable years beginning after December 22, 2010 for an unlimited period. Additionally, capital losses that are carried forward will retain their character as either short-term or long-term capital losses rather than being considered all short-term as under the previous law. As of August 31, 2017, the Fund had capital loss carryforwards of $4,444.
6. Subsequent Events
Management has evaluated the impact of all subsequent events on the Fund through the date the consolidated financial statements were issued and has determined that there was the following subsequent event:
Effective March 5, 2018 (subsequent to the end of the reporting period), Tudor Investment Corporation (“Tudor”) serves as a Trading Adviser to the Fund.
39
Abbey Capital Futures Strategy Fund
Other Information
(Unaudited)
Proxy Voting
Policies and procedures that the Fund uses to determine how to vote proxies relating to portfolio securities as well as information regarding how the Fund voted proxies relating to portfolio securities for the most recent twelve-month period ended June 30 are available without charge, upon request, by calling (844) 261-6484 and on the Securities and Exchange Commission’s (“SEC”) website at http://www.sec.gov.
Quarterly Portfolio Schedules
The Company files its complete schedule of portfolio holdings with the SEC for the first and third fiscal quarters of each fiscal year (quarters ended November 30 and May 31) on Form N-Q. The Company’s Form N-Q is available on the SEC website at http://www.sec.gov and may be reviewed and copied at the SEC Public Reference Room in Washington, D.C. Information on the operation of the SEC Public Reference Room may be obtained by calling (800) SEC-0330.
40
[THIS PAGE INTENTIONALLY LEFT BLANK]
Investment Adviser
Abbey Capital Limited
1-2 Cavendish Row
Dublin 1, Ireland
Administrator and Transfer Agent
U.S. Bancorp Fund Services, LLC
P.O. Box 701
Milwaukee, WI 53201
Principal Underwriter
Quasar Distributors, LLC
777 East Wisconsin Avenue, Floor 6
Milwaukee, WI 53202
Custodian
U.S. Bank, N.A.
1555 North Rivercenter Drive, Suite 302
Milwaukee, WI 53212
Independent Registered Public Accounting Firm
Ernst & Young LLP
One Commerce Square
2005 Market Street, Suite 700
Philadelphia, PA 19103
Legal Counsel
Drinker Biddle & Reath LLP
One Logan Square, Suite 2000
Philadelphia, PA 19103-6996
ABB-SAR18

ADARA SMALLER COMPANIES FUND
of
The RBB Fund, Inc.
SEMI-ANNUAL REPORT
February 28, 2018
(Unaudited)
This report is submitted for the general information of the shareholders of the Fund.
It is not authorized for distribution unless preceded or accompanied by a current prospectus for the Fund.
ADARA SMALLER COMPANIES FUND
Semi-Annual Report
Performance Data
February 28, 2018 (Unaudited)
| Average Annual Total Returns for the periods ended February 28, 2018 | |
| | Six
Months† | One
Year | Since
Inception* | |
| Adara Smaller Companies Fund | 9.89% | 15.33% | 11.06% | |
| Russell 2000® Index | 8.30% | 10.51% | 11.10%** | |
| * | The Fund commenced operations on October 21, 2014. |
| ** | Benchmark performance is from inception date of the Fund only and is not the inception date of the benchmark itself. |
Performance quoted is past performance and does not guarantee future results. The investment return and principal value of an investment in the Fund will fluctuate so that an investor’s shares, when redeemed, may be worth more or less than their original cost. Current performance may be lower or higher than the returns quoted. Returns shown do not reflect taxes that a shareholder would pay on Fund distributions or on the redemption of Fund shares. Performance data current to the most recent month-end may be obtained by calling (844) 261-6482.
The Fund’s total annual Fund operating expenses, as stated in the current prospectus dated December 31, 2017, are 0.95% of average daily net assets. This ratio may differ from the actual expenses incurred by the Fund for the period covered by this report.
The Fund invests in common stocks, preferred stocks, warrants to acquire common stocks and securities convertible into common stocks. Portfolio composition is subject to change.
The Fund evaluates performance as compared to that of the Russell 2000® Index. The Russell 2000® Index is a widely-recognized, capitalization-weighted index that measures the performance of the smallest 2,000 companies in the Russell 3000® Index and is considered representative of small-cap stocks. It is impossible to invest directly in an index.
INVESTMENT CONSIDERATIONS
Investing in the Fund involves risk and an investor may lose money. The success of the Fund’s strategy depends on the Adviser’s ability to select Sub-Advisers and each manager’s ability to select investments for the Fund. The Fund may invest in riskier type investments including small and micro-cap stocks, IPOs, special situations and illiquid securities all of which may be more volatile and less liquid.
1
ADARA SMALLER COMPANIES FUND
Fund Expense Example
February 28, 2018 (Unaudited)
As a shareholder of the Fund, you incur two types of costs: (1) transaction costs and (2) ongoing costs, including management fees and other Fund expenses. This example is intended to help you understand your ongoing costs (in dollars) of investing in the Fund and to compare these costs with the ongoing costs of investing in other mutual funds.
This example is based on an investment of $1,000 invested at the beginning of the six-month period from September 1, 2017 through February 28, 2018 and held for the entire period.
Actual Expenses
The first line of the accompanying table provides information about actual account values and actual expenses. You may use the information in this line, together with the amount you invested, to estimate the expenses that you paid over the period. Simply divide your account value by $1,000 (for example, an $8,600 account value divided by $1,000 = 8.6), then multiply the result by the number in the first line under the heading entitled “Expenses Paid During Period” to estimate the expenses you paid on your account during this period.
Hypothetical Example for Comparison Purposes
The second line of the accompanying table provides information about hypothetical account values and hypothetical expenses based on the Fund’s actual expense ratio and an assumed rate of return of 5% per year before expenses, which is not the Fund’s actual return. The hypothetical account values and expenses may not be used to estimate the actual ending account balance or expenses you paid for the period. You may use this information to compare the ongoing costs of investing in the Fund and other funds. To do so, compare these 5% hypothetical examples with the 5% hypothetical examples that appear in the shareholder reports of other funds.
Please note that the expenses shown in the accompanying table are meant to highlight your ongoing costs only and do not reflect any transactional costs. Therefore, the second line of the accompanying table is useful in comparing ongoing costs only and will not help you determine the relative total costs of owning different funds. In addition, if these transactional costs were included, your costs would have been higher.
| | Beginning
Account Value
September 1, 2017 | Ending
Account Value
February 28, 2018 | Expenses Paid
During Period* |
| Actual | $1,000.00 | $1,098.90 | $4.68 |
Hypothetical
(5% return before expenses) | 1,000.00 | 1,020.33 | 4.51 |
| * | Expenses are equal to the Fund’s annualized six-month expense ratio of 0.90%, multiplied by the average account value over the period, multiplied by the number of days (181) in the most recent fiscal half-year, then divided by 365 to reflect the one-half year period. The Fund’s ending account value on the first line in the table is based on the actual six-month total investment return for the Fund of 9.89%. |
2
ADARA SMALLER COMPANIES FUND
Portfolio Holdings Summary Table
February 28, 2018 (Unaudited)
The following table presents a summary by security type of the portfolio holdings of the Fund:
| | | % of Net
Assets | | | Value | |
| COMMON STOCKS: | | | | | | |
| Software | | | 8.9 | % | | $ | 25,535,683 | |
| Banks | | | 7.0 | | | | 20,178,210 | |
| Commercial Services | | | 5.4 | | | | 15,456,755 | |
| Healthcare-Products | | | 5.1 | | | | 14,564,944 | |
| Retail | | | 4.6 | | | | 13,247,366 | |
| Pharmaceuticals | | | 3.8 | | | | 10,873,042 | |
| Internet | | | 3.6 | | | | 10,503,386 | |
| Semiconductors | | | 3.6 | | | | 10,358,838 | |
| Computers | | | 3.6 | | | | 10,243,133 | |
| Telecommunications | | | 3.6 | | | | 10,221,925 | |
| Machinery-Diversified | | | 3.2 | | | | 9,232,108 | |
| Transportation | | | 2.7 | | | | 7,764,182 | |
| Miscellaneous Manufacturing | | | 2.5 | | | | 7,213,650 | |
| Insurance | | | 2.4 | | | | 6,879,596 | |
| Electronics | | | 2.3 | | | | 6,743,505 | |
| Diversified Financial Services | | | 2.3 | | | | 6,520,857 | |
| Engineering & Construction | | | 2.2 | | | | 6,443,227 | |
| Building Materials | | | 1.9 | | | | 5,363,598 | |
| Biotechnology | | | 1.6 | | | | 4,563,887 | |
| Entertainment | | | 1.6 | | | | 4,544,253 | |
| Aerospace/Defense | | | 1.6 | | | | 4,520,826 | |
| Oil & Gas | | | 1.4 | | | | 3,968,763 | |
| Chemicals | | | 1.3 | | | | 3,636,626 | |
| Investment Companies | | | 1.2 | | | | 3,548,756 | |
| Leisure Time | | | 1.2 | | | | 3,318,635 | |
| Food | | | 1.1 | | | | 3,282,425 | |
| Mining | | | 1.1 | | | | 3,232,807 | |
| Auto Parts & Equipment | | | 1.0 | | | | 2,840,470 | |
| Healthcare-Services | | | 1.0 | | | | 2,782,659 | |
| Home Builders | | | 1.0 | | | | 2,770,264 | |
| Home Furnishings | | | 0.9 | | | | 2,539,504 | |
| Distribution/Wholesale | | | 0.8 | | | | 2,445,918 | |
| Apparel | | | 0.8 | | | | 2,418,928 | |
| Savings & Loans | | | 0.8 | | | | 2,376,210 | |
| Household Products / Wares | | | 0.8 | | | | 2,281,862 | |
| Metal Fabricate/Hardware | | | 0.8 | % | | $ | 2,162,137 | |
| Oil & Gas Services | | | 0.7 | | | | 2,153,543 | |
| Electrical Components & Equipment | | | 0.7 | | | | 2,068,656 | |
| Lodging | | | 0.7 | | | | 2,050,512 | |
| REITS | | | 0.7 | | | | 2,042,362 | |
| Textiles | | | 0.6 | | | | 1,824,154 | |
| Real Estate | | | 0.6 | | | | 1,809,606 | |
| Scientific Research and Development Services | | | 0.5 | | | | 1,417,652 | |
| Beverages | | | 0.5 | | | | 1,308,610 | |
| Energy-Alternate Sources | | | 0.4 | | | | 1,121,276 | |
| Hand / Machine Tools | | | 0.4 | | | | 1,066,054 | |
| Environmental Control | | | 0.3 | | | | 813,975 | |
| Gas | | | 0.3 | | | | 799,837 | |
| Airlines | | | 0.2 | | | | 535,692 | |
| Medical Equipment and Supplies Manufacturing | | | 0.2 | | | | 444,152 | |
| Electric | | | 0.1 | | | | 421,522 | |
| Forest Products & Paper | | | 0.1 | | | | 365,040 | |
| Iron / Steel | | | 0.1 | | | | 363,615 | |
| Education Services | | | 0.1 | | | | 264,282 | |
| Media | | | 0.1 | | | | 236,547 | |
| Agriculture | | | 0.1 | | | | 228,191 | |
| Packaging & Containers | | | 0.0 | | | | 203,115 | |
| Water | | | 0.0 | | | | 168,108 | |
| Trucking & Leasing | | | 0.0 | | | | 166,900 | |
| Cosmetics/Personal Care | | | 0.0 | | | | 97,054 | |
| Office Furnishings | | | 0.0 | | | | 73,883 | |
| Coal | | | 0.0 | | | | 52,695 | |
| SHORT-TERM INVESTMENTS | | | 4.2 | | | | 12,149,669 | |
| LIABILITIES IN EXCESS OF OTHER ASSETS | | | (0.3 | ) | | | (1,004,086 | ) |
| NET ASSETS | | | 100.0 | % | | $ | 287,821,551 | |
Portfolio holdings are subject to change at any time.
The accompanying notes are an integral part of the financial statements.
3
ADARA SMALLER COMPANIES FUND
Portfolio of Investments
February 28, 2018 (Unaudited)
| | | Number of
Shares | | | Value | |
| COMMON STOCKS — 96.1% | | | | | | |
| | | | | | | |
| Aerospace/Defense — 1.6% | | | | | | |
| Aerojet Rocketdyne Holdings, Inc.* | | | 22,286 | | | $ | 601,722 | |
| Aerovironment, Inc.* | | | 1,433 | | | | 71,249 | |
| Cubic Corp. | | | 19,627 | | | | 1,205,098 | |
| Curtiss-Wright Corp. | | | 2,004 | | | | 270,500 | |
| Kaman Corp. | | | 2,787 | | | | 170,620 | |
| KLX, Inc.* | | | 11,908 | | | | 805,933 | |
| Kratos Defense & Security Solutions, Inc.* | | | 31,511 | | | | 379,708 | |
| Moog, Inc., Class A* | | | 1,762 | | | | 147,708 | |
| National Presto Industries, Inc. | | | 1,201 | | | | 109,051 | |
| Orbital ATK, Inc. | | | 1,778 | | | | 234,803 | |
| Triumph Bancorp, Inc.* | | | 10,856 | | | | 444,553 | |
| Triumph Group, Inc. | | | 2,858 | | | | 79,881 | |
| | | | | | | | 4,520,826 | |
| Agriculture — 0.1% | | | | | | | | |
| Andersons, Inc., (The) | | | 3,403 | | | | 119,275 | |
| Universal Corp. | | | 2,216 | | | | 108,916 | |
| | | | | | | | 228,191 | |
| Airlines — 0.2% | | | | | | | | |
| Hawaiian Holdings, Inc. | | | 2,494 | | | | 89,784 | |
| SkyWest, Inc. | | | 8,137 | | | | 445,908 | |
| | | | | | | | 535,692 | |
| Apparel — 0.8% | | | | | | | | |
| Citi Trends, Inc. | | | 8,061 | | | | 178,632 | |
| Crocs, Inc.* | | | 43,105 | | | | 527,605 | |
| JC Penney Co, Inc.* | | | 12,695 | | | | 54,969 | |
| Lakeland Industries, Inc.* | | | 23,652 | | | | 311,024 | |
| Oxford Industries, Inc. | | | 1,483 | | | | 118,521 | |
| Skechers U.S.A., Inc., Class A* | | | 6,336 | | | | 259,269 | |
| Steven Madden Ltd. | | | 3,222 | | | | 141,446 | |
| Stitch Fix, Inc., Class A* | | | 6,820 | | | | 141,174 | |
| Superior Uniform Group, Inc. | | | 17,022 | | | | 427,252 | |
| Unifi, Inc.* | | | 2,830 | | | | 99,050 | |
| Wolverine World Wide, Inc. | | | 5,464 | | | | 159,986 | |
| | | | | | | | 2,418,928 | |
| Auto Parts & Equipment — 1.0% |
| American Axle & Manufacturing Holdings, Inc.* | | | 6,688 | | | | 98,715 | |
| Gentherm, Inc.* | | | 3,355 | | | | 103,334 | |
| Motorcar Parts of America, Inc.* | | | 48,007 | | | | 978,383 | |
| Spartan Motors, Inc. | | | 69,237 | | | | 1,021,246 | |
| Unique Fabricating, Inc. | | | 82,960 | | | | 638,792 | |
| | | | | | | | 2,840,470 | |
| Banks — 7.0% | | | | | | | | |
| American River Bankshares | | | 45,350 | | | | 693,855 | |
| Atlantic Capital Bancshares, Inc.* | | | 26,552 | | | | 459,349 | |
| Bank of Commerce Holdings | | | 57,490 | | | | 620,892 | |
| Banner Corp. | | | 1,722 | | | | 95,192 | |
| Boston Private Financial Holdings, Inc. | | | 14,098 | | | | 205,831 | |
| Central Pacific Financial Corp. | | | 2,762 | | | | 76,977 | |
| City Holding Co. | | | 4,208 | | | | 283,493 | |
| CoBiz Financial, Inc. | | | 13,008 | | | | 246,632 | |
| Community Bank System, Inc. | | | 1,997 | | | | 106,460 | |
| CVB Financial Corp. | | | 8,715 | | | | 200,445 | |
| Esquire Financial Holdings, Inc.* | | | 37,190 | | | | 855,370 | |
| Farmers National Bancorp | | | 40,980 | | | | 553,230 | |
| FCB Financial Holdings, Inc., Class A* | | | 12,717 | | | | 682,267 | |
| First BanCorp* | | | 46,257 | | | | 278,930 | |
| First Bancshares, Inc., (The) | | | 15,790 | | | | 501,332 | |
| First Citizens BancShares, Inc., Class A | | | 859 | | | | 349,699 | |
| First Commonwealth Financial Corp. | | | 11,374 | | | | 158,895 | |
| First Financial Bancorp | | | 7,350 | | | | 199,920 | |
| First Financial Bankshares, Inc. | | | 6,581 | | | | 302,726 | |
| First Northwest Bancorp* | | | 23,460 | | | | 375,360 | |
| First of Long Island Corp. | | | 11,253 | | | | 306,644 | |
| Glacier Bancorp, Inc. | | | 3,879 | | | | 150,893 | |
| Heritage Commerce Corp. | | | 21,264 | | | | 335,546 | |
| Home BancShares, Inc. | | | 34,788 | | | | 799,776 | |
| Hope Bancorp, Inc. | | | 14,673 | | | | 264,994 | |
| Horizon Bancorp | | | 25,835 | | | | 731,130 | |
| Independent Bank Corp. | | | 1,226 | | | | 85,084 | |
| Live Oak Bancshares, Inc. | | | 25,568 | | | | 667,325 | |
| MB Financial, Inc. | | | 6,569 | | | | 269,395 | |
| Metropolitan Bank Holding Corp.* | | | 11,610 | | | | 515,716 | |
| Midland States Bancorp, Inc. | | | 22,640 | | | | 709,764 | |
| MidSouth Bancorp, Inc. | | | 41,570 | | | | 519,625 | |
| Northeast Bancorp | | | 27,150 | | | | 595,942 | |
| Northrim BanCorp, Inc. | | | 13,090 | | | | 435,243 | |
| OFG Bancorp | | | 8,517 | | | | 91,558 | |
| Opus Bank | | | 3,209 | | | | 90,012 | |
| Orrstown Financial Services, Inc. | | | 15,980 | | | | 394,706 | |
| Parke Bancorp, Inc. | | | 12,420 | | | | 257,715 | |
| People's Utah Bancorp | | | 23,360 | | | | 708,976 | |
| Preferred Bank | | | 7,915 | | | | 493,342 | |
| Premier Financial Bancorp, Inc. | | | 35,180 | | | | 619,872 | |
| Southside Bancshares, Inc. | | | 4,513 | | | | 150,734 | |
| Sterling Bancorp, Inc. | | | 24,740 | | | | 346,360 | |
| Summit Financial Group, Inc. | | | 25,940 | | | | 621,263 | |
| Texas Capital Bancshares, Inc.* | | | 1,396 | | | | 125,919 | |
| Tompkins Financial Corp. | | | 1,809 | | | | 138,823 | |
| TriState Capital Holdings, Inc.* | | | 9,365 | | | | 209,308 | |
| TrustCo Bank Corp. | | | 19,387 | | | | 164,790 | |
| UMB Financial Corp. | | | 3,746 | | | | 273,458 | |
| United Bankshares, Inc. | | | 5,943 | | | | 210,977 | |
The accompanying notes are an integral part of the financial statements.
4
ADARA SMALLER COMPANIES FUND
Portfolio of Investments (Continued)
February 28, 2018 (Unaudited)
| | | Number of
Shares | | | Value | |
| Banks — (Continued) | | | | | | |
| United Community Banks, Inc. | | | 28,931 | | | $ | 894,257 | |
| Walker & Dunlop, Inc. | | | 1,239 | | | | 59,881 | |
| West Bancorporation, Inc. | | | 22,130 | | | | 537,759 | |
| Westamerica Bancorp | | | 2,698 | | | | 154,568 | |
| | | | | | | | 20,178,210 | |
| Beverages — 0.5% | | | | | | | | |
| Farmer Brothers Co.* | | | 21,549 | | | | 672,329 | |
| MGP Ingredients, Inc. | | | 7,582 | | | | 636,281 | |
| | | | | | | | 1,308,610 | |
| Biotechnology — 1.6% | | | | | | | | |
| Acorda Therapeutics, Inc.* | | | 3,666 | | | | 87,067 | |
| ANI Pharmaceuticals, Inc.* | | | 2,019 | | | | 129,357 | |
| Audentes Therapeutics, Inc.* | | | 6,946 | | | | 234,011 | |
| Blueprint Medicines Corp.* | | | 7,854 | | | | 679,842 | |
| Cambrex Corp.* | | | 1,154 | | | | 59,950 | |
| ChromaDex Corp.* | | | 78,373 | | | | 427,133 | |
| Cytokinetics, Inc.* | | | 4,423 | | | | 34,278 | |
| Foundation Medicine, Inc.* | | | 6,585 | | | | 544,909 | |
| Ligand Pharmaceuticals, Inc.* | | | 1,187 | | | | 180,293 | |
| Loxo Oncology, Inc.* | | | 9,838 | | | | 1,094,182 | |
| Medicines Co., (The)* | | | 4,827 | | | | 147,803 | |
| Momenta Pharmaceuticals, Inc.* | | | 8,455 | | | | 144,158 | |
| Myriad Genetics, Inc.* | | | 2,083 | | | | 67,531 | |
| NeoGenomics, Inc.* | | | 75,842 | | | | 637,073 | |
| Ovid Therapeutics, Inc.* | | | 14,613 | | | | 96,300 | |
| | | | | | | | 4,563,887 | |
| Building Materials — 1.9% | | | | | | | | |
| AAON, Inc. | | | 2,382 | | | | 87,538 | |
| Apogee Enterprises, Inc. | | | 2,856 | | | | 123,208 | |
| Armstrong Flooring, Inc.* | | | 43,760 | | | | 613,078 | |
| Armstrong World Industries, Inc.* | | | 19,238 | | | | 1,160,051 | |
| Aspen Aerogels, Inc.* | | | 62,996 | | | | 289,782 | |
| Foundation Building Materials, Inc.* | | | 2,906 | | | | 39,783 | |
| Gibraltar Industries, Inc.* | | | 4,141 | | | | 143,693 | |
| Griffon Corp. | | | 5,631 | | | | 105,300 | |
| M/I Homes, Inc.* | | | 4,319 | | | | 125,467 | |
| NCI Building Systems, Inc.* | | | 18,021 | | | | 293,742 | |
| New Relic, Inc.* | | | 8,230 | | | | 590,749 | |
| Patrick Industries, Inc.* | | | 6,882 | | | | 422,899 | |
| PGT Innovations, Inc.* | | | 17,027 | | | | 297,973 | |
| Simpson Manufacturing Co., Inc. | | | 2,069 | | | | 114,457 | |
| Summit Materials, Inc., Class A* | | | 21,782 | | | | 688,965 | |
| Universal Forest Products, Inc. | | | 8,103 | | | | 266,913 | |
| | | | | | | | 5,363,598 | |
| Chemicals — 1.3% | | | | | | | | |
| A Schulman, Inc. | | | 1,631 | | | | 71,519 | |
| Aceto Corp. | | | 1,868 | | | | 13,394 | |
| AdvanSix, Inc.* | | | 9,397 | | | | 388,566 | |
| Balchem Corp. | | | 1,142 | | | | 85,935 | |
| Chemours Co., (The) | | | 9,276 | | | | 440,703 | |
| Ferro Corp.* | | | 13,519 | | | | 289,171 | |
| HB Fuller Co. | | | 4,743 | | | | 239,000 | |
| Innophos Holdings, Inc. | | | 2,039 | | | | 84,741 | |
| Innospec, Inc. | | | 1,121 | | | | 72,809 | |
| KMG Chemicals, Inc. | | | 7,574 | | | | 454,213 | |
| Koppers Holdings, Inc.* | | | 2,012 | | | | 81,285 | |
| Kraton Corp.* | | | 2,728 | | | | 115,694 | |
| Landec Corp.* | | | 72,648 | | | | 944,424 | |
| Rayonier Advanced Materials, Inc. | | | 6,815 | | | | 138,822 | |
| Stepan Co. | | | 2,701 | | | | 216,350 | |
| | | | | | | | 3,636,626 | |
| Coal — 0.0% | | | | | | | | |
| SunCoke Energy, Inc.* | | | 4,934 | | | | 52,695 | |
| | | | | | | | | |
| Commercial Services — 5.4% | | | | | | | | |
| ABM Industries, Inc. | | | 3,179 | | | | 111,774 | |
| AMN Healthcare Services, Inc.* | | | 3,294 | | | | 183,311 | |
| ARC Document Solutions, Inc.* | | | 128,170 | | | | 273,002 | |
| AstroNova, Inc. | | | 18,890 | | | | 254,070 | |
| Barrett Business Services, Inc. | | | 18,555 | | | | 1,378,451 | |
| BG Staffing, Inc. | | | 46,570 | | | | 766,076 | |
| Brink's Co., (The) | | | 4,054 | | | | 297,969 | |
| CAI International, Inc.* | | | 23,610 | | | | 476,922 | |
| Capella Education Co. | | | 1,954 | | | | 151,826 | |
| Cardtronics, Class A, PLC* | | | 2,979 | | | | 66,670 | |
| Care.com, Inc.* | | | 59,773 | | | | 1,068,741 | |
| Chegg, Inc.* | | | 57,951 | | | | 1,153,804 | |
| CRA International, Inc. | | | 12,970 | | | | 648,370 | |
| Cross Country Healthcare, Inc.* | | | 5,678 | | | | 73,530 | |
| Everi Holdings, Inc.* | | | 26,840 | | | | 199,958 | |
| Global Medical REIT, Inc. | | | 68,760 | | | | 446,940 | |
| Green Dot Corp., Class A* | | | 4,948 | | | | 322,263 | |
| Healthcare Services Group, Inc. | | | 3,392 | | | | 154,099 | |
| HealthEquity, Inc.* | | | 12,512 | | | | 720,441 | |
| HMS Holdings Corp.* | | | 9,256 | | | | 148,466 | |
| Hostess Brands, Inc.* | | | 135,570 | | | | 1,659,377 | |
| Insperity, Inc. | | | 2,292 | | | | 149,668 | |
| Kelly Services, Inc., Class A | | | 19,482 | | | | 574,524 | |
| Korn/Ferry International | | | 4,210 | | | | 176,441 | |
| LSC Communications, Inc. | | | 298 | | | | 4,339 | |
| MarketAxess Holdings, Inc. | | | 2,439 | | | | 493,654 | |
| Matthews International Corp., Class A | | | 1,608 | | | | 82,410 | |
| Medifast, Inc. | | | 4,555 | | | | 290,563 | |
| Monro Muffler Brake, Inc. | | | 1,316 | | | | 66,984 | |
| Navigant Consulting, Inc.* | | | 3,071 | | | | 61,051 | |
| On Assignment, Inc.* | | | 3,035 | | | | 232,754 | |
| Quanta Services, Inc.* | | | 17,469 | | | | 601,632 | |
| Rent-A-Center, Inc. | | | 9,822 | | | | 73,861 | |
| Resources Connection, Inc. | | | 46,318 | | | | 720,245 | |
| RR Donnelley & Sons Co. | | | 10,161 | | | | 76,614 | |
The accompanying notes are an integral part of the financial statements.
5
ADARA SMALLER COMPANIES FUND
Portfolio of Investments (Continued)
February 28, 2018 (Unaudited)
| | | Number of
Shares | | | Value | |
| Commercial Services — (Continued) |
| SP Plus Corp.* | | | 10,791 | | | $ | 388,476 | |
| Strayer Education, Inc. | | | 1,101 | | | | 98,694 | |
| Team, Inc.* | | | 5,510 | | | | 90,088 | |
| Teladoc, Inc.* | | | 7,915 | | | | 317,391 | |
| Viad Corp. | | | 7,710 | | | | 401,306 | |
| | | | | | | | 15,456,755 | |
| Computers — 3.6% | | | | | | | | |
| CACI International, Inc., Class A* | | | 1,145 | | | | 170,662 | |
| Computer Services, Inc. | | | 19,169 | | | | 872,190 | |
| DMC Global, Inc. | | | 79,912 | | | | 1,694,134 | |
| Engility Holdings, Inc.* | | | 2,262 | | | | 61,775 | |
| ExlService Holdings, Inc.* | | | 1,497 | | | | 85,359 | |
| Icad, Inc.* | | | 71,137 | | | | 244,000 | |
| Insight Enterprises, Inc.* | | | 2,176 | | | | 76,008 | |
| Lumentum Holdings, Inc.* | | | 7,377 | | | | 449,997 | |
| MAXIMUS, Inc. | | | 1,853 | | | | 124,114 | |
| Mercury Systems, Inc.* | | | 17,228 | | | | 791,971 | |
| Mitek Systems, Inc.* | | | 52,004 | | | | 397,831 | |
| MTS Systems Corp. | | | 1,077 | | | | 52,719 | |
| Nutanix, Inc., Class A* | | | 15,917 | | | | 580,175 | |
| PAR Technology Corp.* | | | 35,289 | | | | 389,591 | |
| Quantum Corp.* | | | 152,383 | | | | 557,722 | |
| SendGrid, Inc.* | | | 21,725 | | | | 567,457 | |
| Sykes Enterprises, Inc.* | | | 20,699 | | | | 601,513 | |
| USA Technologies, Inc.* | | | 27,572 | | | | 224,712 | |
| Varonis Systems, Inc.* | | | 13,242 | | | | 743,538 | |
| VeriFone Systems, Inc.* | | | 47,900 | | | | 795,140 | |
| WNS Holdings Ltd., ADR* | | | 16,945 | | | | 762,525 | |
| | | | | | | | 10,243,133 | |
| Cosmetics/Personal Care — 0.0% |
| Inter Parfums, Inc. | | | 2,289 | | | | 97,054 | |
| | | | | | | | | |
| Distribution/Wholesale — 0.8% | | | | | | | | |
| Anixter International, Inc.* | | | 1,549 | | | | 117,027 | |
| Essendant, Inc. | | | 10,397 | | | | 82,552 | |
| Fossil Group, Inc.* | | | 7,293 | | | | 97,580 | |
| G-III Apparel Group Ltd.* | | | 13,694 | | | | 505,446 | |
| H&E Equipment Services, Inc. | | | 5,526 | | | | 208,275 | |
| Pool Corp. | | | 2,106 | | | | 290,691 | |
| ScanSource, Inc.* | | | 1,959 | | | | 64,157 | |
| SiteOne Landscape Supply, Inc.* | | | 10,788 | | | | 742,646 | |
| Titan Machinery, Inc.* | | | 16,928 | | | | 337,544 | |
| | | | | | | | 2,445,918 | |
| Diversified Financial Services — 2.3% |
| Alcentra Capital Corp. | | | 24,100 | | | | 180,027 | |
| Blackhawk Network Holdings, Inc.* | | | 10,225 | | | | 457,569 | |
| Donnelley Financial Solutions, Inc.* | | | 4,158 | | | | 71,975 | |
| Encore Capital Group, Inc.* | | | 4,540 | | | | 194,312 | |
| Enova International, Inc.* | | | 41,598 | | | | 915,156 | |
| Evercore Partners, Inc., Class A | | | 8,057 | | | | 749,704 | |
| Financial Engines, Inc. | | | 3,587 | | | | 120,164 | |
| First Business Financial Services, Inc. | | | 11,450 | | | | 275,372 | |
| Greenhill & Co., Inc. | | | 3,731 | | | | 75,926 | |
| Interactive Brokers Group, Inc., Class A | | | 3,063 | | | | 212,572 | |
| Investment Technology Group, Inc. | | | 2,378 | | | | 47,132 | |
| LendingTree, Inc.* | | | 832 | | | | 289,952 | |
| Moelis & Co., Class A | | | 14,605 | | | | 741,204 | |
| Oaktree Specialty Lending Corp. | | | 167,830 | | | | 721,669 | |
| PRA Group, Inc.* | | | 3,304 | | | | 126,543 | |
| Silvercrest Asset Management Group, Inc., Class A | | | 65,582 | | | | 990,288 | |
| WageWorks, Inc.* | | | 2,280 | | | | 119,586 | |
| World Acceptance Corp.* | | | 2,155 | | | | 231,706 | |
| | | | | | | | 6,520,857 | |
| Education Services — 0.1% | | | | | | | | |
| Career Education Corp.* | | | 19,976 | | | | 264,282 | |
| | | | | | | | | |
| Electric — 0.1% | | | | | | | | |
| ALLETE, Inc. | | | 4,232 | | | | 288,411 | |
| Avista Corp. | | | 1,395 | | | | 66,723 | |
| El Paso Electric Co. | | | 1,366 | | | | 66,388 | |
| | | | | | | | 421,522 | |
| Electrical Components & Equipment — 0.7% |
| Advanced Energy Industries, Inc.* | | | 2,466 | | | | 163,545 | |
| Encore Wire Corp. | | | 1,278 | | | | 66,967 | |
| EnerSys | | | 3,171 | | | | 220,987 | |
| General Cable Corp. | | | 4,266 | | | | 126,060 | |
| Insteel Industries, Inc. | | | 3,649 | | | | 103,048 | |
| Littelfuse, Inc. | | | 4,452 | | | | 923,790 | |
| ShotSpotter, Inc.* | | | 17,539 | | | | 323,068 | |
| SPX Corp.* | | | 4,521 | | | | 141,191 | |
| | | | | | | | 2,068,656 | |
| Electronics — 2.3% | | | | | | | | |
| Brady Corp., Class A | | | 2,928 | | | | 109,507 | |
| Coherent, Inc.* | | | 1,014 | | | | 212,088 | |
| Conn's, Inc.* | | | 5,809 | | | | 189,954 | |
| ESCO Technologies, Inc. | | | 10,293 | | | | 606,258 | |
| FARO Technologies, Inc.* | | | 12,156 | | | | 721,459 | |
| II-VI, Inc.* | | | 21,020 | | | | 809,270 | |
| Itron, Inc.* | | | 4,655 | | | | 325,850 | |
| Ituran Location and Control Ltd. | | | 21,711 | | | | 750,115 | |
| Methode Electronics, Inc. | | | 2,476 | | | | 97,678 | |
| Napco Security Technologies, Inc.* | | | 51,080 | | | | 515,908 | |
| OSI Systems, Inc.* | | | 8,106 | | | | 511,813 | |
| Plexus Corp.* | | | 2,641 | | | | 159,305 | |
| Rogers Corp.* | | | 6,397 | | | | 878,436 | |
| Sanmina Corp.* | | | 6,648 | | | | 183,152 | |
The accompanying notes are an integral part of the financial statements.
6
ADARA SMALLER COMPANIES FUND
Portfolio of Investments (Continued)
February 28, 2018 (Unaudited)
| | | Number of
Shares | | | Value | |
| Electronics — (Continued) |
| TTM Technologies, Inc.* | | | 8,548 | | | $ | 138,136 | |
| ZAGG, Inc.* | | | 35,520 | | | | 534,576 | |
| | | | | | | | 6,743,505 | |
| Energy-Alternate Sources — 0.4% |
| Green Plains, Inc. | | | 3,277 | | | | 59,969 | |
| Hydrogenics Corp.* | | | 39,346 | | | | 348,212 | |
| REX American Resources Corp.* | | | 1,256 | | | | 101,384 | |
| SolarEdge Technologies, Inc.* | | | 12,222 | | | | 611,711 | |
| | | | | | | | 1,121,276 | |
| Engineering & Construction — 2.2% |
| Aegion Corp.* | | | 17,062 | | | | 391,743 | |
| Comfort Systems USA, Inc. | | | 4,006 | | | | 164,446 | |
| Dycom Industries, Inc.* | | | 7,655 | | | | 836,232 | |
| EMCOR Group, Inc. | | | 4,741 | | | | 361,786 | |
| Exponent, Inc. | | | 1,390 | | | | 108,072 | |
| Granite Construction, Inc. | | | 11,235 | | | | 652,754 | |
| MasTec, Inc.* | | | 14,179 | | | | 722,420 | |
| MYR Group, Inc.* | | | 4,168 | | | | 134,835 | |
| NV5 Global, Inc.* | | | 26,759 | | | | 1,157,327 | |
| Primoris Services Corp. | | | 21,599 | | | | 537,815 | |
| Sterling Construction Co., Inc.* | | | 55,296 | | | | 667,976 | |
| TopBuild Corp.* | | | 10,164 | | | | 707,821 | |
| | | | | | | | 6,443,227 | |
| Entertainment — 1.6% | | | | | | | | |
| Eldorado Resorts, Inc.* | | | 18,674 | | | | 636,783 | |
| Gaia, Inc.* | | | 19,739 | | | | 253,646 | |
| Golden Entertainment, Inc.* | | | 12,930 | | | | 360,617 | |
| International Speedway Corp., Class A | | | 22,161 | | | | 997,245 | |
| National CineMedia, Inc. | | | 76,930 | | | | 579,283 | |
| Pinnacle Entertainment, Inc.* | | | 3,069 | | | | 92,592 | |
| Pinnacle Financial Partners, Inc. | | | 10,376 | | | | 669,771 | |
| PlayAGS, Inc.* | | | 18,423 | | | | 381,540 | |
| Red Rock Resorts, Inc., Class A | | | 8,915 | | | | 298,653 | |
| Scientific Games Corp.* | | | 6,167 | | | | 274,123 | |
| | | | | | | | 4,544,253 | |
| Environmental Control — 0.3% | | | | | | | | |
| Casella Waste Systems, Inc., Class A* | | | 12,154 | | | | 308,955 | |
| Tetra Tech, Inc. | | | 3,198 | | | | 156,542 | |
| Xerium Technologies, Inc.* | | | 59,876 | | | | 348,478 | |
| | | | | | | | 813,975 | |
| Food — 1.1% | | | | | | | | |
| B&G Foods, Inc. | | | 4,803 | | | | 133,043 | |
| Calavo Growers, Inc. | | | 5,688 | | | | 485,471 | |
| Cal-Maine Foods, Inc.* | | | 1,158 | | | | 49,331 | |
| Chefs' Warehouse, Inc. (The)* | | | 16,063 | | | | 362,221 | |
| Darling Ingredients, Inc.* | | | 8,943 | | | | 162,673 | |
| Del Frisco's Restaurant Group, Inc.* | | | 16,653 | | | | 277,272 | |
| DineEquity, Inc. | | | 3,392 | | | | 257,724 | |
| Ingles Markets, Inc., Class A | | | 32,020 | | | | 1,031,044 | |
| J&J Snack Foods Corp. | | | 681 | | | | 91,479 | |
| John B Sanfilippo & Son, Inc. | | | 383 | | | | 22,114 | |
| Sanderson Farms, Inc. | | | 1,371 | | | | 168,839 | |
| Smart & Final Stores, Inc.* | | | 8,652 | | | | 62,294 | |
| Snyder's-Lance, Inc. | | | 3,587 | | | | 178,920 | |
| | | | | | | | 3,282,425 | |
| Forest Products & Paper — 0.1% |
| Neenah Paper, Inc. | | | 743 | | | | 56,951 | |
| PH Glatfelter Co. | | | 5,339 | | | | 108,969 | |
| Skyline Corp.* | | | 9,309 | | | | 199,120 | |
| | | | | | | | 365,040 | |
| Gas — 0.3% | | | | | | | | |
| New Jersey Resources Corp. | | | 2,340 | | | | 89,154 | |
| Northwest Natural Gas Co. | | | 2,390 | | | | 124,638 | |
| South Jersey Industries, Inc. | | | 4,502 | | | | 117,997 | |
| Southwest Gas Holdings, Inc. | | | 1,612 | | | | 106,199 | |
| Spire, Inc. | | | 5,337 | | | | 361,849 | |
| | | | | | | | 799,837 | |
| Hand / Machine Tools — 0.4% | | | | | | | | |
| Franklin Electric Co., Inc. | | | 1,615 | | | | 63,227 | |
| Hardinge, Inc. | | | 54,650 | | | | 1,002,827 | |
| | | | | | | | 1,066,054 | |
| Healthcare-Products — 5.1% | | | | | | | | |
| Abaxis, Inc. | | | 9,986 | | | | 665,767 | |
| ABIOMED, Inc.* | | | 1,897 | | | | 508,737 | |
| Alpha Pro Tech Ltd.* | | | 44,141 | | | | 161,115 | |
| Aratana Therapeutics, Inc.* | | | 35,099 | | | | 130,568 | |
| AxoGen, Inc.* | | | 31,213 | | | | 911,420 | |
| Axon Enterprise, Inc.* | | | 17,423 | | | | 606,843 | |
| BioLife Solutions, Inc.* | | | 66,598 | | | | 344,978 | |
| Cantel Medical Corp. | | | 1,814 | | | | 210,986 | |
| CRH Medical Corp.* | | | 287,280 | | | | 833,112 | |
| Cutera, Inc.* | | | 11,412 | | | | 514,111 | |
| Haemonetics Corp.* | | | 3,260 | | | | 231,134 | |
| ICU Medical, Inc.* | | | 578 | | | | 133,662 | |
| Inogen, Inc.* | | | 6,320 | | | | 763,582 | |
| Integra LifeSciences Holdings Corp.* | | | 3,088 | | | | 162,830 | |
| Intersect ENT, Inc.* | | | 13,114 | | | | 483,251 | |
| Invacare Corp. | | | 5,623 | | | | 96,716 | |
| iRadimed Corp.* | | | 31,317 | | | | 407,121 | |
| iRhythm Technologies, Inc.* | | | 20,008 | | | | 1,243,497 | |
| Masimo Corp.* | | | 3,409 | | | | 298,390 | |
| Meridian Bioscience, Inc. | | | 2,943 | | | | 41,055 | |
| Merit Medical Systems, Inc.* | | | 15,643 | | | | 711,756 | |
| MiMedx Group, Inc.* | | | 5,571 | | | | 39,498 | |
| Natus Medical, Inc.* | | | 2,393 | | | | 74,542 | |
| Novocure Ltd.* | | | 33,613 | | | | 690,747 | |
| NuVasive, Inc.* | | | 1,651 | | | | 79,842 | |
The accompanying notes are an integral part of the financial statements.
7
ADARA SMALLER COMPANIES FUND
Portfolio of Investments (Continued)
February 28, 2018 (Unaudited)
| | | Number of
Shares | | | Value | |
| Healthcare-Products — (Continued) |
| Obalon Therapeutics, Inc.* | | | 34,321 | | | $ | 137,971 | |
| OraSure Technologies, Inc.* | | | 32,734 | | | | 564,989 | |
| Orthofix International N.V.* | | | 4,441 | | | | 248,740 | |
| Repligen Corp.* | | | 22,917 | | | | 785,824 | |
| Sientra, Inc.* | | | 16,708 | | | | 159,561 | |
| Tactile Systems Technology, Inc.* | | | 30,385 | | | | 983,259 | |
| ViewRay, Inc.* | | | 71,580 | | | | 594,830 | |
| West Pharmaceutical Services, Inc. | | | 8,536 | | | | 744,510 | |
| | | | | | | | 14,564,944 | |
| Healthcare-Services — 1.0% | | | | | | | | |
| Amedisys, Inc.* | | | 2,217 | | | | 131,269 | |
| Chemed Corp. | | | 621 | | | | 161,230 | |
| Community Health Systems, Inc.* | | | 15,856 | | | | 81,183 | |
| eHealth, Inc.* | | | 30,178 | | | | 491,600 | |
| Ensign Group, Inc., (The) | | | 2,070 | | | | 55,269 | |
| Kindred Healthcare, Inc. | | | 5,940 | | | | 54,648 | |
| LHC Group, Inc.* | | | 2,720 | | | | 175,114 | |
| Magellan Health, Inc.* | | | 2,346 | | | | 236,711 | |
| Natera, Inc.* | | | 28,541 | | | | 256,869 | |
| OrthoPediatrics Corp.* | | | 21,320 | | | | 376,298 | |
| Providence Service Corp., (The)* | | | 2,212 | | | | 140,595 | |
| Psychemedics Corp. | | | 22,388 | | | | 475,297 | |
| Select Medical Holdings Corp.* | | | 2,823 | | | | 51,096 | |
| US Physical Therapy, Inc. | | | 1,232 | | | | 95,480 | |
| | | | | | | | 2,782,659 | |
| Home Builders — 1.0% | | | | | | | | |
| Cavco Industries, Inc.* | | | 3,528 | | | | 561,305 | |
| Installed Building Products, Inc.* | | | 4,640 | | | | 277,240 | |
| LGI Homes, Inc.* | | | 8,285 | | | | 468,848 | |
| Meritage Homes Corp.* | | | 3,035 | | | | 128,684 | |
| PICO Holdings, Inc. | | | 49,348 | | | | 604,513 | |
| William Lyon Homes, Class A* | | | 2,272 | | | | 57,436 | |
| Winnebago Industries, Inc. | | | 15,436 | | | | 672,238 | |
| | | | | | | | 2,770,264 | |
| Home Furnishings — 0.9% | | | | | | | | |
| American Woodmark Corp.* | | | 1,043 | | | | 133,921 | |
| Aspen Group, Inc.* | | | 38,250 | | | | 284,198 | |
| At Home Group, Inc.* | | | 17,133 | | | | 506,966 | |
| Cactus, Inc., Class A* | | | 1,753 | | | | 43,141 | |
| DXP Enterprises, Inc.* | | | 1,117 | | | | 33,220 | |
| EnviroStar, Inc. | | | 12,357 | | | | 426,316 | |
| Ethan Allen Interiors, Inc. | | | 4,541 | | | | 107,849 | |
| Floor & Decor Holdings, Inc., Class A* | | | 5,847 | | | | 263,524 | |
| Hooker Furniture Corp. | | | 8,270 | | | | 308,884 | |
| iRobot Corp.* | | | 968 | | | | 65,776 | |
| RH* | | | 2,622 | | | | 222,555 | |
| Universal Electronics, Inc.* | | | 2,892 | | | | 143,154 | |
| | | | | | | | 2,539,504 | |
| Household Products / Wares — 0.8% |
| Acme United Corp. | | | 11,359 | | | | 266,936 | |
| Lifetime Brands, Inc. | | | 37,840 | | | | 527,868 | |
| Roku, Inc.* | | | 8,932 | | | | 364,158 | |
| SodaStream International Ltd.* | | | 8,142 | | | | 658,851 | |
| Toro Co., (The) | | | 5,348 | | | | 339,972 | |
| WD-40 Co. | | | 995 | | | | 124,077 | |
| | | | | | | | 2,281,862 | |
| Insurance — 2.4% | | | | | | | | |
| American Equity Investment Life Holding Co. | | | 11,107 | | | | 339,985 | |
| American National Insurance Co. | | | 3,950 | | | | 461,755 | |
| Atlas Financial Holdings, Inc.* | | | 56,997 | | | | 1,000,297 | |
| Employers Holdings, Inc. | | | 3,729 | | | | 145,990 | |
| Genworth Financial, Inc., Class A* | | | 115,950 | | | | 315,384 | |
| HCI Group, Inc. | | | 1,031 | | | | 35,704 | |
| Heritage Insurance Holdings, Inc. | | | 42,430 | | | | 707,732 | |
| Horace Mann Educators Corp. | | | 2,570 | | | | 105,755 | |
| Infinity Property & Casualty Corp. | | | 1,346 | | | | 158,761 | |
| James River Group Holdings Ltd. | | | 1,817 | | | | 59,434 | |
| Kinsale Capital Group, Inc. | | | 5,943 | | | | 291,207 | |
| Maiden Holdings Ltd. | | | 6,856 | | | | 41,136 | |
| NMI Holdings, Inc., Class A* | | | 38,298 | | | | 760,215 | |
| ProAssurance Corp. | | | 2,565 | | | | 122,607 | |
| RLI Corp. | | | 1,478 | | | | 89,862 | |
| Safety Insurance Group, Inc. | | | 1,702 | | | | 121,438 | |
| Selective Insurance Group, Inc. | | | 3,866 | | | | 219,782 | |
| White Mountains Insurance Group Ltd. | | | 2,358 | | | | 1,902,552 | |
| | | | | | | | 6,879,596 | |
| Internet — 3.6% | | | | | | | | |
| 8x8, Inc.* | | | 4,788 | | | | 87,381 | |
| Blucora, Inc.* | | | 3,569 | | | | 83,158 | |
| Boingo Wireless, Inc.* | | | 99,274 | | | | 2,627,783 | |
| Cars.com, Inc.* | | | 48,100 | | | | 1,317,459 | |
| ePlus, Inc.* | | | 8,616 | | | | 659,555 | |
| Etsy, Inc.* | | | 19,798 | | | | 501,087 | |
| ForeScout Technologies, Inc.* | | | 5,877 | | | | 175,017 | |
| HealthStream, Inc.* | | | 2,625 | | | | 63,420 | |
| magicJack VocalTec Ltd.* | | | 122,040 | | | | 1,025,136 | |
| Mimecast Ltd.* | | | 22,954 | | | | 797,422 | |
| New Media Investment Group, Inc. | | | 4,294 | | | | 74,072 | |
| One Stop Systems, Inc.* | | | 87,560 | | | | 424,666 | |
| PC-Tel, Inc. | | | 44,392 | | | | 311,188 | |
| Q2 Holdings, Inc.* | | | 6,681 | | | | 304,320 | |
| Rosetta Stone, Inc.* | | | 40,520 | | | | 554,719 | |
| Stamps.com, Inc.* | | | 1,004 | | | | 191,814 | |
| Trade Desk, Inc., (The), Class A* | | | 10,147 | | | | 570,870 | |
| Zendesk, Inc.* | | | 17,006 | | | | 734,319 | |
| | | | | | | | 10,503,386 | |
The accompanying notes are an integral part of the financial statements.
8
ADARA SMALLER COMPANIES FUND
Portfolio of Investments (Continued)
February 28, 2018 (Unaudited)
| | | Number of
Shares | | | Value | |
| Investment Companies — 1.2% | | | | | | |
| Acacia Research Corp.* | | | 127,690 | | | $ | 440,530 | |
| Cannae Holdings, Inc.* | | | 104,185 | | | | 1,914,920 | |
| Capital Southwest Corp. | | | 34,226 | | | | 588,687 | |
| PennantPark Floating Rate Capital Ltd. | | | 48,447 | | | | 604,619 | |
| | | | | | | | 3,548,756 | |
| Iron / Steel — 0.1% | | | | | | | | |
| AK Steel Holding Corp.* | | | 14,144 | | | | 72,983 | |
| Schnitzer Steel Industries, Inc., Class A | | | 8,548 | | | | 290,632 | |
| | | | | | | | 363,615 | |
| Leisure Time — 1.2% | | | | | | | | |
| Callaway Golf Co. | | | 44,531 | | | | 689,340 | |
| Camping World Holdings, Inc., Class A | | | 6,477 | | | | 270,739 | |
| Century Casinos, Inc.* | | | 38,775 | | | | 309,037 | |
| Lindblad Expeditions Holdings, Inc.* | | | 51,954 | | | | 478,496 | |
| Malibu Boats, Inc., Class A* | | | 22,730 | | | | 728,497 | |
| MCBC Holdings, Inc.* | | | 21,170 | | | | 518,877 | |
| Planet Fitness, Inc., Class A* | | | 8,752 | | | | 323,649 | |
| | | | | | | | 3,318,635 | |
| Lodging — 0.7% | | | | | | | | |
| Belmond Ltd., Class A* | | | 10,812 | | | | 124,879 | |
| Boyd Gaming Corp. | | | 23,497 | | | | 831,324 | |
| Civeo Corp.* | | | 97,393 | | | | 345,745 | |
| ILG, Inc. | | | 8,186 | | | | 248,527 | |
| Marcus Corp., (The) | | | 13,177 | | | | 355,779 | |
| Monarch Casino & Resort, Inc.* | | | 3,416 | | | | 144,258 | |
| | | | | | | | 2,050,512 | |
| Machinery-Diversified — 3.2% | | | | | | | | |
| Albany International Corp., Class A | | | 1,126 | | | | 71,670 | |
| Applied Industrial Technologies, Inc. | | | 1,045 | | | | 73,568 | |
| ASV Holdings, Inc.* | | | 49,340 | | | | 397,680 | |
| Blackline, Inc.* | | | 13,844 | | | | 609,136 | |
| Chart Industries, Inc.* | | | 2,562 | | | | 141,192 | |
| Columbus McKinnon Corp. | | | 24,028 | | | | 852,994 | |
| ExOne Co., (The)* | | | 36,509 | | | | 305,215 | |
| Hurco Cos, Inc. | | | 17,690 | | | | 740,326 | |
| Kadant, Inc. | | | 9,121 | | | | 870,143 | |
| Manitex International, Inc.* | | | 106,100 | | | | 1,112,989 | |
| NN, Inc. | | | 35,450 | | | | 847,255 | |
| Nova Measuring Instruments Ltd.* | | | 10,518 | | | | 288,088 | |
| SPX FLOW, Inc.* | | | 10,543 | | | | 514,077 | |
| Tennant Co. | | | 1,504 | | | | 96,858 | |
| Twin Disc, Inc.* | | | 58,574 | | | | 1,401,090 | |
| Vuzix Corp.* | | | 53,344 | | | | 449,423 | |
| Welbilt, Inc.* | | | 23,241 | | | | 460,404 | |
| | | | | | | | 9,232,108 | |
| Media — 0.1% | | | | | | | | |
| Gannett Co., Inc. | | | 8,195 | | | | 82,278 | |
| Scholastic Corp. | | | 1,251 | | | | 45,549 | |
| TiVo Corp. | | | 7,248 | | | | 108,720 | |
| | | | | | | | 236,547 | |
| Medical Equipment and Supplies Manufacturing — 0.2% |
| AngioDynamics, Inc.* | | | 1,976 | | | | 32,189 | |
| Argenx SE, ADR* | | | 5,376 | | | | 411,963 | |
| | | | | | | | 444,152 | |
| Metal Fabricate/Hardware — 0.8% |
| CIRCOR International, Inc. | | | 1,433 | | | | 67,351 | |
| Haynes International, Inc. | | | 19,234 | | | | 800,134 | |
| Lawson Products, Inc.* | | | 13,438 | | | | 315,121 | |
| Mueller Industries, Inc. | | | 4,223 | | | | 111,867 | |
| Northwest Pipe Co.* | | | 41,860 | | | | 733,806 | |
| TimkenSteel Corp.* | | | 8,182 | | | | 133,858 | |
| | | | | | | | 2,162,137 | |
| Mining — 1.1% | | | | | | | | |
| A-Mark Precious Metals, Inc. | | | 22,692 | | | | 249,839 | |
| Astec Industries, Inc. | | | 8,917 | | | | 525,211 | |
| Century Aluminum Co.* | | | 18,637 | | | | 355,035 | |
| Compass Minerals International, Inc. | | | 7,580 | | | | 457,074 | |
| Kaiser Aluminum Corp. | | | 1,039 | | | | 104,284 | |
| Liberty Oilfield Services, Inc., Class A* | | | 53,853 | | | | 1,001,127 | |
| Materion Corp. | | | 1,920 | | | | 96,768 | |
| Noble Corp., PLC* | | | 17,921 | | | | 69,533 | |
| United States Lime & Minerals, Inc. | | | 4,143 | | | | 295,023 | |
| US Silica Holdings, Inc. | | | 3,048 | | | | 78,913 | |
| | | | | | | | 3,232,807 | |
| Miscellaneous Manufacturing — 2.5% |
| Accuray, Inc.* | | | 71,520 | | | | 396,936 | |
| Actuant Corp., Class A | | | 1,678 | | | | 38,091 | |
| Boise Cascade Co. | | | 3,023 | | | | 121,827 | |
| Core Molding Technologies, Inc. | | | 16,333 | | | | 297,261 | |
| CryoPort, Inc.* | | | 48,517 | | | | 439,564 | |
| EnPro Industries, Inc. | | | 2,498 | | | | 181,005 | |
| Fabrinet* | | | 3,054 | | | | 92,078 | |
| FreightCar America, Inc. | | | 44,382 | | | | 656,410 | |
| Harsco Corp.* | | | 14,378 | | | | 291,154 | |
| Hillenbrand, Inc. | | | 2,960 | | | | 129,944 | |
| Iteris, Inc.* | | | 34,188 | | | | 190,427 | |
| John Bean Technologies Corp. | | | 7,232 | | | | 800,944 | |
| LCI Industries | | | 1,629 | | | | 178,050 | |
| Milacron Holdings Corp.* | | | 2,320 | | | | 49,718 | |
| Mobile Mini, Inc. | | | 1,196 | | | | 50,172 | |
| Movado Group, Inc. | | | 11,362 | | | | 352,222 | |
| Nautilus, Inc.* | | | 2,634 | | | | 31,213 | |
| Nuvectra Corp.* | | | 31,747 | | | | 338,740 | |
| Proto Labs, Inc.* | | | 3,579 | | | | 389,932 | |
The accompanying notes are an integral part of the financial statements.
9
ADARA SMALLER COMPANIES FUND
Portfolio of Investments (Continued)
February 28, 2018 (Unaudited)
| | | Number of
Shares | | | Value | |
| Miscellaneous Manufacturing — (Continued) |
| Pure Storage, Inc., Class A* | | | 14,897 | | | $ | 322,818 | |
| Raven Industries, Inc. | | | 15,177 | | | | 515,259 | |
| Restoration Robotics, Inc.* | | | 65,256 | | | | 367,391 | |
| Sleep Number Corp.* | | | 23,313 | | | | 802,900 | |
| Standard Motor Products, Inc. | | | 1,347 | | | | 62,851 | |
| Sturm Ruger & Co., Inc. | | | 968 | | | | 41,672 | |
| Vista Outdoor, Inc.* | | | 4,357 | | | | 75,071 | |
| | | | | | | | 7,213,650 | |
| Office Furnishings — 0.0% | | | | | | | | |
| Interface, Inc. | | | 3,053 | | | | 73,883 | |
| | | | | | | | | |
| Oil & Gas — 1.4% | | | | | | | | |
| Bill Barrett Corp.* | | | 13,256 | | | | 60,050 | |
| Callon Petroleum Co.* | | | 44,370 | | | | 468,991 | |
| Carrizo Oil & Gas, Inc.* | | | 5,796 | | | | 81,434 | |
| Denbury Resources, Inc.* | | | 47,546 | | | | 104,126 | |
| Evolution Petroleum Corp. | | | 31,294 | | | | 251,917 | |
| Gran Tierra Energy, Inc.* | | | 92,840 | | | | 232,100 | |
| Matador Resources Co.* | | | 17,656 | | | | 509,552 | |
| Murphy USA, Inc.* | | | 15,125 | | | | 1,136,039 | |
| PBF Energy, Inc., Class A | | | 18,400 | | | | 539,304 | |
| PDC Energy, Inc.* | | | 2,970 | | | | 156,014 | |
| QEP Resources, Inc.* | | | 20,000 | | | | 172,400 | |
| SRC Energy, Inc.* | | | 19,542 | | | | 173,337 | |
| Unit Corp.* | | | 4,358 | | | | 83,499 | |
| | | | | | | | 3,968,763 | |
| Oil & Gas Services — 0.7% | | | | | | | | |
| Bristow Group, Inc. | | | 6,128 | | | | 90,449 | |
| Flotek Industries, Inc.* | | | 13,384 | | | | 79,635 | |
| Helix Energy Solutions Group, Inc.* | | | 17,356 | | | | 103,442 | |
| Mammoth Energy Services, Inc.* | | | 7,722 | | | | 202,162 | |
| Natural Gas Services Group, Inc.* | | | 21,640 | | | | 538,836 | |
| Profire Energy, Inc.* | | | 237,800 | | | | 506,514 | |
| Solaris Oilfield Infrastructure, Inc., Class A* | | | 37,582 | | | | 632,505 | |
| | | | | | | | 2,153,543 | |
| Packaging & Containers — 0.0% |
| KapStone Paper and Packaging Corp. | | | 4,714 | | | | 164,471 | |
| Multi-Color Corp. | | | 610 | | | | 38,644 | |
| | | | | | | | 203,115 | |
| Pharmaceuticals — 3.8% | | | | | | | | |
| Achaogen, Inc.* | | | 14,257 | | | | 148,701 | |
| Aclaris Therapeutics, Inc.* | | | 17,106 | | | | 341,094 | |
| Adamas Pharmaceuticals, Inc.* | | | 12,787 | | | | 312,642 | |
| Adaptimmune Therapeutics PLC, ADR* | | | 22,698 | | | | 173,186 | |
| Adverum Biotechnologies, Inc.* | | | 36,223 | | | | 250,844 | |
| Anika Therapeutics, Inc.* | | | 1,077 | | | | 56,058 | |
| Arena Pharmaceuticals, Inc.* | | | 4,370 | | | | 169,425 | |
| Array BioPharma, Inc.* | | | 72,763 | | | | 1,260,255 | |
| Catalent, Inc.* | | | 18,545 | | | | 774,254 | |
| Champions Oncology, Inc.* | | | 84,017 | | | | 293,219 | |
| Chimerix, Inc.* | | | 34,364 | | | | 167,009 | |
| Clementia Pharmaceuticals, Inc.* | | | 20,892 | | | | 333,019 | |
| Collegium Pharmaceutical, Inc.* | | | 22,029 | | | | 528,476 | |
| CTI BioPharma Corp.* | | | 29,749 | | | | 119,591 | |
| Depomed, Inc.* | | | 10,628 | | | | 73,014 | |
| Diplomat Pharmacy, Inc.* | | | 4,301 | | | | 89,633 | |
| Dova Pharmaceuticals, Inc.* | | | 18,272 | | | | 552,911 | |
| Edge Therapeutics, Inc.* | | | 13,517 | | | | 203,431 | |
| Emergent BioSolutions, Inc.* | | | 3,096 | | | | 153,871 | |
| Enanta Pharmaceuticals, Inc.* | | | 4,093 | | | | 321,792 | |
| Foamix Pharmaceuticals Ltd.* | | | 30,338 | | | | 180,511 | |
| Global Blood Therapeutics, Inc.* | | | 13,190 | | | | 773,594 | |
| Impax Laboratories, Inc.* | | | 6,603 | | | | 134,701 | |
| Imprimis Pharmaceuticals, Inc.* | | | 59,000 | | | | 107,380 | |
| Innoviva, Inc.* | | | 9,226 | | | | 143,095 | |
| MyoKardia, Inc.* | | | 8,974 | | | | 522,287 | |
| Nature's Sunshine Products, Inc. | | | 19,746 | | | | 222,143 | |
| Nektar Therapeutics* | | | 11,411 | | | | 987,736 | |
| Neogen Corp.* | | | 2,310 | | | | 134,604 | |
| Optinose, Inc.* | | | 12,104 | | | | 214,362 | |
| Phibro Animal Health Corp., Class A | | | 2,922 | | | | 112,351 | |
| Prestige Brands Holdings, Inc.* | | | 1,938 | | | | 65,504 | |
| Savara, Inc.* | | | 13,647 | | | | 151,755 | |
| Strongbridge Biopharma, PLC* | | | 21,365 | | | | 155,965 | |
| Synergy Pharmaceuticals, Inc.* | | | 89,319 | | | | 161,667 | |
| Ultragenyx Pharmaceutical, Inc.* | | | 6,416 | | | | 306,749 | |
| Viking Therapeutics, Inc.* | | | 28,149 | | | | 176,213 | |
| | | | | | | | 10,873,042 | |
| Real Estate — 0.6% | | | | | | | | |
| Bluegreen Vacations Corp. | | | 13,796 | | | | 266,815 | |
| Community Healthcare Trust, Inc. | | | 1,573 | | | | 37,028 | |
| Great Ajax Corp. | | | 25,830 | | | | 335,273 | |
| HFF, Inc., Class A | | | 2,032 | | | | 92,781 | |
| Marcus & Millichap, Inc.* | | | 12,454 | | | | 389,810 | |
| RE/MAX Holdings, Inc., Class A | | | 1,360 | | | | 75,208 | |
| Redfin Corp.* | | | 27,924 | | | | 574,955 | |
| Whitestone REIT | | | 3,058 | | | | 37,736 | |
| | | | | | | | 1,809,606 | |
| REITS — 0.7% | | | | | | | | |
| Acadia Realty Trust | | | 4,655 | | | | 112,092 | |
| Agree Realty Corp. | | | 1,641 | | | | 77,291 | |
| Armada Hoffler Properties, Inc. | | | 5,342 | | | | 69,873 | |
| CareTrust REIT, Inc. | | | 3,664 | | | | 48,548 | |
| Chatham Lodging Trust | | | 1,795 | | | | 32,651 | |
| CoreSite Realty Corp. | | | 1,355 | | | | 127,167 | |
| DiamondRock Hospitality Co. | | | 8,155 | | | | 83,833 | |
| EastGroup Properties, Inc. | | | 2,590 | | | | 209,868 | |
The accompanying notes are an integral part of the financial statements.
10
ADARA SMALLER COMPANIES FUND
Portfolio of Investments (Continued)
February 28, 2018 (Unaudited)
| | | Number of
Shares | | | Value | |
| REITS — (Continued) | | | | | | |
| Getty Realty Corp. | | | 5,173 | | | $ | 122,083 | |
| Government Properties Income Trust | | | 6,612 | | | | 90,717 | |
| Healthcare Realty Trust, Inc. | | | 7,137 | | | | 189,487 | |
| Hersha Hospitality Trust | | | 4,607 | | | | 77,398 | |
| Kite Realty Group Trust | | | 7,092 | | | | 107,373 | |
| Lexington Realty Trust | | | 12,112 | | | | 96,411 | |
| Medical Properties Trust, Inc. | | | 5,867 | | | | 71,929 | |
| PS Business Parks, Inc. | | | 1,242 | | | | 137,688 | |
| Retail Opportunity Investments Corp. | | | 3,666 | | | | 62,909 | |
| Summit Hotel Properties, Inc. | | | 6,963 | | | | 91,703 | |
| Universal Health Realty Income Trust | | | 3,063 | | | | 169,568 | |
| Urstadt Biddle Properties, Inc., Class A | | | 3,640 | | | | 63,773 | |
| | | | | | | | 2,042,362 | |
| Retail — 4.6% | | | | | | | | |
| Abercrombie & Fitch Co., Class A | | | 5,117 | | | | 105,564 | |
| Asbury Automotive Group, Inc.* | | | 15,883 | | | | 1,045,896 | |
| Ascena Retail Group, Inc.* | | | 24,230 | | | | 55,002 | |
| Big 5 Sporting Goods Corp. | | | 79,967 | | | | 491,797 | |
| Biglari Holdings, Inc.* | | | 2,200 | | | | 922,262 | |
| Boot Barn Holdings, Inc.* | | | 13,943 | | | | 245,676 | |
| Buckle, Inc., (The) | | | 4,527 | | | | 95,293 | |
| Build-A-Bear Workshop, Inc.* | | | 71,170 | | | | 647,647 | |
| Casey's General Stores, Inc. | | | 1,888 | | | | 212,041 | |
| Cato Corp., (The), Class A | | | 2,154 | | | | 24,469 | |
| Children's Place, Inc., (The) | | | 1,027 | | | | 146,142 | |
| Chuy's Holdings, Inc.* | | | 4,399 | | | | 118,773 | |
| Core-Mark Holding Co, Inc. | | | 4,602 | | | | 94,203 | |
| Cracker Barrel Old Country Store, Inc. | | | 790 | | | | 123,319 | |
| El Pollo Loco Holdings, Inc.* | | | 4,078 | | | | 39,761 | |
| Express, Inc.* | | | 20,245 | | | | 146,169 | |
| EZCORP, Inc., Class A* | | | 6,969 | | | | 90,597 | |
| FirstCash, Inc. | | | 2,930 | | | | 215,941 | |
| Five Below, Inc.* | | | 3,696 | | | | 247,078 | |
| Freshpet, Inc.* | | | 29,912 | | | | 598,240 | |
| Genesco, Inc.* | | | 4,461 | | | | 175,317 | |
| Group 1 Automotive, Inc. | | | 953 | | | | 65,605 | |
| Guess?, Inc. | | | 6,372 | | | | 100,614 | |
| Hibbett Sports, Inc.* | | | 25,632 | | | | 660,024 | |
| Ingevity Corp.* | | | 2,186 | | | | 163,753 | |
| J Alexander's Holdings, Inc.* | | | 43,816 | | | | 433,778 | |
| Liberty Expedia Holdings, Inc., Class A* | | | 28,940 | | | | 1,136,184 | |
| Lumber Liquidators Holdings, Inc.* | | | 5,091 | | | | 117,908 | |
| MarineMax, Inc.* | | | 4,583 | | | | 95,785 | |
| Ollie's Bargain Outlet Holdings, Inc.* | | | 10,373 | | | | 615,638 | |
| Papa John's International, Inc. | | | 1,043 | | | | 60,223 | |
| PC Connection, Inc. | | | 26,540 | | | | 658,988 | |
| PCM, Inc.* | | | 68,800 | | | | 488,480 | |
| PetMed Express, Inc. | | | 3,582 | | | | 161,871 | |
| Red Robin Gourmet Burgers, Inc.* | | | 1,719 | | | | 92,224 | |
| Regis Corp.* | | | 8,392 | | | | 135,027 | |
| Shoe Carnival, Inc. | | | 2,090 | | | | 48,822 | |
| Tailored Brands, Inc. | | | 6,230 | | | | 145,844 | |
| Texas Roadhouse, Inc. | | | 14,840 | | | | 820,058 | |
| Vitamin Shoppe, Inc.* | | | 7,759 | | | | 29,096 | |
| Wingstop, Inc. | | | 12,481 | | | | 565,514 | |
| Winmark Corp. | | | 2,588 | | | | 327,900 | |
| World Fuel Services Corp. | | | 17,960 | | | | 410,386 | |
| Zumiez, Inc.* | | | 3,678 | | | | 72,457 | |
| | | | | | | | 13,247,366 | |
| Savings & Loans — 0.8% | | | | | | | | |
| BofI Holding, Inc.* | | | 3,461 | | | | 128,715 | |
| Brookline Bancorp, Inc. | | | 9,875 | | | | 156,519 | |
| Dime Community Bancshares, Inc. | | | 8,292 | | | | 149,256 | |
| FS Bancorp, Inc. | | | 8,530 | | | | 463,179 | |
| Meta Financial Group, Inc. | | | 5,514 | | | | 592,204 | |
| Sterling Bancorp | | | 38,122 | | | | 886,337 | |
| | | | | | | | 2,376,210 | |
| Scientific Research and Development Services — 0.5% |
| AnaptysBio, Inc.* | | | 3,238 | | | | 397,497 | |
| CytoSorbents Corp.* | | | 51,679 | | | | 405,680 | |
| GlycoMimetics, Inc.* | | | 13,473 | | | | 310,014 | |
| TTEC Holdings, Inc. | | | 3,501 | | | | 124,811 | |
| WaVe Life Sciences Ltd.* | | | 3,526 | | | | 179,650 | |
| | | | | | | | 1,417,652 | |
| Semiconductors — 3.6% | | | | | | | | |
| Adesto Technologies Corp.* | | | 29,682 | | | | 191,449 | |
| Amtech Systems, Inc.* | | | 93,500 | | | | 709,665 | |
| AXT, Inc.* | | | 86,290 | | | | 645,018 | |
| Cabot Microelectronics Corp. | | | 1,581 | | | | 161,104 | |
| Cavium, Inc.* | | | 567 | | | | 50,486 | |
| Cirrus Logic, Inc.* | | | 3,525 | | | | 156,193 | |
| Cohu, Inc. | | | 35,940 | | | | 719,878 | |
| FGL Holdings* | | | 75,050 | | | | 723,482 | |
| Ichor Holdings Ltd.* | | | 8,811 | | | | 227,676 | |
| Impinj, Inc.* | | | 24,619 | | | | 313,646 | |
| Kulicke & Soffa Industries, Inc.* | | | 6,419 | | | | 149,563 | |
| Microsemi Corp.* | | | 4,990 | | | | 323,851 | |
| MKS Instruments, Inc. | | | 1,371 | | | | 152,661 | |
| Monolithic Power Systems, Inc. | | | 1,952 | | | | 228,501 | |
| NVE Corp. | | | 5,577 | | | | 387,657 | |
| Power Integrations, Inc. | | | 10,093 | | | | 678,250 | |
The accompanying notes are an integral part of the financial statements.
11
ADARA SMALLER COMPANIES FUND
Portfolio of Investments (Continued)
February 28, 2018 (Unaudited)
| | | Number of
Shares | | | Value | |
| Semiconductors — (Continued) |
| Rambus, Inc.* | | | 3,550 | | | $ | 45,121 | |
| Rudolph Technologies, Inc.* | | | 23,820 | | | | 632,421 | |
| Semtech Corp.* | | | 5,218 | | | | 175,586 | |
| Silicon Laboratories, Inc.* | | | 5,820 | | | | 544,170 | |
| SMART Global Holdings, Inc.* | | | 32,345 | | | | 1,123,018 | |
| Tower Semiconductor Ltd.* | | | 15,972 | | | | 463,507 | |
| Ultra Clean Holdings, Inc.* | | | 31,880 | | | | 614,009 | |
| Veeco Instruments, Inc.* | | | 3,748 | | | | 68,026 | |
| Xcerra Corp.* | | | 87,390 | | | | 873,900 | |
| | | | | | | | 10,358,838 | |
| Software — 8.9% | | | | | | | | |
| Altair Engineering, Inc., Class A* | | | 56,333 | | | | 1,482,684 | |
| Alteryx, Inc., Class A* | | | 27,536 | | | | 941,456 | |
| American Software, Inc., Class A | | | 41,399 | | | | 515,004 | |
| Apptio, Inc., Class A* | | | 55,849 | | | | 1,614,036 | |
| Asure Software, Inc.* | | | 96,256 | | | | 1,371,648 | |
| Blackbaud, Inc. | | | 2,160 | | | | 221,443 | |
| Bottomline Technologies de, Inc.* | | | 13,554 | | | | 514,781 | |
| Box, Inc., Class A* | | | 25,816 | | | | 621,133 | |
| Castlight Health, Inc., Class B* | | | 80,483 | | | | 285,715 | |
| Cogent Communications Holdings, Inc. | | | 1,281 | | | | 54,891 | |
| Computer Programs & Systems, Inc. | | | 33,541 | | | | 999,522 | |
| Control4 Corp.* | | | 6,555 | | | | 157,582 | |
| CSG Systems International, Inc. | | | 28,178 | | | | 1,315,349 | |
| Ebix, Inc. | | | 2,006 | | | | 168,404 | |
| eGain Corp.* | | | 57,533 | | | | 445,881 | |
| Everbridge, Inc.* | | | 43,732 | | | | 1,395,488 | |
| Five9, Inc.* | | | 16,104 | | | | 488,918 | |
| InnerWorkings, Inc.* | | | 78,830 | | | | 727,601 | |
| Instructure, Inc.* | | | 21,706 | | | | 942,040 | |
| j2 Global, Inc. | | | 1,848 | | | | 136,789 | |
| LivePerson, Inc.* | | | 18,884 | | | | 272,874 | |
| Manhattan Associates, Inc.* | | | 1,938 | | | | 81,590 | |
| ManTech International Corp., Class A | | | 12,660 | | | | 713,644 | |
| Medidata Solutions, Inc.* | | | 2,714 | | | | 178,201 | |
| Mitel Networks Corp.* | | | 202,470 | | | | 1,656,205 | |
| MiX Telematics Ltd., ADR | | | 29,769 | | | | 395,928 | |
| MuleSoft, Inc., Class A* | | | 21,394 | | | | 660,647 | |
| Omnicell, Inc.* | | | 13,003 | | | | 567,581 | |
| PDF Solutions, Inc.* | | | 2,232 | | | | 24,864 | |
| Progress Software Corp. | | | 5,306 | | | | 248,692 | |
| QAD, Inc., Class A | | | 21,362 | | | | 961,290 | |
| Quality Systems, Inc.* | | | 3,902 | | | | 48,970 | |
| SharpSpring, Inc.* | | | 41,925 | | | | 208,786 | |
| Shutterfly, Inc.* | | | 5,610 | | | | 430,455 | |
| Simulations Plus, Inc. | | | 31,897 | | | | 495,998 | |
| Synchronoss Technologies, Inc.* | | | 6,351 | | | | 59,318 | |
| SYNNEX Corp. | | | 1,652 | | | | 204,270 | |
| Tabula Rasa HealthCare, Inc.* | | | 26,098 | | | | 843,226 | |
| Take-Two Interactive Software, Inc.* | | | 3,989 | | | | 446,249 | |
| Talend S.A., ADR* | | | 20,282 | | | | 954,877 | |
| Upland Software, Inc.* | | | 12,720 | | | | 303,499 | |
| Virtusa Corp.* | | | 28,880 | | | | 1,378,154 | |
| | | | | | | | 25,535,683 | |
| Telecommunications — 3.6% | | | | | | | | |
| ADTRAN, Inc. | | | 2,768 | | | | 43,319 | |
| AMC Networks, Inc., Class A* | | | 11,720 | | | | 616,120 | |
| ATN International, Inc. | | | 13,496 | | | | 808,410 | |
| Avaya Holdings Corp.* | | | 38,490 | | | | 807,905 | |
| CalAmp Corp.* | | | 14,070 | | | | 329,238 | |
| Comtech Telecommunications Corp. | | | 52,150 | | | | 1,152,515 | |
| Consolidated Communications Holdings, Inc. | | | 8,668 | | | | 100,202 | |
| Entercom Communications Corp., Class A | | | 39,880 | | | | 394,812 | |
| Fusion Telecommunications International, Inc.* | | | 48,196 | | | | 140,250 | |
| GTT Communications, Inc.* | | | 18,671 | | | | 963,424 | |
| Iridium Communications, Inc.* | | | 9,628 | | | | 112,648 | |
| LogMeIn, Inc. | | | 1,382 | | | | 159,690 | |
| NETGEAR, Inc.* | | | 2,616 | | | | 145,842 | |
| ORBCOMM, Inc.* | | | 75,383 | | | | 783,983 | |
| Quantenna Communications, Inc.* | | | 39,425 | | | | 542,094 | |
| QuinStreet, Inc.* | | | 37,670 | | | | 494,607 | |
| RADCOM Ltd.* | | | 29,780 | | | | 586,666 | |
| Silicom Ltd. | | | 9,003 | | | | 570,790 | |
| Telephone & Data Systems, Inc. | | | 21,703 | | | | 608,552 | |
| Viavi Solutions, Inc.* | | | 23,640 | | | | 227,417 | |
| Vonage Holdings Corp.* | | | 62,408 | | | | 633,441 | |
| | | | | | | | 10,221,925 | |
| Textiles — 0.6% | | | | | | | | |
| UniFirst Corp. | | | 11,746 | | | | 1,824,154 | |
| | | | | | | | | |
| Transportation — 2.7% | | | | | | | | |
| Air Transport Services Group, Inc.* | | | 59,798 | | | | 1,582,853 | |
| ArcBest Corp. | | | 4,606 | | | | 152,459 | |
| Atlas Air Worldwide Holdings, Inc.* | | | 8,881 | | | | 540,409 | |
| Echo Global Logistics, Inc.* | | | 4,834 | | | | 127,859 | |
| Forward Air Corp. | | | 15,102 | | | | 815,508 | |
| GasLog Ltd. | | | 6,852 | | | | 113,058 | |
| Heartland Express, Inc. | | | 8,734 | | | | 170,488 | |
| Knight-Swift Transportation Holdings, Inc. | | | 3,275 | | | | 157,724 | |
| Marten Transport Ltd. | | | 32,646 | | | | 706,786 | |
| Modine Manufacturing Co.* | | | 24,614 | | | | 566,122 | |
The accompanying notes are an integral part of the financial statements.
12
ADARA SMALLER COMPANIES FUND
Portfolio of Investments (Concluded)
February 28, 2018 (Unaudited)
| | | Number of
Shares | | | Value | |
| Transportation — (Continued) | | | | | | |
| PAM Transportation Services, Inc.* | | | 26,940 | | | $ | 929,699 | |
| Radiant Logistics, Inc.* | | | 68,987 | | | | 255,252 | |
| Saia, Inc.* | | | 17,366 | | | | 1,261,640 | |
| Stoneridge, Inc.* | | | 17,662 | | | | 384,325 | |
| | | | | | | | 7,764,182 | |
| Trucking & Leasing — 0.0% | | | | | | | | |
| Greenbrier Cos, Inc., (The) | | | 3,222 | | | | 166,900 | |
| | | | | | | | | |
| Water — 0.0% | | | | | | | | |
| American States Water Co. | | | 1,758 | | | | 93,385 | |
| California Water Service Group | | | 1,969 | | | | 74,723 | |
| | | | | | | | 168,108 | |
| TOTAL COMMON STOCKS | | | | | | | | |
| (Cost $212,184,344) | | | | | | | 276,675,968 | |
| | | | | | | | | |
| SHORT-TERM INVESTMENTS — 4.2% |
| STIT-Treasury Portfolio, 1.29% (a) | | | 12,149,669 | | | | 12,149,669 | |
| TOTAL SHORT-TERM INVESTMENTS | | | | | | | | |
| (Cost $12,149,669) | | | | | | | 12,149,669 | |
| TOTAL INVESTMENTS — 100.3% | | | | | | | | |
| (Cost $224,334,013) | | | | | | | 288,825,637 | |
| LIABILITIES IN EXCESS OF OTHER ASSETS — (0.3)% | | | | | | | (1,004,086 | ) |
| NET ASSETS — 100.0% | | | | | | $ | 287,821,551 | |
| * | Non-income producing security. |
| (a) | Seven-day yield as of February 28, 2018. |
| ADR | American Depositary Receipt |
| PLC | Public Limited Company |
| REIT | Real Estate Investment Trust |
The accompanying notes are an integral part of the financial statements.
13
ADARA SMALLER COMPANIES FUND
Statement of Assets and Liabilities
February 28, 2018 (Unaudited)
| ASSETS | | | |
| Investments, at value (cost $212,184,344) | | $ | 276,675,968 | |
| Short-term investments, at value (cost $12,149,669) | | | 12,149,669 | |
| Receivables for: | | | | |
| Investments sold | | | 1,319,027 | |
| Dividends | | | 145,800 | |
| Capital shares sold | | | 120,000 | |
| Total assets | | | 290,410,464 | |
| | | | | |
| LIABILITIES | | | | |
| Payables for: | | | | |
| Investments purchased | | | 2,320,631 | |
| Investment sub-advisory fees | | | 168,659 | |
| Capital shares redeemed | | | 80,000 | |
| Other accrued expenses and liabilities | | | 19,623 | |
| Total liabilities | | | 2,588,913 | |
| Net assets | | $ | 287,821,551 | |
| | | | | |
| NET ASSETS CONSIST OF: | | | | |
| Par value | | $ | 21,016 | |
| Paid-in capital | | | 215,982,456 | |
| Undistributed/(accumulated) net investment income/(loss) | | | (163,234 | ) |
| Accumulated net realized gain/(loss) from investments | | | 7,489,689 | |
| Net unrealized appreciation/(depreciation) on investments | | | 64,491,624 | |
| Net assets | | $ | 287,821,551 | |
| | | | | |
| CAPITAL SHARES: | | | | |
| Shares outstanding ($0.001 par value, 100,000,000 shares authorized) | | | 21,016,253 | |
| Net asset value, offering and redemption price per share | | $ | 13.70 | |
The accompanying notes are an integral part of the financial statements.
14
ADARA SMALLER COMPANIES FUND
Statement of Operations
For the Six Months Ended February 28, 2018 (Unaudited)
| INVESTMENT INCOME | | | |
| Dividends (net of foreign taxes withheld of $3,105) | | $ | 1,335,685 | |
| Total investment income | | | 1,335,685 | |
| | | | | |
| EXPENSES | | | | |
| Sub-advisory fees (Note 2) | | | 1,061,893 | |
| Administration and accounting services fees (Note 2) | | | 57,840 | |
| Legal fees | | | 24,152 | |
| Custodian fees (Note 2) | | | 23,644 | |
| Transfer agent fees (Note 2) | | | 18,853 | |
| Audit fees | | | 16,633 | |
| Directors fees | | | 13,750 | |
| Registration and filing fees | | | 11,560 | |
| Officers fees | | | 8,952 | |
| Printing and shareholder reporting fees | | | 5,931 | |
| Other expenses | | | 18,761 | |
| Total expenses | | | 1,261,969 | |
| Net investment income/(loss) | | | 73,716 | |
| | | | | |
| NET REALIZED AND UNREALIZED GAIN/(LOSS) FROM INVESTMENTS | | | | |
| Net realized gain/(loss) from investments | | | 14,592,327 | |
| Net change in unrealized appreciation/(depreciation) on investments | | | 11,365,306 | |
| Net realized and unrealized gain/(loss) on investments | | | 25,957,633 | |
| NET INCREASE/(DECREASE) IN NET ASSETS RESULTING FROM OPERATIONS | | $ | 26,031,349 | |
The accompanying notes are an integral part of the financial statements.
15
ADARA SMALLER COMPANIES FUND
Statements of Changes in Net Assets
| | | For the
Six Months Ended
February 28, 2018
(Unaudited) | | | For the
Year Ended
August 31, 2017 | |
| INCREASE/(DECREASE) IN NET ASSETS FROM OPERATIONS | | | | | | |
| Net investment income/(loss) | | $ | 73,716 | | | $ | (377,926 | ) |
| Net realized gain/(loss) from investments and foreign currency transactions | | | 14,592,327 | | | | 15,511,406 | |
| Net change in unrealized appreciation/(depreciation) on investments and foreign currency translation | | | 11,365,306 | | | | 19,615,276 | |
| Net increase/(decrease) in net assets resulting from operations | | | 26,031,349 | | | | 34,748,756 | |
| | | | | | | | | |
| DIVIDENDS AND DISTRIBUTIONS TO SHAREHOLDERS FROM: | | | | | | | | |
| Net realized capital gains | | | (10,628,260 | ) | | | — | |
| Net decrease in net assets from dividends and distributions to shareholders | | | (10,628,260 | ) | | | — | |
| | | | | | | | | |
| CAPITAL SHARE TRANSACTIONS: | | | | | | | | |
| Proceeds from shares sold | | | 8,640,723 | | | | 22,400,008 | |
| Reinvestment of distributions | | | 9,704,541 | | | | — | |
| Shares redeemed | | | (8,407,179 | ) | | | (19,769,132 | ) |
| Net increase/(decrease) in net assets resulting from capital share transactions | | | 9,938,085 | | | | 2,630,876 | |
| Total increase/(decrease) in net assets | | | 25,341,174 | | | | 37,379,632 | |
| | | | | | | | | |
| NET ASSETS: | | | | | | | | |
| Beginning of period | | | 262,480,377 | | | | 225,100,745 | |
| End of period | | $ | 287,821,551 | | | $ | 262,480,377 | |
| Undistributed/(accumulated) net investment income/(loss), end of period | | $ | (163,234 | ) | | $ | (236,950 | ) |
| | | | | | | | | |
| SHARE TRANSACTIONS: | | | | | | | | |
| Shares sold | | | 625,989 | | | | 1,796,443 | |
| Shares reinvested | | | 714,620 | | | | — | |
| Shares redeemed | | | (607,841 | ) | | | (1,617,798 | ) |
| Net increase/(decrease) in shares | | | 732,768 | | | | 178,645 | |
The accompanying notes are an integral part of the financial statements.
16
ADARA SMALLER COMPANIES FUND
Financial Highlights
| Contained below is per share operating performance data for shares outstanding, total investment return, ratios to average net assets and other supplemental data for the respective periods. This information has been derived from information provided in the financial statements. |
| | | For the
Six Months Ended February 28,
2018 (Unaudited) | | | For the
Year
Ended
August 31,
2017 | | | For the
Year
Ended
August 31,
2016 | | | For the
Period
October 21,
2014(1)
to August 31,
2015 | |
| Per Share Operating Performance | | | | | | | | | | | | |
| Net asset value, beginning of period | | $ | 12.94 | | | $ | 11.20 | | | $ | 10.59 | | | $ | 10.00 | |
| Net investment income/(loss)(2) | | | 0.00 | | | | (0.02 | ) | | | (0.03 | ) | | | (0.04 | ) |
| Net realized and unrealized gain/(loss) from investments | | | 1.29 | | | | 1.76 | | | | 0.64 | | | | 0.63 | |
| Net increase/(decrease) in net assets resulting from operations | | | 1.29 | | | | 1.74 | | | | 0.61 | | | | 0.59 | |
| Dividends and distributions to shareholders from: | | | | | | | | | | | | | | | | |
| Net realized capital gains | | | (0.53 | ) | | | — | | | | — | (3) | | | — | |
| Total dividends and distributions to shareholders | | | (0.53 | ) | | | — | | | | — | | | | — | |
| Net asset value, end of period | | $ | 13.70 | | | $ | 12.94 | | | $ | 11.20 | | | $ | 10.59 | |
| Total investment return(4) | | | 9.89 | %(5) | | | 15.54 | % | | | 5.76 | % | | | 5.90 | %(5) |
| | | | | | | | | | | | | | | | | |
| Ratios/Supplemental Data | | | | | | | | | | | | | | | | |
| Net assets, end of period (000’s omitted) | | $ | 287,822 | | | $ | 262,480 | | | $ | 225,101 | | | $ | 212,934 | |
| Ratio of expenses to average net assets | | | 0.90 | %(6) | | | 0.92 | % | | | 1.15 | % | | | 1.15 | %(6) |
| Ratio of net investment income/(loss) to average net assets | | | 0.05 | %(6) | | | (0.15 | )% | | | (0.26 | )% | | | (0.41 | )%(6) |
| Portfolio turnover rate | | | 39 | %(5) | | | 88 | % | | | 101 | % | | | 95 | %(5) |
| (1) | Commencement of operations. |
| (2) | Calculated based on average shares outstanding for the period. |
| (3) | Amount represents less than $0.005 per share. |
| (4) | Total investment return is calculated assuming a purchase of shares on the first day and a sale of shares on the last day of each period reported and includes reinvestments of dividends and distributions, if any. |
The accompanying notes are an integral part of the financial statements.
17
ADARA SMALLER COMPANIES FUND
NOTES TO FINANCIAL STATEMENTS
FEBRUARY 28, 2018 (UNAUDITED)
1. Organization and Significant Accounting Policies
The RBB Fund, Inc. (“RBB” or the “Company”) was incorporated under the laws of the State of Maryland on February 29, 1988 and is registered under the Investment Company Act of 1940, as amended (the “1940 Act”), as an open-end management investment company. RBB is a “series fund,” which is a mutual fund divided into separate portfolios. Each portfolio is treated as a separate entity for certain matters under the 1940 Act, and for other purposes, and a shareholder of one portfolio is not deemed to be a shareholder of any other portfolio. Currently, RBB has twenty-nine active investment portfolios, including the Adara Smaller Companies Fund (the “Fund”) (formerly the Altair Smaller Companies Fund), which commenced investment operations on October 21, 2014.
RBB has authorized capital of one hundred billion shares of common stock of which 87.023 billion shares are currently classified into one hundred and eighty-one classes of common stock. Each class represents an interest in an active or inactive RBB investment portfolio.
The Fund’s investment objective seeks capital appreciation.
The Fund is an investment company and follows accounting and reporting guidance in the Financial Accounting Standards Board (“FASB”) Accounting Standards Codification Topic 946 “Financial Services - Investment Companies”.
The end of the reporting period for the Fund is February 28, 2018, and the period covered by these Notes to Financial Statements is the six months ended February 28, 2018 (the “current fiscal period”).
PORTFOLIO VALUATION – The Fund’s net asset value (“NAV”) is calculated once daily at the close of regular trading hours on the New York Stock Exchange (“NYSE”) (generally 4:00 p.m. Eastern time) on each day the NYSE is open. Securities held by the Fund are valued using the closing price or the last sale price on a national securities exchange or the National Association of Securities Dealers Automatic Quotation System (“NASDAQ”) market system where they are primarily traded. Equity securities traded in the over-the-counter (“OTC”) market are valued at their closing prices. If there were no transactions on that day, securities traded principally on an exchange or on NASDAQ will be valued at the mean of the last bid and ask prices prior to the market close. Fixed income securities are valued using an independent pricing service, which considers such factors as security prices, yields, maturities and ratings, and are deemed representative of market values at the close of the market. Foreign securities are valued based on prices from the primary market in which they are traded, and are translated from the local currency into U.S. dollars using current exchange rates. Investments in other open-end investment companies, if any, are valued based on the NAV of those investment companies (which may use fair value pricing as disclosed in their prospectuses). If market quotations are unavailable or deemed unreliable, securities will be valued in accordance with procedures adopted by the Company’s Board of Directors (the “Board”). Relying on prices supplied by pricing services or dealers or using fair valuation may result in values that are higher or lower than the values used by other investment companies and investors to price the same investments.
FAIR VALUE MEASUREMENTS – The inputs and valuation techniques used to measure the fair value of the Fund’s investments are summarized into three levels as described in the hierarchy below:
| | ● Level 1 ��� | Prices are determined using quoted prices in active markets for identical securities. |
| | ● Level 2 — | Prices are determined using other significant observable inputs (including quoted prices for similar securities, interest rates, prepayment speeds, credit risk, etc.). |
| | ● Level 3 — | Prices are determined using significant unobservable inputs (including the Fund’s own assumptions in determining the fair value of investments). |
The inputs or methodologies used for valuing securities are not necessarily an indication of the risk associated with investing in those securities.
18
ADARA SMALLER COMPANIES FUND
NOTES TO FINANCIAL STATEMENTS (CONTINUED)
FEBRUARY 28, 2018 (UNAUDITED)
The following is a summary of the inputs used, as of the end of the reporting period, in valuing the Fund’s investments carried at fair value:
| | | Total | | | LEVEL 1 | | | LEVEL 2 | | | LEVEL 3 | |
| Common Stocks | | $ | 276,675,968 | | | $ | 276,675,968 | | | $ | — | | | $ | — | |
| Short-Term Investments | | | 12,149,669 | | | | 12,149,669 | | | | — | | | | — | |
| Total Investments* | | $ | 288,825,637 | | | $ | 288,825,637 | | | $ | — | | | $ | — | |
| * | Please refer to the Portfolio of Investments for further details. |
At the end of each quarter, management evaluates the classification of Levels 1, 2 and 3 assets and liabilities. Various factors are considered, such as changes in liquidity from the prior reporting period; whether or not a broker is willing to execute at the quoted price; the depth and consistency of prices from third party pricing services; and the existence of contemporaneous, observable trades in the market. Additionally, management evaluates the classification of Level 1 and Level 2 assets and liabilities on a quarterly basis for changes in listings or delistings on national exchanges.
Due to the inherent uncertainty of determining the fair value of investments that do not have a readily available market value, the fair value of the Fund’s investments may fluctuate from period to period. Additionally, the fair value of investments may differ significantly from the values that would have been used had a ready market existed for such investments and may differ materially from the values the Fund may ultimately realize. Further, such investments may be subject to legal and other restrictions on resale or otherwise less liquid than publicly traded securities.
For fair valuations using significant unobservable inputs, U.S. generally accepted accounting principles (“U.S. GAAP”) requires the Fund to present a reconciliation of the beginning to ending balances for reported market values that presents changes attributable to total realized and unrealized gains or losses, purchase and sales, and transfers in and out of Level 3 during the period. Transfers in and out between levels are based on values at the end of the period. U.S. GAAP also requires the Fund to disclose amounts and reasons for all transfers in and out of Level 1 and Level 2 fair value measurements. A reconciliation of Level 3 investments is presented only when the Fund had an amount of Level 3 investments at the end of the reporting period that was meaningful in relation to its net assets. The amounts and reasons for all transfers in and out of each level within the three-tier hierarchy are disclosed when the Fund had an amount of total transfers during the reporting period that was meaningful in relation to its net assets as of the end of the reporting period.
During the current fiscal period, the Fund had no transfers between Levels 1, 2 and 3.
USE OF ESTIMATES — The preparation of financial statements in conformity with U.S. GAAP requires management to make estimates and assumptions that affect the reported amounts of assets and liabilities and disclosure of contingent assets and liabilities at the date of the financial statements and the reported amounts of revenues and expenses during the reporting period. Actual results could differ from those estimates and those differences could be significant.
INVESTMENT TRANSACTIONS, INVESTMENT INCOME AND EXPENSES — The Fund records security transactions based on trade date for financial reporting purposes. The cost of investments sold is determined by use of the specific identification method for both financial reporting and income tax purposes in determining realized gains and losses on investments. Interest income is accrued when earned. Dividend income is recorded on the ex-dividend date. Distributions received on securities that represent a return of capital or capital gain are recorded as a reduction of cost of investments and/or as a realized gain. The Fund’s investment income, expenses (other than class specific expenses) and unrealized and realized gains and losses are allocated daily to each class of shares based upon the relative proportion of net assets of each class at the beginning of the day. Expenses incurred on behalf of a specific class, fund or fund family of the Company are charged directly to the class, fund or fund family (in proportion to net assets). Expenses incurred for all of the RBB funds (such as director or professional fees) are charged to all funds in
19
ADARA SMALLER COMPANIES FUND
NOTES TO FINANCIAL STATEMENTS (CONTINUED)
FEBRUARY 28, 2018 (UNAUDITED)
proportion to their average net assets of RBB, or in such other manner as the Board deems fair or equitable. Expenses and fees, including investment advisory and administration fees, are accrued daily and taken into account for the purpose of determining the NAV of the Fund.
DIVIDENDS AND DISTRIBUTIONS TO SHAREHOLDERS — Dividends from net investment income and distributions from net realized capital gains (including net short-term capital gains), if any, are declared and paid at least annually to shareholders recorded on the ex-dividend date. Income dividends and capital gain distributions are determined in accordance with U.S. federal income tax regulations, which may differ from U.S. GAAP.
U.S. TAX STATUS — No provision is made for U.S. income taxes as it is the Fund’s intention to continue to qualify for and elect the tax treatment applicable to regulated investment companies under Subchapter M of the Internal Revenue Code of 1986, as amended, and make the requisite distributions to its shareholders which will be sufficient to relieve it from U.S. income and excise taxes.
CASH AND CASH EQUIVALENTS — Cash and cash equivalents are valued at cost plus accrued interest, which approximates market value.
OTHER — In the normal course of business, the Fund may enter into contracts that provide general indemnifications. The Fund’s maximum exposure under these arrangements is dependent on claims that may be made against the Fund in the future, and, therefore, cannot be estimated; however, based on experience, the risk of material loss from such claims is considered remote.
2. Investment Adviser and Other Services
Altair Advisers, LLC (“Altair” or the “Adviser”) serves as the investment adviser to the Fund. Aperio Group, LLC, Driehaus Capital Management, LLC, Granite Investment Partners, LLC, Pacific Ridge Capital Partners, LLC, Pier Capital, LLC and River Road Asset Management, LLC each serve as an investment sub-adviser (“Sub-Adviser”) to the Fund.
The Fund is managed by the Adviser and one or more Sub-Advisers unaffiliated with the Adviser. The Adviser also has the ultimate responsibility to oversee the Sub-Advisers, and to recommend their hiring, termination and replacement, subject to approval by the Board. The Adviser has an investment team that is jointly responsible for the day-to-day management of the Fund. The Sub-Advisers provide investment advisory services to the portion of the Fund’s portfolio allocated to them by the Adviser. The Adviser and the Fund have entered into sub-advisory agreements with the Sub-Advisers to manage the Fund, subject to supervision of the Adviser and the Board, and in accordance with the investment objective and restrictions of the Fund. The Fund compensates the Sub-Advisers for their services at an annual rate based on the Fund’s average daily net assets, (the “Sub-Advisory Fee”), not to exceed 1.00%, payable on a monthly basis in arrears.
During the current fiscal period, collectively, sub-advisory fees accrued were $1,061,893, or the rate of 0.75%.
The Fund is currently only available to clients of the Adviser and to other investors at the Fund’s discretion. The Adviser does not receive a separate management fee from the Fund. However, pursuant to the Fund’s investment advisory agreement with the Adviser, the Adviser is entitled to receive reimbursement for out-of-pocket expenses it incurs in connection with its compliance monitoring of Fund trading, up to 0.01% of the Fund’s average daily net assets.
U.S. Bancorp Fund Services, LLC (“USBFS”) serves as administrator for the Fund. For providing administrative and accounting services, USBFS is entitled to receive a monthly fee, subject to certain minimum and out of pocket expenses.
USBFS serves as the Fund’s transfer and dividend disbursing agent. For providing transfer agent services, USBFS is entitled to receive a monthly fee, subject to certain minimum and out of pocket expenses.
20
ADARA SMALLER COMPANIES FUND
NOTES TO FINANCIAL STATEMENTS (CONTINUED)
FEBRUARY 28, 2018 (UNAUDITED)
U.S. Bank, N.A. (the “Custodian”) provides certain custodial services to the Fund. The Custodian is entitled to receive a monthly fee, subject to certain minimum and out of pocket expenses.
Quasar Distributors, LLC serves as the principal underwriter and distributor of the Fund’s shares pursuant to a Distribution Agreement with RBB.
For compensation amounts payable to USBFS, please refer to the Statement of Operations.
3. Directors and Officers Compensation
The Directors of the Company receive an annual retainer and meeting fees for meetings attended. Employees of Vigilant Compliance, LLC serve as President, Chief Compliance Officer and Assistant Treasurer of the Company. Vigilant Compliance, LLC is compensated for the services provided to the Company. An employee of RBB serves as Treasurer and Secretary, and is compensated for services provided. Certain employees of USBFS serve as officers of the Company. They are not compensated by the Fund or the Company. For Directors and Officers compensation amounts, please refer to the Statement of Operations.
4. Purchases and Sales of Investment Securities
During the current fiscal period, aggregate purchases and sales of investment securities (excluding short-term investments) of the Fund were as follows:
| PURCHASES | SALES |
| $118,441,114 | $103,572,356 |
There were no purchases or sales of long-term U.S. Government securities during the current fiscal period.
5. Federal Income Tax Information
The Fund has followed the authoritative guidance on accounting for and disclosure of uncertainty in tax positions, which requires the Fund to determine whether a tax position is more likely than not to be sustained upon examination, including resolution of any related appeals or litigation processes, based on the technical merits of the position. The Fund has determined that there was no effect on the financial statements from following this authoritative guidance. In the normal course of business, the Fund is subject to examination by federal, state and local jurisdictions, where applicable, for tax years for which applicable statutes of limitations have not expired. The Fund is not aware of any tax positions for which it is reasonably possible that the total amounts of the unrecognized tax benefits will significantly change in the next twelve months.
As of August 31, 2017, the federal tax cost and aggregate gross unrealized appreciation and depreciation of investments held by the Fund were as follows:
FEDERAL
TAX COST | UNREALIZED
APPRECIATION | UNREALIZED
(DEPRECIATION) | Net Unrealized
Appreciation/
(Depreciation) |
| $206,693,037 | $59,032,708 | $(7,207,519) | $51,825,189 |
Distributions to shareholders, if any, from net investment income and realized gains are determined in accordance with federal income tax regulations, which may differ from net investment income and realized gains recognized for financial reporting purposes. Accordingly, the character of distributions and composition of net assets for tax purposes may differ from those reflected in the accompanying financial statements. To the extent these differences are permanent, such amounts are reclassified within the capital accounts based on the tax treatment; temporary differences do not require such reclassification.
21
ADARA SMALLER COMPANIES FUND
NOTES TO FINANCIAL STATEMENTS (CONCLUDED)
FEBRUARY 28, 2018 (UNAUDITED)
The following permanent differences as of August 31, 2017, primarily attributable to disallowed expenses and current year write-off of net operating loss, were reclassified among the following accounts:
UNDISTRIBUTED
NET INVESTMENT
INCOME/(LOSS) | ACCUMULATED
NET REALIZED
GAIN/(LOSS) | PAID-IN
CAPITAL |
| $502,502 | $(178,859) | $(323,643) |
As of August 31, 2017, the components of distributable earnings on a tax basis were as follows:
UNDISTRIBUTED
ORDINARY
INCOME | UNDISTRIBUTED
LONG-TERM
CAPITAL GAINS | CAPITAL LOSS
CARRYFORWARDS | NET UNREALIZED
APPRECIATION/
(DEPRECIATION) | QUALIFIED
LATE-YEAR
LOSSES |
| $— | $4,820,068 | $— | $51,825,189 | $(230,267) |
The differences between the book and tax basis components of distributable earnings relate primarily to the timing of recognition of income and gains for federal income tax purposes. Short-term and foreign currency gains are reported as ordinary income for federal income tax purposes.
The tax character of dividends and distributions paid during the fiscal year ended August 31, 2017, were as follows:
ORDINARY
INCOME | LONG-TERM
GAINS | TOTAL |
| $— | $— | $— |
Pursuant to federal income tax rules applicable to regulated investment companies, the Fund may elect to treat certain capital losses between November 1 and August 31 and late year ordinary losses ((i) ordinary losses between January 1 and August 31, and (ii) specified ordinary and currency losses between November 1 and August 31) as occurring on the first day of the following tax year. For the year ended August 31, 2017, any amount of losses elected within the tax return will not be recognized for federal income tax purposes until September 1, 2017.
For the fiscal year ended August 31, 2017, the Fund deferred to September 1, 2017, the following losses:
LATE-YEAR
ORDINARY
LOSS DEFERRAL | SHORT-TERM
CAPITAL
LOSS DEFERRAL | LONG-TERM
CAPITAL
LOSS DEFERRAL |
| $(230,267) | $— | $— |
Under the Regulated Investment Company Modernization Act of 2010, the Fund is permitted to carry forward capital losses incurred in taxable years beginning after December 22, 2010 for an unlimited period. Additionally, capital losses that are carried forward will retain their character as either short-term or long-term capital losses rather than being considered all short-term as under the previous law. During the fiscal year ended August 31, 2017, the Fund had utilized $2,109,700 of capital loss carryforwards. As of August 31, 2017, the Fund had no capital loss carryforwards.
6. Subsequent Events
Management has evaluated the impact of all subsequent events on the Fund through the date the financial statements were issued and has determined that there were no significant events requiring recognition or disclosure in the financial statements.
22
ADARA SMALLER COMPANIES FUND
Other Information (Unaudited)
Proxy Voting
Policies and procedures that the Fund uses to determine how to vote proxies relating to portfolio securities as well as information regarding how the Fund voted proxies relating to portfolio securities for the most recent twelve-month period ended June 30 are available without charge, upon request, by calling (844) 261-6482 and on the Securities and Exchange Commission’s (“SEC”) website at http://www.sec.gov.
Quarterly Portfolio Schedules
The Company files a complete schedule of portfolio holdings with the SEC for the first and third fiscal quarters of each fiscal year (quarters ended November 30 and May 31) on Form N-Q. The Company’s Form N-Q is available on the SEC website at http://www.sec.gov and may be reviewed and copied at the SEC Public Reference Room in Washington, D.C. Information on the operation of the SEC Public Reference Room may be obtained by calling (800) SEC-0330.
23
[THIS PAGE INTENTIONALLY LEFT BLANK]
Investment Adviser
Altair Advisers, LLC
303 West Madison Street, Suite 600
Chicago, IL 60606
Administrator and Transfer Agent
U.S. Bancorp Fund Services, LLC
P.O. Box 701
Milwaukee, WI 53201
Principal Underwriter
Quasar Distributors, LLC
777 East Wisconsin Avenue, Floor 6
Milwaukee, WI 53202
Custodian
U.S. Bank, N.A.
1555 North Rivercenter Drive, Suite 302
Milwaukee, WI 53212
Independent Registered Public Accounting Firm
PricewaterhouseCoopers LLP
Two Commerce Square
2001 Market Street, Suite 1800
Philadelphia, PA 19103
Legal Counsel
Drinker Biddle & Reath LLP
One Logan Square, Suite 2000
Philadelphia, PA 19103-6996
ALT-SAR18
Bogle Investment
Management
Small Cap
Growth Fund
of THE RBB FUND, INC.
Semi-Annual Report
February 28, 2018
(Unaudited)
This report is submitted for the general information of the shareholders of the Fund. It is not authorized for distribution unless preceded or accompanied by a current prospectus for the Fund.
Bogle Investment Management
Small Cap Growth Fund
Performance Data
February 28, 2018 (Unaudited)
Average Annual Total Returns for the Periods Ended February 28, 2018(1) |
| | Six
Months(2) | One
Year | Five
Year | Ten
Year | Since
Inception(3) |
Institutional Class Shares | 7.81% | 12.70% | 12.54% | 9.92% | 11.43% |
Russell 2000® Index | 8.30% | 10.51% | 12.19% | 9.75% | 8.54% |
(1) | Bogle Investment Management, L.P. (the “Adviser” or “Bogle”) waived a portion of its advisory fee and agreed to reimburse a portion of the Bogle Investment Management Small Cap Growth Fund’s (the “Fund”) operating expenses, if necessary, to maintain the expense limitation as set forth in the notes to the financial statements. Total returns shown include fee waivers and expense reimbursements, if any; total returns would have been lower had there been no waivers and reimbursements of fees and expenses in excess of expense limitations. Returns shown include the reinvestment of all dividends and other distributions. Past performance is not predictive of future performance. |
(3) | For the period October 1, 1999 (commencement of operations) through February 28, 2018. |
The performance data quoted represents past performance and does not guarantee future results. Current performance may be lower or higher. Performance data current to the most recent month-end may be obtained at 1-877-264-5346. The investment return and principal value of an investment will fluctuate so that shares, when redeemed, may be worth more or less than their original cost. The performance quoted reflects fee waivers in effect and would have been less in their absence. The total annual Fund operating expense ratio, as stated in the current prospectus dated December 31, 2017, is 1.35% prior to fee waivers.
1
Bogle Investment Management
Small Cap Growth Fund
Fund Expense Examples
February 28, 2018 (Unaudited)
As a shareholder of the Fund, you incur two types of costs: (1) transaction costs and (2) ongoing costs, including management fees and other Fund expenses. This example is intended to help you understand your ongoing costs (in dollars) of investing in the Fund and to compare these costs with the ongoing costs of investing in other mutual funds.
This example is based on an investment of $1,000 invested at the beginning of the six-month period from September 1, 2017 through February 28, 2018, and held for the entire period.
Actual Expenses
The first line of the accompanying table provides information about actual account values and actual expenses. You may use the information in this line, together with the amount you invested, to estimate the expenses that you paid over the period. Simply divide your account value by $1,000 (for example, an $8,600 account value divided by $1,000 = 8.6), then multiply the result by the number in the first line under the heading entitled “Expenses Paid During Period” to estimate the expenses you paid on your account during this period.
Hypothetical Example for Comparison Purposes
The second line of the accompanying table provides information about hypothetical account values and hypothetical expenses based on the Fund’s actual expense ratio and an assumed rate of return of 5% per year before expenses, which is not the Fund’s actual return. The hypothetical account values and expenses may not be used to estimate the actual ending account balance or expenses you paid for the period. You may use this information to compare the ongoing costs of investing in the Fund and other funds. To do so, compare these 5% hypothetical examples with the 5% hypothetical examples that appear in the shareholder reports of other funds.
Please note that the expenses shown in the accompanying table are meant to highlight your ongoing costs only and do not reflect any transactional costs, such as redemption fees. Therefore, the second line of the accompanying table is useful in comparing ongoing costs only and will not help you determine the relative total costs of owning different funds. In addition, if these transactional costs were included, your costs would have been higher.
| | Beginning
Account Value
September 1, 2017 | Ending
Account Value
February 28, 2018 | Expenses Paid
During Period* |
Actual | $1,000.00 | $1,078.10 | $6.44 |
Hypothetical (5% return before expenses) | 1,000.00 | 1,018.60 | 6.26 |
* | Expenses are equal to the Fund’s annualized six-month expense ratio of 1.25%, which includes waived fees or reimbursed expenses, multiplied by the average account value over the period, multiplied by the number of days (181) in the most recent fiscal half-year, then divided by 365 to reflect the one-half year period. The Fund’s ending account value on the first line in the table is based on the actual six-month total investment return of 7.81%. |
2
Bogle Investment Management
Small Cap Growth Fund
Portfolio Holdings Summary Table
February 28, 2018 (Unaudited)
The following table presents a summary by security type of the portfolio holdings of the Fund:
| | | % of Net
Assets | | | Value | |
| Common Stocks: | | | | | | |
| Finance | | | 28.0 | % | | $ | 29,824,382 | |
| Health Technology | | | 14.0 | | | | 14,868,769 | |
| Technology Services | | | 12.1 | | | | 12,925,083 | |
| Electronic Technology | | | 8.8 | | | | 9,402,437 | |
| Producer Manufacturing | | | 6.2 | | | | 6,598,723 | |
| Non-Energy Minerals | | | 4.7 | | | | 4,966,957 | |
| Consumer Services | | | 4.5 | | | | 4,817,486 | |
| Commercial Services | | | 4.4 | | | | 4,665,991 | |
| Consumer Non-Durables | | | 3.8 | | | | 4,045,457 | |
| Process Industries | | | 3.2 | | | | 3,415,577 | |
| Utilities | | | 2.1 | | | | 2,241,146 | |
| Transportation | | | 1.9 | | | | 1,980,409 | |
| Energy Minerals | | | 1.4 | | | | 1,530,886 | |
| Distribution Services | | | 1.0 | | | | 1,066,160 | |
| Industrial Services | | | 1.0 | | | | 1,016,904 | |
| Consumer Durables | | | 0.9 | | | | 962,025 | |
| Communications | | | 0.4 | | | | 466,628 | |
| Health Services | | | 0.2 | | | | 196,090 | |
| Short-Term Investments | | | 1.8 | | | | 1,963,094 | |
| Liabilities In Excess Of Other Assets | | | (0.4 | ) | | | (475,486 | ) |
| Net Assets | | | 100.0 | % | | $ | 106,478,718 | |
Portfolio holdings are subject to change at any time.
The accompanying notes are an integral part of the financial statements.
3
Bogle Investment Management
Small Cap Growth Fund
Portfolio of Investments
February 28, 2018 (Unaudited)
| | | Number
of Shares | | | Value | |
| Common Stocks—98.6% | | | | | | |
| Commercial Services—4.4% | | | |
| Booz Allen Hamilton Holding Corp. | | | 21,985 | | | $ | 833,891 | |
| Etsy, Inc.* | | | 55,642 | | | | 1,408,299 | |
| Groupon, Inc.* | | | 220,057 | | | | 941,844 | |
| Insperity, Inc. | | | 7,288 | | | | 475,906 | |
| ManpowerGroup, Inc. | | | 6,321 | | | | 748,786 | |
| Medpace Holdings, Inc.* | | | 8,027 | | | | 257,265 | |
| | | | | | | | 4,665,991 | |
| Communications—0.4% | | | | | | | | |
| TIM Participacoes SA, ADR | | | 21,928 | | | | 466,628 | |
| | | | | | | | | |
| Consumer Durables—0.9% | | | | | | | | |
| GoPro, Inc., Class A* | | | 178,815 | | | | 962,025 | |
| | | | | | | | | |
| Consumer Non-Durables—3.8% | | | | | | | | |
| Crocs, Inc.* | | | 86,817 | | | | 1,062,640 | |
| Deckers Outdoor Corp.* | | | 11,723 | | | | 1,108,761 | |
| Skechers U.S.A., Inc., Class A* | | | 24,389 | | | | 997,998 | |
| Wolverine World Wide, Inc. | | | 29,920 | | | | 876,058 | |
| | | | | | | | 4,045,457 | |
| Consumer Services—4.5% | | | | | | | | |
| Care.com, Inc.* | | | 46 | | | | 822 | |
| Everi Holdings, Inc.* | | | 8,745 | | | | 65,150 | |
| Gravity Co., Ltd., SP ADR* | | | 3,908 | | | | 339,488 | |
| International Game Technology PLC | | | 26,062 | | | | 690,643 | |
| Liberty Expedia Holdings, Inc., Class A* | | | 22,877 | | | | 898,151 | |
| Liberty TripAdvisor Holdings, Inc., Class A* | | | 32,184 | | | | 334,714 | |
| Madison Square Garden Co., (The), Class A* | | | 3,902 | | | | 952,868 | |
| Weight Watchers International, Inc.* | | | 22,710 | | | | 1,535,650 | |
| | | | | | | | 4,817,486 | |
| Distribution Services—1.0% | | | | | | | | |
| HD Supply Holdings, Inc.* | | | 23,800 | | | | 862,750 | |
| Rush Enterprises, Inc., Class A* | | | 4,785 | | | | 203,410 | |
| | | | | | | | 1,066,160 | |
| Electronic Technology—8.8% | | | | | | | | |
| Aerovironment, Inc.* | | | 18,536 | | | | 921,610 | |
| Axcelis Technologies, Inc.* | | | 8,517 | | | | 208,241 | |
| Control4 Corp.* | | | 121 | | | | 2,909 | |
| Electro Scientific Industries, Inc.* | | | 10,823 | | | | 194,056 | |
| Entegris, Inc. | | | 31,854 | | | | 1,057,553 | |
| Esterline Technologies Corp.* | | | 13,206 | | | | 975,923 | |
| F5 Networks, Inc.* | | | 5,000 | | | | 742,600 | |
| FLIR Systems, Inc. | | | 15,841 | | | | 777,793 | |
| Fortinet, Inc.* | | | 14,020 | | | | 707,589 | |
| Hexcel Corp. | | | 11,692 | | | | 786,638 | |
| ManTech International Corp., Class A | | | 15,631 | | | | 881,119 | |
| Pure Storage, Inc., Class A* | | | 44,301 | | | | 960,003 | |
| SMART Global Holdings, Inc.* | | | 13,686 | | | | 475,178 | |
| Trimble, Inc.* | | | 18,751 | | | | 711,225 | |
| | | | | | | | 9,402,437 | |
| ENERGY MINERALS—1.4% | | | | | | | | |
| SunCoke Energy, Inc.* | | | 96,107 | | | | 1,026,423 | |
| W&T Offshore, Inc.* | | | 129,682 | | | | 504,463 | |
| | | | | | | | 1,530,886 | |
| FINANCE—28.0% | | | | | | | | |
| Associated Banc-Corp | | | 35,823 | | | | 884,828 | |
| BankUnited, Inc. | | | 21,934 | | | | 882,185 | |
| BGC Partners, Inc., Class A | | | 70,866 | | | | 936,849 | |
| BOK Financial Corp. | | | 7,998 | | | | 755,411 | |
| Brown & Brown, Inc. | | | 13,927 | | | | 733,117 | |
| CAI International, Inc.* | | | 1,214 | | | | 24,523 | |
| Commerce Bancshares Inc/MO | | | 14,607 | | | | 843,846 | |
| East West Bancorp, Inc. | | | 11,293 | | | | 740,256 | |
| Evercore, Inc., Class A | | | 12,980 | | | | 1,207,789 | |
| Federated Investors, Inc., Class B | | | 2,192 | | | | 71,415 | |
| First BanCorp Puerto Rico* | | | 152,284 | | | | 918,273 | |
| First Horizon National Corp. | | | 39,684 | | | | 755,980 | |
| First Interstate BancSystem, Inc., Class A | | | 21,267 | | | | 840,047 | |
| GAIN Capital Holdings, Inc. | | | 63,193 | | | | 448,038 | |
| Hamilton Lane, Inc., Class A | | | 16,476 | | | | 575,671 | |
| Hancock Holding Co. | | | 17,480 | | | | 903,716 | |
| Hilltop Holdings, Inc. | | | 33,872 | | | | 823,428 | |
| Houlihan Lokey, Inc., Class A | | | 20,997 | | | | 974,681 | |
| Interactive Brokers Group, Inc., Class A | | | 24,307 | | | | 1,686,906 | |
| INTL FCStone, Inc.* | | | 24,675 | | | | 978,364 | |
| Investment Technology Group, Inc. | | | 55,958 | | | | 1,109,088 | |
| Jupai Holdings Ltd., ADR | | | 33,339 | | | | 636,108 | |
| Legg Mason, Inc. | | | 26,000 | | | | 1,037,660 | |
| LPL Financial Holdings, Inc. | | | 26,444 | | | | 1,699,556 | |
| McGrath RentCorp | | | 15,214 | | | | 770,133 | |
| MGIC Investment Corp.* | | | 79,247 | | | | 1,092,816 | |
| OM Asset Management PLC | | | 64,525 | | | | 989,168 | |
| PHH Corp.* | | | 16,516 | | | | 174,739 | |
| Piper Jaffray Companies | | | 13,015 | | | | 1,086,753 | |
| PJT Partners, Inc., Class A | | | 17,638 | | | | 843,273 | |
The accompanying notes are an integral part of the financial statements.
4
Bogle Investment Management
Small Cap Growth Fund
Portfolio of Investments (Continued)
February 28, 2018 (Unaudited)
| | | Number
of Shares | | | Value | |
| FINANCE—(continued) | | | | | | |
| Stifel Financial Corp. | | | 14,980 | | | $ | 956,773 | |
| Synovus Financial Corp. | | | 16,863 | | | | 831,346 | |
| Texas Capital Bancshares, Inc.* | | | 9,500 | | | | 856,900 | |
| UMB Financial Corp. | | | 12,100 | | | | 883,300 | |
| United Community Banks, Inc. | | | 28,193 | | | | 871,446 | |
| | | | | | | | 29,824,382 | |
| HEALTH SERVICES—0.2% | | | | | | | | |
| China Cord Blood Corp.* | | | 18,693 | | | | 196,090 | |
| | | | | | | | | |
| HEALTH TECHNOLOGY—14.0% | | | | | | | | |
| Adverum Biotechnologies, Inc.* | | | 20,818 | | | | 144,165 | |
| AnaptysBio, Inc.* | | | 7,210 | | | | 885,100 | |
| Bruker Corp. | | | 17,839 | | | | 546,765 | |
| Catalyst Pharmaceuticals, Inc.* | | | 14,274 | | | | 45,534 | |
| China Biologic Products Holdings, Inc.* | | | 7,977 | | | | 644,861 | |
| Concert Pharmaceuticals, Inc.* | | | 29,611 | | | | 647,889 | |
| CytomX Therapeutics, Inc.* | | | 4,398 | | | | 130,665 | |
| Emergent BioSolutions, Inc.* | | | 13,894 | | | | 690,532 | |
| Exelixis, Inc.* | | | 48,080 | | | | 1,240,464 | |
| Five Prime Therapeutics, Inc.* | | | 35,378 | | | | 752,136 | |
| Foundation Medicine, Inc.* | | | 1,095 | | | | 90,611 | |
| Genomic Health, Inc.* | | | 29,953 | | | | 958,496 | |
| Haemonetics Corp.* | | | 13,611 | | | | 965,020 | |
| Halozyme Therapeutics, Inc.* | | | 31,724 | | | | 623,694 | |
| Hill-Rom Holdings, Inc. | | | 8,715 | | | | 729,097 | |
| Lantheus Holdings, Inc.* | | | 7,664 | | | | 117,259 | |
| Madrigal Pharmaceuticals, Inc.* | | | 7,227 | | | | 910,891 | |
| Mirati Therapeutics, Inc.* | | | 2,381 | | | | 64,644 | |
| Myriad Genetics, Inc.* | | | 27,002 | | | | 875,405 | |
| NewLink Genetics Corp.* | | | 22,374 | | | | 160,645 | |
| Ophthotech Corp.* | | | 27,811 | | | | 75,368 | |
| Pieris Pharmaceuticals, Inc.* | | | 16,612 | | | | 141,534 | |
| PTC Therapeutics, Inc.* | | | 10,423 | | | | 268,392 | |
| Retrophin, Inc.* | | | 46,754 | | | | 1,169,785 | |
| Sangamo Therapeutics, Inc.* | | | 30,790 | | | | 737,420 | |
| uniQure NV* | | | 43,343 | | | | 1,101,779 | |
| Versartis, Inc.* | | | 28,143 | | | | 45,029 | |
| XOMA Corp.* | | | 3,934 | | | | 105,589 | |
| | | | | | | | 14,868,769 | |
| INDUSTRIAL SERVICES—1.0% | | | | | | | | |
| Casella Waste Systems, Inc., Class A* | | | 1,825 | | | | 46,391 | |
| Goldfield Corp., (The)* | | | 341 | | | | 1,603 | |
| ION Geophysical Corp.* | | | 822 | | | | 23,098 | |
| Tetra Tech, Inc. | | | 19,322 | | | | 945,812 | |
| | | | | | | | 1,016,904 | |
| Non-Energy Minerals—4.7% | | | | | | | | |
| Alcoa Corp.* | | | 20,018 | | | | 900,209 | |
| Boise Cascade Co. | | | 18,921 | | | | 762,516 | |
| Constellium NV, Class A* | | | 43,767 | | | | 507,697 | |
| Gerdau SA, SP ADR | | | 212,426 | | | | 1,062,130 | |
| Louisiana-Pacific Corp. | | | 39,025 | | | | 1,112,212 | |
| United States Steel Corp. | | | 14,300 | | | | 622,193 | |
| | | | | | | | 4,966,957 | |
| Process Industries—3.2% | | | | | | | | |
| Braskem SA, SP ADR | | | 4,139 | | | | 117,879 | |
| Cabot Microelectronics Corp. | | | 5,089 | | | | 518,569 | |
| Cosan Ltd., Class A | | | 31,117 | | | | 349,133 | |
| Daqo New Energy Corp., ADR* | | | 14,785 | | | | 726,535 | |
| Fibria Celulose SA, SP ADR | | | 40,659 | | | | 764,389 | |
| Ingevity Corp.* | | | 12,536 | | | | 939,072 | |
| | | | | | | | 3,415,577 | |
| Producer Manufacturing—6.2% | | | | | | | | |
| Alamo Group, Inc. | | | 1,634 | | | | 181,619 | |
| Commercial Metals Co. | | | 35,209 | | | | 855,579 | |
| Continental Building Products, Inc.* | | | 2,842 | | | | 77,302 | |
| Crane Co. | | | 2,000 | | | | 184,620 | |
| Delphi Technologies PLC | | | 15,904 | | | | 759,416 | |
| Harsco Corp.* | | | 52,764 | | | | 1,068,471 | |
| Herman Miller, Inc. | | | 9,795 | | | | 351,641 | |
| ITT, Inc. | | | 16,424 | | | | 824,156 | |
| Masonite International Corp.* | | | 211 | | | | 12,882 | |
| Milacron Holdings Corp.* | | | 6,601 | | | | 141,459 | |
| Modine Manufacturing Co.* | | | 600 | | | | 13,800 | |
| Mueller Water Products, Inc., Class A | | | 1,500 | | | | 16,500 | |
| NCI Building Systems, Inc.* | | | 31,299 | | | | 510,174 | |
| SPX FLOW, Inc.* | | | 20,024 | | | | 976,370 | |
| TriMas Corp.* | | | 24,121 | | | | 624,734 | |
| | | | | | | | 6,598,723 | |
| Technology Services—12.1% | | | | | | | | |
| AppFolio, Inc., Class A* | | | 22,544 | | | | 904,014 | |
| Apptio, Inc., Class A* | | | 37,259 | | | | 1,076,785 | |
| Bottomline Technologies de, Inc.* | | | 5,678 | | | | 215,650 | |
| Box, Inc., Class A* | | | 41,939 | | | | 1,009,052 | |
| FireEye, Inc.* | | | 2,345 | | | | 38,904 | |
| MicroStrategy, Inc., Class A* | | | 7,174 | | | | 918,129 | |
| Mimecast Ltd.* | | | 3,060 | | | | 106,304 | |
| MINDBODY, Inc., Class A* | | | 12,246 | | | | 436,570 | |
| New Relic, Inc.* | | | 15,367 | | | | 1,103,043 | |
| Qualys, Inc.* | | | 14,702 | | | | 1,088,683 | |
The accompanying notes are an integral part of the financial statements.
5
Bogle Investment Management
Small Cap Growth Fund
Portfolio of Investments (Concluded)
February 28, 2018 (Unaudited)
| | | Number
of Shares | | | Value | |
| Technology Services—(continued) |
| RingCentral, Inc., Class A* | | | 12,790 | | | $ | 801,294 | |
| Rubicon Project, Inc., (The)* | | | 27,334 | | | | 44,008 | |
| Shutterfly, Inc.* | | | 9,818 | | | | 753,335 | |
| TriNet Group, Inc.* | | | 892 | | | | 42,076 | |
| Varonis Systems, Inc.* | | | 23,072 | | | | 1,295,493 | |
| Veeva Systems, Inc., Class A* | | | 12,932 | | | | 901,360 | |
| Web.com Group, Inc.* | | | 36,472 | | | | 656,496 | |
| Workiva, Inc., Class A* | | | 12,059 | | | | 274,342 | |
| YY, Inc., ADR* | | | 9,739 | | | | 1,259,545 | |
| | | | | | | | 12,925,083 | |
| Transportation—1.9% | | | | | | | | |
| ArcBest Corp. | | | 22,425 | | | | 742,268 | |
| Hub Group, Inc., Class A* | | | 20,501 | | | | 894,869 | |
| YRC Worldwide, Inc.* | | | 39,366 | | | | 343,272 | |
| | | | | | | | 1,980,409 | |
| Utilities—2.1% | | | | | | | | |
| Atlantica Yield PLC | | | 27,807 | | | | 545,851 | |
| Cia de Saneamento Basico do Estado de Sao Paulo, ADR | | | 62,864 | | | | 724,193 | |
| Pampa Energia SA, SP ADR* | | | 15,334 | | | | 971,102 | |
| | | | | | | | 2,241,146 | |
| Total Common Stocks | | | | | | | | |
| (Cost $97,260,615) | | | | | | | 104,991,110 | |
| Short-Term Investments—1.8% | | | | | | | | |
Fidelity Investments Money Market Funds - Government Portfolio, 1.26%(a) | | | | | | | 1,963,094 | |
| TOTAL SHORT-TERM INVESTMENTS | | | | | | | | |
| (Cost $1,963,094) | | | | | | | 1,963,094 | |
| Total Investments—100.4% | | | | | | | | |
| (Cost $99,223,709) | | | | | | | 106,954,204 | |
| Liabilities In Excess Of Other Assets—(0.4)% | | | | | | | (475,486 | ) |
| Net Assets—100.0% | | | | | | $ | 106,478,718 | |
* | Non-income producing security. |
(a) | Seven-day yield as of February 28, 2018. |
ADR — American Depositary Receipt.
PLC — Public Limited Company.
SP ADR — Sponsored American Depositary Receipt.
The accompanying notes are an integral part of the financial statements.
6
Bogle Investment Management
Small Cap Growth Fund
Statement Of Assets And Liabilities
February 28, 2018 (Unaudited)
| Assets | | | |
| Investments, at value (cost $97,260,615) | | $ | 104,991,110 | |
| Short-term investments, at value (cost $1,963,094) | | | 1,963,094 | |
| Receivables for: | | | | |
| Investments sold | | | 6,240,882 | |
| Dividends | | | 82,421 | |
| Prepaid expenses and other assets | | | 23,416 | |
| Total assets | | | 113,300,923 | |
| | | | | |
| Liabilities | | | | |
| Payables for: | | | | |
| Investments purchased | | | 6,644,591 | |
| Investment advisory fees | | | 77,223 | |
| Capital shares redeemed | | | 33,404 | |
| Other accrued expenses and liabilities | | | 66,987 | |
| Total liabilities | | | 6,822,205 | |
| Net assets | | $ | 106,478,718 | |
| | | | | |
| Net Assets Consist of: | | | | |
| Par value | | $ | 3,423 | |
| Paid-in capital | | | 93,116,326 | |
| Undistributed/(accumulated) net investment income/(loss) | | | (380,575 | ) |
| Accumulated net realized gain/(loss) from investments | | | 6,009,049 | |
| Net unrealized appreciation/(depreciation) on investments | | | 7,730,495 | |
| Net assets | | $ | 106,478,718 | |
| | | | | |
| Shares outstanding ($0.001 par value, 100,000,000 shares authorized) | | | 3,422,846 | |
| Net asset value, offering and redemption price per share | | | 31.11 | |
The accompanying notes are an integral part of the financial statements.
7
Bogle Investment Management
Small Cap Growth Fund
Statement Of Operations
For the Six Months Ended February 28, 2018 (Unaudited)
| Investment Income | | | |
| Dividends (net of foreign taxes withheld of $324) | | $ | 427,384 | |
| Total investment income | | | 427,384 | |
| | | | | |
| Expenses: | | | | |
| Advisory fees (Note 2) | | | 544,010 | |
| Transfer agent fees (Note 2) | | | 37,390 | |
| Administration and accounting fees (Note 2) | | | 28,863 | |
| Audit fees | | | 20,757 | |
| Custodian fees (Note 2) | | | 15,989 | |
| Legal fees | | | 14,927 | |
| Registration and filing fees | | | 12,297 | |
| Directors fees | | | 10,540 | |
| Printing and shareholder reporting fees | | | 9,978 | |
| Officers fees | | | 7,436 | |
| Other expenses | | | 6,488 | |
| Total expenses before waivers | | | 708,675 | |
| Less: waivers (Note 2) | | | (28,663 | ) |
| Net expenses after waivers | | | 680,012 | |
| Net investment income/(loss) | | | (252,628 | ) |
| | | | | |
| Net Realized and Unrealized Gain/(Loss) from Investments | | | | |
| Net realized gain/(loss) from investments | | | 8,515,945 | |
| Net change in unrealized appreciation/(depreciation) on investments | | | 45,184 | |
| Net realized and unrealized gain/(loss) on investments | | | 8,561,129 | |
| Net Increase/(Decrease) in Net Assets Resulting from Operations | | $ | 8,308,501 | |
The accompanying notes are an integral part of the financial statements.
8
Bogle Investment Management
Small Cap Growth Fund
Statements of Changes in Net Assets
| | | For the
Six Months Ended February 28, 2018
(Unaudited) | | | For the
Year Ended August 31, 2017 | |
| Increase/(Decrease) in Net Assets From Operations: | | | | | | |
| Net investment income/(loss) | | $ | (252,628 | ) | | $ | (695,143 | ) |
| Net realized gain/(loss) from investments | | | 8,515,945 | | | | 17,835,877 | |
| Net change in unrealized appreciation/(depreciation) on investments | | | 45,184 | | | | 2,929,982 | |
| Net increase/(decrease) in net assets resulting from operations | | | 8,308,501 | | | | 20,070,716 | |
| | | | | | | | | |
| Dividends and Distributions to Shareholders From: | | | | | | | | |
| Net realized capital gains | | | | | | | | |
| Institutional Class | | | (10,781,589 | ) | | | — | |
| Investor Class | | | — | | | | — | |
| Net decrease in net assets from dividends and distributions to shareholders | | | (10,781,589 | ) | | | — | |
| | | | | | | | | |
| Increase/(Decrease) in Net Assets Derived From Capital Share Transactions: | | | | | | | | |
| Institutional Class | | | | | | | | |
| Proceeds from shares sold | | | 1,054,439 | | | | 2,362,029 | |
Proceeds from exchange of Investor Class(1) | | | — | | | | 73,374,316 | |
| Reinvestment of distributions | | | 10,427,403 | | | | — | |
| Distributions for shares redeemed | | | (8,807,857 | ) | | | (36,837,782 | ) |
| Total from Institutional Class | | | 2,673,985 | | | | 38,898,563 | |
| Investor Class | | | | | | | | |
| Proceeds from shares sold | | | — | | | | 1,577,029 | |
| Reinvestment of distributions | | | — | | | | — | |
| Distributions for shares redeemed | | | — | | | | (10,305,292 | ) |
Distributions from exchange to Institutional Class(1) | | | — | | | | (73,374,316 | ) |
| Total from Investor Class | | | — | | | | (82,102,579 | ) |
| Net increase/(decrease) in net assets from capital share transactions | | | 2,673,985 | | | | (43,204,016 | ) |
| Total increase/(decrease) in net assets | | | 200,897 | | | | (23,133,300 | ) |
| | | | | | | | | |
| Net Assets: | | | | | | | | |
| Beginning of period | | | 106,277,821 | | | | 129,411,121 | |
| End of period | | $ | 106,478,718 | | | $ | 106,277,821 | |
| Undistributed/(accumulated) net investment income/(loss), end of period | | $ | (380,575 | ) | | $ | (127,947 | ) |
The accompanying notes are an integral part of the financial statements.
9
Bogle Investment Management
Small Cap Growth Fund
Statements of Changes in Net Assets (Concluded)
| | | For the
Six Months Ended February 28, 2018
(Unaudited) | | | For the
Year Ended August 31, 2017 | |
| Increase/(Decrease) in Shares Outstanding Derived From Share Transactions: | | | | | | |
| Institutional Class | | | | | | |
| Shares sold | | | 32,912 | | | | 78,894 | |
Shares exchanged from Investor Class (1) | | | — | | | | 2,379,818 | |
| Shares reinvested | | | 344,480 | | | | — | |
| Shares redeemed | | | (271,929 | ) | | | (1,259,190 | ) |
| Total from Institutional Class | | | 105,463 | | | | 1,199,522 | |
| Investor Class | | | | | | | | |
| Shares sold | | | — | | | | 55,604 | |
| Shares reinvested | | | — | | | | — | |
| Shares redeemed | | | — | | | | (357,393 | ) |
Shares exchanged into Institutional Class (1) | | | — | | | | (2,439,606 | ) |
| Total from Investor Class | | | — | | | | (2,741,395 | ) |
| Net increase/(decrease) in shares outstanding derived from share transactions | | | 105,463 | | | | (1,541,873 | ) |
(1) | Effective on April 28, 2017, the outstanding Investor Class Shares of the Fund were converted into Institutional Class Shares of the Fund. |
The accompanying notes are an integral part of the financial statements.
10
Bogle Investment Management
Small Cap Growth Fund
Financial Highlights
Contained below is per share operating performance data for shares outstanding, total investment return, ratios to average net assets and other supplemental data for the respective periods. This information has been derived from information provided in the financial statements. |
| | | For the
Six Months ended
February 28,
2018
(Unaudited) | | | For the
Year
Ended
August 31,
2017 | | | For the
Year
Ended
August 31,
2016 | | | For the
Year
Ended
August 31,
2015 | | | For the
Year
Ended
August 31,
2014 | | | For the
Year
Ended
August 31,
2013 | |
| Per Share Operating Performance | | | | | | | | | | | | | | | | | | | | | | | | |
| Net asset value, beginning of period | | $ | 32.04 | | | $ | 27.00 | | | $ | 30.00 | | | $ | 38.07 | | | $ | 29.49 | | | $ | 21.76 | |
Net investment income/(loss)(1) | | | (0.07 | ) | | | (0.18 | ) | | | (0.13 | ) | | | (0.18 | ) | | | (0.23 | ) | | | 0.10 | |
| Net realized and unrealized gain/(loss) from investments | | | 2.48 | | | | 5.22 | | | | 1.21 | | | | (3.09 | ) | | | 8.87 | | | | 7.63 | |
| Net increase/(decrease) in net assets resulting from operations | | | 2.41 | | | | 5.04 | | | | 1.08 | | | | (3.27 | ) | | | 8.64 | | | | 7.73 | |
| Dividends and distributions to shareholders from: | | | | | | | | | | | | | | | | | | | | | | | | |
| Net investment income | | | — | | | | — | | | | — | | | | — | | | | (0.06 | ) | | | — | |
| Net realized capital gains | | | (3.34 | ) | | | — | | | | (4.08 | ) | | | (4.80 | ) | | | — | | | | — | |
| Total dividends and distributions to shareholders | | | (3.34 | ) | | | — | | | | (4.08 | ) | | | (4.80 | ) | | | (0.06 | ) | | | — | |
| Net asset value, end of period | | $ | 31.11 | | | $ | 32.04 | | | $ | 27.00 | | | $ | 30.00 | | | $ | 38.07 | | | $ | 29.49 | |
Total investment return(2) | | | 7.81 | %(5) | | | 18.69 | % | | | 4.37 | % | | | (8.99 | )% | | | 29.34 | % | | | 35.52 | % |
| | | | | | | | | | | | | | | | | | | | | | | | | |
| Ratios/Supplemental Data | | | | | | | | | | | | | | | | | | | | | | | | |
| Net assets, end of period (000’s omitted) | | $ | 106,479 | | | $ | 106,278 | | | $ | 57,180 | | | $ | 88,086 | | | $ | 117,923 | | | $ | 98,898 | |
Ratio of expenses to average net
assets with waivers and reimbursements | | | 1.25 | %(4) | | | 1.27 | % | | | 1.25 | % | | | 1.25 | % | | | 1.25 | % | | | 1.25 | % |
Ratio of expenses to average net assets without waivers and reimbursements(3) | | | 1.30 | %(4) | | | 1.37 | % | | | 1.42 | % | | | 1.35 | % | | | 1.32 | % | | | 1.39 | % |
| Ratio of net investment income/(loss) to average net assets | | | (0.46 | )%(4) | | | (0.61 | )% | | | (0.50 | )% | | | (0.53 | )% | | | (0.66 | )% | | | 0.37 | % |
| Portfolio turnover rate | | | 185.59 | %(5) | | | 366.41 | % | | | 380.45 | % | | | 196.15 | % | | | 175.06 | % | | | 237.59 | % |
(1) | Calculated based on average shares outstanding for the period. |
(2) | Total investment return is calculated assuming a purchase of shares on the first day and a sale of shares on the last day of each period reported and includes reinvestments of dividends and distributions, if any. |
(3) | During the current fiscal period, certain fees were waived and/or reimbursed. If such fee waivers and/or reimbursements had not occurred, the ratios would have been as indicated (See Note 2). |
The accompanying notes are an integral part of the financial statements.
11
Bogle Investment Management
Small Cap Growth Fund
Notes To Financial Statements
February 28, 2018 (Unaudited)
1. Organization and Significant Accounting Policies
The RBB Fund, Inc. (“RBB” or the “Company”) was incorporated under the laws of the State of Maryland on February 29, 1988 and is registered under the Investment Company Act of 1940, as amended, (the “1940 Act”), as an open-end management investment company. RBB is a “series fund,” which is a mutual fund divided into separate portfolios. Each portfolio is treated as a separate entity for certain matters under the 1940 Act, and for other purposes, and a shareholder of one portfolio is not deemed to be a shareholder of any other portfolio. Currently, RBB has twenty-nine active investment portfolios, including the Bogle Investment Management Small Cap Growth Fund (the “Fund”), which commenced investment operations on October 1, 1999.
RBB has authorized capital of one hundred billion shares of common stock of which 87.023 billion shares are currently classified into one hundred and eighty-one classes of common stock. Each class represents an interest in an active or inactive RBB investment portfolio.
The Fund’s investment objective is to provide long-term capital appreciation.
The Fund is an investment company and follows accounting and reporting guidance in the Financial Accounting Standards Board (“FASB”) Accounting Standards Codification Topic 946 “Financial Services - Investment Companies”.
The end of the reporting period for the Fund is February 28, 2018, and the period covered by these Notes to Financial Statements is the six months ended February 28, 2018 (the “current fiscal period”).
Portfolio Valuation — The Fund’s net asset value (“NAV”) is calculated once daily at the close of regular trading hours on the New York Stock Exchange (“NYSE”) (generally 4:00 p.m. Eastern time) on each day the NYSE is open. Securities held by the Fund are valued using the closing price or the last sale price on a national securities exchange or the National Association of Securities Dealers Automatic Quotation System (“NASDAQ”) market system where they are primarily traded. Equity securities traded in the over-the-counter (“OTC”) market are valued at their closing prices. If there were no transactions on that day, securities traded principally on an exchange or on NASDAQ will be valued at the mean of the last bid and ask prices prior to the market close. Fixed income securities are valued using an independent pricing service, which considers such factors as security prices, yields, maturities and ratings, and are deemed representative of market values at the close of the market. Investments in other open-end investment companies, if any, are valued based on the NAV of those investment companies (which may use fair value pricing as discussed in their prospectuses). If market quotations are unavailable or deemed unreliable, securities will be valued in accordance with procedures adopted by the Company’s Board of Directors (the “Board”). Relying on prices supplied by pricing services or dealers or using fair valuation may result in values that are higher or lower than the values used by other investment companies and investors to price the same investments.
Fair Value Measurements — The inputs and valuation techniques used to measure the fair value of the Fund’s investments are summarized into three levels as described in the hierarchy below:
| | ● Level 1 – | Prices are determined using quoted prices in active markets for identical securities. |
| | ● Level 2 – | Prices are determined using other significant observable inputs (including quoted prices for similar securities, interest rates, prepayment speeds, credit risk, etc.). |
| | ● Level 3 – | Prices are determined using significant unobservable inputs (including the Fund’s own assumptions in determining the fair value of investments). |
The inputs or methodologies used for valuing securities are not necessarily an indication of the risk associated with investing in those securities.
12
Bogle Investment Management
Small Cap Growth Fund
Notes To Financial Statements (Continued)
February 28, 2018 (Unaudited)
The following is a summary of the inputs used, as of the end of the reporting period, in valuing the Fund’s investments carried at fair value:
| | | Total | | | Level 1 | | | Level 2 | | | Level 3 | |
| Common Stocks | | $ | 104,991,110 | | | $ | 104,991,110 | | | $ | — | | | $ | — | |
| Short-Term Investments | | | 1,963,094 | | | | 1,963,094 | | | | — | | | | — | |
| Total Investments* | | $ | 106,954,204 | | | $ | 106,954,204 | | | $ | — | | | $ | — | |
* | Please refer to the Portfolio of Investments for further details. |
At the end of each quarter, management evaluates the classification of Levels 1, 2 and 3 assets and liabilities. Various factors are considered, such as changes in liquidity from the prior reporting period; whether or not a broker is willing to execute at the quoted price; the depth and consistency of prices from third party pricing services; and the existence of contemporaneous, observable trades in the market. Additionally, management evaluates the classification of Level 1 and Level 2 assets and liabilities on a quarterly basis for changes in listings or delistings on national exchanges.
Due to the inherent uncertainty of determining the fair value of investments that do not have a readily available market value, the fair value of the Fund’s investments may fluctuate from period to period. Additionally, the fair value of investments may differ significantly from the values that would have been used had a ready market existed for such investments and may differ materially from the values the Fund may ultimately realize. Further, such investments may be subject to legal and other restrictions on resale or otherwise less liquid than publicly traded securities.
For fair valuations using significant unobservable inputs, U.S. generally accepted accounting principles (“U.S. GAAP”) requires the Fund to present a reconciliation of the beginning to ending balances for reported market values that presents changes attributable to total realized and unrealized gains or losses, purchase and sales, and transfers in and out of Level 3 during the period. Transfers in and out between levels are based on values at the end of the period. U.S. GAAP also requires the Fund to disclose amounts and reasons for all transfers in and out of Level 1 and Level 2 fair value measurements. A reconciliation of Level 3 investments is presented only when the Fund had an amount of Level 3 investments at the end of the reporting period that was meaningful in relation to its net assets. The amounts and reasons for all transfers in and out of each level within the three-tier hierarchy are disclosed when the Fund had an amount of total transfers during the reporting period that was meaningful in relation to its net assets as of the end of the reporting period.
During the current fiscal period, the Fund had no transfers between Levels 1, 2 and 3.
Use of Estimates — The preparation of financial statements in conformity with U.S. GAAP requires management to make estimates and assumptions that affect the reported amounts of assets and liabilities and disclosure of contingent assets and liabilities at the date of the financial statements and the reported amounts of revenues and expenses during the reporting period. Actual results could differ from those estimates and those differences could be significant.
Investment Transactions, Investment Income and Expenses — The Fund records security transactions based on trade date for financial reporting purposes. The cost of investments sold is determined by use of the specific identification method for both financial reporting and income tax purposes in determining realized gains and losses on investments. Interest income is accrued when earned. Dividend income is recorded on the ex-dividend date. Distributions received on securities that represent a return of capital or capital gains are recorded as a reduction of cost of investments and/or as a realized gain. The Fund’s investment income, expenses (other than class specific distribution fees) and unrealized and realized gains and losses are allocated daily to each class of shares based upon the relative proportion of net assets of each class at the beginning of the day. Expenses incurred on behalf of a specific class, fund or fund family of the Company are charged directly to the class, fund or fund family (in proportion to net assets). Expenses incurred for all of the RBB funds (such as director or professional fees) are charged to all funds in proportion to their average net assets of RBB, or in such other manner as the Board deems fair or equitable. Expenses and fees, including investment advisory and administration fees, are accrued daily and taken into account for the purpose of determining the NAV of the Fund.
13
Bogle Investment Management
Small Cap Growth Fund
Notes To Financial Statements (Continued)
February 28, 2018 (Unaudited)
Dividends And Distributions To Shareholders — Dividends from net investment income and distributions from net realized capital gains, if any, are declared and paid at least annually to shareholders and recorded on the ex-dividend date. Income dividends and capital gain distributions are determined in accordance with U.S. federal income tax regulations, which may differ from U.S. GAAP.
U.S. Tax Status — No provision is made for U.S. income taxes as it is the Fund’s intention to continue to qualify for and elect the tax treatment applicable to regulated investment companies under Subchapter M of the Internal Revenue Code of 1986, as amended, and make the requisite distributions to its shareholders which will be sufficient to relieve it from U.S. income and excise taxes.
Cash and Cash Equivalents — Cash and cash equivalents are valued at cost plus accrued interest, which approximates market value.
Other — In the normal course of business, the Fund may enter into contracts that provide general indemnifications. The Fund’s maximum exposure under these arrangements is dependent on claims that may be made against the Fund in the future, and, therefore, cannot be estimated; however, based on experience, the risk of material loss from such claims is considered remote.
2. Investment Adviser and Other Services
Bogle Investment Management, L.P. (“Bogle” or the “Adviser”) serves as the investment adviser to the Fund. The Fund compensates the Adviser for its services at an annual rate based on the Fund’s average daily net assets (the “Advisory Fee”), payable on a monthly basis in arrears, as shown in the accompanying table.
The Adviser has contractually agreed to waive advisory fees and/or reimburse expenses to the extent that total annual Fund operating expenses (excluding certain items discussed below) exceed the rate (“Expense Cap”) shown in the accompanying table. In determining the Adviser’s obligation to waive advisory fees and/or reimburse expenses, the following expenses are not taken into account and certain of these expenses could cause net total annual Fund operating expenses to exceed the Expense Cap: acquired fund fees and expenses, brokerage commissions, extraordinary items, interest or taxes. This contractual limitation is in effect until December 31, 2018 and may not be terminated without the approval of the Board. The Adviser may discontinue these arrangements at any time after December 31, 2018. The Fund will not pay the Adviser at a later time for any amounts the Adviser may waive and/or any amounts that the Adviser has assumed. The contractual fee waiver does not provide for recoupment of fees that were waived and/or expenses that were reimbursed.
Advisory Fee | Expense Cap |
1.00% | 1.25% |
During the current fiscal period, investment advisory fees accrued and waived were as follows:
Gross
Advisory Fees | Waivers | Net
Advisory Fees |
$544,010 | $(28,663) | $515,347 |
U.S. Bancorp Fund Services, LLC (“USBFS”) serves as administrator for the Fund. For providing administrative and accounting services, USBFS is entitled to receive a monthly fee, subject to certain minimum and out of pocket expenses.
USBFS serves as the Fund’s transfer and dividend disbursing agent. For providing transfer agent services, USBFS is entitled to receive a monthly fee, subject to certain minimum and out of pocket expenses.
U.S. Bank, N.A. (the “Custodian”) provides certain custodial services to the Fund. The Custodian is entitled to receive a monthly fee, subject to certain minimum and out of pocket expenses.
14
Bogle Investment Management
Small Cap Growth Fund
Notes To Financial Statements (Continued)
February 28, 2018 (Unaudited)
Quasar Distributors, LLC serves as the principal underwriter and distributor of the Fund’s shares pursuant to a Distribution Agreement with RBB.
For compensation amounts payable to USBFS, please refer to the Statement of Operations.
3. Director’s and Officer’s Compensation
The Directors of the Company receive an annual retainer and meeting fees for meetings attended. Employees of Vigilant Compliance, LLC serve as President, Chief Compliance Officer and Assistant Treasurer of the Company. Vigilant Compliance, LLC is compensated for the services provided to the Company. An employee of RBB serves as Treasurer and Secretary, and is compensated for services provided. Certain employees of USBFS serve as officers of the Company. They are not compensated by the Fund or the Company. For Director’s and Officer’s compensation amounts, please refer to the Statement of Operations.
4. Purchases and Sales of Investment Securities
During the current fiscal period, aggregate purchases and sales of investment securities (excluding short-term investments) of the Fund were as follows:
Purchases | Sales |
$199,401,943 | $207,551,969 |
There were no purchases or sales of long-term U.S. Government securities during the current fiscal period.
5. Federal Income Tax Information
The Fund has followed the authoritative guidance on accounting for and disclosure of uncertainty in tax positions, which requires the Fund to determine whether a tax position is more likely than not to be sustained upon examination, including resolution of any related appeals or litigation processes, based on the technical merits of the position. The Fund has determined that there was no effect on the financial statements from following this authoritative guidance. In the normal course of business, the Fund is subject to examination by federal, state and local jurisdictions, where applicable, for tax years for which applicable statutes of limitations have not expired. The Fund is not aware of any tax positions for which it is reasonably possible that the total amounts of unrecognized tax benefits will significantly change in the next twelve months.
As of August 31, 2017, the federal tax cost and aggregate gross unrealized appreciation and depreciation of investments held by the Fund were as follows:
Federal Tax
Cost | Unrealized
Appreciation | Unrealized
(Depreciation) | Net
Unrealized Appreciation/
(Depreciation) |
$98,885,470 | $10,689,388 | $(3,382,048) | $7,307,340 |
Distributions to shareholders, if any, from net investment income and realized gains are determined in accordance with federal income tax regulations, which may differ from net investment income and realized gains recognized for financial reporting purposes. Accordingly, the character of distributions and composition of net assets for tax purposes may differ from those reflected in the accompanying financial statements. To the extent these differences are permanent, such amounts are reclassified within the capital accounts based on the tax treatment; temporary differences do not require such reclassification.
15
Bogle Investment Management
Small Cap Growth Fund
Notes To Financial Statements (Concluded)
February 28, 2018 (Unaudited)
The following permanent differences as of August 31, 2017, primarily attributable to short-term capital gains netted against net operating loss, were reclassified among the following accounts:
Undistributed
Net Investment
Income/(Loss) | Accumulated
Net Realized
Gain/(Loss) | Paid-In
Capital |
$986,113 | $(986,113) | $— |
As of August 31, 2017, the components of distributable earnings on a tax basis were as follows:
Capital Loss Carryforward | Undistributed Ordinary Income | Undistributed Long-Term
Capital Gains | Unrealized
Appreciation/
(Depreciation) | Qualified
Late-Year Loss
Deferral |
$— | $8,524,717 | $— | $7,307,340 | $— |
The differences between the book and tax basis components of distributable earnings relate principally to the timing of recognition of income and gains for federal income tax purposes. Short-term and foreign currency gains are reported as ordinary income for federal income tax purposes.
The tax character of dividends and distributions paid during the fiscal year ended August 31, 2017 was as follows:
Ordinary
Income | Long-Term
Gains | Total |
$— | $— | $— |
Dividends from net investment income and short-term capital gains are treated as ordinary income dividends for federal income tax purposes.
Pursuant to federal income tax rules applicable to regulated investment companies, the Fund may elect to treat certain capital losses between November 1 and August 31 and late year ordinary losses ((i) ordinary losses between January 1 and August 31, and (ii) specified ordinary and currency losses between November 1 and August 31) as occurring on the first day of the following tax year. For the year ended August 31, 2017, any amount of losses elected within the tax return will not be recognized for federal income tax purposes until September 1, 2017.
Under the Regulated Investment Company Modernization Act of 2010, the Fund is permitted to carry forward capital losses incurred in taxable years beginning after December 22, 2010 for an unlimited period. Additionally, capital losses that are carried forward will retain their character as either short-term or long-term capital losses rather than being considered all short-term as under the previous law.
During the fiscal year ended August 31, 2017, the Fund utilized $3,655,064 of total capital loss carryforwards. As of August 31, 2017, the Fund had no tax basis capital loss carryforwards to offset future capital gains.
6. Subsequent Events
Management has evaluated the impact of all subsequent events on the Fund through the date the financial statements were issued and has determined that there were no significant events requiring recognition or disclosure in the financial statements.
16
Bogle Investment Management
Small Cap Growth Fund
Other Information (Unaudited)
Proxy Voting
Policies and procedures that the Fund uses to determine how to vote proxies relating to portfolio securities as well as information regarding how the Fund voted proxies relating to portfolio securities for the most recent twelve-month period ended June 30 are available without charge, upon request, by calling (877) 264-5346 and on the Securities and Exchange Commission’s (“SEC”) website at http://www.sec.gov.
Quarterly Portfolio Schedules
The Company files its complete schedule of portfolio holdings with the SEC for the first and third fiscal quarters of each fiscal year (quarters ended November 30 and May 31) on Form N-Q. The Company’s Form N-Q is available on the SEC website at http://www.sec.gov and may be reviewed and copied at the SEC Public Reference Room in Washington, D.C. Information on the operation of the SEC Public Reference Room may be obtained by calling (800) SEC-0330.
17
Investment Adviser
Bogle Investment Management, L.P.
2310 Washington Street
Suite 310
Newton Lower Falls, MA 02462
Administrator and Transfer Agent
U.S. Bancorp Fund Services, LLC
P.O. Box 701
Milwaukee, WI 53201
Principal Underwriter
Quasar Distributors, LLC
777 East Wisconsin Avenue, Floor 6
Milwaukee, WI 53202
Custodian
U.S. Bank, N.A.
1555 North Rivercenter Drive, Suite 302
Milwaukee, WI 53212
Independent Registered Public Accounting Firm
PricewaterhouseCoopers LLP
Two Commerce Square, Suite 1800
2001 Market Street
Philadelphia, PA 19103-7042
Legal Counsel
Drinker Biddle & Reath LLP
One Logan Square, Suite 2000
Philadelphia, PA 19103-6996
BOG-SAR18
BOSTON PARTNERS INVESTMENT FUNDS |
Table of Contents
General Market Commentary | 1 |
Definitions | 2 |
Average Annual Total Returns for the Period Ended February 28, 2018 | 3 |
Fund Expense Examples | 5 |
Portfolio Holdings Summary Tables | 7 |
Portfolio of Investments | 10 |
Statements of Assets and Liabilities | 54 |
Statements of Operations | 57 |
Statements of Changes in Net Assets | 60 |
Financial Highlights | 66 |
Notes to Financial Statements | 72 |
Other Information | 84 |
BOSTON PARTNERS INVESTMENT FUNDS |
GENERAL MARKET COMMENTARY |
Dear Shareholder,
The bull market in stocks continued for the six-month period ended on February 28, 2018 as the S&P 500® Index (“S&P”) gained 10.84% on a total return basis over that time frame, finding support from a number of factors, both macro-economic and fundamental in nature.
Gross Domestic Product (GDP) grew at an average rate of 2.3% over the period and the Federal Reserve Board’s preferred measure of core inflation remained subdued, averaging just 1.4% and well below their official target of 2%. The Institute of Supply Managers’ (ISM) surveys of business activity, in both manufacturing and services, remained firmly rooted in an expansion mode indicating that the strength of the economy was broad-based. From an international standpoint, the story was nearly identical to that of the United States.
Earnings growth over the period remained robust registering a gain of 10.6%, nearly identical to the return that the S&P generated, an indication that earnings growth, and not a price/earnings (P/E) multiple expansion was the primary driver of equity returns. Sales growth also accelerated to a 5.7%, the fastest pace since 2012. Once again, a similar story could be crafted for international markets.
While five out of six months during the period produced positive returns, the market did suffer its first official “correction” in two years, dropping by -10.2% from its peak on January 26th to the interim trough on February 8th.
The “trigger” for the correction was the Friday, February 2nd release of the employment report for January, which revealed that average hourly earnings had jumped by 2.9% on a year-over-year basis, the biggest increase since 2009. That prompted a sell-off in the bond market with the 10-year Treasury hitting 2.94%, (the highest yield since January 2014) pressuring stocks to drop by 2% and leading to a 28% increase in the VIX Volatility Index (“VIX”) by the end of the day.
Come Monday, February 5th, an estimated $750 billion to $1 trillion in strategies that had bet that volatility would continue to be low and/or contained had to cover their losing positions causing the VIX to spike by over 100%, triggering an additional 4% drop in stock prices that day and a 5.2% loss by the end of the week. During that week 54.5 billion shares of stock traded, the highest level in seven years with the bulk of the activity occurring during the last hour of trading, an indication that computer-based models were dictating the action.
From a sector standpoint, Financials assumed the pole position gaining 18.23%, benefitting from an average increase in Treasury yields of 79 basis points along the yield curve during the period. Historically, an increase in interest rates has been conducive to an expansion in profit margins for banks.
Technology finished a close second with a gain of 18.18% as the sector continued to post impressive top and bottom line results. Boston Partners performance was helped by being overweight both sectors domestically.
Pulling up the rear in performance were two “bond proxy” sectors, Utilities and REIT’s, which were negatively impacted by the increase in rates with an average return of -8.01%. Boston Partners remains underweight in both sectors.
In terms of style, growth continued to beat value during the period with the Russell 1000® Growth Index returning 13.9% to the 7.3% return generated by the Russell 1000® Value Index. Large capitalization stocks outperformed with the Russell 1000® Index beating the Russell Midcap® Index that beat the Russell 2000® Index (10.6% vs 10.4% vs 10.3%).
Momentum was the dominant factor during the period according to MSCI with a return of 17.8% while Minimum Volatility was a laggard at 3.9%.
International bourses generally lagged their U.S. counterparts over the period with the MSCI EAFE Index returning 4.34% in local currency terms while Emerging Markets gained 9.06%. Returns in dollar terms were better, with EAFE up 7.23% and Emerging Markets returning 10.7% as the dollar fell by over 2% during the six months.
Looking Ahead
While certainly painful to go through, the correction during February was far from atypical, as since 1980 the market has experienced an intra-year drawdown in every calendar year, averaging 14% per year over the period.
There were a couple of “silver linings” surrounding the sell-off as well, as the tenacity of the move was not confirmed by the credit markets as high-yield bond spreads to Treasury’s increased by only 26 basis points during the month. Historically, when markets are under true duress that widening would be 150 basis points or more.
The other notable positive aspect to the sell-off came on the valuation front, as the forward price/earnings multiple of the S&P dropped from 18.5X to 16.5X, the byproduct of falling prices and increasing earnings per share (“EPS”) estimates.
News on the earnings front has been very positive as S&P earnings for the fourth quarter are on track for a 14.8% gain, with 74% of the underlying companies beating their consensus targets. Estimates for EPS growth in 2018 have increased by 7.3% this year given the anticipated boost from the recent tax legislation package and are now projected to grow by 18.3% on a year-over-year basis.
All in all, we believe that little has changed in the last month from a macro-economic standpoint as the synchronized global recovery remains intact and both earnings and revenue growth rates and revisions remain robust. At this point, the correction in the market appears to be more mechanical than fundamental in nature.
What has changed is that global central bank policies (primarily the Federal Reserve) are in the midst of transitioning from “tail-wind” centric to “head-wind” centric as spare economic and employment capacity diminishes. It remains to be seen if and/or when the pace and magnitude of the changes will provoke longer lasting disruptive effects on economies and markets. To date, little damage has been inflicted.
BOSTON PARTNERS INVESTMENT FUNDS |
Past Performance is not a guarantee of future results.
Opinions expressed herein are as of February 28, 2018 and are subject to change at any time, are not guaranteed and should not be considered investment advice. This report is for the information of shareholders of the Funds. It may also be used as sales literature when preceded or accompanied by the current prospectus.
Basis points: One hundredth of one percent, used chiefly in expressing differences of interest rates.
Earnings per share: Is the portion of a company's profit allocated to each outstanding share of common stock.
Minimum Volatility: A minimum volatility strategy involves buying stocks based on the estimate of their volatility and correlations with other stocks. Minimum volatility is categorized as a “defensive” factor, meaning it has tended to benefit during periods of economic contraction. This type of strategy is more concerned with volatility management than with maximizing gains. The key objective of a minimum volatility strategy is to capture regional and global exposure to stocks with potentially less risk.
Momentum: High Momentum companies are characterized in the literature as companies with high price performance in the recent history, up to 12-months. High Momentum companies tend to continue their high price performance over the near term, typically over a 6 - 12 month period.
MSCI EAFE Index is a stock market index that is designed to measure the equity market performance of developed markets outside of the U.S. & Canada. It is maintained by Morgan Stanley Capital International (MCSI), a provider of investment decision support tools; the EAFE acronym stands for Europe, Australasia and Far East.
MSCI Emerging Markets (EM) Index is an index created by MSCI designed to measure equity market performance in global emerging markets.
MSCI World Index is an unmanaged index that measures the equity market performance of developed markets.
P/E: Price/Earnings: A valuation ratio of a company’s current share price compared to its per-share earnings.
Russell 1000® Index measures the performance of the 1,000 largest companies in the Russell 3000® Index, which represents approximately 92% of the total market capitalization of the Russell 3000 Index. You cannot invest directly in an index.
Russell 1000® Growth Index is an index of approximately 1,000 of the largest companies in the U.S. equity market. It represents the top companies by market capitalization. The Russell 1000 typically comprises approximately 90% of the total market capitalization of all listed U.S. stocks.
Russell 1000® Value Index measures the performance of those Russell 1000 companies with lower price/book ratios and lower forecasted growth values. The Russell 1000® Value Index refers to a composite of large and mid-cap companies located in the United States that also exhibit a value probability.
Russell 2000® Index measures the performance of the 2,000 smallest companies in the Russell 3000® Index, which represents approximately 8% of the total market capitalization of the Russell 3000® Index and is considered representative of small-cap stocks.
Russell 2000® Value Index is an unmanaged index that measures the performance of the small-cap value segment of the U.S. equity universe. It includes those Russell 2000® Index companies with lower price-to-book ratios and lower forecasted growth values.
Russell 3000® Index measures the performance of the largest 3,000 U.S. companies representing approximately 98% of the investable U.S. equity market.
Russell 3000® Value Index is an unmanaged index that measures the performance of the broad value segment of the U.S. equity value universe. It includes those Russell 3000® Index companies with lower price-to-book ratios and lower forecasted growth values.
Russell Midcap® Index is a market capitalization weighted index comprised of 800 publicly traded U.S. companies with market caps of between $2 and $10 billion. The average Russell Midcap Index member has a market cap of $8 billion to $10 billion, with a median value of $4 billion to $5 billion.
S&P 500® Index is an unmanaged index that measures the performance of 500 large-cap stocks.
Purchasing Managers Indices (PMI) is an indicator of the economic health of the manufacturing sector. The PMI is based on five major indicators: new orders, inventory levels, production, supplier deliveries and the employment environment.
VIX Volatility Index: The CBOE Volatility Index, known by its ticker symbol VIX, is a popular measure of the stock market's expectation of volatility implied by S&P 500 index options, calculated and published by the Chicago Board Options Exchange (CBOE). It is colloquially referred to as the fear index or the fear gauge.
BOSTON PARTNERS INVESTMENT FUNDS |
AVERAGE ANNUAL TOTAL RETURNS FOR THE PERIODS ENDED FEBRUARY 28, 2018 (unaudited) |
| | | Average Annual |
| | Six Month† | 1 Year | 5 Year | 10 Year | Since
Inception |
Boston Partners Small Cap Value Fund II | | | | | |
Institutional Class | 6.53% | 5.01% | 11.12% | 10.26% | N/A |
Investor Class | 6.33% | 4.71% | 10.84% | 9.98% | N/A |
Russell 2000® Value Index | 5.08% | 2.96% | 10.58% | 8.64% | N/A |
Russell 2000® Index(1) | 8.29% | 10.51% | 12.19% | 9.74% | N/A |
| (1) | This is not a primary benchmark of the Fund. Results of the index performance are presented for general comparative purposes. |
Boston Partners Long/Short Equity Fund | | | | | |
Institutional Class | 3.57% | -2.17% | 5.66% | 11.76% | N/A |
Investor Class | 3.45% | -2.40% | 5.40% | 11.43% | N/A |
S&P 500® Index | 10.84% | 17.10% | 14.73% | 9.73% | N/A |
Boston Partners Long/Short Research Fund | | | | | |
Institutional Class(1) | 5.84% | 8.10% | 7.60% | N/A | 8.68% |
S&P 500® Index | 10.84% | 17.10% | 14.73% | N/A | 14.79%(3) |
| | | | | | |
Investor Class(2) | 5.69% | 7.85% | 7.33% | N/A | 8.03% |
S&P 500® Index | 10.84% | 17.10% | 14.73% | N/A | 14.44%(3) |
| (1) | Inception date of the Fund was September 30, 2010. |
| (2) | Inception date of the Fund was November 29, 2010. |
| (3) | Index performance is from inception date of the Class only and is not the inception date of the index itself. |
Boston Partners All-Cap Value Fund | | | | | |
Institutional Class | 10.31% | 14.38% | 14.95% | 11.07% | N/A |
Investor Class | 10.20% | 14.06% | 14.69% | 10.82% | N/A |
Russell 3000® Value Index | 7.10% | 7.39% | 11.93% | 7.95% | N/A |
Russell 3000® Index(1) | 10.44% | 16.22% | 14.36% | 9.78% | N/A |
| (1) | This is not a primary benchmark of the Fund. Results of the index performance are presented for general comparative purposes. |
WPG Partners Small/Micro Cap Value Fund | | | | | |
Institutional Class | 4.10% | -1.29% | 4.99% | 5.99% | N/A |
Russell 2000® Value Index | 5.08% | 2.96% | 10.58% | 8.64% | N/A |
Boston Partners Global Equity Fund | | | | | |
Institutional Class(1) | 9.05% | 15.77% | 11.45% | N/A | 12.97% |
MSCI World Index | 9.09% | 17.99% | 11.31% | N/A | 12.77%(2) |
| (1) | Inception date of the Fund was December 30, 2011. |
| (2) | Index performance is from inception date of the Class only and is not the inception date of the index itself. |
Boston Partners Global Long/Short Fund | | | | | |
Institutional Class(1) | 4.14% | 5.35% | N/A | N/A | 4.23% |
MSCI World Index | 9.09% | 17.99% | N/A | N/A | 8.66%(3) |
| | | | | | |
Investor Class(2) | 4.09% | 5.12% | N/A | N/A | 4.67% |
MSCI World Index | 9.09% | 17.99% | N/A | N/A | 9.20%(3) |
| (1) | Inception date of the Fund was December 31, 2013. |
| (2) | Inception date of the Fund was April 11, 2014. |
| (3) | Index performance is from inception date of the Class only and is not the inception date of the index itself. |
Boston Partners Emerging Markets Long/Short Fund | | | | | |
Institutional Class(1) | 3.71% | 19.60% | N/A | N/A | 8.77% |
MSCI World Index(2) | 9.09% | 17.99% | N/A | N/A | 8.81%(3) |
MSCI Emerging Markets Index | 10.67% | 30.94% | N/A | N/A | 9.35%(3) |
| (1) | Inception date of the Fund was March 1, 2015. The Fund commenced operations as a series of The RBB Fund, Inc. on December 15, 2015, when substantially all of the assets of Boston Partners Emerging Market Long/Short Equity (the "Prior Account") transferred to the Fund. The Fund is managed in all material respects in a manner equivalent to the management of the Prior Account. Accordingly, the performance information shown above for periods prior to December 15, 2015 is that of the Prior Account. |
| (2) | This is not a benchmark of the Fund. Results of the index performance are presented for general comparative purposes. |
| (3) | Index performance is from inception date of the Class only and is not the inception date of the index itself. |
BOSTON PARTNERS INVESTMENT FUNDS |
AVERAGE ANNUAL TOTAL RETURNS FOR THE PERIODS ENDED FEBRUARY 28, 2018 (concluded) (unaudited) |
| | | Average Annual |
| | Six Month† | 1 Year | 5 Year | 10 Year | Since
Inception |
Boston Partners Emerging Markets Fund | | | | | |
Institutional Class(1)(2) | N/A | N/A | N/A | N/A | 6.08% |
MSCI World Index(2)(3) | N/A | N/A | N/A | N/A | 5.05%(4) |
MSCI Emerging Markets Index(2) | N/A | N/A | N/A | N/A | 6.14%(4) |
| (1) | Inception date of the Fund was October 17, 2017. |
| (3) | This is not a primary benchmark of the Fund. Results of the index performance are presented for general comparative purposes. |
| (4) | Index performance is from inception date of the Class only and is not the inception date of the index itself. |
Performance quoted is past performance and does not guarantee future results. Investment return and principal value of an investment will fluctuate so that shares, when redeemed, may be worth more or less than their original cost. Boston Partners Global Investors, Inc. waived a portion of its advisory fee and agreed to reimburse a portion of each Fund’s operating expenses, if necessary, to maintain certain expense ratios as set forth in the notes to the financial statements. Total returns shown include fee waivers, expense reimbursements and expense recoupment, if any; total returns would have been lower had there been no assumption of fees and expenses in excess of expense limitations. Each Fund’s annual operating expense ratios below are as stated in the current prospectuses. These ratios may differ from the actual expenses incurred by a Fund for the period covered by this report. Returns shown include the reinvestment of all dividends and other distributions and do not reflect taxes that a shareholder would pay on Fund distributions or on the redemption of Fund shares. Current performance may be lower or higher than the returns quoted. Visit www.boston-partners.com for returns updated daily. Call 1-888-261-4073 for returns current to the most recent month-end.
Investors should note that the Funds are actively managed mutual funds while the indices are unmanaged, do not incur expenses and are not available for investment.
Small company stocks are generally riskier than large company stocks due to greater volatility and less liquidity.
Value investing involves the risk that a fund’s investment in companies whose securities are believed to be undervalued, relative to their underlying profitability, will not appreciate in value as anticipated.
A long/short strategy uses short sales, which theoretically involve unlimited loss potential since the market price of securities sold short may continuously increase. Increased leverage may cause a fund’s net asset value to be disproportionately volatile. The strategy also may generate high portfolio turnover, which may result in higher costs and capital gains.
International investing is subject to special risks including, but not limited to, currency risk associated with securities denominated in other than the U.S. dollar, which may be affected by fluctuations in currency exchange rates, political, social or economic instability, and differences in taxation, auditing and other financial practices. Investment in emerging market securities may increase these risks.
The following are the Funds’ gross annual operating expense ratios as stated in the most recent prospectuses, for Institutional Class and Investor Class, respectively, dated February 22, 2018:
| | Institutional
Class | Investor
Class |
Boston Partners Small Cap Value Fund II | 1.19% | 1.44% |
Boston Partners Long/Short Equity Fund | 2.81%(1) | 3.06%(1) |
Boston Partners Long/Short Research Fund | 2.24%(1) | 2.49%(1) |
Boston Partners All-Cap Value Fund | 0.89% | 1.14% |
WPG Partners Small/Micro Cap Value Fund | 1.29% | N/A |
Boston Partners Global Equity Fund | 1.05% | 1.30% |
Boston Partners Global Long/Short Fund | 2.64%(1) | 2.89%(1) |
Boston Partners Emerging Markets Long/Short Fund | 2.98%(1) | N/A |
Boston Partners Emerging Markets Fund | 1.34% | N/A |
1 | Includes interest and dividend expense on short sales. |
BOSTON PARTNERS INVESTMENT FUNDS |
FUND EXPENSE EXAMPLES February 28, 2018 (unaudited) |
As a shareholder of the Fund(s), you incur two types of costs: (1) transaction costs, if any, and (2) ongoing costs, including management fees, distribution and/or service (12b-1) fees, and other Fund expenses. These examples are intended to help you understand your ongoing costs (in dollars) of investing in the Fund(s) and to compare these costs with the ongoing costs of investing in other mutual funds.
These examples are based on an investment of $1,000 invested at the beginning of the six-month period from September 1, 2017 through February 28, 2018, and held for the entire period.
ACTUAL EXPENSES
The first line of the accompanying table provides information about actual account values and actual expenses. You may use the information in this line, together with the amount you invested, to estimate the expenses that you paid over the period. Simply divide your account value by $1,000 (for example, an $8,600 account value divided by $1,000 = 8.6), then multiply the result by the number in the first line under the heading entitled “Expenses Paid During Period” to estimate the expenses you paid on your account during this period.
HYPOTHETICAL EXAMPLES FOR COMPARISON PURPOSES
The second line of the accompanying table provides information about hypothetical account values and hypothetical expenses based on a Fund’s actual expense ratio and an assumed rate of return of 5% per year before expenses, which is not the Fund’s actual return. The hypothetical account values and expenses may not be used to estimate the actual ending account balance or expenses you paid for the period. You may use this information to compare the ongoing costs of investing in the Fund(s) and other funds. To do so, compare these 5% hypothetical examples with the 5% hypothetical examples that appear in the shareholder reports of other funds.
Please note that the expenses shown in the accompanying table are meant to highlight your ongoing costs only and do not reflect any transactional costs, if any. Therefore, the second line of the accompanying table is useful in comparing ongoing costs only and will not help you determine the relative total costs of owning different funds. In addition, if these transactional costs were included, your costs would have been higher.
| | Beginning Account
Value
September 1,
2017 | Ending
Account
Value
February 28,
2018* | Annualized
Expense
Ratio | Expenses
Paid During
Period** |
Boston Partners Small Cap Value Fund II | | | | |
Institutional | | | | |
Actual | $1,000.00 | $1,065.30 | 1.10% | $5.63 |
Hypothetical (5% return before expenses) | 1,000.00 | 1,019.34 | 1.10% | 5.51 |
| | | | | |
Investor | | | | |
Actual | $1,000.00 | $1,063.30 | 1.35% | $6.91 |
Hypothetical (5% return before expenses) | 1,000.00 | 1,018.10 | 1.35% | 6.76 |
Boston Partners Long/Short Equity Fund | | | | |
Institutional | | | | |
Actual | $1,000.00 | $1,035.70 | 3.12%(1) | $15.75 |
Hypothetical (5% return before expenses) | 1,000.00 | 1,009.32 | 3.12%(1) | 15.54 |
| | | | | |
Investor | | | | |
Actual | $1,000.00 | $1,034.50 | 3.37%(1) | $17.00 |
Hypothetical (5% return before expenses) | 1,000.00 | 1,008.08 | 3.37%(1) | 16.78 |
Boston Partners Long/Short Research Fund | | | | |
Institutional | | | | |
Actual | $1,000.00 | $1,058.40 | 1.96%(1) | $10.00 |
Hypothetical (5% return before expenses) | 1,000.00 | 1,015.08 | 1.96%(1) | 9.79 |
| | | | | |
Investor | | | | |
Actual | $1,000.00 | $1,056.90 | 2.21%(1) | $11.27 |
Hypothetical (5% return before expenses) | 1,000.00 | 1,013.84 | 2.21%(1) | 11.03 |
BOSTON PARTNERS INVESTMENT FUNDS |
FUND EXPENSE EXAMPLES (concluded) February 28, 2018 (unaudited) |
| | Beginning
Account
Value
September 1,
2017 | Ending
Account
Value
February 28,
2018* | Annualized
Expense
Ratio | Expenses
Paid During
Period** |
Boston Partners All-Cap Value Fund | | | | |
Institutional | | | | |
Actual | $1,000.00 | $1,103.10 | 0.80% | $4.17 |
Hypothetical (5% return before expenses) | 1,000.00 | 1,020.83 | 0.80% | 4.01 |
| | | | | |
Investor | | | | |
Actual | $1,000.00 | $1,102.00 | 1.05% | $5.47 |
Hypothetical (5% return before expenses) | 1,000.00 | 1,019.59 | 1.05% | 5.26 |
WPG Partners Small/Micro Cap Value Fund | | | | |
Institutional | | | | |
Actual | $1,000.00 | $1,041.00 | 1.10% | $5.57 |
Hypothetical (5% return before expenses) | 1,000.00 | 1,019.34 | 1.10% | 5.51 |
Boston Partners Global Equity Fund | | | | |
Institutional | | | | |
Actual | $1,000.00 | $1,090.50 | 0.95% | $4.92 |
Hypothetical (5% return before expenses) | 1,000.00 | 1,020.08 | 0.95% | 4.76 |
Boston Partners Global Long/Short Fund | | | | |
Institutional | | | | |
Actual | $1,000.00 | $1,041.40 | 2.29%(1) | $11.59 |
Hypothetical (5% return before expenses) | 1,000.00 | 1,013.44 | 2.29%(1) | 11.43 |
| | | | | |
Investor | | | | |
Actual | $1,000.00 | $1,040.90 | 2.54%(1) | $12.85 |
Hypothetical (5% return before expenses) | 1,000.00 | 1,012.20 | 2.54%(1) | 12.67 |
Boston Partners Emerging Markets Long/Short Fund | | | | |
Institutional | | | | |
Actual | $1,000.00 | $1,037.10 | 2.00%(1) | $10.10 |
Hypothetical (5% return before expenses) | 1,000.00 | 1,014.88 | 2.00%(1) | 9.99 |
Boston Partners Emerging Markets Fund(2) | | | | |
Institutional | | | | |
Actual(3) | $1,000.00 | $1,060.80 | 1.10% | $4.16 |
Hypothetical (5% return before expenses)(3) | 1,000.00 | 1,019.34 | 1.10% | 5.51 |
* | The Fund’s ending account values on the first line in each table are based on the actual six-month total return of 6.53% and 6.33% for the Institutional Class and Investor Class, respectively, of the Boston Partners Small Cap Value Fund II; 3.57% and 3.45% for the Institutional Class and Investor Class, respectively, of the Boston Partners Long/Short Equity Fund; 5.84% and 5.69% for the Institutional Class and Investor Class, respectively, of the Boston Partners Long/Short Research Fund; 10.31% and 10.20% for the Institutional Class and Investor Class, respectively, of the Boston Partners All-Cap Value Fund; 4.10% for the Institutional Class of the WPG Partners Small/Micro Cap Value Fund; 9.05% for the Institutional Class of the Boston Partners Global Equity Fund; 4.14% and 4.09% for the Institutional Class and Investor Class, respectively, of the Boston Partners Global Long/Short Fund; 3.71% for the Institutional Class of the Boston Partners Emerging Markets Long/Short Fund; and 6.08% for the Institutional Class of the Boston Partners Emerging Markets Fund (for the period beginning October 17, 2017 (commencement of operations) to February 28, 2018). |
** | Expenses are equal to each Fund’s annualized six-month expense ratios in the table above, which include waived fees or reimbursed expenses, multiplied by the average account value over the period, multiplied by the number of days (181) in the most recent fiscal half-year, then divided by 365 to reflect the one-half year period. |
(1) | These amounts include dividends paid on securities which the Funds have sold short (“Short-sale dividends”) and related interest expense. The amount of short-sale dividends and related interest expense was 0.75% of average net assets for the six-month period ended February 28, 2018 for both the Institutional Class and Investor Class of the Boston Partners Long/Short Equity Fund, 0.62% of average net assets for the Institutional Class and Investor Class of the Boston Partners Long/Short Research Fund, 0.65% of average net assets of the Institutional Class and Investor Class of the Boston Partners Global Long/Short Fund and 0.00% of average net assets for the Institutional Class of the Boston Partners Emerging Markets Long/Short Fund. |
(2) | Inception date of the Fund was October 17, 2017. |
(3) | Expenses are equal to the Fund’s annualized expense ratio for the period beginning October 17, 2017 (commencement of operations) to February 28, 2018 of 1.10%, multiplied by the average account value over the period, multiplied by the number of days (134) in the most recent period then divided by 365 days to reflect the days in the period. For comparison purposes, the hypothetical expenses are as if the Fund had been in existence from September 1, 2017 and are equal to the Fund’s annualized expense ratio, multiplied by the average account value over the period, multiplied by the number of days (181) in the most recent six-month period, then divided by 365 to reflect the period. |
BOSTON PARTNERS INVESTMENT FUNDS |
PORTFOLIO HOLDINGS SUMMARY TABLES February 28, 2018 (unaudited) |
BOSTON PARTNERS
SMALL CAP VALUE FUND II
Security Type/
Sector Classification | | % of Net
Assets | | | Value | |
| COMMON STOCK | | | | | | |
| Finance | | | 30.9 | % | | $ | 171,165,499 | |
| Consumer Services | | | 11.7 | | | | 64,660,259 | |
| Capital Goods | | | 10.7 | | | | 59,334,910 | |
| Technology | | | 10.6 | | | | 58,552,342 | |
| Basic Industries | | | 8.3 | | | | 45,868,998 | |
| Energy | | | 7.3 | | | | 40,634,652 | |
| Real Estate Investment Trusts | | | 6.9 | | | | 38,093,370 | |
| Health Care | | | 5.1 | | | | 28,031,708 | |
| Consumer Non-Durables | | | 3.8 | | | | 20,982,899 | |
| Consumer Durables | | | 2.3 | | | | 12,455,510 | |
| Communications | | | 0.8 | | | | 4,554,507 | |
| Utilities | | | 0.5 | | | | 2,813,786 | |
| SHORT-TERM INVESTMENTS | | | 22.3 | | | | 123,234,154 | |
| LIABILITIES IN EXCESS OF OTHER ASSETS | | | (21.2 | ) | | | (117,146,690 | ) |
| NET ASSETS | | | 100.0 | % | | $ | 553,235,904 | |
Portfolio holdings are subject to change at any time.
BOSTON PARTNERS
LONG/SHORT EQUITY FUND
Security Type/
Sector Classification | | % of Net
Assets | | | Value | |
| LONG POSITIONS: | | | | | | |
| COMMON STOCK | | | | | | |
| Finance | | | 17.8 | % | | $ | 164,415,428 | |
| Consumer Services | | | 15.0 | | | | 138,946,527 | |
| Energy | | | 14.7 | | | | 135,669,432 | |
| Technology | | | 10.2 | | | | 94,544,801 | |
| Capital Goods | | | 9.6 | | | | 88,831,623 | |
| Health Care | | | 8.7 | | | | 80,332,668 | |
| Basic Industries | | | 6.6 | | | | 60,407,197 | |
| Transportation | | | 5.6 | | | | 51,388,423 | |
| Consumer Non-Durables | | | 2.7 | | | | 25,356,846 | |
| Communications | | | 1.8 | | | | 16,833,354 | |
| Real Estate Investment Trusts | | | 1.7 | | | | 15,896,479 | |
| Consumer Durables | | | 1.6 | | | | 14,289,591 | |
| Utilities | | | 1.0 | | | | 9,177,213 | |
| EXCHANGE TRADED FUNDS | | | 0.6 | | | | 5,681,391 | |
| SHORT-TERM INVESTMENTS | | | 13.6 | | | | 125,726,781 | |
| | | | | | | | | |
| SHORT POSITIONS: | | | | | | | | |
| COMMON STOCK | | | | | | | | |
| Technology | | | (10.6 | ) | | | (98,028,032 | ) |
| Health Care | | | (9.2 | ) | | | (85,530,390 | ) |
| Consumer Services | | | (4.2 | ) | | | (38,931,695 | ) |
| Consumer Durables | | | (3.6 | ) | | | (32,897,394 | ) |
| Utilities | | | (2.2 | ) | | | (20,008,263 | ) |
| Capital Goods | | | (2.0 | ) | | | (18,257,894 | ) |
| Consumer Non-Durables | | | (1.6 | ) | | | (15,107,227 | ) |
| Communications | | | (1.2 | ) | | | (11,291,372 | ) |
| Finance | | | (1.2 | ) | | | (11,196,086 | ) |
| Real Estate Investment Trusts | | | (0.5 | )% | | | (4,371,854 | ) |
| Basic Industries | | | (0.2 | ) | | | (1,497,656 | ) |
| Energy | | | (0.0 | ) | | | (7 | ) |
| EXCHANGE TRADED FUNDS | | | (3.9 | ) | | | (35,755,771 | ) |
| OPTIONS WRITTEN | | | (0.0 | ) | | | (395,103 | ) |
| OTHER ASSETS IN EXCESS OF LIABILITIES | | | 29.2 | | | | 269,727,492 | |
| NET ASSETS | | | 100.0 | % | | $ | 923,956,502 | |
Portfolio holdings are subject to change at any time.
BOSTON PARTNERS
LONG/SHORT RESEARCH FUND
Security Type/
Sector Classification | | % of Net
Assets | | | Value | |
| LONG POSITIONS: | | | | | | |
| COMMON STOCK | | | | | | |
| Technology | | | 22.6 | % | | $ | 1,603,317,246 | |
| Finance | | | 19.7 | | | | 1,399,498,644 | |
| Capital Goods | | | 11.2 | | | | 791,961,794 | |
| Consumer Services | | | 9.8 | | | | 696,490,102 | |
| Health Care | | | 9.2 | | | | 655,758,741 | |
| Energy | | | 9.0 | | | | 641,281,243 | |
| Basic Industries | | | 5.3 | | | | 379,380,872 | |
| Consumer Non-Durables | | | 4.5 | | | | 319,863,283 | |
| Communications | | | 2.6 | | | | 184,446,180 | |
| Consumer Durables | | | 1.1 | | | | 77,720,725 | |
| Transportation | | | 0.6 | | | | 43,182,754 | |
| WARRANTS | | | 0.0 | | | | 367,505 | |
| SHORT-TERM INVESTMENTS | | | 3.5 | | | | 247,895,596 | |
| | | | | | | | | |
| SHORT POSITIONS: | | | | | | | | |
| COMMON STOCK | | | | | | | | |
| Technology | | | (8.8 | ) | | | (624,015,013 | ) |
| Finance | | | (7.3 | ) | | | (519,221,456 | ) |
| Consumer Services | | | (6.7 | ) | | | (475,314,275 | ) |
| Energy | | | (3.7 | ) | | | (260,914,416 | ) |
| Consumer Non-Durables | | | (3.3 | ) | | | (238,240,527 | ) |
| Capital Goods | | | (2.3 | ) | | | (160,498,564 | ) |
| Basic Industries | | | (2.1 | ) | | | (153,058,161 | ) |
| Health Care | | | (1.8 | ) | | | (127,859,098 | ) |
| Real Estate Investment Trusts | | | (1.7 | ) | | | (121,194,280 | ) |
| Communications | | | (1.2 | ) | | | (88,140,815 | ) |
| Utilities | | | (1.2 | ) | | | (85,845,272 | ) |
| Transportation | | | (0.8 | ) | | | (56,794,449 | ) |
| Consumer Durables | | | (0.8 | ) | | | (54,446,549 | ) |
| OTHER ASSETS IN EXCESS OF LIABILITIES | | | 42.6 | | | | 3,028,325,088 | |
| NET ASSETS | | | 100.0 | % | | $ | 7,103,946,898 | |
Portfolio holdings are subject to change at any time.
The accompanying notes are an integral part of the financial statements.
BOSTON PARTNERS INVESTMENT FUNDS |
PORTFOLIO HOLDINGS SUMMARY TABLES (continued) February 28, 2018 (unaudited) |
BOSTON PARTNERS
ALL-CAP VALUE FUND
Security Type/
Sector Classification | | % of Net
Assets | | | Value | |
| COMMON STOCK | | | | | | |
| Finance | | | 30.1 | % | | $ | 629,917,433 | |
| Technology | | | 24.8 | | | | 517,934,105 | |
| Health Care | | | 15.5 | | | | 323,244,051 | |
| Capital Goods | | | 7.0 | | | | 146,094,412 | |
| Energy | | | 6.5 | | | | 136,818,592 | |
| Consumer Services | | | 5.9 | | | | 122,270,275 | |
| Consumer Non-Durables | | | 2.7 | | | | 55,900,611 | |
| Basic Industries | | | 1.1 | | | | 23,270,157 | |
| Consumer Durables | | | 0.9 | | | | 19,458,714 | |
| Transportation | | | 0.6 | | | | 12,916,219 | |
| Communications | | | 0.4 | | | | 9,315,348 | |
| RIGHTS | | | 0.0 | | | | — | |
| SHORT-TERM INVESTMENTS | | | 12.9 | | | | 268,996,905 | |
| LIABILITIES IN EXCESS OF OTHER ASSETS | | | (8.4 | ) | | | (174,750,673 | ) |
| NET ASSETS | | | 100.0 | % | | $ | 2,091,386,149 | |
Portfolio holdings are subject to change at any time.
WPG PARTNERS
SMALL/MICRO CAP VALUE FUND
Security Type/
Sector Classification | | % of Net
Assets | | | Value | |
| COMMON STOCK | | | | | | |
| Finance | | | 28.2 | % | | $ | 8,664,313 | |
| Capital Goods | | | 15.8 | | | | 4,849,698 | |
| Consumer Services | | | 10.1 | | | | 3,100,172 | |
| Energy | | | 10.1 | | | | 3,096,317 | |
| Technology | | | 7.1 | | | | 2,184,951 | |
| Transportation | | | 6.5 | | | | 2,006,527 | |
| Real Estate Investment Trusts | | | 6.3 | | | | 1,950,320 | |
| Basic Industries | | | 4.9 | | | | 1,505,741 | |
| Utilities | | | 4.0 | | | | 1,247,857 | |
| Health Care | | | 2.3 | | | | 707,757 | |
| Consumer Durables | | | 1.8 | | | | 558,837 | |
| Consumer Non-Durables | | | 0.9 | | | | 272,772 | |
| Communications | | | 0.6 | | | | 178,920 | |
| WARRANTS | | | 0.1 | | | | 24,093 | |
| SHORT-TERM INVESTMENTS | | | 23.5 | | | | 7,228,154 | |
| LIABILITIES IN EXCESS OF OTHER ASSETS | | | (22.2 | ) | | | (6,825,054 | ) |
| NET ASSETS | | | 100.0 | % | | $ | 30,751,375 | |
Portfolio holdings are subject to change at any time.
BOSTON PARTNERS
GLOBAL EQUITY FUND
Security Type/
Sector Classification | | % of Net
Assets | | | Value | |
| COMMON STOCK | | | | | | |
| Financials | | | 24.4 | % | | $ | 160,718,222 | |
| Information Technology | | | 20.6 | | | | 135,919,594 | |
| Industrials | | | 12.3 | | | | 81,357,549 | |
| Energy | | | 8.5 | | | | 55,852,810 | |
| Materials | | | 7.7 | | | | 50,547,731 | |
| Health Care | | | 7.5 | | | | 49,241,312 | |
| Consumer Discretionary | | | 6.9 | | | | 45,715,738 | |
| Consumer Staples | | | 5.1 | | | | 33,696,788 | |
| Telecommunication Services | | | 1.9 | | | | 12,348,198 | |
| Utilities | | | 0.6 | | | | 4,324,514 | |
| PREFERRED STOCK | | | 0.5 | | | | 3,002,320 | |
| SHORT-TERM INVESTMENTS | | | 8.8 | | | | 58,178,724 | |
| LIABILITIES IN EXCESS OF OTHER ASSETS | | | (4.8 | ) | | | (31,716,484 | ) |
| NET ASSETS | | | 100.0 | % | | $ | 659,187,016 | |
Portfolio holdings are subject to change at any time.
BOSTON PARTNERS
GLOBAL LONG/SHORT FUND
Security Type/
Sector Classification | | % of Net
Assets | | | Value | |
| LONG POSITIONS: | | | | | | |
| COMMON STOCK | | | | | | |
| Financials | | | 22.4 | % | | $ | 226,907,328 | |
| Information Technology | | | 21.0 | | | | 212,018,900 | |
| Industrials | | | 12.6 | | | | 127,667,842 | |
| Energy | | | 8.9 | | | | 89,872,104 | |
| Materials | | | 8.0 | | | | 80,912,343 | |
| Health Care | | | 7.9 | | | | 79,890,186 | |
| Consumer Discretionary | | | 7.7 | | | | 77,479,970 | |
| Consumer Staples | | | 5.1 | | | | 52,058,420 | |
| Telecommunication Services | | | 1.9 | | | | 19,600,503 | |
| Utilities | | | 0.7 | | | | 6,866,247 | |
| PREFERRED STOCK | | | 0.4 | | | | 4,787,798 | |
| SHORT-TERM INVESTMENTS | | | 2.4 | | | | 24,042,866 | |
| | | | | | | | | |
| SHORT POSITIONS: | | | | | | | | |
| COMMON STOCK | | | | | | | | |
| Information Technology | | | (8.5 | ) | | | (86,433,084 | ) |
| Consumer Discretionary | | | (8.2 | ) | | | (82,766,689 | ) |
| Industrials | | | (7.5 | ) | | | (75,445,171 | ) |
| Financials | | | (4.8 | ) | | | (49,037,044 | ) |
| Materials | | | (3.9 | ) | | | (39,711,311 | ) |
| Consumer Staples | | | (3.2 | ) | | | (31,946,249 | ) |
| Energy | | | (3.1 | ) | | | (31,215,534 | ) |
| Health Care | | | (2.2 | ) | | | (22,045,849 | ) |
| Utilities | | | (0.6 | ) | | | (6,051,610 | ) |
| Real Estate | | | (0.5 | ) | | | (5,305,999 | ) |
| OPTIONS WRITTEN | | | (0.0 | ) | | | (364,375 | ) |
| OTHER ASSETS IN EXCESS OF LIABILITIES | | | 43.5 | | | | 439,872,146 | |
| NET ASSETS | | | 100.0 | % | | $ | 1,011,653,738 | |
Portfolio holdings are subject to change at any time.
The accompanying notes are an integral part of the financial statements.
8 | Semi-Annual Report 2018 |
BOSTON PARTNERS INVESTMENT FUNDS |
PORTFOLIO HOLDINGS SUMMARY TABLES (concluded) February 28, 2018 (unaudited) |
BOSTON PARTNERS
EMERGING MARKETS LONG/SHORT FUND
Security Type/
Sector Classification | | % of Net
Assets | | | Value | |
| LONG POSITIONS: | | | | | | |
| COMMON STOCK | | | | | | |
| Financials | | | 13.0 | % | | $ | 9,933,939 | |
| Information Technology | | | 9.5 | | | | 7,274,883 | |
| Consumer Discretionary | | | 8.2 | | | | 6,280,436 | |
| Consumer Staples | | | 6.8 | | | | 5,245,811 | |
| Telecommunication Services | | | 4.2 | | | | 3,260,697 | |
| Materials | | | 4.0 | | | | 3,095,516 | |
| Energy | | | 3.3 | | | | 2,503,297 | |
| Industrials | | | 3.2 | | | | 2,475,075 | |
| Utilities | | | 1.9 | | | | 1,437,492 | |
| Real Estate | | | 1.5 | | | | 1,131,003 | |
| Health Care | | | 1.3 | | | | 983,979 | |
| EXCHANGE TRADED FUNDS | | | 0.6 | | | | 450,519 | |
| PREFERRED STOCK | | | 5.1 | | | | 3,899,048 | |
| WARRANTS | | | 0.0 | | | | 4,006 | |
| SHORT-TERM INVESTMENTS | | | 32.7 | | | | 25,050,896 | |
| | | | | | | | | |
| SHORT POSITIONS: | | | | | | | | |
| COMMON STOCK | | | | | | | | |
| Health Care | | | (0.4 | ) | | | (294,172 | ) |
| OTHER ASSETS IN EXCESS OF LIABILITIES | | | 5.1 | | | | 3,929,341 | |
| NET ASSETS | | | 100.0 | % | | $ | 76,661,766 | |
Portfolio holdings are subject to change at any time.
BOSTON PARTNERS
EMERGING MARKETS FUND
Security Type/
Sector Classification | | % of Net
Assets | | | Value | |
| COMMON STOCK | | | | | | |
| Financials | | | 12.8 | % | | $ | 1,228,321 | |
| Consumer Discretionary | | | 11.6 | | | | 1,109,841 | |
| Information Technology | | | 9.8 | | | | 939,529 | |
| Consumer Staples | | | 5.8 | | | | 558,127 | |
| Materials | | | 4.0 | | | | 382,689 | |
| Telecommunication Services | | | 3.4 | | | | 327,215 | |
| Energy | | | 3.3 | | | | 317,342 | |
| Real Estate | | | 2.2 | | | | 208,930 | |
| Industrials | | | 2.1 | | | | 205,124 | |
| Communications | | | 2.0 | | | | 188,467 | |
| Utilities | | | 0.7 | | | | 66,180 | |
| Basic Industries | | | 0.7 | | | | 66,133 | |
| Consumer Non-Durables | | | 0.7 | | | | 61,819 | |
| Health Care | | | 0.5 | | | | 49,207 | |
| Technology | | | 0.4 | | | | 35,679 | |
| Consumer Services | | | 0.3 | | | | 27,135 | |
| EXCHANGE TRADED FUNDS | | | 3.0 | | | | 289,878 | |
| PREFERRED STOCK | | | 0.7 | | | | 69,030 | |
| SHORT-TERM INVESTMENTS | | | 36.3 | | | | 3,474,298 | |
| LIABILITIES IN EXCESS OF OTHER ASSETS | | | (0.3 | ) | | | (25,851 | ) |
| NET ASSETS | | | 100.0 | % | | $ | 9,579,093 | |
Portfolio holdings are subject to change at any time.
The accompanying notes are an integral part of the financial statements.
BOSTON PARTNERS INVESTMENT FUNDS |
BOSTON PARTNERS SMALL CAP VALUE FUND II Portfolio of Investments
February 28, 2018 (unaudited) |
| | | Number of
Shares | | | Value | |
| COMMON STOCKS—98.9% | | | | | | |
| Basic Industries—8.3% | | | | | | |
| Cambrex Corp.(a)* | | | 79,704 | | | $ | 4,140,623 | |
| Ferro Corp.* | | | 95,650 | | | | 2,045,953 | |
| Graphic Packaging Holding Co. | | | 400,696 | | | | 6,134,656 | |
| Innophos Holdings, Inc. | | | 72,762 | | | | 3,023,989 | |
| Orchids Paper Products Co.(a) | | | 98,179 | | | | 1,050,515 | |
| Orion Engineered Carbons SA | | | 132,486 | | | | 3,649,989 | |
| Owens-Illinois, Inc.* | | | 195,848 | | | | 4,222,483 | |
| PolyOne Corp. | | | 35,624 | | | | 1,471,627 | |
| PQ Group Holdings, Inc.* | | | 230,480 | | | | 3,088,432 | |
| Schweitzer-Mauduit International, Inc. | | | 128,875 | | | | 5,053,189 | |
| SunCoke Energy, Inc.(a)* | | | 503,164 | | | | 5,373,792 | |
| Valvoline, Inc.(a) | | | 288,684 | | | | 6,613,750 | |
| | | | | | | | 45,868,998 | |
| Capital Goods—10.7% | | | | | | | | |
| Aegion Corp.* | | | 115,507 | | | | 2,652,041 | |
| Ampco-Pittsburgh Corp. | | | 33,971 | | | | 346,504 | |
| BMC Stock Holdings, Inc.(a)* | | | 260,339 | | | | 4,881,356 | |
| Cabot Corp. | | | 26,860 | | | | 1,616,435 | |
| Continental Building Products, Inc.* | | | 73,106 | | | | 1,988,483 | |
| Engility Holdings, Inc.(a)* | | | 82,750 | | | | 2,259,903 | |
| Ferroglobe PLC* | | | 300,728 | | | | 4,859,764 | |
| Ferroglobe Representation & Warranty Insurance*(a)‡ | | | 276,005 | | | | 0 | |
| Foundation Building Materials, Inc.(a)* | | | 107,770 | | | | 1,475,371 | |
| Granite Construction, Inc. | | | 65,507 | | | | 3,805,957 | |
| Hillenbrand, Inc. | | | 41,138 | | | | 1,805,958 | |
| LCI Industries(a) | | | 50,501 | | | | 5,519,759 | |
| Minerals Technologies, Inc. | | | 77,211 | | | | 5,304,396 | |
| Orion Group Holdings, Inc.* | | | 250,954 | | | | 1,575,991 | |
| Trinseo SA | | | 37,288 | | | | 2,968,125 | |
| Tutor Perini Corp.(a)* | | | 144,287 | | | | 3,484,531 | |
| WESCO International, Inc.* | | | 138,676 | | | | 8,632,581 | |
| World Fuel Services Corp. | | | 269,486 | | | | 6,157,755 | |
| | | | | | | | 59,334,910 | |
| Communications—0.8% | | | | | | | | |
| AMC Networks, Inc. Class A(a)* | | | 86,637 | | | | 4,554,507 | |
| Consumer Durables—2.3% | | | | | | | | |
| Cooper Tire & Rubber Co.(a) | | | 121,749 | | | | 3,816,831 | |
| La-Z-Boy, Inc. | | | 100,684 | | | | 3,090,999 | |
| Standard Motor Products, Inc.(a) | | | 35,345 | | | | 1,649,198 | |
| Strattec Security Corp. | | | 17,514 | | | | 603,357 | |
| Tower International, Inc. | | | 126,250 | | | | 3,295,125 | |
| | | | | | | | 12,455,510 | |
| Consumer Non-Durables—3.8% | | | | | | | | |
| Energizer Holdings, Inc.(a) | | | 53,472 | | | | 2,913,154 | |
| Fresh Del Monte Produce, Inc.(a) | | | 85,780 | | | | 4,004,210 | |
| Skechers U.S.A., Inc. Class A* | | | 136,330 | | | | 5,578,624 | |
| Steven Madden Ltd. | | | 131,903 | | | | 5,790,542 | |
| Universal Corp.(a) | | | 54,860 | | | | 2,696,369 | |
| | | | | | | | 20,982,899 | |
| Consumer Services—11.7% | | | | | | | | |
| ABM Industries, Inc.(a) | | | 81,621 | | | | 2,869,794 | |
| ACCO Brands Corp. | | | 305,117 | | | | 3,859,730 | |
| Booz Allen Hamilton Holding Corp. | | | 42,007 | | | | 1,593,325 | |
| CBIZ, Inc.* | | | 115,323 | | | | 2,081,580 | |
| Civeo Corp.* | | | 411,854 | | | | 1,462,082 | |
| Ennis, Inc.(a) | | | 45,982 | | | | 896,649 | |
| Entercom Communications Corp. Class A(a) | | | 265,130 | | | | 2,624,787 | |
| FTI Consulting, Inc.* | | | 72,216 | | | | 3,443,981 | |
| Group 1 Automotive, Inc.(a) | | | 22,108 | | | | 1,521,915 | |
| Huron Consulting Group, Inc.* | | | 80,483 | | | | 2,816,905 | |
| ICF International, Inc. | | | 59,914 | | | | 3,415,098 | |
| Lithia Motors, Inc. Class A(a) | | | 98,621 | | | | 10,245,736 | |
| MAXIMUS, Inc. | | | 42,006 | | | | 2,813,562 | |
| Navigant Consulting, Inc.* | | | 127,535 | | | | 2,535,396 | |
| On Assignment, Inc.* | | | 104,180 | | | | 7,989,564 | |
| PRA Group, Inc.(a)* | | | 79,404 | | | | 3,041,173 | |
| Scholastic Corp.(a) | | | 55,689 | | | | 2,027,636 | |
| Tetra Tech, Inc. | | | 109,984 | | | | 5,383,717 | |
| TravelCenters of America LLC* | | | 168,439 | | | | 627,435 | |
| Viad Corp. | | | 31,511 | | | | 1,640,148 | |
| XO Group, Inc.* | | | 91,855 | | | | 1,770,046 | |
| | | | | | | | 64,660,259 | |
| Energy—7.3% | | | | | | | | |
| Cactus, Inc. Class A* | | | 81,273 | | | | 2,000,129 | |
| Dril-Quip, Inc.(a)* | | | 80,528 | | | | 3,627,786 | |
| Enerplus Corp. | | | 454,823 | | | | 5,025,794 | |
| Extraction Oil & Gas, Inc.(a)* | | | 240,267 | | | | 2,902,425 | |
| Forum Energy Technologies, Inc.(a)* | | | 207,730 | | | | 2,347,349 | |
| Gulfport Energy Corp.* | | | 153,035 | | | | 1,484,440 | |
| Jagged Peak Energy, Inc.(a)* | | | 248,998 | | | | 3,062,675 | |
| Key Energy Services, Inc.* | | | 111,126 | | | | 1,490,200 | |
| Kosmos Energy Ltd.(a)* | | | 381,200 | | | | 2,054,668 | |
| Nine Energy Service, Inc.* | | | 133,330 | | | | 3,638,576 | |
| ProPetro Holding Corp.(a)* | | | 105,777 | | | | 1,706,183 | |
| RSP Permian, Inc.* | | | 158,925 | | | | 6,088,417 | |
| Superior Energy Services, Inc.(a)* | | | 251,754 | | | | 2,152,497 | |
| WildHorse Resource Development Corp.(a)* | | | 179,830 | | | | 3,053,513 | |
| | | | | | | | 40,634,652 | |
| Finance—30.9% | | | | | | | | |
| Air Lease Corp. | | | 182,397 | | | | 7,965,277 | |
| AMERISAFE, Inc.(a) | | | 39,765 | | | | 2,226,840 | |
| Aspen Insurance Holdings Ltd. | | | 56,593 | | | | 2,059,985 | |
| Assured Guaranty Ltd. | | | 160,237 | | | | 5,540,995 | |
| Axis Capital Holdings Ltd. | | | 34,385 | | | | 1,696,556 | |
| BankUnited, Inc. | | | 140,571 | | | | 5,653,766 | |
| Cadence BanCorp | | | 101,507 | | | | 2,783,322 | |
| CenterState Banks, Inc. | | | 117,691 | | | | 3,205,903 | |
| Columbia Banking System, Inc. | | | 23,712 | | | | 990,687 | |
| Essent Group Ltd.* | | | 169,397 | | | | 7,638,111 | |
| FCB Financial Holdings, Inc., Class A* | | | 72,525 | | | | 3,890,966 | |
The accompanying notes are an integral part of the financial statements.
10 | Semi-Annual Report 2018 |
BOSTON PARTNERS INVESTMENT FUNDS |
BOSTON PARTNERS SMALL CAP VALUE FUND II Portfolio of Investments (continued)
February 28, 2018 (unaudited) |
| | | Number of
Shares | | | Value | |
| Finance—(continued) | | | | | | |
| Federal Agricultural Mortgage Corp., Class C | | | 48,910 | | | $ | 3,720,095 | |
| First Citizens BancShares Inc., Class A | | | 7,097 | | | | 2,889,189 | |
| First Merchants Corp.(a) | | | 78,970 | | | | 3,263,830 | |
| First Midwest Bancorp Inc.(a) | | | 97,051 | | | | 2,350,575 | |
| FirstCash, Inc. | | | 82,894 | | | | 6,109,288 | |
| Flushing Financial Corp. | | | 57,733 | | | | 1,541,471 | |
| Gladstone Capital Corp.(a) | | | 33,047 | | | | 285,526 | |
| Global Indemnity Ltd. Class A* | | | 30,786 | | | | 1,139,082 | |
| Greenhill & Co, Inc. | | | 62,578 | | | | 1,273,462 | |
| Hanmi Financial Corp. | | | 118,720 | | | | 3,626,896 | |
| Hanover Insurance Group Inc., (The) | | | 33,938 | | | | 3,662,250 | |
| Heritage Financial Corp.(a) | | | 74,267 | | | | 2,209,443 | |
| Hope Bancorp, Inc. | | | 118,819 | | | | 2,145,871 | |
| Infinity Property & Casualty Corp. | | | 19,947 | | | | 2,352,749 | |
| James River Group Holdings Ltd. | | | 89,432 | | | | 2,925,321 | |
| Luther Burbank Corp. | | | 193,201 | | | | 2,471,041 | |
| Maiden Holdings Ltd. | | | 658,340 | | | | 3,950,040 | |
| Merchants Bancorp | | | 85,346 | | | | 1,749,593 | |
| National General Holdings Corp. | | | 203,964 | | | | 4,687,093 | |
| Navient Corp.(a) | | | 598,825 | | | | 7,760,772 | |
| Navigators Group, Inc. (The) | | | 38,342 | | | | 2,066,634 | |
| Nelnet, Inc., Class A(a) | | | 136,459 | | | | 7,551,641 | |
| Peapack Gladstone Financial Corp. | | | 68,563 | | | | 2,261,208 | |
| PennyMac Financial Services, Inc. Class A* | | | 157,283 | | | | 3,664,694 | |
| Preferred Bank(a) | | | 27,124 | | | | 1,690,639 | |
| Radian Group, Inc. | | | 171,422 | | | | 3,517,579 | |
| RBB Bancorp | | | 64,797 | | | | 1,656,211 | |
| Silvercrest Asset Management Group, Inc. Class A | | | 172,910 | | | | 2,610,941 | |
| SLM Corp.* | | | 1,007,312 | | | | 10,989,774 | |
| South State Corp. | | | 13,186 | | | | 1,143,226 | |
| State Auto Financial Corp. | | | 48,362 | | | | 1,333,824 | |
| Stewart Information Services Corp. | | | 117,644 | | | | 4,721,054 | |
| Stifel Financial Corp. | | | 116,406 | | | | 7,434,851 | |
| Validus Holdings Ltd. | | | 59,152 | | | | 4,001,041 | |
| Walker & Dunlop, Inc.(a) | | | 170,053 | | | | 8,218,662 | |
| Washington Federal, Inc.(a) | | | 61,659 | | | | 2,139,567 | |
| White Mountains Insurance Group Ltd. | | | 2,972 | | | | 2,397,958 | |
| | | | | | | | 171,165,499 | |
| Health Care—5.1% | | | | | | | | |
| Chemed Corp. | | | 15,677 | | | | 4,070,220 | |
| Envision Healthcare Corp.* | | | 132,480 | | | | 5,100,480 | |
| ICON PLC* | | | 39,242 | | | | 4,446,511 | |
| Integra LifeSciences Holdings Corp.(a)* | | | 33,130 | | | | 1,746,945 | |
| LHC Group, Inc.(a)* | | | 37,175 | | | | 2,393,326 | |
| LifePoint Health, Inc.(a)* | | | 110,455 | | | | 5,091,975 | |
| Select Medical Holdings Corp.* | | | 109,265 | | | | 1,977,697 | |
| Syneos Health, Inc.* | | | 76,481 | | | | 3,204,554 | |
| | | | | | | | 28,031,708 | |
| Real Estate Investment Trusts—6.9% |
| Anworth Mortgage Asset Corp. | | | 264,833 | | | | 1,207,639 | |
| Ares Commercial Real Estate Corp. | | | 288,081 | | | | 3,549,158 | |
| Blackstone Mortgage Trust, Inc. Class A(a) | | | 179,293 | | | | 5,567,048 | |
| Chatham Lodging Trust(a) | | | 75,295 | | | | 1,369,616 | |
| CYS Investments, Inc. | | | 783,342 | | | | 4,950,721 | |
| Front Yard Residential Corp. | | | 55,713 | | | | 584,429 | |
| Gladstone Commercial Corp.(a) | | | 38,880 | | | | 657,461 | |
| MFA Financial, Inc.(a) | | | 619,957 | | | | 4,414,094 | |
| MTGE Investment Corp. | | | 63,130 | | | | 1,073,210 | |
| Realogy Holdings Corp.(a) | | | 222,844 | | | | 5,693,664 | |
| Starwood Property Trust, Inc. | | | 172,066 | | | | 3,484,337 | |
| Two Harbors Investment Corp.(a) | | | 377,263 | | | | 5,541,993 | |
| | | | | | | | 38,093,370 | |
| Technology—10.6% | | | | | | | | |
| Bel Fuse, Inc., Class B | | | 124,299 | | | | 2,150,373 | |
| Belden, Inc.(a) | | | 87,854 | | | | 6,389,621 | |
| Brooks Automation, Inc. | | | 261,081 | | | | 6,973,474 | |
| Ciena Corp.(a)* | | | 248,401 | | | | 5,755,451 | |
| Convergys Corp.(a) | | | 104,192 | | | | 2,418,296 | |
| EnerSys | | | 69,658 | | | | 4,854,466 | |
| EVERTEC, Inc. | | | 90,640 | | | | 1,468,368 | |
| Insight Enterprises, Inc.* | | | 42,104 | | | | 1,470,693 | |
| NCR Corp.(a)* | | | 120,133 | | | | 3,964,389 | |
| NETGEAR, Inc.* | | | 56,148 | | | | 3,130,251 | |
| PC Connection, Inc.(a) | | | 28,007 | | | | 695,414 | |
| SMART Global Holdings, Inc.* | | | 102,659 | | | | 3,564,320 | |
| Sykes Enterprises, Inc.* | | | 152,062 | | | | 4,418,922 | |
| SYNNEX Corp.(a) | | | 39,467 | | | | 4,880,095 | |
| TTEC Holdings, Inc.(a) | | | 152,609 | | | | 5,440,511 | |
| Versum Materials, Inc. | | | 26,410 | | | | 977,698 | |
| | | | | | | | 58,552,342 | |
| Utilities—0.5% | | | | | | | | |
| Portland General Electric Co. | | | 34,030 | | | | 1,352,012 | |
| Pure Cycle Corp.(a)* | | | 183,871 | | | | 1,461,774 | |
| | | | | | | | 2,813,786 | |
| TOTAL COMMON STOCKS (Cost $441,880,854) | | | | | | $ | 547,148,440 | |
The accompanying notes are an integral part of the financial statements.
Semi-Annual Report 2018 | 11 |
BOSTON PARTNERS INVESTMENT FUNDS |
BOSTON PARTNERS SMALL CAP VALUE FUND II Portfolio of Investments (concluded)
February 28, 2018 (unaudited) |
| | | Number of
Shares | | | Value | |
| SHORT-TERM INVESTMENTS—22.3% |
| Fidelity Investments Money Market Funds - Government Portfolio, 1.26% | | | 10,784,033 | | | $ | 10,784,033 | |
| Mount Vernon Liquid Assets Portfolio, LLC, 1.65% | | | 112,450,121 | | | | 112,450,121 | |
| TOTAL SHORT-TERM INVESTMENTS (Cost $123,234,154) | | | | | | | 123,234,154 | |
| TOTAL INVESTMENTS—121.2% | | | | | | | | |
| (Cost $565,115,008) | | | | | | | 670,382,594 | |
| LIABILITIES IN EXCESS OF OTHER ASSETS—(21.2)% | | | | | | | (117,146,690 | ) |
| NET ASSETS—100.0% | | | | | | $ | 553,235,904 | |
PLC | — | Public Limited Company |
(a) | — | All or a portion of the security is on loan. At February 28, 2018, the market value of securities on loan was $108,289,573. |
‡ | — | Security has been valued at fair market value as determined in good faith by or under the direction of The RBB Fund, Inc.'s Board of Directors. As of February 28, 2018, these securities amounted to $0 or 0.0% of net assets. |
A summary of the inputs used to value the Fund's investments carried at fair value as of February 28, 2018 is as follows (see Notes to Portfolio of Investments):
| | | Total | | | Level 1 | | | Level 2 | | | Level 3 | |
| Common Stocks | | $ | 547,148,440 | | | $ | 547,148,440 | | | $ | — | | | $ | — | |
| Short-Term Investments | | | 123,234,154 | | | | 123,234,154 | | | | — | | | | — | |
| Total Assets | | $ | 670,382,594 | | | $ | 670,382,594 | | | $ | — | | | $ | — | |
The accompanying notes are an integral part of the financial statements.
12 | Semi-Annual Report 2018 |
BOSTON PARTNERS INVESTMENT FUNDS |
BOSTON PARTNERS LONG/SHORT EQUITY FUND Portfolio of Investments
February 28, 2018 (unaudited) |
| | | Number of
Shares | | | Value | |
| LONG POSITIONS—111.2% | | | | | | |
| COMMON STOCKS—97.0% | | | | | | |
| Basic Industries—6.6% | | | | | | | | |
| Alcoa Corp.* | | | 89,367 | | | $ | 4,018,834 | |
| American Vanguard Corp. | | | 143,463 | | | | 2,797,529 | |
| BHP Billiton Ltd. - SP ADR(a) | | | 59,404 | | | | 2,762,286 | |
| CF Industries Holdings, Inc. | | | 72,251 | | | | 2,979,631 | |
| Constellium NV, Class A* | | | 221,026 | | | | 2,563,902 | |
| Freeport-McMoRan, Inc.(a)* | | | 343,232 | | | | 6,384,115 | |
| Monsanto Co.(a)† | | | 23,145 | | | | 2,855,399 | |
| Mosaic Co., (The)(a) | | | 153,260 | | | | 4,033,803 | |
| Nexeo Solutions, Inc.(a)* | | | 203,015 | | | | 1,886,009 | |
| Nucor Corp. | | | 56,163 | | | | 3,673,060 | |
| Nutrien Ltd. | | | 60,129 | | | | 2,961,353 | |
| POSCO - SP ADR† | | | 67,985 | | | | 5,591,087 | |
| Rio Tinto PLC - SP ADR† | | | 110,354 | | | | 6,037,467 | |
| RPM International, Inc. | | | 66,168 | | | | 3,293,181 | |
| Tahoe Resources, Inc. | | | 636,541 | | | | 3,106,320 | |
| Ternium SA - SP ADR | | | 129,101 | | | | 4,464,313 | |
| UFP Technologies, Inc.* | | | 35,111 | | | | 998,908 | |
| | | | | | | | 60,407,197 | |
| Capital Goods—9.6% | | | | | | | | |
| Aegion Corp.(a)* | | | 120,885 | | | | 2,775,520 | |
| Argan, Inc. | | | 56,449 | | | | 2,255,138 | |
| BMC Stock Holdings, Inc.* | | | 279,864 | | | | 5,247,450 | |
| Builders FirstSource, Inc.(a)* | | | 208,726 | | | | 4,003,365 | |
| CECO Environmental Corp. | | | 419,438 | | | | 1,723,890 | |
| Colfax Corp.* | | | 92,774 | | | | 2,949,285 | |
| Columbus McKinnon Corp.† | | | 95,387 | | | | 3,386,238 | |
| Daqo New Energy Corp. - ADR*† | | | 49,538 | | | | 2,434,297 | |
| DMC Global, Inc.(a) | | | 148,423 | | | | 3,146,568 | |
| Fairmount Santrol Holdings, Inc.(a)* | | | 599,531 | | | | 2,685,899 | |
| Ferroglobe PLC* | | | 181,975 | | | | 2,940,716 | |
| Ferroglobe Representation & Warranty Insurance*(a)‡ | | | 386,647 | | | | 0 | |
| Fluor Corp.† | | | 108,421 | | | | 6,169,155 | |
| FreightCar America, Inc. | | | 169,033 | | | | 2,499,998 | |
| General Electric Co. | | | 378,357 | | | | 5,338,617 | |
| Graham Corp. | | | 93,582 | | | | 1,891,292 | |
| Harsco Corp.* | | | 92,519 | | | | 1,873,510 | |
| Hexcel Corp.(a) | | | 46,892 | | | | 3,154,894 | |
| Jacobs Engineering Group, Inc. | | | 76,203 | | | | 4,652,955 | |
| KBR, Inc. | | | 216,471 | | | | 3,277,371 | |
| Manitex International, Inc.* | | | 432,058 | | | | 4,532,288 | |
| NCI Building Systems, Inc.(a)* | | | 225,623 | | | | 3,677,655 | |
| NOW, Inc.(a)* | | | 141,802 | | | | 1,345,701 | |
| Quanta Services, Inc.* | | | 58,362 | | | | 2,009,987 | |
| Safran SA - ADR(a) | | | 171,358 | | | | 4,719,885 | |
| Tutor Perini Corp.(a)*† | | | 191,210 | | | | 4,617,722 | |
| WESCO International, Inc.* | | | 37,826 | | | | 2,354,669 | |
| World Fuel Services Corp.† | | | 138,624 | | | | 3,167,558 | |
| | | | | | | | 88,831,623 | |
| Communications—1.8% | | | | | | | | |
| Comcast Corp., Class A† | | | 191,791 | | | | 6,944,752 | |
| KT Corp. - SP ADR* | | | 211,361 | | | | 2,806,874 | |
| Liberty Global PLC, Series C* | | | 145,536 | | | | 4,370,446 | |
| Liberty Latin America Ltd., Class C* | | | 132,581 | | | | 2,711,282 | |
| | | | | | | | 16,833,354 | |
| Consumer Durables—1.6% | | | | | | | | |
| Flexsteel Industries, Inc. | | | 30,824 | | | | 1,197,820 | |
| Honda Motor Co., Ltd. - SP ADR(a) | | | 159,819 | | | | 5,767,868 | |
| La-Z-Boy, Inc. | | | 133,389 | | | | 4,095,042 | |
| Leggett & Platt, Inc.(a) | | | 74,295 | | | | 3,228,861 | |
| | | | | | | | 14,289,591 | |
| Consumer Non-Durables—2.7% | | | | | | | | |
| Coca-Cola European Partners PLC | | | 97,808 | | | | 3,718,660 | |
| Fresh Del Monte Produce, Inc.(a) | | | 59,348 | | | | 2,770,365 | |
| Hostess Brands, Inc.(a)* | | | 225,030 | | | | 2,754,367 | |
| Leucadia National Corp.† | | | 185,615 | | | | 4,452,904 | |
| Molson Coors Brewing Co., Class B | | | 48,083 | | | | 3,666,329 | |
| Nomad Foods Ltd.*† | | | 236,708 | | | | 3,879,644 | |
| PVH Corp.† | | | 28,518 | | | | 4,114,577 | |
| | | | | | | | 25,356,846 | |
| Consumer Services—15.0% | | | | | | | | |
| ACCO Brands Corp. | | | 246,424 | | | | 3,117,264 | |
| Atento SA | | | 368,345 | | | | 3,517,695 | |
| Barrett Business Services, Inc.† | | | 42,716 | | | | 3,173,372 | |
| CarMax, Inc.(a)* | | | 42,828 | | | | 2,651,910 | |
| Civeo Corp.* | | | 960,682 | | | | 3,410,421 | |
| comScore, Inc.* | | | 78,796 | | | | 1,733,512 | |
| Conduent, Inc.* | | | 150,415 | | | | 2,842,843 | |
| Ctrip.com International Ltd. - ADR(a)* | | | 33,071 | | | | 1,520,605 | |
| CVS Health Corp.† | | | 76,507 | | | | 5,181,819 | |
| Dollar Tree, Inc.* | | | 35,353 | | | | 3,628,632 | |
| Drive Shack, Inc.(a)*† | | | 659,232 | | | | 3,329,122 | |
| DSW, Inc., Class A(a) | | | 175,694 | | | | 3,445,359 | |
| eBay, Inc.*† | | | 146,358 | | | | 6,272,904 | |
| Francesca's Holdings Corp.(a)* | | | 337,813 | | | | 1,760,006 | |
| Gray Television, Inc.(a)* | | | 186,298 | | | | 2,570,912 | |
| H&R Block, Inc.(a) | | | 113,998 | | | | 2,887,569 | |
| Hackett Group Inc., (The) | | | 206,339 | | | | 3,720,292 | |
| Heidrick & Struggles International, Inc. | | | 149,636 | | | | 3,950,390 | |
| ICF International, Inc. | | | 55,525 | | | | 3,164,925 | |
| IHS Markit Ltd.* | | | 59,472 | | | | 2,798,158 | |
| International Game Technology PLC† | | | 179,561 | | | | 4,758,366 | |
| JD.com, Inc. - ADR* | | | 63,635 | | | | 3,000,390 | |
| Jones Lang LaSalle, Inc. | | | 23,623 | | | | 3,794,090 | |
| KAR Auction Services, Inc.(a) | | | 62,795 | | | | 3,395,954 | |
| Korn/Ferry International | | | 93,154 | | | | 3,904,084 | |
| Kroger Co., (The) | | | 208,772 | | | | 5,661,897 | |
| Lions Gate Entertainment Corp. Class B | | | 121,624 | | | | 3,264,388 | |
The accompanying notes are an integral part of the financial statements.
Semi-Annual Report 2018 | 13 |
BOSTON PARTNERS INVESTMENT FUNDS |
BOSTON PARTNERS LONG/SHORT EQUITY FUND Portfolio of Investments (continued)
February 28, 2018 (unaudited) |
| | | Number of
Shares | | | Value | |
| Consumer Services—(continued) |
| Liquidity Services, Inc.* | | | 202,259 | | | $ | 1,385,474 | |
| ManpowerGroup, Inc. | | | 19,344 | | | | 2,291,490 | |
| National CineMedia, Inc.(a) | | | 159,301 | | | | 1,199,537 | |
| Nielsen Holdings PLC(a) | | | 73,146 | | | | 2,386,754 | |
| Perficient, Inc.* | | | 198,289 | | | | 3,860,687 | |
| Points International Ltd.* | | | 78,923 | | | | 822,378 | |
| PRGX Global, Inc.* | | | 161,819 | | | | 1,213,642 | |
| Signet Jewelers Ltd.(a) | | | 39,230 | | | | 1,972,484 | |
| Sirius XM Holdings, Inc.(a) | | | 319,316 | | | | 2,005,304 | |
| Stars Group Inc., (The)* | | | 165,887 | | | | 4,563,444 | |
| Tailored Brands, Inc.† | | | 142,675 | | | | 3,340,022 | |
| Tetra Tech, Inc. | | | 69,081 | | | | 3,381,515 | |
| Time Warner, Inc.† | | | 64,845 | | | | 6,027,991 | |
| Twenty-First Century Fox, Inc., Class A† | | | 129,833 | | | | 4,780,451 | |
| Walgreens Boots Alliance, Inc.(a) | | | 61,164 | | | | 4,213,588 | |
| Western Union Co. (The)(a) | | | 153,627 | | | | 3,044,887 | |
| | | | | | | | 138,946,527 | |
| Energy—14.7% | | | | | | | | |
| Anadarko Petroleum Corp. | | | 89,935 | | | | 5,129,892 | |
| Andeavor† | | | 45,913 | | | | 4,114,723 | |
| Archrock, Inc.(a) | | | 295,166 | | | | 2,804,077 | |
| Baker Hughes a GE Co.(a) | | | 193,299 | | | | 5,103,094 | |
| Basic Energy Services, Inc.*† | | | 220,833 | | | | 3,573,078 | |
| Canadian Natural Resources Ltd.† | | | 138,927 | | | | 4,370,643 | |
| CNX Resources Corp.* | | | 128,788 | | | | 2,069,623 | |
| Chevron Corp.† | | | 105,880 | | | | 11,850,090 | |
| Cimarex Energy Co. | | | 24,494 | | | | 2,353,628 | |
| Dawson Geophysical Co.(a)* | | | 228,365 | | | | 1,258,291 | |
| Dril-Quip, Inc.(a)* | | | 59,782 | | | | 2,693,179 | |
| Energen Corp.* | | | 60,281 | | | | 3,297,974 | |
| Enerplus Corp. | | | 336,234 | | | | 3,715,386 | |
| EOG Resources, Inc. | | | 44,951 | | | | 4,558,930 | |
| EQT Corp.† | | | 141,159 | | | | 7,101,709 | |
| Gulf Island Fabrication, Inc.(a) | | | 67,102 | | | | 553,591 | |
| Gulfport Energy Corp.* | | | 112,894 | | | | 1,095,072 | |
| Halliburton Co.† | | | 152,671 | | | | 7,086,988 | |
| Key Energy Services, Inc.(a)* | | | 187,823 | | | | 2,518,706 | |
| Kosmos Energy Ltd.(a)*† | | | 146,353 | | | | 788,843 | |
| LUKOIL PJSC - SP ADR | | | 33,853 | | | | 2,247,839 | |
| McDermott International, Inc.(a)* | | | 375,263 | | | | 2,739,420 | |
| Mitcham Industries, Inc.* | | | 381,308 | | | | 1,342,204 | |
| National Oilwell Varco, Inc.(a) | | | 104,422 | | | | 3,664,168 | |
| Oceaneering International, Inc.(a) | | | 233,576 | | | | 4,293,127 | |
| Parsley Energy, Inc., Class A* | | | 124,827 | | | | 3,155,627 | |
| PBF Energy, Inc. Class A | | | 91,664 | | | | 2,686,672 | |
| PetroChina Co., Ltd. - ADR | | | 41,934 | | | | 2,901,833 | |
| Phillips 66† | | | 102,013 | | | | 9,218,915 | |
| Pioneer Natural Resources Co. | | | 29,290 | | | | 4,986,037 | |
| SandRidge Energy, Inc.* | | | 112,840 | | | | 1,586,530 | |
| Schlumberger Ltd.† | | | 144,381 | | | | 9,477,169 | |
| Superior Energy Services, Inc.(a)* | | | 322,994 | | | | 2,761,599 | |
| Valero Energy Corp.† | | | 42,402 | | | | 3,833,989 | |
| Viper Energy Partners LP(a)† | | | 209,407 | | | | 4,736,786 | |
| | | | | | | | 135,669,432 | |
| Finance—17.8% | | | | | | | | |
| AerCap Holdings NV*† | | | 72,991 | | | | 3,621,083 | |
| Affiliated Managers Group, Inc.† | | | 25,042 | | | | 4,741,953 | |
| AMERCO(a) | | | 7,468 | | | | 2,568,992 | |
| American International Group, Inc.† | | | 105,221 | | | | 6,033,372 | |
| AmTrust Financial Services, Inc.(a)† | | | 509,398 | | | | 6,097,494 | |
| Aspen Insurance Holdings Ltd.† | | | 71,095 | | | | 2,587,858 | |
| Axis Capital Holdings Ltd.† | | | 41,628 | | | | 2,053,926 | |
| Bank of America Corp.† | | | 505,184 | | | | 16,216,406 | |
| Bank of the Ozarks | | | 74,019 | | | | 3,692,808 | |
| Bar Harbor Bankshares(a) | | | 19,990 | | | | 541,729 | |
| Berkshire Hathaway, Inc., Class B*† | | | 47,452 | | | | 9,832,054 | |
| BGC Partners, Inc., Class A | | | 92,411 | | | | 1,221,673 | |
| Century Bancorp, Inc., Class A† | | | 18,921 | | | | 1,453,133 | |
| Charles Schwab Corp., (The)† | | | 84,792 | | | | 4,495,672 | |
| Citigroup, Inc.† | | | 247,599 | | | | 18,691,248 | |
| Discover Financial Services† | | | 72,424 | | | | 5,709,184 | |
| Discovery Communications, Inc.(a)* | | | — | | | | 0 | |
| Fanhua, Inc. - SP ADR | | | 164,132 | | | | 5,482,009 | |
| Federated National Holding Co.(a) | | | 149,100 | | | | 2,303,595 | |
| JPMorgan Chase & Co.† | | | 67,504 | | | | 7,796,712 | |
| Lazard Ltd., Class A† | | | 87,916 | | | | 4,744,827 | |
| Loews Corp. | | | 67,298 | | | | 3,319,810 | |
| Maiden Holdings Ltd.† | | | 918,205 | | | | 5,509,230 | |
| MetLife, Inc. | | | 208,178 | | | | 9,615,742 | |
| Morgan Stanley† | | | 145,763 | | | | 8,165,643 | |
| Oaktree Capital Group LLC(a) | | | 78,931 | | | | 3,291,423 | |
| PennyMac Financial Services, Inc. Class A*† | | | 116,543 | | | | 2,715,452 | |
| State Street Corp.† | | | 61,122 | | | | 6,488,100 | |
| Stifel Financial Corp. | | | 49,669 | | | | 3,172,359 | |
| SVB Financial Group*† | | | 20,898 | | | | 5,203,184 | |
| Synchrony Financial† | | | 116,186 | | | | 4,228,009 | |
| White Mountains Insurance Group Ltd. | | | 3,496 | | | | 2,820,748 | |
| | | | | | | | 164,415,428 | |
| Health Care—8.7% | | | | | | | | |
| Allergan PLC(a) | | | 25,428 | | | | 3,921,506 | |
| Anthem, Inc.† | | | 24,349 | | | | 5,731,267 | |
| Carriage Services, Inc. | | | 114,753 | | | | 3,123,577 | |
| Cigna Corp.† | | | 23,599 | | | | 4,622,808 | |
| Five Star Senior Living, Inc.* | | | 598,297 | | | | 867,531 | |
| Fresenius Medical Care AG & Co. KGaA - ADR(a)† | | | 74,722 | | | | 3,946,816 | |
| HCA Healthcare, Inc.† | | | 53,675 | | | | 5,327,244 | |
| Johnson & Johnson | | | 71,609 | | | | 9,300,577 | |
| Keryx Biopharmaceuticals, Inc.(a)* | | | 201,307 | | | | 923,999 | |
| Laboratory Corp. of America Holdings*† | | | 37,043 | | | | 6,397,326 | |
| LHC Group, Inc.*† | | | 55,959 | | | | 3,602,640 | |
The accompanying notes are an integral part of the financial statements.
14 | Semi-Annual Report 2018 |
BOSTON PARTNERS INVESTMENT FUNDS |
BOSTON PARTNERS LONG/SHORT EQUITY FUND Portfolio of Investments (continued)
February 28, 2018 (unaudited) |
| | | Number of
Shares | | | Value | |
| Health Care—(continued) |
| Medtronic PLC†# | | | 88,101 | | | $ | 7,038,389 | |
| Mylan NV*† | | | 87,770 | | | | 3,538,886 | |
| Novartis AG - SP ADR | | | 79,868 | | | | 6,656,998 | |
| Paratek Pharmaceuticals, Inc.(a)* | | | 116,987 | | | | 1,532,530 | |
| Quest Diagnostics, Inc.(a) | | | 48,428 | | | | 4,990,505 | |
| Stericycle, Inc.(a)* | | | 35,207 | | | | 2,206,423 | |
| UnitedHealth Group, Inc.† | | | 29,199 | | | | 6,603,646 | |
| | | | | | | | 80,332,668 | |
| Real Estate Investment Trusts—1.7% |
| Colony NorthStar, Inc. Class A | | | 444,219 | | | | 3,456,024 | |
| Marcus & Millichap, Inc.* | | | 39,098 | | | | 1,223,767 | |
| MedEquities Realty Trust, Inc. | | | 355,983 | | | | 3,442,356 | |
| New Residential Investment Corp.† | | | 212,287 | | | | 3,424,189 | |
| Realogy Holdings Corp.(a)† | | | 94,670 | | | | 2,418,818 | |
| Wheeler Real Estate Investment Trust, Inc.(a) | | | 384,726 | | | | 1,931,325 | |
| | | | | | | | 15,896,479 | |
| Technology—10.2% | | | | | | | | |
| 51job, Inc. - ADR(a)* | | | 49,449 | | | | 3,237,426 | |
| Avnet, Inc. | | | 95,199 | | | | 4,064,997 | |
| Baidu, Inc. - SP ADR* | | | 16,821 | | | | 4,244,611 | |
| Capgemini SE - ADR | | | 186,228 | | | | 4,668,736 | |
| CDW Corp. | | | 43,354 | | | | 3,161,807 | |
| Citrix Systems, Inc.* | | | 44,659 | | | | 4,108,628 | |
| Cognizant Technology Solutions Corp., Class A†# | | | 63,576 | | | | 5,214,504 | |
| Dolby Laboratories, Inc. Class A† | | | 63,743 | | | | 4,114,611 | |
| Electronics For Imaging, Inc.(a)* | | | 71,895 | | | | 1,969,204 | |
| EVERTEC, Inc.(a) | | | 250,933 | | | | 4,065,115 | |
| First Data Corp., Class A* | | | 266,572 | | | | 4,163,855 | |
| Flex Ltd.*† | | | 269,075 | | | | 4,870,258 | |
| Generac Holdings, Inc.* | | | 67,062 | | | | 2,982,918 | |
| Hollysys Automation Technologies, Ltd. | | | 120,202 | | | | 3,174,535 | |
| Infosys Ltd. - SP ADR(a) | | | 186,873 | | | | 3,300,177 | |
| Insight Enterprises, Inc.* | | | 104,758 | | | | 3,659,197 | |
| InterDigital Inc. | | | 60,464 | | | | 4,341,315 | |
| International Business Machines Corp. | | | 36,956 | | | | 5,758,854 | |
| Net 1 UEPS Technologies, Inc.(a)* | | | 261,810 | | | | 2,683,553 | |
| NetEase, Inc. - ADR | | | 6,409 | | | | 1,880,080 | |
| PayPal Holdings, Inc.*† | | | 42,397 | | | | 3,366,746 | |
| Powell Industries, Inc. | | | 67,726 | | | | 1,803,543 | |
| Quality Systems, Inc.* | | | 168,686 | | | | 2,117,009 | |
| Sabre Corp.(a) | | | 104,887 | | | | 2,409,254 | |
| VeriFone Systems, Inc.* | | | 137,190 | | | | 2,277,354 | |
| VeriSign, Inc.(a)* | | | 22,223 | | | | 2,578,312 | |
| Zebra Technologies Corp., Class A* | | | 31,332 | | | | 4,328,202 | |
| | | | | | | | 94,544,801 | |
| Transportation—5.6% | | | | | | | | |
| AP Moller - Maersk A/S - ADR | | | 289,052 | | | | 2,373,117 | |
| Atlas Air Worldwide Holdings, Inc.(a)* | | | 50,028 | | | | 3,044,204 | |
| Controladora Vuela Cia de Aviacion SAB de CV - ADR(a)* | | | 179,919 | | | | 1,604,878 | |
| Dorian LPG Ltd.* | | | 275,060 | | | | 2,013,439 | |
| Expeditors International of Washington, Inc. | | | 41,878 | | | | 2,720,395 | |
| Forward Air Corp.(a) | | | 41,819 | | | | 2,258,226 | |
| Gener8 Maritime, Inc.(a)* | | | 415,116 | | | | 2,303,894 | |
| Golar LNG Partners LP | | | 108,162 | | | | 1,999,915 | |
| Grupo Aeroportuario del Centro Norte SAB de CV - ADR(a) | | | 71,609 | | | | 2,804,208 | |
| Overseas Shipholding Group, Inc., Class A* | | | 332,600 | | | | 588,702 | |
| Ryanair Holdings PLC - SP ADR* | | | 31,295 | | | | 3,794,832 | |
| Safe Bulkers, Inc.(a)* | | | 1,361,037 | | | | 4,981,395 | |
| Scorpio Bulkers, Inc.(a) | | | 304,688 | | | | 2,361,332 | |
| Scorpio Tankers, Inc. | | | 694,362 | | | | 1,597,033 | |
| SEACOR Marine Holdings, Inc.(a)* | | | 136,271 | | | | 2,305,705 | |
| Teekay LNG Partners LP | | | 192,444 | | | | 3,560,214 | |
| Teekay Offshore Partners LP | | | 750,210 | | | | 1,883,027 | |
| United Parcel Service, Inc. Class B | | | 59,001 | | | | 6,160,294 | |
| XPO Logistics, Inc.(a)* | | | 30,820 | | | | 3,033,613 | |
| | | | | | | | 51,388,423 | |
| Utilities—1.0% | | | | | | | | |
| Archrock Partners LP | | | 146,951 | | | | 1,942,692 | |
| Cheniere Energy, Inc.* | | | 75,350 | | | | 3,957,382 | |
| MPLX LP | | | 94,907 | | | | 3,277,139 | |
| | | | | | | | 9,177,213 | |
| TOTAL COMMON STOCKS (Cost $719,134,961) | | | | | | | 896,089,582 | |
| EXCHANGE TRADED FUNDS—0.6% |
| Energy—0.6% | | | | | | | | |
| Alerian MLP ETF(a) | | | 562,514 | | | | 5,681,391 | |
| TOTAL EXCHANGE TRADED FUNDS (Cost $5,772,731) | | | | | | | 5,681,391 | |
| SHORT-TERM INVESTMENTS—13.6% |
| Morgan Stanley Institutional Liquidity Funds - Treasury Portfolio, 1.29% | | | 14,172,061 | | | | 14,172,061 | |
| Mount Vernon Liquid Assets Portfolio, LLC, 1.65% | | | 111,554,720 | | | | 111,554,720 | |
| TOTAL SHORT-TERM INVESTMENTS (Cost $125,726,781) | | | | | | | 125,726,781 | |
| TOTAL LONG POSITIONS—111.2% | | | | | | | | |
| (Cost $850,634,473) | | | | | | | 1,027,497,754 | |
| SECURITIES SOLD SHORT—(40.4%) |
| COMMON STOCKS—(36.5%) | | | | | | | | |
| Basic Industries—(0.2%) | | | | | | | | |
| Kennady Diamonds, Inc.* | | | (45,900 | ) | | | (107,310 | ) |
| Tanzanian Royalty Exploration Corp.* | | | (171,865 | ) | | | (61,373 | ) |
The accompanying notes are an integral part of the financial statements.
Semi-Annual Report 2018 | 15 |
BOSTON PARTNERS INVESTMENT FUNDS |
BOSTON PARTNERS LONG/SHORT EQUITY FUND Portfolio of Investments (continued)
February 28, 2018 (unaudited) |
| | | Number of
Shares | | | Value | |
| Basic Industries—(continued) |
| Uranium Energy Corp.* | | | (1,022,287 | ) | | $ | (1,328,973 | ) |
| | | | | | | | (1,497,656 | ) |
| Capital Goods—(2.0%) | | | | | | | | |
| AAON, Inc. | | | (78,744 | ) | | | (2,893,842 | ) |
| Applied Energetics, Inc.* | | | (238,070 | ) | | | (14,332 | ) |
| Axon Enterprise, Inc.* | | | (132,338 | ) | | | (4,609,333 | ) |
| DynaMotive Energy Systems Corp.*‡ | | | (72,185 | ) | | | (7 | ) |
| EnviroStar, Inc. | | | (47,643 | ) | | | (1,643,683 | ) |
| John Bean Technologies Corp. | | | (28,464 | ) | | | (3,152,388 | ) |
| Tennant Co. | | | (55,777 | ) | | | (3,592,039 | ) |
| ZAGG, Inc.* | | | (156,297 | ) | | | (2,352,270 | ) |
| | | | | | | | (18,257,894 | ) |
| Communications—(1.2%) | | | | | | | | |
| CTC Communications Group, Inc.*‡ | | | (98,900 | ) | | | 0 | |
| Gogo, Inc.* | | | (261,676 | ) | | | (2,376,018 | ) |
| Netflix, Inc.* | | | (30,597 | ) | | | (8,915,354 | ) |
| | | | | | | | (11,291,372 | ) |
| Consumer Durables—(3.6%) | | | | | | | | |
| iRobot Corp.* | | | (38,172 | ) | | | (2,593,787 | ) |
| Kandi Technologies Group, Inc.* | | | (311,076 | ) | | | (1,679,810 | ) |
| Qsound Labs, Inc.*‡ | | | (4,440 | ) | | | (1 | ) |
| Sharp Corp.* | | | (99,000 | ) | | | (3,438,974 | ) |
| Tesla Motors, Inc.* | | | (63,871 | ) | | | (21,911,585 | ) |
| Universal Electronics, Inc.* | | | (66,126 | ) | | | (3,273,237 | ) |
| | | | | | | | (32,897,394 | ) |
| Consumer Non-Durables—(1.6%) |
| Amish Naturals, Inc.*‡ | | | (25,959 | ) | | | 0 | |
| elf Beauty, Inc.* | | | (198,573 | ) | | | (3,661,686 | ) |
| Freshpet, Inc.* | | | (120,194 | ) | | | (2,403,880 | ) |
| Funko, Inc., Class A* | | | (375,144 | ) | | | (2,768,563 | ) |
| National Beverage Corp. | | | (36,892 | ) | | | (3,613,202 | ) |
| Primo Water Corp.* | | | (218,382 | ) | | | (2,659,893 | ) |
| Valence Technology, Inc.*‡ | | | (27,585 | ) | | | (3 | ) |
| | | | | | | | (15,107,227 | ) |
| Consumer Services—(4.2%) | | | | | | | | |
| Brink's Co. (The) | | | (31,264 | ) | | | (2,297,904 | ) |
| Carvana Co.* | | | (76,230 | ) | | | (1,527,649 | ) |
| Cimpress NV* | | | (47,657 | ) | | | (7,756,177 | ) |
| Corporate Resource Services, Inc.* | | | (218,896 | ) | | | (394 | ) |
| Finish Line Inc., (The), Class A | | | (305,207 | ) | | | (3,241,298 | ) |
| Freshii, Inc.* | | | (140,986 | ) | | | (770,193 | ) |
| HelloFresh SE* | | | (202,008 | ) | | | (3,314,758 | ) |
| Jamba, Inc.* | | | (111,749 | ) | | | (963,277 | ) |
| Overstock.com, Inc.* | | | (47,473 | ) | | | (2,867,369 | ) |
| Red Robin Gourmet Burgers, Inc.* | | | (109,579 | ) | | | (5,878,913 | ) |
| Stitch Fix, Inc., Class A* | | | (54,373 | ) | | | (1,125,521 | ) |
| TransEnterix, Inc.* | | | (566,390 | ) | | | (1,076,141 | ) |
| Tuniu Corp. - SP ADR* | | | (309,373 | ) | | | (2,385,266 | ) |
| Wayfair, Inc. Class A* | | | (73,971 | ) | | | (5,726,835 | ) |
| | | | | | | | (38,931,695 | ) |
| Energy—0.0% | | | | | | | | |
| Beard Co.* | | | (9,710 | ) | | | (7 | ) |
| Finance—(1.2%) | | | | | | | | |
| Farmers & Merchants Bancorp Inc. | | | (66,887 | ) | | | (2,474,819 | ) |
| RLI Corp. | | | (79,791 | ) | | | (4,851,293 | ) |
| Trupanion, Inc.* | | | (130,610 | ) | | | (3,869,974 | ) |
| | | | | | | | (11,196,086 | ) |
| Health Care—(9.2%) | | | | | | | | |
| Abaxis, Inc. | | | (99,391 | ) | | | (6,626,398 | ) |
| Acorda Therapeutics, Inc.* | | | (102,208 | ) | | | (2,427,440 | ) |
| Analogic Corp. | | | (53,488 | ) | | | (4,466,248 | ) |
| AtriCure, Inc.* | | | (206,456 | ) | | | (3,648,078 | ) |
| AxoGen, Inc.* | | | (237,109 | ) | | | (6,923,583 | ) |
| BodyTel Scientific, Inc.*‡ | | | (4,840 | ) | | | (1 | ) |
| CareView Communications, Inc.* | | | (207,465 | ) | | | (7,054 | ) |
| Corindus Vascular Robotics, Inc.* | | | (624,000 | ) | | | (624,000 | ) |
| Cross Country Healthcare, Inc.* | | | (446,329 | ) | | | (5,779,961 | ) |
| Endologix, Inc.* | | | (213,502 | ) | | | (858,278 | ) |
| Exact Sciences Corp.* | | | (79,417 | ) | | | (3,542,792 | ) |
| Heska Corp.* | | | (71,578 | ) | | | (4,865,872 | ) |
| Illumina, Inc.* | | | (12,351 | ) | | | (2,816,275 | ) |
| Invacare Corp. | | | (255,350 | ) | | | (4,392,020 | ) |
| K2M Group Holdings, Inc.* | | | (144,654 | ) | | | (2,995,784 | ) |
| Luminex Corp. | | | (138,029 | ) | | | (2,706,749 | ) |
| Momenta Pharmaceuticals, Inc.* | | | (224,967 | ) | | | (3,835,687 | ) |
| Neogen Corp.* | | | (47,489 | ) | | | (2,767,184 | ) |
| OraSure Technologies, Inc.* | | | (331,724 | ) | | | (5,725,556 | ) |
| Quidel Corp.* | | | (84,926 | ) | | | (3,704,472 | ) |
| STAAR Surgical Co.* | | | (432,339 | ) | | | (6,787,722 | ) |
| Surgery Partners, Inc.* | | | (253,239 | ) | | | (4,013,838 | ) |
| Tactile Systems Technology, Inc.* | | | (104,427 | ) | | | (3,379,258 | ) |
| ViewRay, Inc.* | | | (317,225 | ) | | | (2,636,140 | ) |
| | | | | | | | (85,530,390 | ) |
| Real Estate Investment Trusts—(0.5%) |
| Redfin Corp.* | | | (212,329 | ) | | | (4,371,854 | ) |
| Technology—(10.6%) | | | | | | | | |
| 2U, Inc.* | | | (38,496 | ) | | | (3,186,699 | ) |
| 8x8, Inc.* | | | (143,509 | ) | | | (2,619,039 | ) |
| Alarm.com Holdings, Inc.* | | | (71,427 | ) | | | (2,581,015 | ) |
| Alteryx, Inc., Class A* | | | (98,297 | ) | | | (3,360,774 | ) |
| ANTs software, Inc.*‡ | | | (10,334 | ) | | | (1 | ) |
| Benefitfocus, Inc.* | | | (37,700 | ) | | | (912,340 | ) |
| Capstone Turbine Corp.* | | | (33,777 | ) | | | (30,987 | ) |
| Carbonite, Inc.* | | | (205,832 | ) | | | (5,794,171 | ) |
| Cavium, Inc.* | | | (34,283 | ) | | | (3,052,558 | ) |
| Consygen, Inc.*‡ | | | (200 | ) | | | 0 | |
| Eastman Kodak Co.* | | | (249,721 | ) | | | (1,311,035 | ) |
| Ener1, Inc.*‡ | | | (102,820 | ) | | | (10 | ) |
| Enphase Energy, Inc.* | | | (992,738 | ) | | | (3,295,890 | ) |
| FireEye, Inc.* | | | (204,041 | ) | | | (3,385,040 | ) |
| Harmonic, Inc.* | | | (538,497 | ) | | | (1,628,953 | ) |
| HubSpot, Inc.* | | | (30,613 | ) | | | (3,399,574 | ) |
| Inseego Corp.* | | | (801,495 | ) | | | (1,498,796 | ) |
| Interliant, Inc.*‡ | | | (600 | ) | | | 0 | |
The accompanying notes are an integral part of the financial statements.
16 | Semi-Annual Report 2018 |
BOSTON PARTNERS INVESTMENT FUNDS |
BOSTON PARTNERS LONG/SHORT EQUITY FUND Portfolio of Investments (continued)
February 28, 2018 (unaudited) |
| | | Number of
Shares | | | Value | |
| Technology—(continued) |
| Internap Corp.* | | | (169,436 | ) | | $ | (2,206,060 | ) |
| Knowles Corp.* | | | (248,326 | ) | | | (3,585,827 | ) |
| LivePerson, Inc.* | | | (208,460 | ) | | | (3,012,247 | ) |
| Lumentum Holdings, Inc.* | | | (94,325 | ) | | | (5,753,825 | ) |
| Materialise NV - ADR* | | | (222,600 | ) | | | (2,586,612 | ) |
| Medidata Solutions, Inc.* | | | (52,884 | ) | | | (3,472,363 | ) |
| MINDBODY, Inc. Class A* | | | (149,625 | ) | | | (5,334,131 | ) |
| Nestor, Inc.*‡ | | | (15,200 | ) | | | (2 | ) |
| New Relic, Inc.* | | | (54,392 | ) | | | (3,904,258 | ) |
| PDF Solutions, Inc.* | | | (180,304 | ) | | | (2,008,587 | ) |
| Proofpoint, Inc.* | | | (31,553 | ) | | | (3,381,535 | ) |
| PROS Holdings, Inc.* | | | (130,390 | ) | | | (4,087,727 | ) |
| Remark Holdings, Inc.* | | | (186,613 | ) | | | (1,395,865 | ) |
| Snap, Inc. Class A* | | | (226,843 | ) | | | (3,928,921 | ) |
| SunPower Corp.* | | | (302,711 | ) | | | (2,146,221 | ) |
| Tiger Telematics, Inc.*‡ | | | (6,510 | ) | | | 0 | |
| TrueCar, Inc.* | | | (254,294 | ) | | | (2,820,121 | ) |
| Twilio, Inc., Class A* | | | (89,844 | ) | | | (3,069,071 | ) |
| Uni-Pixel, Inc.* | | | (19,665 | ) | | | (71 | ) |
| Workiva, Inc.* | | | (196,798 | ) | | | (4,477,155 | ) |
| Worldgate Communications, Inc.*‡ | | | (582,655 | ) | | | (58 | ) |
| XRiver Corp.*‡ | | | (34,156 | ) | | | 0 | |
| Zendesk, Inc.* | | | (111,174 | ) | | | (4,800,493 | ) |
| | | | | | | | (98,028,032 | ) |
| Utilities—(2.2%) | | | | | | | | |
| Cadiz, Inc.* | | | (124,171 | ) | | | (1,719,768 | ) |
| California Water Service Group | | | (90,306 | ) | | | (3,427,113 | ) |
| Chesapeake Utilities Corp. | | | (42,510 | ) | | | (2,833,291 | ) |
| El Paso Electric Co. | | | (65,507 | ) | | | (3,183,640 | ) |
| MGE Energy, Inc. | | | (44,622 | ) | | | (2,342,655 | ) |
| New Jersey Resources Corp. | | | (40,857 | ) | | | (1,556,652 | ) |
| ONE Gas, Inc. | | | (24,589 | ) | | | (1,563,614 | ) |
| PNM Resources, Inc. | | | (45,604 | ) | | | (1,605,261 | ) |
| WGL Holdings, Inc. | | | (21,334 | ) | | | (1,776,269 | ) |
| | | | | | | | (20,008,263 | ) |
| TOTAL COMMON STOCKS (Proceeds $(306,601,908)) | | | | | | | (337,117,870 | ) |
| EXCHANGE TRADED FUNDS—(3.9%) |
| Finance—(3.9%) | | | | | | | | |
| iPATH S&P 500 VIX Short-Term Futures ETN* | | | (402,063 | ) | | | (17,831,494 | ) |
| iShares 20+ Year Treasury Bond ETF | | | (78,871 | ) | | | (9,365,931 | ) |
| SPDR Bloomberg Barclays International Treasury Bond ETF | | | (294,912 | ) | | | (8,558,346 | ) |
| | | | | | | | (35,755,771 | ) |
| TOTAL EXCHANGE TRADED FUNDS (Proceeds $(34,684,229)) | | | | | | | (35,755,771 | ) |
| TOTAL SECURITIES SOLD SHORT—(40.4%) (Proceeds $(341,286,137)) | | | | | | | (372,873,641 | ) |
| | | Number of
Contracts | | | Notional
Amount | | | Value | |
| OPTIONS WRITTEN††—0.0% |
| Call Options Written—(0.0%) |
| Sears Holdings Corp. | | | | | | | | | |
| Expiration: 01/18/2019, Exercise Price: 10.00 | | | (3,315 | ) | | | (802,230 | ) | | $ | (43,095 | ) |
| TOTAL CALL OPTIONS WRITTEN (Premiums received $(933,466)) | | | | | | | | | | | (43,095 | ) |
| Put Options Written—(0.0%) |
| Cognizant Technology Solutions Corp., Class A | | | | | | | | | | | | |
| Expiration: 01/18/2019, Exercise Price: 45.00 | | | (694 | ) | | | (5,692,188 | ) | | | (41,640 | ) |
| Medtronic PLC | | | | | | | | | | | | |
| Expiration: 01/18/2019, Exercise Price: 70.00 | | | (695 | ) | | | (5,552,355 | ) | | | (208,848 | ) |
| Wells Fargo & Co. | | | | | | | | | | | | |
| Expiration: 01/18/2019, Exercise Price: 40.00 | | | (1,692 | ) | | | (9,882,972 | ) | | | (101,520 | ) |
| TOTAL PUT OPTIONS WRITTEN (Premiums received $(1,937,914)) | | | | | | | | | | | (352,008 | ) |
| TOTAL OPTIONS WRITTEN (Premiums received $(2,871,380)) | | | | | | | | | | | (395,103 | ) |
| OTHER ASSETS IN EXCESS OF LIABILITIES—29.2% | | | | | | | | | | | 269,727,492 | |
| NET ASSETS—100.0% | | | | | | | | | | $ | 923,956,502 | |
ADR | — | American Depositary Receipt |
PLC | — | Public Limited Company |
SP ADR | — | Sponsored American Depositary Receipt |
(a) | — | All or a portion of the security is on loan. At February 28, 2018, the market value of securities on loan was $106,861,824. |
† | — | Security position is either entirely or partially held in a segregated account as collateral for securities sold short. |
‡ | — | Security has been valued at fair market value as determined in good faith by or under the direction of The RBB Fund, Inc.'s Board of Directors. As of February 28, 2018, short securities amounted to $(83) or 0.0% of net assets. |
# | — | Security segregated as collateral for options written. |
†† | — | Primary risk exposure is equity contracts. |
The accompanying notes are an integral part of the financial statements.
Semi-Annual Report 2018 | 17 |
BOSTON PARTNERS INVESTMENT FUNDS |
BOSTON PARTNERS LONG/SHORT EQUITY FUND Portfolio of Investments (concluded)
February 28, 2018 (unaudited) |
A summary of the inputs used to value the Fund's investments carried at fair value as of February 28, 2018 is as follows (see Notes to Portfolio of Investments):
| | | Total | | | Level 1 | | | Level 2 | | | Level 3 | |
| Common Stock | | | | | | | | | | | | |
| Basic Industries | | $ | 60,407,197 | | | $ | 60,407,197 | | | $ | — | | | $ | — | |
| Capital Goods | | | 88,831,623 | | | | 88,831,623 | | | | — | | | | — | |
| Communications | | | 16,833,354 | | | | 16,833,354 | | | | — | | | | — | |
| Consumer Durables | | | 14,289,591 | | | | 14,289,591 | | | | — | | | | — | |
| Consumer Non-Durables | | | 25,356,846 | | | | 25,356,846 | | | | — | | | | — | |
| Consumer Services | | | 138,946,527 | | | | 138,946,527 | | | | — | | | | — | |
| Energy | | | 135,669,432 | | | | 135,669,432 | | | | — | | | | — | |
| Finance | | | 164,415,428 | | | | 164,415,428 | | | | — | | | | — | |
| Health Care | | | 80,332,668 | | | | 80,332,668 | | | | — | | | | — | |
| Real Estate Investment Trusts | | | 15,896,479 | | | | 15,896,479 | | | | — | | | | — | |
| Technology | | | 94,544,801 | | | | 94,544,801 | | | | — | | | | — | |
| Transportation | | | 51,388,423 | | | | 51,388,423 | | | | — | | | | — | |
| Utilities | | | 9,177,213 | | | | 9,177,213 | | | | — | | | | — | |
| Exchange Traded Funds | | | 5,681,391 | | | | 5,681,391 | | | | — | | | | — | |
| Short-Term Investments | | | 125,726,781 | | | | 125,726,781 | | | | — | | | | — | |
| Total Assets | | $ | 1,027,497,754 | | | $ | 1,027,497,754 | | | $ | — | | | $ | — | |
| | | Total | | | Level 1 | | | Level 2 | | | Level 3 | |
| Securities Sold Short | | | | | | | | | | | | | | | | |
| Basic Industries | | $ | (1,497,656 | ) | | $ | (1,497,656 | ) | | $ | — | | | $ | — | |
| Capital Goods | | | (18,257,894 | ) | | | (18,257,887 | ) | | | — | | | | (7 | ) |
| Communications | | | (11,291,372 | ) | | | (11,291,372 | ) | | | — | | | | — | |
| Consumer Durables | | | (32,897,394 | ) | | | (29,458,419 | ) | | | (3,438,974 | ) | | | (1 | ) |
| Consumer Non-Durables | | | (15,107,227 | ) | | | (15,107,224 | ) | | | — | | | | (3 | ) |
| Consumer Services | | | (38,931,695 | ) | | | (38,931,301 | ) | | | (394 | ) | | | — | |
| Energy | | | (7 | ) | | | — | | | | (7 | ) | | | — | |
| Finance | | | (11,196,086 | ) | | | (11,196,086 | ) | | | — | | | | — | |
| Health Care | | | (85,530,390 | ) | | | (85,530,389 | ) | | | — | | | | (1 | ) |
| Real Estate Investment Trusts | | | (4,371,854 | ) | | | (4,371,854 | ) | | | — | | | | — | |
| Technology | | | (98,028,032 | ) | | | (98,027,961 | ) | | | — | | | | (71 | ) |
| Utilities | | | (20,008,263 | ) | | | (20,008,263 | ) | | | — | | | | — | |
| Exchange Traded Funds | | | (35,755,771 | ) | | | (35,755,771 | ) | | | — | | | | — | |
| Options Written | | | | | | | | | | | | | | | | |
| Equity Contracts | | | (395,103 | ) | | | (43,095 | ) | | | (352,008 | ) | | | — | |
| Total Liabilities | | $ | (373,268,744 | ) | | $ | (369,477,278 | ) | | $ | (3,791,383 | ) | | $ | (83 | ) |
The accompanying notes are an integral part of the financial statements.
18 | Semi-Annual Report 2018 |
BOSTON PARTNERS INVESTMENT FUNDS |
BOSTON PARTNERS LONG/SHORT RESEARCH FUND Portfolio of Investments
February 28, 2018 (unaudited) |
| | | Number of
Shares | | | Value | |
| LONG POSITIONS—99.1% | | | | | | |
| COMMON STOCKS—95.6% | | | | | | |
| Basic Industries—5.3% | | | | | | |
| Berry Global Group, Inc.*† | | | 405,722 | | | $ | 22,071,277 | |
| BHP Billiton PLC | | | 834,605 | | | | 16,943,414 | |
| Celanese Corp., Series A | | | 182,282 | | | | 18,384,963 | |
| DowDuPont, Inc. | | | 281,866 | | | | 19,815,180 | |
| FMC Corp. | | | 209,994 | | | | 16,480,329 | |
| Glencore PLC | | | 7,732,711 | | | | 40,663,923 | |
| Graphic Packaging Holding Co.† | | | 3,173,926 | | | | 48,592,807 | |
| Ivanhoe Mines Ltd., Class A* | | | 4,157,276 | | | | 10,464,465 | |
| Nutrien Ltd. | | | 700,845 | | | | 34,516,616 | |
| Peabody Energy Corp. | | | 512,682 | | | | 20,871,284 | |
| PQ Group Holdings, Inc.* | | | 952,928 | | | | 12,769,235 | |
| RPC Group PLC | | | 3,127,218 | | | | 34,452,934 | |
| Steel Dynamics, Inc. | | | 427,001 | | | | 19,748,796 | |
| Stornoway Diamond Corp.* | | | 26,913,645 | | | | 12,584,310 | |
| Valvoline, Inc. | | | 657,508 | | | | 15,063,508 | |
| WestRock Co.† | | | 546,804 | | | | 35,957,831 | |
| | | | | | | | 379,380,872 | |
| Capital Goods—11.2% | | | | | | | | |
| ABB Ltd. | | | 974,763 | | | | 23,676,993 | |
| AMETEK, Inc. | | | 547,294 | | | | 41,452,048 | |
| Arconic, Inc. | | | 780,173 | | | | 19,028,420 | |
| BAE Systems PLC | | | 1,641,507 | | | | 13,028,658 | |
| Bunzl PLC | | | 912,820 | | | | 24,500,240 | |
| Cemex SAB de CV - SP ADR* | | | 3,843,495 | | | | 25,174,892 | |
| CRH PLC | | | 725,838 | | | | 23,835,629 | |
| Cummins, Inc. | | | 121,652 | | | | 20,458,217 | |
| General Dynamics Corp.† | | | 266,196 | | | | 59,215,300 | |
| Honeywell International, Inc.† | | | 250,708 | | | | 37,884,486 | |
| Huntington Ingalls Industries, Inc. | | | 131,412 | | | | 34,431,258 | |
| L3 Technologies, Inc. | | | 119,959 | | | | 24,897,490 | |
| Lockheed Martin Corp.† | | | 128,100 | | | | 45,147,564 | |
| Masco Corp.† | | | 905,327 | | | | 37,227,046 | |
| Northrop Grumman Corp.† | | | 116,380 | | | | 40,737,655 | |
| Owens Corning | | | 177,307 | | | | 14,415,059 | |
| PACCAR, Inc. | | | 275,176 | | | | 19,699,850 | |
| Parker-Hannifin Corp. | | | 147,287 | | | | 26,286,311 | |
| Raytheon Co.† | | | 317,693 | | | | 69,101,404 | |
| Spirit AeroSystems Holdings, Inc. Class A | | | 286,493 | | | | 26,153,946 | |
| Textron, Inc.† | | | 1,019,030 | | | | 60,988,946 | |
| Trinseo SA | | | 350,714 | | | | 27,916,834 | |
| Tutor Perini Corp.* | | | 679,911 | | | | 16,419,851 | |
| United Technologies Corp.† | | | 333,195 | | | | 44,894,694 | |
| Vinci SA | | | 155,853 | | | | 15,389,003 | |
| | | | | | | | 791,961,794 | |
| Communications—2.6% | | | | | | | | |
| Comcast Corp., Class A† | | | 1,714,730 | | | | 62,090,373 | |
| Liberty Global PLC, Series C*† | | | 1,690,280 | | | | 50,759,109 | |
| Liberty Latin America Ltd. Class C*† | | | 517,925 | | | | 10,591,566 | |
| Verizon Communications, Inc.† | | | 688,904 | | | | 32,888,277 | |
| Vodafone Group PLC | | | 10,057,499 | | | | 28,116,855 | |
| | | | | | | | 184,446,180 | |
| Consumer Durables—1.1% | | | | | | | | |
| BorgWarner, Inc. | | | 730,268 | | | | 35,841,554 | |
| Fiat Chrysler Automobiles NV | | | 866,539 | | | | 18,361,961 | |
| Lear Corp. | | | 64,270 | | | | 11,990,854 | |
| PulteGroup, Inc. | | | 410,629 | | | | 11,526,356 | |
| | | | | | | | 77,720,725 | |
| Consumer Non-Durables—4.5% | | | | | | | | |
| Altria Group, Inc.† | | | 628,352 | | | | 39,554,758 | |
| Asahi Group Holdings Ltd. | | | 629,300 | | | | 32,179,421 | |
| Coca-Cola Bottlers Japan Holdings, Inc. | | | 150,200 | | | | 5,686,179 | |
| Coca-Cola European Partners PLC | | | 1,007,455 | | | | 38,303,439 | |
| Heineken Holding NV | | | 557,958 | | | | 55,500,963 | |
| Kirin Holdings Co. Ltd. | | | 1,127,700 | | | | 29,102,185 | |
| Nomad Foods Ltd.*† | | | 3,324,933 | | | | 54,495,652 | |
| PepsiCo, Inc. | | | 316,196 | | | | 34,696,187 | |
| Philip Morris International, Inc. | | | 293,042 | | | | 30,344,499 | |
| | | | | | | | 319,863,283 | |
| Consumer Services—9.8% | | | | | | | | |
| Alibaba Group Holding Ltd. - SP ADR* | | | 316,004 | | | | 58,820,985 | |
| CBS Corp., Class B† | | | 721,539 | | | | 38,219,921 | |
| CVS Health Corp.† | | | 579,505 | | | | 39,249,874 | |
| Dun & Bradstreet Corp. (The) | | | 134,425 | | | | 16,808,502 | |
| eBay, Inc.*† | | | 1,980,318 | | | | 84,876,430 | |
| Equiniti Group PLC | | | 2,371,153 | | | | 9,312,688 | |
| Hays PLC | | | 7,029,474 | | | | 18,701,515 | |
| Interpublic Group of Cos., Inc., (The) | | | 892,990 | | | | 20,895,966 | |
| Koninklijke Ahold Delhaize NV | | | 818,591 | | | | 18,379,075 | |
| Liberty Interactive Corp., Class A* | | | 1,680,628 | | | | 48,519,730 | |
| ManpowerGroup, Inc. | | | 144,426 | | | | 17,108,704 | |
| Moody's Corp. | | | 112,142 | | | | 18,714,257 | |
| Omnicom Group, Inc.† | | | 251,657 | | | | 19,183,813 | |
| Robert Half International, Inc.† | | | 594,734 | | | | 33,941,469 | |
| S&P Global, Inc. | | | 171,111 | | | | 32,819,090 | |
| Six Flags Entertainment Corp.† | | | 332,833 | | | | 21,331,267 | |
| Teleperformance | | | 121,336 | | | | 17,278,998 | |
| Tesco PLC | | | 12,500,791 | | | | 36,170,856 | |
| Time Warner, Inc.† | | | 383,189 | | | | 35,621,249 | |
| TJX Cos., Inc., (The) | | | 433,428 | | | | 35,835,827 | |
| Twenty-First Century Fox, Inc., Class A† | | | 1,075,112 | | | | 39,585,624 | |
| Western Union Co. (The) | | | 1,771,658 | | | | 35,114,262 | |
| | | | | | | | 696,490,102 | |
| Energy—9.0% | | | | | | | | |
| Anadarko Petroleum Corp. | | | 787,296 | | | | 44,907,364 | |
| Andeavor† | | | 314,458 | | | | 28,181,726 | |
| Cabot Oil & Gas Corp. | | | 619,438 | | | | 14,965,622 | |
| Cactus, Inc., Class A* | | | 1,036,119 | | | | 25,498,889 | |
| Chevron Corp.† | | | 287,257 | | | | 32,149,803 | |
The accompanying notes are an integral part of the financial statements.
Semi-Annual Report 2018 | 19 |
BOSTON PARTNERS INVESTMENT FUNDS |
BOSTON PARTNERS LONG/SHORT RESEARCH FUND Portfolio of Investments (continued)
February 28, 2018 (unaudited) |
| | | Number of
Shares | | | Value | |
| Energy—(continued) | | | | | | |
| Cimarex Energy Co. | | | 272,476 | | | $ | 26,182,219 | |
| ConocoPhillips | | | 777,194 | | | | 42,209,406 | |
| Diamondback Energy, Inc.* | | | 329,889 | | | | 41,117,365 | |
| Energen Corp.*† | | | 325,543 | | | | 17,810,458 | |
| Enerplus Corp. | | | 2,755,543 | | | | 30,471,599 | |
| EQT Corp.† | | | 746,768 | | | | 37,569,898 | |
| Hurricane Energy Plc* | | | 43,570,719 | | | | 18,943,008 | |
| Jagged Peak Energy, Inc.* | | | 1,354,578 | | | | 16,661,309 | |
| Marathon Petroleum Corp.† | | | 247,223 | | | | 15,837,105 | |
| Parsley Energy, Inc., Class A*† | | | 1,804,437 | | | | 45,616,167 | |
| Pioneer Natural Resources Co. | | | 282,427 | | | | 48,077,548 | |
| Royal Dutch Shell PLC, Class A | | | 1,464,997 | | | | 46,266,571 | |
| RSP Permian, Inc.* | | | 739,490 | | | | 28,329,862 | |
| Superior Energy Services, Inc.* | | | 2,584,281 | | | | 22,095,603 | |
| Targa Resources Corp. | | | 426,865 | | | | 19,059,522 | |
| Viper Energy Partners LP† | | | 670,036 | | | | 15,156,214 | |
| Vista Oil & Gas SAB de CV* | | | 1,204,819 | | | | 12,047,775 | |
| YPF SA - SP ADR | | | 524,717 | | | | 12,126,210 | |
| | | | | | | | 641,281,243 | |
| Finance—19.7% | | | | | | | | |
| Air Lease Corp. | | | 232,766 | | | | 10,164,891 | |
| Alleghany Corp.* | | | 52,837 | | | | 32,027,148 | |
| Allstate Corp., (The)† | | | 368,585 | | | | 34,005,652 | |
| American Express Co. | | | 151,957 | | | | 14,817,327 | |
| American International Group, Inc. | | | 670,327 | | | | 38,436,550 | |
| Aon PLC† | | | 213,573 | | | | 29,968,563 | |
| Aviva PLC | | | 5,556,260 | | | | 38,490,041 | |
| Bank of America Corp.† | | | 3,116,671 | | | | 100,045,139 | |
| BB&T Corp.† | | | 305,939 | | | | 16,627,785 | |
| Berkshire Hathaway, Inc., Class B*† | | | 221,797 | | | | 45,956,338 | |
| Capital One Financial Corp.† | | | 154,171 | | | | 15,097,966 | |
| Charles Schwab Corp., (The) | | | 496,962 | | | | 26,348,925 | |
| Chubb Ltd.† | | | 291,167 | | | | 41,322,421 | |
| Citigroup, Inc.† | | | 1,123,751 | | | | 84,831,963 | |
| Citizens Financial Group, Inc.† | | | 785,261 | | | | 34,151,001 | |
| Discover Financial Services† | | | 696,856 | | | | 54,933,159 | |
| DNB ASA | | | 1,217,328 | | | | 23,878,303 | |
| East West Bancorp, Inc. | | | 395,538 | | | | 25,927,516 | |
| Everest Re Group Ltd. | | | 100,245 | | | | 24,082,859 | |
| Fifth Third Bancorp† | | | 783,381 | | | | 25,890,742 | |
| Goldman Sachs Group, Inc., (The)† | | | 91,222 | | | | 23,985,000 | |
| Huntington Bancshares, Inc.† | | | 2,424,651 | | | | 38,067,021 | |
| JPMorgan Chase & Co.† | | | 726,416 | | | | 83,901,048 | |
| KeyCorp | | | 1,764,514 | | | | 37,284,181 | |
| Lloyds Banking Group PLC | | | 22,576,859 | | | | 21,331,475 | |
| Marsh & McLennan Cos., Inc. | | | 387,410 | | | | 32,162,778 | |
| Morgan Stanley | | | 361,341 | | | | 20,242,323 | |
| Navient Corp.† | | | 1,594,292 | | | | 20,662,024 | |
| Raymond James Financial, Inc. | | | 319,195 | | | | 29,592,568 | |
| Regions Financial Corp. | | | 1,957,802 | | | | 38,000,937 | |
| SLM Corp.* | | | 3,033,609 | | | | 33,096,674 | |
| Sompo Holdings, Inc. | | | 633,800 | | | | 24,240,251 | |
| State Street Corp.† | | | 238,694 | | | | 25,337,368 | |
| SunTrust Banks, Inc.† | | | 401,198 | | | | 28,019,668 | |
| Swiss Re AG | | | 244,895 | | | | 24,916,751 | |
| Synchrony Financial | | | 1,125,193 | | | | 40,945,773 | |
| TD Ameritrade Holding Corp.† | | | 465,947 | | | | 26,791,953 | |
| Travelers Cos., Inc., (The)† | | | 194,609 | | | | 27,050,651 | |
| US Bancorp | | | 168,071 | | | | 9,136,340 | |
| Wells Fargo & Co.† | | | 1,039,117 | | | | 60,694,824 | |
| XL Group Ltd. | | | 875,319 | | | | 37,034,747 | |
| | | | | | | | 1,399,498,644 | |
| Health Care—9.2% | | | | | | | | |
| Anthem, Inc.† | | | 175,912 | | | | 41,406,167 | |
| Cardinal Health, Inc.† | | | 535,675 | | | | 37,074,067 | |
| Cigna Corp.† | | | 169,280 | | | | 33,160,259 | |
| Express Scripts Holding Co.* | | | 438,582 | | | | 33,091,012 | |
| Fresenius SE & Co KGaA | | | 242,413 | | | | 19,696,766 | |
| Gilead Sciences, Inc. | | | 207,666 | | | | 16,349,544 | |
| Jazz Pharmaceuticals PLC* | | | 133,315 | | | | 19,304,012 | |
| Johnson & Johnson | | | 871,644 | | | | 113,209,123 | |
| Laboratory Corp. of America Holdings*† | | | 255,433 | | | | 44,113,279 | |
| McKesson Corp. | | | 220,739 | | | | 32,940,881 | |
| Medtronic PLC | | | 310,288 | | | | 24,788,908 | |
| Merck & Co., Inc.† | | | 954,634 | | | | 51,760,256 | |
| Novartis AG - SP ADR | | | 488,951 | | | | 40,754,066 | |
| Pfizer, Inc.† | | | 1,021,899 | | | | 37,105,153 | |
| Roche Holding AG | | | 65,884 | | | | 15,217,886 | |
| UnitedHealth Group, Inc. | | | 151,733 | | | | 34,315,935 | |
| Universal Health Services, Inc., Class B | | | 200,155 | | | | 22,857,701 | |
| Waters Corp.* | | | 188,691 | | | | 38,613,726 | |
| | | | | | | | 655,758,741 | |
| Technology—22.6% | | | | | | | | |
| Alliance Data Systems Corp. | | | 146,467 | | | | 35,292,688 | |
| Alphabet, Inc., Class A*† | | | 128,836 | | | | 142,224,637 | |
| Alphabet, Inc., Class C* | | | 32,058 | | | | 35,415,434 | |
| Amdocs Ltd.† | | | 610,979 | | | | 40,196,308 | |
| Apple, Inc. | | | 200,100 | | | | 35,641,812 | |
| Arrow Electronics, Inc.*† | | | 540,024 | | | | 44,055,158 | |
| Avnet, Inc. | | | 631,041 | | | | 26,945,451 | |
| Baidu, Inc. - SP ADR*† | | | 162,900 | | | | 41,106,186 | |
| Belden, Inc. | | | 320,037 | | | | 23,276,291 | |
| Broadcom Ltd.† | | | 243,201 | | | | 59,939,318 | |
| Capgemini SA | | | 318,685 | | | | 39,722,695 | |
| CDW Corp.† | | | 362,883 | | | | 26,465,057 | |
| Cisco Systems, Inc.† | | | 1,250,192 | | | | 55,983,598 | |
| CommScope Holding Co., Inc.* | | | 367,051 | | | | 14,208,544 | |
| Dell Technologies Inc., Class V* | | | 74,816 | | | | 5,558,081 | |
| DXC Technology Co.† | | | 833,221 | | | | 85,438,481 | |
| Eaton Corp. PLC | | | 384,211 | | | | 31,005,828 | |
| EnerSys | | | 182,935 | | | | 12,748,740 | |
| Flex Ltd.*† | | | 3,521,629 | | | | 63,741,485 | |
| Harris Corp.† | | | 559,858 | | | | 87,421,827 | |
| Hewlett Packard Enterprise Co.† | | | 2,029,357 | | | | 37,725,747 | |
| HP, Inc.† | | | 1,674,164 | | | | 39,158,696 | |
| Jabil, Inc.† | | | 332,971 | | | | 9,020,184 | |
The accompanying notes are an integral part of the financial statements.
20 | Semi-Annual Report 2018 |
BOSTON PARTNERS INVESTMENT FUNDS |
BOSTON PARTNERS LONG/SHORT RESEARCH FUND Portfolio of Investments (continued)
February 28, 2018 (unaudited) |
| | | Number of
Shares | | | Value | |
| Technology—(continued) | | | | | | |
| KLA-Tencor Corp. | | | 292,222 | | | $ | 33,111,675 | |
| Leidos Holdings, Inc.† | | | 542,505 | | | | 34,345,991 | |
| Marvell Technology Group Ltd.† | | | 2,336,340 | | | | 54,880,627 | |
| Micro Focus International PLC - SP ADR† | | | 364,398 | | | | 10,225,008 | |
| Microsoft Corp.† | | | 825,284 | | | | 77,386,881 | |
| NetApp, Inc. | | | 1,212,584 | | | | 73,421,961 | |
| NetEase, Inc. - ADR† | | | 118,885 | | | | 34,874,915 | |
| ON Semiconductor Corp.*† | | | 1,799,454 | | | | 43,042,940 | |
| Oracle Corp.† | | | 1,509,872 | | | | 76,505,214 | |
| Qorvo, Inc.* | | | 126,477 | | | | 10,207,959 | |
| Samsung Electronics Co., Ltd. | | | 35,437 | | | | 77,007,048 | |
| TE Connectivity Ltd.† | | | 606,051 | | | | 62,477,798 | |
| Versum Materials, Inc. | | | 635,791 | | | | 23,536,983 | |
| | | | | | | | 1,603,317,246 | |
| Transportation—0.6% | | | | | | | | |
| Delta Air Lines, Inc.† | | | 367,056 | | | | 19,784,319 | |
| Southwest Airlines Co. | | | 245,137 | | | | 14,178,724 | |
| United Continental Holdings, Inc.* | | | 136,004 | | | | 9,219,711 | |
| | | | | | | | 43,182,754 | |
| TOTAL COMMON STOCKS (Cost $5,149,989,322) | | | | | | | 6,792,901,584 | |
| WARRANTS—0.0% | | | | | | | | |
| Energy—0.0% | | | | | | | | |
| Vista Oil & Gas SAB de CV* | | | 1,204,819 | | | | 367,505 | |
| TOTAL WARRANTS (Cost $0) | | | | | | | 367,505 | |
| SHORT-TERM INVESTMENTS—3.5% |
| Morgan Stanley Institutional Liquidity Funds - Treasury Portfolio, 1.29% | | | 247,895,596 | | | | 247,895,596 | |
| TOTAL SHORT-TERM INVESTMENTS (Cost $247,895,596) | | | | | | | 247,895,596 | |
| TOTAL LONG POSITIONS—99.1% | | | | | | | | |
| (Cost $5,397,884,918) | | | | | | | 7,041,164,685 | |
| SECURITIES SOLD SHORT—(41.7%) |
| COMMON STOCKS—(41.7%) | | | | | | | | |
| Basic Industries—(2.1%) | | | | | | | | |
| Air Liquide SA | | | (135,080 | ) | | | (16,872,554 | ) |
| Antofagasta PLC | | | (1,593,099 | ) | | | (18,939,630 | ) |
| AptarGroup, Inc. | | | (188,036 | ) | | | (16,814,179 | ) |
| Balchem Corp. | | | (241,772 | ) | | | (18,193,343 | ) |
| Cameco Corp. | | | (2,155,964 | ) | | | (19,015,603 | ) |
| Greif, Inc., Class A | | | (190,709 | ) | | | (10,979,117 | ) |
| NewMarket Corp. | | | (53,751 | ) | | | (22,463,080 | ) |
| Quaker Chemical Corp. | | | (105,731 | ) | | | (15,069,839 | ) |
| Sonoco Products Co. | | | (306,667 | ) | | | (14,710,816 | ) |
| | | | | | | | (153,058,161 | ) |
| Capital Goods—(2.3%) | | | | | | | | |
| Acuity Brands, Inc. | | | (125,410 | ) | | | (17,880,958 | ) |
| Airbus Group SE | | | (126,037 | ) | | | (15,086,358 | ) |
| HB Fuller Co. | | | (243,967 | ) | | | (12,293,497 | ) |
| James Hardie Industries PLC | | | (845,545 | ) | | | (14,843,471 | ) |
| John Bean Technologies Corp. | | | (129,409 | ) | | | (14,332,047 | ) |
| Middleby Corp., (The)* | | | (152,273 | ) | | | (18,310,828 | ) |
| MTU Aero Engines AG | | | (128,063 | ) | | | (21,385,558 | ) |
| Rolls-Royce Holdings PLC | | | (2,127,235 | ) | | | (24,468,471 | ) |
| Sun Hydraulics Corp. | | | (222,217 | ) | | | (11,537,507 | ) |
| Wabtec Corp. | | | (127,365 | ) | | | (10,359,869 | ) |
| | | | | | | | (160,498,564 | ) |
| Communications—(1.2%) | | | | | | | | |
| Altice USA, Inc., Class A* | | | (665,563 | ) | | | (12,113,247 | ) |
| Cogent Communications Holdings, Inc. | | | (515,751 | ) | | | (22,099,930 | ) |
| SES SA | | | (1,025,922 | ) | | | (16,358,266 | ) |
| Shaw Communications, Inc., Class B | | | (426,278 | ) | | | (8,251,828 | ) |
| Sprint Corp.* | | | (2,115,333 | ) | | | (10,978,578 | ) |
| Telefonica SA | | | (962,899 | ) | | | (9,345,846 | ) |
| Telefonica SA - SP ADR | | | (933,865 | ) | | | (8,993,120 | ) |
| | | | | | | | (88,140,815 | ) |
| Consumer Durables—(0.8%) | | | | | | | | |
| Harley-Davidson, Inc. | | | (327,423 | ) | | | (14,858,456 | ) |
| Tesla Motors, Inc.* | | | (77,751 | ) | | | (26,673,258 | ) |
| Thor Industries, Inc. | | | (100,115 | ) | | | (12,914,835 | ) |
| | | | | | | | (54,446,549 | ) |
| Consumer Non-Durables—(3.3%) |
| B&G Foods, Inc. | | | (388,566 | ) | | | (10,763,278 | ) |
| Calbee, Inc. | | | (476,600 | ) | | | (15,870,453 | ) |
| Cal-Maine Foods, Inc.* | | | (361,552 | ) | | | (15,402,115 | ) |
| China Resources Beer Holdings Co., Ltd. | | | (4,408,000 | ) | | | (16,976,506 | ) |
| Cie Financiere Richemont SA | | | (139,414 | ) | | | (12,225,291 | ) |
| Coty, Inc. Class A | | | (1,310,719 | ) | | | (25,323,091 | ) |
| Gildan Activewear, Inc. | | | (503,185 | ) | | | (14,567,206 | ) |
| Hain Celestial Group Inc., (The)* | | | (193,961 | ) | | | (6,745,964 | ) |
| Industria de Diseno Textil SA | | | (447,718 | ) | | | (13,555,220 | ) |
| International Flavors & Fragrances, Inc. | | | (80,263 | ) | | | (11,337,149 | ) |
| Kimberly-Clark de Mexico SAB de CV, Class A | | | (4,644,700 | ) | | | (8,441,482 | ) |
| Mattel, Inc. | | | (1,067,628 | ) | | | (16,975,285 | ) |
| McCormick & Co., Inc. | | | (152,230 | ) | | | (16,255,119 | ) |
| PRADA SpA | | | (2,949,800 | ) | | | (12,201,025 | ) |
| Treasury Wine Estates Ltd. | | | (1,076,400 | ) | | | (14,540,605 | ) |
| Tsingtao Brewery Co., Ltd. Class H | | | (1,456,000 | ) | | | (7,958,091 | ) |
| Under Armour, Inc., Class A* | | | (1,152,150 | ) | | | (19,102,647 | ) |
| | | | | | | | (238,240,527 | ) |
| Consumer Services—(6.7%) | | | | | | | | |
| Acxiom Corp.* | | | (523,252 | ) | | | (14,321,407 | ) |
| CarMax, Inc.* | | | (202,591 | ) | | | (12,544,435 | ) |
| Casey's General Stores, Inc. | | | (196,147 | ) | | | (22,029,270 | ) |
| Chegg, Inc.* | | | (1,328,278 | ) | | | (26,446,015 | ) |
| Chipotle Mexican Grill, Inc.* | | | (41,387 | ) | | | (13,178,035 | ) |
The accompanying notes are an integral part of the financial statements.
Semi-Annual Report 2018 | 21 |
BOSTON PARTNERS INVESTMENT FUNDS |
BOSTON PARTNERS LONG/SHORT RESEARCH FUND Portfolio of Investments (continued)
February 28, 2018 (unaudited) |
| | | Number of
Shares | | | Value | |
| Consumer Services—(continued) |
| Cimpress NV* | | | (209,300 | ) | | $ | (34,063,575 | ) |
| Cracker Barrel Old Country Store, Inc. | | | (83,874 | ) | | | (13,092,731 | ) |
| Dentsu, Inc. | | | (269,300 | ) | | | (12,368,185 | ) |
| Domino's Pizza Enterprises Ltd. | | | (493,103 | ) | | | (15,086,079 | ) |
| Edenred | | | (418,145 | ) | | | (14,671,021 | ) |
| Eutelsat Communications SA | | | (460,052 | ) | | | (10,747,723 | ) |
| FactSet Research Systems, Inc. | | | (78,837 | ) | | | (16,018,102 | ) |
| Houghton Mifflin Harcourt Co.* | | | (1,542,685 | ) | | | (10,490,258 | ) |
| Just Eat PLC* | | | (1,628,166 | ) | | | (19,564,240 | ) |
| Kingfisher PLC | | | (3,069,077 | ) | | | (15,105,464 | ) |
| L Brands, Inc. | | | (270,312 | ) | | | (13,334,491 | ) |
| Multi-Color Corp. | | | (206,168 | ) | | | (13,060,743 | ) |
| Murphy USA, Inc.* | | | (223,421 | ) | | | (16,781,151 | ) |
| Next PLC | | | (200,992 | ) | | | (13,404,213 | ) |
| Norwegian Cruise Line Holdings Ltd.* | | | (335,328 | ) | | | (19,080,163 | ) |
| Papa John's International, Inc. | | | (289,024 | ) | | | (16,688,246 | ) |
| Pearson PLC | | | (2,719,835 | ) | | | (27,390,503 | ) |
| Planet Fitness, Inc., Class A* | | | (338,722 | ) | | | (12,525,940 | ) |
| Ritchie Bros. Auctioneers, Inc. | | | (783,256 | ) | | | (25,369,662 | ) |
| Rollins, Inc. | | | (277,590 | ) | | | (13,954,449 | ) |
| Wayfair, Inc. Class A* | | | (244,767 | ) | | | (18,949,861 | ) |
| Wendy's Co. (The) | | | (817,029 | ) | | | (13,031,613 | ) |
| Zalando SE* | | | (386,864 | ) | | | (22,016,700 | ) |
| | | | | | | | (475,314,275 | ) |
| Energy—(3.7%) | | | | | | | | |
| Antero Resources Corp.* | | | (962,581 | ) | | | (18,106,149 | ) |
| Apache Corp. | | | (429,827 | ) | | | (14,678,592 | ) |
| Carrizo Oil & Gas, Inc.* | | | (531,351 | ) | | | (7,465,482 | ) |
| Core Laboratories NV | | | (109,837 | ) | | | (11,308,817 | ) |
| Ecopetrol SA - SP ADR | | | (931,971 | ) | | | (16,318,812 | ) |
| Helmerich & Payne, Inc. | | | (370,796 | ) | | | (23,934,882 | ) |
| Hess Corp. | | | (553,267 | ) | | | (25,129,387 | ) |
| Imperial Oil Ltd. | | | (864,568 | ) | | | (23,413,137 | ) |
| Murphy Oil Corp. | | | (959,426 | ) | | | (24,321,449 | ) |
| National Oilwell Varco, Inc. | | | (1,019,601 | ) | | | (35,777,799 | ) |
| Oasis Petroleum, Inc.* | | | (1,654,638 | ) | | | (13,038,547 | ) |
| PrairieSky Royalty Ltd. | | | (779,352 | ) | | | (17,291,265 | ) |
| Range Resources Corp. | | | (1,525,895 | ) | | | (20,279,145 | ) |
| RPC, Inc. | | | (501,576 | ) | | | (9,850,953 | ) |
| | | | | | | | (260,914,416 | ) |
| Finance—(7.3%) | | | | | | | | |
| Bank of East Asia Ltd., (The) | | | (2,977,606 | ) | | | (13,107,569 | ) |
| Bankinter SA | | | (1,497,065 | ) | | | (16,453,989 | ) |
| CaixaBank SA | | | (2,243,921 | ) | | | (10,894,831 | ) |
| Canadian Western Bank | | | (715,264 | ) | | | (21,142,428 | ) |
| Cincinnati Financial Corp. | | | (233,701 | ) | | | (17,431,758 | ) |
| Commonwealth Bank of Australia | | | (221,820 | ) | | | (13,055,736 | ) |
| Community Bank System, Inc. | | | (350,852 | ) | | | (18,703,920 | ) |
| Credit Suisse Group AG | | | (867,338 | ) | | | (15,960,912 | ) |
| Cullen/Frost Bankers, Inc. | | | (135,972 | ) | | | (14,139,728 | ) |
| CVB Financial Corp. | | | (711,691 | ) | | | (16,368,893 | ) |
| Eaton Vance Corp. | | | (556,404 | ) | | | (29,450,464 | ) |
| Financial Engines, Inc. | | | (459,914 | ) | | | (15,407,119 | ) |
| First Financial Bankshares, Inc. | | | (763,107 | ) | | | (35,102,922 | ) |
| Glacier Bancorp, Inc. | | | (441,956 | ) | | | (17,192,088 | ) |
| Independent Bank Corp. | | | (173,527 | ) | | | (12,042,774 | ) |
| Investors Bancorp, Inc. | | | (835,047 | ) | | | (11,273,135 | ) |
| LendingClub Corp.* | | | (2,417,214 | ) | | | (7,614,224 | ) |
| M&T Bank Corp. | | | (57,791 | ) | | | (10,971,043 | ) |
| Markel Corp.* | | | (16,472 | ) | | | (18,316,864 | ) |
| Mobile Mini, Inc. | | | (622,340 | ) | | | (26,107,163 | ) |
| New York Community Bancorp, Inc. | | | (860,944 | ) | | | (11,726,057 | ) |
| People's United Financial, Inc. | | | (858,553 | ) | | | (16,432,704 | ) |
| Prosperity Bancshares, Inc. | | | (245,968 | ) | | | (18,447,600 | ) |
| RLI Corp. | | | (347,511 | ) | | | (21,128,669 | ) |
| Trustmark Corp. | | | (494,555 | ) | | | (15,449,898 | ) |
| UMB Financial Corp. | | | (191,426 | ) | | | (13,974,098 | ) |
| United Bankshares, Inc. | | | (374,899 | ) | | | (13,308,915 | ) |
| Valley National Bancorp | | | (1,054,824 | ) | | | (13,153,655 | ) |
| Verisk Analytics, Inc.* | | | (137,946 | ) | | | (14,096,702 | ) |
| Westamerica Bancorporation | | | (465,289 | ) | | | (26,656,407 | ) |
| WisdomTree Investments, Inc. | | | (1,468,178 | ) | | | (14,109,191 | ) |
| | | | | | | | (519,221,456 | ) |
| Health Care—(1.8%) | | | | | | | | |
| Alkermes PLC* | | | (310,701 | ) | | | (17,734,813 | ) |
| Coloplast A/S, Class B | | | (150,156 | ) | | | (12,689,653 | ) |
| Insulet Corp.* | | | (146,294 | ) | | | (10,985,216 | ) |
| Nevro Corp.* | | | (135,974 | ) | | | (11,030,211 | ) |
| Ono Pharmaceutical Co., Ltd. | | | (623,100 | ) | | | (18,146,281 | ) |
| Penumbra, Inc.* | | | (108,847 | ) | | | (11,777,245 | ) |
| Stericycle, Inc.* | | | (129,019 | ) | | | (8,085,621 | ) |
| Taisho Pharmaceutical Holdings Co., Ltd. | | | (182,000 | ) | | | (16,514,404 | ) |
| West Pharmaceutical Services, Inc. | | | (123,217 | ) | | | (10,746,987 | ) |
| Wright Medical Group NV* | | | (498,706 | ) | | | (10,148,667 | ) |
| | | | | | | | (127,859,098 | ) |
| Real Estate Investment Trusts—(1.7%) |
| Equinix, Inc. | | | (69,228 | ) | | | (27,144,299 | ) |
| Extra Space Storage, Inc. | | | (298,031 | ) | | | (25,347,536 | ) |
| Iron Mountain, Inc. | | | (490,582 | ) | | | (15,433,710 | ) |
| Lamar Advertising Co. Class A | | | (228,130 | ) | | | (15,163,801 | ) |
| Public Storage | | | (87,318 | ) | | | (16,978,112 | ) |
| Washington Prime Group, Inc. | | | (3,225,469 | ) | | | (21,126,822 | ) |
| | | | | | | | (121,194,280 | ) |
| Technology—(8.8%) | | | | | | | | |
| 2U, Inc.* | | | (359,836 | ) | | | (29,787,224 | ) |
| 58.com, Inc. - ADR* | | | (166,473 | ) | | | (12,547,070 | ) |
| ACI Worldwide, Inc.* | | | (1,118,625 | ) | | | (26,455,481 | ) |
| Arista Networks, Inc.* | | | (54,530 | ) | | | (14,708,922 | ) |
| Blackbaud, Inc. | | | (235,492 | ) | | | (24,142,640 | ) |
| Cerner Corp.* | | | (181,290 | ) | | | (11,631,566 | ) |
| CoStar Group, Inc.* | | | (85,001 | ) | | | (29,081,392 | ) |
| Cree, Inc.* | | | (567,774 | ) | | | (21,478,890 | ) |
The accompanying notes are an integral part of the financial statements.
22 | Semi-Annual Report 2018 |
BOSTON PARTNERS INVESTMENT FUNDS |
BOSTON PARTNERS LONG/SHORT RESEARCH FUND Portfolio of Investments (continued)
February 28, 2018 (unaudited) |
| | | Number of
Shares | | | Value | |
| Technology—(continued) | | | | | | |
| Dassault Systemes SA | | | (177,408 | ) | | $ | (22,887,800 | ) |
| Ellie Mae, Inc.* | | | (213,525 | ) | | | (18,933,262 | ) |
| F5 Networks, Inc.* | | | (70,949 | ) | | | (10,537,346 | ) |
| Guidewire Software, Inc.* | | | (166,259 | ) | | | (13,353,923 | ) |
| HubSpot, Inc.* | | | (224,937 | ) | | | (24,979,254 | ) |
| Infineon Technologies AG | | | (659,102 | ) | | | (17,837,186 | ) |
| Knowles Corp.* | | | (1,329,493 | ) | | | (19,197,879 | ) |
| Manhattan Associates, Inc.* | | | (481,730 | ) | | | (20,280,833 | ) |
| Medidata Solutions, Inc.* | | | (270,823 | ) | | | (17,782,238 | ) |
| MINDBODY, Inc. Class A* | | | (576,199 | ) | | | (20,541,494 | ) |
| National Instruments Corp. | | | (503,434 | ) | | | (25,453,623 | ) |
| Oracle Corp. | | | (223,100 | ) | | | (17,235,432 | ) |
| Proofpoint, Inc.* | | | (194,981 | ) | | | (20,896,114 | ) |
| Snap, Inc. Class A* | | | (1,344,557 | ) | | | (23,287,727 | ) |
| Telefonaktiebolaget LM Ericsson Class B | | | (2,168,240 | ) | | | (14,504,711 | ) |
| Ultimate Software Group Inc., (The)* | | | (103,987 | ) | | | (24,796,740 | ) |
| United Microelectronics Corp. - SP ADR | | | (6,012,998 | ) | | | (14,491,325 | ) |
| Veeva Systems, Inc., Class A* | | | (275,262 | ) | | | (19,185,761 | ) |
| ViaSat, Inc.* | | | (200,601 | ) | | | (13,999,944 | ) |
| WageWorks, Inc.* | | | (343,629 | ) | | | (18,023,341 | ) |
| WEX, Inc.* | | | (99,631 | ) | | | (14,899,816 | ) |
| Wipro Ltd. - ADR | | | (2,340,861 | ) | | | (12,898,144 | ) |
| Workday, Inc., Class A* | | | (193,189 | ) | | | (24,471,251 | ) |
| Zendesk, Inc.* | | | (549,020 | ) | | | (23,706,684 | ) |
| | | | | | | | (624,015,013 | ) |
| Transportation—(0.8%) | | | | | | | | |
| Heartland Express, Inc. | | | (570,632 | ) | | | (11,138,736 | ) |
| JB Hunt Transport Services, Inc. | | | (92,907 | ) | | | (11,015,983 | ) |
| Kuehne + Nagel International AG | | | (77,395 | ) | | | (12,628,056 | ) |
| Panalpina Welttransport Holding AG | | | (140,280 | ) | | | (22,011,674 | ) |
| | | | | | | | (56,794,449 | ) |
| Utilities—(1.2%) | | | | | | | | |
| El Paso Electric Co. | | | (262,029 | ) | | | (12,734,610 | ) |
| IDACORP, Inc. | | | (247,680 | ) | | | (20,074,464 | ) |
| Kinder Morgan Canada Ltd. | | | (864,078 | ) | | | (12,868,244 | ) |
| Tallgrass Energy Partners LP | | | (309,103 | ) | | | (11,854,100 | ) |
| TransCanada Corp. | | | (655,110 | ) | | | (28,313,854 | ) |
| | | | | | | | (85,845,272 | ) |
| TOTAL COMMON STOCKS (Proceeds $(2,652,307,970)) | | | | | | | (2,965,542,875 | ) |
| TOTAL SECURITIES SOLD SHORT—(41.7%) (Proceeds $(2,652,307,970)) | | | | | | | (2,965,542,875 | ) |
| OTHER ASSETS IN EXCESS OF LIABILITIES—42.6% | | | | | | | 3,028,325,088 | |
| NET ASSETS—100.0% | | | | | | $ | 7,103,946,898 | |
ADR | — American Depositary Receipt |
PLC | — Public Limited Company |
SP ADR | — Sponsored American Depositary Receipt |
† | — Security position is either entirely or partially held in a segregated account as collateral for securities sold short. |
Contracts For Difference held by the Fund at February 28, 2018, are as follows:
Reference
Company | Counterparty | Expiration Date | Financing Rate | Payment Frequency | | Number of Contracts Long/(Short) | | | Notional
Amount | | | Unrealized
Appreciation
(Depreciation) | |
| Long | | | | | | | | | | | | | |
| China | | | | | | | | | | | | | |
| Gree Electric Appliances Inc. | Goldman Sachs | 9/15/2020 | 1.63% | Monthly | | | 1,163,440 | | | $ | 9,441,513 | | | $ | (660,803 | ) |
| Gree Electric Appliances Inc. | Goldman Sachs | 9/15/2020 | 1.63% | Monthly | | | 2,372,531 | | | | 19,253,490 | | | | (1,261,222 | ) |
| Jiangsu Yanghe Brewery Joint-Stock Co., Ltd., Class A | Goldman Sachs | 9/15/2020 | 1.63% | Monthly | | | 1,816,000 | | | | 33,839,204 | | | | (3,811,567 | ) |
| Kweichow Moutai | Goldman Sachs | 9/15/2020 | 1.63% | Monthly | | | 278,600 | | | | 31,714,688 | | | | (947,230 | ) |
| Qingdao Haier Co. Ltd. | Goldman Sachs | 9/15/2020 | 1.63% | Monthly | | | 6,791,544 | | | | 20,881,332 | | | | (1,006,607 | ) |
| Wuliangye Yibin Co., Ltd., Class A | Goldman Sachs | 12/31/2021 | 1.63% | Monthly | | | 4,113,812 | | | | 47,845,353 | | | | (3,968,894 | ) |
| | | | | | | | | | | | 162,975,580 | | | | (11,656,323 | ) |
| Total Long | | | | | | | | | | | 162,975,580 | | | | (11,656,323 | ) |
The accompanying notes are an integral part of the financial statements.
Semi-Annual Report 2018 | 23 |
BOSTON PARTNERS INVESTMENT FUNDS |
BOSTON PARTNERS LONG/SHORT RESEARCH FUND Portfolio of Investments (continued)
February 28, 2018 (unaudited) |
Reference
Company | Counterparty | Expiration Date | Financing Rate | Payment Frequency | | Number of Contracts Long/(Short) | | | Notional
Amount | | | Unrealized
Appreciation
(Depreciation) | |
| Short | | | | | | | | | | | | | |
| Brazil | | | | | | | | | | | | | |
| Raia Drogasil SA | Goldman Sachs | 9/15/2020 | 1.42% | Monthly | | | (455,400 | ) | | $ | (10,928,815 | ) | | $ | 556,013 | |
| | | | | | | | | | | | | | | | | |
| Hong Kong | | | | | | | | | | | | | | | | |
| Semiconductor Manufacturing | Goldman Sachs | 12/31/2020 | 0.08% | Monthly | | | (19,013,600 | ) | | | (25,147,175 | ) | | | (3,029,306 | ) |
| | | | | | | | | | | | | | | | | |
| Taiwan | | | | | | | | | | | | | | | | |
| AU Optronics Corp. | Goldman Sachs | 9/15/2020 | 1.42% | Monthly | | | (50,614,000 | ) | | | (22,285,539 | ) | | | 926,995 | |
| Innolux Corp. | Goldman Sachs | 9/15/2020 | 1.42% | Monthly | | | (34,122,000 | ) | | | (14,845,886 | ) | | | 394,368 | |
| | | | | | | | | | | | (37,131,425 | ) | | | 1,321,363 | |
| Total Short | | | | | | | | | | | (73,207,415 | ) | | | (1,151,930 | ) |
| Net unrealized gain/(loss) on Contracts For Difference | | | | | | | | | | $ | (12,808,253 | ) |
A summary of the inputs used to value the Fund's investments carried at fair value as of February 28, 2018 is as follows (see Notes to Portfolio of Investments):
| | | Total | | | Level 1 | | | Level 2 | | | Level 3 | |
| Common Stock | | | | | | | | | | | | |
| Basic Industries | | $ | 379,380,872 | | | $ | 287,320,601 | | | $ | 92,060,271 | | | $ | — | |
| Capital Goods | | | 791,961,794 | | | | 715,208,264 | | | | 76,753,530 | | | | — | |
| Communications | | | 184,446,180 | | | | 156,329,325 | | | | 28,116,855 | | | | — | |
| Consumer Durables | | | 77,720,725 | | | | 77,720,725 | | | | — | | | | — | |
| Consumer Non-Durables | | | 319,863,283 | | | | 197,394,535 | | | | 122,468,748 | | | | — | |
| Consumer Services | | | 696,490,102 | | | | 596,646,970 | | | | 99,843,132 | | | | — | |
| Energy | | | 641,281,243 | | | | 595,014,672 | | | | 46,266,571 | | | | — | |
| Finance | | | 1,399,498,644 | | | | 1,266,641,823 | | | | 132,856,821 | | | | — | |
| Health Care | | | 655,758,741 | | | | 620,844,089 | | | | 34,914,652 | | | | — | |
| Technology | | | 1,603,317,246 | | | | 1,486,587,503 | | | | 116,729,743 | | | | — | |
| Transportation | | | 43,182,754 | | | | 43,182,754 | | | | — | | | | — | |
| Warrants | | | 367,505 | | | | 367,505 | | | | — | | | | — | |
| Short-Term Investments | | | 247,895,596 | | | | 247,895,596 | | | | — | | | | — | |
| Contracts For Difference | | | | | | | | | | | | | | | | |
| Equity Contracts | | | 1,877,376 | | | | — | | | | 1,877,376 | | | | — | |
| Total Assets | | $ | 7,043,042,061 | | | $ | 6,291,154,362 | | | $ | 751,887,699 | | | $ | — | |
The accompanying notes are an integral part of the financial statements.
24 | Semi-Annual Report 2018 |
BOSTON PARTNERS INVESTMENT FUNDS |
BOSTON PARTNERS LONG/SHORT RESEARCH FUND Portfolio of Investments (concluded)
February 28, 2018 (unaudited) |
| | | Total | | | Level 1 | | | Level 2 | | | Level 3 | |
| Securities Sold Short | | | | | | | | | | | | |
| Basic Industries | | $ | (153,058,161 | ) | | $ | (117,245,977 | ) | | $ | (35,812,184 | ) | | $ | — | |
| Capital Goods | | | (160,498,564 | ) | | | (84,714,706 | ) | | | (75,783,858 | ) | | | — | |
| Communications | | | (88,140,815 | ) | | | (62,436,703 | ) | | | (25,704,112 | ) | | | — | |
| Consumer Durables | | | (54,446,549 | ) | | | (54,446,549 | ) | | | — | | | | — | |
| Consumer Non-Durables | | | (238,240,527 | ) | | | (144,913,336 | ) | | | (93,327,191 | ) | | | — | |
| Consumer Services | | | (475,314,275 | ) | | | (340,046,226 | ) | | | (135,268,049 | ) | | | — | |
| Energy | | | (260,914,416 | ) | | | (260,914,416 | ) | | | — | | | | — | |
| Finance | | | (519,221,456 | ) | | | (462,855,988 | ) | | | (56,365,468 | ) | | | — | |
| Health Care | | | (127,859,098 | ) | | | (80,508,760 | ) | | | (47,350,338 | ) | | | — | |
| Real Estate Investment Trusts | | | (121,194,280 | ) | | | (121,194,280 | ) | | | — | | | | — | |
| Technology | | | (624,015,013 | ) | | | (551,549,884 | ) | | | (72,465,129 | ) | | | — | |
| Transportation | | | (56,794,449 | ) | | | (22,154,719 | ) | | | (34,639,730 | ) | | | — | |
| Utilities | | | (85,845,272 | ) | | | (85,845,272 | ) | | | — | | | | — | |
| Contracts For Difference | | | | | | | | | | | | | | | | |
| Equity Contracts | | | (14,685,629 | ) | | | — | | | | (14,685,629 | ) | | | — | |
| Total Liabilities | | $ | (2,980,228,504 | ) | | $ | (2,388,826,816 | ) | | $ | (591,401,688 | ) | | $ | — | |
The accompanying notes are an integral part of the financial statements.
Semi-Annual Report 2018 | 25 |
BOSTON PARTNERS INVESTMENT FUNDS |
BOSTON PARTNERS ALL-CAP VALUE FUND Portfolio of Investments
February 28, 2018 (unaudited) |
| | | Number of
Shares | | | Value | |
| COMMON STOCKS—95.5% | | | | | | |
| Basic Industries—1.1% | | | | | | |
| Crown Holdings, Inc.* | | | 143,619 | | | $ | 7,157,971 | |
| FMC Corp. | | | 70,134 | | | | 5,504,116 | |
| Graphic Packaging Holding Co.(a) | | | 692,885 | | | | 10,608,070 | |
| | | | | | | | 23,270,157 | |
| Capital Goods—7.0% | | | | | | | | |
| AMETEK, Inc. | | | 137,905 | | | | 10,444,925 | |
| Cemex SAB de CV - SP ADR* | | | 1,069,390 | | | | 7,004,505 | |
| CRH PLC - SP ADR(a) | | | 308,575 | | | | 10,213,833 | |
| Cummins, Inc. | | | 83,319 | | | | 14,011,756 | |
| General Dynamics Corp. | | | 77,281 | | | | 17,191,158 | |
| PACCAR, Inc.(a) | | | 298,733 | | | | 21,386,295 | |
| Spirit AeroSystems Holdings, Inc. Class A | | | 105,618 | | | | 9,641,867 | |
| Stanley Black & Decker, Inc. | | | 63,071 | | | | 10,040,272 | |
| Textron, Inc. | | | 137,471 | | | | 8,227,639 | |
| Trinseo SA | | | 82,378 | | | | 6,557,289 | |
| United Technologies Corp.(a) | | | 159,382 | | | | 21,475,131 | |
| WESCO International, Inc.* | | | 159,032 | | | | 9,899,742 | |
| | | | | | | | 146,094,412 | |
| Communications—0.4% | | | | | | | | |
| Comcast Corp., Class A | | | 257,259 | | | | 9,315,348 | |
| Consumer Durables—0.9% | | | | | | | | |
| Fiat Chrysler Automobiles NV(a) | | | 280,490 | | | | 5,943,583 | |
| Lear Corp. | | | 72,440 | | | | 13,515,131 | |
| | | | | | | | 19,458,714 | |
| Consumer Non-Durables—2.7% | | | | | | | | |
| Activision Blizzard, Inc. | | | 94,367 | | | | 6,901,059 | |
| Altria Group, Inc. | | | 241,425 | | | | 15,197,704 | |
| Electronic Arts, Inc.* | | | 55,522 | | | | 6,868,071 | |
| PepsiCo, Inc. | | | 245,455 | | | | 26,933,777 | |
| | | | | | | | 55,900,611 | |
| Consumer Services—5.9% | | | | | | | | |
| Best Buy Co, Inc.(a) | | | 116,270 | | | | 8,422,599 | |
| CVS Health Corp. | | | 202,332 | | | | 13,703,946 | |
| eBay, Inc.* | | | 920,434 | | | | 39,449,801 | |
| Huron Consulting Group, Inc.* | | | 111,219 | | | | 3,892,665 | |
| Interpublic Group of Cos., Inc., (The)(a) | | | 690,429 | | | | 16,156,039 | |
| Lowe's Cos., Inc.(a) | | | 72,351 | | | | 6,481,926 | |
| ManpowerGroup, Inc. | | | 107,564 | | | | 12,742,032 | |
| Nielsen Holdings PLC(a) | | | 213,617 | | | | 6,970,323 | |
| Omnicom Group, Inc.(a) | | | 91,788 | | | | 6,996,999 | |
| Robert Half International, Inc.(a) | | | 101,181 | | | | 5,774,400 | |
| Sportsman's Warehouse Holdings, Inc.(a)* | | | 346,298 | | | | 1,679,545 | |
| | | | | | | | 122,270,275 | |
| Energy—6.5% | | | | | | | | |
| Anadarko Petroleum Corp. | | | 120,623 | | | | 6,880,336 | |
| Andeavor | | | 159,296 | | | | 14,276,108 | |
| Cimarex Energy Co. | | | 96,203 | | | | 9,244,146 | |
| Diamondback Energy, Inc.(a)* | | | 84,292 | | | | 10,506,155 | |
| Energen Corp.* | | | 109,872 | | | | 6,011,097 | |
| EQT Corp.(a) | | | 192,488 | | | | 9,684,071 | |
| Gulfport Energy Corp.* | | | 278,433 | | | | 2,700,800 | |
| Marathon Oil Corp. | | | 515,492 | | | | 7,484,944 | |
| Newfield Exploration Co.(a)* | | | 188,785 | | | | 4,404,354 | |
| Parsley Energy, Inc., Class A(a)* | | | 636,461 | | | | 16,089,734 | |
| Phillips 66 | | | 132,784 | | | | 11,999,690 | |
| Pioneer Natural Resources Co. | | | 109,106 | | | | 18,573,114 | |
| RSP Permian, Inc.(a)* | | | 197,583 | | | | 7,569,405 | |
| Targa Resources Corp. | | | 123,748 | | | | 5,525,348 | |
| WildHorse Resource Development Corp.(a)* | | | 345,659 | | | | 5,869,290 | |
| | | | | | | | 136,818,592 | |
| Finance—30.1% | | | | | | | | |
| Aflac, Inc.(a) | | | 233,870 | | | | 20,786,366 | |
| Air Lease Corp.(a) | | | 353,885 | | | | 15,454,158 | |
| Alleghany Corp.(a)* | | | 27,794 | | | | 16,847,333 | |
| Allstate Corp., (The) | | | 188,510 | | | | 17,391,933 | |
| American International Group, Inc.(a) | | | 466,058 | | | | 26,723,766 | |
| Aon PLC | | | 120,567 | | | | 16,917,961 | |
| Bank of America Corp. | | | 1,521,559 | | | | 48,842,044 | |
| BB&T Corp.(a) | | | 459,256 | | | | 24,960,564 | |
| Capital One Financial Corp. | | | 183,780 | | | | 17,997,575 | |
| Charles Schwab Corp., (The)(a) | | | 162,009 | | | | 8,589,717 | |
| Chubb Ltd. | | | 202,277 | | | | 28,707,152 | |
| Citigroup, Inc. | | | 567,516 | | | | 42,841,783 | |
| Discover Financial Services | | | 157,052 | | | | 12,380,409 | |
| FCB Financial Holdings, Inc., Class A* | | | 92,319 | | | | 4,952,914 | |
| Fifth Third Bancorp(a) | | | 346,890 | | | | 11,464,714 | |
| Goldman Sachs Group, Inc., (The) | | | 69,222 | | | | 18,200,540 | |
| Huntington Bancshares, Inc. | | | 1,092,055 | | | | 17,145,263 | |
| JPMorgan Chase & Co. | | | 567,902 | | | | 65,592,681 | |
| KeyCorp | | | 1,058,158 | | | | 22,358,879 | |
| Loews Corp. | | | 433,604 | | | | 21,389,685 | |
| MetLife, Inc.(a) | | | 353,698 | | | | 16,337,311 | |
| Navient Corp.(a) | | | 549,698 | | | | 7,124,086 | |
| Prudential Financial, Inc. | | | 182,009 | | | | 19,351,197 | |
| Raymond James Financial, Inc. | | | 134,989 | | | | 12,514,830 | |
| SLM Corp.(a)* | | | 362,348 | | | | 3,953,217 | |
| State Street Corp. | | | 155,893 | | | | 16,548,042 | |
| Synchrony Financial | | | 161,170 | | | | 5,864,976 | |
| TD Ameritrade Holding Corp. | | | 159,249 | | | | 9,156,817 | |
| Torchmark Corp. | | | 102,600 | | | | 8,758,962 | |
| Travelers Cos., Inc., (The)(a) | | | 114,372 | | | | 15,897,708 | |
| Wells Fargo & Co. | | | 180,049 | | | | 10,516,662 | |
| White Mountains Insurance Group Ltd. | | | 21,302 | | | | 17,187,519 | |
| WR Berkley Corp. | | | 142,420 | | | | 9,738,680 | |
| XL Group Ltd. | | | 411,770 | | | | 17,421,989 | |
| | | | | | | | 629,917,433 | |
The accompanying notes are an integral part of the financial statements.
26 | Semi-Annual Report 2018 |
BOSTON PARTNERS INVESTMENT FUNDS |
BOSTON PARTNERS ALL-CAP VALUE FUND Portfolio of Investments (continued)
February 28, 2018 (unaudited) |
| | | Number of
Shares | | | Value | |
| Health Care—15.5% | | | | | | |
| Abbott Laboratories | | | 353,821 | | | $ | 21,346,021 | |
| Anthem, Inc. | | | 107,808 | | | | 25,375,847 | |
| Cardinal Health, Inc.(a) | | | 129,876 | | | | 8,988,718 | |
| Cigna Corp. | | | 88,375 | | | | 17,311,779 | |
| Gilead Sciences, Inc. | | | 324,107 | | | | 25,516,944 | |
| Jazz Pharmaceuticals PLC(a)* | | | 70,661 | | | | 10,231,713 | |
| Johnson & Johnson(a) | | | 241,378 | | | | 31,350,175 | |
| Laboratory Corp. of America Holdings* | | | 115,170 | | | | 19,889,859 | |
| McKesson Corp. | | | 164,781 | | | | 24,590,269 | |
| Medtronic PLC | | | 373,235 | | | | 29,817,744 | |
| Merck & Co., Inc. | | | 562,375 | | | | 30,491,972 | |
| Novartis AG - SP ADR | | | 276,590 | | | | 23,053,776 | |
| Pfizer, Inc. | | | 614,460 | | | | 22,311,043 | |
| Roche Holding AG - SP ADR | | | 313,532 | | | | 9,064,210 | |
| UnitedHealth Group, Inc. | | | 105,695 | | | | 23,903,981 | |
| | | | | | | | 323,244,051 | |
| Technology—24.8% | | | | | | | | |
| Alliance Data Systems Corp.(a) | | | 54,088 | | | | 13,033,044 | |
| Allscripts Healthcare Solutions, Inc.(a)* | | | 269,228 | | | | 3,734,192 | |
| Alphabet, Inc., Class A* | | | 20,405 | | | | 22,525,488 | |
| Amdocs Ltd. | | | 142,157 | | | | 9,352,509 | |
| Analog Devices, Inc. | | | 115,737 | | | | 10,433,691 | |
| Arrow Electronics, Inc.* | | | 183,481 | | | | 14,968,380 | |
| Belden, Inc.(a) | | | 118,570 | | | | 8,623,596 | |
| Booking Holdings, Inc.* | | | 8,895 | | | | 18,092,786 | |
| Cisco Systems, Inc. | | | 1,044,437 | | | | 46,769,889 | |
| Cognizant Technology Solutions Corp., Class A | | | 148,265 | | | | 12,160,695 | |
| DXC Technology Co. | | | 352,620 | | | | 36,157,655 | |
| EnerSys | | | 176,021 | | | | 12,266,903 | |
| Fidelity National Information Services, Inc. | | | 60,719 | | | | 5,900,672 | |
| Flex Ltd.* | | | 810,626 | | | | 14,672,331 | |
| Fortive Corp. | | | 152,612 | | | | 11,720,602 | |
| Hewlett Packard Enterprise Co. | | | 921,881 | | | | 17,137,768 | |
| HP, Inc. | | | 886,660 | | | | 20,738,977 | |
| IAC/InterActiveCorp* | | | 46,900 | | | | 6,983,879 | |
| Jabil, Inc.(a) | | | 439,249 | | | | 11,899,255 | |
| KLA-Tencor Corp. | | | 98,628 | | | | 11,175,539 | |
| Leidos Holdings, Inc. | | | 95,727 | | | | 6,060,476 | |
| Micro Focus International PLC - SP ADR(a) | | | 195,456 | | | | 5,484,495 | |
| Microsoft Corp. | | | 377,223 | | | | 35,372,201 | |
| Momo, Inc. - SP ADR* | | | 241,850 | | | | 7,993,143 | |
| NetApp, Inc. | | | 311,072 | | | | 18,835,410 | |
| NetEase, Inc. - ADR | | | 44,843 | | | | 13,154,694 | |
| ON Semiconductor Corp.(a)* | | | 701,446 | | | | 16,778,588 | |
| Oracle Corp. | | | 671,730 | | | | 34,036,559 | |
| Qorvo, Inc.(a)* | | | 269,236 | | | | 21,730,038 | |
| Symantec Corp.(a) | | | 307,184 | | | | 8,075,867 | |
| TE Connectivity Ltd. | | | 237,930 | | | | 24,528,204 | |
| Versum Materials, Inc.(a) | | | 209,952 | | | | 7,772,423 | |
| YY, Inc. - ADR* | | | 75,498 | | | | 9,764,156 | |
| | | | | | | | 517,934,105 | |
| Transportation—0.6% | | | | | | | | |
| Delta Air Lines, Inc.(a) | | | 239,633 | | | | 12,916,219 | |
| | | | | | | | | |
| TOTAL COMMON STOCKS (Cost $1,478,407,474) | | | | | | | 1,997,139,917 | |
| RIGHTS—0.0% | | | | | | | | |
| Technology—0.0% | | | | | | | | |
| CVR Banctec Inc. - Escrow Shares*‡ | | | 14,327 | | | | 0 | |
| TOTAL RIGHTS (Cost $0) | | | | | | | 0 | |
| SHORT-TERM INVESTMENTS—12.9% |
| Morgan Stanley Institutional Liquidity Funds - Treasury Portfolio, 1.29% | | | 85,514,244 | | | | 85,514,244 | |
| Mount Vernon Liquid Assets Portfolio, LLC, 1.65% | | | 183,482,661 | | | | 183,482,661 | |
| TOTAL SHORT-TERM INVESTMENTS (Cost $268,996,905) | | | | | | | 268,996,905 | |
| TOTAL INVESTMENTS—108.4% | | | | | | | | |
| (Cost $1,747,404,379) | | | | | | | 2,266,136,822 | |
| LIABILITIES IN EXCESS OF OTHER ASSETS—(8.4)% | | | | | | | (174,750,673 | ) |
| NET ASSETS—100.0% | | | | | | $ | 2,091,386,149 | |
ADR | — | American Depositary Receipt |
PLC | — | Public Limited Company |
SP ADR | — | Sponsored American Depositary Receipt |
(a) | — | All or a portion of the security is on loan. At February 28, 2018, the market value of securities on loan was $177,505,974. |
‡ | — | Security has been valued at fair market value as determined in good faith by or under the direction of The RBB Fund, Inc.'s Board of Directors. As of February 28, 2018, these securities amounted to $0 or 0.0% of net assets. |
The accompanying notes are an integral part of the financial statements.
Semi-Annual Report 2018 | 27 |
BOSTON PARTNERS INVESTMENT FUNDS |
BOSTON PARTNERS ALL-CAP VALUE FUND Portfolio of Investments (concluded)
February 28, 2018 (unaudited) |
A summary of the inputs used to value the Fund's investments carried at fair value as of February 28, 2018 is as follows (see Notes to Portfolio of Investments):
| | | Total | | | Level 1 | | | Level 2 | | | Level 3 | |
| Common Stock | | | | | | | | | | | | |
| Basic Industries | | $ | 23,270,157 | | | $ | 23,270,157 | | | $ | — | | | $ | — | |
| Capital Goods | | | 146,094,412 | | | | 146,094,412 | | | | — | | | | — | |
| Communications | | | 9,315,348 | | | | 9,315,348 | | | | — | | | | — | |
| Consumer Durables | | | 19,458,714 | | | | 19,458,714 | | | | — | | | | — | |
| Consumer Non-Durables | | | 55,900,611 | | | | 55,900,611 | | | | — | | | | — | |
| Consumer Services | | | 122,270,275 | | | | 122,270,275 | | | | — | | | | — | |
| Energy | | | 136,818,592 | | | | 136,818,592 | | | | — | | | | — | |
| Finance | | | 629,917,433 | | | | 629,917,433 | | | | — | | | | — | |
| Health Care | | | 323,244,051 | | | | 323,244,051 | | | | — | | | | — | |
| Technology | | | 517,934,105 | | | | 517,934,105 | | | | — | | | | — | |
| Transportation | | | 12,916,219 | | | | 12,916,219 | | | | — | | | | — | |
| Rights | | | — | | | | — | | | | — | | | | — | |
| Short-Term Investments | | | 268,996,905 | | | | 268,996,905 | | | | — | | | | — | |
| Total Assets | | $ | 2,266,136,822 | | | $ | 2,266,136,822 | | | $ | — | | | $ | — | |
The accompanying notes are an integral part of the financial statements.
28 | Semi-Annual Report 2018 |
BOSTON PARTNERS INVESTMENT FUNDS |
WPG PARTNERS SMALL/MICRO CAP VALUE FUND Portfolio of Investments
February 28, 2018 (unaudited) |
| | | Number of
Shares | | | Value | |
| COMMON STOCKS—98.6% | | | | | | |
| Basic Industries—4.9% | | | | | | |
| Allegheny Technologies, Inc.(a)* | | | 31,200 | | | $ | 808,392 | |
| Green Plains, Inc.(a) | | | 7,700 | | | | 140,910 | |
| Haynes International, Inc. | | | 9,700 | | | | 403,520 | |
| Schweitzer-Mauduit International, Inc. | | | 3,900 | | | | 152,919 | |
| | | | | | | | 1,505,741 | |
| Capital Goods—15.8% | | | | | | | | |
| BMC Stock Holdings, Inc.(a)* | | | 8,000 | | | | 150,000 | |
| Carpenter Technology Corp.(a) | | | 6,200 | | | | 315,828 | |
| Ferroglobe PLC(a)* | | | 51,500 | | | | 832,240 | |
| Foundation Building Materials, Inc.* | | | 6,300 | | | | 86,247 | |
| FreightCar America, Inc. | | | 29,600 | | | | 437,784 | |
| Great Lakes Dredge & Dock Corp.* | | | 92,300 | | | | 419,965 | |
| KBR, Inc. | | | 45,500 | | | | 688,870 | |
| KeyW Holding Corp., (The)(a)* | | | 47,800 | | | | 358,978 | |
| Landec Corp.(a)* | | | 17,300 | | | | 224,900 | |
| Matrix Service Co.* | | | 19,800 | | | | 283,140 | |
| Orion Group Holdings, Inc.* | | | 47,800 | | | | 300,184 | |
| Smart Sand, Inc.(a)* | | | 40,100 | | | | 297,542 | |
| Tutor Perini Corp.(a)* | | | 18,800 | | | | 454,020 | |
| | | | | | | | 4,849,698 | |
| Communications—0.6% | | | | | | | | |
| Ooma, Inc.* | | | 16,800 | | | | 178,920 | |
| Consumer Durables—1.8% | | | | | | | | |
| Century Communities, Inc.* | | | 5,100 | | | | 151,725 | |
| Libbey, Inc.(a) | | | 28,500 | | | | 178,695 | |
| TRI Pointe Group, Inc.* | | | 14,900 | | | | 228,417 | |
| | | | | | | | 558,837 | |
| Consumer Non-Durables—0.9% | | | | | | | | |
| Matthews International Corp., Class A | | | 4,400 | | | | 225,500 | |
| Sequential Brands Group, Inc.* | | | 23,875 | | | | 47,272 | |
| | | | | | | | 272,772 | |
| Consumer Services—10.1% | | | | | | | | |
| ARC Document Solutions, Inc.* | | | 22,200 | | | | 47,286 | |
| BJ's Restaurants, Inc. | | | 7,300 | | | | 317,550 | |
| Carrols Restaurant Group, Inc.* | | | 10,500 | | | | 134,925 | |
| Chefs' Warehouse, Inc., (The)(a)* | | | 8,300 | | | | 187,165 | |
| Del Taco Restaurants, Inc.* | | | 12,900 | | | | 162,540 | |
| Destination XL Group, Inc.* | | | 9,400 | | | | 23,030 | |
| DSW, Inc., Class A | | | 7,800 | | | | 152,958 | |
| Hibbett Sports, Inc.(a)* | | | 8,900 | | | | 229,175 | |
| ICF International, Inc. | | | 4,300 | | | | 245,100 | |
| MDC Partners, Inc., Class A* | | | 77,300 | | | | 606,805 | |
| Smart & Final Stores, Inc.* | | | 27,200 | | | | 195,840 | |
| SUPERVALU, Inc.(a)* | | | 38,600 | | | | 549,278 | |
| Team, Inc.(a)* | | | 15,200 | | | | 248,520 | |
| | | | | | | | 3,100,172 | |
| Energy—10.1% | | | | | | | | |
| Bill Barrett Corp.* | | | 93,200 | | | | 422,196 | |
| Cactus, Inc., Class A* | | | 6,400 | | | | 157,504 | |
| Eclipse Resources Corp.(a)* | | | 66,200 | | | | 106,582 | |
| Extraction Oil & Gas, Inc.(a)* | | | 13,500 | | | | 163,080 | |
| Flotek Industries, Inc.(a)* | | | 31,300 | | | | 186,235 | |
| Gulfport Energy Corp.* | | | 77,200 | | | | 748,840 | |
| McDermott International, Inc.(a)* | | | 58,500 | | | | 427,050 | |
| Pacific Ethanol, Inc.* | | | 25,600 | | | | 104,960 | |
| ProPetro Holding Corp.(a)* | | | 10,000 | | | | 161,300 | |
| Resolute Energy Corp.(a)* | | | 6,300 | | | | 204,750 | |
| TETRA Technologies, Inc.* | | | 114,000 | | | | 413,820 | |
| | | | | | | | 3,096,317 | |
| Finance—28.2% | | | | | | | | |
| Ameris Bancorp | | | 9,400 | | | | 499,610 | |
| Banner Corp. | | | 8,000 | | | | 442,240 | |
| Central Pacific Financial Corp. | | | 13,600 | | | | 379,032 | |
| CNO Financial Group, Inc. | | | 20,000 | | | | 450,800 | |
| Essent Group Ltd.* | | | 5,500 | | | | 247,995 | |
| First Foundation, Inc.* | | | 23,800 | | | | 434,588 | |
| FirstCash, Inc. | | | 2,900 | | | | 213,730 | |
| Fulton Financial Corp. | | | 26,000 | | | | 470,600 | |
| Hanover Insurance Group Inc., (The) | | | 1,900 | | | | 205,029 | |
| HomeStreet, Inc.* | | | 17,800 | | | | 510,860 | |
| Investors Bancorp, Inc. | | | 15,800 | | | | 213,300 | |
| Kearny Financial Corp. | | | 16,500 | | | | 214,500 | |
| Kemper Corp. | | | 7,300 | | | | 411,720 | |
| Kennedy-Wilson Holdings, Inc.(a) | | | 29,700 | | | | 485,595 | |
| Meridian Bancorp, Inc. | | | 21,400 | | | | 429,070 | |
| MGIC Investment Corp.* | | | 26,600 | | | | 366,814 | |
| National Bank Holdings Corp., Class A(a) | | | 12,300 | | | | 400,857 | |
| Northfield Bancorp, Inc.(a) | | | 24,400 | | | | 378,688 | |
| Popular, Inc. | | | 17,200 | | | | 722,572 | |
| State Bank Financial Corp. | | | 13,500 | | | | 390,690 | |
| United Community Banks, Inc. | | | 9,300 | | | | 287,463 | |
| United Financial Bancorp, Inc. | | | 32,600 | | | | 508,560 | |
| | | | | | | | 8,664,313 | |
| Health Care—2.3% | | | | | | | | |
| Accuray, Inc.* | | | 86,500 | | | | 480,075 | |
| Trinity Biotech PLC - SP ADR* | | | 41,700 | | | | 227,682 | |
| | | | | | | | 707,757 | |
| Real Estate Investment Trusts—6.3% | | | | | | | | |
| Cedar Realty Trust, Inc. | | | 57,600 | | | | 228,672 | |
| GEO Group Inc., (The) | | | 11,000 | | | | 234,300 | |
| Getty Realty Corp. | | | 14,600 | | | | 344,560 | |
| Gramercy Property Trust | | | 19,166 | | | | 414,944 | |
| Ladder Capital Corp. | | | 23,900 | | | | 353,003 | |
| MedEquities Realty Trust, Inc. | | | 24,300 | | | | 234,981 | |
| Seritage Growth Properties, Class A(a) | | | 3,700 | | | | 139,860 | |
| | | | | | | | 1,950,320 | |
The accompanying notes are an integral part of the financial statements.
Semi-Annual Report 2018 | 29 |
BOSTON PARTNERS INVESTMENT FUNDS |
WPG PARTNERS SMALL/MICRO CAP VALUE FUND Portfolio of Investments (concluded)
February 28, 2018 (unaudited) |
| | | Number of
Shares | | | Value | |
| Technology—7.1% | | | | | | |
| Acacia Communications, Inc.(a)* | | | 8,000 | | | $ | 309,600 | |
| Aerohive Networks, Inc.* | | | 35,800 | | | | 150,002 | |
| CommVault Systems, Inc.* | | | 3,600 | | | | 187,380 | |
| Generac Holdings, Inc.* | | | 4,600 | | | | 204,608 | |
| NeoPhotonics Corp.(a)* | | | 39,900 | | | | 242,193 | |
| QAD, Inc., Class A | | | 6,500 | | | | 292,500 | |
| Quantenna Communications, Inc.* | | | 11,700 | | | | 160,875 | |
| Ribbon Communications, Inc.(a)* | | | 25,300 | | | | 163,944 | |
| SuperCom Ltd.* | | | 2,300 | | | | 6,509 | |
| VASCO Data Security International, Inc.* | | | 18,600 | | | | 224,130 | |
| Veeco Instruments, Inc.(a)* | | | 13,400 | | | | 243,210 | |
| | | | | | | | 2,184,951 | |
| Transportation—6.5% | | | | | | | | |
| Ardmore Shipping Corp.* | | | 71,400 | | | | 539,070 | |
| Celadon Group, Inc. | | | 30,700 | | | | 118,195 | |
| Daseke, Inc.* | | | 11,000 | | | | 110,660 | |
| DHT Holdings, Inc. | | | 31,300 | | | | 117,688 | |
| Scorpio Tankers, Inc. | | | 164,100 | | | | 377,430 | |
| Spirit Airlines, Inc.* | | | 4,100 | | | | 163,344 | |
| StealthGas, Inc.* | | | 56,400 | | | | 237,444 | |
| YRC Worldwide, Inc.(a)* | | | 39,300 | | | | 342,696 | |
| | | | | | | | 2,006,527 | |
| Utilities—4.0% | | | | | | | | |
| ALLETE, Inc. | | | 2,800 | | | | 190,820 | |
| Covanta Holding Corp.(a) | | | 24,900 | | | | 372,255 | |
| El Paso Electric Co. | | | 3,100 | | | | 150,660 | |
| NorthWestern Corp. | | | 3,500 | | | | 178,780 | |
| PNM Resources, Inc. | | | 4,000 | | | | 140,800 | |
| Portland General Electric Co. | | | 5,400 | | | | 214,542 | |
| | | | | | | | 1,247,857 | |
| TOTAL COMMON STOCKS (Cost $27,950,381) | | | | | | | 30,324,182 | |
| WARRANTS—0.1% | | | | | | | | |
| Energy—0.1% | | | | | | | | |
| TETRA Technologies, Inc. *(a)‡ | | | 20,950 | | | | 24,093 | |
| TOTAL WARRANTS (Cost $4,475) | | | | | | | 24,093 | |
| SHORT-TERM INVESTMENTS—23.5% |
| Morgan Stanley Institutional Liquidity Funds - Treasury Portfolio, 1.29% | | | 452,351 | | | | 452,351 | |
| Mount Vernon Liquid Assets Portfolio, LLC, 1.65% | | | 6,775,803 | | | | 6,775,803 | |
| TOTAL SHORT-TERM INVESTMENTS (Cost $7,228,154) | | | | | | | 7,228,154 | |
| TOTAL INVESTMENTS—122.2% | | | | | | | | |
| (Cost $35,183,010) | | | | | | | 37,576,429 | |
| LIABILITIES IN EXCESS OF OTHER ASSETS—(22.2)% | | | | | | | (6,825,054 | ) |
| NET ASSETS—100.0% | | | | | | $ | 30,751,375 | |
ADR | — | American Depositary Receipt |
PLC | — | Public Limited Company |
SP ADR | — | Sponsored American Depositary Receipt |
(a) | — | All or a portion of the security is on loan. At February 28, 2018, the market value of securities on loan was $6,507,407. |
‡ | — | Security has been valued at fair market value as determined in good faith by or under the direction of The RBB Fund, Inc.'s Board of Directors. As of February 28, 2018, these securities amounted to $24,093 or 0.1% of net assets. |
A summary of the inputs used to value the Fund's investments carried at fair value as of February 28, 2018 is as follows (see Notes to Portfolio of Investments):
| | | Total | | | Level 1 | | | Level 2 | | | Level 3 | |
| Common Stocks | | $ | 30,324,182 | | | $ | 30,324,182 | | | $ | — | | | $ | — | |
| Warrants | | | 24,093 | | | | — | | | | — | | | | 24,093 | |
| Short-Term Investments | | | 7,228,154 | | | | 7,228,154 | | | | — | | | | — | |
| Total Assets | | $ | 37,576,429 | | | $ | 37,552,336 | | | $ | — | | | $ | 24,093 | |
The accompanying notes are an integral part of the financial statements.
30 | Semi-Annual Report 2018 |
BOSTON PARTNERS INVESTMENT FUNDS |
BOSTON PARTNERS GLOBAL EQUITY FUND Portfolio of Investments
February 28, 2018 (unaudited) |
| | | Number of
Shares | | | Value | |
| LONG POSITIONS—104.8% | | | | | | |
| COMMON STOCKS—95.5% | | | | | | |
| Argentina—0.6% | | | | | | |
| YPF SA - SP ADR | | | 163,465 | | | $ | 3,777,676 | |
| Bermuda—2.0% | | | | | | | | |
| Everest Re Group Ltd. | | | 34,769 | | | | 8,352,905 | |
| Marvell Technology Group Ltd.(a) | | | 204,376 | | | | 4,800,792 | |
| | | | | | | | 13,153,697 | |
| Canada—0.8% | | | | | | | | |
| Nutrien Ltd. | | | 106,419 | | | | 5,241,136 | |
| China—0.9% | | | | | | | | |
| PICC Property & Casualty Co. Ltd., Class H | | | 1,800,000 | | | | 3,530,477 | |
| Vipshop Holdings Ltd. - ADR* | | | 148,705 | | | | 2,585,980 | |
| | | | | | | | 6,116,457 | |
| France—5.4% | | | | | | | | |
| AXA SA | | | 142,802 | | | | 4,472,437 | |
| Capgemini SA | | | 45,903 | | | | 5,721,609 | |
| Renault SA | | | 58,406 | | | | 6,335,306 | |
| Schneider Electric SE | | | 70,208 | | | | 6,084,860 | |
| Teleperformance SA | | | 21,332 | | | | 3,037,809 | |
| TOTAL SA | | | 115,544 | | | | 6,572,018 | |
| Vinci SA | | | 31,795 | | | | 3,139,454 | |
| | | | | | | | 35,363,493 | |
| Germany—3.0% | | | | | | | | |
| Allianz SE | | | 15,943 | | | | 3,703,430 | |
| E.ON SE | | | 426,501 | | | | 4,324,514 | |
| Fresenius SE & Co. KGaA | | | 50,565 | | | | 4,108,554 | |
| Muenchener Rueckversicherungs-Gesellschaft AG | | | 11,385 | | | | 2,545,808 | |
| Siemens AG | | | 39,861 | | | | 5,223,433 | |
| | | | | | | | 19,905,739 | |
| Hong Kong—2.1% | | | | | | | | |
| CK Hutchison Holdings Ltd. | | | 350,000 | | | | 4,374,382 | |
| WH Group Ltd. | | | 7,685,500 | | | | 9,465,500 | |
| | | | | | | | 13,839,882 | |
| Indonesia—0.4% | | | | | | | | |
| Bank Rakyat Indonesia Persero Tbk PT | | | 9,671,900 | | | | 2,659,183 | |
| Ireland—1.1% | | | | | | | | |
| CRH PLC | | | 227,657 | | | | 7,475,976 | |
| Japan—10.3% | | | | | | | | |
| Alps Electric Co., Ltd. | | | 210,200 | | | | 5,730,193 | |
| Asahi Group Holdings Ltd. | | | 64,200 | | | | 3,282,884 | |
| Fuji Electric Co., Ltd. | | | 1,107,000 | | | | 8,376,894 | |
| Haseko Corp. | | | 214,900 | | | | 3,147,521 | |
| KDDI Corp. | | | 179,600 | | | | 4,410,488 | |
| Kirin Holdings Co., Ltd. | | | 133,300 | | | | 3,440,030 | |
| Matsumotokiyoshi Holdings Co., Ltd. | | | 67,600 | | | | 2,843,628 | |
| Mitsubishi Electric Corp. | | | 189,500 | | | | 3,196,391 | |
| Nomura Holdings, Inc. | | | 545,300 | | | | 3,319,445 | |
| Seven & i Holdings Co., Ltd. | | | 118,200 | | | | 4,933,878 | |
| SUMCO Corp. | | | 239,500 | | | | 6,335,746 | |
| Sumitomo Electric Industries Ltd. | | | 210,400 | | | | 3,318,888 | |
| Sumitomo Mitsui Financial Group, Inc. | | | 50,900 | | | | 2,199,982 | |
| Suzuki Motor Corp. | | | 56,500 | | | | 3,223,093 | |
| Tokio Marine Holdings, Inc. | | | 70,800 | | | | 3,243,462 | |
| Tokuyama Corp. | | | 102,600 | | | | 3,044,348 | |
| Zenkoku Hosho Co., Ltd. | | | 90,400 | | | | 3,985,284 | |
| | | | | | | | 68,032,155 | |
| Luxembourg—0.5% | | | | | | | | |
| Ternium SA - SP ADR | | | 92,389 | | | | 3,194,812 | |
| Mexico—0.6% | | | | | | | | |
| Cemex SAB de CV - SP ADR* | | | 595,430 | | | | 3,900,066 | |
| Netherlands—1.6% | | | | | | | | |
| Koninklijke Ahold NV | | | 104,262 | | | | 2,340,900 | |
| Royal Dutch Shell PLC, Class A | | | 250,416 | | | | 7,908,473 | |
| | | | | | | | 10,249,373 | |
| Russia—0.5% | | | | | | | | |
| Sberbank of Russia PJSC - SP ADR(a) | | | 164,572 | | | | 3,334,229 | |
| Singapore—1.8% | | | | | | | | |
| Flex Ltd.* | | | 653,857 | | | | 11,834,812 | |
| South Korea—1.7% | | | | | | | | |
| KT Corp. - SP ADR* | | | 106,884 | | | | 1,419,419 | |
| LG Uplus Corp. | | | 113,427 | | | | 1,314,827 | |
| NAVER Corp. | | | 4,095 | | | | 3,032,637 | |
| Samsung Electronics Co., Ltd. | | | 2,607 | | | | 5,665,191 | |
| | | | | | | | 11,432,074 | |
| Switzerland—3.6% | | | | | | | | |
| ABB Ltd. | | | 184,328 | | | | 4,460,508 | |
| Glencore PLC | | | 905,394 | | | | 4,761,186 | |
| Roche Holding AG | | | 32,552 | | | | 7,518,861 | |
| Swiss Re AG | | | 68,380 | | | | 6,957,298 | |
| | | | | | | | 23,697,853 | |
| United Kingdom—6.8% | | | | | | | | |
| Aviva PLC | | | 1,016,312 | | | | 7,040,328 | |
| Coca-Cola European Partners PLC | | | 122,718 | | | | 4,665,738 | |
| Direct Line Insurance Group PLC | | | 1,025,747 | | | | 5,394,604 | |
| Lloyds Banking Group PLC | | | 5,123,580 | | | | 4,840,953 | |
| Nomad Foods Ltd.* | | | 166,213 | | | | 2,724,231 | |
| Royal Bank of Scotland Group PLC* | | | 672,716 | | | | 2,465,645 | |
| RPC Group PLC | | | 417,446 | | | | 4,599,052 | |
| Smiths Group PLC | | | 183,350 | | | | 4,003,618 | |
| Vodafone Group PLC | | | 1,861,297 | | | | 5,203,463 | |
| WPP PLC | | | 203,836 | | | | 3,903,510 | |
| | | | | | | | 44,841,142 | |
| United States—51.8% | | | | | | | | |
| Air Lease Corp. | | | 96,838 | | | | 4,228,916 | |
| Allstate Corp. (The) | | | 40,183 | | | | 3,707,284 | |
| Alphabet, Inc., Class C* | | | 10,018 | | | | 11,067,185 | |
The accompanying notes are an integral part of the financial statements.
Semi-Annual Report 2018 | 31 |
BOSTON PARTNERS INVESTMENT FUNDS |
BOSTON PARTNERS GLOBAL EQUITY FUND Portfolio of Investments (continued)
February 28, 2018 (unaudited) |
| | | Number of
Shares | | | Value | |
| United States—(continued) | | | | | | |
| American Express Co.(a) | | | 60,539 | | | $ | 5,903,158 | |
| Anadarko Petroleum Corp. | | | 73,185 | | | | 4,174,472 | |
| Andeavor | | | 29,580 | | | | 2,650,960 | |
| Anthem, Inc. | | | 41,508 | | | | 9,770,153 | |
| Arconic, Inc.(a) | | | 82,003 | | | | 2,000,053 | |
| Bank of America Corp. | | | 429,871 | | | | 13,798,859 | |
| Berkshire Hathaway, Inc., Class B* | | | 101,240 | | | | 20,976,928 | |
| Booking Holdings, Inc.* | | | 1,437 | | | | 2,922,916 | |
| Chubb Ltd. | | | 48,261 | | | | 6,849,201 | |
| Cigna Corp. | | | 22,436 | | | | 4,394,988 | |
| Cisco Systems, Inc. | | | 131,840 | | | | 5,903,795 | |
| Citigroup, Inc. | | | 152,037 | | | | 11,477,273 | |
| Comcast Corp., Class A | | | 158,744 | | | | 5,748,120 | |
| Diamondback Energy, Inc.(a)* | | | 51,034 | | | | 6,360,878 | |
| DowDuPont, Inc. | | | 56,352 | | | | 3,961,546 | |
| DXC Technology Co. | | | 86,255 | | | | 8,844,588 | |
| East West Bancorp, Inc. | | | 56,395 | | | | 3,696,692 | |
| Eaton Corp. PLC | | | 117,198 | | | | 9,457,879 | |
| eBay, Inc.* | | | 138,328 | | | | 5,928,738 | |
| EQT Corp. | | | 83,425 | | | | 4,197,112 | |
| Goldman Sachs Group Inc., (The) | | | 33,961 | | | | 8,929,366 | |
| Honeywell International, Inc. | | | 22,225 | | | | 3,358,420 | |
| HP, Inc. | | | 257,747 | | | | 6,028,702 | |
| Jagged Peak Energy, Inc.(a)* | | | 142,308 | | | | 1,750,388 | |
| Johnson & Johnson | | | 57,524 | | | | 7,471,217 | |
| Laboratory Corp. of America Holdings* | | | 67,133 | | | | 11,593,869 | |
| Leidos Holdings, Inc. | | | 118,178 | | | | 7,481,849 | |
| Loews Corp. | | | 60,856 | | | | 3,002,027 | |
| Masco Corp.(a) | | | 129,376 | | | | 5,319,941 | |
| Microsoft Corp. | | | 189,525 | | | | 17,771,759 | |
| Morgan Stanley | | | 95,436 | | | | 5,346,325 | |
| NetApp, Inc. | | | 115,088 | | | | 6,968,578 | |
| Northrop Grumman Corp. | | | 15,206 | | | | 5,322,708 | |
| Oracle Corp. | | | 272,400 | | | | 13,802,508 | |
| Parsley Energy, Inc., Class A(a)* | | | 219,119 | | | | 5,539,328 | |
| Peabody Energy Corp. | | | 86,562 | | | | 3,523,939 | |
| Pfizer, Inc. | | | 120,729 | | | | 4,383,670 | |
| Pioneer Natural Resources Co. | | | 33,679 | | | | 5,733,176 | |
| Raytheon Co. | | | 25,294 | | | | 5,501,698 | |
| RSP Permian, Inc.* | | | 95,651 | | | | 3,664,390 | |
| Steel Dynamics, Inc. | | | 109,175 | | | | 5,049,344 | |
| SunTrust Banks, Inc. | | | 79,185 | | | | 5,530,280 | |
| SYNNEX Corp. | | | 23,818 | | | | 2,945,096 | |
| TE Connectivity Ltd. | | | 58,743 | | | | 6,055,816 | |
| Time Warner, Inc. | | | 52,352 | | | | 4,866,642 | |
| TJX Cos. Inc., (The) | | | 59,228 | | | | 4,896,971 | |
| Trinseo SA | | | 73,992 | | | | 5,889,763 | |
| Twenty-First Century Fox, Inc. Class A(a) | | | 129,462 | | | | 4,766,791 | |
| United Technologies Corp.(a) | | | 31,695 | | | | 4,270,584 | |
| Wells Fargo & Co. | | | 59,157 | | | | 3,455,360 | |
| WestRock Co. | | | 52,167 | | | | 3,430,502 | |
| | | | | | | | 341,672,701 | |
| TOTAL COMMON STOCKS (Cost $534,378,975) | | | | | | | 629,722,456 | |
| PREFERRED STOCKS—0.5% | | | | | | | | |
| Germany—0.5% | | | | | | | | |
| Volkswagen AG, 1.269% | | | 15,433 | | | | 3,002,320 | |
| TOTAL PREFERRED STOCKS (Cost $2,377,452) | | | | | | | 3,002,320 | |
| SHORT-TERM INVESTMENTS—8.8% |
| Morgan Stanley Institutional Liquidity Funds - Treasury Portfolio, 1.29% | | | 22,899,348 | | | | 22,899,348 | |
| Mount Vernon Liquid Assets Portfolio, LLC, 1.65% | | | 35,279,376 | | | | 35,279,376 | |
| TOTAL SHORT-TERM INVESTMENTS (Cost $58,178,724) | | | | | | | 58,178,724 | |
| TOTAL INVESTMENTS—104.8% | | | | | | | | |
| (Cost $594,935,151) | | | | | | | 690,903,500 | |
| LIABILITIES IN EXCESS OF OTHER ASSETS—(4.8)% | | | | | | | (31,716,484 | ) |
| NET ASSETS—100.0% | | | | | | $ | 659,187,016 | |
ADR | — American Depositary Receipt |
PLC | — Public Limited Company |
SP ADR | — Sponsored American Depositary Receipt |
(a) | — All or a portion of the security is on loan. At February 28, 2018, the market value of securities on loan was $34,041,777. |
The accompanying notes are an integral part of the financial statements.
32 | Semi-Annual Report 2018 |
BOSTON PARTNERS INVESTMENT FUNDS |
BOSTON PARTNERS GLOBAL EQUITY FUND Portfolio of Investments (concluded)
February 28, 2018 (unaudited) |
A summary of the inputs used to value the Fund's investments carried at fair value as of February 28, 2018 is as follows (see Notes to Portfolio of Investments):
| | | Total | | | Level 1 | | | Level 2 | | | Level 3 | |
| Common Stock | | | | | | | | | | | | |
| Argentina | | $ | 3,777,676 | | | $ | 3,777,676 | | | $ | — | | | $ | — | |
| Bermuda | | | 13,153,697 | | | | 13,153,697 | | | | — | | | | — | |
| Canada | | | 5,241,136 | | | | 5,241,136 | | | | — | | | | — | |
| China | | | 6,116,457 | | | | 2,585,980 | | | | 3,530,477 | | | | — | |
| France | | | 35,363,493 | | | | — | | | | 35,363,493 | | | | — | |
| Germany | | | 19,905,739 | | | | — | | | | 19,905,739 | | | | — | |
| Hong Kong | | | 13,839,882 | | | | — | | | | 13,839,882 | | | | — | |
| Indonesia | | | 2,659,183 | | | | 2,659,183 | | | | — | | | | — | |
| Ireland | | | 7,475,976 | | | | — | | | | 7,475,976 | | | | — | |
| Japan | | | 68,032,155 | | | | — | | | | 68,032,155 | | | | — | |
| Luxembourg | | | 3,194,812 | | | | 3,194,812 | | | | — | | | | — | |
| Mexico | | | 3,900,066 | | | | 3,900,066 | | | | — | | | | — | |
| Netherlands | | | 10,249,373 | | | | — | | | | 10,249,373 | | | | — | |
| Russia | | | 3,334,229 | | | | 3,334,229 | | | | — | | | | — | |
| Singapore | | | 11,834,812 | | | | 11,834,812 | | | | — | | | | — | |
| South Korea | | | 11,432,074 | | | | 1,419,419 | | | | 10,012,655 | | | | — | |
| Switzerland | | | 23,697,853 | | | | — | | | | 23,697,853 | | | | — | |
| United Kingdom | | | 44,841,142 | | | | 7,389,969 | | | | 37,451,173 | | | | — | |
| United States | | | 341,672,701 | | | | 341,672,701 | | | | — | | | | — | |
| Preferred Stock | | | | | | | | | | | | | | | | |
| Germany | | | 3,002,320 | | | | — | | | | 3,002,320 | | | | — | |
| Short-Term Investments | | | 58,178,724 | | | | 58,178,724 | | | | — | | | | — | |
| Total Assets | | $ | 690,903,500 | | | $ | 458,342,404 | | | $ | 232,561,096 | | | $ | — | |
The accompanying notes are an integral part of the financial statements.
Semi-Annual Report 2018 | 33 |
BOSTON PARTNERS INVESTMENT FUNDS |
BOSTON PARTNERS GLOBAL LONG/SHORT FUND Portfolio of Investments
February 28, 2018 (unaudited) |
| | | Number of
Shares | | | Value | |
| LONG POSITIONS—99.0% | | | | | | |
| COMMON STOCKS—96.2% | | | | | | |
| Argentina—0.6% | | | | | | |
| YPF SA - SP ADR | | | 261,462 | | | $ | 6,042,387 | |
| Bermuda—2.0% | | | | | | | | |
| Everest Re Group Ltd. | | | 55,204 | | | | 13,262,209 | |
| Marvell Technology Group Ltd. | | | 311,892 | | | | 7,326,343 | |
| | | | | | | | 20,588,552 | |
| Canada—0.8% | | | | | | | | |
| Nutrien Ltd. | | | 164,706 | | | | 8,111,771 | |
| China—0.9% | | | | | | | | |
| PICC Property & Casualty Co. Ltd., Class H | | | 2,782,000 | | | | 5,456,549 | |
| Vipshop Holdings Ltd. - ADR* | | | 236,024 | | | | 4,104,457 | |
| | | | | | | | 9,561,006 | |
| France—5.5% | | | | | | | | |
| AXA SA | | | 222,231 | | | | 6,960,085 | |
| Capgemini SA | | | 72,892 | | | | 9,085,670 | |
| Renault SA | | | 91,634 | | | | 9,939,551 | |
| Schneider Electric SE | | | 107,950 | | | | 9,355,923 | |
| Teleperformance SA | | | 33,869 | | | | 4,823,156 | |
| TOTAL SA | | | 183,663 | | | | 10,446,553 | |
| Vinci SA | | | 49,110 | | | | 4,849,146 | |
| | | | | | | | 55,460,084 | |
| Germany—3.2% | | | | | | | | |
| Allianz SE | | | 26,423 | | | | 6,137,849 | |
| E.ON SE | | | 677,177 | | | | 6,866,247 | |
| Fresenius SE & Co. KGaA | | | 80,275 | | | | 6,522,579 | |
| Muenchener Rueckversicherungs-Gesellschaft AG | | | 18,623 | | | | 4,164,302 | |
| Siemens AG | | | 62,126 | | | | 8,141,065 | |
| | | | | | | | 31,832,042 | |
| Hong Kong—2.1% | | | | | | | | |
| CK Hutchison Holdings Ltd. | | | 544,500 | | | | 6,805,288 | |
| WH Group Ltd. | | | 11,741,500 | | | | 14,460,891 | |
| | | | | | | | 21,266,179 | |
| India—0.5% | | | | | | | | |
| Videocon D2H Ltd. - ADR*† | | | 608,176 | | | | 5,047,861 | |
| Indonesia—0.3% | | | | | | | | |
| Bank Rakyat Indonesia Persero Tbk PT | | | 12,517,400 | | | | 3,441,523 | |
| Ireland—1.2% | | | | | | | | |
| CRH PLC | | | 367,868 | | | | 12,080,333 | |
| Japan—10.0% | | | | | | | | |
| Alps Electric Co., Ltd. | | | 327,200 | | | | 8,919,691 | |
| Asahi Group Holdings Ltd. | | | 99,200 | | | | 5,072,618 | |
| Fuji Electric Co., Ltd. | | | 1,663,000 | | | | 12,584,259 | |
| Haseko Corp. | | | 378,200 | | | | 5,539,286 | |
| KDDI Corp. | | | 279,600 | | | | 6,866,217 | |
| Kirin Holdings Co., Ltd. | | | 205,900 | | | | 5,313,594 | |
| Matsumotokiyoshi Holdings Co., Ltd. | | | 107,500 | | | | 4,522,042 | |
| Mitsubishi Electric Corp. | | | 294,900 | | | | 4,974,225 | |
| Nomura Holdings, Inc. | | | 847,600 | | | | 5,159,659 | |
| Seven & i Holdings Co., Ltd. | | | 187,300 | | | | 7,818,234 | |
| SUMCO Corp. | | | 371,200 | | | | 9,819,745 | |
| Sumitomo Electric Industries Ltd. | | | 327,400 | | | | 5,164,468 | |
| Sumitomo Mitsui Financial Group, Inc. | | | 81,100 | | | | 3,505,276 | |
| Suzuki Motor Corp. | | | 91,400 | | | | 5,213,995 | |
| Tokio Marine Holdings, Inc. | | | 109,300 | | | | 5,007,209 | |
| Tokuyama Corp. | | | 150,500 | | | | 4,465,637 | |
| Zenkoku Hosho Co., Ltd. | | | 27,600 | | | | 1,216,746 | |
| | | | | | | | 101,162,901 | |
| Luxembourg—0.5% | | | | | | | | |
| Ternium SA - SP ADR† | | | 146,827 | | | | 5,077,278 | |
| Mexico—0.8% | | | | | | | | |
| Alpek SAB de CV | | | 1,086,363 | | | | 1,410,206 | |
| Cemex SAB de CV - SP ADR* | | | 960,801 | | | | 6,293,247 | |
| | | | | | | | 7,703,453 | |
| Netherlands—1.2% | | | | | | | | |
| Royal Dutch Shell PLC, Class A | | | 389,603 | | | | 12,304,185 | |
| Russia—0.5% | | | | | | | | |
| Sberbank of Russia PJSC - SP ADR | | | 255,869 | | | | 5,183,906 | |
| Singapore—1.8% | | | | | | | | |
| Flex Ltd.*† | | | 997,959 | | | | 18,063,058 | |
| South Korea—1.8% | | | | | | | | |
| KT Corp. - SP ADR* | | | 170,796 | | | | 2,268,171 | |
| LG Uplus Corp. | | | 198,145 | | | | 2,296,865 | |
| NAVER Corp. | | | 6,519 | | | | 4,827,779 | |
| Samsung Electronics Co., Ltd. | | | 4,200 | | | | 9,126,890 | |
| | | | | | | | 18,519,705 | |
| Switzerland—3.7% | | | | | | | | |
| ABB Ltd. | | | 284,317 | | | | 6,880,118 | |
| Glencore PLC | | | 1,415,795 | | | | 7,445,226 | |
| Roche Holding AG | | | 54,226 | | | | 12,525,121 | |
| Swiss Re AG | | | 101,146 | | | | 10,291,062 | |
| | | | | | | | 37,141,527 | |
| United Kingdom—7.3% | | | | | | | | |
| Aviva PLC | | | 1,609,578 | | | | 11,150,076 | |
| Coca-Cola European Partners PLC† | | | 190,146 | | | | 7,229,351 | |
| Direct Line Insurance Group PLC | | | 1,597,957 | | | | 8,403,969 | |
| Lloyds Banking Group PLC | | | 7,744,103 | | | | 7,316,923 | |
| Nomad Foods Ltd.*† | | | 466,241 | | | | 7,641,690 | |
| Royal Bank of Scotland Group PLC* | | | 1,038,783 | | | | 3,807,357 | |
| RPC Group PLC | | | 650,371 | | | | 7,165,215 | |
| Smiths Group PLC | | | 285,072 | | | | 6,224,813 | |
| Vodafone Group PLC | | | 2,922,170 | | | | 8,169,251 | |
| WPP PLC | | | 330,909 | | | | 6,336,989 | |
| | | | | | | | 73,445,634 | |
| United States—51.5% | | | | | | | | |
| Air Lease Corp.† | | | 158,205 | | | | 6,908,812 | |
The accompanying notes are an integral part of the financial statements.
34 | Semi-Annual Report 2018 |
BOSTON PARTNERS INVESTMENT FUNDS |
BOSTON PARTNERS GLOBAL LONG/SHORT FUND Portfolio of Investments (continued)
February 28, 2018 (unaudited) |
| | | Number of
Shares | | | Value | |
| United States—(continued) | | | | | | |
| Allstate Corp. (The)† | | | 62,401 | | | $ | 5,757,116 | |
| Alphabet, Inc., Class C*† | | | 16,002 | | | | 17,677,890 | |
| American Express Co. | | | 95,272 | | | | 9,289,973 | |
| Anadarko Petroleum Corp. | | | 116,486 | | | | 6,644,362 | |
| Andeavor† | | | 44,023 | | | | 3,945,341 | |
| Anthem, Inc.† | | | 67,400 | | | | 15,864,612 | |
| Arconic, Inc. | | | 127,797 | | | | 3,116,969 | |
| Bank of America Corp.† | | | 660,961 | | | | 21,216,848 | |
| Berkshire Hathaway, Inc., Class B*† | | | 67,659 | | | | 14,018,945 | |
| Boardwalk Pipeline Partners LP† | | | 216,357 | | | | 2,438,343 | |
| Booking Holdings, Inc.* | | | 2,256 | | | | 4,588,794 | |
| Chubb Ltd.#† | | | 77,151 | | | | 10,949,270 | |
| Cigna Corp.† | | | 33,874 | | | | 6,635,578 | |
| Cisco Systems, Inc.† | | | 218,385 | | | | 9,779,280 | |
| Citigroup, Inc.† | | | 241,533 | | | | 18,233,326 | |
| Comcast Corp., Class A† | | | 254,783 | | | | 9,225,692 | |
| Diamondback Energy, Inc.*† | | | 81,636 | | | | 10,175,111 | |
| DowDuPont, Inc.† | | | 91,045 | | | | 6,400,464 | |
| DXC Technology Co.† | | | 131,342 | | | | 13,467,809 | |
| East West Bancorp, Inc. | | | 92,784 | | | | 6,081,991 | |
| Eaton Corp. PLC† | | | 180,671 | | | | 14,580,150 | |
| eBay, Inc.*† | | | 215,700 | | | | 9,244,902 | |
| EQT Corp.† | | | 132,175 | | | | 6,649,724 | |
| Goldman Sachs Group Inc., (The) | | | 52,460 | | | | 13,793,308 | |
| Honeywell International, Inc. | | | 36,817 | | | | 5,563,417 | |
| HP, Inc.† | | | 420,954 | | | | 9,846,114 | |
| Jagged Peak Energy, Inc.* | | | 237,237 | | | | 2,918,015 | |
| Johnson & Johnson | | | 89,438 | | | | 11,616,207 | |
| Laboratory Corp. of America Holdings*† | | | 112,458 | | | | 19,421,497 | |
| Leidos Holdings, Inc.† | | | 177,440 | | | | 11,233,726 | |
| Loews Corp. | | | 96,393 | | | | 4,755,067 | |
| Masco Corp. | | | 202,216 | | | | 8,315,122 | |
| Microsoft Corp.† | | | 292,742 | | | | 27,450,417 | |
| Morgan Stanley | | | 148,492 | | | | 8,318,522 | |
| NetApp, Inc. | | | 175,946 | | | | 10,653,530 | |
| Northrop Grumman Corp.† | | | 25,194 | | | | 8,818,908 | |
| Oracle Corp.† | | | 420,753 | | | | 21,319,555 | |
| Parsley Energy, Inc., Class A*† | | | 322,852 | | | | 8,161,699 | |
| Peabody Energy Corp. | | | 134,582 | | | | 5,478,833 | |
| Pfizer, Inc.† | | | 201,173 | | | | 7,304,592 | |
| Pioneer Natural Resources Co.† | | | 52,098 | | | | 8,868,643 | |
| Raytheon Co. | | | 39,776 | | | | 8,651,678 | |
| RSP Permian, Inc.* | | | 151,368 | | | | 5,798,908 | |
| Steel Dynamics, Inc.† | | | 169,952 | | | | 7,860,280 | |
| SunTrust Banks, Inc.† | | | 126,079 | | | | 8,805,357 | |
| SYNNEX Corp. | | | 36,667 | | | | 4,533,875 | |
| TE Connectivity Ltd. | | | 93,536 | | | | 9,642,626 | |
| Time Warner, Inc. | | | 80,441 | | | | 7,477,795 | |
| TJX Cos. Inc., (The) | | | 91,008 | | | | 7,524,541 | |
| Trinseo SA | | | 117,348 | | | | 9,340,901 | |
| Twenty-First Century Fox, Inc. Class A | | | 198,711 | | | | 7,316,539 | |
| United Technologies Corp.† | | | 52,507 | | | | 7,074,793 | |
| Wells Fargo & Co.† | | | 89,418 | | | | 5,222,905 | |
| WestRock Co.† | | | 80,015 | | | | 5,261,786 | |
| | | | | | | | 521,240,458 | |
| TOTAL COMMON STOCKS (Cost $832,634,282) | | | | | | | 973,273,843 | |
| PREFERRED STOCKS—0.4% | | | | | | | | |
| Germany—0.4% | | | | | | | | |
| Volkswagen AG, 1.269% | | | 24,611 | | | | 4,787,798 | |
| TOTAL PREFERRED STOCKS (Cost $3,847,335) | | | | | | | 4,787,798 | |
| SHORT-TERM INVESTMENTS—2.4% |
| Morgan Stanley Institutional Liquidity Funds - Treasury Portfolio, 1.29% | | | 24,042,866 | | | | 24,042,866 | |
| TOTAL SHORT-TERM INVESTMENTS (Cost $24,042,866) | | | | | | | 24,042,866 | |
| TOTAL INVESTMENTS—99.0% | | | | | | | | |
| (Cost $860,524,483) | | | | | | | 1,002,104,507 | |
| SECURITIES SOLD SHORT—(42.5%) | | | | | | | | |
| COMMON STOCKS—(42.5%) | | | | | | | | |
| Australia—(1.7%) | | | | | | | | |
| Amcor Ltd. | | | (262,151 | ) | | | (2,810,107 | ) |
| Domino's Pizza Enterprises Ltd. | | | (136,330 | ) | | | (4,170,904 | ) |
| Healthscope Ltd. | | | (2,049,162 | ) | | | (2,992,977 | ) |
| National Australia Bank Ltd. | | | (132,419 | ) | | | (3,078,100 | ) |
| Treasury Wine Estates Ltd. | | | (141,820 | ) | | | (1,915,783 | ) |
| WiseTech Global Ltd. | | | (315,793 | ) | | | (2,612,418 | ) |
| | | | | | | | (17,580,289 | ) |
| Belgium—(0.3%) | | | | | | | | |
| Colruyt SA | | | (47,263 | ) | | | (2,549,954 | ) |
| Bermuda—(0.4%) | | | | | | | | |
| Arch Capital Group Ltd.* | | | (46,121 | ) | | | (4,069,717 | ) |
| Canada—(1.3%) | | | | | | | | |
| Cameco Corp. | | | (220,939 | ) | | | (1,948,682 | ) |
| Cineplex, Inc. | | | (39,964 | ) | | | (1,026,818 | ) |
| First Quantum Minerals Ltd. | | | (94,323 | ) | | | (1,537,012 | ) |
| PrairieSky Royalty Ltd. | | | (122,419 | ) | | | (2,716,076 | ) |
| Ritchie Bros. Auctioneers, Inc. | | | (86,247 | ) | | | (2,793,541 | ) |
| Shaw Communications, Inc., Class B | | | (187,981 | ) | | | (3,638,909 | ) |
| | | | | | | | (13,661,038 | ) |
| Chile—(0.2%) | | | | | | | | |
| Sociedad Quimica y Minera de Chile SA - SP ADR | | | (42,787 | ) | | | (2,135,071 | ) |
| China—(0.2%) | | | | | | | | |
| Shanghai Electric Group Co. Ltd., Class H* | | | (5,336,000 | ) | | | (2,002,927 | ) |
| Denmark—(0.2%) | | | | | | | | |
| Chr Hansen Holding A/S | | | (24,308 | ) | | | (2,019,055 | ) |
The accompanying notes are an integral part of the financial statements.
Semi-Annual Report 2018 | 35 |
BOSTON PARTNERS INVESTMENT FUNDS |
BOSTON PARTNERS GLOBAL LONG/SHORT FUND Portfolio of Investments (continued)
February 28, 2018 (unaudited) |
| | | Number of
Shares | | | Value | |
| Finland—(0.4%) | | | | | | |
| Huhtamaki OYJ | | | (101,688 | ) | | $ | (4,297,424 | ) |
| France—(1.7%) | | | | | | | | |
| Aeroports de Paris | | | (11,410 | ) | | | (2,307,159 | ) |
| Dassault Systemes SE | | | (16,778 | ) | | | (2,164,567 | ) |
| Getlink SE | | | (314,426 | ) | | | (4,044,133 | ) |
| JCDecaux SA | | | (61,759 | ) | | | (2,393,826 | ) |
| Societe Generale SA | | | (74,517 | ) | | | (4,234,041 | ) |
| Vallourec SA* | | | (471,201 | ) | | | (2,533,460 | ) |
| | | | | | | | (17,677,186 | ) |
| Germany—(1.1%) | | | | | | | | |
| Infineon Technologies AG | | | (94,859 | ) | | | (2,567,156 | ) |
| Krones AG | | | (21,968 | ) | | | (2,964,891 | ) |
| MTU Aero Engines AG | | | (14,322 | ) | | | (2,391,666 | ) |
| Zalando SE* | | | (56,748 | ) | | | (3,229,568 | ) |
| | | | | | | | (11,153,281 | ) |
| Hong Kong—(0.3%) | | | | | | | | |
| Hong Kong & China Gas Co. Ltd. | | | (1,312,000 | ) | | | (2,595,198 | ) |
| India—(0.3%) | | | | | | | | |
| Wipro Ltd. - ADR | | | (477,599 | ) | | | (2,631,570 | ) |
| Ireland—(0.3%) | | | | | | | | |
| James Hardie Industries PLC | | | (160,036 | ) | | | (2,809,418 | ) |
| Japan—(6.8%) | | | | | | | | |
| Aozora Bank Ltd. | | | (97,500 | ) | | | (3,978,496 | ) |
| Asics Corp. | | | (258,700 | ) | | | (4,088,793 | ) |
| Calbee, Inc. | | | (85,000 | ) | | | (2,830,442 | ) |
| Chugai Pharmaceutical Co., Ltd. | | | (44,800 | ) | | | (2,309,003 | ) |
| Ito En Ltd. | | | (84,100 | ) | | | (3,525,265 | ) |
| JINS, Inc. | | | (91,200 | ) | | | (4,407,616 | ) |
| McDonald's Holdings Co. Japan Ltd. | | | (48,000 | ) | | | (2,141,709 | ) |
| Murata Manufacturing Co., Ltd. | | | (17,300 | ) | | | (2,409,607 | ) |
| Nidec Corp. | | | (18,600 | ) | | | (2,970,241 | ) |
| Nippon Paint Holdings Co., Ltd. | | | (92,600 | ) | | | (3,355,996 | ) |
| Nissin Foods Holdings Co., Ltd. | | | (50,400 | ) | | | (3,429,344 | ) |
| Nitori Holdings Co., Ltd. | | | (12,600 | ) | | | (2,114,471 | ) |
| Oracle Corp. | | | (37,000 | ) | | | (2,858,409 | ) |
| Sanrio Co., Ltd. | | | (181,000 | ) | | | (3,254,524 | ) |
| Seiko Epson Corp. | | | (166,100 | ) | | | (3,169,754 | ) |
| Sharp Corp.* | | | (141,700 | ) | | | (4,922,248 | ) |
| Shimano, Inc. | | | (18,900 | ) | | | (2,727,650 | ) |
| Tokyo Electron Ltd. | | | (15,600 | ) | | | (3,048,285 | ) |
| Tsuruha Holdings, Inc. | | | (26,000 | ) | | | (3,764,554 | ) |
| Yamazaki Baking Co., Ltd. | | | (128,900 | ) | | | (2,508,470 | ) |
| Yaskawa Electric Corp. | | | (99,300 | ) | | | (4,567,461 | ) |
| | | | | | | | (68,382,338 | ) |
| Mexico—(0.3%) | | | | | | | | |
| Kimberly-Clark de Mexico SAB de CV, Class A | | | (1,481,200 | ) | | | (2,691,998 | ) |
| Netherlands—(0.4%) | | | | | | | | |
| Cimpress NV* | | | (26,073 | ) | | | (4,243,381 | ) |
| Singapore—(0.6%) | | | | | | | | |
| SATS Ltd. | | | (827,600 | ) | | | (3,236,859 | ) |
| Singapore Press Holdings Ltd. | | | (1,542,200 | ) | | | (3,013,015 | ) |
| | | | | | | | (6,249,874 | ) |
| South Africa—(0.3%) | | | | | | | | |
| Mediclinic International PLC | | | (350,114 | ) | | | (2,841,563 | ) |
| Spain—(0.2%) | | | | | | | | |
| Industria de Diseno Textil SA | | | (54,269 | ) | | | (1,643,062 | ) |
| Sweden—(1.1%) | | | | | | | | |
| Securitas AB, Class B | | | (140,958 | ) | | | (2,421,816 | ) |
| Skanska AB, Class B | | | (218,077 | ) | | | (4,336,923 | ) |
| Telefonaktiebolaget LM Ericsson, Class B | | | (642,508 | ) | | | (4,298,137 | ) |
| | | | | | | | (11,056,876 | ) |
| Switzerland—(0.4%) | | | | | | | | |
| Chocoladefabriken Lindt & Spruengli AG | | | (63 | ) | | | (4,541,272 | ) |
| Taiwan—(0.2%) | | | | | | | | |
| United Microelectronics Corp. - SP ADR | | | (982,291 | ) | | | (2,367,321 | ) |
| United Kingdom—(3.1%) | | | | | | | | |
| Aggreko PLC | | | (244,209 | ) | | | (2,507,668 | ) |
| Antofagasta PLC | | | (282,868 | ) | | | (3,362,889 | ) |
| Blue Prism Group PLC* | | | (48,398 | ) | | | (1,063,414 | ) |
| Hargreaves Lansdown PLC | | | (140,396 | ) | | | (3,320,896 | ) |
| Kingfisher PLC | | | (624,362 | ) | | | (3,073,001 | ) |
| Manchester United PLC, Class A | | | (51,698 | ) | | | (1,018,451 | ) |
| Ocado Group PLC* | | | (327,622 | ) | | | (2,484,570 | ) |
| Pearson PLC | | | (249,503 | ) | | | (2,512,657 | ) |
| Pennon Group PLC | | | (413,456 | ) | | | (3,456,412 | ) |
| Rolls-Royce Holdings PLC | | | (316,108 | ) | | | (3,636,025 | ) |
| Travis Perkins PLC | | | (121,532 | ) | | | (2,149,987 | ) |
| Weir Group PLC, (The) | | | (93,807 | ) | | | (2,617,504 | ) |
| | | | | | | | (31,203,474 | ) |
| United States—(20.7%) | | | | | | | | |
| 2U, Inc.* | | | (39,985 | ) | | | (3,309,958 | ) |
| AAON, Inc. | | | (56,968 | ) | | | (2,093,574 | ) |
| Acuity Brands, Inc. | | | (19,192 | ) | | | (2,736,395 | ) |
| Acxiom Corp.* | | | (134,630 | ) | | | (3,684,823 | ) |
| Antero Resources Corp.* | | | (242,111 | ) | | | (4,554,108 | ) |
| Apache Corp. | | | (83,280 | ) | | | (2,844,012 | ) |
| Balchem Corp. | | | (29,071 | ) | | | (2,187,593 | ) |
| Blackbaud, Inc. | | | (43,127 | ) | | | (4,421,380 | ) |
| CarMax, Inc.* | | | (29,074 | ) | | | (1,800,262 | ) |
| Caterpillar, Inc. | | | (19,847 | ) | | | (3,068,942 | ) |
| Centennial Resource Development Inc., Class A* | | | (73,547 | ) | | | (1,403,277 | ) |
| Cincinnati Financial Corp. | | | (26,942 | ) | | | (2,009,604 | ) |
| Cognex Corp. | | | (30,695 | ) | | | (1,648,628 | ) |
| Community Bank System, Inc. | | | (52,644 | ) | | | (2,806,452 | ) |
| Coty, Inc., Class A | | | (99,087 | ) | | | (1,914,361 | ) |
| Cracker Barrel Old Country Store, Inc. | | | (18,605 | ) | | | (2,904,240 | ) |
| Cree, Inc.* | | | (75,555 | ) | | | (2,858,246 | ) |
The accompanying notes are an integral part of the financial statements.
36 | Semi-Annual Report 2018 |
BOSTON PARTNERS INVESTMENT FUNDS |
BOSTON PARTNERS GLOBAL LONG/SHORT FUND Portfolio of Investments (continued)
February 28, 2018 (unaudited) |
| | | Number of
Shares | | | Value | |
| United States—(continued) | | | | | | |
| Cullen/Frost Bankers, Inc. | | | (29,722 | ) | | $ | (3,090,791 | ) |
| Ellie Mae, Inc.* | | | (51,282 | ) | | | (4,547,175 | ) |
| Equinix, Inc. | | | (7,344 | ) | | | (2,879,582 | ) |
| Exact Sciences Corp.* | | | (62,152 | ) | | | (2,772,601 | ) |
| FactSet Research Systems, Inc. | | | (17,966 | ) | | | (3,650,332 | ) |
| First Financial Bankshares, Inc. | | | (115,819 | ) | | | (5,327,674 | ) |
| Flowserve Corp. | | | (47,406 | ) | | | (2,007,644 | ) |
| Harley-Davidson, Inc. | | | (86,143 | ) | | | (3,909,169 | ) |
| HB Fuller Co. | | | (40,384 | ) | | | (2,034,950 | ) |
| Heartland Express, Inc. | | | (148,304 | ) | | | (2,894,894 | ) |
| Helmerich & Payne, Inc. | | | (46,080 | ) | | | (2,974,464 | ) |
| Hess Corp. | | | (53,821 | ) | | | (2,444,550 | ) |
| iRobot Corp.* | | | (13,782 | ) | | | (936,487 | ) |
| John Bean Technologies Corp. | | | (18,340 | ) | | | (2,031,155 | ) |
| Manhattan Associates, Inc.* | | | (60,062 | ) | | | (2,528,610 | ) |
| Matador Resources Co.* | | | (115,014 | ) | | | (3,319,304 | ) |
| Mattel, Inc. | | | (190,336 | ) | | | (3,026,342 | ) |
| Medidata Solutions, Inc.* | | | (43,042 | ) | | | (2,826,138 | ) |
| Middleby Corp., (The)* | | | (33,245 | ) | | | (3,997,711 | ) |
| MINDBODY, Inc., Class A* | | | (64,378 | ) | | | (2,295,076 | ) |
| Multi-Color Corp. | | | (54,288 | ) | | | (3,439,145 | ) |
| National Instruments Corp. | | | (93,232 | ) | | | (4,713,810 | ) |
| National Oilwell Varco, Inc. | | | (71,233 | ) | | | (2,499,566 | ) |
| Netflix, Inc.* | | | (7,540 | ) | | | (2,197,005 | ) |
| NewMarket Corp. | | | (9,256 | ) | | | (3,868,175 | ) |
| Norwegian Cruise Line Holdings Ltd.* | | | (54,554 | ) | | | (3,104,123 | ) |
| NuVasive, Inc.* | | | (35,861 | ) | | | (1,734,238 | ) |
| Oasis Petroleum, Inc.* | | | (244,638 | ) | | | (1,927,747 | ) |
| Power Integrations, Inc. | | | (47,630 | ) | | | (3,200,736 | ) |
| Proofpoint, Inc.* | | | (26,416 | ) | | | (2,831,003 | ) |
| Prosperity Bancshares, Inc. | | | (57,946 | ) | | | (4,345,950 | ) |
| Public Storage | | | (12,479 | ) | | | (2,426,417 | ) |
| Quaker Chemical Corp. | | | (23,730 | ) | | | (3,382,237 | ) |
| Range Resources Corp. | | | (154,273 | ) | | | (2,050,288 | ) |
| RLI Corp. | | | (66,473 | ) | | | (4,041,558 | ) |
| Rollins, Inc. | | | (73,801 | ) | | | (3,709,976 | ) |
| Snap, Inc., Class A* | | | (135,968 | ) | | | (2,354,966 | ) |
| Sonoco Products Co. | | | (57,867 | ) | | | (2,775,880 | ) |
| Take-Two Interactive Software, Inc.* | | | (12,596 | ) | | | (1,409,114 | ) |
| Tesla, Inc.* | | | (22,082 | ) | | | (7,575,451 | ) |
| Tootsie Roll Industries, Inc. | | | (68,108 | ) | | | (2,274,807 | ) |
| TransDigm Group, Inc. | | | (12,194 | ) | | | (3,515,652 | ) |
| Ultimate Software Group Inc. (The)* | | | (8,641 | ) | | | (2,060,533 | ) |
| UMB Financial Corp. | | | (41,057 | ) | | | (2,997,161 | ) |
| Varian Medical Systems, Inc.* | | | (35,703 | ) | | | (4,260,796 | ) |
| Veeva Systems, Inc. Class A* | | | (33,121 | ) | | | (2,308,534 | ) |
| Vulcan Materials Co. | | | (26,633 | ) | | | (3,135,503 | ) |
| Wabtec Corp. | | | (41,663 | ) | | | (3,388,868 | ) |
| WageWorks, Inc.* | | | (41,561 | ) | | | (2,179,874 | ) |
| Wayfair, Inc. Class A* | | | (37,597 | ) | | | (2,910,760 | ) |
| Wendy's Co. (The) | | | (159,314 | ) | | | (2,541,058 | ) |
| Westamerica Bancorporation | | | (36,416 | ) | | | (2,086,273 | ) |
| WEX, Inc.* | | | (24,236 | ) | | | (3,624,494 | ) |
| Workday, Inc., Class A* | | | (23,234 | ) | | | (2,943,051 | ) |
| | | | | | | | (209,555,253 | ) |
| TOTAL COMMON STOCKS (Proceeds $(415,869,961)) | | | | | | | (429,958,540 | ) |
| TOTAL SECURITIES SOLD SHORT—(42.5%) (Proceeds $(415,869,961)) | | | | | | | (429,958,540 | ) |
| | | Number of
Contracts | | | Notional
Amount | | | | |
OPTIONS WRITTEN††—0.0% |
| Call Options Written—(0.0%) |
| Chubb Ltd. | | | | | | | | | |
| Expiration:05/18/2018, Exercise Price:140.00 | | | (583 | ) | | | (8,273,936 | ) | | | (364,375 | ) |
| TOTAL CALL OPTIONS WRITTEN (Premiums received $(424,413)) | | | | | | | | | | | (364,375 | ) |
| TOTAL OPTIONS WRITTEN (Premiums received $(424,413)) | | | | | | | | | | | (364,375 | ) |
| OTHER ASSETS IN EXCESS OF LIABILITIES—43.5% | | | | | | | | | | | 439,872,146 | |
| NET ASSETS—100.0% | | | | | | | | | | $ | 1,011,653,738 | |
ADR | — American Depositary Receipt |
PLC | — Public Limited Company |
SP ADR | — Sponsored American Depositary Receipt |
† | — Security position is either entirely or partially held in a segregated account as collateral for securities sold short. |
# | — Security segregated as collateral for options written. |
†† | — Primary risk exposure is equity contracts. |
The accompanying notes are an integral part of the financial statements.
Semi-Annual Report 2018 | 37 |
BOSTON PARTNERS INVESTMENT FUNDS |
BOSTON PARTNERS GLOBAL LONG/SHORT FUND Portfolio of Investments (continued)
February 28, 2018 (unaudited) |
Contracts For Difference held by the Fund at February 28, 2018, are as follows:
Reference
Company | Counterparty | Expiration Date | Financing Rate | Payment Frequency | | Number of Contracts Long/(Short) | | | Notional
Amount | | | Unrealized
Appreciation
(Depreciation) | |
| Short | | | | | | | | | | | | | |
| South Korea | | | | | | | | | | | | | |
| Amorepacific Corp. | Goldman Sachs | 9/15/2020 | 1.42% | Monthly | | | (6,712 | ) | | $ | (1,742,110 | ) | | $ | (32,195 | ) |
| Celltrion Inc. | Goldman Sachs | 9/15/2020 | 1.42% | Monthly | | | (12,877 | ) | | | (4,164,888 | ) | | | (519,079 | ) |
| Kakao Corp. | Goldman Sachs | 12/31/2021 | 1.42% | Monthly | | | (18,212 | ) | | | (2,140,304 | ) | | | (58,009 | ) |
| | | | | | | | | | | | (8,047,302 | ) | | | (609,282 | ) |
| Taiwan | | | | | | | | | | | | | | | | |
| Cheng Shin Rubber | Goldman Sachs | 9/15/2020 | 1.42% | Monthly | | | (2,059,000 | ) | | | (3,528,869 | ) | | | (4,300 | ) |
| Feng Tay Enterprise | Goldman Sachs | 9/15/2020 | 1.42% | Monthly | | | (536,000 | ) | | | (2,526,516 | ) | | | (77,494 | ) |
| Largan Precision, Class C | Goldman Sachs | 9/18/2018 | 1.42% | Monthly | | | (29,000 | ) | | | (3,584,573 | ) | | | 322,156 | |
| | | | | | | | | | | | (9,639,958 | ) | | | 240,361 | |
| Total Short | | | | | | | | | | | (17,687,260 | ) | | | (368,921 | ) |
| Net unrealized gain/(loss) on Contracts For Difference | | | | | | | | | | $ | (368,921 | ) |
A summary of the inputs used to value the Fund's investments carried at fair value as of February 28, 2018 is as follows (see Notes to Portfolio of Investments):
| | | Total | | | Level 1 | | | Level 2 | | | Level 3 | |
| Common Stock | | | | | | | | | | | | |
| Argentina | | $ | 6,042,387 | | | $ | 6,042,387 | | | $ | — | | | $ | — | |
| Bermuda | | | 20,588,552 | | | | 20,588,552 | | | | — | | | | — | |
| Canada | | | 8,111,771 | | | | 8,111,771 | | | | — | | | | — | |
| China | | | 9,561,006 | | | | 4,104,457 | | | | 5,456,549 | | | | — | |
| France | | | 55,460,084 | | | | — | | | | 55,460,084 | | | | — | |
| Germany | | | 31,832,042 | | | | — | | | | 31,832,042 | | | | — | |
| Hong Kong | | | 21,266,179 | | | | — | | | | 21,266,179 | | | | — | |
| India | | | 5,047,861 | | | | 5,047,861 | | | | — | | | | — | |
| Indonesia | | | 3,441,523 | | | | 3,441,523 | | | | — | | | | — | |
| Ireland | | | 12,080,333 | | | | — | | | | 12,080,333 | | | | — | |
| Japan | | | 101,162,901 | | | | — | | | | 101,162,901 | | | | — | |
| Luxembourg | | | 5,077,278 | | | | 5,077,278 | | | | — | | | | — | |
| Mexico | | | 7,703,453 | | | | 7,703,453 | | | | — | | | | — | |
| Netherlands | | | 12,304,185 | | | | — | | | | 12,304,185 | | | | — | |
| Russia | | | 5,183,906 | | | | 5,183,906 | | | | — | | | | — | |
| Singapore | | | 18,063,058 | | | | 18,063,058 | | | | — | | | | — | |
| South Korea | | | 18,519,705 | | | | 2,268,171 | | | | 16,251,534 | | | | — | |
| Switzerland | | | 37,141,527 | | | | — | | | | 37,141,527 | | | | — | |
| United Kingdom | | | 73,445,634 | | | | 14,871,041 | | | | 58,574,593 | | | | — | |
| United States | | | 521,240,458 | | | | 521,240,458 | | | | — | | | | — | |
| Preferred Stock | | | | | | | | | | | | | | | | |
| Germany | | | 4,787,798 | | | | — | | | | 4,787,798 | | | | — | |
| Short-Term Investments | | | 24,042,866 | | | | 24,042,866 | | | | — | | | | — | |
| Contracts For Difference | | | | | | | | | | | | | | | | |
| Equity Contracts | | | 322,156 | | | | — | | | | 322,156 | | | | — | |
| Total Assets | | $ | 1,002,426,663 | | | $ | 645,786,782 | | | $ | 356,639,881 | | | $ | — | |
The accompanying notes are an integral part of the financial statements.
38 | Semi-Annual Report 2018 |
BOSTON PARTNERS INVESTMENT FUNDS |
BOSTON PARTNERS GLOBAL LONG/SHORT FUND Portfolio of Investments (concluded)
February 28, 2018 (unaudited) |
| | | Total | | | Level 1 | | | Level 2 | | | Level 3 | |
| Securities Sold Short | | | | | | | | | | | | |
| Australia | | $ | (17,580,289 | ) | | $ | (4,170,904 | ) | | $ | (13,409,385 | ) | | $ | — | |
| Belgium | | | (2,549,954 | ) | | | — | | | | (2,549,954 | ) | | | — | |
| Bermuda | | | (4,069,717 | ) | | | (4,069,717 | ) | | | — | | | | — | |
| Canada | | | (13,661,038 | ) | | | (13,661,038 | ) | | | — | | | | — | |
| Chile | | | (2,135,071 | ) | | | (2,135,071 | ) | | | — | | | | — | |
| China | | | (2,002,927 | ) | | | — | | | | (2,002,927 | ) | | | — | |
| Denmark | | | (2,019,055 | ) | | | — | | | | (2,019,055 | ) | | | — | |
| Finland | | | (4,297,424 | ) | | | — | | | | (4,297,424 | ) | | | — | |
| France | | | (17,677,186 | ) | | | — | | | | (17,677,186 | ) | | | — | |
| Germany | | | (11,153,281 | ) | | | — | | | | (11,153,281 | ) | | | — | |
| Hong Kong | | | (2,595,198 | ) | | | (2,595,198 | ) | | | — | | | | — | |
| India | | | (2,631,570 | ) | | | (2,631,570 | ) | | | — | | | | — | |
| Ireland | | | (2,809,418 | ) | | | — | | | | (2,809,418 | ) | | | — | |
| Japan | | | (68,382,338 | ) | | | — | | | | (68,382,338 | ) | | | — | |
| Mexico | | | (2,691,998 | ) | | | (2,691,998 | ) | | | — | | | | — | |
| Netherlands | | | (4,243,381 | ) | | | (4,243,381 | ) | | | — | | | | — | |
| Singapore | | | (6,249,874 | ) | | | — | | | | (6,249,874 | ) | | | — | |
| South Africa | | | (2,841,563 | ) | | | — | | | | (2,841,563 | ) | | | — | |
| Spain | | | (1,643,062 | ) | | | — | | | | (1,643,062 | ) | | | — | |
| Sweden | | | (11,056,876 | ) | | | — | | | | (11,056,876 | ) | | | — | |
| Switzerland | | | (4,541,272 | ) | | | — | | | | (4,541,272 | ) | | | — | |
| Taiwan | | | (2,367,321 | ) | | | (2,367,321 | ) | | | — | | | | — | |
| United Kingdom | | | (31,203,474 | ) | | | (4,231,852 | ) | | | (26,971,622 | ) | | | — | |
| United States | | | (209,555,253 | ) | | | (209,555,253 | ) | | | — | | | | — | |
| Options Written | | | | | | | | | | | | | | | — | |
| Equity Contracts | | | (364,375 | ) | | | — | | | | (364,375 | ) | | | — | |
| Contracts For Difference | | | | | | | | | | | | | | | | |
| Equity Contracts | | | (691,077 | ) | | | — | | | | (691,077 | ) | | | — | |
| Total Liabilities | | $ | (431,013,992 | ) | | $ | (252,353,303 | ) | | $ | (178,660,689 | ) | | $ | — | |
The accompanying notes are an integral part of the financial statements.
Semi-Annual Report 2018 | 39 |
BOSTON PARTNERS INVESTMENT FUNDS |
BOSTON PARTNERS EMERGING MARKETS LONG/SHORT FUND Portfolio of Investments
February 28, 2018 (unaudited) |
| | | Number of
Shares | | | Value | |
| LONG POSITIONS—95.3% | | | | | | |
| COMMON STOCKS—56.9% | | | | | | |
| Argentina—1.9% | | | | | | |
| Banco Macro SA - ADR | | | 1,539 | | | $ | 174,076 | |
| Grupo Financiero Galicia SA - ADR | | | 2,237 | | | | 140,797 | |
| Grupo Supervielle SA - SP ADR | | | 7,268 | | | | 223,200 | |
| Pampa Energia SA - SP ADR* | | | 7,662 | | | | 485,235 | |
| YPF SA - SP ADR† | | | 19,486 | | | | 450,321 | |
| | | | | | | | 1,473,629 | |
| Australia—0.2% | | | | | | | | |
| Syrah Resources Ltd.* | | | 58,607 | | | | 152,782 | |
| Brazil—5.2% | | | | | | | | |
| BK Brasil Operacao e Assessoria a Restaurantes SA* | | | 36,018 | | | | 183,146 | |
| Cia de Saneamento Basico do Estado de Sao Paulo | | | 37,900 | | | | 439,126 | |
| Eneva SA* | | | 25,600 | | | | 107,229 | |
| Minerva SA | | | 305,200 | | | | 850,676 | |
| Movida Participacoes SA* | | | 175,100 | | | | 413,091 | |
| Qualicorp SA | | | 96,600 | | | | 847,024 | |
| Sul America SA | | | 83,400 | | | | 549,168 | |
| Tupy SA | | | 41,700 | | | | 231,174 | |
| Vale SA - SP ADR | | | 26,381 | | | | 362,211 | |
| | | | | | | | 3,982,845 | |
| Canada—0.7% | | | | | | | | |
| Ivanhoe Mines Ltd., Class A* | | | 66,498 | | | | 167,385 | |
| Lundin Mining Corp. | | | 58,406 | | | | 380,058 | |
| | | | | | | | 547,443 | |
| Chile—0.5% | | | | | | | | |
| Geopark Ltd.* | | | 42,306 | | | | 418,829 | |
| China—8.8% | | | | | | | | |
| Alibaba Group Holding Ltd. - SP ADR* | | | 14,870 | | | | 2,767,902 | |
| China Construction Bank Corp., Class H | | | 528,000 | | | | 541,365 | |
| China Meidong Auto Holdings Ltd. | | | 1,130,000 | | | | 421,626 | |
| Industrial & Commercial Bank of China Ltd. | | | 455,000 | | | | 387,906 | |
| JD.com, Inc. - ADR* | | | 4,369 | | | | 205,998 | |
| NetEase, Inc. - ADR | | | 787 | | | | 230,867 | |
| Ping An Insurance Group Co. of China Ltd., Class H | | | 32,000 | | | | 337,066 | |
| Tencent Holdings Ltd. | | | 8,500 | | | | 465,022 | |
| Tencent Holdings Ltd. - ADR | | | 10,679 | | | | 586,170 | |
| Vipshop Holdings Ltd. - ADR* | | | 28,051 | | | | 487,807 | |
| West China Cement Ltd.* | | | 1,796,000 | | | | 303,336 | |
| | | | | | | | 6,735,065 | |
| Egypt—1.4% | | | | | | | | |
| Eastern Tobacco | | | 33,083 | | | | 1,036,061 | |
| Hong Kong—1.8% | | | | | | | | |
| China Mobile Ltd. - SP ADR | | | 26,062 | | | | 1,211,622 | |
| WH Group Ltd. | | | 167,500 | | | | 206,294 | |
| | | | | | | | 1,417,916 | |
| Hungary—1.0% | | | | | | | | |
| OTP Bank PLC | | | 8,405 | | | | 374,476 | |
| Waberer's International Nyrt* | | | 22,666 | | | | 416,721 | |
| | | | | | | | 791,197 | |
| India—3.3% | | | | | | | | |
| Aurobindo Pharma Ltd. | | | 14,628 | | | | 136,955 | |
| Bharti Airtel Ltd. | | | 23,472 | | | | 153,426 | |
| Gujarat State Petronet Ltd. | | | 128,488 | | | | 405,903 | |
| Indiabulls Housing Finance Ltd. | | | 10,621 | | | | 202,448 | |
| Infosys Ltd. | | | 10,820 | | | | 193,220 | |
| Videocon D2H Ltd. - ADR* | | | 142,681 | | | | 1,184,252 | |
| Westlife Development Ltd.* | | | 13,138 | | | | 65,569 | |
| Yes Bank Ltd. | | | 34,866 | | | | 170,872 | |
| | | | | | | | 2,512,645 | |
| Indonesia—0.8% | | | | | | | | |
| Bank Rakyat Indonesia Persero Tbk PT | | | 2,191,900 | | | | 602,639 | |
| Luxembourg—0.8% | | | | | | | | |
| Adecoagro SA* | | | 71,209 | | | | 640,169 | |
| Mexico—3.4% | | | | | | | | |
| Alpek SAB de CV | | | 382,600 | | | | 496,652 | |
| Banco del Bajio SA* | | | 108,700 | | | | 237,286 | |
| Bolsa Mexicana de Valores SAB de CV | | | 123,300 | | | | 228,866 | |
| Cemex SAB de CV - SP ADR* | | | 49,231 | | | | 322,463 | |
| CFE Capital S de RL de CV* | | | 252,254 | | | | 263,887 | |
| Credito Real SAB de CV SOFOM ER | | | 335,500 | | | | 467,014 | |
| Gentera SAB de CV | | | 238,500 | | | | 194,969 | |
| Gruma SAB de CV | | | 16,270 | | | | 188,346 | |
| Vista Oil & Gas SAB de CV* | | | 17,632 | | | | 176,314 | |
| | | | | | | | 2,575,797 | |
| Netherlands—1.6% | | | | | | | | |
| DP Eurasia NV* | | | 82,723 | | | | 242,576 | |
| Heineken NV | | | 7,581 | | | | 787,218 | |
| VEON Ltd. | | | 71,919 | | | | 207,846 | |
| | | | | | | | 1,237,640 | |
| Philippines—1.0% | | | | | | | | |
| Bloomberry Resorts Corp.* | | | 1,129,000 | | | | 312,166 | |
| East West Banking Corp. | | | 345,300 | | | | 185,645 | |
| Filinvest Land, Inc. | | | 6,281,000 | | | | 213,467 | |
| Melco Resorts And Entertainment Philippines Corp.* | | | 284,600 | | | | 41,805 | |
| | | | | | | | 753,083 | |
| Poland—0.5% | | | | | | | | |
| AmRest Holdings SE* | | | 3,311 | | | | 414,008 | |
| Russia—3.1% | | | | | | | | |
| LUKOIL PJSC - SP ADR | | | 8,105 | | | | 538,172 | |
| Mobile TeleSystems PJSC - SP ADR | | | 22,916 | | | | 274,075 | |
| Sberbank of Russia PJSC - SP ADR | | | 65,397 | | | | 1,324,943 | |
| Tatneft PJSC - SP ADR | | | 3,232 | | | | 204,263 | |
| | | | | | | | 2,341,453 | |
The accompanying notes are an integral part of the financial statements.
40 | Semi-Annual Report 2018 |
BOSTON PARTNERS INVESTMENT FUNDS |
BOSTON PARTNERS EMERGING MARKETS LONG/SHORT FUND Portfolio of Investments (continued)
February 28, 2018 (unaudited) |
| | | Number of
Shares | | | Value | |
| Singapore—0.8% | | | | | | |
| BOC Aviation Ltd. | | | 34,200 | | | $ | 190,787 | |
| DBS Group Holdings Ltd. | | | 19,300 | | | | 414,772 | |
| | | | | | | | 605,559 | |
| South Africa—2.8% | | | | | | | | |
| Capitec Bank Holdings Ltd. | | | 3,066 | | | | 215,143 | |
| Clover Industries Ltd. | | | 268,176 | | | | 370,870 | |
| Naspers Ltd., Class N | | | 4,178 | | | | 1,134,126 | |
| Telkom SA SOC Ltd. | | | 91,790 | | | | 399,785 | |
| | | | | | | | 2,119,924 | |
| South Korea—4.4% | | | | | | | | |
| DB Insurance Co. Ltd.* | | | 3,448 | | | | 220,375 | |
| Hanwha Corp. | | | 6,720 | | | | 274,393 | |
| Hyundai Heavy Industries Co. Ltd.* | | | 1,542 | | | | 185,456 | |
| Hyundai Marine & Fire Insurance Co. Ltd. | | | 6,150 | | | | 234,166 | |
| KB Financial Group, Inc. | | | 1,930 | | | | 113,882 | |
| KT Corp. - SP ADR*† | | | 41,209 | | | | 547,256 | |
| KT&G Corp. | | | 4,488 | | | | 413,614 | |
| LG Corp. | | | 3,551 | | | | 283,011 | |
| LG Uplus Corp. | | | 40,260 | | | | 466,687 | |
| Meritz Fire & Marine Insurance Co. Ltd. | | | 16,830 | | | | 354,497 | |
| NCSoft Corp. | | | 333 | | | | 115,074 | |
| SFA Engineering Corp. | | | 5,232 | | | | 180,572 | |
| | | | | | | | 3,388,983 | |
| Switzerland—0.7% | | | | | | | | |
| Glencore PLC | | | 97,131 | | | | 510,782 | |
| Taiwan—2.5% | | | | | | | | |
| Compeq Manufacturing Co. Ltd. | | | 133,000 | | | | 150,045 | |
| Hon Hai Precision Industry Co., Ltd. | | | 89,000 | | | | 262,249 | |
| Pegatron Corp. | | | 286,000 | | | | 719,046 | |
| Primax Electronics Ltd. | | | 140,000 | | | | 353,666 | |
| Taiwan Semiconductor Manufacturing Co., Ltd. - SP ADR | | | 10,692 | | | | 463,498 | |
| | | | | | | | 1,948,504 | |
| Turkey—2.6% | | | | | | | | |
| Akbank Turk AS | | | 231,566 | | | | 643,253 | |
| Mavi Giyim Sanayi Ve Ticaret AS, Class B* | | | 43,267 | | | | 605,457 | |
| Migros Ticaret AS* | | | 41,443 | | | | 261,426 | |
| Tupras Turkiye Petrol Rafinerileri AS | | | 2,517 | | | | 77,250 | |
| Turkiye Sinai Kalkinma Bankasi AS | | | 576,166 | | | | 256,141 | |
| Yapi ve Kredi Bankasi AS* | | | 106,835 | | | | 133,120 | |
| | | | | | | | 1,976,647 | |
| United Arab Emirates—0.7% | | | | | | | | |
| Abu Dhabi Commercial Bank PJSC* | | | 165,469 | | | | 328,875 | |
| Emaar Malls PJSC* | | | 355,459 | | | | 205,171 | |
| | | | | | | | 534,046 | |
| United Kingdom—1.9% | | | | | | | | |
| Atrium European Real Estate Ltd. | | | 129,465 | | | | 646,796 | |
| Cairn Energy PLC* | | | 97,147 | | | | 247,945 | |
| Ophir Energy PLC* | | | 200,245 | | | | 145,007 | |
| Petra Diamonds Ltd.* | | | 474,854 | | | | 399,847 | |
| | | | | | | | 1,439,595 | |
| United States—4.5% | | | | | | | | |
| Air Lease Corp. | | | 20,461 | | | | 893,532 | |
| Broadcom Ltd. | | | 772 | | | | 190,267 | |
| Kosmos Energy Ltd.* | | | 45,491 | | | | 245,196 | |
| Lam Research Corp. | | | 996 | | | | 191,092 | |
| Liberty Latin America Ltd., Class C*† | | | 40,786 | | | | 834,074 | |
| Micron Technology, Inc.* | | | 6,400 | | | | 312,384 | |
| Philip Morris International, Inc. | | | 4,743 | | | | 491,138 | |
| Versum Materials, Inc. | | | 2,534 | | | | 93,809 | |
| Wynn Resorts Ltd. | | | 1,274 | | | | 213,395 | |
| | | | | | | | 3,464,887 | |
| TOTAL COMMON STOCKS (Cost $41,802,783) | | | | | | | 43,622,128 | |
| EXCHANGE TRADED FUNDS—0.6% |
| Thailand—0.6% | | | | | | | | |
| Jasmine Broadband Internet Infrastructure Fund | | | 1,171,243 | | | | 450,519 | |
| TOTAL EXCHANGE TRADED FUNDS (Cost $406,828) | | | | | | | 450,519 | |
| PREFERRED STOCKS—5.1% | | | | | | | | |
| Brazil—0.7% | | | | | | | | |
| Cia Paranaense de Energia, 11.477% | | | 35,100 | | | | 275,231 | |
| Itau Unibanco Holding SA, 5.660% | | | 16,500 | | | | 258,967 | |
| | | | | | | | 534,198 | |
| Russia—0.4% | | | | | | | | |
| Sberbank of Russia PJSC, 2.626% | | | 71,700 | | | | 286,050 | |
| South Korea—4.0% | | | | | | | | |
| Samsung Electronics Co., Ltd., 2.133% | | | 1,676 | | | | 3,078,800 | |
| TOTAL PREFERRED STOCKS (Cost $3,190,805) | | | | | | | 3,899,048 | |
| WARRANTS—0.0% | | | | | | | | |
| Mexico—0.0% | | | | | | | | |
| Vista Oil & Gas SAB de CV* | | | 13,133 | | | | 4,006 | |
| TOTAL WARRANTS (Cost $0) | | | | | | | 4,006 | |
The accompanying notes are an integral part of the financial statements.
Semi-Annual Report 2018 | 41 |
BOSTON PARTNERS INVESTMENT FUNDS |
BOSTON PARTNERS EMERGING MARKETS LONG/SHORT FUND Portfolio of Investments (continued)
February 28, 2018 (unaudited) |
| | | Number of
Shares | | | Value | |
| SHORT-TERM INVESTMENTS—32.7% |
| Morgan Stanley Institutional Liquidity Funds - Treasury Portfolio, 1.29% | | | 25,050,896 | | | $ | 25,050,896 | |
| TOTAL SHORT-TERM INVESTMENTS (Cost $25,050,896) | | | | | | | 25,050,896 | |
| TOTAL INVESTMENTS—95.3% | | | | | | | | |
| (Cost $70,451,312) | | | | | | | 73,026,597 | |
| SECURITIES SOLD SHORT—(0.4%) |
| COMMON STOCKS—(0.4%) | | | | | | | | |
| Hong Kong—(0.4%) | | | | | | | | |
| Sino Biopharmaceutical Ltd. | | | (157,000 | ) | | $ | (294,172 | ) |
| TOTAL COMMON STOCKS (Proceeds $(294,797)) | | | | | | | (294,172 | ) |
| TOTAL SECURITIES SOLD SHORT—(0.4%) (Proceeds $(294,797)) | | | | | | | (294,172 | ) |
| OTHER ASSETS IN EXCESS OF LIABILITIES—5.1% | | | | | | | 3,929,341 | |
| NET ASSETS—100.0% | | | | | | $ | 76,661,766 | |
ADR | — American Depositary Receipt |
PLC | — Public Limited Company |
NVDR | — Non-Voting Depository Receipt |
SP ADR | — Sponsored American Depositary Receipt |
† | — Security position is either entirely or partially held in a segregated account as collateral for securities sold short. |
Contracts For Difference held by the Fund at February 28, 2018, are as follows:
Reference
Company | Counterparty | Expiration Date | Financing Rate | Payment Frequency | | Number of Contracts Long/(Short) | | | Notional
Amount | | | Unrealized
Appreciation
(Depreciation) | |
| Long | | | | | | | | | | | | | |
| China | | | | | | | | | | | | | |
| Agricultural Bank of China | Goldman Sachs | 9/15/2020 | 0.70% | Monthly | | | 999,000 | | | $ | 548,902 | | | $ | (1,508 | ) |
| Alibaba Group Holding Ltd. - SP ADR | Goldman Sachs | 12/31/2021 | 1.60% | Monthly | | | 4,494 | | | | 836,513 | | | | (5,045 | ) |
| Baidu Inc. - SP ADR | Goldman Sachs | 12/31/2021 | 1.60% | Monthly | | | 4,062 | | | | 1,025,005 | | | | 27,681 | |
| China Lesso Group | Goldman Sachs | 9/15/2020 | 0.70% | Monthly | | | 986,000 | | | | 646,562 | | | | (13,902 | ) |
| China Meidong Auto Holdings Ltd. | Goldman Sachs | 9/15/2020 | 0.70% | Monthly | | | 440,000 | | | | 164,173 | | | | 4,433 | |
| China National, Class H | Goldman Sachs | 9/15/2020 | 0.70% | Monthly | | | 80,000 | | | | 78,489 | | | | 1,789 | |
| China Petroleum, Class H | Goldman Sachs | 9/15/2020 | 0.70% | Monthly | | | 90,000 | | | | 71,430 | | | | 215 | |
| China Telecom Corp. Ltd., Class H | Goldman Sachs | 12/31/2021 | 0.70% | Monthly | | | 1,106,000 | | | | 482,233 | | | | (8,365 | ) |
| China Vanke Co., Class H | Goldman Sachs | 9/15/2020 | 0.70% | Monthly | | | 49,500 | | | | 219,619 | | | | (8,494 | ) |
| Gree Electric Appliances Inc. | Goldman Sachs | 9/15/2020 | 1.63% | Monthly | | | 93,700 | | | | 760,391 | | | | (53,219 | ) |
| Guangzhou Automobile, Class H | Goldman Sachs | 9/15/2020 | 0.70% | Monthly | | | 214,000 | | | | 470,575 | | | | (9,251 | ) |
| Henan Shuang Inv. | Goldman Sachs | 9/15/2020 | 1.63% | Monthly | | | 187,000 | | | | 800,627 | | | | (12,575 | ) |
| Jiangsu Yanghe Brewery Joint-Stock Co., Ltd., Class A | Goldman Sachs | 9/15/2020 | 1.63 | Monthly | | | 23,300 | | | | 434,170 | | | | (48,904 | ) |
| Kweichow Moutai | Goldman Sachs | 9/15/2020 | 1.63% | Monthly | | | 7,500 | | | | 853,769 | | | | (25,500 | ) |
| PICC Property & Casualty Co. Ltd. | Goldman Sachs | 9/15/2020 | 0.70% | Monthly | | | 96,000 | | | | 188,292 | | | | 3,476 | |
| Qingdao Haier Co., Ltd. | Goldman Sachs | 9/15/2020 | 1.63% | Monthly | | | 130,200 | | | | 400,314 | | | | (19,297 | ) |
The accompanying notes are an integral part of the financial statements.
42 | Semi-Annual Report 2018 |
BOSTON PARTNERS INVESTMENT FUNDS |
BOSTON PARTNERS EMERGING MARKETS LONG/SHORT FUND Portfolio of Investments (continued)
February 28, 2018 (unaudited) |
Reference
Company | Counterparty | Expiration Date | Financing Rate | Payment Frequency | | Number of Contracts Long/(Short) | | | Notional
Amount | | | Unrealized
Appreciation
(Depreciation) | |
| Long—(continued) | | | | | | | | | | | | | |
| China—(continued) | | | | | | | | | | | | | |
| Shanghai Haohai Biological Technology Co., Ltd., Class H | Goldman Sachs | 12/31/2021 | 0.70% | Monthly | | | 52,100 | | | $ | 273,268 | | | $ | (16,445 | ) |
| Sichuan Swellfun, Class A | Goldman Sachs | 9/15/2020 | 1.63% | Monthly | | | 43,500 | | | | 294,786 | | | | (19,806 | ) |
| Sunny Optical Technology Group Co., Ltd. | Goldman Sachs | 9/15/2020 | 0.70% | Monthly | | | 14,000 | | | | 228,984 | | | | (6,000 | ) |
| Tencent Holdings Ltd. | Goldman Sachs | 12/31/2021 | 0.70% | Monthly | | | 58,000 | | | | 3,173,094 | | | | (132,213 | ) |
| Wuliangye Yibin Co., Ltd., Class A | Goldman Sachs | 9/15/2020 | 1.63% | Monthly | | | 66,100 | | | | 768,771 | | | | (67,270 | ) |
| | | | | | | | | | | | 12,719,967 | | | | (410,201 | ) |
| Egypt | | | | | | | | | | | | | | | | |
| Commercial International Bank Egypt SAE | Goldman Sachs | 12/31/2021 | 1.60% | Monthly | | | 87,922 | | | | 383,762 | | | | 4,145 | |
| EFG-Hermes Holdings | Goldman Sachs | 9/15/2020 | 1.60% | Monthly | | | 153,273 | | | | 191,808 | | | | 1,318 | |
| | | | | | | | | | | | 575,570 | | | | 5,464 | |
| Greece | | | | | | | | | | | | | | | | |
| Motor Oil SA | Goldman Sachs | 9/15/2020 | -0.37% | Monthly | | | 16,135 | | | | 378,735 | | | | 783 | |
| | | | | | | | | | | | | | | | | |
| Hong Kong | | | | | | | | | | | | | | | | |
| Brilliance China | Goldman Sachs | 9/15/2020 | 0.70% | Monthly | | | 152,000 | | | | 403,891 | | | | 1,679 | |
| CNOOC Ltd. | Goldman Sachs | 9/15/2020 | 0.70% | Monthly | | | 100,000 | | | | 142,714 | | | | (2,247 | ) |
| Haier Electronics Group Co. Ltd. | Goldman Sachs | 9/15/2020 | 0.70% | Monthly | | | 116,000 | | | | 395,150 | | | | (6,703 | ) |
| Joy City Property | Goldman Sachs | 9/15/2020 | 0.70% | Monthly | | | 1,930,000 | | | | 317,949 | | | | (315 | ) |
| K. Wah International Holdings Ltd. | Goldman Sachs | 9/15/2020 | 0.70% | Monthly | | | 235,000 | | | | 151,599 | | | | (1,609 | ) |
| Kunlun Energy Co. Ltd. | Goldman Sachs | 9/15/2020 | 0.70% | Monthly | | | 196,000 | | | | 183,691 | | | | 1,540 | |
| | | | | | | | | | | | 1,594,994 | | | | (7,656 | ) |
| India | | | | | | | | | | | | | | | | |
| Videocon D2H Ltd. - ADR | Goldman Sachs | 12/31/2021 | 1.60% | Monthly | | | 15,586 | | | | 129,364 | | | | 1,665 | |
| | | | | | | | | | | | | | | | | |
| Israel | | | | | | | | | | | | | | | | |
| Gazit Globe Ltd. | Goldman Sachs | 9/15/2020 | 0.10% | Monthly | | | 83,778 | | | | 851,425 | | | | 13,611 | |
| Israel Discount Bank | Goldman Sachs | 9/15/2020 | 0.10% | Monthly | | | 134,278 | | | | 385,034 | | | | 15,420 | |
| Tamar Petroleum Ltd. NPV | Goldman Sachs | 9/15/2020 | 0.10% | Monthly | | | 175,655 | | | | 1,053,066 | | | | (7,734 | ) |
| | | | | | | | | | | | 2,289,525 | | | | 21,297 | |
| Japan | | | | | | | | | | | | | | | | |
| Suzuki Motor Co. | Goldman Sachs | 9/15/2020 | -0.04% | Monthly | | | 5,500 | | | | 313,752 | | | | 8,336 | |
| | | | | | | | | | | | | | | | | |
| Luxembourg | | | | | | | | | | | | | | | | |
| Samsonite International SA | Goldman Sachs | 12/31/2021 | 0.70% | Monthly | | | 92,100 | | | | 401,310 | | | | 5,137 | |
| | | | | | | | | | | | | | | | | |
| Mexico | | | | | | | | | | | | | | | | |
| Grupo GicSA SA de CV | Goldman Sachs | 12/31/2021 | 1.60% | Monthly | | | 1,310,400 | | | | 764,663 | | | | (18,960 | ) |
The accompanying notes are an integral part of the financial statements.
Semi-Annual Report 2018 | 43 |
BOSTON PARTNERS INVESTMENT FUNDS |
BOSTON PARTNERS EMERGING MARKETS LONG/SHORT FUND Portfolio of Investments (continued)
February 28, 2018 (unaudited) |
Reference
Company | Counterparty | Expiration Date | Financing Rate | Payment Frequency | | Number of Contracts Long/(Short) | | | Notional
Amount | | | Unrealized
Appreciation
(Depreciation) | |
| Long—(continued) | | | | | | | | | | | | | |
| South Korea | | | | | | | | | | | | | |
| Bnk Financial Group | Goldman Sachs | 9/15/2020 | 1.60% | Monthly | | | 67,180 | | | $ | 692,700 | | | $ | 25,796 | |
| Eugene Technology | Goldman Sachs | 9/15/2020 | 1.60% | Monthly | | | 27,514 | | | | 551,637 | | | | (15,359 | ) |
| Hana Financial Group, Inc. | Goldman Sachs | 12/31/2021 | 1.17% | Monthly | | | 13,150 | | | | 595,775 | | | | (18,132 | ) |
| Hyundai Mobis Co., Ltd. | Goldman Sachs | 12/31/2021 | 1.60% | Monthly | | | 1,613 | | | | 339,610 | | | | 8,124 | |
| Kiwoom Securities | Goldman Sachs | 9/15/2020 | 1.60% | Monthly | | | 1,528 | | | | 139,420 | | | | (6,373 | ) |
| KT Corp. | Goldman Sachs | 12/31/2021 | 1.60% | Monthly | | | 2,891 | | | | 74,404 | | | | 1,140 | |
| Samsung Electronics Co., Ltd. | Goldman Sachs | 12/31/2021 | 1.60% | Monthly | | | 499 | | | | 1,084,361 | | | | (8,432 | ) |
| Samsung SDI Co., Ltd. | Goldman Sachs | 12/31/2021 | 1.60% | Monthly | | | 3,279 | | | | 518,338 | | | | (26,510 | ) |
| SK Hynix Inc. | Goldman Sachs | 9/15/2020 | 1.60% | Monthly | | | 3,310 | | | | 233,432 | | | | 1,838 | |
| | | | | | | | | | | | 4,229,677 | | | | (37,909 | ) |
| Taiwan | | | | | | | | | | | | | | | | |
| Taiwan Semiconductor Manufacturing Co., Ltd. | Goldman Sachs | 12/31/2021 | 1.60% | Monthly | | | 270,000 | | | | 2,241,971 | | | | (551 | ) |
| | | | | | | | | | | | | | | | | |
| Turkey | | | | | | | | | | | | | | | | |
| Logo Yazilim | Goldman Sachs | 9/15/2020 | 1.60% | Monthly | | | 22,834 | | | | 328,560 | | | | (1,511 | ) |
| Yatas | Goldman Sachs | 9/15/2020 | 1.60% | Monthly | | | 87,380 | | | | 671,181 | | | | 118,633 | |
| | | | | | | | | | | | 999,741 | | | | 117,123 | |
| United Kingdom | | | | | | | | | | | | | | | | |
| BGEO Group PLC | Goldman Sachs | 9/15/2020 | 0.50% | Monthly | | | 15,482 | | | | 721,106 | | | | (9,479 | ) |
| Georgia Healthcare Group PLC | Goldman Sachs | 12/31/2021 | 0.50% | Monthly | | | 21,822 | | | | 99,140 | | | | (4,692 | ) |
| Petra Diamonds Ltd. | Goldman Sachs | 12/31/2021 | 0.50% | Monthly | | | 426,742 | | | | 359,335 | | | | (68,560 | ) |
| TBC Bank Group PLC | Goldman Sachs | 9/15/2020 | 0.50% | Monthly | | | 15,365 | | | | 332,288 | | | | (28,953 | ) |
| | | | | | | | | | | | 1,511,869 | | | | (111,683 | ) |
| Total Long | | | | | | | | | | | 28,151,138 | | | | (427,155 | ) |
| | | | | | | | | | | | | | | | | |
| Short | | | | | | | | | | | | | | | | |
| Argentina | | | | | | | | | | | | | | | | |
| Mercadolibre Inc. Com. | Goldman Sachs | 9/15/2020 | 1.42% | Monthly | | | (689 | ) | | $ | (267,311 | ) | | $ | (8,340 | ) |
| | | | | | | | | | | | | | | | | |
| Brazil | | | | | | | | | | | | | | | | |
| B2W Cia Digital | Goldman Sachs | 9/15/2020 | 1.42% | Monthly | | | (47,500 | ) | | | (345,252 | ) | | | 3,398 | |
| Marcopolo SA | Goldman Sachs | 9/15/2020 | 1.42% | Monthly | | | (157,100 | ) | | | (196,925 | ) | | | (4,550 | ) |
| Natura Cosmeticos SA | Goldman Sachs | 9/15/2020 | 1.42% | Monthly | | | (40,800 | ) | | | (424,223 | ) | | | 9,609 | |
| Raia Drogasil SA | Goldman Sachs | 9/15/2020 | 1.42% | Monthly | | | (9,200 | ) | | | (220,784 | ) | | | 11,453 | |
| | | | | | | | | | | | (1,187,184 | ) | | | 19,910 | |
| Chile | | | | | | | | | | | | | | | | |
| Sociedad Quimica Mineral | Goldman Sachs | 9/15/2020 | 1.42% | Monthly | | | (7,286 | ) | | | (363,571 | ) | | | 38,927 | |
| | | | | | | | | | | | | | | | | |
| China | | | | | | | | | | | | | | | | |
| China Life Insurance Co., Ltd., Class H | Goldman Sachs | 12/31/2021 | 0.07% | Monthly | | | (90,000 | ) | | | (264,364 | ) | | | 1,319 | |
| China Pacific Insurance Group, Ltd., Class H | Goldman Sachs | 12/31/2021 | 0.07% | Monthly | | | (51,400 | ) | | | (250,042 | ) | | | (5,361 | ) |
| Cosco Shipping Development Co., Ltd. | Goldman Sachs | 12/31/2021 | 0.07% | Monthly | | | (1,515,000 | ) | | | (306,343 | ) | | | (2,453 | ) |
The accompanying notes are an integral part of the financial statements.
44 | Semi-Annual Report 2018 |
BOSTON PARTNERS INVESTMENT FUNDS |
BOSTON PARTNERS EMERGING MARKETS LONG/SHORT FUND Portfolio of Investments (continued)
February 28, 2018 (unaudited) |
Reference
Company | Counterparty | Expiration Date | Financing Rate | Payment Frequency | | Number of Contracts Long/(Short) | | | Notional
Amount | | | Unrealized
Appreciation
(Depreciation) | |
| Short—(continued) | | | | | | | | | | | | | |
| China—(continued) | | | | | | | | | | | | | |
| Cosco Shipping Holdings Co., Ltd. | Goldman Sachs | 9/15/2020 | 0.07% | Monthly | | | (544,500 | ) | | $ | (283,664 | ) | | $ | (112 | ) |
| Dongfang Electric Corp. Ltd., Class H | Goldman Sachs | 12/31/2021 | 0.07% | Monthly | | | (454,800 | ) | | | (378,043 | ) | | | (10,297 | ) |
| Great Wall Motor Class H | Macquarie | 9/18/2018 | 0.14% | Monthly | | | (322,000 | ) | | | (376,681 | ) | | | (17,503 | ) |
| Huadian Power International Corp. Ltd., Class H | Goldman Sachs | 12/31/2021 | 0.07% | Monthly | | | (768,000 | ) | | | (267,549 | ) | | | (2,619 | ) |
| Huaneng Power International Inc., Class H | Goldman Sachs | 12/31/2021 | 0.07% | Monthly | | | (314,000 | ) | | | (192,253 | ) | | | (4,457 | ) |
| Maanshan Iron & Steel | Goldman Sachs | 9/15/2020 | 0.07% | Monthly | | | (828,000 | ) | | | (442,134 | ) | | | (982 | ) |
| New China Life Insurance Co., Ltd., Class H | Goldman Sachs | 12/31/2021 | 0.07% | Monthly | | | (40,400 | ) | | | (239,771 | ) | | | 1,335 | |
| Parkson Retail Group Ltd. | Goldman Sachs | 12/31/2021 | 0.07% | Monthly | | | (1,472,000 | ) | | | (170,198 | ) | | | 40,446 | |
| Semiconductor Manufacturing Co., Ltd. | Goldman Sachs | 12/31/2020 | 0.07% | Monthly | | | (129,000 | ) | | | (170,614 | ) | | | (14,565 | ) |
| Shanhai Electric, Class H | Goldman Sachs | 9/15/2020 | 0.07% | Monthly | | | (1,044,000 | ) | | | (391,877 | ) | | | (3,715 | ) |
| Tian Ge Interactive Holdings Ltd. | Goldman Sachs | 12/31/2021 | 0.07% | Monthly | | | (435,000 | ) | | | (389,613 | ) | | | (22,575 | ) |
| Tsingtao Brewery Co., Ltd., Class H | Goldman Sachs | 12/31/2021 | 0.07% | Monthly | | | (56,000 | ) | | | (306,080 | ) | | | 2,721 | |
| Yashili International Holdings Ltd. | Goldman Sachs | 12/31/2021 | 0.07% | Monthly | | | (600,000 | ) | | | (106,569 | ) | | | (3,102 | ) |
| | | | | | | | | | | | (4,535,795 | ) | | | (41,920 | ) |
| Colombia | | | | | | | | | | | | | | | | |
| Ecopetrol SA - SP ADR | Goldman Sachs | 9/15/2020 | 1.42% | Monthly | | | (13,113 | ) | | | (229,609 | ) | | | (2,256 | ) |
| | | | | | | | | | | | | | | | | |
| France | | | | | | | | | | | | | | | | |
| Edenred | Goldman Sachs | 9/15/2020 | -0.36% | Monthly | | | (5,372 | ) | | | (188,482 | ) | | | (6,924 | ) |
| | | | | | | | | | | | | | | | | |
| Hong Kong | | | | | | | | | | | | | | | | |
| Bank Of East Asia Ltd. (The) | Goldman Sachs | 12/31/2021 | 0.07% | Monthly | | | (93,109 | ) | | | (409,870 | ) | | | (13,660 | ) |
| Cathay Pacific Airways | Goldman Sachs | 9/15/2020 | 0.07% | Monthly | | | (298,000 | ) | | | (502,744 | ) | | | (10,816 | ) |
| China Aircraft Leasing Group Holdings Ltd. | Morgan Stanley | 9/15/2020 | 0.09% | Monthly | | | (491,000 | ) | | | (478,117 | ) | | | 10,653 | |
| China Resources Beer Holdings Co., Ltd. | Goldman Sachs | 12/31/2021 | 0.07% | Monthly | | | (104,000 | ) | | | (400,535 | ) | | | (3,812 | ) |
| China Taiping Insurance Holdings Co., Ltd. | Goldman Sachs | 12/31/2021 | 0.07% | Monthly | | | (85,800 | ) | | | (327,498 | ) | | | (4,039 | ) |
| Fullshare Holdings | Goldman Sachs | 9/15/2020 | 0.07% | Monthly | | | (625,000 | ) | | | (349,620 | ) | | | (47,257 | ) |
| HK Electric Investments & HK Electric Investments Ltd. | Goldman Sachs | 12/31/2021 | 0.07% | Monthly | | | (525,000 | ) | | | (492,403 | ) | | | (5,378 | ) |
| Hong Kong & China Gas Co., Ltd. | Goldman Sachs | 12/31/2021 | 0.07% | Monthly | | | (219,200 | ) | | | (433,588 | ) | | | (10,039 | ) |
| Imperial Pacific International Holdings Ltd. | Morgan Stanley | 12/31/2021 | 0.09% | Monthly | | | (4,200,000 | ) | | | (53,131 | ) | | | 2,242 | |
The accompanying notes are an integral part of the financial statements.
Semi-Annual Report 2018 | 45 |
BOSTON PARTNERS INVESTMENT FUNDS |
BOSTON PARTNERS EMERGING MARKETS LONG/SHORT FUND Portfolio of Investments (continued)
February 28, 2018 (unaudited) |
Reference
Company | Counterparty | Expiration Date | Financing Rate | Payment Frequency | | Number of Contracts Long/(Short) | | | Notional
Amount | | | Unrealized
Appreciation
(Depreciation) | |
| Short—(continued) | | | | | | | | | | | | | |
Hong Kong—
(continued) | | | | | | | | | | | | | |
| MTR Corp. | Goldman Sachs | 9/15/2020 | 0.07% | Monthly | | | (64,056 | ) | | $ | (338,073 | ) | | $ | (402 | ) |
| Towngas China Co., Ltd. | Macquarie | 12/31/2021 | 0.14% | Monthly | | | (375,195 | ) | | | (303,478 | ) | | | 7,198 | |
| Vision Fame International Holdings Ltd. | Macquarie | 9/19/2018 | 0.14% | Monthly | | | (138,000 | ) | | | (6,965 | ) | | | (627 | ) |
| | | | | | | | | | | | (4,096,022 | ) | | | (75,936 | ) |
| India | | | | | | | | | | | | | | | | |
| Wipro Ltd. - SP ADR | Goldman Sachs | 9/15/2020 | 1.42% | Monthly | | | (25,302 | ) | | | (139,414 | ) | | | 771 | |
| | | | | | | | | | | | | | | | | |
| Indonesia | | | | | | | | | | | | | | | | |
| H. M. Sampoerna | Macquarie | 9/18/2018 | 1.44% | Monthly | | | (1,281,800 | ) | | | (449,378 | ) | | | 5,253 | |
| Jasa Marga | Macquarie | 9/18/2018 | 1.44% | Monthly | | | (258,600 | ) | | | (100,256 | ) | | | 4,663 | |
| Jasa Marga | Morgan Stanley | 9/18/2018 | 1.42% | Monthly | | | (218,900 | ) | | | (84,864 | ) | | | 3,909 | |
| Unilever Indonesia TBK PT | Macquarie | 9/19/2018 | 1.44% | Monthly | | | (129,500 | ) | | | (507,695 | ) | | | 10,072 | |
| | | | | | | | | | | | (1,142,193 | ) | | | 23,897 | |
| Italy | | | | | | | | | | | | | | | | |
| Prada S.P.A. | Goldman Sachs | 12/31/2021 | 0.07% | Monthly | | | (102,400 | ) | | | (423,549 | ) | | | (5,448 | ) |
| | | | | | | | | | | | | | | | | |
| Malaysia | | | | | | | | | | | | | | | | |
| Digi.com. Bhd | Morgan Stanley | 9/15/2020 | 1.42% | Monthly | | | (414,300 | ) | | | (511,925 | ) | | | 1,864 | |
| Maxis Bhd | Morgan Stanley | 9/15/2020 | 1.42% | Monthly | | | (289,600 | ) | | | (436,951 | ) | | | 12,318 | |
| | | | | | | | | | | | (948,876 | ) | | | 14,182 | |
| Mexico | | | | | | | | | | | | | | | | |
| El Puerto de Liver | Goldman Sachs | 9/15/2020 | 1.42% | Monthly | | | (49,900 | ) | | | (341,082 | ) | | | 9,105 | |
| Fresnillo PLC | Goldman Sachs | 12/31/2021 | 0.47% | Monthly | | | (8,815 | ) | | | (147,279 | ) | | | 18,060 | |
| Grupo Televisa SAB - SP ADR | Goldman Sachs | 9/15/2020 | 1.42% | Monthly | | | (5,938 | ) | | | (101,005 | ) | | | 13,209 | |
| Kimberly-Clark MXC | Goldman Sachs | 9/15/2020 | 1.42% | Monthly | | | (183,600 | ) | | | (333,683 | ) | | | 9,480 | |
| Telesites SAB CV | Goldman Sachs | 9/15/2020 | 1.42% | Monthly | | | (357,300 | ) | | | (284,124 | ) | | | (6,011 | ) |
| | | | | | | | | | | | (1,207,173 | ) | | | 43,843 | |
| Singapore | | | | | | | | | | | | | | | | |
| Sats Ltd. NPV | Goldman Sachs | 9/15/2020 | 1.54% | Monthly | | | (97,600 | ) | | | (381,727 | ) | | | 1,507 | |
| SembCorp. Marine Ltd. | Morgan Stanley | 12/31/2021 | 1.65% | Monthly | | | (202,900 | ) | | | (318,972 | ) | | | 84,877 | |
| Singapore Airlines Ltd. NPV | Goldman Sachs | 9/15/2020 | 1.54% | Monthly | | | (55,400 | ) | | | (461,616 | ) | | | 8,726 | |
| Singapore Press Holdings Ltd. | Goldman Sachs | 9/15/2020 | 1.54% | Monthly | | | (192,400 | ) | | | (375,894 | ) | | | 10,531 | |
| | | | | | | | | | | | (1,538,209 | ) | | | 105,641 | |
| South Africa | | | | | | | | | | | | | | | | |
| MTN Group Ltd. | Goldman Sachs | 9/15/2020 | 6.56% | Monthly | | | (44,979 | ) | | | (487,311 | ) | | | (9,766 | ) |
| Nampak | Goldman Sachs | 9/15/2020 | 6.56% | Monthly | | | (175,565 | ) | | | (236,245 | ) | | | 13,944 | |
| | | | | | | | | | | | (723,556 | ) | | | 4,179 | |
| South Korea | | | | | | | | | | | | | | | | |
| Amorepacific Group | Goldman Sachs | 9/15/2020 | 1.42% | Monthly | | | (3,578 | ) | | | (415,142 | ) | | | 417 | |
| Celltrion Health | Goldman Sachs | 9/19/2018 | 1.42% | Monthly | | | (258 | ) | | | (28,009 | ) | | | 2,112 | |
| Celltrion Health | Macquarie | 9/18/2018 | 1.44% | Monthly | | | (2,350 | ) | | | (255,125 | ) | | | 19,235 | |
| Celltrion Health | Morgan Stanley | 9/19/2018 | 1.42% | Monthly | | | (1,544 | ) | | | (167,623 | ) | | | 12,695 | |
| Celltrion Inc. | Goldman Sachs | 9/15/2020 | 1.42% | Monthly | | | (1,404 | ) | | | (454,104 | ) | | | (56,596 | ) |
| CJ CGV Co., Ltd. | Morgan Stanley | 9/15/2020 | 1.42% | Monthly | | | (7,273 | ) | | | (474,976 | ) | | | 23,662 | |
| Hite Jinro Co. Ltd. | Goldman Sachs | 9/15/2020 | 1.42% | Monthly | | | (15,447 | ) | | | (313,818 | ) | | | (11,395 | ) |
The accompanying notes are an integral part of the financial statements.
46 | Semi-Annual Report 2018 |
BOSTON PARTNERS INVESTMENT FUNDS |
BOSTON PARTNERS EMERGING MARKETS LONG/SHORT FUND Portfolio of Investments (continued)
February 28, 2018 (unaudited) |
Reference
Company | Counterparty | Expiration Date | Financing Rate | Payment Frequency | | Number of Contracts Long/(Short) | | | Notional
Amount | | | Unrealized
Appreciation
(Depreciation) | |
| Short—(continued) | | | | | | | | | | | | | |
| South Korea—(continued) | | | | | | | | | | | | | | | | |
| Kakao Corp. | Goldman Sachs | 12/31/2021 | 1.42% | Monthly | | | (2,152 | ) | | $ | (252,907 | ) | | $ | (6,780 | ) |
| LG Display Co., Ltd. | Goldman Sachs | 9/15/2020 | 1.42% | Monthly | | | (14,510 | ) | | | (399,243 | ) | | | 8,527 | |
| Paradise Co. Ltd. | Morgan Stanley | 12/31/2021 | 1.42% | Monthly | | | (19,610 | ) | | | (331,391 | ) | | | 57,620 | |
| Posco Daewoo Corp. | Macquarie | 9/18/2018 | 1.44% | Monthly | | | (21,770 | ) | | | (405,011 | ) | | | 11,319 | |
| Seah Besteel Corp. | Goldman Sachs | 12/31/2021 | 1.42% | Monthly | | | (13,410 | ) | | | (352,804 | ) | | | (4,028 | ) |
| Tongyang Life Insurance Co., Ltd. | Morgan Stanley | 12/31/2021 | 1.42% | Monthly | | | (22,100 | ) | | | (146,735 | ) | | | 8,946 | |
| | | | | | | | | | | | (3,996,888 | ) | | | 65,733 | |
| Switzerland | | | | | | | | | | | | | | | | |
| Cie Financiere Richemont SA | Goldman Sachs | 9/15/2020 | 6.56% | Monthly | | | (16,120 | ) | | | (142,650 | ) | | | 3,147 | |
| | | | | | | | | | | | | | | | | |
| Taiwan | | | | | | | | | | | | | | | | |
| AU Optronics Corp. | Goldman Sachs | 9/15/2020 | 1.42% | Monthly | | | (834,000 | ) | | | (367,213 | ) | | | 15,275 | |
| Cheng Shin Rubber | Goldman Sachs | 9/15/2020 | 1.42% | Monthly | | | (122,000 | ) | | | (209,093 | ) | | | (231 | ) |
| Eclat Textile Co., Ltd. | Goldman Sachs | 12/31/2021 | 1.42% | Monthly | | | (29,500 | ) | | | (309,320 | ) | | | 4,559 | |
| Feng Tay Enterprise | Goldman Sachs | 9/15/2020 | 1.42% | Monthly | | | (108,000 | ) | | | (509,074 | ) | | | (15,621 | ) |
| Ginko International | Goldman Sachs | 9/15/2020 | 1.42% | Monthly | | | (21,000 | ) | | | (152,431 | ) | | | (2,681 | ) |
| Innolux Corp. | Goldman Sachs | 9/15/2020 | 1.42% | Monthly | | | (759,000 | ) | | | (330,228 | ) | | | 8,765 | |
| Kinsus Interconne | Goldman Sachs | 9/15/2020 | 1.42% | Monthly | | | (160,000 | ) | | | (274,603 | ) | | | (5,836 | ) |
| Largan Precision, Class C | Macquarie | 9/18/2018 | 1.44% | Monthly | | | (2,000 | ) | | | (247,212 | ) | | | 23,288 | |
| United Microelectronics Corp. - SP ADR | Goldman Sachs | 9/15/2020 | 1.42% | Monthly | | | (196,063 | ) | | | (472,512 | ) | | | 5,892 | |
| | | | | | | | | | | | (2,871,686 | ) | | | 33,410 | |
| Thailand | | | | | | | | | | | | | | | | |
| Airports of Thailand PCL | Morgan Stanley | 9/15/2020 | 1.42% | Monthly | | | (188,600 | ) | | | (422,791 | ) | | | (12,673 | ) |
| Robinson Department Store | Macquarie | 9/19/2018 | 1.44% | Monthly | | | (140,500 | ) | | | (299,643 | ) | | | 21,475 | |
| Thai Airways International PCL - NVDR | Morgan Stanley | 12/31/2021 | 1.42% | Monthly | | | (707,500 | ) | | | (340,339 | ) | | | 6,863 | |
| | | | | | | | | | | | (1,062,773 | ) | | | 15,665 | |
| United Kingdom | | | | | | | | | | | | | | | | |
| Antofagasta PLC | Goldman Sachs | 12/31/2021 | 0.47% | Monthly | | | (15,446 | ) | | | (183,630 | ) | | | 9,455 | |
| Standard Chartered PLC | Goldman Sachs | 12/31/2020 | 0.47% | Monthly | | | (32,917 | ) | | | (364,954 | ) | | | 12,817 | |
| Subsea 7 S.A Com. | Goldman Sachs | 9/15/2020 | 0.50% | Monthly | | | (24,692 | ) | | | (366,660 | ) | | | (1,017 | ) |
| | | | | | | | | | | | (915,244 | ) | | | 21,255 | |
| Total Short | | | | | | | | | | | (25,980,185 | ) | | | 249,735 | |
| Net unrealized gain/(loss) on Contracts For Difference | | | | | | | | | | | $ | (177,420 | ) |
The accompanying notes are an integral part of the financial statements.
Semi-Annual Report 2018 | 47 |
BOSTON PARTNERS INVESTMENT FUNDS |
BOSTON PARTNERS EMERGING MARKETS LONG/SHORT FUND Portfolio of Investments (concluded)
February 28, 2018 (unaudited) |
A summary of the inputs used to value the Fund's investments carried at fair value as of February 28, 2018 is as follows (see Notes to Portfolio of Investments):
| | | Total | | | Level 1 | | | Level 2 | | | Level 3 | |
| Common Stock | | | | | | | | | | | | |
| Argentina | | $ | 1,473,629 | | | $ | 1,473,629 | | | $ | — | | | $ | — | |
| Australia | | | 152,782 | | | | — | | | | 152,782 | | | | — | |
| Brazil | | | 3,982,845 | | | | 3,982,845 | | | | — | | | | — | |
| Canada | | | 547,443 | | | | 547,443 | | | | — | | | | — | |
| Chile | | | 418,829 | | | | 418,829 | | | | — | | | | — | |
| China | | | 6,735,065 | | | | 4,700,370 | | | | 2,034,695 | | | | — | |
| Egypt | | | 1,036,061 | | | | — | | | | 1,036,061 | | | | — | |
| Hong Kong | | | 1,417,916 | | | | 1,211,622 | | | | 206,294 | | | | — | |
| Hungary | | | 791,197 | | | | 416,721 | | | | 374,476 | | | | — | |
| India | | | 2,512,645 | | | | 1,184,252 | | | | 1,328,393 | | | | — | |
| Indonesia | | | 602,639 | | | | 602,639 | | | | — | | | | — | |
| Luxembourg | | | 640,169 | | | | 640,169 | | | | — | | | | — | |
| Mexico | | | 2,575,797 | | | | 2,575,797 | | | | — | | | | — | |
| Netherlands | | | 1,237,640 | | | | 450,422 | | | | 787,218 | | | | — | |
| Philippines | | | 753,083 | | | | 753,083 | | | | — | | | | — | |
| Poland | | | 414,008 | | | | 414,008 | | | | — | | | | — | |
| Russia | | | 2,341,453 | | | | 2,341,453 | | | | — | | | | — | |
| Singapore | | | 605,559 | | | | — | | | | 605,559 | | | | — | |
| South Africa | | | 2,119,924 | | | | 370,870 | | | | 1,749,054 | | | | — | |
| South Korea | | | 3,388,983 | | | | 960,870 | | | | 2,428,113 | | | | — | |
| Switzerland | | | 510,782 | | | | — | | | | 510,782 | | | | — | |
| Taiwan | | | 1,948,504 | | | | 463,498 | | | | 1,485,006 | | | | — | |
| Turkey | | | 1,976,647 | | | | 256,141 | | | | 1,720,506 | | | | — | |
| United Arab Emirates | | | 534,046 | | | | 534,046 | | | | — | | | | — | |
| United Kingdom | | | 1,439,595 | | | | 791,803 | | | | 647,792 | | | | — | |
| United States | | | 3,464,887 | | | | 3,464,887 | | | | — | | | | — | |
| Exchange Traded Funds | | | 450,519 | | | | — | | | | 450,519 | | | | — | |
| Preferred Stock | | | | | | | | | | | | | | | | |
| Brazil | | | 534,198 | | | | 534,198 | | | | — | | | | — | |
| Russia | | | 286,050 | | | | — | | | | 286,050 | | | | — | |
| South Korea | | | 3,078,800 | | | | — | | | | 3,078,800 | | | | — | |
| Warrant | | | 4,006 | | | | 4,006 | | | | — | | | | — | |
| Short-Term Investments | | | 25,050,896 | | | | 25,050,896 | | | | — | | | | — | |
| Contracts For Difference | | | | | | | | | | | | | | | | |
| Equity Contracts | | | 840,420 | | | | — | | | | 840,420 | | | | — | |
| Total Assets | | $ | 73,867,017 | | | $ | 54,144,497 | | | $ | 19,722,520 | | | $ | — | |
| | | Total | | | Level 1 | | | Level 2 | | | Level 3 | |
| Securities Sold Short | | | | | | | | | | | | |
| Hong Kong | | $ | (294,172 | ) | | $ | — | | | $ | (294,172 | ) | | $ | — | |
| Contracts For Difference | | | | | | | | | | | | | | | | |
| Equity Contracts | | | (1,017,840 | ) | | | — | | | | (1,017,840 | ) | | | — | |
| Total Liabilities | | $ | (1,312,012 | ) | | $ | — | | | $ | (1,312,012 | ) | | $ | — | |
The accompanying notes are an integral part of the financial statements.
48 | Semi-Annual Report 2018 |
BOSTON PARTNERS INVESTMENT FUNDS |
BOSTON PARTNERS EMERGING MARKETS FUND Portfolio of Investments
February 28, 2018 (unaudited) |
| | | Number of
Shares | | | Value | |
| COMMON STOCKS—60.3% | | | | | | |
| Argentina—2.0% | | | | | | |
| Banco Macro SA - ADR | | | 199 | | | $ | 22,509 | |
| Grupo Financiero Galicia SA - ADR | | | 293 | | | | 18,441 | |
| Grupo Supervielle SA - SP ADR | | | 948 | | | | 29,113 | |
| Pampa Energia SA - SP ADR* | | | 1,045 | | | | 66,180 | |
| YPF SA - SP ADR | | | 2,556 | | | | 59,069 | |
| | | | | | | | 195,312 | |
| Australia—0.2% | | | | | | | | |
| Syrah Resources Ltd.* | | | 7,774 | | | | 20,266 | |
| Brazil—2.1% | | | | | | | | |
| BK Brasil Operacao e Assessoria a Restaurantes SA* | | | 4,550 | | | | 23,136 | |
| Minerva SA | | | 38,300 | | | | 106,753 | |
| Tupy SA | | | 5,300 | | | | 29,382 | |
| Vale SA - SP ADR | | | 3,343 | | | | 45,899 | |
| | | | | | | | 205,170 | |
| Canada—0.8% | | | | | | | | |
| Ivanhoe Mines Ltd., Class A* | | | 8,821 | | | | 22,204 | |
| Lundin Mining Corp. | | | 7,808 | | | | 50,808 | |
| | | | | | | | 73,012 | |
| Chile—0.5% | | | | | | | | |
| Geopark Ltd.* | | | 4,948 | | | | 48,985 | |
| China—17.1% | | | | | | | | |
| Alibaba Group Holding Ltd. - SP ADR* | | | 2,470 | | | | 459,766 | |
| Baidu, Inc. - SP ADR* | | | 518 | | | | 130,712 | |
| China Construction Bank Corp., Class H | | | 68,000 | | | | 69,721 | |
| China Meidong Auto Holdings Ltd. | | | 166,000 | | | | 61,938 | |
| China Telecom Corp. Ltd. | | | 138,000 | | | | 60,170 | |
| Industrial & Commercial Bank of China Ltd. | | | 59,000 | | | | 50,300 | |
| JD.com, Inc. - ADR* | | | 553 | | | | 26,074 | |
| NetEase, Inc. - ADR | | | 99 | | | | 29,042 | |
| Ping An Insurance Group Co. of China Ltd., Class H | | | 4,000 | | | | 42,133 | |
| Shanghai Haohai Biological Technology Co., Ltd., Class H | | | 6,900 | | | | 36,191 | |
| Sunny Optical Technology Group Co., Ltd. | | | 2,000 | | | | 32,712 | |
| Tencent Holdings Ltd. | | | 8,600 | | | | 470,493 | |
| Tencent Holdings Ltd. - ADR | | | 1,221 | | | | 67,021 | |
| Vipshop Holdings Ltd. - ADR* | | | 3,776 | | | | 65,664 | |
| West China Cement Ltd.* | | | 234,000 | | | | 39,521 | |
| | | | | | | | 1,641,458 | |
| Egypt—1.4% | | | | | | | | |
| Eastern Tobacco | | | 4,314 | | | | 135,102 | |
| Hong Kong—1.9% | | | | | | | | |
| China Mobile Ltd. - SP ADR | | | 3,280 | | | | 152,487 | |
| WH Group Ltd. | | | 21,000 | | | | 25,864 | |
| | | | | | | | 178,351 | |
| Hungary—1.1% | | | | | | | | |
| OTP Bank PLC | | | 1,062 | | | | 47,316 | |
| Waberer's International Nyrt* | | | 3,051 | | | | 56,094 | |
| | | | | | | | 103,410 | |
| India—1.8% | | | | | | | | |
| Videocon d2h Ltd. - ADR* | | | 20,644 | | | | 171,345 | |
| Indonesia—1.1% | | | | | | | | |
| Bank Rakyat Indonesia Persero Tbk PT | | | 274,100 | | | | 75,361 | |
| Bank Rakyat Indonesia Persero Tbk PT - ADR | | | 1,824 | | | | 25,144 | |
| | | | | | | | 100,505 | |
| Luxembourg—0.9% | | | | | | | | |
| Adecoagro SA* | | | 9,312 | | | | 83,715 | |
| Mexico—4.5% | | | | | | | | |
| Alpek SAB de CV | | | 50,100 | | | | 65,035 | |
| Banco del Bajio SA* | | | 13,700 | | | | 29,906 | |
| Bolsa Mexicana de Valores SAB de CV | | | 15,500 | | | | 28,771 | |
| Cemex SAB de CV - SP ADR* | | | 6,203 | | | | 40,630 | |
| CFE Capital S de RL de CV* | | | 31,975 | | | | 33,450 | |
| Credito Real SAB de CV SOFOM ER | | | 42,300 | | | | 58,881 | |
| Gentera SAB de CV | | | 31,600 | | | | 25,832 | |
| Gruma SAB de CV | | | 2,155 | | | | 24,947 | |
| Grupo GICSA SA de CV* | | | 167,200 | | | | 97,567 | |
| Vista Oil & Gas SAB de CV* | | | 2,311 | | | | 23,109 | |
| | | | | | | | 428,128 | |
| Netherlands—1.7% | | | | | | | | |
| DP Eurasia NV* | | | 10,825 | | | | 31,743 | |
| Heineken NV | | | 959 | | | | 99,583 | |
| VEON Ltd. | | | 9,682 | | | | 27,981 | |
| | | | | | | | 159,307 | |
| Philippines—1.0% | | | | | | | | |
| Bloomberry Resorts Corp.* | | | 142,300 | | | | 39,346 | |
| East West Banking Corp. | | | 44,600 | | | | 23,978 | |
| Filinvest Land, Inc. | | | 812,000 | | | | 27,597 | |
| Melco Resorts And Entertainment Philippines Corp.* | | | 37,900 | | | | 5,567 | |
| | | | | | | | 96,488 | |
| Russia—3.2% | | | | | | | | |
| LUKOIL PJSC - SP ADR | | | 1,022 | | | | 67,861 | |
| Mobile TeleSystems PJSC - SP ADR | | | 3,040 | | | | 36,359 | |
| Sberbank of Russia PJSC - SP ADR | | | 8,727 | | | | 176,809 | |
| Tatneft PJSC - SP ADR | | | 407 | | | | 25,722 | |
| | | | | | | | 306,751 | |
| Singapore—0.8% | | | | | | | | |
| BOC Aviation Ltd. | | | 4,400 | | | | 24,546 | |
| DBS Group Holdings Ltd. | | | 2,600 | | | | 55,876 | |
| | | | | | | | 80,422 | |
| South Africa—2.9% | | | | | | | | |
| Capitec Bank Holdings Ltd. | | | 400 | | | | 28,068 | |
The accompanying notes are an integral part of the financial statements.
Semi-Annual Report 2018 | 49 |
BOSTON PARTNERS INVESTMENT FUNDS |
BOSTON PARTNERS EMERGING MARKETS FUND Portfolio of Investments (continued)
February 28, 2018 (unaudited) |
| | | Number of
Shares | | | Value | |
| South Africa—(continued) | | | | | | |
| Clover Industries Ltd. | | | 35,575 | | | $ | 49,198 | |
| Naspers Ltd. | | | 541 | | | | 146,856 | |
| Telkom SA SOC Ltd. | | | 11,530 | | | | 50,218 | |
| | | | | | | | 274,340 | |
| South Korea—3.4% | | | | | | | | |
| DB Insurance Co. Ltd.* | | | 452 | | | | 28,889 | |
| Hanwha Corp. | | | 850 | | | | 34,707 | |
| Hyundai Heavy Industries Co., Ltd.* | | | 198 | | | | 23,813 | |
| Hyundai Marine & Fire Insurance Co., Ltd. | | | 810 | | | | 30,841 | |
| KB Financial Group, Inc. | | | 240 | | | | 14,162 | |
| KT Corp. - SP ADR* | | | 6,252 | | | | 83,027 | |
| LG Corp. | | | 459 | | | | 36,582 | |
| Meritz Fire & Marine Insurance Co., Ltd. | | | 2,200 | | | | 46,339 | |
| SFA Engineering Corp. | | | 697 | | | | 24,056 | |
| | | | | | | | 322,416 | |
| Switzerland—0.7% | | | | | | | | |
| Glencore PLC | | | 12,576 | | | | 66,133 | |
| Taiwan—1.2% | | | | | | | | |
| Compeq Manufacturing Co., Ltd. | | | 18,000 | | | | 20,307 | |
| Primax Electronics Ltd. | | | 18,000 | | | | 45,471 | |
| Taiwan Semiconductor Manufacturing Co., Ltd. - SP ADR | | | 1,239 | | | | 53,711 | |
| | | | | | | | 119,489 | |
| Turkey—1.4% | | | | | | | | |
| Mavi Giyim Sanayi Ve Ticaret AS, Class B* | | | 5,603 | | | | 78,406 | |
| Migros Ticaret AS* | | | 5,226 | | | | 32,966 | |
| Tupras Turkiye Petrol Rafinerileri AS | | | 319 | | | | 9,790 | |
| Yapi ve Kredi Bankasi AS* | | | 14,172 | | | | 17,659 | |
| | | | | | | | 138,821 | |
| United Kingdom—4.0% | | | | | | | | |
| Atrium European Real Estate Ltd. | | | 16,767 | | | | 83,767 | |
| BGEO Group PLC | | | 1,902 | | | | 88,590 | |
| Cairn Energy PLC* | | | 12,501 | | | | 31,906 | |
| Georgia Healthcare Group PLC* | | | 2,865 | | | | 13,016 | |
| Ophir Energy PLC* | | | 26,716 | | | | 19,346 | |
| Petra Diamonds Ltd.* | | | 116,771 | | | | 98,326 | |
| TBC Bank Group PLC | | | 2,068 | | | | 44,723 | |
| | | | | | | | 379,674 | |
| United States—4.6% | | | | | | | | |
| Air Lease Corp. | | | 2,645 | | | | 115,507 | |
| Broadcom Ltd. | | | 97 | | | | 23,907 | |
| Kosmos Energy Ltd.* | | | 5,854 | | | | 31,553 | |
| Lam Research Corp. | | | 126 | | | | 24,175 | |
| Liberty Latin America Ltd. Class C* | | | 5,156 | | | | 105,440 | |
| Micron Technology, Inc.* | | | 857 | | | | 41,830 | |
| Philip Morris International, Inc. | | | 597 | | | | 61,819 | |
| Versum Materials, Inc. | | | 318 | | | | 11,772 | |
| Wynn Resorts Ltd. | | | 162 | | | | 27,135 | |
| | | | | | | | 443,138 | |
| TOTAL COMMON STOCKS (Cost $5,700,403) | | | | | | | 5,771,738 | |
| EXCHANGE TRADED FUNDS—3.0% |
| Thailand—0.6% | | | | | | | | |
| Jasmine Broadband Internet Infrastructure Fund | | | 157,600 | | | | 60,621 | |
| United States—2.4% | | | | | | | | |
| iShares MSCI India ETF | | | 6,680 | | | | 229,257 | |
| TOTAL EXCHANGE TRADED FUNDS (Cost $294,858) | | | | | | | 289,878 | |
| PREFERRED STOCKS—0.7% | | | | | | | | |
| Brazil—0.7% | | | | | | | | |
| Cia Paranaense de Energia, 11.477% | | | 4,600 | | | | 36,070 | |
| Itau Unibanco Holding SA, 5.660% | | | 2,100 | | | | 32,960 | |
| | | | | | | | 69,030 | |
| TOTAL PREFERRED STOCKS (Cost $61,474) | | | | | | | 69,030 | |
| SHORT-TERM INVESTMENTS—36.3% |
| Morgan Stanley Institutional Liquidity Funds - Treasury Portfolio, 1.29% | | | 3,474,298 | | | | 3,474,298 | |
| TOTAL SHORT-TERM INVESTMENTS (Cost $3,474,298) | | | | | | | 3,474,298 | |
| TOTAL INVESTMENTS—100.3% | | | | | | | | |
| (Cost $9,531,033) | | | | | | | 9,604,944 | |
| LIABILITIES IN EXCESS OF OTHER ASSETS—(0.3)% | | | | | | | (25,851 | ) |
| NET ASSETS—100.0% | | | | | | $ | 9,579,093 | |
ADR | — American Depositary Receipt |
PLC | — Public Limited Company |
SP ADR | — Sponsored American Depositary Receipt |
The accompanying notes are an integral part of the financial statements.
50 | Semi-Annual Report 2018 |
BOSTON PARTNERS INVESTMENT FUNDS |
BOSTON PARTNERS EMERGING MARKETS FUND Portfolio of Investments (continued)
February 28, 2018 (unaudited) |
Contracts for Difference held by the Fund at February 28, 2018, are as follows:
Reference
Company | Counterparty | Expiration Date | Financing Rate | Payment Frequency | | Number of Contracts Long/(Short) | | | Notional
Amount | | | Unrealized
Appreciation
(Depreciation) | |
| Long | | | | | | | | | | | | | |
| Brazil | | | | | | | | | | | | | |
| Cia de Saneamento Basico | Goldman Sachs | 9/15/2020 | 1.60% | Monthly | | | 4,900 | | | $ | 56,773 | | | $ | 1,848 | |
| Eneva SA | Goldman Sachs | 9/15/2020 | 1.60% | Monthly | | | 3,600 | | | | 15,079 | | | | (415 | ) |
| Movida Participacoes SA | Goldman Sachs | 9/15/2020 | 1.60% | Monthly | | | 22,000 | | | | 51,902 | | | | (1,781 | ) |
| Qualicorp SA | Goldman Sachs | 9/15/2020 | 1.60% | Monthly | | | 12,300 | | | | 107,851 | | | | (2,152 | ) |
| Sul America SA | Goldman Sachs | 9/15/2020 | 1.60% | Monthly | | | 11,300 | | | | 74,408 | | | | 2,305 | |
| | | | | | | | | | | | 306,013 | | | | (194 | ) |
| China | | | | | | | | | | | | | | | | |
| Agricultural Bank | Goldman Sachs | 9/15/2020 | 0.70% | Monthly | | | 129,000 | | | | 70,879 | | | | (194 | ) |
| China Lesso Group | Goldman Sachs | 9/15/2020 | 0.70% | Monthly | | | 127,000 | | | | 83,279 | | | | (1,791 | ) |
| China Meidong Auto Holdings Ltd. | Goldman Sachs | 9/15/2020 | 0.70% | Monthly | | | 44,000 | | | | 16,417 | | | | 443 | |
| China National, Class H | Goldman Sachs | 9/15/2020 | 0.70% | Monthly | | | 10,000 | | | | 9,811 | | | | 224 | |
| China Petroleum, Class H | Goldman Sachs | 9/15/2020 | 0.70% | Monthly | | | 10,000 | | | | 7,937 | | | | 24 | |
| China Vanke Co., Class H | Goldman Sachs | 9/15/2020 | 0.70% | Monthly | | | 6,200 | | | | 27,508 | | | | (1,064 | ) |
| Gree Electric Appliances Inc. | Goldman Sachs | 9/15/2020 | 1.63% | Monthly | | | 11,700 | | | | 94,947 | | | | (6,646 | ) |
| Guangzhou Automobile, Class H | Goldman Sachs | 9/15/2020 | 0.70% | Monthly | | | 28,000 | | | | 61,571 | | | | (1,210 | ) |
| Haier Electronics | Goldman Sachs | 9/15/2020 | 0.70% | Monthly | | | 14,000 | | | | 47,691 | | | | (808 | ) |
| Henan Shuang Inv. | Goldman Sachs | 9/15/2020 | 1.63% | Monthly | | | 23,600 | | | | 101,042 | | | | (1,586 | ) |
| Jiangsu Yanghe Brewery Joint-Stock Co., Ltd., Class A | Goldman Sachs | 9/15/2020 | 1.63% | Monthly | | | 3,100 | | | | 57,765 | | | | (6,507 | ) |
| Kweichow Moutai | Goldman Sachs | 9/15/2020 | 1.63% | Monthly | | | 900 | | | | 102,452 | | | | (3,060 | ) |
| PICC Property & Casualty | Goldman Sachs | 9/15/2020 | 0.70% | Monthly | | | 12,000 | | | | 23,537 | | | | 435 | |
| Qingdao Haier Co. Ltd. | Goldman Sachs | 9/15/2020 | 1.63% | Monthly | | | 17,500 | | | | 53,806 | | | | (2,593 | ) |
| Sichuan Swellfun, Class A | Goldman Sachs | 9/15/2020 | 1.63% | Monthly | | | 5,700 | | | | 38,627 | | | | (2,596 | ) |
| Wuliangye Yibin Co., Ltd., Class A | Goldman Sachs | 9/15/2020 | 1.63% | Monthly | | | 8,300 | | | | 96,532 | | | | (8,448 | ) |
| | | | | | | | | | | | 893,801 | | | | (35,377 | ) |
| Egypt | | | | | | | | | | | | | | | | |
| Commercial International Bank Egypt SAE | Goldman Sachs | 12/31/2021 | 1.60% | Monthly | | | 11,295 | | | | 49,300 | | | | 532 | |
| EFG-Hermes Holdings | Goldman Sachs | 9/15/2020 | 1.60% | Monthly | | | 20,333 | | | | 25,445 | | | | 174 | |
| | | | | | | | | | | | 74,745 | | | | 707 | |
| Greece | | | | | | | | | | | | | | | | |
| Motor Oil SA | Goldman Sachs | 9/15/2020 | -0.37% | Monthly | | | 2,089 | | | | 49,035 | | | | 102 | |
| | | | | | | | | | | | | | | | | |
| Hong Kong | | | | | | | | | | | | | | | | |
| Brilliance China | Goldman Sachs | 9/15/2020 | 0.70% | Monthly | | | 20,000 | | | | 53,144 | | | | 222 | |
| CNOOC Ltd. NPV | Goldman Sachs | 9/15/2020 | 0.70% | Monthly | | | 13,000 | | | | 18,553 | | | | (292 | ) |
| Joy City Property | Goldman Sachs | 9/15/2020 | 0.70% | Monthly | | | 242,000 | | | | 39,867 | | | | (39 | ) |
| K. Wah International Holdings Ltd. | Goldman Sachs | 9/15/2020 | 0.70% | Monthly | | | 31,000 | | | | 19,998 | | | | (213 | ) |
| Kunlun Energy Corp. | Goldman Sachs | 9/15/2020 | 0.70% | Monthly | | | 26,000 | | | | 24,367 | | | | 204 | |
| | | | | | | | | | | | 155,929 | | | | (118 | ) |
The accompanying notes are an integral part of the financial statements.
Semi-Annual Report 2018 | 51 |
BOSTON PARTNERS INVESTMENT FUNDS |
BOSTON PARTNERS EMERGING MARKETS FUND Portfolio of Investments (continued)
February 28, 2018 (unaudited) |
Reference
Company | Counterparty | Expiration Date | Financing Rate | Payment Frequency | | Number of Contracts Long/(Short) | | | Notional
Amount | | | Unrealized
Appreciation
(Depreciation) | |
| Long—(continued) | | | | | | | | | | | | | |
| Israel | | | | | | | | | | | | | |
| Gazit-Globe Ltd. | Goldman Sachs | 9/15/2020 | 0.10% | Monthly | | | 10,850 | | | $ | 110,267 | | | $ | 1,762 | |
| Israel Discount Bank | Goldman Sachs | 9/15/2020 | 0.10% | Monthly | | | 16,918 | | | | 48,511 | | | | 1,943 | |
| Tamar Petroleum Ltd. | Goldman Sachs | 9/15/2020 | 0.10% | Monthly | | | 22,697 | | | | 136,071 | | | | (999 | ) |
| | | | | | | | | | | | 294,849 | | | | 2,706 | |
| Japan | | | | | | | | | | | | | | | | |
| Suzuki Motor Corp. | Goldman Sachs | 9/15/2020 | -0.04% | Monthly | | | 700 | | | | 39,932 | | | | 1,061 | |
| | | | | | | | | | | | | | | | | |
| Luxembourg | | | | | | | | | | | | | | | | |
| Samsonite International SA | Goldman Sachs | 12/31/2021 | 0.70% | Monthly | | | 11,700 | | | | 50,981 | | | | 652 | |
| | | | | | | | | | | | | | | | | |
| Poland | | | | | | | | | | | | | | | | |
| AmRest Holdings SE | Goldman Sachs | 9/15/2020 | 1.60% | Monthly | | | 445 | | | | 55,643 | | | | (115 | ) |
| | | | | | | | | | | | | | | | | |
| Russia | | | | | | | | | | | | | | | | |
| Sberbank of Russia PJSC | Goldman Sachs | 9/15/2020 | 1.60% | Monthly | | | 10,100 | | | | 40,294 | | | | 1,722 | |
| | | | | | | | | | | | | | | | | |
| South Korea | | | | | | | | | | | | | | | | |
| Bnk Financial Group | Goldman Sachs | 9/15/2020 | 1.60% | Monthly | | | 8,700 | | | | 89,707 | | | | 3,171 | |
| Eugene Technology | Goldman Sachs | 9/15/2020 | 1.60% | Monthly | | | 3,682 | | | | 73,822 | | | | (2,172 | ) |
| Hana Financial Group, Inc. | Goldman Sachs | 12/31/2021 | 1.20% | Monthly | | | 1,660 | | | | 75,208 | | | | (2,394 | ) |
| Hyundai Mobis Co., Ltd. | Goldman Sachs | 12/31/2021 | 1.60% | Monthly | | | 213 | | | | 44,846 | | | | 955 | |
| Kiwoom Securities | Goldman Sachs | 9/15/2020 | 1.60% | Monthly | | | 199 | | | | 18,157 | | | | (917 | ) |
| KT&G Corp. | Goldman Sachs | 9/15/2020 | 1.60% | Monthly | | | 604 | | | | 55,665 | | | | 608 | |
| LG Uplus Corp. | Goldman Sachs | 12/31/2021 | 1.60% | Monthly | | | 5,420 | | | | 62,828 | | | | (1,755 | ) |
| NCSoft Corp. | Goldman Sachs | 9/15/2020 | 1.60% | Monthly | | | 45 | | | | 15,551 | | | | (767 | ) |
| Samsung Electronics Co. | Goldman Sachs | 9/15/2020 | 1.60% | Monthly | | | 219 | | | | 402,301 | | | | (8,061 | ) |
| Samsung Electronics Co., Ltd. | Goldman Sachs | 12/31/2021 | 1.60% | Monthly | | | 65 | | | | 141,249 | | | | (1,341 | ) |
| Samsung SDI Co., Ltd. | Goldman Sachs | 12/31/2021 | 1.60% | Monthly | | | 412 | | | | 65,128 | | | | (3,428 | ) |
| SK Hynix Inc. | Goldman Sachs | 9/15/2020 | 1.60% | Monthly | | | 430 | | | | 30,325 | | | | 202 | |
| | | | | | | | | | | | 1,074,787 | | | | (15,899 | ) |
| Taiwan | | | | | | | | | | | | | | | | |
| Hon Hai Precision Industry Co., Ltd. | Goldman Sachs | 9/15/2020 | 1.60% | Monthly | | | 11,000 | | | | 32,413 | | | | (816 | ) |
| Pegatron Corp. | Goldman Sachs | 12/31/2021 | 1.60% | Monthly | | | 37,000 | | | | 93,024 | | | | (3,287 | ) |
| Taiwan Semiconductor Manufacturing Co., Ltd. | Goldman Sachs | 12/31/2021 | 1.60% | Monthly | | | 36,000 | | | | 298,929 | | | | (74 | ) |
| | | | | | | | | | | | 424,366 | | | | (4,178 | ) |
| Turkey | | | | | | | | | | | | | | | | |
| Akbank Turk AS | Goldman Sachs | 9/15/2020 | 1.60% | Monthly | | | 29,158 | | | | 80,996 | | | | 2,600 | |
| Logo Yazilim Sanayi | Goldman Sachs | 9/15/2020 | 1.60% | Monthly | | | 3,074 | | | | 44,232 | | | | (204 | ) |
| Turkiye Sinai Kalkinma Bankasi AS | Goldman Sachs | 9/15/2020 | 1.60% | Monthly | | | 77,651 | | | | 34,520 | | | | 2,275 | |
| Yatas Yatak ve Yorgan | Goldman Sachs | 9/15/2020 | 1.60% | Monthly | | | 11,317 | | | | 86,928 | | | | 15,365 | |
| | | | | | | | | | | | 246,676 | | | | 20,036 | |
The accompanying notes are an integral part of the financial statements.
52 | Semi-Annual Report 2018 |
BOSTON PARTNERS INVESTMENT FUNDS |
BOSTON PARTNERS EMERGING MARKETS FUND Portfolio of Investments (concluded)
February 28, 2018 (unaudited) |
Reference
Company | Counterparty | Expiration Date | Financing Rate | Payment Frequency | | Number of Contracts Long/(Short) | | | Notional
Amount | | | Unrealized
Appreciation
(Depreciation) | |
| Long—(continued) | | | | | | | | | | | | | |
| United Arab Emirates | | | | | | | | | | | | | |
| Abu Dhabi Commercial Bank PJSC | Goldman Sachs | 9/15/2020 | 1.60% | Monthly | | | 22,118 | | | $ | 43,960 | | | $ | (438 | ) |
| Emaar Malls PJSC | Goldman Sachs | 9/15/2020 | 1.60% | Monthly | | | 46,697 | | | | 26,954 | | | | (2,299 | ) |
| | | | | | | | | | | | 70,914 | | | | (2,736 | ) |
| Total Long | | | | | | | | | | | 3,777,965 | | | | (31,631 | ) |
| Net unrealized gain/(loss) on Contracts For Difference | | | | | | | | | | | $ | (31,631 | ) |
A summary of the inputs used to value the Fund's investments carried at fair value as of February 28, 2018 is as follows (see Notes to Portfolio of Investments):
| | | Total | | | Level 1 | | | Level 2 | | | Level 3 | |
| Common Stock | | | | | | | | | | | | |
| Argentina | | $ | 195,312 | | | $ | 195,312 | | | $ | — | | | $ | — | |
| Australia | | | 20,266 | | | | — | | | | 20,266 | | | | — | |
| Brazil | | | 205,170 | | | | 205,170 | | | | — | | | | — | |
| Canada | | | 73,012 | | | | 73,012 | | | | — | | | | — | |
| Chile | | | 48,985 | | | | 48,985 | | | | — | | | | — | |
| China | | | 1,641,458 | | | | 840,217 | | | | 801,241 | | | | — | |
| Egypt | | | 135,102 | | | | — | | | | 135,102 | | | | — | |
| Hong Kong | | | 178,351 | | | | 152,487 | | | | 25,864 | | | | — | |
| Hungary | | | 103,410 | | | | 56,094 | | | | 47,316 | | | | — | |
| India | | | 171,345 | | | | 171,345 | | | | — | | | | — | |
| Indonesia | | | 100,505 | | | | 100,505 | | | | — | | | | — | |
| Luxembourg | | | 83,715 | | | | 83,715 | | | | — | | | | — | |
| Mexico | | | 428,128 | | | | 403,181 | | | | 24,947 | | | | — | |
| Netherlands | | | 159,307 | | | | 59,724 | | | | 99,583 | | | | — | |
| Philippines | | | 96,488 | | | | 96,488 | | | | — | | | | — | |
| Russia | | | 306,751 | | | | 306,751 | | | | — | | | | — | |
| Singapore | | | 80,422 | | | | — | | | | 80,422 | | | | — | |
| South Africa | | | 274,340 | | | | 49,198 | | | | 225,142 | | | | — | |
| South Korea | | | 322,416 | | | | 83,027 | | | | 239,389 | | | | — | |
| Switzerland | | | 66,133 | | | | — | | | | 66,133 | | | | — | |
| Taiwan | | | 119,489 | | | | 53,711 | | | | 65,778 | | | | — | |
| Turkey | | | 138,821 | | | | — | | | | 138,821 | | | | — | |
| United Kingdom | | | 379,674 | | | | 116,129 | | | | 263,545 | | | | — | |
| United States | | | 443,138 | | | | 443,138 | | | | — | | | | — | |
| Exchange Traded Funds | | | 289,878 | | | | 229,257 | | | | 60,621 | | | | — | |
| Preferred Stock | | | | | | | | | | | | | | | | |
| Brazil | | | 69,030 | | | | 69,030 | | | | — | | | | — | |
| Short-Term Investments | | | 3,474,298 | | | | 3,474,298 | | | | — | | | | — | |
| Contracts For Difference | | | | | | | | | | | | | | | | |
| Equity Contracts | | | 38,829 | | | | — | | | | 38,829 | | | | — | |
| Total Assets | | $ | 9,643,773 | | | $ | 7,310,774 | | | $ | 2,332,999 | | | $ | — | |
| | | Total | | | Level 1 | | | Level 2 | | | Level 3 | |
| Contracts For Difference | | | | | | | | | | | | |
| Equity Contracts | | $ | (70,460 | ) | | $ | — | | | $ | (70,460 | ) | | $ | — | |
| Total Liabilities | | $ | (70,460 | ) | | $ | — | | | $ | (70,460 | ) | | $ | — | |
The accompanying notes are an integral part of the financial statements.
Semi-Annual Report 2018 | 53 |
BOSTON PARTNERS INVESTMENT FUNDS |
STATEMENTS OF ASSETS AND LIABILITIES February 28, 2018 (unaudited) |
| | | Boston
Partners
Small Cap
Value Fund II | | | Boston
Partners
Long/Short
Equity Fund | | | Boston
Partners
Long/Short
Research Fund | |
| ASSETS | | | | | | | | | |
| Investments in securities, at value † ^ | | $ | 547,148,440 | | | $ | 901,770,973 | | | $ | 6,793,269,089 | |
| Short-term investments, at value ** | | | 123,234,154 | | | | 125,726,781 | | | | 247,895,596 | |
| Cash | | | — | | | | 481,130 | | | | — | |
| Foreign currency, at value # | | | — | | | | 1,063,348 | | | | 4,613,177 | |
| Receivables | | | | | | | | | | | | |
| Investments sold | | | 2,902,880 | | | | 11,365,934 | | | | 18,331,045 | |
| Deposits with brokers for contracts for difference | | | — | | | | — | | | | 7,510,000 | |
| Deposits with brokers for securities sold short | | | — | | | | 380,096,270 | | | | 3,040,713,865 | |
| Capital shares sold | | | 4,721,173 | | | | 330,170 | | | | 14,451,810 | |
| Dividends and interest | | | 267,518 | | | | 579,074 | | | | 11,500,162 | |
| Due from Advisor | | | — | | | | — | | | | — | |
| Unrealized appreciation on contracts for difference ◊ | | | — | | | | — | | | | 1,877,376 | |
| Prepaid expenses and other assets | | | 32,030 | | | | 44,614 | | | | 181,031 | |
| Total assets | | | 678,306,195 | | | | 1,421,458,294 | | | | 10,140,343,151 | |
| LIABILITIES | | | | | | | | | | | | |
| Securities sold short, at fair value ‡ | | | — | | | | 372,873,641 | | | | 2,965,542,875 | |
| Options written, at value + ◊ | | | — | | | | 395,103 | | | | — | |
| Due to custodian | | | — | | | | — | | | | 35,143,169 | |
| Payables | | | | | | | | | | | | |
| Securities lending collateral | | | 112,450,121 | | | | 111,554,720 | | | | — | |
| Investments purchased | | | 5,296,811 | | | | 10,298,657 | | | | 6,076,392 | |
| Capital shares redeemed | | | 6,740,052 | | | | 492,472 | | | | 4,652,488 | |
| Investment advisory fees | | | 410,347 | | | | 1,653,206 | | | | 6,818,067 | |
| Custodian fees | | | 6,322 | | | | 17,447 | | | | 74,078 | |
| Distribution and service fees | | | 95,338 | | | | 25,563 | | | | — | |
| Dividends on securities sold-short | | | — | | | | 74,720 | | | | 2,669,736 | |
| Administration and accounting fees | | | 22,255 | | | | 45,690 | | | | 351,668 | |
| Transfer agent fees | | | 77 | | | | 14,451 | | | | 220,677 | |
| Unrealized depreciation on contracts for difference ◊ | | | — | | | | — | | | | 14,685,629 | |
| Other accrued expenses and liabilities | | | 48,968 | | | | 56,122 | | | | 161,474 | |
| Total liabilities | | | 125,070,291 | | | | 497,501,792 | | | | 3,036,396,253 | |
| Net Assets | | $ | 553,235,904 | | | $ | 923,956,502 | | | $ | 7,103,946,898 | |
| NET ASSETS CONSIST OF: | | | | | | | | | | | | |
| Par value | | $ | 22,000 | | | $ | 43,211 | | | $ | 412,711 | |
| Paid-in capital | | | 427,245,575 | | | | 758,945,143 | | | | 5,743,327,523 | |
| Undistributed net investment income/(accumulated net investment loss) | | | (489,902 | ) | | | (16,976,694 | ) | | | (36,810,394 | ) |
| Accumulated net realized gain/(loss) from investments, securities sold short, options written, contracts for difference and foreign currency | | | 21,190,682 | | | | 33,837,119 | | | | 79,967,267 | |
| Net unrealized appreciation/(depreciation) on investments, securities sold short, options written, contracts for difference and foreign currency translation | | | 105,267,549 | | | | 148,107,723 | | | | 1,317,049,791 | |
| Net Assets | | $ | 553,235,904 | | | $ | 923,956,502 | | | $ | 7,103,946,898 | |
| INSTITUTIONAL CLASS | | | | | | | | | | | | |
| Net assets | | $ | 420,022,113 | | | $ | 844,871,233 | | | $ | 6,953,043,587 | |
| Shares outstanding | | | 16,525,256 | | | | 39,227,572 | | | | 403,781,909 | |
| Net asset value, offering and redemption price per share | | $ | 25.42 | | | $ | 21.54 | | | $ | 17.22 | |
| INVESTOR CLASS | | | | | | | | | | | | |
| Net assets | | $ | 133,213,791 | | | $ | 79,085,268 | | | $ | 150,903,311 | |
| Shares outstanding | | | 5,474,649 | | | | 3,983,227 | | | | 8,929,359 | |
| Net asset value, offering and redemption price per share | | $ | 24.33 | | | $ | 19.85 | | | $ | 16.90 | |
| † Investments in securities, at cost | | $ | 441,880,854 | | | $ | 724,907,692 | | | $ | 5,149,989,322 | |
| ^ Includes market value of securities on loan | | | 108,289,573 | | | | 106,861,824 | | | | — | |
| ** Short-term investments, at cost | | | 123,234,154 | | | | 125,726,781 | | | | 247,895,596 | |
| # Foreign currency, at cost | | | — | | | | 1,060,415 | | | | 4,799,995 | |
| ‡ Proceeds received, securities sold short | | | — | | | | 341,286,137 | | | | 2,652,307,970 | |
| + Premiums received, options written | | | — | | | | 2,871,380 | | | | — | |
| ◊ Primary risk exposure is equity contracts. | | | | | | | | | | | | |
The accompanying notes are an integral part of the financial statements.
54 | Semi-Annual Report 2018 |
BOSTON PARTNERS INVESTMENT FUNDS |
STATEMENTS OF ASSETS AND LIABILITIES (continued) February 28, 2018 (unaudited) |
| | | Boston
Partners
All-Cap
Value Fund | | | WPG Partners
Small/Micro Cap
Value Fund | | | Boston
Partners Global Equity Fund | |
| ASSETS | | | | | | | | | |
| Investments in securities, at value † ^ | | $ | 1,997,139,917 | | | $ | 30,348,275 | | | $ | 632,724,776 | |
| Short-term investments, at value ** | | | 268,996,905 | | | | 7,228,154 | | | | 58,178,724 | |
| Cash | | | — | | | | 632 | | | | — | |
| Foreign currency, at value # | | | — | | | | — | | | | 308,589 | |
| Receivables | | | | | | | | | | | | |
| Investments sold | | | 5,639,771 | | | | 303,209 | | | | 2,900,211 | |
| Deposits with brokers for contracts for difference | | | — | | | | — | | | | — | |
| Deposits with brokers for securities sold short | | | — | | | | — | | | | — | |
| Capital shares sold | | | 6,038,493 | | | | — | | | | 2,416,000 | |
| Dividends and interest | | | 2,878,101 | | | | 26,458 | | | | 1,305,025 | |
| Due from Advisor | | | — | | | | — | | | | — | |
| Unrealized appreciation on contracts for difference ◊ | | | — | | | | — | | | | — | |
| Prepaid expenses and other assets | | | 90,355 | | | | 9,888 | | | | 31,833 | |
| Total assets | | | 2,280,783,542 | | | | 37,916,616 | | | | 697,865,158 | |
| LIABILITIES | | | | | | | | | | | | |
| Securities sold short, at fair value ‡ | | | — | | | | — | | | | — | |
| Options written, at value + ◊ | | | — | | | | — | | | | — | |
| Due to custodian | | | — | | | | — | | | | 2,215 | |
| Payables | | | | | | | | | | | | |
| Securities lending collateral | | | 183,482,661 | | | | 6,775,803 | | | | 35,279,376 | |
| Investments purchased | | | — | | | | 323,019 | | | | 2,922,202 | |
| Capital shares redeemed | | | 4,518,424 | | | | — | | | | — | |
| Investment advisory fees | | | 1,115,900 | | | | 19,257 | | | | 424,568 | |
| Custodian fees | | | 10,289 | | | | 3,739 | | | | 21,023 | |
| Distribution and service fees | | | 173,990 | | | | — | | | | — | |
| Dividends on securities sold-short | | | — | | | | — | | | | — | |
| Administration and accounting fees | | | 46,074 | | | | 4,245 | | | | 17,079 | |
| Transfer agent fees | | | 11,043 | | | | 5,170 | | | | 2,180 | |
| Unrealized depreciation on contracts for difference ◊ | | | — | | | | — | | | | — | |
| Other accrued expenses and liabilities | | | 39,012 | | | | 34,008 | | | | 9,499 | |
| Total liabilities | | | 189,397,393 | | | | 7,165,241 | | | | 38,678,142 | |
| Net Assets | | $ | 2,091,386,149 | | | $ | 30,751,375 | | | $ | 659,187,016 | |
| NET ASSETS CONSIST OF: | | | | | | | | | | | | |
| Par value | | $ | 77,465 | | | $ | 1,958 | | | $ | 35,473 | |
| Paid-in capital | | | 1,538,429,122 | | | | 28,965,841 | | | | 545,027,362 | |
| Undistributed net investment income/(accumulated net investment loss) | | | 1,717,533 | | | | 55,837 | | | | (359,259 | ) |
| Accumulated net realized gain/(loss) from investments, securities sold short, options written, contracts for difference and foreign currency | | | 32,429,354 | | | | (665,680 | ) | | | 18,479,763 | |
| Net unrealized appreciation/(depreciation) on investments, securities sold short, options written, contracts for difference and foreign currency translation | | | 518,732,675 | | | | 2,393,419 | | | | 96,003,677 | |
| Net Assets | | $ | 2,091,386,149 | | | $ | 30,751,375 | | | $ | 659,187,016 | |
| INSTITUTIONAL CLASS | | | | | | | | | | | | |
| Net assets | | $ | 1,587,479,270 | | | $ | 30,751,375 | | | $ | 659,187,016 | |
| Shares outstanding | | | 58,731,281 | | | | 1,957,783 | | | | 35,472,833 | |
| Net asset value, offering and redemption price per share | | $ | 27.03 | | | $ | 15.71 | | | $ | 18.58 | |
| INVESTOR CLASS | | | | | | | | | | | | |
| Net assets | | $ | 503,906,879 | | | $ | — | | | $ | — | |
| Shares outstanding | | | 18,733,894 | | | | — | | | | — | |
| Net asset value, offering and redemption price per share | | $ | 26.90 | | | $ | — | | | $ | — | |
| † Investments in securities, at cost | | $ | 1,478,407,474 | | | $ | 27,954,856 | | | $ | 536,756,427 | |
| ^ Includes market value of securities on loan | | | 177,505,974 | | | | 6,507,407 | | | | 34,041,777 | |
| ** Short-term investments, at cost | | | 268,996,905 | | | | 7,228,154 | | | | 58,178,724 | |
| # Foreign currency, at cost | | | — | | | | — | | | | 311,355 | |
| ‡ Proceeds received, securities sold short | | | — | | | | — | | | | — | |
| + Premiums received, options written | | | — | | | | — | | | | — | |
| ◊ Primary risk exposure is equity contracts. | | | | | | | | | | | | |
The accompanying notes are an integral part of the financial statements.
Semi-Annual Report 2018 | 55 |
BOSTON PARTNERS INVESTMENT FUNDS |
STATEMENTS OF ASSETS AND LIABILITIES (concluded) February 28, 2018 (unaudited) |
| | | Boston
Partners Global Long/Short Fund | | | Boston
Partners
Emerging Markets Long/Short Fund | | | Boston
Partners
Emerging
Markets Fund | |
| ASSETS | | | | | | | | | |
| Investments in securities, at value † ^ | | $ | 978,061,641 | | | $ | 47,975,701 | | | $ | 6,130,646 | |
| Short-term investments, at value ** | | | 24,042,866 | | | | 25,050,896 | | | | 3,474,298 | |
| Cash | | | — | | | | — | | | | 2,863 | |
| Foreign currency, at value # | | | 453,524 | | | | 349,145 | | | | 42,504 | |
| Receivables | | | | | | | | | | | | |
| Investments sold | | | 8,295,965 | | | | 594,600 | | | | 20,473 | |
| Deposits with brokers for contracts for difference | | | 740,000 | | | | 4,069,844 | | | | — | |
| Deposits with brokers for securities sold short | | | 443,460,188 | | | | 80,337 | | | | — | |
| Capital shares sold | | | 2,352,340 | | | | 18,481 | | | | — | |
| Dividends and interest | | | 2,405,538 | | | | 107,794 | | | | 5,042 | |
| Due from Advisor | | | — | | | | — | | | | 313 | |
| Unrealized appreciation on contracts for difference ◊ | | | 322,156 | | | | 840,420 | | | | 38,829 | |
| Prepaid expenses and other assets | | | 57,952 | | | | 26,628 | | | | 566 | |
| Total assets | | | 1,460,192,170 | | | | 79,113,846 | | | | 9,715,534 | |
| LIABILITIES | | | | | | | | | | | | |
| Securities sold short, at fair value ‡ | | | 429,958,540 | | | | 294,172 | | | | — | |
| Options written, at value + ◊ | | | 364,375 | | | | — | | | | — | |
| Due to custodian | | | — | | | | 140 | | | | — | |
| Payables | | | | | | | | | | | | |
| Securities lending collateral | | | — | | | | — | | | | — | |
| Investments purchased | | | 12,752,624 | | | | 1,007,126 | | | | 51,025 | |
| Capital shares redeemed | | | 2,269,727 | | | | — | | | | — | |
| Investment advisory fees | | | 1,166,820 | | | | 89,354 | | | | — | |
| Custodian fees | | | 38,612 | | | | 18,070 | | | | 6,128 | |
| Distribution and service fees | | | 298 | | | | — | | | | — | |
| Dividends on securities sold-short | | | 751,495 | | | | — | | | | — | |
| Administration and accounting fees | | | 42,323 | | | | 7,085 | | | | 607 | |
| Transfer agent fees | | | 65,284 | | | | 170 | | | | 892 | |
| Unrealized depreciation on contracts for difference ◊ | | | 691,077 | | | | 1,017,840 | | | | 70,460 | |
| Other accrued expenses and liabilities | | | 437,257 | | | | 18,123 | | | | 7,329 | |
| Total liabilities | | | 448,538,432 | | | | 2,452,080 | | | | 136,441 | |
| Net Assets | | $ | 1,011,653,738 | | | $ | 76,661,766 | | | $ | 9,579,093 | |
| NET ASSETS CONSIST OF: | | | | | | | | | | | | |
| Par value | | $ | 85,683 | | | $ | 6,476 | | | $ | 909 | |
| Paid-in capital | | | 899,158,312 | | | | 72,028,613 | | | | 9,308,482 | |
| Undistributed net investment income/(accumulated net investment loss) | | | (11,735,404 | ) | | | (470,883 | ) | | | (49,883 | ) |
| Accumulated net realized gain/(loss) from investments, securities sold short, options written, contracts for difference and foreign currency | | | (3,009,076 | ) | | | 2,792,259 | | | | 278,761 | |
| Net unrealized appreciation/(depreciation) on investments, securities sold short, options written, contracts for difference and foreign currency translation | | | 127,154,223 | | | | 2,305,301 | | | | 40,824 | |
| Net Assets | | $ | 1,011,653,738 | | | $ | 76,661,766 | | | $ | 9,579,093 | |
| INSTITUTIONAL CLASS | | | | | | | | | | | | |
| Net assets | | $ | 978,393,459 | | | $ | 76,661,766 | | | $ | 9,579,093 | |
| Shares outstanding | | | 82,842,892 | | | | 6,475,777 | | | | 908,977 | |
| Net asset value, offering and redemption price per share | | $ | 11.81 | | | $ | 11.84 | | | $ | 10.54 | |
| INVESTOR CLASS | | | | | | | | | | | | |
| Net assets | | $ | 33,260,279 | | | $ | — | | | $ | — | |
| Shares outstanding | | | 2,840,431 | | | | — | | | | — | |
| Net asset value, offering and redemption price per share | | $ | 11.71 | | | $ | — | | | $ | — | |
| † Investments in securities, at cost | | $ | 836,481,617 | | | $ | 45,400,416 | | | $ | 6,056,735 | |
| ^ Includes market value of securities on loan | | | — | | | | — | | | | — | |
| ** Short-term investments, at cost | | | 24,042,866 | | | | 25,050,896 | | | | 3,474,298 | |
| # Foreign currency, at cost | | | 460,062 | | | | 347,606 | | | | 42,634 | |
| ‡ Proceeds received, securities sold short | | | 415,869,961 | | | | 294,797 | | | | — | |
| + Premiums received, options written | | | 424,413 | | | | — | | | | — | |
| ◊ Primary risk exposure is equity contracts. | | | | | | | | | | | | |
The accompanying notes are an integral part of the financial statements.
56 | Semi-Annual Report 2018 |
BOSTON PARTNERS INVESTMENT FUNDS |
STATEMENTS OF OPERATIONS For the Six Months Ended February 28, 2018 (unaudited) |
| | | Boston
Partners
Small Cap
Value Fund II | | | Boston
Partners
Long/Short
Equity Fund | | | Boston
Partners
Long/Short
Research Fund | |
| Investment Income | | | | | | | | | |
| Dividends † | | $ | 5,838,448 | | | $ | 5,922,060 | | | $ | 42,869,199 | |
| Interest | | | 76,044 | | | | 26,808 | | | | 1,833,804 | |
| Income from securities loaned (Note 8) | | | 171,435 | | | | 429,267 | | | | — | |
| Prime broker interest income | | | — | | | | — | | | | 6,173,605 | |
| Total investment income | | | 6,085,927 | | | | 6,378,135 | | | | 50,876,608 | |
| | | | | | | | | | | | | |
| Expenses | | | | | | | | | | | | |
| Advisory fees (Note 2) | | | 2,804,738 | | | | 10,811,224 | | | | 42,553,609 | |
| Distribution fees (Investor Class) (Note 2) | | | 192,690 | | | | 107,543 | | | | 231,363 | |
| Transfer agent fees (Note 2) | | | 179,294 | | | | 247,088 | | | | 1,474,051 | |
| Administration and accounting fees (Note 2) | | | 75,096 | | | | 134,826 | | | | 946,429 | |
| Printing and shareholder reporting fees | | | 27,720 | | | | 27,526 | | | | 171,536 | |
| Legal fees | | | 19,595 | | | | 33,648 | | | | 99,911 | |
| Audit and tax service fees | | | 18,786 | | | | 28,188 | | | | 45,118 | |
| Directors fees | | | 13,602 | | | | 25,469 | | | | 178,826 | |
| Custodian fees (Note 2) | | | 10,918 | | | | 26,552 | | | | 156,393 | |
| Officers fees | | | 8,176 | | | | 15,673 | | | | 101,161 | |
| Other expenses | | | 38,373 | | | | 46,857 | | | | 15,976 | |
| Dividend expense on securities sold-short | | | — | | | | 921,672 | | | | 20,910,490 | |
| Prime broker interest expense | | | — | | | | 2,713,655 | | | | — | |
| Total expenses before waivers and reimbursements | | | 3,388,988 | | | | 15,139,921 | | | | 66,884,863 | |
| Less: waivers and reimbursements | | | (111,087 | ) | | | — | | | | — | |
| Net expenses after waivers and reimbursements | | | 3,277,901 | | | | 15,139,921 | | | | 66,884,863 | |
| Net investment income/(loss) | | | 2,808,026 | | | | (8,761,786 | ) | | | (16,008,255 | ) |
| | | | | | | | | | | | | |
| Net realized gain/(loss) from: | | | | | | | | | | | | |
| Investment securities | | | 29,708,384 | | | | 76,199,849 | | | | 319,951,003 | |
| Investments sold short | | | — | | | | (33,382,678 | ) | | | (241,422,607 | ) |
| Foreign currency transactions | | | (200 | ) | | | 31,995 | | | | 55,500,965 | |
| Contracts for difference** | | | — | | | | — | | | | 44,915,609 | |
| Options written** | | | — | | | | — | | | | — | |
| Net change in unrealized appreciation/(depreciation) on: | | | | | | | | | | | | |
| Investment securities | | | 1,185,151 | | | | 5,452,402 | | | | 336,394,027 | |
| Investments sold short | | | — | | | | (6,473,674 | ) | | | (59,165,827 | ) |
| Foreign currency translation | | | (37 | ) | | | 75,570 | | | | (45,269,581 | ) |
| Options written** | | | — | | | | 669,876 | | | | — | |
| Contracts for difference** | | | — | | | | — | | | | (8,747,718 | ) |
| Net realized and unrealized gain/(loss) | | | 30,893,298 | | | | 42,573,340 | | | | 402,155,871 | |
Net increase/(decrease) in net assets resulting from operations | | $ | 33,701,324 | | | $ | 33,811,554 | | | $ | 386,147,616 | |
| † Net of foreign withholding taxes of | | $ | (9,305 | ) | | $ | (71,277 | ) | | $ | (571,460 | ) |
** | Primary risk exposure is equity contracts. |
The accompanying notes are an integral part of the financial statements.
Semi-Annual Report 2018 | 57 |
BOSTON PARTNERS INVESTMENT FUNDS |
STATEMENTS OF OPERATIONS (continued) For the Six Months Ended February 28, 2018 (unaudited) |
| | | Boston
Partners
All-Cap
Value Fund | | | WPG Partners
Small/Micro Cap
Value Fund | | | Boston
Partners Global Equity Fund | |
| Investment Income | | | | | | | | | |
| Dividends † | | $ | 13,745,401 | | | $ | 184,385 | | | $ | 3,616,185 | |
| Interest | | | 392,343 | | | | 2,957 | | | | 96,796 | |
| Income from securities loaned (Note 8) | | | 176,659 | | | | 51,400 | | | | 24,095 | |
| Prime broker interest income | | | — | | | | — | | | | — | |
| Total investment income | | | 14,314,403 | | | | 238,742 | | | | 3,737,076 | |
| | | | | | | | | | | | | |
| Expenses | | | | | | | | | | | | |
| Advisory fees (Note 2) | | | 6,857,074 | | | | 128,961 | | | | 2,834,827 | |
| Distribution fees (Investor Class) (Note 2) | | | 588,437 | | | | — | | | | — | |
| Transfer agent fees (Note 2) | | | 426,206 | | | | 5,576 | | | | 59,893 | |
| Administration and accounting fees (Note 2) | | | 235,887 | | | | 7,286 | | | | 93,888 | |
| Printing and shareholder reporting fees | | | 60,361 | | | | 719 | | | | 5,803 | |
| Legal fees | | | 57,949 | | | | 1,317 | | | | 17,660 | |
| Audit and tax service fees | | | 19,895 | | | | 22,205 | | | | 23,175 | |
| Directors fees | | | 44,218 | | | | — | | | | 13,875 | |
| Custodian fees (Note 2) | | | 26,666 | | | | 6,146 | | | | 51,777 | |
| Officers fees | | | 28,953 | | | | — | | | | 8,075 | |
| Other expenses | | | 79,896 | | | | 9,755 | | | | 28,130 | |
| Dividend expense on securities sold-short | | | — | | | | — | | | | — | |
| Prime broker interest expense | | | — | | | | — | | | | — | |
| Total expenses before waivers and reimbursements | | | 8,425,542 | | | | 181,965 | | | | 3,137,103 | |
| Less: waivers and reimbursements | | | (19,380 | ) | | | (5,324 | ) | | | (144,784 | ) |
| Net expenses after waivers and reimbursements | | | 8,406,162 | | | | 176,641 | | | | 2,992,319 | |
| Net investment income/(loss) | | | 5,908,241 | | | | 62,101 | | | | 744,757 | |
| | | | | | | | | | | | | |
| Net realized gain/(loss) from: | | | | | | | | | | | | |
| Investment securities | | | 53,396,571 | | | | 762,067 | | | | 27,845,976 | |
| Investments sold short | | | — | | | | — | | | | — | |
| Foreign currency transactions | | | — | | | | (4,961 | ) | | | (103,359 | ) |
| Contracts for difference** | | | — | | | | — | | | | — | |
| Options written** | | | — | | | | — | | | | — | |
| Net change in unrealized appreciation/(depreciation) on: | | | | | | | | | | | | |
| Investment securities | | | 128,834,810 | | | | 486,397 | | | | 25,466,982 | |
| Investments sold short | | | — | | | | — | | | | — | |
| Foreign currency translation | | | (189 | ) | | | — | | | | 14,500 | |
| Options written** | | | — | | | | — | | | | — | |
| Contracts for difference** | | | — | | | | — | | | | — | |
| Net realized and unrealized gain/(loss) | | | 182,231,192 | | | | 1,243,503 | | | | 53,224,099 | |
Net increase/(decrease) in net assets resulting from operations | | $ | 188,139,433 | | | $ | 1,305,604 | | | $ | 53,968,856 | |
| † Net of foreign withholding taxes of | | $ | (14,276 | ) | | $ | (800 | ) | | $ | (131,332 | ) |
** | Primary risk exposure is equity contracts. |
The accompanying notes are an integral part of the financial statements.
58 | Semi-Annual Report 2018 |
BOSTON PARTNERS INVESTMENT FUNDS |
STATEMENTS OF OPERATIONS (concluded) For the Six Months Ended February 28, 2018 (unaudited) |
| | | Boston
Partners
Global Long/Short Fund | | | Boston
Partners
Emerging Markets Long/Short Fund | | | Boston
Partners
Emerging
Markets Fund | |
| Investment Income | | | | | | | | | |
| Dividends † | | $ | 6,071,022 | | | $ | 188,839 | | | $ | 5,620 | |
| Interest | | | 128,664 | | | | 108,348 | | | | 12,042 | |
| Income from securities loaned (Note 8) | | | — | | | | — | | | | — | |
| Prime broker interest income | | | 1,471,253 | | | | — | | | | — | |
| Total investment income | | | 7,670,939 | | | | 297,187 | | | | 17,662 | |
| | | | | | | | | | | | | |
| Expenses | | | | | | | | | | | | |
| Advisory fees (Note 2) | | | 7,756,647 | | | | 594,487 | | | | 23,329 | |
| Distribution fees (Investor Class) (Note 2) | | | 44,797 | | | | — | | | | — | |
| Transfer agent fees (Note 2) | | | 287,138 | | | | 7,989 | | | | 2,442 | |
| Administration and accounting fees (Note 2) | | | 147,720 | | | | 28,287 | | | | 6,356 | |
| Printing and shareholder reporting fees | | | 28,519 | | | | 2,669 | | | | 564 | |
| Legal fees | | | 35,037 | | | | 1,490 | | | | 5,497 | |
| Audit and tax service fees | | | 31,861 | | | | 33,070 | | | | 6,961 | |
| Directors fees | | | 25,455 | | | | 1,329 | | | | — | |
| Custodian fees (Note 2) | | | 91,390 | | | | 51,809 | | | | 10,366 | |
| Officers fees | | | 15,674 | | | | 795 | | | | — | |
| Other expenses | | | 65,724 | | | | 17,118 | | | | 3,640 | |
| Dividend expense on securities sold-short | | | 3,380,124 | | | | — | | | | — | |
| Prime broker interest expense | | | — | | | | 108 | | | | — | |
| Total expenses before waivers and reimbursements | | | 11,910,086 | | | | 739,151 | | | | 59,155 | |
| Less: waivers and reimbursements | | | — | | | | (96,353 | ) | | | (28,964 | ) |
| Net expenses after waivers and reimbursements | | | 11,910,086 | | | | 642,798 | | | | 30,191 | |
| Net investment income/(loss) | | | (4,239,147 | ) | | | (345,611 | ) | | | (12,529 | ) |
| | | | | | | | | | | | | |
| Net realized gain/(loss) from: | | | | | | | | | | | | |
| Investment securities | | | 72,488,007 | | | | 3,121,039 | | | | 167,255 | |
| Investments sold short | | | (50,169,261 | ) | | | — | | | | — | |
| Foreign currency transactions | | | (175,141 | ) | | | (62,449 | ) | | | (5,006 | ) |
| Contracts for difference** | | | (1,719,069 | ) | | | 393,714 | | | | 116,512 | |
| Options written** | | | — | | | | — | | | | — | |
| Net change in unrealized appreciation/(depreciation) on: | | | | | | | | | | | | |
| Investment securities | | | 18,711,085 | | | | (994,728 | ) | | | 73,911 | |
| Investments sold short | | | 7,486,154 | | | | 625 | | | | — | |
| Foreign currency translation | | | (999 | ) | | | (23,861 | ) | | | (1,456 | ) |
| Options written** | | | (145,423 | ) | | | — | | | | — | |
| Contracts for difference** | | | (21,913 | ) | | | (145,188 | ) | | | (31,631 | ) |
| Net realized and unrealized gain/(loss) | | | 46,453,440 | | | | 2,289,152 | | | | 319,585 | |
Net increase/(decrease) in net assets resulting from operations | | $ | 42,214,293 | | | $ | 1,943,541 | | | $ | 307,056 | |
| † Net of foreign withholding taxes of | | $ | (221,674 | ) | | $ | (24,447 | ) | | $ | (431 | ) |
** | Primary risk exposure is equity contracts. |
The accompanying notes are an integral part of the financial statements.
Semi-Annual Report 2018 | 59 |
BOSTON PARTNERS INVESTMENT FUNDS |
STATEMENTS OF CHANGES IN NET ASSETS |
| | | Boston Partners
Small Cap Value Fund II | | | Boston Partners
Long/Short Equity Fund | |
| | | For the
Six Months Ended
February 28, 2018
(unaudited) | | | For the
Year Ended
August 31, 2017 | | | For the
Six Months Ended
February 28, 2018
(unaudited) | | | For the
Year Ended
August 31, 2017 | |
| Increase/(decrease) in net assets from operations: | | | | | | | | | | | | |
| Net investment income/(loss) | | $ | 2,808,026 | | | $ | 2,215,474 | | | $ | (8,761,786 | ) | | $ | (11,541,965 | ) |
| Net realized gain/(loss) from investments, securities sold short, options written, contracts for difference and foreign currency | | | 29,708,184 | | | | 24,012,473 | | | | 42,849,166 | | | | 3,350,098 | |
| Net change in unrealized appreciation/(depreciation) on investments, securities sold short, options written, contracts for difference and foreign currency translation | | | 1,185,114 | | | | 20,433,718 | | | | (275,826 | ) | | | 42,340,418 | |
| Net increase/(decrease) in net assets resulting from operations | | | 33,701,324 | | | | 46,661,665 | | | | 33,811,554 | | | | 34,148,551 | |
| | | | | | | | | | | | | | | | | |
| Dividends and distributions to shareholders from: | | | | | | | | | | | | | | | | |
| Net investment income | | | | | | | | | | | | | | | | |
| Institutional Class | | | (3,131,857 | ) | | | (2,781,092 | ) | | | — | | | | — | |
| Investor Class | | | (786,948 | ) | | | (870,239 | ) | | | — | | | | — | |
| Net realized capital gains | | | | | | | | | | | | | | | | |
| Institutional Class | | | (15,168,411 | ) | | | (4,527,424 | ) | | | (6,788,431 | ) | | | — | |
| Investor Class | | | (5,613,779 | ) | | | (1,908,313 | ) | | | (720,622 | ) | | | — | |
| Net decrease in net assets from dividends and distributions to shareholders | | | (24,700,995 | ) | | | (10,087,068 | ) | | | (7,509,053 | ) | | | — | |
| | | | | | | | | | | | | | | | | |
| Capital transactions: | | | | | | | | | | | | | | | | |
| Institutional Class | | | | | | | | | | | | | | | | |
| Proceeds from shares sold | | | 77,922,859 | | | | 143,360,524 | | | | 59,948,111 | | | | 251,115,617 | |
| Reinvestment of distributions | | | 18,092,538 | | | | 7,224,434 | | | | 5,867,217 | | | | — | |
| Shares redeemed | | | (43,600,772 | ) | | | (93,047,367 | ) | | | (103,596,565 | ) | | | (154,556,632 | ) |
| Redemption fees | | | — | | | | — | | | | — | | | | — | |
| Investor Class | | | | | | | | | | | | | | | | |
| Proceeds from shares sold | | | 18,938,445 | | | | 55,351,017 | | | | 2,584,554 | | | | 28,174,624 | |
| Reinvestment of distributions | | | 6,316,311 | | | | 2,742,456 | | | | 716,185 | | | | — | |
| Shares redeemed | | | (55,378,557 | ) | | | (35,771,687 | ) | | | (14,789,591 | ) | | | (41,269,077 | ) |
| Redemption fees | | | — | | | | — | | | | — | | | | — | |
| Net increase/(decrease) in net assets from capital transactions | | | 22,290,824 | | | | 79,859,377 | | | | (49,270,089 | ) | | | 83,464,532 | |
| Total increase/(decrease) in net assets | | | 31,291,153 | | | | 116,433,974 | | | | (22,967,588 | ) | | | 117,613,083 | |
| | | | | | | | | | | | | | | | | |
| Net assets: | | | | | | | | | | | | | | | | |
| Beginning of period | | | 521,944,751 | | | | 405,510,777 | | | | 946,924,090 | | | | 829,311,007 | |
| End of period | | $ | 553,235,904 | | | $ | 521,944,751 | | | $ | 923,956,502 | | | $ | 946,924,090 | |
| Undistributed net investment income/(accumulated net investment loss), end of period | | $ | (489,902 | ) | | $ | 620,877 | | | $ | (16,976,694 | ) | | $ | (8,214,908 | ) |
| | | | | | | | | | | | | | | | | |
| Share transactions: | | | | | | | | | | | | | | | | |
| Institutional Class | | | | | | | | | | | | | | | | |
| Shares sold | | | 2,942,647 | | | | 5,859,848 | | | | 2,708,575 | | | | 11,819,997 | |
| Shares reinvested | | | 703,990 | | | | 286,570 | | | | 270,753 | | | | — | |
| Shares redeemed | | | (1,649,874 | ) | | | (3,750,327 | ) | | | (4,722,514 | ) | | | (7,287,722 | ) |
| Net increase/(decrease) | | | 1,996,763 | | | | 2,396,091 | | | | (1,743,186 | ) | | | 4,532,275 | |
| Investor Class | | | | | | | | | | | | | | | | |
| Shares sold | | | 742,322 | | | | 2,326,311 | | | | 126,459 | | | | 1,428,241 | |
| Shares reinvested | | | 256,656 | | | | 113,325 | | | | 35,827 | | | | — | |
| Shares redeemed | | | (2,183,782 | ) | | | (1,512,331 | ) | | | (729,695 | ) | | | (2,116,120 | ) |
| Net increase/(decrease) | | | (1,184,804 | ) | | | 927,305 | | | | (567,409 | ) | | | (687,879 | ) |
The accompanying notes are an integral part of the financial statements.
60 | Semi-Annual Report 2018 |
BOSTON PARTNERS INVESTMENT FUNDS |
STATEMENTS OF CHANGES IN NET ASSETS (continued) |
| | | Boston Partners
Long/Short Research Fund | | | Boston Partners
All-Cap Value Fund | |
| | | For the
Six Months Ended
February 28, 2018
(unaudited) | | | For the
Year Ended
August 31, 2017 | | | For the
Six Months Ended
February 28, 2018
(unaudited) | | | For the
Year Ended
August 31, 2017 | |
| Increase/(decrease) in net assets from operations: | | | | | | | | | | | | |
| Net investment income/(loss) | | $ | (16,008,255 | ) | | $ | (48,540,573 | ) | | $ | 5,908,241 | | | $ | 12,034,291 | |
| Net realized gain/(loss) from investments, securities sold short, options written, contracts for difference and foreign currency | | | 178,944,970 | | | | 82,068,221 | | | | 53,396,571 | | | | 68,705,899 | |
| Net change in unrealized appreciation/(depreciation) on investments, securities sold short, options written, contracts for difference and foreign currency translation | | | 223,210,901 | | | | 395,642,097 | | | | 128,834,621 | | | | 127,436,220 | |
| Net increase/(decrease) in net assets resulting from operations | | | 386,147,616 | | | | 429,169,745 | | | | 188,139,433 | | | | 208,176,410 | |
| | | | | | | | | | | | | | | | | |
| Dividends and distributions to shareholders from: | | | | | | | | | | | | | | | | |
| Net investment income | | | | | | | | | | | | | | | | |
| Institutional Class | | | — | | | | — | | | | (10,210,846 | ) | | | (11,995,129 | ) |
| Investor Class | | | — | | | | — | | | | (2,182,624 | ) | | | (3,222,915 | ) |
| Net realized capital gains | | | | | | | — | | | | | | | | | |
| Institutional Class | | | — | | | | — | | | | (52,523,501 | ) | | | (28,594,882 | ) |
| Investor Class | | | — | | | | — | | | | (16,724,996 | ) | | | (9,675,303 | ) |
| Net decrease in net assets from dividends and distributions to shareholders | | | — | | | | — | | | | (81,641,967 | ) | | | (53,488,229 | ) |
| | | | | | | | | | | | | | | | | |
| Capital transactions: | | | | | | | | | | | | | | | | |
| Institutional Class | | | | | | | | | | | | | | | | |
| Proceeds from shares sold | | | 953,599,381 | | | | 1,410,703,594 | | | | 223,779,435 | | | | 407,408,037 | |
| Reinvestment of distributions | | | — | | | | — | | | | 52,423,689 | | | | 33,690,794 | |
| Shares redeemed | | | (737,964,311 | ) | | | (1,867,016,913 | ) | | | (139,944,811 | ) | | | (202,947,193 | ) |
| Redemption fees | | | — | | | | — | | | | — | | | | — | |
| Investor Class | | | | | | | | | | | | | | | | |
| Proceeds from shares sold | | | 26,425,086 | | | | 50,886,104 | | | | 93,964,580 | | | | 142,238,260 | |
| Reinvestment of distributions | | | — | | | | — | | | | 18,427,873 | | | | 12,755,592 | |
| Shares redeemed | | | (97,344,131 | ) | | | (113,462,680 | ) | | | (60,956,816 | ) | | | (114,699,120 | ) |
| Redemption fees | | | — | | | | — | | | | — | | | | — | |
| Net increase/(decrease) in net assets from capital transactions | | | 144,716,025 | | | | (518,889,895 | ) | | | 187,693,950 | | | | 278,446,370 | |
| Total increase/(decrease) in net assets | | | 530,863,641 | | | | (89,720,150 | ) | | | 294,191,416 | | | | 433,134,551 | |
| | | | | | | | | | | | | | | | | |
| Net assets: | | | | | | | | | | | | | | | | |
| Beginning of period | | | 6,573,083,257 | | | | 6,662,803,407 | | | | 1,797,194,733 | | | | 1,364,060,182 | |
| End of period | | $ | 7,103,946,898 | | | $ | 6,573,083,257 | | | $ | 2,091,386,149 | | | $ | 1,797,194,733 | |
| Undistributed net investment income/(accumulated net investment loss), end of period | | $ | (36,810,394 | ) | | $ | (20,802,139 | ) | | $ | 1,717,533 | | | $ | 8,202,762 | |
| | | | | | | | | | | | | | | | | |
| Share transactions: | | | | | | | | | | | | | | | | |
| Institutional Class | | | | | | | | | | | | | | | | |
| Shares sold | | | 56,469,285 | | | | 89,651,745 | | | | 8,321,487 | | | | 16,593,193 | |
| Shares reinvested | | | — | | | | — | | | | 2,009,340 | | | | 1,413,797 | |
| Shares redeemed | | | (43,695,765 | ) | | | (119,188,304 | ) | | | (5,193,805 | ) | | | (8,365,867 | ) |
| Net increase/(decrease) | | | 12,773,520 | | | | (29,536,559 | ) | | | 5,137,022 | | | | 9,641,123 | |
| Investor Class | | | | | | | | | | | | | | | | |
| Shares sold | | | 1,599,798 | | | | 3,295,129 | | | | 3,530,044 | | | | 5,824,450 | |
| Shares reinvested | | | — | | | | — | | | | 709,583 | | | | 537,530 | |
| Shares redeemed | | | (5,896,537 | ) | | | (7,364,065 | ) | | | (2,297,806 | ) | | | (4,701,396 | ) |
| Net increase/(decrease) | | | (4,296,739 | ) | | | (4,068,936 | ) | | | 1,941,821 | | | | 1,660,584 | |
The accompanying notes are an integral part of the financial statements.
Semi-Annual Report 2018 | 61 |
BOSTON PARTNERS INVESTMENT FUNDS |
STATEMENTS OF CHANGES IN NET ASSETS (continued) |
| | | WPG Partners
Small/Micro Cap Value Fund | | | Boston Partners
Global Equity Fund | |
| | | For the
Six Months Ended
February 28, 2018
(unaudited) | | | For the
Year Ended
August 31, 2017 | | | For the
Six Months Ended
February 28, 2018
(unaudited) | | | For the
Year Ended
August 31, 2017 | |
| Increase/(decrease) in net assets from operations: | | | | | | | | | | | | |
| Net investment income/(loss) | | $ | 62,101 | | | $ | 102,865 | | | $ | 744,757 | | | $ | 3,974,180 | |
| Net realized gain/(loss) from investments, securities sold short, options written, contracts for difference and foreign currency | | | 757,106 | | | | 3,354,776 | | | | 27,742,617 | | | | 29,126,368 | |
| Net change in unrealized appreciation/(depreciation) on investments, securities sold short, options written, contracts for difference and foreign currency translation | | | 486,397 | | | | (1,846,986 | ) | | | 25,481,482 | | | | 26,459,740 | |
| Net increase/(decrease) in net assets resulting from operations | | | 1,305,604 | | | | 1,610,655 | | | | 53,968,856 | | | | 59,560,288 | |
| | | | | | | | | | | | | | | | | |
| Dividends and distributions to shareholders from: | | | | | | | | | | | | | | | | |
| Net investment income | | | | | | | | | | | | | | | | |
| Institutional Class | | | (107,927 | ) | | | (151,830 | ) | | | (4,011,353 | ) | | | (8,112,334 | ) |
| Investor Class | | | — | | | | — | | | | — | | | | — | |
| Net realized capital gains | | | | | | | | | | | | | | | | |
| Institutional Class | | | (2,015,406 | ) | | | — | | | | (8,902,218 | ) | | | — | |
| Investor Class | | | — | | | | — | | | | — | | | | — | |
| Net decrease in net assets from dividends and distributions to shareholders | | | (2,123,333 | ) | | | (151,830 | ) | | | (12,913,571 | ) | | | (8,112,334 | ) |
| | | | | | | | | | | | | | | | | |
| Capital transactions: | | | | | | | | | | | | | | | | |
| Institutional Class | | | | | | | | | | | | | | | | |
| Proceeds from shares sold | | | 475,364 | | | | 386,144 | | | | 19,917,316 | | | | 132,357,913 | |
| Reinvestment of distributions | | | 2,038,894 | | | | 140,330 | | | | 12,899,308 | | | | 8,098,384 | |
| Shares redeemed | | | (1,726,525 | ) | | | (5,133,072 | ) | | | (5,209,612 | ) | | | (17,378,631 | ) |
| Redemption fees | | | — | | | | — | | | | — | | | | — | |
| Investor Class | | | | | | | | | | | | | | | | |
| Proceeds from shares sold | | | — | | | | — | | | | — | | | | — | |
| Reinvestment of distributions | | | — | | | | — | | | | — | | | | — | |
| Shares redeemed | | | — | | | | — | | | | — | | | | — | |
| Redemption fees | | | — | | | | — | | | | — | | | | — | |
| Net increase/(decrease) in net assets from capital transactions | | | 787,733 | | | | (4,606,598 | ) | | | 27,607,012 | | | | 123,077,666 | |
| Total increase/(decrease) in net assets | | | (29,996 | ) | | | (3,147,773 | ) | | | 68,662,297 | | | | 174,525,620 | |
| | | | | | | | | | | | | | | | | |
| Net assets: | | | | | | | | | | | | | | | | |
| Beginning of period | | | 30,781,371 | | | | 33,929,144 | | | | 590,524,719 | | | | 415,999,099 | |
| End of period | | $ | 30,751,375 | | | $ | 30,781,371 | | | $ | 659,187,016 | | | $ | 590,524,719 | |
| Undistributed net investment income/(accumulated net investment loss), end of period | | $ | 55,837 | | | $ | 101,663 | | | $ | (359,259 | ) | | $ | 2,907,337 | |
| | | | | | | | | | | | | | | | | |
| Share transactions: | | | | | | | | | | | | | | | | |
| Institutional Class | | | | | | | | | | | | | | | | |
| Shares sold | | | 28,119 | | | | 23,570 | | | | 1,093,840 | | | | 7,816,097 | |
| Shares reinvested | | | 123,869 | | | | 8,279 | | | | 711,097 | | | | 514,837 | |
| Shares redeemed | | | (102,935 | ) | | | (312,202 | ) | | | (286,811 | ) | | | (1,040,014 | ) |
| Net increase/(decrease) | | | 49,053 | | | | (280,353 | ) | | | 1,518,126 | | | | 7,290,920 | |
| Investor Class | | | | | | | | | | | | | | | | |
| Shares sold | | | — | | | | — | | | | — | | | | — | |
| Shares reinvested | | | — | | | | — | | | | — | | | | — | |
| Shares redeemed | | | — | | | | — | | | | — | | | | — | |
| Net increase/(decrease) | | | — | | | | — | | | | — | | | | — | |
| Net increase/(decrease) in shares outstanding | | | — | | | | (280,353 | ) | | | — | | | | 7,290,920 | |
The accompanying notes are an integral part of the financial statements.
62 | Semi-Annual Report 2018 |
BOSTON PARTNERS INVESTMENT FUNDS |
STATEMENTS OF CHANGES IN NET ASSETS (continued) |
| | | Boston Partners
Global Long/Short Fund | | | Boston Partners
Emerging Markets Long/Short Fund | |
| | | For the
Six Months Ended
February 28, 2018
(unaudited) | | | For the
Year Ended
August 31, 2017 | | | For the
Six Months Ended
February 28, 2018
(unaudited) | | | For the
Year Ended
August 31, 2017 | |
| Increase/(decrease) in net assets from operations: | | | | | | | | | | | | |
| Net investment income/(loss) | | $ | (4,239,147 | ) | | $ | (8,659,447 | ) | | $ | (345,611 | ) | | $ | (156,422 | ) |
| Net realized gain/(loss) from investments, securities sold short, options written, contracts for difference and foreign currency | | | 20,424,536 | | | | 17,879,108 | | | | 3,452,304 | | | | 2,821,322 | |
| Net change in unrealized appreciation/(depreciation) on investments, securities sold short, options written, contracts for difference and foreign currency translation | | | 26,028,904 | | | | 28,183,947 | | | | (1,163,152 | ) | | | 3,250,607 | |
| Net increase/(decrease) in net assets resulting from operations | | | 42,214,293 | | | | 37,403,608 | | | | 1,943,541 | | | | 5,915,507 | |
| | | | | | | | | | | | | | | | | |
| Dividends and distributions to shareholders from: | | | | | | | | | | | | | | | | |
| Net investment income | | | | | | | | | | | | | | | | |
| Institutional Class | | | — | | | | (1,846,463 | ) | | | (1,225,534 | ) | | | (801,763 | ) |
| Investor Class | | | — | | | | (41,737 | ) | | | — | | | | — | |
| Net realized capital gains | | | | | | | — | | | | | | | | | |
| Institutional Class | | | — | | | | — | | | | (2,134,264 | ) | | | (96,418 | ) |
| Investor Class | | | — | | | | — | | | | — | | | | — | |
| Net decrease in net assets from dividends and distributions to shareholders | | | — | | | | (1,888,200 | ) | | | (3,359,798 | ) | | | (898,181 | ) |
| | | | | | | | | | | | | | | | | |
| Capital transactions: | | | | | | | | | | | | | | | | |
| Institutional Class | | | | | | | | | | | | | | | | |
| Proceeds from shares sold | | | 167,594,955 | | | | 509,043,085 | | | | 26,620,271 | | | | 41,751,644 | |
| Reinvestment of distributions | | | — | | | | 1,628,987 | | | | 3,358,724 | | | | 898,183 | |
| Shares redeemed | | | (238,214,488 | ) | | | (390,372,329 | ) | | | (8,729,940 | ) | | | (1,776,494 | ) |
| Redemption fees | | | — | | | | — | | | | — | | | | — | |
| Investor Class | | | | | | | | | | | | | | | | |
| Proceeds from shares sold | | | 8,733,812 | | | | 13,182,670 | | | | — | | | | — | |
| Reinvestment of distributions | | | — | | | | 41,560 | | | | — | | | | — | |
| Shares redeemed | | | (10,938,404 | ) | | | (11,692,134 | ) | | | — | | | | — | |
| Redemption fees | | | — | | | | — | | | | — | | | | — | |
| Net increase/(decrease) in net assets from capital transactions | | | (72,824,125 | ) | | | 121,831,839 | | | | 21,249,055 | | | | 40,873,333 | |
| Total increase/(decrease) in net assets | | | (30,609,832 | ) | | | 157,347,247 | | | | 19,832,798 | | | | 45,890,659 | |
| | | | | | | | | | | | | | | | | |
| Net assets: | | | | | | | | | | | | | | | | |
| Beginning of period | | | 1,042,263,570 | | | | 884,916,323 | | | | 56,828,968 | | | | 10,938,309 | |
| End of period | | $ | 1,011,653,738 | | | $ | 1,042,263,570 | | | $ | 76,661,766 | | | $ | 56,828,968 | |
| Undistributed net investment income/(accumulated net investment loss), end of period | | $ | (11,735,404 | ) | | $ | (7,496,257 | ) | | $ | (470,883 | ) | | $ | 1,100,262 | |
| | | | | | | | | | | | | | | | | |
| Share transactions: | | | | | | | | | | | | | | | | |
| Institutional Class | | | | | | | | | | | | | | | | |
| Shares sold | | | 14,176,772 | | | | 45,625,568 | | | | 2,208,682 | | | | 3,775,651 | |
| Shares reinvested | | | — | | | | 147,420 | | | | 294,625 | | | | 90,179 | |
| Shares redeemed | | | (20,270,528 | ) | | | (35,115,302 | ) | | | (716,081 | ) | | | (158,221 | ) |
| Net increase/(decrease) | | | (6,093,756 | ) | | | 10,657,686 | | | | 1,787,226 | | | | 3,707,609 | |
| Investor Class | | | | | | | | | | | | | | | | |
| Shares sold | | | 754,695 | | | | 1,192,120 | | | | — | | | | — | |
| Shares reinvested | | | — | | | | 3,782 | | | | — | | | | — | |
| Shares redeemed | | | (938,127 | ) | | | (1,057,685 | ) | | | — | | | | — | |
| Net increase/(decrease) | | | (183,432 | ) | | | 138,217 | | | | — | | | | — | |
| Net increase/(decrease) in shares outstanding | | | — | | | | 10,795,903 | | | | — | | | | 3,707,609 | |
The accompanying notes are an integral part of the financial statements.
Semi-Annual Report 2018 | 63 |
BOSTON PARTNERS INVESTMENT FUNDS |
STATEMENTS OF CHANGES IN NET ASSETS (concluded) |
| | | Boston
Partners
Emerging Markets Fund | |
| | | For the
Six Months Ended
February 28, 2018
(unaudited) | |
| Increase/(decrease) in net assets from operations: | | | |
| Net investment income/(loss) | | $ | (12,529 | ) |
| Net realized gain/(loss) from investments, securities sold short, options written, contracts for difference and foreign currency | | | 278,761 | |
| Net change in unrealized appreciation/(depreciation) on investments, securities sold short, options written, contracts for difference and foreign currency translation | | | 40,824 | |
| Net increase/(decrease) in net assets resulting from operations | | | 307,056 | |
| | | | | |
| Dividends and distributions to shareholders from: | | | | |
| Net investment income | | | | |
| Institutional Class | | | (37,354 | ) |
| Investor Class | | | — | |
| Net realized capital gains | | | | |
| Institutional Class | | | — | |
| Investor Class | | | — | |
| Net decrease in net assets from dividends and distributions to shareholders | | | (37,354 | ) |
| | | | | |
| Capital transactions: | | | | |
| Institutional Class | | | | |
| Proceeds from shares sold | | | 9,272,037 | |
| Reinvestment of distributions | | | 37,354 | |
| Shares redeemed | | | — | |
| Redemption fees | | | — | |
| Investor Class | | | | |
| Proceeds from shares sold | | | — | |
| Reinvestment of distributions | | | — | |
| Shares redeemed | | | — | |
| Redemption fees | | | — | |
| Net increase/(decrease) in net assets from capital transactions | | | 9,309,391 | |
| Total increase/(decrease) in net assets | | | 9,579,093 | |
| | | | | |
| Net assets: | | | | |
| Beginning of period | | | — | |
| End of period | | $ | 9,579,093 | |
| Undistributed net investment income/(accumulated net investment loss), end of period | | $ | (49,883 | ) |
| | | | | |
| Share transactions: | | | | |
| Institutional Class | | | | |
| Shares sold | | | 905,226 | |
| Shares reinvested | | | 3,751 | |
| Shares redeemed | | | — | |
| Net increase/(decrease) | | | 908,977 | |
| Investor Class | | | | |
| Shares sold | | | — | |
| Shares reinvested | | | — | |
| Shares redeemed | | | — | |
| Net increase/(decrease) | | | — | |
The accompanying notes are an integral part of the financial statements.
64 | Semi-Annual Report 2018 |
(THIS PAGE INTENTIONALLY LEFT BLANK.)
Semi-Annual Report 2018 | 65 |
BOSTON PARTNERS INVESTMENT FUNDS |
FINANCIAL HIGHLIGHTS Per Share Operating Performance |
Contained below is per share operating performance data for each class of shares outstanding, total investment return, ratios to average net assets and other supplemental data for the respective periods. This information has been derived from information provided in the financial statements. |
| | | Net Asset Value, Beginning of Period | | | Net Investment Income/
(Loss)* | | | Net Realized and Unrealized Gain/
(Loss) on Investments | | | Net Increase/ (Decrease) in Net Assets Resulting from Operations | | | Dividends to Shareholders from Net Investment Income | | | Distributions to Shareholders from Net Realized Gains | | | Total Dividend and Distributions to Shareholders | | | Redemption Fees*^ | |
| Boston Partners Small Cap Value Fund II |
| Institutional Class | | | | | | | | | | | | | | | | | | | | | | | | |
| 9/1/17 through 2/28/18† | | $ | 24.96 | | | $ | 0.14 | | | $ | 1.50 | | | $ | 1.64 | | | $ | (0.20 | ) | | $ | (0.98 | ) | | $ | (1.18 | ) | | $ | — | |
| 8/31/17 | | | 23.00 | | | | 0.13 | | | | 2.38 | | | | 2.51 | | | | (0.21 | ) | | | (0.34 | ) | | | (0.55 | ) | | | — | |
| 8/31/16 | | | 21.89 | | | | 0.18 | | | | 2.00 | | | | 2.18 | | | | (0.12 | ) | | | (0.95 | ) | | | (1.07 | ) | | | — | 3 |
| 8/31/15 | | | 22.65 | | | | 0.21 | | | | (0.54 | ) | | | (0.33 | ) | | | (0.15 | ) | | | (0.28 | ) | | | (0.43 | ) | | | — | |
| 8/31/14 | | | 19.06 | | | | 0.15 | | | | 3.53 | | | | 3.68 | | | | (0.09 | ) | | | — | | | | (0.09 | ) | | | — | 3 |
| 8/31/13 | | | 15.31 | | | | 0.09 | | | | 3.75 | | | | 3.84 | | | | (0.09 | ) | | | — | | | | (0.09 | ) | | | — | |
| Investor Class | | | | | | | | | | | | | | | | | | | | | | | | | | | | | | | | |
| 9/1/17 through 2/28/18† | | $ | 23.92 | | | $ | 0.10 | | | $ | 1.43 | | | $ | 1.53 | | | $ | (0.14 | ) | | $ | (0.98 | ) | | $ | (1.12 | ) | | | $ | |
| 8/31/17 | | | 22.06 | | | | 0.07 | | | | 2.29 | | | | 2.36 | | | | (0.16 | ) | | | (0.34 | ) | | | (0.50 | ) | | | — | |
| 8/31/16 | | | 21.04 | | | | 0.12 | | | | 1.92 | | | | 2.04 | | | | (0.07 | ) | | | (0.95 | ) | | | (1.02 | ) | | | — | 3 |
| 8/31/15 | | | 21.79 | | | | 0.14 | | | | (0.51 | ) | | | (0.37 | ) | | | (0.10 | ) | | | (0.28 | ) | | | (0.38 | ) | | | — | |
| 8/31/14 | | | 18.35 | | | | 0.09 | | | | 3.40 | | | | 3.49 | | | | (0.05 | ) | | | — | | | | (0.05 | ) | | | — | 3 |
| 8/31/13 | | | 14.74 | | | | 0.05 | | | | 3.61 | | | | 3.66 | | | | (0.05 | ) | | | — | | | | (0.05 | ) | | | — | |
| Boston Partners Long/Short Equity Fund |
| Institutional Class | | | | | | | | | | | | | | | | | | | | | | | | | | | | | | | | |
| 9/1/17 through 2/28/18† | | $ | 20.96 | | | $ | (0.20 | ) | | $ | 0.95 | | | $ | 0.75 | | | $ | — | | | $ | (0.17 | ) | | $ | (0.17 | ) | | $ | — | |
| 8/31/17 | | | 20.09 | | | | (0.26 | ) | | | 1.13 | | | | 0.87 | | | | — | | | | — | | | | — | | | | — | |
| 8/31/16 | | | 19.04 | | | | (0.35 | ) | | | 3.04 | | | | 2.69 | | | | — | | | | (1.64 | ) | | | (1.64 | ) | | | — | 3 |
| 8/31/15 | | | 22.65 | | | | (0.84 | ) | | | (1.01 | ) | | | (1.85 | ) | | | — | | | | (1.77 | ) | | | (1.77 | ) | | | 0.01 | |
| 8/31/14 | | | 20.94 | | | | (0.63 | ) | | | 3.57 | | | | 2.94 | | | | — | | | | (1.24 | ) | | | (1.24 | ) | | | 0.01 | |
| 8/31/13 | | | 20.47 | | | | (0.54 | ) | | | 2.24 | | | | 1.70 | | | | — | | | | (1.24 | ) | | | (1.24 | ) | | | 0.01 | |
| Investor Class | | | | | | | | | | | | | | | | | | | | | | | | | | | | | | | | |
| 9/1/17 through 2/28/18† | | $ | 19.36 | | | $ | (0.21 | ) | | $ | 0.87 | | | $ | 0.66 | | | $ | — | | | $ | (0.17 | ) | | $ | (0.17 | ) | | $ | — | |
| 8/31/17 | | | 18.60 | | | | (0.29 | ) | | | 1.05 | | | | 0.76 | | | | — | | | | — | | | | — | | | | — | |
| 8/31/16 | | | 17.79 | | | | (0.37 | ) | | | 2.82 | | | | 2.45 | | | | — | | | | (1.64 | ) | | | (1.64 | ) | | | — | 3 |
| 8/31/15 | | | 21.33 | | | | (0.84 | ) | | | (0.94 | ) | | | (1.78 | ) | | | — | | | | (1.77 | ) | | | (1.77 | ) | | | 0.01 | |
| 8/31/14 | | | 19.84 | | | | (0.65 | ) | | | 3.37 | | | | 2.72 | | | | — | | | | (1.24 | ) | | | (1.24 | ) | | | 0.01 | |
| 8/31/13 | | | 19.51 | | | | (0.57 | ) | | | 2.13 | | | | 1.56 | | | | — | | | | (1.24 | ) | | | (1.24 | ) | | | 0.01 | |
| Boston Partners Long/Short Research Fund |
| Institutional Class | | | | | | | | | | | | | | | | | | | | | | | | | | | | | | | | |
| 9/1/17 through 2/28/18† | | $ | 16.27 | | | $ | (0.04 | ) | | $ | 0.99 | | | $ | 0.95 | | | $ | — | | | $ | — | | | $ | — | | | $ | — | |
| 8/31/17 | | | 15.23 | | | | (0.12 | ) | | | 1.16 | | | | 1.04 | | | | — | | | | — | | | | — | | | | — | 3 |
| 8/31/16 | | | 15.20 | | | | (0.06 | )6 | | | 0.67 | | | | 0.61 | | | | — | | | | (0.58 | ) | | | (0.58 | ) | | | — | 3 |
| 8/31/15 | | | 15.14 | | | | (0.14 | ) | | | 0.40 | | | | 0.26 | | | | — | | | | (0.20 | ) | | | (0.20 | ) | | | — | 3 |
| 8/31/14 | | | 13.30 | | | | (0.12 | ) | | | 2.02 | | | | 1.90 | | | | — | | | | (0.06 | ) | | | (0.06 | ) | | | — | 3 |
| 8/31/13 | | | 11.91 | | | | (0.14 | ) | | | 1.66 | | | | 1.52 | | | | — | | | | (0.13 | ) | | | (0.13 | ) | | | — | 3 |
| Investor Class | | | | | | | | | | | | | | | | | | | | | | | | | | | | | | | | |
| 9/1/17 through 2/28/18† | | $ | 15.99 | | | $ | (0.06 | ) | | $ | 0.97 | | | $ | 0.91 | | | $ | — | | | $ | — | | | $ | — | | | $ | — | |
| 8/31/17 | | | 15.00 | | | | (0.15 | ) | | | 1.14 | | | | 0.99 | | | | — | | | | — | | | | — | | | | — | |
| 8/31/16 | | | 15.01 | | | | (0.09 | )6 | | | 0.66 | | | | 0.57 | | | | — | | | | (0.58 | ) | | | (0.58 | ) | | | — | 3 |
| 8/31/15 | | | 15.00 | | | | (0.18 | ) | | | 0.39 | | | | 0.21 | | | | — | | | | (0.20 | ) | | | (0.20 | ) | | | — | 3 |
| 8/31/14 | | | 13.21 | | | | (0.15 | ) | | | 2.00 | | | | 1.85 | | | | — | | | | (0.06 | ) | | | (0.06 | ) | | | — | 3 |
| 8/31/13 | | | 11.86 | | | | (0.18 | ) | | | 1.66 | | | | 1.48 | | | | — | | | | (0.13 | ) | | | (0.13 | ) | | | — | 3 |
* | Calculated based on average shares outstanding for the period. |
^ | Effective January 1, 2016, the Funds do not impose a redemption fee. Prior to January 1, 2016, there was a 1.00% redemption fee on shares redeemed that were held 60 days or less on BP Small Cap Value Fund II, BP Long/Short Research Fund, BP Global Equity Fund and BP Global Long/Short Fund. There was a 2.00% redemption fee on shares redeemed that were held 365 days or less on the BP Long/Short Equity Fund. The WPG Small/Micro Cap Value Fund had a 2.00% redemption fee on shares redeemed within 60 days of purchase. The redemption fees were retained by the Funds for the benefit of the remaining shareholders and recorded as paid-in capital. |
The accompanying notes are an integral part of the financial statements.
66 | Semi-Annual Report 2018 |
BOSTON PARTNERS INVESTMENT FUNDS |
FINANCIAL HIGHLIGHTS (continued) Per Share Operating Performance |
| Net Asset Value, End of Period | | | Total Investment Return1,2 | | | Net Assets, End of Period
(000) | | | Ratio of Expenses to Average Net Assets With Waivers, Reimbursements and Recoupment if any | | | Ratio of Expenses to Average Net Assets With Waivers, Reimbursements and Recoupments if any (Excluding Dividend and Interest Expense) | | | Ratio of Expenses to Average Net Assets Without Waivers, Reimbursements and Recoupments
if any | | | Ratio of Net Investment Income/(Loss) to Average Net Assets With Waivers and Reimbursements | | | Portfolio Turnover Rate | |
| Boston Partners Small Cap Value Fund II | |
| | | | | | | | | | | | | | | | | | | | | | | |
| $ | 25.42 | | | | 6.53 | % | | $ | 420,022 | | | | 1.10 | %4 | | | N/A | | | | 1.14 | %4 | | | 1.07 | %4 | | | 35 | %5 |
| | 24.96 | | | | 10.92 | | | | 362,674 | | | | 1.10 | | | | N/A | | | | 1.18 | | | | 0.53 | | | | 24 | |
| | 23.00 | | | | 10.67 | | | | 279,049 | | | | 1.10 | | | | N/A | | | | 1.22 | | | | 0.86 | | | | 29 | |
| | 21.89 | | | | (1.45 | ) | | | 180,057 | | | | 1.10 | | | | N/A | | | | 1.23 | | | | 0.91 | | | | 14 | |
| | 22.65 | | | | 19.33 | | | | 102,112 | | | | 1.21 | | | | N/A | | | | 1.23 | | | | 0.68 | | | | 16 | |
| | 19.06 | | | | 25.19 | | | | 76,442 | | | | 1.29 | | | | N/A | | | | 1.29 | | | | 0.53 | | | | 19 | |
| | | | | | | | | | | | | | | | | | | | | | | | | | | | | | | |
| $ | 24.33 | | | | 6.33 | % | | $ | 133,214 | | | | 1.35 | %4 | | | N/A | | | | 1.39 | %4 | | | 0.82 | %4 | | | 35 | %5 |
| | 23.92 | | | | 10.68 | | | | 159,271 | | | | 1.35 | | | | N/A | | | | 1.43 | | | | 0.28 | | | | 24 | |
| | 22.06 | | | | 10.38 | | | | 126,461 | | | | 1.35 | | | | N/A | | | | 1.47 | | | | 0.61 | | | | 29 | |
| | 21.04 | | | | (1.68 | ) | | | 129,474 | | | | 1.35 | | | | N/A | | | | 1.48 | | | | 0.66 | | | | 14 | |
| | 21.79 | | | | 19.01 | | | | 112,417 | | | | 1.46 | | | | N/A | | | | 1.48 | | | | 0.43 | | | | 16 | |
| | 18.35 | | | | 24.90 | | | | 87,237 | | | | 1.54 | | | | N/A | | | | 1.54 | | | | 0.28 | | | | 19 | |
| Boston Partners Long/Short Equity Fund |
| | | | | | | | | | | | | | | | | | | | | | | | | | | | | | | |
| $ | 21.54 | | | | 3.57 | % | | $ | 844,871 | | | | 3.12 | %4 | | | 2.37 | %4 | | | 3.12 | %4 | | | (1.80 | )%4 | | | 32 | %5 |
| | 20.96 | | | | 4.33 | | | | 858,821 | | | | 2.80 | | | | 2.39 | | | | 2.80 | | | | (1.21 | ) | | | 63 | |
| | 20.09 | | | | 15.36 | | | | 731,894 | | | | 3.57 | | | | 2.46 | | | | 3.57 | | | | (1.79 | ) | | | 72 | |
| | 19.04 | | | | (8.35 | ) | | | 493,751 | | | | 5.64 | | | | 2.47 | | | | 5.64 | | | | (4.22 | ) | | | 75 | |
| | 22.65 | | | | 14.72 | | | | 676,756 | | | | 4.33 | | | | 2.42 | | | | 4.33 | | | | (2.93 | ) | | | 65 | |
| | 20.94 | | | | 8.61 | | | | 620,804 | | | | 4.30 | | | | 2.43 | | | | 4.30 | | | | (2.58 | ) | | | 67 | |
| | | | | | | | | | | | | | | | | | | | | | | | | | | | | | | |
| $ | 19.85 | | | | 3.45 | % | | $ | 79,085 | | | | 3.37 | %4 | | | 2.62 | %4 | | | 3.37 | %4 | | | (2.05 | )%4 | | | 32 | %5 |
| | 19.36 | | | | 4.09 | | | | 88,103 | | | | 3.05 | | | | 2.64 | | | | 3.05 | | | | (1.46 | ) | | | 63 | |
| | 18.60 | | | | 15.07 | | | | 97,417 | | | | 3.82 | | | | 2.71 | | | | 3.82 | | | | (2.04 | ) | | | 72 | |
| | 17.79 | | | | (8.55 | ) | | | 94,459 | | | | 5.89 | | | | 2.72 | | | | 5.89 | | | | (4.47 | ) | | | 75 | |
| | 21.33 | | | | 14.41 | | | | 211,372 | | | | 4.57 | | | | 2.66 | | | | 4.57 | | | | (3.18 | ) | | | 65 | |
| | 19.84 | | | | 8.30 | | | | 220,307 | | | | 4.55 | | | | 2.68 | | | | 4.55 | | | | (2.83 | ) | | | 67 | |
| Boston Partners Long/Short Research Fund |
| | | | | | | | | | | | | | | | | | | | | | | | | | | | | | | |
| $ | 17.22 | | | | 5.84 | % | | $ | 6,953,044 | | | | 1.96 | %4 | | | 1.34 | %4 | | | 1.96 | %4 | | | (0.47 | )%4 | | | 32 | %5 |
| | 16.27 | | | | 6.83 | | | | 6,361,628 | | | | 2.23 | | | | 1.37 | | | | 2.23 | | | | (0.75 | ) | | | 54 | |
| | 15.23 | | | | 4.10 | | | | 6,403,404 | | | | 2.51 | | | | 1.41 | | | | 2.51 | | | | (0.38 | )6 | | | 53 | |
| | 15.20 | | | | 1.73 | | | | 6,738,894 | | | | 2.43 | | | | 1.39 | | | | 2.43 | | | | (0.92 | ) | | | 62 | |
| | 15.14 | | | | 14.28 | | | | 5,054,388 | | | | 2.52 | | | | 1.39 | | | | 2.52 | | | | (0.81 | ) | | | 57 | |
| | 13.30 | | | | 12.81 | | | | 1,743,406 | | | | 2.75 | | | | 1.48 | | | | 2.71 | | | | (1.09 | ) | | | 65 | |
| | | | | | | | | | | | | | | | | | | | | | | | | | | | | | | |
| $ | 16.90 | | | | 5.69 | % | | $ | 150,903 | | | | 2.21 | %4 | | | 1.59 | %4 | | | 2.21 | %4 | | | (0.72 | )%4 | | | 32 | %5 |
| | 15.99 | | | | 6.60 | | | | 211,455 | | | | 2.48 | | | | 1.63 | | | | 2.48 | | | | (1.00 | ) | | | 54 | |
| | 15.00 | | | | 3.88 | | | | 259,400 | | | | 2.76 | | | | 1.66 | | | | 2.76 | | | | (0.63 | )6 | | | 53 | |
| | 15.01 | | | | 1.41 | | | | 300,586 | | | | 2.68 | | | | 1.64 | | | | 2.68 | | | | (1.17 | ) | | | 62 | |
| | 15.00 | | | | 13.99 | | | | 294,249 | | | | 2.77 | | | | 1.64 | | | | 2.77 | | | | (1.06 | ) | | | 57 | |
| | 13.21 | | | | 12.52 | | | | 132,511 | | | | 3.05 | | | | 1.73 | | | | 3.01 | | | | (1.39 | ) | | | 65 | |
1 | Total return is calculated by assuming a purchase of shares on the first day and a sale of shares on the last day of the period and is not annualized if period is less than one year. |
2 | Redemption fees, if any, are reflected in total return calculations. |
3 | Amount is less than $0.005 per share. |
6 | Includes a non-recurring dividend. Without this dividend, net investment loss per share would have been $(0.10) and $(0.13) for Institutional Class and Investor Class, respectively. The ratio of net investment loss would have been (0.66)% and (0.91)% for Institutional Class and Investor Class, respectively. |
The accompanying notes are an integral part of the financial statements.
Semi-Annual Report 2018 | 67 |
BOSTON PARTNERS INVESTMENT FUNDS |
FINANCIAL HIGHLIGHTS Per Share Operating Performance |
Contained below is per share operating performance data for each class of shares outstanding, total investment return, ratios to average net assets and other supplemental data for the respective periods. This information has been derived from information provided in the financial statements. |
| | | Net Asset Value, Beginning of Period | | | Net
Investment Income/
(Loss)* | | | Net Realized and Unrealized Gain/(Loss) on Investments | | | Net Increase/ (Decrease) in Net Assets Resulting from Operations | | | Dividends to Shareholders from Net Investment Income | | | Distributions to Shareholders from Net Realized Gains | | | Total Dividend and Distributions to Shareholders | | | Redemption Fees*^ | |
| Boston Partners All-Cap Value Fund |
| Institutional Class | | | | | | | | | | | | | | | | | | | | | | | | |
| 9/1/17 through 2/28/18† | | $ | 25.57 | | | $ | 0.09 | | | $ | 2.50 | | | $ | 2.59 | | | $ | (0.18 | ) | | $ | (0.95 | ) | | $ | (1.13 | ) | | $ | — | |
| 8/31/17 | | | 23.12 | | | | 0.20 | | | | 3.17 | | | | 3.37 | | | | (0.27 | ) | | | (0.65 | ) | | | (0.92 | ) | | | — | |
| 8/31/16 | | | 22.08 | | | | 0.30 | | | | 2.15 | | | | 2.45 | | | | (0.30 | ) | | | (1.11 | ) | | | (1.41 | ) | | | — | |
| 8/31/15 | | | 23.00 | | | | 0.30 | | | | (0.08 | ) | | | 0.22 | | | | (0.22 | ) | | | (0.92 | ) | | | (1.14 | ) | | | — | |
| 8/31/14 | | | 19.19 | | | | 0.22 | | | | 4.39 | | | | 4.61 | | | | (0.18 | ) | | | (0.62 | ) | | | (0.80 | ) | | | — | |
| 8/31/13 | | | 15.57 | | | | 0.24 | | | | 3.75 | | | | 3.99 | | | | (0.27 | ) | | | (0.10 | ) | | | (0.37 | ) | | | — | |
| Investor Class | | | | | | | | | | | | | | | | | | | | | | | | | | | | | | | | |
| 9/1/17 through 2/28/18† | | $ | 25.42 | | | $ | 0.05 | | | $ | 2.50 | | | $ | 2.55 | | | $ | (0.12 | ) | | $ | (0.95 | ) | | $ | (1.07 | ) | | $ | — | |
| 8/31/17 | | | 23.00 | | | | 0.14 | | | | 3.15 | | | | 3.29 | | | | (0.22 | ) | | | (0.65 | ) | | | (0.87 | ) | | | — | |
| 8/31/16 | | | 21.98 | | | | 0.25 | | | | 2.13 | | | | 2.38 | | | | (0.25 | ) | | | (1.11 | ) | | | (1.36 | ) | | | — | |
| 8/31/15 | | | 22.90 | | | | 0.25 | | | | (0.08 | ) | | | 0.17 | | | | (0.17 | ) | | | (0.92 | ) | | | (1.09 | ) | | | — | |
| 8/31/14 | | | 19.12 | | | | 0.17 | | | | 4.38 | | | | 4.55 | | | | (0.15 | ) | | | (0.62 | ) | | | (0.77 | ) | | | — | |
| 8/31/13 | | | 15.50 | | | | 0.20 | | | | 3.75 | | | | 3.95 | | | | (0.23 | ) | | | (0.10 | ) | | | (0.33 | ) | | | — | |
| WPG Partners Small/Micro Cap Value Fund |
| Institutional Class | | | | | | | | | | | | | | | | | | | | | | | | | | | | | | | | |
| 9/1/17 through 2/28/18† | | $ | 16.13 | | | $ | 0.03 | | | $ | 0.70 | | | $ | 0.73 | | | $ | (0.06 | ) | | $ | (1.09 | ) | | $ | (1.15 | ) | | $ | — | |
| 8/31/17 | | | 15.50 | | | | 0.05 | | | | 0.65 | | | | 0.70 | | | | (0.07 | ) | | | — | | | | (0.07 | ) | | | — | |
| 8/31/16 | | | 15.40 | | | | 0.07 | | | | 0.46 | | | | 0.53 | | | | (0.10 | ) | | | (0.33 | ) | | | (0.43 | ) | | | — | |
| 8/31/15 | | | 20.42 | | | | 0.13 | | | | (2.84 | ) | | | (2.71 | ) | | | (0.13 | ) | | | (2.18 | ) | | | (2.31 | ) | | | — | 4 |
| 8/31/14 | | | 19.06 | | | | 0.07 | | | | 3.16 | | | | 3.23 | | | | (0.02 | ) | | | (1.85 | ) | | | (1.87 | ) | | | — | |
| 8/31/13 | | | 14.32 | | | | 0.07 | | | | 4.74 | | | | 4.81 | | | | (0.07 | ) | | | — | | | | (0.07 | ) | | | — | |
| Boston Partners Global Equity Fund |
| Institutional Class | | | | | | | | | | | | | | | | | | | | | | | | | | | | | | | | |
| 9/1/17 through 2/28/18† | | $ | 17.39 | | | $ | 0.02 | | | $ | 1.55 | | | $ | 1.57 | | | $ | (0.12 | ) | | $ | (0.26 | ) | | $ | (0.38 | ) | | $ | — | |
| 8/31/17 | | | 15.60 | | | | 0.14 | | | | 1.95 | | | | 2.09 | | | | (0.30 | ) | | | — | | | | (0.30 | ) | | | — | |
| 8/31/16 | | | 14.66 | | | | 0.35 | 7 | | | 0.66 | | | | 1.01 | | | | (0.05 | ) | | | (0.02 | ) | | | (0.07 | ) | | | — | |
| 8/31/15 | | | 15.59 | | | | 0.13 | | | | (0.40 | ) | | | (0.27 | ) | | | (0.14 | ) | | | (0.52 | ) | | | (0.66 | ) | | | — | |
| 8/31/14 | | | 12.97 | | | | 0.18 | | | | 2.82 | | | | 3.00 | | | | (0.02 | ) | | | (0.36 | ) | | | (0.38 | ) | | | — | |
| 8/31/13 | | | 11.00 | | | | 0.12 | | | | 2.07 | | | | 2.19 | | | | (0.13 | ) | | | (0.09 | ) | | | (0.22 | ) | | | — | |
* | Calculated based on average shares outstanding, unless otherwise noted. |
^ | Effective January 1, 2016, the Funds do not impose a redemption fee. Prior to January 1, 2016, there was a 1.00% redemption fee on shares redeemed that were held 60 days or less on BP Small Cap Value Fund II, BP Long/Short Research Fund, BP Global Equity Fund and BP Global Long/Short Fund. There was a 2.00% redemption fee on shares redeemed that were held 365 days or less on the BP Long/Short Equity Fund. The WPG Small/Micro Cap Value Fund had a 2.00% redemption fee on shares redeemed within 60 days of purchase. The redemption fees were retained by the Funds for the benefit of the remaining shareholders and recorded as paid-in capital.
|
The accompanying notes are an integral part of the financial statements.
68 | Semi-Annual Report 2018 |
BOSTON PARTNERS INVESTMENT FUNDS |
FINANCIAL HIGHLIGHTS (continued) Per Share Operating Performance |
| Net Asset Value, End of Period | | | Total Investment Return1,2 | | | Net Assets, End of Period
(000) | | | Ratio of Expenses to Average Net Assets With Waivers, Reimbursements and Recoupment if any | | | Ratio of Expenses to Average Net Assets With Waivers, Reimbursements and Recoupments if any (Excluding Dividend and Interest Expense) | | Ratio of Expenses to Average Net Assets Without Waivers, Reimbursements and Recoupments if any | | | Ratio of Net Investment Income/(Loss) to Average Net Assets With Waivers and Reimbursements | | | Portfolio Turnover Rate | |
| Boston Partners All-Cap Value Fund | |
| | | | | | | | | | | | | | | | | | | | | | |
| $ | 27.03 | | | | 10.31 | % | | $ | 1,587,479 | | | | 0.80 | %5 | | N/A | | | 0.80 | %5 | | | 0.66 | %5 | | | 15 | %6 |
| | 25.57 | | | | 14.88 | | | | 1,370,288 | | | | 0.80 | | | N/A | | | 0.88 | | | | 0.83 | | | | 27 | |
| | 23.12 | | | | 11.68 | | | | 1,016,106 | | | | 0.77 | | | N/A | | | 0.96 | | | | 1.41 | | | | 303 | |
| | 22.08 | | | | 0.88 | | | | 793,098 | | | | 0.70 | | | N/A | | | 0.95 | | | | 1.32 | | | | 33 | |
| | 23.00 | | | | 24.52 | | | | 736,475 | | | | 0.70 | | | N/A | | | 0.94 | | | | 1.05 | | | | 26 | |
| | 19.19 | | | | 26.11 | | | | 441,856 | | | | 0.70 | | | N/A | | | 0.97 | | | | 1.37 | | | | 32 | |
| | | | | | | | | | | | | | | | | | | | | | | | | | | | | |
| $ | 26.90 | | | | 10.20 | % | | $ | 503,907 | | | | 1.05 | %5 | | N/A | | | 1.05 | %5 | | | 0.41 | %5 | | | 15 | %6 |
| | 25.42 | | | | 14.56 | | | | 426,904 | | | | 1.05 | | | N/A | | | 1.13 | | | | 0.58 | | | | 27 | |
| | 23.00 | | | | 11.39 | | | | 347,954 | | | | 1.02 | | | N/A | | | 1.21 | | | | 1.16 | | | | 303 | |
| | 21.98 | | | | 0.66 | | | | 248,643 | | | | 0.95 | | | N/A | | | 1.20 | | | | 1.07 | | | | 33 | |
| | 22.90 | | | | 24.29 | | | | 217,590 | | | | 0.95 | | | N/A | | | 1.20 | | | | 0.80 | | | | 26 | |
| | 19.12 | | | | 25.93 | | | | 77,936 | | | | 0.95 | | | N/A | | | 1.22 | | | | 1.12 | | | | 32 | |
| WPG Partners Small/Micro Cap Value Fund |
| | | | | | | | | | | | | | | | | | | | | | | | | | | | | |
| $ | 15.71 | | | | 4.10 | % | | $ | 30,751 | | | | 1.10 | %5 | | N/A | | | 1.13 | %5 | | | 0.39 | %5 | | | 39 | %6 |
| | 16.13 | | | | 4.50 | | | | 30,781 | | | | 1.10 | | | N/A | | | 1.29 | | | | 0.30 | | | | 78 | |
| | 15.50 | | | | 3.74 | | | | 33,929 | | | | 1.10 | | | N/A | | | 1.55 | | | | 0.47 | | | | 62 | |
| | 15.40 | | | | (14.01 | ) | | | 36,461 | | | | 1.10 | | | N/A | | | 1.41 | | | | 0.78 | | | | 80 | |
| | 20.42 | | | | 17.46 | | | | 46,008 | | | | 1.36 | | | N/A | | | 1.42 | | | | 0.35 | | | | 75 | |
| | 19.06 | | | | 33.71 | | | | 40,754 | | | | 1.54 | | | N/A | | | 1.54 | | | | 0.41 | | | | 72 | |
| Boston Partners Global Equity Fund |
| | | | | | | | | | | | | | | | | | | | | | | | | | | | | |
| $ | 18.58 | | | | 9.05 | % | | $ | 659,187 | | | | 0.95 | %5 | | N/A | | | 1.13 | %5 | | | 0.24 | %5 | | | 47 | %6 |
| | 17.39 | | | | 13.59 | | | | 590,525 | | | | 0.95 | | | N/A | | | 1.04 | | | | 0.84 | | | | 83 | |
| | 15.60 | | | | 6.90 | | | | 415,999 | | | | 0.95 | | | N/A | | | 1.10 | | | | 2.38 | 7 | | | 80 | |
| | 14.66 | | | | (1.75 | ) | | | 279,978 | | | | 0.95 | | | N/A | | | 1.24 | | | | 0.86 | | | | 98 | |
| | 15.59 | | | | 23.39 | | | | 60,087 | | | | 0.96 | | | N/A | | | 1.39 | | | | 1.20 | | | | 136 | |
| | 12.97 | | | | 20.14 | | | | 11,496 | | | | 1.30 | | | N/A | | | 3.05 | | | | 1.00 | | | | 102 | |
1 | Total return is calculated by assuming a purchase of shares on the first day and a sale of shares on the last day of the period and is not annualized if period is less than one year. |
2 | Redemption fees, if any, are reflected in total return calculations. |
3 | Portfolio turnover rate excludes securities delivered/received from processing redemptions/subscriptions in-kind. |
4 | Amount is less than $0.005. |
7 | Includes a non-recurring dividend. Without this dividend, net investment income per share would have been $0.18. The ratio of net investment income would have been 1.25%. |
The accompanying notes are an integral part of the financial statements.
Semi-Annual Report 2018 | 69 |
BOSTON PARTNERS INVESTMENT FUNDS |
FINANCIAL HIGHLIGHTS Per Share Operating Performance |
Contained below is per share operating performance data for each class of shares outstanding, total investment return, ratios to average net assets and other supplemental data for the respective periods. This information has been derived from information provided in the financial statements. |
| | | Net Asset Value, Beginning of Period | | | Net Investment Income/
(Loss)* | | | Net Realized and Unrealized Gain/(Loss) on Investments | | | Net Increase/ (Decrease) in Net Assets Resulting from Operations | | | Dividends to Shareholders from Net Investment Income | | | Distributions to Shareholders from Net Realized Gains | | | Total Dividend and Distributions to Shareholders | | | Redemption Fees*^ | |
| Boston Partners Global Long/Short Fund |
| Institutional Class | | | | | | | | | | | | | | | | | | | | | | | | |
| 9/1/17 through 2/28/18† | | $ | 11.34 | | | $ | (0.05 | ) | | $ | 0.52 | | | $ | 0.47 | | | $ | — | | | $ | — | | | $ | — | | | $ | — | |
| 8/31/17 | | | 10.90 | | | | (0.11 | ) | | | 0.57 | | | | 0.46 | | | | (0.02 | ) | | | — | | | | (0.02 | ) | | | — | |
| 8/31/16 | | | 10.55 | | | | 0.05 | 7 | | | 0.34 | | | | 0.39 | | | | — | | | | (0.04 | ) | | | (0.04 | ) | | | — | 4 |
| 8/31/15 | | | 10.30 | | | | (0.13 | ) | | | 0.38 | | | | 0.25 | | | | — | | | | — | | | | — | | | | — | 4 |
| 12/31/13** through 8/31/14 | | | 10.00 | | | | (0.14 | ) | | | 0.44 | | | | 0.30 | | | | — | | | | — | | | | — | | | | — | 4 |
| Investor Class | | | | | | | | | | | | | | | | | | | | | | | | | | | | | | | | |
| 9/1/17 through 2/28/18† | | $ | 11.25 | | | $ | (0.06 | ) | | $ | 0.52 | | | $ | 0.46 | | | $ | — | | | $ | — | | | $ | — | | | $ | — | |
| 8/31/17 | | | 10.85 | | | | (0.13 | ) | | | 0.54 | | | | 0.41 | | | | (0.01 | ) | | | — | | | | (0.01 | ) | | | — | |
| 8/31/16 | | | 10.51 | | | | 0.027 | | | | 0.36 | | | | 0.38 | | | | — | | | | (0.04 | ) | | | (0.04 | ) | | | — | 4 |
| 8/31/15 | | | 10.29 | | | | (0.16 | ) | | | 0.38 | | | | 0.22 | | | | — | | | | — | | | | — | | | | — | 4 |
| 4/11/14** through 8/31/14 | | | 9.86 | | | | (0.09 | ) | | | 0.52 | | | | 0.43 | | | | — | | | | — | | | | — | | | | — | 4 |
| Boston Partners Emerging Markets Long/Short Fund |
| Institutional Class | | | | | | | | | | | | | | | | | | | | | | | | | | | | | | | | |
| 9/1/17 through 2/28/18† | | $ | 12.12 | | | $ | (0.06 | ) | | $ | 0.49 | | | $ | 0.43 | | | $ | (0.26 | ) | | $ | (0.45 | ) | | $ | (0.71 | ) | | $ | — | |
| 8/31/17 | | | 11.15 | | | | (0.07 | ) | | | 1.96 | | | | 1.89 | | | | (0.82 | ) | | | (0.10 | ) | | | (0.92 | ) | | | — | |
| 12/15/15** through 8/31/16 | | | 10.00 | | | | (0.09 | ) | | | 1.24 | | | | 1.15 | | | | — | | | | — | | | | — | | | | — | |
| Boston Partners Emerging Markets Fund |
| Institutional Class | | | | | | | | | | | | | | | | | | | | | | | | | | | | | | | | |
| 10/17/17** through 2/28/18† | | $ | — | | | $ | (0.02 | ) | | $ | 10.62 | | | $ | 10.60 | | | $ | (0.06 | ) | | $ | — | | | $ | (0.06 | ) | | $ | — | |
* | Calculated based on average shares outstanding, unless otherwise noted. |
** | Commencement of operations. |
^ | Effective January 1, 2016, the Funds do not impose a redemption fee. Prior to January 1, 2016, there was a 1.00% redemption fee on shares redeemed that were held 60 days or less on BP Small Cap Value Fund II, BP Long/Short Research Fund, BP Global Equity Fund and BP Global Long/Short Fund. There was a 2.00% redemption fee on shares redeemed that were held 365 days or less on the BP Long/Short Equity Fund. The WPG Small/Micro Cap Value Fund had a 2.00% redemption fee on shares redeemed within 60 days of purchase. The redemption fees were retained by the Funds for the benefit of the remaining shareholders and recorded as paid-in capital. |
The accompanying notes are an integral part of the financial statements.
70 | Semi-Annual Report 2018 |
BOSTON PARTNERS INVESTMENT FUNDS |
FINANCIAL HIGHLIGHTS (concluded) Per Share Operating Performance |
| Net Asset Value, End of Period | | | Total Investment Return1,2 | | | Net Assets,
End of
Period
(000) | | | Ratio of Expenses to Average Net Assets With Waivers, Reimbursements and Recoupment if any | | | Ratio of Expenses to Average Net Assets With Waivers, Reimbursements and Recoupments if any (Excluding Dividend and Interest Expense) | | | Ratio of Expenses to Average Net Assets Without Waivers, Reimbursements and Recoupments if any | | | Ratio of Net Investment Income/(Loss) to Average Net Assets With Waivers and Reimbursements | | | Portfolio Turnover
Rate | |
| Boston Partners Global Long/Short Fund | |
| | | | | | | | | | | | | | | | | | | | | | | |
| $ | 11.81 | | | | 4.14 | % | | $ | 978,393 | | | | 2.29 | %5 | | | 1.64 | %5 | | | 2.29 | %5 | | | (0.81 | )%5 | | | 51 | %6 |
| | 11.34 | | | | 4.26 | | | | 1,008,234 | | | | 2.63 | | | | 1.70 | | | | 2.63 | | | | (0.94 | ) | | | 109 | % |
| | 10.90 | | | | 3.74 | | | | 853,621 | | | | 2.99 | | | | 1.74 | | | | 2.99 | | | | 0.477 | | | | 137 | |
| | 10.55 | | | | 2.43 | | | | 317,600 | | | | 3.09 | | | | 1.96 | | | | 3.05 | | | | (1.27 | ) | | | 132 | |
| | 10.30 | | | | 3.00 | | | | 37,403 | | | | 3.88 | 5 | | | 2.00 | 5 | | | 4.89 | 5 | | | (2.04 | )5 | | | 726 | |
| | | | | | | | | | | | | | | | | | | | | | | | | | | | | | | |
| $ | 11.71 | | | | 4.09 | % | | $ | 33,260 | | | | 2.54 | %5 | | | 1.89 | %5 | | | 2.54 | %5 | | | (1.06 | )%5 | | | 51 | %6 |
| | 11.25 | | | | 3.92 | | | | 34,030 | | | | 2.88 | | | | 1.95 | | | | 2.88 | | | | (1.17 | ) | | | 109 | |
| | 10.85 | | | | 3.66 | | | | 31,294 | | | | 3.24 | | | | 1.99 | | | | 3.24 | | | | 0.227 | | | | 137 | |
| | 10.51 | | | | 2.14 | | | | 59,919 | | | | 3.34 | | | | 2.21 | | | | 3.30 | | | | (1.52 | ) | | | 132 | |
| | 10.29 | | | | 4.36 | | | | 2,841 | | | | 4.125 | | | | 2.255 | | | | 4.445 | | | | (2.28 | )5 | | | 726 | |
| Boston Partners Emerging Markets Long/Short Fund |
| | | | | | | | | | | | | | | | | | | | | | | | | | | | | | | |
| $ | 11.84 | | | | 3.71 | % | | $ | 76,662 | | | | 2.00 | %5 | | | 2.00 | %5 | | | 2.30 | %5 | | | (1.08 | )%5 | | | 121 | %6 |
| | 12.12 | | | | 18.71 | | | | 56,829 | | | | 2.13 | | | | 2.06 | | | | 2.99 | | | | (0.60 | ) | | | 184 | |
| | 11.15 | | | | 11.50 | | | | 10,938 | | | | 3.87 | 5 | | | 2.10 | 5 | | | 7.82 | 5 | | | (1.26 | )5 | | | 229 | 3,6 |
| Boston Partners Emerging Markets Fund |
| | | | | | | | | | | | | | | | | | | | | | | | | | | | | | | |
| $ | 10.54 | | | | 6.08 | % | | $ | 9,579 | | | | 1.10 | %5 | | | N/A | | | | 2.15 | %5 | | | (0.46 | )%5 | | | 77 | %6 |
1 | Total return is calculated by assuming a purchase of shares on the first day and a sale of shares on the last day of the period and is not annualized if period is less than one year. |
2 | Redemption fees, if any, are reflected in total return calculations. |
3 | Portfolio turnover rate excludes securities delivered/received from processing redemptions/subscriptions in-kind. |
4 | Amount is less than $0.005. |
7 | Includes a non-recurring dividend. Without this dividend, net investment income (loss) per share would have been $(0.09) and $(0.12) for Institutional Class and Investor Class, respectively. The ratio of net investment income (loss) would have been (0.88)% and (1.13)% for Institutional Class and Investor Class, respectively. |
The accompanying notes are an integral part of the financial statements.
Semi-Annual Report 2018 | 71 |
BOSTON PARTNERS INVESTMENT FUNDS |
NOTES TO FINANCIAL STATEMENTS February 28, 2018 (unaudited) |
1. | Organization and Significant Accounting Policies |
The RBB Fund, Inc. (“RBB” or the “Company”) was incorporated under the laws of the State of Maryland on February 29, 1988 and is registered under the Investment Company Act of 1940, as amended (the “1940 Act”), as an open-end management investment company. RBB is a “series fund,” which is a mutual fund divided into separate portfolios. Each portfolio is treated as a separate entity for certain matters under the 1940 Act, and for other purposes, and a shareholder of one portfolio is not deemed to be a shareholder of any other portfolio. Currently, RBB has twenty-nine active investment portfolios, including Boston Partners Small Cap Value Fund II (“BP Small Cap Value Fund II”), Boston Partners Long/Short Equity Fund (“BP Long/Short Equity Fund”), Boston Partners Long/Short Research Fund (“BP Long/Short Research Fund”), Boston Partners All-Cap Value Fund (“BP All-Cap Value Fund”), Boston Partners Global Equity Fund (“BP Global Equity Fund”), Boston Partners Global Long/Short Fund (“BP Global Long/Short Fund”), Boston Partners Emerging Markets Long/Short Fund (“BP Emerging Markets Long/Short Fund”), Boston Partners Emerging Markets Fund (“BP Emerging Markets Fund”) (collectively the “BP Funds”), and WPG Partners Small/Micro Cap Value Fund (“WPG Small/Micro Cap Value Fund” and, collectively with the BP Funds, the “Funds”). As of the end of the reporting period, the Funds (other than the WPG Small/Micro Cap Value Fund, BP Emerging Markets Long/Short Fund, and BP Emerging Markets Fund) each offer two classes of shares, Institutional Class and Investor Class. As of the end of the reporting period, Investor Class shares of the BP Global Equity Fund have not been issued. The WPG Small/Micro Cap Value Fund, BP Emerging Markets Long/Short Fund, and BP Emerging Markets Fund are single class funds, offering only the Institutional Class of shares.
RBB has authorized capital of one hundred billion shares of common stock of which 87.023 billion shares are currently classified into one hundred and eighty-one classes of common stock. Each class represents an interest in an active or inactive RBB investment portfolio.
The investment objective of BP Small Cap Value Fund II and BP All-Cap Value Fund is to seek long-term growth of capital primarily through investment in equity securities. The investment objective of BP Global Equity Fund, BP Global/Long Short Fund, BP Emerging Markets Fund and BP Emerging Markets Long/Short Fund is to seek long-term capital growth. The investment objective of BP Long/Short Equity Fund is to seek long-term capital appreciation while reducing exposure to general equity market risk. The investment objective of WPG Small/Micro Cap Value Fund is to seek appreciation by investing primarily in common stocks, securities convertible into common stocks and in special situations. The investment objective of BP Long/Short Research Fund is to seek long-term total return.
The Funds are investment companies and follows accounting and reporting guidance in the Financial Accounting Standards Board (“FASB”) Accounting Standards Codification Topic 946 - “Financial Services - Investment Companies.”
The end of the reporting period for the Funds is February 28, 2018, and the period covered by these Notes to Financial Statements is the six months ended February 28, 2018 (the “current fiscal period”).
Portfolio Valuation — Each Fund’s net asset value (“NAV”) is calculated once daily at the close of regular trading hours on the New York Stock Exchange (“NYSE”) (generally 4:00 p.m. Eastern time) on each day the NYSE is open. Securities held by a Fund are valued using the closing price or the last sale price on a national securities exchange or the National Association of Securities Dealers Automatic Quotation System (“NASDAQ”) market system where they are primarily traded. Equity securities traded in the over-the-counter (“OTC”) market are valued at their closing prices. If there were no transactions on that day, securities traded principally on an exchange or on NASDAQ will be valued at the mean of the last bid and ask prices prior to the market close. Fixed income securities are valued using an independent pricing service, which considers such factors as security prices, yields, maturities and ratings, and are deemed representative of market values at the close of the market. Foreign securities are valued based on prices from the primary market in which they are traded, and are translated from the local currency into U.S. dollars using current exchange rates. Investments in other open-end investment companies, if any, are valued based on the NAV of the investment companies (which may use fair value pricing as disclosed in their prospectuses). Options for which the primary market is a national securities exchange are valued at the last sale price on the exchange on which they are traded, or, in the absence of any sale, will be valued at the mean of the last bid and ask prices prior to the market close. Options not traded on a national securities exchange are valued at the last quoted bid price for long option positions and the closing ask price for short option positions. If market quotations are unavailable or deemed unreliable, securities will be valued in accordance with procedures adopted by the Company’s Board of Directors (the “Board”). Relying on prices supplied by pricing services or dealers or using fair valuation may result in values that are higher or lower than the values used by other investment companies and investors to price the same investments. Such procedures use fundamental valuation methods, which may include, but are not limited to, an analysis of the effect of any restrictions on the resale of the security, industry analysis and trends, significant changes in the issuer’s financial position, and any other event which could have a significant impact on the
72 | Semi-Annual Report 2018 |
BOSTON PARTNERS INVESTMENT FUNDS |
NOTES TO FINANCIAL STATEMENTS (continued) February 28, 2018 (unaudited) |
value of the security. Determination of fair value involves subjective judgment as the actual market value of a particular security can be established only by negotiations between the parties in a sales transaction, and the difference between the recorded fair value and the value that would be received in a sale could be significant. The Funds may use fair value pricing more frequently for securities traded primarily in non-U.S. markets because, among other things, most foreign markets close well before the Funds value their securities, generally as of 4:00 p.m. Eastern time. The earlier close of these foreign markets gives rise to the possibility that significant events, including broad market moves, government actions or pronouncements, aftermarket trading, or news events may have occurred in the interim. To account for this, the Funds may value foreign securities using fair value prices based on third-party vendor modeling tools (international fair value pricing).
Fair Value Measurements — The inputs and valuation techniques used to measure the fair value of the Funds’ investments are summarized into three levels as described in the hierarchy below:
| | ● | Level 1 — Prices are determined using quoted prices in active markets for identical securities. |
| | ● | Level 2 — Prices are determined using other significant observable inputs (including quoted prices for similar securities, interest rates, prepayment speeds, credit risk, etc.). |
| | ● | Level 3 — Prices are determined using significant unobservable inputs (including the Funds’ own assumptions in determining the fair value of investments). |
The inputs or methodologies used for valuing securities are not necessarily an indication of the risk associated with investing in those securities.
A summary of the inputs used to value each Fund’s investments as of the end of the reporting period is included in each Fund’s Portfolio of Investments.
At the end of each quarter, management evaluates the classification of Levels 1, 2 and 3 assets and liabilities. Various factors are considered, such as changes in liquidity from the prior reporting period; whether or not a broker is willing to execute at the quoted price; the depth and consistency of prices from third party pricing services; and the existence of contemporaneous, observable trades in the market. Additionally, management evaluates the classification of Level 1 and Level 2 assets and liabilities on a quarterly basis for changes in listings or delistings on national exchanges.
Due to the inherent uncertainty of determining the fair value of investments that do not have a readily available market value, the fair value of the Funds’ investments may fluctuate from period to period. Additionally, the fair value of investments may differ significantly from the values that would have been used had a ready market existed for such investments and may differ materially from the values the Funds may ultimately realize. Further, such investments may be subject to legal and other restrictions on resale or otherwise less liquid than publicly traded securities.
For fair valuations using significant unobservable inputs, U.S. generally accepted accounting principles (“U.S. GAAP”) requires each Fund to present a reconciliation of the beginning to ending balances for reported market values that presents changes attributable to total realized and unrealized gains or losses, purchase and sales, and transfers in and out of Level 3 during the period. Transfers in and out between levels are based on values at the end of the period. U.S. GAAP also requires the Funds to disclose amounts and reasons for all transfers in and out of Level 1 and Level 2 fair value measurements. A reconciliation of Level 3 investments is presented only when a Fund had an amount of Level 3 investments at the end of the reporting period that was meaningful in relation to its net assets. The amounts and reasons for all transfers in and out of each level within the three-tier hierarchy are disclosed when a Fund had an amount of total transfers during the reporting period that was meaningful in relation to its net assets as of the end of the reporting period.
Foreign securities that utilize international fair pricing are categorized as Level 2 in the hierarchy. During the current fiscal period, the Funds had no significant transfers between Levels 1, 2 and 3 that require disclosure.
Use of Estimates — The preparation of financial statements in conformity with U.S. GAAP requires management to make estimates and assumptions that affect the reported amounts of assets and liabilities and disclosure of contingent assets and liabilities at the date of the financial statements and the reported amounts of revenues and expenses during the reporting period. Actual results could differ from those estimates and those differences could be significant.
Investment Transactions, Investment Income and Expenses — The Funds record security transactions based on trade date for financial reporting purposes. The cost of investments sold is determined by use of the specific identification method for both financial reporting and income tax purposes in determining realized gains and losses on investments. Interest income is accrued when earned. Dividend income is recorded on the ex-dividend date. Distributions
Semi-Annual Report 2018 | 73 |
BOSTON PARTNERS INVESTMENT FUNDS |
NOTES TO FINANCIAL STATEMENTS (continued) February 28, 2018 (unaudited) |
received on securities that represent a return of capital or capital gain are recorded as a reduction of cost of investments and/or as a realized gain. The Funds’ investment income, expenses (other than class specific expenses) and unrealized and realized gains and losses are allocated daily to each class of shares based upon the relative proportion of net assets of each class at the beginning of the day. Expenses incurred on behalf of a specific class, fund or fund family of the Company are charged directly to the class, fund or fund family (in proportion to net assets). Expenses incurred for all of the RBB funds (such as director or professional fees) are charged to all funds in proportion to their average net assets of RBB, or in such other manner as the Board deems fair or equitable. Expenses and fees, including investment advisory and administration fees, are accrued daily and taken into account for the purpose of determining the NAV of the Funds.
Dividends and Distributions to Shareholders — Dividends from net investment income and distributions from net realized capital gains, if any, are declared and paid at least annually to shareholders and recorded on the ex-dividend date. Income dividends and capital gain distributions are determined in accordance with U.S. federal income tax regulations which may differ from U.S. GAAP.
U.S. Tax Status — No provision is made for U.S. income taxes as it is each Fund’s intention to continue to qualify for and elect the tax treatment applicable to regulated investment companies under Subchapter M of the Internal Revenue Code of 1986, as amended, and make the requisite distributions to its shareholders which will be sufficient to relieve it from U.S. income and excise taxes.
Foreign Currency Translation — Assets and liabilities initially expressed in non-U.S. currencies are translated into U.S. dollars based on the applicable exchange rates at the date of the last business day of the financial statement period. Purchases and sales of securities, interest income, dividends, variation margin received and expenses denominated in foreign currencies are translated into U.S. dollars at the exchange rates in effect on the transaction date.
The Funds do not separately report the effect of changes in foreign exchange rates from changes in market prices of securities held. Such changes are included with the net realized gain or loss and change in unrealized appreciation or depreciation on investments in the Statements of Operations. Other foreign currency transactions resulting in realized and unrealized gain or loss are reported separately as net realized gain or loss and change in unrealized appreciation or depreciation on foreign currencies in the Statements of Operations.
Cash and Cash Equivalents — Cash and cash equivalents are valued at cost plus accrued interest, which approximates market value.
Other — In the normal course of business, the Funds may enter into contracts that provide general indemnifications. Each Fund’s maximum exposure under these arrangements is dependent on claims that may be made against the Funds in the future, and, therefore, cannot be estimated; however, based on experience, the risk of material loss from such claims is considered remote.
Currency Risk — The Funds invest in securities of foreign issuers, including American Depositary Receipts. These markets are subject to special risks associated with foreign investments not typically associated with investing in U.S. markets. Because the foreign securities in which the Funds may invest generally trade in currencies other than the U.S. dollar, changes in currency exchange rates will affect the Funds’ NAV, the value of dividends and interest earned and gains and losses realized on the sale of securities. Because the NAV for the Funds are determined on the basis of U.S. dollars, the Funds may lose money by investing in a foreign security if the local currency of a foreign market depreciates against the U.S. dollar, even if the local currency value of the Funds’ holdings goes up. Generally, a strong U.S. dollar relative to these other currencies will adversely affect the value of the Funds’ holdings in foreign securities.
Emerging Markets Risk — The BP Emerging Markets Long/Short Fund and the BP Emerging Markets Fund invest in emerging market instruments which are subject to certain credit and market risks. The securities and currency markets of emerging market countries are generally smaller, less developed, less liquid and more volatile than the securities and currency markets of the United States and other developed markets. Disclosure and regulatory standards in many respects are less stringent than in other developed markets. There also may be a lower level of monitoring and regulation of securities markets in emerging market countries and the activities of investors in such markets and enforcement of existing regulations may be extremely limited. Political and economic structures in many of these countries may be in their infancy and developing rapidly, and such countries may lack the social, political and economic stability characteristics of more developed countries.
Foreign Securities Market Risk — Securities of many non-U.S. companies may be less liquid and their prices more volatile than securities of comparable U.S. companies. Securities of companies traded in many countries outside
74 | Semi-Annual Report 2018 |
BOSTON PARTNERS INVESTMENT FUNDS |
NOTES TO FINANCIAL STATEMENTS (continued) February 28, 2018 (unaudited) |
the U.S., particularly emerging markets countries, may be subject to further risks due to the inexperience of local investment professionals and financial institutions, the possibility of permanent or temporary termination of trading and greater spreads between bid and asked prices of securities. In addition, non-U.S. stock exchanges and investment professionals are subject to less governmental regulation, and commissions may be higher than in the United States. Also, there may be delays in the settlement of non-U.S. stock exchange transactions.
Options Written — The Funds may enter into options written for: bona fide hedging; attempting to offset changes in the value of securities held or expected to be acquired or be disposed of; attempting to minimize fluctuations in foreign currencies; attempting to gain exposure to a particular market, index or instrument; or other risk management purposes. Such options may relate to particular securities or domestic stock indices, and may or may not be listed on exchanges regulated by the Commodity Futures Trading Commission or on other non-U.S. exchanges. An option on a futures contract gives the purchaser the right, in return for the premium paid, to assume a position in the contract (a long position if the option is a call and a short position if the option is a put) at a specified exercise price at any time during the option exercise period. The writer of the option is required upon exercise to assume a short futures position (if the option is a call) or a long futures position (if the option is a put). Upon exercise of the option, the accumulated cash balance in the writer’s futures margin account is delivered to the holder of the option. That balance represents the amount by which the market price of the futures contract at exercise exceeds, in the case of a call, or is less than, in the case of a put, the exercise price of the option. The maximum risk of loss associated with writing put options is limited to the exercised fair value of the option contract. The maximum risk of loss associated with writing call options is potentially unlimited. The Funds also have the additional risk of being unable to enter into a closing transaction at an acceptable price if a liquid secondary market does not exist. The Funds also may write OTC options where completing the obligation depends upon the credit standing of the other party. Option contracts also involve the risk that they may result in loss due to unanticipated developments in market conditions or other causes. Written options are initially recorded as liabilities to the extent of premiums received and subsequently marked to market to reflect the current value of the option written. Gains or losses are realized when the option transaction expires or closes. When an option is exercised, the proceeds on sales for a written call option or the purchase cost for a written put option is adjusted by the amount of the premium received. Listed option contracts present minimal counterparty credit risk since they are exchange traded and the exchange’s clearinghouse, as counterparty to all exchange-traded options, guarantees the options against default. As of the end of the reporting period, all of the Funds' written options are exchange-traded options.
During the current fiscal period, the Funds’ average quarterly volume of derivatives was as follows:
| Fund | | Purchased Options
(Cost) | | | Written Options
(Proceeds) | |
| BP Long/Short Equity Fund | | $ | — | | | $ | 2,871,380 | |
| BP Global Long/Short Fund | | | — | | | | 1,069,770 | |
Short Sales — When the investment adviser believes that a security is overvalued, the BP Long/Short Equity Fund, the BP Long/Short Research Fund, the BP Global Long/Short Fund and the BP Emerging Markets Long/Short Fund may sell the security short by borrowing the same security from a broker or other institution and selling the security. A Fund will incur a loss as a result of a short sale if the price of the borrowed security increases between the date of the short sale and the date on which the Fund buys and replaces such borrowed security. A Fund will realize a gain if there is a decline in price of the security between those dates where the decline in price exceeds the costs of borrowing the security and other transaction costs. There can be no assurance that a Fund will be able to close out a short position at any particular time or at an acceptable price. Although a Fund’s gain is limited to the amount at which it sold a security short, its potential loss is unlimited. Until a Fund replaces a borrowed security, it will maintain at all times cash, U.S. Government securities, or other liquid securities in an amount which, when added to any amount deposited with a broker as collateral, will at least equal the current market value of the security sold short. Depending on arrangements made with brokers, a Fund may not receive any payments (including interest) on collateral deposited with them.
In accordance with the terms of its prime brokerage agreements, a Fund may receive rebate income or be charged a fee for borrowed securities. Such income or fee is calculated on a daily basis based upon the market value of each borrowed security and a variable rate that is dependent upon the availability of such security. The Funds record these prime broker charges on a net basis as interest income or interest expense. During the current fiscal period, the BP Long/Short Equity Fund, the BP Long/Short Research Fund, the BP Global Long/Short Fund and the BP Emerging Markets Long/Short Fund had net income/(charges) of $(2,694,569), $6,324,392, $1,476,646 and $508 respectively, on borrowed securities. Such amounts are included in prime broker interest income and prime broker interest expense on the Statements of Operations.
Semi-Annual Report 2018 | 75 |
BOSTON PARTNERS INVESTMENT FUNDS |
NOTES TO FINANCIAL STATEMENTS (continued) February 28, 2018 (unaudited) |
As of the end of the reporting period, the BP Long/Short Equity Fund, BP Long/Short Research Fund, BP Global Long/Short Fund and the BP Emerging Markets Long/Short Fund had securities sold short valued at $372,873,641, $2,965,542,875, $429,958,540 and $294,172, respectively, for which securities of $242,411,650, $2,181,688,841, $282,004,560 and $1,831,651 and cash deposits of $380,096,270, $3,048,223,865, $444,200,188 and $4,150,181, respectively, were pledged as collateral.
In accordance with Special Custody and Pledge Agreements with Goldman Sachs & Co. (“Goldman Sachs”) (the Funds’ prime broker), the BP Long/Short Equity Fund, the BP Long/Short Research Fund, the BP Global Long/Short Fund and the BP Emerging Markets Long/Short Fund may borrow from Goldman Sachs to the extent necessary to maintain required margin cash deposits on short positions. Interest on such borrowings is charged to the Fund based on the LIBOR rate plus an agreed upon spread.
The BP Long/Short Equity Fund, the BP Long/Short Research Fund, the BP Global Long/Short Fund and the BP Emerging Markets Long/Short Fund utilized cash borrowings from Goldman Sachs to meet required margin cash deposits as follows during the current fiscal period:
BP Long/Short Equity Fund | BP Long/Short Research Fund |
Days
Unitized | Average Daily
Borrowings | Weighted Average Interest Rate | Days
Unitized | Average Daily
Borrowings | Weighted Average Interest Rate |
97 | EUR 417,365 | 0.02% | 116 | AUD 7,138,632 | 1.96% |
52 | JPY 13,957,875 | 0.42% | 153 | CAD 2,816,091 | 1.55% |
170 | USD 2,372,055 | 1.69% | 145 | CHF 1,978,410 | 0.32% |
| | | | 82 | DKK 3,096,080 | 0.09% |
| | | | 90 | EUR 2,390,922 | 0.02% |
| | | | 76 | GBP 2,264,402 | 0.68% |
| | | | 93 | HKD 24,153,064 | 0.78% |
| | | | 115 | JPY 763,252,806 | 0.42% |
| | | | 19 | MXN 132,625,589 | 8.01% |
| | | | 60 | NOK 6,900,670 | 0.96% |
| | | | 75 | SEK 7,577,525 | 0.05% |
| | | | 181 | SGD 1.76 | 0.00% |
| | | | 74 | USD 14,720,802 | 1.74% |
BP Global Long/Short Fund | BP Emerging Markets Long/Short Fund |
Days
Unitized | Average Daily
Borrowings | Weighted Average Interest Rate | Days
Unitized | Average Daily
Borrowings | Weighted Average Interest Rate |
61 | AUD 232,127 | 1.94% | 54 | DKK 38,897 | 0.06% |
178 | CAD 20,346 | 1.57% | 53 | EUR 10,420 | 0.02% |
6 | CHF 43,306 | 0.32% | 38 | GBP 28,672 | 0.79% |
27 | DKK 270,778 | 0.05% | 95 | HKD 791,447 | 0.75% |
145 | EUR 34,898 | 0.03% | 71 | ILS 130,553 | 0.57% |
127 | GBP 43,119 | 0.74% | 38 | JPY 58,117 | 0.43% |
25 | HKD 141,936 | 0.63% | 85 | NOK 140,354 | 0.94% |
128 | JPY 6,241,084 | 0.44% | 83 | SGD 19,317 | 0.93% |
28 | SEK 202,203 | 0.07% | 70 | USD 60,290 | 1.81% |
48 | SGD 56,081 | 1.43% | 89 | ZAR 44,875 | 7.19% |
34 | USD 2,593,297 | 1.78% | | | |
The BP Long/Short Equity Fund, the BP Long/Short Research Fund, the BP Global Long/Short Fund and the BP Emerging Markets Long/Short Fund incurred interest expense during the current fiscal period, in the amount of $19,086, $150,787, $5,393 and $616, respectively.
Contracts for Difference — The BP Global Long/Short Fund, the BP Long/Short Research Fund, the BP Emerging Markets Long/Short Fund and the BP Emerging Markets Fund (for this section only, each a “Fund”) may enter into Contracts for Differences (“CFDs”). CFDs are leveraged derivative instruments that allow a Fund to take a position on the change in the market price of an underlying asset, such as a stock, or the value of an index or currency exchange rate. With a short CFD, a Fund is seeking to profit from falls in the market price of the asset. CFDs are subject to liquidity risk because
76 | Semi-Annual Report 2018 |
BOSTON PARTNERS INVESTMENT FUNDS |
NOTES TO FINANCIAL STATEMENTS (continued) February 28, 2018 (unaudited) |
the liquidity of CFDs is based on the liquidity of the underlying instrument, and are subject to counterparty risk, i.e., the risk that the counterparty to the CFD transaction may be unable or unwilling to make payments or to otherwise honor its financial obligations under the terms of the contract. It is also possible that the market price of the CFD will move between the time the order is placed by a Fund and when it is executed by the issuer, which can result in the trade being executed at a less favorable price. CFDs, like many other derivative instruments, involve the risk that, if the derivative security declines in value, additional margin would be required to maintain the margin level. The seller may require a Fund to deposit additional sums to cover this decline in value, and the margin call may be at short notice. If additional margin is not provided in time, the seller may liquidate the positions at a loss for which a Fund is liable. The potential for margin calls and large losses are much greater in CFDs than in other leveraged products. Most CFDs are traded OTC. CFDs are not registered with the SEC or any U.S. regulator, and are not subject to U.S. regulation. In a short position, the Fund will receive or pay an amount based upon the amount, if any, by which the notional amount of the CFD would have decreased or increased in value had it sold the particular stocks short, less the dividends that would have been paid on those stocks, plus a floating rate of interest on the notional amount of the CFD. All of these components are reflected in the market value of the CFD.
CFDs are marked-to-market daily based upon quotations from market makers and the resulting changes in market values, if any, are recorded as an unrealized gain or loss in the Statements of Operations. Periodic payments made or received are recorded as realized gains or losses. Entering into CFDs involves, to varying degrees, elements of credit and market risk in excess of the amounts recognized on the Statements of Assets and Liabilities. Such risks involve the possibility that there will be no liquid market for these contracts, that the counterparty to the contract may default on its obligation to perform and that there may be unfavorable changes in market conditions. CFDs outstanding at period end, if any, are listed on the Portfolio of Investments. In connection with CFDs, cash or securities may be segregated as collateral by the Funds’ custodian. As of the end of the reporting period, the BP Long/Short Research Fund, BP Global Long/Short Fund, BP Emerging Markets Long/Short Fund and the BP Emerging Markets Fund held CFDs.
During the current fiscal period, the average volume of CFDs was as follows:
| Fund | | Notional Amount
Long | | | Notional Amount
Short | |
| BP Long/Short Research Fund | | $ | 124,691,936 | | | $ | 75,918,867 | |
| BP Global Long/Short Fund | | | — | | | | 13,314,132 | |
| BP Emerging Markets Long/Short Fund | | | 22,224,385 | | | | 21,093,661 | |
| BP Emerging Markets Fund | | | 2,028,179 | | | | N/A | |
The following is a summary of CFD’s that are subject to enforceable master netting agreements (or similar arrangements) and collateral received and pledged in connection with the master netting agreements (or similar arrangements) as of the end of the reporting period:
| | | | | | Gross Amount NEt Offset in the Statement of Assets and Liabilities | | | | | | Gross Amount NEt Offset in the Statement of Assets and Liabilities | |
| Fund | | Gross Amounts of Recognized Assets | | | Financial Instruments | | | Cash Collateral Received | | | Net
Amount1 | | | Gross Amounts of Recognized Liabilities | | | Financial Instruments | | | Cash Collateral Pledged2 | | | Net
Amount3 | |
| BP Long/Short Research Fund | | | | | | | | | | | | | | | | | | | | | |
| Goldman Sachs | | | 1,877,376 | | | | 1,877,376 | | | | — | | | | — | | | | 14,685,629 | | | | 1,877,376 | | | | 7,510,000 | | | | 5,298,253 | |
| Total | | $ | 1,877,376 | | | $ | 1,877,376 | | | $ | — | | | $ | — | | | $ | 14,685,629 | | | $ | 1,877,376 | | | $ | 7,510,000 | | | $ | 5,298,253 | |
| | | | | | | | | | | | | | | | | | | | | | | | | | | | | | | | | |
| BP Global Long/Short Fund | | | | | | | | | | | | | | | | | | | | | | | | | | | | | | | | |
| Goldman Sachs | | | 322,156 | | | | 322,156 | | | | — | | | | — | | | | 691,077 | | | | 322,156 | | | | 368,921 | | | | — | |
| Total | | $ | 322,156 | | | $ | 322,156 | | | $ | — | | | $ | — | | | $ | 691,077 | | | $ | 322,156 | | | $ | 368,921 | | | $ | — | |
| | | | | | | | | | | | | | | | | | | | | | | | | | | | | | | | | |
| BP Emerging Markets Long/Short Fund | | | | | | | | | | | | | | | | | | | | | | | | | | | | | | | | |
| Goldman Sachs | | | 512,268 | | | | 512,268 | | | | — | | | | — | | | | 987,037 | | | | 512,268 | | | | 474,769 | | | | — | |
| Macquarie | | | 102,504 | | | | 18,130 | | | | — | | | | 84,374 | | | | 18,130 | | | | 18,130 | | | | — | | | | — | |
| Morgan Stanley | | | 225,648 | | | | 12,673 | | | | — | | | | 212,975 | | | | 12,673 | | | | 12,673 | | | | — | | | | — | |
| Total | | $ | 840,420 | | | $ | 543,071 | | | $ | — | | | $ | 297,349 | | | $ | 1,017,840 | | | $ | 543,071 | | | $ | 474,769 | | | $ | — | |
Semi-Annual Report 2018 | 77 |
BOSTON PARTNERS INVESTMENT FUNDS |
NOTES TO FINANCIAL STATEMENTS (continued) February 28, 2018 (unaudited) |
| | | | | | Gross Amount NEt Offset in the Statement of Assets and Liabilities | | | | | | Gross Amount NEt Offset in the Statement of Assets and Liabilities | |
| Fund | | Gross Amounts of Recognized Assets | | | Financial Instruments | | | Cash Collateral Received | | | Net
Amount1 | | | Gross Amounts of Recognized Liabilities | | | Financial Instruments | | | Cash Collateral Pledged2 | | | Net
Amount3 | |
| BP Emerging Markets Fund | | | | | | | | | | | | | | | | | | | |
| Goldman Sachs | | | 38,829 | | | | 32,829 | | | | — | | | | 6,000 | | | | 70,460 | | | | 38,829 | | | | — | | | | 31,631 | |
| Total | | $ | 38,829 | | | $ | 32,829 | | | $ | — | | | $ | 6,000 | | | $ | 70,460 | | | $ | 38,829 | | | $ | — | | | $ | 31,631 | |
1 | Net amount represents the net amount receivable from the counterparty in the event of default. |
2 | Actual collateral pledged may be more than the amount shown. |
3 | Net amount represents the net amount payable to the counterparty in the event of default. |
2. | Investment Advisers and Other Services |
Boston Partners Global Investors, Inc. (“Boston Partners” or the “Adviser”) serves as the investment adviser to each Fund. Each Fund compensates the Adviser for its services at an annual rate based on each Fund’s average daily net assets (the “Advisory Fee”), payable on a monthly basis in arrears, as shown in the following table.
The Adviser has contractually agreed to waive advisory fees and/or reimburse expenses to the extent that total annual Fund operating expenses (excluding certain items discussed below) exceed the rates (“Expense Caps”) shown in the following table of each Fund’s average daily net assets. In determining the Adviser’s obligation to waive advisory fees and/or reimburse expenses, the following expenses are not taken into account and could cause total annual Fund operating expenses to exceed the Expense Caps as applicable: acquired fund fees and expenses, brokerage commissions, extraordinary expenses, interest and taxes. This contractual limitation is in effect until February 28, 2019 and may not be terminated without the approval of the Board. The Adviser may discontinue these arrangements at any time after these dates.
| | | EXPENSE CAPS |
| | ADVISORY FEE | INSTITUTIONAL CLASS | INVESTOR
CLASS |
BP Small Cap Value Fund II | 1.00% | 1.10% | 1.35% |
BP Long/Short Equity Fund | 2.25% | 2.50% | 2.75% |
BP Long/Short Research Fund | 1.25% | 1.50% | 1.75% |
BP All-Cap Value Fund | 0.70% | 0.80% | 1.05% |
WPG Partners Small/Micro Cap Value Fund* | 0.80% | 1.10% | N/A |
BP Global Equity Fund | 0.90% | 0.95% | 1.20% |
BP Global Long/Short Fund | 1.50% | 2.00% | 2.25% |
BP Emerging Markets Long/Short Fund | 1.85% | 2.00% | N/A |
BP Emerging Markets Fund | 0.85% | 1.10% | N/A |
| | * | 0.80% of net asset up to $500 million, 0.75% of net assets in excess of $500 million. |
During the current fiscal period, investment advisory fees accrued, waived and reimbursed were as follows:
| FUND | | GROSS
ADVISORY FEES | | | WAIVERS | | | REIMBURSEMENTS | | | NET
ADVISORY FEES | |
| BP Small Cap Value Fund II | | $ | 2,804,738 | | | $ | 111,087 | | | $ | — | | | $ | 2,693,651 | |
| BP Long/Short Equity Fund | | | 10,811,224 | | | | — | | | | — | | | | 10,811,224 | |
| BP Long/Short Research Fund | | | 42,553,609 | | | | — | | | | — | | | | 42,553,609 | |
| BP All-Cap Value Fund | | | 6,857,074 | | | | 19,380 | | | | — | | | | 6,837,694 | |
| WPG Partners Small/Micro Cap Value Fund | | | 128,961 | | | | 5,324 | | | | — | | | | 123,637 | |
| BP Global Equity Fund | | | 2,834,827 | | | | 144,784 | | | | — | | | | 2,690,043 | |
| BP Global Long/Short Fund | | | 7,756,647 | | | | — | | | | — | | | | 7,756,647 | |
| BP Emerging Markets Long/Short Fund | | | 594,487 | | | | 96,353 | | | | — | | | | 498,134 | |
| BP Emerging Markets Fund | | | 23,329 | | | | 28,964 | | | | — | | | | (5,635 | ) |
78 | Semi-Annual Report 2018 |
BOSTON PARTNERS INVESTMENT FUNDS |
NOTES TO FINANCIAL STATEMENTS (continued) February 28, 2018 (unaudited) |
The Adviser may recoup from each Fund (except BP Long/Short Equity Fund and BP All-Cap Value Fund) fees and expenses previously paid, waived, or absorbed for a period of three years after such fees or expenses were incurred, provided that the repayments do not cause the Funds’ operating expenses (excluding brokerage commissions, taxes, interest expense, acquired fund fees and expenses, and any extraordinary expenses) to exceed the Expense Caps of each class of each Fund that were in effect at the time the fees and expenses were paid, waived, or absorbed by the Adviser, as well as the Expense Caps that are currently in effect, if different.
As of the end of the reporting period, the Funds had amounts available for recoupment as follows:
| | | EXPIRATION | | | | |
| FUND | | AUGUST 31, 2019 | | | AUGUST 31, 2020 | | | AUGUST 31, 2021 | | | Total | |
| BP Small Cap Value Fund II | | $ | 404,770 | | | $ | 374,241 | | | $ | 111,087 | | | $ | 890,098 | |
| WPG Small/Micro Cap Value Fund | | | 149,394 | | | | 64,536 | | | | 5,324 | | | | 219,254 | |
| BP Global Equity Fund | | | 502,669 | | | | 407,721 | | | | 144,784 | | | | 1,055,174 | |
| BP Emerging Markets Long/Short Fund | | | 192,417 | | | | 220,693 | | | | 96,353 | | | | 509,463 | |
| BP Emerging Markets Fund | | | — | | | | — | | | | 28,964 | | | | 28,964 | |
U.S. Bancorp Fund Services, LLC (“USBFS”) serves as administrator for the Funds. For providing administrative and accounting services, USBFS is entitled to receive a monthly fee, subject to certain minimum and out of pocket expenses.
USBFS serves as the Funds’ transfer and dividend disbursing agent. For providing transfer agent services, USBFS is entitled to receive a monthly fee, subject to certain minimum and out of pocket expenses.
U.S. Bank, N.A. (the “Custodian”) provides certain custodial services to the Funds. The Custodian is entitled to receive a monthly fee, subject to certain minimum and out of pocket expenses.
Quasar Distributors, LLC serves as the principal underwriter and distributor of the Funds’ shares pursuant to a Distribution Agreement with RBB.
For compensation amounts payable to USBFS, please refer to the Statements of Operations.
The Board has approved a Distribution Agreement for the Funds and adopted separate Plans of Distribution for the Investor Class Shares of each BP Fund (the “Plans”) pursuant to Rule 12b-1 under the 1940 Act. Under the Plans, Quasar Distributors, LLC (the “Underwriter”) is entitled to receive from each Fund a distribution fee with respect to the Investor Class Shares, which is accrued daily and paid monthly, of up to 0.25% on an annualized basis of the average daily net assets of the Investor Class Shares. Amounts paid to the Distributor under the Plans may be used by the Distributor to cover expenses that are related to (i) the sale of the Investor Class Shares, (ii) ongoing servicing and/or maintenance of the accounts of shareholders, and (iii) sub-transfer agency services, subaccounting services or administrative services related to the sale of the Investor Class Shares, all as set forth in the Plans.
3. | Director’s and Officer’s Compensation |
The Directors of the Company receive an annual retainer and meeting fees for meetings attended. Employees of Vigilant Compliance, LLC serve as President, Chief Compliance Officer and Assistant Treasurer of the Company. Vigilant Compliance, LLC is compensated for the services provided to the Company. An employee of RBB serves as Treasurer and Secretary, and is compensated for services provided. Certain employees of USBFS serve as officers of the Company. They are not compensated by the Funds or the Company. For Director’s and Officer’s compensation amounts, please refer to the Statement of Operations.
Semi-Annual Report 2018 | 79 |
BOSTON PARTNERS INVESTMENT FUNDS |
NOTES TO FINANCIAL STATEMENTS (continued) February 28, 2018 (unaudited) |
4. | Purchases and Sales of Investment Securities |
During the current fiscal period, aggregate purchases and sales of investment securities (excluding short-term investments and derivative transactions) of the Funds were as follows:
| Fund | | Purchases | | | Sales | |
| BP Small Cap Value Fund II | | $ | 201,291,498 | | | $ | 193,452,845 | |
| BP Long/Short Equity Fund | | | 301,293,418 | | | | 423,354,528 | |
| BP Long/Short Research Fund | | | 2,089,210,713 | | | | 2,157,220,337 | |
| BP All-Cap Value Fund | | | 355,869,493 | | | | 284,416,974 | |
| WPG Partners Small/Micro Cap Value Fund | | | 12,535,606 | | | | 13,220,526 | |
| BP Global Equity Fund | | | 297,636,785 | | | | 289,749,318 | |
| BP Global Long/Short Fund | | | 514,411,710 | | | | 642,757,876 | |
| BP Emerging Markets Long/Short Fund | | | 58,052,455 | | | | 49,640,074 | |
| BP Emerging Markets Fund | | | 9,336,966 | | | | 3,446,619 | |
There were no purchases or sales of long-term U.S. Government securities during the current fiscal period.
5. | Capital Share Transactions |
As of the end of the reporting period, each class of each Fund has 100,000,000 shares of $0.001 par value common stock authorized except for the Institutional Class Shares of the BP Long/Short Research Fund, BP Global Long/Short Fund and the WPG Small/Micro Cap Value Fund, which have 750,000,000 shares, 300,000,000 shares and 50,000,000 shares, respectively, of $0.001 par value common stock authorized.
A restricted security is a security which has been purchased through a private offering and cannot be resold to the general public without prior registration under the Securities Act of 1933, as amended (the “1933 Act”), or pursuant to the resale limitations provided by Rule 144 under the 1933 Act, or an exemption from the registration requirements of the 1933 Act. Certain restricted securities may be resold in transactions exempt from registration, normally to qualified institutional buyers, and may be deemed liquid by Boston Partners as applicable, based on policies and procedures established by the Board. Therefore, not all restricted securities are considered illiquid.
As of the end of the reporting period, the Funds did not hold any restricted securities that were illiquid.
7. | Federal Income Tax Information |
The Funds have followed the authoritative guidance on accounting for and disclosure of uncertainty in tax positions, which requires the Funds to determine whether a tax position is more likely than not to be sustained upon examination, including resolution of any related appeals or litigation processes, based on the technical merits of the position. The Funds have determined that there was no effect on the financial statements from following this authoritative guidance. In the normal course of business, the Funds are subject to examination by federal, state and local jurisdictions, where applicable, for tax years for which applicable statutes of limitations have not expired. The Funds are not aware of any tax positions for which it is reasonably possible that the total amounts of unrecognized tax benefits will significantly change in the next twelve months.
80 | Semi-Annual Report 2018 |
BOSTON PARTNERS INVESTMENT FUNDS |
NOTES TO FINANCIAL STATEMENTS (continued) February 28, 2018 (unaudited) |
As of August 31, 2017, the federal tax cost and aggregate gross unrealized appreciation and depreciation of investments held by each Fund were as follows:
| Fund | | Federal Tax
Cost | | | Unrealized Appreciation | | | Unrealized (Depreciation) | | | Net Unrealized Appreciation/ (Depreciation) | |
| BP Small Cap Value Fund II | | $ | 568,852,770 | | | $ | 134,028,395 | | | $ | (33,631,178 | ) | | $ | 100,397,217 | |
| BP Long/Short Equity Fund | | | 1,031,270,976 | | | | 232,936,730 | | | | (87,648,806 | ) | | | 145,287,924 | |
| BP Long/Short Research Fund | | | 5,322,199,213 | | | | 1,607,446,590 | | | | (582,774,353 | ) | | | 1,024,672,237 | |
| BP All-Cap Value Fund | | | 1,756,429,681 | | | | 442,598,642 | | | | (54,997,560 | ) | | | 387,601,082 | |
| WPG Small/Micro Cap Value Fund | | | 38,578,224 | | | | 5,469,157 | | | | (4,993,030 | ) | | | 476,127 | |
| BP Global Equity Fund | | | 571,591,084 | | | | 81,014,243 | | | | (12,965,530 | ) | | | 68,048,713 | |
| BP Global Long/Short Fund | | | 931,995,723 | | | | 153,224,368 | | | | (65,934,369 | ) | | | 87,289,999 | |
| BP Emerging Markets Long/Short Fund | | | 50,555,007 | | | | 3,954,494 | | | | (519,630 | ) | | | 3,434,864 | |
Distributions to shareholders, if any, from net investment income and realized gains are determined in accordance with federal income tax regulations, which may differ from net investment income and realized gains recognized for financial reporting purposes. Accordingly, the character of distributions and composition of net assets for tax purposes may differ from those reflected in the accompanying financial statements. To the extent these differences are permanent, such amounts are reclassified within the capital accounts based on the tax treatment; temporary differences do not require such reclassification.
The following permanent differences as of August 31, 2017 were reclassified among the following accounts. They are primarily attributable to net investment loss, gains and losses on foreign currency transactions, tax reclassification of distributions received, capitalization of short sale dividends, investments in contract for differences and investments in partnerships and passive foreign investment companies.
| Fund | | Undistributed Net Investment Income/(Loss) | | | Accumulated Net Realized Gain/(Loss) | | | Paid-in
Capital | |
| BP Small Cap Value Fund II | | $ | (4,530 | ) | | $ | 4,530 | | | $ | — | |
| BP Long/Short Equity Fund | | | 10,142,356 | | | | (296,556 | ) | | | (9,845,800 | ) |
| BP Long/Short Research Fund | | | 32,459,816 | | | | (3,170,725 | ) | | | (29,289,091 | ) |
| BP All-Cap Value Fund | | | (1,141 | ) | | | 3,254 | | | | (2,113 | ) |
| WPG Small/Micro Cap Value Fund | | | (1,203 | ) | | | 1,202 | | | | 1 | |
| BP Global Equity Fund | | | (101,100 | ) | | | 101,100 | | | | — | |
| BP Global Long/Short Fund | | | 4,049,455 | | | | (1,044,036 | ) | | | (3,005,419 | ) |
| BP Emerging Markets Long/Short Fund | | | 1,343,855 | | | | (1,343,855 | ) | | | — | |
As of August 31, 2017, the components of distributable earnings on a tax basis were as follows:
| Fund | | Undistributed
Ordinary
Income | | | Undistributed
Long-Term
capital Gains | | | Capital Loss
Carryforwards | | | Qualified
Late-year Loss
Deferral | | | Unrealized
Appreciation/
(Depreciation) | |
| BP Small Cap Value Fund II | | $ | 4,383,505 | | | $ | 12,187,278 | | | $ | — | | | $ | — | | | $ | 100,397,217 | |
| BP Long/Short Equity Fund | | | — | | | | 898,833 | | | | — | | | | (7,801,209 | ) | | | 145,568,023 | |
| BP Long/Short Research Fund | | | — | | | | — | | | | (70,902,877 | ) | | | (24,793,075 | ) | | | 1,069,755,000 | |
| BP All-Cap Value Fund | | | 17,104,934 | | | | 41,675,659 | | | | — | | | | — | | | | 387,601,503 | |
| WPG Small/Micro Cap Value Fund | | | 1,307,283 | | | | 817,895 | | | | — | | | | — | | | | 476,127 | |
| BP Global Equity Fund | | | 3,352,237 | | | | 1,647,118 | | | | — | | | | — | | | | 68,069,541 | |
| BP Global Long/Short Fund | | | — | | | | — | | | | — | | | | (17,073,659 | ) | | | 87,269,109 | |
| BP Emerging Markets Long/Short Fund | | | 2,327,851 | | | | 265,218 | | | | — | | | | — | | | | 3,449,865 | |
The differences between the book and tax basis components of distributable earnings relate principally to the timing of recognition of income and gains for federal income tax purposes.
Semi-Annual Report 2018 | 81 |
BOSTON PARTNERS INVESTMENT FUNDS |
NOTES TO FINANCIAL STATEMENTS (continued) February 28, 2018 (unaudited) |
The tax character of dividends and distributions paid during the fiscal year ended August 31, 2017 was as follows:
| | | 2017 | |
| Fund | | Ordinary
Income | | | Long-Term
Gains | | | Total | |
| BP Small Cap Value Fund II | | $ | 3,651,331 | | | $ | 6,435,737 | | | $ | 10,087,068 | |
| BP Long/Short Equity Fund | | | — | | | | — | | | | — | |
| BP Long/Short Research Fund | | | — | | | | — | | | | — | |
| BP All-Cap Value Fund | | | 24,914,603 | | | | 28,573,626 | | | | 53,488,229 | |
| WPG Small/Micro Cap Value Fund | | | 151,830 | | | | — | | | | 151,830 | |
| BP Global Equity Fund | | | 8,112,334 | | | | — | | | | 8,112,334 | |
| BP Global Long/Short Fund | | | — | | | | 1,888,200 | | | | 1,888,200 | |
| BP Emerging Markets Long/Short Fund | | | 898,181 | | | | — | | | | 898,181 | |
Dividends from net investment income and short-term capital gains are treated as ordinary income dividends for federal income tax purposes.
Pursuant to federal income tax rules applicable to regulated investment companies, the Funds may elect to treat certain capital losses between November 1 and August 31 and late year ordinary losses ((i) ordinary losses between January 1 and August 31, and (ii) specified ordinary and currency losses between November 1 and August 31) as occurring on the first day of the following tax year. For the year ended August 31, 2017, any amount of losses elected within the tax return will not be recognized for federal income tax purposes until September 1, 2017.
For the fiscal year ended August 31, 2017, the following Funds deferred to September 1, 2017, the following qualified late year losses.
| Fund | | Late-Year
Ordinary Loss
Deferral | | | Post-October
Capital Loss
Deferral | |
| BP Small Cap Value Fund II | | $ | — | | | $ | — | |
| BP Long/Short Equity Fund | | | 7,801,209 | | | | — | |
| BP Long/Short Research Fund | | | 24,793,075 | | | | — | |
| BP All-Cap Value Fund | | | — | | | | — | |
| WPG Small/Micro Cap Value Fund | | | — | | | | — | |
| BP Global Equity Fund | | | — | | | | — | |
| BP Global Long/Short Fund | | | 7,239,470 | | | | 9,834,189 | |
| BP Emerging Markets Long/Short Fund | | | — | | | | — | |
Accumulated capital losses represent net capital loss carryforwards as of August 31, 2017 that may be available to offset future realized capital gains and thereby reduce future capital gains distributions. Under the Regulated Investment Company Modernization Act of 2010, the Funds are permitted to carry forward capital losses incurred in taxable years beginning after December 22, 2010 for an unlimited period. Any losses incurred during those future taxable years will be required to be utilized prior to any losses incurred in pre-enactment taxable years. Additionally, post-enactment capital losses that are carried forward will retain their character as either short-term or long-term capital losses rather than being considered all short-term as under the previous law.
As of August 31, 2017, the BP Long/Short Research Fund had short-term post-enactment capital losses of $70,902,877. The capital losses can be carried forward for an unlimited period.
Securities may be loaned to financial institutions, such as broker-dealers, and are required to be secured continuously by collateral in cash, cash equivalents, letter of credit or U.S. Government securities maintained on a current basis at an amount at least equal to the market value of the securities loaned. Cash collateral received, pursuant to investment guidelines established by the Funds and approved by the Board, is invested in short-term investments. All such investments are made at the risk of the Funds and, as such, the Funds are liable for investment losses. Such loans would involve risks of delay in receiving additional collateral in the event the value of the collateral decreased below the value of the securities loaned or of delay in recovering the securities loaned or even loss of rights in the collateral should the borrower of the securities fail financially. However, loans will
82 | Semi-Annual Report 2018 |
BOSTON PARTNERS INVESTMENT FUNDS |
NOTES TO FINANCIAL STATEMENTS (concluded) February 28, 2018 (unaudited) |
be made only to borrowers deemed by Boston Partners to be of good standing and only when, in Boston Partners’ judgment, the income to be earned from the loans justifies the attendant risks. Any loans of a Fund’s securities will be fully collateralized and marked to market daily. During the current fiscal period, the Funds participated in securities lending. The market value of securities on loan and collateral as of the end of the reporting period and the income generated from the program during the current fiscal period with respect to such loans were as follows:
| Fund | | Market Value
of Securities
Loaned | | | Market Value
of Collateral | | | Income Received
from Securities
Lending | |
| BP Small Cap Value Fund II | | $ | 108,289,573 | | | $ | 112,450,121 | | | $ | 171,435 | |
| BP Long/Short Equity Fund | | | 106,861,824 | | | | 111,554,720 | | | | 429,267 | |
| BP All-Cap Value Fund | | | 177,505,974 | | | | 183,482,661 | | | | 176,659 | |
| WPG Small/Micro Cap Value Fund | | | 6,507,407 | | | | 6,775,803 | | | | 51,400 | |
| BP Global Equity Fund | | | 34,041,777 | | | | 35,279,376 | | | | 24,095 | |
Securities lending transactions are entered into by the Funds under a Master Securities Lending Agreement (“MSLA”) which permits the Funds, under certain circumstances including an event of default (such as bankruptcy or insolvency), to offset amounts payable by the Funds to the same counterparty against amounts to be received and create one single net payment due to or from the Funds. The following table is a summary of the Funds’ open securities lending transactions which are subject to a MSLA as of the end of the reporting period:
| | | | | | | | | | | | Gross Amount Not Offset in the Statement of Assets and Liabilities | |
| Fund | | Gross Amount of Recognized Assets | | | Gross Amounts Offset in the Statement of Assets and Liabilities | | | Net Amount of Assets Presented in the Statement of Assets and Liabilities | | | Financial Instruments1 | | | Cash
Collateral Received | | | Net
Amount2 | |
| BP Small Cap Value Fund II | | $ | 108,289,573 | | | | — | | | $ | 108,289,573 | | | $ | (108,289,573 | ) | | | — | | | | — | |
| BP Long/Short Equity Fund | | | 106,861,824 | | | | — | | | | 106,861,824 | | | | (106,861,824 | ) | | | — | | | | — | |
| BP All-Cap Value Fund | | | 177,505,974 | | | | — | | | | 177,505,974 | | | | (177,505,974 | ) | | | — | | | | — | |
| WPG Small/Micro Cap Value Fund | | | 6,507,407 | | | | — | | | | 6,507,407 | | | | (6,507,407 | ) | | | — | | | | — | |
| BP Global Equity Fund | | | 34,041,777 | | | | — | | | | 34,041,777 | | | | (34,041,777 | ) | | | — | | | | — | |
1 | Amount disclosed is limited to the amount of assets presented in the Statement of Assets and Liabilites. Actual collateral received may be more than the amount shown. |
2 | Net amount represents the net amount receivable from the counterparty in the event of default. |
Management has evaluated the impact of all subsequent events on the Fund through the date the financial statements were issued and has determined that there were no significant events requiring recognition or disclosure in the financial statements.
Semi-Annual Report 2018 | 83 |
BOSTON PARTNERS INVESTMENT FUNDS |
OTHER INFORMATION (unaudited) |
Proxy Voting
Policies and procedures that the Funds use to determine how to vote proxies relating to portfolio securities as well as information regarding how the Funds voted proxies relating to portfolio securities for the most recent twelve-month period ended June 30 are available without charge, upon request, by calling (888) 261-4073 and on the Securities and Exchange Commission’s (“SEC”) website at http://www.sec.gov.
Quarterly Portfolio Schedule
The Company files a complete schedule of portfolio holdings with the SEC for the first and third fiscal quarters of each fiscal year (quarters ended November 30 and May 31) on Form N-Q. The Company’s Form N-Q is available on the SEC website at http://www.sec.gov and may be reviewed and copied at the SEC Public Reference Room in Washington, D.C. Information on the operation of the SEC Public Reference Room may be obtained by calling (800) SEC-0330.
Approval of Investment Advisory Agreement – Boston Partners Emerging Markets Fund
As required by the 1940 Act, the Board of the Company, including all of the Directors who are not “interested persons” of the Company, as that term is defined in the 1940 Act (the “Independent Directors”), considered the approval of the investment advisory agreement between the Adviser and the Company (the “Investment Advisory Agreement”) on behalf of the Boston Partners Emerging Markets Fund (for this section only, the “Fund”) at a meeting of the Board held on May 16-17, 2017 (the “Meeting”). At the Meeting, the Board, including all of the Independent Directors, approved the Investment Advisory Agreement for an initial term ending August 16, 2018. In approving the Investment Advisory Agreement, the Board considered information provided by the Adviser with the assistance and advice of counsel to the Independent Directors and the Company.
In considering the approval of the Investment Advisory Agreement between the Company and the Adviser with respect to the Fund, the Directors took into account all the materials provided prior to and during the Meeting, the presentations made during the Meeting, and the discussions held during the Meeting. Among other things, the Directors considered (i) the nature, extent, and quality of the Adviser’s services to be provided to the Fund; (ii) descriptions of the experience and qualifications of the Adviser’s personnel providing those services; (iii) the Adviser’s investment philosophies and processes; (iv) the Adviser’s assets under management and client descriptions; (v) the Adviser’s soft dollar commission and trade allocation policies, including information on the types of research and services obtained in connection with soft dollar commissions; (vi) the Adviser’s advisory fee arrangements with the Company and other similarly managed clients; (vii) the Adviser’s compliance procedures; (viii) the Adviser’s financial information, insurance coverage and profitability analysis related to providing advisory services to the Fund; and (ix) the extent to which economies of scale are relevant to the Fund.
As part of their review, the Directors considered the nature, extent and quality of the services to be provided by the Adviser. The Directors concluded the Adviser had substantial resources to provide services to the Fund and that the Adviser’s services provided to other Funds of the Company had been acceptable.
The Board also considered the advisory fee rate to be paid by the Fund under the Investment Advisory Agreement. The Directors noted that the Adviser had contractually agreed to waive management fees and reimburse expenses through at least September 1, 2018 to limit total annual operating expenses to 1.10% for the Boston Partners Emerging Markets Fund – Institutional Class.
After reviewing the information regarding the Fund’s costs, profitability and economies of scale, and after considering the Adviser’s services, the Directors concluded that the investment advisory fees to be paid by the Fund were fair and reasonable and that the Investment Advisory Agreement should be approved for an initial period ending August 16, 2018.
84 | Semi-Annual Report 2018 |


Campbell Dynamic Trend Fund
of
THE RBB FUND, INC.
Semi-Annual Report
February 28, 2018
(Unaudited)
This report is submitted for the general information of the shareholders of the Fund. It is not authorized for distribution unless preceded or accompanied by a current prospectus for the Fund.
Campbell Dynamic Trend Fund
Semi-Annual Report
Performance Data
February 28, 2018 (Unaudited)
| Average Annual Total Returns for the Periods Ended FEBRUARY 28, 2018 |
| | Six
Months* | One
Year | Since
Inception** | |
| Campbell Dynamic Trend Fund | 1.21% | 1.55% | -2.46% | |
| Barclay BTOP50 Index*** | -0.91% | -2.44% | -2.74% | |
| ** | Inception date of the Fund is December 31, 2014. |
| *** | Benchmark performance is from inception date of the Fund only and is not the inception date of the benchmark itself. |
Performance data quoted is past performance and does not guarantee future results. Investment return and principal value will fluctuate so that shares, when redeemed, may be worth more or less than their original cost. Current performance may be lower or higher than the returns quoted above. Returns shown do not reflect taxes that a shareholder would pay on Fund distributions or on the redemption of Fund shares. Call the Fund at 1-844-261-6488 for returns current to the most recent month-end.
The performance data quoted reflects fee waivers in effect and would have been less in their absence. The Fund’s total annual operating expense ratio, as stated in the current prospectus dated December 31, 2017, is 3.47% and the Fund’s net operating expense ratio is 1.27%. Campbell & Company Investment Adviser LLC has contractually agreed to waive its advisory fee and/or reimburse expenses in order to limit total annual Fund operating expenses (excluding acquired fund fees and expenses, brokerage commissions, extraordinary items, interest or taxes) to 1.25% of the Fund’s average daily net assets. This contractual limitation is in effect until December 31, 2018 and may not be terminated without the approval of the Board of Directors of The RBB Fund, Inc. Please see the Consolidated Financial Highlights for current figures.
An investment in the Fund is speculative and involves substantial risk. The Fund is not suitable for all investors. It is possible that an investor may lose some or all of its investment. The Fund invests in long and short positions in futures, forwards and spot contracts, each of which may be tied to commodities, financial indices and instruments, foreign currencies, or equity indices. The Fund also invests in investment grade fixed income securities of all durations and maturities. The Fund may be more volatile than investments in traditional securities. Losses on futures and other derivatives can be caused by unanticipated market movements and may be potentially unlimited. Commodities, currencies, foreign investments, and interest rate-linked instruments each entail special risks. The Fund is non-diversified; therefore gains or losses on a single holding may have a relatively great impact on the Fund. A more complete description of the Fund’s risks can be found in its prospectus, which should be read carefully before investing.
The Fund intends to elect to be treated and to qualify each year, as a regulated investment company (“RIC”) under the U.S. Internal Revenue Code (“Code”). To maintain qualification for federal income tax purposes as a RIC under the Code, the Fund must meet certain source-of-income, asset diversification and distribution of its income requirements. If the Fund were to fail to qualify as a RIC and became subject to federal income tax, shareholders of the Fund would be subject to diminished returns.
The Barclay BTOP50 Index (“BTOP50”) seeks to replicate the overall composition of the managed futures industry with regard to trading style and overall market exposure. The BTOP50 employs a top-down approach in selecting its constituents. The largest investable trading adviser programs, as measured by assets under management, are selected for inclusion in the BTOP50. The index portfolio is equally weighted among the selected programs at the beginning of each calendar year and rebalanced annually. It is impossible to invest directly in an index.
Portfolio composition is subject to change.
1
Campbell Dynamic Trend Fund
Fund Expense Examples
February 28, 2018 (Unaudited)
As a shareholder of the Fund, you incur two types of costs: (1) transaction costs and (2) ongoing costs, including management fees and other Fund expenses. This example is intended to help you understand your ongoing costs (in dollars) of investing in the Fund and to compare these costs with the ongoing costs of investing in other mutual funds.
This example is based on an investment of $1,000 invested at the beginning of the six-month period from September 1, 2017 through February 28, 2018, and held for the entire period.
Actual Expenses
The first line of the accompanying table provides information about actual account values and actual expenses. You may use the information in this line, together with the amount you invested, to estimate the expenses that you paid over the period. Simply divide your account value by $1,000 (for example, an $8,600 account value divided by $1,000 = 8.6), then multiply the result by the number in the first line under the heading entitled “Expenses Paid During Period” to estimate the expenses you paid on your account during this period.
Hypothetical Example for Comparison Purposes
The second line of the accompanying table provides information about hypothetical account values and hypothetical expenses based on the Fund’s actual expense ratio and an assumed rate of return of 5% per year before expenses, which is not the Fund’s actual return. The hypothetical account values and expenses may not be used to estimate the actual ending account balance or expenses you paid for the period. You may use this information to compare the ongoing costs of investing in the Fund and other funds. To do so, compare this 5% hypothetical example with the 5% hypothetical examples that appear in the shareholder reports of other funds.
Please note that the expenses shown in the accompanying table are meant to highlight your ongoing costs only and do not reflect any transactional costs. Therefore, the second line of the accompanying table is useful in comparing ongoing costs only, and will not help you determine the relative total costs of owning different funds. In addition, if these transactional costs were included, your costs would have been higher.
| | Beginning
Account Value
September 1, 2017 | Ending
Account Value
February 28, 2018 | Expenses Paid
During Period* |
| Actual | $1,000.00 | $1,012.10 | $6.29 |
Hypothetical
(5% return before expenses) | 1,000.00 | 1,018.55 | 6.31 |
| * | Expenses are equal to an annualized six-month expense ratio for the period September 1, 2017 to February 28, 2018 of 1.26%, which includes waived fees or reimbursed expenses (including interest expense, if any), multiplied by the average account value over the period, multiplied by the number of days (181) in the recent fiscal half-year then divided by 365 days to reflect the one-half year period. The Fund’s ending account value on the first line in the table is based on the actual six-month total investment return for the Fund of 1.21%. |
2
Campbell Dynamic Trend Fund
Consolidated Portfolio Holdings Summary Table
February 28, 2018 (Unaudited)
The following table presents a consolidated summary of the portfolio holdings of the Fund at February 28, 2018:
| | | % of Net
Assets | | | Value | |
| SHORT-TERM INVESTMENTS: | | | | | | |
| U.S. Treasury Obligations | | | 86.2 | % | | $ | 7,967,424 | |
| OTHER ASSETS IN EXCESS OF LIABILITIES (including futures and forward foreign currency contracts) | | | 13.8 | | | | 1,277,005 | |
| NET ASSETS | | | 100.0 | % | | $ | 9,244,429 | |
Portfolio holdings are subject to change at any time.
Refer to the Consolidated Portfolio of Investments for a detailed listing of the Fund’s holdings.
The accompanying notes are an integral part of the consolidated financial statements.
3
Campbell Dynamic Trend Fund
Consolidated Portfolio of Investments
February 28, 2018 (Unaudited)
| | | Coupon* | | Maturity
Date | | Par | | | Value | |
| Short-Term Investments — 86.2% | | | | | | | | | | |
| U.S. Treasury Obligations — 86.2% | | | | | | | | | | |
| United States Treasury Bill | | 1.069% | | 03/29/18 | | $ | 1,390,000 | | | $ | 1,388,408 | |
| United States Treasury Bill | | 1.274% | | 04/26/18 | | | 1,120,000 | | | | 1,117,350 | |
| United States Treasury Bill | | 1.400% | | 05/24/18 | | | 1,950,000 | | | | 1,942,754 | |
| United States Treasury Bill | | 1.476% | | 06/21/18 | | | 890,000 | | | | 885,473 | |
| United States Treasury Bill | | 1.581% | | 07/19/18 | | | 895,000 | | | | 888,885 | |
| United States Treasury Bill | | 1.795% | | 08/23/18 | | | 1,760,000 | | | | 1,744,554 | |
| | | | | | | | | | | | 7,967,424 | |
| TOTAL SHORT-TERM INVESTMENTS | | | | | | | | | | | | |
| (Cost $7,971,010) | | | | | | | | | | | 7,967,424 | |
| | | | | | | | | | | | | |
| Total Investments — 86.2% | | | | | | | | | | | | |
| (Cost $7,971,010) | | | | | | | | | | | 7,967,424 | |
| | | | | | | | | | | | | |
| Other Assets in Excess of Liabilities — 13.8% | | | | | | | | | | | 1,277,005 | |
| Net Assets — 100.0% | | | | | | | | | | $ | 9,244,429 | |
| * | Short-term investments reflect the annualized effective yield on the date of purchase for discounted investments. |
The accompanying notes are an integral part of the consolidated financial statements.
4
Campbell Dynamic Trend Fund
Consolidated Portfolio of Investments (Continued)
February 28, 2018 (Unaudited)
Futures contracts outstanding as of February 28, 2018 were as follows:
| Long Contracts | | Expiration
Date | | Number of
Contracts | | Notional
Amount | | | Value and Unrealized Appreciation/ (Depreciation) | |
| 10-Year Mini Japanese Government Bond | | Mar-18 | | 11 | | $ | 1,030,976 | | | $ | 711 | |
| 3-Month Euro Euribor | | Mar-19 | | 32 | | | 9,760,025 | | | | 637 | |
| 90-DAY Bank Bill | | Jun-18 | | 11 | | | 8,543,689 | | | | (626 | ) |
| Amsterdam Index | | Mar-18 | | 1 | | | 130,626 | | | | 3,524 | |
| Brent Crude | | May-18 | | 2 | | | 129,460 | | | | (4,103 | ) |
| CAC40 10 Euro | | Mar-18 | | 1 | | | 64,892 | | | | 2,268 | |
| Cattle Feeder Futures | | Mar-18 | | 1 | | | 72,375 | | | | 335 | |
| DJIA Mini E-CBOT | | Mar-18 | | 1 | | | 125,190 | | | | (4,462 | ) |
| Euro-BTP | | Mar-18 | | 2 | | | 244,001 | | | | (5,883 | ) |
| Euro-Oat | | Mar-18 | | 1 | | | 122,000 | | | | (4,174 | ) |
| FTSE 100 Index | | Mar-18 | | 1 | | | 99,481 | | | | (4,455 | ) |
| FTSE/JSE TOP 40 | | Mar-18 | | 1 | | | 43,512 | | | | (334 | ) |
| Gasoline RBOB | | Apr-18 | | 1 | | | 80,833 | | | | (2,875 | ) |
| Gold 100 Oz | | Apr-18 | | 2 | | | 263,580 | | | | (8,085 | ) |
| Hang Seng Index | | Mar-18 | | 1 | | | 196,348 | | | | (3,268 | ) |
| London Metals Exchange Aluminum | | Mar-18 | | 2 | | | 106,475 | | | | (881 | ) |
| London Metals Exchange Aluminum | | Jun-18 | | 2 | | | 106,725 | | | | (3,226 | ) |
| London Metals Exchange Copper | | Mar-18 | | 1 | | | 172,588 | | | | 8,166 | |
| London Metals Exchange Copper | | Jun-18 | | 1 | | | 173,575 | | | | (4,878 | ) |
| London Metals Exchange Nickel | | Mar-18 | | 1 | | | 82,515 | | | | 17,340 | |
| London Metals Exchange Nickel | | Jun-18 | | 1 | | | 82,830 | | | | 1,935 | |
| London Metals Exchange Zinc | | Mar-18 | | 2 | | | 173,000 | | | | 12,263 | |
| London Metals Exchange Zinc | | Jun-18 | | 2 | | | 172,325 | | | | (1,931 | ) |
| Low Sulphur Gasoil G Futures | | Apr-18 | | 2 | | | 115,750 | | | | (7,853 | ) |
| MSCI Singapore Exchange ETS | | Mar-18 | | 5 | | | 151,217 | | | | (372 | ) |
| MSCI Taiwan Index | | Mar-18 | | 2 | | | 79,620 | | | | (94 | ) |
| Nasdaq 100 E-Mini | | Mar-18 | | 1 | | | 137,300 | | | | 11,073 | |
| Nikkie 225 (Osaka Securities Exchange) | | Mar-18 | | 1 | | | 103,590 | | | | (2,966 | ) |
| Palladium | | Jun-18 | | 1 | | | 103,760 | | | | 1,363 | |
| Platinum | | Apr-18 | | 3 | | | 148,215 | | | | 423 | |
| Russell 2000 E-Mini | | Mar-18 | | 1 | | | 75,560 | | | | (2 | ) |
| S&P 500 E-Mini | | Mar-18 | | 1 | | | 135,720 | | | | (4,045 | ) |
| S&P Mid 400 E-Mini | | Mar-18 | | 1 | | | 186,450 | | | | (7,282 | ) |
| S&P/TSX 60 Index | | Mar-18 | | 1 | | | 142,254 | | | | (8,621 | ) |
| SPI 200 Index | | Mar-18 | | 1 | | | 116,524 | | | | (371 | ) |
| Topix Index | | Mar-18 | | 1 | | | 165,706 | | | | (2,209 | ) |
| WTI Crude | | Apr-18 | | 2 | | | 123,280 | | | | (2,865 | ) |
| | | | | | | | | | | $ | (25,823 | ) |
The accompanying notes are an integral part of the consolidated financial statements.
5
Campbell Dynamic Trend Fund
Consolidated Portfolio of Investments (Continued)
February 28, 2018 (Unaudited)
| Short Contracts | | Expiration
Date | | Number of
Contracts | | Notional
Amount | | | Value and Unrealized Appreciation/ (Depreciation) | |
| 90-Day Euro | | Mar-19 | | 38 | | $ | (9,500,000 | ) | | $ | 35,318 | |
| 90-Day Sterling | | Mar-19 | | 28 | | | (4,818,481 | ) | | | 2,736 | |
| Australian 10-Year Bond | | Mar-18 | | 4 | | | (310,680 | ) | | | (1,166 | ) |
| Australian 3-Year Bond | | Mar-18 | | 13 | | | (1,009,709 | ) | | | (3,154 | ) |
| Canadian 10-Year Bond | | Jun-18 | | 3 | | | (233,791 | ) | | | (1,806 | ) |
| Coffee | | May-18 | | 2 | | | (91,500 | ) | | | 819 | |
| Corn | | May-18 | | 3 | | | (57,300 | ) | | | (1,696 | ) |
| Euro-Bobl | | Mar-18 | | 5 | | | (610,002 | ) | | | (2,568 | ) |
| Euro-Bund | | Mar-18 | | 1 | | | (122,000 | ) | | | (1,697 | ) |
| London Metals Exchange Aluminum | | Mar-18 | | 2 | | | (106,475 | ) | | | 2,719 | |
| London Metals Exchange Aluminum | | Jun-18 | | 1 | | | (53,363 | ) | | | 1,209 | |
| London Metals Exchange Copper | | Mar-18 | | 1 | | | (172,588 | ) | | | 4,785 | |
| London Metals Exchange Nickel | | Mar-18 | | 1 | | | (82,515 | ) | | | (1,968 | ) |
| London Metals Exchange Zinc | | Mar-18 | | 2 | | | (173,000 | ) | | | 1,644 | |
| Long Gilt | | Jun-18 | | 2 | | | (275,342 | ) | | | (1,434 | ) |
| Natural Gas | | Apr-18 | | 1 | | | (26,700 | ) | | | 538 | |
| Sugar No. 11 (World) | | May-18 | | 1 | | | (14,986 | ) | | | 501 | |
| U.S. Treasury 10-Year Notes | | Jun-18 | | 7 | | | (683,945 | ) | | | (1,215 | ) |
| U.S. Treasury 2-Year Notes | | Jun-18 | | 31 | | | (6,087,280 | ) | | | (45 | ) |
| U.S. Treasury 5-Year Notes | | Jun-18 | | 17 | | | (1,628,461 | ) | | | (956 | ) |
| U.S. Treasury Long Bond (Chicago Board of Trade) | | Jun-18 | | 1 | | | (120,317 | ) | | | (970 | ) |
| Wheat | | May-18 | | 2 | | | (49,500 | ) | | | (2,956 | ) |
| | | | | | | | | | | $ | 28,638 | |
| Total Futures Contracts | | | | | | | | | | $ | 2,815 | |
The accompanying notes are an integral part of the consolidated financial statements.
6
Campbell Dynamic Trend Fund
Consolidated Portfolio of Investments (Concluded)
February 28, 2018 (Unaudited)
Forward foreign currency contracts outstanding as of February 28, 2018 were as follows:
| Currency Purchased | | Currency Sold | | Expiration
Date | | Counterparty | | Unrealized Appreciation/ (Depreciation) | |
| AUD | | | 1,000,000 | | | USD | | | 781,608 | | | Mar 21 2018 | | UBS | | $ | (4,891 | ) |
| CAD | | | 700,000 | | | USD | | | 558,785 | | | Mar 21 2018 | | UBS | | | (13,045 | ) |
| CHF | | | 350,000 | | | USD | | | 376,627 | | | Mar 21 2018 | | UBS | | | (5,297 | ) |
| EUR | | | 700,000 | | | USD | | | 838,960 | | | Mar 21 2018 | | UBS | | | 16,481 | |
| GBP | | | 400,000 | | | USD | | | 545,003 | | | Mar 21 2018 | | UBS | | | 6,236 | |
| JPY | | | 91,500,000 | | | USD | | | 837,170 | | | Mar 22 2018 | | UBS | | | 21,807 | |
| NOK | | | 4,500,000 | | | USD | | | 557,465 | | | Mar 21 2018 | | UBS | | | 12,768 | |
| NZD | | | 1,000,000 | | | USD | | | 719,713 | | | Mar 21 2018 | | UBS | | | 1,338 | |
| SEK | | | 3,600,000 | | | USD | | | 443,077 | | | Mar 21 2018 | | UBS | | | (7,925 | ) |
| USD | | | 502,331 | | | AUD | | | 650,000 | | | Mar 21 2018 | | UBS | | | (2,536 | ) |
| USD | | | 393,591 | | | CAD | | | 500,000 | | | Mar 21 2018 | | UBS | | | 3,777 | |
| USD | | | 264,294 | | | CHF | | | 250,000 | | | Mar 21 2018 | | UBS | | | (941 | ) |
| USD | | | 423,117 | | | EUR | | | 350,000 | | | Mar 21 2018 | | UBS | | | (4,603 | ) |
| USD | | | 137,040 | | | GBP | | | 100,000 | | | Mar 21 2018 | | UBS | | | (770 | ) |
| USD | | | 541,228 | | | JPY | | | 60,000,000 | | | Mar 22 2018 | | UBS | | | (22,035 | ) |
| USD | | | 186,316 | | | NOK | | | 1,500,000 | | | Mar 21 2018 | | UBS | | | (3,762 | ) |
| USD | | | 309,990 | | | NZD | | | 450,000 | | | Mar 21 2018 | | UBS | | | (14,483 | ) |
| USD | | | 181,582 | | | SEK | | | 1,500,000 | | | Mar 21 2018 | | UBS | | | 269 | |
| Total Forward Foreign Currency Contracts | | | | | | | | $ | (17,612 | ) |
| AUD | Australian Dollar | | JPY | Japanese Yen |
| CAD | Canadian Dollar | | NOK | Norwegian Krone |
| CHF | Swiss Franc | | NZD | New Zealand Dollar |
| EUR | Euro | | SEK | Swedish Krona |
| GBP | British Pound | | USD | United States Dollar |
The accompanying notes are an integral part of the consolidated financial statements.
7
Campbell Dynamic Trend Fund
Consolidated Statement of Assets and Liabilities
February 28, 2018 (Unaudited)
| ASSETS | | | |
| Investments, at value (cost $7,971,010) | | $ | 7,967,424 | |
| Cash | | | 783,946 | |
| Deposits with brokers: | | | | |
| Forward foreign currency contracts | | | 310,000 | |
| Futures contracts | | | 243,014 | |
| Receivables for: | | | | |
| Due from adviser | | | 4,003 | |
| Unrealized apprecation on futures contracts | | | 110,307 | |
| Unrealized appreciation on forward foreign currency contracts | | | 62,676 | |
| Prepaid expenses and other assets | | | 17,290 | |
| Total assets | | | 9,498,660 | |
| LIABILITIES | | | | |
| Payables for: | | | | |
| Administration and accounting fees | | | 5,359 | |
| Transfer agent fees | | | 838 | |
| Custodian fees | | | 563 | |
| Unrealized depreciation on futures contracts | | | 107,492 | |
| Unrealized depreciation on forward foreign currency contracts | | | 80,288 | |
| Other accrued expenses and liabilities | | | 59,691 | |
| Total liabilities | | | 254,231 | |
| Net assets | | $ | 9,244,429 | |
| NET ASSETS CONSIST OF: | | | | |
| Par value | | $ | 1,036 | |
| Paid-in capital | | | 9,142,198 | |
| Accumulated net investment income/(loss) | | | (41,166 | ) |
| Accumulated net realized gain/(loss) from futures contracts, foreign currency transactions and forward foreign currency contracts | | | 160,484 | |
| Net unrealized appreciation/(depreciation) on investments, futures contracts, foreign currency translations and forward foreign currency contracts | | | (18,123 | ) |
| Net assets | | $ | 9,244,429 | |
| CAPITAL SHARES: | | | | |
| Shares outstanding ($0.001 par value, 100,000,000 shares authorized) | | $ | 1,036,065 | |
| Net asset value, offering and redemption price per share | | $ | 8.92 | |
The accompanying notes are an integral part of the consolidated financial statements.
8
Campbell Dynamic Trend Fund
Consolidated Statement of Operations
For The Six Months Ended
February 28, 2018 (Unaudited)
| INVESTMENT INCOME | | | |
| Interest | | $ | 44,295 | |
| Total investment income | | | 44,295 | |
| EXPENSES | | | | |
| Advisory fees (Note 2) | | | 48,330 | |
| Audit and tax service fees | | | 28,708 | |
| Administration and accounting services fees (Note 2) | | | 20,336 | |
| Registration and filing fees | | | 12,979 | |
| Legal fees | | | 8,785 | |
| Officers fees | | | 4,646 | |
| Directors fees | | | 4,635 | |
| Printing and shareholder reporting fees | | | 3,658 | |
| Transfer agent fees (Note 2) | | | 1,574 | |
| Custodian fees (Note 2) | | | 1,154 | |
| Other expenses | | | 4,432 | |
| Total expenses before waivers and reimbursements | | | 139,237 | |
| Less: waivers and reimbursements (Note 2) | | | (81,478 | ) |
| Net expenses after waivers and reimbursements | | | 57,759 | |
| Net investment income/(loss) | | | (13,464 | ) |
| NET REALIZED AND UNREALIZED GAIN/(LOSS) FROM INVESTMENTS | | | | |
| Net realized gain/(loss) from: | | | | |
| Investments | | | (150 | ) |
| Futures contracts | | | 373,006 | |
| Foreign currency transactions | | | (100 | ) |
| Forward foreign currency contracts | | | (101,813 | ) |
| Net change in unrealized appreciation/(depreciation) on: | | | | |
| Investments | | | (3,742 | ) |
| Futures contracts | | | (107,972 | ) |
| Foreign currency translations | | | 275 | |
| Forward foreign currency contracts | | | (34,354 | ) |
| Net realized and unrealized gain/(loss) from investments | | | 125,150 | |
| NET INCREASE/(DECREASE) IN NET ASSETS RESULTING FROM OPERATIONS | | $ | 111,686 | |
The accompanying notes are an integral part of the consolidated financial statements.
9
Campbell Dynamic Trend Fund
Consolidated Statements of Changes in Net Assets
| | | For the
Six Months Ended
February 28, 2018
(Unaudited) | | | For the
Year Ended August 31, 2017 | |
| Increase/(Decrease) in Net Assets From Operations: | | | | | | |
| Net investment income/(loss) | | $ | (13,464 | ) | | $ | (72,695 | ) |
| Net realized gain/(loss) from investments, futures contracts, foreign currency transactions and forward foreign currency contracts | | | 270,943 | | | | (215,793 | ) |
| Net change in unrealized appreciation/(depreciation) on investments, future contracts, foreign currency translation and forward foreign currency contracts | | | (145,793 | ) | | | 35,318 | |
| Net increase/(decrease) in net assets resulting from operations | | | 111,686 | | | | (253,170 | ) |
| | | | | | | | | |
| Dividends and Distributions to Shareholders From: | | | | | | | | |
| Net realized capital gains | | | (204,171 | ) | | | — | |
| Net decrease in net assets from dividends and distributions to shareholders | | | (204,171 | ) | | | — | |
| | | | | | | | | |
| Capital Share Transactions: | | | | | | | | |
| Proceeds from reinvestment of distributions | | | 204,171 | | | | — | |
| Net increase/(decrease) in net assets from capital share transactions | | | 204,171 | | | | — | |
| Total increase/(decrease) in net assets | | | 111,686 | | | | (253,170 | ) |
| | | | | | | | | |
| Net Assets: | | | | | | | | |
| Beginning of period | | | 9,132,743 | | | | 9,385,913 | |
| End of period | | $ | 9,244,429 | | | $ | 9,132,743 | |
| Accumulated net investment income/(loss), end of period | | $ | (41,166 | ) | | $ | (27,702 | ) |
| | | | | | | | | |
| Share Transactions: | | | | | | | | |
| Shares reinvested | | | 22,660 | | | | — | |
| Net increase/(decrease) in shares outstanding | | | 22,660 | | | | — | |
The accompanying notes are an integral part of the consolidated financial statements.
10
Campbell Dynamic Trend Fund
Consolidated Financial Highlights
| Contained below is per share operating performance data for shares outstanding, total investment return, ratios to average net assets and other supplemental data for the respective periods. This information has been derived from information provided in the consolidated statements. |
| | | For the
Six Months Ended
February 28, 2018
(Unaudited) | | | For the
Year
Ended
August 31, 2017 | | | For the
Year
Ended
August 31, 2016 | | | For the
Period
Ended
August 31, 2015(1) | |
| Per Share Operating Performance | | | | | | | | | | | | |
| Net asset value, beginning of period | | $ | 9.01 | | | $ | 9.26 | | | $ | 9.71 | | | $ | 10.00 | |
| Net investment income/(loss)(2) | | | (0.01 | ) | | | (0.07 | ) | | | (0.11 | ) | | | (0.08 | ) |
| Net realized and unrealized gain/(loss) from investments | | | 0.12 | | | | (0.18 | ) | | | (0.21 | ) | | | (0.21 | ) |
| Net increase/(decrease) in net assets resulting from operations | | | 0.11 | | | | (0.25 | ) | | | (0.32 | ) | | | (0.29 | ) |
| Dividends and distributions to shareholders from: | | | | | | | | | | | | | | | | |
| Net realized capital gains | | | (0.20 | ) | | | — | | | | (0.13 | ) | | | — | |
| Total dividends and distributions to shareholders | | | (0.20 | ) | | | — | | | | (0.13 | ) | | | — | |
| Net asset value, end of period | | $ | 8.92 | | | $ | 9.01 | | | $ | 9.26 | | | $ | 9.71 | |
| Total investment return(3) | | | 1.21 | %(6) | | | (2.70 | )% | | | (3.36 | )% | | | (2.90 | )%(6) |
| Ratios/Supplemental Data | | | | | | | | | | | | | | | | |
| Net assets, end of period (000’s) | | $ | 9,244 | | | $ | 9,133 | | | $ | 9,386 | | | $ | 9,715 | |
Ratio of expenses to average net assets
with waivers and reimbursements | | | 1.26 | %(4)(5) | | | 1.27 | %(4) | | | 1.25 | % | | | 1.26 | %(4)(5) |
Ratio of expenses to average net assets
without waivers and reimbursements | | | 3.03 | %(5) | | | 3.47 | % | | | 4.04 | % | | | 4.39 | %(5) |
| Ratio of net investment income/(loss) to average net assets | | | (0.29 | )%(5) | | | (0.80 | )% | | | (1.13 | )% | | | (1.25 | )%(5) |
| Portfolio turnover rate | | | 0.00 | %(6) | | | 0.00 | % | | | 0.00 | % | | | 0.00 | %(6) |
| (1) | The Fund commenced investment operations on December 31, 2014. |
| (2) | Calculated based on average shares outstanding for the period. |
| (3) | Total investment return is calculated assuming a purchase of shares on the first day and a sale of shares on the last day of each period reported and includes reinvestments of dividends and distributions, if any. |
| (4) | Expense ratio includes interest expense. Excluding such interest expense, the ratio of expenses to average net assets would be 1.25%. |
The accompanying notes are an integral part of the consolidated financial statements.
11
Campbell Dynamic Trend Fund
Notes To Consolidated Financial Statements
February 28, 2018 (Unaudited)
1. Organization and Significant Accounting Policies
The RBB Fund, Inc. (“RBB” or the “Company”) was incorporated under the laws of the State of Maryland on February 29, 1988 and is registered under the Investment Company Act of 1940, as amended (the “1940 Act”), as an open-end management investment company. RBB is a “series fund,” which is a mutual fund divided into separate portfolios. Each portfolio is treated as a separate entity for certain matters under the 1940 Act, and for other purposes, and a shareholder of one portfolio is not deemed to be a shareholder of any other portfolio. Currently, RBB has twenty-nine active investment portfolios, including the Campbell Dynamic Trend Fund (the “Fund”), which commenced investment operations on December 31, 2014.
RBB has authorized capital of one hundred billion shares of common stock of which 87.023 billion shares are currently classified into one hundred and eighty-one classes of common stock. Each class represents an interest in an active or inactive RBB investment portfolio.
The Fund’s investment objective is to seek capital appreciation.
The Fund is an investment company and follows accounting and reporting guidance in the Financial Accounting Standards Board (“FASB”) Accounting Standards Codification Topic 946 “Financial Services - Investment Companies.”
The end of the reporting period for the Fund is February 28, 2018, and the period covered by these Notes to Consolidated Financial Statements is the six months ended February 28, 2018 (the “current fiscal period”).
Consolidation of Subsidiary — The Adviser’s Campbell Dynamic Trend Program will be achieved by the Fund investing up to 25% of its total assets in the Campbell Core Offshore Limited (the “Subsidiary”), a wholly-owned and controlled subsidiary for the Fund organized under the laws of the Cayman Islands. The consolidated financial statements of the Fund include the financial statements of the Subsidiary. The Fund consolidates the results of subsidiaries in which the Fund holds a controlling financial interest (greater than 50%). All inter-company accounts and transactions have been eliminated. As of the end of the reporting period, the net assets of the Subsidiary were $282,288, which represented 3.05% of the Fund’s net assets.
Portfolio Valuation — The Fund’s net asset value (“NAV”) is calculated once daily at the close of regular trading hours on the New York Stock Exchange (“NYSE”) (generally 4:00 p.m. Eastern time) on each day the NYSE is open. Securities held by the Fund are valued using the closing price or the last sales price on a national securities exchange or the National Association of Securities Dealers Automatic Quotation System (“NASDAQ”) market system where they are primarily traded. Fixed income securities are valued using an independent pricing service, which considers such factors as security prices, yields, maturities and ratings, and are deemed representative of market values at the close of the market. Investments in other open-end investment companies are valued based on the NAV of those investment companies (which may use fair value pricing as discussed in their prospectuses). Forward exchange contracts are valued by interpolating between spot and forward currency rates as quoted by an independent pricing service. Futures contracts are generally valued using the settlement price determined by the relevant exchange. If market quotations are unavailable or deemed unreliable, securities will be valued in accordance with procedures adopted by the Company’s Board of Directors (the “Board”). Relying on prices supplied by pricing services or dealers or using fair valuation may result in values that are higher or lower than the values used by other investment companies and investors to price the same investments.
Fair Value Measurements — The inputs and valuation techniques used to measure the fair value of the Fund’s investments are summarized into three levels as described in the hierarchy below:
| | ● | Level 1 – Prices are determined using quoted prices in active markets for identical securities. |
| | ● | Level 2 – Prices are determined using other significant observable inputs (including quoted prices for similar securities, interest rates, prepayment speeds, credit risk, etc.). |
12
Campbell Dynamic Trend Fund
Notes To Consolidated Financial Statements (Continued)
February 28, 2018 (Unaudited)
| | ● | Level 3 – Prices are determined using significant unobservable inputs (including the Fund’s own assumptions in determining the fair value of investments). |
The inputs or methodologies used for valuing securities are not necessarily an indication of the risk associated with investing in those securities.
The following is a summary of the inputs used, as of the end of the reporting period, in valuing the Fund’s investments carried at fair value:
| | | Total | | | Level 1 | | | Level 2 | | | Level 3 | |
| Short-Term Investments | | $ | 7,967,424 | | | $ | 7,967,424 | | | $ | — | | | $ | — | |
| Commodity Contracts | | | | | | | | | | | | | | | | |
| Futures Contracts | | | 54,040 | | | | 54,040 | | | | — | | | | — | |
| Equity Contracts | | | | | | | | | | | | | | | | |
| Futures Contracts | | | 16,865 | | | | 16,865 | | | | — | | | | — | |
| Interest Rate Contracts | | | | | | | | | | | | | | | | |
| Futures Contracts | | | 39,402 | | | | 39,402 | | | | — | | | | — | |
| Foreign Currency Contracts | | | | | | | | | | | | | | | | |
| Forward Foreign Currency Contracts | | | 62,676 | | | | — | | | | 62,676 | | | | — | |
| Total Assets | | $ | 8,140,407 | | | $ | 8,077,731 | | | $ | 62,676 | | | $ | — | |
| | | Total | | | Level 1 | | | Level 2 | | | Level 3 | |
| Commodity Contracts | | | | | | | | | | | | |
| Futures Contracts | | $ | (43,317 | ) | | $ | (43,317 | ) | | $ | — | | | $ | — | |
| Equity Contracts | | | | | | | | | | | | | | | | |
| Futures Contracts | | | (38,481 | ) | | | (38,481 | ) | | | — | | | | — | |
| Interest Rate Contracts | | | | | | | | | | | | | | | | |
| Futures Contracts | | | (25,694 | ) | | | (25,694 | ) | | | — | | | | — | |
| Foreign Currency Contracts | | | | | | | | | | | | | | | | |
| Forward Foreign Currency Contracts | | | (80,288 | ) | | | — | | | | (80,288 | ) | | | — | |
| Total Liabilities | | $ | (187,780 | ) | | $ | (107,492 | ) | | $ | (80,288 | ) | | $ | — | |
At the end of each quarter, management evaluates the classification of Levels 1, 2 and 3 assets and liabilities. Various factors are considered, such as changes in liquidity from the prior reporting period; whether or not a broker is willing to execute at the quoted price; the depth and consistency of prices from third party pricing services; and the existence of contemporaneous, observable trades in the market. Additionally, management evaluates the classification of Level 1 and Level 2 assets and liabilities on a quarterly basis for changes in listings or delistings on national exchanges.
Due to the inherent uncertainty of determining the fair value of investments that do not have a readily available market value, the fair value of the Fund’s investments may fluctuate from period to period. Additionally, the fair value of investments may differ significantly from the values that would have been used had a ready market existed for such investments and may differ materially from the values the Fund may ultimately realize. Further, such investments may be subject to legal and other restrictions on resale or otherwise less liquid than publicly traded securities.
For fair valuations using significant unobservable inputs, U.S. generally accepted accounting principles (“U.S. GAAP”) requires the Fund to present a reconciliation of the beginning to ending balances for reported market values that presents changes attributable to total realized and unrealized gains or losses, purchase and sales, and transfers in and out of Level 3 during the period. Transfers in and out between levels are based on values at the end of the period. U.S. GAAP also requires the Fund to disclose amounts and reasons for all transfers in and out of Level 1 and Level 2 fair value measurements. A reconciliation of Level 3 investments is presented only when the Fund had an amount of
13
Campbell Dynamic Trend Fund
Notes To Consolidated Financial Statements (Continued)
February 28, 2018 (Unaudited)
Level 3 investments at the end of the reporting period that was meaningful in relation to its net assets. The amounts and reasons for all transfers in and out of each level within the three-tier hierarchy are disclosed when the Fund had an amount of total transfers during the reporting period that was meaningful in relation to its net assets as of the end of the reporting period.
During the current fiscal period, the Fund had no transfers between Levels 1, 2 and 3.
Disclosures about Derivative Instruments and Hedging Activities — Derivative instruments are defined as financial instruments whose value and performance are based on the value and performance of another security or financial instrument. Derivative instruments that the Fund used during the period include forward foreign currency contracts and futures contracts.
During the current fiscal period, the Fund used long and short contracts on U.S. and foreign equity market indices, U.S. and foreign government bonds, foreign currencies, and commodities (through investment in the Subsidiary), to gain investment exposure in accordance with its investment objective.
The following tables provide quantitative disclosures about fair value amounts of, and gains and losses on, the Fund’s derivative instruments as of and for the current fiscal period.
The following table lists the fair values of the Fund’s derivative holdings as of the end of the reporting period, grouped by contract type and risk exposure category.
| Derivative Type | | Consolidated Statement
of Assets and Liabilities
Location | | Commodity Contracts | | | Equity Contracts | | | Interest
Rate
Contracts | | | Foreign Currency Contracts | | | Total | |
| Asset Derivatives |
| Futures Contracts (a) | | Unrealized
appreciation on
futures contracts | | $ | 54,040 | | | $ | 16,865 | | | $ | 39,402 | | | $ | — | | | $ | 110,307 | |
| Forward Contracts (a) | | Unrealized
appreciation on
forward foreign currency contracts | | | — | | | | — | | | | — | | | | 62,676 | | | | 62,676 | |
| Total Value - Assets | | | | $ | 54,040 | | | $ | 16,865 | | | $ | 39,402 | | | $ | 62,676 | | | $ | 172,983 | |
| Liability Derivatives |
| Futures Contracts (a) | | Unrealized
depreciation on
futures contracts | | $ | (43,317 | ) | | $ | (38,481 | ) | | $ | (25,694 | ) | | $ | — | | | $ | (107,492 | ) |
| Forward Contracts (a) | | Unrealized
depreciation on
forward foreign currency contracts | | | — | | | | — | | | | — | | | | (80,288 | ) | | | (80,288 | ) |
| Total Value - Liabilities | | | | $ | (43,317 | ) | | $ | (38,481 | ) | | $ | (25,694 | ) | | $ | (80,288 | ) | | $ | (187,780 | ) |
| (a) | This amount represents the cumulative appreciation/(depreciation) of forward and futures contracts as reported in the Consolidated Portfolio of Investments. |
14
Campbell Dynamic Trend Fund
Notes To Consolidated Financial Statements (Continued)
February 28, 2018 (Unaudited)
The following table lists the amounts of realized gains/(losses) included in net increase/(decrease) in net assets resulting from operations during the current fiscal period, grouped by contract type and risk exposure.
| Derivative Type | | Consolidated Statement of Operations Location | | Commodity
Contracts | | | Equity
Contracts | | | Interest
Rate
Contracts | | | Foreign
Currency
Contracts | | | Total | |
| Realized Gain/(Loss) |
| Futures Contracts | | Net realized gain/
(loss) from futures contracts | | $ | 15,577 | | | $ | 302,721 | | | $ | 54,708 | | | $ | — | | | $ | 373,006 | |
| Forward Contracts | | Net realized gain/
(loss) from
forward foreign currency contracts | | | — | | | | — | | | | — | | | | (101,813 | ) | | | (101,813 | ) |
| Total Realized Gain/(Loss) | | $ | 15,577 | | | $ | 302,721 | | | $ | 54,708 | | | $ | (101,813 | ) | | $ | 271,193 | |
The following table lists the amounts of change in unrealized appreciation/(depreciation) included in net increase/(decrease) in net assets resulting from operations during the current fiscal period, grouped by contract type and risk exposure.
| Derivative Type | | Consolidated Statement of Operations Location | | Commodity
Contracts | | | Equity
Contracts | | | Interest
Rate
Contracts | | | Foreign
Currency
Contracts | | | Total | |
| Change in Unrealized Appreciation/(Depreciation) |
| Futures Contracts | | Net change in
unrealized
appreciation/ (depreciation) on
futures contracts | | $ | (49,109 | ) | | $ | (54,354 | ) | | $ | (4,509 | ) | | $ | — | | | $ | (107,972 | ) |
| Forward Contracts | | Net change in
unrealized
appreciation/ (depreciation) on forward foreign currency contracts | | | — | | | | — | | | | — | | | | (34,354 | ) | | | (34,354 | ) |
| Total Change in Unrealized Appreciation/(Depreciation) | | $ | (49,109 | ) | | $ | (54,354 | ) | | $ | (4,509 | ) | | $ | (34,354 | ) | | $ | (142,326 | ) |
During the current fiscal period, the Fund’s quarterly average volume of derivatives was as follows:
Long Futures
Notional
Amount | Short Futures
Notional
Amount | Forward Foreign Currency
Contracts — Payable
(Value at Trade Date) | Forward Foreign Currency
Contracts — Receivable
(Value at Trade Date) |
| $52,234,580 | $(13,227,255) | $(10,103,651) | $10,065,396 |
15
Campbell Dynamic Trend Fund
Notes To Consolidated Financial Statements (Continued)
February 28, 2018 (Unaudited)
For financial reporting purposes, the Fund does not offset fair value amounts recognized for derivative instruments and fair value amounts recognized for the right to reclaim cash collateral (receivables) or the obligation to return cash collateral (payables) arising from derivative instruments recognized at fair value executed with the same counterparty under a master netting arrangement.
The following is a summary of financial and derivative instruments that are subject to enforceable master netting agreements (or similar arrangements) and collateral received and pledged in connection with the master netting agreements (or similar arrangements).
| | | | | | Gross Amount Not Offset in Consolidated Statement of Assets and Liabilities | | | | | | | | | Gross Amount Not Offset in Consolidated Statement of Assets and Liabilities | | | | |
| Description | | Gross Amount Presented in the
Consolidated Statement of Assets and Liabilities | | | Financial
Instruments | | | Collateral
Received | | | Net
Amount(1) | | | Gross Amount Presented in the
Consolidated Statement of Assets and Liabilities | | | Financial
Instruments | | | Collateral
Pledged(2) | | | Net
Amount(3) | |
| | | Assets | | | Liabilities | |
| Forward Foreign Currency Contracts | | $ | 62,676 | | | $ | (62,676 | ) | | $ | — | | | $ | — | | | $ | 62,676 | | | $ | (80,288 | ) | | $ | — | | | $ | (17,612 | ) |
| (1) | Net amount represents the net amount receivable from the counterparty in the event of default. |
| (2) | Actual collateral pledged may be more than the amount shown. |
| (3) | Net amount represents the net amount payable to the counterparty in the event of default. |
Use of Estimates — The preparation of consolidated financial statements in conformity with U.S. GAAP requires management to make estimates and assumptions that affect the reported amounts of assets and liabilities and disclosure of contingent assets and liabilities at the date of the consolidated financial statements and the reported amounts of revenues and expenses during the reporting period. Actual results could differ from those estimates and those differences could be significant.
Investment Transactions, Investment Income and Expenses — The Fund records security transactions based on trade date for financial reporting purposes. The cost of investments sold is determined by use of the specific identification method for both financial reporting and income tax purposes in determining realized gains and losses on investments. Interest income is accrued when earned. Dividend income is recorded on the ex-dividend date. Distributions received on securities that represent a return of capital or capital gain are recorded as a reduction of cost of investments and/or as a realized gain. The Fund’s investment income, expenses (other than class specific expenses) and unrealized and realized gains and losses are allocated daily to each class of shares based upon the relative proportion of net assets of each class at the beginning of the day. Expenses incurred on behalf of a specific class, fund or fund family are charged directly to the class, fund or fund family (in proportion to net assets). Expenses incurred for all the RBB funds (such as director or professional fees) are charged to all funds in proportion to their average net assets of RBB, or in such other manner as the Board deems fair or equitable. Expenses and fees, including investment advisory and administration fees, are accrued daily and taken into account for the purpose of determining the NAV of the Fund.
Dividends and Distributions to Shareholders — Dividends from net investment income and distributions from net realized capital gains, if any, are declared and paid at least annually to shareholders recorded on the ex-dividend date. Income dividends and capital gain distributions are determined in accordance with U.S. federal income tax regulations, which may differ from U.S. GAAP.
16
Campbell Dynamic Trend Fund
Notes To Consolidated Financial Statements (Continued)
February 28, 2018 (Unaudited)
U.S. Tax Status — No provision is made for U.S. income taxes as it is the Fund’s intention to continue to qualify for and elect the tax treatment applicable to regulated investment companies under Subchapter M of the Internal Revenue Code of 1986, as amended, and make the requisite distributions to its shareholders which will be sufficient to relieve it from U.S. income and excise taxes.
For tax purposes, the Subsidiary is an exempted Cayman Islands investment company. The Subsidiary has received an undertaking from the Government of the Cayman Islands exempting it from all local income, profits and capital gains taxes. No such taxes are levied in the Cayman Islands at the present time. For U.S. income tax purposes, the Subsidiary is a Controlled Foreign Corporation and as such is not subject to U.S. income tax.
Foreign Currency Translation — Assets and liabilities initially expressed in non-U.S. currencies are translated into U.S. dollars based on the applicable exchange rates at the date of the last business day of the consolidated financial statement period. Purchases and sales of securities, interest income, dividends, variation margin received and expenses denominated in foreign currencies are translated into U.S. dollars at the exchange rates in effect on the transaction date.
The Fund does not separately report the effect of changes in foreign exchange rates from changes in market prices of securities held. Such changes are included with the net realized gain or loss and change in unrealized appreciation or depreciation on investments in the Consolidated Statement of Operations. Other foreign currency transactions resulting in realized and unrealized gain or loss are reported separately as net realized gain or loss and change in unrealized appreciation or depreciation on foreign currencies in the Consolidated Statement of Operations.
Currency Risk — Investment in foreign securities involves currency risk associated with securities that trade or are denominated in currencies other than the U.S. dollar and which may be affected by fluctuations in currency exchange rates. An increase in the strength of the U.S. dollar relative to a foreign currency may cause the U.S. dollar value of an investment in that country to decline. Foreign currencies also are subject to risks caused by inflation, interest rates, budget deficits and low savings rates, political factors and government controls. Forward foreign currency exchange contracts may limit potential gains from a favorable change in value between the U.S. dollar and foreign currencies. Unanticipated changes in currency pricing may result in poorer overall performance for the Fund than if it had not engaged in these contracts.
Commodity Sector Risk — Exposure to the commodities markets may subject the Fund to greater volatility than investments in traditional securities. The value of commodity-linked derivative instruments may be affected by changes in overall market movements, commodity index volatility, changes in interest rates, or factors affecting a particular industry or commodity, such as drought, floods, weather, livestock disease, embargoes, tariffs and international economic, political and regulatory developments. The prices of energy, industrial metals, precious metals, agriculture and livestock sector commodities may fluctuate widely due to factors such as changes in value, supply and demand and governmental regulatory policies. The commodity-linked securities in which the Fund invests may be issued by companies in the financial services sector, and events affecting the financial services sector may cause the Fund’s share value to fluctuate.
Foreign Securities Market Risk — A substantial portion of the trades of the Fund are expected to take place on markets or exchanges outside the United States. There is no limit to the amount of assets of the Fund that may be committed to trading on foreign markets. The risk of loss in trading foreign futures and options on futures contracts can be substantial. Participation in foreign futures and options on futures contracts involves the execution and clearing of trades on, or subject to the rules of, a foreign board of trade or exchange. Some of these foreign markets, in contrast to U.S. exchanges, are so-called principals’ markets in which performance is the responsibility only of the individual counterparty with whom the trader has entered into a commodity interest transaction and not of the exchange or clearing corporation. In these kinds of markets, there is risk of bankruptcy or other failure or refusal to perform by the counterparty.
17
Campbell Dynamic Trend Fund
Notes To Consolidated Financial Statements (Continued)
February 28, 2018 (Unaudited)
Counterparty Risk — The derivative contracts entered into by the Fund or its Subsidiary may be privately negotiated in the over-the-counter market. These contracts also involve exposure to credit risk, since contract performance depends in part on the financial condition of the counterparty. Relying on a counterparty exposes the Fund to the risk that a counterparty will not settle a transaction in accordance with its terms and conditions because of a dispute over the terms of the contract (whether or not bona fide) or because of a credit or liquidity problem, thus causing the Fund to suffer a loss. If a counterparty defaults on its payment obligations to the Fund, this default will cause the value of an investment in the Fund to decrease.
Credit Risk — Credit risk refers to the possibility that the issuer of the security or a counterparty in respect of a derivative instrument will not be able to satisfy its payment obligations to the Fund when due. Changes in an issuer’s credit rating or the market’s perception of an issuer’s creditworthiness may also affect the value of the Fund’s investment in that issuer. Securities rated in the four highest categories by the rating agencies are considered investment grade but they may also have some speculative characteristics. Investment grade ratings do not guarantee that bonds will not lose value or default. In addition, the credit quality of securities may be lowered if an issuer’s financial condition changes.
Futures Contracts — The Fund may use futures contracts in the normal course of pursuing its investment objective. Upon entering into a futures contract, the Fund must deposit initial margin in addition to segregating cash or liquid assets sufficient to meet its obligation to purchase or provide securities, or to pay the amount owed at the expiration of an index-based futures contract. Such liquid assets may consist of cash, cash equivalents, liquid debt or equity securities or other acceptable assets. Pursuant to the futures contract, the Fund agrees to receive from, or pay to the broker, an amount of cash equal to the daily fluctuation in value of the contract. Such a receipt of payment is known as “variation margin” and is recorded by the Fund as an unrealized gain or loss. When the contract is closed, the Fund records a realized gain or loss equal to the difference between the proceeds from (or cost of) the closing transactions and the Fund’s basis in the contract. Futures contracts have market risks, including the risk that the change in the value of the contract may not correlate with changes in the value of the underlying securities. Use of long futures contracts subjects the Fund to risk of loss in excess of the amount shown on the Consolidated Statement of Assets and Liabilities, up to the notional value of the futures contract. Use of short futures contracts subjects the Fund to unlimited risk of loss.
Forward Foreign Currency Contracts — The Fund uses forward foreign currency contracts (“forward contracts”) in the normal course of pursuing its investment objectives. These contracts are marked-to-market daily at the applicable translation rates. The Fund records realized gains or losses at the time the forward contract is closed. A forward contract is extinguished through a closing transaction or upon delivery of the currency or entering an offsetting contract. Risks may arise upon entering these contracts from the potential inability of a counterparty to meet the terms of their contracts and from unanticipated movements in the value of a foreign currency relative to the U.S. dollar or other currencies. The Fund’s maximum risk of loss from counterparty credit risk related to forward foreign currency contracts is the fair value of the contract. The risk may be mitigated to some extent if a master netting arrangement between the Fund and the counterparty is in place and to the extent the Fund obtains collateral to cover the Fund’s exposure to the counterparty.
Cash and Cash Equivalents — Cash and cash equivalents are valued at cost plus accrued interest, which approximates market value.
Other — In the normal course of business, the Fund may enter into contracts that provide general indemnifications. The Fund’s maximum exposure under these arrangements is dependent on claims that may be made against the Fund in the future, and, therefore, cannot be estimated; however, based on experience, the risk of material loss from such claims is considered remote.
18
Campbell Dynamic Trend Fund
Notes To Consolidated Financial Statements (Continued)
February 28, 2018 (Unaudited)
2. Investment Adviser and Other Services
Campbell & Company Investment Adviser LLC (“Campbell” or the “Adviser”) serves as the investment adviser to the Fund. The Adviser is a wholly-owned subsidiary of Campbell & Company, L.P. The Fund compensates the Adviser for its services at an annual rate based on the Fund’s average daily net assets (the “Advisory Fee”), payable on a monthly basis in arrears, as shown in the following table.
The Adviser has contractually agreed to waive advisory fees and/or reimburse expenses to the extent that total annual Fund operating expenses (excluding certain items discussed below) exceed the rate (“Expense Cap”) shown in the following table of the Fund’s average daily net assets. In determining the Adviser’s obligation to waive advisory fees and/or reimburse expenses, the following expenses are not taken into account and could cause total annual Fund operating expenses to exceed the Expense Cap as applicable: acquired fund fees and expenses, brokerage commissions, extraordinary expenses, interest and taxes. This contractual limitation is in effect until December 31, 2018 and may not be terminated without the approval of the Board. The Adviser may discontinue these arrangements at any time after December 31, 2018.
| Advisory Fee | Expense Cap |
| 1.05% | 1.25% |
During the current fiscal period, investment advisory fees accrued and waived were as follows:
Gross
Advisory Fees | Waivers | Net
Advisory Fees |
| $48,330 | $(81,478) | $(33,148) |
If at any time the Fund’s total annual Fund operating expenses for a year are less than the Expense cap, the Adviser is entitled to reimbursement by the Fund of the advisory fees forgone and other payments remitted by the Adviser to the Fund within three years from the date on which such waiver or reimbursement was made, provided such reimbursement does not cause the Fund to exceed the Expense cap that was in effect at the time of the waiver or reimbursement.
As of the end of the reporting period, the Fund had amounts available for recoupment as follows:
| Expiration |
August 31,
2019 | August 31,
2020 | August 31,
2021 | Total |
| $265,599 | $199,666 | $81,478 | $546,743 |
U.S. Bancorp Fund Services, LLC (“USBFS”) serves as administrator for the Fund. For providing administrative and accounting services, USBFS is entitled to receive a monthly fee, subject to certain minimum and out of pocket expenses.
USBFS serves as the Fund’s transfer and dividend disbursing agent. For providing transfer agent services, USBFS is entitled to receive a monthly fee, subject to certain minimum and out of pocket expenses.
U.S. Bank, N.A. (the “Custodian”) provides certain custodial services to the Fund. The Custodian is entitled to receive a monthly fee, subject to certain minimum and out of pocket expenses.
Quasar Distributors, LLC serves as the principal underwriter and distributor of the Fund’s shares pursuant to a Distribution Agreement with RBB.
For compensation amounts payable to USBFS, please refer to the Consolidated Statement of Operations.
19
Campbell Dynamic Trend Fund
Notes To Consolidated Financial Statements (Continued)
February 28, 2018 (Unaudited)
3. Director’s and Officer’s Compensation
The Directors of the Company receive an annual retainer and meeting fees for meetings attended. Employees of Vigilant Compliance, LLC serve as President, Chief Compliance Officer and Assistant Treasurer of the Company. Vigilant Compliance, LLC is compensated for the services provided to the Company. An employee of RBB serves as Treasurer and Secretary and is compensated for services provided. Certain employees of USBFS serve as officers of the Company. They are not compensated by the Fund or the Company. For Director’s and Officer’s compensation amounts, please refer to the Consolidated Statement of Operations.
4. Purchases and Sales of Investment Securities
During the current fiscal period, aggregate purchases and sales of investment securities (excluding short-term investments and derivative transactions) of the Fund were as follows:
There were no purchases or sales of long-term U.S. Government securities during the current fiscal period.
5. Federal Income Tax Information
The Fund has followed the authoritative guidance on accounting for and disclosure of uncertainty in tax positions, which requires the Fund to determine whether a tax position is more likely than not to be sustained upon examination, including resolution of any related appeals or litigation processes, based on the technical merits of the position. The Fund has determined that there was no effect on the consolidated financial statements from following this authoritative guidance. In the normal course of business, the Fund is subject to examination by federal, state and local jurisdictions, where applicable, for tax years for which applicable statutes of limitations have not expired. The Fund is not aware of any tax positions for which it is reasonably possible that the total amounts of unrecognized tax benefits will significantly change in the next twelve months.
As of August 31, 2017, the federal tax cost and aggregate gross unrealized appreciation and depreciation of investments held by the Fund were as follows:
Federal Tax
Cost | Unrealized
Appreciation | Unrealized
(Depreciation) | Net
Unrealized
Appreciation/
(Depreciation) |
| $8,213,142 | $2,768 | $(314,246) | $(311,478) |
Distributions to shareholders, if any, from net investment income and realized gains are determined in accordance with federal income tax regulations, which may differ from net investment income and realized gains recognized for financial reporting purposes. Accordingly, the character of distributions and composition of net assets for tax purposes may differ from those reflected in the accompanying consolidated financial statements. To the extent these differences are permanent, such amounts are reclassified within the capital accounts based on the tax treatment; temporary differences do not require such reclassification.
20
Campbell Dynamic Trend Fund
Notes To Consolidated Financial Statements (Concluded)
February 28, 2018 (Unaudited)
The following permanent differences as of August 31, 2017, primarily attributable to disallowed expenses, short-term realized gains being offset with current net operating loss, investments in wholly-owned controlled foreign corporation and reclassifications for treatment of certain foreign currency transactions were reclassified among the following accounts:
UNDISTRIBUTED
NET INVESTMENT
INCOME/(Loss) | ACCUMULATED
NET REALIZED
GAIN/(Loss) | PAID-IN
CAPITAL |
| $107,162 | $329,907 | $(437,069) |
As of August 31, 2017, the components of distributable earnings on a tax basis were as follows:
Undistributed
Ordinary
Income | Undistributed Long-Term
Capital Gains | Unrealized Appreciation/ (Depreciation) | Qualified
Late-Year
Losses | Capital Loss
Carryforwards | Other
Temporary Differences |
| $159,559 | $— | $34,121 | $— | $— | $— |
The differences between the book and tax basis components of distributable earnings relate principally to the timing of recognition of income and gains of the Subsidiary for federal income tax purposes. Short-term and foreign currency gains are reported as ordinary income for federal income tax purposes.
The tax character of dividends and distributions paid during the fiscal year ended August 31, 2017, were as follows:
Ordinary
Income | Long-Term
Gains | Total |
| $ — | $ — | $ — |
Pursuant to federal income tax rules applicable to regulated investment companies, the Fund may elect to treat certain capital losses between November 1 and August 31 and late year ordinary losses ((i) ordinary losses between January 1 and August 31, and (ii) specified ordinary and currency losses between November 1 and August 31) as occurring on the first day of the following tax year. For the fiscal year ended August 31, 2017, any amount of losses elected within the tax return will not be recognized for federal income tax purposes until September 1, 2017.
Under the Regulated Investment Company Modernization Act of 2010, the Fund is permitted to carry forward capital losses for an unlimited period. Additionally, capital losses that are carried forward will retain their character as either short-term or long-term capital losses rather than being considered all short-term as under the previous law. As of August 31, 2017, the Fund had no tax basis capital loss carryovers to offset future capital gains.
6. Subsequent Events
Management has evaluated the impact of all subsequent events on the Fund through the date the consolidated financial statements were issued and has determined that there were no significant events requiring recognition or disclosure in the consolidated financial statements.
21
Campbell Dynamic Trend Fund
Other Information
(Unaudited)
Proxy Voting
Policies and procedures that the Fund uses to determine how to vote proxies relating to portfolio securities as well as information regarding how the Fund voted proxies relating to portfolio securities for the most recent twelve-month period ended June 30 are available without charge, upon request, by calling (844) 261-6488 and on the Securities and Exchange Commission’s (“SEC”) website at http://www.sec.gov.
Quarterly Portfolio Schedules
The Company files a complete schedule of portfolio holdings with the SEC for the first and third fiscal quarters of each fiscal year (quarters ended November 30 and May 31) on Form N-Q. The Company’s Form N-Q is available on the SEC website at http://www.sec.gov and may be reviewed and copied at the SEC Public Reference Room in Washington, D.C. Information on the operation of the SEC Public Reference Room may be obtained by calling (800) SEC-0330.
22
[THIS PAGE INTENTIONALLY LEFT BLANK]
[THIS PAGE INTENTIONALLY LEFT BLANK]
Investment Adviser
Campbell & Company Investment Adviser LLC
2850 Quarry Lake Drive
Baltimore, Maryland 21209
Administrator and Transfer Agent
U.S. Bancorp Fund Services, LLC
P.O. Box 701
Milwaukee, WI 53201
Principal Underwriter
Quasar Distributors, LLC
777 East Wisconsin Avenue, Floor 6
Milwaukee, WI 53202
Custodian
U.S. Bank, N.A.
1555 North Rivercenter Drive, Suite 302
Milwaukee, WI 53212
Independent Registered Public Accounting Firm
Ernst & Young LLP
One Commerce Square
2005 Market Street, Suite 700
Philadelphia, PA 19103
Legal Counsel
Drinker Biddle & Reath LLP
One Logan Square, Suite 2000
Philadelphia, PA 19103-6996
CADT-SAR18

Campbell Multi-Asset Carry Fund
of
THE RBB FUND, INC.
Semi-Annual Report
February 28 2018
(Unaudited)
This report is submitted for the general information of the shareholders of the Fund. It is not authorized for distribution unless preceded or accompanied by a current prospectus for the Fund.
Campbell Multi-Asset Carry Fund
Performance Data
February 28, 2018 (Unaudited)
| Average Annual Total Returns for the Periods Ended February 28, 2018 |
| | Six
Months* | One
Year | Since
Inception** | |
| Campbell Multi-Asset Carry Fund | -8.08% | -7.75% | -5.36% | |
| Barclay BTOP50 Index*** | -0.91% | -2.44% | -4.13% | |
| ** | Inception date of the Fund is December 21, 2015. |
| *** | Benchmark performance is from inception date of the Fund only and is not the inception date of the benchmark itself. |
Performance data quoted is past performance and does not guarantee future results. Investment return and principal value will fluctuate so that shares, when redeemed, may be worth more or less than their original cost. Current performance may be lower or higher than the returns quoted above. Returns shown do not reflect taxes that a shareholder would pay on Fund distributions or on the redemption of Fund shares. Call the Fund at 1-844-261-6488 for returns current to the most recent month-end.
The performance data quoted reflects fee waivers in effect and would have been less in their absence. The Fund’s total annual operating expense ratio, as stated in the current prospectus dated December 31, 2017, is 2.36% and the Fund’s net operating expense ratio is 1.28%. Campbell & Company Investment Adviser LLC has contractually agreed to waive its advisory fee and/or reimburse expenses in order to limit total annual Fund operating expenses (excluding acquired fund fees and expenses, brokerage commissions, extraordinary items, interest or taxes) to 1.25% of the Fund’s average daily net assets. This contractual limitation is in effect until December 31, 2018 and may not be terminated without the approval of the Board of Directors of The RBB Fund, Inc. Please see the Consolidated Financial Highlights for current figures.
An investment in the Fund is speculative and involves substantial risk. The Fund is not suitable for all investors. It is possible that an investor may lose some or all of its investment. The Fund invests in long and short positions in futures, forwards and spot contracts, each of which may be tied to commodities, financial indices and instruments, foreign currencies, or equity indices. The Fund also invests in investment grade fixed income securities of all durations and maturities. The Fund may be more volatile than investments in traditional securities. Losses on futures and other derivatives can be caused by unanticipated market movements and may be potentially unlimited. Commodities, currencies, foreign investments, and interest rate-linked instruments each entail special risks. The Fund is non-diversified; therefore gains or losses on a single holding may have a relatively great impact on the Fund. A more complete description of the Fund’s risks can be found in its prospectus, which should be read carefully before investing.
The Fund intends to elect to be treated and to qualify each year, as a regulated investment company (“RIC”) under the U.S. Internal Revenue Code (“Code”). To maintain qualification for federal income tax purposes as a RIC under the Code, the Fund must meet certain source-of-income, asset diversification and distribution of its income requirements. If the Fund were to fail to qualify as a RIC and became subject to federal income tax, shareholders of the Fund would be subject to diminished returns.
The Barclay BTOP50 Index (“BTOP50”) seeks to replicate the overall composition of the managed futures industry with regard to trading style and overall market exposure. The BTOP50 employs a top-down approach in selecting its constituents. The largest investable trading adviser programs, as measured by assets under management, are selected for inclusion in the BTOP50. The index portfolio is equally weighted among the selected programs at the beginning of each calendar year and rebalanced annually. It is impossible to invest directly in an index.
Portfolio composition is subject to change.
1
Campbell Multi-Asset Carry Fund
Fund Expense Examples
February 28, 2018 (Unaudited)
As a shareholder of the Fund, you incur two types of costs: (1) transaction costs and (2) ongoing costs, including management fees and other Fund expenses. This example is intended to help you understand your ongoing costs (in dollars) of investing in the Fund and to compare these costs with the ongoing costs of investing in other mutual funds.
This example is based on an investment of $1,000 invested at the beginning of the six-month period from September 1, 2017 through February 28, 2018, and held for the entire period.
ACTUAL EXPENSES
The first line of the accompanying table provides information about actual account values and actual expenses. You may use the information in this line, together with the amount you invested, to estimate the expenses that you paid over the period. Simply divide your account value by $1,000 (for example, an $8,600 account value divided by $1,000 = 8.6), then multiply the result by the number in the first line under the heading entitled “Expenses Paid During Period” to estimate the expenses you paid on your account during this period.
HYPOTHETICAL EXAMPLE FOR COMPARISON PURPOSES
The second line of the accompanying table provides information about hypothetical account values and hypothetical expenses based on the Fund’s actual expense ratio and an assumed rate of return of 5% per year before expenses, which is not the Fund’s actual return. The hypothetical account values and expenses may not be used to estimate the actual ending account balance or expenses you paid for the period. You may use this information to compare the ongoing costs of investing in the Fund and other funds. To do so, compare this 5% hypothetical example with the 5% hypothetical examples that appear in the shareholder reports of other funds.
Please note that the expenses shown in the accompanying table are meant to highlight your ongoing costs only and do not reflect any transactional costs. Therefore, the second line of the accompanying table is useful in comparing ongoing costs only, and will not help you determine the relative total costs of owning different funds. In addition, if these transactional costs were included, your costs would have been higher.
| | Beginning
Account Value
September 1, 2017 | Ending
Account Value
February 28, 2018 | Expenses Paid
During Period* |
| Actual | $1,000.00 | $ 919.20 | $5.95 |
Hypothetical
(5% return before expenses) | 1,000.00 | 1,018.60 | 6.26 |
| * | Expenses are equal to an annualized six-month expense ratio for the period September 1, 2017 to February 28, 2018 of 1.25%, which includes waived fees or reimbursed expenses (including interest expense, if any), multiplied by the average account value over the period, multiplied by the number of days (181) in the recent fiscal half-year then divided by 365 days to reflect the one-half year period. The Fund’s ending account value on the first line in the table is based on the actual six-month total investment return for the Fund of -8.08%. |
2
Campbell Multi-Asset Carry Fund
Consolidated Portfolio Holdings Summary Table
February 28, 2018 (Unaudited)
The following table presents a consolidated summary of the portfolio holdings of the Fund at February 28, 2018:
| | | % of Net
Assets | | | Value | |
| SHORT-TERM INVESTMENTS: | | | | | | |
| U.S. Treasury Obligations | | | 81.3 | % | | $ | 10,834,954 | |
| OTHER ASSETS IN EXCESS OF LIABILITIES (including futures and forward foreign currency contracts) | | | 18.7 | | | | 2,488,834 | |
| NET ASSETS | | | 100.0 | % | | $ | 13,323,788 | |
Portfolio holdings are subject to change at any time.
Refer to the Consolidated Portfolio of Investments for a detailed listing of the Fund’s holdings.
The accompanying notes are an integral part of the consolidated financial statements.
3
Campbell Multi-Asset Carry Fund
Consolidated Portfolio of Investments
February 28, 2018 (Unaudited)
| | | Coupon* | | MATURITY
DATE | | Par | | | Value | |
| Short-Term Investments — 81.3% | | | | | | | | | | |
| U.S. Treasury Obligations — 81.3% | | | | | | | | | | |
| United States Treasury Bill | | 1.048% | | 03/29/18 | | $ | 1,605,000 | | | $ | 1,603,162 | |
| United States Treasury Bill | | 1.269% | | 04/26/18 | | | 825,000 | | | | 823,047 | |
| United States Treasury Bill | | 1.400% | | 05/24/18 | | | 3,825,000 | | | | 3,810,787 | |
| United States Treasury Bill | | 1.469% | | 06/21/18 | | | 1,525,000 | | | | 1,517,243 | |
| United States Treasury Bill | | 1.569% | | 07/19/18 | | | 1,525,000 | | | | 1,514,581 | |
| United States Treasury Bill | | 1.795% | | 08/23/18 | | | 1,580,000 | | | | 1,566,134 | |
| | | | | | | | | | | | 10,834,954 | |
| TOTAL SHORT-TERM INVESTMENTS | | | | | | | | | | | | |
| (Cost $10,840,372) | | | | | | | | | | | 10,834,954 | |
| | | | | | | | | | | | | |
| Total Investments — 81.3% | | | | | | | | | | | | |
| (Cost $10,840,372) | | | | | | | | | | | 10,834,954 | |
| | | | | | | | | | | | | |
| Other Assets in Excess of Liabilities — 18.7% | | | | | | | | | | | 2,488,834 | |
| Net Assets — 100.0% | | | | | | | | | | $ | 13,323,788 | |
| * | Short-term investments reflect the annualized effective yield on the date of purchase for discounted investments. |
The accompanying notes are an integral part of the consolidated financial statements.
4
Campbell Multi-Asset Carry Fund
Consolidated Portfolio of Investments (Continued)
February 28, 2018 (Unaudited)
Futures contracts outstanding as of February 28, 2018 were as follows:
| Long Contracts | | Expiration
Date | | Number of
Contracts | | Notional
Amount | | | Value and
Unrealized Appreciation/ (Depreciation) | |
| 3-Month Euro Euribor | | Mar-19 | | 76 | | $ | 23,180,060 | | | $ | 146 | |
| 90-Day Euro | | Mar-19 | | 222 | | | 55,500,000 | | | | (138,606 | ) |
| 90-Day Sterling | | Mar-19 | | 90 | | | 15,487,974 | | | | (22,638 | ) |
| Amsterdam Index | | Mar-18 | | 1 | | | 130,626 | | | | 3,524 | |
| Australian 10-Year Bond | | Mar-18 | | 1 | | | 77,670 | | | | 581 | |
| Australian 3-Year Bond | | Mar-18 | | 104 | | | 8,077,670 | | | | (12,159 | ) |
| Bank Acceptance | | Mar-18 | | 21 | | | 4,091,334 | | | | (2,459 | ) |
| Brent Crude | | May-18 | | 13 | | | 841,490 | | | | (15,842 | ) |
| CAC40 10 Euro | | Mar-18 | | 1 | | | 64,892 | | | | 2,268 | |
| Canadian 10-Year Bond | | Jun-18 | | 1 | | | 77,930 | | | | 590 | |
| Cotton No.2 | | May-18 | | 14 | | | 580,510 | | | | 16,638 | |
| Euro Stoxx 50 | | Mar-18 | | 5 | | | 209,719 | | | | (6,692 | ) |
| Euro-Bobl | | Mar-18 | | 94 | | | 11,468,030 | | | | (23,894 | ) |
| Euro-Bund | | Mar-18 | | 3 | | | 366,001 | | | | 4,913 | |
| Euro-Schatz | | Mar-18 | | 124 | | | 15,128,039 | | | | 8,513 | |
| FTSE 100 Index | | Mar-18 | | 11 | | | 1,094,291 | | | | (23,239 | ) |
| Gasoline RBOB | | Apr-18 | | 3 | | | 242,500 | | | | (8,197 | ) |
| Hang Seng Index | | Mar-18 | | 1 | | | 196,348 | | | | (3,268 | ) |
| IBEX 35 Index | | Mar-18 | | 13 | | | 1,559,740 | | | | 17,291 | |
| JPN 10-Year Bond (Osaka Securities Exchange) | | Mar-18 | | 3 | | | 2,811,753 | | | | 3,501 | |
| London Metals Exchange Aluminum | | Mar-18 | | 17 | | | 905,038 | | | | (19,823 | ) |
| London Metals Exchange Copper | | Mar-18 | | 1 | | | 172,588 | | | | (5,240 | ) |
| London Metals Exchange Nickel | | Mar-18 | | 2 | | | 165,030 | | | | 3,504 | |
| London Metals Exchange Nickel | | Jun-18 | | 1 | | | 82,830 | | | | (2,163 | ) |
| London Metals Exchange Zinc | | Mar-18 | | 7 | | | 605,500 | | | | 51,408 | |
| London Metals Exchange Zinc | | Jun-18 | | 9 | | | 775,463 | | | | (12,584 | ) |
| MSCI Taiwan Index | | Mar-18 | | 9 | | | 358,290 | | | | (422 | ) |
| Natural Gas | | Apr-18 | | 1 | | | 26,700 | | | | (122 | ) |
| OMX Stockholm 30 Index | | Mar-18 | | 14 | | | 265,605 | | | | 6,147 | |
| Soybean | | May-18 | | 27 | | | 1,424,925 | | | | 18,423 | |
| Soybean Meal | | May-18 | | 14 | | | 552,580 | | | | 48,800 | |
| SPI 200 Index | | Mar-18 | | 10 | | | 1,165,243 | | | | 1,711 | |
| U.S. Treasury 10-Year Notes | | Jun-18 | | 1 | | | 97,709 | | | | 241 | |
| U.S. Treasury 2-Year Notes | | Jun-18 | | 160 | | | 31,418,179 | | | | (9,042 | ) |
| U.S. Treasury 5-Year Notes | | Jun-18 | | 1 | | | 95,792 | | | | 22 | |
| WTI Crude | | Apr-18 | | 21 | | | 1,294,440 | | | | (26,611 | ) |
| | | | | | | | | | | $ | (144,780 | ) |
| Short Contracts | | Expiration
Date | | Number of
Contracts | | Notional
Amount | | | Value and
Unrealized Appreciation/ (Depreciation) | |
| Coffee | | May-18 | | 16 | | $ | (732,000 | ) | | $ | 289 | |
| Copper | | May-18 | | 8 | | | (626,500 | ) | | | 16,856 | |
| Corn | | May-18 | | 71 | | | (1,356,100 | ) | | | (32,041 | ) |
| Gold 100 Oz | | Apr-18 | | 14 | | | (1,845,060 | ) | | | 37,586 | |
| Kansas City Hard Red Winter Wheat | | May-18 | | 14 | | | (365,575 | ) | | | (20,478 | ) |
The accompanying notes are an integral part of the consolidated financial statements.
5
Campbell Multi-Asset Carry Fund
Consolidated Portfolio of Investments (Concluded)
February 28, 2018 (Unaudited)
| Short Contracts | | Expiration Date | | Number of Contracts | | Notional
Amount | | | Value and
Unrealized Appreciation/ (Depreciation) | |
| London Metals Exchange Aluminum | | Mar-18 | | 17 | | $ | (905,038 | ) | | $ | (46,904 | ) |
| London Metals Exchange Aluminum | | Jun-18 | | 1 | | | (53,363 | ) | | | 1,654 | |
| London Metals Exchange Copper | | Mar-18 | | 1 | | | (172,588 | ) | | | (8,150 | ) |
| London Metals Exchange Copper | | Jun-18 | | 1 | | | (173,575 | ) | | | 5,279 | |
| London Metals Exchange Nickel | | Mar-18 | | 2 | | | (165,030 | ) | | | (35,100 | ) |
| London Metals Exchange Nickel | | Jun-18 | | 2 | | | (165,660 | ) | | | (3,486 | ) |
| London Metals Exchange Zinc | | Mar-18 | | 7 | | | (605,500 | ) | | | 4,309 | |
| Nasdaq 100 E-Mini | | Mar-18 | | 6 | | | (823,800 | ) | | | (29,622 | ) |
| S&P 500 E-Mini | | Mar-18 | | 3 | | | (407,160 | ) | | | 3,359 | |
| Silver | | May-18 | | 8 | | | (656,300 | ) | | | 9,271 | |
| Soybean Oil | | May-18 | | 17 | | | (328,746 | ) | | | 6,827 | |
| Sugar No. 11 (World) | | May-18 | | 44 | | | (659,366 | ) | | | 8,368 | |
| Wheat | | May-18 | | 26 | | | (643,500 | ) | | | (35,737 | ) |
| | | | | | | | | | | $ | (117,720 | ) |
| Total Futures Contracts | | | | | | | | | | $ | (262,500 | ) |
Forward foreign currency contracts outstanding as of February 28, 2018 were as follows:
| Currency Purchased | | Currency Sold | | Expiration
Date | | Counterparty | | Unrealized Appreciation/ (Depreciation) | |
| AUD | | | 2,350,000 | | | USD | | | 1,790,948 | | | Mar 21 2018 | | UBS | | $ | 34,338 | |
| CAD | | | 1,300,000 | | | USD | | | 1,035,863 | | | Mar 21 2018 | | UBS | | | (22,345 | ) |
| CHF | | | 150,000 | | | USD | | | 161,080 | | | Mar 21 2018 | | UBS | | | (1,938 | ) |
| EUR | | | 1,650,000 | | | USD | | | 2,002,339 | | | Mar 21 2018 | | UBS | | | 14,058 | |
| JPY | | | 472,500,000 | | | USD | | | 4,306,857 | | | Mar 22 2018 | | UBS | | | 128,838 | |
| NOK | | | 8,550,000 | | | USD | | | 1,090,721 | | | Mar 21 2018 | | UBS | | | (7,278 | ) |
| NZD | | | 3,750,000 | | | USD | | | 2,665,848 | | | Mar 21 2018 | | UBS | | | 38,095 | |
| SEK | | | 8,700,000 | | | USD | | | 1,046,132 | | | Mar 21 2018 | | UBS | | | 5,485 | |
| USD | | | 1,807,316 | | | AUD | | | 2,300,000 | | | Mar 21 2018 | | UBS | | | 20,866 | |
| USD | | | 1,345,316 | | | CAD | | | 1,700,000 | | | Mar 21 2018 | | UBS | | | 19,946 | |
| USD | | | 1,226,253 | | | CHF | | | 1,150,000 | | | Mar 21 2018 | | UBS | | | 6,168 | |
| USD | | | 4,733,175 | | | EUR | | | 3,900,000 | | | Mar 21 2018 | | UBS | | | (32,854 | ) |
| USD | | | 67,156 | | | GBP | | | 50,000 | | | Mar 21 2018 | | UBS | | | (1,749 | ) |
| USD | | | 7,968,875 | | | JPY | | | 880,500,000 | | | Mar 22 2018 | | UBS | | | (297,009 | ) |
| USD | | | 1,284,007 | | | NOK | | | 10,500,000 | | | Mar 21 2018 | | UBS | | | (46,537 | ) |
| USD | | | 1,044,828 | | | NZD | | | 1,450,000 | | | Mar 21 2018 | | UBS | | | (697 | ) |
| USD | | | 1,449,317 | | | SEK | | | 12,000,000 | | | Mar 21 2018 | | UBS | | | (1,189 | ) |
| Total Forward Foreign Currency Contracts | | | | | | | | $ | (143,802 | ) |
| AUD | Australian Dollar | | JPY | Japanese Yen |
| CAD | Canadian Dollar | | NOK | Norwegian Krone |
| CHF | Swiss Franc | | NZD | New Zealand Dollar |
| EUR | Euro | | SEK | Swedish Krona |
| GBP | British Pound | | USD | United States Dollar |
The accompanying notes are an integral part of the consolidated financial statements.
6
Campbell Multi-Asset Carry Fund
Consolidated Statement of Assets and Liabilities
February 28, 2018 (Unaudited)
| ASSETS | | | |
| Investments, at value (cost $10,840,372) | | $ | 10,834,954 | |
| Cash | | | 878,090 | |
| Deposits with broker for: | | | | |
| Forward foreign currency contracts | | | 625,000 | |
| Futures contracts | | | 1,413,850 | |
| Receivables for: | | | | |
| Due from advisor | | | 4,331 | |
| Unrealized appreciation on futures contracts | | | 282,019 | |
| Unrealized appreciation on forward foreign currency contracts | | | 267,794 | |
| Prepaid expenses and other assets | | | 21,980 | |
| Total assets | | | 14,328,018 | |
| LIABILITIES | | | | |
| Payables for: | | | | |
| Administration and accounting fees | | | 7,305 | |
| Transfer agent fees | | | 1,178 | |
| Custodian fees | | | 547 | |
| Unrealized depreciation on futures contracts | | | 544,519 | |
| Unrealized depreciation on forward foreign currency contracts | | | 411,596 | |
| Other accrued expenses and liabilities | | | 39,085 | |
| Total liabilities | | | 1,004,230 | |
| Net assets | | $ | 13,323,788 | |
| | | | | |
| NET ASSETS CONSIST OF: | | | | |
| Par value | | $ | 1,714 | |
| Paid-in capital | | | 14,450,984 | |
| Accumulated net investment income/(loss) | | | 327,832 | |
| Accumulated net realized gain/(loss) from futures contracts, foreign currency transactions and forward foreign currency contracts | | | (1,045,410 | ) |
| Net unrealized appreciation/(depreciation) on investments, futures contracts, foreign currency translation and forward foreign currency contracts | | | (411,332 | ) |
| Net assets | | $ | 13,323,788 | |
| CAPITAL SHARES: | | | | |
| Shares outstanding ($0.001 par value, 100,000,000 shares authorized) | | | 1,713,897 | |
| Net asset value, offering and redemption price per share | | $ | 7.77 | |
The accompanying notes are an integral part of the consolidated financial statements.
7
Campbell Multi-Asset Carry Fund
Consolidated Statement of Operations
For The Six Months Ended
February 28, 2018 (Unaudited)
| INVESTMENT INCOME | | | |
| Interest | | $ | 63,538 | |
| Total investment income | | | 63,538 | |
| EXPENSES | | | | |
| Advisory fees (Note 2) | | | 74,890 | |
| Audit and tax service fees | | | 27,666 | |
| Administration and accounting fees (Note 2) | | | 26,183 | |
| Legal fees | | | 14,753 | |
| Registration and filing fees | | | 10,879 | |
| Officers fees | | | 9,711 | |
| Directors fees | | | 7,941 | |
| Printing and shareholder reporting fees | | | 4,299 | |
| Transfer agent fees (Note 2) | | | 2,784 | |
| Custodian fees (Note 2) | | | 1,290 | |
| Other expenses | | | 6,624 | |
| Total expenses before waivers and reimbursements | | | 187,020 | |
| Less: waivers and reimbursements (Note 2) | | | (97,611 | ) |
| Net expenses after waivers and reimbursements | | | 89,409 | |
| Net investment income/(loss) | | | (25,871 | ) |
| NET REALIZED AND UNREALIZED GAIN/(LOSS) FROM INVESTMENTS | | | | |
| Net realized gain/(loss) from: | | | | |
| Investments | | | (177 | ) |
| Futures contracts | | | (729,424 | ) |
| Foreign currency transactions | | | 6,221 | |
| Forward foreign currency contracts | | | (238,212 | ) |
| Net change in unrealized appreciation/(depreciation) on: | | | | |
| Investments | | | (5,742 | ) |
| Futures contracts | | | (404,117 | ) |
| Foreign currency translation | | | 732 | |
| Forward foreign currency contracts | | | 220,751 | |
| Net realized and unrealized gain/(loss) from investments | | | (1,149,968 | ) |
| NET INCREASE/(DECREASE) IN NET ASSETS RESULTING FROM OPERATIONS | | $ | (1,175,839 | ) |
The accompanying notes are an integral part of the consolidated financial statements.
8
Campbell Multi-Asset Carry Fund
Consolidated Statements of Changes in Net Assets
| | | For the
Six Months Ended
February 28, 2018
(Unaudited) | | | For the
Year Ended
August 31, 2017 | |
| INCREASE/(DECREASE) IN NET ASSETS FROM OPERATIONS: | | | | | | |
| Net investment income/(loss) | | $ | (25,871 | ) | | $ | (126,474 | ) |
| Net realized gain/(loss) from investments, futures contracts, foreign currency transactions and forward foreign currency contracts | | | (961,592 | ) | | | (704,471 | ) |
| Net change in unrealized appreciation/(depreciation) on investments, futures contracts, foreign currency translation and forward foreign currency contracts | | | (188,376 | ) | | | (517,389 | ) |
| Net increase/(decrease) in net assets resulting from operations | | | (1,175,839 | ) | | | (1,348,334 | ) |
| | | | | | | | | |
| DIVIDENDS AND DISTRIBUTIONS TO SHAREHOLDERS FROM: | | | | | | | | |
| Net investment income | | | (10,850 | ) | | | (68,163 | ) |
| Net realized capital gains | | | (106,038 | ) | | | (1,658,102 | ) |
| Net decrease in net assets from dividends and distributions to shareholders | | | (116,888 | ) | | | (1,726,265 | ) |
| | | | | | | | | |
| CAPITAL SHARE TRANSACTIONS: | | | | | | | | |
| Proceeds from reinvestment of distributions | | | 116,888 | | | | 1,726,265 | |
| Net increase/(decrease) in net assets from capital share transactions | | | 116,888 | | | | 1,726,265 | |
| Total increase/(decrease) in net assets | | | (1,175,839 | ) | | | (1,348,334 | ) |
| | | | | | | | | |
| NET ASSETS: | | | | | | | | |
| Beginning of period | | | 14,499,627 | | | | 15,847,961 | |
| End of period | | $ | 13,323,788 | | | $ | 14,499,627 | |
| Accumulated net investment income/(loss), end of period | | $ | 327,832 | | | $ | 364,553 | |
| | | | | | | | | |
| SHARE TRANSACTIONS: | | | | | | | | |
| Shares reinvested | | | 13,482 | | | | 197,966 | |
| Net increase/(decrease) in shares outstanding | | | 13,482 | | | | 197,966 | |
The accompanying notes are an integral part of the consolidated financial statements.
9
Campbell Multi-Asset Carry Fund
Consolidated Financial Highlights
| Contained below is per share operating performance data for shares outstanding, total investment return, ratios to average net assets and other supplemental data for the respective periods. This information has been derived from information provided in the consolidated financial statements. |
| | | For the
Six Months Ended February 28, 2018 (Unaudited) | | | For the
Year Ended
August 31, 2017 | | | For the
Period Ended
August 31, 2016(1) | |
| Per Share Operating Performance | | | | | | | | | |
| Net asset value, beginning of period | | $ | 8.53 | | | $ | 10.55 | | | $ | 10.00 | |
| Net investment income/(loss) (2) | | | (0.02 | ) | | | (0.08 | ) | | | (0.08 | ) |
Net realized and unrealized gain/(loss) from
investments | | | (0.67 | ) | | | (0.79 | ) | | | 0.63 | |
| Net increase/(decrease) in net assets resulting from operations | | | (0.69 | ) | | | (0.87 | ) | | | 0.55 | |
| Dividends and distributions to shareholders from: | | | | | | | | | | | | |
| Net investment income | | | (0.01 | ) | | | (0.05 | ) | | | — | |
| Net realized capital gain | | | (0.06 | ) | | | (1.10 | ) | | | — | |
| Total dividends and distributions to shareholders | | | (0.07 | ) | | | (1.15 | ) | | | — | |
| Net asset value, end of period | | $ | 7.77 | | | $ | 8.53 | | | $ | 10.55 | |
| Total investment return (3) | | | (8.08 | )%(6) | | | (8.60 | )% | | | 5.50 | %(6) |
| Ratios/Supplemental Data | | | | | | | | | | | | |
| Net assets, end of period (000's) | | $ | 13,324 | | | $ | 14,500 | | | $ | 15,848 | |
Ratio of expenses to average net assets
with waivers and reimbursements | | | 1.25 | %(5) | | | 1.28 | %(4) | | | 1.25 | %(5) |
Ratio of expenses to average net assets
without waivers and reimbursements | | | 2.62 | %(5) | | | 2.36 | % | | | 3.29 | %(5) |
Ratio of net investment income/(loss) to
average net assets | | | (0.36 | )%(5) | | | (0.85 | )% | | | (1.09 | )%(5) |
| Portfolio turnover rate | | | 0.00 | %(6) | | | 0.00 | % | | | 0.00 | %(6) |
| (1) | The Fund commenced investment operations on December 21, 2015. |
| (2) | Calculated based on average shares outstanding for the period. |
| (3) | Total investment return is calculated assuming a purchase of shares on the first day and a sale of shares on the last day of each period reported and includes reinvestments of dividends and distributions, if any. |
| (4) | Expense ratio includes interest expense. Excluding such interest expense, the ratio of expenses to average net assets would be 1.25%. |
The accompanying notes are an integral part of the consolidated financial statements.
10
Campbell Multi-Asset Carry Fund
Notes To Consolidated Financial Statements
February 28, 2018 (Unaudited)
1. Organization and Significant Accounting Policies
The RBB Fund, Inc. (“RBB” or the “Company”) was incorporated under the laws of the State of Maryland on February 29, 1988 and is registered under the Investment Company Act of 1940, as amended (the “1940 Act”), as an open-end management investment company. RBB is a “series fund,” which is a mutual fund divided into separate portfolios. Each portfolio is treated as a separate entity for certain matters under the 1940 Act, and for other purposes, and a shareholder of one portfolio is not deemed to be a shareholder of any other portfolio. Currently, RBB has twenty-nine active investment portfolios, including the Campbell Multi-Asset Carry Fund (the “Fund”), which commenced investment operations on December 21, 2015.
RBB has authorized capital of one hundred billion shares of common stock of which 87.023 billion shares are currently classified into one hundred and eighty-one classes of common stock. Each class represents an interest in an active or inactive RBB investment portfolio.
The Fund’s investment objective is to seek positive absolute returns.
The Fund is an investment company and follows accounting and reporting guidance in the Financial Accounting Standards Board (“FASB”) Accounting Standards Codification Topic 946 “Financial Services - Investment Companies.”
The end of the reporting period for the Fund is February 28, 2018, and the period covered by these Notes to Consolidated Financial Statements is the six months ended February 28, 2018 (the “current fiscal period”).
Consolidation of Subsidiary — The Adviser’s Campbell Multi-Asset Carry Program will be achieved by the Fund investing up to 25% of its total assets in the Campbell Core Carry Offshore Limited (the “Subsidiary”), a wholly-owned and controlled subsidiary for the Fund organized under the laws of the Cayman Islands. The consolidated financial statements of the Fund include the financial statements of the Subsidiary. The Fund consolidates the results of subsidiaries in which the Fund holds a controlling financial interest (greater than 50%). All inter-company accounts and transactions have been eliminated. As of the end of the reporting period, the net assets of the Subsidiary were $941,754, which represented 7.07% of the Fund’s net assets.
Portfolio Valuation — The Fund’s net asset value (“NAV”) is calculated once daily at the close of regular trading hours on the New York Stock Exchange (“NYSE”) (generally 4:00 p.m. Eastern time) on each day the NYSE is open. Securities held by the Fund are valued using the closing price or the last sales price on a national securities exchange or the National Association of Securities Dealers Automatic Quotation System (“NASDAQ”) market system where they are primarily traded. Fixed income securities are valued using an independent pricing service, which considers such factors as security prices, yields, maturities and ratings, and are deemed representative of market values at the close of the market. Investments in other open-end investment companies are valued based on the NAV of those investment companies (which may use fair value pricing as discussed in their prospectuses). Forward exchange contracts are valued by interpolating between spot and forward currency rates as quoted by an independent pricing service. Futures contracts are generally valued using the settlement price determined by the relevant exchange. If market quotations are unavailable or deemed unreliable, securities will be valued in accordance with procedures adopted by the Company’s Board of Directors (the “Board”). Relying on prices supplied by pricing services or dealers or using fair valuation may result in values that are higher or lower than the values used by other investment companies and investors to price the same investments.
Fair Value Measurements — The inputs and valuation techniques used to measure the fair value of the Fund’s investments are summarized into three levels as described in the hierarchy below:
| | ● Level 1 – | Prices are determined using quoted prices in active markets for identical securities. |
| | ● Level 2 – | Prices are determined using other significant observable inputs (including quoted prices for similar securities, interest rates, prepayment speeds, credit risk, etc.). |
| | ● Level 3 – | Prices are determined using significant unobservable inputs (including the Fund’s own assumptions in determining the fair value of investments). |
11
Campbell Multi-Asset Carry Fund
Notes To Consolidated Financial Statements (Continued)
February 28, 2018 (Unaudited)
The inputs or methodologies used for valuing securities are not necessarily an indication of the risk associated with investing in those securities.
The following is a summary of the inputs used, as of the end of the reporting period, in valuing the Fund’s investments carried at fair value:
| | | Total | | | Level 1 | | | Level 2 | | | Level 3 | |
| Short-Term Investments | | $ | 10,834,954 | | | $ | 10,834,954 | | | $ | — | | | $ | — | |
| Commodity Contracts | | | | | | | | | | | | | | | | |
| Futures Contracts | | | 229,212 | | | | 229,212 | | | | — | | | | — | |
| Equity Contracts | | | | | | | | | | | | | | | | |
| Futures Contracts | | | 34,300 | | | | 34,300 | | | | — | | | | — | |
| Interest Rate Contracts | | | | | | | | | | | | | | | | |
| Futures Contracts | | | 18,507 | | | | 18,507 | | | | — | | | | — | |
| Foreign Currency Contracts | | | | | | | | | | | | | | | | |
| Forward Foreign Currency Contracts | | | 267,794 | | | | — | | | | 267,794 | | | | — | |
| Total Assets | | $ | 11,384,767 | | | $ | 11,116,973 | | | $ | 267,794 | | | $ | — | |
| | | Total | | | Level 1 | | | Level 2 | | | Level 3 | |
| Commodity Contracts | | | | | | | | | | | | |
| Futures Contracts | | $ | (272,478 | ) | | $ | (272,478 | ) | | $ | — | | | $ | — | |
| Equity Contracts | | | | | | | | | | | | | | | | |
| Futures Contracts | | | (63,243 | ) | | | (63,243 | ) | | | — | | | | — | |
| Interest Rate Contracts | | | | | | | | | | | | | | | | |
| Futures Contracts | | | (208,798 | ) | | | (208,798 | ) | | | — | | | | — | |
| Foreign Currency Contracts | | | | | | | | | | | | | | | | |
| Forward Foreign Currency Contracts | | | (411,596 | ) | | | — | | | | (411,596 | ) | | | — | |
| Total Liabilities | | $ | (956,115 | ) | | $ | (544,519 | ) | | $ | (411,596 | ) | | $ | — | |
At the end of each quarter, management evaluates the classification of Levels 1, 2 and 3 assets and liabilities. Various factors are considered, such as changes in liquidity from the prior reporting period; whether or not a broker is willing to execute at the quoted price; the depth and consistency of prices from third party pricing services; and the existence of contemporaneous, observable trades in the market. Additionally, management evaluates the classification of Level 1 and Level 2 assets and liabilities on a quarterly basis for changes in listings or delistings on national exchanges.
Due to the inherent uncertainty of determining the fair value of investments that do not have a readily available market value, the fair value of the Fund’s investments may fluctuate from period to period. Additionally, the fair value of investments may differ significantly from the values that would have been used had a ready market existed for such investments and may differ materially from the values the Fund may ultimately realize. Further, such investments may be subject to legal and other restrictions on resale or otherwise less liquid than publicly traded securities.
For fair valuations using significant unobservable inputs, U.S. generally accepted accounting principles (“U.S. GAAP”) requires the Fund to present a reconciliation of the beginning to ending balances for reported market values that presents changes attributable to total realized and unrealized gains or losses, purchase and sales, and transfers in and out of Level 3 during the period. Transfers in and out between levels are based on values at the end of the period. U.S. GAAP also requires the Fund to disclose amounts and reasons for all transfers in and out of Level 1 and Level 2 fair value measurements. A reconciliation of Level 3 investments is presented only when the Fund had an amount of Level 3 investments at the end of the reporting period that was meaningful in relation to its net assets. The amounts
12
Campbell Multi-Asset Carry Fund
Notes To Consolidated Financial Statements (Continued)
February 28, 2018 (Unaudited)
and reasons for all transfers in and out of each level within the three-tier hierarchy are disclosed when the Fund had an amount of total transfers during the reporting period that was meaningful in relation to its net assets as of the end of the reporting period.
During the current fiscal period, the Fund had no transfers between Levels 1, 2 and 3.
Disclosures About Derivative Instruments and Hedging Activities — Derivative instruments are defined as financial instruments whose value and performance are based on the value and performance of another security or financial instrument. Derivative instruments that the Fund used during the period include forward foreign currency contracts and futures contracts.
During the current fiscal period, the Fund used long and short contracts on U.S. and foreign equity market indices, U.S. and foreign government bonds, foreign currencies, and commodities (through investment in the Subsidiary) to gain investment exposure in accordance with its investment objective.
The following tables provide quantitative disclosures about fair value amounts of, and gains and losses on, the Fund’s derivative instruments as of and for the current fiscal period.
The following table lists the fair values of the Fund’s derivative holdings as of the end of the reporting period, grouped by contract type and risk exposure category.
| Derivative Type | | Consolidated
Statement
of Assets and
Liabilities
Location | | Commodity
Contracts | | | Equity
Contracts | | | Interest
Rate
Contracts | | | Foreign
Currency
Contracts | | | Total | |
| Asset Derivatives |
| Futures Contracts (a) | | Unrealized
appreciation on
futures contracts | | $ | 229,212 | | | $ | 34,300 | | | $ | 18,507 | | | $ | — | | | $ | 282,019 | |
| Forward Contracts (a) | | Unrealized
appreciation on
forward foreign currency contracts | | | — | | | | — | | | | — | | | | 267,794 | | | | 267,794 | |
| Total Value - Assets | | | | $ | 229,212 | | | $ | 34,300 | | | $ | 18,507 | | | $ | 267,794 | | | $ | 549,813 | |
| Liability Derivatives |
| Futures Contracts (a) | | Unrealized
depreciation on
futures contracts | | $ | (272,478 | ) | | $ | (63,243 | ) | | $ | (208,798 | ) | | $ | — | | | $ | (544,519 | ) |
| Forward Contracts (a) | | Unrealized
depreciation on
forward foreign currency contracts | | | — | | | | — | | | | — | | | | (411,596 | ) | | | (411,596 | ) |
| Total Value - Liabilities | | | | $ | (272,478 | ) | | $ | (63,243 | ) | | $ | (208,798 | ) | | $ | (411,596 | ) | | $ | (956,115 | ) |
| (a) | This amount represents the cumulative appreciation/(depreciation) of forward and futures contracts as reported in the Consolidated Portfolio of Investments. |
13
Campbell Multi-Asset Carry Fund
Notes To Consolidated Financial Statements (Continued)
February 28, 2018 (Unaudited)
The following table lists the amounts of realized gains/(losses) included in net increase/(decrease) in net assets resulting from operations during the current fiscal period, grouped by contract type and risk exposure.
| Derivative Type | | Consolidated Statement of Operations Location | | Commodity
Contracts | | | Equity
Contracts | | | Interest
Rate
Contracts | | | Foreign
Currency
Contracts | | | Total | |
| Realized Gain/(Loss) |
| Futures Contracts | | Net realized gain/
(loss) from
futures contracts | | $ | 249,423 | | | $ | (38,549 | ) | | $ | (940,298 | ) | | $ | — | | | $ | (729,424 | ) |
| Forward Contracts | | Net realized gain/
(loss) from
forward foreign currency contracts | | | — | | | | — | | | | — | | | | (238,212 | ) | | | (238,212 | ) |
| Total Realized Gain/(Loss) | | $ | 249,423 | | | $ | (38,549 | ) | | $ | (940,298 | ) | | $ | (238,212 | ) | | $ | (967,636 | ) |
The following table lists the amounts of change in unrealized appreciation/(depreciation) included in net increase/(decrease) in net assets resulting from operations during the current fiscal period, grouped by contract type and risk exposure.
| Derivative Type | | Consolidated Statement of Operations Location | | Commodity
Contracts | | | Equity
Contracts | | | Interest
Rate
Contracts | | | Foreign
Currency
Contracts | | | Total | |
| Change in Unrealized Appreciation/(Depreciation) |
| Futures Contracts | | Net change in
unrealized
appreciation/ (depreciation) on futures contracts | | $ | (183,131 | ) | | $ | 20,804 | | | $ | (241,790 | ) | | $ | — | | | $ | (404,117 | ) |
| Forward Contracts | | Net change in
unrealized
appreciation/ (depreciation) on forward foreign currency contracts | | | — | | | | — | | | | — | | | | 220,751 | | | | 220,751 | |
| Total Change in Unrealized Appreciation/(Depreciation) | | $ | (183,131 | ) | | $ | 20,804 | | | $ | (241,790 | ) | | $ | 220,751 | | | $ | (183,366 | ) |
During the current fiscal period, the Fund’s quarterly average volume of derivatives was as follows:
Long Futures
Notional
Amount | Short Futures
Notional
Amount | Forward Foreign Currency
Contracts— Payable
(Value at Trade Date) | Forward Foreign Currency
Contracts— Receivable
(Value at Trade Date) |
| $258,530,982 | $(13,335,328) | $(41,426,800) | $41,310,407 |
14
Campbell Multi-Asset Carry Fund
Notes To Consolidated Financial Statements (Continued)
February 28, 2018 (Unaudited)
For financial reporting purposes, the Fund does not offset fair value amounts recognized for derivative instruments and fair value amounts recognized for the right to reclaim cash collateral (receivables) or the obligation to return cash collateral (payables) arising from derivative instruments recognized at fair value executed with the same counterparty under a master netting arrangement.
The following is a summary of financial and derivative instruments that are subject to enforceable master netting agreements (or similar arrangements) and collateral received and pledged in connection with the master netting agreements (or similar arrangements).
| | | | | | Gross Amount
Not Offset in Consolidated
Statement of Assets
and Liabilities | | | | | | | | | Gross Amount
Not Offset in Consolidated
Statement of Assets
and Liabilities | | | | |
| Description | | Gross Amount Presented in the Consolidated Statement of Assets and Liabilities | | | Financial
Instruments | | | Collateral
Received | | | Net
Amount(1) | | | Gross Amount Presented in the Consolidated Statement of Assets and Liabilities | | | Financial
Instruments | | | Collateral
Pledged(2) | | | Net
Amount(3) | |
| | | Assets | | | Liabilities | |
| Forward Foreign Currency Contracts | | $ | 267,794 | | | $ | (267,794 | ) | | $ | — | | | $ | — | | | $ | 267,794 | | | $ | (411,596 | ) | | $ | | | | $ | (143,802 | ) |
| (1) | Net amount represents the net amount receivable from the counterparty in the event of default. |
| (2) | Actual collateral pledged may be more than the amount shown. |
| (3) | Net amount represents the net amount payable to the counterparty in the event of default. |
Use of Estimates — The preparation of consolidated financial statements in conformity with U.S. GAAP requires management to make estimates and assumptions that affect the reported amounts of assets and liabilities and disclosure of contingent assets and liabilities at the date of the consolidated financial statements and the reported amounts of revenues and expenses during the reporting period. Actual results could differ from those estimates and those differences could be significant.
Investment Transactions, Investment Income and Expenses — The Fund records security transactions based on trade date for financial reporting purposes. The cost of investments sold is determined by use of the specific identification method for both financial reporting and income tax purposes in determining realized gains and losses on investments. Interest income is accrued when earned. Dividend income is recorded on the ex-dividend date. Distributions received on securities that represent a return of capital or capital gain are recorded as a reduction of cost of investments and/or as a realized gain. The Fund’s investment income, expenses (other than class specific expenses) and unrealized and realized gains and losses are allocated daily to each class of shares based upon the relative proportion of net assets of each class at the beginning of the day. Expenses incurred on behalf of a specific class, fund or fund family are charged directly to the class, fund or fund family (in proportion to net assets). Expenses incurred for all the RBB funds (such as director or professional fees) are charged to all funds in proportion to their average net assets of RBB, or in such other manner as the Board deems fair or equitable. Expenses and fees, including investment advisory and administration fees, are accrued daily and taken into account for the purpose of determining the NAV of the Fund.
Dividends and Distributions to Shareholders — Dividends from net investment income and distributions from net realized capital gains, if any, are declared and paid at least annually to shareholders recorded on the ex-dividend date. Income dividends and capital gain distributions are determined in accordance with U.S. federal income tax regulations, which may differ from U.S. GAAP.
15
Campbell Multi-Asset Carry Fund
Notes To Consolidated Financial Statements (Continued)
February 28, 2018 (Unaudited)
U.S. Tax Status — No provision is made for U.S. income taxes as it is the Fund’s intention to continue to qualify for and elect the tax treatment applicable to regulated investment companies under Subchapter M of the Internal Revenue Code of 1986, as amended, and make the requisite distributions to its shareholders which will be sufficient to relieve it from U.S. income and excise taxes.
For tax purposes, the Subsidiary is an exempted Cayman Islands investment company. The Subsidiary has received an undertaking from the Government of the Cayman Islands exempting it from all local income, profits and capital gains taxes. No such taxes are levied in the Cayman Islands at the present time. For U.S. income tax purposes, the Subsidiary is a Controlled Foreign Corporation and as such is not subject to U.S. income tax.
Foreign Currency Translation — Assets and liabilities initially expressed in non-U.S. currencies are translated into U.S. dollars based on the applicable exchange rates at the date of the last business day of the consolidated financial statement period. Purchases and sales of securities, interest income, dividends, variation margin received and expenses denominated in foreign currencies are translated into U.S. dollars at the exchange rates in effect on the transaction date.
The Fund does not separately report the effect of changes in foreign exchange rates from changes in market prices of securities held. Such changes are included with the net realized gain or loss and change in unrealized appreciation or depreciation on investments in the Consolidated Statement of Operations. Other foreign currency transactions resulting in realized and unrealized gain or loss are reported separately as net realized gain or loss and change in unrealized appreciation or depreciation on foreign currencies in the Consolidated Statement of Operations.
Currency Risk — Investment in foreign securities involves currency risk associated with securities that trade or are denominated in currencies other than the U.S. dollar and which may be affected by fluctuations in currency exchange rates. An increase in the strength of the U.S. dollar relative to a foreign currency may cause the U.S. dollar value of an investment in that country to decline. Foreign currencies also are subject to risks caused by inflation, interest rates, budget deficits and low savings rates, political factors and government controls. Forward foreign currency exchange contracts may limit potential gains from a favorable change in value between the U.S. dollar and foreign currencies. Unanticipated changes in currency pricing may result in poorer overall performance for the Fund than if it had not engaged in these contracts.
Commodity Sector Risk — Exposure to the commodities markets may subject the Fund to greater volatility than investments in traditional securities. The value of commodity-linked derivative instruments may be affected by changes in overall market movements, commodity index volatility, changes in interest rates, or factors affecting a particular industry or commodity, such as drought, floods, weather, livestock disease, embargoes, tariffs and international economic, political and regulatory developments. The prices of energy, industrial metals, precious metals, agriculture and livestock sector commodities may fluctuate widely due to factors such as changes in value, supply and demand and governmental regulatory policies. The commodity-linked securities in which the Fund invests may be issued by companies in the financial services sector, and events affecting the financial services sector may cause the Fund’s share value to fluctuate.
Foreign Securities Market Risk — A substantial portion of the trades of the Fund are expected to take place on markets or exchanges outside the United States. There is no limit to the amount of assets of the Fund that may be committed to trading on foreign markets. The risk of loss in trading foreign futures and options on futures contracts can be substantial. Participation in foreign futures and options on futures contracts involves the execution and clearing of trades on, or subject to the rules of, a foreign board of trade or exchange. Some of these foreign markets, in contrast to U.S. exchanges, are so-called principals’ markets in which performance is the responsibility only of the individual counterparty with whom the trader has entered into a commodity interest transaction and not of the exchange or clearing corporation. In these kinds of markets, there is risk of bankruptcy or other failure or refusal to perform by the counterparty.
16
Campbell Multi-Asset Carry Fund
Notes To Consolidated Financial Statements (Continued)
February 28, 2018 (Unaudited)
Counterparty Risk — The derivative contracts entered into by the Fund or its Subsidiary may be privately negotiated in the over-the-counter market. These contracts also involve exposure to credit risk, since contract performance depends in part on the financial condition of the counterparty. Relying on a counterparty exposes the Fund to the risk that a counterparty will not settle a transaction in accordance with its terms and conditions because of a dispute over the terms of the contract (whether or not bona fide) or because of a credit or liquidity problem, thus causing the Fund to suffer a loss. If a counterparty defaults on its payment obligations to the Fund, this default will cause the value of an investment in the Fund to decrease.
Credit Risk — Credit risk refers to the possibility that the issuer of the security or a counterparty in respect of a derivative instrument will not be able to satisfy its payment obligations to the Fund when due. Changes in an issuer’s credit rating or the market’s perception of an issuer’s creditworthiness may also affect the value of the Fund’s investment in that issuer. Securities rated in the four highest categories by the rating agencies are considered investment grade but they may also have some speculative characteristics. Investment grade ratings do not guarantee that bonds will not lose value or default. In addition, the credit quality of securities may be lowered if an issuer’s financial condition changes.
Futures Contracts — The Fund may use futures contracts in the normal course of pursuing its investment objective. Upon entering into a futures contract, the Fund must deposit initial margin in addition to segregating cash or liquid assets sufficient to meet its obligation to purchase or provide securities, or to pay the amount owed at the expiration of an index-based futures contract. Such liquid assets may consist of cash, cash equivalents, liquid debt or equity securities or other acceptable assets. Pursuant to the futures contract, the Fund agrees to receive from, or pay to the broker, an amount of cash equal to the daily fluctuation in value of the contract. Such a receipt of payment is known as “variation margin” and is recorded by the Fund as an unrealized gain or loss. When the contract is closed, the Fund records a realized gain or loss equal to the difference between the proceeds from (or cost of) the closing transactions and the Fund’s basis in the contract. Futures contracts have market risks, including the risk that the change in the value of the contract may not correlate with changes in the value of the underlying securities. Use of long futures contracts subjects the Fund to risk of loss in excess of the amount shown on the Consolidated Statement of Assets and Liabilities, up to the notional value of the futures contract. Use of short futures contracts subjects the Fund to unlimited risk of loss.
Forward Foreign Currency Contracts — The Fund uses forward foreign currency contracts (“forward contracts”) in the normal course of pursuing its investment objectives. These contracts are marked-to-market daily at the applicable translation rates. The Fund records realized gains or losses at the time the forward contract is closed. A forward contract is extinguished through a closing transaction or upon delivery of the currency or entering an offsetting contract. Risks may arise upon entering these contracts from the potential inability of a counterparty to meet the terms of their contracts and from unanticipated movements in the value of a foreign currency relative to the U.S. dollar or other currencies. The Fund’s maximum risk of loss from counterparty credit risk related to forward foreign currency contracts is the fair value of the contract. The risk may be mitigated to some extent if a master netting arrangement between the Fund and the counterparty is in place and to the extent the Fund obtains collateral to cover the Fund’s exposure to the counterparty.
Cash and Cash Equivalents — Cash and cash equivalents are valued at cost plus accrued interest, which approximates market value.
Other — In the normal course of business, the Fund may enter into contracts that provide general indemnifications. The Fund’s maximum exposure under these arrangements is dependent on claims that may be made against the Fund in the future, and, therefore, cannot be estimated; however, based on experience, the risk of material loss from such claims is considered remote.
17
Campbell Multi-Asset Carry Fund
Notes To Consolidated Financial Statements (Continued)
February 28, 2018 (Unaudited)
2. Investment Adviser and Other Services
Campbell & Company Investment Adviser LLC (“Campbell” or the “Adviser”) serves as the investment adviser to the Fund. The Adviser is a wholly-owned subsidiary of Campbell & Company, L.P. The Fund compensates the Adviser for its services at an annual rate based on the Fund’s average daily net assets (the “Advisory Fee”), payable on a monthly basis in arrears, as shown in the following table.
The Adviser has contractually agreed to waive its advisory fee and/or reimburse expenses to the extent that total annual Fund operating expenses (excluding certain items discussed below) exceed the rate (“Expense Cap”) shown in the following table of the Fund’s average daily net assets. In determining the Adviser’s obligation to waive advisory fees and/or reimburse expenses, the following expenses are not taken into account and could cause total annual Fund operating expenses to exceed the Expense Cap as applicable: acquired fund fees and expenses, brokerage commissions, extraordinary expenses, interest and taxes. This contractual limitation is in effect until December 31, 2018 and may not be terminated without the approval of the Board. The Adviser may discontinue these arrangements at any time after December 31, 2018.
| Advisory Fee | Expense Cap |
| 1.05% | 1.25% |
During the current fiscal period, investment advisory fees accrued and waived were as follows:
Gross
Advisory
Fees | Waivers | Net
Advisory
Fees |
| $74,890 | $(97,611) | $(22,721) |
If at any time the Fund’s total annual Fund operating expenses for a year are less than the Expense cap, the Adviser is entitled to reimbursement by the Fund of the advisory fees forgone and other payments remitted by the Adviser to the Fund within three years from the date on which such waiver or reimbursement was made, provided such reimbursement does not cause the Fund to exceed the Expense cap that was in effect at the time of the waiver or reimbursement.
As of the end of the reporting period, the Fund had amounts available for recoupment as follows:
| Expiration |
August 31,
2019 | August 31,
2020 | August 31,
2021 | Total |
| $166,493 | $162,443 | $97,611 | $426,547 |
U.S. Bancorp Fund Services, LLC (“USBFS”) serves as administrator for the Fund. For providing administrative and accounting services, USBFS is entitled to receive a monthly fee, subject to certain minimum and out of pocket expenses.
USBFS serves as the Fund’s transfer and dividend disbursing agent. For providing transfer agent services, USBFS is entitled to receive a monthly fee, subject to certain minimum and out of pocket expenses.
U.S. Bank, N.A. (the “Custodian”) provides certain custodial services to the Fund. The Custodian is entitled to receive a monthly fee, subject to certain minimum and out of pocket expenses.
Quasar Distributors, LLC serves as the principal underwriter and distributor of the Fund’s shares pursuant to a Distribution Agreement with RBB.
For compensation amounts payable to USBFS, please refer to the Consolidated Statement of Operations.
18
Campbell Multi-Asset Carry Fund
Notes To Consolidated Financial Statements (Continued)
February 28, 2018 (Unaudited)
3. Director’s and Officer’s Compensation
The Directors of the Company receive an annual retainer and meeting fees for meetings attended. Employees of Vigilant Compliance, LLC serve as President, Chief Compliance Officer and Assistant Treasurer of the Company. Vigilant Compliance, LLC is compensated for the services provided to the Company. An employee of RBB serves as Treasurer and Secretary, and is compensated for services provided. Certain employees of USBFS serve as officers of the Company. They are not compensated by the Fund or the Company. For Director’s and Officer’s compensation amounts, please refer to the Consolidated Statement of Operations.
4. Purchases and Sales of Investment Securities
During the current fiscal period, aggregate purchases and sales of investment securities (excluding short-term investments and derivative transactions) of the Fund were as follows:
There were no purchases or sales of long-term U.S. Government securities during the current fiscal period.
5. Federal Income Tax Information
The Fund has followed the authoritative guidance on accounting for and disclosure of uncertainty in tax positions, which requires the Fund to determine whether a tax position is more likely than not to be sustained upon examination, including resolution of any related appeals or litigation processes, based on the technical merits of the position. The Fund has determined that there was no effect on the consolidated financial statements from following this authoritative guidance. In the normal course of business, the Fund is subject to examination by federal, state and local jurisdictions, where applicable, for tax years for which applicable statutes of limitations have not expired. The Fund is not aware of any tax positions for which it is reasonably possible that the total amounts of unrecognized tax benefits will significantly change in the next twelve months.
As of August 31, 2017, the federal tax cost and aggregate gross unrealized appreciation and depreciation of investments held by the Fund were as follows:
Federal Tax
Cost | Unrealized
Appreciation | Unrealized
(Depreciation) | Net
Unrealized
Appreciation/ (Depreciation) |
| $14,040,692 | $— | $(2,360,606) | $(2,360,606) |
Distributions to shareholders, if any, from net investment income and realized gains are determined in accordance with federal income tax regulations, which may differ from net investment income and realized gains recognized for financial reporting purposes. Accordingly, the character of distributions and composition of net assets for tax purposes may differ from those reflected in the accompanying consolidated financial statements. To the extent these differences are permanent, such amounts are reclassified within the capital accounts based on the tax treatment; temporary differences do not require such reclassification.
19
Campbell Multi-Asset Carry Fund
Notes To Consolidated Financial Statements (Concluded)
February 28, 2018 (Unaudited)
The following permanent differences as of August 31, 2017, primarily attributable to short-term realized gains being offset with current net operating loss, investments in wholly-owned controlled foreign corporation, reclassifications of short-term capital gain distributions and reclassifications for treatment of certain foreign currency transactions were reclassified among the following accounts:
Undistributed
Net Investment
Income/(Loss) | Accumulated
Net Realized
Gain/(Loss) | Paid-In
Capital |
| $635,307 | $914,171 | $(1,549,478) |
As of August 31, 2017, the components of distributable earnings on a tax basis were as follows:
Undistributed
Ordinary
Income | Undistributed
Long-Term
Capital Gains | Unrealized
Appreciation/
(Depreciation) | Qualified
Late-Year
Losses | Other
Temporary
Differences |
| $106,032 | $— | $57,785 | $— | $— |
The differences between the book and tax basis components of distributable earnings relate principally to the timing of recognition of income and gains of the Subsidiary for federal income tax purposes. Short-term and foreign currency gains are reported as ordinary income for federal income tax purposes.
The tax character of dividends and distributions paid during the fiscal year ended August 31, 2017, were as follows:
Ordinary
Income | Long-Term
Gains | Total |
| $ 1,047,488 | $ 678,777 | $ 1,726,265 |
Pursuant to federal income tax rules applicable to regulated investment companies, the Fund may elect to treat certain capital losses between November 1 and August 31 and late year ordinary losses ((i) ordinary losses between January 1 and August 31, and (ii) specified ordinary and currency losses between November 1 and August 31) as occurring on the first day of the following tax year. For the fiscal year ended August 31, 2017, any amount of losses elected within the tax return will not be recognized for federal income tax purposes until September 1, 2017.
Under the Regulated Investment Company Modernization Act of 2010, the Fund is permitted to carry forward capital losses for an unlimited period. Additionally, capital losses that are carried forward will retain their character as either short-term or long-term capital losses rather than being considered all short-term as under the previous law. As of August 31, 2017, the Fund had no capital loss carryforwards.
6. Subsequent Events
Management has evaluated the impact of all subsequent events on the Fund through the date the consolidated financial statements were issued and has determined that there were no significant events requiring recognition or disclosure in the consolidated financial statements.
20
Campbell Multi-Asset Carry Fund
Other Information
(Unaudited)
Proxy Voting
Policies and procedures that the Fund uses to determine how to vote proxies relating to portfolio securities as well as information regarding how the Fund voted proxies relating to portfolio securities for the most recent twelve-month period ended June 30 will be available without charge, upon request, by calling (844) 261-6488 and on the Securities and Exchange Commission’s (“SEC”) website at http://www.sec.gov.
Quarterly Portfolio Schedules
The Company files its complete schedule of portfolio holdings with the SEC for the first and third fiscal quarters of each fiscal year (quarters ended November 30 and May 31) on Form N-Q. The Company’s Form N-Q is available on the SEC website at http://www.sec.gov and may be reviewed and copied at the SEC Public Reference Room in Washington, D.C. Information on the operation of the SEC Public Reference Room may be obtained by calling (800) SEC-0330.
21
Investment Adviser
Campbell & Company Investment Adviser LLC
2850 Quarry Lake Drive
Baltimore, Maryland 21209
Administrator and Transfer Agent
U.S. Bancorp Fund Services, LLC
P.O. Box 701
Milwaukee, WI 53201
Principal Underwriter
Quasar Distributors, LLC
777 East Wisconsin Avenue, Floor 6
Milwaukee, WI 53202
Custodian
U.S. Bank, N.A.
1555 North Rivercenter Drive, Suite 302
Milwaukee, WI 53212
Independent Registered Public Accounting Firm
Ernst & Young LLP
One Commerce Square
2005 Market Street, Suite 700
Philadelphia, PA 19103
Legal Counsel
Drinker Biddle & Reath LLP
One Logan Square, Suite 2000
Philadelphia, PA 19103-6996
CAMC-SAR18
FREE MARKET U.S. EQUITY FUND
FREE MARKET INTERNATIONAL EQUITY FUND
FREE MARKET FIXED INCOME FUND
of
The RBB Fund, Inc.
SEMI-Annual Report
February 28, 2018
(Unaudited)
This report is submitted for the general information of the shareholders of the Funds. It is not authorized for distribution unless preceded or accompanied by a current prospectus for the Funds.
FREE MARKET FUNDS
Semi-Annual Investment Adviser’s Report
February 28, 2018 (Unaudited)
February 28, 2018
Dear Shareholder,
The Free Market Funds (the “Funds”) have continued to gain assets and have surpassed $8.1 billion. We would like to extend a warm and grateful thank you to all investors who have embraced our Free Market Portfolio Strategies.
Over the past six months ended February 28, 2018, investors experienced broad based positive returns in the equity markets. International equity markets over the past six months have seen a steady increase, returning 6.59% as measured by the MSCI World ex USA Index. Emerging markets and international small cap stocks performed even better during the time-period, returning 10.58% and 10.59% respectively as measured by the MSCI Emerging Markets and MSCI EAFE Small Cap Indices. U.S. stocks outpaced international stocks, over the same time-period, with large cap stocks returning 10.84% as represented by the S&P 500® Index. Small cap stocks in the U.S. were right on the heels of U.S. large cap stocks, returning 8.29% as measured by the Russell 2000® Index. In contrast to the broad equity markets, rising interest rates drove bond markets negative over the last six months, with the World Government Bond Index posting a loss of 0.32%.
Matson Money, Inc. (“Matson Money”) strives to deliver the performance of capital markets and add value through Free Market Investment strategies and Structured Market Portfolios. Grounded in the conviction that Free Markets work, Matson Money avoids the cost-generating activity of stock picking and market timing. Instead, we focus on the dimensions of capital markets that we believe reward investors as intelligently and effectively as possible. Our disciplined approach to life-long investing aims to provide both the individual investor and the financial professional with the academic foundation upon which to help achieve investment goals.
In the landmark study done by Eugene Fama and Kenneth French and published in “The Cross-Section of Expected Stock Returns”1 it is documented that, over the long term, investors could have received a premium for investing in small cap stocks and value stocks. These returns seem to be compensation for risk. In fixed income, risk as measured by volatility can be well described by bond maturity and credit quality. Matson Money’s vehicles deliberately seek to target specific risk and return tradeoffs. The Funds are broadly diversified and designed to work together in your total investment plan.
We invite you to contact your financial professional or explore our website, www.MatsonMoney.com, to learn more about the concepts and strategies of Matson Money’s investing.
We appreciate your support and confidence in our firm’s investment philosophy, process and people.

Kenneth E. Gatliff
Portfolio Manager
Matson Money, Inc.
| 1 | Fama, E.F. and K. R. French. 1992. “The Cross-section of Expected Stock Returns”. The Journal of Finance. 47: 427–465. |
1
FREE MARKET FUNDS
Semi-Annual Investment Adviser’s Report (Concluded)
February 28, 2018 (Unaudited)
The Russell 2000® Index consists of the smallest 2,000 companies in a group of 3,000 U.S. companies in the Russell 3000® Index, as ranked by market capitalization.
The S&P 500® Index is a broad based unmanaged index of 500 stocks, which is widely recognized as representative of the equity market in general.
The MSCI Emerging Markets Index captures large and mid cap representation across 24 Emerging Markets (EM) countries. With 842 constituents, the index covers approximately 85% of the free float-adjusted market capitalization in each country.
The MSCI EAFE Small Cap Index is an equity index which captures small cap representation across Developed Markets countries around the world, excluding the US and Canada. With 2,288 constituents, the index covers approximately 14% of the free float-adjusted market capitalization in each country.
The MSCI World ex USA Index captures large and mid cap representation across 22 of 23 Developed Markets (DM) countries--excluding the United States. With 1,018 constituents, the index covers approximately 85% of the free float-adjusted market capitalization in each country.
The World Government Bond Index (WGBI) measures the performance of fixed-rate, local currency, investment grade sovereign bonds. The WGBI is a widely used benchmark that currently comprises sovereign debt from over 20 countries, denominated in a variety of currencies, and has more than 25 years of history available. The WGBI provides a broad benchmark for the global sovereign fixed income market. Sub-indices are available in any combination of currency, maturity, or rating.
One cannot invest directly in an index.
Must be preceded or accompanied by a prospectus.
Mutual fund investing involves risk. Principal loss is possible. Investing in micro-cap or small cap companies involve additional risks such as limited liquidity and greater volatility than large companies. The Fund invests in foreign securities which involve greater volatility and political, economic and currency risks and differences in accounting methods. These risks are greater in emerging markets. Investments in debt securities typically decrease in value when interest rates rise. This risk is usually greater for longer-term debt securities.
Shares of the Funds are distributed by Quasar Distributors, LLC.
2
FREE MARKET FUNDS
Performance Data
February 28, 2018 (Unaudited)
Free Market U.S. Equity Fund
Total Returns for the Periods Ended February 28, 2018 |
| | | Average Annual |
| | Six
Months* | 1 Year | 3 Years | 5 Years | Since
Inception** |
Free Market U.S. Equity Fund | 9.20% | 9.51% | 8.57% | 12.35% | 9.37% |
Russell 2500® Index | 8.71% | 11.17% | 8.29% | 12.30% | 8.94% |
Composite Index*** | 7.90% | 9.55% | 9.03% | 12.48% | 7.97% |
| ** | The Fund commenced operations on December 31, 2007. |
| *** | The Composite Index is comprised of the S&P 500® Index, Russell 1000® Value Index, Russell 2000® Index and Russell 2000® Value Index, weighted 25%, 25%, 25% and 25%, respectively. |
The performance data quoted represents past performance. Past performance is not indicative of future results. Investment return and principal value will fluctuate so that an investor’s shares, when redeemed, may be worth more or less than their original cost. Current performance may be lower or higher. Returns shown include the reinvestment of all dividends and other distributions and do not reflect taxes that a shareholder would pay on Fund distributions or on the redemption of Fund shares. For performance data current to the most recent month-end, please call 1-866-780-0357 ext. 3863. The Fund’s annual operating expense ratio, as stated in the current prospectus, is 0.85% (included in the ratio is 0.29% attributable to acquired fund fees and expenses).
The Fund’s aggregate total return since inception is based on an increase in net asset value from $10.00 per share on December 31, 2007 (commencement of operations) to $18.52 per share on February 28, 2018.
Portfolio composition is subject to change.
The Free Market U.S. Equity Fund’s underlying funds invest in small-cap and micro-cap stocks, large-cap stocks and other equity securities. In addition to the ordinary risks of equity investing, small companies entail special risk. Small companies tend to have more risk than large companies. An investor in the Fund will incur the expenses of the underlying funds in addition to the Fund’s expenses.
Free Market International Equity Fund
Total Returns for the Periods Ended February 28, 2018 |
| | | Average Annual |
| | Six
Months* | 1 Year | 3 Years | 5 Years | Since
Inception** |
Free Market International Equity Fund | 7.38% | 20.82% | 8.16% | 8.33% | 4.16% |
MSCI World (excluding U.S.) Index | 6.60% | 18.87% | 5.32% | 6.58% | 1.81% |
Composite Index*** | 8.80% | 24.01% | 7.93% | 7.63% | 2.85% |
| ** | The Fund commenced operations on December 31, 2007. |
| *** | The Composite Index is comprised of the MSCI EAFE Index, MSCI EAFE Value Index, MSCI EAFE Small Company Index and MSCI Emerging Markets Free Index, weighted 25%, 25%, 25% and 25%, respectively. |
The performance data quoted represents past performance. Past performance is not indicative of future results. Investment return and principal value will fluctuate so that an investor’s shares, when redeemed, may be worth more or less than their original cost. Current performance may be lower or higher. Returns shown include the reinvestment of all dividends and other distributions and do not reflect taxes that a shareholder would pay on Fund distributions or on the redemption of Fund shares. For performance data current to the most recent month-end, please call 1-866-780-0357 ext. 3863. The Fund’s annual operating expense ratio, as stated in the current prospectus, is 1.01% (included in the ratio is 0.43% attributable to acquired fund fees and expenses).
The Fund’s aggregate total return since inception is based on an increase in net asset value from $10.00 per share on December 31, 2007 (commencement of operations) to $11.40 per share on February 28, 2018.
Portfolio composition is subject to change.
The Free Market International Equity Fund’s underlying funds invest in common stock, preferred stock, securities convertible into stocks and other equity securities issued by foreign companies. In addition to the ordinary risks of equity investing, foreign and small companies entail special risk. The return on foreign equities may be adversely affected by currency fluctuations. Emerging markets may be subject to social instability and lack of market liquidity. Small companies tend to have more risk than large companies. An investor in the Fund will incur the expenses of the underlying funds in addition to the Fund’s expenses.
3
FREE MARKET FUNDS
Performance Data
February 28, 2018 (Unaudited)
Free Market Fixed Income Fund
Total Returns for the Periods Ended February 28, 2018 |
| | | Average Annual |
| | Six
Months* | 1 Year | 3 Years | 5 Years | Since
Inception** |
Free Market Fixed Income Fund | -1.25% | -0.13% | 0.39% | 0.28% | 1.43% |
Citigroup World Govt. Bond 1-5 Year Currency Hedged U.S. Dollar Index | -0.32% | 0.65% | 1.00% | 1.16% | 2.07% |
Composite Index*** | -1.11% | 0.27% | 0.70% | 0.87% | 2.12% |
| ** | The Fund commenced operations on December 31, 2007. |
| *** | The Composite Index is comprised of the Three-Month Treasury Bill Index, Bloomberg Barclays Intermediate Government/Credit Bond Index, BofA Merrill Lynch 1-3 Year US Government/Corporate Index and Barclays Capital Aggregate Bond Index, weighted 25%, 25%, 25% and 25%, respectively. |
The performance data quoted represents past performance. Past performance is not indicative of future results. Investment return and principal value will fluctuate so that an investor’s shares, when redeemed, may be worth more or less than their original cost. Current performance may be lower or higher. Returns shown include the reinvestment of all dividends and other distributions and do not reflect taxes that a shareholder would pay on Fund distributions or on the redemption of Fund shares. For performance data current to the most recent month-end, please call 1-866-780-0357 ext. 3863. The Fund’s annual operating expense ratio, as stated in the current prospectus, is 0.74% (included in the ratio is 0.18% attributable to acquired fund fees and expenses).
The Fund’s aggregate total return since inception is based on an increase in net asset value from $10.00 per share on December 31, 2007 (commencement of operations) to $10.14 per share on February 28, 2018.
Portfolio composition is subject to change.
The Free Market Fixed Income Fund’s underlying funds invest in fixed income securities. The underlying funds may invest their assets in bonds and other debt securities issued by domestic and foreign governments and companies. Debt instruments involve the risk that their prices will fall when interest rates rise, and they are subject to the risk that the borrower may default. In addition, the return on foreign debt securities may be adversely affected by currency fluctuations. An investor in the Fund will incur expenses of the underlying funds in addition to the Fund’s expenses.
4
FREE MARKET FUNDS
Fund Expense Example
February 28, 2018 (Unaudited)
As a shareholder of the Fund(s), you incur two types of costs: (1) transaction costs; and (2) ongoing costs, including management fees and other Fund expenses. These examples are intended to help you understand your ongoing costs (in dollars) of investing in the Fund(s) and to compare these costs with the ongoing costs of investing in other mutual funds.
These examples are based on an investment of $1,000 invested at the beginning of the six-month period from September 1, 2017 through February 28, 2018, and held for the entire period.
Actual Expenses
The first line of the accompanying tables provides information about actual account values and actual expenses. You may use the information in this line, together with the amount you invested, to estimate the expenses that you paid over the period. Simply divide your account value by $1,000 (for example, an $8,600 account value divided by $1,000 = 8.6), then multiply the result by the number in the first line under the heading entitled “Expenses Paid During Period” to estimate the expenses you paid on your account during this period.
Hypothetical ExampleS for Comparison Purposes
The second line of the accompanying tables provides information about hypothetical account values and hypothetical expenses based on each Fund’s actual expense ratio and an assumed rate of return of 5% per year before expenses, which is not the Fund’s actual return. The hypothetical account values and expenses may not be used to estimate the actual ending account balance or expenses you paid for the period. You may use this information to compare the ongoing costs of investing in each Fund and other funds. To do so, compare these 5% hypothetical examples with the 5% hypothetical examples that appear in the shareholder reports of other funds.
Please note that the expenses shown in the accompanying tables are meant to highlight your ongoing costs only and do not reflect any transactional costs. Therefore, the second line of the accompanying tables is useful in comparing ongoing costs only and will not help you determine the relative total costs of owning different funds. In addition, if these transactional costs were included, your costs would have been higher.
| | Free Market U.S. Equity Fund |
| | Beginning Account Value
September 1, 2017 | Ending Account Value
February 28, 2018 | Expenses Paid
During Period* |
Actual | $ 1,000.00 | $ 1,092.00 | $2.85 |
Hypothetical (5% return before expenses) | 1,000.00 | 1,022.07 | 2.76 |
| | Free Market International Equity Fund |
| | Beginning Account Value
September 1, 2017 | Ending Account Value
February 28, 2018 | Expenses Paid
During Period* |
Actual | $ 1,000.00 | $ 1,073.80 | $2.88 |
Hypothetical (5% return before expenses) | 1,000.00 | 1,022.02 | 2.81 |
5
FREE MARKET FUNDS
Fund Expense Example (Concluded)
February 28, 2018 (Unaudited)
| | Free Market Fixed Income Fund |
| | Beginning Account Value
September 1, 2017 | Ending Account Value
February 28, 2018 | Expenses Paid
During Period* |
Actual | $ 1,000.00 | $ 987.50 | $2.71 |
Hypothetical (5% return before expenses) | 1,000.00 | 1,022.07 | 2.76 |
| * | Expenses are equal to an annualized six-month expense ratio of 0.55%, 0.56% and 0.55% for the Free Market U.S. Equity Fund, Free Market International Equity Fund and Free Market Fixed Income Fund, respectively, multiplied by the average account value over the period, multiplied by the number of days (181) in the most recent fiscal half-year, then divided by 365 to reflect the one-half year period. The annualized expense ratios do not reflect fees and expenses associated with the underlying funds. If such fees and expenses had been included, the expenses would have been higher. The range of weighted expense ratios of the underlying funds held by the Funds, as stated in the underlying funds’ current prospectuses, were as follows: |
| | Free Market U.S. Equity Fund | Free Market International Equity Fund | Free Market Fixed Income Fund |
| | 0.00%-0.13% | 0.00%-0.11% | 0.01%-0.07% |
Each Fund’s ending account values on the first line in each table are based on the actual six-month total return for each Fund of 9.20% for the Free Market U.S. Equity Fund, 7.38% for the Free Market International Equity Fund and -1.25% for the Free Market Fixed Income Fund.
6
FREE MARKET FUNDS
FREE MARKET U.S. EQUITY FUND
Portfolio of Investments
February 28, 2018 (Unaudited)
| | | Number
of Shares | | | Value | |
| DOMESTIC EQUITY FUNDS — 99.8% | | | |
| iShares Core S&P 500 ETF | | | 61,290 | | | $ | 16,753,008 | |
| U.S. Large Cap Value Portfolio III (a) | | | 34,053,787 | | | | 919,111,723 | |
| U.S. Large Company Portfolio (a) | | | 21,225,543 | | | | 447,646,705 | |
| U.S. Micro Cap Portfolio (b) | | | 21,039,718 | | | | 452,564,334 | |
| U.S. Small Cap Portfolio (b) | | | 12,917,774 | | | | 453,155,501 | |
| U.S. Small Cap Value Portfolio (b) | | | 20,591,108 | | | | 755,487,758 | |
| TOTAL DOMESTIC EQUITY FUNDS | | | | | | | | |
| (Cost $2,215,066,266) | | | | | | | 3,044,719,029 | |
| | | | | | | | | |
| SHORT-TERM INVESTMENTS — 0.2% |
| STIT-Government & Agency Portfolio, 1.30%* | | | 4,664,782 | | | | 4,664,782 | |
| TOTAL SHORT-TERM INVESTMENTS | | | | | | | | |
| (Cost $4,664,782)* | | | | | | | 4,664,782 | |
| TOTAL INVESTMENTS — 100.0% | | | | | | | | |
| (Cost $2,219,731,008) | | | | | | | 3,049,383,811 | |
| OTHER ASSETS IN EXCESS OF LIABILITIES — 0.0% | | | | | | | 1,305,751 | |
| NET ASSETS — 100.0% | | | | | | $ | 3,050,689,562 | |
Portfolio Holdings Summary Table
| | | % of
Net Assets | | | Value | |
| Domestic Equity Funds | | | 99.8 | % | | $ | 3,044,719,029 | |
| Short-Term Investments | | | 0.2 | % | | | 4,664,782 | |
| Other Assets In Excess Of Liabilities | | | 0.0 | % | | | 1,305,751 | |
| NET ASSETS | | | 100.0 | % | | $ | 3,050,689,562 | |
| * | Seven-day yield as of February 28, 2018. |
| (a) | A portfolio of Dimensional Investment Group Inc. |
| (b) | A portfolio of DFA Investment Dimensions Group Inc. |
Portfolio holdings are subject to change at any time.
The accompanying notes are an integral part of the financial statements.
7
FREE MARKET FUNDS
FREE MARKET INTERNATIONAL EQUITY FUND
Portfolio of Investments
February 28, 2018 (Unaudited)
| | | Number of Shares/Beneficial Interest | | | Value | |
| INTERNATIONAL EQUITY FUNDS — 99.9% | | | |
| Asia Pacific Small Company Portfolio (a) | | | 1,294,679 | | | $ | 31,137,024 | |
| Canadian Small Company Series (b) | | | 2,651,701 | | | | 28,770,717 | |
| Continental Small Company Portfolio (a) | | | 1,171,156 | | | | 34,268,028 | |
| Continental Small Company Series (b) | | | 430,577 | | | | 42,592,363 | |
| DFA International Small Cap Value Portfolio (a) | | | 41,512,170 | | | | 946,477,477 | |
| DFA International Value Portfolio III (c) | | | 33,466,224 | | | | 580,638,987 | |
| DFA International Value Series (b) | | | 4,790,381 | | | | 123,016,980 | |
| Emerging Markets Portfolio (a) | | | 4,041,522 | | | | 126,055,070 | |
| Emerging Markets Small Cap Portfolio (a) | | | 4,815,935 | | | | 117,268,017 | |
| Emerging Markets Value Portfolio (a) | | | 3,639,877 | | | | 117,786,427 | |
| Japanese Small Company Portfolio (a) | | | 1,828,638 | | | | 54,584,844 | |
| Large Cap International Portfolio (a) | | | 4,904,882 | | | | 116,883,350 | |
| United Kingdom Small Company Portfolio (a) | | | 186,330 | | | | 5,576,844 | |
| United Kingdom Small Company Series (b) | | | 539,121 | | | | 38,044,014 | |
| TOTAL INTERNATIONAL EQUITY FUNDS | | | | | | | | |
| (Cost $1,900,463,815) | | | | | | | 2,363,100,142 | |
| | | | | | | | | |
| SHORT-TERM INVESTMENTS — 0.1% |
| STIT-Government & Agency Portfolio, 1.30%* | | | 3,470,030 | | | | 3,470,030 | |
| TOTAL SHORT-TERM INVESTMENTS | | | | | | | | |
| (Cost $3,470,030) | | | | | | | 3,470,030 | |
| TOTAL INVESTMENTS — 100.0% | | | | | | | | |
| (Cost $1,903,933,845) | | | | | | | 2,366,570,172 | |
| OTHER ASSETS IN EXCESS OF LIABILITIES — 0.0% | | | | | | | 870,704 | |
| NET ASSETS — 100.0% | | | | | | $ | 2,367,440,876 | |
Portfolio Holdings Summary Table
| | | % of
Net Assets | | | Value | |
| International Equity Funds | | | 99.9 | % | | $ | 2,363,100,142 | |
| Short-Term Investments | | | 0.1 | % | | | 3,470,030 | |
| Other Assets In Excess Of Liabilities | | | 0.0 | % | | | 870,704 | |
| NET ASSETS | | | 100.0 | % | | $ | 2,367,440,876 | |
| * | Seven-day yield as of February 28, 2018. |
| (a) | A portfolio of DFA Investment Dimensions Group Inc. |
| (b) | A portfolio of DFA Investment Trust Company. |
| (c) | A portfolio of Dimensional Investment Group Inc. |
Portfolio holdings are subject to change at any time.
The accompanying notes are an integral part of the financial statements.
8
FREE MARKET FUNDS
FREE MARKET FIXED INCOME FUND
Portfolio of Investments
February 28, 2018 (Unaudited)
| | | Number
of Shares | | | Value | |
| FIXED INCOME FUNDS — 99.5% |
| DFA Five-Year Global Fixed Income Portfolio (a) | | | 62,315,169 | | | $ | 672,380,671 | |
| DFA Inflation-Protected Securities Portfolio (a) | | | 11,734,733 | | | | 134,949,429 | |
| DFA Intermediate Government Fixed Income Portfolio (a) | | | 13,413,541 | | | | 161,767,300 | |
| DFA One-Year Fixed Income Portfolio (a) | | | 38,002,687 | | | | 389,527,544 | |
| DFA Short-Term Government Portfolio (a) | | | 10,297,283 | | | | 107,503,630 | |
| DFA Two-Year Global Fixed Income Portfolio (a) | | | 40,867,761 | | | | 403,364,796 | |
| iShares 1-3 Year Credit Bond ETF | | | 6,208,957 | | | | 644,862,274 | |
| iShares Intermediate Credit Bond ETF | | | 1,503,852 | | | | 161,333,242 | |
| TOTAL FIXED INCOME FUNDS | | | | | | | | |
| (Cost $2,719,412,433) | | | | | | | 2,675,688,886 | |
| | | | | | | | | |
| SHORT-TERM INVESTMENTS — 0.5% |
| STIT-Government & Agency Portfolio, 1.30%* | | | 12,320,331 | | | | 12,320,331 | |
| TOTAL SHORT-TERM INVESTMENTS | | | | | | | | |
| (Cost $12,320,331) | | | | | | | 12,320,331 | |
| TOTAL INVESTMENTS — 100.0% | | | | | | | | |
| (Cost $2,731,732,764) | | | | | | | 2,688,009,217 | |
| OTHER ASSETS IN EXCESS OF LIABILITIES — 0.0% | | | | | | | 1,922,311 | |
| NET ASSETS — 100.0% | | | | | | $ | 2,689,931,528 | |
Portfolio Holdings Summary Table
| | | % of
Net Assets | | | Value | |
| Fixed Income Funds | | | 99.5 | % | | $ | 2,675,688,886 | |
| Short-Term Investments | | | 0.5 | % | | | 12,320,331 | |
| Other Assets In Excess Of Liabilities | | | 0.0 | % | | | 1,922,311 | |
| NET ASSETS | | | 100.0 | % | | $ | 2,689,931,528 | |
| * | Seven-day yield as of February 28, 2018. |
| (a) | A portfolio of DFA Investment Dimensions Group Inc. |
ETF Exchange-Traded Fund
Portfolio holdings are subject to change at any time.
The accompanying notes are an integral part of the financial statements.
9
FREE MARKET FUNDS
Statements of Assets and Liabilities
February 28, 2018 (Unaudited)
| | | Free Market
U.S. Equity
Fund | | | Free Market
International
Equity Fund | | | Free Market
Fixed Income
Fund | |
| ASSETS | | | | | | | | | |
| Investments in non-affiliated funds, at value * | | $ | 3,044,719,029 | | | $ | 2,363,100,142 | | | $ | 2,675,688,886 | |
| Short-term investments, at value * | | | 4,664,782 | | | | 3,470,030 | | | | 12,320,331 | |
| Receivables | | | | | | | | | | | | |
| Receivable for capital shares sold | | | 4,095,085 | | | | 3,164,336 | | | | 4,378,658 | |
| Dividends receivable | | | 2,680 | | | | 2,562 | | | | 436,788 | |
| Prepaid expenses and other assets | | | 69,530 | | | | 69,393 | | | | 67,121 | |
| Total assets | | | 3,053,551,106 | | | | 2,369,806,463 | | | | 2,692,891,784 | |
| LIABILITIES | | | | | | | | | | | | |
| Payables | | | | | | | | | | | | |
| Capital shares redeemed | | | 1,547,157 | | | | 1,318,985 | | | | 1,751,252 | |
| Advisory fees | | | 1,161,033 | | | | 904,453 | | | | 1,017,259 | |
| Administration and accounting fees | | | 111,515 | | | | 88,500 | | | | 102,541 | |
| Transfer agent fees | | | 15,297 | | | | 11,849 | | | | 10,480 | |
| Other accrued expenses and liabilities | | | 26,542 | | | | 41,800 | | | | 78,724 | |
| Total liabilities | | | 2,861,544 | | | | 2,365,587 | | | | 2,960,256 | |
| Net assets | | $ | 3,050,689,562 | | | $ | 2,367,440,876 | | | $ | 2,689,931,528 | |
| | | | | | | | | | | | | |
| NET ASSETS CONSIST OF: | | | | | | | | | | | | |
| Par value | | $ | 164,709 | | | $ | 207,613 | | | $ | 265,359 | |
| Paid-in capital | | | 2,107,588,538 | | | | 1,889,381,004 | | | | 2,733,463,530 | |
| Undistributed/accumulated net investment income/(loss) | | | (9,549,334 | ) | | | (6,739,918 | ) | | | (316,939 | ) |
| Accumulated net realized gain/(loss) from investments | | | 122,832,846 | | | | 21,955,850 | | | | 243,125 | |
| Net unrealized appreciation/(depreciation) on investments | | | 829,652,803 | | | | 462,636,327 | | | | (43,723,547 | ) |
| Net assets | | $ | 3,050,689,562 | | | $ | 2,367,440,876 | | | $ | 2,689,931,528 | |
| Shares outstanding ($0.001 par value, 700,000,000 shares authorized) | | | 164,708,916 | | | | 207,613,085 | | | | 265,358,668 | |
| Net asset value, offering and redemption price per share | | $ | 18.52 | | | $ | 11.40 | | | $ | 10.14 | |
| *Identified Cost: | | | | | | | | | | | | |
| Investments in non-affiliated funds, at cost | | $ | 2,215,066,226 | | | $ | 1,900,463,815 | | | $ | 2,719,412,433 | |
| Short-term investments, at cost | | | 4,664,782 | | | | 3,470,030 | | | | 12,320,331 | |
The accompanying notes are an integral part of the financial statements.
10
FREE MARKET FUNDS
Statements of Operations
For the Six Months Ended February 28, 2018 (Unaudited)
| | | Free Market
U.S. Equity
Fund | | | Free Market
International
Equity Fund | | | Free Market
Fixed Income
Fund | |
| INVESTMENT INCOME | | | | | | | | | |
| Dividends from non-affiliated funds | | $ | 22,956,043 | | | $ | 38,924,599 | | | $ | 24,446,800 | |
| Total investment income | | | 22,956,043 | | | | 38,924,599 | | | | 24,446,800 | |
| | | | | | | | | | | | | |
| EXPENSES | | | | | | | | | | | | |
| Advisory fees (Note 2) | | | 7,297,224 | | | | 5,679,444 | | | | 6,379,318 | |
| Administration and accounting fees (Note 2) | | | 362,109 | | | | 287,634 | | | | 324,485 | |
| Legal fees | | | 96,248 | | | | 76,518 | | | | 95,974 | |
| Directors fees | | | 70,955 | | | | 50,475 | | | | 63,152 | |
| Transfer agent fees (Note 2) | | | 44,734 | | | | 35,316 | | | | 41,092 | |
| Printing and shareholder reporting fees | | | 42,676 | | | | 42,620 | | | | 47,263 | |
| Custodian fees (Note 2) | | | 37,387 | | | | 28,896 | | | | 34,726 | |
| Officers fees | | | 27,689 | | | | 32,511 | | | | 35,370 | |
| Audit fees | | | 23,519 | | | | 23,434 | | | | 22,062 | |
| Registration expense | | | 3,759 | | | | 6,315 | | | | 21,653 | |
| Other expenses | | | 56,586 | | | | 218,573 | | | | 56,705 | |
| Total expenses | | | 8,062,886 | | | | 6,481,736 | | | | 7,121,800 | |
| Net investment income/(loss) | | | 14,893,157 | | | | 32,442,863 | | | | 17,325,000 | |
| | | | | | | | | | | | | |
| NET REALIZED AND UNREALIZED GAIN/(LOSS) FROM INVESTMENTS | | | | | | | | | | | | |
| Net realized gain/(loss) from: | | | | | | | | | | | | |
| Non-affiliated funds | | | 1,617,501 | | | | 1,203,160 | | | | — | |
| Capital gain distributions from non-affiliated fund investments | | | 128,381,141 | | | | 32,041,601 | | | | 590,307 | |
| Net change in unrealized appreciation/(depreciation) on: | | | | | | | | | | | | |
| Non-affiliated funds | | | 107,962,042 | | | | 97,430,642 | | | | (52,252,170 | ) |
| Net realized and unrealized gain/(loss) on investments | | | 237,960,684 | | | | 130,675,403 | | | | (51,661,863 | ) |
| NET INCREASE/(DECREASE) IN NET ASSETS RESULTING FROM OPERATIONS | | $ | 252,853,841 | | | $ | 163,118,266 | | | $ | (34,336,863 | ) |
The accompanying notes are an integral part of the financial statements.
11
FREE MARKET U.S. EQUITY FUND
Statements of Changes in Net Assets
| | | For the
Six Months Ended
February 28, 2018
(Unaudited) | | | For the
Year Ended
August 31, 2017 | |
| INCREASE/(DECREASE) IN NET ASSETS FROM OPERATIONS: | | | | | | |
| Net investment income/(loss) | | $ | 14,893,157 | | | $ | 18,308,432 | |
| Net realized gain/(loss) from investments | | | 129,998,642 | | | | 79,067,501 | |
| Net change in unrealized appreciation/(depreciation) on investments | | | 107,962,042 | | | | 224,766,196 | |
| Net increase/(decrease) in net assets resulting from operations | | | 252,853,841 | | | | 322,142,129 | |
| | | | | | | | | |
| DIVIDENDS AND DISTRIBUTIONS TO SHAREHOLDERS FROM: | | | | | | | | |
| Net investment income | | | (30,989,004 | ) | | | (21,140,849 | ) |
| Net realized capital gains | | | (80,730,468 | ) | | | (96,166,053 | ) |
| Net decrease in net assets from dividends and distributions to shareholders | | | (111,719,472 | ) | | | (117,306,902 | ) |
| | | | | | | | | |
| CAPITAL SHARE TRANSACTIONS: | | | | | | | | |
| Proceeds from shares sold | | | 285,666,115 | | | | 558,348,603 | |
| Reinvestment of distributions | | | 111,642,406 | | | | 117,302,124 | |
| Shares redeemed | | | (212,748,457 | ) | | | (458,532,319 | ) |
| Net increase/(decrease) in net assets from capital shares | | | 184,560,064 | | | | 217,118,408 | |
| Total increase/(decrease) in net assets | | | 325,694,433 | | | | 421,953,635 | |
| | | | | | | | | |
| NET ASSETS: | | | | | | | | |
| Beginning of period | | | 2,724,995,129 | | | | 2,303,041,494 | |
| End of period | | $ | 3,050,689,562 | | | $ | 2,724,995,129 | |
| Undistributed/accumulated net investment income/(loss), end of period | | $ | (9,549,334 | ) | | $ | 6,546,513 | |
| | | | | | | | | |
| SHARES TRANSACTIONS: | | | | | | | | |
| Shares sold | | | 15,199,097 | | | | 32,332,187 | |
| Dividends and distributions reinvested | | | 5,913,263 | | | | 6,792,248 | |
| Shares redeemed | | | (11,271,938 | ) | | | (26,556,984 | ) |
| Net increase/(decrease) in shares outstanding | | | 9,840,422 | | | | 12,567,451 | |
The accompanying notes are an integral part of the financial statements.
12
FREE MARKET INTERNATIONAL EQUITY FUND
Statements of Changes in Net Assets
| | | For the
Six Months Ended
February 28, 2018
(Unaudited) | | | For the
Year Ended
August 31, 2017 | |
| INCREASE/(DECREASE) IN NET ASSETS FROM OPERATIONS: | | | | | | |
| Net investment income/(loss) | | $ | 32,442,863 | | | $ | 27,075,677 | |
| Net realized gain/(loss) from investments | | | 33,244,761 | | | | 24,654,989 | |
| Net change in unrealized appreciation/(depreciation) on investments | | | 97,430,642 | | | | 342,963,709 | |
| Net increase/(decrease) in net assets resulting from operations | | | 163,118,266 | | | | 394,694,375 | |
| | | | | | | | | |
| DIVIDENDS AND DISTRIBUTIONS TO SHAREHOLDERS FROM: | | | | | | | | |
| Net investment income | | | (52,597,992 | ) | | | (34,715,335 | ) |
| Net realized capital gains | | | (22,848,638 | ) | | | (19,714,628 | ) |
| Net decrease in net assets from dividends and distributions to shareholders | | | (75,446,630 | ) | | | (54,429,963 | ) |
| | | | | | | | | |
| CAPITAL SHARE TRANSACTIONS: | | | | | | | | |
| Proceeds from shares sold | | | 213,271,760 | | | | 425,920,465 | |
| Reinvestment of distributions | | | 75,430,897 | | | | 54,427,744 | |
| Shares redeemed | | | (199,001,253 | ) | | | (302,997,096 | ) |
| Net increase/(decrease) in net assets from capital shares | | | 89,701,404 | | | | 177,351,113 | |
| Total increase/(decrease) in net assets | | | 177,373,040 | | | | 517,615,525 | |
| | | | | | | | | |
| NET ASSETS: | | | | | | | | |
| Beginning of period | | | 2,190,067,836 | | | | 1,672,452,311 | |
| End of period | | $ | 2,367,440,876 | | | $ | 2,190,067,836 | |
| Undistributed/accumulated net investment income/(loss), end of period | | $ | (6,739,918 | ) | | $ | 13,415,211 | |
| | | | | | | | | |
| SHARES TRANSACTIONS: | | | | | | | | |
| Shares sold | | | 18,614,962 | | | | 42,918,842 | |
| Dividends and distributions reinvested | | | 6,687,136 | | | | 5,909,636 | |
| Shares redeemed | | | (17,296,841 | ) | | | (30,251,372 | ) |
| Net increase/(decrease) in shares outstanding | | | 8,005,257 | | | | 18,577,106 | |
The accompanying notes are an integral part of the financial statements.
13
FREE MARKET FIXED INCOME FUND
Statements of Changes in Net Assets
| | | For the
Six Months Ended
February 28, 2018
(Unaudited) | | | For the
Year Ended
August 31, 2017 | |
| INCREASE/(DECREASE) IN NET ASSETS FROM OPERATIONS: | | | | | | |
| Net investment income/(loss) | | $ | 17,325,000 | | | $ | 21,480,464 | |
| Net realized gain/(loss) from investments | | | 590,307 | | | | 2,877,926 | |
| Net change in unrealized appreciation/(depreciation) on investments | | | (52,252,170 | ) | | | (11,573,635 | ) |
| Net increase/(decrease) in net assets resulting from operations | | | (34,336,863 | ) | | | 12,784,755 | |
| | | | | | | | | |
| DIVIDENDS AND DISTRIBUTIONS TO SHAREHOLDERS FROM: | | | | | | | | |
| Net investment income | | | (20,521,178 | ) | | | (23,810,742 | ) |
| Net realized capital gains | | | (2,540,339 | ) | | | — | |
| Net decrease in net assets from dividends and distributions to shareholders | | | (23,061,517 | ) | | | (23,810,742 | ) |
| | | | | | | | | |
| CAPITAL SHARE TRANSACTIONS: | | | | | | | | |
| Proceeds from shares sold | | | 374,272,496 | | | | 670,140,283 | |
| Reinvestment of distributions | | | 23,061,430 | | | | 23,810,100 | |
| Shares redeemed | | | (153,036,106 | ) | | | (306,349,610 | ) |
| Net increase/(decrease) in net assets from capital shares | | | 244,297,820 | | | | 387,600,773 | |
| Total increase/(decrease) in net assets | | | 186,899,440 | | | | 376,574,786 | |
| | | | | | | | | |
| NET ASSETS: | | | | | | | | |
| Beginning of period | | | 2,503,032,088 | | | | 2,126,457,302 | |
| End of period | | $ | 2,689,931,528 | | | $ | 2,503,032,088 | |
| Undistributed/accumulated net investment income/(loss), end of period | | $ | (316,939 | ) | | $ | 2,879,239 | |
| | | | | | | | | |
| SHARES TRANSACTIONS: | | | | | | | | |
| Shares sold | | | 36,455,081 | | | | 65,004,040 | |
| Dividends and distributions reinvested | | | 2,257,642 | | | | 2,313,401 | |
| Shares redeemed | | | (14,921,403 | ) | | | (29,673,279 | ) |
| Net increase/(decrease) in shares outstanding | | | 23,791,320 | | | | 37,644,162 | |
The accompanying notes are an integral part of the financial statements.
14
FREE MARKET FUNDS
FREE MARKET U.S. EQUITY FUND
Financial Highlights
Contained below is per share operating performance data for each share outstanding, total investment return, ratios to average net assets and other supplemental data for the respective periods. This information has been derived from information provided in the financial statements. |
| | | For the
Six Months Ended
February 28, 2018
(Unaudited) | | | For the
Year Ended
August 31, 2017 | | | For the
Year Ended
August 31, 2016 | | | For the
Year Ended
August 31, 2015 | | | For the
Year Ended
August 31, 2014 | | | For the
Year Ended
August 31, 2013 | |
| Per Share Operating Performance | | | | | | | | | | | | |
| Net asset value, beginning of period | | $ | 17.60 | | | $ | 16.18 | | | $ | 16.08 | | | $ | 17.37 | | | $ | 14.66 | | | $ | 11.70 | |
Net investment income/(loss)(1) | | | 0.09 | | | | 0.13 | | | | 0.18 | | | | 0.13 | | | | 0.09 | | | | 0.12 | |
| Net realized and unrealized gain/(loss) on investments | | | 1.54 | | | | 2.12 | | | | 1.18 | | | | (0.71 | ) | | | 3.18 | | | | 3.07 | |
| Net increase/(decrease) in net assets resulting from operations | | | 1.63 | | | | 2.25 | | | | 1.36 | | | | (0.58 | ) | | | 3.27 | | | | 3.19 | |
| Dividends and distributions to shareholders from: | | | | | | | | | | | | | | | | | | | | | | | | |
| Net investment income | | | (0.20 | ) | | | (0.15 | ) | | | (0.15 | ) | | | (0.11 | ) | | | (0.10 | ) | | | (0.15 | ) |
| Net realized capital gains | | | (0.51 | ) | | | (0.68 | ) | | | (1.11 | ) | | | (0.60 | ) | | | (0.46 | ) | | | (0.08 | ) |
| Total dividends and distributions to shareholders | | | (0.71 | ) | | | (0.83 | ) | | | (1.26 | ) | | | (0.71 | ) | | | (0.56 | ) | | | (0.23 | ) |
| Net asset value, end of period | | $ | 18.52 | | | $ | 17.60 | | | $ | 16.18 | | | $ | 16.08 | | | $ | 17.37 | | | $ | 14.66 | |
Total investment return(2) | | | 9.20 | %(4) | | | 13.97 | % | | | 9.10 | % | | | (3.55 | )% | | | 22.49 | % | | | 27.61 | % |
| | | | | | | | | | | | | | | | | | | | | | | | | |
| Ratio/Supplemental Data | | | | | | | | | | | | | | | | | | | | | | | | |
| Net assets, end of period (000’s omitted) | | $ | 3,050,690 | | | $ | 2,724,995 | | | $ | 2,303,041 | | | $ | 1,971,430 | | | $ | 1,943,442 | | | $ | 1,355,653 | |
Ratio of expenses to average net assets(3) | | | 0.55 | %(5) | | | 0.56 | % | | | 0.59 | % | | | 0.60 | % | | | 0.60 | % | | | 0.62 | % |
Ratio of net investment income/(loss) to average net assets(3) | | | 1.01 | %(5) | | | 0.72 | % | | | 1.15 | % | | | 0.74 | % | | | 0.54 | % | | | 0.91 | % |
| Portfolio turnover rate | | | 1 | %(4) | | | 5 | % | | | 1 | % | | | 6 | % | | | 3 | % | | | 6 | % |
(1) | The selected per share data is calculated using the average shares outstanding method for the period. |
(2) | Total investment return is calculated by assuming a purchase of shares on the first day and a sale of shares on the last day of each period reported and includes reinvestments of dividends and distributions, if any. |
(3) | The Fund also will indirectly bear its prorated share of expenses of the underlying funds. Such expenses are not included in the calculation of this ratio. |
The accompanying notes are an integral part of the financial statements.
15
FREE MARKET FUNDS
FREE MARKET INTERNATIONAL EQUITY FUND
Financial Highlights
Contained below is per share operating performance data for each share outstanding, total investment return, ratios to average net assets and other supplemental data for the respective periods. This information has been derived from information provided in the financial statements. |
| | | For the
Six Months Ended
February 28, 2018
(Unaudited) | | | For the
Year Ended
August 31, 2017 | | | For the
Year Ended
August 31, 2016 | | | For the
Year Ended
August 31, 2015 | | | For the
Year Ended
August 31, 2014 | | | For the
Year Ended
August 31, 2013 | |
| Per Share Operating Performance | | | | | | | | | | | | |
| Net asset value, beginning of period | | $ | 10.97 | | | $ | 9.24 | | | $ | 9.28 | | | $ | 10.92 | | | $ | 9.36 | | | $ | 8.04 | |
Net investment income/(loss)(1) | | | 0.16 | | | | 0.12 | | | | 0.23 | | | | 0.17 | | | | 0.19 | | | | 0.18 | |
| Net realized and unrealized gain/(loss) on investments | | | 0.65 | | | | 1.91 | | | | 0.05 | | | | (1.39 | ) | | | 1.71 | | | | 1.36 | |
| Net increase/(decrease) in net assets resulting from operations | | | 0.81 | | | | 2.03 | | | | 0.28 | | | | (1.22 | ) | | | 1.90 | | | | 1.54 | |
| Dividends and distributions to shareholders from: | | | | | | | | | | | | | | | | | | | | | | | | |
| Net investment income | | | (0.26 | ) | | | (0.19 | ) | | | (0.16 | ) | | | (0.22 | ) | | | (0.19 | ) | | | (0.15 | ) |
| Net realized capital gains | | | (0.11 | ) | | | (0.11 | ) | | | (0.16 | ) | | | (0.20 | ) | | | (0.15 | ) | | | (0.07 | ) |
| Total dividends and distributions to shareholders | | | (0.38 | ) | | | (0.30 | ) | | | (0.32 | ) | | | (0.42 | ) | | | (0.34 | ) | | | (0.22 | ) |
| Net asset value, end of period | | $ | 11.40 | | | $ | 10.97 | | | $ | 9.24 | | | $ | 9.28 | | | $ | 10.92 | | | $ | 9.36 | |
Total investment return(2) | | | 7.38 | %(4) | | | 22.50 | % | | | 3.13 | % | | | (11.25 | )% | | | 20.49 | % | | | 19.44 | % |
| | | | | | | | | | | | | | | | | | | | | | | | | |
| Ratio/Supplemental Data | | | | | | | | | | | | | | | | | | | | | | | | |
| Net assets, end of period (000’s omitted) | | $ | 2,367,441 | | | $ | 2,190,068 | | | $ | 1,672,452 | | | $ | 1,443,094 | | | $ | 1,414,618 | | | $ | 964,096 | |
Ratio of expenses to average net assets(3) | | | 0.56 | %(5) | | | 0.58 | % | | | 0.63 | % | | | 0.64 | % | | | 0.62 | % | | | 0.65 | % |
Ratio of net investment income/(loss) to average net assets(3) | | | 2.82 | %(5) | | | 1.42 | % | | | 2.60 | % | | | 1.72 | % | | | 1.84 | % | | | 1.96 | % |
| Portfolio turnover rate | | | 1 | %(4) | | | 2 | % | | | 1 | % | | | 3 | % | | | 2 | % | | | 3 | % |
(1) | The selected per share data is calculated using the average shares outstanding method for the period. |
(2) | Total investment return is calculated by assuming a purchase of shares on the first day and a sale of shares on the last day of each period reported and includes reinvestments of dividends and distributions, if any. |
(3) | The Fund also will indirectly bear its prorated share of expenses of the underlying funds. Such expenses are not included in the calculation of this ratio. |
The accompanying notes are an integral part of the financial statements.
16
FREE MARKET FUNDS
FREE MARKET FIXED INCOME FUND
Financial Highlights
Contained below is per share operating performance data for each share outstanding, total investment return, ratios to average net assets and other supplemental data for the respective periods. This information has been derived from information provided in the financial statements. |
| | | For the
Six Months Ended
February 28, 2018
(Unaudited) | | | For the
Year Ended
August 31, 2017 | | | For the
Year Ended
August 31, 2016 | | | For the
Year Ended
August 31, 2015 | | | For the
Year Ended
August 31, 2014 | | | For the
Year Ended
August 31, 2013 | |
| Per Share Operating Performance | | | | | | | | | | | | |
| Net asset value, beginning of period | | $ | 10.36 | | | $ | 10.43 | | | $ | 10.25 | | | $ | 10.31 | | | $ | 10.24 | | | $ | 10.54 | |
Net investment income/(loss)(1) | | | 0.07 | | | | 0.10 | | | | 0.06 | | | | 0.06 | | | | 0.04 | | | | 0.05 | |
| Net realized and unrealized gain/(loss) on investments | | | (0.20 | ) | | | (0.06 | ) | | | 0.17 | | | | (0.02 | ) | | | 0.09 | | | | (0.21 | ) |
| Net increase/(decrease) in net assets resulting from operations | | | (0.13 | ) | | | 0.04 | | | | 0.23 | | | | 0.04 | | | | 0.13 | | | | (0.16 | ) |
| Dividends and distributions to shareholders from: | | | | | | | | | | | | | | | | | | | | | | | | |
| Net investment income | | | (0.08 | ) | | | (0.11 | ) | | | (0.03 | ) | | | (0.07 | ) | | | (0.04 | ) | | | (0.08 | ) |
| Net realized capital gains | | | (0.01 | ) | | | — | | | | (0.02 | ) | | | (0.03 | ) | | | (0.02 | ) | | | (0.06 | ) |
| Total dividends and distributions to shareholders | | | (0.09 | ) | | | (0.11 | ) | | | (0.05 | ) | | | (0.10 | ) | | | (0.06 | ) | | | (0.14 | ) |
| Net asset value, end of period | | $ | 10.14 | | | $ | 10.36 | | | $ | 10.43 | | | $ | 10.25 | | | $ | 10.31 | | | $ | 10.24 | |
Total investment return(2) | | | (1.25 | )%(4) | | | 0.39 | % | | | 2.26 | % | | | 0.37 | % | | | 1.34 | % | | | (1.50 | )% |
| | | | | | | | | | | | | | | | | | | | | | | | | |
| Ratio/Supplemental Data | | | | | | | | | | | | | | | | | | | | | | | | |
| Net assets, end of period (000’s omitted) | | $ | 2,689,932 | | | $ | 2,503,032 | | | $ | 2,126,457 | | | $ | 2,004,504 | | | $ | 1,824,633 | | | $ | 1,316,799 | |
Ratio of expenses to average net assets(3) | | | 0.55 | %(5) | | | 0.56 | % | | | 0.59 | % | | | 0.60 | % | | | 0.61 | % | | | 0.62 | % |
Ratio of net investment income/(loss) to average net assets(3) | | | 1.34 | %(5) | | | 0.94 | % | | | 0.54 | % | | | 0.55 | % | | | 0.37 | % | | | 0.52 | % |
| Portfolio turnover rate | | | 0 | %(4) | | | 0 | % | | | 31 | % | | | 2 | % | | | 0 | % | | | 0 | % |
(1) | The selected per share data is calculated using the average shares outstanding method for the period. |
(2) | Total investment return is calculated by assuming a purchase of shares on the first day and a sale of shares on the last day of each period reported and includes reinvestments of dividends and distributions, if any. |
(3) | The Fund also will indirectly bear its prorated share of expenses of the underlying funds. Such expenses are not included in the calculation of this ratio. |
The accompanying notes are an integral part of the financial statements.
17
FREE MARKET FUNDS
Notes to Financial Statements
February 28, 2018 (Unaudited)
1. | Organization and Significant Accounting Policies |
The RBB Fund, Inc. (“RBB” or the “Company”) was incorporated under the laws of the State of Maryland on February 29, 1988 and is registered under the Investment Company Act of 1940, as amended (the “1940 Act”), as an open-end management investment company. RBB is a “series fund,” which is a mutual fund divided into separate portfolios. Each portfolio is treated as a separate entity for certain matters under the 1940 Act, and for other purposes, and a shareholder of one portfolio is not deemed to be a shareholder of any other portfolio. Currently, RBB has twenty-nine active investment portfolios, including the Free Market U.S. Equity Fund, the Free Market International Equity Fund and the Free Market Fixed Income Fund (each a “Fund,” collectively the “Funds”). Each Fund operates as a “fund of funds” and commenced investment operations on December 31, 2007.
RBB has authorized capital of one hundred billion shares of common stock of which 87.023 billion shares are currently classified into one hundred and eighty-one classes of common stock. Each class represents an interest in an active or inactive RBB investment portfolio.
Free Market U.S. Equity and Free Market International Equity’s investment objective is to seek long-term capital appreciation. Free Market Fixed Income’s investment objective is to seek total return (consisting of current income and capital appreciation).
The Funds are investment companies and follow accounting and reporting guidance in the Financial Accounting Standards Board (FASB) Accounting Standards Codification Topic 946 “Financial Services - Investment Companies”.
The end of the reporting period for the Funds is February 28, 2018, and the period covered by these Notes to Financial Statements is the six months ended February 28, 2018 (the “current fiscal period”).
PORTFOLIO VALUATION — Investments in the underlying funds are valued at each Fund’s net asset value (“NAV”) determined as of the close of business on the New York Stock Exchange (generally 4:00 p.m. Eastern time). As required, some securities and assets may be valued at fair value as determined in good faith by the Company’s Board of Directors (the “Board”). Direct investments in fixed income securities are valued using an independent pricing service, which considers such factors as security prices, yields, maturities and ratings, and are deemed representative of market values at the close of the market.
FAIR VALUE MEASUREMENTS — The inputs and valuation techniques used to measure the fair value of the Funds’ investments are summarized into three levels as described in the hierarchy below:
| | ● | Level 1— Prices are determined using quoted prices in active markets for identical securities. |
| | ● | Level 2— Prices are determined using other significant observable inputs (including quoted prices for similar securities, interest rates, prepayment speeds, credit risk, etc.). |
| | ● | Level 3— Prices are determined using significant unobservable inputs (including the Funds’ own assumptions in determining the fair value of investments). |
The inputs or methodologies used for valuing securities are not necessarily an indication of the risk associated with investing in those securities.
18
FREE MARKET FUNDS
Notes to Financial Statements (Continued)
February 28, 2018 (Unaudited)
The following is a summary of the inputs used, as of the end of the reporting period, in valuing the Funds’ investments carried at fair value:
FREE MARKET U.S. EQUITY FUND
| | | Total | | | Level 1 | | | Level 2 | | | Level 3 | |
| Domestic Equity Funds | | $ | 3,044,719,029 | | | $ | 3,044,719,029 | | | $ | — | | | $ | — | |
| Short-Term Investment | | | 4,664,782 | | | | 4,664,782 | | | | — | | | | — | |
| Total Investments* | | $ | 3,049,383,811 | | | $ | 3,049,383,811 | | | $ | — | | | $ | — | |
* | Please refer to the Portfolio of Investments for further details. |
FREE MARKET INTERNATIONAL EQUITY FUND
| | | Total | | | Level 1 | | | Level 2 | | | Level 3 | |
| International Equity Funds | | $ | 2,363,100,142 | | | $ | 2,130,676,068 | | | $ | 232,424,074 | | | $ | — | |
| Short-Term Investment | | | 3,470,030 | | | | 3,470,030 | | | | — | | | | — | |
| Total Investments* | | $ | 2,366,570,172 | | | $ | 2,134,146,098 | | | $ | 232,424,074 | | | $ | — | |
* | Please refer to the Portfolio of Investments for further details. |
FREE MARKET FIXED INCOME FUND
| | | Total | | | Level 1 | | | Level 2 | | | Level 3 | |
| Fixed Income Funds | | $ | 2,675,688,886 | | | $ | 2,675,688,886 | | | $ | — | | | $ | — | |
| Short-Term Investment | | | 12,320,331 | | | | 12,320,331 | | | | — | | | | — | |
| Total Investments* | | $ | 2,688,009,217 | | | $ | 2,688,009,217 | | | $ | — | | | $ | — | |
* | Please refer to the Portfolio of Investments for further details. |
At the end of each quarter, management evaluates the classification of Levels 1, 2 and 3 assets and liabilities. Various factors are considered, such as changes in liquidity from the prior reporting period; whether or not a broker is willing to execute at the quoted price; the depth and consistency of prices from third party pricing services; and the existence of contemporaneous, observable trades in the market. Additionally, management evaluates the classification of Level 1 and Level 2 assets and liabilities on a quarterly basis for changes in listings or delistings on national exchanges.
Due to the inherent uncertainty of determining the fair value of investments that do not have a readily available market value, the fair value of the Funds’ investments may fluctuate from period to period. Additionally, the fair value of investments may differ significantly from the values that would have been used had a ready market existed for such investments and may differ materially from the values the Funds may ultimately realize. Further, such investments may be subject to legal and other restrictions on resale or otherwise less liquid than publicly traded securities.
For fair valuations using significant unobservable inputs, U.S. generally accepted accounting principles (“U.S. GAAP”) requires each Fund to present a reconciliation of the beginning to ending balances for reported market values that presents changes attributable to total realized and unrealized gains or losses, purchase and sales, and transfers in and out of Level 3 during the period. Transfers in and out between levels are based on values at the end of the period. U.S. GAAP also requires the Funds to disclose amounts and reasons for all transfers in and out of Level 1 and Level 2 fair value measurements. A reconciliation of Level 3 investments is presented only when a Fund had an amount of Level 3 investments at the end of the
19
FREE MARKET FUNDS
Notes to Financial Statements (Continued)
February 28, 2018 (Unaudited)
reporting period that was meaningful in relation to its net assets. The amounts and reasons for all transfers in and out of each level within the three-tier hierarchy are disclosed when a Fund had an amount of total transfers during the reporting period that was meaningful in relation to its net assets as of the end of the reporting period.
During the current fiscal period, the Funds had no transfers between Levels 1, 2 and 3.
USE OF ESTIMATES — The preparation of financial statements in conformity with U.S. GAAP requires management to make estimates and assumptions that affect the reported amounts of assets and liabilities and disclosure of contingent assets and liabilities at the date of the financial statements and the reported amounts of revenues and expenses during the reporting period. Actual results could differ from those estimates and those differences could be significant.
INVESTMENT TRANSACTIONS, INVESTMENT INCOME AND EXPENSES — The Funds record security transactions based on trade date for financial reporting purposes. The cost of investments sold is determined by use of the specific identification method for both financial reporting and income tax purposes in determining realized gains and losses on investments. Interest income is accrued when earned. Dividend income is recorded on the ex-dividend date. Distributions received on securities that represent a return of capital or capital gain are recorded as a reduction of cost of investments and/or as a realized gain. The Funds estimate the components of distributions received that may be considered return of capital distributions or capital gain distributions. Each Fund’s investment income, expenses (other than class specific expenses) and unrealized and realized gains and losses are allocated daily to each class of shares based upon the relative proportion of net assets of each class at the beginning of the day. Expenses incurred on behalf of a specific class, fund or fund family of the Company are charged directly to the class, fund or fund family (in proportion to net assets). Expenses incurred for all of the RBB funds (such as director or professional fees) are charged to all funds in proportion to their average net assets of RBB, or in such other manner as the Board deems fair or equitable. Expenses and fees, including investment advisory and administration fees, are accrued daily and taken into account for the purpose of determining the NAV of the Funds. In addition to the net annual operating expenses that the Funds bear directly, the shareholders indirectly bear the Funds’ pro-rata expenses of the underlying mutual funds in which each Fund invests.
DIVIDENDS AND DISTRIBUTIONS TO SHAREHOLDERS — Dividends from net investment income and distributions from net realized capital gains, if any, are declared and paid at least annually to shareholders recorded on the ex-dividend date for each Fund with the exception of the Free Market Fixed Income Fund which declares and pays quarterly dividends from net investment income. Income dividends and capital gain distributions are determined in accordance with U.S. federal income tax regulations, which may differ from U.S. GAAP.
U.S. TAX STATUS — No provision is made for U.S. income taxes as it is each Fund’s intention to continue to qualify for and elect the tax treatment applicable to regulated investment companies under Subchapter M of the Internal Revenue Code of 1986, as amended, and make the requisite distributions to its shareholders which will be sufficient to relieve it from U.S. income and excise taxes.
CASH AND CASH EQUIVALENTS — Cash and cash equivalents are valued at cost plus accrued interest, which approximates market value.
OTHER — In the normal course of business, the Funds may enter into contracts that provide general indemnifications. Each Fund’s maximum exposure under these arrangements is dependent on claims that may be made against the Funds in the future, and, therefore, cannot be estimated; however, based on experience, the risk of material loss for such claims is considered remote.
20
FREE MARKET FUNDS
Notes to Financial Statements (Continued)
February 28, 2018 (Unaudited)
2. | Investment Adviser and Other Services |
Matson Money, Inc. (“Matson Money” or the “Adviser”), serves as the investment adviser to each Fund. Each Fund compensates the Adviser for its services at an annual rate based on each Fund’s average daily net assets (the “Advisory Fee”), payable on a monthly basis in arrears, as shown in the following table.
| average daily net assets | advisory fee |
| For the first $1 billion | 0.50% |
| Over $1 billion to $5 billion | 0.49 |
| Over $5 billion | 0.47 |
The Adviser has voluntarily agreed to waive advisory fees and/or reimburse expenses to the extent that total annual Fund operating expenses exceed the rates (“Expense Caps”) shown in the following table annually of each Fund’s average daily net assets. The Adviser may not recoup waived advisory fees or reimbursed expenses. The Adviser may discontinue these arrangements at any time.
| FUND | EXPENSE CAPS |
| Free Market U.S. Equity Fund | 1.13% |
| Free Market International Equity Fund | 1.35 |
| Free Market Fixed Income Fund | 1.00 |
During the current fiscal period, investment advisory fees accrued were as follows:
| FUND | | ADVISORY FEES | |
| Free Market U.S. Equity Fund | | $ | 7,297,224 | |
| Free Market International Equity Fund | | | 5,679,444 | |
| Free Market Fixed Income Fund | | | 6,379,318 | |
U.S. Bancorp Fund Services, LLC (“USBFS”) serves as administrator for the Funds. For providing administrative and accounting services, USBFS is entitled to receive a monthly fee, subject to certain minimum and out of pocket expenses.
USBFS serves as the Funds’ transfer and dividend disbursing agent. For providing transfer agent services, USBFS is entitled to receive a monthly fee, subject to certain minimum and out of pocket expenses.
U.S. Bank, N.A. (the “Custodian”) provides certain custodial services to the Funds. The Custodian is entitled to receive a monthly fee, subject to certain minimum and out of pocket expenses.
Quasar Distributors, LLC serves as the principal underwriter and distributor of the Funds’ shares pursuant to a Distribution Agreement with RBB.
For compensation amounts payable to USBFS, please refer to the Statements of Operations.
3. | Director’s and Officer’s Compensation |
The Directors of the Company receive an annual retainer and meeting fees for meetings attended. Employees of Vigilant Compliance, LLC serve as President, Chief Compliance Officer and Assistant Treasurer of the Company. Vigilant Compliance, LLC is compensated for the services provided to the Company. An employee of RBB serves as Treasurer and Secretary and is compensated for services provided. Certain employees of USBFS serve as officers of the Company. They are not compensated by the Funds or the Company. For Director’s and Officer’s compensation amounts, please refer to the Statement of Operations.
21
FREE MARKET FUNDS
Notes to Financial Statements (Continued)
February 28, 2018 (Unaudited)
4. | Purchases and Sales of Investment Securities |
During the current fiscal period, aggregate purchases and sales of investment securities (excluding short-term investments) of the Funds were as follows:
| | | Purchases | | | Sales | |
| Free Market U.S. Equity Fund | | $ | 232,949,321 | | | $ | 18,000,000 | |
| Free Market International Equity Fund | | | 110,422,706 | | | | 30,977,508 | |
| Free Market Fixed Income Fund | | | 239,140,862 | | | | — | |
There were no purchases or sales of long-term U.S. Government securities during the current fiscal period.
5. | Federal Income Tax Information |
The Funds have followed the authoritative guidance on accounting for and disclosure of uncertainty in tax positions, which requires the Funds to determine whether a tax position is more likely than not to be sustained upon examination, including resolution of any related appeals or litigation processes, based on the technical merits of the position. The Funds have determined that there was no effect on the financial statements from following this authoritative guidance. In the normal course of business, the Funds are subject to examination by federal, state and local jurisdictions, where applicable, for tax years for which applicable statutes of limitations have not expired. The Funds are not aware of any tax positions for which it is reasonably possible that the total amounts of unrecognized tax benefits will significantly change in the next twelve months.
As of August 31, 2017, the federal tax cost and aggregate gross unrealized appreciation and depreciation of investments held by each Fund were as follows:
| | | Federal
Tax Cost | | | Unrealized
Appreciation | | | Unrealized
(Depreciation) | | | Net Unrealized Appreciation/ (Depreciation) | |
| Free Market U.S. Equity Fund | | $ | 2,007,489,201 | | | $ | 723,269,653 | | | $ | (7,692,146 | ) | | $ | 715,577,507 | |
| Free Market International Equity Fund | | | 1,830,178,921 | | | | 406,009,930 | | | | (46,892,883 | ) | | | 359,117,047 | |
| Free Market Fixed Income Fund | | | 2,494,680,060 | | | | 16,155,607 | | | | (7,971,649 | ) | | | 8,183,958 | |
Distributions to shareholders, if any, from net investment income and realized gains are determined in accordance with federal income tax regulations, which may differ from net investment income and realized gains recognized for financial reporting purposes. Accordingly, the character of distributions and composition of net assets for tax purposes may differ from those reflected in the accompanying financial statements. To the extent these differences are permanent, such amounts are reclassified within the capital accounts based on the tax treatment; temporary differences do not require such reclassification.
The following permanent differences as of August 31, 2017, primarily attributable to redesignation of dividends paid and reclassifications of short-term capital gain distributions, were reclassified to the following accounts:
| | | Undistributed
Net Investment
Income/(Loss) | | | Accumulated
Net Realized
Gain/(Loss) | | | Paid-In
Capital | |
| Free Market U.S. Equity Fund | | $ | 410,972 | | | $ | (410,972 | ) | | $ | — | |
| Free Market International Equity Fund | | | 370,444 | | | | (370,443 | ) | | | (1 | ) |
| Free Market Fixed Income Fund | | | 369,579 | | | | (369,579 | ) | | | — | |
22
FREE MARKET FUNDS
Notes to Financial Statements (Concluded)
February 28, 2018 (Unaudited)
As of August 31, 2017, the components of distributable earnings on a tax basis were as follows:
| | | Undistributed
Ordinary Income | | | Undistributed
Long-Term
Capital Gains | | | Unrealized
Appreciation/
(Depreciation) | |
| Free Market U.S. Equity Fund | | $ | 6,546,513 | | | $ | 79,677,926 | | | $ | 715,577,507 | |
| Free Market International Equity Fund | | | 10,272,498 | | | | 20,791,078 | | | | 359,117,047 | |
| Free Market Fixed Income Fund | | | 2,879,239 | | | | 2,537,822 | | | | 8,183,958 | |
The differences between the book and tax basis components of distributable earnings relate primarily to the timing of recognition of income and gains for federal income tax purposes. Short-term and foreign currency gains are reported as ordinary income for federal income tax purposes.
The tax character of distributions paid during the fiscal year ended August 31, 2017 were as follows:
| | | Ordinary
Income | | | Long-Term
Gains | | | Total | |
| Free Market U.S. Equity Fund | | $ | 21,140,849 | | | $ | 96,166,053 | | | $ | 117,306,902 | |
| Free Market International Equity Fund | | | 34,715,335 | | | | 19,714,628 | | | | 54,429,963 | |
| Free Market Fixed Income Fund | | | 23,810,742 | | | | — | | | | 23,810,742 | |
Distributions from net investment income and short-term capital gains are treated as ordinary income for federal income tax purposes.
Under the Regulated Investment Company Modernization Act of 2010, the Funds are permitted to carry forward capital losses incurred in taxable years beginning after December 22, 2010 for an unlimited period. Additionally, capital losses that are carried forward will retain their character as either short-term or long-term capital losses rather than being considered all short-term as under the previous law. As of the fiscal year ended August 31, 2017, the Funds did not have any capital loss carryforwards.
Management has evaluated the impact of all subsequent events on the Funds through the date the financial statements were issued and has determined that there were the following subsequent events:
Management of the Funds – Portfolio Managers
Effective April 20, 2018 (the “Effective Date”), Sean Babin will serve as a portfolio manager of the Funds. In addition, as of the Effective Date, Kenneth E. Gatliff will no longer serve as a portfolio manager for the Funds.
Investment Advisory Agreement
Effective as of March 1, 2018, the Adviser has contractually agreed to reduce the investment advisory fee payable by the Funds by implementing a new breakpoint.
Under the revised investment advisory agreement with the Company, the Adviser is entitled to an advisory fee at an annual rate based on each Fund’s average daily net assets (the “Advisory Fee”), payable on a monthly basis in arrears, as shown in the following table.
| AVERAGE DAILY NET ASSETS | ADVISORY FEE |
| For the first $1 billion | 0.50% |
| Over $1 billion to $3 billion | 0.49 |
| Over $3 billion to $5 billion | 0.48 |
| Over $5 billion | 0.47 |
23
FREE MARKET FUNDS
Other Information (Unaudited)
Proxy Voting
Policies and procedures that the Funds use to determine how to vote proxies relating to portfolio securities as well as information regarding how the Funds voted proxies relating to portfolio securities for the most recent twelve-month period ended June 30 are available without charge, upon request, by calling Free Market Funds at (866) 780-0357, ext. 3863 and on the Securities and Exchange Commission’s (“SEC”) website at http://www.sec.gov.
Quarterly Portfolio Schedules
The Company files a complete schedule of portfolio holdings with the SEC for the first and third fiscal quarters of each fiscal year (quarters ended November 30 and May 31) on Form N-Q. The Company’s Form N-Q is available on the SEC website at http://www.sec.gov and may be reviewed and copied at the SEC Public Reference Room in Washington, D.C. Information on the operation of the SEC Public Reference Room may be obtained by calling (800) SEC-0330.
24
[THIS PAGE INTENTIONALLY LEFT BLANK]
[THIS PAGE INTENTIONALLY LEFT BLANK]
Investment Adviser
Matson Money, Inc.
5955 Deerfield Blvd.
Mason, OH 45040
Administrator and Transfer Agent
U.S. Bancorp Fund Services, LLC
P.O. Box 701
Milwaukee, WI 53201
Principal Underwriter
Quasar Distributors, LLC
777 East Wisconsin Avenue, Floor 6
Milwaukee, WI 53202
Custodian
U.S. Bank, N.A.
1555 North Rivercenter Drive, Suite 302
Milwaukee, WI 53212
Independent Registered Public Accounting Firm
PricewaterhouseCoopers LLP
Two Commerce Square, Suite 1800
2001 Market Street
Philadelphia, PA 19103-7042
Legal Counsel
Drinker Biddle & Reath LLP
One Logan Square, Suite 2000
Philadelphia, PA 19103-6996
FMFI-SAR18
MATSON MONEY U.S. EQUITY VI PORTFOLIO
MATSON MONEY INTERNATIONAL EQUITY VI PORTFOLIO
MATSON MONEY FIXED INCOME VI PORTFOLIO
of
The RBB Fund, Inc.
SEMI-Annual Report
February 28, 2018
(Unaudited)
This report is submitted for the general information of the shareholders of the Portfolios. It is not authorized for distribution unless preceded or accompanied by a current prospectus for the Portfolios.
MATSON MONEY VI PORTFOLIOS
Semi-Annual Investment Adviser’s Report
February 28, 2018 (Unaudited)
Dear Shareholder,
The Matson Money VI Funds (the “Funds”) have continued to gain assets since their launch in February 2014 and have surpassed the $66 million mark. We would like to extend a warm and grateful thank you to all investors who have embraced our Free Market Portfolio Strategies.
Over the past six months ended February 28, 2018, investors experienced broad based positive returns in the equity markets. International equity markets over the past six months have seen a steady increase, returning 6.59% as measured by the MSCI World ex USA Index. Emerging markets and international small cap stocks performed even better during the time-period, returning 10.58% and 10.59% respectively as measured by the MSCI Emerging Markets and MSCI EAFE Small Cap Indices. U.S. stocks outpaced international stocks, over the same time-period, with large stocks returning 10.84% as represented by the S&P 500® Index. Small cap stocks in the U.S. were right on the heels of U.S. large cap stocks, returning 8.29% as measured by the Russell 2000® Index. In contrast to the broad equity markets, rising interest rates drove bond markets negative over the last six months, with the World Government Bond Index posting a loss of 0.32%.
Matson Money, Inc. (“Matson Money”) strives to deliver the performance of capital markets and add value through Free Market Investment strategies and Structured Market Portfolios. Grounded in the conviction that Free Markets work, Matson Money avoids the cost-generating activity of stock picking and market timing. Instead, we focus on the dimensions of capital markets that we believe reward investors as intelligently and effectively as possible. Our disciplined approach to life-long investing aims to provide both the individual investor and the financial professional with the academic foundation upon which to help achieve investment goals.
In the landmark study done by Eugene Fama and Kenneth French and published in “The Cross-Section of Expected Stock Returns”1 it is documented that, over the long term, investors could have received a premium for investing in small cap stocks and value stocks. These returns seem to be compensation for risk. In fixed income, risk as measured by volatility can be well described by bond maturity and credit quality. Matson Money’s vehicles deliberately seek to target specific risk and return tradeoffs. The Funds are broadly diversified and designed to work together in your total investment plan.
We invite you to contact your financial professional or explore our website, www.MatsonMoney.com, to learn more about the concepts and strategies of Matson Money’s investing.
We appreciate your support and confidence in our firm’s investment philosophy, process and people.

Kenneth E. Gatliff
Portfolio Manager
Matson Money, Inc.
1 | Fama, E.F. and K. R. French. 1992. “The Cross-section of Expected Stock Returns”. The Journal of Finance. 47: 427–465. |
1
MATSON MONEY VI PORTFOLIOS
Semi-Annual Investment Adviser’s Report (CONCLUDED)
February 28, 2018 (Unaudited)
The Russell 2000® Index consists of the smallest 2,000 companies in a group of 3,000 U.S. companies in the Russell 3000® Index, as ranked by market capitalization.
The S&P 500® Index is a broad based unmanaged index of 500 stocks, which is widely recognized as representative of the equity market in general.
The MSCI Emerging Markets Index captures large and mid cap representation across 24 Emerging Markets (EM) countries. With 842 constituents, the index covers approximately 85% of the free float-adjusted market capitalization in each country.
The MSCI EAFE Small Cap Index is an equity index which captures small cap representation across Developed Markets countries around the world, excluding the US and Canada. With 2,288 constituents, the index covers approximately 14% of the free float-adjusted market capitalization in each country.
The MSCI World ex USA Index captures large and mid cap representation across 22 of 23 Developed Markets (DM) countries--excluding the United States. With 1,018 constituents, the index covers approximately 85% of the free float-adjusted market capitalization in each country
The World Government Bond Index (WGBI) measures the performance of fixed-rate, local currency, investment grade sovereign bonds. The WGBI is a widely used benchmark that currently comprises sovereign debt from over 20 countries, denominated in a variety of currencies, and has more than 25 years of history available. The WGBI provides a broad benchmark for the global sovereign fixed income market. Sub-indices are available in any combination of currency, maturity, or rating.
One cannot invest directly in an index.
Must be preceded or accompanied by a prospectus.
Mutual fund investing involves risk. Principal loss is possible. Investing in micro-cap or small cap companies involve additional risks such as limited liquidity and greater volatility than large companies. The Fund invests in foreign securities which involve greater volatility and political, economic and currency risks and differences in accounting methods. These risks are greater in emerging markets. Investments in debt securities typically decrease in value when interest rates rise. This risk is usually greater for longer-term debt securities.
Shares of the Funds are distributed by Quasar Distributors, LLC.
2
MATSON MONEY VI PORTFOLIOS
Performance Data
February 28, 2018 (Unaudited)
Matson Money U.S. Equity VI Portfolio
Total Returns for the Periods Ended February 28, 2018 |
| | | Average Annual |
| | Six
Months* | 1 Year | Since
Inception |
Matson Money U.S. Equity VI Portfolio | 9.20% | 9.35% | 8.44%** |
Russell 2500® Index | 8.71% | 11.17% | 8.27%**** |
Composite Index*** | 7.90% | 9.55% | 9.19%**** |
** | The Portfolio commenced operations on February 18, 2014. |
*** | The Composite Index is comprised of the S&P 500® Index, Russell 1000® Value Index, Russell 2000® Index and Russell 2000® Value Index, weighted 25%, 25%, 25% and 25%, respectively. |
**** | Index information is not available as of the date of the inception of the Portfolio. The average annual returns for the Russell 2500® Index and the Composite Index are presented as of March 1, 2014. If the Portfolio had commenced operations on March 1, 2014, its average annual return since inception would have been 8.06%. |
The performance data quoted represents past performance. Past performance is not indicative of future results. Investment return and principal value will fluctuate so that an investor’s shares, when redeemed, may be worth more or less than their original cost. Current performance may be lower or higher. Returns shown include the reinvestment of all dividends and other distributions and do not reflect taxes that a shareholder would pay on Portfolio distributions or on the redemption of Portfolio shares. For performance data current to the most recent month-end, please call 1-866-780-0357 ext. 3863. The Portfolio’s annual operating expense ratio, as stated in the current prospectus is 1.08% (included in the ratio is 0.27% attributable to acquired fund fees and expenses).
The Portfolio’s aggregate total return since inception is based on an increase in net asset value from $25.00 per share on February 18, 2014 (commencement of operations) to $30.25 per share on February 28, 2018.
Portfolio composition is subject to change.
The Matson Money U.S. Equity VI Portfolio’s underlying funds invest in small-cap and micro-cap stocks, large-cap stocks and other equity securities. In addition to the ordinary risks of equity investing, small companies entail special risk. Small companies tend to have more risk than large companies. An investor in the Portfolio will incur the expenses of the underlying funds in addition to the Portfolio’s expenses.
3
MATSON MONEY VI PORTFOLIOS
Performance Data
February 28, 2018 (Unaudited)
Matson Money International Equity VI Portfolio
Total Returns for the Periods Ended February 28, 2018 |
| | | Average Annual |
| | Six
Months* | 1 Year | Since
Inception |
Matson Money International Equity VI Portfolio | 7.44% | 20.73% | 5.12%** |
MSCI World (excluding U.S.) Index | 6.60% | 18.87% | 3.92%**** |
Composite Index*** | 8.80% | 24.01% | 5.97%**** |
** | The Portfolio commenced operations on February 18, 2014. |
*** | The Composite Index is comprised of the MSCI EAFE Index, MSCI EAFE Value Index, MSCI EAFE Small Company Index, and MSCI Emerging Markets Index, weighted 25%, 25%, 25% and 25%, respectively. |
**** | Index information is not available as of the date of the inception of the Portfolio. The average annual returns for the MSCI World (excluding U.S.) Index and the Composite Index are presented as of March 1, 2014. If the Portfolio had commenced operations on March 1, 2014, its average annual return since inception would have been 4.75%. |
The performance data quoted represents past performance. Past performance is not indicative of future results. Investment return and principal value will fluctuate so that an investor’s shares, when redeemed, may be worth more or less than their original cost. Current performance may be lower or higher. Returns shown include the reinvestment of all dividends and other distributions and do not reflect taxes that a shareholder would pay on Portfolio distributions or on the redemption of Portfolio shares. For performance data current to the most recent month-end, please call 1-866-780-0357 ext. 3863. The Portfolio’s annual operating expense ratio, as stated in the current prospectus is 1.32% (included in the ratio is 0.44% attributable to acquired fund fees and expenses).
The Portfolio’s aggregate total return since inception is based on an increase in net asset value from $25.00 per share on February 18, 2014 (commencement of operations) to $27.79 per share on February 28, 2018.
Portfolio composition is subject to change.
The Matson Money International Equity VI Portfolio’s underlying funds invest in common stock, preferred stock, securities convertible into stocks and other equity securities issued by foreign companies. In addition to the ordinary risks of equity investing, foreign and small companies entail special risk. The return on foreign equities may be adversely affected by currency fluctuations. Emerging markets may be subject to social instability and lack of market liquidity. Small companies tend to have more risk than large companies. An investor in the Portfolio will incur the expenses of the underlying funds in addition to the Portfolio’s expenses.
4
MATSON MONEY VI PORTFOLIOS
Performance Data
February 28, 2018 (Unaudited)
Matson Money Fixed Income VI Portfolio
Total Returns for the Periods Ended February 28, 2018 |
| | | Average Annual |
| | Six
Months* | 1 Year | Since
Inception |
Matson Money Fixed Income VI Portfolio | -1.39% | -0.40% | 0.17%** |
Citigroup World Govt. Bond 1-5 Year Currency Hedged U.S. Dollar Index | -0.32% | 0.65% | 1.18%**** |
Composite Index*** | -1.11% | 0.27% | 1.03%**** |
** | The Portfolio commenced operations on February 18, 2014. |
*** | The Composite Index is comprised of the Three-Month Treasury Bill Index, Barclays Capital Intermediate Government Bond Index, BofA Merrill Lynch 1-3 Year US Government/Corporate Index and Bloomberg Barclays Aggregate Bond Index, weighted 25%, 25%, 25% and 25%, respectively. |
**** | Index information is not available as of the date of the inception of the Portfolio. The average annual returns for the Citigroup World Govt. Bond 1-5 Year Currency Hedged U.S. Dollar Index and the Composite Index are presented as of March 1, 2014. If the Portfolio had commenced operations on March 1, 2014, its average annual return since inception would have been 0.11%. |
The performance data quoted represents past performance. Past performance is not indicative of future results. Investment return and principal value will fluctuate so that an investor’s shares, when redeemed, may be worth more or less than their original cost. Current performance may be lower or higher. Returns shown include the reinvestment of all dividends and other distributions and do not reflect taxes that a shareholder would pay on Portfolio distributions or on the redemption of Portfolio shares. For performance data current to the most recent month-end, please call 1-866-780-0357 ext. 3863. The Portfolio’s annual operating expense ratio, as stated in the current prospectus is 0.95% (included in the ratio is 0.18% attributable to acquired fund fees and expenses).
The Portfolio’s aggregate total return since inception is based on a decrease in net asset value from $25.00 per share on February 18, 2014 (commencement of operations) to $24.52 per share on February 28, 2018.
Portfolio composition is subject to change.
The Matson Money Fixed Income VI Portfolio’s underlying funds invest in fixed income securities. The underlying funds may invest their assets in bonds and other debt securities issued by domestic and foreign governments and companies. Debt instruments involve the risk that their prices will fall when interest rates rise, and they are subject to the risk that the borrower may default. In addition, the return on foreign debt securities may be adversely affected by currency fluctuations. An investor in the Portfolio will incur expenses of the underlying funds in addition to the Portfolio’s expenses.
5
MATSON MONEY VI PORTFOLIOS
Fund Expense ExampleS
February 28, 2018 (Unaudited)
As a shareholder of the Portfolio(s), you incur two types of costs: (1) transaction costs; and (2) ongoing costs, including management fees and other Portfolio expenses. These examples are intended to help you understand your ongoing costs (in dollars) of investing in the Portfolio(s) and to compare these costs with the ongoing costs of investing in other mutual funds.
These examples are based on an investment of $1,000 invested at the beginning of the six-month period from September 1, 2017 through February 28, 2018, and held for the entire period.
ACTUAL EXPENSES
The first line of the accompanying tables provides information about actual account values and actual expenses. You may use the information in this line, together with the amount you invested, to estimate the expenses that you paid over the period. Simply divide your account value by $1,000 (for example, an $8,600 account value divided by $1,000 = 8.6), then multiply the result by the number in the first line under the heading entitled “Expenses Paid During Period” to estimate the expenses you paid on your account during this period.
HYPOTHETICAL EXAMPLES FOR COMPARISON PURPOSES
The second line of the accompanying tables provides information about hypothetical account values and hypothetical expenses based on each Portfolio’s actual expense ratio and an assumed rate of return of 5% per year before expenses, which is not the Portfolio’s actual return. The hypothetical account values and expenses may not be used to estimate the actual ending account balance or expenses you paid for the period. You may use this information to compare the ongoing costs of investing in each Portfolio and other funds. To do so, compare these 5% hypothetical examples with the 5% hypothetical examples that appear in the shareholder reports of other funds.
Please note that the expenses shown in the accompanying tables are meant to highlight your ongoing costs only and do not reflect any transactional costs, such as redemption fees. Therefore, the second line of the accompanying tables is useful in comparing ongoing costs only and will not help you determine the relative total costs of owning different funds. In addition, if these transactional costs were included, your costs would have been higher.
| | Matson Money U.S. Equity VI Portfolio |
| | Beginning
Account Value
September 1, 2017 | Ending
Account Value
February 28, 2018 | Expenses Paid
During Period* |
Actual | $1,000.00 | $ 1,092.00 | $4.05 |
Hypothetical (5% return before expenses) | 1,000.00 | 1,020.93 | 3.91 |
| | Matson Money International Equity VI Portfolio |
| | Beginning
Account Value
September 1, 2017 | Ending
Account Value
February 28, 2018 | Expenses Paid
During Period* |
Actual | $1,000.00 | $ 1,074.40 | $4.37 |
Hypothetical (5% return before expenses) | 1,000.00 | 1,020.58 | 4.26 |
6
MATSON MONEY VI PORTFOLIOS
Fund Expense ExampleS (Concluded)
February 28, 2018 (Unaudited)
| | Matson Money Fixed Income VI Portfolio |
| | Beginning
Account Value
September 1, 2017 | Ending
Account Value
February 28, 2018 | Expenses Paid
During Period* |
Actual | $1,000.00 | $ 986.10 | $3.79 |
Hypothetical (5% return before expenses) | 1,000.00 | 1,020.98 | 3.86 |
* | Expenses are equal to an annualized six-month expense ratio of 0.78%, 0.85% and 0.77% for Matson Money U.S. Equity VI Portfolio, Matson Money International Equity VI Portfolio and Matson Money Fixed Income VI Portfolio, respectively, multiplied by the average account value over the period, multiplied by the number of days (181) in the most recent fiscal half-year, then divided by 365 to reflect the one-half year period. The annualized expense ratios do not reflect fees and expenses associated with the underlying funds. If such fees and expenses had been included, the expenses would have been higher. The range of weighted expense ratios of the underlying funds held by the Portfolios, as stated in the underlying funds’ current prospectuses, were as follows: |
| | Matson Money
U.S. Equity VI Portfolio | Matson Money International
Equity VI Portfolio | Matson Money Fixed Income VI Portfolio |
| | 0.01%-0.08% | 0.01%-0.19% | 0.01%-0.05% |
Each Portfolio’s ending account values on the first line in each table are based on the actual six-month total return for each Portfolio of 9.20% for Matson Money U.S. Equity VI Portfolio, 7.44% for the Matson Money International Equity VI Portfolio and -1.39% for the Matson Money Fixed Income VI Portfolio.
7
MATSON MONEY VI PORTFOLIOS
MATSON MONEY U.S. EQUITY VI PORTFOLIO
Portfolio of Investments
February 28, 2018 (Unaudited)
| | | Number
of Shares | | | Value | |
| DOMESTIC EQUITY FUNDS — 98.7% | | | |
| U.S. Large Cap Value Portfolio III (b) | | | 215,207 | | | $ | 5,808,433 | |
| U.S. Large Company Portfolio (b) | | | 143,654 | | | | 3,029,655 | |
| U.S. Micro Cap Portfolio (a) | | | 155,049 | | | | 3,335,104 | |
| U.S. Small Cap Portfolio (a) | | | 94,751 | | | | 3,323,864 | |
| U.S. Small Cap Value Portfolio (a) | | | 60,453 | | | | 2,218,013 | |
| VA U.S. Large Value Portfolio (a) | | | 32,945 | | | | 884,250 | |
| VA U.S. Targeted Value Portfolio (a) | | | 173,693 | | | | 3,329,686 | |
| TOTAL DOMESTIC EQUITY FUNDS | | | | | | | | |
| (Cost $19,742,856) | | | | | | | 21,929,005 | |
| | | | | | | | | |
| SHORT-TERM INVESTMENTS — 1.3% | | | | | | | | |
| STIT-Government & Agency Portfolio, 1.30%* | | | 287,214 | | | | 287,214 | |
| TOTAL SHORT-TERM INVESTMENTS | | | | | | | | |
| (Cost $287,214) | | | | | | | 287,214 | |
| TOTAL INVESTMENTS — 100.0% | | | | | | | | |
| (Cost $20,030,070) | | | | | | | 22,216,219 | |
| LIABILITIES IN EXCESS OF OTHER ASSETS — 0.0% | | | | | | | (7,823 | ) |
| NET ASSETS — 100.0% | | | | | | $ | 22,208,396 | |
| Portfolio Holdings Summary Table |
| | | % of
Net Assets | | | Value | |
| Domestic Equity Funds | | | 98.7 | % | | $ | 21,929,005 | |
| Short-Term Investments | | | 1.3 | | | | 287,214 | |
| Other Assets In Excess Of Liabilities | | | 0.0 | | | | (7,823 | ) |
| NET ASSETS | | | 100.0 | % | | $ | 22,208,396 | |
* | Seven-day yield as of February 28, 2018. |
(a) | A portfolio of DFA Investment Dimensions Group Inc. |
(b) | A portfolio of Dimensional Investment Group Inc. |
Portfolio holdings are subject to change at any time.
The accompanying notes are an integral part of the financial statements.
8
MATSON MONEY VI PORTFOLIOS
MATSON MONEY INTERNATIONAL EQUITY VI PORTFOLIO
Portfolio of Investments
February 28, 2018 (Unaudited)
| | | Number
of Shares | | | Value | |
| INTERNATIONAL EQUITY FUNDS — 99.3% | | | |
| DFA International Small Cap Value Portfolio (a) | | | 201,827 | | | $ | 4,601,646 | |
| DFA International Value Portfolio III (b) | | | 281,749 | | | | 4,888,339 | |
| Emerging Markets Portfolio (a) | | | 27,661 | | | | 862,757 | |
| Emerging Markets Small Cap Portfolio (a) | | | 33,067 | | | | 805,184 | |
| Emerging Markets Value Portfolio (a) | | | 24,680 | | | | 798,642 | |
| Large Cap International Portfolio (a) | | | 27,196 | | | | 648,075 | |
| VA International Small Portfolio (a) | | | 198,143 | | | | 2,789,859 | |
| VA International Value Portfolio (a) | | | 58,870 | | | | 804,167 | |
| TOTAL INTERNATIONAL EQUITY FUNDS | | | | | | | | |
| (Cost $13,787,383) | | | | | | | 16,198,669 | |
| | | | | | | | | |
| SHORT-TERM INVESTMENTS — 0.8% | | | | | | | | |
| STIT-Government & Agency Portfolio, 1.30%* | | | 133,216 | | | | 133,216 | |
| TOTAL SHORT-TERM INVESTMENTS | | | | | | | | |
| (Cost $133,216) | | | | | | | 133,216 | |
| TOTAL INVESTMENTS — 100.1% | | | | | | | | |
| (Cost $13,920,599) | | | | | | | 16,331,885 | |
| LIABILITIES IN EXCESS OF OTHER ASSETS — (0.1)% | | | | | | | (14,148 | ) |
| NET ASSETS — 100.0% | | | | | | $ | 16,317,737 | |
| Portfolio Holdings Summary Table |
| | | % of
Net Assets | | | Value | |
| International Equity Funds | | | 99.3 | % | | $ | 16,198,669 | |
| Short-Term Investments | | | 0.8 | | | | 133,216 | |
| Other Assets In Excess Of Liabilities | | | (0.1 | ) | | | (14,148 | ) |
| NET ASSETS | | | 100.0 | % | | $ | 16,317,737 | |
* | Seven-day yield as of February 28, 2018. |
(a) | A portfolio of DFA Investment Dimensions Group Inc. |
(b) | A portfolio of Dimensional Investment Group Inc. |
Portfolio holdings are subject to change at any time.
The accompanying notes are an integral part of the financial statements.
9
MATSON MONEY VI PORTFOLIOS
MATSON MONEY FIXED INCOME VI PORTFOLIO
Portfolio of Investments
February 28, 2018 (Unaudited)
| | | Number
of Shares | | | Value | |
| FIXED INCOME FUNDS — 98.5% | | | |
| DFA Five-Year Global Fixed Income Portfolio (a) | | | 262,274 | | | $ | 2,829,935 | |
| DFA Inflation Protected Securities Portfolio (a) | | | 123,545 | | | | 1,420,763 | |
| DFA Intermediate Government Fixed Income Portfolio (a) | | | 141,059 | | | | 1,701,167 | |
| DFA One-Year Fixed Income Portfolio (a) | | | 316,632 | | | | 3,245,474 | |
| DFA Short-Term Government Portfolio (a) | | | 107,973 | | | | 1,127,234 | |
| DFA Two-Year Global Fixed Income Portfolio (a) | | | 429,266 | | | | 4,236,851 | |
iShares 1-3 Year Credit
Bond ETF | | | 65,264 | | | | 6,778,319 | |
| iShares Intermediate Credit Bond ETF | | | 15,792 | | | | 1,694,166 | |
| VA Global Bond Portfolio (a) | | | 402,246 | | | | 4,243,692 | |
| VA Short-Term Fixed Income Portfolio (a) | | | 55,643 | | | | 565,333 | |
| TOTAL FIXED INCOME FUNDS | | | | | | | | |
| (Cost $28,368,615) | | | | | | | 27,842,934 | |
| | | | | | | | | |
| SHORT-TERM INVESTMENTS — 1.4% | | | | | | | | |
| STIT-Government & Agency Portfolio, 1.30%* | | | 409,369 | | | | 409,369 | |
| TOTAL SHORT-TERM INVESTMENTS | | | | | | | | |
| (Cost $409,369) | | | | | | | 409,369 | |
| TOTAL INVESTMENTS — 99.9% | | | | | | | | |
| (Cost $28,777,984) | | | | | | | 28,252,303 | |
| OTHER ASSETS IN EXCESS OF LIABILITIES — 0.1% | | | | | | | 9,040 | |
| NET ASSETS — 100.0% | | | | | | $ | 28,261,343 | |
| Portfolio Holdings Summary Table |
| | | % of
Net Assets | | | Value | |
| Fixed Income Funds | | | 98.5 | % | | $ | 27,842,934 | |
| Short-Term Investments | | | 1.4 | | | | 409,369 | |
| Other Assets In Excess Of Liabilities | | | 0.1 | | | | 9,040 | |
| NET ASSETS | | | 100.0 | % | | $ | 28,261,343 | |
| * | Seven-day yield as of February 28, 2018. |
| (a) | A portfolio of DFA Investment Dimensions Group Inc. |
Portfolio holdings are subject to change at any time.
The accompanying notes are an integral part of the financial statements.
10
MATSON MONEY VI PORTFOLIOS
Statements of Assets and Liabilities
February 28, 2018 (Unaudited)
| | | Matson Money
U.S. Equity
VI Portfolio | | | Matson Money
International Equity
VI Portfolio | | | Matson Money
Fixed Income
VI Portfolio | |
| ASSETS | | | | | | | | | |
| Investments in non-affiliated funds, at value * | | $ | 21,929,005 | | | $ | 16,198,669 | | | $ | 27,842,934 | |
| Short-term investments, at value * | | | 287,214 | | | | 133,216 | | | | 409,369 | |
| Receivables | | | | | | | | | | | | |
| Receivable for capital shares sold | | | 30,820 | | | | 18,658 | | | | 45,326 | |
| Dividends receivable | | | 290 | | | | 135 | | | | 3,953 | |
| Prepaid expenses and other assets | | | 241 | | | | 192 | | | | 285 | |
| Total assets | | | 22,247,570 | | | | 16,350,870 | | | | 28,301,867 | |
| | | | | | | | | | | | | |
| LIABILITIES | | | | | | | | | | | | |
| Payables | | | | | | | | | | | | |
| Advisory fees | | | 8,587 | | | | 6,325 | | | | 10,787 | |
| Transfer agent fees | | | 3,854 | | | | — | | | | 173 | |
| Administration and accounting fees | | | 709 | | | | 437 | | | | 766 | |
| Capital shares redeemed | | | 449 | | | | 401 | | | | 59 | |
| Other accrued expenses and liabilities | | | 25,575 | | | | 25,970 | | | | 28,739 | |
| Total liabilities | | | 39,174 | | | | 33,133 | | | | 40,524 | |
| Net assets | | $ | 22,208,396 | | | $ | 16,317,737 | | | | 28,261,343 | |
| | | | | | | | | | | | | |
| NET ASSETS CONSIST OF: | | | | | | | | | | | | |
| Par Value | | $ | 734 | | | $ | 587 | | | $ | 1,153 | |
| Paid-in capital | | | 19,170,662 | | | | 13,962,047 | | | | 28,798,842 | |
| Undistributed/accumulated net investment income/(loss) | | | (134,870 | ) | | | (43,511 | ) | | | (859 | ) |
| Accumulated net realized gain/(loss) from investments | | | 985,721 | | | | (12,672 | ) | | | (12,112 | ) |
| Net unrealized appreciation/(depreciation) on investments | | | 2,186,149 | | | | 2,411,286 | | | | (525,681 | ) |
| Net assets | | $ | 22,208,396 | | | $ | 16,317,737 | | | $ | 28,261,343 | |
| Shares outstanding ($0.001 par value, 300,000,000 shares authorized) | | | 734,249 | | | | 587,127 | | | | 1,152,524 | |
| Net asset value, offering and redemption price per share | | $ | 30.25 | | | $ | 27.79 | | | $ | 24.52 | |
| *Identified Cost: | | | | | | | | | | | | |
| Investments in non-affiliated funds, at cost | | $ | 19,742,856 | | | $ | 13,787,383 | | | $ | 28,368,615 | |
| Short-term investments, at cost | | | 287,214 | | | | 133,216 | | | | 409,369 | |
The accompanying notes are an integral part of the financial statements.
11
MATSON MONEY VI PORTFOLIOS
Statements of Operations
For the Six Months Ended February 28, 2018 (Unaudited)
| | | Matson Money
U.S. Equity
VI Portfolio | | | Matson Money
International Equity
VI Portfolio | | | Matson Money
Fixed Income
VI Portfolio | |
| INVESTMENT INCOME | | | | | | | | | |
| Dividends from non-affiliated funds | | $ | 186,564 | | | $ | 299,410 | | | $ | 281,307 | |
| Total investment income | | | 186,564 | | | | 299,410 | | | | 281,307 | |
| | | | | | | | | | | | | |
| EXPENSES: | | | | | | | | | | | | |
| Advisory fees (Note 2) | | | 54,259 | | | | 39,391 | | | | 66,639 | |
| Audit fees | | | 17,443 | | | | 17,028 | | | | 18,408 | |
| Administration and accounting fees (Note 2) | | | 3,864 | | | | 3,170 | | | | 4,455 | |
| Printing and shareholder reporting fees | | | 3,063 | | | | 2,005 | | | | 5,447 | |
| Custodian fees (Note 2) | | | 2,613 | | | | 2,349 | | | | 2,606 | |
| Legal fees | | | 802 | | | | 581 | | | | 1,103 | |
| Officers fees | | | 261 | | | | 168 | | | | 370 | |
| Directors fees | | | 253 | | | | 342 | | | | 734 | |
| Transfer agent fees (Note 2) | | | 152 | | | | 299 | | | | 422 | |
| Other expenses | | | 1,908 | | | | 1,886 | | | | 2,050 | |
| Total expenses | | | 84,618 | | | | 67,219 | | | | 102,234 | |
| Net investment income/(loss) | | | 101,946 | | | | 232,191 | | | | 179,073 | |
| | | | | | | | | | | | | |
| NET REALIZED AND UNREALIZED GAIN/ (LOSS) FROM INVESTMENTS | | | | | | | | | | | | |
| Net realized gain/(loss) from: | | | | | | | | | | | | |
| Non-affiliated funds | | | 199,102 | | | | 67,105 | | | | 362 | |
| Capital gain distributions from non-affiliated fund investments | | | 964,245 | | | | 225,080 | | | | 5,388 | |
| Net change in unrealized appreciation/(depreciation) on: | | | | | | | | | | | | |
| Non-affiliated funds | | | 587,688 | | | | 610,187 | | | | (567,222 | ) |
| Net realized and unrealized gain/(loss) on investments | | | 1,751,035 | | | | 902,372 | | | | (561,472 | ) |
| NET INCREASE/(DECREASE) IN NET ASSETS RESULTING FROM OPERATIONS | | $ | 1,852,981 | | | $ | 1,134,563 | | | $ | (382,399 | ) |
The accompanying notes are an integral part of the financial statements.
12
MATSON MONEY U.S. EQUITY VI PORTFOLIO
Statements of Changes in Net Assets
| | | For the
Six Months Ended
February 28, 2018
(Unaudited) | | | For the
Year Ended
August 31, 2017 | |
| INCREASE/(DECREASE) IN NET ASSETS FROM OPERATIONS: | | | | | | |
| Net investment income/(loss) | | $ | 101,946 | | | $ | 93,335 | |
| Net realized gain/(loss) on investments | | | 1,163,347 | | | | 789,365 | |
| Net change in unrealized appreciation/(depreciation) on investments | | | 587,688 | | | | 1,460,177 | |
| Net increase/(decrease) in net assets resulting from operations | | | 1,852,981 | | | | 2,342,877 | |
| | | | | | | | | |
| DIVIDENDS AND DISTRIBUTIONS TO SHAREHOLDERS FROM: | | | | | | | | |
| Net investment income | | | (231,177 | ) | | | (135,895 | ) |
| Net realized capital gains | | | (885,944 | ) | | | (659,715 | ) |
| Net decrease in net assets from dividends and distributions to shareholders | | | (1,117,121 | ) | | | (795,610 | ) |
| | | | | | | | | |
| CAPITAL SHARE TRANSACTIONS: | | | | | | | | |
| Proceeds from shares sold | | | 2,209,417 | | | | 4,474,773 | |
| Reinvestment of distributions | | | 1,117,121 | | | | 795,610 | |
| Shares redeemed | | | (1,947,016 | ) | | | (4,215,874 | ) |
| Net increase/(decrease) in net assets from capital shares | | | 1,379,522 | | | | 1,054,509 | |
| Total increase/(decrease) in net assets | | | 2,115,382 | | | | 2,601,776 | |
| | | | | | | | | |
| NET ASSETS: | | | | | | | | |
| Beginning of period | | | 20,093,014 | | | | 17,491,238 | |
| End of period | | $ | 22,208,396 | | | $ | 20,093,014 | |
| Undistributed/accumulated net investment income/(loss), end of period | | $ | (134,870 | ) | | $ | (5,639 | ) |
| | | | | | | | | |
| SHARES TRANSACTIONS: | | | | | | | | |
| Shares sold | | | 71,986 | | | | 154,697 | |
| Dividends and distributions reinvested | | | 36,235 | | | | 27,789 | |
| Shares redeemed | | | (63,164 | ) | | | (146,000 | ) |
| Net increase/(decrease) in shares outstanding | | | 45,057 | | | | 36,486 | |
The accompanying notes are an integral part of the financial statements.
13
MATSON MONEY INTERNATIONAL EQUITY VI PORTFOLIO
Statements of Changes in Net Assets
| | | For the
Six Months Ended
February 28, 2018
(Unaudited) | | | For the
Year Ended
August 31, 2017 | |
| INCREASE/(DECREASE) IN NET ASSETS FROM OPERATIONS: | | | | | | |
| Net investment income/(loss) | | $ | 232,191 | | | $ | 167,928 | |
| Net realized gain/(loss) on investments | | | 292,185 | | | | (14,898 | ) |
| Net change in unrealized appreciation/(depreciation) on investments | | | 610,187 | | | | 2,625,450 | |
| Net increase/(decrease) in net assets resulting from operations | | | 1,134,563 | | | | 2,778,480 | |
| | | | | | | | | |
| DIVIDENDS AND DISTRIBUTIONS TO SHAREHOLDERS FROM: | | | | | | | | |
| Net investment income | | | (308,131 | ) | | | (247,347 | ) |
| Net realized capital gains | | | (135,929 | ) | | | (166,208 | ) |
| Net decrease in net assets from dividends and distributions to shareholders | | | (444,060 | ) | | | (413,555 | ) |
| | | | | | | | | |
| CAPITAL SHARE TRANSACTIONS: | | | | | | | | |
| Proceeds from shares sold | | | 1,477,531 | | | | 2,990,019 | |
| Reinvestment of distributions | | | 444,060 | | | | 413,555 | |
| Shares redeemed | | | (1,313,263 | ) | | | (3,317,091 | ) |
| Net increase/(decrease) in net assets from capital shares | | | 608,328 | | | | 86,483 | |
| Total increase/(decrease) in net assets | | | 1,298,831 | | | | 2,451,408 | |
| | | | | | | | | |
| NET ASSETS: | | | | | | | | |
| Beginning of period | | | 15,018,906 | | | | 12,567,498 | |
| End of period | | $ | 16,317,737 | | | $ | 15,018,906 | |
| Undistributed/accumulated net investment income/(loss), end of period | | $ | (43,511 | ) | | $ | 32,429 | |
| | | | | | | | | |
| SHARES TRANSACTIONS: | | | | | | | | |
| Shares sold | | | 53,540 | | | | 122,875 | |
| Dividends and distributions reinvested | | | 16,148 | | | | 18,446 | |
| Shares redeemed | | | (47,238 | ) | | | (134,269 | ) |
| Net increase/(decrease) in shares outstanding | | | 22,450 | | | | 7,052 | |
The accompanying notes are an integral part of the financial statements.
14
MATSON MONEY FIXED INCOME VI PORTFOLIO
Statements of Changes in Net Assets
| | | For the
Six Months Ended
February 28, 2018
(Unaudited) | | | For the
Year Ended
August 31, 2017 | |
| INCREASE/(DECREASE) IN NET ASSETS FROM OPERATIONS: | | | | | | |
| Net investment income/(loss) | | $ | 179,073 | | | $ | 168,173 | |
| Net realized gain/(loss) on investments | | | 5,750 | | | | 31,054 | |
| Net change in unrealized appreciation/(depreciation) on investments | | | (567,222 | ) | | | (115,652 | ) |
| Net increase/(decrease) in net assets resulting from operations | | | (382,399 | ) | | | 83,575 | |
| | | | | | | | | |
| DIVIDENDS AND DISTRIBUTIONS TO SHAREHOLDERS FROM: | | | | | | | | |
| Net investment income | | | (240,545 | ) | | | (107,491 | ) |
| Net realized capital gains | | | (35,480 | ) | | | (106,213 | ) |
| Net decrease in net assets from dividends and distributions to shareholders | | | (276,025 | ) | | | (213,704 | ) |
| | | | | | | | | |
| CAPITAL SHARE TRANSACTIONS: | | | | | | | | |
| Proceeds from shares sold | | | 3,716,473 | | | | 6,706,632 | |
| Reinvestment of distributions | | | 276,025 | | | | 213,703 | |
| Shares redeemed | | | (1,089,492 | ) | | | (2,700,382 | ) |
| Net increase/(decrease) in net assets from capital shares | | | 2,903,006 | | | | 4,219,953 | |
| Total increase/(decrease) in net assets | | | 2,244,582 | | | | 4,089,824 | |
| | | | | | | | | |
| NET ASSETS: | | | | | | | | |
| Beginning of period | | | 26,016,761 | | | | 21,926,937 | |
| End of period | | $ | 28,261,343 | | | $ | 26,016,761 | |
| Undistributed/accumulated net investment income/(loss), end of period | | $ | (859 | ) | | $ | 60,613 | |
| | | | | | | | | |
| SHARES TRANSACTIONS: | | | | | | | | |
| Shares sold | | | 149,457 | | | | 268,602 | |
| Dividends and distributions reinvested | | | 11,180 | | | | 8,634 | |
| Shares redeemed | | | (43,643 | ) | | | (108,026 | ) |
| Net increase/(decrease) in shares outstanding | | | 116,994 | | | | 169,210 | |
The accompanying notes are an integral part of the financial statements.
15
MATSON MONEY VI PORTFOLIOS
MATSON MONEY U.S. EQUITY VI PORTFOLIO
Financial Highlights
Contained below is per share operating performance data for each share outstanding, total investment return, ratios to average net assets and other supplemental data for the respective periods. This information has been derived from information provided in the financial statements. |
| | | For the
Six Months Ended
February 28, 2018
(Unaudited) | | | For the
Year Ended
August 31, 2017 | | | For the
Year Ended
August 31, 2016 | | | For the
Year Ended
August 31, 2015 | | | For the Period February 18, 2014(1) through
August 31, 2014 | |
| Per Share Operating Performance | | | | | | | | | |
| Net asset value, beginning of period | | $ | 29.15 | | | $ | 26.80 | | | $ | 25.65 | | | $ | 26.79 | | | $ | 25.00 | |
Net investment income/(loss)(2) | | | 0.14 | | | | 0.14 | | | | 0.19 | | | | 0.03 | | | | (0.06 | ) |
| Net realized and unrealized gain/(loss) on investments | | | 2.57 | | | | 3.44 | | | | 1.96 | | | | (1.07 | ) | | | 1.85 | |
| Net increase/(decrease) in net assets resulting from operations | | | 2.71 | | | | 3.58 | | | | 2.15 | | | | (1.04 | ) | | | 1.79 | |
| Dividends and distributions to shareholders from: | | | | | | | | | | | | | | | | | | | | |
| Net investment income | | | (0.33 | ) | | | (0.21 | ) | | | (0.15 | ) | | | (0.10 | ) | | | — | |
| Net realized capital gains | | | (1.28 | ) | | | (1.02 | ) | | | (0.85 | ) | | | — | | | | — | |
| Total dividends and distributions to shareholders | | | (1.61 | ) | | | (1.23 | ) | | | (1.00 | ) | | | (0.10 | ) | | | — | |
| Net asset value, end of period | | $ | 30.25 | | | $ | 29.15 | | | $ | 26.80 | | | $ | 25.65 | | | $ | 26.79 | |
Total investment return(3) | | | 9.20 | %(4) | | | 13.42 | % | | | 8.68 | % | | | (3.92 | )% | | | 7.16 | %(4) |
| | | | | | | | | | | | | | | | | | | | | |
| Ratio/Supplemental Data | | | | | | | | | | | | | | | | | | | | |
| Net assets, end of period (000’s omitted) | | $ | 22,208 | | | $ | 20,093 | | | $ | 17,491 | | | $ | 13,598 | | | $ | 7,816 | |
Ratio of expenses to average net assets with waivers, if any(5) | | | 0.78 | %(6) | | | 0.81 | % | | | 0.93 | % | | | 1.13 | % | | | 1.13 | %(6) |
Ratio of expenses to average net assets without waivers, if any(5) | | | 0.78 | %(6) | | | 0.81 | % | | | 0.93 | % | | | 1.44 | % | | | 4.07 | %(6) |
Ratio of net investment income/(loss) to average net assets with waivers(5) | | | 0.94 | %(6) | | | 0.49 | % | | | 0.74 | % | | | 0.12 | % | | | (0.47 | )%(6) |
| Portfolio turnover rate | | | 8 | %(4) | | | 21 | % | | | 7 | % | | | 14 | % | | | 1 | %(4) |
(1) | Commencement of operations. |
(2) | The selected per share data is calculated using the average shares outstanding method for the period. |
(3) | Total investment return is calculated by assuming a purchase of shares on the first day and a sale of shares on the last day of each period reported and includes reinvestments of dividends and distributions, if any. |
(5) | The Portfolio also will indirectly bear its prorated share of expenses of the underlying funds. Such expenses are not included in the calculation of this ratio. |
The accompanying notes are an integral part of the financial statements.
16
MATSON MONEY VI PORTFOLIOS
MATSON MONEY INTERNATIONAL EQUITY VI PORTFOLIO
Financial Highlights
Contained below is per share operating performance data for each share outstanding, total investment return, ratios to average net assets and other supplemental data for the respective periods. This information has been derived from information provided in the financial statements. |
| | | For the
Six Months Ended
February 28, 2018
(Unaudited) | | | For the
Year Ended
August 31, 2017 | | | For the
Year Ended
August 31, 2016 | | | For the
Year Ended
August 31, 2015 | | | For the Period February 18, 2014(1) through
August 31, 2014 | |
| Per Share Operating Performance | | | | | | | | | |
| Net asset value, beginning of period | | $ | 26.60 | | | $ | 22.54 | | | $ | 22.48 | | | $ | 25.82 | | | $ | 25.00 | |
Net investment income/(loss)(2) | | | 0.41 | | | | 0.29 | | | | 0.44 | | | | 0.22 | | | | 0.07 | |
| Net realized and unrealized gain/(loss) on investments | | | 1.56 | | | | 4.51 | | | | 0.10 | | | | (3.26 | ) | | | 0.75 | |
| Net increase/(decrease) in net assets resulting from operations | | | 1.97 | | | | 4.80 | | | | 0.54 | | | | (3.04 | ) | | | 0.82 | |
| Dividends and distributions to shareholders from: | | | | | | | | | | | | | | | | | | | | |
| Net investment income | | | (0.54 | ) | | | (0.44 | ) | | | (0.24 | ) | | | (0.30 | ) | | | — | |
| Net realized capital gains | | | (0.24 | ) | | | (0.30 | ) | | | (0.24 | ) | | | — | (3) | | | — | |
| Total dividends and distributions to shareholders | | | (0.78 | ) | | | (0.74 | ) | | | (0.48 | ) | | | (0.30 | ) | | | — | |
| Net asset value, end of period | | $ | 27.79 | | | $ | 26.60 | | | $ | 22.54 | | | $ | 22.48 | | | $ | 25.82 | |
Total investment return(4) | | | 7.44 | %(5) | | | 21.90 | % | | | 2.47 | % | | | (11.77 | )% | | | 3.28 | %(5) |
| | | | | | | | | | | | | | | | | | | | | |
| Ratio/Supplemental Data | | | | | | | | | | | | | | | | | | | | |
| Net assets, end of period (000’s omitted) | | $ | 16,318 | | | $ | 15,019 | | | $ | 12,567 | | | $ | 9,641 | | | $ | 5,408 | |
Ratio of expenses to average net assets with waivers, if any(6) | | | 0.85 | %(7) | | | 0.88 | % | | | 1.02 | % | | | 1.35 | % | | | 1.35 | %(7) |
Ratio of expenses to average net assets without waivers, if any(6) | | | 0.85 | %(7) | | | 0.88 | % | | | 1.02 | % | | | 1.67 | % | | | 5.07 | %(7) |
Ratio of net investment income to average net assets with waivers(6) | | | 2.95 | %(7) | | | 1.22 | % | | | 2.03 | % | | | 0.91 | % | | | 0.49 | %(7) |
| Portfolio turnover rate | | | 7 | %(5) | | | 21 | % | | | 5 | % | | | 15 | % | | | 2 | %(5) |
(1) | Commencement of operations. |
(2) | The selected per share data is calculated using the average shares outstanding method for the period. |
(3) | Amount less than $(0.005) per share. |
(4) | Total investment return is calculated by assuming a purchase of shares on the first day and a sale of shares on the last day of each period reported and includes reinvestments of dividends and distributions, if any. |
(6) | The Portfolio also will indirectly bear its prorated share of expenses of the underlying funds. Such expenses are not included in the calculation of this ratio. |
The accompanying notes are an integral part of the financial statements.
17
MATSON MONEY VI PORTFOLIOS
MATSON MONEY FIXED INCOME VI PORTFOLIO
Financial Highlights
Contained below is per share operating performance data for each share outstanding, total investment return, ratios to average net assets and other supplemental data for the respective periods. This information has been derived from information provided in the financial statements. |
| | | For the
Six Months Ended
February 28, 2018
(Unaudited) | | | For the
Year Ended
August 31, 2017 | | | For the
Year Ended
August 31, 2016 | | | For the
Year Ended
August 31, 2015 | | | For the Period February 18, 2014(1) through
August 31, 2014 | |
| Per Share Operating Performance | | | | | | | | | |
| Net asset value, beginning of period | | $ | 25.12 | | | $ | 25.31 | | | $ | 24.93 | | | $ | 25.08 | | | $ | 25.00 | |
Net investment income/(loss)(2) | | | 0.17 | | | | 0.18 | | | | 0.05 | | | | 0.03 | | | | (0.05 | ) |
| Net realized and unrealized gain/(loss) on investments | | | (0.52 | ) | | | (0.13 | ) | | | 0.36 | | | | (0.04 | ) | | | 0.13 | |
| Net increase/(decrease) in net assets resulting from operations | | | (0.35 | ) | | | 0.05 | | | | 0.41 | | | | (0.01 | ) | | | 0.08 | |
| Dividends and distributions to shareholders from: | | | | | | | | | | | | | | | | | | | | |
| Net investment income | | | (0.22 | ) | | | (0.12 | ) | | | — | | | | (0.14 | ) | | | — | |
| Net realized capital gains | | | (0.03 | ) | | | (0.12 | ) | | | (0.03 | ) | | | — | | | | — | |
| Total dividends and distributions to shareholders | | | (0.25 | ) | | | (0.24 | ) | | | (0.03 | ) | | | (0.14 | ) | | | — | |
| Net asset value, end of period | | $ | 24.52 | | | $ | 25.12 | | | $ | 25.31 | | | $ | 24.93 | | | $ | 25.08 | |
Total investment return(3) | | | (1.39 | )%(4) | | | 0.19 | % | | | 1.66 | % | | | (0.06 | )% | | | 0.32 | %(4) |
| | | | | | | | | | | | | | | | | | | | | |
| Ratio/Supplemental Data | | | | | | | | | | | | | | | | | | | | |
| Net assets, end of period (000’s omitted) | | $ | 28,261 | | | $ | 26,017 | | | $ | 21,927 | | | $ | 18,098 | | | $ | 9,927 | |
Ratio of expenses to average net assets with waivers, if any(5) | | | 0.77 | %(6) | | | 0.77 | % | | | 0.85 | % | | | 1.00 | % | | | 1.00 | %(6) |
Ratio of expenses to average net assets without waivers, if any(5) | | | 0.77 | %(6) | | | 0.77 | % | | | 0.85 | % | | | 1.37 | % | | | 3.40 | %(6) |
Ratio of net investment income/(loss) to average net assets with waivers(5) | | | 1.34 | %(6) | | | 0.70 | % | | | 0.21 | % | | | 0.10 | % | | | (0.40 | )%(6) |
| Portfolio turnover rate | | | 2 | %(4) | | | 11 | % | | | 40 | % | | | 11 | % | | | 1 | %(4) |
(1) | Commencement of operations. |
(2) | The selected per share data is calculated using the average shares outstanding method for the period. |
(3) | Total investment return is calculated by assuming a purchase of shares on the first day and a sale of shares on the last day of each period reported and includes reinvestments of dividends and distributions, if any. |
(5) | The Portfolio also will indirectly bear its prorated share of expenses of the underlying funds. Such expenses are not included in the calculation of this ratio. |
The accompanying notes are an integral part of the financial statements.
18
MATSON MONEY VI PORTFOLIOS
Notes to Financial Statements
February 28, 2018 (Unaudited)
1. | Organization and Significant Accounting Policies |
The RBB Fund, Inc. (“RBB” or the “Company”) was incorporated under the laws of the State of Maryland on February 29, 1988 and is registered under the Investment Company Act of 1940, as amended (the “1940 Act”), as an open-end management investment company. RBB is a “series fund,” which is a mutual fund divided into separate portfolios. Each portfolio is treated as a separate entity for certain matters under the 1940 Act, and for other purposes, and a shareholder of one portfolio is not deemed to be a shareholder of any other portfolio. Currently, RBB has twenty-nine active investment portfolios, including the Matson Money U.S. Equity VI Portfolio, the Matson Money International Equity VI Portfolio and the Matson Money Fixed Income VI Portfolio (each a “Portfolio,” collectively the “Portfolios”). Each Portfolio operates as a “fund of funds” and commenced investment operations on February 18, 2014. Shares of the Portfolios are offered to separate accounts of participating life insurance companies for the purpose of funding variable annuity contracts and variable life insurance policies.
RBB has authorized capital of one hundred billion shares of common stock of which 87.023 billion shares are currently classified into one hundred and eighty-one classes of common stock. Each class represents an interest in an active or inactive RBB investment portfolio.
Matson Money U.S. Equity VI Portfolio and Matson Money International Equity VI Portfolio’s investment objective is to seek long-term capital appreciation. Matson Money Fixed Income VI Portfolio’s investment objective is to seek total return (consisting of current income and capital appreciation).
The Portfolios are investment companies and follow accounting and reporting guidance in the Financial Accounting Standards Board (“FASB”) Accounting Standards Codification Topic 946 “Financial Services - Investment Companies”.
The end of the reporting period for the Portfolios is February 28, 2018, and the period covered by these Notes to Financial Statements is the six months ended February 28, 2018 (the “current fiscal period”).
PORTFOLIO VALUATION — Investments in the underlying funds are valued at each Portfolio’s net asset value (“NAV”) determined as of the close of business on the New York Stock Exchange (generally 4:00 p.m. Eastern time). As required, some securities and assets may be valued at fair value as determined in good faith by the Company’s Board of Directors (the “Board”). Direct investments in fixed income securities are valued using an independent pricing service, which considers such factors as security prices, yields, maturities and ratings, and are deemed representative of market values at the close of the market.
FAIR VALUE MEASUREMENTS — The inputs and valuation techniques used to measure the fair value of the Portfolios’ investments are summarized into three levels as described in the hierarchy below:
| | ● | Level 1— Prices are determined using quoted prices in active markets for identical securities. |
| | ● | Level 2— Prices are determined using other significant observable inputs (including quoted prices for similar securities, interest rates, prepayment speeds, credit risk, etc.). |
| | ● | Level 3— Prices are determined using significant unobservable inputs (including the Portfolios’ own assumptions in determining the fair value of investments). |
The inputs or methodologies used for valuing securities are not necessarily an indication of the risk associated with investing in those securities.
19
MATSON MONEY VI PORTFOLIOS
Notes to Financial Statements (continued)
February 28, 2018 (Unaudited)
The following is a summary of the inputs used, as of the end of the reporting period, in valuing the Portfolios’ investments carried at fair value:
MATSON MONEY U.S. EQUITY VI PORTFOLIO
| | | Total | | | Level 1 | | | Level 2 | | | Level 3 | |
| Domestic Equity Funds | | $ | 21,929,005 | | | $ | 21,929,005 | | | $ | — | | | $ | — | |
| Short-Term Investments | | | 287,214 | | | | 287,214 | | | | — | | | | — | |
| Total Investments* | | $ | 22,216,219 | | | $ | 22,216,219 | | | $ | — | | | $ | — | |
* | Please refer to the Portfolio of Investments for further details. |
MATSON MONEY INTERNATIONAL EQUITY VI PORTFOLIO
| | | Total | | | Level 1 | | | Level 2 | | | Level 3 | |
| International Equity Funds | | $ | 16,198,669 | | | $ | 16,198,669 | | | $ | — | | | $ | — | |
| Short-Term Investments | | | 133,216 | | | | 133,216 | | | | — | | | | — | |
| Total Investments* | | $ | 16,331,885 | | | $ | 16,331,885 | | | $ | — | | | $ | — | |
* | Please refer to the Portfolio of Investments for further details. |
MATSON MONEY FIXED INCOME VI PORTFOLIO
| | | Total | | | Level 1 | | | Level 2 | | | Level 3 | |
| Fixed Income Funds | | $ | 27,842,934 | | | $ | 27,842,934 | | | $ | — | | | $ | — | |
| Short-Term Investments | | | 409,369 | | | | 409,369 | | | | — | | | | — | |
| Total Investments* | | $ | 28,252,303 | | | $ | 28,252,303 | | | $ | — | | | $ | — | |
* | Please refer to the Portfolio of Investments for further details. |
At the end of each quarter, management evaluates the classification of Levels 1, 2 and 3 assets and liabilities. Various factors are considered, such as changes in liquidity from the prior reporting period; whether or not a broker is willing to execute at the quoted price; the depth and consistency of prices from third party pricing services; and the existence of contemporaneous, observable trades in the market. Additionally, management evaluates the classification of Level 1 and Level 2 assets and liabilities on a quarterly basis for changes in listings or delistings on national exchanges.
Due to the inherent uncertainty of determining the fair value of investments that do not have a readily available market value, the fair value of the Portfolios’ investments may fluctuate from period to period. Additionally, the fair value of investments may differ significantly from the values that would have been used had a ready market existed for such investments and may differ materially from the values the Portfolios may ultimately realize. Further, such investments may be subject to legal and other restrictions on resale or otherwise less liquid than publicly traded securities.
For fair valuations using significant unobservable inputs, U.S. generally accepted accounting principles (“U.S. GAAP”) requires each Portfolio to present a reconciliation of the beginning to ending balances for reported market values that presents changes attributable to total realized and unrealized gains or losses, purchases and sales, and transfers in and out of Level 3 during the period. Transfers in and out between levels are based on values at the end of the period. U.S. GAAP also requires the Portfolios to disclose amounts and reasons for all transfers in and out of Level 1 and Level 2 fair value measurements. A reconciliation of Level 3 investments is presented only when a Portfolio had an amount of Level 3 investments at the end of the
20
MATSON MONEY VI PORTFOLIOS
Notes to Financial Statements (Continued)
February 28, 2018 (Unaudited)
reporting period that was meaningful in relation to its net assets. The amounts and reasons for all transfers in and out of each level within the three-tier hierarchy are disclosed when a Portfolio had an amount of total transfers during the reporting period that was meaningful in relation to its net assets as of the end of the reporting period.
During the current fiscal period, the Portfolios had no transfers between Levels 1, 2 and 3.
USE OF ESTIMATES — The preparation of financial statements in conformity with U.S. GAAP requires management to make estimates and assumptions that affect the reported amounts of assets and liabilities and disclosure of contingent assets and liabilities at the date of the financial statements and the reported amounts of revenues and expenses during the reporting period. Actual results could differ from those estimates and those differences could be significant.
INVESTMENT TRANSACTIONS, INVESTMENT INCOME AND EXPENSES — The Portfolios record security transactions based on trade date for financial reporting purposes. The cost of investments sold is determined by use of the specific identification method for both financial reporting and income tax purposes in determining realized gains and losses on investments. Interest income is accrued when earned. Dividend income is recorded on the ex-dividend date. Distributions received on securities that represent a return of capital or capital gain are recorded as a reduction of cost of investments and/or as a realized gain. The Portfolios estimate the components of distributions received that may be considered return of capital distributions or capital gain distributions. Each Portfolio’s investment income, expenses (other than class specific expenses) and unrealized and realized gains and losses are allocated daily to each class of shares based upon the relative proportion of net assets of each class at the beginning of the day. Expenses incurred on behalf of a specific class, fund or fund family of the Company are charged directly to the class, fund or fund family (in proportion to net assets). Expenses incurred for all of the RBB funds (such as director or professional fees) are charged to all funds in proportion to their average net assets of RBB, or in such other manner as the Board deems fair or equitable. Expenses and fees, including investment advisory and administration fees, are accrued daily and taken into account for the purpose of determining the NAV of the Portfolios. In addition to the net annual operating expenses that the Portfolios bear directly, the shareholders indirectly bear the Portfolios’ pro-rata expenses of the underlying mutual funds in which each Portfolio invests.
DIVIDENDS AND DISTRIBUTIONS TO SHAREHOLDERS — Dividends from net investment income and distributions from net realized capital gains, if any, are declared and paid at least annually to shareholders recorded on the ex-dividend date for each Portfolio. Income dividends and capital gain distributions are determined in accordance with U.S. federal income tax regulations, which may differ from U.S. GAAP.
U.S. TAX STATUS — No provision is made for U.S. income taxes as it is each Portfolio’s intention to continue to qualify for and elect the tax treatment applicable to regulated investment companies under Subchapter M of the Internal Revenue Code of 1986, as amended, and make the requisite distributions to its shareholders which will be sufficient to relieve it from U.S. income and excise taxes.
CASH AND CASH EQUIVALENTS — Cash and cash equivalents are valued at cost plus accrued interest, which approximates market value.
OTHER — In the normal course of business, the Portfolios may enter into contracts that provide general indemnifications. Each Portfolio’s maximum exposure under these arrangements is dependent on claims that may be made against the Portfolios in the future, and, therefore, cannot be estimated; however, based on experience, the risk of material loss for such claims is considered remote.
21
MATSON MONEY VI PORTFOLIOS
Notes to Financial Statements (Continued)
February 28, 2018 (Unaudited)
2. | Investment Adviser and Other Services |
Matson Money, Inc. (“Matson Money” or the “Adviser”), serves as the investment adviser to each Portfolio. Each Portfolio compensates the Adviser for its services at an annual rate based on each Portfolio’s average daily net assets (the “Advisory Fee”), payable on a monthly basis in arrears, as shown in the following table.
AVERAGE DAILY NET ASSETS | ADVISORY FEE |
For the first $1 billion | 0.50% |
Over $1 billion to $5 billion | 0.49 |
Over $5 billion | 0.47 |
The Adviser has contractually agreed to waive advisory fees and/or reimburse expenses to the extent that total annual Portfolio operating expenses (excluding certain items discussed below) exceed the rates (“Expense Caps”) shown in the following table of each Portfolio’s average daily net assets. In determining the Adviser’s obligation to waive advisory fees and/or reimburse expenses, the following expenses are not taken into account and certain of these expenses could cause total annual Portfolio operating expenses to exceed the Expense Caps: acquired fund fees and expenses, brokerage commissions, extraordinary items, interest or taxes. The Adviser may not recoup waived management fees or reimbursed expenses. This contractual limitation is in effect until December 31, 2018 and may not be terminated without the approval of the Board. The Adviser may discontinue these arrangements at any time after December 31, 2018.
PORTFOLIO | EXPENSE CAPS |
Matson Money U.S. Equity VI Portfolio | 1.13% |
Matson Money International Equity VI Portfolio | 1.35 |
Matson Money Fixed Income VI Portfolio | 1.00 |
During the current fiscal period, investment advisory fees accrued were as follows:
PORTFOLIO | ADVISORY FEES |
Matson Money U.S. Equity VI Portfolio | $ 54,259 |
Matson Money International Equity VI Portfolio | 39,391 |
Matson Money Fixed Income VI Portfolio | 66,639 |
U.S. Bancorp Fund Services, LLC (“USBFS”) serves as administrator for the Portfolios. For providing administrative and accounting services, USBFS is entitled to receive a monthly fee, subject to certain minimum and out of pocket expenses.
USBFS serves as the Portfolios’ transfer and dividend disbursing agent. For providing transfer agent services, USBFS is entitled to receive a monthly fee, subject to certain minimum and out of pocket expenses.
U.S. Bank, N.A. (the “Custodian”) provides certain custodial services to the Portfolios. The Custodian is entitled to receive a monthly fee, subject to certain minimum and out of pocket expenses.
Quasar Distributors, LLC serves as the principal underwriter and distributor of the Portfolios’ shares pursuant to a Distribution Agreement with RBB.
For compensation amounts payable to USBFS, please refer to the Statements of Operations.
22
MATSON MONEY VI PORTFOLIOS
Notes to Financial Statements (Continued)
February 28, 2018 (Unaudited)
3. | Director’s and Officer’s Compensation |
The Directors of the Company receive an annual retainer and meeting fees for meetings attended. Employees of Vigilant Compliance, LLC serve as President, Chief Compliance Officer and Assistant Treasurer of the Company. Vigilant Compliance, LLC is compensated for the services provided to the Company. An employee of RBB serves as Treasurer and Secretary and is compensated for services provided. Certain employees of USBFS serve as officers of the Company. They are not compensated by the Portfolios or the Company. For Director’s and Officer’s compensation amounts, please refer to the Statement of Operations.
4. | Purchases and Sales of Investment Securities |
During the current fiscal period, aggregate purchases and sales of investment securities (excluding short-term investments) of the Portfolios were as follows:
| | | PURCHASES | | | SALES | |
| Matson Money U.S. Equity VI Portfolio | | $ | 2,955,270 | | | $ | 1,648,995 | |
| Matson Money International Equity VI Portfolio | | | 1,867,121 | | | | 1,117,122 | |
| Matson Money Fixed Income VI Portfolio | | | 3,177,883 | | | | 403,585 | |
There were no purchases or sales of long-term U.S. Government securities during the current fiscal period.
5. | Federal Income Tax Information |
The Portfolios have followed the authoritative guidance on accounting for and disclosure of uncertainty in tax positions, which requires the Portfolios to determine whether a tax position is more likely than not to be sustained upon examination, including resolution of any related appeals or litigation processes, based on the technical merits of the position. The Portfolios have determined that there was no effect on the financial statements from following this authoritative guidance. In the normal course of business, the Portfolios are subject to examination by federal, state and local jurisdictions, where applicable, for tax years for which applicable statutes of limitations have not expired. The Portfolios are not aware of any tax positions for which it is reasonably possible that the total amounts of unrecognized tax benefits will significantly change in the next twelve months.
As of August 31, 2017, the federal tax cost and aggregate gross unrealized appreciation and depreciation of investments held by each Portfolio were as follows:
| | | FEDERAL TAX
COST | | | UNREALIZED
APPRECIATION | | | UNREALIZED
(DEPRECIATION) | | | NET
UNREALIZED
APPRECIATION/
(DEPRECIATION) | |
| Matson Money U.S. Equity VI Portfolio | | $ | 18,608,969 | | | $ | 1,648,864 | | | $ | (119,237 | ) | | $ | 1,529,627 | |
| Matson Money International Equity VI Portfolio | | | 13,532,401 | | | | 1,838,858 | | | | (312,390 | ) | | | 1,526,468 | |
| Matson Money Fixed Income VI Portfolio | | | 26,032,617 | | | | 98,218 | | | | (73,452 | ) | | | 24,766 | |
Distributions to shareholders from net investment income and realized gains are determined in accordance with federal income tax regulations, which may differ from net investment income and realized gains recognized for financial reporting purposes. Accordingly, the character of distributions and composition of net assets for tax purposes may differ from those reflected in the accompanying financial statements. To the extent these differences are permanent, such amounts are reclassified within the capital accounts based on the tax treatment; temporary differences do not require such reclassification.
23
MATSON MONEY VI PORTFOLIOS
Notes to Financial Statements (Continued)
February 28, 2018 (Unaudited)
The following permanent differences as of August 31, 2017, primarily attributable to reclassifications of short-term capital gain distributions, were reclassified among the following accounts:
| | | UNDISTRIBUTED
NET INVESTMENT
INCOME | | | ACCUMULATED
NET REALIZED
GAIN/(LOSS) | | | PAID-IN
CAPITAL | |
| Matson Money U.S. Equity VI Portfolio | | $ | 15,909 | | | $ | (15,909 | ) | | $ | — | |
| Matson Money International Equity VI Portfolio | | | 15,921 | | | | (15,921 | ) | | | — | |
| Matson Money Fixed Income VI Portfolio | | | 4,494 | | | | (4,494 | ) | | | — | |
As of August 31, 2017, the components of distributable earnings on a tax basis were as follows:
| | | Undistributed
Ordinary Income | | | Undistributed
Long-Term
Capital Gains | | | Net
Unrealized
Appreciation/
(Depreciation) | | | Qualified
Late-Year
Losses | |
| Matson Money U.S. Equity VI Portfolio | | $ | — | | | $ | 777,151 | | | $ | 1,529,627 | | | $ | (5,639 | ) |
| Matson Money International Equity VI Portfolio | | | 32,429 | | | | 105,703 | | | | 1,526,468 | | | | — | |
| Matson Money Fixed Income VI Portfolio | | | 60,613 | | | | 34,393 | | | | 24,766 | | | | — | |
The differences between the book and tax basis components of distributable earnings relate primarily to the timing of recognition of income and gains for federal income tax purposes. Short-term and foreign currency gains are reported as ordinary income for federal income tax purposes.
The tax character of distributions paid during the fiscal year ended August 31, 2017 were as follows:
| | | Ordinary
Income | | | Long-Term
Gains | | | Total | |
| Matson Money U.S. Equity VI Portfolio | | $ | 135,895 | | | $ | 659,715 | | | $ | 795,610 | |
| Matson Money International Equity VI Portfolio | | | 247,347 | | | | 166,208 | | | | 413,555 | |
| Matson Money Fixed Income VI Portfolio | | | 107,491 | | | | 106,213 | | | | 213,704 | |
Distributions from net investment income and short-term capital gains are treated as ordinary income for federal income tax purposes.
Pursuant to federal income tax rules applicable to regulated investment companies, the Portfolios may elect to treat certain capital losses between November 1 and August 31 and late year ordinary losses ((i) ordinary losses between January 1 and August 31, or (ii) specified ordinary and currency losses between November 1 and August 31) as occurring on the first day of the following tax year. For the fiscal year ended August 31, 2017, any amount of losses elected within the tax return will not be recognized for federal income tax purposes until September 1, 2017.
For the fiscal year ended August 31, 2017, the Portfolios deferred to September 1, 2017, the following qualified late-year losses:
| | | Late-Year
Ordinary
Loss Deferral | | | Short-Term
Capital
Loss Deferral | | | Long-Term
Capital
Loss Deferral | |
| Matson Money U.S. Equity VI Portfolio | | $ | (5,639 | ) | | $ | — | | | $ | — | |
24
MATSON MONEY VI PORTFOLIOS
Notes to Financial Statements (Concluded)
February 28, 2018 (Unaudited)
Under the Regulated Investment Company Modernization Act of 2010, the Portfolios are permitted to carry forward capital losses incurred in taxable years beginning after December 22, 2010 for an unlimited period. Additionally, capital losses that are carried forward will retain their character as either short-term or long-term capital losses rather than being considered all short-term as under the previous law. As of the fiscal year ended August 31, 2017, the Portfolios did not have any capital loss carryforwards.
Management has evaluated the impact of all subsequent events on the Portfolios through the date the financial statements were issued and has determined that there was the following subsequent event:
Effective April 20, 2018 (the “Effective Date”), Sean Babin will serve as a portfolio manager of the Portfolios. In addition, as of the Effective Date, Kenneth E. Gatliff will no longer serve as a portfolio manager for the Portfolios.
25
MATSON MONEY VI PORTFOLIOS
Other Information
(Unaudited)
Proxy Voting
Policies and procedures that the Portfolios use to determine how to vote proxies relating to portfolio securities as well as information regarding how the Portfolios voted proxies relating to portfolio securities for the most recent twelve-month period ended June 30 are available without charge, upon request, by calling Matson Money VI Portfolios at (866) 780-0357, ext. 3863 and on the Securities and Exchange Commission’s (“SEC”) website at http://www.sec.gov.
Quarterly Portfolio Schedules
The Company files a complete schedule of portfolio holdings with the SEC for the first and third fiscal quarters of each fiscal year (quarters ended November 30 and May 31) on Form N-Q. The Company’s Form N-Q is available on the SEC website at http://www.sec.gov and may be reviewed and copied at the SEC Public Reference Room in Washington, D.C. Information on the operation of the SEC Public Reference Room may be obtained by calling (800) SEC-0330.
26
Investment Adviser
Matson Money, Inc.
5955 Deerfield Blvd.
Mason, OH 45040
Administrator and Transfer Agent
U.S. Bancorp Fund Services, LLC
P.O. Box 701
Milwaukee, WI 53201
Principal Underwriter
Quasar Distributors, LLC
777 East Wisconsin Avenue, Floor 6
Milwaukee, WI 53202
Custodian
U.S. Bank, N.A.
1555 North Rivercenter Drive, Suite 302
Milwaukee, WI 53212
Independent Registered Public Accounting Firm
PricewaterhouseCoopers LLP
Two Commerce Square, Suite 1800
2001 Market Street
Philadelphia, PA 19103-7042
Legal Counsel
Drinker Biddle & Reath LLP
One Logan Square, Suite 2000
Philadelphia, PA 19103-6996
MMFI-SAR18

Motley Fool Global Opportunities Fund (FOOLX) The portfolio’s “active share” – an industry measure between 0% and 100% that shows how different the portfolio looks from its benchmark – was 93%. The major reason for scoring so highly is philosophical. We seek to own the world’s highest-quality businesses that offer compelling return opportunities, period. We don’t pay much mind to any holding’s presence or weighting in the benchmark, and we don’t mind being different – it works for us. The Fund doesn’t currently own any securities in the Energy, Basic Materials, or Utilities sectors. We don’t see many high quality businesses in this sector right now, and we prefer to fish in more fertile waters. As a global fund, we are afforded the luxury of looking in almost any country to find opportunities. The smallest country represented in the portfolio is Georgia, with 3.7 million citizens. That’s fewer people than live in Los Angeles, but in a land mass 57 times larger. Georgia is a very mountainous country and has several peaks that rise above 16,000 feet. |  |
Motley Fool Small-Mid Cap Growth Fund (TMFGX) The two top-performing stocks in the portfolio during the six-month period were GrubHub and XPO Logistics. GrubHub delivers food, and XPO delivers large items (like washing machines). Technology and one-click ordering have made it easier than ever to order anything your stomach or heart desire and get it quickly. We are invested alongside this trend. While six months is a very small sample size, it is still remarkable to see how the Small-Mid Cap Growth Fund performed relative to its benchmark, the Russell 2500 Growth index. During weeks when the benchmark declined, our fund fell only 65% as much. During weeks when the benchmark advanced, our fund improved by 114% as much. Folks in the industry call this “downside and upside capture.” We call it good investing and a dose of luck. Our three largest holdings, IPG Photonics, Thor Industries, and XPO Logistics, each represent 5% or more of net assets. If you’ve read our prospectus, you’ll know we can’t buy any more of these companies because of our 5% purchase ceiling. They can grow larger (XPO represents more than 7%), but we cannot add to them. We’re happy to have this problem. Each of these holdings has grown into a substantial holding because of fabulous business performance, not because we made a huge bet. | |
Motley Fool Emerging Markets Fund (TMFEX) The Emerging Markets Fund owns stakes in 30 businesses with operations as varied as rubber-glove making to dental plans in countries as varied as Peru and Kenya. The largest industry group represented in the portfolio is Transportation Infrastructure. If you’re passing through a Mexican airport, take extra pride when you purchase a $5 bottle of water, because a portion of that sale will find its way back into your wallet. We also own a pair of port operators who facilitate global trade. Emerging markets in general underperformed domestic stocks over the relevant six-month period. China continues to be a white-hot market, and even though it’s the largest component of most emerging market indexes, it could not drive emerging market indexes to outperform. Our fund has five investments in Chinese companies. The newest is Yum China, which we believe is in a great position to capitalize on the convenience of delivery given its large footprint, digital initiatives, and broad name recognition. | |
| This report has been prepared for shareholders of Motley Fool Global Opportunities Fund, Motley Fool Small-Mid Cap Growth Fund and Motley Fool Emerging Markets Fund. It is not authorized for distribution to prospective investors unless accompanied or preceded by a current prospectus, which contains more complete information about the Funds. Investors are reminded to read the prospectus carefully before investing. Returns quoted represent past performance, which is no guarantee of future results. Current returns may be lower or higher and can be found at foolfunds.com. Share prices will fluctuate and there may be a gain or loss when shares are redeemed. Fund shares are distributed by Foreside Funds Distributors LLC, Berwyn, Pennsylvania. |
| Table of Contents | |
Letter to Shareholders | 1 |
Portfolio Characteristics | 4 |
Fund Expense Examples | 12 |
Schedules of Investments | 14 |
Financial Statements | 24 |
Notes to Financial Statements | 34 |
Notice to Shareholders | 47 |
MOTLEY FOOL FUNDS
Letter to Shareholders
February 28, 2018 (Unaudited)

In Search of the Investing Gold Medal
“You train four years for this one game, but the time that it takes and the amount of work and sacrifice it takes, not just the 23 players on this roster but those who worked hard to get on this team and did not make it. This is what we worked for, the chance to win a gold medal.”
- Monique Lamoureux-Morando, U.S. Women’s Ice Hockey
Dear Fellow Shareholder,
The 2018 Winter Olympics in PyeongChang wrapped up a few weeks ago, and I am still in awe of the athletic prowess demonstrated by the 2,900 athletes who competed. Across the 102 events these athletes demonstrated incredible skill. But focusing too much on the skill sells these athletes short. What is truly remarkable is their ability to perform at such a high level, under pressure, and sometimes in the elements.
Many Olympians get one shot in their entire life to perform for just a few seconds for a shot at a medal. The lucky ones get additional chances four or eight years later. This makes the cost of failure, psychologically, extremely high. Not to mention, the cost of failure physically can be serious (think downhill skiing or skeleton).
The pressure doesn’t end there. The PyeongChang Olympics grabbed headlines for its bad weather, too. It was the coldest games since the 1994 Lillehammer, Norway games. It was so cold and windy that numerous events had to be rescheduled several times! Eventually, some events had to take place in blizzard-like conditions. Still, thanks to endless training, muscle memory, and focus the athletes were able to perform.
Blizzard-like conditions for stocks
Calendar year 2017 was a remarkably balmy year for stocks. The largest peak-to-trough fall was less than 3% for the S&P 500 Index. Global stocks, as measured by the FTSE Global All Cap Index, did not experience a down month the entire year. Astoundingly, 9 of the 10 lowest volatility readings on record (as measured by the VIX) occurred in 2017. In July, the VIX broke through its 23-year low, and in November, it closed at its lowest level ever. The market weather in 2017 was as calm as it gets.
And then came February 2018. Early in the month, global markets dropped between 2% and 5% on several days. The VIX more than tripled. Intraday market swings were breathtaking. Stock-price volatility continued throughout the month and finished with a 4.4% decline. This was a storm, to be sure, but far from a storm of epic proportions. Clearly, the preceding year of sunshine had lulled investors into a false sense of security, and at the earliest hint of a break in the calm investors sprinted to the exits. More than $14 billion was withdrawn from equity mutual funds in the first week of February alone.
Just as Olympic athletes have no control over the weather on their day to compete, your fund managers have no control over the weather in the market. Yet, both the gold medal and your investment dollars hang in the balance anyway. The cost of failure is high. We must perform.
The Olympic Athletes of MFAM
Our strategy for dealing with market volatility is to (1) know what we own and why we own it, (2) know what we want to own, and (3) keep our long-term mindset.
I know of no way to predict market volatility. It is simply a random variable inherent to investing. However, labeling something as random does not minimize its potential emotional impact. Watching asset prices swing wildly can be unnerving. What we do know, is that asset values do not change nearly as dramatically as asset prices. Knowing the businesses and competitive dynamics underlying the stocks we own helps us keep our focus on value instead of price. Clearly articulating a thesis for why we want to underwrite an investment helps keep us focused on the fundamental business drivers, which are almost never tied to market prices. In short, maintaining a business focus instead of a stock focus dilutes the emotional impact that can come with vacillating prices.
Keeping a list of what we believe to be the highest-quality businesses in the world is another key way we deal with volatility. We spend each day trying to identify the types of businesses we’d like to own, and we vet them rigorously. Rather than scramble to conduct research during turbulent times, we simply turn to our wish list and see which opportunities are best. Of course we weigh
these wish-list companies against the opportunities in the ones we already own and act accordingly. True to form, your managers were net buyers during the February sell-off. We made purchases in four companies (three were new) and sold only one. Having this process in place allows for volatility to be an opportunity rather than a threat.
Finally, we deal with volatility by having a long-term mindset firmly embedded in our philosophy and culture. In fact, our core investing belief is that “independent research, conducted with a long-term mindset, can outperform.” As illustrated by the table below, history demonstrates that, while stock returns can and do vary wildly over annual (or shorter) periods, they have consistently been positive and healthy as the time frame lengthens. When your horizon, and behavior, extends beyond five years, your probability of earning positive returns skyrockets. Maintaining a long-term mindset further forces us to search for the type of businesses – high-quality ones – that are most likely to stand the test of time and generate those rewards.
S&P 500® Total Returns: 1926-2015 |
Time Frame | Positive | Negative |
Daily | 54% | 46% |
Quarterly | 68% | 32% |
One Year | 74% | 26% |
Five Years | 86% | 14% |
10 Years | 94% | 6% |
20 Years | 100% | 0% |
Source: Ben Carlson, Playing the Probabilities. A Wealth of Common Sense. |
Pride in our performance
I have no idea if you, dear investor, think our team has earned a gold, silver, or bronze medal. (If so, I’d like to think you’ll play our anthem, “Survivor” by Destiny’s Child, in celebration.) Regardless, I am proud of the training our team puts in each day, our behavior in volatile times, and our commitment to managing portfolios of the highest-quality businesses on earth. Thank you for your continued trust.
Onward,

Bryan Hinmon
Chief Investment Officer, Motley Fool Asset Management
Past performance does not guarantee future results. There can be no guarantee that any strategy (risk management or otherwise) will be successful. All investing involves risk, including potential loss of principal. Securities in a Fund may not match those in an index and performance of the Fund will be differ. You cannot invest directly into an index.
The Letter to Shareholders seeks to describe some of the Adviser’s current opinions and views of the financial markets. Although the Adviser believes it has a reasonable basis for any opinions or views expressed, actual results may differ, sometimes significantly so, from those expected or expressed. The securities held by the Funds that are discussed in the Letter to Shareholders were held during the period covered by the semi-annual report. They do not comprise the entire investment portfolio of the Funds, may be sold at any time, and may no longer be held by the Funds. The opinions of the Adviser with respect to those securities may change at any time.
 New to investing? Reading your first mutual fund semi-annual report? New to investing? Reading your first mutual fund semi-annual report?
Welcome! Here are some important things you need to know. Mutual fund investing offers many potential benefits. But there also are risks. Financial gain is not guaranteed when it comes to investing in equity securities. It’s possible to lose money, including your principal — especially during the short term. We focus on the stocks of high quality businesses. Even the best businesses in the world fall in price — and sometimes a lot. Over the longer term, stock prices usually reflect business values, but the relationship is much more tenuous in the short term. We also construct focused portfolios. This means we’re likely to own far fewer securities than are in the “market” or our benchmark. This could result in higher volatility or performance that is worse from the market and benchmark. To be fair, it could also result in lower volatility and performance that is better. Our funds may invest in foreign companies and in companies with small market capitalization. There are certain risks associated with these types of investments. The risks are described on pages 4, 7 and 10 of this report. Additional risk information is provided in section 2 of the Notes to Financial Statements. |
Motley Fool Global Opportunities Fund
Portfolio Characteristics
(Unaudited)
The Motley Fool Global Opportunities Fund operated as a series of The Motley Fool Funds Trust (the “Predecessor Fund”) prior to December 21, 2016, at which time the Predecessor Fund was reorganized into the Fund. The performance shown for periods prior to December 21, 2016 represents the performance of the Predecessor Fund.
At February 28, 2018, the Motley Fool Global Opportunities Fund Investor Shares had an unaudited net asset value of $24.65 per share attributed to 15,580,007 shares outstanding and the Institutional Shares had an unaudited net asset value of $24.69 per share attributed to 3,008,476 shares outstanding. This compares with an unaudited net asset value as of June 16, 2009 for the Investor Shares of $10.00 per share attributed to 100,000 shares outstanding and as of June 17, 2014 for the Institutional Shares of $20.36 per share attributed to 1 share outstanding. From the Investor Shares launch on June 16, 2009 to February 28, 2018, the Investor Shares had an average annual total return of 13.93% versus a return of 11.97% over the same period for its benchmark, FTSE Global All Cap Net Tax Index. From the Institutional Shares launch on June 17, 2014 to February 28, 2018, the Institutional Shares returned 10.73% versus a return of 7.83% over the same period for the FTSE Global All Cap Net Tax Index.
Average Annual Total Returns for the periods ended February 28, 2018 |
| | Six
months† | One
Year | Five
Year | Since
Inception | Inception
Date |
Investor Shares* | 16.38% | 33.88% | 12.79% | 13.93% | 6/16/2009 |
Institutional Shares* | 16.45% | 34.03% | N/A | 10.73% | 6/17/2014 |
FTSE Global All Cap Net Tax Index** | 8.79% | 18.62% | 10.53% | — (1) | — |
Fund Expense Ratios(2): Investor Shares: Gross 1.15% and Net 1.15%; Institutional Shares: Gross 1.17% and Net 0.95% |
The performance data quoted represents past performance and does not guarantee future results. Current performance may be lower or higher. Performance data current to the most recent month-end may be obtained at www.FoolFunds.com. The investment return and principal value of an investment will fluctuate so that shares, when redeemed, may be worth more or less than their original cost.
(1) | The index returned 11. 97% from the inception date of the Investor Shares and 7.83% from the inception date of the Institutional Shares. |
(2) | The expense ratios of the Fund are set forth according to the 12/31/2017 Prospectus for the Fund and may differ from the expense ratios disclosed in the Financial Highlights tables in this report. See the Financial Highlights for more current expense ratios. |
* | These returns reflect expense waivers by the Fund’s investment adviser. Without these waivers, returns would have been lower. |
** | The FTSE Global All Cap Net Tax Index is a market-capitalization weighted index representing the performance of large, mid and small cap companies in Developed and Emerging markets. The index is comprised of approximately 7,600 securities from 47 countries and captures 98% of the world’s investable market capitalization. Fair value prices and foreign exchange as of 4 pm ET are used in the calculation of this index, and returns are adjusted for withholding taxes applicable to dividends received by a U.S. Regulated Investment Company domiciled in the United States. The index is unmanaged and not available for direct investments. Its performance does not reflect deductions for fees, expenses or taxes. |
The investment objective of the Global Opportunities Fund is to achieve long-term capital appreciation, and it pursues this objective by investing primarily in common stocks of companies located anywhere in the world. The Fund employs a growth at a reasonable price investment strategy and seeks long-term growth by identifying and acquiring securities of companies that are, in the view of Motley Fool Asset Management, LLC (the “Adviser”), high quality. To identify these high-quality businesses, the Adviser engages in research to evaluate each company under consideration using four criteria: management, culture, and incentives; the economics of the business; competitive advantage; and the durability of its competitive advantage period. The Adviser’s approach prizes a long-term mindset and a balance of qualitative and quantitative factors.
The Fund will invest in areas of the market, that, in the view of the Adviser, offer the greatest potential for long-term capital appreciation, and it does not attempt to match the allocations of its benchmark. As such, significant deviation from the benchmark is expected from time to time, especially over shorter time frames.
The allocations to various sectors, countries, or any other macro-economic designation, are the byproduct of rigorous bottom-up analysis rather than an intentional top-down opinion of asset classes. While market conditions are constantly changing, exposure to equity market risk is needed to consistently achieve equity-like returns.
Motley Fool Global Opportunities Fund
Portfolio Characteristics (Continued)
(Unaudited)
The following tables show the top eleven holdings, sector allocations, and top eleven countries in which the Fund was invested in as of February 28, 2018. Portfolio holdings are subject to change without notice.
Top Eleven Holdings | % of Net
Assets |
Amazon.com, Inc. | 5.61% |
NMC Health PLC | 4.47 |
XPO Logistics, Inc. | 4.00 |
IPG Photonics Corp. | 3.86 |
Mastercard, Inc. Class A | 3.66 |
Medtronic PLC | 3.58 |
MercadoLibre, Inc. | 3.08 |
Align Technology, Inc. | 3.04 |
Douzone Bizon Co., Ltd. | 2.96 |
Tencent Holdings Ltd. | 2.81 |
BGEO Group PLC | 2.67 |
| | 39.74% |
The Motley Fool Global Opportunities Fund uses the Global Industry Classification StandardSM (“GICS SM”) as the basis for the classification of securities on the Schedule of Investments (“SOI”).We believe that this makes the SOI classifications more standard with the rest of the industry.
Sector Allocation | % of Net
Assets |
Information Technology | 32.87% |
Consumer Discretionary | 17.68 |
Health Care | 15.98 |
Industrials | 10.64 |
Financials | 10.19 |
Real Estate | 4.00 |
Consumer Staples | 3.92 |
Telecommunication Services | 1.73 |
| | 97.01% |
Motley Fool Global Opportunities Fund
Portfolio Characteristics (Concluded)
(Unaudited)
Top Eleven Countries | % of Net
Assets |
United States * | 57.35% |
United Arab Emirates | 5.31 |
China | 4.82 |
Ireland | 3.58 |
Argentina | 3.08 |
South Korea | 2.96 |
Georgia | 2.67 |
Japan | 2.61 |
Indonesia | 2.54 |
India | 2.12 |
Panama | 2.09 |
| | 89.13% |
* | As of the date of the report, the Fund had a holding of 2.39% in the First American Treasury Obligations Fund, Class X. |
Motley Fool Small-Mid Cap Growth Fund
Portfolio Characteristics
(Unaudited)
The Motley Fool Small-Mid Cap Growth Fund operated as a series of The Motley Fool Funds Trust (the “Predecessor Fund”) prior to December 21, 2016, at which time the Predecessor Fund was reorganized into the Fund. The performance shown for periods prior to December 21, 2016 represents performance of the Predecessor Fund.
At February 28, 2018, the Motley Fool Small-Mid Cap Growth Fund Investor Shares had an unaudited net asset value of $25.22 per share attributed to 10,571,162 shares outstanding and the Institutional Shares had an unaudited net asset value of $25.36 per share attributed to 1,072,118 shares outstanding. This compares with an unaudited net asset value as of November 1, 2010 for the Investor Shares of $10.00 per share attributed to 102,000 shares outstanding and as of June 17, 2014 for the Institutional Shares of $17.94 per share attributed to 1 share outstanding. From the Investor Shares launch on November 1, 2010 to February 28, 2018, the Investor Shares had an average annual total return of 14.64% versus a return of 14.35% over the same period for its benchmark, the Russell 2500 Growth Index. From the Institutional Shares launch on June 17, 2014 to February 28, 2018, the Institutional Shares returned 11.59% versus a return of 10.51% over the same period for the Russell 2500 Growth Index.
Average Annual Total Returns for the periods ended February 28, 2018 |
| | Six
Months† | One
Year | Five
Year | Since
Inception | Inception
Date |
Investor Shares* | 20.82% | 29.20% | 14.51% | 14.64% | 11/1/2010 |
Institutional Shares* | 20.90% | 29.38% | N/A | 11.59% | 6/17/2014 |
Russell 2500 Growth Index** | 12.52% | 19.82% | 14.15% | — (1) | — |
Fund Expense Ratios(2): Investor Shares: Gross 1.16% and Net 1.15%; Institutional Shares: Gross 1.47% and Net 0.95% |
The performance data quoted represents past performance and does not guarantee future results. Current performance may be lower or higher. Performance data current to the most recent month-end may be obtained at www.FoolFunds.com. The investment return and principal value of an investment will fluctuate so that shares, when redeemed, may be worth more or less than their original cost.
(1) | The index returned 14.35% from the inception date of the Investor Shares and 10.51% from the inception date of the Institutional Shares. |
(2) | The expense ratios of the Fund are set forth according to the 12/31/2017 Prospectus for the Fund and may differ from the expense ratios disclosed in the Financial Highlights tables in this report. See the Financial Highlights for more current expense ratios. |
* | These returns reflect expense waivers by the Fund’s investment adviser. Without these waivers, returns would have been lower. |
** | The Russell 2500 Growth Index is an unmanaged, free float-adjusted, market capitalization weighted index that is designed to measure the performance of the small and mid-cap growth segment of the U.S. stock market. The Russell 2500 Growth Index is a subset of the Russell 3000® Index. It includes approximately 2,500 of the smallest securities based on a combination of their market cap and current index membership. The Fund may invest in companies that are not included within the Russell 2500 Growth Index and its investment portfolio is not weighted in terms of issuers the same as the Russell 2500 Growth Index. For this reason, the Fund’s investment performance should not be expected to track, and may exceed or trail, the Russell 2500 Growth Index. The index is unmanaged and not available for direct investment. Its performance does not reflect deductions for fees, expenses or taxes. |
The investment objective of the Small-Mid Cap Growth Fund is to achieve long-term capital appreciation, and it pursues this objective by investing primarily in common stocks of companies organized in the United States. The Fund employs a growth at a reasonable price investment strategy and seeks long-term growth by identifying and acquiring securities of companies that are, in the view of Motley Fool Asset Management, LLC (the “Adviser”), high quality. To identify these high-quality businesses, the Adviser engages in research to evaluate each company under consideration using four criteria: management, culture, and incentives; the economics of the business; competitive advantage; and the durability of its competitive advantage period. The Adviser’s approach prizes a long-term mindset and a balance of qualitative and quantitative factors.
The Fund will invest in areas of the market, that, in the view of the Adviser, offer the greatest potential for long-term capital appreciation, and it does not attempt to match the allocations of its benchmark. As such, significant deviation from the benchmark is expected from time to time, especially over shorter time frames.
Motley Fool Small-Mid Cap Growth Fund
Portfolio Characteristics (concluded)
(Unaudited)
The allocations to various sectors, or any other macro-economic designation, are the byproduct of rigorous bottom-up analysis rather than an intentional top-down opinion of asset classes. While market conditions are constantly changing, exposure to equity market risk is needed to consistently achieve equity-like returns. The Adviser views its time as best spent focused on evaluating businesses and seeking to minimize company-specific risk in order to pursue its objective of long-term capital appreciation.
Although the Small-Mid Cap Fund may invest in companies with any market capitalization, the Adviser expects that investments in the securities of companies having smaller- and mid-market capitalizations will be important components of the Fund’s investment program. Investments in securities of these companies may involve greater risk than do investments in larger, more established companies. Small- and mid-cap stocks tend to be more volatile and less liquid than their large-cap counterparts.
The following tables show the top eleven holdings, and sector allocations in which the Fund was invested in as of February 28, 2018. Portfolio holdings are subject to change without notice.
Top Eleven Holdings* | % of Net
Assets |
XPO Logistics, Inc. | 7.20% |
Thor Industries, Inc. | 5.05 |
IPG Photonics Corp. | 4.98 |
LCI Industries | 4.12 |
Jones Lang LaSalle, Inc. | 3.96 |
Align Technology, Inc. | 3.66 |
Texas Roadhouse, Inc. | 3.48 |
Cooper Companies, Inc. (The) | 3.25 |
ResMed, Inc. | 3.21 |
Markel Corp. | 2.99 |
SBA Communications Corp. | 2.94 |
| | 44.84% |
* | As of the date of the report, the Fund had a holding of 4.21% in the First American Treasury Obligations Fund Class X. |
The Motley Fool Small-Mid Cap Growth Fund uses the Global Industry Classification StandardSM (“GICS SM”) as the basis for the classification of securities on the Schedule of Investments (“SOI”).We believe that this makes the SOI classifications more standard with the rest of the industry.
Sector Allocation | % of Net
Assets |
Consumer Discretionary | 21.02% |
Industrials | 18.24 |
Health Care | 15.92 |
Information Technology | 15.21 |
Financials | 11.90 |
Real Estate | 8.42 |
Consumer Staples | 2.88 |
Materials | 2.17 |
| | 95.76% |
Motley Fool Emerging Markets Fund
Portfolio Characteristics
(Unaudited)
The Motley Fool Emerging Markets Fund operated as a series of The Motley Fool Funds Trust (the “Predecessor Fund”) prior to December 21, 2016, at which time the Predecessor Fund was reorganized into the Fund. The performance shown for periods prior to December 21, 2016 represents the performance of the Predecessor Fund
At February 28, 2018, the Motley Fool Emerging Markets Fund Investor Shares had an unaudited net asset value of $15.40 per share attributed to 2,502,804 shares outstanding. This compares with an unaudited net asset value as of November 1, 2011 for the Investor Shares of $10.00 per share attributed to 106,350 shares outstanding. From the Investor Shares launch on November 1, 2011 to February 28, 2018, the Investor Shares had an average annual total return of 8.16% versus a return of 5.97% over the same period for its benchmark, the FTSE Emerging Markets All Cap China A Inclusion Net Tax Index.
Average Annual Total Returns for periods ended February 28, 2018 |
| | Six
Months† | One
Year | Five
Year | SINCE
Inception | Inception
Date |
Investor Shares* | 8.15% | 31.26% | 7.52% | 8.16% | 11/1/2011 |
FTSE Emerging Markets All Cap China A Inclusion Net Tax Index** | 8.87% | 25.14% | 5.02% | 5.97%(1) | — |
Fund Expense Ratios(2): Investor Shares: Gross 2.00% and Net 1.15% | |
The performance data quoted represents past performance and does not guarantee future results. Current performance may be lower or higher. Performance data current to the most recent month-end may be obtained at www.FoolFunds.com. The investment return and principal value of an investment will fluctuate so that shares, when redeemed, may be worth more or less than their original cost.
(1) | Benchmark performance is from inception date of the Investor Shares only and is not the inception date of the benchmark itself. |
(2) | The expense ratios of the Fund are set forth according to the 12/31/2017 Prospectus for the Fund and may differ from the expense ratios disclosed in the Financial Highlights table in this report. See the Financial Highlights for more current expense ratios. |
* | These returns reflect expense waivers by the Fund’s investment adviser. Without these waivers, returns would have been lower. |
** | The FTSE Emerging Markets All Cap China A Inclusion Net Tax Index is a market-capitalization weighted index representing the performance of large, mid and small cap companies in Emerging markets. The index is comprised of approximately 3,350 securities from 22 countries, and is part of the FTSE China A Inclusion Indexes which contain FTSE China A All Cap Index securities adjusted for the aggregate approved QFII and RQFII quotas available to international investors. Fair value prices and foreign exchange as of 4 pm EST are used in the calculation of this index, and returns are adjusted for withholding taxes applicable to dividends received by a U.S. Regulated Investment Company domiciled in the United States. |
The investment objective of the Emerging Markets Fund is to achieve long-term capital appreciation, and it pursues this objective by investing primarily in common stocks of companies organized in emerging market foreign countries. In prior years, the Fund’s strategy included investments in both developed and emerging markets countries. Along with a name change effective February 28, 2017, the Fund has been focused on emerging economies.
The Fund employs a growth at a reasonable price investment strategy and seeks long-term growth by identifying and acquiring securities of companies that are, in the view of Motley Fool Asset Management, LLC (the “Adviser”), high quality. To identify these high-quality businesses, the Adviser engages in research to evaluate each company under consideration using four criteria: management, culture, and incentives; the economics of the business; competitive advantage; and the durability of its competitive advantage period. The Adviser’s approach prizes a long-term mindset and a balance of qualitative and quantitative factors. While emerging markets have always been included in the Fund, the new focus following the name change mentioned above resulted in several new companies entering the portfolio.
The Fund will invest in areas of the market, that, in the view of the Adviser, offer the greatest potential for long-term capital appreciation, and it does not attempt to match the allocations of its benchmark. As such, significant deviation from the benchmark is expected from time to time, especially over shorter time frames.
Motley Fool Emerging Markets Fund
Portfolio Characteristics (Continued)
(Unaudited)
The allocations to various sectors, countries, or any other macro-economic designation, are the byproduct of rigorous bottom-up analysis rather than an intentional top-down opinion of asset classes. While market conditions are constantly changing, exposure to equity market risk is needed to consistently achieve equity-like returns. The Adviser views its time as best spent focused on evaluating businesses and seeking to minimize company-specific risk in order to pursue its objective of long-term capital appreciation.
Because the Emerging Markets Fund is free to invest in companies of any size around the world, investments in companies with smaller market capitalizations will be an important component of the Fund’s investment program. Small-cap stocks tend to be more volatile and less liquid than their large-cap counterparts. In addition to company risk, fluctuations in currency exchange rates can cause losses when investing in foreign securities, with emerging markets presenting additional risks of illiquidity, political instability, and lax regulation. Please refer to the prospectus for a more detailed discussion of the Fund’s strategies and risks.
While investing in a particular sector is not a principal investment strategy of the Emerging Markets Fund, the portfolio may be significantly invested in a sector as a result of the portfolio management decisions made pursuant to its principal investment strategy.
The following tables show the top eleven holdings, sector allocations, and top eleven countries in which the Fund was invested in as of February 28, 2018. Portfolio holdings are subject to change without notice.
Top Eleven Holdings* | % of Net
Assets |
Tencent Holdings Ltd. | 6.47% |
NMC Health PLC | 6.11 |
MercadoLibre, Inc. | 5.54 |
Top Glove Corp Bhd | 5.14 |
Douzone Bizon Co., Ltd. | 5.03 |
Yum China Holdings, Inc. | 4.05 |
Ctrip.com International Ltd. ADR | 3.97 |
Odontoprev SA | 3.69 |
Taiwan Semiconductor Manufacturing Co., Ltd. SP ADR | 3.66 |
BGEO Group PLC | 3.62 |
International Container Terminal Services, Inc. | 3.53 |
| | 50.81% |
* | As of the date of the report, the Fund had a holding of 5.71% in the First American Treasury Obligations Fund, Class X. |
The Motley Fool Emerging Markets Fund uses the Global Industry Classification StandardSM (“GICS SM”) as the basis for the classification of securities on the Schedule of Investments (“SOI”).We believe that this makes the SOI classifications more standard with the rest of the industry.
Motley Fool Emerging Markets Fund
Portfolio Characteristics (Concluded)
(Unaudited)
Sector Allocation | % of Net
Assets |
Information Technology | 23.00% |
Financials | 16.47 |
Health Care | 16.00 |
Industrials | 14.94 |
Consumer Discretionary | 13.03 |
Consumer Staples | 5.53 |
Telecommunication Services | 4.18 |
Real Estate | 0.97 |
| | 94.12% |
Top Eleven Countries* | % of Net
Assets |
China | 16.80% |
United Arab Emirates | 8.77 |
Mexico | 8.69 |
Indonesia | 6.66 |
Argentina | 5.54 |
Brazil | 5.34 |
Malaysia | 5.14 |
South Korea | 5.03 |
Turkey | 4.80 |
Georgia | 4.69 |
Taiwan | 3.66 |
| | 84.88% |
* | As of the date of the report, the Fund had a holding of 5.71% in the First American Treasury Obligations Fund, Class X. |
Motley Fool Funds
Fund Expense Examples
February 28, 2018 (Unaudited)
As a shareholder of the Funds, you incur two types of costs: (1) transaction costs, and (2) ongoing costs, including advisory fees and other Fund expenses. These examples are intended to help you to understand your ongoing costs (in dollars) of investing in the Fund(s) and to compare these costs with the ongoing costs of investing in other mutual funds.
These examples are based on an investment of $1,000 invested at the beginning of the six-month period from September 1, 2017 to February 28, 2018, and held for the entire period.
Actual Expenses
The first section of the accompanying tables provide information about actual account values and actual expenses. You may use the information in this section, together with the amount you invested, to estimate the expenses that you incurred over the period. Simply divide your account value by $1,000 (for example, an $8,600 account value divided by $1,000 = 8.6), then multiply the result by the number in the first section under the heading entitled “Expenses Paid During Period” to estimate the expenses attributable to your investment during this period.
Hypothetical ExampleS for Comparison Purposes
The second section of the accompanying tables provide information about hypothetical account values and hypothetical expenses based on each Fund’s actual expense ratio and an assumed rate of return of 5% per year before expenses, which is not the Fund’s actual return. Thus, you should not use the hypothetical account values and expenses to estimate the actual ending account balance or your expenses for the period. Rather, these figures are provided to enable you to compare the ongoing costs of investing in the Fund as compared to the costs of investing in other funds. To do so, compare these 5% hypothetical examples with the 5% hypothetical examples that appear in the shareholder reports of the other funds. Please note that the expenses shown in the table are meant to highlight your ongoing costs only and do not reflect any transactional costs. Therefore, the second section of the accompanying table is useful in comparing ongoing costs only and will not help you determine the relative total costs of owning different funds. In addition, if these transactional costs were included, your costs would have been higher.
Do you know how many times a fund, or the market, has returned a smooth 5% over a long period of time? Never. But we have to pick some example. In reality, the market’s returns are always far bumpier, with the market returning 20% one year, followed by a loss of 10% the next year, followed by a 3% gain, etc. These variations affect actual expenses as well. Happily, over almost all time periods of 20 years or longer, according to the research of University of Pennsylvania’s Jeremy Siegel and others, the domestic market’s returns have been at least 5% per year on average. |
| Beginning
Account Value
September 1, 2017 | Ending
Account Value
February 28,
2018 | Annualized
Expense
Ratio(1) | Expenses
Paid During
Period(2) |
Global Opportunities Fund - Investor Shares | | | | |
Actual | $1,000.00 | $1,163.80 | 1.07% | $5.74 |
Hypothetical (5% return before expenses) | 1,000.00 | 1,019.49 | 1.07 | 5.63 |
Global Opportunities Fund - Institutional Shares | | | | |
Actual | $1,000.00 | $1,164.50 | 0.95% | $5.10 |
Hypothetical (5% return before expenses) | 1,000.00 | 1,020.08 | 0.95 | 4.76 |
Motley Fool Funds
Fund Expense Examples (Concluded)
February 28, 2018 (Unaudited)
| Beginning
Account Value
September 1, 2017 | Ending
Account Value
February 28,
2018 | Annualized
Expense
Ratio(1) | Expenses
Paid During
Period(2) |
Small-Mid Cap Growth Fund - Investor Shares | | | | |
Actual | $1,000.00 | $1,208.20 | 1.15% | $6.30 |
Hypothetical (5% return before expenses) | 1,000.00 | 1,019.09 | 1.15 | 5.76 |
Small-Mid Cap Growth Fund - Institutional Shares | | | | |
Actual | $1,000.00 | $1,209.00 | 0.95% | $5.20 |
Hypothetical (5% return before expenses) | 1,000.00 | 1,020.08 | 0.95 | 4.76 |
Emerging Markets Fund - Investor Shares | | | | |
Actual | $1,000.00 | $1,081.50 | 1.15% | $5.94 |
Hypothetical (5% return before expenses) | 1,000.00 | 1,019.09 | 1.15 | 5.76 |
(1) | These ratios reflect expenses waived by the Funds’ investment adviser. Without these waivers, the Funds’ expenses would have been higher and the ending account values would have been lower. |
(2) | Expenses are equal to the Funds’ annualized expense ratio for the period September 1, 2017 to February 28, 2018, multiplied by the average account value over the period, multiplied by the number of days (181) in the most recent fiscal half-year, then divided by 365 to reflect the one-half year period. |
Motley Fool Global Opportunities Fund
Schedule of Investments
February 28, 2018 (Unaudited)
| | | Number of
Shares | | | Value
(Note 2) | |
| | | | | | | |
| Common Stocks — 96.18% | | | | | | |
| Air Freight & Logistics — 4.00% | | | | | | |
| XPO Logistics, Inc. (United States)* | | | 186,000 | | | $ | 18,307,980 | |
| Auto Components — 2.30% | | | | | | | | |
| Gentex Corp. (United States) | | | 200,000 | | | | 4,542,000 | |
| LCI Industries (United States) | | | 55,000 | | | | 6,011,500 | |
| | | | | | | | 10,553,500 | |
| Banks — 6.88% | | | | | | | | |
| Banco Latinoamericano de Comercio Exterior SA (Panama) | | | 343,129 | | | | 9,556,142 | |
| BGEO Group PLC (Georgia) | | | 263,132 | | | | 12,255,913 | |
| HDFC Bank Ltd. ADR (India) | | | 100,000 | | | | 9,718,000 | |
| | | | | | | | 31,530,055 | |
| Biotechnology — 1.61% | | | | | | | | |
| Ionis Pharmaceuticals, Inc. (United States)* | | | 140,000 | | | | 7,394,800 | |
| Commercial Services & Supplies — 1.39% | | | | | | | | |
| KAR Auction Services, Inc. (United States) | | | 117,708 | | | | 6,365,649 | |
| Communications Equipment — 1.44% | | | | | | | | |
| Infinera Corp. (United States)* | | | 661,100 | | | | 6,577,945 | |
| Consumer Finance — 1.28% | | | | | | | | |
| Gentera SAB de CV (Mexico) | | | 7,200,000 | | | | 5,885,845 | |
| Diversified Financial Services — 2.03% | | | | | | | | |
| Berkshire Hathaway, Inc., Class A (United States)* | | | 30 | | | | 9,307,500 | |
| Electronic Equipment, Instruments & Components — 3.86% | | | | | | | | |
| IPG Photonics Corp. (United States)* | | | 72,000 | | | | 17,686,080 | |
| Equity Real Estate Investment Trusts — 4.01% | | | | | | | | |
| American Tower Corp. (United States) | | | 64,000 | | | | 8,917,120 | |
| SBA Communications Corp. (United States)* | | | 60,000 | | | | 9,436,200 | |
| | | | | | | | 18,353,320 | |
| Food & Staples Retailing — 1.67% | | | | | | | | |
| Costco Wholesale Corp. (United States) | | | 40,000 | | | | 7,636,000 | |
See Notes to Financial Statements.
Motley Fool Global Opportunities Fund
Schedule of Investments (continued)
February 28, 2018 (Unaudited)
| | | Number of
Shares | | | Value
(Note 2) | |
| | | | | | | |
| Common Stocks (continued) | | | | | | |
| Food Products — 2.25% | | | | | | |
| Nestle SA (Switzerland) | | | 68,694 | | | $ | 5,457,811 | |
| Nippon Indosari Corpindo Tbk PT (Indonesia) | | | 54,234,800 | | | | 4,852,079 | |
| | | | | | | | 10,309,890 | |
| Health Care Equipment & Supplies — 8.73% | | | | | | | | |
| Align Technology, Inc. (United States)* | | | 53,000 | | | | 13,913,560 | |
| Medtronic PLC (Ireland) | | | 205,272 | | | | 16,399,180 | |
| ResMed, Inc. (United States) | | | 102,000 | | | | 9,717,540 | |
| | | | | | | | 40,030,280 | |
| Health Care Providers & Services — 4.47% | | | | | | | | |
| NMC Health PLC (United Arab Emirates) | | | 435,482 | | | | 20,495,822 | |
| Hotels, Restaurants & Leisure — 3.40% | | | | | | | | |
| Starbucks Corp. (United States) | | | 195,000 | | | | 11,134,500 | |
| Texas Roadhouse, Inc. (United States) | | | 80,500 | | | | 4,448,430 | |
| | | | | | | | 15,582,930 | |
| Internet & Direct Marketing Retail — 9.19% | | | | | | | | |
| Amazon.com, Inc. (United States)* | | | 17,000 | | | | 25,711,650 | |
| Ctrip.com International Ltd. ADR (China)* | | | 200,752 | | | | 9,230,577 | |
| zooplus AG (Germany)* | | | 33,000 | | | | 7,171,697 | |
| | | | | | | | 42,113,924 | |
| Internet Software & Services — 10.21% | | | | | | | | |
| Alphabet, Inc., Class C (United States)* | | | 9,024 | | | | 9,969,084 | |
| Facebook, Inc. (United States)* | | | 55,000 | | | | 9,807,600 | |
| MercadoLibre, Inc. (Argentina) | | | 36,437 | | | | 14,136,463 | |
| Tencent Holdings Ltd. (China) | | | 235,000 | | | | 12,856,502 | |
| | | | | | | | 46,769,649 | |
| IT Services — 5.40% | | | | | | | | |
| Mastercard, Inc. (United States) | | | 95,500 | | | | 16,785,080 | |
| PayPal Holdings, Inc. (United States)* | | | 100,000 | | | | 7,941,000 | |
| | | | | | | | 24,726,080 | |
| Life Sciences Tools & Services — 1.16% | | | | | | | | |
| Horizon Discovery Group PLC (United Kingdom)* | | | 2,135,499 | | | | 5,335,581 | |
See Notes to Financial Statements.
Motley Fool Global Opportunities Fund
Schedule of Investments (continued)
February 28, 2018 (Unaudited)
| | | Number of
Shares | | | Value
(Note 2) | |
| | | | | | | |
| Common Stocks (continued) | | | | | | |
| Machinery — 0.88% | | | | | | |
| FANUC Corp. (Japan) | | | 16,000 | | | $ | 4,043,078 | |
| Media — 1.31% | | | | | | | | |
| Multiplus SA (Brazil) | | | 278,600 | | | | 2,954,263 | |
| System1 Group PLC (United Kingdom) | | | 700,000 | | | | 3,025,806 | |
| | | | | | | | 5,980,069 | |
| Multiline Retail — 1.48% | | | | | | | | |
| Mitra Adiperkasa Tbk PT (Indonesia) | | | 12,301,000 | | | | 6,799,840 | |
| Semiconductors & Semiconductor Equipment — 2.03% | | | | | | | | |
| Taiwan Semiconductor Manufacturing Co., Ltd. SP ADR (Taiwan) | | | 215,000 | | | | 9,320,250 | |
| Software — 8.19% | | | | | | | | |
| Douzone Bizon Co., Ltd. (South Korea) | | | 265,680 | | | | 13,563,672 | |
| Paycom Software, Inc. (United States)* | | | 88,000 | | | | 8,704,960 | |
| Splunk, Inc. (United States)* | | | 97,500 | | | | 9,087,000 | |
| Ultimate Software Group, Inc. (The) (United States)* | | | 26,000 | | | | 6,199,960 | |
| | | | | | | | 37,555,592 | |
| Technology Hardware, Storage & Peripherals — 1.75% | | | | | | | | |
| Apple, Inc. (United States) | | | 45,000 | | | | 8,015,400 | |
| Trading Companies & Distributors — 1.80% | | | | | | | | |
| Watsco, Inc. (United States) | | | 50,000 | | | | 8,268,500 | |
| Transportation Infrastructure — 1.73% | | | | | | | | |
| International Container Terminal Services, Inc. (Philippines) | | | 3,750,000 | | | | 7,920,507 | |
| Wireless Telecommunication Services — 1.73% | | | | | | | | |
| SoftBank Group Corp. (Japan) | | | 96,000 | | | | 7,910,100 | |
| Total Common Stocks (Cost $259,746,225) | | | | | | | 440,776,166 | |
See Notes to Financial Statements.
Motley Fool Global Opportunities Fund
Schedule of Investments (concluded)
February 28, 2018 (Unaudited)
| | | Number of
Shares | | | Value
(Note 2) | |
| | | | | | | |
| Participatory Notes — 0.84% | | | | | | |
| Air Freight & Logistics — 0.84% | | | | | | |
| Aramex PJSC (United Arab Emirates) (a) | | | 3,134,000 | | | $ | 3,859,677 | |
| Total Participatory Notes (Cost $2,790,802) | | | | | | | 3,859,677 | |
| | | | | | | | | |
| Short-Term Investments — 2.39% | | | | | | | | |
| First American Treasury Obligations Fund, Class X (United States) 1.27% (b) | | | 10,939,991 | | | | 10,939,991 | |
| Total Short-Term Investments (Cost $10,939,991) | | | | | | | 10,939,991 | |
| | | | | | | | | |
| Total Investments (Cost $273,477,018) — 99.41% | | | | | | | 455,575,834 | |
| Other Assets in Excess of Liabilities — 0.59% | | | | | | | 2,728,222 | |
| NET ASSETS — 100.00% | | | | | | | | |
| (Applicable to 18,588,483 shares outstanding) | | | | | | $ | 458,304,056 | |
* | Non-income producing security. |
PLC — Public Limited Company
ADR — American Depositary Receipt
SP ADR — Sponsored ADR
(a) | Security exempt form registration under Rule 144A of the Securities Act of 1933. These securities may be resold in transactions exempt from registration, normally to qualified institutional buyers. Total market value of Rule 144A securities is $3,859,677 and represents 0.84% of net assets as of February 28, 2018. |
(b) | Seven-day yeild as of February 28, 2018. |
See Notes to Financial Statements.
Motley Fool Small-Mid Cap Growth Fund
Schedule of Investments
February 28, 2018 (Unaudited)
| | | Number of
Shares | | | Value
(Note 2) | |
| | | | | | | |
| Common Stocks — 95.75% | | | | | | |
| Air Freight & Logistics — 8.67% | | | | | | |
| CH Robinson Worldwide, Inc. (United States) | | | 46,000 | | | $ | 4,294,560 | |
| XPO Logistics, Inc. (United States)* | | | 215,000 | | | | 21,162,450 | |
| | | | | | | | 25,457,010 | |
| Auto Components — 7.28% | | | | | | | | |
| Dorman Products, Inc. (United States)* | | | 35,938 | | | | 2,479,722 | |
| Gentex Corp. (United States) | | | 300,000 | | | | 6,813,000 | |
| LCI Industries (United States) | | | 110,670 | | | | 12,096,231 | |
| | | | | | | | 21,388,953 | |
| Automobiles — 5.05% | | | | | | | | |
| Thor Industries, Inc. (United States) | | | 115,000 | | | | 14,835,000 | |
| Banks — 4.47% | | | | | | | | |
| Access National Corp. (United States) | | | 124,832 | | | | 3,489,054 | |
| Carter Bank & Trust (United States)* | | | 170,000 | | | | 2,864,500 | |
| Huntington Bancshares, Inc. (United States) | | | 100,000 | | | | 1,570,000 | |
| Lakeland Financial Corp. (United States) | | | 60,000 | | | | 2,718,600 | |
| SVB Financial Group (United States)* | | | 10,000 | | | | 2,489,800 | |
| | | | | | | | 13,131,954 | |
| Biotechnology — 2.23% | | | | | | | | |
| Ionis Pharmaceuticals, Inc. (United States)* | | | 124,100 | | | | 6,554,962 | |
| Building Products — 2.22% | | | | | | | | |
| American Woodmark Corp. (United States)* | | | 50,736 | | | | 6,514,502 | |
| Capital Markets — 4.44% | | | | | | | | |
| Diamond Hill Investment Group, Inc. (United States) | | | 36,959 | | | | 7,577,704 | |
| Oaktree Capital Group LLC (United States) | | | 131,072 | | | | 5,465,702 | |
| | | | | | | | 13,043,406 | |
| Chemicals — 0.86% | | | | | | | | |
| Eastman Chemical Co. (United States) | | | 25,000 | | | | 2,527,000 | |
| Commercial Services & Supplies — 1.56% | | | | | | | | |
| KAR Auction Services, Inc. (United States) | | | 85,000 | | | | 4,596,800 | |
| Electronic Equipment, Instruments & Components — 4.98% | | | | | | | | |
| IPG Photonics Corp. (United States)* | | | 59,500 | | | | 14,615,580 | |
See Notes to Financial Statements.
Motley Fool Small-Mid Cap Growth Fund
Schedule of Investments (continued)
February 28, 2018 (Unaudited)
| | | Number of
Shares | | | Value
(Note 2) | |
| | | | | | | |
| Common Stocks (continued) | | | | | | |
| Equity Real Estate Investment Trusts — 4.46% | | | | | | |
| SBA Communications Corp. (United States)* | | | 55,000 | | | $ | 8,649,850 | |
| STAG Industrial, Inc. (United States) | | | 195,000 | | | | 4,440,150 | |
| | | | | | | | 13,090,000 | |
| Food Products — 1.09% | | | | | | | | |
| McCormick & Co, Inc. (United States) | | | 30,000 | | | | 3,203,400 | |
| Health Care Equipment & Supplies — 13.69% | | | | | | | | |
| Align Technology, Inc. (United States)* | | | 41,000 | | | | 10,763,320 | |
| Cooper Cos, Inc. (The) (United States) | | | 41,400 | | | | 9,543,528 | |
| NuVasive, Inc. (United States)* | | | 51,449 | | | | 2,488,074 | |
| ResMed, Inc. (United States) | | | 99,000 | | | | 9,431,730 | |
| Varian Medical Systems, Inc. (United States)* | | | 67,000 | | | | 7,995,780 | |
| | | | | | | | 40,222,432 | |
| Hotels, Restaurants & Leisure — 3.58% | | | | | | | | |
| Papa John's International, Inc. (United States) | | | 5,000 | | | | 288,700 | |
| Texas Roadhouse, Inc. (United States) | | | 184,929 | | | | 10,219,177 | |
| | | | | | | | 10,507,877 | |
| Household Durables — 0.24% | | | | | | | | |
| TRI Pointe Group, Inc. (United States)* | | | 46,000 | | | | 705,180 | |
| Household Products — 1.79% | | | | | | | | |
| Church & Dwight Co., Inc. (United States) | | | 106,600 | | | | 5,243,654 | |
| Insurance — 2.99% | | | | | | | | |
| Markel Corp. (United States)* | | | 7,900 | | | | 8,784,800 | |
| Internet Software & Services — 2.71% | | | | | | | | |
| GrubHub, Inc. (United States)* | | | 80,000 | | | | 7,952,800 | |
| IT Services — 0.85% | | | | | | | | |
| Broadridge Financial Solutions, Inc. (United States) | | | 25,000 | | | | 2,509,500 | |
| Leisure Products — 2.23% | | | | | | | | |
| Hasbro, Inc. (United States) | | | 68,615 | | | | 6,557,536 | |
| Machinery — 1.48% | | | | | | | | |
| Proto Labs, Inc. (United States)* | | | 40,000 | | | | 4,358,000 | |
See Notes to Financial Statements.
Motley Fool Small-Mid Cap Growth Fund
Schedule of Investments (concluded)
February 28, 2018 (Unaudited)
| | | Number of
Shares | | | Value
(Note 2) | |
| | | | | | | |
| Common Stocks (continued) | | | | | | |
| Paper & Forest Products — 1.31% | | | | | | |
| KapStone Paper and Packaging Corp. (United States) | | | 110,400 | | | $ | 3,851,856 | |
| Real Estate Management & Development — 3.96% | | | | | | | | |
| Jones Lang LaSalle, Inc. (United States) | | | 72,500 | | | | 11,644,225 | |
| Road & Rail — 1.18% | | | | | | | | |
| Genesee & Wyoming, Inc. (United States)* | | | 50,000 | | | | 3,476,500 | |
| Software — 6.67% | | | | | | | | |
| Paycom Software, Inc. (United States)* | | | 75,000 | | | | 7,419,000 | |
| Splunk, Inc. (United States)* | | | 77,000 | | | | 7,176,400 | |
| Ultimate Software Group, Inc. (The) (United States)* | | | 21,000 | | | | 5,007,660 | |
| | | | | | | | 19,603,060 | |
| Specialty Retail — 2.64% | | | | | | | | |
| AutoZone, Inc. (United States)* | | | 7,300 | | | | 4,852,456 | |
| Tractor Supply Co. (United States) | | | 44,800 | | | | 2,908,864 | |
| | | | | | | | 7,761,320 | |
| Trading Companies & Distributors — 3.12% | | | | | | | | |
| Fastenal Co. (United States) | | | 76,750 | | | | 4,199,760 | |
| Watsco, Inc. (United States) | | | 30,000 | | | | 4,961,100 | |
| | | | | | | | 9,160,860 | |
| Total Common Stocks (Cost $158,076,756) | | | | | | | 281,298,167 | |
| | | | | | | | | |
| Short-Term Investments — 4.21% | | | | | | | | |
| First American Treasury Obligations Fund, Class X (United States), 1.27% (a) | | | 12,373,646 | | | | 12,373,646 | |
| Total Short-Term Investments (Cost $12,373,646) | | | | | | | 12,373,646 | |
| | | | | | | | | |
| Total Investments (Cost $170,450,402) — 99.96% | | | | | | | 293,671,813 | |
| Other Assets in Excess of Liabilities — 0.04% | | | | | | | 101,383 | |
| NET ASSETS — 100.00% | | | | | | | | |
| (Applicable to 11,643,280 shares outstanding) | | | | | | $ | 293,773,196 | |
* | Non-income producing security. |
(a) | Seven-day yield as of February 28, 2018. |
See Notes to Financial Statements.
Motley Fool Emerging Markets Fund
Schedule of Investments
February 28, 2018 (Unaudited)
| | | Number of
Shares | | | Value
(Note 2) | |
| | | | | | | |
| Common Stocks — 94.12% | | | | | | |
| Banks — 13.61% | | | | | | |
| Banco Latinoamericano de Comercio Exterior SA (Panama) | | | 45,000 | | | $ | 1,253,250 | |
| BGEO Group PLC (Georgia) | | | 30,000 | | | | 1,397,312 | |
| Credicorp Ltd. (Peru) | | | 6,000 | | | | 1,298,700 | |
| HDFC Bank Ltd. ADR (India) | | | 13,350 | | | | 1,297,353 | |
| | | | | | | | 5,246,615 | |
| Beverages — 1.88% | | | | | | | | |
| Coca-Cola Icecek AS (Turkey) | | | 75,000 | | | | 725,540 | |
| Consumer Finance — 2.86% | | | | | | | | |
| Gentera SAB de CV (Mexico) | | | 1,350,000 | | | | 1,103,596 | |
| Diversified Telecommunication Services — 1.13% | | | | | | | | |
| Telkom SA SOC Ltd. (South Africa) | | | 100,000 | | | | 435,543 | |
| Food & Staples Retailing — 1.32% | | | | | | | | |
| CP ALL PCL NVDR (Thailand) | | | 190,000 | | | | 508,442 | |
| Food Products — 2.33% | | | | | | | | |
| Nippon Indosari Corpindo Tbk PT (Indonesia) | | | 10,022,700 | | | | 896,674 | |
| Health Care Equipment & Supplies — 5.15% | | | | | | | | |
| Top Glove Corp. Bhd (Malaysia) | | | 800,000 | | | | 1,983,150 | |
| Health Care Providers & Services — 10.85% | | | | | | | | |
| Georgia Healthcare Group PLC (Georgia)*(a) | | | 90,000 | | | | 408,882 | |
| NMC Health PLC (United Arab Emirates) | | | 50,000 | | | | 2,353,234 | |
| Odontoprev SA (Brazil) | | | 300,000 | | | | 1,421,048 | |
| | | | | | | | 4,183,164 | |
| Hotels, Restaurants & Leisure — 4.05% | | | | | | | | |
| Yum China Holdings, Inc. (China) | | | 36,000 | | | | 1,559,520 | |
| Internet & Direct Marketing Retail — 3.97% | | | | | | | | |
| Ctrip.com International Ltd. ADR (China)* | | | 33,300 | | | | 1,531,134 | |
| Internet Software & Services — 14.31% | | | | | | | | |
| Alibaba Group Holding Ltd. SP ADR (China)* | | | 2,400 | | | | 446,736 | |
| Baidu, Inc. SP ADR (China)* | | | 1,750 | | | | 441,595 | |
| MercadoLibre, Inc. (Argentina) | | | 5,500 | | | | 2,133,835 | |
| Tencent Holdings Ltd. (China) | | | 45,600 | | | | 2,494,709 | |
| | | | | | | | 5,516,875 | |
See Notes to Financial Statements.
Motley Fool Emerging Markets Fund
Schedule of Investments (continued)
February 28, 2018 (Unaudited)
| | | Number of
Shares | | | Value
(Note 2) | |
| | | | | | | |
| Common Stocks (continued) | | | | | | |
| Media — 1.65% | | | | | | |
| Multiplus SA (Brazil) | | | 60,000 | | | $ | 636,238 | |
| Multiline Retail — 3.36% | | | | | | | | |
| Mitra Adiperkasa Tbk PT (Indonesia) | | | 2,342,000 | | | | 1,294,628 | |
| Real Estate Management & Development — 0.97% | | | | | | | | |
| Lippo Karawaci Tbk PT (Indonesia) | | | 10,000,000 | | | | 374,586 | |
| Semiconductors & Semiconductor Equipment — 3.66% | | | | | | | | |
| Taiwan Semiconductor Manufacturing Co. Ltd. SP ADR (Taiwan) | | | 32,500 | | | | 1,408,875 | |
| Software — 5.03% | | | | | | | | |
| Douzone Bizon Co. Ltd. (South Korea) | | | 38,000 | | | | 1,940,001 | |
| Transportation Infrastructure — 14.94% | | | | | | | | |
| DP World Ltd. (United Arab Emirates) | | | 42,000 | | | | 1,026,900 | |
| Grupo Aeroportuario del Pacifico SAB de CV ADR (Mexico) | | | 11,500 | | | | 1,110,325 | |
| Grupo Aeroportuario del Sureste SAB de CV ADR (Mexico) | | | 6,400 | | | | 1,134,592 | |
| International Container Terminal Services, Inc. (Philippines) | | | 645,000 | | | | 1,362,327 | |
| TAV Havalimanlari Holding AS (Turkey) | | | 185,000 | | | | 1,124,224 | |
| | | | | | | | 5,758,368 | |
| Wireless Telecommunication Services — 3.05% | | | | | | | | |
| Safaricom Ltd. (Kenya) | | | 4,000,000 | | | | 1,175,127 | |
| Total Common Stocks (Cost $25,024,870) | | | | | | | 36,278,076 | |
See Notes to Financial Statements.
Motley Fool Emerging Markets Fund
Schedule of Investments (concluded)
February 28, 2018 (Unaudited)
| | | Number of
Shares | | | Value
(Note 2) | |
| | | | | | | |
| Short-Term Investments — 5.71% | | | | | | |
| First American Treasury Obligations Fund, Class X (United States), 1.27% (b) | | | 2,200,999 | | | $ | 2,200,999 | |
| Total Short-Term Investments (Cost $2,200,999) | | | | | | | 2,200,999 | |
| | | | | | | | | |
| Total Investments (Cost $27,225,869) — 99.83% | | | | | | | 38,479,075 | |
| Other Assets in Excess of Liabilities — 0.17% | | | | | | | 64,116 | |
| NET ASSETS — 100.00% | | | | | | | | |
| (Applicable to 2,502,804 shares outstanding) | | | | | | $ | 38,543,191 | |
ADR — American Depositary Receipt
NVDR — Non-Voting Depository Receipt
* | Non-income producing security. |
(a) | Security exempt form registration under Rule 144A of the Securities Act of 1933. These securities may be resold in transactions exempt from registration, normally to qualified institutional buyers. Total market value of Rule 144A securities is $408,882 and represents 1.06% of net assets as of February 28, 2018. |
(b) | Seven-day yield as of February 28, 2018. |
See Notes to Financial Statements.
Motley Fool Funds
StatementS of Assets and Liabilities
February 28, 2018 (Unaudited)
| | | Motley Fool Global Opportunities Fund | | | Motley Fool Small-Mid
Cap Growth Fund | | | Motley Fool Emerging Markets
Fund | |
| ASSETS | | | | | | | | | |
| Investments in securities of unaffiliated issuers, at value (cost $262,537,027, $158,076,756 and $25,024,870, respectively) | | $ | 444,635,843 | | | $ | 281,298,167 | | | $ | 36,278,076 | |
| Short-term investments, at value (cost $10,939,991, $12,373,646 and $2,200,999, respectively) | | | 10,939,991 | | | | 12,373,646 | | | | 2,200,999 | |
| Foreign currency, at value (cost $2,484,531, $0 and $43,476, respectively) | | | 2,537,228 | | | | — | | | | 44,274 | |
| Receivables for: | | | | | | | | | | | | |
| Dividends and tax reclaims | | | 391,325 | | | | 103,404 | | | | 38,665 | |
| Shares of beneficial interest sold | | | 398,525 | | | | 488,071 | | | | 39,865 | |
| Prepaid expenses and other assets | | | 38,221 | | | | 36,996 | | | | 24,474 | |
| Total assets | | | 458,941,133 | | | | 294,300,284 | | | | 38,626,353 | |
| | | | | | | | | | | | | |
| LIABILITIES | | | | | | | | | | | | |
| Payables for: | | | | | | | | | | | | |
| Advisory fees | | | 291,250 | | | | 206,565 | | | | 16,475 | |
| Shares of beneficial interest redeemed | | | 211,040 | | | | 191,554 | | | | 14,566 | |
| Investments purchased | | | — | | | | 49,627 | | | | — | |
| Custodian fees | | | 35,597 | | | | 5,782 | | | | 11,693 | |
| Accounting and administration fees | | | 33,042 | | | | 16,381 | | | | 12,549 | |
| Transfer agent fees | | | 27,453 | | | | 26,432 | | | | 13,867 | |
| Audit fees | | | 10,413 | | | | 10,413 | | | | 10,413 | |
| Other accrued expenses and liabilities | | | 28,282 | | | | 20,334 | | | | 3,599 | |
| Total liabilities | | | 637,077 | | | | 527,088 | | | | 83,162 | |
| Net assets | | $ | 458,304,056 | | | $ | 293,773,196 | | | $ | 38,543,191 | |
| | | | | | | | | | | | | |
| NET ASSETS CONSIST OF: | | | | | | | | | | | | |
| Par value | | $ | 18,588 | | | $ | 11,643 | | | $ | 2,503 | |
| Paid-in-capital | | | 268,535,543 | | | | 167,632,626 | | | | 27,897,889 | |
| Undistributed/(accumulated) net investment income/(loss) | | | (802,076 | ) | | | (838,811 | ) | | | (27,637 | ) |
| Accumulated net realized gain/(loss) from investments and foreign currency transactions | | | 8,400,488 | | | | 3,746,327 | | | | (583,568 | ) |
| Net unrealized appreciation/(depreciation) on investments, foreign currencies, and assets and liabilities denominated in foreign currencies | | | 182,151,513 | | | | 123,221,411 | | | | 11,254,004 | |
| Net assets | | $ | 458,304,056 | | | $ | 293,773,196 | | | $ | 38,543,191 | |
| | | | | | | | | | | | | |
| NET ASSET VALUE: | | | | | | | | | | | | |
| Investor Shares: | | | | | | | | | | | | |
| Net assets applicable to capital shares outstanding | | $ | 384,010,764 | | | $ | 266,579,252 | | | $ | 38,543,191 | |
| Shares outstanding ($0.001 par value, 100,000,000 shares authorized) | | | 15,580,007 | | | | 10,571,162 | | | | 2,502,804 | |
| Net asset value, offering and redemption price per share | | $ | 24.65 | | | $ | 25.22 | | | $ | 15.40 | |
| | | | | | | | | | | | | |
| Institutional Shares: | | | | | | | | | | | | |
| Net assets applicable to capital shares outstanding | | $ | 74,293,292 | | | $ | 27,193,944 | | | | N/A | |
| Shares outstanding ($0.001 par value, 100,000,000 shares authorized) | | | 3,008,476 | | | | 1,072,118 | | | | N/A | |
| Net asset value, offering and redemption price per share | | $ | 24.69 | | | $ | 25.36 | | | | N/A | |
The accompanying notes are an integral part of these financial statements.
Motley Fool Funds
Statements of Operations
February 28, 2018 (Unaudited)
| | | Motley Fool Global Opportunities Fund | | | Motley Fool Small-Mid
Cap Growth Fund | | | Motley Fool Emerging Markets
Fund | |
| INVESTMENT INCOME | | | | | | | | | |
| Dividends | | $ | 1,459,618 | | | $ | 1,176,029 | | | $ | 219,509 | |
| Less foreign taxes withheld | | | (32,846 | ) | | | — | | | | (14,793 | ) |
| Total investment income | | | 1,426,772 | | | | 1,176,029 | | | | 204,716 | |
| EXPENSES | | | | | | | | | | | | |
| Advisory fees | | | 1,787,949 | | | | 1,103,941 | | | | 149,240 | |
| Transfer agent fees - Investor Shares | | | 110,518 | | | | 75,457 | | | | 47,174 | |
| Transfer agent fees - Institutional Shares | | | 30,475 | | | | 22,359 | | | | — | |
| Shareholder account-related services - Investor Shares | | | 96,309 | | | | 70,636 | | | | 11,836 | |
| Shareholder account-related services - Institutional Shares | | | 1,344 | | | | 1,391 | | | | — | |
| Accounting fees - Investor Shares | | | 68,447 | | | | 45,312 | | | | 8,574 | |
| Accounting fees - Institutional Shares | | | 16,907 | | | | 4,499 | | | | — | |
| Custodian fees | | | 41,768 | | | | 9,190 | | | | 13,398 | |
| Shareholder reporting fees - Investor Shares | | | 24,516 | | | | 17,839 | | | | 3,855 | |
| Shareholder reporting fees - Institutional Shares | | | 534 | | | | 470 | | | | — | |
| Professional fees | | | 21,896 | | | | 17,892 | | | | 11,630 | |
| Blue sky fees - Investor Shares | | | 11,639 | | | | 7,463 | | | | 9,078 | |
| Blue sky fees - Institutional Shares | | | 2,109 | | | | 948 | | | | — | |
| Administration fees | | | 9,686 | | | | 5,276 | | | | 1,783 | |
| Directors fees | | | 8,087 | | | | 6,257 | | | | 190 | |
| Officers fees | | | 1,908 | | | | 1,250 | | | | 190 | |
| Other expenses | | | 11,966 | | | | 6,555 | | | | 2,779 | |
| Total expenses | | | 2,246,058 | | | | 1,396,735 | | | | 259,727 | |
| Management fees waived/reimbursed net of amount recaptured - Investor Shares | | | — | | | | 97,136 | | | | — | |
| Management fees waived/reimbursed net of amount recaptured - Institutional Shares | | | (27,114 | ) | | | (23,642 | ) | | | (57,625 | ) |
| Net expenses after waivers/reimbursements | | | 2,218,944 | | | | 1,470,229 | | | | 202,102 | |
| Net investment income/(loss) | | | (792,172 | ) | | | (294,200 | ) | | | 2,614 | |
| NET REALIZED AND UNREALIZED GAIN/(LOSS) FROM INVESTMENTS | | | | | | | | | | | | |
| Net realized gain/(loss) from: | | | | | | | | | | | | |
| Investments | | | 11,195,736 | | | | 5,997,434 | | | | 962,394 | |
| Foreign currency transactions | | | (9,725 | ) | | | — | | | | (48 | ) |
| Net change in unrealized appreciation/(depreciation) on: | | | | | | | | | | | | |
| Investments | | | 54,389,235 | | | | 42,165,709 | | | | 1,912,846 | |
| Foreign currency translation | | | 55,713 | | | | — | | | | 1,560 | |
| Net realized and unrealized gain/(loss) | | | 65,630,959 | | | | 48,163,143 | | | | 2,876,752 | |
| NET INCREASE/(DECREASE) IN NET ASSETS RESULTING FROM OPERATIONS | | $ | 64,838,787 | | | $ | 47,868,943 | | | $ | 2,879,366 | |
The accompanying notes are an integral part of these financial statements.
Motley Fool Global Opportunities Fund
Statements of Changes in Net Assets
| | | For the
Six-Months Ended
February 28, 2018
(Unaudited) | | | For the
Fiscal
Period Ended
August 31,
2017 (1) | | | For the
Year Ended
October 31, 2016 | |
| OPERATIONS | | | | | | | | | |
| Net investment income/(loss) | | $ | (792,172 | ) | | $ | 657,803 | | | $ | 747,966 | |
| Net realized gain/(loss) from investments and foreign currency transactions | | | 11,186,011 | | | | 47,847,421 | | | | 9,546,196 | |
| Net change in unrealized appreciation/(depreciation) on investments, foreign currency translation, and assets and liabilities denominated in foreign currencies | | | 54,444,948 | | | | 24,608,203 | | | | (10,795,721 | ) |
| Net increase/(decrease) in net assets resulting from operations | | | 64,838,787 | | | | 73,113,427 | | | | (501,559 | ) |
| DIVIDENDS AND DISTRIBUTIONS TO SHAREHOLDERS: | | | | | | | | | | | | |
| Dividends from net investment income | | | | | | | | | | | | |
| Investor Shares | | | (740,296 | ) | | | (604,493 | ) | | | (34,910 | ) |
| Institutional Shares | | | (84,137 | ) | | | (186,098 | ) | | | (13,802 | ) |
| Distributions from net realized capital gains | | | | | | | | | | | | |
| Investor Shares | | | (42,375,430 | ) | | | (8,485,045 | ) | | | (166,111 | ) |
| Institutional Shares | | | (7,912,273 | ) | | | (1,167,344 | ) | | | (3,300 | ) |
| Total dividends and distributions to shareholders | | | (51,112,136 | ) | | | (10,442,980 | ) | | | (218,123 | ) |
| CAPITAL SHARE TRANSACTIONS: | | | | | | | | | | | | |
| Investor Shares | | | | | | | | | | | | |
| Proceeds from shares sold (943,146, 1,001,231 and 1,642,369 shares, respectively) | | | 23,117,482 | | | | 22,119,265 | | | | 32,544,953 | |
| Reinvestment of dividends (1,874,618, 449,511 and 9,795 shares, respectively) | | | 42,328,884 | | | | 8,937,049 | | | | 197,667 | |
| Shares redeemed (1,262,461, 4,767,676 and 3,682,983 shares, respectively) | | | (30,862,386 | ) | | | (100,374,196 | ) | | | (72,564,161 | ) |
Redemption fees(2) | | | 7,887 | | | | 33,388 | | | | 38,069 | |
| Total from Investor Shares | | | 34,591,867 | | | | (69,284,494 | ) | | | (39,783,472 | ) |
| Institutional Shares | | | | | | | | | | | | |
| Proceeds from shares sold (221,927, 2,235,895 and 44,003 shares, respectively) | | | 5,574,938 | | | | 46,460,601 | | | | 876,179 | |
| Reinvestment of dividends (349,692, 66,891 and 837 shares, respectively) | | | 7,910,044 | | | | 1,333,174 | | | | 16,889 | |
| Shares redeemed (79,199, 141,726 and 69,455 shares, respectively) | | | (1,943,408 | ) | | | (3,097,677 | ) | | | (1,365,672 | ) |
Redemption fees(2) | | | 262 | | | | 519 | | | | 20 | |
| Total from Institutional Shares | | | 11,541,836 | | | | 44,696,617 | | | | (472,584 | ) |
| Net increase/(decrease) in net assets from capital share transactions | | | 46,133,703 | | | | (24,587,877 | ) | | | (40,256,056 | ) |
| Total increase/(decrease) in net assets | | | 59,860,354 | | | | 38,082,570 | | | | (40,975,738 | ) |
| NET ASSETS: | | | | | | | | | | | | |
| Beginning of period | | | 398,443,702 | | | | 360,361,132 | | | | 401,336,870 | |
End of period (3) | | $ | 458,304,056 | | | $ | 398,443,702 | | | $ | 360,361,132 | |
| Undistributed/accumulated net investment income/(loss) | | $ | (802,076 | ) | | $ | 814,529 | | | $ | (760,546 | ) |
(1) | The Fund changed its fiscal year end to August 31 during the period. |
(2) | Effective December 31, 2017, the Fund eliminated the redemption fee. |
(3) | Including undistributed/accumulated net investment income/(loss). |
The accompanying notes are an integral part of these financial statements.
Motley Fool Small-Mid Cap Growth Fund
Statements of Changes in Net Assets
| | | For the
Six-Months Ended
February 28, 2018
(Unaudited) | | | For the
Fiscal
Period Ended
August 31,
2017 (1) | | | For the
Year Ended
October 31, 2016 | |
| OPERATIONS | | | | | | | | | |
| Net investment income/(loss) | | $ | (294,200 | ) | | $ | (537,448 | ) | | $ | (653,431 | ) |
| Net realized gain/(loss) from investments and foreign currency transactions | | | 5,997,434 | | | | 15,186,364 | | | | (2,484,075 | ) |
| Net change in unrealized appreciation/(depreciation) on investments, foreign currency translation, and assets and liabilities denominated in foreign currencies | | | 42,165,709 | | | | 26,696,119 | | | | (1,992,860 | ) |
| Net increase/(decrease) in net assets resulting from operations | | | 47,868,943 | | | | 41,345,035 | | | | (5,130,366 | ) |
| DIVIDENDS AND DISTRIBUTIONS TO SHAREHOLDERS: | | | | | | | | | | | | |
| Dividends from net investment income | | | | | | | | | | | | |
| Investor Shares | | | — | | | | — | | | | (349,750 | ) |
| Institutional Shares | | | — | | | | — | | | | (20,359 | ) |
| Distributions from net realized capital gains | | | | | | | | | | | | |
| Investor Shares | | | (12,858,211 | ) | | | — | | | | — | |
| Institutional Shares | | | (1,293,568 | ) | | | — | | | | — | |
| Total dividends and distributions to shareholders | | | (14,151,779 | ) | | | — | | | | (370,109 | ) |
| CAPITAL SHARE TRANSACTIONS: | | | | | | | | | | | | |
| Investor Shares | | | | | | | | | | | | |
| Proceeds from shares sold (1,326,705, 894,155 and 1,202,801 shares, respectively) | | | 33,120,811 | | | | 18,375,235 | | | | 21,811,467 | |
| Reinvestment of dividends (520,849, 0 and 18,293 shares, respectively) | | | 12,578,509 | | | | — | | | | 343,728 | |
| Shares redeemed (824,868, 2,559,950 and 2,748,791 shares, respectively) | | | (20,234,368 | ) | | | (52,151,022 | ) | | | (50,140,829 | ) |
Redemption fees(2) | | | 4,200 | | | | 22,135 | | | | 24,628 | |
| Total from Investor Shares | | | 25,469,152 | | | | (33,753,652 | ) | | | (27,961,006 | ) |
| Institutional Shares | | | | | | | | | | | | |
| Proceeds from shares sold (134,895, 818,234 and 77,879 shares, respectively) | | | 3,416,901 | | | | 16,606,797 | | | | 1,388,492 | |
| Reinvestment of dividends (53,255, 0 and 1,083 shares, respectively) | | | 1,293,568 | | | | — | | | | 20,358 | |
| Shares redeemed (35,988, 198,206 and 152,821 shares, respectively) | | | (892,627 | ) | | | (4,083,956 | ) | | | (2,787,636 | ) |
Redemption fees(2) | | | — | | | | 3,350 | | | | 175 | |
| Total from Institutional Shares | | | 3,817,842 | | | | 12,526,191 | | | | (1,378,611 | ) |
| Net increase/(decrease) in net assets from capital share transactions | | | 29,286,994 | | | | (21,227,461 | ) | | | (29,339,617 | ) |
| Total increase/(decrease) in net assets | | | 63,004,158 | | | | 20,117,574 | | | | (34,840,092 | ) |
| NET ASSETS: | | | | | | | | | | | | |
| Beginning of period | | | 230,769,038 | | | | 210,651,464 | | | | 245,491,556 | |
End of period (3) | | $ | 293,773,196 | | | $ | 230,769,038 | | | $ | 210,651,464 | |
| Undistributed/accumulated net investment income/(loss) | | $ | (838,811 | ) | | $ | (544,611 | ) | | $ | (639,202 | ) |
(1) | The Fund changed its fiscal year end to August 31 during the period. |
(2) | Effective December 31, 2017, the Fund eliminated the redemption fee. |
(3) | Including undistributed/accumulated net investment income/(loss). |
The accompanying notes are an integral part of these financial statements.
Motley Fool Emerging Markets Fund
Statements of Changes in Net Assets
| | | For the
Six-Months Ended
February 28, 2018
(Unaudited) | | | For the
Fiscal
Period Ended
August 31,
2017 (1) | | | For the
Year Ended
October 31, 2016 | |
| OPERATIONS | | | | | | | | | |
| Net investment income/(loss) | | $ | 2,614 | | | $ | 310,507 | | | $ | 200,032 | |
| Net realized gain/(loss) from investments and foreign currency transactions | | | 962,346 | | | | (1,181,087 | ) | | | 638,236 | |
| Net change in unrealized appreciation/(depreciation) on investments, foreign currency translation, and assets and liabilities denominated in foreign currencies | | | 1,914,406 | | | | 6,836,590 | | | | 2,234,424 | |
| Net increase/(decrease) in net assets resulting from operations | | | 2,879,366 | | | | 5,966,010 | | | | 3,072,692 | |
| DIVIDENDS AND DISTRIBUTIONS TO SHAREHOLDERS: | | | | | | | | | | | | |
| Dividends from net investment income | | | | | | | | | | | | |
| Investor Shares | | | (314,358 | ) | | | (150,543 | ) | | | (300,972 | ) |
| Institutional Shares | | | — | | | | (27,959 | ) | | | (18,444 | ) |
| Total dividends and distributions to shareholders | | | (314,358 | ) | | | (178,502 | ) | | | (319,416 | ) |
| CAPITAL SHARE TRANSACTIONS: | | | | | | | | | | | | |
| Investor Shares | | | | | | | | | | | | |
| Proceeds from shares sold (263,145, 508,484 and 228,294 shares, respectively) | | | 3,868,642 | | | | 6,665,378 | | | | 2,517,000 | |
| Reinvestment of dividends (22,184, 13,160 and 27,787 shares, respectively) | | | 313,688 | | | | 150,020 | | | | 300,095 | |
| Shares redeemed (181,585, 534,316 and 709,020 shares, respectively) | | | (2,661,124 | ) | | | (6,442,570 | ) | | | (7,766,303 | ) |
Redemption fees(2) | | | 1,146 | | | | 1,728 | | | | 3,403 | |
| Total from Investor Shares | | | 1,522,352 | | | | 374,556 | | | | (4,945,805 | ) |
| Institutional Shares | | | | | | | | | | | | |
Proceeds from shares sold (0, 132,224 and 13,740 shares, respectively)(3) | | | — | | | | 1,528,574 | | | | 147,950 | |
Reinvestment of dividends (0, 2,448 and 1,705 shares, respectively)(3) | | | — | | | | 27,959 | | | | 18,444 | |
Shares redeemed (0, 309,403 and 387 shares, respectively)(3) | | | — | | | | (4,132,249 | ) | | | (4,349 | ) |
Redemption fees(2) | | | — | | | | 61 | | | | — | |
| Total from Institutional Shares | | | — | | | | (2,575,655 | ) | | | 162,045 | |
| Net increase/(decrease) in net assets from capital share transactions | | | 1,522,352 | | | | (2,201,099 | ) | | | (4,783,760 | ) |
| Total increase/(decrease) in net assets | | | 4,087,360 | | | | 3,586,409 | | | | (2,030,484 | ) |
| NET ASSETS: | | | | | | | | | | | | |
| Beginning of period | | | 34,455,831 | | | | 30,869,422 | | | | 32,899,906 | |
End of period (3) | | $ | 38,543,191 | | | $ | 34,455,831 | | | $ | 30,869,422 | |
| Undistributed/accumulated net investment income/(loss) | | $ | (27,637 | ) | | $ | 284,107 | | | $ | 178,488 | |
(1) | The Fund changed its fiscal year end to August 31 during the period. |
(2) | Effective December 31, 2017, the Fund eliminated the redemption fee. |
(3) | Effective on May 2, 2017, the Institutional Shares closed to all new and existing shareholders. Any Institutional Shares that were not exchanged for Investor Shares, or redeemed, by June 30, 2017, were liquidated and the proceeds returned to the shareholder. |
(4) | Including undistributed/accumulated net investment income/(loss). |
The accompanying notes are an integral part of these financial statements.
Motley Fool Global Opportunities Fund
Financial Highlights
Contained below is per share operating performance data for shares outstanding, total investment return, ratios to average net assets and other supplemental data for the respective periods. This information has been derived from information provided in the financial statements.
| | | Six Months Ended February 28, 2018 | | | Fiscal Period Ended August 31, | | | Years Ended October 31, | |
| Investor Shares | | (Unaudited) | | | 2017(1)(2) | | | 2016 | | | 2015 | | | 2014 | | | 2013 | | | 2012 | |
| PER SHARE OPERATING PERFORMANCE | | | | | | | | | | | | | | | | | | | | | |
| Net asset value, beginning of period | | $ | 24.09 | | | $ | 20.36 | | | $ | 20.32 | | | $ | 21.00 | | | $ | 19.24 | | | $ | 15.48 | | | $ | 14.15 | |
Net investment income/(loss)(3) | | | (0.05 | ) | | | 0.03 | | | | 0.04 | | | | 0.05 | | | | 0.11 | | | | 0.07 | | | | 0.14 | |
| Net realized and unrealized gain/(loss) from invetsments | | | 3.71 | | | | 4.30 | | | | 0.01 | | | | (0.29 | ) | | | 1.87 | | | | 3.79 | | | | 1.29 | |
| Net increase/(decrease) in net assets resulting from operations | | | 3.66 | | | | 4.33 | | | | 0.05 | | | | (0.24 | ) | | | 1.98 | | | | 3.86 | | | | 1.43 | |
| Dividends and distributions to shareholders from: | | | | | | | | | | | | | | | | | | | | | | | | | | | | |
| Net investment income | | | (0.05 | ) | | | (0.04 | ) | | | — | * | | | (0.11 | ) | | | (0.04 | ) | | | (0.11 | ) | | | (0.10 | ) |
| Net realized capital gains | | | (3.05 | ) | | | (0.56 | ) | | | (0.01 | ) | | | (0.33 | ) | | | (0.18 | ) | | | — | | | | — | |
| Total dividends and distributions to shareholders | | | (3.10 | ) | | | (0.60 | ) | | | (0.01 | ) | | | (0.44 | ) | | | (0.22 | ) | | | (0.11 | ) | | | (0.10 | ) |
| Redemption and small-balance account fees | | | — | * | | | — | * | | | — | * | | | — | * | | | — | * | | | 0.01 | | | | — | |
| Net asset value, end of period | | $ | 24.65 | | | $ | 24.09 | | | $ | 20.36 | | | $ | 20.32 | | | $ | 21.00 | | | $ | 19.24 | | | | 15.48 | |
Total investment return(4) | | | 16.38 | %(5) | | | 21.91 | %(5) | | | 0.25 | % | | | (1.13 | )% | | | 10.43 | % | | | 25.14 | % | | | 10.21 | |
| RATIOS/SUPPLEMENTAL DATA | | | | | | | | | | | | | | | | | | | | | | | | | | | | |
| Net assets, end of period (thousands) | | $ | 384,011 | | | $ | 337,821 | | | $ | 353,118 | | | $ | 393,611 | | | $ | 413,624 | | | $ | 354,081 | | | $ | 227,881 | |
| Ratio of expenses to average net assets | | | 1.07 | %(6) | | | 1.15 | %(6) | | | 1.14 | % | | | 1.15 | % | | | 1.26 | % | | | 1.36 | % | | | 1.47 | % |
| Ratio of expenses to average net assets (before waivers and reimbursement of expenses and/or recapture of previously waived fees) | | | 1.07 | %(6) | | | 1.15 | %(6) | | | 1.14 | % | | | 1.13 | % | | | 1.23 | % | | | 1.37 | % | | | 1.54 | % |
| Ratio of net investment income/(loss) to average net assets | | | (0.40 | )%(6) | | | 0.18 | %(6) | | | 0.20 | % | | | 0.23 | % | | | 0.55 | % | | | 0.44 | % | | | 0.93 | % |
| Ratio of net investment income/(loss) to average net assets (before waivers and reimbursement of expenses and/or recapture of previously waived fees) | | | (0.40 | )%(5) | | | 0.18 | %(6) | | | 0.20 | % | | | 0.25 | % | | | 0.59 | % | | | 0.43 | % | | | 0.86 | % |
| Portfolio turnover rate | | | 4 | %(5) | | | 38 | %(5) | | | 26 | % | | | 21 | % | | | 24 | % | | | 22 | % | | | 37 | % |
* | Amount represents less than $0.005 per share. |
(1) | The Fund changed its fiscal year end to August 31 during the period. |
(2) | Effective as of December 21, 2016, the Fund acquired all the assets and liabilities of the Motley Fool Global Opportunities Fund, a series of The Motley Fool Funds Trust (the “Predecessor Fund”). The financial highlights for the periods prior to that date reflect the performances of the Predecessor Fund. |
(3) | Per share data calculated using average shares outstanding method. |
(4) | Total investment return reflects the rate an investor would have earned on an investment in the Fund during the period. During the year ended October 31, 2013, 0.06% of the Fund’s total investment return was attributable to redemption and small-balance account fees received. Excluding this item, the total return would have been 25.08%. For the six months ended February 28, 2018, the fiscal period ended August 31, 2017 and the years ended October 31, 2016, October 31, 2015, October 31, 2014 and October 31, 2012, redemption and small-balance account fees received had no effect on the Fund’s Investor Shares total investment return. |
The accompanying notes are an integral part of these financial statements.
Motley Fool Global Opportunities Fund
Financial Highlights
Contained below is per share operating performance data for shares outstanding, total investment return, ratios to average net assets and other supplemental data for the respective periods. This information has been derived from information provided in the financial statements.
| | | Six Months Ended February 28, 2018 | | | Fiscal Period Ended August 31, | | | Years Ended
October 31, | | | Period
Ended
October 31, | |
| Institutional Shares | | (Unaudited) | | | 2017(1)(2) | | | 2016 | | | 2015 | | | 2014(3) | |
| PER SHARE OPERATING PERFORMANCE | | | | | | | | | | | | | | | |
| Net asset value, beginning of period | | $ | 24.09 | | | $ | 20.40 | | | $ | 20.35 | | | $ | 21.01 | | | $ | 20.36 | |
Net investment income/(loss)(4) | | | (0.03 | ) | | | 0.09 | | | | 0.08 | | | | 0.10 | | | | 0.03 | |
| Net realized and unrealized gain/(loss) from investments | | | 3.71 | | | | 4.25 | | | | 0.02 | | | | (0.31 | ) | | | 0.62 | |
| Net increase/(decrease) in net assets resulting from operations | | | 3.68 | | | | 4.34 | | | | 0.10 | | | | (0.21 | ) | | | 0.65 | |
| Dividends and distributions to shareholders from: | | | | | | | | | | | | | | | | | | | | |
| Net investment income | | | (0.03 | ) | | | (0.09 | ) | | | (0.04 | ) | | | (0.12 | ) | | | — | |
| Net realized capital gains | | | (3.05 | ) | | | (0.56 | ) | | | (0.01 | ) | | | (0.33 | ) | | | — | |
| Total dividends and distributions to shareholders | | | (3.08 | ) | | | (0.65 | ) | | | (0.05 | ) | | | (0.45 | ) | | | — | |
| Redemption and small-balance account fees | | | — | * | | | — | * | | | — | * | | | — | * | | | — | * |
| Net asset value, end of period | | $ | 24.69 | | | $ | 24.09 | | | $ | 20.40 | | | $ | 20.35 | | | $ | 21.01 | |
Total investment return(5) | | | 16.45 | %(6) | | | 21.97 | %(6) | | | (0.47 | )% | | | (0.97 | )% | | | 3.19 | %(6) |
| RATIOS/SUPPLEMENTAL DATA | | | | | | | | | | | | | | | | | | | | |
| Net assets, end of period (thousands) | | $ | 74,293 | | | $ | 60,623 | | | $ | 7,243 | | | $ | 7,726 | | | $ | 4,038 | |
| Ratio of expenses to average net assets | | | 0.95 | %(7) | | | 0.95 | %(7) | | | 0.95 | % | | | 0.95 | % | | | 0.95 | %(7) |
| Ratio of expenses to average net assets (before waivers and reimbursement of expenses and/or recapture of previously waived fees) | | | 1.03 | %(7) | | | 1.17 | %(7) | | | 2.12 | % | | | 2.14 | % | | | 3.78 | %(7) |
| Ratio of net investment income/(loss) to average net assets | | | (0.27 | )%(7) | | | 0.48 | %(7) | | | 0.39 | % | | | 0.46 | % | | | 0.39 | %(7) |
| Ratio of net investment income/(loss) to average net assets (before waivers and reimbursement of expenses and/or recapture of previously waived fees) | | | (0.35 | )%(7) | | | 0.26 | %(7) | | | (0.78 | )% | | | 0.73 | % | | | (2.43 | )%(7) |
| Portfolio turnover rate | | | 4 | %(6) | | | 38 | %(6) | | | 26 | % | | | 21 | % | | | 24 | %(6) |
* | Amount represents less than $0.005 per share. |
(1) | The Fund changed its fiscal year end to August 31 during the period. |
(2) | Effective as of December 21, 2016, the Fund acquired all the assets and liabilities of the Motley Fool Global Opportunities Fund, a series of The Motley Fool Funds Trust (the “Predecessor Fund”). The financial highlights for the periods prior to that date reflect the performances of the Predecessor Fund. |
(3) | Commenced operations on June 17, 2014. Because of commencement of operations and related preliminary transaction costs, these ratios are not necessarily indicative of future ratios. |
(4) | Per share data calculated using average shares outstanding method. |
(5) | Total investment return reflects the rate an investor would have earned on an investment in the Fund during the period. Redemption and small-balance account fees received had no effect on the Fund’s Institutional Shares total investment return. |
The accompanying notes are an integral part of these financial statements.
Motley Fool Small-Mid Cap Growth Fund
Financial Highlights
Contained below is per share operating performance data for shares outstanding, total investment return, ratios to average net assets and other supplemental data for the respective periods. This information has been derived from information provided in the financial statements.
| | | Six Months Ended February 28, 2018 | | | Fiscal Period Ended August 31, | | | Years Ended October 31, | |
| Investor Shares | | (Unaudited) | | | 2017(1)(2) | | | 2016 | | | 2015 | | | 2014 | | | 2013 | | | 2012 | |
| PER SHARE OPERATING PERFORMANCE | | | | | | | | | | | | | | | | | | | | | |
| Net asset value, beginning of period | | $ | 22.04 | | | $ | 18.29 | | | $ | 18.72 | | | $ | 18.59 | | | $ | 17.25 | | | $ | 12.58 | | | $ | 11.04 | |
Net investment income/ (loss)(3) | | | (0.03 | ) | | | (0.05 | ) | | | (0.05 | ) | | | 0.03 | | | | 0.07 | | | | — | * | | | (0.06 | ) |
| Net realized and unrealized gain/(loss) from investments | | | 4.56 | | | | 3.80 | | | | (0.35 | ) | | | 0.14 | | | | 1.51 | | | | 4.69 | | | | 1.60 | |
| Net increase/(decrease) in net assets resulting from operations | | | 4.53 | | | | 3.75 | | | | (0.40 | ) | | | 0.17 | | | | 1.58 | | | | 4.69 | | | | 1.54 | |
| Dividends and distributions to shareholders from: | | | | | | | | | | | | | | | | | | | | | | | | | | | | |
| Net investment income | | | — | | | | — | | | | (0.03 | ) | | | (0.04 | ) | | | (0.03 | ) | | | (0.03 | ) | | | — | * |
| Net realized capital gains | | | (1.35 | ) | | | — | | | | — | | | | — | | | | (0.22 | ) | | | — | | | | — | |
| Total dividends and distributions to shareholders | | | (1.35 | ) | | | — | | | | (0.03 | ) | | | (0.04 | ) | | | (0.25 | ) | | | (0.03 | ) | | | — | * |
| Redemption and small-balance account fees | | | — | * | | | — | * | | | — | * | | | — | * | | | 0.01 | | | | 0.01 | | | | — | * |
| Net asset value, end of period | | $ | 25.22 | | | $ | 22.04 | | | $ | 18.29 | | | $ | 18.72 | | | $ | 18.59 | | | $ | 17.25 | | | $ | 12.58 | |
Total investment return(4) | | | 20.82 | %(5) | | | 20.50 | %(5) | | | (2.15 | )% | | | 0.91 | % | | | 9.35 | % | | | 37.44 | % | | | 13.96 | % |
| RATIOS/SUPPLEMENTAL DATA | | | | | | | | | | | | | | | | | | | | | | | | | | | | |
| Net assets, end of period (thousands) | | $ | 266,579 | | | $ | 210,404 | | | $ | 205,149 | | | $ | 238,482 | | | $ | 231,600 | | | $ | 162,336 | | | $ | 67,337 | |
| Ratio of expenses to average net assets | | | 1.15 | %(6) | | | 1.15 | %(6) | | | 1.15 | % | | | 1.15 | % | | | 1.27 | % | | | 1.38 | % | | | 1.37 | % |
| Ratio of expenses to average net assets (before waivers and reimbursement of expenses and/or recapture of previously waived fees) | | | 1.07 | %(6) | | | 1.16 | %(6) | | | 1.17 | % | | | 1.16 | % | | | 1.30 | % | | | 1.54 | % | | | 1.74 | % |
| Ratio of net investment income/(loss) to average net assets | | | (0.25 | )%(6) | | | (0.30 | )%(6) | | | (0.29 | )% | | | 0.17 | % | | | 0.38 | % | | | 0.03 | % | | | (0.51 | )% |
| Ratio of net investment income/(loss) to average net assets (before waivers and reimbursement of expenses and/or recapture of previously waived fees) | | | (0.16 | )%(6) | | | (0.31 | )%(6) | | | (0.31 | )% | | | 0.17 | % | | | 0.36 | % | | | (0.13 | )% | | | (0.88 | )% |
| Portfolio turnover rate | | | 6 | %(5) | | | 24 | %(5) | | | 21 | % | | | 30 | % | | | 18 | % | | | 24 | % | | | 30 | % |
* | Amount represents less than $0.005 per share. |
(1) | The Fund changed its fiscal year end to August 31 during the period. |
(2) | Effective as of December 21, 2016, the Fund acquired all the assets and liabilities of the Motley Fool Small-Mid Cap Growth Fund, a series of The Motley Fool Funds Trust (the “Predecessor Fund”). The financial highlights for the periods prior to that date reflect the performances of the Predecessor Fund. |
(3) | Per share data calculated using average shares outstanding method. |
(4) | Total investment return reflects the rate an investor would have earned on an investment in the Fund during the period. For the years ended October 31, 2014 and October 31, 2013, 0.06% and 0.08%, respectively, of the Fund’s Investor Shares total investment return was attributable to redemption and small-balance account fees received. Excluding this item, the total investment return would have been 9.29% and 37.36%, respectively. For the six months ended February 28, 2018, the fiscal period ended August 31, 2017 and years ended October 31, 2016, October 31, 2015 and October 31, 2012, redemption and small-balance account fees received had no effect on the Fund’s Investor Shares total investment return. |
The accompanying notes are an integral part of these financial statements.
Motley Fool Small-Mid Cap Growth Fund
Financial Highlights
Contained below is per share operating performance data for shares outstanding, total investment return, ratios to average net assets and other supplemental data for the respective periods. This information has been derived from information provided in the financial statements.
| | | Six Months Ended February 28, 2018 | | | Fiscal Period Ended August 31, | | | Years Ended October 31, | | | Period
Ended
October 31, | |
| Institutional Shares | | (Unaudited) | | | 2017(1)(2) | | | 2016 | | | 2015 | | | 2014(3) | |
| PER SHARE OPERATING PERFORMANCE | | | | | | | | | | | | | | | |
| Net asset value, beginning of period | | $ | 22.14 | | | $ | 18.34 | | | $ | 18.75 | | | $ | 18.61 | | | $ | 17.94 | |
Net investment income/(loss)(4) | | | — | * | | | (0.03 | ) | | | (0.02 | ) | | | 0.07 | | | | 0.02 | |
| Net realized and unrealized gain/(loss) from investments | | | 4.56 | | | | 3.83 | | | | (0.33 | ) | | | 0.13 | | | | 0.65 | |
| Net increase/(decrease) in net assets resulting from operations | | | 4.56 | | | | 3.80 | | | | (0.35 | ) | | | 0.20 | | | | 0.67 | |
| Dividends and distributions to shareholders from: | | | | | | | | | | | | | | | | | | | | |
| Net investment income | | | — | | | | — | | | | (0.06 | ) | | | (0.06 | ) | | | — | |
| Net realized capital gains | | | (1.34 | ) | | | — | | | | — | | | | — | | | | — | |
| Total dividends and distributions to shareholders | | | (1.34 | ) | | | — | | | | (0.06 | ) | | | (0.06 | ) | | | — | |
| Redemption and small-balance account fees | | | — | | | | — | * | | | — | * | | | — | * | | | — | * |
| Net asset value, end of period | | $ | 25.36 | | | $ | 22.14 | | | $ | 18.34 | | | $ | 18.75 | | | $ | 18.61 | |
Total investment return(5) | | | 20.90 | %(6) | | | 20.72 | %(6) | | | (1.89 | )% | | | 1.04 | % | | | 3.73 | %(6) |
| RATIOS/SUPPLEMENTAL DATA | | | | | | | | | | | | | | | | | | | | |
| Net assets, end of period (thousands) | | $ | 27,194 | | | $ | 20,365 | | | $ | 5,502 | | | $ | 7,010 | | | $ | 2,798 | |
| Ratio of expenses to average net assets | | | 0.95 | %(7) | | | 0.95 | %(7) | | | 0.95 | % | | | 0.95 | % | | | 0.95 | %(7) |
| Ratio of expenses to average net assets (before waivers and reimbursement of expenses and/or recapture of previously waived fees) | | | 1.15 | %(7) | | | 1.47 | %(7) | | | 2.40 | % | | | 2.45 | % | | | 4.93 | %(7) |
| Ratio of net investment income/(loss) to average net assets | | | (0.40 | )%(7) | | | (0.15 | )%(7) | | | (0.08 | )% | | | 0.35 | % | | | 0.27 | %(7) |
| Ratio of net investment income/(loss) to average net assets (before waivers and reimbursement of expenses and/or recapture of previously waived fees) | | | (0.24 | )%(7) | | | (0.67 | )%(7) | | | (1.53 | )% | | | (1.15 | )% | | | (3.71 | )%(7) |
| Portfolio turnover rate | | | 6 | %(6) | | | 24 | %(6) | | | 21 | % | | | 30 | % | | | 18 | %(6) |
* | Amount represents less than $0.005 per share. |
(1) | The Fund changed its fiscal year end to August 31 during the period. |
(2) | Effective as of December 21, 2016, the Fund acquired all the assets and liabilities of the Motley Fool Small-Mid Cap Growth Fund, a series of The Motley Fool Funds Trust (the “Predecessor Fund”). The financial highlights for the periods prior to that date reflect the performances of the Predecessor Fund. |
(3) | Commenced operations on June 17, 2014. Because of commencement of operations and related preliminary transaction costs, these ratios are not necessarily indicative of future ratios. |
(4) | Per share data calculated using average shares outstanding method. |
(5) | Total investment return reflects the rate an investor would have earned on an investment in the Fund during the period. Redemption and small-balance account fees received had no effect on the Fund’s Institutional Shares total investment return. |
The accompanying notes are an integral part of these financial statements.
Motley Fool Emerging Markets Fund
Financial Highlights
Contained below is per share operating performance data for shares outstanding, total investment return, ratios to average net assets and other supplemental data for the respective periods. This information has been derived from information provided in the financial statements.
| | | Six Months Ended February 28, 2018 | | | Fiscal Period Ended August 31, | | | Years Ended October 31, | |
| Investor Shares | | (Unaudited) | | | 2017(1)(2) | | | 2016 | | | 2015 | | | 2014 | | | 2013 | | | 2012 | |
| PER SHARE OPERATING PERFORMANCE | | | | | | | | | | | | | | | | | | | | | |
| Net asset value, beginning of period | | $ | 14.36 | | | $ | 11.93 | | | $ | 10.88 | | | $ | 12.61 | | | $ | 12.66 | | | $ | 10.94 | | | $ | 10.00 | |
Net investment income/ (loss)(3) | | | — | * | | | 0.12 | | | | 0.07 | | | | 0.09 | | | | 0.16 | | | | 0.13 | | | | 0.18 | |
| Net realized and unrealized gain/(loss) from investments | | | 1.17 | | | | 2.38 | | | | 1.09 | | | | (1.63 | ) | | | (0.12 | ) | | | 1.73 | | | | 0.77 | |
| Net increase/(decrease) in net assets resulting from operations | | | 1.17 | | | | 2.50 | | | | 1.16 | | | | (1.54 | ) | | | 0.04 | | | | 1.86 | | | | 0.95 | |
| Dividends and distributions to shareholders from: | | | | | | | | | | | | | | | | | | | | | | | | | | | | |
| Net investment income | | | (0.13 | ) | | | (0.07 | ) | | | (0.11 | ) | | | (0.19 | ) | | | (0.08 | ) | | | (0.15 | ) | | | (0.01 | ) |
| Net realized capital gains | | | — | | | | — | | | | — | | | | — | | | | (0.02 | ) | | | — | | | | — | |
| Total dividends and distributions to shareholders | | | (0.13 | ) | | | (0.07 | ) | | | (0.11 | ) | | | (0.19 | ) | | | (0.10 | ) | | | (0.15 | ) | | | (0.01 | ) |
| Redemption and small-balance account fees | | | — | * | | | — | * | | | — | * | | | — | * | | | 0.01 | | | | 0.01 | | | | — | * |
| Net asset value, end of period | | $ | 15.40 | | | $ | 14.36 | | | $ | 11.93 | | | $ | 10.88 | | | $ | 12.61 | | | $ | 12.66 | | | $ | 10.94 | |
Total investment return(4) | | | 8.15 | %(5) | | | 21.06 | %(5) | | | (10.76 | )% | | | (12.33 | )% | | | 0.47 | % | | | 17.32 | % | | | 9.52 | % |
| RATIOS/SUPPLEMENTAL DATA | | | | | | | | | | | | | | | | | | | | | | | | | | | | |
| Net assets, end of period (thousands) | | $ | 38,543 | | | $ | 34,456 | | | $ | 28,776 | | | $ | 31,160 | | | $ | 47,566 | | | $ | 40,119 | | | $ | 19,272 | |
| Ratio of expenses to average net assets | | | 1.15 | %(6) | | | 1.15 | %(6) | | | 1.15 | % | | | 1.13 | % | | | 1.24 | % | | | 1.35 | % | | | 1.35 | % |
| Ratio of expenses to average net assets (before waivers and reimbursement of expenses and/or recapture of previously waived fees) | | | 1.48 | %(6) | | | 2.00 | %(6) | | | 2.09 | % | | | 1.84 | % | | | 1.88 | % | | | 2.60 | % | | | 4.13 | % |
| Ratio of net investment income (loss) to average net assets | | | 0.01 | %(6) | | | 1.17 | %(6) | | | 0.64 | % | | | 0.80 | % | | | 1.29 | % | | | 1.15 | % | | | 1.75 | % |
| Ratio of net investment income/ (loss) to average net assets (before waivers and reimbursement of expenses and/or recapture of previously waived fees) | | | (0.31 | )%(6) | | | 0.32 | %(6) | | | (0.30 | )% | | | 0.09 | % | | | 0.66 | % | | | (0.10 | )% | | | (1.03 | )% |
| Portfolio turnover rate | | | 5 | %(5) | | | 21 | %(5) | | | 54 | % | | | 20 | % | | | 25 | % | | | 26 | % | | | 17 | % |
* | Amount represents less than $0.005 per share. |
(1) | The Fund changed its fiscal year end to August 31 during the period. |
(2) | Effective as of December 21, 2016, the Fund acquired all the assets and liabilities of the Motley Fool Emerging Markets Fund, a series of The Motley Fool Funds Trust (the “Predecessor Fund”). The financial highlights for the periods prior to that date reflect the performances of the Predecessor Fund. |
(3) | Per share data calculated using average shares outstanding method. |
(4) | Total investment return reflects the rate an investor would have earned on an investment in the Fund during the period. During the years ended October 31, 2014 and October 31, 2013, 0.08% and 0.09%, respectively of the Fund’s Investor Shares total investment return was attributable to redemption and small-balance account fees received as reference in Note 3. Excluding this item, total investment return would have been 0.39% and 17.23%, respectively For the six months ended February 28, 2018, the fiscal period ended August 31, 2017, years ended October 31, 2016, October 31, 2015 and October 31, 2012, redemption and small-balance account fees received had no effect on the Fund’s Investor Shares total investment return. |
The accompanying notes are an integral part of these financial statements.
MOTLEY FOOL FUNDS
Notes to Financial Statements
February 28, 2018 (Unaudited)
1. Organization AND SIGNIFICANT ACCOUNTING POLICIES
The RBB Fund, Inc. (“RBB” or the “Company”) was incorporated under the laws of the State of Maryland on February 29, 1988 and is registered under the Investment Company Act of 1940, as amended, (the “1940 Act”), as an open-end management investment company. RBB is a “series fund,” which is a mutual fund divided into separate portfolios. Each portfolio is treated as a separate entity for certain matters under the 1940 Act, and for other purposes, and a shareholder of one portfolio is not deemed to be a shareholder of any other portfolio. Currently, RBB has twenty-nine active investment portfolios, including the Motley Fool Global Opportunities Fund (“Global Opportunities Fund”) (formerly known as Motley Fool Independence Fund), Motley Fool Small-Mid Cap Growth Fund (“Small-Mid Cap Growth Fund”) (formerly known as Motley Fool Great America Fund) and Motley Fool Emerging Markets Fund (“Emerging Markets Fund”) (formerly known as Motley Fool Epic Voyage Fund) (each a “Fund” and together the “Funds”), which became series of RBB at the close of business on December 21, 2016. As of February 28, 2018, Global Opportunities Fund and Small-Mid Cap Growth Fund each offer two classes of shares, Investor and Institutional. Emerging Markets Fund offered one class of shares, Investor.
RBB has authorized capital of one hundred billion shares of common stock of which 87.023 billion shares are currently classified into one hundred and eighty-one classes of common stock. Each class represents an interest in an active or inactive RBB investment portfolio.
Prior to December 21, 2016, the Funds were diversified series (the “Predecessor Funds”) of The Motley Fool Funds Trust (the “Trust”), an open-end management investment company (or mutual fund) organized on November 7, 2008, as a statutory trust under the laws of the State of Delaware. Each of the Predecessor Funds was reorganized into a corresponding Fund on December 21, 2016 (the “Reorganization”). As a result of the Reorganization, the performance and accounting history of each Predecessor Fund was assumed by its corresponding Fund. Performance and accounting information prior to December 21, 2016 included herein is that of the relevant Predecessor Fund.
The investment objective of each Fund is to achieve long-term capital appreciation. The Global Opportunities Fund pursues its objective by investing primarily in common stocks of United States companies and of companies that are organized under the laws of other countries around the world. The Small-Mid Cap Fund pursues its objective by investing primarily in common stocks of companies that are organized in the United States and that are engaged in a broad range of industries. The Emerging Markets Fund pursues its objective by investing primarily in common stocks of companies organized in emerging market foreign countries.
Each Fund is an investment company and follows accounting and reporting guidance in the Financial Accounting Standards Board (“FASB”) Accounting Standards Codification Topic 946 “Financial Services - Investment Companies”.
The end of the reporting period for the Funds is February 28, 2018, and the period covered by these Notes to Financial Statements is the six months ended February 28, 2018 (the “current fiscal period”).
PORTFOLIO VALUATION — Each Fund’s net asset value (“NAV”) is calculated once daily at the close of regular trading hours on the New York Stock Exchange (“NYSE”) (generally 4:00 p.m. Eastern time) on each day the NYSE is open. Securities held by a Fund are valued using the closing price or the last sale price on a national securities exchange or the National Association of Securities Dealers Automatic Quotation System (“NASDAQ”) market system where they are primarily traded. Equity securities traded in the over-the-counter (“OTC”) market are valued at their closing prices. If there were no transactions on that day, securities traded principally on an exchange or on NASDAQ will be valued at the mean of the last bid and ask prices prior to the market close. Fixed income securities are valued using an independent pricing service, which considers such factors as security prices, yields, maturities and ratings, and are deemed representative of market values at the close of the market. Foreign securities are valued based on prices from the primary market in which they are traded, and are translated from the local currency into U.S. dollars using current exchange rates. If market quotations are unavailable or deemed unreliable, securities will be valued in accordance with procedures adopted by the Company’s Board of Directors (the “Board”). Relying on prices supplied by pricing services or dealers or using fair valuation may result in values that are higher or lower than the values used by other investment companies and investors to price the same investments. Such procedures use fundamental valuation methods, which may include, but are not limited to, an analysis of the effect of any restrictions on the resale of the security, industry analysis and trends, significant changes in the issuer’s financial position, and any other event which could have a significant impact on the value of the security. Determination of fair value involves subjective judgment as the actual market value of a particular security can be established only by negotiations between the parties in a sales transaction, and the difference between the recorded fair value and
MOTLEY FOOL FUNDS
Notes to Financial Statements (continued)
February 28, 2018 (Unaudited)
the value that would be received in a sale could be significant. The Funds may use fair value pricing more frequently for securities traded primarily in non-U.S. markets because, among other things, most foreign markets close well before the Funds value their securities, generally as of 4:00 p.m. Eastern time. The earlier close of these foreign markets gives rise to the possibility that significant events, including broad market moves, government actions or pronouncements, aftermarket trading, or news events may have occurred in the interim. To account for this, the Funds may value foreign securities using fair value prices based on third-party vendor modeling tools (international fair value pricing).
FAIR VALUE MEASUREMENTS — The inputs and valuation techniques used to measure the fair value of the Funds’ investments are summarized into three levels as described in the hierarchy below:
| | ● | Level 1 – Prices are determined using quoted prices in active markets for identical securities. |
| | ● | Level 2 – Prices are determined using other significant observable inputs (including quoted prices for similar securities, interest rates, prepayment speeds, credit risk, etc.). |
| | ● | Level 3 – Prices are determined using significant unobservable inputs (including the Funds’ own assumptions in determining the fair value of investments). |
The inputs or methodologies used for valuing securities are not necessarily an indication of the risk associated with investing in those securities.
You’d think that it would be easy to determine what a share of the Fund is worth – just add up the value of everything it holds, and then divide by the number of shares. It’s not that simple, though. Some foreign markets have different operating hours (when it’s daytime in Chicago, for example, it is night in Shanghai). That means that when we calculate a Fund’s value at the end of the day, the market quotations for some of the securities held by the Fund could be several hours old, and intervening events may have affected what the stocks are worth. In addition, characteristics of the relevant markets and stocks might, in some cases, cast doubt on a particular valuation. For these reasons, we may rely on a pricing service to determine the value of particular securities. It is possible that when a Fund buys or sells the securities, the price on the real market will be different from the value used for the fair-value pricing. |
The following is a summary of the inputs used, as of the end of the reporting period, in valuing the Funds’ investments carried at fair value:
GLOBAL OPPORTUNITIES FUND
| | | TOTAL | | | LEVEL 1 | | | LEVEL 2 | | | LEVEL 3 | |
| U.S. Common Stocks | | $ | 251,887,053 | | | $ | 251,887,053 | | | $ | — | | | $ | — | |
| Foreign Common Stocks | | | | | | | | | | | | | | | | |
| Banks | | | 31,530,055 | | | | 19,274,142 | | | | 12,255,913 | | | | — | |
| Beverages | | | — | | | | — | | | | — | | | | — | |
| Consumer Finance | | | 5,885,845 | | | | 5,885,845 | | | | — | | | | — | |
| Diversified Telecommunication Services | | | — | | | | — | | | | — | | | | — | |
| Food & Staples Retailing | | | — | | | | — | | | | — | | | | — | |
| Food Products | | | 10,309,890 | | | | 4,852,079 | | | | 5,457,811 | | | | — | |
| Health Care Equipment & Supplies | | | 16,399,180 | | | | 16,399,180 | | | | — | | | | — | |
| Health Care Providers & Services | | | 20,495,822 | | | | — | | | | 20,495,822 | | | | — | |
| Hotels, Restaurants & Leisure | | | — | | | | — | | | | — | | | | — | |
MOTLEY FOOL FUNDS
Notes to Financial Statements (continued)
February 28, 2018 (Unaudited)
Global opportunities fund (Continued)
| | | TOTAL | | | LEVEL 1 | | | LEVEL 2 | | | LEVEL 3 | |
| Internet & Direct Marketing Retail | | $ | 16,402,274 | | | $ | 9,230,577 | | | $ | 7,171,697 | | | $ | — | |
| Internet Software & Services | | | 26,992,965 | | | | 14,136,463 | | | | 12,856,502 | | | | — | |
| Life Sciences Tools & Services | | | 5,335,581 | | | | — | | | | 5,335,581 | | | | — | |
| Machinery | | | 4,043,078 | | | | — | | | | 4,043,078 | | | | — | |
| Media | | | 5,980,069 | | | | 2,954,263 | | | | 3,025,806 | | | | — | |
| Multiline Retail | | | 6,799,840 | | | | 6,799,840 | | | | — | | | | — | |
| Real Estate Management & Development | | | — | | | | — | | | | — | | | | — | |
| Semiconductors & Semiconductor Equipment | | | 9,320,250 | | | | 9,320,250 | | | | — | | | | — | |
| Software | | | 13,563,672 | | | | — | | | | 13,563,672 | | | | — | |
| Transportation Infrastructure | | | 7,920,507 | | | | 7,920,507 | | | | — | | | | — | |
| Wireless Telecommunication Services | | | 7,910,100 | | | | — | | | | 7,910,100 | | | | — | |
| Warrants | | | 3,859,677 | | | | — | | | | 3,859,677 | | | | — | |
| Short-Term Investments | | | 10,939,991 | | | | 10,939,991 | | | | — | | | | — | |
| Total Investments* | | $ | 455,575,849 | | | $ | 359,600,190 | | | $ | 95,975,659 | | | $ | — | |
SMALL-MID CAP GROWTH FUND
| | | TOTAL | | | LEVEL 1 | | | LEVEL 2 | | | LEVEL 3 | |
| U.S. Common Stocks | | $ | 281,298,167 | | | $ | 281,298,167 | | | $ | — | | | $ | — | |
| Short-Term Investments | | | 12,373,646 | | | | 12,373,646 | | | | — | | | | — | |
| Total Investments* | | $ | 293,671,813 | | | $ | 293,671,813 | | | $ | — | | | $ | — | |
EMERGING MARKETS FUND
| | | TOTAL | | | LEVEL 1 | | | LEVEL 2 | | | LEVEL 3 | |
| Foreign Common Stocks | | | | | | | | | | | | |
| Banks | | $ | 5,246,615 | | | $ | 3,849,303 | | | $ | 1,397,312 | | | $ | — | |
| Beverages | | | 725,540 | | | | — | | | | 725,540 | | | | — | |
| Consumer Finance | | | 1,103,596 | | | | 1,103,596 | | | | — | | | | — | |
| Diversified Telecommunication Services | | | 435,543 | | | | — | | | | 435,543 | | | | — | |
| Food & Staples Retailing | | | 508,442 | | | | 508,442 | | | | — | | | | — | |
| Food Products | | | 896,674 | | | | 896,674 | | | | — | | | | — | |
| Health Care Equipment & Supplies | | | 1,983,150 | | | | 1,983,150 | | | | — | | | | — | |
| Health Care Providers & Services | | | 4,183,164 | | | | 1,829,930 | | | | 2,353,234 | | | | — | |
| Hotels, Restaurants & Leisure | | | 1,559,520 | | | | 1,559,520 | | | | — | | | | — | |
| Internet & Direct Marketing Retail | | | 1,531,134 | | | | 1,531,134 | | | | — | | | | — | |
MOTLEY FOOL FUNDS
Notes to Financial Statements (continued)
February 28, 2018 (Unaudited)
EMERGING MARKETS FUND (Continued)
| | | TOTAL | | | LEVEL 1 | | | LEVEL 2 | | | LEVEL 3 | |
| Internet Software & Services | | $ | 5,516,875 | | | $ | 3,022,166 | | | $ | 2,494,709 | | | $ | — | |
| Media | | | 636,238 | | | | 636,238 | | | | — | | | | — | |
| Multiline Retail | | | 1,294,628 | | | | 1,294,628 | | | | — | | | | — | |
| Real Estate Management & Development | | | 374,586 | | | | 374,586 | | | | — | | | | — | |
| Semiconductors & Semiconductor Equipment | | | 1,408,875 | | | | 1,408,875 | | | | — | | | | — | |
| Software | | | 1,940,001 | | | | — | | | | 1,940,001 | | | | — | |
| Transportation Infrastructure | | | 5,758,368 | | | | 4,634,144 | | | | 1,124,224 | | | | — | |
| Wireless Telecommunication Services | | | 1,175,127 | | | | — | | | | 1,175,127 | | | | — | |
| Short-Term Investments | | | 2,200,999 | | | | 2,200,999 | | | | — | | | | — | |
| Total Investments* | | $ | 38,479,075 | | | $ | 26,833,385 | | | $ | 11,645,690 | | | $ | — | |
* | Please refer to the Schedule of Investments for further details. |
At the end of each quarter, management evaluates the classification of Levels 1, 2 and 3 assets and liabilities. Various factors are considered, such as changes in liquidity from the prior reporting period; whether or not a broker is willing to execute at the quoted price; the depth and consistency of prices from third party pricing services; and the existence of contemporaneous, observable trades in the market. Additionally, management evaluates the classification of Level 1 and Level 2 assets and liabilities on a quarterly basis for changes in listings or delistings on national exchanges.
Due to the inherent uncertainty of determining the fair value of investments that do not have a readily available market value, the fair value of the Funds’ investments may fluctuate from period to period. Additionally, the fair value of investments may differ significantly from the values that would have been used had a ready market existed for such investments and may differ materially from the values the Fund may ultimately realize. Further, such investments may be subject to legal and other restrictions on resale or otherwise less liquid than publicly traded securities.
For fair valuations using significant unobservable inputs, U.S. generally accepted accounting principles (“U.S. GAAP”) requires each Fund to present a reconciliation of the beginning to ending balances for reported market values that presents changes attributable to total realized and unrealized gains or losses, purchase and sales, and transfers in and out of Level 3 during the period. Transfers in and out between levels are based on values at the end of the period. U.S. GAAP also requires each Fund to disclose amounts and reasons for all transfers in and out of Level 1 and Level 2 fair value measurements. A reconciliation of Level 3 investments is presented only when a Fund had an amount of Level 3 investments at the end of the reporting period that was meaningful in relation to its net assets. The amounts and reasons for all transfers in and out of each level within the three-tier hierarchy are disclosed when a Fund had an amount of total transfers during the reporting period that was meaningful in relation to its net assets as of the end of the reporting period.
The Global Opportunities Fund and the Emerging Markets Fund had significant transfers between Level 1 to Level 2 of $7,920,507 and $3,951,590 respectively, and between Level 2 to Level 1 of $8,361,387 and $3,007,982 respectively, during the current fiscal period due to fair value pricing.
The Small-Mid Cap Growth Fund did not have any transfers between Level 1 and Level 2 during the current fiscal period.
USE OF ESTIMATES — The preparation of financial statements in conformity with U.S. GAAP requires management to make estimates and assumptions that affect the reported amounts of assets and liabilities and disclosure of contingent assets and liabilities at the date of the financial statements and the reported amounts of revenues and expenses during the reporting period. Actual results could differ from those estimates and those differences could be significant.
MOTLEY FOOL FUNDS
Notes to Financial Statements (continued)
February 28, 2018 (Unaudited)
INVESTMENT TRANSACTIONS, INVESTMENT INCOME AND EXPENSES — The Funds record security transactions based on trade date for financial reporting purposes. The cost of investments sold is determined by use of the specific identification method for both financial reporting and income tax purposes in determining realized gains and losses on investments. Interest income is accrued when earned. Dividend income is recorded on the ex-dividend date. Distributions received on securities that represent a return of capital or capital gains are recorded as a reduction of cost of investments and/or as a realized gain. The Funds’ investment income, expenses (other than class specific expenses) and unrealized and realized gains and losses are allocated daily to each class of shares based upon the relative proportion of net assets of each class at the beginning of the day. Expenses incurred on behalf of a specific class, fund or fund family of the Company are charged directly to the class, fund or fund family (in proportion to net assets). Expenses incurred for all of the RBB funds (such as director or professional fees) are charged to all funds in proportion to their average net assets of RBB, or in such other manner as the Board deems fair or equitable. Expenses and fees, including investment advisory and administration fees, are accrued daily and taken into account for the purpose of determining the NAV of the Funds.
DIVIDENDS AND DISTRIBUTIONS TO SHAREHOLDERS — Each Fund pays dividends from its net investment income and distributes any net capital gains that it realizes. Dividends and capital gains distributions are generally paid once a year and as required to comply with federal excise tax requirements. Distributions to shareholders are determined in accordance with tax regulations and recorded on ex dividend date. All dividends and other distributions will be reinvested in Fund shares unless a shareholder chooses either to (1) receive dividends in cash, while reinvesting capital gains distributions in additional Fund shares; or (2) receive all distributions in cash. Additionally, each Fund reports details of distribution-related transactions on quarterly account statements. You may not receive a separate confirmation statement for these transactions.
When a Fund pays a dividend or other distribution, its net asset value (NAV) per share will decline by the per-share amount of the distribution. Investors are no poorer for this “distribution drop,” however. As this section explains, investors may elect to reinvest their dividend and distribution payments. Doing so would allow them to acquire additional shares at the post-distribution NAV per share. They may also choose to receive a check in the amount of their portion of the dividend or distribution. |
U.S. TAX STATUS — No provision is made for U.S. income taxes as it is each Fund’s intention to continue to qualify for and elect the tax treatment applicable to regulated investment companies under Subchapter M of the Internal Revenue Code of 1986, as amended, and make the requisite distributions to its shareholders which will be sufficient to relieve it from U.S. income and excise taxes.
CASH AND CASH EQUIVALENTS — Cash and cash equivalents are valued at cost plus accrued interest, which approximates market value.
OTHER — In the normal course of business, the Funds may enter into contracts that provide general indemnifications. Each Fund’s maximum exposure under these arrangements is dependent on claims that may be made against the Funds in the future, and, therefore, cannot be estimated; however, based on experience, the risk of material loss from such claims is considered remote.
FOREIGN CURRENCY TRANSLATION — The books and records of the Funds are maintained in U.S. dollars as follows: (1) the values of investment securities and other assets and liabilities stated in foreign currencies are translated at the exchange rates prevailing at the end of the period; and (2) purchases, sales and income are translated at the rates of exchange prevailing on the respective dates of such transactions. Transaction gains or losses resulting from changes in exchange rates during the reporting period or upon settlement from foreign currency transactions are reported in the Statements of Operations for the current period. The Funds do not isolate the portion of gains and losses on investments.
2. Investment Policies and Practices
The sections below describe some of the different types of investments that may be made by the Funds and the investment practices in which the Funds may engage.
MOTLEY FOOL FUNDS
Notes to Financial Statements (continued)
February 28, 2018 (Unaudited)
When we say that the Funds may invest in other types of securities and in other asset classes, the “may” is well worth emphasizing, as the Funds’ primary focus is the common stocks of companies that the Adviser believes are both high-quality and available at a reasonable price. |
FOREIGN SECURITIES — The Global Opportunities Fund and Emerging Markets Fund invest, and the Small-Mid Cap Growth Fund may invest, in equity and fixed-income securities of foreign companies, including companies located in both developed and emerging-market countries. Investment in foreign securities may include the purchase of American Depositary Receipts (“ADRs”) and other depositary receipts (European Depositary Receipts (“EDRs”) and Global Depositary Receipts (“GDRs”)) that represent indirect interests in securities of foreign issuers. A significant portion of a Fund’s exposure to foreign investments may be composed of such investments. Investments in foreign securities are affected by risk factors generally not associated with investments in the securities of U.S. companies in the U.S. With respect to such securities, there may be more limited information publicly available concerning the issuer than would be the case with respect to domestic securities, foreign issuers may use different accounting standards, and foreign trading markets may not be as liquid as are U.S. markets. Foreign securities also involve such risks as currency risks, possible imposition of withholding or confiscatory taxes, possible currency transfer restrictions, expropriation or other adverse political or economic developments, and the difficulty of enforcing obligations in other countries. These risks may be greater in emerging-market countries and in less-developed countries.
If a Fund holds a foreign stock, and the stock is traded on a foreign exchange, with its price denominated in that foreign currency, the value of the stock will change, for the Fund, whenever the relative value of the U.S. dollar and that foreign currency change. To take an imaginary example, if the Fund holds shares in Ruritania Telecom, traded on the Ruritanian Stock Exchange, those shares will be worth more to the Fund if the value of the Ruritanian ploof increases against the U.S. dollar, and vice versa, all other things being equal. |
The purchase of securities denominated in foreign currencies will subject the value of the Funds’ investments in those securities to fluctuations caused by changes in foreign exchange rates. To hedge against the effects of changes in foreign exchange rates, the Funds may enter into forward foreign currency exchange contracts (“forward contracts”). These contracts represent agreements to exchange an amount of currency at an agreed-upon future date and rate. The Funds will generally use forward contracts only to “lock in” the price in U.S. dollars of a foreign security that a Fund plans to purchase or to sell. In certain limited cases, it may use such contracts to hedge against an anticipated substantial decline in the price of a foreign currency against the U.S. dollar that would adversely affect the U.S. dollar value of foreign securities held by the Fund. Forward contracts will not be used in all cases and, in any event, cannot completely protect the Funds against all changes in the values of foreign securities resulting from fluctuations in foreign exchange rates. The Funds will not enter into a forward contract if, as a result, forward contracts would represent more than 20% of a Fund’s total assets. For hedging purposes, the Funds may also use options on foreign currencies, which expose the Funds to certain risks.
Some foreign securities are traded in the U.S. in the form of ADRs. ADRs are receipts typically issued by a U.S. bank or company evidencing ownership of the underlying securities of foreign issuers. EDRs and GDRs are receipts typically issued by foreign banks or trust companies, evidencing ownership of underlying securities issued by either a foreign or U.S. issuer. Generally, depositary receipts in registered form are designed for use in the U.S. and depositary receipts in bearer form are designed for use in securities markets outside the U.S. Depositary receipts may not necessarily be denominated in the same currency as the underlying securities into which they may be converted. Depositary receipts generally involve the same risks as other investments in foreign securities. However, holders of ADRs and other depositary receipts may not have all the legal rights of shareholders and may experience difficulty in receiving shareholder communications.
TYPES OF FIXED-INCOME SECURITIES — A Fund may invest in bonds and other types of debt obligations of U.S. and foreign issuers. Fixed income securities purchased by a Fund may include, among others, bonds, notes, and debentures issued by corporations; debt securities issued or guaranteed by the U.S. government or one of its agencies or instrumentalities (“U.S. Government Securities”); municipal securities; mortgage-backed and asset-backed securities; and debt securities issued or guaranteed by foreign governments, their agencies, instrumentalities, or political subdivisions, or by government-owned,
MOTLEY FOOL FUNDS
Notes to Financial Statements (continued)
February 28, 2018 (Unaudited)
-controlled, or -sponsored entities, including central banks. These investments also include money market instruments and other types of obligations. Investors should recognize that, although securities ratings issued by Standard & Poor’s® Ratings Services (“S&P”), a division of The McGraw-Hill Companies, Inc., and Moody’s Investors Services©, Inc. (“Moody’s”), provide a generally useful guide as to credit risks, they do not offer any criteria to evaluate interest rate risk. Changes in interest rate levels generally cause fluctuations in the prices of fixed-income securities and will, therefore, cause fluctuations in the NAV per share of a Fund. Subsequent to the purchase of a fixed-income security by a Fund, the ratings or credit quality of such security may deteriorate. Any such subsequent adverse changes in the rating or quality of a security held by a Fund would not require a Fund to sell the security.
PARTICIPATORY NOTES — A participatory note, as used by a Fund, is an instrument used by investors to obtain exposure to an equity investment, including common stocks and warrants, in a local market where direct ownership is not permitted (or is impractical.) In countries where direct ownership by a foreign investor, such as a Fund, is not allowed by local law, such as Saudi Arabia, an investor may gain exposure to the market through a participatory note, which derives its value from a group of underlying equity securities. A participatory note is intended (disregarding the effect of any fees and expenses) to reflect the performance of the underlying equity securities on a one-to-one basis so that investors will not normally gain more in absolute terms than they would have made had they invested in the underlying securities directly, and will not normally lose more than they would have lost had they invested in the underlying securities directly.
In addition to providing access to otherwise closed markets, participatory notes can also provide a less expensive option to direct investment (where ownership by foreign investors is permitted) by reducing registration and transaction costs in acquiring and selling local registered shares. The Funds’ investment manager also believes that participatory notes can offer greater liquidity in markets that restrict the ability of the Funds to dispose of an investment by either restricting transactions by size or requiring registration and/or regulatory approvals.
The purchase of participatory notes involves risks that are in addition to the risks normally associated with a direct investment in the underlying securities. The Fund is subject to the risk that the issuer of the participatory note (i.e., the issuing bank or broker-dealer), which is the only responsible party under the note, is unable or refuses to perform under the terms of the participatory note, also known as counterparty risk.
While the holder of a participatory note is entitled to receive from the bank or broker-dealer any dividends or other distributions paid on the underlying securities, the holder is not entitled to the same rights as an owner of the underlying securities, such as voting rights.
Participatory notes may not be traded on exchanges, are privately issued, and may be illiquid. To the extent a participatory note is determined to be illiquid, it would be subject to the Fund’s limitation on investments in illiquid securities. There can be no assurance that the trading price or value of participatory notes will equal the value of the underlying value of the equity securities they seek to replicate.
REAL ESTATE INVESTMENT TRUSTS — Real estate investment trusts (“REITs”) are pooled investment vehicles that manage a portfolio of real estate or real estate-related loans to earn profits for their shareholders. REITs are generally classified as equity REITs, mortgage REITs, or a combination of equity and mortgage REITs. Investing in REITs involves certain unique risks in addition to those risks associated with investing in the real estate industry in general. Equity REITs may be affected by changes in the value of the underlying property owned by the REITs, while mortgage REITs may be affected by the quality of the borrower on any credit extended. REITs are dependent upon management skills, may not be diversified geographically or by property type, and are subject to heavy cash-flow dependency, default by borrowers, and self-liquidation. REITs must also meet certain requirements under the Internal Revenue Code of 1986, as amended (the “Code”), to avoid entity level tax and be eligible to pass through certain tax attributes of their income to shareholders. REITs are consequently subject to the risk of failing to meet these requirements for favorable tax treatment and of failing to maintain their exemptions from registration under the 1940 Act. REITs are also subject to the risks of changes in the Code, affecting their tax status.
REITs (especially mortgage REITs) are also subject to interest rate risks. When interest rates decline, the value of a REIT’s investment in fixed-rate obligations can be expected to rise. Conversely, when interest rates rise, the value of a REIT’s investment in fixed-rate obligations can be expected to decline. In contrast, as interest rates on adjustable-rate mortgage loans are reset
MOTLEY FOOL FUNDS
Notes to Financial Statements (continued)
February 28, 2018 (Unaudited)
periodically, yields on a REIT’s investments in such loans will gradually align themselves to reflect changes in market interest rates, causing the value of such investments to fluctuate less dramatically in response to interest rate fluctuations than would investments in fixed-rate obligations.
The management of a REIT may be subject to conflicts of interest with respect to the operation of the business of the REIT and may be involved in real estate activities competitive with the REIT. REITs may own properties through joint ventures or in other circumstances in which a REIT may not have control over its investments. REITs may use significant amounts of leverage.
REITs often do not provide complete tax information until after the end of the calendar year. Consequently, because of the delay, it may be necessary for a Fund, if invested in REITs, to request permission to extend the deadline for issuance of Forms 1099-DIV beyond January 31. Alternatively, amended Forms 1099-DIV may be sent. During the current fiscal period, the Global Opportunities Fund, Small-Mid Cap Growth Fund and Emerging Markets Fund invested in REITs.
TEMPORARY INVESTMENTS — During periods of adverse market or economic conditions, a Fund may temporarily invest all or a substantial portion of its assets in high-quality, fixed-income securities, money market instruments, and shares of money market mutual funds, or it may hold cash. At such times, a Fund would not be pursuing its stated investment objective with its usual investment strategies. A Fund may also hold these investments for liquidity purposes. Fixed-income securities will be deemed to be of high quality if they are rated “A” or better by S&P or Moody’s or, if unrated, are determined to be of comparable quality by the Adviser. Money market instruments are high-quality, short-term fixed income obligations (which generally have remaining maturities of one year or less), and may include U.S. Government Securities, commercial paper, certificates of deposit and banker’s acceptances issued by domestic branches of United States banks that are members of the Federal Deposit Insurance Corporation, and repurchase agreements for US. Government Securities. In lieu of purchasing money market instruments, a Fund may purchase shares of money market mutual funds that invest primarily in U.S. Government Securities and repurchase agreements involving those securities, subject to certain limitations imposed by the 1940 Act. A Fund, as an investor in a money market fund, will indirectly bear the fees and expenses of the money market fund. These indirect fees and expenses will be in addition to the fees and expenses of the Funds. Repurchase agreements involve certain risks not associated with direct investments in debt securities.
SECURITIES LENDING — Each Fund may lend its portfolio securities pursuant to a securities lending agreement with the Bank of New York Mellon. The Funds may lend its securities to brokers, dealers, and financial institutions in an amount not exceeding 33 1/3% of the value of the Funds total assets. These loans will be secured by collateral (consisting of cash, U.S. Government Securities, or irrevocable letters of credit) maintained in an amount equal to at least 100% of the market value, determined daily, of the loaned securities. The Funds may, subject to certain notice requirements, at any time call the loan and obtain the return of the securities loaned. The Funds will be entitled to payments equal to the interest and dividends on the loaned securities and may receive a premium for lending the securities. The Funds did not lend any portfolio securities during the current fiscal period.
3. investment adviser and other services
Each Fund pays all of its expenses other than those expressly assumed by Motley Fool Asset Management (the “Adviser”). Expenses of each Fund are deducted from the Funds’ total income before dividends are paid. Subject to the supervision of the Board, the Adviser manages the overall investment operations of the Funds in accordance with the Funds’ investment objective and policies and formulates a continuing investment strategy for the Funds pursuant to the terms of the Investment Advisory Agreement between the Adviser and the Company on behalf of the Funds. The Adviser is a wholly owned subsidiary of The Motley Fool Holdings Inc. (“TMF Holdings”), a multimedia financial-services holding company that also owns The Motley Fool, LLC, which publishes investment information and analysis across a wide range of media, including investment newsletter services, websites, and books. TMF Holdings is controlled by David Gardner and Tom Gardner, along with other private shareholders. Each Fund compensates the Adviser for its services at an annual rate based on each Fund’s average daily net assets (the “Advisory Fee”), payable on a monthly basis in arrears, as shown in the following table.
MOTLEY FOOL FUNDS
Notes to Financial Statements (continued)
February 28, 2018 (Unaudited)
The Adviser has contractually agreed to pay, waive or absorb a portion of the operating expenses of each Fund’s share classes to the extent that total annual Fund operating expenses of the Investor and Institutional Shares of each Fund (as applicable) (excluding certain items discussed below) exceed the rates (“Expense Caps”) shown in the following table of each Fund’s average daily net assets. In determining the Adviser’s obligation to waive advisory fees and/or reimburse expenses, the following expenses are not taken into account and could cause net total annual Fund operating expenses to exceed the Expense Caps as applicable: acquired fund fees and expenses, brokerage commissions, extraordinary items, interest and taxes. This contractual limitation is in effect until December 31, 2018 and may not be terminated without the approval of the Board. The Adviser may discontinue these arrangements at any time after December 31, 2018.
| | | EXPENSE CAPS |
FUND | ADVISORY
FEE | INVESTOR
CLASS | INSTITUTIONAL CLASS |
Global Opportunities Fund | 0.85% | 1.15% | 0.95% |
Small-Mid Cap Growth Fund | 0.85% | 1.15% | 0.95% |
Emerging Markets Fund | 0.85% | 1.15% | N/A |
During the current fiscal period, investment advisory fees accrued and waived were as follows:
FUND | GROSS
ADVISORY FEES | RECOUPMENT/ WAIVERS | NET
ADVISORY FEES |
Global Opportunities Fund | $ 1,787,949 | $ (27,114) | $ 1,760,835 |
Small-Mid Cap Growth Fund | 1,103,941 | 73,494 | 1,177,435 |
Emerging Markets Fund | 149,240 | (57,625) | 91,615 |
The Adviser may recover from the Investor and Institutional Shares of each Fund fees and expenses previously paid, waived, or absorbed for a period of three years after such fees or expenses were incurred, provided that the repayments do not cause the Funds’ operating expenses (excluding brokerage commissions, taxes, interest expense, acquired fund fees and expenses, and any extraordinary expenses) to exceed the expense limits of the Investor and Institutional Class, respectively, of each Fund that were in effect at the time the fees and expenses were paid, waived, or absorbed by the Adviser, as well as the expense limits that are currently in effect, if different. Previously waived fees subject to future recovery by the Adviser are as follows:
| | EXPIRATION | |
FUND | OCTOBER 31,
2018 | OCTOBER 31,
2019 | AUGUST 31,
2020 | AUGUST 31,
2021 | TOTAL |
Global Opportunities Fund - Investor Class | $ — | $ — | $ — | $ — | $ — |
Global Opportunities Fund - Institutional Class | 56,078 | 85,311 | 83,548 | 27,114 | 252,051 |
Small-Mid Cap Growth Fund - Investor Class | — | 2,543 | 24,999 | — | 27,542 |
Small-Mid Cap Growth Fund - Institutional Class | 59,879 | 88,812 | 73,109 | 23,642 | 245,442 |
Emerging Markets Fund - Investor Class | 165,052 | 271,449 | 202,227 | 57,625 | 696,353 |
MOTLEY FOOL FUNDS
Notes to Financial Statements (continued)
February 28, 2018 (Unaudited)
BNY Mellon Investment Servicing (US) Inc. (“BNY Mellon”) served as administrator for the Funds through December 3, 2017. Effective December 4, 2017, U.S. Bancorp Fund Services, LLC (“USBFS”) serves as administrator for the Funds. For providing administrative and accounting services, USBFS is entitled to receive a monthly fee, subject to certain minimum and out of pocket expenses.
In addition, BNY Mellon served as the Funds’ transfer and dividend disbursing agent through December 3, 2017. Effective December 4, 2017, USBFS serves as the Funds’ transfer and dividend disbursing agent. For providing transfer agent services, USBFS is entitled to receive a monthly fee, subject to certain minimum and out of pocket expenses.
The Bank of New York Mellon provided certain custodial services to the Funds through December 3, 2017. Effective December 4, 2017, U.S. Bank, N.A. (the “Custodian”) provides certain custodial services to the Funds. The Custodian is entitled to receive a monthly fee, subject to certain minimum and out of pocket expenses.
Foreside Funds Distributors, LLC served as the principal underwriter and distributor of the Funds’ shares pursuant to a Distribution Agreement with RBB.
For compensation amounts payable to USBFS, please refer to the Statements of Operations.
DIRECTOR’S AND OFFICER’S COMPENSATION — The Directors of the Company receive an annual retainer and meeting fees for meetings attended. Employees of Vigilant Compliance, LLC serve as President, Chief Compliance Officer and Assistant Treasurer of the Company. Vigilant Compliance, LLC is compensated for the services provided to the Company. An employee of RBB serves as Treasurer and Secretary, and is compensated for services provided. Certain employees of USBFS serve as officers of the Company. They are not compensated by the Funds or the Company. For Director’s and Officer’s compensation amounts, please refer to the Statement of Operations.
SHAREHOLDER ACCOUNT-RELATED SERVICES — The Company’s Board has authorized it to pay fees to financial intermediaries, including securities dealers, that provide shareholder account-related services to their customers who own shares of the Company’s Funds, or to reimburse the Adviser for such expenses it paid on the Company’s behalf. These financial intermediaries generally have omnibus accounts with the Company’s Transfer Agent and provide shareholder services or sub-transfer agent services to the shareholders who are their customers. The fees paid by the Funds for these services will not exceed the fees they would have incurred if customers of the financial intermediaries maintained their accounts directly with the Company.
During the current fiscal period, the amounts paid by the Funds for third-party shareholder account-related services were as follows:
FUND | SHAREHOLDER
SERVICE FEES |
Global Opportunities Fund | $ 97,653 |
Small-Mid Cap Growth Fund | 72,027 |
Emerging Markets Fund | 11,836 |
REDEMPTION FEE — Prior to January 1, 2018, the Funds imposed a redemption fee of 2.00% on redemptions/exchanges of Fund shares held less than 90 days. The redemption fee is calculated as a percentage of the net asset value of the total redemption proceeds and is retained by the Funds and accounted for as additional paid-in capital. Certain exceptions to the imposition of the redemption fee exist. Effective January 1, 2018, the Funds have eliminated their redemption fees. Please see the Funds’ prospectus for more information.
SMALL-BALANCE ACCOUNT FEE — The Funds charge a small-balance account fee of $24 annually if the value of an account is less than $10,000. The fee is assessed by redeeming shares from that account. Certain exceptions to the imposition of the small-balance account fee exist. Please see the Funds’ prospectus for more information.
MOTLEY FOOL FUNDS
Notes to Financial Statements (continued)
February 28, 2018 (Unaudited)
TRANSACTIONS WITH AFFILIATES — Advisers to investment companies, including Motley Fool Funds, are permitted under 17a-7 of the 1940 Act to purchase or sell securities directly between affiliated clients. When affecting these “cross” transactions, Rule 17a-7 imposes restrictions on how the trades are processed and reported. The specified conditions within Rule 17a-7 are outlined in procedures established by or under the direction of the Board of Directors. The procedures have been designed to provide assurance that any purchase or sale of securities by the Fund from or to another Fund complies with Rule 17a-7 under the 1940 Act.
During the current fiscal period, the Funds did not engage in any security transactions with affiliates.
4. PURCHASES AND SALES OF INVESTMENT SECURITIES
During the current fiscal period, aggregate purchases and sales and maturities of investment securities of the Funds were as follows:
FUND | PURCHASES | SALES |
Global Opportunities Fund | $ 17,540,575 | $ 26,218,766 |
Small-Mid Cap Growth Fund | 30,699,846 | 16,016,184 |
Emerging Markets Fund | 2,149,941 | 1,705,445 |
There were no purchases or sales of long-term U.S. Government Securities during the current fiscal period.
5. Federal Income tax information
The Funds have followed the authoritative guidance on accounting for and disclosure of uncertainty in tax positions, which requires the Funds to determine whether a tax position is more likely than not to be sustained upon examination, including resolution of any related appeals or litigation processes, based on the technical merits of the position. The Funds have determined that there was no effect on the financial statements from following this authoritative guidance. In the normal course of business, the Funds are subject to examination by federal, state and local jurisdictions, where applicable, for tax years for which applicable statutes of limitations have not expired. The Funds are not aware of any tax positions for which it is reasonably possible that the total amounts of unrecognized tax benefits will significantly change in the next twelve months.
As of August 31, 2017, the federal tax cost, aggregate gross unrealized appreciation and depreciation of securities held by each Fund were as follows:
FUND | FEDERAL
TAX COST | UNREALIZED
APPRECIATION | UNREALIZED
(DEPRECIATION) | NET UNREALIZED
APPRECIATION/
(DEPRECIATION) |
Global Opportunities Fund | $ 271,267,819 | $ 135,624,277 | (8,072,562) | $ 127,551,715 |
Small-Mid Cap Growth Fund | 150,147,265 | 81,712,472 | (808,085) | 80,904,387 |
Emerging Markets Fund | 26,548,449 | 9,360,456 | (20,096) | 9,340,360 |
Distributions to shareholders, if any, from net investment income and realized gains are determined in accordance with federal income tax regulations, which may differ from net investment income and realized gains recognized for financial reporting purposes. Accordingly, the character of distributions and composition of net assets for tax purposes may differ from those reflected in the accompanying financial statements. To the extent these differences are permanent, such amounts are reclassified within the capital accounts based on the tax treatment; temporary differences do not require such reclassification.
MOTLEY FOOL FUNDS
Notes to Financial Statements (continued)
February 28, 2018 (Unaudited)
The following permanent differences as of August 31, 2017, primarily attributable to net operating loss adjustments, foreign currency transactions, and investments in partnerships and PFICs, were reclassified among the following accounts:
FUND | UNDISTRIBUTED
NET INVESTMENT
INCOME/(LOSS) | ACCUMULATED
NET REALIZED
GAIN/(LOSS) | PAID-IN
CAPITAL |
Global Opportunities Fund | $ 186,772 | $ (187,040) | $ 268 |
Small-Mid Cap Growth Fund | 632,039 | (203,088) | (428,951) |
Emerging Markets Fund | (26,386) | 26,386 | — |
As of August 31, 201 7, the components of distributable earnings on a tax basis were as follows:
FUND | UNDISTRIBUTED
ORDINARY
INCOME | UNDISTRIBUTED
LONG-TERM
CAPITAL GAINS | CAPITAL
LOSS
CARRYOVER | OTHER | UNREALIZED
APPRECIATION/
(DEPRECIATION) |
Global Opportunities Fund | $ 2,302,285 | $ 46,172,290 | $ — | $ — | $ 127,548,699 |
Small-Mid Cap Growth Fund | — | 12,051,987 | — | (544,611) | 80,904,387 |
Emerging Markets Fund | 284,107 | — | (1,545,914) | — | 9,339,598 |
The differences between the book and tax basis components of distributable earnings relate primarily to the timing of recognition of income and gains for federal income tax purposes.
The tax character of dividends and distributions paid during the fiscal period ended August 31, 2017 and fiscal year ended October 31, 2016 were as follows:
FUND | TAX YEAR
END | ORDINARY
INCOME | LONG-TERM
CAPITAL GAIN | TOTAL |
Global Opportunities Fund | 2017 | $ 799,221 | $ 9,643,760 | $ 10,442,981 |
Global Opportunities Fund | 2016 | 48,712 | 169,411 | 218,123 |
Small-Mid Cap Growth Fund | 2017 | — | — | — |
Small-Mid Cap Growth Fund | 2016 | 370,109 | — | 370,109 |
Emerging Markets Fund | 2017 | 178,502 | — | 178,502 |
Emerging Markets Fund | 2016 | 319,416 | — | 319,416 |
Dividends from net investment income and short-term capital gains are treated as ordinary income dividends for federal income tax purposes.
Pursuant to federal income tax rules applicable to regulated investment companies, the Funds may elect to treat certain capital losses between November 1 and August 31 and late year ordinary losses ((i) ordinary losses between January 1 and August 31, and (ii) specified ordinary and currency losses between November 1 and August 31) as occurring on the first day of the following tax year. For the fiscal year ended August 31, 2017, any amount of losses elected within the tax return will not be recognized for federal income tax purposes until September 1, 2017.
MOTLEY FOOL FUNDS
Notes to Financial Statements (concluded)
February 28, 2018 (Unaudited)
Under the Regulated Investment Company Modernization Act of 2010, the Funds are permitted to carry forward capital losses incurred in taxable years beginning after December 22, 2010 for an unlimited period. Additionally, capital losses that are carried forward will retain their character as either short-term or long-term capital losses rather than being considered all short-term as under the previous law. As of August 31, 2017, the Emerging Markets Fund had unexpiring short-term losses of $479,367 and long-term losses of $1,066,547. Small-Mid Cap Growth Fund deferred qualified late-year losses of $544,611 which will be treated as arising on the first business day of the following fiscal year.
6. Subsequent Events
Management has evaluated the impact of all subsequent events on the Funds through the date the financial statements were issued and has determined that there was the following subsequent event:
Change in Investment Policy
Effective March 1, 2018, the Small-Mid Cap Growth Fund modified its 80% policy to read as follows: “Under normal conditions, the Small-Mid Cap Growth Fund invests at least 80% of its net assets (plus the amount of any borrowings for investment purposes) in securities issued by United States companies having smaller and mid-market capitalizations”.
MOTLEY FOOL FUNDS
Notice to Shareholders (Unaudited)
Information on Proxy Voting
Policies and procedures that the Funds use to determine how to vote proxies relating to portfolio securities as well as information regarding how the Funds voted proxies relating to portfolio securities during the most recent 12-month period ended June 30 are available (i) without charge, upon request, by calling (888) 863-8803; and (ii) on the U.S. Securities and Exchange Commission’s (“SEC”) website at http://www.sec.gov.
Quarterly Schedule of Investments
The Company files a complete schedule of portfolio holdings with the SEC for the first and third quarters of each fiscal year on Form N-Q. Shareholders can obtain the Form N-Q (i) without charge, upon request, by calling(888) 863-8803; (ii) on the SEC’s website at http://www.sec.gov; and (iii) on the Funds website at http://www.FoolFunds.com. The Form N-Q may be reviewed or copied at the SEC Public Reference Room in Washington, D.C. Information on the operation of the Public Reference Room may be obtained by calling (800) SEC-0330.
Investment Adviser
Motley Fool Asset Management, LLC
2000 Duke Street
Suite 275
Alexandria, VA 22314
Administrator and Transfer Agent
U.S. Bancorp Fund Services, LLC
P.O. Box 701
Milwaukee, WI 53212
Custodian
U.S. Bank, N.A.
1555 North Rivercenter Drive, Suite 302
Milwaukee, WI 53212
Distributor
Foreside Funds Distributors LLC
899 Cassatt Road
400 Berwyn Park, Suite 110
Berwyn, PA 19312
Legal Counsel
Drinker Biddle & Reath LLP
One Logan Square, Suite 2000
Philadelphia, PA 19103-6996


Motley Fool 100 Index ETF (TMFC) Nearly 79% of the assets of the ETF are invested in just three sectors (technology, consumer discretionary, and healthcare). The S&P 500®, by contrast, has 52% allotted to those same sectors. Interestingly, these sectors have grown in prominence (primarily technology) over time. Back in 2013, they represented 44% of the S&P 500®. In February, one company in the ETF changed its name. Priceline.com, the well-known online travel agency business, changed its name to Booking Holdings. Booking.com is the company’s primary non-U.S. website and is responsible for generating the bulk of sales and profits. This may come as a surprise to some, but Booking.com has long been the crown jewel in the business. If you are looking to book accommodations and activities for any upcoming fun, give Booking.com a shot and see what you’ve been missing out on. The three largest holdings all begin with the letter A (Apple, Alphabet, and Amazon.com). As far as we know, the index our ETF aims to track (the Motley Fool 100 Index) shows no preference to the front of the alphabet. There are lots of V and W companies in the portfolio, but nothing in the land of X, Y, or Z. |  |
| Table of Contents |  |
Letter to Shareholders | 3 |
Portfolio Characteristics | 5 |
Fund Expense Example | 7 |
Schedule of Investments | 8 |
Financial Statements | 14 |
Notes to Financial Statements | 18 |
Notice to Shareholders | 24 |
Board Approval of Advisory Agreement | 25 |
Motley Fool 100 Index ETF
Letter to Shareholders
February 28, 2018 (Unaudited)
 President
Denise H. Coursey | Dear Fellow Fool 100 ETF Shareholders, Welcome, and from everyone at Motley Fool Asset Management, we sincerely thank you for being in the very first wave of investors in our very first exchange-traded fund (ETF). We are delighted and humbled by the excitement and support from you, our investors, and from our many partners for the Motley Fool 100 ETF. The launch of a new product is always exhilarating, intense, and more than a little nerve-wracking. And with the Motley Fool 100 ETF, we were not only introducing a new product, we were stepping out of our known and comfortable world of mutual funds into the unknown (to us): exchange-traded funds. That meant learning a whole new set of rules, creating new partnerships, building a new website, and filing lots of very long documents with the Securities and Exchange Commission¹. I definitely had a few sleepless nights leading up to our opening day. All of that was well worth it, though, because it allowed us to deliver exactly the product so many of you have been asking for – what we believe to be an easy, less expensive way to invest in The Motley Fool’s top investment ideas. ETFs seem ubiquitous now, but I was surprised how many times over the past few months I was asked to explain how they work and their history. The first exchange-traded fund was introduced in 1993, and now, 25 years later, ETFs are a more than $3 trillion market. It’s not difficult to understand why these investment vehicles have taken off. They’re generally less expensive, tax-efficient², offer low or no minimum investment requirement, and if you have a brokerage account, you can buy any ETF on the market for the same trading cost as buying any stock. Easy, cheap, tax-efficient³. And with the right investment strategy, a very Foolish solution. |
We believe the Motley Fool 100 Index is just that investment strategy – the 100 largest stocks in the Motley Fool universe, weighted by market cap and vetted by the Fool’s analysts. It aims to be a simple, less expensive way to build the core of any portfolio.
We’re delighted so many of you agreed and have been early adopters in investing with us. (By the way, I was right there with you, investing on the first day.) More than that, we hope you will continue to embrace the Foolish long-term, buy-and-hold investing philosophy. We’re only a month into this adventure, and we want to have you with us for many years to come.
Foolish best,

Denise Coursey
¹ | The SEC does not endorse, indemnify, approve, nor disapprove of any security. |
² | Any tax or legal information provided is merely a summary of our understanding and interpretation of some of the current income tax regulations and it is not exhaustive. Investors must consult their tax advisor or legal counsel for advice and information concerning their particular situation. Neither the Fund nor any of its representatives may give legal or tax advice. |
³ | Mutual funds, ETFs, hedge funds, equities, bonds, and other asset classes have different risk profiles, which should be considered when investing. All investments contain risk and may lose value. |
Must be preceded or accompanied by a prospectus.
Shares of any ETF are bought and sold at market price, not net asset value (“NAV”), and are not individually redeemed from the Fund. Brokerage commissions will reduce returns.
The Motley Fool 100 Index is a new market-cap weighted index that measures the performance of The Motley Fool’s 100 largest active buy recommendations or highest-rated stocks in Fool IQ, the company’s analyst opinion database. Every company included in the Index is incorporated and listed in the U.S. You cannot invest directly in an index.
Investing involves risk. Principal loss is possible. The Fund is non-diversified, which means its NAV, market price and total returns may fluctuate or fall more than a diversified fund. Gains or losses on a single stock may have a greater impact on the Fund. The Fund is not actively managed and the Adviser does not attempt to take defensive positions in any market conditions, including adverse markets. The Index is comprised of the 100 largest U.S. companies that are either active recommendations of The Motley Fool LLC’s newsletter or are among the 150 highest rated U.S. companies in The Motley Fool LLC’s analyst opinion database, and are weighted based on their market value relative to the total market value of other companies in the Index. Changes in The Motley Fool LLC’s recommendations or rankings methodologies may have an adverse effect on the Fund. Factors that affect a security’s value can change over time, and these changes may not be reflected in the Index methodology. The Fund is recently organized, with no operating history. As a result, prospective investors have a limited track record on which to base their investment decision. In addition, there can be no assurance that the Fund will grow to, or maintain, an economically viable size.
The Motley Fool 100 ETF is distributed by Quasar Distributors, LLC.
Motley Fool 100 Index ETF
Portfolio Characteristics
(Unaudited)
At February 28, 2018, the Fund had an unaudited net asset value of $19.49 per share attributed to 4,625,000 shares outstanding. This compares with an unaudited net asset value as of January 29, 2018 of $20.00 per share attributed to 100,000 shares outstanding. From the Fund launch on January 29, 2018 to February 28, 2018, the Fund had an average annual total return of -2.55% versus a return of -2.62% over the same period for its benchmark, the Motley Fool 100 Index.
AVERAGE ANNUAL TOTAL RETURNS FOR THE PERIOD ENDED FEBRUARY 28, 2018 |
| | Since
Inception | Inception
Date |
Motley Fool 100 Index ETF | -2.55% | 1/29/18 |
Motley Fool 100 Index* | -2.62%(1) | |
S&P 500® Total Return Index** | -4.68%(1) | |
Fund Expense Ratio(2) | 0.50% | |
The performance data quoted represents past performance and does not guarantee future results. Current performance may be lower or higher. The investment return and principal value of an investment will fluctuate so that shares, when redeemed, may be worth more or less than their original cost.
(1) | Benchmark performance is from inception date of the Fund only and is not the inception date of the benchmark itself. |
(2) | The expense ratios of the Fund are set forth according to the 1/22/2018 Prospectus for the Fund and may differ from the expense ratio disclosed in the Financial Highlights table in this report. See the Financial Highlights for most current expense ratio. |
* | The Motley Fool 100 Index was established by The Motley Fool in 2017 and is a proprietary, rules-based index designed to track the performance of the 100 largest, most liquid U.S. companies that have been recommended by The Motley Fool’s analysts and newsletters. The Index is calculated and administered by Solactive AG (the “Index Calculation Agent”), which is not affiliated with the Fund, the Adviser or The Motley Fool. Additional information regarding the Index, including its value, is available on the websites of the Fund at www.fool100etf.com and the Index Calculation Agent, at www.solactive.com. |
** | The S&P 500® Total Return Index is the total return version of the S&P 500® Index. Dividends are reinvested on a daily basis and all regular cash dividends are assumed reinvested in the index on the ex-dividend date. The S&P 500® Index is a market-capitalization-weighted index of 500 US stocks chosen for market size, liquidity and industry grouping, among other factors. The S&P 500® Index is designed to be a leading indicator of U.S. equities and is meant to refl ect the risk/return characteristics of the large cap universe. The S&P 500® Index was fi rst introduced on the 1st of January, 1923, though expanded to 500 stocks on March 4, 1957. |
The investment objective of the Fund is to seek investment results that correspond (before fees and expenses) generally to the total return performance of the Motley Fool 100 Index.
Motley Fool 100 Index ETF
Portfolio Characteristics (Continued)
(Unaudited)
The following tables show the top eleven holdings and sector allocations, in which the Fund was invested in as of February 28, 2018. Portfolio holdings are subject to change without notice.
Top Eleven Holdings | % of Net
Assets |
Apple, Inc. | 8.95% |
Alphabet, Inc., Class C | 7.41 |
Amazon.com, Inc. | 6.93 |
Microsoft Corp. | 6.86 |
Facebook, Inc., Class A | 4.96 |
Berkshire Hathaway, Inc., Class B | 4.81 |
Johnson & Johnson | 3.33 |
Visa, Inc., Class A | 2.60 |
Intel Corp. | 2.18 |
Cisco Systems, Inc. | 2.09 |
UnitedHealth Group, Inc. | 2.07 |
| | 52.19% |
The Fund uses the Global Industry Classification StandardSM (“GICSSM”) as the basis for the classification of securities on the Schedule of Investments (“SOI”). We believe that this makes the SOI classifications more standard with the rest of the industry.
Sector Allocation | % of Net
Assets |
Information Technology | 48.11% |
Consumer Discretionary | 19.46 |
Health Care | 11.39 |
Financials | 8.25 |
Industrials | 4.45 |
Telecommunication Services | 2.32 |
Consumer Staples | 1.79 |
Real Estate | 1.45 |
Energy | 1.18 |
Materials | 0.89 |
Utilities | 0.45 |
| | 99.74% |
Motley Fool 100 Index ETF
fund expense example
February 28, 2018 (Unaudited)
As a shareholder of the Fund, you incur two types of costs: (1) transaction costs, including brokerage commissions on purchases and sales of Fund shares, and (2) ongoing costs, including management fees. This example is intended to help you understand your ongoing costs (in dollars) of investing in the Fund and to compare these costs with the ongoing costs of investing in other ETFs.
This example is based on an investment of $1,000 invested at the beginning of the six-month period from September 1, 2017 through February 28, 2018, and held for the entire period. The actual values and expenses are based on the 30 day period from inception January 29, 2018 through February 28, 2018.
Actual Expenses
The first line of the accompanying table provides information about actual account values and actual expenses. You may use the information in this line, together with the amount you invested, to estimate the expenses that you paid over the period. Simply divide your account value by $1,000 (for example, an $8,600 account value divided by $1,000 = 8.6), then multiply the result by the number in the first line under the heading entitled “Expenses Paid During Period” to estimate the expenses you paid on your account during this period.
Hypothetical Example for Comparison Purposes
The second line of the accompanying table provides information about hypothetical account values and hypothetical expenses based on the Fund’s actual expense ratio and an assumed rate of return of 5% per year before expenses, which is not the Fund’s actual return. The hypothetical account values and expenses may not be used to estimate the actual ending account balance or expenses you paid for the period. You may use this information to compare the ongoing costs of investing in the Fund and other funds. To do so, compare this 5% hypothetical example with the 5% hypothetical examples that appear in the shareholder reports of other funds.
Please note that the expenses shown in the accompanying table is meant to highlight your ongoing costs only and do not reflect any transactional costs. Therefore, the second line of the accompanying table is useful in comparing ongoing costs only and will not help you determine the relative total costs of owning different funds. In addition, if these transactional costs were included, your costs would have been higher.
 Do you know how many times a fund, or the market, has returned a smooth 5% over a long period of time? Never. But we have to pick some example. In reality, the market’s returns are always far bumpier, with the market returning 20% one year, followed by a loss of 10% the next year, followed by a 3% gain,etc. These variations affect actual expenses as well. Happily, over almost all time periods of 20 years or longer, according to the research of University of Pennsylvania’s Jeremy Siegel and others, the domestic market’s returns have been at least 5% per year on average. Do you know how many times a fund, or the market, has returned a smooth 5% over a long period of time? Never. But we have to pick some example. In reality, the market’s returns are always far bumpier, with the market returning 20% one year, followed by a loss of 10% the next year, followed by a 3% gain,etc. These variations affect actual expenses as well. Happily, over almost all time periods of 20 years or longer, according to the research of University of Pennsylvania’s Jeremy Siegel and others, the domestic market’s returns have been at least 5% per year on average.
|
| Beginning
Account Value
September 1,
2017 | Ending
Account Value
february 28,
2018 | Annualized
Expense
Ratio | Expenses
Paid During
Period* |
Actual | $ 1,000.00 | $ 974.50 | 0.50% | $0.41 |
Hypothetical (5% return before expenses) | 1,000.00 | 1,022.32 | 0.50 | 2.51 |
* | Expenses are equal to the Fund’s annualized six-month expense ratio, multiplied by the average account value over the period, multiplied by the number of days (181) in the most recent fiscal half-year, then divided by 365 to reflect the one-half year period. The actual dollar amounts shown as expenses paid during the period for the Fund are multiplied by 30 days, which is based on the date of inception (January 29, 2018). The Fund’s ending account value on the first line in the table is based on the actual since inception total return for the Fund as of February 28, 2018 of -2.55%. |
Motley Fool 100 Index ETF
Schedule of Investments
February 28, 2018 (Unaudited)
| | | Number of Shares | | | Value
(Note 2) | |
| | | | | | | |
| Common Stocks — 99.74% | | | | | | |
| Aerospace & Defense — 0.28% | | | | | | |
| Textron, Inc. (United States) | | | 2,182 | | | $ | 130,592 | |
| TransDigm Group, Inc. (United States) | | | 438 | | | | 126,280 | |
| | | | | | | | 256,872 | |
| Air Freight & Logistics — 0.60% | | | | | | | | |
| FedEx Corp. (United States) | | | 2,188 | | | | 539,145 | |
| Airlines — 0.54% | | | | | | | | |
| Delta Air Lines, Inc. (United States) | | | 6,023 | | | | 324,640 | |
| United Continental Holdings, Inc. (United States)* | | | 2,364 | | | | 160,255 | |
| | | | | | | | 484,895 | |
| Automobiles — 0.99% | | | | | | | | |
| Ford Motor Co. (United States) | | | 34,666 | | | | 367,806 | |
| Tesla, Inc. (United States)* | | | 1,541 | | | | 528,656 | |
| | | | | | | | 896,462 | |
| Beverages — 0.34% | | | | | | | | |
| Monster Beverage Corp. (United States)* | | | 4,779 | | | | 302,845 | |
| Biotechnology — 2.77% | | | | | | | | |
| Biogen, Inc. (United States)* | | | 1,821 | | | | 526,251 | |
| BioMarin Pharmaceutical, Inc. (United States)* | | | 1,480 | | | | 120,132 | |
| Celgene Corp. (United States)* | | | 6,860 | | | | 597,643 | |
| Gilead Sciences, Inc. (United States) | | | 11,522 | | | | 907,127 | |
| Vertex Pharmaceuticals, Inc. (United States)* | | | 2,068 | | | | 343,350 | |
| | | | | | | | 2,494,503 | |
| Capital Markets — 1.92% | | | | | | | | |
| Charles Schwab Corp. (The) (United States) | | | 11,399 | | | | 604,375 | |
| CME Group, Inc. (United States) | | | 2,965 | | | | 492,664 | |
| Intercontinental Exchange, Inc. (United States) | | | 4,950 | | | | 361,746 | |
| Moody's Corp. (United States) | | | 1,629 | | | | 271,848 | |
| | | | | | | | 1,730,633 | |
| Chemicals — 0.70% | | | | | | | | |
| Ecolab, Inc. (United States) | | | 2,462 | | | | 321,168 | |
| Sherwin-Williams Co. (The) (United States) | | | 776 | | | | 311,626 | |
| | | | | | | | 632,794 | |
The accompanying notes are an integral part of these financial statements.
Motley Fool 100 Index ETF
Schedule of Investments (continued)
February 28, 2018 (Unaudited)
| | | Number of Shares | | | Value
(Note 2) | |
| | | | | | | |
| Common Stocks (continued) | | | | | | |
| Commercial Services & Supplies — 0.38% | | | | | | |
| Cintas Corp. (United States) | | | 908 | | | $ | 154,959 | |
| Republic Services, Inc. (United States) | | | 2,739 | | | | 184,006 | |
| | | | | | | | 338,965 | |
| Communications Equipment — 2.27% | | | | | | | | |
| Arista Networks, Inc. (United States)* | | | 603 | | | | 162,653 | |
| Cisco Systems, Inc. (United States) | | | 42,070 | | | | 1,883,895 | |
| | | | | | | | 2,046,548 | |
| Consumer Finance — 1.06% | | | | | | | | |
| American Express Co. (United States) | | | 7,344 | | | | 716,114 | |
| Synchrony Financial (United States) | | | 6,475 | | | | 235,625 | |
| | | | | | | | 951,739 | |
| Diversified Financial Services — 4.81% | | | | | | | | |
| Berkshire Hathaway, Inc., Class B (United States)* | | | 20,909 | | | | 4,332,345 | |
| Diversified Telecommunication Services — 1.85% | | | | | | | | |
| Verizon Communications, Inc. (United States) | | | 34,990 | | | | 1,670,423 | |
| Electrical Equipment — 0.42% | | | | | | | | |
| Emerson Electric Co. (United States) | | | 5,304 | | | | 376,902 | |
| Electronic Equipment, Instruments & Components — 0.24% | | | | | | | | |
| Corning, Inc. (United States) | | | 7,391 | | | | 214,930 | |
| Equity Real Estate Investment Trusts — 1.45% | | | | | | | | |
| American Tower Corp. (United States) | | | 3,602 | | | | 501,866 | |
| Crown Castle International Corp. (United States) | | | 3,380 | | | | 372,003 | |
| Equinix, Inc. (United States) | | | 660 | | | | 258,786 | |
| Welltower, Inc. (United States) | | | 3,342 | | | | 175,455 | |
| | | | | | | | 1,308,110 | |
| Food & Staples Retailing — 1.45% | | | | | | | | |
| Costco Wholesale Corp. (United States) | | | 3,833 | | | | 731,720 | |
| CVS Health Corp. (United States) | | | 8,468 | | | | 573,537 | |
| | | | | | | | 1,305,257 | |
| Health Care Equipment & Supplies — 1.50% | | | | | | | | |
| Align Technology, Inc. (United States)* | | | 713 | | | | 187,177 | |
| Baxter International, Inc. (United States) | | | 4,643 | | | | 314,749 | |
| Becton Dickinson and Co. (United States) | | | 1,994 | | | | 442,708 | |
The accompanying notes are an integral part of these financial statements.
Motley Fool 100 Index ETF
Schedule of Investments (continued)
February 28, 2018 (Unaudited)
| | | Number of Shares | | | Value
(Note 2) | |
| | | | | | | |
| Common Stocks (continued) | | | | | | |
| Health Care Equipment & Supplies (continued) | | | | | | |
| Intuitive Surgical, Inc. (United States)* | | | 955 | | | $ | 407,259 | |
| | | | | | | | 1,351,893 | |
| Health Care Providers & Services — 3.09% | | | | | | | | |
| Express Scripts Holding Co. (United States)* | | | 4,625 | | | | 348,956 | |
| HCA Healthcare, Inc. (United States) | | | 3,036 | | | | 301,323 | |
| McKesson Corp. (United States) | | | 1,803 | | | | 269,062 | |
| UnitedHealth Group, Inc. (United States) | | | 8,241 | | | | 1,863,785 | |
| | | | | | | | 2,783,126 | |
| Health Care Technology — 0.20% | | | | | | | | |
| Cerner Corp. (United States)* | | | 2,863 | | | | 183,690 | |
| Hotels, Restaurants & Leisure — 1.24% | | | | | | | | |
| Marriott International, Inc. (United States) | | | 3,014 | | | | 425,607 | |
| Starbucks Corp. (United States) | | | 12,167 | | | | 694,736 | |
| | | | | | | | 1,120,343 | |
| Industrial Conglomerates — 1.60% | | | | | | | | |
| 3M Co. (United States) | | | 5,105 | | | | 1,202,278 | |
| Roper Technologies, Inc. (United States) | | | 864 | | | | 237,678 | |
| | | | | | | | 1,439,956 | |
| Insurance — 0.47% | | | | | | | | |
| Aflac, Inc. (United States) | | | 3,302 | | | | 293,482 | |
| Markel Corp. (United States)* | | | 114 | | | | 126,768 | |
| | | | | | | | 420,250 | |
| Internet & Direct Marketing Retail — 9.20% | | | | | | | | |
| Amazon.com, Inc. (United States)* | | | 4,132 | | | | 6,249,443 | |
| Booking Holdings, Inc. (United States)* | | | 420 | | | | 854,297 | |
| Expedia, Inc. (United States) | | | 1,295 | | | | 136,195 | |
| Netflix, Inc. (United States)* | | | 3,605 | | | | 1,050,425 | |
| | | | | | | | 8,290,360 | |
| Internet Software & Services — 13.62% | | | | | | | | |
| Alphabet, Inc., Class C (United States)* | | | 6,044 | | | | 6,676,988 | |
| Altaba, Inc. (United States)* | | | 7,359 | | | | 550,821 | |
| eBay, Inc. (United States)* | | | 8,903 | | | | 381,583 | |
| Facebook, Inc., Class A (United States)* | | | 25,082 | | | | 4,472,622 | |
| Twitter, Inc. (United States)* | | | 6,290 | | | | 200,399 | |
| | | | | | | | 12,282,413 | |
The accompanying notes are an integral part of these financial statements.
Motley Fool 100 Index ETF
Schedule of Investments (continued)
February 28, 2018 (Unaudited)
| | | Number of Shares | | | Value
(Note 2) | |
| | | | | | | |
| Common Stocks (continued) | | | | | | |
| IT Services — 6.56% | | | | | | |
| Automatic Data Processing, Inc. (United States) | | | 3,774 | | | $ | 435,218 | |
| Cognizant Technology Solutions Corp. (United States) | | | 5,021 | | | | 411,822 | |
| Global Payments, Inc. (United States) | | | 1,353 | | | | 153,417 | |
| Mastercard, Inc. (United States) | | | 9,028 | | | | 1,586,761 | |
| PayPal Holdings, Inc. (United States)* | | | 10,366 | | | | 823,164 | |
| Square, Inc. (United States)* | | | 3,515 | | | | 161,866 | |
| Visa, Inc. (United States) | | | 19,060 | | | | 2,343,236 | |
| | | | | | | | 5,915,484 | |
| Life Sciences Tools & Services — 0.50% | | | | | | | | |
| Illumina, Inc. (United States)* | | | 1,212 | | | | 276,360 | |
| IQVIA Holdings, Inc. (United States)* | | | 1,785 | | | | 175,519 | |
| | | | | | | | 451,879 | |
| Machinery — 0.48% | | | | | | | | |
| Cummins, Inc. (United States) | | | 1,354 | | | | 227,702 | |
| PACCAR, Inc. (United States) | | | 2,925 | | | | 209,401 | |
| | | | | | | | 437,103 | |
| Media — 3.89% | | | | | | | | |
| Comcast Corp. (United States) | | | 38,931 | | | | 1,409,692 | |
| Omnicom Group, Inc. (United States) | | | 1,949 | | | | 148,572 | |
| Time Warner, Inc. (United States) | | | 6,415 | | | | 596,338 | |
| Walt Disney Co. (The) (United States) | | | 13,072 | | | | 1,348,508 | |
| | | | | | | | 3,503,110 | |
| Metals & Mining — 0.19% | | | | | | | | |
| Nucor Corp. (United States) | | | 2,590 | | | | 169,386 | |
| Multi-Utilities — 0.45% | | | | | | | | |
| Dominion Energy, Inc. (United States) | | | 5,510 | | | | 408,126 | |
| Oil, Gas & Consumable Fuels — 1.18% | | | | | | | | |
| Enterprise Products Partners LP (United States) | | | 18,343 | | | | 466,279 | |
| Kinder Morgan, Inc. (United States) | | | 18,685 | | | | 302,697 | |
| Magellan Midstream Partners LP (United States) | | | 1,850 | | | | 115,551 | |
| ONEOK, Inc. (United States) | | | 3,145 | | | | 177,158 | |
| | | | | | | | 1,061,685 | |
| Pharmaceuticals — 3.33% | | | | | | | | |
| Johnson & Johnson (United States) | | | 23,129 | | | | 3,003,995 | |
The accompanying notes are an integral part of these financial statements.
Motley Fool 100 Index ETF
Schedule of Investments (continued)
February 28, 2018 (Unaudited)
| | | Number of Shares | | | Value
(Note 2) | |
| | | | | | | |
| Common Stocks (continued) | | | | | | |
| Professional Services — 0.16% | | | | | | |
| Verisk Analytics, Inc. (United States)* | | | 1,375 | | | $ | 140,511 | |
| Semiconductors & Semiconductor Equipment — 3.77% | | | | | | | | |
| Intel Corp. (United States) | | | 39,805 | | | | 1,961,988 | |
| NVIDIA Corp. (United States) | | | 5,220 | | | | 1,263,240 | |
| Skyworks Solutions, Inc. (United States) | | | 1,560 | | | | 170,430 | |
| | | | | | | | 3,395,658 | |
| Software — 12.69% | | | | | | | | |
| Activision Blizzard, Inc. (United States) | | | 6,617 | | | | 483,901 | |
| Adobe Systems, Inc. (United States)* | | | 4,170 | | | | 872,072 | |
| Electronic Arts, Inc. (United States)* | | | 2,649 | | | | 327,681 | |
| Intuit, Inc. (United States) | | | 2,188 | | | | 365,090 | |
| Microsoft Corp. (United States) | | | 65,963 | | | | 6,185,350 | |
| Oracle Corp. (United States) | | | 35,559 | | | | 1,801,775 | |
| Salesforce.com, Inc. (United States)* | | | 6,211 | | | | 722,029 | |
| VMware, Inc. (United States)* | | | 3,485 | | | | 459,149 | |
| Workday, Inc. (United States)* | | | 1,775 | | | | 224,839 | |
| | | | | | | | 11,441,886 | |
| Specialty Retail — 3.07% | | | | | | | | |
| Home Depot, Inc. (The) (United States) | | | 9,576 | | | | 1,745,418 | |
| Lowe's Cos, Inc. (United States) | | | 6,585 | | | | 589,950 | |
| TJX Cos, Inc. (The) (United States) | | | 5,278 | | | | 436,385 | |
| | | | | | | | 2,771,753 | |
| Technology Hardware, Storage & Peripherals — 8.95% | | | | | | | | |
| Apple, Inc. (United States) | | | 45,304 | | | | 8,069,549 | |
| Textiles, Apparel & Luxury Goods — 1.06% | | | | | | | | |
| NIKE, Inc., Class B (United States) | | | 14,252 | | | | 955,312 | |
| Wireless Telecommunication Services — 0.47% | | | | | | | | |
| T-Mobile US, Inc. (United States)* | | | 6,988 | | | | 423,543 | |
| Total Common Stocks (Cost $88,898,771) | | | | | | | 89,904,379 | |
| | | | | | | | | |
The accompanying notes are an integral part of these financial statements.
Motley Fool 100 Index ETF
Schedule of Investments (concluded)
February 28, 2018 (Unaudited)
| | | Number of Shares | | | Value
(Note 2) | |
| | | | | | | |
| Short-Term Investments — 0.18% | | | | | | |
| First American Treasury Obligations Fund, Class X (United States), 1.27% (a) | | | 162,038 | | | $ | 162,038 | |
| Total Short-Term Investments (Cost $162,038) | | | | | | | 162,038 | |
| | | | | | | | | |
| Total Investments (Cost $89,060,809) — 99.92% | | | | | | | 90,066,417 | |
| Other Assets in Excess of Liabilities — 0.08% | | | | | | | 71,575 | |
| NET ASSETS — 100.00% | | | | | | | | |
| (Applicable to 4,625,000 shares outstanding) | | | | | | $ | 90,137,992 | |
* | Non-income producing security. |
(a) | Seven-day yield as of February 28, 2018 |
The accompanying notes are an integral part of these financial statements.
Motley Fool 100 Index ETF
Statement of Assets and Liabilities
February 28, 2018 (Unaudited)
| ASSETS | | | |
| Investments, at value (cost $88,898,771) | | $ | 89,904,379 | |
| Short-term investments, at value (cost $162,038) | | | 162,038 | |
| Receivables for: | | | | |
| Capital shares sold | | | 974,465 | |
| Dividends | | | 75,693 | |
| Total assets | | | 91,116,575 | |
| | | | | |
| LIABILITIES | | | | |
| Payables for: | | | | |
| Investments purchased | | | 955,290 | |
| Advisory fees | | | 23,293 | |
| Total liabilities | | | 978,583 | |
| Net assets | | $ | 90,137,992 | |
| | | | | |
| NET ASSETS CONSIST OF: | | | | |
| Par value | | $ | 4,625 | |
| Paid-in capital | | | 89,049,015 | |
| Undistributed/accumulated net investment income/(loss) | | | 78,744 | |
| Accumulated net realized gain/(loss) from investments | | | — | |
| Net unrealized appreciation/(depreciation) on investments | | | 1,005,608 | |
| Net assets | | $ | 90,137,992 | |
| | | | | |
| Shares outstanding ($0.001 par value, 100,000,000 shares authorized) | | | 4,625,000 | |
| Net asset value, price per share | | $ | 19.49 | |
The accompanying notes are an integral part of these financial statements.
Motley Fool 100 Index ETF
Statement of Operations
for the period ended February 28, 2018 (Unaudited)
| INVESTMENT INCOME | | | |
| Dividends | | $ | 102,037 | |
| Total investment income | | | 102,037 | |
| | | | | |
| EXPENSES | | | | |
| Advisory fees (Note 3) | | | 23,293 | |
| Total expenses | | | 23,293 | |
| Net investment income/(loss) | | | 78,744 | |
| | | | | |
| NET REALIZED AND UNREALIZED GAIN/(LOSS) FROM INVESTMENTS | | | | |
| Net realized gain/(loss) from investments | | | — | |
| Net change in unrealized appreciation/(depreciation) on investments | | | 1,005,608 | |
| Net realized and unrealized gain/(loss) on investments | | | 1,005,608 | |
| NET INCREASE/(DECREASE) IN NET ASSETS RESULTING FROM OPERATIONS | | $ | 1,084,352 | |
The accompanying notes are an integral part of these financial statements.
Motley Fool 100 Index ETF
Statement of Changes in Net Assets
| | | For the
Period Ended
February 28, 2018*
(Unaudited) | |
| INCREASE/(DECREASE) IN NET ASSETS FROM OPERATIONS: | | | |
| Net investment income/(loss) | | $ | 78,744 | |
| Net realized gain/(loss) from investments | | | — | |
| Net change in unrealized appreciation/(depreciation) on investments | | | 1,005,608 | |
| Net increase/(decrease) in net assets resulting from operations | | | 1,084,352 | |
| | | | | |
| CAPITAL SHARE TRANSACTIONS: | | | | |
| Proceeds from shares sold | | | 89,053,640 | |
| Net increase/(decrease) in net assets from capital share transactions | | | 89,053,640 | |
| Total increase/(decrease) in net assets | | | 90,137,992 | |
| | | | | |
| NET ASSETS: | | | | |
| Beginning of period | | | — | |
| End of period | | $ | 90,137,992 | |
| Undistributed/accumulated net investment income/(loss), end of year | | $ | 78,744 | |
| | | | | |
| SHARES TRANSACTIONS: | | | | |
| Shares sold | | | 4,625,000 | |
| Net increase/(decrease) in shares outstanding | | | 4,625,000 | |
* | Inception date of the Fund was January 29, 2018. |
The accompanying notes are an integral part of these financial statements.
Motley Fool 100 Index ETF
Financial Highlights
Contained below is per share operating performance data for shares outstanding, total investment return, ratios to average net assets and other supplemental data for the respective period. This information has been derived from information provided in the financial statements.
| | | For the
Period Ended February 28, 2018(1) | |
| | | (Unaudited) | |
| PER SHARE OPERATING PERFORMANCE | | | | |
| Net asset value, beginning of period | | $ | 20.00 | |
Net investment income/(loss) (2) | | | 0.03 | |
| Net realized and unrealized gain/(loss) from investments | | | (0.54 | ) |
| Net increase/(decrease) in net assets resulting from operations | | | (0.51 | ) |
| Net asset value, end of period | | $ | 19.49 | |
Total investment return (3) | | | (2.55 | %)(4) |
| RATIO/SUPPLEMENTAL DATA | | | | |
| Net assets, end of period (000's omitted) | | $ | 90,138 | |
| Ratio of expenses to average net assets | | | 0.50 | %(5) |
| Ratio of net investment income/(loss) to average net assets | | | 1.69 | %(5) |
| Portfolio turnover rate | | | 0 | %(4) |
(1) | Inception date of the Fund was January 29, 2018. |
(2) | Calculated based on average shares outstanding for the period. |
(3) | Total investment return is calculated assuming a purchase of shares on the first day and a sale of shares on the last day of each period reported and includes reinvestments of dividends and distributions, if any. |
The accompanying notes are an integral part of these financial statements.
Motley Fool 100 Index ETF
Notes to Financial Statements
FEBRUARY 28, 2018 (UNAUDITED)
1. Organization AND SIGNIFICANT ACCOUNTING POLICIES
The RBB Fund, Inc. (“RBB” or the “Company”) was incorporated under the laws of the State of Maryland on February 29, 1988 and is registered under the Investment Company Act of 1940, as amended, (the “1940 Act”), as an open-end management investment company. RBB is a “series fund,” which is a mutual fund divided into separate portfolios. Each portfolio is treated as a separate entity for certain matters under the 1940 Act, and for other purposes, and a shareholder of one portfolio is not deemed to be a shareholder of any other portfolio. Currently, RBB has twenty-nine active investment portfolios, including the Motley Fool 100 Index ETF (the “Fund”), which commenced investment operations on January 29, 2018.
RBB has authorized capital of one hundred billion shares of common stock of which 87.023 billion shares are currently classified into one hundred and eighty-one classes of common stock. Each class represents an interest in an active or inactive RBB investment portfolio.
The investment objective of the Fund is to achieve investment results that correspond (before fees and expenses) generally to the total return performance of the Motley Fool 100 Index (the “Index”). The Index was developed by The Motley Fool, LLC (“The Motley Fool”), an affiliate of the Adviser, and was established in 2017. It is a proprietary, rules-based index designed to track the performance of the 100 largest, most liquid U.S. companies that have been recommended by The Motley Fool’s analysts and newsletters.
The Fund is an investment company and follows accounting and reporting guidance in the Financial Accounting Standards Board (“FASB”) Accounting Standards Codification Topic 946 “Financial Services - Investment Companies”.
The end of the reporting period for the Fund is February 28, 2018, and the period covered by these Notes to Financial Statements is the period January 29, 2018 through February 28, 2018 (the “current fiscal period”).
PORTFOLIO VALUATION — The Fund’s net asset value (“NAV”) is calculated once daily at the close of regular trading hours on the New York Stock Exchange (“NYSE”) (generally 4:00 p.m. Eastern time) on each day the NYSE is open. Securities held by the Fund are valued using the closing price or the last sale price on a national securities exchange or the National Association of Securities Dealers Automatic Quotation System (“NASDAQ”) market system where they are primarily traded. Equity securities traded in the over-the-counter (“OTC”) market are valued at their closing prices. If there were no transactions on that day, securities traded principally on an exchange or on NASDAQ will be valued at the mean of the last bid and ask prices prior to the market close. Fixed income securities are valued using an independent pricing service, which considers such factors as security prices, yields, maturities and ratings, and are deemed representative of market values at the close of the market. Foreign securities are valued based on prices from the primary market in which they are traded, and are translated from the local currency into U.S. dollars using current exchange rates. If market quotations are unavailable or deemed unreliable, securities will be valued in accordance with procedures adopted by the Company’s Board of Directors (the “Board”). Relying on prices supplied by pricing services or dealers or using fair valuation may result in values that are higher or lower than the values used by other investment companies and investors to price the same investments. Such procedures use fundamental valuation methods, which may include, but are not limited to, an analysis of the effect of any restrictions on the resale of the security, industry analysis and trends, significant changes in the issuer’s financial position, and any other event which could have a significant impact on the value of the security. Determination of fair value involves subjective judgment as the actual market value of a particular security can be established only by negotiations between the parties in a sales transaction, and the difference between the recorded fair value and the value that would be received in a sale could be significant.
FAIR VALUE MEASUREMENTS — The inputs and valuation techniques used to measure the fair value of the Fund’s investments are summarized into three levels as described in the hierarchy below:
| | ● | Level 1 – Prices are determined using quoted prices in active markets for identical securities. |
| | ● | Level 2 – Prices are determined using other significant observable inputs (including quoted prices for similar securities, interest rates, prepayment speeds, credit risk, etc.). |
| | ● | Level 3 – Prices are determined using significant unobservable inputs (including the Fund’s own assumptions in determining the fair value of investments). |
The inputs or methodologies used for valuing securities are not necessarily an indication of the risk associated with investing in those securities.
Motley Fool 100 Index ETF
Notes to Financial Statements (continued)
FEBRUARY 28, 2018 (UNAUDITED)
The following is a summary of the inputs used, as of the end of the reporting period, in valuing the Fund’s investments carried at fair value:
| | | TOTAL | | | LEVEL 1 | | | LEVEL 2 | | | LEVEL 3 | |
| Common Stocks | | $ | 89,904,379 | | | $ | 89,904,379 | | | $ | — | | | $ | — | |
| Short-Term Investments | | | 162,038 | | | | 162,038 | | | | — | | | | — | |
| Total Investments* | | $ | 90,066,417 | | | $ | 90,066,417 | | | $ | — | | | $ | — | |
* | Please refer to the Schedule of Investments for further details. |
At the end of each quarter, management evaluates the classification of Levels 1, 2 and 3 assets and liabilities. Various factors are considered, such as changes in liquidity from the prior reporting period; whether or not a broker is willing to execute at the quoted price; the depth and consistency of prices from third party pricing services; and the existence of contemporaneous, observable trades in the market. Additionally, management evaluates the classification of Level 1 and Level 2 assets and liabilities on a quarterly basis for changes in listings or delistings on national exchanges.
Due to the inherent uncertainty of determining the fair value of investments that do not have a readily available market value, the fair value of the Fund’s investments may fluctuate from period to period. Additionally, the fair value of investments may differ significantly from the values that would have been used had a ready market existed for such investments and may differ materially from the values the Fund may ultimately realize. Further, such investments may be subject to legal and other restrictions on resale or otherwise less liquid than publicly traded securities.
For fair valuations using significant unobservable inputs, U.S. generally accepted accounting principles (“U.S. GAAP”) requires the Fund to present a reconciliation of the beginning to ending balances for reported market values that presents changes attributable to total realized and unrealized gains or losses, purchase and sales, and transfers in and out of Level 3 during the period. Transfers in and out between levels are based on values at the end of the period. U.S. GAAP also requires the Fund to disclose amounts and reasons for all transfers in and out of Level 1 and Level 2 fair value measurements. A reconciliation of Level 3 investments is presented only when the Fund had an amount of Level 3 investments at the end of the reporting period that was meaningful in relation to its net assets. The amounts and reasons for all transfers in and out of each level within the three-tier hierarchy are disclosed when the Fund had an amount of total transfers during the reporting period that was meaningful in relation to its net assets as of the end of the reporting period.
During the current fiscal period, the Fund had no transfers between Levels 1, 2 and 3.
USE OF ESTIMATES — The preparation of financial statements in conformity with U.S. GAAP requires management to make estimates and assumptions that affect the reported amounts of assets and liabilities and disclosure of contingent assets and liabilities at the date of the financial statements and the reported amounts of revenues and expenses during the reporting period. Actual results could differ from those estimates and those differences could be significant.
INVESTMENT TRANSACTIONS, INVESTMENT INCOME AND EXPENSES — The Fund records security transactions based on trade date for financial reporting purposes. The cost of investments sold is determined by use of the specific identification method for both financial reporting and income tax purposes in determining realized gains and losses on investments. Interest income is accrued when earned. Dividend income is recorded on the ex-dividend date. Distributions received on securities that represent a return of capital or capital gains are recorded as a reduction of cost of investments and/or as a realized gain. Expenses and fees, including investment advisory fees, are accrued daily and taken into account for the purpose of determining the NAV of the Fund.
DIVIDENDS AND DISTRIBUTIONS TO SHAREHOLDERS — The Fund pays dividends from its net investment income and distributes any net capital gains that it realizes. Dividends and capital gains distributions are generally paid once a year and as required to comply with federal excise tax requirements. Distributions to shareholders are determined in accordance with tax regulations and recorded on ex dividend date. Additionally, each Fund reports details of distribution-related transactions on quarterly account statements. You may not receive a separate confirmation statement for these transactions.
Motley Fool 100 Index ETF
Notes to Financial Statements (continued)
FEBRUARY 28, 2018 (UNAUDITED)
U.S. TAX STATUS — No provision is made for U.S. income taxes as it is the Fund’s intention to continue to qualify for and elect the tax treatment applicable to regulated investment companies under Subchapter M of the Internal Revenue Code of 1986, as amended, and make the requisite distributions to its shareholders which will be sufficient to relieve it from U.S. income and excise taxes.
CASH AND CASH EQUIVALENTS — Cash and cash equivalents are valued at cost plus accrued interest, which approximates market value.
OTHER — In the normal course of business, the Fund may enter into contracts that provide general indemnifications. The Fund’s maximum exposure under these arrangements is dependent on claims that may be made against the Fund in the future, and, therefore, cannot be estimated; however, based on experience, the risk of material loss from such claims is considered remote.
2. Investment Policies and Practices
The sections below describe some of the different types of investments that may be made by the Fund and the investment practices in which the Fund may engage.
 When we say that the Fund may invest in other types of securities and in other asset classes, the “may” is well worth emphasizing, as the Fund’s primary focus is to track the makeup and returns of the Motley Fool 100 Index. When we say that the Fund may invest in other types of securities and in other asset classes, the “may” is well worth emphasizing, as the Fund’s primary focus is to track the makeup and returns of the Motley Fool 100 Index.
|
TYPES OF FIXED-INCOME SECURITIES — The Fund may invest in bonds and other types of debt obligations of U.S. and foreign issuers. Fixed income securities purchased by the Fund may include, among others, bonds, notes, and debentures issued by corporations; debt securities issued or guaranteed by the U.S. government or one of its agencies or instrumentalities (“U.S. Government Securities”); municipal securities; mortgage-backed and asset-backed securities; and debt securities issued or guaranteed by foreign governments, their agencies, instrumentalities, or political subdivisions, or by government-owned, -controlled, or -sponsored entities, including central banks. These investments also include money market instruments and other types of obligations. Investors should recognize that, although securities ratings issued by Standard & Poor’s® Ratings Services (“S&P”), a division of The McGraw-Hill Companies, Inc., and Moody’s Investors Services©, Inc. (“Moody’s”), provide a generally useful guide as to credit risks, they do not offer any criteria to evaluate interest rate risk. Changes in interest rate levels generally cause fluctuations in the prices of fixed-income securities and will, therefore, cause fluctuations in the NAV per share of the Fund. Subsequent to the purchase of a fixed-income security by the Fund, the ratings or credit quality of such security may deteriorate. Any such subsequent adverse changes in the rating or quality of a security held by the Fund would not require the Fund to sell the security.
REAL ESTATE INVESTMENT TRUSTS — Real estate investment trusts (“REITs”) are pooled investment vehicles that manage a portfolio of real estate or real estate-related loans to earn profits for their shareholders. REITs are generally classified as equity REITs, mortgage REITs, or a combination of equity and mortgage REITs. Investing in REITs involves certain unique risks in addition to those risks associated with investing in the real estate industry in general. Equity REITs may be affected by changes in the value of the underlying property owned by the REITs, while mortgage REITs may be affected by the quality of the borrower on any credit extended. REITs are dependent upon management skills, may not be diversified geographically or by property type, and are subject to heavy cash-flow dependency, default by borrowers, and self-liquidation. REITs must also meet certain requirements under the Internal Revenue Code of 1986, as amended (the “Code”), to avoid entity level tax and be eligible to pass through certain tax attributes of their income to shareholders. REITs are consequently subject to the risk of failing to meet these requirements for favorable tax treatment and of failing to maintain their exemptions from registration under the 1940 Act. REITs are also subject to the risks of changes in the Code, affecting their tax status.
REITs (especially mortgage REITs) are also subject to interest rate risks. When interest rates decline, the value of a REIT’s investment in fixed-rate obligations can be expected to rise. Conversely, when interest rates rise, the value of a REIT’s investment in fixed-rate obligations can be expected to decline. In contrast, as interest rates on adjustable-rate mortgage loans are reset periodically, yields on a REIT’s investments in such loans will gradually align themselves to reflect changes in market interest rates, causing the value of such investments to fluctuate less dramatically in response to interest rate fluctuations than would investments in fixed-rate obligations.
Motley Fool 100 Index ETF
Notes to Financial Statements (continued)
FEBRUARY 28, 2018 (UNAUDITED)
The management of a REIT may be subject to conflicts of interest with respect to the operation of the business of the REIT and may be involved in real estate activities competitive with the REIT. REITs may own properties through joint ventures or in other circumstances in which a REIT may not have control over its investments. REITs may use significant amounts of leverage.
REITs often do not provide complete tax information until after the end of the calendar year. Consequently, because of the delay, it may be necessary for the Fund, if invested in REITs, to request permission to extend the deadline for issuance of Forms 1099-DIV beyond January 31. Alternatively, amended Forms 1099-DIV may be sent.
TEMPORARY INVESTMENTS — During periods of adverse market or economic conditions, the Fund may temporarily invest all or a substantial portion of its assets in high-quality, fixed-income securities, money market instruments, and shares of money market mutual funds, or it may hold cash. At such times, the Fund would not be pursuing its stated investment objective with its usual investment strategies. The Fund may also hold these investments for liquidity purposes. Fixed-income securities will be deemed to be of high quality if they are rated “A” or better by S&P or Moody’s or, if unrated, are determined to be of comparable quality by the Adviser. Money market instruments are high-quality, short-term fixed income obligations (which generally have remaining maturities of one year or less), and may include U.S. Government Securities, commercial paper, certificates of deposit and banker’s acceptances issued by domestic branches of United States banks that are members of the Federal Deposit Insurance Corporation, and repurchase agreements for U.S. Government Securities. In lieu of purchasing money market instruments, the Fund may purchase shares of money market mutual funds that invest primarily in U.S. Government Securities and repurchase agreements involving those securities, subject to certain limitations imposed by the 1940 Act. The Fund, as an investor in a money market fund, will indirectly bear the fees and expenses of the money market fund. These indirect fees and expenses will be in addition to the fees and expenses of the Fund. Repurchase agreements involve certain risks not associated with direct investments in debt securities.
3. investment adviser and other services
The Fund pays all of its expenses other than those expressly assumed by Motley Fool Asset Management (the “Adviser”). Expenses of the Fund are deducted from the Fund’s total income before dividends are paid. Subject to the supervision of the Board, the Adviser manages the overall investment operations of the Fund in accordance with the Fund’s investment objective and policies and formulates a continuing investment strategy for the Fund pursuant to the terms of the Investment Advisory Agreement between the Adviser and the Company on behalf of the Fund. The Adviser is a wholly owned subsidiary of The Motley Fool Holdings Inc. (“TMF Holdings”), a multimedia financial-services holding company that also owns The Motley Fool, which publishes investment information and analysis across a wide range of media, including investment newsletter services, websites, and books. TMF Holdings is controlled by David Gardner and Tom Gardner, along with other private shareholders. The Fund compensates the Adviser a unitary management fee for its services at an annual rate of 0.50% based on the Fund’s average daily net assets (the “Advisory Fee”), payable on a monthly basis in arrears. From the Advisory Fee, the Adviser pays most of the expenses of the Fund, including the cost of transfer agency, custody, fund administration, legal, audit and other services. However, the Adviser is not responsible for interest expenses, brokerage commissions and other trading expenses, fees and expenses of the independent directors and their independent legal counsel, taxes and other extraordinary costs such as litigation and other expenses not incurred in the ordinary course of business.
During the current fiscal period, investment advisory fees accrued were as follows:
GROSS
ADVISORY FEES |
$ 23,293 |
U.S. Bancorp Fund Services, LLC (“USBFS”) serves as administrator for the Fund. For providing administrative and accounting services, USBFS is entitled to receive a monthly fee, subject to certain minimum and out of pocket expenses.
USBFS serves as the Fund’s transfer and dividend disbursing agent. For providing transfer agent services, USBFS is entitled to receive a monthly fee, subject to certain minimum and out of pocket expenses.
Motley Fool 100 Index ETF
Notes to Financial Statements (continued)
FEBRUARY 28, 2018 (UNAUDITED)
U.S. Bank, N.A. (the “Custodian”) provides certain custodial services to the Fund. The Custodian is entitled to receive a monthly fee, subject to certain minimum and out of pocket expenses.
Quasar Distributors, LLC serves as the principal underwriter and distributor of the Fund’s shares pursuant to a Distribution Agreement with RBB.
Under the Fund’s unitary fee, the Adviser compensates USBFS for its services provided.
DIRECTOR’S AND OFFICER’S COMPENSATION — The Directors of the Company receive an annual retainer and meeting fees for meetings attended. Employees of Vigilant Compliance, LLC serve as President, Chief Compliance Officer and Assistant Treasurer of the Company. Vigilant Compliance, LLC is compensated for the services provided to the Company. An employee of RBB serves as Treasurer and Secretary, and is compensated for services provided. Certain employees of USBFS serve as officers of the Company. They are not compensated by the Fund or the Company.
4. PURCHASES AND SALES OF INVESTMENT SECURITIES
During the current fiscal period, aggregate purchases and sales and maturities of investment securities (excluding in-kind transactions and short-term investments) of the Fund were as follows:
| PURCHASES | SALES |
| $1,754,129 | $— |
There were no purchases or sales of long-term U.S. Government Securities during the current fiscal period.
During the current fiscal period, aggregate purchases and sales and maturities of in-kind transactions of the Fund were as follows:
PURCHASES | SALES |
$ 87,145,535 | $ — |
5. Federal Income tax information
The Fund follows the authoritative guidance on accounting for and disclosure of uncertainty in tax positions, which requires the Fund to determine whether a tax position is more likely than not to be sustained upon examination, including resolution of any related appeals or litigation processes, based on the technical merits of the position. In the normal course of business, the Fund is subject to examination by federal, state and local jurisdictions, where applicable, for tax years for which applicable statutes of limitations have not expired. The amount and character of tax basis distributions and composition of net assets, including undistributed/(accumulated) net investment income/(loss), are finalized at fiscal year-end; accordingly, tax basis balances have not been determined for the period ended February 28, 2018. Since the Fund does not have a full fiscal year, the tax cost of investments is the same as noted on the Schedule of Investments.
6. SHARE TRANSACTIONS
Shares of the Fund are listed and trade on the Cboe BZX Exchange, Inc. (the “Exchange”). Market prices for the shares may be different from their NAV. The Fund issues and redeems shares on a continuous basis at NAV only in blocks of 25,000 shares, called “Creation Units.” Creation Units are issued and redeemed principally in-kind for securities included in a specified universe. Once created, shares generally trade in the secondary market at market prices that change throughout the day. Except when aggregated in Creation Units, shares are not redeemable securities of the Fund. Creation Units may only be purchased or redeemed by certain financial institutions (“Authorized Participants”). An Authorized Participant is either (i) a broker-dealer or other participant in the clearing process through the Continuous Net Settlement System of the National Securities Clearing Corporation or (ii) a Depository Trust Company participant and, in each case, must have executed a Participant Agreement with the Distributor. Most
Motley Fool 100 Index ETF
Notes to Financial Statements (concluded)
FEBRUARY 28, 2018 (UNAUDITED)
retail investors do not qualify as Authorized Participants nor have the resources to buy and sell whole Creation Units. Therefore, they are unable to purchase or redeem shares directly from the Fund. Rather, most retail investors may purchase shares in the secondary market with the assistance of a broker and are subject to customary brokerage commissions or fees.
The Fund currently offers one class of shares, which has no front-end sales load, no deferred sales charge, and no redemption fee. A fixed transaction fee is imposed for the transfer and other transaction costs associated with the purchase or sale of Creation Units. The standard fixed transaction fee for the Fund is $250, payable to the custodian. In addition, a variable fee may be charged on all cash transactions or substitutes for Creation Units of up to a maximum of 2% as a percentage of the value of the Creation Units subject to the transaction. Variable fees are imposed to compensate the Fund for the transaction costs associated with the cash transactions. Variable fees received by the Fund, if any, are displayed in the capital shares transactions section of the Statement of Changes in Net Assets. The Fund may issue an unlimited number of shares of beneficial interest, with $0.001 par value per share. Shares of the Fund have equal rights and privileges.
7. Subsequent Events
Management has evaluated the impact of all subsequent events on the Fund through the date the financial statements were issued and has determined that there were no significant events requiring recognition or disclosure in the financial statements.
Motley Fool 100 Index ETF
Notice to Shareholders
(Unaudited)
Information on Proxy Voting
Policies and procedures that the Fund uses to determine how to vote proxies relating to portfolio securities as well as information regarding how the Fund voted proxies relating to portfolio securities during the most recent 12-month period ended June 30 are available (i) without charge, upon request, by calling (888) 863-8803; and (ii) on the U.S. Securities and Exchange Commission’s (“SEC”) website at http://www.sec.gov.
Quarterly Schedule of Investments
The Company files a complete schedule of portfolio holdings with the SEC for the first and third quarters of each fiscal year (quarters ended November 30 and May 31) on Form N-Q. Shareholders can obtain the Form N-Q (i) without charge, upon request, by calling (888) 863-8803; and (ii) on the SEC’s website at http://www.sec.gov. The Form N-Q may be reviewed or copied at the SEC Public Reference Room in Washington, D.C. Information on the operation of the Public Reference Room may be obtained by calling (800) SEC-0330.
Motley Fool 100 Index ETF
Board Approval of Advisory Agreement
(Unaudited)
As required by the 1940 Act, the Board of the Company, including all of the Directors who are not “interested persons” of the Company, as that term is defined in the 1940 Act (the “Independent Directors”), considered the approval of the investment advisory agreement between the Adviser and the Company (the “Investment Advisory Agreement”) on behalf of the Fund at a meeting of the Board held on December 7, 2017 (the “Meeting”). At the Meeting, the Board, including all of the Independent Directors, approved the Investment Advisory Agreement for an initial term ending August 16, 2019. In approving the Investment Advisory Agreement, the Board considered information provided by the Adviser with the assistance and advice of counsel to the Independent Directors and the Company.
In considering the approval of the Investment Advisory Agreement between the Company and the Adviser with respect to the Fund, the Directors took into account all materials provided prior to and during the Meeting and at other meetings throughout the past year, the presentations made during the Meeting, and the discussions held during the Meeting. Among other things, the Directors considered (i) the nature, extent, and quality of services to be provided to the Fund by the Adviser; (ii) descriptions of the experience and qualifications of the personnel providing those services; (iii) the Adviser’s investment philosophy and process; (iv) the Adviser’s assets under management and client descriptions; (v) the Adviser’s soft dollar commission and trade allocation policies, including information on the types of research and services obtained in connection with soft dollar commissions; (vi) the Adviser’s advisory fee arrangements and other similarly managed clients, as applicable; (vii) the Adviser’s compliance procedures; (viii) the Adviser’s financial information and insurance coverage; (ix) the extent to which economies of scale are relevant to the Fund; and (x) a report prepared by Broadridge/Lipper comparing the Fund’s proposed management fees and total expense ratio to those of its Lipper Group. The Directors noted that the Fund had not yet commenced operations, and consequently there was no performance information to review with respect to the Fund.
As part of their review, the Directors considered the nature, extent and quality of the services to be provided by the Adviser. The Directors concluded that the Adviser had substantial resources to provide services to the Fund.
The Board also considered the advisory fee rate payable by the Fund under the Investment Advisory Agreement. In this regard, information on the fees to be paid by the Fund and the Fund’s total operating expense ratio were compared to similar information for index exchange-traded funds advised by other, unaffiliated investment advisory firms. The Directors noted that the Fund’s actual advisor fees ranked in the first quintile of its Lipper Expense Group. The Directors also considered that the total expenses of the Fund ranked in the fourth quintile of its Lipper Expense Universe.
After reviewing the information regarding the Adviser’s costs, profitability and economies of scale, and after considering the services to be provided by the Adviser, the Directors concluded that the investment advisory fees to be paid by the Fund to the Adviser were fair and reasonable and that the Investment Advisory Agreement should be approved for an initial period ending August 31, 2019.
Investment Adviser
Motley Fool Asset Management, LLC
2000 Duke Street
Suite 275
Alexandria, VA 22314
Administrator and Transfer Agent
U.S. Bancorp Fund Services, LLC
P.O. Box 701
Milwaukee, WI 53201
Custodian
U.S. Bank, N.A.
1555 North Rivercenter Drive, Suite 302
Milwaukee, WI 53212
Principal Underwriter
Quasar Distributors, LLC
777 East Wisconsin Avenue, Floor 6
Milwaukee, WI 53202
Legal Counsel
Drinker Biddle & Reath LLP
One Logan Square, Suite 2000
Philadelphia, PA 19103-6996
Stay informed about your investment!
Shareholders like you are very important to us, and we’re committed to communicating with you about important matters. The best way to stay “in the know” is to sign up for our free email newsletter. You’ll get quarterly performance updates, insights about the stock market and investing, and more.
Simply send an email to help@foolfunds.com today to sign up!


ORINDA FUNDS
Semi-Annual Report
February 28, 2018
(Unaudited)
Orinda Income Opportunities Fund
of
the RBB Fund, Inc.
Class I Shares – OIOIX
Class A Shares – OIOAX
Class D Shares – OIODX
Table of Contents
Performance Data | 1 |
Fund Expense Examples | 4 |
Allocation of Portfolio Assets | 5 |
Schedule of Investments | 6 |
Schedule of Securities Sold Short | 11 |
Schedule of Options Written | 12 |
Financial Statements | 13 |
Statement of Assets and Liabilities | 13 |
Statement of Operations | 15 |
Statements of Changes in Net Assets | 16 |
Statement of Cash Flows | 18 |
Financial Highlights | 20 |
Notes to the Financial Statements | 23 |
Approval of Investment Advisory Agreement | 35 |
Notice to Shareholders | 36 |
Orinda Income Opportunities Fund Performance Data February 28, 2018 (Unaudited) |
| | Average Annual Total Returns for the Periods ended February 28, 2018 | |
| | | Six
Months† | One
Year | Three
Years | Since
Inception†† | |
| Class I Shares (No Load) | -3.47% | -0.95% | 2.14% | 3.41% | |
| Bloomberg Barclays Capital U.S. Aggregate Bond Index | -2.18% | 0.51% | 1.14% | 2.33% | |
| †† | Inception date of Class I Shares of the Fund was June 28, 2013. |
Until December 31, 2018, the Adviser has agreed to waive its fees to the extent necessary to maintain annualized expense ratios for the Class I Shares of average daily net assets of 1.40% (excluding certain items discussed below). In determining the Adviser’s obligation to waive advisory fees and/or reimburse expenses, the following expenses are not taken into account and could cause the Fund’s net annualized expense ratio to exceed the applicable expense limitation: acquired fund fees and expenses, short sale dividend expenses, brokerage commissions, extraordinary items, interest and taxes. There can be no assurance that the Adviser will continue such waiver for the Fund after December 31, 2018. The Fund’s expense ratio for the Class I Shares, as stated in the current prospectus, is 1.84%.
Performance data quoted represents past performance; past performance does not guarantee future results. The investment return and principal value of an investment will fluctuate so that an investor’s shares, when redeemed, may be worth more or less than their original cost. Current performance of the Fund may be lower or higher than the performance quoted. Performance data current to the most recent month end may be obtained by calling 1-877-903-1313.
The Bloomberg Barclays Capital U.S. Aggregate Bond Index is an unmanaged, market capitalization-weighted index, comprised predominately of U.S. traded investment grade bonds with maturities of one year or more. The index includes Treasury securities, Government agency bonds, mortgage-backed bonds, and corporate bonds. The index is representative of intermediate duration US investment grade debt securities. It is not possible to invest directily in an index.
1
Orinda Income Opportunities Fund Performance Data (Continued) February 28, 2018 (Unaudited) |
| Average Annual Total Returns for the Periods ended February 28, 2018 | |
| | | Six
Months† | One
Year | Three
Years | Since
Inception†† | |
| Class A Shares (No Load) | -3.63% | -1.24% | 1.83% | 3.10% | |
| Class A Shares (Load) | -8.46% | -6.17% | 0.10% | 1.97% | |
| | Bloomberg Barclays Capital U.S. Aggregate Bond Index | -2.18% | 0.51% | 1.14% | 2.33% | |
| †† | Inception date of Class A Shares of the Fund was June 28, 2013. |
Until December 31, 2018, the Adviser has agreed to waive its fees to the extent necessary to maintain annualized expense ratios for the Class A Shares of average daily net assets of 1.70% (excluding certain items discussed below). In determining the Adviser’s obligation to waive advisory fees and/or reimburse expenses, the following expenses are not taken into account and could cause the Fund’s net annualized expense ratio to exceed the applicable expense limitation: acquired fund fees and expenses, short sale dividend expenses, brokerage commissions, extraordinary items, interest and taxes. There can be no assurance that the Adviser will continue such waiver for the Fund after December 31, 2018. The Fund’s expense ratio for the Class A Shares, as stated in the current prospectus, is 2.14%.
Performance data quoted represents past performance; past performance does not guarantee future results. The investment return and principal value of an investment will fluctuate so that an investor’s shares, when redeemed, may be worth more or less than their original cost. Current performance of the Fund may be lower or higher than the performance quoted. Performance data current to the most recent month end may be obtained by calling 1-877-903-1313.
The Bloomberg Barclays Capital U.S. Aggregate Bond Index is an unmanaged, market capitalization-weighted index, comprised predominately of U.S. traded investment grade bonds with maturities of one year or more. The index includes Treasury securities, Government agency bonds, mortgage-backed bonds, and corporate bonds. The index is representative of intermediate duration US investment grade debt securities. It is not possible to invest directily in an index.
2
Orinda Income Opportunities Fund Performance Data (Continued) February 28, 2018 (Unaudited) |
| | | Average Annual Total Returns for the Periods ended February 28, 2018 | |
| | | Six
Months† | One
Year | Three
Years | Since
Inception†† | |
| Class D Shares (No Load) | -3.96% | -1.92% | 1.19% | 2.57% | |
| Bloomberg Barclays Capital U.S. Aggregate Bond Index | -2.18% | 0.51% | 1.14% | 2.33% | |
| †† | Inception date of Class D Shares of the Fund was September 27, 2013. |
Until December 31, 2018, the Adviser has agreed to waive its fees to the extent necessary to maintain annualized expense ratios for the Class D Shares of average daily net assets of 2.40% (excluding certain items discussed below). In determining the Adviser’s obligation to waive advisory fees and/or reimburse expenses, the following expenses are not taken into account and could cause the Fund’s net annualized expense ratio to exceed the applicable expense limitation: acquired fund fees and expenses, short sale dividend expenses, brokerage commissions, extraordinary items, interest and taxes. There can be no assurance that the Adviser will continue such waiver for the Fund after December 31, 2018. The Fund’s expense ratio for the Class D Shares, as stated in the current prospectus, is 2.81%.
Performance data quoted represents past performance; past performance does not guarantee future results. The investment return and principal value of an investment will fluctuate so that an investor’s shares, when redeemed, may be worth more or less than their original cost. Current performance of the Fund may be lower or higher than the performance quoted. Performance data current to the most recent month end may be obtained by calling 1-877-903-1313.
The Bloomberg Barclays Capital U.S. Aggregate Bond Index is an unmanaged, market capitalization-weighted index, comprised predominately of U.S. traded investment grade bonds with maturities of one year or more. The index includes Treasury securities, Government agency bonds, mortgage-backed bonds, and corporate bonds. The index is representative of intermediate duration US investment grade debt securities.It is not possible to invest directily in an index.
3
Orinda Income Opportunities Fund Fund Expense ExampleS February 28, 2018 (Unaudited) |
As a shareholder of the Fund, you incur two types of costs: (1) transaction costs, including sales charges (loads) on purchase payments, (if any); and (2) ongoing costs, including management fees; distribution and/or service (12b-1) fees and other Fund expenses. These examples are intended to help you understand your ongoing costs (in dollars) of investing in the Fund and to compare these costs with the ongoing costs of investing in other mutual funds.
These examples are based on an investment of $1,000 invested at the beginning of the six-month period from September 1, 2017 to February 28, 2018.
ACTUAL EXPENSES
The first line in the accompanying table provides information about actual account values and actual expenses. You may use the information in this line together with the amount you invested, to estimate the expenses that you paid over the period. Simply divide your account value by $1,000 (for example, an $8,600 account value divided by $1,000 = 8.6), then multiply the result by the number in the line under the heading entitled “Expenses Paid During Period” to estimate the expenses you paid on your account during this period.
HYPOTHETICAL EXAMPLE FOR COMPARISON PURPOSES
The second line of the accompanying table provides information about hypothetical account values and hypothetical expenses based on the Fund’s actual expense ratio and assumed rate of return of 5% per year before expenses, which is not the Fund’s actual return. The hypothetical account values and expenses may not be used to estimate the actual ending account balance or expenses you paid for the period. You may use this information to compare the ongoing costs of investing in the Fund and other funds. To do so, compare this 5% hypothetical example with the 5% hypothetical examples that appear in the shareholder reports of the other funds.
Please note that the expenses shown in the accompanying table are meant to highlight your ongoing costs only and do not reflect any transactional costs, such as sales charges (loads) or exchange fees. Therefore, the second line of the accompanying table is useful in comparing ongoing costs only, and will not help you determine the relative total costs of owning different funds. In addition, if these transactional costs were included, your costs would have been higher.
| Beginning
Account Value
September 1, 2017 | Ending
Account Value
February 28, 2018 | Expenses Paid
During Period* |
Actual | | | |
Class I Shares | $ 1,000.00 | $ 965.30 | $ 7.99 |
Class A Shares | 1,000.00 | 963.70 | 9.20 |
Class D Shares | 1,000.00 | 947.26 | 10.89 |
| | | |
Hypothetical (5% return before expenses) | | | |
Class I Shares | $ 1,000.00 | $ 1,016.66 | $ 8.20 |
Class A Shares | 1,000.00 | 1,015.42 | 9.44 |
Class D Shares | 1,000.00 | 1,007.95 | 11.23 |
| * | Expenses are equal to the Class I Shares, Class A Shares, and Class D Shares annualized six-month expense ratios for the period September 1, 2017 to February 28, 2018 of 1.64%, 1.89%, and 2.65%, respectively, multiplied by the average account value over the period, multiplied by the number of days (181) in the most recent fiscal half-year, then divided by 365 to reflect the one half year period. The Fund’s ending account values on the first line in the tables is based on the actual six-month total investment return for the Fund of -3.47%, -3.63% and -3.96% for Class I Shares, Class A Shares and Class D Shares, respectively. |
4
Orinda Income Opportunities Fund Allocation Of Portfolio AssetS February 28, 2018 (Unaudited) |

Percentages represent market value as a percentage of net assets.
5
Orinda Income Opportunities Fund Schedule Of Investments February 28, 2018 (Unaudited) |
| COMMON STOCKS - 2.7% | | Number of
Shares | | | Value | |
| Financials - 0.1% | | | | | | |
| Sutherland Asset Management Corp. | | | 20,000 | | | $ | 276,000 | |
| | | | | | | | | |
| Real Estate - 1.5% | | | | | | | | |
| Landmark Infrastructure Partners LP | | | 177,265 | | | | 2,969,189 | |
Summit Industrial Income REIT (c) | | | 50,000 | | | | 309,772 | |
| | | | | | | | 3,278,961 | |
| Utilities - 1.1% | | | | | | | | |
Pattern Energy Group, Inc. (d) | | | 138,241 | | | | 2,567,135 | |
TOTAL COMMON STOCKS (Cost $6,130,267) | | | | | | | 6,122,096 | |
| | | | | | | | | |
| REITS - 79.6% | | | | | | | | |
| Financials - 18.9% | | | | | | | | |
AGNC Investment Corp. - Series C, 7.00% (3 Month LIBOR USD +5.11%) (b)(d) | | | 65,651 | | | | 1,653,749 | |
Annaly Capital Management, Inc. - Series F, 6.95% (3 Month LIBOR USD +4.99%) (b)(d) | | | 161,174 | | | | 3,984,221 | |
Annaly Capital Management, Inc. - Series G, 6.50% (3 Month LIBOR USD +4.17%) (b)(d) | | | 68,644 | | | | 1,618,625 | |
Arbor Realty Trust, Inc. (d) | | | 442,071 | | | | 3,784,128 | |
| ARMOUR Residential REIT, Inc. - Series B, 7.88% | | | 98,120 | | | | 2,448,094 | |
Chimera Investment Corp. Series A, 8.00% (d) | | | 73,276 | | | | 1,839,228 | |
Chimera Investment Corp. Series B, 8.00% (3 Month LIBOR USD +5.79%) (b)(d) | | | 233,200 | | | | 5,932,608 | |
| Great Ajax Corp., 7.25% | | | 24,350 | | | | 602,059 | |
Invesco Mortgage Capital, Inc. - Series C, 7.50% (3 Month LIBOR USD +5.29%) (b)(d) | | | 144,200 | | | | 3,574,718 | |
PennyMac Mortgage Investment Trust - Series A, 8.13% (3 Month LIBOR USD +5.83%) (b)(d) | | | 88,379 | | | | 2,215,661 | |
PennyMac Mortgage Investment Trust - Series B, 8.00% (3 Month LIBOR USD +5.99%) (b)(d) | | | 173,395 | | | | 4,288,058 | |
| Resource Capital Corp., 8.25% | | | 159,581 | | | | 4,026,229 | |
| Sutherland Asset Management Corp., 7.00% | | | 49,941 | | | | 1,248,525 | |
Two Harbors Investment Corp. - Series A, 8.13% (3 Month LIBOR USD +5.66%) (b)(d) | | | 84,000 | | | | 2,171,400 | |
Two Harbors Investment Corp. - Series B, 7.63% (3 Month LIBOR USD +5.35%) (b)(d) | | | 30,000 | | | | 742,500 | |
Two Harbors Investment Corp. - Series C, 7.25% (3 Month LIBOR USD +5.01%) (b)(d) | | | 130,240 | | | | 3,128,365 | |
| | | | | | | | 43,258,168 | |
| Real Estate - 60.7% | | | | | | | | |
Ashford Hospitality Trust, Inc. - Series D, 8.45% (d) | | | 99,644 | | | | 2,518,004 | |
Ashford Hospitality Trust, Inc. - Series F, 7.38% (d) | | | 178,856 | | | | 4,169,133 | |
| Ashford Hospitality Trust - Series H, Inc., 7.50% | | | 180,000 | | | | 4,213,800 | |
Ashford Hospitality Trust, Inc. - Series I, 7.50% (d) | | | 235,200 | | | | 5,562,480 | |
Bluerock Residential Growth REIT, Inc. (d) | | | 385,205 | | | | 2,900,594 | |
Bluerock Residential Growth REIT, Inc. - Series C, 7.63% (d) | | | 161,553 | | | | 3,939,308 | |
Bluerock Residential Growth REIT, Inc. Series D, 7.13% (d) | | | 77,899 | | | | 1,789,340 | |
CBL & Associates Properties, Inc. - Series D, 7.38% (d) | | | 360,518 | | | | 6,687,609 | |
City Office REIT, Inc. (d) | | | 468,356 | | | | 4,702,294 | |
| City Office REIT, Inc. - Series A, 6.63% | | | 57,384 | | | | 1,397,300 | |
Colony NorthStar, Inc (d) | | | 91,304 | | | | 710,345 | |
| Colony NorthStar, Inc. - Series B, 8.25% | | | 59,544 | | | | 1,489,195 | |
Colony NorthStar, Inc. - Series D, 8.50% (d) | | | 93,152 | | | | 2,361,403 | |
Colony NorthStar, Inc. - Series E, 8.75% (d) | | | 433,587 | | | | 11,212,560 | |
The accompanying notes are an integral part of these financial statements.
6
Orinda Income Opportunities Fund Schedule Of Investments (Continued) February 28, 2018 (Unaudited) |
| REITS - 79.6% (Continued) | | Number of
Shares | | | Value | |
| Real Estate - 60.7% (Continued) | | | | | | |
| Colony NorthStar, Inc. - Series G, 7.50% | | | 77,695 | | | $ | 1,911,297 | |
Colony NorthStar, Inc. - Series H, 7.13% (d) | | | 381,909 | | | | 9,100,892 | |
Colony NorthStar, Inc. - Series I, 7.15% (d) | | | 247,000 | | | | 5,903,300 | |
Colony NorthStar, Inc. - Series J, 7.13% (d) | | | 231,921 | | | | 5,503,485 | |
| Farmland Partners, Inc. - Series B, 6.00% | | | 16,422 | | | | 415,805 | |
Global Medical REIT, Inc. - Series A, 7.50% (d) | | | 101,381 | | | | 2,480,793 | |
Global Net Lease, Inc. (d) | | | 412,415 | | | | 6,450,171 | |
Global Net Lease, Inc. - Series A, 7.25% (d) | | | 108,352 | | | | 2,717,468 | |
| Gramercy Property Trust | | | 37,334 | | | | 808,281 | |
Independence Realty Trust, Inc. (d) | | | 635,131 | | | | 5,411,316 | |
iStar, Inc. - Series D, 8.00% (d) | | | 183,636 | | | | 4,574,373 | |
iStar, Inc. - Series I, 7.50% (d) | | | 197,585 | | | | 4,890,229 | |
Jernigan Capital, Inc. - Series B, 7.00% (a)(d) | | | 198,500 | | | | 4,694,525 | |
| Monmouth Real Estate Investment Corp. | | | 45,609 | | | | 643,999 | |
| RAIT Financial Trust, 7.13% | | | 61,501 | | | | 1,345,027 | |
| RAIT Financial Trust - Series A, 7.75% | | | 62,008 | | | | 427,235 | |
| RAIT Financial Trust - Series B, 8.38% | | | 15,132 | | | | 102,292 | |
| RAIT Financial Trust - Series C, 8.88% | | | 9,900 | | | | 67,914 | |
RAIT Financial Trust, 7.63% (d) | | | 122,875 | | | | 2,291,619 | |
RLJ Lodging Trust - Series A, 1.95% (d) | | | 452,273 | | | | 11,754,575 | |
| Sabra Health Care REIT, Inc. | | | 204,068 | | | | 3,444,668 | |
Seritage Growth Properties - Series A, 7.00% (d) | | | 73,500 | | | | 1,714,020 | |
UMH Properties, Inc. Series D, 6.38% (d) | | | 94,900 | | | | 2,268,110 | |
| UMH Properties, Inc. - Series C, 6.75% | | | 72,500 | | | | 1,814,675 | |
Uniti Group, Inc. (d) | | | 189,803 | | | | 2,913,476 | |
Washington Prime Group, Inc. - Series H, 7.50% (d) | | | 72,970 | | | | 1,660,068 | |
WPT Industrial Real Estate Investment Trust (c) | | | 12,300 | | | | 157,951 | |
| | | | | | | | 139,120,929 | |
TOTAL REITS (Cost $183,901,147) | | | | | | | 182,379,097 | |
| | | | | | | | | |
| CONVERTIBLE PREFERRED STOCKS - 6.0% | | | | | | | | |
| Real Estate - 6.0% | | | | | | | | |
| CorEnergy Infrastructure Trust, Inc. - Series A, 7.38% | | | 214,650 | | | | 5,392,008 | |
Wheeler Real Estate Investment Trust, Inc. - Series B, 9.00% (d) | | | 195,653 | | | | 2,979,795 | |
Wheeler Real Estate Investment Trust, Inc. - Series D, 8.75% (d) | | | 312,553 | | | | 5,329,029 | |
| | | | | | | | 13,700,832 | |
TOTAL CONVERTIBLE PREFERRED STOCKS (Cost $16,908,870) | | | | | | | 13,700,832 | |
The accompanying notes are an integral part of these financial statements.
7
Orinda Income Opportunities Fund Schedule Of Investments (Continued) February 28, 2018 (Unaudited) |
| PREFERRED STOCKS - 34.8% | | Number of
Shares | | | Value | |
| Consumer Discretionary - 0.2% | | | | | | |
| TravelCenters of America LLC - Senior Unsecured, 8.00% | | | 16,602 | | | $ | 412,892 | |
| TravelCenters of America LLC - Senior Unsecured, 8.25% | | | 445 | | | | 11,036 | |
| | | | | | | | 423,928 | |
| | | | | | | | | |
| Energy - 5.2% | | | | | | | | |
GasLog Partners LP - Series A, 8.63% (3 Month LIBOR USD +6.31%) (b)(c)(d) | | | 45,000 | | | | 1,190,250 | |
GasLog Partners LP - Series B, 8.20% (3 Month LIBOR USD +5.84%) (b)(c)(d) | | | 48,500 | | | | 1,228,505 | |
NGL Energy Partners LP - Series B, 9.00% (3 Month LIBOR USD +7.21%) (b) | | | 75,000 | | | | 1,781,250 | |
NuStar Energy LP - Series A, 8.50% (3 Month LIBOR USD +6.77%) (b)(d) | | | 60,000 | | | | 1,455,000 | |
NuStar Energy LP - Series B, 7.63% (3 Month LIBOR USD +5.64%) (b)(d) | | | 25,000 | | | | 565,750 | |
NuStar Energy LP - Series C, 9.00% (3 Month LIBOR USD +6.88%) (b)(d) | | | 50,000 | | | | 1,226,500 | |
Teekay LNG Partners LP - Series B, 8.50% (3 Month LIBOR USD +6.24%) (b)(c)(d) | | | 110,000 | | | | 2,581,700 | |
Tsakos Energy Navigation Ltd. - Series D, 8.75% (c) | | | 19,150 | | | | 476,835 | |
Tsakos Energy Navigation Ltd. - Series E, 9.25% (3 Month LIBOR USD +6.88%) (b)(c) | | | 52,600 | | | | 1,319,734 | |
| | | | | | | | 11,825,524 | |
| | | | | | | | | |
| Financials - 17.8% | | | | | | | | |
| AG Mortgage Investment Trust, Inc. - Series A, 8.25% | | | 12,200 | | | | 307,928 | |
| AG Mortgage Investment Trust, Inc. - Series B, 8.00% | | | 40,819 | | | | 1,014,352 | |
AGNC Investment Corp. - Series B, 7.75% (d) | | | 123,583 | | | | 3,210,686 | |
| Annaly Capital Management, Inc. - Series C, 7.63% | | | 19,897 | | | | 503,593 | |
Annaly Capital Management, Inc. - Series D, 7.50% (d) | | | 34,984 | | | | 878,098 | |
Apollo Commercial Real Estate Finance, Inc. - Series C, 8.00% (d) | | | 363,417 | | | | 9,221,706 | |
| Arbor Realty Trust, Inc., 7.38% | | | 60,000 | | | | 1,531,200 | |
| Arbor Realty Trust, Inc. - Series A, 8.25% | | | 46,261 | | | | 1,172,254 | |
| Arbor Realty Trust, Inc. - Series B, 7.75% | | | 20,323 | | | | 509,294 | |
Arbor Realty Trust, Inc. - Series C, 8.50% (d) | | | 81,007 | | | | 2,090,386 | |
| Capstead Mortgage Corp. - Series E, 7.50% | | | 53,622 | | | | 1,347,521 | |
| Compass Diversified Holdings - Series A, 7.25% | | | 37,400 | | | | 890,494 | |
Cowen, Inc., 7.35% (d) | | | 88,350 | | | | 2,224,653 | |
CYS Investments, Inc. - Series B, 7.50% (d) | | | 91,317 | | | | 2,198,913 | |
Invesco Mortgage Capital, Inc. - Series A, 7.75% (d) | | | 81,453 | | | | 2,036,325 | |
Invesco Mortgage Capital, Inc. - Series B, 7.75% (3 Month LIBOR USD +5.18%) (b)(d) | | | 165,097 | | | | 4,242,993 | |
MFA Financial, Inc. - Series B, 7.50% (d) | | | 62,681 | | | | 1,598,366 | |
| National General Holdings Corp., 7.63% | | | 36,801 | | | | 901,257 | |
Resource Capital Corp., 8.63% (3 Month LIBOR USD +5.93%) (b)(d) | | | 190,912 | | | | 4,877,802 | |
| | | | | | | | 40,757,821 | |
| Industrials - 0.6% | | | | | | | | |
Seaspan Corp. - Series H, 7.88% (c)(d) | | | 64,044 | | | | 1,512,079 | |
| | | | | | | | | |
| Real Estate - 10.9% | | | | | | | | |
Ashford Hospitality Trust, Inc. - Series G, 7.38% (d) | | | 239,578 | | | | 5,551,022 | |
Bluerock Residential Growth REIT, Inc. - Series A, 8.25% (d) | | | 201,020 | | | | 5,136,061 | |
Cedar Realty Trust, Inc. - Series B, 7.25% (d) | | | 4,973 | | | | 121,142 | |
Hersha Hospitality Trust - Series D, 6.50% (d) | | | 166,694 | | | | 3,858,966 | |
| iStar, Inc. - Series G, 7.65% | | | 60,046 | | | | 1,499,949 | |
Landmark Infrastructure Partners LP - Series B, 7.90% (d) | | | 76,800 | | | | 1,864,704 | |
The accompanying notes are an integral part of these financial statements.
8
Orinda Income Opportunities Fund Schedule Of Investments (Continued) February 28, 2018 (Unaudited) |
| PREFERRED STOCKS - 34.8% (Continued) | | Number of
Shares | | | Value | |
| Real Estate - 10.9% (Continued) | | | | | | |
STAG Industrial, Inc. - Series C, 6.88% (d) | | | 45,405 | | | $ | 1,151,925 | |
Summit Hotel Properties, Inc. - Series D, 6.45% (d) | | | 31,693 | | | | 787,254 | |
UMH Properties, Inc. - Series B, 8.00% (d) | | | 33,751 | | | | 883,601 | |
VEREIT, Inc. - Series F, 6.70% (d) | | | 161,260 | | | | 4,046,014 | |
| | | | | | | | 24,900,638 | |
| Telecommunication Services - 0.1% | | | | | | | | |
| Qwest Corp., 6.75% | | | 12,643 | | | | 284,341 | |
TOTAL PREFERRED STOCKS (Cost $76,472,226) | | | | | | | 79,704,331 | |
| | | | | | | | | |
| CONVERTIBLE BONDS - 1.5% | | | Principal
Amount | | | | | |
| Financials - 1.5% | | | | | | | | |
| Western Asset Mortgage Capital Corp. | | | | | | | | |
6.750%, 10/01/2022 (d) | | $ | 3,500,000 | | | | 3,451,000 | |
TOTAL CONVERTIBLE BONDS (Cost $3,500,000) | | | | | | | 3,451,000 | |
| | | | | | | | | |
| CORPORATE BONDS - 0.4% | | | | | | | | |
| Financials - 0.4% | | | | | | | | |
| Uniti Group LP / Uniti Fiber Holdings Inc / CSL Capital LLC | | | | | | | | |
| 7.125%, 12/15/2024 | | | 1,000,000 | | | | 901,250 | |
TOTAL CORPORATE BONDS (Cost $969,513) | | | | | | | 901,250 | |
| | | | | | | | | |
| EXCHANGE TRADED FUNDS - 0.9% | | | | | | | | |
Direxion Daily 20+ Year Treasury Bear 3x Shares (a) | | | 100,231 | | | | 2,126,902 | |
TOTAL EXCHANGE TRADED FUNDS (Cost $1,859,203) | | | | | | | 2,126,902 | |
| | | | | | | | | |
| PURCHASED OPTIONS - 0.2% | | | Contracts | | | | | |
| Put Options - 0.2% | | | | | | | | |
| Vanguard Real Estate ETF | | | | | | | | |
| Expiration: March 2018, Exercise Price: $75.00 | | | 3,300 | | | | 478,500 | |
TOTAL PURCHASED OPTIONS (Cost $451,680) | | | | | | | 478,500 | |
The accompanying notes are an integral part of these financial statements.
9
Orinda Income Opportunities Fund Schedule Of Investments (Continued) February 28, 2018 (Unaudited) |
| SHORT-TERM INVESTMENTS - 3.9% | | Number of
Shares | | | Value | |
STIT-Treasury Obligations Portfolio, 1.32% (e) | | | 8,956,071 | | | $ | 8,956,071 | |
TOTAL SHORT-TERM INVESTMENTS(Cost $8,956,071) | | | | | | | 8,956,071 | |
| | | | | | | | | |
TOTAL INVESTMENTS (Cost $299,148,977) - 130.0% | | | | | | | 297,820,079 | |
| Liabilities in Excess of Other Assets - (30.0)% | | | | | | | (68,802,081 | ) |
| TOTAL NET ASSETS - 100.0% | | | | | | $ | 229,017,998 | |
Percentages are stated as a percent of net assets.
| (b) | Variable rate security. The rate shown represents the rate at February 28, 2018. |
| (c) | U.S. traded security of a foreign issuer or corporation. |
| (d) | All or a portion of the security has been segregated for open short positions. |
| (e) | Seven-day yield as of February 28, 2018. |
The accompanying notes are an integral part of these financial statements.
10
Orinda Income Opportunities Fund Schedule Of Securities Sold Short February 28, 2018 (Unaudited) |
| COMMON STOCKS - (0.2%) | | Number of
Shares | | | Value | |
| Consumer Discretionary - 0.1% | | | | | | |
TravelCenters Of America LLC (a) | | | (77,000 | ) | | $ | (286,825 | ) |
| Telecommunication Services - 0.1% | | | | | | | | |
| Windstream Holdings, Inc. | | | (97,400 | ) | | | (153,892 | ) |
TOTAL COMMON STOCKS (Proceeds $485,120) | | | | | | | (440,717 | ) |
| | | | | | | | | |
| EXCHANGE TRADED FUNDS - (13.3%) | | | | | | | | |
iPATH S&P 500 VIX Short-Term Futures ETN (a)(b) | | | (21,242 | ) | | | (942,083 | ) |
| iShares Mortgage Real Estate ETF | | | (80,000 | ) | | | (3,259,200 | ) |
| iShares US Preferred Stock ETF | | | (196,724 | ) | | | (7,383,052 | ) |
| Utilities Select Sector SPDR Fund | | | (196,250 | ) | | | (9,628,025 | ) |
| Vanguard Real Estate ETF | | | (125,113 | ) | | | (9,177,038 | ) |
TOTAL EXCHANGE TRADED FUNDS (Proceeds $32,226,798) | | | | | | | (30,389,398 | ) |
| | | | | | | | | |
| REITS - (3.4%) | | | | | | | | |
| Real Estate - 3.4% | | | | | | | | |
| CBL & Associates Properties, Inc. | | | (86,000 | ) | | | (398,180 | ) |
| National Retail Properties, Inc. | | | (81,752 | ) | | | (3,044,444 | ) |
| Seritage Growth Properties | | | (82,607 | ) | | | (3,122,545 | ) |
| Washington Prime Group, Inc. | | | (33,175 | ) | | | (217,296 | ) |
| Welltower, Inc. | | | (20,000 | ) | | | (1,050,000 | ) |
| | | | | | | | (7,832,465 | ) |
TOTAL REITS (Proceeds $8,130,343) | | | | | | | (7,832,465 | ) |
| | | | | | | | | |
TOTAL SECURITIES SOLD SHORT (Proceeds $40,842,261) - (16.9%) | | | | | | $ | (38,662,580 | ) |
| (b) | U.S. traded security of a foreign issuer or corporation. |
The accompanying notes are an integral part of these financial statements.
11
Orinda Income Opportunities Fund Schedule Of Options Written February 28, 2018 (Unaudited) |
| PUT OPTIONS | | Counter-
party | | Contracts | | | Notional
Cost | | | Value | |
| VANGUARD REAL ESTATE ETF | | | | | | | | | | | |
| Expiration: March 2018, Exercise Price: $72.00 | | N/A | | | (1,900 | ) | | $ | (13,936,500 | ) | | $ | (95,000 | ) |
| TOTAL PUT OPTIONS | | | | | | | | | | | | | (95,000 | ) |
| | | | | | | | | | | | | | | |
TOTAL OPTIONS WRITTEN (Premiums received $98,766) | | | | | | | | | | | | $ | (95,000 | ) |
The accompanying notes are an integral part of these financial statements.
12
Orinda Income Opportunities Fund Statement Of Assets And Liabilities February 28, 2018 (Unaudited) |
| ASSETS | | | |
| Investments in securities, at value (cost $290,192,906) | | $ | 288,864,008 | |
| Short-term investments, at value (cost $8,956,071) | | | 8,956,071 | |
| Cash | | | 5,782 | |
| Receivables for: | | | | |
| Investments sold | | | 7,406,775 | |
| Deposit at brokers | | | 46,567,314 | |
| Capital shares sold | | | 289,302 | |
| Dividends and interest | | | 1,000,669 | |
| Return of capital | | | 31,878 | |
| Prepaid expenses and other assets | | | 284,112 | |
| Total assets | | | 353,405,911 | |
| | | | | |
| LIABILITIES | | | | |
| Securities sold short, at fair value (proceeds $40,842,261) | | | 38,662,580 | |
| Options written, at value (premiums received $98,766) | | | 95,000 | |
| Payables for: | | | | |
| Loans payable | | | 79,005,957 | |
| Investments purchased | | | 5,623,480 | |
| Distribution and service fees | | | 410,220 | |
| Capital shares redeemed | | | 372,367 | |
| Advisory fees | | | 180,669 | |
| Administration and accounting fees | | | 23,440 | |
| Custodian fees | | | 9,690 | |
| Transfer agent fees | | | 680 | |
| Other accrued expenses and liabilities | | | 3,830 | |
| Total liabilities | | | 124,387,913 | |
| Net assets | | $ | 229,017,998 | |
| | | | | |
| NET ASSETS CONSIST OF: | | | | |
| Par Value | | $ | 10,501 | |
| Paid-in capital | | | 257,550,434 | |
| Undistributed/accumulated net investment income/(loss) | | | (501,539 | ) |
| Accumulated net realized gain/(loss) from investments | | | (28,895,947 | ) |
| Net unrealized appreciation/(depreciation) on: | | | | |
| Investments | | | (1,328,898 | ) |
| Securities sold short | | | 2,179,681 | |
| Written options | | | 3,766 | |
| Net assets | | $ | 229,017,998 | |
The accompanying notes are an integral part of these financial statements.
13
Orinda Income Opportunities Fund Statement Of Assets And Liabilities (Continued) February 28, 2018 (Unaudited) |
| CLASS I SHARES | | | |
| Net assets | | $ | 167,432,835 | |
| Shares outstanding ($0.001 par value, 100,000,000 shares authorized) | | | 7,664,787 | |
| Net asset value and redemption price per share | | $ | 21.84 | |
| | | | | |
| CLASS A SHARES | | | | |
| Net assets | | $ | 40,864,618 | |
| Shares outstanding ($0.001 par value, 100,000,000 shares authorized) | | | 1,877,990 | |
| Net asset value, offering and redemption price per share | | $ | 21.76 | |
| Maximum offering price per share (net asset value divided by 95.00%) | | $ | 22.91 | |
| | | | | |
| CLASS D SHARES | | | | |
| Net assets | | $ | 20,720,545 | |
| Shares outstanding ($0.001 par value, 100,000,000 shares authorized) | | | 958,487 | |
| Net asset value, offering and redemption price per share | | $ | 21.62 | |
The accompanying notes are an integral part of these financial statements.
14
Orinda Income Opportunities Fund Statement Of Operations For the Six Months Ended
February 28, 2018 (Unaudited) |
| INVESTMENT INCOME | | | |
| Dividends (net of foreign withholding taxes of $6,379) | | $ | 13,322,683 | |
| Interest income | | | 389,425 | |
| Total investment income | | | 13,712,108 | |
| | | | | |
| EXPENSES | | | | |
| Advisory fees (Note 2) | | | 1,612,879 | |
| Interest expense | | | 435,123 | |
| Dividend expense on securities sold-short | | | 213,341 | |
| Distribution fees - Class A Shares | | | 130,022 | |
| Distribution fees - Class D Shares | | | 108,969 | |
| Service fees - Class I Shares | | | 98,382 | |
| Service fees - Class A Shares | | | 78,013 | |
| Service fees - Class D Shares | | | 10,897 | |
| Administration and accounting fees (Note 2) | | | 70,053 | |
| Registration and filing fees | | | 37,386 | |
| Printing and shareholder reporting fees | | | 33,980 | |
| Transfer agent fees (Note 2) | | | 26,567 | |
| Custodian fees (Note 2) | | | 15,069 | |
| Audit and tax service fees | | | 12,061 | |
| Other expenses | | | 2,671 | |
| Total expenses | | | 2,885,413 | |
| Net investment income/(loss) | | $ | 10,826,695 | |
| | | | | |
| NET REALIZED AND UNREALIZED GAIN/(LOSS) FROM INVESTMENTS | | | | |
| Net realized gain/(loss) from: | | | | |
| Investments | | $ | (8,454,493 | ) |
| Foreign currency | | | 33 | |
| Securities sold short | | | 882,782 | |
| Written options | | | 200,384 | |
| Net change in unrealized appreciation/(depreciation) on: | | | | |
| Investments | | | (17,856,354 | ) |
| Securities sold short | | | 2,153,479 | |
| Written options | | | (13,696 | ) |
| Net realized and unrealized gain/(loss) on investments | | | (23,087,865 | ) |
| NET INCREASE/(DECREASE) IN NET ASSETS RESULTING FROM OPERATIONS | | $ | (12,261,170 | ) |
The accompanying notes are an integral part of these financial statements.
15
Orinda Income Opportunities Fund Statements Of Changes In Net Assets |
| | | Six Months Ended
February 28,
2018
(Unaudited) | | | Six Months Ended
August 31,
20171 | | | Year Ended
February 28,
2017 | |
| INCREASE/(DECREASE) IN NET ASSETS FROM OPERATIONS: | | | | | | | | | |
| Net investment income/(loss) | | $ | 10,826,695 | | | $ | 8,222,962 | | | $ | 11,718,936 | |
| Net realized gain/(loss) from investments | | | (7,371,294 | ) | | | 22,483 | | | | 1,682,886 | |
| Net change in unrealized appreciation/(depreciation) on investments | | | (15,716,571 | ) | | | (276,109 | ) | | | 28,284,505 | |
| Net increase/(decrease) in net assets resulting from operations | | | (12,261,170 | ) | | | 7,969,336 | | | | 41,686,327 | |
| | | | | | | | | | | | | |
| DIVIDENDS AND DISTRIBUTIONS TO SHAREHOLDERS FROM: | | | | | | | | | | | | |
| Net investment income | | | | | | | | | | | | |
| Class I Shares | | | (6,926,718 | ) | | | (4,918,367 | ) | | | (7,030,088 | ) |
| Class A Shares | | | (3,727,097 | ) | | | (2,691,376 | ) | | | (3,854,794 | ) |
| Class D Shares | | | (646,185 | ) | | | (570,380 | ) | | | (896,541 | ) |
| Return of Capital | | | | | | | | | | | | |
| Class I Shares | | | — | | | | (1,724,314 | ) | | | (3,874,004 | ) |
| Class A Shares | | | — | | | | (979,164 | ) | | | (2,243,473 | ) |
| Class D Shares | | | — | | | | (216,399 | ) | | | (601,099 | ) |
| Net decrease in net assets from dividends and distributions to shareholders | | | (11,300,000 | ) | | | (11,100,000 | ) | | | (18,499,999 | ) |
| | | | | | | | | | | | | |
| CAPITAL SHARE TRANSACTIONS: | | | | | | | | | | | | |
| Class I Shares | | | | | | | | | | | | |
| Proceeds from shares sold | | | 43,500,869 | | | | 25,888,542 | | | | 73,403,073 | |
| Reinvestment of distributions | | | 6,088,123 | | | | 5,748,698 | | | | 9,427,050 | |
| Shares redeemed | | | (61,068,530 | ) | | | (16,854,591 | ) | | | (36,841,939 | ) |
| Total from Class I Shares | | | (11,479,538 | ) | | | 14,782,649 | | | | 45,988,184 | |
| | | | | | | | | | | | | |
| Class A Shares | | | | | | | | | | | | |
| Proceeds from shares sold | | | 24,394,928 | | | | 28,088,135 | | | | 66,186,938 | |
| Reinvestment of distributions | | | 3,564,721 | | | | 3,469,660 | | | | 5,759,197 | |
| Shares redeemed | | | (92,056,731 | ) | | | (19,230,071 | ) | | | (45,028,436 | ) |
| Total from Class A Shares | | | (64,097,082 | ) | | | 12,327,724 | | | | 26,917,699 | |
| | | | | | | | | | | | | |
| Class D Shares | | | | | | | | | | | | |
| Proceeds from shares sold | | | 1,079,610 | | | | 1,194,705 | | | | 3,202,125 | |
| Reinvestment of distributions | | | 510,692 | | | | 632,721 | | | | 1,214,008 | |
| Shares redeemed | | | (1,618,599 | ) | | | (3,215,608 | ) | | | (4,095,955 | ) |
| Total from Class D Shares | | | (28,297 | ) | | | (1,388,182 | ) | | | 320,178 | |
| Net increase/(decrease) in net assets from capital share transactions | | | (75,604,917 | ) | | | 25,722,191 | | | | 73,226,061 | |
| Total increase/(decrease) in net assets | | | (99,166,087 | ) | | | 22,591,527 | | | | 96,412,389 | |
| | | | | | | | | | | | | |
| NET ASSETS: | | | | | | | | | | | | |
| Beginning of period | | | 328,184,085 | | | | 305,592,558 | | | | 209,180,169 | |
| End of period | | $ | 229,017,998 | | | $ | 328,184,085 | | | $ | 305,592,558 | |
| Undistributed/accumulated net investment income/(loss), end of period | | $ | (501,539 | ) | | $ | (28,234 | ) | | $ | — | |
| 1 | The Fund changed its fiscal year end to August 31. |
The accompanying notes are an integral part of these financial statements.
16
Orinda Income Opportunities Fund Statements Of Changes In Net Assets (Continued) |
| | | Six Months Ended
February 28,
2018
(Unaudited) | | | Six Months
Ended
August 31,
20171 | | | Year Ended
February 28,
2017 | |
| SHARES TRANSACTIONS: | | | | | | | | | |
| Class I Shares | | | | | | | | | |
| Shares sold | | | 1,900,636 | | | | 1,103,910 | | | | 3,146,019 | |
| Dividends and distributions reinvested | | | 265,133 | | | | 246,931 | | | | 412,892 | |
| Shares redeemed | | | (2,756,029 | ) | | | (720,196 | ) | | | (1,617,828 | ) |
| Net increase/(decrease) | | | (590,260 | ) | | | (630,645 | ) | | | 1,941,083 | |
| | | | | | | | | | | | | |
| Class A Shares | | | | | | | | | | | | |
| Shares sold | | | 1,066,091 | | | | 1,203,199 | | | | 2,870,331 | |
| Dividends and distributions reinvested | | | 155,742 | | | | 149,547 | | | | 252,826 | |
| Shares redeemed | | | (4,167,614 | ) | | | (823,696 | ) | | | (1,943,378 | ) |
| Net increase/(decrease) | | | (2,945,781 | ) | | | 529,050 | | | | 1,179,779 | |
| | | | | | | | | | | | | |
| Class D Shares | | | | | | | | | | | | |
| Shares sold | | | 47,576 | | | | 51,429 | | | | 137,483 | |
| Dividends and distributions reinvested | | | 22,425 | | | | 27,400 | | | | 53,651 | |
| Shares redeemed | | | (72,250 | ) | | | (138,260 | ) | | | (178,258 | ) |
| Net increase/(decrease) | | | (2,249 | ) | | | (59,431 | ) | | | 12,876 | |
| | | | | | | | | | | | | |
| Net increase/(decrease) in shares outstanding | | | (3,538,290 | ) | | | 1,100,264 | | | | 3,133,738 | |
| 1 | The Fund changed its fiscal year end to August 31. |
The accompanying notes are an integral part of these financial statements.
17
Orinda Income Opportunities Fund Statement Of Cash Flows |
| | | Six Months Ended
February 28,
2018
(Unaudited) | |
| CASH FLOWS FROM OPERATING ACTIVITIES: | | | |
| Net increase/(decrease) in net assets resulting from operations | | $ | (12,261,170 | ) |
| Adjustments to reconcile net increase/(decrease) in net assets from operations to net cash used in operating activities: | | | | |
| Purchases of investments | | | (196,258,778 | ) |
| Purchases to cover securities sold short | | | (428,199,277 | ) |
| Written options closed or exercised | | | (10,607 | ) |
| Proceeds from sales of long-term investments | | | 240,147,545 | |
| Proceeds from securities sold short | | | 433,192,432 | |
| Premiums received on written options | | | 342,662 | |
| Purchases of short-term investments, net | | | 11,043,871 | |
| Return of capital distributions received from underlying investments | | | 1,308,128 | |
| Amortization and accretion of premium and discount | | | (49,604 | ) |
| Net realized gain/(loss) on investments | | | 8,454,493 | |
| Net realized gain/(loss) on short transactions | | | (882,782 | ) |
| Net realized gain/(loss) on written options | | | (200,384 | ) |
| Net realized gain/(loss) on foreign currency translation | | | (33 | ) |
| Change in unrealized appreciation/(depreciation) on investments | | | 17,856,354 | |
| Change in unrealized appreciation/(depreciation) on short transactions | | | (2,153,479 | ) |
| Change in unrealized appreciation/(depreciation) on written options | | | 13,696 | |
| Increases/(decreases) in operating assets: | | | | |
| Increases/(decreases) in dividends and interest receivable | | | 538,271 | |
| Increases/(decreases) in deposits at broker for short sales | | | (4,962,742 | ) |
| Increases/(decreases) in receivable for investment securities sold | | | (5,403,413 | ) |
| Increase in prepaid expenses and other assets | | | (235,612 | ) |
| Increases/(decreases) in operating liabilities: | | | | |
| Increases/(decreases) in payable for investment securities purchased | | | 975,857 | |
| Increases/(decreases) in payable to adviser | | | (97,314 | ) |
| Increases/(decreases) in payable for distribution and service fees | | | 119,149 | |
| Increases/(decreases) in other accrued expenses | | | (19,368 | ) |
| Net cash used in operating activities | | | 63,257,895 | |
| | | | | |
| CASH FLOWS FROM FINANCING ACTIVITIES: | | | | |
| Proceeds from shares sold | | | 69,443,441 | |
| Payment on shares redeemed | | | (155,017,788 | ) |
| Cash distributions paid to shareholders | | | (1,136,464 | ) |
| Increase in loan payable | | | 23,458,698 | |
| Net cash provided by financing activities | | | (63,252,113 | ) |
| Net change in cash | | | 5,782 | |
| | | | | |
| CASH: | | | | |
| Beginning balance | | | — | |
| Ending balance | | $ | 5,782 | |
The accompanying notes are an integral part of these financial statements.
18
Orinda Income Opportunities Fund Statement Of Cash Flows (Continued) |
| | | Six Months Ended
February 28,
2018
(Unaudited) | |
| SUPPLEMENTAL DISCLOSURES: | | | |
| Cash paid for interest | | | 695,913 | |
| Non-cash financing activities - distributions reinvested | | | 10,163,536 | |
| Non-cash financing activities - decrease in receivable for Fund shares sold | | | 468,034 | |
| Non-cash financing activities - increase in payable for Fund shares redeemed | | | (273,928 | ) |
The accompanying notes are an integral part of these financial statements.
19
Orinda Income Opportunities Fund Financial Highlights |
For a capital share outstanding throughout the period
| | | CLASS I SHARES | |
| | | Six Months Ended February 28,
2018 (Unaudited) | | | Six Months Ended
August 31,
2017 2, 3 | | | Year Ended
February 28,
2017 | | | Year Ended
February 29,
2016 | | | Year Ended
February 28,
2015 | | | June 28,
2013
through February 28, 2014 4 | |
| Net Asset Value – Beginning of Period | | $ | 23.42 | | | $ | 23.66 | | | $ | 21.36 | | | $ | 25.29 | | | $ | 25.60 | | | $ | 25.00 | |
| Income from Investment Operations: | | | | | | | | | | | | | | | | | | | | | | | | |
Net investment income/(loss)1 | | | 0.78 | | | | 0.63 | | | | 1.10 | | | | 0.99 | | | | 1.15 | | | | 0.59 | |
| Net realized and unrealized gain/(loss) on investments | | | (1.57 | ) | | | (0.02 | ) | | | 2.90 | | | | (3.36 | ) | | | 0.12 | | | | 0.50 | |
| Total from investment operations | | | (0.79 | ) | | | 0.61 | | | | 4.00 | | | | (2.37 | ) | | | 1.27 | | | | 1.09 | |
| Less Distributions: | | | | | | | | | | | | | | | | | | | | | | | | |
| Dividends from net investment income | | | (0.79 | ) | | | (0.63 | ) | | | (1.10 | ) | | | (1.02 | ) | | | (1.39 | ) | | | (0.45 | ) |
| Distributions from net realized gains | | | — | | | | — | | | | — | | | | — | | | | (0.01 | ) | | | (0.04 | ) |
| Return of Capital | | | — | | | | (0.22 | ) | | | (0.60 | ) | | | (0.54 | ) | | | (0.18 | ) | | | — | |
| Total distributions | | | (0.79 | ) | | | (0.85 | ) | | | (1.70 | ) | | | (1.56 | ) | | | (1.58 | ) | | | (0.49 | ) |
| Net Asset Value – End of Period | | $ | 21.84 | | | $ | 23.42 | | | $ | 23.66 | | | $ | 21.36 | | | $ | 25.29 | | | $ | 25.60 | |
| Total Return | | | (3.47 | )%5 | | | 2.62 | %5 | | | 19.29 | % | | | (9.81 | )% | | | 5.08 | % | | | 4.44 | %5 |
| | | | | | | | | | | | | | | | | | | | | | | | | |
| Ratios and Supplemental Data: | | | | | | | | | | | | | | | | | | | | | | | | |
| Net assets, end of period (thousands) | | $ | 167,433 | | | $ | 193,361 | | | $ | 180,360 | | | $ | 121,400 | | | $ | 151,017 | | | $ | 72,370 | |
| Ratio of operating expenses to average net assets: | | | | | | | | | | | | | | | | | | | | | | | | |
| Before Recoupments/Reimbursements | | | 1.64 | %6 | | | 1.82 | %6 | | | 2.01 | % | | | 1.85 | % | | | 1.64 | % | | | 1.96 | %6 |
| After Recoupments/Reimbursements | | | 1.64 | %6 | | | 1.82 | %6 | | | 2.01 | % | | | 1.84 | % | | | 1.70 | % | | | 1.62 | %6 |
| Ratio of interest expense and dividends on short positions to average net assets | | | 0.41 | %6 | | | 0.55 | %6 | | | 0.68 | % | | | 0.49 | % | | | 0.27 | % | | | 0.02 | %6 |
| Ratio of net investment income/(loss) to average net assets: | | | | | | | | | | | | | | | | | | | | | | | | |
| Before Recoupments/Reimbursements | | | 6.90 | %6 | | | 5.33 | %6 | | | 4.68 | % | | | 4.21 | % | | | 4.71 | % | | | 6.75 | %6 |
| After Recoupments/Reimbursements | | | 6.90 | %6 | | | 5.33 | %6 | | | 4.68 | % | | | 4.22 | % | | | 4.65 | % | | | 7.09 | %6 |
| Portfolio turnover rate | | | 58 | %5 | | | 46 | %5 | | | 121 | % | | | 127 | % | | | 185 | % | | | 119 | %5 |
| 1 | Calculated based on average shares outstanding during the period. |
| 2 | Effective as of the close of business on April 28, 2017, the Fund acquired all the assets and liabilities of the Orinda Income Opportunities Fund, a series of Advisors Series Trust (the “Predecessor Fund”). The financial highlights for the periods prior to that date reflect the performance of the Predecessor Fund. |
| 3 | The Fund changed its fiscal year end to August 31. |
| 4 | Commencement of operations for Class I shares was June 28, 2013. |
The accompanying notes are an integral part of these financial statements.
20
Orinda Income Opportunities Fund Financial Highlights (Continued) |
For a capital share outstanding throughout the period
| | | CLASS A SHARES | |
| | | Six Months Ended February 28,
2018 (Unaudited) | | | Six Months Ended
August 31,
2017 2, 3 | | | Year Ended
February 28,
2017 | | | Year Ended
February 29,
2016 | | | Year Ended
February 28,
2015 | | | June 28,
2013
through February 28, 2014 4 | |
| Net Asset Value – Beginning of Period | | $ | 23.33 | | | $ | 23.58 | | | $ | 21.31 | | | $ | 25.25 | | | $ | 25.57 | | | $ | 25.00 | |
| Income from Investment Operations: | | | | | | | | | | | | | | | | | | | | | | | | |
Net investment income/(loss)1 | | | 0.74 | | | | 0.59 | | | | 1.03 | | | | 0.93 | | | | 0.97 | | | | 0.65 | |
| Net realized and unrealized gain/(loss) on investments | | | (1.56 | ) | | | (0.02 | ) | | | 2.88 | | | | (3.37 | ) | | | 0.22 | | | | 0.39 | |
| Total from investment operations | | | (0.82 | ) | | | 0.57 | | | | 3.91 | | | | (2.44 | ) | | | 1.19 | | | | 1.04 | |
| Less Distributions: | | | | | | | | | | | | | | | | | | | | | | | | |
| Dividends from net investment income | | | (0.75 | ) | | | (0.60 | ) | | | (1.04 | ) | | | (0.96 | ) | | | (1.32 | ) | | | (0.43 | ) |
| Distributions from net realized gains | | | — | | | | — | | | | — | | | | — | | | | (0.01 | ) | | | (0.04 | ) |
| Return of Capital | | | — | | | | (0.22 | ) | | | (0.60 | ) | | | (0.54 | ) | | | (0.18 | ) | | | — | |
| Total distributions | | | (0.75 | ) | | | (0.82 | ) | | | (1.64 | ) | | | (1.50 | ) | | | (1.51 | ) | | | (0.47 | ) |
| Net Asset Value – End of Period | | $ | 21.76 | | | $ | 23.33 | | | $ | 23.58 | | | $ | 21.31 | | | $ | 25.25 | | | $ | 25.57 | |
| Total Return | | | (3.63 | )%5 | | | 2.49 | %5 | | | 18.90 | % | | | (10.09 | )% | | | 4.79 | % | | | 4.22 | %5 |
| | | | | | | | | | | | | | | | | | | | | | | | | |
| Ratios and Supplemental Data: | | | | | | | | | | | | | | | | | | | | | | | | |
| Net assets, end of period (thousands) | | $ | 40,865 | | | $ | 112,549 | | | $ | 101,270 | | | $ | 66,375 | | | $ | 74,834 | | | $ | 14,421 | |
| Ratio of operating expenses to average net assets: | | | | | | | | | | | | | | | | | | | | | | | | |
| Before Recoupments/Reimbursements | | | 1.89 | %6 | | | 2.12 | %6 | | | 2.29 | % | | | 2.15 | % | | | 1.96 | % | | | 2.55 | %6 |
| After Recoupments/Reimbursements | | | 1.89 | %6 | | | 2.12 | %6 | | | 2.29 | % | | | 2.15 | % | | | 2.00 | % | | | 1.92 | %6 |
| Ratio of interest expense and dividends on short positions to average net assets | | | 0.38 | %6 | | | 0.55 | %6 | | | 0.66 | % | | | 0.48 | % | | | 0.28 | % | | | 0.02 | %6 |
| Ratio of net investment income/(loss) to average net assets: | | | | | | | | | | | | | | | | | | | | | | | | |
| Before Recoupments/Reimbursements | | | 6.53 | %6 | | | 5.03 | %6 | | | 4.34 | % | | | 3.97 | % | | | 4.53 | % | | | 5.45 | %6 |
| After Recoupments/Reimbursements | | | 6.53 | %6 | | | 5.03 | %6 | | | 4.34 | % | | | 3.97 | % | | | 4.49 | % | | | 6.08 | %6 |
| Portfolio turnover rate | | | 58 | %5 | | | 46 | %5 | | | 121 | % | | | 127 | % | | | 185 | % | | | 119 | %5 |
| 1 | Calculated based on average shares outstanding during the period. |
| 2 | Effective as of the close of business on April 28, 2017, the Fund acquired all the assets and liabilities of the Orinda Income Opportunities Fund, a series of Advisors Series Trust (the “Predecessor Fund”). The financial highlights for the periods prior to that date reflect the performance of the Predecessor Fund. |
| 3 | The Fund changed its fiscal year end to August 31. |
| 4 | Commencement of operations for Class A shares was June 28, 2013. |
The accompanying notes are an integral part of these financial statements.
21
Orinda Income Opportunities Fund Financial Highlights (Continued) |
For a capital share outstanding throughout the period
| | | CLASS D SHARES | |
| | | Six Months Ended February 28,
2018 (Unaudited) | | | Six Months Ended
August 31,
2017 2, 3 | | | Year Ended
February 28,
2017 | | | Year Ended
February 29,
2016 | | | Year Ended
February 28,
2015 | | | September 27, 2013
through February 28,
2014 4 | |
| Net Asset Value – Beginning of Period | | $ | 23.18 | | | $ | 23.49 | | | $ | 21.25 | | | $ | 25.17 | | | $ | 25.51 | | | $ | 25.01 | |
| Income from Investment Operations: | | | | | | | | | | | | | | | | | | | | | | | | |
Net investment income/(loss)1 | | | 0.66 | | | | 0.51 | | | | 0.87 | | | | 0.82 | | | | 0.92 | | | | 0.53 | |
| Net realized and unrealized gain/(loss) on investments | | | (1.55 | ) | | | (0.02 | ) | | | 2.88 | | | | (3.37 | ) | | | 0.07 | | | | 0.44 | |
| Total from investment operations | | | (0.89 | ) | | | 0.49 | | | | 3.75 | | | | (2.55 | ) | | | 0.99 | | | | 0.97 | |
| Less Distributions: | | | | | | | | | | | | | | | | | | | | | | | | |
| Dividends from net investment income | | | (0.67 | ) | | | (0.58 | ) | | | (0.90 | ) | | | (0.83 | ) | | | (1.14 | ) | | | (0.43 | ) |
| Distributions from net realized gains | | | — | | | | — | | | | — | | | | — | | | | (0.01 | ) | | | (0.04 | ) |
| Return of Capital | | | — | | | | (0.22 | ) | | | (0.61 | ) | | | (0.54 | ) | | | (0.18 | ) | | | — | |
| Total distributions | | | (0.67 | ) | | | (0.80 | ) | | | (1.51 | ) | | | (1.37 | ) | | | (1.33 | ) | | | (0.47 | ) |
| Net Asset Value – End of Period | | $ | 21.62 | | | $ | 23.18 | | | $ | 23.49 | | | $ | 21.25 | | | $ | 25.17 | | | $ | 25.51 | |
| Total Return | | | (3.96 | )%5 | | | 2.13 | %5 | | | 18.10 | % | | | (10.56 | )% | | | 3.97 | % | | | 3.95 | %5 |
| | | | | | | | | | | | | | | | | | | | | | | | | |
| Ratios and Supplemental Data: | | | | | | | | | | | | | | | | | | | | | | | | |
| Net assets, end of period (thousands) | | $ | 20,721 | | | $ | 22,274 | | | $ | 23,963 | | | $ | 21,405 | | | $ | 23,336 | | | $ | 12,450 | |
| Ratio of operating expenses to average net assets: | | | | | | | | | | | | | | | | | | | | | | | | |
| Before Recoupments/Reimbursements | | | 2.65 | %6 | | | 2.79 | %6 | | | 2.98 | % | | | 2.81 | % | | | 2.70 | % | | | 2.77 | %6 |
| After Recoupments/Reimbursements | | | 2.65 | %6 | | | 2.79 | %6 | | | 2.98 | % | | | 2.67 | % | | | 2.76 | % | | | 2.67 | %6 |
| Ratio of interest expense and dividends on short positions to average net assets | | | 0.43 | %6 | | | 0.55 | %6 | | | 0.67 | % | | | 0.49 | % | | | 0.27 | % | | | 0.02 | %6 |
| Ratio of net investment income/(loss) to average net assets: | | | | | | | | | | | | | | | | | | | | | | | | |
| Before Recoupments/Reimbursements | | | 5.91 | %6 | | | 4.36 | %6 | | | 3.76 | % | | | 3.32 | % | | | 3.75 | % | | | 7.62 | %6 |
| After Recoupments/Reimbursements | | | 5.91 | %6 | | | 4.36 | %6 | | | 3.76 | % | | | 3.46 | % | | | 3.69 | % | | | 7.72 | %6 |
| Portfolio turnover rate | | | 58 | %5 | | | 46 | %5 | | | 121 | % | | | 127 | % | | | 185 | % | | | 119 | %5 |
| 1 | Calculated based on average shares outstanding during the period. |
| 2 | Effective as of the close of business on April 28, 2017, the Fund acquired all the assets and liabilities of the Orinda Income Opportunities Fund, a series of Advisors Series Trust (the “Predecessor Fund”). The financial highlights for the periods prior to that date reflect the performance of the Predecessor Fund. |
| 3 | The Fund changed its fiscal year end to August 31. |
| 4 | Commencement of operations for Class D shares was September 27, 2013. |
The accompanying notes are an integral part of these financial statements.
22
Orinda Income Opportunities Fund Notes To Financial Statements February 28, 2018 (Unaudited) |
1. ORGANIZATION AND SIGNIFICANT ACCOUNTing POLICIES
The RBB Fund, Inc. (“RBB” or the “Company”) was incorporated under the laws of the State of Maryland on February 29, 1988 and is registered under the Investment Company Act of 1940, as amended (the “1940 Act”), as an open-end management investment company. RBB is a “series fund,” which is a mutual fund divided into separate portfolios. Each portfolio is treated as a separate entity for certain matters under the 1940 Act, and for other purposes, and a shareholder of one portfolio is not deemed to be a shareholder of any other portfolio. Currently, RBB has twenty-nine active investment portfolios, including the Orinda Income Opportunities Fund (the “Fund”), which became a series of RBB as of the close of business on April 28, 2017. The Fund is authorized to offer three classes of shares, Class I Shares, Class A Shares and Class D Shares. Class A Shares are sold subject to a front-end maximum sales charge of 5.00%. Front-end sales charges may be reduced or waived under certain circumstances. Class I Shares, Class A Shares and Class D Shares commenced investment operations on June 28, 2013, June 28, 2013 and September 27, 2013, respectively.
Prior to April 28, 2017, the Fund was a non-diversified series (the “Predecessor Fund”) of Advisors Series Trust (the “Trust”), an open-end management investment company (or mutual fund) organized on October 3, 1996, as a statutory trust under the laws of the State of Delaware. The Predecessor Fund was reorganized into the Fund on April 28, 2017 (the “Reorganization”). As a result of the Reorganization, the performance and accounting history of the Predecessor Fund was assumed by the Fund. Performance and accounting information prior to April 28, 2017 included herein is that of the Predecessor Fund.
RBB has authorized capital of one hundred billion shares of common stock of which 87.023 billion shares are currently classified into one hundred and eighty-one classes of common stock. Each class represents an interest in an active or inactive RBB investment portfolio.
The Fund’s investment objective is to maximize current income with potential for modest growth of capital.
The Fund is an investment company and follows the accounting and reporting guidance in the Financial Accounting Standards Board (“FASB”) Accounting Standards Codification Topic 946 “Financial Services-Investment Companies.”
The end of the reporting period for the Fund is February 28, 2018, and the period covered by these Notes to Financial Statements is the six months ended February 28, 2018 (the “current fiscal period”).
PORTFOLIO VALUATION — The Fund’s net asset value (“NAV”) is calculated once daily at the close of regular trading hours on the New York Stock Exchange (“NYSE”) (generally 4:00 p.m. Eastern time) on each day the NYSE is open. Securities held by the Fund are valued using the closing price or the last sale price on a national securities exchange or the National Association of Securities Dealers Automatic Quotation System (“NASDAQ”) market system where they are primarily traded. Equity securities traded in the over-the-counter (“OTC”) market are valued at their closing prices. If there were no transactions on that day, securities traded principally on an exchange or on NASDAQ will be valued at the mean of the last bid and ask prices prior to the market close. Fixed income securities are valued using an independent pricing service, which considers such factors as security prices, yields, maturities and ratings, and are deemed representative of market values at the close of the market. Foreign securities are valued based on prices from the primary market in which they are traded, and are translated from the local currency into U.S. dollars using current exchange rates. Investments in other open-end investment companies are valued based on the NAV of the investment companies (which may use fair value pricing as disclosed in their prospectuses). Options for which the primary market is a national securities exchange are valued at the last sale price on the exchange on which they are traded, or, in the absence of any sale, will be valued at the mean of the last bid and ask prices prior to the market close. Options not traded on a national securities exchange are valued at the last quoted bid price for long option positions and the closing ask price for short option positions. If market quotations are unavailable or deemed unreliable, securities will be valued in accordance with procedures adopted by the Company’s Board of Directors (the “Board”). Relying on prices supplied by pricing services or dealers or using fair valuation may result in values that are higher or lower than the values used by other investment companies and investors to price the same investments. Such procedures use fundamental valuation methods, which may include, but are not limited to, an analysis of the effect of any restrictions on the resale of the security, industry analysis and trends, significant changes in the issuer’s financial position, and any other event which could have a significant impact on the value of the security. Determination of fair value involves subjective judgment as the actual market value of a particular security can be established only by negotiations between the parties in a sales transaction, and the difference between the recorded fair value and the value that would be received in a sale could be significant. The Fund may use fair value pricing more frequently for securities traded primarily in non-U.S. markets because, among other things, most foreign
23
Orinda Income Opportunities Fund Notes To Financial Statements (Continued) February 28, 2018 (Unaudited) |
markets close well before the Fund values its securities, generally as of 4:00 p.m. Eastern time. The earlier close of these foreign markets gives rise to the possibility that significant events, including broad market moves, government actions or pronouncements, aftermarket trading, or news events may have occurred in the interim. To account for this, the Fund may value foreign securities using fair value prices based on third-party vendor modeling tools (international fair value pricing).
FAIR VALUE MEASUREMENTS — The inputs and valuation techniques used to measure the fair value of the Fund’s investments are summarized into three levels as described in the hierarchy below:
| | ● | Level 1 — Prices are determined using quoted prices in active markets for identical securities. |
| | ● | Level 2 — Prices are determined using other significant observable inputs (including quoted prices for similar securities, interest rates, prepayment speeds, credit risk, etc.). |
| | ● | Level 3 — Prices are determined using significant unobservable inputs (including the Fund’s own assumptions in determining the fair value of investments). |
The inputs or methodologies used for valuing securities are not necessarily an indication of the risk associated with investing in those securities.
| | | Total | | | Level 1 | | | Level 2 | | | Level 3 | |
| Assets | | | | | | | | | | | | |
| Common Stocks | | | | | | | | | | | | |
| Financials | | $ | 276,000 | | | $ | 276,000 | | | $ | — | | | $ | — | |
| Real Estate | | | 3,278,961 | | | | 3,278,961 | | | | — | | | | — | |
| Utilities | | | 2,567,135 | | | | 2,567,135 | | | | — | | | | — | |
| Total Common Stocks | | | 6,122,096 | | | | 6,122,096 | | | | — | | | | — | |
| REITs | | | | | | | | | | | | | | | | |
| Financials | | | 43,258,168 | | | | 42,656,109 | | | | 602,059 | | | | — | |
| Real Estate | | | 139,120,929 | | | | 136,602,925 | | | | 2,518,004 | | | | — | |
| Total REITs | | | 182,379,097 | | | | 179,259,034 | | | | 3,120,063 | | | | — | |
| Convertible Preferred Stocks | | | | | | | | | | | | | | | | |
| Real Estate | | | 13,700,832 | | | | 13,700,832 | | | | — | | | | — | |
| Total Convertible Preferred Stocks | | | 13,700,832 | | | | 13,700,832 | | | | — | | | | — | |
| Preferred Stocks | | | | | | | | | | | | | | | | |
| Consumer Discretionary | | | 423,928 | | | | 423,928 | | | | — | | | | — | |
| Energy | | | 11,825,524 | | | | 11,825,524 | | | | — | | | | — | |
| Financials | | | 40,757,821 | | | | 37,495,181 | | | | 3,262,640 | | | | — | |
| Industrials | | | 1,512,079 | | | | 1,512,079 | | | | — | | | | — | |
| Real Estate | | | 24,900,638 | | | | 24,900,638 | | | | — | | | | — | |
| Telecommunication Services | | | 284,341 | | | | 284,341 | | | | — | | | | — | |
| Total Preferred Stocks | | | 79,704,331 | | | | 76,441,691 | | | | 3,262,640 | | | | — | |
| Convertible Bonds | | | 3,451,000 | | | | — | | | | 3,451,000 | | | | — | |
| Corporate Bonds | | | 901,250 | | | | — | | | | 901,250 | | | | — | |
| Exchange Traded Funds | | | 2,126,902 | | | | 2,126,902 | | | | — | | | | — | |
| Purchased Options | | | | | | | | | | | | | | | | |
| Put Options | | | 478,500 | | | | 478,500 | | | | — | | | | — | |
| Total Purchased Options | | | 478,500 | | | | 478,500 | | | | — | | | | — | |
| Short-Term Investments | | | 8,956,071 | | | | 8,956,071 | | | | — | | | | — | |
| Total Investments in Securities | | $ | 297,820,079 | | | $ | 287,085,126 | | | $ | 10,734,953 | | | $ | — | |
| Total Assets | | $ | 297,820,079 | | | $ | 287,085,126 | | | $ | 10,734,953 | | | $ | — | |
24
Orinda Income Opportunities Fund Notes To Financial Statements (Continued) February 28, 2018 (Unaudited) |
FAIR VALUE MEASUREMENTS (continued)
| | | Total | | | Level 1 | | | Level 2 | | | Level 3 | |
| Liabilities | | | | | | | | | | | | |
| Securities Sold Short | | $ | 38,662,580 | | | $ | 38,662,580 | | | $ | — | | | $ | — | |
| Written Options | | | 95,000 | | | | 95,000 | | | | — | | | | — | |
| Total Liabilities | | $ | 38,757,580 | | | $ | 38,757,580 | | | $ | — | | | $ | — | |
The following is a summary of the inputs used, as of the end of the reporting period, in valuing the Fund’s investments carried at fair value:
* | Please refer to the Schedule of Investments for further details. |
At the end of each quarter, management evaluates the classification of Levels 1, 2 and 3 assets and liabilities. Various factors are considered, such as changes in liquidity from the prior reporting period; whether or not a broker is willing to execute at the quoted price; the depth and consistency of prices from third party pricing services; and the existence of contemporaneous, observable trades in the market. Additionally, management evaluates the classification of Level 1 and Level 2 assets and liabilities on a quarterly basis for changes in listings or delistings on national exchanges.
Due to the inherent uncertainty of determining the fair value of investments that do not have a readily available market value, the fair value of the Fund’s investments may fluctuate from period to period. Additionally, the fair value of investments may differ significantly from the values that would have been used had a ready market existed for such investments and may differ materially from the values the Fund may ultimately realize. Further, such investments may be subject to legal and other restrictions on resale or otherwise less liquid than publicly traded securities.
For fair valuations using significant unobservable inputs, U.S. generally accepted accounting principles (“U.S. GAAP”) requires the Fund to present a reconciliation of the beginning to ending balances for reported market values that presents changes attributable to total realized and unrealized gains or losses, purchase and sales, and transfers in and out of Level 3 during the period. Transfers in and out between levels are based on values at the end of the period. U.S. GAAP also requires the Fund to disclose amounts and reasons for all transfers in and out of Level 1 and Level 2 fair value measurements. A reconciliation of Level 3 investments is presented only when the Fund had an amount of Level 3 investments at the end of the reporting period that was meaningful in relation to its net assets. The amounts and reasons for all transfers in and out of each level within the three-tier hierarchy are disclosed when the Fund had an amount of total transfers during the reporting period that was meaningful in relation to its net assets as of the end of the reporting period.
Foreign securities that utilize international fair pricing are categorized as Level 2 in the hierarchy.
Transfers between levels are recognized at the end of the reporting period. The Fund transferred $3,572,516 from level 2 to level 1 at February 28, 2018 because these securities were now being priced at the official market close. The Fund transferred $3,690,258 from level 1 to level 2 at February 28, 2018 because the securities were priced at the mean of the last bid and ask prices prior to the market close.
DISCLOSURES ABOUT DERIVATIVE INSTRUMENTS AND HEDGING ACTIVITIES — The Fund may use derivatives for different purposes, such as a substitute for taking a position in the underlying asset and/or as part of a strategy designed to reduce exposure to other risks, such as interest rate or currency risk. The various derivative instruments that the Fund may use are options, futures, swaps, and forward foreign currency contracts, among others. The Fund may also use derivatives for leverage, in which case their use would involve leveraging risk. The Fund’s use of derivative instruments involves risks different from, or possibly greater than, the risks associated with investing directly in securities and other traditional investments. Derivatives are subject to a number of risks, such as liquidity risk, interest rate risk, market risk, credit risk, and management risk. A Fund investing in a derivative instrument could lose more than the principal amount invested.
The Fund has adopted the disclosure provisions of FASB Accounting Standard Codification 815, Derivatives and Hedging (“ASC 815”). ASC 815 requires enhanced disclosures about the Fund’s use of, and accounting for, derivative instruments and the effect of derivative instruments on the Fund’s results of operations and financial position. Tabular disclosure regarding derivative
25
Orinda Income Opportunities Fund Notes To Financial Statements (Continued) February 28, 2018 (Unaudited) |
fair value and gain/loss by contract type (e.g., interest rate contracts, foreign exchange contracts, credit contracts, etc.) is required and derivatives accounted for as hedging instruments under ASC 815 must be disclosed separately from those that do not qualify for hedge accounting. Even though the Fund may use derivatives in an attempt to achieve an economic hedge, the Fund’s derivatives are not accounted for as hedging instruments under ASC 815 because investment companies account for their derivatives at fair value and record any changes in fair value in current period earnings.
The following tables provide quantitative disclosures about fair value amounts of, and gains and losses on, the Fund’s derivative instruments as of and for the current fiscal period.
The following table lists the fair values of the Fund’s derivative holdings as of the end of the reporting period, grouped by contract type and risk exposure category.
| Derivative Type | | Statement
of Assets and
Liabilities
Location | | | Equity
Contracts | |
| Asset Derivatives |
| Written Options | | N/A | | $ | — | |
| Total Value- Assets | | | | $ | — | |
| Derivative Type | | Statement
of Assets and
Liabilities
Location | | Equity
Contracts | |
| Liability Derivatives |
| Written Options | | Options written, at value | | $ | 95,000 | |
| Total Value- Liabilities | | | | $ | 95,000 | |
The following table lists the amounts of realized gains/(losses) included in net increase/(decrease) in net assets resulting from operations during the current fiscal period, grouped by contract type and risk exposure.
| Derivative Type | | Statement
of Operations
Location | | Equity
Contracts | |
| Realized Gain/(Loss) |
| Purchased Options | | Net realized gain/(loss) from investments | | $ | (456,320 | ) |
| Written Options | | Net realized gain/(loss) from written options | | $ | 200,384 | |
| Total Realized Gain/(Loss) | | | | $ | (255,936 | ) |
26
Orinda Income Opportunities Fund Notes To Financial Statements (Continued) February 28, 2018 (Unaudited) |
The following table lists the amounts of change in unrealized appreciation/(depreciation) included in net increase/(decrease) in net assets resulting from operations during the current fiscal period, grouped by contract type and risk exposure.
| Derivative Type | | Statement
of Operations
Location | | Equity
Contracts | |
| Change in Unrealized Appreciation/(Depreciation) |
| Purchased Options | | Net change in unrealized appreciation/(depreciation) on investments | | $ | 26,820 | |
| Written Options | | Net change in unrealized appreciation/(depreciation) on written options | | | (13,696 | ) |
| Total Change in Unrealized Appreciation/(Depreciation) | | | | $ | 13,124 | |
Average Balance Information
During the current fiscal period, the Fund’s quarterly average volume of derivatives was as follows:
Purchased
Options
(Cost) | Written
Options
(Proceeds) |
$ 150,560 | $ (46,176) |
OPTIONS — The Fund may utilize options for hedging purposes as well as direct investment. Some options strategies, including buying puts, tend to hedge the Fund’s investments against price fluctuations. Other strategies, such as writing puts and calls and buying calls, tend to increase market exposure. Options contracts may be combined with each other in order to adjust the risk and return characteristics of each Fund’s overall strategy in a manner deemed appropriate to the Adviser and consistent with each Fund’s investment objective and policies. When a call or put option is written, an amount equal to the premium received is recorded as a liability. The liability is marked-to-market daily to reflect the current fair value of the written option. When a written option expires, a gain is realized in the amount of the premium originally received. If a closing purchase contract is entered into, a gain or loss is realized in the amount of the original premium less the cost of the closing transaction. If a written call option is exercised, a gain or loss is realized from the sale of the underlying security, and the proceeds from such sale are increased by the premium originally received. If a written put option is exercised, the amount of the premium originally received reduces the cost of the security which is purchased upon the exercise of the option.
With options, there is minimal counterparty credit risk to the Fund since the options are covered or secured, which means that the Fund will own the underlying security or, to the extent it does not hold such a portfolio, will maintain a segregated account with the Fund’s custodian consisting of high quality liquid debt obligations equal to the market value of the option, marked to market daily.
Options purchased are recorded as investments and marked-to-market daily to reflect the current fair value of the option contract. If an option purchased expires, a loss is realized in the amount of the cost of the option contract. If a closing transaction is entered into, a gain or loss is realized to the extent that the proceeds from the sale are greater or less than the cost of the option. If a purchase put option is exercised, a gain or loss is realized from the sale of the underlying security by adjusting the proceeds from such sale by the amount of the premium originally paid. If a purchased call option is exercised, the cost of the security purchased upon exercise is increased by the premium originally paid.
FUTURES CONTRACTS AND OPTIONS ON FUTURES CONTRACTS — The Fund is subject to equity price risk, interest rate risk, and foreign currency exchange rate risk in the normal course of pursuing its investment objectives. The Fund uses futures contracts and options on such futures contracts to gain exposure to, or hedge against, changes in the value of equities, interest rates or foreign currencies. A futures contract represents a commitment for the future purchase or sale of an asset at a specified price on a specified date. Upon entering into such contracts, the Fund is required to deposit with the broker, either in cash or securities, an
27
Orinda Income Opportunities Fund Notes To Financial Statements (Continued) February 28, 2018 (Unaudited) |
initial margin deposit in an amount equal to a certain percentage of the contract amount. Subsequent payments (variation margin) are made or received by the Fund each day, depending on the daily fluctuations in the value of the contract, and are recorded for financial statement purposes as unrealized gains or losses by the Fund. Upon entering into such contracts, the Fund bears the risk of interest or exchange rates or securities prices moving unexpectedly, in which case, the Fund may not achieve the anticipated benefits of the futures contracts and may realize a loss. With futures, there is minimal counterparty credit risk to the Fund since futures are exchange traded and the exchange’s clearinghouse, as counterparty to all exchange-traded futures, guarantees the futures against default. The use of futures contracts, and options on futures contracts, involves the risk of imperfect correlation in movements in the price of futures contracts and options thereon, interest rates and the underlying hedged assets.
LEVERAGE AND SHORT SALES — The Fund may use leverage in connection with its investment activities and may effect short sales of securities. Leverage can increase the investment returns of the Fund if the securities purchased increase in value in an amount exceeding the cost of the borrowing. However, if the securities decrease in value, the Fund will suffer a greater loss than would have resulted without the use of leverage. A short sale is the sale by the Fund of a security which it does not own in anticipation of purchasing the same security in the future at a lower price to close the short position. A short sale will be successful if the price of the shorted security decreases. However, if the underlying security goes up in price during the period in which the short position is outstanding, the Fund will realize a loss. The risk on a short sale is unlimited because the Fund must buy the shorted security at the higher price to complete the transaction. Therefore, short sales may be subject to greater risks than investments in long positions. With a long position, the maximum sustainable loss is limited to the amount paid for the security plus the transaction costs, whereas there is no maximum attainable price of the shorted security. The Fund would also incur increased transaction costs associated with selling securities short. In addition, if the Fund sells securities short, it must maintain a segregated account with its custodian containing cash or high-grade securities equal to (i) the greater of the current market value of the securities sold short or the market value of such securities at the time they were sold short, less (ii) any collateral deposited with the Fund’s broker (not including the proceeds from the short sales). The Fund may be required to add to the segregated account as the market price of a shorted security increases. As a result of maintaining and adding to its segregated account, the Fund may maintain higher levels of cash or liquid assets (for example, U.S. Treasury bills, repurchase agreements, high quality commercial paper and long equity positions) for collateral needs thus reducing its overall managed assets available for trading purposes. The Fund is obligated to pay the counterparty any dividends or interest due on securities sold short. Such dividends and interest are recorded as an expense to the Fund.
MUTUAL FUND AND ETF TRADING RISK — The Fund may invest in other mutual funds that are either open-end or closed-end investment companies as well as ETFs. ETFs are investment companies that are bought and sold on a national securities exchange. Unlike mutual funds, ETFs do not necessarily trade at the net asset values of their underlying securities, which means an ETF could potentially trade above or below the value of the underlying portfolios. Additionally, because ETFs trade like stocks on exchanges, they are subject to trading and commission costs unlike mutual funds. Also, both mutual funds and ETFs have management fees that are part of their costs, and the Fund will indirectly bear its proportionate share of the costs.
REITS — The Fund has made certain investments in real estate investment trusts (“REITs”) which pay dividends to their shareholders based upon available funds from operations. It is quite common for these dividends to exceed the REITs’ taxable earnings and profits resulting in the excess portion being designated as a return of capital. The Fund intends to include the gross dividends from such REITs in its annual distributions to shareholders and, accordingly, a portion of the Fund’s distributions may also be designated as a return of capital.
USE OF ESTIMATES — The preparation of financial statements in conformity with U.S. GAAP requires management to make estimates and assumptions that affect the reported amounts of assets and liabilities at the date of the financial statements and the reported amounts of revenues and expenses during the reporting period. Actual results could differ from those estimates and those differences could be significant.
INVESTMENT TRANSACTIONS, INVESTMENT INCOME AND EXPENSES — The Fund records security transactions based on trade date for financial reporting purposes. The cost of investments sold is determined by use of the specific identification method for both financial reporting and income tax purposes in determining realized gains and losses on investments. Interest income is accrued when earned. Dividend income is recorded on the ex-dividend date. Distributions received on securities that represent a return of capital or capital gains are recorded as a reduction of cost of investments and/or as a realized gain. The Fund’s
28
Orinda Income Opportunities Fund Notes To Financial Statements (Continued) February 28, 2018 (Unaudited) |
investment income, expenses (other than class specific expenses) and unrealized and realized gains and losses are allocated daily to each class of shares based upon the relative proportion of net assets of each class at the beginning of the day. Expenses incurred on behalf of a specific class, fund or fund family of the Company are charged directly to the class, fund or fund family (in proportion to net assets). Expenses incurred for all of the RBB funds (such as director or professional fees) are charged to all funds in proportion to their average net assets of RBB, or in such other manner as the Board deems fair or equitable. Expenses and fees, including investment advisory and administration fees, are accrued daily and taken into account for the purpose of determining the NAV of the Funds.
DIVIDENDS AND DISTRIBUTIONS TO SHAREHOLDERS — The Fund distributes substantially all of its net investment income, if any, quarterly, and net realized capital gains, if any, annually. Income dividends and capital gain distributions are determined in accordance with U.S. federal income tax regulations, which may differ from U.S. GAAP.
U.S. TAX STATUS — No provision is made for U.S. income taxes as it is the Fund’s intention to continue to qualify for and elect the tax treatment applicable to regulated investment companies under Subchapter M of the Internal Revenue Code of 1986, as amended, and make the requisite distributions to its shareholders which will be sufficient to relieve it from U.S. income and excise taxes.
FOREIGN CURRENCY TRANSLATION — Assets and liabilities initially expressed in non-U.S. currencies are translated into U.S. dollars based on the applicable exchange rates at the date of the last business day of the financial statement period. Purchases and sales of securities, interest income, dividends, variation margin received and expenses denominated in foreign currencies are translated into U.S. dollars at the exchange rates in effect on the transaction date.
The Fund does not separately report the effect of changes in foreign exchange rates from changes in market prices of securities held. Such changes are included with the net realized gain or loss and change in unrealized appreciation or depreciation on investments in the Statement of Operations. Other foreign currency transactions resulting in realized and unrealized gain or loss are reported separately as net realized gain or loss and change in unrealized appreciation or depreciation on foreign currencies in the Statement of Operations.
MARKET RISK — The value of the Fund’s shares will fluctuate as a result of the movement of the overall stock market or the value of the individual securities held by the Fund, and you could lose money.
MASTER LIMITED PARTNERSHIP RISK — Investments in securities (units) of MLPs involve risks that differ from an investment in common stock. To the extent that an MLP’s interests are all in a particular industry, the MLP will be negatively impacted by economic events adversely impacting that industry. Additionally, holders of the units of MLPs have more limited control and limited rights to vote on matters affecting the partnership. There are also certain tax risks associated with an investment in units of MLPs.
FOREIGN AND EMERGING MARKET SECURITIES RISK — Foreign investments may carry risks associated with investing outside the United States, such as currency fluctuation, economic or financial instability, lack of timely or reliable financial information or unfavorable political or legal developments. Those risks are increased for investments in emerging markets.
CURRENCY RISK — Changes in foreign currency exchange rates will affect the value of what the Fund owns and the Fund’s share price. Generally, when the U.S. dollar rises in value against a foreign currency, an investment in that country loses value because that currency is worth fewer U.S. dollars. Devaluation of a currency by a country’s government or banking authority also will have a significant impact on the value of any investments denominated in that currency. Currency markets generally are not as regulated as securities markets.
SMALL AND MEDIUM COMPANIES RISK — Investing in securities of small and medium capitalization companies may involve greater volatility than investing in larger and more established companies because small and medium capitalization companies can be subject to more abrupt or erratic share price changes than larger, more established companies.
DERIVATIVES RISK — The Fund’s use of derivatives (which may include options, futures and swaps, among others) may reduce the Fund’s returns and/or increase volatility. Derivatives involve the risk of improper valuation, the risk of ambiguous documentation, and the risk that changes in the value of the derivative may not correlate perfectly with the underlying security.
29
Orinda Income Opportunities Fund Notes To Financial Statements (Continued) February 28, 2018 (Unaudited) |
Derivatives are also subject to market risk, interest rate risk, credit risk, counterparty risk and liquidity risk. Derivatives may be more sensitive to changes in economic or market conditions than other types of investments and could result in losses that significantly exceed the Fund’s original investment.
OPTIONS RISK — Purchasing and writing put and call options are highly specialized activities and entail greater than ordinary investment risks. The Fund may not fully benefit from or may lose money on an option if changes in its value do not correspond as anticipated to changes in the value of the underlying securities.
INTEREST RATE RISK — Interest rate risk is the risk that fixed income securities will decline in value because of changes in interest rates. It is likely there will be less governmental action in the near future to maintain low interest rates. The negative impact on fixed income securities from the resulting rate increases for that and other reasons could be swift and significant.
FIXED INCOME SECURITIES RISK — Fixed income securities are subject to interest rate risk and credit risk. There is also the risk that an issuer may “call,” or repay, its high yielding bonds before their maturity dates. Fixed income securities subject to prepayment can offer less potential for gains during a declining interest rate environment and similar or greater potential for loss in a rising interest rate environment. Limited trading opportunities for certain fixed income securities may make it more difficult to sell or buy a security at a favorable price or time.
REAL ESTATE AND REIT CONCENTRATION RISK — The Fund is vulnerable to the risks of the real estate industry, such as the risk that a decline in rental income may occur because of extended vacancies, the failure to collect rents, increased competition from other properties, or poor management. The value and performance of REITs depends on how well the underlying properties owned by the REIT are managed. In addition, the value of an individual REIT’s securities can decline if the REIT fails to continue qualifying for special tax treatment.
CONVERTIBLE BOND RISK — Convertible bonds are hybrid securities that have characteristics of both bonds and common stocks and are therefore subject to both debt security risks and equity risk. Convertible bonds are subject to equity risk especially when their conversion value is greater than the interest and principal value of the bond. The prices of equity securities may rise or fall because of economic or political changes and may decline over short or extended periods of time.
PREFERRED STOCK RISK — Preferred stocks may be more volatile than fixed income securities and are more correlated with the issuer’s underlying common stock than fixed income securities. Additionally, the dividend on a preferred stock may be changed or omitted by the issuer.
INITIAL PUBLIC OFFERING RISK — The Fund may purchase securities of companies that are offered pursuant to an IPO. The risk exists that the market value of IPO shares will fluctuate considerably due to factors such as the absence of a prior public market, unseasoned trading, the small number of shares available for trading and limited information about the issuer. The purchase of IPO shares may involve high transaction costs. IPO shares are subject to market risk and liquidity risk. When the Fund’s asset base is small, a significant portion of the Fund’s performance could be attributable to investments in IPOs, because such investments would have a magnified impact on the Fund. As the Fund’s assets grow, the effect of the Fund’s investments in IPOs on the Fund’s performance probably will decline, which could reduce the Fund’s performance.
PORTFOLIO TURNOVER RISK — A high portfolio turnover rate (100% or more) increases the Fund’s transaction costs (including brokerage commissions and dealer costs), which would adversely impact the Fund’s performance. Higher portfolio turnover may result in the realization of more short-term capital gains than if the Fund had lower portfolio turnover.
CASH AND CASH EQUIVALENTS — Cash and cash equivalents are valued at cost plus accrued interest, which approximates market value.
REDEMPTION FEES — The Fund does not charge redemption fees to shareholders.
OTHER — In the normal course of business, the Fund may enter into contracts that provide general indemnifications. The Fund’s maximum exposure under these arrangements is dependent on claims that may be made against the Fund in the future, and, therefore, cannot be estimated; however, based on experience, the risk of material loss from such claims is considered remote.
30
Orinda Income Opportunities Fund Notes To Financial Statements (Continued) February 28, 2018 (Unaudited) |
2. INVESTMENT ADVISer AND OTHER services
Orinda Asset Management, LLC (the “Adviser”) serves as the investment adviser to the Fund. The Adviser furnishes all investment advice, office space, and facilities, and provides most of the personnel needed by the Fund. The Fund compensates the Adviser for its services at an annual rate based on the Fund’s average daily net assets (the “Advisory Fee”), payable on a monthly basis in arrears, as shown in the following table.
The Adviser has contractually agreed to waive advisory fees and/or reimburse expenses to the extent that the total annual Fund operating expenses (excluding certain items discussed below) exceed the rate (“Expense Cap”) shown in the following table of the average daily net assets for each class of shares. In determining the Adviser’s obligation to waive advisory fees and/or reimburse expenses, the following expenses are not taken into account and could cause total annual Fund operating expenses to exceed the Expense Cap as applicable: acquired fund fees and expenses, brokerage commissions, dividends on securities sold short, extraordinary expenses, interest and taxes. This contractual limitation is in effect until December 31, 2018 and may not be terminated without the approval of the Board. The Adviser may discontinue these arrangements at any time after December 31, 2018.
Advisory
Fee | | Expense Caps |
| | Class I | Class A | Class D |
1.00% | | 1.40% | 1.70% | 2.40% |
During the current fiscal period, investment advisory fees accrued were as follows:
If at any time the Fund’s total annual Fund operating expenses (not including acquired fund fees and expenses, short sale dividend expenses, brokerage commissions, extraordinary items, interest and taxes) for a year are less than the relevant share class’s Expense Cap, the Adviser is entitled to reimbursement by the Fund of the advisory fees forgone and other payments remitted by the Adviser to the Fund within three years from the date on which such waiver or reimbursement was made, provided such reimbursement does not cause the Fund to exceed the relevant share class’s Expense cap that was in effect at the time of the waiver or reimbursement. As of February 28, 2018, the Adviser had no fees left to recoup. During the period ended August 31, 2017 and February 28, 2017, the Adviser reimbursed the Fund for shareholder servicing fees in the amount of $8,402 and $35,183, respectively that was a result of the Fund not fully utilizing the fees that had been earned in fiscal year 2017. This amount will not be subject to recoup in the future.
U.S. Bancorp Fund Services, LLC (“USBFS”) serves as administrator for the Fund. For providing administrative and accounting services, USBFS is entitled to receive a monthly fee, subject to certain minimum and out of pocket expenses.
USBFS serves as the Fund’s transfer and dividend disbursing agent. For providing transfer agent services, USBFS is entitled to receive a monthly fee, subject to certain minimum and out of pocket expenses.
U.S. Bank, N.A. (the “Custodian”) provides certain custodial services to the Fund. The Custodian is entitled to receive a monthly fee, subject to certain minimum and out of pocket expenses.
Quasar Distributors, LLC serves as the principal underwriter and distributor of the Fund’s shares pursuant to a Distribution Agreement with RBB.
For compensation amounts payable to USBFS, please refer to the Statement of Operations.
The Board has adopted a Distribution Plan pursuant to Rule 12b-1 (the “Plan”). The Plan permits the Fund to pay for distribution and related expenses at an annual rate of up to 0.25% of the average daily net assets of the Fund’s Class A shares and up to 1.00% for the Fund’s Class D shares. The expenses covered by the Plan may include the cost in connection with the promotion and distribution of shares and the provision of personal services to shareholders, including, but not necessarily limited to, advertising, compensation
31
Orinda Income Opportunities Fund Notes To Financial Statements (Continued) February 28, 2018 (Unaudited) |
to underwriters, dealers and selling personnel, the printing and mailing of prospectuses to other than current Fund shareholders, and the printing and mailing of sales literature. Payments made pursuant to the Plan will represent compensation for distribution and service activities, not reimbursements for specific expenses incurred.
3. SHAREHOLDER SERVICING FEE
The Fund has entered into a shareholder servicing agreement (the “Agreement”) with the Adviser, under which the Adviser will provide, or arrange for others to provide, certain specified shareholder services. As compensation for the provision of shareholder services, the Fund may pay servicing fees at an annual rate of 0.15% of the average daily net assets of the Class A shares and 0.10% of the average daily net assets of the Class D and Class I shares. Payments to the Adviser under the Agreement may reimburse the Adviser for payments it makes to selected brokers, dealers and administrators which have entered into service agreements with the Adviser for services provided to shareholders of the Fund. The services provided by such intermediaries are primarily designed to assist shareholders of the Fund and include the furnishing of office space and equipment, telephone facilities, personnel, and assistance to the Fund in servicing such shareholders. Services provided by such intermediaries also include the provision of support services to the Fund and include establishing and maintaining shareholders’ accounts and record processing, purchase and redemption transactions, answering routine client inquiries regarding the Fund, and providing such other personal services to shareholders as the Fund may reasonably request. During the current fiscal period, the Fund incurred shareholder servicing fees as follows:
| | Shareholder
servicing fees |
Class I | $ 98,382 |
Class A | 78,013 |
Class D | 10,897 |
4. Director’s and Officer’s Compensation
The Directors of the Company receive an annual retainer and meeting fees for meetings attended. Employees of Vigilant Compliance, LLC serve as President, Chief Compliance Officer and Assistant Treasurer of the Company. Vigilant Compliance, LLC is compensated for the services provided to the Company. An employee of RBB serves as Treasurer and Secretary, and is compensated for services provided. Certain employees of USBFS serve as officers of the Company. They are not compensated by the Fund or the Company. For Director’s and Officer’s compensation amounts, please refer to the Statement of Operations.
5. purchases and sales of investment securities
During the current fiscal period, aggregate purchases and sales of investment securities, (excluding short-term investments) of the Fund were as follows:
Purchases | Sales |
$ 196,258,778 | $ 240,147,545 |
There were no purchases or sales of long-term U.S. Government securities, during the current fiscal period.
6. LEVERAGE & LINE OF CREDIT
The Fund may purchase securities with borrowed money, including bank overdrafts (a form of leverage). The Fund may borrow amounts up to one-third of the value of its assets after giving effect to such borrowing. Leverage exaggerates the effect on the net asset value of any increase or decrease in the market value of the Fund’s portfolio securities. These borrowings will be subject to interest costs, which may or may not be recovered by appreciation of the securities purchased. In certain cases, interest costs may exceed the return received on the securities purchased.
32
Orinda Income Opportunities Fund Notes To Financial Statements (Continued) February 28, 2018 (Unaudited) |
The Fund may also utilize the line of credit for short term financing, if necessary, subject to certain restrictions, in connection with shareholder redemptions. The Fund maintains a separate line of credit with BNP Paribas (acting through its New York Branch). The Fund is charged interest of 1.20% above the one-month London Interbank Offered Rate (“LIBOR”) for borrowings under this agreement. The Fund can borrow up to a maximum of 50% of the market value of assets pledged as collateral. However, depending on the liquidity of the collateral, issuer concentration, debt ratings of fixed income investments, and the share price of equity holdings, the amount eligible to be borrowed can also be less than 50% of the market value of the assets pledged as collateral.
The Fund has pledged a portion of its investment securities as the collateral for their line of credit. As of the end of the reporting period, the value of the investment securities pledged as collateral was $216,325,405. The Fund had an outstanding average daily balance and a weighted average interest rate of $33.10 million and 2.60%, respectively. The maximum amount outstanding for the Fund during the reporting period was $78,859,520.
7. Federal income tax information
The Fund has followed the authoritative guidance on accounting for and disclosure of uncertainty in tax positions, which requires the Fund to determine whether a tax position is more likely than not to be sustained upon examination, including resolution of any related appeals or litigation processes, based on the technical merits of the position. The Fund has determined that there was no effect on the financial statements from following this authoritative guidance. In the normal course of business, the Fund is subject to examination by federal, state and local jurisdictions, where applicable, for tax years for which applicable statutes of limitations have not expired. The Fund is not aware of any tax positions for which it is reasonably possible that the total amounts of unrecognized tax benefits will significantly change in the next twelve months.
As of August 31, 2017, the federal tax cost and aggregate gross unrealized appreciation and depreciation of investments held by the Fund were as follows:
Federal
tax cost | Unrealized
appreciation | Unrealized
Depreciation | Net
unrealized
Appreciation
(depreciation) |
$ 330,792,223 | $ 24,206,158 | $ (11,331,645) | $ 12,874,513 |
Distributions to shareholders, if any, from net investment income and realized gains are determined in accordance with federal income tax regulations, which may differ from net investment income and realized gains recognized for financial reporting purposes. Accordingly, the character of distributions and composition of net assets for tax purposes may differ from those reflected in the accompanying financial statements. To the extent these differences are permanent, such amounts are reclassified within the capital accounts based on the tax treatment; temporary differences do not require such reclassification.
The following permanent differences as of August 31, 2017, were reclassified to the following accounts:
Undistributed
Net Investment
Income/(Loss) | accumulated
net realized
gain/(loss) | paid-in
capital |
$ (71,073) | $ (69,320) | $ 140,393 |
As of August 31, 2017, the components of distributable earnings on a tax basis were as follows:
undistributed
ordinary
income | undistributed
long-term
capital gains | net UNrealized
appreciation/
(depreciation) | capital loss
carryforwards | qualified
late-year
losses |
$ — | $ — | $ 12,874,513 | $ (17,856,280) | $ — |
33
Orinda Income Opportunities Fund Notes To Financial Statements (Continued) February 28, 2018 (Unaudited) |
The differences between the book and tax basis components of distributable earnings relate principally to the timing of recognition of income and gains for federal income tax purposes. Short-term and foreign currency gains are reported as ordinary income for federal income tax purposes.
The tax character of dividends and distributions paid during the six months ended August 31, 2017 and year ended February 28, 2017 were as follows:
| | | | ordinary
income | | | Long-term
capital gains | | | return
of capital | |
Six Months Ended August 31, 2017 | | | $ | 8,180,121 | | | $ | — | | | $ | 2,919,879 | |
Year Ended February 28, 2017 | | | | 11,781,423 | | | | — | | | | 6,718,576 | |
Dividends from net investment income and short-term capital gains are treated as ordinary income dividends for federal income tax purposes.
For the fiscal period ended August 31, 2017, 69.10% of dividends paid from net investment income qualify for the dividends received deduction available to corporate shareholders of the Fund. For shareholders of the Fund, 72.62% of the dividend income distributed for the period ended August 31, 2017 is designated as qualified dividend income under the Jobs and Growth Relief Act of 2003.
8. SUBSEQUENT EVENTS
Management has evaluated the impact of all subsequent events on the Fund through the date the financial statements were issued and has determined that there were no significant events requiring recognition or disclosure in the financial statements.
34
ORINDA INCOME OPPORTUNITIES FUND APPROVAL OF INVESTMENT ADVISORY AGREEMENT February 28, 2018 (Unaudited) |
As required by the 1940 Act, the Board of the Company, including all of the Directors who are not “interested persons” of the Company, as that term is defined in the 1940 Act (the “Independent Directors”), considered the approval of the investment advisory agreement between the Adviser and the Company (the “Investment Advisory Agreement”) on behalf of the Fund at a meeting of the Board held on November 17, 2016 (the “Meeting”). At the Meeting, the Board, including all of the Independent Directors, approved the Investment Advisory Agreement for an initial term ending August 16, 2018. In approving the Investment Advisory Agreement, the Board considered information provided by the Adviser with the assistance and advice of counsel to the Independent Directors and the Company.
In considering the approval of the Investment Advisory Agreement between the Company and the Adviser with respect to each Fund, the Directors took into account all the materials provided prior to and during the Meeting, the presentations made during the Meeting, and the discussions held during the Meeting. Among other things, the Directors considered (i) the nature, extent, and quality of services to be provided to the Fund by the Adviser; (ii) descriptions of the experience and qualifications of the Adviser’s personnel providing those services; (iii) the Adviser’s investment philosophies and processes; (iv) the Adviser’s assets under management and client descriptions; (v) the Adviser’s soft dollar commission and trade allocation policies, including information on the types of research and services obtained in connection with soft dollar commissions; (vi) the Adviser ’s proposed advisory fee arrangements with the Fund and other similarly managed clients; (vii) the Adviser’s compliance procedures; (viii) the Adviser’s financial information and insurance coverage; (ix) the extent to which economies of scale are relevant to the Fund; and (x) performance information provided by the Adviser regarding the Fund.
As part of their review, the Directors considered the nature, extent and quality of the services to be provided by the Adviser. The Directors concluded that the Adviser had substantial resources to provide services to the Fund.
The Directors also considered the investment performance of the Fund. The Directors considered the Fund’s investment performance in light of its investment objectives and investment strategies. The Directors concluded that the investment performance of the Fund as compared to its benchmark and Lipper peer group was acceptable.
The Board also considered the advisory fee rates payable by the Fund under the proposed Investment Advisory Agreement. In this regard, information on the fees to be paid by the Fund and the Fund’s expected total operating expense ratios (before and after fee waivers and expense reimbursements) were compared to similar information for mutual funds advised by other, unaffiliated investment advisory firms. The Directors noted that the Adviser had contractually agreed to waive management fees and reimburse expenses through at least December 31, 2018 to limit total annual operating expenses to agreed upon levels for the Fund.
After reviewing the information regarding the Adviser’s costs, profitability and economies of scale, and after considering the services to be provided by the Adviser, the Directors concluded that the investment advisory fees to be paid by the Fund to the Adviser were fair and reasonable and that the Investment Advisory Agreement should be approved for an initial term ending August 16, 2018.
35
Orinda Income Opportunities Fund Notice To Shareholders February 28, 2018 (Unaudited) |
How to Obtain a Copy of the Fund’s Proxy Voting Policies
A description of the policies and procedures that the Fund uses to determine how to vote proxies relating to portfolio securities is available without charge, upon request, by calling 1-855-467-4632 or on the U.S. Securities and Exchange Commission’s (“SEC”) website at http://www.sec.gov.
How to Obtain a Copy of the Fund’s Proxy Voting Records for the 12-Month Period Ended June 30, 2017
Information regarding how the Fund voted proxies relating to portfolio securities during the most recent 12-month period ended June 30 is available without charge, upon request, by calling 1-855-467-4632. Furthermore, you can obtain the Fund’s proxy voting records on the SEC’s website at http://www.sec.gov.
Quarterly Filings on Form N-Q
The Fund files its complete schedule of portfolio holdings with the SEC for the first and third quarters of each fiscal year on Form N-Q. The Fund’s Form N-Q is available on the SEC’s website at http://www.sec.gov. The Fund’s Form N-Q may be reviewed and copied at the SEC’s Public Reference Room in Washington, DC, and information on the operation of the Public Reference Room may be obtained by calling 1-202-551-8090. Information included in the Fund’s Form N-Q is also available, upon request, by calling 1-855-467-4632.
Householding
In an effort to decrease costs, the Fund intends to reduce the number of duplicate prospectuses and annual and semi-annual reports you receive by sending only one copy of each to those addresses shared by two or more accounts and to shareholders the Transfer Agent reasonably believes are from the same family or household. Once implemented, if you would like to discontinue householding for your accounts, please call toll-free at 1-855-467-4632 to request individual copies of these documents. Once the Transfer Agent receives notice to stop householding, the Transfer Agent will begin sending individual copies thirty days after receiving your request. This policy does not apply to account statements.
36
(This Page Intentionally Left Blank.)
Investment Adviser
Orinda Asset Management LLC
4 Orinda Way, Suite 150-A
Orinda, CA 94563
Distributor
Quasar Distributors, LLC
777 East Wisconsin Avenue, 6th Floor
Milwaukee, WI 53202
Administrator and Transfer Agent
U.S. Bancorp Fund Services, LLC
P.O. Box 701
Milwaukee, WI 53201
Custodian
U.S. Bank National Association
Custody Operations
1555 North River Center Drive, Suite 302
Milwaukee, WI 53212
Independent Registered Public Accounting Firm
Tait, Weller & Baker LLP
1818 Market Street, Suite 2400
Philadelphia, PA 19103
Legal Counsel
Drinker Biddle & Reath LLP
One Logan Square, Suite 2000
Philadelphia, PA 19103-6996
OR-SAR18
This report is intended for shareholders of the Fund and may not be used as sales literature unless preceded or accompanied by a current prospectus.
Past performance results shown in this report should not be considered a representation of future performance. Share price and returns will fluctuate so that shares, when redeemed, may be worth more or less than their original cost. Statements and other information herein are dated and are subject to change.
|
Schneider
Small Cap
Value Fund |
of The RBB Fund, Inc.
SEMI-Annual
Report February 28, 2018
(Unaudited) |

This report is submitted for the general information of the shareholders of the Fund. It is not authorized for distribution unless preceded or accompanied by a current prospectus for the Fund.
SCHNEIDER SMALL CAP VALUE FUND
Semi-Annual Investment Report
Performance Data
February 28, 2018 (Unaudited)
Total Returns for the Periods Ended February 28, 2018 |
| | Average Annual |
| | Six
Months† | 1 Year | 5 Years | 10 Years | Since
Inception* |
Schneider Small Cap Value Fund | 6.05% | -0.26% | 6.80% | 5.37% | 12.79% |
Russell 2000® Value Index | 5.09% | 2.96% | 10.59% | 8.64% | 9.64%** |
* | The Fund commenced operations on September 2, 1998. |
** | Benchmark performance is from inception date of the Fund only and is not the inception date of the benchmark itself. |
The performance data quoted represents past performance. Past performance is not indicative of future results. Investment return and principal value will fluctuate so that an investor’s shares, when redeemed, may be worth more or less than their original cost. Current performance may be lower or higher. Schneider Capital Management, the Fund’s investment adviser, has contractually agreed to waive management fees and/or reimburse expenses through December 31, 2018, to the extent that total annual Fund operating expenses (excluding acquired fund fees and expenses, brokerage commissions, extraordinary items, interest and taxes) exceed 1.15%. Total returns shown include fee waivers and expense reimbursements, if any; total returns would have been lower had there been no waiver or reimbursement of fees and expenses in excess of expense limitations. Returns shown include the reinvestment of all dividends and other distributions and do not reflect taxes that a shareholder would pay on Fund distributions or on the redemption of Fund shares. For performance data current to the most recent month-end, please call 1-888-520-3277. The Fund’s gross and net annual operating expenses, as stated in the current prospectus, are 1.58% and 1.16%, respectively. Shares of the Fund not purchased through reinvested dividends or capital gains and held less than 30 days are subject to a 1.00% redemption fee.
Portfolio holdings are subject to change at any time.
Small company stocks are generally riskier than large company stocks due to greater volatility and less liquidity.
Value investing involves the risk that the Fund’s investment in companies whose securities are believed to be undervalued, relative to their underlying profitability, will not appreciate in value as anticipated.
1
SCHNEIDER SMALL CAP VALUE FUND
Fund Expense Examples
February 28, 2018 (Unaudited)
As a shareholder of the Fund, you incur two types of costs: (1) transaction costs, including redemption fees; and (2) ongoing costs, including management fees and other Fund expenses. This example is intended to help you understand your ongoing costs (in dollars) of investing in the Fund and to compare these costs with the ongoing costs of investing in other mutual funds.
This example is based on an investment of $1,000 invested at the beginning of the six-month period from September 1, 2017 through February 28, 2018, and held for the entire period.
ACTUAL EXPENSES
The first line of the accompanying table provides information about actual account values and actual expenses. You may use the information in this line, together with the amount you invested, to estimate the expenses that you paid over the period. Simply divide your account value by $1,000 (for example, an $8,600 account value divided by $1,000 = 8.6), then multiply the result by the number in the first line under the heading entitled “Expenses Paid During Period” to estimate the expenses you paid on your account during this period.
HYPOTHETICAL EXAMPLE FOR COMPARISON PURPOSES
The second line of the accompanying table provides information about hypothetical account values and hypothetical expenses based on the Fund’s actual expense ratio and an assumed rate of return of 5% per year before expenses, which is not the Fund’s actual return. The hypothetical account values and expenses may not be used to estimate the actual ending account balance or expenses you paid for the period. You may use this information to compare the ongoing costs of investing in the Fund and other funds. To do so, compare this 5% hypothetical example with the 5% hypothetical examples that appear in the shareholder reports of other funds.
Please note that the expenses shown in the accompanying table is meant to highlight your ongoing costs only and do not reflect any transactional costs, such as redemption fees. Therefore, the second line of the accompanying table is useful in comparing ongoing costs only and will not help you determine the relative total costs of owning different funds. In addition, if these transactional costs were included, your costs would have been higher.
| | Beginning
Account Value
September 1, 2017 | Ending
Account Value
February 28, 2018 | Expenses Paid
During Period* |
Actual | $ 1,000.00 | $ 1,060.50 | $5.88 |
Hypothetical (5% return before expenses) | 1,000.00 | 1,019.09 | 5.76 |
* | Expenses are equal to the Fund’s annualized six-month expense ratio for the period September 1, 2017 to February 28, 2018 of 1.15%, which includes waived fees or reimbursed expenses, multiplied by the average account value over the period, multiplied by the number of days (181) in the most recent fiscal half-year, then divided by 365 to reflect the one-half year period. The Fund’s ending account value on the first line in the table is based on the actual six-month total return for the Fund as of February 28, 2018 of 6.05%. |
2
SCHNEIDER SMALL CAP VALUE FUND
Portfolio Holdings Summary Table
February 28, 2018 (Unaudited)
The following table presents a summary by sector of the portfolio holdings of the Fund:
| | | % of
Net Assets | | | Value | |
| COMMON STOCKS: | | | | | | |
| Oil & Gas | | | 25.8 | % | | $ | 10,739,938 | |
| Insurance | | | 11.4 | | | | 4,742,720 | |
| Banks | | | 9.1 | | | | 3,772,429 | |
| Telecommunications | | | 9.0 | | | | 3,764,929 | |
| Commercial Services | | | 5.8 | | | | 2,407,004 | |
| Real Estate Investment Trust | | | 4.8 | | | | 2,005,258 | |
| Machinery-Diversified | | | 4.7 | | | | 1,958,125 | |
| Auto Parts & Equipment | | | 4.6 | | | | 1,905,366 | |
| Pharmaceuticals | | | 4.2 | | | | 1,749,515 | |
| Oil & Gas Services | | | 3.8 | | | | 1,585,743 | |
| Transportation | | | 3.7 | | | | 1,571,548 | |
| Retail | | | 2.7 | | | | 1,120,540 | |
| Semiconductors | | | 2.1 | | | | 887,263 | |
| Real Estate | | | 1.9 | | | | 782,008 | |
| Chemicals | | | 1.5 | | | | 618,662 | |
| Home Builders | | | 0.5 | | | | 198,819 | |
| Building Materials | | | 0.5 | | | | 191,800 | |
| Savings & Loans | | | 0.3 | | | | 126,936 | |
| Warrants | | | 0.0 | | | | 30,130 | |
| Securities Lending Collateral | | | 32.6 | | | | 13,550,165 | |
| Short-Term Investments | | | 3.8 | | | | 1,571,033 | |
| Liabilities In Excess Of Other Assets | | | (32.8 | ) | | | (13,667,860 | ) |
| NET ASSETS | | | 100.0 | % | | $ | 41,612,071 | |
Portfolio holdings are subject to change at any time.
The accompanying notes are an integral part of the financial statements.
3
SCHNEIDER SMALL CAP VALUE FUND
Portfolio of Investments
February 28, 2018 (Unaudited)
| | | Number of
Shares | | | Value | |
| COMMON STOCKS — 96.4% | | | | | | |
| Auto Parts & Equipment — 4.6% | | | | | | |
| Adient PLC(a) | | | 30,702 | | | $ | 1,905,366 | |
| Banks — 9.1% | | | | | | | | |
| Dundee Corp., Class A* | | | 3,133 | | | | 5,705 | |
| HomeStreet, Inc.* | | | 74,750 | | | | 2,145,325 | |
| KeyCorp | | | 53,216 | | | | 1,124,459 | |
| OFG Bancorp | | | 46,227 | | | | 496,940 | |
| | | | | | | | 3,772,429 | |
| Building Materials — 0.5% | | | | | | | | |
| Builders FirstSource, Inc.* | | | 10,000 | | | | 191,800 | |
| Chemicals — 1.5% | | | | | | | | |
| Venator Materials PLC* | | | 32,323 | | | | 618,662 | |
| Commercial Services — 5.8% | | | | | | | | |
| Herc Holdings, Inc.* | | | 33,277 | | | | 2,169,993 | |
| Hudson Global, Inc.* | | | 120,924 | | | | 237,011 | |
| | | | | | | | 2,407,004 | |
| Home Builders — 0.5% | | | | | | | | |
| Taylor Morrison Home Corp., Class A* | | | 8,860 | | | | 198,819 | |
| Insurance — 11.4% | | | | | | | | |
| American Equity Investment Life Holding Co. | | | 67,622 | | | | 2,069,909 | |
| Assured Guaranty Ltd. | | | 59,698 | | | | 2,064,357 | |
| Enstar Group Ltd.* | | | 3,073 | | | | 608,454 | |
| | | | | | | | 4,742,720 | |
| Machinery-Diversified — 4.7% | | | | | | | | |
| Intevac, Inc.* | | | 323,657 | | | | 1,958,125 | |
| Oil & Gas — 25.8% | | | | | | | | |
| Chesapeake Energy Corp.*(a) | | | 1,165,288 | | | | 3,286,112 | |
| Halcon Resources Corp.* | | | 1 | | | | 7 | |
| MRC Global, Inc.* | | | 33,019 | | | | 545,804 | |
| NOW, Inc.*(a) | | | 84,787 | | | | 804,629 | |
| Oasis Petroleum, Inc.* | | | 29,525 | | | | 232,657 | |
| QEP Resources, Inc.* | | | 401,536 | | | | 3,461,240 | |
| Range Resources Corp.(a) | | | 9,882 | | | | 131,332 | |
| Whiting Petroleum Corp.* | | | 83,725 | | | | 2,278,157 | |
| | | | | | | | 10,739,938 | |
| Oil & Gas Services — 3.8% | | | | | | | | |
| Weatherford International PLC*(a) | | | 571,794 | | | | 1,503,818 | |
| Willbros Group, Inc.* | | | 86,400 | | | | 81,925 | |
| | | | | | | | 1,585,743 | |
| Pharmaceuticals — 4.2% | | | | | | | | |
| Mallinckrodt PLC*(a) | | | 104,887 | | | | 1,749,515 | |
| Real Estate — 1.9% | | | | | | | | |
| Alexander & Baldwin, Inc. | | | 35,562 | | | | 782,008 | |
| Real Estate Investment Trust — 4.8% | | | | | | | | |
| Boardwalk Real Estate Investment Trust(a) | | | 47,991 | | | | 1,694,629 | |
| Forest City Realty Trust, Inc., Class A | | | 13,969 | | | | 297,121 | |
| NorthStar Realty Europe Corp. | | | 1,314 | | | | 13,508 | |
| | | | | | | | 2,005,258 | |
| Retail — 2.7% | | | | | | | | |
| Tuesday Morning Corp.*(a) | | | 355,727 | | | | 1,120,540 | |
| Savings & Loans — 0.3% | | | | | | | | |
| Flagstar Bancorp, Inc.* | | | 3,600 | | | | 126,936 | |
| Semiconductors — 2.1% | | | | | | | | |
| Veeco Instruments, Inc.*(a) | | | 48,885 | | | | 887,263 | |
| Telecommunications — 9.0% | | | | | | | | |
| Aviat Networks, Inc.* | | | 181,742 | | | | 3,047,808 | |
| UTStarcom Holdings Corp.* | | | 130,149 | | | | 717,121 | |
| | | | | | | | 3,764,929 | |
| Transportation — 3.7% | | | | | | | | |
| Aegean Marine Petroleum Network, Inc.(a) | | | 185,118 | | | | 425,771 | |
| Ardmore Shipping Corp.* | | | 110,810 | | | | 836,616 | |
| Scorpio Tankers, Inc. | | | 134,418 | | | | 309,161 | |
| | | | | | | | 1,571,548 | |
| TOTAL COMMON STOCKS | | | | | | | | |
| (Cost $41,769,683) | | | | | | | 40,128,603 | |
| | | | | | | | | |
| WARRANTS — 0.0% | | | | | | | | |
| Oil & Gas — 0.0% | | | | | | | | |
| C&J Energy Services, Inc. * | | | 4,153 | | | | 30,130 | |
| TOTAL WARRANTS | | | | | | | | |
| (Cost $—) | | | | | | | 30,130 | |
| | | | | | | | | |
| SECURITIES LENDING COLLATERAL — 32.6% | | | | | | | | |
| Mount Vernon Liquid Assets Portfolio, LLC, 1.65% | | | 13,550,165 | | | | 13,550,165 | |
| TOTAL SECURITIES LENDING COLLATERAL | | | | | | | | |
| (Cost $13,550,165) | | | | | | | 13,550,165 | |
The accompanying notes are an integral part of the financial statements.
4
SCHNEIDER SMALL CAP VALUE FUND
Portfolio of Investments (Concluded)
February 28, 2018 (Unaudited)
| | | Number of
Shares | | | Value | |
| SHORT-TERM INVESTMENTS — 3.8% | | | |
| STIT-Treasury Obligations Portfolio, 1.31%(b) | | | 1,571,033 | | | $ | 1,571,033 | |
| TOTAL SHORT-TERM INVESTMENTS | | | | | | | | |
| (Cost $1,571,033) | | | | | | | 1,571,033 | |
| | | | | | | | | |
| TOTAL INVESTMENTS — 132.8% | | | | | | | | |
| (Cost $56,891,104) | | | | | | | 55,279,931 | |
| LIABILITIES IN EXCESS OF OTHER ASSETS — (32.8)% | | | | | | | (13,667,860 | ) |
| NET ASSETS — 100.0% | | | | | | $ | 41,612,071 | |
* | Non-income producing security. |
(a) | All or a portion of the security is on loan. At February 28, 2018, the market value of securities on loan was $12,303,269. |
(b) | Seven-day yield as of February 28, 2018. |
PLC | Public Limited Company |
The accompanying notes are an integral part of the financial statements.
5
SCHNEIDER SMALL CAP VALUE FUND
Statement of Assets and Liabilities
February 28, 2018 (Unaudited)
| ASSETS | | | |
| Investments, at value^ (cost $55,319,848) | | $ | 53,708,898 | |
| Short-term investments, at value (cost $1,571,033) | | | 1,571,033 | |
| Receivables for: | | | | |
| Investments sold | | | 35,753 | |
| Dividends | | | 14,151 | |
| Prepaid expenses | | | 21,232 | |
| Total assets | | | 55,351,067 | |
| | | | | |
| LIABILITIES | | | | |
| Payables for: | | | | |
| Securities lending collateral | | | 13,550,165 | |
| Investments purchased | | | 135,813 | |
| Advisory fees | | | 19,263 | |
| Administration and accounting fees | | | 8,493 | |
| Other accrued expenses and liabilities | | | 25,262 | |
| Total liabilities | | | 13,738,996 | |
| Net Assets | | $ | 41,612,071 | |
| | | | | |
| NET ASSETS CONSIST OF: | | | | |
| Par value | | $ | 3,025 | |
| Paid-in capital | | | 42,778,967 | |
| Undistributed/(accumulated) net investment income/(loss) | | | (24,603 | ) |
| Accumulated net realized gain/(loss) from investments | | | 465,632 | |
| Net unrealized appriciation/(depreciation) on investments | | | (1,610,950 | ) |
| Net Assets | | $ | 41,612,071 | |
| | | | | |
| Shares outstanding ($0.001 par value, 100,000,000 shares authorized) | | | 3,024,971 | |
| Net asset value, offering and redemption price per share | | | 13.76 | |
| ^Includes market value of securities on loan | | $ | 12,303,269 | |
The accompanying notes are an integral part of the financial statements.
6
SCHNEIDER SMALL CAP VALUE FUND
Statement of Operations
For the Six Months Ended February 28, 2018 (Unaudited)
| INVESTMENT INCOME | | | |
| Dividends (net of foreign withholding taxes of $5,997) | | $ | 344,413 | |
| Securities lending income | | | 75,785 | |
| Total Investment Income | | | 420,198 | |
| | | | | |
| EXPENSES | | | | |
| Advisory fees (Note 2) | | | 222,934 | |
| Administration and accounting services fees (Note 2) | | | 21,358 | |
| Audit fees | | | 20,940 | |
| Legal fees | | | 13,378 | |
| Registration and filing fees | | | 13,359 | |
| Transfer agent fees (Note 2) | | | 12,326 | |
| Directors' fees | | | 9,854 | |
| Officers' fees | | | 7,231 | |
| Printing and shareholder reporting fees | | | 5,582 | |
| Custodian fees (Note 2) | | | 4,393 | |
| Other expenses | | | 5,681 | |
| Total expenses | | | 337,036 | |
| Less: waivers | | | (80,662 | ) |
| Net expenses after waivers | | | 256,374 | |
| Net investment income (loss) | | | 163,824 | |
| | | | | |
| NET REALIZED AND UNREALIZED GAIN/(LOSS) FROM INVESTMENTS | | | | |
| Net realized gain/(loss) from: | | | | |
| Investments | | | 2,470,846 | |
| Net change in unrealized appreciation (depreciation) on: | | | | |
| Investments | | | (8,258 | ) |
| Net realized and unrealized gain (loss) on investments | | | 2,462,588 | |
| NET INCREASE (DECREASE) IN NET ASSETS RESULTING FROM OPERATIONS | | $ | 2,626,412 | |
The accompanying notes are an integral part of the financial statements.
7
SCHNEIDER SMALL CAP VALUE FUND
Statements of Changes in Net Assets
| | | For the
Six Months Ended
February 28, 2018
(Unaudited) | | | For the
Year Ended
August 31, 2017 | |
| INCREASE/(DECREASE) IN NET ASSETS FROM OPERATIONS: | | | | | | |
| Net investment income/(loss) | | $ | 163,824 | | | $ | (164,197 | ) |
| Net realized gain/(loss) from investments | | | 2,470,846 | | | | 11,057,111 | |
| Net change in unrealized appreciation/(depreciation) on investments | | | (8,258 | ) | | | (2,927,020 | ) |
| Net increase/(decrease) in net assets resulting from operations | | | 2,626,412 | | | | 7,965,894 | |
| | | | | | | | | |
| DIVIDENDS AND DISTRIBUTIONS TO SHAREHOLDERS FROM: | | | | | | | | |
| Net investment income | | | (188,427 | ) | | | — | |
| Net realized capital gains | | | (8,787,559 | ) | | | — | |
| Net decrease in net assets from dividends and distributions to shareholders | | | (8,975,986 | ) | | | — | |
| | | | | | | | | |
| CAPITAL SHARE TRANSACTIONS: | | | | | | | | |
| Proceeds from shares sold | | | 386,559 | | | | 6,471,850 | |
| Reinvestment of distributions | | | 7,194,872 | | | | — | |
| Redemption fees* | | | 5,959 | | | | 86,813 | |
| Shares redeemed | | | (1,296,608 | ) | | | (9,728,036 | ) |
| Net increase/(decrease) in net assets from capital shares | | | 6,290,782 | | | | (3,169,373 | ) |
| Total increase/(decrease) in net assets | | | (58,792 | ) | | | 4,796,521 | |
| | | | | | | | | |
| NET ASSETS: | | | | | | | | |
| Beginning of period | | | 41,670,863 | | | | 36,874,342 | |
| End of period | | $ | 41,612,071 | | | $ | 41,670,863 | |
| Undistributed/(accumulated) net investment income/(loss), end of period | | $ | (24,603 | ) | | $ | — | |
| | | | | | | | | |
| SHARES TRANSACTIONS: | | | | | | | | |
| Shares sold | | | 25,778 | | | | 401,314 | |
| Dividends and distributions reinvested | | | 497,227 | | | | — | |
| Shares redeemed | | | (82,517 | ) | | | (598,006 | ) |
| Net increase/(decrease) in shares outstanding | | | 440,488 | | | | (196,692 | ) |
* | Prior to December 31, 2017, there was a 1.75% redemption fee on shares redeemed which have been held less than one year. Effective December 31, 2017, the Fund has changed its redemption fees to 1.00% on redemptions of Fund shares held less than 30 days. The redemption fees are retained by the Fund for the benefit of the remaining shareholders and recorded as paid-in capital. |
The accompanying notes are an integral part of the financial statements.
8
SCHNEIDER SMALL CAP VALUE FUND
Financial Highlights
Contained below is per share operating performance data for each share outstanding, total investment return, ratios to average net assets and other supplemental data for the respective periods. This information has been derived from information provided in the financial statements. |
| | | For the
Six Months Ended February 28, 2018 | | | For the Years Ended August 31, | |
| | | (Unaudited) | | | 2017 | | | 2016 | | | 2015 | | | 2014 | | | 2013 | |
| Per Share Operating Performance | | | | | | | | | | | | | | | | | | |
| Net asset value, beginning of period | | $ | 16.12 | | | $ | 13.26 | | | $ | 11.00 | | | $ | 20.16 | | | $ | 21.07 | | | $ | 16.09 | |
Net investment income/(loss)(1) | | | 0.06 | | | | (0.06 | ) | | | 0.03 | | | | (0.01 | ) | | | (0.09 | ) | | | 0.08 | |
| Net realized and unrealized gain/(loss) on investments | | | 1.08 | | | | 2.89 | | | | 2.29 | | | | (4.53 | ) | | | 2.63 | | | | 4.90 | |
| Net increase/(decrease) in net assets resulting from operations | | | 1.14 | | | | 2.83 | | | | 2.32 | | | | (4.54 | ) | | | 2.54 | | | | 4.98 | |
| Dividends and distributions to shareholders from: | | | | | | | | | | | | | | | | | | | | | | | | |
| Net investment income | | | (0.07 | ) | | | — | | | | (0.03 | ) | | | — | | | | — | | | | — | |
| Net realized gains | | | (3.43 | ) | | | — | | | | (0.03 | ) | | | (4.58 | ) | | | (3.45 | ) | | | — | |
| Tax return of capital | | | — | | | | — | | | | — | | | | (0.04 | ) | | | — | | | | — | |
| Total dividends and distributions to shareholders | | | (3.50 | ) | | | — | | | | (0.06 | ) | | | (4.62 | ) | | | (3.45 | ) | | | — | |
| Redemption fees | | | — | (2) | | | 0.03 | | | | — | (2) | | | — | (2) | | | — | (2) | | | — | (2) |
| Net asset value, end of period | | $ | 13.76 | | | $ | 16.12 | | | $ | 13.26 | | | $ | 11.00 | | | $ | 20.16 | | | $ | 21.07 | |
Total investment return(3) | | | 6.05 | %(5) | | | 21.57 | % | | | 21.15 | % | | | (25.88 | )% | | | 12.59 | % | | | 30.95 | % |
| | | | | | | | | | | | | | | | | | | | | | | | | |
| Ratio/Supplemental Data | | | | | | | | | | | | | | | | | | | | | | | | |
| Net assets, end of period (000’s omitted) | | $ | 41,612 | | | $ | 41,671 | | | $ | 36,874 | | | $ | 30,387 | | | $ | 61,240 | | | $ | 70,556 | |
Ratio of expenses to average net assets(4) | | | 1.15 | %(6) | | | 1.15 | % | | | 1.15 | % | | | 1.15 | % | | | 1.15 | % | | | 1.15 | % |
| Ratio of expenses to average net assets without waivers and expense reimbursements | | | 1.51 | %(6) | | | 1.57 | % | | | 2.13 | % | | | 1.82 | % | | | 1.52 | % | | | 1.50 | % |
Ratio of net investment income/(loss) to average net assets(4) | | | 0.73 | %(6) | | | (0.37 | )% | | | 0.23 | % | | | (0.05 | )% | | | (0.44 | )% | | | 0.38 | % |
| Portfolio turnover rate | | | 45.04 | %(5) | | | 137.61 | % | | | 113.69 | % | | | 88.80 | % | | | 72.33 | % | | | 63.87 | % |
(1) | Calculated based on average shares outstanding for the period. |
(2) | Amount is less than $0.005 per share. |
(3) | Total investment return is calculated by assuming a purchase of shares on the first day and a sale of shares on the last day of each period reported and includes reinvestments of dividends and distributions, if any. |
(4) | Reflects waivers and reimbursements. |
The accompanying notes are an integral part of the financial statements.
9
SCHNEIDER SMALL CAP VALUE FUND
Notes to Financial Statements
February 28, 2018 (Unaudited)
1. | Organization and Significant Accounting Policies |
The RBB Fund, Inc. (“RBB” or the “Company”) was incorporated under the laws of the State of Maryland on February 29, 1988 and is registered under the Investment Company Act of 1940, as amended (the “1940 Act”), as an open-end management investment company. RBB is a “series fund,” which is a mutual fund divided into separate portfolios. Each portfolio is treated as a separate entity for certain matters under the 1940 Act, and for other purposes, and a shareholder of one portfolio is not deemed to be a shareholder of any other portfolio. Currently, RBB has twenty-nine active investment portfolios, including the Schneider Small Cap Value Fund (the “Fund”), which commenced investment operations on September 2, 1998. As of the date hereof, the Fund offers one class of shares.
RBB has authorized capital of one hundred billion shares of common stock of which 87.023 billion shares are currently classified into one hundred and eighty-one classes of common stock. Each class represents an interest in an active or inactive RBB investment portfolio.
The Fund’s investment objective seeks long-term capital growth.
The Fund is an investment company and follows accounting and reporting guidance in the Financial Accounting Standards Board (“FASB”) Accounting Standards Codification Topic 946 “Financial Services - Investment Companies”.
The end of the reporting period for the Fund is February 28, 2018, and the period covered by these Notes to Financial Statements is the six months ended February 28, 2018 (the “current fiscal period”).
PORTFOLIO VALUATION — The Fund’s net asset value (“NAV”) is calculated once daily at the close of regular trading hours on the New York Stock Exchange (“NYSE”) (generally 4:00 p.m. Eastern time) on each day the NYSE is open. Securities held by the Fund are valued using the closing price or the last sale price on a national securities exchange or the National Association of Securities Dealers Automatic Quotation System (“NASDAQ”) market system where they are primarily traded. Equity securities traded in the over-the-counter (“OTC”) market are valued at their closing prices. If there were no transactions on that day, securities traded principally on an exchange or on NASDAQ will be valued at the mean of the last bid and ask prices prior to the market close. Fixed income securities are valued using an independent pricing service, which considers such factors as security prices, yields, maturities and ratings, and are deemed representative of market values at the close of the market. Foreign securities are valued based on prices from the primary market in which they are traded, and are translated from the local currency into U.S. dollars using current exchange rates. Investments in other open-end investment companies are valued based on the NAV of the investment companies (which may use fair value pricing as discussed in their prospectuses). If market quotations are unavailable or deemed unreliable, securities will be valued in accordance with procedures adopted by the Company’s Board of Directors (the “Board”). Relying on prices supplied by pricing services or dealers or using fair valuation may result in values that are higher or lower than the values used by other investment companies and investors to price the same investments.
FAIR VALUE MEASUREMENTS — The inputs and valuation techniques used to measure the fair value of the Fund’s investments are summarized into three levels as described in the hierarchy below:
| | ● | Level 1— Prices are determined using quoted prices in active markets for identical securities. |
| | ● | Level 2— Prices are determined using other significant observable inputs (including quoted prices for similar securities, interest rates, prepayment speeds, credit risk, etc.). |
| | ● | Level 3— Prices are determined using significant unobservable inputs (including the Fund’s own assumptions in determining the fair value of investments). |
The inputs or methodologies used for valuing securities are not necessarily an indication of the risk associated with investing in those securities.
10
SCHNEIDER SMALL CAP VALUE FUND
Notes to Financial Statements (Continued)
February 28, 2018 (Unaudited)
The following is a summary of the inputs used, as of the end of the reporting period, in valuing the Fund’s investments carried at fair value:
| | | TOTAL | | | LEVEL 1 | | | LEVEL 2 | | | LEVEL 3 | |
| Common Stocks | | $ | 40,128,603 | | | $ | 40,128,603 | | | $ | — | | | $ | — | |
| Warrants | | | 30,130 | | | | 30,130 | | | | — | | | | — | |
| Securities Lending Collateral | | | 13,550,165 | | | | 13,550,165 | | | | — | | | | — | |
| Short-Term Investments | | | 1,571,033 | | | | 1,571,033 | | | | — | | | | — | |
| Total* | | $ | 55,279,931 | | | $ | 55,279,931 | | | $ | — | | | $ | — | |
* | Please refer to the Portfolio of Investments for further details. |
At the end of each period, management evaluates the classification of Levels 1, 2 and 3 assets and liabilities. Various factors are considered, such as changes in liquidity from the prior reporting period; whether or not a broker is willing to execute at the quoted price; the depth and consistency of prices from third party pricing services; and the existence of contemporaneous, observable trades in the market. Additionally, management evaluates the classification of Level 1 and Level 2 assets and liabilities on a quarterly basis for changes in listings or delistings on national exchanges.
Due to the inherent uncertainty of determining the fair value of investments that do not have a readily available market value, the fair value of the Fund’s investments may fluctuate from period to period. Additionally, the fair value of investments may differ significantly from the values that would have been used had an active market existed for such investments and may differ materially from the values the Fund may ultimately realize. Further, such investments may be subject to legal and other restrictions on resale or otherwise less liquid than publicly traded securities.
For fair valuations using significant unobservable inputs, U.S. generally accepted accounting principles (“U.S. GAAP”) requires the Fund to present a reconciliation of the beginning to ending balances for reported market values that presents changes attributable to total realized and unrealized gains or losses, purchase and sales, and transfers in and out of Level 3 during the period. Transfers in and out between levels are based on values at the end of the period. U.S. GAAP also requires the Fund to disclose amounts and reasons for all transfers in and out of Level 1 and Level 2 fair value measurements. A reconciliation of Level 3 investments is presented only when the Fund had an amount of Level 3 investments at the end of the reporting period that was meaningful in relation to its net assets. The amounts and reasons for all transfers in and out of each level within the three-tier hierarchy are disclosed when the Fund had an amount of total transfers during the reporting period that was meaningful in relation to its net assets as of the end of the reporting period.
During the current fiscal period, the Fund had no transfers between Levels 1, 2 and 3.
USE OF ESTIMATES — The preparation of financial statements in conformity with U.S. GAAP requires management to make estimates and assumptions that affect the reported amounts of assets and liabilities and disclosure of contingent assets and liabilities at the date of the financial statements and the reported amounts of revenues and expenses during the reporting period. Actual results could differ from those estimates and those differences could be significant.
INVESTMENT TRANSACTIONS, INVESTMENT INCOME AND EXPENSES — The Fund records security transactions based on trade date for financial reporting purposes. The cost of investments sold is determined by use of the specific identification method for both financial reporting and income tax purposes in determining realized gains and losses on investments. Interest income is accrued when earned. Dividend income is recorded on the ex-dividend date. Distributions received on securities that represent a return of capital or capital gain are recorded as a reduction of cost of investments and/or as a realized gain. The Fund estimates the components of distributions received that may be considered return of capital distributions or capital gain distributions. The Fund’s investment income, expenses (other than class specific expenses) and unrealized and realized gains and losses are allocated daily to each class of shares based upon the relative proportion of net assets of each class at the beginning of the day. Expenses incurred on behalf of a specific class, fund or fund family of the Company are charged directly
11
SCHNEIDER SMALL CAP VALUE FUND
Notes to Financial Statements (Continued)
February 28, 2018 (Unaudited)
to the class, fund or fund family (in proportion to net assets). Expenses incurred for all of the RBB funds (such as director or professional fees) are charged to all funds in proportion to their average net assets of RBB, or in such other manner as the Board deems fair or equitable. Expenses and fees, including investment advisory and administration fees, are accrued daily and taken into account for the purpose of determining the NAV of the Fund.
DIVIDENDS AND DISTRIBUTIONS TO SHAREHOLDERS — Dividends from net investment income and distributions from net realized capital gains, if any, are declared, and paid at least annually to shareholders recorded on the ex-dividend date. Income dividends and capital gain distributions are determined in accordance with U.S. federal income tax regulations, which may differ from U.S. GAAP.
U.S. TAX STATUS — No provision is made for U.S. income taxes as it is the Fund’s intention to continue to qualify for and elect the tax treatment applicable to regulated investment companies under Subchapter M of the Internal Revenue Code of 1986, as amended, and make the requisite distributions to its shareholders which will be sufficient to relieve it from U.S. income and excise taxes.
CASH AND CASH EQUIVALENTS — Cash and cash equivalents are valued at cost plus accrued interest, which approximates market value.
REDEMPTION FEES — Prior to December 31, 2017, the Fund imposed a redemption fee of 1.75% on redemptions of Fund shares held less than one year. Effective December 31, 2017, the Fund has changed its redemption fees to 1.00% on redemptions of Fund shares held less than 30 days. The fees are reflected on the Statement of Changes in Net Assets. The Fund reserves the right to modify or eliminate the redemption fee or any waivers of such fee at any time.
OTHER — In the normal course of business, the Fund may enter into contracts that provide general indemnifications. The Fund’s maximum exposure under these arrangements is dependent on claims that may be made against the Fund in the future, and, therefore, cannot be estimated; however, based on experience, the risk of material loss from such claims is considered remote.
2. | Investment Adviser and Other Services |
Schneider Capital Management Company (“SCM” or the “Adviser”) serves as the investment adviser to the Fund. The Fund compensates the Adviser for its services at an annual rate based on the Fund’s average daily net assets (the “Advisory Fee”), payable on a monthly basis in arrears, as shown in the following table.
The Adviser has contractually agreed to waive advisory fees and/or reimburse expenses to the extent that total annual Fund operating expenses (excluding certain items discussed below) exceed the rate (“Expense Cap”) shown in the following table of the Fund’s average daily net assets. In determining the Adviser’s obligation to waive advisory fees and/or reimburse expenses, the following expenses are not taken into account and could cause net total annual Fund operating expenses to exceed the Expense Cap as applicable: acquired fund fees and expenses, brokerage commissions, extraordinary items, interest and taxes. This contractual limitation is in effect until December 31, 2018 and may not be terminated without the approval of the Board. The Adviser may discontinue these arrangements at any time after December 31, 2018. The Fund will not pay the Adviser at a later time for any amounts it may waive or any amounts that the Adviser has assumed.
Advisory Fee | Expense Cap
Institutional Class |
1.00% | 1.15% |
12
SCHNEIDER SMALL CAP VALUE FUND
Notes to Financial Statements (Continued)
February 28, 2018 (Unaudited)
During the current fiscal period, investment advisory fees accrued and waived were as follows:
Gross Advisory
Fees | Waivers | Net Advisory
Fees |
$222,934 | $(80,662) | $142,272 |
U.S. Bancorp Fund Services, LLC (“USBFS”) serves as administrator for the Fund. For providing administrative and accounting services, USBFS is entitled to receive a monthly fee, subject to certain minimum and out of pocket expenses.
USBFS serves as the Fund’s transfer and dividend disbursing agent. For providing transfer agent services, USBFS is entitled to receive a monthly fee, subject to certain minimum and out of pocket expenses.
U.S. Bank, N.A. (the “Custodian”) provides certain custodial services to the Fund. The Custodian is entitled to receive a monthly fee, subject to certain minimum and out of pocket expenses.
Quasar Distributors, LLC serves as the principal underwriter and distributor of the Fund’s shares pursuant to a Distribution Agreement with RBB.
For compensation amounts payable to USBFS, please refer to the Statement of Operations.
3. | Director’s and Officer’s Compensation |
The Directors of the Company receive an annual retainer and meeting fees for meetings attended. Employees of Vigilant Compliance, LLC serve as President, Chief Compliance Officer and Assistant Treasurer of the Company. Vigilant Compliance, LLC is compensated for the services provided to the Company. An employee of RBB serves as Treasurer and Secretary and is compensated for services provided. Certain employees of USBFS serve as officers of the Company. They are not compensated by the Fund or the Company. For Director’s and Officer’s compensation amounts, please refer to the Statement of Operations.
4. | Purchases and Sales of Investment Securities |
During the current fiscal period, aggregate purchases and sales of investment securities (excluding short-term investments) of the Fund were as follows:
Purchases | Sales |
$18,553,832 | $19,067,600 |
There were no purchases or sales of long-term U.S. Government securities during the current fiscal period.
5. | Federal Income Tax Information |
The Fund has followed the authoritative guidance on accounting for and disclosure of uncertainty in tax positions, which requires the Fund to determine whether a tax position is more likely than not to be sustained upon examination, including resolution of any related appeals or litigation processes, based on the technical merits of the position. The Fund has determined that there was no effect on the financial statements from following this authoritative guidance. In the normal course of business, the Fund is subject to examination by federal, state and local jurisdictions, where applicable, for tax years for which applicable statutes of limitations have not expired. The Fund is not aware of any tax positions for which it is reasonably possible that the total amounts of unrecognized tax benefits will significantly change in the next twelve months.
13
SCHNEIDER SMALL CAP VALUE FUND
Notes to Financial Statements (Continued)
February 28, 2018 (Unaudited)
As of August 31, 2017, the federal tax cost and aggregate gross unrealized appreciation and depreciation of investments held by the Fund were as follows:
Federal Tax
Cost | Unrealized
Appreciation | Unrealized
(Depreciation) | Net
Unrealized
Appreciation/
(Depreciation) |
$57,538,038 | $4,390,483 | $(7,845,264) | $(3,454,781) |
Distributions to shareholders, if any, from net investment income and realized gains are determined in accordance with federal income tax regulations, which may differ from net investment income and realized gains recognized for financial reporting purposes. Accordingly, the character of distributions and composition of net assets for tax purposes may differ from those reflected in the accompanying financial statements. To the extent these differences are permanent, such amounts are reclassified within the capital accounts based on the tax treatment; temporary differences do not require such reclassification.
The following permanent differences as of August 31, 2017, primarily attributable to short-term capital gains being netted against net operating loss, were reclassified among the following accounts:
Undistributed Net
Investment
Income/(loss) | Accumulated
Net Realized
Gain/(Loss) | Paid-In
Capital |
$194,064 | $(194,064) | $— |
As of August 31, 2017, the components of distributable earnings on a tax basis were as follows:
Undistributed
Ordinary
Income/(loss) | Undistributed
Long-Term
capital Gains/(loss) | Net
Unrealized
Appreciation/
(Depreciation) | Qualified
Late-Year
Losses |
$7,467,600 | $1,166,834 | $(3,454,781) | $— |
The differences between the book and tax basis components of distributable earnings relate principally to the timing of recognition of income and gains for federal income tax purposes. Short-term and foreign currency gains are reportable as ordinary income for federal income tax purposes.
The tax character of dividends and distributions paid during the fiscal year ended August 31, 2017 were as follows:
Ordinary
Income | Long-Term
Gains | Return of
Capital | Total |
$ — | $ — | $ — | $ — |
Dividends from net investment income and short-term capital gains are treated as ordinary income dividends for federal income tax purposes.
Pursuant to federal income tax rules applicable to regulated investment companies, the Fund may elect to treat certain capital losses between November 1 and August 31 and late year ordinary losses ((i) ordinary losses between January 1 and August 31, and (ii) specified ordinary and currency losses between November 1 and August 31) as occurring on the first day of the following tax year. For the year ended August 31, 2017, any amount of losses elected within the tax return will not be recognized for federal income tax purposes until September 1, 2017.
14
SCHNEIDER SMALL CAP VALUE FUND
Notes to Financial Statements (Continued)
February 28, 2018 (Unaudited)
For the fiscal year ended August 31, 2017, the Fund deferred to September 1, 2017, the following losses:
Late-Year
Ordinary
Loss Deferral | Short-Term
Capital
Loss Deferral | Long-Term
Capital
Loss Deferral |
$— | $— | $— |
Accumulated capital losses represent net capital loss carryforwards as of August 31, 2017 that may be available to offset future realized capital gains and thereby reduce future capital gains distributions. Under the Regulated Investment Company Modernization Act of 2010, the Fund is permitted to carry forward capital losses incurred in taxable years beginning after December 22, 2010 for an unlimited period. Additionally, capital losses that are carried forward will retain their character as either short-term or long-term capital losses rather than being considered all short-term as under the previous law. During the year ended August 31, 2017, the Fund utilized $56,873 of capital loss carryfowards. As of August 31, 2017, the Fund did not have any capital loss carryforwards.
The Fund may make secured loans of its portfolio securities to brokers, dealers and other financial institutions to earn additional income and receive cash collateral equal to at least 102% of the current market value of the loaned securities, as marked to market each day that the NAV of the Fund is determined. When the collateral falls below specified amounts, the lending agent will use its best effort to obtain additional collateral on the next business day to meet required amounts under the security lending agreement. The Fund will pay administrative and custodial fees in connection with the loan of securities. Collateral is invested in short-term investments and the Fund will bear the risk of loss of the invested collateral. Securities lending will expose the Fund to the risk of loss should a borrower default on its obligation to return the borrowed securities. The market value of the securities on loan and collateral as of the end of the reporting period and the income generated from the program during the current fiscal period with respect to such secured loans were as follows:
Market Value of
Securities Loaned | Market Value
of Collateral | Income Received
from Securities
Lending |
$12,303,269 | $13,550,165 | $75,785 |
Securities lending transactions are entered into by the Fund under a Master Securities Lending Agreement (“MSLA”) which permits the Fund, under certain circumstances including an event of default (such as bankruptcy or insolvency), to offset amounts payable by the Fund to the same counterparty against amounts to be received and create one single net payment due to or from the Fund. The following table is a summary of the Fund’s open securities lending transactions which are subject to a MSLA as of the end of the reporting period:
| | | | Gross Amount Not Offset in the
Statement of Assets and Liabilities |
Gross Amounts of
Recognized
Assets | Gross Amounts
Offset in the
Statement of
Assets and
Liabilities | Net Amount of
Assets Presented in
the Statement
of Assets and
Liabilities | Financial
Instruments1 | Cash
Collateral
Received | Net
Amount2 |
$12,303,269 | $— | $12,303,269 | ($12,303,269) | $— | $— |
1 | Amount disclosed is limited to the amount of assets presented in the Statement of Assets and Liabilities. Actual collateral received may be more than the amount shown. |
2 | Net amount represents the net amount receivable from the counterparty in the event of default. |
15
SCHNEIDER SMALL CAP VALUE FUND
Notes to Financial Statements (Concluded)
February 28, 2018 (Unaudited)
Management has evaluated the impact of all subsequent events on the Fund through the date the financial statements were issued and has determined that there were no significant events requiring recognition or disclosure in the financial statements.
16
SCHNEIDER SMALL CAP VALUE FUND
Other Information (Unaudited)
Proxy Voting
Policies and procedures that the Fund uses to determine how to vote proxies relating to portfolio securities as well as information regarding how the Fund voted proxies relating to portfolio securities for the most recent twelve-month period ended June 30 are available without charge, upon request, by calling (888) 520-3277 and on the Securities and Exchange Commission’s (“SEC”) website at http://www.sec.gov.
Quarterly Portfolio Schedules
The Company files a complete schedule of portfolio holdings with the SEC for the first and third fiscal quarters of each fiscal year (quarters ended November 30 and May 31) on Form N-Q. The Company’s Form N-Q is available on the SEC website at http://www.sec.gov and may be reviewed and copied at the SEC Public Reference Room in Washington, D.C. Information on the operation of the SEC Public Reference Room may be obtained by calling (800) SEC-0330.
17
Investment Adviser
Schneider Capital Management
460 E. Swedesford Road
Suite 1080
Wayne, PA 19087
Administrator and Transfer Agent
U.S. Bancorp Fund Services, LLC
P.O. Box 701
Milwaukee, WI 53201
Principal Underwriter
Quasar Distributors, LLC
777 East Wisconsin Avenue, Floor 6
Milwaukee, WI 53202
Custodian
U.S. Bank, N.A.
1555 North Rivercenter Drive, Suite 302
Milwaukee, WI 53212
Independent Registered Public Accounting Firm
PricewaterhouseCoopers LLP
Two Commerce Square, Suite 1800
2001 Market Street
Philadelphia, PA 19103-7042
Legal Counsel
Drinker Biddle & Reath LLP
One Logan Square, Suite 2000
Philadelphia, PA 19103-6996
SCH-SAR18

SUMMIT GLOBAL INVESTMENTS
U.S. LOW VOLATILITY EQUITY FUND
SUMMIT GLOBAL INVESTMENTS
SMALL CAP LOW VOLATILITY FUND
SUMMIT GLOBAL INVESTMENTS
GLOBAL LOW VOLATILITY FUND
of
The RBB Fund, Inc.
SEMI-ANNUAL REPORT
February 28, 2018
(Unaudited)
This report is submitted for the general information of the shareholders of the Funds.
It is not authorized for distribution unless preceded or accompanied by a current prospectus for the Funds.
SUMMIT GLOBAL INVESTMENTS
Semi-Annual Investment Adviser’s Report
February 28, 2018 (Unaudited)
Dear Shareholder:
We appreciate the confidence you have placed in us and are continually grateful to work with you. It enables all of us at Summit Global Investments to do what we love every day. We believe that investors are ultimately rewarded when equity risk is prudently managed. Our strategy utilizes time-tested investment principles and seeks to be fully invested in the equity market while also seeking to provide a smoother ride than other investment strategies.
We firmly believe that investing with a long-term, risk-return perspective is key to experiencing superior risk-adjusted returns. While staying the course with a low volatility portfolio does not eliminate risk, it has the potential to considerably lessen the effect of market gyrations.
Our investment approach to portfolio construction takes into consideration a multitude of factors that ultimately help drive the price of equities. We sincerely value and believe strongly that return and risk must coincide and be effectively managed together. Investing in cap-weighted indexes, higher risk strategies, or products or markets just for exposure without regard to the investment’s return seems unwarranted. Investing for return must always be weighed against the risk of the investments.
Since our last letter to shareholders dated August 31, 2017, U.S. equities have experienced quite the ride. Volatility spiked in February and the market experienced a correction followed by a sharp recovery from the lows. For the six-month period from September 1, 2017 through February 28, 2018, the total return for the U.S Low Volatility Equity Fund was 10.51% vs. 10.84% for the S&P 500® Index. The Fund has faced numerous headwinds such as growth securities winning, concentration outperforming, strong isolated momentum, and most importantly, historic low volatility prior to February’s volatility spike. Nevertheless, the Fund has largely kept pace, only underperforming by -0.31% while capturing 97.13% of the return of the S&P 500® Index. On a risk-adjusted basis the Fund outperformed by 2.63%, as the beta1 for the Fund, as of February 28, 2018, was 0.75. The Fund continues to have a lower beta than the Index with positioning designed to seek downside protection in the event of continued market declines.
For the six months ending February 28, 2018, the Small Cap Low Volatility Fund has faced numerous headwinds such as the dollar weakening, growth securities winning, concentration outperforming, strong isolated momentum, and most importantly, historic low volatility. The Fund has returned 2.71% vs 8.30% for the Russell 2000 Index®. On a risk-adjusted basis the Fund underperformed by -2.10%, as the beta1 for the Fund, as of February 28, 2018, was 0.58. The Fund continues to have a lower beta than the Index with positioning designed to seek downside protection.
In 2017 Summit Global Investments officially began management of the Global Low Volatility Fund. From September 1, 2017 through February 28, 2018 the Fund has faced numerous headwinds such as the dollar weakening, growth securities winning, concentration outperforming, strong isolated momentum, and most importantly, historic low volatility. Despite such markets the Fund has returned 6.03% vs 9.29% for the MSCI ACWI Index. On a risk-adjusted basis the Fund outperformed by 0.16%, as the beta1 for the Fund, as of February 28, 2018, was 0.63. The Fund continues to have a lower beta than the Index with positioning designed to seek downside protection.
Economic Update
The economy has continued to grow modestly through the fourth quarter of 2017 and into the first quarter of 2018. During the first quarter, equity markets were generally weak and volatile. Growth stocks, as a style, significantly outperformed value stocks across all market caps.
The U.S. economy is expected to continue to grow during 2018 according to the Federal Reserve Leading Index. We do not see significant signs of a recession in the near term.
Both U.S. and non-U.S. valuations are near their 10-year peaks. Although equity market valuations are clearly stretched, we’re still finding attractively valued companies in which to invest.
| 1 | Beta attempts to measure relative market risk. A beta rating above 1.0 indicates greater volatility than the market. A beta rating below 1.0 indicates lower volatility than the market. |
1
SUMMIT GLOBAL INVESTMENTS
Semi-Annual Investment Adviser’s Report (Continued)
February 28, 2018 (Unaudited)
Our expectations:
| | ● | Increased volatility will likely remain elevated throughout 2018. |
| | ● | U.S. economic growth are likely to remain modest as the probability of a recession remains low |
| | ● | Globally central bank balance sheets in aggregate should start to decline as debt matures creating a headwind for global growth |
| | ● | Valuations will likely remain elevated as measured by nearly every valuation metric |
| | ● | Unemployment rate should remain at generational lows |
| | ● | U.S. technology behemoth companies are likely to come under increasing regulatory scrutiny |
Volatility Matters
Stock market volatility, measured by the CBOE Volatility Index: VIX®, hit historical lows in 2017. In fact, the index had fallen below 10, hitting twenty-seven year lows. In the last shareholder letter, we asked, “Why is volatility so low when uncertainty of Washington politics, infrastructure spending, tax reform, and healthcare changes remains so high?”

In periods of extreme low volatility, it becomes increasingly difficult for low volatility strategies to outpace and differentiate themselves from the market. However, over history, a Minsky moment — that is, market turmoil following an extended period of speculation and/or unsustainable growth — sometimes occurs when complacency sets in, as stability is often the prelude to instability, as we experienced in February. Usually, low volatility investment strategies perform well during periods of high or rising market volatility.
2
SUMMIT GLOBAL INVESTMENTS
Semi-Annual Investment Adviser’s Report (Continued)
February 28, 2018 (Unaudited)
Interest Rates
In December, the Federal Reserve bank increased the Fed Funds rate by 0.25% to an upper-bound target of 1.50%. This is the fifth such increase since December 2015. Based upon the futures market, the implied probability of another 0.25% hike in the Fed Funds rate in March & June is 61%. Expectations exist for more than two rate hikes remaining in 2018. The recent tax cuts should boost economic growth enough for the Fed to have confidence to keep raising interest rates.
Note: In the following graphs, the shaded periods represent recessions.

Historically, an inverted yield curve, measured by the difference between the 10-Year Treasury yield and the 2-Year Treasury yield, has been an excellent indicator of oncoming recessions. During the two months of 2018, the yield curve continued to flatten, with the spread down to 0.47%. However, it’s still a quite a long way from falling below zero, or inverting.
Sentiment
Sentiment increased globally as economic growth picked up in both developed and emerging markets. In the U.S., the University of Michigan Consumer Sentiment Index increased from a quarter ago and remains near its highest level in 17 years.

3
SUMMIT GLOBAL INVESTMENTS
Semi-Annual Investment Adviser’s Report (ConTINUED)
February 28, 2018 (Unaudited)
Consumers are clearly feeling good with the unemployment rate, household net worth hitting new highs, and the lowest household debt service ratio in the past 30 years. Finally, the Conference Board of Ten Leading Economic Indicators rose from a year ago, confirming that the economy continues to grow modestly.
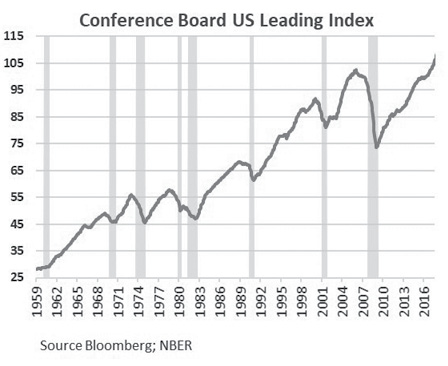
Valuations Remain Elevated
During the past six months, most global valuation signals remained elevated. Robust earnings growth is expected across global equity markets. Strong earnings often support higher valuation multiples; however, risk of a market selloff has clearly increased.
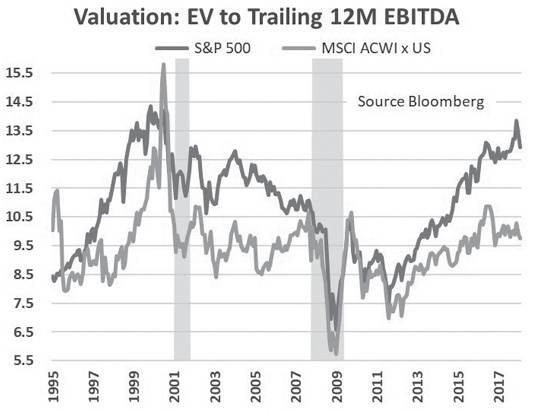
4
SUMMIT GLOBAL INVESTMENTS
Semi-Annual Investment Adviser’s Report (CONTINUED)
February 28, 2018 (Unaudited)
Both U.S. and non-U.S. valuations are at or near their 10-year peaks. The spread between them has been rising with the U.S. approximately 30-40% more expensive than international markets. Although, notably, the U.S. stock market seems to always trade at a premium to international stocks.
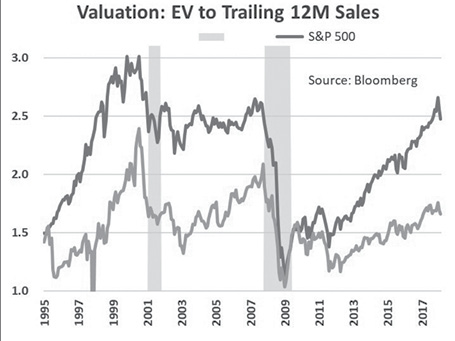
Lastly, while the markets are somewhat expensive, there usually exists attractively valued individual companies in which to invest. Summit Global Investments seeks attractively valued low volatility companies as part of our investment discipline.
SGI’s Multi-Factor, Multi-Faceted Investment Approach
At Summit Global Investments we are strong believers that low volatility, or managed risk, investing has the potential to ultimately result in more accumulated wealth and a smoother ride for the investor. In addition to our low volatility focus, we utilize multi-factor models and additional risk overlays as part of our investment processes.
Research has shown that a blended or multi-factor approach explains stock returns with greater consistency then single factor models which tend to go in and out of favor. Utilizing a multi-factor approach may help limit the drastic return extremes of single factor exposure (such as many passive “smart beta” approaches).
Important factor tilts that have been present are: value (cheaper companies), quality (profitable, less levered companies), momentum (companies with strong near term returns), lower capitalization (than the index), and dividend yield. We utilize a proprietary alpha model that analyzes companies across multiple dimensions. Our portfolio managers and research team continuously test the predictive power of our alpha model in addition to exploring the market for additional anomalies that we may be able to exploit. Ultimately, we fine tune these customized factors to complement our low volatility approach. These market anomalies have been well researched both internally here at SGI as well as in academia.
We recognize the inherent bias in many low volatility strategies to be highly concentrated in the most defensive sectors. We strive to produce a well-diversified portfolio, including sector allocations, to limit that structural bias within low volatility investing. In addition, we deploy both a multi-dimensional systematic and discretionary oversight to our sector allocations. This allows us to limit, or cap, our exposure to less attractive sectors from a risk adjusted basis.
5
SUMMIT GLOBAL INVESTMENTS
Semi-Annual Investment Adviser’s Report (ConTINUED)
February 28, 2018 (Unaudited)
Finally, a distinct advantage of Summit Global Investments is our ability to fundamentally analyze all companies in our portfolios. Many purely quantitative strategies end up investing in companies with higher than desired downside risk given their lack of fundamental analysis. Given our desire to manage risk, we find it imperative to identify and eliminate companies with higher potential for downside loss. We seek to eliminate companies with changing business models, management turnover, in major litigation or under investigations, and other critical issues.
We feel strongly that having multiple risk management processes should allow us to hedge and grow client portfolios.
Firm Update
We’re enthusiastic about several developments here at SGI. The firm has surpassed $700 million in assets with a strong pipeline of new business opportunities across all strategies. Three new senior investment professionals recently joined the investment team and we plan to make additional strategic personnel hires to be proactive and stay ahead of our business growth.
Conclusion
We continue to reiterate that large market events are being driven more and more by world events than ever before. Company revenue and profits, business plans and investments, and ultimately success or failure is more correlated to global events than ever in history. As such, companies must be as strong or stronger, balance sheet wise, than the country in which they are headquartered. We must keep an eye on such events and company strength throughout the coming months and years.
The team at SGI has identified some themes that require close monitoring through the end of 2018. Those themes include:
| | ● | Continuation of modest U.S. economic growth |
| | ● | The Federal Reserve will likely raise the fed funds rate at least two more times in 2018 |
| | ● | No dramatic increase in U.S. long term interest rates because of modest U.S. economic growth and very low international interest rates |
| | ● | Globally, monetary policies in major economies could be less accommodative |
| | ● | Store closures for brick and mortar retailers should accelerate as eCommerce continues to gain market share |
| | ● | Narrowing of the valuation difference between U.S. and non-U.S. equities |
| | ● | Political battles in Washington will continue, however clarity regarding health care and trade policies could benefit the market |
| | ● | Due to outsized future expectations, the FAANG stocks will ultimately disappoint |
| | ● | Volatility will likely continue to be elevated |
In addition to global and political events, companies are unique in how each prepares, responds and survives the impact of such macro events and economic cycles. While some cycles may, vary in length and events differ in impact, we believe, for U.S. equity exposure, the Funds' approach should be effective over full market cycles.
Our philosophy to navigate such markets is simple and consistent throughout up and down markets. We believe that being invested in a low volatility equity portfolio over full market cycles provides lower price fluctuations, the potential for more consistent and reliable returns with smaller drawdowns, and adds increased diversification when combined with other investment strategies. Our approach takes into account each underlying company’s stock volatility, expected
6
SUMMIT GLOBAL INVESTMENTS
Semi-Annual Investment Adviser’s Report (CONTINUED)
February 28, 2018 (Unaudited)
market return and how it correlates with other stocks within the portfolio, ultimately seeking to maximize return with an overall lower risk than a cap-weighted benchmark. The Funds seek to outperform the Index over a full market cycle while reducing overall volatility.
Financial markets are always unpredictable, but there are several time-tested investment principles that may help put the odds in your favor. It is our sincere effort to follow such principles as we seek to provide acceptable long-term, risk-adjusted returns.
We continue to adhere to our disciplined, managed-risk, multi-factor investment process. Over a full market cycle, this approach aims to limit downside risks and strives for participation in market rallies. After eight plus years of an equity bull market, we believe it is time for investors to be proactively prudent. We’re grateful for the opportunity to help steward the Funds.
Sincerely,
Summit Global Investments, LLC
Mutual fund investing involves risk. Loss of principle is possible. A portfolio comprised of low volatility stocks may not produce investment exposure that has lower variability to changes in such stocks’ price levels. Investing in low volatility stocks may limit the Fund’s gains in rising markets.
Diversification does not assure a profit, nor does it protect against a loss in a declining market. Growth stocks typically are more volatile than value stocks; however, value stocks have a lower expected growth rate in earnings and sales.
Earnings Growth is not a measure of the Fund’s future performance.
S&P 500: S&P 500 Index is a market capitalization-weighted index of 500 common stocks chosen for market size, liquidity, and industry group representation to represent U.S. equity performance.
Russell 2000: The Russell 2000® Index is an unmanaged market capitalization-weighted index of 2,000 small company stocks of U.S. domiciled companies.
MSCI ACWI: The MSCI ACWI Index captures large and mid-cap representation across 23 Developed Markets (DM) and 24 Emerging Markets (EM) countries. With 2,495 constituents, the index covers approximately 85% of the global investable equity opportunity set.
VIX: The CBOE Volatility Index (VIX) is a popular measure of the stock market’s expectation of volatility implied by S&P 500 Index options, calculated and published by the Chicago Board Options Exchange.
Federal Reserve Leading Index: The Federal Reserve Bank of Philadelphia publishes the leading index monthly and it includes economic variables that tend to move before changes in the overall economy. These indicators give a sense of the future state of the economy.
Consumer Sentiment Index: The University of Michigan collects data on consumer attitudes and expectations regarding personal finances, business conditions, and market conditions. This data is summarized in the Consumer Sentiment Index and published monthly.
Conference Board Leading Index: The Conference Board is a non-profit research organization that uses ten component indicators that tend to move before changes in the overall economy. These indicators summarized and published monthly give a sense of the future state of the economy.
It is not possible to invest directly in an index.
7
SUMMIT GLOBAL INVESTMENTS
Semi-Annual Investment Adviser’s Report (ConCLUDED)
February 28, 2018 (Unaudited)
Upside Capture Ratio: The upside capture ration is a statistical measure used to evaluate how well an investment manager performed relative to an index during periods when that index has risen.
EV to EBITDA: Enterprise value to earnings before interest, taxes, depreciation, and amortization is a popular valuation multiple used to measure the value of a company. It is often used in conjunction with other valuation multiples to determine the fair market value of a company or group of companies.
Smart Beta: Smart beta defines a set of investment strategies along various factor dimensions that emphasize alternative index construction methodologies using transparent rules versus traditional market capitalization-based indices.
Alpha: Alpha is a measure of the active return on an investment compared to a suitable market index.
FAANG is an acronym for the five most popular and best performing tech stocks in the market, namely Facebook, Apple, Amazon, Netflix and Alphabet’s Google.
Fund holdings and sector allocations are subject to change and should not be considered recommendations to buy or sell any security. Please refer to the Schedule of Investments in this report for a complete list of fund holdings.
8
SUMMIT GLOBAL INVESTMENTS
U.S. LOW VOLATILITY EQUITY FUND - CLASS I SHARES
Performance Data
February 28, 2018 (Unaudited)
Average Annual Total Returns for the periods ended February 28, 2018 | |
| | Six
Months† | One
Year | Three
Year | Five
Year | Since
Inception* | |
Class I Shares | 10.51% | 13.91% | 9.48% | 12.48% | 12.45% | |
S&P 500® Index** | 10.84% | 17.10% | 11.14% | 14.73% | 14.52% | |
* | Class I Shares of the Fund commenced operations on February 29, 2012. |
** | Benchmark performance is from inception date of the Class I Shares only and is not the inception date of the benchmark itself. |
Performance quoted is past performance and does not guarantee future results. The investment return and principal value of an investment in the Fund will fluctuate so that an investor’s shares, when redeemed, may be worth more or less than their original cost. Current performance may be lower or higher. Returns shown do not reflect taxes that a shareholder would pay on Fund distributions or on the redemption of Fund shares. Performance data current to the most recent month-end may be obtained by calling (855) 744-8500.
The Fund’s total annual gross and net operating expenses, as stated in the current prospectus dated December 31, 2017, are 1.14% and 0.98%, respectively, of average daily net assets for Class I Shares. These ratios may differ from the actual expenses incurred by the Fund for the period covered by this report. The Fund’s investment adviser (the “Adviser”), has contractually agreed to waive management fees and/or reimburse expenses through December 31, 2018 to the extent that total annual Fund operating expenses (excluding certain items discussed below) exceed 0.98% of the Fund’s average daily net assets attributable to Class I Shares. In determining the Adviser’s obligation to waive advisory fees and/or reimburse expenses, the following expenses are not taken into account and could cause net total annual Fund operating expenses to exceed 0.98%: acquired fund fees and expenses, brokerage commissions, extraordinary items, interest or taxes. The contractual limitation may not be terminated before December 31, 2018 without the approval of the Board of Directors of The RBB Fund, Inc. If at any time the Fund’s total annual Fund operating expenses for a year are less than 0.98% of the Fund’s average daily net assets attributable to Class I Shares, the Adviser is entitled to reimbursement by the Fund of the advisory fees forgone and other payments remitted by the Adviser to the Fund within three years from the date on which such waiver or reimbursement was made, provided such reimbursement does not cause the Fund to exceed expense limitations that were in effect at the time of the waiver or reimbursement.
The Fund’s investments will generally consist of securities, which may include common stocks, preferred stocks, warrants to acquire common stock and securities convertible into common stock. Portfolio composition is subject to change. The Fund evaluates performance as compared to that of the Standard & Poor’s 500® Index (“S&P 500®”). The S&P 500® is a widely recognized, unmanaged index of 500 common stocks which are generally representative of the U.S. stock market as a whole. It is impossible to invest directly in an index.
9
SUMMIT GLOBAL INVESTMENTS
U.S. LOW VOLATILITY EQUITY FUND - CLASS A SHARES
Performance Data (continued)
February 28, 2018 (Unaudited)
Average Annual Total Returns for the periods ended February 28, 2018 | |
| | Six
Months† | One
Year | Since
Inception* | |
Class A Shares (without sales charge) | 10.40% | 13.65% | 10.65% | |
Class A Shares (with sales charge) | 4.63% | 7.68% | 8.14% | |
S&P 500® Index** | 10.84% | 17.10% | 14.24% | |
* | Class A Shares of the Fund commenced operations on October 29, 2015. |
** | Benchmark performance is from inception date of the Class A Shares only and is not the inception date of the benchmark itself. |
Class A Shares of the Fund have a 5.25% maximum sales charge.
Performance quoted is past performance and does not guarantee future results. The investment return and principal value of an investment in the Fund will fluctuate so that an investor’s shares, when redeemed, may be worth more or less than their original cost. Current performance may be lower or higher. Returns shown do not reflect taxes that a shareholder would pay on Fund distributions or on the redemption of Fund shares. Performance data current to the most recent month-end may be obtained by calling (855) 744-8500.
The Fund’s total annual gross and net operating expenses, as stated in the current prospectus dated December 31, 2017, are 1.39% and 1.23%, respectively, of average daily net assets for Class A Shares. These ratios may differ from the actual expenses incurred by the Fund for the period covered by this report. The Fund’s investment adviser (the “Adviser”), has contractually agreed to waive management fees and/or reimburse expenses through December 31, 2018 to the extent that total annual Fund operating expenses (excluding certain items discussed below) exceed 1.23% of the Fund’s average daily net assets attributable to Class A Shares. In determining the Adviser’s obligation to waive advisory fees and/or reimburse certain expenses, the following expenses are not taken into account and could cause net total annual Fund operating expenses to exceed 1.23%: acquired fund fees and expenses, brokerage commissions, extraordinary items, interest or taxes. The contractual limitation may not be terminated before December 31, 2018 without the approval of the Board of Directors of The RBB Fund, Inc. If at any time the Fund’s total annual Fund operating expenses for a year are less than 1.23% of the Fund’s average daily net assets attributable to Class A Shares, the Adviser is entitled to reimbursement by the Fund of the advisory fees forgone and other payments remitted by the Adviser to the Fund within three years from the date on which such waiver or reimbursement was made, provided such reimbursement does not cause the Fund to exceed expense limitations that were in effect at the time of the waiver or reimbursement.
The Fund’s investments will generally consist of securities, which may include common stocks, preferred stocks, warrants to acquire common stock and securities convertible into common stock. Portfolio composition is subject to change. The Fund evaluates performance as compared to that of the Standard & Poor’s 500® Index (“S&P 500®”). The S&P 500® is a widely recognized, unmanaged index of 500 common stocks which are generally representative of the U.S. stock market as a whole. It is impossible to invest directly in an index.
10
SUMMIT GLOBAL INVESTMENTS
U.S. LOW VOLATILITY EQUITY FUND - CLASS C SHARES
Performance Data (Continued)
February 28, 2018 (Unaudited)
Average Annual Total Returns for the periods ended February 28, 2018 | |
| | Six
Months† | One
Year | Since
Inception* | |
Class C Shares | 10.01% | 12.91% | 11.10% | |
S&P 500® Index** | 10.84% | 17.10% | 16.42% | |
* | Class C Shares of the Fund commenced operations on December 31, 2015. |
** | Benchmark performance is from inception date of the Class C Shares only and is not the inception date of the benchmark itself. |
Performance quoted is past performance and does not guarantee future results. The investment return and principal value of an investment in the Fund will fluctuate so that an investor’s shares, when redeemed, may be worth more or less than their original cost. Current performance may be lower or higher. Returns shown do not reflect taxes that a shareholder would pay on Fund distributions or on the redemption of Fund shares. Performance data current to the most recent month-end may be obtained by calling (855) 744-8500.
The Fund’s total annual gross and net operating expenses, as stated in the current prospectus dated December 31, 2017, are 2.14% and 1.98%, respectively, of average daily net assets for Class C Shares. These ratios may differ from the actual expenses incurred by the Fund for the period covered by this report. The Fund’s investment adviser (the “Adviser”), has contractually agreed to waive management fees and/or reimburse expenses through December 31, 2018 to the extent that total annual Fund operating expenses (excluding certain items discussed below) exceed 1.98% of the Fund’s average daily net assets attributable to Class C Shares. In determining the Adviser’s obligation to waive advisory fees and/or reimburse expenses, the following expenses are not taken into account and could cause net total annual Fund operating expenses to exceed 1.98%: acquired fund fees and expenses, brokerage commissions, extraordinary items, interest or taxes. The contractual limitation may not be terminated before December 31, 2018 without the approval of the Board of Directors of The RBB Fund, Inc. If at any time the Fund’s total annual Fund operating expenses for a year are less than 1.98% of the Fund’s average daily net assets attributable to Class C Shares, the Adviser is entitled to reimbursement by the Fund of the advisory fees forgone and other payments remitted by the Adviser to the Fund within three years from the date on which such waiver or reimbursement was made, provided such reimbursement does not cause the Fund to exceed expense limitations that were in effect at the time of the waiver or reimbursement.
The Fund’s investments will generally consist of securities, which may include common stocks, preferred stocks, warrants to acquire common stock and securities convertible into common stock. Portfolio composition is subject to change. The Fund evaluates performance as compared to that of the Standard & Poor’s 500® Index (“S&P 500®”). The S&P 500® is a widely recognized, unmanaged index of 500 common stocks which are generally representative of the U.S. stock market as a whole. It is impossible to invest directly in an index.
11
SUMMIT GLOBAL INVESTMENTS
SMALL CAP LOW VOLATILITY FUND - CLASS I SHARES
Performance Data (Continued)
February 28, 2018 (Unaudited)
Average Annual Total Returns for the periods ended February 28, 2018 | |
| | Six
Months† | One
Year | Since
Inception* | |
Class I Shares | 2.71% | 6.22% | 13.65% | |
Russell 2000® Index** | 8.30% | 10.51% | 18.90% | |
* | Class I Shares of the Fund commenced operations on March 31, 2016. |
** | Benchmark performance is from inception date of the Class I Shares only and is not the inception date of the benchmark itself. |
Performance quoted is past performance and does not guarantee future results. The investment return and principal value of an investment in the Fund will fluctuate so that an investor’s shares, when redeemed, may be worth more or less than their original cost. Current performance may be lower or higher. Returns shown do not reflect taxes that a shareholder would pay on Fund distributions or on the redemption of Fund shares. Performance data current to the most recent month-end may be obtained by calling (855) 744-8500.
The Fund’s total annual gross and net operating expenses, as stated in the current prospectus dated December 31, 2017, are 2.40% and 1.42%, respectively, of average daily net assets for Class I Shares. These ratios may differ from the actual expenses incurred by the Fund for the period covered by this report. The Fund’s investment adviser (the “Adviser”), has contractually agreed to waive management fees and/or reimburse expenses through December 31, 2018 to the extent that total annual Fund operating expenses (excluding certain items discussed below) exceed 1.23% of the Fund’s average daily net assets attributable to Class I Shares. In determining the Adviser’s obligation to waive advisory fees and/or reimburse expenses, the following expenses are not taken into account and could cause net total annual Fund operating expenses to exceed 1.23%: acquired fund fees and expenses, brokerage commissions, extraordinary items, interest or taxes. This contractual limitation may not be terminated before December 31, 2018 without the approval of the Board of Directors of The RBB Fund, Inc. If at any time the Fund’s total annual Fund operating expenses for a year are less than 1.23% of the Fund’s average daily net assets attributable to Class I Shares, the Adviser is entitled to reimbursement by the Fund of the advisory fees forgone and other payments remitted by the Adviser to the Fund within three years from the date on which such waiver or reimbursement was made, provided such reimbursement does not cause the Fund to exceed expense limitations that were in effect at the time of the waiver or reimbursement.
The Fund’s investments will generally consist of securities, which may include common stocks, preferred stocks, warrants to acquire common stock and securities convertible into common stock. Portfolio composition is subject to change. The Fund evaluates performance as compared to that of the Russell 2000® Index (“Russell 2000®”). The Russell 2000® is a widely recognized, unmanaged index of 2,000 common stocks which are generally representative of the U.S. Small Companies. It is impossible to invest directly in an index.
The Fund invests in equity securities and in stocks of small companies which are subject to market, economic and business risks that may cause their price to rise or fall over time. Stocks of small companies may be more volatile, less liquid or not as readily marketable as those of larger companies. Small companies may also have limited product lines, markets or financial resources and may be dependent on relatively small or inexperienced management groups. Although the Fund seeks lower volatility, there is no guarantee the Fund will perform as expected.
12
SUMMIT GLOBAL INVESTMENTS
SMALL CAP LOW VOLATILITY FUND - CLASS A SHARES
Performance Data (Continued)
February 28, 2018 (Unaudited)
Average Annual Total Returns for the periods ended February 28, 2018 | |
| | Six
Months† | One
Year | Since
Inception* | |
Class A Shares (without sales charge) | 2.55% | 5.98% | 13.44% | |
Class A Shares (with sales charge) | -2.86% | 0.45% | 10.31% | |
Russell 2000® Index** | 8.30% | 10.51% | 18.90% | |
* | Class A Shares of the Fund commenced operations on March 31, 2016. |
** | Benchmark performance is from inception date of the Class A Shares only and is not the inception date of the benchmark itself. |
Class A Shares of the Fund have a 5.25% maximum sales charge.
Performance quoted is past performance and does not guarantee future results. The investment return and principal value of an investment in the Fund will fluctuate so that an investor’s shares, when redeemed, may be worth more or less than their original cost. Current performance may be lower or higher. Returns shown do not reflect taxes that a shareholder would pay on Fund distributions or on the redemption of Fund shares. Performance data current to the most recent month-end may be obtained by calling (855) 744-8500.
The Fund’s total annual gross and net operating expenses, as stated in the current prospectus dated December 31, 2017, are 2.65% and 1.67%, respectively, of average daily net assets for Class A Shares. These ratios may differ from the actual expenses incurred by the Fund for the period covered by this report. The Fund’s investment adviser (the “Adviser”), has contractually agreed to waive management fees and/or reimburse expenses through December 31, 2018 to the extent that total annual Fund operating expenses (excluding certain items discussed below) exceed 1.48% of the Fund’s average daily net assets attributable to Class A Shares. In determining the Adviser’s obligation to waive advisory fees and/or reimburse expenses, the following expenses are not taken into account and could cause net total annual Fund operating expenses to exceed 1.48%: acquired fund fees and expenses, brokerage commissions, extraordinary items, interest or taxes. This contractual limitation may not be terminated before December 31, 2018 without the approval of the Board of Directors of The RBB Fund, Inc. If at any time the Fund’s total annual Fund operating expenses for a year are less than 1.48% of the Fund’s average daily net assets attributable to Class A Shares, the Adviser is entitled to reimbursement by the Fund of the advisory fees forgone and other payments remitted by the Adviser to the Fund within three years from the date on which such waiver or reimbursement was made, provided such reimbursement does not cause the Fund to exceed expense limitations that were in effect at the time of the waiver or reimbursement.
The Fund’s investments will generally consist of securities, which may include common stocks, preferred stocks, warrants to acquire common stock and securities convertible into common stock. Portfolio composition is subject to change. The Fund evaluates performance as compared to that of the Russell 2000® Index (“Russell 2000®”). The Russell 2000® is a widely recognized, unmanaged index of 2,000 common stocks which are generally representative of the U.S. Small Companies. It is impossible to invest directly in an index.
The Fund invests in equity securities and in stocks of small companies which are subject to market, economic and business risks that may cause their price to rise or fall over time. Stocks of small companies may be more volatile, less liquid or not as readily marketable as those of larger companies. Small companies may also have limited product lines, markets or financial resources and may be dependent on relatively small or inexperienced management groups. Although the Fund seeks lower volatility, there is no guarantee the Fund will perform as expected.
13
SUMMIT GLOBAL INVESTMENTS
SMALL CAP LOW VOLATILITY FUND - CLASS C SHARES
Performance Data (Continued)
February 28, 2018 (Unaudited)
Average Annual Total Returns for the periods ended February 28, 2018 | |
| | Six
Months† | One
Year | Since
Inception* | |
Class C Shares | 2.16% | 5.08% | 12.54% | |
Russell 2000® Index** | 8.30% | 10.51% | 18.90% | |
* | Class C Shares of the Fund commenced operations on March 31, 2016. |
** | Benchmark performance is from inception date of the Class C Shares only and is not the inception date of the benchmark itself. |
Performance quoted is past performance and does not guarantee future results. The investment return and principal value of an investment in the Fund will fluctuate so that an investor’s shares, when redeemed, may be worth more or less than their original cost. Current performance may be lower or higher. Returns shown do not reflect taxes that a shareholder would pay on Fund distributions or on the redemption of Fund shares. Performance data current to the most recent month-end may be obtained by calling (855) 744-8500.
The Fund’s total annual gross and net operating expenses, as stated in the current prospectus dated December 31, 2017, are 3.40% and 2.42%, respectively, of average daily net assets for Class C Shares. These ratios may differ from the actual expenses incurred by the Fund for the period covered by this report. The Fund’s investment adviser (the “Adviser”), has contractually agreed to waive management fees and/or reimburse expenses through December 31, 2018 to the extent that total annual Fund operating expenses (excluding certain items discussed below) exceed 2.23% of the Fund’s average daily net assets attributable to Class C Shares. In determining the Adviser’s obligation to waive advisory fees and/or reimburse expenses, the following expenses are not taken into account and could cause net total annual Fund operating expenses to exceed 2.23%: acquired fund fees and expenses, brokerage commissions, extraordinary items, interest or taxes. This contractual limitation may not be terminated before December 31, 2018 without the approval of the Board of Directors of The RBB Fund, Inc. If at any time the Fund’s total annual Fund operating expenses for a year are less than 2.23% of the Fund’s average daily net assets attributable to Class C Shares, the Adviser is entitled to reimbursement by the Fund of the advisory fees forgone and other payments remitted by the Adviser to the Fund within three years from the date on which such waiver or reimbursement was made, provided such reimbursement does not cause the Fund to exceed expense limitations that were in effect at the time of the waiver or reimbursement.
The Fund’s investments will generally consist of securities, which may include common stocks, preferred stocks, warrants to acquire common stock and securities convertible into common stock. Portfolio composition is subject to change. The Fund evaluates performance as compared to that of the Russell 2000® Index (“Russell 2000®”). The Russell 2000® is a widely recognized, unmanaged index of 2,000 common stocks which are generally representative of the U.S. Small Companies. It is impossible to invest directly in an index.
The Fund invests in equity securities and in stocks of small companies which are subject to market, economic and business risks that may cause their price to rise or fall over time. Stocks of small companies may be more volatile, less liquid or not as readily marketable as those of larger companies. Small companies may also have limited product lines, markets or financial resources and may be dependent on relatively small or inexperienced management groups. Although the Fund seeks lower volatility, there is no guarantee the Fund will perform as expected.
14
SUMMIT GLOBAL INVESTMENTS
GLOBAL LOW VOLATILITY FUND
Performance Data (Concluded)
February 28, 2018 (Unaudited)
Average Annual Total Returns for the periods ended February 28, 2018* | |
| | Six
Months† | One
Year | Three
Year | Five
Year | Since
Inception | |
Class I Shares** | 6.03% | 14.71% | 3.66% | 12.28% | 17.90% | |
MSCI ACWI Index*** | 9.29% | 19.41% | 8.93% | 10.66% | 14.09% | |
* | Returns for periods prior to January 3, 2017 were generated under the Management of the Fund’s former investment adviser. |
** | The Fund operated as a series of Scotia Institutional Funds prior to the close of business on March 21, 2014 (the “Predecessor Fund”), at which time the Predecessor Fund was reorganized into the Scotia Dynamic U.S. Growth Fund a newly created series of The RBB Fund, Inc. The fiscal year end of the Predecessor Fund was September 30. The performance shown for periods prior to March 21, 2014 represents the performance for the Predecessor Fund. While the Predecessor Fund commenced operations on March 31, 2009, the Predecessor Fund began investing consistent with its investment objective on April 1, 2009. Effective January 3, 2017, the Scotia Dynamic U.S. Growth Fund changed its name to the Summit Global Investments Global Low Volatility Fund (the “Fund”). The performance data includes adjustments in accordance with accounting principles generally accepted in the United States of America and, consequently, the net asset value for financial reporting purposes and the returns based upon those net asset values may differ from the net asset values and returns for shareholder transactions. |
*** | Benchmark performance is from inception date of the Predecessor Fund only and is not the inception date of the benchmark itself. |
Performance quoted is past performance and does not guarantee future results. The investment return and principal value of an investment in the Fund will fluctuate so that an investor’s shares, when redeemed, may be worth more or less than their original cost. Current performance may be lower or higher. Returns shown do not reflect taxes that a shareholder would pay on Fund distributions or on the redemption of Fund shares. Performance data current to the most recent month-end may be obtained by calling 1-855-744-8500.
The Fund’s total annual gross and net operating expenses, as stated in the current prospectus dated December 31, 2017, are 1.32% and 0.84%, respectively, of average daily net assets for Class I Shares. These ratios may differ from the actual expenses incurred by the Fund for the period covered by this report. The Fund’s investment adviser (the “Adviser”), has contractually agreed to waive management fees and/or reimburse certain expenses of the Fund through December 31, 2018 to the extent necessary to ensure that the Fund’s total annual operating expenses (excluding taxes, extraordinary expenses, brokerage commissions and interest) do not exceed 0.84% (on an annual basis) of Class I’s average daily net assets (the “Expense Limitation”). The Expense Limitation shall remain in effect until December 31, 2018, unless the Board of Directors of The RBB Fund, Inc. approves its earlier termination. If at any time the Fund’s total annual Fund operating expenses for a year are less than 0.84% of the Fund’s average daily net assets attributable to Class I Shares, the Adviser is entitled to reimbursement by the Fund of the advisory fees forgone and other payments remitted by the Adviser to the Fund within three years from the date on which such waiver or reimbursement was made, provided such reimbursement does not cause the Fund to exceed expense limitations that were in effect at the time of the waiver or reimbursement.
International investing is subject to special risks including, but not limited to, currency risk associated with securities denominated in other than the U.S. dollar, which may be affected by fluctuations in currency exchange rates, political, social or economic instability, and differences in taxation, auditing, and other financial practices.
The MSCI ACWI Index (the “Index”) captures large and mid cap representation across 23 Developed Markets (DM) and 24 Emerging Markets (EM) countries. With more than 2,400 constituents, the index covers approximately 85% of the global investable equity opportunity set. It is not possible to invest directly with an index.
15
SUMMIT GLOBAL INVESTMENTS
Fund Expense Examples
February 28, 2018 (Unaudited)
As a shareholder of the Fund(s), you incur two types of costs: (1) transaction costs, including sales charges (loads) on purchase payments (if applicable); and (2) ongoing costs, including management fees; distribution and/or service (12b-1) fees; and other Fund expenses. These examples are intended to help you understand your ongoing costs (in dollars) of investing in the Fund(s) and to compare these costs with the ongoing costs of investing in other mutual funds.
These examples are based on an investment of $1,000 invested at the beginning of the six-month period from September 1, 2017 through February 28, 2018 and held for the entire period.
Actual Expenses
The first line of the accompanying tables provide information about actual account values and actual expenses. You may use the information in this line, together with the amount you invested, to estimate the expenses that you paid over the period. Simply divide your account value by $1,000 (for example, an $8,600 account value divided by $1,000 = 8.6), then multiply the result by the number in the first line under the heading entitled “Expenses Paid During Period” to estimate the expenses you paid on your account during this period.
Hypothetical Example for Comparison Purposes
The second line of the accompanying tables provide information about hypothetical account values and hypothetical expenses based on each Fund’s actual expense ratio and an assumed rate of return of 5% per year before expenses, which is not the Fund’s actual return. The hypothetical account values and expenses may not be used to estimate the actual ending account balance or expenses you paid for the period. You may use this information to compare the ongoing costs of investing in each Fund and other funds. To do so, compare these 5% hypothetical examples with the 5% hypothetical examples that appear in the shareholder reports of other funds.
Please note that the expenses shown in the accompanying tables are meant to highlight your ongoing costs only and do not reflect any transactional costs, such as sales charges (loads), redemption fees or exchange fees. Therefore, the second line of the accompanying tables is useful in comparing ongoing costs only and will not help you determine the relative total costs of owning different funds. In addition, if these transactional costs were included, your costs would have been higher.
| | Summit Global Investments U.S. Low Volatility Equity Fund |
| | Beginning
Account Value
September 1, 2017 | Ending
Account Value
February 28, 2018 | Expenses Paid
During Period* |
Class I Shares | | | |
Actual | $ 1,000.00 | $ 1,105.10 | $ 5.12 |
Hypothetical (5% return before expenses) | 1,000.00 | 1,019.93 | 4.91 |
Class A Shares | | | |
Actual | $ 1,000.00 | $ 1,104.00 | $ 6.42 |
Hypothetical (5% return before expenses) | 1,000.00 | 1,018.70 | 6.16 |
Class C Shares | | | |
Actual | $ 1,000.00 | $ 1,100.10 | $ 10.31 |
Hypothetical (5% return before expenses) | 1,000.00 | 1,014.98 | 9.89 |
16
SUMMIT GLOBAL INVESTMENTS
Fund Expense Examples (Concluded)
February 28, 2018 (Unaudited)
| | Summit Global Investments Small Cap Low Volatility Fund |
| | Beginning
Account Value
September 1, 2017 | Ending
Account Value
February 28, 2018 | Expenses Paid
During Period** |
Class I Shares | | | |
Actual | $ 1,000.00 | $ 1,027.10 | $ 6.18 |
Hypothetical (5% return before expenses) | 1,000.00 | 1,018.70 | 6.16 |
Class A Shares | | | |
Actual | $ 1,000.00 | $ 1,025.50 | $ 7.43 |
Hypothetical (5% return before expenses) | 1,000.00 | 1,017.46 | 7.40 |
Class C Shares | | | |
Actual | $ 1,000.00 | $ 1,021.60 | $ 11.18 |
Hypothetical (5% return before expenses) | 1,000.00 | 1,013.74 | 11.13 |
| | Summit Global Investments Global Low Volatility Fund |
| | Beginning
Account Value
September 1, 2017 | Ending
Account Value
February 28, 2018 | Expenses Paid
During Period*** |
Class I Shares | | | |
Actual | $ 1,000.00 | $ 1,060.30 | $ 4.29 |
Hypothetical (5% return before expenses) | 1,000.00 | 1,020.63 | 4.21 |
* | Expenses are equal to the Fund’s annualized six-month expense ratio of 0.98%, 1.23% and 1.98% for Class I Shares, Class A Shares and Class C Shares of the Summit Global Investments U.S. Low Volatility Equity Fund, respectively, which includes waived fees and reimbursed expenses, multiplied by the average account value over the period, multiplied by the number of days (181) in the most recent fiscal half-year, then divided by 365 to reflect the one-half year period. The Fund’s ending account values on the first line in the tables is based on the actual six-month total investment return for the Fund of 10.51%, 10.40% and 10.01% for Class I Shares, Class A Shares and Class C Shares, respectively. |
** | Expenses are equal to the Fund’s annualized six-month expense ratio of 1.23%, 1.48% and 2.23% for Class I Shares, Class A Shares and Class C Shares of the Summit Global Investments Small Cap Low Volatility Fund, respectively, which includes waived fees and reimbursed expenses, multiplied by the average account value over the period, multiplied by the number of days (181) in the most recent fiscal half-year, then divided by 365 to reflect the one-half year period. The Fund’s ending account value on the first line in the table is based on the actual six-month total investment return for the Fund of 2.71%, 2.55 % and 2.16% for Class I Shares, Class A Shares and Class C Shares, respectively. |
*** | Expenses are equal to the Fund’s annualized six-month expense ratio of 0.84% for Class I Shares of the Summit Global Investments Global Low Volatility Fund, which includes waived fees and reimbursed expenses, multiplied by the average account value over the period, multiplied by the number of days (181) in the most recent fiscal half-year, then divided by 365 to reflect the one-half year period. The Fund’s ending account value on the first line in the table is based on the actual six-month total investment return for the Fund of 6.03% for Class I Shares. |
17
SUMMIT GLOBAL INVESTMENTS
U.S. LOW VOLATILITY EQUITY FUND
Portfolio Holdings Summary Table
February 28, 2018 (Unaudited)
The following table presents a summary by industry of the portfolio holdings of the Fund:
| | | % of Net
Assets | | | Value | |
| COMMON STOCKS: | | | | | | |
| IT Services | | | 8.7 | % | | $ | 9,166,297 | |
| Specialty Retail | | | 8.2 | | | | 8,609,615 | |
| Software | | | 7.8 | | | | 8,161,009 | |
| Insurance | | | 7.6 | | | | 7,944,296 | |
| Food & Staples Retailing | | | 7.4 | | | | 7,733,537 | |
| Health Care Providers & Services | | | 5.4 | | | | 5,729,186 | |
| Oil, Gas & Consumable Fuels | | | 4.5 | | | | 4,751,380 | |
| Biotechnology | | | 4.4 | | | | 4,668,651 | |
| Capital Markets | | | 4.4 | | | | 4,645,360 | |
| Communications Equipment | | | 3.5 | | | | 3,722,710 | |
| Beverages | | | 3.3 | | | | 3,476,832 | |
| Pharmaceuticals | | | 3.0 | | | | 3,106,924 | |
| Professional Services | | | 2.7 | | | | 2,853,500 | |
| Diversified Telecommunication Services | | | 2.5 | | | | 2,597,254 | |
| Commercial Services & Supplies | | | 2.4 | | | | 2,556,048 | |
| Technology Hardware, Storage & Peripherals | | | 2.2 | | | | 2,357,128 | |
| Household Products | | | 2.0 | | | | 2,057,088 | |
| Internet Software & Services | | | 1.6 | | | | 1,687,624 | |
| Health Care Equipment & Supplies | | | 1.5 | | | | 1,593,531 | |
| Food Products | | | 1.4 | | | | 1,434,596 | |
| Textiles, Apparel & Luxury Goods | | | 1.4 | | | | 1,424,287 | |
| Electric Utilities | | | 1.3 | | | | 1,325,845 | |
| Machinery | | | 1.2 | | | | 1,241,916 | |
| Real Estate Investment Trusts (REITs) | | | 0.9 | | | | 938,268 | |
| Semiconductors & Semiconductor Equipment | | | 0.8 | | | | 824,408 | |
| Diversified Financial Services | | | 0.7 | | | | 766,640 | |
| Banks | | | 0.7 | | | | 731,403 | |
| Airlines | | | 0.5 | | | | 543,696 | |
| Independent Power and Renewable Electricity Producers | | | 0.5 | | | | 504,368 | |
| Electronic Equipment, Instruments & Components | | | 0.4 | | | | 428,773 | |
| Distributors | | | 0.3 | | | | 307,944 | |
| Personal Products | | | 0.3 | | | | 290,724 | |
| Aerospace & Defense | | | 0.3 | | | | 281,952 | |
| Consumer Finance | | | 0.3 | | | | 263,277 | |
| Media | | | 0.2 | | | | 257,900 | |
| Chemicals | | | 0.2 | | | | 236,124 | |
| Building Products | | | 0.2 | | | | 224,665 | |
| Real Estate Management & Development | | | 0.2 | | | | 215,050 | |
| Air Freight & Logistics | | | 0.2 | | | | 214,728 | |
| Hotels, Restaurants & Leisure | | | 0.2 | | | | 211,270 | |
| Multi-Utilities | | | 0.2 | | | | 202,875 | |
| Multiline Retail | | | 0.2 | | | | 198,639 | |
| Automobiles | | | 0.1 | | | | 186,736 | |
| SHORT-TERM INVESTMENTS | | | 0.8 | | | | 889,307 | |
| OTHER ASSETS IN EXCESS OF LIABILITIES | | | 3.4 | | | | 3,621,774 | |
| NET ASSETS | | | 100 | % | | $ | 105,185,135 | |
Portfolio holdings are subject to change at any time.
The accompanying notes are an integral part of the financial statements.
18
SUMMIT GLOBAL INVESTMENTS
U.S. LOW VOLATILITY EQUITY FUND
Portfolio of Investments
February 28, 2018 (Unaudited)
| | | Number
of Shares | | | Value | |
| COMMON STOCKS - 95.8% | | | | | | |
| Aerospace & Defense — 0.3% | | | | | | |
| Lockheed Martin Corp. | | | 800 | | | $ | 281,952 | |
| Air Freight & Logistics — 0.2% | | | | | | | | |
| CH Robinson Worldwide, Inc. | | | 2,300 | | | | 214,728 | |
| Airlines — 0.5% | | | | | | | | |
| Southwest Airlines Co. | | | 9,400 | | | | 543,696 | |
| Automobiles — 0.1% | | | | | | | | |
| Ford Motor Co. | | | 17,600 | | | | 186,736 | |
| Banks — 0.7% | | | | | | | | |
| BB&T Corp. | | | 4,500 | | | | 244,575 | |
| JPMorgan Chase & Co. | | | 2,400 | | | | 277,200 | |
| Regions Financial Corp. | | | 10,800 | | | | 209,628 | |
| | | | | | | | 731,403 | |
| Beverages — 3.3% | | | | | | | | |
| Coca-Cola Co., (The) | | | 4,400 | | | | 190,168 | |
| Monster Beverage Corp.* | | | 3,900 | | | | 247,143 | |
| PepsiCo, Inc. | | | 27,700 | | | | 3,039,521 | |
| | | | | | | | 3,476,832 | |
| Biotechnology — 4.4% | | | | | | | | |
| AbbVie, Inc. | | | 18,600 | | | | 2,154,438 | |
| Biogen, Inc.* | | | 8,700 | | | | 2,514,213 | |
| | | | | | | | 4,668,651 | |
| Building Products — 0.2% | | | | | | | | |
| AO Smith Corp., Class A | | | 3,500 | | | | 224,665 | |
| Capital Markets — 4.4% | | | | | | | | |
| Northern Trust Corp. | | | 10,000 | | | | 1,058,700 | |
| S&P Global, Inc. | | | 18,700 | | | | 3,586,660 | |
| | | | | | | | 4,645,360 | |
| Chemicals — 0.2% | | | | | | | | |
| PPG Industries, Inc. | | | 2,100 | | | | 236,124 | |
| Commercial Services & Supplies — 2.4% | | | | | | | | |
| Cintas Corp. | | | 1,600 | | | | 273,056 | |
| Republic Services, Inc. | | | 30,000 | | | | 2,015,400 | |
| Waste Management, Inc. | | | 3,100 | | | | 267,592 | |
| | | | | | | | 2,556,048 | |
| Communications Equipment — 3.5% | | | | | | | | |
| Cisco Systems, Inc. | | | 76,500 | | | | 3,425,670 | |
| F5 Networks, Inc.* | | | 2,000 | | | | 297,040 | |
| | | | | | | | 3,722,710 | |
| Consumer Finance — 0.3% | | | | | | | | |
| American Express Co. | | | 2,700 | | | | 263,277 | |
| Distributors — 0.3% | | | | | | | | |
| LKQ Corp.* | | | 7,800 | | | | 307,944 | |
| Diversified Financial Services — 0.7% | | | | | | | | |
| Berkshire Hathaway, Inc., Class A* | | | 3,700 | | | | 766,640 | |
| Diversified Telecommunication Services — 2.5% |
| AT&T, Inc. | | | 65,500 | | | | 2,377,650 | |
| Verizon Communications, Inc. | | | 4,600 | | | | 219,604 | |
| | | | | | | | 2,597,254 | |
| Electric Utilities — 1.3% | | | | | | | | |
| Alliant Energy Corp. | | | 5,300 | | | | 204,845 | |
| Pinnacle West Capital Corp. | | | 2,700 | | | | 207,792 | |
| Xcel Energy, Inc. | | | 21,100 | | | | 913,208 | |
| | | | | | | | 1,325,845 | |
| Electronic Equipment, Instruments & Components — 0.4% |
| Corning, Inc. | | | 7,300 | | | | 212,284 | |
| TE Connectivity Ltd., (Switzerland) | | | 2,100 | | | | 216,489 | |
| | | | | | | | 428,773 | |
| Food & Staples Retailing — 7.4% |
| Costco Wholesale Corp. | | | 4,500 | | | | 859,050 | |
| Kroger Co., (The) | | | 10,300 | | | | 279,336 | |
| Sysco Corp. | | | 49,300 | | | | 2,940,745 | |
| Wal-Mart Stores, Inc. | | | 40,600 | | | | 3,654,406 | |
| | | | | | | | 7,733,537 | |
| Food Products — 1.4% | | | | | | | | |
| Hershey Co., (The) | | | 14,600 | | | | 1,434,596 | |
| Health Care Equipment & Supplies — 1.5% |
| Baxter International, Inc. | | | 19,500 | | | | 1,321,905 | |
| Medtronic PLC, (Ireland) | | | 3,400 | | | | 271,626 | |
| | | | | | | | 1,593,531 | |
| Health Care Providers & Services — 5.4% | | | | | | | | |
| Aetna, Inc. | | | 13,200 | | | | 2,337,192 | |
| Anthem, Inc. | | | 900 | | | | 211,842 | |
| Humana, Inc. | | | 800 | | | | 217,456 | |
| UnitedHealth Group, Inc. | | | 13,100 | | | | 2,962,696 | |
| | | | | | | | 5,729,186 | |
| Hotels, Restaurants & Leisure — 0.2% | | | | | | | | |
| Starbucks Corp. | | | 3,700 | | | | 211,270 | |
| Household Products — 2.0% | | | | | | | | |
| Clorox Co., (The) | | | 1,500 | | | | 193,620 | |
| Colgate-Palmolive Co. | | | 9,600 | | | | 662,112 | |
| Procter & Gamble Co., (The) | | | 15,300 | | | | 1,201,356 | |
| | | | | | | | 2,057,088 | |
| Independent Power and Renewable Electricity Producers — 0.5% |
| AES Corp. | | | 46,400 | | | | 504,368 | |
| Insurance — 7.6% | | | | | | | | |
| Allstate Corp., (The) | | | 2,600 | | | | 239,876 | |
| American International Group, Inc. | | | 17,300 | | | | 991,982 | |
| Marsh & McLennan Cos, Inc. | | | 25,600 | | | | 2,125,312 | |
| Principal Financial Group, Inc. | | | 3,200 | | | | 199,456 | |
| Progressive Corp., (The) | | | 66,400 | | | | 3,823,312 | |
| Prudential Financial, Inc. | | | 3,000 | | | | 318,960 | |
The accompanying notes are an integral part of the financial statements.
19
SUMMIT GLOBAL INVESTMENTS
U.S. LOW VOLATILITY EQUITY FUND
Portfolio of Investments (Concluded)
February 28, 2018 (Unaudited)
| | | Number
of Shares | | | Value | |
| Insurance — 7.6% (Continued) |
| XL Group Ltd. | | | 5,800 | | | $ | 245,398 | |
| | | | | | | | 7,944,296 | |
| Internet Software & Services — 1.6% | | | | | | | | |
| Facebook, Inc., Class A* | | | 5,300 | | | | 945,096 | |
| VeriSign, Inc.* | | | 6,400 | | | | 742,528 | |
| | | | | | | | 1,687,624 | |
| IT Services — 8.7% | | | | | | | | |
| Accenture PLC, Class A, (Ireland) | | | 18,000 | | | | 2,898,180 | |
| Cognizant Technology Solutions Corp. | | | 40,900 | | | | 3,354,618 | |
| Fidelity National Information Services, Inc. | | | 3,100 | | | | 301,258 | |
| Fiserv, Inc.* | | | 9,500 | | | | 1,362,205 | |
| Global Payments, Inc. | | | 2,000 | | | | 226,780 | |
| Paychex, Inc. | | | 12,200 | | | | 794,586 | |
| Total System Services, Inc. | | | 2,600 | | | | 228,670 | |
| | | | | | | | 9,166,297 | |
| Machinery — 1.2% | | | | | | | | |
| Snap-on, Inc. | | | 7,800 | | | | 1,241,916 | |
| Media — 0.2% | | | | | | | | |
| Walt Disney Co., (The) | | | 2,500 | | | | 257,900 | |
| Multiline Retail — 0.2% | | | | | | | | |
| Dollar General Corp. | | | 2,100 | | | | 198,639 | |
| Multi-Utilities — 0.2% | | | | | | | | |
| CenterPoint Energy, Inc. | | | 7,500 | | | | 202,875 | |
| Oil, Gas & Consumable Fuels — 4.5% |
| EOG Resources, Inc. | | | 4,500 | | | | 456,390 | |
| Occidental Petroleum Corp. | | | 6,900 | | | | 452,640 | |
| Phillips 66 | | | 10,000 | | | | 903,700 | |
| Valero Energy Corp. | | | 32,500 | | | | 2,938,650 | |
| | | | | | | | 4,751,380 | |
| Personal Products — 0.3% | | | | | | | | |
| Estee Lauder Cos, Inc., Class A, (The) | | | 2,100 | | | | 290,724 | |
| Pharmaceuticals — 3.0% | | | | | | | | |
| Bristol-Myers Squibb Co. | | | 3,300 | | | | 218,460 | |
| Eli Lilly & Co. | | | 6,300 | | | | 485,226 | |
| Johnson & Johnson | | | 16,200 | | | | 2,104,056 | |
| Zoetis, Inc. | | | 3,700 | | | | 299,182 | |
| | | | | | | | 3,106,924 | |
| Professional Services — 2.7% | | | | | | | | |
| Robert Half International, Inc. | | | 50,000 | | | | 2,853,500 | |
| Real Estate Investment Trusts (REITs) — 0.9% |
| American Tower Corp. | | | 4,000 | | | | 557,320 | |
| Regency Centers Corp. | | | 3,200 | | | | 185,952 | |
| UDR, Inc. | | | 5,800 | | | | 194,996 | |
| | | | | | | | 938,268 | |
| Real Estate Management & Development — 0.2% |
| CBRE Group, Inc., Class A* | | | 4,600 | | | | 215,050 | |
| Semiconductors & Semiconductor Equipment — 0.8% |
| Broadcom Ltd., (Singapore) | | | 800 | | | | 197,168 | |
| Lam Research Corp. | | | 1,000 | | | | 191,860 | |
| Skyworks Solutions, Inc. | | | 2,200 | | | | 240,350 | |
| Texas Instruments, Inc. | | | 1,800 | | | | 195,030 | |
| | | | | | | | 824,408 | |
| Software — 7.8% | | | | | | | | |
| Activision Blizzard, Inc. | | | 2,900 | | | | 212,077 | |
| Adobe Systems, Inc.* | | | 1,500 | | | | 313,695 | |
| Citrix Systems, Inc.* | | | 26,800 | | | | 2,465,600 | |
| Intuit, Inc. | | | 23,000 | | | | 3,837,780 | |
| Microsoft Corp. | | | 11,600 | | | | 1,087,732 | |
| Salesforce.com, Inc.* | | | 2,100 | | | | 244,125 | |
| | | | | | | | 8,161,009 | |
| Specialty Retail — 8.2% | | | | | | | | |
| Best Buy Co., Inc. | | | 17,900 | | | | 1,296,676 | |
| Home Depot, Inc., (The) | | | 16,600 | | | | 3,025,682 | |
| Lowe's Cos, Inc. | | | 2,900 | | | | 259,811 | |
| Ross Stores, Inc. | | | 3,400 | | | | 265,506 | |
| TJX Cos, Inc., (The) | | | 45,500 | | | | 3,761,940 | |
| | | | | | | | 8,609,615 | |
| Technology Hardware, Storage & Peripherals — 2.2% |
| Apple, Inc. | | | 11,500 | | | | 2,048,380 | |
| HP, Inc. | | | 13,200 | | | | 308,748 | |
| | | | | | | | 2,357,128 | |
| Textiles, Apparel & Luxury Goods — 1.4% |
| VF Corp. | | | 19,100 | | | | 1,424,287 | |
| | | | | | | | | |
| TOTAL COMMON STOCKS | | | | | | | | |
| (Cost $81,077,535) | | | | | | | 100,674,054 | |
| |
| SHORT-TERM INVESTMENTS - 0.8% |
Fidelity Investments Money Market Funds - Government Portfolio, 1.26% (a) | | | 889,307 | | | | 889,307 | |
| TOTAL SHORT-TERM INVESTMENTS | | | | | | | | |
| (Cost $889,307) | | | | | | | 889,307 | |
| TOTAL INVESTMENTS - 96.6% | | | | | | | | |
| (Cost $81,966,842) | | | | | | | 101,563,361 | |
| OTHER ASSETS IN EXCESS OF LIABILITIES - 3.4% | | | | | | | 3,621,774 | |
| NET ASSETS - 100.0% | | | | | | $ | 105,185,135 | |
* | Non-income producing security. |
(a) | Seven-day yield as of February 28, 2018 |
PLC Public Limited Company.
The accompanying notes are an integral part of the financial statements.
20
SUMMIT GLOBAL INVESTMENTS
SMALL CAP LOW VOLATILITY FUND
Portfolio Holdings Summary Table
February 28, 2018 (Unaudited)
The following table presents a summary by industry of the portfolio holdings of the Fund:
| | | % of Net
Assets | | | Value | |
| COMMON STOCKS: | | | | | | |
| Hotels, Restaurants & Leisure | | | 6.4 | % | | $ | 1,407,847 | |
| Chemicals | | | 5.8 | | | | 1,267,668 | |
| Banks | | | 5.8 | | | | 1,261,453 | |
| Commercial Services & Supplies | | | 5.5 | | | | 1,212,121 | |
| Electronic Equipment, Instruments & Components | | | 4.7 | | | | 1,037,683 | |
| Real Estate Investment Trusts | | | 4.4 | | | | 960,448 | |
| Auto Components | | | 4.0 | | | | 863,705 | |
| Machinery | | | 3.7 | | | | 800,267 | |
| Health Care Equipment & Supplies | | | 3.5 | | | | 760,001 | |
| Capital Markets | | | 3.3 | | | | 729,721 | |
| Electric Utilities | | | 3.2 | | | | 698,899 | |
| IT Services | | | 2.9 | | | | 624,069 | |
| Semiconductors & Semiconductor Equipment | | | 2.8 | | | | 605,619 | |
| Health Care Providers & Services | | | 2.3 | | | | 493,210 | |
| Professional Services | | | 2.2 | | | | 482,156 | |
| Specialty Retail | | | 2.1 | | | | 459,308 | |
| Electrical Equipment | | | 2.0 | | | | 432,678 | |
| Pharmaceuticals | | | 1.8 | | | | 403,545 | |
| Household Durables | | | 1.8 | | | | 401,705 | |
| Water Utilities | | | 1.7 | | | | 374,250 | |
| Food Products | | | 1.7 | | | | 364,608 | |
| Multi-Utilities | | | 1.6 | | | | 350,156 | |
| Trading Companies & Distributors | | | 1.1 | | | | 246,400 | |
| Media | | | 1.1 | | | | 244,150 | |
| Internet & Direct Marketing Retail | | | 1.1 | | | | 244,026 | |
| Leisure Products | | | 1.1 | | | | 235,271 | |
| Diversified Consumer Services | | | 1.1 | | | | 234,092 | |
| Real Estate Management & Development | | | 1.1 | | | | 232,360 | |
| Textiles, Apparel & Luxury Goods | | | 1.0 | | | | 228,280 | |
| Thrifts & Mortgage Finance | | | 1.0 | | | | 218,161 | |
| Containers & Packaging | | | 1.0 | | | | 213,375 | |
| Communications Equipment | | | 1.0 | | | | 210,755 | |
| Air Freight & Logistics | | | 1.0 | | | | 210,600 | |
| Insurance | | | 1.0 | | | | 208,535 | |
| Construction & Engineering | | | 0.9 | | | | 205,250 | |
| Diversified Financial Services | | | 0.9 | | | | 203,740 | |
| Paper & Forest Products | | | 0.9 | | | | 191,625 | |
| Internet Software & Services | | | 0.9 | | | | 190,272 | |
| Investment Companies | | | 0.9 | | | | 187,436 | |
| Gas Utilities | | | 0.7 | | | | 179,955 | |
| SHORT-TERM INVESTMENTS | | | 3.7 | | | | 818,493 | |
| OTHER ASSETS IN EXCESS OF LIABILITIES | | | 5.3 | | | | 1,154,667 | |
| NET ASSETS | | | 100 | % | | $ | 21,848,560 | |
Portfolio holdings are subject to change at any time.
The accompanying notes are an integral part of the financial statements.
21
SUMMIT GLOBAL INVESTMENTS
SMALL CAP LOW VOLATILITY FUND
Portfolio of Investments
February 28, 2018 (Unaudited)
| | | Number
of Shares | | | Value | |
| COMMON STOCKS - 91.0% | | | | | | |
| Air Freight & Logistics — 1.0% | | | | | | |
| Forward Air Corp. | | | 3,900 | | | $ | 210,600 | |
| Auto Components — 4.0% | | | | | | | | |
| Cooper-Standard Holdings, Inc.* | | | 1,800 | | | | 219,312 | |
| Dorman Products, Inc.* | | | 3,100 | | | | 213,900 | |
| Fox Factory Holding Corp.* | | | 5,500 | | | | 206,525 | |
| Standard Motor Products, Inc. | | | 4,800 | | | | 223,968 | |
| | | | | | | | 863,705 | |
| Banks — 5.8% | | | | | | | | |
| Bryn Mawr Bank Corp. | | | 4,800 | | | | 209,040 | |
| Community Trust Bancorp, Inc. | | | 4,500 | | | | 195,750 | |
| First Busey Corp. | | | 7,100 | | | | 210,515 | |
| Great Southern Bancorp, Inc. | | | 4,300 | | | | 208,120 | |
| Preferred Bank | | | 3,600 | | | | 224,388 | |
| QCR Holdings, Inc. | | | 4,900 | | | | 213,640 | |
| | | | | | | | 1,261,453 | |
| Capital Markets — 3.3% | | | | | | | | |
| Fidus Investment Corp. | | | 12,900 | | | | 166,152 | |
| New Mountain Finance Corp. | | | 15,100 | | | | 191,015 | |
| Solar Capital Ltd. | | | 10,000 | | | | 203,000 | |
| WhiteHorse Finance, Inc. | | | 15,400 | | | | 169,554 | |
| | | | | | | | 729,721 | |
| Chemicals — 5.8% | | | | | | | | |
| AdvanSix, Inc.* | | | 4,800 | | | | 198,480 | |
| Cabot Corp. | | | 3,600 | | | | 216,648 | |
| Innospec, Inc. | | | 3,100 | | | | 201,345 | |
| KMG Chemicals, Inc. | | | 4,052 | | | | 242,998 | |
| Quaker Chemical Corp. | | | 1,400 | | | | 199,542 | |
| Sensient Technologies Corp. | | | 2,900 | | | | 208,655 | |
| | | | | | | | 1,267,668 | |
| Commercial Services & Supplies — 5.5% |
| ABM Industries, Inc. | | | 5,300 | | | | 186,348 | |
| Matthews International Corp., Class A | | | 4,100 | | | | 210,125 | |
| MSA Safety, Inc. | | | 2,600 | | | | 209,638 | |
| SP Plus Corp.* | | | 5,300 | | | | 190,800 | |
| UniFirst Corp. | | | 1,400 | | | | 217,420 | |
| Viad Corp. | | | 3,800 | | | | 197,790 | |
| | | | | | | | 1,212,121 | |
| Communications Equipment — 1.0% |
| Ituran Location and Control Ltd., (Israel) | | | 6,100 | | | | 210,755 | |
| Construction & Engineering — 0.9% |
| Comfort Systems USA, Inc. | | | 5,000 | | | | 205,250 | |
| Containers & Packaging — 1.0% |
| Silgan Holdings, Inc. | | | 7,500 | | | | 213,375 | |
| Diversified Consumer Services — 1.1% |
| Carriage Services, Inc. | | | 8,600 | | | | 234,092 | |
| Diversified Financial Services — 0.9% |
Compass Diversified Holdings † | | | 12,200 | | | | 203,740 | |
| Electric Utilities — 3.2% | | | | | | | | |
| El Paso Electric Co. | | | 3,700 | | | | 179,820 | |
| Hawaiian Electric Industries, Inc. | | | 5,800 | | | | 191,168 | |
| PNM Resources, Inc. | | | 4,700 | | | | 165,440 | |
| Spark Energy, Inc., Class A | | | 17,470 | | | | 162,471 | |
| | | | | | | | 698,899 | |
| Electrical Equipment — 2.0% | | | | | | | | |
| EnerSys | | | 3,200 | | | | 223,008 | |
| Regal Beloit Corp. | | | 2,900 | | | | 209,670 | |
| | | | | | | | 432,678 | |
| Electronic Equipment, Instruments & Components — 4.7% |
| Celestica, Inc., (Canada)* | | | 19,500 | | | | 212,160 | |
| ePlus, Inc.* | | | 2,710 | | | | 207,451 | |
| Orbotech Ltd., (Israel)* | | | 3,900 | | | | 214,344 | |
| PC Connection, Inc. | | | 8,000 | | | | 198,640 | |
| Plexus Corp.* | | | 3,400 | | | | 205,088 | |
| | | | | | | | 1,037,683 | |
| Food Products — 1.7% | | | | | | | | |
| B&G Foods, Inc. | | | 5,900 | | | | 163,430 | |
| Lancaster Colony Corp. | | | 1,700 | | | | 201,178 | |
| | | | | | | | 364,608 | |
| Gas Utilities — 0.7% | | | | | | | | |
| Chesapeake Utilities Corp. | | | 2,700 | | | | 179,955 | |
| Health Care Equipment & Supplies — 3.5% |
| Globus Medical, Inc., Class A* | | | 5,900 | | | | 281,076 | |
| ICU Medical, Inc.* | | | 1,100 | | | | 254,375 | |
| LeMaitre Vascular, Inc. | | | 6,460 | | | | 224,550 | |
| | | | | | | | 760,001 | |
| Health Care Providers & Services — 2.3% |
| Addus HomeCare Corp.* | | | 6,800 | | | | 233,580 | |
| Chemed Corp. | | | 1,000 | | | | 259,630 | |
| | | | | | | | 493,210 | |
| Hotels, Restaurants & Leisure — 6.4% |
| Choice Hotels International, Inc. | | | 3,000 | | | | 237,450 | |
| Cracker Barrel Old Country Store, Inc. | | | 1,500 | | | | 234,150 | |
| Dave & Buster's Entertainment, Inc.* | | | 4,400 | | | | 196,988 | |
| Denny's Corp.* | | | 16,500 | | | | 248,160 | |
| Ruth's Hospitality Group, Inc. | | | 10,100 | | | | 247,955 | |
| Texas Roadhouse, Inc. | | | 4,400 | | | | 243,144 | |
| | | | | | | | 1,407,847 | |
| Household Durables — 1.8% | | | | | | | | |
| Helen of Troy Ltd., (Bermuda)* | | | 2,500 | | | | 225,125 | |
| Tupperware Brands Corp. | | | 3,600 | | | | 176,580 | |
| | | | | | | | 401,705 | |
The accompanying notes are an integral part of the financial statements.
22
SUMMIT GLOBAL INVESTMENTS
SMALL CAP LOW VOLATILITY FUND
Portfolio of Investments (Concluded)
February 28, 2018 (Unaudited)
| | | Number
of Shares | | | Value | |
| Insurance — 1.0% | | | | | | |
| Argo Group International Holdings Ltd., (Bermuda) | | | 3,580 | | | $ | 208,535 | |
| Internet & Direct Marketing Retail — 1.1% |
| PetMed Express, Inc. | | | 5,400 | | | | 244,026 | |
| Internet Software & Services — 0.9% |
| CommerceHub, Inc., Class A* | | | 9,600 | | | | 190,272 | |
| Investment Companies — 0.9% | | | | | | | | |
| TPG Specialty Lending, Inc. | | | 10,390 | | | | 187,436 | |
| IT Services — 2.9% | | | | | | | | |
| Sykes Enterprises, Inc.* | | | 6,921 | | | | 201,124 | |
| TTEC Holdings, Inc. | | | 5,300 | | | | 188,945 | |
| WNS Holdings Ltd., (India) ADR* | | | 5,200 | | | | 234,000 | |
| | | | | | | | 624,069 | |
| Leisure Products — 1.1% | | | | | | | | |
| MCBC Holdings, Inc.* | | | 9,599 | | | | 235,271 | |
| Machinery — 3.7% | | | | | | | | |
| Alamo Group, Inc. | | | 1,893 | | | | 210,407 | |
| Global Brass & Copper Holdings, Inc. | | | 6,500 | | | | 183,950 | |
| Hillenbrand, Inc. | | | 4,900 | | | | 215,110 | |
| Kadant, Inc. | | | 2,000 | | | | 190,800 | |
| | | | | | | | 800,267 | |
| Media — 1.1% | | | | | | | | |
| John Wiley & Sons, Inc., Class A | | | 3,800 | | | | 244,150 | |
| Multi-Utilities — 1.6% | | | | | | | | |
| NorthWestern Corp. | | | 3,400 | | | | 173,672 | |
| Unitil Corp. | | | 4,198 | | | | 176,484 | |
| | | | | | | | 350,156 | |
| Paper & Forest Products — 0.9% | | | | | | | | |
| Neenah Paper, Inc. | | | 2,500 | | | | 191,625 | |
| Pharmaceuticals — 1.8% | | | | | | | | |
| Phibro Animal Health Corp., Class A | | | 6,100 | | | | 234,545 | |
| Prestige Brands Holdings, Inc.* | | | 5,000 | | | | 169,000 | |
| | | | | | | | 403,545 | |
| Professional Services — 2.2% | | | | | | | | |
| Korn/Ferry International | | | 5,100 | | | | 213,741 | |
| On Assignment, Inc.* | | | 3,500 | | | | 268,415 | |
| | | | | | | | 482,156 | |
| Real Estate Investment Trusts — 4.4% | | | | | | | | |
| Apollo Commercial Real Estate Finance, Inc. | | | 11,700 | | | | 213,642 | |
| LTC Properties, Inc. | | | 4,600 | | | | 169,970 | |
| Potlatch Corp. | | | 4,200 | | | | 214,830 | |
| Urban Edge Properties | | | 8,900 | | | | 192,062 | |
| Urstadt Biddle Properties, Inc., Class A | | | 9,700 | | | | 169,944 | |
| | | | | | | | 960,448 | |
| Real Estate Management & Development — 1.1% |
| RMR Group Inc., Class A, (The) | | | 3,700 | | | | 232,360 | |
| Semiconductors & Semiconductor Equipment — 2.8% |
| Cabot Microelectronics Corp. | | | 2,100 | | | | 213,990 | |
| Nova Measuring Instruments Ltd., (Israel)* | | | 7,700 | | | | 210,903 | |
| NVE Corp. | | | 2,600 | | | | 180,726 | |
| | | | | | | | 605,619 | |
| Specialty Retail — 2.1% | | | | | | | | |
| Aaron's, Inc. | | | 5,800 | | | | 268,018 | |
| Haverty Furniture Cos, Inc. | | | 9,400 | | | | 191,290 | |
| | | | | | | | 459,308 | |
| Textiles, Apparel & Luxury Goods — 1.0% | | | | | | | | |
| Steven Madden Ltd. | | | 5,200 | | | | 228,280 | |
| Thrifts & Mortgage Finance — 1.0% | | | | | | | | |
| First Defiance Financial Corp. | | | 4,100 | | | | 218,161 | |
| Trading Companies & Distributors — 1.1% |
| Applied Industrial Technologies, Inc. | | | 3,500 | | | | 246,400 | |
| Water Utilities — 1.7% | | | | | | | | |
| California Water Service Group | | | 5,100 | | | | 193,545 | |
| Connecticut Water Service, Inc. | | | 3,500 | | | | 180,705 | |
| | | | | | | | 374,250 | |
| TOTAL COMMON STOCKS | | | | | | | | |
| (Cost $18,850,870) | | | | | | | 19,875,400 | |
| | | | | | | | | |
| SHORT-TERM INVESTMENTS - 3.7% | | | | | | | | |
Fidelity Investments Money Market Funds - Government Portfolio, 1.26% (a) | | | 818,493 | | | | 818,493 | |
| TOTAL SHORT-TERM INVESTMENTS | | | | | | | | |
| (Cost $818,493) | | | | | | | 818,493 | |
| TOTAL INVESTMENTS - 94.7% | | | | | | | | |
| (Cost $19,669,363) | | | | | | | 20,693,893 | |
| OTHER ASSETS IN EXCESS OF LIABILITIES - 5.3% | | | | | | | 1,154,667 | |
| NET ASSETS - 100.0% | | | | | | $ | 21,848,560 | |
* | Non-income producing security. |
(a) | Seven-day yield as of February 28, 2018. |
† | Master Limited Partnership. |
ADR American Depositary Receipt
The accompanying notes are an integral part of the financial statements.
23
SUMMIT GLOBAL INVESTMENTS
GLOBAL LOW VOLATILITY FUND
Portfolio Holdings Summary Table
February 28, 2018 (Unaudited)
The following table presents a summary by industry of the portfolio holdings of the Fund:
| | | % of Net
Assets | | | Value | |
| COMMON STOCKS: | | | | | | |
| Pharmaceuticals | | | 9.8 | % | | $ | 2,076,489 | |
| Software | | | 8.3 | | | | 1,756,196 | |
| Aerospace & Defense | | | 6.2 | | | | 1,307,838 | |
| Health Care Equipment & Supplies | | | 6.1 | | | | 1,295,694 | |
| Internet Software & Services | | | 6.0 | | | | 1,277,378 | |
| Diversified Telecommunication Services | | | 5.8 | | | | 1,227,899 | |
| Hotels, Restaurants & Leisure | | | 5.8 | | | | 1,226,915 | |
| Household Products | | | 5.7 | | | | 1,211,963 | |
| IT Services | | | 4.1 | | | | 879,525 | |
| Road & Rail | | | 4.0 | | | | 856,663 | |
| Personal Products | | | 3.9 | | | | 822,491 | |
| Real Estate Investment Trusts (REITs) | | | 3.9 | | | | 821,334 | |
| Banks | | | 3.9 | | | | 820,682 | |
| Specialty Retail | | | 2.1 | | | | 454,740 | |
| Chemicals | | | 2.1 | | | | 448,175 | |
| Capital Markets | | | 2.1 | | | | 447,600 | |
| Diversified Financial Services | | | 2.0 | | | | 435,120 | |
| Air Freight & Logistics | | | 2.0 | | | | 429,456 | |
| Oil, Gas & Consumable Fuels | | | 2.0 | | | | 419,234 | |
| Machinery | | | 2.0 | | | | 418,522 | |
| Media | | | 1.9 | | | | 412,640 | |
| Beverages | | | 1.9 | | | | 406,268 | |
| Electric Utilities | | | 1.9 | | | | 404,576 | |
| Food Products | | | 1.9 | | | | 402,866 | |
| Insurance | | | 1.9 | | | | 400,214 | |
| Food & Staples Retailing | | | 1.7 | | | | 374,442 | |
| SHORT-TERM INVESTMENTS | | | 1.1 | | | | 243,357 | |
| LIABILITIES IN EXCESS OF OTHER ASSETS | | | (0.1 | ) | | | (16,392 | ) |
| NET ASSETS | | | 100 | % | | $ | 21,261,885 | |
Portfolio holdings are subject to change at any time.
The accompanying notes are an integral part of the financial statements.
24
SUMMIT GLOBAL INVESTMENTS
GLOBAL LOW VOLATILITY FUND
Portfolio of Investments
February 28, 2018 (Unaudited)
| | | Number
of Shares | | | Value | |
| COMMON STOCKS - 99.0% | | | | | | |
| Aerospace & Defense — 6.2% | | | | | | |
| General Dynamics Corp. | | | 1,950 | | | $ | 433,778 | |
| Raytheon Co. | | | 2,030 | | | | 441,545 | |
| United Technologies Corp. | | | 3,210 | | | | 432,515 | |
| | | | | | | | 1,307,838 | |
| Air Freight & Logistics — 2.0% | | | | | | | | |
| CH Robinson Worldwide, Inc. | | | 4,600 | | | | 429,456 | |
| Banks — 3.9% | | | | | | | | |
| Bank of Montreal, (Canada) | | | 5,400 | | | | 410,454 | |
| Royal Bank of Canada, (Canada) | | | 5,200 | | | | 410,228 | |
| | | | | | | | 820,682 | |
| Beverages — 1.9% | | | | | | | | |
| Coca-Cola Co., (The) | | | 9,400 | | | | 406,268 | |
| Capital Markets — 2.1% | | | | | | | | |
| T Rowe Price Group, Inc. | | | 4,000 | | | | 447,600 | |
| Chemicals — 2.1% | | | | | | | | |
| Nutrien Ltd., (Canada) | | | 9,100 | | | | 448,175 | |
| Diversified Financial Services — 2.0% | | | | | | | | |
| Berkshire Hathaway, Inc., Class B* | | | 2,100 | | | | 435,120 | |
| Diversified Telecommunication Services — 5.8% |
| BCE, Inc., (Canada) | | | 9,180 | | | | 400,523 | |
| Telekomunikasi Indonesia Persero Tbk PT, (Indonesia) SP ADR | | | 14,200 | | | | 412,226 | |
| TELUS Corp., (Canada) | | | 11,500 | | | | 415,150 | |
| | | | | | | | 1,227,899 | |
| Electric Utilities — 1.9% | | | | | | | | |
| Duke Energy Corp. | | | 5,370 | | | | 404,576 | |
| Food & Staples Retailing — 1.7% | | | | | | | | |
| Wal-Mart Stores, Inc. | | | 4,160 | | | | 374,442 | |
| Food Products — 1.9% | | | | | | | | |
| Hershey Co., (The) | | | 4,100 | | | | 402,866 | |
| Health Care Equipment & Supplies — 6.1% | | | | | | | | |
| ResMed, Inc. | | | 4,540 | | | | 432,526 | |
| Smith & Nephew PLC, (United Kingdom) SP ADR | | | 11,900 | | | | 422,093 | |
| Stryker Corp. | | | 2,720 | | | | 441,075 | |
| | | | | | | | 1,295,694 | |
| Hotels, Restaurants & Leisure — 5.8% | | | | | | | | |
| Carnival PLC, (United Kingdom) ADR | | | 6,100 | | | | 406,870 | |
| McDonald's Corp. | | | 2,520 | | | | 397,505 | |
| Starbucks Corp. | | | 7,400 | | | | 422,540 | |
| | | | | | | | 1,226,915 | |
| Household Products — 5.7% | | | | | | | | |
| Clorox Co., (The) | | | 3,200 | | | | 413,056 | |
| Colgate-Palmolive Co. | | | 5,800 | | | | 400,026 | |
| Procter & Gamble Co., (The) | | | 5,080 | | | | 398,881 | |
| | | | | | | | 1,211,963 | |
| Insurance — 1.9% | | | | | | | | |
| Chubb Ltd. | | | 2,820 | | | | 400,214 | |
| Internet Software & Services — 6.0% | | | | | | | | |
| Alibaba Group Holding Ltd., SP ADR* | | | 2,300 | | | | 428,122 | |
| Facebook, Inc., Class A* | | | 2,300 | | | | 410,136 | |
| Tencent Holdings Ltd., ADR | | | 8,000 | | | | 439,120 | |
| | | | | | | | 1,277,378 | |
| IT Services — 4.1% | | | | | | | | |
| Mastercard, Inc., Class A | | | 2,500 | | | | 439,400 | |
| Visa, Inc., Class A | | | 3,580 | | | | 440,125 | |
| | | | | | | | 879,525 | |
| Machinery — 2.0% | | | | | | | | |
| FANUC Corp., (Japan) ADR | | | 16,500 | | | | 418,522 | |
| Media — 1.9% | | | | | | | | |
| Walt Disney Co., (The) | | | 4,000 | | | | 412,640 | |
| Oil, Gas & Consumable Fuels — 2.0% |
| TransCanada Corp., (Canada) | | | 9,700 | | | | 419,234 | |
| Personal Products — 3.9% | | | | | | | | |
| Estee Lauder Cos, Inc., Class A, (The) | | | 3,070 | | | | 425,011 | |
| Unilever, (Netherlands) | | | 7,600 | | | | 397,480 | |
| | | | | | | | 822,491 | |
| Pharmaceuticals — 9.8% | | | | | | | | |
| Bayer AG, (Germany) SP ADR | | | 13,900 | | | | 406,436 | |
| Eli Lilly & Co. | | | 5,470 | | | | 421,299 | |
| Novo Nordisk, (Denmark) SP ADR | | | 8,300 | | | | 427,284 | |
| Roche Holding AG, (Switzerland) SP ADR | | | 14,200 | | | | 410,522 | |
| Sanofi, (France) ADR | | | 10,470 | | | | 410,948 | |
| | | | | | | | 2,076,489 | |
| Real Estate Investment Trusts (REITs) — 3.9% |
| Crown Castle International Corp. | | | 3,900 | | | | 429,234 | |
| Equinix, Inc. | | | 1,000 | | | | 392,100 | |
| | | | | | | | 821,334 | |
| Road & Rail — 4.0% | | | | | | | | |
| Canadian National Railway Co., (Canada) | | | 5,500 | | | | 425,535 | |
| Union Pacific Corp. | | | 3,310 | | | | 431,128 | |
| | | | | | | | 856,663 | |
The accompanying notes are an integral part of the financial statements.
25
SUMMIT GLOBAL INVESTMENTS
GLOBAL LOW VOLATILITY FUND
Portfolio of Investments (Concluded)
February 28, 2018 (Unaudited)
| | | Number
of Shares | | | Value | |
| Software — 8.3% | | | | | | |
| Adobe Systems, Inc.* | | | 2,210 | | | $ | 462,178 | |
| Check Point Software Technologies Ltd., (Israel)* | | | 4,190 | | | | 435,299 | |
| Microsoft Corp. | | | 4,700 | | | | 440,719 | |
| SAP SE, (Germany) SP ADR | | | 4,000 | | | | 418,000 | |
| | | | | | | | 1,756,196 | |
| Specialty Retail — 2.1% | | | | | | | | |
| TJX Cos, Inc., (The) | | | 5,500 | | | | 454,740 | |
| | | | | | | | | |
| TOTAL COMMON STOCKS | | | | | | | | |
| (Cost $19,000,810) | | | | | | | 21,034,920 | |
| | | | | | | | | |
| SHORT-TERM INVESTMENTS - 1.1% | | | | | | | | |
Fidelity Investments Money Market Funds - Government Portfolio, 1.26% (a) | | | 243,357 | | | | 243,357 | |
| TOTAL SHORT-TERM INVESTMENTS | | | | | | | | |
| (Cost $243,357) | | | | | | | 243,357 | |
| TOTAL INVESTMENTS - 100.1% | | | | | | | | |
| (Cost $19,244,167) | | | | | | | 21,278,277 | |
| LIABILITIES IN EXCESS OF OTHER ASSETS - (0.1)% | | | | | | | (16,392 | ) |
| NET ASSETS - 100.0% | | | | | | $ | 21,261,885 | |
* | Non-income producing security. |
(a) | Seven-day yield as of February 28, 2018. |
ADR American Depositary Receipt
PLC Public Limited Company
SP ADR Sponsored ADR
The accompanying notes are an integral part of the financial statements.
26
SUMMIT GLOBAL INVESTMENTS
Statements of Assets and Liabilities
February 28, 2018 (Unaudited)
| | | Summit Global
Investments
U.S. Low
Volatility
Equity Fund | | | Summit Global
Investments
Small Cap
Low Volatility
Fund | | | Summit Global
Investments
Global
Low Volatility
Fund | |
| ASSETS | | | | | | | | | |
| Investments, at value (cost $81,077,535, $18,850,870 and $19,000,810, respectively) | | $ | 100,674,054 | | | $ | 19,875,400 | | | $ | 21,034,920 | |
| Short-term investments, at value (cost $889,307, $818,493 and $243,357, respectively) | | | 889,307 | | | | 818,493 | | | | 243,357 | |
| Receivables for: | | | | | | | | | | | | |
| Capital shares sold | | | 3,624,064 | | | | 1,152,954 | | | | 1,250 | |
| Dividends | | | 128,210 | | | | 10,940 | | | | 38,178 | |
| Prepaid and other expenses | | | 51,931 | | | | 36,809 | | | | 10,345 | |
| Total assets | | $ | 105,367,566 | | | $ | 21,894,596 | | | $ | 21,328,050 | |
| | | | | | | | | | | | | |
| LIABILITIES | | | | | | | | | | | | |
| Payables for: | | | | | | | | | | | | |
| Advisory fees | | $ | 42,684 | | | $ | 7,960 | | | $ | 5,094 | |
| Capital shares redeemed | | | 32,670 | | | | 10,183 | | | | 27,586 | |
| Other accrued expenses and liabilities | | | 107,077 | | | | 27,893 | | | | 33,485 | |
| Total liabilities | | | 182,431 | | | | 46,036 | | | | 66,165 | |
| Net assets | | $ | 105,185,135 | | | $ | 21,848,560 | | | $ | 21,261,885 | |
| | | | | | | | | | | | | |
| NET ASSETS CONSIST OF: | | | | | | | | | | | | |
| Par value | | $ | 6,620 | | | $ | 1,883 | | | $ | 737 | |
| Paid-in capital | | | 81,127,533 | | | | 20,886,386 | | | | 21,368,964 | |
| Undistributed/accumulated net investment income/(loss) | | | 193,728 | | | | (14,685 | ) | | | 89,920 | |
| Accumulated net realized gain/(loss) from investments | | | 4,260,735 | | | | (49,554 | ) | | | (2,231,846 | ) |
| Net unrealized appreciation/(depreciation) on investments | | | 19,596,519 | | | | 1,024,530 | | | | 2,034,110 | |
| Net assets | | $ | 105,185,135 | | | $ | 21,848,560 | | | $ | 21,261,885 | |
The accompanying notes are an integral part of the financial statements.
27
SUMMIT GLOBAL INVESTMENTS
Statements of Assets and Liabilities (Concluded)
February 28, 2018 (Unaudited)
| | | Summit Global
Investments
U.S. Low
Volatility
Equity Fund | | | Summit Global
Investments
Small Cap
Low Volatility
Fund | | | Summit Global
Investments
Global
Low Volatility
Fund | |
| CLASS I SHARES: | | | | | | | | | | | | |
| Net assets applicable to Class I Shares | | $ | 94,576,169 | | | $ | 18,536,556 | | | $ | 21,261,885 | |
| Shares outstanding ($0.001 par value, 100,000,000 shares authorized) | | | 5,952,183 | | | | 1,597,099 | | | | 736,946 | |
| Net asset value, offering and redemption price per share | | $ | 15.89 | | | $ | 11.61 | | | $ | 28.85 | |
| | | | | | | | | | | | | |
| CLASS A SHARES: | | | | | | | | | | | | |
| Net assets applicable to Class A Shares | | $ | 9,138,320 | | | $ | 3,138,615 | | | $ | — | |
| Shares outstanding ($0.001 par value, 100,000,000 shares authorized) | | | 573,778 | | | | 270,393 | | | | — | |
| Net asset value and redemption price per share | | $ | 15.93 | | | $ | 11.61 | | | $ | — | |
| Maximum offering price per share (100/94.75 of $15.93 and $11.61, respectively) | | $ | 16.81 | | | $ | 12.10 | | | $ | — | |
| | | | | | | | | | | | | |
| CLASS C SHARES: | | | | | | | | | | | | |
| Net assets applicable to Class C Shares | | $ | 1,470,646 | | | $ | 173,389 | | | $ | — | |
| Shares outstanding ($0.001 par value, 100,000,000 shares authorized) | | | 94,099 | | | | 15,111 | | | | — | |
| Net asset value, offering and redemption price per share | | $ | 15.63 | | | $ | 11.47 | | | $ | — | |
The accompanying notes are an integral part of the financial statements.
28
SUMMIT GLOBAL INVESTMENTS
Statements of Operations
For the Six Months Ended February 28, 2018 (Unaudited)
| | | Summit Global
Investments
U.S. Low
Volatility
Equity Fund | | | Summit Global
Investments
Small Cap
Low Volatility
Fund | | | Summit Global
Investments
Global
Low Volatility
Fund | |
| INVESTMENT INCOME | | | | | | | | | |
| Dividends (net of foreign withholding taxes of $126, $642 and $7,904, respectively) | | $ | 1,008,918 | | | $ | 166,724 | | | $ | 179,250 | |
| Total investment income | | | 1,008,918 | | | | 166,724 | | | | 179,250 | |
| | | | | | | | | | | | | |
| EXPENSES | | | | | | | | | | | | |
| Advisory fees (Note 2) | | | 376,806 | | | | 93,684 | | | | 77,582 | |
| Transfer agent fees (Note 2) | | | 51,226 | | | | 8,305 | | | | 6,707 | |
| Administration and accounting fees (Note 2) | | | 44,788 | | | | 9,334 | | | | 10,185 | |
| Registration and filing fees | | | 27,539 | | | | 22,193 | | | | 13,796 | |
| Legal fees | | | 22,662 | | | | 3,931 | | | | 8,225 | |
| Directors fees | | | 22,520 | | | | 2,534 | | | | 4,931 | |
| Officers fees | | | 18,451 | | | | 2,155 | | | | 3,655 | |
| Audit and tax service fees | | | 17,559 | | | | 15,326 | | | | 9,368 | |
| Distribution fees - Class A Shares | | | 17,404 | | | | 4,027 | | | | — | |
| Printing and shareholder reporting fees | | | 11,522 | | | | 1,624 | | | | 10,206 | |
| Distribution fees - Class C Shares | | | 5,143 | | | | 768 | | | | — | |
| Custodian fees (Note 2) | | | 1,787 | | | | 3,284 | | | | 1,656 | |
| Other expenses | | | 12,921 | | | | 3,343 | | | | 6,373 | |
| Total expenses before waivers and reimbursements | | | 630,328 | | | | 170,508 | | | | 152,684 | |
| Less: waivers and reimbursements (Note 2) | | | (78,538 | ) | | | (44,160 | ) | | | (63,354 | ) |
| Net expenses after waivers and reimbursements | | | 551,790 | | | | 126,348 | | | | 89,330 | |
| Net investment income/(loss) | | | 457,128 | | | | 40,376 | | | | 89,920 | |
| | | | | | | | | | | | | |
| NET REALIZED AND UNREALIZED GAIN/(LOSS) FROM INVESTMENTS | | | | | | | | | | | | |
| Net realized gain/(loss) from investments | | | 9,499,014 | | | | 477,407 | | | | 829,609 | |
| Net change in unrealized appreciation/(depreciation) on investments | | | 598,615 | | | | (259,628 | ) | | | 412,929 | |
| Net realized and unrealized gain/(loss) on investments | | | 10,097,629 | | | | 217,779 | | | | 1,242,538 | |
NET INCREASE/(DECREASE) IN NET ASSETS RESULTING FROM OPERATIONS | | $ | 10,554,757 | | | $ | 258,155 | | | $ | 1,332,458 | |
The accompanying notes are an integral part of the financial statements.
29
SUMMIT GLOBAL INVESTMENTS
U.S. LOW VOLATILITY EQUITY FUND
Statements of Changes in Net Assets
| | | For the
Six Months Ended
February 28, 2018
(Unaudited) | | | For the
Year Ended
August 31, 2017 | |
| INCREASE/(DECREASE) IN NET ASSETS FROM OPERATIONS: | | | | | | |
| Net investment income/(loss) | | $ | 457,128 | | | $ | 1,455,100 | |
| Net realized gain/(loss) from investments | | | 9,499,014 | | | | 1,060,318 | |
| Net change in unrealized appreciation/(depreciation) on investments | | | 598,615 | | | | 5,777,761 | |
| Net increase/(decrease) in net assets resulting from operations | | | 10,554,757 | | | | 8,293,179 | |
| DIVIDENDS AND DISTRIBUTIONS TO SHAREHOLDERS FROM: | | | | | | | | |
| Net investment income | | | | | | | | |
| Class I Shares | | | (1,036,799 | ) | | | (1,016,757 | ) |
| Class A Shares | | | (51,814 | ) | | | (180,710 | ) |
| Class C Shares | | | (5,498 | ) | | | (5,671 | ) |
| Total net investment income | | | (1,094,111 | ) | | | (1,203,138 | ) |
| Net realized capital gains | | | | | | | | |
| Class I Shares | | | (5,396,669 | ) | | | (1,371,748 | ) |
| Class A Shares | | | (521,669 | ) | | | (292,535 | ) |
| Class C Shares | | | (85,402 | ) | | | (11,450 | ) |
| Total net realized capital gains | | | (6,003,740 | ) | | | (1,675,733 | ) |
| Net decrease in net assets from dividends and distributions to shareholders | | | (7,097,851 | ) | | | (2,878,871 | ) |
| INCREASE/(DECREASE) IN NET ASSETS FROM CAPITAL SHARE TRANSACTIONS: | | | | | | | | |
| Class I Shares | | | | | | | | |
| Proceeds from shares sold | | | 8,949,323 | | | | 20,225,596 | |
| Reinvestment of distributions | | | 6,276,150 | | | | 2,279,346 | |
| Shares redeemed | | | (15,442,536 | ) | | | (40,980,435 | ) |
| Redemption fees* | | | 770 | | | | 6,643 | |
| Total from Class I Shares | | | (216,299 | ) | | | (18,468,850 | ) |
| Class A Shares | | | | | | | | |
| Proceeds from shares sold | | | 1,816,073 | | | | 6,325,586 | |
| Reinvestment of distributions | | | 571,954 | | | | 466,338 | |
| Shares redeemed | | | (16,046,974 | ) | | | (4,908,192 | ) |
| Redemption fees* | | | 3,400 | | | | 520 | |
| Total from Class A Shares | | | (13,655,547 | ) | | | 1,884,252 | |
| Class C Shares | | | | | | | | |
| Proceeds from shares sold | | | 237,264 | | | | 1,031,081 | |
| Reinvestment of distributions | | | 90,899 | | | | 17,121 | |
| Shares redeemed | | | (125,386 | ) | | | (251,350 | ) |
| Redemption fees* | | | 154 | | | | 8 | |
| Total from Class C Shares | | | 202,931 | | | | 796,860 | |
| Net increase/(decrease) in net assets from capital shares transactions | | | (13,668,909 | ) | | | (15,787,738 | ) |
| Total increase/(decrease) in net assets | | | (10,212,003 | ) | | | (10,373,430 | ) |
| NET ASSETS: | | | | | | | | |
| Beginning of period | | | 115,397,138 | | | | 125,770,568 | |
| End of period | | $ | 105,185,135 | | | $ | 115,397,138 | |
| Undistributed/accumulated net investment income/(loss), end of period | | $ | 193,728 | | | $ | 830,711 | |
The accompanying notes are an integral part of the financial statements.
30
SUMMIT GLOBAL INVESTMENTS
U.S. LOW VOLATILITY EQUITY FUND
Statements of Changes in Net Assets (Concluded)
| | | For the
Six Months Ended
February 28, 2018
(Unaudited) | | | For the
Year Ended
August 31, 2017 | |
| SHARE TRANSACTIONS: | | | | | | |
| Class I Shares | | | | | | |
| Shares sold | | | 563,046 | | | | 1,369,045 | |
| Shares reinvested | | | 400,265 | | | | 155,799 | |
| Shares redeemed | | | (970,744 | ) | | | (2,786,555 | ) |
| Total Class I Shares | | | (7,433 | ) | | | (1,261,711 | ) |
| Class A Shares | | | | | | | | |
| Shares sold | | | 114,716 | | | | 428,066 | |
| Shares reinvested | | | 36,384 | | | | 31,897 | |
| Shares redeemed | | | (1,018,484 | ) | | | (333,270 | ) |
| Total Class A Shares | | | (867,384 | ) | | | 126,693 | |
| Class C Shares | | | | | | | | |
| Shares sold | | | 15,261 | | | | 70,954 | |
| Shares reinvested | | | 5,883 | | | | 1,185 | |
| Shares redeemed | | | (7,922 | ) | | | (16,932 | ) |
| Total Class C Shares | | | 13,222 | | | | 55,207 | |
| Net increase/(decrease) in shares outstanding | | | (861,595 | ) | | | (1,079,811 | ) |
* | Prior to December 31, 2017, there was a 1.50% redemption fee to the value of shares redeemed or exchanged within 60 days of purchase. The redemption fees were retained by the Fund for the benefit of the remaining shareholders and recorded as paid-in capital. Effective December 31, 2017, the Fund eliminated its redemption fee. |
The accompanying notes are an integral part of the financial statements.
31
SUMMIT GLOBAL INVESTMENTS
SMALL CAP LOW VOLATILITY FUND
Statements of Changes in Net Assets
| | | For the
Six Months Ended
February 28, 2018
(Unaudited) | | | For the
Year Ended
August 31, 2017 | |
| INCREASE/(DECREASE) IN NET ASSETS FROM OPERATIONS: | | | | | | |
| Net investment income/(loss) | | $ | 40,376 | | | $ | 37,507 | |
| Net realized gain/(loss) from investments | | | 477,407 | | | | 1,255,269 | |
| Net change in unrealized appreciation/(depreciation) on investments | | | (259,628 | ) | | | 570,119 | |
| Net increase/(decrease) in net assets resulting from operations | | | 258,155 | | | | 1,862,895 | |
| DIVIDENDS AND DISTRIBUTIONS TO SHAREHOLDERS FROM: | | | | | | | | |
| Net investment income | | | | | | | | |
| Class I Shares | | | (65,165 | ) | | | (44,499 | ) |
| Class A Shares | | | (4,708 | ) | | | (6,975 | ) |
| Class C Shares | | | — | | | | — | |
| Total net investment income | | | (69,873 | ) | | | (51,474 | ) |
| Net realized capital gains | | | | | | | | |
| Class I Shares | | | (1,486,849 | ) | | | (2,053 | ) |
| Class A Shares | | | (273,868 | ) | | | (471 | ) |
| Class C Shares | | | (19,328 | ) | | | (10 | ) |
| Total net realized capital gains | | | (1,780,045 | ) | | | (2,534 | ) |
| Net decrease in net assets from dividends and distributions to shareholders | | | (1,849,918 | ) | | | (54,008 | ) |
| INCREASE/(DECREASE) IN NET ASSETS FROM CAPITAL SHARE TRANSACTIONS: | | | | | | | | |
| Class I Shares | | | | | | | | |
| Proceeds from shares sold | | | 8,873,888 | | | | 3,687,970 | |
| Reinvestment of distributions | | | 1,175,459 | | | | 46,552 | |
| Shares redeemed | | | (3,043,704 | ) | | | (2,395,742 | ) |
| Redemption fees* | | | 27 | | | | 54 | |
| Total from Class I Shares. | | | 7,005,670 | | | | 1,338,834 | |
| Class A Shares | | | | | | | | |
| Proceeds from shares sold | | | 511,170 | | | | 1,213,017 | |
| Reinvestment of distributions | | | 278,576 | | | | 7,444 | |
| Shares redeemed | | | (596,262 | ) | | | (412,426 | ) |
| Redemption fees* | | | 75 | | | | 81 | |
| Total from Class A Shares. | | | 193,559 | | | | 808,116 | |
| Class C Shares | | | | | | | | |
| Proceeds from shares sold | | | 58,669 | | | | 203,995 | |
| Reinvestment of distributions | | | 19,328 | | | | 10 | |
| Shares redeemed | | | (56,298 | ) | | | (70,906 | ) |
| Redemption fees* | | | 1 | | | | — | |
| Total from Class C Shares | | | 21,700 | | | | 133,099 | |
| Net increase/(decrease) in net assets from capital share transactions | | | 7,220,929 | | | | 2,280,049 | |
| Total increase/(decrease) in net assets | | | 5,629,166 | | | | 4,088,936 | |
| NET ASSETS: | | | | | | | | |
| Beginning of period | | | 16,219,394 | | | | 12,130,458 | |
| End of period | | $ | 21,848,560 | | | $ | 16,219,394 | |
| Undistributed net investment income/(loss), end of period | | $ | (14,685 | ) | | $ | 14,812 | |
The accompanying notes are an integral part of the financial statements.
32
SUMMIT GLOBAL INVESTMENTS
SMALL CAP LOW VOLATILITY FUND
Statements of Changes in Net Assets (Concluded)
| | | For the
Six Months Ended
February 28, 2018
(Unaudited) | | | For the
Year Ended
August 31, 2017 | |
| SHARE TRANSACTIONS: | | | | | | |
| Class I Shares | | | | | | |
| Shares sold | | | 700,246 | | | | 306,838 | |
| Shares reinvested | | | 96,507 | | | | 3,825 | |
| Shares redeemed | | | (242,441 | ) | | | (199,853 | ) |
| Total from Class I Shares | | | 554,312 | | | | 110,810 | |
| Class A Shares | | | | | | | | |
| Shares sold | | | 40,937 | | | | 101,225 | |
| Shares reinvested | | | 22,853 | | | | 611 | |
| Shares redeemed | | | (46,450 | ) | | | (34,308 | ) |
| Total from Class I Shares | | | 17,340 | | | | 67,528 | |
| Class C Shares | | | | | | | | |
| Shares sold | | | 4,578 | | | | 17,060 | |
| Shares reinvested | | | 1,601 | | | | 1 | |
| Shares redeemed | | | (4,742 | ) | | | (5,775 | ) |
| Total from Class C Shares | | | 1,437 | | | | 11,286 | |
| Net increase/(decrease) in shares outstanding | | | 573,089 | | | | 189,624 | |
* | Prior to December 31, 2017, there was a 1.50% redemption fee to the value of shares redeemed or exchanged within 60 days of purchase. The redemption fees were retained by the Fund for the benefit of the remaining shareholders and recorded as paid-in capital. Effective December 31, 2017, the Fund eliminated its redemption fee. |
The accompanying notes are an integral part of the financial statements.
33
SUMMIT GLOBAL INVESTMENTS
GLOBAL LOW VOLATILITY FUND
Statements of Changes in Net Assets
| | | For the
Six Months Ended
February 28, 2018
(Unaudited) | | | For the
Year Ended
August 31, 2017 | |
| INCREASE/(DECREASE) IN NET ASSET FROM OPERATIONS: | | | | | | |
| Net investment income/(loss) | | $ | 89,920 | | | $ | 92,781 | |
| Net realized gain/(loss) from investments | | | 829,609 | | | | 5,612,229 | |
| Net change in unrealized appreciation/(depreciation) on investments | | | 412,929 | | | | (5,601,962 | ) |
| Net increase/(decrease) in net assets resulting from operations | | | 1,332,458 | | | | 103,048 | |
| | | | | | | | | |
| DIVIDENDS AND DISTRIBUTIONS TO SHAREHOLDERS FROM: | | | | | | | | |
| Class I Shares | | | | | | | | |
| Net realized capital gains | | | — | | | | — | |
| Net decrease in net assets from dividends and distributions to shareholders | | | — | | | | — | |
| | | | | | | | | |
| INCREASE/(DECREASE) IN NET ASSETS DERIVED FROM CAPITAL SHARE TRANSACTIONS: |
| Class I Shares | | | | | | | | |
| Proceeds from shares sold | | | 619,037 | | | | 25,430,511 | |
| Reinvestment of distributions | | | — | | | | — | |
| Shares redeemed | | | (3,454,543 | ) | | | (67,148,680 | ) |
| Redemption fees* | | | 5 | | | | 2,495 | |
| Net increase/(decrease) in net assets from capital shares transactions | | | (2,835,501 | ) | | | (41,715,674 | ) |
| Total increase/(decrease) in net assets | | $ | (1,503,043 | ) | | $ | (41,612,626 | ) |
| | | | | | | | | |
| NET ASSETS: | | | | | | | | |
| Beginning of period | | $ | 22,764,928 | | | $ | 64,377,554 | |
| End of period | | $ | 21,261,885 | | | $ | 22,764,928 | |
| Undistributed/accumulated net investment gain/(loss), end of period | | $ | 89,920 | | | $ | — | |
| | | | | | | | | |
| INCREASE/(DECREASE) IN SHARES OUTSTANDING DERIVED FROM SHARE TRANSACTIONS: |
| Class I Shares | | | | | | | | |
| Shares sold | | | 20,975 | | | | 965,782 | |
| Shares reinvested | | | — | | | | — | |
| Shares redeemed | | | (120,958 | ) | | | (2,711,424 | ) |
| Net increase/(decrease) in shares outstanding | | | (99,983 | ) | | | (1,745,642 | ) |
* | Prior to December 31, 2017, there was a 2.00% redemption fee to the value of shares redeemed or exchanged within 60 days of purchase. The redemption fees were retained by the Fund for the benefit of the remaining shareholders and recorded as paid-in capital. Effective December 31, 2017, the Fund eliminated its redemption fee. |
The accompanying notes are an integral part of the financial statements.
34
SUMMIT GLOBAL INVESTMENTS
U.S. LOW VOLATILITY EQUITY FUND
Financial Highlights
Contained below is per share operating performance data for Class I Shares outstanding, total investment return, ratios to average net assets and other supplemental data for the respective periods. This information has been derived from information provided in the financial statements. |
| | | Class I Shares | |
| | | For the
Six Months
Ended
February 28,
2018 (Unaudited) | | | For the
Year
Ended
August 31,
2017 | | | For the
Year
Ended
August 31,
2016 | | | For the
Year
Ended
August 31,
2015 | | | For the
Year
Ended
August 31,
2014 | | | For the
Year
Ended
August 31,
2013 | |
| Per Share Operating Performance | | | | | | | | | | | | | | | | | | |
| Net asset value, beginning of period | | $ | 15.43 | | | $ | 14.69 | | | $ | 13.78 | | | $ | 13.72 | | | $ | 11.85 | | | $ | 10.18 | |
Net investment income/(loss)(1) | | | 0.09 | | | | 0.22 | | | | 0.21 | | | | 0.21 | | | | 0.16 | | | | 0.15 | |
Net realized and unrealized gain/(loss) on investments(2) | | | 1.51 | | | | 0.90 | | | | 1.66 | | | | 0.44 | | | | 2.01 | | | | 1.64 | |
| Net increase/(decrease) in net assets resulting from operations | | | 1.60 | | | | 1.12 | | | | 1.87 | | | | 0.65 | | | | 2.17 | | | | 1.79 | |
| Dividends and distributions to shareholders from: | | | | | | | | | | | | | | | | | | | | | | | | |
| Net investment income | | | (0.18 | ) | | | (0.16 | ) | | | (0.21 | ) | | | (0.16 | ) | | | (0.08 | ) | | | (0.05 | ) |
| Net realized capital gains | | | (0.96 | ) | | | (0.22 | ) | | | (0.75 | ) | | | (0.43 | ) | | | (0.22 | ) | | | (0.07 | ) |
| Total dividends and distributions to shareholders | | | (1.14 | ) | | | (0.38 | ) | | | (0.96 | ) | | | (0.59 | ) | | | (0.30 | ) | | | (0.12 | ) |
| Net asset value, end of period | | $ | 15.89 | | | $ | 15.43 | | | $ | 14.69 | | | $ | 13.78 | | | $ | 13.72 | | | $ | 11.85 | |
Total investment return(3) | | | 10.51 | %(4) | | | 7.73 | % | | | 13.99 | % | | | 4.82 | % | | | 18.57 | % | | | 17.78 | % |
| | | | | | | | | | | | | | | | | | | | | | | | | |
| Ratios/Supplemental Data | | | | | | | | | | | | | | | | | | | | | | | | |
| Net assets, end of period (000’s omitted) | | $ | 94,576 | | | $ | 91,977 | | | $ | 106,110 | | | $ | 72,850 | | | $ | 60,266 | | | $ | 25,638 | |
| Ratio of expenses to average net assets with waivers and reimbursements | | | 0.98 | %(5) | | | 0.98 | % | | | 0.98 | % | | | 0.98 | % | | | 0.98 | % | | | 0.98 | % |
| Ratio of expenses to average net assets without waivers and reimbursements | | | 1.13 | %(5) | | | 1.14 | % | | | 1.14 | % | | | 1.20 | % | | | 1.35 | % | | | 2.74 | % |
| Ratio of net investment income/(loss) to average net assets | | | 0.90 | %(5) | | | 1.32 | % | | | 1.49 | % | | | 1.47 | % | | | 1.25 | % | | | 1.34 | % |
Portfolio turnover rate(5) | | | 63 | %(4)(6) | | | 31 | % | | | 41 | % | | | 42 | % | | | 110 | % | | | 81 | % |
(1) | The selected per share data is calculated based on average shares outstanding method for the period. |
(2) | The amount shown may not correlate with the change in the aggregate gains and losses due to the timing of sales and purchases of the Fund’s shares in relation to fluctuating market values for the Fund’s portfolio. |
(3) | Total investment return is calculated assuming a purchase of shares on the first day and a sale of shares on the last day of each period reported and includes reinvestments of dividends and distributions, if any. |
(6) | Portfolio turnover rate is calculated for the Fund, as a whole, for the entire period. |
The accompanying notes are an integral part of the financial statements.
35
SUMMIT GLOBAL INVESTMENTS
U.S. LOW VOLATILITY EQUITY FUND
Financial Highlights
Contained below is per share operating performance data for Class A Shares outstanding, total investment return, ratios to average net assets and other supplemental data for the period. This information has been derived from information provided in the financial statements. |
| | | Class A Shares | |
| | | For the
Six Months
Ended
February 28,
2018
(Unaudited) | | | For the
Year
Ended
August 31,
2017 | | | For the
Period
October 29,
2015(1) to
August 31,
2016 | |
| Per Share Operating Performance | | | | | | | | | |
| Net asset value, beginning of period | | $ | 15.40 | | | $ | 14.67 | | | $ | 14.69 | |
Net investment income/(loss)(2) | | | 0.05 | | | | 0.16 | | | | 0.14 | |
Net realized and unrealized gain/(loss) on investments(3) | | | 1.54 | | | | 0.92 | | | | 0.79 | |
| Net increase/(decrease) in net assets resulting from operations | | | 1.59 | | | | 1.08 | | | | 0.93 | |
| Dividends and distributions to shareholders from: | | | | | | | | | | | | |
| Net investment income | | | (0.10 | ) | | | (0.13 | ) | | | (0.20 | ) |
| Net realized capital gains | | | (0.96 | ) | | | (0.22 | ) | | | (0.75 | ) |
| Total dividends and distributions to shareholders | | | (1.06 | ) | | | (0.35 | ) | | | (0.95 | ) |
| Net asset value, end of period | | $ | 15.93 | | | $ | 15.40 | | | $ | 14.67 | |
Total investment return(4) | | | 10.40 | %(5) | | | 7.48 | % | | | 6.74 | %(5) |
| | | | | | | | | | | | | |
| Ratios/Supplemental Data | | | | | | | | | | | | |
| Net assets, end of period (000’s omitted) | | $ | 9,138 | | | $ | 22,195 | | | $ | 19,288 | |
| Ratio of expenses to average net assets with waivers and reimbursements | | | 1.23 | %(6) | | | 1.23 | % | | | 1.23 | %(6) |
| Ratio of expenses to average net assets without waivers and reimbursements | | | 1.35 | %(6) | | | 1.39 | % | | | 1.38 | %(6) |
| Ratio of net investment income/(loss) to average net assets | | | 0.62 | %(6) | | | 1.07 | % | | | 1.15 | %(6) |
Portfolio turnover rate(7) | | | 63 | %(5) | | | 31 | % | | | 41 | %(5) |
(1) | Commencement of operations. |
(2) | The selected per share data is calculated based on the average shares outstanding method for the period. |
(3) | The amount shown may not correlate with the change in the aggregate gains and losses due to the timing of sales and purchases of the Fund’s shares in relation to fluctuating market values for the Fund’s portfolio. |
(4) | Total investment return is calculated assuming a purchase of shares on the first day and a sale of shares on the last day of each period reported and includes reinvestments of dividends and distributions, if any. Total investment return does not reflect Sales Charge. |
(7) | Portfolio turnover rate is calculated for the Fund, as a whole, for the entire period. |
The accompanying notes are an integral part of the financial statements.
36
SUMMIT GLOBAL INVESTMENTS
U.S. LOW VOLATILITY EQUITY FUND
Financial Highlights
Contained below is per share operating performance data for Class C Shares outstanding, total investment return, ratios to average net assets and other supplemental data for the period. This information has been derived from information provided in the financial statements. |
| | | Class C Shares | |
| | | For the
Six Months
Ended
February 28,
2018
(Unaudited) | | | For the
Year
Ended
August 31,
2017 | | | For the
Period
December 31,
2015(1) to
August 31,
2016 | |
| Per Share Operating Performance | | | | | | | | | |
| Net asset value, beginning of period | | $ | 15.15 | | | $ | 14.51 | | | $ | 13.57 | |
Net investment income/(loss)(2) | | | (0.01 | ) | | | 0.04 | | | | 0.03 | |
Net realized and unrealized gain/(loss) on investments(3) | | | 1.51 | | | | 0.93 | | | | 0.91 | |
| Net increase/(decrease) in net assets resulting from operations | | | 1.50 | | | | 0.97 | | | | 0.94 | |
| Dividends and distributions to shareholders from: | | | | | | | | | | | | |
| Net investment income | | | (0.06 | ) | | | (0.11 | ) | | | — | |
| Net realized capital gains | | | (0.96 | ) | | | (0.22 | ) | | | — | |
| Total dividends and distributions to shareholders | | | (1.02 | ) | | | (0.33 | ) | | | — | |
| Net asset value, end of period | | $ | 15.63 | | | $ | 15.15 | | | $ | 14.51 | |
Total investment return(4) | | | 10.01 | %(5) | | | 6.74 | % | | | 6.93 | %(5) |
| | | | | | | | | | | | | |
| Ratios/Supplemental Data | | | | | | | | | | | | |
| Net assets, end of period (000’s omitted) | | $ | 1,471 | | | $ | 1,226 | | | $ | 373 | |
| Ratio of expenses to average net assets with waivers and reimbursements | | | 1.98 | %(6) | | | 1.98 | % | | | 1.99 | %(6) |
| Ratio of expenses to average net assets without waivers and reimbursements | | | 2.13 | %(6) | | | 2.15 | % | | | 2.16 | %(6) |
| Ratio of net investment income/(loss) to average net assets | | | (0.10 | )%(6) | | | 0.30 | % | | | 0.32 | %(6) |
Portfolio turnover rate(7) | | | 63 | %(5) | | | 31 | % | | | 41 | %(5) |
(1) | Commencement of operations. |
(2) | The selected per share data is calculated based on the average shares outstanding method for the period. |
(3) | The amount shown may not correlate with the change in the aggregate gains and losses due to the timing of sales and purchases of the Fund’s shares in relation to fluctuating market values for the Fund’s portfolio. |
(4) | Total investment return is calculated assuming a purchase of shares on the first day and a sale of shares on the last day of each period reported and includes reinvestments of dividends and distributions, if any. |
(7) | Portfolio turnover rate is calculated for the Fund, as a whole, for the entire period. |
The accompanying notes are an integral part of the financial statements.
37
SUMMIT GLOBAL INVESTMENTS
SMALL CAP LOW VOLATILITY FUND
Financial Highlights
Contained below is per share operating performance data for Class I Shares outstanding, total investment return, ratios to average net assets and other supplemental data for the respective periods. This information has been derived from information provided in the financial statements. |
| | | Class I Shares | |
| | | For the
Six Months
Ended
February 28,
2018
(Unaudited) | | | For the
Year
Ended
August 31,
2017 | | | For the
Period
March 31, 2016(1)
to August 31,
2016 | |
| Per Share Operating Performance | | | | | | | | | |
| Net asset value, beginning of period | | $ | 12.39 | | | $ | 10.83 | | | $ | 10.00 | |
Net investment income/(loss)(2) | | | 0.03 | | | | 0.04 | | | | 0.02 | |
Net realized and unrealized gain/(loss) on investments(3) | | | 0.36 | | | | 1.57 | | | | 0.81 | |
| Net increase/(decrease) in net assets resulting from operations | | | 0.39 | | | | 1.61 | | | | 0.83 | |
| Dividends and distributions to shareholders from: | | | | | | | | | | | | |
| Net investment income | | | (0.05 | ) | | | (0.05 | ) | | | — | |
| Net realized capital gains | | | (1.12 | ) | | | — | (7) | | | — | |
| Total dividends and distributions to shareholders | | | (1.17 | ) | | | (0.05 | ) | | | — | |
| Net asset value, end of period | | $ | 11.61 | | | $ | 12.39 | | | $ | 10.83 | |
Total investment return(4) | | | 2.71 | %(5) | | | 14.86 | % | | | 8.30 | %(5) |
| | | | | | | | | | | | | |
| Ratios/Supplemental Data | | | | | | | | | | | | |
| Net assets, end of period (000’s omitted) | | $ | 18,537 | | | $ | 12,919 | | | $ | 10,095 | |
| Ratio of expenses to average net assets with waivers and reimbursements | | | 1.23 | %(6) | | | 1.23 | % | | | 1.23 | %(6) |
| Ratio of expenses to average net assets without waivers and reimbursements | | | 1.68 | %(6) | | | 2.21 | % | | | 4.43 | %(6) |
| Ratio of net investment income/(loss) to average net assets | | | 0.46 | %(6) | | | 0.31 | % | | | 0.53 | %(6) |
Portfolio turnover rate(8) | | | 36 | %(5) | | | 95 | % | | | 0.01 | %(5) |
(1) | Commencement of operations. |
(2) | The selected per share data is calculated based on the average shares outstanding method for the period. |
(3) | The amount shown may not correlate with the change in the aggregate gains and losses due to the timing of sales and purchases of the Fund’s shares in relation to fluctuating market values for the Fund’s portfolio. |
(4) | Total investment return is calculated assuming a purchase of shares on the first day and a sale of shares on the last day of each period reported and includes reinvestments of dividends and distributions, if any. |
(7) | Amount represents less than $0.005 per share. |
(8) | Portfolio turnover rate is calculated for the Fund, as a whole, for the entire period. |
The accompanying notes are an integral part of the financial statements.
38
SUMMIT GLOBAL INVESTMENTS
SMALL CAP LOW VOLATILITY FUND
Financial Highlights
Contained below is per share operating performance data for Class A Shares outstanding, total investment return, ratios to average net assets and other supplemental data for the period. This information has been derived from information provided in the financial statements. |
| | | Class A Shares | |
| | | For the
Six Months
Ended
February 28,
2018
(Unaudited) | | | For the
Year
Ended
August 31,
2017 | | | For the
Period
March 31, 2016(1)
to August 31,
2016 | |
| Per Share Operating Performance | | | | | | | | | |
| Net asset value, beginning of period | | $ | 12.38 | | | $ | 10.83 | | | $ | 10.00 | |
Net investment income/(loss)(2) | | | 0.01 | | | | 0.01 | | | | 0.01 | |
Net realized and unrealized gain/(loss) on investments(3) | | | 0.36 | | | | 1.57 | | | | 0.82 | |
| Net increase/(decrease) in net assets resulting from operations | | | 0.37 | | | | 1.58 | | | | 0.83 | |
| Dividends and distributions to shareholders from: | | | | | | | | | | | | |
| Net investment income | | | (0.02 | ) | | | (0.03 | ) | | | — | |
| Net realized capital gains | | | (1.12 | ) | | | — | (7) | | | — | |
| Total dividends and distributions to shareholders | | | (1.14 | ) | | | (0.03 | ) | | | — | |
| Net asset value, end of period | | $ | 11.61 | | | $ | 12.38 | | | $ | 10.83 | |
Total investment return(4) | | | 2.55 | %(5) | | | 14.63 | % | | | 8.30 | %(5) |
| | | | | | | | | | | | | |
| Ratios/Supplemental Data | | | | | | | | | | | | |
| Net assets, end of period (000’s omitted) | | $ | 3,139 | | | $ | 3,132 | | | $ | 2,010 | |
| Ratio of expenses to average net assets with waivers and reimbursements | | | 1.48 | %(6) | | | 1.48 | % | | | 1.48 | %(6) |
| Ratio of expenses to average net assets without waivers and reimbursements | | | 1.93 | %(6) | | | 2.44 | % | | | 4.68 | %(6) |
| Ratio of net investment income/(loss) to average net assets | | | 0.23 | %(6) | | | 0.06 | % | | | 0.28 | %(6) |
Portfolio turnover rate(8) | | | 36 | %(5) | | | 95 | % | | | 0.01 | %(5) |
(1) | Commencement of operations. |
(2) | The selected per share data is calculated based on the average shares outstanding method for the period. |
(3) | The amount shown may not correlate with the change in the aggregate gains and losses due to the timing of sales and purchases of the Fund’s shares in relation to fluctuating market values for the Fund’s portfolio. |
(4) | Total investment return is calculated assuming a purchase of shares on the first day and a sale of shares on the last day of each period reported and includes reinvestments of dividends and distributions, if any. |
(7) | Amount represents less than $0.005 per share. |
(8) | Portfolio turnover rate is calculated for the Fund, as a whole, for the entire period. |
The accompanying notes are an integral part of the financial statements.
39
SUMMIT GLOBAL INVESTMENTS
SMALL CAP LOW VOLATILITY FUND
Financial Highlights
Contained below is per share operating performance data for Class C Shares outstanding, total investment return, ratios to average net assets and other supplemental data for the period. This information has been derived from information provided in the financial statements. |
| | | Class C Shares | |
| | | For the
Six Months
Ended
February 28,
2018
(Unaudited) | | | For the
Year
Ended
August 31,
2017 | | | For the
Period
March 31, 2016(1)
to August 31,
2016 | |
| Per Share Operating Performance | | | | | | | | | |
| Net asset value, beginning of period | | $ | 12.27 | | | $ | 10.80 | | | $ | 10.00 | |
Net investment income/(loss)(2) | | | (0.03 | ) | | | (0.08 | ) | | | (0.02 | ) |
Net realized and unrealized gain/(loss) on investments(3) | | | 0.35 | | | | 1.55 | | | | 0.82 | |
| Net increase/(decrease) in net assets resulting from operations | | | 0.32 | | | | 1.47 | | | | 0.80 | |
| Dividends and distributions to shareholders from: | | | | | | | | | | | | |
| Net realized capital gains | | | (1.12 | ) | | | — | (7) | | | — | |
| Net asset value, end of period | | $ | 11.47 | | | $ | 12.27 | | | $ | 10.80 | |
Total investment return(4) | | | 2.16 | %(5) | | | 13.63 | % | | | 8.00 | %(5) |
| | | | | | | | | | | | | |
| Ratios/Supplemental Data | | | | | | | | | | | | |
| Net assets, end of period (000’s omitted) | | $ | 173 | | | $ | 168 | | | $ | 26 | |
| Ratio of expenses to average net assets with waivers and reimbursements | | | 2.23 | %(6) | | | 2.23 | % | | | 2.23 | %(6) |
| Ratio of expenses to average net assets without waivers and reimbursements | | | 2.67 | %(6) | | | 2.89 | % | | | 5.43 | %(6) |
| Ratio of net investment income/(loss) to average net assets | | | (0.53 | )%(6) | | | (0.67 | )% | | | (0.47 | )%(6) |
Portfolio turnover rate(8) | | | 36 | %(5) | | | 95 | % | | | 0.01 | %(5) |
(1) | Commencement of operations. |
(2) | The selected per share data is calculated based on the average shares outstanding method for the period. |
(3) | The amount shown may not correlate with the change in the aggregate gains and losses due to the timing of sales and purchases of the Fund’s shares in relation to fluctuating market values for the Fund’s portfolio. |
(4) | Total investment return is calculated assuming a purchase of shares on the first day and a sale of shares on the last day of each period reported and includes reinvestments of dividends and distributions, if any. |
(7) | Amount represents less than $0.005 per share. |
(8) | Portfolio turnover rate is calculated for the Fund, as a whole, for the entire period. |
The accompanying notes are an integral part of the financial statements.
40
SUMMIT GLOBAL INVESTMENTS
GLOBAL LOW VOLATILITY FUND
Financial Highlights
Contained below is per share operating performance data for shares outstanding, total investment return, ratios to average net assets and other supplemental data for the respective periods. This information has been derived from information provided in the financial statements. |
| | | Class I Shares | |
| | | For the
Six Months
Ended
February 28,
2018
(Unaudited) | | | For the
Year
Ended
August 31,
2017 | | | For the
Year
Ended
August 31,
2016 | | | For the
Year
Ended
August 31,
2015 | | | For the
Eleven Months Ended
August 31,
2014(1)(2) | | | For the
Year
Ended
Sept. 30,
2013 | | | For the
Year
Ended
Sept. 30,
2012 | |
| Per Share Operating Performance | | | | | | | | | | | | | | | | | | | | | |
| Net asset value, beginning of period | | $ | 27.20 | | | $ | 24.93 | | | $ | 28.29 | | | $ | 27.64 | | | $ | 27.45 | | | $ | 22.45 | | | $ | 18.83 | |
Net investment income/(loss)(3) | | | 0.12 | | | | 0.06 | | | | (0.19 | ) | | | (0.21 | ) | | | (0.20 | ) | | | (0.14 | ) | | | (0.16 | ) |
| Net realized and unrealized gain/(loss) on investments | | | 1.53 | | | | 2.21 | | | | (1.25 | ) | | | 3.04 | | | | 2.96 | | | | 5.14 | | | | 4.21 | |
| Net increase/(decrease) in net assets resulting from operations | | | 1.65 | | | | 2.27 | | | | (1.44 | ) | | | 2.83 | | | | 2.76 | | | | 5.00 | | | | 4.05 | |
| Dividends and distributions to shareholders from: | | | | | | | | | | | | | | | | | | | | | | | | | | | | |
| Net investment income | | | — | | | | — | | | | — | | | | — | | | | — | | | | — | | | | — | |
| Net realized capital gains | | | — | | | | — | | | | (1.93 | ) | | | (2.18 | ) | | | (2.57 | ) | | | — | | | | (0.50 | ) |
| Total dividends and distributions to shareholders | | | — | | | | — | | | | (1.93 | ) | | | (2.18 | ) | | | (2.57 | ) | | | — | | | | (0.50 | ) |
Redemption fees added to paid-in capital(3) | | | — | | | | — | (4) | | | 0.01 | | | | — | (4) | | | — | | | | — | | | | 0.07 | |
| Net asset value, end of period | | $ | 28.85 | | | $ | 27.20 | | | $ | 24.93 | | | $ | 28.29 | | | $ | 27.64 | | | $ | 27.45 | | | $ | 22.45 | |
Total investment return(5) | | | 6.03 | %(6) | | | 9.15 | % | | | (5.44 | )% | | | 11.49 | % | | | 10.62 | %(6)(8) | | | 22.27 | % | | | 22.31 | % |
| | | | | | | | | | | | | | | | | | | | | | | | | | | | | |
| Ratios/Supplemental Data | | | | | | | | | | | | | | | | | | | | | | | | | | | | |
| Net assets, end of period (000’s omitted) | | $ | 21,252 | | | $ | 22,765 | | | $ | 64,378 | | | $ | 71,523 | | | $ | 59,924 | | | $ | 55,737 | | | $ | 59,007 | |
| Ratio of expenses to average net assets with waivers and reimbursements | | | 0.84 | %(7) | | | 0.84 | % | | | 0.84 | % | | | 0.84 | % | | | 0.84 | %(8)(7) | | | 0.86 | % | | | 0.95 | % |
| Ratio of expenses to average net assets without waivers and reimbursements | | | 1.38 | %(7) | | | 1.32 | % | | | 1.13 | % | | | 1.20 | % | | | 1.13 | %(8)(7) | | | 1.13 | % | | | 1.25 | % |
| Ratio of net investment income/(loss) to average net assets | | | 0.81 | %(7) | | | 0.26 | % | | | (0.76 | )% | | | (0.77 | )% | | | (0.80 | )%(8)(7) | | | (0.63 | )% | | | (0.75 | )% |
Portfolio turnover rate(9) | | | 41 | %(6) | | | 247 | % | | | 375 | % | | | 297 | % | | | 277 | %(6) | | | 345 | % | | | 324 | % |
(1) | The Fund changed its fiscal year end to August 31. |
(2) | Effective as of the close of business on March 21, 2014, the Fund acquired all the assets and liabilities of the Dynamic U.S. Growth Fund (“Predecessor Fund”), a series of Scotia Institutional Funds. The financial highlights for the periods prior to that date reflect the performance of the Predecessor Fund. |
(3) | The selected per share data was calculated based on average shares outstanding method for the period. |
(4) | Amount represents less than $0.005 per share. |
(5) | Total investment return is calculated assuming a purchase of shares on the first day and a sale of shares on the last day of each period reported and includes reinvestments of dividends and distributions, if any. |
(8) | Includes adjustments in accordance with accounting principles generally accepted in the United States of America and, consequently, the net asset value for financial reporting purposes and the returns based upon those net asset values may differ from the net asset values and returns for the shareholder transactions. |
(9) | Portfolio turnover rate is calculated for the Fund, as a whole, for the entire period. |
The accompanying notes are an integral part of the financial statements.
41
SUMMIT GLOBAL INVESTMENTS FUNDS
Notes to Financial Statements
February 28, 2018 (Unaudited)
1. Organization and Significant Accounting Policies
The RBB Fund, Inc. (“RBB” or the “Company”) was incorporated under the laws of the State of Maryland on February 29, 1988 and is registered under the Investment Company Act of 1940, as amended, (the “1940 Act”) as an open-end management investment company. RBB is a “series fund,” which is a mutual fund divided into separate portfolios. Each portfolio is treated as a separate entity for certain matters under the 1940 Act, and for other purposes, and a shareholder of one portfolio is not deemed to be a shareholder of any other portfolio. Currently, RBB has twenty-nine active investment portfolios, including the Summit Global Investments U.S. Low Volatility Equity Fund, Summit Global Investments Small Cap Low Volatility Fund and Summit Global Investments Global Low Volatility Fund (each a “Fund” and, collectively, the “Funds”). The Summit Global Investments U.S. Low Volatility Equity Fund and Summit Global Investments Small Cap Low Volatility Fund commenced investment operations on February 29, 2012 and March 31, 2016, respectively. The Dynamic U.S. Growth Fund (the “Predecessor Fund”), a series of Scotia Institutional Funds, transferred all of its assets and liabilities to the Fund in a tax-free reorganization (the “Reorganization”). The Reorganization occurred at the close of business on March 21, 2014. The Predecessor Fund commenced operations on March 31, 2009. As a result of the Reorganization, the performance and accounting history of the Predecessor Fund was assumed by the Fund. Performance and accounting information prior to the close of business on March 21, 2014 included herein is that of the Predecessor Fund. Effective January 3, 2017, the Fund changed its name from the Scotia Dynamic U.S. Growth Fund to the Summit Global Investments Global Low Volatility Fund and Summit Global Investments, LLC (“Summit” or the “Adviser”) took over management of the Fund from its predecessor investment manager.
As of the end of the reporting period, the Summit Global Investments U.S. Low Volatility Equity Fund offers three classes of shares: Class I Shares, Class A Shares and Class C Shares; the Summit Global Investments Small Cap Low Volatility Fund offers three classes of shares: Class I Shares, Class A Shares (formerly Retail Shares) and Class C Shares and the Summit Global Investments Global Low Volatility Fund offers three classes of shares: Class I Shares, Class A Shares (formerly Class II Shares) and Class C Shares (formerly Institutional Shares). As of the end of the reporting period, Class A Shares and Class C Shares of the Summit Global Investments Global Low Volatility Fund were not yet operational.
RBB has authorized capital of one hundred billion shares of common stock of which 87.023 billion shares are currently classified into one hundred and eighty-one classes of common stock. Each class represents an interest in an active or inactive RBB investment portfolio.
The investment objective of the Summit Global Investments U.S. Low Volatility Equity Fund is to outperform the S&P 500® Index over a market cycle while reducing overall volatility. The investment objective of the Summit Global Investments Small Cap Low Volatility Fund is to outperform the Russell 2000® Index over a market cycle while reducing overall volatility. The investment objective of the Summit Global Investments Global Low Volatility Fund is to seek long-term capital appreciation.
The Funds are investment companies and follow accounting and reporting guidance in the Financial Accounting Standards Board (“FASB”) Accounting Standards Codification Topic 946 “Financial Services - Investment Companies.”
The end of the reporting period for the Funds is February 28, 2018, and the period covered by these Notes to Financial Statements is the six months ended February 28, 2018 (the “current fiscal period”).
Portfolio Valuation — Each Fund’s net asset value (“NAV”) is calculated once daily at the close of regular trading hours on the New York Stock Exchange (“NYSE”) (generally 4:00 p.m. Eastern time) on each day the NYSE is open. Securities held by the Funds are valued using the closing price or the last sale price on a national securities exchange or the National Association of Securities Dealers Automatic Quotation System (“NASDAQ”) market system where they are primarily traded. Equity securities traded in the over-the-counter (“OTC”) market are valued at their closing prices. If there were no transactions on that day, securities traded principally on an exchange or on NASDAQ will be valued at the mean of the last bid and ask prices prior to the market close. Fixed income securities are valued using an independent pricing service, which considers such factors as security prices, yields, maturities and ratings, and are deemed representative of market values at the close of the market. Investments in other open-end investment
42
SUMMIT GLOBAL INVESTMENTS FUNDS
Notes to Financial Statements (Continued)
February 28, 2018 (Unaudited)
companies, if any, are valued based on the NAV of those investment companies (which may use fair value pricing as discussed in their prospectuses). If market quotations are unavailable or deemed unreliable, securities will be valued in accordance with procedures adopted by the Company’s Board of Directors (the “Board”). Relying on prices supplied by pricing services or dealers or using fair valuation may result in values that are higher or lower than the values used by other investment companies and investors to price the same investments.
Fair Value Measurements — The inputs and valuation techniques used to measure the fair value of the Funds’ investments are summarized into three levels as described in the hierarchy below:
| | ● Level 1 — | Prices are determined using quoted prices in active markets for identical securities. |
| | ● Level 2 — | Prices are determined using other significant observable inputs (including quoted prices for similar securities, interest rates, prepayment speeds, credit risk, etc.). |
| | ● Level 3 — | Prices are determined using significant unobservable inputs (including the Funds’ own assumptions in determining the fair value of investments). |
The inputs or methodologies used for valuing securities are not necessarily an indication of the risk associated with investing in those securities.
The following is a summary of the inputs used, as of the end of the reporting period, in valuing the Funds’ investments carried at fair value:
| | | Total | | | Level 1 | | | Level 2 | | | Level 3 | |
| Summit Global Investments U.S Low Volatility Equity Fund | | | | | | | |
| Common Stocks | | $ | 100,674,054 | | | $ | 100,674,054 | | | $ | — | | | $ | — | |
| Short-Term Investments | | | 889,307 | | | | 889,307 | | | | — | | | | — | |
| Total Investments* | | $ | 101,563,361 | | | $ | 101,563,361 | | | $ | — | | | $ | — | |
| | | | | | | | | | | | | | | | | |
| Summit Global Investments Small Cap Low Volatility Fund | | | | | | | | | | | | |
| Common Stocks | | $ | 19,875,400 | | | $ | 19,875,400 | | | $ | — | | | $ | — | |
| Short-Term Investments | | | 818,493 | | | | 818,493 | | | | — | | | | — | |
| Total Investments* | | $ | 20,693,893 | | | $ | 20,693,893 | | | $ | — | | | $ | — | |
| | | | | | | | | | | | | | | | | |
| Summit Global Investments global Low Volatility Fund | | | | | | | | | | | | | |
| Common Stocks | | $ | 21,034,920 | | | $ | 21,034,920 | | | $ | — | | | $ | — | |
| Short-Term Investments | | | 243,357 | | | | 243,357 | | | | — | | | | — | |
| Total Investments* | | $ | 21,278,277 | | | $ | 21,278,277 | | | $ | — | | | $ | — | |
* | Please refer to the Portfolio of Investments for further details. |
At the end of each quarter, management evaluates the classification of Levels 1, 2 and 3 assets and liabilities. Various factors are considered, such as changes in liquidity from the prior reporting period; whether or not a broker is willing to execute at the quoted price; the depth and consistency of prices from third party pricing services; and the existence of contemporaneous, observable trades in the market. Additionally, management evaluates the classification of Level 1 and Level 2 assets and liabilities on a quarterly basis for changes in listings or delistings on national exchanges.
43
SUMMIT GLOBAL INVESTMENTS FUNDS
Notes to Financial Statements (Continued)
February 28, 2018 (Unaudited)
Due to the inherent uncertainty of determining the fair value of investments that do not have a readily available market value, the fair value of the Funds’ investments may fluctuate from period to period. Additionally, the fair value of investments may differ significantly from the values that would have been used had a ready market existed for such investments and may differ materially from the values the Funds may ultimately realize. Further, such investments may be subject to legal and other restrictions on resale or otherwise less liquid than publicly traded securities.
For fair valuations using significant unobservable inputs, U.S. generally accepted accounting principles (“U.S. GAAP”) requires each Fund to present a reconciliation of the beginning to ending balances for reported market values that presents changes attributable to total realized and unrealized gains or losses, purchase and sales, and transfers in and out of Level 3 during the period. Transfers in and out between levels are based on values at the end of the period. U.S. GAAP also requires the Funds to disclose amounts and reasons for all transfers in and out of Level 1 and Level 2 fair value measurements. A reconciliation of Level 3 investments is presented only when a Fund had an amount of Level 3 investments at the end of the reporting period that was meaningful in relation to its net assets. The amounts and reasons for all transfers in and out of each level within the three-tier hierarchy are disclosed when a Fund had an amount of total transfers during the reporting period that was meaningful in relation to its net assets as of the end of the reporting period.
During the current fiscal period, the Funds had no transfers between Levels 1, 2 and 3.
Use of Estimates — The preparation of financial statements in conformity with U.S. GAAP requires management to make estimates and assumptions that affect the reported amounts of assets and liabilities and disclosure of contingent assets and liabilities at the date of the financial statements and the reported amounts of revenues and expenses during the reporting period. Actual results could differ from those estimates and those differences could be significant.
Investment Transactions, Investment Income and Expenses — The Funds record security transactions based on trade date for financial reporting purposes. The cost of investments sold is determined by use of the specific identification method for both financial reporting and income tax purposes in determining realized gains and losses on investments. Interest income is accrued when earned. Dividend income is recorded on the ex-dividend date. Distributions received on securities that represent a return of capital or capital gain are recorded as a reduction of cost of investments and/or as a realized gain. The Funds’ investment income, expenses (other than class specific expenses) and unrealized and realized gains and losses are allocated daily to each class of shares based upon the relative proportion of net assets of each class at the beginning of the day. Expenses incurred on behalf of a specific class, fund or fund family of the Company are charged directly to the class, fund or fund family (in proportion to net assets). Expenses incurred for all of the RBB funds (such as director or professional fees) are charged to all funds in proportion to their average net assets of RBB, or in such other manner as the Board deems fair or equitable. Expenses and fees, including investment advisory and administration fees, are accrued daily and taken into account for the purpose of determining the NAV of the Funds.
Dividends and Distributions to Shareholders — Dividends from net investment income and distributions from net realized capital gains, if any, are declared and paid at least annually to shareholders and recorded on the ex-dividend date. Income dividends and capital gain distributions are determined in accordance with U.S. federal income tax regulations, which may differ from U.S. GAAP.
U.S. Tax Status — No provision is made for U.S. income taxes as it is each Fund’s intention to continue to qualify for and elect the tax treatment applicable to regulated investment companies under Subchapter M of the Internal Revenue Code of 1986, as amended, and make the requisite distributions to its shareholders which will be sufficient to relieve it from U.S. income and excise taxes.
Cash and Cash Equivalents — Cash and cash equivalents are valued at cost plus accrued interest, which approximates market value.
44
SUMMIT GLOBAL INVESTMENTS FUNDS
Notes to Financial Statements (Continued)
February 28, 2018 (Unaudited)
REDEMPTION/EXCHANGE FEES — Prior to December 31, 2017, the Summit Global Investments U.S. Low Volatility Equity Fund, Summit Global Investments Small Cap Low Volatility Fund and Summit Global Investments Global Low Volatility Fund imposed a redemption/exchange fee of 1.50%, 1.50% and 2.00%, respectively, on redemptions/exchanges of Fund shares held less than 60 days. The fees are reflected on the Statement of Changes in Net Assets. Effective December 31, 2017, the Funds have eliminated their redemption/exchange fees.
Other — In the normal course of business, the Funds may enter into contracts that provide general indemnifications. Each Fund’s maximum exposure under these arrangements is dependent on claims that may be made against the Funds in the future, and, therefore, cannot be estimated; however, based on experience, the risk of material loss from such claims is considered remote.
2. Investment Adviser and Other Services
Summit Global Investments, LLC (“Summit” or the “Adviser”) serves as the investment adviser to each Fund. Each Fund compensates the Adviser for its services at an annual rate based on each Fund’s average daily net assets (the “Advisory Fee”), payable on a monthly basis in arrears, as shown in the following table.
The Adviser has contractually agreed to waive advisory fees and/or reimburse expenses to the extent that total annual Fund operating expenses (excluding certain items discussed below) exceed the rates (“Expense Caps”) shown in the following table of each Fund’s average daily net assets. In determining the Adviser’s obligation to waive advisory fees and/or reimburse expenses, the following expenses are not taken into account and could cause total annual Fund operating expenses to exceed the Expense Caps as applicable: acquired fund fees and expenses, brokerage commissions, extraordinary expenses, interest and taxes. This contractual limitation is in effect until December 31, 2018 and may not be terminated without the approval of the Board. The Adviser may discontinue these arrangements at any time after December 31, 2018.
| | ADVISORY FEE | EXPENSE CAPS |
FUND | | CLASS I | CLASS A | CLASS C |
Summit Global Investments U.S. Low Volatility Equity Fund | 0.70% | 0.98% | 1.23% | 1.98% |
Summit Global Investments Small Cap Low Volatility Fund | 0.95 | 1.23 | 1.48 | 2.23 |
Summit Global Investments Global Low Volatility Fund | 0.70 | 0.84 | 1.09 | 1.84 |
During the current fiscal period, investment advisory fees accrued, waived and reimbursed were as follows:
| FUND | | Gross
Advisory Fees | | | Waivers | | | Reimbursements | | | Net
Advisory Fees | |
| Summit Global Investments U.S. Low Volatility Equity Fund | | $ | 376,806 | | | $ | (78,538 | ) | | $ | — | | | $ | 298,268 | |
| Summit Global Investments Small Cap Low Volatility Fund | | | 93,684 | | | | (44,160 | ) | | | — | | | | 49,524 | |
| Summit Global Investments Global Low Volatility Fund | | | 77,582 | | | | (63,354 | ) | | | — | | | | 14,228 | |
If at any time a Fund’s total annual Fund operating expenses for a year are less than the relevant share class’s Expense cap, the Adviser is entitled to reimbursement by the Fund of the advisory fees forgone and other payments remitted by the Adviser to the Fund within three years from the date on which such waiver or reimbursement was made, provided such reimbursement does not cause the Fund to exceed the relevant share class’s Expense cap that was in effect at the time of the waiver or reimbursement.
45
SUMMIT GLOBAL INVESTMENTS FUNDS
Notes to Financial Statements (Continued)
February 28, 2018 (Unaudited)
As of the end of the reporting period, the Funds had amounts available for recoupment as follows:
| | | expiration | |
| FUND | | August 31,
2019 | | | August 31,
2020 | | | August 31,
2021 | |
| Summit Global Investments U.S. Low Volatility Equity Fund | | $ | 151,284 | | | $ | 180,221 | | | $ | 78,538 | |
| Summit Global Investments Small Cap Low Volatility Fund | | | 108,075 | | | | 140,932 | | | | 44,160 | |
| Summit Global Investments Global Low Volatility Fund | | | — | | | | 98,278 | | | | 63,354 | |
U.S. Bancorp Fund Services, LLC (“USBFS”) serves as administrator for the Funds. For providing administrative and accounting services, USBFS is entitled to receive a monthly fee, subject to certain minimum and out of pocket expenses.
USBFS serves as the Funds’ transfer and dividend disbursing agent. For providing transfer agent services, USBFS is entitled to receive a monthly fee, subject to certain minimum and out of pocket expenses.
U.S. Bank, N.A. (the “Custodian”) provides certain custodial services to the Funds. The Custodian is entitled to receive a monthly fee, subject to certain minimum and out of pocket expenses.
Quasar Distributors, LLC serves as the principal underwriter and distributor of the Funds’ shares pursuant to a Distribution Agreement with RBB.
For compensation amounts payable to USBFS, please refer to the Statements of Operations.
The Board has adopted a Plan of Distribution (the “Plan”) for the Class A Shares and Class C Shares of the Funds pursuant to Rule 12b-1 under the 1940 Act. Under the Plan, the distributor is entitled to receive from the Fund a distribution fee with respect to the Shares, which is accrued daily and paid monthly, of up to 0.25% on an annualized basis of the average daily net assets of the Class A Shares and and up to 1.00% of the Class C Shares. The actual amount of such compensation under the Plan is agreed upon by the Board and by the Distributor. Because these fees are paid out of a Fund’s assets on an ongoing basis, over time these fees will increase the cost of your investment and may cost you more than paying other types of sales charges. Amounts paid to the Distributor under the Plan may be used by the Distributor to cover expenses that are related to (i) the sale of the Shares, (ii) ongoing servicing and/or maintenance of the accounts of shareholders, and (iii) sub-transfer agency services, subaccounting services or administrative services related to the sale of the Shares, all as set forth in each Fund’s 12b-1 Plan.
3. SHAREHOLDER SERVICING PLAN
The Summit Global Investments Global Low Volatility Fund had adopted a Shareholder Services Plan for the Class I Shares. Under the Shareholder Services Plan, the Fund could pay service fees to firms that provide shareholder services, such as responding to shareholder inquiries and assisting shareholders with their accounts, not exceeding ten basis points (0.10%) of the Fund’s average daily net assets attributable to Class I Shares. Effective December 31, 2017, the Fund has eliminated its Shareholder Services Plan.
4. Director’s and Officer’s Compensation
The Directors of the Company receive an annual retainer and meeting fees for meetings attended. Employees of Vigilant Compliance, LLC serve as President, Chief Compliance Officer and Assistant Treasurer of the Company. Vigilant Compliance, LLC is compensated for the services provided to the Company. An employee of RBB serves as
46
SUMMIT GLOBAL INVESTMENTS FUNDS
Notes to Financial Statements (Continued)
February 28, 2018 (Unaudited)
Treasurer and Secretary and is compensated for services provided. Certain employees of USBFS serve as officers of the Company. They are not compensated by the Funds or the Company. For Director’s and Officer’s compensation amounts, please refer to the Statement of Operations.
5. Purchases and Sales of Investment Securities
During the current fiscal period, aggregate purchases and sales of investment securities (excluding short-term investments) of the Funds were as follows:
| FUND | | Purchases | | | Sales | |
| Summit Global Investments U.S. Low Volatility Equity Fund | | $ | 67,164,122 | | | $ | 88,971,908 | |
| Summit Global Investments Small Cap Low Volatility Fund | | | 10,703,162 | | | | 6,915,063 | |
| Summit Global Investments Global Low Volatility Fund | | | 8,843,040 | | | | 11,650,698 | |
There were no purchases or sales of long-term U.S. Government securities during the current fiscal period.
6. Federal Income Tax Information
The Funds have followed the authoritative guidance on accounting for and disclosure of uncertainty in tax positions, which requires the Funds to determine whether a tax position is more likely than not to be sustained upon examination, including resolution of any related appeals or litigation processes, based on the technical merits of the position. The Funds have determined that there was no effect on the financial statements from following this authoritative guidance. In the normal course of business, the Funds are subject to examination by federal, state and local jurisdictions, where applicable, for tax years for which applicable statutes of limitations have not expired. The Funds are not aware of any tax positions for which it is reasonably possible that the total amounts of unrecognized tax benefits will significantly change in the next twelve months.
As of August 31, 2017, the federal tax cost and aggregate gross unrealized appreciation and depreciation of investments held by each Fund were as follows:
| FUND | | Federal Tax
Cost | | | Unrealized
Appreciation | | | Unrealized
(Depreciation) | | | Net Unrealized Appreciation/ (Depreciation) | |
| Summit Global Investments U.S. Low Volatility Equity Fund | | $ | 96,376,606 | | | $ | 20,397,306 | | | $ | (1,421,203 | ) | | $ | 18,976,103 | |
| Summit Global Investments Small Cap Low Volatility Fund | | | 14,950,452 | | | | 1,607,423 | | | | (334,043 | ) | | | 1,273,380 | |
| Summit Global Investments Global Low Volatility Fund | | | 21,137,132 | | | | 2,016,354 | | | | (395,173 | ) | | | 1,621,181 | |
Distributions to shareholders, if any, from net investment income and realized gains are determined in accordance with federal income tax regulations, which may differ from net investment income and realized gains recognized for financial reporting purposes. Accordingly, the character of distributions and composition of net assets for tax purposes may differ from those reflected in the accompanying financial statements. To the extent these differences are permanent, such amounts are reclassified within the capital accounts based on the tax treatment; temporary differences do not require such reclassification.
47
SUMMIT GLOBAL INVESTMENTS FUNDS
Notes to Financial Statements (conTINUED))
February 28, 2018 (Unaudited)
The following permanent differences as of August 31, 2017, primarily attributable to the reclassification of short-term gains in the Summit Global Investments U.S. Low Volatility Equity Fund non-taxable distribution from Corporate stock in the Summit Global Investments Small Cap Low Volatility Fund and short-term capital gains netted against net operating loss in the Summit Global Investments Global Low Volatility Fund, were reclassified to the following accounts:
| FUND | | Undistributed
Net Investments
Income/(LOSS) | | | Accumulated
Net Realized
Gain/(Loss) | | | Paid-In
Capital | |
| Summit Global Investments U.S. Low Volatility Equity Fund | | $ | (66,974 | ) | | $ | 66,973 | | | $ | 1 | |
| Summit Global Investments Small Cap Low Volatility Fund | | | (349 | ) | | | 349 | | | | — | |
| Summit Global Investments Global Low Volatility Fund | | | 231,224 | | | | (461 | ) | | | (230,763 | ) |
As of August 31, 2017, the components of distributable earnings on a tax basis were as follows:
| FUND | | Undistributed
Ordinary Income | | | Undistributed
Long-Term
Capital Gains | | | Unrealized
Appreciation/
(Depreciation) | |
| Summit Global Investments U.S. Low Volatility Equity Fund | | $ | 829,871 | | | $ | 788,102 | | | $ | 18,976,103 | |
| Summit Global Investments Small Cap Low Volatility Fund | | | 892,587 | | | | 386,087 | | | | 1,273,380 | |
| Summit Global Investments Global Low Volatility Fund | | | (3,061,455 | ) | | | 1,621,181 | | | | — | |
The differences between the book and tax basis components of distributable earnings relate primarily to the timing of recognition of income and gains for federal income tax purposes.
The tax character of dividends and distributions paid during the fiscal year ended August 31, 2017 were as follows:
| FUND | | Ordinary
Income | | | Long-Term
Gains | | | Total | |
| Summit Global Investments U.S. Low Volatility Equity Fund | | $ | 1,244,977 | | | $ | 1,633,894 | | | $ | 2,878,871 | |
| Summit Global Investments Small Cap Low Volatility Fund | | | 53,019 | | | | 989 | | | | 54,008 | |
| Summit Global Investments Global Low Volatility Fund | | | — | | | | — | | | | — | |
Dividends from net investment income and short-term capital gains are treated as ordinary income dividends for federal income tax purposes.
Under the Regulated Investment Company Modernization Act of 2010, the Funds are permitted to carry forward capital losses incurred in taxable years beginning after December 22, 2010 for an unlimited period. Additionally, capital losses that are carried forward will retain their character as either short-term or long-term capital losses rather than being considered all short-term as under the previous law. As of the fiscal year ended August 31, 2017, the Funds did not have any capital loss carryforwards.
48
SUMMIT GLOBAL INVESTMENTS FUNDS
Notes to Financial Statements (concluded)
February 28, 2018 (Unaudited)
7. Subsequent Events
On March 19th, 2018, subsequent to the end of the reporting period, the Adviser's contractual expense waiver and/or reimbursement arrangement with the Funds was extended through March 31, 2019.
49
SUMMIT GLOBAL INVESTMENTS FUNDS
Other Information (Unaudited)
Proxy Voting
Policies and procedures that the Funds use to determine how to vote proxies relating to portfolio securities as well as information regarding how the Funds voted proxies relating to portfolio securities for the most recent twelve-month period ended June 30 are available without charge, upon request, by calling (855) 744-8500 and on the Securities and Exchange Commission’s (“SEC”) website at http://www.sec.gov.
Quarterly Portfolio Schedules
The Company files a complete schedule of portfolio holdings with the SEC for the first and third fiscal quarters of each fiscal year (quarters ended November 30 and May 31) on Form N-Q. The Company’s Form N-Q is available on the SEC website at http://www.sec.gov and may be reviewed and copied at the SEC Public Reference Room in Washington, D.C. Information on the operation of the SEC Public Reference Room may be obtained by calling (800) SEC-0330.
50
SUMMIT GLOBAL INVESTMENTS FUNDS
Semi-Annual Report to Shareholders
Investment Adviser and Other Services
BBD, LLP (“BBD”) was replaced as the independent registered public accounting firm for Summit Global Investments Global Low Volatility Fund (the “Fund”) of The RBB Fund, Inc. (“RBB”) effective upon the completion of services related to the audit for the Fund’s 2017 fiscal year. During the Fund’s two most recent fiscal years ended August 31, 2016 and 2017, BBD’s reports on the Fund’s financial statements contained no adverse opinion or disclaimer of opinion, nor were they qualified or modified as to uncertainty, audit scope, or accounting principles. During the Fund’s two most recent fiscal years ended August 31, 2016 and 2017 and the interim period commencing August 31, 2017 and ending September 19, 2017, there were no disagreements with BBD on any matter of accounting principles or practices, financial statement disclosure, or auditing scope or procedure, which disagreements, if not resolved to the satisfaction of BBD, would have caused it to make reference to the subject matter of the disagreement in connection with its report on the financial statements for such years. During the Fund’s two most recent fiscal years and the subsequent interim period ended September 19, 2017, there were no events of the kind described in Item 304(a)(1)(v) of Regulation S-K under the Securities Exchange Act of 1934.
On September 19, 2017, RBB, by actions of its Audit Committee and Board of Directors, including a majority of the members of the Board of Directors who are not "interested persons" of the Fund (as that term is defined in the Investment Company Act of 1940, as amended), selected Ernst & Young LLP (“EY”) as the independent registered public accounting firm to audit the Fund’s financial statements for the fiscal year ending August 31, 2018. During the Fund’s two most recent fiscal years ended August 31, 2016 and 2017 and the subsequent interim period ended September 19, 2017, neither the Fund nor anyone on its behalf has consulted EY on items which (i) concerned the application of accounting principles to a specified transaction, either completed or proposed, or the type of audit opinion that might be rendered on the Fund’s financial statements, or (ii) concerned the subject of a disagreement (as defined in paragraph (a)(1)(iv) of Item 304 of Regulation S-K) or reportable events (as described in paragraph (a)(1)(v) of said Item 304).
51
[THIS PAGE INTENTIONALLY LEFT BLANK]
Investment Adviser
Summit Global Investments, LLC
620 South Main Street
Bountiful, UT 84010
Administrator and Transfer Agent
U.S. Bancorp Fund Services, LLC
P.O. Box 701
Milwaukee, WI 53201
Principal Underwriter
Quasar Distributors, LLC
777 East Wisconsin Avenue, Floor 6
Milwaukee, WI 53202
Custodian
U.S. Bank, N.A.
1555 North Rivercenter Drive, Suite 302
Milwaukee, WI 53212
Independent Registered Public Accounting Firm
Ernst & Young LLP
One Commerce Square
2005 Market Street, Suite 700
Philadelphia, PA 19103
Legal Counsel
Drinker Biddle & Reath LLP
One Logan Square, Suite 2000
Philadelphia, PA 19103-6996
SGI-SAR18
Item 2. Code of Ethics.
Not applicable for semi-annual reports.
Item 3. Audit Committee Financial Expert.
Not applicable for semi-annual reports.
Item 4. Principal Accountant Fees and Services.
Not applicable for semi-annual reports.
Item 5. Audit Committee of Listed Registrants.
Not applicable for semi-annual reports.
Item 6. Investments.
| (a) | Schedule of Investments is included as part of the report to shareholders filed under Item 1 of this Form. |
Item 7. Disclosure of Proxy Voting Policies and Procedures for Closed-End Management Investment Companies.
Not applicable to open-end investment companies.
Item 8. Portfolio Managers of Closed-End Management Investment Companies.
Not applicable to open-end investment companies.
Item 9. Purchases of Equity Securities by Closed-End Management Investment Company and Affiliated Purchasers.
Not applicable to open-end investment companies.
Item 10. Submission of Matters to a Vote of Security Holders.
There have been no material changes to the procedures by which the shareholders may recommend nominees to the registrant’s board of directors, where those changes were implemented after the registrant last provided disclosure in response to the requirements of Item 407(c)(2)(iv) of Regulation S-K (17 CFR 229.407) (as required by Item 22(b)(15) of Schedule 14A (17 CFR 240.14a-101)), or this Item.
Item 11. Controls and Procedures.
| (a) | The Registrant’s Principal Executive and Principal Financial Officers have reviewed the Registrant's disclosure controls and procedures (as defined in Rule 30a-3(c) under the Investment Company Act of 1940 (the “Act”)) as of a date within 90 days of the filing of this report, as required by Rule 30a-3(b) under the Act and Rules 13a-15(b) or 15d-15(b) under the Securities Exchange Act of 1934. Based on their review, such officers have concluded that the disclosure controls and procedures are effective in ensuring that information required to be disclosed in this report is appropriately recorded, processed, summarized and reported and made known to them by others within the Registrant and by the Registrant’s service provider. |
| (b) | There were no changes in the Registrant's internal control over financial reporting (as defined in Rule 30a-3(d) under the Act) that occurred during the second fiscal quarter of the period covered by this report that has materially affected, or is reasonably likely to materially affect, the Registrant's internal control over financial reporting. |
Item 12. Disclosure of Securities Lending Activities for Closed-End Management Investment Companies
Not applicable to open-end investment companies.
Item 13. Exhibits.
(2) A separate certification for each principal executive officer and principal financial officer pursuant to Section 302 of the Sarbanes-Oxley Act of 2002. Filed herewith.
(3) Not applicable to open-end investment companies.
(4) There was a change in the registrant’s independent public accountant for the period covered by this report. Filed herewith.
| (b) | Certifications pursuant to Section 906 of the Sarbanes-Oxley Act of 2002. Furnished herewith. |
SIGNATURES
Pursuant to the requirements of the Securities Exchange Act of 1934 and the Investment Company Act of 1940, the registrant has duly caused this report to be signed on its behalf by the undersigned, thereunto duly authorized.
| (Registrant) | The RBB Fund, Inc. | |
| | | |
| By (Signature and Title)* | /s/ Salvatore Faia | |
| | Salvatore Faia, President | |
| | (principal executive officer) | |
| | | |
| Date | 4/27/2018 | |
Pursuant to the requirements of the Securities Exchange Act of 1934 and the Investment Company Act of 1940, this report has been signed below by the following persons on behalf of the registrant and in the capacities and on the dates indicated.
| By (Signature and Title)* | /s/ Salvatore Faia | |
| | Salvatore Faia, President | |
| | (principal executive officer) | |
| | | |
| Date | 4/27/2018 | |
| | | |
| By (Signature and Title)* | /s/ James Shaw | |
| | James Shaw, Treasurer | |
| | (principal financial officer) | |
| | | |
| Date | 4/27/2018 | |
| * | Print the name and title of each signing officer under his or her signature. |