UNITED STATES
SECURITIES AND EXCHANGE COMMISSION
Washington, D.C. 20549
FORM N-CSR
CERTIFIED SHAREHOLDER REPORT OF REGISTERED
MANAGEMENT INVESTMENT COMPANIES
Investment Company Act file number 811-05518
The RBB Fund, Inc.
(Exact name of registrant as specified in charter)
615 East Michigan Street
Milwaukee, WI 53202
(Address of principal executive offices) (Zip code)
Salvatore Faia
c/o U.S. Bancorp Fund Services, LLC
615 East Michigan Street
Milwaukee, WI 53202
(Name and address of agent for service)
Registrant's telephone number, including area code: (414) 765-5145
Date of fiscal year end: October 31
Date of reporting period: April 30, 2017
Explanatory Note: This filing covers the Motley Fool Independence Fund, the Motley Fool Great America Fund and the Motley Fool Emerging Markets Fund (formerly, the Motley Fool Epic Voyage Fund), each of which has declared October 31 as its fiscal year end.
Form N-CSR is to be used by management investment companies to file reports with the Commission not later than 10 days after the transmission to stockholders of any report that is required to be transmitted to stockholders under Rule 30e-1 under the Investment Company Act of 1940 (17 CFR 270.30e-1). The Commission may use the information provided on Form N-CSR in its regulatory, disclosure review, inspection, and policymaking roles.
A registrant is required to disclose the information specified by Form N-CSR, and the Commission will make this information public. A registrant is not required to respond to the collection of information contained in Form N-CSR unless the Form displays a currently valid Office of Management and Budget ("OMB") control number. Please direct comments concerning the accuracy of the information collection burden estimate and any suggestions for reducing the burden to Secretary, Securities and Exchange Commission, 450 Fifth Street, NW, Washington, DC 20549-0609. The OMB has reviewed this collection of information under the clearance requirements of 44 U.S.C. § 3507.
Item 1. Reports to Stockholders.
The Report to Shareholders is attached herewith.
Motley Fool Independence Fund (FOOLX) |  |
The Independence Fund has seen some significant changes at the top. Since our annual report dated Oct. 31, 2016, the Fund’s Top 11 positions contain six new entrants: Align Technology, BGEO Group, IPG Photonics, NXP Semiconductors, Tencent Holdings, and Zooplus.
Of those companies new to the Top 11, only two were completely new additions to the Fund: Align Technology and NXP Semiconductors. Align is known for its “Invisalign” brand of clear plastic braces. By April 30, the stock had gained 40% since our first purchase last November.
On Oct. 31, 2016 the Fund had investments in 61 companies. By April 30, we had positions in only 52 companies. That included 10 new investments and a fond farewell to 19 others. While we can’t promise anything, you should expect a bit less turnover going forward.
Motley Fool Great America Fund (TMFGX) | |
Since the filing of our previous annual report, we switched our benchmark from the Russell Midcap Index to the Russell 2500 Growth Index. There’s no intention to change the way we manage the Fund, but this index better reflects the type of companies we own and provides a better comparison. Over the past three, five, and 10 years these indexes annualized returns were within 1% of each other, but over both the past six months and the past year the Russell 2500 Growth beat the Russell Midcap by more than 4%.
Like the Independence Fund, Great America also became focused on fewer companies during the period. We made four new investments while closing 14, resulting in a period-end total of 43 companies in the portfolio.
One of those new positions is Varex Imaging, which spun out from Varian Medical Systems. And one of our closed positions was Panera Bread, which is being acquired.
Motley Fool Emerging Markets Fund (TMFEX) | |
The former Motley Fool Epic Voyage Fund is now the Motley Fool Emerging Markets Fund. We will apply the same criteria as before to find high-quality investments, but we’ll now concentrate our efforts on developing countries. As of Oct. 31, 2016, the Fund had an already-low exposure to developed-market companies at nearly 18% of assets. By April 30, our developed-market exposure was only 6% of assets.
In the process of becoming an emerging-market fund, we sold out of 10 companies we held last October while making one new investment. This reduced our total number of holdings to 29 companies.
Our Top 11 holdings account for 46% of the Fund’s assets. This includes companies headquartered in 10 countries (two of the Top 11 are based in China). In all, our 29 investments represent businesses based in 19 countries.
This report has been prepared for shareholders of Motley Fool Independence Fund, Motley Fool Great America Fund and Motley Fool Emerging Markets Fund. It is not authorized for distribution to prospective investors unless accompanied or preceded by a current prospectus, which contains more complete information about the Funds. Investors are reminded to read the prospectus carefully before investing. Returns quoted represent past performance, which is no guarantee of future results. Current returns may be lower or higher and can be found at foolfunds.com. Share prices will fluctuate and there may be a gain or loss when shares are redeemed. Fund shares are distributed by Foreside Funds Distributors LLC, Berwyn, Pennsylvania.
| Table of Contents | |
| Letter from the President | 3 | |
| Letter to Shareholders | 6 | |
| Motley Fool Independence Fund | | |
| Portfolio Characteristics | 10 | |
| About Your Expenses | 13 | |
| Financial Statements | 18 | |
| Motley Fool Great America Fund | | |
| Portfolio Characteristics | 26 | |
| About your Expenses | 30 | |
| Financial Statements | 34 | |
| Motley Fool Emerging Markets Fund | | |
| Portfolio Characteristics | 42 | |
| About your Expenses | 46 | |
| Financial Statements | 50 | |
| Notes to Financial Statements | 58 | |
| Board Approval of Advisory Agreement | 84 | |
Letter from the President
President Denise H. Coursey | | Dear Fellow Shareholder, Have you ever taken a personality test? I was skeptical the first time I took one. And I’m still a little skeptical about some of the results. But there’s one thing the test told me that I agreed with: I am an introvert. An introvert is someone who prefers quiet thinking and reflection more than entertaining or talking to large groups. And that description fits me to a T. But I’m not the only one. It turns out that Warren Buffett, the greatest investor of our time, is also an introvert. And some folks have even suggested that Mr. Buffett’s introvert tendencies help him with his investing decisions. |
Your Portfolio Managers Are Also A Bunch Of Introverts
The team at Motley Fool Funds doesn’t share Buffett’s investing track record... yet. (But we think ours is pretty darn good.) We do, however, share his enjoyment of quiet thinking. On any given day in the office, you’ll find most of us wearing earbuds or hiding away in quiet corners, poring over earnings statements, prospectuses, and industry articles.
But there’s one event every year that makes us come out of our introverted shells: our annual shareholder party.
The 2017 Shareholder Party Is Coming This Autumn
Yes, despite our propensity for libraries and the occasional one-on-one conversation over coffee, once a year the raucous introverts at Motley Fool Asset Management (MFAM) host a party for our shareholders in Alexandria, Va. That’s you! And you should come. It’s always big fun.
Think about this for a second. How many other fund companies invite you to their offices to talk face-to-face with the people investing your money? How many other fund companies have offered “speed-dating” with their portfolio managers? Or handed out Willie Nelson bandanas complete with faux braids? I’m going to guess we’re the only ones.
Full disclosure: No portfolio managers actually dated during speed-dating. If they did so on their own time, I don’t want to know about it. We had timed, small-group conversations with each of our portfolio managers that we called “speed-dating.” And the Willie bandanas were courtesy of our guest speakers from Texas Roadhouse.
Our shareholder parties tend to be intimate gatherings – 75 or so shareholders — though we’d love to meet more of you. That means you really can talk to any of our portfolio managers, or even me, big old introvert that I am, one on one.
| A series of The RBB Fund, Inc. | 3 |
We get lots of repeat visitors, whom we get to know by name. (Shout out to Toby B., who comes to every event.) And of course, we’ll answer any question you throw at us. (Unless our lawyers say no. We always listen to our lawyers.) We’ve had questions about Brexit, the Trump effect, marijuana stocks, and, of course, our funds’ performance. (Those last two are completely unrelated.)
The bottom line is, our annual shareholder party is your chance to meet the men and women running your mutual funds. These people are pretty special, if I do say so. And they want to meet you and hear your stories. In an industry that can be faceless and impersonal, I think that makes MFAM stand out.
I hope you’ll join us this fall. We’ll have more details soon on the date and time. To get your personal invitation, email us at RSVP@foolfunds.com, and you will be signed up for invitations to future events, announcements, and our newsletter.
Can’t make the trek to the East Coast? We also host meet-ups when our investors are on the road, so send us an email (again, that’s RSVP@foolfunds.com), and we’ll be sure to let you know when we’re in your neck of the woods.
And for my fellow introverts out there, here are some conversation starters for each of our portfolio managers:
| ● | Bryan Hinmon: Ask Bryan about his summer backpacking trip to Glacier National Park. |
| ● | David Meier: Dave would love to talk your ear off about soccer. |
| ● | Charly Travers: Charly has a toddler who consumes all of his free time. |
| ● | Bill Barker: Ask Bill about Winnie, his adorable and rambunctious new puppy. |
| ● | Nate Weisshaar: Ask Nate how many countries he’s visited – and which is his favorite. |
| ● | Tony Arsta: Tony goes to Vegas for March Madness every year. But he never tells us how he bets or how much he’s won (or lost). |
I look forward to meeting you – and to continue to serve you. As always, I thank you for the trust you place in us, and we will continue to work hard to earn and deserve your trust.
Foolish best,
Denise H. Coursey
President, Motley Fool Asset Management
| 4 | A series of The RBB Fund, Inc. |
*We have two extroverts on the whole team — Matt Trogdon, our director of marketing and media, and Kelsey Mowrey, our director of shareholder experience. They’re in the right roles, aren’t they?
If you see either of them at our shareholder meeting, please talk with them. They have to work hard every day to get us introverts talking. They deserve a break.
| A series of The RBB Fund, Inc. | 5 |
Letter to Shareholders
Portfolio Manager Bryan Hinmon | | Your People “An organization of highly motivated people is hard to duplicate. The motivation will last if it is deeply rooted in employees’ commitment to the intrinsic purpose of their work.” – Bill George Dear Fellow Shareholder, High finance seems to have an aversion to the qualitative, softer points of analysis. This analysis can’t be done by Watson, Siri, Alexa, or Google Home. It has no place in “smart beta” or “semi-variance.” A lack of both precision and easy measurement, however, does not warrant ignoring such things. They matter. A lot. In fact, the team managing your investments starts with an analysis of management and culture. This is the first pillar of our definition of quality, which guides the strategy of quality growth at a reasonable price that we employ to manage your investments. We believe people matter. |
On a Mission with the Mission
Bill George became chief executive officer of Minnesota-based medical device maker Medtronic in 1991. At the time, Medtronic earned $1 billion in annual sales from inventing and selling pacemakers and had a $6 billion market capitalization. During his decade in charge, George built Medtronic into a diversified medical-technology leader, culminating in sales of $6 billion and a market capitalization of $60 billion. Under George, Medtronic stock compounded at 28% annually, versus 12% for the S&P 500. The performance is mind-boggling.
But when asked what made this success possible, George said something you probably wouldn’t expect: “Talk about the mission, every day, every minute, every hour, until you sound like a broken record.”
That approach is incongruent with the way many investment professionals perform stock research and construct portfolios. But the team that manages your investments is all over this way of thinking.
In his book Start With Why: How Great Leaders Inspire Everyone to Take Action, consultant and author Simon Sinek made popular what George was so good at, noting that inspirational leaders start by identifying their purpose, cause, or vision — in other words, why their company exists. Starting with the “why” lays the foundation for inspiring employees and customers who believe the same things.
| 6 | A series of The RBB Fund, Inc. |
He notes that human behavior can be influenced in only two ways: by manipulating it or by inspiring it. Which method do you think leads to superior company performance?
Bill George was fond of citing how a Medtronic product or therapy improved the lives of a patient every few seconds. What an extremely powerful motivator that must have been for employees. With hindsight, we can see that the combination of a mission-forward leader and a good underlying business produced extraordinary results. This combination is rare, but worth searching for.
Today, a Medtronic therapy improves the lives of more than two people every second. Current chief executive Omar Ishrak took over in June 2011, and the mission focus remains alive and well while the stock has continued to outperform the market. We are pleased that Medtronic is among the largest positions in the Independence Fund.
As you peruse the following pages of this semiannual report you’ll find schedules of investments for each fund. These are the businesses you are part-owners of. We’re proud that up and down the ranks in each fund are situations akin to Medtronic – exceptional management paired with strong business models. These are your people. Their skill in inspiring their employees and customers, combined with our ability to purchase shares at reasonable prices, are the keys to long term investing success in the funds.
Looking in the Mirror
We are your people, too. Motley Fool Asset Management exists to help the world (i.e., you) invest better, effortlessly. Our “why” is inspirational and acts as a motivator for our team, but we think more broadly about how to make your people a differentiating strength. This concept is known as “organizational alpha” and has to do with how we construct and mobilize our investment team to remove bias, improve decision-making, and seeks to achieve better investing results.
One way we pursue organizational alpha is by building a cognitively diverse investing team. For us, that means a group with varied backgrounds, interests, and personality types. Our investing team of six has degrees in philosophy, law, finance, mechanical engineering, computer science, and pharmacological sciences. We communicate in five languages and have embraced influences from the dozens of countries we have visited. We play court tennis, board games, soccer, parkour, and Quidditch. And while we skew heavily introverted, our personality types are assorted and complementary. These distinctions help ensure that our individual interpretations of each investment situation will be unique and defend against group-think.
Simply having a group of circles, triangles, and trapezoids sitting near one another doesn’t guarantee anything, though. We systematically apply a process of debate and discussion that allows for the free flow of opinions. This is where the diversity of our views shines: While we have an agreed-upon definition of quality, its interpretation for a given company is influenced by our varied influences and outlooks. Looking at the same business from six unique angles helps us come closer to discovering the truth of each investing idea, reduces the chance we miss an important factor, and broadens the potential futures we can imagine and handicap. Ultimately, we believe that the combination of six different views guided by an inspirational purpose and shared view of quality is multiplicative, not additive, and improves our decision-making.
| A series of The RBB Fund, Inc. | 7 |
Working for You
Paraphrasing Bill George: An organization of deeply motivated and intelligently organized people seeking out investments in deeply motivated leaders is hard to duplicate.
We will continue to shape our people and efforts in ways that seeks to deliver exceptional performance. We will continue to work hard to find the types of leaders that can inspire and drive exceptional results.
People matter, and we are pleased to use these pages to shine a light on your people. To that end, we’re always excited to interact with our shareholders, which is why we cannot wait to speak with you at our annual shareholder meeting. We’re looking forward to answering your questions about the market, our funds, and our investments.
Thank you for your continued trust.
Onward,
Bryan Hinmon
| 8 | A series of The RBB Fund, Inc. |
There can be no guarantee that any strategy will be successful. All investing involves risk, including potential loss of principal.
The Letter to Shareholders seeks to describe some of the Adviser’s current opinions and views of the financial markets. Although the Adviser believes it has a reasonable basis for any opinions or views expressed, actual results may differ, sometimes significantly so, from those expected or expressed. The securities held by the Funds that are discussed in the Letter to Shareholders were held during the period covered by the semiannual report. They do not comprise the entire investment portfolio of the Funds, may be sold at any time, and may no longer be held by the Funds. The opinions of the Adviser with respect to those securities may change at any time.
|  New to investing? Reading your first mutual fund semi-annual report? Welcome! Here are some important things you need to know. Mutual fund investing offers many potential benefits. But there also are risks. Financial gain is not guaranteed when it comes to investing in equity securities. It’s possible to lose money, including your principal — especially during the short term. We focus on stocks we have good reason to believe are undervalued by the market. We expect the price of these stocks eventually to rise as the market recognizes the true worth of the companies issuing them. But keep in mind that value stocks can remain undervalued by the market for a long time. And it’s possible that the intrinsic worth of any particular company may not match our valuation. Our funds may invest in foreign companies and in companies with small market capitalization. There are certain risks associated with these types of investments. The risks are described on pages 11, 27, and 43 of this report. Additional risk information is provided in section 3 of the Notes to Financial Statements, pp. 65-69. | |
| A series of The RBB Fund, Inc. | 9 |
Motley Fool Independence Fund Portfolio Characteristics (Unaudited)
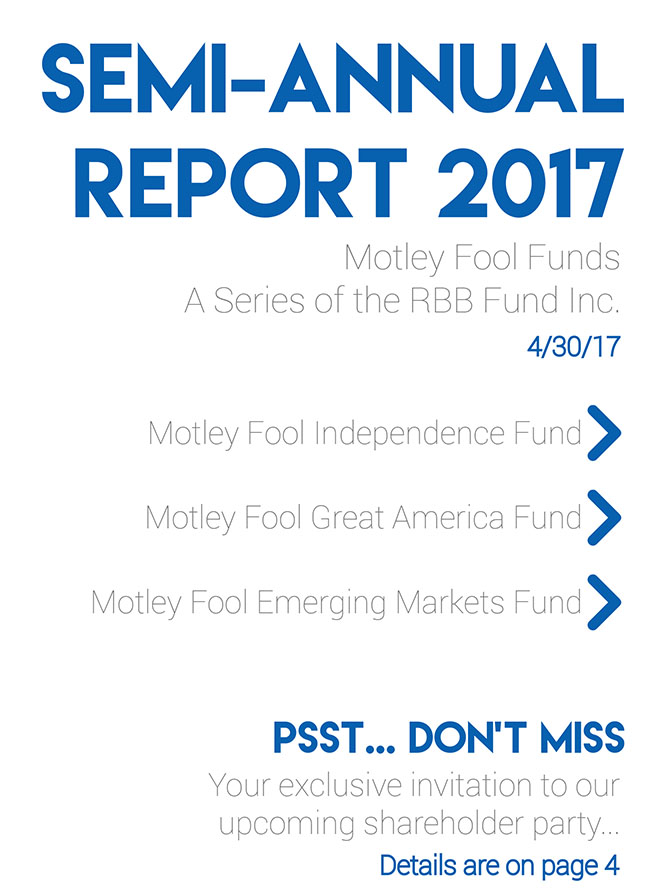
The Motley Fool Independence Fund operated as a series of The Motley Fool Funds Trust (the “Predecessor Fund”) prior to December 21, 2016, at which time the Predecessor Fund was reorganized into the Fund. The performance shown for periods prior to December 21, 2016 represents the performance of the Predecessor Fund. At April 30, 2017, the Motley Fool Independence Fund Investor Shares had an unaudited net asset value of $22.51 per share attributed to 14,412,998 shares outstanding and the Institutional Shares had an unaudited net asset value of $22.50 per share attributed to 2,278,638 shares outstanding. This compares with an unaudited net asset value as of June 16, 2009 for the Investor Shares of $10.00 per share attributed to 100,000 shares outstanding and as of June 17, 2014 for the Institutional Shares of $20.36 per share attributed to 1 share outstanding. From the Investor Shares launch on June 16, 2009 to April 30, 2017, the Investor Shares had an average annual total return of 12.34% versus a return of 11.30% over the same period for its benchmark, FTSE Global All Cap Index. From the Institutional Shares launch on June 17, 2014 to April 30, 2017, the Institutional Shares returned 5.61% versus a return of 4.92% over the same period for the FTSE Global All Cap Index.
The graph below shows the performance of $10,000 invested in the Investor Shares at inception. The results shown below do not reflect the deduction of taxes that a shareholder would pay on fund distributions or the redemption of fund shares.
Average Annual Total Returns as of 4/30/2017
| | One Year | Five Year | Since Inception | Inception Date |
| Investor Shares* | 17.55% | 9.49% | 12.34% | 6/16/2009 |
| Institutional Shares* | 17.67% | — | 5.61% | 6/17/2014 |
| FTSE Global All Cap Net Tax Index** | 16.27% | 9.61% | — (1) | — |
Fund Expense Ratios(2): Investor Shares: Gross 1.14% and Net 1.14%; Institutional Shares: Gross 2.12% and Net 0.95%
The performance data quoted represents past performance and does not guarantee future results. Current performance may be lower or higher. Performance data current to the most recent month-end may be obtained at www.FoolFunds.com. The investment return and principal value of an investment will fluctuate so that shares, when redeemed, may be worth more or less than their original cost.
(1) | The index returned 11.30% from the inception date of the Investor Shares and 4.92% from the inception date of the Institutional Shares. |
(2) | The expense ratios of the Fund are set forth according to the 2/28/2017 Prospectus for the Fund and may differ from the expense ratios disclosed in the Financial Highlights tables in this report. See the Financial Highlights for more current expense ratios. |
| * | These returns reflect expense waivers by the Fund’s investment adviser. Without these waivers, returns would have been lower. |
| 10 | Motley Fool Independence Fund (Unaudited) |
| ** | The FTSE Global All Cap Index is a market-capitalization weighted index representing the performance of large, mid and small cap companies in Developed and Emerging markets. The index is comprised of approximately 7,600 securities from 47 countries and captures 98% of the world’s investable market capitalization. Fair value prices and foreign exchange as of 4 pm ET are used in the calculation of this index, and returns are adjusted for withholding taxes applicable to dividends received by a U.S. Regulated Investment Company domiciled in the United States. |
The investment objective of the Independence Fund is to achieve long-term capital appreciation. The Fund pursues this objective by investing primarily in common stocks of companies located anywhere in the world. The Fund employs a growth at a reasonable price investment strategy and seeks long-term growth of capital by acquiring securities of companies that, in the view of Motley Fool Asset Management, LLC (the “Adviser”), have high quality businesses with strong market positions, manageable leverage, robust streams of cash flow, and trade at attractive prices. The Fund will invest in areas of the market, that, in the view of the Adviser, offer the greatest potential for long-term capital appreciation. The Fund may invest in other types of securities and in other asset classes when, in the judgement of the Adviser, such investments offer attractive potential returns. As such, the Fund’s performance will deviate significantly from its benchmark from time to time. It is the view of the Adviser that this deviation is less meaningful over shorter time frames and is more relevant over multi-year periods.
Because the Independence Fund is free to invest in companies of any size around the world, at times, the Fund may be heavily invested in small-cap stocks and foreign securities, each of which presents extra risk. Small-cap stocks tend to be more volatile and less liquid than their large-cap counterparts. Fluctuations in currency exchange rates can cause losses when investing in foreign securities, with emerging markets presenting additional risks of illiquidity, political instability, and lax regulation. While investing in a particular sector is not a principal investment strategy of the Independence Fund, the portfolio may be significantly invested in a sector as a result of the portfolio management decisions made pursuant to its principal investment strategy. You are strongly encouraged to read more about the Fund’s strategies and risks in the prospectus.
The Independence Fund prefers to invest in high-quality businesses when possible. To identify these high-quality businesses, the Adviser engages in research to evaluate each company under consideration using four criteria: management, culture, and incentives; the economics of the business; competitive advantage; and the durability of its competitive advantage period. The Adviser’s approach prizes a long-term mindset and a balance of qualitative and quantitative factors. The following tables show the top eleven holdings, sector allocations, and top eleven countries in which the Fund was invested in as of April 30, 2017. Portfolio holdings are subject to change without notice.
Certain mutual fund ratings and review services have created style boxes, which look more or less like a tic-tac-toe board; arranging funds by the size of the companies they typically invest in (large-, mid-, and small-cap) along one axis, and along a “value” to “growth” basis on the other axis. This may be a helpful way – at times –to think about certain investment opportunities, but we don’t believe we’ll improve your returns by limiting ourselves to any one portion of that style box.
Top Eleven Holdings* | % of Net Assets |
| Amazon.com, Inc. | 4.19% |
| BGEO Group PLC | 3.26 |
| Align Technology, Inc. | 3.15 |
| NMC Health PLC | 2.99 |
| Medtronic PLC | 2.96 |
| NXP Semiconductors NV | 2.96 |
Motley Fool Independence Fund (Unaudited) | 11 |
Top Eleven Holdings* | % of Net Assets |
| Banco Latinoamericano de Comercio Exterior SA | 2.62 |
| DuzonBizon Co., Ltd. | 2.56 |
| IPG Photonics Corp. | 2.42 |
| zooplus AG | 2.26 |
| Tencent Holdings Ltd. | 2.25 |
| | 31.62% |
| * | As of the date of the report, the Fund had a holding of 2.22% in the BNY Mellon Cash Reserve. |
The Motley Fool Independence Fund uses the Global Industry Classification StandardSM (“GICS SM”) as the basis for the classification of securities on the Schedule of Investments (“SOI”). We believe that this makes the SOI classifications more standard with the rest of the industry.
| Sector Allocation | % of Net Assets |
| Information Technology | 25.96% |
| Consumer Discretionary | 18.50 |
| Health Care | 15.54 |
| Financials | 13.85 |
| Industrials | 9.84 |
| Consumer Staples | 7.06 |
| Real Estate | 4.17 |
| Energy | 1.54 |
| Telecommunication Services | 1.33 |
| | 97.79% |
| Top Eleven Countries | % of Net Assets |
United States* | 51.80% |
| United Arab Emirates | 4.98 |
| United Kingdom | 3.61 |
| Indonesia | 3.33 |
| Georgia | 3.26 |
| Japan | 3.04 |
| Ireland | 2.96 |
| Netherlands | 2.96 |
| Panama | 2.62 |
| South Korea | 2.56 |
| Germany | 2.26 |
| | 83.38% |
| * | As of the date of the report, the Fund had a holding of 2.22% in the BNY Mellon Cash Reserve. |
12 | Motley Fool Independence Fund (Unaudited) |
About Your Expenses
As a shareholder of the Independence Fund, you incur (1) transaction costs and (2) ongoing costs, including advisory fees and other Fund expenses. This example is intended to help you to understand your ongoing costs (in dollars) of investing in the Fund and to compare these costs with the ongoing costs of investing in other mutual funds. It is based on an investment of $1,000 invested at the beginning of the period and held for the entire period from November 1, 2016 to April 30, 2017.
Actual Expenses
The first section of the table below provides information about actual account values and actual expenses. You may use the information in this section, together with the amount you invested, to estimate the expenses that you incurred over the period. Simply divide your account value by $1,000 (for example, an $8,600 account value divided by $1,000 = 8.6), then multiply the result by the number in the first section under the heading entitled “Expenses Paid During Period” to estimate the expenses attributable to your investment during this period.
Hypothetical Example for Comparison Purposes
The second section of the table below provides information about hypothetical account values and hypothetical expenses based on the Independence Fund’s actual expense ratio and an assumed rate of return of 5% per year before expenses, which is not the Fund’s actual return. Thus, you should not use the hypothetical account values and expenses to estimate the actual ending account balance or your expenses for the period. Rather, these figures are provided to enable you to compare the ongoing costs of investing in the Fund as compared to the costs of investing in other funds. To do so, compare this 5% hypothetical example with the 5% hypothetical examples that appear in the shareholder reports of the other funds. Please note that the expenses shown in the table are meant to highlight your ongoing costs only and do not reflect any transactional costs. Therefore, the second section of the table is useful in comparing ongoing costs only and will not help you determine the relative total costs of owning different funds. In addition, if these transactional costs were included, your costs would have been higher.
Do you know how many times a fund, or the market, has returned a smooth 5% over a long period of time? Never. But we have to pick some example. In reality, the market’s returns are always far bumpier, with the market returning 20% one year, followed by a loss of 10% the next year, followed by a 3% gain, etc. These variations affect actual expenses as well. Happily, over almost all time periods of 20 years or longer, according to the research of University of Pennsylvania’s Jeremy Siegel and others, the domestic market’s returns have been at least 5% per year on average.
| | Beginning Account Value 11/01/16 | Ending Account Value 4/30/17 | Annualized Expense Ratio(1) | Expenses Paid During Period(2) |
| Investor Shares | | | | |
| Actual | $1,000 | $1,139.14 | 1.15% | $6.10 |
| Hypothetical | $1,000 | $1,019.09 | 1.15% | $5.76 |
| Institutional Shares | | | | |
| Actual | $1,000 | $1,139.20 | 0.95% | $5.04 |
| Hypothetical | $1,000 | $1,020.08 | 0.95% | $4.76 |
(1) | These ratios reflect expenses waived by the Fund’s investment adviser. Without these waivers, the Fund’s expenses would have been higher and the ending account values would have been lower. |
(2) | Expenses are equal to the Fund’s annualized expense ratio for the period November 1, 2016 to April 30, 2017,multiplied by the average account value over the period, multiplied by the number of days (181) in the most recent fiscal half-year, then divided by 365. |
Motley Fool Independence Fund (Unaudited) | 13 |
Motley Fool Independence Fund
Schedule of Investments
April 30, 2017
(Unaudited)
| Issues | | Shares | | | Value (Note 2) | |
| Equity Securities — 94.60% | | | | | | |
| Air Freight & Logistics — 1.53% | | | | | | |
| XPO Logistics, Inc. (United States)* | | | 116,000 | | | $ | 5,729,240 | |
| Auto Components — 1.10% | | | | | | | | |
| Gentex Corp. (United States) | | | 200,000 | | | | 4,130,000 | |
| Banks — 9.85% | | | | | | | | |
| Banco Latinoamericano de Comercio Exterior SA (Panama) | | | 343,129 | | | | 9,840,940 | |
| BGEO Group PLC (Georgia) | | | 263,132 | | | | 12,246,046 | |
| HDFC Bank Ltd. (India)(a) | | | 100,000 | | | | 7,961,000 | |
| Sberbank of Russia PJSC (Russia) | | | 2,400,000 | | | | 6,970,939 | |
| | | | | | | | 37,018,925 | |
| Biotechnology — 1.80% | | | | | | | | |
| Ionis Pharmaceuticals, Inc. (United States)* | | | 140,000 | | | | 6,746,600 | |
| Commercial Services & Supplies — 1.37% | | | | | | | | |
| KAR Auction Services, Inc. (United States) | | | 117,708 | | | | 5,134,423 | |
| Communications Equipment — 1.75% | | | | | | | | |
| Infinera Corp. (United States)* | | | 661,100 | | | | 6,558,112 | |
| Diversified Financial Services — 1.98% | | | | | | | | |
| Berkshire Hathaway, Inc. Class A (United States)* | | | 30 | | | | 7,433,400 | |
| Diversified Telecommunication Services — 3.35% | | | | | | | | |
| Level 3 Communications, Inc. (United States)* | | | 82,500 | | | | 5,012,700 | |
| SBA Communications Corp. (United States)* | | | 60,000 | | | | 7,589,400 | |
| | | | | | | | 12,602,100 | |
| Electronic Equipment, Instruments & Components — 2.42% | | | | | | | | |
| IPG Photonics Corp. (United States)* | | | 72,000 | | | | 9,095,040 | |
| Equity Real Estate Investment Trusts — 2.15% | | | | | | | | |
| American Tower Corp. (United States) | | | 64,000 | | | | 8,060,160 | |
| Food & Staples Retailing — 1.89% | | | | | | | | |
| Costco Wholesale Corp. (United States) | | | 40,000 | | | | 7,100,800 | |
| Food Products — 3.18% | | | | | | | | |
| Nestle SA (Switzerland) | | | 68,694 | | | | 5,290,847 | |
See Notes to Financial Statements.
14 | Motley Fool Independence Fund |
| Issues | | Shares | | | Value (Note 2) | |
| Equity Securities (continued) | | | | | | |
| Food Products (continued) | | | | | | |
| PT Nippon Indosari Corpindo Tbk (Indonesia) | | | 54,234,800 | | | $ | 6,666,957 | |
| | | | | | | | | |
| | | | | | | | 11,957,804 | |
| Health Care Equipment & Supplies — 9.23% | | | | | | | | |
| Align Technology, Inc. (United States)* | | | 88,000 | | | | 11,846,560 | |
| Medtronic PLC (Ireland) | | | 133,772 | | | | 11,115,115 | |
| Natus Medical, Inc. (United States)* | | | 136,900 | | | | 4,791,500 | |
| ResMed, Inc. (United States) | | | 102,000 | | | | 6,934,980 | |
| | | | | | | | 34,688,155 | |
| Health Care Providers & Services — 2.99% | | | | | | | | |
| NMC Health PLC (United Arab Emirates)* | | | 435,482 | | | | 11,226,569 | |
| Hotels, Restaurants & Leisure — 2.91% | | | | | | | | |
| Starbucks Corp. (United States) | | | 80,000 | | | | 4,804,800 | |
| Texas Roadhouse, Inc. (United States) | | | 130,500 | | | | 6,117,840 | |
| | | | | | | | 10,922,640 | |
| Insurance — 2.01% | | | | | | | | |
| Markel Corp. (United States)* | | | 7,800 | | | | 7,562,880 | |
| Internet & Catalog Retail — 8.24% | | | | | | | | |
| Amazon.com, Inc. (United States)* | | | 17,000 | | | | 15,724,830 | |
| Ctrip.com International Ltd. (China)*(a) | | | 88,800 | | | | 4,485,288 | |
| TripAdvisor, Inc. (United States)* | | | 50,000 | | | | 2,250,500 | |
| zooplus AG (Germany)* | | | 45,413 | | | | 8,481,587 | |
| | | | | | | | 30,942,205 | |
| Internet Software & Services — 7.87% | | | | | | | | |
| Alphabet, Inc. Class C (United States)* | | | 9,024 | | | | 8,175,383 | |
| Facebook, Inc. Class A (United States)* | | | 55,000 | | | | 8,263,750 | |
| MercadoLibre, Inc. (Argentina) | | | 20,437 | | | | 4,678,234 | |
| Tencent Holdings Ltd. (China) | | | 270,000 | | | | 8,460,001 | |
| | | | | | | | 29,577,368 | |
| IT Services — 1.72% | | | | | | | | |
| Mastercard, Inc. Class A (United States) | | | 55,500 | | | | 6,455,760 | |
| Leisure Products — 1.71% | | | | | | | | |
| Shimano, Inc. (Japan) | | | 42,000 | | | | 6,427,845 | |
| Life Sciences Tools & Services — 1.52% | | | | | | | | |
| Horizon Discovery Group PLC (United Kingdom)* | | | 2,135,499 | | | | 5,725,421 | |
See Notes to Financial Statements.
Motley Fool Independence Fund | 15 |
| Issues | | Shares | | | Value (Note 2) | |
| Equity Securities (continued) | | | | | | |
| Machinery — 1.33% | | | | | | |
| FANUC Corp. (Japan) | | | 24,600 | | | $ | 5,008,464 | |
| Media — 2.99% | | | | | | | | |
| Multiplus SA (Brazil) | | | 278,600 | | | | 3,427,586 | |
| System1 Group PLC (United Kingdom) | | | 700,000 | | | | 7,817,519 | |
| | | | | | | | 11,245,105 | |
| Multiline Retail — 1.55% | | | | | | | | |
| PT Mitra Adiperkasa Tbk (Indonesia)* | | | 12,301,000 | | | | 5,837,184 | |
| Oil, Gas & Consumable Fuels — 1.54% | | | | | | | | |
| Kinder Morgan, Inc. (United States) | | | 280,000 | | | | 5,776,400 | |
| Semiconductors & Semiconductor Equipment — 4.85% | | | | | | | | |
| NXP Semiconductors NV (Netherlands)* | | | 105,000 | | | | 11,103,750 | |
| Taiwan Semiconductor Manufacturing Co., Ltd. (Taiwan)(a) | | | 215,000 | | | | 7,110,050 | |
| | | | | | | | 18,213,800 | |
| Software — 5.63% | | | | | | | | |
| DuzonBizon Co., Ltd. (South Korea) | | | 401,680 | | | | 9,598,984 | |
| Splunk, Inc. (United States)* | | | 97,500 | | | | 6,270,225 | |
| Ultimate Software Group, Inc. (The) (United States)* | | | 26,000 | | | | 5,269,420 | |
| | | | | | | | 21,138,629 | |
| Technology Hardware, Storage & Peripherals — 1.72% | | | | | | | | |
| Apple, Inc. (United States) | | | 45,000 | | | | 6,464,250 | |
| Trading Companies & Distributors — 1.85% | | | | | | | | |
| Watsco, Inc. (United States) | | | 50,000 | | | | 6,940,000 | |
| Transportation Infrastructure — 2.57% | | | | | | | | |
| DP World Ltd. (United Arab Emirates) | | | 145,000 | | | | 2,963,800 | |
| International Container Terminal Services, Inc. (Philippines) | | | 3,750,000 | | | | 6,675,888 | |
| | | | | | | | 9,639,688 | |
| Total Equity Securities (Cost $243,550,134) | | | | | | | 355,358,967 | |
| | | | | | | | | |
| Participatory Notes — 3.19% | | | | | | | | |
| Air Freight & Logistics — 1.20% | | | | | | | | |
| Aramex PJSC (United Arab Emirates)(b) | | | 3,134,000 | | | | 4,505,188 | |
| Food Products — 1.99% | | | | | | | | |
| Almarai Co. (Saudi Arabia)(b) | | | 383,678 | | | | 7,476,618 | |
| Total Participatory Notes (Cost $6,617,958) | | | | | | | 11,981,806 | |
See Notes to Financial Statements.
| 16 | Motley Fool Independence Fund |
| Issues | | Shares | | | Value (Note 2) | |
| Other Investments — 2.22% | | | | | | |
| Temporary Cash Investment — 2.22% | | | | | | |
| BNY Mellon Cash Reserve | | | 8,341,562 | | | $ | 8,341,562 | |
| Total Other Investments (Cost $8,341,562) | | | | | | | 8,341,562 | |
| | | | | | | | | |
| Total Investments Portfolio (Cost $258,509,654) — 100.01% | | | | | | | 375,682,335 | |
| Liabilities in Excess of Other Assets — (0.01)% | | | | | | | (44,177 | ) |
| NET ASSETS — 100.00% | | | | | | | | |
| (Applicable to 16,691,636 shares outstanding) | | | | | | $ | 375,638,158 | |
| * | Non-income producing security. |
| (a) | ADR — American Depositary Receipts |
| (b) | Security exempt from registration under Rule 144A of the Securities Act of 1933. These securities may be resold in transactions exempt from registration, normally to qualified institutional buyers. Total market value of Rule 144A securities is $11,981,806 and represents 3.19% of net assets as of April 30, 2017. |
PLC — Public Limited Company
See Notes to Financial Statements.
Motley Fool Independence Fund | 17 |
Statement of Assets and Liabilities
| | | As of April 30, 2017 | |
| | | (Unaudited) | |
| Assets: | | | |
| Investments in securities of unaffiliated issuers, at value (at cost, $258,509,654) | | $ | 375,682,335 | |
| Receivables: | | | | |
| Dividends and tax reclaims | | | 531,124 | |
| Shares of beneficial interest sold | | | 248,010 | |
| Prepaid expenses and other assets | | | 42,309 | |
| Total Assets | | | 376,503,778 | |
| | | | | |
| Liabilities | | | | |
| Payables: | | | | |
| Shares of beneficial interest redeemed | | | 410,169 | |
| Dividend withholding tax | | | 17,232 | |
| Accrued expenses: | | | | |
| Audit fees | | | 10,387 | |
| Accounting and administration fees | | | 77,473 | |
| Advisory fees | | | 247,672 | |
| Custodian fees | | | 21,468 | |
| Transfer agent fees | | | 35,068 | |
| Trustee/Director fees | | | 2,342 | |
| Other expenses | | | 43,809 | |
| Total Liabilities | | | 865,620 | |
| Net Assets | | $ | 375,638,158 | |
The accompanying notes are an integral part of these financial statements.
| 18 | Motley Fool Independence Fund |
Statement of Assets and Liabilities
| | | As of April 30, 2017 | |
| | | (Unaudited) | |
| Net Assets Consist of: | | | |
| Paid-in-Capital | | $ | 225,954,653 | |
| Accumulated Net Investment Loss | | | (466,112 | ) |
| Accumulated Net Realized Gain on Investments and Foreign Currency Transactions | | | 32,987,383 | |
| Net Unrealized Appreciation/(Depreciation) on Investments, Foreign Currencies, and Assets and Liabilities Denominated in Foreign Currencies | | | 117,162,234 | |
| Net Assets | | $ | 375,638,158 | |
| | | | | |
| Net Asset Value: | | | | |
| $0.001 par value, unlimited shares authorized | | | | |
| Investor Shares: | | | | |
| Net assets applicable to capital shares outstanding | | $ | 324,372,580 | |
| Shares outstanding | | | 14,412,998 | |
| Net asset value, offering, and redemption price per share* | | $ | 22.51 | |
| | | | | |
| Institutional Shares: | | | | |
| Net assets applicable to capital shares outstanding | | $ | 51,265,578 | |
| Shares outstanding ($0.001 par value; 100,000,000 shares authorized) | | | 2,278,638 | |
| Net asset value, offering, and redemption price per share* | | $ | 22.50 | |
| * | A charge of 2% is imposed on the redemption proceeds of shares redeemed or exchanged within 90 days of purchase. |
The accompanying notes are an integral part of these financial statements.
| Motley Fool Independence Fund | 19 |
Statement of Operations
| | | Six-Months Ended April 30, 2017 | |
| | | (Unaudited) | |
| Investment Income | | | |
| Dividends | | $ | 1,666,165 | |
| Interest | | | — | |
| Less foreign taxes withheld | | | (107,217 | ) |
| Total Investment Income | | | 1,558,948 | |
| Expenses | | | | |
| Investment advisory fees | | | 1,503,605 | |
| Transfer agent fees - Investor Shares | | | 124,439 | |
| Transfer agent fees - Institutional Shares | | | 19,500 | |
| Accounting fees - Investor Shares | | | 105,529 | |
| Accounting fees - Institutional Shares | | | 21,931 | |
| Shareholder account-related services - Investor Shares | | | 106,300 | |
| Shareholder account-related services - Institutional Shares | | | 2,067 | |
| Custodian fees | | | 46,992 | |
| Administration fees | | | 30,127 | |
| Shareholder reporting fees - Investor Shares | | | 20,654 | |
| Shareholder reporting fees - Institutional Shares | | | 1,403 | |
| Professional fees | | | 16,092 | |
| Blue sky fees - Investor Shares | | | 6,734 | |
| Blue sky fees - Institutional Shares | | | 5,109 | |
| Trustee/Director fees | | | 6,129 | |
| Chief Compliance Officer fees | | | 4,187 | |
| Other expenses | | | 18,102 | |
| Total expenses | | | 2,038,900 | |
| Management fees waived/reimbursed net of amount recaptured - Investor Shares | | | — | |
| Expenses waived/reimbursed net of amount recaptured - Institutional Shares | | | (43,886 | ) |
| Net expenses | | | 1,995,014 | |
| Net Investment Income (Loss) | | | (436,066 | ) |
| Realized and Unrealized Gain (Loss) | | | | |
| Net realized gain (loss) from: | | | | |
| Investment securities | | | 33,118,616 | |
| Foreign currency transactions | | | 21,120 | |
| Net realized gain (loss) on investments and foreign currency transactions | | | 33,139,736 | |
| Change in net unrealized appreciation/(depreciation) on: | | | | |
| Investment securities | | | 14,059,674 | |
| Foreign currency translations | | | 10,046 | |
| Change in net unrealized appreciation/(depreciation) on investments, foreign currencies, and assets and liabilities denominated in foreign currencies | | | 14,069,720 | |
| Net realized and unrealized gain (loss) | | | 47,209,456 | |
| Net Increase (Decrease) in Net Assets Resulting from Operations | | $ | 46,773,390 | |
The accompanying notes are an integral part of these financial statements.
| 20 | Motley Fool Independence Fund |
Statements of Changes in Net Assets
| | | Six-Months Ended April 30, 2017 (Unaudited) | | | Year Ended October 31, 2016 | |
| Operations: | | | | | | |
| Net Investment Income (Loss) | | $ | (436,066 | ) | | $ | 747,966 | |
| Net Realized Gain (Loss) on Investments and Foreign Currency Transactions | | | 33,139,736 | | | | 9,546,196 | |
| Change in Net Unrealized Appreciation/(Depreciation) on Investments, Foreign Currencies, and Assets and Liabilities Denominated in Foreign Currencies | | | 14,069,720 | | | | (10,795,721 | ) |
| Net increase (decrease) in net assets resulting from operations | | | 46,773,390 | | | | (501,559 | ) |
| Dividends to Shareholders: | | | | | | | | |
| Dividends from net investment income | | | | | | | | |
| Investor Shares | | | (604,493 | ) | | | (34,910 | ) |
| Institutional Shares | | | (186,099 | ) | | | (13,802 | ) |
| Distributions from net realized capital gains | | | | | | | | |
| Investor Shares | | | (8,485,045 | ) | | | (166,111 | ) |
| Institutional Shares | | | (1,167,344 | ) | | | (3,300 | ) |
| Total dividends and distributions | | | (10,442,981 | ) | | | (218,123 | ) |
| Capital Share Transactions: | | | | | | | | |
| Proceeds from shares sold | | | | | | | | |
| Investor Shares (540,107 and 1,642,369 shares, respectively) | | | 11,239,852 | | | | 32,544,953 | |
| Institutional Shares (1,946,252 and 44,003 shares, respectively) | | | 39,626,381 | | | | 876,179 | |
| Reinvestment of dividends | | | | | | | | |
| Investor Shares (449,511 and 9,795 shares, respectively) | | | 8,937,049 | | | | 197,667 | |
| Institutional Shares (66,891 and 837 shares, respectively) | | | 1,333,174 | | | | 16,889 | |
| Value of shares redeemed | | | | | | | | |
| Investor Shares (3,918,258 and 3,682,983 shares, respectively) | | | (80,347,673 | ) | | | (72,564,161 | ) |
| Institutional Shares (89,501 and 69,455 shares, respectively) | | | (1,866,012 | ) | | | (1,365,672 | ) |
| Redemption and small-balance account fees | | | | | | | | |
| Investor Shares | | | 23,846 | | | | 38,069 | |
| Institutional Shares | | | — | | | | 20 | |
| Net increase (decrease) from capital share transactions | | | (21,053,383 | ) | | | (40,256,056 | ) |
| Total increase (decrease) in net assets | | | 15,277,026 | | | | (40,975,738 | ) |
| Net Assets: | | | | | | | | |
| Beginning of Period | | | 360,361,132 | | | | 401,336,870 | |
End of Period* | | $ | 375,638,158 | | | $ | 360,361,132 | |
| | | | | | | | | |
*Including undistributed net investment income (loss) | | $ | (466,112 | ) | | $ | (760,546 | ) |
The accompanying notes are an integral part of these financial statements.
| Motley Fool Independence Fund | 21 |
Financial Highlights
(for a share outstanding throughout each period)
| | | Six Months Ended April 30, 2017 | | | Years Ended October 31, | |
| Investor Shares | | (Unaudited)(1)(2) | | | 2016 | | | 2015 | | | 2014 | | | 2013 | | | 2012 | |
| Net Asset Value, Beginning of Year | | $ | 20.36 | | | $ | 20.32 | | | $ | 21.00 | | | $ | 19.24 | | | $ | 15.48 | | | $ | 14.15 | |
| Income (Loss) From Investment Operations | | | | | | | | | | | | | | | | | | | | | | | | |
Net Investment Income (Loss)(3) | | | (0.03 | ) | | | 0.04 | | | | 0.05 | | | | 0.11 | | | | 0.07 | | | | 0.14 | |
| Net Gain (Loss) on Securities (Realized and Unrealized) | | | 2.77 | | | | 0.01 | | | | (0.29 | ) | | | 1.87 | | | | 3.79 | | | | 1.29 | |
| Total From Investment Operations | | | 2.74 | | | | 0.05 | | | | (0.24 | ) | | | 1.98 | | | | 3.86 | | | | 1.43 | |
| Less Distributions | | | | | | | | | | | | | | | | | | | | | | | | |
| Net Investment Income | | | (0.04 | ) | | | — | * | | | (0.11 | ) | | | (0.04 | ) | | | (0.11 | ) | | | (0.10 | ) |
| Net Realized Capital Gains | | | (0.56 | ) | | | (0.01 | ) | | | (0.33 | ) | | | (0.18 | ) | | | — | | | | — | |
| Total Distributions | | | (0.60 | ) | | | (0.01 | ) | | | (0.44 | ) | | | (0.22 | ) | | | (0.11 | ) | | | (0.10 | ) |
| Redemption and Small-Balance Account Fees | | | 0.01 | | | | * | | | | — | * | | | — | * | | | 0.01 | | | | — | * |
| Net Asset Value, End of Year | | $ | 22.51 | | | $ | 20.36 | | | $ | 20.32 | | | $ | 21.00 | | | $ | 19.24 | | | $ | 15.48 | |
Total Return(4)(5) | | | 13.91 | % | | | 0.25 | % | | | (1.13 | %) | | | 10.43 | % | | | 25.14 | % | | | 10.21 | % |
| Net Assets, End of Year (thousands) | | $ | 324,373 | | | $ | 353,118 | | | $ | 393,611 | | | $ | 413,624 | | | $ | 354,081 | | | $ | 227,881 | |
| | | | | | | | | | | | | | | | | | | | | | | | | |
| Ratios/Supplemental Data | | | | | | | | | | | | | | | | | | | | | | | | |
| Ratio of Expenses to Average Net Assets | | | 1.15 | % | | | 1.14 | % | | | 1.15 | % | | | 1.26 | % | | | 1.36 | % | | | 1.47 | % |
| Ratio of Expenses to Average Net Assets (Before Waivers and Reimbursement of Expenses and/or Recapture of Previously Waived Fees) | | | 1.15 | % | | | 1.14 | % | | | 1.13 | % | | | 1.23 | % | | | 1.37 | % | | | 1.54 | % |
The accompanying notes are an integral part of these financial statements.
| 22 | Motley Fool Independence Fund |
Financial Highlights
| | | Six Months Ended April 30, 2017 | | | Years Ended October 31, | |
| Investor Shares | | (Unaudited)(1)(2) | | | 2016 | | | 2015 | | | 2014 | | | 2013 | | | 2012 | |
| Ratio of Net Investment Income (Loss) to Average Net Assets | | | (0.27 | )% | | | 0.20 | % | | | 0.23 | % | | | 0.55 | % | | | 0.44 | % | | | 0.93 | % |
| Ratio of Net Investment Income (Loss) to Average Net Assets (Before Waivers and Reimbursement of Expenses and/or Recapture of Previously Waived Fees) | | | (0.27 | )% | | | 0.20 | % | | | 0.25 | % | | | 0.59 | % | | | 0.43 | % | | | 0.86 | % |
| Portfolio Turnover | | | 26 | % | | | 26 | % | | | 21 | % | | | 24 | % | | | 22 | % | | | 37 | % |
| * | Amount represents less than $0.005 per share. |
| (1) | Effective as of December 21, 2016, the Fund acquired all the assets and liabilities of the Motley Fool Independence Fund, a series of The Motley Fool Funds Trust (the “Predecessor Fund”). The financial highlights for the periods prior to that date reflect the performances of the Predecessor Fund. |
| (2) | For the six months ended April 30, 2017, all ratios for the period have been annualized. Total return and portfolio turnover for the period have not been annualized. |
| (3) | Per share data calculated using average shares outstanding method. |
| (4) | During the six months ended April 30, 2017 and the year ended October 31, 2013, 0.05% and 0.06%, respectively, of the Fund’s total return was attributable to redemption and small-balance account fees received as referenced in Note 4. Excluding this item, the total return would have been 13.86% and 25.08%, respectively. For the years ended October 31, 2016, October 31, 2015, October 31, 2014 and October 31, 2012, redemption and small-balance account fees received had no effect on the Fund’s total return. |
| (5) | Total return reflects the rate an investor would have earned on an investment in the Fund during the period. |
The accompanying notes are an integral part of these financial statements.
| Motley Fool Independence Fund | 23 |
Financial Highlights
| | | Six Months Ended April 30, 2017 | | | Years Ended October 31, | | | Period Ended October 31, | |
| Institutional Shares | | (Unaudited)(1)(2) | | | 2016 | | | 2015 | | | 2014(3)(4) | |
| Net Asset Value, Beginning of Period | | $ | 20.40 | | | $ | 20.35 | | | $ | 21.01 | | | $ | 20.36 | |
| Income (Loss) From Investment Operations | | | | | | | | | | | | | | | | |
Net Investment Income (Loss)(5) | | | — | | | | 0.08 | | | | 0.10 | | | | 0.03 | |
| Net Gain (Loss) on Securities (Realized and Unrealized) | | | 2.76 | | | | 0.02 | | | | (0.31 | ) | | | 0.62 | |
| Total From Investment Operations | | | 2.76 | | | | 0.10 | | | | (0.21 | ) | | | 0.65 | |
| Less Distributions | | | | | | | | | | | | | | | | |
| Net Investment Income | | | (0.09 | ) | | | (0.04 | ) | | | (0.12 | ) | | | — | |
| Net Realized Capital Gains | | | (0.56 | ) | | | (0.01 | ) | | | (0.33 | ) | | | — | |
| Total Distributions | | | (0.66 | ) | | | (0.05 | ) | | | (0.45 | ) | | | — | |
| Redemption and Small-Balance Account Fees | | | — | | | | — | | | | — | * | | | — | |
| Net Asset Value, End of Period | | $ | 22.50 | | | $ | 20.40 | | | $ | 20.35 | | | $ | 21.01 | |
| | | | | | | | | | | | | | | | | |
Total Return(6)(7) | | | 13.92 | % | | | (0.47 | %) | | | (0.97 | %) | | | 3.19 | % |
| Net Assets, End of Period (thousands) | | $ | 51,266 | | | $ | 7,243 | | | $ | 7,726 | | | $ | 4,038 | |
| | | | | | | | | | | | | | | | | |
| Ratios/Supplemental Data | | | | | | | | | | | | | | | | |
| | | | | | | | | | | | | | | | | |
| Ratio of Expenses to Average Net Assets | | | 0.95 | % | | | 0.95 | % | | | 0.95 | % | | | 0.95 | % |
| Ratio of Expenses to Average Net Assets (Before Waivers and Reimbursement of Expenses and/or Recapture of Previously Waived Fees) | | | 1.18 | % | | | 2.12 | % | | | 2.14 | % | | | 3.78 | % |
| Ratio of Net Investment Income (Loss) to Average Net Assets | | | (0.02 | )% | | | 0.39 | % | | | 0.46 | % | | | 0.39 | % |
| Ratio of Net Investment Income (Loss) to Average Net Assets (Before Waivers and Reimbursement of Expenses and/or Recapture of Previously Waived Fees) | | | (0.25 | %) | | | (0.78 | %) | | | 0.73 | % | | | (2.43 | %) |
| Portfolio Turnover | | | 26 | % | | | 26 | % | | | 21 | % | | | 24 | % |
| * | Amount represents less than $0.005 per share. |
| (1) | Effective as of December 21, 2016, the Fund acquired all the assets and liabilities of the Motley Fool Independence Fund, a series of The Motley Fool Funds Trust (the “Predecessor Fund”). The financial highlights for the periods prior to that date reflect the performances of the Predecessor Fund. |
| (2) | For the six months ended April 30, 2017, all ratios for the period have been annualized. Total return and portfolio turnover for the period have not been annualized. |
| (3) | Commenced operations on June 17, 2014. All ratios for the period have been annualized. Total return for the period has not been annualized. |
The accompanying notes are an integral part of these financial statements.
| 24 | Motley Fool Independence Fund |
Financial Highlights
| (4) | Because of commencement of operations and related preliminary transaction costs, these ratios are not necessary indicative of future ratios. |
| (5) | Per share data calculated using average shares outstanding method. |
| (6) | For the six months ended April 30, 2017 and the years ended October 31, 2016, October 31, 2015, and the period ended October 31, 2014, redemption and small-balance account fees received had no effect on the Fund’s total return. |
| (7) | Total return reflects the rate an investor would have earned on an investment in the Fund during the period. |
The accompanying notes are an integral part of these financial statements.
| Motley Fool Independence Fund | 25 |
Motley Fool Great America Fund Portfolio Characteristics (Unaudited)
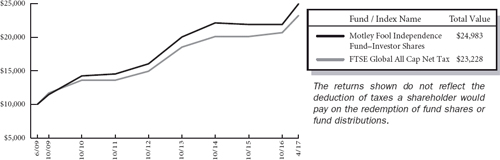
The Motley Fool Great America Fund operated as a series of The Motley Fool Funds Trust (the “Predecessor Fund”) prior to December 21, 2016, at which time the Predecessor Fund was reorganized into the Fund. The performance shown for periods prior to December 21, 2016 represents performance of the Predecessor Fund. At April 30, 2017, the Motley Fool Great America Fund Investor Shares had an unaudited net asset value of $20.87 per share attributed to 9,944,472 shares outstanding and the Institutional Shares had an unaudited net asset value of $20.96 per share attributed to 872,281 shares outstanding. This compares with an unaudited net asset value as of November 1, 2010 for the Investor Shares of $10.00 per share attributed to 102,000 shares outstanding and as of June 17, 2014 for the Institutional Shares of $17.94 per share attributed to 1 share outstanding. From the Investor Shares launch on November 1, 2010 to April 30, 2017, the Investor Shares had an average annual total return of 12.37% versus a return of 13.57% over the same period for its benchmark, the Russell 2500 Growth Index, and a return of 13.36% for its previous benchmark, the Russell MidCap Index. Over the same period, the Russell 2000 Index returned 12.84%. From the Institutional Shares launch on June 17, 2014 to April 30, 2017, the Institutional Shares returned 5.79%, versus a return of 7.70% over the same period for the Russell 2500 Growth Index, and a return of 7.85% for the Russell MidCap Index. Over the same period, the Russell 2000 Index returned 7.86%.
Please note that we are using a new benchmark for the Fund, the Russell 2500 Growth Index, as a replacement for the Russell Midcap Index and the Russell 2000 Index. The reason for the change is because the Russell 2500 Growth Index more appropriately reflects the types of securities held in the Fund’s portfolio and provides better comparative performance information.
The graph below shows the performance of $10,000 invested in the Investor Shares at inception. The results shown below do not reflect the deduction of taxes that a shareholder would pay on fund distributions or the redemption of fund shares.
Average Annual Total Returns as of 4/30/2017
| | One Year | Five Year | Since Inception | Inception Date |
| Investor Shares* | 14.55% | 11.32% | 12.37% | 11/1/2010 |
| Institutional Shares* | 14.91% | — | 5.79% | 6/17/2014 |
| Russell 2500 Growth Index** | 20.43% | 12.72% | — (1) | — |
| Russell Midcap Index*** | 16.70% | 13.34% | — (2) | — |
| Russell 2000 Index**** | 25.59% | 12.92% | — (3) | — |
Fund Expense Ratios(4): Investor Shares: Gross 1.17% and Net 1.15%; Institutional Shares: Gross 2.40% and Net 0.95% |
| |
| 26 | Motley Fool Great America Fund (Unaudited) |
The performance data quoted represents past performance and does not guarantee future results. Current performance may be lower or higher. Performance data current to the most recent month-end may be obtained at www.FoolFunds.com. The investment return and principal value of an investment will fluctuate so that shares, when redeemed, may be worth more or less than their original cost.
(1) | The index returned 13.57% from the inception date of the Investor Shares and 7.70% from the inception date of the Institutional Shares. |
| (2) | The index returned 13.36% from the inception date of the Investor Shares and 7.85% from the inception date of the Institutional Shares. |
| (3) | The index returned 12.84% from the inception date of the Investor Shares and 7.86% from the inception date of the Institutional Shares. |
| (4) | The expense ratios of the Fund are set forth according to the 2/28/2017 Prospectus for the Fund and may differ from the expense ratios disclosed in the Financial Highlights tables in this report. See the Financial Highlights for more current expense ratios. |
| * | These returns reflect expense waivers by the Fund’s investment adviser. Without these waivers, returns would have been lower. |
| ** | The Russell 2500 Growth Index is an unmanaged, free float-adjusted, market capitalization weighted index that is designed to measure the performance of the small and mid-cap growth segment of the U.S. stock market. The Russell 2500 Growth Index is a subset of the Russell 3000® Index. It includes approximately 2,500 of the smallest securities based on a combination of their market cap and current index membership. The Fund may invest in companies that are not included within the Russell 2500 Growth Index and its investment portfolio is not weighted in terms of issuers the same as the Russell 2500 Growth Index. For this reason, the Fund’s investment performance should not be expected to track, and may exceed or trail, the Russell 2500 Growth Index. |
| *** | The Russell Midcap Index is an unmanaged, free float-adjusted, market capitalization weighted index that is designed to measure the performance of the mid-cap segment of the U.S. equity universe. The Russell Midcap Index is a subset of the Russell 1000® Index. It includes approximately 800 of the smallest securities based on a combination of their market cap and current index membership. The Russell Midcap Index represents approximately 31% of the total market capitalization of the Russell 1000 companies. The Fund may invest in companies that are not included within the Russell Midcap Index and its investment portfolio is not weighted in terms of issuers the same as the Russell Midcap Index. For this reason, the Fund’s investment performance should not be expected to track, and may exceed or trail, the Russell Midcap Index. |
| **** | The Russell 2000 Index is an unmanaged, free float-adjusted, market capitalization weighted index that is designed to measure the performance of the small-cap segment of the U.S. equity universe. The Russell 2000 Index is a subset of the Russell 3000 Index. It includes approximately 2,000 of the smallest securities based on a combination of their market cap and current index membership. The Fund may invest in companies that are not included within the Russell 2000 Index and its investment portfolio is not weighted in terms of issuers the same as the Russell 2000 Index. For this reason, the Fund’s investment performance should not be expected to track, and may exceed or trail, the Russell 2000 Index. |
The investment objective of the Great America Fund is to achieve long-term capital appreciation. The Fund pursues this objective by investing primarily in common stocks of companies organized in the United States. The Fund employs a growth at a reasonable price investment strategy and seeks long-term growth of capital by acquiring securities of companies that, in the view of Motley Fool Asset Management, LLC (the “Adviser”), have high quality businesses with strong market positions, manageable leverage, robust streams of cash flow, and trade at attractive prices. The Fund may invest in other types of securities and in other asset classes, when, in the view of the Adviser, such investments offer attractive potential returns. As such, the Fund’s performance will deviate significantly from its benchmark from time to time. It is the view of the Adviser that this deviation is less meaningful over shorter time frames and is more relevant over multi-year periods.
Although the Great America Fund may invest in companies with any market capitalization, the Adviser expects that investments in the securities of companies having smaller- and mid-market capitalizations will be important components of the Fund’s investment program. Investments in securities of these companies may involve greater risk than do investments in larger, more established companies. Small- and mid-cap stocks tend to be more volatile and less liquid than their large cap counterparts. While investing in a particular sector is not a principal investment strategy of the Great America Fund, its portfolio may be significantly invested in a sector as a result of the portfolio management decisions made pursuant to its principal investment strategy. Currently, The Great America Fund is significantly invested in the consumer discretionary sector, which means it will be more affected by the performance of the consumer discretionary sector than a fund that is not so significantly invested. The success of consumer product manufacturers and retailers is closely to the performance of the overall domestic and global economy, interest rates, competition, and consumer confidence. Success depends heavily on disposable household income and consumer spending. Also, companies in the consumer discretionary sector may be subject to severe competition, which may have an adverse impact on their respective profitability. Changes in demographics and consumer tastes can also affect the demand for, and success of, consumer products and services in the marketplace. You are strongly encouraged to read more about the Fund’s strategies and risks in the prospectus.
| Motley Fool Great America Fund (Unaudited) | 27 |
The Great America Fund prefers to invest in high-quality businesses when possible. To identify these high-quality businesses, the Adviser engages in research to evaluate each company under consideration using four criteria: management, culture, and incentives; the economics of the business; competitive advantage; and the durability of its competitive advantage period. The Adviser’s approach prizes a long-term mindset and a balance of qualitative and quantitative factors. The following tables show the top eleven holdings and sectors in which the Fund was invested as of April 30, 2017. Portfolio holdings are subject to change without notice.
Certain mutual fund ratings and review services have created style boxes,which look more or less like a tic-tac-toe board; arranging funds by the size of the companies they typically invest in (large-, mid-, and small-cap) along one axis, and along a “value” to “growth” basis on the other axis.This may be a helpful way – at times –to think about certain investment opportunities, but we don’t believe we’ll improve your returns by limiting ourselves to any one portion of that style box.
Top Eleven Holdings* | % of Net Assets |
| Thor Industries, Inc. | 4.90% |
| XPO Logistics, Inc. | 4.70 |
| LCI Industries | 4.46 |
| Align Technology, Inc. | 4.14 |
| Texas Roadhouse, Inc. | 3.84 |
| IPG Photonics Corp. | 3.61 |
| Markel Corp. | 3.39 |
| Cooper Companies, Inc. (The) | 3.14 |
| Gentex Corp. | 3.11 |
| SBA Communications Corp. | 3.08 |
| ResMed, Inc. | 2.98 |
| | 41.35% |
| * | As of the date of the report, the Fund had a holding of 4.54% in the BNY Mellon Cash Reserve. |
The Motley Fool Great America Fund uses the Global Industry Classification StandardSM (“GICS SM”) as the basis for the classification of securities on the Schedule of Investments (“SOI”). We believe that this makes the SOI classifications more standard with the rest of the industry.
| 28 | Motley Fool Great America Fund (Unaudited) |
| Sector Allocation | % of Net Assets |
| Consumer Discretionary | 27.75% |
| Health Care | 17.81 |
| Industrials | 16.18 |
| Financials | 12.08 |
| Information Technology | 10.44 |
| Real Estate | 7.88 |
| Telecommunication Services | 1.41 |
| Materials | 1.03 |
| Consumer Staples | 1.02 |
| | 95.60% |
| Motley Fool Great America Fund (Unaudited) | 29 |
About Your Expenses
As a shareholder of the Great America Fund, you incur (1) transaction costs and (2) ongoing costs, including advisory fees and other Fund expenses. This example is intended to help you to understand your ongoing costs (in dollars) of investing in the Fund and to compare these costs with the ongoing costs of investing in other mutual funds. It is based on an investment of $1,000 invested at the beginning of the period and held for the entire period from November 1, 2016 to April 30, 2017.
Actual Expenses
The first section of the table below provides information about actual account values and actual expenses. You may use the information in this section, together with the amount you invested, to estimate the expenses that you incurred over the period. Simply divide your account value by $1,000 (for example, an $8,600 account value divided by $1,000 = 8.6), then multiply the result by the number in the first section under the heading entitled “Expenses Paid During Period” to estimate the expenses attributable to your investment during this period.
Hypothetical Example for Comparison Purposes
The second section of the table below provides information about hypothetical account values and hypothetical expenses based on the Fund’s actual expense ratio and an assumed rate of return of 5% per year before expenses, which is not the Fund’s actual return. Thus, you should not use the hypothetical account values and expenses to estimate the actual ending account balance or your expenses for the period. Rather, these figures are provided to enable you to compare the ongoing costs of investing in the Fund as compared to the costs of investing in other funds. To do so, compare this 5% hypothetical example with the 5% hypothetical examples that appear in the shareholder reports of the other funds. Please note that the expenses shown in the table are meant to highlight your ongoing costs only and do not reflect transactional costs. Therefore, the second section of the table is useful in comparing ongoing costs only and will not help you determine the relative total costs of owning different funds. In addition, if these transaction costs were included, your costs would have been higher.
Do you know how many times a fund, or the market, has returned a smooth 5% over a long period of time? Never. But we have to pick some example. In reality, the market’s returns are always far bumpier, with the market returning 20% one year, followed by a loss of 10% the next year, followed by a 3% gain, etc. These variations affect actual expenses as well. Happily, over almost all time periods of 20 years or longer, according to the research of University of Pennsylvania’s Jeremy Siegel and others, the domestic market’s returns have been at least 5% per year on average.
| | Beginning Account Value 11/01/16 | Ending Account Value 4/30/17 | Annualized Expense Ratio(1) | Expenses Paid During Period(2) |
| Investor Shares | | | | |
| Actual | $1,000 | $1,141.07 | 1.15% | $6.10 |
| Hypothetical | $1,000 | $1,019.09 | 1.15% | $5.76 |
| Institutional Shares | | | | |
| Actual | $1,000 | $1,142.86 | 0.95% | $5.05 |
| Hypothetical | $1,000 | $1,020.08 | 0.95% | $4.76 |
(1) | These ratios reflect expenses waived by the Fund’s investment adviser. Without these waivers, the Fund’s expenses would have been higher and the ending account values would have been lower. |
(2) | Expenses are equal to the Fund’s annualized expense ratio for the period November 1, 2016 to April 30, 2017,multiplied by the average account value over the period, multiplied by the number of days (181) in the most recent fiscal half-year, then divided by 365. |
| 30 | Motley Fool Great America Fund (Unaudited) |
Motley Fool Great America Fund
Schedule of Investments
April 30, 2017
(Unaudited)
| Issues | | Shares | | | Value (Note 2) | |
| Equity Securities — 95.60% | | | | | | |
| Air Freight & Logistics — 6.18% | | | | | | |
| CH Robinson Worldwide, Inc. (United States) | | | 46,000 | | | $ | 3,344,200 | |
| XPO Logistics, Inc. (United States)* | | | 215,000 | | | | 10,618,850 | |
| | | | | | | | 13,963,050 | |
| Airlines — 1.29% | | | | | | | | |
| Spirit Airlines, Inc. (United States)* | | | 51,000 | | | | 2,920,770 | |
| Auto Components — 8.90% | | | | | | | | |
| Dorman Products, Inc. (United States)* | | | 35,938 | | | | 2,988,245 | |
| Gentex Corp. (United States) | | | 340,000 | | | | 7,021,000 | |
| LCI Industries (United States) | | | 99,670 | | | | 10,081,620 | |
| | | | | | | | 20,090,865 | |
| Automobiles — 4.90% | | | | | | | | |
| Thor Industries, Inc. (United States) | | | 115,000 | | | | 11,060,700 | |
| Banks — 3.36% | | | | | | | | |
| Access National Corp. (United States) | | | 90,529 | | | | 2,564,687 | |
| Huntington Bancshares, Inc. (OH) (United States) | | | 100,000 | | | | 1,286,000 | |
| Towne Bank (Portsmouth VA) (United States) | | | 115,067 | | | | 3,733,924 | |
| | | | | | | | 7,584,611 | |
| Biotechnology — 4.46% | | | | | | | | |
| Genomic Health, Inc. (United States)* | | | 131,935 | | | | 4,335,384 | |
| Ionis Pharmaceuticals, Inc. (United States)* | | | 119,000 | | | | 5,734,610 | |
| | | | | | | | 10,069,994 | |
| Building Products — 2.06% | | | | | | | | |
| American Woodmark Corp. (United States)* | | | 50,636 | | | | 4,653,448 | |
| Capital Markets — 5.32% | | | | | | | | |
| Diamond Hill Investment Group, Inc. (United States)* | | | 29,023 | | | | 5,866,999 | |
| Oaktree Capital Group LLC (United States) | | | 131,072 | | | | 6,160,384 | |
| | | | | | | | 12,027,383 | |
| Commercial Services & Supplies — 1.64% | | | | | | | | |
| KAR Auction Services, Inc. (United States) | | | 85,000 | | | | 3,707,700 | |
| Communications Equipment — 1.67% | | | | | | | | |
| Infinera Corp. (United States)* | | | 379,500 | | | | 3,764,640 | |
| | | | | | | | | |
See Notes to Financial Statements.
| Motley Fool Great America Fund | 31 |
| Issues | | Shares | | | Value (Note 2) | |
| Equity Securities (continued) | | | | | | |
| Diversified Telecommunication Services — 4.49% | | | | | | |
| Level 3 Communications, Inc. (United States)* | | | 52,418 | | | $ | 3,184,918 | |
| SBA Communications Corp. (United States)* | | | 55,000 | | | | 6,956,950 | |
| | | | | | | | 10,141,868 | |
| Electronic Equipment, Instruments & Components — 3.61% | | | | | | | | |
| IPG Photonics Corp. (United States)* | | | 64,500 | | | | 8,147,640 | |
| Equity Real Estate Investment Trusts — 1.93% | | | | | | | | |
| STAG Industrial, Inc. (United States) | | | 165,000 | | | | 4,349,400 | |
| Health Care Equipment & Supplies — 13.35% | | | | | | | | |
| Align Technology, Inc. (United States)* | | | 69,500 | | | | 9,356,090 | |
| Cooper Companies, Inc. (The) (United States) | | | 35,400 | | | | 7,091,682 | |
| ResMed, Inc. (United States) | | | 99,000 | | | | 6,731,010 | |
| Varex Imaging Corp. (United States)* | | | 26,800 | | | | 899,408 | |
| Varian Medical Systems, Inc. (United States)* | | | 67,000 | | | | 6,079,580 | |
| | | | | | | | 30,157,770 | |
| Hotels, Restaurants & Leisure — 3.84% | | | | | | | | |
| Texas Roadhouse, Inc. (United States) | | | 184,929 | | | | 8,669,472 | |
| Household Durables — 1.10% | | | | | | | | |
| TRI Pointe Group, Inc. (United States)* | | | 200,000 | | | | 2,490,000 | |
| Household Products — 1.02% | | | | | | | | |
| Church & Dwight, Co., Inc. (United States) | | | 46,600 | | | | 2,308,098 | |
| Insurance — 3.39% | | | | | | | | |
| Markel Corp. (United States)* | | | 7,900 | | | | 7,659,840 | |
| IT Services — 1.66% | | | | | | | | |
| Sabre Corp. (United States) | | | 160,000 | | | | 3,745,600 | |
| Machinery — 1.03% | | | | | | | | |
| Proto Labs, Inc. (United States)* | | | 40,000 | | | | 2,320,000 | |
| Paper & Forest Products — 1.03% | | | | | | | | |
| KapStone Paper and Packaging Corp. (United States) | | | 110,400 | | | | 2,328,336 | |
| Real Estate Management & Development — 2.87% | | | | | | | | |
| Jones Lang LaSalle, Inc. (United States) | | | 56,500 | | | | 6,489,590 | |
| Road & Rail — 1.50% | | | | | | | | |
| Genesee & Wyoming, Inc. Class A (United States)* | | | 50,000 | | | | 3,388,000 | |
| Software — 3.51% | | | | | | | | |
| Splunk, Inc. (United States)* | | | 57,000 | | | | 3,665,670 | |
See Notes to Financial Statements.
| 32 | Motley Fool Great America Fund |
| Issues | | Shares | | | Value (Note 2) | |
| Equity Securities (continued) | | | | | | |
| Software (continued) | | | | | | |
| Ultimate Software Group, Inc. (The) (United States)* | | | 21,000 | | | $ | 4,256,070 | |
| | | | | | | | 7,921,740 | |
| Specialty Retail — 7.55% | | | | | | | | |
| AutoZone, Inc. (United States)* | | | 9,600 | | | | 6,645,024 | |
| Cabela’s, Inc. (United States)* | | | 89,000 | | | | 4,859,400 | |
| Tractor Supply Co. (United States) | | | 89,500 | | | | 5,540,945 | |
| | | | | | | | 17,045,369 | |
| Textiles, Apparel & Luxury Goods — 1.47% | | | | | | | | |
| Under Armour, Inc. Class C (United States)* | | | 171,615 | | | | 3,331,047 | |
| Trading Companies & Distributors — 2.47% | | | | | | | | |
| Fastenal Co. (United States) | | | 31,750 | | | | 1,418,590 | |
| Watsco, Inc. (United States) | | | 30,000 | | | | 4,164,000 | |
| | | | | | | | 5,582,590 | |
| Total Equity Securities (Cost $144,603,111) | | | | | | | 215,919,521 | |
| | | | | | | | | |
| Other Investments — 4.54% | | | | | | | | |
| Temporary Cash Investment — 4.54% | | | | | | | | |
| BNY Mellon Cash Reserve | | | 10,252,708 | | | | 10,252,708 | |
| Total Other Investments (Cost $10,252,708) | | | | | | | 10,252,708 | |
| Total Investment Portfolio (Cost $154,855,819) — 100.14% | | | | | | | 226,172,229 | |
| Liabilities in Excess of Other Assets — (0.14)% | | | | | | | (305,407 | ) |
| NET ASSETS — 100.00% | | | | | | | | |
| (Applicable to 10,816,753 shares outstanding) | | | | | | $ | 225,866,822 | |
| * | Non-income producing security. |
See Notes to Financial Statements.
| Motley Fool Great America Fund | 33 |
Statement of Assets and Liabilities
| | | As of
April 30, 2017
(Unaudited) | |
| Assets: | | | |
| Investments in securities of unaffiliated issuers, at value (at cost, $154,855,819) | | $ | 226,172,229 | |
| Receivables: | | | | |
| Dividends | | | 43,115 | |
| Shares of beneficial interest sold | | | 154,147 | |
| Prepaid expenses and other assets | | | 36,337 | |
| Total Assets | | | 226,405,828 | |
| | | | | |
| Liabilities | | | | |
| Payables: | | | | |
| Cash overdraft | | | 5 | |
| Shares of beneficial interest redeemed | | | 266,702 | |
| Accrued expenses: | | | | |
| Audit fees | | | 10,387 | |
| Accounting and administration fees | | | 63,157 | |
| Advisory fees | | | 148,370 | |
| Custodian fees | | | 4,654 | |
| Transfer agent fees | | | 19,576 | |
| Trustee/Director fees | | | 2,342 | |
| Other expenses | | | 23,813 | |
| Total Liabilities | | | 539,006 | |
| Net Assets | | $ | 225,866,822 | |
The accompanying notes are an integral part of these financial statements.
| 34 | Motley Fool Great America Fund |
Statement of Assets and Liabilities
| | | As of
April 30, 2017
(Unaudited) | |
| Net Assets Consist of: | | | |
| Paid-in-Capital | | $ | 146,227,238 | |
| Accumulated Net Investment Income | | | (937,431 | ) |
| Accumulated Net Realized Gain on Investments | | | 9,260,605 | |
| Net Unrealized Appreciation/(Depreciation) on Investments | | | 71,316,410 | |
| Net Assets | | $ | 225,866,822 | |
| | | | | |
| Net Asset Value: | | | | |
| $0.001 par value, unlimited shares authorized | | | | |
| Investor Shares: | | | | |
| Net assets applicable to capital shares outstanding | | $ | 207,586,168 | |
| Shares outstanding | | | 9,944,472 | |
| Net asset value, offering, and redemption price per share* | | $ | 20.87 | |
| | | | | |
| | | | | |
| Institutional Shares: | | | | |
| Net assets applicable to capital shares outstanding | | $ | 18,280,654 | |
| Shares outstanding ($0.001 par value; 100,000,000 shares authorized) | | | 872,281 | |
| Net asset value, offering, and redemption price per share* | | $ | 20.96 | |
| * | A charge of 2% is imposed on the redemption proceeds of shares redeemed or exchanged within 90 days of purchase. |
The accompanying notes are an integral part of these financial statements.
| Motley Fool Great America Fund | 35 |
Statement of Operations
| | | Six-Months Ended
April 30, 2017(Unaudited) | |
| Investment Income | | | |
| Dividends | | $ | 960,903 | |
| Interest | | | 358 | |
| Total Investment Income | | | 961,261 | |
| | | | | |
| Expenses | | | | |
| Investment advisory fees | | | 942,314 | |
| Accounting fees - Investor Shares | | | 72,186 | |
| Accounting fees - Institutional Shares | | | 14,342 | |
| Shareholder account-related services - Investor Shares | | | 74,096 | |
| Shareholder account-related services - Institutional Shares | | | 3,136 | |
| Administration fees | | | 30,025 | |
| Transfer agent fees - Investor Shares | | | 66,555 | |
| Transfer agent fees - Institutional Shares | | | 19,443 | |
| Shareholder reporting fees - Investor Shares | | | 15,261 | |
| Shareholder reporting fees - Institutional Shares | | | 1,342 | |
| Professional fees | | | 16,092 | |
| Blue sky fees - Investor Shares | | | 7,731 | |
| Blue sky fees - Institutional Shares | | | 5,524 | |
| Custodian fees | | | 9,900 | |
| Trustee/Director fees | | | 6,129 | |
| Chief Compliance Officer fees | | | 4,187 | |
| Other expenses | | | 13,331 | |
| Total expenses | | | 1,301,594 | |
| Expenses waived/reimbursed net of amount recaptured - Investor Shares | | | (628 | ) |
| Expenses waived/reimbursed net of amount recaptured - Institutional Shares | | | (41,476 | ) |
| Net expenses | | | 1,259,490 | |
| Net Investment Income (Loss) | | | (298,229 | ) |
| Realized and Unrealized Gain (Loss) | | | | |
| Net realized gain (loss) from: | | | | |
| Investment securities | | | 12,343,209 | |
| Net realized gain (loss) on investments | | | 12,343,209 | |
| Change in net unrealized appreciation/(depreciation) on: | | | | |
| Investment securities | | | 16,956,827 | |
| Change in net unrealized appreciation/(depreciation) on investments | | | 16,956,827 | |
| Net realized and unrealized gain (loss) | | | 29,300,036 | |
| Net Increase (Decrease) in Net Assets Resulting from Operations | | $ | 29,001,807 | |
The accompanying notes are an integral part of these financial statements.
| 36 | Motley Fool Great America Fund |
Statements of Changes in Net Assets
| | | Six-Months Ended
April 30, 2017
(Unaudited) | | | Year
Ended
October 31,
2016 | |
| Operations: | | | | | | |
| Net Investment Income (Loss) | | $ | (298,229 | ) | | $ | (653,431 | ) |
| Net Realized Gain (Loss) on Investments | | | 12,343,209 | | | | (2,484,075 | ) |
| Change in Net Unrealized Appreciation/(Depreciation) on Investments | | | 16,956,827 | | | | (1,992,860 | ) |
| Net increase (decrease) in net assets resulting from operations | | | 29,001,807 | | | | (5,130,366 | ) |
| | | | | | | | | |
| Dividends to Shareholders: | | | | | | | | |
| Dividends from net investment income | | | | | | | | |
| Investor Shares | | | — | | | | (349,750 | ) |
| Institutional Shares | | | — | | | | (20,359 | ) |
| Total dividends and distributions | | | — | | | | (370,109 | ) |
| | | | | | | | | |
| Capital Share Transactions: | | | | | | | | |
| Proceeds from shares sold | | | | | | | | |
| Investor Shares (595,390 and 1,202,801 shares, respectively) | | | 11,987,542 | | | | 21,811,467 | |
| Institutional Shares (699,814 and 77,879 shares, respectively) | | | 14,011,509 | | | | 1,388,492 | |
| Reinvestment of dividends | | | | | | | | |
| Investor Shares (0 and 18,293 shares, respectively) | | | — | | | | 343,728 | |
| Institutional Shares (0 and 1,083 shares, respectively) | | | — | | | | 20,358 | |
| Value of shares redeemed | | | | | | | | |
| Investor Shares (1,865,189 and 2,748,791 shares, respectively) | | | (37,227,214 | ) | | | (50,140,829 | ) |
| Institutional Shares (127,461 and 152,821 shares, respectively) | | | (2,578,916 | ) | | | (2,787,636 | ) |
| Redemption and small-balance account fees | | | | | | | | |
| Investor Shares | | | 17,680 | | | | 24,628 | |
| Institutional Shares | | | 2,950 | | | | 175 | |
| Net increase (decrease) from capital share transactions | | | (13,786,449 | ) | | | (29,339,617 | ) |
| Total increase (decrease) in net assets | | | 15,215,358 | | | | (34,840,092 | ) |
| | | | | | | | | |
| Net Assets: | | | | | | | | |
| Beginning of Period | | | 210,651,464 | | | | 245,491,556 | |
End of Period* | | $ | 225,866,822 | | | $ | 210,651,464 | |
| | | | | | | | | |
*Including undistributed net investment income (loss) | | $ | (937,431 | ) | | $ | (639,202 | ) |
The accompanying notes are an integral part of these financial statements.
| Motley Fool Great America Fund | 37 |
Financial Highlights
(for a share outstanding throughout each period)
| | | Six Months Ended April 30, 2017 | | | Years Ended October 31, | |
| Investor Shares | | (Unaudited)(1)(2) | | | 2016 | | | 2015 | | | 2014 | | | 2013 | | | 2012 | |
| Net Asset Value, Beginning of Year | | $ | 18.29 | | | $ | 18.72 | | | $ | 18.59 | | | $ | 17.25 | | | $ | 12.58 | | | $ | 11.04 | |
| Income (Loss) From Investment Operations | | | | | | | | | | | | | | | | | | | | | | | | |
Net Investment Income (Loss)(3) | | | (0.03 | ) | | | (0.05 | ) | | | 0.03 | | | | 0.07 | | | | — | * | | | (0.06 | ) |
| Net Gain (Loss) on Securities (Realized and Unrealized) | | | 2.61 | | | | (0.35 | ) | | | 0.14 | | | | 1.51 | | | | 4.69 | | | | 1.60 | |
| Total From Investment Operations | | | 2.58 | | | | (0.40 | ) | | | 0.17 | | | | 1.58 | | | | 4.69 | | | | 1.54 | |
| Less Distributions | | | | | | | | | | | | | | | | | | | | | | | | |
| Net Investment Income | | | — | | | | (0.03 | ) | | | (0.04 | ) | | | (0.03 | ) | | | (0.03 | ) | | | — | * |
| Net Realized Capital Gains | | | — | | | | — | | | | — | | | | (0.22 | ) | | | — | | | | — | |
| Total Distributions | | | — | | | | (0.03 | ) | | | (0.04 | ) | | | (0.25 | ) | | | (0.03 | ) | | | — | * |
| Redemption and Small-Balance Account Fees | | | — | * | | | — | | | | — | * | | | 0.01 | | | | 0.01 | | | | — | * |
| Net Asset Value, End of Year | | $ | 20.87 | | | $ | 18.29 | | | $ | 18.72 | | | $ | 18.59 | | | $ | 17.25 | | | $ | 12.58 | |
Total Return(4)(5) | | | 14.11 | % | | | (2.15 | %) | | | 0.91 | % | | | 9.35 | % | | | 37.44 | % | | | 13.96 | % |
| Net Assets, End of Year (thousands) | | $ | 207,586 | | | $ | 205,149 | | | $ | 238,482 | | | $ | 231,600 | | | $ | 162,336 | | | $ | 67,337 | |
| Ratios/Supplemental Data | | | | | | | | | | | | | | | | | | | | | | | | |
| Ratio of Expenses to Average Net Assets | | | 1.15 | % | | | 1.15 | % | | | 1.15 | % | | | 1.27 | % | | | 1.38 | % | | | 1.37 | % |
| Ratio of Expenses to Average Net Assets (Before Waivers and Reimbursement of Expenses and/or Recapture of Previously Waived Fees) | | | 1.15 | % | | | 1.17 | % | | | 1.16 | % | | | 1.30 | % | | | 1.54 | % | | | 1.74 | % |
| Ratio of Net Investment Income (Loss) to Average Net Assets | | | (0.28 | %) | | | (0.29 | %) | | | 0.17 | % | | | 0.38 | % | | | 0.03 | % | | | (0.51 | %) |
The accompanying notes are an integral part of these financial statements.
| 38 | Motley Fool Great America Fund |
Financial Highlights
| | | Six Months Ended April 30, 2017 | | | Years Ended October 31, | |
| Investor Shares | | (Unaudited)(1)(2) | | | 2016 | | | 2015 | | | 2014 | | | 2013 | | | 2012 | |
| Ratio of Net Investment Income (Loss) to Average Net Assets (Before Waivers and Reimbursement of Expenses and/or Recapture of Previously Waived Fees) | | | (0.28 | %) | | | (0.31 | %) | | | 0.17 | % | | | 0.36 | % | | | (0.13 | %) | | | (0.88 | %) |
| Portfolio Turnover | | | 15 | % | | | 21 | % | | | 30 | % | | | 18 | % | | | 24 | % | | | 30 | % |
| * | Amount represents less than $0.005 per share. |
(1) | Effective as of December 21, 2016, the Fund acquired all the assets and liabilities of the Motley Fool Great America Fund, a series of The Motley Fool Funds Trust (the “Predecessor Fund”). The financial highlights for the periods prior to that date reflect the performances of the Predecessor Fund. |
(2) | For the six months ended April 30, 2017, all ratios for the period have been annualized. Total return and portfolio turnover for the period have not been annualized. |
(3) | Per share data calculated using average shares outstanding method. |
(4) | During the years ended October 31, 2014 and October 31, 2013, 0.06% and 0.08%, respectively, of the Fund’s total return was attributable to redemption and small-balance account fees received as referenced in Note 4. Excluding this item, the total return would have been 9.29% and 37.36%, respectively. For the six months ended April 30, 2017, and the years ended October 31, 2016, October 31, 2015 and October 31, 2012, redemption and small-balance account fees received had no effect on the Fund’s total return. |
(5) | Total return reflects the rate an investor would have earned on an investment in the Fund during the period. |
The accompanying notes are an integral part of these financial statements.
| Motley Fool Great America Fund | 39 |
Financial Highlights
| | | Six Months Ended April 30, 2017 | | | Years Ended October 31, | | | Period Ended October 31, | |
| Institutional Shares | | (Unaudited)(1)(2) | | | 2016 | | | 2015 | | | 2014(3)(4) | |
| Net Asset Value, Beginning of Period | | $ | 18.34 | | | $ | 18.75 | | | $ | 18.61 | | | $ | 17.94 | |
| Income (Loss) From Investment Operations | | | | | | | | | | | | | | | | |
Net Investment Income (Loss)(5) | | | (0.02 | ) | | | (0.02 | ) | | | 0.07 | | | | 0.02 | |
| Net Gain (Loss) on Securities (Realized and Unrealized) | | | 2.63 | | | | (0.33 | ) | | | 0.13 | | | | 0.65 | |
| Total From Investment Operations | | | 2.61 | | | | (0.35 | ) | | | 0.20 | | | | 0.67 | |
| Less Distributions | | | | | | | | | | | | | | | | |
| Net Investment Income | | | — | | | | (0.06 | ) | | | (0.06 | ) | | | — | |
| Net Realized Capital Gains | | | — | | | | — | | | | — | | | | — | |
| Total Distributions | | | — | | | | (0.06 | ) | | | (0.06 | ) | | | — | |
| Redemption and Small-Balance Account Fees | | | 0.01 | | | | — | | | | — | * | | | — | |
| Net Asset Value, End of Period | | $ | 20.96 | | | $ | 18.34 | | | $ | 18.75 | | | $ | 18.61 | |
Total Return(6)(7) | | | 14.29 | % | | | (1.89 | %) | | | 1.04 | % | | | 3.73 | % |
| Net Assets, End of Period (thousands) | | $ | 18,281 | | | $ | 5,502 | | | $ | 7,010 | | | $ | 2,798 | |
| Ratios/Supplemental Data | | | | | | | | | | | | | | | | |
| Ratio of Expenses to Average Net Assets | | | 0.95 | % | | | 0.95 | % | | | 0.95 | % | | | 0.95 | % |
| Ratio of Expenses to Average Net Assets (Before Waivers and Reimbursement of Expenses and/or Recapture of Previously Waived Fees) | | | 1.49 | % | | | 2.40 | % | | | 2.45 | % | | | 4.93 | % |
| Ratio of Net Investment Income (Loss) to Average Net Assets | | | (0.18 | %) | | | (0.08 | %) | | | 0.35 | % | | | 0.27 | % |
| Ratio of Net Investment Income (Loss) to Average Net Assets (Before Waivers and Reimbursement of Expenses and/or Recapture of Previously Waived Fees) | | | (0.72 | %) | | | (1.53 | %) | | | (1.15 | %) | | | (3.71 | %) |
| Portfolio Turnover | | | 15 | % | | | 21 | % | | | 30 | % | | | 18 | % |
| * | Amount represents less than $0.005 per share. |
(1) | Effective as of December 21, 2016, the Fund acquired all the assets and liabilities of the Motley Fool Great America Fund, a series of The Motley Fool Funds Trust (the “Predecessor Fund”). The financial highlights for the periods prior to that date reflect the performances of the Predecessor Fund. |
(2) | For the six months ended April 30, 2017, all ratios for the period have been annualized. Total return and portfolio turnover for the period have not been annualized. |
(3) | Commenced operations on June 17, 2014. All ratios for the period have been annualized. Total return for the period has not been annualized. |
The accompanying notes are an integral part of these financial statements.
| 40 | Motley Fool Great America Fund |
Financial Highlights
(4) | Because of commencement of operations and related preliminary transaction costs, these ratios are not necessary indicative of future ratios. |
(5) | Per share data calculated using average shares outstanding method. |
(6) | During the six months ended April 30, 2017, 0.06% of the Fund’s total return was attributable to redemption and small-balance account fees received as referenced in Note 4. Excluding this item, the total return would have been 14.23%. For the years ended October 31, 2016, October 31, 2015 and the period ended October 31, 2014, redemption and small-balance account fees received had no effect on the Fund’s total return. |
(7) | Total return reflects the rate an investor would have earned on an investment in the Fund during the period. |
The accompanying notes are an integral part of these financial statements.
| Motley Fool Great America Fund | 41 |
Motley Fool Emerging Markets Fund Portfolio Characteristics (Unaudited)
The Motley Fool Emerging Markets Fund operated as a series of The Motley Fool Funds Trust (the “Predecessor Fund”) prior to December 21, 2016, at which time the Predecessor Fund was reorganized into the Fund. The performance shown for periods prior to December 21, 2016 represents the performance of the Predecessor Fund. (At April 30, 2017, the Motley Fool Emerging Markets Fund Investor Shares had an unaudited net asset value of $12.76 per share attributed to 2,130,103 shares outstanding and the Institutional Shares had an unaudited net asset value of $12.78 per share attributed to 278,640 shares outstanding. This compares with an unaudited net asset value as of November 1, 2011 for the Investor Shares of $10.00 per share attributed to 106,350 shares outstanding and as of June 17, 2014 for the Institutional Shares of $13.06 per share attributed to 1 share outstanding. From the Investor Shares launch on November 1, 2011 to April 30, 2017, the Investor Shares had an average annual total return of 5.59% versus a return of 3.32% over the same period for its benchmark, the FTSE Emerging Markets All Cap China A Inclusion Net Tax Index and a return of 6.59% for its previous benchmark the FTSE Global All Cap ex-US Net Tax Index. From the Institutional Shares launch on June 17, 2014 to April 30, 2017, the Institutional Shares returned 0.47%, versus a return of 1.02% over the same period for the FTSE Emerging Markets All Cap China A Inclusion Net Tax Index, and a return of 0.56% for the FTSE Global All Cap ex-US Net Tax Index.
Please note that we are using a new benchmark for the Fund, the FTSE Emerging Markets All Cap China A Inclusion Net Tax Index, as a replacement for the FTSE Global All Cap ex-US Net Tax Index. The reason for the change was because the FTSE Emerging Markets All Cap China A Inclusion Net Tax Index more appropriately reflects the types of securities held in the Fund’s portfolio and provides better comparative performance information.
The graph below shows the performance of $10,000 invested in the Investor Shares at inception. The results shown below do not reflect the deduction of taxes that a shareholder would pay on fund distributions or the redemption of fund shares.
Average Annual Total Returns as of 4/30/2017
| | One Year | Five Year | Since Inception | Inception Date |
| Investor Shares* | 15.72% | 4.83% | 5.59% | 11/1/2011 |
| Institutional Shares* | 15.97% | — | 0.47% | 6/17/2014 |
| FTSE Emerging Markets All Cap China A Inclusion Net Tax Index** | 18.34% | 2.29% | — (1) | — |
| FTSE Global All Cap ex-US Net Tax Index*** | 13.72% | 5.77% | — (2) | — |
Fund Expense Ratios(3): Investor Shares: Gross 2.09% and Net 1.15%; Institutional Shares: Gross 5.66% and Net 0.95% |
| 42 | Motley Fool Emerging Markets Fund (Unaudited) |
The performance data quoted represents past performance and does not guarantee future results. Current performance may be lower or higher. Performance data current to the most recent month-end may be obtained at www.FoolFunds.com. The investment return and principal value of an investment will fluctuate so that shares, when redeemed, may be worth more or less than their original cost.
| (1) | The Index returned 3.32% from the inception date of the Investor Shares and 1.02% from the inception date of the Institutional Shares. |
| (2) | The Index returned 6.59% from the inception date of the Investor Shares and 0.56% from the inception date of the Institutional Shares. |
| (3) | The expense ratios of the Fund are set forth according to the 2/28/2017 Prospectus for the Fund may differ from the expense ratios disclosed in the Financial Highlights tables in this report. See the Financial Highlights for more current expense ratios. |
| * | These returns reflect expense waivers by the Fund’s investment adviser. Without these waivers, returns would have been lower. |
| ** | The FTSE Emerging Markets All Cap China A Inclusion Net Tax Index is a market-capitalization weighted index representing the performance of large, mid and small cap companies in Emerging markets. The index is comprised of approximately 3,350 securities from 22 countries, and is part of the FTSE China A Inclusion Indexes which contain FTSE China A All Cap Index securities adjusted for the aggregate approved QFII and RQFII quotas available to international investors. Fair value prices and foreign exchange as of 4 pm EST are used in the calculation of this index, and returns are adjusted for withholding taxes applicable to dividends received by a U.S. Regulated Investment Company domiciled in the United States. |
| *** | The FTSE Global All Cap ex-US Net Tax Index is a market-capitalization weighted index representing the performance of large, mid and small cap companies in Developed and Emerging markets, excluding the USA. The index is comprised of approximately 6,600 securities from 47 countries. Fair value prices and foreign exchange as of 4 pm ET are used in the calculation of this index, and returns are adjusted for withholding taxes applicable to dividends received by a U.S. Regulated Investment Company domiciled in the United States. |
The investment objective of the Emerging Markets Fund is to achieve long-term capital appreciation. The Fund pursues this objective by investing primarily in common stocks of companies organized in emerging market foreign countries. The Fund employs a growth at a reasonable price investment strategy and seeks long-term growth of capital by acquiring securities of companies that, in the view of Motley Fool Asset Management, LLC (the “Adviser”), have high quality businesses with strong market positions, manageable leverage, robust streams of cash flow, and trade at attractive prices. The Fund may invest in other types of securities and in other asset classes when, in the judgement of the Adviser, such investments offer attractive potential returns. As such, the Fund’s performance will deviate significantly from its benchmark from time to time. It is the view of the Adviser that this deviation is less meaningful over shorter time frames and is more relevant over multi-year periods.
Because the Emerging Markets Fund is free to invest in companies of any size around the world, investments in companies with smaller market capitalizations (less than $2 billion) will be an important component of the Emerging Market Fund’s investment program, although the Fund may invest in issuers of all capitalization sizes. Small-cap stocks tend to be more volatile and less liquid than their large-cap counterparts. Fluctuations in currency exchange rates can cause losses when investing in foreign securities, with emerging markets presenting additional risks of illiquidity, political instability, and lax regulation. While investing in a particular sector is not a principal investment strategy of the Emerging Markets Fund, the portfolio may be significantly invested in a sector as a result of the portfolio management decisions made pursuant to its principal investment strategy. You are strongly encouraged to read more about the Fund’s strategies and risks in the prospectus.
The Emerging Markets Fund prefers to invest in high-quality businesses when possible. To identify these high-quality businesses, the Adviser engages in research to evaluate each company under consideration using four criteria: management, culture, and incentives; the economics of the business; competitive advantage; and the durability of its competitive advantage period. The Adviser’s approach prizes a long-term mindset and a balance of qualitative and quantitative factors. The following tables show the top eleven holdings, sector allocations, and top eleven countries in which the Fund was invested in as of April 30, 2017. Portfolio holdings are subject to change without notice.
| Motley Fool Emerging Markets Fund (Unaudited) | 43 |
Certain mutual fund ratings and review services have created style boxes, which look more or less like a tic-tac-toe board; arranging funds by the size of the companies they typically invest in (large-, mid-, and small-cap) along one axis, and along a “value” to “growth” basis on the other axis. This may be a helpful way – at times – to think about certain investment opportunities, but we don’t believe we’ll improve your returns by limiting ourselves to any one portion of that style box.
Top Eleven Holdings* | % of Net Assets |
| Tencent Holdings Ltd. | 4.65% |
| BGEO Group PLC | 4.54 |
| Almarai Co. | 4.30 |
| Banco Latinoamericano de Comercio Exterior SA | 4.20 |
| NMC Health PLC | 4.19 |
| Ctrip.com International Ltd. | 4.19 |
| DuzonBizon Co., Ltd. | 4.11 |
| MercadoLibre, Inc. | 4.09 |
| PT Nippon Indosari Corpindo Tbk | 4.01 |
| Grupo Aeroportuario del Sureste SAB de CV | 3.94 |
| Sberbank of Russia PJSC | 3.87 |
| | 46.09% |
| * | As of the date of the report, the Fund had a holding of 4.82% in the BNY Mellon Cash Reserve. |
The Motley Fool Emerging Markets Fund uses the Global Industry Classification StandardSM (“GICS SM”) as the basis for the classification of securities on the Schedule of Investments (“SOI”). We believe that this makes the SOI classifications more standard with the rest of the industry.
| Sector Allocation | % of Net Assets |
| Financials | 23.74% |
| Information Technology | 17.38 |
| Industrials | 16.82 |
| Health Care | 11.78 |
| Consumer Staples | 10.79 |
| Consumer Discretionary | 10.21 |
| Telecommunication Services | 2.43 |
| Real Estate | 1.91 |
| | 95.06% |
| 44 | Motley Fool Emerging Markets Fund (Unaudited) |
| Top Eleven Countries | % of Net Assets |
| Mexico | 10.20% |
| China | 9.86 |
| Brazil | 8.18 |
| Indonesia | 7.62 |
| United Arab Emirates | 6.98 |
| Georgia | 5.89 |
| Turkey | 4.99 |
| Saudi Arabia | 4.30 |
| Panama | 4.20 |
| South Korea | 4.11 |
| Argentina | 4.09 |
| | 71.15% |
| Motley Fool Emerging Markets Fund (Unaudited) | 45 |
About Your Expenses
As a shareholder of the Emerging Markets Fund, you incur (1) transaction costs and (2) ongoing costs, including advisory fees and other Fund expenses. This example is intended to help you to understand your ongoing costs (in dollars) of investing in the Fund and to compare these costs with the ongoing costs of investing in other mutual funds. It is based on an investment of $1,000 invested at the beginning of the period and held for the entire period from November 1, 2016 to April 30, 2017.
Actual Expenses
The first section of the table below provides information about actual account values and actual expenses. You may use the information in this section, together with the amount you invested, to estimate the expenses that you incurred over the period. Simply divide your account value by $1,000 (for example, an $8,600 account value divided by $1,000 = 8.6), then multiply the result by the number in the first section under the heading entitled “Expenses Paid During Period” to estimate the expenses attributable to your investment during this period.
Hypothetical Example for Comparison Purposes
The second section of the table below provides information about hypothetical account values and hypothetical expenses based on the Fund’s actual expense ratio and an assumed rate of return of 5% per year before expenses, which is not the Fund’s actual return. Thus, you should not use the hypothetical account values and expenses to estimate the actual ending account balance or your expenses for the period. Rather, these figures are provided to enable you to compare the ongoing costs of investing in the Fund as compared to the costs of investing in other funds. To do so, compare this 5% hypothetical example with the 5% hypothetical examples that appear in the shareholder reports of the other funds. Please note that the expenses shown in the table are meant to highlight your ongoing costs only and do not reflect transactional costs. Therefore, the second section of the table is useful in comparing ongoing costs only and will not help you determine the relative total costs of owning different funds. In addition, if these transaction costs were included, your costs would have been higher.
Do you know how many times a fund, or the market, has returned a smooth 5% over a long period of time? Never. But we have to pick some example. In reality, the market’s returns are always far bumpier, with the market returning 20% one year, followed by a loss of 10% the next year, followed by a 3% gain, etc. These variations affect actual expenses as well. Happily, over almost all time periods of 20 years or longer, according to the research of University of Pennsylvania’s Jeremy Siegel and others, the domestic market’s returns have been at least 5% per year on average.
| | Beginning Account Value 11/01/16 | Ending Account Value 4/30/17 | Annualized Expense Ratio(1) | Expenses Paid During Period(2) |
| Investor Shares | | | | |
| Actual | $1,000 | $1,075.73 | 1.15% | $5.92 |
| Hypothetical | $1,000 | $1,019.09 | 1.15% | $5.76 |
| Institutional Shares | | | | |
| Actual | $1,000 | $1,076.43 | 0.95% | $4.89 |
| Hypothetical | $1,000 | $1,020.08 | 0.95% | $4.76 |
| (1) | These ratios reflect expenses waived by the Fund’s investment adviser. Without these waivers, the Fund’s expenses would have been higher and the ending account values would have been lower. |
| (2) | Expenses are equal to the Fund’s annualized expense ratio for the period November 1, 2016 to April 30, 2017, multiplied by the average account value over the period, multiplied by the number of days (181) in the most recent fiscal half-year, then divided by 365. |
| 46 | Motley Fool Emerging Markets Fund (Unaudited) |
Motley Fool Emerging Markets Fund
Schedule of Investments
April 30, 2017
(Unaudited)
| Issues | | Shares | | | Value (Note 2) | |
| Equity Securities — 90.75% | | | | | | |
| Banks — 19.07% | | | | | | |
| Banco Latinoamericano de Comercio Exterior SA (Panama) | | | 45,000 | | | $ | 1,290,600 | |
| BGEO Group PLC (Georgia) | | | 30,000 | | | | 1,396,187 | |
| Credicorp Ltd. (Peru) | | | 6,000 | | | | 921,960 | |
| HDFC Bank Ltd. (India)(a) | | | 13,350 | | | | 1,062,793 | |
| Sberbank of Russia PJSC (Russia) | | | 410,000 | | | | 1,190,869 | |
| | | | | | | | 5,862,409 | |
| Beverages — 2.48% | | | | | | | | |
| Coca-Cola Icecek AS (Turkey) | | | 75,000 | | | | 762,845 | |
| Capital Markets — 2.27% | | | | | | | | |
| Tarpon Investimentos SA (Brazil) | | | 553,500 | | | | 697,532 | |
| Consumer Finance — 2.41% | | | | | | | | |
| Gentera SAB de CV (Mexico) | | | 440,000 | | | | 739,751 | |
| Equity Real Estate Investment Trusts — 1.90% | | | | | | | | |
| Lippo Malls Indonesia Retail Trust (Singapore) | | | 1,925,000 | | | | 585,567 | |
| Food Products — 4.01% | | | | | | | | |
| PT Nippon Indosari Corpindo Tbk (Indonesia) | | | 10,022,700 | | | | 1,232,067 | |
| Health Care Equipment & Supplies — 2.74% | | | | | | | | |
| Top Glove Corp. Bhd (Malaysia) | | | 800,000 | | | | 841,970 | |
| Health Care Providers & Services — 9.05% | | | | | | | | |
| Georgia Healthcare Group PLC (Georgia)*(b) | | | 90,000 | | | | 413,817 | |
| NMC Health PLC (United Arab Emirates) | | | 50,000 | | | | 1,288,982 | |
| Odontoprev SA (Brazil) | | | 300,000 | | | | 1,078,433 | |
| | | | | | | | 2,781,232 | |
| Internet & Catalog Retail — 4.19% | | | | | | | | |
| Ctrip.com International Ltd. (China)*(a) | | | 25,500 | | | | 1,288,005 | |
| Internet Software & Services — 9.77% | | | | | | | | |
| Baidu, Inc. (China)*(a) | | | 1,750 | | | | 315,403 | |
| MercadoLibre, Inc. (Argentina) | | | 5,500 | | | | 1,259,005 | |
| Tencent Holdings Ltd. (China) | | | 45,600 | | | | 1,428,800 | |
| | | | | | | | 3,003,208 | |
| See Notes to Financial Statements. |
| Motley Fool Emerging Markets Fund | 47 |
| Issues | | Shares | | | Value (Note 2) | |
| Equity Securities (continued) | | | | | | |
| Media — 2.40% | | | | | | |
| Multiplus SA (Brazil) | | | 60,000 | | | $ | 738,174 | |
| Multiline Retail — 3.61% | | | | | | | | |
| PT Mitra Adiperkasa Tbk (Indonesia)* | | | 2,342,000 | | | | 1,111,347 | |
| Semiconductors & Semiconductor Equipment — 3.49% | | | | | | | | |
| Taiwan Semiconductor Manufacturing Co., Ltd. (Taiwan)(a) | | | 32,500 | | | | 1,074,775 | |
| Software — 4.11% | | | | | | | | |
| DuzonBizon Co., Ltd. (South Korea) | | | 52,900 | | | | 1,264,156 | |
| Transportation Infrastructure — 16.82% | | | | | | | | |
| DP World Ltd. (United Arab Emirates) | | | 42,000 | | | | 858,480 | |
| Grupo Aeroportuario del Pacifico SAB de CV (Mexico)(a) | | | 11,500 | | | | 1,183,235 | |
| Grupo Aeroportuario del Sureste SAB de CV (Mexico)(a) | | | 6,400 | | | | 1,212,160 | |
| International Container Terminal Services, Inc. (Philippines) | | | 645,000 | | | | 1,148,252 | |
| TAV Havalimanlari Holding AS (Turkey) | | | 185,000 | | | | 770,526 | |
| | | | | | | | 5,172,653 | |
| Wireless Telecommunication Services — 2.43% | | | | | | | | |
| Safaricom Ltd. (Kenya) | | | 4,000,000 | | | | 746,124 | |
| Total Equity Securities (Cost $24,298,769) | | | | | | | 27,901,815 | |
| | | | | | | | | |
| Participatory Notes — 4.31% | | | | | | | | |
| Food Products — 4.31% | | | | | | | | |
| Almarai Co. (Saudi Arabia)(b) | | | 67,915 | | | | 1,323,439 | |
| Total Participatory Notes (Cost $587,403) | | | | | | | 1,323,439 | |
| | | | | | | | | |
| Other Investments — 4.82% | | | | | | | | |
| Temporary Cash Investment — 4.82% | | | | | | | | |
| BNY Mellon Cash Reserve | | | 1,483,144 | | | | 1,483,144 | |
| Total Other Investments (Cost $1,483,144) | | | | | | | 1,483,144 | |
| Total Investment Portfolio (Cost $26,369,316) — 99.88% | | | | | | | 30,708,398 | |
| Assets in Excess of Other Liabilities — 0.12% | | | | | | | 37,311 | |
| NET ASSETS — 100.00% | | | | | | | | |
| (Applicable to 2,408,743 shares outstanding) | | | | | | $ | 30,745,709 | |
| See Notes to Financial Statements. |
| 48 | Motley Fool Emerging Markets Fund |
| * | Non-income producing security. |
| (a) | ADR — American Depositary Receipts |
| (b) | Security exempt from registration under Rule 144A of the Securities Act of 1933. These securities may be resold in transactions exempt from registration, normally to qualified institutional buyers. Total market value of Rule 144A securities is $1,737,256 and represents 5.65% of net assets as of April 30, 2017. |
PLC — Public Limited Company
| See Notes to Financial Statements. |
| Motley Fool Emerging Markets Fund | 49 |
Statement of Assets and Liabilities
| | | As of April 30, 2017 (Unaudited) | |
| Assets: | | | |
| Investments in securities of unaffiliated issuers, at value (at cost, $26,369,316) | | $ | 30,708,398 | |
| Receivables: | | | | |
| Dividends and tax reclaims | | | 69,885 | |
| Shares of beneficial interest sold | | | 47,869 | |
| Reimbursement due from adviser | | | 3,438 | |
| Prepaid expenses and other assets | | | 35,046 | |
| Total Assets | | | 30,864,636 | |
| | | | | |
| Liabilities | | | | |
| Payables: | | | | |
| Shares of beneficial interest redeemed | | | 37,326 | |
| Accrued expenses: | | | | |
| Audit fees | | | 10,387 | |
| Accounting and administration fees | | | 40,517 | |
| Custodian fees | | | 6,535 | |
| Transfer agent fees | | | 9,729 | |
| Trustee/Director fees | | | 2,342 | |
| Other expenses | | | 12,091 | |
| Total Liabilities | | | 118,927 | |
| Net Assets | | $ | 30,745,709 | |
| The accompanying notes are an integral part of these financial statements. |
| 50 | Motley Fool Emerging Markets Fund |
Statement of Assets and Liabilities
| | | As of April 30, 2017
(Unaudited) | |
| Net Assets Consist of: | | | |
| Paid-in-Capital | | $ | 26,474,671 | |
| Undistributed Net Investment Income | | | 98,824 | |
| Accumulated Net Realized Loss on Investments | | | (165,511 | ) |
| Net Unrealized Appreciation/(Depreciation) on Investments, Foreign Currencies, and Assets and Liabilities Denominated in Foreign Currencies | | | 4,337,725 | |
| Net Assets | | $ | 30,745,709 | |
| | | | | |
| Net Asset Value: | | | | |
| $0.001 par value, unlimited shares authorized | | | | |
| Investor Shares: | | | | |
| Net assets applicable to capital shares outstanding | | $ | 27,183,352 | |
| Shares outstanding | | | 2,130,103 | |
| Net asset value, offering, and redemption price per share* | | $ | 12.76 | |
| | | | | |
| Institutional Shares: | | | | |
| Net assets applicable to capital shares outstanding | | $ | 3,562,357 | |
| Shares outstanding ($0.001 par value; 100,000,000 shares authorized) | | | 278,640 | |
| Net asset value, offering, and redemption price per share* | | $ | 12.78 | |
| * | A charge of 2% is imposed on the redemption proceeds of shares redeemed or exchanged within 90 days of purchase. |
The accompanying notes are an integral part of these financial statements.
| Motley Fool Emerging Markets Fund | 51 |
Statement of Operations
| | | Six-Months Ended April 30, 2017
(Unaudited) | |
| Investment Income | | | |
| Dividends | | $ | 309,458 | |
| Less foreign taxes withheld | | | (44,699 | ) |
| Total Investment Income | | | 264,759 | |
| Expenses | | | | |
| Investment advisory fees | | | 124,910 | |
| Transfer agent fees - Investor Shares | | | 32,564 | |
| Transfer agent fees - Institutional Shares | | | 19,368 | |
| Administration fees | | | 29,945 | |
| Accounting fees - Investor Shares | | | 9,208 | |
| Accounting fees - Institutional Shares | | | 10,004 | |
| Professional fees | | | 16,092 | |
| Custodian fees | | | 15,462 | |
| Shareholder account-related services - Investor Shares | | | 13,296 | |
| Shareholder account-related services - Institutional Shares | | | 60 | |
| Blue sky fees - Investor Shares | | | 6,801 | |
| Blue sky fees - Institutional Shares | | | 5,413 | |
| Shareholder reporting fees - Investor Shares | | | 6,478 | |
| Shareholder reporting fees - Institutional Shares | | | 1,115 | |
| Trustee/Director fees | | | 6,129 | |
| Chief Compliance Officer fees | | | 4,188 | |
| Other expenses | | | 18,778 | |
| Total expenses | | | 319,811 | |
| Management fees waived/reimbursed net of amount recaptured - Investor Shares | | | (110,008 | ) |
| Expenses waived/reimbursed net of amount recaptured - Institutional Shares | | | (31,033 | ) |
| Management fees waived/reimbursed net of amount recaptured - Institutional Shares | | | (12,848 | ) |
| Net expenses | | | 165,922 | |
| Net Investment Income (Loss) | | | 98,837 | |
| Realized and Unrealized Gain (Loss) | | | | |
| Net realized gain (loss) from: | | | | |
| Investment securities | | | 244,350 | |
| Foreign currency transactions | | | (18,647 | ) |
| Net realized gain (loss) on investments and foreign currency transactions | | | 225,703 | |
| Change in net unrealized appreciation/(depreciation) on: | | | | |
| Investment securities | | | 1,834,505 | |
| Foreign currency translations | | | 212 | |
| Change in net unrealized appreciation/(depreciation) on investments, foreign currencies, and assets and liabilities denominated in foreign currencies | | | 1,834,717 | |
| Net realized and unrealized gain (loss) | | | 2,060,420 | |
| Net Increase (Decrease) in Net Assets Resulting from Operations | | $ | 2,159,257 | |
The accompanying notes are an integral part of these financial statements.
52 | Motley Fool Emerging Markets Fund |
Statement of Changes in Net Assets
| | | Six-Months Ended April 30, 2017
(Unaudited) | | | Year Ended October 31, 2016 | |
| Operations: | | | | | | |
| Net Investment Income (Loss) | | $ | 98,837 | | | $ | 200,032 | |
| Net Realized Gain (Loss) on Investments and Foreign Currency Transactions | | | 225,703 | | | | 638,236 | |
| Change in Net Unrealized Appreciation (Depreciation) on Investments and Foreign Currency Translation | | | 1,834,717 | | | | 2,234,424 | |
| Net increase (decrease) in net assets resulting from operations | | | 2,159,257 | | | | 3,072,692 | |
| Dividends to Shareholders: | | | | | | | | |
| Dividends from net investment income | | | | | | | | |
| Investor Shares | | | (150,543 | ) | | | (300,972 | ) |
| Institutional Shares | | | (27,959 | ) | | | (18,444 | ) |
| Total dividends and distributions | | | (178,502 | ) | | | (319,416 | ) |
| Capital Share Transactions: | | | | | | | | |
| Proceeds from shares sold Investor Shares (141,927 and 228,294 shares, respectively) | | | 1,666,821 | | | | 2,517,000 | |
| Institutional Shares (132,224 and 13,740 shares, respectively) | | | 1,528,574 | | | | 147,950 | |
| Reinvestment of dividends Investor Shares (13,160 and 27,787 shares, respectively) | | | 150,020 | | | | 300,095 | |
| Institutional Shares (2,448 and 1,705 shares, respectively) | | | 27,959 | | | | 18,444 | |
| Value of shares redeemed | | | | | | | | |
| Investor Shares (436,716 and 709,020 shares, respectively) | | | (5,110,784 | ) | | | (7,766,303 | ) |
| Institutional Shares (30,763 and 387 shares, respectively) | | | (368,729 | ) | | | (4,349 | ) |
| Redemption fees and small-balance account fees | | | | | | | | |
| Investor Shares | | | 1,610 | | | | 3,403 | |
| Institutional Shares | | | 61 | | | | — | |
| Net increase (decrease) from capital share transactions | | | (2,104,468 | ) | | | (4,783,760 | ) |
| Total increase (decrease) in net assets | | | (123,713 | ) | | | (2,030,484 | ) |
| Net Assets: | | | | | | | | |
| Beginning of Period | | | 30,869,422 | | | | 32,899,906 | |
End of Period* | | $ | 30,745,709 | | | $ | 30,869,422 | |
*Including undistributed net investment income | | $ | 98,824 | | | $ | 178,488 | |
The accompanying notes are an integral part of these financial statements.
Motley Fool Emerging Markets Fund | 53 |
Financial Highlights
(for a share outstanding throughout each period)
| | | Six Months Ended April 30, 2017 | | | Years Ended October 31, | | | Period Ended October 31, | |
| Investor Shares | | (Unaudited)(1)(2) | | | 2016 | | | 2015 | | | 2014 | | | 2013 | | | 2012(3)(4) | |
| Net Asset Value, Beginning of Period | | $ | 11.93 | | | $ | 10.88 | | | $ | 12.61 | | | $ | 12.66 | | | $ | 10.94 | | | $ | 10.00 | |
| Income (Loss) From Investment Operations | | | | | | | | | | | | | | | | | | | | | | | | |
Net Investment Income (Loss)(5) | | | 0.04 | | | | 0.07 | | | | 0.09 | | | | 0.16 | | | | 0.13 | | | | 0.18 | |
| Net Gain (Loss) on Securities (Realized and Unrealized) | | | 0.86 | | | | 1.09 | | | | (1.63 | ) | | | (0.12 | ) | | | 1.73 | | | | 0.77 | |
| Total From Investment Operations | | | 0.90 | | | | 1.16 | | | | (1.54 | ) | | | 0.04 | | | | 1.86 | | | | 0.95 | |
| Less Distributions | | | | | | | | | | | | | | | | | | | | | | | | |
| Net Investment Income | | | (0.07 | ) | | | (0.11 | ) | | | (0.19 | ) | | | (0.08 | ) | | | (0.15 | ) | | | (0.01 | ) |
| Net Realized Capital Gains | | | — | | | | — | | | | — | | | | (0.02 | ) | | | — | | | | — | |
| Total Distributions | | | (0.07 | ) | | | (0.11 | ) | | | (0.19 | ) | | | (0.10 | ) | | | (0.15 | ) | | | (0.01 | ) |
| Redemption and Small-Balance Account Fees | | | — | * | | | — | | | | — | * | | | 0.01 | | | | 0.01 | | | | — | * |
| Net Asset Value, End of Period | | $ | 12.76 | | | $ | 11.93 | | | $ | 10.88 | | | $ | 12.61 | | | $ | 12.66 | | | $ | 10.94 | |
Total Return(6)(7) | | | 7.57 | % | | | (10.76 | %) | | | (12.33 | %) | | | 0.47 | % | | | 17.32 | % | | | 9.52 | % |
| Net Assets, End of Period (thousands) | | $ | 27,183 | | | $ | 28,776 | | | $ | 31,160 | | | $ | 47,566 | | | $ | 40,119 | | | $ | 19,272 | |
| | | | | | | | | | | | | | | | | | | | | | | | | |
| Ratios/Supplemental Data | | | | | | | | | | | | | | | | | | | | | | | | |
| | | | | | | | | | | | | | | | | | | | | | | | | |
| Ratio of Expenses to Average Net Assets | | | 1.15 | % | | | 1.15 | % | | | 1.13 | % | | | 1.24 | % | | | 1.35 | % | | | 1.35 | % |
| Ratio of Expenses to Average Net Assets (Before Waivers and Reimbursement of Expenses and/or Recapture of Previously Waived Fees) | | | 1.99 | % | | | 2.09 | % | | | 1.84 | % | | | 1.88 | % | | | 2.60 | % | | | 4.13 | % |
The accompanying notes are an integral part of these financial statements.
54 | Motley Fool Emerging Markets Fund |
Financial Highlights
| | | Six Months Ended April 30, 2017 | | | Years Ended October 31, | | | Period Ended October 31, | |
| Investor Shares | | (Unaudited)(1)(2) | | | 2016 | | | 2015 | | | 2014 | | | 2013 | | | 2012(3)(4) | |
| Ratio of Net Investment Income (Loss) to Average Net Assets | | | 0.64 | % | | | 0.64 | % | | | 0.80 | % | | | 1.29 | % | | | 1.15 | % | | | 1.75 | % |
| Ratio of Net Investment Income (Loss) to Average Net Assets (Before Waivers and Reimbursement of Expenses and/or Recapture of Previously Waived Fees) | | | (0.19 | %) | | | (0.30 | %) | | | 0.09 | % | | | 0.66 | % | | | (0.10 | %) | | | (1.03 | %) |
| Portfolio Turnover | | | 13 | % | | | 54 | % | | | 20 | % | | | 25 | % | | | 26 | % | | | 17 | % |
| * | Amount represents less than $0.005 per share. |
(1) | Effective as of December 21, 2016, the Fund acquired all the assets and liabilities of the Motley Fool Emerging Markets Fund, a series of The Motley Fool Funds Trust (the “Predecessor Fund”). The financial highlights for the periods prior to that date reflect the performances of the Predecessor Fund. |
(2) | For the six months ended April 30, 2017, all ratios for the period have been annualized. Total return and portfolio turnover for the period have not been annualized. |
(3) | Inception date of the Emerging Markets Fund was November 1, 2011. All ratios for the period have been annualized. Total return and portfolio turnover for the period have not been annualized. |
(4) | Because of commencement of operations and related preliminary transaction costs, these ratios are not necessarily indicative of future ratios. |
(5) | Per share data calculated using average shares outstanding method. |
(6) | During the years ended October 31, 2014 and October 31, 2013, 0.08% and 0.09%, respectively of the Fund’s total return was attributable to redemption and small-balance account fees received as referenced in Note 4. Excluding this item, the total return would have been 0.39% and 17.23%, respectively. For the six months ended April 30, 2017, years ended October 31, 2016 and October 31, 2015, and the period ended October 31, 2012, redemption and small-balance account fees received had no effect on the Fund’s total return. |
(7) | Total return reflects the rate an investor would have earned on an investment in the Fund during the period. |
The accompanying notes are an integral part of these financial statements.
Motley Fool Emerging Markets Fund | 55 |
Financial Highlights
| | | Six Months Ended April 30, 2017 | | | Years Ended October 31, | | | Period Ended October 31, | |
| Institutional Shares | | (Unaudited)(1)(2) | | | 2016 | | | 2015 | | | 2014(3)(4) | |
| Net Asset Value, Beginning of Period | | $ | 11.98 | | | $ | 10.90 | | | $ | 12.62 | | | $ | 13.06 | |
| Income (Loss) From Investment Operations | | | | | | | | | | | | | | | | |
Net Investment Income (Loss)(5) | | | 0.05 | | | | 0.09 | | | | 0.12 | | | | 0.04 | |
| Net Gain (Loss) on Securities (Realized and Unrealized) | | | 0.85 | | | | 1.10 | | | | (1.65 | ) | | | (0.48 | ) |
| Total From Investment Operations | | | 0.90 | | | | 1.19 | | | | (1.53 | ) | | | (0.44 | ) |
| Less Distributions | | | | | | | | | | | | | | | | |
| Net Investment Income | | | (0.10 | ) | | | (0.11 | ) | | | (0.19 | ) | | | — | |
| Net Realized Capital Gains | | | — | | | | — | | | | — | | | | — | |
| Total Distributions | | | (0.10 | ) | | | (0.11 | ) | | | (0.19 | ) | | | — | |
| Redemption and Small-Balance Account Fees | | | — | * | | | — | | | | — | * | | | — | |
| Net Asset Value, End of Period | | $ | 12.78 | | | $ | 11.98 | | | $ | 10.90 | | | $ | 12.62 | |
Total Return(6)(7) | | | 7.64 | % | | | (11.02 | %) | | | (12.23 | %) | | | (3.37 | %) |
| Net Assets, End of Period (thousands) | | $ | 3,562 | | | $ | 2,094 | | | $ | 1,740 | | | $ | 1,615 | |
| | | | | | | | | | | | | | | | | |
| Ratios/Supplemental Data | | | | | | | | | | | | | | | | |
| | | | | | | | | | | | | | | | | |
| Ratio of Expenses to Average Net Assets | | | 0.95 | % | | | 0.95 | % | | | 0.93 | % | | | 0.95 | % |
| Ratio of Expenses to Average Net Assets (Before Waivers and Reimbursement of Expenses and/or Recapture of Previously Waived Fees) | | | 3.81 | % | | | 5.66 | % | | | 5.91 | % | | | 6.35 | % |
| Ratio of Net Investment Income (Loss) to Average Net Assets | | | 0.93 | % | | | 0.84 | % | | | 1.06 | % | | | 0.78 | % |
| Ratio of Net Investment Income (Loss) to Average Net Assets (Before Waivers and Reimbursement of Expenses and/or Recapture of Previously Waived Fees) | | | (1.93 | %) | | | (3.87 | %) | | | 3.92 | % | | | (4.62 | %) |
| Portfolio Turnover | | | 13 | % | | | 54 | % | | | 20 | % | | | 25 | % |
| * | Amount represents less than $0.005 per share. |
(1) | Effective as of December 21, 2016, the Fund acquired all the assets and liabilities of the Motley Fool Emerging Markets Fund, a series of The Motley Fool Funds Trust (the “Predecessor Fund”). The financial highlights for the periods prior to that date reflect the performances of the Predecessor Fund. |
(2) | For the six months ended April 30, 2017, all ratios for the period have been annualized. Total return and portfolio turnover for the period have not been annualized. |
(3) | Commenced operations on June 17, 2014. All ratios for the period have been annualized. Total return for the period has not been annualized. |
(4) | Because of commencement of operations and related preliminary transaction costs, these ratios are not necessary indicative of future ratios. |
(5) | Per share data calculated using average shares outstanding method. |
(6) | For the six months ended April 30, 2017 and years ended October 31, 2016 and October 31, 2015, and period ended October 31, 2014, redemption and small-balance account fees received had no effect on the Fund’s total return. |
The accompanying notes are an integral part of these financial statements.
56 | Motley Fool Emerging Markets Fund |
Financial Highlights
(7) | Total return reflects the rate an investor would have earned on an investment in the Fund during the period. |
The accompanying notes are an integral part of these financial statements.
| Motley Fool Emerging Markets Fund | 57 |
Notes to Financial Statements
1. Organization:
The RBB Fund, Inc. (“RBB” or the “Company”) was incorporated under the laws of the State of Maryland on February 29, 1988 and is registered under the Investment Company Act of 1940, as amended, (the “1940 Act”) as an open-end management investment company. RBB is a “series fund,” which is a mutual fund divided into separate portfolios. Each portfolio is treated as a separate entity for certain matters under the 1940 Act, and for other purposes, and a shareholder of one portfolio is not deemed to be a shareholder of any other portfolio. Currently, RBB has twenty-six active investment portfolios, including Motley Fool Independence Fund (“Independence Fund”), Motley Fool Great America Fund (“Great America Fund”) and Motley Fool Emerging Markets Fund (“Emerging Markets Fund”) (formerly known as Motley Fool Epic Voyage Fund) (each a “Fund” and together the “Funds”), which became series of RBB at the close of business on December 21, 2016. As of April 30, 2017, each Fund offered two classes of shares, Investor and Institutional.
Prior to December 21, 2016, Independence Fund, Great America Fund, and Emerging Markets Fund were diversified series (the “Predecessor Funds”) of The Motley Fool Funds Trust (the “Trust”), an open-end management investment company (or mutual fund) organized on November 7, 2008, as a statutory trust under the laws of the State of Delaware. Each of the Predecessor Funds was reorganized into its corresponding Fund on December 21, 2016 (the “Reorganization”). As a result of the Reorganization, the performance and accounting history of each Predecessor Fund was assumed by its corresponding Fund. Performance and accounting information prior to December 21, 2016 included herein is that of the relevant Predecessor Fund.
The investment objective of each Fund is to achieve long-term capital appreciation. The Independence Fund pursues its objective by investing primarily in common stocks of U.S. companies and of companies that are organized under the laws of other countries around the world. The Great America Fund pursues its objective by investing primarily in common stocks of companies that are organized in the United States and that are engaged in a broad range of industries. The Emerging Markets Fund pursues its objective by investing primarily in common stocks of companies organized in emerging market foreign countries.
In the normal course of business, the Funds may enter into contracts that provide general indemnifications. Each Fund’s maximum exposure under these arrangements is dependent on claims that may be made against the Fund in the future, and, therefore, cannot be estimated; however, based on experience, the risk of material loss for such claims is considered remote.
| 58 | A series of The RBB Fund, Inc. |
2. Significant Accounting Policies:
Basis of Preparation
The policies described below are followed consistently by the Funds in the preparation of their financial statements in conformity with accounting principles generally accepted in the United States of America (“U.S. GAAP”) for U.S. mutual funds.
The preparation of financial statements in accordance with U.S. GAAP requires management to make estimates and assumptions that affect the reported amounts and disclosures. Actual results could differ from those estimates.
Portfolio Valuation
Securities held by a Fund are generally valued at market value as of the close of regular trading on each business day (generally 4 pm Eastern time) that the New York Stock Exchange (“NYSE”) is open. Securities, other than stock options, listed on the NYSE or other exchanges are valued on the basis of the last quoted sale price on the exchange on which they are primarily traded. However, if the last sale price on the NYSE is different from the last sale price on any other exchange, the NYSE price will be used. If there are no sales on that day, then the securities are valued at the bid price on the NYSE or other primary exchange for that day. Securities traded in the OTC market are valued on the basis of the last sales price as reported by NASDAQ. If there are no sales on that day, then the securities are valued at the mean between the closing bid and asked prices as reported by NASDAQ. Stock options and stock index options traded on national securities exchanges or on NASDAQ are valued at the mean between the latest bid and asked prices for such options. Securities for which market quotations are not readily available or whose values have been affected by events occurring before the Funds’ pricing time but after the close of the securities markets, and other assets are valued at fair value as determined pursuant to procedures adopted in good faith by the Board of Directors (the “Board”). Debt securities that mature in fewer than 60 days are valued at amortized cost, which approximates market value (unless the Board determines that this method does not represent fair value), if their original maturity was 60 days or less or by amortizing the value as of the 61st day before maturity, if their original term to maturity exceeded 60 days.
When fair value pricing is employed, the prices of securities used by a Fund to calculate its net asset value (the “NAV”) may differ from quoted or published prices for the same securities.
| A series of The RBB Fund, Inc. | 59 |
You’d think that it would be easy to determine what a share of the Fund is worth – just add up the value of everything it holds, and then divide by the number of shares. It’s not that simple, though. Some foreign markets have different operating hours (when it’s daytime in Chicago, for example, it is night in Shanghai). That means that when we calculate a Fund’s value at the end of the day, the market quotations for some of the securities held by the Fund could be several hours old, and intervening events may have affected what the stocks are worth. In addition, characteristics of the relevant markets and stocks might, in some cases, cast doubt on a particular valuation. For these reasons, we may rely on a pricing service to determine the value of particular securities. It is possible that when a Fund buys or sells the securities, the price on the real market will be different from the value used for the fair-value pricing. |
The values of securities held by the Funds and other assets used in computing NAV are generally determined as of the time trading in such securities is completed each day, which, in the case of foreign securities, generally occurs at various times before the close of the NYSE. Trading in securities listed on foreign securities exchanges are valued at the last sale or, if no sales are reported, at the bid price as of the close of the exchange, subject to possible adjustment as described in the Prospectus. Foreign currency exchange rates are also generally determined before the close of the NYSE. On occasion, the values of such securities and exchange rates may be affected by events occurring between the time as of which determinations of such values or exchange rates are made and the close of the NYSE. When such events materially affect the value of securities held by the Funds or their liabilities, such securities and liabilities will be valued at fair value in accordance with procedures adopted in good faith by the Board. In this regard, the Company has retained a third-party fair-value pricing service to quantitatively analyze the price movement of the Funds’ holdings on foreign exchanges and to automatically determine fair value if the variation from the prior day’s closing price exceeds specified parameters. As of April 30, 2017, such price movements for certain securities had exceeded specified parameters and the third-party fair-value service quantitatively fair valued the affected securities. The Board will review and monitor the methods used by the service to assure itself that securities are valued at their fair values. The values of any assets and liabilities initially expressed in foreign currencies will be converted to U.S. dollars based on exchange rates supplied by a quotation service.
Fair Value Measurements
The Financial Accounting Standards Board (“FASB”) “Fair Value Measurements and Disclosures” defines fair value as the price that a Fund would receive upon selling an investment in an orderly transaction to an independent buyer in the principal market, or in the absence of a principal market, the most advantageous market for the investment. Valuation techniques should maximize the use of observable market data and minimize the use of unobservable inputs. Inputs refer broadly to the assumptions that market participants would use in pricing an asset. Inputs may be observable or unobservable. Observable inputs are inputs that reflect the assumptions market participants would use in pricing the asset or liability developed based on market data obtained from sources independent of the reporting entity. Unobservable inputs are inputs that reflect the reporting entity’s own assumptions about the assumptions market participants would use in pricing the asset or liability developed based on the best information available in the circumstances.
| 60 | A series of The RBB Fund, Inc. |
Fair value measurements utilize a hierarchy based on the observability of inputs used to establish fair value.
Investment assets reported at fair value are classified based on the lowest level input that is significant to fair value:
Level 1 — quoted prices in active markets for identical securities
Investments whose values are based on quoted market prices in active markets, and whose values are therefore classified as Level 1 prices, include active listed domestic and foreign equity securities.
Level 2 — observable inputs other than Level 1 (including quoted prices for similar securities, interest rates, prepayment speeds, credit risk, etc.)
Investments that trade in markets that are not considered to be active, but whose values are based on quoted market prices, dealer quotations or valuations provided by alternative pricing sources supported by observable inputs are classified as Level 2 prices. These generally include investment grade corporate bonds and less liquid listed domestic and foreign equity securities.
Level 3 — significant unobservable inputs (including the Fund’s own assumptions in determining the fair value of investments)
Investments whose values are classified as Level 3 prices have significant unobservable inputs, as they may trade infrequently or not at all.
The Independence Fund and the Emerging Markets Fund had significant transfers between Level 1 to Level 2 of $13,762,557 and $1,527,314 respectively, and between Level 2 to Level 1 of $7,786,098 and $2,160,491 respectively, during the six months ended April 30, 2017 due to fair value pricing.
The Great America Fund did not have any transfers between Level 1 and Level 2 during the six months ended April 30, 2017.
The following is a summary of the inputs used in valuing the assets and liabilities carried at fair value as of April 30, 2017:
| A series of The RBB Fund, Inc. | 61 |
| | | Independence Fund | |
| Valuation Inputs | | Value | |
| Level 1 — Quoted Prices | | | | |
| U.S. Common Stocks | | $ | 186,238,953 | |
| Foreign Common Stocks | | | | |
| Banks | | | 17,801,940 | |
| Health Care Equipment & Supplies | | | 11,115,115 | |
| Internet & Catalog Retail | | | 4,485,288 | |
| Internet Software & Services | | | 4,678,234 | |
| Life Sciences Tools & Services | | | 5,725,421 | |
| Media | | | 11,245,105 | |
| Multiline Retail | | | 5,837,184 | |
| Semiconductors & Semiconductor Equipment | | | 18,213,800 | |
| Transportation Infrastructure | | | 2,963,800 | |
| Temporary Cash Investment | | | 8,341,562 | |
| Total Level 1 | | | 276,646,402 | |
| Level 2 — Other Significant Observable Inputs | | | | |
| Foreign Common Stocks | | | | |
| Banks | | | 19,216,985 | |
| Food Products | | | 11,957,804 | |
| Health Care Providers & Services | | | 11,226,569 | |
| Internet & Catalog Retail | | | 8,481,587 | |
| Internet Software & Services | | | 8,460,001 | |
| Leisure Products | | | 6,427,845 | |
| Machinery | | | 5,008,464 | |
| Software | | | 9,598,984 | |
| Transportation Infrastructure | | | 6,675,888 | |
| Participatory Notes | | | 11,981,806 | |
| Total Level 2 | | | 99,035,933 | |
| Level 3 — Significant Unobservable Inputs | | | — | |
| Total Value of Investments | | $ | 375,682,335 | |
| | Great America Fund | |
| Valuation Inputs | Value | |
| Level 1 — Quoted Prices | | | |
| U.S. Common Stocks | | $ | 215,919,521 | |
| 62 | A series of The RBB Fund, Inc. |
| | | Great America Fund | |
| Valuation Inputs | | Value | |
| Temporary Cash Investment | | $ | 10,252,708 | |
| Level 2 — Other Significant Observable Inputs | | | — | |
| Level 3 — Significant Unobservable Inputs | | | — | |
| Total Value of Investments | | $ | 226,172,229 | |
| | | Emerging Markets Fund | |
| Valuation Inputs | | Value | |
| Level 1 — Quoted Prices | | | |
| Foreign Common Stocks | | | |
| Banks | | $ | 3,275,354 | |
| Capital Markets | | | 697,532 | |
| Consumer Finance | | | 739,751 | |
| Equity Real Estate Investment Trusts | | | 585,567 | |
| Health Care Providers & Services | | | 1,492,250 | |
| Internet & Catalog Retail | | | 1,288,005 | |
| Internet Software & Services | | | 1,574,408 | |
| Media | | | 738,174 | |
| Multiline Retail | | | 1,111,347 | |
| Semiconductors & Semiconductor Equipment | | | 1,074,775 | |
| Transportation Infrastructure | | | 3,253,874 | |
| Wireless Telecommunication Services | | | 746,124 | |
| Temporary Cash Investment | | | 1,483,144 | |
| Total Level 1 | | | 18,060,305 | |
| Level 2 — Other Significant Observable Inputs | | | | |
| Foreign Common Stocks | | | | |
| Banks | | | 2,587,055 | |
| Beverages | | | 762,845 | |
| Food Products | | | 1,232,067 | |
| Health Care Equipment & Supplies | | | 841,970 | |
| Health Care Providers & Services | | | 1,288,982 | |
| Internet Software & Services | | | 1,428,800 | |
| Software | | | 1,264,156 | |
| Transportation Infrastructure | | | 1,918,779 | |
| A series of The RBB Fund, Inc. | 63 |
| | Emerging Markets Fund | |
| Valuation Inputs | Value | |
| Participatory Notes | | $ | 1,323,439 | |
| Total Level 2 | | | 12,648,093 | |
| Level 3 — Significant Unobservable Inputs | | | — | |
| Total Value of Investments | | $ | 30,708,398 | |
The inputs or methodology used for valuing securities are not necessarily an indication of the risk associated with investing in those securities.
Dividends and Distributions
When a Fund pays a dividend or other distribution, its net asset value (NAV) per share will decline by the per-share amount of the distribution. Investors are no poorer for this “distribution drop,” however. As this section explains, investors may elect to reinvest their dividend and distribution payments. Doing so would allow them to acquire additional shares at the post-distribution NAV per share. They may also choose to receive a check in the amount of their portion of the dividend or distribution.
Each Fund pays dividends from its net investment income and distributes any net capital gains that it realizes. Dividends and capital gains distributions are generally paid once a year. All dividends and other distributions will be reinvested in Fund shares unless a shareholder chooses either to (1) receive dividends in cash, while reinvesting capital gains distributions in additional Fund shares; or (2) receive all distributions in cash. Additionally, each Fund reports details of distribution-related transactions on quarterly account statements. You may not receive a separate confirmation statement for these transactions.
Securities Transactions, Investment Income and Expenses
Securities transactions are accounted for as of the trade date. Costs used in determining realized gains and losses on the sales of investment securities are on the basis of identified cost. Dividend income is recorded on the ex-dividend date. Interest income is recorded on an accrual basis. Discount and premium are amortized using the effective interest method. Expenses directly attributable to a Fund are directly charged to that Fund. Common expenses of the Company are allocated using methods approved by the Board.
Foreign Currency Translation
The books and records of the Funds are maintained in U.S. dollars as follows: (1) the values of investment securities and other assets and liabilities stated in foreign currencies are translated at the exchange rates prevailing at the end of the period; and (2) purchases, sales and income are translated at the rates of exchange prevailing on the respective dates of such transactions. Transaction gains or losses resulting from changes in exchange rates during the reporting period or upon settlement from foreign currency transactions are reported in the Statements of Operations for the current period. The Funds do not isolate the portion of gains and losses on investments.
| 64 | A series of The RBB Fund, Inc. |
3. Investment Policies and Practices:
The sections below describe some of the different types of investments that may be made by the Funds and the investment practices in which the Funds may engage.
When we say that the Funds may invest in other types of securities and in other asset classes, the “may” is well worth emphasizing, as the Fund’s primary focus is the common stock companies that the Adviser believes are both promising and undervalued.
Foreign Securities
The Independence Fund and Emerging Markets Fund invest, and the Great America Fund may invest, in equity and fixed-income securities of foreign companies, including companies located in both developed and emerging-market countries. Investment in foreign securities may include the purchase of American Depositary Receipts (“ADRs”) and other depositary receipts (European Depositary Receipts (“EDRs”) and Global Depositary Receipts (“GDRs”)) that represent indirect interests in securities of foreign issuers. A significant portion of a Fund’s exposure to foreign investments may be composed of such investments. Investments in foreign securities are affected by risk factors generally not associated with investments in the securities of U.S. companies in the U.S. With respect to such securities, there may be more limited information publicly available concerning the issuer than would be the case with respect to domestic securities, foreign issuers may use different accounting standards, and foreign trading markets may not be as liquid as are U.S. markets. Foreign securities also involve such risks as currency risks, possible imposition of withholding or confiscatory taxes, possible currency transfer restrictions, expropriation or other adverse political or economic developments, and the difficulty of enforcing obligations in other countries. These risks may be greater in emerging-market countries and in less-developed countries.
| A series of The RBB Fund, Inc. | 65 |
| If a Fund holds a foreign stock, and the stock is traded on a foreign exchange, with its price denominated in that foreign currency, the value of the stock will change, for the Fund, whenever the relative value of the U.S. dollar and that foreign currency change. To take an imaginary example, if the Fund holds shares in Ruritania Telecom, traded on the Ruritanian Stock Exchange, those shares will be worth more to the Fund if the value of the Ruritanian ploof increases against the U.S. dollar, and vice versa, all other things being equal. | |
The purchase of securities denominated in foreign currencies will subject the value of the Funds’ investments in those securities to fluctuations caused by changes in foreign exchange rates. To hedge against the effects of changes in foreign exchange rates, the Funds may enter into forward foreign currency exchange contracts (“forward contracts”). These contracts represent agreements to exchange an amount of currency at an agreed-upon future date and rate. The Funds will generally use forward contracts only to “lock in” the price in U.S. dollars of a foreign security that a Fund plans to purchase or to sell. In certain limited cases, it may use such contracts to hedge against an anticipated substantial decline in the price of a foreign currency against the U.S. dollar that would adversely affect the U.S. dollar value of foreign securities held by the Fund. Forward contracts will not be used in all cases and, in any event, cannot completely protect the Funds against all changes in the values of foreign securities resulting from fluctuations in foreign exchange rates. The Funds will not enter into a forward contract if, as a result, forward contracts would represent more than 20% of a Fund’s total assets. For hedging purposes, the Funds may also use options on foreign currencies, which expose the Funds to certain risks.
Some foreign securities are traded in the U.S. in the form of ADRs. ADRs are receipts typically issued by a U.S. bank or Company company evidencing ownership of the underlying securities of foreign issuers. EDRs and GDRs are receipts typically issued by foreign banks or trust companies, evidencing ownership of underlying securities issued by either a foreign or U.S. issuer. Generally, depositary receipts in registered form are designed for use in the U.S. and depositary receipts in bearer form are designed for use in securities markets outside the U.S. Depositary receipts may not necessarily be denominated in the same currency as the underlying securities into which they may be converted. Depositary receipts generally involve the same risks as other investments in foreign securities. However, holders of ADRs and other depositary receipts may not have all the legal rights of shareholders and may experience difficulty in receiving shareholder communications.
Types of Fixed-Income Securities
A Fund may invest in bonds and other types of debt obligations of U.S. and foreign issuers. Fixed income securities purchased by a Fund may include, among others, bonds, notes, and debentures issued by corporations; debt securities issued or guaranteed by the U.S. government or one of its agencies or instrumentalities (“U.S. Government Securities”); municipal securities; mortgage-backed and asset-backed securities; and debt securities issued or guaranteed by foreign governments, their agencies, instrumentalities, or political subdivisions, or by government-owned, -controlled, or -sponsored entities, including central banks. These investments also include money market instruments and other types of obligations. Investors should recognize that, although securities ratings issued by Standard & Poor’s® Ratings Services (“S&P”), a division of The McGraw-Hill Companies, Inc., and Moody’s Investors Services©, Inc. (“Moody’s”), provide a generally useful guide as to credit risks, they do not offer any criteria to evaluate interest rate risk. Changes in interest rate levels generally cause fluctuations in the prices of fixed-income securities and will, therefore, cause fluctuations in the NAV per share of a Fund. Subsequent to the purchase of a fixed-income security by a Fund, the ratings or credit quality of such security may deteriorate. Any such subsequent adverse changes in the rating or quality of a security held by a Fund would not require a Fund to sell the security.
| 66 | A series of The RBB Fund, Inc. |
Participatory Notes
A participatory note, as used by a Fund, is an instrument used by investors to obtain exposure to an equity investment, including common stocks and warrants, in a local market where direct ownership is not permitted (or is impractical.) In countries where direct ownership by a foreign investor, such as a Fund, is not allowed by local law, such as Saudi Arabia, an investor may gain exposure to the market through a participatory note, which derives its value from a group of underlying equity securities. A participatory note is intended (disregarding the effect of any fees and expenses) to reflect the performance of the underlying equity securities on a one-to-one basis so that investors will not normally gain more in absolute terms than they would have made had they invested in the underlying securities directly, and will not normally lose more than they would have lost had they invested in the underlying securities directly.
In addition to providing access to otherwise closed markets, participatory notes can also provide a less expensive option to direct investment (where ownership by foreign investors is permitted) by reducing registration and transaction costs in acquiring and selling local registered shares. The Funds’ investment manager also believes that participatory notes can offer greater liquidity in markets that restrict the ability of the Funds to dispose of an investment by either restricting transactions by size or requiring registration and/or regulatory approvals.
The purchase of participatory notes involves risks that are in addition to the risks normally associated with a direct investment in the underlying securities. The Fund is subject to the risk that the issuer of the participatory note (i.e., the issuing bank or broker-dealer), which is the only responsible party under the note, is unable or refuses to perform under the terms of the participatory note, also known as counterparty risk.
While the holder of a participatory note is entitled to receive from the bank or broker-dealer any dividends or other distributions paid on the underlying securities, the holder is not entitled to the same rights as an owner of the underlying securities, such as voting rights.
| A series of The RBB Fund, Inc. | 67 |
Participatory notes may not be traded on exchanges, are privately issued, and may be illiquid. To the extent a participatory note is determined to be illiquid, it would be subject to the Fund’s limitation on investments in illiquid securities. There can be no assurance that the trading price or value of participatory notes will equal the value of the underlying value of the equity securities they seek to replicate.
Real Estate Investment Trusts
Real estate investment trusts (“REITs”) are pooled investment vehicles that manage a portfolio of real estate or real estate-related loans to earn profits for their shareholders. REITs are generally classified as equity REITs, mortgage REITs, or a combination of equity and mortgage REITs. Investing in REITs involves certain unique risks in addition to those risks associated with investing in the real estate industry in general. Equity REITs may be affected by changes in the value of the underlying property owned by the REITs, while mortgage REITs may be affected by the quality of the borrower on any credit extended. REITs are dependent upon management skills, may not be diversified geographically or by property type, and are subject to heavy cash-flow dependency, default by borrowers, and self-liquidation. REITs must also meet certain requirements under the Internal Revenue Code of 1986, as amended (the “Code”), to avoid entity level tax and be eligible to pass through certain tax attributes of their income to shareholders. REITs are consequently subject to the risk of failing to meet these requirements for favorable tax treatment and of failing to maintain their exemptions from registration under the 1940 Act. REITs are also subject to the risks of changes in the Code, affecting their tax status.
REITs (especially mortgage REITs) are also subject to interest rate risks. When interest rates decline, the value of a REIT’s investment in fixed-rate obligations can be expected to rise. Conversely, when interest rates rise, the value of a REIT’s investment in fixed-rate obligations can be expected to decline. In contrast, as interest rates on adjustable-rate mortgage loans are reset periodically, yields on a REIT’s investments in such loans will gradually align themselves to reflect changes in market interest rates, causing the value of such investments to fluctuate less dramatically in response to interest rate fluctuations than would investments in fixed-rate obligations.
The management of a REIT may be subject to conflicts of interest with respect to the operation of the business of the REIT and may be involved in real estate activities competitive with the REIT. REITs may own properties through joint ventures or in other circumstances in which a REIT may not have control over its investments. REITs may use significant amounts of leverage.
REITs often do not provide complete tax information until after the end of the calendar year. Consequently, because of the delay, it may be necessary for a Fund, if invested in REITs, to request permission to extend the deadline for issuance of Forms 1099-DIV beyond January 31. Alternatively, amended Forms 1099-DIV may be sent. During the six months ended April 30, 2017, the Independence, Great America, and Emerging Markets Funds invested in REITs.
| 68 | A series of The RBB Fund, Inc. |
Temporary Investments
During periods of adverse market or economic conditions, a Fund may temporarily invest all or a substantial portion of its assets in high-quality, fixed-income securities, money market instruments, and shares of money market mutual funds, or it may hold cash. At such times, a Fund would not be pursuing its stated investment objective with its usual investment strategies. A Fund may also hold these investments for liquidity purposes. Fixed-income securities will be deemed to be of high quality if they are rated “A” or better by S&P or Moody’s or, if unrated, are determined to be of comparable quality by the Adviser. Money market instruments are high-quality, short-term fixed income obligations (which generally have remaining maturities of one year or less), and may include U.S. Government Securities, commercial paper, certificates of deposit and banker’s acceptances issued by domestic branches of United States banks that are members of the Federal Deposit Insurance Corporation, and repurchase agreements for US. Government Securities. In lieu of purchasing money market instruments, a Fund may purchase shares of money market mutual funds that invest primarily in U.S. Government Securities and repurchase agreements involving those securities, subject to certain limitations imposed by the 1940 Act. A Fund, as an investor in a money market fund, will indirectly bear the fees and expenses of the money market fund. These indirect fees and expenses will be in addition to the fees and expenses of the Funds. Repurchase Agreements involve certain risks not associated with direct investments in debt securities.
Securities Lending
Each Fund may lend its portfolio securities pursuant to a securities lending agreement with the Bank of New York Mellon. The Funds may lend its securities to brokers, dealers, and financial institutions in an amount not exceeding 33 1/3% of the value of the Funds total assets. These loans will be secured by collateral (consisting of cash, U.S. Government Securities, or irrevocable letters of credit) maintained in an amount equal to at least 100% of the market value, determined daily, of the loaned securities. The Funds may, subject to certain notice requirements, at any time call the loan and obtain the return of the securities loaned. The Funds will be entitled to payments equal to the interest and dividends on the loaned securities and may receive a premium for lending the securities. The Funds did not lend any portfolio securities during the six months ended April 30, 2017.
4. Fees and Transactions with Related Parties:
Fund Expenses
Each Fund pays all of its expenses other than those expressly assumed by Motley Fool Asset Management (the “Adviser”). Expenses of each Fund are deducted from the Funds’ total income before dividends are paid.
| A series of The RBB Fund, Inc. | 69 |
Investment Adviser
Subject to the supervision of the Board, the Adviser manages the overall investment operations of the Funds in accordance with the Funds’ investment objective and policies and formulates a continuing investment strategy for the Funds pursuant to the terms of the Investment Advisory Agreement between the Adviser and the Company on behalf of the Funds. The Adviser is a wholly owned subsidiary of The Motley Fool Holdings Inc. (“TMF Holdings”), a multimedia financial-services holding company that also owns The Motley Fool, LLC, which publishes investment information and analysis across a wide range of media, including investment newsletter services, websites, and books. TMF Holdings is controlled by David Gardner and Tom Gardner, along with other private shareholders.
Each Fund pays the Adviser a fee that is computed daily and paid monthly at an annual rate of 0.85% of each Fund’s average daily net assets.
The Adviser has contractually agreed to pay, waive or absorb a portion of the operating expenses of the Investor and Institutional Shares of each Fund through the end of February 2018, to the extent necessary to limit the annual operating expenses of the Investor and Institutional Shares of each Fund (excluding brokerage commissions, taxes, interest expense, acquired fund fees and expenses, and any other extraordinary expenses) to an amount not exceeding the rates listed below annually of each Fund’s average daily net assets.
| Expense Limits |
| Independence Fund - Investor Shares | 1.15% |
| Independence Fund - Institutional Shares | 0.95% |
| Great America Fund - Investor Shares | 1.15% |
| Great America Fund - Institutional Shares | 0.95% |
| Emerging Markets Fund - Investor Shares | 1.15% |
| Emerging Markets Fund - Institutional Shares | 0.95% |
The Adviser may recover from the Investor and Institutional Shares of each Fund fees and expenses previously paid, waived, or absorbed for a period of three years after such fees or expenses were incurred, provided that the repayments do not cause the Funds’ operating expenses (excluding brokerage commissions, taxes, interest expense, acquired fund fees and expenses, and any extraordinary expenses) to exceed the expense limits of the Investor and Institutional Class, respectively, of each Fund that were in effect at the time the fees and expenses were paid, waived, or absorbed by the Adviser, as well as the expense limits that are currently in effect, if different. Previously waived fees subject to future recovery by the Adviser are as follows:
| 70 | A series of The RBB Fund, Inc. |
| Independence Fund | | | |
| | | Recovery Available | |
| Year End | | Investor Shares | | | Institutional Shares | |
| 2017 | | $ | — | | | $ | 31,638 | |
| 2018 | | $ | — | | | $ | 80,208 | |
| 2019 | | $ | — | | | $ | 85,311 | |
| 2020 | | $ | — | | | $ | 43,886 | |
| Total | | $ | — | | | $ | 241,043 | |
| Great America Fund | | | | | | |
| | | Recovery Available | |
| Year End | | Investor Shares | | | Institutional Shares | |
| 2017 | | $ | 43,040 | | | $ | 29,553 | |
| 2018 | | $ | 55,441 | | | $ | 85,273 | |
| 2019 | | $ | 47,054 | | | $ | 88,812 | |
| 2020 | | $ | 6,212 | | | $ | 41,476 | |
| Total | | $ | 151,747 | | | $ | 245,114 | |
| Emerging Markets Fund | | | | | | |
| | | Recovery Available | |
| Year End | | Investor Shares | | | Institutional Shares | |
| 2017 | | $ | 141,914 | | | $ | 32,000 | |
| 2018 | | $ | 269,503 | | | $ | 86,768 | |
| 2019 | | $ | 271,449 | | | $ | 90,012 | |
| 2020 | | $ | 110,008 | | | $ | 43,881 | |
| Total | | $ | 792,874 | | | $ | 252,661 | |
| A series of The RBB Fund, Inc. | 71 |
Directors’ and Officers’ Compensation
The Directors of the Company receive an annual retainer and meeting fees for meetings attended. Employees of Vigilant Compliance, LLC serve as President, Chief Compliance Officer and Assistant Treasurer of the Company. Vigilant Compliance, LLC is compensated for the services provided to the Company. An employee of RBB serves as Treasurer and Secretary, and is compensated for services provided. Certain employees of U.S. Bancorp Fund Services, LLC serve as officers of the Company. They are not compensated by the Funds or the Company.
Each Trustee of the Trust who was not an “interested person,” as defined by the 1940 Act, of the Predecessor Funds was paid an annual retainer of $40,000. Officers of the Predecessor Funds, all of whom were members, officers, or employees of the Adviser, or their affiliates, received no compensation from the Trust.
Other Service Providers
Administration and Accounting Services
The Company has entered into an Administration and Accounting Services Agreement with BNY Mellon. Pursuant to the Administration and Accounting Services Agreement, BNY Mellon provides various administrative and accounting services necessary for the operations of the Company and the Funds. Services provided by BNY Mellon include facilitating general Fund management; monitoring the Funds’ compliance with federal and state regulations; supervising the maintenance of the Funds’ general ledger, the preparation of the Funds’ financial statements, the determination of the Funds’ daily NAVs, and the payment of dividends and other distributions to shareholders; and preparing specified financial, tax, and other reports. The Funds pay the Administrator an annual fee calculated based upon the Funds’ average net assets. The fee is paid monthly. The Funds also reimburse the Administrator for certain out-of-pocket expenses.
Transfer Agent
BNY Mellon serves as the Funds’ transfer agent and dividend disbursing agent. BNY Mellon receives a fee based mainly upon the number of accounts serviced. Certain minimum fees and transaction charges may apply.
For the six months ended April 30, 2017, BNY Mellon received $605,166 aggregate fees and expenses from the Funds and the Predecessor Funds for services rendered under the various agreements described above.
Custodian
BNY Mellon serves as custodian of the Company’s assets and is responsible for maintaining custody of the Funds’ cash and investments and retaining subcustodians, including in connection with the custody of foreign securities.
| 72 | A series of The RBB Fund, Inc. |
Custodian fees for the Funds are calculated based on the average daily gross assets of the Funds. BNY Mellon also receives other transaction based charges and is reimbursed for out-of-pocket expenses.
For the six months ended April 30, 2017, BNY Mellon received $72,354 in aggregate fees and expenses from the Funds and the Predecessor Funds for services rendered under the custody agreements described above.
Distribution
Foreside Funds Distributors LLC serves as the principal underwriter of the Funds pursuant to an Underwriting Agreement for the limited purpose of acting as statutory underwriter to facilitate the distribution of shares of the Funds. The Funds do not pay any fees to the Distributor in its capacity as Underwriter. The fees are paid by the Adviser.
Shareholder Account-Related Services
The Company’s Board has authorized it to pay fees to financial intermediaries, including securities dealers, that provide shareholder account-related services to their customers who own shares of the Company’s Funds, or to reimburse the Adviser for such expenses it paid on the Company’s behalf. These financial intermediaries generally have omnibus accounts with the Company’s Transfer Agent and provide shareholder services or sub-transfer agent services to the shareholders who are their customers. The fees paid by the Funds for these services will not exceed the fees they would have incurred if customers of the financial intermediaries maintained their accounts directly with the Company. For the six months ended April 30, 2017, Motley Fool Independence Fund paid $108,367, Motley Fool Great America Fund paid $77,232 and Motley Fool Emerging Markets Fund paid $13,356 for such third-party shareholder account-related services. These amounts include what was paid by the Predecessor Funds.
Redemption Fee
The Funds charge a redemption fee of 2.00% on proceeds from Shares redeemed or exchanged within 90 days following their acquisition. The redemption fee is calculated as a percentage of the net asset value of the total redemption proceeds and is retained by the Funds and accounted for as additional paid-in capital. Certain exceptions to the imposition of the redemption fee exist. Please see the Funds’ prospectus for more information.
Small-Balance Account Fee
The Funds charge a small-balance account fee of $24 annually if the value of an account is less than $10,000. The fee is assessed by redeeming shares from that account. Certain exceptions to the imposition of the small-balance account fee exist. Please see the Funds’ prospectus for more information.
| A series of The RBB Fund, Inc. | 73 |
Transactions with Affiliates
Advisers to investment companies, including Motley Fool Funds, are permitted under 17a-7 of the 1940 Act to purchase or sell securities directly between affiliated clients. When affecting these “cross” transactions, Rule 17a-7 imposes restrictions on how the trades are processed and reported. The specified conditions within Rule 17a-7 are outlined in procedures established by or under the direction of the Board of Directors. The procedures have been designed to provide assurance that any purchase or sale of securities by the Fund from or to another Fund complies with Rule 17a-7 under the 1940 Act.
For the six months ended April 30, 2017, the Funds and the Predecessor Funds did not engage in any security transactions with affiliates.
5. Control Persons and Principal Holders (Unaudited):
Any person beneficially owning, directly or indirectly, more than 25% of the outstanding shares of a Fund is presumed to control the Fund. Through the exercise of voting rights with respect to shares of the Fund, such a person may be able to determine the outcome of shareholders voting on matters as to which the approval of shareholders of the Fund is required. Principal holders are persons who own of record or are known by the Fund to own beneficially 5% or more of the outstanding shares of the Fund. As of April 30, 2017, the following individuals owned 5% or more of the Funds:
| Independence Fund | |
| Name | % of Shares |
| Charles Schwab & Co. Inc. | 27.89% |
| National Financial Services LLC | 21.36% |
| TD Ameritrade Inc. | 10.05% |
| Great America Fund | |
| Name | % of Shares |
| Charles Schwab & Co. Inc. | 31.93% |
| National Financial Services LLC | 26.16% |
| TD Ameritrade Inc. | 10.64% |
| 74 | A series of The RBB Fund, Inc. |
| Emerging Markets Fund | |
| Name | % of Shares |
| National Financial Services LLC | 22.70% |
| Charles Schwab & Co. Inc. | 21.60% |
| TD Ameritrade Inc. | 11.52% |
6. Investment Transactions:
For the six months ended April 30, 2017, the cost of purchases and proceeds from sales and maturities of investment securities for the Funds and the Predecessor Funds were as follows:
| Cost of Purchases and Proceeds from Sales and Maturities of Long-Term Securities | |
| (other than Temporary Cash Investments) | |
| | | | | | | |
| Fund | | Purchases | | | Sales and Maturity Proceeds | |
| Independence Fund | | $ | 91,481,858 | | | $ | 126,149,333 | |
| Great America Fund | | | 32,025,931 | | | | 46,094,934 | |
| Emerging Markets Fund | | | 3,654,150 | | | | 6,990,708 | |
7. Shares of Common Stock:
RBB has authorized capital of one hundred billion shares of common stock of which 84.423 billion shares are currently classified into one hundred and seventy-one classes of common stock. Each class represents an interest in an active or inactive RBB investment portfolio.
8. Federal Income Taxes:
Each Fund intends to qualify as a regulated investment company (“RIC”) under Subchapter M of the Code. If so qualified, a Fund will not be subject to federal income tax on that part of its net investment income and net capital gains that it distributes to its shareholders. Certain federal income and excise taxes would be imposed on a Fund if it fails to make certain required distributions of its income to shareholders. The Funds intend, however, to make distributions in a manner that will avoid the imposition of any such taxes. For this reason, no provision for excise or income taxes is required. Each Fund is treated as a separate entity for federal income tax purposes.
The Funds may be subject to taxes imposed by countries in which they invest in issuers existing or operating in such countries. Such taxes are generally based on income earned. The Funds accrue such taxes when the related income is earned. Dividend and interest income is recorded net of non-U.S. taxes paid.
| A series of The RBB Fund, Inc. | 75 |
Net investment income (loss) and net realized gains (losses) may differ for financial statements and tax purposes primarily due to differing treatments for foreign currency transactions, investments in partnerships and Passive Foreign Investment Companies (“PFICs”), and loss deferrals due to wash sales and qualified late-year losses.
Distribution of the Funds and/or the Predecessor Funds , as applicable, during the years ended October 31, 2016 and October 31, 2015, were characterized as follows for tax purposes:
| Independence Fund | | | | | | |
| | | | | | | |
| Tax Year End | | Ordinary Income | | | Long-Term Capital Gain | |
| 2016 | | $ | 48,712 | | | $ | 169,411 | |
| 2015 | | $ | 1,957,567 | | | $ | 6,957,635 | |
| Great America Fund | | | | | | |
| | | | | | | |
| Tax Year End | | Ordinary Income | | | Long-Term Capital Gain | |
| 2016 | | $ | 370,109 | | | $ | — | |
| 2015 | | $ | 522,273 | | | $ | — | |
| Emerging Markets Fund | | | | | | |
| | | | | | | |
| Tax Year End | | Ordinary Income | | | Long-Term Capital Gain | |
| 2016 | | $ | 319,416 | | | $ | — | |
| 2015 | | $ | 701,942 | | | $ | — | |
At October 31, 2016, the components of distributable earnings for the Predecessor Funds, on a tax basis were as follows:
| 76 | A series of The RBB Fund, Inc. |
| Independence Fund |
| | | | | | | | | | | | | | |
Undistributed Ordinary Income | | | Undistributed Long-Term Capital Gain | | | Capital Loss Carryover | | | Other | | | Net Unrealized Appreciation (Depreciation) on Investments | |
| $ | 760,546 | | | $ | 9,652,280 | | | $ | — | | | $ | — | | | $ | 102,940,270 | |
| Great America Fund |
| | | | | | | | | | | | | | |
Undistributed Ordinary Income | | | Undistributed Long-Term Capital Gain | | | Capital Loss Carryover | | | Other | | | Net Unrealized Appreciation (Depreciation) on Investments | |
| $ | — | | | $ | — | | | $ | (3,132,797 | ) | | $ | (639,202 | ) | | $ | 54,409,776 | |
| Emerging Markets Fund |
| | | | | | | | | | | | | | |
Undistributed Ordinary Income | | | Undistributed Long-Term Capital Gain | | | Capital Loss Carryover | | | Other | | | Net Unrealized Appreciation (Depreciation) on Investments | |
| $ | 178,488 | | | $ | — | | | $ | (391,213 | ) | | $ | — | | | $ | 2,503,008 | |
During the year ended October 31, 2016 the Predecessor Fund to the Emerging Markets Fund utilized capital loss carryovers to offset realized capital gains for Federal income tax purposes in the amount of $659,763.
For federal income tax purposes, the Funds measure capital loss carryovers annually at October 31, their fiscal year end. Capital loss carryovers may be carried forward and applied against future capital gains. Under the Regulated Investment Company Modernization Act of 2010, capital losses incurred by these funds after October 31, 2012 will not be subject to expiration and will retain their character as either short-term or long-term capital losses. In addition, such losses must be utilized prior to the losses incurred in the years preceding enactment. As of October 31, 2016, Great America Fund and Emerging Markets Fund had unexpiring short-term losses of $3,132,797 and $391,213, respectively.
Great America Fund deferred qualified late-year losses of $639,202 which will be treated as arising on the first business day of the year ending October 31, 2017.
At April 30, 2017, the aggregate cost of investment securities for federal income tax purposes (excluding foreign currency) and the net unrealized appreciation from investments for those securities having an excess of value over cost and net unrealized depreciation from investments for those securities having an excess of cost over value (based on cost for federal income tax purposes) were as follows:
| A series of The RBB Fund, Inc. | 77 |
| Independence Fund |
| | | | | | | | | | | |
| Federal Tax Cost | | | Net Unrealized Appreciation (Depreciation) | | | Appreciated Securities | | | Depreciated Securities | |
| $ | 258,667,516 | | | $ | 117,014,819 | | | $ | 126,630,523 | | | $ | (9,615,704 | ) |
| Great America Fund |
| | | | | | | | | | | |
| Federal Tax Cost | | | Net Unrealized Appreciation (Depreciation) | | | Appreciated Securities | | | Depreciated Securities | |
| $ | 154,855,819 | | | $ | 71,316,410 | | | $ | 72,729,755 | | | $ | (1,413,345 | ) |
| Emerging Markets Fund |
| | | | | | | | | | | |
| Federal Tax Cost | | | Net Unrealized Appreciation (Depreciation) | | | Appreciated Securities | | | Depreciated Securities | |
| $ | 26,369,316 | | | $ | 4,339,082 | | | $ | 7,306,992 | | | $ | (2,967,910 | ) |
The differences between book basis and tax basis unrealized appreciation is attributable primarily to the deferral of losses on wash sales and cumulative basis adjustments for partnerships.
At October 31, 2016, capital contributions, accumulated undistributed net investment income, and accumulated net realized gain (loss) from investments have been adjusted for current period permanent book/tax differences which arose principally from differing book/tax treatments due to distributions in excess, foreign currency transactions, and investments in partnerships and PFICs. The following amounts were reclassified within the capital accounts of the Predecessor Funds:
| 78 | A series of The RBB Fund, Inc. |
| Independence Fund |
| | | | | | | | |
| Paid in Capital | | | Accumulated Undistributed Income | | | Accumulated Net Realized Gain (Loss) on Investments | |
| $ | — | | | $ | 72,297 | | | $ | (72,297 | ) |
| Great America Fund |
| | | | | | | | |
| Paid in Capital | | | Accumulated Undistributed Income | | | Accumulated Net Realized Gain (Loss) on Investments | |
| $ | (5,803 | ) | | $ | 94,761 | | | $ | (88,958 | ) |
| Emerging Markets Fund |
| | | | | | | | |
| Paid in Capital | | | Accumulated Undistributed Income | | | Accumulated Net Realized Gain (Loss) on Investments | |
| $ | — | | | $ | (21,527 | ) | | $ | 21,527 | |
Management has analyzed the Funds’ tax positions and has concluded that no provision for income tax is required in the financial statements. The Funds are not aware of any tax positions for which it is reasonably possible that the total amounts of unrecognized tax benefits will significantly change in the next twelve months. However, management’s conclusions may be subject to review and adjustment at a later date based on certain factors including, but not limited to, further implementation guidance from the FASB, new tax laws, regulations, and administrative interpretations (including court decisions).
| A series of The RBB Fund, Inc. | 79 |
9. Subsequent Events:
Subsequent events have been evaluated through the date that the financial statements were issued. All subsequent events determined to be relevant and material to the financial statements have been appropriately recorded or disclosed.
Based on the recommendation of the Adviser and such other factors and events as deemed relevant, the Board of the Company has approved the termination of the Institutional Shares of the Motley Fool Emerging Markets Fund as of June 30, 2017. The Institutional Shares of the Fund will be closed to all new and existing shareholders on May 2, 2017. Institutional shareholders of the Fund will have the right to exchange their Institutional Shares for Investor Shares of the Fund, or to redeem their investment in Institutional Shares by June 30, 2017. Any Institutional Shares of the Fund that are not exchanged for Investor Shares of the Fund, or redeemed, by June 30, 2017, will be liquidated and the proceeds returned to the shareholder.
| 80 | A series of The RBB Fund, Inc. |
Notice to Shareholders (Unaudited)
Information on Proxy Voting
Policies and procedures that the Funds use to determine how to vote proxies relating to portfolio securities as well as information regarding how the Funds voted proxies relating to portfolio securities during the most recent 12-month period ended June 30 are available (i) without charge, upon request, by calling (888) 863-8803; (ii) on the U.S. Securities and Exchange Commission’s (“SEC”) website at http://www.sec.gov; and (iii) on the Funds website at http://www.FoolFunds.com.
Quarterly Schedule of Investments
The Company files a complete schedule of portfolio holdings with the SEC for the first and third quarters of each fiscal year on Form N-Q. Shareholders can obtain the Form N-Q (i) without charge, upon request, by calling(888) 863-8803; (ii) on the SEC’s website at http://www.sec.gov; and (iii) on the Funds website at http:// www.FoolFunds.com. The Form N-Q may be reviewed or copied at the SEC Public Reference Room in Washington, D.C. Information on the operation of the Public Reference Room may be obtained by calling (800) SEC-0330.
| A series of The RBB Fund, Inc. | 81 |
The Motley Fool Funds Privacy Policy
What Does Motley Fool Funds Do With Your Personal Information?
Why?: Financial companies choose how they share your personal information. Federal law gives consumers the right to limit some but not all sharing. Federal law also requires us to tell you how we collect, share, and protect your personal information. Please read this notice carefully to understand what we do.
What?: The type of personal information we collect and share, depends on the product or service you have with us. This information can include:
| ● | Social Security number and transaction history |
| ● | Account balances and checking account information |
| ● | Account transactions and wire transfer instructions |
When you are no longer a customer, we continue to share your information as described in this notice.
How?: All financial companies need to share customers’ personal information to run their everyday business. In the section below, we list the reasons financial companies can share their customers’ personal information; the reasons The Motley Fool Funds chooses to share; and whether you can limit this sharing.
| Reasons we share your personal information | Does the Motley Fool Funds share? | Can you limit this sharing? |
For our everyday business purposes — such as to process your transaction, maintain your account(s), provide you with necessary information, respond to court orders and legal investigation, or report to credit bureaus | Yes | No |
For our marketing purposes — to offer our products and services to you | Yes | Yes |
| For joint marketing with other financial companies | No | We don’t share |
For our affiliates’ everyday business purposes — information about your transactions and experiences | Yes | No |
For our affiliates’ everyday business purposes — information about your creditworthiness | No | We don’t share |
| For our affiliates to market to you | Yes | Yes |
| For nonaffiliates to market to you | No | We don’t share |
To limit our sharing:
● Visit us online: http://www.FoolFunds.com/marketing/EmailRestriction.aspx
Please note:
If you are a new customer, we can begin sharing your information 30 days from the days from the date we sent this notice. When you are no longer our customer, we continue to share your information as described in this notice.
| 82 | A series of The RBB Fund, Inc. |
However, you can contact us at any time to limit our sharing.
Questions: Call 1-888-863-8803 or go to www.FoolFunds.com
What we do:
How does The Motley Fool Funds protect my personal information?
To protect your personal information from unauthorized access and use, we use security measures that comply with federal law. These measures include physical, electronic, and procedural safeguards, including encryption, authentication, and secured buildings and files.
How does The Motley Fool Funds collect my personal information?
We collect your personal information, for example, when you
| ● | open an account or provide account information |
| ● | make deposits or withdrawals from your account |
| ● | make a wire transfer or tell us where to send the money |
We also collect your personal information from other companies.
Why can’t I limit all sharing?
Federal law gives you the right to limit only
| ● | sharing for affiliates’ everyday business purposes — information about your creditworthiness |
| ● | deposits or withdrawals from your account |
| ● | sharing for nonaffiliates to market to you |
State laws and individual companies may give you additional rights to limit sharing.
What happens when I limit sharing for an account I hold jointly with someone else?
Your choices will apply to everyone on your account.
Definitions:
Affiliates - Companies related by common ownership or control. They can be financial and nonfinancial companies.
Our affiliates include companies with a Motley Fool name; financial companies such as Motley Fool Asset Management, LLC; and nonfinancial companies such as The Motley Fool, LLC and The Motley Fool Holdings, Inc.
Nonaffiliates - Companies not related by common ownership or control. They can be financial and nonfinancial companies.
The Motley Fool Funds does not share with nonaffiliates so they can market to you.
Joint marketing - A formal agreement between nonaffiliated financial companies that together market financial products or services to you.
The Motley Fool Funds doesn’t jointly market.
| A series of The RBB Fund, Inc. | 83 |
Board Approval of Advisory Agreement (Unaudited)
As required by the 1940 Act, the Board of the Company, including all of the Directors who are not “interested persons” of the Company, as that term is defined in the 1940 Act (the “Independent Directors”), considered the approval of the investment advisory agreement between Motley Fool Asset Management, LLC (“Motley Fool”) and the Company (the “Investment Advisory Agreement”) on behalf of the Funds at a meeting of the Board held on September 22, 2016 (the “Meeting”). At the Meeting, the Board, including all of the Independent Directors, approved the Investment Advisory Agreement for an initial term ending August 16, 2018. In approving the Investment Advisory Agreement, the Board considered information provided by Motley Fool with the assistance and advice of counsel to the Independent Directors and the Company.
In considering the approval of the Investment Advisory Agreement between the Company and Motley Fool with respect to each Fund, the Directors took into account all the materials provided prior to and during the Meeting, the presentations made during the Meeting, and the discussions held during the Meeting. Among other things, the Directors considered (i) the nature, extent, and quality of Motley Fool’s services to be provided to the Funds; (ii) descriptions of the experience and qualifications of Motley Fool’s personnel providing those services; (iii) Motley Fool’s investment philosophies and processes; (iv) Motley Fool’s assets under management and client descriptions; (v) Motley Fool’s soft dollar commission and trade allocation policies, including information on the types of research and services obtained in connection with soft dollar commissions; (vi) Motley Fool’s proposed advisory fee arrangements with the Company and other similarly managed clients; (vii) Motley Fool’s compliance procedures; (viii) Motley Fool’s financial information, insurance coverage and profitability analysis related to providing advisory services to the Fund; (ix) the extent to which economies of scale are relevant to the Fund; and (x) a report prepared by Lipper, Inc. comparing the Funds’ proposed management fees and anticipated total expense ratio to those in the Funds’ respective Lipper Groups.
As part of their review, the Directors considered the nature, extent and quality of the services to be provided by Motley Fool. The Directors concluded that Motley Fool had substantial resources to provide services to the Funds.
The Board also considered the advisory fee rates payable by the Funds under the proposed Investment Advisory Agreement. In this regard, information on the fees to be paid by the Funds and each Fund’s total operating expense ratios (before and after fee waivers and expense reimbursements) were compared to similar information for mutual funds advised by other, unaffiliated investment advisory firms. The Directors noted that Motley Fool had contractually agreed to waive management fees and reimburse expenses for each of the Funds through at least the first twelve months of the Fund’s operations to limit total annual operating expenses to 1.15% and 0.95% for the Investor Shares Class and Institutional Shares Class of the Funds, respectively.
| 84 | A series of The RBB Fund, Inc. |
After reviewing the information regarding the Funds’ costs, profitability and economies of scale, and after considering the services to be provided by Motley Fool, the Directors concluded that the investment advisory fees to be paid by each Fund were fair and reasonable and that the Investment Advisory Agreement should be approved for an initial term ending August 16, 2018.
Special Meeting of Shareholders
A special meeting of shareholders (the “Special Meeting”) of the Predecessor Funds was held on December 21, 2016. At the Special Meeting, shareholders of the Predecessor Funds voted on one proposal – the Approval of an Agreement and Plan of Reorganization under which all of the assets of a Predecessor Fund would be transferred to a corresponding newly formed series (each a “New Fund” and together the “New Funds”) of the Company, in exchange solely for (i) shares of the New Fund having equal value, which would be distributed proportionately by class to the shareholders of the Predecessor Fund and (ii) the New Fund’s assumption of the Predecessor Fund’s liabilities. Further details regarding the proposal and the Special Meeting are contained in a definitive proxy statement filed with the Securities and Exchange Commission on October 14, 2016.
At the Special Meeting, the proposal was approved by shareholders of each of the Predecessor Funds as follows:
Motley Fool Independence Fund
For
Votes | Against
Votes | Abstained
Votes |
| 7,671,947 | 290,365 | 140,965 |
Motley Fool Great America Fund
For
Votes | Against Votes | Abstained
Votes |
| 5,024,147 | 150,435 | 110,496 |
Motley Fool Emerging Markets Fund (formerly known as Motley Fool Epic Voyage Fund)
For
Votes | Against Votes | Abstained Votes |
| 1,276,476 | 28,832 | 17,064 |
| A series of The RBB Fund, Inc. | 85 |
Investment Adviser
Motley Fool Asset Management, LLC
2000 Duke Street
Suite 175
Alexandria, VA 22314
Administrator and Transfer Agent
BNY Mellon Investment Servicing (US) Inc.
P.O. Box 9780
Providence, RI 02940-9780
Custodian
The Bank of New York Mellon
One Wall Street
New York, NY 10286
Distributor
Foreside Funds Distributors LLC
899 Cassatt Road
400 Berwyn Park, Suite 110
Berwyn, PA 19312
Legal Counsel
Drinker Biddle & Reath LLP
One Logan Square, Suite 2000
Philadelphia, PA 19103-6996
| 86 | A series of The RBB Fund, Inc. |
QUESTIONS FOR THE MOTLEY
FOOL FUNDS TEAM?
We want to make sure you, the shareholders, get all your investing questions answered. Use the space below to write out your questions for our team, and bring this sheet when you come to our shareholder party! You can sign up for future party updates by sending us an email at rsvp@foolfunds.com.

Item 2. Code of Ethics.
Not applicable.
Item 3. Audit Committee Financial Expert.
Not applicable.
Item 4. Principal Accountant Fees and Services.
Not applicable.
Item 5. Audit Committee of Listed Registrants.
Not applicable.
Item 6. Investments.
| (a) | Schedule of Investments in securities of unaffiliated issuers as of the close of the reporting period is included as part of the report to shareholders filed under Item 1 of this form. |
Item 7. Disclosure of Proxy Voting Policies and Procedures for Closed-End Management Investment Companies.
Not applicable.
Item 8. Portfolio Managers of Closed-End Management Investment Companies.
Not applicable.
Item 9. Purchases of Equity Securities by Closed-End Management Investment Company and Affiliated Purchasers.
Not applicable.
Item 10. Submission of Matters to a Vote of Security Holders.
There have been no material changes to the procedures by which members may recommend nominees to the Registrant's board of directors, where those changes were implemented after the Registrant last provided disclosure in response to the requirements of Item 407(c)(2)(iv) of Regulation S-K (17 CFR 229.407) (as required by Item 22(b)(15) of Schedule 14A (17 CFR 240.14a-101)), or this Item.
Item 11. Controls and Procedures.
| (a) | The registrant’s principal executive and principal financial officers, or persons performing similar functions, have concluded that the registrant’s disclosure controls and procedures (as defined in Rule 30a-3(c) under the Investment Company Act of 1940, as amended (the “1940 Act”) (17 CFR 270.30a-3(c))) are effective, as of a date within 90 days of the filing date of the report that includes the disclosure required by this paragraph, based on their evaluation of these controls and procedures required by Rule 30a-3(b) under the 1940 Act (17 CFR 270.30a-3(b)) and Rules 13a-15(b) or 15d-15(b) under the Securities Exchange Act of 1934, as amended (17 CFR 240.13a-15(b) or 240.15d-15(b)). |
| (b) | There were no changes in the registrant’s internal control over financial reporting (as defined in Rule 30a-3(d) under the 1940 Act (17 CFR 270.30a-3(d))) that occurred during the registrant’s second fiscal quarter of the period covered by this report that has materially affected, or is reasonably likely to materially affect, the registrant’s internal control over financial reporting. |
Item 12. Exhibits.
| (a)(2) | Certifications pursuant to Rule 30a-2(a) under the 1940 Act and Section 302 of the Sarbanes-Oxley Act of 2002 are attached hereto. |
| (b) | Certifications pursuant to Rule 30a-2(b) under the 1940 Act and Section 906 of the Sarbanes-Oxley Act of 2002 are attached hereto. |
SIGNATURES
Pursuant to the requirements of the Securities Exchange Act of 1934 and the Investment Company Act of 1940, the registrant has duly caused this report to be signed on its behalf by the undersigned, thereunto duly authorized.
| (Registrant) | The RBB Fund, Inc. | |
| | | |
| By (Signature and Title)* | /s/Salvatore Faia | |
| | Salvatore Faia, President | |
| | (principal executive officer) | |
| | | |
| Date | June 28, 2017 | |
Pursuant to the requirements of the Securities Exchange Act of 1934 and the Investment Company Act of 1940, this report has been signed below by the following persons on behalf of the registrant and in the capacities and on the dates indicated.
| By (Signature and Title)* | /s/Salvatore Faia | |
| | Salvatore Faia, President | |
| | (principal executive officer) | |
| | | |
| Date | June 28, 2017 | |
| | | |
| By (Signature and Title)* | /s/James Shaw | |
| | James Shaw, Treasurer | |
| | (principal financial officer) | |
| | | |
| Date | June 28, 2017 | |
* | Print the name and title of each signing officer under his or her signature. |