UNITED STATES
SECURITIES AND EXCHANGE COMMISSION
Washington, D.C. 20549
FORM N-CSR
CERTIFIED SHAREHOLDER REPORT OF REGISTERED MANAGEMENT
INVESTMENT COMPANIES
Investment Company Act file number 811-05518
The RBB Fund, Inc.
(Exact name of registrant as specified in charter)
Bellevue Park Corporate Center
103 Bellevue Parkway
Wilmington, DE 19809
(Address of principal executive offices) (Zip code)
Salvatore Faia
BNY Mellon Investment Servicing (US) Inc.
103 Bellevue Parkway
Wilmington, DE 19809
(Name and address of agent for service)
Registrant’s telephone number, including area code: 302-791-1851
Date of fiscal year end: August 31
Date of reporting period: February 28, 2015
Form N-CSR is to be used by management investment companies to file reports with the Commission not later than 10 days after the transmission to stockholders of any report that is required to be transmitted to stockholders under Rule 30e-1 under the Investment Company Act of 1940 (17 CFR 270.30e-1). The Commission may use the information provided on Form N-CSR in its regulatory, disclosure review, inspection, and policymaking roles.
A registrant is required to disclose the information specified by Form N-CSR, and the Commission will make this information public. A registrant is not required to respond to the collection of information contained in Form N-CSR unless the Form displays a currently valid Office of Management and Budget (“OMB”) control number. Please direct comments concerning the accuracy of the information collection burden estimate and any suggestions for reducing the burden to Secretary, Securities and Exchange Commission, 100 F Street, NE, Washington, DC 20549. The OMB has reviewed this collection of information under the clearance requirements of 44 U.S.C. § 3507.
Item 1. Reports to Stockholders.
The Report to Shareholders is attached herewith.

ABBEY CAPITAL FUTURES STRATEGY FUND
of
THE RBB FUND, INC.
SEMI-ANNUAL REPORT
FEBRUARY 28, 2015
(UNAUDITED)
This report is submitted for the general information of the shareholders of the Fund. It is not authorized for distribution unless preceded or accompanied by a current prospectus for the Fund.
ABBEY CAPITAL FUTURES STRATEGY FUND
SEMI-ANNUAL INVESTMENT ADVISER’S REPORT
(UNAUDITED)
Dear Shareholder,
The Abbey Capital Futures Strategy Fund (the “Fund”) Class I Shares returned +22.2% net of fees for the six month period ended February 28, 2015, outperforming the Barclay CTA Index and S&P Total Return Index, which returned +9.0% and +6.1%, respectively. The period was characterized by relatively strong, persistent trends in bond, currency and commodity markets, benefiting the Fund’s core allocation to trendfollowing systems, through its investment in the Abbey Capital Offshore Fund (the “Subsidiary”), a wholly owned subsidiary of the Fund. The Fund’s investment in the Subsidiary may not exceed 25% of the value of its total assets, as measured at the end of each quarter of its taxable year.
| | | | | | | | | | | | | | | | | | | | |
| | Q3 2014 | | Q4 2014 | | SEPT. 1, 2014 TO
FEB. 28, 2015 | | SINCE
INCEPTION ON
JULY 1, 2014 |
Class I | | | | 8.40 | % | | | | 9.45 | % | | | | 22.20 | % | | | | 26.60 | %* |
Class A | | | | 4.63 | % | | | | 9.36 | % | | | | 22.01 | % | | | | 22.01 | %*** |
Class A (max Load)** | | | | 2.13 | % | | | | 3.09 | % | | | | 15.01 | % | | | | 15.01 | %*** |
BofA Merrill Lynch 3-Month T-Bill Index | | | | 0.01 | % | | | | 0.00 | % | | | | 0.01 | % | | | | 0.02 | % |
S&P 500 Total Return Index | | | | 1.13 | % | | | | 4.93 | % | | | | 6.12 | % | | | | 8.85 | % |
Barclay CTA Index | | | | 3.84 | % | | | | 3.02 | % | | | | 9.00 | % | | | | 10.67 | % |
Performance quoted is past performance and does not guarantee future results. Investment return and principal value will fluctuate so that shares, when redeemed, may be worth more or less than their original cost. Current performance may be lower or higher than the returns quoted. Visit www.abbeycapital.com for returns updated daily. Call (US Toll Free) 1-844-261-6484 or (international callers) + 1-508-871-3276 for returns current to the most recent month-end.
The performance quoted reflects fee waivers in effect and would have been less in their absence. The Fund’s gross annual operating expense ratio, as stated in the current prospectus, is 2.63% and 2.38%, and the Fund’s net operating expense ratio is 2.24% and 1.99% for Class A Shares and Class I Shares, respectively. Abbey Capital Limited has contractually agreed to waive its advisory fee and/or reimburse expenses in order to limit Total Annual Fund Operating Expenses (excluding acquired fund fees and expenses, brokerage commissions, extraordinary items, interest or taxes) to 2.24% and 1.99% of the Fund’s average daily net assets attributable to Class A Shares and Class I Shares, respectively. This contractual limitation is in effect until June 30, 2016 and may not be terminated without the approval of the Board of Directors.
* The inception date of the Class I Shares was July 1, 2014.
** The Fund charges a 5.75% maximum sales charge on purchases (as a percentage of offering price) of Class A Shares. The returns shown reflect a deduction of the maximum front-end sales charge of 5.75%.
*** The inception date of the Class A Shares was August 29, 2014.
Market Commentary
Contrasting central bank policies proved to be the key driver of markets over the six months ended February 28, 2015, while rising global growth concerns at times weighed on investor sentiment and influenced markets too. A strengthening US economy evidenced by solid employment gains and improving housing and GDP data intensified investor speculation on the likely timing of a rate increase by the US Federal Reserve. In the eurozone, however, the European Central Bank (the “ECB”) confirmed it would adopt unconventional policy measures to counteract sluggish growth and falling inflation. This contrast in monetary policy prompted a widening in the yield spread between the two regions, accelerating the downtrend in EUR/USD that commenced in May 2014. In January 2015, the ECB’s decision to expand monetary stimulus to include the purchase of sovereign debt added further momentum to the trends in bond and currency markets, while in February, additional improvements in the US labour market and signs of rising inflation strengthened speculation of a June 2015 rate increase, providing a further boost for the dollar.
1
ABBEY CAPITAL FUTURES STRATEGY FUND
SEMI-ANNUAL INVESTMENT ADVISER’S REPORT (CONTINUED)
(UNAUDITED)
Global growth concerns were also a focus for investors, coming to the fore in October 2014, as the International Monetary Fund downgraded their 2014 and 2015 global growth forecasts and as US manufacturing and eurozone sentiment data disappointed. Also weighing on markets was an acceleration of the fall in crude oil prices due to the outcome of the OPEC meeting in November 2014, at which member countries voted to maintain output levels. The fall in commodity prices also provided evidence of weak demand and contributed to global deflationary pressures. Continuing from late 2014 into 2015, political developments in Greece contributed to rising investor risk aversion as the far-left Syriza party came to power, spurring protracted debt negotiations with eurozone lenders. A general improvement in US and eurozone economic data, however, allowed for a pick-up in investor sentiment during February as fading global growth and deflation concerns gave way to a renewed focus on the contrast in monetary policy among major central banks.
Performance Attribution
Returns for the Subsidiary over the period were driven by gains in major currency, bond and energy markets, with the Subsidiary’s Diversified Trendfollowing (“Trendfollowing”) trading advisers, capturing strong trends in these sectors. Within currencies, the Subsidiary benefited from generally long USD exposure, particularly against the EUR but also against the JPY, CAD and GBP. The decision by the Swiss National Bank to remove its exchange-rate cap against the EUR created considerable volatility in currency markets, with losses from a long USD/CHF exposure mostly offset from short EUR/CHF positions. Bond markets provided further positive attribution, with Trendfollowing and Value trading advisers’ positions profiting from mostly long exposures to Canadian, UK, and Japanese government debt. Elsewhere, gains in energy were derived from short positions across the sector, most notably in crude oil contracts. Smaller gains were made in equity markets, with gains for Value and Global Macro trading advisers’ positions primarily in Canadian, Japanese and German indices, outweighing Trendfollowing losses, incurred mainly due to long exposure to the S&P 500 and FTSE 100 indices. By sector, small losses were sustained by the Fund in soft commodities and grains, with the former due to short soybean positions and the latter due to short corn exposure. Elsewhere, short USD exposure to the TRY, ZAR and BRL drove small losses within emerging-market currencies.
Portfolio Allocations*
| | | | | | | | | | |
MANAGER | | PROGRAM | | TRADING STYLE*** | | ALLOCATION
DATE | | AUGUST 31,
2014
% PORTFOLIO
RISK* | | FEBRUARY 28,
2015
% PORTFOLIO
RISK* |
| | | | | |
| Cantab Capital Partners, LLP | | CCP Core Macro
Fund | | Diversified
Trendfollowing | | July 02, 2014 | | 13.31% | | 15.32% |
| | | | | |
| Altis Partners (Jersey) Limited | | Altis Emerald | | Diversified
Trendfollowing | | July 10, 2014 | | 13.00% | | 13.89% |
| | | | | |
| P/E Global, LLC | | P/E Emerald | | Global Macro | | July 14, 2014 | | 12.54% | | 13.92% |
2
ABBEY CAPITAL FUTURES STRATEGY FUND
SEMI-ANNUAL INVESTMENT ADVISER’S REPORT (CONCLUDED)
(UNAUDITED)
| | | | | | | | | | |
MANAGER | | PROGRAM | | TRADING STYLE*** | | ALLOCATION
DATE | | AUGUST 31,
2014
% PORTFOLIO
RISK* | | FEBRUARY 28,
2015
% PORTFOLIO
RISK* |
| | | | | |
| Harmonic Capital Partners LLP | | Harmonic Emerald | | Value | | July 17, 2014 | | 12.34% | | 11.39% |
| | | | | |
| Revolution Capital Management, LLC | | Revolution Emerald | | Diversified
Trendfollowing | | July 02, 2014** | | 12.32% | | 4.56% |
| | | | | |
| Eclipse Capital Management, Inc. | | Eclipse Emerald | | Diversified
Trendfollowing | | July 14, 2014 | | 12.26% | | 15.79% |
| | | | | |
| Graham Capital Management L.P. | | Tactical Trend | | Diversified
Trendfollowing | | July 02, 2014 | | 12.13% | | 16.47% |
| | | | | |
| Trigon Investment Advisors, LLC | | Trigon Emerald | | Global Macro | | July 02, 2014 | | 12.11% | | 8.65% |
*Trading Adviser allocations as a percentage of Subsidiary portfolio risk. Portfolio risk exposures are calculated by adjusting notional trading adviser allocations by their target allocated volatility.
**Revolution Capital Management, LLC was terminated as a trading adviser to the Subsidiary as of September 04, 2014 and was reappointed as a trading adviser to the Subsidiary as of October 21, 2014.
*** Managers have been classified in accordance with the Trading Style that best describes each of their primary trading strategies as determined by the Investment Adviser.
Key to Currency Abbreviations
3
ABBEY CAPITAL FUTURES STRATEGY FUND
PERFORMANCE DATA
(UNAUDITED)
| | | | | | | | |
TOTAL RETURNSFORTHE PERIODS ENDED FEBRUARY 28, 2015† | |
| | |
| | | Six
Months | | | Since
Inception†† | |
Abbey Capital Futures Strategy Fund, A Shares (without sales charge) | | | 22.01% | | | | 22.01% | |
Abbey Capital Futures Strategy Fund, A Shares (with sales charge) | | | 15.01% | | | | 15.01% | |
BofA Merrill Lynch 3-Month U.S. Treasury Bill Index | | | 0.01% | | | | 0.01% | * |
S&P 500 Total Return Index | | | 6.12% | | | | 6.12% | * |
Barclay CTA Index | | | 9.00% | | | | 9.00% | * |
| | |
Abbey Capital Futures Strategy Fund, I Shares | | | 22.20% | | | | 26.60% | |
BofA Merrill Lynch 3-Month U.S. Treasury Bill Index | | | 0.01% | | | | 0.02% | ** |
S&P 500 Total Return Index | | | 6.12% | | | | 8.85% | ** |
Barclay CTA Index | | | 9.00% | | | | 10.67% | ** |
| †† | Inception date of Class A Shares and Class I Shares of the Fund was August 29, 2014 and July 1, 2014, respectively. |
| * | Benchmark performance is from the inception date of Class A Shares only and is not the inception date of the benchmark itself. |
| ** | Benchmark performance is from the inception date of Class I Shares only and is not the inception date of the benchmark itself. |
An investment in the Abbey Capital Futures Strategy Fund is speculative and involves substantial risk. The Fund is not suitable for all investors. It is possible that an investor may lose some or all of their investment. The Fund invests in long and short positions in futures, forwards, spot contracts, swaps, and options, each of which may be tied to commodities, financial indices and instruments, foreign currencies, or equity indices. The Fund also invests in investment grade fixed income securities of all durations and maturities. The Fund may be more volatile than investments in traditional securities. Losses on futures and other derivatives can be caused by unanticipated market movements and may be potentially unlimited. Commodities, currencies, foreign investments, and interest rate-linked instruments each entail special risks. The Fund is non-diversified; therefore gains or losses on a single holding may have a relatively great impact on the Fund. A more complete description of the Fund’s risks can be found in its prospectus, which should read carefully before investing.
The Fund charges a 5.75% maximum sales charge on purchases (as a percentage of offering price) of Class A Shares. The performance quoted reflects fee waivers in effect and would have been less in their absence. The Fund’s gross annual operating expense ratio, as stated in the current prospectus, is 2.63% and 2.38%, and the Fund’s net operating expense ratio is 2.24% and 1.99% for Class A Shares and Class I Shares, respectively. Abbey Capital Limited has contractually agreed to waive its advisory fee and/or reimburse expenses in order to limit Total Annual Fund Operating Expenses (excluding acquired fund fees and expenses, brokerage commissions, extraordinary items, interest or taxes) to 2.24% and 1.99% of the Fund’s average daily net assets attributable to Class A Shares and Class I Shares, respectively. This contractual limitation is in effect until June 30, 2016 and may not be terminated without the approval of the Board of Directors.
The S&P 500® Total Return Index is the total return version of the S&P 500® Index. Dividends are reinvested on a daily basis and all regular cash dividends are assumed reinvested in the index on the ex-dividend date.
The Barclay CTA Index is a leading industry benchmark of representative performance of commodity trading advisors.
The BofA Merrill Lynch 3-Month U.S. Treasury Bill Index is an unmanaged market index of U.S. Treasury securities maturing in 90 days that assumes reinvestment of all income.
Portfolio composition is subject to change.
4
ABBEY CAPITAL FUTURES STRATEGY FUND
FUND EXPENSE EXAMPLES
(UNAUDITED)
As a shareholder of the Fund, you incur two types of costs: (1) transaction costs, including sales charges (loads) on purchase payments, (if any) and (2) ongoing costs, including management fees, shareholder servicing fees and other Fund expenses. These examples are intended to help you understand your ongoing costs (in dollars) of investing in the Fund and to compare these costs with the ongoing costs of investing in other mutual funds.
This example is based on an investment of $1,000 invested at the beginning of the six month period from September 1, 2014 through February 28, 2015, and held for the entire period.
ACTUAL EXPENSES
The first line of the accompanying table provides information about actual account values and actual expenses. You may use the information in this line, together with the amount you invested, to estimate the expenses that you paid over the period. Simply divide your account value by $1,000 (for example, an $8,600 account value divided by $1,000 = 8.6), then multiply the result by the number in the first line under the heading entitled “Expenses Paid During Period” to estimate the expenses you paid on your account during this period.
HYPOTHETICAL EXAMPLEFOR COMPARISON PURPOSES
The second line of the accompanying table provides information about hypothetical account values and hypothetical expenses based on the Fund’s actual expense ratio and an assumed rate of return of 5% per year before expenses, which is not the Fund’s actual return. The hypothetical account values and expenses may not be used to estimate the actual ending account balance or expenses you paid for the period. You may use this information to compare the ongoing costs of investing in the Fund and other funds. To do so, compare these 5% hypothetical examples with the 5% hypothetical examples that appear in the shareholder reports of other funds.
Please note that the expenses shown in the accompanying table are meant to highlight your ongoing costs only and do not reflect any transactional costs, such as sales charges (loads) on purchase payments (if any). Therefore, the second line of the accompanying table is useful in comparing ongoing costs only, and will not help you determine the relative total costs of owning different funds. In addition, if these transactional costs were included, your costs would have been higher.
| | | | | | |
| | | CLASS A SHARES |
| | | BEGINNING ACCOUNT VALUE | | ENDING ACCOUNT VALUE | | EXPENSES PAID |
| | | SEPTEMBER 1, 2014 | | FEBRUARY 28, 2015 | | DURING PERIOD |
Actual* | | $1,000.00 | | $1,220.10 | | $12.41 |
Hypothetical** | | | | | | |
(5% return before expenses) | | 1,000.00 | | 1,013.49 | | 11.38 |
| |
| | | CLASS I SHARES |
| | | BEGINNING ACCOUNT VALUE | | ENDING ACCOUNT VALUE | | EXPENSES PAID |
| | | SEPTEMBER 1, 2014 | | FEBRUARY 28, 2015 | | DURING PERIOD |
Actual*** | | $1,000.00 | | $1,222.00 | | $11.18 |
Hypothetical | | | | | | |
(5% return before expenses) | | 1,000.00 | | 1,014.73 | | 10.14 |
| * | Expenses equal to an annualized expense ratio for the period September 1, 2014 to February 28, 2015 of 2.28% for the Class A Shares of the Fund, which includes waived fees or reimbursed expenses (including dividend and interest expense), multiplied by the average account value over the period, multiplied by the number of days in the most recent period (179) then divided by 365 days. The annualized amount of interest expense was 0.04% for the period September 1, 2014 to February 28, 2015. Without this expense, the annualized expense ratio would have been 2.24%. The Fund’s ending account value on the first line in the table is based on the actual six month return for the Class A Shares of the Fund of 22.01%. |
5
ABBEY CAPITAL FUTURES STRATEGY FUND
FUND EXPENSE EXAMPLES (CONCLUDED)
(UNAUDITED)
| ** | Hypothetical expenses are as if the Class A Shares had been in existence from September 1, 2014, and are equal to the Class A Shares annualized expense ratios, multiplied by the average account value over the period, multiplied by the number of days in the most recent six-month period (181), then divided by 365 to reflect the period. |
| *** | Expenses equal to an annualized expense ratio for the period September 1, 2014 to February 28, 2015 of 2.03% for the Class I Shares of the Fund, which includes waived fees or reimbursed expenses (including dividend and interest expense), multiplied by the average account value over the period, multiplied by the number of days in the most recent fiscal half-year (181) then divided by 365 days to reflect the one half-year period. The annualized amount of interest expense was 0.04% for the period September 1, 2014 to February 28, 2015. Without this expense, the annualized expense ratio would have been 1.99%. The Fund’s ending account value on the first line in the table is based on the actual six month return for the Class I Shares of the Fund of 22.20%. |
6
ABBEY CAPITAL FUTURES STRATEGY FUND
CONSOLIDATED PORTFOLIO HOLDINGS SUMMARY TABLE
FEBRUARY 28, 2015
(UNAUDITED)
The following table presents a summary by sector of the portfolio holdings of the Fund.
| | | | | | | | |
| | | % OF NET | | | | |
| SECURITY TYPE/SECTOR CLASSIFICATION | | ASSETS | | | VALUE | |
| |
SHORT-TERM INVESTMENTS: | | | | | | | | |
U.S. Treasury Obligations | | | 64.6% | | | $ | 48,433,688 | |
PURCHASED OPTIONS | | | 0.6 | | | | 438,968 | |
OTHER ASSETS IN EXCESS OF LIABILITIES | | | 34.8 | | | | 26,041,279 | |
| | | | | | | | |
NET ASSETS | | | 100.0% | | | $ | 74,913,935 | |
| | | | | | | | |
Portfolio holdings are subject to change at any time.
Refer to the Consolidated Portfolio of Investments for a detailed listing of the Fund’s holdings.
The accompanying notes are an integral part of the financial statements.
7
ABBEY CAPITAL FUTURES STRATEGY FUND
CONSOLIDATED PORTFOLIO OF INVESTMENTS
FEBRUARY 28, 2015
(UNAUDITED)
| | | | | | | | | | | | | | | | |
| | | | | | MATURITY | | | PAR | | | | |
| | | COUPON* | | | DATE | | | (000’S) | | | VALUE | |
SHORT-TERM INVESTMENTS — 64.6% | | | | | | | | | | | | | | | | |
U.S. TREASURY OBLIGATIONS—64.6% | | | | | | | | | | | | | | | | |
U.S. Treasury Bills | | | 0.018% | | | | 03/12/15 | | | $ | 4,300 | | | $ | 4,299,974 | |
U.S. Treasury Bills | | | 0.033% | | | | 04/09/15 | | | | 4,300 | | | | 4,299,923 | |
U.S. Treasury Bills | | | 0.051% | | | | 05/07/15 | | | | 4,300 | | | | 4,299,824 | |
U.S. Treasury Bills | | | 0.071% | | | | 06/04/15 | | | | 7,240 | | | | 7,239,428 | |
U.S. Treasury Bills | | | 0.051% | | | | 06/25/15 | | | | 2,300 | | | | 2,299,724 | |
U.S. Treasury Bills | | | 0.066% | | | | 07/02/15 | | | | 2,800 | | | | 2,799,644 | |
U.S. Treasury Bills | | | 0.061% | | | | 07/09/15 | | | | 7,000 | | | | 6,998,999 | |
U.S. Treasury Bills | | | 0.063% | | | | 07/23/15 | | | | 5,000 | | | | 4,998,955 | |
U.S. Treasury Bills | | | 0.030% | | | | 07/30/15 | | | | 3,100 | | | | 3,099,516 | |
U.S. Treasury Bills | | | 0.051% | | | | 08/06/15 | | | | 4,300 | | | | 4,298,921 | |
U.S. Treasury Bills | | | 0.063% | | | | 08/20/15 | | | | 3,800 | | | | 3,798,780 | |
| | | | | | | | | | | | | | | | |
| | | | | | | | | | | | | | | 48,433,688 | |
| | | | | | | | | | | | | | | | |
TOTAL SHORT-TERM INVESTMENTS (Cost $ 48,431,847) | | | | | | | | | | | | | | | 48,433,688 | |
| | | | | | | | | | | | | | | | |
TOTAL PURCHASED OPTIONS — 0.6%
(Cost $ 460,084) | | | | | | | | | | | | | | | 438,968 | |
| | | | | | | | | | | | | | | | |
TOTAL INVESTMENTS — 65.2%
(Cost $ 48,891,931) | | | | | | | | | | | | | | | 48,872,656 | |
| | | | | | | | | | | | | | | | |
| | | | |
OTHER ASSETSIN EXCESSOF LIABILITIES — 34.8% | | | | | | | | | | | | | | | 26,041,279 | |
| �� | | | | | | | | | | | | | | | |
NET ASSETS — 100.0% | | | | | | | | | | | | | | $ | 74,913,935 | |
| | | | | | | | | | | | | | | | |
*Short-term investments reflect the annualized effective yield on the date of purchase for discounted investments.
The accompanying notes are an integral part of the financial statements.
8
ABBEY CAPITAL FUTURES STRATEGY FUND
CONSOLIDATED PORTFOLIO OF INVESTMENTS (CONTINUED)
FEBRUARY 28, 2015
(UNAUDITED)
FUTURES CONTRACTS
| | | | | | | | | | | | |
| | | | | | | | | | UNREALZED | |
| | | EXPIRATION | | NUMBER OF | | NOTIONAL | | | APPRECIATION | |
LONG CONTRACTS | | DATE | | CONTRACTS | | COST | | | (DEPRECIATION) | |
10-Year Mini Japanese Government Bond Futures | | 03/10/15 | | 35 | | $ | 4,321,638 | | | $ | 5,927 | |
10-Year Mini Japanese Government Bond Futures | | 06/10/15 | | 1 | | | 123,503 | | | | (75 | ) |
3-Month Euro Euribor | | 06/15/15 | | 5 | | | 1,396,399 | | | | 2,336 | |
3-Month Euro Euribor | | 09/14/15 | | 6 | | | 1,675,978 | | | | 2,588 | |
3-Month Euro Euribor | | 12/14/15 | | 79 | | | 22,092,276 | | | | 8,840 | |
3-Month Euro Euribor | | 03/14/16 | | 15 | | | 4,192,372 | | | | 4,043 | |
3-Month Euro Euribor | | 06/13/16 | | 54 | | | 15,091,454 | | | | 14,883 | |
3-Month Euro Euribor | | 09/19/16 | | 29 | | | 8,107,431 | | | | 4,420 | |
3-Month Euro Euribor | | 12/19/16 | | 15 | | | 4,193,253 | | | | 1,483 | |
3-Month Euro Euribor | | 03/13/17 | | 7 | | | 1,956,215 | | | | 839 | |
3-Month Euro Euribor | | 06/19/17 | | 2 | | | 558,627 | | | | 336 | |
3-Month Euro Euribor | | 09/18/17 | | 2 | | | 558,277 | | | | 462 | |
3-Month Euro Euribor | | 12/18/17 | | 1 | | | 279,118 | | | | 126 | |
90-DAY Bank Bill | | 06/11/15 | | 21 | | | 16,319,911 | | | | 7,015 | |
90-DAY Bank Bill | | 09/10/15 | | 22 | | | 17,099,194 | | | | 9,401 | |
90-DAY Bank Bill | | 12/10/15 | | 25 | | | 19,431,860 | | | | 10,203 | |
90-DAY Bank Bill | | 03/10/16 | | 6 | | | 4,664,950 | | | | 916 | |
90-DAY Eurodollar Futures | | 06/15/15 | | 9 | | | 2,239,563 | | | | 2,000 | |
90-DAY Eurodollar Futures | | 09/14/15 | | 9 | | | 2,237,738 | | | | (225 | ) |
90-DAY Eurodollar Futures | | 12/14/15 | | 132 | | | 32,740,705 | | | | 5,195 | |
90-DAY Eurodollar Futures | | 03/14/16 | | 9 | | | 2,227,850 | | | | (125 | ) |
90-DAY Eurodollar Futures | | 06/13/16 | | 54 | | | 13,347,763 | | | | (11,113 | ) |
90-DAY Eurodollar Futures | | 09/19/16 | | 10 | | | 2,464,313 | | | | 188 | |
90-DAY Eurodollar Futures | | 03/13/17 | | 2 | | | 490,125 | | | | 1,025 | |
90-DAY Eurodollar Futures | | 06/19/17 | | 1 | | | 244,750 | | | | 475 | |
90-DAY Eurodollar Futures | | 09/18/17 | | 1 | | | 244,013 | | | | 925 | |
90-DAY Eurodollar Futures | | 12/18/17 | | 1 | | | 244,163 | | | | 513 | |
90-Day Eurodollar Futures | | 03/19/18 | | 1 | | | 244,850 | | | | (375 | ) |
90-Day Eurodollar Futures | | 06/18/18 | | 1 | | | 244,063 | | | | 225 | |
90-DAY Sterling Futures | | 06/17/15 | | 7 | | | 1,339,138 | | | | 3,628 | |
90-DAY Sterling Futures | | 09/16/15 | | 13 | | | 2,487,398 | | | | 4,303 | |
90-DAY Sterling Futures | | 12/16/15 | | 75 | | | 14,360,111 | | | | (3,725 | ) |
90-DAY Sterling Futures | | 03/16/16 | | 22 | | | 4,203,410 | | | | 1,428 | |
90-DAY Sterling Futures | | 06/15/16 | | 70 | | | 13,368,031 | | | | (9,263 | ) |
90-DAY Sterling Futures | | 09/21/16 | | 18 | | | 3,432,294 | | | | (2,393 | ) |
90-DAY Sterling Futures | | 12/21/16 | | 16 | | | 3,050,036 | | | | (5,249 | ) |
90-DAY Sterling Futures | | 03/15/17 | | 3 | | | 570,705 | | | | (444 | ) |
90-DAY Sterling Futures | | 06/21/17 | | 2 | | | 379,749 | | | | 39 | |
90-DAY Sterling Futures | | 09/20/17 | | 2 | | | 380,193 | | | | (791 | ) |
90-DAY Sterling Futures | | 12/20/17 | | 1 | | | 190,203 | | | | (675 | ) |
Amsterdam Index Futures | | 03/20/15 | | 5 | | | 522,007 | | | | 19,386 | |
Australian 10-Year Bond Futures | | 03/16/15 | | 36 | | | 3,656,642 | | | | 46,137 | |
Australian 3-Year Bond Futures | | 03/16/15 | | 8 | | | 695,623 | | | | 6,427 | |
Bank Acceptance Futures | | 03/16/15 | | 1 | | | 198,094 | | | | (20 | ) |
Bank Acceptance Futures | | 06/15/15 | | 14 | | | 2,778,018 | | | | (2,320 | ) |
Bank Acceptance Futures | | 09/14/15 | | 17 | | | 3,374,660 | | | | (2,810 | ) |
Bank Acceptance Futures | | 12/14/15 | | 24 | | | 4,764,589 | | | | (3,610 | ) |
Bank Acceptance Futures | | 03/14/16 | | 3 | | | 595,332 | | | | (300 | ) |
Bank Acceptance Futures | | 06/13/16 | | 1 | | | 198,224 | | | | 40 | |
CAC 40 10 Euro Futures | | 03/20/15 | | 50 | | | 2,688,145 | | | | 82,328 | |
Canadian 10-Year Bond Futures | | 06/30/15 | | 93 | | | 10,594,192 | | | | 91,769 | |
Canola Futures (Winnipeg Commodity Exchange) | | 05/14/15 | | 15 | | | 110,366 | | | | 2,257 | |
Canola Futures (Winnipeg Commodity Exchange) | | 07/14/15 | | 18 | | | 131,791 | | | | 3,126 | |
Canola Futures (Winnipeg Commodity Exchange) | | 11/13/15 | | 14 | | | 100,626 | | | | 2,093 | |
Cocoa Futures | | 03/16/15 | | 1 | | | 31,124 | | | | 293 | |
Cocoa Futures | | 05/13/15 | | 4 | | | 119,440 | | | | 1,200 | |
Cocoa Futures | | 07/16/15 | | 1 | | | 29,740 | | | | 240 | |
The accompanying notes are an integral part of the financial statements.
9
ABBEY CAPITAL FUTURES STRATEGY FUND
CONSOLIDATED PORTFOLIO OF INVESTMENTS (CONTINUED)
FEBRUARY 28, 2015
(UNAUDITED)
| | | | | | | | | | | | |
| | | | | | | | | | UNREALZED | |
| | | EXPIRATION | | NUMBER OF | | NOTIONAL | | | APPRECIATION | |
LONG CONTRACTS | | DATE | | CONTRACTS | | COST | | | (DEPRECIATION) | |
Cocoa Futures (Intercontinental Exchange) | | 09/15/15 | | 1 | | $ | 30,491 | | | $ | 293 | |
Cocoa Futures (London International Financials Futures Exchange) | | 05/13/15 | | 17 | | | 515,122 | | | | 16,612 | |
Cocoa Futures (London International Financials Futures Exchange) | | 07/16/15 | | 11 | | | 337,425 | | | | 4,091 | |
Cotton No. 2 Futures | | 05/20/15 | | 4 | | | 131,025 | | | | (1,165 | ) |
Cotton No.2 Futures | | 07/09/15 | | 3 | | | 97,915 | | | | (85 | ) |
DAX Index Futures | | 03/20/15 | | 10 | | | 2,957,199 | | | | 227,739 | |
Dow Jones Industrial Average E-Mini Chicago Board of Trade | | 03/20/15 | | 23 | | | 2,033,210 | | | | 51,395 | |
EUR/CHF 3-Month Futures | | 12/14/15 | | 9 | | | 2,375,833 | | | | 4,799 | |
EUR/CHF 3-Month Futures (Intercontinental Exchange) | | 03/14/16 | | 3 | | | 793,229 | | | | — | |
EUR/CHF 3-Month Futures (London International Financials Futures Exchange) | | 06/15/15 | | 4 | | | 1,057,822 | | | | 551 | |
EUR/CHF 3-Month Futures (London International Financials Futures Exchange) | | 09/14/15 | | 9 | | | 2,380,474 | | | | 865 | |
Euro BUXL 30-Year Bond Futures | | 03/06/15 | | 1 | | | 184,754 | | | | 1,791 | |
Euro BUXL 30-Year Bond Futures | | 06/08/15 | | 1 | | | 184,262 | | | | 962 | |
Euro STOXX 50 | | 03/20/15 | | 41 | | | 1,544,639 | | | | 102,482 | |
Euro-Bobl Futures | | 03/06/15 | | 88 | | | 12,843,334 | | | | 74,730 | |
Euro-Bobl Futures | | 06/08/15 | | 55 | | | 7,962,803 | | | | (1,030 | ) |
Euro-Bund Futures | | 06/08/15 | | 24 | | | 4,220,978 | | | | 2,563 | |
Euro-Schatz Futures | | 03/06/15 | | 43 | | | 5,351,699 | | | | 4,655 | |
Euro-Schatz Futures | | 06/08/15 | | 7 | | | 871,081 | | | | (17 | ) |
FTSE 100 Index Futures | | 03/20/15 | | 12 | | | 1,251,447 | | | | 30,568 | |
FTSE 250 Y2 | | 03/20/15 | | 5 | | | 250,073 | | | | 15,778 | |
FTSE/JSE Top 40 | | 03/19/15 | | 6 | | | 237,185 | | | | 5,073 | |
FTSE/MIB Index Futures | | 03/20/15 | | 2 | | | 233,041 | | | | 16,998 | |
GBP/AUD Futures | | 03/16/15 | | 3 | | | 579,127 | | | | 464 | |
GBP/CAD Futures | | 03/16/15 | | 2 | | | 378,170 | | | | 8,289 | |
GBP/JPY Futures | | 03/16/15 | | 2 | | | 382,842 | | | | 3,302 | |
GBP/NZD Futures | | 03/16/15 | | 1 | | | 195,331 | | | | (2,099 | ) |
Hang Seng Index Futures | | 03/30/15 | | 14 | | | 2,233,135 | | | | 4,648 | |
H-Shares Index Futures | | 03/30/15 | | 3 | | | 233,664 | | | | 3,198 | |
IBEX 35 Index Futures | | 03/20/15 | | 3 | | | 362,509 | | | | 11,979 | |
JPY 10-Year Bond (Osaka Securities Exchange) | | 03/11/15 | | 4 | | | 4,915,611 | | | | 29,843 | |
Long Gilt Futures | | 06/30/15 | | 36 | | | 6,594,646 | | | | (4,678 | ) |
Mill Wheat Euro | | 05/11/15 | | 1 | | | 11,148 | | | | (643 | ) |
Mini HSI Index Futures | | 03/30/15 | | 8 | | | 255,610 | | | | 137 | |
MSCI Singapore Exchange ETS | | 03/30/15 | | 7 | | | 396,096 | | | | (3,683 | ) |
MSCI Taiwan Index | | 03/30/15 | | 7 | | | 251,240 | | | | (570 | ) |
Nasdaq 100 E-Mini | | 03/20/15 | | 45 | | | 3,888,985 | | | | 109,265 | |
Nikkei 225 (Chicago Mercantile Exchange) | | 03/12/15 | | 2 | | | 176,275 | | | | 12,525 | |
Nikkei 225 (Singapore Exchange) | | 03/12/15 | | 30 | | | 2,227,482 | | | | 131,766 | |
Nikkei 225 Mini | | 03/12/15 | | 32 | | | 473,277 | | | | 30,163 | |
Rapeseed Euro | | 04/30/15 | | 6 | | | 120,297 | | | | 3,329 | |
Russell 2000 Mini | | 03/20/15 | | 9 | | | 1,089,205 | | | | 19,235 | |
S&P 500 E-Mini Futures | | 03/20/15 | | 24 | | | 2,520,542 | | | | 2,818 | |
S&P Mid 400 E-Mini | | 03/20/15 | | 4 | | | 573,230 | | | | 28,610 | |
S&P/TSX 60 IX Futures | | 03/19/15 | | 11 | | | 1,526,294 | | | | 38,397 | |
SGX CNX Nifty | | 03/26/15 | | 18 | | | 322,016 | | | | (1,832 | ) |
Soybean Meal Futures | | 05/14/15 | | 8 | | | 271,240 | | | | 2,680 | |
Soybean Meal Futures | | 07/14/15 | | 3 | | | 101,550 | | | | 150 | |
SPI 200 Futures | | 03/19/15 | | 5 | | | 552,686 | | | | 24,966 | |
Topix Index Futures | | 03/12/15 | | 10 | | | 1,191,231 | | | | 84,004 | |
U.S. Long Bond (Chicago Board of Trade) | | 06/19/15 | | 11 | | | 1,768,906 | | | | 11,375 | |
U.S. Treasury 2-Year Notes (Chicago Board of Trade) | | 06/30/15 | | 12 | | | 2,620,391 | | | | 2,547 | |
U.S. Treasury 5-Year Notes (Chicago Board of Trade) | | 06/30/15 | | 49 | | | 5,834,328 | | | | 10,453 | |
The accompanying notes are an integral part of the financial statements.
10
ABBEY CAPITAL FUTURES STRATEGY FUND
CONSOLIDATED PORTFOLIO OF INVESTMENTS (CONTINUED)
FEBRUARY 28, 2015
(UNAUDITED)
| | | | | | | | | | | | |
| | | | | | | | | | UNREALZED | |
| | | EXPIRATION | | NUMBER OF | | NOTIONAL | | | APPRECIATION | |
LONG CONTRACTS | | DATE | | CONTRACTS | | COST | | | (DEPRECIATION) | |
USD/NOK Futures | | 03/16/15 | | 1 | | $ | 100,169 | | | $ | (165 | ) |
USD/SEK Futures | | 03/16/15 | | 1 | | | 96,473 | | | | 3,566 | |
| | | | | | | | | | | | |
| | | | | | $ | 343,470,980 | | | $ | 1,429,232 | |
| | | | | | | | | | | | |
| | | | |
| | | | | | | | | | UNREALZED | |
| | | EXPIRATION | | NUMBER OF | | NOTIONAL | | | APPRECIATION | |
SHORT CONTRACTS | | DATE | | CONTRACTS | | COST | | | (DEPRECIATION) | |
90-DAY Eurodollar Futures | | 12/19/16 | | 87 | | $ | (21,386,080 | ) | | $ | (12,657 | ) |
AUD/JPY X-Rate | | 03/16/15 | | 1 | | | (154,115 | ) | | | (2,073 | ) |
AUD/NZD X-Rate | | 03/16/15 | | 3 | | | (475,217 | ) | | | 6,309 | |
AUD/USD Currency Futures | | 03/16/15 | | 43 | | | (3,384,940 | ) | | | 29,220 | |
Brent Crude Futures | | 03/16/15 | | 3 | | | (167,730 | ) | | | (20,010 | ) |
CAD Currency Futures | | 03/17/15 | | 30 | | | (2,401,560 | ) | | | 5,160 | |
CAD/JPY X-Rate | | 03/16/15 | | 1 | | | (157,409 | ) | | | (2,458 | ) |
CHF Currency Futures | | 03/16/15 | | 1 | | | (131,500 | ) | | | 512 | |
Coffee ’C’ Future | | 05/29/15 | | 10 | | | (583,088 | ) | | | 56,213 | |
Coffee ’C’ Future | | 07/21/15 | | 1 | | | (63,994 | ) | | | 10,181 | |
Copper Futures | | 05/27/15 | | 10 | | | (644,552 | ) | | | (28,323 | ) |
Copper Futures | | 07/29/15 | | 1 | | | (64,825 | ) | | | (2,363 | ) |
Corn Futures | | 05/14/15 | | 23 | | | (446,950 | ) | | | (5,288 | ) |
Corn Futures | | 07/14/15 | | 3 | | | (59,225 | ) | | | (963 | ) |
Corn Futures | | 09/14/15 | | 2 | | | (40,412 | ) | | | (412 | ) |
Corn Futures | | 12/14/15 | | 2 | | | (41,013 | ) | | | (738 | ) |
Dollar Index | | 03/16/15 | | 4 | | | (403,593 | ) | | | 22,309 | |
E-Mini Crude Oil | | 03/19/15 | | 1 | | | (28,400 | ) | | | 3,520 | |
E-Mini Crude Oil | | 04/20/15 | | 1 | | | (23,700 | ) | | | (2,370 | ) |
E-Mini Crude Oil | | 05/18/15 | | 1 | | | (27,175 | ) | | | 255 | |
E-Mini Natural Gas | | 03/26/15 | | 3 | | | (24,288 | ) | | | 3,783 | |
E-Mini Natural Gas | | 04/27/15 | | 4 | | | (29,063 | ) | | | 1,353 | |
E-Mini Natural Gas | | 05/26/15 | | 5 | | | (34,838 | ) | | | (313 | ) |
EUR/AUD Futures | | 03/16/15 | | 1 | | | (139,241 | ) | | | (874 | ) |
EUR/CAD Futures | | 03/16/15 | | 1 | | | (140,989 | ) | | | 850 | |
EUR/CHF Futures | | 03/16/15 | | 1 | | | (129,071 | ) | | | (11,001 | ) |
EUR/GBP Futures | | 03/16/15 | | 4 | | | (585,333 | ) | | | 25,493 | |
EUR/JPY Futures | | 03/16/15 | | 9 | | | (1,268,140 | ) | | | 7,858 | |
EUR/JPY Futures | | 03/16/15 | | 1 | | | (139,864 | ) | | | (167 | ) |
Euro E-Mini Futures | | 03/16/15 | | 4 | | | (284,525 | ) | | | 4,650 | |
Euro Foreign Exchange Currency Futures | | 03/16/15 | | 152 | | | (22,299,451 | ) | | | 1,028,951 | |
Euro-Bund Future | | 03/10/15 | | 24 | | | (4,311,553 | ) | | | 28,927 | |
Gas Oil Futures (Intercontinental Exchange) | | 04/10/15 | | 4 | | | (224,275 | ) | | | (8,025 | ) |
Gasoline RBOB Futures | | 03/31/15 | | 5 | | | (388,815 | ) | | | (26,544 | ) |
GBP Currency Futures | | 03/16/15 | | 3 | | | (280,131 | ) | | | (9,294 | ) |
GBP/CHF Futures | | 03/16/15 | | 1 | | | (172,484 | ) | | | (20,651 | ) |
Gold 100 Oz Futures | | 04/28/15 | | 17 | | | (2,075,320 | ) | | | 13,050 | |
Gold 100 Oz Futures | | 06/26/15 | | 1 | | | (120,980 | ) | | | (420 | ) |
JPY Currency Futures | | 03/16/15 | | 36 | | | (3,783,832 | ) | | | 24,533 | |
JPY E-Mini Futures | | 03/16/15 | | 9 | | | (474,331 | ) | | | 4,419 | |
KC HRW Wheat Futures | | 05/14/15 | | 6 | | | (164,513 | ) | | | 2,663 | |
KC HRW Wheat Futures | | 07/14/15 | | 10 | | | (280,500 | ) | | | 7,500 | |
Lean Hogs Futures | | 04/15/15 | | 7 | | | (219,020 | ) | | | 30,090 | |
Lean Hogs Futures | | 06/12/15 | | 3 | | | (102,900 | ) | | | 3,450 | |
Lean Hogs Futures | | 07/15/15 | | 1 | | | (33,040 | ) | | | (230 | ) |
Live Cattle Futures | | 04/30/15 | | 1 | | | (60,500 | ) | | | (180 | ) |
Live Cattle Futures | | 06/30/15 | | 1 | | | (57,430 | ) | | | (110 | ) |
Live Cattle Futures | | 08/31/15 | | 3 | | | (170,950 | ) | | | 490 | |
London Mercantile Exchange Aluminum Forward | | 03/18/15 | | 12 | | | (488,876 | ) | | | (53,899 | ) |
London Mercantile Exchange Aluminum Forward | | 04/15/15 | | 5 | | | (222,897 | ) | | | (3,603 | ) |
London Mercantile Exchange Aluminum Forward | | 05/20/15 | | 4 | | | (179,775 | ) | | | (1,625 | ) |
The accompanying notes are an integral part of the financial statements.
11
ABBEY CAPITAL FUTURES STRATEGY FUND
CONSOLIDATED PORTFOLIO OF INVESTMENTS (CONTINUED)
FEBRUARY 28, 2015
(UNAUDITED)
| | | | | | | | | | | | |
| | | | | | | | | | UNREALZED | |
| | | EXPIRATION | | NUMBER OF | | NOTIONAL | | | APPRECIATION | |
SHORT CONTRACTS | | DATE | | CONTRACTS | | COST | | | (DEPRECIATION) | |
London Mercantile Exchange Aluminum Forward | | 06/17/15 | | 17 | | $ | (769,889 | ) | | $ | (3,080 | ) |
London Mercantile Exchange Copper Forward | | 03/18/15 | | 2 | | | (473,176 | ) | | | 177,276 | |
London Mercantile Exchange Copper Forward | | 04/15/15 | | 2 | | | (273,277 | ) | | | (22,198 | ) |
London Mercantile Exchange Copper Forward | | 05/20/15 | | 1 | | | (137,869 | ) | | | (9,644 | ) |
London Mercantile Exchange Copper Forward | | 06/17/15 | | 4 | | | (563,250 | ) | | | (26,100 | ) |
London Mercantile Exchange Lead Forward | | 03/18/15 | | 2 | | | (98,243 | ) | | | 12,218 | |
London Mercantile Exchange Lead Forward | | 04/15/15 | | 5 | | | (228,812 | ) | | | 13,312 | |
London Mercantile Exchange Lead Forward | | 05/20/15 | | 4 | | | (183,056 | ) | | | 10,356 | |
London Mercantile Exchange Lead Forward | | 06/17/15 | | 3 | | | (132,475 | ) | | | 2,875 | |
London Mercantile Exchange Nickel Forward | | 03/18/15 | | 1 | | | (86,796 | ) | | | 2,505 | |
London Mercantile Exchange Nickel Forward | | 04/15/15 | | 3 | | | (265,802 | ) | | | 12,596 | |
London Mercantile Exchange Nickel Forward | | 05/20/15 | | 1 | | | (88,770 | ) | | | 4,230 | |
London Mercantile Exchange Nickel Forward | | 06/17/15 | | 1 | | | (85,578 | ) | | | 918 | |
London Mercantile Exchange Tin Forward Spot | | 04/15/15 | | 2 | | | (184,525 | ) | | | 5,125 | |
London Mercantile Exchange Tin Forward Spot | | 05/20/15 | | 2 | | | (185,580 | ) | | | 6,080 | |
London Mercantile Exchange Tin Forward Spot | | 06/17/15 | | 2 | | | (179,945 | ) | | | 365 | |
London Mercantile Exchange Zinc Forward ($) | | 03/18/15 | | 2 | | | (94,501 | ) | | | (8,086 | ) |
London Mercantile Exchange Zinc Forward ($) | | 04/15/15 | | 4 | | | (210,850 | ) | | | 5,100 | |
London Mercantile Exchange Zinc Forward ($) | | 05/20/15 | | 3 | | | (158,106 | ) | | | 3,381 | |
London Mercantile Exchange Zinc Forward ($) | | 06/17/15 | | 10 | | | (518,300 | ) | | | 1,550 | |
MXN Futures | | 03/16/15 | | 11 | | | (372,010 | ) | | | 4,060 | |
Natural Gas Futures | | 03/27/15 | | 19 | | | (532,740 | ) | | | 13,280 | |
Natural Gas Futures | | 04/28/15 | | 1 | | | (35,900 | ) | | | 8,190 | |
Natural Gas Futures | | 05/27/15 | | 1 | | | (35,080 | ) | | | 6,960 | |
Natural Gas Futures | | 06/26/15 | | 1 | | | (30,180 | ) | | | 1,540 | |
Natural Gas Futures | | 07/29/15 | | 1 | | | (30,740 | ) | | | 1,940 | |
Natural Gas Futures | | 08/27/15 | | 1 | | | (30,080 | ) | | | 1,380 | |
Natural Gas Futures | | 09/28/15 | | 2 | | | (71,040 | ) | | | 13,080 | |
Natural Gas Futures | | 10/28/15 | | 1 | | | (31,480 | ) | | | 1,510 | |
Natural Gas Futures | | 11/25/15 | | 1 | | | (31,180 | ) | | | (390 | ) |
New York Harbor Ultra-Low Sulfur Diesel Futures | | 03/31/15 | | 4 | | | (306,016 | ) | | | (25,565 | ) |
Nikkei 225 (Osaka Securities Exchange) | | 03/12/15 | | 1 | | | (146,290 | ) | | | (11,034 | ) |
NZD Futures | | 03/16/15 | | 4 | | | (303,290 | ) | | | 1,170 | |
Palladium Futures | | 06/26/15 | | 1 | | | (78,040 | ) | | | (3,910 | ) |
Platinum Futures | | 04/28/15 | | 4 | | | (242,075 | ) | | | 4,955 | |
Red Wheat Futures (Minneapolis Grain Exchange) | | 05/14/15 | | 1 | | | (28,275 | ) | | | (50 | ) |
Red Wheat Futures (Minneapolis Grain Exchange) | | 07/14/15 | | 1 | | | (28,050 | ) | | | (575 | ) |
Robusta Coffee Futures | | 05/29/15 | | 6 | | | (116,480 | ) | | | 2,060 | |
Robusta Coffee Futures | | 07/31/15 | | 4 | | | (78,010 | ) | | | 850 | |
Silver Futures | | 05/27/15 | | 9 | | | (736,030 | ) | | | (9,080 | ) |
Soybean Futures | | 05/14/15 | | 8 | | | (396,450 | ) | | | (16,250 | ) |
Soybean Futures | | 07/14/15 | | 3 | | | (147,562 | ) | | | (7,650 | ) |
Soybean Oil Futures | | 05/14/15 | | 13 | | | (247,656 | ) | | | (9,354 | ) |
Soybean Oil Futures | | 07/14/15 | | 6 | | | (116,262 | ) | | | (2,934 | ) |
Sugar No. 11 (World) | | 04/30/15 | | 28 | | | (466,413 | ) | | | 34,586 | |
Sugar No. 11 (World) | | 06/30/15 | | 11 | | | (188,272 | ) | | | 15,176 | |
Sugar No. 11 (World) | | 09/30/15 | | 10 | | | (170,117 | ) | | | 5,253 | |
U.S. Treasury 10-Year Notes (Chicago Board of Trade) | | 06/19/15 | | 11 | | | (1,442,594 | ) | | | 36,828 | |
Wheat Futures (Chicago Board of Trade) | | 05/14/15 | | 11 | | | (285,937 | ) | | | 3,787 | |
Wheat Futures (Chicago Board of Trade) | | 07/14/15 | | 13 | | | (342,137 | ) | | | 6,250 | |
Wheat Futures (Chicago Board of Trade) | | 09/14/15 | | 2 | | | (52,112 | ) | | | (387 | ) |
White Sugar Futures (London International Financials Futures Exchange) | | 04/15/15 | | 6 | | | (115,945 | ) | | | 4,405 | |
White Sugar Futures (London International Financials Futures Exchange) | | 07/16/15 | | 1 | | | (19,315 | ) | | | 515 | |
WTI Crude Futures | | 03/20/15 | | 5 | | | (256,190 | ) | | | 7,390 | |
| | | | | | | | | | | | |
| | | | | | $ | (82,001,151 | ) | | $ | 1,383,913 | |
| | | | | | | | | | | | |
The accompanying notes are an integral part of the financial statements.
12
ABBEY CAPITAL FUTURES STRATEGY FUND
CONSOLIDATED PORTFOLIO OF INVESTMENTS (CONTINUED)
FEBRUARY 28, 2015
(UNAUDITED)
| | | | | | | | | | | | |
| | | | | | | | | | UNREALZED | |
| | | EXPIRATION | | NUMBER OF | | NOTIONAL | | | APPRECIATION | |
SHORT CONTRACTS | | DATE | | CONTRACTS | | COST | | | (DEPRECIATION) | |
Total Futures Contracts | | | | | | $ | $261,469,829 | | | $ | $2,813,145 | |
| | | | | | | | | | | | |
Forward foreign currency contracts outstanding as of February 28, 2015 were as follows:
| | | | | | | | | | | | | | | | | | | | |
| | | | | | | | | | | | | | | | UNREALIZED | |
| | | | | | | | | | | | | | | | APPRECIATION | |
| CURRENCY PURCHASED | | | CURRENCY SOLD | | | EXPIRATION | | COUNTERPARTY | | (DEPRECIATION) | |
| |
| AUD | | | 79,367 | | | | USD | | | | 62,141 | | | 03/02/15 | | BOA | | $ | (123) | |
| AUD | | | 63,579 | | | | USD | | | | 49,658 | | | 03/03/15 | | BOA | | | 23 | |
| AUD | | | 1,700,000 | | | | USD | | | | 1,327,097 | | | 03/16/15 | | BOA | | | 143 | |
| AUD | | | 3,698,584 | | | | USD | | | | 2,989,936 | | | 03/18/15 | | BOA | | | (102,727) | |
| AUD | | | 1,695,000 | | | | USD | | | | 1,327,552 | | | 03/20/15 | | BOA | | | (4,567) | |
| AUD | | | 548,000 | | | | USD | | | | 429,585 | | | 03/27/15 | | BOA | | | (2,058) | |
| BRL | | | 1,442,492 | | | | USD | | | | 533,892 | | | 03/18/15 | | BOA | | | (28,353) | |
| CAD | | | 14,234 | | | | USD | | | | 11,384 | | | 03/02/15 | | BOA | | | 2 | |
| CAD | | | 749,480 | | | | USD | | | | 600,000 | | | 03/16/15 | | BOA | | | (582) | |
| CAD | | | 877,166 | | | | USD | | | | 721,621 | | | 03/18/15 | | BOA | | | (20,104) | |
| CAD | | | 3,066,000 | | | | USD | | | | 2,454,735 | | | 03/20/15 | | BOA | | | (2,764) | |
| CHF | | | 1,029,000 | | | | USD | | | | 1,103,533 | | | 03/20/15 | | BOA | | | (23,339) | |
| CLP | | | 15,488,214 | | | | USD | | | | 24,882 | | | 03/18/15 | | BOA | | | 185 | |
| CZK | | | 2,633,137 | | | | USD | | | | 110,837 | | | 03/18/15 | | BOA | | | (3,804) | |
| EUR | | | 74,236 | | | | USD | | | | 83,306 | | | 03/02/15 | | BOA | | | (233) | |
| EUR | | | 104,847 | | | | USD | | | | 117,647 | | | 03/03/15 | | BOA | | | (318) | |
| EUR | | | 500,000 | | | | USD | | | | 564,256 | | | 03/16/15 | | BOA | | | (4,636) | |
| EUR | | | 1,824,124 | | | | USD | | | | 2,162,530 | | | 03/18/15 | | BOA | | | (120,844) | |
| EUR | | | 1,692,000 | | | | USD | | | | 1,917,429 | | | 03/20/15 | | BOA | | | (23,574) | |
| GBP | | | 20,494 | | | | USD | | | | 31,785 | | | 03/02/15 | | BOA | | | (146) | |
| GBP | | | 29,174 | | | | USD | | | | 45,090 | | | 03/03/15 | | BOA | | | (50) | |
| GBP | | | 2,750,000 | | | | USD | | | | 4,199,790 | | | 03/16/15 | | BOA | | | 45,381 | |
| GBP | | | 759,418 | | | | USD | | | | 1,162,575 | | | 03/18/15 | | BOA | | | 9,719 | |
| GBP | | | 868,000 | | | | USD | | | | 1,331,796 | | | 03/20/15 | | BOA | | | 8,093 | |
| HUF | | | 33,729,275 | | | | USD | | | | 124,895 | | | 03/18/15 | | BOA | | | (340) | |
| INR | | | 34,897,917 | | | | USD | | | | 556,905 | | | 03/18/15 | | BOA | | | 5,610 | |
| JPY | | | 22,830,997 | | | | EUR | | | | 171,000 | | | 03/27/15 | | BOA | | | (495) | |
| JPY | | | 5,862,084 | | | | USD | | | | 49,133 | | | 03/02/15 | | BOA | | | (129) | |
| JPY | | | 6,658,335 | | | | USD | | | | 55,684 | | | 03/03/15 | | BOA | | | (24) | |
| JPY | | | 148,609,311 | | | | USD | | | | 1,250,000 | | | 03/16/15 | | BOA | | | (7,466) | |
| JPY | | | 143,448,486 | | | | USD | | | | 1,211,842 | | | 03/18/15 | | BOA | | | (12,423) | |
| JPY | | | 89,635,000 | | | | USD | | | | 755,862 | | | 03/20/15 | | BOA | | | (6,373) | |
| KRW | | | 341,971,228 | | | | USD | | | | 313,557 | | | 03/18/15 | | BOA | | | (2,185) | |
| MXN | | | 7,518,075 | | | | USD | | | | 509,710 | | | 03/18/15 | | BOA | | | (6,667) | |
| MXN | | | 1,332,000 | | | | USD | | | | 90,162 | | | 03/20/15 | | BOA | | | (1,051) | |
| MYR | | | 205,694 | | | | USD | | | | 57,201 | | | 03/18/15 | | BOA | | | (204) | |
| NOK | | | 304,637 | | | | USD | | | | 40,296 | | | 03/02/15 | | BOA | | | (558) | |
| NOK | | | 128,373 | | | | USD | | | | 16,805 | | | 03/03/15 | | BOA | | | (59) | |
| NOK | | | 7,604,975 | | | | USD | | | | 1,000,000 | | | 03/16/15 | | BOA | | | (8,362) | |
| NOK | | | 6,578,187 | | | | USD | | | | 878,005 | | | 03/18/15 | | BOA | | | (20,305) | |
| NZD | | | 72,340 | | | | USD | | | | 54,746 | | | 03/02/15 | | BOA | | | (28) | |
| NZD | | | 155,382 | | | | USD | | | | 117,382 | | | 03/03/15 | | BOA | | | 149 | |
The accompanying notes are an integral part of the financial statements.
13
ABBEY CAPITAL FUTURES STRATEGY FUND
CONSOLIDATED PORTFOLIO OF INVESTMENTS (CONTINUED)
FEBRUARY 28, 2015
(UNAUDITED)
| | | | | | | | | | | | | | | | | | | | |
| | | | | | | | | | | | | | | | UNREALIZED | |
| | | | | | | | | | | | | | | | APPRECIATION | |
| CURRENCY PURCHASED | | | CURRENCY SOLD | | | EXPIRATION | | COUNTERPARTY | | (DEPRECIATION) | |
| |
| NZD | | | 4,400,000 | | | | USD | | | | 3,306,277 | | | 03/16/15 | | BOA | | $ | 17,060 | |
| NZD | | | 6,796,207 | | | | USD | | | | 5,151,712 | | | 03/18/15 | | BOA | | | (19,658) | |
| NZD | | | 1,007,000 | | | | USD | | | | 745,230 | | | 03/20/15 | | BOA | | | 15,021 | |
| NZD | | | 147,000 | | | | USD | | | | 111,111 | | | 03/27/15 | | BOA | | | (217) | |
| PLN | | | 1,729,190 | | | | USD | | | | 480,006 | | | 03/18/15 | | BOA | | | (13,814) | |
| RUB | | | 2,862,936 | | | | USD | | | | 47,048 | | | 03/18/15 | | BOA | | | (938) | |
| SEK | | | 124,392 | | | | USD | | | | 14,959 | | | 03/02/15 | | BOA | | | (38) | |
| SEK | | | 94,270 | | | | USD | | | | 11,293 | | | 03/03/15 | | BOA | | | 15 | |
| SEK | | | 5,585,550 | | | | USD | | | | 690,915 | | | 03/18/15 | | BOA | | | (20,829) | |
| SGD | | | 470,779 | | | | USD | | | | 350,537 | | | 03/18/15 | | BOA | | | (5,247) | |
| SGD | | | 1,183,000 | | | | USD | | | | 871,911 | | | 03/27/15 | | BOA | | | (4,468) | |
| TRY | | | 4,254,058 | | | | USD | | | | 1,796,191 | | | 03/18/15 | | BOA | | | (107,431) | |
| TWD | | | 8,272,397 | | | | USD | | | | 261,875 | | | 03/18/15 | | BOA | | | 1,541 | |
| USD | | | 62,479 | | | | AUD | | | | 79,367 | | | 03/02/15 | | BOA | | | 461 | |
| USD | | | 49,722 | | | | AUD | | | | 63,579 | | | 03/03/15 | | BOA | | | 41 | |
| USD | | | 907,665 | | | | AUD | | | | 1,161,000 | | | 03/06/15 | | BOA | | | 637 | |
| USD | | | 1,706,775 | | | | AUD | | | | 2,200,000 | | | 03/16/15 | | BOA | | | (10,829) | |
| USD | | | 1,904,409 | | | | AUD | | | | 2,396,101 | | | 03/18/15 | | BOA | | | 33,951 | |
| USD | | | 2,484,094 | | | | AUD | | | | 3,075,000 | | | 03/20/15 | | BOA | | | 83,989 | |
| USD | | | 215,176 | | | | AUD | | | | 278,000 | | | 03/27/15 | | BOA | | | (1,708) | |
| USD | | | 383,216 | | | | BRL | | | | 1,058,147 | | | 03/18/15 | | BOA | | | 12,376 | |
| USD | | | 11,402 | | | | CAD | | | | 14,234 | | | 03/02/15 | | BOA | | | 15 | |
| USD | | | 580,000 | | | | CAD | | | | 726,677 | | | 03/13/15 | | BOA | | | (1,207) | |
| USD | | | 4,250,000 | | | | CAD | | | | 5,309,918 | | | 03/16/15 | | BOA | | | 3,244 | |
| USD | | | 1,161,116 | | | | CAD | | | | 1,388,579 | | | 03/18/15 | | BOA | | | 50,595 | |
| USD | | | 2,500,521 | | | | CAD | | | | 2,984,000 | | | 03/20/15 | | BOA | | | 114,129 | |
| USD | | | 2,071,449 | | | | CHF | | | | 1,970,000 | | | 03/20/15 | | BOA | | | 3,441 | |
| USD | | | 18,106 | | | | CLP | | | | 11,272,494 | | | 03/18/15 | | BOA | | | (137) | |
| USD | | | 267,020 | | | | CZK | | | | 6,174,747 | | | 03/18/15 | | BOA | | | 16,027 | |
| USD | | | 84,221 | | | | EUR | | | | 74,236 | | | 03/02/15 | | BOA | | | 1,148 | |
| USD | | | 117,541 | | | | EUR | | | | 104,847 | | | 03/03/15 | | BOA | | | 212 | |
| USD | | | 1,409,607 | | | | EUR | | | | 1,250,000 | | | 03/16/15 | | BOA | | | 10,558 | |
| USD | | | 4,786,108 | | | | EUR | | | | 4,028,189 | | | 03/18/15 | | BOA | | | 277,479 | |
| USD | | | 1,838,936 | | | | EUR | | | | 1,562,000 | | | 03/20/15 | | BOA | | | 90,591 | |
| USD | | | 616,047 | | | | EUR | | | | 544,000 | | | 03/27/15 | | BOA | | | 7,091 | |
| USD | | | 31,601 | | | | GBP | | | | 20,494 | | | 03/02/15 | | BOA | | | (39) | |
| USD | | | 44,980 | | | | GBP | | | | 29,174 | | | 03/03/15 | | BOA | | | (60) | |
| USD | | | 615,083 | | | | GBP | | | | 400,000 | | | 03/16/15 | | BOA | | | (2,397) | |
| USD | | | 1,216,862 | | | | GBP | | | | 790,335 | | | 03/18/15 | | BOA | | | (3,157) | |
| USD | | | 2,568,047 | | | | GBP | | | | 1,665,000 | | | 03/20/15 | | BOA | | | (2,131) | |
| USD | | | 121,820 | | | | HUF | | | | 31,695,303 | | | 03/18/15 | | BOA | | | 4,775 | |
| USD | | | 245,719 | | | | INR | | | | 15,562,037 | | | 03/18/15 | | BOA | | | (5,124) | |
| USD | | | 49,329 | | | | JPY | | | | 5,862,084 | | | 03/02/15 | | BOA | | | 325 | |
| USD | | | 55,783 | | | | JPY | | | | 6,658,335 | | | 03/03/15 | | BOA | | | 123 | |
| USD | | | 580,000 | | | | JPY | | | | 69,263,426 | | | 03/13/15 | | BOA | | | 909 | |
| USD | | | 300,000 | | | | JPY | | | | 35,669,602 | | | 03/16/15 | | BOA | | | 1,764 | |
| USD | | | 2,710,724 | | | | JPY | | | | 323,101,426 | | | 03/18/15 | | BOA | | | 9,168 | |
| USD | | | 2,166,600 | | | | JPY | | | | 257,647,000 | | | 03/20/15 | | BOA | | | 12,266 | |
| USD | | | 750,762 | | | | JPY | | | | 89,652,000 | | | 03/27/15 | | BOA | | | 1,052 | |
The accompanying notes are an integral part of the financial statements.
14
ABBEY CAPITAL FUTURES STRATEGY FUND
CONSOLIDATED PORTFOLIO OF INVESTMENTS (CONTINUED)
FEBRUARY 28, 2015
(UNAUDITED)
| | | | | | | | | | | | | | | | | | | | |
| | | | | | | | | | | | | | | | UNREALIZED | |
| | | | | | | | | | | | | | | | APPRECIATION | |
| CURRENCY PURCHASED | | | CURRENCY SOLD | | | EXPIRATION | | COUNTERPARTY | | (DEPRECIATION) | |
| |
| USD | | | 331,922 | | | | KRW | | | | 365,917,569 | | | 03/18/15 | | BOA | | $ | (1,253) | |
| USD | | | 431,831 | | | | MXN | | | | 6,405,720 | | | 03/18/15 | | BOA | | | 3,217 | |
| USD | | | 844,011 | | | | MXN | | | | 12,413,000 | | | 03/20/15 | | BOA | | | 13,575 | |
| USD | | | 37,022 | | | | MYR | | | | 132,959 | | | 03/18/15 | | BOA | | | 180 | |
| USD | | | 39,845 | | | | NOK | | | | 304,637 | | | 03/02/15 | | BOA | | | 106 | |
| USD | | | 16,814 | | | | NOK | | | | 128,373 | | | 03/03/15 | | BOA | | | 68 | |
| USD | | | 600,000 | | | | NOK | | | | 4,569,262 | | | 03/16/15 | | BOA | | | 4,199 | |
| USD | | | 386,957 | | | | NOK | | | | 2,917,689 | | | 03/18/15 | | BOA | | | 6,533 | |
| USD | | | 54,819 | | | | NZD | | | | 72,340 | | | 03/02/15 | | BOA | | | 101 | |
| USD | | | 117,494 | | | | NZD | | | | 155,382 | | | 03/03/15 | | BOA | | | (38) | |
| USD | | | 73,774 | | | | NZD | | | | 100,000 | | | 03/16/15 | | BOA | | | (1,756) | |
| USD | | | 2,369,389 | | | | NZD | | | | 3,147,772 | | | 03/18/15 | | BOA | | | (7,604) | |
| USD | | | 1,390,970 | | | | NZD | | | | 1,838,000 | | | 03/20/15 | | BOA | | | 3,342 | |
| USD | | | 109,394 | | | | NZD | | | | 147,000 | | | 03/27/15 | | BOA | | | (1,499) | |
| USD | | | 398,748 | | | | PLN | | | | 1,410,612 | | | 03/18/15 | | BOA | | | 18,445 | |
| USD | | | 45,542 | | | | RUB | | | | 2,862,936 | | | 03/18/15 | | BOA | | | (569) | |
| USD | | | 14,929 | | | | SEK | | | | 124,392 | | | 03/02/15 | | BOA | | | 9 | |
| USD | | | 11,228 | | | | SEK | | | | 94,270 | | | 03/03/15 | | BOA | | | (80) | |
| USD | | | 1,450,000 | | | | SEK | | | | 12,128,497 | | | 03/16/15 | | BOA | | | (4,995) | |
| USD | | | 1,715,418 | | | | SEK | | | | 13,658,113 | | | 03/18/15 | | BOA | | | 76,884 | |
| USD | | | 284,323 | | | | SGD | | | | 378,504 | | | 03/18/15 | | BOA | | | 6,712 | |
| USD | | | 869,091 | | | | SGD | | | | 1,183,000 | | | 03/27/15 | | BOA | | | 1,648 | |
| USD | | | 1,228,950 | | | | TRY | | | | 2,947,078 | | | 03/18/15 | | BOA | | | 59,030 | |
| USD | | | 183,379 | | | | TWD | | | | 5,764,589 | | | 03/18/15 | | BOA | | | (182) | |
| USD | | | 721,105 | | | | ZAR | | | | 8,451,503 | | | 03/18/15 | | BOA | | | (1,287) | |
| ZAR | | | 15,888,652 | | | | USD | | | | 1,377,647 | | | 03/18/15 | | BOA | | | (19,565) | |
| | | | | | | | | | | | | | | | | | | | |
Total Forward Foreign Currency Contracts | | | | | | | $ | 390,210 | |
| | | | | | | | | | | | | | | | | | | | |
The accompanying notes are an integral part of the financial statements.
15
ABBEY CAPITAL FUTURES STRATEGY FUND
CONSOLIDATED PORTFOLIO OF INVESTMENTS (CONTINUED)
FEBRUARY 28, 2015
(UNAUDITED)
| | | | | | |
| | | NUMBER
OF
CONTRACTS | | VALUE | |
PURCHASED OPTIONS — 0.6% | | | | | | |
CALL OPTIONS PURCHASED — 0.3% | | | | | | |
Nikkei 225 Symbiotic Microfinance Index Expires 09/11/15 Strike Price 18,000 | | 34 | | $ | 214,587 | |
| | | | | | |
TOTAL CALL OPTIONS PURCHASED (Cost $ 121,109) | | | | | 214,587 | |
| | | | | | |
PUT OPTIONS PURCHASED — 0.3% | | | | | | |
90-Day Eurodollar Futures Expires 06/15/15 Strike Price 99.50 | | 424 | | | 15,900 | |
90-Day Eurodollar Futures Expires 03/16/15 Strike Price 99.63 | | 127 | | | 794 | |
AUD USD Currency Futures Expires 04/02/15 Strike Price 75 | | 23 | | | 6,900 | |
AUD USD Currency Futures Expires 03/06/15 Strike Price 75 | | 23 | | | 920 | |
Crude Oil Futures Expires 03/17/15 Strike Price 46 | | 39 | | | 42,120 | |
EUR Foreign Exchange Currency Expires 04/02/15 Strike Price 1.09 | | 34 | | | 16,575 | |
EUR Foreign Exchange Currency Expires 03/06/15 Strike Price 1.14 | | 28 | | | 75,250 | |
IMM Eurodollar Futures Expires 09/14/15 Strike Price 99.25 | | 265 | | | 26,500 | |
IMM Eurodollar Futures Expires 09/14/15 Strike Price 99 | | 187 | | | 5,844 | |
IMM Eurodollar Futures Expires 12/14/15 Strike Price 99.25 | | 70 | | | 31,062 | |
U.S. 10-Year Treasury Bond Futures Expires 03/27/15 Strike Price 125 | | 23 | | | 2,516 | |
| | | | | | |
TOTAL PUT OPTIONS PURCHASED | | | | | | |
(Cost $ 338,975) | | | | | 224,381 | |
| | | | | | |
TOTAL PURCHASED OPTIONS — 0.6% (Cost $ 460,084) | | | | | 438,968 | |
| | | | | | |
| | | | | | |
| | | NUMBER
OF
CONTRACTS | | VALUE | |
WRITTEN OPTIONS — (0.4)% | | | | | | |
CALL OPTIONS WRITTEN—(0.3)% | | | | | | |
IMM Eurodollar Futures Expires 12/14/15 Strike Price 99.25 | | 93 | | $ | (36,619 | ) |
Nikkei 225 Symbiotic Microfinance Index Expires 09/11/15 Strike Price 17,000 | | 17 | | | (155,256 | ) |
| | | | | | |
TOTAL CALL OPTIONS WRITTEN (Premiums Received $ 124,368) | | | | | (191,875 | ) |
| | | | | | |
PUT OPTIONS WRITTEN—(0.1)% | | | | | | |
90-Day Eurodollar Futures Expires 03/16/15 Strike Price 99.38 | | 71 | | | (444 | ) |
90-Day Eurodollar Futures Expires 06/15/15 Strike Price 99.38 | | 57 | | | (712 | ) |
90-Day Eurodollar Futures Expires 06/15/15 Strike Price 99.13 | | 42 | | | (263 | ) |
AUD USD Currency Futures Expires 04/02/15 Strike Price 71 | | 23 | | | (805 | ) |
Crude Oil Futures Expires 03/17/15 Strike Price 43 | | 39 | | | (21,060 | ) |
EUR Foreign Exchange Currency Expires 03/06/15 Strike Price 1.10 | | 28 | | | (4,550 | ) |
EUR Foreign Exchange Currency Expires 04/02/15 Strike Price 1.05 | | 17 | | | (1,062 | ) |
Eurodollar 1-Year MIDCV Expires 12/11/15 Strike Price 97.75 | | 93 | | | (22,669 | ) |
IMM Eurodollar Futures Expires 09/14/15 Strike Price 98.75 | | 452 | | | (8,475 | ) |
| | | | | | |
TOTAL PUT OPTIONS WRITTEN (Premiums Received $ 146,875) | | | | | (60,040 | ) |
| | | | | | |
TOTAL WRITTEN OPTIONS — (0.4)% (Premiums Received $ 271,243) | | | (251,915 | ) |
| | | | | | |
|
| The accompanying notes are an integral part of the financial statements. |
ABBEY CAPITAL FUTURES STRATEGY FUND
CONSOLIDATED PORTFOLIO OF INVESTMENTS (CONCLUDED)
FEBRUARY 28, 2015
(UNAUDITED)
| IBEX | Index of the Bolsa de Madrid |
| MSCI | Morgan Stanley Capital International |
| RBOB | Reformulated Blendstock for Oxygenate Blending |
| TSX | Toronto Stock Exchange |
|
| The accompanying notes are an integral part of the financial statements. |
ABBEY CAPITAL FUTURES STRATEGY FUND
CONSOLIDATED STATEMENT OF ASSETS AND LIABILITIES
FEBRUARY 28, 2015
(UNAUDITED)
| | | | |
ASSETS | | | | |
Investments, at value (cost $48,891,931) | | $ | 48,872,656 | |
Cash | | | 17,223,873 | |
Deposits with broker for forward foreign currency contracts and futures contracts | | | 1,513,654 | |
Receivables for: | | | | |
Capital shares sold | | | 4,654,840 | |
Variation margin | | | 2,813,145 | |
Prepaid expenses and other assets | | | 62,939 | |
Unrealized appreciation on forward foreign currency contracts | | | 1,033,358 | |
| | | | |
Total assets | | | 76,174,465 | |
| | | | |
LIABILITIES | | | | |
Options written, at value (premiums received $271,243) | | | 251,915 | |
Foreign currency, at value (cost $123,580) | | | 123,688 | |
Payables for: | | | | |
Capital shares redeemed | | | 93,452 | |
Advisory fees | | | 68,550 | |
Directors’ and officers’ fees | | | 1,670 | |
Administration and accounting services fees | | | 10,522 | |
Unrealized depreciation on forward foreign currency contracts | | | 643,148 | |
Other accrued expenses and liabilities | | | 67,585 | |
| | | | |
Total liabilities | | | 1,260,530 | |
| | | | |
Net Assets | | $ | 74,913,935 | |
| | | | |
| |
NET ASSETS CONSIST OF | | | | |
Capital stock, $0.001 par value | | $ | 6,038 | |
Paid-in capital | | | 66,691,160 | |
Accumulated net investment loss | | | (1,233,590 | ) |
Accumulated net realized gain from investments, futures transactions, foreign currency translations, forward foreign currency contracts and written options | | | 6,246,220 | |
Net unrealized appreciation on investments, futures transactions, foreign currency translations,forward foreign currency contracts and written options | | | 3,204,107 | |
| | | | |
Net assets | | $ | 74,913,935 | |
| | | | |
| |
CLASS A SHARES | | | | |
Net assets | | $ | 3,360,386 | |
| | | | |
Shares outstanding ($0.001 par value, 100,000,000 shares authorized) | | | 270,973 | |
| | | | |
Net asset value, offering and redemption price per share | | $ | 12.40 | |
| | | | |
Maximum offering price per share (100/94.25 of $12.40) | | $ | 13.16 | |
| | | | |
| |
CLASS I SHARES | | | | |
Net assets | | $ | 71,553,549 | |
| | | | |
Shares outstanding ($0.001 par value, 100,000,000 shares authorized) | | | 5,767,110 | |
| | | | |
Net asset value, offering and redemption price per share | | $ | 12.41 | |
| | | | |
|
| The accompanying notes are an integral part of the financial statements. |
18
ABBEY CAPITAL FUTURES STRATEGY FUND
CONSOLIDATED STATEMENT OF OPERATIONS
FOR THE SIX MONTHS ENDED
FEBRUARY 28, 2015
(UNAUDITED)
| | | | |
INVESTMENT INCOME | | | | |
Interest | | $ | 5,963 | |
| | | | |
Total investment income | | | 5,963 | |
| | | | |
EXPENSES | | | | |
Advisory fees (Note 2) | | | 266,771 | |
Administration and accounting services fees (Note 2) | | | 74,136 | |
Transfer agent fees (Note 2) | | | 33,341 | |
Audit and tax service fees | | | 19,214 | |
Registration and filing fees | | | 16,041 | |
Legal fees | | | 12,850 | |
Custodian fees (Note 2) | | | 11,924 | |
Interest expense | | | 7,958 | |
Printing and shareholder reporting fees | | | 4,959 | |
Directors’ and officers’ fees | | | 4,463 | |
Insurance fees | | | 2,059 | |
Distribution fees (A Shares) (Note 2) | | | 1,594 | |
Other expenses | | | 12,297 | |
| | | | |
Total expenses before waivers and reimbursements | | | 467,607 | |
Less: waivers and reimbursements (Note 2) | | | (49,027 | ) |
| | | | |
Net expenses after waivers and reimbursements | | | 418,580 | |
| | | | |
Net investment loss | | | (412,617 | ) |
| | | | |
NET REALIZED AND UNREALIZED GAIN/(LOSS) FROM INVESTMENTS | | | | |
Net realized gain/(loss) from: | | | | |
Investments | | | 351,240 | |
Futures | | | 5,225,137 | |
Foreign currency transactions | | | (56,534 | ) |
Forward foreign currency contracts | | | 911,002 | |
Written options | | | (141,631 | ) |
Net change in unrealized appreciation/(depreciation) on: | | | | |
Investments | | | (17,872 | ) |
Futures | | | 2,074,118 | |
Foreign currency translation. | | | (2,130 | ) |
Forward foreign currency contracts | | | 329,194 | |
Written options | | | 15,422 | |
| | | | |
Net realized and unrealized gain from investments | | | 8,687,946 | |
| | | | |
NET INCREASE IN NET ASSETS RESULTING FROM OPERATIONS | | $ | 8,275,329 | |
| | | | |
|
| The accompanying notes are an integral part of the financial statements. |
19
ABBEY CAPITAL FUTURES STRATEGY FUND
CONSOLIDATED STATEMENTS OF CHANGES IN NET ASSETS
| | | | | | | | | | | | | | | | |
| | | FOR THE
SIX MONTHS ENDED
FEBRUARY 28, 2015
(UNAUDITED) | | | FOR THE
PERIOD ENDED
AUGUST 31, 2014(1) | |
| INCREASE/(DECREASE)IN NET ASSETS FROM OPERATIONS: | | | | | | | | | | | | | | | | |
Net investment loss | | | | | | $ | (412,617 | ) | | | | | | $ | (69,607 | ) |
Net realized gain from investments, futures transactions, foreign currency transactions, forward foreign currency contracts and written options | | | | | | | 6,289,214 | | | | | | | | 22,262 | |
Net change in unrealized appreciation/(depreciation) on investments, futures transactions, foreign currency translation, forward foreign currency contracts and written options | | | | | | | 2,398,732 | | | | | | | | 805,375 | |
| | | | | | | | | | | | | | | | |
Net increase in net assets resulting from operations | | | | | | | 8,275,329 | | | | | | | | 758,030 | |
| | | | | | | | | | | | | | | | |
| DIVIDENDSANDDISTRIBUTIONSTOSHAREHOLDERSFROM: | | | | | | | | | | | | | | | | |
Net investment income | | | | | | | | | | | | | | | | |
Class A Shares | | | | | | | (20,951 | ) | | | | | | | — | |
Class I Shares | | | | | | | (748,827 | ) | | | | | | | — | |
| | | | | | | | | | | | | | | | |
Total from net investment income | | | | | | | (769,778 | ) | | | | | | | — | |
| | | | | | | | | | | | | | | | |
| | | | |
Net realized gains | | | | | | | | | | | | | | | | |
Class A Shares | | | | | | | (1,218 | ) | | | | | | | — | |
Class I Shares | | | | | | | (41,776 | ) | | | | | | | — | |
| | | | | | | | | | | | | | | | |
Total from net realized gains | | | | | | | (42,994 | ) | | | | | | | — | |
| | | | | | | | | | | | | | | | |
Net decrease in net assets from dividends and distributions to shareholders | | | | | | | (812,772 | ) | | | | | | | — | |
| | | | | | | | | | | | | | | | |
| | | | |
| CAPITAL TRANSACTIONS: | | | | | | | | | | | | | | | | |
Class A Shares | | | | | | | | | | | | | | | | |
Proceeds from shares sold | | | | | | | 2,112,393 | | | | | | | | 1,000,000 | |
Proceeds from reinvestment of distributions | | | | | | | 15,771 | | | | | | | | — | |
Shares redeemed | | | | | | | (567 | ) | | | | | | | — | |
| | | | | | | | | | | | | | | | |
Total Class A Shares | | | | | | | 2,127,597 | | | | | | | | 1,000,000 | |
| | | | | | | | | | | | | | | | |
Class I Shares | | | | | | | | | | | | | | | | |
Proceeds from shares sold | | | | | | | 52,140,363 | | | | | | | | 23,590,500 | |
Proceeds from reinvestment of distributions | | | | | | | 416,475 | | | | | | | | — | |
Shares redeemed | | | | | | | (11,581,587 | ) | | | | | | | (1,000,000 | ) |
| | | | | | | | | | | | | | | | |
Total Class I Shares | | | | | | | 40,975,251 | | | | | | | | 22,590,500 | |
| | | | | | | | | | | | | | | | |
Net increase in net assets from capital share transactions | | | | | | | 43,102,848 | | | | | | | | 23,590,500 | |
| | | | | | | | | | | | | | | | |
Total increase in net assets | | | | | | | 50,565,405 | | | | | | | | 24,348,530 | |
| | | | | | | | | | | | | | | | |
| NET ASSETS | | | | | | | | | | | | | | | | |
Beginning of period | | | | | | | 24,348,530 | | | | | | | | — | |
| | | | | | | | | | | | | | | | |
End of period | | | | | | $ | 74,913,935 | | | | | | | $ | 24,348,530 | |
| | | | | | | | | | | | | | | | |
Accumulated net investment loss, end of period | | | | | | $ | (1,233,590 | ) | | | | | | $ | (51,195 | ) |
| | | | | | | | | | | | | | | | |
|
| The accompanying notes are an integral part of the financial statements. |
20
ABBEY CAPITAL FUTURES STRATEGY FUND
CONSOLIDATED STATEMENTS OF CHANGES IN NET ASSETS
(CONCLUDED)
| | | | | | | | | | | | | | | | |
| | | FOR THE
SIX MONTHS ENDED
FEBRUARY 28, 2015
(UNAUDITED) | | | FOR THE
PERIOD ENDED
AUGUST 31, 2014(1) | |
| SHARE TRANSACTIONS: | | | | | | | | | | | | | | | | |
Class A Shares | | | | | | | | | | | | | | | | |
Shares sold | | | | | | | 173,116 | | | | | | | | 96,525 | |
Shares reinvested | | | | | | | 1,381 | | | | | | | | — | |
Shares redeemed | | | | | | | (49 | ) | | | | | | | — | |
| | | | | | | | | | | | | | | | |
Total Class A Shares | | | | | | | 174,448 | | | | | | | | 96,525 | |
| | | | | | | | | | | | | | | | |
| | | | |
Class I Shares | | | | | | | | | | | | | | | | |
Shares sold | | | | | | | 4,498,567 | | | | | | | | 2,349,865 | |
Shares reinvested | | | | | | | 36,469 | | | | | | | | — | |
Shares redeemed | | | | | | | (1,021,266 | ) | | | | | | | (96,525 | ) |
| | | | | | | | | | | | | | | | |
Total Class I Shares | | | | | | | 3,513,770 | | | | | | | | 2,253,340 | |
| | | | | | | | | | | | | | | | |
| | | | |
Net increase in shares | | | | | | | 3,688,218 | | | | | | | | 2,349,865 | |
| | | | | | | | | | | | | | | | |
| (1) | Commenced operations on July 1, 2014. |
|
| The accompanying notes are an integral part of the financial statements. |
21
ABBEY CAPITAL FUTURES STRATEGY FUND
CONSOLIDATED FINANCIAL HIGHLIGHTS
Contained below is per share operating performance data for Class A Shares outstanding, total investment return, ratios to average net assets and other supplemental data for the respective periods. This information has been derived from information provided in the financial statements.
| | | | | | | | |
| | | CLASS A SHARES | |
| | | FOR THE
PERIOD
ENDED
FEBRUARY 28, 2015
(UNAUDITED)(1) | |
| PER SHARE OPERATING PERFORMANCE | | | | | | | | |
Net asset value, beginning of period | | | | | | $ | 10.36 | |
| | | | | | | | |
Net investment loss(2) | | | | | | | (0.13 | ) |
Net realized and unrealized gain from investments | | | | | | | 2.39 | |
| | | | | | | | |
Net increase in net assets resulting from operations | | | | | | | 2.26 | |
| | | | | | | | |
Dividends and distributions to shareholders from: | | | | | | | | |
Net investment income | | | | | | | (0.21 | ) |
Net realized gains | | | | | | | (0.01 | ) |
| | | | | | | | |
Total dividends and distributions to shareholders | | | | | | | (0.22 | ) |
| | | | | | | | |
Net asset value, end of period | | | | | | $ | 12.40 | |
| | | | | | | | |
Total investment return(3) | | | | | | | 22.01 | %(4) |
| | | | | | | | |
| | |
| RATIOS/SUPPLEMENTAL DATA | | | | | | | | |
Net assets, end of period (000’s omitted) | | | | | | $ | 3,360 | |
Ratio of expenses to average net assets
with waivers and reimbursements
(including dividend and interest expense) | | | | | | | 2.28 | %(5) |
Ratio of expenses to average net assets
with waivers and reimbursements
(excluding dividend and interest expense) | | | | | | | 2.24 | %(5) |
Ratio of expenses to average net assets
without waivers and reimbursements
(including dividend and interest expense) | | | | | | | 2.52 | %(5) |
Ratio of net investment loss to average net assets | | | | | | | (2.25 | )%(5) |
Portfolio turnover rate | | | | | | | 0.00 | %(4) |
| (1) | The Class A Shares commenced operations on August 29, 2014. |
| (2) | Calculated based on average shares outstanding for the period. |
| (3) | Total investment return is calculated assuming a purchase of shares on the first day and a sale of shares on the last day of each period reported and includes reinvestments of dividends and distributions, if any. Total return does not reflect any applicable sales charge. |
|
| The accompanying notes are an integral part of the financial statements. |
22
ABBEY CAPITAL FUTURES STRATEGY FUND
CONSOLIDATED FINANCIAL HIGHLIGHTS (CONCLUDED)
Contained below is per share operating performance data for Class I Shares outstanding, total investment return, ratios to average net assets and other supplemental data for the period. This information has been derived from information provided in the financial statements.
| | | | | | | | | | | | | | | | |
| | | CLASS I SHARES | |
| | | FOR THE
SIX MONTHS
ENDED
FEBRUARY 28, 2015
(UNAUDITED) | | | FOR THE
PERIOD ENDED
AUGUST 31, 2014(1) | |
| PER SHARE OPERATING PERFORMANCE | | | | | | | | | | | | | | | | |
Net asset value, beginning of period | | | | | | $ | 10.36 | | | | | | | $ | 10.00 | |
| | | | | | | | | | | | | | | | |
Net investment loss(2) | | | | | | | (0.11 | ) | | | | | | | (0.03 | ) |
Net realized and unrealized gain from investments | | | | | | | 2.39 | | | | | | | | 0.39 | |
| | | | | | | | | | | | | | | | |
Net increase in net assets resulting from operations | | | | | | | 2.28 | | | | | | | | 0.36 | |
| | | | | | | | | | | | | | | | |
Dividends and distributions to shareholders from: | | | | | | | | | | | | | | | | |
Net investment income | | | | | | | (0.22 | ) | | | | | | | — | |
Net realized gains | | | | | | | (0.01 | ) | | | | | | | — | |
| | | | | | | | | | | | | | | | |
Total dividends and distributions to shareholder | | | | | | | (0.23 | ) | | | | | | | — | |
| | | | | | | | | | | | | | | | |
Net asset value, end of period | | | | | | $ | 12.41 | | | | | | | $ | 10.36 | |
| | | | | | | | | | | | | | | | |
Total investment return(3) | | | | | | | 22.20 | %(4) | | | | | | | 3.60 | %(4) |
| | | | | | | | | | | | | | | | |
| | | | |
| RATIOS/SUPPLEMENTAL DATA | | | | | | | | | | | | | | | | |
Net assets, end of period (000’s omitted) | | | | | | $ | 71,554 | | | | | | | $ | 24,349 | |
Ratio of expenses to average net assets
with waivers and reimbursements
(including interest expense) | | | | | | | 2.03 | %(5) | | | | | | | 2.01 | %(5) |
Ratio of expenses to average net assets
with waivers and reimbursements
(excluding interest expense) | | | | | | | 1.99 | %(5) | | | | | | | 1.99 | %(5) |
Ratio of expenses to average net assets
without waivers and reimbursements
(including interest expense) | | | | | | | 2.27 | %(5) | | | | | | | 4.71 | %(5) |
Ratio of net investment loss to average net assets | | | | | | | (2.00 | )%(5) | | | | | | | (1.99 | )%(5) |
Portfolio turnover rate | | | | | | | 0.00 | %(4) | | | | | | | 0.00 | %(4) |
| (1) | The Class I Shares commenced operations on July 1, 2014. |
| (2) | Calculated based on average shares outstanding for the period. |
| (3) | Total investment return is calculated assuming a purchase of shares on the first day and a sale of shares on the last day of each period reported and includes reinvestments of dividends and distributions, if any. |
|
| The accompanying notes are an integral part of the financial statements. |
23
ABBEY CAPITAL FUTURES STRATEGY FUND
NOTES TO CONSOLIDATED FINANCIAL STATEMENTS
FEBRUARY 28, 2015
(UNAUDITED)
1. ORGANIZATIONAND SIGNIFICANT ACCOUNTING POLICIES
The RBB Fund, Inc. (“RBB” or the “Company”) was incorporated under the laws of the State of Maryland on February 29, 1988 and is registered under the Investment Company Act of 1940, as amended, (the “1940 Act”) as an open-end management investment company. RBB is a “series fund,” which is a mutual fund divided into separate portfolios. Each portfolio is treated as a separate entity for certain matters under the 1940 Act, and for other purposes, and a shareholder of one portfolio is not deemed to be a shareholder of any other portfolio. Currently, RBB has twenty-two active investment portfolios, including the Abbey Capital Futures Strategy Fund (the “Fund”), which commenced investment operations on July 1, 2014. The Fund is authorized to offer three classes of shares, Class I Shares, Class A Shares and Class C Shares. Class A Shares are sold subject to a front-end maximum sales charge of 5.75%. Front-end sales charges may be reduced or waived under certain circumstances. As of February 28, 2015, Class C Shares have not been offered to the public.
RBB has authorized capital of one hundred billion shares of common stock of which 82.373 billion shares are currently classified into one hundred and fifty-three classes of common stock. Each class represents an interest in an active or inactive RBB investment portfolio.
The Fund seeks to achieve its investment objective by allocating its assets between a “Managed Futures” strategy and a “Fixed Income” strategy.
CONSOLIDATIONOF SUBSIDIARY — The Managed Futures strategy will be achieved by the Fund investing up to 25% of its total assets in Abbey Capital Offshore Fund Limited, a wholly-owned and controlled subsidiary of the Fund organized under the laws of the Cayman Islands (the “Subsidiary”). The consolidated financial statements of the Fund include the Subsidiary. The Fund consolidates the results of subsidiaries in which the Fund holds a controlling economic interest (greater than 50%). All inter-company accounts and transactions have been eliminated. As of February 28, 2015, the net assets of the Subsidiary were $15,638,470, which represented 20.9% of the Fund’s net assets.
PORTFOLIO VALUATION — The Fund’s net asset value (“NAV”) is calculated once daily at the close of regular trading hours on the New York Stock Exchange (“NYSE”) (generally 4:00 p.m. Eastern time) on each day the NYSE is open. Securities held by the Fund are valued using the closing price or the last sale price on a national securities exchange or the National Association of Securities Dealers Automatic Quotation System (“NASDAQ”) market system where they are primarily traded. Fixed income securities having a remaining maturity of greater than 60 days are valued using an independent pricing service, which considers such factors as security prices, yields, maturities and ratings, and are deemed representative of market values at the close of the market. Fixed income securities having a remaining maturity of 60 days or less are valued at amortized cost, which approximates market value. Forward exchange contracts are valued by interpolating between spot and forward currency rates as quoted by an independent pricing service. Futures contracts are generally valued using the settlement price determined by the relevant exchange. Options for which the primary market is a national securities exchange are valued at the last sale price on the exchange on which they are traded, or, in the absence of any sale, will be valued at the mean of the last bid and ask prices prior to the market close. Options not traded on a national securities exchange are valued at the last quoted bid price for long option positions and the closing ask price for short option positions. If market quotations are unavailable or deemed unreliable, securities will be valued in accordance with procedures adopted by the Company’s Board of Directors. Relying on prices supplied by pricing services or dealers or using fair valuation may result in values that are higher or lower than the values used by other investment companies and investors to price the same investments.
FAIR VALUE MEASUREMENTS — The inputs and valuation techniques used to measure fair value of the Fund’s investments are summarized into three levels as described in the hierarchy below:
• Level 1 – quoted prices in active markets for identical securities;
24
ABBEY CAPITAL FUTURES STRATEGY FUND
NOTES TO CONSOLIDATED FINANCIAL STATEMENTS
FEBRUARY 28, 2015
(UNAUDITED) (CONTINUED)
| | | | |
| | • Level 2 – | | other significant observable inputs (including quoted prices for similar securities, interest rates, prepayment speeds, credit risk, etc.); and |
| | |
| | • Level 3 – | | significant unobservable inputs (including the Fund’s own assumptions in determining the fair value of investments). |
The inputs or methodology used for valuing securities are not necessarily an indication of the risk associated with investing in those securities.
The following is a summary of the inputs used, as of February 28, 2015, in valuing the Fund’s investments carried at fair value:
| | | | | | | | | | | | | | |
| | | | | | | | | LEVEL 2 | | | LEVEL 3 |
| | | TOTAL FAIR | | | LEVEL 1 | | | SIGNIFICANT | | | SIGNIFICANT |
| | | VALUE AT | | | QUOTED | | | OBSERVABLE | | | UNOBSERVABLE |
| | | FEBRUARY 28, 2015 | | | PRICE | | | INPUTS | | | INPUTS |
|
Short-Term Investments | | $ | 48,433,688 | | | $ | — | | | $ | 48,433,688 | | | $— |
Commodity Contracts | | | | | | | | | | | | | | |
Futures | | | 559,906 | | | | 559,906 | | | | — | | | — |
Purchased Options | | | 42,120 | | | | 42,120 | | | | — | | | — |
Equity Contracts | | | | | | | | | | | | | | |
Futures | | | 1,053,458 | | | | 1,053,458 | | | | — | | | — |
Purchased Options | | | 214,587 | | | | 214,587 | | | | — | | | — |
Foreign Exchange Contracts | | | | | | | | | | | | | | |
Forward Foreign Currency Contracts | | | 1,033,358 | | | | — | | | | 1,033,358 | | | — |
Futures | | | 1,181,115 | | | | 1,181,115 | | | | — | | | — |
Purchased Options | | | 99,645 | | | | 99,645 | | | | — | | | — |
Interest Rate Contracts | | | | | | | | | | | | | | |
Futures | | | 449,022 | | | | 449,022 | | | | — | | | — |
Purchased Options | | | 82,616 | | | | 82,616 | | | | — | | | — |
|
Total Assets | | $ | 53,149,515 | | | $ | 3,682,469 | | | $ | 49,467,046 | | | $— |
|
| | | | |
| | | | | | | | | LEVEL 2 | | | LEVEL 3 |
| | | TOTAL FAIR | | | LEVEL 1 | | | SIGNIFICANT | | | SIGNIFICANT |
| | | VALUE AT | | | QUOTED | | | OBSERVABLE | | | UNOBSERVABLE |
| | | FEBRUARY 28, 2015 | | | PRICE | | | INPUTS | | | INPUTS |
|
Commodity Contracts | | | | | | | | | | | | | | |
Futures | | $ | (302,561 | ) | | $ | (302,561 | ) | | $ | — | | | $— |
Written Options | | | (21,060 | ) | | | (21,060 | ) | | | — | | | — |
Equity Contracts | | | | | | | | | | | | | | |
Futures | | | (17,120 | ) | | | (17,120 | ) | | | — | | | — |
Written Options | | | (155,256 | ) | | | (155,256 | ) | | | — | | | — |
Foreign Exchange Contracts | | | | | | | | | | | | | | |
Forward Foreign Currency Contracts | | | (643,148 | ) | | | — | | | | (643,148 | ) | | — |
Futures | | | (48,781 | ) | | | (48,781 | ) | | | — | | | — |
Written Options | | | (6,417 | ) | | | (6,417 | ) | | | — | | | — |
Interest Rate Contracts | | | | | | | | | | | | | | |
Futures | | | (61,894 | ) | | | (61,894 | ) | | | — | | | — |
Written Options | | | (69,182 | ) | | | (69,182 | ) | | | — | | | — |
|
Total Liabilities | | $ | (1,325,419 | ) | | $ | (682,271 | ) | | $ | (643,148 | ) | | $— |
|
At the end of each quarter, management evaluates the classification of Levels 1, 2 and 3 assets and liabilities. Various factors are considered, such as changes in liquidity from the prior reporting period; whether or not a broker is willing to execute at the quoted price; the depth and consistency of prices from third party pricing services; and the existence
25
ABBEY CAPITAL FUTURES STRATEGY FUND
NOTES TO CONSOLIDATED FINANCIAL STATEMENTS
FEBRUARY 28, 2015
(UNAUDITED) (CONTINUED)
of contemporaneous, observable trades in the market. Additionally, management evaluates the classification of Level 1 and Level 2 assets and liabilities on a quarterly basis for changes in listings or delistings on national exchanges.
Due to the inherent uncertainty of determining the fair value of investments that do not have a readily available market value, the fair value of the Fund’s investments may fluctuate from period to period. Additionally, the fair value of investments may differ significantly from the values that would have been used had a ready market existed for such investments and may differ materially from the values the Fund may ultimately realize. Further, such investments may be subject to legal and other restrictions on resale or otherwise less liquid than publicly traded securities.
For fair valuations using significant unobservable inputs, U.S. generally accepted accounting principles (“U.S. GAAP”) require the Fund to present a reconciliation of the beginning to ending balances for reported market values that presents changes attributable to total realized and unrealized gains or losses, purchase and sales, and transfers in and out of Level 3 during the period. Transfers in and out between levels are based on values at the end of the period. U.S. GAAP also requires the Fund to disclose amounts and reasons for all transfers in and out of Level 1 and Level 2 fair value measurements. A reconciliation of Level 3 investments is presented only when the Fund had an amount of Level 3 investments at the end of the reporting period that was meaningful in relation to its net assets. The amounts and reasons for all transfers in and out of each level within the three-tier hierarchy are disclosed when the Fund had an amount of total transfers during the reporting period that was meaningful in relation to its net assets as of the end of the reporting period.
For the six months ended February 28, 2015, the Fund had no transfers between Level 1, 2 and 3.
DISCLOSURESABOUT DERIVATIVE INSTRUMENTSAND HEDGING ACTIVITIES
Derivative instruments are defined as financial instruments whose value and performance are based on the value and performance of another security or financial instrument. Derivative instruments that the Fund used during the period include options, forward foreign currency contracts and futures contracts.
During the six months ended February 28, 2015, the Fund used long and short contracts on U.S. and foreign equity market indices, U.S. and foreign government bonds, foreign currencies, interest rates, and commodities (through investment in the Subsidiary), to gain investment exposure in accordance with its investment objective.
The following tables provide quantitative disclosures about fair value amounts of and gains and losses on the Fund’s derivative instruments as of February 28, 2015.
The following table lists the fair values of the Fund’s derivative holdings as of February 28, 2015 grouped by contract type and risk exposure category.
| | | | | | | | | | | | | | | | | | | | | | |
| | | CONSOLIDATED | | | | | | | | | | | | | | | |
| | | STATEMENT | | | | | | | | | | | | | | | |
| | | OF ASSETS AND | | | | | INTEREST | | | FOREIGN | | | | | | | |
| | | LIABILITIES | | EQUITY | | | RATE | | | CURRENCY | | | COMMODITY | | | | |
DERIVATIVE TYPE | | LOCATION | | CONTRACTS | | | CONTRACTS | | | CONTRACTS | | | CONTRACTS | | | TOTAL | |
| |
Asset Derivatives | |
| |
| | | | | | |
Purchased Options | | Investments, at value | | $ | 214,587 | | | $ | 82,616 | | | $ | 99,645 | | | $ | 42,120 | | | $ | 438,968 | |
| | | | | | | | | |
Forward Contracts | | Unrealized appreciation on forward foreign currency contracts | | | — | | | | — | | | | 1,033,358 | | | | — | | | | 1,033,358 | |
| |
Futures Contracts | | Receivable:
Variation Margin | | | 1,053,458 | | | | 449,022 | | | | 1,181,115 | | | | 559,906 | | | | 3,243,501 | |
| |
26
ABBEY CAPITAL FUTURES STRATEGY FUND
NOTES TO CONSOLIDATED FINANCIAL STATEMENTS
FEBRUARY 28, 2015
(UNAUDITED) (CONTINUED)
| | | | | | | | | | | | | | | | | | | | | | |
| | | CONSOLIDATED | | | | | | | | | | | | | | | |
| | | STATEMENT | | | | | | | | | | | | | | | |
| | | OF ASSETS AND | | | | | INTEREST | | | FOREIGN | | | | | | | |
| | | LIABILITIES | | EQUITY | | | RATE | | | CURRENCY | | | COMMODITY | | | | |
DERIVATIVE TYPE | | LOCATION | | CONTRACTS | | | CONTRACTS | | | CONTRACTS | | | CONTRACTS | | | TOTAL | |
| |
| | | | | | |
Total Value - Assets | | | | $ | 1,268,045 | | | $ | 531,638 | | | $ | 2,314,118 | | | $ | 602,026 | | | $ | 4,715,827 | |
| |
|
Liability Derivatives | |
| |
Written Options | | Options written, at value | | $ | (155,256 | ) | | $ | (69,182 | ) | | $ | (6,417 | ) | | $ | (21,060 | ) | | $ | (251,915 | ) |
| |
Forward Contracts | | Unrealized
depreciation on
forward foreign currency contracts | | | — | | | | — | | | | (643,148 | ) | | | — | | | | (643,148 | ) |
| |
Futures Contracts | | Receivable: Variation Margin | | | (17,120 | ) | | | (61,894 | ) | | | (48,781 | ) | | | (302,561 | ) | | | (430,356 | ) |
| |
Total Value - Liabilities | | | | $ | (172,376 | ) | | $ | (131,076 | ) | | $ | (698,346 | ) | | $ | (323,621 | ) | | $ | (1,325,419 | ) |
| |
The following table lists the amounts of realized gains or (losses) included in net increase in net assets resulting from operations for the six months ended February 28, 2015, grouped by contract type and risk exposure.
| | | | | | | | | | | | | | | | | | | | | | |
| | | CONSOLIDATED | | | | | | | | | | | | | | | |
| | | STATEMENT | | | | | | | | | | | | | | | |
| | | OF ASSETS AND | | | | | INTEREST | | | FOREIGN | | | | | | | |
| | | LIABILITIES | | EQUITY | | | RATE | | | CURRENCY | | | COMMODITY | | | | |
DERIVATIVE TYPE | | LOCATION | | CONTRACTS | | | CONTRACTS | | | CONTRACTS | | | CONTRACTS | | | TOTAL | |
| |
|
Realized Gain (Loss) | |
| |
Purchased Options | | Net realized gain (loss) from Investments | | $ | (75,495) | | | $ | 18,546 | | | $ | 441,164 | | | $ | (27,756 | ) | | $ | 356,459 | |
| |
Futures Contracts | | Net realized gain (loss) from Futures | | | (155,012 | ) | | | 1,745,154 | | | | 2,261,114 | | | | 1,373,881 | | | | 5,225,137 | |
| |
Forward Contracts | | Net realized gain (loss) from Forward Foreign Currency Contracts | | | — | | | | — | | | | 911,002 | | | | — | | | | 911,002 | |
| |
Written Options | | Net realized gain (loss) from Written Options | | | 54,322 | | | | (1,306 | ) | | | (218,691 | ) | | | 24,044 | | | | (141,631 | ) |
| |
Total Realized Gain (Loss) | | | | $ | (176,185 | ) | | $ | 1,762,394 | | | $ | 3,394,589 | | | $ | 1,370,169 | | | $ | 6,350,967 | |
| |
The following table lists the amounts of change in unrealized appreciation (depreciation) included in net increase in net assets resulting from operations for the six months ended February 28, 2015, grouped by contract type and risk exposure.
27
ABBEY CAPITAL FUTURES STRATEGY FUND
NOTES TO CONSOLIDATED FINANCIAL STATEMENTS
FEBRUARY 28, 2015
(UNAUDITED) (CONTINUED)
| | | | | | | | | | | | | | | | | | | | | | |
| | | CONSOLIDATED | | | | | | | | | | | | | | | |
| | | STATEMENT | | | | | | | | | | | | | | | |
| | | OF ASSETS AND | | | | | INTEREST | | | FOREIGN | | | | | | | |
| | | LIABILITIES | | EQUITY | | | RATE | | | CURRENCY | | | COMMODITY | | | | |
DERIVATIVE TYPE | | LOCATION | | CONTRACTS | | | CONTRACTS | | | CONTRACTS | | | CONTRACTS | | | TOTAL | |
| |
Change in unrealized appreciation (depreciation) | |
| |
Purchased Options | | Net change in unrealized appreciation (depreciation) from Investments | | $ | 104,908 | | | $ | (73,075 | ) | | $ | (31,026 | ) | | $ | (20,175 | ) | | $ | (19,368 | ) |
| |
Futures Contracts | | Net change in unrealized appreciation (depreciation) from Futures | | | 946,727 | | | | 180,706 | | | | 787,953 | | | | 158,732 | | | | 2,074,118 | |
| |
Forward Contracts | | Net change in unrealized appreciation (depreciation) from Forward Foreign Currency Contracts | | | — | | | | — | | | | 329,194 | | | | — | | | | 329,194 | |
| |
Written Options | | Net change in unrealized appreciation (depreciation) from Written Options | | | (67,656 | ) | | | 25,075 | | | | 42,864 | | | | 15,139 | | | | 15,422 | |
| |
Total change in unrealized appreciation (depreciation) | | | | $ | 983,979 | | | $ | 132,706 | | | $ | 1,128,985 | | | $ | 153,696 | | | $ | 2,399,366 | |
| |
For the six months ended February 28, 2015, the Fund’s average volume of derivatives is as follows:
| | | | | | | | | | |
PURCHASED
OPTIONS
(COST) | | WRITTEN
OPTIONS
(PROCEEDS) | | LONG FUTURES
NOTIONAL
COST | | SHORT FUTURES
NOTIONAL
COST | | FORWARD FOREIGN
CURRENCY
CONTRACTS — PAYABLE
(VALUE AT TRADE DATE) | | FORWARD FOREIGN
CURRENCY
CONTRACTS — RECEIVABLE
(VALUE AT TRADE DATE) |
| $251,100 | | $(105,086) | | $215,293,883 | | $(75,865,853) | | $(70,141,800) | | $70,304,411 |
For financial reporting purposes, the Fund does not offset fair value amounts recognized for derivative instruments and fair value amounts recognized for the right to reclaim cash collateral (receivables) or the obligation to return cash collateral (payables) arising from derivative instruments recognized at fair value executed with the same counterparty under a master netting arrangement.
The following is a summary of financial and derivative instruments that are subject to enforceable master netting agreements (or similar arrangements) and collateral received and pledged in connection with the master netting agreements (or similar arrangements).
28
ABBEY CAPITAL FUTURES STRATEGY FUND
NOTES TO CONSOLIDATED FINANCIAL STATEMENTS
FEBRUARY 28, 2015
(UNAUDITED) (CONTINUED)
| | | | | | | | | | | | | | | | | | | | | | | | | | | | | | | | |
| | | | | |
| Gross Amount Not
Offset in Statement of Assets and Liabilities |
| | | | | | | | | |
| Gross Amount Not
Offset in Statement of Assets and Liabilities |
| | | | |
Description | |
| Gross Amount
Presented in the
Statement of
Assets and
Liabilities |
| |
| Financial
Received |
| |
| Collateral
Instruments |
| |
| Net
Amount(1) |
| |
| Gross Amount
Presented in the
Statement of
Assets and
Liabilities |
| |
| Financial
Instruments |
| |
| Collateral
Pledged |
| |
| Net
Amount(2) |
|
| | | | | |
| | | Assets | | | Liabilities | |
| | | | | | | | |
| | | | | | | | |
Forward Foreign Currency | | | | | | | | | | | | | | | | | | | | | | | | | | | | | | | | |
Contracts | | | $1,033,358 | | | | ($643,148 | ) | | | $— | | | | $390,210 | | | | $643,148 | | | | ($643,148 | ) | | | $— | | | | $— | |
| (1) | Net amount represents the net amount receivable from the counterparty in the event of default. |
| (2) | Net amount represents the net amount payable from the counterparty in the event of default. |
USEOF ESTIMATES — The Fund is an investment company and, accordingly, follow the investment company accounting and reporting guidance under U.S. GAAP. The preparation of financial statements in conformity with U.S. GAAP requires management to make estimates and assumptions that affect the reported amounts of assets and liabilities and disclosure of contingent assets and liabilities at the date of the financial statements and the reported amounts of revenues and expenses during the period. Actual results could differ from those estimates and those differences could be significant.
INVESTMENT TRANSACTIONS, INVESTMENT INCOMEAND EXPENSES — The Fund records security transactions based on trade date for financial reporting purposes. The cost of investments sold is determined by use of the specific identification method for both financial reporting and income tax purposes in determining realized gains and losses on investments. Interest income is accrued when earned. Dividend income is recorded on the ex-dividend date. Distributions received on securities that represent a return of capital or capital gains are recorded as a reduction of cost of investments and/or as a realized gain. Expenses incurred on behalf of a specific class, fund or fund family are charged directly to the class, fund or fund family to each class of shares based upon the relative proportion of net assets of each class at the beginning of the day. Expenses incurred for all the RBB funds (such as director or professional fees) are charged to all funds in proportion to their average net assets of RBB, or in such other manner as the Company’s Board of Directors deems fair or equitable. Expenses and fees, including investment advisory and administration fees, are accrued daily and taken into account for the purpose of determining the NAV of the Fund.
DIVIDENDSAND DISTRIBUTIONSTO SHAREHOLDERS — Dividends from net investment income and distributions from net realized capital gains, if any, are declared and paid at least annually to shareholders and recorded on ex-dividend date. Income dividends and capital gain distributions are determined in accordance with U.S. federal income tax regulations which may differ from U.S. GAAP.
U.S. TAX STATUS — No provision is made for U.S. income taxes as it is the Fund’s intention to qualify for and elect the tax treatment applicable to regulated investment companies under Subchapter M of the Internal Revenue Code of 1986, as amended, and make the requisite distributions to its shareholders which will be sufficient to relieve it from U.S. income and excise taxes.
For tax purposes, the Subsidiary is an exempted Cayman investment company. The Subsidiary has received an undertaking from the Government of the Cayman Islands exempting it from all local income, profits and capital gains taxes. No such taxes are levied in the Cayman Islands at the present time. For U.S. income tax purposes, the Subsidiary is a Controlled Foreign Corporation and as such is not subject to U.S. income tax.
29
ABBEY CAPITAL FUTURES STRATEGY FUND
NOTES TO CONSOLIDATED FINANCIAL STATEMENTS
FEBRUARY 28, 2015
(UNAUDITED) (CONTINUED)
FOREIGN CURRENCY TRANSLATION — Assets and liabilities initially expressed in non-U.S. currencies are translated into U.S. dollars based on the applicable exchange rates at the date of the last business day of the financial statement period. Purchases and sales of securities, interest income, dividends, variation margin received and expenses denominated in foreign currencies are translated into U.S. dollars at the exchange rates in effect on the transaction date.
The Fund does not separately report the effect of changes in foreign exchange rates from changes in market prices of securities held. Such changes are included with the net realized gain or loss and change in unrealized appreciation or depreciation on investment securities in the Statement of Operations. Other foreign currency transactions resulting in realized and unrealized gain or loss are reported separately as net realized gain or loss and change in unrealized appreciation or depreciation on foreign currencies in the Statement of Operations.
CURRENCY RISK — Investment in foreign securities involves currency risk associated with securities that trade or are denominated in currencies other than the U.S. dollar and which may be affected by fluctuations in currency exchange rates. An increase in the strength of the U.S. dollar relative to a foreign currency may cause the U.S. dollar value of an investment in that country to decline. Foreign currencies also are subject to risks caused by inflation, interest rates, budget deficits and low savings rates, political factors and government controls. Forward foreign currency exchange contracts may limit potential gains from a favorable change in value between the U.S. dollar and foreign currencies. Unanticipated changes in currency pricing may result in poorer overall performance for the Fund than if it had not engaged in these contracts.
COMMODITY SECTOR RISK — Exposure to the commodities markets may subject the Fund to greater volatility than investments in traditional securities. The value of commodity-linked derivative instruments may be affected by changes in overall market movements, commodity index volatility, changes in interest rates, or factors affecting a particular industry or commodity, such as drought, floods, weather, livestock disease, embargoes, tariffs and international economic, political and regulatory developments. The prices of energy, industrial metals, precious metals, agriculture and livestock sector commodities may fluctuate widely due to factors such as changes in value, supply and demand and governmental regulatory policies. The commodity-linked securities in which the Fund invests may be issued by companies in the financial services sector, and events affecting the financial services sector may cause the Fund’s Share value to fluctuate.
FOREIGN SECURITIES MARKET RISK — A substantial portion of the trades of the Fund are expected to take place on markets or exchanges outside the United States. There is no limit to the amount of assets of the Fund that may be committed to trading on foreign markets. The risk of loss in trading foreign futures and options on futures contracts can be substantial. Participation in foreign futures and options on futures contracts involves the execution and clearing of trades on, or subject to the rules of, a foreign board of trade or exchange. Some of these foreign markets, in contrast to U.S. exchanges, are so-called principals’ markets in which performance is the responsibility only of the individual counterparty with whom the trader has entered into a commodity interest transaction and not of the exchange or clearing corporation. In these kinds of markets, there is risk of bankruptcy or other failure or refusal to perform by the counterparty.
COUNTERPARTY RISK — The derivative contracts entered into by the Fund or its Subsidiary may be privately negotiated in the over-the-counter market. These contracts also involve exposure to credit risk, since contract performance depends in part on the financial condition of the counterparty. Relying on a counterparty exposes the Fund to the risk that a counterparty will not settle a transaction in accordance with its terms and conditions because of a dispute over the terms of the contract (whether or not bona fide) or because of a credit or liquidity problem, thus causing the Fund to suffer a loss. If a counterparty defaults on its payment obligations to the Fund, this default will cause the value of an investment in the Fund to decrease.
CREDIT RISK — Credit risk refers to the possibility that the issuer of the security or a counterparty in respect of a derivative instrument will not be able to satisfy its payment obligations to the Fund when due. Changes in an
30
ABBEY CAPITAL FUTURES STRATEGY FUND
NOTES TO CONSOLIDATED FINANCIAL STATEMENTS
FEBRUARY 28, 2015
(UNAUDITED) (CONTINUED)
issuer’s credit rating or the market’s perception of an issuer’s creditworthiness may also affect the value of the Fund’s investment in that issuer. Securities rated in the four highest categories by the rating agencies are considered investment grade but they may also have some speculative characteristics. Investment grade ratings do not guarantee that bonds will not lose value or default. In addition, the credit quality of securities may be lowered if an issuer’s financial condition changes.
OPTIONS — An option on a futures contract gives the purchaser the right, in exchange for a premium, to assume a position in a futures contract at a specified exercise price during the term of the option. The Fund may use futures contracts and related options for: bona fide hedging; attempting to offset changes in the value of securities held or expected to be acquired or be disposed of; attempting to minimize fluctuations in foreign currencies; attempting to gain exposure to a particular market, index or instrument; or other risk management purposes. The risk associated with purchasing an option is that the Fund pays a premium whether or not the option is exercised. Additionally, the Fund bears the risk of loss of premium and change in market value should the counterparty not perform under the contract. Put and call options are accounted for in the same manner as other securities owned. The cost of securities acquired through the exercise of call options is increased by the premiums paid. The proceeds from securities sold through the exercise of put options are decreased by the premiums paid.
OPTIONS WRITTEN — The Fund may enter into options written for: bona fide hedging; attempting to offset changes in the value of securities held or expected to be acquired or be disposed of; attempting to minimize fluctuations in foreign currencies; attempting to gain exposure to a particular market, index or instrument; or other risk management purposes. Such options may relate to particular securities or domestic stock indices, and may or may not be listed on exchanges regulated by the Commodity Futures Trading Commission or on other non-U.S. exchanges. An option on a futures contract gives the purchaser the right, in return for the premium paid, to assume a position in the contract (a long position if the option is a call and a short position if the option is a put) at a specified exercise price at any time during the option exercise period. The writer of the option is required upon exercise to assume a short futures position (if the option is a call) or a long futures position (if the option is a put). Upon exercise of the option, the accumulated cash balance in the writer’s futures margin account is delivered to the holder of the option. That balance represents the amount by which the market price of the futures contract at exercise exceeds, in the case of a call, or is less than, in the case of a put, the exercise price of the option. The maximum risk of loss associated with writing put options is limited to the exercised fair value of the option contract. The maximum risk of loss associated with writing call options is potentially unlimited. The Fund also has the additional risk of being unable to enter into a closing transaction at an acceptable price if a liquid secondary market does not exist. The Fund also may write over-the-counter options where completing the obligation depends upon the credit standing of the other party. Option contracts also involve the risk that they may result in loss due to unanticipated developments in market conditions or other causes. Written options are initially recorded as liabilities to the extent of premiums received and subsequently marked to market to reflect the current value of the option written. Gains or losses are realized when the option transaction expires or closes. When an option is exercised, the proceeds on sales for a written call option or the purchase cost for a written put option is adjusted by the amount of the premium received. Listed option contracts present minimal counterparty credit risk since they are exchange traded and the exchange’s clearinghouse, as counterparty to all exchange-traded options, guarantees the options against default. As of February 28, 2015, all of the Fund’s written options are exchange-traded options.
31
ABBEY CAPITAL FUTURES STRATEGY FUND
NOTES TO CONSOLIDATED FINANCIAL STATEMENTS
FEBRUARY 28, 2015
(UNAUDITED) (CONTINUED)
The Fund had transactions in options written during the fiscal period ended February 28, 2015 as follows:.
| | | | | | | | | | |
| | | NUMBER OF
CONTRACTS | | PREMIUMS
RECEIVED |
Options outstanding at August 31, 2014 | | | | 93 | | | | $ | 65,784 | |
Options written | | | | 1,465 | | | | | 500,686 | |
Options closed | | | | (422 | ) | | | | (255,683 | ) |
Options expired | | | | (204 | ) | | | | (39,544 | ) |
| | | | | | | | | | |
Options outstanding at February 28, 2015 | | | | 932 | | | | $ | 271,243 | |
| | | | | | | | | | |
FUTURES CONTRACTS — The Fund may use futures contracts for hedging or speculative purposes consistent with its investment objective. Upon entering into a futures contract, the Fund must deposit initial margin in addition to segregating cash or liquid assets sufficient to meet its obligation to purchase or provide securities, or to pay the amount owed at the expiration of an index-based futures contract. Such liquid assets may consist of cash, cash equivalents, liquid debt or equity securities or other acceptable assets. Pursuant to the futures contract, the Fund agrees to receive from, or pay to the broker, an amount of cash equal to the daily fluctuation in value of the contract. Such a receipt of payment is known as “variation margin” and is recorded by the Fund as an unrealized gain or loss. When the contract is closed, the Fund records a realized gain or loss equal to the difference between the proceeds from (or cost of) the closing transactions and the Fund’s basis in the contract. Futures contracts have market risks, including the risk that the change in the value of the contract may not correlate with changes in the value of the underlying securities. Use of long futures contracts subjects the Fund to risk of loss in excess of the amount shown on the Statement of Assets and Liabilities, up to the notional value of the futures contract. Use of short futures contracts subjects the Fund to unlimited risk of loss.
FORWARD FOREIGN CURRENCY CONTRACTS — In the normal course of pursuing its investment objectives, the Fund is subject to foreign investment and currency risk. The Fund may enter into forward foreign currency contracts (“forward contracts”) for purposes of hedging, duration management, as a substitute for securities, to increase returns, for currency hedging or risk management, or to otherwise help achieve the Fund’s investment goal. These contracts are marked-to-market daily at the applicable translation rates. The Fund records realized gains or losses at the time the forward contract is closed. A forward contract is extinguished through a closing transaction or upon delivery of the currency or entering an offsetting contract. Risks may arise upon entering these contracts from the potential inability of a counterparty to meet the terms of their contracts and from unanticipated movements in the value of a foreign currency relative to the U.S. dollar or other currencies. The Fund’s maximum risk of loss from counterparty credit risk related to Forward Foreign Currency Contracts is the fair value of the contract. The risk may be mitigated to some extent if a master netting arrangement between the Fund and the counterparty is in place and to the extent the Fund obtains collateral to cover the Fund’s exposure to the counterparty.
CASHAND CASH EQUIVALENTS — The Fund considers liquid assets deposited into bank demand deposit accounts to be cash equivalents. These investments represent amounts held with financial institutions that are readily accessible to pay Fund expenses or purchase investments. Cash and cash equivalents are valued at cost plus accrued interest, which approximates market value.
OTHER — In the normal course of business, the Fund may enter into contracts that provide general indemnifications. The Fund’s maximum exposure under these arrangements is dependent on claims that may be made against the Fund in the future, and, therefore, cannot be estimated; however, based on experience, the risk of material loss from such claims is considered remote.
32
ABBEY CAPITAL FUTURES STRATEGY FUND
NOTES TO CONSOLIDATED FINANCIAL STATEMENTS
FEBRUARY 28, 2015
(UNAUDITED) (CONTINUED)
2. INVESTMENT ADVISERAND OTHER SERVICES
Abbey Capital Limited (“Abbey Capital” or the “Adviser”) serves as the investment adviser to the Fund. The Fund is managed by the Adviser and one or more Trading Advisers unaffiliated with the Adviser. The Adviser also has the ultimate responsibility to oversee the Trading Advisers, and to recommend their hiring, termination, and replacement, subject to approval by the Board of Directors. The Fund compensates the Adviser for its services at the annual rate of 1.97% of its average annual net assets, payable on a monthly basis in arrears. The Adviser compensates the Trading Advisers out of the advisory fee that it receives from the Fund.
The Adviser has contractually agreed to waive its advisory fee and/or reimburse expenses in order to limit Total Annual Fund Operating Expenses (excluding certain items discussed below) to 1.99%, 2.24% and 2.99% of the Fund’s average daily net assets attributable to Class I Shares, Class A Shares and Class C Shares, respectively. In determining the Adviser’s obligation to waive advisory fees and/or reimburse expenses, the following expenses are not taken into account and could cause net Total Annual Fund Operating Expenses to exceed 1.99%, 2.24% or 2.99%, as applicable: acquired fund fees and expenses, brokerage commissions, extraordinary items, interest or taxes. This contractual limitation is in effect until June 30, 2016 and may not be terminated without the approval of the Board of Directors. If at any time during the first three years the Advisory Agreement is in effect, the Fund’s Total Annual Fund Operating Expenses for that year are less than 1.99%, 2.24% or 2.99%, as applicable, the Adviser may recoup any waived amount from the Fund if such reimbursement does not cause the Fund to exceed existing expense limitations. For the six months ended February 28, 2015, investment advisory fees accrued and waived were $266,771 and $49,027, respectively. At February 28, 2015, the amount of potential recovery by the Adviser was as follows:
| | | | | | |
| EXPIRATION | |
| 2017 | | | 2018 | |
$ | 94,261 | | | $ | 49,027 | |
Altis Partners (Jersey) Limited, Cantab Capital Partners LLP, Eclipse Capital Management, Inc., Graham Capital Management, LP, Harmonic Capital Partners LLP, P/E Global, LLC, Revolution Capital Management, LLC, and Trigon Investment Advisors, LLC each serves as a Trading Adviser to the Fund.
BNY Mellon Investment Servicing (US) Inc. (“BNY Mellon”) serves as administrator for the Fund. For providing administrative and accounting services, BNY Mellon is entitled to receive a monthly fee equal to an annual percentage rate of the Fund’s average daily net assets, subject to certain minimum monthly fees.
Included in the administration and accounting services fees, shown on the Statement of Operations, are fees for providing regulatory administration services to RBB. For providing these services, BNY Mellon is entitled to receive compensation as agreed to by the Company and BNY Mellon. This fee is allocated to each portfolio in proportion to its net assets of the Company.
In addition, BNY Mellon serves as the Fund’s transfer and dividend disbursing agent. For providing transfer agent services, BNY Mellon is entitled to receive a monthly fee, subject to certain minimum, and out of pocket expenses.
The Bank of New York Mellon (the “Custodian”) provides certain custodial services to the Fund. The Custodian is entitled to receive a monthly fee, subject to certain minimum, and out of pocket expenses.
Foreside Funds Distributors LLC serves as the principal underwriter and distributor of the Fund’s shares pursuant to a Distribution Agreement with RBB.
3. DIRECTOR COMPENSATION
The Directors of the Company receive an annual retainer and meeting fees for meetings attended. The remuneration paid to the Directors by the Fund during the six months ended February 28, 2015 was $4,150. Certain employees of BNY Mellon serve as an Officer or Director of the Company. They are not compensated by the Fund or the Company.
33
ABBEY CAPITAL FUTURES STRATEGY FUND
NOTES TO CONSOLIDATED FINANCIAL STATEMENTS
FEBRUARY 28, 2015
(UNAUDITED) (CONCLUDED)
4. INVESTMENTIN SECURITIES
For the six months ended February 28, 2015, aggregate purchases and sales of investment securities (excluding short-term investments) of the Fund were as follows:
| | | | |
| | | PURCHASES | | SALES |
Investments in Non-U.S. Government Securities | | $— | | $— |
Investments in U.S. Government Securities | | — | | — |
5. FEDERAL INCOME TAX INFORMATION
The Fund has followed the authoritative guidance on accounting for and disclosure of uncertainty in tax positions, which requires the Fund to determine whether a tax position is more likely than not to be sustained upon examination, including resolution of any related appeals or litigation processes, based on the technical merits of the position. The Fund has determined that there was no effect on the financial statements from following this authoritative guidance. In the normal course of business, the Fund is subject to examination by federal, state and local jurisdictions, where applicable, for tax years for which applicable statutes of limitations have not expired.
As of February 28, 2015, federal tax cost, aggregate gross unrealized appreciation and depreciation of securities held by the Fund were as follows:
| | | | | | |
FEDERAL TAX
COST | | UNREALIZED
APPRECIATION | | UNREALIZED
DEPRECIATION | | NET
UNREALIZED
DEPRECIATION |
| $48,891,931 | | $137,794 | | $(157,069) | | $(19,275) |
Distributions to shareholders from net investment income and realized gains are determined in accordance with federal income tax regulations, which may differ from net investment income and realized gains recognized for financial reporting purposes. Accordingly, the character of distributions and composition of net assets for tax purposes may differ from those reflected in the accompanying financial statements. To the extent these differences are permanent, such amounts are reclassified within the capital accounts based on the tax treatment; temporary differences do not require such reclassification.
As of August 31, 2014, the components of distributable earnings on a tax basis were as follows:
| | | | | | | | |
UNDISTRIBUTED
ORDINARY INCOME | | UNDISTRIBUTED
LONG-TERM GAINS | | UNREALIZED
APPRECIATION | | QUALIFIED
LATE-YEAR
LOSSES | | OTHER TEMPORARY
DIFFERENCES |
| $769,775 | | $— | | $(15,595) | | $— | | $— |
The differences between the book and tax basis components of distributable earnings relate principally to the timing of recognition of income and gains of the Subsidiary for federal income tax purposes. Short-term and foreign currency gains are reported as ordinary income for federal income tax purposes.
Under the Regulated Investment Company Modernization Act of 2010, the Fund is permitted to carry forward capital losses for an unlimited period. Additionally, capital losses that are carried forward will retain their character as either short-term or long-term capital losses rather than being considered all short-term as under the previous law. As of August 31, 2014, the Fund had no capital loss carryforwards.
6. SUBSEQUENT EVENTS
Management has evaluated the impact of all subsequent events on the Fund through the date the financial statements were issued, and has determined that there were no subsequent events.
34
ABBEY CAPITAL FUTURES STRATEGY FUND
OTHER INFORMATION
(UNAUDITED)
PROXY VOTING
Policies and procedures that the Fund uses to determine how to vote proxies relating to portfolio securities as well as information regarding how the Fund voted proxies relating to portfolio securities for the most recent 12-month period ended June 30 are available without charge, upon request, by calling (844) 261-6484 and on the Securities and Exchange Commission’s (“SEC”) website at http://www.sec.gov.
QUARTERLY PORTFOLIO SCHEDULES
The Company files its complete schedule of portfolio holdings with the SEC for the first and third fiscal quarters of each fiscal year (quarters ended November 30 and May 31) on Form N-Q. The Company’s Form N-Q is available on the SEC website at http://www.sec.gov and may be reviewed and copied at the SEC Public Reference Room in Washington, D.C. Information on the operation of the SEC Public Reference Room may be obtained by calling (800) SEC-0330.
35
[THIS PAGE INTENTIONALLY LEFT BLANK]
[THIS PAGE INTENTIONALLY LEFT BLANK]
Investment Adviser
Abbey Capital Limited
1-2 Cavendish Row
Dublin 1, Ireland
Administrator
BNY Mellon Investment Servicing (US) Inc.
301 Bellevue Parkway
Wilmington, DE 19809
Transfer Agent
BNY Mellon Investment Servicing (US) Inc.
4400 Computer Drive
Westborough, MA 01581
Principal Underwriter
Foreside Funds Distributors LLC
400 Berwyn Park
899 Cassatt Road
Berwyn, PA 19312
Custodian
The Bank of New York Mellon
One Wall Street
New York, NY 10286
Independent Registered Public Accounting Firm
Ernst & Young LLP
One Commerce Square
2005 Market Street, Suite 700
Philadelphia, PA 19103
Counsel
Drinker Biddle & Reath LLP
One Logan Square, Ste. 2000
Philadelphia, PA 19103-6996
ABB-SAR15

ALTAIR SMALLER COMPANIES FUND
of
The RBB Fund, Inc.
SEMI-ANNUAL REPORT
February 28, 2015
(Unaudited)
This report is submitted for the general information of the shareholders of the Fund.
It is not authorized for distribution unless preceded or accompanied by a current prospectus for the Fund.
ALTAIR SMALLER COMPANIES FUND
Performance Data
February 28, 2015
(Unaudited)
| | | | |
| Total Returns for the period ended February 28, 2015 | |
| | | Since | |
| | | Inception* | |
Altair Smaller Companies Fund | | | 7.50% | |
Russell 2000® Index** | | | 11.30% | |
| * | Not annualized. The Fund commenced operations on October 21, 2014. |
** Benchmark performance is from inception date of the Fund only and is not the inception date of the benchmark itself.
Performance quoted is past performance and does not guarantee future results. The investment return and principal value of an investment in the Fund will fluctuate so that an investor’s shares, when redeemed, may be worth more or less than their original cost. Current performance may be lower or higher. Returns shown do not reflect taxes that a shareholder would pay on Fund distributions or on the redemption of Fund shares. Performance data current to the most recent month-end may be obtained by calling (855) 744-8500.
The Fund’s total annual Fund operating expenses, as stated in the current prospectus dated December 31, 2014, are 1.15% of average daily net assets. This rate may fluctuate and may differ from the actual expenses incurred by the Fund for the period covered by this report. The Adviser has contractually agreed to reimburse expenses in an aggregate amount equal to the amount by which the total annual Fund operating expenses (other than acquired fund fees and expenses, short sale dividend expenses, brokerage commissions, litigation, extraordinary items, interest or taxes) exceeds 1.35% of the average daily net assets of the Fund. This contractual limitation is in effect until at least October 20, 2015 and may not be terminated without approval by the Company’s Board of Directors.
The Fund invests in common stock, preferred stocks, warrants to acquire common stock and securities convertible into common stock. Portfolio composition is subject to change.
The Fund evaluates performance as compared to that of the Russell 2000® Index. The Russell 2000® Index is a widely-recognized, capitalization-weighted index that measures the performance of the smallest 2,000 companies in the Russell 3000® Index and is considered representative of small-cap stocks. It is impossible to invest directly in an index.
Investment Considerations
Investing in the Fund involves risk and an investor may lose money. The success of the Fund’s strategy depends on the Adviser’s ability to select Sub-Advisers and each manager’s ability to select investments for the Fund. The Fund may invest in riskier type investments including small and micro-cap stocks, IPOs, special situations and illiquid securities all of which may be more volatile and less liquid.
1
ALTAIR SMALLER COMPANIES FUND
Fund Expense Examples
(Unaudited)
As a shareholder of the Fund, you incur two types of costs: (1) transaction costs and (2) ongoing costs, including management fees and other Fund expenses. These examples are intended to help you understand your ongoing costs (in dollars) of investing in the Fund and to compare these costs with the ongoing costs of investing in other mutual funds.
These examples are based on an investment of $1,000 invested at the beginning of the period from October 21, 2014 (date of commencement of operations) through February 28, 2015 and held for the entire period.
Actual Expenses
The first line of the accompanying table provides information about actual account values and actual expenses. You may use the information in this line, together with the amount you invested, to estimate the expenses that you paid over the period. Simply divide your account value by $1,000 (for example, an $8,600 account value divided by $1,000 = 8.6), then multiply the result by the number in the first line under the heading entitled “Expenses Paid During Period” to estimate the expenses you paid on your account during this period.
Hypothetical Examples for Comparison Purposes
The second line of the accompanying table provides information about hypothetical account values and hypothetical expenses based on the Fund’s actual expense ratio and an assumed rate of return of 5% per year before expenses, which is not your Fund’s actual return. The hypothetical account values and expenses may not be used to estimate the actual ending account balance or expenses you paid for the period. You may use this information to compare the ongoing costs of investing in the Fund and other funds. To do so, compare these 5% hypothetical examples with the 5% hypothetical examples that appear in the shareholder reports of other funds.
Please note that the expenses shown in the accompanying table are meant to highlight your ongoing costs only and do not reflect any transactional costs, such as redemption fees. Therefore, the second line of the accompanying table is useful in comparing ongoing costs only and will not help you determine the relative total costs of owning different funds. In addition, if these transactional costs were included, your costs would have been higher.
| | | | | | |
| | |
| | | | | Ending Account Value | | Expenses Paid |
| | | Beginning Account Value* | | February 28, 2015 | | During Period |
Actual** | | $1,000.00 | | $1,075.00 | | $4.29 |
Hypothetical
(5% return before expenses)*** | | 1,000.00 | | 1,019.04 | | 5.81 |
| * | The Fund commenced operations on October 21, 2014. |
| ** | Expenses equal to an annualized expense ratio for the period October 21, 2014 to February 28, 2015 of 1.16% for the Fund, multiplied by the average account value over the period, multiplied by the number of days in the most recent period (130) then divided by 365 days. The Fund’s ending account value on the first line in the table is based on the actual total return since inception for the Fund of 7.50%. |
| *** | For comparison purposes, the hypothetical expenses are as if the Fund had been in existence from September 1, 2014 and are equal to the Fund’s annualized expense ratio, multiplied by the average account value over the period, multiplied by the number of days in the most recent six-month period (181), then divided by 365. |
2
ALTAIR SMALLER COMPANIES FUND
Portfolio Holdings Summary Table
February 28, 2015
(Unaudited)
The following table presents a summary by sector of the portfolio holdings of the Fund.
| | | | | | | | | | |
| | | % of Net | | |
Security Type/Sector Classification | | Assets | | Value |
COMMON STOCKS: | | | | | | | | | | |
Retail | | | | 8.3 | % | | | $ | 16,398,518 | |
Commercial Services | | | | 7.8 | | | | | 15,311,937 | |
Software | | | | 6.0 | | | | | 11,808,440 | |
Healthcare-Products | | | | 5.9 | | | | | 11,715,993 | |
Computers | | | | 4.8 | | | | | 9,487,953 | |
Pharmaceuticals | | | | 4.6 | | | | | 9,003,997 | |
Banks | | | | 4.5 | | | | | 8,874,873 | |
Semiconductors | | | | 4.3 | | | | | 8,429,316 | |
Biotechnology | | | | 3.5 | | | | | 6,894,063 | |
Internet | | | | 3.3 | | | | | 6,597,597 | |
Diversified Financial Services | | | | 2.8 | | | | | 5,594,238 | |
Transportation | | | | 2.6 | | | | | 5,090,218 | |
Building Materials | | | | 2.2 | | | | | 4,367,106 | |
Electronics | | | | 2.1 | | | | | 4,132,894 | |
Healthcare-Services | | | | 2.0 | | | | | 3,866,497 | |
Insurance | | | | 1.9 | | | | | 3,708,127 | |
Telecommunications | | | | 1.8 | | | | | 3,551,732 | |
Food | | | | 1.8 | | | | | 3,515,840 | |
REITS | | | | 1.7 | | | | | 3,400,936 | |
Apparel | | | | 1.6 | | | | | 3,162,206 | |
Chemicals | | | | 1.6 | | | | | 3,120,485 | |
Oil & Gas | | | | 1.3 | | | | | 2,598,040 | |
Miscellaneous Manufacturing | | | | 1.2 | | | | | 2,302,523 | |
Aerospace/Defense | | | | 1.1 | | | | | 2,190,710 | |
Machinery-Diversified | | | | 1.0 | | | | | 2,029,818 | |
Beverages | | | | 0.9 | | | | | 1,789,559 | |
Auto Parts & Equipment | | | | 0.9 | | | | | 1,760,397 | |
Home Furnishings | | | | 0.9 | | | | | 1,718,127 | |
Electrical Components & Equipment | | | | 0.8 | | | | | 1,649,896 | |
Airlines | | | | 0.8 | | | | | 1,635,246 | |
Textiles | | | | 0.8 | | | | | 1,490,464 | |
Entertainment | | | | 0.7 | | | | | 1,462,883 | |
Leisure Time | | | | 0.7 | | | | | 1,459,457 | |
Environmental Control | | | | 0.7 | | | | | 1,414,932 | |
Oil & Gas Services | | | | 0.6 | | | | | 1,261,913 | |
Engineering & Construction | | | | 0.6 | | | | | 1,132,077 | |
Metal Fabricate/Hardware | | | | 0.6 | | | | | 1,116,409 | |
Advertising. | | | | 0.5 | | | | | 1,064,863 | |
Investment Companies | | | | 0.5 | | | | | 1,028,216 | |
Home Builders | | | | 0.5 | | | | | 938,411 | |
Real Estate | | | | 0.5 | | | | | 926,569 | |
Savings & Loans | | | | 0.5 | | | | | 886,857 | |
Housewares | | | | 0.4 | | | | | 708,426 | |
Water | | | | 0.3 | | | | | 645,728 | |
Gas | | | | 0.3 | | | | | 624,388 | |
Mining | | | | 0.3 | | | | | 620,162 | |
Packaging & Containers | | | | 0.3 | | | | | 600,894 | |
Distribution / Wholesale | | | | 0.3 | | | | | 599,027 | |
Electric | | | | 0.3 | | | | | 587,228 | |
Lodging | | | | 0.3 | | | | | 545,496 | |
Forest Products & Paper | | | | 0.3 | | | | | 513,678 | |
Trucking & Leasing | | | | 0.3 | | | | | 509,733 | |
The accompanying notes are an integral part of the financial statements.
3
ALTAIR SMALLER COMPANIES FUND
Portfolio Holdings Summary Table
February 28, 2015
(Unaudited)
| | | | | | | | | | |
| | | % of Net | | |
Security Type/Sector Classification | | Assets | | Value |
Hand / Machine Tools | | | | 0.2 | % | | | $ | 424,824 | |
Household Products / Wares | | | | 0.2 | | | | | 404,212 | |
Energy-Alternate Sources | | | | 0.1 | | | | | 239,152 | |
Office Furnishings | | | | 0.1 | | | | | 114,154 | |
Agriculture | | | | 0.1 | | | | | 111,206 | |
Media | | | | 0.1 | | | | | 106,694 | |
Machinery-Construction & Mining | | | | 0.1 | | | | | 99,953 | |
Cosmetics/Personal Care | | | | 0.0 | | | | | 54,614 | |
Coal | | | | 0.0 | | | | | 53,363 | |
Iron / Steel | | | | 0.0 | | | | | 43,060 | |
Other Assets in Excess of Liabilities | | | | 4.8 | | | | | 9,480,667 | |
| | | | | | | | | | |
NET ASSETS | | | | 100.0 | % | | | $ | 196,976,992 | |
| | | | | | | | | | |
Portfolio holdings are subject to change at any time.
The accompanying notes are an integral part of the financial statements.
4
ALTAIR SMALLER COMPANIES FUND
Portfolio of Investments
February 28, 2015
(Unaudited)
| | | | | | | | |
| | | Number | | | | |
| | | of Shares | | | Value | |
| |
COMMON STOCKS—95.2% | | | | | |
Advertising — 0.5% | | | | | | | | |
EVINE Live, Inc.* | | | 33,225 | | | $ | 210,302 | |
Harte-Hanks, Inc. | | | 46,710 | | | | 362,002 | |
MDC Partners, Inc., Class A (Canada) | | | 18,930 | | | | 492,559 | |
| | | | | | | | |
| | | | | | | 1,064,863 | |
| | | | | | | | |
Aerospace/Defense — 1.1% | | | | | |
AAR Corp. | | | 2,389 | | | | 70,237 | |
Cubic Corp. | | | 4,526 | | | | 236,574 | |
Curtiss-Wright Corp. | | | 1,629 | | | | 118,233 | |
GenCorp, Inc.* | | | 14,202 | | | | 274,099 | |
Kaman Corp. | | | 1,631 | | | | 67,687 | |
KLX, Inc.* | | | 12,230 | | | | 488,466 | |
LMI Aerospace, Inc.* | | | 13,003 | | | | 185,163 | |
M/A-COM Technology Solutions Holdings, Inc.* | | | 10,366 | | | | 349,542 | |
Moog, Inc., Class A* | | | 2,464 | | | | 185,933 | |
Orbital ATK, Inc. | | | 1,778 | | | | 117,878 | |
Teledyne Technologies, Inc.* | | | 961 | | | | 96,898 | |
| | | | | | | | |
| | | | | | | 2,190,710 | |
| | | | | | | | |
Agriculture — 0.1% | | | | | | | | |
Andersons, Inc. (The) | | | 1,301 | | | | 57,595 | |
Universal Corp. | | | 1,119 | | | | 53,611 | |
| | | | | | | | |
| | | | | | | 111,206 | |
| | | | | | | | |
Airlines — 0.8% | | | | | | | | |
Allegiant Travel | | | 2,589 | | | | 475,392 | |
Controladora Vuela Cia de Aviacion SAB de CV, ADR (Mexico)* | | | 27,308 | | | | 274,445 | |
Hawaiian Holdings, Inc.* | | | 9,987 | | | | 184,859 | |
SkyWest, Inc. | | | 2,999 | | | | 43,845 | |
Spirit Airlines, Inc.* | | | 4,567 | | | | 355,221 | |
Virgin America, Inc.* | | | 8,604 | | | | 301,484 | |
| | | | | | | | |
| | | | | | | 1,635,246 | |
| | | | | | | | |
Apparel — 1.6% | | | | | | | | |
Carter’s, Inc. | | | 3,973 | | | | 352,683 | |
G-III Apparel Group Ltd* | | | 5,019 | | | | 528,149 | |
Iconix Brand Group, Inc.* | | | 2,326 | | | | 78,549 | |
Oxford Industries, Inc. | | | 1,003 | | | | 55,195 | |
Rocky Brands, Inc. | | | 30,420 | | | | 604,750 | |
Sequential Brands Group, Inc.* | | | 27,207 | | | | 275,607 | |
Skechers U.S.A., Inc., Class A* | | | 8,071 | | | | 549,958 | |
Steven Madden Ltd.* | | | 3,386 | | | | 123,623 | |
Superior Uniform Group, Inc. | | | 21,088 | | | | 386,965 | |
Unifi, Inc.* | | | 1,244 | | | | 40,206 | |
| | | | | | | | |
| | | Number | | | | |
| | | of Shares | | | Value | |
| | |
Apparel — (Continued) | | | | | | | | |
Wolverine World Wide, Inc. | | | 5,449 | | | $ | 166,521 | |
| | | | | | | | |
| | | | | | | 3,162,206 | |
| | | | | | | | |
Auto Parts & Equipment — 0.9% | | | | | |
Dorman Products, Inc.* | | | 1,049 | | | | 46,271 | |
Motorcar Parts of America, Inc.* | | | 20,783 | | | | 545,554 | |
Remy International, Inc. | | | 28,362 | | | | 648,645 | |
Spartan Motors, Inc. | | | 81,580 | | | | 406,268 | |
Standard Motor Products, Inc. | | | 1,276 | | | | 53,490 | |
Titan International, Inc. | | | 6,029 | | | | 60,169 | |
| | | | | | | | |
| | | | | | | 1,760,397 | |
| | | | | | | | |
Banks — 4.5% | | | | | |
1st Source Corp. | | | 8,181 | | | | 252,548 | |
American River Bankshares* | | | 45,650 | | | | 436,414 | |
Bank Of Commerce Holdings | | | 62,510 | | | | 359,432 | |
Bank Of The Ozarks, Inc. | | | 10,351 | | | | 378,847 | |
BankUnited, Inc. | | | 10,208 | | | | 330,841 | |
Banner Corp. | | | 1,722 | | | | 75,183 | |
Central Pacific Financial Corp. | | | 4,424 | | | | 101,487 | |
City Holding Co. | | | 4,208 | | | | 194,199 | |
Customers Bancorp, Inc.* | | | 17,449 | | | | 386,321 | |
CVB Financial Corp. | | | 4,745 | | | | 74,259 | |
First BanCorp (Puerto Rico)* | | | 14,781 | | | | 97,407 | |
First Citizens Bancshares, Inc., Class A | | | 744 | | | | 187,674 | |
First Financial Bancorp | | | 7,350 | | | | 128,111 | |
First Financial Bankshares, Inc. | | | 2,174 | | | | 57,111 | |
First Security Group, Inc.* | | | 99,750 | | | | 220,447 | |
FNB Corp. | | | 13,275 | | | | 170,318 | |
Glacier Bancorp, Inc. | | | 9,042 | | | | 219,630 | |
Home BancShares, Inc. | | | 5,717 | | | | 180,943 | |
MB Financial, Inc. | | | 873 | | | | 27,229 | |
National Penn Bancshares, Inc. | | | 10,089 | | | | 108,255 | |
Northrim BanCorp, Inc. | | | 17,670 | | | | 417,896 | |
OFG Bancorp (Puerto Rico) | | | 4,479 | | | | 78,159 | |
Orrstown Financial Services, Inc.* | | | 21,020 | | | | 352,085 | |
Pacific Continental Corp. | | | 31,140 | | | | 423,193 | |
Pacific Mercantile Bancorp* | | | 71,410 | | | | 497,014 | |
Park Sterling Corp. | | | 82,220 | | | | 559,096 | |
Premier Financial Bancorp, Inc. | | | 32,270 | | | | 486,954 | |
Privatebancorp, Inc. | | | 2,852 | | | | 99,050 | |
S&T Bancorp, Inc. | | | 3,937 | | | | 111,535 | |
Signature Bank* | | | 3,066 | | | | 378,191 | |
Southside Bancshares, Inc. | | | 1,927 | | | | 55,324 | |
The accompanying notes are an integral part of the financial statements.
5
ALTAIR SMALLER COMPANIES FUND
Portfolio of Investments (Continued)
February 28, 2015
(Unaudited)
| | | | | | | | |
| | | Number | | | | |
| | | of Shares | | | Value | |
| | |
Banks — (Continued) | | | | | | | | |
Square 1 Financial, Inc.,
Class A* | | | 7,157 | | | $ | 198,106 | |
Suffolk Bancorp | | | 17,180 | | | | 386,550 | |
Susquehanna Bancshares, Inc. | | | 13,349 | | | | 179,010 | |
Tompkins Financial Corp. | | | 1,660 | | | | 86,237 | |
TrustCo Bank Corp. | | | 10,035 | | | | 67,837 | |
UMB Financial Corp. | | | 1,279 | | | | 65,920 | |
United Bankshares, Inc. | | | 2,652 | | | | 99,317 | |
Wilshire Bancorp, Inc. | | | 9,430 | | | | 89,679 | |
Wintrust Financial Corp. | | | 5,459 | | | | 257,064 | |
| | | | | | | | |
| | | | | | | 8,874,873 | |
| | | | | | | | |
Beverages — 0.9% | | | | | | | | |
Boston Beer Co., Inc. (The), Class A* | | | 455 | | | | 121,758 | |
Craft Brew Alliance, Inc.* | | | 51,843 | | | | 648,037 | |
Farmer Bros Co.* | | | 31,645 | | | | 766,758 | |
Reed’s, Inc.* | | | 46,853 | | | | 253,006 | |
| | | | | | | | |
| | | | | | | 1,789,559 | |
| | | | | | | | |
Biotechnology — 3.5% | | | | | | | | |
Acceleron Pharma, Inc.* | | | 9,158 | | | | 372,090 | |
Acorda Therapeutics, Inc.* | | | 2,361 | | | | 79,896 | |
Alder Biopharmaceuticals, Inc.* | | | 9,198 | | | | 247,242 | |
AMAG Pharmaceuticals, Inc.* | | | 7,244 | | | | 356,622 | |
ANI Pharmaceuticals, Inc.* | | | 5,163 | | | | 347,780 | |
Avalanche Biotechnologies, Inc.* | | | 4,508 | | | | 163,099 | |
Bluebird Bio, Inc.* | | | 5,831 | | | | 555,811 | |
Dynavax Technologies Corp.* | | | 13,294 | | | | 233,974 | |
Exact Sciences Corp.* | | | 8,431 | | | | 189,445 | |
Five Prime Therapeutics, Inc.* | | | 11,998 | | | | 308,829 | |
Harvard Bioscience, Inc.* | | | 57,572 | | | | 314,343 | |
Ligand Pharmaceuticals* | | | 978 | | | | 53,858 | |
Lion Biotechnologies, Inc.* | | | 20,764 | | | | 186,461 | |
Loxo Oncology, Inc.* | | | 12,694 | | | | 162,991 | |
MacroGenics, Inc.* | | | 12,663 | | | | 437,760 | |
Medicines Co., (The)* | | | 4,827 | | | | 138,849 | |
Momenta Pharmaceuticals, Inc.* | | | 19,293 | | | | 263,349 | |
Myriad Genetics, Inc.* | | | 15,134 | | | | 515,615 | |
NeoGenomics, Inc.* | | | 143,573 | | | | 651,821 | |
OvaScience, Inc.* | | | 4,254 | | | | 193,600 | |
Repligen, Corp.* | | | 16,825 | | | | 432,571 | |
Sage Therapeutics, Inc.* | | | 7,639 | | | | 331,915 | |
Spectrum Pharmaceuticals, Inc.* | | | 6,770 | | | | 42,177 | |
Sunesis Pharmaceuticals, Inc.* | | | 56,927 | | | | 126,378 | |
Synageva BioPharma Corp.* | | | 1,900 | | | | 187,587 | |
| | | | | | | | |
| | | | | | | 6,894,063 | |
| | | | | | | | |
| | | | | | | | |
| | | Number | | | | |
| | | of Shares | | | Value | |
| | |
Building Materials — 2.2% | | | | | | | | |
AAON, Inc. | | | 3,281 | | | $ | 73,855 | |
Apogee Enterprises, Inc. | | | 10,558 | | | | 484,084 | |
Boise Cascade Co.* | | | 2,196 | | | | 78,200 | |
Caesarstone Sdot-Yam Ltd. (Israel) | | | 5,775 | | | | 377,743 | |
Drew Industries, Inc.* | | | 1,629 | | | | 96,095 | |
Gibraltar Industries, Inc.* | | | 4,141 | | | | 60,707 | |
Griffon Corp. | | | 4,619 | | | | 75,382 | |
Headwaters, Inc.* | | | 4,288 | | | | 70,409 | |
NCI Building Systems, Inc.* | | | 17,153 | | | | 288,857 | |
Patrick Industries, Inc.* | | | 19,630 | | | | 1,084,558 | |
PGT, Inc.* | | | 49,591 | | | | 504,340 | |
Quanex Building Products Corp. | | | 2,595 | | | | 50,836 | |
Simpson Manufacturing Co., Inc. | | | 4,180 | | | | 151,316 | |
Stock Building Supply Holdings, Inc.* | | | 18,568 | | | | 288,361 | |
Universal Forest Products, Inc. | | | 1,696 | | | | 91,669 | |
US Concrete, Inc.* | | | 19,367 | | | | 590,694 | |
| | | | | | | | |
| | | | | | | 4,367,106 | |
| | | | | | | | |
Chemicals — 1.6% | | | | | | | | |
A. Schulman, Inc. | | | 914 | | | | 38,918 | |
American Vanguard Corp. | | | 25,391 | | | | 286,156 | |
Codexis, Inc.* | | | 47,867 | | | | 168,971 | |
Hawkins, Inc. | | | 6,457 | | | | 251,758 | |
HB Fuller Co. | | | 2,609 | | | | 116,622 | |
Innophos Holdings, Inc. | | | 1,242 | | | | 69,713 | |
Intrepid Potash, Inc.* | | | 5,565 | | | | 78,578 | |
KMG Chemicals, Inc. | | | 25,760 | | | | 558,219 | |
Koppers Holdings, Inc. | | | 2,566 | | | | 41,364 | |
Kraton Performance Polymers, Inc.* | | | 10,237 | | | | 206,582 | |
Landec Corp.* | | | 69,515 | | | | 970,429 | |
OM Group, Inc. | | | 2,104 | | | | 60,574 | |
Quaker Chemical Corp. | | | 932 | | | | 75,660 | |
Rayonier Advanced Materials, Inc. | | | 6,596 | | | | 122,422 | |
Stepan Co. | | | 1,814 | | | | 74,519 | |
| | | | | | | | |
| | | | | | | 3,120,485 | |
| | | | | | | | |
Coal — 0.0% | | | | | | | | |
Cloud Peak Energy, Inc.* | | | 6,437 | | | | 53,363 | |
| | | | | | | | |
Commercial Services — 7.8% | | | | | | | | |
ABM Industries, Inc. | | | 2,589 | | | | 80,492 | |
American Public Education, Inc.* | | | 1,727 | | | | 55,955 | |
AMN Healthcare Services Inc.* | | | 45,595 | | | | 1,028,623 | |
ARC Document Solutions, Inc.* | | | 62,422 | | | | 528,091 | |
The accompanying notes are an integral part of the financial statements.
6
ALTAIR SMALLER COMPANIES FUND
Portfolio of Investments (Continued)
February 28, 2015
(Unaudited)
| | | | | | | | |
| | | Number | | | | |
| | | of Shares | | | Value | |
|
Commercial Services — (Continued) | |
Ascent Capital Group, Inc., Class A* | | | 9,096 | | | $ | 399,951 | |
Barrett Business Services, Inc. | | | 17,040 | | | | 634,740 | |
Brink’s Co. (The) | | | 23,298 | | | | 655,606 | |
Capella Education Co. | | | 1,133 | | | | 73,441 | |
Cardtronics, Inc.* | | | 2,550 | | | | 93,304 | |
CRA International, Inc.* | | | 8,759 | | | | 263,558 | |
Cross Country Healthcare, Inc.* | | | 86,185 | | | | 1,116,958 | |
Electro Rent Corp. | | | 45,668 | | | | 590,031 | |
Franklin Covey Co.* | | | 14,760 | | | | 264,204 | |
Green Dot Corp., Class A* | | | 4,646 | | | | 72,059 | |
Hackett Group, Inc. (The) | | | 85,178 | | | | 750,418 | |
Healthcare Services Group, Inc. | | | 13,607 | | | | 456,787 | |
Heidrick & Struggles International, Inc. | | | 15,792 | | | | 378,061 | |
ICF International, Inc.* | | | 4,105 | | | | 172,000 | |
Insperity, Inc. | | | 3,310 | | | | 171,458 | |
Kelly Services, Inc., Class A | | | 13,093 | | | | 226,640 | |
Korn/Ferry International* | | | 3,049 | | | | 93,299 | |
Landauer, Inc. | | | 1,098 | | | | 41,878 | |
LendingTree, Inc.* | | | 14,590 | | | | 773,854 | |
Matthews International, Corp., Class A | | | 1,608 | | | | 77,779 | |
Medifast, Inc.* | | | 13,790 | | | | 436,316 | |
Monro Muffler Brake, Inc. | | | 1,564 | | | | 98,907 | |
Monster Worldwide, Inc.* | | | 8,469 | | | | 56,912 | |
Multi-Color Corp. | | | 10,306 | | | | 703,694 | |
On Assignment, Inc.* | | | 12,147 | | | | 464,137 | |
PAREXEL International Corp.* | | | 2,736 | | | | 176,363 | |
Patriot National, Inc.* | | | 14,115 | | | | 190,694 | |
Paylocity Holding Corp.* | | | 19,467 | | | | 581,869 | |
PFSweb, Inc.* | | | 45,616 | | | | 510,443 | |
Providence Service Corp. (The)* | | | 927 | | | | 42,642 | |
Resources Connection, Inc. | | | 3,737 | | | | 66,220 | |
SFX Entertainment, Inc.* | | | 58,143 | | | | 276,761 | |
Sotheby’s | | | 13,741 | | | | 603,917 | |
SP Plus Corp.* | | | 27,934 | | | | 631,588 | |
Strayer Education, Inc.* | | | 725 | | | | 44,131 | |
Team Health Holdings, Inc.* | | | 5,021 | | | | 297,595 | |
TriNet Group, Inc.* | | | 10,904 | | | | 396,251 | |
Viad Corp. | | | 1,391 | | | | 36,945 | |
WEX, Inc.* | | | 2,883 | | | | 308,452 | |
WuXi PharmaTech Cayman, Inc., ADR* | | | 9,735 | | | | 388,913 | |
| | | | | | | | |
| | | | | | | 15,311,937 | |
| | | | | | | | |
| | | | | | | | |
| | | Number | | | | |
| | | of Shares | | | Value | |
| | |
Computers — 4.8% | | | | | | | | |
CACI International, Inc., Class A* | | | 1,067 | | | $ | 93,138 | |
Computer Services, Inc. | | | 13,386 | | | | 542,802 | |
Convergys Corp. | | | 32,112 | | | | 717,703 | |
Datalink Corp.* | | | 55,050 | | | | 625,368 | |
Digimarc Corp. | | | 10,323 | | | | 273,766 | |
Dot Hill Systems Corp.* | | | 139,350 | | | | 565,761 | |
DST Systems, Inc. | | | 2,104 | | | | 223,634 | |
EPAM Systems, Inc.* | | | 6,988 | | | | 431,020 | |
ExlService Holdings, Inc.* | | | 1,497 | | | | 52,245 | |
Icad, Inc.* | | | 49,266 | | | | 489,704 | |
iGATE Corp.* | | | 11,484 | | | | 491,515 | |
Insight Enterprises, Inc.* | | | 3,352 | | | | 88,158 | |
Manhattan Associates, Inc.* | | | 12,102 | | | | 603,285 | |
MAXIMUS Inc. | | | 3,243 | | | | 192,083 | |
Mercury Systems, Inc.* | | | 22,462 | | | | 382,303 | |
MTS Systems Corp. | | | 711 | | | | 51,512 | |
Netscout Systems, Inc.* | | | 2,208 | | | | 89,027 | |
PAR Technology Corp.* | | | 27,080 | | | | 132,963 | |
Qualys, Inc.* | | | 4,513 | | | | 207,733 | |
Qumu Corp.* | | | 21,980 | | | | 329,920 | |
Silicon Graphics International Corp.* | | | 29,454 | | | | 271,860 | |
Super Micro Computer, Inc.* | | | 20,875 | | | | 838,758 | |
Sykes Enterprises, Inc.* | | | 22,038 | | | | 512,384 | |
Synaptics, Inc.* | | | 6,755 | | | | 580,592 | |
TeleTech Holdings, Inc. | | | 1,804 | | | | 43,837 | |
Virtusa Corp.* | | | 5,784 | | | | 227,658 | |
Xplore Technologies Corp.* | | | 61,056 | | | | 429,224 | |
| | | | | | | | |
| | | | | | | 9,487,953 | |
| | | | | | | | |
Cosmetics/Personal Care — 0.0% | | | | | |
Inter Parfums | | | 1,921 | | | | 54,614 | |
| | | | | | | | |
Distribution / Wholesale — 0.3% | | | | | |
Houston Wire & Cable Co. | | | 20,504 | | | | 217,547 | |
Pool Corp. | | | 2,106 | | | | 145,672 | |
Rentrak Corp.* | | | 4,307 | | | | 235,808 | |
| | | | | | | | |
| | | | | | | 599,027 | |
| | | | | | | | |
Diversified Financial Services — 2.8% | | | | | |
Blackhawk Network Holdings, Inc., Class B* | | | 19,895 | | | | 729,749 | |
Ellie Mae, Inc.* | | | 24,318 | | | | 1,285,206 | |
Enova International, Inc.* | | | — | | | | 9 | |
Evercore Partners, Inc., Class A | | | 2,877 | | | | 147,389 | |
Financial Engines, Inc. | | | 3,401 | | | | 137,060 | |
FNFV Group* | | | 56,573 | | | | 842,372 | |
The accompanying notes are an integral part of the financial statements.
7
ALTAIR SMALLER COMPANIES FUND
Portfolio of Investments (Continued)
February 28, 2015
(Unaudited)
| | | | | | | | |
| | | Number | | | | |
| | | of Shares | | | Value | |
|
Diversified Financial Services — (Continued) | |
Interactive Brokers Group, Inc., Class A | | | 3,063 | | | $ | 97,618 | |
Investment Technology Group, Inc.* | | | 2,365 | | | | 53,260 | |
JMP Group, Inc. | | | 50,220 | | | | 377,152 | |
Ladenburg Thalmann Financial Services, Inc.* | | | 49,293 | | | | 190,271 | |
MarketAxess Holdings, Inc. | | | 2,439 | | | | 194,120 | |
PRA Group, Inc.* | | | 5,713 | | | | 286,164 | |
Silvercrest Asset Management Group, Inc., Class A | | | 18,232 | | | | 254,701 | |
Stifel Financial Corp.* | | | 2,852 | | | | 156,204 | |
WageWorks Inc.* | | | 7,543 | | | | 433,345 | |
Westwood Holdings Group, Inc. | | | 4,611 | | | | 288,095 | |
World Acceptance Corp.* | | | 1,480 | | | | 121,523 | |
| | | | | | | | |
| | | | | | | 5,594,238 | |
| | | | | | | | |
Electric — 0.3% | | | | | | | | |
ALLETE, Inc. | | | 1,822 | | | | 99,918 | |
Avista Corp. | | | 2,871 | | | | 97,901 | |
El Paso Electric Co. | | | 2,208 | | | | 83,507 | |
NorthWestern Corp. | | | 2,048 | | | | 110,981 | |
UIL Holdings Corp. | | | 3,856 | | | | 194,921 | |
| | | | | | | | |
| | | | | | | 587,228 | |
| | | | | | | | |
Electrical Components & Equipment — 0.8% | |
Advanced Energy Industries, Inc.* | | | 2,466 | | | | 65,645 | |
Capstone Turbine Corp.* | | | 270,256 | | | | 191,233 | |
Encore Wire Corp. | | | 3,347 | | | | 124,810 | |
EnerSys | | | 3,907 | | | | 255,127 | |
General Cable Corp. | | | 6,009 | | | | 90,375 | |
Highpower International, Inc.* | | | 35,560 | | | | 181,000 | |
Insteel Industries, Inc. | | | 17,220 | | | | 373,846 | |
Littelfuse, Inc. | | | 1,184 | | | | 118,779 | |
PowerSecure International, Inc.* . | | | 22,460 | | | | 249,081 | |
| | | | | | | | |
| | | | | | | 1,649,896 | |
| | | | | | | | |
Electronics — 2.1% | | | | | | | | |
American Science & Engineering, Inc. | | | 1,340 | | | | 70,069 | |
Badger Meter, Inc. | | | 1,318 | | | | 76,971 | |
Benchmark Electronics, Inc.* | | | 3,636 | | | | 85,301 | |
Brady Corp., Class A | | | 2,753 | | | | 74,221 | |
Checkpoint Systems, Inc.* | | | 3,223 | | | | 43,510 | |
Coherent, Inc.* | | | 1,772 | | | | 113,833 | |
CTS Corp. | | | 2,248 | | | | 39,250 | |
ESCO Technologies, Inc. | | | 1,906 | | | | 73,457 | |
| | | | | | | | |
| | | Number | | | | |
| | | of Shares | | | Value | |
| |
Electronics — (Continued) | | | | | |
FARO Technologies, Inc.* | | | 778 | | | $ | 46,657 | |
II-VI, Inc.* | | | 3,812 | | | | 66,672 | |
IMAX Corp. (Canada)* | | | 11,269 | | | | 394,077 | |
Ituran Location and Control Ltd. (Israel) | | | 12,033 | | | | 277,240 | |
Knowles Corp.* | | | 11,917 | | | | 228,211 | |
Methode Electronics, Inc. | | | 1,743 | | | | 67,785 | |
Napco Security Technologies, Inc.* | | | 36,680 | | | | 203,574 | |
Newport Corp.* | | | 3,175 | | | | 63,373 | |
OSI Systems, Inc.* | | | 790 | | | | 57,251 | |
Plexus Corp.* | | | 1,246 | | | | 50,152 | |
Rogers Corp.* | | | 991 | | | | 77,575 | |
TASER International, Inc.* | | | 26,245 | | | | 616,233 | |
Tech Data Corp.* | | | 8,000 | | | | 476,000 | |
Vishay Intertechnology, Inc. | | | 21,960 | | | | 312,710 | |
ZAGG, Inc.* | | | 80,360 | | | | 618,772 | |
| | | | | | | | |
| | | | | | | 4,132,894 | |
| | | | | | | | |
Energy-Alternate Sources — 0.1% | | | | | |
Green Plains, Inc. | | | 1,582 | | | | 36,782 | |
Hydrogenics Corp. (Canada)* | | | 14,750 | | | | 202,370 | |
| | | | | | | | |
| | | | | | | 239,152 | |
| | | | | | | | |
Engineering & Construction — 0.6% | | | | | |
Comfort Systems USA, Inc. | | | 17,266 | | | | 322,874 | |
Dycom Industries, Inc.* | | | 2,682 | | | | 118,947 | |
EMCOR Group, Inc. | | | 4,741 | | | | 208,746 | |
Exponent, Inc. | | | 695 | | | | 60,138 | |
Sterling Construction Co., Inc.* | | | 42,400 | | | | 117,024 | |
Tutor Perini Corp.* | | | 13,079 | | | | 304,348 | |
| | | | | | | | |
| | | | | | | 1,132,077 | |
| | | | | | | | |
Entertainment — 0.7% | | | | | |
AMC Entertainment Holdings, Inc., Class A | | | 12,239 | | | | 420,777 | |
International Speedway Corp., Class A | | | 24,171 | | | | 750,026 | |
Marriott Vacations Worldwide Corp. | | | 2,258 | | | | 171,743 | |
Pinnacle Entertainment, Inc.* | | | 3,069 | | | | 78,996 | |
Scientific Games Corp.,
Class A* | | | 3,060 | | | | 41,341 | |
| | | | | | | | |
| | | | | | | 1,462,883 | |
| | | | | | | | |
Environmental Control — 0.7% | | | | | |
Clean Harbors, Inc.* | | | 9,433 | | | | 525,324 | |
Progressive Waste Solutions Ltd. (Canada) | | | 4,860 | | | | 136,031 | |
Tetra Tech, Inc. | | | 3,198 | | | | 81,325 | |
The accompanying notes are an integral part of the financial statements.
8
ALTAIR SMALLER COMPANIES FUND
Portfolio of Investments (Continued)
February 28, 2015
(Unaudited)
| | | | | | | | |
| | | Number | | | | |
| | | of Shares | | | Value | |
|
Environmental Control — (Continued) | |
US Ecology, Inc. | | | 13,770 | | | $ | 672,252 | |
| | | | | | | | |
| | | | | | | 1,414,932 | |
| | | | | | | | |
Food — 1.8% | | | | | | | | |
B&G Foods, Inc. | | | 3,623 | | | | 103,799 | |
Calavo Growers, Inc. | | | 4,486 | | | | 188,188 | |
Cal-Maine Foods, Inc. | | | 1,158 | | | | 43,576 | |
Darling Ingredients, Inc.* | | | 23,831 | | | | 415,136 | |
Ingles Markets, Inc., Class A | | | 5,242 | | | | 226,664 | |
Inventure Foods, Inc.* | | | 22,353 | | | | 225,542 | |
J&J Snack Foods Corp. | | | 553 | | | | 55,958 | |
John B Sanfilippo & Son, Inc. | | | 4,320 | | | | 160,056 | |
Lifeway Foods, Inc.* | | | 20,167 | | | | 377,728 | |
Rocky Mountain Chocolate | | | | | | | | |
Factory, Inc. | | | 23,364 | | | | 357,936 | |
Sanderson Farms, Inc. | | | 652 | | | | 55,557 | |
Snyder’s-Lance, Inc. | | | 3,587 | | | | 110,659 | |
SpartanNash Co. | | | 1,672 | | | | 44,392 | |
SunOpta, Inc. (Canada)* | | | 19,239 | | | | 222,210 | |
TreeHouse Foods, Inc.* | | | 1,237 | | | | 103,364 | |
United Natural Foods, Inc.* | | | 5,077 | | | | 421,594 | |
Village Super Market, Inc., Class A | | | 14,603 | | | | 403,481 | |
| | | | | | | | |
| | | | | | | 3,515,840 | |
| | | | | | | | |
Forest Products & Paper — 0.3% | | | | | |
Deltic Timber Corp. | | | 582 | | | | 38,517 | |
Neenah Paper, Inc. | | | 1,352 | | | | 81,688 | |
Orchids Paper Products, Co. | | | 8,482 | | | | 239,023 | |
PH Glatfelter, Co. | | | 5,074 | | | | 124,313 | |
Veritiv Corp.* | | | 595 | | | | 30,137 | |
| | | | | | | | |
| | | | | | | 513,678 | |
| | | | | | | | |
Gas — 0.3% | | | | | |
Laclede Group, Inc. (The) | | | 2,023 | | | | 104,710 | |
New Jersey Resources Corp. | | | 1,990 | | | | 124,534 | |
Northwest Natural Gas Co. | | | 1,113 | | | | 52,589 | |
Piedmont Natural Gas Co., Inc. | | | 3,482 | | | | 129,879 | |
South Jersey Industries, Inc. | | | 1,954 | | | | 110,753 | |
Southwest Gas Corp. | | | 1,780 | | | | 101,923 | |
| | | | | | | | |
| | | | | | | 624,388 | |
| | | | | | | | |
Hand / Machine Tools — 0.2% | | | | | |
Hardinge, Inc. | | | 37,200 | | | | 424,824 | |
| | | | | | | | |
Healthcare-Products — 5.9% | | | | | |
Abaxis, Inc. | | | 7,317 | | | | 445,752 | |
ABIOMED, Inc.* | | | 1,897 | | | | 115,319 | |
Affymetrix, Inc.* | | | 5,381 | | | | 62,958 | |
| | | | | | | | |
| | | Number | | | | |
| | | of Shares | | | Value | |
|
Healthcare-Products — (Continued) | |
Analogic Corp. | | | 858 | | | $ | 74,354 | |
AtriCure, Inc.* | | | 23,254 | | | | 411,131 | |
Avinger, Inc.* | | | 14,614 | | | | 166,600 | |
Cantel Medical Corp. | | | 1,814 | | | | 82,356 | |
Cardiovascular Systems, Inc.* | | | 5,391 | | | | 203,295 | |
Cepheid* | | | 5,984 | | | | 340,131 | |
CONMED Corp. | | | 1,664 | | | | 85,363 | |
Cyberonics, Inc.* | | | 1,406 | | | | 96,311 | |
Cynosure, Inc., Class A* | | | 15,067 | | | | 458,338 | |
DexCom, Inc.* | | | 9,368 | | | | 569,012 | |
Digirad Corp. | | | 65,508 | | | | 279,719 | |
Greatbatch, Inc.* | | | 1,035 | | | | 55,000 | |
Haemonetics Corp.* | | | 2,900 | | | | 128,934 | |
Hanger, Inc.* | | | 3,657 | | | | 94,680 | |
ICU Medical, Inc.* | | | 578 | | | | 51,390 | |
Inogen, Inc.* | | | 11,185 | | | | 371,901 | |
Integra LifeSciences Holdings Corp.* | | | 1,091 | | | | 65,471 | |
K2M Group Holdings, Inc.* | | | 34,045 | | | | 697,582 | |
LDR Holding Corp.* | | | 20,666 | | | | 807,834 | |
Masimo Corp.* | | | 3,409 | | | | 100,463 | |
Mazor Robotics Ltd., ADR (Israel)* | | | 25,429 | | | | 304,131 | |
Merit Medical Systems, Inc.* | | | 2,635 | | | | 51,672 | |
NanoString Technologies, Inc.* | | | 11,994 | | | | 126,057 | |
Natus Medical, Inc.* | | | 9,399 | | | | 336,390 | |
Novadaq Technologies, Inc. (Canada)* | | | 19,833 | | | | 328,236 | |
NuVasive, Inc.* | | | 2,647 | | | | 121,100 | |
OraSure Technologies, Inc.* | | | 65,195 | | | | 466,796 | |
Oxford Immunotec Global, PLC (United Kingdom)* | | | 13,364 | | | | 188,031 | |
Photomedex, Inc.* | | | 44,290 | | | | 79,722 | |
Spectranetics Corp. (The)* | | | 21,391 | | | | 723,230 | |
STERIS Corp. | | | 5,196 | | | | 335,246 | |
Synergetics USA, Inc.* | | | 97,180 | | | | 439,254 | |
Trinity Biotech, PLC, ADR (Ireland) | | | 29,665 | | | | 526,850 | |
Vascular Solutions, Inc.* | | | 6,918 | | | | 201,867 | |
West Pharmaceutical Services, Inc. | | | 9,104 | | | | 498,171 | |
Zeltiq Aesthetics, Inc.* | | | 36,720 | | | | 1,225,346 | |
| | | | | | | | |
| | | | | | | 11,715,993 | |
| | | | | | | | |
Healthcare-Services — 2.0% | | | | | |
AAC Holdings, Inc.* | | | 17,377 | | | | 625,398 | |
The accompanying notes are an integral part of the financial statements.
9
ALTAIR SMALLER COMPANIES FUND
Portfolio of Investments (Continued)
February 28, 2015
(Unaudited)
| | | | | | | | |
| | | Number | | | | |
| | | of Shares | | | Value | |
|
Healthcare-Services — (Continued) | |
Acadia Healthcare Co., Inc.* | | | 5,277 | | | $ | 333,665 | |
Air Methods Corp.* | | | 1,304 | | | | 69,099 | |
Almost Family, Inc.* | | | 18,030 | | | | 642,229 | |
Amedisys, Inc.* | | | 2,217 | | | | 66,887 | |
Amsurg Corp.* | | | 2,682 | | | | 161,188 | |
Bio-Reference Laboratories* | | | 1,492 | | | | 52,130 | |
Cancer Genetics, Inc.* | | | 13,850 | | | | 121,326 | |
Centene Corp.* | | | 8,820 | | | | 542,077 | |
Chemed Corp. | | | 621 | | | | 72,334 | |
Ensign Group, Inc. (The) | | | 930 | | | | 40,985 | |
Healthways, Inc.* | | | 3,189 | | | | 71,370 | |
IPC The Hospitalist Co., Inc.* | | | 1,552 | | | | 67,108 | |
Kindred Healthcare, Inc. | | | 3,507 | | | | 74,419 | |
LHC Group, Inc.* | | | 1,302 | | | | 44,008 | |
Magellan Health, Inc.* | | | 941 | | | | 60,290 | |
Molina Healthcare, Inc.* | | | 2,020 | | | | 128,654 | |
Psychemedics Corp. | | | 18,358 | | | | 301,255 | |
Select Medical Holdings Corp. | | | 3,778 | | | | 51,230 | |
Surgical Care Affiliates, Inc.* | | | 10,494 | | | | 340,845 | |
| | | | | | | | |
| | | | | | | 3,866,497 | |
| | | | | | | | |
Home Builders — 0.5% | | | | | |
Cavco Industries, Inc.* | | | 6,865 | | | | 491,946 | |
Installed Building Products, Inc.* | | | 7,904 | | | | 137,846 | |
Meritage Homes Corp.* | | | 2,475 | | | | 110,162 | |
Ryland Group, Inc., (The) | | | 3,091 | | | | 140,641 | |
Winnebago Industries, Inc. | | | 2,491 | | | | 57,816 | |
| | | | | | | | |
| | | | | | | 938,411 | |
| | | | | | | | |
Home Furnishings — 0.9% | | | | | |
American Woodmark Corp.* | | | 1,043 | | | | 54,924 | |
Bassett Furniture Industries, Inc. | | | 4,667 | | | | 119,989 | |
Daktronics, Inc. | | | 3,747 | | | | 38,332 | |
DTS, Inc.* | | | 1,271 | | | | 37,456 | |
Hooker Furniture Corp. | | | 16,102 | | | | 297,082 | |
iRobot Corp.* | | | 2,573 | | | | 84,523 | |
La-Z-Boy, Inc. | | | 3,067 | | | | 76,522 | |
Norcraft Cos., Inc.* | | | 8,968 | | | | 184,830 | |
Select Comfort Corp.* | | | 3,684 | | | | 118,256 | |
Skullcandy, Inc.* | | | 62,672 | | | | 652,415 | |
Universal Electronics, Inc.* | | | 952 | | | | 53,798 | |
| | | | | | | | |
| | | | | | | 1,718,127 | |
| | | | | | | | |
Household Products / Wares — 0.2% | | | | | |
Acme United Corp. | | | 14,649 | | | | 281,700 | |
SodaStream International Ltd. (Israel)* | | | 2,328 | | | | 41,718 | |
| | | | | | | | |
| | | Number | | | | |
| | | of Shares | | | Value | |
|
Household Products / Wares — (Continued) | |
WD-40 Co. | | | 995 | | | $ | 80,794 | |
| | | | | | | | |
| | | | | | | 404,212 | |
| | | | | | | | |
Housewares — 0.4% | | | | | | | | |
Lifetime Brands, Inc. | | | 32,950 | | | | 527,530 | |
Toro, Co. (The) | | | 2,674 | | | | 180,896 | |
| | | | | | | | |
| | | | | | | 708,426 | |
| | | | | | | | |
Insurance — 1.9% | | | | | | | | |
American Equity Investment Life Holding Co. | | | 3,576 | | | | 101,880 | |
AMERISAFE, Inc. | | | 900 | | | | 37,386 | |
Atlas Financial Holdings, Inc. (Cayman Islands)* | | | 16,440 | | | | 295,591 | |
Employers Holdings, Inc. | | | 3,729 | | | | 87,967 | |
Federated National Holding Co. | | | 10,305 | | | | 298,124 | |
Hallmark Financial Services, Inc.* | | | 48,230 | | | | 544,034 | |
Hilltop Holdings, Inc.* | | | 16,334 | | | | 303,812 | |
Horace Mann Educators Corp. | | | 3,432 | | | | 110,613 | |
Infinity Property & Casualty Corp. | | | 1,164 | | | | 90,268 | |
Meadowbrook Insurance Group, Inc. | | | 6,122 | | | | 51,180 | |
Montpelier Re Holdings Ltd. (Bermuda) | | | 2,088 | | | | 75,252 | |
Navigators Group, Inc. (The)* | | | 2,756 | | | | 205,901 | |
RLI Corp. | | | 1,220 | | | | 59,036 | |
Safety Insurance Group, Inc. | | | 656 | | | | 38,376 | |
Selective Insurance Group, Inc. | | | 3,866 | | | | 105,271 | |
Stewart Information Services Corp. | | | 982 | | | | 36,953 | |
Universal Insurance Holdings, Inc. | | | 2,126 | | | | 52,937 | |
White Mountains Insurance Group Ltd. (Bermuda) | | | 1,819 | | | | 1,213,546 | |
| | | | | | | | |
| | | | | | | 3,708,127 | |
| | | | | | | | |
Internet — 3.3% | | | | | | | | |
8X8, Inc.* | | | 24,798 | | | | 183,753 | |
Blucora, Inc.* | | | 2,353 | | | | 34,871 | |
Blue Nile, Inc.* | | | 13,250 | | | | 397,235 | |
comScore, Inc.* | | | 13,034 | | | | 672,424 | |
ePlus, Inc.* | | | 10,589 | | | | 880,687 | |
FTD Cos., Inc.* | | | 1,055 | | | | 36,714 | |
GrubHub, Inc.* | | | 8,234 | | | | 345,910 | |
HealthStream, Inc.* | | | 925 | | | | 23,939 | |
j2 Global, Inc. | | | 1,848 | | | | 124,278 | |
The accompanying notes are an integral part of the financial statements.
10
ALTAIR SMALLER COMPANIES FUND
Portfolio of Investments (Continued)
February 28, 2015
(Unaudited)
| | | | | | | | |
| | | Number | | | | |
| | | of Shares | | | Value | |
| | |
Internet — (Continued) | | | | | | | | |
magicJack VocalTec Ltd. (Israel)* | | | 33,090 | | | $ | 255,455 | |
NIC, Inc. | | | 3,334 | | | | 58,345 | |
Perficient, Inc.* | | | 2,095 | | | | 41,649 | |
Q2 Holdings, Inc.* | | | 17,043 | | | | 337,622 | |
QuinStreet, Inc.* | | | 33,736 | | | | 226,369 | |
Reis, Inc. | | | 42,782 | | | | 1,035,752 | |
RingCentral, Inc.* | | | 11,415 | | | | 180,015 | |
Stamps.com, Inc.* | | | 4,498 | | | | 252,158 | |
TeleCommunication Systems, Inc., Class A* | | | 185,590 | | | | 593,888 | |
TheStreet, Inc. | | | 113,780 | | | | 228,698 | |
Tucows, Inc., Class A* | | | 9,308 | | | | 176,200 | |
VASCO Data Security International, Inc.* | | | 7,202 | | | | 184,515 | |
Zendesk, Inc.* | | | 13,233 | | | | 327,120 | |
| | | | | | | | |
| | | | | | | 6,597,597 | |
| | | | | | | | |
Investment Companies — 0.5% | | | | | |
Capital Southwest Corp. | | | 14,428 | | | | 702,644 | |
MCG Capital Corp. | | | 83,480 | | | | 325,572 | |
| | | | | | | | |
| | | | | | | 1,028,216 | |
| | | | | | | | |
Iron / Steel — 0.0% | | | | | | | | |
AK Steel Holding Corp.* | | | 9,742 | | | | 43,060 | |
| | | | | | | | |
Leisure Time — 0.7% | | | | | | | | |
Arctic Cat, Inc. | | | 12,515 | | | | 456,296 | |
Black Diamond, Inc.* | | | 32,800 | | | | 237,800 | |
Interval Leisure Group, Inc. | | | 2,465 | | | | 66,555 | |
Malibu Boats, Inc., Class A* | | | 9,408 | | | | 190,512 | |
Nautilus, Inc.* | | | 16,340 | | | | 249,348 | |
Town Sports International Holdings, Inc. | | | 37,420 | | | | 258,946 | |
| | | | | | | | |
| | | | | | | 1,459,457 | |
| | | | | | | | |
Lodging — 0.3% | | | | | | | | |
Boyd Gaming Corp.* | | | 4,776 | | | | 65,957 | |
Marcus Corp. (The) | | | 6,692 | | | | 130,427 | |
Monarch Casino & Resort, Inc.* | | | 19,182 | | | | 349,112 | |
| | | | | | | | |
| | | | | | | 545,496 | |
| | | | | | | | |
Machinery-Construction & Mining — 0.1% | | | | | |
Astec Industries, Inc. | | | 2,337 | | | | 99,953 | |
| | | | | | | | |
Machinery-Diversified — 1.0% | | | | | | | | |
Albany International Corp., Class A. | | | 1,008 | | | | 38,012 | |
Columbus Mckinnon Corp. | | | 14,010 | | | | 372,106 | |
DXP Enterprises, Inc.* | | | 1,621 | | | | 74,242 | |
| | | | | | | | |
| | | Number | | | | |
| | | of Shares | | | Value | |
| |
Machinery-Diversified — (Continued) | | | | | |
Hurco Cos, Inc. | | | 14,060 | | | $ | 479,868 | |
Lindsay Corp. | | | 734 | | | | 64,284 | |
Manitex International, Inc.* | | | 43,592 | | | | 512,206 | |
Twin Disc, Inc. | | | 26,596 | | | | 489,100 | |
| | | | | | | | |
| | | | | | | 2,029,818 | |
| | | | | | | | |
Media — 0.1% | | | | | | | | |
EW Scripps Co. (The), Class A* | | | 2,619 | | | | 60,394 | |
Scholastic Corp. | | | 1,251 | | | | 46,300 | |
| | | | | | | | |
| | | | | | | 106,694 | |
| | | | | | | | |
Metal Fabricate/Hardware — 0.6% | | | | | |
Haynes International, Inc. | | | 1,856 | | | | 74,945 | |
Mueller Industries, Inc. | | | 2,467 | | | | 85,876 | |
NN, Inc. | | | 31,473 | | | | 872,117 | |
RTI International Metals, Inc.* | | | 2,995 | | | | 83,471 | |
| | | | | | | | |
| | | | | | | 1,116,409 | |
| | | | | | | | |
Mining — 0.3% | | | | | | | | |
Century Aluminum Co.* | | | 2,048 | | | | 38,851 | |
Kaiser Aluminum Corp. | | | 1,268 | | | | 95,797 | |
Stillwater Mining Co.* | | | 4,358 | | | | 63,191 | |
United States Lime & Minerals, Inc. | | | 4,857 | | | | 327,848 | |
US Silica Holdings, Inc. | | | 2,915 | | | | 94,475 | |
| | | | | | | | |
| | | | | | | 620,162 | |
| | | | | | | | |
Miscellaneous Manufacturing — 1.2% | | | | | |
Barnes Group, Inc. | | | 3,127 | | | | 125,143 | |
CLARCOR, Inc. | | | 4,982 | | | | 327,865 | |
EnPro Industries, Inc. | | | 1,200 | | | | 78,924 | |
Federal Signal Corp. | | | 4,418 | | | | 72,853 | |
John Bean Technologies Corp. | | | 2,493 | | | | 86,158 | |
LSB Industries, Inc.* | | | 1,372 | | | | 51,560 | |
Lydall, Inc.* | | | 17,398 | | | | 554,300 | |
Myers Industries, Inc. | | | 17,424 | | | | 346,737 | |
Proto Labs, Inc.* | | | 4,941 | | | | 351,206 | |
Smith & Wesson Holding Corp.* | | | 15,362 | | | | 207,848 | |
Sturm Ruger & Co., Inc. | | | 968 | | | | 50,297 | |
Tredegar Corp. | | | 2,414 | | | | 49,632 | |
| | | | | | | | |
| | | | | | | 2,302,523 | |
| | | | | | | | |
Office Furnishings — 0.1% | | | | | | | | |
Interface, Inc. | | | 5,654 | | | | 114,154 | |
| | | | | | | | |
Oil & Gas — 1.3% | | | | | | | | |
Bill Barrett Corp.* | | | 3,309 | | | | 33,222 | |
Bonanza Creek Energy, Inc.* | | | 6,885 | | | | 185,551 | |
Carrizo Oil & Gas, Inc.* | | | 1,709 | | | | 81,331 | |
Diamondback Energy, Inc.* | | | 4,102 | | | | 292,103 | |
The accompanying notes are an integral part of the financial statements.
11
ALTAIR SMALLER COMPANIES FUND
Portfolio of Investments (Continued)
February 28, 2015
(Unaudited)
| | | | | | | | |
| | | Number | | | | |
| | | of Shares | | | Value | |
| | |
Oil & Gas — (Continued) | | | | | | | | |
Evolution Petroleum Corp. | | | 61,333 | | | $ | 418,291 | |
Gran Tierra Energy, Inc.* | | | 14,480 | | | | 36,634 | |
Miller Energy Resources, Inc.* | | | 40,623 | | | | 68,653 | |
Northern Oil and Gas, Inc.* | | | 4,399 | | | | 37,919 | |
Ocean Rig UDW, Inc. (Cyprus) | | | 3,031 | | | | 24,248 | |
PDC Energy, Inc.* | | | 8,109 | | | | 419,073 | |
RSP Permian, Inc.* | | | 12,611 | | | | 342,515 | |
Stone Energy Corp.* | | | 3,087 | | | | 52,294 | |
Synergy Resources Corp.* | | | 16,580 | | | | 198,131 | |
Trecora Resources* | | | 18,665 | | | | 269,336 | |
WPX Energy, Inc.* | | | 12,870 | | | | 138,739 | |
| | | | | | | | |
| | | | | | | 2,598,040 | |
| | | | | | | | |
Oil & Gas Services — 0.6% | | | | | | | | |
Basic Energy Services, Inc.* | | | 6,847 | | | | 50,942 | |
C&J Energy Services, Inc.* | | | 3,996 | | | | 54,465 | |
CARBO Ceramics, Inc. | | | 2,034 | | | | 74,119 | |
Flotek Industries, Inc.* | | | 2,137 | | | | 36,500 | |
Matrix Service Co.* | | | 4,096 | | | | 76,186 | |
Natural Gas Services Group, Inc.* | | | 25,398 | | | | 489,674 | |
Newpark Resources, Inc.* | | | 8,952 | | | | 84,775 | |
PHI, Inc., Non Voting Shares* | | | 4,298 | | | | 138,482 | |
SEACOR Holdings, Inc.* | | | 1,898 | | | | 137,624 | |
Tesco Corp. (Canada) | | | 5,795 | | | | 61,601 | |
TETRA Technologies, Inc.* | | | 9,639 | | | | 57,545 | |
| | | | | | | | |
| | | | | | | 1,261,913 | |
| | | | | | | | |
Packaging & Containers — 0.3% | |
AEP Industries, Inc.* | | | 8,450 | | | | 428,077 | |
KapStone Paper and Packaging, Corp. | | | 5,015 | | | | 172,817 | |
| | | | | | | | |
| | | | | | | 600,894 | |
| | | | | | | | |
Pharmaceuticals — 4.6% | | | | | | | | |
Aerie Pharmaceuticals, Inc.* | | | 9,284 | | | | 261,066 | |
Akorn, Inc.* | | | 4,232 | | | | 227,724 | |
Aquinox Pharmaceuticals, Inc.* | | | 12,926 | | | | 126,028 | |
Aratana Therapeutics, Inc.* | | | 9,607 | | | | 185,031 | |
Auspex Pharmaceuticals, Inc.* | | | 11,718 | | | | 787,918 | |
BioSpecifics Technologies Corp.* | | | 4,027 | | | | 156,892 | |
Cempra, Inc.* | | | 17,717 | | | | 586,787 | |
Depomed, Inc.* | | | 32,944 | | | | 723,120 | |
Egalet Corp.* | | | 11,180 | | | | 167,812 | |
Flamel Technologies S.A., ADR* | | | 14,713 | | | | 230,258 | |
Foamix Pharmaceuticals Ltd. (Israel)* | |
|
28,632 |
| | | 256,543 | |
Heron Therapeutics, Inc.* | | | 22,894 | | | | 297,393 | |
| | | | | | | | |
| | | Number | | | | |
| | | of Shares | | | Value | |
| |
Pharmaceuticals — (Continued) | | | | | |
Heska Corp.* | | | 9,094 | | | $ | 195,521 | |
IGI Laboratories, Inc.* | | | 23,437 | | | | 269,994 | |
Impax Laboratories, Inc.* | | | 3,480 | | | | 140,209 | |
Imprimis Pharmaceuticals, Inc.* | | | 33,805 | | | | 257,932 | |
Lannett Co., Inc.* | | | 1,189 | | | | 74,194 | |
Mirati Therapeutics, Inc.* | | | 10,750 | | | | 255,527 | |
Neogen Corp.* | | | 1,733 | | | | 88,643 | |
Nevro Corp.* | | | 8,861 | | | | 370,656 | |
Omega Protein Corp.* | | | 16,210 | | | | 173,123 | |
Owens & Minor, Inc. | | | 15,358 | | | | 547,666 | |
Pacira Pharmaceuticals* | | | 1,650 | | | | 189,370 | |
Pernix Therapeutics Holdings, Inc.* | | | 26,986 | | | | 289,560 | |
Prestige Brands Holdings, Inc.* | | | 4,121 | | | | 158,823 | |
Receptos, Inc.* | | | 2,087 | | | | 264,298 | |
Regulus Therapeutics, Inc.* | | | 10,831 | | | | 200,590 | |
Relypsa, Inc.* | | | 5,786 | | | | 224,497 | |
Sagent Pharmaceuticals* | | | 1,360 | | | | 36,965 | |
Supernus Pharmaceuticals, Inc.* | | | 27,928 | | | | 251,073 | |
Tetraphase Pharmaceuticals, Inc.* | | | 4,516 | | | | 178,201 | |
uniQure B.V. (Netherlands)* | | | 18,592 | | | | 432,078 | |
Xencor, Inc.* | | | 13,548 | | | | 211,349 | |
XenoPort, Inc.* | | | 27,322 | | | | 187,156 | |
| | | | | | | | |
| | | | | | | 9,003,997 | |
| | | | | | | | |
Real Estate — 0.5% | | | | | | | | |
HFF, Inc., Class A | | | 2,656 | | | | 94,500 | |
Marcus & Millichap, Inc.* | | | 22,531 | | | | 832,069 | |
| | | | | | | | |
| | | | | | | 926,569 | |
| | | | | | | | |
REITS — 1.7% | | | | | | | | |
Acadia Realty Trust | | | 3,174 | | | | 108,424 | |
Agree Realty Corp. | | | 5,460 | | | | 179,252 | |
American Assets Trust, Inc. | | | 2,447 | | | | 100,376 | |
Associated Estates Realty Corp. | | | 3,390 | | | | 81,190 | |
Aviv REIT, Inc. | | | 1,658 | | | | 59,655 | |
Cedar Realty Trust, Inc. | | | 12,473 | | | | 93,298 | |
Chesapeake Lodging Trust | | | 3,277 | | | | 116,530 | |
CoreSite Realty Corp. | | | 1,355 | | | | 64,281 | |
DiamondRock Hospitality Co. | | | 7,911 | | | | 114,551 | |
EastGroup Properties, Inc. | | | 1,543 | | | | 97,209 | |
EPR Properties | | | 2,549 | | | | 155,514 | |
Franklin Street Properties Corp. | | | 5,197 | | | | 65,638 | |
Geo Group, Inc. (The) | | | 9,374 | | | | 404,488 | |
Getty Realty Corp. | | | 3,180 | | | | 57,367 | |
The accompanying notes are an integral part of the financial statements.
12
ALTAIR SMALLER COMPANIES FUND
Portfolio of Investments (Continued)
February 28, 2015
(Unaudited)
| | | | | | | | |
| | | Number | | | | |
| | | of Shares | | | Value | |
| | |
REITS — (Continued) | | | | | | | | |
Government Properties, Income Trust | | | 5,094 | | | $ | 119,149 | |
Healthcare Realty Trust, Inc. | | | 4,931 | | | | 140,731 | |
Kite Realty Group Trust | | | 4,418 | | | | 125,118 | |
Lexington Realty Trust | | | 5,515 | | | | 59,727 | |
LTC Properties, Inc. | | | 2,216 | | | | 98,900 | |
Medical Properties Trust, Inc. | | | 11,100 | | | | 168,054 | |
Pennsylvania Real Estate Investment Trust | | | 5,900 | | | | 134,402 | |
Post Properties, Inc. | | | 2,005 | | | | 114,024 | |
PS Business Parks, Inc. | | | 1,372 | | | | 114,123 | |
Sabra Health Care REIT, Inc. | | | 3,169 | | | | 103,595 | |
Saul Centers, Inc. | | | 501 | | | | 26,989 | |
Sovran Self Storage, Inc. | | | 1,313 | | | | 120,822 | |
UMH Properties, Inc. | | | 30,478 | | | | 288,322 | |
Universal Health Realty Income Trust | | | 1,755 | | | | 89,207 | |
| | | | | | | | |
| | | | | | | 3,400,936 | |
| | | | | | | | |
Retail — 8.3% | | | | | | | | |
Ascena Retail Group, Inc.* | | | 27,904 | | | | 373,914 | |
Barnes & Noble, Inc.* | | | 2,744 | | | | 68,326 | |
Big 5 Sporting Goods Corp. | | | 46,650 | | | | 596,187 | |
Biglari Holdings, Inc.* | | | 1,530 | | | | 665,871 | |
BJ’s Restaurants, Inc.* | | | 758 | | | | 39,583 | |
Bob Evans Farms, Inc. | | | 1,254 | | | | 73,459 | |
Brown Shoe, Co., Inc. | | | 2,536 | | | | 76,080 | |
Buckle, Inc. | | | 1,784 | | | | 89,735 | |
Buffalo Wild Wings, Inc.* | | | 3,292 | | | | 629,167 | |
Build-A-Bear Workshop, Inc.* | | | 35,065 | | | | 759,859 | |
Burlington Stores, Inc.* | | | 11,812 | | | | 656,393 | |
Cabela’s, Inc.* | | | 6,482 | | | | 352,880 | |
Casey’s General Stores, Inc. | | | 1,671 | | | | 146,630 | |
Cato Corp. (The), Class A | | | 1,302 | | | | 57,731 | |
Childrens Place, Inc., (The) | | | 7,086 | | | | 403,831 | |
Christopher & Banks Corp.* | | | 70,600 | | | | 353,000 | |
Citi Trends, Inc.* | | | 5,403 | | | | 143,990 | |
Cracker Barrel Old Country Store, Inc. | | | 990 | | | | 149,520 | |
Dave & Buster’s Entertainment, Inc.* | | | 12,030 | | | | 375,336 | |
Denny’s Corp* | | | 25,501 | | | | 293,517 | |
DineEquity, Inc. | | | 907 | | | | 98,437 | |
El Pollo Loco Holdings, Inc.* | | | 7,221 | | | | 177,564 | |
Fiesta Restaurant Group, Inc.* | | | 6,350 | | | | 412,814 | |
Flex Pharma, Inc.* | | | 9,213 | | | | 160,168 | |
| | | | | | | | |
| | | Number | | | | |
| | | of Shares | | | Value | |
| | |
Retail — (Continued) | | | | | | | | |
Francesca’s Holdings Corp.* | | | 21,513 | | | $ | 322,480 | |
Fred’s, Inc., Class A | | | 2,762 | | | | 51,594 | |
Good Times Restaurants, Inc.* | | | 27,105 | | | | 227,411 | |
Gordmans Stores, Inc.* | | | 138,170 | | | | 543,008 | |
Group 1 Automotive, Inc. | | | 970 | | | | 78,900 | |
Haverty Furniture Cos., Inc. | | | 1,761 | | | | 40,591 | |
Hibbett Sports, Inc.* | | | 1,910 | | | | 93,418 | |
Jack In The Box, Inc. | | | 6,282 | | | | 607,407 | |
Kate Spade & Co.* | | | 5,312 | | | | 182,998 | |
Kirkland’s, Inc.* | | | 11,746 | | | | 279,202 | |
Kona Grill, Inc.* | | | 31,965 | | | | 781,864 | |
Lithia Motors, Inc., Class A | | | 1,495 | | | | 141,218 | |
Lumber Liquidators Holdings, Inc.* | | | 1,903 | | | | 98,690 | |
MarineMax, Inc.* | | | 46,454 | | | | 1,177,609 | |
Mattress Firm Holding Corp.* | | | 2,902 | | | | 176,761 | |
Men’s Wearhouse, Inc. (The) | | | 2,500 | | | | 125,475 | |
New York & Co., Inc.* | | | 77,790 | | | | 174,250 | |
Outerwall, Inc. | | | 6,492 | | | | 418,864 | |
Papa John’s International, Inc. | | | 8,238 | | | | 509,438 | |
PC Connection, Inc. | | | 20,930 | | | | 536,227 | |
PCM, Inc.* | | | 40,090 | | | | 385,265 | |
Pep Boys-Manny Moe & Jack (The)* | | | 5,450 | | | | 48,396 | |
Popeyes Louisiana Kitchen, Inc.* | | | 4,605 | | | | 276,346 | |
Rave Restaurant Group, Inc.* | | | 12,611 | | | | 164,195 | |
Red Robin Gourmet Burgers, Inc.* | | | 711 | | | | 59,347 | |
Restoration Hardware Holdings, Inc.* | | | 3,729 | | | | 328,525 | |
Ruby Tuesday, Inc.* | | | 42,092 | | | | 276,965 | |
Ruth’s Hospitality Group, Inc. | | | 2,293 | | | | 34,991 | |
Sonic Automotive, Inc. | | | 1,545 | | | | 38,208 | |
Sonic Corp. | | | 2,998 | | | | 95,306 | |
Stage Stores, Inc. | | | 12,293 | | | | 263,316 | |
Stein Mart, Inc. | | | 3,665 | | | | 60,253 | |
Texas Roadhouse, Inc. | | | 2,804 | | | | 105,543 | |
Travelcenters of America, LLC* | | | 16,299 | | | | 222,481 | |
Tuesday Morning Corp.* | | | 13,338 | | | | 253,155 | |
Zumiez, Inc.* | | | 1,670 | | | | 64,829 | |
| | | | | | | | |
| | | | | | | 16,398,518 | |
| | | | | | | | |
Savings & Loans — 0.5% | | | | | | | | |
Astoria Financial Corp. | | | 5,686 | | | | 74,600 | |
Banc of California, Inc. | | | 43,210 | | | | 471,853 | |
Brookline Bancorp, Inc. | | | 9,875 | | | | 95,590 | |
The accompanying notes are an integral part of the financial statements.
13
ALTAIR SMALLER COMPANIES FUND
Portfolio of Investments (Continued)
February 28, 2015
(Unaudited)
| | | | | | | | |
| | | Number | | | | |
| | | of Shares | | | Value | |
| |
Savings & Loans — (Continued) | | | | | |
Dime Community Bancshares, Inc. | | | 9,675 | | | $ | 150,544 | |
Sterling Bancorp | | | 6,871 | | | | 94,270 | |
| | | | | | | | |
| | | | | | | 886,857 | |
| | | | | | | | |
Semiconductors — 4.3% | | | | | |
Ambarella, Inc.* | | | 3,619 | | | | 207,694 | |
Amtech Systems, Inc.* | | | 39,460 | | | | 426,957 | |
AXT, Inc.* | | | 111,960 | | | | 306,770 | |
Brooks Automation, Inc. | | | 4,536 | | | | 54,432 | |
Cabot Microelectronics Corp.* | | | 1,045 | | | | 54,141 | |
Cavium, Inc.* | | | 5,698 | | | | 390,256 | |
CEVA, Inc.* | | | 1,443 | | | | 28,730 | |
Cirrus Logic, Inc.* | | | 3,525 | | | | 106,138 | |
Cohu, Inc. | | | 42,174 | | | | 459,275 | |
Diodes, Inc.* | | | 2,819 | | | | 80,313 | |
Exar Corp.* | | | 3,753 | | | | 40,232 | |
Integrated Silicon Solution, Inc. | | | 30,010 | | | | 493,364 | |
IPG Photonics Corp.* | | | 4,846 | | | | 464,731 | |
Kulicke & Soffa Industries, Inc.* | | | 3,484 | | | | 55,744 | |
Mattson Tech., Inc.* | | | 45,485 | | | | 217,418 | |
Mellanox Technologies Ltd. (Israel)* | | | 7,505 | | | | 357,538 | |
Microsemi Corp.* | | | 4,990 | | | | 160,878 | |
MKS Instruments, Inc. | | | 2,932 | | | | 103,676 | |
Monolithic Power Systems, Inc. | | | 1,952 | | | | 102,929 | |
Nanometrics, Inc.* | | | 2,355 | | | | 42,107 | |
Nova Measuring Instruments Ltd. (Israel)* | | | 12,653 | | | | 141,587 | |
Power Integrations, Inc. | | | 2,268 | | | | 124,422 | |
QLogic Corp.* | | | 5,584 | | | | 83,816 | |
Rovi Corp.* | | | 26,865 | | | | 668,401 | |
Rubicon Technology, Inc.* | | | 59,300 | | | | 258,548 | |
Rudolph Technologies, Inc.* | | | 57,241 | | | | 705,781 | |
Silicon Motion Technology Corp., ADR (Cayman Islands) | | | 32,143 | | | | 854,682 | |
Tessera Technologies, Inc. | | | 2,426 | | | | 97,186 | |
Tower Semiconductor Ltd. (Israel)* | | | 48,645 | | | | 782,698 | |
Ultra Clean Holdings, Inc.* | | | 67,660 | | | | 558,872 | |
| | | | | | | | |
| | | | | | | 8,429,316 | |
| | | | | | | | |
Software — 6.0% | | | | | |
American Software, Inc., Class A | | | 25,721 | | | | 247,950 | |
Blackbaud, Inc. | | | 2,160 | | | | 98,064 | |
Bottomline Technologies, Inc.* | | | 2,060 | | | | 54,549 | |
Callidus Software, Inc.* | | | 110,166 | | | | 1,574,273 | |
| | | | | | | | |
| | | Number | | | | |
| | | of Shares | | | Value | |
| |
Software — (Continued) | | | | | |
CSG Systems International, Inc. | | | 34,927 | | | $ | 1,044,667 | |
Cvent, Inc.* | | | 19,125 | | | | 553,669 | |
Dealertrack Technologies, Inc.* | | | 2,534 | | | | 100,777 | |
Ebix, Inc. | | | 2,006 | | | | 52,718 | |
Everyday Health, Inc.* | | | 11,642 | | | | 166,481 | |
Globant SA (Luxembourg)* | | | 24,601 | | | | 410,591 | |
ImageWare Systems, Inc.* | | | 74,109 | | | | 140,807 | |
InContact, Inc.* | | | 43,073 | | | | 504,385 | |
InnerWorkings, Inc.* | | | 47,010 | | | | 298,513 | |
Interactive Intelligence Group, Inc.* | | | 1,203 | | | | 51,055 | |
MAM Software Group, Inc.* | | | 46,876 | | | | 260,162 | |
ManTech International Corp., Class A | | | 1,634 | | | | 54,085 | |
Mavenir Systems, Inc.* | | | 16,727 | | | | 243,712 | |
Medidata Solutions, Inc.* | | | 3,734 | | | | 179,643 | |
MicroStrategy, Inc., Class A* | | | 492 | | | | 87,743 | |
Omnicell, Inc.* | | | 2,250 | | | | 78,863 | |
Paycom Software, Inc.* | | | 28,844 | | | | 919,547 | |
Pegasystems, Inc. | | | 9,067 | | | | 179,436 | |
Progress Software Corp.* | | | 4,675 | | | | 127,815 | |
Proofpoint, Inc.* | | | 19,824 | | | | 1,122,832 | |
QAD, Inc., Class A | | | 18,044 | | | | 387,946 | |
Qlik Technologies, Inc.* | | | 11,683 | | | | 378,997 | |
Quality Systems, Inc. | | | 6,661 | | | | 115,768 | |
Radware Ltd. (Israel)* | | | 17,053 | | | | 362,206 | |
Rally Software Development Corp.* | | | 27,602 | | | | 328,464 | |
Simulations Plus, Inc. | | | 49,407 | | | | 314,229 | |
SolarWinds, Inc.* | | | 7,333 | | | | 372,003 | |
Synchronoss Technologies, Inc.* | | | 1,988 | | | | 87,989 | |
SYNNEX Corp. | | | 1,242 | | | | 94,703 | |
Take-Two Interactive Software, Inc.* | | | 5,044 | | | | 133,616 | |
Tyler Technologies, Inc.* | | | 2,828 | | | | 337,578 | |
Verint Systems, Inc.* | | | 5,628 | | | | 342,604 | |
| | | | | | | | |
| | | | | | | 11,808,440 | |
| | | | | | | | |
Telecommunications — 1.8% | | | | | |
ADTRAN, Inc. | | | 4,465 | | | | 96,131 | |
Atlantic Tele-Network, Inc. | | | 5,741 | | | | 395,153 | |
CalAmp Corp.* | | | 2,647 | | | | 50,690 | |
Comtech Telecommunications Corp. | | | 900 | | | | 32,166 | |
General Communication, Inc., Class A* | | | 4,528 | | | | 62,803 | |
The accompanying notes are an integral part of the financial statements.
14
ALTAIR SMALLER COMPANIES FUND
Portfolio of Investments (Concluded)
February 28, 2015
(Unaudited)
| | | | | | | | |
| | | Number | | | | |
| | | of Shares | | | Value | |
|
Telecommunications — (Continued) | |
GTT Communications, Inc.* | | | 36,260 | | | $ | 562,393 | |
Harmonic, Inc.* | | | 6,829 | | | | 53,334 | |
Ixia* | | | 6,177 | | | | 70,294 | |
LogMeIn, Inc.* | | | 1,382 | | | | 72,831 | |
Lumos Networks Corp. | | | 1,930 | | | | 33,235 | |
NeuStar, Inc., Class A* | | | 21,321 | | | | 565,433 | |
NTELOS Holdings Corp. | | | 21,312 | | | | 96,330 | |
ORBCOMM, Inc.* | | | 43,502 | | | | 247,961 | |
Qorvo, Inc.* | | | — | | | | 29 | |
ShoreTel, Inc.* | | | 49,046 | | | | 365,393 | |
Spok Holdings, Inc. | | | 2,865 | | | | 53,260 | |
Telephone & Data Systems, Inc. | | | 24,714 | | | | 628,724 | |
ViaSat, Inc.* | | | 2,534 | | | | 165,572 | |
| | | | | | | | |
| | | | | | | 3,551,732 | |
| | | | | | | | |
Textiles — 0.8% | | | | | | | | |
G&K Services, Inc., Class A | | | 1,071 | | | | 77,101 | |
UniFirst Corp. | | | 11,894 | | | | 1,413,363 | |
| | | | | | | | |
| | | | | | | 1,490,464 | |
| | | | | | | | |
Transportation — 2.6% | | | | | | | | |
Aegean Marine Petroleum Network (Marshall Islands) | | | 17,346 | | | | 254,292 | |
Air Transport Services Group, Inc.* | | | 51,154 | | | | 459,874 | |
Atlas Air Worldwide Holdings, Inc.* | | | 2,112 | | | | 95,779 | |
Celadon Group, Inc. | | | 2,164 | | | | 56,805 | |
Covenant Transportation Group, Inc., Class A* | | | 9,478 | | | | 301,874 | |
Era Group, Inc.* | | | 1,194 | | | | 26,340 | |
Forward Air Corp. | | | 1,750 | | | | 93,625 | |
Heartland Express, Inc. | | | 3,680 | | | | 92,626 | |
HUB Group, Inc., Class A* | | | 3,609 | | | | 145,695 | |
Knight Transportation, Inc. | | | 1,307 | | | | 43,209 | |
| | | | | | | | |
| | | Number | | | | |
| | | of Shares | | | Value | |
|
Transportation — (Continued) | |
Marten Transport Ltd. | | | 24,801 | | | $ | 575,135 | |
Matson, Inc. | | | 2,740 | | | | 108,148 | |
Old Dominion Freight Line, Inc.* | | | 5,506 | | | | 430,129 | |
PAM Transportation Services, Inc.* | | | 13,640 | | | | 715,691 | |
Saia, Inc.* | | | 9,179 | | | | 422,509 | |
Swift Transportation, Co.* | | | 13,279 | | | | 375,530 | |
Teekay Tankers Ltd., Class A (Marshall Islands) | | | 40,861 | | | | 239,037 | |
UTI Worldwide, Inc. (British Virgin Islands)* | | | 38,480 | | | | 503,319 | |
Werner Enterprises, Inc. | | | 4,696 | | | | 150,601 | |
| | | | | | | | |
| | | | | | | 5,090,218 | |
| | | | | | | | |
Trucking & Leasing — 0.3% | | | | | | | | |
General Finance Corp.* | | | 54,869 | | | | 509,733 | |
| | | | | | | | |
Water — 0.3% | | | | | | | | |
American States Water Co. | | | 2,811 | | | | 112,805 | |
PICO Holdings, Inc.* | | | 31,038 | | | | 532,923 | |
| | | | | | | | |
| | | | | | | 645,728 | |
| | | | | | | | |
TOTAL COMMON STOCKS
(Cost $172,965,678) | | | | 187,496,325 | |
| | | | | | | | |
TOTAL INVESTMENTS - 95.2%
(Cost $172,965,678) | | | | 187,496,325 | |
| | | | | | | | |
OTHER ASSETS IN EXCESS OF LIABILITIES - 4.8% | | | | 9,480,667 | |
| | | | | | | | |
NET ASSETS - 100.0% | | | $ | 196,976,992 | |
| | | | | | | | |
| * | Non-income producing security. |
| ADR | American Depositary Receipt |
| PLC | Public Limited Company |
| REIT | Real Estate Investment Trust |
The accompanying notes are an integral part of the financial statements.
15
ALTAIR SMALLER COMPANIES FUND
Statement of Assets and Liabilities
February 28, 2015
(Unaudited)
| | | | |
ASSETS | | | | |
Investments, at value (Cost $172,965,678) | | $ | 187,496,325 | |
Cash | | | 9,873,543 | |
Receivables for: | | | | |
Investments sold | | | 1,358,511 | |
Capital shares sold | | | 40,000 | |
Dividends | | | 76,767 | |
Prepaid expenses | | | 17,836 | |
| | | | |
Total assets | | | 198,862,982 | |
| | | | |
| |
LIABILITIES | | | | |
Payables for: | | | | |
Investments purchased | | | 1,661,223 | |
Investment sub-advisory fees | | | 202,245 | |
Administration and accounting services fees | | | 12,789 | |
Other accrued expenses and liabilities | | | 9,733 | |
| | | | |
Total liabilities | | | 1,885,990 | |
| | | | |
Net Assets | | $ | 196,976,992 | |
| | | | |
NET ASSETS CONSISTS OF | | | | |
Par value | | $ | 18,320 | |
Paid-in capital | | | 185,917,391 | |
Accumulated net investment loss | | | (189,771 | ) |
Accumulated net realized loss from investments | | | (3,299,595 | ) |
Net unrealized appreciation on investments | | | 14,530,647 | |
| | | | |
Net Assets | | $ | 196,976,992 | |
| | | | |
| |
CAPITAL SHARES: | | | | |
Net Assets | | $ | 196,976,992 | |
| | | | |
Shares outstanding ($0.001 par value, 100,000,000 shares authorized) | | | 18,320,312 | |
| | | | |
Net asset value, offering and redemption price per share | | $ | 10.75 | |
| | | | |
The accompanying notes are an integral part of the financial statements.
16
ALTAIR SMALLER COMPANIES FUND
Statement of Operations
For The Period Ended February 28, 2015(1)
(Unaudited)
| | | | |
INVESTMENT INCOME | | | | |
Dividends and interest (net of foreign taxes withheld of $1,190) | | $ | 429,224 | |
| | | | |
Total investment income. | | | 429,224 | |
| | | | |
EXPENSES | | | | |
Sub-Advisory fees (Note 2) | | | 514,020 | |
Administration and accounting services fees (Note 2) | | | 48,739 | |
Registration and filing fees | | | 13,265 | |
Custodian fees (Note 2) | | | 12,300 | |
Audit fees | | | 7,444 | |
Directors’ and officers’ fees | | | 6,893 | |
Printing and shareholder reporting fees | | | 5,302 | |
Transfer agent fees (Note 2) | | | 4,855 | |
Legal fees | | | 3,181 | |
Other expenses | | | 2,996 | |
| | | | |
Total expenses | | | 618,995 | |
| | | | |
Net investment loss | | | (189,771 | ) |
| | | | |
NET REALIZED AND UNREALIZED GAIN FROM INVESTMENTS | | | | |
Net realized loss from: | | | | |
Investments | | | (3,299,595 | ) |
Net change in unrealized appreciation on: | | | | |
Investments | | | 14,530,647 | |
| | | | |
Net realized and unrealized gain from investments | | | 11,231,052 | |
| | | | |
NET INCREASE IN NET ASSETS RESULTING FROM OPERATIONS | | $ | 11,041,281 | |
| | | | |
| (1) | The Fund commenced investment operations on October 21, 2014. |
The accompanying notes are an integral part of the financial statements.
17
ALTAIR SMALLER COMPANIES FUND
Statement of Changes in Net Assets
| | | | | |
| | | For the Period |
| | | Ended |
| | | February 28, 2015 |
| | | (Unaudited)(1) |
INCREASE IN NET ASSETS FROM OPERATIONS: | | | | | |
Net investment loss | | | $ | (189,771 | ) |
Net realized loss from investments | | | | (3,299,595 | ) |
Net change in unrealized appreciation on investments | | | | 14,530,647 | |
| | | | | |
Net increase in net assets resulting from operations | | | | 11,041,281 | |
| | | | | |
| |
CAPITAL TRANSACTIONS: | | | | | |
Proceeds from shares sold | | | | 187,519,447 | |
Shares redeemed | | | | (1,583,736 | ) |
| | | | | |
Net increase in net assets from capital share transactions | | | | 185,935,711 | |
| | | | | |
Total increase in net assets | | | | 196,976,992 | |
| | | | | |
NET ASSETS | | | | | |
Beginning of period | | | | — | |
| | | | | |
End of period | | | $ | 196,976,992 | |
| | | | | |
Accumulated net investment loss, end of period | | | $ | (189,771 | ) |
| | | | | |
CAPITAL SHARE TRANSACTIONS: | | | | | |
Shares sold | | | | 18,474,000 | |
Shares redeemed | | | | (153,688 | ) |
| | | | | |
Net increase in shares | | | | 18,320,312 | |
| | | | | |
| (1) | The Fund commenced investment operations on October 21, 2014. |
The accompanying notes are an integral part of the financial statements.
18
ALTAIR SMALLER COMPANIES FUND
Financial Highlights
Contained below is per share operating performance data for shares outstanding, total investment return, ratios to average net assets and other supplemental data for the representative period. This information has been derived from information provided in the financial statements.
| | | | | |
| | | |
| | | For the period |
| | | ended |
| | | February 28, 2015 |
| | | (Unaudited)(1) |
Per Share Operating Performance | | | | | |
Net asset value, beginning of period | | | $ | 10.00 | |
| | | | | |
Net investment loss(2) | | | | (0.01 | ) |
Net realized and unrealized gain from investments | | | | 0.76 | |
| | | | | |
Net increase in net assets resulting from operations | | | | 0.75 | |
| | | | | |
Net asset value, end of period | | | $ | 10.75 | |
| | | | | |
Total investment return(3) | | | | 7.50 | %(4) |
| | | | | |
Ratios/Supplemental Data | | | | | |
Net assets, end of period (000’s omitted) | | | $ | 196,977 | |
Ratio of expenses to average net assets | | | | 1.16 | %(5) |
Ratio of net investment loss to average net assets | | | | (0.36 | )%(5) |
Portfolio turnover rate | | | | 39 | %(4) |
| (1) | The Fund commenced investment operations on October 21, 2014. |
| (2) | Calculated based on average shares outstanding for the period. |
| (3) | Total investment return is calculated assuming a purchase of shares on the first day and a sale of shares on the last day of each period reported and includes reinvestments of dividends and distributions, if any. |
The accompanying notes are an integral part of the financial statements.
19
ALTAIR SMALLER COMPANIES FUND
Notes to Financial Statements
February 28, 2015
(Unaudited)
1. Organization and Significant Accounting Policies
The RBB Fund, Inc. (“RBB” or the “Company”) was incorporated under the laws of the State of Maryland on February 29, 1988 and is registered under the Investment Company Act of 1940, as amended, (the “Investment Company Act”) as an open-end management investment company. RBB is a “series fund,” which is a mutual fund divided into separate portfolios. Each portfolio is treated as a separate entity for certain matters under the Investment Company Act, and for other purposes, and, a shareholder of one portfolio is not deemed to be a shareholder of any other portfolio. Currently, RBB has twenty-two active investment portfolios, including the Altair Smaller Companies Fund (the “Fund”), which commenced investment operations on October 21, 2014.
RBB has authorized capital of one hundred billion shares of common stock of which 82.373 billion shares are currently classified into one hundred and fifty-three classes of common stock. Each class represents an interest in an active or inactive RBB investment portfolio.
Portfolio Valuation– The Fund’s net asset value (“NAV”) is calculated once daily at the close of regular trading hours on the New York Stock Exchange (“NYSE”) (typically 4:00 p.m. Eastern time) on each day the NYSE is open. Securities held by the Fund are valued using the closing price or the last sale price on a national securities exchange or the National Association of Securities Dealers Automatic Quotation System (“NASDAQ”) market system where they are primarily traded. Equity securities traded in the over-the-counter market are valued at their closing prices. If there were no transactions on that day, securities traded principally on an exchange or on NASDAQ will be valued at the mean of the last bid and ask prices prior to the market close. Foreign securities are valued based on prices from the primary market in which they are traded, and are translated from the local currency into U.S. dollars using current exchange rates. Investments in other open-end investment companies, if any, are valued based on the NAV of those investment companies (which may use fair value pricing as disclosed in their prospectuses). If market quotations are unavailable or deemed unreliable, securities will be valued in accordance with procedures adopted by the Company’s Board of Directors. Relying on prices supplied by pricing services or dealers or using fair valuation may result in values that are higher or lower than the values used by other investment companies and investors to price the same investments.
Fair Value Measurements – The inputs and valuation techniques used to measure fair value of the Fund’s investments are summarized into three levels as described in the hierarchy below:
| | | | |
• Level 1 | | — | | quoted prices in active markets for identical securities; |
• Level 2 | | — | | other significant observable inputs (including quoted prices for similar securities, interest rates, prepayment speeds, credit risk, etc.); and |
| | |
• Level 3 | | — | | significant unobservable inputs (including the Fund’s own assumptions in determining the fair value of investments). |
The inputs or methodology used for valuing securities are not necessarily an indication of the risk associated with investing in those securities.
20
ALTAIR SMALLER COMPANIES FUND
Notes to Financial Statements (Continued)
February 28, 2015
(Unaudited)
The following is a summary of the inputs used, as of February 28, 2015, in valuing the Fund’s investments carried at fair value:
| | | | | | | | | | | | |
| | | | | | | | | Level 2 | | |
| | | | | | | | | Other | | Level 3 |
| | | Total Value at | | | Level 1 | | | Significant | | Significant |
| | | February 28, | | | Quoted | | | Observable | | Unobservable |
| | | 2015 | | | Price | | | Inputs | | Inputs |
Investments in Securities* | | | $187,496,325 | | | | $187,496,325 | | | $ — | | $ — |
| | | | | | | | | | | | |
| | | | | | | | | | | | |
* Please refer to Portfolio of Investments for further details. | | |
At the end of each quarter, management evaluates the classification of Levels 1, 2 and 3 assets and liabilities. Various factors are considered, such as changes in liquidity from the prior reporting period; whether or not a broker is willing to execute at the quoted price; the depth and consistency of prices from third party pricing services; and the existence of contemporaneous, observable trades in the market. Additionally, management evaluates the classification of Level 1 and Level 2 assets and liabilities on a quarterly basis for changes in listings or delistings on national exchanges.
Due to the inherent uncertainty of determining the fair value of investments that do not have a readily available market value, the fair value of the Fund’s investments may fluctuate from period to period. Additionally, the fair value of investments may differ significantly from the values that would have been used had a ready market existed for such investments and may differ materially from the values the Fund may ultimately realize. Further, such investments may be subject to legal and other restrictions on resale or otherwise less liquid than publicly traded securities.
For fair valuations using significant unobservable inputs, U.S. generally accepted accounting principles (“U.S. GAAP”) require the Fund to present a reconciliation of the beginning to ending balances for reported market values that presents changes attributable to total realized and unrealized gains or losses, purchase and sales, and transfers in and out of Level 3 during the period. Transfers in and out between levels are based on values at the end of the period. U.S. GAAP also requires the Fund to disclose amounts and reasons for all transfers in and out of Level 1 and Level 2 fair value measurements. A reconciliation of Level 3 investments is presented only when the Fund had an amount of Level 3 investments at the end of the reporting period that was meaningful in relation to its net assets. The amounts and reasons for all transfers in and out of each level within the three-tier hierarchy are disclosed when the Fund had an amount of total transfers during the reporting period that was meaningful in relation to its net assets as of the end of the reporting period.
For the period ended February 28, 2015, there were no transfers between Levels 1, 2 and 3 for the Fund.
Use of Estimates — The Fund is an investment company and, accordingly, follows the investment company accounting and reporting guidance under U.S. GAAP. The preparation of financial statements in conformity with U.S. GAAP requires management to make estimates and assumptions that affect the reported amounts of assets and liabilities and disclosure of contingent assets and liabilities at the date of the financial statements and the reported amounts of revenues and expenses during the period. Actual results could differ from those estimates and those differences could be significant.
Investment Transactions, Investment Income and Expenses — The Fund records security transactions based on trade date for financial reporting purposes. The cost of investments sold is determined by use of the specific identification method for both financial reporting and income tax purposes in determining realized gains and losses on investments. Interest income is accrued when earned. Dividend income is recorded on the ex-dividend date. Distributions received on securities that represent a return of capital or capital gains are recorded as a reduction of cost of investments and/or as a realized gain. The Fund’s policy is to allocate investment income, expenses and unrealized and realized gains and losses among classes on a daily basis, when applicable. Expenses incurred on behalf of a specific class, fund or fund family are charged directly to the class, fund or fund family to each class of shares based upon the relative proportion
21
ALTAIR SMALLER COMPANIES FUND
Notes to Financial Statements (Continued)
February 28, 2015
(Unaudited)
of net assets of each class at the beginning of the day. Expenses incurred for all the RBB funds (such as director or professional fees) are charged to all funds in proportion to their average net assets of RBB, or in such other manner as the Company’s Board of Directors deems fair or equitable. Expenses and fees, including investment advisory and administration fees, are accrued daily and taken into account for the purpose of determining the NAV of the Fund.
Dividends and Distributions to Shareholders — Dividends from net investment income, if any, are declared and paid annually. Net realized capital gains (including net short-term capital gains), if any, are declared and paid annually. Income dividends and capital gain distributions are determined in accordance with U.S. federal income tax regulations which may differ from U.S. GAAP.
U.S. Tax Status — No provision is made for U.S. income taxes as it is the Fund’s intention to qualify for and elect the tax treatment applicable to regulated investment companies under Subchapter M of the Internal Revenue Code of 1986, as amended, and make the requisite distributions to its shareholders which will be sufficient to relieve it from U.S. income and excise taxes.
Cash and Cash Equivalents — The Fund considers liquid assets deposited into a bank demand deposit account to be cash equivalents. These investments represent amounts held with financial institutions that are readily accessible to pay Fund expenses or purchase investments. Cash and cash equivalents are valued at cost plus accrued interest, which approximates market value.
Other — In the normal course of business, the Fund may enter into contracts that provide general indemnifications. The Fund’s maximum exposure under these arrangements is dependent on claims that may be made against the Fund in the future, and, therefore, cannot be estimated; however, based on experience, the risk of material loss from such claims is considered remote.
2. Investment Adviser and Other Services
Altair Advisers LLC (“Altair” or the “Adviser”) serves as the Fund’s investment adviser. Aperio Group, LLC, Driehaus Capital Management LLC, Granite Investment Partners, LLC, Pacific Ridge Capital Partners, LLC, Pier Capital LLC, and River Road Asset Management, LLC each serves as an investment sub-adviser (“Sub-Adviser”) to the Fund.
The Fund is managed by the Adviser and one or more Sub-Advisers unaffiliated with the Adviser. The Adviser also has the ultimate responsibility to oversee the Sub-Advisers, and to recommend their hiring, termination, and replacement, subject to approval by the Board of Directors. The Adviser has an investment team that is jointly responsible for the day-to-day management of the Fund. The Sub-Advisers provide investment advisory services to the portion of the Fund’s portfolio allocated to them by the Adviser. The Adviser and the Fund have entered into sub-advisory agreements with the Sub-Advisers to manage the Fund, subject to supervision of the Adviser and the Board, and in accordance with the investment objective and restrictions of the Fund. For their services, each Sub-Adviser is entitled to receive a fee based upon a percentage of the Fund’s average daily net assets, which will be paid by the Fund and not by the Adviser.
The Fund is currently only available to clients of the Adviser and to other investors at the Fund’s discretion. The Adviser does not receive a separate management fee from the Fund. However, pursuant to the Fund’s investment advisory agreement with the Adviser, the Adviser is entitled to receive reimbursement for out-of-pocket expenses it incurs in connection with its compliance monitoring of Fund trading, up to 0.01% of the Fund’s average daily net assets.
The Adviser has contractually agreed to reimburse expenses in an aggregate amount equal to the amount by which the total annual Fund operating expenses (excluding certain items discussed below) exceeds 1.35% of the average daily net assets of the Fund. In determining the Adviser’s obligation to reimburse expenses, the following expenses are not taken into account and could cause net total annual operating expenses to exceed 1.35%: acquired fund fees and expenses,
22
ALTAIR SMALLER COMPANIES FUND
Notes to Financial Statements (Continued)
February 28, 2015
(Unaudited)
short sale dividend expenses, brokerage commissions, litigation, extraordinary items, interest or taxes. This contractual limitation is in effect until at least October 20, 2015 and may not be terminated without approval by the Company’s Board of Directors. If at any time during the first three years the investment advisory agreement is in effect, the Fund’s total annual Fund operating expenses for that year are less than 1.35%, the Adviser may recoup any waived or reimbursed amounts from the Fund if such reimbursement does not cause the Fund to exceed expense limitations that were in effect at the time of the waiver or reimbursement. For the period ended February 28, 2015, the Adviser earned no fees and did not waive or reimburse any fees.
For the period October 21, 2014 through February 28, 2015, collectively, the Sub-Advisers earned fees of $514,020.
BNY Mellon Investment Servicing (US) Inc. (“BNY Mellon”) serves as administrator for the Fund. For providing administrative and accounting services, BNY Mellon is entitled to receive a monthly fee equal to an annual percentage rate of the Fund’s average daily net assets, subject to certain minimum monthly fees.
Included in the administration and accounting service fees, shown on the Statement of Operations, are fees for providing regulatory administration services to RBB. For providing these services, BNY Mellon is entitled to receive compensation as agreed to by the Company and BNY Mellon. This fee is allocated to each portfolio of the Company in proportion to its net assets of the Company.
In addition, BNY Mellon serves as the Fund’s transfer and dividend disbursing agent. For providing transfer agent services, BNY Mellon is entitled to receive a monthly fee, subject to certain minimum, and out of pocket expenses.
The Bank of New York Mellon (the “Custodian”) provides certain custodial services to the Fund. The Custodian is entitled to receive a monthly fee, subject to certain minimum, and out of pocket expenses.
Foreside Funds Distributors LLC, serves as the principal underwriter and distributor of the Fund’s shares pursuant to a Distribution Agreement with RBB. The Distributor is not affiliated with the Adviser, the Trust, or any other service provider.
3. Director Compensation
The Directors of the Company receive an annual retainer and meeting fees for meetings attended. The aggregate remuneration paid to the Directors by the Fund during the period ended February 28, 2015 was $2,719. Certain employees of BNY Mellon serve as an Officer or Director of the Company. They are not compensated by the Fund or the Company.
4. Investment in Securities
For the period ended February 28, 2015, aggregate purchases and sales of investment securities (excluding short-term investments) of the Fund were as follows:
| | | | |
| | | Purchases | | Sales |
Investment Securities | | $222,655,142 | | $46,385,399 |
5. Federal Income Tax Information
The Fund has followed the authoritative guidance on accounting for and disclosure of uncertainty in tax positions, which requires the Fund to determine whether a tax position is more likely than not to be sustained upon examination, including resolution of any related appeals or litigation processes, based on the technical merits of the position. The
23
ALTAIR SMALLER COMPANIES FUND
Notes to Financial Statements (Concluded)
February 28, 2015
(Unaudited)
Fund has determined that there was no effect on the financial statements from following this authoritative guidance. In the normal course of business, the Fund is subject to examination by federal, state and local jurisdictions, where applicable, for tax years for which applicable statutes of limitations have not expired.
As of February 28, 2015, the federal tax cost, aggregate gross unrealized appreciation and depreciation of securities held by the Fund were as follows:
| | | | | | |
| | | | | | |
Federal tax cost | | $ | 172,965,678 | | |
| | | | | |
Gross unrealized appreciation | | $ | 18,654,881 | | |
Gross unrealized depreciation | | | (4,124,234 | ) | |
| | | | | |
Net unrealized appreciation | | $ | 14,530,647 | | |
| | | | | |
6. Subsequent Events
Management has evaluated the impact of all subsequent events on the Fund though the date the financial statements were issued, and has determined that there were no subsequent events requiring recognition or disclosure in the financial statements.
24
ALTAIR SMALLER COMPANIES FUND
Other Information
(Unaudited)
Proxy Voting
Policies and procedures that the Fund uses to determine how to vote proxies relating to portfolio securities as well as information regarding how the Fund voted proxies relating to portfolio securities for the most recent six-month period ended June 30 will be available without charge, upon request, by calling (844) 261-6482 and on the Securities and Exchange Commission’s (“SEC”) website at http://www.sec.gov.
Quarterly Portfolio Schedules
The Company will file its complete schedule of portfolio holdings with the SEC for the first and third fiscal quarters of each fiscal year (quarters ended November 30 and May 31) on Form N-Q. The Company’s Forms N-Q will be available on the SEC’s website at http://www.sec.gov and may be reviewed and copied at the SEC’s Public Reference Room in Washington, D.C. Information on the operation of the SEC’s Public Reference Room may be obtained by calling (202) 551-8090.
Approval of Investment Advisory Agreement and Sub-Advisory Agreements
As required by the Investment Company Act, the Board of Directors (the “Board”) of the Company, including all of the Directors who are not “interested persons” of the Company, as that term is defined in the 1940 Act (the “Independent Directors”), considered (1) the approval of the investment advisory agreement (the “Investment Advisory Agreement”) between Altair Advisers LLC (“Altair”) and the Company on behalf of the Fund, at meetings of the Board held on May 13, 2014 and September 16, 2014 and (2) the approval of the sub-advisory agreements (the “Sub-Advisory Agreements”) between Altair and each of Aperio Group (“Aperio”), Driehaus Capital Management LLC (“Driehaus”), Granite Investment Partners, LLC (“Granite”), Pacific Ridge Capital Partners, LLC (“Pacific Ridge”), Pier Capital LLC (“Pier Capital”), and River Road Asset Management, LLC (“River Road”) (the “Sub-Advisers”), at a meeting of the Board held on May 13, 2014. At the meetings, the Board, including all of the Independent Directors, approved the Investment Advisory Agreement and the Sub-Advisory Agreements for an initial period ending August 16, 2016. The Board’s decision to approve the Investment Advisory Agreement and the Sub-Advisory Agreements reflects the exercise of its business judgment to approve the arrangements. In approving the Investment Advisory Agreement and the Sub-Advisory Agreements, the Board considered information provided by Altair and each of the Sub-Advisers with the assistance and advice of counsel to the Independent Directors and the Company.
In considering the approval of the Investment Advisory Agreement between the Company and Altair with respect to the Fund and the Sub-Advisory Agreements with the Sub-Advisers, the Directors took into account all the materials provided prior to and during the meetings, and the discussions held during the meetings. Among other things, the Directors considered (i) the nature, extent, and quality of services to be provided to the Fund by Altair and each Sub-Adviser; (ii) descriptions of the experience and qualifications of the personnel providing those services; (iii) Altair’s and the Sub-Advisers’ investment philosophies and processes; (iv) Altair’s and the Sub-Advisers’ assets under management and client descriptions; (v) Altair’s and the Sub-Advisers’ soft dollar commission and trade allocation policies, including information on the types of research and services obtained in connection with soft dollar commissions; (vi) Altair’s and the Sub-Advisers’ advisory fee arrangement with the Company and other similarly managed clients, as applicable; (vii) Altair’s and the Sub-Advisers’ compliance procedures; (viii) Altair’s and the Sub-Advisers’ financial information, insurance coverage and profitability analysis related to providing advisory services to the Fund; (ix) the extent to which economies of scale are relevant to the Fund; (x) a report prepared by Lipper comparing the Fund’s management fees and total expense ratio to those of its Lipper peer group (“Lipper materials”); and (xi) performance information provided by Altair regarding a similarly managed account. The Directors also took into account at the September 16, 2014 meeting their review of updated Lipper materials distributed in advance of that meeting.
25
ALTAIR SMALLER COMPANIES FUND
Other Information (Concluded)
(Unaudited)
As part of their review, the Directors considered the nature, extent and quality of the services to be provided by Altair and each Sub-Adviser. The Directors concluded that Altair and each Sub-Adviser had substantial resources to provide services to the Fund.
The Board also considered the advisory fee rate payable by the Fund under the Investment Advisory Agreement and the advisory fee rates payable by the Fund under the Sub-Advisory Agreements. In this regard, information on the fees paid by the Fund and the Fund’s total operating expense ratio (before and after fee waivers and expense reimbursements) was compared to similar information for mutual funds advised by other, unaffiliated investment advisory firms. In addition, the Directors noted that Altair has contractually agreed to waive fees and reimburse expenses through December 31, 2016 to the extent that total annual Fund operating expenses exceed 1.35% of the Fund’s average daily net assets.
After reviewing the information regarding the Fund’s costs, profitability and economies of scale, and after considering the services to be provided by Altair and each Sub-Adviser, the Directors concluded that the investment advisory and sub-advisory fees to be paid by the Fund were fair and reasonable and that the Investment Advisory Agreement and Sub-Advisory Agreements should be approved for initial periods ending August 16, 2016.
26
ALTAIR SMALLER COMPANIES FUND
Privacy Notice
(Unaudited)
| | |
FACTS | | WHAT DOES THE ALTAIR SMALLER COMPANIES FUND DO WITH YOUR PERSONAL INFORMATION? |
Why? | | Financial companies choose how they share your personal information. Federal law gives consumers the right to limit some but not all sharing. Federal law also requires us to tell you how we collect, share, and protect your personal information. Please read this notice carefully to understand what we do. |
What? | | The types of personal information we collect and share depend on the product or service you have with us. This information may include: • Social Security number • account balances • account transactions • transaction history • wire transfer instructions • checking account information When you are no longer our customer, we continue to share your information as described in this notice. |
How? | | All financial companies need to share customers’ personal information to run their everyday business. In the section below, we list the reasons financial companies can share their customers’ personal information; the reasons Altair Smaller Companies Fund chooses to share; and whether you can limit this sharing. |
| | | | | | |
| Reasons we can share your information | | Does the Altair Smaller Companies Fund Share? | | Can you limit this sharing? |
For our everyday business purpose — such as to process your transactions, maintain your account(s), respond to court orders and legal investigations, or report to credit bureaus | | Yes | | No |
For our marketing purposes — to offer our products and services to you | | Yes | | No |
For joint marketing with other financial companies | | Yes | | No |
For affiliates’ everyday business purposes — information about your transactions and experiences | | Yes | | No |
For affiliates’ everyday business purposes — information about your creditworthiness | | No | | We don’t share |
For our affiliates to market to you | | No | | We don’t share |
For nonaffiliates to market to you | | No | | We don’t share |
| |
Questions? | | Call 1-844-261-6482 |
27
ALTAIR SMALLER COMPANIES FUND
Privacy Notice
(Unaudited)
| | |
How does the Altair Smaller
Companies Fund protect my
personal information? | | To protect your personal information from unauthorized access and use, we use security measures that comply with federal law. These measures include computer safeguards and secured files and buildings. |
How does the Altair Smaller
Companies Fund collect my
personal information? | | We collect your personal information, for example, when you • open an account • provide account information • give us your contact information • make a wire transfer • tell us where to send the money We also collect your information from others, such as credit bureaus, affiliates, or other companies. |
Why can’t I limit all sharing? | | Federal law gives you the right to limit only • sharing for affiliates’ everyday business purposes — information about your creditworthiness • affiliates from using your information to market to you • sharing for nonaffiliates to market to you State laws and individual companies may give you additional rights to limit sharing. |
Definitions | | |
Affiliates | | Companies related by common ownership or control. They can be financial and nonfinancial companies. • Our affiliates include Altair Advisers LLC, the investment adviser to the Altair Smaller Companies Fund. |
Nonaffiliates | | Companies not related by common ownership or control. They can be financial and nonfinancial companies. • Altair Smaller Companies Fund doesn’t share with nonaffiliates so they can market to you. |
Joint marketing | | A formal agreement between nonaffiliated financial companies that together
market financial products or services to you. • Altair Smaller Companies Fund may share your information with other financial
institutions with whom they have joint marketing arrangements who may suggest
additional fund services or other investments products which may be of interest
to you. We do not currently have any joint marketing arrangements with other
financial institutions. |
28
[THIS PAGE INTENTIONALLY LEFT BLANK.]
Investment Adviser
Altair Advisers LLC
303 West Madison Street
Chicago, IL 60606
Administrator
BNY Mellon Investment Servicing (US) Inc.
301 Bellevue Parkway
Wilmington, DE 19809
Transfer Agent
BNY Mellon Investment Servicing (US) Inc.
4400 Computer Drive
Westborough, MA 01581
Principal Underwriter
Foreside Funds Distributors LLC
400 Berwyn Park
899 Cassatt Road
Berwyn, PA 19312
Custodian
The Bank of New York Mellon
One Wall Street
New York, NY 10286
Independent Registered Public Accounting Firm
PricewaterhouseCoopers LLP
Two Commerce Square
2001 Market Street, Suite 1700
Philadelphia, PA 19103
Legal Counsel
Drinker, Biddle & Reath LLP
One Logan Square, Ste. 2000
Philadelphia, PA 19103
ALT-SAR15
BOGLE INVESTMENT MANAGEMENT
SMALL CAP
GROWTH FUND
of THE RBB FUND, INC.
SEMI-ANNUAL REPORT
FEBRUARY 28, 2015
(UNAUDITED)
This report is submitted for the general information of the shareholders of the Fund. It is not authorized for distribution unless preceded or accompanied by a current prospectus for the Fund.
BOGLE INVESTMENT MANAGEMENT
SMALL CAP GROWTH FUND
SEMI-ANNUAL REPORTFORTHE SIX-MONTH PERIOD ENDED FEBRUARY 28, 2015
(UNAUDITED)
Fellow Shareholder:
For the most recent semiannual reporting period ended February 28, 2015, the Bogle Investment Management Small Cap Growth Fund (the “Fund”) Investor shares returned -1.24% and the Institutional shares returned -1.20%, both net of fees, underperforming the Fund’s benchmark, the unmanaged Russell 2000® Index of small cap stocks (the “Benchmark”), which returned +5.70%. The Fund’s longer term annualized returns are shown in the chart below. The balance of this letter covers the market environment, performance attribution, Fund characteristics, and a discussion of some of the business and investment philosophies at Bogle Investment Management, L.P.
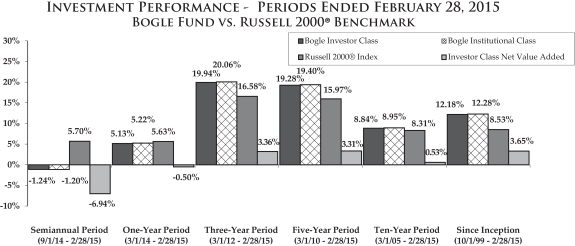
All Fund returns are presented net of fees and include the reinvestment of all dividends and other earnings. Multi-year period returns are annualized. Returns shown represent past performance and do not guarantee future results. Current performance may be lower or higher than the returns shown above. The investment return and principal value of an investment in the Fund will fluctuate so that an investor’s shares, when redeemed, may be worth more or less than their original cost. Returns current to the most recent month-end may be obtained at 1-877-264-5346. The figures do not reflect the deduction of taxes that a shareholder would pay on Fund distributions or the redemption of Fund shares. The performance quoted reflects fee waivers in effect and would have been less in their absence.
Indexes are unmanaged and it is not possible to invest directly in an index.
The Fund’s investment adviser, Bogle Investment Management, L.P., has contractually agreed to waive management fees and/or reimburse expenses through December 31, 2015 to the extent that total annual Fund operating expenses (excluding certain items) exceed 1.25% and 1.35% for the Institutional Class and Investor Class, respectively. The Adviser, in its discretion, has the right to extend this waiver. The total expense ratios for the Institutional Class and Investor Class, as stated in the current prospectus dated December 31, 2014, are 1.32% and 1.42%, respectively.
Market Environment. Although U.S. equity markets advanced over the most recent semiannual period ended February 28, 2015, they did so amid greater market volatility. Market volatility, as measured by the VIX level of implied, expected volatility, spiked up above its long-term average in October, December and January. The rapid decline of oil prices dominated headlines, as it fell over -50% from the beginning of the period, on September 1, 2014, through late January. U.S. small cap equity stocks trended downward from the start of September through mid-October with the Benchmark losing more than -10%. The Benchmark rebounded strongly, however, rising more than +11% in the second half of October. While the Benchmark’s performance in November was essentially flat, December witnessed a return of intra-month volatility, dropping almost -3% in the first half of the month,
1
then gaining almost +6% in the second half to finish the month in positive territory. This see-saw pattern continued through the last two months of the period, with the Benchmark returning -3.22% in January and then gaining +5.94% in February.
For much of the semiannual period, investors tended to favor growth stocks over value stocks with the Russell 2000® Growth Index advancing +9.11%, compared with the Russell 2000® Value Index returning +2.31%. Investors did not seem to have a preference for small or large cap stocks over the period with the large cap Russell 1000® Index returning +6.00% compared to the small cap Russell 2000® return of +5.70%.
Performance Attribution. For the most recent semiannual reporting period, the Fund’s Investor Class of shares underperformed the Benchmark by -6.94%, net of all fees, and the Institutional Class of shares underperformed by -6.90%, net of all fees. The Fund’s underperformance was worst in October (Investor Class returning +0.63% compared to +6.59 for the Benchmark) and December (Investor Class returning -0.22% compared to +2.85% for the Benchmark). The Fund outperformed the Benchmark the final two months of the period from January 1 through February 28, returning +4.82% compared to +2.53% for the Benchmark. The Fund’s underperformance is attributed mostly to negative stock selection, though sector exposures (relative to the Benchmark) also had a negative impact. Although the Fund typically has only small sector exposure differences compared to the Benchmark, stocks in several sectors (including energy and industrial services) that were affected by the price of oil, experienced such steep declines that even small sector differences resulted in unusually negative relative performance.
Our investment process continues to be driven by a proprietary stock selection model that combines insights from longer-term fundamental financial data with non-fundamental, often shorter-term data. This combination can be thought of, conceptually, as the exploitation of investment opportunities created, primarily, by stocks with attractive financial characteristics that are not fully understood by the market, and secondarily, by opportunistically trading these securities when market data indicate that there is a statistical probability that their current prices will either revert toward, or start to diverge from, their short-term equilibrium price levels. Stocks that our model finds attractive will typically have some or most of the following characteristics when compared to their closest peers: more attractive free cash flow, less leverage and more transparent balance sheet, more conservative accounting, organic improvement in underlying business, less expensive share price, improving earnings outlook, and less controversy. Our non-fundamental models consider recent share price volatility and trends, trading volume, and other stock- and industry-group-specific market data to determine whether a stock is likely to diverge from or regress toward its shorter-term fundamental level. Our fundamental models tend to work best when markets are focused more on discriminating between similar stocks than on broader macroeconomic themes that tend to result in investors moving in unison into or out of broad groups or portfolios of stocks. During these latter environments we expect our non-fundamental signals to provide most of their value by finding both a greater number of opportunities from, and greater likelihood of success with, mispricings caused by investors trading more aggressively than normal.
During most market environments we expect some of our underlying models to contribute positively to performance and some to detract (due to the low correlations among individual models). However, in certain unusual market environments, the majority of our models might flounder at the same time. These environments tend to be shorter term in nature and are often triggered by some type of market shock or other event that causes investors to extrapolate the implications of the event across the economy, and thus stocks. We believe that the average investor tends to overreact during these periods, and while their behavior creates longer term opportunities for our models to exploit, it can cause our models to underperform in the short term. During the most recent semiannual period, the dramatic drop in the price of oil was such an event. Spot and expected future prices of oil have, of course, a significant impact on many companies directly, either as a component of revenue or a cost, but oil prices are also often interpreted as a bellwether of overall economic growth, which has a significant impact on corporate and individual confidence and spending. As investors scrambled last fall to extrapolate how the drop in price would affect the economy and their investments, our models struggled. As we have indicated in previous correspondence with you, these difficult periods are unpleasant, but they typically can set us up for a period of good relative performance. And as oil prices and equity markets stabilized in January and February, and the companies whose stock we own began to report their earnings, our models started to perform better. As long term investors we need to take some risks in seeking our goal of outperforming the Benchmark over full market cycles. There will always be shorter term periods of underperformance along the way. Although we never know how long these periods of underperformance will last, we have strong convictions that our models will be rewarded over the longer term.
2
For the semiannual period, the economic sector groups that detracted the most were energy minerals (stocks with negative contributions were Comstock Resources, CRK, and Penn West Petroleum, PWE) and industrial services (negative contributors included Pioneer Energy Services, PES, and Precision Drilling, PDS). Positive contributors included Core Mark, CORE, California Resources, CRC, and Lannet, LCI.
Fund Characteristics. As of the end of the most recent semiannual reporting period ended February 28, 2015, the Fund held 220 stocks, with the largest holding representing 1.75% of portfolio assets. As shown in the table to the right, the Fund looks similar to its investable universe across a variety of fundamental risk characteristics. As of February 28, 2015, the Fund’s median market capitalization was slightly smaller than its investable universe. The Fund’s median price-to-sales ratio was below its investable universe, reflecting the influence of our relative valuation model.
The Fund’s annualized active volatility (the variability of the difference between Fund and Benchmark performance, also called “tracking error”) was 6.6% during the most recent semiannual reporting period, close to the Fund’s long-term average of 6.4%. The Fund’s beta with the Benchmark, at approximately 1.05, was stable during the period.
Progress at Bogle Investment Management, L.P. At the end of February 2015, net assets in the Fund were $203.8 million. This 13% decline from the end of the Fund’s fiscal year, August 31, 2014, is due mostly to investment performance. We appreciate you staying the course with your investments during this recent period of difficult performance. We remain confident in our investment models over the long-term.
| | | | | | | | |
FUNDAMENTAL CHARACTERISTICS FEBRUARY 28, 2015 | |
Median | | BOGLX* | | | Investable
Universe | |
Market Cap. (mil.) | | | $2,111 | | | | $3,395 | |
Price/Historical Earnings | | | 21.7x | | | | 23.1x | |
Price/Forward Earnings | | | 19.4x | | | | 20.0x | |
Price/Sales | | | 1.4x | | | | 2.2x | |
| * The Bogle Small Cap Growth Fund Investor Shares. Median characteristics refer to the Fund’s holdings, not the Fund itself. | |
| | | | | | | | |
RISK STATISTICS* SEMIANNUAL PERIOD | |
Measurement | | BOGLX | | | Russell
2000® | |
Standard Deviation | | | 19.2% | | | | 17.2% | |
Active Volatility | | | 6.6% | | | | | |
Beta with Russell 2000® | | | 1.05 | | | | | |
| * Risk statistics apply to the Fund and benchmark. Standard deviation is a statistical measure of the range of performance. Active risk is the standard deviation of the difference between the Fund and benchmark performance. Beta is a measure of a portfolio’s sensitivity to market movement. | |
Although we currently have capacity to manage, under our current investment process and market conditions, an additional approximately $200 million, we continue to be content with the business approach that we’ve always had- that the Fund be “bought and not sold,” in other words, do no advertising, provide to high quality investors information about our investment process, and let investors decide whether it is a good fit in their portfolios.
As a reminder, information about the Fund, including sector allocation, fundamental characteristics, and top ten holdings, can be viewed on our website, www.boglefunds.com. The net asset values (the “NAVs”) are updated daily while the other Fund information is updated quarterly.
As always, please let us know if there is any way we can improve your investment experience with us.
Respectfully,
Bogle Investment Management, L.P.
Management Office: 781-283-5000
Shareholder Services Toll Free: 1-877-BOGLEIM (264-5346)
The Russell 2000® Index is an index of stocks 1001 through 3000 in the Russell 3000® Index as ranked by total market capitalization. A direct investment in the index is not possible. The Russell ® Indexes are a trademark of the Frank Russell Company (“FRC”). FRC is the owner of the copyrights relating to the Russell Indexes and is the source of the Performance Values for the Russell Indexes.
3
Investing in small companies can involve more volatility, less liquidity and less available information than investing in large companies. The Fund may invest in undervalued securities which may not appreciate in value as anticipated or remain undervalued for long periods of time.
Portfolio composition is subject to change. The current and future portfolio holdings of the Fund are subject to investment risk.
4
BOGLE INVESTMENT MANAGEMENT
SMALL CAP GROWTH FUND
FUND EXPENSE EXAMPLES
(UNAUDITED)
As a shareholder of the Fund, you incur two types of costs: (1) transaction costs and (2) ongoing costs, including management fees, shareholder servicing fees and other Fund expenses. These examples are intended to help you understand your ongoing costs (in dollars) of investing in the Fund and to compare these costs with the ongoing costs of investing in other mutual funds.
These examples are based on an investment of $1,000 invested at the beginning of the six-month period from September 1, 2014 through February 28, 2015, and held for the entire period.
ACTUAL EXPENSES
The first line of the accompanying tables provides information about actual account values and actual expenses. You may use the information in this line, together with the amount you invested, to estimate the expenses that you paid over the period. Simply divide your account value by $1,000 (for example, an $8,600 account value divided by $1,000 = 8.6), then multiply the result by the number in the first line under the heading entitled “Expenses Paid During Period” to estimate the expenses you paid on your account during this period.
HYPOTHETICAL EXAMPLEFOR COMPARISON PURPOSES
The second line of the accompanying tables provides information about hypothetical account values and hypothetical expenses based on the Fund’s actual expense ratio and an assumed rate of return of 5% per year before expenses, which is not the Fund’s actual return. The hypothetical account values and expenses may not be used to estimate the actual ending account balance or expenses you paid for the period. You may use this information to compare the ongoing costs of investing in the Fund and other funds. To do so, compare these 5% hypothetical examples with the 5% hypothetical examples that appear in the shareholder reports of other funds.
Please note that the expenses shown in the accompanying tables are meant to highlight your ongoing costs only and do not reflect any transactional costs, such as redemption fees. Therefore, the second line of the accompanying tables is useful in comparing ongoing costs only, and will not help you determine the relative total costs of owning different funds. In addition, if these transactional costs were included, your costs would have been higher.
| | | | | | | | | | | | |
| | | INSTITUTIONAL CLASS | |
| | | BEGINNING ACCOUNT VALUE
SEPTEMBER 1, 2014 | | | ENDING ACCOUNT VALUE
FEBRUARY 28, 2015 | | | EXPENSES PAID DURING
PERIOD* | |
Actual | | $ | 1,000.00 | | | $ | 988.00 | | | $ | 6.16 | |
Hypothetical
(5% return before expenses) | | | 1,000.00 | | | | 1,018.60 | | | | 6.26 | |
| |
| | | INVESTOR CLASS | |
| | | BEGINNING ACCOUNT VALUE
SEPTEMBER 1, 2014 | | | ENDING ACCOUNT VALUE
FEBRUARY 28, 2015 | | | EXPENSES PAID DURING
PERIOD* | |
Actual | | $ | 1,000.00 | | | $ | 987.60 | | | $ | 6.65 | |
Hypothetical
(5% return before expenses) | | | 1,000.00 | | | | 1,018.10 | | | | 6.76 | |
| * | Expenses are equal to the Fund’s annualized six-month expense ratio of 1.25% for the Institutional Class and 1.35% for the Investor Class, which includes waived fees or reimbursed expenses, multiplied by the average account value over the period, multiplied by the number of days (181) in the most recent fiscal half-year, then divided by 365 to reflect the one-half year period. The Fund’s ending account values on the first line in each table are based on the actual six-month total investment return for each class of (1.20)% for the Institutional Class and (1.24)% for the Investor Class. |
5
BOGLE INVESTMENT MANAGEMENT
SMALL CAP GROWTH FUND
PORTFOLIO HOLDINGS SUMMARY TABLE
FEBRUARY 28, 2015
(UNAUDITED)
The following table presents a summary by security type of the portfolio holdings of the Fund:
| | | | | | | | |
| SECURITY TYPE & SECTOR CLASSIFICATION | | % OF NET
ASSETS | | | VALUE | |
| | |
COMMON STOCKS: | | | | | | | | |
Financial | | | 18.4% | | | $ | 37,460,499 | |
Consumer Cyclical | | | 18.1 | | | | 36,966,240 | |
Consumer Growth | | | 17.5 | | | | 35,682,871 | |
Technology | | | 14.5 | | | | 29,448,275 | |
Energy | | | 10.7 | | | | 21,876,722 | |
Communications | | | 8.6 | | | | 17,537,967 | |
Industrial | | | 7.4 | | | | 15,056,046 | |
Basic Industry | | | 4.1 | | | | 8,364,167 | |
Utility | | | 0.1 | | | | 197,349 | |
SHORT-TERM INVESTMENTS | | | 0.9 | | | | 1,886,654 | |
LIABILITIESIN EXCESSOF OTHER ASSETS | | | (0.3) | | | | (643,123) | |
| | | | | | | | |
NET ASSETS | | | 100.0% | | | $ | 203,833,667 | |
| | | | | | | | |
Portfolio holdings are subject to change at any time.
The accompanying notes are an integral part of the financial statements.
6
BOGLE INVESTMENT MANAGEMENT
SMALL CAP GROWTH FUND
PORTFOLIOOF INVESTMENTS
FEBRUARY 28, 2015 (UNAUDITED)
| | | | | | | | |
| | | NUMBER
OF SHARES | | | VALUE | |
COMMON STOCKS—99.4% | |
BASIC INDUSTRY—4.1% | | | | | | | | |
AngloGold Ashanti Ltd., SP ADR * | | | 199,212 | | | $ | 2,245,119 | |
Braskem SA, SP ADR | | | 25,198 | | | | 229,050 | |
Century Aluminum Co. * | | | 64,673 | | | | 1,226,847 | |
Constellium NV, Class A * | | | 54,778 | | | | 1,035,852 | |
Dominion Diamond Corp. * | | | 51,749 | | | | 879,733 | |
Gerdau SA, SP ADR | | | 348,132 | | | | 1,242,831 | |
Gold Fields Ltd., SP ADR | | | 211,859 | | | | 985,144 | |
Mercer International, Inc. * | | | 24,094 | | | | 343,821 | |
Schnitzer Steel Industries, Inc., Class A | | | 3,535 | | | | 55,500 | |
United States Lime & Minerals, Inc. | | | 209 | | | | 14,108 | |
Veritiv Corp. * | | | 2,096 | | | | 106,162 | |
| | | | | | | | |
| | | | 8,364,167 | |
| | | | | | | | |
COMMUNICATIONS—8.6% | |
1-800-Flowers.com, Inc., Class A * | | | 42,648 | | | | 532,247 | |
CDW Corp. | | | 53,545 | | | | 2,014,898 | |
comScore, Inc. * | | | 9,866 | | | | 508,987 | |
Comverse, Inc. * | | | 4,534 | | | | 81,340 | |
CTC Media, Inc. | | | 85,727 | | | | 360,911 | |
Earthlink Holdings Corp. | | | 35,122 | | | | 149,971 | |
EchoStar Corp., Class A * | | | 35,272 | | | | 1,917,033 | |
ePlus, Inc. * | | | 12,769 | | | | 1,061,998 | |
Inteliquent, Inc. | | | 21,015 | | | | 309,971 | |
InterDigital, Inc. | | | 10,973 | | | | 580,143 | |
LogMein, Inc. * | | | 37,337 | | | | 1,967,660 | |
Marchex, Inc., Class B | | | 20,987 | | | | 86,676 | |
McClatchy Co., (The),
Class A * | | | 742 | | | | 1,721 | |
NICE Systems Ltd., SP ADR | | | 10,133 | | | | 591,463 | |
Novatel Wireless, Inc. * | | | 16,399 | | | | 86,259 | |
Orbitz Worldwide, Inc. * | | | 14,469 | | | | 167,551 | |
Qorvo, Inc. * | | | 19,864 | | | | 1,378,562 | |
Radio One, Inc., Class D * | | | 3,403 | | | | 8,882 | |
Sierra Wireless, Inc. (CA) * | | | 48,958 | | | | 1,838,862 | |
Sohu.com, Inc. * | | | 28,847 | | | | 1,517,929 | |
Straight Path Communications, Inc., Class B * | | | 2,549 | | | | 51,872 | |
TechTarget, Inc. * | | | 3,207 | | | | 38,933 | |
VASCO Data Security International, Inc. * | | | 70,060 | | | | 1,794,937 | |
Web.com Group, Inc. * | | | 27,404 | | | | 489,161 | |
| | | | | | | | |
| | | | 17,537,967 | |
| | | | | | | | |
CONSUMER CYCLICAL—18.1% | |
Allison Transmission Holdings, Inc. | | | 43,404 | | | | 1,381,115 | |
American Woodmark Corp. * | | | 14,449 | | | | 760,884 | |
| | | | | | | | |
| | | NUMBER
OF SHARES | | | VALUE | |
CONSUMER CYCLICAL—(CONTINUED) | |
Arctic Cat, Inc. | | | 39,705 | | | $ | 1,447,644 | |
Bassett Furniture Industries, Inc. | | | 1,575 | | | | 40,493 | |
BJ’s Restaurants, Inc. * | | | 13,214 | | | | 690,035 | |
Build-A-Bear Workshop, Inc. * | | | 6,621 | | | | 143,477 | |
Burlington Stores, Inc. * | | | 29,424 | | | | 1,635,092 | |
Citi Trends, Inc. * | | | 18,315 | | | | 488,095 | |
Cooper Tire & Rubber Co. | | | 9,966 | | | | 379,306 | |
Core-Mark Holding Co., Inc. | | | 50,646 | | | | 3,561,427 | |
CST Brands, Inc. | | | 37,290 | | | | 1,552,383 | |
Denny’s Corp. * | | | 68,014 | | | | 782,841 | |
H&E Equipment Services, Inc. | | | 34,414 | | | | 842,455 | |
HD Supply Holdings, Inc. * | | | 55,183 | | | | 1,628,174 | |
HNI Corp. | | | 35,663 | | | | 1,818,813 | |
Jack in the Box, Inc. | | | 23,752 | | | | 2,296,581 | |
Jetblue Airways Corp. * | | | 99,023 | | | | 1,702,205 | |
Marriott Vacations Worldwide Corp. | | | 25,772 | | | | 1,960,218 | |
Meritor, Inc. * | | | 122,827 | | | | 1,755,198 | |
Nautilus, Inc. * | | | 20,725 | | | | 316,264 | |
Penn National Gaming, Inc. * | | | 2,693 | | | | 43,869 | |
SeaWorld Entertainment, Inc. | | | 30,085 | | | | 563,793 | |
Select Comfort Corp. * | | | 41,333 | | | | 1,326,789 | |
Skechers U.S.A., Inc., Class A * | | | 48,497 | | | | 3,304,586 | |
Steelcase, Inc., Class A | | | 14,128 | | | | 264,476 | |
Strattec Security Corp. | | | 327 | | | | 22,239 | |
Tower International, Inc. * | | | 39,821 | | | | 1,077,954 | |
Universal Electronics, Inc. * | | | 36,700 | | | | 2,073,917 | |
Visteon Corp. * | | | 9,080 | | | | 912,812 | |
VOXX International Corp. * | | | 12,309 | | | | 105,857 | |
Wabash National Corp. * | | | 34,340 | | | | 503,081 | |
Zumiez, Inc. * | | | 40,808 | | | | 1,584,167 | |
| | | | | | | | |
| | | | 36,966,240 | |
| | | | | | | | |
CONSUMER GROWTH—17.5% | |
Acorda Therapeutics, Inc. * | | | 47,963 | | | | 1,623,068 | |
Affymetrix, Inc. * | | | 149,092 | | | | 1,744,376 | |
Alere, Inc. * | | | 11,465 | | | | 521,313 | |
Alliance HealthCare Services, Inc. * | | | 2,810 | | | | 67,187 | |
Anacor Pharmaceuticals, Inc. * | | | 14,777 | | | | 642,799 | |
Andersons, Inc., (The) | | | 1,852 | | | | 81,988 | |
ARC Document Solutions, Inc. * | | | 11,948 | | | | 101,080 | |
Array BioPharma, Inc. * | | | 56,548 | | | | 450,122 | |
Ascent Capital Group, Inc., Class A * | | | 1,024 | | | | 45,025 | |
The accompanying notes are an integral part of the financial statements.
7
BOGLE INVESTMENT MANAGEMENT
SMALL CAP GROWTH FUND
PORTFOLIOOF INVESTMENTS (CONTINUED)
FEBRUARY 28, 2015 (UNAUDITED)
| | | | | | | | |
| | | NUMBER
OF SHARES | | | VALUE | |
CONSUMER GROWTH—(CONTINUED) | |
Avis Budget Group, Inc. * | | | 17,460 | | | $ | 1,058,425 | |
Bio-Rad Laboratories, Inc., Class A * | | | 3,837 | | | | 487,990 | |
BioSpecifics Technologies Corp. * | | | 3,782 | | | | 147,347 | |
Cambrex Corp. * | | | 18,240 | | | | 624,720 | |
Centene Corp. * | | | 25,238 | | | | 1,551,127 | |
China Biologic Products,
Inc. * | | | 306 | | | | 23,440 | |
Cia Brasileira de Distribuicao, SP PRF ADR | | | 33,775 | | | | 1,150,039 | |
Civeo Corp. | | | 98,734 | | | | 389,012 | |
Coca-Cola Bottling Co. Consolidated | | | 369 | | | | 38,520 | |
CRA International, Inc. * | | | 6,074 | | | | 182,767 | |
CTPartners Executive Search, Inc. * | | | 1,053 | | | | 7,287 | |
Dyax Corp. * | | | 108,964 | | | | 1,646,446 | |
Enzo Biochem, Inc. * | | | 8,577 | | | | 26,246 | |
Enzon Pharmaceuticals, Inc. | | | 58,661 | | | | 61,594 | |
Euronet Worldwide, Inc. * | | | 3,988 | | | | 225,322 | |
Farmer Bros. Co. * | | | 2,678 | | | | 64,888 | |
FibroGen, Inc. * | | | 19,678 | | | | 626,154 | |
Five Prime Therapeutics,
Inc. * | | | 3,990 | | | | 102,703 | |
Genesis Healthcare, Inc. * | | | 2,455 | | | | 17,455 | |
Health Net, Inc. * | | | 48,716 | | | | 2,793,863 | |
HealthEquity, Inc. * | | | 5,227 | | | | 105,951 | |
ICON PLC * | | | 44,351 | | | | 3,060,663 | |
Infinity Pharmaceuticals,
Inc. * | | | 9,274 | | | | 140,965 | |
Ingles Markets, Inc., Class A | | | 15,902 | | | | 687,602 | |
Insperity, Inc. | | | 34,811 | | | | 1,803,210 | |
John B. Sanfilippo & Son, Inc. | | | 2,233 | | | | 82,733 | |
K12, Inc. * | | | 41,653 | | | | 705,185 | |
Lannett Co., Inc. * | | | 41,011 | | | | 2,559,086 | |
LendingTree, Inc. * | | | 5,092 | | | | 270,080 | |
Luminex Corp. * | | | 21,929 | | | | 345,162 | |
Mannatech, Inc. * | | | 1,521 | | | | 34,998 | |
MoneyGram International,
Inc. * | | | 84,751 | | | | 719,960 | |
Natus Medical, Inc. * | | | 20,987 | | | | 751,125 | |
Net 1 UEPS Technologies,
Inc. * | | | 21,657 | | | | 295,835 | |
NuVasive, Inc. * | | | 18,278 | | | | 836,219 | |
OncoGenex Pharmaceutical, Inc. * | | | 10,856 | | | | 24,915 | |
OraSure Technologies, Inc. * | | | 20,420 | | | | 146,207 | |
Orthofix International,
N.V. * | | | 3,179 | | | | 103,095 | |
PAREXEL International
Corp. * | | | 31,844 | | | | 2,052,664 | |
| | | | | | | | |
| | | NUMBER
OF SHARES | | | VALUE | |
CONSUMER GROWTH—(CONTINUED) | |
RadNet, Inc. * | | | 9,014 | | | $ | 78,963 | |
SciClone Pharmaceuticals,
Inc. * | | | 42,921 | | | | 330,921 | |
Sucampo Pharmaceuticals, Inc. Class A * | | | 4,011 | | | | 61,689 | |
United Therapeutics Corp. * | | | 9,972 | | | | 1,546,159 | |
VCA , Inc. * | | | 29,664 | | | | 1,580,498 | |
Viad Corp. | | | 22,414 | | | | 595,316 | |
Willdan Group, Inc. * | | | 17,275 | | | | 244,441 | |
XenoPort, Inc. * | | | 2,471 | | | | 16,926 | |
| | | | | | | | |
| | | | 35,682,871 | |
| | | | | | | | |
ENERGY—10.7% | |
C&J Energy Services, Inc. * | | | 158,067 | | | | 2,154,453 | |
California Resources Corp. | | | 386,566 | | | | 2,767,812 | |
Enerplus Corp. | | | 186,291 | | | | 1,885,265 | |
Gulfmark Offshore, Inc. | | | 114,429 | | | | 1,881,213 | |
Murphy USA, Inc. * | | | 47,420 | | | | 3,366,346 | |
Pacific Drilling SA * | | | 372,872 | | | | 1,357,254 | |
Pacific Ethanol, Inc. * | | | 50,193 | | | | 460,772 | |
Parker Drilling Co. * | | | 383,591 | | | | 1,185,296 | |
Penn West Petroleum Ltd. | | | 339,177 | | | | 685,138 | |
Pioneer Energy Services
Corp. * | | | 187,661 | | | | 998,357 | |
REX American Resources
Corp. * | | | 31,332 | | | | 1,703,208 | |
Superior Energy Services, Inc. | | | 92,037 | | | | 2,059,788 | |
WPX Energy, Inc. * | | | 127,256 | | | | 1,371,820 | |
| | | | | | | | |
| | | | 21,876,722 | |
| | | | | | | | |
FINANCIAL—18.4% | |
Aircastle, Ltd. | | | 6,399 | | | | 147,625 | |
Ambac Financial Group,
Inc. * | | | 56,383 | | | | 1,403,373 | |
Assurant, Inc. | | | 29,682 | | | | 1,818,616 | |
Assured Guaranty Ltd. | | | 56,274 | | | | 1,492,386 | |
Bancorp, Inc., (The) * | | | 1,529 | | | | 14,281 | |
Calamos Asset Management, Inc., Class A | | | 64,348 | | | | 821,724 | |
Central Pacific Financial Corp. | | | 11,769 | | | | 269,981 | |
East West Bancorp, Inc. | | | 34,586 | | | | 1,381,711 | |
eHealth, Inc. * | | | 74,732 | | | | 680,061 | |
Enova International, Inc. * | | | 46,823 | | | | 1,081,143 | |
Evercore Partners, Inc., Class A | | | 359 | | | | 18,391 | |
Federated National Holding Co. | | | 20,106 | | | | 581,666 | |
First BanCorp Puerto Rico * | | | 282,569 | | | | 1,862,130 | |
First Citizens BancShares, Inc., Class A | | | 4,646 | | | | 1,171,954 | |
The accompanying notes are an integral part of the financial statements.
8
BOGLE INVESTMENT MANAGEMENT
SMALL CAP GROWTH FUND
PORTFOLIOOF INVESTMENTS (CONTINUED)
FEBRUARY 28, 2015 (UNAUDITED)
| | | | | | | | |
| | | NUMBER
OF SHARES | | | VALUE | |
FINANCIAL—(CONTINUED) | |
First Horizon National Corp. | | | 121,014 | | | $ | 1,729,290 | |
Gain Capital Holdings, Inc. | | | 75,600 | | | | 717,444 | |
Genworth Financial, Inc., Class A * | | | 219,556 | | | | 1,701,559 | |
Interactive Brokers Group, Inc., Class A | | | 69,921 | | | | 2,228,382 | |
INTL. FCStone, Inc. * | | | 1,171 | | | | 31,886 | |
Investment Technology Group, Inc. * | | | 79,366 | | | | 1,787,322 | |
Janus Capital Group, Inc. | | | 99,072 | | | | 1,632,707 | |
Maiden Holdings, Ltd. | | | 400 | | | | 5,724 | |
Manning & Napier, Inc. | | | 25,065 | | | | 301,281 | |
Marcus & Millichap, Inc. * | | | 1,874 | | | | 69,207 | |
MBIA, Inc. * | | | 216,318 | | | | 1,946,862 | |
Navigators Group, Inc.,
(The) * | | | 19,776 | | | | 1,477,465 | |
Nelnet, Inc., Class A | | | 40,141 | | | | 1,871,373 | |
Piper Jaffray Cos., Inc. * | | | 47,588 | | | | 2,605,443 | |
Reinsurance Group of America, Inc. | | | 24,449 | | | | 2,183,540 | |
Selective Insurance Group, Inc. | | | 61,348 | | | | 1,670,506 | |
SLM Corp. | | | 1,700 | | | | 16,099 | |
Springleaf Holdings, Inc. * | | | 44,548 | | | | 1,712,871 | |
United Insurance Holdings Corp. | | | 32,194 | | | | 785,856 | |
Universal Insurance Holdings, Inc. | | | 426 | | | | 10,607 | |
WSFS Financial Corp. | | | 2,959 | | | | 230,033 | |
| | | | | | | | |
| | | | 37,460,499 | |
| | | | | | | | |
INDUSTRIAL—7.4% | |
AAON, Inc. | | | 2,100 | | | | 47,271 | |
AMERCO, Inc. | | | 1,482 | | | | 484,347 | |
Argan, Inc. | | | 17,636 | | | | 571,935 | |
AU Optronics Corp., SP ADR | | | 211,574 | | | | 1,106,532 | |
Blount International, Inc. * | | | 102,740 | | | | 1,704,457 | |
Broadwind Energy, Inc. * | | | 8,368 | | | | 41,422 | |
Chart Industries, Inc. * | | | 58,296 | | | | 2,036,862 | |
China Digital TV Holding Co., Ltd., ADR | | | 7,895 | | | | 28,580 | |
Continental Building Products, Inc. * | | | 956 | | | | 19,942 | |
Covenant Transport, Inc., Class A * | | | 18,160 | | | | 578,396 | |
Federal Signal Corp. | | | 105,001 | | | | 1,731,466 | |
Flextronics International
Ltd. * | | | 107,619 | | | | 1,310,799 | |
GrafTech International
Ltd. * | | | 1,374 | | | | 5,359 | |
| | | | | | | | |
| | | NUMBER
OF SHARES | | | VALUE | |
INDUSTRIAL—(CONTINUED) | |
Highpower International,
Inc. * | | | 102,905 | | | $ | 523,786 | |
ITT Corp. | | | 42,045 | | | | 1,726,788 | |
Mueller Water Products, Inc., Class A | | | 60,724 | | | | 556,232 | |
PAM Transportation Services, Inc. * | | | 3,317 | | | | 174,043 | |
SL Industries, Inc. * | | | 546 | | | | 21,158 | |
Terex Corp. | | | 71,296 | | | | 1,954,223 | |
Trex Co, Inc. * | | | 5,731 | | | | 288,556 | |
US Concrete, Inc. * | | | 475 | | | | 14,488 | |
USA Truck, Inc. * | | | 3,349 | | | | 101,977 | |
ZAGG, Inc. * | | | 3,562 | | | | 27,427 | |
| | | | | | | | |
| | | | 15,056,046 | |
| | | | | | | | |
TECHNOLOGY—14.5% | |
Aspen Technology, Inc. * | | | 49,066 | | | | 1,894,193 | |
Avid Technology, Inc. * | | | 2,793 | | | | 43,794 | |
Brocade Communications Systems, Inc. | | | 232,935 | | | | 2,886,065 | |
ChipMOS Technologies Bermuda Ltd. | | | 2,505 | | | | 58,667 | |
DST Systems, Inc. | | | 16,800 | | | | 1,785,672 | |
Envestnet, Inc. * | | | 26,419 | | | | 1,423,456 | |
Fair Isaac Corp. | | | 20,961 | | | | 1,784,200 | |
Fairchild Semiconductor International, Inc. * | | | 53,189 | | | | 927,616 | |
FormFactor, Inc. * | | | 61,188 | | | | 600,866 | |
Integrated Device Technology, Inc. * | | | 167,443 | | | | 3,456,024 | |
Jive Software, Inc. * | | | 50,375 | | | | 254,898 | |
Manhattan Associates, Inc. * | | | 30,741 | | | | 1,532,439 | |
Marvell Technology Group Ltd. | | | 127,345 | | | | 2,052,801 | |
Mattson Technology, Inc. * | | | 81,163 | | | | 387,959 | |
MAXIMUS, Inc. | | | 25,852 | | | | 1,531,214 | |
Merge Healthcare, Inc. * | | | 49,779 | | | | 199,116 | |
Planar Systems, Inc. * | | | 17,042 | | | | 104,808 | |
Progress Software Corp. * | | | 19,418 | | | | 530,888 | |
Quality Systems, Inc. | | | 86,865 | | | | 1,509,714 | |
Qualys, Inc. * | | | 37,452 | | | | 1,723,916 | |
Sigma Designs, Inc. | | | 12,701 | | | | 93,606 | |
Skyworks Solutions, Inc. | | | 30,149 | | | | 2,645,575 | |
Sykes Enterprises, Inc. * | | | 8,451 | | | | 196,486 | |
Tessera Technologies, Inc. | | | 29,295 | | | | 1,173,558 | |
Tower Semiconductor Ltd. * | | | 40,444 | | | | 650,744 | |
| | | | | | | | |
| | | | 29,448,275 | |
| | | | | | | | |
UTILITY—0.1% | |
Pampa Energia SA, SP
ADR * | | | 15,334 | | | | 197,349 | |
| | | | | | | | |
TOTAL COMMON STOCKS
(Cost $181,970,610) | | | | 202,590,136 | |
| | | | | | | | |
The accompanying notes are an integral part of the financial statements.
9
BOGLE INVESTMENT MANAGEMENT
SMALL CAP GROWTH FUND
PORTFOLIOOF INVESTMENTS (CONCLUDED)
FEBRUARY 28, 2015 (UNAUDITED)
| | | | | | | | |
| | | NUMBER
OF SHARES | | | VALUE | |
SHORT-TERM INVESTMENTS—0.9% | |
BofA Cash Reserves Fund | | | 1,886,654 | | | $ | 1,886,654 | |
| | | | | | | | |
TOTAL SHORT-TERM INVESTMENTS
(Cost $1,886,654) | | | | 1,886,654 | |
| | | | | | | | |
TOTAL INVESTMENTS—100.3%
(Cost $183,857,264) | | | | 204,476,790 | |
| | | | | | | | |
LIABILITIESIN EXCESSOF OTHER
ASSETS—(0.3)% | | | | (643,123 | ) |
| | | | | | | | |
NET ASSETS—100.0% | | | $ | 203,833,667 | |
| | | | | | | | |
* Non-income producing
ADR—American Depositary Receipt
PLC—Public Limited Company
SP ADR—Sponsored American Depositary Receipt
SP PRF ADR—Sponsored Preferred American Depositary Receipt
The accompanying notes are an integral part of the financial statements.
10
BOGLE INVESTMENT MANAGEMENT
SMALL CAP GROWTH FUND
STATEMENTOF ASSETSAND LIABILITIES
FEBRUARY 28, 2015
(UNAUDITED)
| | | | |
ASSETS | |
Investments, at value (cost $183,857,264) | | $ | 204,476,790 | |
Receivables for: | | | | |
Investments sold | | | 5,010,285 | |
Capital shares sold | | | 461,569 | |
Dividends and interest | | | 117,609 | |
Prepaid expenses and other assets | | | 25,617 | |
| | | | |
Total assets | | | 210,091,870 | |
| | | | |
LIABILITIES | | | | |
Payables for: | | | | |
Investments purchased | | | 4,521,401 | |
Capital shares redeemed | | | 1,421,719 | |
Investment advisory fees and shareholder servicing fees | | | 153,795 | |
Directors’ and officers’ fees | | | 730 | |
Other accrued expenses and liabilities | | | 160,558 | |
| | | | |
Total liabilities | | | 6,258,203 | |
| | | | |
Net assets | | $ | 203,833,667 | |
| | | | |
NET ASSETS CONSISTOF | | | | |
Capital stock, $0.001 par value | | $ | 6,321 | |
Paid-in capital | | | 173,967,010 | |
Accumulated net investment loss | | | (571,409 | ) |
Accumulated net realized gain from investments | | | 9,812,219 | |
Net unrealized appreciation on investments | | | 20,619,526 | |
| | | | |
Net assets | | $ | 203,833,667 | |
| | | | |
INSTITUTIONAL CLASS | | | | |
Net assets | | $ | 100,617,627 | |
| | | | |
Shares outstanding ($0.001 par value, 100,000,000 shares authorized) | | | 3,089,124 | |
| | | | |
Net asset value, offering and redemption price per share | | $ | 32.57 | |
| | | | |
INVESTOR CLASS | | | | |
Net assets | | $ | 103,216,040 | |
| | | | |
Shares outstanding ($0.001 par value, 100,000,000 shares authorized) | | | 3,231,572 | |
| | | | |
Net asset value, offering and redemption price per share | | $ | 31.94 | |
| | | | |
The accompanying notes are an integral part of the financial statements.
11
BOGLE INVESTMENT MANAGEMENT
SMALL CAP GROWTH FUND
STATEMENTOF OPERATIONS
FORTHE SIX MONTHS ENDED FEBRUARY 28, 2015
(UNAUDITED)
| | | | |
INVESTMENT INCOME | | | | |
Dividends (net of foreign withholding taxes of $14,616) | | $ | 758,782 | |
| | | | |
Total investment income | | | 758,782 | |
| | | | |
EXPENSES | | | | |
Advisory fees | | | 1,022,355 | |
Administration and accounting fees | | | 147,759 | |
Transfer agent fees | | | 82,860 | |
Shareholder servicing fees (Investor Class) | | | 51,457 | |
Custodian fees | | | 34,827 | |
Professional fees | | | 24,907 | |
Registration and filing fees | | | 18,865 | |
Printing and shareholder reporting fees | | | 13,560 | |
Directors’ and officers’ fees | | | 13,400 | |
Insurance fees | | | 5,118 | |
Other expenses | | | 2,675 | |
| | | | |
Total expenses before waivers | | | 1,417,783 | |
Less: waivers | | | (87,592 | ) |
| | | | |
Net expenses after waivers | | | 1,330,191 | |
| | | | |
Net investment loss | | | (571,409 | ) |
| | | | |
NET REALIZEDAND UNREALIZED GAIN/(LOSS) FROM INVESTMENTS | | | | |
Net realized gain from investments | | | 13,571,558 | |
Net change in unrealized depreciation on investments | | | (17,847,182 | ) |
| | | | |
Net realized and unrealized loss on investments | | | (4,275,624 | ) |
| | | | |
NET DECREASEIN NET ASSETS RESULTING FROM OPERATIONS | | $ | (4,847,033 | ) |
| | | | |
The accompanying notes are an integral part of the financial statements.
12
BOGLE INVESTMENT MANAGEMENT
SMALL CAP GROWTH FUND
STATEMENTOF CHANGESIN NET ASSETS
| | | | | | | | |
| | | FORTHE
SIX MONTHS ENDED
FEBRUARY 28, 2015
(UNAUDITED) | | | FORTHE
YEAR ENDED
AUGUST 31, 2014 | |
INCREASE/(DECREASE)IN NET ASSETS FROM OPERATIONS: | | | | | | | | |
Net investment loss | | $ | (571,409 | ) | | $ | (1,554,746 | ) |
Net realized gain from investments | | | 13,571,558 | | | | 36,367,817 | |
Net change in unrealized appreciation/(depreciation) on investments | | | (17,847,182 | ) | | | 18,834,972 | |
| | | | | | | | |
Net increase/(decrease) in net assets resulting from operations | | | (4,847,033 | ) | | | 53,648,043 | |
| | | | | | | | |
DIVIDENDSAND DISTRIBUTIONSTO SHAREHOLDERS FROM: | | | | | | | | |
Net investment income | | | | | | | | |
Institutional Class | | | – | | | | (211,232 | ) |
Investor Class | | | – | | | | (92,941 | ) |
Net realized capital gains | | | | | | | | |
Institutional Class | | | (13,849,300 | ) | | | – | |
Investor Class | | | (13,815,545 | ) | | | – | |
| | | | | | | | |
Net decrease in net assets from dividends and distributions to shareholders | | | (27,664,845 | ) | | | (304,173 | ) |
| | | | | | | | |
INCREASE/(DECREASE)IN NET ASSETS DERIVED FROM CAPITAL TRANSACTIONS: | | | | | | | | |
Institutional Class | | | | | | | | |
Proceeds from shares sold | | | 11,587,515 | | | | 37,241,140 | |
Reinvestment of distributions | | | 13,557,227 | | | | 205,141 | |
Distributions for shares redeemed | | | (26,127,220 | ) | | | (47,869,174 | ) |
| | | | | | | | |
Total from Institutional Class | | | (982,478 | ) | | | (10,422,893 | ) |
Investor Class | | | | | | | | |
Proceeds from shares sold | | | 13,070,622 | | | | 31,368,704 | |
Reinvestment of distributions | | | 13,118,880 | | | | 87,771 | |
Distributions for shares redeemed | | | (23,453,275 | ) | | | (16,267,560 | ) |
| | | | | | | | |
Total from Investor Class | | | 2,736,227 | | | | 15,188,915 | |
| | | | | | | | |
Net increase in net assets from capital share transactions | | | 1,753,749 | | | | 4,766,022 | |
| | | | | | | | |
Total increase/(decrease) in net assets | | | (30,758,129 | ) | | | 58,109,892 | |
NET ASSETS | | | | | | | | |
Beginning of period | | | 234,591,796 | | | | 176,481,904 | |
| | | | | | | | |
End of period | | $ | 203,833,667 | | | $ | 234,591,796 | |
| | | | | | | | |
Accumulated net investment loss, end of period | | $ | (571,409 | ) | | $ | – | |
| | | | | | | | |
The accompanying notes are an integral part of the financial statements.
13
BOGLE INVESTMENT MANAGEMENT
SMALL CAP GROWTH FUND
STATEMENTOF CHANGESIN NET ASSETS (CONCLUDED)
| | | | | | | | |
| | | FORTHE
SIX MONTHS ENDED
FEBRUARY 28, 2015
(UNAUDITED) | | | FORTHE
YEAR ENDED
AUGUST 31, 2014 | |
INCREASE/(DECREASE)IN SHARES OUTSTANDING DERIVED FROM SHARE TRANSACTIONS: | | | | | | | | |
Institutional Class | | | | | | | | |
Shares sold | | | 353,930 | | | | 1,084,194 | |
Shares reinvested | | | 437,754 | | | | 6,207 | |
Shares redeemed | | | (800,103 | ) | | | (1,346,938 | ) |
| | | | | | | | |
Total from Institutional Class | | | (8,419 | ) | | | (256,537 | ) |
| | | | | | | | |
Investor Class | | | | | | | | |
Shares sold | | | 392,915 | | | | 913,039 | |
Shares reinvested | | | 431,968 | | | | 2,698 | |
Shares redeemed | | | (708,813 | ) | | | (475,125 | ) |
| | | | | | | | |
Total from Investor Class | | | 116,070 | | | | 440,612 | |
| | | | | | | | |
Net increase in shares outstanding | | | 107,651 | | | | 184,075 | |
| | | | | | | | |
The accompanying notes are an integral part of the financial statements.
14
BOGLE INVESTMENT MANAGEMENT
SMALL CAP GROWTH FUND
FINANCIAL HIGHLIGHTS
Contained below is per share operating performance data for each class of shares outstanding, total investment return, ratios to average net assets and other supplemental data for the respective periods. This information has been derived from information provided in the financial statements.
| | | | | | | | | | | | | | | | | | | | | | | | |
| | | INSTITUTIONAL CLASS | |
| | | FOR THE
SIX MONTHS
ENDED
2/28/15
(UNAUDITED) | | | FOR THE
YEAR
ENDED
8/31/14 | | | FOR THE
YEAR
ENDED
8/31/13 | | | FOR THE
YEAR
ENDED
8/31/12 | | | FOR THE
YEAR
ENDED
8/31/11 | | | FOR THE
YEAR
ENDED
8/31/10 | |
PER SHARE OPERATING PERFORMANCE | | | | | | | | | | | | | | | | | | | | | | | | |
Net asset value, beginning of period | | $ | 38.07 | | | $ | 29.49 | | | $ | 21.76 | | | $ | 19.38 | | | $ | 14.81 | | | $ | 14.03 | |
| | | | | | | | | | | | | | | | | | | | | | | | |
Net investment income/(loss)* | | | (0.08 | ) | | | (0.23 | ) | | | 0.10 | | | | (0.04 | ) | | | (0.10 | ) | | | (0.07 | ) |
Net realized and unrealized gain/(loss) from investments | | | (0.62 | ) | | | 8.87 | | | | 7.63 | | | | 2.42 | | | | 4.67 | | | | 0.85 | |
| | | | | | | | | | | | | | | | | | | | | | | | |
Net increase/(decrease) in net assets resulting
from operations | | | (0.70 | ) | | | 8.64 | | | | 7.73 | | | | 2.38 | | | | 4.57 | | | | 0.78 | |
| | | | | | | | | | | | | | | | | | | | | | | | |
Dividends and distributions to shareholders from: | | | | | | | | | | | | | | | | | | | | | | | | |
Net investment income | | | — | | | | (0.06 | ) | | | — | | | | — | | | | — | | | | — | |
Net realized gain | | | (4.80 | ) | | | — | | | | — | | | | — | | | | — | | | | — | |
| | | | | | | | | | | | | | | | | | | | | | | | |
Total dividends and distributions to shareholders | | | (4.80 | ) | | | (0.06 | ) | | | — | | | | — | | | | — | | | | — | |
| | | | | | | | | | | | | | | | | | | | | | | | |
Net asset value, end of period | | $ | 32.57 | | | $ | 38.07 | | | $ | 29.49 | | | $ | 21.76 | | | $ | 19.38 | | | $ | 14.81 | |
| | | | | | | | | | | | | | | | | | | | | | | | |
Total investment return(1) | | | (1.20 | )%(3) | | | 29.34 | % | | | 35.52 | % | | | 12.28 | % | | | 30.86 | % | | | 5.56 | % |
| | | | | | | | | | | | | | | | | | | | | | | | |
RATIOS/SUPPLEMENTAL DATA | | | | | | | | | | | | | | | | | | | | | | | | |
Net assets, end of period (000’s omitted) | | $ | 100,618 | | | $ | 117,923 | | | $ | 98,898 | | | $ | 48,526 | | | $ | 38,274 | | | $ | 31,714 | |
Ratio of expenses to average net assets
with waivers and reimbursements | | | 1.25 | %(2) | | | 1.25 | % | | | 1.25 | % | | | 1.25 | % | | | 1.25 | % | | | 1.25 | % |
Ratio of expenses to average net assets
without waivers and reimbursements | | | 1.34 | %(2) | | | 1.32 | % | | | 1.39 | % | | | 1.51 | % | | | 1.44 | % | | | 1.51 | % |
Ratio of net investment income/(loss) to average net assets | | | (0.51 | )%(2) | | | (0.66 | )% | | | 0.37 | % | | | (0.21 | )% | | | (0.48 | )% | | | (0.48 | )% |
Portfolio turnover rate | | | 88.18 | %(3) | | | 175.06 | % | | | 237.59 | % | | | 288.88 | % | | | 302.71 | % | | | 196.03 | % |
| * | Calculated based on average shares outstanding for the period. |
| (1) | Total investment return is calculated assuming a purchase of shares on the first day and a sale of shares on the last day of each period reported and includes reinvestments of dividends and distributions, if any. |
The accompanying notes are an integral part of the financial statements.
15
BOGLE INVESTMENT MANAGEMENT
SMALL CAP GROWTH FUND
FINANCIAL HIGHLIGHTS
Contained below is per share operating performance data for each class of shares outstanding, total investment return, ratios to average net assets and other supplemental data for the respective periods. This information has been derived from information provided in the financial statements.
| | | | | | | | | | | | | | | | | | | | | | | | |
| | | INVESTOR CLASS | |
| | | FORTHE
SIX MONTHS
ENDED
2/28/15
(UNAUDITED) | | | FOR THE
YEAR
ENDED
8/31/14 | | | FOR THE
YEAR
ENDED
8/31/13 | | | FOR THE
YEAR
ENDED
8/31/12 | | | FOR THE
YEAR
ENDED
8/31/11 | | | FOR THE
YEAR
ENDED
8/31/10 | |
PER SHARE OPERATING PERFORMANCE | | | | | | | | | | | | | | | | | | | | | | | | |
Net asset value, beginning of period | | $ | 37.45 | | | $ | 29.00 | | | $ | 21.42 | | | $ | 19.10 | | | $ | 14.61 | | | $ | 13.86 | |
| | | | | | | | | | | | | | | | | | | | | | | | |
Net investment income/(loss)* | | | (0.10 | ) | | | (0.26 | ) | | | 0.07 | | | | (0.07 | ) | | | (0.12 | ) | | | (0.09 | ) |
Net realized and unrealized gain/(loss)
from investments | | | (0.61 | ) | | | 8.74 | | | | 7.51 | | | | 2.39 | | | | 4.61 | | | | 0.84 | |
| | | | | | | | | | | | | | | | | | | | | | | | |
Net increase/(decrease) in net assets resulting
from operations | | | (0.71 | ) | | | 8.48 | | | | 7.58 | | | | 2.32 | | | | 4.49 | | | | 0.75 | |
| | | | | | | | | | | | | | | | | | | | | | | | |
Dividends and distributions to shareholders from: | | | | | | | | | | | | | | | | | | | | | | | | |
Net investment income | | | — | | | | (0.03 | ) | | | — | | | | — | | | | — | | | | — | |
Net realized gain | | | (4.80 | ) | | | — | | | | — | | | | — | | | | — | | | | — | |
| | | | | | | | | | | | | | | | | | | | | | | | |
Total dividends and distributions to shareholders | | | (4.80 | ) | | | (0.03 | ) | | | — | | | | — | | | | — | | | | — | |
| | | | | | | | | | | | | | | | | | | | | | | | |
Net asset value, end of period | | $ | 31.94 | | | $ | 37.45 | | | $ | 29.00 | | | $ | 21.42 | | | $ | 19.10 | | | $ | 14.61 | |
| | | | | | | | | | | | | | | | | | | | | | | | |
Total investment return(1) | | | (1.24 | )%(3) | | | 29.28 | % | | | 35.39 | % | | | 12.15 | % | | | 30.73 | % | | | 5.41 | % |
| | | | | | | | | | | | | | | | | | | | | | | | |
RATIOS/SUPPLEMENTAL DATA | | | | | | | | | | | | | | | | | | | | | | | | |
Net assets, end of period (000’s omitted) | | $ | 103,216 | | | $ | 116,669 | | | $ | 77,584 | | | $ | 58,011 | | | $ | 74,155 | | | $ | 48,446 | |
Ratio of expenses to average net assets
with waivers and reimbursements | | | 1.35 | %(2) | | | 1.35 | % | | | 1.35 | % | | | 1.35 | % | | | 1.35 | % | | | 1.35 | % |
Ratio of expenses to average net assets
without waivers and reimbursements | | | 1.44 | %(2) | | | 1.43 | % | | | 1.49 | % | | | 1.60 | % | | | 1.54 | % | | | 1.62 | % |
Ratio of net investment income/(loss) to
average net assets | | | (0.61 | )%(2) | | | (0.76 | )% | | | 0.27 | % | | | (0.36 | )% | | | (0.58 | )% | | | (0.58 | )% |
Portfolio turnover rate | | | 88.18 | %(3) | | | 175.06 | % | | | 237.59 | % | | | 288.88 | % | | | 302.71 | % | | | 196.03 | % |
| * | Calculated based on average shares outstanding for the period. |
| (1) | Total investment return is calculated assuming a purchase of shares on the first day and a sale of shares on the last day of each period reported and includes reinvestments of dividends and distributions, if any. |
The accompanying notes are an integral part of the financial statements.
16
BOGLE INVESTMENT MANAGEMENT
SMALL CAP GROWTH FUND
NOTESTO FINANCIAL STATEMENTS
(UNAUDITED)
| 1. | ORGANIZATIONAND SIGNIFICANT ACCOUNTING POLICIES |
The RBB Fund, Inc. (“RBB” or the “Company”) was incorporated under the laws of the State of Maryland on February 29, 1988 and is registered under the Investment Company Act of 1940, as amended, (the “1940 Act”) as an open-end management investment company. RBB is a “series fund,” which is a mutual fund divided into separate portfolios. Each portfolio is treated as a separate entity for certain matters under the 1940 Act, and for other purposes, and a shareholder of one portfolio is not deemed to be a shareholder of any other portfolio. Currently, RBB has twenty-two active investment portfolios, including the Bogle Investment Management Small Cap Growth Fund (the “Fund”), which commenced investment operations on October 1, 1999. As of February 28, 2015, the Fund offers two classes of shares, Institutional Class and Investor Class.
RBB has authorized capital of one hundred billion shares of common stock of which 82.373 billion shares are currently classified into one hundred and fifty-three classes of common stock. Each class represents an interest in an active or inactive RBB investment portfolio.
PORTFOLIO VALUATION — The Fund’s net asset value (“NAV”) is calculated once daily at the close of regular trading hours on the New York Stock Exchange (“NYSE”) (generally 4:00 p.m. Eastern time) on each day the NYSE is open. Securities held by the Fund are valued using the closing price or the last sale price on a national securities exchange or the National Association of Securities Dealers Automatic Quotation System (“NASDAQ”) market system where they are primarily traded. Equity securities traded in the over-the-counter market are valued at their closing prices. If there were no transactions on that day, securities traded principally on an exchange or on NASDAQ will be valued at the mean of the last bid and ask prices prior to the market close. Fixed income securities having a remaining maturity of greater than 60 days are valued using an independent pricing service. Fixed income securities having a remaining maturity of 60 days or less are valued at amortized cost, which approximates market value. Investments in other open-end investment companies are valued based on the NAV of those investment companies (which may use fair value pricing as discussed in their prospectuses). If market quotations are unavailable or deemed unreliable, securities will be valued in accordance with procedures adopted by RBB’s Board of Directors (the “Board”). Relying on prices supplied by pricing services or dealers or using fair valuation may result in values that are higher or lower than the values used by other investment companies and investors to price the same investments.
FAIR VALUE MEASUREMENTS — The inputs and valuation techniques used to measure fair value of the Fund’s investments are summarized into three levels as described in the hierarchy below:
| | • Level 1 – | quoted prices in active markets for identical securities; |
| | • Level 2 – | other significant observable inputs (including quoted prices for similar securities, interest rates, prepayment speeds, credit risk, etc.); and |
| | • Level 3 – | significant unobservable inputs (including the Fund’s own assumptions in determining the fair value of investments). |
The inputs or methodology used for valuing securities are not necessarily an indication of the risk associated with investing in those securities.
The following is a summary of the inputs used, as of February 28, 2015, in valuing the Fund’s investments carried at fair value:
| | | | | | | | | | | | | | | | |
| | | Total
Value at
February 28, 2015 | | | Level 1
Quoted
Price | | | Level 2
Significant
Observable
Inputs | | | Level 3
Significant
Unobservable
Inputs | |
TOTAL INVESTMENTS* | | | $204,476,790 | | | | $204,476,790 | | | | $ — | | | | $ — | |
| | | | | | | | | | | | | | | | |
| * | See Portfolio of Investments for detail on portfolio holdings. |
17
BOGLE INVESTMENT MANAGEMENT
SMALL CAP GROWTH FUND
NOTESTO FINANCIAL STATEMENTS (CONTINUED)
(UNAUDITED)
At the end of each quarter, management evaluates the classification of Levels 1, 2 and 3 assets and liabilities. Various factors are considered, such as changes in liquidity from the prior reporting period; whether or not a broker is willing to execute at the quoted price; the depth and consistency of prices from third party pricing services; and the existence of contemporaneous, observable trades in the market. Additionally, management evaluates the classification of Level 1 and Level 2 assets and liabilities on a quarterly basis for changes in listings or delistings on national exchanges.
Due to the inherent uncertainty of determining the fair value of investments that do not have a readily available market value, the fair value of the Fund’s investments may fluctuate from period to period. Additionally, the fair value of investments may differ significantly from the values that would have been used had a ready market existed for such investments and may differ materially from the values the Fund may ultimately realize. Further, such investments may be subject to legal and other restrictions on resale or otherwise less liquid than publicly traded securities.
For fair valuations using significant unobservable inputs, U.S. generally accepted accounting principles (“U.S. GAAP”) require the Fund to present a reconciliation of the beginning to ending balances for reported market values that presents changes attributable to total realized and unrealized gains or losses, purchase and sales, and transfers in and out of Level 3 during the period. Transfers in and out between Levels are based on values at the end of the period. U.S. GAAP also requires the Fund to disclose amounts and reasons for all transfers in and out of Level 1 and Level 2 fair value measurements. A reconciliation of Level 3 investments is presented only when the Fund had an amount of Level 3 investments at the end of the reporting period that was meaningful in relation to its net assets. The amounts and reasons for all transfers in and out of each Level within the three-tier hierarchy are disclosed when the Fund had an amount of total transfers during the reporting period that was meaningful in relation to its net assets as of the end of the reporting period.
For the six months ended February 28, 2015, there were no transfers between Levels 1, 2 and 3 for the Fund that require disclosure.
USEOF ESTIMATES — The Fund is an investment company and, accordingly, follows the investment company accounting and reporting guidance under U.S. GAAP. The preparation of financial statements in conformity with U.S. GAAP requires management to make estimates and assumptions that affect the reported amounts of assets and liabilities and disclosure of contingent assets and liabilities at the date of the financial statements and the reported amounts of revenues and expenses during the period. Actual results could differ from those estimates and those differences could be significant.
INVESTMENT TRANSACTIONS, INVESTMENT INCOMEAND EXPENSES — The Fund records security transactions based on trade date for financial reporting purposes. The cost of investments sold is determined by use of the specific identification method for both financial reporting and income tax purposes in determining realized gains and losses on investments. Interest income is accrued when earned. Dividend income is recorded on the ex-dividend date. The Fund’s net investment income (other than class specific shareholder servicing fees) and unrealized and realized gains and losses are allocated daily to each class of shares based upon the relative proportion of net assets of each class at the beginning of the day. Expenses incurred on behalf of a specific class, fund or fund family of the Company are charged directly to the class, fund or fund family (in proportion to net assets). Expenses incurred for all of the RBB funds (such as director or professional fees) are charged to all funds in proportion to their average net assets of RBB, or in such other manner as the Company’s Board deems fair or equitable. Expenses and fees, including investment advisory and administration fees, are accrued daily for the purpose of determining the NAV of the Fund.
DIVIDENDSAND DISTRIBUTIONSTO SHAREHOLDERS — Dividends from net investment income and distributions from net realized capital gains, if any, will be declared and paid at least annually to shareholders and recorded on the ex-dividend date. Income dividends and capital gains distributions are determined in accordance with U.S. federal income tax regulations which may differ from U.S. GAAP.
18
BOGLE INVESTMENT MANAGEMENT
SMALL CAP GROWTH FUND
NOTESTO FINANCIAL STATEMENTS (CONTINUED)
(UNAUDITED)
U.S. TAX STATUS — No provision is made for U.S. income taxes as it is the Fund’s intention to qualify for and elect the tax treatment applicable to regulated investment companies under Subchapter M of the Internal Revenue Code of 1986, as amended, and make the requisite distributions to its shareholders which will be sufficient to relieve it from U.S. income and excise taxes.
CASHAND CASH EQUIVALENTS — The Fund considers liquid assets deposited into bank demand deposit accounts to be cash equivalents. These investments represent amounts held with financial institutions that are readily accessible to pay Fund expenses or purchase investments. Cash and cash equivalents are valued at cost plus accrued interest, which approximates market value.
OTHER — In the normal course of business, the Fund may enter into contracts that provide general indemnifications. The Fund’s maximum exposure under these arrangements is dependent on claims that may be made against the Fund in the future, and, therefore, cannot be estimated; however, based on experience, the risk of material loss from such claims is considered remote.
| 2. | INVESTMENT ADVISERAND OTHER SERVICES |
Bogle Investment Management, L.P. (the “Adviser” or “Bogle”) serves as the Fund’s investment adviser. For its advisory services, the Adviser is entitled to receive a monthly fee from the Fund calculated at an annual rate of 1.00% of the Fund’s average daily net assets.
The Adviser has contractually agreed to waive management fees and reimburse expenses to the extent that total annual Fund operating expenses (excluding certain items discussed below) exceed 1.25% and 1.35% for the Institutional Class and Investor Class, respectively. In determining the Adviser’s obligation to waive advisory fees and/or reimburse expenses, the following expenses are not taken into account and could cause total annual Fund operating expenses to exceed 1.25% and 1.35%, as applicable: acquired fund fees and expenses, brokerage commissions, extraordinary items, interest or taxes. This contractual limitation is in effect until December 31, 2015 and may not be terminated without the approval of the Company’s Board. The Adviser may discontinue these arrangements at any time after December 31, 2015.
The contractual fee waiver does not provide for recoupment of fees that were waived or expenses that were reimbursed. For the six months ended February 28, 2015, investment advisory fees and waivers of the Fund were as follows:
| | | | | | | | | | |
GROSS
ADVISORY FEES | | | WAIVERS | | | NET
ADVISORY FEES | |
| $ | 1,022,355 | | | $ | 74,812 | | | $ | 947,543 | |
The Fund will not pay the Adviser at a later time for any amounts waived or any amounts assumed.
In addition to serving as the Fund’s investment adviser, Bogle provides certain shareholder services to the Investor Class of the Fund. As compensation for such services, the Adviser receives a monthly fee equal to an annual rate of 0.10% of the average daily net assets of the Fund’s Investor Class.
BNY Mellon Investment Servicing (US) Inc. (“BNY Mellon”) serves as administrator for the Fund. For providing administrative and accounting services, BNY Mellon is entitled to receive a monthly fee equal to an annual percentage rate of the Fund’s average daily net assets, subject to certain minimum monthly fees.
BNY Mellon has voluntarily agreed to waive a portion of its administration and accounting fees for the Fund. For the six months ended February 28, 2015, administration and accounting fees and waivers of the Fund were as follows:
| | | | | | | | | | |
GROSS ADMINISTRATION
AND ACCOUNTING
FEES | | | WAIVERS | | | NET ADMINISTRATION
AND ACCOUNTING
FEES | |
| $ | 147,759 | | | $ | 12,780 | | | $ | 134,979 | |
19
BOGLE INVESTMENT MANAGEMENT
SMALL CAP GROWTH FUND
NOTESTO FINANCIAL STATEMENTS (CONTINUED)
(UNAUDITED)
Included in the administration and accounting services fees, shown on the Statement of Operations, are fees for providing regulatory administration services to RBB. For providing these services, BNY Mellon is entitled to receive compensation as agreed to by the Company and BNY Mellon. This fee is allocated to each portfolio of the Company in proportion to its net assets of the Company.
In addition, BNY Mellon serves as the Fund’s transfer and dividend disbursing agent. For providing transfer agent services, BNY Mellon is entitled to receive a monthly fee, subject to certain minimum, and out of pocket expenses.
The Bank of New York Mellon (the “Custodian”) provides certain custodial services to the Fund. The Custodian is entitled to receive a monthly fee, subject to certain minimum, and out of pocket expenses.
Foreside Funds Distributors, LLC serves as the principal underwriter and distributor of the Fund’s shares pursuant to a Distribution Agreement with RBB.
The Fund will not pay The Bank of New York Mellon Corporation or any of its members or BNY Mellon’s affiliates at a later time for any amounts waived or any amounts assumed.
The Directors of the Company receive an annual retainer, meeting fees and reimbursement of out-of-pocket expenses for meetings attended. The remuneration paid to the Directors by the Fund during the six months ended February 28, 2015 was $6,498. Certain employees of BNY Mellon serve as an Officer or Director of the Company. They are not compensated by the Fund or the Company.
| 4. | INVESTMENTIN SECURITIES |
For the six months ended February 28, 2015, aggregate purchases and sales of investment securities (excluding short-term investments) of the Fund were as follows:
| | | | | | |
| INVESTMENT SECURITIES | |
| PURCHASES | | | SALES | |
| $ | 182,344,753 | | | $ | 209,731,556 | |
| 5. | FEDERAL INCOME TAX INFORMATION |
The Fund has followed the authoritative guidance on accounting for and disclosure of uncertainty in tax positions, which requires the Fund to determine whether a tax position is more likely than not to be sustained upon examination, including resolution of any related appeals or litigation processes, based on the technical merits of the position. The Fund has determined that there was no effect on the financial statements from following this authoritative guidance. In the normal course of business, the Fund is subject to examination by federal, state and local jurisdictions, where applicable, for tax years for which applicable statutes of limitations have not expired.
As of February 28, 2015, federal tax cost, aggregate gross unrealized appreciation and depreciation of securities held by the Fund were as follows:
| | | | | | | | | | | | | | |
FEDERAL TAX
COST | | | UNREALIZED
APPRECIATION | | | UNREALIZED
DEPRECIATION | | | NET UNREALIZED
APPRECIATION | |
| $ | 183,857,264 | | | $ | 30,334,404 | | | $ | (9,714,878 | ) | | $ | 20,619,526 | |
Distributions to shareholders from net investment income and realized gains are determined in accordance with federal income tax regulations, which may differ from net investment income and realized gains recognized for financial reporting purposes. Accordingly, the character of distributions and composition of net
20
BOGLE INVESTMENT MANAGEMENT
SMALL CAP GROWTH FUND
NOTESTO FINANCIAL STATEMENTS (CONCLUDED)
(UNAUDITED)
assets for tax purposes may differ from those reflected in the accompanying financial statements. To the extent these differences are permanent, such amounts are reclassified within the capital accounts based on the tax treatment; temporary differences do not require such reclassification.
As of August 31, 2014, the components of distributable earnings on a tax basis were as follows:
| | | | | | | | | | | | | | |
CAPITAL LOSS
CARRYFORWARD | | | UNDISTRIBUTED
ORDINARY INCOME | | | UNDISTRIBUTED
LONG-TERM GAINS | | | UNREALIZED
APPRECIATION | |
| $ | — | | | $ | 11,234,764 | | | $ | 13,069,863 | | | $ | 38,067,587 | |
The differences between the book and tax basis components of distributable earnings relate principally to the timing of recognition of income and gains for federal income tax purposes. Short-term and foreign currency gains are reported as ordinary income for federal income tax purposes.
The tax character of dividend and distributions paid during the fiscal year ended August 31, 2014 was as follows:
| | | | | | |
| | | | ORDINARY
INCOME | |
| | 2014 | | | $ | 304,173 | |
Dividends from net investment income and short-term capital gains are treated as ordinary income dividends for federal income tax purposes.
Pursuant to federal income tax rules applicable to regulated investment companies, the Fund may elect to treat certain capital losses between November 1 and August 31 and late year ordinary losses ((i) ordinary losses between January 1 and August 31, and (ii) specified ordinary and currency losses between November 1 and August 31) as occurring on the first day of the following tax year. For the year ended August 31, 2014, any amount of losses elected within the tax return will not be recognized for federal income tax purposes until September 1, 2014.
Under the Regulated Investment Company Modernization Act of 2010 (the “Modernization Act”), the Fund is permitted to carry forward capital losses incurred in taxable years beginning after December 22, 2010 for an unlimited period. Any losses incurred during those future taxable years will be required to be utilized prior to any losses incurred in pre-enactment taxable years. Additionally, post-enactment capital losses that are carried forward will retain their character as either short-term or long-term capital losses rather than being considered all short-term as under the previous law.
As of August 31, 2014, the Fund did not have any pre- or post-enactment capital loss carryforwards. During the fiscal year ended August 31, 2014, the Fund utilized $10,532,621 of pre-enactment capital loss carryforwards.
Management has evaluated the impact of all subsequent events on the Fund through the date the financial statements were issued, and has determined that there were no subsequent events requiring recognition or disclosure in the financial statements.
21
BOGLE INVESTMENT MANAGEMENT
SMALL CAP GROWTH FUND
OTHER INFORMATION
(UNAUDITED)
PROXY VOTING
Policies and procedures that the Fund uses to determine how to vote proxies relating to portfolio securities as well as information regarding how the Fund voted proxies relating to portfolio securities for the most recent 12-month period ended June 30 are available without charge, upon request, by calling (877) 264-5346 and on the Securities and Exchange Commission’s (“SEC”) website at http://www.sec.gov.
QUARTERLY PORTFOLIO SCHEDULES
The Company files its complete schedule of portfolio holdings with the SEC for the first and third fiscal quarters of each fiscal year (quarters ended November 30 and May 31) on Form N-Q. The Company’s Form N-Q is available on the SEC website at http://www.sec.gov and may be reviewed and copied at the SEC Public Reference Room in Washington, D.C. Information on the operation of the SEC Public Reference Room may be obtained by calling (202) 551-8090.
22
Investment Adviser
Bogle Investment Management, L.P.
2310 Washington Street
Suite 310
Newton Lower Falls, MA 02462
Administrator
BNY Mellon Investment Servicing (US) Inc.
301 Bellevue Parkway
Wilmington, DE 19809
Transfer Agent
BNY Mellon Investment Servicing (US) Inc.
4400 Computer Drive
Westborough, MA 01581
Principal Underwriter
Foreside Funds Distributors LLC
400 Berwyn Park
899 Cassatt Road
Berwyn, PA 19312
Custodian
The Bank of New York Mellon
One Wall Street
New York, NY 10286
Independent Registered Public Accounting Firm
PricewaterhouseCoopers LLP
Two Commerce Square, Suite 1700
2001 Market Street
Philadelphia, PA 19103-7042
Counsel
Drinker Biddle & Reath LLP
One Logan Square
Suite 2000
Philadelphia, PA 19103-6996
BOG-SAR15

CAMPBELL CORE TREND FUND
of
THE RBB FUND, INC.
SEMI-ANNUAL R EPORT
FEBRUARY 28, 2015
(UNAUDITED)
This report is submitted for the general information of the shareholders of the Fund. It is not authorized for distribution unless preceded or accompanied by a current prospectus for the Fund.
CAMPBELL CORE TREND FUND
PERFORMANCE DATA
(UNAUDITED)
TOTAL RETURNS AS OF FEBRUARY 28, 2015*
| | |
| | | Since Inception** |
Campbell Core Trend Fund, Institutional Shares | | 6.20% |
BofA Merrill Lynch 3-Month U.S. Treasury Bill Index*** | | 0.00% |
Barclay BTOP50 Index*** | | 3.70% |
| ** | Inception date of the Fund is December 31, 2014. |
| *** | Benchmark performance is from inception date of the Fund only and is not the inception date of the benchmark itself |
Performance data quoted is past performance and does not guarantee future results. Investment return and principal value will fluctuate so that shares, when redeemed, may be worth more or less than their original cost. Current performance may be lower or higher than the returns quoted above. Returns shown do not reflect taxes that a shareholder would pay on Fund distributions or on the redemption of Fund shares. Call Campbell Core Trend Fund at 1-844-261-6488 for returns current to the most recent month-end.
An investment in the Fund is speculative and involves substantial risk. The Fund is not suitable for all investors. It is possible that an investor may lose some or all of its investment. The Fund invests in long and short positions in futures, forwards, spot contracts, each of which may be tied to commodities, financial indices and instruments, foreign currencies, or equity indices. The Fund also invests in investment grade fixed income securities of all durations and maturities. The Fund may be more volatile than investments in traditional securities. Losses on futures and other derivatives can be caused by unanticipated market movements and may be potentially unlimited. Commodities, currencies, foreign investments, and interest rate-linked instruments each entail special risks. The Fund is non-diversified; therefore gains or losses on a single holding may have a relatively great impact on the Fund. A more complete description of the Fund’s risks can be found in its prospectus, which should read carefully before investing.
The performance data quoted reflects fee waivers in effect and would have been less in their absence. The Fund’s total annual operating expense ratio, as stated in the current prospectus dated December 30, 2014, is 1.62% and the Fund’s net operating expense ratio is 1.25%. Campbell & Company Investment Adviser LLC has contractually agreed to waive its advisory fee and/or reimburse expenses in order to limit total annual Fund operating expenses (excluding acquired fund fees and expenses, brokerage commissions, extraordinary items, interest or taxes) to 1.25% of the Fund’s average daily net assets attributable to Institutional Shares. This contractual limitation is in effect until December 31, 2015 and may not be terminated without the approval of the Board of Directors of The RBB Fund, Inc.
The BofA Merrill Lynch 3-Month U.S. Treasury Bill Index is an unmanaged market index of U.S. Treasury securities maturing in 90 days that assumes reinvestment of all income.
The Barclay BTOP50 Index (“BTOP50”) seeks to replicate the overall composition of the managed futures industry with regard to trading style and overall market exposure. The BTOP50 employs a top-down approach in selecting its constituents. The largest investable trading advisor programs, as measured by assets under management, are selected for inclusion in the BTOP50. The index portfolio is equally weighted among the selected programs at the beginning of each calendar year and rebalanced annually. It is impossible to invest directly in an index.
Portfolio composition is subject to change.
1
CAMPBELL CORE TREND FUND
FUND EXPENSE EXAMPLES
(UNAUDITED)
As a shareholder of the Fund, you incur two types of costs: (1) transaction costs and (2) ongoing costs, including management fees, shareholder servicing fees and other Fund expenses. These examples are intended to help you understand your ongoing costs (in dollars) of investing in the Fund and to compare these costs with the ongoing costs of investing in other mutual funds.
This example is based on an investment of $1,000 invested at the beginning of the period from December 31, 2014 (commencement of operations) through February 28, 2015, and held for the entire period.
ACTUAL EXPENSES
The first line of the accompanying table provides information about actual account values and actual expenses. You may use the information in this line, together with the amount you invested, to estimate the expenses that you paid over the period. Simply divide your account value by $1,000 (for example, an $8,600 account value divided by $1,000 = 8.6), then multiply the result by the number in the first line under the heading entitled “Expenses Paid During Period” to estimate the expenses you paid on your account during this period.
HYPOTHETICAL EXAMPLEFOR COMPARISON PURPOSES
The second line of the accompanying table provides information about hypothetical account values and hypothetical expenses based on the Fund’s actual expense ratio and an assumed rate of return of 5% per year before expenses, which is not the Fund’s actual return. The hypothetical account values and expenses may not be used to estimate the actual ending account balance or expenses you paid for the period. You may use this information to compare the ongoing costs of investing in the Fund and other funds. To do so, compare these 5% hypothetical examples with the 5% hypothetical examples that appear in the shareholder reports of other funds.
Please note that the expenses shown in the accompanying table are meant to highlight your ongoing costs only and do not reflect any transactional costs, such as redemption fees. Therefore, the second line of the accompanying table is useful in comparing ongoing costs only, and will not help you determine the relative total costs of owning different funds. In addition, if these transactional costs were included, your costs would have been higher.
| | | | | | |
| | | INSTITUTIONAL SHARES |
| | | |
| | | BEGINNING ACCOUNT VALUE* | | ENDING ACCOUNT VALUE
FEBRUARY 28, 2015 | | EXPENSES PAID
DURING PERIOD |
Actual** | | $1,000.00 | | $1,062.00 | | $2.03 |
Hypothetical
(5% return before expenses)*** | | 1,000.00 | | 1,018.55 | | 6.31 |
| * | The Fund commenced operations on December 31, 2014. |
| ** | Expenses equal to an annualized expense ratio for the period December 31, 2014 (commencement of operations) to February 28, 2015 of 1.26% for the Institutional Shares of the Fund, which includes waived fees or reimbursed expenses (including dividend and interest expense), multiplied by the average account value over the period, multiplied by the number of days in the most recent period (57) then divided by 365 days. The annualized amount of interest expense was 0.01% for the period December 31, 2014 to February 28, 2015. Without this expense, the annualized expense ratio would have been 1.25%. The Fund’s ending account value on the first line in the table is based on the actual total return since inception for the Institutional Shares of the Fund of 6.20%. |
| *** | For comparison purposes, the hypothetical expenses are as if the Fund had been in existence from September 1, 2014 and are equal to the Institutional Shares annualized expense ratio, multiplied by the average account value over the period, multiplied by the number of days in the most recent six-month period (181), then divided by 365. |
2
CAMPBELL CORE TREND FUND
CONSOLIDATED PORTFOLIO HOLDINGS SUMMARY TABLE
FEBRUARY 28, 2015
(UNAUDITED)
The following table presents a summary by sector of the portfolio holdings of the Fund.
| | | | | | | | |
| SECURITY TYPE/SECTOR CLASSIFICATION | | % OF NET ASSETS | | | VALUE | |
| |
SHORT-TERM INVESTMENTS: | | | | | | | | |
U.S. Treasury Obligations | | | 61.2% | | | $ | 6,499,792 | |
OTHER ASSETS IN EXCESS OF LIABILITIES | | | 38.8 | | | | 4,125,198 | |
| | | | | | | | |
NET ASSETS | | | 100.0% | | | $ | 10,624,990 | |
| | | | | | | | |
Portfolio holdings are subject to change at any time.
Refer to the Consolidated Portfolio of Investments for a detailed listing of the Fund’s holdings.
The accompanying notes are an integral part of the consolidated financial statements.
3
CAMPBELL CORE TREND FUND
CONSOLIDATED PORTFOLIO OF INVESTMENTS
FEBRUARY 28, 2015
(UNAUDITED)
| | | | | | | | | | | | | | | | |
| | | COUPON* | | | MATURITY | | | PAR | | | VALUE | |
SHORT-TERM INVESTMENTS — 61.2% | | | | | | | | | | | | | | | | |
U.S. TREASURY OBLIGATIONS—61.2% | | | | | | | | | | | | | | | | |
U.S. Treasury Bill | | | 0.025% | | | | 04/16/15 | | | $ | 6,500,000 | | | $ | 6,499,792 | |
| | | | | | | | | | | | | | | | |
TOTAL SHORT-TERM INVESTMENTS (Cost $ 6,499,792) | | | | | | | | | | | | | | | 6,499,792 | |
| | | | | | | | | | | | | | | | |
| | | | |
TOTAL INVESTMENTS — 61.2%
(Cost $ 6,499,792) | | | | | | | | | | | | | | $ | 6,499,792 | |
| | | | | | | | | | | | | | | | |
| | | | |
OTHER ASSETSIN EXCESSOF LIABILITIES — 38.8% | | | | | | | | | | | | | | | 4,125,198 | |
| | | | | | | | | | | | | | | | |
NET ASSETS — 100.0% | | | | | | | | | | | | | | $ | 10,624,990 | |
| | | | | | | | | | | | | | | | |
*Short-term investments reflect the annualized effective yield on the date of purchase for discounted investments.
The accompanying notes are an integral part of the consolidated financial statements.
4
CAMPBELL CORE TREND FUND
CONSOLIDATED PORTFOLIO OF INVESTMENTS (CONTINUED)
FEBRUARY 28, 2015
(UNAUDITED)
FUTURES CONTRACTS
| | | | | | | | | | | | |
LONG CONTRACTS | | EXPIRATION DATE | | NUMBER OF
CONTRACTS | | NOTIONAL
COST | | | UNREALIZED
APPRECIATION
(DEPRECIATION) | |
10-Year Mini Japanese Government Bond Futures | | March 2015 | | 21 | | $ | 2,599,841 | | | $ | (3,302 | ) |
3-Month Euro Euribor | | March 2016 | | 20 | | | 4,753,919 | | | | 2,018 | |
90-DAY Bank Bill | | June 2015 | | 6 | | | 3,885,304 | | | | 2,059 | |
90-DAY Eurodollar Futures | | March 2016 | | 1 | | | 495,125 | | | | (75 | ) |
90-DAY Sterling Futures | | March 2016 | | 18 | | | 3,443,449 | | | | (3,126 | ) |
Amsterdam Index Futures | | March 2015 | | 4 | | | 420,418 | | | | 12,697 | |
Australian 10-Year Bond Futures | | March 2015 | | 11 | | | 1,023,225 | | | | 5,325 | |
Australian 3-Year Bond Futures | | March 2015 | | 46 | | | 3,751,780 | | | | 21,737 | |
CAC 40 10 Euro Futures | | March 2015 | | 7 | | | 377,454 | | | | 10,413 | |
Canadian 10-Year Bond | | June 2015 | | 11 | | | 1,252,740 | | | | 11,191 | |
Cotton No. 2 Futures | | May 2015 | | 1 | | | 32,025 | | | | 440 | |
DAX Index Future | | March 2015 | | 1 | | | 288,755 | | | | 27,854 | |
Euro STOXX 50 | | March 2015 | | 7 | | | 265,348 | | | | 15,868 | |
Euro-Bobl Future | | March 2015 | | 85 | | | 11,413,510 | | | | 36,592 | |
Euro-Bund Future | | March 2015 | | 18 | | | 2,831,494 | | | | 23,589 | |
FTSE 100 Index Futures | | March 2015 | | 2 | | | 206,120 | | | | 7,549 | |
Hang Seng Index Futures | | March 2015 | | 2 | | | 159,558 | | | | 284 | |
IBEX 35 Index Futures | | March 2015 | | 2 | | | 243,156 | | | | 6,503 | |
London Mercantile Exchange Aluminum Futures | | March 2015 | | 7 | | | 318,813 | | | | (2,194 | ) |
London Mercantile Exchange Copper Futures | | March 2015 | | 2 | | | 280,490 | | | | 15,410 | |
London Mercantile Exchange Nickel Futures | | March 2015 | | 2 | | | 175,260 | | | | (6,678 | ) |
London Mercantile Exchange Zinc Futures | | March 2015 | | 3 | | | 160,594 | | | | (6,713 | ) |
Long Gilt Futures | | June 2015 | | 4 | | | 732,713 | | | | (494 | ) |
MSCI Taiwan Index | | March 2015 | | 6 | | | 214,240 | | | | 620 | |
Nasdaq 100 E-Mini | | March 2015 | | 4 | | | 344,680 | | | | 10,720 | |
Nikkei 225 Index Futures | | March 2015 | | 5 | | | 372,666 | | | | 20,542 | |
OMXS 30 Index Futures | | March 2015 | | 39 | | | 741,993 | | | | 25,801 | |
S&P 500 E-Mini Futures | | March 2015 | | 3 | | | 309,288 | | | | 6,133 | |
S&P/TSX 60 Index Futures | | March 2015 | | 3 | | | 282,025 | | | | 2,464 | |
SPI 200 Futures | | March 2015 | | 4 | | | 443,290 | | | | 18,832 | |
U.S. Treasury 10-Year Notes | | June 2015 | | 4 | | | 636,508 | | | | 2,477 | |
U.S. Treasury 5-Year Notes | | July 2015 | | 5 | | | 714,617 | | | | 1,070 | |
U.S. Treasury Long Bond | | June 2015 | | 3 | | | 482,367 | | | | 3,164 | |
| | | | | | | | | | | | |
| | | | | | $ | 43,652,765 | | | $ | 268,770 | |
| | | | | | | | | | | | |
| | | | |
SHORT CONTRACTS | | EXPIRATION DATE | | NUMBER OF
CONTRACTS | | NOTIONAL
COST | | | UNREALIZED
APPRECIATION
(DEPRECIATION) | |
Brent Crude Futures | | April 2015 | | 2 | | $ | (99,736 | ) | | $ | (25,424 | ) |
Coffee ’C’ Future | | May 2015 | | 3 | | | (178,650 | ) | | | 20,588 | |
Corn Futures | | May 2015 | | 8 | | | (157,238 | ) | | | (63 | ) |
Gasoline RBOB Futures | | April 2015 | | 2 | | | (147,428 | ) | | | (18,715 | ) |
Gold 100 Oz Futures | | April 2015 | | 1 | | | (121,000 | ) | | | (310 | ) |
Live Cattle Futures | | April 2015 | | 2 | | | (118,610 | ) | | | (2,750 | ) |
London Mercantile Exchange Aluminum Futures | | March 2015 | | 15 | | | (686,619 | ) | | | 8,150 | |
London Mercantile Exchange Copper Futures | | March 2015 | | 3 | | | (452,398 | ) | | | 8,548 | |
London Mercantile Exchange Nickel Futures | | March 2015 | | 3 | | | (262,458 | ) | | | 9,585 | |
London Mercantile Exchange Zinc Futures | | March 2015 | | 6 | | | (314,740 | ) | | | 6,978 | |
Low Sulfer Gasoline Futures | | April 2015 | | 3 | | | (167,525 | ) | | | (6,700 | ) |
Natural Gas Futures | | April 2015 | | 3 | | | (55,050 | ) | | | 370 | |
Silver Futures | | May 2015 | | 1 | | | (82,255 | ) | | | (535 | ) |
Sugar No.11 (World) | | May 2015 | | 8 | | | (129,965 | ) | | | 6,586 | |
Wheat Futures | | May 2015 | | 5 | | | (103,438 | ) | | | 838 | |
WTI Crude Futures | | April 2015 | | 3 | | | (156,380 | ) | | | 7,100 | |
| | | | | | | | | | | | |
| | | | | | $ | (3,233,490 | ) | | $ | 14,246 | |
| | | | | | | | | | | | |
Total Futures Contracts | | | | | | $ | 40,419,275 | | | $ | 283,016 | |
| | | | | | | | | | | | |
The accompanying notes are an integral part of the consolidated financial statements.
5
CAMPBELL CORE TREND FUND
CONSOLIDATED PORTFOLIO OF INVESTMENTS (CONTINUED)
FEBRUARY 28, 2015
(UNAUDITED)
Forward foreign currency contracts outstanding as of February 28, 2015 were as follows:
| | | | | | | | | | | | | | | | | | | | |
| CURRENCY PURCHASED | | | CURRENCY SOLD | | | EXPIRATION | | COUNTERPARTY | | UNREALIZED APPRECIATION (DEPRECIATION) | |
| |
| AUD | | | 300,000 | | | | USD | | | | 240,449 | | | March 2015 | | UBS | | $ | (6,345 | ) |
| AUD | | | 300,000 | | | | USD | | | | 244,482 | | | March 2015 | | UBS | | | (10,378 | ) |
| CAD | | | 400,000 | | | | USD | | | | 332,974 | | | March 2015 | | UBS | | | (13,099 | ) |
| CAD | | | 300,000 | | | | USD | | | | 241,367 | | | March 2015 | | UBS | | | (1,460 | ) |
| CAD | | | 100,000 | | | | USD | | | | 79,577 | | | March 2015 | | UBS | | | 392 | |
| CAD | | | 100,000 | | | | USD | | | | 80,320 | | | March 2015 | | UBS | | | (350 | ) |
| CHF | | | 604,442 | | | | USD | | | | 694,312 | | | March 2015 | | UBS | | | (59,701 | ) |
| CHF | | | 200,000 | | | | USD | | | | 196,496 | | | March 2015 | | UBS | | | 13,486 | |
| CHF | | | 173,593 | | | | USD | | | | 181,459 | | | March 2015 | | UBS | | | 798 | |
| CHF | | | 114,765 | | | | USD | | | | 128,114 | | | March 2015 | | UBS | | | (7,621 | ) |
| CHF | | | 107,200 | | | | USD | | | | 120,639 | | | March 2015 | | UBS | | | (8,088 | ) |
| EUR | | | 400,000 | | | | USD | | | | 467,181 | | | March 2015 | | UBS | | | (19,441 | ) |
| EUR | | | 400,000 | | | | USD | | | | 470,714 | | | March 2015 | | UBS | | | (22,974 | ) |
| EUR | | | 200,000 | | | | USD | | | | 225,914 | | | March 2015 | | UBS | | | (2,044 | ) |
| EUR | | �� | 100,000 | | | | USD | | | | 114,043 | | | March 2015 | | UBS | | | (2,108 | ) |
| GBP | | | 500,000 | | | | USD | | | | 767,025 | | | March 2015 | | UBS | | | 4,780 | |
| GBP | | | 400,000 | | | | USD | | | | 611,775 | | | March 2015 | | UBS | | | 5,669 | |
| GBP | | | 100,000 | | | | USD | | | | 152,029 | | | March 2015 | | UBS | | | 2,332 | |
| GBP | | | 100,000 | | | | USD | | | | 152,493 | | | March 2015 | | UBS | | | 1,868 | |
| GBP | | | 100,000 | | | | USD | | | | 154,486 | | | March 2015 | | UBS | | | (125 | ) |
| JPY | | | 99,150,000 | | | | USD | | | | 836,469 | | | March 2015 | | UBS | | | (7,377 | ) |
| JPY | | | 51,150,000 | | | | USD | | | | 434,211 | | | March 2015 | | UBS | | | (6,495 | ) |
| JPY | | | 44,400,000 | | | | USD | | | | 372,486 | | | March 2015 | | UBS | | | (1,214 | ) |
| JPY | | | 7,900,000 | | | | USD | | | | 67,178 | | | March 2015 | | UBS | | | (1,118 | ) |
| MXN | | | 8,000,000 | | | | USD | | | | 541,289 | | | March 2015 | | UBS | | | (6,228 | ) |
| MXN | | | 2,400,000 | | | | USD | | | | 163,711 | | | March 2015 | | UBS | | | (3,193 | ) |
| MXN | | | 1,500,000 | | | | USD | | | | 100,942 | | | March 2015 | | UBS | | | (618 | ) |
| MXN | | | 300,000 | | | | USD | | | | 20,292 | | | March 2015 | | UBS | | | (227 | ) |
| MXN | | | 300,000 | | | | USD | | | | 20,346 | | | March 2015 | | UBS | | | (281 | ) |
| NOK | | | 1,600,000 | | | | USD | | | | 207,392 | | | March 2015 | | UBS | | | 1,190 | |
| NOK | | | 1,100,000 | | | | USD | | | | 142,437 | | | March 2015 | | UBS | | | 963 | |
| NOK | | | 800,000 | | | | USD | | | | 104,733 | | | March 2015 | | UBS | | | (442 | ) |
| NOK | | | 400,000 | | | | USD | | | | 52,422 | | | March 2015 | | UBS | | | (276 | ) |
| NZD | | | 300,000 | | | | USD | | | | 227,101 | | | March 2015 | | UBS | | | (696 | ) |
| NZD | | | 200,000 | | | | USD | | | | 154,572 | | | March 2015 | | UBS | | | (3,636 | ) |
| NZD | | | 100,000 | | | | USD | | | | 75,456 | | | March 2015 | | UBS | | | 12 | |
| SEK | | | 2,900,000 | | | | USD | | | | 351,817 | | | March 2015 | | UBS | | | (3,889 | ) |
| SEK | | | 1,100,000 | | | | USD | | | | 135,601 | | | March 2015 | | UBS | | | (3,628 | ) |
| SEK | | | 800,000 | | | | USD | | | | 97,026 | | | March 2015 | | UBS | | | (1,046 | ) |
| SEK | | | 400,000 | | | | USD | | | | 50,010 | | | March 2015 | | UBS | | | (2,020 | ) |
| SGD | | | 600,000 | | | | USD | | | | 449,024 | | | March 2015 | | UBS | | | (9,024 | ) |
| SGD | | | 600,000 | | | | USD | | | | 449,125 | | | March 2015 | | UBS | | | (9,125 | ) |
| SGD | | | 300,000 | | | | USD | | | | 222,541 | | | March 2015 | | UBS | | | (2,541 | ) |
| SGD | | | 100,000 | | | | USD | | | | 73,671 | | | March 2015 | | UBS | | | (338 | ) |
| USD | | | 652,671 | | | | AUD | | | | 800,000 | | | March 2015 | | UBS | | | 28,393 | |
The accompanying notes are an integral part of the consolidated financial statements.
6
CAMPBELL CORE TREND FUND
CONSOLIDATED PORTFOLIO OF INVESTMENTS (CONTINUED)
FEBRUARY 28, 2015
(UNAUDITED)
| | | | | | | | | | | | | | | | | | | | |
| CURRENCY PURCHASED | | | CURRENCY SOLD | | | EXPIRATION | | COUNTERPARTY | | UNREALIZED APPRECIATION (DEPRECIATION) | |
| |
| USD | | | 316,505 | | | | AUD | | | | 400,000 | | | March 2015 | | UBS | | $ | 4,366 | |
| USD | | | 159,196 | | | | AUD | | | | 200,000 | | | March 2015 | | UBS | | | 3,126 | |
| USD | | | 78,320 | | | | AUD | | | | 100,000 | | | March 2015 | | UBS | | | 286 | |
| USD | | | 78,050 | | | | AUD | | | | 100,000 | | | March 2015 | | UBS | | | 16 | |
| USD | | | 77,570 | | | | AUD | | | | 100,000 | | | March 2015 | | UBS | | | (465 | ) |
| USD | | | 1,106,485 | | | | CAD | | | | 1,300,000 | | | March 2015 | | UBS | | | 66,890 | |
| USD | | | 164,437 | | | | CAD | | | | 200,000 | | | March 2015 | | UBS | | | 4,499 | |
| USD | | | 80,174 | | | | CAD | | | | 100,000 | | | March 2015 | | UBS | | | 205 | |
| USD | | | 78,366 | | | | CAD | | | | 100,000 | | | March 2015 | | UBS | | | (1,603 | ) |
| USD | | | 495,642 | | | | CHF | | | | 500,000 | | | March 2015 | | UBS | | | (29,314 | ) |
| USD | | | 404,641 | | | | CHF | | | | 400,000 | | | March 2015 | | UBS | | | (15,324 | ) |
| USD | | | 315,963 | | | | CHF | | | | 300,000 | | | March 2015 | | UBS | | | 989 | |
| USD | | | 106,340 | | | | CHF | | | | 100,000 | | | March 2015 | | UBS | | | 1,349 | |
| USD | | | 98,987 | | | | CHF | | | | 100,000 | | | March 2015 | | UBS | | | (6,004 | ) |
| USD | | | 1,798,580 | | | | EUR | | | | 1,500,000 | | | March 2015 | | UBS | | | 119,555 | |
| USD | | | 697,404 | | | | EUR | | | | 600,000 | | | March 2015 | | UBS | | | 25,794 | |
| USD | | | 573,346 | | | | EUR | | | | 500,000 | | | March 2015 | | UBS | | | 13,671 | |
| USD | | | 116,123 | | | | EUR | | | | 100,000 | | | March 2015 | | UBS | | | 4,188 | |
| USD | | | 456,638 | | | | GBP | | | | 300,000 | | | March 2015 | | UBS | | | (6,445 | ) |
| USD | | | 155,755 | | | | GBP | | | | 100,000 | | | March 2015 | | UBS | | | 1,394 | |
| USD | | | 150,226 | | | | GBP | | | | 100,000 | | | March 2015 | | UBS | | | (4,135 | ) |
| USD | | | 1,119,187 | | | | JPY | | | | 133,900,000 | | | March 2015 | | UBS | | | (484 | ) |
| USD | | | 342,268 | | | | JPY | | | | 40,400,000 | | | March 2015 | | UBS | | | 4,444 | |
| USD | | | 189,400 | | | | JPY | | | | 22,500,000 | | | March 2015 | | UBS | | | 1,255 | |
| USD | | | 86,652 | | | | JPY | | | | 10,300,000 | | | March 2015 | | UBS | | | 523 | |
| USD | | | 80,793 | | | | JPY | | | | 9,600,000 | | | March 2015 | | UBS | | | 518 | |
| USD | | | 884,637 | | | | MXN | | | | 13,100,000 | | | March 2015 | | UBS | | | 8,474 | |
| USD | | | 322,338 | | | | MXN | | | | 4,800,000 | | | March 2015 | | UBS | | | 1,301 | |
| USD | | | 127,622 | | | | MXN | | | | 1,900,000 | | | March 2015 | | UBS | | | 545 | |
| USD | | | 73,452 | | | | MXN | | | | 1,100,000 | | | March 2015 | | UBS | | | (119 | ) |
| USD | | | 60,283 | | | | MXN | | | | 900,000 | | | March 2015 | | UBS | | | 89 | |
| USD | | | 751,426 | | | | NOK | | | | 5,600,000 | | | March 2015 | | UBS | | | 21,388 | |
| USD | | | 91,418 | | | | NOK | | | | 700,000 | | | March 2015 | | UBS | | | 163 | |
| USD | | | 79,499 | | | | NOK | | | | 600,000 | | | March 2015 | | UBS | | | 1,281 | |
| USD | | | 52,519 | | | | NOK | | | | 400,000 | | | March 2015 | | UBS | | | 373 | |
| USD | | | 52,421 | | | | NOK | | | | 400,000 | | | March 2015 | | UBS | | | 275 | |
| USD | | | 227,395 | | | | NZD | | | | 300,000 | | | March 2015 | | UBS | | | 991 | |
| USD | | | 222,469 | | | | NZD | | | | 300,000 | | | March 2015 | | UBS | | | (3,935 | ) |
| USD | | | 155,720 | | | | NZD | | | | 200,000 | | | March 2015 | | UBS | | | 4,784 | |
| USD | | | 74,454 | | | | NZD | | | | 100,000 | | | March 2015 | | UBS | | | (1,014 | ) |
| USD | | | 854,504 | | | | SEK | | | | 6,600,000 | | | March 2015 | | UBS | | | 62,669 | |
| USD | | | 788,928 | | | | SEK | | | | 6,500,000 | | | March 2015 | | UBS | | | 9,090 | |
| USD | | | 134,673 | | | | SEK | | | | 1,100,000 | | | March 2015 | | UBS | | | 2,700 | |
| USD | | | 73,471 | | | | SEK | | | | 600,000 | | | March 2015 | | UBS | | | 1,486 | |
| USD | | | 23,746 | | | | SEK | | | | 200,000 | | | March 2015 | | UBS | | | (249 | ) |
| USD | | | 12,089 | | | | SEK | | | | 100,000 | | | March 2015 | | UBS | | | 91 | |
| USD | | | 12,085 | | | | SEK | | | | 100,000 | | | March 2015 | | UBS | | | 87 | |
| USD | | | 1,283,512 | | | | SGD | | | | 1,700,000 | | | March 2015 | | UBS | | | 36,846 | |
| USD | | | 743,377 | | | | SGD | | | | 1,000,000 | | | March 2015 | | UBS | | | 10,044 | |
The accompanying notes are an integral part of the consolidated financial statements.
7
CAMPBELL CORE TREND FUND
CONSOLIDATED PORTFOLIO OF INVESTMENTS (CONCLUDED)
FEBRUARY 28, 2015
(UNAUDITED)
| | | | | | | | | | | | | | | | | | | | |
| CURRENCY PURCHASED | | | CURRENCY SOLD | | | EXPIRATION | | COUNTERPARTY | | UNREALIZED APPRECIATION (DEPRECIATION) | |
| |
| USD | | | 298,101 | | | | SGD | | | | 400,000 | | | March 2015 | | UBS | | $ | 4,768 | |
| USD | | | 221,804 | | | | SGD | | | | 300,000 | | | March 2015 | | UBS | | | 1,804 | |
| USD | | | 152,186 | | | | ZAR | | | | 1,800,000 | | | March 2015 | | UBS | | | (1,513 | ) |
| USD | | | 136,238 | | | | ZAR | | | | 1,600,000 | | | March 2015 | | UBS | | | (384 | ) |
| USD | | | 102,998 | | | | ZAR | | | | 1,200,000 | | | March 2015 | | UBS | | | 532 | |
| USD | | | 25,506 | | | | ZAR | | | | 300,000 | | | March 2015 | | UBS | | | (111 | ) |
| ZAR | | | 2,200,000 | | | | USD | | | | 189,216 | | | March 2015 | | UBS | | | (1,361 | ) |
| ZAR | | | 1,300,000 | | | | USD | | | | 112,079 | | | March 2015 | | UBS | | | (1,074 | ) |
| ZAR | | | 900,000 | | | | USD | | | | 77,614 | | | March 2015 | | UBS | | | (764 | ) |
| ZAR | | | 100,000 | | | | USD | | | | 8,692 | | | March 2015 | | UBS | | | (153 | ) |
| | | | | | |
| | | | | | | | | | | | | | | | | | | | |
Total Forward Foreign Currency Contracts | | | | | | | $ | 191,135 | |
| | | | | | | | | | | | | | | | | | | | |
| IBEX | Index of the Bolsa de Madrid |
| MSCI | Morgan Stanley Capital International |
| RBOB | Reformulated Blendstock for Oxygenate Blending |
| TSX | Toronto Stock Exchange |
The accompanying notes are an integral part of the consolidated financial statements.
8
CAMPBELL CORE TREND FUND
CONSOLIDATED STATEMENT OF ASSETS AND LIABILITIES
FEBRUARY 28, 2015
(UNAUDITED)
| | | | |
ASSETS | | | | |
Investments, at value (cost $6,499,792) | | $ | 6,499,792 | |
Cash | | | 2,497,834 | |
Cash collateral on futures contracts and forward foreign currency contracts | | | 1,013,025 | |
Foreign Cash (Cost $410,739) | | | 408,400 | |
Receivables for: | | | | |
Variation margin | | | 6,550 | |
Due from Adviser | | | 13,179 | |
Prepaid expenses | | | 20,838 | |
Unrealized appreciation on forward foreign currency contracts | | | 482,732 | |
| | | | |
Total assets | | | 10,942,350 | |
| | | | |
LIABILITIES | | | | |
Payables for: | | | | |
Administration and accounting fees | | | 6,049 | |
Directors’ and officers’ fees | | | 1,374 | |
Transfer agent fees | | | 1,121 | |
Custodian fees | | | 612 | |
Unrealized depreciation on forward foreign currency contracts | | | 291,597 | |
Other accrued expenses and liabilities | | | 16,607 | |
| | | | |
Total liabilities | | | 317,360 | |
| | | | |
Net Assets | | $ | 10,624,990 | |
| | | | |
| |
NET ASSETS CONSIST OF | | | | |
Capital stock, $0.001 Par value | | $ | 1,000 | |
Paid-in capital | | | 9,999,000 | |
Accumulated net investment loss | | | (20,247 | ) |
Accumulated net realized gain from futures transactions, foreign currency transactions and forward foreign currency contracts | | | 173,425 | |
Net unrealized appreciation on futures transactions, foreign currency translation and forward foreign currency contracts | | | 471,812 | |
| | | | |
Net assets | | $ | 10,624,990 | |
| | | | |
INSTITUTIONAL SHARES | | | | |
Net assets | | $ | 10,624,990 | |
| | | | |
Shares outstanding ($0.001 par value, 100,000,000 shares authorized) | | | 1,000,000 | |
| | | | |
Net asset value, offering price per share | | $ | 10.62 | |
| | | | |
|
| The accompanying notes are an integral part of consolidated financial statements. |
9
CAMPBELL CORE TREND FUND
CONSOLIDATED STATEMENT OF OPERATIONS
FOR THE PERIOD ENDED
FEBRUARY 28, 2015(1)
(UNAUDITED)
| | | | |
INVESTMENT INCOME | | | | |
Interest | | $ | 265 | |
| | | | |
Total investment income | | | 265 | |
| | | | |
EXPENSES | | | | |
Advisory fees (Note 2) | | | 17,112 | |
Administration and accounting fees (Note 2) | | | 23,464 | |
Audit and tax service fees | | | 9,422 | |
Registration and filing fees | | | 5,273 | |
Transfer agent fees (Note 2) | | | 5,120 | |
Legal fees | | | 3,825 | |
Directors’ and officers’ fees | | | 3,330 | |
Custodian fees (Note 2) | | | 3,197 | |
Printing and shareholder reporting fees | | | 1,952 | |
Interest expense | | | 141 | |
Other expenses | | | 1,132 | |
| | | | |
Total expenses before waivers and reimbursements | | | 73,968 | |
Less: waivers and reimbursements (Note 2) | | | (53,456 | ) |
| | | | |
Net expenses after waivers and reimbursements | | | 20,512 | |
| | | | |
Net investment loss | | | (20,247 | ) |
| | | | |
NET REALIZED AND UNREALIZED GAIN/(LOSS) FROM INVESTMENTS | | | | |
Net realized gain/(loss) from: | | | | |
Futures | | | 173,764 | |
Foreign currency transactions | | | (339 | ) |
| | | | |
Net realized gain/(loss) from investments | | | 173,425 | |
| | | | |
Net change in unrealized appreciation/(depreciation) on: | | | | |
Futures | | | 283,016 | |
Foreign currency translation | | | (2,339 | ) |
Forward foreign currency contracts | | | 191,135 | |
| | | | |
Net change in unrealized appreciation/(depreciation) on investments | | | 471,812 | |
| | | | |
Net realized and unrealized gain from investments | | | 645,237 | |
| | | | |
NET INCREASE IN NET ASSETS RESULTING FROM OPERATIONS | | $ | 624,990 | |
| | | | |
| (1) | The Fund commenced investment operations on December 31, 2014. |
|
| The accompanying notes are an integral part of consolidated financial statements. |
10
CAMPBELL CORE TREND FUND
CONSOLIDATED STATEMENT OF CHANGES IN NET ASSETS
| | | | | | | | |
| | | FOR THE
PERIOD ENDED
FEBRUARY 28, 2015
(UNAUDITED)(1) | |
| INCREASE/(DECREASE) IN NET ASSETS FROM OPERATIONS: | | | | | | | | |
Net investment loss | | | | | | $ | (20,247 | ) |
Net realized gain from futures transactions and foreign currency transactions | | | | | | | 173,425 | |
Net change in unrealized appreciation/(depreciation) on futures transactions, foreign currency translation and forward foreign currency contracts | | | | | | | 471,812 | |
| | | | | | | | |
Net increase in net assets resulting from operations | | | | | | | 624,990 | |
| | | | | | | | |
| | |
| CAPITAL TRANSACTIONS: | | | | | | | | |
Institutional Shares | | | | | | | | |
Proceeds from shares sold | | | | | | | 10,000,000 | |
| | | | | | | | |
Total Institutional Shares | | | | | | | 10,000,000 | |
| | | | | | | | |
Net increase in net assets from capital share transactions | | | | | | | 10,000,000 | |
| | | | | | | | |
Total increase in net assets | | | | | | | 10,624,990 | |
| | | | | | | | |
| | |
| NET ASSETS | | | | | | | | |
Beginning of period | | | | | | | — | |
| | | | | | | | |
End of period | | | | | | $ | 10,624,990 | |
| | | | | | | | |
Accumulated net investment loss, end of period | | | | | | $ | (20,247 | ) |
| | | | | | | | |
| | |
| SHARE TRANSACTIONS: | | | | | | | | |
Institutional Shares | | | | | | | | |
Shares sold | | | | | | | 1,000,000 | |
| | | | | | | | |
Total Institutional Shares | | | | | | | 1,000,000 | |
| | | | | | | | |
| | |
Net increase in shares | | | | | | | 1,000,000 | |
| | | | | | | | |
| (1) | The Fund commenced investment operations on December 31, 2014. |
|
| The accompanying notes are an integral part of consolidated financial statements. |
11
CAMPBELL CORE TREND FUND
CONSOLIDATED FINANCIAL HIGHLIGHTS
Contained below is per share operating performance data for shares outstanding, total investment return, ratios to average net assets and other supplemental data for the period. This information has been derived from information provided in the consolidated financial statements.
| | | | | | | | |
| | | INSTITUTIONAL SHARES | |
| |
| | | FOR THE
PERIOD
ENDED
FEBRUARY 28, 2015
(UNAUDITED)(1) | |
| PER SHARE OPERATING PERFORMANCE | | | | | | | | |
Net asset value, beginning of period | | | | | | $ | 10.00 | |
| | | | | | | | |
Net investment loss(2) | | | | | | | (0.02 | ) |
Net realized and unrealized gain from investments | | | | | | | 0.64 | |
| | | | | | | | |
Net increase in net assets resulting from operations | | | | | | | 0.62 | |
| | | | | | | | |
Net asset value, end of period | | | | | | $ | 10.62 | |
| | | | | | | | |
| | |
Total investment return(3) | | | | | | | 6.20 | %(4) |
| | | | | | | | |
| | |
| RATIOS/SUPPLEMENTAL DATA | | | | | | | | |
Net assets, end of period (000’s omitted) | | | | | | $ | 10,625 | |
Ratio of expenses to average net assets
with waivers and reimbursements
(including interest expense) | | | | | | | 1.26 | %(5) |
Ratio of expenses to average net assets
with waivers and reimbursements
(excluding interest expense) | | | | | | | 1.25 | %(5) |
Ratio of expenses to average net assets
without waivers and reimbursements
(including interest expense) | | | | | | | 4.54 | %(5) |
Ratio of net investment loss to average net assets | | | | | | | (1.24 | )%(5) |
Portfolio turnover rate | | | | | | | 0.00 | %(4) |
| (1) | The Fund commenced investment operations on December 31, 2014. |
| (2) | Calculated based on average shares outstanding for the period. |
| (3) | Total investment return is calculated assuming a purchase of shares on the first day and a sale of shares on the last day of each period reported and includes reinvestments of dividends and distributions, if any. |
|
| The accompanying notes are an integral part of the consolidated financial statements. |
12
CAMPBELL CORE TREND FUND
NOTES TO CONSOLIDATED FINANCIAL STATEMENTS
FEBRUARY 28, 2015
(UNAUDITED)
1. ORGANIZATIONAND SIGNIFICANT ACCOUNTING POLICIES
The RBB Fund, Inc. (“RBB” or the “Company”) was incorporated under the laws of the State of Maryland on February 29, 1988 and is registered under the Investment Company Act of 1940, as amended, (the “1940 Act”) as an open-end management investment company. RBB is a “series fund,” which is a mutual fund divided into separate portfolios. Each portfolio is treated as a separate entity for certain matters under the 1940 Act, and for other purposes, and a shareholder of one portfolio is not deemed to be a shareholder of any other portfolio. Currently, RBB has twenty-two active investment portfolios, including the Campbell Core Trend Fund (the “Fund”), which commenced investment operations on December 31, 2014. The Fund offers Institutional Class shares.
RBB has authorized capital of one hundred billion shares of common stock of which 82.373 billion shares are currently classified into one hundred and fifty-three classes of common stock. Each class represents an interest in an active or inactive RBB investment portfolio.
CONSOLIDATIONOF SUBSIDIARY — The Fund pursues its investment objective by allocating (i) up to 25% of its assets in its wholly-owned subsidiary, Campbell Core Offshore Limited (the “Subsidiary”), that employs the Adviser’s Campbell Core Trend Program and (ii) the remainder of its assets directly in an actively managed, short duration fixed-income portfolio. The consolidated financial statements of the Fund include the financial statements of the Subsidiary. The Fund consolidates the results of subsidiaries in which the Fund holds a controlling economic interest (greater than 50%). All inter-company accounts and transactions have been eliminated. As of February 28, 2015, the net assets of the Subsidiary were $2,201,179, which represented 20.7% of the Fund’s net assets.
PORTFOLIO VALUATION — The Fund’s net asset value (“NAV”) is calculated once daily at the close of regular trading hours on the New York Stock Exchange (“NYSE”) (generally 4:00 p.m. Eastern time) on each day the NYSE is open. Fixed income securities having a remaining maturity of greater than 60 days are valued using an independent pricing service, which considers such factors as security prices, yields, maturities and ratings, and are deemed representative of market values at the close of the market. Fixed income securities having a remaining maturity of 60 days or less are valued at amortized cost, which approximates market value. Forward exchange contracts are valued by interpolating between spot and forward currency rates as quoted by an independent pricing service. Futures contracts are generally valued using the settlement price determined by the relevant exchange. If market quotations are unavailable or deemed unreliable, securities will be valued in accordance with procedures adopted by the Company’s Board of Directors. Relying on prices supplied by pricing services or dealers or using fair valuation may result in values that are higher or lower than the values used by other investment companies and investors to price the same investments.
FAIR VALUE MEASUREMENTS — The inputs and valuation techniques used to measure fair value of the Fund’s investments are summarized into three levels as described in the hierarchy below:
| | |
● Level 1 – | | quoted prices in active markets for identical securities; |
| |
● Level 2 – | | other significant observable inputs (including quoted prices for similar securities, interest rates, prepayment speeds, credit risk, etc.); and |
| |
● Level 3 – | | significant unobservable inputs (including the Fund’s own assumptions in determining the fair value of investments). |
The inputs or methodology used for valuing securities are not necessarily an indication of the risk associated with investing in those securities.
13
CAMPBELL CORE TREND FUND
NOTES TO CONSOLIDATED FINANCIAL STATEMENTS
FEBRUARY 28, 2015
(UNAUDITED) (CONTINUED)
The following is a summary of the inputs used, as of February 28, 2015, in valuing the Fund’s investments carried at fair value:
| | | | | | | | | | | | | | | | |
| | | TOTAL FAIR VALUE AT FEBRUARY 28, 2015 | | | LEVEL 1 QUOTED PRICE | | | LEVEL 2 SIGNIFICANT OBSERVABLE INPUTS | | | LEVEL 3 SIGNIFICANT UNOBSERVABLE INPUTS | |
|
| |
| | | | |
Short-Term Investments | | $ | 6,499,792 | | | $ | — | | | $ | 6,499,792 | | | $ | — | |
Commodity Contracts
Futures | | | 84,593 | | | | 84,593 | | | | — | | | | — | |
Equity Contracts
Futures | | | 166,280 | | | | 166,280 | | | | — | | | | — | |
Interest Rate Contracts
Futures | | | 109,222 | | | | 109,222 | | | | — | | | | — | |
Foreign Exchange Contracts | | | | | | | | | | | | | | | | |
Forward Foreign Currency Contracts | | | 482,732 | | | | — | | | | 482,732 | | | | — | |
| | | | | | | | | | | | | | | | |
Total Assets | | $ | 7,342,619 | | | $ | 360,095 | | | $ | 6,982,524 | | | $ | — | |
| | | | | | | | | | | | | | | | |
| | | | |
| | | TOTAL FAIR VALUE AT FEBRUARY 28, 2015 | | | LEVEL 1 QUOTED PRICE | | | LEVEL 2 SIGNIFICANT OBSERVABLE INPUTS | | | LEVEL 3 SIGNIFICANT UNOBSERVABLE INPUTS | |
|
| |
| | | | |
Commodity Contracts
Futures | | $ | (70,082 | ) | | $ | (70,082 | ) | | $ | — | | | $ | — | |
Interest Rate Contracts
Futures | | | (6,997 | ) | | | (6,997 | ) | | | — | | | | — | |
Foreign Exchange Contracts | | | | | | | | | | | | | | | | |
Forward Foreign Currency Contracts | | | (291,597 | ) | | | — | | | | (291,597 | ) | | | — | |
| | | | | | | | | | | | | | | | |
Total Liabilities | | $ | (368,676 | ) | | $ | (77,079 | ) | | $ | (291,597 | ) | | $ | — | |
| | | | | | | | | | | | | | | | |
At the end of each quarter, management evaluates the classification of Levels 1, 2 and 3 assets and liabilities. Various factors are considered, such as changes in liquidity from the prior reporting period; whether or not a broker is willing to execute at the quoted price; the depth and consistency of prices from third party pricing services; and the existence of contemporaneous, observable trades in the market. Additionally, management evaluates the classification of Level 1 and Level 2 assets and liabilities on a quarterly basis for changes in listings or delistings on national exchanges.
Due to the inherent uncertainty of determining the fair value of investments that do not have a readily available market value, the fair value of the Fund’s investments may fluctuate from period to period. Additionally, the fair value of investments may differ significantly from the values that would have been used had a ready market existed for such investments and may differ materially from the values the Fund may ultimately realize. Further, such investments may be subject to legal and other restrictions on resale or otherwise less liquid than publicly traded securities.
For fair valuations using significant unobservable inputs, U.S. generally accepted accounting principles (“U.S. GAAP”) require the Fund to present a reconciliation of the beginning to ending balances for reported market values that presents changes attributable to total realized and unrealized gains or losses, purchase and sales, and transfers in and out of Level 3 during the period. Transfers in and out between levels are based on values at the end of the period. U.S. GAAP also requires the Fund to disclose amounts and reasons for all transfers in and out of Level 1 and Level 2 fair value measurements. A reconciliation of Level 3 investments is presented only when the Fund had an amount of Level 3 investments at the end of the reporting period that was meaningful in relation to its net assets. The amounts and reasons for all transfers in and out of each level within the three-tier hierarchy are disclosed when the Fund had
14
CAMPBELL CORE TREND FUND
NOTES TO CONSOLIDATED FINANCIAL STATEMENTS
FEBRUARY 28, 2015
(UNAUDITED) (CONTINUED)
an amount of total transfers during the reporting period that was meaningful in relation to its net assets as of the end of the reporting period.
For the period ended February 28, 2015, the Fund had no transfers between Levels 1, 2 and 3.
DISCLOSURES ABOUT DERIVATIVE INSTRUMENTSAND HEDGING ACTIVITIES
Derivative instruments are defined as financial instruments whose value and performance are based on the value and performance of another security or financial instrument. Derivative instruments that the Fund used during the period include forward foreign currency contracts and futures contracts.
During the period ended February 28, 2015, the Fund used long and short contracts on foreign currencies and U.S. and foreign equity market indices, U.S. and foreign government bonds, and commodities (through investment in the Subsidiary), to gain investment exposure in accordance with its investment objective.
The following tables provide quantitative disclosures about fair value amounts of, and gains and losses on, the Fund’s derivative instruments as of February 28, 2015.
The following table lists the fair values of the Fund’s derivative holdings as of February 28, 2015 grouped by contract type and risk exposure category.
| | | | | | | | | | | | | | | | | | | | | | |
| | | CONSOLIDATED | | | | | | | | | | | | | | | |
| | | STATEMENT | | | | | | | | | | | | | | | |
| | | OF ASSETS AND | | | | | INTEREST | | | FOREIGN | | | | | | | |
| | | LIABILITIES | | EQUITY | | | RATE | | | CURRENCY | | | COMMODITY | | | | |
| DERIVATIVE TYPE | | LOCATION | | CONTRACTS | | | CONTRACTS | | | CONTRACTS | | | CONTRACTS | | | TOTAL | |
|
| |
| Asset Derivatives | |
| |
Forward Contracts | | Unrealized
appreciation on forward foreign currency contracts | | $ | — | | | $ | — | | | $ | 482,732 | | | $ | — | | | $ | 482,732 | |
| |
Futures Contracts(a) | | Receivable:
Variation Margin | | | 166,280 | | | | 109,222 | | | | — | | | | 84,593 | | | | 360,095 | |
| |
Total Value - Assets | | | | $ | 166,280 | | | $ | 109,222 | | | $ | 482,732 | | | $ | 84,593 | | | $ | 842,827 | |
| |
|
| Liability Derivatives | |
| |
Forward Contracts | | Unrealized
depreciation on
forward foreign
currency contracts | | $ | — | | | $ | — | | | $ | (291,597 | ) | | $ | — | | | $ | (291,597 | ) |
| |
Futures Contracts(a) | | Receivable:
Variation Margin | | | — | | | | (6,997 | ) | | | — | | | | (70,082 | ) | | | (77,079 | ) |
| |
Total Value - Liabilities | | | | $ | — | | | $ | (6,997 | ) | | $ | (291,597 | ) | | $ | (70,082 | ) | | $ | (368,676 | ) |
| |
| (a) | This amount represents the cumulative appreciation/depreciation of futures contracts as reported in the Consolidated Portfolio of Investments. The Consolidated Statement of Assets and Liabilities only reflects the current day’s variation margin receivable from/payable to brokers. |
15
CAMPBELL CORE TREND FUND
NOTES TO CONSOLIDATED FINANCIAL STATEMENTS
FEBRUARY 28, 2015
(UNAUDITED) (CONTINUED)
The following table lists the amounts of realized gains or (losses) included in net increase in net assets resulting from operations for the period ended February 28, 2015, grouped by contract type and risk exposure.
| | | | | | | | | | | | | | | | | | | | |
| | | CONSOLIDATED | | | | | | | | | | | | | | |
| | | STATEMENT OF | | | | | INTEREST | | | FOREIGN | | | | | | |
| | | OPERATIONS | | EQUITY | | | RATE | | | CURRENCY | | COMMODITY | | | | |
| DERIVATIVE TYPE | | LOCATION | | CONTRACTS | | | CONTRACTS | | | CONTRACTS | | CONTRACTS | | | TOTAL | |
|
| |
| Realized Gain (Loss) | |
| |
Futures Contracts | | Net realized gain
(loss) from Futures | | $ | 16,217 | | | $ | 155,908 | | | $— | | $ | 1,639 | | | $ | 173,764 | |
| |
The following table lists the amounts of change in unrealized appreciation (depreciation) included in net increase in net assets resulting from operations for the period ended February 28, 2015, grouped by contract type and risk exposure.
| | | | | | | | | | | | | | | | | | | | | | |
| | | CONSOLIDATED | | | | | | | | | | | | | | | |
| | | STATEMENT OF | | | | | INTEREST | | | FOREIGN | | | | | | | |
| | | OPERATIONS | | EQUITY | | | RATE | | | CURRENCY | | | COMMODITY | | | | |
| DERIVATIVE TYPE | | LOCATION | | CONTRACTS | | | CONTRACTS | | | CONTRACTS | | | CONTRACTS | | | TOTAL | |
|
| |
| Change in unrealized appreciation (depreciation) | |
| |
Futures Contracts | | Net change in
unrealized appreciation (depreciation) from
Futures | | $ | 166,280 | | | $ | 102,225 | | | $ | — | | | $ | 14,511 | | | $ | 283,016 | |
| |
Forward Contracts | | Net change in
unrealized appreciation
(depreciation) from
Forward Foreign
Currency Contracts | | | — | | | | — | | | | 191,135 | | | | — | | | | 191,135 | |
| |
| Total change in unrealized appreciation (depreciation) | | | | $ | 166,280 | | | $ | 102,225 | | | $ | 191,135 | | | $ | 14,511 | | | $ | 474,151 | |
| |
16
CAMPBELL CORE TREND FUND
NOTES TO CONSOLIDATED FINANCIAL STATEMENTS
FEBRUARY 28, 2015
(UNAUDITED) (CONTINUED)
For the period ended February 28, 2015, the Fund’s average volume of derivatives is as follows:
| | | | | | |
| | | | | FORWARD FOREIGN | | FORWARD FOREIGN |
| LONG FUTURES | | SHORT FUTURES | | CURRENCY | | CURRENCY |
| NOTIONAL | | NOTIONAL | | CONTRACTS — PAYABLE | | CONTRACTS — RECEIVABLE |
| COST | | COST | | (VALUE AT TRADE DATE) | | (VALUE AT TRADE DATE) |
| $43,652,765 | | $(3,233,490) | | $(29,411,887) | | $29,411,887 |
For financial reporting purposes, the Fund does not offset fair value amounts recognized for derivative instruments and fair value amounts recognized for the right to reclaim cash collateral (receivables) or the obligation to return cash collateral (payables) arising from derivative instruments recognized at fair value executed with the same counterparty under a master netting arrangement.
The following is a summary of financial and derivative instruments that are subject to enforceable master netting agreements (or similar arrangements) and collateral received and pledged in connection with the master netting agreements (or similar arrangements).
| | | | | | | | | | | | | | | | | | | | | | | | | | | | | | | | |
| | | | | | Gross Amount Not | | | | | | | | | Gross Amount Not | | | | |
| | | Gross Amount | | | Offset | | | | | | Gross Amount | | | Offset | | | | |
| | | Presented in the | | | in Consolidated | | | | | | Presented in the | | | in Consolidated | | | | |
| | | Consolidated | | | Statement of | | | | | | Consolidated | | | Statement of | | | | |
| | | Statement of | | | Assets and Liabilities | | | | | | Statement of | | | Assets and Liabilities | | | | |
| | | Assets and | | | Financial | | | Collateral | | | Net | | | Assets and | | | Financial | | | Collateral | | | Net | |
| Description | | Liabilities | | | Instruments | | | Received | | | Amount(1) | | | Liabilities | | | Instruments | | | Pledged | | | Amount(2) | |
| |
| | | | | |
| | | Assets | | | | Liabilities | |
Forward Foreign Currency Contracts | | | $482,732 | | | | ($291,597 | ) | | | $— | | | | $191,135 | | | | $291,597 | | | | ($291,597 | ) | | | $— | | | | $— | |
| (1) | Net amount represents the net amount receivable from the counterparty in the event of default. |
| (2) | Net amount represents the net amount payable from the counterparty in the event of default. |
USEOF ESTIMATES — The Fund is an investment company and, accordingly, follows the investment company accounting and reporting guidance under U.S. GAAP. The preparation of financial consolidated statements in conformity with U.S. GAAP requires management to make estimates and assumptions that affect the reported amounts of assets and liabilities and disclosure of contingent assets and liabilities at the date of the consolidated financial statements and the reported amounts of revenues and expenses during the period. Actual results could differ from those estimates and those differences could be significant.
INVESTMENT TRANSACTIONS, INVESTMENT INCOMEAND EXPENSES — The Fund records security transactions based on trade date for financial reporting purposes. The cost of investments sold is determined by use of the specific identification method for both financial reporting and income tax purposes in determining realized gains and losses on investments. Interest income is accrued when earned. Dividend income is recorded on the ex-dividend date. Distributions received on securities that represent a return of capital or capital gains are recorded as a reduction of cost of investments and/or as a realized gain. Expenses incurred on behalf of a specific class, fund or fund family are charged directly to the class, fund or fund family to each class of shares based upon the relative proportion of net assets of each class at the beginning of the day. Expenses incurred for all the RBB funds (such as director or professional fees) are charged to all funds in proportion to their average net assets of RBB, or in such other manner as the Company’s Board of
17
CAMPBELL CORE TREND FUND
NOTES TO CONSOLIDATED FINANCIAL STATEMENTS
FEBRUARY 28, 2015
(UNAUDITED) (CONTINUED)
Directors deems fair or equitable. Expenses and fees, including investment advisory and administration fees, are accrued daily and taken into account for the purpose of determining the NAV of the Fund.
DIVIDENDSAND DISTRIBUTIONSTO SHAREHOLDERS — Dividends from net investment income and distributions from net realized capital gains, if any, are declared and paid at least annually to shareholders and recorded on ex-dividend date. Income dividends and capital gain distributions are determined in accordance with U.S. federal income tax regulations which may differ from U.S. GAAP.
U.S. TAX STATUS — No provision is made for U.S. income taxes as it is the Fund’s intention to qualify for and elect the tax treatment applicable to regulated investment companies under Subchapter M of the Internal Revenue Code of 1986, as amended, and make the requisite distributions to its shareholders which will be sufficient to relieve it from U.S. income and excise taxes.
For tax purposes, the Subsidiary is an exempted Cayman investment company. The Subsidiary has received an undertaking from the Government of the Cayman Islands exempting it from all local income, profits and capital gains taxes. No such taxes are levied in the Cayman Islands at the present time. For U.S. income tax purposes, the Subsidiary is a Controlled Foreign Corporation and as such is not subject to U.S. income tax.
FOREIGN CURRENCY TRANSLATION — Assets and liabilities initially expressed in non-U.S. currencies are translated into U.S. dollars based on the applicable exchange rates at the date of the last business day of the consolidated financial statement period. Purchases and sales of securities, interest income, dividends, variation margin received and expenses denominated in foreign currencies are translated into U.S. dollars at the exchange rates in effect on the transaction date.
The Fund does not separately report the effect of changes in foreign exchange rates from changes in market prices of securities held. Such changes are included with the net realized gain or loss and change in unrealized appreciation or depreciation on investment securities in the Consolidated Statement of Operations. Other foreign currency transactions resulting in realized and unrealized gain or loss are reported separately as net realized gain or loss and change in unrealized appreciation or depreciation on foreign currencies in the Consolidated Statement of Operations.
CURRENCY RISK — Investment in foreign securities involves currency risk associated with securities that trade or are denominated in currencies other than the U.S. dollar and which may be affected by fluctuations in currency exchange rates. An increase in the strength of the U.S. dollar relative to a foreign currency may cause the U.S. dollar value of an investment in that country to decline. Foreign currencies also are subject to risks caused by inflation, interest rates, budget deficits and low savings rates, political factors and government controls. Forward foreign currency exchange contracts may limit potential gains from a favorable change in value between the U.S. dollar and foreign currencies. Unanticipated changes in currency pricing may result in poorer overall performance for the Fund than if it had not engaged in these contracts.
COMMODITY SECTOR RISK — Exposure to the commodities markets may subject the Fund to greater volatility than investments in traditional securities. The value of commodity-linked derivative instruments may be affected by changes in overall market movements, commodity index volatility, changes in interest rates, or factors affecting a particular industry or commodity, such as drought, floods, weather, livestock disease, embargoes, tariffs and international economic, political and regulatory developments. The prices of energy, industrial metals, precious metals, agriculture and livestock sector commodities may fluctuate widely due to factors such as changes in value, supply and demand and governmental regulatory policies. The commodity-linked securities in which the Fund invests may be issued by companies in the financial services sector, and events affecting the financial services sector may cause the Fund’s share value to fluctuate.
18
CAMPBELL CORE TREND FUND
NOTES TO CONSOLIDATED FINANCIAL STATEMENTS
FEBRUARY 28, 2015
(UNAUDITED) (CONTINUED)
FOREIGN SECURITIES MARKET RISK — A substantial portion of the trades of the Fund are expected to take place on markets or exchanges outside the United States. There is no limit to the amount of assets of the Fund that may be committed to trading on foreign markets. The risk of loss in trading foreign futures and options on futures contracts can be substantial. Participation in foreign futures and options on futures contracts involves the execution and clearing of trades on, or subject to the rules of, a foreign board of trade or exchange. Some of these foreign markets, in contrast to U.S. exchanges, are so-called principals’ markets in which performance is the responsibility only of the individual counterparty with whom the trader has entered into a commodity interest transaction and not of the exchange or clearing corporation. In these kinds of markets, there is risk of bankruptcy or other failure or refusal to perform by the counterparty.
COUNTERPARTY RISK — The derivative contracts entered into by the Fund or its Subsidiary may be privately negotiated in the over-the-counter market. These contracts also involve exposure to credit risk, since contract performance depends in part on the financial condition of the counterparty. Relying on a counterparty exposes the Fund to the risk that a counterparty will not settle a transaction in accordance with its terms and conditions because of a dispute over the terms of the contract (whether or not bona fide) or because of a credit or liquidity problem, thus causing the Fund to suffer a loss. If a counterparty defaults on its payment obligations to the Fund, this default will cause the value of an investment in the Fund to decrease.
CREDIT RISK — Credit risk refers to the possibility that the issuer of the security or a counterparty in respect of a derivative instrument will not be able to satisfy its payment obligations to the Fund when due. Changes in an issuer’s credit rating or the market’s perception of an issuer’s creditworthiness may also affect the value of the Fund’s investment in that issuer. Securities rated in the four highest categories by the rating agencies are considered investment grade but they may also have some speculative characteristics. Investment grade ratings do not guarantee that bonds will not lose value or default. In addition, the credit quality of securities may be lowered if an issuer’s financial condition changes.
FUTURES CONTRACTS — The Fund may use futures contracts for hedging or speculative purposes consistent with its investment objective. Upon entering into a futures contract, the Fund must deposit initial margin in addition to segregating cash or liquid assets sufficient to meet its obligation to purchase or provide securities, or to pay the amount owed at the expiration of an index-based futures contract. Such liquid assets may consist of cash, cash equivalents, liquid debt or equity securities or other acceptable assets. Pursuant to the futures contract, the Fund agrees to receive from, or pay to the broker, an amount of cash equal to the daily fluctuation in value of the contract. Such a receipt of payment is known as “variation margin” and is recorded by the Fund as an unrealized gain or loss. When the contract is closed, the Fund records a realized gain or loss equal to the difference between the proceeds from (or cost of) the closing transactions and the Fund’s basis in the contract. Futures contracts have market risks, including the risk that the change in the value of the contract may not correlate with changes in the value of the underlying securities. Use of long futures contracts subjects the Fund to risk of loss in excess of the amount shown on the Consolidated Statement of Assets and Liabilities, up to the notional value of the futures contract. Use of short futures contracts subjects the Fund to unlimited risk of loss.
FORWARD FOREIGN CURRENCY CONTRACTS — In the normal course of pursuing its investment objectives, the Fund is subject to foreign investment and currency risk. The Fund may enter into forward foreign currency contracts (“forward contracts”) for purposes of hedging, duration management, as a substitute for securities, to increase returns, for currency hedging or risk management, or to otherwise help achieve the Fund’s investment goal. These contracts are marked-to-market daily at the applicable translation rates. The Fund records realized gains or losses at the time the forward contract is closed. A forward contract is extinguished through a closing transaction or upon delivery of the currency or entering an offsetting contract. Risks may arise upon entering these contracts from the potential inability of a counterparty to meet the terms of their contracts and from unanticipated movements in the value of a foreign currency relative to the U.S. dollar or other currencies. A Fund’s maximum risk of loss from counterparty credit risk
19
CAMPBELL CORE TREND FUND
NOTES TO CONSOLIDATED FINANCIAL STATEMENTS
FEBRUARY 28, 2015
(UNAUDITED) (CONTINUED)
related to Forward Foreign Currency Contracts is the fair value of the contract. The risk may be mitigated to some extent if a master netting arrangement between a Fund and the counterparty is in place and to the extent a Fund obtains collateral to cover the Fund’s exposure to the counterparty.
CASH AND CASH EQUIVALENTS — The Fund considers liquid assets deposited into bank demand deposit accounts to be cash equivalents. These investments represent amounts held with financial institutions that are readily accessible to pay Fund expenses or purchase investments. Cash and cash equivalents are valued at cost plus accrued interest, which approximates market value.
OTHER — In the normal course of business, the Fund may enter into contracts that provide general indemnifications. The Fund’s maximum exposure under these arrangements is dependent on claims that may be made against the Fund in the future, and, therefore, cannot be estimated; however, based on experience, the risk of material loss from such claims is considered remote.
2. INVESTMENT ADVISERAND OTHER SERVICES
Campbell & Company Investment Adviser LLC (“Campbell” or the “Adviser”) serves as the Fund’s investment adviser. The Adviser is a wholly-owned subsidiary of Campbell & Company, LP. For its advisory services, the Adviser is entitled to receive a monthly fee from the Fund calculated at an annual rate of 1.05% of the Fund’s average daily net assets.
Campbell has contractually agreed to waive its advisory fee and/or reimburse expenses in order to limit total annual Fund operating expenses (excluding certain items discussed below) to 1.25% of the Fund’s average daily net assets. In determining the Adviser’s obligation to waive advisory fees and/or reimburse expenses, the following expenses are not taken into account and could cause net total annual Fund operating expenses to exceed 1.25%: acquired fund fees and expenses, brokerage commissions, extraordinary items, interest or taxes. This contractual limitation is in effect until December 31, 2015 and may not be terminated without the approval of the Board of Directors of The RBB Fund, Inc. If at any time the Fund’s total annual Fund operating expenses for a year are less than 1.25%, the Adviser may recoup from the Fund any waived amount or other payments remitted by the Adviser within three years from the date on which such waiver or reimbursement was made if such reimbursement does not cause the Fund to exceed expense limitations that were in effect at the time of the waiver or reimbursement.
For the period ended February 28, 2015, investment advisory fees accrued and waived were $17,112 and fees reimbursed by the Adviser were $13,178. At February 28, 2015, the amount of potential recovery by the Adviser was as follows:
BNY Mellon Investment Servicing (US) Inc. (“BNY Mellon”) serves as administrator for the Fund. For providing administrative and accounting services, BNY Mellon is entitled to receive a monthly fee equal to an annual percentage rate of the Fund’s average daily net assets, subject to certain minimum monthly fees. For the period ended February 28, 2015, BNY Mellon accrued administration and accounting fees totaling $23,464 and waived fees totaling $16,666.
Included in the administration and accounting service fees, shown on the Consolidated Statement of Operations, are fees for providing regulatory administration services to RBB. For providing these services, BNY Mellon is entitled to receive compensation as agreed to by the Company and BNY Mellon. This fee is allocated to each portfolio in proportion to its net assets of the Company.
20
CAMPBELL CORE TREND FUND
NOTES TO CONSOLIDATED FINANCIAL STATEMENTS
FEBRUARY 28, 2015
(UNAUDITED) (CONCLUDED)
In addition, BNY Mellon serves as the Fund’s transfer and dividend disbursing agent. For providing transfer agent services, BNY Mellon is entitled to receive a monthly fee, subject to certain minimum, and out of pocket expenses. For the period ended February 28, 2015, BNY Mellon accrued transfer agent fees totaling $5,120 and waived fees totaling $4,000.
The Bank of New York Mellon (the “Custodian”) provides certain custodial services to the Fund. The Custodian is entitled to receive a monthly fee, subject to certain minimum, and out of pocket expenses. For the period ended February 28, 2015, the Custodian accrued custodian fees totaling $3,197 and waived fees totaling $2,500.
BNY Mellon and the Custodian have the ability to recover such amounts previously waived, if the Fund terminates its agreements with BNY Mellon or the Custodian within three years of signing the agreements.
Foreside Funds Distributors LLC serves as the principal underwriter and distributor of the Fund’s shares pursuant to a Distribution Agreement with RBB.
3. DIRECTOR COMPENSATION
The Directors of the Company receive an annual retainer and meeting fees for meetings attended. The remuneration paid to the Directors by the Fund during the period ended February 28, 2015 was $24. Certain employees of BNY Mellon serve as an Officer or Director of the Company. They are not compensated by the Fund or the Company.
4. INVESTMENTIN SECURITIES
For the period ended February 28, 2015, there were no purchases and sales of investment securities for the Fund excluding short term investments for cash management purposes.
5. FEDERAL INCOME TAX INFORMATION
The Fund has followed the authoritative guidance on accounting for and disclosure of uncertainty in tax positions, which requires the Fund to determine whether a tax position is more likely than not to be sustained upon examination, including resolution of any related appeals or litigation processes, based on the technical merits of the position. The Fund has determined that there was no effect on the consolidated financial statements from following this authoritative guidance. In the normal course of business, the Fund is subject to examination by federal, state and local jurisdictions, where applicable, for tax years for which applicable statutes of limitations have not expired.
As of February 28, 2015, federal tax cost, aggregate gross unrealized appreciation and depreciation of securities held by the Fund were as follows:
| | | | | | |
FEDERAL TAX
COST | | UNREALIZED
APPRECIATION | | UNREALIZED
DEPRECIATION | | NET
UNREALIZED
APPRECIATION |
| $6,499,792 | | $— | | $— | | $— |
6. SUBSEQUENT EVENTS
Management has evaluated the impact of all subsequent events on the Fund through the date the consolidated financial statements were issued, and has determined that there were no subsequent events requiring recognition or disclosure in the consolidated financial statements.
21
CAMPBELL CORE TREND FUND
OTHER INFORMATION
(UNAUDITED)
PROXY VOTING
Policies and procedures that the Fund uses to determine how to vote proxies relating to portfolio securities as well as information regarding how the Fund voted proxies relating to portfolio securities for the most recent 12-month period ended June 30 will be available without charge, upon request, by calling (844) 261-6488 and on the Securities and Exchange Commission’s (“SEC”) website at http://www.sec.gov.
QUARTERLY PORTFOLIO SCHEDULES
The Company will file its complete schedule of portfolio holdings with the SEC for the first and third fiscal quarters of each fiscal year (quarters ended November 30 and May 31) on Form N-Q. The Company’s Form N-Q will be available on the SEC website at http://www.sec.gov and may be reviewed and copied at the SEC Public Reference Room in Washington, D.C. Information on the operation of the SEC Public Reference Room may be obtained by calling (800) SEC-0330.
APPROVALOF INVESTMENT ADVISORY AGREEMENT
As required by the 1940 Act, the Board of the Company, including all of the Directors who are not “interested persons” of the Company, as that term is defined in the 1940 Act (the “Independent Directors”), considered the approval of the investment advisory agreement between Campbell & Company Investment Adviser LLC (“Campbell”) and the Company (the “Investment Advisory Agreement”) on behalf of the Fund at a meeting of the Board held on November 18, 2014 (the “Meeting”). At the Meeting, the Board, including all of the Independent Directors, approved the Investment Advisory Agreement for an initial two-year term. In approving the Investment Advisory Agreement, the Board considered information provided by Campbell with the assistance and advice of counsel to the Independent Directors and the Company.
In considering the approval of the Investment Advisory Agreement between the Company and Campbell with respect to the Fund, the Directors took into account all the materials provided in advance of the Meeting, including the Lipper materials, and the discussions held during the Meeting. Among other things, the Directors considered (i) the nature, extent, and quality of Campbell’s services to be provided to the Fund; (ii) descriptions of the experience and qualifications of Campbell’s personnel providing those services; (iii) Campbell’s investment philosophies and processes; (iv) Campbell’s assets under management and client descriptions; (v) Campbell’s soft dollar commission and trade allocation policies, including information on the types of research and services obtained in connection with soft dollar commissions; (vi) Campbell’s advisory fee arrangement with the Company and other similarly managed clients; (vii) Campbell’s compliance policies and procedures; (viii) Campbell’s financial information, insurance coverage and profitability analysis related to providing advisory services to the Fund; (ix) the extent to which economies of scale are relevant to the Fund; and (x) a report prepared by Lipper comparing the Fund’s management fees and total expense ratio to those of its Lipper peer group (“Lipper materials”).
At the Meeting, as part of their review, the Directors considered the nature, extent and quality of the services provided by Campbell. The Directors concluded that Campbell had substantial resources to provide services to the Fund. At the Meeting, the Board also considered the advisory fee rate payable by the Fund under the Investment Advisory Agreement. In this regard, information on the fees to be paid by the Fund and the Fund’s total operating expense ratio (before and after fee waivers and expense reimbursements) was compared to similar information for mutual funds advised by other, unaffiliated investment advisory firms. In addition, the Directors noted that Campbell has contractually agreed to waive management fees and reimburse expenses through December 31, 2015 to the extent that total annual Fund operating expenses exceed 1.25% of the Fund’s average daily net assets.
After reviewing the information regarding the Fund’s costs, Campbell’s estimated profitability and economies of scale, and after considering Campbell’s services, the Directors concluded that the investment advisory fees to be paid by the Fund were fair and reasonable and that the Investment Advisory Agreement should be approved for an initial two-year period ending August 16, 2016. The Board also determined that, based on the information it had received from Campbell regarding the potential change of control of the firm, its approval of the Investment Advisory Agreement with Campbell would also institute its approval of the Investment Advisory Agreement with Campbell under the new ownership structure provided the change of control occurs prior to the commencement of operations of the Fund.
22
CAMPBELL CORE TREND FUND
PRIVACY NOTICE
(UNAUDITED)
Campbell Core Trend Fund
| | |
| FACTS | | WHAT DOES THE CAMPBELL CORE TREND FUND DO WITH YOUR PERSONAL INFORMATION? |
Why? | | Financial companies choose how they share your personal information. Federal law gives consumers the right to limit some but not all sharing. Federal law also requires us to tell you how we collect, share, and protect your personal information. Please read this notice carefully to understand what we do. |
What? | | The types of personal information we collect and share depend on the product or service you have with us. This information can include: ●Social Security number ●account balances ●account transactions ●transaction history ●wire transfer instructions ●checking account information When you are no longer our customer, we continue to share your information as described in this notice. |
How? | | All financial companies need to share customers’ personal information to run their everyday business. In the section below, we list the reasons financial companies can share their customers’ personal information; the reasons the Campbell Core Trend Fund chooses to share; and whether you can limit this sharing. |
| | | | | | |
| Reasons we can share your information | | | | Does the Campbell Core Trend Fund Share? | | Can you limit this sharing? |
For our everyday business purpose — such as to process your transactions, maintain your account(s), respond to court orders and legal investigations, or report to credit bureaus | | | | Yes | | No |
For our marketing purposes — to offer our products and services to you | | | | Yes | | No |
For joint marketing with other financial companies | | | | No | | We don’t share |
For affiliates’ everyday business purposes — information about your transactions and experiences | | | | Yes | | Yes |
For affiliates’ everyday business purposes — information about your creditworthiness | | | | No | | We don’t share |
For our affiliates to market to you | | | | No | | We don’t share |
For nonaffiliates to market to you | | | | No | | We don’t share |
| | |
Questions? | | Call 1-844-261-6488 |
| | |
| | |
23
CAMPBELL CORE TREND FUND
PRIVACY NOTICE
(UNAUDITED)
| | |
What we do | | |
How does the Campbell Core Trend Fund protect my personal information? | | To protect your personal information from unauthorized access and use, we use security measures that comply with federal law. These measures include computer safeguards and secured files and buildings. |
How does the Campbell Core Trend Fund collect my personal information? | | We collect your personal information, for example, when you • open an account • provide account information • give us your contact information • make a wire transfer • tell us where to send the money We also collect your information from others, such as credit bureaus, affiliates, or other companies. |
Why can’t I limit all sharing? | | Federal law gives you the right to limit only • sharing for affiliates’ everyday business purposes — information about your creditworthiness • affiliates from using your information to market to you • sharing for nonaffiliates to market to you State laws and individual companies may give you additional rights to limit sharing. |
Definitions | | |
Affiliates | | Companies related by common ownership or control. They can be financial and nonfinancial companies. • Our affiliates include Campbell Core Trend Fund’s investment adviser, Campbell & Company Investment Adviser LLC. |
Nonaffiliates | | Companies not related by common ownership or control. They can be financial and nonfinancial companies. • The Campbell Core Trend Fund doesn’t share with nonaffiliates so they can market to you. |
Joint marketing | | A formal agreement between nonaffiliated financial companies that together market financial products or services to you. • The Campbell Core Trend Fund does not jointly market. |
24
Investment Adviser
Campbell & Company Investment Adviser LLC
2850 Quarry Lake Drive
Baltimore, Maryland 21209
Administrator
BNY Mellon Investment Servicing (US) Inc.
301 Bellevue Parkway
Wilmington, DE 19809
Transfer Agent
BNY Mellon Investment Servicing (US) Inc.
4400 Computer Drive
Westborough, MA 01581
Principal Underwriter
Foreside Funds Distributors LLC
400 Berwyn Park
899 Cassatt Road
Berwyn, PA 19312
Custodian
The Bank of New York Mellon
One Wall Street
New York, NY 10286
Independent Registered Public Accounting Firm
Ernst & Young LLP
One Commerce Square
2005 Market Street, Suite 700
Philadelphia, PA 19103
Counsel
Drinker Biddle & Reath LLP
One Logan Square, Ste. 2000
Philadelphia, PA 19103-6996
CAM-SAR15
FREE MARKET U.S. EQUITY FUND
FREE MARKET INTERNATIONAL EQUITY FUND
FREE MARKET FIXED INCOME FUND
of
THE RBB FUND, INC.
SEMI-ANNUAL REPORT
February 28, 2015
(Unaudited)
This report is submitted for the general information of the shareholders of the Funds. It is not authorized for distribution unless preceded or accompanied by a current prospectus for the Funds.
FREE MARKET FUNDS
Semi-Annual Investment Adviser’s Report
February 28, 2015
(Unaudited)
Dear Shareholder,
The Free Market Funds (the “Funds”) have continued to gain assets and have well surpassed the $5 billion mark. We would like to extend a warm and grateful thank you to all investors who have embraced our Free Market Portfolio Strategies.
Over the past six months ended February 28, 2015, investors who remained invested and diversified have continued to experience the gains from the upward rally in the markets (despite a few bumps along the way). Global equity markets over the past six months ended February 28, 2015 have risen 1.18% as measured by the MSCI All Country World Index. Furthermore, U.S. stocks performed better than international stocks with the S&P 500 Index returning 6.12% over the six months ended February 28, 2015. The Barclays Capital US Government/Credit Intermediate Bond Index was also in the positive with a return of 1.34% for the last six months ended February 28, 2015.
Matson Money, Inc. (“Matson Money”) strives to deliver the performance of capital markets and add value through Free Market Investment strategies and Structured Market Portfolios. Grounded in the conviction that free markets work, Matson Money avoids the cost-generating activity of stock picking and market timing. Instead, we focus on the dimensions of capital markets that we believe reward investors as intelligently and effectively as possible. Our disciplined approach to life-long investing provides both the individual investor and the financial professional with the academic foundation upon which to help achieve investment goals.
Sound economic and financial research has documented that, over the long term, small cap stocks outperform large cap stocks, and value stocks outperform growth stocks1. These returns seem to be compensation for risk. In fixed income, risk is well described by bond maturity and credit quality. The Funds deliberately target specific risk and return trade offs. The Funds are broadly diversified and designed to work together in your total investment plan.
We invite you to contact your financial professional or explore our website, www.MatsonMoney.com, to learn more about the concepts and strategies of Matson Money’s investing.
We appreciate your support and confidence in our firm’s investment philosophy, process and people.

Daniel J. List
Chief Compliance Officer and Vice President of Portfolio Management
Matson Money, Inc.
| 1 | Fama, Eugene F., and Kenneth R. French, 1992 “The cross-section of Expected Stock Returns”, Journal of Finance 47 (June), pp. 427-465. |
1
FREE MARKET FUNDS
Performance Data
(Unaudited)
Free Market U.S. Equity Fund
| | | | | | | | | | | | | | | | | | | | |
| Total Returns for the Periods Ended February 28, 2015 | |
| | | | | | Average Annual | |
| | | Six
Months* | | | 1 Year | | | 3 Years | | | 5 Years | | | Since
Inception** | |
Free Market U.S. Equity Fund | | | 2.33% | | | | 7.93% | | | | 17.66% | | | | 16.10% | | | | 9.71% | |
Russell 2500® Index | | | 5.12% | | | | 8.24% | | | | 17.45% | | | | 16.89% | | | | 9.21% | |
Composite Index*** | | | 4.42% | | | | 9.30% | | | | 16.96% | | | | 15.40% | | | | 7.43% | |
| ** | Annualized — The Fund commenced operations on December 31, 2007. |
| *** | The Composite Index is comprised of the S&P 500® Index, Russell 1000® Value Index, Russell 2000® Index and Russell 2000® Value Index, weighted 25%, 25%, 25% and 25%, respectively. |
The performance data quoted represents past performance. Past performance is not indicative of future results. Investment return and principal value will fluctuate so that an investor’s shares, when redeemed, may be worth more or less than their original cost. Current performance may be lower or higher. Returns shown include the reinvestment of all dividends and other distributions and do not reflect taxes that a shareholder would pay on Fund distributions or on the redemption of Fund shares. For performance data current to the most recent month-end, please call 1-866-780-0357 ext. 3863. The Fund’s annual operating expense ratio, as stated in the current prospectus, is 0.83% (included in the ratio is 0.23% attributable to acquired fund fees and expenses).
The Fund’s aggregate total return since inception is based on an increase in net asset value from $10.00 per share on December 31, 2007 (commencement of operations) to $17.06 per share on February 28, 2015.
Portfolio composition is subject to change.
The Free Market U.S. Equity Fund’s underlying funds invest in small-cap and micro-cap stocks, large-cap stocks and other equity securities. In addition to the ordinary risks of equity investing, small companies entail special risk. Small companies tend to have more risk than large companies. An investor in the Fund will incur the expenses of the underlying funds in addition to the Fund’s expenses.
Free Market International Equity Fund
| | | | | | | | | | | | | | | | | | | | |
| Total Returns for the Periods Ended February 28, 2015 | |
| | | | | | Average Annual | |
| | | Six
Months* | | | 1 Year | | | 3 Years | | | 5 Years | | | Since
Inception** | |
Free Market International Equity Fund | | | -4.84% | | | | -2.52% | | | | 8.04% | | | | 7.56% | | | | 2.54% | |
MSCI World (excluding U.S.) Index | | | -2.47% | | | | -0.16% | | | | 8.58% | | | | 7.41% | | | | 0.37% | |
Composite Index*** | | | -3.41% | | | | 0.03% | | | | 7.45% | | | | 7.42% | | | | 0.84% | |
| ** | Annualized — The Fund commenced operations on December 31, 2007. |
| *** | The Composite Index is comprised of the MSCI EAFE Index, MSCI EAFE Value Index, MSCI EAFE Small Company Index, and MSCI Emerging Markets Free Index, weighted 25%, 25%, 25% and 25%, respectively. |
The performance data quoted represents past performance. Past performance is not indicative of future results. Investment return and principal value will fluctuate so that an investor’s shares, when redeemed, may be worth more or less than their original cost. Current performance may be lower or higher. Returns shown include the reinvestment of all dividends and other distributions and do not reflect taxes that a shareholder would pay on Fund distributions or on the redemption of Fund shares. For performance data current to the most recent month-end, please call 1-866-780-0357 ext. 3863. The Fund’s annual operating expense ratio, as stated in the current prospectus, is 1.07% (included in the ratio is 0.45% attributable to acquired fund fees and expenses).
The Fund’s aggregate total return since inception is based on an increase in net asset value from $10.00 per share on December 31, 2007 (commencement of operations) to $9.95 per share on February 28, 2015.
Portfolio composition is subject to change.
The Free Market International Equity Fund’s underlying funds invest in common stock, preferred stock, securities convertible into stocks and other equity securities issued by foreign companies. In addition to the ordinary risks of equity investing, foreign and small companies entail special risk. The return on foreign equities may be adversely affected by currency fluctuations. Emerging markets may be subject to social instability and lack of market liquidity. Small companies tend to have more risk than large companies. An investor in the Fund will incur the expenses of the underlying funds in addition to the Fund’s expenses.
2
FREE MARKET FUNDS
Performance Data
(Unaudited)
Free Market Fixed Income Fund
| | | | | | | | | | | | | | | | | | | | |
| Total Returns for the Periods Ended February 28, 2015 | |
| | | | | | Average Annual | |
| | | Six
Months* | | | 1 Year | | | 3 Years | | | 5 Years | | | Since
Inception** | |
Free Market Fixed Income Fund | | | 0.57% | | | | 1.01% | | | | 0.56% | | | | 1.38% | | | | 1.88% | |
Citigroup World Govt. Bond 1-5 Year Currency Hedged U.S. Dollar Index | | | 0.86% | | | | 1.73% | | | | 1.47% | | | | 1.70% | | | | 2.53% | |
Composite Index*** | | | 1.09% | | | | 2.19% | | | | 1.34% | | | | 2.17% | | | | 2.80% | |
| ** | Annualized — The Fund commenced operations on December 31, 2007. |
| *** | The Composite Index is comprised of the Three-Month Treasury Bill Index, Barclays Capital Intermediate Government Bond Index, BofA Merrill Lynch 1-3 Year US Government/Corporate Index and Barclays Capital Aggregate Bond Index, weighted 25%, 25%, 25% and 25%, respectively. |
The performance data quoted represents past performance. Past performance is not indicative of future results. Investment return and principal value will fluctuate so that an investor’s shares, when redeemed, may be worth more or less than their original cost. Current performance may be lower or higher. Returns shown include the reinvestment of all dividends and other distributions and do not reflect taxes that a shareholder would pay on Fund distributions or on the redemption of Fund shares. For performance data current to the most recent month-end, please call 1-866-780-0357 ext. 3863. The Fund’s annual operating expense ratio, as stated in the current prospectus, is 0.78% (included in the ratio is 0.17% attributable to acquired fund fees and expenses).
The Fund’s aggregate total return since inception is based on an increase in net asset value from $10.00 per share on December 31, 2007 (commencement of operations) to $10.27 per share on February 28, 2015.
Portfolio composition is subject to change.
The Free Market Fixed Income Fund’s underlying funds invest in fixed income securities. The underlying funds may invest their assets in bonds and other debt securities issued by domestic and foreign governments and companies. Debt instruments involve the risk that their prices will fall when interest rates rise, and they are subject to the risk that the borrower may default. In addition, the return on foreign debt securities may be adversely affected by currency fluctuations. An investor in the Fund will incur expenses of the underlying funds in addition to the Fund’s expenses.
3
FREE MARKET FUNDS
Fund Expense Examples
(Unaudited)
As a shareholder of the Fund(s), you incur two types of costs: (1) transaction costs and (2) ongoing costs, including management fees and other Fund expenses. These examples are intended to help you understand your ongoing costs (in dollars) of investing in the Fund(s) and to compare these costs with the ongoing costs of investing in other mutual funds.
These examples are based on an investment of $1,000 invested at the beginning of the six-month period from September 1, 2014 through February 28, 2015, and held for the entire period.
Actual Expenses
The first line of the accompanying tables provides information about actual account values and actual expenses. You may use the information in this line, together with the amount you invested, to estimate the expenses that you paid over the period. Simply divide your account value by $1,000 (for example, an $8,600 account value divided by $1,000 = 8.6), then multiply the result by the number in the first line under the heading entitled “Expenses Paid During Period” to estimate the expenses you paid on your account during this period.
Hypothetical Example for Comparison Purposes
The second line of the accompanying tables provides information about hypothetical account values and hypothetical expenses based on the Fund’s actual expense ratio and an assumed rate of return of 5% per year before expenses, which is not your Fund’s actual return. The hypothetical account values and expenses may not be used to estimate the actual ending account balance or expenses you paid for the period. You may use this information to compare the ongoing costs of investing in the Fund and other funds. To do so, compare these 5% hypothetical examples with the 5% hypothetical examples that appear in the shareholder reports of other funds.
Please note that the expenses shown in the accompanying tables are meant to highlight your ongoing costs only and do not reflect any transactional costs, such as redemption fees. Therefore, the second line of the accompanying tables is useful in comparing ongoing costs only, and will not help you determine the relative total costs of owning different funds. In addition, if these transactional costs were included, your costs would have been higher.
| | | | | | | | | | | | |
| | | Free Market U.S. Equity Fund | |
| | | Beginning Account Value
September 1, 2014 | | | Ending Account Value
February 28, 2015 | | | Expenses Paid
During Period* | |
Actual | | $ | 1,000.00 | | | $ | 1,023.30 | | | $ | 3.06 | |
Hypothetical (5% return before expenses) | | | 1,000.00 | | | | 1,021.77 | | | | 3.06 | |
| |
| | | Free Market International Equity Fund | |
| | | Beginning Account Value
September 1, 2014 | | | Ending Account Value
February 28, 2015 | | | Expenses Paid
During Period* | |
Actual | | $ | 1,000.00 | | | $ | 951.60 | | | $ | 3.00 | |
Hypothetical (5% return before expenses) | | | 1,000.00 | | | | 1,021.72 | | | | 3.11 | |
4
FREE MARKET FUNDS
Fund Expense Examples (Concluded)
(Unaudited)
| | | | | | | | | | | | |
| |
| | | Free Market Fixed Income Fund | |
| | | Beginning Account Value
September 1, 2014 | | | Ending Account Value
February 28, 2015 | | | Expenses Paid
During Period* | |
Actual | | $ | 1,000.00 | | | $ | 1,005.70 | | | $ | 3.03 | |
Hypothetical (5% return before expenses) | | | 1,000.00 | | | | 1,021.77 | | | | 3.06 | |
| * | Expenses are equal to an annualized six-month expense ratio of 0.61% for the Free Market U.S. Equity Fund, 0.63% for the Free Market International Equity Fund and 0.61% for the Free Market Fixed Income Fund, multiplied by the average account value over the period, multiplied by the number of days in the most recent fiscal half-year (181), then divided by 365 to reflect the one-half year period. The annualized expense ratios do not reflect fees and expenses associated with the underlying funds. If such fees and expenses had been included, the expenses would have been higher. The range of weighted expense ratios of the underlying funds held by the Funds, as stated in the underlying funds’ current prospectuses, were as follows: |
| | | | |
Free Market U.S.
Equity Fund | | Free Market International
Equity Fund | | Free Market Fixed
Income Fund |
| 0.01%-0.13% | | 0.01%-0.27% | | 0.01%-0.07% |
Each Fund’s ending account values on the first line in each table are based on the actual six-month total return for each Fund of 2.33% for the Free Market U.S. Equity Fund, -4.84% for the Free Market International Equity Fund and 0.57% for the Free Market Fixed Income Fund.
5
FREE MARKET FUNDS
FREE MARKET U.S. EQUITY FUND
Portfolio of Investments
February 28, 2015
(Unaudited)
| | | | | | | | |
| | | Number
of Shares | | | Value | |
| | |
EQUITY FUNDS — 99.9% | | | | | | | | |
U.S. Large Cap Value
Portfolio III(a) | | | 24,897,233 | | | $ | 618,696,237 | |
U.S. Large Company Portfolio(a) | | | 18,511,165 | | | | 308,025,780 | |
U.S. Micro Cap Portfolio(b) | | | 15,853,567 | | | | 309,620,170 | |
U.S. Small Cap Portfolio(b) | | | 9,746,325 | | | | 310,225,512 | |
U.S. Small Cap Value Portfolio(b) | | | 14,684,251 | | | | 516,885,648 | |
| | | | | | | | |
TOTAL EQUITY FUNDS (Cost $1,459,850,956) | | | | | | | 2,063,453,347 | |
| | | | | | | | |
TOTAL INVESTMENTS — 99.9%
(Cost $1,459,850,956) | | | | 2,063,453,347 | |
| | | | | | | | |
OTHER ASSETS IN EXCESS OF LIABILITIES — 0.1% | | | | | | | 1,063,415 | |
| | | | | | | | |
NET ASSETS — 100.0% | | | | | | $ | 2,064,516,762 | |
| | | | | | | | |
Portfolio Holdings Summary Table
| | | | | | | | |
| | | % of
Net Assets | | | Value | |
Equity Funds | | | 99.9% | | | $ | 2,063,453,347 | |
Other Assets In Excess Of Liabilities | | | 0.1% | | | | 1,063,415 | |
| | | | | | | | |
NET ASSETS | | | 100.0% | | | $ | 2,064,516,762 | |
| | | | | | | | |
| (a) | A portfolio of Dimensional Investment Group Inc. |
| (b) | A portfolio of DFA Investment Dimensions Group Inc. |
Portfolio holdings are subject to change at any time.
The accompanying notes are an integral part of the financial statements.
6
FREE MARKET FUNDS
FREE MARKET INTERNATIONAL EQUITY FUND
Portfolio of Investments
February 28, 2015
(Unaudited)
| | | | | | | | |
| | | Number
of Shares | | | Value | |
| |
INTERNATIONAL EQUITY FUNDS — 99.9% | | | | | |
Asia Pacific Small Company Portfolio(a) | | | 911,587 | | | $ | 18,878,959 | |
Canadian Small Company Series(b) | | | 1,830,716 | | | | 18,307,162 | |
Continental Small Company Portfolio(a) | | | 1,461,065 | | | | 30,054,107 | |
Continental Small Company Series(b) | | | 248,909 | | | | 16,026,411 | |
DFA International Small Cap Value Portfolio(a) | | | 30,179,670 | | | | 599,368,241 | |
DFA International Value
Portfolio III(c) | | | 27,376,300 | | | | 445,138,633 | |
Emerging Markets Portfolio(a) | | | 2,954,262 | | | | 76,692,650 | |
Emerging Markets Small Cap Portfolio(a) | | | 3,459,885 | | | | 71,723,408 | |
Emerging Markets Value Portfolio(a) | | | 2,705,582 | | | | 71,562,634 | |
Japanese Small Company Portfolio(a) | | | 1,711,852 | | | | 33,363,998 | |
Large Cap International Portfolio(a) | | | 3,350,173 | | | | 73,636,792 | |
United Kingdom Small Company Portfolio(a) | | | 206,187 | | | | 7,294,882 | |
United Kingdom Small Company Series(b) | | | 322,040 | | | | 20,452,776 | |
| | | | | | | | |
TOTAL INTERNATIONAL EQUITY FUNDS (Cost $1,339,693,280) | | | | | | | 1,482,500,653 | |
| | | | | | | | |
TOTAL INVESTMENTS — 99.9% (Cost $1,339,693,280) | | | | 1,482,500,653 | |
| | | | | | | | |
OTHER ASSETS IN EXCESS OF LIABILITIES — 0.1% | | | | | | | 1,479,635 | |
| | | | | | | | |
NET ASSETS — 100.0% | | | | | | $ | 1,483,980,288 | |
| | | | | | | | |
Portfolio Holdings Summary Table
| | | | | | | | |
| | | % of
Net Assets | | | Value | |
International Equity Funds | | | 99.9 | % | | $ | 1,482,500,653 | |
Other Assets In Excess Of Liabilities | | | 0.1 | % | | | 1,479,635 | |
| | | | | | | | |
NET ASSETS | | | 100.0 | % | | $ | 1,483,980,288 | |
| | | | | | | | |
| (a) | A portfolio of DFA Investment Dimensions Group Inc. |
| (b) | A portfolio of DFA Investment Trust Company. |
| (c) | A portfolio of Dimensional Investment Group Inc. |
Portfolio holdings are subject to change at any time.
The accompanying notes are an integral part of the financial statements.
7
FREE MARKET FUNDS
FREE MARKET FIXED INCOME FUND
Portfolio of Investments
February 28, 2015
(Unaudited)
| | | | | | | | |
| | | Number
of Shares | | | Value | |
| |
FIXED INCOME FUNDS — 99.5% | | | | | |
DFA Five-Year Global Fixed Income Portfolio(a) | | | 43,683,814 | | | $ | 481,832,466 | |
DFA Inflation-Protected Securities Portfolio(a) | | | 8,206,409 | | | | 97,245,948 | |
DFA Intermediate Government Fixed Income Portfolio(a) | | | 18,221,013 | | | | 231,224,654 | |
DFA One-Year Fixed Income Portfolio(a) | | | 45,670,025 | | | | 471,314,656 | |
DFA Short-Term Government Portfolio(a) | | | 14,397,239 | | | | 154,050,462 | |
DFA Two-Year Global Fixed Income Portfolio(a) | | | 48,518,027 | | | | 481,298,826 | |
| | | | | | | | |
TOTAL FIXED INCOME FUNDS (Cost $1,925,663,922) | | | | | | | 1,916,967,012 | |
| | | | | | | | |
TOTAL INVESTMENTS — 99.5% (Cost $1,925,663,922) | | | | | | | 1,916,967,012 | |
| | | | | | | | |
OTHER ASSETS IN EXCESS OF LIABILITIES — 0.5% | | | | | | | 8,792,038 | |
| | | | | | | | |
NET ASSETS — 100.0% | | | | | | $ | 1,925,759,050 | |
| | | | | | | | |
Portfolio Holdings Summary Table
| | | | | | | | |
| | | % of
Net Assets | | | Value | |
Fixed Income Funds | | | 99.5% | | | $ | 1,916,967,012 | |
Other Assets In Excess Of Liabilities | | | 0.5% | | | | 8,792,038 | |
| | | | | | | | |
NET ASSETS | | | 100.0% | | | $ | 1,925,759,050 | |
| | | | | | | | |
| (a) | A portfolio of DFA Investment Dimensions Group Inc. |
Portfolio holdings are subject to change at any time.
The accompanying notes are an integral part of the financial statements.
8
FREE MARKET FUNDS
Statements of Assets and Liabilities
February 28, 2015
(Unaudited)
| | | | | | | | | | | | |
| | | Free Market
U.S. Equity
Fund | | | Free Market
International
Equity Fund | | | Free Market
Fixed Income
Fund | |
ASSETS | | | | | | | | | | | | |
Investments in non-affiliated funds, at value † | | $ | 2,063,453,347 | | | $ | 1,482,500,653 | | | $ | 1,916,967,012 | |
Cash and cash equivalents | | | 3,467,849 | | | | 3,246,899 | | | | 11,689,120 | |
Receivables | | | | | | | | | | | | |
Receivable for investments sold | | | 228,367 | | | | 157,514 | | | | 218,375 | |
Receivable for capital shares sold | | | 1,290,467 | | | | 1,058,846 | | | | 1,082,610 | |
Dividends and interest receivable | | | 38 | | | | 19 | | | | 80 | |
Prepaid expenses and other assets | | | 88,663 | | | | 69,548 | | | | 88,727 | |
| | | | | | | | | | | | |
Total assets | | | 2,068,528,731 | | | | 1,487,033,479 | | | | 1,930,045,924 | |
| | | | | | | | | | | | |
LIABILITIES | | | | | | | | | | | | |
Payables | | | | | | | | | | | | |
Investments purchased | | | 2,100,000 | | | | 1,800,000 | | | | 2,437,805 | |
Capital shares redeemed | | | 777,965 | | | | 479,535 | | | | 749,824 | |
Advisory fees | | | 772,048 | | | | 508,949 | | | | 728,278 | |
Administration and accounting fees | | | 73,340 | | | | 72,288 | | | | 91,222 | |
Transfer agent fees | | | 115,014 | | | | 68,565 | | | | 101,950 | |
Other accrued expenses and liabilities | | | 173,602 | | | | 123,854 | | | | 177,795 | |
| | | | | | | | | | | | |
Total liabilities | | | 4,011,969 | | | | 3,053,191 | | | | 4,286,874 | |
| | | | | | | | | | | | |
Net Assets | | $ | 2,064,516,762 | | | $ | 1,483,980,288 | | | $ | 1,925,759,050 | |
| | | | | | | | | | | | |
NET ASSETS CONSISTS OF | | | | | | | | | | | | |
Par value | | $ | 121,039 | | | $ | 149,121 | | | $ | 187,601 | |
Paid-in capital | | | 1,386,454,028 | | | | 1,336,095,897 | | | | 1,933,562,305 | |
Accumulated net investment loss | | | (2,326,260 | ) | | | (1,599,861 | ) | | | (2,610,719 | ) |
Accumulated net realized gain from investments | | | 76,665,564 | | | | 6,527,758 | | | | 3,316,773 | |
Net unrealized appreciation/(depreciation) on investments | | | 603,602,391 | | | | 142,807,373 | | | | (8,696,910 | ) |
| | | | | | | | | | | | |
Net Assets | | $ | 2,064,516,762 | | | $ | 1,483,980,288 | | | $ | 1,925,759,050 | |
| | | | | | | | | | | | |
Shares outstanding ($0.001 par value, 300,000,000 shares authorized) | | | 121,039,394 | | | | 149,121,414 | | | | 187,601,064 | |
| | | | | | | | | | | | |
Net asset value, offering and redemption price per share | | $ | 17.06 | | | $ | 9.95 | | | $ | 10.27 | |
| | | | | | | | | | | | |
† Investment in non-affiliated funds, at cost | | $ | 1,459,850,956 | | | $ | 1,339,693,280 | | | $ | 1,925,663,922 | |
| | | | | | | | | | | | |
The accompanying notes are an integral part of the financial statements.
9
FREE MARKET FUNDS
Statements of Operations
For the Six Months Ended February 28, 2015
(Unaudited)
| | | | | | | | | | | | |
| | | Free Market
U.S. Equity
Fund | | | Free Market
International
Equity Fund | | | Free Market
Fixed Income
Fund | |
Investment Income | | | | | | | | | | | | |
Dividends from non-affiliated funds | | $ | 15,098,217 | | | $ | 20,178,851 | | | $ | 15,638,510 | |
Interest from non-affiliated funds | | | 241 | | | | 139 | | | | 528 | |
| | | | | | | | | | | | |
Total investment income | | | 15,098,458 | | | | 20,178,990 | | | | 15,639,038 | |
| | | | | | | | | | | | |
| | | |
Expenses | | | | | | | | | | | | |
Advisory fees (Note 2) | | | 4,813,635 | | | | 3,390,670 | | | | 4,625,450 | |
Administration and accounting fees (Note 2) | | | 441,597 | | | | 400,184 | | | | 445,201 | |
Transfer agent fees (Note 2) | | | 248,892 | | | | 176,505 | | | | 239,505 | |
Professional fees | | | 117,272 | | | | 88,698 | | | | 115,315 | |
Printing and shareholder reporting fees | | | 102,347 | | | | 57,693 | | | | 93,444 | |
Custodian fees (Note 2) | | | 60,276 | | | | 46,639 | | | | 59,149 | |
Directors’ and officers’ fees | | | 36,031 | | | | 30,496 | | | | 35,204 | |
Other expenses | | | 79,291 | | | | 106,761 | | | | 98,718 | |
| | | | | | | | | | | | |
Total expenses | | | 5,899,341 | | | | 4,297,646 | | | | 5,711,986 | |
| | | | | | | | | | | | |
Net investment income | | | 9,199,117 | | | | 15,881,344 | | | | 9,927,052 | |
| | | | | | | | | | | | |
| | | |
Net realized and unrealized gain from investments | | | | | | | | | | | | |
Net realized gain from: | | | | | | | | | | | | |
Non-affiliated funds | | | 17,518,553 | | | | 2,014,637 | | | | 506,459 | |
Capital gain distributions from non-affiliated fund investments | | | 70,579,654 | | | | 18,347,299 | | | | 3,354,447 | |
Net change in unrealized depreciation on: | | | | | | | | | | | | |
Non-affiliated funds | | | (50,214,613 | ) | | | (99,739,944 | ) | | | (4,280,966 | ) |
| | | | | | | | | | | | |
Net realized and unrealized gain/(loss) on investments | | | 37,883,594 | | | | (79,378,008 | ) | | | (420,060 | ) |
| | | | | | | | | | | | |
Net increase/(decrease) in net assets resulting from operations | | $ | 47,082,711 | | | $ | (63,496,664 | ) | | $ | 9,506,992 | |
| | | | | | | | | | | | |
The accompanying notes are an integral part of the financial statements.
10
FREE MARKET U.S. EQUITY FUND
Statements of Changes in Net Assets
| | | | | | | | |
| | | For the
Six Months Ended
February 28, 2015
(Unaudited) | | | For the
Year Ended
August 31, 2014 | |
Increase in net assets from operations: | | | | | | | | |
Net investment income | | $ | 9,199,117 | | | $ | 9,008,786 | |
Net realized gain from investments | | | 88,098,207 | | | | 66,531,162 | |
Net change in unrealized appreciation/(depreciation) from investments | | | (50,214,613 | ) | | | 247,588,404 | |
| | | | | | | | |
Net increase in net assets resulting from operations | | | 47,082,711 | | | | 323,128,352 | |
| | | | | | | | |
| | |
Dividends and distributions to shareholders from: | | | | | | | | |
Net investment income | | | (12,868,563 | ) | | | (9,536,519 | ) |
Net realized capital gains | | | (69,294,465 | ) | | | (44,315,396 | ) |
| | | | | | | | |
Net decrease in net assets from dividends and distributions to shareholders | | | (82,163,028 | ) | | | (53,851,915 | ) |
| | | | | | | | |
| | |
Capital share transactions: | | | | | | | | |
Proceeds from shares sold | | | 230,112,528 | | | | 515,748,465 | |
Reinvestment of distributions | | | 82,140,004 | | | | 53,851,915 | |
Shares redeemed | | | (156,097,409 | ) | | | (251,088,223 | ) |
| | | | | | | | |
Net increase in net assets from capital shares | | | 156,155,123 | | | | 318,512,157 | |
| | | | | | | | |
Total increase in net assets | | | 121,074,806 | | | | 587,788,594 | |
| | | | | | | | |
| | |
Net assets: | | | | | | | | |
Beginning of period | | | 1,943,441,956 | | | | 1,355,653,362 | |
| | | | | | | | |
End of period | | $ | 2,064,516,762 | | | $ | 1,943,441,956 | |
| | | | | | | | |
Undistributed/accumulated net investment income/(loss), end of period | | $ | (2,326,260 | ) | | $ | 1,343,186 | |
| | | | | | | | |
| | |
Capital share transactions: | | | | | | | | |
Shares sold | | | 13,662,140 | | | | 31,414,367 | |
Dividends and distributions reinvested | | | 4,843,161 | | | | 3,277,658 | |
Shares redeemed | | | (9,325,311 | ) | | | (15,298,894 | ) |
| | | | | | | | |
Net increase in shares outstanding | | | 9,179,990 | | | | 19,393,131 | |
| | | | | | | | |
The accompanying notes are an integral part of the financial statements.
11
FREE MARKET INTERNATIONAL EQUITY FUND
Statements of Changes in Net Assets
| | | | | | | | |
| | | For the
Six Months Ended
February 28, 2015
(Unaudited) | | | For the
Year Ended
August 31, 2014 | |
Increase/decrease in net assets from operations: | | | | | | | | |
Net investment income | | $ | 15,881,344 | | | $ | 22,646,918 | |
Net realized gain from investments | | | 20,361,936 | | | | 29,805,092 | |
Net change in unrealized appreciation/(depreciation) from investments | | | (99,739,944 | ) | | | 154,746,684 | |
| | | | | | | | |
Net increase/(decrease) in net assets resulting from operations | | | (63,496,664 | ) | | | 207,198,694 | |
| | | | | | | | |
| | |
Dividends and distributions to shareholders from: | | | | | | | | |
Net investment income | | | (30,251,548 | ) | | | (21,275,248 | ) |
Net realized capital gains | | | (27,870,005 | ) | | | (16,001,172 | ) |
| | | | | | | | |
Net decrease in net assets from dividends and distributions to shareholders | | | (58,121,553 | ) | | | (37,276,420 | ) |
| | | | | | | | |
| | |
Capital share transactions: | | | | | | | | |
Proceeds from shares sold | | | 206,048,538 | | | | 391,563,874 | |
Reinvestment of distributions | | | 58,105,492 | | | | 37,276,420 | |
Shares redeemed | | | (73,173,727 | ) | | | (148,239,892 | ) |
| | | | | | | | |
Net increase in net assets from capital shares | | | 190,980,303 | | | | 280,600,402 | |
| | | | | | | | |
Total increase in net assets | | | 69,362,086 | | | | 450,522,676 | |
| | | | | | | | |
| | |
Net assets: | | | | | | | | |
Beginning of period | | | 1,414,618,202 | | | | 964,095,526 | |
| | | | | | | | |
End of period | | $ | 1,483,980,288 | | | $ | 1,414,618,202 | |
| | | | | | | | |
Undistributed/accumulated net investment income/(loss), end of period | | $ | (1,599,861 | ) | | $ | 12,770,343 | |
| | | | | | | | |
| | |
Capital share transactions: | | | | | | | | |
Shares sold | | | 20,813,782 | | | | 36,958,338 | |
Dividends and distributions reinvested | | | 6,168,311 | | | | 3,594,640 | |
Shares redeemed | | | (7,438,413 | ) | | | (13,995,432 | ) |
| | | | | | | | |
Net increase in shares outstanding | | | 19,543,680 | | | | 26,557,546 | |
| | | | | | | | |
The accompanying notes are an integral part of the financial statements.
12
FREE MARKET FIXED INCOME FUND
Statements of Changes in Net Assets
| | | | | | | | |
| | | For the
Six Months Ended
February 28, 2015
(Unaudited) | | | For the
Year Ended
August 31, 2014 | |
Increase in net assets from operations: | | | | | | | | |
Net investment income | | $ | 9,927,052 | | | $ | 5,784,700 | |
Net realized gain from investments | | | 3,860,906 | | | | 5,965,336 | |
Net change in unrealized appreciation/(depreciation) from investments | | | (4,280,966 | ) | | | 8,828,057 | |
| | | | | | | | |
Net increase in net assets resulting from operations | | | 9,506,992 | | | | 20,578,093 | |
| | | | | | | | |
| | |
Dividends and distributions to shareholders from: | | | | | | | | |
Net investment income | | | (12,641,658 | ) | | | (6,397,117 | ) |
Net realized capital gains | | | (5,364,149 | ) | | | (3,094,776 | ) |
| | | | | | | | |
Net decrease in net assets from dividends and distributions to shareholders | | | (18,005,807 | ) | | | (9,491,893 | ) |
| | | | | | | | |
| | |
Capital share transactions: | | | | | | | | |
Proceeds from shares sold | | | 247,175,160 | | | | 654,712,458 | |
Reinvestment of distributions | | | 18,003,175 | | | | 9,491,893 | |
Shares redeemed | | | (155,553,455 | ) | | | (167,456,841 | ) |
| | | | | | | | |
Net increase in net assets from capital shares | | | 109,624,880 | | | | 496,747,510 | |
| | | | | | | | |
Total increase in net assets | | | 101,126,065 | | | | 507,833,710 | |
| | | | | | | | |
| | |
Net assets: | | | | | | | | |
Beginning of period | | | 1,824,632,985 | | | | 1,316,799,275 | |
| | | | | | | | |
End of period | | $ | 1,925,759,050 | | | $ | 1,824,632,985 | |
| | | | | | | | |
Undistributed/accumulated net investment income/(loss), end of period | | $ | (2,610,719 | ) | | $ | 103,887 | |
| | | | | | | | |
| | |
Capital share transactions: | | | | | | | | |
Shares sold | | | 24,018,194 | | | | 63,714,255 | |
Dividends and distributions reinvested | | | 1,762,515 | | | | 928,801 | |
Shares redeemed | | | (15,115,589 | ) | | | (16,292,693 | ) |
| | | | | | | | |
Net increase in shares outstanding | | | 10,665,120 | | | | 48,350,363 | |
| | | | | | | | |
The accompanying notes are an integral part of the financial statements.
13
FREE MARKET FUNDS
FREE MARKET U.S. EQUITY FUND
Financial Highlights
Contained below is per share operating performance data for each share outstanding, total investment return, ratios to average net assets and other supplemental data for the respective periods. This information has been derived from information provided in the financial statements.
| | | | | | | | | | | | | | | | | | | | | | | | |
| | | For the
Six Months Ended
February 28, 2015
(Unaudited) | | | For the
Year Ended
August 31, 2014 | | | For the
Year Ended
August 31, 2013 | | | For the
Year Ended
August 31, 2012 | | | For the
Year Ended
August 31, 2011 | | | For the
Year Ended
August 31, 2010 | |
Per Share Operating Performance | | | | | | | | | | | | | | | | | | | | | | | | |
Net asset value, beginning of period | | $ | 17.37 | | | $ | 14.66 | | | $ | 11.70 | | | $ | 10.33 | | | $ | 8.65 | | | $ | 8.21 | |
| | | | | | | | | | | | | | | | | | | | | | | | |
Net investment income(1) | | | 0.08 | | | | 0.09 | | | | 0.12 | | | | 0.08 | | | | 0.06 | | | | 0.02 | |
Net realized and unrealized gain on investments | | | 0.32 | | | | 3.18 | | | | 3.07 | | | | 1.43 | | | | 1.68 | | | | 0.46 | |
| | | | | | | | | | | | | | | | | | | | | | | | |
Net increase in net assets resulting from operations | | | 0.40 | | | | 3.27 | | | | 3.19 | | | | 1.51 | | | | 1.74 | | | | 0.48 | |
| | | | | | | | | | | | | | | | | | | | | | | | |
Dividends and distributions to shareholders from: | | | | | | | | | | | | | | | | | | | | | | | | |
Net investment income | | | (0.11 | ) | | | (0.10 | ) | | | (0.15 | ) | | | (0.06 | ) | | | (0.06 | ) | | | (0.03 | ) |
Net realized capital gains | | | (0.60 | ) | | | (0.46 | ) | | | (0.08 | ) | | | (0.08 | ) | | | — | (2) | | | — | |
Tax return of capital | | | — | | | | — | | | | — | | | | — | | | | — | | | | (0.01 | ) |
| | | | | | | | | | | | | | | | | | | | | | | | |
Total dividends and distributions to shareholders | | | (0.71 | ) | | | (0.56 | ) | | | (0.23 | ) | | | (0.14 | ) | | | (0.06 | ) | | | (0.04 | ) |
| | | | | | | | | | | | | | | | | | | | | | | | |
Net asset value, end of period | | $ | 17.06 | | | $ | 17.37 | | | $ | 14.66 | | | $ | 11.70 | | | $ | 10.33 | | | $ | 8.65 | |
| | | | | | | | | | | | | | | | | | | | | | | | |
Total investment return(3) | | | 2.33 | %(4) | | | 22.49 | % | | | 27.61 | % | | | 14.77 | % | | | 20.11 | % | | | 5.88 | % |
| | | | | | | | | | | | | | | | | | | | | | | | |
| | | | | | |
Ratio/Supplemental Data | | | | | | | | | | | | | | | | | | | | | | | | |
Net assets, end of period (000’s omitted) | | $ | 2,064,517 | | | $ | 1,943,442 | | | $ | 1,355,653 | | | $ | 933,514 | | | $ | 679,147 | | | $ | 485,191 | |
Ratio of expenses to average net assets(5) | | | 0.61 | %(6) | | | 0.60 | % | | | 0.62 | % | | | 0.64 | % | | | 0.64 | % | | | 0.67 | % |
Ratio of net investment income to average net assets(5) | | | 0.95 | %(6) | | | 0.54 | % | | | 0.91 | % | | | 0.73 | % | | | 0.55 | % | | | 0.22 | % |
Portfolio turnover rate | | | 2 | %(4) | | | 3 | % | | | 6 | % | | | 4 | % | | | 9 | % | | | 3 | % |
| (1) | The selected per share data was calculated using the average shares outstanding method for the period. |
| (2) | Amount less than $(0.005) per share. |
| (3) | Total investment return is calculated by assuming a purchase of shares on the first day and a sale of shares on the last day of each period reported and includes reinvestments of dividends and distributions, if any. |
| (5) | The Fund also will indirectly bear its prorated share of expenses of the underlying funds. Such expenses are not included in the calculation of this ratio. |
The accompanying notes are an integral part of the financial statements.
14
FREE MARKET FUNDS
FREE MARKET INTERNATIONAL EQUITY FUND
Financial Highlights
Contained below is per share operating performance data for each share outstanding, total investment return, ratios to average net assets and other supplemental data for the respective periods. This information has been derived from information provided in the financial statements.
| | | | | | | | | | | | | | | | | | | | | | | | |
| | | For the
Six Months Ended
February 28, 2015
(Unaudited) | | | For the
Year Ended
August 31, 2014 | | | For the
Year Ended
August 31, 2013 | | | For the
Year Ended
August 31, 2012 | | | For the
Year Ended
August 31, 2011 | | | For the
Year Ended
August 31, 2010 | |
Per Share Operating Performance | | | | | | | | | | | | | | | | | | | | | | | | |
Net asset value, beginning of period | | $ | 10.92 | | | $ | 9.36 | | | $ | 8.04 | | | $ | 8.78 | | | $ | 7.97 | | | $ | 8.02 | |
| | | | | | | | | | | | | | | | | | | | | | | | |
Net investment income(1) | | | 0.11 | | | | 0.19 | | | | 0.18 | | | | 0.18 | | | | 0.16 | | | | 0.11 | |
Net realized and unrealized gain/(loss) on investments | | | (0.66 | ) | | | 1.71 | | | | 1.36 | | | | (0.64 | ) | | | 0.78 | | | | (0.04 | ) |
| | | | | | | | | | | | | | | | | | | | | | | | |
Net increase/(decrease) in net assets resulting from operations | | | (0.55 | ) | | | 1.90 | | | | 1.54 | | | | (0.46 | ) | | | 0.94 | | | | 0.07 | |
| | | | | | | | | | | | | | | | | | | | | | | | |
Dividends and distributions to shareholders from: | | | | | | | | | | | | | | | | | | | | | | | | |
Net investment income | | | (0.22 | ) | | | (0.19 | ) | | | (0.15 | ) | | | (0.17 | ) | | | (0.13 | ) | | | (0.09 | ) |
Net realized capital gains | | | (0.20 | ) | | | (0.15 | ) | | | (0.07 | ) | | | (0.11 | ) | | | — | | | | (0.03 | ) |
| | | | | | | | | | | | | | | | | | | | | | | | |
Total dividends and distributions to shareholders | | | (0.42 | ) | | | (0.34 | ) | | | (0.22 | ) | | | (0.28 | ) | | | (0.13 | ) | | | (0.12 | ) |
| | | | | | | | | | | | | | | | | | | | | | | | |
Net asset value, end of period | | $ | 9.95 | | | $ | 10.92 | | | $ | 9.36 | | | $ | 8.04 | | | $ | 8.78 | | | $ | 7.97 | |
| | | | | | | | | | | | | | | | | | | | | | | | |
Total investment return(2) | | | (4.84 | )%(3) | | | 20.49 | % | | | 19.44 | % | | | (4.98 | )% | | | 11.60 | % | | | 0.86 | % |
| | | | | | | | | | | | | | | | | | | | | | | | |
| | | | | | |
Ratio/Supplemental Data | | | | | | | | | | | | | | | | | | | | | | | | |
Net assets, end of period (000’s omitted) | | $ | 1,483,980 | | | $ | 1,414,618 | | | $ | 964,096 | | | $ | 648,710 | | | $ | 516,073 | | | $ | 365,465 | |
Ratio of expenses to average net assets(4) | | | 0.63 | %(5) | | | 0.62 | % | | | 0.65 | % | | | 0.65 | % | | | 0.66 | % | | | 0.68 | % |
Ratio of net investment income to average net assets(4) | | | 2.33 | %(5) | | | 1.84 | % | | | 1.96 | % | | | 2.21 | % | | | 1.66 | % | | | 1.29 | % |
Portfolio turnover rate | | | 0 | %(3) | | | 2 | % | | | 3 | % | | | 3 | % | | | 4 | % | | | 8 | % |
| (1) | The selected per share data was calculated using the average shares outstanding method for the period. |
| (2) | Total investment return is calculated by assuming a purchase of shares on the first day and a sale of shares on the last day of each period reported and includes reinvestments of dividends and distributions, if any. |
| (4) | The Fund also will indirectly bear its prorated share of expenses of the underlying funds. Such expenses are not included in the calculation of this ratio. |
The accompanying notes are an integral part of the financial statements.
15
FREE MARKET FUNDS
FREE MARKET FIXED INCOME FUND
Financial Highlights
Contained below is per share operating performance data for each share outstanding, total investment return, ratios to average net assets and other supplemental data for the respective periods. This information has been derived from information provided in the financial statements.
| | | | | | | | | | | | | | | | | | | | | | | | |
| | | For the
Six Months Ended
February 28, 2015
(Unaudited) | | | For the
Year Ended
August 31, 2014 | | | For the
Year Ended
August 31, 2013 | | | For the
Year Ended
August 31, 2012 | | | For the
Year Ended
August 31, 2011 | | | For the
Year Ended
August 31, 2010 | |
Per Share Operating Performance | | | | | | | | | | | | | | | | | | | | | | | | |
Net asset value, beginning of period | | $ | 10.31 | | | $ | 10.24 | | | $ | 10.54 | | | $ | 10.48 | | | $ | 10.50 | | | $ | 10.35 | |
| | | | | | | | | | | | | | | | | | | | | | | | |
Net investment income(1) | | | 0.05 | | | | 0.04 | | | | 0.05 | | | | 0.11 | | | | 0.12 | | | | 0.13 | |
Net realized and unrealized gain/(loss) on investments | | | 0.01 | | | | 0.09 | | | | (0.21 | ) | | | 0.09 | | | | 0.09 | | | | 0.27 | |
| | | | | | | | | | | | | | | | | | | | | | | | |
Net increase/(decrease) in net assets resulting from operations | | | 0.06 | | | | 0.13 | | | | (0.16 | ) | | | 0.20 | | | | 0.21 | | | | 0.40 | |
| | | | | | | | | | | | | | | | | | | | | | | | |
Dividends and distributions to shareholders from: | | | | | | | | | | | | | | | | | | | | | | | | |
Net investment income | | | (0.07 | ) | | | (0.04 | ) | | | (0.08 | ) | | | (0.14 | ) | | | (0.22 | ) | | | (0.21 | ) |
Net realized capital gains | | | (0.03 | ) | | | (0.02 | ) | | | (0.06 | ) | | | — | (2) | | | — | (2) | | | (0.04 | ) |
Tax return of capital | | | — | | | | — | | | | — | | | | — | | | | (0.01 | ) | | | — | |
| | | | | | | | | | | | | | | | | | | | | | | | |
Total dividends and distributions to shareholders | | | (0.10 | ) | | | (0.06 | ) | | | (0.14 | ) | | | (0.14 | ) | | | (0.23 | ) | | | (0.25 | ) |
| | | | | | | | | | | | | | | | | | | | | | | | |
Net asset value, end of period | | $ | 10.27 | | | $ | 10.31 | | | $ | 10.24 | | | $ | 10.54 | | | $ | 10.48 | | | $ | 10.50 | |
| | | | | | | | | | | | | | | | | | | | | | | | |
Total investment return(3) | | | 0.57 | %(4) | | | 1.34 | % | | | (1.50 | )% | | | 1.90 | % | | | 2.06 | % | | | 3.96 | % |
| | | | | | | | | | | | | | | | | | | | | | | | |
| | | | | | |
Ratio/Supplemental Data | | | | | | | | | | | | | | | | | | | | | | | | |
Net assets, end of period (000’s omitted) | | $ | 1,925,759 | | | $ | 1,824,633 | | | $ | 1,316,799 | | | $ | 946,975 | | | $ | 761,683 | | | $ | 459,282 | |
Ratio of expenses to average net assets(5) | | | 0.61 | %(6) | | | 0.61 | % | | | 0.62 | % | | | 0.63 | % | | | 0.65 | % | | | 0.68 | % |
Ratio of net investment income to average net assets(5) | | | 1.06 | %(6) | | | 0.37 | % | | | 0.52 | % | | | 1.08 | % | | | 1.12 | % | | | 1.31 | % |
Portfolio turnover rate | | | 1 | %(4) | | | 0 | % | | | 0 | % | | | 1 | % | | | 0 | % | | | 1 | % |
| (1) | The selected per share data was calculated using the average shares outstanding method for the period. |
| (2) | Amount less than $(0.005) per share. |
| (3) | Total investment return is calculated by assuming a purchase of shares on the first day and a sale of shares on the last day of each period reported and includes reinvestments of dividends and distributions, if any. |
| (5) | The Fund also will indirectly bear its prorated share of expenses of the underlying funds. Such expenses are not included in the calculation of this ratio. |
The accompanying notes are an integral part of the financial statements.
16
FREE MARKET FUNDS
Notes to Financial Statements
February 28, 2015
(Unaudited)
| 1. | Organization and Significant Accounting Policies |
The RBB Fund, Inc. (“RBB” or the “Company”) was incorporated under the laws of the State of Maryland on February 29, 1988 and is registered under the Investment Company Act of 1940, as amended (the “1940 Act”), as an open-end management investment company. RBB is a “series fund,” which is a mutual fund divided into separate portfolios. Each portfolio is treated as a separate entity for certain matters under the 1940 Act, and for other purposes, and a shareholder of one portfolio is not deemed to be a shareholder of any other portfolio. Currently, RBB has twenty-two active investment portfolios, including the Free Market U.S. Equity Fund, the Free Market International Equity Fund, and the Free Market Fixed Income Fund (each a “Fund,” collectively the “Funds”). Each Fund operates as a “Fund of Funds” and commenced investment operations on December 31, 2007.
RBB has authorized capital of one hundred billion shares of common stock of which 82.373 billion shares are currently classified into one hundred and fifty-three classes of common stock. Each class represents an interest in an active or inactive RBB investment portfolio.
PORTFOLIO VALUATION — Investments in the underlying funds are valued at each fund’s net asset value determined as of the close of business on the New York Stock Exchange (generally 4:00 p.m. Eastern time). As required, some securities and assets may be valued at fair value as determined in good faith by the Company’s Board of Directors. Direct investments in fixed income securities having a remaining maturity of 60 days or less are valued at amortized cost, which approximates market value.
FAIR VALUE MEASUREMENTS — The inputs and valuations techniques used to measure fair value of the Funds’ investments are summarized into three levels as described in the hierarchy below:
| | • Level 1 — | quoted prices in active markets for identical securities; |
| | • Level 2 — | other significant observable inputs (including quoted prices for similar securities, interest rates, prepayment speeds, credit risk, etc.); and |
| | • Level 3 — | significant unobservable inputs (including the Funds’ own assumptions in determining the fair value of investments). |
The inputs or methodology used for valuing securities are not necessarily an indication of the risk associated with investing in those securities.
The following is a summary of the inputs used, as of February 28, 2015, in valuing the Funds’ investments carried at fair value:
FREE MARKET U.S. EQUITY FUND
| | | | | | | | | | | | | | | | |
| | | Total Value at
February 28, 2015 | | | Level 1
Quoted
Price | | | Level 2
Significant
Observable
Input | | | Level 3
Significant
Unobservable
Input | |
Investments in Securities* | | $ | 2,063,453,347 | | | $ | 2,063,453,347 | | | $ | — | | | $ | — | |
| | | | | | | | | | | | | | | | |
*Please refer to the Portfolio of Investments for further details.
FREE MARKET INTERNATIONAL EQUITY FUND
| | | | | | | | | | | | | | | | |
| | | Total Value at
February 28, 2015 | | | Level 1
Quoted
Price | | | Level 2
Significant
Observable
Input | | | Level 3
Significant
Unobservable
Input | |
Investments in Securities* | | $ | 1,482,500,653 | | | $ | 1,427,714,304 | | | $ | 54,786,349 | | | $ | — | |
| | | | | | | | | | | | | | | | |
*Please refer to the Portfolio of Investments for further details.
17
FREE MARKET FUNDS
Notes to Financial Statements (Continued)
February 28, 2015
(Unaudited)
FREE MARKET FIXED INCOME FUND
| | | | | | | | | | | | | | | | |
| | | Total Value at
February 28, 2015 | | | Level 1
Quoted
Price | | | Level 2
Significant
Observable
Input | | | Level 3
Significant
Unobservable
Input | |
Investments in Securities* | | $ | 1,916,967,012 | | | $ | 1,916,967,012 | | | $ | — | | | $ | — | |
| | | | | | | | | | | | | | | | |
*Please refer to the Portfolio of Investments for further details.
At the end of each quarter, management evaluates the classification of Levels 1, 2 and 3 assets and liabilities. Various factors are considered, such as changes in liquidity from the prior reporting period; whether or not a broker is willing to execute at the quoted price; the depth and consistency of prices from third party pricing services; and the existence of contemporaneous, observable trades in the market. Additionally, management evaluates the classification of Level 1 and Level 2 assets and liabilities on a quarterly basis for changes in listings or delistings on national exchanges.
Due to the inherent uncertainty of determining the fair value of investments that do not have a readily available market value, the fair value of the Funds’ investments may fluctuate from period to period. Additionally, the fair value of investments may differ significantly from the values that would have been used had a ready market existed for such investments and may differ materially from the values the Funds may ultimately realize. Further, such investments may be subject to legal and other restrictions on resale or otherwise less liquid than publicly traded securities.
For fair valuations using significant unobservable inputs, U.S. generally accepted accounting principles (“U.S. GAAP”) require each Fund to present a reconciliation of the beginning to ending balances for reported market values that presents changes attributable to total realized and unrealized gains or losses, purchase and sales, and transfers in and out of Level 3 during the period. Transfers in and out between Levels are based on values at the end of the period. U.S. GAAP also requires a Fund to disclose amounts and reasons for all transfers in and out of Level 1 and Level 2 fair value measurements. A reconciliation of Level 3 investments is presented only when a Fund had an amount of Level 3 investments at the end of the reporting period that was meaningful in relation to its net assets. The amounts and reasons for all transfers in and out of each Level within the three-tier hierarchy are disclosed when a Fund had an amount of total transfers during the reporting period that was meaningful in relation to its net assets as of the end of the reporting period.
For the six months ended February 28, 2015, there were no transfers between Level 1, 2 and 3 for the Funds.
USE OF ESTIMATES — The Funds are investment companies and, accordingly, follow the investment company accounting and reporting guidance under U.S. GAAP. The preparation of financial statements in conformity with U.S. GAAP requires management to make estimates and assumptions that affect the reported amounts of assets and liabilities and disclosure of contingent assets and liabilities at the date of the financial statements and the reported amounts of revenues and expenses during the period. Actual results could differ from those estimates and those differences could be significant.
INVESTMENT TRANSACTIONS, INVESTMENT INCOME AND EXPENSES — Transactions are accounted for on the trade date for financial reporting purposes. The cost of investments sold is determined by use of the specific identification method for both financial reporting and income tax purposes in determining realized gains and losses on investments. Interest income is accrued when earned. Dividend income is recorded on the ex-dividend date. Distributions received on securities that represent a return of capital or capital gain are recorded as a reduction of cost of investments and/or as a realized gain. The Funds estimate the components of distributions received that may be considered return of capital distributions or capital gain distributions. Each Fund’s investment income, expenses and unrealized and realized gains and losses are allocated daily. Expenses incurred on behalf of a specific class, fund or fund family of the Company are charged directly to the class, fund or fund family (in proportion to net assets). Expenses incurred for all of the RBB funds (such as director or professional fees) are charged to all funds in proportion to their average net assets of RBB, or in such other manner as the Company’s Board of Directors deems fair or equitable. Expenses and fees, including investment advisory and administration fees, are accrued daily and taken into account for the purpose of determining the net asset value of the Funds. In addition to the net
18
FREE MARKET FUNDS
Notes to Financial Statements (Continued)
February 28, 2015
(Unaudited)
annual operating expenses that the Funds bear directly, the shareholders indirectly bear the Funds’ pro-rata expenses of the underlying mutual funds in which each Fund invests.
DIVIDENDS AND DISTRIBUTIONS TO SHAREHOLDERS — Dividends from net investment income and distributions from net realized capital gains, if any, are declared and paid at least annually to shareholders and recorded on the ex-dividend date for all Funds with the exception of the Free Market Fixed Income Fund which declares and pays quarterly dividends from net investment income. Income dividends and capital gain distributions are determined in accordance with U.S. federal income tax regulations which may differ from U.S. GAAP.
U.S. TAX STATUS — No provision is made for U.S. income taxes as it is each Fund’s intention to qualify for and elect the tax treatment applicable to regulated investment companies under Subchapter M of the Internal Revenue Code of 1986, as amended, and make the requisite distributions to its shareholders which will be sufficient to relieve it from U.S. income and excise taxes.
CASH AND CASH EQUIVALENTS — The Funds consider liquid assets deposited with a bank demand deposit account to be cash equivalents. These investments represent amounts held with financial institutions that are readily accessible to pay Fund expenses or purchase investments. Cash and cash equivalents are valued at cost plus accrued interest, which approximates market value.
OTHER — In the normal course of business, the Funds may enter into contracts that provide general indemnifications. The Funds’ maximum exposure under these arrangements is dependent on claims that may be made against the Funds in the future, and, therefore, cannot be estimated; however, based on experience, the risk of material loss for such claims is considered remote.
| 2. | Investment Adviser and Other Services |
Matson Money, Inc. (“Matson Money” or the “Adviser”), serves as each Fund’s investment adviser. For its advisory services, Matson Money is entitled to receive 0.50% of the first $1 billion of each Fund’s average daily net assets, 0.49% of each Fund’s average daily net assets over $1 billion to $5 billion and 0.47% of each Fund’s average daily net assets over $5 billion, computed daily and payable monthly. The Adviser has voluntarily agreed to waive its advisory fee and/or reimburse expenses in order to limit Total Annual Operating Expenses to 1.13%, 1.35% and 1.00% of the average daily net assets of the Free Market U.S. Equity Fund, Free Market International Equity Fund and Free Market Fixed Income Fund, respectively. The Adviser may discontinue these arrangements at any time.
BNY Mellon Investment Servicing (US) Inc. (“BNY Mellon”), serves as administrator for the Funds. For providing administrative and accounting services, BNY Mellon is entitled to receive a monthly fee equal to an annual percentage rate of the Funds’ average daily net assets and is subject to certain minimum monthly fees.
Included in the administration and accounting services fees, shown on the Statement of Operations, are fees for providing regulatory administration services to RBB. For providing these services, BNY Mellon is entitled to receive compensation as agreed to by the Company and BNY Mellon. This fee is allocated to each portfolio of the Company in proportion to its net assets of the Company.
In addition, BNY Mellon serves as the Funds’ transfer and dividend disbursing agent. For providing transfer agent services, BNY Mellon is entitled to receive a monthly fee, subject to certain minimum, and out of pocket expenses.
The Bank of New York Mellon (the “Custodian”) provides certain custodial services to the Funds. The Custodian is entitled to receive a monthly fee, subject to certain minimum, and out of pocket expenses.
Foreside Funds Distributors LLC serves as the principal underwriter and distributor of the Funds’ shares pursuant to a Distribution Agreement with RBB. The Distributor is not affiliated with the Adviser, the Trust, or any other service provider.
19
FREE MARKET FUNDS
Notes to Financial Statements (Continued)
February 28, 2015
(Unaudited)
The Directors of the Company receive an annual retainer and meeting fees for meetings attended. The aggregate remuneration paid to the Directors by the Funds during the six months ended February 28, 2015 was $77,111. Certain employees of BNY Mellon serve as an Officer or Director of the Company. They are not compensated by the Funds or the Company.
| 4. | Investment in Securities |
For the six months ended February 28, 2015, aggregate purchases and sales of investment securities (excluding short-term investments) of the Funds were as follows:
| | | | | | | | |
| | | Purchases | | | Sales | |
Free Market U.S. Equity Fund | | $ | 193,082,978 | | | $ | 38,877,535 | |
Free Market International Equity Fund | | | 173,442,369 | | | | 2,384,691 | |
Free Market Fixed Income Fund | | | 122,206,528 | | | | 16,518,587 | |
| 5. | Federal Income Tax Information |
The Funds have followed the authoritative guidance on accounting for and disclosure of uncertainty in tax positions, which requires the Funds to determine whether a tax position is more likely than not to be sustained upon examination, including resolution of any related appeals or litigation processes, based on the technical merits of the position. The Funds have determined that there was no effect on the financial statements from following this authoritative guidance. In the normal course of business, the Funds are subject to examination by federal, state and local jurisdictions, where applicable, for tax years for which applicable statutes of limitations have not expired.
As of February 28, 2015, the federal tax cost, aggregate gross unrealized appreciation and depreciation of securities held by each Fund were as follows:
| | | | | | | | | | | | | | | | |
| | | Federal Tax
Cost | | | Unrealized
Appreciation | | | Unrealized
Depreciation | | | Net
Unrealized
Appreciation
(Depreciation) | |
Free Market U.S. Equity Fund | | $ | 1,459,850,956 | | | $ | 603,602,391 | | | $ | — | | | $ | 603,602,391 | |
Free Market International Equity Fund | | | 1,339,693,280 | | | | 154,911,025 | | | | (12,103,652 | ) | | | 142,807,373 | |
Free Market Fixed Income Fund | | | 1,925,663,922 | | | | 3,401,193 | | | | (12,098,103 | ) | | | (8,696,910 | ) |
Distributions to shareholders from net investment income and realized gains are determined in accordance with federal income tax regulations, which may differ from net investment income and realized gains recognized for financial reporting purposes. Accordingly, the character of distributions and composition of net assets for tax purposes may differ from those reflected in the accompanying financial statements. To the extent these differences are permanent, such amounts are reclassified within the capital accounts based on the tax treatment; temporary differences do not require such reclassification.
As of August 31, 2014, the components of distributable earnings on a tax basis were as follows:
| | | | | | | | | | | | | | | | |
| | | Undistributed
Ordinary Income | | | Undistributed
Long-Term
Capital Gains | | | Unrealized
Appreciation/
(Depreciation) | | | Other
Temporary
Differences | |
Free Market U.S. Equity Fund | | $ | 1,343,185 | | | $ | 63,083,422 | | | $ | 648,595,405 | | | $ | — | |
Free Market International Equity Fund | | | 12,058,652 | | | | 26,867,703 | | | | 230,427,132 | | | | — | |
Free Market Fixed Income Fund | | | 103,887 | | | | 4,990,390 | | | | (4,586,318 | ) | | | — | |
20
FREE MARKET FUNDS
Notes to Financial Statements (Continued)
February 28, 2015
(Unaudited)
The differences between the book and tax basis components of distributable earnings relate primarily to the timing of recognition of income and gains for federal income tax purposes. Short-term and foreign currency gains are reported as ordinary income for federal income tax purposes.
The tax characters of distributions paid during the fiscal year ended August 31, 2014 were as follows:
| | | | | | | | | | | | | | |
| | | | | Ordinary
Income | | | Long-Term
Gains | | | Total | |
Free Market U.S. Equity Fund | | | | $ | 9,536,519 | | | $ | 44,315,395 | | | $ | 53,851,914 | |
Free Market International Equity Fund | | | | | 21,275,248 | | | | 16,001,172 | | | | 37,276,420 | |
Free Market Fixed Income Fund | | | | | 6,397,117 | | | | 3,094,776 | | | | 9,491,893 | |
Distributions from net investment income and short term capital gains are treated as ordinary income for federal income tax purposes.
Under the Regulated Investment Company Modernization Act of 2010, the Funds are permitted to carry forward capital losses incurred in taxable years beginning after December 22, 2010 for an unlimited period. Any losses incurred during those future taxable years will be required to be utilized prior to any losses incurred in pre-enactment taxable years. Additionally, post-enactment capital losses that are carried forward will retain their character as either short-term or long-term capital losses rather than being considered all short-term as under the previous law. As of August 31, 2014, the Funds did not have any pre- or post-enactment capital loss carryforwards.
Management has evaluated the impact of all subsequent events on the Funds through the date the financial statements were issued, and has determined that there were no subsequent events requiring recognition or disclosure in the financial statements.
21
FREE MARKET FUNDS
Other Information
(Unaudited)
Proxy Voting
Policies and procedures that the Funds use to determine how to vote proxies relating to portfolio securities as well as information regarding how the Funds voted proxies relating to portfolio securities for the most recent 12-month period ended June 30 are available without charge, upon request, by calling Free Market Funds at (866) 780-0357, ext. 3863 and on the Securities and Exchange Commission’s (“SEC”) website at http://www.sec.gov.
Quarterly Portfolio Schedules
The Company files a complete schedule of portfolio holdings with the SEC for the first and third fiscal quarters of each fiscal year (quarters ended November 30 and May 31) on Form N-Q. The Company’s Form N-Q is available on the SEC website at http://www.sec.gov and may be reviewed and copied at the SEC Public Reference Room in Washington, D.C. Information on the operation of the SEC Public Reference Room may be obtained by calling (800) SEC-0330.
22
Investment Adviser
MATSON MONEY, INC.
5955 Deerfield Blvd.
Mason, OH 45040
Administrator
BNY Mellon Investment Servicing (US) Inc.
301 Bellevue Parkway
Wilmington, DE 19809
Transfer Agent
BNY Mellon Investment Servicing (US) Inc.
4400 Computer Drive
Westborough, MA 01581
Principal Underwriter
Foreside Funds Distributors LLC
400 Berwyn Park
899 Cassatt Road
Berwyn, PA 19312
Custodian
The Bank of New York Mellon
One Wall Street
New York, NY 10286
Independent Registered Public Accounting Firm
PricewaterhouseCoopers LLP
Two Commerce Square, Suite 1700
2001 Market Street
Philadelphia, PA 19103-7042
Counsel
Drinker Biddle & Reath LLP
One Logan Square, Ste. 2000
Philadelphia, PA 19103-6996
FMF-SAR15
MATSON MONEY U.S. EQUITY VI PORTFOLIO
MATSON MONEY INTERNATIONAL EQUITY VI PORTFOLIO
MATSON MONEY FIXED INCOME VI PORTFOLIO
of
THE RBB FUND, INC.
SEMI-ANNUAL REPORT
February 28, 2015
(Unaudited)
This report is submitted for the general information of the shareholders of the Funds. It is not authorized for distribution unless preceded or accompanied by a current prospectus for the Funds.
MATSON MONEY VI PORTFOLIOS
Semi-Annual Investment Adviser’s Report
February 28, 2015
(Unaudited)
February 28, 2015
Dear Shareholder,
The Matson Money VI Portfolios (the “Portfolios”) have gained assets since their launch in early February 2014 and have already surpassed the $30 million mark. We would like to extend a warm and grateful thank you to all investors who have embraced our Free Market Portfolio Strategies.
Over the past six months, investors who remained invested and diversified have continued to experience the gains from the upward rally in the markets (despite a few bumps along the way). Global equity markets over the past six months ended February 28, 2015 have risen 1.18% as measured by the MSCI All Country World Index. Furthermore, U.S. stocks performed better than international stocks with the S&P 500 Index returning 6.12% over the past half a year. The Barclays Capital US Government/Credit Intermediate Bond Index was also in the positive with a return of 1.34% for the last six months.
Matson Money, Inc. (“Matson Money”) strives to deliver the performance of capital markets and add value through Free Market Investment strategies and Structured Market Portfolios. Grounded in the conviction that free markets work, Matson Money avoids the cost-generating activity of stock picking and market timing. Instead, we focus on the dimensions of capital markets that we believe reward investors as intelligently and effectively as possible. Our disciplined approach to life-long investing provides both the individual investor and the financial professional with the academic foundation upon which to help achieve investment goals.
Sound economic and financial research has documented that, over the long term, small cap stocks outperform large cap stocks, and value stocks outperform growth stocks1. These returns seem to be compensation for risk. In fixed income, risk is well described by bond maturity and credit quality. The Portfolios deliberately target specific risk and return trade offs. The Portfolios are broadly diversified and designed to work together in your total investment plan.
We invite you to contact your financial professional or explore our website, www.MatsonMoney.com, to learn more about the concepts and strategies of Matson Money’s investing.
We appreciate your support and confidence in our firm’s investment philosophy, process and people.

Daniel J. List
Chief Compliance Officer and
Vice President of Portfolio Management
Matson Money, Inc.
| 1 | Fama, Eugene F., and Kenneth R. French, 1992 “The Cross-Section of Expected Stock Returns”, Journal of Finance 47 (June), pp. 427-465. |
1
MATSON MONEY VI PORTFOLIOS
Performance Data
February 28, 2015 (Unaudited)
Matson Money U.S. Equity VI Portfolio
| | | | | | | | | | | | |
| Total Returns for the Periods Ended February 28, 2015 | |
| | | | | | Average Annual | |
| | | Six
Months* | | | 1 Year | | | Since
Inception** | |
Matson Money U.S. Equity VI Portfolio | | | 1.89% | | | | 7.60% | | | | 8.93% | |
Russell 2500® Index | | | 5.12% | | | | 8.24% | | | | 12.61% | |
Composite Index*** | | | 4.42% | | | | 9.30% | | | | 13.11% | |
| ** | Annualized — The Portfolio commenced operations on February 18, 2014. |
| *** | The Composite Index is comprised of the S&P 500® Index, Russell 1000® Value Index, Russell 2000® Index and Russell 2000® Value Index, weighted 25%, 25%, 25% and 25%, respectively. |
The performance data quoted represents past performance. Past performance is not indicative of future results. Investment return and principal value will fluctuate so that an investor’s shares, when redeemed, may be worth more or less than their original cost. Current performance may be lower or higher. Returns shown include the reinvestment of all dividends and other distributions and do not reflect taxes that a shareholder would pay on Portfolio distributions or on the redemption of Portfolio shares. For performance data current to the most recent month-end, please call 1-866-780-0357 ext. 3863. The Portfolio’s annual operating gross expense ratio, as stated in the current prospectus is 4.36% (included in the ratio is 0.29% attributable to acquired fund fees and expenses). The Portfolio’s annual net expense ratio as stated in the prospectus is 1.13%.
The Matson Money U.S. Equity VI Portfolio underlying funds invest in small-cap and micro-cap stocks, large-cap stocks and other equity securities. In addition to the ordinary risks of equity investing, small companies entail special risk. Small companies tend to have more risk than large companies. An investor in the Portfolio will incur the expenses of the underlying funds in addition to the Portfolio’s expenses.
Matson Money International Equity VI Portfolio
| | | | | | | | | | | | |
| Total Returns for the Periods Ended February 28, 2015 | |
| | | | | | Average Annual | |
| | | Six
Months* | | | 1 Year | | | Since
Inception** | |
Matson Money International Equity VI Portfolio | | | -5.09% | | | | -3.18% | | | | -1.89% | |
MSCI World (excluding U.S.) Index | | | -2.47% | | | | -0.16% | | | | 4.87% | |
Composite Index*** | | | -3.41% | | | | 0.03% | | | | 4.71% | |
| ** | Annualized — The Portfolio commenced operations on February 18, 2014. |
| *** | The Composite Index is comprised of the MSCI EAFE Index, MSCI EAFE Value Index, MSCI EAFE Small Cap Index, and MSCI Emerging Markets Index, weighted 25%, 25%, 25% and 25%, respectively. |
The performance data quoted represents past performance. Past performance is not indicative of future results. Investment return and principal value will fluctuate so that an investor’s shares, when redeemed, may be worth more or less than their original cost. Current performance may be lower or higher. Returns shown include the reinvestment of all dividends and other distributions and do not reflect taxes that a shareholder would pay on Portfolio distributions or on the redemption of Portfolio shares. For performance data current to the most recent month-end, please call 1-866-780-0357 ext. 3863. The Portfolio’s annual operating gross expense ratio, as stated in the current prospectus is 5.61% (included in the ratio is 0.54% attributable to acquired fund fees and expenses). The Portfolio’s annual net expense ratio as stated in the prospectus is 1.35%.
Portfolio composition is subject to change.
The Matson Money International Equity VI Portfolio’s underlying funds invest in common stock, preferred stock, securities convertible into stocks and other equity securities issued by foreign companies. In addition to the ordinary risks of equity investing, foreign and small companies entail special risk. The return on foreign equities may be adversely affected by currency fluctuations. Emerging markets may be subject to social instability and lack of market liquidity. Small companies tend to have more risk than large companies. An investor in the Portfolio will incur the expenses of the underlying funds in addition to the Portfolio’s expenses.
2
MATSON MONEY VI PORTFOLIOS
Performance Data
February 28, 2015 (Unaudited)
Matson Money Fixed Income VI Portfolio
| | | | | | | | | | | | |
| Total Returns for the Periods Ended February 28, 2015 | |
| | | | | | Average Annual | |
| | | Six
Months* | | | 1 Year | | | Since
Inception** | |
Matson Money Fixed Income VI Portfolio | | | 0.31% | | | | 0.51% | | | | 0.61% | |
Citigroup World Govt. Bond 1-5 Year Currency Hedged U.S. Dollar Index | | | 0.86% | | | | 1.73% | | | | 1.73% | |
Composite Index*** | | | 1.09% | | | | 2.19% | | | | 2.25% | |
| ** | Annualized — The Portfolio commenced operations on February 18, 2014. |
| *** | The Composite Index is comprised of the Three-Month Treasury Bill Index, Barclays Capital Intermediate Government Bond Index, BofA Merrill Lynch 1-3 Year US Government/Corporate Index and Barclays Capital Aggregate Bond Index, weighted 25%, 25%, 25% and 25%, respectively. |
The performance data quoted represents past performance. Past performance is not indicative of future results. Investment return and principal value will fluctuate so that an investor’s shares, when redeemed, may be worth more or less than their original cost. Current performance may be lower or higher. Returns shown include the reinvestment of all dividends and other distributions and do not reflect taxes that a shareholder would pay on Portfolio distributions or on the redemption of Portfolio shares. For performance data current to the most recent month-end, please call 1-866-780-0357 ext. 3863. The Portfolio’s annual operating gross expense ratio, as stated in the current prospectus is 3.59% (included in the ratio is 0.19% attributable to acquired fund fees and expenses). The Portfolio’s annual net expense ratio as stated in the prospectus is 1.00%.
Portfolio composition is subject to change.
The Matson Money Fixed Income VI Portfolio’s underlying funds invest in fixed income securities. The underlying funds may invest their assets in bonds and other debt securities issued by domestic and foreign governments and companies. Debt instruments involve the risk that their prices will fall when interest rates rise, and they are subject to the risk that the borrower may default. In addition, the return on foreign debt securities may be adversely affected by currency fluctuations. An investor in the Portfolio will incur expenses of the underlying funds in addition to the Portfolio’s expenses.
3
MATSON MONEY VI PORTFOLIOS
Portfolio Expense Examples
(Unaudited)
As a shareholder of the Portfolio(s), you incur two types of costs: (1) transaction costs; and (2) ongoing costs, including management fees and other Portfolio expenses. These examples are intended to help you understand your ongoing costs (in dollars) of investing in the Portfolio(s) and to compare these costs with the ongoing costs of investing in other mutual funds.
These examples are based on an investment of $1,000 invested at the beginning of the six-month period from September 1, 2014 through February 28, 2015, and held for the entire period.
Actual Expenses
The first line of the accompanying tables provides information about actual account values and actual expenses. You may use the information in this line, together with the amount you invested, to estimate the expenses that you paid over the period. Simply divide your account value by $1,000 (for example, an $8,600 account value divided by $1,000 = 8.6), then multiply the result by the number in the first line under the heading entitled “Expenses Paid During Period” to estimate the expenses you paid on your account during this period.
Hypothetical Example for Comparison Purposes
The second line of the accompanying tables provides information about hypothetical account values and hypothetical expenses based on each Portfolio’s actual expense ratio and an assumed rate of return of 5% per year before expenses, which is not your Portfolio’s actual return. The hypothetical account values and expenses may not be used to estimate the actual ending account balance or expenses you paid for the period. You may use this information to compare the ongoing costs of investing in each Portfolio and other funds. To do so, compare these 5% hypothetical examples with the 5% hypothetical examples that appear in the shareholder reports of other funds.
Please note that the expenses shown in the accompanying tables are meant to highlight your ongoing costs only and do not reflect any transactional costs, such as redemption fees. Therefore, the second line of the accompanying tables is useful in comparing ongoing costs only, and will not help you determine the relative total costs of owning different funds. In addition, if these transactional costs were included, your costs would have been higher.
| | | | | | | | | | | | |
| | | Matson Money U.S. Equity VI Portfolio | |
| | | Beginning Account Value
September 1, 2014 | | | Ending Account Value
February 28, 2015 | | | Expenses Paid
During Period* | |
Actual | | $ | 1,000.00 | | | $ | 1,018.90 | | | $ | 5.66 | |
Hypothetical (5% return before expenses) | | | 1,000.00 | | | | 1,019.19 | | | | 5.66 | |
| |
| | | Matson Money International Equity VI Portfolio | |
| | | Beginning Account Value
September 1, 2014 | | | Ending Account Value
February 28, 2015 | | | Expenses Paid
During Period* | |
Actual | | $ | 1,000.00 | | | $ | 949.10 | | | $ | 6.52 | |
Hypothetical (5% return before expenses) | | | 1,000.00 | | | | 1,018.10 | | | | 6.76 | |
4
MATSON MONEY VI PORTFOLIOS
Portfolio Expense Examples (Concluded)
(Unaudited)
| | | | | | | | | | | | |
| |
| | | Matson Money Fixed Income VI Portfolio | |
| | | Beginning Account Value
September 1, 2014 | | | Ending Account Value
February 28, 2015 | | | Expenses Paid
During Period* | |
Actual | | $ | 1,000.00 | | | $ | 1,003.10 | | | $ | 4.97 | |
Hypothetical (5% return before expenses) | | | 1,000.00 | | | | 1,019.84 | | | | 5.01 | |
| * | Expenses are equal to an annualized six-month expense ratio of 1.13%, 1.35% and 1.00% for Matson Money U.S. Equity VI Portfolio, Matson Money International Equity VI Portfolio and Matson Money Fixed Income VI Portfolio, respectively, multiplied by the average account value over the period, multiplied by the number of days in the most recent fiscal half-year (181), then divided by 365 to reflect the one-half year period. The annualized expense ratios do not reflect fees and expenses associated with the underlying funds. If such fees and expenses had been included, the expenses would have been higher. The range of weighted expense ratios of the underlying funds held by the Portfolios, as stated in their current prospectuses, were as follows: |
The annualized expense ratios do not reflect fees and expenses associated with the underlying funds. If such fees and expenses had been included, the expenses would have been higher. The range weighted expense ratios of the underlying funds held by the Portfolios, as stated in their current prospectuses, were as follows:
| | | | |
Matson Money U.S.
Equity VI Portfolio | | Matson Money International
Equity VI Portfolio | | Matson Money Fixed
Income VI Portfolio |
| 0.01%-0.08% | | 0.01%-0.19% | | 0.01%-0.04% |
Each Portfolio’s ending account values on the first line each table are based on the actual six-month total return for each Portfolio of 1.89% for Matson Money U.S. Equity VI Portfolio, (5.09)% for the Matson Money International Equity VI Portfolio and 0.31% for the Matson Money Fixed Income VI Portfolio.
5
MATSON MONEY VI PORTFOLIOS
MATSON MONEY U.S. EQUITY VI PORTFOLIO
Portfolio of Investments
February 28, 2015
(Unaudited)
| | | | | | | | |
| | | Number of
Shares | | | Value | |
| | |
EQUITY FUNDS — 106.4% | | | | | | | | |
U.S. Large Cap Value
Portfolio III(a) | | | 135,916 | | | $ | 3,377,518 | |
U.S. Large Company Portfolio(a) | | | 115,518 | | | | 1,922,212 | |
U.S. Micro Cap Portfolio(b) | | | 99,417 | | | | 1,941,622 | |
U.S. Small Cap Portfolio(b) | | | 61,130 | | | | 1,945,756 | |
U.S. Small Cap Value Portfolio(b) | | | 36,844 | | | | 1,296,917 | |
VA U.S. Large Value Portfolio(b) | | | 22,212 | | | | 519,749 | |
VA U.S. Targeted Value
Portfolio(b) | | | 104,035 | | | | 1,944,423 | |
| | | | | | | | |
TOTAL EQUITY FUNDS
(Cost $12,639,321) | | | | | | | 12,948,197 | |
| | | | | | | | |
TOTAL INVESTMENTS — 106.4%
(Cost $12,639,321) | | | | | | | 12,948,197 | |
| | | | | | | | |
LIABILITIES IN EXCESS OF OTHER ASSETS — (6.4)% | | | | | | | (782,836 | ) |
| | | | | | | | |
NET ASSETS — 100.0% | | | | | | $ | 12,165,361 | |
| | | | | | | | |
Portfolio Holdings Summary Table
| | | | | | | | |
| | | % of
Net Assets | | | Value | |
Equity Funds | | | 106.4% | | | $ | 12,948,197 | |
Liabilities In Excess Of Other Assets | | | (6.4% | ) | | | (782,836 | ) |
| | | | | | | | |
NET ASSETS | | | 100.0% | | | $ | 12,165,361 | |
| | | | | | | | |
| (a) | A portfolio of Dimensional Investment Group Inc. |
| (b) | A portfolio of DFA Investment Dimensions Group Inc. |
Portfolio holdings are subject to change at any time.
The accompanying notes are an integral part of the financial statements.
6
MATSON MONEY VI PORTFOLIOS
MATSON MONEY INTERNATIONAL EQUITY VI PORTFOLIO
Portfolio of Investments
February 28, 2015
(Unaudited)
| | | | | | | | |
| | | Number of
Shares | | | Value | |
| |
INTERNATIONAL EQUITY FUNDS — 105.7% | | | | | |
DFA International Small Cap Value Portfolio(a) | | | 133,158 | | | $ | 2,644,527 | |
DFA International Value Portfolio III(b) | | | 174,452 | | | | 2,836,583 | |
Emerging Markets Portfolio(a) | | | 19,103 | | | | 495,907 | |
Emerging Markets Small Cap Portfolio(a) | | | 22,318 | | | | 462,656 | |
Emerging Markets Value Portfolio(a) | | | 17,421 | | | | 460,782 | |
Large Cap International Portfolio(a) | | | 20,655 | | | | 453,987 | |
VA International Small Portfolio(b) | | | 137,534 | | | | 1,607,777 | |
VA International Value Portfolio(b) | | | 37,980 | | | | 472,850 | |
| | | | | | | | |
TOTAL INTERNATIONAL EQUITY FUNDS | | | | | |
(Cost $9,681,080) | | | | | | | 9,435,069 | |
| | | | | | | | |
TOTAL INVESTMENTS — 105.7%
(Cost $9,681,080) | | | | | | | 9,435,069 | |
| | | | | | | | |
LIABILITIES IN EXCESS OF OTHER ASSETS — (5.7)% | | | | | | | (509,585 | ) |
| | | | | | | | |
NET ASSETS — 100.0% | | | | | | $ | 8,925,484 | |
| | | | | | | | |
Portfolio Holdings Summary Table
| | | | | | | | |
| | | % of
Net Assets | | | Value | |
International Equity Funds | | | 105.7% | | | $ | 9,435,069 | |
Liabilities in Excess Of Other Assets | | | (5.7% | ) | | | (509,585 | ) |
| | | | | | | | |
NET ASSETS | | | 100.0% | | | $ | 8,925,484 | |
| | | | | | | | |
| (a) | A portfolio of DFA Investment Dimensions Group Inc. |
| (b) | A portfolio of Dimensional Investment Group Inc. |
Portfolio holdings are subject to change at any time.
The accompanying notes are an integral part of the financial statements.
7
MATSON MONEY VI PORTFOLIOS
MATSON MONEY FIXED INCOME VI PORTFOLIO
Portfolio of Investments
February 28, 2015
(Unaudited)
| | | | | | | | |
| | | Number of
Shares | | | Value | |
| | |
FIXED INCOME FUNDS — 109.4% | | | | | | | | |
DFA Five-Year Global Fixed Income Portfolio(a) | | | 135,067 | | | $ | 1,489,789 | |
DFA Inflation Protected Securities Portfolio(a) | | | 63,541 | | | | 752,964 | |
DFA Intermediate Government Fixed Income Portfolio(a) | | | 140,763 | | | | 1,786,286 | |
DFA One-Year Fixed Income Portfolio(a) | | | 328,862 | | | | 3,393,855 | |
DFA Short-Term Fixed Portfolio(a) | | | 29,019 | | | | 295,989 | |
DFA Short-Term Government Portfolio(a) | | | 110,985 | | | | 1,187,539 | |
DFA Two-Year Global Fixed Income Portfolio(a) | | | 375,149 | | | | 3,721,478 | |
VA Global Bond Portfolio(a) | | | 206,731 | | | | 2,234,748 | |
| | | | | | | | |
TOTAL FIXED INCOME FUNDS
(Cost $14,867,377) | | | | | | | 14,862,648 | |
| | | | | | | | |
TOTAL INVESTMENTS — 109.4%
(Cost $14,867,377) | | | | | | | 14,862,648 | |
| | | | | | | | |
LIABILITIES IN EXCESS OF OTHER ASSETS — (9.4)% | | | | | | | (1,273,141 | ) |
| | | | | | | | |
NET ASSETS — 100.0% | | | | | | $ | 13,589,507 | |
| | | | | | | | |
Portfolio Holdings Summary Table
| | | | | | | | |
| | | % of
Net Assets | | | Value | |
Fixed Income Funds | | | 109.4% | | | $ | 14,862,648 | |
Liabilities In Excess Of Other Assets | | | (9.4% | ) | | | (1,273,141 | ) |
| | | | | | | | |
NET ASSETS | | | 100.0% | | | $ | 13,589,507 | |
| | | | | | | | |
| (a) | A portfolio of DFA Investment Dimensions Group Inc. |
Portfolio holdings are subject to change at any time.
The accompanying notes are an integral part of the financial statements.
8
MATSON MONEY VI PORTFOLIOS
Statements of Assets And Liabilities
February 28, 2015
(Unaudited)
| | | | | | | | | | | | |
| | | Matson Money
U.S. Equity
VI Portfolio | | | Matson Money
International Equity
VI Portfolio | | | Matson Money
Fixed Income
VI Portfolio | |
ASSETS | | | | | | | | | | | | |
Investments in non-affiliated funds, at value † | | $ | 12,948,197 | | | $ | 9,435,069 | | | $ | 14,862,648 | |
Cash and cash equivalents | | | 102,088 | | | | 88,125 | | | | 123,850 | |
Receivables | | | | | | | | | | | | |
Receivable for investments sold | | | 2,495 | | | | 2,121 | | | | 2,775 | |
Prepaid expenses and other assets | | | 5,444 | | | | 5,428 | | | | 5,588 | |
| | | | | | | | | | | | |
Total assets | | | 13,058,224 | | | | 9,530,743 | | | | 14,994,861 | |
| | | | | | | | | | | | |
LIABILITIES | | | | | | | | | | | | |
Payables | | | | | | | | | | | | |
Capital shares redeemed | | | 860,150 | | | | 575,105 | | | | 1,358,245 | |
Investments purchased | | | 10,575 | | | | 8,148 | | | | 29,541 | |
Administration and accounting services fees | | | 7,610 | | | | 7,400 | | | | 7,614 | |
Advisory fees | | | 3,387 | | | | 3,490 | | | | 5,944 | |
Other accrued expenses and liabilities | | | 11,141 | | | | 11,116 | | | | 4,010 | |
| | | | | | | | | | | | |
Total liabilities | | | 892,863 | | | | 605,259 | | | | 1,405,354 | |
| | | | | | | | | | | | |
Net Assets | | $ | 12,165,361 | | | $ | 8,925,484 | | | $ | 13,589,507 | |
| | | | | | | | | | | | |
NET ASSETS CONSISTS OF | | | | | | | | | | | | |
Par value | | $ | 447 | | | $ | 369 | | | $ | 543 | |
Paid-in capital | | | 11,484,810 | | | | 9,085,506 | | | | 13,599,552 | |
Accumulated net investment loss | | | (24,247 | ) | | | (25,860 | ) | | | (28,963 | ) |
Accumulated net realized gain from investments | | | 395,475 | | | | 111,480 | | | | 23,104 | |
Net unrealized appreciation/(depreciation) on investments | | | 308,876 | | | | (246,011 | ) | | | (4,729 | ) |
| | | | | | | | | | | | |
Net Assets | | $ | 12,165,361 | | | $ | 8,925,484 | | | $ | 13,589,507 | |
| | | | | | | | | | | | |
Shares outstanding ($0.001 par value, 100,000,000 shares authorized) | | | 447,245 | | | | 368,900 | | | | 543,056 | |
| | | | | | | | | | | | |
Net asset value, offering and redemption price per share | | $ | 27.20 | | | $ | 24.19 | | | $ | 25.02 | |
| | | | | | | | | | | | |
† Investment in non-affiliated funds, at cost | | $ | 12,639,321 | | | $ | 9,681,080 | | | $ | 14,867,377 | |
| | | | | | | | | | | | |
The accompanying notes are an integral part of the financial statements.
9
MATSON MONEY VI PORTFOLIOS
Statements of Operations
For the Six Months Ended February 28, 2015
(Unaudited)
| | | | | | | | | | | | |
| | | Matson Money
U.S. Equity
VI Portfolio | | | Matson Money
International Equity
VI Portfolio | | | Matson Money
Fixed Income
VI Portfolio | |
Investment Income | | | | | | | | | | | | |
Dividends from non-affiliated funds | | $ | 84,606 | | | $ | 120,328 | | | $ | 122,659 | |
| | | | | | | | | | | | |
| | | |
Expenses | | | | | | | | | | | | |
Advisory fees (Note 2) | | | 25,706 | | | | 18,093 | | | | 31,675 | |
Audit fees | | | 13,256 | | | | 13,065 | | | | 13,475 | |
Legal fees | | | 10,858 | | | | 7,339 | | | | 16,280 | |
Custodian fees (Note 2) | | | 6,159 | | | | 6,159 | | | | 6,159 | |
Compliance fees | | | 4,482 | | | | 4,431 | | | | 4,482 | |
Directors’ and officers’ fees | | | 4,248 | | | | 4,186 | | | | 4,196 | |
Administration and accounting services fees (Note 2) | | | 3,848 | | | | 3,164 | | | | 4,421 | |
Transfer agent fees (Note 2) | | | 1,159 | | | | 779 | | | | 1,457 | |
Other expenses | | | 3,988 | | | | 536 | | | | 1,008 | |
| | | | | | | | | | | | |
Total expenses | | | 73,704 | | | | 57,752 | | | | 83,153 | |
| | | | | | | | | | | | |
Less: Advisory fee waiver | | | (15,607 | ) | | | (8,898 | ) | | | (19,804 | ) |
| | | | | | | | | | | | |
Net operating expenses | | | 58,097 | | | | 48,854 | | | | 63,349 | |
| | | | | | | | | | | | |
Net investment income | | | 26,509 | | | | 71,474 | | | | 59,310 | |
| | | | | | | | | | | | |
| | | |
Net realized and unrealized gain from investments | | | | | | | | | | | | |
Net realized gain from: | | | | | | | | | | | | |
Non-affiliated funds | | | — | | | | — | | | | 91 | |
Capital gain distributions from non-affiliated fund investments | | | 395,633 | | | �� | 111,527 | | | | 23,034 | |
Net change in unrealized depreciation on: | | | | | | | | | | | | |
Non-affiliated funds | | | (21,314 | ) | | | (301,594 | ) | | | (38,742 | ) |
| | | | | | | | | | | | |
Net realized and unrealized gain/(loss) on investments | | | 374,319 | | | | (190,067 | ) | | | (15,617 | ) |
| | | | | | | | | | | | |
Net increase/(decrease) in net assets resulting from operations | | $ | 400,828 | | | $ | (118,593 | ) | | $ | 43,693 | |
| | | | | | | | | | | | |
The accompanying notes are an integral part of the financial statements.
10
MATSON MONEY U.S. EQUITY VI PORTFOLIO
Statements of Changes in Net Assets
| | | | | | | | |
| | | For the
Six Months Ended
February 28, 2015
(Unaudited) | | | For the Period
February 18, 2014*
through
August 31, 2014 | |
Increase/(decrease) in net assets from operations: | | | | | | | | |
Net investment income/(loss) | | $ | 26,509 | | | $ | (10,724 | ) |
Net realized gain from investments | | | 395,633 | | | | 830 | |
Net change in unrealized appreciation/(depreciation) from investments | | | (21,314 | ) | | | 330,190 | |
| | | | | | | | |
Net increase in net assets resulting from operations | | | 400,828 | | | | 320,296 | |
| | | | | | | | |
| | |
Dividends and distributions to shareholders from: | | | | | | | | |
Net investment income | | | (41,020 | ) | | | — | |
| | | | | | | | |
Net decrease in net assets from dividends and distributions to shareholders | | | (41,020 | ) | | | — | |
| | | | | | | | |
| | |
Capital share transactions: | | | | | | | | |
Proceeds from shares sold | | | 5,057,401 | | | | 7,592,809 | |
Reinvestment of distributions | | | 41,020 | | | | — | |
Shares redeemed | | | (1,109,249 | ) | | | (96,724 | ) |
| | | | | | | | |
Net increase in net assets from capital shares | | | 3,989,172 | | | | 7,496,085 | |
| | | | | | | | |
Total increase in net assets | | | 4,348,980 | | | | 7,816,381 | |
| | | | | | | | |
| | |
Net assets: | | | | | | | | |
Beginning of period | | | 7,816,381 | | | | — | |
| | | | | | | | |
End of period | | $ | 12,165,361 | | | $ | 7,816,381 | |
| | | | | | | | |
Accumulated net investment loss, end of period | | $ | (24,247 | ) | | $ | (9,736 | ) |
| | | | | | | | |
| | |
Capital share transactions: | | | | | | | | |
Shares sold | | | 194,911 | | | | 295,612 | |
Dividends and distributions reinvested | | | 1,520 | | | | — | |
Shares redeemed | | | (41,005 | ) | | | (3,793 | ) |
| | | | | | | | |
Total share transactions | | | 155,426 | | | | 291,819 | |
| | | | | | | | |
| * | Commencement of operations |
The accompanying notes are an integral part of the financial statements.
11
MATSON MONEY INTERNATIONAL EQUITY VI PORTFOLIO
Statements of Changes in Net Assets
| | | | | | | | |
| | | For the
Six Months Ended
February 28, 2015
(Unaudited) | | | For the Period
February 18, 2014*
through
August 31, 2014 | |
Increase/(decrease) in net assets from operations: | | | | | | | | |
Net investment income | | $ | 71,474 | | | $ | 7,620 | |
Net realized gain from investments | | | 111,527 | | | | 1,459 | |
Net change in unrealized appreciation/(depreciation) from investments | | | (301,594 | ) | | | 55,583 | |
| | | | | | | | |
Net increase/(decrease) in net assets resulting from operations | | | (118,593 | ) | | | 64,662 | |
| | | | | | | | |
| | |
Dividends and distributions to shareholders from: | | | | | | | | |
Net investment income | | | (104,954 | ) | | | — | |
Net realized capital gains | | | (1,506 | ) | | | — | |
| | | | | | | | |
Net decrease in net assets from dividends and distributions to shareholders | | | (106,460 | ) | | | — | |
| | | | | | | | |
| | |
Capital share transactions: | | | | | | | | |
Proceeds from shares sold | | | 4,276,454 | | | | 5,464,106 | |
Reinvestment of distributions | | | 106,460 | | | | — | |
Shares redeemed | | | (639,951 | ) | | | (121,194 | ) |
| | | | | | | | |
Net increase in net assets from capital shares | | | 3,742,963 | | | | 5,342,912 | |
| | | | | | | | |
Total increase in net assets | | | 3,517,910 | | | | 5,407,574 | |
| | | | | | | | |
| | |
Net assets: | | | | | | | | |
Beginning of period | | | 5,407,574 | | | | — | |
| | | | | | | | |
End of period | | $ | 8,925,484 | | | $ | 5,407,574 | |
| | | | | | | | |
Undistributed/accumulated net investment income/(loss), end of period | | $ | (25,860 | ) | | $ | 7,620 | |
| | | | | | | | |
| | |
Capital share transactions: | | | | | | | | |
Shares sold | | | 181,328 | | | | 214,126 | |
Dividends and distributions reinvested | | | 4,641 | | | | — | |
Shares redeemed | | | (26,463 | ) | | | (4,732 | ) |
| | | | | | | | |
Total share transactions | | | 159,506 | | | | 209,394 | |
| | | | | | | | |
| * | Commencement of operations |
The accompanying notes are an integral part of the financial statements.
12
MATSON MONEY FIXED INCOME VI PORTFOLIO
Statements of Changes in Net Assets
| | | | | | | | |
| | | For the
Six Months Ended
February 28, 2015
(Unaudited) | | | For the Period
February 18, 2014*
through
August 31, 2014 | |
Increase/(decrease) in net assets from operations: | | | | | | | | |
Net investment income/(loss) | | $ | 59,310 | | | $ | (13,039 | ) |
Net realized gain/(loss) from investments | | | 23,125 | | | | (13 | ) |
Net change in unrealized appreciation/(depreciation) from investments | | | (38,742 | ) | | | 34,013 | |
| | | | | | | | |
Net increase in net assets resulting from operations | | | 43,693 | | | | 20,961 | |
| | | | | | | | |
| | |
Dividends and distributions to shareholders from: | | | | | | | | |
Net investment income | | | (75,242 | ) | | | — | |
| | | | | | | | |
Net decrease in net assets from dividends and distributions to shareholders | | | (75,242 | ) | | | — | |
| | | | | | | | |
| | |
Capital share transactions: | | | | | | | | |
Proceeds from shares sold | | | 5,198,420 | | | | 9,971,763 | |
Reinvestment of distributions | | | 75,242 | | | | — | |
Shares redeemed | | | (1,579,991 | ) | | | (65,339 | ) |
| | | | | | | | |
Net increase in net assets from capital shares | | | 3,693,671 | | | | 9,906,424 | |
| | | | | | | | |
Total increase in net assets | | | 3,662,122 | | | | 9,927,385 | |
| | | | | | | | |
| | |
Net assets: | | | | | | | | |
Beginning of period | | | 9,927,385 | | | | — | |
| | | | | | | | |
End of period | | $ | 13,589,507 | | | $ | 9,927,385 | |
| | | | | | | | |
Accumulated net investment loss, end of period | | $ | (28,963 | ) | | $ | (13,031 | ) |
| | | | | | | | |
| | |
Capital share transactions: | | | | | | | | |
Shares sold | | | 207,415 | | | | 398,366 | |
Dividends and distributions reinvested | | | 3,022 | | | | — | |
Shares redeemed | | | (63,135 | ) | | | (2,612 | ) |
| | | | | | | | |
Total share transactions | | | 147,302 | | | | 395,754 | |
| | | | | | | | |
| * | Commencement of operations |
The accompanying notes are an integral part of the financial statements.
13
MATSON MONEY VI PORTFOLIOS
MATSON MONEY U.S. EQUITY VI PORTFOLIO
Financial Highlights
Contained below is per share operating performance data for each share outstanding, total investment return, ratios to average net assets and other supplemental data for the respective periods. This information has been derived from information provided in the financial statements.
| | | | | | | | |
| | | For the
Six Months Ended
February 28, 2015
(Unaudited) | | | For the Period
February 18, 2014(1)
through
August 31, 2014 | |
Per Share Operating Performance | | | | | | | | |
Net asset value, beginning of period | | $ | 26.79 | | | $ | 25.00 | |
| | | | | | | | |
Net investment income/(loss)(2) | | | 0.07 | | | | (0.06 | ) |
Net realized and unrealized gain on investments | | | 0.44 | | | | 1.85 | |
| | | | | | | | |
Net increase in net assets resulting from operations | | | 0.51 | | | | 1.79 | |
| | | | | | | | |
Dividends and distributions to shareholders from: | | | | | | | | |
Net investment income | | | (0.10 | ) | | | — | |
Net realized capital gains | | | — | | | | — | |
| | | | | | | | |
Total dividends and distributions to shareholders | | | (0.10 | ) | | | — | |
| | | | | | | | |
Net asset value, end of period | | $ | 27.20 | | | $ | 26.79 | |
| | | | | | | | |
Total investment return(3) | | | 1.89 | %(4) | | | 7.16 | %(4) |
| | | | | | | | |
| | |
Ratio/Supplemental Data | | | | | | | | |
Net assets, end of period (000’s omitted) | | $ | 12,165 | | | $ | 7,816 | |
Ratio of expenses to average net assets with waivers(5) | | | 1.13 | %(6) | | | 1.13 | %(6) |
Ratio of expenses to average net assets without waivers | | | 1.43 | %(6) | | | 4.07 | %(6) |
Ratio of net investment income/(loss) to average net assets with waivers(5) | | | 0.52 | %(6) | | | (0.47 | )%(6) |
Portfolio turnover rate | | | 0 | % | | | 1.32 | %(4) |
| (1) | Commencement of operations. |
| (2) | The selected per share data was calculated using the average shares outstanding method for the period. |
| (3) | Total investment return is calculated by assuming a purchase of shares on the first day and a sale of shares on the last day of each period reported and includes reinvestments of dividends and distributions, if any. |
| (5) | The Portfolio also will indirectly bear its prorated share of expenses of the underlying funds. Such expenses are not included in the calculation of this ratio. |
The accompanying notes are an integral part of the financial statements.
14
MATSON MONEY VI PORTFOLIOS
MATSON MONEY INTERNATIONAL EQUITY VI PORTFOLIO
Financial Highlights
Contained below is per share operating performance data for each share outstanding, total investment return, ratios to average net assets and other supplemental data for the respective periods. This information has been derived from information provided in the financial statements.
| | | | | | | | |
| | | For the
Six Months Ended
February 28, 2015
(Unaudited) | | | For the Period
February 18, 2014(1)
through
August 31, 2014 | |
Per Share Operating Performance | | | | | | | | |
Net asset value, beginning of period | | $ | 25.82 | | | $ | 25.00 | |
| | | | | | | | |
Net investment income(2) | | | 0.23 | | | | 0.07 | |
Net realized and unrealized gain/(loss) on investments | | | (1.56 | ) | | | 0.75 | |
| | | | | | | | |
Net increase/(decrease) in net assets resulting from operations | | | (1.33 | ) | | | 0.82 | |
| | | | | | | | |
Dividends and distributions to shareholders from: | | | | | | | | |
Net investment income | | | (0.30 | ) | | | — | |
Net realized capital gains | | | — | (3) | | | — | |
| | | | | | | | |
Total dividends and distributions to shareholders | | | (0.30 | ) | | | — | |
| | | | | | | | |
Net asset value, end of period | | $ | 24.19 | | | $ | 25.82 | |
| | | | | | | | |
Total investment return(4) | | | (5.09 | )(5) | | | 3.28 | %(5) |
| | | | | | | | |
| | |
Ratio/Supplemental Data | | | | | | | | |
Net assets, end of period (000’s omitted) | | $ | 8,925 | | | $ | 5,408 | |
Ratio of expenses to average net assets with waivers(6) | | | 1.35 | (7) | | | 1.35 | %(7) |
Ratio of expenses to average net assets without waivers | | | 1.60 | (7) | | | 5.07 | %(7) |
Ratio of net investment income to average net assets with waivers(6) | | | 1.98 | (7) | | | 0.49 | %(7) |
Portfolio turnover rate | | | 0 | % | | | 2.47 | %(5) |
| (1) | Commencement of operations. |
| (2) | The selected per share data was calculated using the average shares outstanding method for the period. |
| (3) | Amount less than $(0.005) per share. |
| (4) | Total investment return is calculated by assuming a purchase of shares on the first day and a sale of shares on the last day of each period reported and includes reinvestments of dividends and distributions, if any. |
| (6) | The Portfolio also will indirectly bear its prorated share of expenses of the underlying funds. Such expenses are not included in the calculation of this ratio. |
The accompanying notes are an integral part of the financial statements.
15
MATSON MONEY VI PORTFOLIOS
MATSON MONEY FIXED INCOME VI PORTFOLIO
Financial Highlights
Contained below is per share operating performance data for each share outstanding, total investment return, ratios to average net assets and other supplemental data for the respective periods. This information has been derived from information provided in the financial statements.
| | | | | | | | |
| | | For the
Six Months Ended
February 28, 2015
(Unaudited) | | | For the Period
February 18, 2014(1)
through
August 31, 2014 | |
Per Share Operating Performance | | | | | | | | |
Net asset value, beginning of period | | $ | 25.08 | | | $ | 25.00 | |
| | | | | | | | |
Net investment income/(loss)(2) | | | 0.12 | | | | (0.05 | ) |
Net realized and unrealized gain/(loss) on investments | | | (0.04 | ) | | | 0.13 | |
| | | | | | | | |
Net increase in net assets resulting from operations | | | 0.08 | | | | 0.08 | |
| | | | | | | | |
Dividends and distributions to shareholders from: | | | | | | | | |
Net investment income | | | (0.14 | ) | | | — | |
Net realized capital gains | | | — | | | | — | |
| | | | | | | | |
Total dividends and distributions to shareholders | | | (0.14 | ) | | | — | |
| | | | | | | | |
Net asset value, end of period | | $ | 25.02 | | | $ | 25.08 | |
| | | | | | | | |
Total investment return(3) | | | 0.31 | %(4) | | | 0.32 | %(4) |
| | | | | | | | |
| | |
Ratio/Supplemental Data | | | | | | | | |
Net assets, end of period (000’s omitted) | | $ | 13,590 | | | $ | 9,927 | |
Ratio of expenses to average net assets with waivers(5) | | | 1.00 | %(6) | | | 1.00 | %(6) |
Ratio of expenses to average net assets without waivers | | | 1.31 | %(6) | | | 3.40 | %(6) |
Ratio of net investment income/(loss) to average net assets with waivers(5) | | | 0.94 | %(6) | | | (0.40 | )%(6) |
Portfolio turnover rate | | | 0.08 | %(4) | | | 0.55 | %(4) |
| (1) | Commencement of operations. |
| (2) | The selected per share data was calculated using the average shares outstanding method for the period. |
| (3) | Total investment return is calculated by assuming a purchase of shares on the first day and a sale of shares on the last day of each period reported and includes reinvestments of dividends and distributions, if any. |
| (5) | The Portfolio also will indirectly bear its prorated share of expenses of the underlying funds. Such expenses are not included in the calculation of this ratio. |
The accompanying notes are an integral part of the financial statements.
16
MATSON MONEY VI PORTFOLIOS
Notes to Financial Statements
February 28, 2015
(Unaudited)
| 1. | Organization and Significant Accounting Policies |
The RBB Fund, Inc. (“RBB” or the “Company”) was incorporated under the laws of the State of Maryland on February 29, 1988 and is registered under the Investment Company Act of 1940, as amended (the “1940 Act”), as an open-end management investment company. RBB is a “series fund,” which is a mutual fund divided into separate portfolios. Each portfolio is treated as a separate entity for certain matters under the 1940 Act, and for other purposes, and a shareholder of one portfolio is not deemed to be a shareholder of any other portfolio. Currently, RBB has twenty-two active investment portfolios, including the Matson Money U.S. Equity VI Portfolio, the Matson Money International Equity VI Portfolio, and the Matson Money Fixed Income VI Portfolio (each a “Portfolio,” collectively the “Portfolios”). Each Portfolio operates as a “fund of funds” and commenced investment operations on February 18, 2014. Shares of the Portfolios are offered to separate accounts of participating life insurance companies for the purpose of funding variable annuity contracts and variable life insurance policies.
RBB has authorized capital of one hundred billion shares of common stock of which 82.373 billion shares are currently classified into one hundred and fifty-three classes of common stock. Each class represents an interest in an active or inactive RBB investment portfolio.
PORTFOLIO VALUATION — Investments in the underlying funds are valued at each fund’s net asset value determined as of the close of business on the New York Stock Exchange (generally 4:00 p.m. Eastern time). As required, some securities and assets may be valued at fair value as determined in good faith by the Company’s Board of Directors. Direct investments in fixed income securities having a remaining maturity of 60 days or less are valued at amortized cost, which approximates market value.
FAIR VALUE MEASUREMENTS — The inputs and valuations techniques used to measure fair value of the Portfolios’ investments are summarized into three levels as described in the hierarchy below:
| | • Level 1 — | quoted prices in active markets for identical securities; |
| | • Level 2 — | other significant observable inputs (including quoted prices for similar securities, interest rates, prepayment speeds, credit risk, etc.); and |
| | • Level 3 — | significant unobservable inputs (including the Portfolios’ own assumptions in determining the fair value of investments). |
The inputs or methodology used for valuing securities are not necessarily an indication of the risk associated with investing in those securities.
The following is a summary of the inputs used, as of February 28, 2015, in valuing the Portfolios’ investments carried at fair value:
MATSON MONEY U.S. EQUITY VI PORTFOLIO
| | | | | | | | | | | | | | | | |
| | | Total Value at
February 28, 2015 | | | Level 1
Quoted
Price | | | Level 2
Significant
Observable
Input | | | Level 3
Significant
Unobservable
Input | |
Investments in Securities* | | $ | 12,948,197 | | | $ | 12,948,197 | | | $ | — | | | $ | — | |
| | | | | | | | | | | | | | | | |
* Please refer to the Portfolio of Investments for further details.
MATSON MONEY INTERNATIONAL EQUITY VI PORTFOLIO
| | | | | | | | | | | | | | | | |
| | | Total Value at
February 28, 2015 | | | Level 1
Quoted
Price | | | Level 2
Significant
Observable
Input | | | Level 3
Significant
Unobservable
Input | |
Investments in Securities* | | $ | 9,435,069 | | | $ | 9,435,069 | | | $ | — | | | $ | — | |
| | | | | | | | | | | | | | | | |
* Please refer to the Portfolio of Investments for further details.
17
MATSON MONEY VI PORTFOLIOS
Notes to Financial Statements (Continued)
February 28, 2015
(Unaudited)
MATSON MONEY FIXED INCOME VI PORTFOLIO
| | | | | | | | | | | | | | | | |
| | | Total Value at
February 28, 2015 | | | Level 1
Quoted
Price | | | Level 2
Significant
Observable
Input | | | Level 3
Significant
Unobservable
Input | |
Investments in Securities* | | $ | 14,862,648 | | | $ | 14,862,648 | | | $ | — | | | $ | — | |
| | | | | | | | | | | | | | | | |
* Please refer to the Portfolio of Investments for further details.
At the end of each quarter, management evaluates the classification of Levels 1, 2 and 3 assets and liabilities. Various factors are considered, such as changes in liquidity from the prior reporting period; whether or not a broker is willing to execute at the quoted price; the depth and consistency of prices from third party pricing services; and the existence of contemporaneous, observable trades in the market. Additionally, management evaluates the classification of Level 1 and Level 2 assets and liabilities on a quarterly basis for changes in listings or delistings on national exchanges.
Due to the inherent uncertainty of determining the fair value of investments that do not have a readily available market value, the fair value of the Portfolios’ investments may fluctuate from period to period. Additionally, the fair value of investments may differ significantly from the values that would have been used had a ready market existed for such investments and may differ materially from the values the Portfolios may ultimately realize. Further, such investments may be subject to legal and other restrictions on resale or otherwise less liquid than publicly traded securities.
For fair valuations using significant unobservable inputs, U.S. generally accepted accounting principles (“U.S. GAAP”) require each Portfolio to present a reconciliation of the beginning to ending balances for reported market values that presents changes attributable to total realized and unrealized gains or losses, purchases and sales, and transfers in and out of Level 3 during the period. Transfers in and out between levels are based on values at the end of the period. U.S. GAAP also requires a Portfolio to disclose amounts and reasons for all transfers in and out of Level 1 and Level 2 fair value measurements. A reconciliation of Level 3 investments is presented only when a Portfolio had an amount of Level 3 investments at the end of the reporting period that was meaningful in relation to its net assets. The amounts and reasons for all transfers in and out of each level within the three-tier hierarchy are disclosed when a Portfolio had an amount of total transfers during the reporting period that was meaningful in relation to its net assets as of the end of the reporting period.
For the six months ended February 28, 2015, there were no transfers between Levels 1, 2 and 3 for the Portfolios.
USE OF ESTIMATES — The Portfolios are investment companies and, accordingly, follow the investment company accounting and reporting guidance under U.S. GAAP. The preparation of financial statements in conformity with U.S. GAAP requires management to make estimates and assumptions that affect the reported amounts of assets and liabilities and disclosure of contingent assets and liabilities at the date of the financial statements and the reported amounts of revenues and expenses during the period. Actual results could differ from those estimates and those differences could be significant.
INVESTMENT TRANSACTIONS, INVESTMENT INCOME AND EXPENSES — Transactions are accounted for on the trade date for financial reporting purposes. The cost of investments sold is determined by use of the specific identification method for both financial reporting and income tax purposes in determining realized gains and losses on investments. Interest income is accrued when earned. Dividend income is recorded on the ex-dividend date. Distributions received on securities that represent a return of capital or capital gain are recorded as a reduction of cost of investments and/or as a realized gain. The Portfolios estimate the components of distributions received that may be considered return of capital distributions or capital gain distributions. Each Portfolio’s investment income, expenses and unrealized and realized gains and losses are allocated daily. Expenses incurred on behalf of a specific class, fund or fund family of the Company are charged directly to the class, fund or fund family (in proportion to net assets). Expenses incurred for all of the RBB funds (such as director or professional fees) are charged to all Portfolios in proportion to their average net assets of RBB, or in such other manner as the Company’s Board of Directors deems fair or equitable. Expenses and fees, including investment advisory and administration fees, are accrued daily and taken into account for the purpose of determining the net asset value of the
18
MATSON MONEY VI PORTFOLIOS
Notes to Financial Statements (Continued)
February 28, 2015
(Unaudited)
Portfolios. In addition to the net annual operating expenses that the Portfolios bear directly, the shareholders indirectly bear the Portfolios’ pro-rata expenses of the underlying mutual funds in which each Portfolio invests.
DIVIDENDS AND DISTRIBUTIONS TO SHAREHOLDERS — Dividends from net investment income and distributions from net realized capital gains, if any, are declared and paid at least annually to shareholders and recorded on ex-dividend date for all Portfolios with the exception of the Matson Money Fixed Income VI Portfolio which declares and pays quarterly dividends from net investment income. Income dividends and capital gain distributions are determined in accordance with U.S. federal income tax regulations which may differ from U.S. GAAP.
U.S. TAX STATUS — No provision is made for U.S. income taxes as it is each Portfolio’s intention to qualify for and elect the tax treatment applicable to regulated investment companies under Subchapter M of the Internal Revenue Code of 1986, as amended, and make the requisite distributions to its shareholders which will be sufficient to relieve it from U.S. income and excise taxes.
CASH AND CASH EQUIVALENTS — The Portfolios consider liquid assets deposited with a bank demand deposit account to be cash equivalents. These investments represent amounts held with financial institutions that are readily accessible to pay Portfolio expenses or purchase investments. Cash and cash equivalents are valued at cost plus accrued interest, which approximates market value.
OTHER — In the normal course of business, the Portfolios may enter into contracts that provide general indemnifications. The Portfolios’ maximum exposure under these arrangements is dependent on claims that may be made against the Portfolios in the future, and, therefore, cannot be estimated; however, based on experience, the risk of material loss for such claims is considered remote.
| 2. | Investment Adviser and Other Services |
Matson Money, Inc. (“Matson Money” or the “Adviser”), serves as each Portfolio’s investment adviser. The Adviser is entitled to an advisory fee at the annual rate of 0.50% of the first $1 billion of each Portfolio’s average daily net assets, 0.49% of each Portfolio’s average daily net assets over $1 billion to $5 billion and 0.47% of each Portfolio’s average daily net assets over $5 billion. The Adviser has contractually agreed to waive its advisory fee and/or reimburse expenses in order to limit total annual Portfolio operating expenses (excluding certain items disclosed below) to 1.13%, 1.35% and 1.00% of the average daily net assets of the Matson Money U.S. Equity VI Portfolio, Matson Money International Equity VI Portfolio and Matson Money Fixed Income VI Portfolio, respectively. In determining the Adviser’s obligation to waive advisory fees and/or reimburse expenses, the following expenses are not taken into account: acquired fund fees and expenses, brokerage commissions, extraordinary items, interest or taxes. This contractual limitation is in effect until December 31, 2015 and may not be terminated without the approval of the Company’s Board of Directors. The Adviser may discontinue these arrangements at any time after December 31, 2015.
As of February 28, 2015, Matson Money has waived and reimbursed fees as follows:
| | | | | | | | |
Portfolios | | Investment
Advisor
Expense
Waived | | | Investment
Advisor
Expense
Reimbursement | |
Matson Money U.S. Equity VI Portfolio | | $ | 15,607 | | | $ | — | |
Matson Money International Equity VI Portfolio | | | 8,898 | | | | — | |
Matson Money Fixed Income VI Portfolio | | | 19,804 | | | | — | |
The Portfolios will not pay the Adviser at a later time for any amounts waived or any amounts assumed.
BNY Mellon Investment Servicing (US) Inc. (“BNY Mellon”), serves as administrator for the Portfolios. For providing administrative and accounting services, BNY Mellon is entitled to receive a monthly fee equal to an annual percentage rate of the Portfolios’ average daily net assets and is subject to certain minimum monthly fees.
19
MATSON MONEY VI PORTFOLIOS
Notes to Financial Statements (Continued)
February 28, 2015
(Unaudited)
Included in the administration and accounting services fees, shown on the Statement of Operations, are fees for providing regulatory administration services to RBB. For providing these services, BNY Mellon is entitled to receive compensation as agreed to by the Company and BNY Mellon. This fee is allocated to each portfolio of the Company in proportion to its net assets of the Company.
In addition, BNY Mellon serves as the Portfolios’ transfer and dividend disbursing agent. For providing transfer agent services, BNY Mellon is entitled to receive a monthly fee, subject to certain minimum, and out of pocket expenses.
The Bank of New York Mellon (the “Custodian”) provides certain custodial services to the Portfolios. The Custodian is entitled to receive a monthly fee, subject to certain minimum, and out of pocket expenses.
Foreside Funds Distributors LLC serves as the principal underwriter and distributor of the Portfolios’ shares pursuant to a Distribution Agreement with RBB.
The Directors of the Company receive an annual retainer and meeting fees for meetings attended. The aggregate remuneration paid to the Directors by the Portfolios during the six months ended February 28, 2015 was $11,594. Certain employees of BNY Mellon serve as an Officer or Director of the Company. They are not compensated by the Portfolios or the Company.
| 4. | Investment in Securities |
For the six months ended February 28, 2015, aggregate purchases and sales of investment securities (excluding short-term investments) of the Portfolios were as follows:
| | | | | | | | |
| | | Purchases | | | Sales | |
Matson Money U.S. Equity VI Portfolio | | $ | 5,251,762 | | | $ | — | |
Matson Money International Equity VI Portfolio | | | 4,406,985 | | | | — | |
Matson Money Fixed Income VI Portfolio | | | 5,094,115 | | | | 10,662 | |
| 5. | Federal Income Tax Information |
The Portfolios have followed the authoritative guidance on accounting for and disclosure of uncertainty in tax positions, which requires the Portfolios to determine whether a tax position is more likely than not to be sustained upon examination, including resolution of any related appeals or litigation processes, based on the technical merits of the position. The Portfolios have determined that there was no effect on the financial statements from following this authoritative guidance. In the normal course of business, the Portfolios are subject to examination by federal, state and local jurisdictions, where applicable, for tax years for which applicable statutes of limitations have not expired.
As of February 28, 2015, the federal tax cost, aggregate gross unrealized appreciation and depreciation of securities held by each Portfolio were as follows:
| | | | | | | | | | | | | | | | |
| | | Federal Tax
Cost | | | Unrealized
Appreciation | | | Unrealized
Depreciation | | | Net
Unrealized
Appreciation/
(Depreciation) | |
Matson Money U.S. Equity VI Portfolio | | $ | 12,639,321 | | | $ | 314,349 | | | $ | (5,473 | ) | | $ | 308,876 | |
Matson Money International Equity VI Portfolio | | | 9,681,080 | | | | — | | | | (246,011 | ) | | | (246,011 | ) |
Matson Money Fixed Income VI Portfolio | | | 14,867,377 | | | | 28,916 | | | | (33,645 | ) | | | (4,729 | ) |
Distributions to shareholders from net investment income and realized gains are determined in accordance with federal income tax regulations, which may differ from net investment income and realized gains recognized for financial reporting
20
MATSON MONEY VI PORTFOLIOS
Notes to Financial Statements (Concluded)
February 28, 2015
(Unaudited)
purposes. Accordingly, the character of distributions and composition of net assets for tax purposes may differ from those reflected in the accompanying financial statements. To the extent these differences are permanent, such amounts are reclassified within the capital accounts based on the tax treatment; temporary differences do not require such reclassification.
As of August 31, 2014, the components of distributable earnings on a tax basis were as follows:
| | | | | | | | | | | | | | | | |
| | | Undistributed
Ordinary Income | | | Undistributed
Long-Term
Capital Gains | | | Unrealized
Appreciation/
(Depreciation) | | | Qualified
Late-Year
Losses | |
Matson Money U.S. Equity VI Portfolio | | $ | — | | | $ | — | | | $ | 330,032 | | | $ | (9,736 | ) |
Matson Money International Equity VI Portfolio | | | 9,125 | | | | — | | | | 55,537 | | | | — | |
Matson Money Fixed Income VI Portfolio | | | — | | | | — | | | | 33,992 | | | | (13,031 | ) |
The differences between the book and tax basis components of distributable earnings relate primarily to the timing of recognition of income and gains for federal income tax purposes. Short-term and foreign currency gains are reported as ordinary income for federal income tax purposes.
For the period ended August 31, 2014, there were no dividends and distributions paid to shareholders.
Distributions from net investment income and short term capital gains are treated as ordinary income for federal income tax purposes.
Under the Regulated Investment Company Modernization Act of 2010 (the “Modernization Act”), the Portfolios are permitted to carry forward capital losses incurred in taxable years beginning after December 22, 2010 for an unlimited period. Any losses incurred during those future taxable years will be required to be utilized prior to any losses incurred in pre-enactment taxable years. Additionally, post-enactment capital losses that are carried forward will retain their character as either short-term or long-term capital losses rather than being considered all short-term as under the previous law. As of August 31, 2014, the Portfolios did not have any capital loss carryforwards.
Management has evaluated the impact of all subsequent events on the Portfolios through the date the financial statements were issued, and has determined that there were no subsequent events requiring recognition or disclosure in the financial statements.
21
MATSON MONEY VI PORTFOLIOS
Other Information
(Unaudited)
Proxy Voting
Policies and procedures that the Portfolios use to determine how to vote proxies relating to portfolio securities as well as information regarding how the Portfolios voted proxies relating to portfolio securities for the most recent 12-month period ended June 30 are available without charge, upon request, by calling Matson Money VI Portfolios at (866) 780-0357, ext. 3863 and on the Securities and Exchange Commission’s (“SEC”) website at http://www.sec.gov.
Quarterly Portfolio Schedules
The Company files a complete schedule of portfolio holdings with the SEC for the first and third fiscal quarters of each fiscal year (quarters ended November 30 and May 31) on Form N-Q. The Company’s Form N-Q is available on the SEC website at http://www.sec.gov and may be reviewed and copied at the SEC Public Reference Room in Washington, D.C. Information on the operation of the SEC Public Reference Room may be obtained by calling (800) SEC-0330.
22
Investment Adviser
MATSON MONEY, INC.
5955 Deerfield Blvd.
Mason, OH 45040
Administrator
BNY Mellon Investment Servicing (US) Inc.
301 Bellevue Parkway
Wilmington, DE 19809
Transfer Agent
BNY Mellon Investment Servicing (US) Inc.
4400 Computer Drive
Westborough, MA 01581
Principal Underwriter
Foreside Funds Distributors LLC
400 Berwyn Park
899 Cassatt Road
Berwyn, PA 19312
Custodian
The Bank of New York Mellon
One Wall Street
New York, NY 10286
Independent Registered Public Accounting Firm
PricewaterhouseCoopers LLP
Two Commerce Square, Suite 1700
2001 Market Street
Philadelphia, PA 19103-7042
Counsel
Drinker Biddle & Reath LLP
One Logan Square, Ste. 2000
Philadelphia, PA 19103-6996
MAT-SAR15
| | |
| BOSTON PARTNERS INVESTMENT FUNDS | | |
Boston Partners Small Cap Value Fund II
(formerly Robeco Boston Partners Small Cap Value Fund II Fund)
Boston Partners Long/Short Equity Fund
(formerly Robeco Boston Partners Long/Short Equity Fund)
Boston Partners Long/Short Research Fund
(formerly Robeco Boston Partners Long/Short Research Fund)
Boston Partners All-Cap Value Fund
(formerly Robeco Boston Partners All-Cap Value Fund)
WPG Partners Small/Micro Cap Value Fund
(formerly Robeco WPG Small/Micro Cap Value Fund)
Boston Partners Global Equity Fund
(formerly Robeco Boston Partners Global Equity Fund)
Boston Partners Global Long/Short Fund
(formerly Robeco Boston Partners Global Long/Short Fund)
Table of Contents
| | |
| BOSTON PARTNERS INVESTMENT FUNDS | | |
| | |
GENERAL MARKET COMMENTARY | | |
Dear Shareholder,
For the period ending February 28th, the US economy seems to have hit a soft patch in recent months due in part to poor weather, congestion at ports as a result of labor unrest, a challenging export environment, and capital spending cuts primarily from the energy sector. 2015 GDP growth estimates of 3% at the beginning of the year have crept closer to 2% while Q1 estimates have fallen closer to 1%. Employment growth continues to be strong and all eyes are on wage growth figures to give a hint of when the Fed will begin raising rates. Current expectations of the first rate hike have been pushed out to the second half of 2015. We will also pay close attention to consumer confidence and spending to decipher whether the drop in gasoline prices since September 2014 will result in accelerated economic growth during the remainder of the year.
Some of the “headline” fears of the past months such as deflation risk, the strong US dollar and lackluster European economies appear to be dissipating of late as the self-correcting global economy responds. Deflation worries, fueled by the precipitous drop in oil prices, are beginning to fade somewhat as commodity suppliers react to weakness. Active US oil rigs, for instance, have dropped by over 50% since October 2014 as a rational counter to falling prices. The strong US dollar will hurt some companies that do not have differentiated products resulting in lost market share. Other companies will benefit from lower costs of sourcing from foreign supplies. Traditionally, volume and pricing trends, and not transitory translation effects, drive stock valuations. Good businesses will continue to perform well in a rising dollar environment. Outside the US, quantitative easing by the ECB has resulted in a new wave of investor optimism for the European economy with positive GDP forecasted in 2015.
The S&P 500 fluctuated during the past six months as well, ending modestly higher over the period. Earnings growth for the market ground to a halt due to translation effects from the strong US dollar, declining oil prices damaging energy sector earnings and slowing growth in international developed and emerging market economies. Less economically sensitive growth stocks outperformed in early 2015 as investors were willing to “pay up” for perceived predictability. Small and mid-cap companies, which have a lower percentage of revenues from outside the US, also outperformed large cap early in 2015. The US dollar strengthened over the first couple of months this year, which further contributed to the preference for lower capitalization stocks. Bond yields around the globe continued to fall as bond purchases by the ECB drove German yields to all-time lows, helping push down other sovereign yields as well.
US equity valuations continue to be on the richer side of fair, supported to some extent by the very low bond yields in the US and most developed markets. As value investors, we believe stock prices follow earnings and cash flows over time. While earnings growth in the US stalled in the fourth quarter of 2014, free cash flow growth and capital returns to shareholders have continued to increase. Free cash flow yields continue to look very attractive compared to US corporate bond yields. As investors gain confidence that the economy will improve from the tepid first quarter and earnings growth will reappear in the second half of 2015 and 2016, US equity markets should continue to modestly improve.
As noted above, there are many moving parts in the global economic and political landscape. Rather than trying to predict these variable outcomes, we will continue to do what we do best—identify stocks that we believe will outperform for your portfolio. By focusing on companies with low valuation, high and increasing returns on capital and improving business momentum, we believe we can create excess returns for you regardless of the investing environment.
Sincerely,
Boston Partners
Portfolio composition is subject to change. The current and future portfolio holdings of the Funds are subject to investment risk.
| | | | |
| SEMI-ANNUAL REPORT 2015 | | | 1 | |
| | |
| BOSTON PARTNERS INVESTMENT FUNDS | | |
| | |
Total Returns for the Periods Ended February 28, 2015 (unaudited) |
| | | | | | | | | | | | | | | | | | | | |
| | | | | | | | | Average Annual | |
| | | Six-Month | | | 1 Year | | | 5 Year | | | 10 Year | | | Since
Inception | |
| | | | |
| Boston Partners Small Cap Value Fund II | | | | | | | | | | | | | | | | | |
Institutional Class | | | 2.43 | % | | | 5.79 | % | | | 14.48 | % | | | 8.75 | % | | | N/A | |
Investor Class | | | 2.29 | % | | | 5.49 | % | | | 14.18 | % | | | 8.47 | % | | | N/A | |
Russell 2000® Value Index | | | 2.31 | % | | | 3.96 | % | | | 13.97 | % | | | 7.13 | % | | | N/A | |
Russell 2000® Index1 | | | 5.70 | % | | | 5.63 | % | | | 15.97 | % | | | 8.31 | % | | | N/A | |
1 This is not a primary benchmark of the Fund. Results of the index performance are presented for general comparative purposes. | |
| | | | |
| Boston Partners Long/Short Equity Fund | | | | | | | | | | | | | | | | | |
Institutional Class | | – | 8.93 | % | | | 3.81 | % | | | 9.67 | % | | | 11.38 | % | | | N/A | |
Investor Class | | – | 9.06 | % | | | 3.56 | % | | | 9.39 | % | | | 11.05 | % | | | N/A | |
S&P 500® Index | | | 6.12 | % | | | 15.51 | % | | | 16.18 | % | | | 7.99 | % | | | N/A | |
| | | | |
| Boston Partners Long/Short Research Fund | | | | | | | | | | | | | | | | | |
Institutional Class1 | | | 3.53 | % | | | 8.25 | % | | | N/A | | | | N/A | | | | 11.29 | % |
S&P 500® Index | | | 6.12 | % | | | 15.51 | % | | | N/A | | | | N/A | | | | 17.33 | %3 |
| | | | | |
Investor Class2 | | | 3.43 | % | | | 8.04 | % | | | N/A | | | | N/A | | | | 10.46 | % |
S&P 500® Index | | | 6.12 | % | | | 15.51 | % | | | N/A | | | | N/A | | | | 17.56 | %3 |
1 Inception date September 30, 2010 | |
2 Inception date November 29, 2010 | |
3 Index performance is from Inception date of the Fund only and is not the inception date of the index itself. | |
| | | | |
| Boston Partners All-Cap Value Fund | | | | | | | | | | | | | | | | | |
Institutional Class | | | 5.63 | % | | | 14.33 | % | | | 15.77 | % | | | 9.92 | % | | | N/A | |
Investor Class | | | 5.46 | % | | | 14.03 | % | | | 15.52 | % | | | 9.66 | % | | | N/A | |
Russell 3000® Value Index | | | 3.39 | % | | | 12.70 | % | | | 15.39 | % | | | 7.20 | % | | | N/A | |
Russell 3000® Index1 | | | 5.98 | % | | | 14.12 | % | | | 16.36 | % | | | 8.30 | % | | | N/A | |
1 This is not a primary benchmark of the Fund. Results of the index performance are presented for general comparative purposes. | |
| | | | |
| WPG Partners Small/Micro Cap Value Fund | | | | | | | | | | | | | | | | | |
Institutional Class | | – | 5.07 | % | | | –1.15 | % | | | 13.09 | % | | | 6.07 | % | | | N/A | |
Russell 2000® Value Index | | | 2.31 | % | | | 3.96 | % | | | 13.97 | % | | | 7.13 | % | | | N/A | |
| | | | |
| Boston Partners Global Equity Fund | | | | | | | | | | | | | | | | | |
Institutional Class1 | | | 2.94 | % | | | 8.00 | % | | | N/A | | | | N/A | | | | 17.78 | % |
MSCI World Index | | | 2.37 | % | | | 8.45 | % | | | N/A | | | | N/A | | | | 16.82 | %2 |
1 Inception date December 30, 2011 | |
2 Index performance is from Inception date of the Fund only and is not the inception date of the index itself. | |
| | | | |
| Boston Partners Global Long/Short Fund | | | | | | | | | | | | | | | | | |
Institutional Class1 | | | 1.07 | % | | | 4.41 | % | | | N/A | | | | N/A | | | | 3.52 | % |
MSCI World Index | | | 2.37 | % | | | 8.45 | % | | | N/A | | | | N/A | | | | 8.29 | %3 |
| | | | | |
Investor Class2 | | | 0.97 | % | | | N/A | | | | N/A | | | | N/A | | | | 5.38 | %4 |
MSCI World Index | | | 2.37 | % | | | N/A | | | | N/A | | | | N/A | | | | 4.46 | %3 |
1 Inception date December 31, 2013 | |
2 Inception date April 11, 2014 | |
3 Index performance is from Inception date of the Fund only and is not the inception date of the index itself. | |
4 Not Annualized | | | | | | | | | | | | | | | | | | | | |
| | |
| 2 | | SEMI-ANNUAL REPORT 2015 |
| | |
| BOSTON PARTNERS INVESTMENT FUNDS | | |
The performance data quoted represents past performance. Past performance is not indicative of future results. Investment return and principal value will fluctuate so that an investor’s shares, when redeemed, may be worth more or less than their original cost. Robeco Investment Management, Inc. waived a portion of its advisory fee and agreed to reimburse a portion of each Fund’s operating expenses, if necessary, to maintain certain expense ratios as set forth in the notes to the financial statements. Total returns shown include fee waivers, expense reimbursements and expense recoupment, if any; total returns would have been lower had there been no assumption of fees and expenses in excess of expense limitations. Each Fund’s annual operating expense ratios below are as stated in the current prospectuses. These rates can fluctuate and may differ from the actual expenses incurred by a Fund for the period covered by this report. Returns shown include the reinvestment of all dividends and other distributions and do not reflect taxes that a shareholder would pay on Fund distributions or on the redemption of Fund shares. Current performance may be lower or higher than the performance data quoted. For performance data current to the most recent month-end, please call
1-888-261-4073 or visit our web site at www.boston-partners.com.
Investors should note that the Funds are actively managed mutual funds while the indices are unmanaged, do not incur expense and are not available for investment.
Small company stocks are generally riskier than large company stocks due to greater volatility and less liquidity.
Value investing involves the risk that a fund’s investment in companies whose securities are believed to be undervalued, relative to their underlying profitability, will not appreciate in value as anticipated.
A long/short strategy uses short sales which theoretically involve unlimited loss potential since the market price of securities sold short may continuously increase. Increased leverage may cause a fund’s net asset value to be disproportionately volatile. The strategy also may generate high portfolio turnover which may result in higher costs and capital gains.
International investing is subject to special risks including, but not limited to, currency risk associated with securities denominated in other than the U.S. dollar, which may be affected by fluctuations in currency exchange rates, political, social or economic instability, and differences in taxation, auditing and other financial practices. Investment in emerging market securities may increase these risks.
The following are the Funds’ gross annual operating expense ratios as stated in the most recent prospectuses, dated January 26, 2015:
| | | | |
| | | Institutional
Class | | Investor
Class |
Boston Partners Small Cap Value Fund II | | 1.23% | | 1.48% |
Boston Partners Long/Short Equity Fund | | 4.33%1 | | 4.58%1 |
Boston Partners Long/Short Research Fund | | 2.52%1 | | 2.77%1 |
Boston Partners All-Cap Value Fund | | 0.94% | | 1.19% |
WPG Partners Small/Micro Cap Value Fund | | 1.35% | | N/A |
Boston Partners Global Equity Fund | | 1.39% | | 1.64% |
Boston Partners Global Long/Short Fund | | 4.89%1 | | 5.14%1 |
| | |
1 Includes interest and dividend expense on short sales. | | | | |
| | | | |
| SEMI-ANNUAL REPORT 2015 | | | 3 | |
| | |
| BOSTON PARTNERS INVESTMENT FUNDS | | |
| | |
FUND EXPENSE EXAMPLES (unaudited) | | |
As a shareholder of the Fund(s), you incur two types of costs: (1) transaction costs, including redemption fees (if applicable); and (2) ongoing costs, including management fees, distribution fees and other Fund expenses. The examples are intended to help you understand your ongoing costs (in dollars) of investing in the Fund(s) and to compare these costs with the ongoing costs of investing in other mutual funds.
The examples are based on an investment of $1,000 invested at the beginning of the six-month period from September 1, 2014 through February 28, 2015, and held for the entire period.
Actual Expenses
The first line of the accompanying tables provides information about actual account values and actual expenses. You may use the information in this line, together with the amount you invested, to estimate the expenses that you paid over the period. Simply divide your account value by $1,000 (for example, an $8,600 account value divided by $1,000 = 8.6), then multiply the result by the number in the first line under the heading entitled “Expenses Paid During Period” to estimate the expenses you paid on your account during this period.
Hypothetical Example for Comparison Purposes
The second line of the accompanying tables provides information about hypothetical account values and hypothetical expenses based on a Fund’s actual expense ratio and an assumed rate of return of 5% per year before expenses, which is not the Fund’s actual return. The hypothetical account values and expenses may not be used to estimate the actual ending account balance or expenses you paid for the period. You may use this information to compare the ongoing costs of investing in the Fund(s) and other funds. To do so, compare these 5% hypothetical examples with the 5% hypothetical examples that appear in the shareholder reports of other funds.
Please note that the expenses shown in the accompanying tables are meant to highlight your ongoing costs only and do not reflect any transactional costs, such as redemption fees. Therefore, the second line of the accompanying tables is useful in comparing ongoing costs only, and will not help you determine the relative total costs of owning different funds. In addition, if these transactional costs were included, your costs would have been higher.
Expense Table
| | | | | | | | | | | | | | | | |
| | | Beginning Account
Value
September 1, 2014 | | | Ending Account
Value
February 28, 2015 | | | Annualized
Expense
Ratio | | | Expenses
Paid During
Period* | |
| Boston Partners Small Cap Value Fund II | | | | | | | | | | | | | | | | |
Institutional | | | | | | | | | | | | | | | | |
Actual | | | $1,000.00 | | | | $1,024.30 | | | | 1.10 | % | | | $5.52 | |
Hypothetical | | | 1,000.00 | | | | 1,019.34 | | | | 1.10 | % | | | 5.51 | |
Investor | | | | | | | | | | | | | | | | |
Actual | | | $1,000.00 | | | | $1,022.90 | | | | 1.35 | % | | | $6.77 | |
Hypothetical | | | 1,000.00 | | | | 1,018.10 | | | | 1.35 | % | | | 6.76 | |
| Boston Partners Long/Short Equity Fund | | | | | | | | | | | | | | | | |
Institutional | | | | | | | | | | | | | | | | |
Actual | | | $1,000.00 | | | | $910.70 | | | | 5.28 | %(1) | | | $25.01 | |
Hypothetical | | | 1,000.00 | | | | 998.61 | | | | 5.28 | %(1) | | | 26.16 | |
Investor | | | | | | | | | | | | | | | | |
Actual | | | $1,000.00 | | | | $909.40 | | | | 5.53 | %(1) | | | $26.18 | |
Hypothetical | | | 1,000.00 | | | | 997.37 | | | | 5.53 | %(1) | | | 27.39 | |
| Boston Partners Long/Short Research Fund | | | | | | | | | | | | | | | | |
Institutional | | | | | | | | | | | | | | | | |
Actual | | | $1,000.00 | | | | $1,035.30 | | | | 2.35 | %(1) | | | $11.86 | |
Hypothetical | | | 1,000.00 | | | | 1,013.14 | | | | 2.35 | %(1) | | | 11.73 | |
Investor | | | | | | | | | | | | | | | | |
Actual | | | $1,000.00 | | | | $1,034.30 | | | | 2.59 | %(1) | | | $13.06 | |
Hypothetical | | | 1,000.00 | | | | 1,011.95 | | | | 2.59 | %(1) | | | 12.92 | |
| | |
| 4 | | SEMI-ANNUAL REPORT 2015 |
| | |
| BOSTON PARTNERS INVESTMENT FUNDS | | |
| | |
FUND EXPENSE EXAMPLES (unaudited) (concluded) | | |
| | | | | | | | | | | | | | | | |
| | | Beginning Account
Value
September 1, 2014 | | | Ending Account
Value
February 28, 2015 | | | Annualized
Expense
Ratio | | | Expenses
Paid During
Period* | |
| Boston Partners All-Cap Value Fund | | | | | | | | | | | | | | | | |
Institutional | | | | | | | | | | | | | | | | |
Actual | | | $1,000.00 | | | | $1,056.30 | | | | 0.70 | % | | | $3.57 | |
Hypothetical | | | 1,000.00 | | | | 1,021.32 | | | | 0.70 | % | | | 3.51 | |
Investor | | | | | | | | | | | | | | | | |
Actual | | | $1,000.00 | | | | $1,054.60 | | | | 0.95 | % | | | $4.84 | |
Hypothetical | | | 1,000.00 | | | | 1,020.08 | | | | 0.95 | % | | | 4.76 | |
| WPG Partners Small/Micro Cap Value Fund | | | | | | | | | | | | | | | | |
Institutional | | | | | | | | | | | | | | | | |
Actual | | | $1,000.00 | | | | $949.30 | | | | 1.10 | % | | | $5.32 | |
Hypothetical | | | 1,000.00 | | | | 1,019.34 | | | | 1.10 | % | | | 5.51 | |
| Boston Partners Global Equity Fund | | | | | | | | | | | | | | | | |
Institutional | | | | | | | | | | | | | | | | |
Actual | | | $1,000.00 | | | | $1,029.40 | | | | 0.95 | % | | | $4.78 | |
Hypothetical | | | 1,000.00 | | | | 1,020.08 | | | | 0.95 | % | | | 4.76 | |
| Boston Partners Global Long/Short Fund | | | | | | | | | | | | | | | | |
Institutional | | | | | | | | | | | | | | | | |
Actual | | | $1,000.00 | | | | $1,010.70 | | | | 2.78 | %(1) | | | $13.86 | |
Hypothetical | | | 1,000.00 | | | | 1,011.01 | | | | 2.78 | %(1) | | | 13.86 | |
Investor | | | | | | | | | | | | | | | | |
Actual | | | $1,000.00 | | | | $1,009.70 | | | | 3.03 | %(1) | | | $15.10 | |
Hypothetical | | | 1,000.00 | | | | 1,009.77 | | | | 3.03 | %(1) | | | 15.10 | |
| * | Expenses are equal to the Fund’s annualized six-month expense ratios in the table above, which include waived fees or reimbursed expenses, multiplied by the average account value over the period, multiplied by the number of days (181) in the most recent fiscal half- year, then divided by 365 to reflect the one-half year period. The Fund’s ending account values on the first line in each table are based on the actual six-month total return of 2.43% and 2.29% for the Institutional Class and Investor Class, respectively, of the Boston Partners Small Cap Value Fund II; -8.93% and -9.06% for the Institutional Class and Investor Class, respectively, of the Boston Partners Long/Short Equity Fund; 3.53% and 3.43% for the Institutional Class and Investor Class, respectively, of the Boston Partners Long/Short Research Fund; 5.63% and 5.46% for the Institutional Class and Investor Class, respectively, of the Boston Partners All-Cap Value Fund; -5.07% for the Institutional Class of the WPG Partners Small/Micro Cap Value Fund; 2.94% for the Institutional Class of the Boston Partners Global Equity Fund and 1.07% and 0.97% for the Institutional Class and Investor Class, respectively, of the Boston Partners Global Long/Short Fund. |
| (1) | These amounts include dividends paid on securities which the Funds have sold short (“short-sale dividends”) and related interest expense. The amount of short-sale dividends and related interest expense was 2.90% and 0.97% of average net assets for the six-month period ended February 28, 2015 for both the Institutional Class and Investor Class of the Boston Partners Long/Short Equity Fund and Boston Partners Long/Short Research Fund, respectively, and 0.80% of average net assets for the Institutional Class and Investor Class, respectively, of the Boston Partners Global Long/Short Fund. |
| | | | |
| SEMI-ANNUAL REPORT 2015 | | | 5 | |
| | |
| BOSTON PARTNERS INVESTMENT FUNDS | | FEBRUARY 28, 2015 |
| | |
PORTFOLIO HOLDINGS SUMMARY TABLES (unaudited) | | |
BOSTON PARTNERS
SMALL CAP VALUE FUND II
| | | | | | | | |
| Security Type/Sector Classification | | % of Net
Assets | | | Value | |
COMMON STOCK | | | | | | | | |
Consumer Services | | | 19.8 | % | | $ | 54,556,433 | |
Finance | | | 19.7 | | | | 54,400,659 | |
Capital Goods | | | 14.5 | | | | 39,954,888 | |
Health Care | | | 10.1 | | | | 27,887,443 | |
Technology | | | 8.9 | | | | 24,540,098 | |
Real Estate Investment Trusts | | | 8.7 | | | | 24,155,074 | |
Basic Industries | | | 4.1 | | | | 11,407,294 | |
Consumer Non-Durables | | | 3.6 | | | | 9,886,652 | |
Consumer Durables | | | 3.4 | | | | 9,476,535 | |
Energy | | | 2.5 | | | | 6,826,037 | |
Transportation | | | 1.6 | | | | 4,465,611 | |
Utilities | | | 0.7 | | | | 1,806,644 | |
SECURITIES LENDING COLLATERAL | | | 3.7 | | | | 10,148,370 | |
LIABILITIES IN EXCESS OF OTHER ASSETS | | | (1.3 | ) | | | (3,604,365 | ) |
| | | | | | | | |
NET ASSETS | | | 100.0 | % | | $ | 275,907,373 | |
| | | | | | | | |
Portfolio holdings are subject to change at any time.
BOSTON PARTNERS
LONG/SHORT EQUITY FUND
| | | | | | | | |
| Security Type/Sector Classification | | % of Net
Assets | | | Value | |
COMMON STOCK | | | | | | | | |
Finance | | | 21.4 | % | | $ | 161,189,441 | |
Technology | | | 15.2 | | | | 114,264,958 | |
Consumer Services | | | 14.5 | | | | 108,649,989 | |
Health Care | | | 11.5 | | | | 86,646,619 | |
Capital Goods | | | 10.9 | | | | 82,188,994 | |
Basic Industries | | | 9.8 | | | | 73,955,983 | |
Energy | | | 6.8 | | | | 51,234,444 | |
Communications | | | 6.5 | | | | 48,907,030 | |
Consumer Non-Durables | | | 4.1 | | | | 30,467,044 | |
Consumer Durables | | | 2.5 | | | | 18,721,502 | |
Real Estate Investment Trusts | | | 1.4 | | | | 10,186,905 | |
Transportation | | | 0.2 | | | | 1,313,202 | |
OPTIONS PURCHASED | | | 0.2 | | | | 1,920,900 | |
SECURITIES LENDING COLLATERAL | | | 4.0 | | | | 29,918,254 | |
SECURITIES SOLD SHORT | | | | | | | | |
Basic Industries | | | (0.4 | ) | | | (2,650,240 | ) |
Real Estate Investment Trusts | | | (0.4 | ) | | | (2,714,610 | ) |
Energy | | | (0.5 | ) | | | (3,895,180 | ) |
Utilities | | | (0.7 | ) | | | (5,311,703 | ) |
Transportation | | | (2.3 | ) | | | (17,560,274 | ) |
Finance | | | (2.4 | ) | | | (17,844,207 | ) |
Consumer Non-Durables | | | (3.2 | ) | | | (24,137,071 | ) |
Consumer Durables | | | (4.7 | ) | | | (35,258,971 | ) |
Communications | | | (6.0 | ) | | | (45,063,242 | ) |
Capital Goods | | | (6.2 | ) | | | (46,655,693 | ) |
Consumer Services | | | (12.6 | ) | | | (95,020,409 | ) |
Technology | | | (23.0 | ) | | | (172,582,137 | ) |
Health Care | | | (24.2 | ) | | | (182,007,045 | ) |
WRITTEN OPTIONS | | | (0.1 | ) | | | (1,008,930 | ) |
OTHER ASSETS IN EXCESS OF LIABILITIES | | | 77.7 | | | | 583,915,175 | |
| | | | | | | | |
NET ASSETS | | | 100.0 | % | | $ | 751,770,728 | |
| | | | | | | | |
Portfolio holdings are subject to change at any time.
BOSTON PARTNERS
LONG/SHORT RESEARCH FUND
| | | | | | | | |
| Security Type/Sector Classification | | % of Net
Assets | | | Value | |
COMMON STOCK | | | | | | | | |
Finance | | | 18.9 | % | | $ | 1,190,372,751 | |
Technology | | | 16.8 | | | | 1,053,356,417 | |
Consumer Services | | | 11.1 | | | | 700,440,685 | |
Capital Goods | | | 10.6 | | | | 665,667,491 | |
Health Care | | | 10.2 | | | | 644,095,831 | |
Energy | | | 9.0 | | | | 562,736,665 | |
Basic Industries | | | 6.2 | | | | 389,299,560 | |
Communications | | | 3.9 | | | | 243,175,950 | |
Consumer Non-Durables | | | 3.5 | | | | 220,675,217 | |
Consumer Durables | | | 2.5 | | | | 160,099,311 | |
Real Estate Investment Trusts | | | 0.7 | | | | 42,224,269 | |
Transportation | | | 0.4 | | | | 22,028,808 | |
Utilities | | | 0.2 | | | | 11,584,298 | |
WARRANTS | | | 0.0 | | | | 602,152 | |
SECURITIES SOLD SHORT | | | | | | | | |
Utilities | | | (0.3 | ) | | | (21,317,962 | ) |
Consumer Durables | | | (1.1 | ) | | | (68,154,591 | ) |
Transportation | | | (1.7 | ) | | | (107,216,914 | ) |
Real Estate Investment Trusts | | | (2.0 | ) | | | (126,754,660 | ) |
Capital Goods | | | (3.0 | ) | | | (187,931,542 | ) |
Health Care | | | (3.1 | ) | | | (193,900,084 | ) |
Basic Industries | | | (3.3 | ) | | | (204,293,090 | ) |
Energy | | | (3.6 | ) | | | (224,056,494 | ) |
Communications | | | (3.6 | ) | | | (224,147,405 | ) |
Consumer Non-Durables | | | (4.1 | ) | | | (258,202,980 | ) |
Finance | | | (4.8 | ) | | | (303,122,832 | ) |
Technology | | | (5.9 | ) | | | (373,825,127 | ) |
Consumer Services | | | (7.5 | ) | | | (473,577,091 | ) |
WRITTEN OPTIONS | | | (0.2 | ) | | | (11,916,356 | ) |
OTHER ASSETS IN EXCESS OF LIABILITIES | | | 50.2 | | | | 3,155,693,354 | |
| | | | | | | | |
NET ASSETS | | | 100.0 | % | | $ | 6,283,635,631 | |
| | | | | | | | |
Portfolio holdings are subject to change at any time.
BOSTON PARTNERS
ALL-CAP VALUE FUND
| | | | | | | | |
| Security Type/Sector Classification | | % of Net
Assets | | | Value | |
COMMON STOCK | | | | | | | | |
Finance | | | 25.1 | % | | $ | 252,583,815 | |
Technology | | | 21.8 | | | | 220,057,835 | |
Health Care | | | 17.5 | | | | 175,871,039 | |
Consumer Services | | | 8.3 | | | | 83,551,779 | |
Capital Goods | | | 7.9 | | | | 79,576,127 | |
Energy | | | 7.5 | | | | 75,312,564 | |
Consumer Non-Durables | | | 4.9 | | | | 49,713,962 | |
Consumer Durables | | | 2.4 | | | | 24,598,124 | |
Communications | | | 2.4 | | | | 23,977,187 | |
Basic Industries | | | 1.3 | | | | 13,078,769 | |
Real Estate Investment Trusts | | | 0.0 | | | | — | |
SECURITIES LENDING COLLATERAL | | | 0.0 | | | | 154,906 | |
RIGHTS | | | 0.0 | | | | — | |
WRITTEN OPTIONS | | | (0.1 | ) | | | (837,000 | ) |
OTHER ASSETS IN EXCESS OF LIABILITIES | | | 1.0 | | | | 10,025,315 | |
| | | | | | | | |
NET ASSETS | | | 100.0 | % | | $ | 1,007,664,422 | |
| | | | | | | | |
Portfolio holdings are subject to change at any time.
THEACCOMPANYINGNOTESAREANINTEGRALPARTOFTHEFINANCIALSTATEMENTS.
| | |
| 6 | | SEMI-ANNUAL REPORT 2015 |
| | |
| BOSTON PARTNERS INVESTMENT FUNDS | | FEBRUARY 28, 2015 |
| | |
PORTFOLIO HOLDINGS SUMMARY TABLES (unaudited) (concluded) | | |
WPG PARTNERS
SMALL/MICRO CAP VALUE FUND
| | | | | | | | |
| Security Type/Sector Classification | | % of Net
Assets | | | Value | |
COMMON STOCK | | | | | | | | |
Finance | | | 25.2 | % | | $ | 10,738,702 | |
Real Estate Investment Trusts | | | 12.1 | | | | 5,153,287 | |
Capital Goods | | | 10.8 | | | | 4,597,248 | |
Technology | | | 9.5 | | | | 4,054,473 | |
Consumer Services | | | 7.7 | | | | 3,288,081 | |
Transportation | | | 6.0 | | | | 2,542,924 | |
Health Care | | | 4.8 | | | | 2,053,959 | |
Utilities | | | 4.4 | | | | 1,875,865 | |
Energy | | | 4.0 | | | | 1,711,600 | |
Consumer Non-Durables | | | 2.9 | | | | 1,220,805 | |
Consumer Durables | | | 2.3 | | | | 984,537 | |
Basic Industries | | | 1.9 | | | | 813,425 | |
SECURITIES LENDING COLLATERAL | | | 8.9 | | | | 3,789,509 | |
LIABILITIES IN EXCESS OF OTHER ASSETS | | | (0.5 | ) | | | (212,029 | ) |
| | | | | | | | |
NET ASSETS | | | 100.0 | % | | $ | 42,612,386 | |
| | | | | | | | |
Portfolio holdings are subject to change at any time.
BOSTON PARTNERS
GLOBAL EQUITY FUND
| | | | | | | | |
| Security Type/Sector Classification | | % of Net
Assets | | | Value | |
COMMON STOCK | | | | | | | | |
Finance | | | 20.5 | % | | $ | 16,482,171 | |
Information Technology | | | 13.8 | | | | 11,081,733 | |
Consumer Discretionary | | | 13.2 | | | | 10,568,920 | |
Industrial | | | 12.6 | | | | 10,138,268 | |
Health Care | | | 12.2 | | | | 9,787,391 | |
Materials | | | 10.8 | | | | 8,638,052 | |
Energy | | | 6.1 | | | | 4,909,890 | |
Consumer Staples | | | 5.4 | | | | 4,300,536 | |
Telecommunications Services | | | 2.7 | | | | 2,144,925 | |
OTHER ASSETS IN EXCESS OF LIABILITIES | | | 2.7 | | | | 2,156,293 | |
| | | | | | | | |
NET ASSETS | | | 100.0 | % | | $ | 80,208,179 | |
| | | | | | | | |
Portfolio holdings are subject to change at any time.
BOSTON PARTNERS
GLOBAL LONG/SHORT FUND
| | | | | | | | |
| Security Type/Sector Classification | | % of Net
Assets | | | Value | |
COMMON STOCK | | | | | | | | |
Financials | | | 19.8 | % | | $ | 32,055,374 | |
Health Care | | | 12.1 | | | | 19,556,778 | |
Information Technology | | | 11.8 | | | | 19,105,118 | |
Industrials | | | 9.6 | | | | 15,553,461 | |
Consumer Discretionary | | | 8.2 | | | | 13,258,857 | |
Energy | | | 6.4 | | | | 10,272,051 | |
Consumer Services | | | 5.6 | | | | 8,974,742 | |
Basic Industries | | | 5.2 | | | | 8,435,991 | |
Materials | | | 4.6 | | | | 7,475,730 | |
Capital Goods | | | 3.7 | | | | 5,970,365 | |
Telecommunication Services | | | 3.5 | | | | 5,605,435 | |
Consumer Durables | | | 2.1 | | | | 3,374,243 | |
Communications | | | 1.4 | | | | 2,326,294 | |
Consumer Staples | | | 1.4 | | | | 2,201,702 | |
WARRANTS | | | 0.0 | | | | 2,902 | |
SECURITIES SOLD SHORT | | | | | | | | |
Telecommunication Services | | | (0.4 | ) | | | (704,657 | ) |
Health Care | | | (2.8 | ) | | | (4,532,586 | ) |
Energy | | | (4.4 | ) | | | (7,115,497 | ) |
Consumer Staples | | | (4.5 | ) | | | (7,187,022 | ) |
Information Technology | | | (5.6 | ) | | | (9,098,598 | ) |
Materials | | | (5.8 | ) | | | (9,312,552 | ) |
Financials | | | (6.3 | ) | | | (10,117,048 | ) |
Industrials | | | (8.4 | ) | | | (13,629,524 | ) |
Consumer Discretionary | | | (9.6 | ) | | | (15,502,791 | ) |
WRITTEN OPTIONS | | | 0.0 | | | | (36,735 | ) |
OTHER ASSETS IN EXCESS OF LIABILITIES | | | 52.4 | | | | 84,662,044 | |
| | | | | | | | |
NET ASSETS | | | 100.0 | % | | $ | 161,594,077 | |
| | | | | | | | |
Portfolio holdings are subject to change at any time.
THEACCOMPANYINGNOTESAREANINTEGRALPARTOFTHEFINANCIALSTATEMENTS.
| | | | |
| SEMI-ANNUAL REPORT 2015 | | | 7 | |
| | |
| BOSTON PARTNERS INVESTMENT FUNDS | | FEBRUARY 28, 2015 (unaudited) |
| | |
BOSTON PARTNERS SMALL CAP VALUE FUND II | | PORTFOLIOOF INVESTMENTS |
| | | | | | | | |
| | | Number of
Shares | | | Value | |
COMMON STOCK—97.6% | |
Basic Industries—4.1% | |
Cloud Peak Energy, Inc. * | | | 217,070 | | | $ | 1,799,510 | |
Graphic Packaging Holding Co. * | | | 409,425 | | | | 6,178,223 | |
PolyOne Corp. | | | 19,759 | | | | 785,223 | |
Schweitzer-Mauduit International, Inc. | | | 39,700 | | | | 1,858,754 | |
Sensient Technologies Corp. | | | 12,350 | | | | 785,584 | |
| | | | | | | | |
| | | | | | | 11,407,294 | |
| | | | | | | | |
Capital Goods—14.5% | |
Actuant Corp., Class A | | | 26,705 | | | | 679,375 | |
Aegion Corp. * | | | 73,455 | | | | 1,328,801 | |
Ampco-Pittsburgh Corp. | | | 22,200 | | | | 416,250 | |
Brady Corp., Class A | | | 60,608 | | | | 1,633,992 | |
Cabot Corp. | | | 34,420 | | | | 1,553,030 | |
Cubic Corp. | | | 31,550 | | | | 1,649,119 | |
Curtiss-Wright Corp. | | | 24,050 | | | | 1,745,549 | |
Drew Industries, Inc. * | | | 62,035 | | | | 3,659,445 | |
Globe Specialty Metals, Inc. | | | 105,935 | | | | 1,763,818 | |
Granite Construction, Inc. | | | 41,655 | | | | 1,379,614 | |
Hillenbrand, Inc. | | | 42,025 | | | | 1,332,192 | |
Huntington Ingalls Industries, Inc. | | | 14,095 | | | | 1,992,046 | |
LSB Industries, Inc. * | | | 37,225 | | | | 1,398,915 | |
MRC Global, Inc. * | | | 78,570 | | | | 1,011,196 | |
Mueller Industries, Inc. | | | 26,550 | | | | 924,206 | |
Orion Marine Group, Inc. * | | | 160,520 | | | | 1,637,304 | |
Rofin-Sinar Technologies, Inc. * | | | 33,395 | | | | 800,478 | |
Stock Building Supply Holdings, Inc. * | | | 103,520 | | | | 1,607,666 | |
Terex Corp. | | | 116,760 | | | | 3,200,392 | |
WESCO International, Inc. * | | | 49,295 | | | | 3,422,552 | |
World Fuel Services Corp. | | | 124,547 | | | | 6,818,948 | |
| | | | | | | | |
| | | | | | | 39,954,888 | |
| | | | | | | | |
Consumer Durables—3.4% | |
Tempur Sealy International, Inc. * | | | 48,850 | | | | 2,809,364 | |
Thor Industries, Inc. | | | 57,315 | | | | 3,534,043 | |
Tower International, Inc. * | | | 80,095 | | | | 2,168,172 | |
Winnebago Industries, Inc. | | | 41,575 | | | | 964,956 | |
| | | | | | | | |
| | | | | | | 9,476,535 | |
| | | | | | | | |
Consumer Non-Durables—3.6% | |
Fresh Del Monte Produce, Inc. (a) | | | 34,060 | | | | 1,199,253 | |
Matthews International Corp., Class A | | | 14,565 | | | | 704,509 | |
Nu Skin Enterprises, Inc., Class A (a) | | | 38,110 | | | | 2,064,800 | |
Skechers U.S.A., Inc., Class A * | | | 14,665 | | | | 999,273 | |
Steven Madden Ltd. * | | | 50,537 | | | | 1,845,106 | |
Take-Two Interactive Software, Inc. * | | | 67,725 | | | | 1,794,035 | |
Universal Corp. (a) | | | 26,710 | | | | 1,279,676 | |
| | | | | | | | |
| | | | | | | 9,886,652 | |
| | | | | | | | |
Consumer Services—19.8% | |
Abercrombie & Fitch Co.,
Class A | | | 107,535 | | | | 2,660,416 | |
ABM Industries, Inc. | | | 70,810 | | | | 2,201,483 | |
American Eagle Outfitters, Inc. (a) | | | 190,210 | | | | 2,847,444 | |
Ascena Retail Group, Inc. * | | | 80,000 | | | | 1,072,000 | |
| | | | | | | | |
| | | Number of
Shares | | | Value | |
Consumer Services—(continued) | |
Booz Allen Hamilton Holding Corp. | | | 63,765 | | | $ | 1,897,646 | |
Brink’s Co., (The) | | | 54,675 | | | | 1,538,554 | |
CBIZ, Inc. * | | | 73,340 | | | | 648,326 | |
Civeo Corp., | | | 261,910 | | | | 1,031,925 | |
Ennis, Inc. | | | 29,240 | | | | 407,898 | |
Finish Line, Inc., (The), Class A | | | 151,445 | | | | 3,707,374 | |
FTD Cos, Inc. * | | | 57,455 | | | | 1,999,434 | |
FTI Consulting, Inc. * | | | 45,920 | | | | 1,693,070 | |
G&K Services, Inc., Class A | | | 24,687 | | | | 1,777,217 | |
Group 1 Automotive, Inc. | | | 24,540 | | | | 1,996,084 | |
Heidrick & Struggles International, Inc. | | | 53,175 | | | | 1,273,009 | |
ICF International, Inc. * | | | 38,100 | | | | 1,596,390 | |
International Speedway Corp., Class A | | | 54,823 | | | | 1,701,158 | |
KAR Auction Services, Inc. | | | 82,375 | | | | 3,004,216 | |
Knoll, Inc. | | | 64,263 | | | | 1,364,303 | |
Korn/Ferry International * | | | 25,215 | | | | 771,579 | |
Live Nation Entertainment, Inc. * | | | 32,795 | | | | 839,224 | |
MAXIMUS, Inc. | | | 32,110 | | | | 1,901,875 | |
Men’s Wearhouse, Inc., (The) | | | 74,545 | | | | 3,741,414 | |
Navigant Consulting, Inc. * | | | 165,865 | | | | 2,320,451 | |
Papa Murphy’s Holdings Inc. * (a) | | | 164,751 | | | | 2,201,073 | |
Rent-A-Center, Inc. | | | 42,515 | | | | 1,173,414 | |
RPX Corp. * | | | 142,795 | | | | 2,081,951 | |
Starz, Class A | | | 41,855 | | | | 1,391,260 | |
Steiner Leisure Ltd. * | | | 10,820 | | | | 499,018 | |
Tetra Tech, Inc. | | | 69,940 | | | | 1,778,574 | |
Viad Corp. | | | 20,035 | | | | 532,130 | |
XO Group, Inc. * | | | 58,410 | | | | 906,523 | |
| | | | | | | | |
| | | | | | | 54,556,433 | |
| | | | | | | | |
Energy—2.5% | | | | | | | | |
Contango Oil & Gas Co. * | | | 14,810 | | | | 348,479 | |
Forum Energy Technologies, Inc. * | | | 59,750 | | | | 1,166,918 | |
Helix Energy Solutions Group, Inc. * | | | 115,785 | | | | 1,787,720 | |
Parsley Energy, Inc., Class A * | | | 133,745 | | | | 1,991,463 | |
Western Refining, Inc. | | | 32,515 | | | | 1,531,457 | |
| | | | | | | | |
| | | | | | | 6,826,037 | |
| | | | | | | | |
Finance—19.7% | | | | | | | | |
Ameris Bancorp | | | 32,298 | | | | 845,239 | |
AMERISAFE, Inc. | | | 25,285 | | | | 1,050,339 | |
Apollo Investment Corp. (a) | | | 90,635 | | | | 706,047 | |
BBCN Bancorp, Inc. | | | 182,780 | | | | 2,513,225 | |
Centerstate Banks, Inc. | | | 74,845 | | | | 877,932 | |
Columbia Banking System, Inc. | | | 38,695 | | | | 1,090,425 | |
Essent Group Ltd. * | | | 41,860 | | | | 971,989 | |
Federal Agricultural Mortgage Corp., Class C | | | 79,060 | | | | 2,525,176 | |
Fifth Street Finance Corp. | | | 126,490 | | | | 895,549 | |
First American Financial Corp. | | | 132,485 | | | | 4,640,950 | |
First Citizens Bancshares, Inc., Class A | | | 4,585 | | | | 1,156,566 | |
First NBC Bank Holding Co. * | | | 45,650 | | | | 1,493,668 | |
FirstMerit Corp. | | | 86,741 | | | | 1,574,349 | |
THEACCOMPANYINGNOTESAREANINTEGRALPARTOFTHEFINANCIALSTATEMENTS.
| | |
| 8 | | SEMI-ANNUAL REPORT 2015 |
| | |
| BOSTON PARTNERS INVESTMENT FUNDS | | FEBRUARY 28, 2015 (unaudited) |
| | |
BOSTON PARTNERS SMALL CAP VALUE FUND II (continued) | | PORTFOLIOOF INVESTMENTS |
| | | | | | | | |
| | | Number of
Shares | | | Value | |
Finance—(continued) | | | | | | | | |
Flushing Financial Corp. | | | 36,710 | | | $ | 718,782 | |
Gladstone Capital Corp. (a) | | | 21,450 | | | | 185,543 | |
Global Indemnity PLC * | | | 19,508 | | | | 527,691 | |
Heritage Financial Corp. | | | 47,225 | | | | 761,267 | |
Infinity Property & Casualty Corp. | | | 15,300 | | | | 1,186,515 | |
James Rivers Group Holdings, LTD. * | | | 56,869 | | | | 1,249,412 | |
Maiden Holdings Ltd. | | | 219,755 | | | | 3,144,694 | |
Nationstar Mortgage Holdings, Inc. * (a) | | | 68,710 | | | | 1,831,122 | |
Navigators Group, Inc., (The) * | | | 12,190 | | | | 910,715 | |
Nelnet, Inc., Class A | | | 53,821 | | | | 2,509,135 | |
OneBeacon Insurance Group Ltd. | | | 84,600 | | | | 1,269,000 | |
Park Sterling Corp. | | | 59,895 | | | | 407,286 | |
PHH Corp. * | | | 100,660 | | | | 2,444,025 | |
Platinum Underwriters Holdings Ltd. (a) | | | 33,085 | | | | 2,526,040 | |
Radian Group, Inc. | | | 93,585 | | | | 1,479,579 | |
RCS Capital Corp., Class A (a) | | | 125,880 | | | | 1,435,032 | |
Safety Insurance Group, Inc. | | | 13,815 | | | | 808,178 | |
Stancorp Financial Group, Inc. | | | 19,115 | | | | 1,264,648 | |
Stewart Information Services Corp. | | | 89,900 | | | | 3,382,937 | |
SVB Financial Group * | | | 6,070 | | | | 746,003 | |
Symetra Financial Corp. | | | 106,185 | | | | 2,397,657 | |
Walker & Dunlop, Inc. * | | | 127,625 | | | | 2,045,829 | |
Washington Federal, Inc. | | | 39,210 | | | | 828,115 | |
| | | | | | | | |
| | | | | | | 54,400,659 | |
| | | | | | | | |
Health Care—10.1% | | | | | | | | |
Amsurg Corp. * | | | 28,925 | | | | 1,738,392 | |
Chemed Corp. (a) | | | 22,680 | | | | 2,641,766 | |
Hanger, Inc. * | | | 61,060 | | | | 1,580,843 | |
ICON PLC * | | | 31,170 | | | | 2,151,042 | |
Integra LifeSciences Holdings Corp. * | | | 40,540 | | | | 2,432,805 | |
Kindred Healthcare, Inc. | | | 113,497 | | | | 2,408,406 | |
LHC Group, Inc. * | | | 23,635 | | | | 798,863 | |
LifePoint Hospitals, Inc. * | | | 20,625 | | | | 1,484,175 | |
Omnicell, Inc. * | | | 35,080 | | | | 1,229,554 | |
Owens & Minor, Inc. | | | 36,427 | | | | 1,298,987 | |
PAREXEL International Corp. * | | | 30,540 | | | | 1,968,608 | |
Select Medical Holdings Corp. | | | 122,305 | | | | 1,658,456 | |
Symmetry Surgical, Inc. | | | 181,996 | | | | 1,346,772 | |
Thoratec Corp. * | | | 49,980 | | | | 2,035,186 | |
U.S. Physical Therapy, Inc. | | | 73,451 | | | | 3,113,588 | |
| | | | | | | | |
| | | | | | | 27,887,443 | |
| | | | | | | | |
Real Estate Investment Trusts—8.7% | |
Altisource Residential Corp., Class B | | | 35,430 | | | | 731,630 | |
American Capital Mortgage Investment Corp. | | | 40,145 | | | | 740,675 | |
American Residential Properties, Inc. * | | | 98,810 | | | | 1,713,365 | |
Anworth Mortgage Asset Corp. | | | 168,417 | | | | 880,821 | |
Ares Commercial Real Estate Corp. | | | 148,530 | | | | 1,782,360 | |
| | | | | | | | |
| | | Number of
Shares | | | Value | |
Real Estate Investment Trusts—(continued) | |
Chatham Lodging Trust | | | 80,285 | | | $ | 2,329,871 | |
Colony Financial, Inc. | | | 30,550 | | | | 770,166 | |
CYS Investments, Inc. | | | 299,435 | | | | 2,721,864 | |
Gladstone Commercial Corp. | | | 24,720 | | | | 449,162 | |
Hatteras Financial Corp. | | | 126,765 | | | | 2,326,138 | |
MFA Financial, Inc. | | | 394,250 | | | | 3,138,230 | |
Monmouth Real Estate Investment Corp., Class A | | | 96,635 | | | | 1,089,076 | |
QTS Realty Trust, Inc. | | | 22,210 | | | | 795,340 | |
Silver Bay Realty Trust Corp. | | | 57,182 | | | | 924,061 | |
Two Harbors Investment Corp. | | | 360,375 | | | | 3,762,315 | |
| | | | | | | | |
| | | | | | | 24,155,074 | |
| | | | | | | | |
Technology—8.9% | | | | | | | | |
Bel Fuse, Inc., Class B | | | 79,139 | | | | 1,510,763 | |
Belden, Inc. | | | 55,260 | | | | 4,905,983 | |
Brooks Automation, Inc. | | | 61,755 | | | | 741,060 | |
Coherent, Inc. * | | | 20,670 | | | | 1,327,841 | |
Convergys Corp., | | | 29,780 | | | | 665,583 | |
EnerSys, Inc. | | | 65,270 | | | | 4,262,131 | |
Insight Enterprises, Inc. * | | | 26,775 | | | | 704,182 | |
Magnachip Semiconductor Corp. * | | | 58,260 | | | | 332,665 | |
NETGEAR, Inc. * | | | 39,585 | | | | 1,276,220 | |
PC Connection, Inc. | | | 17,600 | | | | 450,912 | |
Qorvo Inc. * | | | 1 | | | | 42 | |
Sykes Enterprises, Inc. * | | | 112,530 | | | | 2,616,323 | |
SYNNEX Corp. | | | 56,885 | | | | 4,337,481 | |
TeleTech Holdings, Inc. * | | | 27,855 | | | | 676,877 | |
Teradyne, Inc. | | | 37,890 | | | | 732,035 | |
| | | | | | | | |
| | | | | | | 24,540,098 | |
| | | | | | | | |
Transportation—1.6% | | | | | | | | |
Diana Shipping, Inc. * | | | 54,030 | | | | 374,428 | |
Landstar System, Inc. | | | 11,770 | | | | 826,489 | |
Quality Distribution, Inc. * | | | 59,560 | | | | 654,564 | |
Virgin America, Inc. * | | | 74,490 | | | | 2,610,130 | |
| | | | | | | | |
| | | | | | | 4,465,611 | |
| | | | | | | | |
Utilities—0.7% | | | | | | | | |
PNM Resources, Inc. | | | 63,280 | | | | 1,806,644 | |
| | | | | | | | |
TOTAL COMMON STOCK
(Cost $203,239,712) | | | | | | | 269,363,368 | |
| | | | | | | | |
SECURITIES LENDING COLLATERAL—3.7% | |
BlackRock Liquidity TempFund, Institutional Shares | | | 10,148,370 | | | | 10,148,370 | |
| | | | | | | | |
TOTAL SECURITIES LENDING COLLATERAL
(Cost $10,148,370) | | | | | | | 10,148,370 | |
| | | | | | | | |
TOTAL INVESTMENTS—101.3%
(Cost $213,388,082) | | | | | | | 279,511,738 | |
| | | | | | | | |
LIABILITIES IN EXCESS OF OTHER ASSETS—(1.3)% | | | | | | | (3,604,365 | ) |
| | | | | | | | |
NET ASSETS—100.0% | | | | | | $ | 275,907,373 | |
| | | | | | | | |
| | | | |
| PLC | | — | | Public Limited Company |
| * | | — | | Non-income producing. |
| (a) | | — | | All or a portion of the security is on loan (see Note 6 of the Notes to Financial Statements). |
THEACCOMPANYINGNOTESAREANINTEGRALPARTOFTHEFINANCIALSTATEMENTS.
| | | | |
| SEMI-ANNUAL REPORT 2015 | | | 9 | |
| | |
| BOSTON PARTNERS INVESTMENT FUNDS | | FEBRUARY 28, 2015 (unaudited) |
| | |
BOSTON PARTNERS SMALL CAP VALUE FUND II (concluded) | | PORTFOLIOOF INVESTMENTS |
A summary of the inputs used to value the Fund’s investments as of February 28, 2015 is as follows (see Note 1 in the Notes to Financial Statements):
| | | | | | | | | | | | | | | | |
| | | Total
Value as of
February 28, 2015 | | | Level 1
Quoted
Price | | | Level 2
Significant
Observable
Inputs | | | Level 3
Significant
Unobservable
Inputs | |
Common Stock * | | $ | 269,363,368 | | | $ | 269,363,368 | | | $ | — | | | $ | — | |
Securities Lending Collateral | | | 10,148,370 | | | | 10,148,370 | | | | — | | | | — | |
| | | | | | | | | | | | | | | | |
Total Assets | | $ | 279,511,738 | | | $ | 279,511,738 | | | $ | — | | | $ | — | |
| | | | | | | | | | | | | | | | |
| * | See Portfolio of Investments detail for industry and security type breakout. |
THEACCOMPANYINGNOTESAREANINTEGRALPARTOFTHEFINANCIALSTATEMENTS.
| | |
| 10 | | SEMI-ANNUAL REPORT 2015 |
| | |
| BOSTON PARTNERS INVESTMENT FUNDS | | FEBRUARY 28, 2015 (unaudited) |
| | |
BOSTON PARTNERS LONG/SHORT EQUITY FUND | | PORTFOLIOOF INVESTMENTS |
| | | | | | | | |
| | | Number of
Shares | | | Value | |
LONG POSITIONS—109.0% | |
COMMON STOCK—104.8% | |
Basic Industries—9.8% | |
AEP Industries, Inc. * † | | | 152,724 | | | $ | 7,736,998 | |
Agnico Eagle Mines Ltd. | | | 57,969 | | | | 1,863,703 | |
American Vanguard Corp. † | | | 460,719 | | | | 5,192,303 | |
Avery Dennison Corp. † | | | 185,455 | | | | 9,931,115 | |
Cameco Corp. | | | 106,730 | | | | 1,648,978 | |
Cloud Peak Energy, Inc. * † | | | 370,358 | | | | 3,070,268 | |
Constellium NV, Class A * | | | 103,665 | | | | 1,960,305 | |
Crown Holdings, Inc. * † | | | 106,664 | | | | 5,653,192 | |
Eldorado Gold Corp. | | | 393,714 | | | | 2,283,541 | |
Freeport-McMoRan Copper & Gold, Inc. † | | | 186,669 | | | | 4,037,650 | |
Goldcorp, Inc. | | | 74,304 | | | | 1,633,202 | |
Greif, Inc., Class B † | | | 43,250 | | | | 2,056,105 | |
Koppers Holdings, Inc. † | | | 167,246 | | | | 2,696,005 | |
Monsanto Co. † | | | 38,280 | | | | 4,610,060 | |
Owens-Illinois, Inc. * † | | | 255,468 | | | | 6,683,043 | |
Pan American Silver Corp. † | | | 177,195 | | | | 1,714,362 | |
POSCO — ADR | | | 45,698 | | | | 2,771,127 | |
Reliance Steel & Aluminum Co. † | | | 90,266 | | | | 5,146,065 | |
Royal Gold Inc. † | | | 17,425 | | | | 1,256,342 | |
Universal Stainless & Alloy Products, Inc. * | | | 88,931 | | | | 2,011,619 | |
| | | | | | | | |
| | | | | | | 73,955,983 | |
| | | | | | | | |
Capital Goods—10.9% | |
Actuant Corp., Class A | | | 127,251 | | | | 3,237,265 | |
AECOM Technology Corp. * † | | | 194,569 | | | | 5,848,744 | |
Alamo Group, Inc. † | | | 150,348 | | | | 7,539,952 | |
Babcock & Wilcox Co., (The) † | | | 148,072 | | | | 4,596,155 | |
Cemex SAB de CV ADR * † | | | 344,208 | | | | 3,493,711 | |
Chicago Bridge & Iron Co. NV (a) | | | 76,096 | | | | 3,512,591 | |
Commercial Metals Co. † | | | 195,522 | | | | 2,942,606 | |
Crane Co. | | | 49,839 | | | | 3,330,740 | |
Fluor Corp. † | | | 66,198 | | | | 3,839,484 | |
Global Brass & Copper Holdings, Inc. † | | | 375,105 | | | | 5,266,474 | |
Great Lakes Dredge & Dock Corp. * | | | 377,944 | | | | 2,305,458 | |
Joy Global, Inc. † | | | 66,624 | | | | 2,952,776 | |
LSB Industries, Inc. † | | | 144,315 | | | | 5,423,358 | |
Orion Marine Group, Inc. * † | | | 311,176 | | | | 3,173,995 | |
Preformed Line Products Co. | | | 31,756 | | | | 1,459,188 | |
Rofin-Sinar Technologies, Inc. * † | | | 281,016 | | | | 6,735,954 | |
Safran SA — ADR * † | | | 201,474 | | | | 3,523,780 | |
Wesco Aircraft Holdings Inc † | | | 316,250 | | | | 4,746,912 | |
WESCO International, Inc. * † | | | 60,079 | | | | 4,171,285 | |
World Fuel Services Corp. † | | | 74,677 | | | | 4,088,566 | |
| | | | | | | | |
| | | | | | | 82,188,994 | |
| | | | | | | | |
Communications—6.5% | |
Blucora, Inc. * † | | | 499,368 | | | | 7,400,634 | |
China Unicom Hong Kong Ltd. ADR (a) | | | 185,640 | | | | 3,139,172 | |
Comcast Corp., Class A † | | | 121,112 | | | | 7,191,631 | |
Hawaiian Telcom Holdco, Inc. * † | | | 226,091 | | | | 5,878,366 | |
IAC/InterActiveCorp. | | | 53,123 | | | | 3,581,553 | |
| | | | | | | | |
| | | Number of
Shares | | | Value | |
Communications—(continued) | |
Iridium Communications, Inc. * (a) | | | 1,257,970 | | | $ | 12,051,353 | |
Monster Worldwide, Inc. * | | | 309,344 | | | | 2,078,792 | |
NTELOS Holdings Corp. | | | 590,205 | | | | 2,667,727 | |
TubeMogul Inc. | | | 78,629 | | | | 1,086,653 | |
Verisign, Inc * (a) | | | 59,843 | | | | 3,831,149 | |
| | | | | | | | |
| | | | | | | 48,907,030 | |
| | | | | | | | |
Consumer Durables—2.5% | |
Cooper-Standard Holding, Inc. * † | | | 63,698 | | | | 3,453,069 | |
Dorel Industries, Inc., Class B (a) | | | 120,039 | | | | 3,903,080 | |
Helen of Troy Ltd. * † | | | 65,106 | | | | 4,988,422 | |
Tenneco, Inc. * † | | | 109,494 | | | | 6,376,931 | |
| | | | | | | | |
| | | | | | | 18,721,502 | |
| | | | | | | | |
Consumer Non-Durables—4.1% | |
Archer-Daniels-Midland Co. | | | 50,209 | | | | 2,404,007 | |
Energizer Holdings, Inc. † | | | 30,840 | | | | 4,127,317 | |
Freshpet, Inc * | | | 29,982 | | | | 552,568 | |
Leucadia National Corp. † | | | 255,898 | | | | 6,072,460 | |
New Remy Holdco Corp. | | | 78,006 | | | | 1,784,002 | |
Unilever NV † | | | 115,239 | | | | 5,009,439 | |
Universal Corp. † | | | 219,521 | | | | 10,517,251 | |
| | | | | | | | |
| | | | | | | 30,467,044 | |
| | | | | | | | |
Consumer Services—14.5% | |
Barnes & Noble, Inc. * † | | | 432,427 | | | | 10,767,432 | |
Cenveo, Inc. * | | | 501,234 | | | | 1,047,579 | |
CVS Health Corp. † | | | 79,916 | | | | 8,300,875 | |
Eldorado Resorts, Inc. * | | | 329,820 | | | | 1,517,171 | |
Ennis, Inc. † | | | 293,328 | | | | 4,091,926 | |
FTD Cos, Inc. * † | | | 82,904 | | | | 2,885,059 | |
Global Cash Access Holdings, Inc. * | | | 255,955 | | | | 1,819,840 | |
GNC Holdings, Inc., Class A † | | | 74,775 | | | | 3,595,930 | |
International Speedway Corp., Class A † | | | 404,327 | | | | 12,546,267 | |
ITE Group PLC | | | 635,388 | | | | 1,674,965 | |
Liberty Interactive Corp., Class A * † | | | 131,176 | | | | 3,873,627 | |
Liberty Ventures, Series A * † | | | 18,649 | | | | 749,329 | |
Melco Crown Entertainment Ltd. — ADR | | | 64,323 | | | | 1,545,038 | |
New Oriental Education & Technology Group. — Sponsored ADR * | | | 154,967 | | | | 2,969,168 | |
Outerwall, Inc. * † (a) | | | 56,869 | | | | 3,669,188 | |
Overstock.com, Inc. * (a) | | | 79,561 | | | | 1,807,626 | |
Points International Ltd. * | | | 114,029 | | | | 1,110,642 | |
Realogy Holdings Corp. * † | | | 90,484 | | | | 4,162,264 | |
Scripps Networks Interactive, Inc., Class A | | | 39,239 | | | | 2,836,980 | |
SeaWorld Entertainment, Inc. † | | | 130,247 | | | | 2,440,829 | |
Speedway Motorsports, Inc. | | | 117,945 | | | | 2,797,655 | |
Steiner Leisure Ltd. * † | | | 67,289 | | | | 3,103,369 | |
Systemax, Inc. * † | | | 423,655 | | | | 5,096,570 | |
Tetra Tech, Inc. † | | | 166,929 | | | | 4,245,004 | |
Tropicana Entertainment, Inc. * | | | 96,830 | | | | 1,612,219 | |
United Stationers, Inc. | | | 99,280 | | | | 4,009,919 | |
Walgreens Boots Alliance, Inc. * † | | | 63,682 | | | | 5,290,701 | |
THEACCOMPANYINGNOTESAREANINTEGRALPARTOFTHEFINANCIALSTATEMENTS.
| | | | |
| SEMI-ANNUAL REPORT 2015 | | | 11 | |
| | |
| BOSTON PARTNERS INVESTMENT FUNDS | | FEBRUARY 28, 2015 (unaudited) |
| | |
BOSTON PARTNERS LONG/SHORT EQUITY FUND (continued) | | PORTFOLIOOF INVESTMENTS |
| | | | | | | | |
| | | Number of
Shares | | | Value | |
Consumer Services—(continued) | |
Walt Disney Co., (The) † | | | 49,359 | | | $ | 5,137,285 | |
Wyndham Worldwide Corp. † | | | 43,130 | | | | 3,945,532 | |
| | | | | | | | |
| | | | | | | 108,649,989 | |
| | | | | | | | |
Energy—6.8% | |
Apache Corp. | | | 37,611 | | | | 2,476,308 | |
BP PLC — Sponsored ADR | | | 1 | | | | 26 | |
Canadian Natural Resources Ltd. † | | | 125,751 | | | | 3,665,642 | |
Dawson Geophysical Co. * | | | 536,061 | | | | 2,808,959 | |
Exxon Mobil Corp. | | | 128,093 | | | | 11,341,354 | |
Gazprom OAO — Sponsored ADR | | | 786,929 | | | | 3,938,580 | |
Grand Tierra Energy, Inc. * | | | 677,605 | | | | 1,714,341 | |
Gulfmark Offshore, Inc., Class A † | | | 64,469 | | | | 1,059,870 | |
Halliburton Co. † | | | 75,252 | | | | 3,231,321 | |
Legacy Oil + Gas, Inc. * | | | 646,724 | | | | 1,047,693 | |
Lukoil OAO — Sponsored ADR | | | 44,769 | | | | 2,172,192 | |
Pacific Drilling SA * (a) | | | 224,236 | | | | 816,219 | |
Parsley Energy, Inc., Class A * | | | 149,648 | | | | 2,228,259 | |
Phillips 66 | | | 62,751 | | | | 4,923,443 | |
Suncor Energy, Inc. | | | 134,321 | | | | 4,043,062 | |
TransGlobe Energy Corp. | | | 533,373 | | | | 1,557,449 | |
Valero Energy Corp. | | | 68,240 | | | | 4,209,726 | |
| | | | | | | | |
| | | | | | | 51,234,444 | |
| | | | | | | | |
Finance—21.4% | |
ACE Ltd. † | | | 62,989 | | | | 7,181,376 | |
AerCap Holdings NV * † | | | 124,021 | | | | 5,518,934 | |
American International Group, Inc. † | | | 227,709 | | | | 12,599,139 | |
Aspen Insurance Holdings Ltd. † | | | 123,917 | | | | 5,681,594 | |
Axis Capital Holdings Ltd. † | | | 102,228 | | | | 5,298,477 | |
Bank of America Corp. † | | | 543,230 | | | | 8,588,466 | |
Berkshire Hathaway, Inc., Class B * † | | | 85,736 | | | | 12,638,344 | |
BitGold, Inc. | | | 525,109 | | | | 373,848 | |
Century Bancorp, Inc., Class A † | | | 36,535 | | | | 1,415,366 | |
CIT Group, Inc. | | | 76,497 | | | | 3,537,986 | |
Citigroup, Inc. † | | | 179,287 | | | | 9,398,225 | |
Endurance Specialty Holdings Ltd. † | | | 91,301 | | | | 5,804,005 | |
ePlus, Inc. * † | | | 74,187 | | | | 6,170,133 | |
Fairfax Financial Holdings Ltd. † | | | 4,453 | | | | 2,335,705 | |
Flushing Financial Corp. † | | | 96,517 | | | | 1,889,803 | |
FNFV Group * | | | 303,555 | | | | 4,519,934 | |
JPMorgan Chase & Co. † | | | 174,485 | | | | 10,692,441 | |
Loews Corp. † | | | 142,959 | | | | 5,862,749 | |
Maiden Holdings Ltd. † | | | 755,806 | | | | 10,815,584 | |
National Western Life Insurance Co., Class A † | | | 9,494 | | | | 2,386,602 | |
New Hampshire Thrift Bancshares, Inc. | | | 29,229 | | | | 452,173 | |
PartnerRE Ltd. † | | | 50,077 | | | | 5,733,816 | |
PHH Corp. | | | 94,783 | | | | 2,301,331 | |
Renaissance Holdings Ltd. † | | | 53,669 | | | | 5,502,683 | |
Sprott, Inc. | | | 5,419,040 | | | | 10,793,864 | |
Steel Excel, Inc. * † | | | 127,172 | | | | 3,052,128 | |
| | | | | | | | |
| | | Number of
Shares | | | Value | |
Finance—(continued) | |
Validus Holdings Ltd. † | | | 157,215 | | | $ | 6,546,433 | |
White Mountains Insurance Group Ltd. † | | | 6,143 | | | | 4,098,302 | |
| | | | | | | | |
| | | | | | | 161,189,441 | |
| | | | | | | | |
Health Care—11.5% | |
Alphatec Holdings, Inc. * | | | 1,277,448 | | | | 1,852,300 | |
Amgen, Inc. † | | | 40,470 | | | | 6,382,928 | |
Amsurg Corp. * | | | 55,056 | | | | 3,308,866 | |
Charles River Laboratories International, Inc. * † | | | 40,238 | | | | 3,085,047 | |
DaVita HealthCare Partners, Inc. * † | | | 104,586 | | | | 7,802,116 | |
Express Scripts Holding Co. * † | | | 86,621 | | | | 7,344,595 | |
Fresenius Medical Care AG & Co. KGaA — ADR † | | | 196,496 | | | | 8,009,177 | |
Hanger, Inc. * † | | | 132,896 | | | | 3,440,677 | |
Hologic, Inc. * † | | | 196,244 | | | | 6,354,381 | |
Humana, Inc. | | | 31,756 | | | | 5,220,051 | |
Laboratory Corp. of America Holdings * † | | | 42,387 | | | | 5,214,873 | |
LHC Group, Inc. * | | | 76,434 | | | | 2,583,469 | |
LifePoint Hospitals, Inc. | | | 23,861 | | | | 1,717,038 | |
Lion Biotechnologies Inc * | | | 179,360 | | | | 1,610,653 | |
Omnicare, Inc. | | | 31,751 | | | | 2,436,572 | |
Sanofi — ADR † | | | 87,941 | | | | 4,296,797 | |
Teva Pharmaceutical Industries Ltd. — Sponsored ADR † | | | 169,158 | | | | 9,645,389 | |
UnitedHealth Group, Inc. † | | | 55,810 | | | | 6,341,690 | |
| | | | | | | | |
| | | | | | | 86,646,619 | |
| | | | | | | | |
Real Estate Investment Trusts—1.4% | |
Annaly Capital Management, Inc. † | | | 241,815 | | | | 2,568,075 | |
Blackstone Mortgage Trust, Inc., Class A | | | 74,378 | | | | 2,150,268 | |
Hatteras Financial Corp. † | | | 144,742 | | | | 2,656,016 | |
Two Harbors Investment Corp. † | | | 269,401 | | | | 2,812,546 | |
| | | | | | | | |
| | | | | | | 10,186,905 | |
| | | | | | | | |
Technology—15.2% | |
Alpha & Omega Semiconductor Ltd. * | | | 399,060 | | | | 3,539,662 | |
Arrow Electronics, Inc. * † | | | 42,367 | | | | 2,625,059 | |
Avnet, Inc. † | | | 50,167 | | | | 2,298,150 | |
Box, Inc., Class A * | | | 150,303 | | | | 2,804,654 | |
Celestica, Inc. * | | | 614,381 | | | | 7,237,408 | |
CIBER, Inc. | | | 294,176 | | | | 1,153,170 | |
Clicksoftware Technologies Ltd. * † | | | 1,639,383 | | | | 13,623,273 | |
Cognizant Technology Solutions Corp., Class A * | | | 56,342 | | | | 3,520,530 | |
Computer Task Group, Inc. | | | 186,904 | | | | 1,426,078 | |
Comtech Telecommunications Corp. † | | | 131,650 | | | | 4,705,171 | |
CSG Systems International, Inc. † | | | 338,411 | | | | 10,121,873 | |
Datawatch Corp. (a) | | | 95,731 | | | | 636,611 | |
EMC Corp. † | | | 166,804 | | | | 4,827,308 | |
THEACCOMPANYINGNOTESAREANINTEGRALPARTOFTHEFINANCIALSTATEMENTS.
| | |
| 12 | | SEMI-ANNUAL REPORT 2015 |
| | |
| BOSTON PARTNERS INVESTMENT FUNDS | | FEBRUARY 28, 2015 (unaudited) |
| | |
BOSTON PARTNERS LONG/SHORT EQUITY FUND (continued) | | PORTFOLIOOF INVESTMENTS |
| | | | | | | | |
| | | Number of
Shares | | | Value | |
Technology—(continued) | |
Flextronics International Ltd. * | | | 244,679 | | | $ | 2,980,190 | |
Guidance Software, Inc * | | | 306,118 | | | | 1,796,913 | |
Ingram Micro, Inc., Class A * † | | | 73,838 | | | | 1,824,537 | |
Jabil Circuit, Inc. † | | | 203,365 | | | | 4,467,929 | |
Oracle Corp. † | | | 93,891 | | | | 4,114,304 | |
Pegasystems, Inc. † | | | 230,877 | | | | 4,569,056 | |
PTC, Inc. * | | | 58,497 | | | | 2,027,214 | |
QAD, Inc., Class A * | | | 204,775 | | | | 4,402,662 | |
Quality Systems, Inc. | | | 115,637 | | | | 2,009,771 | |
Rovi Corp. * † | | | 99,388 | | | | 2,472,773 | |
Sykes Enterprises, Inc. * † | | | 183,302 | | | | 4,261,771 | |
Tech Data Corp. * † | | | 41,172 | | | | 2,449,734 | |
TeleNav, Inc. * | | | 471,291 | | | | 4,015,399 | |
Teradata Corp. * † | | | 86,767 | | | | 3,862,867 | |
Ubiquiti Networks, Inc. * (a) | | | 130,962 | | | | 4,143,638 | |
Vocera Communications, Inc. * | | | 316,182 | | | | 3,281,969 | |
Western Union Co., (The) † | | | 157,033 | | | | 3,065,284 | |
| | | | | | | | |
| | | | | | | 114,264,958 | |
| | | | | | | | |
Transportation—0.2% | |
Aurizon Holdings Ltd. | | | 352,065 | | | | 1,313,202 | |
| | | | | | | | |
| | | | | | | 1,313,202 | |
| | | | | | | | |
TOTAL COMMON STOCK (Cost $665,139,994) | | | | | | | 787,726,111 | |
| | | | | | | | |
| | | Number of
Contracts | | | | |
OPTIONS PURCHASED ††—0.2% | |
Brocade Communications Systems, Inc. Put Options Expires 01/20/17
Strike Price $10.00 | | | 1,935 | | | | 686,925 | |
Outerwall, Inc. Call Options
Expires 01/15/16
Strike Price $60.00 | | | 657 | | | | 712,845 | |
Outerwall, Inc. Call Options
Expires 01/15/16
Strike Price $65.00 | | | 599 | | | | 521,130 | |
| | | | | | | | |
TOTAL OPTIONS PURCHASED (Cost $1,702,343) | | | | | | | 1,920,900 | |
| | | | | | | | |
| | | Number of
Shares | | | | |
SECURITIES LENDING COLLATERAL—4.0% | |
BlackRock Liquidity TempFund, Institutional Shares | | | 29,918,254 | | | | 29,918,254 | |
| | | | | | | | |
TOTAL SECURITIES LENDING COLLATERAL
(Cost $29,918,254) | | | | | | | 29,918,254 | |
| | | | | | | | |
TOTAL INVESTMENTS—108.4%
(Cost $696,760,591) | | | | | | | 819,565,265 | |
| | | | | | | | |
SECURITIES SOLD SHORT—(86.6%) | |
COMMON STOCK—(86.6%) | | | | | | | | |
Basic Industries—(0.4%) | | | | | | | | |
Century Aluminum Co. * | | | (127,106 | ) | | | (2,411,201 | ) |
Ethanex Energy, Inc. | | | (648 | ) | | | 0 | |
| | | | | | | | |
| | | Number of
Shares | | | Value | |
Basic Industries—(continued) | | | | | | | | |
Kennady Diamonds, Inc. * | | | (45,900 | ) | | $ | (142,829 | ) |
Tanzanian Royalty Exploration
Corp. * | | | (171,865 | ) | | | (96,210 | ) |
| | | | | | | | |
| | | | | | | (2,650,240 | ) |
| | | | | | | | |
Capital Goods—(6.2%) | | | | | | | | |
Applied Energetics, Inc. * | | | (238,070 | ) | | | (2,381 | ) |
Builders FirstSource, Inc. * | | | (301,640 | ) | | | (1,818,889 | ) |
DXP Enterprises, Inc. * | | | (32,878 | ) | | | (1,505,812 | ) |
DynaMotive Energy Systems Corp. | | | (72,185 | ) | | | (7 | ) |
Installed Building Products, Inc. * | | | (134,501 | ) | | | (2,345,697 | ) |
Interface, Inc. | | | (207,225 | ) | | | (4,183,873 | ) |
Kimball International, Inc. | | | (23,567 | ) | | | (225,065 | ) |
KLX, Inc. * | | | (93,416 | ) | | | (3,731,035 | ) |
Lindsay Corp. | | | (50,108 | ) | | | (4,388,459 | ) |
Martin Marietta Materials, Inc. | | | (27,164 | ) | | | (3,866,252 | ) |
NN, Inc. | | | (118,827 | ) | | | (3,292,696 | ) |
Smith & Wesson Holding Corp. * | | | (308,553 | ) | | | (4,174,722 | ) |
Taser International, Inc. * | | | (111,025 | ) | | | (2,606,867 | ) |
Trex Co., Inc. * | | | (212,318 | ) | | | (10,690,211 | ) |
Vulcan Materials Co. | | | (46,069 | ) | | | (3,823,727 | ) |
| | | | | | | | |
| | | | | | | (46,655,693 | ) |
| | | | | | | | |
Communications—(6.0%) | | | | | | | | |
1-800-FLOWERS.COM, Inc., Class A * | | | (516,778 | ) | | | (6,449,389 | ) |
CTC Communications Group, Inc. | | | (98,900 | ) | | | 0 | |
Descartes Systems Group, Inc., (The) * | | | (175,564 | ) | | | (2,651,016 | ) |
eGain Communications Corp. * | | | (142,473 | ) | | | (495,806 | ) |
Equinix, Inc. | | | (27,657 | ) | | | (6,200,008 | ) |
Grubhub, Inc. * | | | (150,236 | ) | | | (6,311,414 | ) |
Interliant, Inc. * | | | (600 | ) | | | 0 | |
LivePerson, Inc. * | | | (159,895 | ) | | | (1,844,389 | ) |
Meetme, Inc. * | | | (274,187 | ) | | | (531,923 | ) |
Rackspace Hosting, Inc. * | | | (136,753 | ) | | | (6,792,521 | ) |
RigNet, Inc. * | | | (62,103 | ) | | | (1,963,697 | ) |
Shutterstock, Inc. * | | | (51,736 | ) | | | (2,925,671 | ) |
TubeMogul Inc. | | | (182,295 | ) | | | (2,519,317 | ) |
Twitter, Inc. * | | | (54,104 | ) | | | (2,601,320 | ) |
WebMD Health Corp. * | | | (60,216 | ) | | | (2,652,515 | ) |
Yelp, Inc. * | | | (23,422 | ) | | | (1,124,256 | ) |
| | | | | | | | |
| | | | | | | (45,063,242 | ) |
| | | | | | | | |
Consumer Durables—(4.7%) | | | | | | | | |
American Axle & Manaufacturing Holdings, Inc. * | | | (92,999 | ) | | | (2,317,535 | ) |
Cavco Industries, Inc. * | | | (38,736 | ) | | | (2,775,822 | ) |
GoPro, Inc., Class A * | | | (119,582 | ) | | | (5,020,052 | ) |
Mobileye NV * | | | (255,647 | ) | | | (9,070,356 | ) |
Motorcar Parts of America, Inc. * † | | | (104,203 | ) | | | (2,735,329 | ) |
Qsound Labs, Inc. * | | | (4,440 | ) | | | (4 | ) |
Select Comfort Corp. * | | | (107,396 | ) | | | (3,447,412 | ) |
Tesla Motors, Inc. * | | | (36,483 | ) | | | (7,418,453 | ) |
Universal Electronics Inc. * | | | (43,780 | ) | | | (2,474,008 | ) |
| | | | | | | | |
| | | | | | | (35,258,971 | ) |
| | | | | | | | |
THEACCOMPANYINGNOTESAREANINTEGRALPARTOFTHEFINANCIALSTATEMENTS.
| | | | |
| SEMI-ANNUAL REPORT 2015 | | | 13 | |
| | |
| BOSTON PARTNERS INVESTMENT FUNDS | | FEBRUARY 28, 2015 (unaudited) |
| | |
BOSTON PARTNERS LONG/SHORT EQUITY FUND (continued) | | PORTFOLIOOF INVESTMENTS |
| | | | | | | | |
| | | Number of
Shares | | | Value | |
Consumer Non-Durables—(3.2%) | |
Amish Naturals, Inc. | | | (25,959 | ) | | $ | 0 | |
Deckers Outdoor Corp. * | | | (21,410 | ) | | | (1,589,478 | ) |
Farmer Bros Co. * | | | (21,719 | ) | | | (526,251 | ) |
Freshpet, Inc. * | | | (447,314 | ) | | | (8,243,997 | ) |
IGI Laboratories, Inc. * | | | (323,367 | ) | | | (3,725,188 | ) |
Keurig Green Mountain, Inc. | | | (22,267 | ) | | | (2,840,824 | ) |
Monster Beverage Corp. * | | | (33,742 | ) | | | (4,761,671 | ) |
Pilgrim’s Pride Corp. | | | (85,340 | ) | | | (2,340,876 | ) |
Senomyx, Inc. * | | | (20,448 | ) | | | (108,783 | ) |
Valence Technology, Inc. | | | (27,585 | ) | | | (3 | ) |
| | | | | | | | |
| | | | | | | (24,137,071 | ) |
| | | | | | | | |
Consumer Services—(12.6%) | | | | | | | | |
Amaya Inc * | | | (81,769 | ) | | | (2,354,105 | ) |
Arctic Cat, Inc. | | | (94,621 | ) | | | (3,449,882 | ) |
BJ’s Restaurants, Inc. * | | | (81,416 | ) | | | (4,251,543 | ) |
Buffalo Wild Wings, Inc. * | | | (22,109 | ) | | | (4,225,472 | ) |
Container Store Group, Inc. (The) * | | | (314,210 | ) | | | (5,787,748 | ) |
Corporate Resource Services, Inc. * | | | (218,896 | ) | | | (34,607 | ) |
Fresh Market, Inc., (The) * | | | (76,218 | ) | | | (2,900,857 | ) |
Habit Restaurants Inc., (The) * | | | (49,011 | ) | | | (1,609,521 | ) |
inContact, Inc. * | | | (229,260 | ) | | | (2,684,635 | ) |
Lumber Liquidators Holdings, Inc. * | | | (90,977 | ) | | | (4,718,067 | ) |
Mattress Firm Holding Corp. * | | | (28,300 | ) | | | (1,723,753 | ) |
Netflix, Inc. * | | | (34,631 | ) | | | (16,446,608 | ) |
Nutrisystem, Inc. | | | (83,413 | ) | | | (1,435,538 | ) |
Red Robin Gourmet Burgers, Inc. * | | | (48,344 | ) | | | (4,035,274 | ) |
Shake Shack, Inc., Class A * | | | (53,162 | ) | | | (2,293,940 | ) |
Sprouts Farmers Market, Inc. * | | | (54,262 | ) | | | (1,997,384 | ) |
Sturm Ruger & Co., Inc. | | | (38,349 | ) | | | (1,992,614 | ) |
Texas Roadhouse, Inc. | | | (107,213 | ) | | | (4,035,497 | ) |
Tile Shop Holdings, Inc. * | | | (476,113 | ) | | | (5,256,288 | ) |
Tuesday Morning Corp. * | | | (336,333 | ) | | | (6,383,600 | ) |
Viggle, Inc. * | | | (61 | ) | | | (103 | ) |
VistaPrint NV | | | (55,652 | ) | | | (4,646,942 | ) |
Williams-Sonoma, Inc. | | | (49,874 | ) | | | (4,012,363 | ) |
World Wrestling Entertainment, Inc., Class A | | | (120,305 | ) | | | (1,977,814 | ) |
Zillow Group, Inc., Class A * | | | (58,965 | ) | | | (6,766,254 | ) |
| | | | | | | | |
| | | | | | | (95,020,409 | ) |
| | | | | | | | |
Energy—(0.5%) | | | | | | | | |
Beard Co. * | | | (9,710 | ) | | | (15 | ) |
Neste Oil OYJ | | | (149,322 | ) | | | (3,895,165 | ) |
| | | | | | | | |
| | | | | | | (3,895,180 | ) |
| | | | | | | | |
Finance—(2.4%) | | | | | | | | |
Bofi Holding, Inc. * | | | (41,256 | ) | | | (3,647,030 | ) |
Credit Acceptance Corp. * | | | (42,950 | ) | | | (7,872,735 | ) |
LendingClub Corp. * | | | (208,153 | ) | | | (4,240,077 | ) |
WisdomTree Investments, Inc. | | | (111,523 | ) | | | (2,084,365 | ) |
| | | | | | | | |
| | | | | | | (17,844,207 | ) |
| | | | | | | | |
| | | | | | | | |
| | | Number of
Shares | | | Value | |
Health Care—(24.2%) | | | | | | | | |
ABIOMED, Inc. * | | | (31,166 | ) | | $ | (1,894,581 | ) |
Acadia Pharmaceuticals, Inc. * | | | (57,148 | ) | | | (2,169,910 | ) |
Accelerate Diagnostics, Inc. * | | | (313,000 | ) | | | (6,260,000 | ) |
Accuray, Inc. * | | | (306,780 | ) | | | (2,754,884 | ) |
Air Methods Corp. * | | | (49,780 | ) | | | (2,637,842 | ) |
Albany Molecular Research, Inc. * | | | (277,831 | ) | | | (4,506,419 | ) |
Align Technology, Inc. * | | | (84,135 | ) | | | (4,825,142 | ) |
Ani Pharmaceuticals, Inc. * | | | (36,350 | ) | | | (2,448,536 | ) |
Aratana Therapeutics, Inc. * | | | (133,958 | ) | | | (2,580,031 | ) |
Arena Pharmaceuticals, Inc. * | | | (351,983 | ) | | | (1,587,443 | ) |
athenahealth, Inc. * | | | (25,856 | ) | | | (3,285,522 | ) |
Biotime, Inc. * | | | (93,456 | ) | | | (392,515 | ) |
BodyTel Scientific, Inc. | | | (4,840 | ) | | | 0 | |
CareView Communications, Inc. * | | | (207,465 | ) | | | (107,882 | ) |
Cerner Corp. * | | | (47,837 | ) | | | (3,447,134 | ) |
Concordia Healthcare Corp. | | | (156,403 | ) | | | (7,840,482 | ) |
DexCom, Inc. * | | | (101,001 | ) | | | (6,134,801 | ) |
Endologix, Inc. * | | | (220,880 | ) | | | (3,483,278 | ) |
Flamel Technologies — Sponsored ADR * | | | (202,510 | ) | | | (3,169,281 | ) |
Fluidigm Corp. * | | | (50,158 | ) | | | (2,216,984 | ) |
GenMark Diagnostics, Inc. * | | | (150,977 | ) | | | (1,918,918 | ) |
GW Pharmaceuticals PLC * | | | (28,115 | ) | | | (2,275,066 | ) |
HealthStream, Inc. * | | | (208,514 | ) | | | (5,396,342 | ) |
HeartWare International, Inc. * | | | (49,524 | ) | | | (4,220,930 | ) |
HMS Holdings Corp. * | | | (164,996 | ) | | | (2,894,030 | ) |
Inovio Pharmaceuticals, Inc * | | | (63,859 | ) | | | (451,802 | ) |
Insulet Corp. * | | | (125,805 | ) | | | (3,991,793 | ) |
Insys Therapeutics, Inc. * | | | (88,300 | ) | | | (5,303,298 | ) |
Intercept Pharmaceuticals, Inc. | | | (11,069 | ) | | | (2,450,345 | ) |
Intrexon Corp. * | | | (132,037 | ) | | | (5,421,439 | ) |
Intuitive Surgical, Inc. * | | | (6,932 | ) | | | (3,466,000 | ) |
Keryx Biopharmaceuticals, Inc. * | | | (226,341 | ) | | | (2,752,307 | ) |
Kite Pharma, Inc. * | | | (22,711 | ) | | | (1,486,208 | ) |
Lannett Co, Inc. * | | | (66,160 | ) | | | (4,128,384 | ) |
Ligand Pharmaceuticals, Inc. * | | | (38,891 | ) | | | (2,141,727 | ) |
Mannkind Corp. * | | | (274,529 | ) | | | (1,789,929 | ) |
MiMedx Group, Inc. * | | | (516,925 | ) | | | (5,350,174 | ) |
Mindray Medical International Ltd. — ADR | | | (71,299 | ) | | | (2,014,910 | ) |
Mirati Therapeutics, Inc. * | | | (72,629 | ) | | | (1,726,391 | ) |
NanoString Technologies Inc * | | | (84,331 | ) | | | (886,319 | ) |
Neuralstem, Inc. * | | | (466,549 | ) | | | (1,754,224 | ) |
Nevro Corp. * | | | (138,720 | ) | | | (5,802,658 | ) |
Novadaq Technologies, Inc. * | | | (180,158 | ) | | | (2,981,615 | ) |
Novavax, Inc. * | | | (471,820 | ) | | | (4,317,153 | ) |
Opko Health, Inc. * | | | (155,129 | ) | | | (2,258,678 | ) |
OraSure Technologies, Inc. * | | | (172,061 | ) | | | (1,231,957 | ) |
Organovo Holdings, Inc. * | | | (450,481 | ) | | | (2,666,848 | ) |
Osiris Therapeutics, Inc. * | | | (183,043 | ) | | | (3,161,153 | ) |
OvaScience, Inc. * | | | (111,338 | ) | | | (5,066,992 | ) |
PDL BioPharma, Inc. | | | (340,068 | ) | | | (2,373,675 | ) |
Pharmacyclics, Inc. * | | | (25,829 | ) | | | (5,577,256 | ) |
Puma Biotechnology, Inc. * | | | (12,091 | ) | | | (2,575,504 | ) |
Relypsa, Inc. * | | | (16,506 | ) | | | (640,433 | ) |
Rockwell Medical, Inc. * | | | (134,542 | ) | | | (1,345,420 | ) |
Seattle Genetics, Inc. * | | | (93,272 | ) | | | (3,381,110 | ) |
Spectranetics Corp. * | | | (122,321 | ) | | | (4,135,673 | ) |
Synageva Biopharma Corp. * | | | (31,136 | ) | | | (3,074,057 | ) |
THEACCOMPANYINGNOTESAREANINTEGRALPARTOFTHEFINANCIALSTATEMENTS.
| | |
| 14 | | SEMI-ANNUAL REPORT 2015 |
| | |
| BOSTON PARTNERS INVESTMENT FUNDS | | FEBRUARY 28, 2015 (unaudited) |
| | |
BOSTON PARTNERS LONG/SHORT EQUITY FUND (continued) | | PORTFOLIOOF INVESTMENTS |
| | | | | | | | |
| | | Number of
Shares | | | Value | |
Health Care—(continued) | | | | | | | | |
Tekmira Pharmaceuticals Corp. * | | | (48,901 | ) | | $ | (888,531 | ) |
TherapeuticsMD, Inc. * | | | (390,346 | ) | | | (1,979,054 | ) |
Unilife Corp. * | | | (191,696 | ) | | | (757,199 | ) |
Utah Medical Products, Inc. | | | (11,917 | ) | | | (707,870 | ) |
Wright Medical Group, Inc. * | | | (142,956 | ) | | | (3,521,006 | ) |
| | | | | | | | |
| | | | | | | (182,007,045 | ) |
| | | | | | | | |
Real Estate Investment Trusts—(0.4%) | |
Digital Realty Trust, Inc. | | | (40,895 | ) | | | (2,714,610 | ) |
| | | | | | | | |
| | | | | | | (2,714,610 | ) |
| | | | | | | | |
Technology—(23.0%) | |
3D Systems Corp. * | | | (100,844 | ) | | | (3,072,717 | ) |
ANTs Software, Inc. | | | (10,334 | ) | | | (1 | ) |
Arista Networks, Inc. * | | | (22,021 | ) | | | (1,524,073 | ) |
Box, Inc., Class A * | | | (593,154 | ) | | | (11,068,254 | ) |
Capstone Turbine Corp. * | | | (735,133 | ) | | | (520,180 | ) |
Cavium, Inc. * | | | (116,461 | ) | | | (7,976,414 | ) |
Ciena Corp. * | | | (182,367 | ) | | | (3,815,118 | ) |
Cirrus Logic, Inc. * | | | (199,024 | ) | | | (5,992,613 | ) |
Consygen, Inc. | | | (200 | ) | | | 0 | |
Cornerstone OnDemand, Inc. * | | | (51,869 | ) | | | (1,657,993 | ) |
CyberArk Software Ltd. * | | | (58,399 | ) | | | (3,461,309 | ) |
Demandware, Inc. * | | | (51,478 | ) | | | (3,252,895 | ) |
Ellie Mae, Inc. * | | | (103,821 | ) | | | (5,486,940 | ) |
Endurance International Group Holdings, Inc. * | | | (112,011 | ) | | | (2,085,645 | ) |
Ener1, Inc. | | | (102,820 | ) | | | (10 | ) |
Enphase Energy, Inc. * | | | (115,069 | ) | | | (1,585,651 | ) |
Finisar Corp. * | | | (175,683 | ) | | | (3,691,100 | ) |
FireEye, Inc. * | | | (91,288 | ) | | | (4,041,320 | ) |
First Solar, Inc. * | | | (34,731 | ) | | | (2,075,004 | ) |
GT Advanced Technologies, Inc. * | | | (198,179 | ) | | | (58,760 | ) |
Guidewire Software, Inc. * | | | (151,179 | ) | | | (8,414,623 | ) |
Himax Technologies, Inc. — ADR | | | (301,722 | ) | | | (2,172,398 | ) |
HubSpot, Inc. * | | | (95,336 | ) | | | (3,917,356 | ) |
Imageware Systems, Inc. * | | | (388,259 | ) | | | (737,692 | ) |
Infinera Corp. * | | | (279,139 | ) | | | (4,759,320 | ) |
KLA-Tencor Corp. | | | (31,464 | ) | | | (2,043,744 | ) |
Lam Research Corp. * | | | (24,895 | ) | | | (2,052,842 | ) |
Lexmark International, Inc., Class A (a) | | | (69,515 | ) | | | (2,965,510 | ) |
Micron Technology, Inc. * | | | (51,631 | ) | | | (1,583,523 | ) |
Mobileiron, Inc. * | | | (456,306 | ) | | | (4,074,813 | ) |
Neonode, Inc. * | | | (224,412 | ) | | | (688,945 | ) |
Nestor, Inc. * | | | (15,200 | ) | | | (2 | ) |
NetSuite, Inc. * | | | (49,596 | ) | | | (4,782,046 | ) |
Nimble Storage, Inc. * | | | (89,341 | ) | | | (2,256,754 | ) |
Palo Alto Networks, Inc. * | | | (15,880 | ) | | | (2,258,454 | ) |
Plug Power, Inc. * | | | (441,015 | ) | | | (1,358,326 | ) |
Proofpoint, Inc. * | | | (82,492 | ) | | | (4,672,347 | ) |
Qlik Technologies, Inc. * | | | (102,399 | ) | | | (3,321,824 | ) |
SanDisk Corp. | | | (48,551 | ) | | | (3,880,681 | ) |
SciQuest Inc * | | | (135,112 | ) | | | (2,352,300 | ) |
Sierra Wireless, Inc. * | | | (161,770 | ) | | | (6,076,081 | ) |
Skyworks Solutions, Inc. | | | (58,327 | ) | | | (5,118,194 | ) |
| | | | | | | | |
| | | Number of
Shares | | | Value | |
Technology—(continued) | |
Sonus Networks, Inc. | | | (175,559 | ) | | $ | (2,995,037 | ) |
SunEdison, Inc. * | | | (127,808 | ) | | | (2,829,669 | ) |
Tableau Software, Inc., Class A * | | | (25,822 | ) | | | (2,427,526 | ) |
Textura Corp. * | | | (108,267 | ) | | | (3,054,212 | ) |
Tiger Telematics, Inc. | | | (6,510 | ) | | | 0 | |
Tower Semiconductor Ltd. * | | | (283,565 | ) | | | (4,562,561 | ) |
Uni-Pixel, Inc. * | | | (19,665 | ) | | | (134,312 | ) |
Universal Display Corp. * | | | (132,091 | ) | | | (4,542,609 | ) |
Veeva Systems, Inc., Class A * | | | (164,001 | ) | | | (5,062,711 | ) |
VeriFone Systems, Inc. * | | | (125,645 | ) | | | (4,421,448 | ) |
ViaSat, Inc. * | | | (42,486 | ) | | | (2,776,035 | ) |
Vicor Corp. * | | | (203,036 | ) | | | (2,676,014 | ) |
Workday, Inc., Class A * | | | (51,530 | ) | | | (4,405,815 | ) |
Workiva, Inc. | | | (143,778 | ) | | | (1,840,358 | ) |
WorldGate Communications, Inc. | | | (582,655 | ) | | | (58 | ) |
Xybernaut Corp. | | | (34,156 | ) | | | 0 | |
| | | | | | | | |
| | | | | | | (172,582,137 | ) |
| | | | | | | | |
Transportation—(2.3%) | |
American Railcar Industries, Inc. | | | (235,849 | ) | | | (13,245,280 | ) |
Student Transportation, Inc. | | | (753,053 | ) | | | (4,314,994 | ) |
| | | | | | | | |
| | | | | | | (17,560,274 | ) |
| | | | | | | | |
Utilities—(0.7%) | |
SolarCity Corp. * | | | (103,421 | ) | | | (5,311,703 | ) |
| | | | | | | | |
TOTAL COMMON STOCK (Proceeds $550,185,489) | | | | | | | (650,700,782 | ) |
| | | | | | | | |
TOTAL SECURITIES SOLD SHORT—(86.6%) (Proceeds $550,185,489) | | | | | | | (650,700,782 | ) |
| | | | | | | | |
| | | Number of
Contracts | | | | |
OPTIONS WRITTEN ††—(0.1%) | |
BP PLC Put Options
Expires 01/15/16
Strike Price $47.00 | | | (1,052 | ) | | | (749,550 | ) |
Schlumberger US Call Options
Expires 01/20/17
Strike Price $80.00 | | | (264 | ) | | | (259,380 | ) |
| | | | | | | | |
TOTAL OPTIONS WRITTEN
(Premiums received $1,016,312) | | | | | | | (1,008,930 | ) |
| | | | | | | | |
OTHER ASSETS IN EXCESS OF LIABILITIES—77.7% | | | | | | | 583,915,175 | |
| | | | | | | | |
NET ASSETS—100.0% | | | | | | $ | 751,770,728 | |
| | | | | | | | |
| | | | |
| ADR | | — | | American Depositary Receipt |
| PLC | | — | | Public Limited Company |
| * | | — | | Non-income producing. |
| (a) | | — | | All or a portion of the security is on loan (see Note 6 of the Notes to Financial Statements). |
THEACCOMPANYINGNOTESAREANINTEGRALPARTOFTHEFINANCIALSTATEMENTS.
| | | | |
| SEMI-ANNUAL REPORT 2015 | | | 15 | |
| | |
| BOSTON PARTNERS INVESTMENT FUNDS | | FEBRUARY 28, 2015 (unaudited) |
| | |
BOSTON PARTNERS LONG/SHORT EQUITY FUND (concluded) | | PORTFOLIOOF INVESTMENTS |
| | | | |
| † | | — | | Security position is either entirely or partially held in a segregated account as collateral for securities sold short. |
| †† | | — | | Primary risk exposure is equity contracts. |
A summary of the inputs used to value the Fund’s investments as of February 28, 2015 is as follows (see Note 1 in the Notes to Financial Statements):
| | | | | | | | | | | | | | | | |
| | | Total
Value as of
February 28, 2015 | | | Level 1
Quoted
Price | | | Level 2
Significant
Observable
Inputs | | | Level 3
Significant
Unobservable
Inputs | |
Common Stock | | | | | | | | | | | | | | | | |
Basic Industries | | $ | 73,955,983 | | | | 73,955,983 | | | $ | — | | | $ | — | |
Capital Goods | | | 82,188,994 | | | | 82,188,994 | | | | — | | | | — | |
Communications | | | 48,907,030 | | | | 48,907,030 | | | | — | | | | — | |
Consumer Durables | | | 18,721,502 | | | | 18,721,502 | | | | — | | | | — | |
Consumer Non-Durables | | | 30,467,044 | | | | 30,467,044 | | | | — | | | | — | |
Consumer Services | | | 108,649,989 | | | | 108,649,989 | | | | — | | | | — | |
Energy | | | 51,234,444 | | | | 51,234,444 | | | | — | | | | — | |
Finance | | | 161,189,441 | | | | 161,189,441 | | | | — | | | | — | |
Health Care | | | 86,646,619 | | | | 86,646,619 | | | | — | | | | — | |
Real Estate Investment Trusts | | | 10,186,905 | | | | 10,186,905 | | | | — | | | | — | |
Technology | | | 114,264,958 | | | | 114,264,958 | | | | — | | | | — | |
Transportation | | | 1,313,202 | | | | — | | | | 1,313,202 | | | | — | |
Options Purchased | | | | | | | | | | | | | | | | |
Equity Contracts | | | 1,920,900 | | | | 1,920,900 | | | | — | | | | — | |
Securities Lending Collateral | | | 29,918,254 | | | | 29,918,254 | | | | — | | | | — | |
| | | | | | | | | | | | | | | | |
Total Assets | | $ | 819,565,265 | | | $ | 818,252,063 | | | $ | 1,313,202 | | | $ | — | |
| | | | | | | | | | | | | | | | |
| | | | |
| | | Total
Value as of
February 28, 2015 | | | Level 1
Quoted
Price | | | Level 2
Significant
Observable
Inputs | | | Level 3
Significant
Unobservable
Inputs | |
Securities Sold Short | | | | | | | | | | | | | | | | |
Basic Industries | | $ | (2,650,240 | ) | | $ | (2,650,240 | ) | | $ | — | | | $ | — | |
Capital Goods | | | (46,655,693 | ) | | | (46,655,686 | ) | | | — | | | | (7 | ) |
Communications | | | (45,063,242 | ) | | | (45,063,242 | ) | | | — | | | | — | |
Consumer Durables | | | (35,258,971 | ) | | | (35,258,967 | ) | | | (4 | ) | | | — | |
Consumer Non-Durables | | | (24,137,071 | ) | | | (24,137,068 | ) | | | — | | | | (3 | ) |
Consumer Services | | | (95,020,409 | ) | | | (95,020,409 | ) | | | — | | | | — | |
Energy | | | (3,895,180 | ) | | | (15 | ) | | | (3,895,165 | ) | | | — | |
Finance | | | (17,844,207 | ) | | | (17,844,207 | ) | | | — | | | | — | |
Health Care | | | (182,007,045 | ) | | | (182,007,045 | ) | | | — | | | | — | |
Real Estate Investment Trusts | | | (2,714,610 | ) | | | (2,714,610 | ) | | | — | | | | — | |
Technology | | | (172,582,137 | ) | | | (172,582,066 | ) | | | (69 | ) | | | (2 | ) |
Transportation | | | (17,560,274 | ) | | | (17,560,274 | ) | | | — | | | | — | |
Utilities | | | (5,311,703 | ) | | | (5,311,703 | ) | | | — | | | | — | |
Options Written | | | | | | | | | | | | | | | | |
Equity Contracts | | | (1,008,930 | ) | | | (1,008,930 | ) | | | — | | | | — | |
| | | | | | | | | | | | | | | | |
Total Liabilities | | $ | (651,709,712 | ) | | $ | (647,814,462 | ) | | $ | (3,895,238 | ) | | $ | (12 | ) |
| | | | | | | | | | | | | | | | |
THEACCOMPANYINGNOTESAREANINTEGRALPARTOFTHEFINANCIALSTATEMENTS.
| | |
| 16 | | SEMI-ANNUAL REPORT 2015 |
| | |
| BOSTON PARTNERS INVESTMENT FUNDS | | FEBRUARY 28, 2015 (unaudited) |
| | |
BOSTON PARTNERS LONG/SHORT RESEARCH FUND | | PORTFOLIOOF INVESTMENTS |
| | | | | | | | |
| | | Number of
Shares | | | Value | |
LONG POSITIONS—94.0% | | | | | | | | |
COMMON STOCK—94.0% | | | | | | | | |
Basic Industries—6.2% | | | | | | | | |
Avery Dennison Corp. † | | | 604,097 | | | $ | 32,349,396 | |
Barrick Gold Corp. | | | 1,415,495 | | | | 18,429,745 | |
Berry Plastics Group, Inc. * † | | | 1,327,888 | | | | 45,559,837 | |
Cloud Peak Energy, Inc. * † | | | 648,665 | | | | 5,377,433 | |
Crown Holdings, Inc. * † | | | 830,485 | | | | 44,015,705 | |
Graphic Packaging Holding Co. † | | | 4,029,680 | | | | 60,807,871 | |
Huntsman Corp. † | | | 1,941,620 | | | | 43,608,785 | |
Lintec Corp. | | | 561,800 | | | | 13,400,146 | |
Mosaic Co. (The) | | | 366,395 | | | | 19,514,198 | |
Packaging Corp of America † | | | 545,429 | | | | 45,194,247 | |
Smurfit Kappa Group PLC | | | 1,794,409 | | | | 50,186,824 | |
Stornoway Diamond Corp. * | | | 19,386,145 | | | | 10,855,373 | |
| | | | | | | | |
| | | | | | | 389,299,560 | |
| | | | | | | | |
Capital Goods—10.6% | | | | | | | | |
Allison Transmission Holdings, Inc. † | | | 295,316 | | | | 9,396,955 | |
Boeing Co. (The) | | | 106,292 | | | | 16,034,148 | |
Carlisle Cos, Inc. † | | | 119,417 | | | | 11,114,140 | |
Continental Building Products, Inc. * | | | 404,775 | | | | 8,443,607 | |
Crane Co. † | | | 329,306 | | | | 22,007,520 | |
CRH PLC | | | 704,133 | | | | 19,878,527 | |
Cubic Corp. † | | | 313,169 | | | | 16,369,344 | |
Danaher Corp. † | | | 484,711 | | | | 42,305,576 | |
Ebara Corp. | | | 1,911,000 | | | | 8,148,772 | |
Emerson Electric Co. † | | | 351,436 | | | | 20,355,173 | |
Fluor Corp. † | | | 277,778 | | | | 16,111,124 | |
General Dynamics Corp. † | | | 173,120 | | | | 24,025,594 | |
Global Brass & Copper Holdings, Inc. † | | | 678,492 | | | | 9,526,028 | |
Honeywell International, Inc. † | | | 197,268 | | | | 20,275,205 | |
Huntington Ingalls Industries, Inc. † | | | 280,488 | | | | 39,641,369 | |
Ingersoll-Rand PLC | | | 676,594 | | | | 45,460,351 | |
Kaba Holding AG | | | 36,525 | | | | 19,818,097 | |
Lockheed Martin Corp. † | | | 229,534 | | | | 45,918,277 | |
Masco Corp. † | | | 1,335,424 | | | | 34,974,755 | |
Nitto Denko Corp. | | | 362,000 | | | | 22,995,328 | |
Northrop Grumman Corp. † | | | 229,723 | | | | 38,067,398 | |
Parker Hannifin Corp. † | | | 133,004 | | | | 16,318,261 | |
Raytheon Co. † | | | 221,712 | | | | 24,115,614 | |
Safran SA | | | 451,861 | | | | 31,766,500 | |
Textron, Inc. † | | | 681,639 | | | | 30,203,424 | |
Timken Co. † | | | 391,209 | | | | 16,618,558 | |
Triumph Group, Inc. † | | | 328,755 | | | | 19,656,261 | |
United Technologies Corp. † | | | 170,388 | | | | 20,772,001 | |
WESCO International, Inc. * | | | 221,080 | | | | 15,349,584 | |
| | | | | | | | |
| | | | | | | 665,667,491 | |
| | | | | | | | |
Communications—3.9% | | | | | | | | |
Baidu, Inc. — Sponsored ADR * † | | | 52,003 | | | | 10,595,611 | |
Comcast Corp., Class A † | | | 782,537 | | | | 46,467,047 | |
Google, Inc., Class A * † | | | 47,129 | | | | 26,516,189 | |
Google, Inc., Class C * † | | | 8,656 | | | | 4,833,510 | |
Liberty Broadband Corp., Class A * † | | | 33,266 | | | | 1,725,175 | |
| | | | | | | | |
| | | Number of
Shares | | | Value | |
Communications—(continued) | | | | | | | | |
Liberty Broadband Corp., Class C * † | | | 86,496 | | | $ | 4,502,956 | |
Liberty Global PLC, Class A * | | | 135,905 | | | | 7,347,024 | |
Liberty Global PLC, Series C * † | | | 1,168,386 | | | | 60,954,698 | |
NetEase, Inc. — ADR † | | | 158,413 | | | | 15,847,637 | |
Time Warner Cable, Inc. † | | | 93,886 | | | | 14,463,138 | |
Verizon Communications, Inc. | | | 411,267 | | | | 20,337,153 | |
Vodafone Group PLC | | | 4,297,335 | | | | 14,874,446 | |
Yahoo!, Inc. * † | | | 332,235 | | | | 14,711,366 | |
| | | | | | | | |
| | | | | | | 243,175,950 | |
| | | | | | | | |
Consumer Durables—2.5% | | | | | | | | |
Lear Corp. † | | | 228,346 | | | | 24,871,446 | |
Newell Rubbermaid, Inc. † | | | 973,694 | | | | 38,256,437 | |
Samsung Electronics Co. Ltd. | | | 15,902 | | | | 19,667,690 | |
Tenneco, Inc. * † | | | 838,921 | | | | 48,858,759 | |
TS Tech Co. Ltd. | | | 1,022,600 | | | | 28,444,979 | |
| | | | | | | | |
| | | | | | | 160,099,311 | |
| | | | | | | | |
Consumer Non-Durables—3.5% | | | | | | | | |
Activision Blizzard, Inc. † | | | 795,950 | | | | 18,561,554 | |
Aryzta AG | | | 361,019 | | | | 28,876,765 | |
Bunge Ltd. † | | | 253,318 | | | | 20,716,346 | |
Constellation Brands, Inc., Class A * † | | | 184,631 | | | | 21,180,868 | |
Iconix Brand Group, Inc. * | | | 423,794 | | | | 14,311,523 | |
Imperial Tobacco Group PLC | | | 122,762 | | | | 6,041,426 | |
Lorillard, Inc. † | | | 377,135 | | | | 25,803,577 | |
Ontex Group NV * | | | 545,855 | | | | 16,248,230 | |
Sankyo Co., Ltd. | | | 327,500 | | | | 12,361,216 | |
Stock Spirits Group PLC | | | 5,278,864 | | | | 16,055,088 | |
Tyson Foods, Inc., Class A † | | | 980,843 | | | | 40,518,624 | |
| | | | | | | | |
| | | | | | | 220,675,217 | |
| | | | | | | | |
Consumer Services—11.1% | |
Apollo Education Group, Inc. * | | | 711,189 | | | | 19,664,376 | |
CBS Corp., Class B non-voting shares † | | | 526,104 | | | | 31,092,746 | |
Cerved Information Solutions SpA * | | | 2,871,538 | | | | 17,997,389 | |
Civeo Corp. | | | 2,051,056 | | | | 8,081,161 | |
CVS Health Corp. † | | | 403,441 | | | | 41,905,417 | |
Equifax, Inc. † | | | 378,820 | | | | 35,370,423 | |
Expedia, Inc. † | | | 148,329 | | | | 13,609,186 | |
Gap, Inc., (The) † | | | 715,021 | | | | 29,744,874 | |
H&R Block, Inc. † | | | 1,009,265 | | | | 34,466,400 | |
Home Depot, Inc. (The) † | | | 331,150 | | | | 37,999,463 | |
ITV PLC | | | 9,044,563 | | | | 31,423,479 | |
Liberty Media Corp., Class A * † | | | 210,660 | | | | 8,124,103 | |
Liberty Media Corp., Class C * † | | | 344,060 | | | | 13,280,716 | |
Macy’s, Inc. † | | | 530,663 | | | | 33,813,846 | |
Manpowergroup, Inc. † | | | 436,131 | | | | 35,091,100 | |
Moody’s Corp. † | | | 289,255 | | | | 28,040,380 | |
Omnicom Group, Inc. † | | | 411,496 | | | | 32,730,392 | |
Outerwall, Inc. * | | | 329,084 | | | | 21,232,500 | |
Phoenix New Media Ltd. — ADR * | | | 980,940 | | | | 7,200,100 | |
ProSiebenSat.1 Media AG | | | 385,784 | | | | 18,930,396 | |
Robert Half International, Inc. † | | | 531,155 | | | | 32,910,364 | |
Sally Beauty Holdings, Inc. * † | | | 559,584 | | | | 18,757,256 | |
THEACCOMPANYINGNOTESAREANINTEGRALPARTOFTHEFINANCIALSTATEMENTS.
| | | | |
| SEMI-ANNUAL REPORT 2015 | | | 17 | |
| | |
| BOSTON PARTNERS INVESTMENT FUNDS | | FEBRUARY 28, 2015 (unaudited) |
| | |
BOSTON PARTNERS LONG/SHORT RESEARCH FUND (continued) | | PORTFOLIOOF INVESTMENTS |
| | | | | | | | |
| | | Number of
Shares | | | Value | |
Consumer Services—(continued) | |
Six Flags Entertainment Corp. † | | | 244,197 | | | $ | 11,059,682 | |
Starz, Class A * | | | 257,235 | | | | 8,550,491 | |
Time, Inc. † | | | 263,056 | | | | 6,234,427 | |
Towers Watson & Co., Class A † | | | 308,883 | | | | 40,618,115 | |
Tribune Media Co., Class A * | | | 385,999 | | | | 25,464,354 | |
Viacom, Inc., Class B † | | | 395,048 | | | | 27,629,657 | |
WPP PLC | | | 1,245,125 | | | | 29,417,892 | |
| | | | | | | | |
| | | | | | | 700,440,685 | |
| | | | | | | | |
Energy—9.0% | |
Anadarko Petroleum Corp. | | | 293,057 | | | | 24,684,191 | |
California Resources Corp. | | | — | | | | 1 | |
Canadian Natural Resources Ltd. | | | 995,068 | | | | 29,006,232 | |
Diamondback Energy, Inc. * † | | | 716,342 | | | | 51,010,714 | |
Energen Corp. † | | | 535,593 | | | | 34,620,732 | |
EOG Resources, Inc. | | | 393,047 | | | | 35,264,177 | |
EQT Corp. † | | | 471,658 | | | | 37,643,025 | |
Exxon Mobil Corp. | | | 586,152 | | | | 51,897,898 | |
Inpex Corp. | | | 1,027,900 | | | | 12,149,694 | |
Kosmos Energy Ltd. * † | | | 1,498,729 | | | | 13,458,586 | |
Marathon Petroleum Corp. † | | | 437,307 | | | | 45,917,235 | |
Occidental Petroleum Corp. † | | | 544,499 | | | | 42,405,582 | |
Pacific Drilling SA * | | | 1,773,592 | | | | 6,455,875 | |
Parsley Energy, Inc., Class A * † | | | 3,262,593 | | | | 48,580,010 | |
Phillips 66 † | | | 643,440 | | | | 50,484,302 | |
Precision Drilling Corp. | | | 2,251,727 | | | | 13,713,017 | |
QEP Resources, Inc. † | | | 1,229,694 | | | | 26,413,827 | |
Rice Energy, Inc. * † | | | 1,389,325 | | | | 27,202,984 | |
Viper Energy Partners LP | | | 622,557 | | | | 11,828,583 | |
| | | | | | | | |
| | | | | | | 562,736,665 | |
| | | | | | | | |
Finance—18.9% | |
ACE Ltd. † | | | 348,641 | | | | 39,748,560 | |
Alleghany Corp. * † | | | 73,067 | | | | 34,527,080 | |
Allianz SE, Registered Shares | | | 57,525 | | | | 9,632,656 | |
Allstate Corp., (The) † | | | 629,986 | | | | 44,477,012 | |
Ally Financial, Inc. * | | | 975,465 | | | | 20,270,163 | |
Aon PLC † | | | 365,239 | | | | 36,655,386 | |
Bank of America Corp. † | | | 1,224,043 | | | | 19,352,120 | |
BB&T Corp. † | | | 1,202,288 | | | | 45,747,058 | |
Berkshire Hathaway, Inc., Class B * † | | | 267,464 | | | | 39,426,868 | |
Capital One Financial Corp. † | | | 721,434 | | | | 56,784,070 | |
Charles Schwab Corp., (The) † | | | 636,759 | | | | 18,682,509 | |
Citigroup, Inc. † | | | 1,099,810 | | | | 57,652,040 | |
Discover Financial Services † | | | 851,551 | | | | 51,927,580 | |
Endurance Specialty Holdings Ltd. † | | | 246,603 | | | | 15,676,553 | |
Fifth Third Bancorp † | | | 2,627,444 | | | | 50,867,316 | |
Goldman Sachs Group, Inc., (The) † | | | 225,612 | | | | 42,818,901 | |
Huntington Bancshares, Inc. † | | | 3,529,569 | | | | 38,613,485 | |
Investors Bancorp, Inc. | | | 1,888,625 | | | | 21,681,415 | |
JPMorgan Chase & Co. † | | | 944,401 | | | | 57,872,893 | |
MetLife, Inc. † | | | 343,366 | | | | 17,453,294 | |
Navient Corp. † | | | 1,585,023 | | | | 33,919,492 | |
PNC Financial Services Group, Inc., (The) † | | | 400,046 | | | | 36,788,230 | |
Prudential Financial, Inc. † | | | 249,986 | | | | 20,211,368 | |
Raymond James Financial, Inc. † | | | 337,225 | | | | 19,265,664 | |
Regions Financial Corp. † | | | 2,585,085 | | | | 24,842,667 | |
| | | | | | | | |
| | | Number of
Shares | | | Value | |
Finance—(continued) | |
Reinsurance Group of America, Inc. † | | | 198,923 | | | $ | 17,765,813 | |
SLM Corp. | | | 2,199,931 | | | | 20,833,347 | |
State Street Corp. † | | | 395,958 | | | | 29,479,073 | |
SunTrust Banks, Inc. † | | | 415,879 | | | | 17,051,039 | |
TD Ameritrade Holding Corp. † | | | 565,503 | | | | 20,510,794 | |
Torchmark Corp. † | | | 347,437 | | | | 18,501,020 | |
Travelers Cos., Inc., (The) † | | | 357,649 | | | | 38,425,809 | |
Validus Holdings Ltd. | | | 850,389 | | | | 35,410,198 | |
Wells Fargo & Co. † | | | 1,064,081 | | | | 58,300,998 | |
WR Berkley Corp. † | | | 718,611 | | | | 35,865,875 | |
XL Group PLC † | | | 1,197,083 | | | | 43,334,405 | |
| | | | | | | | |
| | | | | | | 1,190,372,751 | |
| | | | | | | | |
Health Care—10.2% | |
AbbVie, Inc. | | | 569,029 | | | | 34,426,255 | |
Amgen, Inc. † | | | 241,718 | | | | 38,123,763 | |
Anthem, Inc. | | | 290,527 | | | | 42,547,679 | |
Cardinal Health, Inc. † | | | 409,372 | | | | 36,020,642 | |
Express Scripts Holding Co. * † | | | 533,025 | | | | 45,195,190 | |
Gilead Sciences, Inc. * | | | 361,571 | | | | 37,433,446 | |
ICON PLC * | | | 349,529 | | | | 24,120,996 | |
Johnson & Johnson † | | | 212,063 | | | | 21,738,578 | |
Laboratory Corp. of America Holdings * † | | | 205,940 | | | | 25,336,798 | |
McKesson Corp. † | | | 157,805 | | | | 36,090,004 | |
Medtronic, Inc. † | | | 531,255 | | | | 41,220,050 | |
Merck & Co., Inc. † | | | 536,069 | | | | 31,381,479 | |
Novartis AG — Sponsored ADR | | | 134,701 | | | | 13,793,382 | |
Omnicare, Inc. † | | | 535,216 | | | | 41,072,476 | |
Pfizer, Inc. † | | | 880,962 | | | | 30,234,616 | |
Shire PLC — ADR | | | 72,818 | | | | 17,615,402 | |
Teva Pharmaceutical Industries Ltd. — Sponsored ADR | | | 948,923 | | | | 54,107,589 | |
Universal Health Services, Inc., Class B † | | | 381,865 | | | | 43,284,398 | |
Zimmer Holdings, Inc. † | | | 252,123 | | | | 30,353,088 | |
| | | | | | | | |
| | | | | | | 644,095,831 | |
| | | | | | | | |
Real Estate Investment Trusts—0.7% | |
American Capital Agency Corp. REIT † | | | 834,046 | | | | 17,877,776 | |
American Homes 4 Rent, Class A | | | 519,267 | | | | 8,666,566 | |
American Residential Properties, Inc. * † | | | 410,150 | | | | 7,112,001 | |
Boston Properties, Inc. † | | | 62,353 | | | | 8,567,926 | |
| | | | | | | | |
| | | | | | | 42,224,269 | |
| | | | | | | | |
Technology—16.8% | |
Alliance Data Systems Corp. * † | | | 49,406 | | | | 13,760,065 | |
Amdocs Ltd. † | | | 555,795 | | | | 29,179,238 | |
Apple, Inc. † | | | 407,742 | | | | 52,378,537 | |
Arrow Electronics, Inc. * † | | | 643,577 | | | | 39,876,031 | |
Avago Technologies Ltd. † | | | 394,851 | | | | 50,390,885 | |
Avnet, Inc. † | | | 747,685 | | | | 34,251,450 | |
THEACCOMPANYINGNOTESAREANINTEGRALPARTOFTHEFINANCIALSTATEMENTS.
| | |
| 18 | | SEMI-ANNUAL REPORT 2015 |
| | |
| BOSTON PARTNERS INVESTMENT FUNDS | | FEBRUARY 28, 2015 (unaudited) |
| | |
BOSTON PARTNERS LONG/SHORT RESEARCH FUND (continued) | | PORTFOLIOOF INVESTMENTS |
| | | | | | | | |
| | | Number of
Shares | | | Value | |
Technology—(continued) | |
Brocade Communications Systems, Inc. | | | 4,270,512 | | | $ | 52,911,644 | |
CA, Inc. | | | 395,070 | | | | 12,847,676 | |
CDW Corp. † | | | 802,235 | | | | 30,188,103 | |
Cisco Systems, Inc. † | | | 951,685 | | | | 28,084,224 | |
EMC Corp. † | | | 1,496,305 | | | | 43,303,067 | |
Evertec, Inc. † | | | 1,251,700 | | | | 26,097,945 | |
Fidelity National Information Services, Inc. † | | | 433,684 | | | | 29,312,702 | |
Flextronics International Ltd. * † | | | 4,176,730 | | | | 50,872,571 | |
Global Payments, Inc. | | | 196,324 | | | | 18,034,323 | |
Harris Corp. † | | | 232,011 | | | | 18,022,614 | |
Jabil Circuit, Inc. † | | | 1,719,364 | | | | 37,774,427 | |
MediaTek, Inc. | | | 2,586,000 | | | | 38,829,033 | |
Microsoft Corp. † | | | 999,624 | | | | 43,833,512 | |
Motorola Solutions, Inc. † | | | 436,550 | | | | 29,659,207 | |
NetApp, Inc. † | | | 739,473 | | | | 28,580,631 | |
NXP Semiconductors NV * | | | 496,113 | | | | 42,117,513 | |
ON Semiconductor Corp. * | | | 3,232,271 | | | | 41,211,455 | |
Oracle Corp. † | | | 1,006,613 | | | | 44,109,782 | |
Qorvo Inc. * | | | 443,419 | | | | 30,773,293 | |
QUALCOMM, Inc. † | | | 151,162 | | | | 10,960,757 | |
Seagate Technology PLC † | | | 584,432 | | | | 35,720,484 | |
TE Connectivity Ltd. † | | | 367,582 | | | | 26,513,690 | |
Texas Instruments, Inc. † | | | 614,090 | | | | 36,108,492 | |
Total System Services, Inc. † | | | 623,548 | | | | 23,819,534 | |
Western Digital Corp. † | | | 451,400 | | | | 48,290,772 | |
Zebra Technologies Corp., Class A * | | | 60,876 | | | | 5,542,760 | |
| | | | | | | | |
| | | | | | | 1,053,356,417 | |
| | | | | | | | |
Transportation—0.4% | |
Delta Air Lines, Inc. | | | 494,807 | | | | 22,028,808 | |
| | | | | | | | |
| | | | | | | 22,028,808 | |
| | | | | | | | |
Utilities—0.2% | |
AES Corp. | | | 893,161 | | | | 11,584,298 | |
| | | | | | | | |
| | | | | | | 11,584,298 | |
| | | | | | | | |
TOTAL COMMON STOCK—94.0%
(Cost $5,041,300,517) | | | | 5,905,757,253 | |
| | | | | | | | |
WARRANTS—0.0% | | | | | | | | |
Basic Industries—0.0% | | | | | | | | |
Stornoway Diamond Corp. Exercise Price CAD 0.90, Expires 07/08/16 * | | | 7,527,500 | | | | 602,152 | |
| | | | | | | | |
| | | | | | | 602,152 | |
| | | | | | | | |
TOTAL WARRANTS—0.0%
(Cost $773,078) | | | | | | | 602,152 | |
| | | | | | | | |
TOTAL INVESTMENTS—94.0%
(Cost $5,042,073,595) | | | | | | | 5,906,359,405 | |
| | | | | | | | |
SECURITIES SOLD SHORT—(44.0%) | |
COMMON STOCK—(44.0%) | |
Basic Industries—(3.3%) | |
Air Products & Chemicals, Inc. | | | (63,623 | ) | | | (9,934,095 | ) |
Aptargroup, Inc. | | | (208,296 | ) | | | (13,720,458 | ) |
| | | | | | | | |
| | | Number of
Shares | | | Value | |
Basic Industries—(continued) | |
Ball Corp. † | | | (164,654 | ) | | $ | (11,807,338 | ) |
BASF SE | | | (175,102 | ) | | | (16,778,089 | ) |
CONSOL Energy, Inc. | | | (446,788 | ) | | | (14,386,574 | ) |
Detour Gold Corp. * | | | (1,162,533 | ) | | | (11,243,120 | ) |
EI Du Pont de Nemours & Co. | | | (306,209 | ) | | | (23,838,371 | ) |
EMS-Chemie Holding AG | | | (21,247 | ) | | | (9,334,792 | ) |
FP Corp. | | | (371,800 | ) | | | (12,902,046 | ) |
Huhtamaki OYJ | | | (172,631 | ) | | | (5,099,416 | ) |
Intrepid Potash, Inc. * | | | (1,048,148 | ) | | | (14,799,850 | ) |
Linde AG | | | (63,213 | ) | | | (12,848,714 | ) |
Oji Holdings Corp. | | | (3,178,000 | ) | | | (13,425,206 | ) |
Resolute Forest Products, Inc. * | | | (314,064 | ) | | | (5,728,527 | ) |
Scotts Miracle-Gro Co. (The), Class A | | | (199,565 | ) | | | (13,073,503 | ) |
Viscofan SA | | | (130,670 | ) | | | (8,048,951 | ) |
Wausau Paper Corp. | | | (779,983 | ) | | | (7,324,040 | ) |
| | | | | | | | |
| | | | | | | (204,293,090 | ) |
| | | | | | | | |
Capital Goods—(3.0%) | |
Asahi Glass Co., Ltd. | | | (1,250,000 | ) | | | (7,891,422 | ) |
Fastenal Co. | | | (530,586 | ) | | | (22,045,848 | ) |
GEA Group AG | | | (208,622 | ) | | | (10,309,838 | ) |
James Hardie Industries PLC | | | (839,310 | ) | | | (9,911,961 | ) |
Kone OYJ | | | (207,137 | ) | | | (9,542,130 | ) |
Now, Inc. * | | | (729,177 | ) | | | (15,495,011 | ) |
Proto Labs, Inc. * | | | (345,967 | ) | | | (24,591,334 | ) |
Raven Industries, Inc. | | | (324,676 | ) | | | (6,766,248 | ) |
Sun Hydraulics Corp. | | | (211,511 | ) | | | (8,185,476 | ) |
Trex Co., Inc. * | | | (415,239 | ) | | | (20,907,284 | ) |
USG Corp. * | | | (385,281 | ) | | | (10,861,071 | ) |
Vulcan Materials Co. | | | (93,849 | ) | | | (7,789,467 | ) |
WW Grainger, Inc. | | | (101,012 | ) | | | (23,930,753 | ) |
Zardoya Otis SA | | | (803,262 | ) | | | (9,703,699 | ) |
| | | | | | | | |
| | | | | | | (187,931,542 | ) |
| | | | | | | | |
Communications—(3.6%) | |
Belgacom SA | | | (349,758 | ) | | | (13,136,782 | ) |
CenturyLink, Inc. | | | (330,150 | ) | | | (12,499,479 | ) |
Cogent Communications Group, Inc. | | | (190,113 | ) | | | (6,980,949 | ) |
Eutelsat Communications SA | | | (470,993 | ) | | | (16,075,883 | ) |
Frontier Communications Corp | | | (1,986,858 | ) | | | (15,855,127 | ) |
Internap Network Services Corp. * | | | (928,039 | ) | | | (8,834,931 | ) |
Millicom International Cellular SA — SDR | | | (195,453 | ) | | | (13,631,203 | ) |
Pandora Media, Inc. * | | | (994,080 | ) | | | (14,712,384 | ) |
Rackspace Hosting, Inc. * | | | (481,294 | ) | | | (23,905,873 | ) |
Shutterstock, Inc. * | | | (96,052 | ) | | | (5,431,741 | ) |
Sprint Corp. * | | | (3,150,441 | ) | | | (16,130,258 | ) |
Synchronoss Technologies, Inc. * | | | (398,263 | ) | | | (17,627,120 | ) |
TalkTalk Telecom Group PLC | | | (3,491,555 | ) | | | (18,264,757 | ) |
Telefonica SA — Sponsored ADR | | | (964,300 | ) | | | (14,937,007 | ) |
Twitter, Inc. * | | | (319,886 | ) | | | (15,380,119 | ) |
Yelp, Inc. * | | | (223,829 | ) | | | (10,743,792 | ) |
| | | | | | | | |
| | | | | | | (224,147,405 | ) |
| | | | | | | | |
THEACCOMPANYINGNOTESAREANINTEGRALPARTOFTHEFINANCIALSTATEMENTS.
| | | | |
| SEMI-ANNUAL REPORT 2015 | | | 19 | |
| | |
| BOSTON PARTNERS INVESTMENT FUNDS | | FEBRUARY 28, 2015 (unaudited) |
| | |
BOSTON PARTNERS LONG/SHORT RESEARCH FUND (continued) | | PORTFOLIOOF INVESTMENTS |
| | | | | | | | |
| | | Number of
Shares | | | Value | |
Consumer Durables—(1.1%) | |
Autoliv, Inc. | | | (216,849 | ) | | $ | (24,395,513 | ) |
Dorman Products, Inc. * | | | (186,639 | ) | | | (8,232,646 | ) |
Electrolux AB—Series B | | | (172,111 | ) | | | (5,618,722 | ) |
Leggett & Platt, Inc. | | | (218,870 | ) | | | (9,860,094 | ) |
Tesla Motors, Inc. * | | | (53,460 | ) | | | (10,870,556 | ) |
Valeo SA | | | (61,102 | ) | | | (9,177,060 | ) |
| | | | | | | | |
| | | | | | | (68,154,591 | ) |
| | | | | | | | |
Consumer Non-Durables—(4.1%) | |
Beiersdorf AG | | | (200,080 | ) | | | (17,363,569 | ) |
Campbell Soup Co. | | | (357,917 | ) | | | (16,675,353 | ) |
Clorox Co., (The) | | | (174,374 | ) | | | (18,943,991 | ) |
Colgate-Palmolive Co. | | | (261,341 | ) | | | (18,508,170 | ) |
Flowers Foods, Inc. | | | (769,595 | ) | | | (16,654,036 | ) |
Hain Celestial Group, Inc., (The) * | | | (275,653 | ) | | | (17,236,582 | ) |
JM Smucker Co., (The) | | | (147,051 | ) | | | (16,962,333 | ) |
Keurig Green Mountain, Inc. | | | (108,018 | ) | | | (13,780,936 | ) |
Mattel, Inc. | | | (433,804 | ) | | | (11,417,721 | ) |
McCormick & Co., Inc. non-voting shares | | | (221,829 | ) | | | (16,721,470 | ) |
Mondelez International, Inc., Class A | | | (469,958 | ) | | | (17,357,899 | ) |
Remy Cointreau SA | | | (1 | ) | | | (42 | ) |
Snyders-Lance, Inc. | | | (469,516 | ) | | | (14,484,569 | ) |
Tsingtao Brewery Co., Ltd. Class H | | | (1,598,000 | ) | | | (10,111,521 | ) |
Tumi Holdings, Inc. * | | | (853,050 | ) | | | (19,952,840 | ) |
Under Armour, Inc., Class A * | | | (259,501 | ) | | | (19,984,172 | ) |
Want Want China Holdings Ltd. | | | (10,898,000 | ) | | | (12,047,776 | ) |
| | | | | | | | |
| | | | | | | (258,202,980 | ) |
| | | | | | | | |
Consumer Services—(7.5%) | |
Acxiom Corp. * | | | (559,365 | ) | | | (11,187,300 | ) |
Aramark | | | (421,705 | ) | | | (13,346,963 | ) |
Avis Budget Group, Inc. * | | | (306,923 | ) | | | (18,605,672 | ) |
Bob Evans Farms, Inc. | | | (465,186 | ) | | | (27,250,596 | ) |
Buffalo Wild Wings, Inc. * | | | (95,567 | ) | | | (18,264,765 | ) |
CarMax, Inc. * | | | (340,403 | ) | | | (22,844,445 | ) |
Cheesecake Factory, Inc., (The) | | | (529,251 | ) | | | (25,150,008 | ) |
DreamWorks Animation SKG, Inc., Class A * | | | (699,538 | ) | | | (14,977,109 | ) |
Fresh Market, Inc., (The) * | | | (412,618 | ) | | | (15,704,241 | ) |
Hennes & Mauritz AB, Class B | | | (569,070 | ) | | | (24,812,001 | ) |
Krispy Kreme Doughnuts, Inc. * | | | (1,181,767 | ) | | | (25,786,156 | ) |
L Brands, Inc. | | | (149,791 | ) | | | (13,759,801 | ) |
Mattress Firm Holding Corp. * | | | (196,341 | ) | | | (11,959,130 | ) |
Monro Muffler Brake, Inc. | | | (432,135 | ) | | | (27,328,217 | ) |
Netflix, Inc. * | | | (27,781 | ) | | | (13,193,475 | ) |
Qunar Cayman Islands Ltd. * | | | (315,288 | ) | | | (8,572,681 | ) |
Restoration Hardware Holdings, Inc. * | | | (193,182 | ) | | | (17,019,334 | ) |
Ritchie Bros Auctioneers, Inc. | | | (695,935 | ) | | | (17,523,643 | ) |
Rollins, Inc. | | | (410,788 | ) | | | (13,777,830 | ) |
Sprouts Farmers Market, Inc. * | | | (542,390 | ) | | | (19,965,376 | ) |
Texas Roadhouse, Inc. | | | (572,068 | ) | | | (21,532,640 | ) |
Ultimate Software Group, Inc., (The) * | | | (103,189 | ) | | | (16,989,553 | ) |
United Natural Foods, Inc. * | | | (283,003 | ) | | | (23,500,569 | ) |
Vitamin Shoppe, Inc. * | | | (343,316 | ) | | | (14,556,598 | ) |
| | | | | | | | |
| | | Number of
Shares | | | Value | |
Consumer Services—(continued) | |
Wendy’s Co., (The) | | | (2,096,623 | ) | | $ | (23,251,549 | ) |
Woolworths Ltd. | | | (531,393 | ) | | | (12,717,439 | ) |
| | | | | | | | |
| | | | | | | (473,577,091 | ) |
| | | | | | | | |
Energy—(3.6%) | |
Atwood Oceanics, Inc. * | | | (300,794 | ) | | | (9,327,622 | ) |
Bristow Group, Inc. | | | (248,260 | ) | | | (15,377,224 | ) |
Cabot Oil & Gas Corp. | | | (463,290 | ) | | | (13,435,410 | ) |
Chesapeake Energy Corp. | | | (727,581 | ) | | | (12,136,051 | ) |
Concho Resources, Inc. * | | | (153,639 | ) | | | (16,734,360 | ) |
Continental Resources, Inc. * | | | (607,214 | ) | | | (27,014,951 | ) |
CVR Energy, Inc. | | | (233,723 | ) | | | (9,814,029 | ) |
Denbury Resources, Inc. | | | (1,689,281 | ) | | | (14,189,960 | ) |
EQT Midstream Partners LP | | | (123,902 | ) | | | (10,311,124 | ) |
Hess Corp. | | | (215,271 | ) | | | (16,162,547 | ) |
Matador Resources Co. * | | | (744,543 | ) | | | (16,126,801 | ) |
Oasis Petroleum, Inc. * | | | (725,370 | ) | | | (10,394,552 | ) |
Repsol SA | | | (862,370 | ) | | | (16,628,115 | ) |
Ultra Petroleum Corp. * | | | (1,051,780 | ) | | | (17,112,461 | ) |
Vermilion Energy, Inc. | | | (433,707 | ) | | | (19,291,287 | ) |
| | | | | | | | |
| | | | | | | (224,056,494 | ) |
| | | | | | | | |
Finance—(4.8%) | |
Aberdeen Asset Management PLC | | | (1,822,281 | ) | | | (13,151,187 | ) |
Astoria Financial Corp. | | | (925,558 | ) | | | (12,143,321 | ) |
BancorpSouth, Inc. | | | (566,187 | ) | | | (12,676,927 | ) |
Commonwealth Bank of Australia | | | (157,077 | ) | | | (11,268,474 | ) |
Community Bank System, Inc. | | | (385,991 | ) | | | (13,710,400 | ) |
CVB Financial Corp. | | | (819,108 | ) | | | (12,819,040 | ) |
Eaton Vance Corp. | | | (388,832 | ) | | | (16,369,827 | ) |
Financial Engines, Inc. | | | (321,149 | ) | | | (12,942,305 | ) |
First Financial Bankshares, Inc. | | | (577,563 | ) | | | (15,172,580 | ) |
Glacier Bancorp, Inc. | | | (427,198 | ) | | | (10,376,639 | ) |
HDFC Bank Ltd. — ADR | | | (161,870 | ) | | | (10,037,559 | ) |
Home Bancshares, Inc. | | | (390,590 | ) | | | (12,362,174 | ) |
LPL Financial Holdings, Inc. | | | (300,201 | ) | | | (13,467,017 | ) |
Mobile Mini, Inc. | | | (329,789 | ) | | | (13,682,946 | ) |
New York Community Bancorp, Inc. | | | (1,097,182 | ) | | | (18,224,193 | ) |
Northern Trust Corp. | | | (162,633 | ) | | | (11,356,662 | ) |
PacWest Bancorp | | | (240,329 | ) | | | (11,015,480 | ) |
Siam Commercial Bank PCL, (The) — NVDR | | | (2,035,500 | ) | | | (10,672,031 | ) |
Trustmark Corp. | | | (593,723 | ) | | | (13,685,315 | ) |
UMB Financial Corp. | | | (195,575 | ) | | | (10,079,936 | ) |
United Bankshares, Inc. | | | (565,720 | ) | | | (21,186,214 | ) |
Valley National Bancorp | | | (1,052,240 | ) | | | (10,101,504 | ) |
Westamerica Bancorporation | | | (385,909 | ) | | | (16,621,101 | ) |
| | | | | | | | |
| | | | | | | (303,122,832 | ) |
| | | | | | | | |
Health Care—(3.1%) | |
Agilent Technologies, Inc. | | | (279,220 | ) | | | (11,785,876 | ) |
athenahealth, Inc. * | | | (143,911 | ) | | | (18,286,771 | ) |
Carl Zeiss Meditec AG | | | (564,543 | ) | | | (15,513,797 | ) |
Cerner Corp. * | | | (218,361 | ) | | | (15,735,094 | ) |
CSL Ltd. | | | (164,222 | ) | | | (11,825,012 | ) |
Elekta AB, B Shares | | | (1,520,521 | ) | | | (15,876,377 | ) |
GW Pharmaceuticals PLC * | | | (109,291 | ) | | | (8,843,828 | ) |
THEACCOMPANYINGNOTESAREANINTEGRALPARTOFTHEFINANCIALSTATEMENTS.
| | |
| 20 | | SEMI-ANNUAL REPORT 2015 |
| | |
| BOSTON PARTNERS INVESTMENT FUNDS | | FEBRUARY 28, 2015 (unaudited) |
| | |
BOSTON PARTNERS LONG/SHORT RESEARCH FUND (continued) | | PORTFOLIOOF INVESTMENTS |
| | | | | | | | |
| | | Number of
Shares | | | Value | |
Health Care—(continued) | |
Health Net, Inc. * | | | (311,081 | ) | | $ | (17,840,495 | ) |
Henry Schein, Inc. * | | | (87,034 | ) | | | (12,189,112 | ) |
Novo Nordisk A/S | | | (426,197 | ) | | | (20,395,476 | ) |
Pharmacyclics, Inc. * | | | (72,980 | ) | | | (15,758,571 | ) |
Puma Biotechnology, Inc. * | | | (34,600 | ) | | | (7,370,146 | ) |
ResMed, Inc. | | | (162,977 | ) | | | (10,489,200 | ) |
Sirona Dental Systems, Inc. * | | | (132,023 | ) | | | (11,990,329 | ) |
| | | | | | | | |
| | | | | | | (193,900,084 | ) |
| | | | | | | | |
Real Estate Investment Trusts—(2.0%) | |
Equinix, Inc. | | | (97,800 | ) | | | (21,924,245 | ) |
Gaming and Leisure Properties, Inc. | | | (759,025 | ) | | | (25,692,996 | ) |
HCP, Inc. | | | (322,310 | ) | | | (13,653,052 | ) |
Health Care REIT, Inc. | | | (153,723 | ) | | | (11,853,581 | ) |
Iron Mountain Inc. | | | — | ^ | | | (1 | ) |
Omega Healthcare Investors, Inc. | | | (304,298 | ) | | | (12,190,178 | ) |
Plum Creek Timber Co., Inc. | | | (255,578 | ) | | | (11,102,308 | ) |
Realty Income Corp. | | | (315,587 | ) | | | (15,798,285 | ) |
Rouse Properties, Inc. | | | (841,436 | ) | | | (14,540,014 | ) |
| | | | | | | | |
| | | | | | | (126,754,660 | ) |
| | | | | | | | |
Technology—(5.9%) | |
3D Systems Corp. * | | | (373,291 | ) | | | (11,374,177 | ) |
Arista Networks, Inc. * | | | (85,819 | ) | | | (5,939,533 | ) |
Aspen Technology, Inc. * | | | (308,582 | ) | | | (11,912,808 | ) |
Blackbaud, Inc. | | | (719,904 | ) | | | (32,683,642 | ) |
Cirrus Logic, Inc. * | | | (250,933 | ) | | | (7,555,593 | ) |
Dassault Systemes SA | | | (294,994 | ) | | | (20,612,796 | ) |
Finisar Corp. * | | | (679,543 | ) | | | (14,277,198 | ) |
Infosys Technologies Ltd. — Sponsored ADR | | | (716,105 | ) | | | (26,288,215 | ) |
Itron, Inc. * | | | (542,100 | ) | | | (19,775,808 | ) |
LG Display Co., Ltd. * | | | (1,424,324 | ) | | | (22,034,292 | ) |
National Instruments Corp. | | | (754,107 | ) | | | (23,482,892 | ) |
NetSuite, Inc. * | | | (191,971 | ) | | | (18,509,844 | ) |
Red Hat, Inc. * | | | (246,367 | ) | | | (17,028,887 | ) |
Salesforce.com, Inc. * | | | (413,892 | ) | | | (28,715,827 | ) |
Trimble Navigation Ltd. * | | | (569,194 | ) | | | (14,878,731 | ) |
Tyler Technologies, Inc. * | | | (164,720 | ) | | | (19,662,626 | ) |
VeriFone Systems, Inc. * | | | (791,693 | ) | | | (27,859,677 | ) |
ViaSat, Inc. * | | | (215,132 | ) | | | (14,056,725 | ) |
VMware, Inc., Class A * | | | (38,812 | ) | | | (3,301,737 | ) |
VTech Holdings Ltd. | | | (754,500 | ) | | | (10,759,299 | ) |
Wipro Ltd. — ADR | | | (1,677,418 | ) | | | (23,114,820 | ) |
| | | | | | | | |
| | | | | | | (373,825,127 | ) |
| | | | | | | | |
Transportation—(1.7%) | |
Canadian Pacific Railway Ltd. | | | (59,419 | ) | | | (11,148,193 | ) |
Heartland Express, Inc. | | | (480,548 | ) | | | (12,095,393 | ) |
J.B. Hunt Transport Services, Inc. | | | (215,903 | ) | | | (18,459,707 | ) |
Kansas City Southern | | | (102,201 | ) | | | (11,838,964 | ) |
Keikyu Corp. | | | (847,220 | ) | | | (6,904,635 | ) |
Knight Transportation, Inc. | | | (351,228 | ) | | | (11,611,598 | ) |
Norwegian Air Shuttle ASA * | | | (277,708 | ) | | | (8,421,648 | ) |
Panalpina Welttransport Holding AG, Registered Shares | | | (90,822 | ) | | | (12,617,692 | ) |
| | | | | | | | |
| | | Number of
Shares | | | Value | |
Transportation—(continued) | |
Ryder System, Inc. | | | (150,219 | ) | | $ | (14,119,084 | ) |
| | | | | | | | |
| | | | | | | (107,216,914 | ) |
| | | | | | | | |
Utilities—(0.3%) | |
Ormat Technologies, Inc. | | | (249,830 | ) | | | (8,519,203 | ) |
Spectra Energy Corp. | | | (360,630 | ) | | | (12,798,759 | ) |
| | | | | | | | |
| | | | | | | (21,317,962 | ) |
| | | | | | | | |
TOTAL COMMON STOCK
(Proceeds $2,588,002,151) | | | | | | | (2,766,500,772 | ) |
| | | | | | | | |
TOTAL SECURITIES SOLD SHORT—(44.0%)
(Proceeds $2,588,002,151) | | | | | | | (2,766,500,772 | ) |
| | | | | | | | |
| | | Number of
Contracts | | | | |
OPTIONS WRITTEN ††—(0.2%) | |
Diamondback Energy Inc. Call Options
Expires 03/20/15
Strike Price $55 | | | (1,430 | ) | | | (2,409,550 | ) |
Diamondback Energy Inc. Call Options
Expires 03/20/15
Strike Price $60 | | | (5,000 | ) | | | (6,150,000 | ) |
EOG Resources
Call Options
Expires 04/17/15
Strike Price $90.00 | | | (3,500 | ) | | | (1,260,000 | ) |
Exxon Mobil Corp.
Call Options
Expires 04/17/15
Strike Price $87.5 | | | (2,500 | ) | | | (775,000 | ) |
Exxon Mobil Corp.
Call Options
Expires 04/17/15
Strike Price $90.00 | | | (2,500 | ) | | | (427,500 | ) |
Occidental Petroleum Corp. Call Options
Expires 05/15/15
Strike Price $80 | | | (4,494 | ) | | | (894,306 | ) |
| | | | | | | | |
TOTAL OPTIONS WRITTEN (Premiums received $10,017,914) | | | | | | | (11,916,356 | ) |
| | | | | | | | |
TOTAL INVESTMENTS—49.8%
(Cost $2,444,053,530) | | | | | | | 3,127,942,277 | |
| | | | | | | | |
OTHER ASSETS IN EXCESS OF LIABILITIES—50.2% | | | | | | | 3,155,693,354 | |
| | | | | | | | |
NET ASSETS—100.0% | | | | | | $ | 6,283,635,631 | |
| | | | | | | | |
| | | | |
| ADR | | — | | American Depositary Receipt |
| LP | | — | | Limited Partnership |
| NVDR | | — | | Non-Voting Depository Receipt |
| PCL | | — | | Public Company Limited |
| PLC | | — | | Public Limited Company |
| REIT | | — | | Real Estate Investment Trust |
| SDR | | — | | Swedish Depositary Receipt |
THEACCOMPANYINGNOTESAREANINTEGRALPARTOFTHEFINANCIALSTATEMENTS.
| | | | |
| SEMI-ANNUAL REPORT 2015 | | | 21 | |
| | |
| BOSTON PARTNERS INVESTMENT FUNDS | | FEBRUARY 28, 2015 (unaudited) |
| | |
BOSTON PARTNERS LONG/SHORT RESEARCH FUND (concluded) | | PORTFOLIOOF INVESTMENTS |
| | | | |
| * | | — | | Non-income producing. |
| † | | — | | Security position is either entirely or partially held in a segregated account as collateral for securities sold short. |
| ^ | | — | | Amount is less than 0.5 shares. |
| †† | | — | | Primary risk exposure is equity contracts. |
A summary of the inputs used to value the Fund’s investments as of February 28, 2015 is as follows (see Note I in the Notes to Financial Statements):
| | | | | | | | | | | | | | | | |
| | | Total
Value as of
February 28, 2015 | | | Level 1
Quoted
Price | | | Level 2
Significant
Observable
Inputs | | | Level 3
Significant
Unobservable
Inputs | |
Common Stock | | | | | | | | | | | | | | | | |
Basic Industries | | $ | 389,299,560 | | | $ | 325,712,590 | | | $ | 63,586,970 | | | $ | — | |
Capital Goods | | | 665,667,491 | | | | 563,060,267 | | | | 102,607,224 | | | | — | |
Communications | | | 243,175,950 | | | | 228,301,504 | | | | 14,874,446 | | | | — | |
Consumer Durables | | | 160,099,311 | | | | 111,986,642 | | | | 48,112,669 | | | | — | |
Consumer Non-Durables | | | 220,675,217 | | | | 179,437,236 | | | | 41,237,981 | | | | — | |
Consumer Services | | | 700,440,685 | | | | 602,671,529 | | | | 97,769,156 | | | | — | |
Energy | | | 562,736,665 | | | | 550,586,971 | | | | 12,149,694 | | | | — | |
Finance | | | 1,190,372,751 | | | | 1,180,740,095 | | | | 9,632,656 | | | | — | |
Health Care | | | 644,095,831 | | | | 644,095,831 | | | | — | | | | — | |
Real Estate Investment Trusts | | | 42,224,269 | | | | 42,224,269 | | | | — | | | | — | |
Technology | | | 1,053,356,417 | | | | 1,014,527,384 | | | | 38,829,033 | | | | — | |
Transportation | | | 22,028,808 | | | | 22,028,808 | | | | — | | | | — | |
Utilities | | | 11,584,298 | | | | 11,584,298 | | | | — | | | | — | |
Warrants | | | 602,152 | | | | 602,152 | | | | — | | | | — | |
| | | | | | | | | | | | | | | | |
Total Assets | | $ | 5,906,359,405 | | | $ | 5,477,559,576 | | | $ | 428,799,829 | | | $ | — | |
| | | | | | | | | | | | | | | | |
| | | | |
| | | Total
Value as of
February 28, 2015 | | | Level 1
Quoted
Price | | | Level 2
Significant
Observable
Inputs | | | Level 3
Significant
Unobservable
Inputs | |
Securities Sold Short | | | | | | | | | | | | | | | | |
Basic Industries | | $ | (204,293,090 | ) | | $ | (125,855,876 | ) | | $ | (78,437,214 | ) | | $ | — | |
Capital Goods | | | (187,931,542 | ) | | | (140,572,492 | ) | | | (47,359,050 | ) | | | — | |
Communications | | | (224,147,405 | ) | | | (163,038,780 | ) | | | (61,108,625 | ) | | | — | |
Consumer Durables | | | (68,154,591 | ) | | | (53,358,809 | ) | | | (14,795,782 | ) | | | — | |
Consumer Non-Durables | | | (258,202,980 | ) | | | (218,680,072 | ) | | | (39,522,908 | ) | | | — | |
Consumer Services | | | (473,577,091 | ) | | | (436,047,651 | ) | | | (37,529,440 | ) | | | — | |
Energy | | | (224,056,494 | ) | | | (207,428,379 | ) | | | (16,628,115 | ) | | | — | |
Finance | | | (303,122,832 | ) | | | (268,031,140 | ) | | | (35,091,692 | ) | | | — | |
Health Care | | | (193,900,084 | ) | | | (146,165,799 | ) | | | (47,734,285 | ) | | | — | |
Real Estate Investment Trusts | | | (126,754,660 | ) | | | (126,754,660 | ) | | | — | | | | — | |
Technology | | | (373,825,127 | ) | | | (342,453,032 | ) | | | (31,372,095 | ) | | | — | |
Transportation | | | (107,216,914 | ) | | | (79,272,939 | ) | | | (27,943,975 | ) | | | — | |
Utilities | | | (21,317,962 | ) | | | (21,317,962 | ) | | | — | | | | — | |
Options Written | | | | | | | | | | | | | | | | |
Equity Contracts | | | (11,916,356 | ) | | | (11,916,356 | ) | | | — | | | | — | |
| | | | | | | | | | | | | | | | |
Total Liabilities | | $ | (2,778,417,128 | ) | | $ | (2,340,893,947 | ) | | $ | (437,523,181 | ) | | $ | — | |
| | | | | | | | | | | | | | | | |
THEACCOMPANYINGNOTESAREANINTEGRALPARTOFTHEFINANCIALSTATEMENTS.
| | |
| 22 | | SEMI-ANNUAL REPORT 2015 |
| | |
| BOSTON PARTNERS INVESTMENT FUNDS | | FEBRUARY 28, 2015 (unaudited) |
| | |
BOSTON PARTNERS ALL-CAP VALUE FUND | | PORTFOLIOOF INVESTMENTS |
| | | | | | | | |
| | | Number of
Shares | | | Value | |
RIGHTS—0.0% | | | | | | | | |
CVR Banctec, Inc. Escrow Shares | | | 14,327 | | | $ | 0 | |
| | | | | | | | |
TOTAL RIGHTS
(Cost $0) | | | | | | | 0 | |
| | | | | | | | |
COMMON STOCK—99.1% | | | | | | | | |
Basic Industries—1.3% | | | | | | | | |
Avery Dennison Corp. | | | 58,355 | | | | 3,124,910 | |
Graphic Packaging Holding Co. | | | 294,060 | | | | 4,437,365 | |
Huntsman Corp. | | | 110,190 | | | | 2,474,867 | |
International Paper Co. | | | 53,920 | | | | 3,041,627 | |
| | | | | | | | |
| | | | | | | 13,078,769 | |
| | | | | | | | |
Capital Goods—7.9% | | | | | | | | |
Cubic Corp. | | | 33,280 | | | | 1,739,546 | |
Emerson Electric Co. | | | 70,220 | | | | 4,067,142 | |
Fluor Corp. | | | 52,158 | | | | 3,025,164 | |
General Electric Co. | | | 793,785 | | | | 20,630,472 | |
Huntington Ingalls Industries, Inc. | | | 45,485 | | | | 6,428,395 | |
Illinois Tool Works, Inc. | | | 31,775 | | | | 3,141,276 | |
Masco Corp. | | | 119,295 | | | | 3,124,336 | |
Oshkosh Corp. | | | 42,075 | | | | 2,052,839 | |
Parker Hannifin Corp. | | | 70,022 | | | | 8,590,999 | |
Raytheon Co. | | | 55,270 | | | | 6,011,718 | |
Stanley Black & Decker, Inc. | | | 32,810 | | | | 3,226,535 | |
Terex Corp. | | | 115,630 | | | | 3,169,418 | |
Textron, Inc. | | | 70,030 | | | | 3,103,029 | |
Timken Co. | | | 102,410 | | | | 4,350,377 | |
WESCO International, Inc. * | | | 99,595 | | | | 6,914,881 | |
| | | | | | | | |
| | | | | | | 79,576,127 | |
| | | | | | | | |
Communications—2.4% | | | | | | | | |
DIRECTV * | | | 132,845 | | | | 11,770,067 | |
Google, Inc., Class A * # | | | 9,330 | | | | 5,249,338 | |
NetEase, Inc. — ADR | | | 69,550 | | | | 6,957,782 | |
| | | | | | | | |
| | | | | | | 23,977,187 | |
| | | | | | | | |
Consumer Durables—2.4% | | | | | | | | |
Brunswick Corp. | | | 54,285 | | | | 2,944,418 | |
Harley-Davidson, Inc. | | | 75,320 | | | | 4,788,092 | |
Lear Corp. | | | 76,633 | | | | 8,346,866 | |
Newell Rubbermaid, Inc. | | | 81,115 | | | | 3,187,008 | |
Thor Industries, Inc. | | | 86,470 | | | | 5,331,740 | |
| | | | | | | | |
| | | | | | | 24,598,124 | |
| | | | | | | | |
Consumer Non-Durables—4.9% | | | | | | | | |
Activision Blizzard, Inc. | | | 681,635 | | | | 15,895,728 | |
Bunge Ltd. | | | 33,875 | | | | 2,770,297 | |
Electronic Arts, Inc. * | | | 172,548 | | | | 9,866,295 | |
Lorillard, Inc. | | | 183,420 | | | | 12,549,596 | |
PepsiCo, Inc. | | | 87,210 | | | | 8,632,046 | |
| | | | | | | | |
| | | | | | | 49,713,962 | |
| | | | | | | | |
Consumer Services—8.3% | | | | | | | | |
AutoZone, Inc. * | | | 4,940 | | | | 3,174,839 | |
Bed Bath & Beyond, Inc. * | | | 71,705 | | | | 5,353,495 | |
CVS Health Corp. | | | 69,125 | | | | 7,180,014 | |
eBay, Inc. * | | | 183,215 | | | | 10,609,981 | |
Equifax, Inc. | | | 37,935 | | | | 3,541,991 | |
H&R Block, Inc. | | | 155,515 | | | | 5,310,837 | |
| | | | | | | | |
| | | Number of
Shares | | | Value | |
Consumer Services—(continued) | |
Kohl’s Corp. | | | 189,521 | | | $ | 13,986,650 | |
Korn/Ferry International * | | | 88,886 | | | | 2,719,912 | |
Macy’s, Inc. | | | 137,475 | | | | 8,759,907 | |
Manpowergroup, Inc. | | | 74,180 | | | | 5,968,523 | |
Omnicom Group, Inc. | | | 128,825 | | | | 10,246,741 | |
Sportsman’s Warehouse Holdings, Inc. * | | | 245,175 | | | | 1,804,488 | |
Viacom, Inc., Class B | | | 69,980 | | | | 4,894,401 | |
| | | | | | | | |
| | | | | | | 83,551,779 | |
| | | | | | | | |
Energy—7.5% | | | | | | | | |
Anadarko Petroleum Corp. | | | 58,725 | | | | 4,946,407 | |
Canadian Natural Resources Ltd. | | | 192,890 | | | | 5,622,743 | |
Energen Corp. | | | 113,780 | | | | 7,354,739 | |
EOG Resources, Inc. | | | 30,835 | | | | 2,766,516 | |
EQT Corp. | | | 44,460 | | | | 3,548,353 | |
Exxon Mobil Corp. | | | 113,015 | | | | 10,006,348 | |
Marathon Petroleum Corp. | | | 62,085 | | | | 6,518,925 | |
Occidental Petroleum Corp. | | | 155,710 | | | | 12,126,695 | |
Parsley Energy, Inc., Class A * (a) | | | 82,150 | | | | 1,223,214 | |
Phillips 66 | | | 151,645 | | | | 11,898,067 | |
QEP Resources, Inc. | | | 145,165 | | | | 3,118,144 | |
Rice Energy, Inc. * | | | 143,300 | | | | 2,805,814 | |
Western Refining, Inc. | | | 71,690 | | | | 3,376,599 | |
| | | | | | | | |
| | | | | | | 75,312,564 | |
| | | | | | | | |
Finance—25.1% | | | | | | | | |
ACE Ltd. | | | 83,960 | | | | 9,572,280 | |
Alleghany Corp. * | | | 16,252 | | | | 7,679,720 | |
Allstate Corp., (The) | | | 81,635 | | | | 5,763,431 | |
American International Group, Inc. | | | 181,400 | | | | 10,036,862 | |
Aon PLC | | | 52,460 | | | | 5,264,886 | |
Axis Capital Holdings Ltd. | | | 63,350 | | | | 3,283,431 | |
BB&T Corp. | | | 316,715 | | | | 12,051,006 | |
Capital One Financial Corp. | | | 249,980 | | | | 19,675,926 | |
Citigroup, Inc. | | | 391,372 | | | | 20,515,720 | |
FCB Financial Holdings, Inc., Class A * | | | 50,936 | | | | 1,293,774 | |
FCB Financial Holdings, Inc., Class B * | | | 12,734 | | | | 323,444 | |
Federated Investors, Inc., Class B | | | 83,750 | | | | 2,757,887 | |
Fifth Third Bancorp | | | 799,115 | | | | 15,470,866 | |
Goldman Sachs Group, Inc., (The) | | | 52,515 | | | | 9,966,822 | |
JPMorgan Chase & Co. | | | 504,465 | | | | 30,913,615 | |
Loews Corp. | | | 213,544 | | | | 8,757,439 | |
MetLife, Inc. | | | 153,960 | | | | 7,825,787 | |
Navient Corp. | | | 249,890 | | | | 5,347,646 | |
OneBeacon Insurance Group Ltd. | | | 193,230 | | | | 2,898,450 | |
Peoples Choice Financial Corp. 144A * ‡ | | | 1,465 | | | | 0 | |
Prudential Financial, Inc. | | | 125,520 | | | | 10,148,292 | |
Raymond James Financial, Inc. | | | 118,500 | | | | 6,769,905 | |
SLM Corp. | | | 249,885 | | | | 2,366,411 | |
Solar Cayman Ltd. 144A * ‡ | | | 19,375 | | | | 0 | |
State Street Corp. | | | 118,835 | | | | 8,847,266 | |
Torchmark Corp. | | | 85,947 | | | | 4,576,678 | |
Travelers Cos., Inc., (The) | | | 100,290 | | | | 10,775,158 | |
Validus Holdings Ltd. | | | 169,329 | | | | 7,050,860 | |
THEACCOMPANYINGNOTESAREANINTEGRALPARTOFTHEFINANCIALSTATEMENTS.
| | | | |
| SEMI-ANNUAL REPORT 2015 | | | 23 | |
| | |
| BOSTON PARTNERS INVESTMENT FUNDS | | FEBRUARY 28, 2015 (unaudited) |
| | |
BOSTON PARTNERS ALL-CAP VALUE FUND (continued) | | PORTFOLIOOF INVESTMENTS |
| | | | | | | | |
| | | Number of
Shares | | | Value | |
Finance—(continued) | | | | | | | | |
Wells Fargo & Co. | | | 90,745 | | | $ | 4,971,919 | |
White Mountains Insurance Group Ltd. | | | 9,795 | | | | 6,534,734 | |
WR Berkley Corp. | | | 163,875 | | | | 8,179,001 | |
XL Group PLC | | | 81,895 | | | | 2,964,599 | |
| | | | | | | | |
| | | | | | | 252,583,815 | |
| | | | | | | | |
Health Care—17.5% | | | | | | | | |
AbbVie, Inc. | | | 95,730 | | | | 5,791,665 | |
Allscripts Healthcare Solutions, Inc. * | | | 185,665 | | | | 2,228,908 | |
Amgen, Inc. | | | 119,565 | | | | 18,857,792 | |
Anthem, Inc. | | | 41,715 | | | | 6,109,162 | |
Boston Scientific Corp. * | | | 219,840 | | | | 3,715,296 | |
Cardinal Health, Inc. | | | 90,695 | | | | 7,980,253 | |
Express Scripts Holding Co. * | | | 119,190 | | | | 10,106,120 | |
Gilead Sciences, Inc. * | | | 78,810 | | | | 8,159,199 | |
Johnson & Johnson | | | 178,565 | | | | 18,304,698 | |
McKesson Corp. | | | 24,565 | | | | 5,618,016 | |
Medtronic PLC | | | 245,675 | | | | 19,061,939 | |
Merck & Co., Inc. | | | 172,055 | | | | 10,072,100 | |
Novartis AG—Sponsored ADR | | | 162,235 | | | | 16,612,864 | |
Pfizer, Inc. | | | 487,526 | | | | 16,731,892 | |
Shire PLC—ADR | | | 28,595 | | | | 6,917,416 | |
St. Jude Medical, Inc. | | | 74,795 | | | | 4,987,331 | |
Teva Pharmaceutical Industries Ltd.—Sponsored ADR | | | 144,900 | | | | 8,262,198 | |
UnitedHealth Group, Inc. | | | 55,920 | | | | 6,354,190 | |
| | | | | | | | |
| | | | | | | 175,871,039 | |
| | | | | | | | |
Real Estate Investment Trusts—0.0% | | | | | |
TMST, Inc. ‡ | | | 191,097 | | | | 0 | |
| | | | | | | | |
Technology—21.8% | | | | | | | | |
Amdocs Ltd. | | | 98,035 | | | | 5,146,837 | |
Arrow Electronics, Inc. * | | | 126,537 | | | | 7,840,233 | |
Avnet, Inc. | | | 156,342 | | | | 7,162,027 | |
Brocade Communications Systems, Inc. | | | 692,070 | | | | 8,574,747 | |
CA, Inc. | | | 265,540 | | | | 8,635,361 | |
Cisco Systems, Inc. | | | 606,550 | | | | 17,899,291 | |
Computer Sciences Corp. | | | 75,360 | | | | 5,344,531 | |
EMC Corp. | | | 718,635 | | | | 20,797,297 | |
Fidelity National Information Services, Inc. | | | 129,245 | | | | 8,735,670 | |
Flextronics International Ltd. * | | | 1,147,626 | | | | 13,978,085 | |
Global Payments, Inc. | | | 48,345 | | | | 4,440,972 | |
II-VI, Inc. * | | | 186,815 | | | | 3,267,394 | |
Jabil Circuit, Inc. | | | 242,335 | | | | 5,324,100 | |
Microsemi Corp. * | | | 190,365 | | | | 6,137,368 | |
Microsoft Corp. | | | 343,830 | | | | 15,076,946 | |
Motorola Solutions, Inc. | | | 121,445 | | | | 8,250,973 | |
NetApp, Inc. | | | 116,430 | | | | 4,500,020 | |
ON Semiconductor Corp. * | | | 847,730 | | | | 10,808,558 | |
Oracle Corp. | | | 408,755 | | | | 17,911,644 | |
Seagate Technology PLC | | | 49,995 | | | | 3,055,694 | |
Symantec Corp. | | | 199,270 | | | | 5,013,633 | |
TE Connectivity Ltd. | | | 231,095 | | | | 16,668,882 | |
Total System Services, Inc. | | | 172,470 | | | | 6,588,354 | |
| | | | | | | | |
| | | Number of
Shares | | | Value | |
Technology—(continued) | | | | | | | | |
Vishay Intertechnology, Inc. | | | 179,145 | | | $ | 2,551,025 | |
Western Digital Corp. | | | 59,340 | | | | 6,348,193 | |
| | | | | | | | |
| | | | | | | 220,057,835 | |
| | | | | | | | |
TOTAL COMMON STOCK
(Cost $768,477,492) | | | | | | | 998,321,201 | |
| | | | | | | | |
SECURITIES LENDING COLLATERAL—0.0% | |
BlackRock Liquidity TempFund, Institutional Shares | | | 154,906 | | | | 154,906 | |
| | | | | | | | |
TOTAL SECURITIES LENDING COLLATERAL (Cost $154,906) | | | | | | | 154,906 | |
| | | | | | | | |
TOTAL INVESTMENTS—99.1% (Cost $768,632,398) | | | | | | | 998,476,107 | |
| | | | | | | | |
| | | Number of
Contracts | | | | |
OPTIONS WRITTEN ††—(0.1%) | |
Google, Inc. Call Options Expires 01/15/16
Strike Price $500 | | | (93 | ) | | | (837,000 | ) |
| | | | | | | | |
TOTAL OPTIONS WRITTEN (Premiums received $546,688) | | | | | | | (837,000 | ) |
| | | | | | | | |
OTHER ASSETS IN EXCESS OF LIABILITIES—1.0% | | | | | | | 10,025,315 | |
| | | | | | | | |
NET ASSETS—100.0% | | | | | | $ | 1,007,664,422 | |
| | | | | | | | |
| | | | |
| ADR | | — | | American Depositary Receipt |
| PLC | | — | | Public Limited Company |
| 144A | | — | | Security was purchased pursuant to Rule 144A under the Securities Act of 1933, as amended, and may not be resold subject to that rule except to qualified institutional buyers. As of February 28, 2015, these securities amounted to $0 or 0.0% of net assets. These Rule 144A securities have not been deemed illiquid. |
| * | | — | | Non-income producing. |
| ‡ | | — | | Security has been valued at fair market value as determined in good faith by or under the direction of The RBB Fund, Inc.’s Board of Directors. As of February 28, 2015, these securities amounted to 0 or 0% of net assets. |
| # | | — | | Security segregated as collateral for options written. |
| (a) | | — | | All or a portion of the security is on loan (see Note 6 of the Notes to Financial Statements). |
| †† | | — | | Primary risk exposure is equity contracts. |
THEACCOMPANYINGNOTESAREANINTEGRALPARTOFTHEFINANCIALSTATEMENTS.
| | |
| 24 | | SEMI-ANNUAL REPORT 2015 |
| | |
| BOSTON PARTNERS INVESTMENT FUNDS | | FEBRUARY 28, 2015 (unaudited) |
| | |
BOSTON PARTNERS ALL-CAP VALUE FUND (concluded) | | PORTFOLIOOF INVESTMENTS |
A summary of the inputs used to value the Fund’s investments as of February 28, 2015 is as follows (see Note 1 in the Notes to Financial Statements):
| | | | | | | | | | | | | | | | |
| | | Total
Value as of
February 28, 2015 | | | Level 1
Quoted
Price | | | Level 2
Significant
Observable
Inputs | | | Level 3
Significant
Unobservable
Inputs | |
Common Stock | | | | | | | | | | | | | | | | |
Basic Industries | | $ | 13,078,769 | | | $ | 13,078,769 | | | $ | — | | | $ | — | |
Capital Goods | | | 79,576,127 | | | | 79,576,127 | | | | — | | | | — | |
Communications | | | 23,977,187 | | | | 23,977,187 | | | | — | | | | — | |
Consumer Durables | | | 24,598,124 | | | | 24,598,124 | | | | — | | | | — | |
Consumer Non-Durables | | | 49,713,962 | | | | 49,713,962 | | | | — | | | | — | |
Consumer Services | | | 83,551,779 | | | | 83,551,779 | | | | — | | | | — | |
Energy | | | 75,312,564 | | | | 75,312,564 | | | | — | | | | — | |
Finance | | | 252,583,815 | | | | 250,966,597 | | | | 1,617,218 | | | | — | |
Health Care | | | 175,871,039 | | | | 175,871,039 | | | | — | | | | — | |
Real Estate Investment Trusts | | | — | | | | — | | | | — | | | | — | |
Technology | | | 220,057,835 | | | | 220,057,835 | | | | — | | | | — | |
Rights | | | — | | | | — | | | | — | | | | — | |
Securities Lending Collateral | | | 154,906 | | | | 154,906 | | | | — | | | | — | |
| | | | | | | | | | | | | | | | |
Total Assets | | $ | 998,476,107 | | | $ | 996,858,889 | | | $ | 1,617,218 | | | $ | — | |
| | | | | | | | | | | | | | | | |
| | | | |
| | | Total
Value as of
February 28, 2015 | | | Level 1
Quoted
Price | | | Level 2
Significant
Observable
Inputs | | | Level 3
Significant
Unobservable
Inputs | |
Options Written | | | | | | | | | | | | | | | | |
Equity Contracts | | $ | (837,000 | ) | | $ | (837,000 | ) | | $ | — | | | $ | — | |
| | | | | | | | | | | | | | | | |
Total Liabilities | | $ | (837,000 | ) | | $ | (837,000 | ) | | $ | — | | | $ | — | |
| | | | | | | | | | | | | | | | |
THEACCOMPANYINGNOTESAREANINTEGRALPARTOFTHEFINANCIALSTATEMENTS.
| | | | |
| SEMI-ANNUAL REPORT 2015 | | | 25 | |
| | |
| BOSTON PARTNERS INVESTMENT FUNDS | | FEBRUARY 28, 2015 (unaudited) |
| | |
WPG PARTNERS SMALL/MICRO CAP VALUE FUND | | PORTFOLIOOF INVESTMENTS |
| | | | | | | | |
| | | Number of
Shares | | | Value | |
COMMON STOCK—91.6% | |
Basic Industries—1.9% | |
Cloud Peak Energy, Inc. * | | | 20,300 | | | $ | 168,287 | |
GrafTech International Ltd. * | | | 95,000 | | | | 370,500 | |
Novagold Resources, Inc. * (a) | | | 62,500 | | | | 232,500 | |
Schweitzer-Mauduit International, Inc. | | | 900 | | | | 42,138 | |
| | | | | | | | |
| | | | | | | 813,425 | |
| | | | | | | | |
Capital Goods—10.8% | |
Aegion Corp. * | | | 14,500 | | | | 262,305 | |
Carpenter Technology Corp. | | | 3,600 | | | | 152,496 | |
FreightCar America, Inc. | | | 20,100 | | | | 629,130 | |
Global Power Equipment Group, Inc. | | | 34,400 | | | | 457,520 | |
Great Lakes Dredge & Dock Corp. * | | | 144,100 | | | | 879,010 | |
KBR, Inc. | | | 18,600 | | | | 302,994 | |
Landec Corp. * | | | 37,800 | | | | 527,688 | |
MYR Group, Inc. * | | | 9,200 | | | | 254,288 | |
Orion Marine Group, Inc. * | | | 20,300 | | | | 207,060 | |
Primoris Services Corp. | | | 10,300 | | | | 212,695 | |
Tutor Perini Corp. * | | | 30,600 | | | | 712,062 | |
| | | | | | | | |
| | | | | | | 4,597,248 | |
| | | | | | | | |
Consumer Durables—2.3% | |
LGI Homes, Inc. * (a) | | | 10,700 | | | | 151,512 | |
Libbey, Inc. | | | 17,200 | | | | 654,116 | |
New Remy Holdco Corp. * | | | 3,657 | | | | 83,629 | |
TRI Pointe Homes, Inc. * | | | 6,000 | | | | 95,280 | |
| | | | | | | | |
| | | | | | | 984,537 | |
| | | | | | | | |
Consumer Non-Durables—2.9% | |
Callaway Golf Co. | | | 25,000 | | | | 224,750 | |
Crocs, Inc. * | | | 24,000 | | | | 267,600 | |
Matthews International Corp., Class A | | | 10,900 | | | | 527,233 | |
Universal Corp. | | | 4,200 | | | | 201,222 | |
| | | | | | | | |
| | | | | | | 1,220,805 | |
| | | | | | | | |
Consumer Services—7.7% | |
Ascena Retail Group, Inc. * | | | 8,900 | | | | 119,260 | |
Carmike Cinemas, Inc. * | | | 7,000 | | | | 218,750 | |
Destination XL Group, Inc. * | | | 20,000 | | | | 94,400 | |
FTI Consulting, Inc. * | | | 12,000 | | | | 442,440 | |
ICF International, Inc. * | | | 4,700 | | | | 196,930 | |
K12, Inc. * | | | 21,600 | | | | 365,688 | |
KAR Auction Services, Inc. | | | 5,300 | | | | 193,291 | |
MDC Partners, Inc., Class A (a) | | | 28,700 | | | | 746,774 | |
PRGX Global, Inc. * | | | 40,000 | | | | 200,400 | |
Shoe Carnival, Inc. | | | 7,600 | | | | 186,504 | |
Titan Machinery, Inc. * (a) | | | 22,200 | | | | 320,124 | |
Vitamin Shoppe, Inc. * | | | 4,800 | | | | 203,520 | |
| | | | | | | | |
| | | | | | | 3,288,081 | |
| | | | | | | | |
Energy—4.0% | |
Aegean Marine Petroleum Network, Inc. | | | 8,000 | | | | 117,280 | |
Approach Resources, Inc. * (a) | | | 89,500 | | | | 691,835 | |
Bill Barrett Corp. * | | | 56,500 | | | | 567,260 | |
| | | | | | | | |
| | | Number of
Shares | | | Value | |
Energy—(continued) | |
Nuverra Environmental Solutions, Inc. * (a) | | | 30,300 | | | $ | 113,322 | |
Resolute Energy Corp. * | | | 26,300 | | | | 27,878 | |
TETRA Technologies, Inc. * | | | 32,500 | | | | 194,025 | |
| | | | | | | | |
| | | | | | | 1,711,600 | |
| | | | | | | | |
Finance—25.2% | |
Central Pacific Financial Corp. | | | 33,600 | | | | 770,784 | |
CNO Financial Group, Inc. | | | 37,800 | | | | 614,628 | |
Customers Bancorp Inc * | | | 25,800 | | | | 571,212 | |
Employers Holdings, Inc. | | | 26,200 | | | | 618,058 | |
FBR & Co. * | | | 18,495 | | | | 448,504 | |
Fidelity & Guaranty Life | | | 29,500 | | | | 610,060 | |
FNFV Group * | | | 13,800 | | | | 205,482 | |
Hanover Insurance Group,
Inc., (The) | | | 4,100 | | | | 287,984 | |
Investors Bancorp, Inc. | | | 53,700 | | | | 616,476 | |
Kemper Corp. | | | 16,900 | | | | 621,920 | |
Kennedy-Wilson Holdings, Inc. | | | 20,700 | | | | 553,932 | |
Maiden Holdings Ltd. | | | 50,100 | | | | 716,931 | |
Meadowbrook Insurance Group, Inc. | | | 34,900 | | | | 291,764 | |
Medley Management, Inc., Class A | | | 4,000 | | | | 41,560 | |
Meridian Bancorp, Inc. * | | | 22,600 | | | | 280,014 | |
Nelnet, Inc., Class A | | | 6,900 | | | | 321,678 | |
Northfield Bancorp, Inc. | | | 33,832 | | | | 489,549 | |
Popular Inc * | | | 25,900 | | | | 893,809 | |
State Bank Financial Corp. | | | 33,400 | | | | 681,360 | |
THL Credit, Inc. | | | 13,200 | | | | 159,588 | |
United Community Banks, Inc. | | | 25,700 | | | | 488,814 | |
WSFS Financial Corp. | | | 3,000 | | | | 233,220 | |
Yadkin Financial Corp. * | | | 11,500 | | | | 221,375 | |
| | | | | | | | |
| | | | | | | 10,738,702 | |
| | | | | | | | |
Health Care—4.8% | | | | | | | | |
Accuray, Inc. * (a) | | | 113,100 | | | | 1,015,638 | |
Alere, Inc. * | | | 5,800 | | | | 263,726 | |
Invacare Corp. | | | 1,700 | | | | 32,249 | |
Natus Medical, Inc. * | | | 5,400 | | | | 193,266 | |
Symmetry Surgical, Inc. * | | | 5,800 | | | | 42,920 | |
Trinity Biotech PLC — Sponsored ADR | | | 28,500 | | | | 506,160 | |
| | | | | | | | |
| | | | | | | 2,053,959 | |
| | | | | | | | |
Real Estate Investment Trusts—12.1% | | | | | |
American Capital Mortgage Investment Corp. | | | 10,500 | | | | 193,725 | |
CatchMark Timber Trust, Inc., Class A | | | 32,000 | | | | 388,160 | |
Cedar Realty Trust, Inc. | | | 55,600 | | | | 415,888 | |
Excel Trust, Inc. | | | 25,000 | | | | 342,500 | |
FelCor Lodging Trust, Inc. | | | 48,700 | | | | 524,499 | |
Geo Group, Inc., (The) | | | 18,800 | | | | 811,220 | |
Gramercy Property Trust Inc. | | | 80,600 | | | | 568,230 | |
Hatteras Financial Corp. | | | 10,500 | | | | 192,675 | |
Highwoods Properties, Inc. | | | 9,800 | | | | 446,978 | |
Rouse Properties, Inc. (a) | | | 26,100 | | | | 451,008 | |
Starwood Property Trust, Inc. | | | 12,800 | | | | 312,320 | |
Two Harbors Investment Corp. | | | 20,100 | | | | 209,844 | |
THEACCOMPANYINGNOTESAREANINTEGRALPARTOFTHEFINANCIALSTATEMENTS.
| | |
| 26 | | SEMI-ANNUAL REPORT 2015 |
| | |
| BOSTON PARTNERS INVESTMENT FUNDS | | FEBRUARY 28, 2015 (unaudited) |
| | |
WPG PARTNERS SMALL/MICRO CAP VALUE FUND (concluded) | | PORTFOLIOOF INVESTMENTS |
| | | | | | | | |
| | | Number of
Shares | | | Value | |
Real Estate Investment Trusts—(continued) | | | | | |
Winthrop Realty Trust | | | 18,400 | | | $ | 296,240 | |
| | | | | | | | |
| | | | | | | 5,153,287 | |
| | | | | | | | |
Technology—9.5% | | | | | | | | |
CIBER, Inc. * | | | 99,400 | | | | 389,648 | |
Computer Task Group, Inc. | | | 18,500 | | | | 141,155 | |
Digi International, Inc. * | | | 43,100 | | | | 455,998 | |
Diodes, Inc. * | | | 8,200 | | | | 233,618 | |
Dot Hill Systems Corp. * | | | 66,100 | | | | 268,366 | |
Exar Corp. * | | | 53,400 | | | | 572,448 | |
Extreme Networks, Inc. * | | | 60,300 | | | | 214,065 | |
Finisar Corp. * | | | 10,700 | | | | 224,807 | |
Generac Holdings, Inc. * (a) | | | 8,000 | | | | 394,320 | |
Kofax Ltd. * | | | 50,800 | | | | 346,456 | |
Plantronics, Inc. | | | 8,800 | | | | 443,872 | |
Ultratech, Inc. * | | | 6,200 | | | | 111,848 | |
Xcerra Corp. * | | | 28,400 | | | | 257,872 | |
| | | | | | | | |
| | | | | | | 4,054,473 | |
| | | | | | | | |
Transportation—6.0% | | | | | | | | |
Air Transport Services Group, Inc. * | | | 27,800 | | | | 249,922 | |
Celadon Group, Inc. | | | 15,500 | | | | 406,875 | |
DHT Holding, Inc. | | | 28,100 | | | | 193,890 | |
JetBlue Airways Corp. * (a) | | | 4,900 | | | | 84,231 | |
Navigator Holdings Ltd. * | | | 17,400 | | | | 320,334 | |
Rand Logistics, Inc. * | | | 27,500 | | | | 91,300 | |
Scorpio Bulkers, Inc. * | | | 26,900 | | | | 68,595 | |
Scorpio Tankers, Inc. | | | 98,200 | | | | 850,412 | |
StealthGas, Inc. * | | | 45,100 | | | | 277,365 | |
| | | | | | | | |
| | | | | | | 2,542,924 | |
| | | | | | | | |
| | | | | | | | |
| | | Number of
Shares | | | Value | |
Utilities—4.4% | | | | | | | | |
Cadiz, Inc. *(a) | | | 30,300 | | | $ | 348,450 | |
Chesapeake Utilities Corp. | | | 6,000 | | | | 283,200 | |
Empire District Electric Co. (The) | | | 7,200 | | | | 182,520 | |
Piedmont Natural Gas Co., Inc. | | | 7,600 | | | | 283,480 | |
Portland General Electric Co. | | | 6,500 | | | | 242,385 | |
UIL Holdings Corp. | | | 10,600 | | | | 535,830 | |
| | | | | | | | |
| | | | | | | 1,875,865 | |
| | | | | | | | |
TOTAL COMMON STOCK
(Cost $32,040,132) | | | | 39,034,906 | |
| | | | | | | | |
SECURITIES LENDING COLLATERAL—8.9% | |
BlackRock Liquidity TempFund, Institutional Shares | | | 3,789,509 | | | | 3,789,509 | |
| | | | | | | | |
TOTAL SECURITIES LENDING COLLATERAL
(Cost $3,789,509) | | | | | | | 3,789,509 | |
| | | | | | | | |
TOTAL INVESTMENTS—100.5%
(Cost $35,829,641) | | | | | | | 42,824,415 | |
| | | | | | | | |
LIABILITIES IN EXCESS OF OTHER ASSETS—(0.5)% | | | | | | | (212,029 | ) |
| | | | | | | | |
NET ASSETS—100.0% | | | | | | $ | 42,612,386 | |
| | | | | | | | |
| | | | |
| ADR | | — | | American Depositary Receipt |
| PLC | | — | | Public Limited Company |
| * | | — | | Non-income Producing |
| (a) | | — | | All or a portion of the security is on loan (see Note 6 of the Notes to Financial Statements). |
A summary of the inputs used to value the Fund’s investments as of February 28, 2015 is as follows (see Note I in the Notes to Financial Statements):
| | | | | | | | | | | | | | | | |
| | | Total
Value as of
February 28, 2015 | | | Level 1
Quoted
Price | | | Level 2
Significant
Observable
Inputs | | | Level 3
Significant
Unobservable
Inputs | |
Common Stock * | | $ | 39,034,906 | | | $ | 39,034,906 | | | $ | — | | | $ | — | |
Securities Lending Collateral | | | 3,789,509 | | | | 3,789,509 | | | | — | | | | — | |
| | | | | | | | | | | | | | | | |
Total Assets | | $ | 42,824,415 | | | $ | 42,824,415 | | | $ | — | | | $ | — | |
| | | | | | | | | | | | | | | | |
| * | See Portfolio of Investments detail for industry and security type breakout. |
THEACCOMPANYINGNOTESAREANINTEGRALPARTOFTHEFINANCIALSTATEMENTS.
| | | | |
| SEMI-ANNUAL REPORT 2015 | | | 27 | |
| | |
| BOSTON PARTNERS INVESTMENT FUNDS | | FEBRUARY 28, 2015 (unaudited) |
| | |
BOSTON PARTNERS GLOBAL EQUITY FUND | | PORTFOLIOOF INVESTMENTS |
| | | | | | | | |
| | | Number of
Shares | | | Value | |
COMMON STOCK—97.3% | |
Australia—0.9% | |
Australia & New Zealand Banking Group Ltd. | | | 27,220 | | | $ | 750,940 | |
| | | | | | | | |
Bermuda—0.5% | |
Validus Holdings Ltd. | | | 9,295 | | | | 387,044 | |
| | | | | | | | |
Canada—1.2% | |
Barrick Gold Corp. | | | 24,970 | | | | 325,109 | |
Canadian Natural Resources Ltd. | | | 13,105 | | | | 381,367 | |
Precision Drillling Corp. | | | 47,605 | | | | 289,796 | |
| | | | | | | | |
| | | | | | | 996,272 | |
| | | | | | | | |
China—0.6% | |
Shenzhou International Group Holdings Ltd. | | | 124,000 | | | | 490,537 | |
| | | | | | | | |
France—4.3% | |
Bollore | | | 142,305 | | | | 780,369 | |
Cap Gemini SA | | | 12,665 | | | | 1,022,368 | |
Safran SA | | | 16,055 | | | | 1,128,690 | |
Sopra Steria Group | | | 355 | | | | 30,971 | |
Teleperformance SA | | | 6,015 | | | | 464,236 | |
| | | | | | | | |
| | | | | | | 3,426,634 | |
| | | | | | | | |
Germany—4.2% | |
Allianz SE, Registered Shares | | | 2,340 | | | | 391,837 | |
Aurelius AG | | | 25,540 | | | | 1,060,874 | |
Fresenius SE & Co. KGaA | | | 9,920 | | | | 568,452 | |
Muenchener Rueckversicherungs AG, Registered Shares | | | 2,750 | | | | 570,792 | |
NORMA Group AG | | | 14,348 | | | | 766,119 | |
| | | | | | | | |
| | | | | | | 3,358,074 | |
| | | | | | | | |
Hong Kong—3.0% | |
Cheung Kong Holdings Ltd. | | | 53,000 | | | | 1,049,073 | |
China Mobile Ltd. | | | 39,000 | | | | 529,237 | |
China Unicom Hong Kong Ltd. | | | 274,000 | | | | 462,083 | |
Hutchison Whampoa Ltd. | | | 28,000 | | | | 383,403 | |
| | | | | | | | |
| | | | | | | 2,423,796 | |
| | | | | | | | |
Ireland—6.1% | |
CRH, Inc. | | | 36,160 | | | | 1,020,841 | |
Greencore Group PLC | | | 184,650 | | | | 960,478 | |
Ingersoll-Rand, Inc. | | | 10,025 | | | | 673,580 | |
Medtronic PLC | | | 13,630 | | | | 1,057,552 | |
Smurfit Kappa Group PLC | | | 42,290 | | | | 1,182,785 | |
| | | | | | | | |
| | | | | | | 4,895,236 | |
| | | | | | | | |
Israel—0.7% | |
Teva Pharmaceutical Industries Ltd. — Sponsored ADR | | | 10,565 | | | | 602,416 | |
| | | | | | | | |
Italy—1.6% | |
Assicurazioni Generali SpA | | | 40,460 | | | | 833,465 | |
Cerved Information Solutions SpA * | | | 68,665 | | | | 430,359 | |
| | | | | | | | |
| | | | | | | 1,263,824 | |
| | | | | | | | |
| | | | | | | | |
| | | Number of
Shares | | | Value | |
Japan—7.4% | |
Hoshizaki Electric Co. Ltd. | | | 12,200 | | | $ | 722,710 | |
Inpex Corp. | | | 57,500 | | | | 679,645 | |
Lintec Corp. | | | 28,500 | | | | 679,787 | |
Nippon Telegraph & Telephone Corp. | | | 9,100 | | | | 567,188 | |
Nitto Denko Corp. | | | 17,400 | | | | 1,105,300 | |
Resona Holdings, Inc. | | | 134,900 | | | | 758,246 | |
Toshiba Corp. | | | 172,000 | | | | 711,919 | |
TS Tech Co. Ltd. | | | 25,400 | | | | 706,535 | |
| | | | | | | | |
| | | | | | | 5,931,330 | |
| | | | | | | | |
Netherlands—0.7% | |
Koninklijke Philips NV | | | 18,770 | | | | 561,156 | |
| | | | | | | | |
South Korea—0.5% | |
Samsung Electronics Co. Ltd. | | | 320 | | | | 395,778 | |
| | | | | | | | |
Switzerland—3.9% | |
Georg Fischer AG, Registered Shares | | | 825 | | | | 592,640 | |
Glencore PLC | | | 63,755 | | | | 294,516 | |
Novartis AG, Registered Shares | | | 7,710 | | | | 788,533 | |
Roche Holding AG, Participation Certificate | | | 2,805 | | | | 764,333 | |
Swatch Group AG (The), Registered Shares | | | 8,020 | | | | 705,694 | |
| | | | | | | | |
| | | | | | | 3,145,716 | |
| | | | | | | | |
Taiwan—0.5% | |
MediaTek, Inc. | | | 25,000 | | | | 375,377 | |
| | | | | | | | |
United Kingdom—11.5% | |
Alent PLC | | | 136,258 | | | | 738,085 | |
Aon PLC | | | 5,215 | | | | 523,377 | |
Berendsen PLC | | | 24,000 | | | | 407,307 | |
BHP Billiton PLC | | | 13,215 | | | | 329,813 | |
Cambian Group PLC * | | | 168,495 | | | | 539,773 | |
Dairy Crest Group PLC | | | 22,500 | | | | 172,333 | |
HSBC Holdings PLC | | | 86,367 | | | | 769,893 | |
ITV PLC | | | 209,185 | | | | 726,770 | |
Liberty Global PLC, Series C * | | | 44,465 | | | | 2,319,739 | |
Melrose Industries PLC. | | | 137,120 | | | | 633,544 | |
Rio Tinto PLC | | | 8,025 | | | | 394,948 | |
Stock Spirits Group PLC | | | 137,019 | | | | 416,728 | |
Vodafone Group PLC | | | 169,420 | | | | 586,417 | |
WH Smith PLC | | | 31,960 | | | | 660,910 | |
| | | | | | | | |
| | | | | | | 9,219,637 | |
| | | | | | | | |
United States—49.7% | |
ACE Ltd. | | | 10,900 | | | | 1,242,709 | |
Activision Blizzard, Inc. | | | 48,770 | | | | 1,137,316 | |
Allstate Corp., (The) | | | 10,950 | | | | 773,070 | |
American International Group, Inc. | | | 10,825 | | | | 598,947 | |
Amgen, Inc. | | | 7,465 | | | | 1,177,380 | |
Anadarko Petroleum Corp. | | | 4,650 | | | | 391,670 | |
Apple, Inc. | | | 21,725 | | | | 2,790,794 | |
Avery Dennison Corp. | | | 5,825 | | | | 311,929 | |
Avnet, Inc. | | | 15,930 | | | | 729,753 | |
Berkshire Hathaway, Inc., Class B * | | | 7,145 | | | | 1,053,245 | |
Berry Plastics Group, Inc. * | | | 15,310 | | | | 525,286 | |
THEACCOMPANYINGNOTESAREANINTEGRALPARTOFTHEFINANCIALSTATEMENTS.
| | |
| 28 | | SEMI-ANNUAL REPORT 2015 |
| | |
| BOSTON PARTNERS INVESTMENT FUNDS | | FEBRUARY 28, 2015 (unaudited) |
| | |
BOSTON PARTNERS GLOBAL EQUITY FUND (concluded) | | PORTFOLIOOF INVESTMENTS |
| | | | | | | | |
| | | Number of
Shares | | | Value | |
United States—(continued) | |
Capital One Financial Corp. | | | 23,085 | | | $ | 1,817,020 | |
Cardinal Health, Inc. | | | 5,850 | | | | 514,742 | |
Comcast Corp., Class A | | | 28,155 | | | | 1,671,844 | |
Crane Co. | | | 5,750 | | | | 384,273 | |
CVS Health Corp. | | | 26,485 | | | | 2,750,997 | |
EMC Corp. | | | 27,890 | | | | 807,137 | |
Energen Corp. | | | 7,325 | | | | 473,488 | |
EOG Resources, Inc. | | | 4,370 | | | | 392,076 | |
EQT Corp. | | | 4,980 | | | | 397,454 | |
Express Scripts Holding Co. * | | | 4,670 | | | | 395,969 | |
Fifth Third Bancorp | | | 86,505 | | | | 1,674,737 | |
Gilead Sciences, Inc. | | | 3,555 | | | | 368,049 | |
Google, Inc., Class C | | | 2,065 | | | | 1,153,096 | |
Graphic Packaging Holding Co. * | | | 62,825 | | | | 948,029 | |
Honeywell International, Inc. | | | 6,710 | | | | 689,654 | |
Huntsman Corp. | | | 11,245 | | | | 252,563 | |
Johnson & Johnson | | | 10,030 | | | | 1,028,175 | |
Lear Corp. | | | 4,385 | | | | 477,614 | |
Macy’s, Inc. | | | 15,975 | | | | 1,017,927 | |
Marathon Petroleum Corp. | | | 3,720 | | | | 390,600 | |
McKesson Corp. | | | 2,810 | | | | 642,647 | |
Microsoft Corp. | | | 13,420 | | | | 588,467 | |
Northrop Grumman Corp. | | | 4,580 | | | | 758,952 | |
Packaging Corp of America | | | 6,385 | | | | 529,061 | |
Parsley Energy, Inc., Class A * | | | 38,160 | | | | 568,202 | |
Pfizer, Inc. | | | 31,750 | | | | 1,089,660 | |
Phillips 66 | | | 8,915 | | | | 699,471 | |
| | | | | | | | |
| | | Number of
Shares | | | Value | |
United States—(continued) | |
Rice Energy, Inc. * | | | 12,570 | | | $ | 246,121 | |
Rofin-Sinar Technologies, Inc. * | | | 15,680 | | | | 375,850 | |
Tenneco, Inc. * | | | 11,505 | | | | 670,051 | |
Tribune Media Co., Class A * | | | 8,815 | | | | 581,526 | |
United Technologies Corp. | | | 3,935 | | | | 479,716 | |
Universal Health Services, Inc., Class B | | | 6,965 | | | | 789,483 | |
Wells Fargo & Co. | | | 20,615 | | | | 1,129,496 | |
Western Digital Corp. | | | 10,400 | | | | 1,112,592 | |
WR Berkley Corp. | | | 13,365 | | | | 667,047 | |
Zebra Technologies Corp., Class A | | | 6,175 | | | | 562,234 | |
| | | | | | | | |
| | | | | | | 39,828,119 | |
| | | | | | | | |
TOTAL COMMON STOCK
(Cost $69,160,549) | | | | | | | 78,051,886 | |
| | | | | | | | |
TOTAL INVESTMENTS—97.3%
(Cost $69,160,549) | | | | | | | 78,051,886 | |
| | | | | | | | |
OTHER ASSETS IN EXCESS OF LIABILITIES—2.7% | | | | | | | 2,156,293 | |
| | | | | | | | |
NET ASSETS—100.0% | | | | | | $ | 80,208,179 | |
| | | | | | | | |
| | | | |
| ADR | | — | | American Depositary Receipt |
| PLC | | — | | Public Limited Company |
| * | | — | | Non-income producing. |
A summary of the inputs used to value the Fund’s investments as of February 28, 2015 is as follows (see Note I in the Notes to Financial Statements):
| | | | | | | | | | | | | | | | |
| | | Total
Value as of
February 28, 2015 | | | Level 1
Quoted
Price | | | Level 2
Significant
Observable
Inputs | | | Level 3
Significant
Unobservable
Inputs | |
Common Stock | | | | | | | | | | | | | | | | |
Australia | | $ | 750,940 | | | $ | — | | | $ | 750,940 | | | $ | — | |
Bermuda | | | 387,044 | | | | 387,044 | | | | — | | | | — | |
Canada | | | 996,272 | | | | 996,272 | | | | — | | | | — | |
China | | | 490,537 | | | | — | | | | 490,537 | | | | — | |
France | | | 3,426,634 | | | | — | | | | 3,426,634 | | | | — | |
Germany | | | 3,358,074 | | | | — | | | | 3,358,074 | | | | — | |
Hong Kong | | | 2,423,796 | | | | 383,403 | | | | 2,040,393 | | | | — | |
Ireland | | | 4,895,236 | | | | 1,731,132 | | | | 3,164,104 | | | | — | |
Israel | | | 602,416 | | | | 602,416 | | | | — | | | | — | |
Italy | | | 1,263,824 | | | | — | | | | 1,263,824 | | | | — | |
Japan | | | 5,931,330 | | | | — | | | | 5,931,330 | | | | — | |
Netherlands | | | 561,156 | | | | — | | | | 561,156 | | | | — | |
South Korea | | | 395,778 | | | | — | | | | 395,778 | | | | — | |
Switzerland | | | 3,145,716 | | | | — | | | | 3,145,716 | | | | — | |
Taiwan | | | 375,377 | | | | — | | | | 375,377 | | | | — | |
United Kingdom | | | 9,219,637 | | | | 3,799,617 | | | | 5,420,020 | | | | — | |
United States | | | 39,828,119 | | | | 39,828,119 | | | | — | | | | — | |
| | | | | | | | | | | | | | | | |
Total Assets | | $ | 78,051,886 | | | $ | 47,728,003 | | | $ | 30,323,883 | | | $ | — | |
| | | | | | | | | | | | | | | | |
THEACCOMPANYINGNOTESAREANINTEGRALPARTOFTHEFINANCIALSTATEMENTS.
| | | | |
| SEMI-ANNUAL REPORT 2015 | | | 29 | |
| | |
| BOSTON PARTNERS INVESTMENT FUNDS | | FEBRUARY 28, 2015 (unaudited) |
| | |
BOSTON PARTNERS GLOBAL LONG/SHORT FUND | | PORTFOLIOOF INVESTMENTS |
| | | | | | | | |
| | | Number of
Shares | | | Value | |
LONG POSITIONS—95.4% | |
COMMON STOCK—95.4% | |
Australia—0.5% | |
Australia & New Zealand Banking Group Ltd. | | | 30,826 | | | $ | 850,422 | |
| | | | | | | | |
| | | | | | | 850,422 | |
| | | | | | | | |
Canada—1.5% | |
Barrick Gold Corp. | | | 56,811 | | | | 739,679 | |
Canadian Natural Resources Ltd. † | | | 29,338 | | | | 853,477 | |
Precision Drilling Corp. | | | 101,545 | | | | 618,158 | |
Stornoway Diamond Corp. * | | | 369,790 | | | | 207,066 | |
| | | | | | | | |
| | | | | | | 2,418,380 | |
| | | | | | | | |
China—1.1% | |
China Telecom Corp., Ltd.—Class H | | | 1,052,000 | | | | 681,486 | |
Shenzhou International Group Holdings Ltd. | | | 287,000 | | | | 1,135,357 | |
| | | | | | | | |
| | | | | | | 1,816,843 | |
| | | | | | | | |
France—4.6% | |
Bollore SA † | | | 298,950 | | | | 1,639,375 | |
Cap Gemini SA † | | | 25,657 | | | | 2,071,133 | |
Havas SA | | | 926 | | | | 8,021 | |
Safran SA † | | | 36,161 | | | | 2,542,172 | |
Sopra Steria Group | | | 996 | | | | 86,893 | |
Teleperformance † | | | 13,618 | | | | 1,051,034 | |
| | | | | | | | |
| | | | | | | 7,398,628 | |
| | | | | | | | |
Germany—3.8% | |
Aurelius AG † | | | 48,981 | | | | 2,034,560 | |
Fresenius SE & Co. KGaA † | | | 21,162 | | | | 1,212,659 | |
Muenchener Rueckversicherungs-Gesellschaft AG, Registered Shares | | | 5,998 | | | | 1,244,948 | |
Norma Group SE † | | | 30,574 | | | | 1,632,515 | |
| | | | | | | | |
| | | | | | | 6,124,682 | |
| | | | | | | | |
Hong Kong—3.3% | |
Cheung Kong Holdings Ltd. | | | 125,000 | | | | 2,474,228 | |
China Mobile Ltd. | | | 119,000 | | | | 1,614,850 | |
China Unicom Hong Kong Ltd. | | | 422,000 | | | | 711,675 | |
Hutchison Whampoa Ltd. | | | 42,000 | | | | 575,105 | |
| | | | | | | | |
| | | | | | | 5,375,858 | |
| | | | | | | | |
Ireland—6.0% | |
CRH PLC | | | 48,719 | | | | 1,375,396 | |
Greencore Group PLC † | | | 361,526 | | | | 1,880,518 | |
Ingersoll-Rand PLC † | | | 21,643 | | | | 1,454,193 | |
Medtronic PLC † | | | 30,954 | | | | 2,401,721 | |
Smurfit Kappa Group PLC † | | | 90,121 | | | | 2,520,544 | |
| | | | | | | | |
| | | | | | | 9,632,372 | |
| | | | | | | | |
Israel—0.8% | |
Teva Pharmaceutical Industries Ltd.—Sponsored ADR † | | | 23,616 | | | | 1,346,584 | |
| | | | | | | | |
| | | | | | | 1,346,584 | |
| | | | | | | | |
| | | | | | | | |
| | | Number of
Shares | | | Value | |
Italy—1.4% | |
Assicurazioni Generali SpA † | | | 85,728 | | | $ | 1,765,974 | |
Cerved Information Solutions SpA * † | | | 87,422 | | | | 547,918 | |
| | | | | | | | |
| | | | | | | 2,313,892 | |
| | | | | | | | |
Japan—7.8% | |
Hoshizaki Electric Co., Ltd. | | | 25,600 | | | | 1,516,506 | |
Inpex Corp. | | | 133,100 | | | | 1,573,231 | |
Lintec Corp. | | | 52,900 | | | | 1,261,780 | |
Nippon Telegraph & Telephone Corp. | | | 21,400 | | | | 1,333,828 | |
Nitto Denko Corp. | | | 36,000 | | | | 2,286,828 | |
Resona Holdings, Inc. | | | 297,300 | | | | 1,671,064 | |
Toshiba Corp. | | | 344,000 | | | | 1,423,837 | |
TS Tech Co., Ltd. | | | 55,800 | | | | 1,552,151 | |
| | | | | | | | |
| | | | | | | 12,619,225 | |
| | | | | | | | |
Netherlands—0.7% | |
Koninklijke Philips NV † | | | 40,058 | | | | 1,197,592 | |
| | | | | | | | |
| | | | | | | 1,197,592 | |
| | | | | | | | |
South Korea—0.5% | |
Samsung Electronics Co., Ltd. | | | 639 | | | | 790,319 | |
| | | | | | | | |
| | | | | | | 790,319 | |
| | | | | | | | |
Switzerland—5.9% | |
ACE Ltd. † | | | 23,550 | | | | 2,684,936 | |
Georg Fischer AG, Registered Shares † | | | 1,872 | | | | 1,344,755 | |
Glencore PLC † | | | 142,780 | | | | 659,571 | |
Novartis AG, Registered Shares † | | | 16,681 | | | | 1,706,034 | |
Roche Holding AG, Participation Certificate † | | | 6,072 | | | | 1,654,556 | |
Swatch Group AG (The), Registered Shares | | | 16,991 | | | | 1,495,067 | |
| | | | | | | | |
| | | | | | | 9,544,919 | |
| | | | | | | | |
Taiwan—0.5% | |
MediaTek, Inc. | | | 48,000 | | | | 720,725 | |
| | | | | | | | |
| | | | | | | 720,725 | |
| | | | | | | | |
United Kingdom—9.5% | |
Alent PLC † | | | 295,693 | | | | 1,601,717 | |
Aon PLC † | | | 11,490 | | | | 1,153,136 | |
Berendsen PLC † | | | 53,773 | | | | 912,589 | |
Cambian Group PLC * † | | | 235,182 | | | | 753,404 | |
Dairy Crest Group PLC † | | | 17,881 | | | | 136,955 | |
HSBC Holdings PLC † | | | 183,154 | | | | 1,632,673 | |
ITV PLC † | | | 452,585 | | | | 1,572,414 | |
Liberty Global PLC, Series C * † | | | 64,358 | | | | 3,357,557 | |
Melrose Industries PLC | | | 274,162 | | | | 1,266,727 | |
Stock Spirits Group PLC † | | | 60,574 | | | | 184,229 | |
Vodafone Group PLC † | | | 365,062 | | | | 1,263,596 | |
WH Smith PLC † | | | 71,565 | | | | 1,479,916 | |
| | | | | | | | |
| | | | | | | 15,314,913 | |
| | | | | | | | |
THEACCOMPANYINGNOTESAREANINTEGRALPARTOFTHEFINANCIALSTATEMENTS.
| | |
| 30 | | SEMI-ANNUAL REPORT 2015 |
| | |
| BOSTON PARTNERS INVESTMENT FUNDS | | FEBRUARY 28, 2015 (unaudited) |
| | |
BOSTON PARTNERS GLOBAL LONG/SHORT FUND (continued) | | PORTFOLIOOF INVESTMENTS |
| | | | | | | | |
| | | Number of
Shares | | | Value | |
United States—47.5% | |
Activision Blizzard, Inc. † | | | 103,632 | | | $ | 2,416,698 | |
Allstate Corp., (The) † | | | 25,234 | | | | 1,781,520 | |
American International Group, Inc. | | | 21,834 | | | | 1,208,075 | |
Amgen, Inc. † | | | 15,530 | | | | 2,449,392 | |
Anadarko Petroleum Corp. | | | 9,398 | | | | 791,594 | |
Apple, Inc. † | | | 47,158 | | | | 6,057,917 | |
Avery Dennison Corp. † | | | 12,692 | | | | 679,657 | |
Avnet, Inc. † | | | 33,847 | | | | 1,550,531 | |
Berkshire Hathaway, Inc., Class B * † | | | 15,881 | | | | 2,341,018 | |
Berry Plastics Group, Inc. * † | | | 34,965 | | | | 1,199,649 | |
Capital One Financial Corp. † | | | 49,437 | | | | 3,891,186 | |
Comcast Corp., Class A † | | | 32,081 | | | | 1,904,970 | |
CVS Health Corp. † | | | 48,106 | | | | 4,996,770 | |
EMC Corp. † | | | 58,871 | | | | 1,703,727 | |
Energen Corp. † | | | 15,811 | | | | 1,022,023 | |
EOG Resources, Inc. | | | 11,410 | | | | 1,023,705 | |
Express Scripts Holding Co. * | | | 9,375 | | | | 794,906 | |
Fifth Third Bancorp † | | | 185,238 | | | | 3,586,208 | |
Gilead Sciences, Inc. * † | | | 7,744 | | | | 801,736 | |
Google, Inc., Class C * † | | | 4,166 | | | | 2,326,294 | |
Graphic Packaging Holding Co. * † | | | 102,864 | | | | 1,552,218 | |
Honeywell International, Inc. † | | | 14,976 | | | | 1,539,233 | |
Huntsman Corp. † | | | 25,709 | | | | 577,424 | |
Johnson & Johnson † | | | 18,064 | | | | 1,851,741 | |
Lear Corp. † | | | 10,201 | | | | 1,111,093 | |
Macy’s, Inc. † | | | 33,127 | | | | 2,110,852 | |
Marathon Petroleum Corp. † | | | 7,520 | | | | 789,600 | |
McKesson Corp. † | | | 6,270 | | | | 1,433,949 | |
Microsoft Corp. † | | | 18,326 | | | | 803,595 | |
Northrop Grumman Corp. † | | | 9,654 | | | | 1,599,764 | |
Packaging Corp. of America † | | | 15,088 | | | | 1,250,192 | |
Parsley Energy, Inc., Class A * † | | | 85,775 | | | | 1,277,190 | |
Pfizer, Inc. † | | | 73,042 | | | | 2,506,801 | |
Phillips 66 † | | | 19,319 | | | | 1,515,769 | |
Rice Energy, Inc. * † | | | 27,802 | | | | 544,363 | |
Rofin-Sinar Technologies, Inc. * | | | 31,666 | | | | 759,034 | |
Tenneco, Inc. * † | | | 25,289 | | | | 1,472,831 | |
Tribune Media Co., Class A * † | | | 19,997 | | | | 1,319,202 | |
United Technologies Corp. † | | | 8,772 | | | | 1,069,395 | |
Universal Health Services, Inc., Class B † | | | 12,322 | | | | 1,396,699 | |
Viper Energy Partners LP † | | | 13,839 | | | | 262,941 | |
Wells Fargo & Co. † | | | 44,144 | | | | 2,418,650 | |
Western Digital Corp. † | | | 23,537 | | | | 2,517,988 | |
WR Berkley Corp. | | | 26,383 | | | | 1,316,776 | |
Zebra Technologies Corp., Class A * † | | | 12,915 | | | | 1,175,911 | |
| | | | | | | | |
| | | | | | | 76,700,787 | |
| | | | | | | | |
TOTAL COMMON STOCK
(Cost $146,072,247) | | | | | | | 154,166,141 | |
| | | | | | | | |
| | | | | | | | |
| | | Number of
Shares | | | Value | |
WARRANTS—0.0% | |
Canada—0.0% | |
Stornoway Diamond Corp. * Exercise Price CAD 0.90 Expires 7/08/16 | | | 36,284 | | | $ | 2,902 | |
| | | | | | | | |
| | | | | | | 2,902 | |
| | | | | | | | |
TOTAL WARRANTS
(Cost $3,889) | | | | | | | 2,902 | |
| | | | | | | | |
TOTAL INVESTMENTS—95.4%
(Cost $146,076,136) | | | | | | | 154,169,043 | |
| | | | | | | | |
SECURITIES SOLD SHORT—(47.8%) | |
COMMON STOCK—(47.8%) | |
Australia—(0.4%) | |
Woolworths Ltd. | | | (28,227 | ) | | | (675,536 | ) |
| | | | | | | | |
| | | | | | | (675,536 | ) |
| | | | | | | | |
Bermuda—(0.5%) | |
Brilliance China Automotive Holdings Ltd. | | | (190,000 | ) | | | (372,856 | ) |
Global Brands Group Holding Ltd. * | | | (2,664,000 | ) | | | (456,886 | ) |
| | | | | | | | |
| | | | | | | (829,742 | ) |
| | | | | | | | |
Canada—(1.9%) | | | | | | | | |
Canadian Pacific Railway Ltd. | | | (3,422 | ) | | | (642,036 | ) |
Canadian Western Bank | | | (23,512 | ) | | | (546,563 | ) |
Teck Resources Ltd., Class B | | | (45,078 | ) | | | (724,075 | ) |
Ultra Petroleum Corp. * | | | (30,221 | ) | | | (491,696 | ) |
Vermilion Energy, Inc. | | | (14,576 | ) | | | (648,340 | ) |
| | | | | | | | |
| | | | | | | (3,052,710 | ) |
| | | | | | | | |
Chile—(0.4%) | | | | | | | | |
Latam Airlines Group SA — Sponsored ADR * | | | (53,398 | ) | | | (564,417 | ) |
| | | | | | | | |
| | | | | | | (564,417 | ) |
| | | | | | | | |
China—(0.6%) | | | | | | | | |
China Mengniu Dairy Co., Ltd. | | | (94,000 | ) | | | (424,514 | ) |
Tsingtao Brewery Co., Ltd. Class H | | | (92,000 | ) | | | (582,140 | ) |
| | | | | | | | |
| | | | | | | (1,006,654 | ) |
| | | | | | | | |
Denmark—(0.6%) | | | | | | | | |
Novo Nordisk A/S | | | (19,050 | ) | | | (909,637 | ) |
| | | | | | | | |
| | | | | | | (909,637 | ) |
| | | | | | | | |
Finland—(0.8%) | | | | | | | | |
Huhtamaki OYJ | | | (12,835 | ) | | | (379,138 | ) |
Konecranes OYJ | | | (23,761 | ) | | | (823,601 | ) |
| | | | | | | | |
| | | | | | | (1,202,739 | ) |
| | | | | | | | |
France—(1.4%) | | | | | | | | |
Edenred | | | (33,537 | ) | | | (913,627 | ) |
Pernod Ricard SA | | | (4,610 | ) | | | (545,472 | ) |
Remy Cointreau SA | | | (11,447 | ) | | | (839,651 | ) |
| | | | | | | | |
| | | | | | | (2,298,750 | ) |
| | | | | | | | |
THEACCOMPANYINGNOTESAREANINTEGRALPARTOFTHEFINANCIALSTATEMENTS.
| | | | |
| SEMI-ANNUAL REPORT 2015 | | | 31 | |
| | |
| BOSTON PARTNERS INVESTMENT FUNDS | | FEBRUARY 28, 2015 (unaudited) |
| | |
BOSTON PARTNERS GLOBAL LONG/SHORT FUND (continued) | | PORTFOLIOOF INVESTMENTS |
| | | | | | | | |
| | | Number of
Shares | | | Value | |
Germany—(1.3%) | | | | | | | | |
BASF SE | | | (11,013 | ) | | $ | (1,055,254 | ) |
GEA Group AG | | | (11,760 | ) | | | (581,164 | ) |
Linde AG | | | (2,359 | ) | | | (479,492 | ) |
| | | | | | | | |
| | | | | | | (2,115,910 | ) |
| | | | | | | | |
Hong Kong—(1.1%) | | | | | | | | |
ASM Pacific Technology, Ltd. | | | (46,500 | ) | | | (471,818 | ) |
BYD Electronic International Co., Ltd. | | | (451,000 | ) | | | (503,302 | ) |
Geely Automobile Holdings Ltd. | | | (1,830,000 | ) | | | (817,868 | ) |
| | | | | | | | |
| | | | | | | (1,792,988 | ) |
| | | | | | | | |
Israel—(0.4%) | | | | | | | | |
Stratasys Ltd. * | | | (11,391 | ) | | | (706,925 | ) |
| | | | | | | | |
| | | | | | | (706,925 | ) |
| | | | | | | | |
Italy—(0.4%) | | | | | | | | |
UniCredit SpA | | | (104,469 | ) | | | (694,702 | ) |
| | | | | | | | |
| | | | | | | (694,702 | ) |
| | | | | | | | |
Japan—(2.1%) | | | | | | | | |
Fast Retailing Co., Ltd. | | | (2,200 | ) | | | (853,439 | ) |
FP Corp. | | | (23,200 | ) | | | (805,077 | ) |
Hulic Co., Ltd. | | | (56,900 | ) | | | (622,931 | ) |
McDonald’s Holdings Co., Ltd. | | | (23,900 | ) | | | (527,271 | ) |
Oji Holdings Corp. | | | (138,000 | ) | | | (582,970 | ) |
| | | | | | | | |
| | | | | | | (3,391,688 | ) |
| | | | | | | | |
Luxembourg—(0.3%) | | | | | | | | |
B&M European Value Retail SA * | | | (99,564 | ) | | | (489,313 | ) |
| | | | | | | | |
| | | | | | | (489,313 | ) |
| | | | | | | | |
Mexico—(0.3%) | | | | | | | | |
Kimberly-Clark de Mexico SAB de CV ADR | | | (54,743 | ) | | | (551,009 | ) |
| | | | | | | | |
| | | | | | | (551,009 | ) |
| | | | | | | | |
New Zealand—(0.3%) | | | | | | | | |
Ryman Healthcare Ltd. | | | (87,288 | ) | | | (536,683 | ) |
| | | | | | | | |
| | | | | | | (536,683 | ) |
| | | | | | | | |
Norway—(0.3%) | | | | | | | | |
DNB ASA | | | (31,162 | ) | | | (506,773 | ) |
| | | | | | | | |
| | | | | | | (506,773 | ) |
| | | | | | | | |
Singapore—(1.0%) | | | | | | | | |
Keppel Corp Ltd. | | | (99,000 | ) | | | (634,900 | ) |
Sembcorp Marine Ltd. | | | (424,100 | ) | | | (928,525 | ) |
| | | | | | | | |
| | | | | | | (1,563,425 | ) |
| | | | | | | | |
Spain—(0.4%) | | | | | | | | |
CaixaBank SA | | | — | | | | (2 | ) |
Repsol SA | | | (31,370 | ) | | | (604,873 | ) |
| | | | | | | | |
| | | | | | | (604,875 | ) |
| | | | | | | | |
Sweden—(1.1%) | | | | | | | | |
Autoliv, Inc. | | | (8,074 | ) | | | (908,325 | ) |
Elekta AB, Class B | | | (41,774 | ) | | | (436,179 | ) |
| | | | | | | | |
| | | Number of
Shares | | | Value | |
Sweden—(continued) | | | | | | | | |
Nordea Bank AB | | | (34,982 | ) | | $ | (471,642 | ) |
| | | | | | | | |
| | | | | | | (1,816,146 | ) |
| | | | | | | | |
Switzerland—(1.0%) | | | | | | | | |
Clariant AG, Registered Shares | | | (33,078 | ) | | | (598,964 | ) |
SGS SA, Registered Shares | | | (469 | ) | | | (948,371 | ) |
| | | | | | | | |
| | | | | | | (1,547,335 | ) |
| | | | | | | | |
Thailand—(0.3%) | |
Siam Commercial Bank PCL, (The) — NVDR | | | (88,300 | ) | | | (462,953 | ) |
| | | | | | | | |
| | | | | | | (462,953 | ) |
| | | | | | | | |
United Kingdom—(3.4%) | |
Aberdeen Asset Management PLC | | | (115,906 | ) | | | (836,480 | ) |
Cobham PLC | | | (110,821 | ) | | | (582,879 | ) |
G4S PLC | | | (197,205 | ) | | | (905,739 | ) |
GW Pharmaceuticals PLC — ADR * | | | (4,749 | ) | | | (384,289 | ) |
Ocado Group PLC * | | | (161,165 | ) | | | (915,326 | ) |
Rotork PLC | | | (14,753 | ) | | | (557,667 | ) |
Smiths Group PLC | | | (48,184 | ) | | | (857,159 | ) |
TSB Banking Group PLC * | | | (106,106 | ) | | | (427,979 | ) |
| | | | | | | | |
| | | | | | | (5,467,518 | ) |
| | | | | | | | |
United States—(27.5%) | |
Air Products & Chemicals, Inc. | | | (6,312 | ) | | | (985,556 | ) |
Alere, Inc. * | | | (18,720 | ) | | | (851,198 | ) |
AptarGroup, Inc. | | | (15,034 | ) | | | (990,290 | ) |
Astoria Financial Corp. | | | (60,324 | ) | | | (791,451 | ) |
BancorpSouth, Inc. | | | (29,955 | ) | | | (670,692 | ) |
Bemis Co., Inc. | | | (19,213 | ) | | | (937,594 | ) |
Blackbaud, Inc. | | | (15,372 | ) | | | (697,889 | ) |
Bristow Group, Inc. | | | (11,843 | ) | | | (733,555 | ) |
Buffalo Wild Wings, Inc. * | | | (4,312 | ) | | | (824,109 | ) |
Cabot Oil & Gas Corp. | | | (13,412 | ) | | | (388,948 | ) |
CarMax, Inc. * | | | (16,662 | ) | | | (1,118,187 | ) |
Clorox Co.(The) | | | (4,234 | ) | | | (459,982 | ) |
Cogent Communications Holdings, Inc. | | | (19,190 | ) | | | (704,657 | ) |
Colgate-Palmolive Co. | | | (8,933 | ) | | | (632,635 | ) |
Concho Resources, Inc. * | | | (5,174 | ) | | | (563,552 | ) |
CONSOL Energy, Inc. | | | (17,582 | ) | | | (566,140 | ) |
Continental Resources, Inc. * | | | (19,475 | ) | | | (866,443 | ) |
Dorman Products, Inc. * | | | (12,603 | ) | | | (555,918 | ) |
Eaton Vance Corp. | | | (9,017 | ) | | | (379,616 | ) |
EI du Pont de Nemours & Co. | | | (11,288 | ) | | | (878,771 | ) |
First Financial Bankshares, Inc. | | | (28,706 | ) | | | (754,107 | ) |
Glacier Bancorp, Inc. | | | (24,767 | ) | | | (601,590 | ) |
Hess Corp. | | | (7,216 | ) | | | (541,777 | ) |
Intrepid Potash, Inc. * | | | (42,955 | ) | | | (606,525 | ) |
Itron, Inc. * | | | (20,065 | ) | | | (731,971 | ) |
Kansas City Southern | | | (6,734 | ) | | | (780,067 | ) |
Krispy Kreme Doughnuts Inc * | | | (31,125 | ) | | | (679,147 | ) |
L Brands, Inc. | | | (9,784 | ) | | | (898,758 | ) |
Matador Resources Co. * | | | (24,010 | ) | | | (520,057 | ) |
Mattel, Inc. | | | (22,496 | ) | | | (592,095 | ) |
Michael Kors Holdings Ltd. * | | | (5,452 | ) | | | (367,519 | ) |
THEACCOMPANYINGNOTESAREANINTEGRALPARTOFTHEFINANCIALSTATEMENTS.
| | |
| 32 | | SEMI-ANNUAL REPORT 2015 |
| | |
| BOSTON PARTNERS INVESTMENT FUNDS | | FEBRUARY 28, 2015 (unaudited) |
| | |
BOSTON PARTNERS GLOBAL LONG/SHORT FUND (continued) | | PORTFOLIOOF INVESTMENTS |
| | | | | | | | |
| | | Number of
Shares | | | Value | |
United States—(continued) | |
Mobile Mini, Inc. | | | (15,067 | ) | | $ | (625,130 | ) |
Mondelez International, Inc. | | | (15,188 | ) | | | (560,969 | ) |
Monro Muffler Brake, Inc. | | | (14,014 | ) | | | (886,245 | ) |
Monster Beverage Corp. * | | | (7,483 | ) | | | (1,056,001 | ) |
National Instruments Corp. | | | (25,134 | ) | | | (782,673 | ) |
Netflix, Inc. * | | | (2,176 | ) | | | (1,033,404 | ) |
NetSuite, Inc. * | | | (5,292 | ) | | | (510,255 | ) |
Northern Trust Corp. | | | (13,010 | ) | | | (908,488 | ) |
NOW Inc. * | | | (39,875 | ) | | | (847,344 | ) |
Oasis Petroleum, Inc. * | | | (40,636 | ) | | | (582,314 | ) |
Palo Alto Networks, Inc. * | | | (4,449 | ) | | | (632,737 | ) |
Pandora Media, Inc. * | | | (31,563 | ) | | | (467,132 | ) |
Pharmacyclics, Inc. * | | | (2,358 | ) | | | (509,163 | ) |
Plum Creek Timber Co., Inc. | | | (8,390 | ) | | | (364,462 | ) |
Proto Labs, Inc. * | | | (5,431 | ) | | | (386,035 | ) |
Puma Biotechnology, Inc. * | | | (2,171 | ) | | | (462,445 | ) |
Rackspace Hosting, Inc. | | | (12,533 | ) | | | (622,514 | ) |
ResMed, Inc. | | | (6,883 | ) | | | (442,990 | ) |
Restoration Hardware Holdings Inc. * | | | (5,386 | ) | | | (474,507 | ) |
Rollins, Inc. | | | (13,852 | ) | | | (464,596 | ) |
salesforce.com, Inc. * | | | (8,162 | ) | | | (566,280 | ) |
Shutterstock, Inc. * | | | (7,326 | ) | | | (414,285 | ) |
Snyders-Lance, Inc. | | | (12,987 | ) | | | (400,649 | ) |
Spectra Energy Corp. | | | (17,126 | ) | | | (607,802 | ) |
Sun Hydraulics Corp. | | | (14,920 | ) | | | (577,404 | ) |
Tesla Motors, Inc. * | | | (3,496 | ) | | | (710,877 | ) |
Trex Co., Inc. * | | | (20,037 | ) | | | (1,008,863 | ) |
Tumi Holdings, Inc. * | | | (32,620 | ) | | | (762,982 | ) |
UMB Financial Corp. | | | (13,353 | ) | | | (688,214 | ) |
Under Armour, Inc., Class A * | | | (7,603 | ) | | | (585,507 | ) |
United Natural Foods, Inc. * | | | (5,521 | ) | | | (458,464 | ) |
VeriFone Systems, Inc. | | | (21,516 | ) | | | (757,148 | ) |
ViaSat, Inc. * | | | (9,878 | ) | | | (645,429 | ) |
Vitamin Shoppe, Inc. * | | | (15,855 | ) | | | (672,252 | ) |
Wausau Paper Corp. | | | (30,761 | ) | | | (288,846 | ) |
| | | | | | | | |
| | | Number of
Shares | | | Value | |
United States—(continued) | |
Westamerica Bancorporation | | | (9,018 | ) | | $ | (388,405 | ) |
Yelp, Inc. * | | | (12,255 | ) | | | (588,240 | ) |
| | | | | | | | |
| | | | | | | (44,411,847 | ) |
| | | | | | | | |
TOTAL COMMON STOCK
(Proceeds $75,265,583) | | | | | | | (77,200,275 | ) |
| | | | | | | | |
TOTAL SECURITIES SOLD SHORT—(47.8%)
(Proceeds $75,265,583) | | | | | | | (77,200,275 | ) |
| | | | | | | | |
| | | Number of
Contracts | | | | |
OPTIONS WRITTEN ††—0.0% | | | | | | | | |
EOG Resources, Inc. Call Options Expires 03/20/2015 Strike Price $87.50 | | | (93 | ) | | | (36,735 | ) |
| | | | | | | | |
TOTAL OPTIONS WRITTEN (Premiums received $77,557) | | | | | | | (36,735 | ) |
| | | | | | | | |
OTHER ASSETS IN EXCESS OF LIABILITIES—52.4% | | | | | | | 84,662,044 | |
| | | | | | | | |
NET ASSETS—100.0% | | | | | | $ | 161,594,077 | |
| | | | | | | | |
| | | | |
| ADR | | — | | American Depositary Receipt |
| NVDR | | — | | Non-Voting Depositary Receipt |
| PLC | | — | | Public Limited Company |
| * | | — | | Non-income producing. |
| † | | — | | Security position is either entirely or partially held in a segregated account as collateral for securities sold short. |
| †† | | — | | Primary risk exposure is equity contracts. |
Contracts For Difference held by the Fund at February 28, 2015, are as follows:
| | | | | | | | | | | | | | | | |
| Reference Company | | Counterparty | | | Number of
Contracts (Short) | | | Notional
Amount | | | Unrealized
Appreciation | |
Chailease Holding Co., Ltd. | | | Goldman Sachs | | | | (290,000 | ) | | $ | 735,463 | | | $ | 30,993 | |
THEACCOMPANYINGNOTESAREANINTEGRALPARTOFTHEFINANCIALSTATEMENTS.
| | | | |
| SEMI-ANNUAL REPORT 2015 | | | 33 | |
| | |
| BOSTON PARTNERS INVESTMENT FUNDS | | FEBRUARY 28, 2015 (unaudited) |
| | |
BOSTON PARTNERS GLOBAL LONG/SHORT FUND (concluded) | | PORTFOLIOOF INVESTMENTS |
A summary of the inputs used to value the Fund’s investments as of February 28, 2015 is as follows (see Note 1 in the Notes to Financial Statements):
| | | | | | | | | | | | | | | | |
| | | Total
Value as of
February 28, 2015 | | | Level 1
Quoted
Price | | | Level 2
Significant
Observable
Inputs | | | Level 3
Significant
Unobservable
Inputs | |
Common Stock | | | | | | | | | | | | | | | | |
Australia | | $ | 850,422 | | | $ | — | | | $ | 850,422 | | | $ | — | |
Canada | | | 2,418,380 | | | | 2,418,380 | | | | — | | | | — | |
China | | | 1,816,843 | | | | — | | | | 1,816,843 | | | | — | |
France | | | 7,398,628 | | | | — | | | | 7,398,628 | | | | — | |
Germany | | | 6,124,682 | | | | — | | | | 6,124,682 | | | | — | |
Hong Kong | | | 5,375,858 | | | | 575,105 | | | | 4,800,753 | | | | — | |
Ireland | | | 9,632,372 | | | | 3,855,914 | | | | 5,776,458 | | | | — | |
Israel | | | 1,346,584 | | | | 1,346,584 | | | | — | | | | — | |
Italy | | | 2,313,892 | | | | — | | | | 2,313,892 | | | | — | |
Japan | | | 12,619,225 | | | | — | | | | 12,619,225 | | | | — | |
Netherlands | | | 1,197,592 | | | | — | | | | 1,197,592 | | | | — | |
South Korea | | | 790,319 | | | | — | | | | 790,319 | | | | — | |
Switzerland | | | 9,544,919 | | | | 2,684,936 | | | | 6,859,983 | | | | — | |
Taiwan | | | 720,725 | | | | — | | | | 720,725 | | | | — | |
United Kingdom | | | 15,314,913 | | | | 9,866,587 | | | | 5,448,326 | | | | — | |
United States | | | 76,700,787 | | | | 76,700,787 | | | | — | | | | — | |
Warrants | | | 2,902 | | | | 2,902 | | | | — | | | | — | |
Contracts for difference | | | 30,993 | | | | — | | | | 30,993 | | | | — | |
| | | | | | | | | | | | | | | | |
Total Assets | | $ | 154,200,036 | | | $ | 97,451,195 | | | $ | 56,748,841 | | | $ | — | |
| | | | | | | | | | | | | | | | |
| | | | |
| | | Total
Value as of
February 28, 2015 | | | Level 1
Quoted
Price | | | Level 2
Significant
Observable
Inputs | | | Level 3
Significant
Unobservable
Inputs | |
Securities Sold Short | | | | | | | | | | | | | | | | |
Australia | | $ | (675,536 | ) | | $ | — | | | $ | (675,536 | ) | | $ | — | |
Bermuda | | | (829,742 | ) | | | (372,856 | ) | | | (456,886 | ) | | | — | |
Canada | | | (3,052,710 | ) | | | (3,052,710 | ) | | | — | | | | — | |
Chile | | | (564,417 | ) | | | (564,417 | ) | | | — | | | | — | |
China | | | (1,006,654 | ) | | | — | | | | (1,006,654 | ) | | | — | |
Denmark | | | (909,637 | ) | | | (909,637 | ) | | | — | | | | — | |
Finland | | | (1,202,739 | ) | | | — | | | | (1,202,739 | ) | | | — | |
France | | | (2,298,750 | ) | | | — | | | | (2,298,750 | ) | | | — | |
Germany | | | (2,115,910 | ) | | | — | | | | (2,115,910 | ) | | | — | |
Hong Kong | | | (1,792,988 | ) | | | — | | | | (1,792,988 | ) | | | — | |
Israel | | | (706,925 | ) | | | (706,925 | ) | | | — | | | | — | |
Italy | | | (694,702 | ) | | | — | | | | (694,702 | ) | | | — | |
Japan | | | (3,391,688 | ) | | | — | | | | (3,391,688 | ) | | | — | |
Luxembourg | | | (489,313 | ) | | | — | | | | (489,313 | ) | | | — | |
Mexico | | | (551,009 | ) | | | (551,009 | ) | | | — | | | | — | |
New Zealand | | | (536,683 | ) | | | — | | | | (536,683 | ) | | | — | |
Norway | | | (506,773 | ) | | | — | | | | (506,773 | ) | | | — | |
Singapore | | | (1,563,425 | ) | | | — | | | | (1,563,425 | ) | | | — | |
Spain | | | (604,875 | ) | | | — | | | | (604,875 | ) | | | — | |
Sweden | | | (1,816,146 | ) | | | (1,344,504 | ) | | | (471,642 | ) | | | — | |
Switzerland | | | (1,547,335 | ) | | | — | | | | (1,547,335 | ) | | | — | |
Thailand | | | (462,953 | ) | | | — | | | | (462,953 | ) | | | — | |
United Kingdom | | | (5,467,518 | ) | | | (384,289 | ) | | | (5,083,229 | ) | | | — | |
United States | | | (44,411,847 | ) | | | (44,411,847 | ) | | | — | | | | — | |
Options | | | | | | | | | | | | | | | | |
Equity Contracts | | | (36,735 | ) | | | (36,735 | ) | | | — | | | | — | |
| | | | | | | | | | | | | | | | |
Total Liabilities | | $ | (77,237,010 | ) | | $ | (52,334,929 | ) | | $ | (24,902,081 | ) | | $ | — | |
| | | | | | | | | | | | | | | | |
THEACCOMPANYINGNOTESAREANINTEGRALPARTOFTHEFINANCIALSTATEMENTS.
| | |
| 34 | | SEMI-ANNUAL REPORT 2015 |
| | |
| BOSTON PARTNERS INVESTMENT FUNDS | | FEBRUARY 28, 2015 (unaudited) |
| | |
STATEMENTS OF ASSETS AND LIABILITIES | | |
| | | | | | | | | | | | | | | | |
| | | Boston
Partners
Small Cap
Value Fund II | | | Boston
Partners
Long/Short
Equity Fund | | | Boston
Partners
Long/Short
Research Fund | | | Boston
Partners
All-Cap
Value Fund | |
ASSETS | | | | | | | | | | | | | | | | |
Investments in securities, at value † ^ | | $ | 279,511,738 | | | $ | 819,565,265 | | | $ | 5,906,359,405 | | | $ | 998,476,107 | |
Cash | | | 6,543,001 | | | | — | | | | 414,469,072 | | | | 23,275,077 | |
Foreign currency, at value # | | | — | | | | 11,183,153 | | | | 30,113,692 | | | | — | |
Receivables | | | | | | | | | | | | | | | | |
Investments sold | | | 738,138 | | | | 22,843,764 | | | | 59,020,730 | | | | 18,917,163 | |
Cash segregated with brokers for securities sold short | | | — | | | | 652,334,257 | | | | 2,770,181,505 | | | | — | |
Dividends and interest | | | 178,362 | | | | 47,484,792 | | | | 144,836,866 | | | | 1,650,312 | |
Capital shares sold | | | 594,995 | | | | 428,003 | | | | 22,701,527 | | | | 1,766,326 | |
Prepaid expenses and other assets | | | 16,368 | | | | 247,851 | | | | 107,875 | | | | 50,436 | |
| | | | | | | | | | | | | | | | |
Total assets | | | 287,582,602 | | | | 1,554,087,085 | | | | 9,347,790,672 | | | | 1,044,135,421 | |
| | | | | | | | | | | | | | | | |
LIABILITIES | | | | | | | | | | | | | | | | |
Securities sold short, at fair value ‡ | | $ | — | | | $ | 650,700,782 | | | $ | 2,766,500,772 | | | $ | — | |
Options written, at value * | | | — | | | | 1,008,930 | | | | 11,916,356 | | | | 837,000 | |
Due to Custodian, at value | | | — | | | | 35,360,911 | | | | — | | | | — | |
Foreign cash overdraft # | | | — | | | | — | | | | 30,400,143 | | | | — | |
Payables | | | | | | | | | | | | | | | | |
Securities lending collateral | | | 10,148,370 | | | | 29,918,254 | | | | — | | | | 154,906 | |
Investments purchased | | | 938,779 | | | | 24,759,632 | | | | 103,679,648 | | | | 34,208,407 | |
Capital shares redeemed | | | 329,459 | | | | 3,610,663 | | | | 9,523,080 | | | | 662,014 | |
Distributions to shareholders | | | 187 | | | | 49,975 | | | | 42,234 | | | | — | |
Due to prime broker | | | — | | | | 55,092,375 | | | | 131,183,275 | | | | — | |
Investment advisory fees | | | 196,013 | | | | 1,354,239 | | | | 5,908,816 | | | | 441,162 | |
Custodian fees | | | 14,111 | | | | 37,416 | | | | 328,992 | | | | 68,473 | |
Distribution and service fees | | | 24,151 | | | | 32,804 | | | | 54,908 | | | | 42,482 | |
Dividends on securities sold-short | | | — | | | | 284,001 | | | | 4,177,129 | | | | — | |
Administration and accounting fees | | | 21,086 | | | | 57,296 | | | | 212,400 | | | | 50,891 | |
Prime broker interest payable | | | — | | | | 9,699 | | | | 41,020 | | | | — | |
Printing and shareholder reporting fees | | | — | | | | — | | | | 29,640 | | | | — | |
Other accrued expenses and liabilities | | | 3,073 | | | | 39,380 | | | | 156,628 | | | | 5,664 | |
| | | | | | | | | | | | | | | | |
Total liabilities | | | 11,675,229 | | | | 802,316,357 | | | | 3,064,155,041 | | | | 36,470,999 | |
| | | | | | | | | | | | | | | | |
Net Assets | | $ | 275,907,373 | | | $ | 751,770,728 | | | $ | 6,283,635,631 | | | $ | 1,007,664,422 | |
| | | | | | | | | | | | | | | | |
NET ASSETS CONSIST OF | | | | | | | | | | | | | | | | |
Par value | | $ | 12,346 | | | $ | 40,257 | | | $ | 406,237 | | | $ | 43,627 | |
Paid-in capital | | | 206,926,447 | | | | 761,336,065 | | | | 5,628,895,615 | | | | 752,425,956 | |
Undistributed net investment income/(accumulated net investment loss) | | | (86,883 | ) | | | (34,986,994 | ) | | | (57,433,571 | ) | | | 1,062,640 | |
Accumulated net realized gain from investments securities sold short, written options and foreign currency translation | | | 2,931,807 | | | | 4,077,910 | | | | 27,791,756 | | | | 24,578,802 | |
Net unrealized appreciation on investments, securities sold short, written options, contracts for difference and foreign currency translation | | | 66,123,656 | | | | 21,303,490 | | | | 683,975,594 | | | | 229,553,397 | |
| | | | | | | | | | | | | | | | |
Net Assets | | $ | 275,907,373 | | | $ | 751,770,728 | | | $ | 6,283,635,631 | | | $ | 1,007,664,422 | |
| | | | | | | | | | | | | | | | |
INSTITUTIONAL CLASS | | | | | | | | | | | | | | | | |
Net assets | | $ | 148,398,698 | | | $ | 612,055,255 | | | $ | 6,039,895,756 | | | $ | 784,511,121 | |
Shares outstanding | | | 6,522,342 | | | | 32,361,011 | | | | 390,282,362 | | | | 33,939,404 | |
| | | | | | | | | | | | | | | | |
Net asset value, offering and redemption price per share | | $ | 22.75 | | | $ | 18.91 | | | $ | 15.48 | | | $ | 23.12 | |
| | | | | | | | | | | | | | | | |
INVESTOR CLASS | | | | | | | | | | | | | | | | |
Net assets | | $ | 127,508,675 | | | $ | 139,715,473 | | | $ | 243,739,875 | | | $ | 223,153,301 | |
Shares outstanding | | | 5,823,998 | | | | 7,896,308 | | | | 15,954,564 | | | | 9,687,999 | |
| | | | | | | | | | | | | | | | |
Net asset value, offering and redemption price per share | | $ | 21.89 | | | $ | 17.69 | | | $ | 15.28 | | | $ | 23.03 | |
| | | | | | | | | | | | | | | | |
† Investment in securities, at cost | | $ | 213,388,082 | | | $ | 696,760,591 | | | $ | 5,042,073,595 | | | $ | 768,632,398 | |
^ Includes market value of securities on loan | | $ | 7,363,665 | | | $ | 23,348,070 | | | $ | — | | | $ | 136,988 | |
# Foreign currency, at cost | | $ | — | | | $ | 12,176,426 | | | $ | (408,829 | ) | | $ | — | |
‡ Proceeds received, securities sold short | | $ | — | | | $ | 550,185,489 | | | $ | 2,588,002,151 | | | $ | — | |
* Premiums received, options written | | $ | — | | | $ | 1,016,312 | | | $ | 10,017,914 | | | $ | 546,688 | |
THEACCOMPANYINGNOTESAREANINTEGRALPARTOFTHEFINANCIALSTATEMENTS.
| | | | |
| SEMI-ANNUAL REPORT 2015 | | | 35 | |
| | |
| BOSTON PARTNERS INVESTMENT FUNDS | | FEBRUARY 28, 2015 (unaudited) |
| | |
STATEMENTS OF ASSETS AND LIABILITIES (concluded) |
| | | | | | | | | | | | |
| | | WPG Partners
Small/Micro Cap
Value Fund | | | Boston
Partners Global
Equity Fund | | | Boston
Partners Global
Long/Short
Fund | |
ASSETS | | | | | | | | | | | | |
Investments in securities, at value † ^ | | $ | 42,824,415 | | | $ | 78,051,886 | | | $ | 154,169,043 | |
Cash | | | 2,550,360 | | | | 1,138,066 | | | | 10,196,626 | |
Foreign currency, at value # | | | — | | | | 45,905 | | | | 19,759,873 | |
Receivables | | | | | | | | | | | | |
Investments sold | | | 255,044 | | | | 1,151,477 | | | | 2,967,427 | |
Cash segregated with brokers for securities sold short | | | — | | | | — | | | | 57,235,630 | |
Dividends and interest | | | 36,705 | | | | 116,669 | | | | 217,415 | |
Capital shares sold | | | 1,259,730 | | | | 1,350,000 | | | | 2,291,921 | |
Investment adviser | | | — | | | | 2,541 | | | | — | |
Unrealized gain on contracts for difference | | | — | | | | — | | | | 30,993 | |
Prepaid expenses and other assets | | | 12,682 | | | | 19,305 | | | | 43,892 | |
| | | | | | | | | | | | |
Total assets | | | 46,938,936 | | | | 81,875,849 | | | | 246,912,820 | |
| | | | | | | | | | | | |
LIABILITIES | | | | | | | | | | | | |
Securities sold short, at fair value ‡ | | $ | — | | | $ | — | | | $ | 77,200,275 | |
Options written, at value * | | | — | | | | — | | | | 36,735 | |
Payables | | | | | | | | | | | | |
Securities lending collateral | | | 3,789,509 | | | | — | | | | — | |
Investments purchased | | | 475,709 | | | | 1,569,778 | | | | 7,529,951 | |
Capital shares redeemed | | | — | | | | — | | | | 201,918 | |
Due to prime broker | | | — | | | | — | | | | 44,359 | |
Investment advisory fees | | | 16,036 | | | | 34,487 | | | | 185,299 | |
Custodian fees | | | 17,054 | | | | 14,102 | | | | 10,606 | |
Distribution and service fees | | | — | | | | — | | | | 1,730 | |
Dividends on securities sold-short | | | — | | | | — | | | | 79,019 | |
Administration and accounting fees | | | 8,748 | | | | 23,021 | | | | 4,957 | |
Prime broker interest payable | | | — | | | | — | | | | 3,188 | |
Printing and shareholder reporting fees | | | 1,762 | | | | 930 | | | | — | |
Other accrued expenses and liabilities | | | 17,732 | | | | 25,352 | | | | 20,706 | |
| | | | | | | | | | | | |
Total liabilities | | | 4,326,550 | | | | 1,667,670 | | | | 85,318,743 | |
| | | | | | | | | | | | |
Net Assets | | $ | 42,612,386 | | | $ | 80,208,179 | | | $ | 161,594,077 | |
| | | | | | | | | | | | |
NET ASSETS CONSIST OF | | | | | | | | | | | | |
Par value | | $ | 2,506 | | | $ | 5,221 | | | $ | 15,529 | |
Paid-in capital | | | 37,799,936 | | | | 71,708,401 | | | | 157,730,552 | |
Undistributed net investment income/(accumulated net investment loss) | | | 105,633 | | | | 18,962 | | | | (650,345 | ) |
Accumulated net realized loss from investments, securities sold short, contracts for difference and foreign currency translation | | | (2,290,463 | ) | | | (410,275 | ) | | | (1,560,605 | ) |
Net unrealized appreciation on investments, securities sold short, written options, contracts for difference and foreign currency translation | | | 6,994,774 | | | | 8,885,870 | | | | 6,058,946 | |
| | | | | | | | | | | | |
Net Assets | | $ | 42,612,386 | | | $ | 80,208,179 | | | $ | 161,594,077 | |
| | | | | | | | | | | | |
INSTITUTIONAL CLASS | | | | | | | | | | | | |
Net assets | | $ | 42,612,386 | | | $ | 80,208,179 | | | $ | 150,899,471 | |
Shares outstanding | | | 2,506,362 | | | | 5,220,797 | | | | 14,499,426 | |
| | | | | | | | | | | | |
Net asset value, offering and redemption price per share | | $ | 17.00 | | | $ | 15.36 | | | $ | 10.41 | |
| | | | | | | | | | | | |
INVESTOR CLASS | | | | | | | | | | | | |
Net assets | | $ | — | | | $ | — | | | $ | 10,694,606 | |
Shares outstanding | | | — | | | | — | | | | 1,029,174 | |
| | | | | | | | | | | | |
Net asset value, offering and redemption price per share | | $ | — | | | $ | — | | | $ | 10.39 | |
| | | | | | | | | | | | |
† Investment in securities, at cost | | $ | 35,829,641 | | | $ | 69,160,549 | | | $ | 146,076,136 | |
^ Includes market value of securities on loan | | $ | 2,686,234 | | | | — | | | | — | |
# Foreign currency, at cost | | $ | — | | | $ | 46,559 | | | $ | 19,921,363 | |
‡ Proceeds received, securities sold short | | $ | — | | | $ | — | | | $ | 75,265,583 | |
* Premiums received, options written | | $ | — | | | $ | — | | | $ | 77,557 | |
THEACCOMPANYINGNOTESAREANINTEGRALPARTOFTHEFINANCIALSTATEMENTS.
| | |
| 36 | | SEMI-ANNUAL REPORT 2015 |
| | |
| BOSTON PARTNERS INVESTMENT FUNDS | | FOR THE SIX MONTHS ENDED FEBRUARY 28, 2015 (unaudited) |
| | | | | | | | | | | | | | | | |
| | | Boston
Partners
Small Cap
Value Fund II | | | Boston
Partners
Long/Short
Equity Fund | | | Boston
Partners
Long/Short
Research Fund | | | Boston
Partners
All-Cap
Value Fund | |
Investment Income | | | | | | | | | | | | | | | | |
Dividends † | | $ | 2,349,021 | | | $ | 5,034,738 | | | $ | 38,999,277 | | | $ | 7,826,706 | |
Interest | | | 485 | | | | 68,959 | | | | 319,740 | | | | 1,077 | |
Income from securities loaned (Note 6) | | | 125,592 | | | | 96,399 | | | | — | | | | 3,913 | |
| | | | | | | | | | | | | | | | |
Total investment income | | | 2,475,098 | | | | 5,200,096 | | | | 39,319,017 | | | | 7,831,696 | |
| | | | | | | | | | | | | | | | |
Expenses | | | | | | | | | | | | | | | | |
Advisory fees (Note 2) | | | 1,225,959 | | | | 9,467,667 | | | | 35,768,801 | | | | 3,808,077 | |
Distribution fees (Investor Class) (Note 2) | | | 147,625 | | | | 245,813 | | | | 372,886 | | | | 268,244 | |
Administration and accounting fees (Note 2) | | | 110,196 | | | | 319,329 | | | | 1,279,638 | | | | 325,345 | |
Transfer agent fees (Note 2) | | | 36,332 | | | | 66,981 | | | | 1,343,186 | | | | 33,190 | |
Registration and filing fees | | | 23,719 | | | | 24,754 | | | | 195,966 | | | | 50,281 | |
Audit fees | | | 13,989 | | | | 17,626 | | | | 19,331 | | | | 13,385 | |
Directors’ and officers’ fees | | | 13,178 | | | | 18,229 | | | | 79,930 | | | | 20,230 | |
Custodian fees (Note 2) | | | 12,848 | | | | 41,286 | | | | 347,848 | | | | 52,130 | |
Legal fees | | | 10,807 | | | | 46,340 | | | | 294,684 | | | | 52,348 | |
Dividend expense on securities sold-short | | | — | | | | 1,587,816 | | | | 21,426,960 | | | | — | |
Prime broker interest expense | | | — | | | | 10,635,349 | | | | 6,251,729 | | | | — | |
Other expenses | | | 2,769 | | | | 23,597 | | | | 304,736 | | | | 41,768 | |
| | | | | | | | | | | | | | | | |
Total expenses before waivers and reimbursements | | | 1,597,422 | | | | 22,494,787 | | | | 67,685,695 | | | | 4,664,998 | |
Less: waivers and reimbursements | | | (95,942 | ) | | | — | | | | — | | | | (1,059,386 | ) |
| | | | | | | | | | | | | | | | |
Net expenses after waivers and reimbursements | | | 1,501,480 | | | | 22,494,787 | | | | 67,685,695 | | | | 3,605,612 | |
| | | | | | | | | | | | | | | | |
Net investment income/(loss) | | | 973,618 | | | | (17,294,691 | ) | | | (28,366,678 | ) | | | 4,226,084 | |
| | | | | | | | | | | | | | | | |
Net realized gain/(loss) from: | | | | | | | | | | | | | | | | |
Investments | | | 5,749,136 | | | | 33,746,635 | | | | 68,437,296 | | | | 32,294,354 | |
Investments sold-short | | | — | | | | (7,328,238 | ) | | | 34,894,660 | | | | — | |
Foreign currency transactions | | | — | | | | (195,696 | ) | | | (4,841,358 | ) | | | — | |
Written options * | | | — | | | | 315,725 | | | | 932,779 | | | | 212,360 | |
Net change in unrealized appreciation/(depreciation) on: | | | | | | | | | | | | | | | | |
Investments | | | 1,832,979 | | | | (53,081,406 | ) | | | 198,250,435 | | | | 17,195,711 | |
Investments sold short | | | — | | | | (34,591,846 | ) | | | (58,620,894 | ) | | | — | |
Foreign currency translation | | | — | | | | (993,566 | ) | | | 160,228 | | | | — | |
Written options * | | | — | | | | (304,308 | ) | | | (2,304,655 | ) | | | (237,679 | ) |
| | | | | | | | | | | | | | | | |
Net realized and unrealized gain/(loss) on investments | | | 7,582,115 | | | | (62,432,700 | ) | | | 236,908,491 | | | | 49,464,746 | |
| | | | | | | | | | | | | | | | |
Net increase/(decrease) in net assets resulting from operations | | $ | 8,555,733 | | | $ | (79,727,391 | ) | | $ | 208,541,813 | | | $ | 53,690,830 | |
| | | | | | | | | | | | | | | | |
† Net of foreign withholding taxes of | | $ | — | | | $ | (137,335 | ) | | $ | (342,493 | ) | | $ | (23,029 | ) |
| | | | | | | | | | | | | | | | |
| * | Primary risk is equity contracts |
THEACCOMPANYINGNOTESAREANINTEGRALPARTOFTHEFINANCIALSTATEMENTS.
| | | | |
| SEMI-ANNUAL REPORT 2015 | | | 37 | |
| | |
| BOSTON PARTNERS INVESTMENT FUNDS | | FOR THE SIX MONTHS ENDED FEBRUARY 28, 2015 (unaudited) |
| | |
STATEMENTS OF OPERATIONS (concluded) | | |
| | | | | | | | | | | | |
| | | WPG Partners
Small/Micro Cap
Value Fund | | | Boston
Partners Global
Equity Fund | | | Boston
Partners Global
Long/Short
Fund | |
Investment Income | | | | | | | | | | | | |
Dividends † | | $ | 325,176 | | | $ | 452,927 | | | $ | 551,727 | |
Interest | | | 103 | | | | 113 | | | | 21,938 | |
Income from securities loaned (Note 6) | | | 107,274 | | | | — | | | | — | |
| | | | | | | | | | | | |
Total investment income | | | 432,553 | | | | 453,040 | | | | 573,665 | |
| | | | | | | | | | | | |
Expenses | | | | | | | | | | | | |
Advisory fees (Note 2) | | | 165,565 | | | | 291,325 | | | | 653,288 | |
Administration and accounting fees (Note 2) | | | 38,696 | | | | 61,382 | | | | 54,455 | |
Transfer agent fees (Note 2) | | | 24,039 | | | | 15,340 | | | | 64,967 | |
Custodian fees (Note 2) | | | 14,808 | | | | 24,803 | | | | 61,699 | |
Audit fees | | | 13,689 | | | | 18,637 | | | | 11,858 | |
Directors’ and officers’ fees | | | 11,664 | | | | 12,188 | | | | 7,390 | |
Registration and filing fees | | | 10,628 | | | | 23,006 | | | | 12,051 | |
Legal fees | | | 2,481 | | | | 3,208 | | | | 3,356 | |
Distribution fees (Investor Class) (Note 2) | | | — | | | | — | | | | 7,373 | |
Dividend expense on securities sold-short | | | — | | | | — | | | | 198,640 | |
Prime broker interest expense | | | — | | | | — | | | | 149,024 | |
Other expenses | | | 1,307 | | | | 3,837 | | | | 1,314 | |
| | | | | | | | | | | | |
Total expenses before waivers and reimbursements | | | 282,877 | | | | 453,726 | | | | 1,225,415 | |
Less: waivers and reimbursements | | | (55,226 | ) | | | (146,217 | ) | | | (6,701 | ) |
| | | | | | | | | | | | |
Net expenses after waivers and reimbursements | | | 227,651 | | | | 307,509 | | | | 1,218,714 | |
| | | | | | | | | | | | |
Net investment income/(loss) | | | 204,902 | | | | 145,531 | | | | (645,049 | ) |
| | | | | | | | | | | | |
Net realized gain/(loss) from: | | | | | | | | | | | | |
Investments | | | (984,680 | ) | | | (13,887 | ) | | | (1,634,704 | ) |
Investments sold-short | | | — | | | | — | | | | 871,546 | |
Foreign currency transactions | | | — | | | | (37,058 | ) | | | (262,121 | ) |
Written options * | | | — | | | | — | | | | (45,520 | ) |
Net change in unrealized appreciation/(depreciation) on: | | | | | | | | | | | | |
Investments | | | (1,600,636 | ) | | | 2,895,042 | | | | 6,696,733 | |
Investments sold short | | | — | | | | — | | | | (2,321,310 | ) |
Foreign currency translation | | | — | | | | (4,256 | ) | | | (170,961 | ) |
Written options * | | | — | | | | — | | | | 40,822 | |
Contracts for difference | | | — | | | | — | | | | 43,688 | |
| | | | | | | | | | | | |
Net realized and unrealized gain/(loss) on investments | | | (2,585,316 | ) | | | 2,839,841 | | | | 3,218,173 | |
| | | | | | | | | | | | |
Net increase/(decrease) in net assets resulting from operations | | $ | (2,380,414 | ) | | $ | 2,985,372 | | | $ | 2,573,124 | |
| | | | | | | | | | | | |
† Net of foreign withholding taxes of | | $ | (989 | ) | | $ | (9,895 | ) | | $ | (62,609 | ) |
| | | | | | | | | | | | |
| * | Primary risk is equity contracts |
THEACCOMPANYINGNOTESAREANINTEGRALPARTOFTHEFINANCIALSTATEMENTS.
| | |
| 38 | | SEMI-ANNUAL REPORT 2015 |
| | |
| BOSTON PARTNERS INVESTMENT FUNDS | | FEBRUARY 28, 2015 |
| | |
STATEMENTS OF CHANGES IN NET ASSETS | | |
| | | | | | | | | | | | | | | | |
| | | Boston Partners
Small Cap Value Fund II | | | Boston Partners
Long/Short Equity Fund | |
| | | For the
Six Months Ended
February 28, 2015
(unaudited) | | | For the
Year Ended
August 31, 2014 | | | For the
Six Months Ended
February 28, 2015
(unaudited) | | | For the
Year Ended
August 31, 2014 | |
Increase/(decrease) in net assets from operations: | | | | | | | | | | | | | | | | |
Net investment income/(loss) | | $ | 973,618 | | | $ | 1,061,610 | | | $ | (17,294,691 | ) | | $ | (25,293,589 | ) |
Net realized gain from investments, securities sold short, written options and foreign currency | | | 5,749,136 | | | | 11,625,465 | | | | 26,538,426 | | | | 63,810,043 | |
Net change in unrealized appreciation/(depreciation) from investments, securities sold short, written options and foreign currency | | | 1,832,979 | | | | 20,145,483 | | | | (88,971,126 | ) | | | 70,697,079 | |
| | | | | | | | | | | | | | | | |
Net increase/(decrease) in net assets resulting from operations | | | 8,555,733 | | | | 32,832,558 | | | | (79,727,391 | ) | | | 109,213,533 | |
| | | | | | | | | | | | | | | | |
Dividends and distributions to shareholders from: | | | | | | | | | | | | | | | | |
Net investment income | | | | | | | | | | | | | | | | |
Institutional Class | | | (951,560 | ) | | | (345,221 | ) | | | — | | | | — | |
Investor Class | | | (605,107 | ) | | | (237,918 | ) | | | — | | | | — | |
Net realized capital gains | | | | | | | | | | | | | | | | |
Institutional Class | | | (1,769,477 | ) | | | — | | | | (54,248,415 | ) | | | (36,987,514 | ) |
Investor Class | | | (1,642,628 | ) | | | — | | | | (17,937,422 | ) | | | (13,170,066 | ) |
| | | | | | | | | | | | | | | | |
Net decrease in net assets from dividends and distributions to shareholders | | | (4,968,772 | ) | | | (583,139 | ) | | | (72,185,837 | ) | | | (50,157,580 | ) |
| | | | | | | | | | | | | | | | |
Capital transactions: | | | | | | | | | | | | | | | | |
Institutional Class | | | | | | | | | | | | | | | | |
Proceeds from shares sold | | | 23,886,470 | | | | 28,174,661 | | | | 132,332,765 | | | | 162,787,046 | |
Reinvestment of distributions | | | 2,215,225 | | | | 324,783 | | | | 41,021,708 | | | | 26,413,733 | |
Shares redeemed | | | (12,136,567 | ) | | | (17,191,647 | ) | | | (122,566,206 | ) | | | (179,141,615 | ) |
Redemption fees (Note 8) | | | 857 | | | | 2,396 | | | | 28,777 | | | | 341,715 | |
Investor Class | | | | | | | | | | | | | | | | |
Proceeds from shares sold | | | 52,345,364 | | | | 25,973,463 | | | | 25,746,998 | | | | 42,099,643 | |
Reinvestment of distributions | | | 2,662,389 | | | | 233,663 | | | | 17,388,360 | | | | 12,197,068 | |
Shares redeemed | | | (11,182,483 | ) | | | (18,920,805 | ) | | | (78,404,318 | ) | | | (76,854,075 | ) |
Redemption fees (Note 8) | | | 900 | | | | 2,956 | | | | 8,369 | | | | 116,495 | |
| | | | | | | | | | | | | | | | |
Net increase/(decrease) in net assets from capital transactions | | | 57,792,155 | | | | 18,599,470 | | | | 15,556,453 | | | | (12,039,990 | ) |
| | | | | | | | | | | | | | | | |
Total increase/(decrease) in net assets | | | 61,379,116 | | | | 50,848,889 | | | | (136,356,775 | ) | | | 47,015,963 | |
Net assets | | | | | | | | | | | | | | | | |
Beginning of period | | | 214,528,257 | | | | 163,679,368 | | | | 888,127,503 | | | | 841,111,540 | |
| | | | | | | | | | | | | | | | |
End of period | | $ | 275,907,373 | | | $ | 214,528,257 | | | $ | 751,770,728 | | | $ | 888,127,503 | |
| | | | | | | | | | | | | | | | |
Undistributed net investment income/(loss), end of period | | $ | (86,883 | ) | | $ | 496,166 | | | $ | (34,986,994 | ) | | $ | (17,692,303 | ) |
| | | | | | | | | | | | | | | | |
Share transactions: | | | | | | | | | | | | | | | | |
Institutional Class | | | | | | | | | | | | | | | | |
Shares sold | | | 2,399,331 | | | | 1,287,470 | | | | 6,529,890 | | | | 7,541,514 | |
Shares reinvested | | | 120,853 | | | | 15,262 | | | | 2,087,619 | | | | 1,291,625 | |
Shares redeemed | | | (506,194 | ) | | | (804,194 | ) | | | (6,141,298 | ) | | | (8,592,855 | ) |
| | | | | | | | | | | | | | | | |
Net increase | | | 2,013,990 | | | | 498,538 | | | | 2,476,211 | | | | 240,284 | |
| | | | | | | | | | | | | | | | |
Investor Class | | | | | | | | | | | | | | | | |
Shares sold | | | 1,133,829 | | | | 1,306,062 | | | | 1,301,815 | | | | 2,068,807 | |
Shares reinvested | | | 104,442 | | | | 11,392 | | | | 945,533 | | | | 632,300 | |
Shares redeemed | | | (573,623 | ) | | | (912,305 | ) | | | (4,260,050 | ) | | | (3,894,482 | ) |
| | | | | | | | | | | | | | | | |
Net increase/(decrease) | | | 664,648 | | | | 405,149 | | | | (2,012,702 | ) | | | (1,193,375 | ) |
| | | | | | | | | | | | | | | | |
THEACCOMPANYINGNOTESAREANINTEGRALPARTOFTHEFINANCIALSTATEMENTS.
| | | | |
| SEMI-ANNUAL REPORT 2015 | | | 39 | |
| | |
| BOSTON PARTNERS INVESTMENT FUNDS | | FEBRUARY 28, 2015 |
| | |
STATEMENTS OF CHANGES IN NET ASSETS (continued) | | |
| | | | | | | | | | | | | | | | |
| | | Boston Partners
Long/Short Research Fund | | | Boston Partners
All-Cap Value Fund | |
| | | For the
Six Months Ended
February 28, 2015
(unaudited) | | | For the
Year Ended
August 31, 2014 | | | For the
Six Months Ended
February 28, 2015
(unaudited) | | | For the
Year Ended
August 31, 2014 | |
Increase/(decrease) in net assets from operations: | | | | | | | | | | | | | | | | |
Net investment income/(loss) | | $ | (28,366,678 | ) | | $ | (30,664,883 | ) | | $ | 4,226,084 | | | $ | 7,757,538 | |
Net realized gain from investments, securities sold short, written options and foreign currency | | | 99,423,377 | | | | 16,068,536 | | | | 32,506,714 | | | | 40,311,296 | |
Net change in unrealized appreciation/(depreciation) from investments, securities sold short, written options and foreign currency | | | 137,485,114 | | | | 451,206,324 | | | | 16,958,032 | | | | 112,721,801 | |
| | | | | | | | | | | | | | | | |
Net increase in net assets resulting from operations | | | 208,541,813 | | | | 436,609,977 | | | | 53,690,830 | | | | 160,790,635 | |
| | | | | | | | | | | | | | | | |
Dividends and distributions to shareholders from: | | | | | | | | | | | | | | | | |
Net investment income | | | | | | | | | | | | | | | | |
Institutional Class | | | — | | | | — | | | | (7,085,713 | ) | | | (4,677,165 | ) |
Investor Class | | | — | | | | — | | | | (1,598,987 | ) | | | (911,496 | ) |
Net realized capital gains | | | | | | | | | | | | | | | | |
Institutional Class | | | (73,750,367 | ) | | | (10,191,255 | ) | | | (29,675,856 | ) | | | (15,951,494 | ) |
Investor Class | | | (4,130,770 | ) | | | (644,954 | ) | | | (8,739,309 | ) | | | (3,674,790 | ) |
| | | | | | | | | | | | | | | | |
Net decrease in net assets from dividends and distributions to shareholders | | | (77,881,137 | ) | | | (10,836,209 | ) | | | (47,099,865 | ) | | | (25,214,945 | ) |
| | | | | | | | | | | | | | | | |
Capital transactions: | | | | | | | | | | | | | | | | |
Institutional Class | | | | | | | | | | | | | | | | |
Proceeds from shares sold | | | 1,350,433,582 | | | | 3,419,038,875 | | | | 74,946,159 | | | | 242,389,813 | |
Reinvestment of distributions | | | 38,567,891 | | | | 5,470,231 | | | | 30,283,496 | | | | 18,483,816 | |
Shares redeemed | | | (528,778,609 | ) | | | (515,145,972 | ) | | | (62,631,111 | ) | | | (74,884,387 | ) |
Redemption fees (Note 8) | | | 76,904 | | | | 154,051 | | | | — | | | | — | |
Investor Class | | | | | | | | | | | | | | | | |
Proceeds from shares sold | | | 61,892,599 | | | | 180,979,395 | | | | 33,131,893 | | | | 141,871,828 | |
Reinvestment of distributions | | | 4,096,486 | | | | 626,724 | | | | 10,146,888 | | | | 4,474,110 | |
Shares redeemed | | | (121,954,991 | ) | | | (44,186,169 | ) | | | (38,868,850 | ) | | | (33,638,548 | ) |
Redemption fees (Note 8) | | | 4,297 | | | | 9,674 | | | | — | | | | — | |
| | | | | | | | | | | | | | | | |
Net increase in net assets from capital transactions | | | 804,338,159 | | | | 3,046,946,809 | | | | 47,008,475 | | | | 298,696,632 | |
| | | | | | | | | | | | | | | | |
Total increase in net assets | | | 934,998,835 | | | | 3,472,720,577 | | | | 53,599,440 | | | | 434,272,322 | |
Net assets | | | | | | | | | | | | | | | | |
Beginning of period | | | 5,348,636,796 | | | | 1,875,916,219 | | | | 954,064,982 | | | | 519,792,660 | |
| | | | | | | | | | | | | | | | |
End of period | | $ | 6,283,635,631 | | | $ | 5,348,636,796 | | | $ | 1,007,664,422 | | | $ | 954,064,982 | |
| | | | | | | | | | | | | | | | |
Undistributed net investment income/(loss), end of period | | $ | (57,433,571 | ) | | $ | (29,066,893 | ) | | $ | 1,062,640 | | | $ | 5,521,256 | |
| | | | | | | | | | | | | | | | |
Share transactions: | | | | | | | | | | | | | | | | |
Institutional Class | | | | | | | | | | | | | | | | |
Shares sold | | | 89,073,918 | | | | 237,515,897 | | | | 3,319,794 | | | | 11,615,055 | |
Shares reinvested | | | 2,532,409 | | | | 384,686 | | | | 1,351,338 | | | | 902,530 | |
Shares redeemed | | | (35,069,289 | ) | | | (35,242,438 | ) | | | (2,757,369 | ) | | | (3,515,836 | ) |
| | | | | | | | | | | | | | | | |
Net increase | | | 56,537,038 | | | | 202,658,145 | | | | 1,913,763 | | | | 9,001,749 | |
| | | | | | | | | | | | | | | | |
Investor Class | | | | | | | | | | | | | | | | |
Shares sold | | | 4,141,864 | | | | 12,636,422 | | | | 1,474,381 | | | | 6,795,381 | |
Shares reinvested | | | 271,830 | | | | 44,386 | | | | 454,203 | | | | 219,104 | |
Shares redeemed | | | (8,072,984 | ) | | | (3,099,558 | ) | | | (1,743,407 | ) | | | (1,587,653 | ) |
| | | | | | | | | | | | | | | | |
Net increase/(decrease) | | | (3,659,290 | ) | | | 9,581,250 | | | | 185,177 | | | | 5,426,832 | |
| | | | | | | | | | | | | | | | |
THEACCOMPANYINGNOTESAREANINTEGRALPARTOFTHEFINANCIALSTATEMENTS.
| | |
| 40 | | SEMI-ANNUAL REPORT 2015 |
| | |
| BOSTON PARTNERS INVESTMENT FUNDS | | FEBRUARY 28, 2015 |
| | |
STATEMENTS OF CHANGES IN NET ASSETS (continued) | | |
| | | | | | | | | | | | | | | | |
| | | WPG Partners
Small/Micro Cap Value Fund | | | Boston Partners
Global Equity Fund | |
| | | For the
Six Months Ended
February 28, 2015
(unaudited) | | | For the
Year Ended
August 31, 2014 | | | For the
Six Months Ended
February 28, 2015
(unaudited) | | | For the
Year Ended
August 31, 2014 | |
Increase/(decrease) in net assets from operations: | | | | | | | | | | | | | | | | |
Net investment income | | $ | 204,902 | | | $ | 156,573 | | | $ | 145,531 | | | $ | 628,987 | |
Net realized gain/(loss) from investments, securities sold short, written options and foreign currency | | | (984,680 | ) | | | 6,948,796 | | | | (50,945 | ) | | | 2,302,099 | |
Net change in unrealized appreciation/(depreciation) from investments, securities sold short, written options and foreign currency | | | (1,600,636 | ) | | | (60,529 | ) | | | 2,890,786 | | | | 4,347,444 | |
| | | | | | | | | | | | | | | | |
Net increase/(decrease) in net assets resulting from operations | | | (2,380,414 | ) | | | 7,044,840 | | | | 2,985,372 | | | | 7,278,530 | |
| | | | | | | | | | | | | | | | |
Dividends and distributions to shareholders from: | | | | | | | | | | | | | | | | |
Net investment income | | | | | | | | | | | | | | | | |
Institutional Class | | | (276,767 | ) | | | (50,358 | ) | | | (672,980 | ) | | | (91,861 | ) |
Net realized capital gains | | | | | | | | | | | | | | | | |
Institutional Class | | | (4,758,990 | ) | | | (3,952,860 | ) | | | (2,575,967 | ) | | | (1,411,674 | ) |
| | | | | | | | | | | | | | | | |
Net decrease in net assets from dividends and distributions to shareholders | | | (5,035,757 | ) | | | (4,003,218 | ) | | | (3,248,947 | ) | | | (1,503,535 | ) |
| | | | | | | | | | | | | | | | |
Capital transactions: | | | | | | | | | | | | | | | | |
Institutional Class | | | | | | | | | | | | | | | | |
Proceeds from shares sold | | | 1,769,927 | | | | 1,940,266 | | | | 17,929,822 | | | | 54,896,316 | |
Reinvestment of distributions | | | 4,460,767 | | | | 3,615,431 | | | | 2,531,256 | | | | 1,503,534 | |
Shares redeemed | | | (2,210,166 | ) | | | (3,343,540 | ) | | | (76,414 | ) | | | (13,584,041 | ) |
| | | | | | | | | | | | | | | | |
Net increase in net assets from capital transactions | | | 4,020,528 | | | | 2,212,157 | | | | 20,384,664 | | | | 42,815,809 | |
| | | | | | | | | | | | | | | | |
Total increase/(decrease) in net assets | | | (3,395,643 | ) | | | 5,253,779 | | | | 20,121,089 | | | | 48,590,804 | |
Net assets | | | | | | | | | | | | | | | | |
Beginning of period | | | 46,008,029 | | | | 40,754,250 | | | | 60,087,090 | | | | 11,496,286 | |
| | | | | | | | | | | | | | | | |
End of period | | $ | 42,612,386 | | | $ | 46,008,029 | | | $ | 80,208,179 | | | $ | 60,087,090 | |
| | | | | | | | | | | | | | | | |
Undistributed net investment income, end of period | | $ | 105,633 | | | $ | 177,498 | | | $ | 18,962 | | | $ | 546,411 | |
| | | | | | | | | | | | | | | | |
Share transactions: | | | | | | | | | | | | | | | | |
Institutional Class | | | | | | | | | | | | | | | | |
Shares sold | | | 104,046 | | | | 96,374 | | | | 1,198,587 | | | | 3,756,181 | |
Shares reinvested | | | 270,350 | | | | 185,502 | | | | 172,546 | | | | 105,585 | |
Shares redeemed | | | (121,437 | ) | | | (166,761 | ) | | | (5,107 | ) | | | (893,583 | ) |
| | | | | | | | | | | | | | | | |
Net increase | | | 252,959 | | | | 115,115 | | | | 1,366,026 | | | | 2,968,183 | |
| | | | | | | | | | | | | | | | |
THEACCOMPANYINGNOTESAREANINTEGRALPARTOFTHEFINANCIALSTATEMENTS.
| | | | |
| SEMI-ANNUAL REPORT 2015 | | | 41 | |
| | |
| BOSTON ADVISORS INVESTMENT FUNDS | | FEBRUARY 28, 2015 |
| | |
STATEMENTS OF CHANGES IN NET ASSETS (concluded) | | |
| | | | | | | | |
| | | Boston Partners
Global Long/Short Fund | |
| | | For the
Six Months Ended
February 28, 2015
(unaudited) | | | For the
Period Ended
August 31, 2014* | |
Increase/(decrease) in net assets from operations: | | | | | | | | |
Net investment loss | | $ | (645,049 | ) | | $ | (237,573 | ) |
Net realized loss from investments, securities sold short, written options and foreign currency | | | (1,070,799 | ) | | | (544,340 | ) |
Net change in unrealized appreciation from investments, securities sold short, written options and foreign currency | | | 4,288,972 | | | | 1,769,974 | |
| | | | | | | | |
Net increase in net assets resulting from operations | | | 2,573,124 | | | | 988,061 | |
| | | | | | | | |
Capital transactions: | | | | | | | | |
Institutional Class | | | | | | | | |
Proceeds from shares sold | | | 118,859,334 | | | | 36,909,632 | |
Shares redeemed | | | (7,743,191 | ) | | | (441,329 | ) |
Redemption fees (Note 8) | | | 8,414 | | | | 252 | |
Investor Class | | | | | | | | |
Proceeds from shares sold | | | 7,999,808 | | | | 2,787,714 | |
Shares redeemed | | | (348,281 | ) | | | — | |
Redemption fees (Note 8) | | | 525 | | | | 14 | |
| | | | | | | | |
Net increase in net assets from capital transactions | | | 118,776,609 | | | | 39,256,283 | |
| | | | | | | | |
Total increase in net assets | | | 121,349,733 | | | | 40,244,344 | |
Net assets | | | | | | | | |
Beginning of period | | | 40,244,344 | | | | — | |
| | | | | | | | |
End of period | | $ | 161,594,077 | | | $ | 40,244,344 | |
| | | | | | | | |
Undistributed net investment loss, end of period | | $ | (650,345 | ) | | $ | (5,296 | ) |
| | | | | | | | |
Share transactions: | | | | | | | | |
Institutional Class | | | | | | | | |
Shares sold | | | 11,653,425 | | | | 3,676,348 | |
Shares redeemed | | | (786,898 | ) | | | (43,449 | ) |
| | | | | | | | |
Net increase | | | 10,866,527 | | | | 3,632,899 | |
| | | | | | | | |
Investor Class | | | | | | | | |
Shares sold | | | 789,769 | | | | 276,209 | |
Shares redeemed | | | (36,804 | ) | | | — | |
| | | | | | | | |
Net increase | | | 752,965 | | | | 276,209 | |
| | | | | | | | |
| * | Inception date of the Fund was December 31, 2013. |
THEACCOMPANYINGNOTESAREANINTEGRALPARTOFTHEFINANCIALSTATEMENTS.
| | |
| 42 | | SEMI-ANNUAL REPORT 2015 |
(THIS PAGE INTENTIONALLY LEFT BLANK.)
| | | | |
| SEMI-ANNUAL REPORT 2015 | | | 43 | |
| | |
| BOSTON PARTNERS INVESTMENT FUNDS | | |
| | |
FINANCIAL HIGHLIGHTS | | PER SHARE OPERATING PERFORMANCE |
Contained below is per share operating performance data for each class of shares outstanding, total investment return, ratios to average net assets and other supplemental data for the respective periods. This information has been derived from information provided in the financial statements.
| | | | | | | | | | | | | | | | | | | | | | | | | | | | | | | | | | |
| | |
Net
Asset
Value,
Beginning
of Period | | | Net
Investment
Income/(Loss)* | | | Net Realized
and Unrealized
Gain/(Loss) on
Investments | | | Net Increase/ (Decrease)
in Net Assets
Resulting
from
Operations | | | Dividends to
Shareholders
from Net
Investment
Income | | | Distributions to
Shareholders
from Net
Realized Gains | | | Total
Dividend and
Distributions
to Shareholders | | | Redemption
Fees* | | | |
| Boston Partners Small Cap Value Fund II | | | | | | | | | | | | | | | | | | | |
Institutional Class | | | | | | | | | | | | | | | | | | | | | | | | | | | | | | | |
9/1/14 through 2/28/15† | | $ | 22.65 | | | $ | 0.10 | | | $ | 0.43 | | | $ | 0.53 | | | $ | (0.15 | ) | | $ | (0.28 | ) | | $ | (0.43 | ) | | $ | — | | | |
8/31/14 | | | 19.06 | | | | 0.15 | | | | 3.53 | | | | 3.68 | | | | (0.09 | ) | | | — | | | | (0.09 | ) | | | — | 3 | | |
8/31/13 | | | 15.31 | | | | 0.09 | | | | 3.75 | | | | 3.84 | | | | (0.09 | ) | | | — | | | | (0.09 | ) | | | — | | | |
8/31/12 | | | 12.92 | | | | 0.05 | | | | 2.39 | | | | 2.44 | | | | (0.05 | ) | | | — | | | | (0.05 | ) | | | — | 3 | | |
8/31/11 | | | 11.02 | | | | 0.03 | | | | 1.91 | | | | 1.94 | | | | (0.04 | ) | | | — | | | | (0.04 | ) | | | — | 3 | | |
8/31/10 | | | 10.49 | | | | 0.06 | | | | 0.52 | | | | 0.58 | | | | (0.05 | ) | | | — | | | | (0.05 | ) | | | — | 3 | | |
Investor Class | | | | | | | | | | | | | | | | | | | | | | | | | | | | | | | | | | |
9/1/14 through 2/28/15† | | $ | 21.79 | | | $ | 0.07 | | | $ | 0.41 | | | $ | 0.48 | | | $ | (0.10 | ) | | $ | (0.28 | ) | | $ | (0.38 | ) | | $ | — | | | |
8/31/14 | | | 18.35 | | | | 0.09 | | | | 3.40 | | | | 3.49 | | | | (0.05 | ) | | | — | | | | (0.05 | ) | | | — | 3 | | |
8/31/13 | | | 14.74 | | | | 0.05 | | | | 3.61 | | | | 3.66 | | | | (0.05 | ) | | | — | | | | (0.05 | ) | | | — | | | |
8/31/12 | | | 12.44 | | | | 0.02 | | | | 2.30 | | | | 2.32 | | | | (0.02 | ) | | | — | | | | (0.02 | ) | | | — | 3 | | |
8/31/11 | | | 10.62 | | | | (— | )3 | | | 1.84 | | | | 1.84 | | | | (0.02 | ) | | | — | | | | (0.02 | ) | | | — | 3 | | |
8/31/10 | | | 10.11 | | | | 0.03 | | | | 0.50 | | | | 0.53 | | | | (0.02 | ) | | | — | | | | (0.02 | ) | | | — | 3 | | |
| Boston Partners Long/Short Equity Fund | | | | | | | | | | | | | | | | | | | |
Institutional Class | | | | | | | | | | | | | | | | | | | | | | | | | | | | | | | | | | |
9/1/14 through 2/28/15† | | $ | 22.65 | | | $ | (0.42 | ) | | $ | (1.56 | ) | | $ | (1.98 | ) | | $ | — | | | $ | (1.77 | ) | | $ | (1.77 | ) | | $ | 0.01 | | | |
8/31/14 | | | 20.94 | | | | (0.63 | ) | | | 3.57 | | | | 2.94 | | | | — | | | | (1.24 | ) | | | (1.24 | ) | | | 0.01 | | | |
8/31/13 | | | 20.47 | | | | (0.54 | ) | | | 2.24 | | | | 1.70 | | | | — | | | | (1.24 | ) | | | (1.24 | ) | | | 0.01 | | | |
8/31/12 | | | 19.88 | | | | (0.54 | ) | | | 3.15 | | | | 2.61 | | | | — | | | | (2.03 | ) | | | (2.03 | ) | | | 0.01 | | | |
8/31/11 | | | 17.41 | | | | (0.47 | ) | | | 4.55 | | | | 4.08 | | | | — | | | | (1.62 | ) | | | (1.62 | ) | | | 0.01 | | | |
8/31/10 | | | 15.75 | | | | (0.37 | ) | | | 1.98 | | | | 1.61 | | | | — | | | | — | | | | — | | | | 0.05 | | | |
Investor Class | | | | | | | | | | | | | | | | | | | | | | | | | | | | | | | | | | |
9/1/14 through 2/28/15† | | $ | 21.33 | | | $ | (0.42 | ) | | $ | (1.46 | ) | | $ | (1.88 | ) | | $ | — | | | $ | (1.77 | ) | | $ | (1.77 | ) | | $ | 0.01 | | | |
8/31/14 | | | 19.84 | | | | (0.65 | ) | | | 3.37 | | | | 2.72 | | | | — | | | | (1.24 | ) | | | (1.24 | ) | | | 0.01 | | | |
8/31/13 | | | 19.51 | | | | (0.57 | ) | | | 2.13 | | | | 1.56 | | | | — | | | | (1.24 | ) | | | (1.24 | ) | | | 0.01 | | | |
8/31/12 | | | 19.08 | | | | (0.56 | ) | | | 3.01 | | | | 2.45 | | | | — | | | | (2.03 | ) | | | (2.03 | ) | | | 0.01 | | | |
8/31/11 | | | 16.80 | | | | (0.50 | ) | | | 4.39 | | | | 3.89 | | | | — | | | | (1.62 | ) | | | (1.62 | ) | | | 0.01 | | | |
8/31/10 | | | 15.31 | | | | (0.40 | ) | | | 1.84 | | | | 1.44 | | | | — | | | | — | | | | — | | | | 0.05 | | | |
| Boston Partners Long/Short Research Fund | | | | | | | | | | | | | | | | | | | |
Institutional Class | | | | | | | | | | | | | | | | | | | | | | | | | | | | | | | | | | |
9/1/14 through 2/28/15† | | $ | 15.14 | | | $ | (0.07 | ) | | $ | 0.61 | | | $ | 0.54 | | | $ | — | | | $ | (0.20 | ) | | $ | (0.20 | ) | | $ | — | | | |
8/31/14 | | | 13.30 | | | | (0.12 | ) | | | 2.02 | | | | 1.90 | | | | — | | | | (0.06 | ) | | | (0.06 | ) | | | — | 3 | | |
8/31/13 | | | 11.91 | | | | (0.14 | ) | | | 1.66 | | | | 1.52 | | | | — | | | | (0.13 | ) | | | (0.13 | ) | | | — | 3 | | |
8/31/12 | | | 10.60 | | | | (0.13 | ) | | | 1.53 | | | | 1.40 | | | | — | | | | (0.09 | ) | | | (0.09 | ) | | | — | 3 | | |
9/30/10** through 8/31/11 | | | 10.00 | | | | (0.12 | ) | | | 0.71 | | | | 0.59 | | | | — | | | | — | | | | — | | | | 0.01 | | | |
Investor Class | | | | | | | | | | | | | | | | | | | | | | | | | | | | | | | | | | |
9/1/14 through 2/28/15† | | $ | 15.00 | | | $ | (0.09 | ) | | $ | 0.57 | | | $ | 0.48 | | | $ | — | | | $ | (0.20 | ) | | $ | (0.20 | ) | | $ | — | | | |
8/31/14 | | | 13.21 | | | | (0.15 | ) | | | 2.00 | | | | 1.85 | | | | — | | | | (0.06 | ) | | | (0.06 | ) | | | — | 3 | | |
8/31/13 | | | 11.86 | | | | (0.18 | ) | | | 1.66 | | | | 1.48 | | | | — | | | | (0.13 | ) | | | (0.13 | ) | | | — | 3 | | |
8/31/12 | | | 10.58 | | | | (0.15 | ) | | | 1.52 | | | | 1.37 | | | | — | | | | (0.09 | ) | | | (0.09 | ) | | | — | 3 | | |
11/29/10** through 8/31/11 | | | 10.40 | | | | (0.12 | ) | | | 0.29 | | | | 0.17 | | | | — | | | | — | | | | — | | | | 0.01 | | | |
| * | Calculated based on average shares outstanding for the period. |
| 1 | Total return is calculated by assuming a purchase of shares on the first day and a sale of shares on the last day of the period and is not annualized if period is less than one year. |
| 2 | Redemption fees, if any, are reflected in total return calculations. |
| 3 | Amount is less than $0.005 per share. |
| 4 | Portfolio turnover rate excludes securities received from processing a subscription-in-kind. |
THEACCOMPANYINGNOTESAREANINTEGRALPARTOFTHEFINANCIALSTATEMENTS.
| | |
| 44 | | SEMI-ANNUAL REPORT 2015 |
| | |
| BOSTON PARTNERS INVESTMENT FUNDS | | |
| | |
FINANCIAL HIGHLIGHTS (continued) | | PER SHARE OPERATING PERFORMANCE |
| | | | | | | | | | | | | | | | | | | | | | | | | | | | | | | | |
| | | Net
Asset
Value,
End of
Period | | | Total
Investment
Return1,2 | | | Net
Assets,
End of
Period
(000) | | | Ratio of
Expenses to
Average Net
Assets With
Waivers,
Reimbursements
and Recoupments
if any | | | Ratio of
Expenses to
Average Net
Assets With
Waivers,
Reimbursements
and Recoupments
if any (Excluding
Dividend and
Interest Expense) | | | Ratio of
Expenses to
Average Net
Assets Without
Waivers,
Reimbursements
and Recoupments
if any | | | Ratio of Net
Investment
Income/(Loss)
to Average Net
Assets With
Waivers and
Reimbursements | | | Portfolio
Turnover
Rate | |
| | | | | | | | | | | | | | | | | | | | | | | | | | | | | | | | |
| | | | | | | | | | | | | | | | | | | | | | | | | | | | | | | | |
| | $ | 22.75 | | | | 2.43 | % | | $ | 148,399 | | | | 1.10 | %5 | | | N/A | | | | 1.18 | %5 | | | 0.92 | %5 | | | 8 | %6 |
| | | 22.65 | | | | 19.33 | | | | 102,112 | | | | 1.21 | | | | N/A | | | | 1.23 | | | | 0.68 | | | | 16 | |
| | | 19.06 | | | | 25.19 | | | | 76,442 | | | | 1.29 | | | | N/A | | | | 1.29 | | | | 0.53 | | | | 19 | |
| | | 15.31 | | | | 18.98 | | | | 53,604 | | | | 1.30 | | | | N/A | | | | 1.36 | | | | 0.37 | | | | 32 | |
| | | 12.92 | | | | 17.59 | | | | 30,172 | | | | 1.30 | | | | N/A | | | | 1.37 | | | | 0.22 | | | | 38 | |
| | | 11.02 | | | | 5.47 | | | | 25,736 | | | | 1.30 | | | | N/A | | | | 1.39 | | | | 0.51 | | | | 43 | |
| | | | | | | | | | | | | | | | | | | | | | | | | | | | | | | | |
| | $ | 21.89 | | | | 2.29 | % | | $ | 127,509 | | | | 1.35 | %5 | | | N/A | | | | 1.43 | %5 | | | 0.67 | %5 | | | 8 | %6 |
| | | 21.79 | | | | 19.01 | | | | 112,417 | | | | 1.46 | | | | N/A | | | | 1.48 | | | | 0.43 | | | | 16 | |
| | | 18.35 | | | | 24.90 | | | | 87,237 | | | | 1.54 | | | | N/A | | | | 1.54 | | | | 0.28 | | | | 19 | |
| | | 14.74 | | | | 18.67 | | | | 66,689 | | | | 1.55 | | | | N/A | | | | 1.61 | | | | 0.12 | | | | 32 | |
| | | 12.44 | | | | 17.28 | | | | 70,490 | | | | 1.55 | | | | N/A | | | | 1.62 | | | | (0.03 | ) | | | 38 | |
| | | | 10.62 | | | | 5.26 | | | | 61,260 | | | | 1.55 | | | | N/A | | | | 1.63 | | | | 0.25 | | | | 43 | |
| | | | | | | | | | | | | | | | | |
| | | | | | | | | | | | | | | | | | | | | | | | | | | | | | | | |
| | $ | 18.91 | | | | (8.93 | )% | | $ | 612,055 | | | | 5.28 | %5 | | | 2.38 | %5 | | | 5.28 | %5 | | | (4.05 | )%5 | | | 37 | %6 |
| | | 22.65 | | | | 14.72 | | | | 676,756 | | | | 4.33 | | | | 2.42 | | | | 4.33 | | | | (2.93 | ) | | | 65 | |
| | | 20.94 | | | | 8.61 | | | | 620,804 | | | | 4.30 | | | | 2.43 | | | | 4.30 | | | | (2.58 | ) | | | 67 | |
| | | 20.47 | | | | 14.16 | | | | 505,108 | | | | 4.29 | | | | 2.48 | | | | 4.29 | | | | (2.68 | ) | | | 71 | |
| | | 19.88 | | | | 23.66 | | | | 344,935 | | | | 3.70 | | | | 2.47 | | | | 3.71 | | | | (2.35 | ) | | | 103 | |
| | | 17.41 | | | | 10.54 | | | | 164,438 | | | | 3.40 | | | | 2.50 | | | | 3.46 | | | | (2.10 | ) | | | 81 | |
| | | | | | | | | | | | | | | | | | | | | | | | | | | | | | | | |
| | $ | 17.69 | | | | (9.06 | )% | | $ | 139,715 | | | | 5.53 | %5 | | | 2.63 | %5 | | | 5.53 | %5 | | | (4.30 | )%5 | | | 37 | %6 |
| | | 21.33 | | | | 14.41 | | | | 211,372 | | | | 4.57 | | | | 2.66 | | | | 4.57 | | | | (3.18 | ) | | | 65 | |
| | | 19.84 | | | | 8.30 | | | | 220,307 | | | | 4.55 | | | | 2.68 | | | | 4.55 | | | | (2.83 | ) | | | 67 | |
| | | 19.51 | | | | 13.90 | | | | 170,834 | | | | 4.54 | | | | 2.73 | | | | 4.54 | | | | (2.93 | ) | | | 71 | |
| | | 19.08 | | | | 23.37 | | | | 128,184 | | | | 3.95 | | | | 2.72 | | | | 3.96 | | | | (2.60 | ) | | | 103 | |
| | | | 16.80 | | | | 9.73 | | | | 82,088 | | | | 3.65 | | | | 2.75 | | | | 3.70 | | | | (2.35 | ) | | | 81 | |
| | | | | | | | | | | | | | | | | |
| | | | | | | | | | | | | | | | | | | | | | | | | | | | | | | | |
| | $ | 15.48 | | | | 3.53 | % | | $ | 6,039,896 | | | | 2.35 | %5 | | | 1.38 | %5 | | | 2.35 | %5 | | | (0.98 | )%5 | | | 32 | %6 |
| | | 15.14 | | | | 14.28 | | | | 5,054,388 | | | | 2.52 | | | | 1.39 | | | | 2.52 | | | | (0.81 | ) | | | 57 | |
| | | 13.30 | | | | 12.81 | | | | 1,743,406 | | | | 2.75 | | | | 1.48 | | | | 2.71 | | | | (1.09 | ) | | | 65 | |
| | | 11.91 | | | | 13.32 | | | | 254,170 | | | | 2.81 | | | | 1.54 | | | | 2.84 | | | | (1.12 | ) | | | 53 | 4 |
| | | 10.60 | | | | 6.00 | | | | 37,237 | | | | 2.70 | 5 | | | 1.74 | 5 | | | 4.05 | 5 | | | (1.21 | )5 | | | 61 | 6 |
| | | | | | | | | | | | | | | | | | | | | | | | | | | | | | | | |
| | $ | 15.28 | | | | 3.43 | % | | $ | 243,740 | | | | 2.59 | %5 | | | 1.62 | %5 | | | 2.59 | %5 | | | (1.22 | )%5 | | | 32 | %6 |
| | | 15.00 | | | | 13.99 | | | | 294,249 | | | | 2.77 | | | | 1.64 | | | | 2.77 | | | | (1.06 | ) | | | 57 | |
| | | 13.21 | | | | 12.52 | | | | 132,511 | | | | 3.05 | | | | 1.73 | | | | 3.01 | | | | (1.39 | ) | | | 65 | |
| | | 11.86 | | | | 13.06 | | | | 48,296 | | | | 3.00 | | | | 1.79 | | | | 3.04 | | | | (1.31 | ) | | | 53 | 4 |
| | | | 10.58 | | | | 1.73 | | | | 20,308 | | | | 2.99 | 5 | | | 1.98 | 5 | | | 4.08 | 5 | | | (1.47 | )5 | | | 61 | 6 |
THEACCOMPANYINGNOTESAREANINTEGRALPARTOFTHEFINANCIALSTATEMENTS.
| | | | |
| SEMI-ANNUAL REPORT 2015 | | | 45 | |
| | |
| BOSTON PARTNERS INVESTMENT FUNDS | | |
| | |
FINANCIAL HIGHLIGHTS (continued) | | PER SHARE OPERATING PERFORMANCE |
Contained below is per share operating performance data for each class of shares outstanding, total investment return, ratios to average net assets and other supplemental data for the respective periods. This information has been derived from information provided in the financial statements.
| | | | | | | | | | | | | | | | | | | | | | | | | | | | | | | | | | |
| | | Net Asset
Value,
Beginning
of Period | | | Net
Investment
Income/(Loss)* | | | Net Realized
and Unrealized
Gain/(Loss) on
Investments | | | Net
Increase/
(Decrease)
in Net Assets
Resulting
from
Operations | | | Dividends to
Shareholders
from Net
Investment
Income | | | Distributions to
Shareholders
from Net
Realized Gains | | | Total
Dividend and
Distributions
to Shareholders | | | Redemption Fees* | | | |
| Boston Partners All-Cap Value Fund | | | | | | | | | | | | | | | | | | | | | | | | | | | |
Institutional Class | | | | | | | | | | | | | | | | | | | | | | | | | | | | | | | | | | |
9/1/14 through 2/28/15† | | $ | 23.00 | | | $ | 0.11 | | | $ | 1.15 | | | $ | 1.26 | | | $ | (0.22 | ) | | $ | (0.92 | ) | | $ | (1.14 | ) | | $ | — | | | |
8/31/14 | | | 19.19 | | | | 0.22 | | | | 4.39 | | | | 4.61 | | | | (0.18 | ) | | | (0.62 | ) | | | (0.80 | ) | | | — | | | |
8/31/13 | | | 15.57 | | | | 0.24 | | | | 3.75 | | | | 3.99 | | | | (0.27 | ) | | | (0.10 | ) | | | (0.37 | ) | | | — | | | |
8/31/12 | | | 14.34 | | | | 0.20 | | | | 2.04 | | | | 2.24 | | | | (0.12 | ) | | | (0.89 | ) | | | (1.01 | ) | | | — | | | |
8/31/11 | | | 12.85 | | | | 0.15 | | | | 1.63 | | | | 1.78 | | | | (0.10 | ) | | | (0.19 | ) | | | (0.29 | ) | | | — | | | |
8/31/10 | | | 12.56 | | | | 0.10 | | | | 0.32 | | | | 0.42 | | | | (0.13 | ) | | | — | | | | (0.13 | ) | | | — | | | |
Investor Class | | | | | | | | | | | | | | | | | | | | | | | | | | | | | | | | | | |
9/1/14 through 2/28/15† | | $ | 22.90 | | | $ | 0.08 | | | $ | 1.14 | | | $ | 1.22 | | | $ | (0.17 | ) | | $ | (0.92 | ) | | $ | (1.09 | ) | | $ | — | | | |
8/31/14 | | | 19.12 | | | | 0.17 | | | | 4.38 | | | | 4.55 | | | | (0.15 | ) | | | (0.62 | ) | | | (0.77 | ) | | | — | | | |
8/31/13 | | | 15.50 | | | | 0.20 | | | | 3.75 | | | | 3.95 | | | | (0.23 | ) | | | (0.10 | ) | | | (0.33 | ) | | | — | | | |
8/31/12 | | | 14.28 | | | | 0.16 | | | | 2.03 | | | | 2.19 | | | | (0.08 | ) | | | (0.89 | ) | | | (0.97 | ) | | | — | | | |
8/31/11 | | | 12.79 | | | | 0.11 | | | | 1.63 | | | | 1.74 | | | | (0.06 | ) | | | (0.19 | ) | | | (0.25 | ) | | | — | | | |
8/31/10 | | | 12.52 | | | | 0.07 | | | | 0.31 | | | | 0.38 | | | | (0.11 | ) | | | — | | | | (0.11 | ) | | | — | | | |
| WPG Partners Small/Micro Cap Value Fund | | | | | | | | | | | | | | | | | | | | | | | | | | | |
Institutional Class | | | | | | | | | | | | | | | | | | | | | | | | | | | | | | | | | | |
9/1/14 through 2/28/15† | | $ | 20.42 | | | $ | 0.09 | | | $ | (1.20 | ) | | $ | (1.11 | ) | | $ | (0.13 | ) | | $ | (2.18 | ) | | $ | (2.31 | ) | | $ | — | | | |
8/31/14 | | | 19.06 | | | | 0.07 | | | | 3.16 | | | | 3.23 | | | | (0.02 | ) | | | (1.85 | ) | | | (1.87 | ) | | | — | | | |
8/31/13 | | | 14.32 | | | | 0.07 | | | | 4.74 | | | | 4.81 | | | | (0.07 | ) | | | — | | | | (0.07 | ) | | | — | | | |
8/31/12 | | | 12.31 | | | | (0.05 | ) | | | 2.06 | | | | 2.01 | | | | — | | | | — | | | | — | | | | — | 3 | | |
8/31/11 | | | 11.65 | | | | (0.06 | ) | | | 0.72 | | | | 0.66 | | | | — | | | | — | | | | — | | | | — | | | |
8/31/10 | | | 10.57 | | | | (0.05 | ) | | | 1.16 | | | | 1.11 | | | | (0.03 | ) | | | — | | | | (0.03 | ) | | | — | 3 | | |
| Boston Partners Global Equity Fund | | | | | | | | | | | | | | | | | | | | | | | | | | | |
Institutional Class | | | | | | | | | | | | | | | | | | | | | | | | | | | | | | | | | | |
9/1/14 through 2/28/15† | | $ | 15.59 | | | $ | 0.03 | | | $ | 0.40 | | | $ | 0.43 | | | $ | (0.14 | ) | | $ | (0.52 | ) | | $ | (0.66 | ) | | $ | — | | | |
8/31/14 | | | 12.97 | | | | 0.18 | | | | 2.82 | | | | 3.00 | | | | (0.02 | ) | | | (0.36 | ) | | | (0.38 | ) | | | — | | | |
8/31/13 | | | 11.00 | | | | 0.12 | | | | 2.07 | | | | 2.19 | | | | (0.13 | ) | | | (0.09 | ) | | | (0.22 | ) | | | — | | | |
12/30/11** through 8/31/12 | | | 10.00 | | | | 0.10 | | | | 0.90 | | | | 1.00 | | | | — | | | | — | | | | — | | | | — | | | |
| Boston Partners Global Long/Short Fund | | | | | | | | | | | | | | | | | | | | | | | | | | | |
Institutional Class | | | | | | | | | | | | | | | | | | | | | | | | | | | | | | | | | | |
9/1/14 through 2/28/15† | | $ | 10.30 | | | $ | (0.07 | ) | | $ | 0.18 | | | $ | 0.11 | | | $ | — | | | $ | — | | | $ | — | | | $ | — | | | |
12/31/13** through 8/31/14 | | | 10.00 | | | | (0.14 | ) | | | 0.44 | | | | 0.30 | | | | — | | | | — | | | | — | | | | — | 3 | | |
Investor Class | | | | | | | | | | | | | | | | | | | | | | | | | | | | | | | | | | |
9/1/14 through 2/28/15† | | $ | 10.29 | | | $ | (0.08 | ) | | $ | 0.18 | | | $ | 0.10 | | | $ | — | | | $ | — | | | $ | — | | | $ | — | | | |
4/11/14** through 8/31/14 | | | 9.86 | | | | (0.09 | ) | | | 0.52 | | | | 0.43 | | | | — | | | | — | | | | — | | | | — | 3 | | |
| * | Calculated based on average shares outstanding, unless otherwise noted. |
| 1 | Total return is calculated by assuming a purchase of shares on the first day and a sale of shares on the last day of the period and is not annualized if period is less than one year. |
| 2 | Redemption fees, if any, are reflected in total return calculations. |
| 3 | Amount is less than $0.005. |
THEACCOMPANYINGNOTESAREANINTEGRALPARTOFTHEFINANCIALSTATEMENTS.
| | |
| 46 | | SEMI-ANNUAL REPORT 2015 |
| | |
| BOSTON PARTNERS INVESTMENT FUNDS | | |
| | |
FINANCIAL HIGHLIGHTS (concluded) | | PER SHARE OPERATING PERFORMANCE |
| | | | | | | | | | | | | | | | | | | | | | | | | | | | | | | | |
| | | Net
Asset
Value,
End of
Period | | | Total
Investment
Return1,2 | | | Net
Assets,
End of
Period
(000) | | | Ratio of
Expenses to
Average Net
Assets With
Waivers and
Reimbursements | | | Ratio of
Expenses to
Average Net
Assets With
Waivers,
Reimbursements
and Recoupments
if any (Excluding
Dividend and
Interest Expense) | | | Ratio of
Expenses to
Average Net
Assets Without
Waivers and Reimbursements | | | Ratio of Net
Investment
Income/(Loss)
to Average Net
Assets With
Waivers and
Reimbursements | | | Portfolio
Turnover
Rate | |
| | | | | | | | | | | | | | | | | | | | | | | | | | | | | | | | |
| | | | | | | | | | | | | | | | | | | | | | | | | | | | | | | | |
| | $ | 23.12 | | | | 5.63 | % | | $ | 784,511 | | | | 0.70 | %4 | | | N/A | | | | 0.92 | %4 | | | 0.94 | %4 | | | 18 | %5 |
| | | 23.00 | | | | 24.52 | | | | 736,475 | | | | 0.70 | | | | N/A | | | | 0.94 | | | | 1.05 | | | | 26 | |
| | | 19.19 | | | | 26.11 | | | | 441,856 | | | | 0.70 | | | | N/A | | | | 0.97 | | | | 1.37 | | | | 32 | |
| | | 15.57 | | | | 16.73 | | | | 343,885 | | | | 0.70 | | | | N/A | | | | 1.03 | | | | 1.38 | | | | 33 | |
| | | 14.34 | | | | 13.75 | | | | 210,113 | | | | 0.70 | | | | N/A | | | | 1.03 | | | | 1.00 | | | | 47 | |
| | | 12.85 | | | | 3.31 | | | | 112,437 | | | | 0.80 | | | | N/A | | | | 1.15 | | | | 0.75 | | | | 48 | |
| | | | | | | | | | | | | | | | | | | | | | | | | |
| | $ | 23.03 | | | | 5.46 | % | | $ | 223,153 | | | | 0.95 | %4 | | | N/A | | | | 1.17 | %4 | | | 0.69 | %4 | | | 18 | %5 |
| | | 22.90 | | | | 24.29 | | | | 217,590 | | | | 0.95 | | | | N/A | | | | 1.20 | | | | 0.80 | | | | 26 | |
| | | 19.12 | | | | 25.93 | | | | 77,936 | | | | 0.95 | | | | N/A | | | | 1.22 | | | | 1.12 | | | | 32 | |
| | | 15.50 | | | | 16.44 | | | | 25,189 | | | | 0.95 | | | | N/A | | | | 1.28 | | | | 1.13 | | | | 33 | |
| | | 14.28 | | | | 13.55 | | | | 26,436 | | | | 0.95 | | | | N/A | | | | 1.28 | | | | 0.75 | | | | 47 | |
| | | | 12.79 | | | | 3.01 | | | | 13,016 | | | | 1.03 | | | | N/A | | | | 1.39 | | | | 0.55 | | | | 48 | |
| | | | | | | | | | | | | | | | | | | | | | | | | | | | | | | | |
| | | | | | | | | | | | | | | | | | | | | | | | | | | | | | | | |
| | $ | 17.00 | | | | (5.07 | )% | | $ | 42,613 | | | | 1.10 | %4 | | | N/A | | | | 1.37 | %4 | | | 0.99 | %4 | | | 37 | %5 |
| | | 20.42 | | | | 17.46 | | | | 46,008 | | | | 1.36 | | | | N/A | | | | 1.42 | | | | 0.35 | | | | 75 | |
| | | 19.06 | | | | 33.71 | | | | 40,754 | | | | 1.54 | | | | N/A | | | | 1.54 | | | | 0.41 | | | | 72 | |
| | | 14.32 | | | | 16.33 | | | | 37,367 | | | | 1.70 | | | | N/A | | | | 1.70 | | | | (0.34 | ) | | | 84 | |
| | | 12.31 | | | | 5.67 | | | | 33,238 | | | | 1.67 | | | | N/A | | | | 1.72 | | | | (0.43 | ) | | | 85 | |
| | | | 11.65 | | | | 10.54 | | | | 32,394 | | | | 1.69 | | | | N/A | | | | 1.77 | | | | (0.39 | ) | | | 94 | |
| | | | | | | | | | | | | | | | | | | | | | | | | | | | | | | | |
| | | | | | | | | | | | | | | | | | | | | | | | | | | | | | | | |
| | $ | 15.36 | | | | 2.94 | % | | $ | 80,208 | | | | 0.95 | %4 | | | N/A | | | | 1.40 | %4 | | | 0.40 | %4 | | | 46 | %5 |
| | | 15.59 | | | | 23.39 | | | | 60,087 | | | | 0.96 | | | | N/A | | | | 1.39 | | | | 1.20 | | | | 136 | |
| | | 12.97 | | | | 20.14 | | | | 11,496 | | | | 1.30 | | | | N/A | | | | 3.05 | | | | 1.00 | | | | 102 | |
| | | | 11.00 | | | | 10.00 | 5 | | | 11,234 | | | | 1.30 | 4 | | | N/A | | | | 3.56 | 4 | | | 1.39 | 4 | | | 83 | 5 |
| | | | | | | | | | | | | | | | | | | | | | | | | | | | | | | | |
| | | | | | | | | | | | | | | | | | | | | | | | | | | | | | | | |
| | $ | 10.41 | | | | 1.07 | % | | $ | 150,899 | | | | 2.78 | %4 | | | 1.98 | %4 | | | 2.80 | %4 | | | (1.48 | %)4 | | | 53 | %5 |
| | | 10.30 | | | | 3.00 | | | | 37,403 | | | | 3.88 | 4 | | | 2.00 | 4 | | | 4.89 | 4 | | | (2.04 | )4 | | | 72 | 5 |
| | | | | | | | | | | | | | | | | | | | | | | | | | | | | | | | |
| | $ | 10.39 | | | | 0.97 | % | | $ | 10,695 | | | | 3.03 | %4 | | | 2.23 | %4 | | | 3.05 | %4 | | | (1.73 | %)4 | | | 53 | %5 |
| | | | 10.29 | | | | 4.36 | | | | 2,841 | | | | 4.12 | 4 | | | 2.25 | 4 | | | 4.44 | 4 | | | (2.28 | )4 | | | 72 | 5 |
THEACCOMPANYINGNOTESAREANINTEGRALPARTOFTHEFINANCIALSTATEMENTS.
| | | | |
| SEMI-ANNUAL REPORT 2015 | | | 47 | |
| | |
| BOSTON PARTNERS INVESTMENT FUNDS | | |
| | |
NOTES TO FINANCIAL STATEMENTS (unaudited) | | |
| 1. | Organization and Significant Accounting Policies |
The RBB Fund, Inc. (“RBB” or the “Company”) was incorporated under the laws of the State of Maryland on February 29, 1988 and is registered under the Investment Company Act of 1940, as amended (the “1940 Act”), as an open-end management investment company. RBB is a “series trust,” which is a mutual fund divided into separate portfolios. Each portfolio is treated as a separate entity for certain matters under the 1940 Act, and for other purposes, and a shareholder of one portfolio is not deemed to be a shareholder of any other portfolio. Currently, RBB has twenty-two active investment portfolios, including Boston Partners Small Cap Value Fund II (“BP Small Cap Value Fund II”), Boston Partners Long/Short Equity Fund (“BP Long/Short Equity Fund”), Boston Partners Long/Short Research Fund (“BP Long/Short Research Fund”), Boston Partners All-Cap Value Fund (“BP All-Cap Value Fund”), Boston Partners Global Equity Fund (“BP Global Equity Fund”), Boston Partners Global Long/Short Fund (“BP Global Long/Short Fund”) (collectively “BP Funds”), and WPG Partners Small/Micro Cap Value Fund (“WPG Small/Micro Cap Value Fund” and, collectively with the BP Funds, the “Funds”). As of February 28, 2015, the BP Funds each offer two classes of shares, Institutional Class and Investor Class. As of February 28, 2015, Investor Class shares of the BP Global Equity Fund have not been issued. The WPG Small/Micro Cap Value Fund is a single class fund, offering only the Institutional Class of shares.
RBB has authorized capital of one hundred billion shares of common stock of which 82.373 billion shares are currently classified into one hundred and fifty-three classes of common stock. Each class represents an interest in an active or inactive RBB investment portfolio.
Portfolio Valuation — Each Fund’s net asset value (“NAV”) is calculated once daily at the close of regular trading hours on the New York Stock Exchange (“NYSE”) (generally 4:00 p.m. Eastern time) on each day the NYSE is open. Securities held by a Fund are valued using the closing price or the last sale price on a national securities exchange or the National Association of Securities Dealers Automatic Quotation System (“NASDAQ”) market system where they are primarily traded. Equity securities traded in the over-the-counter (“OTC”) market are valued at their closing prices. If there were no transactions on that day, securities traded principally on an exchange or on NASDAQ will be valued at the mean of the last bid and ask prices prior to the market close. Fixed income securities having a remaining maturity of greater than 60 days are valued using an independent pricing service, which considers such factors as security prices, yields, maturities and ratings, and are deemed representative of market values at the close of the market. Fixed income securities having a remaining maturity of 60 days or less are valued at amortized cost which approximates market value. Foreign securities are valued based on prices from the primary market in which they are traded, and are translated from the local currency into U.S. dollars using current exchange rates. Investments in other open-end investment companies are valued based on the NAV of the investment companies (which may use fair value pricing as disclosed in their prospectuses). Options for which the primary market is a national securities exchange are valued at the last sale price on the exchange on which they are traded, or, in the absence of any sale, will be valued at the mean of the last bid and ask prices prior to the market close. Options not traded on a national securities exchange are valued at the last quoted bid price for long option positions and the closing ask price for short option positions. If market quotations are unavailable or deemed unreliable, securities will be valued in accordance with procedures adopted by the Company’s Board of Directors. Relying on prices supplied by pricing services or dealers or using fair valuation may result in values that are higher or lower than the values used by other investment companies and investors to price the same investments. Such procedures use fundamental valuation methods, which may include, but are not limited to, an analysis of the effect of any restrictions on the resale of the security, industry analysis and trends, significant changes in the issuer’s financial position, and any other event which could have a significant impact on the value of the security. Determination of fair value involves subjective judgment as the actual market value of a particular security can be established only by negotiations between the parties in a sales transaction, and the difference between the recorded fair value and the value that would be received in a sale could be significant. The Funds may use fair value pricing more frequently for securities traded primarily in non-U.S. markets because, among other things, most foreign markets close well before the Funds value their securities, generally as of 4:00 p.m. Eastern time. The earlier close of these foreign markets gives rise to the possibility that significant events, including broad market moves, government actions or pronouncements, aftermarket trading, or news events may have occurred in the interim. To account for this, the Funds may value foreign securities using fair value prices based on third-party vendor modeling tools (international fair value pricing).
| | |
| 48 | | SEMI-ANNUAL REPORT 2015 |
| | |
| BOSTON PARTNERS INVESTMENT FUNDS | | |
| | |
NOTES TO FINANCIAL STATEMENTS (unaudited) (continued) | | |
Fair Value Measurements — The inputs and valuation techniques used to measure fair value of the Funds’ investments are summarized into three levels as described in the hierarchy below:
| | |
| • Level 1 — | | quoted prices in active markets for identical securities; |
| |
| • Level 2 — | | other significant observable inputs (including quoted prices for similar securities, interest rates, prepayment speeds, credit risk, etc.); and |
| |
| • Level 3 — | | significant unobservable inputs (including the Funds’ own assumptions in determining the fair value of investments). |
The inputs or methodology used for valuing securities are not necessarily an indication of the risk associated with investing in those securities.
A summary of the inputs used to value each Fund’s investments as of February 28, 2015 is included in each Fund’s Portfolio of Investments.
At the end of each quarter, management evaluates the classification of Levels 1, 2 and 3 assets and liabilities. Various factors are considered, such as changes in liquidity from the prior reporting period; whether or not a broker is willing to execute at the quoted price; the depth and consistency of prices from third party pricing services; and the existence of contemporaneous, observable trades in the market. Additionally, management evaluates the classification of Level 1 and Level 2 assets and liabilities on a quarterly basis for changes in listings or delistings on national exchanges.
Due to the inherent uncertainty of determining the fair value of investments that do not have a readily available market value, the fair value of the Funds’ investments may fluctuate from period to period. Additionally, the fair value of investments may differ significantly from the values that would have been used had a ready market existed for such investments and may differ materially from the values the Funds may ultimately realize. Further, such investments may be subject to legal and other restrictions on resale or otherwise less liquid than publicly traded securities.
For fair valuations using significant unobservable inputs, U.S. generally accepted accounting principles (“U.S. GAAP”) require the Funds to present a reconciliation of the beginning to ending balances for reported market values that presents changes attributable to total realized and unrealized gains or losses, purchase and sales, and transfers in and out of Level 3 during the period. Transfers in and out between levels are based on values at the end of the period. U.S. GAAP also requires the Funds to disclose amounts and reasons for all transfers in and out of Level 1 and Level 2 fair value measurements. A reconciliation of Level 3 investments is presented only when a Fund had an amount of Level 3 investments at the end of the reporting period that was meaningful in relation to its net assets. The amounts and reasons for all transfers in and out of each level within the three-tier hierarchy are disclosed when a Fund had an amount of total transfers during the reporting period that was meaningful in relation to its net assets as of the end of the reporting period.
Foreign securities that utilize international fair pricing are categorized as Level 2 in the hierarchy. For the BP Long/Short Equity Fund, BP Long/Short Research Fund, BP Global Equity Fund and BP Global Long/Short Fund, securities with an end of period value of $1,313,202, $17,997,389, $430,358 and $555,939, respectively, transferred from Level 1 into Level 2. This transfer occurred as a result of this security being valued utilizing the international fair value pricing at February 28, 2015. For the BP Long/Short Equity Fund, BP Long/Short Research Fund, BP Global Equity Fund and BP Global Long/Short Fund, securities with an end of period value of $1,674,965, $16,055,088, $800,132 and $759,334, respectively, transferred from Level 2 into Level 1. These transfers occurred as a result of these securities no longer being valued utilizing the international fair value pricing at February 28, 2015.
Use of Estimates — The Funds are investment companies and, accordingly, follow the investment company accounting and reporting guidance under U.S. GAAP. The preparation of financial statements in conformity U.S. GAAP requires management to make estimates and assumptions that affect the reported amounts of assets and liabilities and disclosure of contingent assets and liabilities at the date of the financial statements and the reported amounts of revenues and expenses during the period. Actual results could differ from those estimates and those differences could be significant.
Investment Transactions, Investment Income and Expenses — The Funds record security transactions based on trade date for financial report purposes. The cost of investments sold is determined by use of the specific identification method for both financial reporting and income tax purposes in determining realized gains and losses on investments. Interest income is accrued when earned. Dividend income is recorded on the ex-dividend date. Distributions received on securities that represent a return of capital or capital gains are recorded as a reduction of cost of investments and/or as a realized
| | | | |
| SEMI-ANNUAL REPORT 2015 | | | 49 | |
| | |
| BOSTON PARTNERS INVESTMENT FUNDS | | |
| | |
NOTES TO FINANCIAL STATEMENTS (unaudited) (continued) | | |
gain. The Funds’ investment income, expenses (other than class specific distribution fees) and unrealized and realized gains and losses are allocated daily to each class of shares based upon the relative proportion of net assets of each class at the beginning of the day. Expenses incurred on behalf of a specific class, fund or fund family of the Company are charged directly to the class, fund or fund family (in proportion to net assets). Expenses incurred for all of the RBB funds (such as director or professional fees) are charged to all funds in proportion to their average net assets of RBB, or in such other manner as the Company’s Board of Directors deems fair or equitable. Expenses and fees, including investment advisory and administration fees, are accrued daily and taken into account for the purpose of determining the NAV of the Funds.
Dividends and Distributions to Shareholders — Dividends from net investment income and distributions from net realized capital gains, if any, are declared and paid at least annually to shareholders and recorded on ex-dividend date for all Funds. Income dividends and capital gain distributions are determined in accordance with U.S. federal income tax regulations which may differ from U.S. GAAP.
U.S. Tax Status — No provision is made for U.S. income taxes as it is each Fund’s intention to qualify for and elect the tax treatment applicable to regulated investment companies under Subchapter M of the Internal Revenue Code of 1986, as amended, and make the requisite distributions to its shareholders which will be sufficient to relieve it from U.S. income and excise taxes.
Cash and Cash Equivalents — The Funds consider liquid assets deposited into a bank demand deposit account to be cash equivalents. These investments represent amounts held with financial institutions that are readily accessible to pay Fund expenses or purchase investments. Cash and cash equivalents are valued at cost plus accrued interest, which approximates market value.
Other — In the normal course of business, the Funds may enter into contracts that provide general indemnifications. The Funds’ maximum exposure under these arrangements is dependent on claims that may be made against the Funds in the future, and, therefore, cannot be estimated; however, based on experience, the risk of material loss from such claims is considered remote.
Foreign Currency Translation — Assets and liabilities initially expressed in non-U.S. currencies are translated into U.S. dollars based on the applicable exchange rates at the date of the last business day of the financial statement period. Purchases and sales of securities, interest income, dividends, variation margin received and expenses denominated in foreign currencies are translated into U.S. dollars at the exchange rates in effect on the transaction date.
The Funds do not separately report the effect of changes in foreign exchange rates from changes in market prices of securities held. Such changes are included with the net realized gain or loss and change in unrealized appreciation or depreciation on investment securities in the Statement of Operations. Other foreign currency transactions resulting in realized and unrealized gain or loss are reported separately as net realized gain or loss and change in unrealized appreciation or depreciation on foreign currencies in the Statement of Operations.
Currency Risk — The Funds invest in securities of foreign issuers, including American Depositary Receipts. These markets are subject to special risks associated with foreign investments not typically associated with investing in U.S. markets. Because the foreign securities in which the Funds may invest generally trade in currencies other than the U.S. dollar, changes in currency exchange rates will affect the Funds’ NAV, the value of dividends and interest earned and gains and losses realized on the sale of securities. Because the NAV for the Funds are determined on the basis of U.S. dollars, the Funds may lose money by investing in a foreign security if the local currency of a foreign market depreciates against the U.S. dollar, even if the local currency value of the Funds’ holdings goes up. Generally, a strong U.S. dollar relative to these other currencies will adversely affect the value of the Funds’ holdings in foreign securities.
Foreign Securities Market Risk — Securities of many non-U.S. companies may be less liquid and their prices more volatile than securities of comparable U.S. companies. Securities of companies traded in many countries outside the U.S., particularly emerging markets countries, may be subject to further risks due to the inexperience of local investment professionals and financial institutions, the possibility of permanent or temporary termination of trading and greater spreads between bid and asked prices of securities. In addition, non-U.S. stock exchanges and investment professionals are subject to less governmental regulation, and commissions may be higher than in the United States. Also, there may be delays in the settlement of non-U.S. stock exchange transactions.
| | |
| 50 | | SEMI-ANNUAL REPORT 2015 |
| | |
| BOSTON PARTNERS INVESTMENT FUNDS | | |
| | |
NOTES TO FINANCIAL STATEMENTS (unaudited) (continued) | | |
Options Written — The Funds are subject to equity price risk in the normal course of pursuing their investment objectives and may enter into options written to hedge against changes in the value of equities. Such options may relate to particular securities or domestic stock indices, and may or may not be listed on a domestic securities exchange or issued by the Options Clearing Corporation. An option contract is a commitment that gives the purchaser of the contract the right, but not the obligation, to buy or sell an underlying asset at a specific price on or before a specified future date. On the other hand, the writer of an option contract is obligated, upon the exercise of the option, to buy or sell an underlying asset at a specific price on or before a specified future date. The maximum risk of loss associated with writing put options is limited to the exercised fair value of the option contract. The maximum risk of loss associated with writing call options is potentially unlimited. A Fund also has the additional risk of being unable to enter into a closing transaction at an acceptable price if a liquid secondary market does not exist. A Fund also may write OTC options where completing the obligation depends upon the credit standing of the other party. Option contracts also involve the risk that they may result in loss due to unanticipated developments in market conditions or other causes.
Written options are initially recorded as liabilities to the extent of premiums received and subsequently marked to market to reflect the current value of the option written. Gains or losses are realized when the option transaction expires or closes. When an option is exercised, the proceeds on sales for a written call option or the purchase cost for a written put option is adjusted by the amount of the premium received. Listed option contracts present minimal counterparty credit risk since they are exchange traded and the exchange’s clearinghouse, as counterparty to all exchange-traded options, guarantees the options against default. A Fund’s maximum risk of loss from counterparty credit risk related to OTC option contracts is limited to the premium paid. As of February 28, 2015, all of each Fund’s written options were exchange-traded options.
The BP Long/Short Equity Fund, the BP Long/Short Research Fund, the BP All-Cap Value Fund and the BP Global Long Short Fund had transactions in options written during the six month period ended February 28, 2015 as follows:
| | | | | | | | | | | | | | | | | | | | | | | | | | | | | | | | |
| | | BP Long/Short Equity Fund | | | BP Long/Short Research Fund | | | BP All-Cap Value Fund | | | BP Global Long/Short Fund | |
| | | Number of
Contracts | | | Premiums
Received | | | Number of
Contracts | | | Premiums
Received | | | Number of
Contracts | | | Premiums
Received | | | Number of
Contracts | | | Premiums
Received | |
Options outstanding at August 31, 2014 | | | 355 | | | $ | 326,590 | | | | 5,378 | | | $ | 3,161,737 | | | | 2,123 | | | $ | 743,607 | | | | — | | | $ | — | |
Options written | | | 1,316 | | | | 1,016,312 | | | | 31,403 | | | | 15,811,183 | | | | 93 | | | | 546,687 | | | | 173 | | | | 91,153 | |
Options closed | | | — | | | | — | | | | (13,265 | ) | | | (6,405,796 | ) | | | — | | | | — | | | | — | | | | — | |
Options expired | | | (343 | ) | | | (315,724 | ) | | | (3,082 | ) | | | (1,667,185 | ) | | | (849 | ) | | | (212,360 | ) | | | — | | | | — | |
Options exercised | | | (12 | ) | | | (10,866 | ) | | | (1,010 | ) | | | (882,025 | ) | | | (1,274 | ) | | | (531,246 | ) | | | (80 | ) | | | (13,596 | ) |
| | | | | | | | | | | | | | | | | | | | | | | | | | | | | | | | |
Options outstanding at February 28, 2015 | | | 1,316 | | | $ | 1,016,312 | | | | 19,424 | | | $ | 10,017,914 | | | | 93 | | | $ | 546,688 | | | | 93 | | | $ | 77,557 | |
| | | | | | | | | | | | | | | | | | | | | | | | | | | | | | | | |
For the six month period ended February 28, 2015, the average volume of derivatives was as follows:
| | | | | | | | |
Fund | | PURCHASED
OPTIONS
(COST) | | | WRITTEN
OPTIONS
(PROCEEDS) | |
BP Long/Short Equity Fund | | $ | 1,319,318 | | | $ | 772,700 | |
BP Long/Short Research Fund | | | — | | | | 6,184,677 | |
BP All-Cap Value Fund | | | — | | | | 677,967 | |
BP Global Long/Short Fund | | | — | | | | 30,385 | |
Short Sales — When the investment adviser believes that a security is overvalued, the BP Long/Short Equity Fund, the BP Long/Short Research Fund and the BP Global Long/Short Fund may sell the security short by borrowing the same security from a broker or other institution and selling the security. A Fund will incur a loss as a result of a short sale if the price of the borrowed security increases between the date of the short sale and the date on which the Fund buys and replaces such borrowed security. A Fund will realize a gain if there is a decline in price of the security between those dates where the decline in price exceeds the costs of borrowing the security and other transaction costs. There can be no assurance that a Fund will be able to close out a short position at any particular time or at an acceptable price. Although a Fund’s gain is limited to the amount at which it sold a security short, its potential loss is unlimited. Until a Fund replaces a borrowed security, it will maintain at all times cash, U.S. Government securities, or other liquid securities in an amount which, when added to any amount deposited with a broker as collateral, will at least equal the current market value of the security sold short. Depending on arrangements made with brokers, a Fund may not receive any payments (including interest) on collateral deposited with them.
In accordance with the terms of its prime brokerage agreements, a Fund may receive rebate income or be charged a fee on borrowed securities. Such income or fee is calculated on a daily basis based upon the market value of each borrowed security and a variable rate that is dependent upon the availability of such security. The Funds record these prime broker
| | | | |
| SEMI-ANNUAL REPORT 2015 | | | 51 | |
| | |
| BOSTON PARTNERS INVESTMENT FUNDS | | |
| | |
NOTES TO FINANCIAL STATEMENTS (unaudited) (continued) | | |
charges on a net basis as interest income or interest expense. For the six month period ended February 28, 2015, the BP Long/Short Equity Fund, the BP Long/Short Research Fund and the Global Long/Short Fund had net charges of $10,516,403, $5,956,588 and $92,718, respectively, on borrowed securities. Such amounts are included in prime broker interest expense on the statement of operations.
As of February 28, 2015, the BP Long/Short Equity Fund, BP Long/Short Research Fund and the BP Global Long/Short Fund had securities sold short valued at $650,700,782, $2,766,500,772 and $77,200,275, respectively, for which securities of $481,758,929, $2,567,394,065 and $77,807,768 and cash deposits of $652,334,257, $2,770,181,505, and $57,235,630, respectively, were pledged as collateral.
In accordance with Special Custody and Pledge Agreements with Goldman Sachs & Co. (“Goldman Sachs”) (the Funds’ prime broker), the BP Long/Short Equity Fund, the BP Long/Short Research Fund and the BP Global Long/Short Fund may borrow from Goldman Sachs to the extent necessary to maintain required margin cash deposits on short positions. Interest on such borrowings is charged to the Fund based on the LIBOR rate plus an agreed upon spread.
The BP Long/Short Equity Fund, the BP Long/Short Research Fund and BP Global Long/Short Fund utilized cash borrowings from Goldman Sachs to meet required margin cash deposits as follows during the six month period ended February 28, 2015:
| | | | | | | | | | | | | | | | | | | | | | | | | | | | | | | | | | | | | | | | | | | |
| BP Long/Short Equity Fund | | BP Long/Short Research Fund | | BP Global Long/Short Fund |
Days
Utilized | | Average Daily
Borrowings | | Weighted Average
Interest Rate | | Days
Utilized | | Average Daily
Borrowings | | Weighted Average
Interest Rate | | Days
Utilized | | Average Daily
Borrowings | | Weighted Average
Interest Rate |
| 143 | | | | CAD 4,681,852 | | | | | 1.43 | % | | | | 45 | | | | | AUD 1,436,151 | | | | | 2.92 | % | | | | 131 | | | | | AUD 471,407 | | | | | 2.93 | % |
| 152 | | | | EUR 1,790,157 | | | | | 0.41 | % | | | | 106 | | | | | CAD 2,411,181 | | | | | 1.28 | % | | | | 156 | | | | | CAD 104,766 | | | | | 1.42 | % |
| 154 | | | | USD 40,954,083 | | | | | 0.53 | % | | | | 34 | | | | | DKK 23,392,690 | | | | | 0.44 | % | | | | 135 | | | | | CHF 394,444 | | | | | 0.42 | % |
| | | | | | | | | | | | | | 28 | | | | | EUR 11,235,827 | | | | | 0.39 | % | | | | 179 | | | | | DKK 665,779 | | | | | 0.48 | % |
| | | | | | | | | | | | | | 47 | | | | | GBP 2,580,039 | | | | | 0.90 | % | | | | 28 | | | | | EUR 3,673,977 | | | | | 0.39 | % |
| | | | | | | | | | | | | | 8 | | | | | HKD 25,324,920 | | | | | 0.48 | % | | | | 177 | | | | | GBP 537,821 | | | | | 0.87 | % |
| | | | | | | | | | | | | | 39 | | | | | JPY 1,519,358,849 | | | | | 0.51 | % | | | | 148 | | | | | HKD 3,254,738 | | | | | 0.50 | % |
| | | | | | | | | | | | | | 83 | | | | | SEK 9,767,195 | | | | | 0.47 | % | | | | 156 | | | | | JPY 88,808,439 | | | | | 0.52 | % |
| | | | | | | | | | | | | | 157 | | | | | USD 93,488,431 | | | | | 0.54 | % | | | | 30 | | | | | NOK 269,780 | | | | | 1.67 | % |
| | | | | | | | | | | | | | | | | | | | | | | | | | | | | 152 | | | | | NZD 241,388 | | | | | 3.93 | % |
| | | | | | | | | | | | | | | | | | | | | | | | | | | | | 180 | | | | | SEK 1,581,574 | | | | | 0.61 | % |
| | | | | | | | | | | | | | | | | | | | | | | | | | | | | 104 | | | | | SGD 161,703 | | | | | 0.58 | % |
| | | | | | | | | | | | | | | | | | | | | | | | | | | | | 181 | | | | | THB 8,517,952 | | | | | 2.33 | % |
As of February 28, 2015, the BP Long/Short Equity Fund, the BP Long/Short Research Fund and BP Global Long/Short Fund, had borrowings of $55,092,375, $131,183,275 and $44,359, respectively. Such amounts are included in due to prime broker on the Statements of Assets and Liabilities. Interest expenses for the six month period ended February 28, 2015, totaled $118,946, $251,712 and $27,244, respectively.
Contracts for Difference — The BP Global Long/Short Fund and BP Long/Short Research Fund (for this section only, each a “Fund”) may enter into Contracts for Differences (“CFDs”). CFDs are leveraged derivative instruments that allow a Fund to take a position on the change in the market price of an underlying asset, such as a stock, or the value of an index or currency exchange rate. With a short CFD, a Fund is seeking to profit from falls in the market price of the asset. CFDs are subject to liquidity risk because the liquidity of CFDs is based on the liquidity of the underlying instrument, and are subject to counterparty risk, i.e., the risk that the counterparty to the CFD transaction may be unable or unwilling to make payments or to otherwise honor its financial obligations under the terms of the contract. It is also possible that the market price of the CFD will move between the time the order is placed by a Fund and when it is executed by the issuer, which can result in the trade being executed at a less favorable price. CFDs, like many other derivative instruments, involve the risk that, if the derivative security declines in value, additional margin would be required to maintain the margin level. The seller may require a Fund to deposit additional sums to cover this decline in value, and the margin call may be at short notice. If additional margin is not provided in time, the seller may liquidate the positions at a loss for which a Fund is liable. The potential for margin calls and large losses are much greater in CFDs than in other leveraged products. Most CFDs are traded OTC. CFDs are not registered with the SEC or any U.S. regulator, and are not subject to U.S. regulation. In a short position, the Fund will receive or pay an amount based upon the amount, if any, by which the notional amount of the CFD would have decreased or increased in value had it sold the particular stocks short, less the dividends that would have been paid on those stocks, plus a floating rate of interest on the notional amount of the CFD. All of these components are reflected in the market value of the CFD.
| | |
| 52 | | SEMI-ANNUAL REPORT 2015 |
| | |
| BOSTON PARTNERS INVESTMENT FUNDS | | |
| | |
NOTES TO FINANCIAL STATEMENTS (unaudited) (continued) | | |
CFDs are marked-to-market daily based upon quotations from market makers and the resulting changes in market values, if any, are recorded as an unrealized gain or loss in the Statement of Operations. Periodic payments made or received are recorded as realized gains or losses. Entering into CFDs involves, to varying degrees, elements of credit and market risk in excess of the amounts recognized on the Statement of Assets and Liabilities. Such risks involve the possibility that there will be no liquid market for these contracts, that the counterparty to the contract may default on its obligation to perform and that there may be unfavorable changes in market conditions. CFDs outstanding at period end, if any, are listed on the Schedule of Investments. In connection with CFDs, cash or securities may be segregated as collateral by the Funds’ custodian. As of February 28, 2015, the BP Global Long/Short Fund held CFDs.
For the six month period ended February 28, 2015, the average volume of Contracts for Difference was as follows:
| | | | |
Fund | | Notional Amount | |
BP Global Long/Short Fund | | $ | 501,146 | |
| 2. | Investment Advisers and Other Services |
Robeco Investment Management, Inc. (“Robeco”) provides investment advisory services to the BP Funds and the WPG Small/Micro Cap Value Fund. For its advisory services with respect to the BP Funds, Robeco is entitled to receive 1.00% of the BP Small Cap Value Fund II’s average daily net assets, 2.25% of the BP Long/Short Equity Fund’s average daily net assets, 1.25% of the BP Long/Short Research Fund’s average daily net assets, 0.80% of the BP All-Cap Value Fund’s average daily net assets, 0.90% of the BP Global Equity Fund’s average daily net assets and 1.50% of the BP Global Long/Short Fund’s average daily net assets, each accrued daily and payable monthly.
Robeco has contractually agreed to limit the BP Long/Short Equity Fund and BP All-Cap Value Fund’s total annual operating expenses (excluding certain items discussed below) to the extent that such expenses exceed the ratios in the table below. This limit is calculated daily based on the BP Long/Short Equity Fund and BP All-Cap Value Fund’s average daily net assets. These limitations are effected in waivers of advisory fees and reimbursements of expenses exceeding the advisory fee as necessary. These contractual limitations are in effect until at least January 26, 2016 and may not be terminated without approval of the Company’s Board of Directors. Robeco may not recoup any of its waived investment advisory fees with respect to these Funds. The contractual limitations of the BP Long/Short Equity Fund and BP All-Cap Value Fund are the following:
| | | | | | | | |
| | | Institutional | | | Investor | |
BP Long/Short Equity Fund | | | 2.50 | % | | | 2.75 | % |
BP All-Cap Value Fund | | | 0.70 | % | | | 0.95 | % |
For BP Small Cap Value Fund II, from September 1, 2013 through May 27, 2014, Robeco had contractually agreed to forgo all or a portion of its advisory fee and/or reimburse expenses in an aggregate amount equal to the amount by which the total annual Fund operating expenses (excluding certain items discussed below) exceeds 1.30% and 1.55%, of the average daily net assets attributable to the Funds’ Institutional Class shares and Investor Class shares, respectively. Effective May 28, 2014, Robeco has contractually agreed to forgo all or a portion of its advisory fee and/or reimburse expenses in an aggregate amount equal to the amount by which the total annual Fund operating expenses (excluding certain items discussed below) exceeds 1.10% and 1.35%, of the average daily net assets attributable to the Funds’ Institutional Class shares and Investor Class shares, respectively. This contractual limitation is in effect until December 31, 2016 and may not be terminated without the approval of the Board of Directors. If at any time during the three years from May 28, 2014 to May 28, 2017 in which the Fund’s advisory agreement with Robeco is in effect, the Fund’s total annual Fund operating expenses for that year are less than 1.10% for the Institutional Class and 1.35% for the Investor Class, Robeco is entitled to reimbursement by the Fund of the advisory fees foregone and other payments remitted by Robeco to the Fund during such three-year period.
For the BP Long/Short Research Fund and BP Global Long/Short Fund, Robeco has contractually agreed to forgo all or a portion of its advisory fee and/or reimburse expenses in an aggregate amount equal to the amount by which the total annual Fund operating expenses (excluding certain items discussed below) exceeds 1.50% and 2.00%, respectively, of the average daily net assets attributable to the Funds’ Institutional Class shares and 1.75% and 2.25%, respectively, of the average daily net assets attributable to the Funds’ Investor Class. This contractual limitation is in effect until at least January 26, 2016 and may not be terminated without approval of the Company’s Board of Directors. If at any time during the first three years the Funds’ advisory agreement with Robeco is in effect, the Funds’ Total annual Fund operating expenses for that year are less than 1.50% for the
| | | | |
| SEMI-ANNUAL REPORT 2015 | | | 53 | |
| | |
| BOSTON PARTNERS INVESTMENT FUNDS | | |
| | |
NOTES TO FINANCIAL STATEMENTS (unaudited) (continued) | | |
Institutional Class and 1.75% for the Investor Class of the BP Long/Short Research Fund or 2.00% for the Institutional Class and 2.25% for the Investor Class of the BP Global Long/Short Fund, Robeco is entitled to reimbursement by the Funds of the advisory fees forgone and other payments remitted by Robeco to the Funds during such three-year period.
From September 1, 2013 through September 30, 2013, for the BP Global Equity Fund, Robeco had contractually agreed to waive all or a portion of its advisory fee and/or reimburse expenses in an aggregate amount equal to the amount by which the Fund’s total annual Fund operating expenses (excluding certain items discussed below) exceeds 1.30% of the average daily net assets attributable to the Fund’s Institutional Class shares and 1.55% of the average daily net assets attributable to the Fund’s Investor Class. Effective October 1, 2013, Robeco has contractually agreed to waive all or a portion of its advisory fee and/or reimburse expenses in an aggregate amount equal to the amount by which the Fund’s total annual Fund operating expenses (excluding certain items discussed below) exceeds 0.95% of the average daily net assets attributable to the Fund’s Institutional Class shares and 1.20% of the average daily net assets attributable to the Fund’s Investor Class. This contractual limitation is in effect until at least January 26, 2016 and may not be terminated without approval of the Company’s Board of Directors.
If at any time during the first three years each Fund’s advisory agreement with Robeco is in effect, each Fund’s total annual Fund operating expenses for that year are less than 0.95% for the Institutional Class and 1.20% for the Investor Class, Robeco is entitled to reimbursement by each Fund of the advisory fees waived and other payments remitted by Robeco to each Fund during such three-year period.
For its advisory services with respect to the WPG Small/Micro Cap Value Fund, for the period September 1, 2013 through May 27, 2014, Robeco was entitled to receive advisory fees, accrued daily and paid monthly, as follows:
| | |
| WPG Small/Micro Cap Value Fund | | 0.90% of net assets up to $300 million |
| | 0.80% of net assets $300 million to $500 million |
| | 0.75% of net assets in excess of $500 million |
Effective May 28, 2014, Robeco is entitled to receive advisory fees, accrued daily and paid monthly, as follows:
| | |
| WPG Small/Micro Cap Value Fund | | 0.80% of net assets up to $500 million |
| | 0.75% of net assets in excess of $500 million |
From September 1, 2013 through May 27, 2014, Robeco had contractually agreed to limit the WPG Small/Micro Cap Value Fund’s total annual Fund operating expenses (excluding certain items discussed below) to 1.70%. Effective May 28, 2014, Robeco contractually agreed to limit the WPG Small/Micro Cap Value Fund’s total annual Fund operating expenses (excluding certain items discussed below) to 1.10%. The contractual limitation is in effect until at least December 31, 2016 and may not be terminated without approval of the Company’s Board of Directors. If at any time during the three years from May 28, 2014 to May 28, 2017 in which the Fund’s advisory agreement with Robeco is in effect, the Fund’s total annual Fund operating expenses for that year are less than 1.10%, Robeco is entitled to reimbursement by the Fund of the advisory fees waived and other payments remitted by Robeco to the Fund during such three-year period.
At February 28, 2015, the amount of potential recoupment by Robeco was as follows:
| | | | | | | | | | | | | | | | | | | | |
| | | Expiration
August 31, 2015 | | | Expiration
August 31, 2016 | | | Expiration
August 31, 2017 | | | Expiration
August 31, 2018 | | | Total | |
BP Small-Cap Value Fund II | | $ | — | | | $ | — | | | $ | 41,219 | | | $ | 95,942 | | | $ | 137,161 | |
BP WPG Small/Micro Cap Value Fund | | | — | | | | — | | | | 27,146 | | | | 55,226 | | | | 82,372 | |
BP Global Equity Fund | | | 133,820 | | | | 202,243 | | | | 217,404 | | | | 146,217 | | | | 699,684 | |
BP Global Long/Short Fund | | | — | | | | — | | | | 87,459 | | | | 6,701 | | | | 94,160 | |
For the six-month period ended February 28, 2015, Robeco has waived and reimbursed fees as follows:
| | | | | | | | |
Funds | | Investment Adviser
Expense Waived | | | Investment Adviser
Reimbursement | |
BP Small Cap Value Fund II | | $ | 95,942 | | | $ | — | |
BP Long/Short Equity Fund | | | — | | | | — | |
BP Long/Short Research Fund | | | — | | | | — | |
BP All-Cap Value Fund | | | 1,059,386 | | | | — | |
BP WPG Small/Micro Cap Value Fund | | | 55,226 | | | | — | |
BP Global Equity Fund | | | 146,217 | | | | — | |
BP Global Long/Short Fund | | | 6,701 | | | | — | |
| | |
| 54 | | SEMI-ANNUAL REPORT 2015 |
| | |
| BOSTON PARTNERS INVESTMENT FUNDS | | |
| | |
NOTES TO FINANCIAL STATEMENTS (unaudited) (continued) | | |
In determining Robeco’s obligation to waive advisory fees and/or reimburse expenses, the following expenses are not taken into account and could cause a Fund’s net annualized expense ratio to exceed the applicable expense limitation: acquired fund fees and expenses, short sale dividend expenses, brokerage commissions, extraordinary items, interest and taxes.
BNY Mellon Investment Servicing (US) Inc. (“BNY Mellon”), serves as administrator for the Funds. For providing administration and accounting services, BNY Mellon is entitled to receive a monthly fee equal to an annual percentage rate of each Fund’s average daily net assets, subject to certain minimum monthly fees.
Included in the administration and accounting service fees, shown on the Statement of Operations, are fees for providing regulatory administrative services to RBB. For providing these services, BNY Mellon is entitled to receive compensation as agreed to by the Company and BNY Mellon. This fee is allocated to each portfolio of the Company in proportion to its net assets of the Company.
In addition, BNY Mellon serves as the Funds’ transfer and dividend disbursing agent. For providing transfer agency services, BNY Mellon is entitled to receive a monthly fee, subject to certain minimum, and out of pocket expenses.
The Bank of New York Mellon (the “Custodian”) provides certain custodial services to the Funds. The Custodian is entitled to receive a monthly fee, subject to certain minimum, and out of pocket expenses.
The Board of Directors of the Company has approved a Distribution Agreement for the Funds and adopted separate Plans of Distribution for the Investor Class of each BP Fund (the “Plans”) pursuant to Rule 12b-1 under the 1940 Act. Under the Plans, Foreside Funds Distributors LLC (the “Underwriter”) is entitled to receive from each Fund a distribution fee with respect to the Investor Class, which is accrued daily and paid monthly, of up to 0.25% on an annualized basis of the average daily net assets of the Investor Class. Amounts paid to the Distributor under the Plans may be used by the Distributor to cover expenses that are related to (i) the sale of the Investor Class Shares, (ii) ongoing servicing and/or maintenance of the accounts of shareholders, and (iii) sub-transfer agency services, subaccounting services or administrative services related to the sale of the Investor Class, all as set forth in the Plans.
The Directors of the Company receive an annual retainer and meeting fees for meetings attended. The aggregate remuneration paid to the Directors by the Funds during the six-month period ended February 28, 2015 was $125,259. Certain employees of BNY Mellon serve as an Officer or Director of the Company. They are not compensated by the Funds or the Company.
| 4. | Investment in Securities |
For the six month period ended February 28, 2015, aggregate purchases and sales of investment securities (excluding short-term investments and U.S. government obligations) were as follows:
| | | | | | | | |
| Fund | | Purchases | | | Sales | |
BP Small Cap Value Fund II | | $ | 75,024,423 | | | $ | 19,796,402 | |
BP Long/Short Equity Fund | | | 302,726,958 | | | | 377,192,552 | |
BP Long/Short Research Fund | | | 2,243,479,611 | | | | 1,773,895,131 | |
BP All-Cap Value Fund | | | 185,473,938 | | | | 166,529,153 | |
WPG Small/Micro Cap Value Fund | | | 14,806,604 | | | | 17,236,326 | |
BP Global Equity Fund | | | 45,989,936 | | | | 29,586,774 | |
BP Global Long/Short Fund | | | 157,296,551 | | | | 46,593,731 | |
| 5. | Capital Share Transactions |
As of February 28, 2015, each class of each Fund has 100,000,000 shares of $0.001 par value common stock authorized except for the Institutional Class of the BP Long/Short Research Fund and the WPG Small/Micro Cap Value Fund, which have 500,000,000 shares and 50,000,000 shares, respectively, of $0.001 par value common stock authorized.
Securities may be loaned to financial institutions, such as broker-dealers, and are required to be secured continuously by collateral in cash, cash equivalents, letter of credit or U.S. Government securities maintained on a current basis at an amount at least equal to the market value of the securities loaned. Cash collateral received, pursuant to investment guidelines established by the Funds and approved by the Company’s Board of Directors, is invested in short-term investments. All such investments
| | | | |
| SEMI-ANNUAL REPORT 2015 | | | 55 | |
| | |
| BOSTON PARTNERS INVESTMENT FUNDS | | |
| | |
NOTES TO FINANCIAL STATEMENTS (unaudited) (continued) | | |
are made at the risk of the Funds and, as such, the Funds are liable for investment losses. Such loans would involve risks of delay in receiving additional collateral in the event the value of the collateral decreased below the value of the securities loaned or of delay in recovering the securities loaned or even loss of rights in the collateral should the borrower of the securities fail financially. However, loans will be made only to borrowers deemed by Robeco to be of good standing and only when, in Robeco’s judgment, the income to be earned from the loans justifies the attendant risks. Any loans of a Fund’s securities will be fully collateralized and marked to market daily. During the six month period ended February 28, 2015, the Funds participated in securities lending. The market value of securities on loan and collateral as of February 28, 2015 and the income generated from the program during the six month period ended February 28, 2015 with respect to such loans were as follows:
| | | | | | | | | | | | |
Fund | | Market Value
of Securities
Loaned | | | Market Value
of Collateral | | | Income Received
from Securities
Lending | |
BP Small Cap Value Fund II | | $ | 7,363,665 | | | $ | 10,148,370 | | | $ | 125,592 | |
BP Long/Short Equity Fund | | | 23,348,070 | | | | 29,918,254 | | | | 96,399 | |
BP All-Cap Value Fund | | | 136,988 | | | | 154,906 | | | | 3,913 | |
WPG Small/Micro Cap Value Fund | | | 2,686,234 | | | | 3,789,509 | | | | 107,274 | |
Securities lending transactions are entered into by the Funds under a Master Securities Lending Agreement (“MSLA”) which permits the Funds, under certain circumstances including an event of default (such as bankruptcy or insolvency), to offset amounts payable by the Funds to the same counterparty against amounts to be received and create one single net payment due to or from the Funds. The following table is a summary of the Funds’ open securities lending transactions which are subject to a MSLA as of February 28, 2015:
| | | | | | | | | | | | | | | | | | | | | | | | |
| | | | | | | | | | | | Gross Amount Net Offset in the
Statement of Assets and Liabilities | |
Fund | | Gross Amount of
Recognized Assets | | | Gross Amounts
Offset in the
Statement of
Assets and Liabilities | | | Net Amount of
Assets Presented in
the Statement of
Assets and Liabilities | | | Financial
Instruments | | | Cash
Collateral
Received | | | Net
Amount | |
BP Small Cap Value Fund II | | $ | 7,363,665 | | | | — | | | $ | 7,363,665 | | | | — | | | $ | 7,363,665 | | | | — | |
BP Long/Short Equity Fund | | | 23,348,070 | | | | — | | | | 23,348,070 | | | | — | | | | 23,348,070 | | | | — | |
BP All-Cap Value Fund | | | 136,988 | | | | — | | | | 136,988 | | | | — | | | | 136,988 | | | | — | |
WPG Small/Micro Cap Value Fund | | | 2,686,234 | | | | — | | | | 2,686,234 | | | | — | | | | 2,686,234 | | | | — | |
| 1 | Amount disclosed is limited to the amount of assets presented in the Statement of Assets and Liabilities. Actual collateral received may be more than the amount shown. |
A restricted security is a security which has been purchased through a private offering and cannot be resold to the general public without prior registration under the Securities Act of 1933, as amended (the “1933 Act”), or pursuant to the resale limitations provided by Rule 144 under the 1933 Act, or an exemption from the registration requirements of the 1933 Act. Certain restricted securities may be resold in transactions exempt from registration, normally to qualified institutional buyers, and may be deemed liquid by Robeco as applicable, based on policies and procedures established by the Company’s Board of Directors. Therefore, not all restricted securities are considered illiquid.
At February 28, 2015, the following Fund held restricted securities that were illiquid:
| | | | | | | | | | | | | | | | | | |
| | | Acquisition Date | | Acquisition
Cost | | | Shares/Par | | | Value | | | % of
Net Assets | |
BP All-Cap Value Fund | | | | | | | | | | | | | | | | | | |
| Common Stocks: | | | | | | | | | | | | | | | | | | |
Peoples Choice Financial Corp. 144A | | 12/21/04-01/23/06 | | $ | 14,293 | | | | 1,465 | | | $ | 0.00 | | | | 0.0 | |
Solar Cayman Ltd. 144A | | 03/24/10 | | | — | | | | 19,375 | | | | 0.00 | | | | 0.0 | |
| | | | | | | | | | | | | | | | | | |
| | | | $ | 14,293 | | | | 20,840 | | | $ | — | | | | 0.0 | % |
| | | | | | | | | | | | | | | | | | |
There is a 1.00% redemption fee on shares redeemed which have been held 60 days or less on BP Small Cap Value Fund II, BP Long/Short Research Fund, BP Global Equity Fund and BP Global Long/Short Fund. There is a 2.00% redemption fee on shares redeemed which have been held 365 days or less on the BP Long/Short Equity Fund. The WPG Small/Micro
| | |
| 56 | | SEMI-ANNUAL REPORT 2015 |
| | |
| BOSTON PARTNERS INVESTMENT FUNDS | | |
| | |
NOTES TO FINANCIAL STATEMENTS (unaudited) (continued) | | |
Cap Value Fund has a 2.00% redemption fee on shares redeemed within 60 days of purchase. The redemption fees are retained by the Funds for the benefit of the remaining shareholders and recorded as paid-in capital.
| 9. | Federal Income Tax Information |
The Funds have followed the authoritative guidance on accounting for and disclosure of uncertainty in tax positions, which requires the Funds to determine whether a tax position is more likely than not to be sustained upon examination, including resolution of any related appeals or litigation processes, based on the technical merits of the position. The Funds have determined that there was no effect on the financial statements from following this authoritative guidance. In the normal course of business, the Funds are subject to examination by federal, state and local jurisdictions, where applicable, for tax years for which applicable statutes of limitations have not expired.
As of February 28, 2015, federal tax cost and aggregate gross unrealized appreciation and depreciation of securities held by each Fund were as follows:
| | | | | | | | | | | | | | | | |
Fund | | Federal Tax
Cost | | | Unrealized
Appreciation | | | Unrealized
Depreciation | | | Net
Unrealized
Appreciation | |
BP Small Cap Value Fund II | | $ | 213,388,082 | | | $ | 74,958,074 | | | $ | (8,834,418 | ) | | $ | 66,123,656 | |
BP Long/Short Equity Fund | | | 696,760,591 | | | | 156,748,120 | | | | (33,943,446 | ) | | | 122,804,674 | |
BP Long/Short Research Fund | | | 5,042,073,595 | | | | 955,960,476 | | | | (91,674,666 | ) | | | 864,285,810 | |
BP All-Cap Value Fund | | | 768,632,398 | | | | 240,295,333 | | | | (10,451,624 | ) | | | 229,843,709 | |
WPG Small/Micro Cap Value Fund | | | 35,829,641 | | | | 8,880,017 | | | | (1,885,243 | ) | | | 6,994,774 | |
BP Global Equity Fund | | | 69,160,549 | | | | 11,732,322 | | | | (2,840,985 | ) | | | 8,891,337 | |
BP Global Long/Short Fund | | | 146,076,136 | | | | 9,767,847 | | | | (1,674,940 | ) | | | 8,092,907 | |
Distributions to shareholders from net investment income and realized gains are determined in accordance with federal income tax regulations, which may differ from net investment income and realized gains recognized for financial reporting purposes. Accordingly, the character of distributions and composition of net assets for tax purposes may differ from those reflected in the accompanying financial statements. To the extent these differences are permanent, such amounts are reclassified within the capital accounts based on the tax treatment; temporary differences do not require such reclassification.
As of August 31, 2014, the components of distributable earnings on a tax basis were as follows:
| | | | | | | | | | | | | | | | | | | | | | | | |
Fund | | Undistributed
Ordinary
Income | | | Undistributed
Long-Term
Gains | | | Capital Loss
Carryforwards | | | Unrealized
Appreciation
(Depreciation) | | | Qualified
Late-year
Loss
Deferral | | | Other
Temporary
Differences | |
BP Small Cap Value Fund II | | $ | 517,650 | | | $ | 1,447,207 | | | $ | — | | | $ | 63,416,762 | | | $ | — | | | $ | — | |
BP Long/Short Equity Fund | | | — | | | | 54,313,379 | | | | (843,234 | ) | | | 106,529,791 | | | | (17,692,302 | ) | | | — | |
BP Long/Short Research Fund | | | — | | | | 34,894,577 | | | | — | | | | 516,767,966 | | | | (27,989,440 | ) | | | — | |
BP All-Cap Value Fund | | | 15,443,775 | | | | 22,304,230 | | | | — | | | | 210,855,869 | | | | — | | | | — | |
WPG Small/Micro Cap Value Fund | | | 2,710,470 | | | | 1,593,933 | | | | — | | | | 7,921,711 | | | | — | | | | — | |
BP Global Equity Fund | | | 1,899,488 | | | | 1,065,409 | | | | — | | | | 5,793,235 | | | | — | | | | — | |
BP Global Long/Short Fund | | | — | | | | — | | | | (161,107 | ) | | | 1,435,979 | | | | — | | | | — | |
The differences between the book and tax basis components of distributable earnings relate principally to the timing of recognition of income and gains for federal income tax purposes.
The tax character of dividends and distributions paid during the fiscal year ended August 31, 2014 were as follows:
| | | | | | | | | | | | |
| | | 2014 | |
Fund | | Ordinary
Income | | | Long-Term
Gains | | | Total | |
BP Small Cap Value Fund II | | $ | 583,139 | | | $ | — | | | $ | 583,139 | |
BP Long/Short Equity Fund | | | 2,623,279 | | | | 47,534,301 | | | | 50,157,580 | |
BP Long/Short Research Fund | | | — | | | | 10,836,209 | | | | 10,836,209 | |
BP All-Cap Value Fund | | | 12,757,029 | | | | 12,457,916 | | | | 25,214,945 | |
WPG Small/Micro Cap Value Fund | | | 50,358 | | | | 3,952,860 | | | | 4,003,218 | |
BP Global Equity Fund | | | 1,079,874 | | | | 423,661 | | | | 1,503,535 | |
BP Global Long/Short Fund | | | — | | | | — | | | | — | |
| | | | |
| SEMI-ANNUAL REPORT 2015 | | | 57 | |
| | |
| BOSTON PARTNERS INVESTMENT FUNDS | | |
| | |
NOTES TO FINANCIAL STATEMENTS (unaudited) (concluded) | | |
Dividends from net investment income and short-term capital gains are treated as ordinary income dividends for federal income tax purposes.
Accumulated capital losses represent net capital loss carryforwards as of August 31, 2014 that may be available to offset future realized capital gains and thereby reduce future capital gains distributions. Under the Regulated Investment Company Modernization Act of 2010, the Funds are permitted to carry forward capital losses incurred in taxable years beginning after December 22, 2010 for an unlimited period. Any losses incurred during those future taxable years will be required to be utilized prior to any losses incurred in pre-enactment taxable years. Additionally, post-enactment capital losses that are carried forward will retain their character as either short-term or long-term capital losses rather than being considered all short-term as under the previous law.
As of August 31, 2014, the Funds had the following pre-enactment net capital loss carryforwards to offset future net capital gains, if any, to the extent provided by U.S. Treasury regulations. To the extent that these carryforwards are used to offset future capital gains, it is probable that the gains that are offset will not be distributed to shareholders.
| | | | | | | | | | | | | | | | |
Fund | | August 31, 2016 | | | August 31, 2017 | | | August 31, 2018 | | | Total | |
BP Long/Short Equity Fund | | $ | 843,234 | | | $ | — | | | $ | — | | | $ | 843,234 | |
As of August 31, 2014, the BP Global Long/Short Fund had post-enactment capital loss carryforwards of $161,107, all of which are short-term losses and have an unlimited period of capital loss carryforward.
Due to limitations imposed by the Internal Revenue Code and the regulations thereunder, the capital losses from the BP Long/Short Equity Fund that were acquired in its reorganization with the WPG 130/30 Large Cap Core Fund on April 17, 2009, could not be fully used against its current year capital gains. The remaining loss of $843,234 is carried forward and $421,617 can be utilized annually against the BP Long/Short Equity Fund’s realized capital gains through August 31, 2016.
Management has evaluated the impact of all subsequent events on the Funds through the date the financial statements were issued, and has determined that there were no subsequent events requiring recognition or disclosure in the financial statements.
| | |
| 58 | | SEMI-ANNUAL REPORT 2015 |
| | |
| BOSTON PARTNERS INVESTMENT FUNDS | | |
| | |
OTHER INFORMATION (unaudited) | | |
Proxy Voting
Policies and procedures that the Funds use to determine how to vote proxies relating to portfolio securities as well as information regarding how the Funds voted proxies relating to portfolio securities for the most recent 12-month period ended June 30 are available without charge, upon request, by calling (888) 261-4073 and on the Securities and Exchange Commission’s (“SEC”) website at http://www.sec.gov.
Quarterly Portfolio Schedule
The Company files a complete schedule of portfolio holdings with the SEC for the first and third fiscal quarters of each fiscal year (quarters ended November 30 and May 31) on Form N-Q. The Company’s Form N-Q is available on the SEC website at http://www.sec.gov and may be reviewed and copied at the SEC Public Reference Room in Washington, D.C. Information on the operation of the SEC Public Reference Room may be obtained by calling (800) SEC-0330.
| | | | |
| SEMI-ANNUAL REPORT 2015 | | | 59 | |
| | |
| BOSTON PARTNERS INVESTMENT FUNDS | | |
| | |
PRIVACY NOTICE (unaudited) | | |
| | |
| FACTS | | WHAT DO THE BOSTON PARTNERS INVESTMENT FUNDS DO WITH YOUR PERSONAL INFORMATION? |
| Why? | | Financial companies choose how they share your personal information. Federal law gives consumers the right to limit some but not all sharing. Federal law also requires us to tell you how we collect, share, and protect your personal information. Please read this notice carefully to understand what we do. |
| What? | | The types of personal information we collect and share depend on the product or service you have with us. This information can include: • Social Security number • account balances • account transactions • transaction history • wire transfer instructions • checking account information When you are no longer our customer, we continue to share your information as described in this notice. |
| How? | | All financial companies need to share customers’ personal information to run their everyday business. In the section below, we list the reasons financial companies can share their customers’ personal information; the reasons the Boston Partners Investment Funds chooses to share; and whether you can limit this sharing. |
| | | | |
| Reasons we can share your personal information | | Do the Boston Partners Investment Funds share? | | Can you limit this sharing? |
For our everyday business purposes – such as to process your transactions, maintain your account(s), respond to court orders and legal investigations, or report to credit bureaus | | Yes | | No |
For our marketing purposes – to offer our products and services to you | | Yes | | No |
| For joint marketing with other financial companies | | No | | We don’t share |
| For our affiliates’ everyday business purposes – information about your transactions and experiences | | Yes | | No |
| For our affiliates’ everyday business purposes – information about your creditworthiness | | No | | We don’t share |
| For our affiliates to market to you | | Yes | | Yes |
| For nonaffiliates to market to you | | No | | We don’t share |
| | |
| Questions? | | Call (888) 261-4073 or go to www.boston-partners.com |
| | |
| 60 | | SEMI-ANNUAL REPORT 2015 |
| | |
| BOSTON PARTNERS INVESTMENT FUNDS | | |
| | |
PRIVACY NOTICE (unaudited) (concluded) | | |
| | |
What we do | | |
| | |
| How do the Boston Partners Investment Funds protect my personal information? | | To protect your personal information from unauthorized access and use, we use security measures that comply with federal law. These measures include computer safeguards and secured files and buildings. |
| How do the Boston Partners Investment Funds collect my personal information? | | We collect your personal information, for example, when you • open an account • provide account information • give us your contact information • make a wire transfer • tell us where to send the money We also collect your information from others, such as credit bureaus, affiliates, or other companies. |
| Why can’t I limit all sharing? | | Federal law gives you the right to limit only • sharing for affiliates’ everyday business purposes – information about your creditworthiness • affiliates from using your information to market to you • sharing for nonaffiliates to market to you State laws and individual companies may give you additional rights to limit sharing. |
Definitions |
| Affiliates | | Companies related by common ownership or control. They can be financial and nonfinancial companies. Our affiliates include: • Robeco Investment Management, Inc. • Robeco Securities, LLC |
| Nonaffiliates | | Companies not related by common ownership or control. They can be financial and nonfinancial companies. • The Boston Partners Investment Funds don’t share with nonaffiliates so they can market to you. The Boston Partners Investment Funds may share information with nonaffiliates that perform marketing services on our behalf. |
| Joint marketing | | A formal agreement between nonaffiliated financial companies that together market financial products or services to you. • The Boston Partners Investment Funds may share your information with other financial institutions with whom we have joint marketing arrangements who may suggest additional fund services or other investment products which may be of interest to you. |
| | | | |
| SEMI-ANNUAL REPORT 2015 | | | 61 | |
INVESTMENT ADVISER
Robeco Investment Management Inc.
909 Third Avenue, 32nd Floor
New York, NY 10022
ADMINISTRATOR
BNY Mellon Investment Servicing (US) Inc.
301 Bellevue Parkway
Wilmington, DE 19809
TRANSFER AGENT
BNY Mellon Investment Servicing (US) Inc.
4400 Computer Drive
Westborough, MA 01581
PRINCIPAL
UNDERWRITER
Foreside Funds Distributors LLC
400 Berwyn Park
899 Cassatt Road
Berwyn, PA 19312
CUSTODIAN
The Bank of New York Mellon
One Wall Street
New York, NY 10286
INDEPENDENT REGISTERED PUBLIC ACCOUNTING FIRM
Ernst & Young LLP
One Commerce Square
2005 Market Street, Suite 700
Philadelphia, PA 19103
COUNSEL
Drinker Biddle & Reath LLP
One Logan Square, Ste. 2000
Philadelphia, PA 19103-6996
S1 FUND
of THE RBB FUND, INC.
SEMI–ANNUAL REPORT
FEBRUARY 28, 2015
(UNAUDITED)
This report is submitted for the general information of the shareholders of the Fund. It is not authorized for distribution unless preceded or accompanied by a current prospectus for the Fund.
S1 FUND
PERFORMANCE DATA
(UNAUDITED)
| | | | | | | | | | |
TOTAL RETURNS FOR THE PERIODS ENDED FEBRUARY 28, 2015 | | |
| | | | | Average Annual | | |
| | | Six
Months* | | One
Year | | Three
Year | | Since
Inception** | | |
S1 Fund, I Shares | | (7.11)% | | (10.22)% | | 1.89% | | 1.19% | | |
S&P 500® Index*** | | 5.05% | | 13.18% | | 15.54% | | 14.91% | | |
HFRX Equity Hedge Index*** | | 1.66% | | 1.38% | | 5.06% | | 0.87% | | |
| ** | Inception date of the Fund is September 30, 2010. |
| *** | Benchmark performance is from the inception date of the Fund only and is not the inception date of the benchmark itself. |
Performance data quoted is past performance and reflects fee waivers that were in effect. Performance would have been less in their absence. The Fund liquidated on March 17, 2015. Call Simple Alternatives at 1 866-882-1226 for information about the Fund’s performance subsequent to the date of this report (February 28, 2015). The Fund’s total annual operating expense ratio, as stated in the current prospectus, is 4.69% and the Fund’s net operating expense ratio is 4.20%. Net operating expense includes interest and dividends on short sales and acquired fund fees.
The Fund evaluates performance as compared to that of the Standard & Poor’s 500® Index (“S&P 500®”). The S&P 500® is a widely recognized, unmanaged index of 500 common stocks which are generally representative of the U.S. stock market as a whole. It is impossible to invest directly in an index.
2
S1 FUND
FUND EXPENSE EXAMPLES
(UNAUDITED)
As a shareholder of the Fund, you incur two types of costs: (1) transaction costs and (2) ongoing costs, including management fees, shareholder servicing fees and other Fund expenses. These examples are intended to help you understand your ongoing costs (in dollars) of investing in the Fund and to compare these costs with the ongoing costs of investing in other mutual funds.
This example is based on an investment of $1,000 invested at the beginning of the six-month period from September 1, 2014 through February 28, 2015 and held for the entire period.
ACTUAL EXPENSES
The first line of the accompanying table provides information about actual account values and actual expenses. You may use the information in this line, together with the amount you invested, to estimate the expenses that you paid over the period. Simply divide your account value by $1,000 (for example, an $8,600 account value divided by $1,000 = 8.6), then multiply the result by the number in the first line under the heading entitled “Expenses Paid During Period” to estimate the expenses you paid on your account during this period.
HYPOTHETICAL EXAMPLE FOR COMPARISON PURPOSES
The second line of the accompanying table provides information about hypothetical account values and hypothetical expenses based on the Fund’s actual expense ratio and an assumed rate of return of 5% per year before expenses, which is not the Fund’s actual return. The hypothetical account values and expenses may not be used to estimate the actual ending account balance or expenses you paid for the period. You may use this information to compare the ongoing costs of investing in the Fund and other funds. To do so, compare these 5% hypothetical examples with the 5% hypothetical examples that appear in the shareholder reports of other funds.
Please note that the expenses shown in the accompanying table are meant to highlight your ongoing costs only and do not reflect any transactional costs, such as redemption fees. Therefore, the second line of the accompanying table is useful in comparing ongoing costs only, and will not help you determine the relative total costs of owning different funds. In addition, if these transactional costs were included, your costs would have been higher.
| | | | | | | | | | | | | | | | | | | |
| | | I SHARES |
| | | BEGINNING ACCOUNT VALUE
SEPTEMBER 1, 2014 | | | | ENDING ACCOUNT VALUE
FEBRUARY 28, 2015 | | | | EXPENSES PAID
DURING PERIOD |
Actual* | | | | $ 1,000.00 | | | | | | | $ 928.90 | | | | | | | $19.08 | |
Hypothetical | | | | | | | | | | | | | | | | | | | |
(5% return before expenses) | | | | 1,000.00 | | | | | | | 1,005.01 | | | | | | | 19.84 | |
| * | Expenses equal to an annualized expense ratio for the six-month period ended February 28, 2015 of 3.99% for the I Shares of the Fund, which includes waived fees or reimbursed expenses (including dividend and interest expense), multiplied by the average account value over the period, multiplied by the number of days in the most recent period (181) then divided by 365 days. The Fund’s ending account value on the first line in the table is based on the actual six-months total return for the I Shares of the Fund of (7.11)%. These amounts include dividends paid on securities which the Fund has sold short (“short-sale dividends”) and related interest expense. The annualized amount of short-sale dividends and related interest expense was 1.04% of the Fund’s average net assets attributable to I Shares for the most recent fiscal year. |
3
S1 FUND
PORTFOLIO HOLDINGS SUMMARY TABLE
FEBRUARY 28, 2015
(UNAUDITED)
The following table presents a summary by sector of the portfolio holdings of the Fund.
| | | | | | | | | | |
| SECURITY TYPE/SECTOR CLASSIFICATION | | % OF NET
ASSETS | | VALUE |
U.S. TREASURY NOTE | | | | 1.0 | % | | | $ | 102,648 | |
FOREIGN GOVERNMENT NOTE | | | | 0.1 | | | | | 8,146 | |
OTHER ASSETS IN EXCESS OF LIABILITIES | | | | 98.9 | | | | | 10,386,470 | |
| | | | | | | | | | |
NET ASSETS | | | | 100.0 | % | | | $ | 10,497,264 | |
| | | | | | | | | | |
Portfolio holdings are subject to change at any time.
Please note that securities are classified according to the Bloomberg Sub-Industry Categories for diversification testing purposes. We believe this is the classification that best reflects the industry and risks associated with each position.
The accompanying notes are an integral part of the financial statements.
4
S1 FUND
PORTFOLIOOF INVESTMENTS
FEBRUARY 28, 2015
(UNAUDITED)
| | | | | | | | | | |
| | | PAR
(000’S) | | | VALUE | | | |
FOREIGN GOVERNMENT NOTE — 0.1% | | | |
Canadian Government Bond | | | | | | | |
3.000% 12/01/15 | | | CAD 10 | | | $ | 8,146 | | | |
| | | | | | | | | | |
TOTAL FOREIGN GOVERNMENT NOTE (Cost $10,037) | | | | 8,146 | | | |
| | | | | | | | | | |
| | |
U.S. TREASURY NOTE — 1.0% | | | | | | | |
2.625% 04/30/16 | | | $100 | | | | 102,648 | | | |
| | | | | | | | | | |
TOTAL U.S. TREASURY NOTE (Cost $100,758) | | | | 102,648 | | | |
| | | | | | | | | | |
| | |
TOTAL INVESTMENTS — 1.1%
(Cost $110,795) | | | | 110,794 | | | |
| | | | | | | | | | |
| | |
OTHER ASSETSIN EXCESSOF | | | | | | | |
LIABILITIES — 98.9% | | | | | | | 10,386,470 | | | |
| | | | | | | | | | |
NET ASSETS — 100.0% | | | | | | $ | 10,497,264 | | | |
| | | | | | | | | | |
CAD Canadian Dollar
The accompanying notes are an integral part of the financial statements.
5
S1 FUND
STATEMENTOF ASSETSAND LIABILITIES
FEBRUARY 28, 2015
(UNAUDITED)
| | | | |
ASSETS | | | | |
Investments, at value (cost $110,795) | | $ | 110,794 | |
Cash | | | 11,168,795 | |
Deposits held with prime broker for securities sold short and written options | | | 27,998 | |
Receivables for: | | | | |
Investments sold | | | 887 | |
Dividends and interest | | | 8,461 | |
| | | | |
Total assets | | | 11,316,935 | |
| | | | |
LIABILITIES | | | | |
Payables for: | | | | |
Capital shares redeemed | | | 736,041 | |
Investment advisory fees | | | 3,588 | |
Dividends on securities sold short | | | 3,596 | |
Due to prime broker | | | 1,985 | |
Other accrued expenses and liabilities | | | 74,461 | |
| | | | |
Total liabilities | | | 819,671 | |
| | | | |
Net Assets | | $ | 10,497,264 | |
| | | | |
| |
NET ASSETS CONSIST OF | | | | |
Capital stock, $0.001 par value | | $ | 1,172 | |
Paid-in capital | | | 11,990,459 | |
Accumulated net investment loss | | | (2,478,197 | ) |
Accumulated net realized gain from investments, foreign currency transactions, securities sold short and written options | | | 983,878 | |
Net unrealized depreciation on investments and foreign currency translations | | | (48 | ) |
| | | | |
Net assets | | $ | 10,497,264 | |
| | | | |
I SHARES | | | | |
Net assets | | $ | 10,497,264 | |
| | | | |
Shares outstanding ($0.001 par value, 100,000,000 shares authorized) | | | 1,171,670 | |
| | | | |
Net asset value, offering and redemption price per share | | $ | 8.96 | |
| | | | |
The accompanying notes are an integral part of the financial statements.
6
S1 FUND
STATEMENTOF OPERATIONS
FOR THE SIX MONTHS ENDED
FEBRUARY 28, 2015
(UNAUDITED)
| | | | |
INVESTMENT INCOME | | | | |
Dividends (net of foreign withholding taxes of $3,906) | | $ | 178,381 | |
Interest | | | 2,333 | |
| | | | |
Total investment income | | | 180,714 | |
| | | | |
EXPENSES | | | | |
Advisory fees (Note 2) | | | 813,791 | |
Dividend expense on securities sold short | | | 177,913 | |
Prime broker interest expense | | | 130,312 | |
Administration and accounting fees (Note 2) | | | 107,765 | |
Transfer agent fees (Note 2) | | | 51,331 | |
Custodian fees (Note 2) | | | 32,626 | |
Registration and filing fees | | | 31,976 | |
Printing and shareholder reporting fees | | | 20,492 | |
Directors’ and officers’ fees | | | 10,145 | |
Insurance fees | | | 7,585 | |
Legal fees | | | 6,492 | |
Audit fees | | | 5,287 | |
Other expenses | | | 59 | |
| | | | |
Total expenses before waivers and reimbursements | | | 1,395,774 | |
Less: waivers and reimbursements (Note 2) | | | (214,546 | ) |
| | | | |
Net expenses after waivers | | | 1,181,228 | |
| | | | |
Net investment loss | | | (1,000,514 | ) |
| | | | |
NET REALIZED AND UNREALIZED GAIN/(LOSS) FROM INVESTMENTS | | | | |
Net realized gain/(loss) from: | | | | |
Investments | | | 6,023,791 | |
Securities sold short | | | (2,261,010 | ) |
Foreign currency transactions | | | 427,409 | |
Written options | | | (192,104 | ) |
Net change in unrealized appreciation/(depreciation) on: | | | | |
Investments | | | (11,117,010 | ) |
Securities sold short | | | 2,510,458 | |
Foreign currency translation | | | (83,412 | ) |
Written options | | | 36,123 | |
| | | | |
Net realized and unrealized gain/(loss) from investments | | | (4,655,755 | ) |
| | | | |
NET DECREASE IN NET ASSETS RESULTING FROM OPERATIONS | | $ | (5,656,269 | ) |
| | | | |
The accompanying notes are an integral part of the financial statements.
7
S1 FUND
STATEMENTSOF CHANGESIN NET ASSETS
| | | | | | | | |
| | | FOR THE
SIX MONTHS ENDED
FEBRUARY 28, 2015
(UNAUDITED) | | | FOR THE
YEAR ENDED
AUGUST 31, 2014 | |
INCREASE/(DECREASE)IN NET ASSETS FROM OPERATIONS: | | | | | | | | |
Net investment loss | | $ | (1,000,514 | ) | | $ | (2,873,760 | ) |
Net realized gain from investments, securities sold short, foreign currency transactions and written options. | | | 3,998,086 | | | | 6,376,336 | |
Net change in unrealized appreciation/(depreciation) on investments,securities sold short, futures transactions, foreign currency translations, forward currency contracts and written options | | | (8,653,841 | ) | | | 4,331,076 | |
| | | | | | | | |
Net increase/(decrease) in net assets resulting from operations | | | (5,656,269 | ) | | | 7,833,652 | |
| | | | | | | | |
| | |
DIVIDENDSAND DISTRIBUTIONSTO SHAREHOLDERS FROM: | | | | | | | | |
Net realized gains | | | (5,147,391 | ) | | | (2,667,365 | ) |
| | | | | | | | |
Total dividends and distributions to shareholders | | | (5,147,391 | ) | | | (2,667,365 | ) |
| | | | | | | | |
| | |
CAPITAL TRANSACTIONS: | | | | | | | | |
I Shares | | | | | | | | |
Proceeds from shares sold. | | | 5,001,918 | | | | 48,863,982 | |
Proceeds from reinvestment of distributions. | | | 4,941,996 | | | | 2,611,352 | |
Shares redeemed | | | (85,783,226 | ) | | | (44,300,330 | ) |
| | | | | | | | |
Net increase/(decrease) in net assets from capital share transactions | | | (75,839,312 | ) | | | 7,175,004 | |
| | | | | | | | |
Total increase/(decrease) in net assets | | | (86,642,972 | ) | | | 12,341,291 | |
| | | | | | | | |
| | |
NET ASSETS | | | | | | | | |
Beginning of period | | | 97,140,236 | | | | 84,798,945 | |
| | | | | | | | |
End of period. | | $ | 10,497,264 | | | $ | 97,140,236 | |
| | | | | | | | |
Accumulated net investment loss, end of period | | $ | (2,478,197 | ) | | $ | (1,477,683 | ) |
| | | | | | | | |
| | |
SHARE TRANSACTIONS: | | | | | | | | |
I Shares | | | | | | | | |
Shares sold | | | 478,785 | | | | 4,469,573 | |
Shares reinvested | | | 549,722 | | | | 239,354 | |
Shares redeemed | | | (8,693,987 | ) | | | (4,036,017 | ) |
| | | | | | | | |
Net increase/(decrease) in shares | | | (7,665,480 | ) | | | 672,910 | |
| | | | | | | | |
The accompanying notes are an integral part of the financial statements.
8
S1 FUND
STATEMENTOF CASH FLOWS
FORTHE SIX MONTHS ENDED
FEBRUARY 28, 2015
(UNAUDITED)
| | | | |
CASHFLOWSPROVIDEDBYOPERATINGACTIVITIES: | | | | |
Net decrease in net assets from operations | | $ | (5,656,269 | ) |
| |
Adjustments to reconcile net increase in net assets to net cash used in operating activities: | | | | |
Purchases of investments securities | | | (70,339,200 | ) |
Proceeds from disposition of long-term investments securities | | | 151,340,994 | |
Purchases to cover short sales | | | (81,474,635 | ) |
Proceeds from short sales | | | 36,774,559 | |
Net cost of purchased options | | | 199,655 | |
Proceeds from written options | | | 774,380 | |
Cost of closed and exercised options | | | (1,156,644 | ) |
Net amortization/(accretion) of premium/(discount) | | | 359 | |
Net realized gain on investments and investments sold short | | | (3,762,781 | ) |
Net change in unrealized appreciation on investments, investments sold short and written options | | | 8,570,429 | |
Decrease in deposits with brokers for securities sold short | | | 43,934,421 | |
Decrease in foreign currency deposits held with prime broker for securities sold short and written options | | | 516,976 | |
Decrease in dividend and interest receivable | | | 31,701 | |
Decrease in prepaid expenses and other assets | | | 22,452 | |
Decrease in foreign currency due to prime broker for securities sold short and written options | | | (7,133,350 | ) |
Decrease in dividends payable on securities sold short | | | (35,578 | ) |
Decrease in payable to investment advisor | | | (163,888 | ) |
Decrease in accrued expenses | | | (53,897 | ) |
| | | | |
Net cash used in operating activities | | | 72,389,684 | |
| | | | |
| |
CASHFLOWSFROMFINANCINGACTIVITIES: | | | | |
Decrease in due to prime broker payable | | | (13,865,246 | ) |
Net cost of fundshare activity | | | (79,950,391 | ) |
Distributions paid from realized capital gains | | | (205,395 | ) |
| | | | |
Net cash used by financing activities | | | (94,021,032 | ) |
| | | | |
Net decrease in cash and foreign currency | | | (21,631,348 | ) |
| |
CASH: | | | | |
Cash at beginning of the period | | | 32,800,143 | |
| | | | |
Cash at end of the period | | $ | 11,168,795 | |
| | | | |
| |
SUPPLEMENTALDISCLOSUREOFCASHFLOWINFORMATION: | | | | |
Cash paid during the period for interest expense | | $ | 130,383 | |
| | | | |
9
S1 FUND
FINANCIAL HIGHLIGHTS
Contained below is per share operating performance data for shares outstanding, total investment return, ratios to average net assets and other supplemental data for the respective periods. This information has been derived from information provided in the financial statements.
| | | | | | | | | | | | | | | | | | | | |
| | | I SHARES | |
| | | FORTHE
SIX MONTHS
ENDED
FEBRUARY 28, 2015
(UNAUDITED) | | | FORTHE
YEAR
ENDED
AUGUST 31, 2014 | | | FORTHE
YEAR
ENDED
AUGUST 31, 2013 | | | FORTHE
YEAR
ENDED
AUGUST 31, 2012 | | | FORTHE
PERIOD
ENDED
AUGUST 31, 2011(1) | |
PER SHARE OPERATING PERFORMANCE | | | | | | | | | | | | | | | | | | | | |
Net asset value, beginning of period | | $ | 10.99 | | | $ | 10.39 | | | $ | 10.06 | | | $ | 9.96 | | | $ | 10.00 | |
| | | | | | | | | | | | | | | | | | | | |
Net investment loss(2) | | | (0.17 | ) | | | (0.36 | ) | | | (0.29 | ) | | | (0.32 | ) | | | (0.29 | ) |
Net realized and unrealized gain/(loss) from investments | | | (0.61 | ) | | | 1.28 | | | | 0.64 | | | | 0.42 | | | | 0.25 | (3) |
| | | | | | | | | | | | | | | | | | | | |
Net increase/(decrease) in net assets resulting from operations | | | (0.78 | ) | | | 0.92 | | | | 0.35 | | | | 0.10 | | | | (0.04 | ) |
| | | | | | | | | | | | | | | | | | | | |
Dividends and distributions to shareholders from: | | | | | | | | | | | | | | | | | | | | |
Net realized gains | | | (1.25 | ) | | | (0.32 | ) | | | (0.02 | ) | | | — | | | | — | |
| | | | | | | | | | | | | | | | | | | | |
Total dividends and distributions to shareholders | | | (1.25 | ) | | | (0.32 | ) | | | (0.02 | ) | | | — | | | | — | |
| | | | | | | | | | | | | | | | | | | | |
Net asset value, end of period | | $ | 8.96 | | | $ | 10.99 | | | $ | 10.39 | | | $ | 10.06 | | | $ | 9.96 | |
| | | | | | | | | | | | | | | | | | | | |
Total investment
return(4) | | | (7.11 | )%(5) | | | 8.90 | % | | | 3.52 | % | | | 1.00 | % | | | (0.40 | )%(5) |
| | | | | | | | | | | | | | | | | | | | |
RATIOS/SUPPLEMENTAL DATA | | | | | | | | | | | | | | | | | | | | |
Net assets, end of period (000’s omitted) | | $ | 10,497 | | | $ | 97,140 | | | $ | 84,799 | | | $ | 64,289 | | | $ | 51,234 | |
Ratio of expenses to average net assets with waivers and reimbursements | | | | | | | | | | | | | | | | | | | | |
(including dividend and interest expense) | | | 3.99 | %(6) | | | 4.19 | % | | | 4.43 | % | | | 4.42 | % | | | 4.06 | %(6) |
Ratio of expenses to average net assets with waivers and reimbursements | | | | | | | | | | | | | | | | | | | | |
(excluding dividend and interest expense) | | | 2.95 | %(6) | | | 2.95 | % | | | 2.95 | % | | | 2.95 | % | | | 2.95 | %(6) |
Ratio of expenses to average net assets without waivers and reimbursements | | | | | | | | | | | | | | | | | | | | |
(including dividend and interest expense) | | | 4.71 | %(6) | | | 4.68 | % | | | 4.81 | % | | | 5.24 | % | | | 6.39 | %(6) |
Ratio of net investment loss to average net assets | | | (3.38 | )%(6) | | | (3.31 | )% | | | (2.76 | )% | | | (3.24 | )% | | | (3.16 | )%(6) |
Portfolio turnover rate | | | 156.86 | %(5) | | | 328.09 | % | | | 310.41 | % | | | 249.27 | % | | | 440.88 | %(5) |
| (1) | The Fund commenced investment operations on September 30, 2010. |
| (2) | Calculated based on average shares outstanding for the period. |
| (3) | The amount shown may not correlate with the change in the aggregate gains and losses due to the timing of sales and purchases of the Fund’s shares in relation to fluctuating market values for the Fund’s portfolio. |
| (4) | Total investment return is calculated assuming a purchase of shares on the first day and a sale of shares on the last day of each period reported and includes reinvestments of dividends and distributions, if any. |
The accompanying notes are an integral part of the financial statements.
10
S1 FUND
NOTES TO FINANCIAL STATEMENTS
FEBRUARY 28, 2015
(UNAUDITED)
1. ORGANIZATIONAND SIGNIFICANT ACCOUNTING POLICIES
The RBB Fund, Inc. (“RBB” or the “Company”) was incorporated under the laws of the State of Maryland on February 29, 1988 and is registered under the Investment Company Act of 1940, as amended, (the “1940 Act”) as an open-end management investment company. RBB is a “series fund,” which is a mutual fund divided into separate portfolios. Each portfolio is treated as a separate entity for certain matters under the 1940 Act, and for other purposes, and a shareholder of one portfolio is not deemed to be a shareholder of any other portfolio. Currently, RBB has twenty-two active investment portfolios, including the S1 Fund (the “Fund”), which commenced investment operations on September 30, 2010. The Fund offers two classes of shares, I Shares and R Shares. As of February 28, 2015, Class R Shares have not been issued.
RBB has authorized capital of one hundred billion shares of common stock of which 82.373 billion shares are currently classified into one hundred and fifty-three classes of common stock. Each class represents an interest in an active or inactive RBB investment portfolio.
On February 12, 2015, the Board of Directors of the Company approved a Plan of Liquidation and Termination (“Plan of Liquidation”) with respect to the Fund. Effective February 18, 2015, new account requests and exchanges into the Fund are no longer permissible, and all redemption fees are waived. Under the Plan of Liquidation, the effective date of liquidation and termination was on March 17, 2015 (the “Liquidation Date”). Consistent with the provisions of the Plan of Liquidation, the proportionate interests of shareholders in the assets of the Fund and their rights to receive liquidating distributions will be fixed on the basis of the shareholders of the Fund as of the close of business on the Liquidation Date.
PORTFOLIO VALUATION — The Fund’s net asset value (“NAV”) is calculated once daily at the close of regular trading hours on the New York Stock Exchange (“NYSE”) (generally 4:00 p.m. Eastern time) on each day the NYSE is open. Securities held by the Fund are valued using the closing price or the last sale price on a national securities exchange or the National Association of Securities Dealers Automatic Quotation System (“NASDAQ”) market system where they are primarily traded. Equity securities traded in the over-the-counter (“OTC”) market are valued at their closing prices. If there were no transactions on that day, securities traded principally on an exchange or on NASDAQ will be valued at the mean of the last bid and ask prices prior to the market close. Fixed income securities having a remaining maturity of greater than 60 days are valued using an independent pricing service, which considers such factors as security prices, yields, maturities and ratings, and are deemed representative of market values at the close of the market. Fixed income securities having a remaining maturity of 60 days or less are valued at amortized cost, which approximates market value. Foreign securities are valued based on prices from the primary market in which they are traded, and are translated from the local currency into U.S. dollars using current exchange rates. Options for which the primary market is a national securities exchange are valued at the last sale price on the exchange on which they are traded, or, in the absence of any sale, will be valued at the mean of the last bid and ask prices prior to the market close. Options not traded on a national securities exchange are valued at the last quoted bid price for long option positions and the closing ask price for short option positions. If market quotations are unavailable or deemed unreliable, securities will be valued in accordance with procedures adopted by the Company’s Board of Directors. Relying on prices supplied by pricing services or dealers or using fair valuation may result in values that are higher or lower than the values used by other investment companies and investors to price the same investments. The Fund may use fair value pricing more frequently for securities traded primarily in non-U.S. markets because, among other things, most foreign markets close well before the Fund values its securities, generally as of 4:00 p.m. Eastern time. The earlier close of these foreign markets gives rise to the possibility that significant events, including broad market moves, government actions or pronouncements, aftermarket trading, or news events may have occurred in the interim. To account for this, the Fund may value foreign securities using fair value prices based on third-party vendor modeling tools (international fair value pricing).
11
S1 FUND
NOTES TO FINANCIAL STATEMENTS
FEBRUARY 28, 2015
(UNAUDITED) (CONTINUED)
FAIR VALUE MEASUREMENTS — The inputs and valuations techniques used to measure fair value of the Fund’s investments are summarized into three levels as described in the hierarchy below:
| | |
| | • Level 1 – quoted prices in active markets for identical securities; |
| | • Level 2 – other significant observable inputs (including quoted prices for similar securities, interest rates, prepayment speeds, credit risk, etc.); and |
| | • Level 3 – significant unobservable inputs (including the Fund’s own assumptions in determining the fair value of investments). |
The inputs or methodology used for valuing securities are not necessarily an indication of the risk associated with investing in those securities.
The following is a summary of the inputs used, as of February 28, 2015, in valuing the Fund’s investments carried at fair value:
| | | | | | | | | | | | |
| | | TOTAL FAIR VALUE AT
FEBRUARY 28, 2015 | | | LEVEL 1
QUOTED
PRICE | | LEVEL 2
SIGNIFICANT
OBSERVABLE
INPUTS | | | LEVEL 3
SIGNIFICANT
UNOBSERVABLE
INPUTS |
Foreign Government Note | | $ | 8,146 | | | $— | | $ | 8,146 | | | $— |
U.S. Treasury Note | | | 102,648 | | | — | | | 102,648 | | | — |
Total Assets | | $ | 110,794 | | | $— | | $ | 110,794 | | | $— |
| |
At the end of each quarter, management evaluates the classification of Levels 1, 2 and 3 assets and liabilities. Various factors are considered, such as changes in liquidity from the prior reporting period; whether or not a broker is willing to execute at the quoted price; the depth and consistency of prices from third party pricing services; and the existence of contemporaneous, observable trades in the market. Additionally, management evaluates the classification of Level 1 and Level 2 assets and liabilities on a quarterly basis for changes in listings or delistings on national exchanges.
Due to the inherent uncertainty of determining the fair value of investments that do not have a readily available market value, the fair value of the Fund’s investments may fluctuate from period to period. Additionally, the fair value of investments may differ significantly from the values that would have been used had a ready market existed for such investments and may differ materially from the values the Fund may ultimately realize. Further, such investments may be subject to legal and other restrictions on resale or otherwise less liquid than publicly traded securities.
For fair valuations using significant unobservable inputs, U.S. generally accepted accounting principles (“U.S. GAAP”) require the Fund to present a reconciliation of the beginning to ending balances for reported market values that presents changes attributable to total realized and unrealized gains or losses, purchase and sales, and transfers in and out of Level 3 during the period. Transfers in and out between Levels are based on values at the end of the period. U.S. GAAP also requires the Fund to disclose amounts and reasons for all transfers in and out of Level 1 and Level 2 fair value measurements. A reconciliation of Level 3 investments is presented only when the Fund had an amount of Level 3 investments at the end of the reporting period that was meaningful in relation to its net assets. The amounts and reasons for all transfers in and out of each Level within the three-tier hierarchy are disclosed when the Fund had an amount of total transfers during the reporting period that was meaningful in relation to its net assets as of the end of the reporting period.
For the six months ended February 28, 2015, the Fund had no significant transfers between Levels 1, 2 and 3.
12
S1 FUND
NOTES TO FINANCIAL STATEMENTS
FEBRUARY 28, 2015
(UNAUDITED) (CONTINUED)
DISCLOSURESABOUT DERIVATIVE INSTRUMENTSAND HEDGING ACTIVITIES
The following tables provide quantitative disclosures about amounts of gains and losses on the Fund’s derivative instruments as of February 28, 2015.
The following table lists the amounts of realized gains or losses included in net increase in net assets resulting from operations for the six months ended February 28, 2015, grouped by contract type and risk exposure.
| | | | | | |
| DERIVATIVE TYPE | | INCOME STATEMENT
LOCATION | | EQUITY
CONTRACTS | | TOTAL |
| | | Realized Gain (Loss) | | | | |
Purchased Options | | Net realized gain (loss) from Investments | | $(973,068) | | $(973,068) |
Written Options | | Net realized gain (loss) from Written Options | | (192,104) | | (192,104) |
Total Realized Gain (Loss) | | | | $(1,165,172) | | $(1,165,172) |
The following table lists the amounts of change in unrealized appreciation (depreciation) included in net increase in net assets resulting from operations for the six months ended February 28, 2015, grouped by contract type and risk exposure.
| | | | | | | | | | |
| DERIVATIVE TYPE | | INCOME STATEMENT
LOCATION | | EQUITY
CONTRACTS | | | TOTAL | |
| | | Change in appreciation (depreciation) | | | | | | |
Purchased Options | | Net change in unrealized appreciation
(depreciation) on Investments | | $ | 305,666 | | | $ | 305,666 | |
Written Options | | Net change in unrealized appreciation
(depreciation) on Written Options | | | 36,123 | | | | 36,123 | |
Total change in appreciation (depreciation) | | | | $ | 341,789 | | | $ | 341,789 | |
For the six months ended February 28, 2015, the Fund’s average volume of derivatives is as follows:
| | |
PURCHASED
OPTIONS
(COST) | | WRITTEN
OPTIONS
(PROCEEDS) |
$489,587 | | $152,836 |
USEOF ESTIMATES — The Fund is an investment company and, accordingly, follows the investment company accounting and reporting guidance under U.S. GAAP. The preparation of financial statements in conformity with U.S. GAAP requires management to make estimates and assumptions that affect the reported amounts of assets and liabilities and disclosure of contingent assets and liabilities at the date of the financial statements and the reported amounts of revenues and expenses during the period. Actual results could differ from those estimates and those differences could be significant.
INVESTMENT TRANSACTIONS,INVESTMENT INCOMEAND EXPENSES — The Fund records security transactions based on trade date for financial reporting purposes. The cost of investments sold is determined by use of the specific identification method for both financial reporting and income tax purposes in determining realized gains and losses on investments. Interest income is accrued when earned. Dividend income is recorded on the ex-dividend date. Distributions received on securities that represent a return of capital or capital gains are recorded as a reduction of cost of investments
13
S1 FUND
NOTES TO FINANCIAL STATEMENTS
FEBRUARY 28, 2015
(UNAUDITED) (CONTINUED)
and/or as a realized gain. Expenses incurred on behalf of a specific class, fund or fund family are charged directly to the class, fund or fund family to each class of shares based upon the relative proportion of net assets of each class at the beginning of the day. Expenses incurred for all the RBB funds (such as director or professional fees) are charged to all funds in proportion to their average net assets of RBB, or in such other manner as the Company’s Board of Directors deems fair or equitable. Expenses and fees, including investment advisory and administration fees, are accrued daily and taken into account for the purpose of determining the NAV of the Fund.
DIVIDENDSAND DISTRIBUTIONSTO SHAREHOLDERS — Dividends from net investment income and distributions from net realized capital gains, if any, are declared and paid at least annually to shareholders and recorded on ex-dividend date. Income dividends and capital gain distributions are determined in accordance with U.S. federal income tax regulations which may differ from U.S. GAAP.
U.S. TAX STATUS — No provision is made for U.S. income taxes as it is the Fund’s intention to qualify for and elect the tax treatment applicable to regulated investment companies under Subchapter M of the Internal Revenue Code of 1986, as amended, and make the requisite distributions to its shareholders which will be sufficient to relieve it from U.S. income and excise taxes.
FOREIGN CURRENCY TRANSLATION — Assets and liabilities initially expressed in non-U.S. currencies are translated into U.S. dollars based on the applicable exchange rates at the date of the last business day of the financial statement period. Purchases and sales of securities, interest income, dividends, variation margin received and expenses denominated in foreign currencies are translated into U.S. dollars at the exchange rates in effect on the transaction date.
The Fund does not separately report the effect of changes in foreign exchange rates from changes in market prices of securities held. Such changes are included with the net realized gain or loss and change in unrealized appreciation or depreciation on investment securities in the Statement of Operations. Other foreign currency transactions resulting in realized and unrealized gain or loss are reported separately as net realized gain or loss and change in unrealized appreciation or depreciation on foreign currencies in the Statement of Operations.
CURRENCY RISK — The Fund invests in securities of foreign issuers, including American Depositary Receipts. These markets are subject to special risks associated with foreign investments not typically associated with investing in U.S. markets. Because the foreign securities in which the Fund may invest generally trade in currencies other than the U.S. dollar, changes in currency exchange rates will affect the Fund’s NAV, the value of dividends and interest earned and gains and losses realized on the sale of securities. Because the NAV for the Fund is determined on the basis of U.S. dollars, the Fund may lose money by investing in a foreign security if the local currency of a foreign market depreciates against the U.S. dollar, even if the local currency value of the Fund holdings goes up. Generally, a strong U.S. dollar relative to these other currencies will adversely affect the value of the Fund holdings in foreign securities.
FOREIGN SECURITIES — Securities of many non-U.S. companies may be less liquid and their prices more volatile than securities of comparable U.S. companies. Securities of companies traded in many countries outside the U.S., particularly emerging markets countries, may be subject to further risks due to the inexperience of local investment professionals and financial institutions, the possibility of permanent or temporary termination of trading and greater spreads between bid and asked prices of securities. In addition, non-U.S. stock exchanges and investment professionals are subject to less governmental regulation, and commissions may be higher than in the United States. Also, there may be delays in the settlement of non-U.S. stock exchange transactions.
PURCHASED OPTIONS — The Fund is subject to equity and other risk exposure in the normal course of pursuing its investment objectives. The Fund purchases option contracts. This transaction is used to hedge against changes in interest rates, foreign exchange rates and values of equities. The risk associated with purchasing an option is that the Fund pays a premium whether or not the option is exercised. Additionally, the Fund bears the risk of loss of premium and change in market value should the counterparty not perform under the contract. Put and call options are accounted
14
S1 FUND
NOTES TO FINANCIAL STATEMENTS
FEBRUARY 28, 2015
(UNAUDITED) (CONTINUED)
for in the same manner as other securities owned. The cost of securities acquired through the exercise of call options is increased by the premiums paid. The proceeds from securities sold through the exercise of put options are decreased by the premiums paid.
OPTIONS WRITTEN — The Fund is subject to equity and other risk exposure in the normal course of pursuing its investment objectives and may enter into options written to hedge against changes in interest rates, foreign exchange rates and values of equities. Such options may relate to particular securities or domestic stock indices, and may or may not be listed on a domestic securities exchange or issued by the Options Clearing Corporation. An option contract is a commitment that gives the purchaser of the contract the right, but not the obligation, to buy or sell an underlying asset at a specific price on or before a specified future date. On the other hand, the writer of an option contract is obligated, upon the exercise of the option, to buy or sell an underlying asset at a specific price on or before a specified future date. The maximum risk of loss associated with writing put options is limited to the exercised fair value of the option contract. The maximum risk of loss associated with writing call options is potentially unlimited. The Fund also has the additional risk of being unable to enter into a closing transaction at an acceptable price if a liquid secondary market does not exist. The Fund also may write OTC options where completing the obligation depends upon the credit standing of the other party. Option contracts also involve the risk that they may result in loss due to unanticipated developments in market conditions or other causes. Written options are initially recorded as liabilities to the extent of premiums received and subsequently marked to market to reflect the current value of the option written. Gains or losses are realized when the option transaction expires or closes. When an option is exercised, the proceeds on sales for a written call option or the purchase cost for a written put option is adjusted by the amount of the premium received. Listed option contracts present minimal counterparty credit risk since they are exchange traded and the exchange’s clearinghouse, as counterparty to all exchange-traded options, guarantees the options against default. A Fund’s maximum risk of loss from counterparty credit risk related to OTC option contracts is limited to the premium paid.
As of February 28, 2015, the Fund had no options written.
The Fund had transactions in options written during the six months ended February 28, 2015 as follows:
| | | | | | | | | | |
| | | NUMBEROF
CONTRACTS | | PREMIUMS
RECEIVED |
Options outstanding at
August 31, 2014 | | | | 5,326 | | | | $ | 382,264 | |
Options written | | | | 8,830 | | | | | 774,380 | |
Options closed | | | | (9,485 | ) | | | | (939,554 | ) |
Options expired | | | | (4,671 | ) | | | | (217,090 | ) |
| | | | | | | | | | |
Options outstanding at
February 28, 2015 | | | | — | | | | $ | — | |
| | | | | | | | | | |
SHORT SALES — When the investment adviser or a sub-adviser believes that a security is overvalued, the Fund may sell the security short by borrowing the same security from a broker or other institution and selling the security. The Fund will incur a loss as a result of a short sale if the price of the borrowed security increases between the date of the short sale and the date on which the Fund buys and replaces such borrowed security. The Fund will realize a gain if there is a decline in price of the security between those dates where the decline in price exceeds the costs of borrowing the security and other transaction costs. There can be no assurance that the Fund will be able to close out a short position at any particular time or at an acceptable price. Although the Fund’s gain is limited to the amount at which it sold a security short, its potential loss is unlimited. Until the Fund replaces a borrowed security, it will maintain at all times cash, U.S. Government securities, or other liquid securities in an amount which, when added to any amount deposited with a broker as collateral, will at least equal the current market value of the security sold
15
S1 FUND
NOTES TO FINANCIAL STATEMENTS
FEBRUARY 28, 2015
(UNAUDITED) (CONTINUED)
short. Depending on arrangements made with brokers, the Fund may not receive any payments (including interest) on collateral deposited with them.
In accordance with the terms of its prime brokerage agreements, the Fund may receive rebate income or be charged a fee on borrowed securities. Such income or fee is calculated on a daily basis based upon the market value of each borrowed security and a variable rate that is dependent upon the availability of such security. The Fund records these prime broker charges on a net basis as interest income or interest expense. For the six months ended February 28, 2015, the Fund had net charges of $88,185 on borrowed securities. Such amounts are included in prime broker interest expense on the Statement of Operations.
As of February 28, 2015, the Fund had no securities sold short. In accordance with the Special Custody and Pledge Agreement with Goldman Sachs & Co. (“Goldman Sachs”) (the Fund’s prime broker), the Fund may borrow from Goldman Sachs to the extent necessary to maintain required margin cash deposits on short positions. Interest on such borrowings is charged to the Fund based on the LIBOR rate plus an agreed upon spread.
The Fund utilized cash borrowings from Goldman Sachs to meet required margin cash deposits as follows during the six months ended February 28, 2015:
| | | | | | | | |
DAYS
UTILIZED | | AVERAGE DAILY
BORROWINGS | | | WEIGHTED AVERAGE
INTEREST RATE |
166 | | CAD | | | 701,865 | | | 1.52% |
6 | | CHF | | | 1 | | | 0.00% |
179 | | EUR | | | 1,774,083 | | | 0.51% |
175 | | GBP | | | 1,351,510 | | | 0.98% |
182 | | JPY | | | 41,005 | | | 0.64% |
1 | | MXN | | | 1 | | | 0.00% |
177 | | USD | | | 8,020,963 | | | 0.63% |
As of February 28, 2015, the Fund had borrowings of $1,985. Interest expense on cash borrowings for the six months ended February 28, 2015 totaled $42,127.
FUTURES CONTRACTS — The Fund is subject to equity and other risk exposure in the normal course of pursuing its investment objectives. The Fund may use futures contracts for hedging or speculative purposes consistent with its investment objective. Upon entering into a futures contract, the Fund must deposit initial margin in addition to segregating cash or liquid assets sufficient to meet its obligation to purchase or provide securities, or to pay the amount owed at the expiration of an index-based futures contract. Such liquid assets may consist of cash, cash equivalents, liquid debt or equity securities or other acceptable assets. Pursuant to the futures contract, the Fund agrees to receive from, or pay to the broker, an amount of cash equal to the daily fluctuation in value of the contract. Such a receipt of payment is known as “variation margin” and is recorded by the Fund as an unrealized gain or loss. When the contract is closed, the Fund records a realized gain or loss equal to the difference between the proceeds from (or cost of) the closing transactions and the Fund’s basis in the contract. Futures contracts have market risks, including the risk that the change in the value of the contract may not correlate with changes in the value of the underlying securities. Use of long futures contracts subjects the Fund to risk of loss in excess of the amount shown on the Statement of Assets and Liabilities, up to the notional value of the futures contract. Use of short futures contracts subjects the Fund to unlimited risk of loss. During the six months ended February 28, 2015, the Fund did not enter into any futures contracts.
FORWARD FOREIGN CURRENCY CONTRACTS — In the normal course of pursuing its investment objectives, the Fund is subject to foreign investment and currency risk. The Fund may enter into forward foreign currency contracts (“forward contracts”) for purposes of hedging, duration management, as a substitute for securities, to increase returns, for currency hedging or risk management, or to otherwise help achieve the Fund’s investment goal. These contracts
16
S1 FUND
NOTES TO FINANCIAL STATEMENTS
FEBRUARY 28, 2015
(UNAUDITED) (CONTINUED)
are marked-to-market daily at the applicable translation rates. The Fund records realized gains or losses at the time the forward contract is closed. A forward contract is extinguished through a closing transaction or upon delivery of the currency or entering an offsetting contract. Risks may arise upon entering these contracts from the potential inability of a counterparty to meet the terms of their contracts and from unanticipated movements in the value of a foreign currency relative to the U.S. dollar or other currencies. During the six months ended February 28, 2015, the Fund did not enter into any forward contracts.
CASHAND CASH EQUIVALENTS — The Fund considers liquid assets deposited into bank demand deposit accounts to be cash equivalents. These investments represent amounts held with financial institutions that are readily accessible to pay Fund expense or purchase investments. Cash and cash equivalents are valued at cost plus accrued interest, which approximates market value.
OTHER — In the normal course of business, the Fund may enter into contracts that provide general indemnifications. The Fund’s maximum exposure under these arrangements is dependent on claims that may be made against the Fund in the future, and, therefore, cannot be estimated; however, based on experience, the risk of material loss from such claims is considered remote.
2. INVESTMENT ADVISERAND OTHER SERVICES
Simple Alternatives, LLC (“Simple Alternatives” or the “Adviser”) serves as the Fund’s investment adviser. For its advisory services, the Adviser is entitled to receive a monthly fee from the Fund calculated at an annual rate of 2.75% of the Fund’s average daily net assets.
The Adviser has contractually agreed to forgo all or a portion of its advisory fee and/or reimburse expenses in a aggregate amount equal to the amount by which the total annual Fund operating expenses (other than acquired fund fees and expenses, short sale dividend expenses, brokerage commissions, litigation, extraordinary items, interest or taxes and any other items as agreed upon by the Company and the Adviser from time to time) exceed 2.95% of the average daily net assets of the Fund’s I Shares and 3.20% of the average daily net assets of the Fund’s R Shares, respectively. This contractual limitation is in effect until at least December 31, 2015 and may not be terminated prior to December 31, 2015 without approval by the Company’s Board of Directors. If at any time during the first three years the Fund’s Advisory Agreement with the Adviser is in effect, the Fund’s total annual Fund operating expenses for that year are less than 2.95% or 3.20%, as applicable, the Adviser is entitled to reimbursement by the Fund of the advisory fees forgone and other payments remitted by the Adviser to the Fund during such three-year period if such reimbursement by the Fund does not cause the Fund to exceed existing expense limitations. For the six months ended February 28, 2015, investment advisory fees accrued and waived were $813,791 and $214,546, respectively. As of February 28, 2015, the amount of potential recovery by the Adviser was as follows:
| | | | | | |
EXPIRATION |
2015 | | 2016 | | 2017 | | 2018 |
$472,047 | | $288,049 | | $425,749 | | $214,546 |
No recovery is expected due to the pending liquidation and termination of the Fund (Note 1).
Simple Alternatives has currently retained the services of Roaring Blue Lion Capital Management, LLC; Courage Capital Management, LLC; Garelick Capital Partners, L.P.; Maerisland Capital, LLC; Sonica Capital LLC; and Starwood Real Estate Securities, LLC as sub-advisers (each a “Sub-Adviser”) of the Fund. Pursuant to sub-advisory agreements between the Adviser and each Sub-Adviser, each Sub-Adviser manages the investment and reinvestment of the portion of the Fund’s portfolio allocated to it by the Adviser. The Fund is not required to invest with any minimum number of Sub-Advisers, and does not have minimum or maximum limitations with respect to allocations of assets to any Sub-Adviser. The Sub-Advisers are compensated by the Adviser and not by the Fund.
17
S1 FUND
NOTES TO FINANCIAL STATEMENTS
FEBRUARY 28, 2015
(UNAUDITED) (CONTINUED)
BNY Mellon Investment Servicing (US) Inc. (“BNY Mellon”) serves as administrator for the Fund. For providing administrative and accounting services, BNY Mellon is entitled to receive a monthly fee equal to an annual percentage rate of the Fund’s average daily net assets, subject to certain minimum monthly fees.
Included in the administration and accounting service fees, shown on the Statement of Operations, are fees for providing regulatory administration services to RBB.
In addition, BNY Mellon serves as the Fund’s transfer and dividend disbursing agent. For providing transfer agent services, BNY Mellon is entitled to receive a monthly fee, subject to certain minimum, and out of pocket expenses.
The Bank of New York Mellon (the “Custodian”) provides certain custodial services to the Fund. The Custodian is entitled to receive a monthly fee, subject to certain minimum, and out of pocket expenses.
Foreside Funds Distributors LLC serves as the principal underwriter and distributor of the Fund’s shares pursuant to a Distribution Agreement with RBB.
3. DIRECTOR COMPENSATION
The Directors of the Company receive an annual retainer and meeting fees for meetings attended. The remuneration paid to the Directors by the Fund during the six months ended February 28, 2015 was $4,715. Certain employees of BNY Mellon serve as an Officer or Director of the Company. They are not compensated by the Fund or the Company.
4. INVESTMENTIN SECURITIES
For the six months ended February 28, 2015, aggregate purchases and sales of investment securities (excluding short-term investments) of the Fund were as follows:
| | | | |
| | | PURCHASES | | SALES |
Investments in Non-U.S. Government Securities | | $67,487,849 | | $145,557,425 |
5. FEDERAL INCOME TAX INFORMATION
The Fund has followed the authoritative guidance on accounting for and disclosure of uncertainty in tax positions, which requires the Fund to determine whether a tax position is more likely than not to be sustained upon examination, including resolution of any related appeals or litigation processes, based on the technical merits of the position. The Fund has determined that there was no effect on the financial statements from following this authoritative guidance. In the normal course of business, the Fund is subject to examination by federal, state and local jurisdictions, where applicable, for tax years for which applicable statutes of limitations have not expired.
As of February 28, 2015, federal tax cost, aggregate gross unrealized appreciation and depreciation of securities held by the Fund were as follows:
| | | | | | |
FEDERAL TAX COST | | UNREALIZED
APPRECIATION | | UNREALIZED
DEPRECIATION | | NET
UNREALIZED
APPRECIATION |
$110,795 | | $1,886 | | $(1,887) | | $(1) |
Distributions to shareholders from net investment income and realized gains are determined in accordance with federal income tax regulations, which may differ from net investment income and realized gains recognized for financial reporting purposes. Accordingly, the character of distributions and composition of net assets for tax purposes may differ from those reflected in the accompanying financial statements. To the extent these differences are permanent, such amounts are reclassified within the capital accounts based on the tax treatment; temporary differences do not require such reclassification.
18
S1 FUND
NOTES TO FINANCIAL STATEMENTS
FEBRUARY 28, 2015
(UNAUDITED) (CONCLUDED)
As of August 31, 2014, the components of distributable earnings on a tax basis were as follows:
| | | | | | | | |
UNDISTRIBUTED
ORDINARY INCOME | | UNDISTRIBUTED
LONG-TERM GAINS | | UNREALIZED
APPRECIATION | | QUALIFIED
LATE-YEAR
LOSSES | | OTHER TEMPORARY
DIFFERENCES |
$— | | $4,053,329 | | $6,657,886 | | $(1,401,922) | | $— |
The differences between the book and tax basis components of distributable earnings relate principally to the timing of recognition of income and gains for federal income tax purposes. Short-term and foreign currency gains are reported as ordinary income for federal income tax purposes.
Pursuant to federal income tax rules applicable to regulated investment companies, the Fund may elect to treat certain capital losses between November 1 and August 31 and late year ordinary losses ((i) ordinary losses between January 1 and August 31, and (ii) specified ordinary and currency losses between November 1 and August 31) as occurring on the first day of the following tax year. For the year ended August 31, 2014, any amount of losses elected within the tax return will not be recognized for federal income tax purposes until September 1, 2014.
Under the Regulated Investment Company Modernization Act of 2010, the Fund is permitted to carry forward capital losses incurred in taxable years beginning after December 22, 2010 for an unlimited period. Any losses incurred during those future taxable years will be required to be utilized prior to any losses incurred in pre-enactment taxable years. Additionally, post-enactment capital losses that are carried forward will retain their character as either short-term or long-term capital losses rather than being considered all short-term as under the previous law. As of August 31, 2014, the Fund had no capital loss carryforwards.
6. SUBSEQUENT EVENTS
Management has evaluated the impact of all subsequent events on the Fund through the date the financial statements were issued, and has determined that there was the following subsequent event:
As described in Note 1, the Board of Directors of the Company approved a Plan of Liquidation of the Fund, pursuant to which the Fund was liquidated on March 17, 2015.
19
S1 FUND
OTHER INFORMATION
(UNAUDITED)
PROXY VOTING
Policies and procedures that the Fund uses to determine how to vote proxies relating to portfolio securities as well as information regarding how the Fund voted proxies relating to portfolio securities for the most recent 12-month period ended June 30 are available without charge, upon request, by calling (866) 882-1226 and on the Securities and Exchange Commission’s (“SEC”) website at http://www.sec.gov.
QUARTERLY PORTFOLIO SCHEDULES
The Company files its complete schedule of portfolio holdings with the SEC for the first and third fiscal quarters of each fiscal year (quarters ended November 30 and May 31) on Form N-Q. The Company’s Form N-Q is available on the SEC website at http://www.sec.gov and may be reviewed and copied at the SEC Public Reference Room in Washington, D.C. Information on the operation of the SEC Public Reference Room may be obtained by calling (800) SEC-0330.
20
[THIS PAGE INTENTIONALLY LEFT BLANK]
[THIS PAGE INTENTIONALLY LEFT BLANK]
Investment Adviser
Simple Alternatives, LLC
90 Grove Street
Suite 205
Ridgefield, CT 06877
Administrator
BNY Mellon Investment Servicing (US) Inc.
301 Bellevue Parkway
Wilmington, DE 19809
Transfer Agent
BNY Mellon Investment Servicing (US) Inc.
4400 Computer Drive
Westborough, MA 01581
Principal Underwriter
Foreside Funds Distributors LLC
400 Berwyn Park
899 Cassatt Road
Berwyn, PA 19312
Custodian
The Bank of New York Mellon
One Wall Street
New York, NY 10286
Independent Registered Public Accounting Firm
Ernst & Young LLP
One Commerce Square
2005 Market Street, Suite 700
Philadelphia, PA 19103
Counsel
Drinker Biddle & Reath LLP
One Logan Square, Ste. 2000
Philadelphia, PA 19103-6996
of the RBB Fund, Inc.
Schneider Small Cap Value Fund
Schneider Value Fund
|
|
SEMI-ANNUAL REPORT February 28, 2015 (Unaudited) |

This report is submitted for the general information of the shareholders of the Funds. It is not authorized for distribution unless preceded or accompanied by a current prospectus for the Funds.
THE SCHNEIDER FUNDS
Semi-Annual Investment Adviser’s Report
February 28, 2015
(Unaudited)
Fellow Shareholder:
The semi-annual report for the Schneider Funds covers the six months ended February 28, 2015.
Investment Review
The U.S. economy is showing signs of moving out of the slow growth trajectory of the last five years. Meanwhile, the U.S. dollar has strengthened against all major currencies. Signs of economic growth are beginning to sprout in Europe, helped in part by the large quantitative easing program recently enacted by the European Central Bank (the “ECB”), while China, the former growth engine of the world, is experiencing an economic slowdown.
The Small Cap Value Fund returned -10.31% for the six-month period ended February 28, 2015 (see table on page 3). The Value Fund posted a -2.72% return during the same period (see table on page 4). Both of the funds trailed their respective indexes.
In what we believe is a fairly valued market, we are finding compelling investment opportunities with significant upside potential, and we maintain high expectations for our portfolio holdings as a whole.
After modest growth in 2014, the current housing season is showing signs of vibrancy. The mid-single digit price increases compared to last year appear to be holding. Trends are turning positive as an improving employment picture and better wage growth are helping millennials, the key demographic in the first-time home buyer market, leave their parent’s basement and strike out on their own. Low mortgage rates, and a slight easing of credit standards, are also supporting demand.
New single family home construction in 2015 is expected to be in the 750,000-800,000 unit range, well below the normal level of over 1 million units per year. As the economy continues to improve and demand strengthens, the housing industry can expect to see strong growth in new builds for several years as this gap is closed. Prospectively, continued improvement in the economy will buoy the housing market and builders should see strong revenue growth and operating leverage as construction activity expands and higher prices are more easily absorbed by the market.
The regional banks have, by and large, weathered the recent market challenges better than the bigger banks. While the regulators are requiring even greater levels of capital for the money center banks, regional and community banks face a less restrictive regulatory backdrop. In addition, the continuation of benign credit trends, lower charge-offs related to the housing crisis and improved loan growth have helped stabilize the regional banks. Loan growth is expanding across all geographic regions and economic sectors, with particular strength in the commercial and industrial category. Also, there is renewed interest for mergers and acquisitions which can be supportive of valuations. All banks continue to face net interest margin pressure, which is suppressing net income; however, when the pending Federal Reserve rate hike finally occurs, their net interest margins will begin to rise.
The energy industry has been overwhelmed by the short-term collapse in oil and natural gas prices, which has obscured oil’s positive long-term fundamental backdrop. While the large, integrated oil companies presently discount a much rosier commodity price outlook and have offered shell-shocked investors a bastion of safety amid the tumult, the dramatic decline in the price of oil and gas has decimated the domestic E&P (Exploration and Production) and oil services industries where we had a moderate exposure. Valuations for many of these companies have returned to levels not seen since 2009, in stark contrast to the rest of the market which has more than doubled since then.
With the energy industry and many of its companies trading at multi-year lows, our belief is that energy is as cheap as it has ever been. A reversal in sentiment in which investor focus has shifted from resource upside potential to balance sheet preservation has resulted in an extensive list of attractively valued companies. Even those companies with healthier balance sheets, seasoned management teams, desirable assets, and leading technology platforms have experienced sizeable reductions in their valuations. We have been selectively adding names to the Funds’ portfolio, focusing on those companies with staying power that appear to have been indiscriminately abandoned with little or no consideration for the quality of their assets and their ability to navigate challenging environments. This compression in value (both absolute and relative), we believe, creates tremendous opportunities for those investors who have a longer-term investment horizon.
Outlook
The U.S. economy has operated at a higher growth rate in the last few quarters than the first five years of the recovery as evidenced by a healthier employment picture and estimates of 2.7% real GDP growth for 2015. Small businesses, that are responsible for the majority of the hiring and economic activity, continue to heal after lagging their larger brethren. Domestically-focused small businesses may have an advantage versus their multi-national competitors, which must address the effects of a surging U.S. dollar on their foreign earnings and operations.
The impact of a strong dollar is materially affecting some industries: for example, the U.S. steel industry is under tremendous pressure as exports decline and the competition from less expensive imports draws buyer attention. Conversely, imported Japanese auto
1
THE SCHNEIDER FUNDS
Semi-Annual Investment Adviser’s Report (Continued)
February 28, 2015
(Unaudited)
lines are enjoying increased interest from U.S. consumers as imports become more affordable. When the U.S. Federal Reserve begins to raise rates later this year, (as we expect) demand for the dollar could increase and with it the potential to further exacerbate the strength of the currency.
While long-term U.S. interest rates are at very low levels, the interest rates in other major economies are even lower. The spread between the U.S. 10-Year Treasury bond and the German 10-year Bund is at a 25 year high, partly due to the ECB’s quantitative easing program. In addition to the benefits of low rates, the strong dollar and lower oil prices are helping Europe crawl out of its recent anemic economic growth pattern. Numerous emerging markets are in a more conventional easing mode as well. This should help their economic growth, although China may not benefit due to its structural problems.
After growing over 1 million barrels per day in 2014, U.S. oil production is in the process of plateauing. U.S. E&P companies, which are among the world’s low cost producers, also have the shortest investment cycles and have begun to significantly rein in capital expenditure budgets. With the domestic oil rig count having been cut in half and the gas rig count at its lowest level since at least 1987, the pace of U.S. production growth will slow and could begin to sequentially decline. In addition, lower prices will eventually begin to affect global production as the inherent lags in the drilling and completion process pass with time, further limiting supply and paving the way for a rebound in commodity prices.

Arnold C. Schneider III, CFA
Portfolio Manager
Schneider Capital Management
2
THE SCHNEIDER FUNDS
SCHNEIDER SMALL CAP VALUE FUND
Performance Data
February 28, 2015 (Unaudited)
| | | | | | | | | | | | | | | | | | | | |
| Total Returns for the Periods Ended February 28, 2015 | |
| | | | | | Average Annual | |
| | | Six
Months* | | | One Year | | | Five Years | | | Ten Years | | | Since
Inception** | |
Schneider Small Cap Value | | | -10.31% | | | | -13.69% | | | | 8.35% | | | | 3.73% | | | | 13.52% | |
Russell 2000® Value Index | | | 2.31% | | | | 3.96% | | | | 13.97% | | | | 7.13% | | | | 9.94% | |
* Not Annualized ** Inception date 9/2/98 | | | | | | | | | | | | | | | | | | | | |
The performance data quoted represents past performance. Past performance is not indicative of future results. Investment return and principal value will fluctuate so that an investor’s shares, when redeemed, may be worth more or less than their original cost. Current performance may be lower or higher. Schneider Capital Management Company, the Fund’s investment adviser, has contractually agreed to waive management fees and/or reimburse expenses through December 31, 2015, to the extent that total annual Fund operating expenses (excluding acquired fund fees and expenses, brokerage commissions, extraordinary items, interest and taxes) exceed 1.15%. Total returns shown include fee waivers and expense reimbursements, if any; total returns would have been lower had there been no waiver or reimbursement of fees and expenses in excess of expense limitations. Returns shown include the reinvestment of all dividends and other distributions and do not reflect taxes that a shareholder would pay on Fund distributions or on the redemption of Fund shares. For performance data current to the most recent month-end, please call 1-888-520-3277. The Fund’s gross and net annual operating expenses, as stated in the current prospectus, are 1.52% and 1.15%, respectively. Shares of the Fund not purchased through reinvested dividends or capital gains and held less than one year are subject to a 1.75% redemption fee.
Small company stocks are generally riskier than large company stocks due to greater volatility and less liquidity.
Value investing involves the risk that the Fund’s investment in companies whose securities are believed to be undervalued, relative to their underlying profitability, will not appreciate in value as anticipated.
3
THE SCHNEIDER FUNDS
SCHNEIDER VALUE FUND
Performance Data
February 28, 2015 (Unaudited)
| | | | | | | | | | | | | | | | | | | | |
| Total Returns for the Periods Ended February 28, 2015 | |
| | | | | | Average Annual | |
| | | Six
Months* | | | One Year | | | Five Years | | | Ten Years | | | Since
Inception** | |
Schneider Value | | | -2.72% | | | | 2.30% | | | | 8.94% | | | | 2.67% | | | | 8.75% | |
Russell 1000® Value Index | | | 3.48% | | | | 13.48% | | | | 15.51% | | | | 7.21% | | | | 10.28% | |
* Not Annualized ** Inception date 9/30/02 | | | | | | | | | | | | | | | | | | | | |
The performance data quoted represents past performance. Past performance is not indicative of future results. Investment return and principal value will fluctuate so that an investor’s shares, when redeemed, may be worth more or less than their original cost. Current performance may be lower or higher. Schneider Capital Management Company, the Fund’s investment adviser, has contractually agreed to waive management fees and/or reimburse expenses through December 31, 2015, to the extent that total annual fund operating expenses (excluding acquired fund fees and expenses, brokerage commissions, extraordinary items, interest and taxes) exceed 0.90%. Total returns shown include fee waivers and expense reimbursements, if any; total returns would have been lower had there been no waiver or reimbursement of fees and expenses in excess of expense limitations. Returns shown include the reinvestment of all dividends and other distributions and do not reflect taxes that a shareholder would pay on Fund distributions or on the redemption of Fund shares. For performance data current to the most recent month-end, please call 1-888-520-3277. The Fund’s gross and net annual operating expenses, as stated in the current prospectus, are 1.50% and 0.90%, respectively. Shares of the Fund not purchased through reinvested dividends or capital gains and held less than 90 days are subject to a 1.00% redemption fee.
Value investing involves the risk that the Fund’s investment in companies whose securities are believed to be undervalued, relative to their underlying profitability, will not appreciate in value as anticipated.
4
THE SCHNEIDER FUNDS
Fund Expense Examples
(Unaudited)
As a shareholder of the Fund(s), you incur two types of costs: (1) transaction costs, including redemption fees; and (2) ongoing costs, including management fees and other Fund expenses. These examples are intended to help you understand your ongoing costs (in dollars) of investing in the Fund(s) and to compare these costs with the ongoing costs of investing in other mutual funds.
These examples are based on an investment of $1,000 invested at the beginning of the six months from September 1, 2014 through February 28, 2015, and held for the entire period.
Actual Expenses
The first line of the accompanying tables provides information about actual account values and actual expenses. You may use the information in this line, together with the amount you invested, to estimate the expenses that you paid over the period. Simply divide your account value by $1,000 (for example, an $8,600 account value divided by $1,000 = 8.6), then multiply the result by the number in the first line under the heading entitled “Expenses Paid During Period” to estimate the expenses you paid on your account during this period.
Hypothetical Example for Comparison Purposes
The second line of the accompanying table for each Fund provides information about hypothetical account values and hypothetical expenses based on the Fund’s actual expense ratio and an assumed rate of return of 5% per year before expenses, which is not your Fund’s actual return. The hypothetical account values and expenses may not be used to estimate the actual ending account balance or expenses you paid for the period. You may use this information to compare the ongoing costs of investing in the Fund and other funds. To do so, compare these 5% hypothetical examples with the 5% hypothetical examples that appear in the shareholder reports of other funds.
Please note that the expenses shown in the accompanying tables are meant to highlight your ongoing costs only and do not reflect any transactional costs, such as redemption fees. Therefore, the second line of the accompanying table for each Fund is useful in comparing ongoing costs only, and will not help you determine the relative total costs of owning different funds. In addition, if these transactional costs were included, your costs would have been higher.
| | | | | | | | | | | | |
| | | Schneider Small Cap Value Fund | |
| | | Beginning Account Value
September 1, 2014 | | | Ending Account Value
February 28, 2015 | | | Expenses Paid
During Period* | |
Actual | | $ | 1,000.00 | | | $ | 896.90 | | | $ | 5.41 | |
Hypothetical (5% return before expenses) | | | 1,000.00 | | | | 1,019.09 | | | | 5.76 | |
| |
| | | Schneider Value Fund | |
| | | Beginning Account Value
September 1, 2014 | | | Ending Account Value
February 28, 2015 | | | Expenses Paid
During Period* | |
Actual | | $ | 1,000.00 | | | $ | 972.80 | | | $ | 4.40 | |
Hypothetical (5% return before expenses) | | | 1,000.00 | | | | 1,020.33 | | | | 4.51 | |
| * | Expenses are equal to an annualized six-month expense ratio of 1.15% for the Schneider Small Cap Value Fund and 0.90% for the Schneider Value Fund, which includes waived fees or reimbursed expenses, multiplied by the average account value over the period, multiplied by the number of days in the most recent fiscal half-year (181), then divided by 365 to reflect the one-half year period. The Fund’s ending account values on the first line in each table are based on the actual six-month total return for each Fund of -10.31% for the Schneider Small Cap Value Fund and -2.72% for the Schneider Value Fund. |
5
THE SCHNEIDER FUNDS
SCHNEIDER SMALL CAP VALUE FUND
Portfolio Holdings Summary Table
February 28, 2015
(Unaudited)
The following table presents a summary by sector of the portfolio holdings of the Fund:
| | | | | | | | |
| | | % of Net
Assets | | | Value | |
Common Stocks: | | | | | | | | |
Savings & Loans | | | 12.8 | % | | $ | 5,329,608 | |
Oil & Gas | | | 12.6 | | | | 5,237,751 | |
Commercial Services | | | 9.7 | | | | 4,044,483 | |
Telecommunications | | | 8.8 | | | | 3,688,585 | |
Real Estate Investment Trusts | | | 5.3 | | | | 2,191,841 | |
Home Builders | | | 5.2 | | | | 2,185,253 | |
Industrial | | | 5.0 | | | | 2,065,237 | |
Coal | | | 4.5 | | | | 1,888,522 | |
Insurance | | | 4.4 | | | | 1,846,722 | |
Banks | | | 3.7 | | | | 1,554,811 | |
Healthcare — Services | | | 3.2 | | | | 1,329,150 | |
Electronics | | | 2.7 | | | | 1,123,019 | |
Semiconductors | | | 2.7 | | | | 1,117,998 | |
Retail | | | 2.4 | | | | 992,620 | |
Mining | | | 1.9 | | | | 796,343 | |
Machinery — Diversified | | | 1.8 | | | | 752,871 | |
Miscellaneous Manufacturing | | | 1.6 | | | | 674,573 | |
Internet | | | 1.3 | | | | 552,286 | |
Healthcare — Products | | | 1.2 | | | | 516,091 | |
Metals Fabricating | | | 0.5 | | | | 211,087 | |
Real Estate | | | 0.4 | | | | 162,363 | |
Software | | | 0.3 | | | | 129,404 | |
Auto Parts & Equipment | | | 0.2 | | | | 70,376 | |
Securities Lending Collateral | | | 7.2 | | | | 2,998,346 | |
Corporate Bonds | | | 1.4 | | | | 582,188 | |
Exchange Traded Fund | | | 0.9 | | | | 376,002 | |
Liabilities In Excess Of Other Assets | | | (1.7 | ) | | | (718,819 | ) |
| | | | | | | | |
NET ASSETS | | | 100.0 | % | | $ | 41,698,711 | |
| | | | | | | | |
Portfolio holdings are subject to change at any time.
The accompanying notes are an integral part of the financial statements.
6
THE SCHNEIDER FUNDS
SCHNEIDER VALUE FUND
Portfolio Holdings Summary Table
February 28, 2015
(Unaudited)
The following table presents a summary by sector of the portfolio holdings of the Fund:
| | | | | | | | |
| | | % of Net
Assets | | | Value | |
Common Stocks: | | | | | | | | |
Banks | | | 27.7 | % | | $ | 8,166,968 | |
Insurance | | | 14.9 | | | | 4,398,581 | |
Oil & Gas | | | 14.0 | | | | 4,129,771 | |
Home Builders | | | 8.5 | | | | 2,513,498 | |
Lodging | | | 6.7 | | | | 1,983,597 | |
Leisure Time | | | 4.5 | | | | 1,332,237 | |
Coal | | | 4.0 | | | | 1,168,597 | |
Real Estate | | | 2.0 | | | | 593,602 | |
Office Products | | | 1.9 | | | | 563,605 | |
Aircraft | | | 1.7 | | | | 511,959 | |
Commercial Services | | | 1.7 | | | | 503,923 | |
IT Services | | | 1.3 | | | | 397,251 | |
Real Estate Investment Trusts | | | 1.2 | | | | 345,558 | |
Aerospace & Defense | | | 0.3 | | | | 95,790 | |
Electric | | | 0.3 | | | | 83,427 | |
Electronics | | | 0.1 | | | | 30,097 | |
Securities Lending Collateral | | | 3.2 | | | | 948,569 | |
Exchange Traded Fund | | | 1.7 | | | | 506,389 | |
Assets In Excess Of Other Liabilities | | | 4.3 | | | | 1,259,417 | |
| | | | | | | | |
NET ASSETS | | | 100.0 | % | | $ | 29,532,836 | |
| | | | | | | | |
Portfolio holdings are subject to change at any time.
The accompanying notes are an integral part of the financial statements.
7
THE SCHNEIDER FUNDS
SCHNEIDER SMALL CAP VALUE FUND
Portfolio of Investments
February 28, 2015
(Unaudited)
| | | | | | | | |
| | | Shares | | | Value | |
COMMON STOCKS — 92.2% | | | | | | | | |
Auto Parts & Equipment — 0.2% | | | | | | | | |
Commercial Vehicle Group, Inc. * | | | 12,282 | | | $ | 70,376 | |
| | | | | | | | |
Banks — 3.7% | | | | | | | | |
Bancorp, Inc. (The) * | | | 42,529 | | | | 397,221 | |
Bank of the Ozarks, Inc. | | | | | | | 12 | |
Dundee Corp., Class A * | | | 6,205 | | | | 59,568 | |
First Horizon National Corp. | | | 51,345 | | | | 733,720 | |
First United Corp. * | | | 100 | | | | 904 | |
MainSource Financial Group, Inc. | | | 19,422 | | | | 363,386 | |
| | | | | | | | |
| | | | 1,554,811 | |
| | | | | | | | |
Coal — 4.5% | | | | | | | | |
Arch Coal, Inc. * (a) | | | 319,054 | | | | 417,961 | |
Peabody Energy Corp. (a) | | | 186,147 | | | | 1,470,561 | |
| | | | | | | | |
| | | | 1,888,522 | |
| | | | | | | | |
Commercial Services — 9.7% | | | | | | | | |
Aegean Marine Petroleum Network, Inc. | | | 163,423 | | | | 2,395,781 | |
Ardmore Shipping Corp. | | | 67,064 | | | | 708,867 | |
Baltic Trading, Ltd. (a) | | | 59,095 | | | | 105,780 | |
Hudson Global Inc. * | | | 151,418 | | | | 414,885 | |
Stolt-Nielsen, Ltd. | | | 25,707 | | | | 419,170 | |
| | | | | | | | |
| | | | 4,044,483 | |
| | | | | | | | |
Electronics — 2.7% | | | | | | | | |
Kemet Corp. * | | | 198,216 | | | | 905,847 | |
Pulse Electronics Corp. * | | | 42,964 | | | | 49,409 | |
Viasystems Group, Inc. * | | | 9,581 | | | | 167,763 | |
| | | | | | | | |
| | | | 1,123,019 | |
| | | | | | | | |
Healthcare - Products — 1.2% | | | | | | | | |
Orthofix International NV * | | | 15,914 | | | | 516,091 | |
| | | | | | | | |
Healthcare - Services — 3.2% | | | | | | | | |
Five Star Quality Care, Inc. * | | | 365,151 | | | | 1,329,150 | |
| | | | | | | | |
Home Builders — 5.2% | | | | | | | | |
Taylor Morrison Home Corp., Class A * | | | 113,343 | | | | 2,185,253 | |
| | | | | | | | |
Industrial — 5.0% | | | | | | | | |
FreightCar America, Inc. | | | 65,982 | | | | 2,065,237 | |
| | | | | | | | |
Insurance — 4.4% | | | | | | | | |
Assured Guaranty, Ltd. | | | 19,510 | | | | 517,405 | |
Stewart Information Services Corp. | | | 35,326 | | | | 1,329,317 | |
| | | | | | | | |
| | | | 1,846,722 | |
| | | | | | | | |
Internet — 1.3% | | | | | | | | |
ModusLink Global Solutions, Inc. * | | | 147,670 | | | | 552,286 | |
| | | | | | | | |
Machinery - Diversified — 1.8% | | | | | | | | |
Intevac, Inc. * | | | 109,748 | | | | 752,871 | |
| | | | | | | | |
| | | | | | | | |
| | | Shares | | | Value | |
Metals Fabricating — 0.5% | | | | | | | | |
AM Castle & Co. * (a) | | | 65,555 | | | $ | 211,087 | |
| | | | | | | | |
Mining — 1.9% | | | | | | | | |
Alumina Ltd. SP ADR | | | 59,167 | | | | 334,885 | |
Thompson Creek Metals Co., Inc. * | | | 176,372 | | | | 280,431 | |
Ur-Energy, Inc. * | | | 205,712 | | | | 181,027 | |
| | | | | | | | |
| | | | | | | 796,343 | |
| | | | | | | | |
Miscellaneous Manufacturing — 1.6% | | | | | |
Orbotech, Ltd. * | | | 41,925 | | | | 674,573 | |
| | | | | | | | |
Oil & Gas — 12.6% | | | | | | | | |
MRC Global, Inc. * | | | 63,760 | | | | 820,591 | |
Swift Energy Co. * (a) | | | 205,547 | | | | 643,362 | |
Willbros Group, Inc. * | | | 276,621 | | | | 1,753,777 | |
WPX Energy, Inc. * | | | 187,386 | | | | 2,020,021 | |
| | | | | | | | |
| | | | | | | 5,237,751 | |
| | | | | | | | |
Real Estate — 0.4% | | | | | | | | |
Forest City Enterprises, Inc., Class A * | | | 2,344 | | | | 59,186 | |
Forestar Group, Inc. * | | | 7,175 | | | | 103,177 | |
| | | | | | | | |
| | | | | | | 162,363 | |
| | | | | | | | |
Real Estate Investment Trusts — 5.3% | | | | | |
Parkway Properties, Inc. | | | 26,191 | | | | 461,224 | |
Piedmont Office Realty Trust, Inc. | | | 8,727 | | | | 159,966 | |
Redwood Trust, Inc. (a) | | | 15,430 | | | | 295,022 | |
Rexford Industrial Realty, Inc. | | | 49,211 | | | | 789,344 | |
Sunstone Hotel Investors, Inc. | | | 27,867 | | | | 486,285 | |
| | | | | | | | |
| | | | | | | 2,191,841 | |
| | | | | | | | |
Retail — 2.4% | | | | | | | | |
Office Depot, Inc. * | | | 105,936 | | | | 992,620 | |
| | | | | | | | |
Savings & Loans — 12.8% | | | | | | | | |
First Niagara Financial Group, Inc. | | | 80,021 | | | | 708,986 | |
Flagstar Bancorp, Inc. * | | | 173,642 | | | | 2,568,165 | |
HomeStreet, Inc. * | | | 96,844 | | | | 1,675,401 | |
Pulaski Financial Corp. | | | 31,343 | | | | 377,056 | |
| | | | | | | | |
| | | | | | | 5,329,608 | |
| | | | | | | | |
Semiconductors — 2.7% | | | | | | | | |
Alpha & Omega Semiconductor, Ltd. * | | | 15,464 | | | | 137,166 | |
Axcelis Technologies, Inc. * | | | 250,663 | | | | 701,856 | |
SunEdison Semiconductor Ltd. * | | | 11,595 | | | | 278,976 | |
| | | | | | | | |
| | | | | | | 1,117,998 | |
| | | | | | | | |
Software — 0.3% | | | | | | | | |
Take-Two Interactive Software, Inc. * | | | 4,885 | | | | 129,404 | |
| | | | | | | | |
Telecommunications — 8.8% | | | | | | | | |
Aviat Networks, Inc. * | | | 1,329,879 | | | | 1,688,946 | |
Comverse, Inc. * | | | 43,850 | | | | 786,669 | |
The accompanying notes are an integral part of the financial statements.
8
THE SCHNEIDER FUNDS
SCHNEIDER SMALL CAP VALUE FUND
Portfolio of Investments (Concluded)
February 28, 2015
(Unaudited)
| | | | | | | | |
| | | Shares | | | Value | |
Telecommunications — (Continued) | | | | | |
UTStarcom Holdings Corp. * (a) | | | 421,170 | | | $ | 1,212,970 | |
| | | | | | | | |
| | | | | | | 3,688,585 | |
| | | | | | | | |
TOTAL COMMON STOCKS
(Cost $36,686,668) | | | | | | | 38,460,994 | |
| | | | | | | | |
| | | Par
(000) | | | | |
CORPORATE BONDS — 1.4% | | | | | |
LandAmerica Financial Group, Inc. CONV ‡
3.25%, 05/15/34 | | $ | 33 | | | | 8,068 | |
RAIT Financial Trust CONV
7.00%, 04/01/31 | | | 463 | | | | 574,120 | |
| | | | | | | | |
TOTAL CORPORATE BONDS
(Cost $463,000) | | | | | | | 582,188 | |
| | | | | | | | |
| | | Shares | | | | |
EXCHANGE TRADED FUND — 0.9% | | | | | |
Finance — 0.9% | | | | | | | | |
iShares Russell 2000 Value
Index Fund | | | 3,691 | | | | 376,002 | |
| | | | | | | | |
TOTAL EXCHANGE TRADED FUND
(Cost $371,102) | | | | | | | 376,002 | |
| | | | | | | | |
| | | | | | | | |
| | | Shares | | | Value | |
SECURITIES LENDING COLLATERAL — 7.2% | | | | | |
BlackRock Liquidity TempFund, Institutional Shares | | | 2,998,346 | | | $ | 2,998,346 | |
| | | | | | | | |
TOTAL SECURITIES LENDING
COLLATERAL
(Cost $2,998,346) | | | | | | | 2,998,346 | |
| | | | | | | | |
TOTAL INVESTMENTS — 101.7%
(Cost $40,519,116) | | | | | | | 42,417,530 | |
| | | | | | | | |
LIABILITIES IN EXCESS OF OTHER ASSETS — (1.7)% | | | | | | | (718,819 | ) |
| | | | | | | | |
NET ASSETS — 100.0% | | | | | | $ | 41,698,711 | |
| | | | | | | | |
| (a) | All or a portion of the security is on loan. At February 28, 2015, the market value of securities on loan was $2,818,839. |
| ‡ | Holding in default resolution. Value has been determined in good faith by or under the direction of The RBB Fund, Inc.’s Board of Directors to be the estimated value of the future payouts under the default resolution. As of February 28, 2015, this holding amounted to $8,068 or 0.0% of net assets and is deemed illiquid by the portfolio manager pursuant to the Fund’s policies and procedures. |
| SP ADR | Sponsored American Depository Receipt |
The accompanying notes are an integral part of the financial statements.
9
THE SCHNEIDER FUNDS
SCHNEIDER VALUE FUND
Portfolio of Investments
February 28, 2015
(Unaudited)
| | | | | | | | |
| | | Shares | | | Value | |
COMMON STOCKS — 90.8% | | | | | | | | |
Aerospace & Defense — 0.3% | | | | | | | | |
Boeing Co. (The) | | | 635 | | | $ | 95,790 | |
| | | | | | | | |
Aircraft — 1.7% | | | | | | | | |
Bombardier, Inc., Class B * | | | 250,000 | | | | 511,959 | |
| | | | | | | | |
Banks — 27.7% | | | | | | | | |
Barclays PLC, SP ADR | | | 31,301 | | | | 496,434 | |
Citigroup, Inc. | | | 31,664 | | | | 1,659,827 | |
First Niagara Financial Group, Inc. | | | 66,020 | | | | 584,937 | |
JPMorgan Chase & Co. | | | 19,800 | | | | 1,213,344 | |
Regions Financial Corp. | | | 58,065 | | | | 558,005 | |
State Street Corp. | | | 18,533 | | | | 1,379,782 | |
SunTrust Banks, Inc. | | | 55,479 | | | | 2,274,639 | |
| | | | | | | | |
| | | | 8,166,968 | |
| | | | | | | | |
Coal — 4.0% | | | | | | | | |
Arch Coal, Inc. * | | | 123,455 | | | | 161,726 | |
Peabody Energy Corp. (a) | | | 127,452 | | | | 1,006,871 | |
| | | | | | | | |
| | | | 1,168,597 | |
| | | | | | | | |
Commercial Services — 1.7% | | | | | | | | |
Aegean Marine Petroleum Network, Inc. | | | 34,374 | | | | 503,923 | |
| | | | | | | | |
Electric — 0.3% | | | | | | | | |
FirstEnergy Corp. | | | 2,385 | | | | 83,427 | |
| | | | | | | | |
Electronics — 0.1% | | | | | | | | |
Avnet, Inc. | | | 657 | | | | 30,097 | |
| | | | | | | | |
Home Builders — 8.5% | | | | | | | | |
Lennar Corp., Class A | | | 16,865 | | | | 846,792 | |
Taylor Morrison Home Corp., Class A * | | | 10,960 | | | | 211,309 | |
Toll Brothers, Inc. * | | | 37,990 | | | | 1,455,397 | |
| | | | | | | | |
| | | | 2,513,498 | |
| | | | | | | | |
Insurance — 14.9% | | | | | | | | |
Allstate Corp., (The) | | | 7,686 | | | | 542,632 | |
American International Group, Inc. | | | 13,733 | | | | 759,847 | |
Assured Guaranty, Ltd. | | | 29,993 | | | | 795,414 | |
First American Financial Corp. | | | 13,766 | | | | 482,223 | |
Genworth Financial, Inc., Class A * | | | 19,220 | | | | 148,955 | |
Hartford Financial Services Group, Inc. | | | 29,356 | | | | 1,202,422 | |
Voya Financial, Inc. | | | 10,570 | | | | 467,088 | |
| | | | | | | | |
| | | | 4,398,581 | |
| | | | | | | | |
IT Services — 1.3% | | | | | | | | |
Symantec Corp. | | | 15,789 | | | | 397,251 | |
| | | | | | | | |
Leisure Time — 4.5% | | | | | | | | |
Carnival Corp. | | | 30,285 | | | | 1,332,237 | |
| | | | | | | | |
| | | | | | | | |
| | | Shares | | | Value | |
Lodging — 6.7% | | | | | | | | |
Marriott International, Inc., Class A | | | 23,870 | | | $ | 1,983,597 | |
| | | | | | | | |
Office Products — 1.9% | | | | | | | | |
Office Depot, Inc. * | | | 60,150 | | | | 563,605 | |
| | | | | | | | |
Oil & Gas — 14.0% | | | | | | | | |
Chesapeake Energy Corp. | | | 63,143 | | | | 1,053,225 | |
Devon Energy Corp. | | | 1,662 | | | | 102,363 | |
SM Energy Co. | | | 6,291 | | | | 305,239 | |
Weatherford International PLC. * | | | 122,124 | | | | 1,549,754 | |
WPX Energy, Inc. * | | | 103,821 | | | | 1,119,190 | |
| | | | | | | | |
| | | | 4,129,771 | |
| | | | | | | | |
Real Estate — 2.0% | | | | | | | | |
Forest City Enterprises, Inc., Class A * | | | 23,509 | | | | 593,602 | |
| | | | | | | | |
Real Estate Investment Trusts — 1.2% | | | | | |
NorthStar Realty Finance Corp. | | | 14,142 | | | | 271,809 | |
Paramount Group, Inc. | | | 4,019 | | | | 73,749 | |
| | | | | | | | |
| | | | 345,558 | |
| | | | | | | | |
TOTAL COMMON STOCKS
(Cost $20,265,182) | | | | | | | 26,818,461 | |
| | | | | | | | |
EXCHANGE TRADED FUND — 1.7% | | | | | |
Finance — 1.7% | | | | | | | | |
iShares Russell 1000 Value Index Fund | | | 4,820 | | | | 506,389 | |
| | | | | | | | |
TOTAL EXCHANGE TRADED FUND
(Cost $497,556) | | | | | | | 506,389 | |
| | | | | | | | |
SECURITIES LENDING COLLATERAL — 3.2% | | | | | |
BlackRock Liquidity TempFund, Institutional Shares | | | 948,569 | | | | 948,569 | |
| | | | | | | | |
TOTAL SECURITIES LENDING COLLATERAL
(Cost $948,569) | | | | | | | 948,569 | |
| | | | | | | | |
TOTAL INVESTMENTS — 95.7%
(Cost $21,711,307) | | | | | | | 28,273,419 | |
| | | | | | | | |
ASSETS IN EXCESS OF OTHER LIABILITIES — 4.3% | | | | | | | 1,259,417 | |
| | | | | | | | |
NET ASSETS — 100.0% | | | | | | $ | 29,532,836 | |
| | | | | | | | |
| (a) | All or a portion of the security is on loan. At February 28, 2015, market value of securities on loan was $966,929. |
| PLC | Public Limited Company |
| SP ADR | Sponsored American Depositary Receipt |
The accompanying notes are an integral part of the financial statements.
10
THE SCHNEIDER FUNDS
Statements of Assets & Liabilities
February 28, 2015
(Unaudited)
| | | | | | | | |
| | | Schneider
Small Cap
Value Fund | | | Schneider
Value Fund | |
| | |
ASSETS | | | | | | | | |
Investments, at value †^ | | $ | 42,417,530 | | | $ | 28,273,419 | |
Cash and cash equivalents | | | 2,104,602 | | | | 1,974,721 | |
Receivables | | | | | | | | |
Investments sold | | | 564,422 | | | | 218,756 | |
Dividends and interest | | | 21,428 | | | | 35,069 | |
Prepaid expenses and other assets | | | 4,729 | | | | 12,332 | |
| | | | | | | | |
Total assets | | | 45,112,711 | | | | 30,514,297 | |
| | | | | | | | |
| | |
LIABILITIES | | | | | | | | |
Payables | | | | | | | | |
Securities lending collateral | | | 2,998,346 | | | | 948,569 | |
Investments purchased | | | 326,787 | | | | — | |
Capital shares redeemed | | | 31,343 | | | | — | |
Advisory fees | | | 14,914 | | | | 3,397 | |
Other accrued expenses and liabilities | | | 42,610 | | | | 29,495 | |
| | | | | | | | |
Total liabilities | | | 3,414,000 | | | | 981,461 | |
| | | | | | | | |
Net Assets | | $ | 41,698,711 | | | $ | 29,532,836 | |
| | | | | | | | |
| | |
NET ASSETS CONSIST OF | | | | | | | | |
Par value | | $ | 3,134 | | | $ | 1,525 | |
Paid-in capital | | | 42,907,790 | | | | 148,763,927 | |
Undistributed/accumulated net investment income/(loss) | | | (42,250 | ) | | | 14,282 | |
Accumulated net realized loss from investments | | | (3,068,377 | ) | | | (125,809,010 | ) |
Net unrealized appreciation on investments | | | 1,898,414 | | | | 6,562,112 | |
| | | | | | | | |
Net Assets | | $ | 41,698,711 | | | $ | 29,532,836 | |
| | | | | | | | |
Shares outstanding ($0.001 par value, 100,000,000 shares authorized) | | | 3,133,927 | | | | 1,525,023 | |
| | | | | | | | |
Net asset value, offering and redemption price per share | | $ | 13.31 | | | $ | 19.37 | |
| | | | | | | | |
† Investment in securities, at cost | | $ | 40,519,116 | | | $ | 21,711,307 | |
| | | | | | | | |
^ Includes market value of securities on loan | | $ | 2,818,839 | | | $ | 966,929 | |
| | | | | | | | |
The accompanying notes are an integral part of the financial statements.
11
THE SCHNEIDER FUNDS
Statements of Operations
For the Six Months Ended February 28, 2015
(Unaudited)
| | | | | | | | |
| | | Schneider
Small Cap
Value Fund | | | Schneider
Value Fund | |
| | |
Investment Income | | | | | | | | |
Dividends † | | $ | 191,973 | | | $ | 184,570 | |
Securities Lending Income | | | 25,391 | | | | 3,006 | |
Interest | | | 18,509 | | | | 115 | |
| | | | | | | | |
Total investment income | | | 235,873 | | | | 187,691 | |
| | | | | | | | |
| | |
Expenses | | | | | | | | |
Advisory fees | | | 235,595 | | | | 105,371 | |
Administration and accounting fees | | | 60,967 | | | | 57,301 | |
Transfer agent fees | | | 26,860 | | | | 22,482 | |
Professional fees | | | 17,130 | | | | 14,217 | |
Registration and filing fees | | | 14,746 | | | | 10,586 | |
Printing and shareholder reporting fees | | | 14,077 | | | | 1,845 | |
Directors’ and officers’ fees | | | 11,949 | | | | 11,728 | |
Custodian fees | | | 11,021 | | | | 11,413 | |
Other expenses | | | 3,895 | | | | 1,867 | |
| | | | | | | | |
Total expenses before waivers and reimbursements | | | 396,240 | | | | 236,810 | |
Less: waivers and reimbursements | | | (125,305 | ) | | | (101,333 | ) |
| | | | | | | | |
Net expenses after waivers and reimbursements | | | 270,935 | | | | 135,477 | |
| | | | | | | | |
Net investment income/(loss) | | | (35,062 | ) | | | 52,214 | |
| | | | | | | | |
| | |
Net realized and unrealized gain/(loss) from investments
Net realized gain/(loss) from: | | | | | | | | |
Investments | | | 1,618,357 | | | | 1,676,442 | |
Net change in unrealized depreciation on: | | | | | | | | |
Investments | | | (7,742,562 | ) | | | (2,588,105 | ) |
| | | | | | | | |
Net realized and unrealized loss on investments | | | (6,124,205 | ) | | | (911,663 | ) |
| | | | | | | | |
| | |
Net decrease in net assets resulting from operations | | $ | (6,159,267 | ) | | $ | (859,449 | ) |
| | | | | | | | |
† Net of foreign withholding taxes of | | $ | (579 | ) | | $ | (965 | ) |
| | | | | | | | |
The accompanying notes are an integral part of the financial statements.
12
THE SCHNEIDER FUNDS
SCHNEIDER SMALL CAP VALUE FUND
Statement of Changes in Net Assets
| | | | | | | | |
| | | For the Six Months
Ended
February 28, 2015
(Unaudited) | | | For the Year
Ended
August 31, 2014 | |
Increase/(decrease) in net assets from operations: | | | | | | | | |
Net investment loss | | $ | (35,062 | ) | | $ | (299,985 | ) |
Net realized gain from investments | | | 1,618,357 | | | | 13,970,629 | |
Net change in unrealized depreciation from investments | | | (7,742,562 | ) | | | (5,113,247 | ) |
| | | | | | | | |
Net increase/(decrease) in net assets resulting from operations | | | (6,159,267 | ) | | | 8,557,397 | |
| | | | | | | | |
| | |
Dividends and distributions to shareholders from: | | | | | | | | |
Net realized capital gains | | | (12,288,232 | ) | | | (10,779,654 | ) |
| | | | | | | | |
Net decrease in net assets from dividends and distributions to shareholders | | | (12,288,232 | ) | | | (10,779,654 | ) |
| | | | | | | | |
| | |
Capital transactions: | | | | | | | | |
Proceeds from shares sold | | | 534,194 | | | | 734,685 | |
Reinvestment of distributions | | | 10,101,137 | | | | 9,110,476 | |
Redemption fees * | | | 521 | | | | 14,213 | |
Shares redeemed | | | (11,729,700 | ) | | | (16,953,169 | ) |
| | | | | | | | |
Net decrease in net assets from capital share transactions | | | (1,093,848 | ) | | | (7,093,795 | ) |
| | | | | | | | |
Total decrease in net assets | | | (19,541,347 | ) | | | (9,316,052 | ) |
| | | | | | | | |
| | |
Net assets: | | | | | | | | |
Beginning of period | | | 61,240,058 | | | | 70,556,110 | |
| | | | | | | | |
End of period | | $ | 41,698,711 | | | $ | 61,240,058 | |
| | | | | | | | |
Accumulated net investment loss, end of period | | $ | (42,250 | ) | | $ | (7,188 | ) |
| | | | | | | | |
| | |
Share transactions: | | | | | | | | |
Shares sold | | | 39,019 | | | | 35,697 | |
Shares reinvested | | | 783,641 | | | | 466,248 | |
Shares redeemed | | | (726,072 | ) | | | (813,574 | ) |
| | | | | | | | |
Net increase/(decrease) in shares outstanding | | | 96,588 | | | | (311,629 | ) |
| | | | | | | | |
| * | There is a 1.75% redemption fee on shares redeemed which have been held less than one year in the Schneider Small Cap Value Fund. The redemption fees are retained by the Fund for the benefit of the remaining shareholders and recorded as paid-in capital. |
The accompanying notes are an integral part of the financial statements.
13
THE SCHNEIDER FUNDS
SCHNEIDER VALUE FUND
Statement of Changes in Net Assets
| | | | | | | | |
| | | For the Six Months
Ended
February 28, 2015
(Unaudited) | | | For the Year
Ended
August 31, 2014 | |
Increase/(decrease) in net assets from operations: | | | | | | | | |
Net investment income | | $ | 52,214 | | | $ | 96,249 | |
Net realized gain from investments | | | 1,676,442 | | | | 4,990,523 | |
Net change in unrealized appreciation/(depreciation) from investments | | | (2,588,105 | ) | | | 2,227,340 | |
| | | | | | | | |
Net increase/(decrease) in net assets resulting from operations | | | (859,449 | ) | | | 7,314,112 | |
| | | | | | | | |
| | |
Dividends and distributions to shareholders from: | | | | | | | | |
Net investment income | | | (134,181 | ) | | | (132,641 | ) |
| | | | | | | | |
Net decrease in net assets from dividends and distributions to shareholders | | | (134,181 | ) | | | (132,641 | ) |
| | | | | | | | |
| | |
Capital transactions: | | | | | | | | |
Proceeds from shares sold | | | 142,402 | | | | 165,688 | |
Reinvestment of distributions | | | 130,012 | | | | 126,471 | |
Shares redeemed | | | (5,501,601 | ) | | | (5,590,418 | ) |
| | | | | | | | |
Net decrease in net assets from capital share transactions | | | (5,229,187 | ) | | | (5,298,259 | ) |
| | | | | | | | |
Total increase/(decrease) in net assets | | | (6,222,817 | ) | | | 1,883,212 | |
| | | | | | | | |
| | |
Net assets: | | | | | | | | |
Beginning of period | | | 35,755,653 | | | | 33,872,441 | |
| | | | | | | | |
End of period | | $ | 29,532,836 | | | $ | 35,755,653 | |
| | | | | | | | |
Undistributed net investment income, end of period | | $ | 14,282 | | | $ | 96,249 | |
| | | | | | | | |
| | |
Share transactions: | | | | | | | | |
Shares sold | | | 7,447 | | | | 9,187 | |
Shares reinvested | | | 6,793 | | | | 6,957 | |
Shares redeemed | | | (280,968 | ) | | | (300,652 | ) |
| | | | | | | | |
Net decrease in shares outstanding | | | (266,728 | ) | | | (284,508 | ) |
| | | | | | | | |
| * | There is a 1.00% redemption fee on shares redeemed which have been held less than one year in the Schneider Value Fund. The redemption fees are retained by the Fund for the benefit of the remaining shareholders and recorded as paid-in capital. |
The accompanying notes are an integral part of the financial statements.
14
THE SCHNEIDER FUNDS
SCHNEIDER SMALL CAP VALUE FUND
Financial Highlights
Contained below is per share operating performance data for a share outstanding during each period, total investment return, ratios to average net assets and other supplemental data for the respective periods. This information has been derived from information provided in the financial statements.
| | | | | | | | | | | | | | | | | | | | | | | | |
| | | For the
Six Months
Ended
February 28, 2015
(Unaudited) | | | For the Years Ended August 31, | |
| | | | 2014 | | | 2013 | | | 2012 | | | 2011 | | | 2010 | |
Per Share Operating Performance | | | | | | | | | | | | | | | | | | | | | | | | |
Net asset value, beginning of period | | $ | 20.16 | | | $ | 21.07 | | | $ | 16.09 | | | $ | 13.70 | | | $ | 13.19 | | | $ | 12.34 | |
| | | | | | | | | | | | | | | | | | | | | | | | |
Net investment income/(loss) | | | (0.01 | )(1) | | | (0.09 | )(1) | | | 0.08 | (1) | | | (0.11 | ) | | | (0.06 | ) | | | (0.11 | ) |
Net realized and unrealized gain/(loss) on investments and foreign currency transactions | | | (2.22 | ) | | | 2.63 | | | | 4.90 | | | | 2.49 | | | | 0.56 | | | | 1.01 | |
| | | | | | | | | | | | | | | | | | | | | | | | |
Net increase/(decrease) in net assets resulting from operations | | | (2.23 | ) | | | 2.54 | | | | 4.98 | | | | 2.38 | | | | 0.50 | | | | 0.90 | |
| | | | | | | | | | �� | | | | | | | | | | | | | | |
Dividends and distributions to shareholders from: | | | | | | | | | | | | | | | | | | | | | | | | |
Net investment income | | | — | | | | — | | | | — | | | | — | | | | — | | | | (0.07 | ) |
Net realized gains | | | (4.62 | ) | | | (3.45 | ) | | | — | | | | — | | | | — | | | | — | |
| | | | | | | | | | | | | | | | | | | | | | | | |
Total dividends and distributions to shareholders | | | (4.62 | ) | | | (3.45 | ) | | | — | | | | — | | | | — | | | | (0.07 | ) |
| | | | | | | | | | | | | | | | | | | | | | | | |
Redemption fees | | | — | (2) | | | — | (2) | | | — | (2) | | | 0.01 | | | | 0.01 | | | | 0.02 | |
| | | | | | | | | | | | | | | | | | | | | | | | |
Net asset value, end of period | | $ | 13.31 | | | $ | 20.16 | | | $ | 21.07 | | | $ | 16.09 | | | $ | 13.70 | | | $ | 13.19 | |
| | | | | | | | | | | | | | | | | | | | | | | | |
Total investment return(3) | | | (10.31 | )%(4) | | | 12.59 | % | | | 30.95 | % | | | 17.45 | % | | | 3.87 | % | | | 7.48 | % |
| | | | | | | | | | | | | | | | | | | | | | | | |
| | | | | | |
Ratio/Supplemental Data | | | | | | | | | | | | | | | | | | | | | | | | |
Net assets, end of period (000’s omitted) | | $ | 41,699 | | | $ | 61,240 | | | $ | 70,556 | | | $ | 62,691 | | | $ | 69,698 | | | $ | 73,243 | |
Ratio of expenses to average net assets(5) | | | 1.15 | %(6) | | | 1.15 | % | | | 1.15 | % | | | 1.15 | % | | | 1.15 | % | | | 1.15 | % |
Ratio of expenses to average net assets without waivers and expense reimbursements | | | 1.68 | %(6) | | | 1.52 | % | | | 1.50 | % | | | 1.52 | % | | | 1.40 | % | | | 1.43 | % |
Ratio of net investment income/(loss) to average net assets(5) | | | (0.15 | )%(6) | | | (0.44 | )% | | | 0.38 | % | | | (0.64 | )% | | | (0.33 | )% | | | (0.65 | )% |
Portfolio turnover rate | | | 43.07 | %(4) | | | 72.33 | % | | | 63.87 | % | | | 67.85 | % | | | 59.18 | % | | | 83.39 | % |
| (1) | Calculated based on average shares outstanding for the period. |
| (2) | Amount is less than $0.005 per share. |
| (3) | Total investment return is calculated by assuming a purchase of shares on the first day and a sale of shares on the last day of each period reported and includes reinvestments of dividends and distributions, if any. |
| (5) | Reflects waivers and reimbursements. |
The accompanying notes are an integral part of the financial statements.
15
THE SCHNEIDER FUNDS
SCHNEIDER VALUE FUND
Financial Highlights
Contained below is per share operating performance data for a share outstanding during each period, total investment return, ratios to average net assets and other supplemental data for the respective periods. This information has been derived from information provided in the financial statements.
| | | | | | | | | | | | | | | | | | | | | | | | |
| | | For the
Six Months
Ended
February 28, 2015
(Unaudited) | | | For the Years Ended August 31, | |
| | | | 2014 | | | 2013 | | | 2012 | | | 2011 | | | 2010 | |
Per Share Operating Performance | | | | | | | | | | | | | | | | | | | | | | | | |
Net asset value, beginning of period | | $ | 19.96 | | | $ | 16.31 | | | $ | 12.77 | | | $ | 12.50 | | | $ | 11.72 | | | $ | 12.14 | |
| | | | | | | | | | | | | | | | | | | | | | | | |
Net investment income | | | 0.03 | (1) | | | 0.05 | (1) | | | 0.10 | | | | 0.10 | | | | 0.07 | | | | 0.08 | |
Net realized and unrealized gain/(loss) from investments and foreign currency transactions | | | (0.53 | ) | | | 3.67 | | | | 3.58 | | | | 0.23 | | | | 0.80 | | | | (0.23 | ) |
| | | | | | | | | | | | | | | | | | | | | | | | |
Net increase/(decrease) in net assets resulting from operations | | | (0.50 | ) | | | 3.72 | | | | 3.68 | | | | 0.33 | | | | 0.87 | | | | (0.15 | ) |
| | | | | | | | | | | | | | | | | | | | | | | | |
Dividends and distributions to shareholders from: | | | | | | | | | | | | | | | | | | | | | | | | |
Net investment income | | | (0.09 | ) | | | (0.07 | ) | | | (0.14 | ) | | | (0.06 | ) | | | (0.09 | ) | | | (0.27 | ) |
| | | | | | | | | | | | | | | | | | | | | | | | |
Total dividends and distributions to shareholders | | | (0.09 | ) | | | (0.07 | ) | | | (0.14 | ) | | | (0.06 | ) | | | (0.09 | ) | | | (0.27 | ) |
| | | | | | | | | | | | | | | | | | | | | | | | |
Redemption fees | | | — | | | | — | | | | — | (2) | | | — | (2) | | | — | (2) | | | — | (2) |
| | | | | | | | | | | | | | | | | | | | | | | | |
Net asset value, end of period | | $ | 19.37 | | | $ | 19.96 | | | $ | 16.31 | | | $ | 12.77 | | | $ | 12.50 | | | $ | 11.72 | |
| | | | | | | | | | | | | | | | | | | | | | | | |
Total investment return(3) | | | (2.72 | )%(4) | | | 22.83 | % | | | 29.08 | % | | | 2.67 | % | | | 7.35 | % | | | (1.30 | )% |
| | | | | | | | | | | | | | | | | | | | | | | | |
| | | | | | |
Ratio/Supplemental Data | | | | | | | | | | | | | | | | | | | | | | | | |
Net assets, end of period (000’s omitted) | | $ | 29,533 | | | $ | 35,756 | | | $ | 33,872 | | | $ | 43,719 | | | $ | 67,940 | | | $ | 98,953 | |
Ratio of expenses to average net
assets(5) | | | 0.90 | %(6) | | | 0.90 | % | | | 0.90 | % | | | 0.90 | % | | | 0.90 | % | | | 0.90 | % |
Ratio of expenses to average net assets without waivers and expense reimbursements | | | 1.58 | %(6) | | | 1.50 | % | | | 1.55 | % | | | 1.28 | % | | | 1.07 | % | | | 1.03 | % |
Ratio of net investment income to average net assets(5) | | | 0.35 | %(6) | | | 0.27 | % | | | 0.39 | % | | | 0.63 | % | | | 0.31 | % | | | 0.52 | % |
Portfolio turnover rate | | | 32.89 | %(4) | | | 44.34 | % | | | 53.08 | % | | | 55.87 | % | | | 67.80 | % | | | 79.30 | % |
| (1) | Calculated based on average shares outstanding for the period. |
| (2) | Amount is less than $0.005 per share. |
| (3) | Total investment return is calculated by assuming a purchase of shares on the first day and a sale of shares on the last day of each period reported and includes reinvestments of dividends and distributions, if any. |
| (5) | Reflects waivers and reimbursements. |
The accompanying notes are an integral part of the financial statements.
16
THE SCHNEIDER FUNDS
Notes to Financial Statements
February 28, 2015
(Unaudited)
| 1. | Organization and Significant Accounting Policies |
The RBB Fund, Inc. (“RBB” or the “Company”) was incorporated under the laws of the State of Maryland on February 29, 1988 and is registered under the Investment Company Act of 1940, as amended (the “1940 Act”), as an open-end management investment company. RBB is a “series fund,” which is a mutual fund divided into separate portfolios. Each portfolio is treated as a separate entity for certain matters under the 1940 Act, and for other purposes, and a shareholder of one portfolio is not deemed to be a shareholder of any other portfolio. Currently, RBB has twenty-two active investment portfolios, including the Schneider Small Cap Value Fund (the “Small Cap Value Fund”) and the Schneider Value Fund (the “Value Fund”) (each a “Fund,” collectively the “Funds”), which commenced investment operations on September 2, 1998 and September 30, 2002, respectively. As of the date hereof, each Fund offers Institutional Class shares.
RBB has authorized capital of one hundred billion shares of common stock of which 82.373 billion shares are currently classified into one hundred and fifty-three classes of common stock. Each class represents an interest in an active or inactive RBB investment portfolio.
PORTFOLIO VALUATION — Each Fund’s net asset value (“NAV”) is calculated once daily at the close of regular trading hours on the New York Stock Exchange (“NYSE”) (generally 4:00 p.m. Eastern time) on each day the NYSE is open. Securities held by the Funds are valued using the closing price or the last sale price on a national securities exchange or the National Association of Securities Dealers Automatic Quotation System (“NASDAQ”) market system where they are primarily traded. Equity securities traded in the over-the-counter market are valued at their closing prices. If there were no transactions on that day, securities traded principally on an exchange or on NASDAQ will be valued at the mean of the last bid and ask prices prior to the market close. Fixed Income securities having a remaining maturity of greater than 60 days are valued using an independent pricing service. Fixed Income securities having a remaining maturity of 60 days or less are valued at amortized cost, which approximates market value. Foreign securities are valued based on prices from the primary market in which they are traded, and are translated from the local currency into U.S. dollars using current exchange rates. Investments in other open-end investment companies are valued based on the NAV of the investment companies (which may use Fair Value Pricing as discussed in their prospectuses). If market quotations are unavailable or deemed unreliable, securities will be valued in accordance with procedures adopted by the Company’s Board of Directors. Relying on prices supplied by pricing services or dealers or using fair valuation may result in values that are higher or lower than the values used by other investment companies and investors to price the same investments.
FAIR VALUE MEASUREMENT — The inputs and valuations techniques used to measure fair value of the Funds’ investments are summarized into three levels as described in the hierarchy below:
| | • Level 1 — | quoted prices in active markets for identical securities; |
| | • Level 2 — | other significant observable inputs (including quoted prices for similar securities, interest rates, prepayment speeds, credit risk, etc.); and |
| | • Level 3 — | significant unobservable inputs (including the Funds’ own assumptions in determining the fair value of investments). |
The inputs or methodology used for valuing securities are not necessarily an indication of the risk associated with investing in those securities.
17
THE SCHNEIDER FUNDS
Notes to Financial Statements (Continued)
February 28, 2015
(Unaudited)
The following summary of the inputs used, as of February 28, 2015, in valuing the Funds’ investments carried at fair value:
Small Cap Value Fund
| | | | | | | | | | | | | | | | |
| | | Total
Value as of
February 28, 2015 | | | Level 1
Quoted
Price | | | Level 2
Significant
Observable
Inputs | | | Level 3
Significant
Unobservable
Inputs | |
Common Stocks* | | $ | 38,460,994 | | | $ | 38,460,994 | | | $ | — | | | $ | — | |
Corporate Bonds | | | 582,188 | | | | — | | | | 574,120 | | | | 8,068 | |
Exchange Traded Fund | | | 376,002 | | | | 376,002 | | | | — | | | | — | |
Securities Lending Collateral | | | 2,998,346 | | | | 2,998,346 | | | | — | | | | — | |
| | | | | | | | | | | | | | | | |
Total | | $ | 42,417,530 | | | $ | 41,835,342 | | | $ | 574,120 | | | $ | 8,068 | |
| | | | | | | | | | | | | | | | |
Value Fund
| | | | | | | | | | | | | | | | |
| | | Total
Value as of
February 28, 2015 | | | Level 1
Quoted
Price | | | Level 2
Significant
Observable
Inputs | | | Level 3
Significant
Unobservable
Inputs | |
Common Stocks* | | $ | 26,818,461 | | | $ | 26,818,461 | | | $ | — | | | $ | — | |
Exchange Traded Fund | | | 506,389 | | | | 506,389 | | | | — | | | | — | |
Securities Lending Collateral | | | 948,569 | | | | 948,569 | | | | — | | | | — | |
| | | | | | | | | | | | | | | | |
Total | | $ | 28,273,419 | | | $ | 28,273,419 | | | $ | — | | | $ | — | |
| | | | | | | | | | | | | | | | |
* Please refer to the Portfolio of Investments for further details on portfolio holdings.
The fair value of a Fund’s bonds are generally based on quotes received from brokers of independent pricing services. Bonds with quotes that are based on actual trades with a sufficient level of activity on or near the measurement date are classified as Level 2 assets. Bonds that are priced using quotes derived from implied values, indicative bids, or a limited amount of actual trades are classified as Level 3 assets because the inputs used by the brokers and pricing services to derive the values are not readily observable.
Investments designated as Level 3 may include assets valued using quotes or indications furnished by brokers which are based on models or estimates and may not be executable prices. In light of the developing market conditions, Schneider Capital Management continues to search for observable data points and evaluate broker quotes and indications received for portfolio investments. Determination of fair values is uncertain because it involves subjective judgments and estimates not easily substantiated by auditing procedures.
At the end of each quarter, management evaluates the classification of Levels 1, 2 and 3 assets and liabilities. Various factors are considered, such as changes in liquidity from the prior reporting period; whether or not a broker is willing to execute at the quoted price; the depth and consistency of prices from third party pricing services; and the existence of contemporaneous, observable trades in the market. Additionally, management evaluates the classification of Level 1 and Level 2 assets and liabilities on a quarterly basis for changes in listings or delistings on national exchanges.
Due to the inherent uncertainty of determining the fair value of investments that do not have a readily available market value, the fair value of the Funds’ investments may fluctuate from period to period. Additionally, the fair value of investments may differ significantly from the values that would have been used had an active market existed for such investments and may differ materially from the values the Funds may ultimately realize. Further, such investments may be subject to legal and other restrictions on resale or otherwise less liquid than publicly traded securities.
For fair valuations using significant unobservable inputs, U.S. generally accepted accounting principles (“U.S. GAAP”) require each Fund to present a reconciliation of the beginning to ending balances for reported market values that presents
18
THE SCHNEIDER FUNDS
Notes to Financial Statements (Continued)
February 28, 2015
(Unaudited)
changes attributable to total realized and unrealized gains or losses, purchase and sales, and transfers in and out of Level 3 during the period. Transfers in and out between levels are based on values at the end of the period. U.S. GAAP also requires a Fund to disclose amounts and reasons for all transfers in and out of Level 1 and Level 2 fair value measurements. A reconciliation of Level 3 investments is presented only when a Fund had an amount of Level 3 investments at the end of the reporting period that was meaningful in relation to its net assets. The amounts and reasons for all transfers in and out of each level within the three-tier hierarchy are disclosed when a Fund had an amount of total transfers during the reporting period that was meaningful in relation to its net assets as of the end of the reporting period.
For the six months ended February 28, 2015, there were no transfers between Levels 1, 2 and 3 for the Small Cap Value Fund and the Value Fund.
USE OF ESTIMATES — The Funds are investment companies and, accordingly, follow the investment company accounting and reporting guidance under U.S. GAAP. The preparation of financial statements in conformity with U.S. GAAP requires management to make estimates and assumptions that affect the reported amounts of assets and liabilities and disclosure of contingent assets and liabilities at the date of the financial statements and the reported amounts of revenues and expenses during the period. Actual results could differ from those estimates and those differences could be significant.
INVESTMENT TRANSACTIONS, INVESTMENT INCOME, AND EXPENSES — The Funds record security transactions based on trade date for financial reporting purposes. The cost of investments sold is determined by use of the specific identification method for both financial reporting and income tax purposes in determining realized gains and losses on investments. Interest income is accrued as earned. Dividend income is recorded on the ex-dividend date. Distributions received on securities that represent a return of capital or capital gain are recorded as a reduction of cost of investments and/or as a realized gain. Each Fund estimates the components of distributions received that may be considered return of capital distributions or capital gain distributions. Expenses incurred on behalf of a specific class, fund or fund family of the Company are charged directly to the class, fund or fund family (in proportion to net assets). Expenses incurred for all of the RBB funds (such as director or professional fees) are charged to all funds in proportion to their average net assets of RBB, or in such other manner as the Board of Directors deems fair or equitable. Expenses and fees, including investment advisory and administration fees, are accrued daily and taken into account for the purpose of determining the NAV of the Funds.
FOREIGN CURRENCY TRANSLATION — Foreign securities and other foreign assets and liabilities are valued using the foreign currency exchange rate effective at the end of the reporting period. The books and records of the Funds are maintained in U.S. dollars. Cost of investments is translated at the currency exchange rate effective at the trade date. The gain or loss resulting from a change in currency exchange rates between the trade and settlement dates of a portfolio transaction is treated as a gain or loss on foreign currency. Likewise, the gain or loss resulting from a change in currency exchange rates, between the date income is accrued and paid, is treated as a gain or loss on foreign currency.
DIVIDENDS AND DISTRIBUTIONS TO SHAREHOLDERS — Dividends from net investment income and distributions from net realized capital gains, if any, are declared, recorded on the ex-dividend date and paid at least annually to shareholders. Income dividends and capital gain distributions are determined in accordance with U.S. federal income tax regulations, which may differ from U.S. GAAP.
U.S. TAX STATUS — No provision is made for U.S. income taxes as it is each Fund’s intention to qualify for and elect the tax treatment applicable to regulated investment companies under Subchapter M of the Internal Revenue Code of 1986, as amended, and make the requisite distributions to its shareholders which will be sufficient to relieve it from U.S. income and excise taxes.
CASH AND CASH EQUIVALENTS — The Funds consider liquid assets deposited into a bank demand deposit account to be cash equivalents. These investments represent amounts held with financial institutions that are readily accessible to pay Fund expenses or purchase investments. Cash and cash equivalents are valued at cost plus accrued interest, which approximates market value.
OTHER — In the normal course of business, the Funds may enter into contracts that provide general indemnifications. The Funds’ maximum exposure under these arrangements is dependent on claims that may be made against the Funds in
19
THE SCHNEIDER FUNDS
Notes to Financial Statements (Continued)
February 28, 2015
(Unaudited)
the future, and, therefore, cannot be estimated; however, based on experience, the risk of material loss for such claims is considered remote.
| 2. | Investment Adviser and Other Services |
Schneider Capital Management Company (“SCM” or the “Adviser”) serves as each Fund’s investment adviser. For its advisory services, SCM is entitled to receive 1.00% of the Small Cap Value Fund’s average daily net assets and 0.70% of the Value Fund’s average daily net assets, computed daily and payable monthly.
SCM has contractually agreed to waive its advisory fees and/or reimburse expenses to the extent that total annual operating expenses (excluding certain items discussed below) of the Small Cap Value Fund and the Value Fund exceed 1.15% and 0.90%, respectively. In determining SCM’s obligation to waive advisory fees and/or reimburse expenses, the following expenses are not taken into account and could cause net total annual operating expenses to exceed 1.15% and 0.90% respectively: acquired fund fees and expenses, brokerage commissions, extraordinary items, interest and taxes. This contractual limitation is in effect until December 31, 2015 and may not be terminated without the approval of the Company’s Board of Directors.
For the six months ended February 28, 2015, advisory fees and waivers of advisory fees were as follows:
| | | | | | | | | | | | |
| | | Gross Advisory Fees | | | Waivers | | | Net Advisory Fees | |
Small Cap Value Fund | | $ | 235,595 | | | $ | (125,305 | ) | | $ | 110,290 | |
Value Fund | | | 105,371 | | | | (101,333 | ) | | | 4,038 | |
The Funds will not pay SCM at a later time for any amounts it may waive or any amounts that SCM has assumed.
BNY Mellon Investment Servicing (US) Inc. (“BNY Mellon”) serves as administrator for the Funds. For providing administration and accounting services, BNY Mellon is entitled to receive a monthly fee equal to an annual percentage rate of each Fund’s average daily net assets, subject to certain minimum monthly fees.
Included in the administration and accounting services fees, shown on the Statement of Operations, are fees for providing regulatory administration services to RBB. For providing these services, BNY Mellon is entitled to receive compensation as agreed to by the Company and BNY Mellon. This fee is allocated to each portfolio of the Company in proportion to its net assets of the Company.
In addition, BNY Mellon serves as the Funds’ transfer and dividend disbursing agent. For providing transfer agent services, BNY Mellon is entitled to receive a monthly fee, subject to certain minimum monthly and out of pocket expenses.
The Bank of New York Mellon (the “Custodian”) provides certain custodial services to the Funds. The Custodian is entitled to receive a monthly fee, subject to certain minimum, and out of pocket expenses.
Foreside Funds Distributors LLC serves as the principal underwriter and distributor of the Funds’ shares pursuant to a Distribution Agreement with RBB.
The Directors of the Company receive an annual retainer and meeting fees for meetings attended. The aggregate remuneration paid to the Directors by the Funds during the six months ended February 28, 2015 was $8,586. Certain employees of BNY Mellon serve as an Officer or Director of the Company. They are not compensated by the Funds or the Company.
20
THE SCHNEIDER FUNDS
Notes to Financial Statements (Continued)
February 28, 2015
(Unaudited)
| 4. | Investment in Securities |
For the six months ended February 28, 2015, aggregate purchases and sales of investment securities (excluding short-term investments) were as follows:
| | | | | | | | |
| | | Purchases | | | Sales | |
Small Cap Value Fund | | | $19,518,746 | | | | $31,125,749 | |
Value Fund | | | 9,338,868 | | | | 13,983,200 | |
| 5. | Federal Income Tax Information |
The Funds have followed the authoritative guidance on accounting for and disclosure of uncertainty in tax positions, which requires the Funds to determine whether a tax position is more likely than not to be sustained upon examination, including resolution of any related appeals or litigation processes, based on the technical merits of the position. Each Fund has determined that there was no effect on the financial statements from following this authoritative guidance. In the normal course of business, the Funds are subject to examination by federal, state and local jurisdictions, where applicable, for tax years for which applicable statutes of limitations have not expired.
As of February 28, 2015, federal tax cost, aggregate gross unrealized appreciation and depreciation of securities held by the Funds were as follows:
| | | | | | | | | | | | | | | | |
| | | Federal Tax
Cost | | | Unrealized
Appreciation | | | Unrealized
Depreciation | | | Net Unrealized
Appreciation | |
Small Cap Value Fund | | $ | 40,519,116 | | | $ | 8,511,930 | | | $ | (6,613,516 | ) | | $ | 1,898,414 | |
Value Fund | | | 21,711,307 | | | | 8,480,538 | | | | (1,918,426 | ) | | | 6,562,112 | |
Distributions to shareholders from net investment income and realized gains are determined in accordance with federal income tax regulations, which may differ from net investment income and realized gains recognized for financial reporting purposes. Accordingly, the character of distributions and composition of net assets for tax purposes may differ from those reflected in the accompanying financial statements. To the extent these differences are permanent, such amounts are reclassified within the capital accounts based on the tax treatment; temporary differences do not require such reclassification.
As of August 31, 2014, the components of distributable earnings on a tax basis were as follows:
| | | | | | | | | | | | | | | | | | | | |
| | | Capital Loss
Carryforwards | | | Undistributed
Ordinary
Income | | | Undistributed
Long-Term Gains | | | Unrealized
Appreciation | | | Qualified
Late-Year
Losses | |
Small Cap Value Fund | | $ | — | | | $ | 536,527 | | | $ | 11,043,473 | | | $ | 5,655,286 | | | $ | — | |
Value Fund | | | (123,392,204 | ) | | | 96,249 | | | | — | | | | 5,296,721 | | | | (239,752 | ) |
The differences between the book and tax basis components of distributable earnings relate principally to the timing of recognition of income and gains for federal income tax purposes. Short-term and foreign currency gains are reportable as ordinary income for federal income tax purposes.
The tax character of dividends and distributions paid during the fiscal year ended August 31, 2014 and 2013 was as follows:
| | | | | | | | | | | | | | | | |
| | | | | | Ordinary
Income | | | Long-Term
Gains | | | Total | |
Small Cap Value Fund | | | 2014 | | | $ | 3,741,955 | | | $ | 7,037,699 | | | $ | 10,779,654 | |
| | | 2013 | | | | — | | | | — | | | | — | |
Value Fund | | | 2014 | | | | 132,641 | | | | — | | | | 132,641 | |
| | | 2013 | | | | 339,819 | | | | — | | | | 339,819 | |
21
THE SCHNEIDER FUNDS
Notes to Financial Statements (Continued)
February 28, 2015
(Unaudited)
Dividends from net investment income and short-term capital gains are treated as ordinary income dividends for federal income tax purposes.
Accumulated capital losses represent net capital loss carry forwards as of August 31, 2014 that may be available to offset future realized capital gains and thereby reduce future capital gains distributions. Under the Regulated Investment Company Modernization Act of 2010, the Funds are permitted to carry forward capital losses incurred in taxable years beginning after December 22, 2010 for an unlimited period. Any losses incurred during those future taxable years will be required to be utilized prior to any losses incurred in pre-enactment taxable years. Additionally, post-enactment capital losses that are carried forward will retain their character as either short-term or long-term capital losses rather than being considered all short-term as under the previous law.
As of August 31, 2014, the Funds had the following pre-enactment net capital loss carryforwards to offset future net capital gains, if any, to the extent provided by Treasury regulations. To the extent that these carryforwards are used to offset future capital gains, it is probable that the gains that are offset will not be distributed to shareholders.
| | | | | | | | | | | | | | | | | | | | |
| | | August 31, 2016 | | | August 31, 2017 | | | August 31, 2018 | | | August 31, 2019 | | | Total | |
Small Cap Value Fund | | $ | — | | | $ | — | | | $ | — | | | $ | — | | | $ | — | |
Value Fund | | | 2,338,216 | | | | 75,945,572 | | | | 42,948,995 | | | | 2,159,421 | | | | 123,392,204 | |
As of August 31, 2014, the Funds did not have any post-enactment capital loss carryforwards.
The Funds may make secured loans of their portfolio securities to brokers, dealers and other financial institutions to earn additional income and receive cash collateral equal to at least 102% of the current market value of the loaned securities, as marked to market each day that the NAV of the Funds is determined. When the collateral falls below specified amounts, the lending agent will use its best effort to obtain additional collateral on the next business day to meet required amounts under the security lending agreement. The Funds will pay administrative and custodial fees in connection with the loan of securities. Collateral is invested in short-term investments and the Funds will bear the risk of loss of the invested collateral. Securities lending will expose the Funds to the risk of loss should a borrower default on its obligation to return the borrowed securities. The market value of the securities on loan and collateral as of February 28, 2015 and the income received for the six months ended February 28, 2015 were as follows:
| | | | | | | | | | | | |
| | | Fair Value of
Securities Loaned | | | Fair Value
of Collateral | | | Income Received
from Securities
Lending | |
Small Cap Value Fund | | $ | 2,818,839 | | | $ | 2,998,346 | | | $ | 25,391 | |
Value Fund | | | 966,929 | | | | 948,569 | | | | 3,006 | |
Securities lending transactions are entered into by each Fund under a Master Securities Lending Agreement (“MSLA”) which permits the Funds, under certain circumstances including an event of default (such as bankruptcy or insolvency), to offset amounts payable by the Funds to the same counterparty against amounts to be received and create one single net
22
THE SCHNEIDER FUNDS
Notes to Financial Statements (Concluded)
February 28, 2015
(Unaudited)
payment due to or from the Funds. The following table is a summary of each Fund’s open securities lending transactions which are subject to a MSLA as of February 28, 2015:
| | | | | | | | | | | | | | | | | | | | | | | | |
Securities Lending | | Gross Amounts of
Recognized Assets | | | Gross Amounts
Offset in the
Statement of
Assets and
Liabilities | | | Net Amounts of
Assets Presented in
the Statement of
Assets and Liabilities | | | Gross Amount Not Offset in the
Statement of Assets and Liabilities | |
| | | | | Financial
Instruments1 | | | Cash
Collateral
Received | | | Net
Amount | |
Small Cap Value Fund | | $ | 2,818,839 | | | $ | — | | | $ | 2,818,839 | | | $ | (2,818,839 | ) | | $ | — | | | $ | — | |
Value Fund | | | 966,929 | | | | — | | | | 966,929 | | | | (966,929 | ) | | | — | | | | — | |
| 1 | Amount disclosed is limited to the amount of assets presented in the Statement of Assets and Liabilities. Actual collateral received may be more than the amount shown. |
Management has evaluated the impact of all subsequent events on the Funds through the date the financial statements were issued and have determined that there were no subsequent events requiring recognition or disclosure in the financial statements.
23
THE SCHNEIDER FUNDS
Other Information
(Unaudited)
Proxy Voting
Policies and procedures that the Funds use to determine how to vote proxies relating to portfolio securities as well as information regarding how the Funds voted proxies relating to portfolio securities for the most recent 12-month period ended June 30 are available without charge, upon request, by calling (888) 520-3277 and on the Securities and Exchange Commission’s (“SEC”) website at http://www.sec.gov.
Quarterly Portfolio Schedules
The Company files a complete schedule of portfolio holdings with the SEC for the first and third fiscal quarters of each fiscal year (quarters ended November 30 and May 31) on Form N-Q. The Company’s Form N-Q is available on the SEC website at http://www.sec.gov and may be reviewed and copied at the SEC Public Reference Room in Washington, D.C. Information on the operation of the SEC Public Reference Room may be obtained by calling (800) SEC-0330.
24
[THIS PAGE INTENTIONALLY LEFT BLANK.]
Investment Adviser
Schneider Capital Management
460 E. Swedesford Road
Suite 1080
Wayne, PA 19087
Administrator
BNY Mellon Investment Servicing (US) Inc.
301 Bellevue Parkway
Wilmington, DE 19809
Transfer Agent
BNY Mellon Investment Servicing (US) Inc.
4400 Computer Drive
Westborough, MA 01581
Principal Underwriter
Foreside Funds Distributors LLC
400 Berwyn Park
899 Cassatt Road
Berwyn, PA 19312
Custodian
The Bank of New York Mellon
One Wall Street
New York, NY 10286
Independent Registered Public Accounting Firm
PricewaterhouseCoopers LLP
Two Commerce Square, Suite 1700
2001 Market Street
Philadelphia, PA 19103-7042
Counsel
Drinker Biddle & Reath LLP
One Logan Square, Ste. 2000
Philadelphia, PA 19103-6996
SCH-SAR15
SCOTIA DYNAMIC U.S. GROWTH FUND
of
The RBB Fund, Inc.
Class I Shares
SEMI-ANNUAL REPORT
(Unaudited)
February 28, 2015
This report is submitted for the general information of the shareholders of the Fund.
It is not authorized for distribution unless preceded or accompanied by a current prospectus for the Fund.
SCOTIA DYNAMIC U.S. GROWTH FUND
Semi-Annual Investment Adviser’s Report
February 28, 2015
(Unaudited)
February 28, 2015
Dear Shareholder:
We are pleased to provide you with this semi-annual report for the Scotia Dynamic U.S. Growth Fund (“Fund”). In this report, you will find important financial information about the Fund for the six-month period ended February 28, 2015.
During the six-month period ended February 28, 2015, the Fund’s broad based benchmark, the Russell 1000 Growth Index (“the Index”), returned 8.46% while the Fund earned a return of 9.60%. The Fund outperformed the Index primarily as a result of individual security selection within the information technology sector and security selection as well as an overweight position in the healthcare sector; healthcare was also the top performer for the Index. Not having exposure to the energy sector during the period was also a notable positive for relative Fund performance as the benchmark’s energy holdings posted a large negative return. At the security level, the primary contributors to performance included network security company Palo Alto Networks, data analytics software company Tableau Software, and biopharmaceutical company Pharmacyclics. At period end, the Fund remained primarily invested in the information technology, consumer discretionary and healthcare sectors, with these three sectors comprising over 85% of the Fund. As of February 28, 2015, the Fund held 22 individual stocks. As a result of the portfolio’s concentration, each individual security within the portfolio has a much more meaningful impact on the Fund’s performance than any individual security within the Index.
On a macro level, we reached the end of QE Infinity, a quantitative easing program of the Federal Reserve, in October 2014. Many viewed this period as the artificial suppression of interest rates, but we viewed it as the artificial suppression of volatility. Since the fall of last year, volatility returned to the markets with a vengeance which has made a lot of investors nervous but this volatility has created opportunities for the Fund.
We employ a disciplined, repeatable, and proven investment process that focuses on a bottom-up stock selection approach to generate excess returns. Our investment process begins by screening a universe of more than 5,000 publicly listed companies to seek out those with high revenue growth, high earnings growth, and the ability to become significantly larger companies. Sector weights in our Fund are derived strictly from this bottom-up stock selection process. Looking at the returns of our Fund over the years, the overwhelming majority has been driven by stock selection. Stock selection is what we do best and what we focus on; it seems to have become a lost art in the industry, possibly related to the concept of risk on - risk off. We believe that concept is just about coming to its end, and we are excited about the opportunities ahead.
Thank you for your investment and confidence in the Fund. We appreciate the opportunity you have given us to assist you in meeting your investment goals. We are grateful for the trust placed in us.
Sincerely,
Noah Blackstein, CFA
Vice President & Portfolio Manager
Scotia Institutional Asset Management U.S., Ltd.
Current and future portfolio holdings are subject to change and risk.
1
SCOTIA DYNAMIC U.S. GROWTH FUND
Performance Data
February 28, 2015
(Unaudited)
| | | | | | | | | | | | | | | | | | | | |
| | | | | | Total Returns For the Periods Ended February 28, 2015 | |
| | | | | | Average Annual | |
| | | Six | | | | | | Three | | | | | | Since | |
| | | Months* | | | One Year | | | Years | | | Five Years | | | Inception | |
Scotia Dynamic U.S. Growth Fund -
Class I Shares** | | | 9.60% | | | | 4.46% | | | | 15.31% | | | | 22.56% | | | | 25.87% | |
Russell 1000® Growth Index*** | | | 8.46% | | | | 16.24% | | | | 18.06% | | | | 17.21% | | | | 9.23% | |
| ** | The Fund operated as a series of Scotia Institutional Funds prior to the close of business on March 21, 2014 (the “Predecessor Fund”), at which time the Predecessor Fund was reorganized into the Scotia Dynamic U.S. Growth Fund (the “Fund”), a newly created series of The RBB Fund, Inc. The fiscal year end of the Predecessor Fund was September 30. The performance shown for periods prior to March 21, 2014 represents the performance for the Predecessor Fund. While the Predecessor Fund commenced operations on March 31, 2009, the Predecessor Fund began investing consistent with its investment objective on April 1, 2009. |
| *** | Benchmark performance is from inception date of the Predecessor Fund only and is not the inception date of the benchmark itself. |
Performance quoted is past performance and does not guarantee future results. The investment return and principal value of an investment in the Fund will fluctuate so that an investor’s shares, when redeemed, may be worth more or less than their original cost. Current performance may be lower or higher. Returns shown do not reflect taxes that a shareholder would pay on Fund distributions or on the redemption of Fund shares. Performance data current to the most recent month-end may be obtained by calling 1-888-572-0968.
The Fund applies a 2.00% redemption fee to the value of shares redeemed or exchanged within 60 days of purchase. This redemption fee is not reflected in the returns shown above. The performance data quoted reflects fee waivers in effect and would have been less in their absence.
The Fund’s total annual gross and net operating expenses, as stated in the current prospectus dated December 31, 2014, are 1.13% and 0.84%, respectively, of average daily net assets for Class I Shares. These rates may fluctuate and may differ from the actual expenses incurred by the Fund for the period covered by this report. The Fund’s investment adviser has contractually agreed to waive management fees and/or reimburse certain expenses of the Fund through December 31, 2015 to the extent necessary to ensure that the Fund’s total annual operating expenses (excluding taxes, extraordinary expenses, brokerage commissions and interest) do not exceed 0.84% (on an annual basis) of Class I’s average daily net assets (the “Expense Limitation”). The Expense Limitation shall remain in effect until December 31, 2015, unless the Board of Directors of The RBB Fund, Inc. approves its earlier termination.
The Fund is non-diversified and invests in a limited number of securities. As a result, the Fund’s investment performance may be more volatile, as it may be more susceptible to risks associated with a single economic, political, or regulatory event than a fund that invests in a greater number of issuers.
From time to time the Fund may focus its investments in one or more specific economic sectors and may be subject to greater risk from downturns affecting a specific sector.
The value of the Fund’s investments in equity securities may fluctuate drastically from day-to-day causing price volatility.
The Russell 1000® Growth Index measures the performance of the large-cap growth segment of the U.S. equity universe. It includes those Russell 1000 companies with higher price-to-book ratios and higher forecasted growth values. The Index is constructed to provide a comprehensive and unbiased barometer for the large-cap growth segment. The index assumes the reinvestment of all dividends. The performance of an index assumes no transaction costs, taxes, management fees or other expenses. A direct investment in an index is not possible.
2
SCOTIA DYNAMIC U.S. GROWTH FUND
Fund Expense Examples
(Unaudited)
As a shareholder of the Fund, you incur two types of costs: (1) transaction costs including redemption fees; and (2) ongoing costs, including management fees, shareholder servicing fees and other Fund expenses. These examples are intended to help you understand your ongoing costs (in dollars) of investing in the Fund and to compare these costs with the ongoing costs of investing in other mutual funds.
These examples are based on an investment of $1,000 invested at the beginning of the six-month period from September 1, 2014 through February 28, 2015 and held for the entire period.
Actual Expenses
The first line of the table below provides information about actual account values and actual expenses. You may use the information in this line, together with the amount you invested, to estimate the expenses that you paid over the period. Simply divide your account value by $1,000 (for example, an $8,600 account value divided by $1,000 = 8.6), then multiply the result by the number in the first line under the heading entitled “Expenses Paid During Period” to estimate the expenses you paid on your account during this period.
Hypothetical Examples for Comparison Purposes
The second line of the table below provides information about hypothetical account values and hypothetical expenses based on the Fund’s actual expense ratio and an assumed rate of return of 5% per year before expenses, which is not your Fund’s actual return. The hypothetical account values and expenses may not be used to estimate the actual ending account balance or expenses you paid for the period. You may use this information to compare the ongoing costs of investing in the Fund and other funds. To do so, compare these 5% hypothetical examples with the 5% hypothetical examples that appear in the shareholder reports of other funds.
Please note that the expenses shown in the table below are meant to highlight your ongoing costs only and do not reflect any transactional costs, such as redemption fees. Therefore, the second line of the accompanying table is useful in comparing ongoing costs only and will not help you determine the relative total costs of owning different funds. In addition, if transactional costs were included, your costs would have been higher.
| | | | | | |
| | | Class I Shares |
| | | Beginning Account Value | | Ending Account Value | | Expenses Paid |
| | | September 1, 2014 | | February 28, 2015 | | During Period* |
Actual | | $1,000.00 | | $1,096.00 | | $4.37 |
Hypothetical
(5% return before expenses) | | 1,000.00 | | 1,020.63 | | 4.21 |
| * | Expenses are equal to the Fund’s annualized six month expense ratio of 0.84% for Class I Shares, which includes waived fees and reimbursed expenses, multiplied by the average account value over the period multiplied by the number of days (181) in the most recent fiscal half-year, then divided by 365 to reflect the one half-year period. The Fund’s ending account value on the first line in the table is based on the actual six month total investment return for the Fund as of February 28, 2015 of 9.60% for Class I Shares. |
3
SCOTIA DYNAMIC U.S. GROWTH FUND
Portfolio Holdings Summary Table
February 28, 2015
(Unaudited)
The following table presents a summary by sector of the portfolio holdings of the Fund.
| | | | | | | | | | |
| | | % of Net | | |
Security Type/Sector Classification | | Assets | | Value |
COMMON STOCKS: | | | | | | | | | | |
Information Technology | | | | 37.0 | % | | | $ | 22,231,868 | |
Consumer Discretionary | | | | 30.7 | | | | | 18,472,585 | |
Health Care | | | | 19.4 | | | | | 11,637,059 | |
Consumer Staples | | | | 5.3 | | | | | 3,175,200 | |
Other Assets in Excess of Liabilities | | | | 7.6 | | | | | 4,554,381 | |
| | | | | | | | | | |
NET ASSETS | | | | 100.0 | % | | | $ | 60,071,093 | |
| | | | | | | | | | |
Portfolio holdings are subject to change at any time.
The accompanying notes are an integral part of the financial statements.
4
SCOTIA DYNAMIC U.S. GROWTH FUND
Portfolio of Investments
February 28, 2015
(Unaudited)
| | | | | | | | |
| | | Number | | | | |
| | | of Shares | | | Value | |
COMMON STOCKSD - 92.4% | | | | | | | | |
Consumer Discretionary — 30.7% | | | | | |
Amazon.com, Inc.* | | | 4,600 | | | $ | 1,748,736 | |
Expedia, Inc. | | | 12,900 | | | | 1,183,575 | |
lululemon athletica, Inc.* | | | 36,400 | | | | 2,491,216 | |
Netflix, Inc.* | | | 2,600 | | | | 1,234,766 | |
O’Reilly Automotive, Inc.* | | | 10,100 | | | | 2,102,113 | |
Tractor Supply Co. | | | 20,700 | | | | 1,824,084 | |
Ulta Salon Cosmetics & Fragrance, Inc.* | | | 21,600 | | | | 3,040,416 | |
Under Armour, Inc., Class A* | | | 42,900 | | | | 3,303,729 | |
Zoe’s Kitchen, Inc.* | | | 45,000 | | | | 1,543,950 | |
| | | | | | | | |
| | | | | | | 18,472,585 | |
| | | | | | | | |
Consumer Staples — 5.3% | | | | | | | | |
Monster Beverage Corp.* | | | 22,500 | | | | 3,175,200 | |
| | | | | | | | |
| | | | | | | 3,175,200 | |
| | | | | | | | |
Health Care — 19.4% | | | | | | | | |
Biogen Idec, Inc.* | | | 5,900 | | | | 2,416,581 | |
Celgene Corp.* | | | 20,300 | | | | 2,467,059 | |
Illumina, Inc.* | | | 15,900 | | | | 3,107,814 | |
Medivation, Inc.* | | | 22,800 | | | | 2,679,684 | |
Veeva Systems, Inc., Class A* | | | 31,290 | | | | 965,921 | |
| | | | | | | | |
| | | | | | | 11,637,059 | |
| | | | | | | | |
| | | | | | | | |
| | | Number | | | | |
| | | of Shares | | | Value | |
Information Technology — 37.0% | | | | | |
Facebook, Inc., Class A* | | | 36,600 | | | $ | 2,890,302 | |
LinkedIn Corp., Class A* | | | 7,200 | | | | 1,923,840 | |
Palo Alto Networks, Inc.* | | | 21,200 | | | | 3,015,064 | |
Qualys, Inc.* | | | 1,900 | | | | 87,457 | |
Salesforce.Com, Inc.* | | | 51,700 | | | | 3,586,946 | |
ServiceNow, Inc.* | | | 52,100 | | | | 3,973,146 | |
Skyworks Solutions, Inc. | | | 24,700 | | | | 2,167,425 | |
Tableau Software, Inc., Class A* | | | 48,800 | | | | 4,587,688 | |
| | | | | | | | |
| | | | | | | 22,231,868 | |
| | | | | | | | |
TOTAL COMMON STOCKS
(Cost $47,789,857) | | | | | | | 55,516,712 | |
| | | | | | | | |
TOTAL INVESTMENTS - 92.4%
(Cost $47,789,857) | | | | | | | 55,516,712 | |
| | | | | | | | |
OTHER ASSETS IN EXCESS OF LIABILITIES - 7.6% | | | | | | | 4,554,381 | |
| | | | | | | | |
NET ASSETS - 100.0% | | | | | | $ | 60,071,093 | |
| | | | | | | | |
| D | More narrow industries are utilized for compliance purposes, whereas broad sectors are utilized for reporting purposes. |
| * | Non-income producing security. |
The accompanying notes are an integral part of the financial statements.
5
SCOTIA DYNAMIC U.S. GROWTH FUND
Statement of Assets and Liabilities
February 28, 2015
(Unaudited)
| | | | |
ASSETS | | | | |
Investments, at value (Cost $47,789,857) | | $ | 55,516,712 | |
Cash | | | 1,251,281 | |
Receivables for: | | | | |
Investments sold | | | 7,629,584 | |
Capital shares sold | | | 61,978 | |
Dividends | | | 5,992 | |
Prepaid expenses | | | 18,656 | |
| | | | |
Total assets | | | 64,484,203 | |
| | | | |
| |
LIABILITIES | | | | |
Payables for: | | | | |
Investments purchased | | | 4,197,210 | |
Capital shares redeemed | | | 126,457 | |
Distribution to shareholders | | | 2,686 | |
Advisory fees | | | 11,601 | |
Administration and accounting services fees | | | 21,254 | |
Other accrued expenses and liabilities | | | 53,902 | |
| | | | |
Total liabilities | | | 4,413,110 | |
| | | | |
Net Assets | | $ | 60,071,093 | |
| | | | |
NET ASSETS CONSISTS OF | | | | |
Par value | | $ | 2,160 | |
Paid-in capital | | | 51,349,416 | |
Accumulated net investment loss | | | (231,942 | ) |
Accumulated net realized gain from investments | | | 1,224,604 | |
Net unrealized appreciation on investments. | | | 7,726,855 | |
| | | | |
Net Assets | | $ | 60,071,093 | |
| | | | |
| |
CLASS I SHARES: | | | | |
Net Assets applicable to Class I Shares | | $ | 60,071,093 | |
| | | | |
Shares outstanding ($0.001 par value, 100,000,000 shares authorized) | | | 2,159,971 | |
| | | | |
Net asset value, offering price per share | | $ | 27.81 | |
| | | | |
The accompanying notes are an integral part of the financial statements.
6
SCOTIA DYNAMIC U.S. GROWTH FUND
Statements of Operations
For the Six Months Ended February 28, 2015
(Unaudited)
| | | | |
INVESTMENT INCOME | | | | |
Dividends | | $ | 9,871 | |
Interest | | | 59 | |
| | | | |
Total investment income | | | 9,930 | |
| | | | |
EXPENSES | | | | |
Advisory fees (Note 2) | | | 187,162 | |
Administration and accounting services fees (Note 2) | | | 44,197 | |
Shareholder servicing fees | | | 28,794 | |
Registration and filing fees | | | 16,262 | |
Transfer agent fees (Note 2) | | | 15,543 | |
Legal fees | | | 13,750 | |
Audit fees | | | 13,294 | |
Printing and shareholder reporting fees | | | 12,622 | |
Custodian fees (Note 2) | | | 10,460 | |
Directors’ and officers’ fees | | | 2,674 | |
Insurance expense | | | 1,271 | |
Other expenses | | | 6,335 | |
| | | | |
Total expenses before waivers and reimbursements | | | 352,364 | |
Less: waivers and reimbursements (Note 2) | | | (110,492 | ) |
| | | | |
Net expenses after waivers and reimbursements | | | 241,872 | |
| | | | |
Net investment loss | | | (231,942 | ) |
| | | | |
NET REALIZED AND UNREALIZED GAIN FROM INVESTMENTS | | | | |
Net realized gain from: | | | | |
Investments | | | 2,498,397 | |
Net change in unrealized appreciation on: | | | | |
Investments | | | 2,963,587 | |
| | | | |
Net realized and unrealized gain from investments | | | 5,461,984 | |
| | | | |
NET INCREASE IN NET ASSETS RESULTING FROM OPERATIONS | | $ | 5,230,042 | |
| | | | |
The accompanying notes are an integral part of the financial statements.
7
SCOTIA DYNAMIC U.S. GROWTH FUND
Statements of Changes in Net Assets
| | | | | | | | | | | | | | | |
| | | For the | | | | |
| | | Six Months Ended | | For the | | For the |
| | | February 28, 2015 | | Eleven Months Ended | | Year Ended |
| | | (Unaudited) | | August 31, 2014* | | September 30, 2013 |
INCREASE/(DECREASE) IN NET ASSETS FROM OPERATIONS: | | | | | | | | | | | | | | | |
Net investment loss | | | $ | (231,942 | ) | | | $ | (487,645 | ) | | | $ | (307,756 | ) |
Net realized gain from investments | | | | 2,498,397 | | | | | 6,742,166 | | | | | 6,250,314 | |
Net change in unrealized appreciation/ (depreciation) on investments | | | | 2,963,587 | | | | | (5,023,483 | ) | | | | 2,137,548 | |
| | | | | | | | | | | | | | | |
Net increase in net assets resulting from operations | | | | 5,230,042 | | | | | 1,231,038 | | | | | 8,080,106 | |
| | | | | | | | | | | | | | | |
DIVIDENDS AND DISTRIBUTIONS TO SHAREHOLDERS FROM: | | | | | | | | | | | | | | | |
Class I Shares | | | | | | | | | | | | | | | |
Net realized gains | | | | (4,595,816 | ) | | | | (5,671,518 | ) | | | | — | |
| | | | | | | | | | | | | | | |
Net decrease in net assets from dividends and distributions to shareholders | | | | (4,595,816 | ) | | | | (5,671,518 | ) | | | | — | |
| | | | | | | | | | | | | | | |
CAPITAL TRANSACTIONS: | | | | | | | | | | | | | | | |
Class I Shares | | | | | | | | | | | | | | | |
Proceeds from shares sold | | | | 5,118,534 | | | | | 55,361,805 | | | | | 28,465,703 | |
Reinvestment of distributions | | | | 4,441,210 | | | | | 5,501,369 | | | | | — | |
Shares redeemed | | | | (10,047,327 | ) | | | | (52,236,586 | ) | | | | (39,815,730 | ) |
| | | | | | | | | | | | | | | |
Net increase/(decrease) in net assets from capital share transactions | | | | (487,583 | ) | | | | 8,626,588 | | | | | (11,350,027 | ) |
Redemption fees** | | | | 950 | | | | | — | | | | | — | |
| | | | | | | | | | | | | | | |
Total increase/(decrease) in net assets | | | | 147,593 | | | | | 4,186,108 | | | | | (3,269,921 | ) |
| | | | | | | | | | | | | | | |
NET ASSETS | | | | | | | | | | | | | | | |
Beginning of period | | | | 59,923,500 | | | | | 55,737,392 | | | | | 59,007,313 | |
| | | | | | | | | | | | | | | |
End of period | | | $ | 60,071,093 | | | | $ | 59,923,500 | | | | $ | 55,737,392 | |
| | | | | | | | | | | | | | | |
Accumulated net investment loss, end of period | | | $ | (231,942 | ) | | | $ | — | | | | $ | — | |
| | | | | | | | | | | | | | | |
CAPITAL SHARE TRANSACTIONS: | | | | | | | | | | | | | | | |
Class I Shares | | | | | | | | | | | | | | | |
Shares sold | | | | 185,671 | | | | | 1,975,436 | | | | | 1,273,440 | |
Shares reinvested | | | | 182,241 | | | | | 210,700 | | | | | — | |
Shares redeemed | | | | (375,950 | ) | | | | (2,048,881 | ) | | | | (1,871,114 | ) |
| | | | | | | | | | | | | | | |
Net increase/(decrease) in shares | | | | (8,038 | ) | | | | 137,255 | | | | | (597,674 | ) |
| | | | | | | | | | | | | | | |
| * | The Fund changed its fiscal year end to August 31. |
| ** | Prior to February 1, 2012, shares of the Fund redeemed within 90 days of purchase were charged a 2.00% redemption fee. From February 1, 2012 until July 14, 2014, no redemption fee was imposed. Effective July 14, 2014, the Fund applies a 2.00% redemption fee to the value of shares redeemed within 60 days of purchase. |
The accompanying notes are an integral part of the financial statements.
8
SCOTIA DYNAMIC U.S. GROWTH FUND
Financial Highlights
Contained below is per share operating performance data for shares outstanding, total investment return, ratios to average net assets and other supplemental data for the representative periods. This information has been derived from information provided in the financial statements.
| | | | | | | | | | | | | | | | | | | | | | | | | | | | |
| | | Class I Shares | |
| | | For the
Six Months Ended
February 28, 2015
(Unaudited) | | | For the
Eleven Months Ended
August 31, 2014(1)(2) | | | For the
Year Ended
September 30, 2013 | | | For the
Year Ended
September 30, 2012 | | | For the
Year Ended
September 30, 2011 | | | For the
Year Ended
September 30, 2010 | | | For the
Period Ended
September 30, 2009(3) | |
Per Share Operating Performance | | | | | | | | | | | | | | | | | | | | | | | | | | | | |
Net asset value, beginning of period | | $ | 27.64 | | | $ | 27.45 | | | $ | 22.45 | | | $ | 18.83 | | | $ | 16.36 | | | $ | 12.32 | | | $ | 10.00 | |
| | | | | | | | | | | | | | | | | | | | | | | | | | | | |
Net investment loss(4) | | | (0.11 | ) | | | (0.20 | ) | | | (0.14 | ) | | | (0.16 | ) | | | (0.16 | ) | | | (0.13 | ) | | | (0.05 | ) |
Net realized and unrealized gain from investments | | | 2.46 | | | | 2.96 | | | | 5.14 | | | | 4.21 | | | | 2.82 | | | | 5.80 | | | | 2.37 | |
| | | | | | | | | | | | | | | | | | | | | | | | | | | | |
Net increase in net assets resulting from operations | | | 2.35 | | | | 2.76 | | | | 5.00 | | | | 4.05 | | | | 2.66 | | | | 5.67 | | | | 2.32 | |
| | | | | | | | | | | | | | | | | | | | | | | | | | | | |
Dividends and distributions to shareholders from: | | | | | | | | | | | | | | | | | | | | | | | | | | | | |
Net investment income | | | — | | | | — | | | | — | | | | — | | | | — | | | | (0.23 | ) | | | — | |
Net realized gains | | | (2.18 | ) | | | (2.57 | ) | | | — | | | | (0.50 | ) | | | (0.24 | ) | | | (1.40 | ) | | | — | |
| | | | | | | | | | | | | | | | | | | | | | | | | | | | |
Total dividends and distributions to shareholders | | | (2.18 | ) | | | (2.57 | ) | | | — | | | | (0.50 | ) | | | (0.24 | ) | | | (1.63 | ) | | | — | |
| | | | | | | | | | | | | | | | | | | | | | | | | | | | |
Redemption fees added to paid-in capital(4) | | | — | (5) | | | — | | | | — | | | | 0.07 | | | | 0.05 | | | | — | (5) | | | — | |
| | | | | | | | | | | | | | | | | | | | | | | | | | | | |
Net asset value, end of period | | $ | 27.81 | | | $ | 27.64 | | | $ | 27.45 | | | $ | 22.45 | | | $ | 18.83 | | | $ | 16.36 | | | $ | 12.32 | |
| | | | | | | | | | | | | | | | | | | | | | | | | | | | |
Total investment return(6) | | | 9.60 | %(7) | | | 10.62 | %(7) | | | 22.27 | % | | | 22.31 | % | | | 16.54 | % | | | 49.82 | % | | | 23.20 | %(7) |
| | | | | | | | | | | | | | | | | | | | | | | | | | | | |
Ratios/Supplemental Data | | | | | | | | | | | | | | | | | | | | | | | | | | | | |
Net assets, end of period (000’s omitted) | | $ | 60,071 | | | $ | 59,924 | | | $ | 55,737 | | | $ | 59,007 | | | $ | 53,332 | | | $ | 10,319 | | | $ | 616 | |
Ratio of expenses to average net assets with waivers and reimbursements | | | 0.84 | %(8) | | | 0.84 | %(8) | | | 0.86 | % | | | 0.95 | % | | | 0.95 | % | | | 0.95 | % | | | 0.95 | %(8) |
Ratio of expenses to average net assets without waivers and reimbursements | | | 1.22 | %(8) | | | 1.13 | %(8) | | | 1.13 | % | | | 1.25 | % | | | 1.32 | % | | | 6.14 | % | | | 30.21 | %(8) |
Ratio of net investment loss to average net assets | | | (0.81 | )%(8) | | | (0.80 | )%(8) | | | (0.63 | )% | | | (0.75 | )% | | | (0.80 | )% | | | (0.90 | )% | | | (0.83 | )%(8) |
Portfolio turnover rate | | | 119.46 | %(7) | | | 276.74 | %(7) | | | 345.12 | % | | | 323.54 | % | | | 358.15 | % | | | 244.38 | % | | | 205.10 | %(7) |
| (1) | The Fund changed its fiscal year end to August 31. |
The accompanying notes are an integral part of the financial statements.
9
SCOTIA DYNAMIC U.S. GROWTH FUND
Financial Highlights (Continued)
| (2) | Effective as of the close of business on March 21, 2014, the Fund acquired all the assets and liabilities of the Dynamic U.S. Growth Fund (“Predecessor Fund”), a series of Scotia Institutional Funds. The financial highlights for the periods prior to that date reflect the performance of the Predecessor Fund. |
| (3) | The Fund commenced investment operations on March 31, 2009. |
| (4) | The selected per share data was calculated based on average shares outstanding method for the period. (5) Amount represent less than $0.005 per share. |
| (6) | Total investment return is calculated assuming a purchase of shares on the first day and a sale of shares on the last day of each period reported and includes reinvestments of dividends and distributions, if any. |
The accompanying notes are an integral part of the financial statements.
10
SCOTIA DYNAMIC U.S. GROWTH FUND
Notes to Financial Statements
February 28, 2015
(Unaudited)
1. Organization and Significant Accounting Policies
The RBB Fund, Inc. (“RBB” or the “Company”) was incorporated under the laws of the State of Maryland on February 29, 1988 and is registered under the Investment Company Act of 1940, as amended, (the “Investment Company Act”) as an open-end management investment company. RBB is a “series fund,” which is a mutual fund divided into separate portfolios. Each portfolio is treated as a separate entity for certain matters under the Investment Company Act, and for other purposes, and, a shareholder of one portfolio is not deemed to be a shareholder of any other portfolio. Currently, RBB has twenty-two active investment portfolios, including the Scotia Dynamic U.S. Growth Fund (the “Fund”). The Fund is authorized to issue three classes of shares, Institutional Shares, Class I Shares and Class II Shares. As of February 28, 2015, Institutional Shares and Class II shares were not yet being offered to the public.
RBB has authorized capital of one hundred billion shares of common stock of which 82.373 billion shares are currently classified into one hundred and fifty-three classes of common stock. Each class represents an interest in an active or inactive RBB investment portfolio. The Fund has issued shares with a par value of $0.001.
The Dynamic U.S. Growth Fund (the “Predecessor Fund”), a series of Scotia Institutional Funds, transferred all of its assets and liabilities to the Fund in a tax-free reorganization (the “Reorganization”). The Reorganization occurred at the close of business on March 21, 2014. The Predecessor Fund commenced operations on March 31, 2009. As a result of the Reorganization, the performance and accounting history of the Predecessor Fund was assumed by the Fund. Performance and accounting information prior to the close of business on March 21, 2014 included herein is that of the Predecessor Fund. See Note 7 for additional information on the Reorganization.
At the date of the reorganization, the Fund changed its fiscal year end to August 31.
Portfolio Valuation – The Fund’s net asset value (“NAV”) is calculated once daily at the close of regular trading hours on the New York Stock Exchange (“NYSE”) (generally 4:00 p.m. Eastern time) on each day the NYSE is open. Securities held by the Fund are valued using the closing price or the last sale price on a national securities exchange or the National Association of Securities Dealers Automatic Quotation (“NASDAQ”) market system where they are primarily traded. Equity securities traded in the over-the-counter market are valued at their closing prices. If there were no transactions on that day, securities traded principally on an exchange or on NASDAQ will be valued at the mean of the last bid and ask prices prior to the market close. Investments in other open-end investment companies, if any, are valued based on the NAV of those investment companies (which may use fair value pricing as disclosed in their prospectuses). If market quotations are unavailable or deemed unreliable, securities will be valued in accordance with procedures adopted by the Company’s Board of Directors. Relying on prices supplied by pricing services or dealers or using fair valuation may result in values that are higher or lower than the values used by other investment companies and investors to price the same investments.
11
SCOTIA DYNAMIC U.S. GROWTH FUND
Notes to Financial Statements (Continued)
February 28, 2015
(Unaudited)
Fair Value Measurements – The inputs and valuation techniques used to measure fair value of the Fund’s investments are summarized into three Levels as described in the hierarchy below:
| | • Level 1 — | quoted prices in active markets for identical securities; |
| | • Level 2 — | other significant observable inputs (including quoted prices for similar securities, interest rates, prepayment speeds, credit risk, etc.); and |
| | • Level 3 — | significant unobservable inputs (including the Fund’s own assumptions in determining the fair value of investments). |
The inputs or methodology used for valuing securities are not necessarily an indication of the risk associated with investing in those securities.
The following is a summary of the inputs used, as of February 28, 2015, in valuing the Fund’s investments carried at fair value:
| | | | | | | | | | | | |
| | | Total Value at
February 28,
2015 | | | Level 1
Quoted
Price | | | Level 2
Other
Significant
Observable
Inputs | | Level 3
Significant
Unobservable
Inputs |
Investments in Securities* | | $ | 55,516,712 | | | $ | 55,516,712 | | | $ — | | $ — |
| | | | | | | | | | | | |
* Please refer to Portfolio of Investments for further details.
At the end of each quarter, management evaluates the classification of Levels 1, 2 and 3 assets and liabilities. Various factors are considered, such as changes in liquidity from the prior reporting period; whether or not a broker is willing to execute at the quoted price; the depth and consistency of prices from third party pricing services; and the existence of contemporaneous, observable trades in the market. Additionally, management evaluates the classification of Level 1 and Level 2 assets and liabilities on a quarterly basis for changes in listings or delistings on national exchanges.
Due to the inherent uncertainty of determining the fair value of investments that do not have a readily available market value, the fair value of the Fund’s investments may fluctuate from period to period. Additionally, the fair value of investments may differ significantly from the values that would have been used had a ready market existed for such investments and may differ materially from the values the Fund may ultimately realize. Further, such investments may be subject to legal and other restrictions on resale or otherwise be less liquid than publicly traded securities.
For fair valuations using significant unobservable inputs, U.S. generally accepted accounting principles (“U.S. GAAP”) require the Fund to present a reconciliation of the beginning to ending balances for reported market values that presents changes attributable to total realized and unrealized gains or losses, purchase and sales, and transfers in and out of Level 3 during the period. Transfers in and out between Levels are based on values at the end of the period. U.S. GAAP also requires the Fund to disclose amounts and reasons for all transfers in and out of Level 1 and Level 2 fair value measurements. A reconciliation of Level 3 investments is presented only when the Fund had an amount of Level 3 investments at the end of the reporting period that was meaningful in relation to its net assets. The amounts and reasons for all transfers in and out of each Level within the three-tier hierarchy are disclosed when the Fund had an amount of total transfers during the reporting period that was meaningful in relation to its net assets as of the end of the reporting period.
For the six months ended February 28, 2015, there were no transfers between Levels 1, 2 and 3 for the Fund.
12
SCOTIA DYNAMIC U.S. GROWTH FUND
Notes to Financial Statements (Continued)
February 28, 2015
(Unaudited)
Use of Estimates — The Fund is an investment company and, accordingly, follows the investment company accounting and reporting guidance under U.S. GAAP. The preparation of financial statements in conformity with U.S. GAAP requires management to make estimates and assumptions that affect the reported amounts of assets and liabilities and disclosure of contingent assets and liabilities at the date of the financial statements and the reported amounts of revenues and expenses during the period. Actual results could differ from those estimates and those differences could be significant.
Investment Transactions, Investment Income and Expenses — The Fund records security transactions based on trade date for financial reporting purposes. The cost of investments sold is determined by use of the specific identification method for both financial reporting and income tax purposes in determining realized gains and losses on investments. Interest income is accrued when earned. Dividend income is recorded on the ex-dividend date. Distributions received on securities that represent a return of capital or capital gains are recorded as a reduction of cost of investments and/or as a realized gain. The Fund’s policy is to allocate investment income, expenses and unrealized and realized gains and losses among classes on a daily basis, when applicable. Expenses incurred on behalf of a specific class, fund or fund family of the Company are charged directly to the class, fund or fund family to each class of shares based upon the relative proportion of net assets of each class at the beginning of the day. Expenses incurred for all the RBB funds (such as director or professional fees) are charged to all funds in proportion to their average net assets of RBB, or in such other manner as the Company’s Board of Directors deems fair or equitable. Expenses and fees, including investment advisory and administration fees, are accrued daily and taken into account for the purpose of determining the NAV of the Fund.
Dividends and Distributions to Shareholders — Dividends from net investment income and distributions from net realized capital gains, if any, are declared and paid at least annually to shareholders and recorded on ex-dividend date. Income dividends and capital gain distributions are determined in accordance with U.S. federal income tax regulations which may differ from U.S. GAAP.
U.S. Tax Status — No provision is made for U.S. income taxes as it is the Fund’s intention to qualify for and elect the tax treatment applicable to regulated investment companies under Subchapter M of the Internal Revenue Code of 1986, as amended, and make the requisite distributions to its shareholders which will be sufficient to relieve it from U.S. income and excise taxes.
Cash and Cash Equivalents — The Fund considers liquid assets deposited into a bank demand deposit account to be cash equivalents. These investments represent amounts held with financial institutions that are readily accessible to pay Fund expenses or purchase investments. Cash and cash equivalents are valued at cost plus accrued interest, which approximates market value.
Redemption Fees — On May 13, 2014, the Board of Directors of the Company approved the imposition of a redemption fee of 2.00% on redemptions and exchanges of Fund shares held less than 60 days effective on July 14, 2014. The fees will be reflected on the Statements of Changes in Net Assets. The Fund reserves the right to modify or eliminate the redemption fee or any waivers of such fee at any time.
Other — In the normal course of business, the Fund may enter into contracts that provide general indemnifications. The Fund’s maximum exposure under these arrangements is dependent on claims that may be made against the Fund in the future, and, therefore, cannot be estimated; however, based on experience, the risk of material loss from such claims is considered remote.
13
SCOTIA DYNAMIC U.S. GROWTH FUND
Notes to Financial Statements (Continued)
February 28, 2015
(Unaudited)
2. Investment Adviser and Other Services
Scotia Institutional Asset Management US, Ltd. (“SIAM” or the “Adviser”) serves as the Fund’s investment adviser. For its advisory services, the Adviser is entitled to receive an advisory fee calculated daily and payable monthly at an annual rate 0.65% of the average daily net assets of the Fund.
The Adviser has contractually agreed to waive advisory fees and reimburse expenses to the extent that Total Annual Fund Operating Expenses (excluding taxes, extraordinary expenses, brokerage commissions and interest) exceed 0.74% for Institutional Shares, 0.84% for Class I Shares and 0.99% for Class II Shares (Institutional Shares and Class II Shares have not commenced operations as of February 28, 2015) until December 31, 2015. Prior to such date, this contractual agreement may only be terminated by the Fund’s Board of Directors. The expenses that are excluded from the waiver could cause the net total annual fund operating expenses to exceed 0.74%, 0.84% or 0.99%, as applicable. If it becomes unnecessary for the Adviser to waive fees or make reimbursements, the Adviser may recapture any of its prior waivers or reimbursements for a period not to exceed three years from the date on which the waiver or reimbursement was made to the extent that such a recapture does not cause the Total Annual Fund Operating Expenses (excluding taxes, extraordinary expenses, brokerage commissions and interest) to exceed the applicable expense limitation that was in effect at the time of the waiver or reimbursement.
As of February 28, 2015, the amount of the Adviser’s potential recovery was as follows:
| | |
| Expiration |
| August 31, 2017 | | August 31, 2018 |
| $109,821 | | $110,492 |
For the six months ended February 28, 2015, the Adviser earned fees of $187,162 and waived fees of $110,492. For the period March 24, 2014 through August 31, 2014, the Adviser earned fees of $186,594 and waived fees of $109,821. For the period from October 1, 2013 through March 21, 2014, SII US earned advisory fees of $209,443 and waived fees of $64,486. SII US is no longer eligible to recover any amounts previously waived or reimbursed.
BNY Mellon Investment Servicing (US) Inc. (“BNY Mellon”) serves as administrator for the Fund. For providing administrative and accounting services, BNY Mellon is entitled to receive a monthly fee equal to an annual percentage rate of the Fund’s average daily net assets, subject to certain minimum monthly fees.
Included in the administration and accounting services fees, shown on the Statement of Operations, are fees for providing regulatory administration services to RBB. For providing these services, BNY Mellon is entitled to receive compensation as agreed to by the Company and BNY Mellon. This fee is allocated to each portfolio of the Company in proportion to its net assets of the Company.
In addition, BNY Mellon serves as the Fund’s transfer and dividend disbursing agent. For providing transfer agent services, BNY Mellon is entitled to receive a monthly fee, subject to certain minimum, and out of pocket expenses.
The Bank of New York Mellon (the “Custodian”) provides certain custodial services to the Fund. The Custodian is entitled to receive a monthly fee, subject to certain minimum, and out of pocket expenses.
Foreside Funds Distributors LLC, serves as the principal underwriter and distributor of the Fund’s shares pursuant to a Distribution Agreement with RBB.
14
SCOTIA DYNAMIC U.S. GROWTH FUND
Notes to Financial Statements (Continued)
February 28, 2015
(Unaudited)
3. Shareholder Servicing Plan
The Fund has adopted Shareholder Services Plans for the Class I and Class II Shares. Under the Shareholder Services Plans, the Fund may pay service fees to firms that provide shareholder services, such as responding to shareholder inquiries and assisting shareholders with their accounts, not exceeding ten basis points (0.10%) and twenty-five basis points (0.25%), respectively, of the Fund’s average daily net assets attributable to Class I Shares and Class II Shares.
4. Director Compensation
The Directors of the Company receive an annual retainer and meeting fees for meetings attended. The remuneration paid to the Directors by the Fund for the six months ended February 28, 2015 was $4,504. Certain employees of BNY Mellon serve as an Officer or Director of the Company. They are not compensated by the Fund or the Company.
5. Investment in Securities
For the six months ended February 28, 2015, aggregate purchases and sales of investment securities (excluding short-term investments) of the Fund were as follows:
| | | | | | | | |
| | | Purchases | | | Sales | |
Investment Securities | | $ | 68,524,643 | | | $ | 79,141,669 | |
6. Federal Income Tax Information
The Fund has followed the authoritative guidance on accounting for and disclosure of uncertainty in tax positions, which requires the Fund to determine whether a tax position is more likely than not to be sustained upon examination, including resolution of any related appeals or litigation processes, based on the technical merits of the position. The Fund has determined that there was no effect on the financial statements from following this authoritative guidance. In the normal course of business, the Fund is subject to examination by federal, state and local jurisdictions, where applicable, for tax years for which applicable statutes of limitations have not expired.
As of February 28, 2015, the federal tax cost and aggregate gross unrealized appreciation and depreciation of securities held by the Fund were as follows:
| | | | | | |
| | | | | | |
Federal tax cost | | $ | 47,789,857 | | |
| | | | | |
Gross unrealized appreciation | | $ | 7,772,772 | | |
Gross unrealized depreciation | | | (45,917 | ) | |
| | | | | |
Net unrealized appreciation | | $ | 7,726,855 | | |
| | | | | |
Distributions to shareholders, if any, from net investment income and realized gains are determined in accordance with federal income tax regulations, which may differ from net investment income and realized gains recognized for financial reporting purposes. Accordingly, the character of distributions and composition of net assets for tax purposes may differ from those reflected in the accompanying financial statements. To the extent these differences are permanent, such amounts are reclassified within the capital accounts based on the tax treatment; temporary differences do not require such reclassification.
15
SCOTIA DYNAMIC U.S. GROWTH FUND
Notes to Financial Statements (Concluded)
February 28, 2015
(Unaudited)
As of August 31, 2014, the components of distributable earnings on a tax basis were as follows:
| | | | |
Undistributed
Ordinary Income | | Undistributed
Long-Term Gains | | Net Unrealized
Appreciation |
| $1,974,975 | | $2,620,839 | | $3,489,477 |
The differences between the book and tax basis components of distributable earnings relate primarily to the timing of recognition of income and gains for federal income tax purposes. Short-term and foreign currency gains are reported as ordinary income for federal income tax purposes.
The tax character of dividends and distributions paid during the eleven month period ended August 31, 2014, fiscal year ended September 30, 2013 and fiscal year ended September 30, 2012 were as follows:
| | | | | | | | |
| | | Ordinary | | | Long-Term | |
| | | Income | | | Gains | |
2014 | | $ | 3,859,576 | | | $ | 1,811,942 | |
2013 | | $ | — | | | $ | — | |
2012 | | $ | 1,229,248 | | | $ | — | |
Accumulated capital losses represent net capital loss carry forwards as of August 31, 2014 that may be available to offset future realized capital gains and thereby reduce future capital gains distributions. Under the Regulated Investment Company Modernization Act of 2010 (the “Modernization Act”), the Fund is permitted to carry forward capital losses incurred in taxable years beginning after December 22, 2010 for an unlimited period. Any losses incurred during those future taxable years will be required to be utilized prior to any losses incurred in pre-enactment taxable years. Additionally, post-enactment capital losses that are carried forward will retain their character as either short-term or long-term capital losses rather than being considered all short-term as under the previous law. As of August 31, 2014, the Fund did not have any capital loss carryforwards.
7. Reorganization
At a Special Meeting of Shareholders held on March 14, 2014, shareholders of the Predecessor Fund approved an Agreement and Plan of Reorganization pursuant to which the assets and identified liabilities of the Predecessor Fund were transferred to the Fund in exchange for Class I shares of the Fund. The closing of the Reorganization, which was a tax-free transaction, took place at the close of business on March 21, 2014.
| | | | | | | | | | |
Predecessor Fund (Series of Scotia Institutional Funds) | | Acquiring Fund (Series of RBB Funds) | | Net Assets | | | Shares
Outstanding | |
Dynamic U.S. Growth Fund | | Scotia Dynamic U.S. Growth | | | | | | | | |
Class I | | Fund Class I | | $ | 93,463,746 | | | | 3,403,112 | |
8. Subsequent Events
Management has evaluated the impact of all subsequent events on the Fund through the date the financial statements were issued, and has determined that there were no subsequent events requiring recognition or disclosure in the financial statements.
16
SCOTIA DYNAMIC U.S. GROWTH FUND
Other Information
(Unaudited)
Proxy Voting
Policies and procedures that the Fund uses to determine how to vote proxies relating to portfolio securities as well as information regarding how the Fund voted proxies relating to portfolio securities for the most recent twelve-month period ended June 30 are available without charge, upon request, by calling (888) 572-0968 and on the Securities and Exchange Commission’s (“SEC”) website at http://www.sec.gov.
Quarterly Portfolio Schedules
The Company files its complete schedule of portfolio holdings with the SEC for the first and third fiscal quarters of each fiscal year (quarters ended November 30 and May 31) on Form N-Q. The Company’s Forms N-Q will be available on the SEC’s website at http://www.sec.gov and may be reviewed and copied at the SEC’s Public Reference Room in Washington, D.C. Information on the operation of the SEC’s Public Reference Room may be obtained by calling (800) SEC-0330.
17
Investment Adviser
Scotia Institutional Asset Management U.S., Ltd.
1 Adelaide St. E., Ste. 2800,
Toronto, ON M5C 2V9
Administrator
BNY Mellon Investment Servicing (US) Inc.
301 Bellevue Parkway
Wilmington, DE 19809
Transfer Agent
BNY Mellon Investment Servicing (US) Inc.
4400 Computer Drive
Westborough, MA 01581
Principal Underwriter
Foreside Funds Distributors LLC
400 Berwyn Park
899 Cassatt Road
Berwyn, PA 19312
Custodian
The Bank of New York Mellon
One Wall Street
New York, NY 10286
Independent Registered Public Accounting Firm
BBD, LLP
1835 Market Street, 26th Floor
Philadelphia, PA 19103
Legal Counsel
Drinker, Biddle & Reath LLP
One Logan Square, Ste. 2000
Philadelphia, PA 19103-6996
SCO-SAR15

SUMMIT GLOBAL INVESTMENTS
U.S. LOW VOLATILITY EQUITY FUND
of
The RBB Fund, Inc.
Class I Shares
SEMI-ANNUAL REPORT
February 28, 2015
(Unaudited)
This report is submitted for the general information of the shareholders of the Fund.
It is not authorized for distribution unless preceded or accompanied by a current prospectus for the Fund.
SUMMIT GLOBAL INVESTMENTS
U.S. LOW VOLATILITY EQUITY FUND
Semi-Annual Investment Adviser’s Report
February 28, 2015
(Unaudited)
Dear Shareholder:
We appreciate the confidence you have placed in us and are continually grateful to work with you. It enables all of us at Summit Global Investments to do what we love and enjoy everyday; managing equities. At Summit we believe that investors are ultimately rewarded when risk is prudently managed. Our strategy utilizes time-tested investment principles and seeks to be fully invested in the equity market while providing a smoother ride than other investment strategies.
We firmly believe that investing with a long-term, risk-return perspective is key to experiencing superior risk-adjusted returns. While staying the course with a low volatility portfolio doesn’t eliminate risk, it can considerably lessen the effect of the market gyrations.
Summit’s investment approach to portfolio construction takes into consideration a multitude of factors that ultimately help drive the price of equities. We sincerely value and believe strongly that return and risk must coincide and be effectively managed together. Investing in cap-weighted indexes, higher risk strategies, or products or markets just for exposure without regard to the investment’s return seems unwarranted.
Investing for return must always be weighed against the risk of the investments. As such, we continually look to be efficient and effective in providing shareholders with superior risk-adjusted equity returns.
Since our last letter to shareholders dated August 31, 2014, U.S. equities continued to experience overall gains. Volatility spiked in October and the market experienced a small inter-month correction, but recovered by month end. The price of oil fell from $90 per barrel to under $50 per barrel as the global economy slowed and oil sands brought increased supply. Though stocks in the energy sector were punished, consumers enjoyed lower gas prices and increased discretionary spending.
For the six month period from September 1, 2014 through February 28, 2015, the total return for the Fund was 8.47% vs. 6.12% (including dividends) for the S&P 500® Index (the “Index”), outperforming the Index by 2.35%. Risk-adjusted1, the Index rose 4.28%, thus the Fund outperformed the Index by 4.19% on a risk-adjusted basis during the period. The beta2 for the Fund, as of February 28, 2015, was 0.70.
For the calendar year 2014, the total return was 14.94% vs. 13.68% for the Index, outperforming the Index by 1.26%. Risk-adjusted1, the Index rose 9.58%, thus the Fund outperformed the Index by 5.36% on a risk-adjusted basis. The beta2 for the Fund, as of December 31, 2014, was 0.70.
The Fund benefited from its over-allocation to Healthcare and Utilities, and its under-allocation to Energy. Poor stock selection within Healthcare detracted from performance, while good stock selection within Energy helped performance.
We continue to reiterate that large market events are being driven more and more by world events than ever before. U.S. markets do not stand alone, isolated from the world. U.S. companies are global companies. Their revenue and profits, business plans and investments, and ultimately success or failure is more correlated to global events than ever in history. As such, companies must be as strong or stronger, balance sheet wise, than the country in which they are headquartered. We must keep an eye on such events and company strength throughout the coming months and years.
In addition to global and political events, companies are unique in how each prepares, responds and survives the impact of such macro events and economic cycles. While some cycles may vary in length and events differ in impact, we believe, for U.S. equity exposure, the Fund’s approach is effective over full market cycles.
Our philosophy to navigate such markets is simple and consistent throughout up and down markets. We believe that being invested in a low volatility equity portfolio over full market cycles provides lower price fluctuations, more consistent and reliable returns with smaller drawdowns, and adds increased diversification when combined with other investment strategies. Our approach takes into account each underlying company’s stock volatility, expected market return and how it correlates with other stocks within the portfolio, ultimately seeking to maximize return with an overall lower risk than a cap-weighted benchmark. As stated in the prospectus, the Fund seeks to outperform the S&P 500® Index over a full market cycle while reducing overall volatility.
1
SUMMIT GLOBAL INVESTMENTS
U.S. LOW VOLATILITY EQUITY FUND
Semi-Annual Investment Adviser’s Report (Continued)
February 28, 2015
(Unaudited)
Financial markets are always unpredictable, but there are several time-tested investment principles that may help put the odds in your favor. It is our sincere effort to follow such principles and provide acceptable long-term, risk-adjusted returns.
While we remain optimistic about the opportunities within the U.S. equity market, we remain focused on monitoring the risk of individual companies and the overall portfolio. During these times of continued uncertainty we believe the Fund will provide access to market returns with less overall risk.
Sincerely,
Summit Global Investments, LLC
1A more comparable risk benchmark using 70% of the S&P 500 return and 30% cash.
2Beta attempts to measure relative market risk. A beta rating above 1.0 indicates greater volatility than the market. A beta rating below 1.0 indicates lower volatility than the market.
2
SUMMIT GLOBAL INVESTMENTS
U.S. LOW VOLATILITY EQUITY FUND
Performance Data
February 28, 2015
(Unaudited)
| | | | | | | | | | | | | | | | |
| Total Returns For the Periods Ended February 28, 2015 | |
| | | | | | Average Annual | |
| | | | | | | | | Three | | | Since | |
| | | Six Months* | | | One Year | | | Years | | | Inception | |
| | | | | |
Summit Global Investments U.S. Low Volatility
Equity Fund - Class I Shares ** | | | 8.47% | | | | 16.81% | | | | 15.53% | | | | 15.53% | |
S&P 500® Index (excluding dividends)*** | | | 5.05% | | | | 13.18% | | | | 15.52% | | | | 15.52% | |
| ** | The Fund commenced operations on February 29, 2012. |
| *** | Benchmark performance is from inception date of the Fund only and is not the inception date of the benchmark itself. |
Performance quoted is past performance and does not guarantee future results. The investment return and principal value of an investment in the Fund will fluctuate so that an investor’s shares, when redeemed, may be worth more or less than their original cost. Current performance may be lower or higher. Returns shown do not reflect taxes that a shareholder would pay on Fund distributions or on the redemption of Fund shares. Performance data current to the most recent month-end may be obtained by calling (855) 744-8500.
The Fund applies a 1.50% redemption fee to the value of shares redeemed within 60 days of purchase. This redemption fee is not reflected in the returns shown above. The performance data quoted reflects fee waivers in effect and would have been less in their absence. The Fund’s total annual gross and net operating expenses, as stated in the current prospectus dated December 31, 2014, are 1.35% and 0.98%, respectively, of average daily net assets for Class I Shares. These rates may fluctuate and may differ from the actual expenses incurred by the Fund for the period covered by this report. The Fund’s investment adviser has contractually agreed to waive management fees and/or reimburse certain expenses of the Fund through December 31, 2015 to the extent necessary to ensure that the Fund’s total annual operating expenses (excluding acquired fund fees and expenses, brokerage commissions, extraordinary items, interest or taxes) do not exceed 0.98% (on an annual basis) of the Fund’s average daily net assets (the “Expense Limitation”). The Expense Limitation shall remain in effect until December 31, 2015, unless the Board of Directors of The RBB Fund, Inc. approves its earlier termination.
The Fund invests in common stock, preferred stocks, warrants to acquire common stock and securities convertible into common stock. Portfolio composition is subject to change.
The Fund evaluates performance as compared to that of the Standard & Poor’s 500® Index (“S&P 500®”). The S&P 500® is a widely recognized, unmanaged index of 500 common stocks which are generally representative of the U.S. stock market as a whole. It is impossible to invest directly in an index.
3
SUMMIT GLOBAL INVESTMENTS
U.S. LOW VOLATILITY EQUITY FUND
Fund Expense Examples
(Unaudited)
As a shareholder of the Fund, you incur two types of costs: (1) transaction costs, including redemption fees; and (2) ongoing costs, including management fees and other Fund expenses. These examples are intended to help you understand your ongoing costs (in dollars) of investing in the Fund and to compare these costs with the ongoing costs of investing in other mutual funds.
These examples are based on an investment of $1,000 invested at the beginning of the six-month period from September 1, 2014 through February 28, 2015 and held for the entire period.
Actual Expenses
The first line of the accompanying table provides information about actual account values and actual expenses. You may use the information in this line, together with the amount you invested, to estimate the expenses that you paid over the period. Simply divide your account value by $1,000 (for example, an $8,600 account value divided by $1,000 = 8.6), then multiply the result by the number in the first line under the heading entitled “Expenses Paid During Period” to estimate the expenses you paid on your account during this period.
Hypothetical Examples for Comparison Purposes
The second line of the accompanying table provides information about hypothetical account values and hypothetical expenses based on the Fund’s actual expense ratio and an assumed rate of return of 5% per year before expenses, which is not your Fund’s actual return. The hypothetical account values and expenses may not be used to estimate the actual ending account balance or expenses you paid for the period. You may use this information to compare the ongoing costs of investing in the Fund and other funds. To do so, compare these 5% hypothetical examples with the 5% hypothetical examples that appear in the shareholder reports of other funds.
Please note that the expenses shown in the accompanying table are meant to highlight your ongoing costs only and do not reflect any transactional costs, such as redemption fees. Therefore, the second line of the accompanying table is useful in comparing ongoing costs only and will not help you determine the relative total costs of owning different funds. In addition, if these transactional costs were included, your costs would have been higher.
| | | | | | |
| | | Class I Shares |
| | | Beginning Account Value | | Ending Account Value | | Expenses Paid |
| | | September 1, 2014 | | February 28, 2015 | | During Period* |
Actual | | $1,000.00 | | $1,084.70 | | $5.07 |
Hypothetical
(5% return before expenses) | | 1,000.00 | | 1,019.93 | | 4.91 |
| * | Expenses are equal to the Fund’s annualized six month expense ratio of 0.98% for Class I Shares, which includes waived fees and reimbursed expenses, multiplied by the average account value over the period multiplied by the number of days (181) in the most recent fiscal half-year, then divided by 365 to reflect the one half-year period. The Fund’s ending account values on the first line in the table is based on the actual six month total investment return for the Fund of 8.47% for Class I Shares. |
4
SUMMIT GLOBAL INVESTMENTS
U.S. LOW VOLATILITY EQUITY FUND
Portfolio Holdings Summary Table
February 28, 2015
(Unaudited)
The following table presents a summary by sector of the portfolio holdings of the Fund.
| | | | | | | | | | |
| | | % of Net | | |
Security Type/Sector Classification | | Assets | | Value |
COMMON STOCKS: | | | | | | | | | | |
Pharmaceuticals | | | | 13.6 | % | | | $ | 9,474,494 | |
Electric | | | | 10.0 | | | | | 6,975,742 | |
Retail | | | | 9.1 | | | | | 6,349,954 | |
Computers | | | | 7.9 | | | | | 5,524,217 | |
Food | | | | 7.7 | | | | | 5,373,793 | |
Real Estate Investment Trusts | | | | 6.4 | | | | | 4,470,093 | |
Telecommunications | | | | 5.4 | | | | | 3,775,519 | |
Healthcare-Services | | | | 5.4 | | | | | 3,748,426 | |
Oil & Gas | | | | 4.0 | | | | | 2,813,024 | |
Software | | | | 3.5 | | | | | 2,469,327 | |
Banks | | | | 3.1 | | | | | 2,150,369 | |
Insurance | | | | 3.0 | | | | | 2,113,576 | |
Household Products/Wares | | | | 2.9 | | | | | 2,006,326 | |
Environmental Control | | | | 2.5 | | | | | 1,771,398 | |
Healthcare-Products | | | | 2.1 | | | | | 1,486,120 | |
Semiconductors | | | | 2.0 | | | | | 1,424,097 | |
Media | | | | 1.5 | | | | | 1,056,349 | |
Housewares | | | | 1.5 | | | | | 1,028,219 | |
Commercial Services | | | | 1.4 | | | | | 986,859 | |
Transportation | | | | 1.1 | | | | | 796,885 | |
Electronics | | | | 1.1 | | | | | 774,912 | |
Cosmetics/Personal Care | | | | 1.0 | | | | | 720,146 | |
Office/Business Equipment | | | | 0.5 | | | | | 363,769 | |
Internet | | | | 0.5 | | | | | 344,428 | |
Miscellaneous Manufacturing | | | | 0.4 | | | | | 270,036 | |
Airlines | | | | 0.2 | | | | | 102,911 | |
Pipelines | | | | 0.1 | | | | | 64,733 | |
Machinery-Construction & Mining | | | | 0.1 | | | | | 43,937 | |
Other Assets in Excess of Liabilities | | | | 2.0 | | | | | 1,403,921 | |
| | | | | | | | | | |
NET ASSETS | | | | 100.0 | % | | | $ | 69,883,580 | |
| | | | | | | | | | |
Portfolio holdings are subject to change at any time.
The accompanying notes are an integral part of the financial statements.
5
SUMMIT GLOBAL INVESTMENTS U.S. LOW VOLATILITY EQUITY FUND
Portfolio of Investments
February 28, 2015
(Unaudited)
| | | | | | | | |
| | | Number | | | | |
| | | of Shares | | | Value | |
| |
COMMON STOCKS - 98.0% | | | | | |
Airlines — 0.2% | | | | | | | | |
Southwest Airlines Co. | | | 2,380 | | | $ | 102,911 | |
| | | | | | | | |
| | | | | | | 102,911 | |
| | | | | | | | |
Banks — 3.1% | | | | | | | | |
Northern Trust Corp. | | | 1,050 | | | | 73,321 | |
US Bancorp. | | | 38,540 | | | | 1,719,269 | |
Wells Fargo & Co. | | | 6,530 | | | | 357,779 | |
| | | | | | | | |
| | | | | | | 2,150,369 | |
| | | | | | | | |
Commercial Services — 1.4% | | | | | |
Cintas Corp. | | | 3,640 | | | | 303,867 | |
Total System Services, Inc. | | | 16,050 | | | | 613,110 | |
Western Union Co., (The) | | | 3,580 | | | | 69,882 | |
| | | | | | | | |
| | | | | | | 986,859 | |
| | | | | | | | |
Computers — 7.9% | | | | | | | | |
Accenture PLC, Class A | | | 4,480 | | | | 403,334 | |
Apple, Inc. | | | 12,770 | | | | 1,640,434 | |
EMC Corp. | | | 51,440 | | | | 1,488,674 | |
Hewlett-Packard Co. | | | 46,120 | | | | 1,606,821 | |
NetApp, Inc. | | | 9,960 | | | | 384,954 | |
| | | | | | | | |
| | | | | | | 5,524,217 | |
| | | | | | | | |
Cosmetics/Personal Care — 1.0% | | | | | |
Colgate-Palmolive Co. | | | 1,610 | | | | 114,020 | |
Procter & Gamble Co., (The) | | | 7,120 | | | | 606,126 | |
| | | | | | | | |
| | | | | | | 720,146 | |
| | | | | | | | |
Electric — 10.0% | | | | | | | | |
AES Corp. | | | 23,040 | | | | 298,829 | |
CMS Energy Corp. | | | 4,550 | | | | 159,841 | |
DTE Energy Co. | | | 1,770 | | | | 145,193 | |
Duke Energy Corp. | | | 10,140 | | | | 796,497 | |
Edison International | | | 23,270 | | | | 1,495,097 | |
Exelon Corp. | | | 13,240 | | | | 449,101 | |
FirstEnergy Corp. | | | 1,760 | | | | 61,565 | |
NRG Energy, Inc. | | | 7,510 | | | | 180,090 | |
PG&E Corp. | | | 1,300 | | | | 69,849 | |
PPL Corp. | | | 23,640 | | | | 806,124 | |
SCANA Corp. | | | 2,990 | | | | 170,280 | |
Southern Co. (The) | | | 3,630 | | | | 166,218 | |
TECO Energy, Inc. | | | 41,860 | | | | 821,712 | |
Wisconsin Energy Corp. | | | 15,970 | | | | 814,151 | |
Xcel Energy, Inc. | | | 15,340 | | | | 541,195 | |
| | | | | | | | |
| | | | | | | 6,975,742 | |
| | | | | | | | |
Electronics — 1.1% | | | | | | | | |
Garmin Ltd. | | | 1,050 | | | | 52,112 | |
Thermo Fisher Scientific, Inc. | | | 5,560 | | | | 722,800 | |
| | | | | | | | |
| | | | | | | 774,912 | |
| | | | | | | | |
Environmental Control — 2.5% | | | | | |
Republic Services, Inc. | | | 25,260 | | | | 1,033,639 | |
Stericycle, Inc.* | | | 4,570 | | | | 616,813 | |
| | | | | | | | |
| | | Number | | | | |
| | | of Shares | | | Value | |
| |
Environmental Control — (Continued) | | | | | |
Waste Management, Inc. | | | 2,220 | | | $ | 120,946 | |
| | | | | | | | |
| | | | | | | 1,771,398 | |
| | | | | | | | |
Food — 7.7% | | | | | | | | |
ConAgra Foods, Inc. | | | 35,080 | | | | 1,227,098 | |
General Mills, Inc. | | | 7,900 | | | | 424,941 | |
Hershey Co., (The) | | | 1,740 | | | | 180,577 | |
Hormel Foods Corp. | | | 19,080 | | | | 1,116,371 | |
Kellogg Co. | | | 13,800 | | | | 889,824 | |
McCormick & Co., Inc. | | | 3,920 | | | | 295,490 | |
Sysco Corp. | | | 31,790 | | | | 1,239,492 | |
| | | | | | | | |
| | | | | | | 5,373,793 | |
| | | | | | | | |
Healthcare-Products — 2.1% | | | | | |
Baxter International, Inc. | | | 8,090 | | | | 559,423 | |
DENTSPLY International, Inc. | | | 1,240 | | | | 65,732 | |
Medtronic, PLC | | | 2,750 | | | | 213,373 | |
Patterson Cos., Inc. | | | 11,540 | | | | 577,865 | |
Varian Medical Systems, Inc.* | | | 750 | | | | 69,727 | |
| | | | | | | | |
| | | | | | | 1,486,120 | |
| | | | | | | | |
Healthcare-Services — 5.4% | | | | | |
Aetna, Inc. | | | 17,070 | | | | 1,699,318 | |
Anthem, Inc. | | | 1,300 | | | | 190,385 | |
Cigna Corp. | | | 670 | | | | 81,492 | |
Quest Diagnostics, Inc. | | | 6,400 | | | | 448,896 | |
UnitedHealth Group, Inc. | | | 11,690 | | | | 1,328,335 | |
| | | | | | | | |
| | | | | | | 3,748,426 | |
| | | | | | | | |
Household Products/Wares — 2.9% | | | | | |
Clorox Co., (The) | | | 16,570 | | | | 1,800,165 | |
Kimberly-Clark Corp. | | | 1,880 | | | | 206,161 | |
| | | | | | | | |
| | | | | | | 2,006,326 | |
| | | | | | | | |
Housewares — 1.5% | | | | | | | | |
Newell Rubbermaid, Inc. | | | 26,170 | | | | 1,028,219 | |
| | | | | | | | |
| | | | | | | 1,028,219 | |
| | | | | | | | |
Insurance — 3.0% | | | | | | | | |
Berkshire Hathaway, Inc., Class B* | | | 6,990 | | | | 1,030,396 | |
Cincinnati Financial Corp. | | | 13,000 | | | | 685,880 | |
Principal Financial Group, Inc. | | | 6,280 | | | | 321,348 | |
Progressive Corp., (The) | | | 2,850 | | | | 75,952 | |
| | | | | | | | |
| | | | | | | 2,113,576 | |
| | | | | | | | |
Internet — 0.5% | | | | | | | | |
VeriSign, Inc.* | | | 5,380 | | | | 344,428 | |
| | | | | | | | |
| | | | | | | 344,428 | |
| | | | | | | | |
Machinery-Construction & Mining — 0.1% | | | | | |
Caterpillar, Inc. | | | 530 | | | | 43,937 | |
| | | | | | | | |
| | | | | | | 43,937 | |
| | | | | | | | |
The accompanying notes are an integral part of the financial statements.
6
SUMMIT GLOBAL INVESTMENTS U.S. LOW VOLATILITY EQUITY FUND
Portfolio of Investments (Concluded)
February 28, 2015
(Unaudited)
| | | | | | | | |
| | | Number | | | | |
| | | of Shares | | | Value | |
| | |
Media — 1.5% | | | | | | | | |
Scripps Networks Interactive, Inc. | | | 1,050 | | | $ | 75,915 | |
Walt Disney Co., (The) | | | 9,420 | | | | 980,434 | |
| | | | | | | | |
| | | | | | | 1,056,349 | |
| | | | | | | | |
Miscellaneous Manufacturing — 0.4% | | | | | |
General Electric Co. | | | 10,390 | | | | 270,036 | |
| | | | | | | | |
| | | | | | | 270,036 | |
| | | | | | | | |
Office/Business Equipment — 0.5% | | | | | |
Pitney Bowes, Inc. | | | 15,700 | | | | 363,769 | |
| | | | | | | | |
| | | | | | | 363,769 | |
| | | | | | | | |
Oil & Gas — 4.0% | | | | | | | | |
Chevron Corp. | | | 7,330 | | | | 781,964 | |
ConocoPhillips | | | 11,520 | | | | 751,104 | |
Exxon Mobil Corp. | | | 12,340 | | | | 1,092,584 | |
Marathon Petroleum Corp. | | | 620 | | | | 65,100 | |
Occidental Petroleum Corp. | | | 1,570 | | | | 122,272 | |
| | | | | | | | |
| | | | | | | 2,813,024 | |
| | | | | | | | |
Pharmaceuticals — 13.6% | | | | | |
Actavis PLC* | | | 1,050 | | | | 305,928 | |
Eli Lilly & Co. | | | 22,680 | | | | 1,591,456 | |
Express Scripts Holding Co.* | | | 12,560 | | | | 1,064,962 | |
Johnson & Johnson | | | 13,190 | | | | 1,352,107 | |
Merck & Co., Inc. | | | 28,070 | | | | 1,643,218 | |
Pfizer, Inc. | | | 54,770 | | | | 1,879,706 | |
Zoetis, Inc. | | | 35,520 | | | | 1,637,117 | |
| | | | | | | | |
| | | | | | | 9,474,494 | |
| | | | | | | | |
Pipelines — 0.1% | | | | | | | | |
Williams Cos., Inc. (The) | | | 1,320 | | | | 64,733 | |
| | | | | | | | |
| | | | | | | 64,733 | |
| | | | | | | | |
Real Estate Investment Trusts — 6.4% | | | | | |
American Tower Corp. | | | 1,300 | | | | 128,882 | |
Apartment Investment & Management Co., Class A | | | 5,540 | | | | 208,747 | |
Crown Castle International Corp. | | | 1,200 | | | | 103,572 | |
Equity Residential | | | 5,000 | | | | 385,150 | |
General Growth Properties, Inc. | | | 20,040 | | | | 581,360 | |
HCP, Inc. | | | 1,340 | | | | 56,762 | |
Health Care REIT, Inc. | | | 10,470 | | | | 807,342 | |
Public Storage | | | 2,000 | | | | 394,440 | |
Simon Property Group, Inc. | | | 5,380 | | | | 1,024,137 | |
Ventas, Inc. | | | 10,470 | | | | 779,701 | |
| | | | | | | | |
| | | | | | | 4,470,093 | |
| | | | | | | | |
| | | | | | | | |
| | | Number | | | | |
| | | of Shares | | | Value | |
| | |
Retail — 9.1% | | | | | | | | |
Bed Bath & Beyond, Inc.* | | | 1,050 | | | $ | 78,393 | |
Coach, Inc. | | | 1,060 | | | | 46,163 | |
Costco Wholesale Corp. | | | 11,200 | | | | 1,645,952 | |
Dollar Tree, Inc.* | | | 25,580 | | | | 2,038,214 | |
Macy’s, Inc. | | | 4,740 | | | | 302,033 | |
McDonald’s Corp. | | | 6,500 | | | | 642,850 | |
Wal-Mart Stores, Inc. | | | 19,020 | | | | 1,596,349 | |
| | | | | | | | |
| | | | | | | 6,349,954 | |
| | | | | | | | |
Semiconductors — 2.0% | | | | | |
Intel Corp. | | | 42,830 | | | | 1,424,097 | |
| | | | | | | | |
| | | | | | | 1,424,097 | |
| | | | | | | | |
Software — 3.5% | | | | | | | | |
Fidelity National Information Services, Inc. | | | 1,420 | | | | 95,978 | |
Intuit, Inc. | | | 12,560 | | | | 1,226,233 | |
Microsoft Corp. | | | 26,160 | | | | 1,147,116 | |
| | | | | | | | |
| | | | | | | 2,469,327 | |
| | | | | | | | |
Telecommunications — 5.4% | | | | | |
AT&T, Inc. | | | 43,990 | | | | 1,520,294 | |
Cisco Systems, Inc. | | | 19,360 | | | | 571,314 | |
Motorola Solutions, Inc. | | | 890 | | | | 60,467 | |
Verizon Communications, Inc. | | | 32,830 | | | | 1,623,444 | |
| | | | | | | | |
| | | | | | | 3,775,519 | |
| | | | | | | | |
Transportation — 1.1% | | | | | |
C.H. Robinson Worldwide, Inc. | | | 6,960 | | | | 517,128 | |
United Parcel Service, Inc.,
Class B | | | 2,750 | | | | 279,757 | |
| | | | | | | | |
| | | | | | | 796,885 | |
| | | | | | | | |
TOTAL COMMON STOCKS
(Cost $59,075,156) | | | | 68,479,659 | |
| | | | | | | | |
TOTAL INVESTMENTS - 98.0%
(Cost $59,075,156) | | | | 68,479,659 | |
| | | | | | | | |
OTHER ASSETS IN EXCESS OF
LIABILITIES - 2.0% | | | | 1,403,921 | |
| | | | | | | | |
NET ASSETS - 100.0% | | | $ | 69,883,580 | |
| * | Non-income producing security. |
The accompanying notes are an integral part of the financial statements.
7
SUMMIT GLOBAL INVESTMENTS
U.S. LOW VOLATILITY EQUITY FUND
Statement of Assets and Liabilities
February 28, 2015
(Unaudited)
| | | | |
ASSETS | | | | |
Investments, at value (Cost $59,075,156) | | $ | 68,479,659 | |
Cash | | | 1,246,378 | |
Receivables for: | | | | |
Investments sold | | | 23,273 | |
Capital shares sold | | | 27,120 | |
Dividends | | | 143,272 | |
Prepaid expenses and other assets | | | 34,465 | |
| | | | |
Total assets | | | 69,954,167 | |
| | | | |
| |
LIABILITIES | | | | |
Payables for: | | | | |
Capital shares redeemed | | | 17,376 | |
Advisory fees | | | 22,433 | |
Audit fees | | | 12,924 | |
Administration and accounting services fees | | | 8,744 | |
Directors’ and officers’ fees | | | 1,120 | |
Other accrued expenses and liabilities | | | 7,990 | |
| | | | |
Total liabilities | | | 70,587 | |
| | | | |
Net Assets | | $ | 69,883,580 | |
| | | | |
NET ASSETS CONSISTS OF | | | | |
Par value | | $ | 4,902 | |
Paid-in capital | | | 59,397,388 | |
Undistributed net investment income | | | 206,801 | |
Accumulated net realized gain from investments | | | 869,986 | |
Net unrealized appreciation on investments | | | 9,404,503 | |
| | | | |
Net Assets | | $ | 69,883,580 | |
| | | | |
| |
I SHARES: | | | | |
Net Assets applicable to Class I Shares | | $ | 69,883,580 | |
| | | | |
Shares outstanding ($0.001 par value, 100,000,000 shares authorized) | | | 4,902,172 | |
| | | | |
Net asset value, offering and redemption price per share | | $ | 14.26 | |
| | | | |
The accompanying notes are an integral part of the financial statements.
8
SUMMIT GLOBAL INVESTMENTS
U.S. LOW VOLATILITY EQUITY FUND
Statement of Operations
For the Six Months Ended February 28, 2015
(Unaudited)
| | | | |
INVESTMENT INCOME | | | | |
Dividends and interest | | $ | 827,820 | |
| | | | |
Total investment income | | | 827,820 | |
| | | | |
EXPENSES | | | | |
Advisory fees (Note 2) | | | 225,147 | |
Administration and accounting services fees (Note 2) | | | 44,463 | |
Transfer agent fees (Note 2) | | | 34,328 | |
Registration and filing fees | | | 16,930 | |
Custodian fees (Note 2) | | | 13,184 | |
Audit fees | | | 13,137 | |
Printing and shareholder reporting fees | | | 9,577 | |
Legal fees | | | 7,050 | |
Directors’ and officers’ fees | | | 5,930 | |
Other expenses | | | 12,257 | |
| | | | |
Total expenses before waivers and reimbursements | | | 382,003 | |
Less: waivers and reimbursements (Note 2) | | | (66,797 | ) |
| | | | |
Net expenses after waivers and reimbursements | | | 315,206 | |
| | | | |
Net investment income | | | 512,614 | |
| | | | |
NET REALIZED AND UNREALIZED GAIN FROM INVESTMENTS | | | | |
Net realized gain from: | | | | |
Investments | | | 949,528 | |
Net change in unrealized appreciation on: | | | | |
Investments | | | 3,827,661 | |
| | | | |
Net realized and unrealized gain from investments | | | 4,777,189 | |
| | | | |
NET INCREASE IN NET ASSETS RESULTING FROM OPERATIONS | | $ | 5,289,803 | |
| | | | |
The accompanying notes are an integral part of the financial statements.
9
SUMMIT GLOBAL INVESTMENTS
U.S. LOW VOLATILITY EQUITY FUND
Statements of Changes in Net Assets
| | | | | | | | | | | | | | | |
| | | For the | | | | |
| | | Six Months Ended | | For the |
| | | February 28, 2015 | | Year Ended |
| | | (Unaudited) | | August 31, 2014 |
INCREASE IN NET ASSETS FROM OPERATIONS: | | | | | | | | | | | | |
Net investment income | | | $ | 512,614 | | | | $ | 571,518 | | | |
Net realized gain from investments | | | | 949,528 | | | | | 2,064,024 | | | |
Net change in unrealized appreciation on investments | | | | 3,827,661 | | | | | 4,691,346 | | | |
| | | | | | | | | | | | | |
Net increase in net assets resulting from operations | | | | 5,289,803 | | | | | 7,326,888 | | | |
| | | | | | | | | | | | | |
| | | |
DIVIDENDS AND DISTRIBUTIONS TO SHAREHOLDERS FROM: | | | | | | | | | | | | |
Class I Shares | | | | | | | | | | | | |
Net investment income | | | | (764,753 | ) | | | | (250,235 | ) | | |
Net realized gains | | | | (1,984,239 | ) | | | | (668,385 | ) | | |
| | | | | | | | | | | | | |
Net decrease in net assets from dividends and distributions to shareholders | | | | (2,748,992 | ) | | | | (918,620 | ) | | |
| | | | | | | | | | | | | |
CAPITAL TRANSACTIONS: | | | | | | | | | | | | |
Class I Shares | | | | | | | | | | | | |
Proceeds from shares sold | | | | 10,371,893 | | | | | 33,583,169 | | | |
Reinvestment of distributions | | | | 2,688,722 | | | | | 918,422 | | | |
Shares redeemed | | | | (5,984,915 | ) | | | | (6,284,602 | ) | | |
Redemption fees | | | | 782 | | | | | 2,994 | | | |
| | | | | | | | | | | | | |
Net increase in net assets from capital share transactions | | | | 7,076,482 | | | | | 28,219,983 | | | |
| | | | | | | | | | | | | |
Total increase in net assets | | | | 9,617,293 | | | | | 34,628,251 | | | |
| | | | | | | | | | | | | |
NET ASSETS | | | | | | | | | | | | |
Beginning of period | | | | 60,266,287 | | | | | 25,638,036 | | | |
| | | | | | | | | | | | | |
End of period | | | $ | 69,883,580 | | | | $ | 60,266,287 | | | |
| | | | | | | | | | | | | |
Undistributed net investment income, end of period | | | $ | 206,801 | | | | $ | 458,940 | | | |
| | | | | | | | | | | | | |
CAPITAL SHARE TRANSACTIONS: | | | | | | | | | | | | |
Class I Shares | | | | | | | | | | | | |
Shares sold | | | | 739,041 | | | | | 2,641,785 | | | |
Shares reinvested | | | | 198,723 | | | | | 74,608 | | | |
Shares redeemed | | | | (428,866 | ) | | | | (486,015 | ) | | |
| | | | | | | | | | | | | |
Net increase in shares | | | | 508,898 | | | | | 2,230,378 | | | |
| | | | | | | | | | | | | |
The accompanying notes are an integral part of the financial statements.
10
SUMMIT GLOBAL INVESTMENTS
U.S. LOW VOLATILITY EQUITY FUND
Financial Highlights
|
Contained below is per share operating performance data for shares outstanding, total investment return, ratios to average net assets and other supplemental data for the representative periods. This information has been derived from information provided in the financial statements. |
| | | | | | | | | | | | | | | | | | | | |
| | | For the | | | | | | |
| | | Six Months Ended | | For the | | For the | | For the Period |
| | | February 28, 2015 | | Year Ended | | Year Ended | | February 29, 2012 to |
| | | (Unaudited) | | August 31, 2014 | | August 31, 2013 | | August 31, 2012(1) |
Per Share Operating Performance | | | | | | | | | | | | | | | | | | | | |
Net asset value, beginning of period | | | $ | 13.72 | | | | $ | 11.85 | | | | $ | 10.18 | | | | $ | 10.00 | |
| | | | | | | | | | | | | | | | | | | | |
Net investment income(2) | | | | 0.11 | | | | | 0.16 | | | | | 0.15 | | | | | 0.08 | |
Net realized and unrealized gain from investments(3) | | | | 1.02 | | | | | 2.01 | | | | | 1.64 | | | | | 0.10 | |
| | | | | | | | | | | | | | | | | | | | |
Net increase in net assets resulting from operations | | | | 1.13 | | | | | 2.17 | | | | | 1.79 | | | | | 0.18 | |
| | | | | | | | | | | | | | | | | | | | |
Dividends and distributions to shareholders from: | | | | | | | | | | | | | | | | | | | | |
Net investment income | | | | (0.16 | ) | | | | (0.08 | ) | | | | (0.05 | ) | | | | — | |
Net realized gains | | | | (0.43 | ) | | | | (0.22 | ) | | | | (0.07 | ) | | | | — | |
| | | | | | | | | | | | | | | | | | | | |
Total dividends and distributions to shareholders | | | | (0.59 | ) | | | | (0.30 | ) | | | | (0.12 | ) | | | | — | |
| | | | | | | | | | | | | | | | | | | | |
Net asset value, end of period | | | $ | 14.26 | | | | $ | 13.72 | | | | $ | 11.85 | | | | $ | 10.18 | |
| | | | | | | | | | | | | | | | | | | | |
Total investment return(4) | | | | 8.47 | %(5) | | | | 18.57 | % | | | | 17.78 | % | | | | 1.80 | %(5) |
| | | | | | | | | | | | | | | | | | | | |
Ratios/Supplemental Data | | | | | | | | | | | | | | | | | | | | |
Net assets, end of period (000’s omitted) | | | $ | 69,884 | | | | $ | 60,266 | | | | $ | 25,638 | | | | $ | 3,602 | |
Ratio of expenses to average net assets with waivers and reimbursements | | | | 0.98 | %(6) | | | | 0.98 | % | | | | 0.98 | % | | | | 0.98 | %(6) |
Ratio of expenses to average net assets without waivers and reimbursements | | | | 1.19 | %(6) | | | | 1.35 | % | | | | 2.74 | % | | | | 20.03 | %(6) |
Ratio of net investment income to average net assets | | | | 1.59 | %(6) | | | | 1.25 | % | | | | 1.34 | % | | | | 1.64 | %(6) |
Portfolio turnover rate | | | | 15 | %(5) | | | | 110 | % | | | | 81 | % | | | | 95 | %(5) |
| (1) | The Fund commenced investment operations on February 29, 2012. |
| (2) | The selected per share data was calculated based on average shares outstanding method for the period. |
| (3) | The amount shown may not correlate with the change in the aggregate gains and losses due to the timing of sales and purchases of the Fund’s shares in relation to fluctuating market values for the Fund’s portfolio. |
| (4) | Total investment return is calculated assuming a purchase of shares on the first day and a sale of shares on the last day of each period reported and includes reinvestments of dividends and distributions, if any. |
The accompanying notes are an integral part of the financial statements.
11
SUMMIT GLOBAL INVESTMENTS U.S. LOW VOLATILITY EQUITY FUND
Notes to Financial Statements
February 28, 2015
(Unaudited)
1. Organization and Significant Accounting Policies
The RBB Fund, Inc. (“RBB” or the “Company”) was incorporated under the laws of the State of Maryland on February 29, 1988 and is registered under the Investment Company Act of 1940, as amended, (the “Investment Company Act”) as an open-end management investment company. RBB is a “series fund,” which is a mutual fund divided into separate portfolios. Each portfolio is treated as a separate entity for certain matters under the Investment Company Act, and for other purposes, and, a shareholder of one portfolio is not deemed to be a shareholder of any other portfolio. Currently, RBB has twenty-two active investment portfolios, including the Summit Global Investments U.S. Low Volatility Equity Fund (the “Fund”), which commenced investment operations on February 29, 2012. As of February 28, 2015, the Fund offers three classes of shares, Class A Shares, Retail Shares and Class I Shares. As of February 28, 2015, Class A Shares and Retail Shares have not been issued.
RBB has authorized capital of one hundred billion shares of common stock of which 82.373 billion shares are currently classified into one hundred and fifty-three classes of common stock. Each class represents an interest in an active or inactive RBB investment portfolio.
Portfolio Valuation – The Fund’s net asset value (“NAV”) is calculated once daily at the close of regular trading hours on the New York Stock Exchange (“NYSE”) (typically 4:00 p.m. Eastern time) on each day the NYSE is open. Securities held by the Fund are valued using the closing price or the last sale price on a national securities exchange or the National Association of Securities Dealers Automatic Quotation System (“NASDAQ”) market system where they are primarily traded. Equity securities traded in the over-the-counter market are valued at their closing prices. If there were no transactions on that day, securities traded principally on an exchange or on NASDAQ will be valued at the mean of the last bid and ask prices prior to the market close. Investments in other open-end investment companies, if any, are valued based on the NAV of those investment companies (which may use fair value pricing as disclosed in their prospectuses). If market quotations are unavailable or deemed unreliable, securities will be valued in accordance with procedures adopted by the Company’s Board of Directors. Relying on prices supplied by pricing services or dealers or using fair valuation may result in values that are higher or lower than the values used by other investment companies and investors to price the same investments.
Fair Value Measurements – The inputs and valuation techniques used to measure fair value of the Fund’s investments are summarized into three levels as described in the hierarchy below:
| | |
• Level 1 — | | quoted prices in active markets for identical securities; |
| |
• Level 2 — | | other significant observable inputs (including quoted prices for similar securities, interest rates, prepayment speeds, credit risk, etc.); and |
| |
• Level 3 — | | significant unobservable inputs (including the Fund’s own assumptions in determining the fair value of investments). |
The inputs or methodology used for valuing securities are not necessarily an indication of the risk associated with investing in those securities.
12
SUMMIT GLOBAL INVESTMENTS U.S. LOW VOLATILITY EQUITY FUND
Notes to Financial Statements (Continued)
February 28, 2015
(Unaudited)
The following is a summary of the inputs used, as of February 28, 2015, in valuing the Fund’s investments carried at fair value:
| | | | | | | | | | | | |
| | | | | | | | | Level 2 | | |
| | | | | | | | | Other | | Level 3 |
| | | Total Value at | | | Level 1 | | | Significant | | Significant |
| | | February 28, | | | Quoted | | | Observable | | Unobservable |
| | | 2015 | | | Price | | | Inputs | | Inputs |
Investments in Securities* | | | $68,479,659 | | | | $68,479,659 | | | $ — | | $ — |
| | | | | | | | | | | | |
| | | | | | | | | | | | |
* Please refer to Portfolio of Investments for further details. | | | | | |
At the end of each quarter, management evaluates the classification of Levels 1, 2 and 3 assets and liabilities. Various factors are considered, such as changes in liquidity from the prior reporting period; whether or not a broker is willing to execute at the quoted price; the depth and consistency of prices from third party pricing services; and the existence of contemporaneous, observable trades in the market. Additionally, management evaluates the classification of Level 1 and Level 2 assets and liabilities on a quarterly basis for changes in listings or delistings on national exchanges.
Due to the inherent uncertainty of determining the fair value of investments that do not have a readily available market value, the fair value of the Fund’s investments may fluctuate from period to period. Additionally, the fair value of investments may differ significantly from the values that would have been used had a ready market existed for such investments and may differ materially from the values the Fund may ultimately realize. Further, such investments may be subject to legal and other restrictions on resale or otherwise less liquid than publicly traded securities.
For fair valuations using significant unobservable inputs, U.S. generally accepted accounting principles (“U.S. GAAP”) require the Fund to present a reconciliation of the beginning to ending balances for reported market values that presents changes attributable to total realized and unrealized gains or losses, purchase and sales, and transfers in and out of Level 3 during the period. Transfers in and out between levels are based on values at the end of the period. U.S. GAAP also requires the Fund to disclose amounts and reasons for all transfers in and out of Level 1 and Level 2 fair value measurements. A reconciliation of Level 3 investments is presented only when the Fund had an amount of Level 3 investments at the end of the reporting period that was meaningful in relation to its net assets. The amounts and reasons for all transfers in and out of each level within the three-tier hierarchy are disclosed when the Fund had an amount of total transfers during the reporting period that was meaningful in relation to its net assets as of the end of the reporting period.
For the six months ended February 28, 2015, there were no transfers between Levels 1, 2 and 3 for the Fund.
Use of Estimates — The Fund is an investment company and, accordingly, follows the investment company accounting and reporting guidance under U.S. GAAP. The preparation of financial statements in conformity with U.S. GAAP requires management to make estimates and assumptions that affect the reported amounts of assets and liabilities and disclosure of contingent assets and liabilities at the date of the financial statements and the reported amounts of revenues and expenses during the period. Actual results could differ from those estimates and those differences could be significant.
Investment Transactions, Investment Income and Expenses — The Fund records security transactions based on trade date for financial reporting purposes. The cost of investments sold is determined by use of the specific identification method for both financial reporting and income tax purposes in determining realized gains and losses on investments. Interest income is accrued when earned. Dividend income is recorded on the ex-dividend date. Distributions received on securities that represent a return of capital or capital gains are recorded as a reduction of cost of investments and/or as a realized gain. The Fund’s policy is to allocate investment income, expenses and unrealized and realized gains and losses among classes on a daily basis, when applicable. Expenses incurred on behalf of a specific class, fund or fund
13
SUMMIT GLOBAL INVESTMENTS U.S. LOW VOLATILITY EQUITY FUND
Notes to Financial Statements (Continued)
February 28, 2015
(Unaudited)
family are charged directly to the class, fund or fund family to each class of shares based upon the relative proportion of net assets of each class at the beginning of the day. Expenses incurred for all the RBB funds (such as director or professional fees) are charged to all funds in proportion to their average net assets of RBB, or in such other manner as the Company’s Board of Directors deems fair or equitable. Expenses and fees, including investment advisory and administration fees, are accrued daily and taken into account for the purpose of determining the NAV of the Fund.
Dividends and Distributions to Shareholders — Dividends from net investment income, if any, are declared and paid quarterly. Net realized capital gains, if any, are declared and paid annually. Income dividends and capital gain distributions are determined in accordance with U.S. federal income tax regulations which may differ from U.S. GAAP.
U.S. Tax Status — No provision is made for U.S. income taxes as it is the Fund’s intention to qualify for and elect the tax treatment applicable to regulated investment companies under Subchapter M of the Internal Revenue Code of 1986, as amended, and make the requisite distributions to its shareholders which will be sufficient to relieve it from U.S. income and excise taxes.
Cash and Cash Equivalents — The Fund considers liquid assets deposited into a bank demand deposit account to be cash equivalents. These investments represent amounts held with financial institutions that are readily accessible to pay Fund expenses or purchase investments. Cash and cash equivalents are valued at cost plus accrued interest, which approximates market value.
Redemption Fees — The Fund retains a redemption fee of 1.50% on redemptions of Fund shares held less than 60 days. The fees are reflected on the Statements of Changes in Net Assets. The Fund reserves the right to modify or eliminate the redemption fees or waivers at any time.
Other — In the normal course of business, the Fund may enter into contracts that provide general indemnifications. The Fund’s maximum exposure under these arrangements is dependent on claims that may be made against the Fund in the future, and, therefore, cannot be estimated; however, based on experience, the risk of material loss from such claims is considered remote.
2. Investment Adviser and Other Services
Summit Global Investments, LLC (“Summit” or the “Adviser”) serves as the Fund’s investment adviser. For its advisory services, the Adviser is entitled to receive a monthly advisory fee from the Fund calculated at an annual rate of 0.70% of the Fund’s average daily net assets.
Summit has contractually agreed to waive its advisory fees and/or reimburse expenses, to the extent that total annual operating expenses (excluding certain items discussed below) exceed 1.23% of the average daily net assets for Class A Shares and Retail Shares and 0.98% of the average daily net assets for Class I Shares. In determining Summit’s obligation to waive advisory fees and/or reimburse expenses, the following expenses are not taken into account and could cause net total annual operating expenses to exceed 1.23% or 0.98%, as applicable: acquired fund fees and expenses, brokerage commissions, extraordinary items, interest or taxes. This contractual limitation is in effect until December 31, 2015 and may not be terminated before December 31, 2015 without approval by the Company’s Board of Directors. If at any time during the three years from January 1, 2014 through December 31, 2016 in which the advisory agreement is in effect, the Fund’s total annual Fund operating expenses for that year are less than 1.23% of the average daily net assets attributable to the Fund’s Class A Shares or Retail Shares or less than 0.98% of the average daily net assets attributable to the Fund’s Class I Shares, the Adviser is entitled to reimbursement by the Fund of the advisory fees forgone and other payments remitted by the Adviser to the Fund during such three-year period. For the six months ended February
14
SUMMIT GLOBAL INVESTMENTS U.S. LOW VOLATILITY EQUITY FUND
Notes to Financial Statements (Continued)
February 28, 2015
(Unaudited)
28, 2015, advisory fees accrued were $225,147, of which $66,797 were waived by the Adviser. As of February 28, 2015, the amounts available for recoupment were $215,828, $106,429 and $66,797 expiring in 2015, 2016 and 2018, respectively.
BNY Mellon Investment Servicing (US) Inc. (“BNY Mellon”) serves as administrator for the Fund. For providing administrative and accounting services, BNY Mellon is entitled to receive a monthly fee equal to an annual percentage rate of the Fund’s average daily net assets, subject to certain minimum monthly fees.
Included in the administration and accounting services fees, shown on the Statement of Operations, are fees for providing regulatory administration services to RBB. For providing these services, BNY Mellon is entitled to receive compensation as agreed to by the Company and BNY Mellon. This fee is allocated to each portfolio of the Company in proportion to its net assets of the Company.
In addition, BNY Mellon serves as the Fund’s transfer and dividend disbursing agent. For providing these transfer agent services, BNY Mellon is entitled to receive a monthly fee, subject to certain minimum, and out of pocket expenses.
The Bank of New York Mellon (the “Custodian”) provides certain custodial services to the Fund. The Custodian is entitled to receive a monthly fee, subject to certain minimum, and out of pocket expenses.
Foreside Funds Distributors LLC, serves as the principal underwriter and distributor of the Fund’s shares pursuant to a Distribution Agreement with RBB.
3. Director Compensation
The Directors of the Company receive an annual retainer and meeting fees for meetings attended. The aggregate remuneration paid to the Directors by the Fund during the six months ended February 28, 2015 was $4,548. Certain employees of BNY Mellon serve as an Officer or Director of the Company. They are not compensated by the Fund or the Company.
4. Investment in Securities
For the six months ended February 28, 2015, aggregate purchases and sales of investment securities (excluding short-term investments) of the Fund were as follows:
| | | | |
| | | Purchases | | Sales |
Investment Securities | | $15,699,763 | | $9,719,070 |
5. Federal Income Tax Information
The Fund has followed the authoritative guidance on accounting for and disclosure of uncertainty in tax positions, which requires the Fund to determine whether a tax position is more likely than not to be sustained upon examination, including resolution of any related appeals or litigation processes, based on the technical merits of the position. The Fund has determined that there was no effect on the financial statements from following this authoritative guidance. In the normal course of business, the Fund is subject to examination by federal, state and local jurisdictions, where applicable, for tax years for which applicable statutes of limitations have not expired.
15
SUMMIT GLOBAL INVESTMENTS U.S. LOW VOLATILITY EQUITY FUND
Notes to Financial Statements (Concluded)
February 28, 2015
(Unaudited)
As of February 28, 2015, the federal tax cost, aggregate gross unrealized appreciation and depreciation of securities held by the Fund were as follows:
| | | | | | |
| | | | | | |
Federal tax cost | | $ | 59,075,156 | | |
| | | | | |
Gross unrealized appreciation | | $ | 9,925,950 | | |
Gross unrealized depreciation | | | (521,447 | ) | |
| | | | | |
Net unrealized appreciation | | $ | 9,404,503 | | |
| | | | | |
Distributions to shareholders, if any, from net investment income and realized gains are determined in accordance with federal income tax regulations, which may differ from net investment income and realized gains recognized for financial reporting purposes. Accordingly, the character of distributions and composition of net assets for tax purposes may differ from those reflected in the accompanying financial statements. To the extent these differences are permanent, such amounts are reclassified within the capital accounts based on the tax treatment; temporary differences do not require such reclassification.
As of August 31, 2014, the components of distributable earnings on a tax basis were as follows:
| | | | | | | | |
| | | Undistributed | | Undistributed | | Net Unrealized | | |
| | Ordinary Income | | Long-Term Gains | | Appreciation | |
| | $1,652,595 | | $757,020 | | $5,530,864 | |
The differences between the book and tax basis components of distributable earnings relate primarily to the timing of recognition of income and gains for federal income tax purposes.
The tax character of dividends and distributions paid during the year ended August 31, 2014 was as follows:
| | | | | | | | |
| | | Ordinary | | Long-Term | | | | |
| | Income | | Gains | | Total | |
| | $834,929 | | $83,691 | | $918,620 | |
Under the Regulated Investment Company Modernization Act of 2010 (the “Modernization Act”), the Fund is permitted to carry forward capital losses incurred in taxable years beginning after December 22, 2010 for an unlimited period. Additionally, post-enactment capital losses that are carried forward will retain their character as either short-term or long-term capital losses rather than being considered all short-term as under the previous law. As of August 31, 2014, the Fund did not have any capital loss carryforwards.
6. Subsequent Events
Management has evaluated the impact of all subsequent events on the Fund though the date the financial statements were issued, and has determined that there were no subsequent events requiring recognition or disclosure in the financial statements.
16
SUMMIT GLOBAL INVESTMENTS
U.S. LOW VOLATILITY EQUITY FUND
Other Information
(Unaudited)
Proxy Voting
Policies and procedures that the Fund uses to determine how to vote proxies relating to portfolio securities as well as information regarding how the Fund voted proxies relating to portfolio securities for the most recent six-month period ended June 30 are available without charge, upon request, by calling (855) 744-8500 and on the Securities and Exchange Commission’s (“SEC”) website at http://www.sec.gov.
Quarterly Portfolio Schedules
The Company will file its complete schedule of portfolio holdings with the SEC for the first and third fiscal quarters of each fiscal year (quarters ended November 30 and May 31) on Form N-Q. The Company’s Forms N-Q will be available on the SEC’s website at http://www.sec.gov and may be reviewed and copied at the SEC’s Public Reference Room in Washington, D.C. Information on the operation of the SEC’s Public Reference Room may be obtained by calling (800) SEC-0330.
17
[THIS PAGE INTENTIONALLY LEFT BLANK.]
Investment Adviser
Summit Global Investments, LLC
620 South Main Street
Bountiful, UT 84010
Administrator
BNY Mellon Investment Servicing (US) Inc.
301 Bellevue Parkway
Wilmington, DE 19809
Transfer Agent
BNY Mellon Investment Servicing (US) Inc.
4400 Computer Drive
Westborough, MA 01581
Principal Underwriter
Foreside Funds Distributors LLC
400 Berwyn Park
899 Cassatt Road
Berwyn, PA 19312
Custodian
The Bank of New York Mellon
One Wall Street
New York, NY 10286
Independent Registered Public Accounting Firm
Ernst & Young LLP
One Commerce Square
2005 Market Street, Suite 700
Philadelphia, PA 19103
Legal Counsel
Drinker, Biddle & Reath LLP
One Logan Square, Ste. 2000
Philadelphia, PA 19103
SUM-SAR15
Item 2. Code of Ethics.
Not applicable.
Item 3. Audit Committee Financial Expert.
Not applicable.
Item 4. Principal Accountant Fees and Services.
Not applicable.
Item 5. Audit Committee of Listed Registrants.
Not applicable.
Item 6. Investments.
| (a) | Schedule of Investments in securities of unaffiliated issuers as of the close of the reporting period is included as part of the report to shareholders filed under Item 1 of this Form. |
Item 7. Disclosure of Proxy Voting Policies and Procedures for Closed-End Management Investment Companies.
Not applicable.
Item 8. Portfolio Managers of Closed-End Management Investment Companies.
Not applicable.
Item 9. Purchases of Equity Securities by Closed-End Management Investment Company and Affiliated Purchasers.
Not applicable.
Item 10. Submission of Matters to a Vote of Security Holders.
There have been no material changes to the procedures by which the shareholders may recommend nominees to the registrant’s board of directors, where those changes were implemented after the registrant last provided disclosure in response to the requirements of Item 407(c)(2)(iv) of Regulation S-K (17 CFR 229.407) (as required by Item 22(b)(15) of Schedule 14A (17 CFR 240.14a-101)), or this Item.
Item 11. Controls and Procedures.
| | (a) | The registrant’s principal executive and principal financial officers, or persons performing similar functions, have concluded that the registrant’s disclosure controls and procedures (as defined in Rule 30a-3(c) under the Investment Company Act of 1940, as amended (the “1940 Act”)) are effective, as of a date within 90 days of the filing date of the report, based on their evaluation of these controls and procedures required by Rule 30a-3(b) under the 1940 Act and Rules 13a-15(b) or 15d-15(b) under the Securities Exchange Act of 1934, as amended. |
| | (b) | There were no changes in the registrant’s internal control over financial reporting (as defined in Rule 30a-3(d) under the 1940 Act) that occurred during the registrant’s second fiscal quarter of the period covered by this report that has materially affected, or is reasonably likely to materially affect, the registrant’s internal control over financial reporting. |
Item 12. Exhibits.
| | (a)(2) | Certifications pursuant to Rule 30a-2(a) under the 1940 Act and Section 302 of the Sarbanes-Oxley Act of 2002 are attached hereto. |
| | (b) | Certifications pursuant to Rule 30a-2(b) under the 1940 Act and Section 906 of the Sarbanes-Oxley Act of 2002 are attached hereto. |
SIGNATURES
Pursuant to the requirements of the Securities Exchange Act of 1934 and the Investment Company Act of 1940, the registrant has duly caused this report to be signed on its behalf by the undersigned, thereunto duly authorized.
| | | | |
(Registrant) The RBB Fund, Inc. | | |
| |
By (Signature and Title)* /s/ Salvatore Faia | | |
| | Salvatore Faia, President | | |
| | (principal executive officer) | | |
| |
Date 05/01/15 | | |
Pursuant to the requirements of the Securities Exchange Act of 1934 and the Investment Company Act of 1940, this report has been signed below by the following persons on behalf of the registrant and in the capacities and on the dates indicated.
| | | | |
By (Signature and Title)* /s/ Salvatore Faia | | |
| | Salvatore Faia, President | | |
| | (principal executive officer) | | |
| |
Date 05/01/15 | | |
| |
By (Signature and Title)* /s/ Joel Weiss | | |
| | Joel Weiss, Treasurer | | |
| | (principal financial officer) | | |
| |
Date 05/01/15 | | |
| * | Print the name and title of each signing officer under his or her signature. |